Supporting Nested OpenMP Parallelism in the TAU Performance System
20
DOI: 10.1007/s10766-007-0050-5 International Journal of Parallel Programming, Vol. 35, No. 4, August 2007 (© 2007) Supporting Nested OpenMP Parallelism in theTAU Performance System Alan Morris, 1,2 Allen D. Malony, 1 and Sameer S. Shende 1 Received November 6, 2006; revised January 15, 2007; accepted January 26, 2007 Nested OpenMP parallelism allows an application to spawn teams of nested threads. This hierarchical nature of thread creation and usage poses problems for performance measurement tools that must determine thread context to properly maintain per-thread performance data. In this paper we describe the problem and a novel solution for identifying threads uniquely. Our approach has been implemented in the TAU performance system and has been success- fully used in profiling and tracing OpenMP applications with nested paralle- lism. We also describe how extensions to the OpenMP standard can help tool developers uniquely identify threads. KEY WORDS: OpenMP; Nested parallelism; TAU. 1. INTRODUCTION OpenMP (1) research systems have supported nested parallelism since its introduction in the OpenMP standard e.g., (2,3) , and most commercial com- pilers now support nested parallelism in their products. Although some commercial packages provide tools for debugging and performance ana- lysis in the presence of nested parallelism (e.g., Sun Studio (4) and Intel’s stools (5) ), the recent OpenMP 2.5 specification (6) does not provide suf- ficient support for developing portable performance measurement and analysis tools with nested parallelism awareness. This deficiency is being 1 Performance Research Laboratory, Department of Computer and Information Science, University of Oregon, Eugene, OR, USA. E-mails: {amorris,malony,sameer}@cs.uoregon.edu 2 To whom correspondence should be addressed. 417 0885-7458/07/0800-0417/0 © 2007 Springer Science+Business Media, LLC
-
Upload
independent -
Category
Documents
-
view
3 -
download
0
Transcript of Supporting Nested OpenMP Parallelism in the TAU Performance System

DOI: 10.1007/s10766-007-0050-5International Journal of Parallel Programming, Vol. 35, No. 4, August 2007 (© 2007)
Supporting Nested OpenMPParallelism in theTAU PerformanceSystem
Alan Morris,1,2 Allen D. Malony,1 and Sameer S. Shende1
Received November 6, 2006; revised January 15, 2007; accepted January 26, 2007
Nested OpenMP parallelism allows an application to spawn teams of nestedthreads. This hierarchical nature of thread creation and usage poses problemsfor performance measurement tools that must determine thread context toproperly maintain per-thread performance data. In this paper we describe theproblem and a novel solution for identifying threads uniquely. Our approachhas been implemented in the TAU performance system and has been success-fully used in profiling and tracing OpenMP applications with nested paralle-lism. We also describe how extensions to the OpenMP standard can help tooldevelopers uniquely identify threads.
KEY WORDS: OpenMP; Nested parallelism; TAU.
1. INTRODUCTION
OpenMP(1) research systems have supported nested parallelism since itsintroduction in the OpenMP standard e.g.,(2,3), and most commercial com-pilers now support nested parallelism in their products. Although somecommercial packages provide tools for debugging and performance ana-lysis in the presence of nested parallelism (e.g., Sun Studio(4) and Intel’sstools(5)), the recent OpenMP 2.5 specification(6) does not provide suf-ficient support for developing portable performance measurement andanalysis tools with nested parallelism awareness. This deficiency is being
1 Performance Research Laboratory, Department of Computer and Information Science,University of Oregon, Eugene, OR, USA. E-mails: {amorris,malony,sameer}@cs.uoregon.edu
2 To whom correspondence should be addressed.
417
0885-7458/07/0800-0417/0 © 2007 Springer Science+Business Media, LLC

418 Morris, Malony, and Shende
discussed in the OpenMP tools community(7) and hopefully will be addres-sed in future OpenMP specifications.
In the meantime, there is interest in studying how performance mea-surement systems can determine nesting context during execution in orderto capture performance data for threads and interpret the data vis a visnesting level. In this paper, we present extensions to the TAU parallelperformance system(8) to support nested parallelism. Section 2 describesTAU to a sufficient level of detail to understand how our extensions wereaccomplished. We describe the current problems facing tool developers insupporting nested parallelism in Section 3 and discuss three possible solu-tions in Section 4. We introduce our solution, a novel method for TAUto track thread identity and map performance to thread-specific categories.The goal was to produce a portable solution and this result was achie-ved. Section 5 describes the details. The TFS application(9,10) from RWTHAachen1 is used as a case study for the TAU solution. Section 6 providesa detailed performance analysis of a nested parallel execution of TFS.
The present issues for portable performance measurement of OpenMPnested parallel execution are, as remarked above, hopefully temporary. InSection 7, we outline discussions underway in the OpenMP tools commu-nity and what might be expected in the future to address the problem.Conclusions are given in Section 8.
2. TAU PERFORMANCE SYSTEM
The TAU performance system is composed of three maincomponents: instrumentation, measurement, and analysis. The process ofinstrumentation in TAU consists of inserting measurement probes into anapplication to expose performance events. The measurement library, trig-gered by these probes, collects performance data for the events that occurduring execution. Analysis tools are used to process and study the col-lected data and to visualize it. Figure 1 shows the three components thatmake up the TAU performance system and how they are related.
2.1. Instrumentation
In order to observe performance, additional instructions or probesare typically inserted into a program. This process is called instrumenta-tion, more accurately direct instrumentation. From the perspective of per-formance analysis, the execution of a program is regarded as a sequenceof significant events. Each event represents some action or state of the
1http://www-zhv.rwth-aachen.de/index.html

Supporting Nested OpenMP Parallelism 419
Fig. 1. TAU performance system architecture.

420 Morris, Malony, and Shende
program, and as the events occur, they activate probes which measureevent performance. In this manner, instrumentation exposes key characte-ristics of an execution to the performance system.
TAU implements a flexible instrumentation model that permits a userto insert performance instrumentation hooks into the application at seve-ral levels of program compilation and execution. The C, C++, and For-tran languages are supported, as well as standard message passing (e.g.,MPI) and multi-threading (e.g., POSIX threads, OpenMP) libraries. Multi-mode and hybrid executions are also allowed. Instrumentation supportincludes automatic source-level mechanisms, dynamic instrumentation,(11)
library interposition and preloading techniques, and runtime instrumenta-tion control.
2.2. Measurement
TAU provides a variety of measurement options that are chosen whenthe system is installed. Each configuration of TAU is represented in aset of measurement libraries and a stub makefile representing the TAUconfiguration. Profiling and tracing are the two performance evaluationtechniques that TAU supports. Profiling presents aggregate statistics ofperformance metrics for different events and tracing captures performanceinformation in timestamped event logs for analysis. In tracing, we canobserve along a global timeline when events take place in different pro-cesses and threads. Events tracked by both profiling and tracing includeentry and exit from routines, interprocess message communication events,and other user-defined atomic events. Tracing has the advantage of cap-turing temporal relationships between event records, but at the expense ofgenerating large trace files. The choice to profile trades the loss of tempo-ral information with gains in profile data efficiency.
Within the space of profiling, there is a wide range of data that canbe collected. First, with standard flat profiling, we can track both wall-clock time as well as hardware performance counters. Several data ele-ments are recorded for each measured event, including the inclusive andexclusive time, the number of event invocations, and the number of instru-mented child event invocations.
TAU also provides the capability to track callpath profiles. Here, theobjective is to determine the distribution of measured metrics along thedynamic routine (event) calling paths of an application. We speak of thedepth of a callpath as the number of parent routines included in each path.A callpath of depth 1 is a flat profile. A callpath of depth k representsa sequence of the last k − 1 routines called by a routine at the head ofthe callpath. The key concept to understand for callpath profiling is that

Supporting Nested OpenMP Parallelism 421
a callpath represents a performance event to the TAU measurement andanalysis components. Just as a callpath of depth 1 will represent a parti-cular routine and TAU will profile exclusive and inclusive values for thatroutine, every unique callpath of depth k in a program’s execution willrepresent a unique performance event to be profiled.
2.3. Analysis
The TAU performance system includes several tools for analysis andvisualization of performance data. These range for simple command linereporting tools to analysis tools with advanced GUI and presentation gra-phics support. TAU also provides support for performance data manage-ment.
ParaProf(12) is the primary performance data viewer in TAU. It iscapable of calculating simple statistics (e.g., mean, standard deviation) anddisplaying bar charts and histograms for flat profile data. With callpathdata, ParaProf can display expandable tree-tables as shown in Fig. 2, andcall-graphs as shown in Fig. 3. Additionally, large scale data can be dis-played in three-dimensional interactive charts such as Fig. 4.
Empirical performance evaluation of parallel applications can gene-rate significant amounts of performance data and analysis results frommultiple experiments as performance is investigated and problems diagno-sed. To better manage performance information, we developed the Perfor-mance Data Management Framework (PerfDMF).(13) PerfDMF utilizes arelational database to store performance profiles. It provides an abstractprofile query and analysis programming interface, and a toolkit of com-monly used utilities for building and extending performance analysis tools.
Large scale performance studies may involve extremely large perfor-mance datasets from repeated executions across multiple platforms withvarying parameters. The potential size of datasets and the need to assi-milate results from multiple experiments makes it a daunting challengeto not only process the information, but discover and understand perfor-mance insights. In order to perform analysis on these large collections ofperformance experiment data, we developed PerfExplorer,(14) a frameworkfor parallel performance data mining and knowledge discovery. The frame-work architecture enables the development and integration of data miningoperations that will be applied to large- scale parallel performance profiles.PerfExplorer operates as a client- server system and is built on PerfDMFto access the parallel profiles and save its analysis results.

422 Morris, Malony, and Shende
Fig. 2. Nested Parallelism in TFS.
3. ISSUES WITH NESTED PARALLELISM IN OPENMP
OpenMP allows for nested parallel regions during execution.Nested parallelism can be enabled and disabled through the use of theOMP NESTED environment variable or by calling the omp set nested()

Supporting Nested OpenMP Parallelism 423
Fig. 3. The callgraph of each thread from an 8 thread run of TFS.
routine. A simple example is illustrated in Fig. 5.2 Here we see the effectsof nested OpenMP parallelism. Without nested parallelism enabled, theinner region pragma has no effect. Each thread from the outer regionwill execute the inner region in serial for a total of two executions of
2Adapted from http://docs.sun.com/source/819-0501/2 nested.html

424 Morris, Malony, and Shende
Fig. 4. 3D display of TFS performance data (inclusive time).
the inner region. When nested parallelism is enabled, both the inner andouter regions will be parallelized independently and will have two threadsin each team, resulting in four executions of the inner region.
This example also illustrates that the omp get thread num() run-time call cannot be used for unique thread identification within the

Supporting Nested OpenMP Parallelism 425
#include <omp.h>#include <stdio.h>
void report_num_threads(int level) { printf("Level %d: omp_get_num_threads()=%d", level, omp_get_num_threads()); printf(", omp_get_thread_num()=%d\n", omp_get_thread_num());}
int main(int argc, char **argv) { #pragma omp parallel num_threads(2) { report_num_threads(1); #pragma omp parallel num_threads(2) { report_num_threads(2); } } return(0);}
% OMP_NESTED=0 ./a.outLevel 1: omp_get_num_threads()=2, omp_get_thread_num()=0Level 2: omp_get_num_threads()=1, omp_get_thread_num()=0Level 1: omp_get_num_threads()=2, omp_get_thread_num()=1Level 2: omp_get_num_threads()=1, omp_get_thread_num()=0
% OMP_NESTED=1 ./a.outLevel 1: omp_get_num_threads()=2, omp_get_thread_num()=0Level 1: omp_get_num_threads()=2, omp_get_thread_num()=1Level 2: omp_get_num_threads()=2, omp_get_thread_num()=0Level 2: omp_get_num_threads()=2, omp_get_thread_num()=1Level 2: omp_get_num_threads()=2, omp_get_thread_num()=0Level 2: omp_get_num_threads()=2, omp_get_thread_num()=1
Fig. 5. An example illustrating nested OpenMP parallelism, the output (right) is obtainedby executing the program on the left.
process. While four threads are active at one time, the values fromomp get thread num() are only zero and one since the maximum size ofa given team is two.
Nested OpenMP parallelism poses a challenge to traditional performanceanalysis tools. The example in Fig. 5 is useful in pointing out the issues. Typi-cally, a performance tool will attempt to measure the performance for eachthread individually. To do so, there must be an agreement between the applica-tion and performance tool for proper thread identification to occur and mea-sured events appropriately assigned. Tools often require that the user configurethem with the same thread package that the application is using, be it Pthreads,OpenMP, or another thread package. When the tool and the application usethe same underlying thread package, proper thread identification can be per-formed. Moreover, to provide proper thread safety, the measurement systemmust be aware of the thread environment to perform proper synchronizationwhen necessary.
When nested parallelism is used in OpenMP, the nesting context is notavailable to the performance interface. It may appear that nested parallelismcan be determined from static analysis and a tool such as Opari(15,16) couldinsert additional instrumentation providing nesting information. However, sta-tic analysis is insufficient because the dynamic execution paths at runtime cancreate arbitrary nesting depths. A runtime solution for thread identification isnecessary.
Native thread libraries typically provide thread local storage (TLS)that performance tools use to track thread identities and other thread-

426 Morris, Malony, and Shende
specific state information. The OpenMP runtime library provides theomp get thread num() API call that returns the thread number or identifierwithin the active team of threads. Unfortunately, the value returned from thiscall lies between 0 and omp get num threads()-1, which is not the total num-ber of threads in the program, but the size of the team from which the call ismade. TAU and other tools have traditionally used this call for thread identi-fication. When an instrumented section of code is entered, the measurementlibrary identifies the calling thread and performs measurements associated withthat thread. Thread identification is critical because the measurement systemmust internally maintain the callstack for each running thread. Each of thesedata structures are keyed by the thread identifier. However, when using nestedOpenMP parallelism, multiple teams may be active at any one time and morethan one active thread will return the same index from omp get thread num().This will cause errors in the measurement system as it will observe what appearsare overlapping timers where a thread enters one routine, but exits from a dif-ferent one.
Nested parallelism in OpenMP offers the additional challenge of map-ping the per-thread performance data back to the nested parallelism abs-tractions in the source code. To do so, it is necessary to distinguish theperformance measurements for each thread based on the nesting context.When done properly, the execution profile should resemble a tree-like hie-rarchy of threads.
4. SOLUTIONS
The problem of thread identification in nested OpenMP programs iswidespread in the community, for purposes other than performance eva-luation. As such, several solutions have been proposed.
4.1. Extending the OpenMP API
A promising solution to this problem is to extend the OpenMP spe-cification itself to allow for more in depth query and knowledge of nestedparallelism. an Mey of RWTH proposed an extension to the OpenMP spe-cification in the form of runtime library calls that return the current nes-ting level, the number of threads within that level, and the current threadidentifier at that level. This provides enough information to uniquely iden-tify threads for performance measurement purposes as well as informationnecessary for the proper mapping of the runtime execution to the applica-tion developer’s model of nested parallelism in the application.
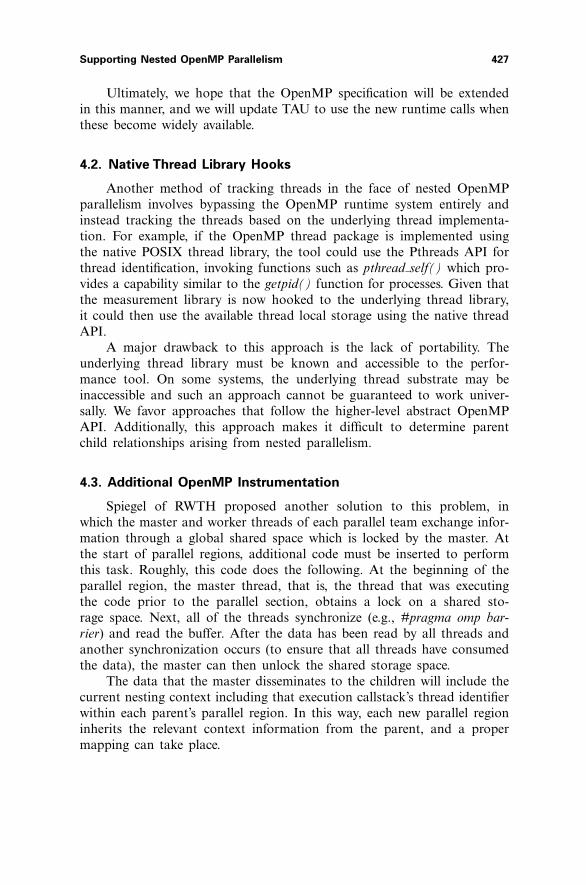
Supporting Nested OpenMP Parallelism 427
Ultimately, we hope that the OpenMP specification will be extendedin this manner, and we will update TAU to use the new runtime calls whenthese become widely available.
4.2. Native Thread Library Hooks
Another method of tracking threads in the face of nested OpenMPparallelism involves bypassing the OpenMP runtime system entirely andinstead tracking the threads based on the underlying thread implementa-tion. For example, if the OpenMP thread package is implemented usingthe native POSIX thread library, the tool could use the Pthreads API forthread identification, invoking functions such as pthread self() which pro-vides a capability similar to the getpid() function for processes. Given thatthe measurement library is now hooked to the underlying thread library,it could then use the available thread local storage using the native threadAPI.
A major drawback to this approach is the lack of portability. Theunderlying thread library must be known and accessible to the perfor-mance tool. On some systems, the underlying thread substrate may beinaccessible and such an approach cannot be guaranteed to work univer-sally. We favor approaches that follow the higher-level abstract OpenMPAPI. Additionally, this approach makes it difficult to determine parentchild relationships arising from nested parallelism.
4.3. Additional OpenMP Instrumentation
Spiegel of RWTH proposed another solution to this problem, inwhich the master and worker threads of each parallel team exchange infor-mation through a global shared space which is locked by the master. Atthe start of parallel regions, additional code must be inserted to performthis task. Roughly, this code does the following. At the beginning of theparallel region, the master thread, that is, the thread that was executingthe code prior to the parallel section, obtains a lock on a shared sto-rage space. Next, all of the threads synchronize (e.g., #pragma omp bar-rier) and read the buffer. After the data has been read by all threads andanother synchronization occurs (to ensure that all threads have consumedthe data), the master can then unlock the shared storage space.
The data that the master disseminates to the children will include thecurrent nesting context including that execution callstack’s thread identifierwithin each parent’s parallel region. In this way, each new parallel regioninherits the relevant context information from the parent, and a propermapping can take place.

428 Morris, Malony, and Shende
A tool such as Opari could be extended to support the additional ins-trumentation required for this type of thread synchronization at the sourcelevel. This approach has the advantage that it tracks the full nesting infor-mation, so at any given time, the performance tool can identify whichteam member from each team and each level of nesting is invoking a mea-surement point. This allows for a better mapping of thread level perfor-mance information back to the source code and application developer’sunderstanding of nested parallelism.
The drawback of this approach is, of course, the additional synchro-nization and locking at parallel region boundaries. We have not performedstudies to measure the overhead involved, but we estimate that it might besignificant for some programs.
5. OPENMP SUPPORT IN TAU
5.1. Existing Support
The TAU performance system supports performance evaluation ofOpenMP programs at the region, construct, and routine level. Additio-nally, the user may manually instrument regions of code using the TAUAPI. For OpenMP-based applications, the Opari tool is used to insert ins-trumentation based on the POMP(15) interface at OpenMP regions and forOpenMP constructs. The Program Database Toolkit (PDT)(17) is used toinstrument OpenMP source at the routine level.
Construct level measurement refers to the tracking of OpenMPconstructs by themselves. The resulting profile will show time spent ineach type of OpenMP construct. For example, the time spent in “forenter/exit [OpenMP]” and “barrier enter/exit [OpenMP]”represents the aggregate time spent in all OpenMP for and barrierconstructs.
Region level measurement goes beyond construct measurement to pro-vide specific information about each separate parallel region. For example,a timer called “for [OpenMP location: file:mandel.cpp <96,109>]” represents the time spent in the particular OpenMP for regionfrom lines 96 to 109 in the file mandel.cpp. Thus, the construct measu-rements are partitioned based on the region to which they apply.
During measurement, TAU uses the OpenMP thread synchroniza-tion calls for updating shared performance data structures when necessary.Construct-based measurement uses globally accessible timers to aggre-gate construct-specific performance costs over all OpenMP regions. Forregion-based measurement, the region descriptor is used to partition theconstruct information for each region.

Supporting Nested OpenMP Parallelism 429
In our earlier work,(15,18) TAU relied upon the OpenMP runtime APIcall, omp get thread num(), to distinguish threads for indexing into theruntime performance data structures. Unfortunately, this method is inade-quate for nested parallelism due to the issues discussed above. Instead, weneed a mechanism to uniquely identify the current thread.
5.2. Support of Nested Parallelism
We propose a new scheme for thread identification. Our approachinvolves the use of the OpenMP directive, #pragma threadprivate(). Thebasic idea is to identify and use some piece of data that is unique for eachthread and persists within a thread’s execution such that the same identi-fier can be derived at the start of a thread’s execution of a region and atany point until the end of the region. Although the values of a thread-private variable are not guaranteed to persist between parallel regions, weare at least guaranteed that no two currently active threads will point tothe same memory location for a given threadprivate variable. Using thisscheme, TAU can then uniquely identify threads even in the presence ofnested parallelism.
The approach requires a single threadprivate variable that is initiali-zed inside the TAU library (when TAU is built using OpenMP threading).This variable and/or its address can be used to distinguish it from otherthreads executing concurrently. When the TAU runtime system encountersa thread that it has not seen before, it registers the thread and assigns itan identifier on a first come, first serve basis.
In contrast to the other proposed approaches, this method has theadvantage of faster speed, as no runtime API calls are made in identifyinga thread. The thread registration in the TAU runtime system is performedonly when a given thread is seen for the first time, so there is no additionaloverhead at parallel region boundaries. Additionally, this method requiresno knowledge of the underlying native thread library, it is based solelyon the OpenMP system. The main drawback with this method is that weare unable to identify the nesting depth or retain the team identifier fora given thread. A thread is assigned a unique identifier, but this typicallydoes not map back to the nested teams within the application source code.Nevertheless, as we see below, this new method produces performance datathat can be mapped back to the source code and does expose nested paral-lelism where it occurs.

430 Morris, Malony, and Shende
6. A CASE STUDY
To demonstrate TAU’s new scheme for performance measurementof nested parallelism in OpenMP, we conducted a performance study ofTFS,(9,10) a computational fluid dynamics code developed at the Aerody-namics Institute at RWTH Aachen. TFS was initially parallelized usingParaWise(19) to generate an intra-block parallelization where the parallelloops operated over a single dimension within a block. Then, a secondversion was developed that used parallel loops to iterate over blocks.Finally, a hybrid, multi-level version was developed which combined boththe intra- and inter- block parallelizations using nested OpenMP paral-lelism. In recent performance testing, the developers reported a spee-dup of 21 for TFS using nested OpenMP parallelism on a SunFire 25 Ksystem.(20)
We analyzed the TFS code by first integrating TAU into the TFSbuild system and instrumented its source code using the TAU’s compila-tion scripts. This process required only a single modification to the TFSbuild system where the name of the compiler used in the makefile waschanged from FC=f90 to FC=tau f90.sh. This script acts as a compi-ler wrapper, allowing for automatic instrumentation of Fortran programs(similarly, tau cc.sh and tau cxx.sh are used for C and C++ compi-lation, respectively) . In the case of OpenMP code, it automatically invokesthe Opari tool to instrument OpenMP constructs and regions by rewritingOpenMP directives using the POMP interface. The code is then parsedby PDT to create PDB files that contain source-level information aboutthe routine names, and their respective entry and exit locations. The scriptthen instruments the entry and exit points using the tau instrumentor uti-lity. Finally, the instrumented code is compiled and linked with the TAUlibrary.
We ran TFS on the SunFire machines at RWTH Aachen using eightthreads. With TAU’s support for nested OpenMP parallelism, we canrun the instrumented version of TFS without the thread identifier clashthat occurred previously. The flat profile for TFS is shown in Fig. 6.Each thread is represented by a row in the graph, and each timer/regionis a column. The event in the second column (colored red) is .TAUapplication, a special timer created at the start of thread executionwhich is then stopped at the end of program execution. The effect is toshow roughly how much time each thread spends idle since its exclusivetime is roughly the wall clock time of the application minus the activeparallel regions.
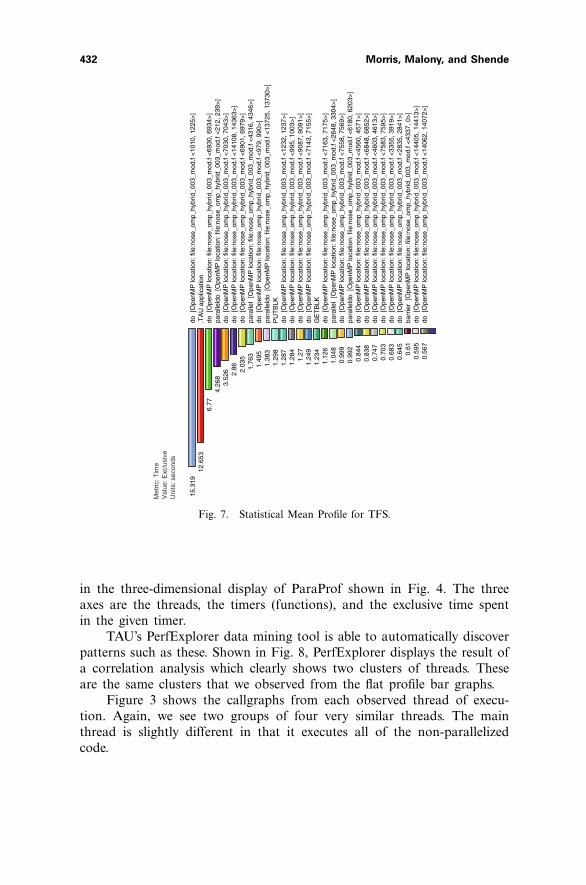
Figure 7 shows the statistical mean exclusive value across all threads.Note that the timer names for parallel regions and constructs contain the

Supporting Nested OpenMP Parallelism 431
Met
ric: T
ime
Val
ue: E
xclu
sive
std.
dev
.m
ean
n,c,
t 0,0
,0n,
c,t 0
,0,1
n,c,
t 0,0
,2n,
c,t 0
,0,3
n,c,
t 0,0
,4n,
c,t 0
,0,5
n,c,
t 0,0
,6n,
c,t 0
,0,7
Fig. 6. Flat Profile for TFS.
source filename and line number. This data is provided by the Opari toolthrough the POMP interface.
By looking at the flat profile we find that there is a clear pattern inthe data wherein threads 0, 1, 3, and 4 have a similar execution profile,and threads 2, 5, 6 and 7 are also very similar. This pattern is also visible
432 Morris, Malony, and Shende
Met
ric: T
ime
Val
ue: E
xclu
sive
Uni
ts: s
econ
ds
do [
Ope
nMP
loca
tion:
file
:nos
e_om
p_hy
brid
_003
_mod
.f <
1010
, 122
5>]
15.3
19.T
AU
app
licat
ion
12.6
53do
[O
penM
P lo
catio
n: fi
le:n
ose_
omp_
hybr
id_0
03_m
od.f
<69
30, 6
934>
] 6
.77
para
lleld
o [O
penM
P lo
catio
n: fi
le:n
ose_
omp_
hybr
id_0
03_m
od.f
<21
2, 2
39>
] 4
.268
do [
Ope
nMP
loca
tion:
file
:nos
e_om
p_hy
brid
_003
_mod
.f <
7030
, 704
3>]
3.5
26do
[O
penM
P lo
catio
n: fi
le:n
ose_
omp_
hybr
id_0
03_m
od.f
<14
108,
143
63>
] 2
.86
do [
Ope
nMP
loca
tion:
file
:nos
e_om
p_hy
brid
_003
_mod
.f <
6901
, 697
9>]
2.0
35pa
ralle
l [O
penM
P lo
catio
n: fi
le:n
ose_
omp_
hybr
id_0
03_m
od.f
<43
16, 4
346>
] 1
.763
do [
Ope
nMP
loca
tion:
file
:nos
e_om
p_hy
brid
_003
_mod
.f <
979,
990
>]
1.4
95pa
ralle
ldo
[Ope
nMP
loca
tion:
file
:nos
e_om
p_hy
brid
_003
_mod
.f <
1372
5, 1
3730
>]
1.3
83P
UT
BLK
1.2
98do
[O
penM
P lo
catio
n: fi
le:n
ose_
omp_
hybr
id_0
03_m
od.f
<12
32, 1
237>
] 1
.287
do [
Ope
nMP
loca
tion:
file
:nos
e_om
p_hy
brid
_003
_mod
.f <
995,
100
3>]
1.2
84do
[O
penM
P lo
catio
n: fi
le:n
ose_
omp_
hybr
id_0
03_m
od.f
<90
87, 9
091>
] 1
.27
do [
Ope
nMP
loca
tion:
file
:nos
e_om
p_hy
brid
_003
_mod
.f <
7143
, 715
5>]
1.2
49G
ET
BLK
1.2
34do
[O
penM
P lo
catio
n: fi
le:n
ose_
omp_
hybr
id_0
03_m
od.f
<71
63, 7
175>
] 1
.126
para
llel
[Ope
nMP
loca
tion:
file
:nos
e_om
p_hy
brid
_003
_mod
.f <
2648
, 330
4>]
1.0
48do
[O
penM
P lo
catio
n: fi
le:n
ose_
omp_
hybr
id_0
03_m
od.f
<75
58, 7
569>
] 0
.999
para
lleld
o [O
penM
P lo
catio
n: fi
le:n
ose_
omp_
hybr
id_0
03_m
od.f
<61
80, 6
203>
] 0
.992
do [
Ope
nMP
loca
tion:
file
:nos
e_om
p_hy
brid
_003
_mod
.f <
4560
, 457
1>]
0.8
44do
[O
penM
P lo
catio
n: fi
le:n
ose_
omp_
hybr
id_0
03_m
od.f
<68
48, 6
852>
] 0
.838
do [
Ope
nMP
loca
tion:
file
:nos
e_om
p_hy
brid
_003
_mod
.f <
4603
, 461
3>]
0.7
47do
[O
penM
P lo
catio
n: fi
le:n
ose_
omp_
hybr
id_0
03_m
od.f
<75
83, 7
595>
] 0
.703
do [
Ope
nMP
loca
tion:
file
:nos
e_om
p_hy
brid
_003
_mod
.f <
3355
, 391
9>]
0.6
83do
[O
penM
P lo
catio
n: fi
le:n
ose_
omp_
hybr
id_0
03_m
od.f
<28
35, 2
841>
] 0
.645
barr
ier
[Ope
nMP
loca
tion:
file
:nos
e_om
p_hy
brid
_003
_mod
.f <
4337
, 0>
] 0
.61
do [
Ope
nMP
loca
tion:
file
:nos
e_om
p_hy
brid
_003
_mod
.f <
1440
5, 1
4413
>]
0.5
95do
[O
penM
P lo
catio
n: fi
le:n
ose_
omp_
hybr
id_0
03_m
od.f
<14
062,
140
72>
] 0
.567
Fig. 7. Statistical Mean Profile for TFS.
in the three-dimensional display of ParaProf shown in Fig. 4. The threeaxes are the threads, the timers (functions), and the exclusive time spentin the given timer.
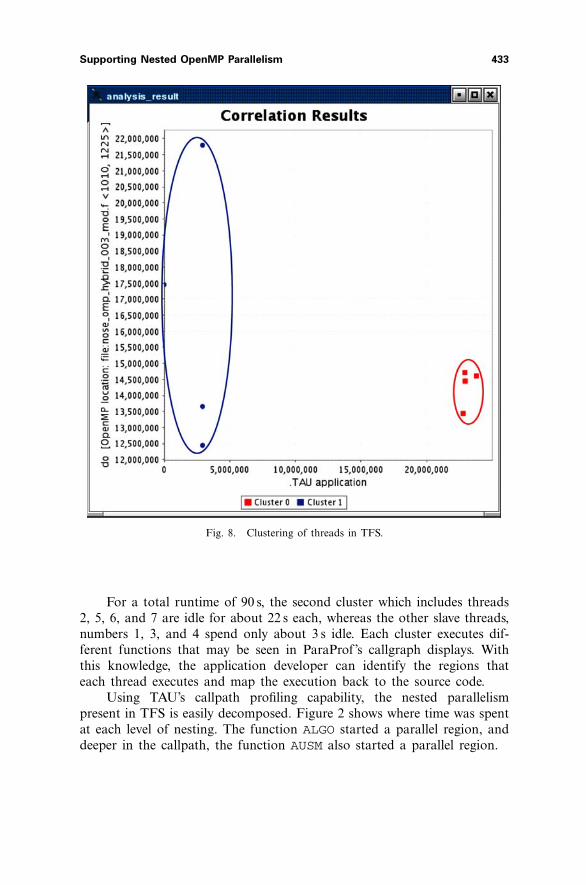
TAU’s PerfExplorer data mining tool is able to automatically discoverpatterns such as these. Shown in Fig. 8, PerfExplorer displays the result ofa correlation analysis which clearly shows two clusters of threads. Theseare the same clusters that we observed from the flat profile bar graphs.
Figure 3 shows the callgraphs from each observed thread of execu-tion. Again, we see two groups of four very similar threads. The mainthread is slightly different in that it executes all of the non-parallelizedcode.
Supporting Nested OpenMP Parallelism 433
Fig. 8. Clustering of threads in TFS.
For a total runtime of 90 s, the second cluster which includes threads2, 5, 6, and 7 are idle for about 22 s each, whereas the other slave threads,numbers 1, 3, and 4 spend only about 3 s idle. Each cluster executes dif-ferent functions that may be seen in ParaProf’s callgraph displays. Withthis knowledge, the application developer can identify the regions thateach thread executes and map the execution back to the source code.
Using TAU’s callpath profiling capability, the nested parallelismpresent in TFS is easily decomposed. Figure 2 shows where time was spentat each level of nesting. The function ALGO started a parallel region, anddeeper in the callpath, the function AUSM also started a parallel region.

434 Morris, Malony, and Shende
7. FUTURE WORK
As noted earlier, there is active discussion underway in the OpenMPtools forum as to what the appropriate interface should be for runtimetools such as performance measurement libraries. We hope that runtimesystem functions will be made available for thread identification and nes-ting context to be queried. There is currently a proposal being reviewed bythe OpenMP Architecture Review Board to this effect.
For the purposes of enhancing the TAU performance system, wewould like to support a higher level mapping of thread identifiers back tothe application developer’s model of nested parallelism. In the case of non-nested parallelism, TAU already provides a clear picture of the executionperformance of each thread in each team. This picture is currently not asclear in the nested case because we have only a single number to identifya thread. We anticipate adding support for thread naming in TAU whe-rein a thread is labeled in the nested OpenMP case by its nesting depthand identifier, or by the identifier in each team where it originated (suchas “thread 0 → 3 → 2”). This will allow us to display performance ins-trumentation based on the hierarchical structure of each thread team. Theruntime, hopefully provided in a future OpenMP specification, will providethe necessary information to maintain these structures in the measurementsystem.
8. CONCLUSION
Performance evaluation of OpenMP codes is critical in making thegreatest use of SMP-capable machines, both in the the small and largescale. Application developers rely on performance tools such as TAU tostudy the performance of their programs under varying conditions.
Performance tools that measure per-thread performance data mustbe able to uniquely identify threads of execution at runtime in order toassign resulting measurements. Additionally, they must support concur-rent multi-threaded execution with simultaneous event invocations acrossall the threads in the process.
This process is complicated in the presence of nested parallelism inOpenMP when thread identities queried from the runtime system onlyrepresent identities within a subset of the currently active threads (thelocal team). Additionally, there is no support in the specification foraccessing information about nesting context. In this paper, we describethe nested parallelism problem currently faced by tools for portableOpenMP performance analysis. Several possible solutions are discussed.The approach we implemented in the TAU performance system uses

Supporting Nested OpenMP Parallelism 435
thread private storage to create a unique thread identifier. The approach isportable and has been validated with both Sun and Intel’s OpenMP com-pilers. We demonstrated TAU’s new capability to track nested OpenMPparallelism in the TFS application and analyzed a sample execution.
ACKNOWLEDGEMENTS
Research at the University of Oregon is sponsored by contracts (DE-FG02-05ER25663, DE-FG02-05ER25680) from the MICS program of theUS Dept. of Energy, Office of Science.
REFERENCES
1. OpenMP, http://www.openmp.org/drupal/.2. Y. Tanaka, K. Taura, M. Sato, and A. Yonezawa, Performance Evaluation of OpenMP
Applications with Nested Parallelism, in Languages, Compilers, and Run-Time Systemsfor Scalable Computers, pp. 100–112 (2000).
3. M. Gonzalez, E. Ayguade, X. Martorell, J. Labarta, N. Navarro, and J. Oliver, Nanos-Compiler: Supporting Flexible Multilevel Parallelism Exploitation in OpenMP, Concur-rency - Pract. Exp. 12(12):1205–1218 (2000).
4. Sun Studio compilers, http://developers.sun.com/prodtech/cc (2006).5. Intel compilers, http://www.intel.com/cd/software/products/asmo-na/
eng/compilers (2006).6. OpenMP API Specification 2.5, http://www.openmp.org/drupal/mp-documents/
spec25.pdf, May (2005).7. OpenMP tools mailing list, [email protected], http://openmp.org/
mailman/listinfo/omp-tools.8. S. Shende and A. D. Malony, The TAU Parallel Performance System, Int. J. High
Perform. Comput. Appl. 20(2):287–331 (2006).9. E. Fares, M. Meinke, and W. Schroder, Numerical Simulation of the Interaction of
Flap Side-Edge Vortices and Engine Jets, in Proceedings of the 22nd InternationalCongress of Aeronautical Sciences, ICAS 0212, September (2000).
10. E. Fares, M. Meinke, and W. Schroder, Numerical Simulation of the Interactionof Wingtip Vortices and Engine Jets in the Near Field, in Proceedings of the 38thAerospace Sciences Meeting and Exhibit, AIAA Paper 20002222, January (2000)
11. Bryan R. Buck and Jeffrey K. Hollingsworth, An API for Runtime Code Patching,J. High Perform. Comput. Appl. 14(4), Winter (2000).
12. R. Bell, A. D. Malony, and S. Shende, A Portable, Extensible, and Scalable Tool forParallel Performance Profile Analysis, Proc. EUROPAR 2003 conference, LNCS 2790,Springer, Berlin, pp. 17–26 (2003).
13. K. A. Huck, A. D. Malony, R. Bell, and A. Morris, Design and Implementation ofa Parallel Performance Data Management Framework, Proc. International Conferenceon Parallel Processing (ICPP 2005), IEEE Computer Society (2005).
14. K. A. Huck and A. D. Malony, PerfExplorer: A Performance Data Mining Frame-work for Large-Scale Parallel Computing, in Proceedings of SC 2005 conference, ACM(2005).

436 Morris, Malony, and Shende
15. B. Mohr, A. D. Malony, S. Shende, and F. Wolf, Towards a Performance Tool Inter-face for OpenMP: An Approach Based on Directive Rewriting, in Proceedings of ThirdEuropean Workshop on OpenMP, (EWOMP 2001), September (2001).
16. B. Mohr and F. Wolf, KOJAK – A Tool Set for Automatic Performance Analysis ofParallel Applications, in Proc. of the European Conference on Parallel Computing (Euro-Par), Springer-Verlag, Berlin LNCS 2790, pp. 1301–1304, August 26–29 (2003).
17. K. Lindlan, J. Cuny, A. Malony, S. Shende, B. Mohr, R. Rivenburgh, and C. Rasmus-sen, A Tool Framework for Static and Dynamic Analysis of Object-Oriented Softwarewith Templates, SC 2000 conference (2000).
18. B. Mohr, A. D. Malony, S. Shende, and F. Wolf, Design and Prototype of a Perfor-mance Tool Interface for OpenMP, J. Supercomput. 23 105–128 (2002).
19. ParaWise, http://www.parallelsp.com/parawise.htm (2006).20. I. Horschler, S. P. Johnson, and D. an Mey, 100 (Processor) Years Simula-
tion of Flow through the Human Nose using OpenMP, http://www.rz.rwth-aachen.de/computing/events/2005/sunhpc colloquium/07 Hoerschler.pdf (2006).