Ultraviolet Emission-line Ratios of Cataclysmic Variables
16
THE ASTROPHYSICAL JOURNAL, 477 : 832È847, 1997 March 10 1997. The American Astronomical Society. All rights reserved. Printed in U.S.A. ( ULTRAVIOLET EMISSION-LINE RATIOS OF CATACLYSMIC VARIABLES1 CHRISTOPHER W. MAUCHE Lawrence Livermore National Laboratory, L-41, P.O. Box 808, Livermore, CA 94550 ; mauche=cygnus.llnl.gov Y. PAUL LEE2 Lawrence Livermore National Laboratory, Livermore, CA 94550, and Department of Physics, University of California, Davis, CA 95616 AND TIMOTHY R. KALLMAN Laboratory for High Energy Astrophysics, NASA/Goddard Space Flight Center, Code 665, Greenbelt, MD 20771 ; tim=xstar.gsfc.nasa.gov Received 1995 October 12 ; accepted 1996 October 3 ABSTRACT We present a statistical analysis of the ultraviolet emission lines of cataclysmic variables (CVs) based on B430 ultraviolet spectra of 20 sources extracted from the International Ultraviolet Explorer Uniform Low Dispersion Archive. These spectra are used to measure the emission-line Ñuxes of N V, Si IV,C IV, and He II and to construct diagnostic Ñux ratio diagrams. We investigate the Ñux ratio parameter space populated by individual CVs and by various CV subclasses (e.g., AM Her stars, DQ Her stars, dwarf novae, nova-like variables). For most systems, these ratios are clustered within a range of D1 decade for log Si IV/C IV B [0.5 and log He II/C IV B [1.0 and D1.5 decades for log N V/C IV B [0.25. These ratios are compared to photoionization and collisional ionization models to constrain the excitation mechanism and the physical conditions of the line-emitting gas. We Ðnd that the collisional models do the poorest job of reproducing the data. The photoionization models reproduce the Si IV/C IV line ratios for some shapes of the ionizing spectrum, but the predicted N V/C IV line ratios are simultaneously too low by typically D0.5 decades. Worse, for no parameters are any of the models able to reproduce the observed He II/C IV line ratios ; this ratio is far too small in the collisional and scattering models and too large by typically D0.5 decades in the photoionization models. Subject headings : atomic processes È line : formation È stars : novae, cataclysmic variables È ultraviolet : stars 1. INTRODUCTION During its 17 plus years of operation, the International Ultraviolet Explorer (IUE) satellite et al. (Boggess 1978) acquired a large number ([105) of UV spectra from all classes of astronomical objects. Cataclysmic variables have been studied intensively with IUE, and these spectra have revealed a wide variety of phenomena that were previously unknown or poorly studied. These include mass loss via high-velocity winds, the heating and cooling of the white dwarf, the spectrum of the accretion disk, and the response of the disk to dwarf nova outbursts. As a result, we now have a much more complete understanding of the nature of CVs : the geometry, velocity law, mass-loss rate, and ioniza- tion structure of the wind ; the disk instability mechanism and the heating and cooling waves that drive the disk to and from outburst ; the relative energetics of the accretion disk and boundary layer ; subclasses ; and even evolutionary scenarios. These advances are due in part to the fact that CVs emit a large fraction of their luminosity in the UV. With few exceptions, the strategy that has prevailed to date in the study of CVs with IUE and other instruments is to make an observation or set of observations of a single object and to analyze and interpret those data separately 1 Based on observations with the International Ultraviolet Explorer satellite, which is sponsored and operated by the National Aeronautics and Space Administration, the Science Research Council of the United Kingdom, and the European Space Agency. 2 Present address : Space Telescope Science Institute, 3700 San Martin Drive, Baltimore, MD 21218 ; plee=stsci.edu. from the data of other similar objects. Only when this step is complete are the data compared with those from other similar objects. An alternative strategy is to examine the data from all the objects of a given class simultaneously. This is practical only in situations where a large body of data exists, of fairly uniform quality, and when the various members of a given class form a relatively homogeneous group. A few such studies of CVs using various manifesta- tions of the IUE archive have appeared in the literature. studied the absolute continuum spectral Ñux Verbunt (1987) distributions of disk-fed CVs. Dous studied the la (1991) relative continuum spectral Ñux distributions of all classes of CVs but concentrated on disk-fed systems. For the dis- crete spectral features, only the inclination dependence of the equivalent widths was discussed. Zhang, & Chen Deng, studied the dependence on the orbital period and (1994) inclination of the relative continuum spectral Ñux distribu- tions and the equivalent widths of the lines of dwarf novae in quiescence. It is unfortunate that so little quantitative work has been performed to date on the emission lines of CVs. Emission lines are powerful diagnostics of the physical conditions in all types of objects including these interacting binaries. The emission-line Ñuxes or relative Ñuxes can constrain the tem- perature, ionization state, density, elemental abundance, and geometrical distribution of the gas. However, the dependence of measurable quantities on these parameters is often complicated, necessitating numerical model Ðtting in many situations. The range of possible assumptions regard- ing the physical mechanisms of heating and ionization, 832
Transcript of Ultraviolet Emission-line Ratios of Cataclysmic Variables
THE ASTROPHYSICAL JOURNAL, 477 :832È847, 1997 March 101997. The American Astronomical Society. All rights reserved. Printed in U.S.A.(
ULTRAVIOLET EMISSION-LINE RATIOS OF CATACLYSMIC VARIABLES1CHRISTOPHER W. MAUCHE
Lawrence Livermore National Laboratory, L-41, P.O. Box 808, Livermore, CA 94550 ; mauche=cygnus.llnl.gov
Y. PAUL LEE2Lawrence Livermore National Laboratory, Livermore, CA 94550, and
Department of Physics, University of California, Davis, CA 95616
AND
TIMOTHY R. KALLMAN
Laboratory for High Energy Astrophysics, NASA/Goddard Space Flight Center, Code 665, Greenbelt, MD 20771 ;tim=xstar.gsfc.nasa.gov
Received 1995 October 12 ; accepted 1996 October 3
ABSTRACTWe present a statistical analysis of the ultraviolet emission lines of cataclysmic variables (CVs) based
on B430 ultraviolet spectra of 20 sources extracted from the International Ultraviolet Explorer UniformLow Dispersion Archive. These spectra are used to measure the emission-line Ñuxes of N V, Si IV, C IV,and He II and to construct diagnostic Ñux ratio diagrams. We investigate the Ñux ratio parameter spacepopulated by individual CVs and by various CV subclasses (e.g., AM Her stars, DQ Her stars, dwarfnovae, nova-like variables). For most systems, these ratios are clustered within a range of D1 decade forlog Si IV/C IV B [0.5 and log He II/C IV B [1.0 and D1.5 decades for log N V/C IV B [0.25. Theseratios are compared to photoionization and collisional ionization models to constrain the excitationmechanism and the physical conditions of the line-emitting gas. We Ðnd that the collisional models dothe poorest job of reproducing the data. The photoionization models reproduce the Si IV/C IV line ratiosfor some shapes of the ionizing spectrum, but the predicted N V/C IV line ratios are simultaneously toolow by typically D0.5 decades. Worse, for no parameters are any of the models able to reproduce theobserved He II/C IV line ratios ; this ratio is far too small in the collisional and scattering models and toolarge by typically D0.5 decades in the photoionization models.Subject headings : atomic processes È line : formation È stars : novae, cataclysmic variables È
ultraviolet : stars
1. INTRODUCTION
During its 17 plus years of operation, the InternationalUltraviolet Explorer (IUE) satellite et al.(Boggess 1978)acquired a large number ([105) of UV spectra from allclasses of astronomical objects. Cataclysmic variables havebeen studied intensively with IUE, and these spectra haverevealed a wide variety of phenomena that were previouslyunknown or poorly studied. These include mass loss viahigh-velocity winds, the heating and cooling of the whitedwarf, the spectrum of the accretion disk, and the responseof the disk to dwarf nova outbursts. As a result, we nowhave a much more complete understanding of the nature ofCVs : the geometry, velocity law, mass-loss rate, and ioniza-tion structure of the wind ; the disk instability mechanismand the heating and cooling waves that drive the disk toand from outburst ; the relative energetics of the accretiondisk and boundary layer ; subclasses ; and even evolutionaryscenarios. These advances are due in part to the fact thatCVs emit a large fraction of their luminosity in the UV.
With few exceptions, the strategy that has prevailed todate in the study of CVs with IUE and other instruments isto make an observation or set of observations of a singleobject and to analyze and interpret those data separately
1 Based on observations with the International Ultraviolet Explorersatellite, which is sponsored and operated by the National Aeronautics andSpace Administration, the Science Research Council of the UnitedKingdom, and the European Space Agency.
2 Present address : Space Telescope Science Institute, 3700 San MartinDrive, Baltimore, MD 21218 ; plee=stsci.edu.
from the data of other similar objects. Only when this step iscomplete are the data compared with those from othersimilar objects. An alternative strategy is to examine thedata from all the objects of a given class simultaneously.This is practical only in situations where a large body ofdata exists, of fairly uniform quality, and when the variousmembers of a given class form a relatively homogeneousgroup. A few such studies of CVs using various manifesta-tions of the IUE archive have appeared in the literature.
studied the absolute continuum spectral ÑuxVerbunt (1987)distributions of disk-fed CVs. Dous studied thela (1991)relative continuum spectral Ñux distributions of all classesof CVs but concentrated on disk-fed systems. For the dis-crete spectral features, only the inclination dependence ofthe equivalent widths was discussed. Zhang, & ChenDeng,
studied the dependence on the orbital period and(1994)inclination of the relative continuum spectral Ñux distribu-tions and the equivalent widths of the lines of dwarf novaein quiescence.
It is unfortunate that so little quantitative work has beenperformed to date on the emission lines of CVs. Emissionlines are powerful diagnostics of the physical conditions inall types of objects including these interacting binaries. Theemission-line Ñuxes or relative Ñuxes can constrain the tem-perature, ionization state, density, elemental abundance,and geometrical distribution of the gas. However, thedependence of measurable quantities on these parameters isoften complicated, necessitating numerical model Ðtting inmany situations. The range of possible assumptions regard-ing the physical mechanisms of heating and ionization,
832

ULTRAVIOLET LINE RATIOS 833
together with the technical challenges of constructingmodels, add to the difficulty of performing such studies. Asa result, emission lines have received less attention as diag-nostics of CVs than have continuum properties.
In the present paper, we begin to remedy this situationwith an analysis of the Ñux ratios of the emission lines of allclasses of CVs using spectra extracted from the IUEUniform Low Dispersion Archive (ULDA). We begin bydescribing the data and our analysis procedures We(° 2).then present the results of the data analysis followed by(° 3),a discussion of models for the line emission In we(° 4). ° 5compare data and models, and in we close with a° 6summary of our conclusions.
2. DATA ANALYSIS
The IUE ULDA et al. provides a(Wamsteker 1989)unique source of archival data that satisÐes the require-ments for a comprehensive study of a large sample ofobjects owing to its uniform quality and the large number ofspectra accumulated over the long life of IUE. Although theIUE Ðnal archive et al. has since(Nichols-Bohlin 1994)superseded the ULDA, the reprocessing e†ort of the Ðnalarchive had not begun when this study was begun in 1992.To build the data sample, the IUE Merged Log was search-ed using software at the IUE Regional Analysis Facility,then at the University of Colorado. The search criteria werethe camera (SWP), dispersion (low), and IUE object class(dwarf novae, classic novae, irregular variables, and nova-like variables). All spectra meeting these criteria wereextracted from the ULDA resident at Goddard SpaceFlight Center, which at that time contained (nearly) all low-dispersion IUE spectra through 1988 (SWP sequencenumbers through B35190). The spectra were then writtento disk with header information extracted from the IUEMerged Log. Excluded from further consideration were 13very early (prior to 1978 July) spectra of AM Her and SSCyg lacking data quality Ñags. The Ðnal data set consistedof B1300 spectra of B100 CVs.
From this data set, we selected all spectra exhibiting pureemission lines. Sources that met this criteria include AMHer stars, DQ Her stars, dwarf novae in quiescence, andeclipsing nova-like variables and dwarf novae in outburst.To this data set we added the IUE spectra of the eclipsingnova-like variable V374 Pup listed in Table 1 of etMaucheal. as we were working on that source at the time.(1994),Excluded from analysis were noneclipsing nova-like vari-ables and dwarf novae in outburst, since the UV resonancelines of such systems are either in absorption or are P CygniproÐles.
For these spectra, we measured the integrated Ñuxesabove the continuum of the strongest emission lines in theSWP bandpass : N V j1240, Si IV j1400, C IV j1550, andHe II j1640. To determine the Ñux of these lines, the con-tinuum to the left and right of each line (e.g., 1500È1530 A�and 1570È1600 for C IV) was Ðtted with a linear functionA�by the method of least squares. This method works wellwith all of the emission lines except N V, because the left sideof this line falls on the wing of the geocoronal Lyman-aemission line. To overcome this problem, a continuumpoint to the left of the N V line was speciÐed interactively,and the Ðt included the region to the right of the line (1255È1270 plus this continuum point to the left. Care wasA� )taken to insure that the continuum over this small wave-length region was a reasonable extrapolation both in nor-
malization and slope to the continuum at longerwavelengths. In all cases the least-squares Ðt was madeunder the assumption that the errors in the Ñux densityp
ifiat each wavelength point were the same. After the nor-j
imalization a and slope b of the continuum was determined,the size of the errors p were estimated by assuming that thereduced s2 of the Ðt was equal to 1 : p2\ ;
i/1N ( fi[ a
This procedure is necessary because the[ bji)2/(N [ 2).
ULDA (unlike the IUE Ðnal archive) does not include theerror associated with each Ñux point. The integrated Ñuxesof the emission lines were then determined by summing theÑux minus the Ðtted continuum over the region of the line(e.g., 1530È1570 for C IV). The error on the integrated ÑuxA�was determined by propagating the error p through thecalculation. Finally, careful track was kept of the number ofpixels labeled by the data quality Ñags as either saturated ornearly saturated (extrapolated ITF). Such pixels compro-mise the quality of the Ñux density measurements and con-sequently the integrated line Ñuxes ; saturated pixels areparticularly bad in this regard because they systematicallyproduce only lower limits to the Ñux density. In the Ðnal cutto the data, Ñux measurements for a given line were retainedonly if the total number of saturated and extrapolatedpixels included in the summation was less than or equal tosome number n. While n \ 1 would have been the idealchoice, such a stringent selection criterion would cull toomany measurements. As a reasonable compromise, wesettled on n \ 3 for this selection criterion, allowing a fewmild sinners to pass with the saints. The roster at this stageof the analysis consisted of B700 spectra of B60 CVs. Ofthis number, we present results based on B430 spectra ofthe 20 systems with the largest number ([10) of Ñux mea-surements.
3. OBSERVATIONAL RESULTS
Just as color-color diagrams are a useful way to discussthe continuum spectral Ñux distributions of CVs (e.g., Wade
et al. Ñux ratio diagrams are a useful way1988 ; Deng 1994),to display and discuss the Ñuxes of their emission lines. Fluxratios remove the variables of luminosity and distance fromthe comparison of di†erent sources ; Ñux ratios are unaf-fected by aperture losses, which occur for IUE spectraobtained through the small aperture ; and Ñux ratios aremuch less sensitive to reddening than the Ñuxes themselves.Owing to the increase of the extinction efficiency at shortwavelengths, reddening has the largest di†erential e†ect onthe Ñuxes of the He II and N V lines. Luckily, for a typicalextinction of the ratio of theE
B~V¹ 0.1 (Verbunt 1987),
measured Ñuxes of these lines is only ¹18% higher than theintrinsic ratio. As we shall see, this correction, while system-atic, is much smaller than either the typical measurementerrors or the typical dispersion in the Ñux ratios of anygiven source.
Of the many possibilities, we choose to plot the ratios N V
j1240/C IV j1550 and He II j1640/C IV j1550 versus Si IV
j1400/C IV j1550 (Figs. In what follows, we often refer1È8).to these ratios simply as N V/C IV and He II/C IV versusSi IV/C IV. It should be emphasized that the identiÐcationsof these lines are not unique ; at *j B 5 the IUE resolu-A� ,tion is not sufficient to exclude several other possible lines inthe vicinity of these wavelengths. We defer a discussion ofsuch potential confusion, and of the physical motivation forour choice of lines, until the following section and begin bypresenting the phenomenological behavior of these ratios as

834 MAUCHE, LEE, & KALLMAN Vol. 477
FIG. 1.ÈLine Ñux ratio diagrams for AM Her stars
derived from the data. We begin by discussing the variousmembers of the various CV subclasses and then discuss thesources that do not appear to Ðt the pattern established bythe other members of their subclass (sources we enjoy refer-ring to as ““ weird ÏÏ).
3.1. Results Arranged by Subclass
3.1.1. AM Her stars : AM Her, V 834 Cen, and QQ Vul
shows that AM Her, V834 Cen, and QQ VulFigure 1form a sequence of increasing N V/C IV with increasing SiIV/C IV. He II/C IV is reasonably constant at B0.2^ 0.1.
3.1.2. DQ Her stars : EX Hya, T V Col, FO Aqr, and DQ Her
Among these DQ Her stars, TV Col displays the greatestamount of variability in its continuum and line Ñuxes, and,as is evident in in its UV line ratios. The upperFigure 2,
right portion of the observed range of line ratios is popu-lated by the observations obtained during the optical andUV Ñare observed by & Mateo during theSzkody (1984) ;Ñare, both N V and He II increased relative to C IV. Therelatively tight phase space occupied by the line ratios ofFO Aqr is approximately the same as that of TV Col inoutburst. The ionization state of the line-emitting gas in EXHya and DQ Her is lower than the two other DQ Hers, asevidenced by their higher Si IV/C IV line ratios and the lowerHe II/C IV line ratios.
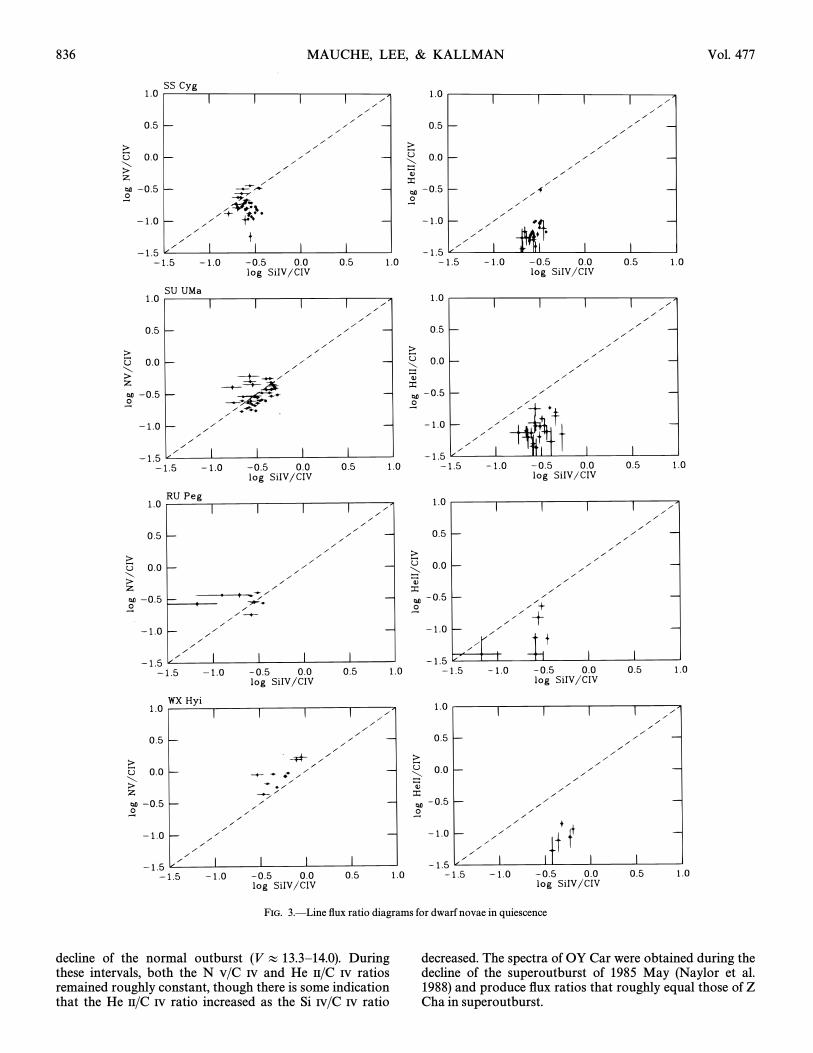
3.1.3. Dwarf Novae in Quiescence : SS Cyg, SU UMa, RU Peg, andW X Hya
As shown in WX Hyi has the largest ratios ofFigure 3,N V/C IV and Si IV/C IV among all the AM Her stars, DQHer stars, and other dwarf novae in quiescence. SU UMaand RU Peg have N V/C IV ratios of B0.3, but the value forSS Cyg is B30% lower at B0.2.

No. 2, 1997 ULTRAVIOLET LINE RATIOS 835
FIG. 2.ÈLine Ñux ratio diagrams for DQ Her stars
3.1.4. Eclipsing Dwarf Novae : Z Cha and OY Car
As shown in relative to all other ““ normal ÏÏ CVs,Figure 4,Z Cha and OY Car both have strong N V relative to C IV.Almost all of the spectra of Z Cha were obtained during thepeak and decline of the superoutburst of 1987 April
et al. and of a normal outburst of 1988(Harlaftis 1992a)January et al. The evolution of the spec-(Harlaftis 1992b).trum during these observations is manifest most clearly inthe Si IV/C IV ratio, which was highest during the decline ofthe superoutburst (V B 12.3È12.7) and lowest during the
836 MAUCHE, LEE, & KALLMAN Vol. 477
FIG. 3.ÈLine Ñux ratio diagrams for dwarf novae in quiescence
decline of the normal outburst (V B 13.3È14.0). Duringthese intervals, both the N V/C IV and He II/C IV ratiosremained roughly constant, though there is some indicationthat the He II/C IV ratio increased as the Si IV/C IV ratio
decreased. The spectra of OY Car were obtained during thedecline of the superoutburst of 1985 May et al.(Naylor
and produce Ñux ratios that roughly equal those of Z1988)Cha in superoutburst.

No. 2, 1997 ULTRAVIOLET LINE RATIOS 837
FIG. 4.ÈLine Ñux ratio diagrams for eclipsing dwarf novae
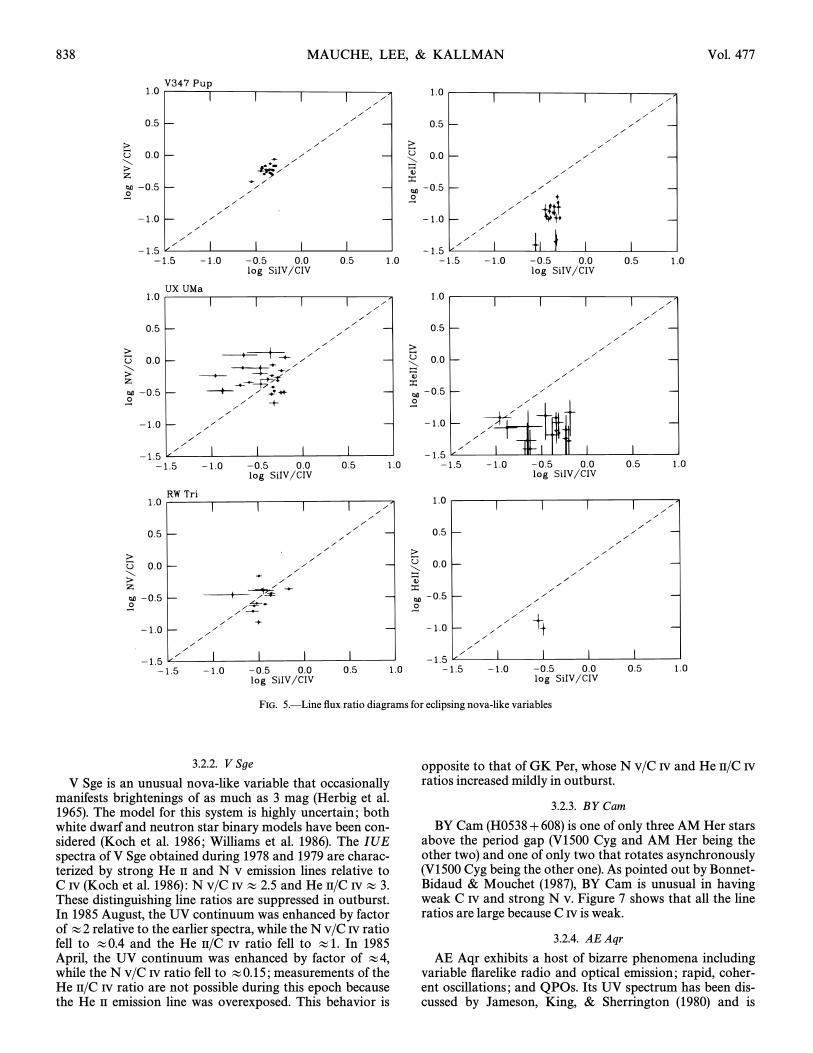
3.1.5. Eclipsing Nova-like Variables : UX UMa, V 347 Pup, andRW Tri
As shown in the eclipsing nova-like variablesFigure 5,UX UMa, V347 Pup, and RW Tri have moderately strongN V relative to C IV, with N V/C IV ratios intermediatebetween those of dwarf novae in quiescence and eclipsingdwarf novae. The phase space occupied by V347 Pup isamazingly tight and is disturbed only by eclipse e†ects : thesingle discrepant Si IV/C IV ratio was obtained from theeclipse spectrum of this source and is due to the fact that theC IV emission line is eclipsed less than the other emissionlines. The cause of the large spread in line ratios of UXUMa appears to be due to a di†erent mechanism: there areepochs when Si IV is weak relative to C IV and other epochswhen it is reasonably strong. These epochs do not seem tocorrelate with the continuum Ñux. The He II/Si IV ratio ofUX UMa is typically less than that of V347 Pup.
3.1.6. Intercomparison of Various Subclasses
combines the line ratios of the objects from theFigure 6previous Ðgures grouped together into magnetic (upperpanels) and nonmagnetic (lower panels) systems. It is appar-ent from this Ðgure and the previous discussion that the lineratios of the various subclasses are rather homogeneous,with a dispersion of D1 decade. This dispersion is due toalmost equal contributions from the dispersion of valuesfrom the various observations of individual objects (D0.5decade) and from the dispersion from one object to another(D0.5 decade).
There are clear and signiÐcant di†erences between thesetwo subclasses : (1) He II/C IV is D0.25 decades larger inmagnetic systems ; (2) Si IV/C IV is slightly larger in the
nonmagnetic systems, but the di†erence is small comparedto the dispersion ; (3) The upper limit on the N V/C IV
distribution is greater in the nonmagnetic systems, while thelower limit of the distribution is similar in the two cases.
It is also instructive to consider the di†erences withinthese two subclasses. The greater range of the N V/C IV
distribution is due to the eclipsing dwarf novae Z Cha andOY Car (squares and circles, respectively, in the lowerpanels of otherwise the N V/C IV distributions ofFig. 6) ;magnetic and nonmagnetic systems are similar. Among themagnetic systems, TV Col (triangles in the upper panels of
has signiÐcantly lower Si IV/C IV than any otherFig. 6)object ; the Si IV/C IV distribution would be much tighter ifthis object were excluded from the sample.
3.2. Systems Showing Anomalous Behavior : ““W eird ÏÏ CV s3.2.1. GK Per
GK Per is unusual among CVs in a number of respects. Ithas an evolved secondary and hence a very long orbitalperiod and a large accretion disk. Unlike most CVs, the UVcontinuum of this DQ Her type system peaks in the IUEbandpass. The cause of this anomaly is thought to be due tothe disruption of the inner disk by the magnetic Ðeld of thewhite dwarf & Sabadin et al.(Bianchini 1983 ; Wu 1989 ;
et al. Wheeler, & Mineshige AsMauche 1990 ; Kim, 1992).shown in Figures and GK Per also distinguishes itself7 8,from other CVs in its anomalously large He II/C IV ratio. Inoutburst, both He II and N V are stronger than C IV,whereas the opposite is true in quiescence. While the Si IV/C IV ratio spans a rather broad range of B0.2È1, this rangeis present in both outburst and quiescence.
838 MAUCHE, LEE, & KALLMAN Vol. 477
FIG. 5.ÈLine Ñux ratio diagrams for eclipsing nova-like variables
3.2.2. V Sge
V Sge is an unusual nova-like variable that occasionallymanifests brightenings of as much as 3 mag et al.(Herbig
The model for this system is highly uncertain ; both1965).white dwarf and neutron star binary models have been con-sidered et al. et al. The IUE(Koch 1986 ; Williams 1986).spectra of V Sge obtained during 1978 and 1979 are charac-terized by strong He II and N V emission lines relative toC IV et al. N V/C IV B 2.5 and He II/C IV B 3.(Koch 1986) :These distinguishing line ratios are suppressed in outburst.In 1985 August, the UV continuum was enhanced by factorof B2 relative to the earlier spectra, while the N V/C IV ratiofell to B0.4 and the He II/C IV ratio fell to B1. In 1985April, the UV continuum was enhanced by factor of B4,while the N V/C IV ratio fell to B0.15 ; measurements of theHe II/C IV ratio are not possible during this epoch becausethe He II emission line was overexposed. This behavior is
opposite to that of GK Per, whose N V/C IV and He II/C IV
ratios increased mildly in outburst.
3.2.3. BY Cam
BY Cam (H0538]608) is one of only three AM Her starsabove the period gap (V1500 Cyg and AM Her being theother two) and one of only two that rotates asynchronously(V1500 Cyg being the other one). As pointed out by Bonnet-
& Mouchet BY Cam is unusual in havingBidaud (1987),weak C IV and strong N V. shows that all the lineFigure 7ratios are large because C IV is weak.
3.2.4. AE Aqr
AE Aqr exhibits a host of bizarre phenomena includingvariable Ñarelike radio and optical emission ; rapid, coher-ent oscillations ; and QPOs. Its UV spectrum has been dis-cussed by King, & Sherrington and isJameson, (1980)

No. 2, 1997 ULTRAVIOLET LINE RATIOS 839
FIG. 6.ÈLine Ñux ratio diagrams for all ““ normal ÏÏ magnetic and nonmagnetic CVs. Error bars are suppressed to reduce clutter. Values for TV Col areshown as triangles, FO Aqr as pentagons, Z Cha as squares, and OY Car as circles.
distinguished by the near absence of C IV. Unfortunately,the Ñux measurements of the C IV emission line are veryuncertain because this line is so weak and because the mea-surements are possibly contaminated by the Si II 3pÈ4smultiplet at 1526.71, 1533.43 (e.g., Neverthe-A� Kelley 1987).less, it is clear that N V and Si IV have similar strengths andare B10 times stronger than He II and C IV, which havesimilar strengths.
4. LINE RATIO MODELING
We now present some simple models for the systematicbehavior we expect from CV line ratios. Although CVs as aclass share a number of fundamental properties, they alsodi†er between subclasses in the likely properties of the gasresponsible for line emission. For example, in disk-fedsystems, such as nova-like variables and dwarf novae, apossible site for line emission is the disk atmosphere. In thiscase, the atmosphere may be heated either by viscosity (e.g.,
& Wehrse or by photons from other parts ofShaviv 1991)the disk or from the vicinity of the white dwarf (e.g., etKoal. A wind is also present in nova-like variables and1996).dwarf novae in outburst (see & Raymond forMauche 1996a recent review of CV winds). In AM Her stars, the lineemission may come from the stream of material being trans-ferred from the secondary to the white dwarf, which isheated either mechanically or by photons from the shock atthe white dwarf surface. DQ Her stars may have emissionfrom either or both of these sites.
Beyond these simple considerations, there is considerableuncertainty about the nature of the emission region : thegeometrical arrangement of the gas relative to the source of
ionizing photons (if present), the density and optical depthof the gas, the elemental abundances of the gas, the spec-trum and Ñux of the ionizing radiation, and the presenceand distribution of any other sources of heating. Thesequantities are not only uncertain, they may di†er from oneobject to another in a subclass. Furthermore, all subclassescontain anomalous members. We therefore consider modelsfor CV emission regions that employ the very simplestassumptions, namely, slab models each with a single ion-izing spectrum, gas composition, and density. We thenexplore plausible choices for photon Ñux, column density,and mechanical heating rate (if any). The results serve notonly as a test of the validity of the models when comparedto the observations, but also provide insight into thephysics of the line emission, which will hopefully remainuseful when more detailed models are considered.
Further support for this strategy comes from the resultsof the previous section : the objects of a given subclass showsigniÐcant clustering in the two line ratio diagrams, andthere are clear di†erences from one subclass to another.Therefore, we can deÐne our modeling goals as follows : totest whether one or more sets of models can reproduce themean values of the observed line ratios for the various sub-classes of objects, and to test whether any models can repro-duce the dispersion or systematic variability of the observedline ratios. Given the uncertainties of the models and theobserved dispersion in line ratios, we will consider agree-ment between the models and observations to be adequateif the two agree to within the dispersion of the observedvalues, i.e., approximately 1 decade. We will show thatalthough this is clearly a very crude criterion, it turns out tobe very constraining for the models.

840 MAUCHE, LEE, & KALLMAN Vol. 477
FIG. 7.ÈLine Ñux ratio diagrams for ““ weird ÏÏ CVs. Note change of scale relative to previous Ðgures.
4.1. Model Ingredients
Although the mechanism of line emission is uncertain, wefavor photoionization as the source of ionization, excita-tion, and heating of the gas. This is partly because the
observed continuum spectra, and their extrapolation intothe unobservable spectral regions, provide a convenient andplausible energy source. Further support for this idea comesfrom et al. and et al. who com-Jameson (1980) King (1983),pared the observed line strengths from AE Aqr and UX

No. 2, 1997 ULTRAVIOLET LINE RATIOS 841
FIG. 8.ÈLine Ñux ratio diagram for all CVs. Error bars are suppressedto reduce clutter. Values for ““ normal ÏÏ CVs are shown as crosses, GK Peras triangles, V Sge as pentagons, BY Cam as squares, AE Aqr as circles.
UMa to simple predictions of both photoionized andcoronal models and found the coronal models inconsistentwith the observed lines. Nevertheless, for the sake of com-pleteness, we examine both photoionized and coronalmodels.
The models are calculated using the XSTAR v1.19 photo-ionization code & McCray &(Kallman 1982 ; KallmanKrolik The models consist of a spherical shell of gas1993).with a point source of continuum radiation at the center ;this may be used to represent a slab in the limit that theshell thickness is small compared with the radius. In whatfollows we will use the line Ñuxes emergent from the illumi-nated face of the slab, which is equivalent to those emittedinto the interior of the spherical shell. The input parametersinclude the source spectrum, the gas composition anddensity, the initial ionization parameter (determining theinitial radius, see below for a deÐnition), and the columndensity of the shell (determining the outer radius). Con-struction of a model consists of the simultaneous determi-nation of the state of the gas and the radiation Ðeld as afunction of distance from the source. The state of the gas ateach radius follows from the assumption of a stationarylocal balance between heating and cooling and betweenionization and recombination.
When the gas is optically thin, the radiation Ðeld at eachradius is determined simply by geometrical dilution of thegiven source spectrum. Then, as shown by Tucker,Tarter,& Salpeter the state of the gas depends only on the(1969),ionization parameter m, which is proportional to the ratio ofthe radiation Ñux to the gas density. We adopt the deÐni-tion of the ionization parameter used by Tarter et al. :
m \ L /(nr2), where L is the ionizing energy luminosity of thecentral source (between 1 and 1000 ryd), n is the gas density,and r is the distance from the source. This scaling law allowsthe results of one model calculation to be applied to a widevariety of situations. For a given choice of spectral shape,this parameter is proportional to the various other custom-ary ionization parameter deÐnitions : whereUH \FH/n, FHis the incident photon number Ñux above the hydrogenLyman limit ; to where is the inci-!\ Fl(lL)/(2hcn), Fl(lL)dent energy Ñux at the Lyman limit ; and to $\ L /(4nR2cnkT ). This simple picture breaks down when thecloud optical depth is non-negligible, since the source spec-trum then depends on position, and the escape of coolingradiation in lines and recombination continua depends onthe total column density of each ion species and hence onthe ionization state of the gas throughout the cloud. Inaddition, the rates for cooling and line emission can dependon gas density owing to the density dependence of line col-lisional deexcitation and dielectronic recombination.However, even in this case the ionization parameterremains a convenient means of characterizing the results.
The state of the gas is deÐned by its temperature and bythe ion abundances. All ions are predominantly in theground state, and except for hydrogen and helium thepopulations of excited levels may be neglected. The relativeabundances of the ions of a given element are found bysolving the ionization equilibrium equations under theassumption of local balance, subject to the constraint ofparticle number conservation for each element. Ionizationbalance is a†ected by a variety of physical processes, mostnotably photoionization and radiative and dielectronicrecombination. The temperature is found by solving theequation of thermal equilibrium, by equating the netheating of the gas due to absorption of incident radiationwith cooling due to emission by the gas. These rates arederived from integrals over the absorbed and emitted radi-ation spectra. Although Compton scattering is not explic-itly included as a source or sink of radiation, its e†ect isincluded in the calculation of the thermal balance.
The emitted spectrum includes continuum emission bybremsstrahlung and recombination and line emission by avariety of processes including recombination, collisions,and Ñuorescence following inner shell photoionization. Linetransfer is treated using an escape probability formalismand includes the e†ects of line destruction by collisions andcontinuum absorption. Transfer of the continuum is calcu-lated using a single stream approximation, as described in
& McCrayKallman (1982).Rates for atomic processes involving electron collisions
have been modiÐed since the publication of &KallmanMcCray to be consistent with those used by(1982)
& Smith Recombination and ionizationRaymond (1977).rates for Fe have been updated to those of &ArnaudRaymond In addition, we have added many optical(1992).and UV lines from ions of medium Z elements (C, N, O, Ne,Si, and S) using collisional and radiative rates from
The elements Mg, Ar, Ca, and Ni haveMendoza (1983).also been added. The models have a total of 168 ions,producing 1715 lines, of which 665 have energies greaterthan 120 eV (10 and approximately 800 are resonanceA� ),lines. For each ion we also calculate the emission from radi-ative recombination onto all the excited levels that produceresonance lines. The number of such continua is equal tothe number of resonance lines in the calculation. Some of
842 MAUCHE, LEE, & KALLMAN Vol. 477
the results of the models are sensitive to the rates for die-lectronic recombination. We use the high-temperature ratesgiven by & Pequignot together with theAldrovandi (1973),low-temperature rates from & StoreyNussbaumer (1983).These rates di†er signiÐcantly for several relevant ions, e.g.,Si III, relative to those of & Van SteenbergShull (1983),which were used in most earlier versions of XSTAR. Finally,all models assume element abundances that are close tosolar : H:He :C:N:O: Ne :Mg:Si :S : Ar :Ca :Fe :Ni\ 1 :0.1 :3.7E[4 : 1.1E[4 :6.8E[4 : 2.8E[5 :3.5E[5 : 3.5E[5 :1.6E[5 : 4.5E[06 :2.1E[6 : 2.5E[5 :2.0E[6 (Withbroe1971).
An emission line may be produced by two types of physi-cal processes. First is what we will call ““ thermal emission,ÏÏwhich is recombination or collisional excitation by thermalelectrons. Second is excitation by photons from the incidentcontinuum. Since this is an elastic scattering process, we willrefer to it as ““ scattering.ÏÏ This process will produce anapparent emission feature if our line of sight to the contin-uum source is at least partially blocked, and the scatteringregion must be concentrated on the plane of the sky (see
& Kriss for more discussion of these issues). IfKrolik 1995the scattering region has a bulk velocity greater than thethermal line width then a P Cygni or inverse P Cygni proÐlewill form even if the scattering region is spherical. Scatteringfails to account for the presence of He II j1640, since this is asubordinate line and the population of the lower level willbe negligibly small under conditions appropriate to pho-toionized gas. SigniÐcant opacity in this line would requirea temperature greater than D3 ] 105 K and level popu-lations that are close to LTE values. In spite of this, we haveinvestigated the possibility that this mechanism can explainthe ratios of the other lines we consider. We assume that theÑuxes in scattered lines are proportional to the opacities inthe lines. This is likely to be justiÐed if the line opticaldepths are less than unity and if the wind ionization balanceis approximately uniform. If so, the line Ñux ratios willequal the opacity ratios.
4.2. Input ParametersThe models we explore fall into two categories : photoion-
ized models and collisional (coronal) models. For each wepresent the line ratios for both thermal emission and scat-tering emission mechanisms. The photoionization modelparameters are chosen in an attempt to crudely representthe range of observed ionizing spectra from CVs. Thesetypically consist of a soft component, which is consistentwith a 10È50 eV blackbody, together with a hard X-raycomponent such as a 10 keV bremsstrahlung (e.g., Co� rdova& Mason The ratio of strengths of these two com-1982a).ponents varies from one object to another, and with out-burst state and subclass. However, a typical ratio is 100 :1(soft :hard) for nonmagnetic systems, and 1 :1 for magneticsystems & Mason Beyond such simple(Co� rdova 1982b).considerations, the detailed shape of the ionizing radiationÐeld is difficult to determine accurately. This is due to thestrong inÑuence of photoelectric absorption by interstellarand circumstellar gas and to the limited bandpass and spec-tral resolution of most past observations in the soft X-rayband (e.g., et al. Owing toRamsay 1994 ; Mauche 1996).such uncertainties we choose a few very simple ionizingspectra for consideration in our photoionization models :model A, 30 eV blackbody ; model B, 10 keV brems ; modelC, 50 eV blackbody ; model D, 10 eV blackbody. Model G is
the mechanically heated (coronal) ionization model. Allthese models have a total (neutral ] ionized) hydrogencolumn density of cm~2, chosen to make themNH \ 1019optically thin to the continuum and e†ectively thin to theescaping resonance lines. In addition, we present two pho-toionized models that are close to being optically thick,both of which have of column density cm~2.NH \ 1023Model E has a 30 eV blackbody ionizing spectrum, andmodel F has a 10 keV brems ionizing spectrum. For eachmodel we determine the net line Ñux contained in the wave-length intervals 1237È1243, 1390È1403, 1547È1551, and1639È1641 which we refer to as N V, Si IV, C IV, and He II,A� ,respectively. As we will show, these wavelength intervalsalso contain other lines that can mimic these strong lines,and these other lines are likely to a†ect the interpretation ofthe IUE low-resolution data as well. The results of ourmodelsÈthe Si IV/C IV, N V/C IV, and He II/C IV lineratiosÈare summarized in Tables and For the1, 2, 3.photoionization models, we consider various values of theionization parameter for six choices of ionizing continuumshape. For the collisional models, we consider 10 values ofthe gas temperature. We also tested for the dependence ongas density and found that it is negligible for the conditionswe consider ; all the models presented here have densityn \ 109 cm~3.
4.3. Model ResultsWhen the line ratios shown in Tables are plotted in1È3
two diagrams in the same way as the IUE data, severalcommon properties emerge. These are shown in Figures 9and with various symbols denoting the ionizing spectra :10,model A ( Ðlled squares), model B ( Ðlled circles), model C(crosses), model D (plus signs), model E (open squares),model F (open circles). We have also tried a model consist-ing of a 30 eV blackbody together with a 10 keV bremsspectrum in a ratio of 99 :1 ; the results are so similar tomodel A as to be indistinguishable, i.e., the 30 eV blackbodyhas far more inÑuence on the ionization balance than doesthe 10 keV brems in these ratios. Model G, the coronal case,produces line ratio combinations that are almost entirelyoutside the range spanned by these Ðgures. For the otherspectra, as expected, there is little or no dependence onmodel density for optically thin photoionized models.
The shape of the trajectory of the model results in theseplanes is similar for most of the models. They resemble a““ U ÏÏ shape, although in some cases the right upright of theU is missing, and in others it is tipped nearly 45¡ to thevertical. We can understand the results better if we label thepoints along the U as follows : A\ upper left extreme oftrajectory ; B\ bottom of steepest part of left upright ;C\ lowest point of trajectory ; D \ bottom of rightupright ; E \ upper right extreme of trajectory. These areshown schematically in In general, the trajectoryFigure 11.is traversed from point A to point E as the ionizationparameter decreases and may be understood in terms of therelative ease of ionization of the various ions responsible forline emission. The ionization parameter at which the abun-dance of a given ion peaks, relative to its parent element,can be derived crudely from the ionization potential. Thus,the four ions responsible for the strongest observed linesmay be ordered in terms of decreasing ease of ionizationaccording to Si IV, He II, C IV, and N V. For the metal ionsthe ionization parameter at which the emissivities of thelines peak is approximately the same as the ionization

No. 2, 1997 ULTRAVIOLET LINE RATIOS 843
TABLE 1
PHOTOIONIZATION MODEL LINE RATIOS
log m log Si IV/C IV log N V/C IV log He II/C IV
Model A: 30 eV Blackbody Spectrum
[1.5 . . . . . . 0.00 [2.02 0.68[1.0 . . . . . . [0.55 [1.40 [0.44[0.5 . . . . . . [1.12 [0.97 [0.900.0 . . . . . . . . [1.56 [0.59 [0.760.5 . . . . . . . . [2.20 [0.37 [0.581.0 . . . . . . . . [2.92 [0.24 [0.41
Model B : 10 keV Bremsstrahlung Spectrum
[1.5 . . . . . . 0.78 0.91 3.65[1.0 . . . . . . 0.73 [0.15 2.99[0.5 . . . . . . 0.62 [1.38 1.870.0 . . . . . . . . 0.19 [1.39 0.520.5 . . . . . . . . [0.76 [1.15 [0.641.0 . . . . . . . . [1.05 [0.68 [0.84
Model C: 50 eV Blackbody Spectrum
[3.0 . . . . . . 1.54 2.18 5.06[2.5 . . . . . . 1.26 1.04 4.19[2.0 . . . . . . 0.97 [0.25 3.16[1.5 . . . . . . 0.67 [1.66 1.90[1.0 . . . . . . 0.11 [1.69 0.47[0.5 . . . . . . [1.00 [1.17 [0.710.0 . . . . . . . . [2.01 [0.97 [0.900.5 . . . . . . . . [2.69 [0.62 [0.671.0 . . . . . . . . [3.20 [0.26 [0.321.5 . . . . . . . . [3.56 0.22 0.31
Model D: 10 eV Blackbody Spectrum
[3.0 . . . . . . [1.86 0.35 3.50[2.5 . . . . . . [1.50 [0.90 2.30[2.0 . . . . . . [0.86 [2.23 1.06[1.5 . . . . . . [0.48 [2.90 0.15[1.0 . . . . . . [0.71 [2.52 [0.48[0.5 . . . . . . [0.90 [1.88 [0.750.0 . . . . . . . . [0.80 [1.08 [0.790.5 . . . . . . . . [0.58 [0.31 [0.691.0 . . . . . . . . [0.45 0.25 [0.481.5 . . . . . . . . [0.45 0.57 [0.16
Model E : 30 eV Blackbody Spectrum, log NH \ 23
[1.5 . . . . . . 0.15 [1.83 1.46[1.0 . . . . . . [0.31 [1.47 0.18[0.5 . . . . . . [0.74 [1.13 [0.490.0 . . . . . . . . [0.90 [0.96 [0.590.5 . . . . . . . . [0.93 [0.92 [0.581.0 . . . . . . . . [0.93 [0.91 [0.581.5 . . . . . . . . [0.93 [0.89 [0.58
Model F : 10 keV Bremsstrahlung Spectrum, log NH \ 23
[1.5 . . . . . . 0.86 1.33 4.20[1.0 . . . . . . 0.77 0.44 3.49[0.5 . . . . . . 0.67 [0.81 2.420.0 . . . . . . . . 0.30 [1.36 1.050.5 . . . . . . . . [0.37 [1.15 [0.071.0 . . . . . . . . [0.69 [0.91 [0.441.5 . . . . . . . . [0.73 [0.79 [0.48
parameter at which the ion abundances peak. Thus, at thehighest ionization parameters we consider, nitrogen isionized to or beyond N V, carbon is ionized beyond C IV,and silicon is ionized beyond Si IV. However, the abundanceof N V, and hence its line emissivity, is greater than thecorresponding quantities for C IV, which in turn are greaterthan for Si IV. Thus, at high ionization parameter, N V/C IV
is relatively large and Si IV/C IV is small, corresponding to
TABLE 2
SCATTERING MODEL LINE RATIOS
log m log Si IV/C IV log N V/C IV log He II/C IV
Model A@ : 30 eV Blackbody Spectrum
[1.5 . . . . . . 0.36 [1.44 [9.44[1.0 . . . . . . [0.26 [0.98 [8.84[0.5 . . . . . . [1.06 [0.65 [8.040.0 . . . . . . . . [1.86 [0.33 [6.400.5 . . . . . . . . [3.09 [0.19 [4.861.0 . . . . . . . . [4.65 [0.13 [3.35
Model B@ : 10 keV Bremsstrahlung Spectrum
[1.5 . . . . . . 1.26 0.68 [12.02[1.0 . . . . . . 1.20 0.08 [10.71[0.5 . . . . . . 1.07 [0.71 [9.490.0 . . . . . . . . 0.68 [0.86 [8.100.5 . . . . . . . . [0.59 [0.81 [7.141.0 . . . . . . . . [2.25 [0.47 [4.57
Model C@ : 50 eV Blackbody Spectrum
[3.0 . . . . . . 2.01 1.86 [11.36[2.5 . . . . . . 1.70 1.02 [10.81[2.0 . . . . . . 1.41 0.07 [10.32[1.5 . . . . . . 1.10 [0.97 [9.69[1.0 . . . . . . 0.53 [1.24 [8.85[0.5 . . . . . . [0.75 [0.79 [8.450.0 . . . . . . . . [2.23 [0.68 [7.130.5 . . . . . . . . [4.35 [0.42 [5.091.0 . . . . . . . . [6.98 [0.14 [3.191.5 . . . . . . . . [O 0.26 [1.42
Model D@ : 10 eV Blackbody Spectrum
[3.0 . . . . . . [1.28 0.35 [11.04[2.5 . . . . . . [1.24 [0.48 [10.32[2.0 . . . . . . [0.61 [1.41 [9.50[1.5 . . . . . . [0.13 [2.22 [9.62[1.0 . . . . . . [0.45 [2.06 [9.77[0.5 . . . . . . [0.85 [1.48 [9.570.0 . . . . . . . . [1.08 [0.74 [8.620.5 . . . . . . . . [1.16 [0.02 [7.521.0 . . . . . . . . [1.19 0.51 [6.851.5 . . . . . . . . [1.20 0.81 [6.52
Model E@ : 30 eV Blackbody Spectrum, log NH \ 23
[1.5 . . . . . . 2.01 0.92 [6.19[1.0 . . . . . . 1.85 0.27 [5.06[0.5 . . . . . . 1.85 [0.03 [3.900.0 . . . . . . . . 1.90 [0.01 [2.240.5 . . . . . . . . 1.90 [0.02 [0.771.0 . . . . . . . . 1.92 [0.18 0.581.5 . . . . . . . . 1.96 0.09 1.91
Model F@ : 10 keV Bremsstrahlung Spectrum, log NH \ 23
[1.5 . . . . . . 1.23 1.21 [11.89[1.0 . . . . . . 1.19 0.77 [10.29[0.5 . . . . . . 1.19 0.28 [8.470.0 . . . . . . . . 1.19 [0.21 [6.360.5 . . . . . . . . 1.14 [0.62 [4.501.0 . . . . . . . . 1.08 [0.79 [1.931.5 . . . . . . . . 1.05 [0.81 1.19
point A of the trajectory in the N V/C IV versus Si IV/C IV
plane. At intermediate ionization parameter, carbon recom-bines to C IV and nitrogen recombines below N V, so that NV/C IV is small and Si IV/C IV is also small (point B). Atlower ionization parameter, silicon recombines to Si IV andcarbon may recombine to below C IV, resulting in an inter-mediate value of Si IV/C IV (point C). At very low ionization

844 MAUCHE, LEE, & KALLMAN Vol. 477
TABLE 3
COLLISIONAL IONIZATION MODEL LINE RATIOS
T(10,000 K) log Si IV/C IV log N V/C IV log He II/C IV
Model G: Constant Temperature
3 . . . . . . . . . . [0.12 [2.63 [1.675 . . . . . . . . . . [0.46 [3.00 [2.617 . . . . . . . . . . [1.83 [2.91 [3.549 . . . . . . . . . . [2.65 [2.79 [4.0411 . . . . . . . . . [2.80 [2.16 [3.9913 . . . . . . . . . [2.65 [1.29 [3.5815 . . . . . . . . . [2.44 [0.52 [3.1317 . . . . . . . . . [2.29 0.04 [2.7419 . . . . . . . . . [2.17 0.38 [2.4221 . . . . . . . . . [2.09 0.52 [2.16
parameter, Si IV/C IV is at a maximum, and there is anapparent increase in N V/C IV (points D, E). This cannot beunderstood in terms of conventional ionization balance,since the C IV abundance always exceeds the N V abun-dance at low ionization parameter. Rather, it is due to con-fusion between the N V 2sÈ2p doublet at 1238.82, 1242.80 A�and the Mg II 3sÈ4p doublet at 1239.93, 1240.39 (e.g.,A�
Since Mg II has a lower ionization potentialKelley 1987).than any of the other ions in question, Mg II/C IV increasesat low ionization parameter, thus explaining the apparentincrease in N V/C IV.
FIG. 9.ÈModel line Ñux ratio diagram for photoionized thermal emis-sion models. Note that range of x-axis di†ers from previous Ðgure.Symbols are as follows : model A ( Ðlled squares), model B ( Ðlled circles),model C (crosses), model D (plus signs), model E (open squares), model F(open circles). Observed line Ñux ratios for all ““ normal ÏÏ CVs are shown aspoints.
FIG. 10.ÈModel line Ñux ratio diagram for photoionized scattering linemodels. Symbols are as follows : model A@ ( Ðlled squares), model B@ ( Ðlledcircles), model C@ (crosses), model D@ (plus signs). Observed line Ñux ratiosfor all ““ normal ÏÏ CVs are shown as points.
The behavior of He II j1640 di†ers from the other linesowing to the fact that it is emitted by recombination, whilethe others are emitted by collisional excitation. Thus, theemissivity of He II j1640 remains nearly constant at highionization parameter, while the C IV j1550 line emissivitydecreases with increasing ionization parameter. This is inspite of the fact that He II is more easily ionized than C IV.This explains the AB part of the trajectory in the He II/C IV
versus Si IV/C IV plane. As the ionization parameterdecreases, C IV recombines to C III and below, while He II
and He III are still abundant, thus explaining the DE part ofthe trajectory.
The model behavior under the scattering scenario is qual-itatively similar to the thermal excitation scenario, exceptfor the weakness of He II. The line strengths in the scatteringcase are less dependent on the gas temperature than in thethermal excitation case, and the oscillator strength for theMg II 3sÈ4p transition is small, so that the trajectory lacksthe DE segment in the N V/C IV versus Si IV/C IV plane.
The fact that the coronal models fail almost completely toproduce line ratios within the range of our diagrams indi-cates that it is unlikely that this process dominates in CVline-emitting gas. This result is not surprising, owing to thewell-known fact that coronal equilibrium produces ionabundances that have less overlap in parameter space (e.g.,temperature) between adjacent ion stages than does photo-ionization.
4.4. Spectral DependenceThe shape of the ionizing spectrum inÑuences the loca-
tion of the various points along the trajectory in the two
FIG. 11.ÈSchematic model line Ñux ratio diagram showing ““ U ÏÏ-shaped trajectory.

No. 2, 1997 ULTRAVIOLET LINE RATIOS 845
line ratio diagrams, and also the existence of part of thetrajectory, most notably the segments between points C andE.
For soft spectra, such as the 30 eV blackbody, recombi-nation to species below Si IV does not occur for the param-eter range considered (log m \ [1.5 to ]1.0), so the CDEpart of the trajectory is absent in the N V/C IV versus Si IV/C IV plane. Also, when the ionization parameter is suitablefor producing large N V/C IV, the Si IV/C IV ratio is so smallas to be o† the scale ofFigure 9.
For very soft spectra, such as the 10 eV blackbody, thereare insufficient hard photons to produce N V. Thus, pointsA and B are missing in the N V/C IV versus Si IV/C IV plane.The DE part of the trajectory is entirely due to Mg II j1240.
For hard spectra, such as the 10 keV brems spectrum,X-rays can make Si IV via Auger ionization even at very lowionization parameter. Thus, the range of Si IV/C IV is greatlyexpanded and can reach 10 at point D in the N V/C IV
versus Si IV/C IV plane. Other models, such as a 30 eVblackbody, can make large Si IV/C IV at low ionizationparameter, but they also have very weak N V line emission,so that the 1240 feature is dominated by Mg II and theyA�are on DE segment of the trajectory.
At high ionization parameter He II is a ““ bolometer ÏÏ ofthe ionizing spectrum, since it is dominated by recombi-nation. That is, the He II strength depends only on thenumber of photons in the He II Lyman continuum (vº 54.4eV). So, harder spectra make stronger He II, and conversely.This behavior may still hold at point C. At small ionizationparameter, He II is likely to be more abundant than C IV orSi IV. This explains the CDE segment of the trajectory in theHe II/C IV versus Si IV/C IV plane. This fact does not seem todepend strongly on spectral shape, although the value ofSi IV/C IV at points C, D, and E does depend on the spec-trum; this ratio increases at all these points for harderspectra, and conversely.
The 10 eV blackbody models show a ““ hook ÏÏ in theirtrajectory in which the Si IV/C IV appears to increase withincreasing ionization parameter at the upper end of therange of values we consider. This is counter to the expectedbehavior of Si IV at high ionization parameter, since weexpect silicon to become ionized beyond Si IV and the Si IV
abundance to decrease at high ionization parameter. Thereason for the model behavior is the confusion between theSi IV doublet at 1393.76, 1402.77 and the O IV 2s22pÈA�2s2p2 multiplet at 1397È1407 (e.g., TheA� Kelley 1987).unique behavior of the 10 eV blackbody models is due tothe fact that the O IV lines increase at high ionizationparameter only for the softest spectra ; harder spectra ionizeoxygen past O IV when other ion abundances are at similarvalues. Like the N V and Mg II lines near 1240 the Si IVA� ,and O IV lines near 1400 can be confused in IUE low-A�resolution data.
The overlap in ionization parameter space of the regionswhere N V, Si IV, C IV, and He II predominate does not di†ergreatly between models with hard X-ray spectra (e.g., 10keV brems) and those with blackbodies with kT [ 30 eV. Amore pronounced di†erence is due to the fact that the latterspectra have all their ionizing photons crammed into asmaller energy range. Therefore, the ionization parameterscale, which simply counts the energy in ionizing photons,and the distribution of ionization, which really depends onthe photon density in the EUV/soft X-ray region, are verydi†erent in the two cases. For example, in the 10 keV brems
case, C IV predominates at log m \ 0, while in the 30 eVblackbody case it predominates near log m \ [1. Thus, ourmodel grid, which spans the range [3 \ log m \]1.5,does not include the region where the gas has recombinedbelow C IV, etc., in the blackbody case. This accounts for theabsence of the CDE part of the line ratio trajectory for theblackbody models.
5. COMPARISON WITH OBSERVATIONS
The models presented in the previous section provide auseful context in which to examine the likely physical condi-tions in CV line-emitting regions. As was discussed earlier,we do not expect these simple models to account for thedetails of the observed spectra, but we do hope that theywill at least crudely reproduce some of the features of theobservations. These might include : the range of theobserved ratios to within the dispersion of the observedvalues, i.e., approximately 1 decade, and possibly the di†er-ential behavior of a given source as it varies in time. In fact,we Ðnd little evidence for agreement between the observ-ations and any of the models beyond the simplest measuresof consistency for some of the line ratios. We begin thecomparison of model results with observations by consider-ing the ““ normal ÏÏ CVs.
5.1. ““Normal ÏÏ CV sThe observed ratios of ““ normal ÏÏ CVs lumped together
regardless of class are clustered within a range of D1(Fig. 6)decade for log Si IV/C IV B [0.5 and log He II/C IV B [1.0and D1.5 decades for log N V/C IV B [0.25. The largerrange of the N V/C IV ratio is due largely to the large lineratios of the eclipsing dwarf novae Z Cha and OY Car(squares and circles, respectively, in Otherwise, theFig. 6).range is D1 decade centered on B [0.5. This same generalrange is spanned by the models, but there is little detailedagreement.
One notable failure of the models is the behavior in theHe II/C IV versus Si IV/C IV plane. The photoionizationmodels always produce He II/C IV/C IV. This isIV Z Sibecause, although the He II line is emitted following radi-ative recombination and the C IV and Si IV lines are formedby collisional excitation, photons at energies greater than54.4 eV that are responsible for ionizing He II are alsoresponsible for heating the gas. So, models which efficientlyheat the gas and emit Si IV and C IV also have efficientionization of He II and hence efficient production of the1640 line. In contrast, ““ normal ÏÏ CVs show He II/C IVA�values less than Si IV/C IV by D0.5 decades. Magneticsystems have He II/C IV line ratios that are systematicallyhigher (and Si IV/C IV line ratios that are systematicallylower) than those of the nonmagnetic systems by D0.25decades. Only the DQ Her stars TV Col and FO Aqr(triangles and pentagons, respectively, in haveFig. 6)He II/C IV º Si IV/C IV.
It is interesting to note that the ““ hook ÏÏ in the trajectoryof the 10 eV blackbody models referred to in the previoussection occurs near the values of these line ratios wheremost observed objects cluster. Furthermore, the 10 eVmodels come closest to reproducing the observed He II/C IV
ratios ; they are the only ones for which He II/C IV fallsbelow Si IV/C IV.
The coronal models produce He II/C IV values of order1% of Si IV/C IV when this latter ratio is in the observedrange ; even at this relatively favorable point, the N V/C IV
846 MAUCHE, LEE, & KALLMAN Vol. 477
ratio is much smaller than observed. This suggests that thecoronal emission mechanism is less likely than photoioniza-tion for all CVs.
In the N V/C IV versus Si IV/C IV plane, the models andthe data span a similar range of ratios, so there is less indi-cation of the failure of any of the models. The 50 eV black-body models are least successful at reproducing the mostcommonly observed values of these ratios simultaneously.The 30 eV blackbody and 10 keV brems models both spanthe observed range, as do the optically thick models (whichalso use these ionizing spectra). The ““ hook ÏÏ in the trajec-tory of the 10 eV blackbody models causes the Si IV/C IV
ratio to lie almost entirely in the range [1.5¹ log Si IV/C IV ¹ [0.5, which is close to that spanned by the observedratios of most ““ normal ÏÏ CVs.
In addition to asking whether there exists a model thatcan reproduce a given ratio, we can ask whether the dis-tribution of observed ratios is consistent with the analogousmodel quantity. For example, if the ionizing spectrum andemission mechanism are independent of time, but the lumi-nosity and hence the ionization parameter varies with time,we expect that the ratios of a given object will lie along a““ U ÏÏ-shaped trajectory in the line ratio diagram. In con-trast, there appears no clear pattern in the observed ratiosfor objects with many observations, other than a clusteringin a well-deÐned region of the diagram.
5.2. ““W eird ÏÏ CV sConsider next the ““ weird ÏÏ CVs. Figures and demon-7 8
strate that V Sge, GK Per, BY Cam, and AE Aqr form asequence of dramatically increasing Si IV/C IV and N V/C IV
at nearly constant He II/C IV. In V Sge and GK Per, He II/C IV [ Si IV/C IV, unlike most of the ““ normal ÏÏ CVs, butconsistent with the photoionization models. The extremeline ratios of BY Cam and AE Aqr are harder to under-stand. & Mouchet have suggested aBonnet-Bidaud (1987)depletion of carbon by a factor of D10 to explain the anom-alous line ratios of BY Cam. If a similar deÐciency appliesto AE Aqr, depletion by a factor of D60 is required.Although such abundance anomalies are possible, they areunlikely to explain the positive correlation between N V/C IV and Si IV/C IV observed in AE Aqr and possibly BYCam (see Figs. and The observed correlation between7 8).these ratios lends support to the hypothesis that confusionbetween the N V 2sÈ2p doublet and the Mg II 3sÈ4p doublet,together with a low value of the ionization parameter andhence a large value of the Si IV/C IV ratio, is responsible forthe apparent anomalous line ratios of BY Cam and AE Aqr.However, none of the models reproduce the nearly perfectlinear proportionality between N V/C IV and Si IV/C IV
observed in AE Aqr.There are several possibilities why the models and the
observed line ratios are discrepant. First, it is possible thatwe have failed to consider ionizing spectra of the right type.Since the 10 eV blackbody appears to come closest to pro-viding agreement with the He II/C IV and Si IV/C IV ratiossimultaneously, it is possible that there are confusing linesthat we have not included in our models, or that becomeimportant under other conditions, which a†ect the results.Alternatively, the emission region may consist of multiplecomponents with di†ering physical conditions. If so, thevarious components must have line ratios that bracket theobserved values. This is ruled out by our models : no singleset of models brackets the observed ratio of He II/C IV, for
example. The observed values of this ratio are bracketed bythe photoionization models on the high side and thecoronal models on the low side, so that a superposition ofthese models might provide consistent line ratios. However,we consider this possibility to be somewhat contrived, and amore detailed exploration is needed to test whether it canaccount for all the ratios simultaneously. Another possibleexplanation for the He II/C IV ratio is that our assumptionof a stationary steady state is invalid for the line-emittingregion. If, for example, the heating and ionization of the gasoccurs as the result of many impulsive events, then the time-average value of the ratios could di†er signiÐcantly from thesteady state model predictions, owing to the di†ering time-scales for relaxation of the upper levels of the He II line fromthat of C IV. Such a scenario has been suggested to accountfor the strength of the He II lines from the Sun (Raymond
The di†erential behavior of the line ratios from a1990).given object could be due at least in part to changes in theionizing spectrum or ionization mechanism, rather thansimply due to changes solely in ionization parameter. Thiscould account for the departures from the variability behav-ior predicted by the models. In spite of the difficulty inreproducing the observed line ratios, steady state photoion-ization models are capable of Ðtting the absolute strengthsof the observed lines et al.(Ko 1996).
6. SUMMARY
We have presented a statistical analysis of the Si IV/C IV,N V/C IV, and He II/C IV emission-line ratios of 20 CVsbased on B430 UV spectra extracted from the IUE ULDA.We Ðnd for most systems that these ratios are clusteredwithin a range of D1 decade for log Si IV/C IV B [0.5 andlog He II/C IV B [1.0 and D1.5 decades for log N V/C IV B [0.25. The larger range of the N V/C IV ratio is duelargely to the large line ratios of the eclipsing dwarf novae ZCha and OY Car ; otherwise, the range of log N V/C IV isD1 decade centered on B [0.5. The clearest di†erencebetween magnetic and nonmagnetic CVs is the He II/C IV
ratio, which is D0.25 decades larger in magnetic systems.To place constraints on the excitation mechanism and
the physical conditions of the line-emitting gas of CVs, wehave investigated the theoretical line ratios of gas in eitherphotoionization and collisional ionization equilibrium.Given the uncertain and variable geometry, density, opticaldepth of the line-emitting gas and the shape and luminosityof the ionizing spectrum, we have restricted ourselves toconsideration of simple slab models each with Ðxed gascomposition, density, and column density. The variableshave been the shape and ionization parameter of the ion-izing spectrum and the density and column density of theslab ; for the collisional models, the temperature was varied.Line emission is produced in these models by recombi-nation or collisional excitation by thermal electrons or byexcitation by the ionizing continuum (““ scattering ÏÏ).
Within the conÐnes of these simple models, we Ðnd littleagreement between the observations and any of the models.SpeciÐcally, the observed Si IV/C IV line ratios are repro-duced by many of the models, but the predicted N V/C IV
line ratios are simultaneously too low by typically D0.5decades. Worse, for no parameters are any of the modelsable to reproduce the observed He II/C IV line ratios ; thisratio is far too small in the collisional and scattering modelsand too large by typically D0.5 decades in the photoioniza-tion models. Among the latter, the 10 eV blackbody models
No. 2, 1997 ULTRAVIOLET LINE RATIOS 847
do the best job of reproducing the three line ratios simulta-neously, but the match with the N V/C IV line ratio isaccomplished only if the observed emission feature near1240 is due to the Mg II 3sÈ4p doublet at 1239.93, 1240.39A�
instead of the N V 2sÈ2p doublet at 1238.82, 1242.80A� A� .Despite the above generally unfavorable comparisons
between observations and simple photoionization and col-lisional models, our investigation has proven useful inrevealing both the problems and promises of understandingthe UV line ratios of CVs. Future detailed work could beproÐtably performed on any and all of the above CV sub-classes with more detail in the shape of the ionizing spec-trum and the geometrical distribution, density, and columndensity of the emission region(s). Where the distance is wellknown, not only line ratios but absolute line strengths canbe Ðtted. With larger e†ective area, weaker lines, less subjectto optical depth e†ects, can be included. With higher spec-tral resolution, the UV lines be can uniquely identiÐed, thusremoving the annoying ambiguity of some of the line identi-Ðcations. Additional constraints on the physical conditions
and optical depth of the line-emitting gas is possible if theUV doublets are resolved. At comparable or slightly higherspectral higher resolution, the velocity Ðeld of the line-emitting gas can be constrained to constrain the ionizationparameter and hence the density. With realistic photontransport in the models, the line shapes further constrainthe models. By extending the bandpass into the far-UV,lines from species with both lower and higher ionizationpotentials (e.g., C III, N III, O VI, P V, S IV, S VI) provideadditional diagnostics. The UV data can and is beingobtained with HST , but to obtain the far-UV data, werequire the likes of HUT (e.g., ORFEUS (e.g.,Long 1996),
et al. and FUSE.Raymond 1995),
We thank John Raymond for useful insights and sugges-tions and the referee for helpful comments that signiÐcantlyimproved the original manuscript. Work at LawrenceLivermore National Laboratory was performed under theauspices of the US Department of Energy under contractno. W-7405-Eng-48.
REFERENCES
S., & Pequignot, D. 1973, A&A, 25, 137 ; 47, 321Aldrovandi, (1976)M., & Raymond, J. 1992, ApJ, 398,Arnaud, 394
A., & Sabadin, F. 1983, A&A, 125,Bianchini, 112A., et al. 1978, Nature, 275,Boggess, 372
J. M., & Mouchet, M. 1987, A&A, 188,Bonnet-Bidaud, 89F. A., & Mason, K. O. 1982a, in Accretion Driven Stellar X-rayCo� rdova,
Sources, ed. W. H. G. Lewin & E. P. J. van den Heuvel (Cambridge :Cambridge Univ. Press), 147
1982b, ApJ, 260,ÈÈÈ. 716S.-B., Zhang, Z.-Y., & Chen, J.-S. 1994, A&A, 281,Deng, 759
E. T., Hassall, B. J. M., Naylor, T., Charles, P. A., & Sonneborn,Harlaftis,G. 1992a, MNRAS, 257, 607
E. T., Naylor, T., Hassall, B. J. M., Charles, P. A., Sonneborn, G.,Harlaftis,& Bailey, J. 1992b, MNRAS, 259, 593
G. H., Preston, G. W., Smak, J., Paczyn� ski, B. 1965, ApJ, 141,Herbig, 617R. F., King, A. R., & Sherrington, M. R. 1980, MNRAS, 191,Jameson, 559T. R., & Krolik, J. H. 1993, NASA Int.Kallman, Rep.T. R., & McCray, R. 1982, ApJS, 50,Kallman, 263
R. L. 1987, Atomic and Ionic Spectrum Lines below 2000 Angs-Kelley,troms : Hydrogen through Krypton (New York : AIP)
S.-W., Wheeler, J. C., & Mineshige, S. 1992, ApJ, 384,Kim, 269A. R., Frank, J., Jameson, R. F., & Sherrington, M. R. 1983,King,
MNRAS, 203, 677Y.-K., Lee, Y. P., Schlegel, E. M., & Kallman, T. R. 1996, ApJ, 457,Ko, 363
R. H., Corcoran, M. F., Holenstein, B. D., & McCluskey, G. E. 1986,Koch,ApJ, 306, 618
J. H., & Kriss, G. A. 1995, ApJ, 447,Krolik, 512Dous, C. 1991, A&A, 252,la 100
K. S. 1996, in Cataclysmic Variables and Related Objects, ed.Long,A. Evans & J. H. Wood (Dordrecht : Kluwer), 233
C. W. 1996, in X-ray Imaging and Spectroscopy of Cosmic HotMauche,Plasmas, ed. F. Makino (Tokyo : Universal Academy Press), in press
C. W., Miller, G. S., Raymond, J. C., & Lamb, F. K. 1990, inMauche,Accretion-Powered Compact Binaries, ed. C. W. Mauche (Cambridge :Cambridge Univ. Press), 195
C. W., & Raymond, J. C. 1996, in Cosmic Winds and the Helio-Mauche,sphere, ed. J. R. Jokipii, C. P. Sonett, & M. S. Giampapa (Tucson : Univ.Arizona Press), in press
C. W., Raymond, J. C., Buckley, D. A. H., Mouchet, M., Bonnell,Mauche,J., Sullivan, D. J., Bonnet-Bidaud, J.-M., & Bunk, W. H. 1994, ApJ, 424,347
C. 1983, in IAU Symp. 103, Planetary Nebulae, ed. D. R. FlowerMendoza,(Dordrecht : Reidel), 143
T., Bath, G. T., Charles, P. A., Hassall, B. J. M., Sonneborn, G., vanNaylor,der Woerd, H., & van Paradijs, J. 1988, MNRAS, 231, 237
J., Garhart, M., De La Pen8 a, M., & Bushouse, H. 1994,Nichols-Bohlin,IUE NASA Newsletter 53
H., & Storey, P. J. 1983, A&A, 126,Nussbaumer, 75G., Mason, K. O., Cropper, M., Watson, M. G., & Clayton, K. L.Ramsay,
1994, MNRAS, 270, 692J. C. 1990, ApJ, 367,Raymond, 387J. C., Mauche, C. W., Bowyer, S., & Hurwitz, M. 1995, ApJ, 440,Raymond,
331J. C., & Smith, B. W. 1977, ApJS, 35,Raymond, 419
G., & Wehrse, R. 1991, A&A, 251,Shaviv, 117J. M., & Van Steenberg, M. 1983, ApJS, 48,Shull, 95
P., & Mateo, M. 1984, ApJ, 280,Szkody, 729C. B., Tucker, W., & Salpeter, E. E. 1969, ApJ, 156,Tarter, 943
F. 1987, A&AS, 71,Verbunt, 339R. A. 1988, ApJ, 335,Wade, 394
W., et al. 1989, A&AS, 79,Wamsteker, 1G. A., King, A. R., Uomoto, A. K., & Hiltner, W. A. 1986,Williams,
MNRAS, 219, 809G. L. 1971, in The Menzel Symposium on Solar Physics, AtomicWithbroe,
Spectra, and Gaseous Nebulae, ed. K. B. Gebbie (NBS Spec. Pub. 353),127
C.-C., Panek, R. J., Holm, A. V., Raymond, J. C., Hartmann, L. W., &Wu,Swank, J. H. 1989, ApJ, 339, 443