Cataclysmic Variables from Sloan Digital Sky Survey. VI. The Sixth Year (2005)
33
Work supported in part by US Department of Energy contract DE-AC02-76SF00515 Cataclysmic Variables from SDSS VI. The Sixth Year (2005) 1 Paula Szkody 2 , Arne Henden 3,4 , Lee Mannikko 2 , Anjum Mukadam 2 , Gary D. Schmidt 5 , John J. Bochanski 2 , Marcel Ag¨ ueros 2 , Scott F. Anderson 2 , Nicole M. Silvestri 2 , William E. Dahab 6 , Masamune Oguri 6,7 , Donald P. Schneider 8 , Min-Su Shin 6 , Michael A. Strauss 6 , Gillian R. Knapp 6 , Andrew A. West 2 ABSTRACT The 28 cataclysmic variables found in 2005 in the Sloan Digital Sky Survey are presented with their coordinates, magnitudes and spectra. Five of these systems are previously known CVs (HH Cnc, SX LMi, QZ Ser, RXJ1554.2+2721 and HS1016+3412) and the rest are new discoveries. Additional spectroscopic, photometric and/or polarimetric observations of 10 systems were carried out, resulting in estimates of the orbital periods for seven of the new binaries. The 23 new CVs include one eclipsing system, one new Polar and five systems whose spectra clearly reveal atmospheric absorption lines from the underlying white dwarf. Subject headings: binaries: eclipsing — binaries: spectroscopic — cataclysmic variables — stars: dwarf novae 2 Department of Astronomy, University of Washington, Box 351580, Seattle, WA 98195 3 US Naval Observatory, Flagstaff Station, P. O. Box 1149, Flagstaff, AZ 86002-1149 4 AAVSO, 25 Birch St., Cambridge, MA 02138 5 The University of Arizona, Steward Observatory, Tucson, AZ 85721 6 Princeton University Observatory, Peyton Hall, Princeton, NJ 08544 7 Kavli Institute for Particle Astrophysics and Cosmology, Stanford University, 2575 Sand Hill Road, Menlo Park, CA 94025 8 Department of Astronomy and Astrophysics, 525 Davey Laboratory, Pennsylvania State University, University Park, PA 16802 1 Based on observations obtained with the Sloan Digital Sky Survey and with the Apache Point Obser- vatory (APO) 3.5m telescope, which are owned and operated by the Astrophysical Research Consortium (ARC) June 2007 SLAC-PUB-12578 Submitted to Astrophysical Journal
Transcript of Cataclysmic Variables from Sloan Digital Sky Survey. VI. The Sixth Year (2005)
Work supported in part by US Department of Energy contract DE-AC02-76SF00515
Cataclysmic Variables from SDSS VI. The Sixth Year (2005) 1
Paula Szkody2, Arne Henden3,4, Lee Mannikko2, Anjum Mukadam2, Gary D. Schmidt5,
John J. Bochanski2, Marcel Agueros2, Scott F. Anderson2, Nicole M. Silvestri2, William E.
Dahab6, Masamune Oguri6,7, Donald P. Schneider8, Min-Su Shin6, Michael A. Strauss6,
Gillian R. Knapp6, Andrew A. West2
ABSTRACT
The 28 cataclysmic variables found in 2005 in the Sloan Digital Sky Survey
are presented with their coordinates, magnitudes and spectra. Five of these
systems are previously known CVs (HH Cnc, SX LMi, QZ Ser, RXJ1554.2+2721
and HS1016+3412) and the rest are new discoveries. Additional spectroscopic,
photometric and/or polarimetric observations of 10 systems were carried out,
resulting in estimates of the orbital periods for seven of the new binaries. The
23 new CVs include one eclipsing system, one new Polar and five systems whose
spectra clearly reveal atmospheric absorption lines from the underlying white
dwarf.
Subject headings: binaries: eclipsing — binaries: spectroscopic — cataclysmic
variables — stars: dwarf novae
2Department of Astronomy, University of Washington, Box 351580, Seattle, WA 98195
3US Naval Observatory, Flagstaff Station, P. O. Box 1149, Flagstaff, AZ 86002-1149
4AAVSO, 25 Birch St., Cambridge, MA 02138
5The University of Arizona, Steward Observatory, Tucson, AZ 85721
6Princeton University Observatory, Peyton Hall, Princeton, NJ 08544
7Kavli Institute for Particle Astrophysics and Cosmology, Stanford University, 2575 Sand Hill Road,
Menlo Park, CA 94025
8Department of Astronomy and Astrophysics, 525 Davey Laboratory, Pennsylvania State University,
University Park, PA 16802
1Based on observations obtained with the Sloan Digital Sky Survey and with the Apache Point Obser-
vatory (APO) 3.5m telescope, which are owned and operated by the Astrophysical Research Consortium
(ARC)
June 2007
SLAC-PUB-12578
Submitted to Astrophysical Journal

– 2 –
1. Introduction
The Sloan Digital Sky Survey (SDSS; York et al. 2000) has recently produced Data
Release 5, which includes photometry of 215 million sources over 8000 square degrees and
spectroscopy of over 1 million objects (Adelman-McCarthy et al. 2007). Previous releases
are detailed by Stoughton et al. (2002), Abazajian et al. (2003, 2004, 2005), and Adelman-
McCarthy et al. (2006)2. Among the many results stemming from the SDSS data is the
discovery of a significant number of cataclysmic variables (CVs), the short period binary
stars in which a white dwarf accretes matter from a companion which usually resembles a
late-type main sequence star (all types of CVs are reviewed by Warner (1995) while those
with magnetic white dwarfs are reviewed by Wickramasinghe & Ferrario (2000)). The CV
population has been found to consist primarily of short orbital period (under 2 hrs) systems
with very low mass transfer rates (Szkody et al. 2002, 2003a,b, 2004, 2005, 2006, Schmidt et
al. 2005, 2006). Some of these rates are so low that the accretion occurs by a wind from the
secondary, rather than a stream of material from a filled Roche lobe. In addition, at these
low rates, the accretion disk or column is so faint that the photosphere of the underlying
stars can be seen spectroscopically.
This paper continues the series of yearly identifications of CVs in SDSS. We provide
accurate coordinates, SDSS magnitudes and colors and the SDSS spectra, along with some
additional observations to improve the classifications. Since the list is large and continually
growing, it will require an extensive observational campaign by many in the community to
obtain good orbital periods and classifications for all sources. If this can be accomplished
for all the objects, and the biases in the spectroscopic selection correctly determined, the
SDSS data can ultimately provide a basis for rigorous tests of stellar evolution models for
close binaries (Howell, Nelson & Rappaport 2001) that predict the numbers of systems over
the range of orbital periods.
2. Observations and Reductions
The details concerning the SDSS imaging and spectroscopic instrumentation and reduc-
tions are described by Szkody et al. (2002) and by several SDSS papers. As a brief summary,
SDSS astrometic (Pier et al. 2003) and photometric (Gunn et al. 1998, 2006; Lupton, Gunn,
& Szalay 1999; Hogg et al. 2001; Lupton et al. 2001; Ivezic et al. 2004; Lupton 2005 and
Tucker et al. 2006) pipelines provide magnitudes in five filters (u, g , r , i , z ; Fukugita et al.
2data are available from http://www.sdss.org

– 3 –
1996; Smith et al. 2002). Objects are chosen for spectroscopic observations by a number of
selection algorithms (see Stoughton et al. 2002). These algorithms cover color loci of quasars
(Richards et al. 2002), cool stars, white dwarfs, serendipity and white dwarf plus cool dwarf
binaries. While this covers a wide range of color space, it does not guarantee that all CVs
are targeted for spectra. The SDSS spectra cover 3800-9200A at a resolving power of ∼1800
and pipelines provide wavelength and flux calibrations. The spectra are then classified as
(e.g., star, galaxy, quasar) by an automatic software package.
CVs are identified in the SDSS spectra through an algorithm that selects objects with
Balmer and Helium emission/absorption lines at zero redshift and the resulting objects are
then classified by eye. As a cross-check, all spectra are viewed on some plates to see if
the algorithm misses any candidates. We estimate that we find more than 90% of the CVs
that exist in the SDSS spectra, with a few missed through mis-identification or low S/N
of the spectra. Table 1 lists the 23 new CVs, along with the 5 previously known ones,
that had SDSS spectra obtained from 2005 Jan 1 through Dec 31, giving the plate, fiber,
and modified Julian date (MJD) of each spectrum. The coordinates are equinox J2000.0
and use the IAU convention of truncation rather than rounding at the given decimal. The
coordinates have an astrometric accuracy of 0.10 arcsec. The magnitudes and colors are
from the point-spread function photometry with no correction for interstellar reddening. To
simplify the designations throughout this paper, we refer to the objects as SDSSJ hhmm
(hours and min of RA). One object in Table 1 (SDSSJ 0334) has no SDSS spectrum. It was
discovered serendipitously in a search for bright (i <15) UV-excess quasars in the SDSS.
The SDSS images of this object are saturated or nearly so in several bands, but the SDSS
photometry remains good for a few magnitudes beyond saturation, as described in the DR2
paper.
The available followup observations of these systems are listed in Table 2. Differen-
tial photometry was obtained at the Sonoita Research Observatory (SRO) with the 0.35m
telescope, using an SBIG STL-1001E camera with a 1024×1024 CCD. Additional photom-
etry on SDSSJ 0334 was obtained at the US Naval Observatory Flagstaff Station (NOFS),
with the 1.0m telescope and 1024 × 1024 SITe/Tektronix CCD. No filter was used for the
SRO or NOFS observations; these CCDs have approximately wideband Johnson V mgni-
tude response when used unfiltered. The fields were calibrated with other nights of all-sky
photometry using Landolt standards so that the comparison stars could be placed onto the
Johnson V magnitude system. The data on SDSSJ 0334 are calibrated from a photometric
night, whereas SDSSJ 0328 and 2243 have less accurate zeropoints determined.
Two nights of photometry on the Apache Point Observatory (APO) 3.5m telescope
using the Dual Imaging Spectrograph (DIS) in imaging mode with no filters were obtained

– 4 –
for SDSSJ 1443. This object was calibrated against g magnitudes for other SDSS stars in
the field.
Several other objects were observed for brief intervals on single nights, using DIS in
spectroscopic mode. Most of these spectra were obtained with the high resolution gratings
(resolution about 2A) with a 1.5 arcsec slit over several hours and were used to construct
radial velocity curves. One spectrum (2005 Dec 27 on SDSSJ 0334) was obtained with the
medium resolution gratings (∼5A) for classification purposes. All spectra were flux and
wavelength calibrated using standard IRAF 3 routines. The SDSS spectra were measured
with the centroid-finding “e” routine in the IRAF splot package to obtain the equivalent
widths and fluxes for the Balmer and helium emission lines (Table 3). For simple lines, this
routine provided the centroid wavelengths of the lines for the APO data. For lines with good
S/N but complicated structure (absorption or narrow emission structure within the line),
the velocities were determined with the double-Gaussian method (Shafter 1983). If a plot of
velocity vs time showed a sinusoidal variation during the 2-3 hrs of data, a least squares fit to
the velocities was used to find γ (systemic velocity), K (semi-amplitude), P (orbital period),
and T0 (the epoch of red to blue crossing of the systemic velocity), with the results listed in
Table 4. Note that due to the short length of the data, most periods are only estimates and
will need several nights of data for accurate determinations. However, they should provide
a starting point as to whether systems have short or long periods.
Circular polarization was measured for SDSSJ 0328, using the CCD Spectropolarimeter
SPOL with a low resolution grating on the 2.3m Bok telescope on Kitt Peak.
3. Results
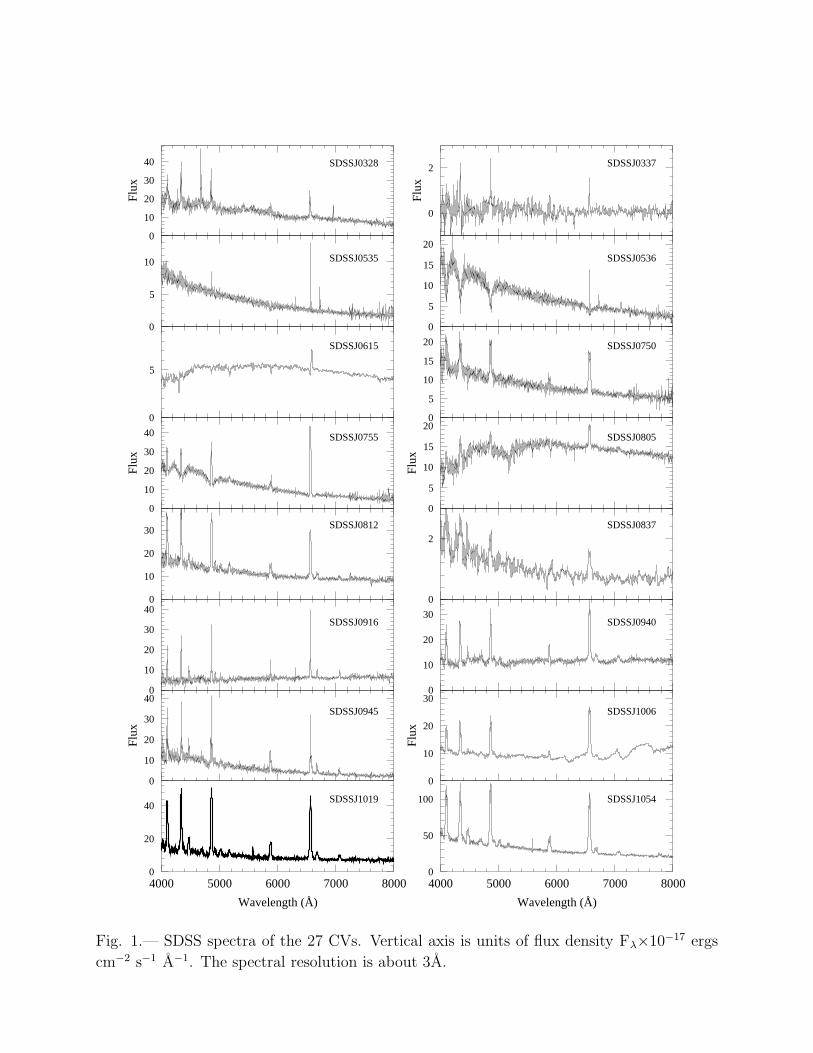
The 27 systems with SDSS spectra are shown in Figure 1 and the equivalent widths and
fluxes of the prominent hydrogen Balmer and helium emission lines are given for all 28 in
Table 3. Using similar categories to the previous papers, we sort and present the systems
with identifiable/interesting characteristics.
3IRAF (Image Reduction and Analysis Facility) is distributed by the National Optical Astronomy Ob-
servatories, which are operated by AURA, Inc., under cooperative agreement with the National Science
Foundation.

– 5 –
3.1. Previously Known Systems
The objects listed in Table 1 contain five known CVs: the four dwarf novae HH Cnc
(SDSSJ 0916), SX LMi (SDSSJ 1054), QZ Ser (SDSSJ 1556) and HS1016+3412 (SDSSJ
1019), and the highly magnetic CV (polar) AP CrB (SDSSJ 1554; HS1552+2730; RXJ1554.2+2721).
The general characteristics and literature references of HH Cnc, SX LMi and QZ Ser are avail-
able from the on-line CV catalog of Ronald Downes 4. HH Cnc has not been sufficiently
studied to identify an orbital period, while the three other dwarf novae have periods below
2 hrs (Table 1). HH Cnc and SX LMi appear to be typical short period dwarf novae with
outbursts and superoutbursts (Kato & Uemura 2001; Wagner et al. 1998), while QZ Ser is
one of the rare peculiar short period dwarf novae with a K type secondary (Thorstensen et
al. 2002).
AP CrB was originally found in the Hamburg Quasar Survey (Jiang et al. 2000).
Tovmassian et al. (2001) identified it as a polar with a period in the middle of the CV period
gap between 2-3 hrs (the period was later refined to 151.865 min by Thorstensen & Fenton
2002). Gansicke et al. (2004) identified Zeeman split Lyα absorption from an HST STIS
spectrum, revealing a high field strength of 144 MG. A recent paper (Schwoope, Schreiber
& Szkody 2006) has already discussed the SDSS spectrum and the cyclotron harmonic that
is visible near 4800A.
HS1016+3412 was recently identified as a dwarf nova by Aungwerojwit et al. (2006;
hereafter A06). They found one outburst (magnitude of 15.4) on 2004 Nov. 2, while most
of their photometry showed the system at V∼17.5, with one measurement at V∼18.6. The
SDSS photometry shows a g magnitude near their faintest measurement, while the SDSS
spectrum looks similar to the one shown by A06. Our APO data were obtained prior to the
publication of A06 and so were analyzed independently for a period. Figure 2 and Table
4 present our radial velocity results for the Hα and Hβ lines. A plot of the velocities vs
time showed a clear sinusoidal motion with a period slightly longer than our dataset of 107
minutes. The results of A06 using a longer dataset for Hα produced a period of 114.3±2.7
min, a value that is consistent with our periods (within our estimated 10% error bars).
Table 4 also shows our best sine wave fit with the period fixed at the 114.3 min value. Our
K amplitude is less than that found by A06, but this value is a function of how the velocities
are measured. A06 used a double Gaussian with a separation of 100 km s−1 whereas we used
the centroid “e” routine in iraf for our fit.
4http://archive.stsci.edu/prepds/cvcat/index.html

– 6 –
3.2. High Inclination Systems
The systems with high inclination typically show an obvious double-peaked structure in
their Balmer emission lines, with the central depression sometimes reaching to the continuum
in the higher order lines. These features are readily apparent in SDSSJ 1152, 1433 and 1435,
and to a lesser extent in SDSSJ 0750. Of these, only SDSSJ 1433 has followup photometric
observations, which revealed eclipses (described below). APO spectra were able to find a
period for SDSSJ 1435, but the sparse and low S/N spectra of SDSSJ 0750 (Table 2) were
not sufficient to determine the orbital period, or whether eclipses are present.
SDSSJ 1433: The two nights of APO photometry revealed 6 eclipses. The four eclipses
on 30 May yield an orbital period of 78.12±0.45 min (unfortunately the 2 nights were too
far separated to be used to refine the period further). Figure 3 shows the light curves on
the two nights (May 3 and 30) and Table 5 lists all the eclipse times in HJD (these times
are the faintest points of the light curve). The eclipse is deep (2.5 mag) and centered on a
broad hump, indicating that there is some structure in the disk. The hump is not as strong
as the typical hot spot hump that results from the mass transfer stream impacting the disk
(e.g. SDSSJ 1556; Szkody et al. 2006), nor is the light curve similar to the ultrashort period
CVs that show a double-humped light curve (e.g. SDSSJ 0804; Szkody et al. 2006) thought
to be due to the impact stream and its overflow to the opposite side of the disk. The May 3
light curve shows a more consistent hump feature than on May 30, and there is evidence of a
secondary eclipse feature as well. The eclipse itself is asymmetric, and clearly shows a steep
ingress due to the white dwarf eclipse, followed by a gradual ingress due to a spot and then
a steep rise as the white dwarf re-appears. Figure 4 shows the 4 eclipses from 30 May folded
to match the ingresses and egresses. An almost linear decrease to the bottom of the eclipse
is evident in the 3 min prior to the faintest magnitude. Higher time-resolution photometry
in several colors will be able to constrain the geometry, as is done for other deeply eclipsing
systems (Wood et al. 1989).
SDSSJ 1435: The time-resolved spectra of SDSSJ 1435 show a large amplitude sine
wave that starts a repetition during the observation length of 108 min, with blue and red
peaks clearly shifting back and forth during the interval. The best fit periods for the Hα and
Hβ lines are 83 and 74 min so our estimate is 78±8 min; longer data strings will be needed
to refine this value further. Figure 5 shows the radial velocity curves.

– 7 –
3.3. Dwarf Novae
To identify a dwarf nova, several observations must be done in order to detect an
outburst. Objects which are potential candidates are those that show large differences in
their brightness between the SDSS photometry and spectroscopy. The Digitized Sky Survey
(DSS5) and USNO 6 catalogs provide additional epochs to look for large brightness changes.
One candidate dwarf nova is SDSSJ 0837, whose SDSS spectrum (Figure 1) is significantly
fainter (g∼20) than its SDSS g mag of 19.0. Another good candidate is SDSSJ 0334, which
we found during followup observations of bright UV excess sources and confirmed as a dwarf
nova.
SDSSJ 0334: The SDSS photometry of SDSSJ 0334 shows a bright object (g=14.6) while
spectroscopy at APO on 2005 Dec 27 shows an ∼18th magnitude source with the typical
Balmer emission line spectrum of a dwarf nova at quiescence (Figure 6 top). This strong
variability is consistent with the USNO catalog entries of B=22.05 and R=17.8. Additional
photometry at NOFS on 2006 Jan 27 also showed the object at V∼18 (Figure 7). APO
time-resolved data obtained on 2006 Oct 22 (Figure 6 bottom) showed an intermediate state
(V∼16), with the higher Balmer lines surrounded by absorption (likely from an extended
accretion disk during a decline from outburst). The SRO photometry on 2006 Feb 3 and 4
also caught a decline from outburst, as the Feb 3 data showed a steady decline from V∼16.26
to 16.48 and the Feb 4 data continued the decline from V∼17.4 to 18.0 Thus, with 2/3 of the
observations obtained at quiescence and 1/3 at outbursts, it is likely that SDSSJ 0334 is a
dwarf nova with a relatively frequent outburst timescale. The time-resolved spectra indicate
an orbital period of 114 min for both Hα and Hβ and the relatively low K amplitude likely
indicates a low inclination system (Figure 8 and Table 4). The quiescent light curve (Figure
7) shows some low amplitude (0.2 mag) modulation but a longer time series is needed to see
if this repeats on the orbital timescale.
3.4. Nova-likes with He II
The known polar SDSSJ 1554 shows a prominent high excitation He II line compared
to Hβ (Figure 1) that is one of the identifying traits of polars (Figure 1). An even stronger
ratio of He II/Hβ is apparent in SDSSJ 0328, for which followup observations (see below)
confirm a polar nature as well. A weak He II emission line is the strongest line evident in
5http://archive.stsci.edu/dss/
6http://www.nofs.navy.mil/projects/pmm/
– 8 –
SDSSJ 2243, but its spectrum (Figure 1) shows a strong blue continuum with very weak
Balmer lines. It is likely that SDSSJ 2243 is a novalike variable with an accretion disk and
a high mass transfer rate. Although 10 spectra were obtained over a time-span of almost 2
hrs (Table 2), the weakness of the lines and poor S/N prevented any determination of an
orbital period. Two nights of SRO photometry showed only random variations at the 0.1
mag level.
SDSSJ 0328: Spectropolarimetric observations with the Bok telescope showed SDSSJ
0328 to be a polarized source that was clearly variable on a timescale of about 2 hr. The
circular polarization summed over time and the entire spectrum has a value of +0.48% and is
larger at shorter wavelengths. Over the 2 hr period, the polarization varies with an amplitude
of 2.5%. Figure 9 shows the visual magnitude and polarization change over the orbit. There
is a bright phase that is about 1 mag brighter than the rest of the orbit and that lasts for
about 0.55 of the orbit. This phase has positive circular polarization. Since the faint phase
has negative polarization, it is clear that there are two actively accreting magnetic poles
in this system. The spectrum shows clear cyclotron humps that move with phase. These
harmonics are even visible in the survey spectrum (Figure 1). Figure 10 shows spectra from
the Bok telescope at the bright and faint phases. The faint phase spectrum shows cyclotron
harmonics near 4750A, 5600A, and 6700A, which indicate a magnetic field of 33±5 MG. The
line emission also changes dramatically throughout the orbit, almost completely disappearing
at the peak of the bright phase, suggesting that the accretion funnel may be eclipsed by the
secondary (or by the upstream funnel). However, since the cyclotron humps and circular
polarization are still present, the white dwarf and accretion spot are not eclipsed.
A fit to the velocities measured from the Hα emission line produced the radial velocity
curve shown in Figure 9. This provided a period of 120±9 min, and a semi-amplitude of
320±55 km s−1. The systemic velocity crossing occurs very nearly at the middle of the bright
phase. The timing implies that the accretion primarily feeds the bright pole. Two nights
of SRO photometry (Figure 11) a month later covered several orbits and the large orbital
modulation enabled a refinement of the period to 121.97±0.25 min.
3.5. Systems Showing the Underlying Stars
If the disk does not dominate the total system light, the underlying white dwarf can
be seen. This typically occurs for situations when the inclination is high (so that the edge
rather than the face of the disk is the source) and/or the accretion rate is very low so that
the disk is not optically thick and extensive. From Figure 1, it is apparent that SDSSJ 0536,
0755, 1433, 1435, and 1559 show broad absorption lines that are likely from a WD. Of these,

– 9 –
SDSSJ 1433 and 1435 have been discussed as high inclination systems. SDSSJ 0536 and 1559
show narrow emission as well as the absorption, indicative of irradiation of the secondary
star by the white dwarf. Followup observations were obtained for SDSSJ 0755.
SDSSJ 0755: We obtained 156 min of time-resolved APO spectroscopy of SDSSJ 0755;
the data reveal a clear sinusoid modulation of the Hα and Hβ emission lines that repeats
during the observation interval. There are also narrow peaks within the emission lines that
shift from blue to red on a similar timescale. The best fit sine waves to the data (Figure
12 and Table 4) give a period of 83 min for Hα and 87 min for Hβ. While this difference
can be a measure of our uncertainty, the Hα line is stronger and less contaminated by the
underlying absorption so may be a better indicator of the true period.
Figure 1 also reveals the presence of M stars in the spectra of SDSSJ 1006 and 1554. As
previously mentioned, SDSSJ 1554 is a known polar so there is no accretion disk to contribute
light, although cyclotron emission is present. Thorstensen & Fenton (2002) identified an M4
dwarf that produces the visible TiO bands. The TiO bands in SDSSJ 1006 indicate a spectral
type of M2 (± 1 spectral subclass) for its secondary.
The spectra of SDSSJ 0615 and 0805 show a downturn to the blue and absorption
features indicative of an early K star. These systems could have long orbital periods or
could have a secondary that evolved from a more massive progenitor (Thorstensen et al.
2002).
3.6. Other Disk Systems
The spectrum of SDSSJ 1107 has the appearance of a typical accretion disk system,
with strong, broad Balmer emission lines. However, our 100 min of followup spectra showed
no consistent radial velocity variation throughout this interval (both centroid and double-
Gaussian methods of velocity determination were tried). The lines are clearly doubled and
show narrow peak components during some spectra, which do not repeat a cycle during our
observations, indicating that the period may be longer than most of the SDSS systems. It is
also possible that the inclination is low so that the K amplitude is small so that the orbital
velocity amplitude falls within our noise.
SDSSJ 1610 was first identified as KUV16081+2229 and classified as an sdB (Wegner
& Swanson 1990). The width of the absorption lines makes a novalike classification more
reasonable. However, the weak lines will make determination of an orbital period very
difficult.
– 10 –
SDSSJ 1642: Figure 1 shows SDSSJ 1642 to be be a typical disk system with a blue
continuum and strong emission lines. Although the APO spectral coverage is short, both
Hα and Hβ show a clear modulation from blue to red. Figure 13 shows the best fit sine wave
to the 7 observed points. The period is close to the length of the dataset (70±7 min from
Table 4), so a longer time series will be needed to further constrain the orbital parameters.
3.7. ROSAT Correlations
Four systems from Table 1 have X-ray detections (>2.5σ) within the positional errors
of the ROSAT All Sky Survey (RASS; Voges et al. 1999, 2000). The X-ray count rates and
exposure times for these sources are listed in Table 6. The known Polar RXJ1554.2+2721 is
apparent, as are three other disk CVs. The new Polar SDSSJ 0328 was not detected, but it
could have been in a low accretion state during the RASS.
4. Conclusions
The sixth year of SDSS operations has brought the total number of CVs in the SDSS
database to 213, of which 177 are new discoveries. There are now 100 CVs with known or
estimated orbital periods. Of these, 70 are under 2 hrs, 10 are in the period gap (mostly
polars) and 20 are long period systems above the period gap. These numbers are now
reaching statistical significance to be used in population studies. However, it should be kept
in mind that SDSS is not complete in area i.e. the selection for spectral fibers is based on a
complicated mix of colors of quasars, white dwarfs, serendipity and binary pairs. The final
numbers will come from variability studies with followup spectra to determine the correct
percentage of “missed” objects. Since the color range covered is large, the total numbers
will change, but the mix of percentages are not expected to change by large amounts.
Among this dataset are several objects of interest for future studies. The deep eclipse of
SDSSJ 1433 could be parameterized with higher time resolution and multi-color photometry.
A light curve for SDSSJ 1152 could reveal eclipses. The short period systems showing the
white dwarfs are prime candidates to search for pulsations of the white dwarf, as has been
found in eight of the SDSS-discovered CVs (Warner & Woudt 2004, Woudt & Warner 2004,
Gansicke et al. 2006, Nilsson et al. 2006, Mukadam et al. 2006). The systems showing
K stars (SDSSJ 0615 and 0805) should have high priority to determine if their periods are
under 2 hrs (indicating an abnormal evolution scenario) or several hours, as typical for CVs
with secondaries earlier than M.
– 11 –
Funding for the SDSS and SDSS-II has been provided by the Alfred P. Sloan Foundation,
the Participating Institutions, the National Science Foundation, the U.S. Department of
Energy, the National Aeronautics and Space Administration, the Japanese Monbukagakusho,
the Max Planck Society, and the Higher Education Funding Council for England. The SDSS
Web Site is http://www.sdss.org/.
The SDSS is managed by the Astrophysical Research Consortium for the Participating
Institutions. The Participating Institutions are the American Museum of Natural History,
Astrophysical Institute Potsdam, University of Basel, University of Cambridge, Case Western
Reserve University, University of Chicago, Drexel University, Fermilab, the Institute for Ad-
vanced Study, the Japan Participation Group, Johns Hopkins University, the Joint Institute
for Nuclear Astrophysics, the Kavli Institute for Particle Astrophysics and Cosmology, the
Korean Scientist Group, the Chinese Academy of Sciences (LAMOST), Los Alamos National
Laboratory, the Max-Planck-Institute for Astronomy (MPIA), the Max-Planck-Institute for
Astrophysics (MPA), New Mexico State University, Ohio State University, University of
Pittsburgh, University of Portsmouth, Princeton University, the United States Naval Obser-
vatory, and the University of Washington.
We are grateful to John Thorstensen for useful comments on the manuscript. P.S.
and A.M. acknowledge support from NSF grant AST 0607840 and from NASA through
the Hubble Fellowship grant HST-HF-01175.01-A awarded by the Space Telescope Science
Institute, which is operated by the Association of Universities for Research in Astronomy,
Inc., for NASA, under contract NAS 5-26555. Studies of magnetic stars and stellar systems at
Steward Observatory is supported by the NSF through AST 03-06080. M.O. was supported
in part by the Department of Energy contract DE-AC02-76SF00515.
REFERENCES
Abazajian, K. et al. 2003, AJ, 126, 2081 (DR1)
Abazajian, K. et al. 2004, AJ, 128, 502 (DR2)
Abazajian, K. et al. 2005, AJ, 129, 1755 (DR3)
Adelman-McCarthy, J. K. et al. 2006, ApJS, 162, 38 (DR4)
Adelman-McCarthy, J. K. et al. 2007, ApJS, submitted (DR5)
Aungwerojwit, A. et al. 2006, A&A, 455, 659 (A06)
Fukugita, M., Ichikawa, T., Gunn, J. E., Doi, M., Shimasaku, K., & Schneider, D. P. 1996,
AJ, 111, 1748

– 12 –
Gansicke, B. T. et al. 2004, ApJ, 613, L141
Gansicke, B. T. et al. 2006, MNRAS, 365, 969
Gunn, J. E. et al. 1998, AJ, 116, 3040
Gunn, J. E. et al. 2006, AJ, 131, 2332
Hogg, D. W., Finkbeiner, D. P., Schlegel, D. J. & Gunn, J. E. 2001, AJ, 122, 2129
Howell, S. B., Nelson, L. A. & Rappaport, S. 2001, ApJ, 550, 897
Ivezic, Z. et al. 2004, AN, 325, 583
Jiang, X. J., Engels, D., Wei, J. Y., Tesch, F. & Hu, J. Y. 2000, A&A, 362, 263
Kato, T. & Uemura, M. 2001, IBVS, 5097
Lupton, R. 2005, AJ, submitted
Lupton, R. H., Gunn, J. E. & Szalay, A. 1999, AJ, 118, 1406
Lupton, R. H., Gunn, J. E., Ivezic, Z., Knapp, G. R., Kent, S. M. & Yasuda, N. 2001, ASP
Conf. Ser. 238, p. 269
Mukadam, A. et al. 2006, AJ, submitted.
Nilsson, R., Uthas, H., Ytre-Eide, M., Solheim, J.-E. & Warner, B. 2006, MNRAS, 370, L56
Pier, J. R., Munn, J. A., Hindsley, R. B., Hennessy, G. S., Kent, S. M., Lupton, R. H. &
Ivezic, Z. 2003, AJ, 125, 1559
Richards, G. T. et al. 2002, AJ, 123, 2945
Schmidt, G. D. et al. 2005, ApJ, 630, 1037
Schmidt, G. D., Szkody, P., Henden, A. & Anderson, S. F. 2006, ApJ, in press
Schwope, A. D., Schreiber, M. R. & Szkody, P. 2006, A&A, 452, 955
Shafter, A. W. 1983, ApJ, 267, 222
Smith, J. A. et al. 2002, AJ, 123, 485
Stoughton, C. et al. 2002, AJ, 123, 485
Szkody, P. et al. 2002, AJ, 123, 430 (Paper I)
Szkody, P. et al. 2003a, ApJ, 583, 902
Szkody, P. et al. 2003b, AJ, 126, 1499 (Paper II)
Szkody, P. et al. 2004, AJ, 128, 1882 (Paper III)
Szkody, P. et al. 2005, AJ, 129, 2386 (Paper IV)
Szkody, P. et al. 2006, AJ, 131, 973 (Paper V)

– 13 –
Thorstensen, J. & Fenton, W. H. 2002, PASP, 114, 74
Thorstensen, J., Fenton, W. H., Patterson, J. O., Kemp, J., Krajci, T. & Baraffe, I. 2002,
ApJ, 567, L49
Tovmassian, G. H., Greiner, J., Zharikov, S. V., Echevarria, J. & Kniazev, A. 2001, A&A,
380, 504
Tucker, D. et al. 2006, A.N., 327, 821
Voges, W. et al. 1999, A&A, 349, 389
Voges, W. et al. 2000, IAU Circ., No. 7432
Wagner, R. M. et al. 1998, AJ, 115, 787
Warner, B. 1995, in Cataclysmic Variable Stars, CUP
Warner, B. & Woudt, P. 2004, in Variable Stars in the Local Group, ASP Conf. Ser. 310,
eds. D. Kurtz & K. Pollard, p.382
Wood, J. H., Horne, K., Berriman, G. & Wade, R. A. 1989, ApJ, 341, 974
Woudt, P. & Warner, B. 2004, MNRAS, 348, 599
Wegner, G. & Swanson, S. R. 1990, AJ, 100, 1274
Wickramasinghe, D. T. & Ferrario, L. 2000, PASP, 112, 873
York, D. G. et al. 2000, AJ, 120, 1579
This preprint was prepared with the AAS LATEX macros v5.2.
– 14 –
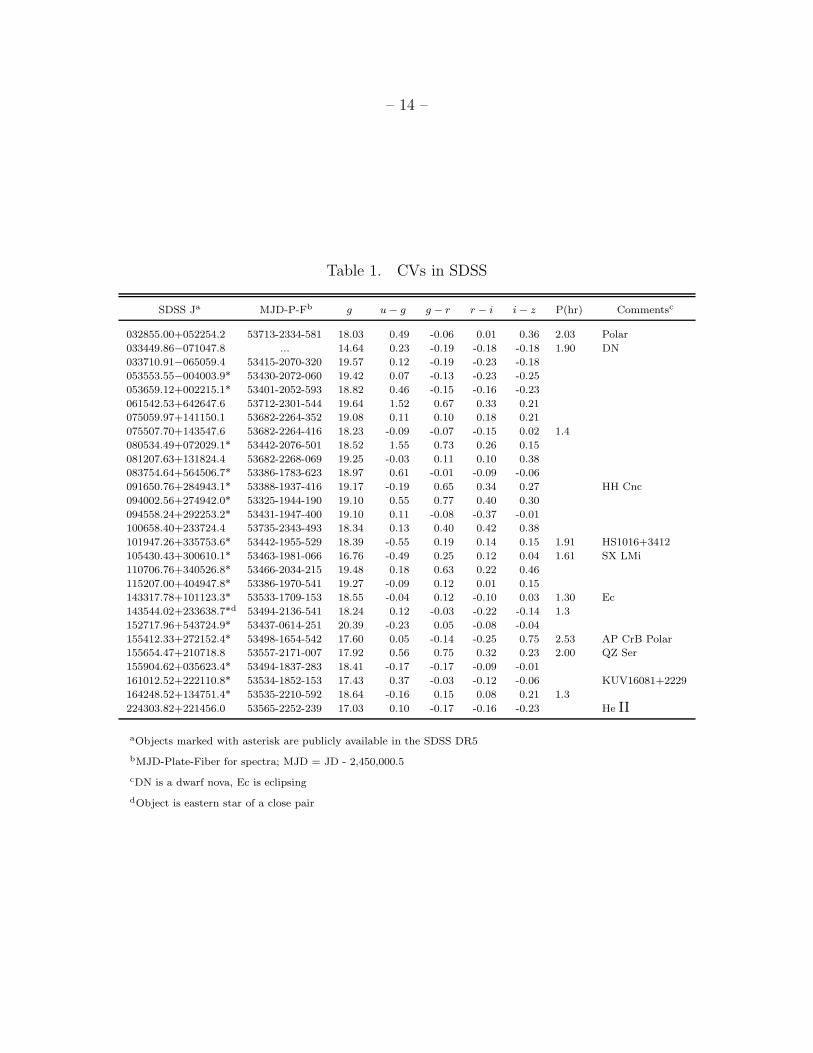
Table 1. CVs in SDSS
SDSS Ja MJD-P-Fb g u − g g − r r − i i − z P(hr) Commentsc
032855.00+052254.2 53713-2334-581 18.03 0.49 -0.06 0.01 0.36 2.03 Polar
033449.86−071047.8 ... 14.64 0.23 -0.19 -0.18 -0.18 1.90 DN
033710.91−065059.4 53415-2070-320 19.57 0.12 -0.19 -0.23 -0.18
053553.55−004003.9* 53430-2072-060 19.42 0.07 -0.13 -0.23 -0.25
053659.12+002215.1* 53401-2052-593 18.82 0.46 -0.15 -0.16 -0.23
061542.53+642647.6 53712-2301-544 19.64 1.52 0.67 0.33 0.21
075059.97+141150.1 53682-2264-352 19.08 0.11 0.10 0.18 0.21
075507.70+143547.6 53682-2264-416 18.23 -0.09 -0.07 -0.15 0.02 1.4
080534.49+072029.1* 53442-2076-501 18.52 1.55 0.73 0.26 0.15
081207.63+131824.4 53682-2268-069 19.25 -0.03 0.11 0.10 0.38
083754.64+564506.7* 53386-1783-623 18.97 0.61 -0.01 -0.09 -0.06
091650.76+284943.1* 53388-1937-416 19.17 -0.19 0.65 0.34 0.27 HH Cnc
094002.56+274942.0* 53325-1944-190 19.10 0.55 0.77 0.40 0.30
094558.24+292253.2* 53431-1947-400 19.10 0.11 -0.08 -0.37 -0.01
100658.40+233724.4 53735-2343-493 18.34 0.13 0.40 0.42 0.38
101947.26+335753.6* 53442-1955-529 18.39 -0.55 0.19 0.14 0.15 1.91 HS1016+3412
105430.43+300610.1* 53463-1981-066 16.76 -0.49 0.25 0.12 0.04 1.61 SX LMi
110706.76+340526.8* 53466-2034-215 19.48 0.18 0.63 0.22 0.46
115207.00+404947.8* 53386-1970-541 19.27 -0.09 0.12 0.01 0.15
143317.78+101123.3* 53533-1709-153 18.55 -0.04 0.12 -0.10 0.03 1.30 Ec
143544.02+233638.7*d 53494-2136-541 18.24 0.12 -0.03 -0.22 -0.14 1.3
152717.96+543724.9* 53437-0614-251 20.39 -0.23 0.05 -0.08 -0.04
155412.33+272152.4* 53498-1654-542 17.60 0.05 -0.14 -0.25 0.75 2.53 AP CrB Polar
155654.47+210718.8 53557-2171-007 17.92 0.56 0.75 0.32 0.23 2.00 QZ Ser
155904.62+035623.4* 53494-1837-283 18.41 -0.17 -0.17 -0.09 -0.01
161012.52+222110.8* 53534-1852-153 17.43 0.37 -0.03 -0.12 -0.06 KUV16081+2229
164248.52+134751.4* 53535-2210-592 18.64 -0.16 0.15 0.08 0.21 1.3
224303.82+221456.0 53565-2252-239 17.03 0.10 -0.17 -0.16 -0.23 He II
aObjects marked with asterisk are publicly available in the SDSS DR5
bMJD-Plate-Fiber for spectra; MJD = JD - 2,450,000.5
cDN is a dwarf nova, Ec is eclipsing
dObject is eastern star of a close pair

– 15 –
Table 2. Follow-up Data
SDSSJ UT Date Site Time (UT) Exp (s) Data Obtained
0328 2005 Dec 30 Bok 05:27-07:22 6600 Circular Polarimetry
0328 2006 Feb 01 SRO 02:24-06:01 240 Photometry
0328 2006 Feb 02 SRO 02:10-06:14 240 Photometry
0334 2005 Dec 27 APO 05:04 300 1 spectrum
0334 2006 Jan 27 NOFS 02:03-06:29 80 Photometry
0334 2006 Feb 03 SRO 02:12-05:23 240 Photometry
0334 2006 Feb 04 SRO 02:17-05:27 240 Photometry
0334 2006 Oct 22 APO 06:15-08:48 600 13 spectra
0750 2005 Dec 08 APO 11:12-12:35 600 3 spectra
0755 2005 Dec 08 APO 08:20-10:56 600 13 spectra
1019 2006 May 29 APO 03:06-04:54 600 9 spectra
1107 2006 May 29 APO 04:58-06:38 600 9 spectra
1433 2006 May 03 APO 07:11-10:03 10 DIS imaging
1433 2006 May 30 APO 03:07-07:42 15 DIS imaging
1435 2006 May 23 APO 07:38-09:26 600 9 spectra
1642 2006 May 23 APO 09:45-11:05 600 7 spectra
2243 2006 Oct 22 APO 01:47-03:40 600 10 spectra
2243 2006 Nov 23 SRO 03:15-05:45 240 Photometry
2243 2006 Nov 25 SRO 02:42-06:08 240 Photometry

– 16 –
Table 3. SDSS Emission Line Fluxes and Equivalent Widthsa
SDSSJ Hβ Hα He4471 HeII4686
F EW F EW F EW F EW
0328 3.5 21 2.6 26 ... ... 3.4 20
0334 8.7 44 16.4 76 1.3 8 ... ...
0337 0.3 73 0.2 330 ... ... ... ...
0535 0.1 2 0.4 17 ... ... ... ...
0536 ... ... 0.3 9 ... ... ... ...
0615 0.1 3 0.6 12 ... ... ... ...
0750 3.6 35 4.5 67 ... ... ... ...
0755 3.8 31 8.4 122 ... ... ... ...
0805 1.0 7 1.9 13 ... ... ... ...
0812 6.0 44 6.7 72 1.3 8 0.7 6
0837 0.4 38 0.4 52 ... ... ... ...
0916 2.9 60 3.8 55 0.7 13 0.2 3
0940 4.2 35 6.5 53 1.2 10 1.1 10
0945 3.6 41 4.0 105 0.9 8 0.2 2
1019 10.7 93 11.7 137 2.3 19 1.1 11
1054 32.4 4864 30.2 116 6.7 17 3.1 8
1107 6.4 45 10.4 85 1.3 9 ... ...
1152 1.6 32 2.8 97 ... ... ... ...
1433 5.1 51 9.6 154 ... ... ... ...
1435 2.9 19 6.2 76 ... ... ... ...
1527 0.7 31 1.2 100 ... ... ... ...
1554 14.7 29 20.0 68 2.7 7 4.2 10
1556 4.0 27 6.0 38 1.4 9 ... ...
1559 0.3 3 0.5 8 ... ... ... ...
1610 ... ... 0.4 3 ... ... ... ...
1642 10.4 58 8.9 67 2.1 11 0.8 4
2243 0.9 2 0.7 3 ... ... 0.8 2
aFluxes are in units of 10−15 ergs cm−2 s−1, equivalent widths are
in units of A

– 17 –
Table 4. Radial Velocity Solutions
SDSSJ Line P (min)a γ K (km s−1) T0 (JD245+) σ
0328 Hα 120±9 44±19 321±30 3735.768 22
0334 Hα 114 31±1 46±5 4030.800 12
0334 Hβ 114 52±2 73±6 4030.803 15
0755 Hα 83 -1.9±0.3 62±5 3712.867 12
0755 Hβ 87 72±2 97±14 3712.869 35
1019 Hα 104 62.5±0.1 59±3 3884.683 5
1019 Hβ 117 58±1 51±8 3884.693 14
1019 Hα 114.3 57.1±0.2 62±3 3884.685 6
1019 Hβ 114.3 60±1 50±8 3884.692 14
1435 Hα 83 -14±3 86±15 3878.821 28
1435 Hβ 74 34±5 197±22 3878.830 43
1642 Hα 64 -84±2 141±12 3878.930 19
1642 Hβ 77 -102±2 145±32 3878.931 52
aPeriods with whole integers are generally uncertain by 10%, as evidenced
by the dispersion between values obtained from the 2 lines.

– 18 –
Table 5. SDSSJ1433 eclipse timesa
Eclipses(HJD)
2,453,858.85649
2,453,858.91075
2,458,885.65143
2,458,885.70565
2,458,885.75991
2,458,885.81418
aEclipse tim-
ings are deepest
points of the
eclipse.

– 19 –
Table 6. ROSAT Detections
SDSSJ ROSAT (c s−1)a Exp (s) RXS Type
0945 0.03±0.01 445 J094558.3+292249
1019 0.03±0.01 415 J101946.7+335811 DN
1054 0.04±0.01 369 J105430.9+300620=SX LMi DN
1554 0.11±0.02 381 J155412.7+272143 Polar
aFor a 2 keV bremsstrahlung spectrum, 1 c s−1 corresponds to a 0.1-2.4 keV
flux of about 7×10⁻¹² ergs cm−2 s−1
– 20 –
0
10
20
30
40
Flu
x
0
2
Flu
x
0
5
10
0
5
10
15
20
0
5
0
5
10
15
20
0
10
20
30
40
Flu
x
0
5
10
15
20F
lux
0
10
20
30
0
2
0
10
20
30
40
0
10
20
30
0
10
20
30
40
Flu
x
0
10
20
30
Flu
x
4000 5000 6000 7000 8000
Wavelength (Å)
0
20
40
4000 5000 6000 7000 8000
Wavelength (Å)
0
50
100
SDSSJ0328 SDSSJ0337
SDSSJ0535 SDSSJ0536
SDSSJ0615 SDSSJ0750
SDSSJ0755 SDSSJ0805
SDSSJ0812 SDSSJ0837
SDSSJ0916 SDSSJ0940
SDSSJ0945 SDSSJ1006
SDSSJ1019 SDSSJ1054
Fig. 1.— SDSS spectra of the 27 CVs. Vertical axis is units of flux density Fλ×10−17 ergs
cm−2 s−1 A−1. The spectral resolution is about 3A.

– 21 –
0
10
20
30
40
50
Flu
x
0
10
Flu
x0
10
20
30
40
0
10
20
30
0
1
2
3
4
5
6
0
100
200
300
0
10
20
30
40
Flu
x
0
10
20
Flu
x
0
10
20
30
40
4000 5000 6000 7000 8000
Wavelength (Å)
0
20
40
4000 5000 6000 7000 8000
Wavelength (Å)
0
20
40
60
80
SDSSJ1107 SDSSJ1152
SDSSJ1433 SDSSJ1435
SDSSJ1527 SDSSJ1554
SDSSJ1556 SDSSJ1559
SDSSJ1610 SDSSJ1642
SDSSJ2243
Fig. 1.— Continued.

– 22 –
Fig. 2.— Hα and Hβ velocity curves of SDSSJ 1019 with the best fit sinusoids (Table 4)
superposed. Sigmas of fits listed in Table 4.

– 23 –
0 0.05 0.1 0.15HJD 2453858.8+
18
19
20
21
Mag
nitu
de (
~g)
0.05 0.1 0.15 0.20HJD 2453885.6+
18
19
20
21
Fig. 3.— May 3 (top) and May 30 (bottom) light curves of SDSSJ 1433 showing the 4
observed eclipses. Error bars are ≤0.02 mag except during eclipses when they are up to 0.2
mag.

– 24 –
0 10 20 30 40 50 60 70
Time (min)
18
18.5
19
19.5
20
20.5
21
Mag
nitu
de ~
g
34 36 38 40 42
Fig. 4.— Four eclipses of SDSSJ 1433 on May 30 folded on the orbital period. Right panel is
expanded around the eclipse to show the asymmetric structure during the faintest 3 minutes.

– 25 –
Fig. 5.— Hα and Hβ velocity curves of SDSSJ 1435 with the best fit sinusoids (Table 4)
superposed.

– 26 –
4000 5000 6000 7000 80000
SDSSJ 0334
Dec 27 2005
4000 5000 6000 70000
Wavelength
Oct 22 2006
Fig. 6.— APO spectra of SDSSJ 0334 at quiescence 2005 Dec 27 (top) and during an
outburst 2006 Oct 22 (bottom).

– 27 –
2.6 2.65 2.7 2.75
18.4
18.2
18
17.8
17.6
HJD-2453760
SDSSJ0334
Fig. 7.— NOFS light curve of SDSSJ0334 at quiescence on 2006 Jan 27. Error bars on each
point are 0.03 mag.

– 28 –
Fig. 8.— Hα and Hβ velocity curves of SDSSJ 0334 with the best fit sinusoids (Table 4)
superposed.

– 29 –
Fig. 9.— V light, circular polarization and Hα radial velocity curves of SDSSJ 0328.

– 30 –
Fig. 10.— Bright and faint phase spectra of the polar SDSSJ 0328 showing the changing
cyclotron humps and strengths of the emission lines.

– 31 –
7.6 7.65 7.7 7.7518.5
18
17.5
Feb 1SDSSJ 0328
8.6 8.65 8.7 8.7518.5
18
17.5
HJD-2453760
Feb 2
Fig. 11.— SRO photometry of SDSSJ 0328 showing the one mag variation throughout
several orbits. Error bars are 0.04 at the peak of the modulation and up to 0.1 mag at the
minimum brightness.

– 32 –
Fig. 12.— Hα and Hβ velocity curves of SDSSJ 0755 with the best fit sinusoids (Table 4)
superposed.

– 33 –
Fig. 13.— Hα and Hβ velocity curves of SDSSJ 1642 with the best fit sinusoids (Table 4)
superposed.