Statistical properties of dwarf novae-type cataclysmic variables
Upload
independentCategory
view
0download
0
Seediscussions,stats,andauthorprofilesforthispublicationat:https://www.researchgate.net/publication/231119311
CataclysmicvariablesfromSDSS.VII.Theseventhyear(2006)
ArticleinTheAstronomicalJournal·March2009
DOI:10.1088/0004-6256/137/4/4011·Source:arXiv
CITATIONS
40
READS
30
13authors,including:
PaulaSzkody
UniversityofWashingtonSeattle
392PUBLICATIONS11,530CITATIONS
SEEPROFILE
RosalieMcgurk
UniversityofCalifornia,SantaCruz
18PUBLICATIONS241CITATIONS
SEEPROFILE
A.NebotGómez-Morán
UniversityofStrasbourg
44PUBLICATIONS870CITATIONS
SEEPROFILE
M.R.Schreiber
UniversidaddeValparaíso(Chile)
162PUBLICATIONS5,010CITATIONS
SEEPROFILE
AllcontentfollowingthispagewasuploadedbyRosalieMcgurkon01December2016.
Theuserhasrequestedenhancementofthedownloadedfile.

arX
iv:0
901.
3177
v1 [
astr
o-ph
.GA
] 2
1 Ja
n 20
09
Cataclysmic Variables from SDSS VII. The Seventh Year (2006)1
Paula Szkody2, Scott F. Anderson2, Michael Hayden2, Martin Kronberg2, Rosalie
McGurk2, Thomas Riecken2, Gary D. Schmidt3, Andrew A. West4, Boris T. Gansicke5,
Ada N. Gomez-Moran6, Donald P. Schneider7, Matthias R. Schreiber8, Axel D. Schwope6
ABSTRACT
Coordinates, magnitudes and spectra are presented for 39 cataclysmic vari-
ables found in Sloan Digital Sky Survey spectra that were primarily obtained in
2006. Of these, 12 were CVs identified prior to the SDSS spectra (GY Cnc, GO
Com, ST LMi, NY Ser, MR Ser, QW Ser, EU UMa, IY UMa, HS1340+1524,
RXJ1610.1+0352, Boo 1, Leo 5). Follow-up spectroscopic observations of seven
systems (including one from year 2005 and another from year 2004) were ob-
tained, resulting in estimates of the orbital periods for 3 objects. The new CVs
include two candidates for high inclination, eclipsing systems, 4 new Polars and
three systems whose spectra clearly reveal atmospheric absorption lines from the
underlying white dwarf.
Subject headings: binaries: eclipsing — binaries: spectroscopic — cataclysmic
variables — stars: dwarf novae
2Department of Astronomy, University of Washington, Box 351580, Seattle, WA 98195
3The University of Arizona, Steward Observatory, Tucson, AZ 85721
4MIT Kavli Institute, 77 Massachusetts Ave, Cambridge MA 02138
5Department of Physics, University of Warwick, Coventry CV4 7AL, UK
6Astrophysikalisches Institut Potsdam, An der Sternwarte 16, 14482 Potsdam, Germany
7Department of Astronomy and Astrophysics, 525 Davey Laboratory, Pennsylvania State University,
University Park, PA 16802
8Universidad de Valparaiso, Departametno de Fisica y Astronomia, Chile
1Based on observations obtained with the Sloan Digital Sky Survey and with the Apache Point Obser-
vatory (APO) 3.5m telescope, which are owned and operated by the Astrophysical Research Consortium
(ARC)

– 2 –
1. Introduction
The Sixth data release from the Sloan Digital Sky Survey (SDSS; York et al. 2000)
presented the complete photometry of the Galactic cap as well as further spectroscopy with
improved calibrations (Adelman-McCarthy et al. 2008). Previous releases are detailed by
Stoughton et al. (2002), Abazajian et al. (2003, 2004, 2005), and Adelman-McCarthy et
al. (2006, 2007)2. This paper continues the series of identification of cataclysmic variables
(CVs) from the available spectra, with each paper comprising the objects found in spectra
obtained in a given calendar year (Szkody et al. 2002, 2003, 2004, 2005, 2006, 2007; Papers
I-VI). The results for the CVs found in plates obtained in 2006 are presented here. These
objects include dwarf novae, novalike systems and systems containing highly magnetic white
dwarfs (a comprehensive review of all the various kinds of CVs is contained in Warner
(1995)). The number of CVs found in SDSS now constitute a significant sample of uniform
(in resolution and wavelength coverage) spectra for over 200 objects, and population studies
and implications of the results for different types of CVs are emerging (Schmidt et al. 2005;
Gansicke et al. 2008). While the SDSS is not a targeted CV survey and not all objects in the
photometric sky coverage have spectra obtained to find CVs, Gansicke et al. (200) compare
the SDSS sample with the past Palomar Green and Hamburg Quasar Surveys and consider
selection effects. They conclude that the primary advantages of SDSS lie in its great depth
and the large amount of spectroscopic followup of candidates. The increased depth results
in a significant difference in the period distribution found from the SDSS sample of CVs
compared to these previous (brighter) surveys in that the majority of the SDSS CVs are
found at periods below 2 hrs and there is an overabundance of systems at periods between
80-86 min. This distribution and period spike follow the predictions of CV evolution models
more closely than past surveys.
The above results stem from concentrated efforts by many people in the community to
obtain follow-up photometry and spectroscopy in order to determine the orbital periods and
characteristics of the CVs in the SDSS database (Gansicke et al. (2008) summarize available
results for 116, almost half of the total number). Our brief descriptions of the spectra and
our few followup observations are intended to aid these followup studies.
2data are available from http://www.sdss.org

– 3 –
2. Observations and Reductions
Detailed information about the SDSS survey (Pier et al. 2003, Gunn et al. 1998, 2006;
Lupton, Gunn, & Szalay 1999; Hogg et al. 2001; Lupton et al. 2001; Ivezic et al. 2004;
Tucker et al. 2006; Fukugita et al. 1996; Smith et al. 2002; Tucker et al. 2006; Padmanabhan
et al. 2008) and how the CVs are found (Szkody et al. 2002) from the selection algorithms
(Stoughton et al. 2002, Richards et al. 2002) already exist in the literature. It is important to
keep in mind that objects in the imaging data are chosen for spectra from colors that match
criteria selected by various working groups. CVs are primarily found that match colors of
quasar, serendipity, and white dwarf groups, as the CVs can be blue if they contain a thick
disk, red if they contain a polar and both red and blue if the disk is thin and the individual
stars are viewed (typical colors of the CVs found in SDSS are plotted in color-color diagrams
shown in Papers I,II). While Table 1 shows that the CVs that do have spectra encompass
a wide range of color, this does not guarantee that all the CVs in the imaging area covered
have spectra obtained.
The search of all spectral plates that are obtained is accomplished via a software program
that selects all objects with Balmer emission/absorption lines and the selected spectra are
visually examined. All the spectra on a few plates were visually examined to evaluate the
effectiveness of the selection algorithm. While a few are missed if they are very faint or they
are misidentified, we estimate the software finds about 90% of the existing CVs. Table 1 lists
the CVs found in SDSS spectra from 2006 Jan 1 through Dec 31, with the plate, fiber, and
modified Julian date (MJD) of each spectrum. There are also a few objects that were missed
in previous years and later recovered. The coordinates are given as equinox J2000.0, with the
IAU convention of truncation rather than rounding at the last decimal, and the coordinates
have an astrometric accuracy of 0.10 arcsec. Photometric magnitudes and colors are from
the point-spread function photometry and there is no correction for interstellar reddening.
For ease of reference, we will hereafter refer to the objects as SDSSJhhmm (hours and min
of RA).
For a few objects, we were able to accomplish followup spectroscopy with the APO
3.5m telescope, using the Dual Imaging Spectrograph (DIS) with the high resolution gratings
(resolution about 2A) with a 1.5 arcsec slit (Table 2). Two of these followup objects are
from CVs found in previous papers (SDSSJ0812 from Paper V and SDSSJ1006 from Paper
VI). The spectra were obtained over several hours and were used to construct radial velocity
curves. Calibration for flux and wavelength, as well as measurements of the lines were
accomplished with standard IRAF 3 routines. The SDSS spectra were measured with the
3IRAF (Image Reduction and Analysis Facility) is distributed by the National Optical Astronomy Ob-

– 4 –
centroid-finding “e” routine in the IRAF splot package to obtain the equivalent widths and
fluxes for the Balmer and helium emission lines (Table 3). For the radial velocity curves, a
least squares fit of a sine curve to the velocities was used to find γ (systemic velocity), K
(semi-amplitude), P (orbital period), and T0 (the epoch of red to blue crossing of the systemic
velocity); the results are given in Table 4. Note that due to the short time baseline of the
data, the periods are only estimates (with about 10% accuracy) and will need several nights
of further data for better determinations. Our measurements,however, provide a starting
point as to whether systems have short or long periods.
3. Results
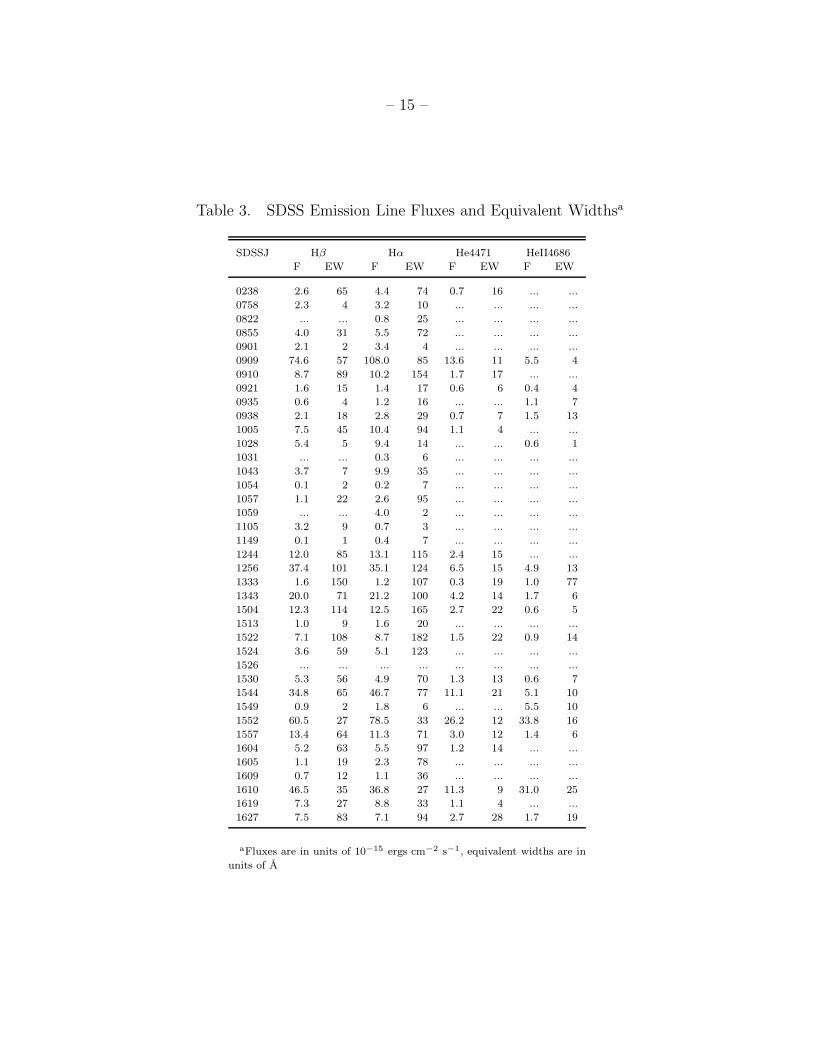
The SDSS spectra for the 39 systems are shown in Figure 1 and the equivalent widths
and fluxes of the prominent hydrogen Balmer and helium emission lines are listed in Table
3. A summary of the various categories of objects is given below.
3.1. Previously Known Systems
Of the 39 entries in Table 1, 12 are CVs that were found prior to SDSS spectra.
These include the novalike Leo5 (1H1025+220;SDSSJ1029) and seven dwarf novae: Boo1
(SDSSJ1504), GY Cnc (SDSSJ0909), GO Com (SDSSJ1256), NY Ser (SDSSJ1513), QW
Ser (SDSSJ1526), IY UMa (SDSSJ1043) and HS1340+1524 (SDSSJ1343). Leo5 was previ-
ously identified as a CV candidate during follow-up of HEAO-1 sources, and spectroscopically
confirmed by Munari & Zwitter(1998). Boo1 was discovered as a faint emission line star by
Filipenko et al. (1985), who tentatively classified the object as a dwarf nova, even though
no outburst was observed, and no follow-up observations have been obtained so far. GYCnc
was identified as an eclipsing dwarf nova with Porb = 252.6min; an updated ephemeris is
given by Feline et al. (2005). GOCom has been long known as a dwarf nova (Brun &
Petit 1957), and had Porb = 95min determined by Howell et al. (1995). NYSer was identi-
fied as a CV in the Palomar-Green Survey (Green et al. 1986), and a short outburst cycle
was noted by Iida et al. (1995). Nogami et al. (1998) measured a superhump period of
153min, making NYSer the first SUUMa type dwarf nova in the period gap between 2-3
hrs where few CVs are found (Warner 1995). Patterson et al. (2003) determined the orbital
period as 140.4min. QWSer was identified as a dwarf nova by Takamizawa (1998), and
servatories, which are operated by AURA, Inc., under cooperative agreement with the National Science
Foundation.
– 5 –
Porb = 107.3min was determined by Patterson et al. (2003). IYUMa is another eclipsing
dwarf nova with an Porb = 106.4min (Uemura et al. 2000), for an updated ephemeris see
Steeghs et al. (2003). HS1340+1524 (SDSSJ1343) is a dwarf nova with infrequent short
outbursts, and Porb = 92.7min (Aungwerojwit et al. 2006).
Finally, there are four previously known polars among the SDSS CVs presented here.
Two of them were observed in a low state: STLMi (SDSSJ1105), one of the few polars
identified in the optical (Shore et al. 1982) with Porb = 113.9min (Schmidt et al. 1983,
Cropper 1986); and EUUMa (SDSSJ1149), discovered with ROSAT (Mittaz et al. 1992)
with Porb = 90min (Howell et al. 1995). The two other polars were observed by SDSS during
high states, MRSer (SDSSJ1552), identified in the PG survey (Liebert et al. 1982) with
Porb = 113.5min (Schwope et al. 1991), and RXSJ161008.0+035222 (SDSSJ1610), identified
as a ROSAT polar by Schwope et al. (2000, 2002), with recent polarimetry published by
Rodrigues et al. (2006) which refined the orbital period to 109.5 min.
Table 1 also includes four Polars that we found since Paper VI which have detailed
information recently published (Schmidt et al. 2007, 2008); we include them in the Table for
completeness: SDSSJ0921, SDSSJ1031, SDSSJ1059, and SDSSJ1333. Of these, SDSSJ1031
and SDSSJ1059 belong to the group of extremely low mass transfer rate polars, while the
rest are normal polars with high and low states of accretion. Note that the magnitudes listed
for SDSSJ0921 and SDSSJ1333 in Schmidt et al. 2008 are in juxtaposed order in their Table
(the magnitudes are actually in order of g , i , r , u, z instead of u, g , r , i , z as labeled.
3.2. High Inclination Systems
Previous work on SDSS systems has shown that those with deep central absorption in the
Balmer lines typically have high inclination and show photometric eclipses. Two systems,
SDSSJ1057 and SDSSJ1524 (Figure 1), show this central absorption, and are promising
candidates for having deep eclipses of the white dwarf by the secondary star.
3.3. Dwarf Novae
While CVs can be generally identified by their emission line spectrum, the identification
of a dwarf nova requires that an outburst is apparent. This can be apparent from a difference
in the SDSS photometry versus the spectra (which are obtained at different times) or as large
differences in magnitude in past USNO or DSS catalogs or in other non-SDSS observations.
The known dwarf nova QW Ser (SDSSJ1526) was caught at outburst in the SDSS spectra
– 6 –
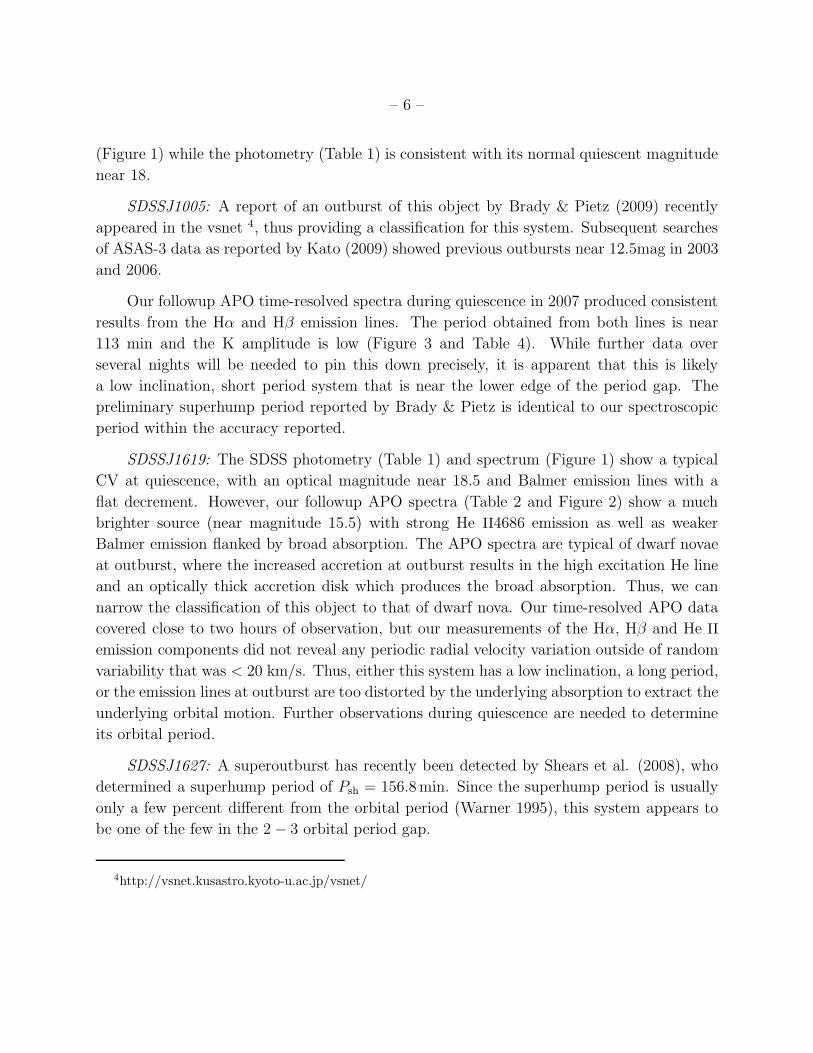
(Figure 1) while the photometry (Table 1) is consistent with its normal quiescent magnitude
near 18.
SDSSJ1005: A report of an outburst of this object by Brady & Pietz (2009) recently
appeared in the vsnet 4, thus providing a classification for this system. Subsequent searches
of ASAS-3 data as reported by Kato (2009) showed previous outbursts near 12.5mag in 2003
and 2006.
Our followup APO time-resolved spectra during quiescence in 2007 produced consistent
results from the Hα and Hβ emission lines. The period obtained from both lines is near
113 min and the K amplitude is low (Figure 3 and Table 4). While further data over
several nights will be needed to pin this down precisely, it is apparent that this is likely
a low inclination, short period system that is near the lower edge of the period gap. The
preliminary superhump period reported by Brady & Pietz is identical to our spectroscopic
period within the accuracy reported.
SDSSJ1619: The SDSS photometry (Table 1) and spectrum (Figure 1) show a typical
CV at quiescence, with an optical magnitude near 18.5 and Balmer emission lines with a
flat decrement. However, our followup APO spectra (Table 2 and Figure 2) show a much
brighter source (near magnitude 15.5) with strong He II4686 emission as well as weaker
Balmer emission flanked by broad absorption. The APO spectra are typical of dwarf novae
at outburst, where the increased accretion at outburst results in the high excitation He line
and an optically thick accretion disk which produces the broad absorption. Thus, we can
narrow the classification of this object to that of dwarf nova. Our time-resolved APO data
covered close to two hours of observation, but our measurements of the Hα, Hβ and He II
emission components did not reveal any periodic radial velocity variation outside of random
variability that was < 20 km/s. Thus, either this system has a low inclination, a long period,
or the emission lines at outburst are too distorted by the underlying absorption to extract the
underlying orbital motion. Further observations during quiescence are needed to determine
its orbital period.
SDSSJ1627: A superoutburst has recently been detected by Shears et al. (2008), who
determined a superhump period of Psh = 156.8min. Since the superhump period is usually
only a few percent different from the orbital period (Warner 1995), this system appears to
be one of the few in the 2 − 3 orbital period gap.
4http://vsnet.kusastro.kyoto-u.ac.jp/vsnet/

– 7 –
3.4. Nova-likes with He II
The He II4686 line is a strong indicator of a polar or of high accretion. All of the polars
mentioned in section 3.1 show this line (except for the two with extremely low accretion
rates). In addition to these known polars, Figure 1 reveals three other systems with unusually
strong He II4686.
SDSSJ1549: This object has a very peculiar spectrum, showing a strong continuum,
weak Balmer emission but very strong He II. The SDSS spectrum is very similar to that
of UMa 6 (SDSSJ0932) shown in Paper V. UMa 6 has a very long orbital period for a CV
(10 hrs5) and a deep optical eclipse (Hilton et al. 2008). Our 2.5 hrs of APO time-resolved
spectroscopy (Table 2) showed 40 km/s variability in both Hα and He II but no simple
sinusoidal motion consistent with an orbital radial velocity. Thus, this system will require
much longer monitoring to ascertain its nature.
SDSSJ0938: The spectrum of SDSSJ0938 looks typical for a polar (Figure 1) in a high
state of accretion. It is virtually identical to the known polar SDSSJ1610 also in Figure 1.
Spectropolarimetry will be able to provide definitive information on this issue. While our
APO observations (Table 2) were not long enough to obtain an orbital period, a smooth,
large amplitude (70 km/s) variation throughout the 65 min is consistent with a polar with
a period that is under 2 hrs.
SDSSJ0935: While this object has stronger He II than Hβ emission (Figure 1 and Table
3), the spectral appearance is different than for the above two objects. The continuum is
very strong and the emission lines are broad and weak. This spectrum appears more like an
old nova than a system containing a magnetic white dwarf (Warner 1995).
3.5. Systems Showing the Underlying Stars
The ability of SDSS to obtain spectra of CVs that are fainter than previous surveys has
resulted in discovering many systems that have low accretion rates, hence accretion disks
which do not overwhelm the light of the underlying stars. In these cases, the white dwarfs
are revealed through their broad absorption lines flanking the Balmer emission and, if the
secondary star is a late main sequence object, it is evident by TiO features in the red. From
Figure 1, it is apparent that SDSSJ1005, SDSSJ1057 and SDSSJ1605 show the white dwarf,
while SDSSJ0230, SDSSJ1059, SDSSJ1105, SDSSJ1544 show an M star (SDSSJ1105 and
5http://cbastro.org/results/highlights/uma6
– 8 –
SDSSJ1059 are known polars with no accretion disk) and SDSSJ0805 appears to show a K
star (albeit of somewhat later type than the K stars in SDSSJ0615 and SDSSJ0805 found in
Paper VI).
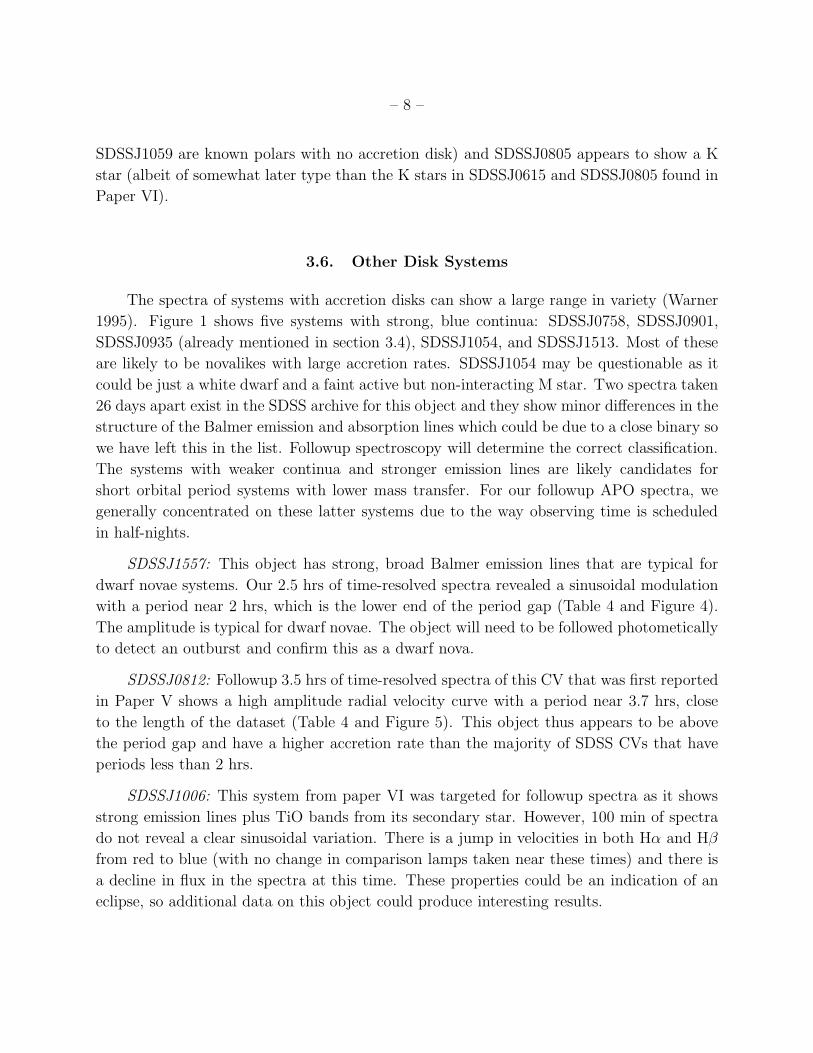
3.6. Other Disk Systems
The spectra of systems with accretion disks can show a large range in variety (Warner
1995). Figure 1 shows five systems with strong, blue continua: SDSSJ0758, SDSSJ0901,
SDSSJ0935 (already mentioned in section 3.4), SDSSJ1054, and SDSSJ1513. Most of these
are likely to be novalikes with large accretion rates. SDSSJ1054 may be questionable as it
could be just a white dwarf and a faint active but non-interacting M star. Two spectra taken
26 days apart exist in the SDSS archive for this object and they show minor differences in the
structure of the Balmer emission and absorption lines which could be due to a close binary so
we have left this in the list. Followup spectroscopy will determine the correct classification.
The systems with weaker continua and stronger emission lines are likely candidates for
short orbital period systems with lower mass transfer. For our followup APO spectra, we
generally concentrated on these latter systems due to the way observing time is scheduled
in half-nights.
SDSSJ1557: This object has strong, broad Balmer emission lines that are typical for
dwarf novae systems. Our 2.5 hrs of time-resolved spectra revealed a sinusoidal modulation
with a period near 2 hrs, which is the lower end of the period gap (Table 4 and Figure 4).
The amplitude is typical for dwarf novae. The object will need to be followed photometically
to detect an outburst and confirm this as a dwarf nova.
SDSSJ0812: Followup 3.5 hrs of time-resolved spectra of this CV that was first reported
in Paper V shows a high amplitude radial velocity curve with a period near 3.7 hrs, close
to the length of the dataset (Table 4 and Figure 5). This object thus appears to be above
the period gap and have a higher accretion rate than the majority of SDSS CVs that have
periods less than 2 hrs.
SDSSJ1006: This system from paper VI was targeted for followup spectra as it shows
strong emission lines plus TiO bands from its secondary star. However, 100 min of spectra
do not reveal a clear sinusoidal variation. There is a jump in velocities in both Hα and Hβ
from red to blue (with no change in comparison lamps taken near these times) and there is
a decline in flux in the spectra at this time. These properties could be an indication of an
eclipse, so additional data on this object could produce interesting results.

– 9 –
3.7. ROSAT Correlations
Ten of the objects in Table 1 have been detected with the ROSAT All Sky Survey
(RASS; Voges et al. 1999, 2000). The exposure times and count rates are listed in Table 5.
Among the 10 detections are the known polars EU UMa, MR Ser and RXJ1610+03 and the
dwarf novae GY Cnc, GO Com, QW Ser and HS1340+15. Several of the sources are only
in the faint source catalog with marginal detections (no error is listed for the faint detection
of SDSSJ1005). The lack of detection of the other polars such as ST LMi and the LARPS
detailed in Schmidt et al. (2007, 2008) are indications of states of very low mass transfer
for those systems. On the other hand, the detection of SDSSJ0938 lends further support for
this object being a possible polar. As in UMa 6, the strong HeII present in SDSSJ1549 is
not correlated with X-ray emission.
4. Conclusions
The addition of these 39 objects to the previous list brings the total number of CVs
in the SDSS database to 252, of which 204 are new discoveries. There are now more than
100 CVs with known or estimated orbital periods (see Gansicke et al. 2008 for a recent
summary). The distribution of periods of objects from SDSS is significantly different than
previous surveys with brighter limits. The SDSS objects exist predominantly at short periods
and show a period spike at 81 min, as predicted by binary evolution theories. Thus, this
database can serve as a testbed for evolution and further period determinations will refine
these numbers.
The following objects should be of high interest for future studies. Followup photometry,
spectroscopy and especially polarimetry of SDSJS0938 will confirm if this system contains a
magnetic white dwarf. Photometry of SDSSJ1057 and SDSSJ1524 is likely to reveal eclipses
which can determine inclinations and periods. SDSSJ1006 from Paper VI may also have
eclipses. High time-resolution photometry of SDSSJ1005, SDSSJ1057 and SDSSJ1605 should
be done to search for pulsations of the white dwarf. Long term photometry of SDSSJ1549
is needed to determine if the large differences in magnitude that are apparent are due to a
long orbital period with eclipses (like UMa 6) or different states of low and high accretion.
Spectroscopy (especially in the IR) for the two systems showing indications of the secondary
star (SDSSJ0230 and SDSSJ1544) can produce better information on the secondary and the
likely longer orbital periods in these two systems.
Funding for the SDSS and SDSS-II has been provided by the Alfred P. Sloan Foundation,

– 10 –
the Participating Institutions, the National Science Foundation, the U.S. Department of
Energy, the National Aeronautics and Space Administration, the Japanese Monbukagakusho,
the Max Planck Society, and the Higher Education Funding Council for England. The SDSS
Web Site is http://www.sdss.org/.
The SDSS is managed by the Astrophysical Research Consortium for the Participating
Institutions. The Participating Institutions are the American Museum of Natural History,
Astrophysical Institute Potsdam, University of Basel, University of Cambridge, Case Western
Reserve University, University of Chicago, Drexel University, Fermilab, the Institute for Ad-
vanced Study, the Japan Participation Group, Johns Hopkins University, the Joint Institute
for Nuclear Astrophysics, the Kavli Institute for Particle Astrophysics and Cosmology, the
Korean Scientist Group, the Chinese Academy of Sciences (LAMOST), Los Alamos National
Laboratory, the Max-Planck-Institute for Astronomy (MPIA), the Max-Planck-Institute for
Astrophysics (MPA), New Mexico State University, Ohio State University, University of
Pittsburgh, University of Portsmouth, Princeton University, the United States Naval Obser-
vatory, and the University of Washington.
P.S. acknowledges support from NSF grant AST 0607840. Studies of magnetic stars
and stellar systems at Steward Observatory is supported by the NSF through AST 03-06080.
M.R.S. acknowledges support from FONDECYT (grant 1061199).
REFERENCES
Abazajian, K. et al. 2003, AJ, 126, 2081 (DR1)
Abazajian, K. et al. 2004, AJ, 128, 502 (DR2)
Abazajian, K. et al. 2005, AJ, 129, 1755 (DR3)
Adelman-McCarthy, J. K. et al. 2006, ApJS, 162, 38 (DR4)
Adelman-McCarthy, J. K. et al. 2007, ApJS, 172, 634 (DR5)
Adelman-McCarthy, J. K. et al. 2008, ApJS, 175, 297 (DR6)
Aungwerojwit, A. et al. 2006, A&A, 455, 659 (A06)
Brady, S. & Pietz, J. 2009, vsnet alert 10926.
Brun, A. & Petit, M. 1957, Peremennye Zvezdy, 12, 18
Cropper, M. 1985, MNRAS, 222, 853
Feline, W. J., Dhillon, V. S., Marsh, T. R., Watson, C. A. & Littlefair, S. P. 2005 MNRAS,
364, 1158

– 11 –
Filippenko, A. V., Sargent, W. L. W. & Hazard, C. 1985, PASP, 97, 41
Fukugita, M., Ichikawa, T., Gunn, J. E., Doi, M., Shimasaku, K., & Schneider, D. P. 1996,
AJ, 111, 1748
Green, R. F., Schmidt, M. & Liebert, J. 1986, ApJS, 61, 305
Hilton, E. et al. 2008, AJ, submitted
Gansicke, B. T. et al. 2008, MNRAS, submitted
Gunn, J. E. et al. 1998, AJ, 116, 3040
Gunn, J. E. et al. 2006, AJ, 131, 2332
Hogg, D. W., Finkbeiner, D. P., Schlegel, D. J. & Gunn, J. E. 2001, AJ, 122, 2129
Howell, S. B., Sirk, M. M., Malina, R. F., Mittaz, J. P. D. & Mason, K. O. 1995, ApJ, 439,
991
Howell, S. B., Szkody, P. & Cannizzo, J. K. 1995, ApJ, 439, 337
Iida, M., Nogami, D. & Kato, T. 1995, IBVS, 4208, 1
Ivezic, Z. et al. 2004, AN, 325, 583
Kato, T. 2009, vsnet alert 10938
Liebert, J. et al. 1982, ApJ, 256, 594
Lupton, R. H., Gunn, J. E. & Szalay, A. 1999, AJ, 118, 1406
Lupton, R. H., Gunn, J. E., Ivezic, Z., Knapp, G. R., Kent, S. M. & Yasuda, N. 2001, ASP
Conf. Ser. 238, p. 269
Mittaz, J. P. D., Rosen, S. R., Mason, K. O. & Howell, S. B. 1992, MNRAS, 258, 277
Munari, U. & Zwitter, T. 1998, A&AS, 128, 277
Nogami, D., Kato, T., Baba, H. & Masuda, S. 1998, PASJ, 50, L1
Padmanabhan, N. et al. 2008, ApJ, 674, 1217
Patterson, J. et al. 2003, PASP, 115, 1308
Pier, J. R., Munn, J. A., Hindsley, R. B., Hennessy, G. S., Kent, S. M., Lupton, R. H. &
Ivezic, Z. 2003, AJ, 125, 1559
Richards, G. T. et al. 2002, AJ, 123, 2945
Rodrigues, C. V. et al. 2006, MNRAS, 369, 1942
Schmidt, G. D. 2007, ApJ, 654, 521
Schmidt, G. D., Stockman, H. S. & Grandi, S. A. 1983, ApJ, 271, 735

– 12 –
Schmidt, G. D. et al. 2005, ApJ, 630, 1037
Schmidt, G. D., Smith, P. S., Szkody, P. & Anderson, S. F. 2008, PASP, 120, 160
Schwope, A.D., Naundorf, C. E., Thomas, H. C. & Beuermann, K. 1991, A&A, 244, 373
Schwope, A. et al. 2000, AN, 321, 1
Schope, A. D. et al. 2002, A&A, 396, 895
Shears, J. et al. 2008, JBAA, submitted
Shore, S. N., Foltz, C. B., Byard, P. L., Wagner, R. M. & Wasilewski, A. J. 1982, PASP, 94,
682
Smith, J. A. et al. 2002, AJ, 123, 485
Steeghs, D. et al. 2003, MNRAS, 339, 810
Stoughton, C. et al. 2002, AJ, 123, 485
Szkody, P. et al. 2002, AJ, 123, 430 (Paper I)
Szkody, P. et al. 2003, AJ, 126, 1499 (Paper II)
Szkody, P. et al. 2004, AJ, 128, 1882 (Paper III)
Szkody, P. et al. 2005, AJ, 129, 2386 (Paper IV)
Szkody, P. et al. 2006, AJ, 131, 973 (Paper V)
Szkody, P. et al. 2007, AJ, 134, 185 (Paper VI)
Takamizawa, K. 1998, VSOLJ Var. Star Bull., 30, 3
Tucker, D. et al. 2006, AN, 327, 821
Uemura, M. et al. 2000, PASJ, 52, L9
Voges, W. et al. 1999, A&A, 349, 389
Voges, W. et al. 2000, IAU Circ., No. 7432
Warner, B. 1995, in Cataclysmic Variable Stars, CUP
York, D. G. et al. 2000, AJ, 120, 1579
This preprint was prepared with the AAS LATEX macros v5.2.

– 13 –
Table 1. CVs in SDSS
SDSS J MJD-P-Fa g u − g g − r r − i i − z P(hr) Commentsb
023003.79+260440.3 53764-2399-405 19.91 0.29 0.72 0.60 0.43 ...
075808.81+104345.5 53794-2418-278 16.96 0.14 -0.13 -0.10 -0.07 ...
082253.12+231300.6 53317-1926-544 21.84 0.76 1.93 0.65 0.31 ...
085521.18+111815.0 54085-2575-318 18.81 0.13 0.06 0.15 0.31 ...
090113.51+144704.6 53826-2434-400 16.14 0.21 -0.02 -0.07 -0.07 ...
090950.53+184947.3 53687-2285-030 16.05 -0.13 0.34 0.39 0.31 4.21 GY Cnc
091001.63+164820.0 53828-2435-075 18.87 -0.34 0.30 0.01 0.22 ...
092122.84+203857.1 53708-2289-316 19.85 0.79 0.68 -0.01 -0.35 >1.5 Polar
093537.46+161950.8 54085-2581-332 19.10 0.42 0.08 -0.01 -0.01 ... HeII
093839.25+534403.8 53764-2404-414 19.15 0.94 0.31 0.19 0.02 ... HeII
100515.38+191107.9 53768-2372-473 18.22 -0.07 -0.05 0.15 0.26 1.9 DN
102800.08+214813.5 53741-2366-072 16.06 0.37 -0.07 -0.10 -0.09 ... 1H1025+220 Leo 5
103100.55+202832.2 53770-2375-636 18.26 0.09 -0.28 -0.36 0.15 1.37 Polar
104356.72+580731.9 52427-0949-0358 17.52 0.18 -0.10 0.02 0.45 1.77 IY UMa
105443.06+285032.7 53800-2359-497 19.23 -0.32 -0.49 -0.15 0.14 ...
105754.25+275947.5 53800-2359-102 19.90 -0.30 0.27 -0.18 0.16 ...
105905.07+272755.5 53800-2359-051 22.09 1.27 1.84 0.35 1.05 >3 Polar
110539.76+250628.6 53789-2212-201 17.63 0.39 0.04 0.57 0.76 1.90 ST LMi Polar
114955.69+284507.3 53799-2222-010 17.63 -0.05 -0.06 -0.11 0.27 1.50 EU UMa Polar
124417.89+300401.0 53828-2237-560 18.61 -0.03 0.10 0.10 0.27 ...
125637.10+263643.2 53823-2240-092 17.98 0.06 0.07 0.02 0.18 1.58 GO Com
133309.19+143706.9 53847-1775-428 18.50 0.57 0.36 0.18 0.03 2.2 Polar
134323.16+150916.8 53858-1776-576 17.34 -0.36 0.18 0.04 0.06 1.54 HS1340+1524
150441.76+084752.6 53883-1717-260 19.14 -0.54 -0.02 0.06 0.35 ... Boo 1
151302.29+231508.4 53820-2155-163 16.09 0.16 -0.13 -0.04 -0.03 2.35 NY Ser
152212.20+080340.9 53857-1721-209 18.42 -0.14 -0.02 0.02 0.15 ...
152419.33+220920.0 53878-2161-189 19.04 -0.03 0.16 0.09 0.31 ...
152613.96+081802.3 53857-1721-021 17.79 0.00 -0.02 0.13 0.29 1.79 QW Ser
153015.04+094946.3 53852-1722-141 18.90 -0.49 0.41 0.02 -0.06 ...
154453.60+255348.8 53846-1849-074 16.60 -0.13 0.46 0.15 0.34 ...
154953.41+173939.0 53875-2170-276 19.44 0.31 0.39 0.18 0.01 ...
155247.18+185629.1 53875-2170-441 17.21 0.21 -0.11 0.29 0.69 1.89 MR Ser Polar
155720.75+180720.2 53875-2170-588 18.70 -0.58 0.22 0.15 0.10 2.1 ...
160419.02+161548.5 53875-2200-292 19.09 -0.37 0.26 0.07 0.05 ...
160501.35+203056.9 53793-2205-247 19.89 -0.10 0.01 -0.07 -0.17 ...
160932.67+055044.6 53886-1823-411 18.77 0.12 -0.07 -0.10 -0.04 ...
161007.50+035232.7 53886-1823-092 17.36 -0.25 0.15 0.41 0.47 3.18 Polar
161909.10+135145.5 53881-2530-327 18.49 0.43 0.68 0.39 0.27 ... DN
162718.39+120435.0 53881-2530-068 19.22 -0.23 0.17 0.23 0.37 2.61c DN
aMJD-Plate-Fiber for spectra; MJD = JD - 2,400,000.5
bDN is a dwarf nova
csuperhump period

– 14 –
Table 2. APO Follow-up Spectroscopy
SDSSJ UT Date Time (UT) Exp (s) Spectra
1549 2006 Jun 17 04:21-06:56 600 14
0812a 2006 Oct 22 08:55-12:26 600 17
1005 2007 Apr 20 03:18-05:54 600 14
1619 2007 May 10 04:43-06:43 600 11
1006b 2007 May 10 02:48-04:31 600 09
1557 2007 Jul 19 03:43-06:24 600 14
0938 2008 Jan 16 05:56-07:10 600 07
aobject discovered in Paper V
bobject discovered in Paper VI
– 15 –
Table 3. SDSS Emission Line Fluxes and Equivalent Widthsa
SDSSJ Hβ Hα He4471 HeII4686
F EW F EW F EW F EW
0238 2.6 65 4.4 74 0.7 16 ... ...
0758 2.3 4 3.2 10 ... ... ... ...
0822 ... ... 0.8 25 ... ... ... ...
0855 4.0 31 5.5 72 ... ... ... ...
0901 2.1 2 3.4 4 ... ... ... ...
0909 74.6 57 108.0 85 13.6 11 5.5 4
0910 8.7 89 10.2 154 1.7 17 ... ...
0921 1.6 15 1.4 17 0.6 6 0.4 4
0935 0.6 4 1.2 16 ... ... 1.1 7
0938 2.1 18 2.8 29 0.7 7 1.5 13
1005 7.5 45 10.4 94 1.1 4 ... ...
1028 5.4 5 9.4 14 ... ... 0.6 1
1031 ... ... 0.3 6 ... ... ... ...
1043 3.7 7 9.9 35 ... ... ... ...
1054 0.1 2 0.2 7 ... ... ... ...
1057 1.1 22 2.6 95 ... ... ... ...
1059 ... ... 4.0 2 ... ... ... ...
1105 3.2 9 0.7 3 ... ... ... ...
1149 0.1 1 0.4 7 ... ... ... ...
1244 12.0 85 13.1 115 2.4 15 ... ...
1256 37.4 101 35.1 124 6.5 15 4.9 13
1333 1.6 150 1.2 107 0.3 19 1.0 77
1343 20.0 71 21.2 100 4.2 14 1.7 6
1504 12.3 114 12.5 165 2.7 22 0.6 5
1513 1.0 9 1.6 20 ... ... ... ...
1522 7.1 108 8.7 182 1.5 22 0.9 14
1524 3.6 59 5.1 123 ... ... ... ...
1526 ... ... ... ... ... ... ... ...
1530 5.3 56 4.9 70 1.3 13 0.6 7
1544 34.8 65 46.7 77 11.1 21 5.1 10
1549 0.9 2 1.8 6 ... ... 5.5 10
1552 60.5 27 78.5 33 26.2 12 33.8 16
1557 13.4 64 11.3 71 3.0 12 1.4 6
1604 5.2 63 5.5 97 1.2 14 ... ...
1605 1.1 19 2.3 78 ... ... ... ...
1609 0.7 12 1.1 36 ... ... ... ...
1610 46.5 35 36.8 27 11.3 9 31.0 25
1619 7.3 27 8.8 33 1.1 4 ... ...
1627 7.5 83 7.1 94 2.7 28 1.7 19
aFluxes are in units of 10−15 ergs cm−2 s−1, equivalent widths are in
units of A

– 16 –
Table 4. Radial Velocity Solutions
SDSSJ Line P (min)a γ K (km s−1) T0 (JD2,454,000+) σ
0812 Hα 229 -30±1 208±11 30.989 27
0812 Hβ 215 -38±1 172±13 30.988 35
1005 Hα 112 42±1 19±4 210.658 10
1005 Hβ 114 38±1 27±3 210.663 7
1557 Hα 122 -50±3 89±13 300.720 34
1557 Hβ 133 -43±2 117±13 300.727 33
aPeriods are generally uncertain by 10%, as evidenced by the dispersion
between values obtained from the 2 lines.

– 17 –
Table 5. ROSAT Detections
SDSSJ ROSAT (c s−1)a Exp (s) RXS Type
0909 0.08±0.02 364 J090950.6+184956=GY Cnc DN
0938 0.03±0.01 409 J093838.0+534417 ...
1005 0.03 414 J100511.9+191105 DN
1149 3.33±0.16 127 J114955.5+284510=EU UMa Polar
1256 0.06±0.01 476 J125637.6+263656=GO Com DN
1343 0.07±0.02 354 J134323.1+150916 DN
1526 0.05±0.02 277 J152613.9+081845=QW Ser DN
1552 0.04±0.01 595 J155246.3+185608=MR Ser Polar
1557 0.014±0.007 587 J155720.3+180715 ...
1610 0.36±0.04 494 J161008.0+035222 Polar
aFor a 2 keV bremsstrahlung spectrum, 1 c s−1 corresponds to a 0.1-2.4 keV
flux of about 7×10⁻¹² ergs cm−2 s−1
– 18 –
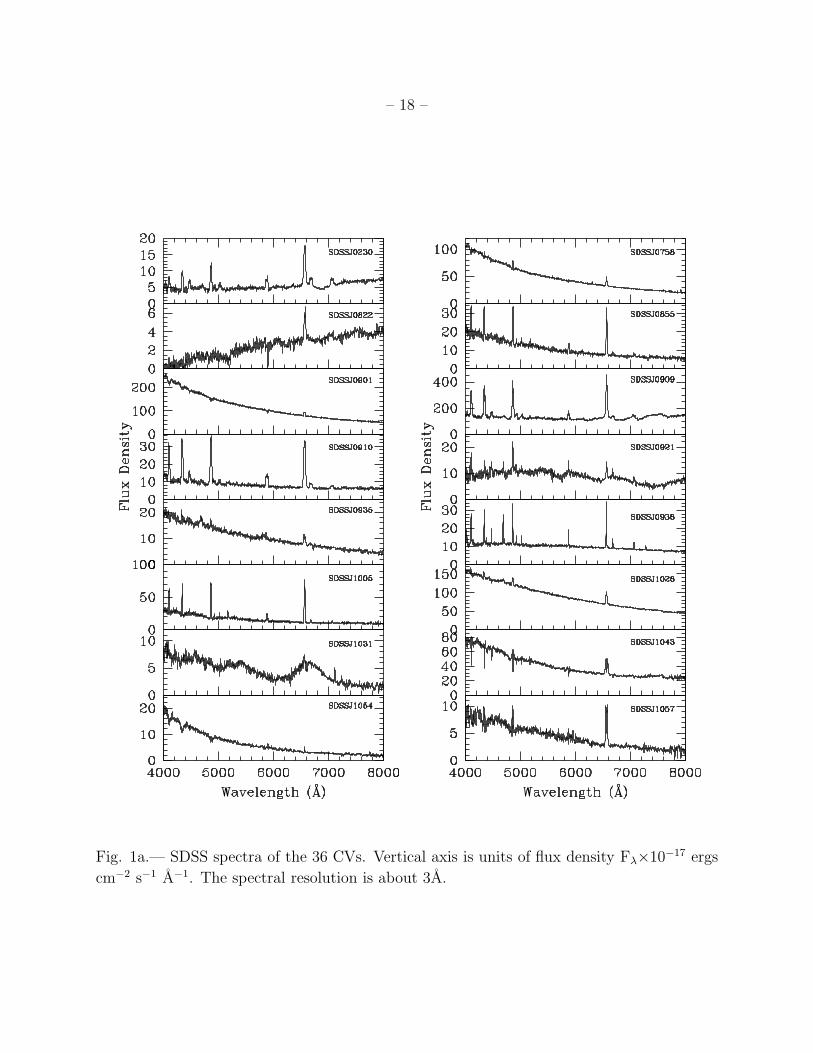
Fig. 1a.— SDSS spectra of the 36 CVs. Vertical axis is units of flux density Fλ×10−17 ergs
cm−2 s−1 A−1. The spectral resolution is about 3A.

– 19 –
0
5
10
Fig. 1b.— Continued.

– 20 –
Fig. 1c.— Continued.

– 21 –
4000 4200 4400 4600 4800 50000
Wavelength
SDSSJ1619 APO
Fig. 2.— Combined APO spectra of SDSSJ1619 obtained on 2007 May 10 during an outburst.
Note increased HeII emission, Balmer absorption, and higher flux as compared to spectrum
in Figure 1. The spectral resolution is about 2A.

– 22 –
Fig. 3.— Hα and Hβ velocity curves of SDSSJ1005 with the best fit sinusoids (Table 4)
superposed. Sigmas of fits listed in Table 4.

– 23 –
Fig. 4.— Hα and Hβ velocity curves of SDSSJ1557 with the best fit sinusoids (Table 4)
superposed.

– 24 –
Fig. 5.— Hα and Hβ velocity curves of SDSSJ0812 with the best fit sinusoids (Table 4)
superposed.
Copyright © 2022 FDOKUMEN