Deforming first-movement concerto form: Moscheles' Seventh ...
Upload
khangminh22Category
view
0download
0
1
LATVIA’S SEVENTH NATIONAL COMMUNICATION
and THIRD BIENNIAL REPORT under the United Nations Framework Convention on Climate Change
December 2017

2
DATA SHEET
Title
LATVIA’S SEVENTH NATIONAL COMMUNICATION and THIRD BIENNIAL REPORT under the United Nations Framework Convention on Climate Change
Date
December 2017
Authors
Vita Ratniece, Līga Rubene, Intars Cakars, Lauris Siņics, Ieva Griķe Latvian Environment, Geology and Meteorology Centre
Gaidis Klāvs, Jānis Reķis, Ivars Kudreņickis Institute of Physical Energetics
Laima Bērziņa, Karīna Zaharāne Latvia University of Agriculture
Andis Lazdiņš, Arta Bārdule Latvian State Forest Research Institute “Silava”
Kristīne Zommere-Rotčenkova, Gusts Zustenieks, Agita Gancone Ministry of the Environmental Protection and Regional Development
Climate Change Department / Climate Change and Adaptation Policy division
Edited and approved
By sectoral ministries
Cover photo and chapter cover photos
Anete Auziņa
Contact
Kristīne Zommere-Rotčenkova Senior Official Climate Change Department / Climate Change and Adaptation Policy division Tel. +371 67026508 [email protected]

3
CONTENTS
DATA SHEET ................................................................................................................................................................. 1
INTRODUCTION ............................................................................................................................................................ 6
1 EXECUTIVE SUMMARY ....................................................................................................................................... 9
1.1 NATIONAL CIRCUMSTANCES ..................................................................................................................................... 9 1.2 GREENHOUSE GAS INVENTORY INFORMATION ......................................................................................................... 10 1.3 POLICIES AND MEASURES ...................................................................................................................................... 13 1.4 PROJECTIONS ........................................................................................................................................................ 15 1.5 VULNERABILITY ASSESSMENT, CLIMATE CHANGE IMPACTS AND ADAPTATION MEASURES .......................................... 17 1.6 RESEARCH AND SYSTEMATIC OBSERVATION ........................................................................................................... 19 1.7 EDUCATION, TRAINING AND PUBLIC AWARENESS ..................................................................................................... 21
2 NATIONAL CIRCUMSTANCES .......................................................................................................................... 24
2.1 GOVERNMENT STRUCTURE .................................................................................................................................... 24 2.2 POPULATION PROFILE ............................................................................................................................................ 24 2.3 GEOGRAPHIC PROFILE ........................................................................................................................................... 26 2.4 CLIMATE PROFILE .................................................................................................................................................. 26 2.5 ECONOMIC PROFILE ............................................................................................................................................... 29 2.6 ENERGY PROFILE .................................................................................................................................................. 32
2.6.1 Electricity market ................................................................................................................................................. 34 2.6.2 Natural gas market .............................................................................................................................................. 35
2.7 TRANSPORT PROFILE ............................................................................................................................................. 36 2.7.1 Passenger Transport ........................................................................................................................................... 36 2.7.2 Freight traffic ....................................................................................................................................................... 37
2.8 INDUSTRY .............................................................................................................................................................. 38 2.9 WASTE .................................................................................................................................................................. 41 2.10 BUILDING STOCK AND URBAN STRUCTURE .............................................................................................................. 41
2.10.1 Residental buildings ............................................................................................................................................ 41 2.10.2 Non-residental buildings ...................................................................................................................................... 43
2.11 AGRICULTURE ....................................................................................................................................................... 44 2.12 FORESTRY ............................................................................................................................................................ 46
3 GREENHOUSE GAS INVENTORY INFORMATION ........................................................................................... 49
3.1 SUMMARY TABLES AND DESCRIPTIVE SUMMARY OF GHG EMISSION TRENDS ........................................................... 49 3.1.1 Overall Greenhouse Gas Emission Trends ......................................................................................................... 49 3.1.2 Emission Trends by Gas ..................................................................................................................................... 56 3.1.3 Information on Indirect Greenhouse Gas Emissions ........................................................................................... 59 3.1.4 Accuracy/Uncertainty of the Data ........................................................................................................................ 60 3.1.5 Changes since the Sixth National Communication Report ................................................................................. 61
3.2 NATIONAL SYSTEM................................................................................................................................................. 62 3.2.1 Institutional Arrangements .................................................................................................................................. 62 3.2.2 Quality Assurance/Quality Control Procedures ................................................................................................... 66 3.2.3 The Inventory Methodology and Data ................................................................................................................. 67 3.2.4 Key Category Analysis ........................................................................................................................................ 68
3.3 NATIONAL REGISTRY .............................................................................................................................................. 71
4 POLICIES AND MEASURES .............................................................................................................................. 75
4.1 THE POLICY MAKING PROCESS .............................................................................................................................. 75 4.2 NATIONAL AND REGIONAL PROGRAMMES ................................................................................................................ 75
4.2.1 Participation in the flexible mechanisms of the Kyoto protocol ........................................................................... 77 4.2.2 EU ETS quotas auctioning .................................................................................................................................. 78 4.2.3 Participation in EEA Financial Mechanism 2009-2014........................................................................................ 78 4.2.4 Low-Carbon Development Strategy .................................................................................................................... 79

4
4.3 POLICIES AND MEASURES AND THEIR EFFECTS ....................................................................................................... 79 4.3.1 Energy ................................................................................................................................................................. 80 4.3.2 Transport ............................................................................................................................................................. 97 4.3.3 Agriculture ......................................................................................................................................................... 103 4.3.4 Waste Management .......................................................................................................................................... 108 4.3.5 Industrial Processes and Product Use .............................................................................................................. 109 4.3.6 Land use, Land use Change and Forestry ........................................................................................................ 111 4.3.7 Cross-sectorial .................................................................................................................................................. 112 4.3.8 Policies and measures no longer in place ......................................................................................................... 114
5 PROJECTIONS AND THE TOTAL EFFECTS OF POLICIES AND MEASURES .............................................. 118
5.1 PROJECTIONS ...................................................................................................................................................... 118 5.1.1 Energy ............................................................................................................................................................... 122 5.1.2 Transport ........................................................................................................................................................... 126 5.1.3 Industrial Processes and Product Use .............................................................................................................. 127 5.1.4 Agriculture ......................................................................................................................................................... 128 5.1.5 Waste Management .......................................................................................................................................... 131 5.1.6 Land use, Land use Change and Forestry ........................................................................................................ 133
5.2 SENSITIVITY ANALYSIS ......................................................................................................................................... 135 5.2.1 Energy ............................................................................................................................................................... 135 5.2.2 Agriculture ......................................................................................................................................................... 137 5.2.3 Waste Management .......................................................................................................................................... 138
5.3 SUPPLEMENTARITY .............................................................................................................................................. 138 5.4 TOTAL EFFECT OF POLICIES AND MEASURES .......................................................................................................... 139 5.5 METHODOLOGY ................................................................................................................................................... 139
5.5.1 Energy ............................................................................................................................................................... 139 5.5.2 Industrial Processes and Product Use .............................................................................................................. 140 5.5.3 Agriculture ......................................................................................................................................................... 141 5.5.4 Land Use, Land Use Change and Forestry ....................................................................................................... 142 5.5.5 Waste Management .......................................................................................................................................... 147
6 VULNERABILITY ASSESSMENT, CLIMATE CHANGE IMPACTS AND ADAPTATION MEASURES ............ 150
6.1 OBSERVED PATTERNS OF CLIMATE CHANGE ......................................................................................................... 150 6.2 EXPECTED IMPACTS AND VULNERABILITIES OF CLIMATE CHANGE ........................................................................... 153
6.2.1 Vulnerabilities of Climate Change ..................................................................................................................... 153 6.2.2 Climate change impacts on different sectors of the economy and infrastructure, including human health ....... 155 6.2.3 The economic impact of climate change ........................................................................................................... 157
6.3 NATIONAL ADAPTATION STRATEGY ........................................................................................................................ 158
7 FINANCIAL RESOURCES AND TRANSFER OF TECHNOLOGY ................................................................... 167
8 RESEARCH AND SYSTEMATIC OBSERVATION ........................................................................................... 169
8.1 GENERAL POLICY ON AND FUNDING OF RESEARCH AND SYSTEMATIC OBSERVATION............................................... 169 8.1.1 General Policy on Research ............................................................................................................................. 169 8.1.2 Research funding .............................................................................................................................................. 171 8.1.3 Research management ..................................................................................................................................... 174 8.1.4 Climate/energy research in the Latvian research system ................................................................................. 177
8.2 RESEARCH ON CLIMATE PROCESSES, CLIMATE CHANGE IMPACTS AND ADAPTATION ................................................. 183 8.2.1 Research on Climate Change Impact and Adaptation ...................................................................................... 183 8.2.3 Research in Support of the National Greenhouse Gas Inventory ..................................................................... 186
8.3 SYSTEMATIC OBSERVATIONS ............................................................................................................................... 188 8.4 ACTION TAKEN TO SUPPORT RELATED CAPACITY-BUILDING IN DEVELOPING COUNTRIES ........................................... 193
9 EDUCATION, TRAINING AND PUBLIC AWARENESS .................................................................................... 195
9.1 GENERAL POLICY TOWARD EDUCATION, TRAINING AND PUBLIC AWARENESS ......................................................... 195 9.2 PRIMARY, SECONDARY AND HIGHER EDUCATION .................................................................................................. 196

5
9.2.1 General education ............................................................................................................................................. 196 9.2.2 Vocational Education And Training ................................................................................................................... 197 9.2.3 Higher education ............................................................................................................................................... 198
9.3 ENVIRONMENTAL EDUCATION/EDUCATION FOR SUSTAINABLE DEVELOPMENT ......................................................... 199 9.3.1 General Policy ................................................................................................................................................... 199 9.3.2 Environmental Education/Education for Sustainable Development in General and professional Education National curricula ................................................................................................................................................................. 199 9.3.3 Environmental Education in Higher Education .................................................................................................. 201
9.4 PUBLIC INFORMATION CAMPAIGNS ........................................................................................................................ 202 9.5 LOCAL ACTIVITIES ................................................................................................................................................ 203 9.6 PROJECTS AND TRAINING PROGRAMMES .............................................................................................................. 204 9.7 RESOURCE OR INFORMATION CENTRES ................................................................................................................ 206 9.8 INVOLVEMENT OF THE PUBLIC AND NON-GOVERNMENTAL ORGANIZATIONS ............................................................. 208 9.9 INTERNATIONAL COOPERATION ON EDUCATION, TRAINING AND PUBLIC AWARENESS .............................................. 210
SOURCES OF INFORMATION .................................................................................................................................. 211
ABBREVIATIONS ...................................................................................................................................................... 218
ANNEX 1 LATVIA’S THIRD BIENNIAL REPORT TO THE UNFCCCC ...................................................................... 222
I INTRODUCTION ........................................................................................................................................................... 223 II GHG EMISSIONS AND TRENDS ................................................................................................................................. 224
II.I Summary information on GHG emissions and trends ..................................................................................................... 224 II.II National Inventory Arrangements ................................................................................................................................... 225 II.III Changes in National Inventory Arrangements Since Second Biennal Report............................................................... 227
III QUANTIFIED ECONOMY-WIDE EMISSION REDUCTION (QEWER) TARGET ........................................................ 229 IV PROGRESS IN ACHIEVEMENT OF QEWER TARGET ............................................................................................. 231 V POLICIES AND MEASURES ....................................................................................................................................... 233 VI PROJECTIONS ........................................................................................................................................................... 235 VI PROVISION OF FINANCIAL, TECHNOLOGICAL AND CAPACITY-BUILDING SUPPORT TO DEVELOPING
COUNTRY PARTIES ....................................................................................................................................................... 240 APPENDIX OF ANNEX 1: COMMON TABULAR FORMAT WORKBOOK FOR THE 3RD BIENNIAL REPORT ............. 241
CTF Table 1: Emission trends .............................................................................................................................................. 242 CTF Table 2: Description of quantified economy-wide emission reduction target ............................................................... 268 CTF Table 3: Progress in achievement of the quantified economy-wide emission reduction target: information on mitigation actions and their effects ....................................................................................................................................................... 271 CTF Table 4: Reporting on progress .................................................................................................................................... 300 CTF Table 4(a)II: Progress in achievement of the quantified economy-wide emission reduction targets – further information on mitigation actions relevant to the counting of emissions and removals from the land use, land-use change and forestry sector in relation to activities under Article 3, paragraphs 3 and 4, of the Kyoto Protocol ................................................... 303 CTF Table 4(b): Reporting on progress ............................................................................................................................... 305 CTF Table 5: Summary of key variables and assumptions used in the projections analysis ............................................... 306 CTF Table 6(a): Information on updated greenhouse gas projections under a ‘with measures’ scenario ........................... 307 CTF Table 7: Provision of public financial support: summary information ........................................................................... 308 CTF Table 7(a): Provision of public financial support: contribution through multilateral channels ....................................... 310 CTF Table 9: Provision of capacity-building support ............................................................................................................ 313
ANNEX 2 SUMMARY OF REPORTING OF THE SUPPLEMENTARY INFORMATION UNDER ARTICLE 7, PARAGRAPH 2, OF THE KYOTO PROTOCOL ........................................................................................................ 314

6
INTRODUCTION
This report represents Seventh National Communication of the Republic of Latvia under Article 12 of the United Nations Framework Convention on Climate Change (UNFCCC), under Article 7 of the Kyoto Protocol and according to the decisions 2/CP.17 and 9/CP.16 of the Conference of the Parties (COP) under the UNFCCC. It covers issues related to the implementation of the UNFCCC by Latvia and shows progress Latvia is making towards meeting its goals.
As endorsed in UNFCCC decision 2/CP.17, Latvia has opted to submit its third Biennial Report as Annex 1 to this 7th National Communication. The tables as defined in the common tabular format (CTF) for the UNFCCC biennial reporting guidelines for developed country Parties (UNFCCC decision 19/CP.18) are enclosed as Appendix to Annex I. For the CTF submission to the UNFCCC, the electronic reporting facility provided by the UNFCCC secretariat has been used as required by UNFCCC decision 19/CP.18. In order to avoid duplication of information, overlapping contents are concentrated in the Seventh National Communication.
This report outlines comprehensive information on the main events and Latvia’s achievements during the time period from 2013 until 2017. Information in this report has been prepared according to “Guidelines for the preparation of national communications by Parties included in Annex I to the Convention, Part II: UNFCCC reporting guidelines on national communication”.
Latvia’s Seventh National Communication report provides the latest information of climate change, its impacts and mitigation options:
− Summary of information about national profiles (government structure, population, geographic, climate, economic profiles) and circumstances relevant to GHG emissions and removals on a sectorial basis (Chapter 2);
− Information on most recent GHG inventory, National system and National registry (Chapter 3);
− An overview of actual climate change mitigation policies and measures (Chapter 4);
− Projections of GHG emissions until 2035 and the total effects of policies and measures (Chapter 5);
− Latvia’s vulnerability assessment, climate change impacts and adaptation measures (Chapter 6);
− Information on financial resources and transfer of technology (Chapter 7)
− Information about climate research activities and systematic observation (Chapter 8);
− An overview of education, training and public awareness related to climate change issue (Chapter 9).
Since the publication of the Sixth National Communication under the UNFCCC in 2013, Latvia’s climate change policy has advanced. Latvia is well on track to achieving the emission reduction national target defined by the EU’s climate and energy package. At the national level, progress is seen in many sectors. Since Sixth National Communication report the sectorial policy documents have been updated containing the necessary measures which ensure Latvia achieves national target for 2020 (described in details in the report) and lays out a pathway towards meeting the long-term energy and climate objectives set by the European Union. The comprehensive national adaptation strategy has been developed and is currently in the approval stage in the period since the Sixth National Communication.

7
The Seventh National Communication report presents a wide variety of activities concerning mitigation, adaptation, climate change research, education. It is highly important to consult society and stakeholders. The Report describes both the participation of the government and its different ministries as the climate change policy is implemented through close cooperation among Ministry of Environmental Protection and Regional Development and other ministries, and the contribution of other stakeholders such as municipalities, research, business and civil society.
In 2010, the EU submitted a pledge to reduce its GHG emissions by 2020 by 20 % compared to 1990 levels. This target under the UNFCCC has only been submitted by EU-28 and not by each of its Member States (MS), namely, Latvia as part of the EU-28 takes on a quantified economy-wide emission reduction target jointly with all MS. In 2009, under the EU 2020 Climate and Energy Package, the EU introduced a clear internal rules to achieve the 20% reduction of total GHG emissions from 1990 levels, which is equivalent to a 14 % reduction compared to 2005 levels. This 14 % reduction objective is divided between EU Emission trading scheme (ETS) and non-ETS sectors. The EU ETS target is to be achieved by the EU as a whole. The vast majority of emissions within the EU which fall outside the scope of the EU ETS are non-ETS emissions addressed under the Effort Sharing Decision (ESD) (Decision No 406/2009/EC). The ESD target was divided into national targets from 2005 levels, to be achieved individually by each MS. Latvia’s emission reduction target for 2020 includes the positive limit +17% compared to 2005 established for ESD sector in line with Effort Sharing Decision. The data compiled in this report shows that Latvia is on track for reaching this ESD target.

8
EXECUTIVE SUMMARY
9
1 EXECUTIVE SUMMARY
1.1 National Circumstances
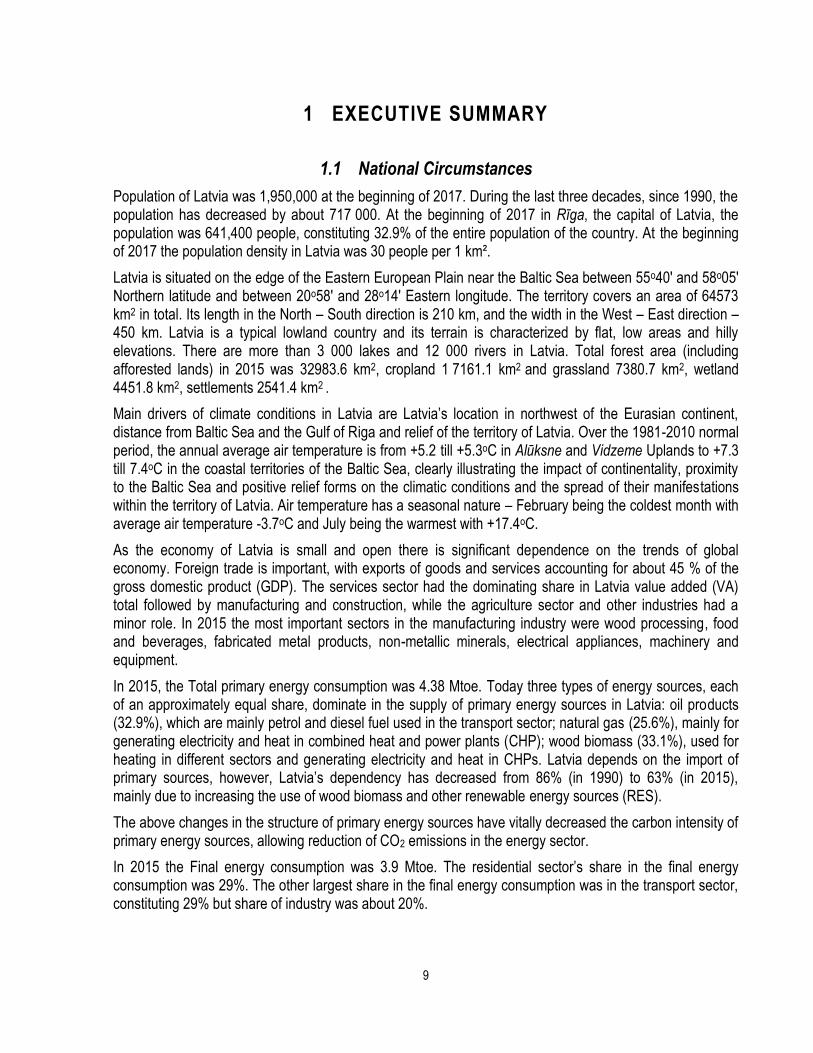
Population of Latvia was 1,950,000 at the beginning of 2017. During the last three decades, since 1990, the population has decreased by about 717 000. At the beginning of 2017 in Rīga, the capital of Latvia, the population was 641,400 people, constituting 32.9% of the entire population of the country. At the beginning of 2017 the population density in Latvia was 30 people per 1 km².
Latvia is situated on the edge of the Eastern European Plain near the Baltic Sea between 55o40' and 58o05' Northern latitude and between 20o58' and 28o14' Eastern longitude. The territory covers an area of 64573 km2 in total. Its length in the North – South direction is 210 km, and the width in the West – East direction – 450 km. Latvia is a typical lowland country and its terrain is characterized by flat, low areas and hilly elevations. There are more than 3 000 lakes and 12 000 rivers in Latvia. Total forest area (including afforested lands) in 2015 was 32983.6 km2, cropland 1 7161.1 km2 and grassland 7380.7 km2, wetland 4451.8 km2, settlements 2541.4 km2 .
Main drivers of climate conditions in Latvia are Latvia’s location in northwest of the Eurasian continent, distance from Baltic Sea and the Gulf of Riga and relief of the territory of Latvia. Over the 1981-2010 normal period, the annual average air temperature is from +5.2 till +5.3oC in Alūksne and Vidzeme Uplands to +7.3 till 7.4oC in the coastal territories of the Baltic Sea, clearly illustrating the impact of continentality, proximity to the Baltic Sea and positive relief forms on the climatic conditions and the spread of their manifestations within the territory of Latvia. Air temperature has a seasonal nature – February being the coldest month with average air temperature -3.7oC and July being the warmest with +17.4oC.
As the economy of Latvia is small and open there is significant dependence on the trends of global economy. Foreign trade is important, with exports of goods and services accounting for about 45 % of the gross domestic product (GDP). The services sector had the dominating share in Latvia value added (VA) total followed by manufacturing and construction, while the agriculture sector and other industries had a minor role. In 2015 the most important sectors in the manufacturing industry were wood processing, food and beverages, fabricated metal products, non-metallic minerals, electrical appliances, machinery and equipment.
In 2015, the Total primary energy consumption was 4.38 Mtoe. Today three types of energy sources, each of an approximately equal share, dominate in the supply of primary energy sources in Latvia: oil products (32.9%), which are mainly petrol and diesel fuel used in the transport sector; natural gas (25.6%), mainly for generating electricity and heat in combined heat and power plants (CHP); wood biomass (33.1%), used for heating in different sectors and generating electricity and heat in CHPs. Latvia depends on the import of primary sources, however, Latvia’s dependency has decreased from 86% (in 1990) to 63% (in 2015), mainly due to increasing the use of wood biomass and other renewable energy sources (RES).
The above changes in the structure of primary energy sources have vitally decreased the carbon intensity of primary energy sources, allowing reduction of CO2 emissions in the energy sector.
In 2015 the Final energy consumption was 3.9 Mtoe. The residential sector’s share in the final energy consumption was 29%. The other largest share in the final energy consumption was in the transport sector, constituting 29% but share of industry was about 20%.

10
Passenger transport (as measured in passenger kilometres) has grown considerably since 2000 (average by 2.5% per year). The year 2015 showed also rapid increase of freight traffic (measured in tonne-kilometres) against 2000 (5.7% per year).
Road transport constitutes the largest share of energy consumption in transport. In 2015 passenger cars, trucks, buses and motorcycles used about 93% of the total consumption in transport. Due to the decrease in rail freight transport over the last three years the share of rail transport in the total consumption decreased.
1.2 Greenhouse Gas Inventory Information
As a Party to the United Nations Framework Convention on Climate Change (UNFCCC) and the Kyoto Protocol (KP) as well as EU, Latvia has an obligation to prepare, publish and submit greenhouse gas inventories on an annual basis.
The annual submission (National inventory report and Common reporting format tables) contains emission estimates for the timeseries since 1990 till year prior to the previous year (x-2).
The GHG inventory is prepared according to the UNFCCC Decision 24/CP.19 Annex I reporting guidelines “Guidelines for the preparation of national communications by Parties included in Annex I of the Convention, Part I: UNFCCC reporting guidelines on annual greenhouse gas inventories on annual inventories” (UNFCCC reporting guidelines), the 2006 IPCC Guidelines for National Greenhouse Gas inventories (2006 IPCC Guidelines), 2013 Supplement to the 2006 IPCC Guidelines for National Greenhouse Gas Inventories: Wetlands (IPCC Wetlands Supplement) and 2013 Revised Supplementary Methods and Good Practice Guidance Arising from the Kyoto Protocol (IPCC KP Supplement).
Since the Sixth National Communication report Latvia has developed a range of measures to improve the national greenhouse gas inventory system and produce more accurate and comprehensive emission estimation, mainly due to methodological changes, activity data and emission factor improvement in all sectors. These measures are described in Chapter 3.1.5 and are reported on sectorial basis.
Latvia’s most recent inventory covers the year 2015 and was submitted to the UNFCCC secretariat in April 13, 2017. The inventory results for the period between 1990 and 2015 are summarised below and illustrated in Figure 1.1.
Figure 1.1 GHG emission time series for 1990–2015 (kt CO2 eq.)

11
Total GHG emissions including indirect CO2, without land use, land use change and forestry (LULUCF) sector had considerably decreased during the time period 1990–2000 (60.4%) when the national economy of Latvia transformed from central planning economy to a market economy (1990 – 1995). This transformation created structural changes of the economy: the share of industry in GDP considerably decreased and, on the contrary, the share of services – increased. The Energy and Agriculture sectors had in this period the largest decrease of GHG emissions against 1990, respectively 51% and 55.6%. Reforms accomplished in Latvia have left a positive effect on economic development. GDP, between 1996 and 2000, has increased by 5.7% in average per year. Nevertheless, GHG emissions continued to decrease in this period due to fuel switch in energy sector from low quality fossil fuels (coal and HFO) to natural gas and biomass.
The GHG emissions considerably decreased during the time period from 1990–2000 when the national economy of Latvia transformed from central planning economy to a market economy which affected all sectors of the national economy.
The rapid growth of Latvia’s economy in the period 2000-2007, during which GDP growth constituted 82%, resulted also in the growth of the total GHG emissions per 18.6%. In its turn, in the period 2008-2015 the active implementation of climate policies and measures took place, which decreased GHG emissions in 2015 per 7.9% compared to 2007.
The total GHG emissions in 2015, compared to 2014, were by 1% higher. This increase was determined mainly due to the emissions increase (per 6.1%) in Transport sector, Energy industries (per 2.4%) and Agriculture (per 2.9%). At the same time the decrease of emissions in Manufacturing and construction (per 7%), Industrial processes and product use (IPPU) (per 7.7%) and Waste sector (per 5.7%) can be observed.
Annual fluctuations in the emissions, particularly in Energy sector, have been notable. These have arisen especially from variation in the energy demand for heating depending on weather conditions (heating degree days), availability of hydro resources in national hydro energy power plants, imports of electricity, and the annual structure and volume of domestic energy (electricity and heat) production.
The major source of GHG emissions in 2015, excluding LULUCF, was CO2 (7,256 thousand tons), accounting for 64.1% of the total emissions, accordingly CH4 constituted 16.6%, N2O – 17.2%, and fluorinated gases – 2.1% of total emissions. Energy sector caused 62.9% of total GHG emissions, Agriculture – 24.2%, IPPU – 6.7%, Waste management – 6.1%, and indirect CO2 emissions arising from Energy sector – 0.1%.
The main source of CO2 emission in 2015 was the combustion of fossil fuels – 92.2% (including the following subsectors: Energy industry – 24.1%; Manufacturing industry and Construction – 8.8%; Transport – 42.3%; Other sectors – commercial enterprises, households, agriculture, forestry etc. – 16.9% from total CO2 emissions). Other CO2 emission sources were IPPU – 7.2%, Agriculture – 0.36%, Waste management (burning) – 0.002%. On its turn, because of the photosynthesis of plants in forests and arable land the total annual GHG removal exceeded the annual GHG emission increase. In 2015 the net CO2 removal of the LULUCF sector was 295.98 kt.
The second most important GHG in Latvia is CH4. In 2015 the CH4 emissions without LULUCF decreased by almost 47% comparing to 1990. Main CH4 emission sources were enteric fermentation processes of livestock (46.5%), solid municipal waste landfills (20.6%) and waste water treatment plants (12.5%) as well as leakage from natural gas pipeline systems (5.5%).
Since 1990, the total N2O emissions without LULUCF have decreased by 31%. In recent years a small increase of the total emission volume was observed. In 2015 the N2O emissions have increased by 4.0% comparing to 2014. Main N2O sources in 2015 were agricultural soils (85.3%) and manure management

12
(5.0%). Also small amounts of N2O were caused in fuel combustion sectors (5.5%), biological treatment of solid waste (1%) and waste water treatment and discharge (1%).
Emissions for the following hydrofluorocarbons (fluorinated gases) are estimated in Latvia: HFC-23, HCF-32, HFC-125, HFC-134a, HFC-143a, HFC-152a, HFC-227ea, HFC-245fa, HFC-365mfc, and also SF6. The most consumed gas is HFC-134a, applied in stationary freezing devices and air conditioning equipment. Although the amount of fluorinated gases and the emissions caused by commercial use and industrial processes are rather small, above-mentioned cannot be underestimated in the light of the GHG Global Warming Potential. Since 1995 the emissions of fluorinated gases were increasing year-by-year (1995 – 2.67 kt CO2 eq., 2015 – 237.18 kt CO2 eq.). The main reason which caused emission growth was substitution of ozone depleting substances (ODS) with F-gases in refrigeration and air conditioning appliances. The usage of products which substitute ODSs in Latvia mainly depends on import. The imported amounts could be associated with economic situation in the country consequently this led to F-gases emission growth especially in latest years. As the significant part of total F-gas emissions (30% in 2015) results from use of mobile air conditioning systems in road transport, the emission growth is also a result of increase of cars with conditioning systems filled with F-gases.
In the period from 1990 to 2015 indirect GHG emissions have decreased: NOx by 60.9%, CO by 66.0% and NMVOC by 49.5%. SO2 emissions have decreased significantly from 1990 to 2015 by 95.5%. Taking into account the amount of indirect GHGs emissions, except NMVOC emissions, in a great extent are determined by the fuel combustion in Energy sector, the GHGs emissions decrease in the period of 1990-1995 was mainly caused by the rapid decrease of fuel consumption in this sector. However, in the subsequent years there were different causes for the reduction of different indirect GHGs emissions. SO2
emissions decrease took place mainly due to implementation of more stringent regulations regarding maximum Sulphur content in the liquid fuels utilized in both Energy sector stationary sources and transport (mobile sources) as well as fuel switch to renewables. The decrease of NOx emissions was mainly caused by the wider penetration of new state-of-art technologies in Energy sector (in stationary sources as well as in transport vehicles due to the implementation of catalytic converters), this penetration was favoured by the implementation of regulations regarding NOx emissions specific values from large combustion plants and all types of road transport (passenger cars, heavy-duty vehicles (HDV) and light-duty vehicles (LDV)).
National system for GHG inventory and projections
On 12th of December 2017 Cabinet of Ministers has approved Regulation No. 737 “Development and management of national system for greenouse gas inventory and projections” which replaces previous national legislation (Regulations of the Cabinet of Ministers No. 217 (27.03.2012) “The National Inventory System of Greenhouse Gas Emission Units”). This legislative act determines the institutions that are responsible for GHG inventory and projections preparation, regulates institutional cooperation for establishment and management of the national GHG inventory and projections system, including data collection mechanism and the reporting procedure. The new regulation includes also the procedures of Quality Assurance/ Quality Control for GHG inventory and projections preparation.
National registry
European Union Registry (EU registry) in Latvia is governed by the applicable EU laws on GHG emission trading also guaranteeing compliance with the decisions approved in the addendum to the Conference of the Parties serving as the meeting of the Parties to the Kyoto Protocol (13/CMP.1 and 15/CMP.1). The EU registry software has been designed and coordinated with the requirements of the Data Exchange Standards (DES) for the Registry Systems under the Kyoto Protocol. According to the Law “On Pollution” Section 324, the national GHG emission unit’s registry shall be established and maintained by the Latvian

13
Environment, Geology and Meteorology Centre. The EU registry serves to guarantee accurate accounting for all allowances issued under the EU emissions trading system (EU ETS).
1.3 Policies and Measures
Policy framework
Ministry of Environmental Protection and Regional Development (MEPRD) is the leading administrative institution in Latvia in the field of environmental protection as well as it ensures planning and coordination process of state and regional development, local governments’ development and supervision, territorial development planning. MEPRD has overall responsibility for national climate policy and compliance with the EU and UNFCCC requirements. MEPRD also coordinates the national green investment schemes. Institutions supervised by the MEPRD – State Environmental Service, Environment State Bureau, state Ltd. Latvian Environment, Geology and Meteorology Centre (LEGMC), as well as state Ltd. Latvian Environmental Investment Fund ensure implementation of the climate policy within framework of their competence.
Latvia’s participation in global climate policy efforts and actions is key priority of national climate policy. Latvia’s climate policy is based on international agreements: the UNFCCC and its Kyoto protocol (Doha amendment) followed by Paris Agreement, the common polices of the EU, such as the EU 2020 Climate and Energy Package and Effort Sharing Decision to be followed by 2030 Climate and Energy Policy Framework. Key cross-sectorial policy documents, approved by Latvia Parliament (Saeima), such as “Sustainable Development Strategy for Latvia until 2030” (10.06.2010), “National Development Plan 2014-2020” (20.12.2012), embody in the basic principles of EU climate policy.
Latvia’ climate policy is defined in the framework policy document “Environmental Policy Strategy 2014-2020” (approved by Cabinet of Ministers, 26.03.2014) which states the national total GHG target (12.19 kt CO2 eq.) for 2020 and the overall goals of climate policy: (i) ensure Latvia’s contribution to global change mitigation, taking into account Latvia’s environmental, social and economic interests, and (ii) promote Latvia’s ability to adapt to climate change and its impacts.
Other ministries are involved in the issues related to development and implementation of the climate change policy according their competence field, particularly, Ministry of Finance (MoF), Ministry of Economics (MoE), Ministry of Transport (MoT), Ministry of Agriculture (MoA), Ministry of Education and Science (MES) and institutions supervised by the relevant ministries.
Under the EU 2020 Climate and Energy Package, the EU is committed to reducing its GHG emissions by 20% by 2020 from the 1990 level. The majority of the reduction will be reached via the EU ETS. Latvia’s quantified obligation under the 2020 Climate and Energy Package for sectors not covered by the EU ETS is positive growth limited by +17% compared to 2005 in line with Effort Sharing Decision 406/2009/EC. In its turn, Latvia’s quantified target for 2030 for sectors not covered by the EU ETS, according 2030 Climate and Energy Policy Framework, is reduction of emissions by 6 per cent compared to 2005.
Latvia has national legislation to ensure the fulfilment of its commitments under the Kyoto Protocol. A specific act provides an administrative framework for participation in Joint Implementation (JI) and Clean Development Mechanism (CDM) project activities and in emissions trading under the Kyoto Protocol. Latvia strives to implement its climate policies in such a way that the social, environmental and economic impacts on other countries, and on developing countries in particular, are minimised.

14
Sectorial policies and measures
In energy sector the main policies and measures used for the with measures (WM) projection include the EU ETS, increasing a deployment of RES and energy saving measures. The EU ETS is an EU-wide measure, while RES and energy conservation are supported by various national measures: investment co-financing (EU Structural Funds, national green investment schemes, state and municipalities budgets), fuel and electricity taxation, feed-in tariffs, other regulatory measures, informing energy end-use consumers. Regulatory measures to promote energy conservation include energy efficiency requirements for district heating systems (DHS), development of metering and billing of electricity and district heat for end-use consumers, re-casted Law on the energy performance of buildings, establishment of energy efficiency classes (both residential and non-residential buildings), further development of national Construction Standards, development of energy management systems practice in large enterprises, in enterprises – large electricity consumers, in state administration institutions and municipalities fulfilling certain qualification criteria). Investment co-financing programmes have covered all end-use sectors - DHS, households, industrial buildings and technologies, public sector, commercial tertiary sector – and have been focused on both renewable energy sources and energy efficiency.
Within the transport sector the regulatory measures with important impact relate to biofuel mix obligation, mandatory annual inspections of technical conditions of motor vehicles, public procurement to promote clean and energy efficient road transport. Starting from 01.01.2017 the reform of cars annual taxation introduce the taxation based on CO2 emissions specific values. Regarding excise tax, increase of duty rates is taken place (e.g. in 2020 the rates for diesel and gasoline will be around 24% higher compared to 2015). Investment measures of on-going EU Funds 2014-2020 planning period is development of the infrastructure of environmentally friendly public transport (new tram lines and public buses) and electrification and modernisation of the Latvian railway network. Investment support programme to promote electric vehicles and charging infrastructure was co-financed by national green investment scheme in 2014-2015, continued in EU Funds 2014-2020 planning period by electric vehicles charging infrastructure development programme.
The most significant CO2 emissions from industrial processes and product use sector are included in the EU ETS. Implementation of Best Available Techniques (BAT), framework procedures of which is laid down by the Law “On Pollution”, is the measure which is particularly important one for GHG emissions reduction in industrial processes. EU regulations on F-gases constitute the most significant emission reduction measure in the sector beyond the EU ETS. Law “On Pollution”, transposing the appropriate EU directives, also lays down the procedures, by which emission of volatile organic compounds from installations, in which organic solvents are used, shall be limited.
Within the agricultural sector most of the measures fall under the sphere of the EU’s Common Agricultural Policy (CAP). The measures include regulatory measures, particularly implementation of Nitrates Directive, Water Framework Directive. The concrete measures are focused on providing good agriculture practice – crop fertilization plans, management of nitrate use at vulnerable territories, improvement of manure management systems, requirements of manure spreading and integrated farming. Economic measures driven by CAP are introduction of leguminous plants on arable land, organic farming, maintenance of amelioration systems, promotion of biogas production.
Within the LULUCF sector, the most important measures in cropland are development and adaptation of drainage system, support to introduction and promotion of integrated horticulture, growing of legumes as well as other agro-environment related measures. Important measures in forest land are development and adaptation of drainage system, afforestation and improvement of stand quality in naturally afforested areas, regeneration of forest stands after natural disturbances, improvement of ecological value and sustainability

15
of forest ecosystems. The particular regulations define a procedure of calculation and compensation and criteria for negative effect caused by deforestation.
Within the waste management sector the most important policies and measures relate to the separate waste collection and preparation for re-use, recycling and material recovery, management of certain types of hazardous waste. EU Funds 2014-2020 planning period envisages the investment support to increase re-using, recycling and regeneration of various sorts of waste thus reducing the amount of waste disposed to landfills. In order to promote recycling and reuse the Natural Resources Tax Law sets the rate for waste disposal, important, the rate for solid municipal waste in 2020 will be approximately four times higher than in 2016.
Cross sectorial policies and measures
Latvia is implementing cross-sectorial climate change mitigation policies and measures that affect several sectors of the national economy simultaneously. Such cross-sectorial policies include implementation of the EU ETS, national green investment schemes, applying of fiscal instruments (CO2 tax in synergy with air polluting emissions taxation), green procurement, public information programmes to control and reduce emissions.
Effect of policies and measures on longer term trends
A large proportion of current climate and energy policies in Latvia also contribute to the reduction of GHG emissions in the longer term. For example, buildings have long lifetimes, and therefore, the regulations for the energy efficiency of new and existing buildings, a renovation of existing buildings, use of low-emissions heating in them, have long-lasting impacts. Measures that promote investments in renewable energy and that improve the competitiveness of renewable energy sources also reduce GHG emissions in the longer term. Long-term impacts relate also to improving public transport infrastructure. Prohibiting certain F-gases or halting the disposal of biodegradable waste in landfills can be expected to lead to permanent changes in current practices, and therefore to yield long-term emission reductions.
1.4 Projections
The with measures (WM) and with additional measures (WAM) projections correspond to the projections of the Informative Report that were presented by the Government in March 2017. The WM projection includes measures that were implemented or adopted in 2016 or earlier.
The GHG emission projections of Latvia up to 2035 are based upon the long-term macroeconomic projection up to 2035 developed by the MoE. The scenario projects that the growth rates of exports and the manufacturing industry will remain comparatively high based mainly on both the increased competitiveness of Latvian producers and the growing external demand. According to this scenario it is expected that GDP, similarly to private consumption, will double during 2005-2030 with the average annual growth of 3%. The population in Latvia is expected to continue to decrease by 14.5% from 2.250 to 1.915 million in the same time period.
Total GHG emissions under WM scenario increase by 9.9% up to 2020 and 15.7% up to 2030 compared to the year 2014. Compared with the base year of 1990, the total GHG emissions are expected to be 55.8% lower in 2020 and 53.3% lower in 2030. The energy sector will account for the biggest share amounting to 60.6 % of the total projected GHG emissions in the year 2020, followed by the agriculture sector with its share amounting to 26.8 % and the industrial processes with 6.8 % share.

16
Figure 1.2 GHG emissions according to the latest greenhouse gas emission inventory (2005-2015) and the WM projection (up to 2030) in the EU ETS and non-ETS sectors
The ratio between ETS and non-ETS the sectors is projected almost unchanged by 2030. The projection is that emissions of the ETS sector decrease by 12% compared with 2005, while in the non-ETS sector 14.5% increase is projected in 2030 against 2005.
According to the WM projection, the emissions from the non-ETS sector in the year 2020 will be by 8.9% above the 2005 level, which is sufficient for reaching the target set by the EU Climate and Energy Package (17% increase in 2020 compared with 2005).
The WM scenario projects that in 2030 the greatest part of the non-ETS sector emissions will be from emissions in agriculture, which share will increase by 4.5% points against 2014. The share of transport in the total non-ETS sector emissions will almost not change up to 2030, but the share of other sectors decreases by 3.2% points and that of the waste sector – by 2.4% points compared with 2014.
Figure 1.3 GHG emissions in the non-ETS sector by category based on the latest greenhouse gas inventory submitted in 2017 and the WM projection (up to 2030)

17
GHG projected emissions for the WAM scenario, calculation based on the implementation results of additional policies and measures. The additional GHG emission mitigation measures under the WAM scenario allow an essential reduction of the projected emissions mainly in the energy sector, excluding transport. Thus, in 2020 under the WAM scenario emissions in the energy sector are by 1.4% lower and in 2030 by 13% lower than in the respective years under the WM scenario. The main reason for the decrease is wider RES use and energy efficiency increase in the energy end-use and supply sectors.
Total effect of policies and measures
The total effect of the policies and measures is estimated by aggregating the impact estimates of individual policies and measures and by comparing the baseline scenario (without measures) from the year 2000 to the emissions in 2005, 2010 and 2015 and the scenario with measures (WM) projection’s projected emissions for 2020 and 2030. The total effect of the policies and measures contains noticeable uncertainties. However, the estimated range was 850-1400 kt CO2 eq. in 2010, and it is estimated that it will be approximately 2675 kt CO2 eq. in 2020 and 5010 kt CO2 eq. in 2030 with the existing measures.
1.5 Vulnerability Assessment, Climate Change Impacts and Adaptation Measures
Latvia has good climate research traditions and a history of comprehensive meteorological observations for almost 100 years. Recently LEGMC, the Latvian National Hydrometeorological and Climate Service and maintainer of the national hydrological (surface and underground), meteorological and air quality monitoring network, has analysed past climate changes in Latvia and developed climate change scenarios for Latvia for the period until the year 2100.
Since the beginning of the 20th century, records of average air temperature in Latvia have a long-term trend of warming. The year 2015 was the warmest year in 93 years, while 2014 and 2016 were the 8 th and 11th warmest years respectively. Along with average air temperature, there is an observed increase in extreme values. The most significant increase has been in values of minimum, mean and maximum air temperatures. Therefore, the most notable changes have occurred in winter and spring seasons. Under the impact of general air temperature increase, the length of growing season and the number of summer days and tropical nights have increased, while the number of frost days and ice days has decreased.
In the period from 1961 to 2010, one may observe an increase in precipitation, especially in winter and spring seasons. Moreover, precipitation intensity has increased, which in turn has increased both the intensity and frequency of extreme precipitation events.
In last decades, there are observed changes in climate parameter and index value trends (particularly tropical nights and summer days) due to the urban “heat island” effect in Rīga. Due to this effect, Rīga stands out in the average and maximum air temperature climate normals for the 1981-2010 period.
Analysis of recent climate and future climate change scenarios shows notable climate change tendencies. Most significant changes are related to the extreme values of climate variables, indicating that in the future Latvia will more often face uncharacteristic and extreme weather conditions. Therefore, in order to prevent risks related to climate change and their possible consequences, it is essential to develop and introduce research- and result-based adaptation activities in all economy sectors. For this reason, besides climate change scenarios, LEGMC experts have conceptually designed a system for monitoring adaptation to climate change on a national scale. Adaptation monitoring of different economy sectors will be based on the climate change impact assessments and results of various studies performed by experts, and will be running on regular basis. Furthermore, besides several research projects and programmes related to the impacts of climate change, such system may contribute to the development of Latvian adaptation policies and the national adaptation strategy.

18
Vulnerabilities
Climate change in Latvia affects both its natural capital (species, habitats, ecosystems), as well as the health, welfare and safety and economic activities of the population. Research results on risk and vulnerability assessment and identification of the adaptation measures in six areas – construction and infrastructure, civil protection and emergency assistance, health and welfare, biodiversity and ecosystems services, agriculture and forestry, tourism and landscape planning - was recently (2016 and 2017) published.
Extreme climate events may have major consequences on urban and terrestrial environment. Storms and heavy rainfalls causing large amount of damages will impact the general functioning of society, including functioning of rescue services. The main climate change related risks are damages by storm surges to buildings and roads at the coast and in cities at river mouths, damages caused by heavy rainfall induced precipitation floods and spring/ice-drift floods, snowstorm induced overloads to building constructions, damages to power transmission networks and transport communications (railway, road), indoor overheating, increase in heat stroke events, exacerbations of chronic (cardiovascular, diabetes, etc.) and respiratory diseases and more death cases, increase of acute intestinal infections, insect-born infectious diseases become endemic. Water courses and bodies will suffer increase of contamination and eutrophication, increase in water temperature and a longer stratification period, decrease in the volume of dissolved oxygen in the bottom layer. It is anticipated emergence of new species, including pests, risk of spread of pests and pathogens or increasing their vital capacity. The changes in biodiversity, e.g., in the distribution patterns of species and habitats may have considerable impact changing the operational conditions of other sectors. A gradual shift in average conditions that favour rare or new pests may be particularly problematic for agriculture and forestry, besides, these sectors is impacted by storms, damages to plantings by black frost, desiccation, in its turn, lack of winter frost makes logging difficult. Tourism sector is impacted by change of the length and characteristics of winter and summer tourism seasons. Within the research it is estimated also these impacts of climate changes that may bring potential benefits to some sectors, such as reduced demand for heating, increase in the population and economic value of roes and the Baltic herring; increased productivity of crops as well as longer season will allow to introduce varieties demanding little longer vegetation period, etc.; longer period of the visibility of the summer landscape and the diversification and increase in summer tourism offerings (activities, events), and some others. On the other hand, these benefits can be gained only if the relevant sectors adapt themselves to the new conditions.
Adaptation
Draft of “Latvia’s National Climate Change Adaptation Strategy until 2030” has been prepared in 2017. The overarching goal of the Strategy is to reduce the climate change related risks and vulnerabilities of people, economy, infrastructure, buildings and nature and promote the opportunities offered by climate change. The Strategy has 5 strategic objectives:
“Human life and health are protected from the negative impacts of climate change”’;
“The economy is able to adapt to and take advantage of the opportunities of climate change”;
“Infrastructure and buildings are climate-resilient and planned according to the potential climate change related risks”;
“Latvian nature and cultural heritage values are preserved and the negative impact of climate change on them is reduced”;
“The necessary information, knowledge and awareness required for the development and implementation of climate change adaptation policy ir provided”.

19
To meet the strategic objectives the subordinated directions of action are defined as well as particular measures are identified and grouped according the directions of actions.
Key precondition is integration of adaptation policy and measures into decision making process and territorial development planning and spatial planning procedures. The importance of preventive measures are underlined. Further development of current legislation, e.g. construction standards, land-use guidelines etc., shall take into consideration climate change related impacts.
1.6 Research and Systematic Observation
Science and innovation are the key resources to achieve the state development aims. The strategic objective “Advanced Research and Innovation and Higher Education” of the National Development Plan 2014–2020 sets the increase investment in research and development (R&D) with targeted efforts to attract human resources, develop innovative ideas, improve the research infrastructure, facilitate co-operation between higher education, science and the private sector, through the commercialisation of knowledge, promote the creation of innovative and internationally competitive products with high added value, increasing the share of output of such products in the national economy.
Since 2001, priority directions in science are defined to finance fundamental and applied research in order to purposefully implement the science policy and to use the financial resources effectively.
Science funding is granted both institutionally (basic funding of research) and on a competitive basis. Competitive research funding is allocated for projects by the National Research Programme, Fundamental and Applied Research Programme, European International Programmes, bilateral co-operation programmes.
Average annual research funding in 2011-2015 was ~ 143 MEUR. Research funding as a share of GDP in the years 2010-2015 has varied between 0.6% and 0.7%, decreasing in 2016 to 0.44%. In near years it is planned state budget financing, ~ 39 MEUR annually 2017-2019.
National Research Programmes (NRP) are being implemented in the priority directions in science approved by the Cabinet of Ministers Order. The NRP system in Latvia was launched in 2005. Relevant sectorial ministries are involved in setting the objectives and tasks of the Programmes. For the period 2014-2017 it was approved six priority directions in science, among them environment, climate and energy. In December 13, 2017, it has been approved nine priority directions in science for the period 2018-2021, among them the priority direction No.2 “Energy supply safety strengthening, energy sector development, energy efficiency, sustainable transport” and the priority direction No.3 “Climate change, nature protection and environment”, as well as the development of bioeconomics is foreseen within the priority direction No.4.
Climate change is recognised as one of the significant challenges currently facing society. Climate change mitigation and adaptation issues are covered by a wide range of research from fundamental research to applied research performed in number of research programmes and projects.
NRPs in energy and environmental science are those most directly linked to the climate change issue. In 2014-2017, two multi-disciplinary programmes directly related to climate change mitigation and adaptation issues are under implementation. In total, funding of these programmes amounts around 4.5 MEUR. These programmes are: (1) “Energy-efficient and low carbon solutions for a secure, sustainable and climate variability reducing energy supply (LATENERGI)”, and (2) “The value and dynamic of Latvia`s ecosystems under changing climate” (EVIDEnT). In 2010-2014, a NRP "Innovative technologies for energy generation and utilization and ensuring low carbon emissions by renewable sources, activities to limit degradation of environment and climate change" was implemented.

20
Energy efficiency, climate adaptation issues, including assessment of socio-economic impacts are also addressed in a number of projects of the Fundamental and Applied Research Programme.
Significant contribution to specific applied climate-related research is provided by the MEPRD/Latvian Environmental Protection Fund (LEPF) as well. These studies address problems to promote the development and introduction of environment and climate friendly management practices in Latvia. Specific studies have addressed, e.g., the flood risk management, application of decentralized waste water treatment systems, waste management practices, effective environmental tax systems, and other topics.
An important contribution was the research into technological development and pilot projects carried out under the National Green Investment Scheme (Climate Change Financial Instrument), in 2010-2015, and under the framework of the European Economic Area (EEA) and Norway Financial Mechanisms, in 2014-2016, both programmes “National climate policy” and "Innovation in Green Production”.
Environmental impact reduction issues are/were also addressed in research projects supported by EU Structural Funds, particularly projects related to energy efficiency and use of energy resources are/were supported.
Latvian research institutions and organizations actively participate in EU horizontal programmes, both H2020 (including European Research Area Network (ERA-NET)), LIFE programme, Interreg programmes, the latest plays significant role in promoting the practical implementation of research developments.
The Baltic Sea Region Adaptation Strategy and Action Plan (2013) analyzed the scenarios of how climate change affects the society and the potentials for the active action. An important contribution to the further analysis of the risks and vulnerabilities of climate change, identification of appropriate adaptation measures, long-term analysis of their benefits and costs was provided by research conducted under the framework of the EEA Financial Mechanism 2009-2014 programme "National Climate Policy” in the project "Development of proposals for the National Climate Change Adaptation Strategy by identifying scientific data and measures for adaptation to climate change, as well as impact and cost assessment", including six major studies in the field of landscape planning and tourism, biodiversity and ecosystem services, health and welfare, agriculture and forestry, construction and infrastructure, and civil protection and emergency planning. LEGMC has prepared a study on the historical manifestations and the expected future projections and scenarios of climate change in Latvia.
One of the most important sources of monitoring data on climate change is the European Organization for the Exploitation of Meteorological Satellites (Latvia and LEGMC is a member of EUMETSAT), which provides high-resolution (time and space) data to various sectors of the economy. In its turn, Latvia's membership in the European Medium-Term Weather Forecast (ECMWF) provides a unique opportunity for observing data sets to be used in climate studies to help assess meteorological conditions above terrestrial and aquatorium also in areas where there is insufficient ground observation or lack of observation. ECMWF data have been used in the study for updating Regulations of the Cabinet of Ministers of Latvia (2015) "Latvian Construction Standard LBN 003-15 "Building Climatology", recalculating snow loads for the entire territory of Latvia. Besides, the use of ECMWF climatic reanalyses in weather forecasting in Latvia allows assessing the probability and impact of extreme weather phenomena at the regional level, thus ensuring the possibility to implement relevant adaptation measures.
Within the framework of the "National Climate Policy" programme of the EEA Financial Mechanism, in 2014-2017, important activities have been carried out to improve the system of inventory of GHG emissions. The implemented activities contributed both to the improvement of the GHG inventory system and its synergy with air pollution data, development of a unified air pollution, GHG inventory data and projection database, and expert capacity building.

21
1.7 Education, Training and Public Awareness
Climate change is already anchored in the education and public awareness policies and practices and these policies and practices are continuously being developed. The environmental policy framework document - Environmental Policy Strategy 2014-2020 - pays high attention to education, training and awareness issues.
Environmental Protection Law defines both education for sustainable development and environmental education. Environmental Education and Education for Sustainable Development are included in general and professional education national curricula and climate change issues are part of this curricula. Important contribution in teaching materials has been provided in 2016 by the support of the EEA Financial mechanism 2009-2014, programme “National climate policy” small grant scheme “Capacity Building in the Field of Research and Measures for Enhancing Society’s Understanding about Climate Change and its Consequences”.
At a primary and secondary school level, the Environmental Education Fund works under the programme of “Eco-schools” of the international organisation Foundation for Environmental Education. In the 2016/2017 school year 125 schools in Latvia were awarded the international Green Flag; The Latvian Eco-School Certificate in the 2016/2017 school year was awarded to 57 education institutions.
Universities and other higher education institutions provide climate change education as a part of different degree programmes. The Environmental Protection Law states that environmental science should be integrated within the content of various courses, meaning that environmental science is run as an interdisciplinary theme.There are also particular study programmes on environmental science – on September 2017 there were run in total 18 such programmes (different degree levels) in 7 higher education institutions in Latvia. Academic studies and research are closely related within these programmes.
Above mentioned EEA programme has provided important contribution for development of climate education modules and materials both in higher education and in further (continuing) education (professional audiences, staff of state and municipal institutions, etc.). In accordance with the Environmental Protection Law, in May 2004 the Latvian Council of Environmental Science and Education - a coordinating and advisory inter-sectoral institution – was established.
A broad range of non-governmental organisations (NGO) are actively involved in the capacity building of climate change issues through research, education, training and media activities. Advisory Councils is one of the most effective tools for public participation and NGO representation. In particular, the Environmental Advisory Council and the Advisory Council of Climate Change Financial Instrument (CCFI) (national green investment scheme) of the MEPRD have to be mentioned. Due to the interdisciplinary nature of climate change, specific climate change adaptation issues are necessarily included in the agenda of other advisory councils as well. LEPF implements specially focused programmes for promoting and strengthening the co-operation between the NGO sector and the state environmental authorities.
In the period since 2010, large-scale public information and training programmes focusing on climate issues have been implemented. Within the CCFI programme “Promotion of public understanding on the role and possibilities of GHG emissions reduction” 22 projects in 2010-2012 were implemented. In its turn, in addition to already described above activities of EEA Financial Mechanism’s Small grant scheme in 2015-2016, in total 13 educational projects and informative campaigns to enhance society’s understanding and knowledge on climate change were organized as part of 4 projects (which included series of different campaigns). The annual targeted public information has been provided regularly by LEPF financed programmes as well. Public awareness raising and education directly relate to the Fund's project competitions.
22
Climate Change Portal of MEPRD will provide the most up-to-date information on climate change, climate change mitigation and adaptation to climate change elaborated to various target groups. Important resources are also websites of NGOs, specialised in the field of their competence, e.g., emission calculator by NGO “Pasaules dabas fonds”.
Campaigns are important for raising climate change awareness, popularising the environmental protection aspects, sustainable way of living and consumption. Particularly the “International Earth Day”, the “Earth hour”, “International Passive House Open Days”, events of the “International Water Day”, the “Nature Concert hall”, the campaign "My Sea", events organised by Society “Pēdas” (Footprints) have to be noted.
On September 2017, there are 21 active local actors of the Covenant of Mayors in Latvia - 6 republic cities and 15 municipalities (novadi), which together cover 58% of all Latvian inhabitants in the beginning of 2017.

23
NATIONAL CIRCUMSTANCES

24
2 NATIONAL CIRCUMSTANCES
2.1 Government Structure
Latvia is a parliamentary republic. The unicameral parliament (Saeima), with 100 members, is elected in general, equal, direct, secret and proportional elections for a four-year period. The Saeima, and also the people, have the right to legislate, in accordance with the procedures, and to the extent, provided for by the Constitution. Draft laws may be submitted to the Saeima by the President, the Cabinet of Ministers, committees of the Saeima, by not less than five members of the Saeima, or, in accordance with the procedures and in the cases provided for in the Constitution, by one-tenth of the electorate.
The Saeima elects President for a term of four years. The President represents the State in international relations, appoints and also receives the diplomatic representatives. The President has the right to initiate legislation. The President proclaims laws passed by the Saeima. The President, by means of a written and reasoned request to the Chairperson of the Saeima, may require a law to be reconsidered.
The candidate for the post of the Prime Minister who is invited by the President invites ministers to form the Government. The Prime Minister is responsible before the Saeima. Cabinet of Ministers is a collegial institution. Cabinet of Ministers, within the scope of its competence, considers policy planning documents, external and internal legal acts, orders of the Cabinet of Ministers, informative statements, national positions and official opinions of the State. Ministries are top-level direct administration institutions that are directly subordinated to a respective minister - Member of the Cabinet of Ministers. There were 13 ministries in Latvia in 2017, as well as the State Chancellery.
There are 119 local self-governments (9 cities and 110 municipalities) in Latvia after reform of 2009. There are currently no regional self-governments in Latvia.
The overall responsibility for climate change policy making lies within the Ministry of Environment Protection and Regional Development (MEPRD), and a number of other national institutions are involved in the implementation of this policy, including the Ministry of Finance (MoF), MoE, MoT, MoA, MES, and institutions supervised by relevant ministries.
Matters related to the UNFCCC fall within the administrative responsibility of the MEPRD, which acts as the national focal point to the UNFCCC.
More information about the institutional framework of Latvia’s climate policy is presented in Chapter 4 of this report.
2.2 Population Profile
Population of Latvia was 1,950,000 at the beginning of 2017. During the last three decades, since 1990, the population has decreased by about 717 thousand. In all the decades the average decline was about 1.1% per year though different tendencies could be observed in urban and rural population. In the period 1990-2000 the urban population showed more rapid average annual decrease than the rural, but in the period 2010-2017 the situation was reverse – the rural exceeded that of the urban. In 2017 the urban population constituted 68.3% and the rural – 31.7% (Figure 2.1). At the beginning of 2017 in Rīga, the capital of Latvia, the population was 641,400 people, constituting 32.9% of the entire population of the country.

25
Figure 2.1 Changes in Latvian population in 1980–2017
At the beginning of 2017 the population density in Latvia was 30 people per 1 km², but in 1990–1992 it was 41 persons. The population density fluctuated between 4 persons per 1 km² (Rucava region and Rugāji region) up to 2 110 people per 1 km² (Rīga), but in the regions near Rīga (Stopiņi region) it was 194 people per 1 km².
Figure 2.2 Changes in demographic dependency ratio in Latvia in 1990–2017
The aging of the population continues (Figure 2.2). The ratio of the working age population has decreased by 2.5% points in 2017 compared to 2010. At the same time the ratio of people above the working age has increased by 1.1% points. Migration vitally affects the decrease of the working age population. In 2016 almost three times more people of the working age emigrated (17.3 thous.) than immigrated (6.3 thous.).
At the beginning of 2017 the number of households in Latvia was 822.5 thousand which was by 11.4% less than in 2000. The average size of households has shrunk. In 2000 it was 2.53 people, while it was 2.34 persons in 2017.

26
2.3 Geographic Profile
Latvia is situated on the edge of the Eastern European Plain near the Baltic Sea between 55o40' and 58o05' Northern latitude and between 20o58' and 28o14' Eastern longitude. The total length of the border of Latvia amounts to 1,368 km on land and 498 km along the Baltic Sea coast. Latvia borders with Estonia in the North, with Lithuania in the South, with Belarus - in the South East and with Russia - in the East.
The territory covers an area of 64573 km2 in total. Its length in the North – South direction is 210 km, and the width in the West – East direction – 450 km. Latvia is a typical lowland country and its terrain is characterized by flat, low areas and hilly elevations. The average height above sea level is 87 m and the highest peak is Gaiziņkalns (311.6 m above sea level). Latvia also has more than 3 000 lakes and 12 000 rivers. Total forest area1 (including afforested lands) in 2015 was 32983.6 km2, cropland 1 7161.1 km2 and grassland 7380.7 km2, wetland 4451.8 km2, settlements 2541.4 km2 .
2.4 Climate Profile
According to World Meteorological Organization (WMO), climate is the synthesis of weather conditions in a given area, characterized by long-term statistics (mean values, variances, probabilities of extreme values, etc.) of the meteorological elements in that area2. In a narrow sense, it is the average weather condition in an area over a long period of time. Climate is a natural resource vital to our well-being, health and prosperity, and it has an influence on all economy sectors. Main drivers of climate conditions in Latvia are Latvia’s location in the northwest of the Eurasian continent, distance from Baltic Sea and the Gulf of Riga and relief of the territory of Latvia. These effects appear in the values of Gams’ hygric continentality index (Figure 2.3).
Figure 2.3 Values of Gams’ hygric continentality index
Solar radiation
The Sun is the most powerful source of energy and heat that is vital for life on Earth. As an alternative energy source, which may be used in the national economy, the energy generated by the sun is dependent on solar radiation intensity and season. In Latvia, due to seasonality, the duration of the daytime and hence
1 National statistical forest inventory 2 International Meteorological Vocabulary, WMO - No. 182

27
sunshine varies greatly throughout the year, with the longest on the 22nd (17-18 hours) of June and the shortest on the 22nd (6-7 hours) of December. According to the 1981-2010 normal, in Latvia the sun shines on average about 1840 hours per year with local variation of about 1690 hours in the Eastern Uplands and 1960 hours in the Southwest regions (Figure 2.4).
Figure 2.4 Annual hours of sunshine in Latvia (data from Liepāja and Alūksne stations). Dark yellow and black lines indicate 5 year smoothed values for Liepāja and Alūksne stations respectively
Air temperature
Over the 1981-2010 normal period, the annual average air temperature is from +5.2… +5.3oC in Alūksne and Vidzeme Uplands to +7.3… +7.4oC in the coastal territories of the Baltic Sea, clearly illustrating the impact of continentality, proximity to the Baltic Sea and positive relief forms on the climatic conditions and the spread of their manifestations within the territory of Latvia (Figure 2.5). Due to the urban “heat island” effect, Rīga is an exception to this distribution, with an annual average air temperature of +7.9oC. Air temperature has a seasonal nature – February being the coldest month with average air temperature -3.7oC and July being the warmest with +17.4oC. The absolute maximum +37.8oC was observed on 4th August 2014 in Ventspils, while absolute minimum -43.2oC – on 8th February 1956 in Daugavpils.
Growing season length is a climate index, which is directly affected by the air temperature. During the period 1981-2010, a typical growing season in Latvia has been from 188 to 202 days a year and in the Western districts – even up to 211 days per year.

28
Figure 2.5 Annual average air temperature over the 1981-2010 period normal, oC
Precipitation
Annual precipitation amount in Latvia over the 1981-2010 normal period is from 590-670 mm in the Zemgale region to 770-870 mm in western parts of Vidzeme and Kurzeme Uplands (Figure 2.6). The least amount of precipitation is observed during the spring season, when the activity of the cyclones that were dominant during the autumn and winter seasons has ended, while the convective processes typical for the summer season have not yet begun. The highest amount of precipitation is observed during the summer season. On average, in Latvia there are 17 heavy precipitation and 4 very heavy precipitation days a year and the average annual maximum one-day precipitation amount is 34 mm. The highest recorded daily amount of precipitation is 160 mm.
Figure 2.6 Annual average precipitation over the 1981-2010 period normal, mm
Snow cover
In winter, a large part of the precipitation is in the form of snow. The seasonal snow cover stores large quantity of water, which afterwards greatly influences the surface water and groundwater cycle. Hence, the snow cover characteristics are directly related to the development of hydro-electric power generation and assessment of flood risk. The snow cover duration and its depth have a pronounced effect on the growth of natural and cultivated plants, recreational and winter sports and road maintenance.

29
Over the 1981-2010 period, the onset of snow cover in autumn takes place in November - the earliest in Alūksne and the Vidzeme Uplands (1st ten day period), while in most of the county snow cover forms in the 2nd ten day period. Along the Baltic Sea coastline, the snow cover is first established in the 3rd ten day period of November. Ending of persistent snow cover in most of the country occurs in the 3rd ten day period of March or 1st ten day period of April, whereas in Alūksne, in most years, it occurs in the 2nd ten day period of April. The average number of days with snow cover is from approximately 60-65 days at the coast of the Baltic Sea to 130 days in Alūksne. The greatest snow cover depths are observed in the 3rd ten day period of February (on average from 7 cm in the western parts to 27 cm in the eastern parts). The maximum snow cover depth of 130 cm was observed in the Vidzeme Uplands (Figure 2.7).
Figure 2.7 Number of days with snow cover in Latvia (Alūksne and Liepāja stations). Green and red lines indicate 5 year smoothed values for Alūksne and Liepāja weather stations respectively
Wind
Annual average wind speed over the 1981-2010 period is 2.5-4 m/s, and it is characterized by a clear gradient from sea territories to land. Furthermore, annual average wind speed values are closely related to storm activity in autumn and winter. Seasonally, the strongest winds blow from November to February, when monthly average wind speeds in coastal areas are approximately 5 m/s, while inlands – only about 3 m/s. Lowest wind speed is observed in summer – on average wind speed is just below 3 m/s and in some stations even below 2 m/s. The number of calm days in Latvia is on average from approximately 55 days at the Baltic Sea coast to about 130 days per year in the eastern regions. Meanwhile, stormy days in Latvia are observed very rarely - from 0-1 day per year in most parts to 7-8 days on average in Liepāja and Ventspils.
2.5 Economic Profile
Reforms implemented in Latvia and integration in the EU have left a positive impact on the economic development of the country. Rapid economic growth was observed in the period 2000-2007. A substantial inflow of foreign capital from 2005 to 2007 stimulated significant increase in the private consumption and investments in Latvia. The average growth rate of the GDP exceeded 10%.
Since the second half of 2007, the growth rates began to decrease which was determined by the processes influencing both internal (weakening of domestic demand) and external (decrease of growth rates globally)

30
economic environment. During the crisis, the GDP decreased by one fourth. Since 2010, the economic recession in Latvia has stopped, and the growth resumed. From 2011 to 2013, the GDP increased on average by 4.4% annually.
Figure 2.8 Gross Domestic Product, 2000 – 2015 (at 2010 prices)
In 2014 the GDP increased by 2.4%, and in 2015 – by 2.7% (Figure 2.8). Slowing down of the growth rates during the last two years was determined by trends in the external economic environment – slower growth in the EU and other global markets. As the economy of Latvia is small and open there is significant dependence on the trends of global economy.
The Latvian export-import balance improved considerably during the crisis period. In 2007 the export-import balance exceeded -20% from the GDP. In 2013 and 2014 the export-import balance was -3.2% and -2.2% from the GDP respectively, but in 2015 it was -1.4% from the GDP.
External trade of Latvia experienced a dynamic development after the crisis. In 2012, compared with 2009, the goods export in actual prices almost doubled, while the goods import increased by more than 80%. In the period 2009-2012 export increased average by 25% annually, but import – by 23%. The increase was mainly due to the growing export of agricultural products and foodstuffs as well as products of metalwork. Export of products from such sectors as wood industry, machinery, electrical equipment and appliances, and mineral products increased considerably.
Starting with 2013 the goods export in actual prices had more moderate growth by 1.1% to 2.3% annually, which was largely determined by the growth rate of the world economy.

31
Figure 2.9 Export of Latvian goods and services, billion EURO
In 2015 the main exported goods (in actual prices) were agricultural products and foodstuffs (18.7%), machinery, electrical equipment and appliances, (18.6%), wood and its products (16.7%), products of the chemical industry (10.2%), metals and metal products (8.7%) and other goods. In 2015 the main exported services included transportation (39.3%), travel (20%), financial and insurance services (11.5%), information and computing services (6.4%).
The structure of goods and services export by country groups in 2015 is given in Figure 2.10.
Figure 2.10 Latvia’s export structure by country groups in 2015, %
In 2015 the main imported goods (in actual prices) were agricultural products and foodstuffs (15.2%), machinery, electrical equipment and appliances, (21.7%), products of the chemical industry (15%), mineral products (12.1%), transport vehicles (9.9%) and other goods.
The following countries are the main trading partners of Latvia: Lithuania, Estonia, Germany, Poland, Russia, Sweden, the Netherlands, Denmark, the United Kingdom, and Finland.
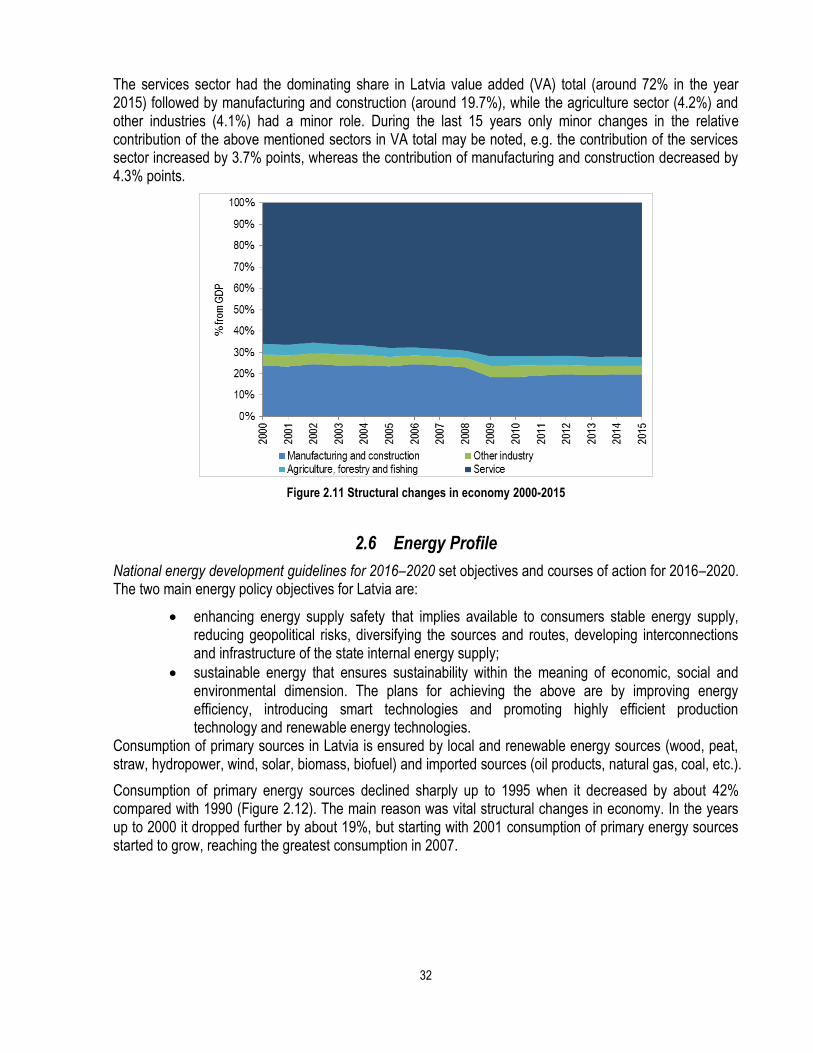
32
The services sector had the dominating share in Latvia value added (VA) total (around 72% in the year 2015) followed by manufacturing and construction (around 19.7%), while the agriculture sector (4.2%) and other industries (4.1%) had a minor role. During the last 15 years only minor changes in the relative contribution of the above mentioned sectors in VA total may be noted, e.g. the contribution of the services sector increased by 3.7% points, whereas the contribution of manufacturing and construction decreased by 4.3% points.
Figure 2.11 Structural changes in economy 2000-2015
2.6 Energy Profile
National energy development guidelines for 2016–2020 set objectives and courses of action for 2016–2020. The two main energy policy objectives for Latvia are:
enhancing energy supply safety that implies available to consumers stable energy supply, reducing geopolitical risks, diversifying the sources and routes, developing interconnections and infrastructure of the state internal energy supply;
sustainable energy that ensures sustainability within the meaning of economic, social and environmental dimension. The plans for achieving the above are by improving energy efficiency, introducing smart technologies and promoting highly efficient production technology and renewable energy technologies.
Consumption of primary sources in Latvia is ensured by local and renewable energy sources (wood, peat, straw, hydropower, wind, solar, biomass, biofuel) and imported sources (oil products, natural gas, coal, etc.).
Consumption of primary energy sources declined sharply up to 1995 when it decreased by about 42% compared with 1990 (Figure 2.12). The main reason was vital structural changes in economy. In the years up to 2000 it dropped further by about 19%, but starting with 2001 consumption of primary energy sources started to grow, reaching the greatest consumption in 2007.

33
Figure 2.12 Consumption of primary energy sources in Latvia 1990-2015
The structure of primary energy sources has changed over years. The first cardinal changes occurred up to 1995 when natural gas, and sometimes also biomass, replaced residual fuel oil for generating electricity and heat, and coal for heat production. Further vital changes began in 2010 when through different state support measures natural gas started to be replaced by biomass in district heating systems.
Today three types of energy sources, each of an approximately equal share, dominate in the supply of primary energy sources in Latvia: oil products (32.9%), which are mainly petrol and diesel fuel used in the transport sector; natural gas (25.6%), mainly for generating electricity and heat in CHPs; wood biomass (33.1%), used for heating in different sectors and generating electricity and heat in CHPs.
Like many other EU countries Latvia depends on the import of primary sources, however, Latvia’s dependency has decreased from 86% (in 1990) to 63% (in 2015), mainly due to increasing the use of wood biomass and other RES. At present RES take a considerable share in the balance of Latvia’s primary sources. The main and widely used sources are wood and hydropower, to a lesser degree also biogas, wind energy, straw and sunlight. The share of renewable energy in the supply of primary energy sources has grown from 31.8% (in 2000) to 37.1% (in 2015).
The above changes in the structure of primary energy sources have vitally decreased the carbon capacity of primary energy sources (measured as CO2 t/toe in primary sources), allowing reduction of CO2 emissions in the energy sector. The carbon intensity in primary sources has decreased from 2.35 t CO2/toe to 1.56 t CO2/toe, or by 33.8%.
The final energy consumption underwent trends similar to those of the consumption of primary energy sources, namely, in 2000 it was by about 49% lower than in 1990 (Figure 2.13). Starting with 2001, increase in the final energy consumption was observed. In 2015 it was 3.9 Mtoe, and compared with the year 2000 the increase was by about 15%. The greatest changes occurred in the residential sector where energy consumption decreased in that period by about 16% and its share in the final energy consumption decreased by about 12% points and in 2015 was 29%. The other largest share in the final energy consumption was in the transport sector, constituting 29% in 2015 and the increase was by 7% points against 2000. In industry the final energy consumption had grown by 37% in the period 2000-2015 and in 2015 its share was about 20% of the total consumption and the increase was by about 3% points, compared with 2000.

34
Figure 2.13 Final energy consumption by sector in Latvia 1990-2015
When analysing the total final consumption as to structural fuel changes in the period 2000-2015, the following key factors could be underlined:
The consumption (in absolute units) of natural gas, oil products, wood fuel as well as electricity grew by 5-47%, while district heating (DH) decreased by around 13.5%.
The share of DH fell from 18.4% to 13%, the main causes − the measures taken for improving energy efficiency in buildings which led to decrease in the DH consumption (in absolute units), and switching from DH system to de-centralised supply systems based on natural gas and RES.
The consumption of oil products increased by 28.4% but the share grew from 32.5% to 35.1%, the main cause − rapid increase in the number of private cars.
The growth in the number of electric appliances in households and developments in the services sector raised the total electricity consumption by around 45%, while its share in the total final consumption increased by 2.9% points;
The wood fuel share decreased by 1.4% points in the period.
2.6.1 Electricity market
Latvia started opening its electricity market on 1 July 2007 when amendments to the Electricity Market Law took effect ensuring the right to electricity consumers to change the electricity trader. The next important step was taken on 1 November 2012 when all electricity consumers which were legal entities were obliged to purchase electricity for agreed price from the trader, and thus about 24500 entities, consuming about 75% of electricity, bought it in the free market. The market liberalization was completed on 1 January 2015 as all individual consumers (households) could become the free market participants.
The EU energy market legislation, the third package, provides that one of the factors for ensuring optimal functioning of the market is unbundling energy suppliers from network operators. Legal unbundling of transmission and distribution operators was performed in the restructuring process of “AS Latvenergo”, a vertically integrated electricity merchant, whose shareholder was the MoE. On 1 January 2012 “AS Augstsprieguma tīkls” was unbundled from “AS Latvenergo” and became an independent transmission system operator which is responsible for the development of the transmission network, security of electricity
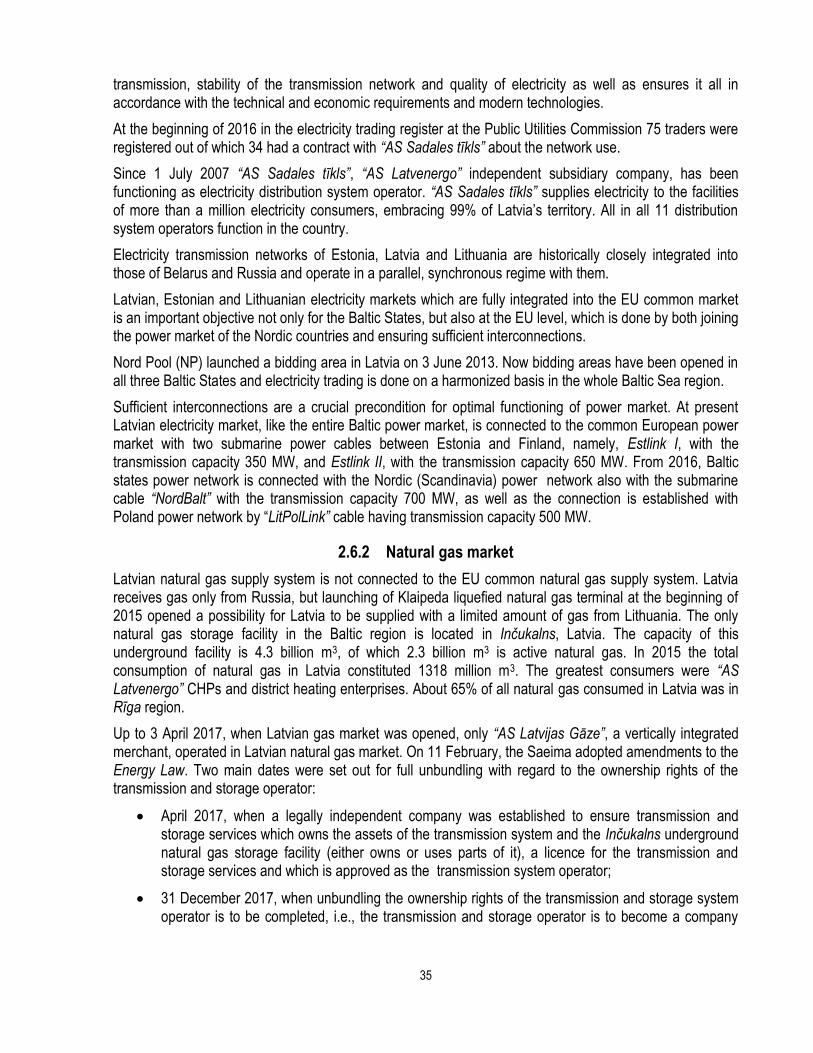
35
transmission, stability of the transmission network and quality of electricity as well as ensures it all in accordance with the technical and economic requirements and modern technologies.
At the beginning of 2016 in the electricity trading register at the Public Utilities Commission 75 traders were registered out of which 34 had a contract with “AS Sadales tīkls” about the network use.
Since 1 July 2007 “AS Sadales tīkls”, “AS Latvenergo” independent subsidiary company, has been functioning as electricity distribution system operator. “AS Sadales tīkls” supplies electricity to the facilities of more than a million electricity consumers, embracing 99% of Latvia’s territory. All in all 11 distribution system operators function in the country.
Electricity transmission networks of Estonia, Latvia and Lithuania are historically closely integrated into those of Belarus and Russia and operate in a parallel, synchronous regime with them.
Latvian, Estonian and Lithuanian electricity markets which are fully integrated into the EU common market is an important objective not only for the Baltic States, but also at the EU level, which is done by both joining the power market of the Nordic countries and ensuring sufficient interconnections.
Nord Pool (NP) launched a bidding area in Latvia on 3 June 2013. Now bidding areas have been opened in all three Baltic States and electricity trading is done on a harmonized basis in the whole Baltic Sea region.
Sufficient interconnections are a crucial precondition for optimal functioning of power market. At present Latvian electricity market, like the entire Baltic power market, is connected to the common European power market with two submarine power cables between Estonia and Finland, namely, Estlink I, with the transmission capacity 350 MW, and Estlink II, with the transmission capacity 650 MW. From 2016, Baltic states power network is connected with the Nordic (Scandinavia) power network also with the submarine cable “NordBalt” with the transmission capacity 700 MW, as well as the connection is established with Poland power network by “LitPolLink” cable having transmission capacity 500 MW.
2.6.2 Natural gas market
Latvian natural gas supply system is not connected to the EU common natural gas supply system. Latvia receives gas only from Russia, but launching of Klaipeda liquefied natural gas terminal at the beginning of 2015 opened a possibility for Latvia to be supplied with a limited amount of gas from Lithuania. The only natural gas storage facility in the Baltic region is located in Inčukalns, Latvia. The capacity of this underground facility is 4.3 billion m3, of which 2.3 billion m3 is active natural gas. In 2015 the total consumption of natural gas in Latvia constituted 1318 million m3. The greatest consumers were “AS Latvenergo” CHPs and district heating enterprises. About 65% of all natural gas consumed in Latvia was in Rīga region.
Up to 3 April 2017, when Latvian gas market was opened, only “AS Latvijas Gāze”, a vertically integrated merchant, operated in Latvian natural gas market. On 11 February, the Saeima adopted amendments to the Energy Law. Two main dates were set out for full unbundling with regard to the ownership rights of the transmission and storage operator:
April 2017, when a legally independent company was established to ensure transmission and storage services which owns the assets of the transmission system and the Inčukalns underground natural gas storage facility (either owns or uses parts of it), a licence for the transmission and storage services and which is approved as the transmission system operator;
31 December 2017, when unbundling the ownership rights of the transmission and storage system operator is to be completed, i.e., the transmission and storage operator is to become a company

36
independent of “AS Latvijas Gāze”, the owners of which are neither directly or indirectly linked with “AS Latvijas Gāze” or it shareholders.
According these legal requirements, the monopoly ”AS Latvijas Gāze” had been reorganized and independent both (1) transmission system operator (“AS Conexus Baltic Grid”) has been established and started operation from January 2017, and (2) distribution system operator (“AS Gaso”) has been established and started operation from the 1st December 2017.
2.7 Transport Profile
Transport demand and supply are influenced primarily by developments in economy, demographic factors, employment patterns and the provision of infrastructure.
The main types of transport include rail transport, road transport (public and private), air transport and water transport (sea, inland water). Road transport constitutes the largest share of energy consumption in transport. In 2015 passenger cars, trucks, buses and motorcycles used about 93% of the total consumption in transport. Due to the decrease in rail freight transport over the last three years the share of rail transport in the total consumption decreased and in 2015 it constituted only 6.5%. The remaining 0.5% was made up by air and water transport.
The infrastructure of roads, railway, seaports and airports forms the Latvian transport network. In 2016 the total road length in Latvia was 50 290 km, out of which 20 122 km were national roads and 30 168 km municipal roads. The average road density was 1.122 km per 1 km2.
The total length of Latvian rail network is 1859 km, out of which 317 km are double-track and 250 km are electrified. Transit cargo constitutes 79% of freight transportation, out of which the greatest part is directed to the ports which are the final destination of the East-West transit corridor. Transit cargo plays an important role in Latvian economy as it constitutes about 1/3 of the total export of all services.
Latvia has three big ports (Ventspils, Rīga and Liepāja), the ratio of which in total cargo turnover constituted 98.2% in 2016, and seven small ports (Engure, Lielupe, Mērsrags, Pāvilosta, Roja, Salacgrīva, Skulte). The three big ports are outspokenly ports of export as the cargos shipped from them (mainly transit cargos from Russia, Belarus and other CIS countries) exceed greatly the volume of the cargos received.
Though air transport is not of significance for local transportation, the development of Riga International Airport plays an important role in the development of other sectors, especially tourism. Riga International Airport is the biggest international airport in the Baltic States and the number of passengers it serves increases continuously; it reached 5.4 million passengers in 2016.
2.7.1 Passenger Transport
Passenger transport (as measured in passenger kilometres) has grown considerably since 2000 (on average by 2.5% per year). The rapid growth was ensured by the trends developing up to 2007, but afterwards the growth rate stabilized. The growth rate was due to the rapidly increasing number of passenger cars up to 2007 (Figure 2.14).
In 2015 most of passenger movement was ensured by road transport: passenger cars – 84.7%, buses – 11.7% and railway – 3.6%. These modes of transport have demonstrated different trends since 2000 (see Figure 2.14). The passenger kilometres travelled by passenger cars in Latvia increased steadily in the period under consideration (by 51%) and their share in the total passenger transport increased by 7.8% points, while rail and tram travel decreased by around 28% and their share in passenger transport

37
decreased by 3.2% points and passenger kilometres travelled by bus almost did not change, but their share decreased by 4.6% points.
Figure 2.14 Passenger travel by transport mode
2.7.2 Freight traffic
The year 2015 showed also rapid increase of freight traffic (measured in tonne-kilometres) against 2000 (5.7% per year) (Figure 2.15). This trend was mainly driven by the growth of road transport (205%) which by far exceeded the increase in rail freight traffic (42%). It has to be noted that the volume of rail freight strongly depends on the export shipment volumes in the ports and harbours of Latvia. In Latvia the dominant position in inland transportation is taken by trucks due to transporting over short distances (less than 300 km). Rail freight transport ensures mainly export and import freight transportation from and to the ports of Latvia. In 2015 the share of road freight traffic in the total freight transportation was 43.7%, which was by 17.3% more than in 2000. The share of rail freight traffic constituted 56.3%.
Figure 2.15 Freight traffic by transport mode

38
2.8 Industry
The manufacturing industry has significant place in Latvian economy and it is one of the largest economic sectors. In 2015 it generated 13.2% of total value added. The manufacturing industry employed about 13.8% of total employment. It was also vitally important for promoting foreign trade of Latvia as export made about 2/3 of the industry turnover. Nearly 75% of all exported products were sold in the markets of the EU countries, while in 2015 export to CIS countries was 13% of total export of the manufacturing industry.
Figure 2.16 Value added in the manufacturing industry, MEUR (2010)
During the 15-year period the value added in manufacturing industry increased by average 2.6% annually. The 2008-2010 economic recession had a serious impact upon the manufacturing industry as production dropped by about 27%. Up to 2007 it was average 6.7% per year. In the years 2010-2012 the manufacturing industry developed rapidly and contributed substantially to the development of economy.
In 2015 the output of the manufacturing industry increased by 4.3%. The greatest contribution to it was made by such sectors as wood processing, metal production, manufacturing of electronic and optical appliances as well as machinery and equipment production. In the biggest sector – wood processing – the production volume had a stable increase by 7.1% in 2015.
In 2015 the most important sectors in the manufacturing industry as to value-added production were wood processing (24%), food and beverages (18.1%), fabricated metal products (8.4%), non-metallic minerals (7.0%), electrical appliances, machinery and equipment (10.6%), chemicals and pharmaceuticals (5.6%). Compared to 2007, the most substantial changes in the structure of value-added production were decrease in the shares of food and beverages by 11.9% points and textiles industry by 2% points, while it increased in wood processing by 6.3% points, electrical appliances, machinery and equipment by 3.2% points and fabricated metal products by 1.7% points (Figure 2.16).
In 2015 the most important sectors in the manufacturing industry as to the number of jobs were wood processing (21%), food and beverages (20.6%), fabricated metal products (10.2%), light industry (10.1%), chemicals and pharmaceuticals (7%), non-metallic minerals (4.5%).

39
Figure 2.17 Export goods ratio in the sectors of manufacturing industry
Figure 2.17 reveals that the development of the manufacturing industry largely depends on demand, market forces and competitiveness in external markets as the greatest part of the output products is exported.
Energy consumption in industry
The manufacturing industry production volume growth increased the final energy consumption as well; in the last 15 years it increased by about 36%. Changes in the final energy consumption were different in different sectors. Decrease occurred in such sectors as food and beverage – by 46%, textiles – by 85%, steel production – by 89%, transport equipment – by 34%, while increase was in wood industry by about 4 times, non metallic minerals – by about twice, chemicals – by 59%.
Figure 2.18 Final energy consumption in manufacturing by sectors, ktoe
The changes in energy consumption caused substantial changes regarding the share of total consumption by each sector. Decrease in the share of food and beverage sector was by about 16% points, textiles – by 8% points, steel production – by 23% points (Figure 2.18). The greatest increase in the share of total consumption was in wood industry (45% points), non metallic minerals production (6% points). Only the non metallic minerals sector and wood industry can be regarded energy intensive industries in 2015. Figure 2.19

40
below is a comparative figure of the shares in value added and energy consumption by the manufacturing sectors.
Figure 2.19 Shares in value added and energy consumption by the manufacturing sectors
In the period 2000-2015 substantial changes occurred also in the consumption of types of energy and the structure of the energy sources consumed. Electricity consumption increased by 19%, but its share decreased by 2.6% points and was 18.6% in 2015. Consumption of natural gas decreased by 46%, but its share by 22.8% points and constituted 14.7% in 2015. Consumption of oil products (residual fuel and diesel oil) dropped by 80% and its share by 23% points and was only 3.8% in 2015. Consumption of wood biomass increased six times and in 2015 its share was 55% of total energy consumption in the manufacturing industry (Figure 2.20).
Figure 2.20 Final energy consumption in manufacturing
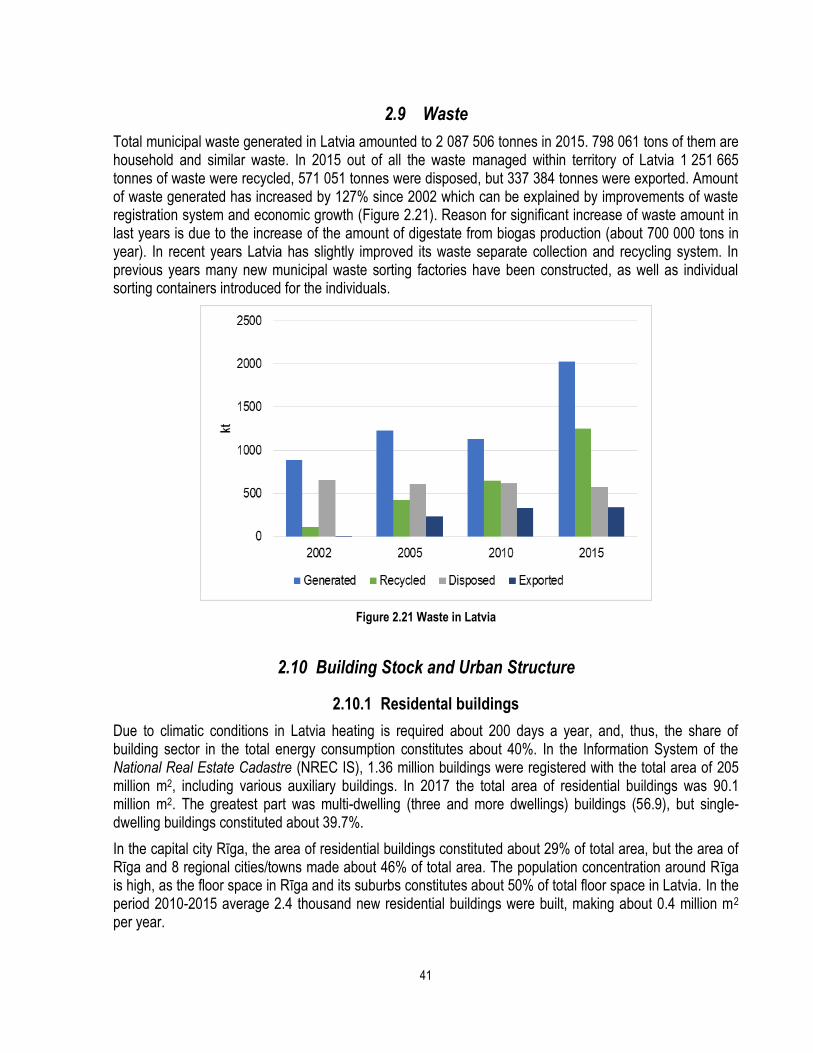
41
2.9 Waste
Total municipal waste generated in Latvia amounted to 2 087 506 tonnes in 2015. 798 061 tons of them are household and similar waste. In 2015 out of all the waste managed within territory of Latvia 1 251 665 tonnes of waste were recycled, 571 051 tonnes were disposed, but 337 384 tonnes were exported. Amount of waste generated has increased by 127% since 2002 which can be explained by improvements of waste registration system and economic growth (Figure 2.21). Reason for significant increase of waste amount in last years is due to the increase of the amount of digestate from biogas production (about 700 000 tons in year). In recent years Latvia has slightly improved its waste separate collection and recycling system. In previous years many new municipal waste sorting factories have been constructed, as well as individual sorting containers introduced for the individuals.
Figure 2.21 Waste in Latvia
2.10 Building Stock and Urban Structure
2.10.1 Residental buildings
Due to climatic conditions in Latvia heating is required about 200 days a year, and, thus, the share of building sector in the total energy consumption constitutes about 40%. In the Information System of the National Real Estate Cadastre (NREC IS), 1.36 million buildings were registered with the total area of 205 million m2, including various auxiliary buildings. In 2017 the total area of residential buildings was 90.1 million m2. The greatest part was multi-dwelling (three and more dwellings) buildings (56.9), but single-dwelling buildings constituted about 39.7%.
In the capital city Rīga, the area of residential buildings constituted about 29% of total area, but the area of Rīga and 8 regional cities/towns made about 46% of total area. The population concentration around Rīga is high, as the floor space in Rīga and its suburbs constitutes about 50% of total floor space in Latvia. In the period 2010-2015 average 2.4 thousand new residential buildings were built, making about 0.4 million m2 per year.

42
Figure 2.22 Changes in the floor space of households
The improving living conditions caused increase of both the average area of dwelling and area per inhabitant (Figure 2.22). In the period 2010-2015 the first indicator grew by 8.7%, and the other – by 15%. As the number of population decreased the number of households in the given period decreased from 837.1 thousand to 803.8 thousand, and the average household size decreased from 2.5 to 2.44 persons.
The Figure 2.23 shows residential buildings by the period of construction. It reveals that about 65% had been built up to 1980. In each period slightly different building materials and technologies were used and each period had different requirements for thermal insulation which tightened over years.
Figure 2.23 Residential buildings by the period of construction
Different energy sources were used for heating residential houses. In 2015 the three most important sources were wood biomass (57.2%), district heating (32%) and natural gas (7%) (Figure 2.24).

43
Figure 2.24 Energy sources for heating residential buildings in 2015
The share of district heating was considerable. Heat for district heating was supplied by boiler houses and CHPs. Boiler houses used wood biomass (about 74.5%) and natural gas (25%), while the ratio was reverse in CHPs – natural gas 74.5% and wood biomass 25%.
2.10.2 Non-residental buildings
The NREC IS data provide information on 30 thousand registered non-residential buildings with the total area 26.4 million m2 which require energy for maintaining microclimate and 32.9 thousand industrial buildings with the total area 18.1 million m2 which also consume energy. Still the different production technologies used in these buildings cause cardinal differences in the energy consumption.
Figure 2.25 Types of non-residential buildings by area use
The greatest part (71.5%) of non-residential building areas was constituted by the following three groups: education and science buildings (24.4%), office buildings (24.4%), and wholesale and retail sale buildings (22.6%) (Figure 2.25). The state and municipalities owned about 48% of the total non-residential areas. Education and science buildings (40%) and office buildings (21%) made the greatest part of the state owned areas.

44
Article 5 of the Energy Efficiency Directive (Directive 2012/27/EU) provides that starting with 2014 for 7 following years there are to be renovated 3% of the total area of heated and/or cooled buildings owned and occupied by the central government to meet at least the minimum energy efficiency standards. To achieve the objective, about 0.55 million m2 of the buildings owned or used by the central government are to be renovated by 2020.
2.11 Agriculture
Agricultural land is one of the most significant natural resources in Latvia. Climatic conditions and soil fertility are suitable for different branches of agricultural production, including grain, rape and vegetable production. Historically the dairy sector has always been a priority in agricultural sector of Latvia; however beef, veal and pork production also is developing. During the last years the number of sheep has increased gradually. Consequently, farming is one of the main economic activities in the rural areas.
At the end of 2015, there were 83.6 thousand agricultural holdings in Latvia; the average size thereof constituted 34.8 hectares – 5.3 hectares or 18 % more than in 2010. Agricultural area on average per holding has expanded from 19.6 hectares in 2010 to 23.6 hectares in 20153. During the time period 2000-2015 the total utilised agricultural area increased by 19%, reaching 1 884.80 thousand ha in 2015. The structure of arable land in 2015 is represented in Figure 2.26.
Figure 2.26 The structure of arable land in 2015
The total sown area increased by 33 % during the time period 2000-2015 (Figure 2.27).
3 The collection of statistics “Agriculture in Latvia”, Central Statistical Bureau, 2016
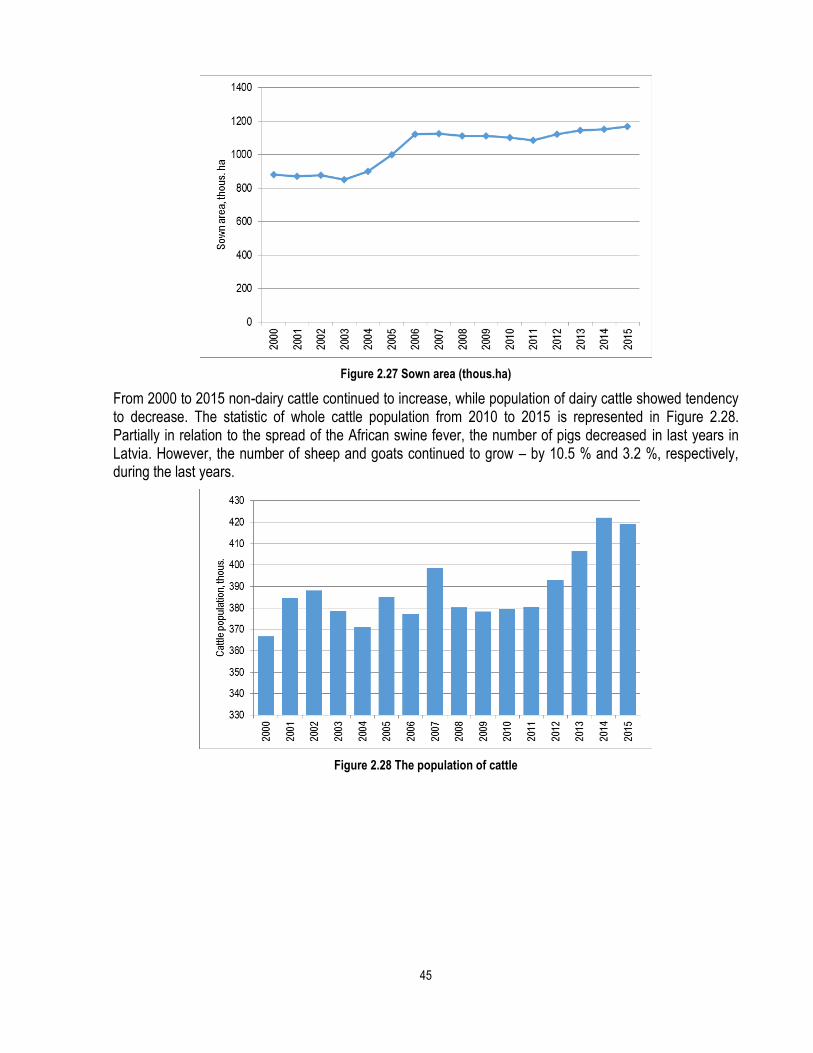
45
Figure 2.27 Sown area (thous.ha)
From 2000 to 2015 non-dairy cattle continued to increase, while population of dairy cattle showed tendency to decrease. The statistic of whole cattle population from 2010 to 2015 is represented in Figure 2.28. Partially in relation to the spread of the African swine fever, the number of pigs decreased in last years in Latvia. However, the number of sheep and goats continued to grow – by 10.5 % and 3.2 %, respectively, during the last years.
Figure 2.28 The population of cattle

46
2.12 Forestry
The total area of Latvia is 6.46 million ha including 6.22 million ha of land area. According to the National Forest Inventory 51% of the land area is forest (excluding forest infrastructure like road networks and seed orchards), 38% is farmland (including 27% of cropland and 11% of grassland), 7% are wetlands, including water bodies, and 4% are settlements. Latvia is among the most densely forested countries in Europe. Since the beginning of last century the forest area of Latvia has almost doubled by occupying 3,298,363 ha in 2015. In terms of property share – 48 % are state owned forests, the remaining forests are under private ownership with an average property size of 10.6 ha. Forests are of major importance for the national economy of Latvia as well as provide different ecosystem services including purification of air by capturing CO2 and recreation.
The species dominating in the forest stand of Latvia are - pine, spruce and birch occupying 73.4% from the total forest area. Though, coniferous forests dominate in state owned forests. In the result of fast overgrowing of agricultural and coniferous forest felling areas with deciduous trees the share of birch and other broadleaves is increasing in the forest stand of Latvia. Forest resources constitute the main national wealth.
As the forest area in Latvia has been constantly increasing over the past 20 years, the volume of timber in the forest, the growing stock has also increased substantially. 93% of Latvia’s forests (3,155,00 ha with 592 million m³ of timber) were available for wood supply in 2010. In 2014, total growing stock volume in Latvia was 668 million m3 including 355 million m3 or 53% of total growing stock volume in state owned forests (Figure 2.29). According to recent estimates, growing stock increment is 19.4 million m3 per year.
Figure 2.29 Total growing stock volume in Latvia4
In Latvia, traditional forest management cycle (up to 120 years depending on tree species and site index) consist of following stages: regeneration (0-3 years); tending of young stands (2-20 years); forest thinning (30-65 years); clear cutting/ regeneration cutting (up to 120 years). All of mentioned forest management cycle stages are regulated according to laws and relevant regulations. All the forests owned and managed by the state are certified by Programme for the Endorsement of Forest Certification (PEFC) promoting
4 CSB data

47
sustainable forest management and partly Forest Stewardship Council (FSC) certified assuring that products come from responsibly managed forests that provide environmental, social and economic benefits.
In Latvia, the reforms in forestry sector were started in 1998 when the The Cabinet of Ministers of the Republic of Latvia adopted the Forest Policy. The main goal defined in the policy is to ensure a sustainable management of Latvian forests and it is being accomplished by documents of policy planning and regulations: the Forest Law, Forest-based Sector Development Guidelines (2015-2020) and other forest related regulations. In the context of forest policy “sustainable management” means the stewardship and use of forests and forest lands in a way, and at a rate, that maintains their biodiversity, productivity, regeneration capacity, vitality and their potential to fulfil, now and in the future, relevant ecological, economic and social functions, at local, national, and global levels, and that does not cause damage to other ecosystems. The Forest Policy underlines that forest is an important part of Latvian environment and economics. The goals of the policy are:
to ensure that the area of forest is not decreasing by setting limits to the forest land transformation;
to ensure maintenance and increase of productivity of forest lands;
to encourage afforestation of agriculturally non-effective land.
The Forest Law (adopted in 2000 with latest changes in 2017) is the central law of the forest sector of Latvia, stating the following goals:
to promote economically, ecologically and socially sustainable management and utilization of forests by ensuring equal rights to all owners and legal possessors of forest, ownership privacy, independence in economic actions and equal duties;
to regulate terms of management.
According to the Forest Law the Cabinet of Ministers defines terms of evaluation of a sustainable forest management by meeting criteria and indicators of Pan-Europe. Following the definitions of this Law, the responsibility of a forest owner or legal possessor is to regenerate forest stand after regenerative felling.
The Regulation on Determination Criteria of Compensation and Calculation of Deforestation defines a procedure of calculation and compensation and criteria for negative effect caused by deforestation. It defines that the compensation to the government should be paid if the land that is registered with National Real Estate Cadaster information system as the forest area deforested. The compensation should be paid for:
decrease of carbon dioxide attraction potential (can be compensated with afforestation);
reduction of biological diversity;
decrease of quality of the environmental and natural resource protection zones and sanitary protection zone functions.
Forest-based Sector Development Guidelines (2014-2020) is a medium-term policy planning document. Guidelines consist of the forest-based sector development medium-term strategic goals, guidelines of policy development, directions of actions to achieve these goals, problems hindering achievement of these goals, and results in policies. Forest-based Sector Development Guidelines are the main document of growth and development of Latvian forestry sector. The development solutions included in this document give fundamental investment in achieving goals of other planning documents.

48
GREENHOUSE GAS INVENTORY INFORMATION
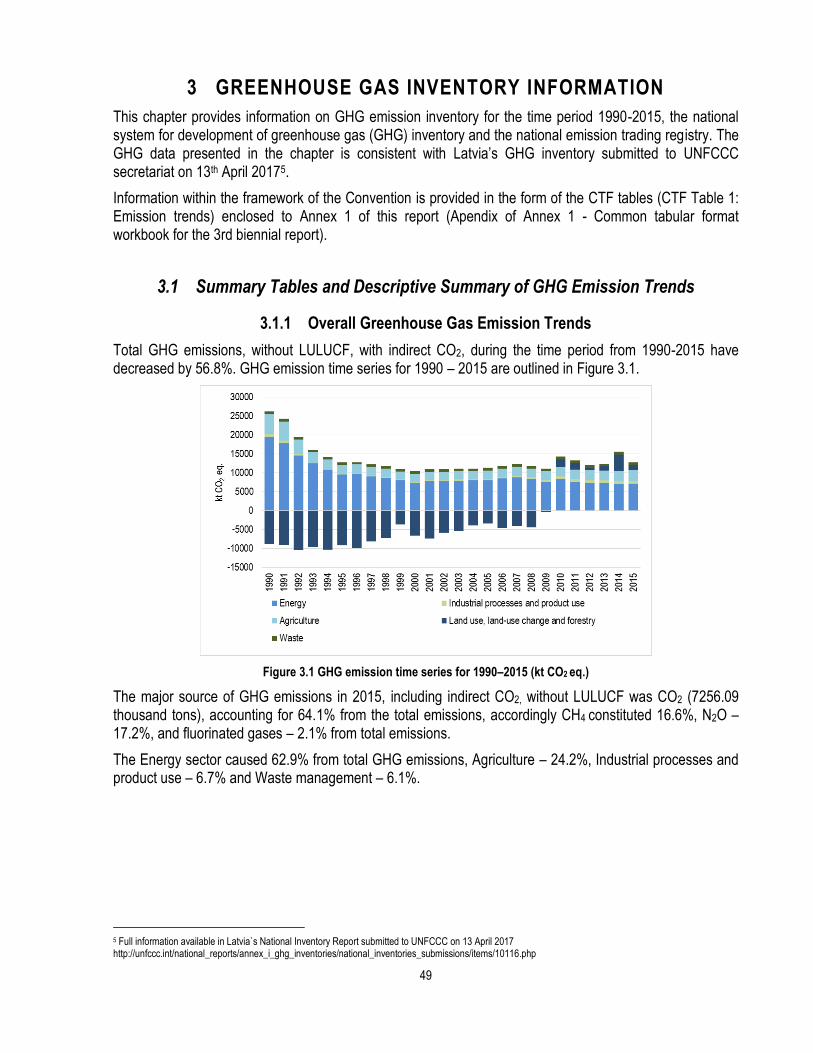
49
3 GREENHOUSE GAS INVENTORY INFORMATION
This chapter provides information on GHG emission inventory for the time period 1990-2015, the national system for development of greenhouse gas (GHG) inventory and the national emission trading registry. The GHG data presented in the chapter is consistent with Latvia’s GHG inventory submitted to UNFCCC secretariat on 13th April 20175.
Information within the framework of the Convention is provided in the form of the CTF tables (CTF Table 1: Emission trends) enclosed to Annex 1 of this report (Apendix of Annex 1 - Common tabular format workbook for the 3rd biennial report).
3.1 Summary Tables and Descriptive Summary of GHG Emission Trends
3.1.1 Overall Greenhouse Gas Emission Trends
Total GHG emissions, without LULUCF, with indirect CO2, during the time period from 1990-2015 have decreased by 56.8%. GHG emission time series for 1990 – 2015 are outlined in Figure 3.1.
Figure 3.1 GHG emission time series for 1990–2015 (kt CO2 eq.)
The major source of GHG emissions in 2015, including indirect CO2, without LULUCF was CO2 (7256.09 thousand tons), accounting for 64.1% from the total emissions, accordingly CH4 constituted 16.6%, N2O – 17.2%, and fluorinated gases – 2.1% from total emissions.
The Energy sector caused 62.9% from total GHG emissions, Agriculture – 24.2%, Industrial processes and product use – 6.7% and Waste management – 6.1%.
5 Full information available in Latvia`s National Inventory Report submitted to UNFCCC on 13 April 2017 http://unfccc.int/national_reports/annex_i_ghg_inventories/national_inventories_submissions/items/10116.php

50
Figure 3.2 GHG emissions relative to GDP, 2000 – 2015, excluding LULUCF
Since 2000 GHG emissions have increased relatively less than gross domestic product (GDP) in spite of large annual fluctuations. The relation GHG/GDP which characterizes GHG intensity of Latvia`s economy has decreased by 37%. Decreasing trend was observed till 2008 when it was stopped by economic recession. A fall of this indicator resumed after 2010.
The main sources of GHG emissions and CO2 removals in 1990 – 2015 are outlined in Table 3.1 and Table 3.2, whereas the amounts of emissions per sectors of national economy are provided in Table 3.3 and Table 3.4.
The Energy sector, including Transport, is the most significant source of GHG emissions with 62.9% share of the total emissions in the 2015. This reflects extensive consumption of energy for a long heating period, as well as energy consumption for transport that composes 44% (according to the latest submission) of emissions in the energy sector. There are not many energy- intensive manufacturing branches in Latvia. Energy-related CO2 emissions vary mainly according to the economic growth trend, the primary energy supply structure and climate conditions including the impact on hydropower production and electricity import. Overall, during the recent years, the emissions have a decreasing trend. Total emissions in Energy sector in 2015 decreased by 63.3% if compared to the base year. In all Energy sectors excluding Transport GHG emissions in 2015 are significantly lower compared to 1990. The largest part of Energy sector emissions comes from Transport sector (44.0%). Emissions from Transport increased by 6.1% compared to 2014 mainly due to increase of passenger kilometres by private cars (par 10%) and increased transported volume of goods (by 7.5%) compared to 2014. The second and third largest sources in Energy sector with 24.9% and 20.0% shares from Energy emissions, accordingly, are Energy industries and Other sectors (included commercial sector, households, combustion in agriculture, forestry, fisheries). In the recent years Manufacturing industries and Construction has a decreasing share in Energy emissions, reaching the lowest level since the base year in 2015 – only 9.5%. A small part of Energy emissions are produced by natural gas leakages from pipeline systems (1.4% in 2015) and military activities (0.1% in 2015).
Agriculture is the second significant source of GHG emissions, with approximately 24.2% of Latvia’s total GHG emissions excluding LULUCF in 2015. Emissions from agriculture include CH4, N2O emissions from enteric fermentation, manure management and agricultural soils and CO2 emissions from liming and urea application. GHG emissions increased in 2015 by 2.9% comparing to 2014 due to increase of sheep, goats,

51
poultry and rabbit numbers. Milk yield of dairy cows increased by 1.6%. Statistics also showed increase of synthetic N fertilizer consumption (+4.0%), sown area (+1.6%) and lime and urea application to soils (+5.3%, 31.4%). Also increase of emissions was promoted by increasing of liquid manure share in total manure management amount. In 2015, given in CO2 eq, the N2O contributed 64.0%, CH4 contributed 35.0% of total GHG emission from the agricultural sector, remaining 1.0% refer to CO2 emissions from liming and urea application. Nevertheless, the total emissions have reduced approximately by 49.0% since 1990 due to transition to market economy and subsequent decrease in agricultural production.
The emissions from Industrial Processes and Product Use (IPPU) (referred to as non-energy related ones), include CO2, CH4, N2O and F-gases (HFCs and SF6). The category constitutes 6.7% of the total GHG emissions excluding LULUCF in 2015. Compared to 1990 emissions from IPPU have increased by 7.9%, but compared to 2014 emissions decreased by 7.7% mainly due to decrease of emissions from cement production.
The largest decrease in IPPU emissions occurred between years 1991 and 1993, when industry was affected by a crisis. Emission fluctuations in product use sectors are also linked with the economic situation of the country. In the latest years emissions increased significantly due to the overall increase of activity in industrial production processes.
F-gases emissions from 2.F Product uses as substitutes for ozone depleting substances (ODS) constitute 2.0% from total GHG emissions including indirect CO2, excluding LULUCF in 2015. Emissions from HFC and SF6 have grown significantly since 1995. Compared to 2014 F-gases emissions increased by 10.7% due to the increase of activity data reported by F-gases importers and users.
In 2015 NMVOC emissions from Solvent Use sector have decreased by 0.3%, compared to 2014. Solvent Use sector was significant NMVOC emission source in Latvia and it covered 25.2% (10.38 kt) from the total Latvia’s NMVOC emissions in 2015.
Emissions from the Waste sector contribute 6.1% of total GHG emissions excluding LULUCF in 2015. Emissions from Waste include CH4 and N2O emissions from solid waste disposal, biological treatment of solid waste, incineration and open burning of waste as well as waste water treatment and discharge. Waste emissions have been fluctuating since 1990, but not in big range. In 2015, emissions were approximately 1.2% higher than in 1990, but compared to 2014 emissions decreased by 5.7% due to decrease of emissions from wastewater handling and increase of methane recovery in landfills.
Indirect CO2 emission sources in Latvia are NMVOC emissions from petrol evaporation in road transport – cars; CH4 and NMVOC emissions from natural gas leakages, as well as NMVOC emissions from gasoline distribution and they are reported separately under Energy sector in CRF Table 6. Together they constitute 16.7 kt CO2 eq. which is 0.1% from Latvia`s total GHG emissions without LULUCF, with indirect CO2 in 2015.
Net GHG emissions from LULUCF in 2015 were 1377.1 kt CO2 eq. Aggregated net removals of the GHG reduced by 116 % in 2015 in comparison to 1990 mostly due to the increase of harvest rate in mature forests (more than double), increase of natural mortality due to ageing of forest stands and reduction of increment in ageing forests. However considerable role in the increase of the GHG emissions has conversion of forest land to settlements, as well as conversion of naturally afforested lands to cropland and grassland. The land use conversion to cropland is associated mostly with removal of woody vegetation from naturally afforested farmlands abandoned in 1980s and 1990s. Although the increment of living biomass in forest land remaining forest and afforested land is still larger than the carbon losses due to commercial felling and natural mortality, the gap between gains and losses is decreasing, causing reduction of the net removals of CO2 in forest land. Hence the total growing stock of living biomass is still increasing in forest lands. Increase of the GHG emissions in 1999 is associated with significant increase of harvesting stock in

52
forest lands, but increase of the GHG emissions in 2014 is due to increase of the harvesting rate, higher mortality rate and slight reduction of increment of living biomass in forest lands according to the NFI data.
Reporting under Article 3, paragraphs 3 and 4, of the Kyoto Protocol. Under the Kyoto Protocol emissions and removals resulting from forestry activities in Article 3.3 (Afforestation, Reforestation and Deforestation activities) and Article 3.4 (Forest Management) are included in the reporting and accounting.
In 2015, net annual emissions from forest management, afforestation, reforestation and deforestation activities were -854.99 kt CO2 eq. Absolute decrease of the net annual CO2 removals in 2015 if compared to 1990 is 13 768.12 kt CO2 eq., mostly because of reduction of the net CO2 removals in living biomass due to forest management activities (by 14 458.00 kt CO2 eq. between 1990 and 2015). Removals of CO2 in living biomass is the most significant driver to have negative balance of the net GHG emissions during the reporting period. GHG emissions from soils, particularly, from organic soils are a key source of emissions. In 2015, net annual emissions from soils were 5 740.49 kt CO2 eq., mostly resulting from forest management activities accounted under Article 3.4 of the Kyoto Protocol (92.9% from total emissions from soils).
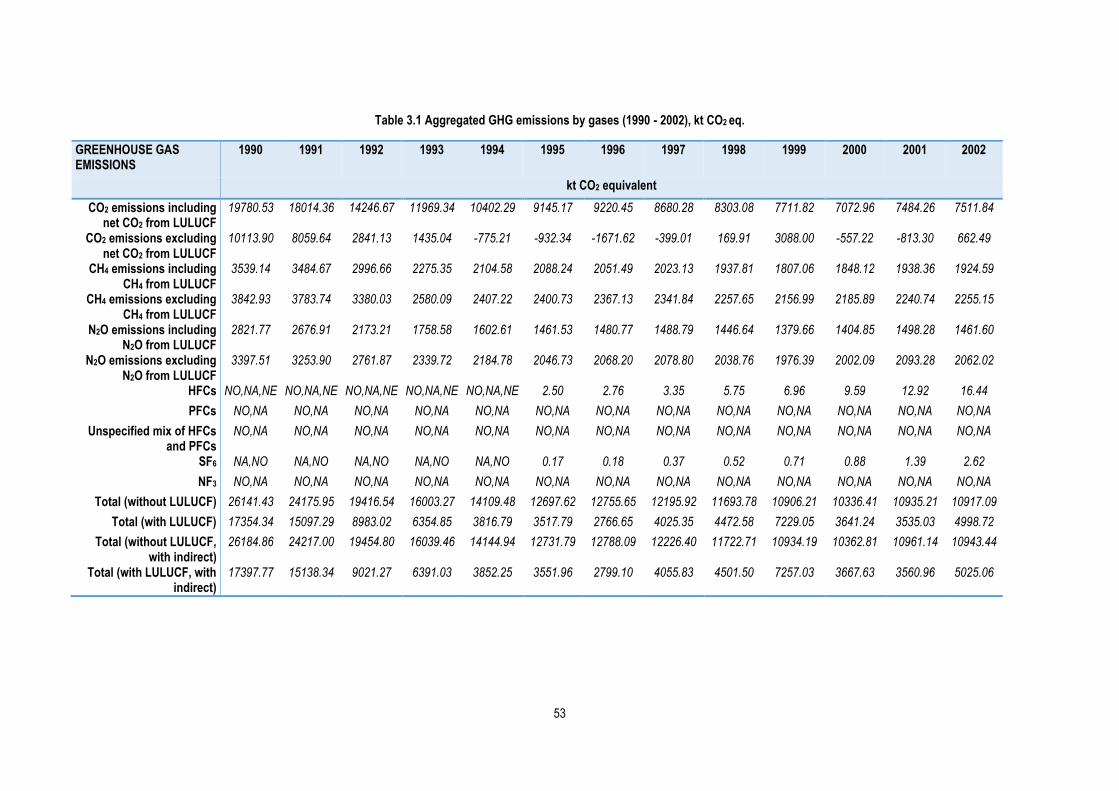
53
Table 3.1 Aggregated GHG emissions by gases (1990 - 2002), kt CO2 eq.
GREENHOUSE GAS EMISSIONS
1990 1991 1992 1993 1994 1995 1996 1997 1998 1999 2000 2001 2002
kt CO2 equivalent
CO2 emissions including net CO2 from LULUCF
19780.53 18014.36 14246.67 11969.34 10402.29 9145.17 9220.45 8680.28 8303.08 7711.82 7072.96 7484.26 7511.84
CO2 emissions excluding net CO2 from LULUCF
10113.90 8059.64 2841.13 1435.04 -775.21 -932.34 -1671.62 -399.01 169.91 3088.00 -557.22 -813.30 662.49
CH4 emissions including CH4 from LULUCF
3539.14 3484.67 2996.66 2275.35 2104.58 2088.24 2051.49 2023.13 1937.81 1807.06 1848.12 1938.36 1924.59
CH4 emissions excluding CH4 from LULUCF
3842.93 3783.74 3380.03 2580.09 2407.22 2400.73 2367.13 2341.84 2257.65 2156.99 2185.89 2240.74 2255.15
N2O emissions including N2O from LULUCF
2821.77 2676.91 2173.21 1758.58 1602.61 1461.53 1480.77 1488.79 1446.64 1379.66 1404.85 1498.28 1461.60
N2O emissions excluding N2O from LULUCF
3397.51 3253.90 2761.87 2339.72 2184.78 2046.73 2068.20 2078.80 2038.76 1976.39 2002.09 2093.28 2062.02
HFCs NO,NA,NE NO,NA,NE NO,NA,NE NO,NA,NE NO,NA,NE 2.50 2.76 3.35 5.75 6.96 9.59 12.92 16.44
PFCs NO,NA NO,NA NO,NA NO,NA NO,NA NO,NA NO,NA NO,NA NO,NA NO,NA NO,NA NO,NA NO,NA
Unspecified mix of HFCs and PFCs
NO,NA NO,NA NO,NA NO,NA NO,NA NO,NA NO,NA NO,NA NO,NA NO,NA NO,NA NO,NA NO,NA
SF6 NA,NO NA,NO NA,NO NA,NO NA,NO 0.17 0.18 0.37 0.52 0.71 0.88 1.39 2.62
NF3 NO,NA NO,NA NO,NA NO,NA NO,NA NO,NA NO,NA NO,NA NO,NA NO,NA NO,NA NO,NA NO,NA
Total (without LULUCF) 26141.43 24175.95 19416.54 16003.27 14109.48 12697.62 12755.65 12195.92 11693.78 10906.21 10336.41 10935.21 10917.09
Total (with LULUCF) 17354.34 15097.29 8983.02 6354.85 3816.79 3517.79 2766.65 4025.35 4472.58 7229.05 3641.24 3535.03 4998.72
Total (without LULUCF, with indirect)
26184.86 24217.00 19454.80 16039.46 14144.94 12731.79 12788.09 12226.40 11722.71 10934.19 10362.81 10961.14 10943.44
Total (with LULUCF, with indirect)
17397.77 15138.34 9021.27 6391.03 3852.25 3551.96 2799.10 4055.83 4501.50 7257.03 3667.63 3560.96 5025.06

54
Table 3.2 Aggregated GHG emissions by gases (2003 - 2015), kt CO2 eq.
GREENHOUSE GAS EMISSIONS 2003 2004 2005 2006 2007 2008 2009 2010 2011 2012 2013 2014 2015
Change from
1990 to latest
reported year (%)
kt CO2 equivalent
CO2 emissions including net CO2 from LULUCF
7706.77 7713.19 7790.92 8292.90 8610.90 8174.33 7438.76 8529.66 7799.31 7519.14 7350.38 7151.01 7239.36 -63.40
CO2 emissions excluding net CO2 from LULUCF
1374.89 2799.57 3439.09 2745.08 3707.93 2867.05 6168.00 9596.39 8597.88 7141.96 7388.80 10413.46 7535.34 -25.50
CH4 emissions including CH4 from LULUCF
1847.00 1822.43 1880.66 1857.38 1913.67 1871.00 1851.99 1836.19 1766.80 1849.78 1886.41 1956.93 1883.88 -46.77
CH4 emissions excluding CH4 from LULUCF
2156.05 2125.48 2160.54 2180.51 2193.20 2149.75 2152.00 2144.65 2088.33 2186.14 2240.46 2332.89 2256.72 -41.28
N2O emissions including N2O from LULUCF
1515.18 1506.99 1563.25 1574.14 1628.75 1619.07 1642.88 1674.21 1683.25 1773.61 1807.60 1867.87 1942.25 -31.17
N2O emissions excluding N2O from LULUCF
2115.07 2108.21 2163.11 2183.09 2232.19 2224.18 2268.73 2317.90 2345.30 2454.26 2507.13 2572.77 2650.58 -21.98
HFCs 20.27 36.06 52.06 86.61 112.51 132.10 142.38 155.01 175.99 181.18 197.21 205.63 227.06 100.00
PFCs NO,NA NO,NA NO,NA NO,NA NO,NA NO,NA NO,NA NO,NA NO,NA NO,NA NO,NA NA,NO NA,NO 0.00
Unspecified mix of HFCs and PFCs
NO,NA NO,NA NO,NA NO,NA NO,NA NO,NA NO,NA NO,NA NO,NA NO,NA NO,NA NA,NO NA,NO 0.00
SF6 2.76 3.25 3.78 4.07 4.55 5.23 7.33 7.35 7.47 7.78 8.50 8.58 10.12 100.00
NF3 NO,NA NO,NA NO,NA NO,NA NO,NA NO,NA NO,NA NO,NA NO,NA NO,NA NO,NA NA,NO NA,NO 0.00
Total (without LULUCF) 11091.98 11081.92 11290.67 11815.09 12270.39 11801.73 11083.34 12202.43 11432.81 11331.49 11250.11 11190.02 11302.67 -56.76
Total (with LULUCF) 5669.04 7072.58 7818.58 7199.35 8250.38 7378.31 10738.45 14221.31 13214.96 11971.32 12342.10 15533.33 12679.81 -26.94
Total (without LULUCF, with indirect)
11113.04 11102.24 11312.30 11831.54 12288.33 11818.95 11099.68 12218.08 11443.23 11343.80 11265.27 11210.22 11319.39 -56.77
Total (with LULUCF, with indirect)
5690.10 7092.89 7840.21 7215.80 8268.33 7395.53 10754.79 14236.96 13225.39 11983.63 12357.25 15553.53 12696.54 -27.02

55
Table 3.3 Aggregated GHG emissions by sectors (1990 - 2001), kt CO2 eq.
1990 1991 1992 1993 1994 1995 1996 1997 1998 1999 2000 2001 kt CO2 equivalent
1. Energy 19386.62 17862.27 14511.48 12405.30 10770.85 9499.55 9567.70 8991.97 8572.90 7932.00 7310.01 7731.21 2. IPPU 705.05 623.70 311.00 150.99 197.15 208.02 217.51 229.64 237.86 270.43 223.37 245.76 4. Agriculture 5370.68 4978.09 3918.39 2841.69 2546.43 2383.04 2355.35 2340.31 2236.78 2047.54 2081.38 2201.84 5. LULUCF -8787.09 -9078.66 -10433.52 -9648.42 -10292.69 -9179.82 -9988.99 -8170.57 -7221.21 -3677.16 -6695.18 -7400.18 6. Waste 679.09 711.88 675.67 605.29 595.05 607.00 615.09 634.01 646.25 656.24 721.66 756.41 7. Other NO NO NO NO NO NO NO NO NO NO NO NO Total emissions (including LULUCF)
17354.34 15097.29 8983.02 6354.85 3816.79 3517.79 2766.65 4025.35 4472.58 7229.05 3641.24 3535.03
Table 3.4 Aggregated GHG emissions by sectors (2002 - 2015), kt CO2 eq.
2002 2003 2004 2005 2006 2007 2008 2009 2010 2011 2012 2013 2014 2015
Change from 1990 to latest reported year
(%) kt CO2 equivalent
1. Energy 7734.19 7889.44 7916.18 8027.85 8458.55 8782.73 8327.93 7607.63 8404.69 7534.19 7217.40 7139.41 6974.24 7115.05 -63.30
2. IPPU 260.95 277.65 309.16 308.25 369.93 394.40 402.89 405.14 680.25 807.14 881.70 819.79 823.68 760.54 7.87
4. Agriculture 2183.59 2234.80 2168.01 2245.76 2253.68 2347.46 2325.77 2353.79 2376.00 2395.87 2506.49 2570.33 2663.32 2739.64 -48.99
5. LULUCF -5918.37 -5422.94 -4009.35 -3472.09 -4615.74 -4020.01 -4423.42 -344.89 2018.88 1782.15 639.83 1091.99 4343.32 1377.15 -115.67
6. Waste 738.36 690.08 688.57 708.80 732.93 745.79 745.14 716.78 741.48 695.61 725.91 720.59 728.77 687.44 1.23
7. Other NO NO NO NO NO NO NO NO NO NO NO NO NO NO 0.00
Total emissions (including LULUCF)
4998.72 5669.04 7072.58 7818.58 7199.35 8250.38 7378.31 10738.45 14221.31 13214.96 11971.32 12342.10 15533.33 12679.81 -26.94

56
3.1.2 Emission Trends by Gas
Further paragraphs provide detailed information on direct and indirect GHG emissions.
3.1.2.1 Carbon Dioxide Emissions and Removals
Carbon dioxide (CO2) is the main greenhouse gas causing climate change. In 2015, CO2 emissions constitute 64.1% of Latvia’s total greenhouse gas emissions. In 2015, total CO2 equivalent emissions without LULUCF had decreased by approximately 63.4% since 1990 (Figure 3.3).
Figure 3.3 CO2 emissions and removals 1990 – 2015 (kt)
The most important source of CO2 emissions (kt) in 2015 was fossil fuel combustion – 92.2%, including Energy Industries – 24.1%, Manufacturing Industries and Construction – 8.8%; Transport – 42.3%, Other sectors (Agriculture, Forestry, etc.) – 16.9%.
Outside the energy sector, the only major CO2 emissions come from Industrial Processes and Product Use – 7.2% (mainly from Mineral production), Agriculture 0.4% and Waste 0.002 %. Detailed distribution of CO2 emissions and removals and development in 1990-2015 is given in Figure 3.4.
Figure 3.4 CO2 emission development by sector 1990-2015 and CO2 emissions by sector in 2015
Taking into account that a large proportion of fuel resources utilised in stationary combustion equipment is used for heating of buildings, the relatively large fluctuations in the emissions from year to year are due to changes in heating degree days. In the last fifteen years, the coldest was 2010, and the emissions rose by 11.5% compared to the previous year. The increasing use of RES in heating and electricity production is a factor that has been determining the trend of reducing CO2 emissions over the last 5 years.

57
3.1.2.2 Methane Emissions
Methane (CH4) emissions without and with CH4 from LULUCF had decreased by accordingly 46.8% and 41.3% in 2015 comparing to 1990 (see Figure 3.5).
Main sources of CH4 emissions in Latvia are Enteric Fermentation of Livestock, Solid Waste Disposal Sites and Energy sector. Other important sources of CH4 emissions are leakage from natural gas pipeline systems and combustion of biomass. CH4 emissions in 2015 contribute approximately 16.6% of total GHG emissions (excluding LULUCF, including indirect CO2). The methane emissions (kt) decreased by 46.8% in 2015 since 1990.
Figure 3.5 CH4 emissions 1990 – 2015 (kt)
Detailed distribution of CH4 emissions and emission development in 1990-2015 is given in Figure 3.6.
Figure 3.6 CH4 emission development by sector 1990-2015 and CH4 emissions by sector in 2015
3.1.2.3 Nitrous Oxide Emissions
Nitrous oxide (N2O) emissions without and with N2O from LULUCF had decreased by accordingly 31.2% and 22.0% in 2015 comparing to 1990 (see Figure 3.7).

58
Figure 3.7 N2O emissions 1990 – 2015 (kt)
Agricultural soils are the main source of N2O emissions in Latvia generating 85.3% of all N2O emissions (kt) in 2015. Other N2O emission sources are Energy sector - transport and biomass, combustion of liquid and other solid fuels in sectors of energy conversion and industry, waste and sewage. Since 1990, total N2O emissions had decreased by 31.2% in 2015, mainly due the decrease in the emissions from agriculture.
Detailed distribution of N2O emissions and emission development in 1990-2015 is given in Figure 3.8.
Figure 3.8 N2O emission development by sector 1990-2015 and N2O emissions by sector in 2015
3.1.2.4 Hydrofluorocarbons and Sulphur Hexafluoride Emissions
Emissions for the following hydrofluorocarbons (fluorinated greenhouse gases) are estimated in Latvia: HFC–23, HFC–32, HFC–125, HFC–134a, HFC–143a, HFC–152a, HFC-245fa, HFC-365mfc, HFC–227ea and SF6. The base year for F-gas reporting under Kyoto Protocol is 1995.
The most consumed gas is HFC-134a, applied in stationary freezing devices and air conditioning equipment. Although the amount of fluorinated gases and the emissions caused by commercial use and industrial processes are rather small, the meaning of the said cannot be underestimated in the light of the GHG Global Warming Potential.
Emissions from HFCs and Sulphur hexafluoride (SF6) consumption are reported for the period 1995-2015. Since 1995 HFC emissions have increased very significantly due to substitution of ozone depleting substances in refrigeration and air conditioning as well as due to increase of cars, trucks and

59
busses equipped with mobile air conditioners. In 2015 the total F-gas emissions have also increased by 10.7% compared with 2014 (see Figure 3.9). Emissions of the PFCs and NF3 does not occur (NO) in Latvia for all time series.
Figure 3.9 Development in HFC and SF6 emissions in 1995-2015
3.1.3 Information on Indirect Greenhouse Gas Emissions
Emissions from indirect GHGs are presented in Table 3.5.
Table 3.5 Indirect GHG emissions 1990-2015 (kt)
NOx CO NMVOC SO2 kt
1990 92.84 387.03 81.99 100.45 1991 85.36 354.36 76.98 81.68 1992 70.47 372.83 70.66 69.79 1993 61.55 336.67 65.60 65.74 1994 56.32 319.72 62.76 66.71 1995 51.81 294.75 60.82 49.39 1996 51.60 300.28 60.25 55.67 1997 49.79 271.71 57.14 43.96 1998 46.16 253.92 54.31 39.84 1999 44.76 253.59 52.16 31.95 2000 44.05 239.35 51.11 17.56 2001 46.87 239.25 53.70 14.10 2002 45.74 240.64 52.14 12.77 2003 47.34 230.15 50.89 11.32 2004 46.52 221.72 50.21 9.26 2005 44.92 202.54 48.83 8.44 2006 45.76 218.80 47.32 8.06 2007 45.49 185.80 46.56 7.87 2008 41.77 173.34 42.02 6.59 2009 39.27 185.13 42.67 6.41 2010 41.92 148.00 41.14 4.32 2011 36.04 151.98 40.06 4.29 2012 36.18 156.32 42.73 4.42 2013 35.99 142.65 41.64 3.91 2014 36.02 139.20 41.74 3.87 2015 36.21 133.03 41.15 3.76
In the period from 1990 to 2015 indirect GHG emissions decreased: NOx by 61%, CO by 66%, NMVOC by 50% and SO2 by 96%.

60
Starting from 2001, slight fluctuations in NOx, NMVOC and CO emissions can be observed as a reason of increasing firewood consumption in Residential sector as well as fuel consumption in Transport sector in particular years. SO2 emissions have decreased significantly because of fuel switch and approved legislation.
Figure 3.10 Indirect GHG emission by sector in 2015 (% of total indirect GHG emissions in sector)
In 2015, the most important sector producing indirect GHGs (including LULUCF) was Energy sector (including fugitive emissions) (Figure 3.10). Fuel combustion in Energy sector causes the largest part of NOx emissions (83.0% from total NOx emissions in 2015), but IPPU and Agriculture sectors make 5.2% and 11.5%, accordingly. Very small part of NOx emissions is produced in LULUCF sector (0.3% from total NOx emissions).
Almost all CO emissions (93.5%) appear in Energy sector, mainly from fuel combustion in Residential and Commercial/Institutional subsectors (72.7% from all CO emissions). A small part of CO emissions come from LULUCF sector (5.3%) and Industrial processes and product use (IPPU) sector (1.2%).
The major part of SO2 emissions (94.9%) comes from Energy sector (fuel combustion), but the other sulphur dioxide emissions come from IPPU (Cement production and Iron and Steel production), and a negligible part of SO2 comes also from Waste sector (Waste incineration).
The largest amounts of NMVOC emissions are produced in Energy sector (51.3%; fuel combustion mainly in Residential sector) and 28.5% from total NMVOC emissions in 2015 are produced in IPPU sector, mainly from solvent use. 18.3% of NMVOC emissions are produced in Agriculture sector, but the remaining 1.9% in Waste sector.
In Agriculture sector, CO and SO2 emissions, and in LULUCF sector, NMVOC and SO2 emissions do not appear.
3.1.4 Accuracy/Uncertainty of the Data
The uncertainty estimates of the 2017 submission have been done according to the Approach 1 method presented in 2006 IPCC Guidelines. The Approach 1 is based on emission estimates and uncertainty coefficients for activity data and emission factors. The mandatory, detailed reporting tables of the uncertainty analysis (Table 3.3 of volume 1 of the 2006 IPCC Guidelines with and without LULUCF) are provided in Annex 2 of Latvia`s National Inventory Report submitted to the UNFCCC secretariat on 13 April 2017.
The uncertainty analysis was done for all sectors: Energy, IPPU, Agriculture, Waste and LULUCF. Uncertainties are estimated for direct greenhouse gases, e.g. CO2, CH4, N2O and F-gases only.

61
The uncertainty calculation is based on Excel file, which is sent to sectoral experts for updating annually. Responsible experts are requested to go through uncertainties and make updates if necessary. When information is received by experts, the inventory compiler summarizes all the uncertainties and does the uncertainty analysis. For each source, the combined uncertainty for activity data and emission factors was estimated and given in per cent.
Detailed descriptions of uncertainty assessment are included in Latvia`s National Inventory Report submitted to the UNFCCC secretariat on 13 April 2017 in the chapters of each sub sector.
3.1.5 Changes since the Sixth National Communication Report
After publication of the Sixth National Communication report of the Republic of Latvia improvements affecting the emission time series were introduced in the GHG inventory mainly due to changes in IPCC guidelines versions (since 2015 2006 IPCC Guidelines are mandatory), methodological changes, activity data improvement and emission factor changes in all sectors.
The explanations of the last calculations are included in the Latvia`s National Inventory Report submitted to the UNFCCC secretariat on 13 April 2017. The main changes are outlined in Table 3.6.
Table 3.6 Main changes in the Seventh National Communication report compared to the Sixth National Communication report
Sector Changes in NC7 compared to NC6
Energy Updated emission factors and changed oxidation factors in 2006 IPCC Guidelines for almost every type of fuel, as well as changed GWPs which influenced emissions expressed in CO2 eq. National emission factors for residential sectors are also applied.
Changes in activity data due to updates by Central Statistical Bureau (CSB) and, after a suggestion from 3rd party expert it was decided to use Energy Balance data with a precision of 1 TJ instead of Annual Questionnaires where the precision was 1 kt.
Transport Updated emission factors and changed oxidation factors in 2006 IPCC Guidelines for almost every type of fuel, as well as changed GWPs which influenced emissions expressed in CO2 eq. National specific CO2 emission factor for gasoline have been updated and applied.
Changes in activity data due to updates of energy balance by CSB.
IPPU According to 2006 IPCC Guidelines the new sector IPPU (Industrial Processes and Product Use) was formed from previous “Industrial Processes” in 1996 IPCC Guidelines and former “Solvent and Other Product Use” sector. Additionally new source category Non-Energy Products from Fuels and Solvent Use (2D) was introduced in the Latvia`s GHG inventory.
Due to switching of guidelines as well as according to review recommendations emissions were recalculated in mainly all sectors.
Emissions from F-gases were fully recalculated according to latest activity data gained from F-gas research conducted in 2016 within the project of EEA Financial Mechanism 2009-2014 Programme.
Agriculture Significant improvements are done in the agriculture sector mainly by implementation of results of pre-defined project “Development of the National System for Greenhouse Gas Inventory and Reporting on Policies, Measures and Projections” under 2009 – 2014 EEA Grants Programme National Climate Policy in calculation. Emissions are calculated on the implementation of a new methodology to determine manure management (including pasture period) and feeding situation

62
Sector Changes in NC7 compared to NC6
distribution for all livestock. Most of nitrogen excretion values are changed due to the availability of national research results. Other improvements refer to implementation of country specific value of FracLEACH-(H) or N losses by leaching/runoff and updated values of N in sewage sludge, digestate and animal manure applied to soils.
LULUCF Significant improvements are done in the LULUCF sector mainly by implementation of 2006 IPCC Guidelines, IPCC Wetlands Supplement (2013) and IPCC KP Supplement (2013) in calculation. Furthermore significant changes are related to the improvement of activity data (for instance, replacement of extrapolated land use change data with actual NFI data, updated country specific information on annual increment, mortality and harvesting stock, etc.) and implementation of new county specific factors (for instance, biomass expansion factors and carbon content in wood).
Waste New estimations about waste disposed and composted amounts were done. Changes were implemented on the basis of research about Latvia`s landfills and composting in households. For CH4 emissions calculations IPCC Waste Model (2006) was used. Two calculations were done separately – one for managed waste polygons, other for unmanaged landfills. CH4 and N2O emissions from home composting were included in the inventory.
Number of national population, not served by urban waste water collecting system, divided into users of septic tanks and latrines. The number of latrine users also harmonized between GHG and NEC/CLRTAP inventories.
Improved methodology on estimation of emissions of CH4 from sewage sludge, establishing threshold to distinct aerobic and anaerobic sludge.
Implemented estimation of Nitrogen removed with sludge in the calculation of N2O emissions from human sewage.
Factors for estimation of co-discharged degradable organic carbon and not-consumed protein added in the according calculations.
Implemented estimation of N2O emissions from modern, centralized treatment plants.
Implemented use of activity data on annual protein consumption.
3.2 National System
3.2.1 Institutional Arrangements
The national inventory arrangements are described below. The description is prepared according to requirements for reporting on national inventory systems under the Kyoto Protocol, European Union Monitoring Mechanism Regulation (EU MMR) 6 and UNFCCC reporting guidelines (Decision No 24/CP.197 of the Conference of Parties).
Latvian national GHG inventory system is designed and operated according to the Kyoto Protocol to ensure the transparency, consistency, comparability, completeness and accuracy of inventory.
6 Regulation (EU) No 525/2013 of the European Parliament and the Council of 21 May 2013 on a mechanism for monitoring and reporting greenhouse gas emissions and for reporting other information at national and Union level relevant to climate change and repealing Decision No 280/2004/EC, available at http://eur-lex.europa.eu/legal-content/EN/TXT/PDF/?uri=CELEX:32013R0525&from=LV 7Decision No 24/CP.19 of the Conference of Parties, avaliable at http://unfccc.int/resource/docs/2013/cop19/eng/10a03.pdf

63
Inventory activities include planning, preparation and management. The inventory phases are:
collecting activity data;
selecting methods and emission factors appropriately;
estimating anthropogenic GHG emissions by sources and removals by sinks;
implementing uncertainty assessment;
implementing QA/QC activities.
A schematic model for the national system (NIS) according to the Cabinet of Ministers of Republic of Latvia Regulation No.737 (12.12.2017) is shown in
Figure 3.11.

64
Figure 3.11 The structure of Latvia`s GHG Inventory System
65
MEPRD Climate Change Department is responsible for:
Preparation of legal basis for maintaining the National System;
Informing the inventory compilers about requirements of the national system;
Overall coordination of GHG inventory process;
Final checking and approving of the GHG inventory before official submission to the European Commission and the UNFCCC secretariat;
Formal agreements with inventory experts and for third party experts that evaluate quality assurance process;
Coordinating the work between the involved institutions, experts, European Commission and the UNFCCC (including coordination of UNFCCC inventory reviews);
Timely submission of GHG inventory to the UNFCCC secretariat and European Commission;
Keeping of archive of official submissions to the UNFCCC and European Commission.
LEGMC is a governmental limited liability company and is responsible for:
Activity data collection for Energy, IPPU and Waste sectors (activity data are mainly collected from other institutions and LEGMC (Air and Climate division, Chemicals and Hazardous Waste division, Inland Waters division) use them to calculate emissions);
Preparation of the emissions estimates for the Energy, IPPU and Waste sectors;
Preparation of QC procedures for relevant categories and documentation and archiving of used materials for emission calculation;
LEGMC Air and Climate Division compiles the final NIR using information from all involved institutions as well as summarizes emission data in CRF Reporter;
Quality manager from LEGMC Air and Climate division performs the overall QC/QA procedures for all sectors according to the QA/QC plan;
LEGMC is the National Emissions Trading Authority in Latvia and prepares relevant information for GHG inventory from registry – on emission reduction units, certified emission reductions, temporary certified emission reductions, long term certified emission reductions and assigned amount units for annual inventory submissions in accordance with guidelines for preparation of information under Article 7 of the Kyoto Protocol (Standard Electronic Format (SEF) tables).
Calculation of emissions and removals from the LULUCF, KP-LULUCF sector were done by Latvian State Forest Research Institute "Silava" in collaboration with MoA. Latvian State Forest Research Institute (LSFRI) "Silava" is responsible for activity data collection, estimation of emissions/removals, preparation of QC procedures as well as documentation and archiving of used materials for calculations.
Institute of Physical Energetic (IPE) calculates emissions from Transport sector. IPE is responsible for activity data collection, emission estimation from Transport, preparation of QC procedures as well as documentation and archiving of used materials for calculations.
Emission calculations from Agriculture sector were done by Latvia University of Agriculture in collaboration with MoA. Latvia University of Agriculture is responsible for collecting of necessary activity data cooperating with Central Statistical Bureau (CSB), preparation of the emission estimates, preparation of QC procedures as well as documentation and archiving of used materials for calculations.
The main data supplier for the Latvian GHG inventory is the CSB.

66
For ensuring the continuity of the functions of the national system, the delegation contracts are signed between the MEPRD, LEGMC, LSFRI "Silava", IPE and Latvia University of Agriculture.
Before final GHG inventory was submitted to the European Commission and UNFCCC secretariat draft inventory submission was sent to the involved Latvia’s ministries for comments and approving. Based on received comments inventory was corrected accordingly.
Several sectoral meetings were held before and during preparation of inventory report to discuss and agree on methodological issues, problems that have arisen and improvements that need to be implemented. There were discussions on the different problems that came up during the last inventory preparation to find solutions on how to improve the overall system.
3.2.2 Quality Assurance/Quality Control Procedures
QA/QC procedures are an important component in the development of GHG emission inventory preparation. The basic aim of the QA/QC process is to ensure the quality of the inventory and to contribute to the improvement of the inventory. Improving the submission during QA/QC process, the main findings and conclusions concerning the inventory quality and improvements needs to be considered and communicated into Latvia`s GHG inventory system for making decisions concerning the annual inventory process and next inventory preparation.
According to Cabinet of Ministers Regulation No.737 (12.12.2017) all institutions involved in inventory process are responsible for implementing QC procedures.
The Cabinet of Ministers Regulation No.737 determines:
the quality objectives for GHG inventory;
tasks and responsibilities of involved institutions;
QA/QC time schedule;
QA/QC plan prepared to improve transparency, comparability, and completeness of GHG inventory. In the QA/QC plan quality control procedures to be used before and during the compilation of GHG inventory are described;
check-lists and procedure descriptions for experts and independent experts for quality assurance of the GHG inventory;
background for inventory improvement plan preparation activities.
The general and category-specific QC procedures are performed by sectoral experts during inventory calculation and compilation according to the QA/QC and verification plan. MEPRD as national entity is responsible for overall QC procedures and quality assurance of national system, including UNFCCC and EU reviews.
The outcomes of the QA/QC process results in a reassessment of inventory or source category uncertainty estimates. For example, if data quality is found to be lower than previously thought and this situation cannot be rectified in the timeframe of the current inventory, the uncertainty estimates are re-evaluated. Increased effort on QC results in improved emissions estimates and reduced uncertainties.
QC system includes various activities set to ensure transparent data flow through all inventory process:
Assumptions and criteria for the selection of activity data and emission factors are documented;
Transcription errors in data input and references;
Correctness of calculations of emissions;
Correctness of emission parameters, units, conversion factors;
Correctness in use of notation keys (the use of the notation keys “NE” and “IE” is explained transparently in the NIR and CRF table 9);

67
Integrity of database files;
Consistency in data between source categories.
The QC procedures comply with the 2006 IPCC Guidelines. General inventory QC checks include routine checks of the integrity, correctness and completeness of data, identification of errors and deficiencies and documentation and archiving of inventory data and quality control actions.
For submission 2017, QC activities were carried out at the various stages of the inventory compilation process - processing, handling, documenting, cross checking, and recalculations. These activities are implemented by sectoral experts and quality manager in LEGMC who is responsible for QC procedures before inventory submission for overall QC procedures and final approving in MEPRD.
Quality Assurance (QA) activities include a planned system of review procedures conducted by personnel not directly involved in the inventory compilation/development process. According to Regulation No. 737 MEPRD is responsible for ensuring QA procedures for GHG inventory.
The QA reviews are performed after the implementation of QC procedures to the finalised inventory. The inventory QA system comprises reviews to assess the quality of the inventory.
A basic review of the draft GHG emission and removal estimates and the draft report takes place before the final submissions to the EU and UNFCCC (January to March) by the involved institutions on GHG inventory preparation process.
Improvements for GHG inventory are compiled based on the findings of the UNFCCC, European Commission, internal reviews and recommendations from third party experts (periodically all sectors are revised by third party experts).
The centralized archiving system (common FTP folder) is created where experts have to upload and download all necessary information for inventory preparation, inter alia spreadsheets which need to be filled for quality control and quality assurance. Instruction for experts how to prepare NIR to ensure comparability of NIR and CRF is prepared and available to experts. Moreover to ensure the continuity, instructions for sector specific emission calculation and description preparation are prepared and available in centralized archiving system.
More detailed information on the applied quality control procedures is provided in section 1.2.3 of the Latvia`s National Inventory Report submitted to the UNFCCC secretariat in April 13, 2017.
3.2.3 The Inventory Methodology and Data
Latvia’s GHG emissions inventory is based on:
2006 IPCC Guidelines;
2013 Supplement to the 2006 IPCC Guidelines for National Greenhouse Gas Inventories: Wetlands (IPCC Wetlands Supplement);
2013 Revised Supplementary Methods and Good Practice Guidance Arising from the Kyoto Protocol (IPCC KP Supplement);
EMEP/CORINAIR Guidebook 2007 and EMEP/EEA 2009;
EMEP/EEA air pollutant emission inventory guidebook 2013;
EMEP/EEA air pollutant emission inventory guidebook 2016.
The main sources for emission factors are guidelines mentioned above as well as national studies for country specific parameters and emission factors (e.g. CO2 emission factors, aspects influencing SO2 emission factors, distribution of animal waste management systems, average N excretion etc.). Activity data sources are listed in Table 3.7. The availability of activity data is ensured through Cabinet of Ministers Regulation No. 737.

68
Table 3.7 Activity data sources for GHG inventory preparation
Sector Activity Data sources
Energy CSB Energy Balance; IEA/ OECD – EUROSTAT – UNECE Annual questionnaires; LEGMC “2-AIR” database; Researches of experts
Transport CSB Energy Balance; IEA/AIE – EUROSTAT – UNECE Annual questionnaires; Data of Road Traffic safety Directorate; Research of experts
IPPU National production and sales statistics; Direct information from enterprises operating with pollutants; CSB; Chemicals Register; Assumptions by experts; State Agency of Medicines; Researches by experts; LEGMC “2-AIR” database
Agriculture National agricultural statistics obtained from CSB; National studies
LULUCF; LULUCF KP
National forest monitoring program State forest service MoA CSB State Firefighting & Rescue Service
National studies and expert judgment Waste Latvian Environment, Geology and Meteorology Centre “3-Waste” and “2-Water” databases;
Methane recovery installations; CSB
The process for selecting emission factors and methodology for development of emission estimates as well as the process for recalculating previously submitted inventory data and the procedure for the official consideration and approval of the inventory are available in Latvia`s National Inventory Report submitted to the UNFCCC secretariat on 13 April 2017 under Chapters 1.2-1.4 or relevant sectoral chapters.
3.2.4 Key Category Analysis
The identification of key categories is described in the 2006 IPCC Guidelines Chapter 4: Methodological Choice and Identification of Key Categories.
Key categories are the emissions/removals, which have a significant influence on the total inventory in terms of the absolute level of emissions and the trend of emissions or both. Level Assessment identifies source category whose level has a significant effect on total national emissions. Trend Assessment identifies sources that are the key because of their contribution to the total trend of national emissions.
It is important to identify key categories so that the resources available for inventory preparation may be prioritized and the best possible estimates are prepared for the most significant source categories.
IPCC methodologies offer two different methods for identifying key categories: Approach 1 and Approach 2. In the Approach 1 method, the emission sources are sorted according to their contribution to emission level or trend. In the Approach 2 method, the relative uncertainties of the source categories are also taken into account. The key categories are the emission categories, which represent together 95% of the inventory uncertainty if using level and trend assessment and 90% of the total value of the total trend assessment with uncertainty.

69
For 2017 submission both approaches are used to identify key categories for time period 1990-2015. The identification was divided in two parts, key categories excluding LULUCF and key categories including LULUCF source categories. The starting point for the choice of source categories with LULUCF is the list presented in the 2006 IPCC Guidelines, Chapter 4 Methodological Choice and Identification of Key Categories, Table 4.1. The base year for CO2, CH4, and N2O greenhouse gas emissions was 1990.
Summary of key categories is shown in Table 3.8. Key categories are identified by Approach 1 and Approach 2 (level and trend) in order to provide additional insight into the reasons why particular categories are key.
Table 3.8 Key categories in 2017 submission
IPCC category/Group Gas Identification criteria
with LULUCF
without LULUCF
1.A.1.a Public Electricity and Heat Production - Gaseous Fuels
CO2 L1,L2,T1,T2 X X
1.A.1.a Public Electricity and Heat Production - Liquid Fuels
CO2 T1,T2 X X
1.A.1.a Public Electricity and Heat Production - Peat CO2 T1,T2 X X
1.A.1.a Public Electricity and Heat Production - Solid Fuels
CO2 T1,T2 X X
1.A.1.a Public Electricity and Heat Production - Biomass Fuels
N2O T2 X
1.A.1.c Manufacture of Solid Fuels and Other Energy Industries - Gaseous Fuels
CO2 L1 X
1.A.1.c Manufacture of Solid Fuels and Other Energy Industries - Peat
CO2 T1 X
1.A.2.a Iron and Steel - Gaseous Fuels CO2 T1 X X
1.A.2.a Iron and Steel - Liquid Fuels CO2 T1 X X
1.A.2.a Iron and Steel - Other fossil fuels CO2 T1 X
1.A.2.c Chemicals - Liquid Fuels CO2 T1,T2 X X
1.A.2.d. Pulp, Paper and Print - Gaseous Fuels CO2 T1 X X
1.A.2.e Food Processing, Beverages and Tobacco - Gaseous Fuels
CO2 L1 X X
1.A.2.e Food Processing, Beverages and Tobacco - Liquid Fuels
CO2 T1,T2 X X
1.A.2.e Food Processing, Beverages and Tobacco - Solid Fuels
CO2 T1,T2 X X
1.A.2.f Non-metallic Minerals - Other Fossil Fuels CO2 L1 X X
1.A.2.f Non-metallic Minerals - Gaseous Fuels CO2 L1,T1,T1 X X
1.A.2.f Non-metallic Minerals - Liquid Fuels CO2 T1,T2 X X
1.A.2.f Non-metallic Minerals - Solid Fuels CO2 L1,L2,T1,T2 X X
1.A.3.b Road Transportation - Diesel Oil CO2 L1,L2,T1,T2 X X
1.A.3.b Road Transportation - Diesel Oil N2O L2,T1,T2 X
1.A.3.b Road Transportation - Gasoline CO2 L1,L2,T1 X X
1.A.3.b Road Transportation - LPG CO2 L1,T1,T2 X X
1.A.3.c Railways - Liquid Fuels CO2 L1,T1 X X
1.A.3.c Railways - Liquid Fuels N2O L1,L2 X
1.A.4.a Commercial/Institutional - Gaseous Fuels CO2 L1,L2,T1 X X
1.A.4.a Commercial/Institutional - Liquid Fuels CO2 L1,L2,T1,T2 X X
1.A.4.a Commercial/Institutional - Solid Fuels CO2 L1,T1,T2 X X
1.A.4.a Commercial/Institutional - Biomass Fuels CH4 L1,L2,T2 X
1.A.4.a Commercial/Institutional - Peat CO2 T1 X
1.A.4.b Residential - Biomass Fuels CH4 L1,L2,T1,T2 X X
1.A.4.b Residential - Gaseous Fuels CO2 L1,L2,T1 X X
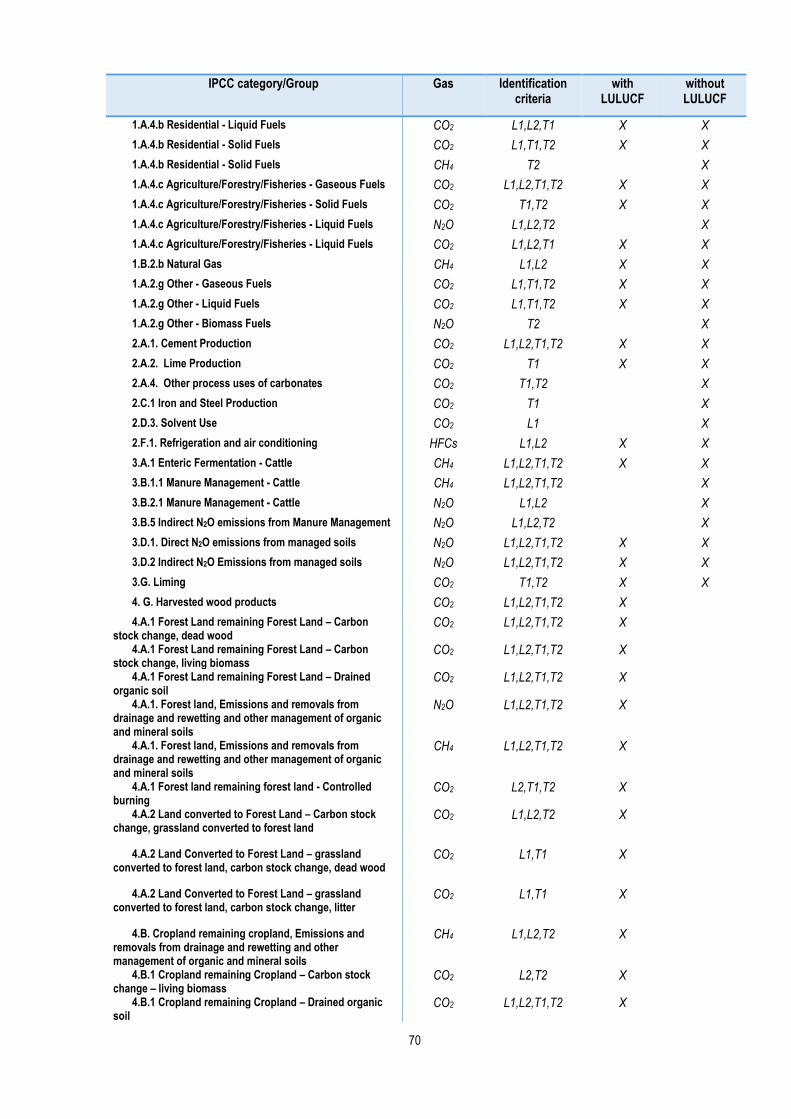
70
IPCC category/Group Gas Identification criteria
with LULUCF
without LULUCF
1.A.4.b Residential - Liquid Fuels CO2 L1,L2,T1 X X
1.A.4.b Residential - Solid Fuels CO2 L1,T1,T2 X X
1.A.4.b Residential - Solid Fuels CH4 T2 X
1.A.4.c Agriculture/Forestry/Fisheries - Gaseous Fuels CO2 L1,L2,T1,T2 X X
1.A.4.c Agriculture/Forestry/Fisheries - Solid Fuels CO2 T1,T2 X X
1.A.4.c Agriculture/Forestry/Fisheries - Liquid Fuels N2O L1,L2,T2 X
1.A.4.c Agriculture/Forestry/Fisheries - Liquid Fuels CO2 L1,L2,T1 X X
1.B.2.b Natural Gas CH4 L1,L2 X X
1.A.2.g Other - Gaseous Fuels CO2 L1,T1,T2 X X
1.A.2.g Other - Liquid Fuels CO2 L1,T1,T2 X X
1.A.2.g Other - Biomass Fuels N2O T2 X
2.A.1. Cement Production CO2 L1,L2,T1,T2 X X
2.A.2. Lime Production CO2 T1 X X
2.A.4. Other process uses of carbonates CO2 T1,T2 X
2.C.1 Iron and Steel Production CO2 T1 X
2.D.3. Solvent Use CO2 L1 X
2.F.1. Refrigeration and air conditioning HFCs L1,L2 X X
3.A.1 Enteric Fermentation - Cattle CH4 L1,L2,T1,T2 X X
3.B.1.1 Manure Management - Cattle CH4 L1,L2,T1,T2 X
3.B.2.1 Manure Management - Cattle N2O L1,L2 X
3.B.5 Indirect N2O emissions from Manure Management N2O L1,L2,T2 X
3.D.1. Direct N2O emissions from managed soils N2O L1,L2,T1,T2 X X
3.D.2 Indirect N2O Emissions from managed soils N2O L1,L2,T1,T2 X X
3.G. Liming CO2 T1,T2 X X
4. G. Harvested wood products CO2 L1,L2,T1,T2 X
4.A.1 Forest Land remaining Forest Land – Carbon stock change, dead wood
CO2 L1,L2,T1,T2 X
4.A.1 Forest Land remaining Forest Land – Carbon stock change, living biomass
CO2 L1,L2,T1,T2 X
4.A.1 Forest Land remaining Forest Land – Drained organic soil
CO2 L1,L2,T1,T2 X
4.A.1. Forest land, Emissions and removals from drainage and rewetting and other management of organic and mineral soils
N2O L1,L2,T1,T2 X
4.A.1. Forest land, Emissions and removals from drainage and rewetting and other management of organic and mineral soils
CH4 L1,L2,T1,T2 X
4.A.1 Forest land remaining forest land - Controlled burning
CO2 L2,T1,T2 X
4.A.2 Land converted to Forest Land – Carbon stock change, grassland converted to forest land
CO2 L1,L2,T2 X
4.A.2 Land Converted to Forest Land – grassland converted to forest land, carbon stock change, dead wood
CO2 L1,T1 X
4.A.2 Land Converted to Forest Land – grassland converted to forest land, carbon stock change, litter
CO2 L1,T1 X
4.B. Cropland remaining cropland, Emissions and removals from drainage and rewetting and other management of organic and mineral soils
CH4 L1,L2,T2 X
4.B.1 Cropland remaining Cropland – Carbon stock change – living biomass
CO2 L2,T2 X
4.B.1 Cropland remaining Cropland – Drained organic soil
CO2 L1,L2,T1,T2 X

71
IPCC category/Group Gas Identification criteria
with LULUCF
without LULUCF
4.B.1 Land converted to Cropland – Carbon stock change – dead organic matter
CO2 T2 x
4.B.2 Land converted to Cropland – Carbon stock change, forest land converted to cropland
CO2 L1,L2,T1,T2 X
4.B.2 Land converted to Cropland – Drained organic soil CO2 L1,L2,T1,T2 X
4.C. Grassland, Emissions and removals from drainage and rewetting and other management of organic and mineral soils
CH4 L2 X
4.C.1 Grassland remaining Grassland – Carbon stock change – living biomass
CO2 T2 X
4.C.1 Grassland remaining Grassland – Drained organic soil
CO2 L1,L2 X
4.C.2 Land converted to Grassland – Drained organic soil
CO2 L1,L2,T1,T2 X
4.C.2 Land converted to Grassland –Mineral soil CO2 L1,L2,T1,T2 X
4.D.1 Wetlands remaining Wetlands – Carbon stock change – living biomass
CO2 L1,L2,T1,T2 X
4.D.1 Wetlands remaining Wetlands – Carbon stock change –organic soils
CO2 L1,L2,T1,T2 X
4.D.1. Wetlands, Peat extraction from lands, organic soils
CO2 L1,L2,T1,T2 X
4.E.1 Settlements remaining Settlements – Carbon stock change – living biomass
CO2 L1,L2,T1,T2 X
4.E.2 Land converted to Settlements – Carbon stock change – dead organic matter
CO2 L1,L2,T1,T2 X
4.E.2 Land converted to Settlements – Carbon stock change – living biomass
CO2 L1,L2,T1,T2 X
4.E.2 Land converted to Settlements – Mineral soils CO2 L1,T1 X
4.E.2 Land converted to Settlements – Organic soils CO2 L1,L2,T1,T2 X
4.E.2 Lands converted to settlements, Direct nitrous oxide (N2O) emissions from nitrogen (N) mineralization/immobilization associated with loss/gain of soil organic matter resulting from change of land use or management of mineral soils
N2O L2,T2 X
5.A.1. Managed Waste Disposal on Land CH4 L1,L2 X X
5.A.2. Unmanaged Waste Disposal Sites CH4 L1,L2,T1,T2 X X
5.D.1 Domestic Wastewater CH4 L1,L2,T1 X X
5.D.2 Industrial Wastewater CH4 L1,L2,T1,T2 X X
5.B.1. Composting CH4 L1,L2,T2 X
5.B.1. Composting N2O L2,T2 X
3.3 National Registry
Directive 2009/29/EC adopted in 2009, provides for the centralization of the EU ETS operations into a single European Union registry operated by the European Commission as well as for the inclusion of the aviation sector. At the same time, and with a view to increasing efficiency in the operations of their respective national registries, the EU Member States who are also Parties to the Kyoto Protocol (28) plus Iceland, Liechtenstein and Norway decided to operate their registries in a consolidated manner in accordance with all relevant decisions applicable to the establishment of Party registries - in particular Decision 13/CMP.1 and Decision 24/CP.8.
The consolidated platform which implements the national registries in a consolidated manner (including the registry of the EU) is called the Union registry and was developed together with the new EU registry on the basis the following modalities:

72
Each Party retains its organization designated as its registry administrator to maintain the national registry of that Party and remains responsible for all the obligations of Parties that are to be fulfilled through registries;
Each Kyoto unit issued by the Parties in such a consolidated system is issued by one of the constituent Parties and continues to carry the Party of origin identifier in its unique serial number;
Each Party retains its own set of national accounts as required by paragraph 21 of the Annex to Decision 15/CMP.1. Each account within a national registry keeps a unique account number comprising the identifier of the Party and a unique number within the Party where the account is maintained;
Kyoto transactions continue to be forwarded to and checked by the UNFCCC International Transaction Log (ITL), which remains responsible for verifying the accuracy and validity of those transactions;
The transaction log and registries continue to reconcile their data with each other in order to ensure data consistency and facilitate the automated checks of the ITL;
The requirements of paragraphs 44 to 48 of the Annex to Decision 13/CMP.1 concerning making non-confidential information accessible to the public is fulfilled by each Party through a publically available web page hosted by the Union registry;
All registries reside on a consolidated IT platform sharing the same infrastructure technologies. The chosen architecture implements modalities to ensure that the consolidated national registries are uniquely identifiable, protected and distinguishable from each other, notably:
With regards to the data exchange, each national registry connects to the ITL directly and establishes a secure communication link through a consolidated communication channel (VPN tunnel);
The ITL remains responsible for authenticating the national registries and takes the full and final record of all transactions involving Kyoto units and other administrative processes in order for those actions not to be disputed or repudiated;
With regards to the data storage, the consolidated platform continues to guarantee that data is kept confidential and protected against unauthorized manipulation;
The data storage architecture also ensures that the data pertaining to a national registry are distinguishable and uniquely identifiable from the data pertaining to other consolidated national registries;
In addition, each consolidated national registry keeps a distinct user access entry point (URL) and a distinct set of authorisation and configuration rules.
Following the successful implementation of the Union registry, the 28 national registries concerned were re-certified in June 2012 and switched over to their new national registry on 20 June 2012. Croatia was migrated and consolidated as of 1 March 2013. During the go-live process, all relevant transaction and holdings data were migrated to the Union registry platform and the individual connections to and from the ITL were re-established for each Party.
The following changes to the national registry have occurred since the last National Communication (Table 3.9).

73
Table 3.9 Changes to the EU national registry
Reporting Item Description
15/CMP.1 Annex II.E paragraph 32.(a) Change of name or contact
None
15/CMP.1 Annex II.E paragraph 32.(b) Change regarding cooperation arrangement
No change of cooperation arrangement occurred during the reported period.
15/CMP.1 Annex II.E paragraph 32.(c) Change to database structure or the capacity of national registry
In 2016 new tables were added to the database for the implementation of the CP2 functionality. Versions of the Union registry released after 6.1.6 (the production version at the time of the last NC submission) introduced other minor changes in the structure of the database. These changes were limited and only affected EU ETS functionality. No change was required to the database and application backup plan or to the disaster recovery plan. No change to the capacity of the national registry occurred during the reported period.
15/CMP.1 Annex II.E paragraph 32.(d) Change regarding conformance to technical standards
Each release of the registry is subject to both regression testing and tests related to new functionality. These tests also include thorough testing against the DES and were successfully carried out prior to each release of a new version in Production. Annex H testing is carried out every year. No other change in the registry's conformance to the technical standards occurred for the reported period.
15/CMP.1 Annex II.E paragraph 32.(e) Change to discrepancies procedures
No change of discrepancies procedures occurred during the reported period.
15/CMP.1 Annex II.E paragraph 32.(f) Change regarding security
The mandatory use of hardware tokens for authentication and signature was introduced for registry administrators.
15/CMP.1 Annex II.E paragraph 32.(g) Change to list of publicly available information
Publicly available information is provided via the Union registry homepage for each registry e.g. https://ets-registry.webgate.ec.europa.eu/euregistry/XX/public/reports/publicReports.xhtml
15/CMP.1 Annex II.E paragraph 32.(h) Change of Internet address
No change of the registry internet address occurred during the reporting period.
15/CMP.1 Annex II.E paragraph 32.(i) Change regarding data integrity measures
No change of data integrity measures occurred during the reporting period.
15/CMP.1 Annex II.E paragraph 32.(j) Change regarding test results
Both regression testing and tests on the new functionality are carried out prior to release of the new versions in Production. The site acceptance tests are carried out by quality assurance consultants on behalf of and assisted by the European Commission. Annex H testing is carried out on an annual basis.

74
POLICIES AND MEASURES

75
4 POLICIES AND MEASURES
4.1 The Policy Making Process
Procedure of the policy development process in Latvia is determined by the Rules of Procedure of the Cabinet of Ministers and Rules of Procedure of the Parliament (Saeima).
Draft laws may be submitted to the Saeima by the President, the Cabinet of Ministers or committees of the Saeima, by not less than five members of the Saeima, or, in accordance with the procedures and in the cases provided for in the Constitution, by one-tenth of the electorate.
Ministries develop state policies and draft legal acts. General principles are established for coordinating their contentual development and for adopting a legislative document at the governmental level. This several-step process includes drafting by responsible department of particular ministry, presentation of draft in Advisory Boards of the particular ministry, submitting the draft document to the Meeting of the State Secretaries, which announces draft legal acts on which the ministries and other institutions have to present opinion, Meeting of the Committee of the Cabinet of Ministers if necessary according to the procedure for the particular document, and the decision of the Cabinet of Ministers.
MEPRD is the leading state administrative institution in the field of environmental protection which includes protection of environment and nature, maintenance and rational utilization of natural resources as well as it ensures planning and coordination process of state and regional development, local governments’ development and supervision, territorial development planning and implementation of e-Government. In order to ensure that environment protection requirements are set for certain polluting activities by application of the system of permits, the MEPRD and institutions supervised by MERPD carry out control over implementation of the environmental requirements and compliance to them.
MEPRD is the institution that has the overall responsibility for national climate police and compliance with the EU and UNFCCC requirements. Issues related to development and implementation of the climate change policy are carried out by MEPRD, MoF, MoE, MoT, MoA, MES and institutions supervised by the relevant ministries.
MEPRD also coordinates acquisition of funds of the national green investment schemes (climate change financial instrument, 2009-2015, and currently emissions quotas auctioning instrument). Supervision of practical implementation of these instruments is performed by the “Environmental Investment Fund Ltd.”. The MEPRDS is the holder of 100% of shares of it.
Institutions supervised by the MEPRD – State Environmental Service, Environment State Bureau and the state limited liability company “Latvian Environment, Geology and Meteorology Centre”, ensure implementation of the climate policy within framework of their competence.
4.2 National and Regional Programmes
Administrative divisions of Latvia (valid since 1 July 2009) has one-level municipalities only. According to the Administrative territorial reform of Latvia, Latvia changed its administrative divisions from two-level municipalities to one level municipalities. Taking into account this administrative structure, there are no subnational or regional programmes developed or implemented in Latvia.
Currently there are 119 municipalities in Latvia (9 republican cities and 110 municipalities). 21 (6 cities and 15 municipalities) of them currently (October 2017) are active participants of the Covenant of Mayors for Climate and Energy. 3 municipalities (Daugavpils city and Valka and Smiltene municipalities) has joined the new initiative “Adapt” of the Covenant.

76
The National Development Plan 2014–2020 (NDP2020) is hierarchically the highest national-level medium-term planning document. NDP2020 is closely related to the Sustainable Development Strategy of Latvia until 2030 (Latvia2030) and the National Reform Programme for the Implementation of the EU2020 Strategy (NRP).
The goal of NDP2020 is to agree upon the most important medium-term priorities, areas of action, objectives and the indicators of their implementation. NDP2020 was developed in cooperation of the experts at the Cross-Sectoral Coordination Centre (CSCC) with the social and cooperation partners of the government, government ministries, planning regions and local governments.
Ensure the sustainable use of the energy resources required by the national economy by promoting the availability of a market for the resources, a decrease of the energy intensity and emission intensity in certain sectors, and an increase of the proportion of renewable energy resources in the total consumption, while focusing on competitive energy prices. One of the measurable outcomes for the goal is Intensity of GHG emission in the economy (tCO2 eq per 1000 LVL GDP) – 1.13 in 2020 and 1.07 in 2030.
National Reform Programme of Latvia for the Implementation of the “Europe 2020” Strategy8 (approved 26.04.2011) defines that, in accordance with the Effort Sharing Decision, GHG emissions increase in Latvia in the non-ETS sector in total shall not increase by more than +17% in 2020, comparing to 2005. Total GHG emissions in Latvia, including both EU ETS and non-ETS sectors, in accordance with the Programme, shall not increase in 2020 by more than 12.19 million CO2 eq. tons.
In 26 March 2014 Cabinet of Ministers adopted Latvia’s Environmental Policy Strategy 2014-20209 replacing the previous one. The Strategy is the national level planning document for the environmental sector that includes directions for low-carbon policies development, low-carbon technology implementation and sustainable land management in farming. The general climate policy objectives under the section No.6 “Climate” are defined as follows: (1) to provide contribution of Latvia to prevention of global climate change by taking into account Latvia’s environmental, social and economic interests, and (2) to promote Latvia’s preparedness for adaptation to climate change and its impacts.
The following policies and measures are defined by the Strategy as the most important:
1. implementation of GHG emissions reduction measures in all sectors of economy, alongside with promoting sustainable, low carbon intensive and cost-effective development of national economy,
2. integration of the climate policy targets in the policy of other sectors by setting responsibilities of each sector and promoting cooperation between the state, local governments and the private sector,
3. raising public awareness about climate change and adaptation to climate change as well as involving people in the policy development and implementation,
4. implementation of effective adaptation measures and their integration in the spatial planning and sector policies.
In order to evaluate settled policies and measures following targets have been defined:
Limited or stabilised total LV GHG emissions - 12,16 (MtCO2 eq) in 2020;
Limited or stabilised non-ETS GHG emissions – 9,9 (MtCO2 eq) in 2020;
Reduced ETS GHG emissions – 2,26 (MtCO2 eq) in 2020;
8 Latvia’s National Reform Programme of Latvia for the Implementation of the “Europe 2020” Strategy. Approved by the Cabinet of Ministers, 26 April 2011, available at http://ec.europa.eu/europe2020/pdf/nrp/nrp_latvia_en.pdf 9 Environmental Policy Strategy 2014-2020 (Vides Politikas Pamatnostādnes 2014-2020.gadam)”. Approved by the Cabinet of Ministers, 26 March 2014, available at http://polsis.mk.gov.lv/documents/4711, in Latvian
77
GHG intensity of national economy (tCO2 eq per 1000LVL GDP) – 1,13 in 2020; 1.07 in 2030;
Ensured CO2 removals target in forestry - 16,30 (MtCO2 eq) in 2020 (for every year in 2013-2020).
To reach the above quantitative targets, the Strategy sets the following concrete activities:
1. ensure execution of ETS activities (responsible ministry –MEPRD)
2. prepare the planning document for low carbon development (responsible ministry – MEPRD),
3. promote sustainable use of biomass for energy production by applying low carbon emitting technologies (responsible ministry – MoE, involved – MoA and MEPRD),
4. promote ensuring the supply of economically and ecologically sustainable biomass (responsible ministry – MoA),
5. promote energy efficiency in buildings (responsible ministry – MoE, involved – MEPRD, local governments),
6. increase the efficiency of lighting infrastructure (responsible ministry – MEPRD, involved – local governments),
7. promote ensuring of CO2 removal in forest lands (responsible ministry – MoA, involved – MEPRD),
8. promote carbon removal in wood products with long useful lifetime (responsible ministries – MoA, MoE),
9. introduce low carbon emitting technologies and sustainable farming practices in agriculture (responsible ministry – MoA),
10. integrate climate issues in the transport policy at national and local level (responsible ministry – MoT, involved – local governments),
11. develop environmentally friendly transport infrastructure and promote the use of renewable energy resources in public transport (responsible ministry – MoT, involved – MoE, MEPRD, local governments),
12. prepare and execute the plan for promoting Green Public Procurement (responsible ministry – MEPRD),
13. research in the fields of climate change and adaptation (responsible ministries – MEPRD, MoA, involved – MoE, MES),
14. promote the use of renewable energy resources and energy efficiency in district heating (responsible ministry – MoE),
15. develop Green Technologies Incubator (responsible ministry – MoE),
16. prepare and implement a climate change action plan (the responsible ministry – MEPRD, involved – MoE, MoA, MoT).
4.2.1 Participation in the flexible mechanisms of the Kyoto protocol
Latvia as a Party to the Kyoto Protocol has a possibility to participate in the flexible mechanisms provided for in the Protocol. In years 2009-2015 especially important in case of Latvia was the international emissions trading (IET) mechanism, in which Latvia acted as a seller. Latvian government ensured that every assigned amount unit (AAU) sold was used for “greening” purposes which means climate change mitigation, promotion of low carbon economy development by application of innovative environmental technologies, increase of RES use and improvement of energy efficiency as well as capacity building for climate change policy design and implementation. Revenues obtained from the
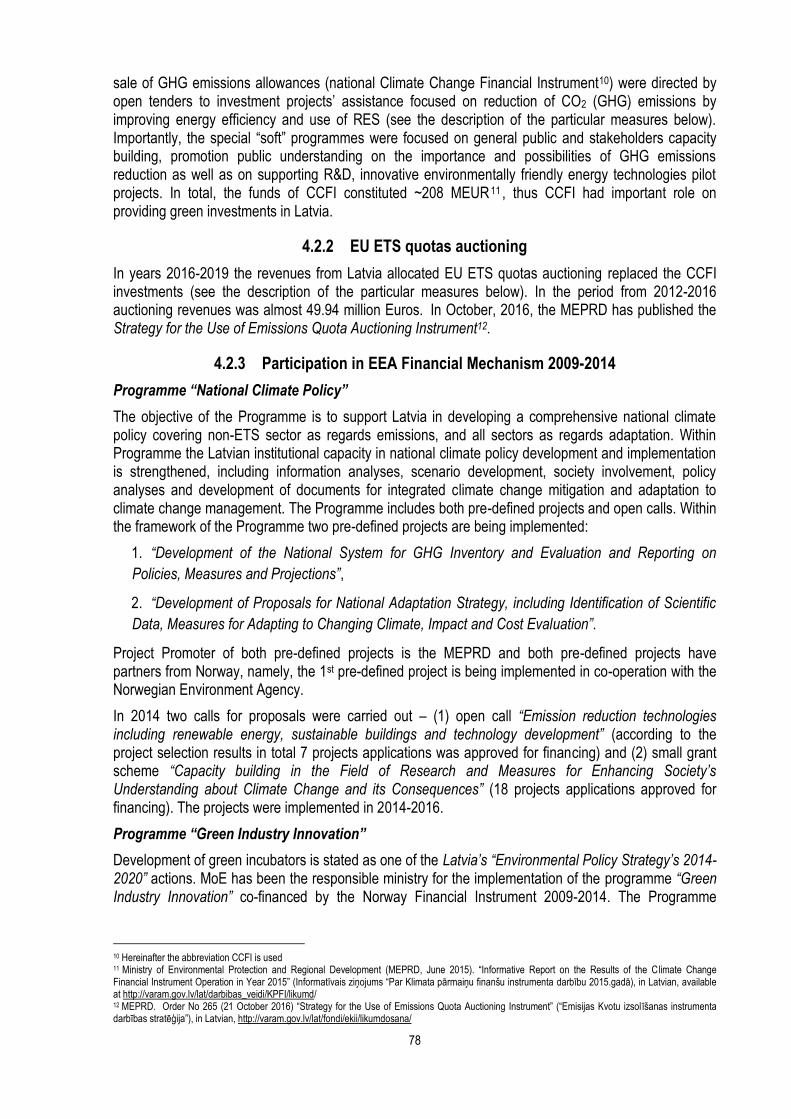
78
sale of GHG emissions allowances (national Climate Change Financial Instrument10) were directed by open tenders to investment projects’ assistance focused on reduction of CO2 (GHG) emissions by improving energy efficiency and use of RES (see the description of the particular measures below). Importantly, the special “soft” programmes were focused on general public and stakeholders capacity building, promotion public understanding on the importance and possibilities of GHG emissions reduction as well as on supporting R&D, innovative environmentally friendly energy technologies pilot projects. In total, the funds of CCFI constituted ~208 MEUR11 , thus CCFI had important role on providing green investments in Latvia.
4.2.2 EU ETS quotas auctioning
In years 2016-2019 the revenues from Latvia allocated EU ETS quotas auctioning replaced the CCFI investments (see the description of the particular measures below). In the period from 2012-2016 auctioning revenues was almost 49.94 million Euros. In October, 2016, the MEPRD has published the Strategy for the Use of Emissions Quota Auctioning Instrument12.
4.2.3 Participation in EEA Financial Mechanism 2009-2014
Programme “National Climate Policy”
The objective of the Programme is to support Latvia in developing a comprehensive national climate policy covering non-ETS sector as regards emissions, and all sectors as regards adaptation. Within Programme the Latvian institutional capacity in national climate policy development and implementation is strengthened, including information analyses, scenario development, society involvement, policy analyses and development of documents for integrated climate change mitigation and adaptation to climate change management. The Programme includes both pre-defined projects and open calls. Within the framework of the Programme two pre-defined projects are being implemented:
1. “Development of the National System for GHG Inventory and Evaluation and Reporting on
Policies, Measures and Projections”,
2. “Development of Proposals for National Adaptation Strategy, including Identification of Scientific
Data, Measures for Adapting to Changing Climate, Impact and Cost Evaluation”.
Project Promoter of both pre-defined projects is the MEPRD and both pre-defined projects have partners from Norway, namely, the 1st pre-defined project is being implemented in co-operation with the Norwegian Environment Agency.
In 2014 two calls for proposals were carried out – (1) open call “Emission reduction technologies including renewable energy, sustainable buildings and technology development” (according to the project selection results in total 7 projects applications was approved for financing) and (2) small grant scheme “Capacity building in the Field of Research and Measures for Enhancing Society’s Understanding about Climate Change and its Consequences” (18 projects applications approved for financing). The projects were implemented in 2014-2016.
Programme “Green Industry Innovation”
Development of green incubators is stated as one of the Latvia’s “Environmental Policy Strategy’s 2014-2020” actions. MoE has been the responsible ministry for the implementation of the programme “Green Industry Innovation” co-financed by the Norway Financial Instrument 2009-2014. The Programme
10 Hereinafter the abbreviation CCFI is used 11 Ministry of Environmental Protection and Regional Development (MEPRD, June 2015). “Informative Report on the Results of the C limate Change Financial Instrument Operation in Year 2015” (Informatīvais ziņojums “Par Klimata pārmaiņu finanšu instrumenta darbību 2015.gadā), in Latvian, available at http://varam.gov.lv/lat/darbibas_veidi/KPFI/likumd/ 12 MEPRD. Order No 265 (21 October 2016) “Strategy for the Use of Emissions Quota Auctioning Instrument” (“Emisijas Kvotu izsolīšanas instrumenta darbības stratēģija”), in Latvian, http://varam.gov.lv/lat/fondi/ekii/likumdosana/

79
includes pre-defined project “Establishment of Green Technology Incubator”, open call “Financial assistance for implementation of green technologies in production process” and small grant scheme.
4.2.4 Low-Carbon Development Strategy
Information on Latvia’s low-carbon development strategy was submitted as a separate reporting item in 14 January 2015. Currently Latvia elaborates low-carbon development strategy for 2050 and up to now has carried out 5 interactive workshops in regions of Latvia on climate change and low carbon development up to year 2050. Workshops were mainly targeted at local, regional and national authorities, non-governmental organisations, local community group leaders and business representatives, as well as other interested parties.
Taking into account the administrative government structure of Latvia, there are no subnational or regional programmes developed or implemented in Latvia.
4.3 Policies and Measures and their Effects
During last years Latvia’s national climate policy has undergone more integration with the planning and decision making processes in energy production and consumption, transport, agriculture, waste management, forestry and land-use sectors. The Table 4.1 below presents the actual sectorial policy planning key documents and selects the priority goals of them which have positive impact to meet national climate policy objectives.
Table 4.1 Climate change policy directions
Climate
policy
directions/
sectors
Goals of sectorial policies related to
climate change
Sectorial policy planning documents
Energy
To increase the share of RES
To increase the energy efficiency
To implement efficient energy saving
technologies
To implement energy management
systems
Latvian Energy Long Term Strategy 2030-Competitive Energy for Society Energy Policy Strategy 2014-2020 Latvia National Renewable Action Plan for implementing RES Directive 2009/28/EC 3rd National Energy Efficiency Action Plan (2014 Information Report on the Progress towards the Indicative National Energy Efficiency Targets in 2014-2016 according to Directive 2012/27/EU) 4th National Energy Efficiency Action Plan (2017 Information Report on the Progress towards the Indicative National Energy Efficiency Targets in 2017-2019 according to Directive 2012/27/EU) Latvia national Plan of the Alternative Measures of Energy Efficiency Policy to Reach the Target of Energy End-Use Consumption Saving 2014-2020 (Article 7 of Energy Efficiency Directive 2012/27/EU) National Operational Programme “Growth and Employment”, 2014-2020, part “Shift towards low carbon economy”

80
Climate
policy
directions/
sectors
Goals of sectorial policies related to
climate change
Sectorial policy planning documents
Transport To develop public transportation and
cycling
To implement energy efficient transport
To implement environmentally friendly
transport
To increase use of alternative fuels
Transport Development Strategy 2014-2020 Electromobility Development Plan 2014-2016 Alternative Fuels Development Plan 2017-2020 National Operational Programme “Growth and Employment”, 2014-2020, part “Shift towards low carbon economy” Conceptual Report “On Use of RES in Transport Sector” (2017)
IPPU To increase energy and resource
efficiency in industrial processes
To introduce principles of cleaner
production
Agriculture To introduce Good Agricultural
Practice
To arrange manure storage and
manure processing
To introduce balanced animal feeding
To introduce precise fertilization
Rural Development Programme 2014-2020
Waste management
To implement reusing, recycling and
regeneration of waste
To reduce waste generation
To increase biogas utilization in
landfills
To develop and upgrade quality of
sewerage system services
Waste management Plan 2013-2020 National Operational Programme “Growth and Employment”, 2014-2020, part “Protection of Environment and Effective Use of Resources” River Basins management Plans 2016-2021
Forestry To increase productivity of forests
To promote afforestation
To expand use of wood products
To implement efficient
environmentally friendly technologies
Forests and Forest based Industries Development Strategy 2015-2020
4.3.1 Energy
4.3.1.1 Regulatory measures
Increasing a deployment of renewable energy sources
As known, the RES Directive 2009/28/EC does not prescribe the measures to achieve the targets stated and thus leaves significant flexibility on how they can be implemented at national level.
Pursuant to Annex I(A) to the Directive 2009/28/EC, Latvia’s target is to increase the use of RES from 32.6% of gross final energy consumption (GFEC) in 2005 up to 40% in 2020. This goal is stated by the Latvia National Renewable Energy Action Plan13 which also sets the following sub-targets regarding the share of renewable energy in 2020: (i) in the transport sector - at least 10% of GFEC, (ii) in the
13 Republic of Latvia National Renewable Energy Action Plan for implementing Directive 2009/28/ES of the European Parliament and of the Council of 23 April 2009 on the promotion of the use of energy from renewable sources and amending and subsequently repealing Directives 2001/77/EC and 2003/30/EC by 2020, available at http://www.ebb-eu.org/legis/ActionPlanDirective2009_28/national_renewable_energy_action_plan_latvia_en.pdf

81
electricity sector – at least 59.8% of GFEC, (iii) in the heating and cooling sector – 53.4% of GFEC, (iv) in the building sector regarding heating and cooling – 58% (in residential sector buildings – 72%, in commercial sector buildings – 44% of GFEC).
The Electricity Market Law (adopted 05 May 2005, transposition of the Directive 2009/28/EC by the Amendments of 08 July 2011, the latest Amendments adopted 23 November 201614) stipulates the increase of the RES share in electricity consumption. The purpose of this Law is: (1) to promote the production of electricity by using RES; (2) to establish prerequisites for the operation of an efficiently functioning electricity market; (3) to ensure that all energy customers are provided with electricity safely and in good quality, in the most efficient possible way, for justified prices; (4) to ensure all energy customers with the right to choose an electricity trader freely; (5) to promote energy independence ensuring different suppliers of energy resources necessary for production of electricity.
Preferential Feed-in Tariffs (FIT) for Renewables and for Combined Heat-Power Production are prescribed by the Electricity Market Law and the Cabinet of Ministers (Governmental) Regulations15,16 issued pursuant to this Law. During the last years important changes had been adopted:
For the time being the preferential FIT are continuing in relation to the existing RES and CHP units which had obtained the mentioned rights before noted Amendments17 to the Cabinet of Ministers Regulations had come into force.
The new support scheme will be elaborated for application after 2020 to correspond to the principles of RES electricity support defined by the Commission Communication 2014/C 200/01. This new scheme will be applied for new units together with the existing scheme, the latest will end after expiring of all rights acquired within its frame.
Principle to avoid overcompensation by applying of limited internal return rate (IRR) is introduced in the existing FIT system. To correct the amount of FIT support, the Amendments, adopted 05 July 2016 are introducing the new principle – applying of limited IRR. Namely, the Section 63 of the Amendments18 and the Sections 56 of the Amendments19 state the total investments’ IRR shall not exceed 9% for all support period, and the IRR shall be calculated individually for each of RES and CHP units. After agreeing them with the European Commission these Amendments came into force 01 May 2017.
The total installed electric capacity, which has right to sell electricity within FIT procedure, in 2016 constituted20: (i) small hydro plants – 28.5 MWel, (ii) wind plants – 64.2 MWel, (iii) solid biomass plants – 57 MWel21, (iv) biogas plants – 65.1 MWel, (v) natural gas CHP plants with electric capacity below
14 Electricity Market Law (Elektroenerģijas tirgus likums), in Latvian, available at http://likumi.lv/doc.php?id=108834 15 Cabinet of Ministers Regulations No262 (16.03.2010) “Regarding the Production of Electricity Using Renewable Energy Sources and the Procedures for the Determination of the Price”, actual version in Latvian, available at http://likumi.lv/doc.php?id=207458 16 Cabinet of Ministers Regulations No221 (10.03.2009) “Regarding Electricity Production and Price Determination upon Production of Electricity in Cogeneration”, actual version in Latvian, available at http://likumi.lv/doc.php?id=189260 17 The Article 100 of the Amendments (17.05.2011; prolonged 28.08.2012 and 15.12.2015) of the Cabinet of Ministers Regulations No262 (16.03.2010) “Regulations regarding the Production of Electricity Using Renewable Energy Sources and the Procedures for the Determination of the Price” and the Article 70 of the Amendments (28.08.2012; prolonged 15.12.2015) of the Cabinet of Ministers Regulations No221 (10.03.2009) “Regulations regarding Electricity Production and Price Determination upon Production of Electricity in Cogeneration” state that the Ministry of Economics shall not organize tenders for the acquisition of the right to sell electricity produced in biomass, biogas, solar or wind power plants (from 26.05.2011 until 01.01.2020) and cogeneration (from 10.09.2012 until 01.01.2020) and the producer may not qualify for selling electricity within the scope of mandatory procurement and for acquisition of the right to receive a guaranteed fee for the installed electric capacity. In June 2016 the Amendments of the Electricity Market Law came into force which do not foreseen to confer new feed-in tariff rights within the existing feed-in tariff system. 18 The Cabinet of Ministers Regulations No 444 „The Amendments to the Cabinet of Ministers Regulations No 262”, adopted 05 July 2015, will be in force after agreeing with the European Commission. In Latvian, available at http://likumi.lv/ta/id/283555 19 The Cabinet of Ministers Regulations No 443 „The Amendments to the Cabinet of Ministers Regulations No 221”, adopted 05 July 2015, will be in force after agreeing with the European Commission. In Latvian, available at http://likumi.lv/ta/id/283554 20 ME. Information regarding mandatory procurement of electricity: Feed-in payments 2015 (Informācija par izdotajiem lēmumiem par elektroenerģijas obligāto iepirkumu: komersantiem 2015 .gadā obligātā iepirkuma ietvaros izmaksātās summas), in Latvian, available at https://www.em.gov.lv/lv/nozares_politika/atjaunojama_energija_un_kogeneracija/informacija_par_izdotajiem_lemumiem_par_elektroenergijas_obligato_iepirkumu/. 21 It exists also other form of support: CHP stations may receive the guaranteed payment for installed electric capacity, regarding RES utilising CHP such payment in 2016 was paid to 23 MWel biomass CHP capacity (feed-in tariff not paid for this capacity).

82
4MWel –104 MWel. In total these plants produced in 2016, supported by FIT, 873 GWh RES and RES-CHP electricity and 630 GWh natural-gas CHP electricity.
Increasing the energy efficiency
Related EU Directives
Directive 2012/27/EU on Energy Efficiency;
Recast of the Energy Performance of Buildings Directive (Directive 2010/31/EU).
The 1st National Energy Efficiency Action Plan of the Republic of Latvia22, elaborated in compliance to the End-use efficiency and energy services Directive 2006/32/EC, had planned for the total savings of 3483 GWh in year 2016, of which 2701 GWh in Residential sector, 408 GWh in Tertiary sector, 170 GWh in Industry sector and 204 GWh in Transport Sector. This goal has not been changed by the following NEEAPs of Latvia. Thus energy efficiency in buildings is clear priority of national energy sector policy.
Based on the requirements of Article 3 of Directive 2012/27/EU, the indicative national energy efficiency target set for Latvia based on primary energy savings in 2020 is 0.670 Mtoe, which is equivalent to final energy savings of 0.457 Mtoe (19 PJ), providing for energy savings in multi-apartment residential buildings, municipal and central government buildings, industry, services and transport, as well as district heating systems23.
The new Latvia’s “Energy Policy Strategy 2014-2020”24, adopted February 2016, defines the following indicators in year 2020 in compliance with EU energy efficiency policy and Energy Efficiency Directive 2012/27/EU:
total savings of primary resources in year 2020 – 0.670 Mtoe,
total cumulative energy savings – 0.85 Mtoe (9896 GWh),
average specific heat energy consumption in buildings in year 2020 – not higher 150 kWh/m2 (with climate correction),
renovation of state administration buildings – 3% of total area annualy until year 2020,
The new "Energy Efficiency Law"25 which contains legal norms arising from the Directive 2012/27/EU was adopted 03 March 2016 and are in force from 29 March 2016. The Energy Efficiency Law includes the framework for the measures used for meeting the target set by Article 7 of the Directive:
Energy Efficiency Obligation Scheme26
Energy Audits and Energy Efficiency Improvement in Large Enterprises (the transposition of the framework defined by the Directive).
Energy Management Systems (EMS) in Enterprises – Large Electricity Consumers (LEC) (national measure in addition to the framework defined by the Directive): the enterprise is considered as a LEC if its own annual electricity consumption is above 500 MWh; the LEC shall implement up to the 1st April 2022 at least three energy efficiency measures, which have the highest energy savings or the highest economical return.
22 Latvia`s National Energy Efficiency Action Plans, available at http://ec.europa.eu/energy/node/84 23 ME (17 March 2014). Information report “On the progress towards the indicative national energy efficiency targets in 2014 –2016 according to Directive 2012/27/EU of the European Parliament and of the Council of 25 October 2012 on energy efficiency, amending Directives 2009/125/EC and 2010/30/EU and repealing Directives 2004/8/EC and 2006/32/EC”, available at https://ec.europa.eu/energy/sites/ener/files/documents/2014_neeap_en_latvia.pdf 24 Latvia’s “Energy Policy Strategy 2014-2020” (Enerģētikas Attīstības Pamatnostādnes 2014.–2020.gadam”), adopted by the Cabinet of Ministers, 09 February 2016, in Latvian, available at http://likumi.lv/ta/id/280236 25 Energy Efficiency Law (Energoefektivitātes likums), in Latvian, available at http://likumi.lv/doc.php?id=280932 26 Implemented by Cabinet of Ministers Regulations No226 (2017) “Regulations on Energy Efficiency Obligation Scheme” adopted 25 April 2017, in force 19 May 2017. According the Regulations (Art.2), the obliged parties for the start and the first EEOS sub-period are electricity retail sellers which (1) had sold at least 10 GWh of electricity in 2016, or (2) had sold at least 10 GWh of electricity in any of years related to EEOS sub-period.

83
EMS in state administration institutions: it is stated mandatory implementation of EMS in those state direct administration institutions which have buildings with total heating area 10000 m2 and above, the EMS shall be implemented up to the 1st November 2017 at the latest or during one year after the noted provision came into force.
EMS in municipalities: it is stated mandatory implementation of EMS in: (1) Latvia largest nine cities shall implement the certified (according to the standard) EMS up to 1st April 2017 at the latest, on October 2017 seven cities has implemented EMS, (2) other Latvia municipalities shall implement EMS if they have the territorial development index 0.5 and above and population above 10000 inhabitants, these EMS shall be implemented up to 1st November 2017 at the latest or during one year after the noted provisions have come into force, currently 10 Latvia municipalities have such duty. (3) other municipalities may introduce EMS voluntary, and one Latvia municipality on October 2017 has performed this voluntary implementation.
Historically the first Regulations of the Cabinet of Ministers regarding the industrial energy audits had been adopted in March 2013. As the Energy Efficiency Law had entered into force, in 26 July 2016 the Cabinet of Ministers had adopted re-casted Regulations No.487 “Regulations on Enterprise Energy Audit”27.
The recast Law on the Energy Performance of Buildings, adopted December 201228 in accordance with the requirements of the Directive 2010/31/EC and replacing the previous law with the same title, which was adopted in 2008 in accordance with the requirements of the Directive 2002/91/EC, recasts the general legal framework of setting the mandatory minimum energy performance requirements for buildings, recasts the general principles of mandatory energy efficiency certification for buildings, verification of buildings heating and ventilation systems, etc.
It is introduced by the Cabinet of Ministers Regulations No.38329 (2013) six (A-F) energy efficiency classes for residential and non-residential buildings. In case of class F - energy performance indicator (EPI) for heating exceeds 150 kWh per m2 per year - the building needs energy performance improvement measures. The noted Regulations state minimum permissible level of energy performance of buildings for buildings to be reconstructed or renovated (for multi-apartment residential house – EPI for heating does not exceed 90 kWh per m2 per year; for one-apartment and two-apartment residential buildings of different types – EPI for heating does not exceed 100 kWh per m2 per year; for non-residential buildings – EPI for heating does not exceed 110 kWh per m2 per year). Minimum permissible level of energy performance of buildings for new buildings is laid down in Annex 5 to this Regulation taking into account the day of approval of a construction intention of the building (transition process to nearly zero-energy building is thus established). From 1 January 2021 and hereinafter all new buildings shall be nearly zero-energy buildings. A building shall be classified as a nearly-zero energy building, if it meets all of the following requirements: (1) building EPI corresponds to Class A (EPI for heating does not exceed 40 kWh (for residential buildings) or 45 kWh (for non-residential buildings) per m2 per year) by concurrently ensuring conformity of indoor climatic conditions with the requirements of the laws and regulations in the field of construction, hygiene and labour protection; (2) the total primary energy consumption for heating, hot water supply, mechanical ventilation, cooling, lighting accounts for no more than 95 kWh per m2 per year; (3) in the building high-efficiency systems is used, which: (i) ensure recovery of no less than 75 % of the ventilation heat loss during the heating season; (ii) at least partially the use of renewable energy is ensured; (4) low efficiency fossil fuel heating equipment is not installed in the building.
27 Cabinet of Ministers Regulations No 487 (26.07.2016) “Regulations on Enterprise Energy Audit” (Uzņēmumu energoaudita noteikumi), in Latvian, available at http://likumi.lv/ta/id/283807 28 Law on the Energy Performance of Buildings (recast, Ēku energoefektivitātes likums), in Latvian, available at http://likumi.lv/doc.php?id=253635 29 Cabinet of Ministers Regulations No 383 (09.07.2013) “Regulations Regarding Energy Certification of Buildings” (Noteikumi Nr.383 „Par ēku energosertifikāciju”), in force 19 July 2013, https://m.likumi.lv/saistitie.php?id=258322&saistitie_id=7

84
The particular policy is focused to define minimal requirements for energy management in the residential buildings. Namely, the new chapter IV „Requirements for Ensuring the Energy Efficiency of a Residential House” had been adopted September 2011 (in force 1st January 2012) as the Amendments of the Cabinet of Ministers Regulations No.907 „Regulations Regarding the Survey, Technical Servicing, Current Repairs and Minimal Requirements for Energy Efficiency of the Residential House”30.
Minimum thermal insulation standards. The Latvian Construction Standard LBN 002-01 “Thermotechnics of Building Envelopes” came into force 1st January 2003; the Amendments31, adopted in April 2014, had introduced the requirements of the recast Directive 2010/31/EU on Energy Performance of Buildings. The new values are mandatory for the projects which have been developed starting from the 22th April 2014.
In 30 June 2015 the Cabinet of Ministers adopted the new Latvian Construction Standard LBN002-15 “Thermotechnics of Building Envelopes”32, however these regulations, compared to the previous 2014 version, had not been changed in point of fact, only minor changes were done.
Regarding the Performance of Heat Generators for Space Heating and the Production of Hot Water, in 26 September 2013 the Commission Regulation (EU) No 813/2013 of 2 August 2013 implementing Directive 2009/125/EC with regard to ecodesign requirements for space heaters and combination heaters had come into force. Latvia had used the transition period of 2 years. Namely, up to 25 September 2015 the national, Cabinet of Ministers, Regulations on Hot-Water Boilers were in force.
Energy Efficiency Requirements for District Heating (DH) Systems. The Cabinet of Ministers Regulations33 No.243 define the minimum energy efficiency requirements for DH technologies: heat production boilers (respectively, 92% - gaseous fuel, 85% - liquid fuel, 75% -solid fuel), combined heat-power production units (respectively, 80% - gaseous and liquid fuels, 75% - solid fuels), solar heat collectors (respectively, 70% - vacuum tube collectors, 75% flat plate collectors), heat pumps (shall correspond at least class “C”) as well as maximum heat losses in DH pipeline network (from 01.01.2018 – not higher than 19%, from 01.01.2019 – not higher than 17%). The given Regulations are issued pursuant to the Article 46.5 of the Energy Law.
Mandatory individual water meters for consumers connected to DH system. 3 November 2015 the Amendments to the Cabinet of Ministers Regulation No.876 On Heat Energy Supply and Consumption have been adopted34 which transposed the requirements of the Energy Efficiency Directive 2012/27/EU. The noted Amendments provide for the installation of meters or heat cost allocators in multi-apartment and multi-purpose buildings that share the bill for the heat energy consumed, with a view to recording the amounts of heat energy consumed for heating purposes in each apartment or set of premises that is invoiced separately. This requirement applies to new buildings and buildings to be converted or renovated (if funded by EU funds, State or municipal budgets), for which a building permit has been issued after 1st January 2016 and to which heating is supplied from a common heat source or a district heating system, these provisions are in force from 31 December 2016.
30 Cabinet of Ministers Regulations No 907 „Regulations Regarding the Survey, Technical Servicing, Current Repairs and Minimal Requirements for Energy Efficiency of the Residential House”, Chapter IV “Requirements for Ensuring the Energy Efficiency of a Residential House” (Noteikumi par dzīvojamās mājas apsekošanu, tehnisko apkopi, kārtējo remontu un energoefektivitātes minimālajām prasībām, 4.nodaļa ‘Prasības dzīvojamās mājas energoefektivitātes nodrošināšanai), in Latvian, available at http://likumi.lv/doc.php?id=218831 31 The Amendments to the Latvian Construction Standard LBN 002-01 “Thermotechnics of Building Envelopes” (Grozījumi Ministru Kabineta 2001.gada 27.novembra noteikumos Nr.495 “Noteikumi par Latvijas būvnormatīvu LBN 002-01 “Ēku norobežojoši konstrukciju siltumtehnika), adopted 8 April 2014 , in Latvian, available at http://likumi.lv/doc.php?id=265703 32 Latvian Construction Standard LBN002-15 “Thermotechnics of Building Envelopes” (Latvijas būvnormatīvs LBN 002-15 “Ēku norobežojoši konstrukciju siltumtehnika), in Latvian, available at http://likumi.lv/ta/id/275015 33 Cabinet of Ministers Regulations No 243 (19.04.2016) “Regulations Regarding Requirements of Energy Efficiency to the District Heating Systems Existent in the Possession of a Licensed or Registered Energy Supply Merchant and the Procedures for the Inspection of the Conformity Thereof” (Noteikumi Nr.1214 „Noteikumi par energoefektivitātes prasībām licencēta vai reģistrēta energoapgādes komersanta valdījumā esošām centralizētām siltumapgādes sistēmām un to atbilstības pārbaudes kārtību”), in force 06 May 2016, in Latvian, available at http://www.likumi.lv/doc.php?id=281914 34 Amendments to the Cabinet of Ministers Regulations No 876 (2008) “Heat Energy Supply and Consumption Regulations”, adopted as the Cabinet of Ministers Regulations No 628 (3 November 2015), in force 10 November 2015, in Latvian, available at http://likumi.lv/doc.php?id=277661

85
4.3.1.2 Economic measures
Programmes for District Heating (DH) Systems
In EU funds planning period of 2007-2013 (implementation finished 2015) the support was provided by the Cohesion Fund (CF) in the framework of the Latvia national Operation Programme „Infrastructure and Services”, part „Energy”. The “Energy” programme was aimed at increasing the efficiency of heat supply, reducing the loss of heat energy in district heating (DH) transmission and distribution systems and fostering replacement of imported fossil fuels with RES, including both the increase of heat production units and CHP units utilising the RES. The programme consisted of 2 activities:
(1) „Measures to increase the efficiency of district heating systems” (activity No.3521) to support heat supply efficiency improvements in DH systems pipeline networks and development of effective biomass utilising heat production units,
(2) „Development of combined heat-power plants utilising renewable energy sources” (activity No.3522) to support development of biomass utilising CHP units.
The support (up to 50% of project's total eligible costs) for the whole programme provided by the CF constituted 92.40335 MEUR of which 63.819 MEUR (~ 69%) for the Activity No.3521 and 28.583 MEUR (~ 31%) for the Activity No.3522.
As a result of the programme (i) it is implemented 10 CHP projects, utilising RES, with total electrical capacity of 37 MWel and heat capacity 106 MWth, (ii) the total supported biomass based heat boilers production capacity are more than 200 MWth , (iii) ~ 150 km of heat pipelines were reconstructed.
In EU Funds planning period of 2014-2020 the investment support from CF is provided within the framework of the national Operational Programme “Growth and Employment”, Thematic Objective No.4 “Supporting the shift towards a low-carbon economy in all sectors”, the Specific Objective 4.3.1. “To promote energy efficiency and use of local RES in district heating systems”. The total amount of CF support is planned 60 MEUR36,37(sections 333-344).
Programmes for Household sector
Programme for Renewable Energy Technologies in Households: national CCFI. The support was provided in years 2011-2012. Eligible micro-generation technologies were: solar heat collectors (up to 25 kW), solar PV (up to 10 kW), wind (up to 10 kW), wood, wood chips, wood pellets and straw technologies (up to 50 kW) as well as combined use of them. As a result38, it was financially supported 1759 projects (of which 36% - heat pumps, 32% - solar heat collectors, 25% - biomass heating equipment, 5% - wind, 2% - solar PV); the total support by CCFI constituted 8.57 MEUR. The total CO2 savings up to ~20 thsd tons are envisaged39.
Programmes for Energy Efficiency in Household sector: Apartment Buildings
In EU Funds planning period of 2007-2013 (implementation finished 2016) the investments in energy efficient apartment building renovation were co-financed by the EU Regional Development Fund (ERDF) in the framework of the Latvia national Operational Programme „Infrastructure and Services”, part „Energy Efficiency in Housing” (activity No.344). The programme had 2 target audiences: (1) apartment
35 Hereinafter for the 2007-2013 planning period the financial data are taken from the EU Funds Implementation Progress: monthly report March 2016, in
Latvian, available at http://www.esfondi.lv/es-fondu-finansu-progress 36 Hereinafter for the 2014-2020 planning period the financial data are taken from the EU Funds Implementation Progress: monthly report November 2017,
http://www.esfondi.lv/finansu-un-raditaju-plani-to-izpilde 37Ministry of Finance. Operational Programme “Growth and Employment 2014-2020”. Latvia, http://www.esfondi.lv/upload/Planosana/FMProg_270115_OP_ENG_2.pdf 38 Latvian Environmental Investment Fund (responsible authority for the implementation of CCFI programmes), information material, 28 March 2013 (Latvijas Vides Investīciju Fonda informatīvais ziņojums “Noslēgusies projektu ieviešana konkursā "Atjaunojamo energoresursu izmantošana mājsaimniecību sektorā"), in Latvian, available at http://www.lvif.gov.lv/?object_id=30643 39 Ministry of Environmental Protection and Regional Development (MEPRD, June 2015). “Informative Report on the Results of the Climate Change Financial Instrument Operation in Year 2015” (Informatīvais ziņojums “Par Klimata pārmaiņu finanšu instrumenta darbību 2015.gadā), in Latvian, available at http://varam.gov.lv/lat/darbibas_veidi/KPFI/likumd/

86
owners of multi-apartment buildings, and (2) tenants of municipal social residential buildings. As result of the renovation project, at least 20% of heat energy saving must be reached. The Cabinet of Ministers Regulations40 No.272, adopted in April 2011, in addition to this general criterion had introduced also the specific quantitative threshold criterion - after reconstruction the annual heat energy consumption for heating shall not increase 120 kWh/m2 (for 1 and 2 storey multi-apartment houses) or 100 kWh/m2 (for 3 and more storeys multi-apartment buildings). The support for the whole programme provided by ERDF is stated 67.956 MEUR, of which 62.804 MEUR for multi-apartment buildings and 5.152 MEUR for social residential buildings. It has been renovated 740 multi-apartment buildings and 55 social residential buildings41(page 8).
In EU Funds planning period of 2014-2020 (implementation 2017-2022 including), increasing of energy efficiency in multi-apartment buildings is supported within the framework of the Operational Programme “Growth and Employment”: Thematic Objective No.4 “Supporting the shift towards a low-carbon economy in all sectors”, Specific Objective 4.2.1. “To increase energy efficiency in public and residential buildings”. Beneficiaries - community of flat owners of multi-apartment buildings. Planned total amount of public financial support for the implementation of the measure is up to 166.5 MEUR, of which (i) ERDF co-financing – 141.5 MEUR, and (ii) national (state budget) public financing - 25 MEUR. The financial assistance is provided in the following forms: (1) subsidy (grant), including consultancies and overall programme management – up to 134.5 MEUR, (2) repayable low-interest loan, (3) guarantee for the loan, the latest two instruments in total up to 32 MEUR42. Including also contribution of beneficiaries, the total amount of financing for the measure is evaluated up to 301 MEUR.
Programmes for Industrial Buildings and Technologies
Investment Support in Industrial Buildings and Technologies Energy Efficiency to Reduce GHG emissions was important focus of national CCFI. Starting from 2010 until June (including) 2015 it was implemented the projects of 6 open tenders of CCFI, namely, “Complex Measures to Reduce GHG Emissions in Industrial Buildings” and “Complex Measures to Reduce GHG Emissions: Tenders No1-5”. It was eligible energy efficiency investments of different kind both in buildings and technological equipment, installation of efficient lightning as well as heat supply switch from fossils to RES and installation of RES based heat supply systems (up to 3 MW). In addition to industry sector, the enterprises of tertiary sector (selected NACE codes) were eligible as well. The total co-financing, provided by the CCFI within all noted above tenders, were ~ 31.65 MEUR43, total eligible costs – more than 60 MEUR. The CCFI 2016 annual monitoring report states ~ 49 thousand tons of annual CO2 savings.
Efficient use of energy resources, reduction of energy consumption and transfer to RES in manufacturing industry: 2014-2020 EU Funds planning period. Development of new, innovative energy-saving technology, measures increasing energy efficiency and share of RES is supported within the framework of the national Operational Programme “Growth and Employment”, Thematic Objective No.4 “Supporting the shift towards a low-carbon economy in all sectors”, the Specific Objective 4.1.1. “To promote efficient use of energy resources and reduction in energy consumption in the manufacturing
40 Cabinet of Ministers Regulations No 272 (05.04.2011) Regarding the 9th and 10th Open Tender „Improvement of Heat Insulation of Multi-Apartment Residential Buildings” Financed by the National Operational Programme “Infrastructure and Services” Activity 3.4.4.1 ( Noteikumi Nr.272 „Noteikumi par darbības programmas „Infrastruktūra un pakalpojumi” papildinājuma 3.4.4.1. aktivitāti „Daudzdzīvokļu māju siltumnoturības uzlabošanas pasākumi” projektu iesniegumu atlases devīto un desmito kārtu”), in force 20 April 2011. Actual consolidated version in Latvian available at http://likumi.lv/doc.php?id=228846 41 ME (2016). Report on the progress achieved in 2014 towards implementing national energy efficiency targets for the year 2020 pursuant to Article 24(1) and Section 1 of Annex XIV to Directive 2012/27/EU, available at: https://ec.europa.eu/energy/sites/ener/files/documents/Latvia%202016%20Energy%20Efficiency%20Annual%20Report%20EN.pdf 42 Cabinet of Ministers Regulations No160 (15.03.2016) Regarding the 4.2.1.1. specific target “Energy Efficiency Measures in Residential Buildings” of the Specific Objective No4.2.1 “To increase energy efficiency in public and residential buildings” of the Operational Programme “Growth and Employment (Noteikumi “Darbības programmas “Izaugsme un nodarbinātība” 4.2.1 specifiskā atbalsta mērķa “Veicināt energoefektivitātes paaugstināšanu valsts un dzīvojamās ēkās” 4.2.1.1. specifiskā atbalsta mērķa “Veicināt energoefektivitātes paaugstināšanu dzīvojamās ēkās “ 43 Ministry of Environmental Protection and Regional Development (MEPRD, June 2015). “Informative Report on the Results of the Climate Change Financial Instrument Operation in Year 2015” (Informatīvais ziņojums “Par Klimata pārmaiņu finanšu instrumenta darbību 2015.gadā), in Latvian, available at http://varam.gov.lv/lat/darbibas_veidi/KPFI/likumd/

87
industry sector” 44(sections 292-304). The manufacturing industry is corresponding to the part C (except C12 – tobacco production) of NACE 2 version. The target group are both small (micro), small, medium and large enterprises. The maximum intensity of support is 30%. Planned total amount of financial support by Cohesion Fund (CF) ~25.75 MEUR.
Investments Support Programme to Improve Energy Efficiency in Food Processing Enterprises. In 2014-2020 EU Funds planning period (implementation 2017-2022 including) the support is provided within the framework of the Measure 04.2 “Investments” of the national Rural Development Programme 2014-2020, financially supported by EAFRD. The total planned amount of investment support constitute ~ 80 MEUR, of which 11.388 MEUR (total public + private investment envisaged 28.346 MEUR) is directly planned to improve energy efficiency of food processing enterprises and agriculture sector in general. Other investments may bring energy efficiency improvements indirectly as well. The support might be used also for implementation of RES technologies45 in the enterprise.
Programmes for Public Sector
Investment Support Programmes in Public Sector Energy Efficiency had been important focus of national CCFI and were implemented in the period 2010-June 2015. The 8 open tenders were implemented, namely, (1) “Energy Efficiency Measures in Municipal Buildings”, (2) “Complex Measures to Reduce GHG Emissions in Municipal Buildings”, (3) “Energy Efficiency Measures in Higher Educational Institutions Buildings “, (4) “Complex Measures to Reduce GHG Emissions in Municipal and State Professional Educational Buildings”, (5) “Complex Measures to Reduce GHG Emissions: Tenders No.2-5”, (eligible within (5) - education, health care sector and culture sector buildings). Eligible investments included energy efficiency investments in a building envelope, in building heating and lightning systems and heat supply switch to RES (up to 3 MW) technologies. Minimum threshold requirements for energy consumption after renovation has been stated 90-100 (depending on the particular tender) kWh/m2/year. The total financial support provided by CCFI, summing up all noted above tenders, constituted ~ 114.6 MEUR (beneficiary must cover not less than 15% of total eligible costs of the project), the contracted annual CO2 savings ~ 48 thousand tons. The CCFI 2015 and 2016 Monitoring Reports indicate that monitored savings for the whole programme are around 14% higher contracted savings. In addition, a particular CCFI programme “Reduction of GHG emissions in Municipal Public Territories Lightning Infrastructure” had been targeted to improve efficiency of public (outdoor) territories lighting. The total support provided by CCFI within the four tenders of this programme constituted 10.5 MEUR46, the contracted annual CO2 savings ~ 4 thousand tons. Thus, the total annual CO2 savings in public sector, resulting from CCFI investments, is ~ 58 thousand tons46.
Increasing Energy Efficiency in Municipal Buildings: EU Funds planning period 2014-2020. Increasing of energy efficiency in public buildings of local governments is supported within the framework of the Operational Programme “Growth and Employment”, Thematic Objective No.4 “Supporting the shift towards a low-carbon economy in all sectors”, the Specific Objective 4.2.2. “To facilitate the increase of energy efficiency in municipal buildings, according to the integrated development programme of the municipality”47 (sections 312-316). The programme’s total planned financing is at least 55.29 MEUR, of which ERDF co-financing 46.996 MEUR and state budget subsidies & municipal budgets 8.293 MEUR48. The ERDF maximal contribution is 85% of project’s total eligible costs.
44Ministry of Finance. Operational Programme “Growth and Employment 2014-2020”. Latvia, http://www.esfondi.lv/upload/Planosana/FMProg_270115_OP_ENG_2.pdf 45 except investments for energy/fuel production using biomass of agriculture sector or forestry origin, as this support is stated under other investment priority of the Rural Development Programme. 46 Ministry of Environmental Protection and Regional Development (MEPRD, June 2015). “Informative Report on the Results of the Climate Change Financial Instrument Operation in Year 2015” (Informatīvais ziņojums “Par Klimata pārmaiņu finanšu instrumenta darbību 2015.gadā), in Latvian, available at http://varam.gov.lv/lat/darbibas_veidi/KPFI/likumd/ 47Ministry of Finance. Operational Programme “Growth and Employment 2014-2020”. Latvia, available at http://www.esfondi.lv/upload/Planosana/FMProg_270115_OP_ENG_2.pdf 48 Cabinet of Ministers Regulations No 152 (24.03.2016) Regarding the 4.2.2. Specific Objective “To Facilitate the Increase of Energy Efficiency and Utilisation of Renewable Sources in Municipal Buildings, According to the Integrated Development Programmes of Municipalities” of the Operational Programme “Growth and Employment” (Noteikumi Nr152 “Darbības programmas “Izaugsme un nodarbinātība” 4.2.2 specifiskā atbalsta mērķa “Atbilstoši

88
Increasing Energy Efficiency in State (Central Government) Public Buildings: EU Funds planning period of 2014-2020. Increasing of energy efficiency in public buildings of central government is supported within the framework of the Operational Programme “Growth and Employment”, Thematic Objective No.4 “Supporting the shift towards a low-carbon economy in all sectors”, the Specific Objective 4.2.1. “To increase energy efficiency in public and residential buildings”49 (sections 306-311). The project’s costs are eligible, if it is reached: (1) at least 30% of heat energy savings, (ii) planned heat energy consumption for heating is not higher 90 kWh/1 m2/ year (in case, the building’s floors are 3.5 meters high (in average) this value is recalculated ), (iii) the minimum requirements of the Latvian Construction Standard “Thermotechnics of Building Envelopes” are fulfilled. The total public financing for the given programme is planned 115.127 MEUR, of which 97.858 MEUR provided by the ERDF and 17.269 MEUR provided by the state budget.
Investment Support Programmes on Energy Efficiency Measures to reduce GHG emissions: national Emissions Allowances Auctioning Instrument (EAAI). The revenues due to auctioning in 2012-2015 the ETS national Emissions Quotas (both Carbon Emissions Allowance (EAU) and Aviation Emissions Allowance (EUAA)) constitute in total 38.434 MEUR50, in 2016 revenues constituted 11.502 MEUR. The use of revenues has significant demonstration value. Currently two EAAI programmes are under implementation:
26 January 2016 the Cabinet of Ministers had adopted the Regulations No.69 on GHG emissions reduction by Low Energy Building51. It was approved 7 projects (implementation up to 2019 including) with EAAI co-financing of 23 MEUR52. In case of renovation of existing building, the building shall be at least 20 years old. The EAAI grant shall cover not higher than 85% of the project’s total eligible costs. The total costs of all approved projects is ~ 47 MEUR. Annual heat energy consumption for heating after implementation of the project is required not higher than 35 kWh/m2 for new building and not higher than 40 kWh/m2 for renovation of existing buildings. Annual total energy consumption (heating, hot water, mechanical ventilation, cooling, lightning) for both cases is required not higher than 95 kWh/m2.
12 January 2016 the Cabinet of Ministers had adopted the Regulations No.35 on GHG emissions reduction by Energy Efficiency Improvements in Buildings which have the status of Architecture Monuments of State Significance53. It was approved 9 projects (implementation up to 2020) with EAAI co-financing of 8.868 MEUR54. The total costs of all approved projects is ~ 17 MEUR.
Reducing GHG emissions in following years: Strategy of EAAI. In 21 October the MEPRD had approved the “Strategy for the use of EAAI”55. According the Strategy, the revenues will be spent for financing: (1) Investment projects – 70% of total revenues, (2) Development of
pašvaldības integrētajām attīstības programmām sekmēt energoefektivitātes paaugstināšanu un atjaunojamo energoresursu izmantošanu pašvaldību ēkās” īstenošanas noteikumi). In force 24 March 2016, in Latvian,available at http://likumi.lv/doc.php?id=281111 . 49 Ministry of Finance. Operational Programme “Growth and Employment 2014-2020”. Latvia, available at http://www.esfondi.lv/upload/Planosana/FMProg_270115_OP_ENG_2.pdf 50 MEPRD. Annual Informative Reports “Use of Auctionings’ Revenues”, years 2012-2015 (ikgadējie Informativie ziņojumi “Par izsoļu ieņēmumu izmantošanu”, 2012-2015.gadi), available at http://varam.gov.lv/lat/fondi/ekii/likumdosana/ 51 Cabinet of Ministers Regulations No 69 (26.01.2016) Regarding the Open Tender “Greenhouse Gas Emissions Reduction – Low Energy Buildings” for the Projects Financed by the Emissions Quotas Auctioning Instrument (Noteikumi Nr. 69 (2016) “Emisijas kvotu izsolīšanas instrumenta finansēto projektu atklāta konkursa "Siltumnīcefekta gāzu emisiju samazināšana – zema enerģijas patēriņa ēkas" nolikums), in force 13 February 2016, in Latvian, available at http://likumi.lv/ta/id/280234 52 One new low energy building - new Musical Secondary School with the function of concerthall, in Ventspils city (project’s total eligible costs 17.647
MEUR, EAAI financing 15 MEUR), and six renovations (3 schools, 2 culture centres, library) to low energy buildings criteria (projects’ total eligible costs 10.7 MEUR, total EAAI financing 7.999 MEUR). 53 Cabinet of Ministers Regulations No35 (12.01.2016) Regarding the Open Tender “Greenhouse Gas Emissions Reduction in Buildings which are Architectural Monuments of State Significance” for the Projects Financed by the Emissions Quotas Auctioning Instrument” (Noteikumi Nr. 35 (2016) “ Emisijas kvotu izsolīšanas instrumenta finansēto projektu atklāta konkursa "Siltumnīcefekta gāzu emisiju samazināšana valsts nozīmes aizsargājamos arhitektūras pieminekļos), in force 30 January 2016, in Latvian, available at http://likumi.lv/ta/id/279830 54 Two large scale projects (projects’ total eligible costs 7.546 MEUR, total EAAI financing 6 MEUR) and seven small scale projects (projects’ total eligible
costs 3.631 MEUR, total EAAI financing 2.868 MEUR). 55 MEPRD. Order No 265 (21 October 2016) “Strategy for the Use of Emissions Quota Auctioning Instrument” (“Emisijas Kvotu izsolīšanas instrumenta darbības stratēģija”), in Latvian, available at http://varam.gov.lv/lat/fondi/ekii/likumdosana/

89
technologies and processes – 5% of total revenues, (3) Initiatives projects – 20% of total revenues, (4) Administrative costs – 5% of total revenues.
As indicative EAAI programmes for investments it is stated:
GHG emissions reduction by applying urban technologies
GHG emissions reduction in production processes, by providing recovering and re-use of energy,
GHG emissions reduction by RES utilising microgeneration technologies in households
Technologies and solutions for climate change adaptation
The Initiatives projects are targeted to reduce GHG emissions by changing consumption behaviour and lifestyle without additional investments. The beneficiary shall calculate the GHG emissions baseline and prove the perspective for GHG emissions reduction. The fixed price for 1 CO2 eq ton will be fixed in the Cabinet of Ministers Regulations regarding the Open tender for the Initiatives projects, the beneficiary will receive the grant for each ton of proved emissions reduction.
Programmes to Promote Production of Energy from Biomass in Agriculture sector
In EU Funds planning period of 2007-2013 (implementation finished 2015) the support to energy production from biogas was provided for the agriculture sector business entities & service co-operatives by national Rural Development Programme, co-financed by European Agriculture Fund for Rural Development (EAFRD), as the sub-measure 312(311)/3. The support was provided to develop the production of electricity in CHP mode by utilising biogas fermented in anaerobic processes from biomass of agriculture and forestry sector origin. The measure was directly focused to increase RES electricity in national electricity supply – at least 51% of electricity produced shall be sold (utilised outside the beneficiary’s own production premises). To provide strong synergy effect with by-products and waste processing of agriculture sector, Regulations of the Cabinet of Ministers56 No.696, defining the procedure of support, had stated that at least 50% (basic version of Regulations) or 70% (2011 Amendments of the Regulations) of the raw materials required for biogas production have to be provided by beneficiary’s own farm; 2011 Amendments also had stated that at least 30% of raw materials for fermentation of biogas should be provided by the by-products of animal origin and derived products. In 2015 and 2016, 49 biogas plants in agriculture sector, with total electric capacity of ~50MWel had been under operation in Latvia57. These stations had sold in 2016, within the procedure of mandatory procurement and preferential feed-in tariffs, to the national grid ~322 GWh (1.16 PJ) renewable electricity.
In 2014-2020 EU Funds planning period (implementation 2017-2022 including) the financial support is stated within the framework of the Measure 06 “Farm and business development by supporting the non-agriculture activities”, Activity 6.4.1 of the national Rural Development Programme 2014-2020 58 financially supported by the EAFRD. It is stated that (i) beneficiary biogas plant shall operate in CHP mode and shall utilise at least 70% of the produced heat (to provide own production or shall be sold to other business entities), (ii) at least 70% of raw products for fermentation should be provided by the by-products of beneficiaries farm, like manure, waste and residue of food production and processing. The
56 Cabinet of Ministers Regulations No 696 Regarding the State and EU financial support for the activity “Support for business entities establishment and development (including diversification of non- agriculture related activities)”, sub-activity “Energy production from biomass of agriculture and forestry origin” (adopted 25 August 2008, in force 11 September 2008 – 27 March 2010), in Latvian, available at http://www.likumi.lv/doc.php?id=180818. 57 ME. Information regarding mandatory procurement of electricity: Feed-in payments 2015 (Informācija par izdotajiem lēmumiem par elektroenerģijas obligāto iepirkumu: komersantiem 2015 .gadā obligātā iepirkuma ietvaros izmaksātās summas), in Latvian, available at https://www.em.gov.lv/lv/nozares_politika/atjaunojama_energija_un_kogeneracija/informacija_par_izdotajiem_lemumiem_par_elektroenergijas_obligato_iepirkumu/. 58 Rural Development Programme for Latvia 2014-2020 (Latvijas Lauku Attīstības Programma 2014-2020.gadam), actual version of 17.August 2016 in Latvian, available at https://www.zm.gov.lv/zemkopibas-ministrija/statiskas-lapas/latvijas-lauku-attistibas-programma-2014-2020-gadam-?id=6426#jump

90
total amount of public allocations is planned 16 MEUR, of which share of EAFRD – 10.880 MEUR, and it is envisaged at least 45.7 MEUR total investments (public + private).
Programme for Renewable Technologies for Heat and Electricity Production to Reduce GHG emissions: national CCFI
The support for installation of RES technologies of different type for both heat, electricity and CHP production (the capacity of one RES unit - up to 3 MW) was provided in years 2010-2012 from the revenues of the GHG emissions trading under procedures pursuant to the Article 17 of the UNFCCC Kyoto Protocol The eligible beneficiaries were both energy producing entities, business sector entities (operators participating in EU ETS were non-eligible) and public sector institutions. It was implemented 2 open tenders “Technology switch from fossil to renewable energy sources” and “Utilisation of renewable energy sources for GHG emissions reduction” supervised by MEPRD. The total support provided by the CCFI for these tenders constituted 18.567 MEUR59, the contracted CO2 emissions savings ~ 90 thousand tons annually.
4.3.1.3 Fiscal policies and measures
Fuel taxation
Articles 5&14 of the Law “On Excise Duties”60,61 determine the rates of duty for mineral oils and their substitutes utilised for heat production. The actual rates are: (i) fuel oil with the colorimetric index equal or above 2.0 and kenematic viscosity at 50oC equal or above 25 mm2/s – 15.65 EUR/ton; (2) kerosene, diesel (gas oil) and fuel oil (with the colorimetric index below 2.0 and kenematic viscosity at 50oC below 25 mm2/s) as well as oil products and lubricants waste utilised as fuel for heat production – 56.91 EUR /ton. The exempt is made for the oil products utilised for electricity production and for production in combined heat-power mode. The reduced tax rate (21.34 EUR/ton) is applied for oil products with at least 5% mix of rapeseed oil or biodiesel, produced in Latvia or imported from EU member state, zero rate is applied for pure biodiesel. The oil gasses and other hydrocarbons if utilised by private persons as fuel or in gas furnaces (not as the transport fuel) is exempted from the duty as well. Articles 61& 151 of the Law “On Excise Duties” determine the rates of duty for natural gas utilised for energy production. The taxation was in force 01.01.2010-31.08.2010 and has been re-introduced from 01.07.2011. Currently the differentiated rates are applied. The general rate is 1.65 EUR per 1 MWh (the highest calorific value). The reduced (33%, 0.55 EUR/1 MWh) rate is applied for natural gas utilised as fuel for industrial production processes as well as other processes related to production, for providing necessary climate conditions in production premises, for enterprises placed in industrial parks. The exemption is applied for natural gas utilised in agriculture sector for providing heat for greenhouses, industrial scale henhouses/sheds and incubators The exemption from taxation is stated also for: (i) natural gas utilised for other purposes (not as fuel or transport fuel) or utilised in two ways (including processes of chemical reduction, electrolytic and metallurgy processes), (ii) amount of natural gas used by the operator of natural gas transmission, storage and distribution system for the technological needs of natural gas supply (including losses during supply), (iii) natural gas utilised in mineralogy processes.
Natural Resources Tax Law
The procedure of taxation applicable for coal, coke and lignite is prescribed by the Natural Resources Tax Law, Annex 9. The taxation on coal utilisation was introduced starting from the 1st January 2007; the actual rate is 0.35 EUR/GJ or 9.80 EUR/ 1 ton if information of specific heating value is not available,
59 The support rate constituted up to 35-65% of project's total eligible costs for energy producing entities and business sector entities depending on the size of the entity and up to 75% - for public sector institutions). 60 For transport fuel taxation see below, in Transport chapter 61 Law “On Excise Duties” (Likums “Par akcīzes nodokli”), in Latvian, available at http://likumi.lv/doc.php?id=81066

91
after 2019 the slight increase will be in force, respectively 0.38 EUR/GJ or 10.65 EUR/ton. The exemption is stated for coal utilised for electricity production and combined heat-power production.
Taxation applicable for the use of water for electricity production in hydropower plants (HPP) is prescribed by the Natural Resources Tax Law. This type of taxation has been introduced from 1st January 2014. In the period 01.01.2014-31.12.2016 this tax was applied for HPP with the capacity below 2 MW. From 01.01.2017 the tax is applied for all HPP. The current rate is 0.00853 EUR per 100 m3 water flow through the hydrotechnical construction.
Extraction of local natural resources utilised for primary energy production. In relation to Latvia energy sector the tax rate for peat extraction may be considered, defined by Annex 1 of the Natural Resource Tax Law. The actual rate from the 1st January 2014 is 0.55 EUR per 1 ton of peat with moisture 40%. However, peat utilisation for energy production in Latvia is very minimal.
Taxation applicable for the use of geological structures as underground natural gas storage. The procedure of taxation is prescribed by the Natural Resources Tax Law. The following tax rate are applied - 0.0143 EUR for pumped 100 m3 of natural gas.
Taxation applicable for electricity
The procedure is prescribed by the Electricity Tax Law62. The actual rate is 1.01 EUR/MWh. According the Law, electricity supplied to an end user, as well as electricity, which is supplied for own consumption (exemption stated), shall be taxable. Taxpayers shall be both the entities who supply electricity to end users and have entered into contracts or otherwise agreed regarding the supply (selling) of electricity, and autonomous producers63. The taxpayers shall be also end-users which purchase electricity in electricity spot exchange.
The following tax exemptions had been made for the electricity by the basic version of the Law (Article 6).
obtained from (i) renewable energy resources, (ii) in hydro power stations; (iii) in CHP stations complying with the efficiency criteria specified in the regulatory enactments regarding the generation of electricity through the process of cogeneration.
used for the following purposes: (i) electricity generation, (ii) the generation of heat energy and electricity in CHP mode, (iii) the carriage of goods and public carriage of passengers, including on rail transport and in public carriage of passengers in towns, (iv) household users, (v) street lighting services.
The Amendments of the Law, in force from 01 January 2017, had cancelled the most part of tax exemptions stated above. According these Amendments only three exemptions are still in force:
the carriage of goods and public carriage of passengers, including on rail transport and in public carriage of passengers in towns,
household users,
street lighting services.
4.3.1.4 Information and Education measures
The particular CCFI programme “Promotion Understanding on the Importance and Possibilities of GHG Emissions Reduction” was implemented in years 2010-2013. The financial support was available for publications in mass media for both general and targeted audiences, thematic broadcasts, thematic workshops, trainings for targeted audience groups, educational projects for pupils and students of Latvia primary, general and professional educational institutions. The beneficiaries were registered in Latvia
62 Electricity Tax Law (Elektroenerģijas nodokļa likums), in Latvian, available at http://www.likumi.lv/doc.php?id=150692 63 The exemption is done for the autonomous producers, who generate and consume electricity for their own needs and fulfil the following requirements: the total generation capacity does not exceed 2 MW, and energy resources taxable with excise duty, coal taxable with the nature resource tax or electricity taxable with the electricity tax is used for the generation of the electricity.

92
mass media, broadcast organizations, NGO, foundations, municipal or regional energy agencies, higher educational institutions. The total support provided by CCFI was 0.753 MEUR 64 , 22 information/education/training projects were implemented.
In years 2015-2016 the promotion of public understanding on the importance and possibilities of GHG emissions reduction has been supported by the programme “National Climate Policy” of the EEA Financial Mechanism for years 2009-2014. The following activities have been supported: (1) education/training programmes for professional audiences, municipal specialists and teachers, (2) education modules for vocational secondary education programmes and professional education programmes of high (graduate) schools, (3) educational activities and actions for pupils of primary, general secondary and vocational education schools, (4) information campaigns and public actions in mass media, websites, radio. In addition to it, the financing has been also allocated to support research projects related to climate change, important, these projects also had significant information component. As a result of the open tender it was approved in total 18 projects. The contracted EEA financial support for these projects constituted ~ 1.85 MEUR. In addition, within the large scale projects’ programme it was supported the low energy buildings (5 projects with the total EEA support of 4.454 MEUR). The measure has important demonstration value.
Energy Audits of Residential Multi-apartment buildings
The objective of the measure is more efficient use of final energy, reducing energy loss and emissions by providing recommendations for increasing energy efficiency. Currently the financial support (this support is defined by the municipal by-laws issued pursuant to the Section 27.2 “Assistance in the Renovation and Restoration of Residential Housing” of the Law “On Assistance in Solving Apartment Matters”) is provided by a number of municipalities to provide necessary documentation for the application within the described above Programme for Energy Efficiency in Household sector: Apartment Buildings, 2014-2020 planning period. In the 2007-2013 programming period of EU Funds, the financial support for energy auditing of multi-apartment buildings had been provided also by the ERDF, namely, within the framework of the eligible costs provided for renovation works, the financing was provided also for energy audit and preparation of construction works’ technical documentation as the first stage of full renovation project.
Informing Energy Consumers of Residential Sector (Multi-apartment buildings)
Currently the implementation of the 2014-2020 planning period of EU Funds is on-going. Informative and technical support for multi-apartment buildings renovation are provided by the informative campaign/programme “Let’s live warmer!” applying wide scope of methods to reach target groups of owners of apartments and apartment owners’ associations, building managers, building contractors, producers and sellers of building materials. The programme’s continuation is based on wide experience obtained in the previous EU Funds planning period. In 2013 the Latvian campaign “Let’s Live Warmer” received the EU Sustainable Energy Weak Winner Award in the category “Communicating”, in 2015 the campaign was announced as the national winner of Energy Globe Award.
Labelling
The transposition of the requirements of the Directive 2009/125/EC into Latvia national legislation has been done by the Cabinet of Ministers Regulations No.941 65 , in force 15 December 2011. The transposition of the requirements of the Revised Directive on Labelling and standard product information of Energy Related Products (2010/30/EU) into Latvia national legislation has been done by the Cabinet
64 Ministry of Environmental Protection and Regional Development (MEPRD, June 2015). “Informative Report on the Results of the Climate Change Financial Instrument Operation in Year 2015” (Informatīvais ziņojums “Par Klimata pārmaiņu finanšu instrumenta darbību 2015.gadā), in Latvian, available at http://varam.gov.lv/lat/darbibas_veidi/KPFI/likumd/ 65 Cabinet of Ministers Regulations No.941 (06.12.2011) Regarding Ecodesign Requirements for Energy-Related Products” (Noteikumi Nr.941 “Noteikumi par ekodizaina prasībām ar enerģiju saistītām precēm (produktiem“), in force 15 December 2011, in Latvian, available at http://likumi.lv/doc.php?id=241282

93
of Ministers Regulations No.480 66 in force 20 July 2011. Thus the legislative framework for the harmonised national measures on end-user information, particularly by means of labelling and standard product information, on the consumption of energy and where relevant of other essential resources during products’ use, and supplementary information concerning energy-related products, thereby allowing end-users to choose more efficient products is established in Latvia. Taking into account that the requirements stated by the EC Delegated Regulations shall be implemented directly, to avoid unnecessary overlapping of normative documents, a number of national legislative documents regarding labelling of household appliances had been stated as expired.
4.3.1.5 Voluntary negotiated measures
To co-operate with industrial/business sector and other actors, e.g., municipalities, the Cabinet of Ministers had adopted in July 2011 the Regulations No.555 for signing the voluntary agreements67 e.g., the State might specify subsidies for industrial/business sector actors for energy audits and individual energy efficiency improvement measures implemented in accordance with these agreements, or to provide for municipalities the methodological support in designing their sustainable energy action plans, which may include the offer of suitable models, training on the application of the models and data aggregation, energy audit support programmes, etc. As the Energy Efficiency Law has entered into force, in 11 October 2016 the Cabinet of Ministers adopted the new Regulations No.669 “Procedure for Entering into and Supervision of Energy Efficiency Improvement Agreements”68. The agreement shall have the target – at least 10% of energy efficiency improvement. The achievement of the energy savings target shall be justified by the energy efficiency action plan. An agreement shall be entered into for a time period of not shorter five years.
Information regarding mitigation actions and their effects in Energy sector is summarized in Table 4.2.
66 Cabinet of Ministers Regulations No 480 (21.06.2011) Regarding Labelling of Energy and Other Resources Consumption Related Products as well as Their Advertisment and Supervision (Noteikumi Nr.480 „Noteikumi par kārtību, kādā tiek marķētas preces, kas saistītas ar enerģijas un citu resursu patēriņu, kā arī to reklāmu un uzraudzību”), in force 20 July 2011, in Latvian, available at http://likumi.lv/doc.php?id=232553 67 Cabinet of Ministers Regulations No555 (12 July 2011) Regarding the Procedure for Entering into and Supervision of Energy Efficiency Improvement Agreements” (Noteikumi par kārtību, kādā noslēdz un pārrauga vienošanos par energoefektivitātes paaugstināšanu), issued pursuant to the Section 12 of the Energy End-Use Efficiency Law (Enerģijas galapatēriņa efektivitātes likums), in force 15.07.2011-31.10.2016, in Latvian, available at http://likumi.lv/doc.php?id=233052 68 Cabinet of Ministers Regulations No 669 (11 October 2016 ) “Procedure for Entering into and Supervision of Energy Efficiency Improvement Agreements” (Kārtība, kādā noslēdz un pārrauga brīvprātīgu vienošanos par energoefektivitātes uzlabošanu), , issued pursuant to Section 8.3 of Energy Efficiency Law, in force 01.11.2016, in Latvian, available at http://likumi.lv/ta/id/285879

94
Table 4.2 Information on mitigation actions and their effects in Energy sector
Name of mitigation action Objective and/or activity affected Type of
instrument Status of
implementation Implementing entity
Estimate of mitigation impact,
kt CO2 eq. 2020 2025 2030
Investment Support Programme for District Heating (DH) Systems: 2007-2013 EU Funds programming period
Increase in renewable energy; Efficiency improvement in the energy and transformation sector
Economic
Implemented
Ministry of Economics
390.00 300.00 150.00
Energy Efficiency Requirements for District Heating Systems
Reduction of energy losses Regulatory
Adopted
Ministry of Economics NE NE NE
Investment Support Programme in Renewable Technologies for Heat and Electricity Production to Reduce GHG emissions
Increase in renewable energy deployment
Economic Implemented Ministry of Environmental Protection and Regional Development
99.00 99.00 65.00
Investment Support to Produce Energy from Biomass of Agriculture and Forestry Origin: 2007-2013 EU Funds programming period
Increase in renewable energy; Improved animal waste management systems (Agriculture)
Economic Implemented Ministry of Agriculture 69.30 69.30 69.30
Investment Support to Produce Energy from Biomass of Agriculture Origin: 2014-2020 EU Funds programming period
Increase in renewable energy; Improved animal waste management systems (Agriculture)
Economic Planned Ministry of Agriculture 12.00 21.00 21.00
Investment Support Programmes to Increase Energy Efficiency in Apartment Buildings: 2007-2013 EU Funds Programming Period
Efficiency improvements of buildings
Economic Implemented Ministry of Economics 43.00 43.00 43.00
Energy Performance of Buildings Efficiency improvements of buildings
Regulatory Implemented Ministry of Economics IE IE IE
Energy management systems (EMS) in commercial and public sector
Efficiency improvement in industrial, commercial and municipal end-use sectors
Regulatory, Voluntary Agreement
Implemented Ministry of Economics NE NE NE
Energy Audits of Residential Multi-apartment buildings
Efficiency improvements of buildings
Information, Fiscal
Implemented Ministry of Economics IE IE IE
Informing Energy Consumers of Residential Sector (Multi-apartment buildings)
Efficiency improvements of buildings; Efficiency improvement of appliances
Information Implemented Ministry of Economics IE IE IE
Financial Support (Grants) for Renewable Energy Technologies deployment in Households
Increase in renewable energy Economic Implemented Ministry of Environment Protection and Regional Development
15.00 15.00 5.00
Investment Support Programmes in Public Sector Energy Efficiency
Efficiency improvement in services/ tertiary sector; Increase in
Economic Implemented Ministry of Environment Protection and Regional
54.00 54.00 54.00
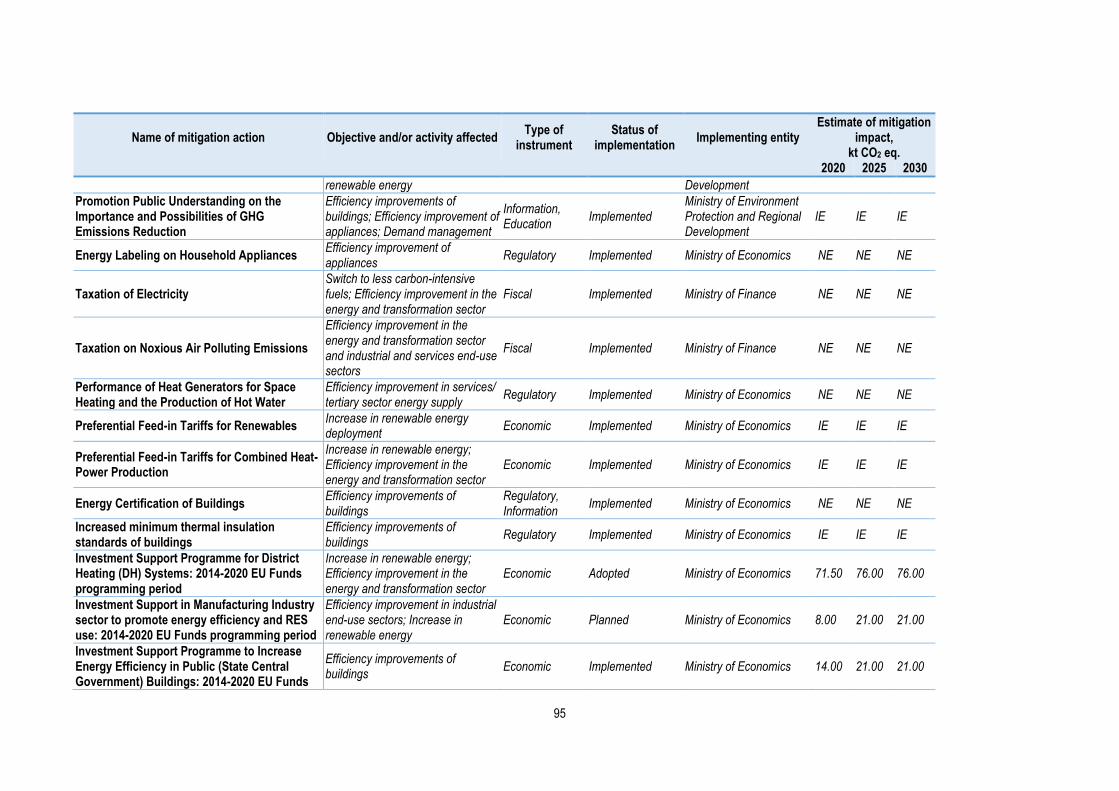
95
Name of mitigation action Objective and/or activity affected Type of
instrument Status of
implementation Implementing entity
Estimate of mitigation impact,
kt CO2 eq. 2020 2025 2030
renewable energy Development
Promotion Public Understanding on the Importance and Possibilities of GHG Emissions Reduction
Efficiency improvements of buildings; Efficiency improvement of appliances; Demand management
Information, Education
Implemented Ministry of Environment Protection and Regional Development
IE IE IE
Energy Labeling on Household Appliances Efficiency improvement of appliances
Regulatory Implemented Ministry of Economics NE NE NE
Taxation of Electricity Switch to less carbon-intensive fuels; Efficiency improvement in the energy and transformation sector
Fiscal Implemented Ministry of Finance NE NE NE
Taxation on Noxious Air Polluting Emissions
Efficiency improvement in the energy and transformation sector and industrial and services end-use sectors
Fiscal Implemented Ministry of Finance NE NE NE
Performance of Heat Generators for Space Heating and the Production of Hot Water
Efficiency improvement in services/ tertiary sector energy supply
Regulatory Implemented Ministry of Economics NE NE NE
Preferential Feed-in Tariffs for Renewables Increase in renewable energy deployment
Economic Implemented Ministry of Economics IE IE IE
Preferential Feed-in Tariffs for Combined Heat-Power Production
Increase in renewable energy; Efficiency improvement in the energy and transformation sector
Economic Implemented Ministry of Economics IE IE IE
Energy Certification of Buildings Efficiency improvements of buildings
Regulatory, Information
Implemented Ministry of Economics NE NE NE
Increased minimum thermal insulation standards of buildings
Efficiency improvements of buildings
Regulatory Implemented Ministry of Economics IE IE IE
Investment Support Programme for District Heating (DH) Systems: 2014-2020 EU Funds programming period
Increase in renewable energy; Efficiency improvement in the energy and transformation sector
Economic Adopted Ministry of Economics 71.50 76.00 76.00
Investment Support in Manufacturing Industry sector to promote energy efficiency and RES use: 2014-2020 EU Funds programming period
Efficiency improvement in industrial end-use sectors; Increase in renewable energy
Economic Planned Ministry of Economics 8.00 21.00 21.00
Investment Support Programme to Increase Energy Efficiency in Public (State Central Government) Buildings: 2014-2020 EU Funds
Efficiency improvements of buildings
Economic Implemented Ministry of Economics 14.00 21.00 21.00
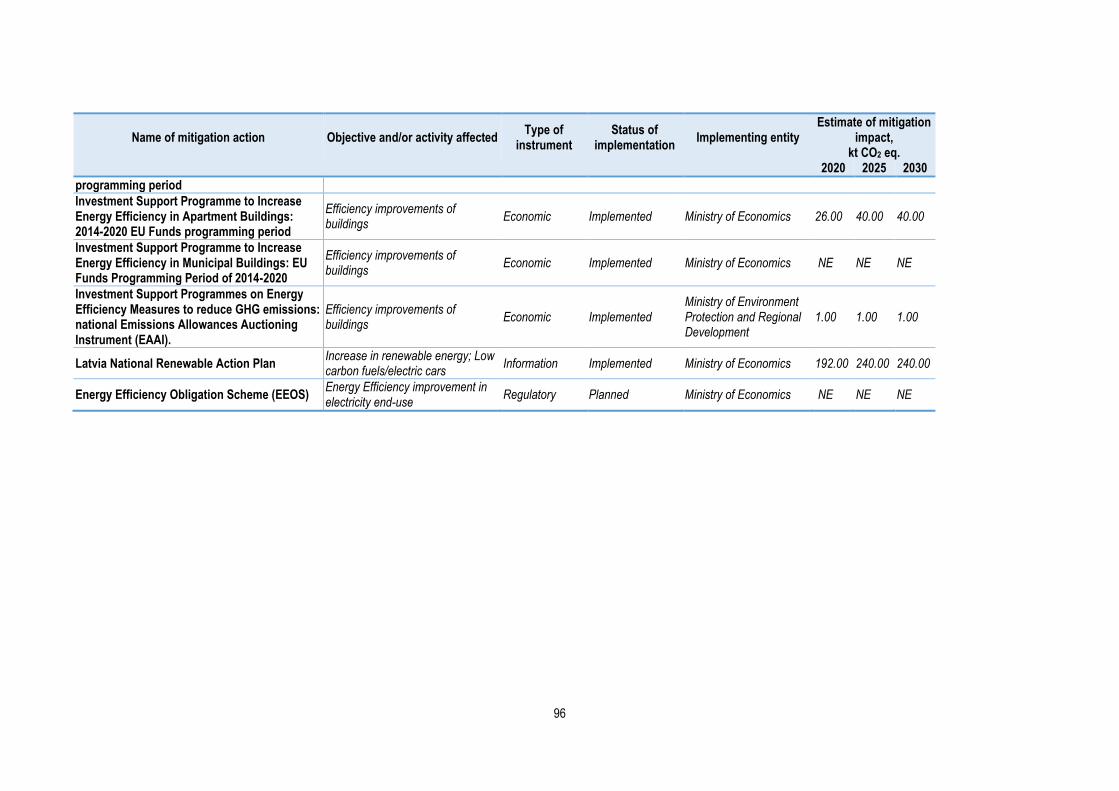
96
Name of mitigation action Objective and/or activity affected Type of
instrument Status of
implementation Implementing entity
Estimate of mitigation impact,
kt CO2 eq. 2020 2025 2030
programming period
Investment Support Programme to Increase Energy Efficiency in Apartment Buildings: 2014-2020 EU Funds programming period
Efficiency improvements of buildings
Economic Implemented Ministry of Economics 26.00 40.00 40.00
Investment Support Programme to Increase Energy Efficiency in Municipal Buildings: EU Funds Programming Period of 2014-2020
Efficiency improvements of buildings
Economic Implemented Ministry of Economics NE NE NE
Investment Support Programmes on Energy Efficiency Measures to reduce GHG emissions: national Emissions Allowances Auctioning Instrument (EAAI).
Efficiency improvements of buildings
Economic Implemented Ministry of Environment Protection and Regional Development
1.00 1.00 1.00
Latvia National Renewable Action Plan Increase in renewable energy; Low carbon fuels/electric cars
Information Implemented Ministry of Economics 192.00 240.00 240.00
Energy Efficiency Obligation Scheme (EEOS) Energy Efficiency improvement in electricity end-use
Regulatory Planned Ministry of Economics NE NE NE

97
4.3.2 Transport
4.3.2.1 Regulatory measures
Biofuel Mix Obligation Requirement
To ensure efficient growth of the share of RES in the transport sector, the mandatory 4.5-5% volume of bioethanol mix for the gasoline of “95” trademark and mandatory 4.5-5% volume of biodiesel mix for the diesel fuel69 were introduced as from October 1, 2009 according to Regulations of the Cabinet of Ministers No.64870 (Art.8.1 and 9.1).
Mandatory annual systematic inspection of technical conditions of motor vehicles
It is providing exploitation of transport vehicles in accordance with the technical requirements and in compliance with emissions limits. Only vehicles that comply with technical and environmental requirements are being allowed to take part in road transport.
Public Procurement: Promotion of clean and energy efficient road transport
The Directive 2014/24/EU on Public procurement, the Directive’s 2012/27/EU on energy efficiency legal norms regarding public procurement, the Directive’s 2009/33/EC on promotion of clean and energy-efficient road transport vehicles and the Directive’s 2014/25/EU on procurement by entities operating in the water, energy, transport and postal services sectors legal norms regarding procurements in the field of road transport are transposed in Latvia by Public Procurement Law.
Amendments to the Section 17.3. of the Public Procurement Law71 entered into force 29 March 2016 introduce the term “energy efficiency”, thus adding it to the environmental protection and climate change mitigation provisions, in technical specifications for public supply and service contracts. These Amendments ensure that state direct management bodies procure energy efficient products and services (the new Section 46 “Special provisions in relation to energy efficiency” had been included and entered into force from 1st July 2016). In a new Public Procurement Law, in force 1st March 201772, these provisions are stated respectively in the Sections 20.4 and 55.
As new Public Procurement Law has come into force, the Cabinet of Ministers Regulations No.106 “Regulations on the road transport categories for the procurement of which the special requirements shall apply and the methodology for the calculation of the costs for the putting into service of the road transport referred” have come into force 1 March 2017 as well.
Amendments to the Section 18 of the Law on Public Transport Services (entered into force 29 March 2016) state that Public Transport Service Provider when purchasing road transport vehicles:
shall take into account the effect of the putting into operation thereof on energy and the environment, evaluating at least the energy consumption and the amount of the emission of carbon dioxide, nitric oxides, non-methane hydrocarbons and solid particles as well as economical substantiation of the full life-cycle of the vehicle,
may take into account, in addition to evaluation of energy consumption and emissions, also the possibility to operate the vehicle by the fuel having high biofuel mix (above 10%), by pure biofuel or by electric power, if such operation is technically possible and economically justified.
69 Including diesels of A-F categories, utilised in moderate climate conditions, exemption is made for artic diesels of 0-4 classes. 70 Cabinet of Ministers Regulations No. 648 “Amendments on the Cabinet of Ministers Regulations No332, 26 September 2000, “Requirements for Conformity Assessment of Petrol and Diesel Fuel” ( Noteikumi Nr.648 “Grozījumi Ministru kabineta 2000.gada 26.septembra noteikumos Nr.332 "Noteikumi par benzīna un dīzeļdegvielas atbilstības novērtēšanu"), adopted 25 June 2009, the articles 8.1 and 9.1 in force from 01 October 2009, in Latvian, available at http://likumi.lv/doc.php?id=194227 71 Public Procurement Law (Publisko iepirkumu likums) in force up to 29.02.2017, in Latvian, available at http://likumi.lv/doc.php?id=133536 72 Public Procurement Law (Publisko iepirkumu likums) in force from 01.03.2017, in Latvian, available at http://likumi.lv/ta/id/287760

98
4.3.2.2 Economic measures
Electromobility Development
To enhance the development of electromobility, the “Electromobility Development Plan for 2014-2016”73 set out specific support policy areas referring to the main elements: promotion, including purchase subsidies, of electric vehicles; application of reduced tax rates/tax allowances; construction of the fast charging station network, innovative products, as well as public education and information about electromobility.
In 2016 the MoT has elaborated the Alternative Fuels Development Plan 2017-2020, approved by Cabinet of Ministers Order No.202 in 25 April 2017.
Support for Electric Vehicles (EV) and EV Charging Infrastructure: 2014-2015, national CCFI
The national CCFI programme for CO2 emissions reduction in transport sector by supporting acquisition of new EV and installation of publicly available EV charging infrastructure had been implemented by the open tender announced in 2014. The support was provided only for “pure” EV (electric engine is the only one having zero GHG emissions). The beneficiaries were public institutions, derived public persons and registered in Latvia business entities. The projects had been implemented up to 31 March 2015. The total co-financing provided by CCFI constituted ~ 3 MEUR 74 . Within the programme it was supported acquisition of 174 EV and installation of 11 charging stations. In overall the CCFI contributed 55% in the total costs (5.4 MEUR) of the programme. CCFI 2016 monitoring report indicates 0.35 thousand tons of annual CO2 savings.
Electric Vehicles (EV) Charging Infrastructure Development: EU Funds Planning Period of 2014-2020
Development of EV charging infrastructure is supported within the framework of the national Operational Programme “Growth and Employment”, Thematic Objective No.4 “Supporting the shift towards a low-carbon economy in all sectors”, the Specific Objective 4.4.1. “To develop EV charging infrastructure in Latvia”75(sections 346-358). Investments are contributing in the fulfilment of requirements foreseen in the Directive on Deployment of Alternative Fuels Infrastructure (2014/94/EU) regarding electromobility. Investments are in line with priorities set up in “Electromobility Development Plan for 2014-2016” allowing to ensure single national level charging infrastructure coverage. Introduction of the network of EV charging points will promote energy efficient development of vehicle market, as a result of which the use of EVs in road transport will be promoted.
3 November 2015 the Cabinet of Ministers had adopted the Regulations No 637 on Development of Electric Vehicles Charging Infrastructure co-financed by the EU ERDF76. The responsible implementer of the measure – state stock company “Road Traffic Safety Directorate”. Activities supported: the creation of national EV charging infrastructure and the development of operator centre software for their management. Planned total amount of financial support – 8.344 MEUR, of which ERDF support – 7.092 MEUR, state budget – 1.252 MEUR. It shall be reached the following ERDF specific result and output indicator, target value in year 2023 indicated: (1) number of installed EV charging points - 150 points (direct current fast charging stations with capacity at least 50 kW), (2) registered number of electric vehicles in Latvia - 747 EVs.
73 Electromobility Development Plan for 2014-2016 (Elektromobilitātes attīstības plāns 2014.-2016.gadam), viewed by Cabinet of Ministers 4 February 2014, in Latvian, available at http://tap.mk.gov.lv/mk/tap/?pid=40304985 74 Ministry of Environmental Protection and Regional Development (MEPRD, June 2015). “Informative Report on the Results of the Climate Change Financial Instrument Operation in Year 2015” (Informatīvais ziņojums “Par Klimata pārmaiņu finanšu instrumenta darbību 2015.gadā), in Latvian, available at http://varam.gov.lv/lat/darbibas_veidi/KPFI/likumd/ 75Ministry of Finance. Operational Programme “Growth and Employment 2014-2020”. Latvia, available at http://www.esfondi.lv/upload/Planosana/FMProg_270115_OP_ENG_2.pdf 76 Cabinet of Ministers Regulation No 637 (03.11.2015) Regarding the 4.4.1. Specific Objective “To Develop the Electric Vehicles’ Charging Infrastructure of in Latvia” of the Operational Programme “Growth and Employment” (Noteikumi Nr152 “Darbības programmas “Izaugsme un nodarbinātība” 4.4.1 specifiskā atbalsta mērķa “Attīstīt ETL uzlādes infrastruktūru Latvijā” īstenošanas noteikumi), in force 11 November 2015, in Latvian, available at http://likumi.lv/doc.php?id=277693

99
Development the infrastructure of environmentally friendly public transport
In EU Funds Planning Period of 2014-2020 (implementation 2017-2022 including) development of the infrastructure of public transport (PT) are supported within the framework of the national Operational Programme “Growth and Employment”, Thematic Objective No.4 “Supporting the shift towards a low-carbon economy in all sectors”, the Specific Objective 4.5.1. “To develop the infrastructure of environmentally friendly public transport”. The use of PT is promoted by increase of number of environmentally friendly vehicles (buses) of PT and length of tram lines; the flow of passengers will direct from private transport to PT, decreasing the flow of road transport in cities. Thus, more effective urban transport infrastructure will be developed and emissions will be reduced. Investments are made in accordance with city development plans. Planned total amount of financial support: (1) for tram infrastructure development ~ 113 MEUR, of which Cohesion Fund support 96 MEUR and national financing at least ~ 17 MEUR, (2) for environmental friendly buses ~ 14.7 MEUR, of which Cohesion Fund support ~12.5 MEUR and national financing at least ~ 2.2 MEUR. These investments will result in at least 8 km new and improved tram lines and purchase of 50 environmentally friendly buses. It is anticipated that number of passengers of environmentally friendly PT will increase per 1.61 million (from baseline value of 86.81 million in 2012 to target value of 88.42 million passengers in 202377 (sections 360 –
371)).
Electrification of the Latvian railway network
Railway development is among the most significant prerequisites for the creation of a sustainable transportation system. The Thematic Objective No.6 “Sustainable Transportation System” of the 2014-2020 Operational Programme “Growth and Employment” defines the Investment Priority 6.2. “Developing and restoration of comprehensive, quality and interoperable railway systems, and promoting noise reduction measures”. This Investment Priority includes one Specific Objective SO 6.2.1. “To ensure a competitive and environmentally friendly TEN-T network promoting its safety, quality and capacity” having two measures: (1) Latvian Railway Electrification, and (2) Modernization and Construction of Latvian Railway Infrastructure. Under the noted SO complex investments into the railway system are envisaged providing railway electrification as well as Latvian main railway hubs will be developed/renovated, a unified trains movement planning and traffic management systems will be implemented in review of traffic organization and optimisation of control equipment, the passenger service infrastructure will be upgraded, the alarm system will be upgraded that will contribute in improving the total efficiency of railway carriage and significant reduction of CO2 emissions in railway cargo transportation. The investments under the noted SO are planned to ensure sustainability of the investments made in 2007-2013 programming period of EU funds. The beneficiary is the State Stock Company “Latvian Railway” (VAS “Latvijas dzelzceļš”). Cohesion Fund financing for the SO is planned ~ 454 MEUR, national financing at least 80 MEUR.
Total length of Latvian railway tracks in 2015 is 1862 km78. In 2015 only 251 km (14% of total) has been electrified, with total length of contact lines 637 km. Thus, rate of electrification is significantly below European average 55%. Currently the electrified lines are used for passenger trains only. Electrification of main railway lines will reduce the total costs of railway corridor, increase competitiveness, attract additional cargoes, decrease external expenses and the environmental burden, ensure compatibility with the EU transportation policy and long term objectives. The planned investments from the Cohesions Fund (CF) directly focused to railway electrification is 346.6 MEUR, national financing at least 61 MEUR, attracting additional financing is considered. It is envisaged total length of reconstructed or upgraded railway lines will constitute in year 2023 - 300 km resulting in decrease of annual CO2 emissions by 45126 tons.
77 Ministry of Finance. Operational Programme “Growth and Employment 2014-2020”. Latvia, available at http://www.esfondi.lv/upload/Planosana/FMProg_270115_OP_ENG_2.pdf 78 The total extended length of rails is 3172 km (including in this figure station ways and access ways). In these figures it is not included 33 km of historical narrow-gauge railway.

100
4.3.2.3 Fiscal measures
Latvia 2014 Report on the Progress towards the Indicative National Energy Efficiency Targets in 2014-201679 underlines the energy efficiency of vehicles can be upgraded by improving the taxation policy, and it is essential for Latvia to ensure in the transport sector adequate energy or CO2 taxes that have the effect of reducing end-use energy consumption.
Excise Tax – Transport sector
Law “On Excise Duties”80 establishes procedure by which duty shall be imposed. The Art.5,14 and 18 determine the rates of duty for gasoline and diesel oil. The actual duties and their development is presented in Table 4.3 below.
Table 4.3 The 2015-2017, 2018- 2019, and from 1 January 2020 duties for gasoline and diesel used in transport sector
Duties,
EUR per 1000 litres
2015 2016-2017 2018-2019 From 01.01.2020
Unlead gasoline
411.21 436 476 509
Unlead gasoline with 5% (volume) of ethanol
produced from agriculture origin raw materials 411.21 436 476 509
Unlead gasoline with 70-85% (volume) of ethanol
produced from agriculture origin raw materials in
Latvia or imported from EU member state
123.36
131 30% from the base rate
Lead gasoline
455.32 455.32 594 594
Diesel (gas oil);
332.95 341 372 414
Diesel (gas oil) with any mix of biodiesel
332.95 341 372 414
Pure biodiesel, produced in Latvia or imported
from EU member state
0 0 0 0
Oil gasses and other hydrocarbons (per 1000 kg) 161 206 244 285
To promote the competitiveness of agriculture sector, the reduced tax rate is applied for the certain amount of diesel (gas oil) which is used for agriculture land cultivation purposes, 50 EUR/1000 litres.
The Amendments of the Law (the articles 61&151 ), adopted in 2010, had introduced excise duty for natural gas utilised as transport fuel. For the period 01.07.2010-31.03.2017 this rate was 99.6 EUR per 1000m3. Starting from 1 April 2017 this rate is determined 9.64 EUR/1 MWh taking into account the highest calorific value.
Exemption from electricity taxation
Electricity Tax Law81 states the exemption for the electricity used for carriage of goods and public carriage of passengers including on rail transport and public transport in towns.
79 ME (17 March 2014). Information report “On the progress towards the indicative national energy efficiency targets in 2014 –2016 according to Directive 2012/27/EU of the European Parliament and of the Council of 25 October 2012 on energy efficiency, amending Directives 2009/125/EC and 2010/30/EU and repealing Directives 2004/8/EC and 2006/32/EC”, available at https://ec.europa.eu/energy/sites/ener/files/documents/2014_neeap_en_latvia.pdf 80 Law “On Excise Duties” (Likums “Par akcīzes nodokli”), in Latvian, available at http://likumi.lv/doc.php?id=81066 81 Electricity Tax Law (Elektroenerģijas nodokļa likums), in Latvian, available at http://www.likumi.lv/doc.php?id=150692

101
Annual taxation of vehicles
The measure is aimed at structural changes of the car fleet which will foster a reduction in fuel consumption. The actual legal system is established by the Law „On the Vehicle Operation Tax and Company Car Tax”82 . The law established the annual taxation system for cars, which have been registered in Latvia after 01.01.2005 depending on engine size, maximal power of engine and full mass of vehicle. For cars, registered before 01.01.2005, tax rate continues to depend on the full mass of the car. The latest amendments of the Law, adopted 23 November 2016, are introducing the new approach - cars annual taxation based on the specific CO2 emissions of the car83. For the cars registered up to 31.12.2016 the new approach will be applied starting from 2019 (thus, for the cars registered in the period 01.01.2009-31.12.2016 the “old approach” will be continued for years 2017 and 2018). For the cars undergoing registration in Latvia after 31.12.2016 – immediately. The reduced tax rates are applied based on the:
environmental aspects: the tax is not applied for the vehicles driven by the electric motor only (electromobiles)84,
social factors – (i) the tax is not applied for one vehicle if the owner of the motorcycle or car is the handicapped person or family which has handicapped child, (ii) 20% (up to 31.12.2015) and 50% (from 01.01.2016) tax rate reduction is applied for one car/family car, if the family has the status of multichildren family (three or more under-age children), (iii) state services fulfilments - the taxation is not applied or reduced 50% tax rate is applied, (iv) the taxation is not applied for the vehicles having sport vehicle or historical vehicle status,
competitiveness of agriculture sector economics: the reduced tax rate (25%) is applied for cargo vehicles used in agriculture sector to provide both production process and agriculture products transportation process.
Differential vehicle registration tax rate (in force up to 31.12.2016)
The described measure fostered the economic advantages of cars with a smaller engine size and less fuel consumption, having less specific CO2 emissions. The legal was framed by the Law “On Car and Motorcycle Tax”85, which determined the tax rate for the vehicles’ first time registration in Latvia (for the cars which were previously non-registered or registered abroad). The Law stated two different approaches:
for those cars, which had been registered for the first time abroad before 01.01.2009 and underwent the first time registration in Latvia – based on age of car and engine size;
for those cars cars, which were previously non-registered or had been registered for the first time abroad after 01.01.2009, and underwent the first time registration in Latvia – based on specific CO2 emissions.
Due to the latest amendments of the Law “On the Vehicle Operation Tax and Company Car Tax”, adopted in 23 November 2016, are introducing the new approach - cars annual taxation based on the specific CO2 emissions of the car (see the chapter above), the noted Law “On Car and Motorcycle Tax” is repealed from 01.01.2017.
82 Law „On the Vehicle Operation Tax and Company Car Tax” (Transportlīdzekļa ekspluatācijas nodokļa un uzņēmumu vieglo transportlīdzekļu nodokļa likums), latest amendments of the Law adopted in 23 November 2016, in Latvian, available at http://likumi.lv/ta/id/287291 83 If the data on CO2 specific emissions are not available, the taxation continues to be based on the full mass of the car, engine volume and engine maximal
power 84 Starting from 01.01.2016 it is applied Company Car Tax rate of 10 EUR per month for the electromobiles owned by the companies 85 Law “On Car and Motorcycle Tax” (Likums “Par vieglo automobiļu un motociklu nodokli), in force up to 31.12.2016, in Latvian, available at https://likumi.lv/doc.php?id=81065

102
4.3.2.4 Information and Education
New passenger cars labelling on fuel economy rating provides information regarding fuel consumption (litres per 100 km or km per litre) and CO2 emissions (grams per km). The labelling was introduced in Latvia in 2002 to fulfil the requirements of the Directive 1999/94/EC. In July 2004 Regulations of the Cabinet of Ministers No.608 86 came into force implementing the requirements of the Directive 2003/73/EC.
Information regarding mitigation actions and their effects in Transport sector is summarized in Table 4.4.
Table 4.4 Information on mitigation actions and their effects in Transport sector
Name of mitigation action
Objective and/or activity affected
Type of instrument
Status of implementation
Implementing entity
Estimate of mitigation impact,
kt CO2 eq. 2020 2025 2030
Biofuel Mix Obligation Requirement
Low carbon fuels/electric cars ; increase in renewable energy
Regulatory Implemented Ministry of Economics
81.00 81.00 81.00
Excise Tax – Transport sector
Efficiency improvements of vehicles; Low carbon fuels/electric cars; Demand management in transport
Fiscal Implemented Ministry of Finance NE NE NE
Annual taxation of vehicles
Efficiency improvements of vehicles; Modal shift to public transport or non-motorized transport
Fiscal Implemented Ministry of Transport
41.00 41.00 41.00
New Passenger Cars Labelling on Fuel Economy Rating
Efficiency improvements of vehicles; Low carbon fuels/electric cars
Regulatory, Information
Implemented Ministry of Economics
56.00 115.00 115.00
Systematic inspection of the technical conditions of motor vehicles
Efficiency improvements of vehicles
Regulatory Implemented Ministry of Transport
NE NE NE
Development of public transport network
Modal shift to public transport or non-motorized transport
Economic Implemented Ministry of Transport
NE NE NE
Electromobility Development
Low carbon fuels/electric cars
Economic Implemented
Ministry of Environment Protection and Regional Development
NE NE NE
Electrification of railway network
Switching from fossil fuel to low carbon fuel (electricity from renewables)
Economic Planned Ministry of Transport
45.00 45.00
86 Regulations of the Cabinet of Ministers No.608 on information intended for consumers included in labels and advertisment about the fuel consumption of new passenger cars and CO2 emissions (Noteikumi par marķējumā un reklāmas publikācijās patērētājiem sniedzamo informāciju par jaunu vieglo automobiļu degvielas patēriņu un CO2 izplūdi), in Latvian, available at http://likumi.lv/doc.php?id=91538

103
4.3.3 Agriculture
4.3.3.1 Regulatory measures
Implementation of the Nitrates Directive (ND) 91/676/EEC and Water Framework Directive (WFD) 2000/60/EEC in to national legislation promoted several measures to reduce GHG emissions and indirectly affected ammonia emissions set in the National Emission Ceilings Directive 2001/81/EC. Legal norms arising from Council Directive 91/676/EEC concerning the protection of waters against pollution caused by nitrates from agricultural sources have been included in Law on Pollution (20 June, 2002) that set base to regulation on protection of water and soil from pollution with nitrates caused by agricultural activity.
The Law sets requirement to the Cabinet of Ministers to regulate the criteria for determination and managing of highly vulnerable territories with increased requirements for the protection of water and soil. Law on Pollution also classifying polluting activities into Categories A, B, and C, considering the quantity and effect or the risk of pollution caused to human health and the environment. In agriculture sector polluting activities requiring a Category A permit are farms for the intensive rearing of pigs and poultry with more than 40 000 places for poultry or with more than 2 000 places for production pigs with weight over 30 kg (with more than 750 places for sows). These farms shall apply the best available techniques to prevent pollution.
The purpose of Law on Environmental Impact Assessment (30 May, 2001) is to prevent or reduce the negative impact of the implementation of the activities of a planning document thereof on the environment. Objects requiring Impact Assessment in agriculture sector are installations for the intensive rearing of pigs or poultry with more than 85000 places for broilers; 60000 places for hens; 3000 places for production pigs (over 30 kilograms); and 900 places for sows.
According to Law on Pollution several requirements regarding agricultural practice and manure spreading were introduced in the Regulations of the Cabinet of Ministers No.834 adopted on 23 December 2014 “Regulations on protections of water and soil from pollution caused by nitrates from agricultural activities” and Regulations of the Cabinet of Ministers No.829 adopted on 23 December 2014 “Specific requirements for carrying of polluting activities in animal sheds”. Requirements included in Regulations that could be linked to mitigation measures of GHG emissions are described below.
Crop fertilisation plans
Crop fertilisation planning is based on the knowledge of physical and chemical properties of soil and involves performing soil tests, designing a fertilisation plan and its practical implementation as well as calculating the balance of N, which plays an important role in efficient farming. The main purpose is to ensure optimum crop fertilisation, increase crop growth and yields, meanwhile decreasing the amount of unabsorbed N results in economic and environmental losses, as N2O emissions are produced. In Latvia, if the managed agricultural land in vulnerable territories is larger than 20 ha and more, or farmer grows vegetables, potatoes, fruit trees or fruit bushes in an area of 3 ha and more in vulnerable territories, farms need to prepare fertilisation plans based on N content in manure and requirements for certain crop fertilization and expected yield.
Management of nitrate use at vulnerable territories
Management of nitrates in vulnerable territories and requirements for pollution decrease caused by nitrates from agricultural sources include restriction for nitrogen usage, reduction of nitrogen leaching and indirect N2O emissions. The limit of nitrogen usage is 170 kg of nitrogen from manure and digesters per hectare.
Improvement of manure management systems
An appropriate manure management system allows storing manure in an environment-friendly way, avoiding/reducing N2O emissions. The measure consists of renovating/improving an existing manure

104
management system or constructing a new system. Requirements refer to farms with more than 10 AU (animal units), and 5 AU in vulnerable territories.
Requirements of manure spreading
The main target is to increase nutrient uptake efficiency and decrease nutrient run-off and N2O emissions. Incorporation of manure promote denitrification and decrease direct and indirect N2O emissions.
4.3.3.2 Common Agricultural Policy driven economic measures
The latest reform of the Common Agricultural Policy (CAP) introduces a new instrument, the green payment, to deal with the environmental impacts of agriculture. The green measures include crop diversification, maintaining permanent grasslands and introduction of ecological focus areas. In Latvia, the current programming period until 2020, also envisages financial support for introducing mitigation measures of GHG emissions with a focus on climate and environmentally friendly agricultural practices or the green component.
Crop diversification is designed to encourage a diversity of crops on holdings which have arable land. Land that is considered as Ecological Focus Area may include: buffer strips, nitrogen fixing crops, and other. Buffer strips promote minimizing of nitrogen leaching, however introduction of leguminous plants on arable land lead to the fertility improvement of the farm’s agro system by fixing atmospheric nitrogen.
The purpose of Law on Agriculture and Rural Development (1 May, 2004) is to provide a legal basis for agricultural development and to specify sustainable agricultural and rural development policy in accordance with the CAP of the European Union. Regulations of the Cabinet of Ministers No.126 adopted on 10 March 2015 sets procedure for awarding of direct payments to farmers. The procedure is based on EU Regulation No. 1307/2013 of the European Parliament and of the Council of 17 December 2013 establishing rules for direct payments to farmers under support schemes within the framework of the common agricultural policy and repealing Council Regulation (EC) No. 637/2008 of 23 June 2008 and Council Regulation (EC) No 73/2009 of 19 January 2009, as well as Commission Delegated Regulation (EU) No 639/2014 of 11 March 2014 supplementing Regulation (EU) No 1307/2013 of the European Parliament and of the Council establishing rules for direct payments to farmers under support schemes within the framework of the common agricultural policy, and Commission Implementing Regulation No 641/2014 of 16 June 2014 laying down rules for the application of Regulation (EU) No 1307/2013 of the European Parliament and of the Council establishing rules for direct payments to farmers under support schemes within the framework of the common agricultural policy. According to the law and resulting regulations – Regulations of the Cabinet of Ministers No.126 (10.03.2015), Regulations of the Cabinet of Ministers No. 598 adopted on 30 September 2014, Regulations of the Cabinet of Ministers No. 600 adopted on 30 September 2014 and Regulations of the Cabinet of Ministers No. 268 adopted on 16 March 2010 following mitigation measures of GHG emissions are implemented in Latvia.
Introduction of leguminous plants on arable land
Growing leguminous plants considerably increase the accumulation of symbiotically fixed atmospheric nitrogen in soil. Legumes can fix up to 300 kg N ha-1 and this N amount is equivalent obtained by means of fertilisers. In addition, legumes provide the aftercrop with the N accumulated in soil, which reduces the amount of N to be applied in the next season.
Legumes are able to enrich soil with N. Interest in growing legumes grows with rising N fertilizer prices. The replacement of the N fertilizer with legumes depends on (1) the quantity of legume returned to the soil, (2) the content of symbiotically fixated N in the residues, (3) the availability of N residue from legume to the subsequent crops and (4) the amount of residue incorporated to soil.

105
However, legumes have higher N2O and CO2 emissions compared to cereals and grasses. N2O can be released from N during the growing season, but larger amounts are released from the decomposition after cropping season.
Organic farming
This measure includes environmentally friendly farming methods with no influence on nature, improved cropland management and reduction of synthetic fertiliser use. Benefits of this measure are decreased nitrate leaching and increased biodiversity. The state ensures support to organic farmers through subsidies.
Maintenance of amelioration systems
The measure involves the renovation of existing amelioration systems or the construction of new systems in wet arable lands. An amelioration system allows draining excessive water from the area of the root of a crop; as a result, oxygen can access the root as well as an optimum moisture regime sets in. The soil structure which is improved by amelioration system ensures better fertiliser absorption and less nitrogen run-off, thus affecting N2O emissions.
Promotion of biogas production
The purpose of measure is to use bioresources (mainly or only manure) to produce biogas which is burnt to generate electrical and/or thermal energy. By implementing this measure the manure is efficiently used, odour is reduced and high-quality fertilizer called digestate is obtained. In agriculture, animal waste is a good raw material for the process, same as food waste, energy crops and crop residues. An anaerobic digester can be built to serve one single farm or collect waste from neighbouring farms. There are a couple of differences in the technology process. Solution depends on the type of manure on the farm, climate zone, investment opportunities and existing equipment.
4.3.3.3 Market driven economic measures
Precision fertiliser application
Precision fertiliser application is a set of activities that involve the use of the newest technologies (the GPS, the GIS, sensors, software, applications, specially equipped fertiliser spreaders, etc.) in planning fertiliser application rates and in fertiliser spreading. This measure leads to fertiliser savings which results in reduction of N2O emissions. The main advantages of this activity are (1) increase in yields providing optimum crop fertilisation, (2) financial saving by ensuring that field areas with sufficient crop nutrients are not over-fertilised, (3) environmental benefits by N2O emissions decrease and decrease in nitrate leaching. The implementation of measure can reach fertilizer savings to 15-80%.
Integrated farming
Regulations of the Cabinet of Ministers No. 1056 adopted on 15 September 2009 set requirements for integrated farming in Latvia. The implementation of integrated farming is set of activities that involve rotation of crops, soil agrochemical tests, development of crop fertilization plans, fields monitoring and limited crop protection chemicals. This measure is based on environmentally friendly cultivation technology and optimal use of fertilizers by ensuring crop health, yield and soil fertility. The rules specify the farming and storage requirements for farmers who want to label products, certifying that they have been grown using integrated breeding methods. Farmers who grow the products using the integrated farming method must register - The State Plant Protection Service.
Planning feed rations
Feed planning is a set of concerted activities: acquiring information about livestock needs (productivity tests), designing feed recipes, doing feed tests and preparing the feed. Feed planning means optimising the content of nutrients in the feed according to what is needed for animals, i.e. according to their sex, age and reproductive status. This measure reduces the negative impact on the environment, as a

106
balanced diet and animal performance influence the pace of production of N from manure, which, in its turn, affects N2O emissions.
The largest and widest rural consultancy enterprise covering the whole territory of Latvia – Latvian Rural Advisory and Training Centre provides program “LĒDA”. The program also offers a Rational Evaluator function that displays economic information, key nutrient relationships, and timetables for specific feed levels to show if these feed rate components have reached their goal values. The cattle feeding plans are developed by a livestock consultant using the computer program “LĒDA. The program offers: catering plan for animal groups; catering plan for each animal individually; information of feed needed during the period; advice on ways to buy a meal plan and feed; formation on expected milk yield or live weight gain; fodder costs per liter of milk production; lactation curve.
Minimum tillage
The weed control methods and agricultural machinery allows the cultivation of many crops with minimal or no tillage. This practice is increasingly being used worldwide. The impact of reduced tillage on N2O emissions depends on soil and climatic conditions: reducing nitrogen emissions in some areas promotes N2O emissions; elsewhere it can reduce emissions or have no measurable impact.
Minimum soil tillage increases the content of organic matter in soil, which reduces the intensity of oxidation and contributes to the accumulation of carbon in the soil and increases water infiltration capacity and assists in maintaining an optimum moisture regime in soil for crops, which increases crop yields and reduces the leaching of nutrients. The drier and more stable-structured soils are more suitable for minimum tillage.
Nitrification inhibitors
Various nitrification inhibitors, which are chemical compounds, can be used to slow down the conversion of ammonium-N to nitrate-N. These inhibitors can increase the amount of N available to the plants and can have the beneficial effect of decreasing the quantity of nitrate leaching into the groundwater and nitrate in run-off water ending up in rivers. The nitrification inhibitor provides nitrogen availability of plants. Nitrification inhibitors are not widely used, but there are companies that offer to buy this fertilizer.
Information regarding mitigation actions and their effects in Agriculture sector is summarized in Table 4.5.
107
Table 4.5 Information on mitigation actions and their effects in Agriculture sector
Name of mitigation action Objective and/or activity affected Type of
instrument Status of
implementation Implementing
entity
Estimate of mitigation impact,
kt CO2 eq. 2020 2025 2030
Increase of land area under organic farming relative to total agricultural land
Reduction of fertilizer/manure use on cropland; Other activities improving cropland management
Economic, Information
Implemented Ministry of Agriculture
213.00 292.00 370.00
Support for evolving of precision agriculture technologies in crop growing farms to reduce nitrogen use
improving cropland management Voluntary Agreement
Planned Ministry of Agriculture
NE NE NE
Support for evolving of precision livestock feeding approach in cattle breeding farms to develop feeding plans and promote high quality feed use to increase the digestibility
Improved livestock management Voluntary Agreement
Planned Ministry of Agriculture
NE NE NE
Introduction of leguminous plants on arable land improving cropland management Voluntary Agreement
Adopted Ministry of Agriculture
NE NE NE
Management of nitrate vulnerable territories Reduction of fertilizer/manure use on cropland
Regulatory Implemented Ministry of Agriculture
NE NE NE
Requirements for the protection of soil and water from agricultural pollution caused by nitrates
Reduction of fertilizer/manure use on cropland
Regulatory Implemented Ministry of Agriculture
NE NE NE
Crop fertilization plans in vulnerable zones Reduction of fertilizer/manure use on cropland; improving cropland management
Regulatory Implemented Ministry of Agriculture
NE NE NE
Requirements for manure storage and spreading Improved animal waste management systems
Regulatory Implemented Ministry of Agriculture
NE NE NE
Agricultural land under integrated farming practice. Improving cropland management Voluntary Agreement
Implemented Ministry of Agriculture
NE NE NE
Cropland drainage Activities improving cropland management
Economic Implemented Ministry of Agriculture
6.10 6.10 6.10
Production of legumes Improved management of organic soils Economic Implemented Ministry of Agriculture
66.00 66.00 66.00
Extensified crop rotation Improved management of organic soils Economic Implemented Ministry of Agriculture
33.00 33.00 33.00

108
4.3.4 Waste Management
The most important document that describes the Latvian progress and planned policies on waste management is "Waste management plan 2013th - 2020 ", approved by the Cabinet of Ministers order No. 100, 21 March 2013. The waste management system is one of the most important directions of the EU and Latvian legislation on environmental protection. In general, this is governed by the Latvian more than 40 laws and regulations, including the Waste Management Law, the Law on Regulators of Public Utilities, the Municipalities Law and the Natural Resources Tax Law. The Regulations of the Cabinet of Ministers, which have an effect on GHG emissions within the waste sector:
Regulations of the Cabinet of Ministers No. 1032 adopted on 27 December 2011 "Regulations Regarding the Construction of Landfill Sites, the Management, Closure and Re-cultivation of Landfill Sites and Waste Dumps ";
“Regulations Regarding Separate Waste Collection, Preparation for Re-use, Recycling and Material Recovery”;
Regulations of the Cabinet of Ministers No. 485 adopted on 21 June 2011 "Procedures for the Management of Certain Types of Hazardous Waste";
Regulations of the Cabinet of Ministers No. 401 adopted on 24 May 2011 "Requirements for Incineration of Waste and Operation of Waste Incineration Plants";
Regulations of the Cabinet of Ministers No. 470 adopted on 21 June 2011 "Mining waste management procedures";
Regulations of the Cabinet of Ministers No. 588 adopted on 30 August 2016 Operational programme "Growth and Jobs" specific target 5.2.1. “To promote different types of waste reuse, recycling and recovery” for measure 5.2.1.2. “Waste recycling promoting” implementing rules”;
Regulations of Cabinet of Ministers No. 494 of 26 July 2016 Operational programme "Growth and Jobs" specific target 5.2.1. “To promote different types of waste reuse, recycling and recovery” for measure 5.2.1.2. “Waste separate collection system development” implementing rules”.
In order to promote recycling of waste and reuse of products Natural Resources Tax Law sets the tax rate for waste disposal (Table 4.6 and Table 4.7).
Table 4.6 The tax rates for waste disposal from July 1, 2009
No. Waste type Unit
The tax rate for the period 01.07.2009. – 31.07.2009 (Ls)
The tax rate for the period 01.01.2010. – 31.12.2010 (Ls)
The tax rate for the period 01.01.2011. – 31.12.2011 (Ls)
The tax rate for the period from 01.01.2012. (Ls)*
1. Municipal waste
tonne 1.25 3.00 5.00 7.00
2.
Construction and building destruction waste (including soil excavated from polluted sites in non-treated form)
tonne 1.25 5.00 10.00 15.00
3. Asbestos in the form of fibres and dust
tonne 10.00 25.00 25.00 25.00
4. Hazardous waste
tonne 25.00 25.00 25.00 25.00
5. Production waste tonne 1.25 3.00 10.00 15.00
* Note: 1 EUR = 0.702804 Ls

109
Table 4.7 The tax rates for waste disposal from January 1, 2017
No. Waste type Unit The tax rate for the period 01.01.2017. – 31.12.2017. (Euro)
The tax rate for the period 01.01.2018. – 31.12.2018. (Euro)
The tax rate for the period 01.01.2019. – 31.12.2019. (Euro)
The tax rate for the period 01.01.2020. – 31.12.2020. (Euro)
1. Municipal and industrial waste, which are not hazardous
tonne 25.00 35.00 43.00 50.00
2. Hazardous waste (also industrial hazardous waste)
tonne 45.00 50.00 55.00 60.00
*Measure is included “with additional measures” projection
Information regarding mitigation actions and their effects in Waste sector is summarized in Table 4.8.
Table 4.8 Information on mitigation actions and their effects in Waste sector
Name of mitigation action
Objective and/or activity
affected
Type of instrument
Status of implementation
Implementing entity Estimate of
mitigation impact, kt CO2 eq.
2020 2025 2030
Reducing of biodegradable waste landfilling
Reduced landfilling
Regulatory Implemented Ministry of Environmental Protection and Regional Development
NE NE NE
Increase of Municipal waste recycling
Enhanced recycling
Regulatory Implemented Ministry of Environmental Protection and Regional Development
NE NE NE
4.3.5 Industrial Processes and Product Use
Implementation of Best Available Techniques (BAT) is the PAM which is particularly important one for GHG emissions reduction in IPPU. Requirements set in Directive 2010/75/EU of the European Parliament and of the Council of 24 November 2010 on industrial emissions (integrated pollution prevention and control) are overtaken with national Law “On Pollution”87. Law “On Pollution” states principal framework for the implementation of BAT. Namely, conclusions on the best available techniques is a description of the BAT specified by the European Commission for the sector of industry or polluting activity, as well as the emission levels associated with the BAT, consumption levels of raw materials, monitoring of the polluting activity and the remediation measures of the site applicable to the polluting activity. Operator of pollution activity shall use the conclusions regarding the BAT as the basis. The Law’s Section 21 “BAT and Choice Thereof in Respect of Category A Polluting Activities” states that (1) BAT are applicable to the most effective and progressive technological and operational methods development stage in which is shown the actual applicability of specific methods in order to prevent and – in cases where prevention is impossible – reduce emissions and the impact on the environment as a whole, and they are intended in order to specify the basic principle for the calculation of emission limits, (2) the concept “techniques” shall include the technology used and the way in which the installation is designed, built, maintained, operated or decommissioned, (3) Techniques are available if they are economically and technologically substantiated and, irrespective of whether they have previously been used or introduced in production in Latvia, it is possible to implement them in a specific industrial sector, taking into account the relevant costs and advantages, (4) Techniques are the best if they include such technologies and methods by the application of which it is possible to ensure the highest level of environmental protection at large. The responsible authority - the State Environmental Service - is
87 Law on Pollution (Likums par piesārņojumu), adopted 15.03.2001, in Latvian, available at https://likumi.lv/doc.php?id=6075

110
checking the operators` applications for receiving polluting activity permits, including the operator’s proposal regarding the choice of BAT.
F-gases
The most important EU regulations affecting the amount of F-gases are:
The Regulation (EU) No 517/2014 of The European Parliament and of the Council on fluorinated greenhouse gases and repealing Regulation (EC) No 842/2006;
The Directive 2006/40/EC of the European Parliament and of the Council relating to emissions from air-conditioning systems in motor vehicles and amending Council Directive 70/156/EEC.
Also technical development has affected the development of emissions. The F-gas Regulation follows two tracks of action:
improving the prevention of leaks from equipment containing F-gases. Measures comprise: containment of gases and proper recovery of equipment; training and certification of personnel and of companies handling these gases; labelling of equipment containing F-gases; reporting on imports, exports and production of F-gases. Several bans on the placing in the market, maintenance and service products and equipment containing HFCs with high GWPs are requirements of the new regulation.
avoiding F-gases in some applications where environmentally superior alternatives are cost-effective. Measures include restrictions on placing in the market and use of certain products and equipment containing F-gases.
At national level the Regulation No.563 of the Cabinet of Ministers of Latvia88 on special restrictions and prohibitions regarding activities with ozone-depleting substances (ODS) and F-gases sets requirements for F-gas operators according to previous F-gas Regulation (EC) No. 842/2006 which is now replaced with the Regulation (EU) No 517/2014. National Regulation No.563 is related to containment, use, recovery and destruction of certain F-gases. These rules accompany the provisions relating to the labelling of products and equipment containing these gases, to the notification of information, to prohibitions on commercialisation, as well as to the training and certification of personnel and enterprises. The Regulation No.563 prescribes specific restrictions and prohibitions on the handling of ODS and F-gases, as well as the responsible institutions for implementation of the European Parliament and of the Council Regulation (EC) No.1005/2009 and Regulation (EC) No.842/2006.
Solvent Use
Law “On Pollution”87 laying down the procedures by which emission of volatile organic compounds from installations, in which organic solvents are used, shall be limited. Legal norms arising from the following directives have been included in this Law:
Directive 2010/75/EU of the European Parliament and of the Council of 24 November 2010 on industrial emissions (integrated pollution prevention and control),
Directive 2004/42/EC of the European Parliament and of the Council of 21 April 2004 on the limitation of emissions of volatile organic compounds due to the use of organic solvents in certain paints and varnishes and vehicle refinishing products and amending Directive 1999/13/EC,
Regulations of the Cabinet of Ministers No.18689 adopted on 2 April 2013 “Regulations to limit emission of volatile organic compounds from installations, in which organic solvents are used”
88 Cabinet of Ministers Regulation No 563 (12.07.2011) on on special restrictions and prohibitions regarding activities with ozone-depleting substances and fluorinated greenhouse gases (Noteikumi Nr563 Noteikumi par īpašiem ierobežojumiem un aizliegumiem attiecībā uz darbībām ar ozona slāni noārdošām vielām un fluorētām siltumnīcefekta gāzēm) in Latvian, available at https://likumi.lv/doc.php?id=233736 89 Cabinet of Ministers Regulation No 186 (02.04.2013) on how to limit emission of volatile organic compounds from installations, in which organic solvents are used” (Kārtība, kādā ierobežojama gaistošo organisko savienojumu emisija no iekārtām, kurās izmanto organiskos šķīdinātājus) contains legal norms

111
contains legal norms arising from Directive 2010/75/EU and Regulations of the Cabinet of Ministers No.231 adopted on 3 April 2007 “Regulations Regarding the Limitation of Emissions of Volatile Organic Compounds From Certain Products” contains legal norms arising from Directive 2004/42/EC.
Information regarding mitigation actions and their effects in IPPU sector is summarized in Table 4.9.
Table 4.9 Information on mitigation actions and their effects in IPPU sector
Name of mitigation action
Objective and/or activity affected
Type of instrument
Status of implementation
Implementing entity
Estimate of mitigation impact,
kt CO2 eq. 2020 2025 2030
Investment Support in Industrial Buildings' and Technologies' Energy Efficiency to Reduce GHG emissions
Efficiency improvement in industrial end-use sectors; Efficiency improvements of buildings; Efficiency improvement in services/ tertiary sector
Economic Implemented
Ministry of Environment Protection and Regional Development
38.00 38.00 38.00
Investment Support to Improve Energy Efficiency in Food Processing Enterprises
Efficiency improvement in industrial end-use sectors
Economic Adopted Ministry of Agriculture
NE NE NE
Reduce emissions of fluorinated greenhouse gases
Reduction of emissions of fluorinated gases; Replacement of fluorinated gases by other substances
Regulatory Implemented
Ministry of Environmental Protection and Regional Development
NE NE NE
4.3.6 Land use, Land use Change and Forestry
Rural Development Programme 2014-2020 (hereinafter referred to as – RDP 2014-2020) is the most important tool contributing to the climate change mitigation in LULUCF sector. The climate change mitigation measures in LULUCF sector are designated on the base of consultations with non-governmental organizations and taking into account national circumstances, in order to pursue the mitigation potential and contribute to implementation of other policies and ecosystem services, like biological diversity and water protection. RDP 2014-2020 sets three long-term strategic rural development policy goals:
competitiveness of agriculture;
sustainable management of natural resources and climate policies;
balanced territorial development in rural areas.
Following climate change mitigation measures are included in the RDP 2014-2020:
development and adaptation of drainage systems in cropland;
support to introduction and promotion of integrated horticulture;
growing of legumes;
maintenance of biodiversity in grasslands;
development and adaptation of drainage systems in forest land;
arising from Directive 2010/75/EU, in Latvian, available at https://likumi.lv/doc.php?id=256096 and Cabinet of Ministers Regulation No 231 (03.04.2007) on the Limitation of Emissions of Volatile Organic Compounds From Certain Products” (Noteikumi par gaistošo organisko savienojumu emisijas ierobežošanu no noteiktiem produktiem) contains legal norms arising from Directive 2004/42/EC, in Latvian, available at https://likumi.lv/doc.php?id=155476

112
afforestation and improvement of stand quality in naturally afforested areas;
regeneration of forest stands after forest fires and other natural damages and preventive measures in forests;
improvement of ecological value and sustainability of forest ecosystems.
There are several regulations adopted for implementation of the measures listed in the RDP 2014-2020, particularly:
Regulations of Cabinet of Ministers No. 171 from 07.04.2015 on assignment, administration and supervising of the European Union support for improvement of environment, climate and rural landscape during the 2014-2020 planning period;
Regulations of Cabinet of Ministers No. 455 from 04.08.2015 on assignment, administration and supervising of the European Union support for implementation of the “Investments into increase of the forest area and vitality of forests” measure;
Regulations of Cabinet of Ministers No. 381 from 14.06.2016 on assignment, administration and supervising of the state and European Union support for implementation of the activity “Establishment and improvement of equipment and communication systems for monitoring of forest health, fires, pests and diseases” within the scope of sub-measure “Support for preventive forest measures and regeneration of forest in case of forest fires, natural disturbances and other extreme events” implemented under as a part of the measure “Investments in forest development and improvement of forest vitality”.
Information regarding mitigation actions and their effects in LULUCF sector is summarized in Table 4.10.
Table 4.10 Information on mitigation actions and their effects in LULUCF sector
Name of mitigation action
Objective and/or activity affected
Type of instrument
Status of implementation
Implementing entity
Estimate of mitigation impact,
kt CO2 eq. 2020 2025 2030
Forest thinning Improve forest management
Economic Implemented Ministry of Agriculture
28.00 28.00 28.00
Forest regeneration
improving forest management
Economic Implemented Ministry of Agriculture
18.00 18.00 18.00
Drainage in forest Prevention of drainage or rewetting of wetlands
Economic Planned Ministry of Agriculture
15.00 15.00 15.00
Afforestation Afforestation and reforestation
Economic Implemented Ministry of Agriculture
48.00 48.00 48.00
4.3.7 Cross-sectorial
Latvia is implementing cross-sectorial climate change mitigation policies and measures that affect several sectors of the national economy simultaneously. Such cross-sectorial policies include implementation of the EU greenhouse gas emission allowance trading scheme, applying of fiscal instruments, green procurement, public information programmes to control and reduce emissions.
European Union emission allowances trading system
The regional emission allowances trading system has been in operation in the EU Member States as from January 1, 2005. The system was established by the Directive of the European Parliament and Council 2003/87/EC of 13 October 2003, which establishes the system of trade of allowances of emissions of greenhouse gases in the Community and amends the Council Directive 96/61/EC. The basic goal of the EU ETS is to promote actual reduction of CO2 emissions from installations covered by ETS, thus, helping the Member States and also the European Union to comply with the relevant

113
obligations for reduction of emissions provided for in Kyoto Protocol in the most profitable manner. The scheme has been divided into a number of trading periods. The first ETS trading period lasted three years, from January 2005 to December 2007. The second trading period ran from January 2008 until December 2012, coinciding with the first commitment period of the Kyoto Protocol. The third trading period began in January 2013 and will span until December 2020. Compared to 2005, when the EU ETS was first implemented, the proposed caps for 2020 represent a 21% reduction of greenhouse gases.
The Latvian National Emissions Allowances Allocation Plan for 2013-2020 was approved by the Ordinance of the Cabinet of Ministers No. 499 of 29 September 2011 “On Emissions Allowances Allocation Plan for 2013-2020” (with amendments in 2013). According to the plan there had been 65 installations from Latvia participating in the EU ETS during the period. In 2016 it participates 63 stationary operators and 3 avio operators.
The procedure of CO2 emissions taxation is prescribed by the Natural Resources Tax Law90. The tax rate per 1 ton of CO2 emission has been gradually raised up from the starting rate of 0.142 EUR (01.07.2005) up to 4.5 EUR (from 01.01.2017). The subject of CO2 taxation is CO2 emitting activities (installations), for which a GHG emission permit is required- if the amount of the activity (installation) is below the limit defined for inclusion in EU Emissions Trading Scheme. The tax shall not be paid for the emissions of CO2 which emerges (i) while using RES and local fuel peat, and (ii) from the installations participating in EU ETS.
Taxation on noxious air polluting emissions creates synergy effect with CO2 taxation. The procedure of air polluting emissions taxation is prescribed by the Natural Resources Tax Law. The taxable are emissions of PM10 (75 EUR/ton), CO (7.83 EUR/ton), NH3, H2S and other non-organic compounds (18.50 EUR/ton), SO2, NOx, VOC, CnHm (85.37 EUR/ton), metals (Cd, Ni, Sn, Hg, Pb, Zn, Cr, As, Se, Cu) and their compounds recalculated for the relevant metal, V2O5 recalculated to vanadium (1138.30 EUR /ton).
Green Public Procurement
The green public procurement guidelines were adopted in Latvia in December 2008, this document encompasses a detailed document named “Recommendations for the Promotion of Green Procurement by State and Municipal Authorities” published in the website of the Latvian Procurement Monitoring Bureau. These recommendations contain references to procurement legal documents, models for including energy efficiency criteria into the procurement conditions as well as explanations regarding the practical application of these criteria. The requirements of green procurement had been included in the programmes co-financed by national CCFI. In 17 February 2015 the Cabinet of Ministers had approved the “Green Procurement Promotion Plan for years 2015-2017”. According the provisions of the Section 19 of the re-casted Public Procurement Law (in force from 1 march 2017), the Cabinet of Ministers has adopted the Regulations No 353 “Requirements of Green Public Procurement and the Procedure They shall be Applied”91, which have come into force 1 July 2017.
The particular CCFI programme “Promotion Understanding on the Importance and Possibilities of GHG Emissions Reduction” was implemented in years 2010-2013. The financial support was available for publications in mass media for both general and targeted audiences, thematic broadcasts, thematic workshops, trainings for targeted audience groups, educational projects for pupils and students of Latvia primary, general and professional educational institutions. The beneficiaries were registered in Latvia mass media, broadcast organizations, NGO, foundations, municipal or regional energy agencies, higher
90 Natural Resources Tax Law (Dabas resursu nodokļa likums), in Latvian, available at http://likumi.lv/doc.php?id=124707 91 MEPRD. Order No 265 “Strategy for the Use of Emissions Allocations Auctioning Instrument” (“Emisijas Kvotu izsolīšanas instrumenta darbības stratēģija”), in Latvian, available at http://varam.gov.lv/lat/fondi/ekii/likumdosana/

114
educational institutions. The total support provided by CCFI was 0.753 MEUR 92 , 22 information/education/training projects were implemented.
In years 2015-2016 the promotion of public understanding on the importance and possibilities of GHG emissions reduction has been supported by the programme “National Climate Policy” of the EEA Financial Mechanism for years 2009-2014. The following activities have been supported within the Small Grant Scheme: (1) education/training programmes for professional audiences, municipal specialists and teachers, (2) education modules for vocational secondary education programmes and professional education programmes of high (graduate) schools, (3) educational activities and actions for pupils of primary, general secondary and vocational education schools, (4) information campaigns and public actions in mass media, websites, radio, (5) research projects related to climate change issues, important, these projects also had significant public information component. As a result of the open tender it was approved in total 18 projects. The contracted EEA financial support for these projects constituted ~ 1.85 MEUR. In addition, within the Open Call (large scale projects’) programme it was supported the low energy buildings (5 projects with the total EEA support of 4.454 MEUR). The measure has important demonstration value.
Information regarding cross-sectoral mitigation actions and their effects is summarized in Table 4.11.
Table 4.11 Information on cross-sectoral mitigation actions and their effects
Name of mitigation action
Objective and/or activity affected
Type of instrument
Status of implementation
Implementing entity
Estimate of mitigation
impact, kt CO2 eq.
2020 2025 2030
Taxation of CO2 emissions
Efficiency improvement in public energy production Efficiency improvement in industrial end-use sectors, Energy Consumption: Efficiency improvement in services/ tertiary sector
Fiscal Implemented Ministry of Finance NE NE NE
Implementation of the EU Emissions Trading Scheme
Increase in renewable energy; Efficiency improvement in the energy and transformation sector
Regulatory Implemented
Ministry of Environment Protection and Regional Development
NE NE NE
4.3.8 Policies and measures no longer in place
Most of the policy documents mentioned in the Sixth National Communication report have been renewed for next planning period until year 2020 (Table 4.12).
Table 4.12 Policy documents mentioned in NC6 and their status in 2017
Policy document reported in Sixth National
Communication report Status in 2017
Environmental Policy Strategy 2009-2015 Actualised and continued by adopting March 2014 Environmental Policy Strategy 2014-2020
The Latvian National Emissions Allowances
Allocation Plan for 2013 – 2020
In action
Latvian National Development Plan for 2014 - 2020 In action
Latvian Industry Development Guidelines 2004 –
2013 Continued by adopting June 2013 Latvia National Industrial Policy Strategy 2014-2020
92 Ministry of Environmental Protection and Regional Development (MEPRD, June 2015). “Informative Report on the Results of the Climate Change Financial Instrument Operation in Year 2015” (Informatīvais ziņojums “Par Klimata pārmaiņu finanšu instrumenta darbību 2015.gadā), in Latvian, available at http://varam.gov.lv/lat/darbibas_veidi/KPFI/likumd/

115
Policy document reported in Sixth National
Communication report Status in 2017
Energy Development Guidelines 2007-2013 Actualised by adopting in 2016 Energy Policy Strategy 2014-2020
Guidelines on Use of Renewable Energy Sources 2006-2013
expired
Latvia National Renewable Action Plan for implementing Directive 2009/28/EC
in action, regular biannual reports prepared 2014 and 2016
1st, 2nd National Energy Efficiency Action Plan Further developments: 3rd (2014) and 4th (2017) National Energy Efficiency Actions Plans elaborated
Transport Development Strategy 2007-2013 Continued by adopting in Dec 2013 Transport Development Strategy 2014-2020
Rural Development Programme 2007-2013 As new planning period started, continued by Rural Development Programme 2014-2020
Waste management Plan 2013-2020 In action
Development plan for Forests and forest based
industries development
Continued by adopting Oct 2015 Forests and Forest based Industries Development Strategy 2015-2020
The general policies of NC6 are still in place. Taking into account that new, 2014-2020, planning period had started, there are change of financing sources for the range of measures and activities (Table 4.13). For particular measures focus point has been specified, at the same time general objectives of the measures remain.
Table 4.13 General policies and their financing sources
General Policy Financing source
2007-2013 planning period (2009-2015)
2014-2020 planning period (2016-2020)
Energy
Efficiency of District Heating systems. RES in District Heating Systems
Cohesion Fund, NOP “Infrastructure and Services”
Cohesion Fund, NOP “Growth and Employment”
Production of Energy from Biomass in Agriculture Sector
EAFRD, national Rural Development Programme
EAFRD, national Rural Development Programme
Energy Efficiency in Apartment Buildings
ERDF, NOP “Infrastructure and Services”
ERDF, NOP “Growth and Employment
Energy Efficiency and RES in Industrial (Production) Buildings and Technologiens
National green investment scheme (CCFI)
Cohesion Fund, NOP “Growth and Employment”
Energy Efficiency and RES in Public Buildings
National green investment scheme (CCFI)
Cohesion Fund, NOP “Growth and Employment”
Transport
Electromobility Development
National green investment scheme (CCFI), main focus on co-financing purchase of electrical vehicles in public and business sectors
ERDF, NOP “Growth and Employment”, focus on charging infrastructure development
In 2015 it was finished such particular national green investment scheme (CCFI) programmes as: Renewable Technologies for Heat and Electricity Production to Reduce GHG emissions, Renewable Energy Technologies in Households, Municipal Public Territories Lightning Infrastructure. Currently there are no adopted continuations of these programmes. On the other hand, the new strategy of national Strategy of Emissions Quota Auctioning Instrument states as the perspective investment sectors: GHG emissions reduction by applying urban technologies, GHG emissions reduction in production processes, by providing recovering and re-use of energy, GHG emissions reduction by RES utilising microgeneration technologies in households
The note should be done regarding the feed-in tariff system in Latvia. During elaboration of NC6 it was stopped by Cabinet of Ministers Regulations (from 2011/2012 up to 2016) the acquisition of the right to
116
sell electricity within the mandatory procurement system. In December 2015 it was prolonged up to 2020. In 22 June 2016 the Amendments of the Electricity Market Law came into force which do not foresee to confer feed-in tariff rights within the existing feed-in tariff system. Thus for the time being the preferential feed-in tariffs is continuing in relation to the existing RES and CHP units which had obtained the mentioned rights before noted governmental Regulations had come into force. The new support scheme will be elaborated to correspond to the new principles of RES electricity support defined by the Commission Communication 2014/C 200/01. This new scheme will be applied for the new units together with the existing scheme, the latest will end after expiring of all rights acquired within its frame.

117
PROJECTIONS

118
5 PROJECTIONS AND THE TOTAL EFFECTS OF POLICIES AND MEASURES
5.1 Projections
The projections presented in this chapter correspond to the projections of the Informative Report that were presented by the Government in March 2017 and submitted to EC on 30 May 2017 93. The scenarios underlying the emission projections have incorporated new insights with regard to economic and demographic developments, sector developments, fossil fuel prices, the CO2 price and policies when compared with the previous projection of the Sixth National Communication. Recent statistics were also taken into account.
GHG emissions in Latvia have been projected for the years 2020, 2025, 2030 and 2035. The projections are based on the policies and measures approved by the Latvia parliament and government up to the year 2016, which means that it is a projection “with measures” (WM). In addition to this scenario, there are also projected emissions with planned policies and measures. These are the measures which are principally announced by the high-level strategic development documents but still the implementation of these measures have not been elaborated in details yet and legal regulations have not been adopted but are expected to be adopted and implemented from a specific future year onwards. This is the “scenario with additional measures” (WAM).
In addition five sensitivity analysis regarding GHG emissions projections have been carried out. GDP and population assumptions impacts on projected GHG emissions have been analysed in energy and waste management sector. In energy sector it has been analysed also the impact of imported electricity price and amount. In its turn, sensitivity analysis in agriculture sector has been focused how different values of grain and milk prices may impact GHG projections in this sector.
The GHG emission projections of Latvia up to 2035 are based upon the long-term macroeconomic projection up to 2035 developed by the MoE. The scenario projects that the growth rates of exports and the manufacturing industry will remain comparatively high based mainly on both the increased competitiveness of Latvian producers and the growing external demand. According to this scenario it is expected that GDP, similarly to private consumption, will double during 2005-2030 with the average annual growth 3%. The number of population in Latvia is expected to continue to decrease by 14.5% from 2.250 to 1.915 million in the same time period (Table 5.1).
Table 5.1 The main macro economic indices applied for projecting GHG emissions
2020 2025 2030 2035
Number of inhabitants, thous. 1930.35 1916.47 1915.72 1919.00 2016 -2020 2021 – 2025 2026 – 2030 2031 - 2035
Private consumption, annual changes per period, %
4.2 4.4 3.3 3.0
GDP growth, annual changes per period, % 3.8 4.4 3.3 3.0 agriculture 2.6 2.7 1.6 1.5
service 4.5 6.0 4.6 4.5 manufacturing 5.3 5.1 4.0 3.5
Total GHG emissions under WM scenario increase by 9.9% up to 2020 and 15.7% up to 2030 compared to the year 2014 (Table 5.2). Compared with the base year of 1990, the total GHG emissions are expected to be 55.8% lower in 2020 and 53.3% lower in 2030. The energy sector will account for the biggest share amounting to 60.6 % of the total projected GHG emissions in the year 2020, followed by
93 Report on Policies and Measures under Article 13 and on Projections under Article 14 of Regulation (EU) No 525/2013 Of The European Parlament and
of The Council, available at http://cdr.eionet.europa.eu/lv/eu/mmr/art04-13-14_lcds_pams_projections/projections/envws0bea/

119
the agriculture sector with its share amounting to 26.8 % and the IPPU with 6.8 % share. The projected emissions change trends differ across different sectors. The highest increase of the total GHG emissions in the year 2020 is projected in the agriculture sector (13.6 %) vs. the year 2014. Emissions increase is largely determined by the projected increase in agricultural output. In the energy sector emissions almost do not change as the increase is by only 0.6% in 2020. On the one hand energy demand is projected in industry and transport, while the WM scenario projects wider RES use and the implementation of energy efficiency measures in households, tertiary and the industry sector by 2020.
Table 5.2 Actual and projected GHG emissions per sector under WM scenario, kt CO2 eq.
Sector 2014
(reference year)
2020 2025 2030 2035
Energy excluding transport 4021 3976 3893 4064 4324
Transport 2952 3040 3187 3265 3378
IPPU 838 787 799 816 816
Agriculture 2726 3098 3317 3386 3409
Waste 837 664 650 664 639
Total excluding LULUCF 11393 11565 11846 12195 12566
Land Use, Land-Use Change and Forestry
4217 2667 2903 3373 3415
In 2030 the share of agriculture and IPPU sectors increases in the total GHG emissions, constituting 27.8% and 6.7% respectively. At the same time the contribution of the energy and waste sectors to total emissions decreases.
Figure 5.1 GHG emissions by gas according to the latest emission inventory (1990-2015) and the WM projection (up to 2035)
Compared with the base year 1990, the total GHG emissions are expected to be by 55.8% lower in 2020 and 53.3% lower in 2030. Correspondingly, CO2 emissions are projected to be by 63.7% lower in 2020 and 61.3% lower in 2030. Though CH4 emissions are projected to increase by about 11% up to 2030 against 2014, the projection admits it to be by about 41% lower than in 1990. N2O emissions are projected to increase by about 20% up to 2030 against 2014 and be by about 17.8% lower than in 1990.
The Figure 5.2 shows GHG emissions distribution between the ETS and non-ETS sectors. The ETS share in the total GHG emissions has decreased by 4.8% compared with 2005 and in 2015 it was 20.4%. The share of the non-ETS sector was 79.6% in 2015. The ratio between the sectors is projected almost unchanged by 2030. The projection is that emissions of the ETS sector decrease by 12% compared with 2005, while in the non-ETS sector 14.5% increase is projected in 2030 against 2005.

120
According to the WM projection, the emissions from the non-ETS sector in the year 2020 will be by 8.9% above the 2005 level, which is sufficient for reaching the target set by the EU Climate and Energy Package (17% increase in 2020 compared with 2005, see Section 1.3 which describes the EU targets).
Figure 5.2 GHG emissions according to the latest greenhouse gas emission inventory (2005-2015) and the WM projection (up to 2030) in the EU ETS and non-ETS sectors
Figure 5.3 reveals that part of the non-ETS sector emissions in 2014 is composed by transport (33%), agriculture (30.5%), and the other which include the residential and commercial sectors (15.5%) and the waste sector (9.3%). The WM scenario projects that in 2030 the greatest part of the non-ETS sector emissions will be from emissions in agriculture, which share will increase by 4.5% points against 2014. The share of transport in the total non-ETS sector emissions will almost not change up to 2030, but the share of other sectors decreases by 3.2% points and that of the waste sector – by 2.4% points compared with 2014.
Figure 5.3 GHG emissions in the non-ETS sector by category based on the latest greenhouse gas inventory (2014) and the WM projection (up to 2030)

121
GHG projected emissions for the WAM scenario, calculation based on the implementation results of additional policies and measures, are seen Table 5.3 which shows the projected emissions under the WAM scenario by sectors and the difference with the WM scenario.
Total GHG emissions under the WAM scenario in 2020 remain almost unchanged, but in 2030 they increase by 5%. The additional GHG emission mitigation measures under the WAM scenario allow an essential reduction of the projected emissions mainly in the energy sector, excluding transport. Thus, in 2020 under the WAM scenario emissions in the energy sector are by 1.4% lower and in 2030 by 13% lower than in the respective years under the WM scenario. The main reason for the decrease is wider RES use and energy efficiency increase in the energy end-use and supply sectors.
Table 5.3 Actual and projected GHG emissions per sector under WAM scenario, kt CO2 eq.
Sector 2014
(reference year)
2020 2025 2030 2035
Energy excluding transport 4021 3921 3645 3535 3849
Transport 2952 3029 3174 3266 3350
IPPU 838 787 799 816 816
Agriculture 2726 3002 3213 3281 3308
Waste 837 664 650 664 639
Total excluding LULUCF 11393 11402 11481 11563 11962
Difference with WM, % -1.4% -3.1% -5.2% -4.8%
Land Use, Land-Use Change and Forestry
4217 2667 2903 3373 3415
Agriculture is the other sector revealing emissions reduction under the WM scenario. Reduction compared to the WM scenario is by about 3% in the period 2020-2030.
In any of the sectors the trends in the projected emission changes under the WM and WAM scenario are different as well as the range of the applied additional measures and impacts. The matter is discussed in detail in the following sections on emission analysis.
GHG projections reported in NC7 are calculated in 2017 and are based on the latest available information about development trends and plans in different GHG inventory sectors. When comparing the projections in NC6 (see Figure 5.4) with the present projections, the latter project considerably lower emissions in 2020 and 2030 by 16.2% and 23.9% respectively. Projections in NC7 are lower for all sectors, except waste, where GHG emissions in 2020 and 2030 are higher by 41% and 51% respectively than in NC6. The slightest difference is in the transport sector where GHG emissions in 2020 and 2030 are only by 10.6% and 8% respectively lower than in NC6. In other sectors emissions projected for 2030 in NC7 are lower by 27-34% compared with those in NC6.

122
Figure 5.4 Actual GHG emissions and comparison of WM projections between NC6 and NC7
The above differences in GHG emissions projections are due to several reasons (Figure 5.4). First, these are recalculations of the actual emissions reported in the national greenhouse gas inventory that change the historical emissions trends. Second, these are new assumptions about socio-economic indicators used in GHG emissions calculation (the population, GDP and trends regarding value added). Third, the fact that during the four-year period between the submitted GHG projections a range of different GHG emissions reduction measures have been implemented that have reduced the actual emissions in 2015 and which impact will be felt also up to 2030. Measures have been carried out with greater impact upon emissions reduction, i.e. wide use of RES for energy production and energy efficiency measures in all energy consumption sectors. It may be noted that while all additional measures stated in NC6 were under the WAM scenario, in NC7 are already all included under the WM scenario.
5.1.1 Energy
GHG emissions projections in the energy sector are calculated namely, by means of the “scenario with existing measures” (WM) and “scenario with additional measures” (WAM). The basic indicators determining GHG emissions amount in the energy sector are changes in final energy consumption (FEC) and gross primary energy supply (GPES) over certain time period and carbon intensity of the fuel mix in energy production. FEC has been calculated based on the forecasts of macroeconomic indicators (Gross Domestic Product, value added by branches, private consumption, the number of population, etc.). Parameters, characterizing each separate sector, are used additionally to calculate FEC in the relevant sector, e.g. the total floor area of dwellings in residential sector, the number of households, number of vehicles, number of vehicle kilometres travelled, etc.
In both the above scenarios the same indicators of macroeconomic projection are used for calculation of GHG emissions.
The main policies and measures that are integrated in the modelled scenarios for the energy sector are the deployment of RES, energy efficiency measures and penetration of new technologies, peculiarly in transport sector. The WM scenario forecasts that in 2020 Latvia meets two objectives – the use of RES (40% of GFEC) and the indicative energy efficiency target. The WAM scenario forecasts additional RES use and the implementation of energy efficiency measures, which are included in the national strategic documents.
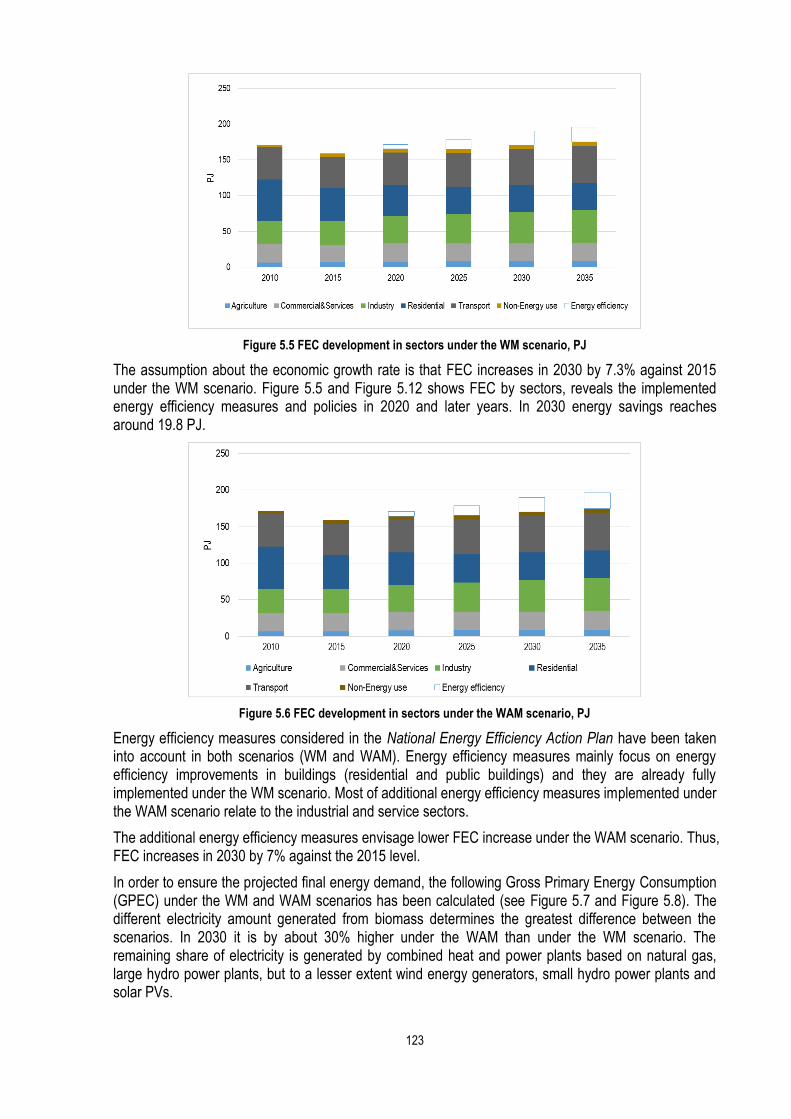
123
Figure 5.5 FEC development in sectors under the WM scenario, PJ
The assumption about the economic growth rate is that FEC increases in 2030 by 7.3% against 2015 under the WM scenario. Figure 5.5 and Figure 5.12 shows FEC by sectors, reveals the implemented energy efficiency measures and policies in 2020 and later years. In 2030 energy savings reaches around 19.8 PJ.
Figure 5.6 FEC development in sectors under the WAM scenario, PJ
Energy efficiency measures considered in the National Energy Efficiency Action Plan have been taken into account in both scenarios (WM and WAM). Energy efficiency measures mainly focus on energy efficiency improvements in buildings (residential and public buildings) and they are already fully implemented under the WM scenario. Most of additional energy efficiency measures implemented under the WAM scenario relate to the industrial and service sectors.
The additional energy efficiency measures envisage lower FEC increase under the WAM scenario. Thus, FEC increases in 2030 by 7% against the 2015 level.
In order to ensure the projected final energy demand, the following Gross Primary Energy Consumption (GPEC) under the WM and WAM scenarios has been calculated (see Figure 5.7 and Figure 5.8). The different electricity amount generated from biomass determines the greatest difference between the scenarios. In 2030 it is by about 30% higher under the WAM than under the WM scenario. The remaining share of electricity is generated by combined heat and power plants based on natural gas, large hydro power plants, but to a lesser extent wind energy generators, small hydro power plants and solar PVs.

124
Figure 5.7 GPEC by fuels under the WM scenario, PJ
Figure 5.8 GPEC by fuels under the WAM scenario, PJ
GPEC increases in 2030 by 9% compared to 2015 under the WM scenario. The RES share is 35.9% and 39% respectively in the years 2015 and 2030. Under the WAM scenario GPEC increases in 2030 by 9.8% compared to 2015 and wider use of solid biomass is one of the main reasons as its technologies have lower energy efficiency. The RES share under the WAM scenario constitutes 44.4% in 2030.
The total GHG emissions caused by energy production and use (1.Energy) will increase by the year 2030 only under the “scenario with existing measures”, and the increase will be corresponding by 1% and 5.1% in 2020 and 2030 against the 2014 level (Figure 5.10).

125
Figure 5.9 GHG emission projections under the WM scenario
Figure 5.10 GHG emission projections under the WM and WAM scenario
The energy sector is affected strongly by the measures of reducing emissions, enhancing energy efficiency and increasing the share of renewable energy sources.
If in the energy generation sector (electricity generation and district heating system) the main GHG emission reduction measures relate to wider use of RES to replace fossil fuel and reducing energy losses in the supply system, then in the consumption sectors the priority target is energy efficiency raising.
The increase of the use of renewable energy sources is done in the electricity and district heating sectors by increasing first of all the use of biomass in heating boilers, followed by increasing the use of biomass in CHPs and the use of other RES in the generation of electricity and heating. There are also wide possibilities to replace fossil fuel with biomass in the industrial sector. To increase the use of RES in the residential and service sectors as well as the transport sector is fairly limited.
As already mentioned above, the RES share is considerably higher under the WAM than WM scenario and this fact is largely responsible for lower GHG emissions in WAM compared to WM. The projected GHG emissions under the WAM scenario in 2020 and 2030 is corresponding by 0.3% and 2.5% lower compared to 2014 and it is by 528 kt CO2 eq lower than under the WM scenario (Table 5.4).
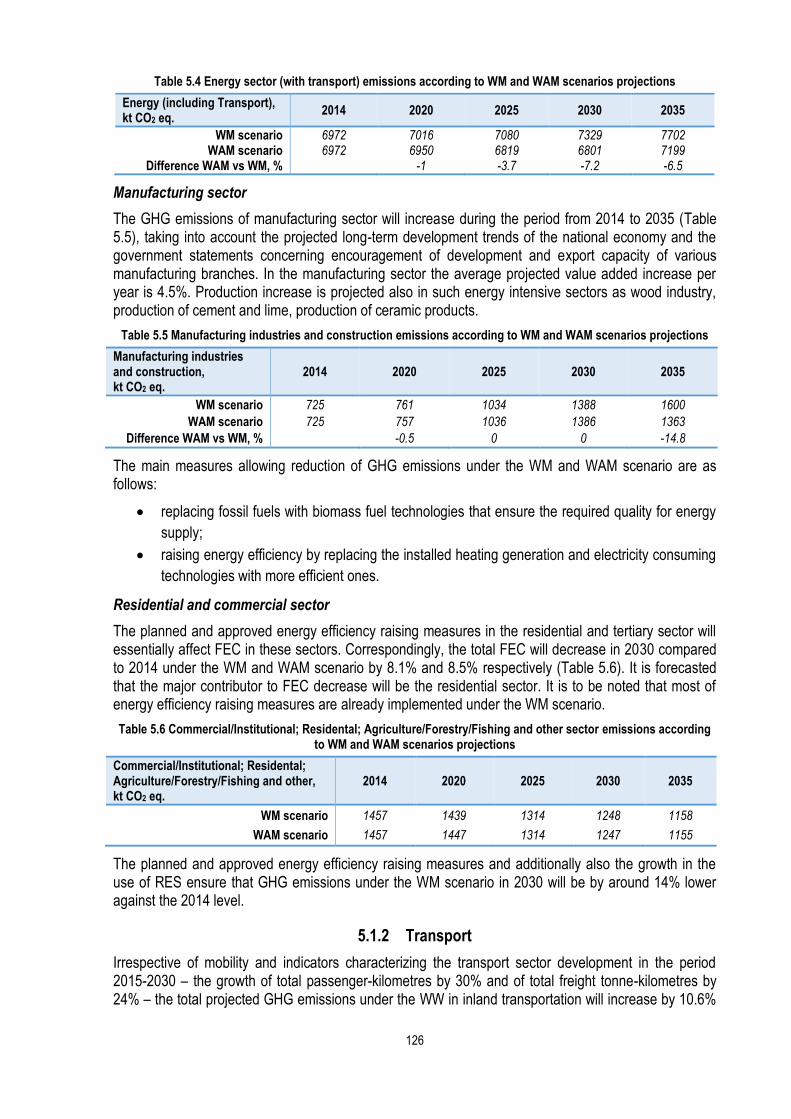
126
Table 5.4 Energy sector (with transport) emissions according to WM and WAM scenarios projections
Energy (including Transport), kt CO2 eq.
2014 2020 2025 2030 2035
WM scenario 6972 7016 7080 7329 7702 WAM scenario 6972 6950 6819 6801 7199
Difference WAM vs WM, % -1 -3.7 -7.2 -6.5
Manufacturing sector
The GHG emissions of manufacturing sector will increase during the period from 2014 to 2035 (Table 5.5), taking into account the projected long-term development trends of the national economy and the government statements concerning encouragement of development and export capacity of various manufacturing branches. In the manufacturing sector the average projected value added increase per year is 4.5%. Production increase is projected also in such energy intensive sectors as wood industry, production of cement and lime, production of ceramic products.
Table 5.5 Manufacturing industries and construction emissions according to WM and WAM scenarios projections
Manufacturing industries and construction, kt CO2 eq.
2014 2020 2025 2030 2035
WM scenario 725 761 1034 1388 1600
WAM scenario 725 757 1036 1386 1363
Difference WAM vs WM, % -0.5 0 0 -14.8
The main measures allowing reduction of GHG emissions under the WM and WAM scenario are as follows:
replacing fossil fuels with biomass fuel technologies that ensure the required quality for energy
supply;
raising energy efficiency by replacing the installed heating generation and electricity consuming
technologies with more efficient ones.
Residential and commercial sector
The planned and approved energy efficiency raising measures in the residential and tertiary sector will essentially affect FEC in these sectors. Correspondingly, the total FEC will decrease in 2030 compared to 2014 under the WM and WAM scenario by 8.1% and 8.5% respectively (Table 5.6). It is forecasted that the major contributor to FEC decrease will be the residential sector. It is to be noted that most of energy efficiency raising measures are already implemented under the WM scenario.
Table 5.6 Commercial/Institutional; Residental; Agriculture/Forestry/Fishing and other sector emissions according to WM and WAM scenarios projections
Commercial/Institutional; Residental; Agriculture/Forestry/Fishing and other, kt CO2 eq.
2014 2020 2025 2030 2035
WM scenario 1457 1439 1314 1248 1158
WAM scenario 1457 1447 1314 1247 1155
The planned and approved energy efficiency raising measures and additionally also the growth in the use of RES ensure that GHG emissions under the WM scenario in 2030 will be by around 14% lower against the 2014 level.
5.1.2 Transport
Irrespective of mobility and indicators characterizing the transport sector development in the period 2015-2030 – the growth of total passenger-kilometres by 30% and of total freight tonne-kilometres by 24% – the total projected GHG emissions under the WW in inland transportation will increase by 10.6%

127
in 2030 against the 2014 level (Table 5.7). GHG emissions of inland transportation comprise road transport, railway, domestic navigation and aviation. GHG emissions of international aviation and navigation have been reported under International bunkers93.
Table 5.7 Transport emissions according to WM and WAM scenarios projections
Transport, kt CO2 eq.
2014 2020 2025 2030 2035
WM scenario 2952 3040 3187 3265 3378
WAM scenario 2952 3029 3174 3266 3350
Difference WAM vs WM, % -0.4 -0.4 0 -0.8
Most GHG emissions in the transport sector are caused by road transport, which accounts for 91% of the total emissions in 2030. Thus, the main emission impacting factor in the transport sector is the penetration rate of new technologies (hybrid, electric, hydrogen and other) with higher demands for emission limits and replacing the stock of the existing vehicles. This trend is already included in the emission projections under the WM scenario.
GHG emissions in the rail transport account for about 8% of the total projected emissions in the transport sector in 2030. As no specific solutions for railway electrification have been developed yet, then the WM GHG projection scenarios do not envisage transition from diesel fuel to electric energy in rail freight transport.
Navigation and local aviation account for a very small share of total emissions.
5.1.3 Industrial Processes and Product Use
GHG emissions from the use of raw materials in technological equipment and which are not directly related to the combustion of fuel are accounted under IPPU sector, including emissions from solvent use and F-gases. As already stated above, the macroeconomic forecast envisages sharp growth of the manufacturing sector by 2030. As most emissions from IPPU sector come from the mineral industry (cement production), then the growth of the construction sector and cement production are the main driving forces for GHG emissions projection. According to the forecast, the average annual growth of the construction sector is at least by 4.5% per year by 2030.
The total projected GHG emissions under the “scenario with existing measures” in IPPU sector will decrease corresponding by 6% and 2.6 % in 2020 and 2030 against the 2014 level (Table 5.8).
Table 5.8 IPPU emissions according to WM and WAM scenarios projections
IPPU, kt CO2 eq 2014 2020 2025 2030 2035
WM scenario 838 787 799 816 816
WAM scenario 838 787 799 816 816
GHG emissions in IPPU sector under the WM scenario are projected taking into account that the production processes of enterprises will comply with the requirements provided for in the Law “On Pollution”. In compliance with the requirements of this law enterprises have to organise the production process by implementing the best and most modern technologies providing for the lowest level of GHG emissions.
F-gases
Currently emissions from refrigeration and air conditioning equipment constitute the mayor part of total F-gas emissions (94% in 2014) and it is expected that emissions from these appliances will constitute the biggest share from F-gas emissions in the future. It is projected that F-gas emissions will grow till 2019. Afterwards it is expected that emissions will gradually decrease due to prohibitions regarding placing on the market certain F-gases according to EC regulation on F-gases (517/2014) as well as

128
according to prohibition to mobile air-conditioning systems designed to contain F-gases with a global warming potential higher than 150 from a certain date.
Solvent Use
The use of solvents and products containing solvents results in emissions of non-methane volatile organic compounds (NMVOC). NMVOC emissions are regarded as an indirect greenhouse gases as it over a period of time will oxidize into CO2 when emitted to the atmosphere.
Indirect CO2 emissions projections in the Solvent use sector are calculated using top-down accounting model essentially based on the number of inhabitants. The structure and emission calculation is performed according to EMEP/EEA 2016 and 2006 IPCC Guidelines.
The indirect CO2 emissions from Solvent use sector are projected to decrease slightly during the period 2015-2040. For instance, emissions of indirect CO2 have decreased by 0.99%, from 23.22 kt in 2015 to 22.99 kt indirect CO2 in 2040. In 2015 the main share of total indirect emissions from Solvent use sector contributed Paint application subsector (42.2% or 9.8 kt). Taking into account that the total population is expected to decline, the emissions from solvent use are projected to decrease accordingly.
5.1.4 Agriculture
It is projected that there will be an increasing trend of total GHG emissions in the agriculture sector during the period 2020-2035. The total GHG emissions will increase by 13.6% in 2020 and 24.2% in 2030 comparing to 2014. The most rapid increase of emissions is related to CH4 emission from manure management where it is expected that CH4 emission will increase by 21.7% in 2020 and 49.1% in 2030 comparing to 2014. Also projections show an increase of N2O emission from soils by 14.9% in 2020 and 24.2% in 2030 comparing with 2014. All emissions from the agriculture sector projected with WM (with measures) scenario are represented in in Table 5.9.
Table 5.9 Projected GHG emissions from agriculture sector in WM scenario (kt CO2 eq.)
Subcategory 2014 2020 2025 2030 2035
CH4 emission from enteric fermentation
872.7 978.1 1079.8 1081.6 1056.1
CH4 emission from manure management
99.5 121.1 141.2 148.4 150.5
N2O emission from manure management
104.3 105.4 111.6 110.9 108.6
N2O emission from soils 1625.5 1867.74 1958.5 2018.7 2067.44 CO2 emission from liming and urea
application 24.4 26.1 26.1 26.1 26.1
Total 2726.4 3098.4 3317.1 3385.7 3408.8
Historical and projected CH4 emissions from enteric fermentation are included in Table 5.10. Calculation results show the increase of enteric fermentation emission by 23.9% till 2030. After 2030 the annual enteric fermentation CH4 emission growth rate will decrease and will reach +21.0% of base year 2014 emission level.
Table 5.10 Projected CH4 emission from enteric fermentation (kt)
Subcategory 2014 2020 2025 2030 2035
CH4 emission from enteric fermentation
34.91 39.12 43.19 43.26 42.25
An important parameter that causes the total amount of enteric fermentation CH4 emission is the population of ruminant livestock. Population of cattle results in more than 90% of CH4 emission by enteric fermentation in Latvia. It is forecasted that the number of dairy cows will decrease by 6.4% in 2030 comparing to 2014. However, projections show that in 2030 the average annual milk yield per dairy cow will increase by +37.6% of 2014 milk yield level. It is expected that the average milk yield will reach 8000 kg yr-1 in 2030 compared with 5812 kg yr-1 in 2014.

129
A rapid increase of dairy cows productivity will lead to an increase of gross energy (GE) intake and, consequently, to higher enteric fermentation CH4 emission per dairy cow. For the purposes of inventory and projections GE for dairy cattle is calculated on the basis of milk yields, therefore average milk yield per cow is one of key indicators for calculation of CH4 emissions.
Projections also show the increase of the cattle number by 20.8% in 2020 and 32.5% in 2030 comparing to 2014 that also will promote the increase of enteric fermentation CH4 emission in the period 2020-2035. Detailed information of projected livestock numbers and dairy cow productivity is included in Table 5.11.
Table 5.11 Projections of the livestock number (ths.) and milk yield per dairy cow (kg)
Projected item 2014 2020 2025 2030 2035
Dairy Cattle 165.9 158.1 161.5 155.2 145.2 Milk yield 5812 6801 7466 8000 8403
Cattle 256.1 309.3 345.1 339.3 328.9 Sheep 92.5 131.2 160.1 189.1 218.0 Goats 12.3 12.7 12.7 12.7 12.7
Horses 10.1 7.1 5.1 3.6 2.9 Swine 349.4 345.2 341.1 338.5 336.9
Poultry 4413.9 4690.5 4690.5 4690.5 4690.5
Historical and projected CH4 emissions from manure management are included in Table 5.12. Projections show that manure management CH4 emission will increase by 21.7% in 2020, and 49.1% in 2030 comparing to 2014.
Table 5.12 Projected CH4 emission from manure management (kt)
Subcategory 2014 2020 2025 2030 2035
CH4 emission from manure management
3.98 4.84 5.65 5.93 6.02
The main activity data for calculation of CH4 emission from manure management is livestock population, mainly cattle, swine and poultry, and animal waste management systems (AWMS) distribution. It is expected that agricultural production levels of dairy farming and swine production will be intensified with the aim to improve production efficiency. This will lead to livestock concentration in big farms with preference to slurry or liquid manure management system (Table 5.13). Manure management CH4 emission factors for slurry based systems are noticeably higher due to high methane conversion factor (MCF) comparing to solid manure storage, pasture or anaerobic digesters that are also typical MMS for Latvia.
Table 5.13 Projections of manure management systems (MMS) distribution (share) for dairy cattle and swine
MMS 2014 2020 2025 2030 2035
Dairy cattle
Liquid 0.274 0.437 0.533 0.588 0.637 Solid 0.525 0.383 0.312 0.264 0.217
Pasture 0.073 0.059 0.043 0.037 0.030 Anaerobic digesters 0.128 0.121 0.112 0.111 0.116
Swine
Liquid 0.522 0.643 0.661 0.674 0.679 Solid 0.116 0.048 0.030 0.018 0.012
Pasture 0.000 0.000 0.000 0.000 0.000 Anaerobic digesters 0.362 0.309 0.309 0.308 0.309
Historical and projected N2O emissions from manure management are represented in Table 5.14. Slight fluctuations of N2O emissions from manure management in projected time series are related to relatively small emission factors for Latvia’s typical manure management systems. The highest increase of N2O emission from manure management is referred to 2025, when emission from subcategory is projected to increase by 6.9% comparing to 2014. This increase of N2O emission from manure management is influenced by the highest point of projected number of dairy and non-dairy cattle.

130
Table 5.14 Projected N2O emission from manure management (kt)
Subcategory 2014 2020 2025 2030 2035
N2O emission from manure management
0.350 0.354 0.374 0.372 0.364
Main activity data for calculation of emissions from manure management are livestock population data and animal manure management systems (MMS) data as well as excreted nitrogen rate per domestic animal. For inventory purposes Latvia uses country specific nitrogen excretion values, these values are also used for projections. Data on MMS are calculated on the basis of results of agricultural census data, national research projects results and livestock numbers in the herd. In recent years cattle farms have turned to liquid slurry management system due to closing down of small farms and reflecting the trend to use this management system in the developed countries, however, liquid slurry produces more methane and promotes an increase of this kind of emissions. One of the measures to reduce emissions from manure management is to use manure for biogas production. Latvia uses anaerobic digesters as MMS for dairy and non-dairy cattle, swine and poultry that help to reduce a rapid increase of emissions of N2O from manure management.
Historical and projected N2O emissions from agricultural soils are represented in Table 5.15. Emission in this category will increase by 24.2% till 2030 comparing to 2014.
Table 5.15 Projected N2O emissions from soils (kt)
Subcategory 2014 2020 2025 2030 2035
N2O emissions from soils 5.45 6.27 6.57 6.77 6.94
55% of total direct N2O emission in 2014 from soils originated from cultivation of organic soils. Projections show that this subcategory will stay important as the main source of GHG emissions from soils till 2030; however, the share of direct N2O emission from cultivation of organic soils will decrease to 39.0% during this time period. The second largest source of direct GHG emissions from soils is the use of synthetic nitrogen fertilizers that constitute approximately one-quarter of total emissions in this category. It is projected that emission from this source will increase almost by 50.3% in 2030 comparing to 2014. Activity data projections show that already in 2020 the use of synthetic nitrogen fertilizer will increase to 28.0% compared to 2014. The consumption of synthetic nitrogen fertilizer will increase more than 50.0% in 2030 compared to 2014. The third most important source of emissions from soils is N2O emission from crop residues (12% of the total direct emissions from soils in 2014). It is expected that emission in this subcategory will increase to 31.6% in 2020 and 52.9% in 2030, comprising in 15% of the total direct soil emissions comparing to 2014.
The main activity data for calculation of projected N2O emission from agricultural soils contain the used amount of synthetics and organic nitrogen fertilizers, an area of harvested crops and the yield, and the cultivated area of organic soils. The calculated amounts of synthetic nitrogen fertilizers are linked to a planned significant increase of areas for grain cultivation; however, the cultivation of organic soils will be reduced. Projected activity data for calculation of N2O emissions from agricultural soils are included in in Table 5.16.
Table 5.16 Projected activity data for estimation of GHG emissions from agricultural soils
Activity data 2014 2020 2025 2030 2035
Used N with synthetic fertilizers, kt 72.90 93.3 102.4 110.0 116.4 Used N with manure, kt 16.80 17.80 18.90 19.00 18.60
Organic soils, ha 141976.2 123870.2 122696.9 121668.5 120905.1 Wheat yield, t ha-1 3.65 4.44 4.70 4.93 5.14 Barley yield, t ha-1 3.49 3.20 3.38 3.55 3.70
Rye yield, t ha-1 3.54 3.56 3.77 3.96 4.14 Oats yield, t ha-1 2.32 2.43 2.55 2.65 2.74
Wheat sown area, ths. ha 402.5 541.5 586.0 623.4 654.0 Barley sown area, ths. ha 119.9 96.3 90.0 84.7 80.1
Rye sown area, ths. ha 32.3 31.3 29.4 27.7 26.3 Oats sown area, ths. ha 66.8 62.2 62.2 62.2 62.2

131
According to emissions projections by using WM scenario several emission mitigation measures were evaluated: improvement of manure management systems, introduction of leguminous plants on arable land, promotion of biogas production, development of organic and integrated farming, planning feed rations for livestock farming and installation of precision farming technologies in crop farming.
5.1.5 Waste Management
The calculation of the activity data and emission projections was done on the basis of the following main assumptions and the existing policies and plans:
Projections on the country’s population and macroeconomic parameters;
The requirements set in the Landfill Directive (1999/31/EC) on the volume of the disposed biodegradable waste are met;
The requirements set for 2020 in the Waste Framework Directive (2008/98/EC) on recycling of municipal waste are met.
Consequently, composting and other recycling activities will increase. Latvia developing separate waste collection system and recovery. Composting of biodegradable waste is set one of priorities in Waste management plan.
To project activity data for waste water handling sector, following assumptions and existing policies were used:
Projections of national population, GDP of manufacturing industry and private consumption.
Urban Waste Water Directive 271/91/EEC (UWWTD), implemented in the Latvian legislation in 2002 with Regulations of the Cabinet of Ministers No. 34 adopted on 22 January 2002 “Regulations Regarding Discharge of Polluting Substances into Water”. According to conditions of accession European Union in 2004, there were 3 deadlines designated for Latvia to implemented UWWTD – 31st December of 2008 for agglomerations larger than 100 000 of population equivalent (p.e.), 31st December of 2011 for agglomerations 10 000 – 100 000 p.e. and 31st December for agglomerations 2 000 – 10 000 p.e. At the moment, all the deadlines of full implementation have been met, and UWWTD must be fully implemented.
Regulations of the Cabinet of Ministers No. 403 adopted on 21 June 2016 “The Implementing Rules of Specific Aid Objective 5.3.1. “Developing and Improving of the Water Supply and Sewerage Systems and the Quality of Services to Provide Connectivity” of Operational Program “Growth and Jobs”, designated targets and financial resources (~126 million euro from Cohesion Fund of Europe Union) to increase number of population, connected to a centralized waste water collection and treatment system in a certain agglomerations. This measure should be fully implemented until 31st December of 2022.
Only WM scenario applies for waste water handling sector, additional measures are not planned.
Projected emissions (WM scenario) from subsectors of waste sector are included in the following Table 5.17 (kt CO2 eq.).
Table 5.17 Projected GHG emissions from waste sector in WM scenario (kt CO2 eq.)
Sector 2014 2020 2025 2030 2035
5.A. Solid Waste Disposal 528.75 310.82 237.75 198.39 173.02
5.B. Biological Treatment of Solid Waste 38.53 41.19 44.91 44.86 44.86
5.C. Incineration and Open Burning of the Waste
4.94 0.19 0.19 0.19 0.19
5.D. Waste Water Treatment and Discharge 264.71 311.61 366.93 420.64 420.64
Total Waste emissions 836.94 663.81 649.77 664.08 638.70
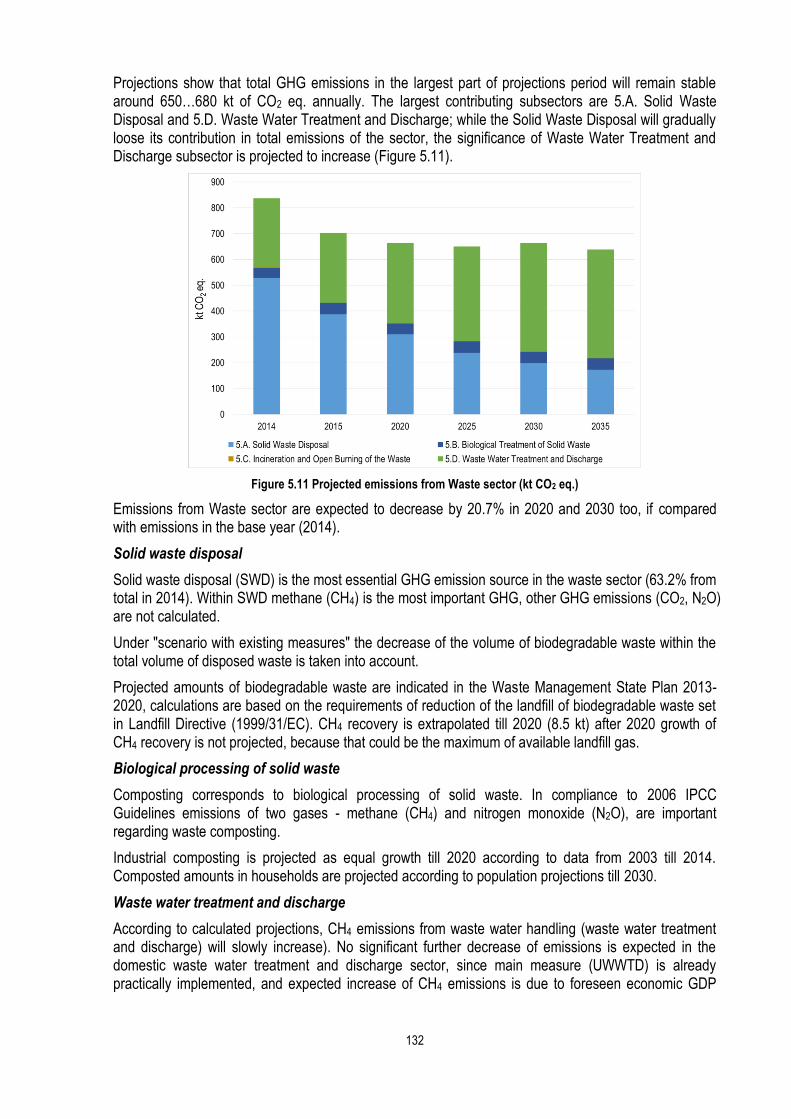
132
Projections show that total GHG emissions in the largest part of projections period will remain stable around 650…680 kt of CO2 eq. annually. The largest contributing subsectors are 5.A. Solid Waste Disposal and 5.D. Waste Water Treatment and Discharge; while the Solid Waste Disposal will gradually loose its contribution in total emissions of the sector, the significance of Waste Water Treatment and Discharge subsector is projected to increase (Figure 5.11).
Figure 5.11 Projected emissions from Waste sector (kt CO2 eq.)
Emissions from Waste sector are expected to decrease by 20.7% in 2020 and 2030 too, if compared with emissions in the base year (2014).
Solid waste disposal
Solid waste disposal (SWD) is the most essential GHG emission source in the waste sector (63.2% from total in 2014). Within SWD methane (CH4) is the most important GHG, other GHG emissions (CO2, N2O) are not calculated.
Under "scenario with existing measures" the decrease of the volume of biodegradable waste within the total volume of disposed waste is taken into account.
Projected amounts of biodegradable waste are indicated in the Waste Management State Plan 2013-2020, calculations are based on the requirements of reduction of the landfill of biodegradable waste set in Landfill Directive (1999/31/EC). CH4 recovery is extrapolated till 2020 (8.5 kt) after 2020 growth of CH4 recovery is not projected, because that could be the maximum of available landfill gas.
Biological processing of solid waste
Composting corresponds to biological processing of solid waste. In compliance to 2006 IPCC Guidelines emissions of two gases - methane (CH4) and nitrogen monoxide (N2O), are important regarding waste composting.
Industrial composting is projected as equal growth till 2020 according to data from 2003 till 2014. Composted amounts in households are projected according to population projections till 2030.
Waste water treatment and discharge
According to calculated projections, CH4 emissions from waste water handling (waste water treatment and discharge) will slowly increase). No significant further decrease of emissions is expected in the domestic waste water treatment and discharge sector, since main measure (UWWTD) is already practically implemented, and expected increase of CH4 emissions is due to foreseen economic GDP

133
growth in the manufacturing industry sector, which is source of CH4 emissions from industrial waste water treatment and discharge sector.
Emissions of N2O in the waste water treatment and discharge sector will gradually increase. Main driving force of this increase is projected rise of protein consumption, which is activity data for N2O emission calculation from domestic waste water treatment and discharge, as result of projected increase of private consumption from macroeconomic forecasts. Emissions of N2O from industrial waste water treatment and discharge will increase together with forecasted rise of GDP for manufacturing industry too, but because of these emissions are negligible in comparison with N2O emissions from domestic waste water t sector, they do not affect significantly total N2O emission forecasts.
5.1.6 Land use, Land use Change and Forestry
This chapter provides projections for GHG emissions and removals for the period up to 2035. Taking into account the best available data, two emission projection scenarios on the future projections of the GHG emissions and CO2 removals in LULUCF sector are provided. With measures (WM) scenario represents projections with existing measures, which are proposed in the Rural Development Programme 2014-2020. Without measures (WOM) scenario is provided to evaluate impact of measures included in the WM scenario on emission projections.
The net impact of the existing measures (WM scenario) during the whole impact period is 18 073 kt CO2; the total affected area – 172 kha; the average annual impact is 1.5 tonnes CO2 ha-1 (249 kilotons CO2 eq. year-1 in all affected areas, Table 5.18). The most efficient measure is afforestation (97.3 kt CO2 eq. year-1). According to Tier 1 based methodology, duration of the impact of the measures in cropland is 20-30 years; duration of impact of the measures in forest land is 76-102 years. The most of the impact is expected after 2030 due to long lasting effect of the measures in affected forest lands. In total forest lands contributes to 90 % of the proposed climate change mitigation effect.
Table 5.18 Summary of potentially impact of the existing measures
Mea
sure
Imp
act
per
iod
, yea
rs
Init
ial p
rog
no
sis
of
tota
l
affe
cted
are
a, h
a
To
tal G
HG
red
uct
ion
po
ten
tial
, to
nn
es C
O2 eq
.
An
nu
al G
HG
red
uct
ion
po
ten
tial
per
are
a u
nit
,
ton
nes
CO
2 eq
. yea
r-1
An
nu
al G
HG
red
uct
ion
po
ten
tial
per
are
a u
nit
,
ton
nes
CO
2 eq
yea
r-1 h
a-1
GH
G r
edu
ctio
n p
ote
nti
al
un
til 2
020,
to
nn
es C
O2 eq
.
GH
G r
edu
ctio
n p
ote
nti
al in
2021
-203
0, t
on
nes
CO
2 eq
.
GH
G r
edu
ctio
n p
ote
nti
al
afte
r 20
30, t
on
nes
CO
2 eq
.
Measures in forest land
Development and adaptation of drainage systems in forest land
76 11971 1181825 15612 1.3 93670 156117 932038
Afforestation 2014-2020
81 6600 3935472 48666 7.4 291995 486658 3156820
Afforestation 2007-2013
81 12000 7046283 48666 7.4 956903 869912 869912
Improvement of ecological value and sustainability of forest ecosystems
78 15000 2196836 28056 1.9 168337 280562 1747937
Regeneration of forest stands after natural disasters
102 31000* 1862524 18195 0.6 109169 181949 1571406
Total impact - 171686 18073919 249518 1.5 2162015 2878434 8683916
* The prognosis of total affected area of measure “Regeneration of forest stands after natural disasters” is calculated based on the relevant expenditures in the previous period.

134
In WOM scenario, the net annual GHG emissions in LULUCF sector in 2020 will increase to 2953 kilotons CO2 eq. and in 2035 – they will increase to 3661 kilotons CO2 eq. The main drivers for increase of the GHG emissions in LULUCF sector is ageing of forest leading to decrease of increment and increase of mortality and deforestation due to restoration of economic activity in rural regions. The only net source of CO2 removals in LULUCF sector contributing to nearly 2 million tonnes of CO2 eq. removals annually is HWP.
Implementation of existing measures (WM scenario) will reduce CO2 emissions by 255 kt CO2 annually, in average, reaching maximum at 2020 (Figure 5.12 and Figure 5.13). The estimated impact of the measures in 2015 and 2016 according to the initially proposed implementation plan are, respectively, 120 kt and 153 kt CO2 eq. (Figure 5.13). Due to the fact that the implementation differs from the plan and the proposed figures represents average annual values, actual impact may differ from the plan. The proposed impact (absolute values and relative changes) of the climate change mitigation measures can reach 10% of the GHG emissions in WOM scenario until 2020 (Figure 5.14). The most of the impact is due to afforestation and forest thinning; however production of legumes may have considerable but uncertain effect. Field measurement based impact assessment of the new management practices is necessary to elaborate country accounting methods for this and other agriculture related measures.
Figure 5.12 Net GHG emissions in LULUCF sector in WM scenario
Figure 5.13 Impact of the measures

135
Figure 5.14 Comparison of WM and WOM scenario
5.2 Sensitivity Analysis
Performing GHG emissions calculations in different sectors, it has to be taken into account that there are sector-specific key drivers which influence emissions projected amount as well as uncertainties regarding the future trends of parameters, used for GHG emissions projecting, exist. Therefore, the availability of sensitivity analyses around the chosen baseline (WM scenario) would be particularly useful to show how changes in key drivers would affect emissions. Five sensitivity analysis regarding GHG emissions projections have been carried out. GDP and population assumptions impacts on projected GHG emissions have been analysed in energy and waste management sector. In energy sector it has been analysed also the impact of imported electricity price and amount. In its turn, sensitivity analysis in agriculture sector has been focused how different values of grain and milk prices may impact GHG projections in this sector.
5.2.1 Energy
As it is known, assumptions on the future development of the parameters may essentially affect the projected GHG emissions. In order to assess the dependence of GHG emission projections on the development trends of separate parameters, sensitivity analysis was done to emission projections in the energy sector. Two indicators were selected for the sensitivity analysis of GHG emissions in Latvia under the alternative scenario. First – it was GDP and population growth rate, second – the amount of electricity import, vital for the Latvian energy sector.

136
Figure 5.15 Results of sensitivity analysis in the energy sector under the impact of assumptions of lower GDP growth
If under the WM scenario the average annual GDP growth rate is 3.9% (in the period 2017-2030), under the alternative scenario the average annual GDP growth rate is 1.9%. This GDP growth rate corresponds to an assumptions implemented under the PRIME model reference scenario.
The modelling results reveal that under the scenario of lower GDP and population growth (see scenario WM_low GDP) total GHG emissions in 2030 are by 12.4% lower than under the WM scenario (Figure 5.15). The scenario of lower GDP growth rate has the most vital impact upon energy consumption and respectively also upon GHG emissions in industry – GHG emissions in 2030 are lower than under the WM scenario by around 23%. The transport sector ranks second as to the impact as there GHG emissions are lower by 14% in 2030. In its turn, the projected relative impact of low GDP and population on GHG emissions in service and household sector is significantly lower. Even the assumption on lower population number significantly impacts the energy consumption in household sector (WM_low GDP scenario in 2030 projects 16% lower energy consumption compared to WM scenario), the total GHG emissions in WM-low GDP scenario in service and households sector are only per 6.7% lower than in WM scenario. In a great extent this result is determined by already high biomass consumption in household sector.
In Latvia electricity supply from hydro energy and the amount of electricity import changes from year to year. These changes leave an essential impact on the GHG emissions volume.
Figure 5.16 Results of sensitivity analysis in the energy sector under the impact of assumptions of higher electricity import amount

137
Under the alternative scenario with the assumption for possibly lower electricity import amount (see scenario WM_low_elec-import) the permitted electricity import amount was reduced almost twice after 2020 as compared to the WM scenario. The alternative scenario GHG emissions in 2030 are by around 7% higher than under the WM scenario (Figure 5.16).
Assumptions on different electricity import amounts leave the most critical impact on emissions in the energy industry and the ETS sector. The alternative scenario forecasts GHG emissions in the energy industry in 2030 by around 34% higher than under the WM scenario.
5.2.2 Agriculture
The sensitivity analysis is used to determine how different values of grain and milk prices can impact a particular dependent variable (the number of dairy cows, non-dairy cattle, and swine, as well as sown area of wheat) under a given set of assumptions. Then specified activity data are included in GHG emission calculation algorithms according to 2006 IPCC Guidelines. The number of cattle and swine, as well as sown area of wheat is projected on the basis of regression models with milk and grain prices as independent variables to measure the effect of price changes on activity data for GHG emission calculation.
Milk price scenario uses an assumption that the price of milk increases more rapidly and reach + 10% in 2050, against the baseline scenario, used to project activity data. Grain prise scenario uses an assumption that the price of grain increases more rapidly and reach + 10% in 2050, against the WM scenario outcame. According to milk price scenario assumption, it is projected that the number of dairy cows will increase by 0.4% in 2020 and 4.1% in 2030, comparing to the baseline scenario outcame. Grain prise scenario projections show that wheat sown area probably will increase by 1.0% in 2030, comparing to the WM scenario.
Consequently, GHG emissions will increase more rapidly if milk prices will be higher and the number of dairy cows will go up. Comparing to the WM scenario, if the number of dairy cattle will increase in the case of high milk prices, total GHG emissions in agriculture sector will increase by 5.7% in 2030 (3578.3 kt CO2 eq. against 3385.7 kt CO2 eq.). In the case of grain prise scenario, it is projected that GHG emissions in agriculture sector will grow more slowly and will reach 3514.2 kt CO2 eq. in 2030. Results of a sensitivity analysis are included in Figure 5.17. All other parameters of projections for both scenarios are similar to inputs for the WM scenario projections.
Figure 5.17 Sensitivity analysis of GHG emission projections for agriculture sector
The comparison of milk and grain prices for activity data projections is included in Table 5.19.

138
Table 5.19 Input variables for activity data projections
Year
Base Milk price scenario Grain price scenario
Milk price,
EUR t
Grain price,
EUR t
Milk price,
EUR t
Grain price,
EUR t
Milk price,
EUR t
Grain price,
EUR t
2020 270 169 273 169 270 171
2025 311 185 320 185 311 190
2030 334 197 348 197 334 205
2035 357 207 377 207 357 219
5.2.3 Waste Management
Macroeconomic factors, such as forecasts of GDP for manufacturing industry and private consumption, are very important driving force, affecting activity data for emission calculation from the sector. Thus, they were selected for sensitivity analysis.
During sensitivity analysis, average 4.5% growth rate of GDP for manufacturing industry was substituted with slightly slower 3% growth rate, and average 4% growth rate of private consumption was substituted with 3% growth rate. Emission projections, calculated with slower growth rate of GDP and private consumption, are shown with the WM_L line in the following figure.
Figure 5.18 Results of sensitivity analysis on emissions in the waste water handling sector on the assumptions of
the lower GDP and private consumption growth
The results of analysis (Figure 5.18) show that assumed slower growth rate of GDP and private consumption produce lower emissions – for example, 6.4% lower emissions by the 2020 and 16.2% lower emissions by the 2030.
5.3 Supplementarity
As the chapter on projections only focuses on the development of GHG emissions until 2030, the question of supplementarity cannot be raised for this time horizon as no targets are finally defined and no final decisions are taken with regard to the (supplementary) use of Kyoto mechanisms.

139
5.4 Total effect of policies and measures
In the estimate for the total effect of policies and measures (PaMs), the Business as Usual (BAU) scenario of the Latvia climate strategy from the year 2001 was used (named here as BAU (2000) scenario). The BAU scenario presents a development path without measures implemented after the year 2000. The BAU scenario presents GHG emissions without the LULUCF sector.
The total effect of the policies and measures (PaMs) is calculated based on the difference between the inventory emissions and the BAU (2000) (for 2010 and 2015) and the difference between the WM projection and the BAU (2000) (for 2020 and 2030).
Figure 5.19 Projected GHG emissions in BAU(2000) and WM scenario
Based on the results presented in Figure 5.19 the total effect of PaMs in 2010 was 1400 kt CO2 eq., which means that the emissions in 2010 would have been 10.4 % higher without the PaMs implemented since the year 2000. According to the comparison of the BAU (2020) scenario with the WM projection for 2020, the total effect of PaMs in 2020 will be 2675 kt CO2 eq. (-18.8% compared to the BAU (2020) figure) and in 2030 will be 5010 kt CO2 eq.(-29.4% compared to the BAU (2020) figure).
The aggregated estimates for the greenhouse gas reduction impacts of individual policies and measures presented in Chapter 4 are 1509 kt and 1515 kt CO2 eq. for 2020 and 2030 (without LULUCF), respectively. However, the impact estimates of individual policies and measures are not fully additive, which may result in an overestimation of the mitigation impact. On the other hand, the mitigation impact has not been estimated for all policies and measures. The total effect of policies and measures contains noticeable uncertainties.
5.5 Methodology
5.5.1 Energy
To model the complex development of the Latvian energy system and perform calculation of GHG projections it is used internationally widely-applied partial equilibrium, bottom-up, dynamic, linear programming optimisation model MARKAL code for the energy-environmental system optimisation which we have been adapting to Latvia’s circumstances since 1995 by creating the MARKAL-Latvia country model and applying it for the national level studies.
The MARKAL modeli s driven by useful energy demands, expressed in energy units or energy demands expressed as energy services in other units (e.g., lumen hours for lighting). The model integrates the

140
end-use sectors and the supply side, holding descriptions of different energy sources and carriers that pass through the energy system’s stages – transformation and distribution processes, energy end-use processes in all economic sectors, including a set of technological and energy efficiency options as well as associated emissions. The model is based on the minimization of the long term discounted cost of all modelled energy-environmental system. The system’s cost includes investment and operation and maintenance costs for all technologies, plus costs of all fuels, minus the revenue from exported fuels, minus the salvage value of all residual technologies at the end of the modelled horizon. The model covers 11 periods of 5 years each, so that the modelled horizon covers 1998 to 2052, inclusive.
In the MARKAL-Latvia model the energy demand is divided in five main sectors – industry, residential, agriculture, commercial & service and transport – and further divided in subgroups or subsectors, e.g., energy consumption in the residential sector is divided into space heating and hot water in single or multifamily houses, the use of particular electrical appliances. The projection is calculated for each of these subsectors by linking directly or indirectly via elasticities and/or other indicators (e.g., energy intensities or specific consumption and changes in them, the number of households, persons per households, household area, etc.) to the economic development scenario (GDP, value added, private consumption, population). In the years 2000, 2005, 2010 and 2015, the actual installed capacities and activity levels of technologies are imposed, thus providing that the model results exactly represent the real system being modelled.
MARKAL determines future investments and activity of technologies at each time period, while ensuring demands, emission caps and sets of other different constraints.
Projection on prices of energy resources, as well as useful energy demand (energy service demand) or other secondary parameters, like the area of heated premises of buildings or mileage of cars that reflects the required amount of energy are needed as the input data in MARKAL model. Consumption of electricity and district heating is calculated internally within the model.
The model structure is adapted, so that emissions can be calculated not only by the type of fuel, but also by sector and corresponding type of technologies.
Demand for energy is directly linked with economic development, thus, the projected changes of consumption of useful energy are related to the long-term macroeconomic projections. For the purpose of developing energy demand scenario, the long-term macroeconomic projection up to year 2030 developed by the MoE, has been used. This projection has been applied in projecting electricity consumption, heat consumption, as well as fuel consumption in individual sectors.
Price projection of imported energy resources (oil products, natural gas, coal) have been developed based upon information from International Energy Agency World Energy Outlook (IEA WEO 2015). Prices of local energy resources depend on the geographical location of usage; therefore, the price may differ. Projection of average prices of these fuels have been developed based upon available statistics, various studies, taking into account the projection price trends of imported energy resources. Solid biomass (wood) is split to four price groups with difference available amounts of sources. Actual prices of energy resources are projected without taking into account taxes. All implemented takses in Latvia are further added in the model.
5.5.2 Industrial Processes and Product Use
GHG emissions projections in the IPPU sector are calculated using top-down accounting model. The model includes both the projection of activity data and GHG emission calculation. For calculation of GHG emissions the historical emissions factors of the latest submitted inventory are applied and these factors are constant for all projected time period. In its turn, the necessary activity data are projected based on the historical data and the macro-economical parameters characterising the development of particular branch of industry sector (value added or industrial production index).

141
F-gases
F-gas projections calculation is based on MS Excel top-down accounting model. The structure and emission calculation is performed according to 2006 IPCC Guidelines and adjusted for projection estimation incorporating parameters according to macroeconomic forecast.
The use of F-gases is projected taking into account:
number of inhabitants, households and the number of freezing equipment (refrigerators and freezers) used;
changes in GDP growth rate;
the development of the service sector and the amount of stationary refrigeration used in it;
changes in the number of road transport which determine the amount of the used air conditioning systems in motor vehicles.
The projection of F-gases under the WM scenario is based on the assessed impacts of the EC Regulation on F-gases (517/2014) repealing Regulation 842/2006 and the EC directive on emissions from air conditioning systems in motor vehicles (2006/40/EC) (MAC Directive).
Solvent use
Indirect CO2 emissions projections in the Solvent use sector are calculated using top-down accounting model essentially based on the number of inhabitants. The structure and emission calculation is performed according to EMEP/EEA 2016 and 2006 IPCC Guidelines.
5.5.3 Agriculture
Projections of emissions with existing measures are based on primary activity data provided by MoA in collaboration with Latvia University of Agriculture. Econometric scenario based model Latvian Agricultural Sector Analysis Model (LASAM) is used for the activity data generation of Latvian agriculture. LASAM provides an outlook for animal farming, producing forecasts in dairy, beef, sheep, goat, pig, poultry and horse farming and crop farming based on regression analysis principles. LASAM estimates a forecast of the utilised agricultural area (UUA) and the structure of UUA, allow calculating the use of fertilisers in the agriculture sector. The source data for the calculations within the model are gathered from CSB, EUROSTAT, domestic use balance sheets and Farm Accountancy Data Network (FADN). The exogenous price forecasts until 2025 are gathered from the DG AGRI of the European Commission and Food and Agriculture Organization of the United Nations, further projected by the team of LUA. The macroeconomic forecasts are integrated from the forecasted values of MoE of Latvia.
Secondary data projections including manure management system distribution, nitrogen excretion of livestock, use of organic fertilizer nitrogen and nitrogen content in crop residues are done by Latvia University of Agriculture experts based on results of pre-defined project “Development of the National System for Greenhouse Gas Inventory and Reporting on Policies, Measures and Projections” under 2009 –2014 EEA Grants Programme National Climate Policy. Methodological approach used for manure management distribution projections are available in the scientific literature94,95. Projections of managed organic soils are provided by Latvian State Forest Research Institute “Silava”.
Projections of GHG emissions from the agriculture sector in Latvia are compiled by Latvia University of Agriculture experts according to 2006 IPCC Guidelines.
94 Cabinet of Ministers Regulations No.848 (20.12.2016) Regarding Development of Environmentally Friendly Public Transport (Buses) Infrastructure co-financed by the EU Cohesion Fund (Noteikumi “Darbības programmas “Izaugsme un nodarbinātība” 4.5.1.specifiskā atbalsta mērķa “Attīstīt videi draudzīgu sabiedriskā transporta infrastruktūru” 4.5.1.2.pasākuma “Attīstīt videi draudzīgu sabiedriskā transporta infrastruktūru (autobusi)” īstenošanas noteikumi), in force 24.12.2016, in Latvian, available at http://likumi.lv/doc.php?id=2876 95 J. Priekulis, A. Aboltins, A. Laurs, L.Melece (2015)Research in manure management in Latvia / 14th International scientific conference "Engineering for rural development" : proceedings, Jelgava, Latvia, May 20 - 22, 2015 Latvia University of Agriculture. Faculty of Engineering. - Jelgava, 2015. - Vol.14, p.88-93. Available: http://tf.llu.lv/conference/proceedings2015/Papers/015_Laurs.pdf

142
5.5.4 Land Use, Land Use Change and Forestry
The main data source for land use and carbon stock changes is National forest monitoring program. Other data sources and research data are used as supplementary data sources, for quality assurance purposes as well as to provide activity data for those sources which are not covered by the National forest monitoring programme.
Area of organic soils in croplands and grasslands is updated according to the inventory of historical data about farmlands implemented in 2009 96 . Area of cropland and grassland in LULUCF reporting is synchronized with Agriculture reporting, including recalculation of cultivated organic soils.
The NFI and research data are used to estimate time series for areas and gross increment. Mortality data are calculated on the base of the NFI data and mortality factors97. Distinction between forest land remaining forest land and areas converted to forest land is made according to the age of dominant species in forests on afforested land – if age of dominant species is less than zero in 1990, it is considered as land converted to forest, in other cases it is considered as forest land remaining forest land.
Changes of organic carbon in litter and soil organic matter in naturally dry and wet soils are assumed to be zero according to research data on carbon stock in forest soil in 2006 and 201298. Carbon stock changes are reported separately on naturally dry and wet mineral and organic soils and drained mineral and organic soils. Conversion of forests on drained organic soils to forest on naturally wet soil is accounted as rewetting.
The activity data for calculation of emissions due to incineration of harvesting residues in clear-cuts was based on the study until 2010 99 . Now a questionnaire for private forest owners on utilization of harvesting residues is used100. According to this questionnaire in 2005-2009 about 7% of residues are left for incineration and in 2010-2015 – 4.13 % of the residues are incinerated. In case of on-site incineration of harvesting residues during commercial harvesting, all emissions also are applied to the forest land remaining forest land category, because no commercial felling takes place in young stands (younger than 20 years) on land converted to forest land.
5.5.4.1 Activity data
Forest land
Calculations of carbon stock changes and GHG emissions in forest lands are based on activity data provided by the NFI (area, living biomass and dead wood) and Level I forest monitoring data (soil organic carbon). National statistics (State forest service) are used to estimate commercial felling related emissions and removals. The calculation of GHG emissions and CO2 removals in historical forest lands is based mainly on research report “Elaboration of the model for calculation of the CO2 removals and
96 L.U. Consulting. 2010. Elaboration of soil and terrain data and simulation of application of the criteria elaborated by the European Commission for identification of less valuable regions. Summary of the project report (Augšņu un reljefa izejas datu sagatavošana un Eiropas Komisijas izstrādāto augsnes un reljefa kritēriju mazāk labvēlīgo apvidu noteikšanai piemērošanas simulācija) Projekta kopsavilkuma ziņojums. Latvijas Republikas Zemkopības Ministrija. 97 Lazdiņš et al. 2012. Evaluation of wood mortality for different age of trees, dominant species and forest stand type and recalculation of historical CO2
removals in living biomass since 1990 (Koksnes atmiruma novērtēšana dažāda vecuma, valdošās sugas un meža tipa audzēs un vēsturisko CO2 piesaistes dzīvajā biomasā datu pārrēķināšana no 1990. Gada), Salaspils, 2012. 98 Lazdiņš et al. 2013. Support for the climate research programme. Report on performance of tasks in 2013 (Atbalsts klimata pētījumu programmai. Pārskats par 2013. gada darba uzdevumu izpildi) Salaspils, 2013. 99 Līpiņš L. 2004. Assessment of wood resources and efficiency of wood utilization (Koksnes izejvielu resursu un to izmantošanas efektivitātes novērtējums), Latvia University of Agriculture. 100 Lazdiņš A. & Zariņš J. 2013. Greenhouse gas emissions in Latvia due to incineration of harvesting residues and forest fires (Meža ugunsgrēku un mežizstrādes atlieku dedzināšanas radītās siltumnīcefekta gāzu emisijas Latvijā), In: Referātu Tēzes. Presented at the 71st Scientific Conference of University of Latvia, Section “Ģeogrāfija, ģeoloģija, vides zinātne”. University of Latvia, Riga, pp. 133–137.

143
GHG emissions due to forest management”101 and factors and coefficients elaborated within the scope of the research program on impact of forest management on GHG emissions and CO2 removals102.
Cropland
Total area of cropland in Latvia in 2015 is 1716.1 kha, including 1700.6 kha of cropland remaining cropland103. Activity data for calculations of emissions from organic soils are provided by research project96. Area of land remaining cropland is estimated using remote sensing based research data104 on the base of the NFI. Area of organic soils in farmland according to summaries of land surveys is 5.18 ± 0.5 %. It is assumed that share of organic soil in cropland remaining cropland, cropland converted to grassland, grassland converted to cropland and grassland remaining grassland is equal.
Grassland
Total area of grassland in Latvia in 2015 is 738.1 kha, including 594.3 kha of grassland remaining grassland103. Grassland remaining grassland is divided into mineral and organic soils. Area of the grassland is estimated using research data105 on the base of remote sensing data analysis.
It is assumed that mineral soils are neither a source nor sink of CO2. Organic soils and drainage ditches in grasslands are accounted as a source of methane also as it is recommended in IPCC 2014106 Chapter 2.
Settlements
Under the settlements category emissions from soil, litter, living and dead biomass due to conversion of land use type are reported. Removals in living and dead biomass in settlements are accounted using the NFI.
The total area of settlements is estimated according to the information provided by the NFI. According to the expert estimation, increase of area of settlements during last 20 years took place due to conversion of forest land. Increase of area of settlements (deforestation) is generally associated with road construction. All roads, including forest roads are reported in the settlements category; therefore, the deforested area is considerably higher than official statistics, where forest roads are not accounted as deforested area.
Area of land converted to settlements is estimated by evaluation of vegetation index of the NFI points (16 thousand plots across the country) in series of satellite images produced in 1990, 1995 and 2000. Final land use is considered according to empiric data obtained during field visits.
Wetlands
According to the 2006 IPCC Guidelines wetlands include land that is covered or saturated by water for all or part of the year and that does not fall into the forest land, cropland, and grassland or settlement categories. Total area of wetlands including peat-lands drained for peat extraction is reported according to the research results.
101 Andis Lazdiņš, Forest Data National Modelling Tool in Latvia (Swedish Environmental Protection Agency, Sweden, Stockholm, Valhallavägen 195, room Sarek, 2012); Andis Lazdiņš, Jānis Donis, and Līga Strūve, Latvia’s National Methodology for Reference Level of Forest Management Activities (English Summary) (LSFRI Silava, 2012). 102 Lazdiņš et al. 2013. Mežsaimniecisko darbību ietekmes uz siltumnīcefekta gāzu emisijām un CO2 piesaisti novērtējums. Pārskats par 2013. gada darba uzdevumu izpildi (Evaluation of impact of forest management practices on greenhouse gas emissions and CO2 removals. Report on performance of tasks in 2013). 103 “Latvia’s National Inventory Report Submission under UNFCCC and the Kyoto Protocol Common Reporting Formats (CRF) 1990 – 2014” (Riga: Ministry of Environmental Protection and Regional Development of the Republic of Latvia, 2016). 104 Lazdiņš et al. 2013. Support for the climate research programme. Report on performance of tasks in 2013 (Atbalsts klimata pētījumu programmai. Pārskats par 2013. gada darba uzdevumu izpildi) Salaspils. 105 Lazdiņš A. & Čugunovs M. 2013. Evaluation of carbon dioxide (CO2) removals and greenhouse gas (GHG) emissions, and impact of land use in intensive and extensive cultivated cropland, grassland and biologically valuable grassland (Oglekļa dioksīda (CO2) piesaistes un siltumnīcefekta gāzu (SEG) emisiju un zemes lietojuma veida ietekmes novērtējums intensīvi un ekstensīvi kultivētās aramzemēs, daudzgadīgos zālājos un bioloģiski vērtīgos zālājos), Salaspils, 2013. 106 Takahiro Hiraishi et al., “2013 Supplement to the 2006 IPCC Guidelines for National Greenhouse Gas Inventories: Wetlands” (Switzerland, 2013), http://www.ipcc-nggip.iges.or.jp/public/wetlands/pdf/Wetlands_Supplement_Entire_Report.pdf.

144
5.5.4.2 Methodologies and emission factors
Methodologies in calculation of the GHG emissions are based on the National GHG inventory for 1990-2014.
Forest land
Carbon stock change in living and dead woody biomass is based on data provided by the NFI. Emissions from drained organic soils are accounted using emission factor 2.6 tonnes C ha-1 and 2.8 kg N2O-N ha-1.
GHG emissions from rewetted organic soils are estimated according to the Tier 1 methods. CO2 emissions are calculated using equation 3.3 complemented by equations 3.4 and 3.5 of the IPCC 2014.
Emission factor for CO2-C (0.5 tonnes CO2-C ha-1 yr-1) is taken from table 3.1 of the IPCC 2014. N2O emissions from rewetted organic soils according to Tier 1 method are assumed to be negligible and are not estimated, CH4 emissions are calculated applying Tier 1 method using equation 3.7 of the IPCC 2014. Default emission factor (216 kg CH4-C ha-1 yr-1) from table 3.3 of IPCC 2014106 are used.
Cropland
Carbon stock change in living and dead woody biomass is based on data provided by the NFI. Carbon stock in living and dead biomass is calculated using the same coefficients as in calculations of carbon stock changes in forested land.
Net carbon stock changes in mineral soil in cropland are reported as not occurring because no significant changes in management systems took place since 1990 and according to Tier 1 method of the 2006 IPCC Guidelines Chapter 5107 the carbon stock changes in mineral soil should be reported in case of changes in management practice.
CO2 emissions from drained organic soils in croplands are calculated using IPCC 2014 Tier 1 method. Emission factor – 7.9 tonnes C ha-1 annually.
Unlike to cropland remaining cropland carbon stock change in living biomass in forest land converted to cropland is calculated as losses in living biomass due to felling of trees, considering average carbon stock in living biomass in forest land remaining forest in a particular year. Losses in dead wood are accounted similarly, as loss of average carbon stock in dead wood in a particular year. Carbon stock in litter is considered as constant value 12.14 ± 2.8 tonnes C ha-1. Instant oxidation method is applied to living biomass, dead wood and litter carbon pools.
The initial carbon stock in mineral forest soil at 0-30 cm depth (reference C stock) is 82.6 ± 7.8 tonnes ha-1 according to study results108. Initial carbon stock at 0-30 cm depth in grassland is considered 77 ± 6.9 tonnes ha-1. The carbon stock in forest land converted to cropland after transition period of 20 years according to the Equation 2.25 is 57 tonnes C ha-1 at 0-30 cm depth; respectively, reduction of carbon stock in mineral soils is 25.6 tonnes ha-1or 1.3 tonnes C ha-1 annually. The carbon stock in grassland converted to cropland after transition period of 20 years according to the Equation 2.25 is 52.7 tonnes C ha-1 at 0-30 cm depth; respectively, increase of carbon stock in mineral soils is 23.7 tonnes ha-1 or 1.2 tonnes C ha-1 annually.
In organic soil of forest land and grassland converted to cropland the factor for cropland remaining cropland (7.9 tonnes C ha-1 annually) is used to estimate carbon stock changes.
107 Section 5.2.3.1 Choice of Method, Tier 1. 108 Lazdiņš et al. 2013. Evaluation of impact of forest management practices on greenhouse gas emissions and CO2 removals. Report on performance of
tasks in 2013 (Mežsaimniecisko darbību ietekmes uz siltumnīcefekta gāzu emisijām un co₂ piesaisti novērtējums. Pārskats par 2013. gada darba uzdevumu izpildi).

145
Grassland
Woody biomass increment are taken from the NFI, but the historical data setsare recalculated (Jansons, 2007). Mortality factors are taken from forest land assuming that mortality in grassland is equal to average mortality in forest land. Decay period for dead wood is considered 20 years according to 2006 IPCC Guidelines 109.
The emission factor of drained organic soils is considered to be 6.1 tonnes C ha-1 yearly according to IPCC 2013a.
N2O and CH4 emissions from biomass burning are calculated according to the Tier 1 methodology in 2006 IPCC Guidelines using country specific activity data.
Carbon stock changes in mineral soils in cropland converted to grassland are reported as net removals because carbon stock in grasslands in average at 0-30 cm depth is significantly higher than in cropland108 and the difference is 23.7 tonnes C ha-1.
Methane emissions from ditches on organic soils have been included in estimates also for lands converted to grasslands and it is calculated with the same approach as grassland remaining grassland.
Settlements
The CO2 removals are accounted for living and dead biomass categories in settlements remaining settlements based on the NFI data. Removals are accounted based on weighted gross increment, mortality factors, BEFs, carbon content and wood density in a particular year in forest land. For emissions from dead wood pool in settlements remaining settlements 20 years transition period is considered.
Emissions from soils in settlements remaining settlements are calculated according to 2006 IPCC Guidelines Tier 1 method. It is assumed that inputs equal outputs so that settlement mineral soil C stocks do not change in settlements remaining settlements. Emissions from organic soils in settlements remaining settlements are calculated using equation 2.26 in IPCC 2006109. Emissions from organic soils are calculated using emission factors for cultivated organic soils. Annual emission factor for cultivated organic soils in cool temperate climatic temperature regime is 7.9 tonnes C ha-1 yr-1.
The emissions (losses in carbon pools) are reported under category forest land converted to settlements. Carbon stock changes associated with commercial felling, including removal of woody vegetation on forest infrastructure (roadsides, ditches etc.) are accounted considering that losses in living biomass are equal to average growing stock in forest land remaining forest in a particular year. Similarly, dead wood stock in forest land remaining forest in a particular year is considered as carbon losses from dead wood due to conversion of forest land to settlements. Instant oxidation method is considered for living and dead wood carbon pools.
Carbon stock changes in dead biomass are accounted using instant oxidation method considering that all dead biomass converts to emissions in the year of the land use change. Average carbon stock in dead biomass (12.14 tonnes C ha-1 in litter and 6.0 tonnes C ha-1 in dead wood).
The change in soil C stocks for land converted to settlements is computed using equation 2.24 in 2006 IPCC Guidelines, which combines the change in soil organic C stocks for mineral soils and organic soils. Change in soil organic C stocks in mineral soils is estimated using Equation 2.25 in 2006 IPCC Guidelines. Emission from mineral soil is accounted assuming that carbon accumulated in upper 30 cm (82.6 tonnes C ha-1) partially turns into emissions within 20 years (0.8 tonnes C h-1 annually). The impact factor (FLU x FMG x FI) is 0.8.
109 Simon Eggleston et al., eds., “2006 IPCC Guidelines for National Greenhouse Gas Inventories. Agriculture, Forestry and Other Land Use,” in 2006 IPCC Guidelines for National Greenhouse Gas Inventories, vol. 4 (Japan: Institute for Global Environmental Strategies (IGES), 2006), 678.

146
Wetlands
Latvia reports CO2 emissions associated only with industrial peat extraction in this category. The rest of the area of wetlands is not managed and CO2 emissions are not calculated, exception is area with woody vegetation located adjacent to water courses, water body or swamps and which does not fit to definition of forest land category.
Emission factor for carbon stock changes (2.8 tonnes C ha-1 yr-1) due to drainage is taken from IPCC 2014110.
Aggregated emissions from industrial peat-lands are equal for the whole time series due to lack of data about status of industrial peat-lands prepared for extraction 20-40 years ago.
Carbon content in air dry peat (0.45 tonnes C per tonne of peat) is considered according to Table 7.5 of 2006 IPCC Guidelines111. Moisture of peat reported in national statistics is considered 40 %.
Direct N2O emissions
Direct N2O emissions from drainage of organic soils are estimated for forest lands, croplands, grasslands, settlements and wetlands land-use categories. Direct emissions of N2O due to drainage of organic soils are calculated according Equation 2.7 of the IPCC 2014106.
Activity data consist of areas of land remaining in a land-use category and land converted to other land-use category on drained organic soils. Default N2O emission factors for drained organic soils are taken from Table 2.5 of the IPCC 2014106.
N2O emissions from land converted to another land-use category on drained organic soils are calculated in the same way as emissions from land remaining in a land-use category.
Direct N2O emissions from N inputs to managed soils and from N mineralisation resulted from loss of soil organic C stocks in mineral soils due to land-use change are estimated by Tier 1 methodology using equation 11.1 of 2006 IPCC Guidelines, supplemented by equation 11.8 from 2006 IPCC Guidelines. Default factor for N mineralised from mineral soil as a result of loss of soil carbon (0.01 kg N2O - N (kg N)-1) from table 11.1 is used. Default C:N ratio (15) for soil organic matter is used for estimation of annual amount of N mineralised in mineral soils as a result of loss of soil carbon due to land use change to cropland109. Default emission factors of cropland are applied, C:N ratio for soil organic matter applied based on expert judgement is 15, and annual carbon losses in organic soil in settlements are accounted using emissions factor from cropland – 7.9 tonnes C ha-1 yearly106.
Indirect N2O emissions
Indirect N2O emissions corresponding to land-use change from N mineralisation associated with loss of soil organic matter from change of land use or management are estimated for land-use change to croplands and settlements on mineral soils. Indirect N2O emissions from land use change to cropland are calculated according to 2006 IPCC Guidelines. Amount of N2O-N emissions produced from leaching and run-off as a result from land use change to cropland are estimated by Tier 1 methodology using equation 11.10, which is supplemented by equation 11.8 from 2006 IPCC Guidelines 109.
Default C:N ratio (15) for soil organic matter is used for estimation of annual amount of N mineralised in mineral soils as a result of leaching/run-off associated with loss of soil carbon through land use change to cropland. Default values of fraction of all N added to/mineralised in managed soils due to leaching and run-off (0.3 kg N (kg of N additions)-1) and emission factor for N2O emissions from N leaching and run-off (0.0075 kg N2O-N (kg N leached and run-off)-1) are taken from table 11.3 of 2006 IPCC Guidelines.
110Emission factors for CO2–C and associated uncertainty for lands managed for peat extraction, by climate zone 111Conversion factors for CO2–C for volume and weight production data

147
Indirect N2O emissions from land use change to settlements are also accounted using the 2006 IPCC Guidelines Tier 1 method. Amount of N2O-N emissions produced from leaching and run-off as a result from land use change to settlements are estimated using equation 11.10 supplemented by equation 11.8 from 2006 IPCC Guidelines. For estimation of annual amount of N mineralised in mineral soils as a result of leaching/run-off associated with loss of soil carbon thorough land use change to settlements, C:N ratio 15 for soil organic matter based on expert judgement is utilized. Loss of 20 % of soil carbon in land converted to settlement is used to estimate carbon stock changes. Default values of fraction of all N added to mineralised in managed soils due to leaching and run-off (0.3 kg N (kg of N additions)-1) and emission factor for N2O emissions from N leaching and run-off (0.0075 kg N2O-N (kg N leached and run-off)-1) are taken from table 11.3 of 2006 IPCC Guidelines 109.
CH4 emissions
Drained organic soil in forest land is source of CH4 emissions. CH4 emissions are calculated by equation 2.6 in IPCC 2014106.
The CH4 emission factor for organic soils of drained forest land (table 2.3 and table 2.4 in IPCC 2014) is 2.5 kg CH4 ha-1 yr-1 and emission factor for drainage ditches is 217 kg CH4 ha-1 yr-1. Data for fraction of drainage ditches of total drained area on organic soils is obtained by evaluation fraction of ditches in state managed forest lands to all drained forest organic soils.
Drained organic soil in cropland is another source of CH4 emissions. CH4 emissions are calculated by equation 2.6 in IPCC 2014. The emission factor for organic soils (table 2.3 and table 2.4 in IPCC 2014) is 0 ± 2.8 kg CH4 ha-1 yr-1 and emission factor for drainage ditches 1165 ± 830 kg CH4 ha-1 yr-1; respectively, only CH4 emissions from ditches are calculated.
Emission factors for CH4 emissions from drained organic soil and drainage ditches in grassland are respectively 16 kg and 1165 kg CH4 yearly according to tables 2.3 and 2.4 in IPCC 2014. CH4 emissions from drained organic soils in settlements are estimated by the same methodology as in cropland using the same emission factors.CH4 emissions from drained organic soils in wetlands are calculated according to methodology applied in drained forests on organic soil. As drainage of wetlands in national conditions is occurring only in territories for peat extraction default emission factors for drained organic soil (6.1 kg CH4 ha-1 yr-1) and drainage ditches (542 kg CH4 ha-1 yr-1) for peat extraction are utilized.
Harvested wood products (HWP)
The net emissions from the harvested wood products are calculated according to the methodology elaborated by Rüter, 2011112. The methodology corresponds to Tier 2 for HWP in IPCC 2014b. Three main HWP groups are used in calculations – sawnwood, wood based panels and paper and paperboard.
The proportion is calculated by equation No. 6 to estimate share of harvesting stock extracted due to deforestation and is used to calculate share of domestic industrial roundwood.
The coefficients and numeric values used in calculation are default conversion factors recommended in IPCC 2014106. Input data in calculation are extrapolated to 1900.
5.5.5 Waste Management
Solid waste disposal
Two separate IPCC Waste Model (2006) calculations were used. One for unmanaged sites (closed dumpsites) and other for managed (landfills since 2002). For unmanaged sites calculation method for bulk wastes was used, because there are no correct information about disposed waste content available. According to Ltd “Virsma” research 2011– DOC factor for these calculations was used as 0.17. Other factors are default from IPCC guidelines.
112 Sebastian Rüter, “Projection of Net-Emissions from Harvested Wood Products in European Countries” (Hamburg, 2011).

148
For managed sites method “waste by composition” in IPCC Waste Model (2006) was used. DOC and k values and other factors are taken from IPCC 2006 guidelines. Waste composition is taken from Ltd “Virsma” research 2011 (Table 5.20).
Table 5.20 Average waste composition in landfills in Latvia (%)
Paper Plastics Organic (food, hygiene waste, other organics)
Wood Textile, rubber
Minerals (ceramics)
Glass Metals
Average in Country
6.40 8.54 47.90 2.11 3.35 8.69 20.64 2.36
Composting
Projected CH4 and N2O emissions from composting are calculated according to 2006 IPCC Guidelines. Emission factors are multiplied with composted waste amounts. Composted waste amount in households is projected according to changes in population, but industrially composted amounts are projected according to time series from 2003 and projected disposed waste amounts.
Waste water handling
Following approaches were used for projections of activity data to estimate projected emissions of GHG from waste water handling sector:
For CH4 emissions from domestic/commercial waste water handling subsector:
Forecasts of national population;
Expected distribtuion ofnational population by type and level of treatment, based on historical trends and requirements of UWWTD;
Projections of sewage sludge production based on its correlation with private consumption and historical trend of share of anaerobic sludge.
For N2O emissions from domestic/commercial waste water handling subsector:
Forecasts of national population;
Projections of protein consumption based on its correlation with private consumption;
Expected rate of national population served by modern centralized treatment plants, based on historical trends and requirements of UWWTD.
For CH4 and N2O emissions from industrial waste water handling subsector, forecasts of GDP for manufacturing industry sector. Based on projected activity data emission projections were calculated according to IPCC 2006 Guidelines. Country-specific emission factors were used to calculate CH4 emissions, but for emissions of N2O default IPCC emission factors were used. No changes in emission factors were made for emission projections.
More detailed description of methodology and emission factors can be found in the Latvian National Inventory Report submitted on 13 April 2017 to UNFCCC secretariat.

149
VULNERABILITY ASSESSMENT, CLIMATE CHANGE IMPACTS AND ADAPTATION MEASURES

150
6 VULNERABILITY ASSESSMENT, CLIMATE CHANGE IMPACTS AND ADAPTATION MEASURES
6.1 Observed Patterns of Climate Change
Recently, LEGMC has analysed past climate changes in Latvia and developed climate change scenarios for Latvia for the period until the year 2100. Projected climate changes for future time periods are based on the RCP 4.5 and RCP 8.5 scenarios developed for the IPCC in Fifth Assessment Report. The conclusions in this chapter are mostly based on the results described in LEGMC’s report summary113.
Since the beginning of the 20th century, records of average air temperature in Latvia have a long-term trend of warming. The year 2015 was the warmest year in 93 years, while 2014 and 2016 were the 8 th and 11th warmest years respectively. Along with average air temperature, there is an observed increase in extreme values. The most significant increase has been in minimum values of minimum, mean and maximum air temperature. Therefore, the most notable changes have occurred in winter and spring seasons. Under the impact of general air temperature increase, the length of growing season and the number of summer days and tropical nights have increased, while the number of frost days and ice days has decreased.
Upon analysing climate model projections for future periods (till 2100), a further temperature increase is clearly seen, especially in the minimum air temperature. Due to this, the length of the growing season and the number of summer days and tropical nights will continue increasing, and the number of frost days and ice days will decrease significantly.
Over the last 50 years, an increase in precipitation, especially in winter and spring seasons, is observed. Moreover, precipitation intensity has increased, which in turn has increased both the intensity and frequency of extreme precipitation events. A further increase in precipitation amount is expected up to year 2100, with its severity determined by the projected precipitation intensity increase. Due to the projected changes, the most significant increase in precipitation is expected in winter, when, along with increase in temperature, one may expect a larger percentage of rain precipitation.
Over the long-term period, average wind speed curve is trending slightly downwards and, although climate model projections show uncertainty, they mostly confirm continuation of this type of mean wind speed change tendency up to the end of the 21st century.
Analysis of recent climate and future climate change scenarios shows notable climate change tendencies. Most significant changes are related to the extreme values of climate variables, indicating that in the future Latvia will more often face uncharacteristic and extreme weather conditions.
Table 6.1 summarizes the observed and projected changes in the Latvian climate based on the recently developed scenarios113.
113 Climate tool available at http://www2.meteo.lv/klimatariks/summary.pdf

151
Table 6.1 Previous and future changes (according to the RCP4.5 and RCP8.5 scenarios) in climate variables in relation to the long-term mean climate variable values in the past
Climate variables Previous changes
(1981-2010 with respect to 1961-1990) Future changes
(2071-2100 with respect to 1961-1990)
Maximum air temperature Annual maximum and mean value of maximum air temperature have increased by 0.7oC, while minimum value – by 1.4oC
Annual mean maximum air temperature, according to moderate and significant climate change scenarios, can increase by 3.4-5.4oC, while a more rapid increase for extreme values is projected – annual maximum temperature by 3.6-5.7oC. Annual minimum value of maximum air temperature can increase by 6.5-9.5oC
Mean air temperature Annual maximum and mean value has increased by 0.7oC, while minimum value of mean air temperature – by 1.7oC
Until the end of century, annual mean air temperature can increase by 3.5- 5.5oC, while annual maximum value – by 3.2-5.4oC. Annual minimum value of mean air temperature is projected to increase by 7.5-11oC
Minimum air temperature Annual mean and maximum value of minimum air temperature have increased by 0.7oC and 0.8oC respectively, while minimum value – by 1.9oC
Most significant increase is projected for annual minimum air temperature: 9.5-13.5oC, while for annual mean and maximum values - from 3.1oC and 3.6oC, respectively, to 5.6oC
Summer days Due to observed climate change there is increase in number of summer days by 3 days By the end of 21st century, the projected increase of summer days on average is 31 to 53 days
Tropical nights Latvia has always had a small number of tropical nights, so no valid conclusions about the trends in changes of the number of such nights can be made, however, an increase in the frequency of such nights has been observed during the last couple of decades
The number of tropical nights by year 2100 can increase by 4 to 14 nights
Growing season length The general increase in air temperatures has also affected the length of the growing season – by an average of 2 additional days per year since 1961
It is expected that by 2100 the increase of air temperatures will affect the duration of the growing season – the scenarios project an extension of the growing season by 27 to 49 days
Frost days During the observed period, the average number of frost days in Latvia has decreased by 9 days per year, in some locations even by as much as 10 to 16 days per year
The number of frost days may decrease by an average of 52 to 81 days per year and according to significant climate change scenario in the most part of Latvia the reduction is projected at over 80 days per year
Ice days Similar to frost days, the average number of ice days in Latvia has decreased on average by 9 days per year, in some locations – by an average of 5-11 days per year
By 2100, the number of ice days will probably decrease by 32 to 46 days. It is important to note that certain models already project a number of ice days within the range from 0 to 10 in the near future

152
Climate variables Previous changes
(1981-2010 with respect to 1961-1990) Future changes
(2071-2100 with respect to 1961-1990)
Precipitation totals The past climate change has resulted in the increase of the amount of precipitation in Latvia by an average of 6%, or about 39 mm
By the end of the century, an increase of the total annual precipitation by 13 to 16% (about 80-100 mm) is projected according to moderate and significant climate change scenarios respectively
Highest 1-day precipitation amount
On average, the annual maximum diurnal precipitation amount in Latvia has increased by about 1 mm
The maximum amount of one-day precipitation amount probably will increase by 3 to 6 mm
Highest 5-day precipitation amount
In last 50 years, the maximum 5-day precipitation amount on average has increased by 2 mm The maximum amount of 5-day precipitation amount may increase by 9 to 12 mm
Simple daily intensity index At the end of the discussed period, the simple daily intensity index values are on average higher by 0.1-0.6 mm/per day than at the beginning of the period
The scenarios project an increase of the intensity of precipitation – by about 0.1 to 1.3 mm/per day
Heavy precipitation days Within the discussed period, the average number of days with heavy precipitation has increased by 2 days
By the year 2100, the number of days with heavy precipitation will increase by an average of 3 to 5 days
Very heavy precipitation days
Influenced by increase in precipitation intensity, number of days with very heavy precipitation has on average increased by 1 day
According to the climate change scenarios, the number of days with very heavy precipitation will increase by 2 to 3 days
Annual-mean wind speed Since 1966, average wind speed in Latvia has decreased by 8%. However, extremes of the maximum mean wind speed values are be observed both at the start and the end of the period
In the future, a decrease in the mean wind speed by 3 to 7% is projected, however projections show uncertainty
Stormy days Stormy days in Latvia are observed very rarely, and up to recently, the number of such days on average in Latvia has decreased by 1 day
Only small changes in the mean number of stormy days are projected for Latvia, so no valid conclusions about changes in numbers of stormy days can be made
Calm days Due to the decrease in mean wind speed, the number of calm days has increased by about 13 days
Most climate models project increase in the number of calm days in Latvia on average by 2 to 24 days

153
6.2 Expected Impacts and Vulnerabilities of Climate Change
6.2.1 Vulnerabilities of Climate Change
Climate change in Latvia affects both its natural capital (species, habitats, ecosystems), as well as the health, welfare and safety and economic activities of the population. In 2016-2017, research was conducted to assess climate change related risks and vulnerabilities and to identify adaptation measures in the six areas described below. Main risks are summarized in Figure 6.1.
Figure 6.1 Main climate change related risks in Latvia114
114 Latvia's National Climate Change Adaptation Strategy until 2030, draft
154
Construction and infrastructure
In total, 14 risks115 were identified, the 9 most significant of them are showed in Figure 6.1. The comparatively highest consequences will be caused by the “Increased risk of damage by storm surge to buildings at the coast and in cities at river mouths” and “Increased risk of damage to electrical transmission network / short circuits”. These risks are of a very high and high probability of occurrence. Other significant risks will have a relatively lower impact, but at the same time they will also have a very high probability of occurrence. It should be noted that the “Reduced demand for heating” was identified as a potential benefit – lower energy costs for consumers.
Civil protection and emergency response
The research116 identified that climate change in the future could cause 14 risks directly affecting this area and 5 secondary risks affecting the area, the Figure 6.1 shows the 4 most important risks that directly affect the area. The most significant are: (i) the risk of “forest and peat fires” in the context of climate change is projected as a medium risk but with a very high probability, while (ii) the risk of storms and windfalls is predicted with severe consequences and moderate probability. The other two risks are forecasted to be relatively lower – as medium ones, but their probability is different: (iii) “risk of heavy rainfall and its caused flood” – a very high probability; and (iv) the risk of “spring floods and floods caused by ice drift” – medium probability. At the same time, it should be noted that compared to today and in view of the projected future trends in climate change in Latvia, it is expected that both the probability of the occurrence and the consequences of spring flood risk will decrease in the future, but the consequences for all other risks will only increase. In general, net economic losses in 2100, due to the 4 mentioned main risks, will double compared to the current situation.
Health and welfare
The most relevant are 5 risks117 showed in the Figure 6.1, which can potentially be caused by the climate change in Latvia. Among the major risks, as the most significant, with the highest level of risk and the highest probability of occurrence, have been identified: (i) “increased risk of exacerbations of chronic diseases (cardiovascular diseases (CVS), diabetes, etc.”) and more death cases” and (ii) “Increase in heat stroke events”. With regard to damage to human health, the worst negative effects in the context of climate change are expected from CVS. In its turn, it is expected that the heat stroke will have a small impact on lost years of life. Other health risks will be of minor threat to human health. From other risks, the highest expected costs are projected for respiratory diseases.
Biodiversity and ecosystem services
Biodiversity and ecosystem services in Latvia in the context of climate change will be potentially affected by the 7 major risks118 described in Figure 6.1. The highest probability of occurrence and the most explicit consequences are “the risk of contamination and eutrophication in water courses and water bodies” and “the risk of increase in water temperature and a longer stratification period, as well as a decrease in the volume of dissolved oxygen in the bottom layer”, which will directly affect ecosystem
115 Biedrība “Zaļā brīvība” (foundation ”Green Liberty”), 2017. Risk and vulnerability assessment and identification of adaptation measures in the area of construction and infrastructure. Final report, Riga, 208 pages, in Latvian, available at http://petijumi.mk.gov.lv/sites/default/files/title_file/petijums_varam_2016_2017_risk_un_ievain_novert_un_pielag_pasak_identif_buvniec_un_infrastr_joma.pdf 116 Process analysis researh centre (Procesu analīzes izpētes centrs) (2017. Risk and vulnerability assessment and identification of adaptation measures in the area of civil protection and emergency assistance. Final report, Riga, 165 pages, in Latvian, available at http://petijumi.mk.gov.lv/sites/default/files/title_file/petijums_varam_2016_2017_risk_un_ievain_novert_un_pielag_pasak_identific_civilas_aizsardz_arkart_palidz_joma.pdf 117 Ltd. “Estonian. Latvian & Lithuanian Environment” (2016) Risk and vulnerability assessment and identification of adaptation measures in the area of health and welfare. Final report , Riga, 123 pages, in Latvian, available at http://petijumi.mk.gov.lv/sites/default/files/title_file/petijums_2016_varam_risku_un_ievain_novertej_pielagos_pasak_identific_veselibas_un_labklaj_joma.pdf 118 Ltd. “Estonian. Latvian & Lithuanian Environment” (2016) Risk and vulnerability assessment and identificatio of adaptation measures in the area of
biodiversity and ecosystem services. Final report, Riga, 200 lpp, in Latvian, available at http://petijumi.mk.gov.lv/sites/default/files/title_file/petijums_2016_varam_risku_un_ievainoj_novertej_un_pielagos_pasak_identific_biologisk_daudzveid_un_ekosist_pakalp_joma.pdf
155
services related to water courses and water bodies and their biological resources. In general, future climate change will have an impact on the direct provision of ecosystem services (such as uncultivated freshwater / marine plant and animal food) and regulatory ecosystem services (such as lifecycle maintenance, conservation of habitats and gene pools). At the same time, the research notes that the “Emergence of new species” risk also identified the potential benefits to biodiversity, namely the emergence of new specially protected species and increased biodiversity, positively affected both regulatory ecosystem services, intangible ecosystem services and enabling ecosystem services.
Agriculture and forestry
The manifestations of climate change in Latvia can cause 15 risks in agriculture and 9 risks in forestry, the most important of them are described in Figure 6.1. The risks are mainly of economic impact. Social impacts are formed indirectly from economic impacts. The impact of these risks is particularly noticeable in the case when several farms are affected in one region. Climate change in forestry can cause potential losses on average from 25% to 50% for tree growth or for wood stock and / or timber assortment value. Besides, in agriculture, climate change can lead to an average of 10-20% loss of the yield. The research119 also identifies the potential benefits in the context of climate change, such as increased productivity of crops, the possibility of choosing serotinous, but more efficient and / or higher quality varieties, the possibility to start growing crops, which demand a little longer vegetation period, the possibility to cut perennial grasslands several times, thus increasing the availability of fresh fodder, the possibility to grow high-quality seedlings in shorter period of time, practised so far in covered areas, and others.
Tourism and landscape planning
The 4 most important climate change related risks identified in the research120, which may affect this area in the future, are shown in Figure 6.1. The research also identifies potential benefits in the context of climate change, such as the longer period of the visibility of the summer landscape and the diversification and increase in summer tourism offerings (activities, events); the increase in the number of tourists willing to visit risk areas, and the benefits of outbound winter tourism offerings to companies.
6.2.2 Climate change impacts on different sectors of the economy and infrastructure, including human health
Construction and infrastructure planning
Several manifestations of climate change are relevant to this area in Latvia. They are related to the increase in the annual mean air temperature, the increase in the frequency and duration of heat waves, longer meteorological summer, the increase in the maximum daily temperature, the reduction of frost days and days without thaw, the increase in precipitation, the maximum increase in one day’s precipitation and of five days of precipitation, the increase in the number of days with very high rainfall, a sharp increase in snow precipitation above the norm (the maximum increase in one day’s precipitation in winter, the increase in the number of days with very high precipitation and the decrease in the number of days without a thaw, which in general characterizes more frequent wet snow manifestations), the maximum increase in wind gust at the coast, the long-term rise in average sea water levels and the development of coastal erosion as well as groundwater level fluctuations influenced by changes in precipitation and sea levels, and changes in river runoff.
119 State Forest Science Institute “Silava” and Latvia University of Agriculture (2016). Risk and vulnerability assessment and identification of adaptation measures in the area of agriculture and forestry. Final report, 172 pages, in Latvian, available at http://petijumi.mk.gov.lv/sites/default/files/title_file/petijums_2016_varam_risku_un_ievan_noverte_un_pielag_pasak_identif_lauksaimniec_un_mesaimniec_joma.pdf 120 Ltd. “Baltkonsults”. Risk and vulnerability assessment and identification of adaptation measures in the area of landscape planning and tourism. Report, Riga, 142 pages, in Latvian, available at http://petijumi.mk.gov.lv/sites/default/files/title_file/petijums_2016_varam_risku_un_ievaonoj_novertej_un_pielag_pasak_identif_ainavu_planosa_un_turisma_joma.pdf
156
Civil protection and emergency assistance
In the field of civil protection and emergency assistance, extreme weather and climate events are of crucial importance from the point of view of climate change. The rare extreme events are those that have the greatest impact and cause the greatest damage to human welfare121. The manifestations of climate change that may affect the civil protection and emergency assistance planning in Latvia are such as: increase in the number of summer days, tropical nights and the duration and frequency of heat waves, increase in the frequency and duration of continuous drought. The area will also be affected by an increase in the number of days with a very high rainfall, a maximum increase in one day’s rainfall and a decrease in the amount of annual precipitation in the form of snow. Changes in the amount of rainfall will contribute to a change in river runoff from the current peak in spring to a high runoff in autumn and drought in summer, without a clear peak of spring floods. Also significant will be changes (elevation) in the sea level, the increase in the maximum wind gust at the coast, the increase in the number of days with the maximum wind speed at the west winds, the change in the number of stormy days.
Health and welfare
The manifestations of climate change that are important in the area of health and welfare in Latvia are: increase in average temperature, longer meteorological spring / summer / autumn, decrease in the duration of meteorological winter, increase in annual precipitation, increase in frequency of heavy rainfalls, increase in annual water temperature, increase in frequency and duration of heat waves. Climate change has a major impact on people’s physical and mental health and on socio-economic welfare. Impact effects can occur both directly (for example, flood or heat waves caused injuries, death cases, material damage), and indirectly, and can be identified only from long-term observations (e.g. physical and mental disorders, changes in social behaviour). The impact on different social groups in Latvia may vary, depending on the specific geographic location and the ability of people to overcome the risks of climate change. High population in large cities (particularly in capital city Rīga) creates a high load on the environment, infrastructure, health and social care. Moreover, the high concentration of people at certain locations causes potentially greater losses, especially in the event of extreme climate change. The effect of “urban heat islands” caused by the urban environment and increasing due to climate change, should be considered. In contrast, the effects of climate change on rural areas may be associated with the lack of access to the necessary assistance and services, as well as with overall coping with climate risks. In Latvia, climate change will most likely affect groups of people already at risk of exclusion (families with young children, elderly people, people with chronic diseases, people with disabilities, poor people, etc.). Without the necessary support and assistance, their socioeconomic situation may deteriorate significantly, which in general can further increase social inequality in the country. Thus, climate change can be a threat to the basic value and productivity of the human capital in Latvia.
Biodiversity and ecosystem services
The effects of climate change that can affect biodiversity and ecosystem services in Latvia include increase in air temperatures, increase in winter lowest temperatures, the occurrence of early spring phonological phases, longer summer season and higher water temperatures, changes in rainfall (seasonal increases and declines in the summer period), greater possibility of more frequent and longer drought periods, decreasing snow cover, increasing in frequency of extreme weather events. Climate change has additional impacts on already endangered biodiversity. At present, there is a risk that Latvia’s natural biodiversity will decrease in the future. Biodiversity has a direct link to human welfare. As a result of destruction of species, habitats and ecosystems people will lose the opportunity to use their qualities and thus lose essential ecosystem services (e.g., bogs, besides biodiversity, are not only moisture regulators but also organic carbon sinks). The reduction of biodiversity and ecosystem
121 EEA, 2017. Climate change, impacts and vulnerability in Europe 2016: an indicator-based report. European Environment Agency Report No.01/2017, available at http://www.eea.europa.eu/publications/climate-change-impacts-and-vulnerability-2016.

157
services as a result of climate change and anthropogenic impacts interactions can threaten the maintenance and sustainable development of the natural capital of Latvia. The impact of climate change on biodiversity in Latvia is currently difficult to assess due to lack of data, but in the future it will be done by mapping and determining the quality of biotopes of EU importance in the whole territory of Latvia, which will be completed by 2019.
Agriculture and Forestry
The impacts of climate change that may be at risk include: increase in winter mean temperatures and the decrease in the duration of meteorological winter, the increase in summer mean temperature and the increase in the duration of the meteorological summer, more frequent and longer droughts in summer; increase in the number of days with very high summer temperatures, increase in the total annual rainfall, changes in rainfall in the summer months, increase in the likelihood of sudden and strong thunderstorms in summer; increase in wind gusts, increased uncertainty in snow cover thickness, decrease in the number of days with frosen soil, formation of air mass contact bands, creating suitable conditions for freezing rain.
Tourism and landscape planning
Due to climatic conditions, tourism in Latvia is characterized by a seasonality with a distinct summer season. The effects of climate change that can have a significant influence on the tourism industry and landscape planning in Latvia include the increase in the annual mean air temperature, the increase in the mean temperature of the winter season (December, January, February), the increase in the minimum value of daily maximum temperature, the decrease in the number of frost days, the increase in the number of days without the thaw, the decrease in the average number of days with snow, the decrease in the average snow cover in winter season, the reduction in winter ice cover duration, the increase in the mean air temperature in summer months (June, July, August), the increase in the number of vegetation days, the increase in the number of summer days, the increase in the number of tropical nights, the increase in the monthly mean air temperature in May and September, the increase in annual precipitation, the increase in continuous precipitation period, the increase in the number of days with high and very high precipitation, the increase in the maximum daily precipitation, the increase in the maximum wind gust at the coast, the increase in the number of days with the maximum wind speed at the west wind direction at the coast.
6.2.3 The economic impact of climate change
Table 6.2 Assessment of ex-post economic costs of climate change122
Climate change impact Ex-post economic costs
Direct damage caused by storms to forest owners
About 164 million EUR, total in the last decade
Damage caused by dendrophagous insects to forest owners
About 36 million EUR, total in the last decade
Annual compensations paid by Latvian insurers for damage caused by natural disasters, 2007-2016
Annual compensations vary from 0.3 million EUR (2009) to 1.39 million EUR (2013) Note: Data is not complete and further detailed accounting is required in the future
Compensations paid to Latvian farmers for damage caused by the adverse weather conditions (including compensation for damage caused by floods and droughts, combating infectious diseases, compensation for animals fallen from midges bites, etc.), 2004-2016
~ 60 million EUR, total in the period, The biggest support of 36 million EUR was provided in 2006, amounts paid in other years were significantly lower.
122 Latvia's National Climate Change Adaptation Strategy until 2030, draft

158
Funds from the State budget for unforeseen events, allocated to municipalities 2008-2016
Flood damage compensations 3.87 million EUR, total in the period
Heavy rainfall damage compensations 1.7 million EUR, total in the period
Storm damage compensations 0.85 million EUR, total in the period
Expenses related to roof repairs, purchase of generators for electricity supply
1.47 million EUR, total in the period
Table 6.3 Sectoral estimates of the economic impacts of climate change related most relevant risks in Latvia (net impact, including losses and benefits122
Sector Economic Impact
Civil protection and emergency assistance
Losses Currently: ~ 11 million EUR/year In 2100: ~ 20 million EUR/year
Tourism and landscape By 2100, losses in the range of 29.5-57.5 million EUR/year
Health and welfare Losses In 2016-2100: ~26 million EUR/year
Built environment, costs due to floods
Losses From 2040 to 2070: about 1.5 million EUR/year, 2070-2100: up to 3 -3.2 million EUR/year
Agriculture
Potential average loss of 10-20% of the yield Taking the lowest risk, according to average yield and grain purchase price in 2015, losses from 43 million EUR/year
Forestry Potential losses on average from 25% to 50% for tree growth or for wood stand / or for timber assortment value
Biodiversity and ecosystem services Benefit of ~295 million EUR in 2100
6.3 National adaptation strategy
The overarching goal of the Latvia’s National Climate Change Adaptation Strategy for the period to 2030 is to reduce the risks and vulnerabilities of people, economy, infrastructure, buildings and nature in Latvia as a result of climate change and to promote the opportunities offered by climate change.
Thus, the 4 focal points of the Strategy are: (1) people, (2) national economy, (3) infrastructure and construction, (4) nature. They unitedly form the framework for implementation of the Strategy in two directions:
Reduction of negative effects, risks and vulnerabilities caused by the climate change;
Promoting opportunities provided by the climate change.
The Strategy defines the following principles for the development and implementation of Latvia’s climate change adaptation policy :
Principle of scientific justification – the latest scientific achievements in climate change impact assessment, vulnerability and risk assessment, adaptation policies are used and regularly reviewed. This principle implies that the strategy is based on the latest scientific research and evidence-based results on the expected climate change in Latvia and its potential impact in specific areas and creates the basis where the Latvia’s climate change adapting policy facilitates further development of the scientific capacity in Latvia. The principle of scientific justification must be respected in ensuring the qualitative and representative climate and

159
adaptation monitoring, forecasting, modelling and assessment to be used for decision making in Latvia;
Principle of preventive action – prevention of existing impacts, vulnerabilities and risks related to climate change is aimed at preventing potential future losses, taking into account that today’s investments can offset much greater losses in the event of a future risk, as well as allows to use the potential benefits. The development of the strategy takes into account potential scenarios for future climate development and the associated risks and benefits;
Principle of cross-sectoral efficiency – priority for adaptation strategy is based on current programmes and a wide range of policy instruments and provides additional benefits for mitigating climate change and achieving sustainable development objectives. Planned actions and measures in different sectors and fields are coordinated with each other, ensuring synergies in funding and providing other resources for the implementation of priority measures;
Integration in policy planning and decision making – an assessment of climate change impacts, risks, vulnerabilities and appropriate adaptation measures become an integral part of the planning and decision-making process in all relevant areas and levels of activity. Emphasis is placed on actions aimed at integration of adapting aspects of climate change, such as territorial development, spatial and policy planning;
Principle of the protection of the most vulnerable groups – adaptation measures are developed to meet the individual needs of people, including the most vulnerable groups of the society. One of the strategic goals is to protect human life and health from the negative consequences of climate change.
To achieve the overarching goal, 5 strategic objectives (SO) have been set, respectively, followed by directions of action (DA), see Figure 6.2. For each direction of action, a priority action plan has been developed for the first 7-year cycle of the Strategy.

160
Figure 6.2 Layout of overarching goal, strategic objectives and directions of actions of the Latvia’s National Climate Change Adaptation Strategy until 2030
Strategic objective SO1 “Human life and health are protected from negative impacts of climate change” is achieved by actions in two areas:
In the area of health and welfare, additional assistance should be provided to vulnerable groups of society (elderly people, children, people needing social care etc.) and to reduce the load on the health care system. The implementation of various preventive measures will reduce the load on the health care system that can be caused by extreme climatic events or factors.
The task of the Civil Protection and Early Warning System is to protect people's health, life and safety in Latvia, in this case, by timely forecasting, warning and response to extreme climate events. It should be emphasized that the risk assessment of the hydrometeorological phenomena is based on the results of a high-resolution numerical model adapted to the territory of Latvia.
Strategic objective SO2 “The economy is able to adapt to and take advantage of the opportunities of climate change” is aimed at preserving economic resources and promoting competitiveness as a result of the negative impacts of climate change and increasing the benefits from opportunities that climate change can bring to the Latvian economy (warmer and wetter climate, longer vegetation period, etc.). The directions of action are focused on preservation of resources and promotion of competitiveness in sectors important for the Latvian economy – agriculture, forestry and tourism. The creation of effective financial instruments for compensation of losses, as well as the development and introduction of new products and technologies for the promotion of the provided opportunities relates to the economy as a whole.

161
Strategic objective SO3 “Infrastructure and buildings are climate-resilient and planned according to the potential climate change related risks” is aimed at ensuring climate-resilient conditions in a changing climate, especially extreme. The directions of action are directed towards the use of the green infrastructure, timely and regular review of construction standards, and providing the climate-proofing of buildings, constructions and engineering communications.
Strategic objective SO4 “The Latvian nature and cultural heritage values are preserved and the negative impact of climate change on them is reduced” aims to preserve as much as possible the biological diversity of species that is threatened by various risks due to climate change, including invasive alien species and various pathogens, and to preserve as much as possible or at least not undermine the state of the ecosystems. The strategic objective also includes safeguarding cultural and historical values from the negative impacts of climate change. Directions of action are aimed at preserving biodiversity, protecting ecosystems, protecting nature and cultural heritage, protecting the Baltic Sea coast as a unique natural and cultural heritage site, and introducing and maintaining control systems for invasive alien species, pests and pathogens.
Strategic objective SO5 “Climate change adaptation policy based on the latest scientific argumentation is provided and available, providing the information, knowledge and awareness necessary for implementation” is a horizontal objective related both to all six areas, described above in sections 6.2.1 and 6.2.2, and the strategic objectives above. A policy must be built on knowledge, information and awareness. This, in turn, requires investments in science and research, climate change and adaptation monitoring, data collection and processing, forecasting and modelling tools and instruments. The public needs to be aware of the impact and risks of climate change, including specific target groups such as entrepreneurs, travellers, etc., while emphasizing the responsibility of each person for the adaptation needs to climate change. This objective includes directions of action for strengthening the science and research capacity, developing a monitoring system, forecasting and modelling, making the necessary changes to spatial planning and other development planning documents and regulatory acts, as well as drafting national legislation for provision of hydrometeorological and climatic information as well as climate change data and adaptation indicators, effective adaptation measures application in all areas of national economy.
The List of Priority Measures is structured around measures in line with the five strategic objectives and the eighteen directions of action that were prioritized in the process of multicriteria analysis according to the following criteria: (1) the technical feasibility of a measure, (2) the compatibility of the cost of a measure with budgetary possibilities, (3) the organizational feasibility of the measure, (4) the multiplier effect of the measure, positive synergy with possible solutions of other problems. Below is an overview of measures with high and/or moderate priorities (Table 6.4).
Table 6.4 Overview of measures with high and/or moderate priorities
SO 1: - "Human life and health are protected from negative impacts of climate change"
DA 1.1: - The public health care system is able to respond to the negative impacts of climate change
Measures: 1. Install and maintain air cooling systems in public buildings, especially in health care institutions, social care and
social rehabilitation institutions, kindergartens, train stations. 2. Provide the possibility for chronic disease patients in risk groups to check the health status parameters (blood
pressure, blood sugar, etc.) for free of charge during heat waves. 3. Provide toilets and showers in the vicinity of popular bathing areas, providing cooling and hygiene possibilities
in hot weather.
DA 1.2: - The Civil Protection and impact-oriented Early Warning System is responsive, regularly updated and focused on extreme weather forecasting
Measures: 1. Implement and improve impact-oriented early warning and forecasting systems to alert extreme weather
conditions, including heat waves and floods, etc. Early Warning to be included in the cell broadcast (i.e., mobile) network.
2. Plan and introduce warnings and safety measures for visitors of sea precipices in the sites prone to risk of landslides and mudflows.
162
DA 1.3: Establishment of the support system of preventive measures to protect human health and life from the negative effects of climate change
Measures: 1. Provide the availability of drinking water in public areas (stations, bus stations, bathing places, parks, shops). 2. Provide information to public on cooling possibilities during heat waves: research and involvement of co-
operation partners, production of leaflets, printing of maps, creation and maintenance of mobile application. 3. Provide additional minitoring of elderly people and people with disabilities during heat waves. 4. Provide additional preventive and informative measures in educational institutions, social care institutions and
other institutions providing centralized catering services. 5. Inform healthy lifestyle followers engaged in activities in the open air, as well as other groups of population,
particularly in urban areas, about air pollution (dust, exhaust gases) and heat waves. In cities, maintain a regular information page showing the effects of climatic factors.
6. Train childcare service providers and children camp staff members on heat waves and reduction of their impacts on health.
7. Inform the public about infection vectors, symptoms of illnesses and prevention measures in particular areas of risk, for example, in popular recreational areas, camps, festivals, etc. on hot days of the summer season.
8. Develop a legal framework for reduced workload in the event of excess temperature.
SO2: - "The economy is able to adapt to and take advantage of the opportunities of climate change"
DA 2.1. Effective loss compensation mechanisms and instruments - climate risk insurance
Measures: 1. Develop a system for strengthening the insurance market and reducing the risk to the national budget in order
to compensate for losses from natural disasters / climatic factors.
DA 2.2: Protecting vital resources in forestry and agriculture from negative impacts of climate change
Measures: Agriculture
1. Diversification of crop species that can serve as a mean of dividing the risks of climate change. Farmer education measures on the possibilities and potential benefits of crop diversification.
2. Ensure the monitoring of the spread of crop and animal pests and to introduce integrated plant protection in agriculture.
3. Introduce and grow climate-tolerant varieties and take appropriate technological measures in agriculture. 4. Maintenance and restoration of the melioration system in order to prevent as much as possible the potential
negative effects of floods; introduction of environmental requirements to reduce the release of nutrients into water bodies (sediment deposits, buffer zones, etc.).
Forestry 5. Review and update the Latvia’s Rural Development Program for 2014-2020 and the Forests and Forest based
Industries Development Strategy 2015-2020, supplementing it with measures to prevent climate change. 6. Establish lower-density plantations using the breeded and morphologically and physiologically qualitative
seedlings in forestry, in order to reduce the impact of storms on the forest. 7. When renewing the forest, by planting or sowing, use breeded planting material to increase the resistance of
the forest to climate change impacts and increase its productivity. 8. Provide maintenance of young forest at the height of 4-6 m in order to ensure stability against wind damage. 9. By afforestation of unused low-quality agricultural land with locally appropriate species, creating wind-resistant
stands, taking into account other adaptation issues – creation of a lower-density sustainable plantations and monitoring their development.
10. Interbreeding on the forest stand, array or property level to diversify the climatic risks at the level of forest ownership.
11. Expand the forest road network to provide better accessibility in extreme climatic (fire, etc.) events. 12. Construct forest drainage systems that help to strengthen the resistance of trees to the effects of wind. 13. Use delivery vehicles with less pressure on the soil to preserve unfrosen soil in forests in winter without frost. 14. Fertilization of forests to increase the resistance of trees to pests and pathogens. 15. Promote forestry avoiding clear-cuttings in order to increase resilience to damage caused by climate change. 16. Provide and maintain monitoring of forest pests and diseases. 17. More widely use the species of introduced European trees. 18. More widely use European tree species, for which Latvia is the northern border of the distribution range.
DA 2.3: Conservation and protection of tourism and landscape resources and values from the negative impacts of climate change
Measures: 1. Carry out detailed surveys and assessments of landscapes from a climate change perspective and identify
areas and sights that are sensitive to climate change and are of significant importance to the countryside. Define the maintenance, management and conservation measures for these areas.
2. Adapt the tourist infrastructure for the winter season (snow cannons, etc.)

163
3. Construct indoor active recreation and sports facilities as an alternative to outdoor activities. 4. Provide educational information on the climate and climate change in Latvia, incl. travellers and tourism
companies. 5. Apply different methods for regulating tourism demand. 6. Improve the function, design and materials of clothing suitable for outdoor tourism activities under unstable
weather conditions. 7. Diversify tourism offerings to ensure the activity in all seasons (water tourism, development of inter-season
offers, industrial tourism, development of combined routes (yacht-city). 8. Integrate the aspects of climate change, mitigation and adaptation into the landscape planning, tourism
planning and relevant documents (at national, regional, municipal level). Continue integrating landscape planning into territorial development and spatial planning.
9. Introduce technological solutions for providing climate control and conditioning in tourist dwellings and enterprises.
SO 3: Infrastructure and buildings are climate-resilient and planned according to the potential climate change related risks
DA 3.1: Use of green infrastructure to mitigate climate risks
Measures: 1. Implement projects in green spaces (green parks, green walls, green roofs, combination of suitable trees and
shrubs, etc.) in cities and densely populated areas. Identify the most important locations where such projects can provide the greatest return, protecting from floods, preserving valuable landscape elements, helping to regulate rainwater drainage systems, providing natural shading in cities, etc.
2. Creation of hydrotechnical structures (dams and protective structures) as a scenic viewpoint (where applicable)
DA 3.2. Provision and adaptation of an engineering communication system for extreme climatic events
Measures: 1. Replacing the overhead electricity transmission line system with underground cables (cabling) and cleaning of
protective belts of overhead lines. Identify the most sensitive sections of the electricity transmission network for cabling and cleaning of protective belts, taking into account the intensity of wind gusts in the given area and state of the forest.
2. Arrange the rain water collecting systems by integrating them with the green infrastructure elements, predefining their required capacity.
3. Find solutions for funding of reconstruction and development of transport infrastructure after the current financial planning period (until 2020), and integrate there key issues related to adaptation to climate change, such as putting in order culverts, a thicker drainage layer, etc.).
4. Develop guidelines for changes in rainwater drainage due to the impacts of climate change that can be used in road construction planning and design.
5. Develop a support and inspection mechanism for ports in order to take into account potential storm surge risks according to the latest forecasts.
DA 3.3: Adapting existing buildings and built structures to climate change impacts and loads
Measures: 1. Improve the supervision of buildings that are not compliant with construction standards. 2. Implement natural shade solutions for buildings in order to reduce the need for installation of air conditioning
systems and the cost of use. 3. Develop flood forecasts for all major coastal cities in Latvia as a result of climate change. 4. Develop or update flood risk management plans for major coastal cities. 5. Update marine spatial planning documents taking into account the latest sea level increase and coastal
erosion forecasts. 6. Plan and estimate additional capacity for rainwater collection, including maximum rainfall estimates of different
probabilities in order to protect buildings and structures from rainwater load (washout beneath foundation, etc.). 7. More precisely define the values of snow loads on the map of Latvia in order to improve the planning accuracy
and reduce the potential danger. 8. Improvement of building constructions in specific storm hazard nodes, e.g., flat roof structures.
DA 3.4: Timely and regular review of construction standards and technologies and adaptation to climate change projections
Measures: 1. Adapting construction standards to upcoming climate change related impacts. Determining the necessity of
changes in specific construction standards, covering the parameter formats used in the Latvian construction standards and national annexes of standards.
2. Revision of road and street construction standards in line with climate change projections.
SO 4: Latvian nature and cultural heritage values are preserved and the negative impact of climate change on them is reduced
DA 4.1: Reducing the negative impacts of climate change on ecosystems and conservation of biodiversity

164
Measures: 1. Develop an information and education programme on biodiversity and the effects of climate change on it. 2. Design and maintain small dispersed wetlands in areas where agricultural land prevails, view biodiversity in
the context of landscape ecology, creating a unified wetland network. 3. Reduce the fragmentation and isolation of natural and semi-natural territories by reviewing regulatory acts and
including the requirement for the creation of a green corridor within the framework of spatial planning 4. Create and maintain long-term grasslands in areas where arable land is dominant in open areas and to ensure
connectivity between biologically valuable grasslands. 5. Mowing river and lake banks and the coastal areas (including the promotion of economic exploitation of reeds). 6. When developing the habitat management programme, integrate there climate change impacts and scenarios.
DA 4.2: Establishing of control system for limiting the spread of invasive alien species, pests and pathogens
Measures: 1. Control of invasive alien species population, including specially protected nature territories (SPNT). Regular
review of the list of invasive species.
DA 4.3: Protection of the Baltic Sea coastal values from the negative impacts of climate change
Measures: 1. Strengthen the coastline of the Baltic Sea. Build and maintain see defences, add beaches, create artificial
reefs. Create them landscape-friendly. 2. Adapt the seaside tourism infrastructure and access to the beach and the seaside to erosion affected
precipices (for example, in Jūrkalne parish). 3. Define measures to maintain the sustainability of the beach infrastructure against the risks posed by climate
change (both beaches of the open sea and the Gulf of Rīga and inland beaches threatened by flood, incresed water level and coastal erosion).
4. Develop and adapt integrated plans and plannings for the management and protection of the coastal zone on the Baltic Sea, in the context of the Baltic Sea Region and climate change impacts.
DA 4.4. Protection of natural and cultural landscape values from the negative impacts of climate change
Measures: 1. Carry out a detailed study and assessment of landscapes from different landscape functional views and
climate change aspects, and identify the areas and sights that carry natural and cultural landscape values, are relevant to tourism and are sensitive to climate change. Define the maintenance, management and conservation measures for these areas.
2. Adapt the management of SPNT with the aim of preserving and protecting the biodiversity and landscape values from the negative impacts of climate change. Identify anthropogenic loads and monitor them in SPNT during winter and summer seasons.
3. When assessing the landscapes at the national level, Latvian landscapes sensitive to climate change should be identified.
SO5: The necessary information, knowledge and awareness required for the development and implementation of climate change adaptation policy ir provided
DA 5.1: Human awareness and responsibility raising for climate change impacts and risks, and adaptation to them
Measures: 1. Develop a human security training course that integrates climate change issues. 2. Develop educational information on climate change, its impact, weather forecasting, etc. for residents and
guests of Latvia. 3. Supplement the official Latvian tourism portal http://www.latvia.travel with useful tourist information about the
climate of Latvia, for example, information on water level in rivers used for water tourism, more comprehensive information on the Latvian climate in all seasons in foreign languages.
DA 5.2 Development and maintenance of monitoring reporting and assessment systems on adaptation to climate change
Measures: 1. Create and maintain models for projection of climate and climate change, and make them publicly accessible. 2. Create and maintain a single database on losses caused by disasters and extreme weather events, to improve
knowledge and information on climate change related risk and damage events to different sectors. 3. Make the necessary changes in environmental regulatory acts and policy planning documents, including there
requirements for climate change and adaptation monitoring. 4. Include climate change adaptation monitoring parameters, indicators and requirements in the Environmental
Monitoring Programme. 5. Provide continuous monitoring of the sea coast geological processes and modelling of coastal erosion.
DA 5.3.: Increasing the science and research capacity and its application in implementation of climate change policy (climate change impacts and risks, vulnerability and adaptation to climate change)

165
Measures: 1. Carry out in-depth research on climate change that will examine relevant sectoral issues, complement
information and data on climate change. 2. Set up (renew) inter-institutional working groups and expert working groups on adaptation to climate change
issues. 3. Strengthen international co-operation in science and research on the impacts, risks and vulnerabilities of
climate change and aspects of adaptation.
DA 5.4.: Integration of mitigation solutions of anticipated climate change impact and risk mitigation solutions into policy making and territorial development planning
Measures: 1. In the framework of the methodological guidance of the planning regions and local governments, integrate
climate change, mitigation and adaptation issues into the development or updating of territorial development planning documents, including regular updating of the guidelines of sectoral policies and organizing educational and informative measures for specialists of planning regional and local governments.
2. Municipalities (large cities, coastal areas, etc.), vulnerable to the climate change are recommended to develop climate change adaptation policy strategies.
3. Make the necessary changes in environmental legislation, in particular the Law on Environmental Impact Assessment, providing for the climate impact assessment and adaptation to be taken into account within the EIA procedure.
Funding for identified priority measures is to be provided within the framework of state, local government and external funding, depending on the content of the measure. The Strategy recommends that municipalities, when preparing and updating development programmes and other development planning documents, including spatial planning documents, take into account the need for adaptation to climate change and develop and incorporate appropriate targeted measures, as well as further assess climate risk and adaptation aspects in the already planned measures also, generally considering adaptation as one of the horizontal actions. No additional funding for adaptation to climate change is planned in the current budget framework. Adaptation measures are largely related to the activities already underway (e.g. civil protection, flood control, building climatology, construction standards, etc.), and the Strategy provides a common view, coordination and effective operation.

166
FINANCIAL RESOURCES AND TRANSFER OF TECHNOLOGY
167
7 FINANCIAL RESOURCES AND TRANSFER OF TECHNOLOGY
This section includes information on the provision of financial, technological and capacity-building support to developing countries by Latvia.
Support to developing countries plays an important role in reaching the agreed goal of limiting the global average temperature increase to below 2 °C above pre-industrial levels, achieving the transformation to low GHG emissions economies, and supporting climate-resilient sustainable development. Developed countries have committed to a long-term goal of jointly mobilizing USD 100 billion per year by 2020. This pledge has helped to significantly scale up climate finance. At the same time it should be emphasized that Latvia, as well as some of the other EU Member States due to strict budgetary constraints have limited opportunities to participate in the financing of climate change and to support developing countries. As regards of scaling up climate finance, Latvia would like to acknowledge that an essential factor is the leverage of private finance. Private finance and investment will be pivotal to achieving long-term transformation of developing countries into low-carbon, sustainable, and climate-resilient economies.
Latvia is not an Annex II Party therefore the provisions of United Nations Framework Convention on Climate Change Article 4.3, 4.4 and 4.5 are not applicable, but it was decided to report provision of financial support according to EU Regulation No.525/2013 of the European Parliament and of the Council on a mechanism for monitoring and reporting greenhouse gas emissions and for reporting other information at national and Union level relevant to climate change and repealing Decision No.280/2004/EC.
Despite limited resources, Latvia contributed 350 000 euro to the Green Climate Fund at the end of December, 2014 and intends to continue to work on the support to developing countries in the future. Latvia has fulfilled its obligations under agreement in respect of participation in the Eastern Europe Energy Efficiency and Environment partnership Fund (E5P) – annually EUR 10 000 for the period 2011-2015. In fact, payment for 2014 was carried out in 2015 and the last instalment for 2015 was carried out in 2016. Furthermore an additional voluntary contribution to E5P also was carried out in 2014 in amount of EUR 35 000. All these funds are being allocated to energy efficiency projects in Ukraine.
Taking into account that there is no currency conversion integrated into the BR CTF application therefore Parties could choose their own methodology used for currency exchange for the information provided in table 7, 7(a) and 7(b). Domestic currency in 2013 was Latvian lats. According to data from Central Bank of Latvia (www.bank.lv) average year rate in 2013 was 1 USD=0.5295LVL. According to data from European Central Bank (www.ecb.europa.eu) average year rate in 2013 was 1 EUR=1.3281 USD. Considering that Latvia in 2014 joined the Eurozone, national currency lats was replaced with euro. According to data from European Central Bank (www.ecb.europa.eu) average year rate in 2014 was 1 EUR=1.3285 USD. According to data from Central Bank of Latvia (www.bank.lv) average year rate in 2015 was 1 EUR=1.10951289 USD and in 2016 1 EUR = 1.10690311 USD. Both aforementioned values of the currency exchange are used in calculations.
Summarized information on the financial and provision of capacity building support can be found in the Tables 7 and 9 included in the Annex of Latvia’s Third Biennial Report.
The technology support and transfer were not provisioned.
168
RESEARCH AND SYSTEMATIC OBSERVATION
169
8 RESEARCH AND SYSTEMATIC OBSERVATION
8.1 General Policy on and Funding of Research and Systematic Observation
8.1.1 General Policy on Research
Science and innovation in Latvia are the key resources to achieve the state development aims. In Latvia, by 2030, the goal is set to create a solid research and development human capital123. The National Development Plan 2014–2020124 in the strategic objective “Advanced Research and Innovation and Higher Education” sets the following goals:
Increase investment in research and development to 1.5% of the gross domestic product in 2020, with targeted efforts to attract human resources, develop innovative ideas, improve the research infrastructure, facilitate co-operation between higher education, science and the private sector, as well as the transfer of research and innovation to business.Through the commercialisation of knowledge, promote the creation of innovative and internationally competitive products with high added value as well as their introduction into production, increasing the share of output of such products in the national economy.
Smart Specialization Strategy – the national economic development strategy, which defines the directions of economic transformation, growth priorities and areas of smart specialization, by targeted focusing of research and innovation resources in areas of knowledge where the country has comparative advantages or has basis for creating such advantages, is the background for targeted use of EU Structural Funds resources up to the year 2020125,126.
Guidelines for the Development of Science, Technology and Innovation for 2014-2020 is a medium-term policy planning document that defines the goals and priorities of the national science, technology development and innovation (STI) policy during this period. In the National Development Planning System, the Guidelines are part of the Smart Specialization Strategy and contribute to the achievement of the goals set out in the country’s long-term and medium-term policy planning documents. The ultimate goal of the STI policy, defined by the Guidelines, is the development of the knowledge base and innovation capacity of Latvia and the coordination of the innovation system. To achieve this goal, six sub-goals and, respectively, strategic directions for action were set:
develop human capital in the field of STI by increasing the number of persons employed in research in scientific institutions and the business sector at least up to 7 thousand by 2020, focusing on identified areas of knowledge specialization;
promote international competitiveness of Latvian science, observing the principle of regional development and concentrating research in a smaller number of larger and stronger institutions, promoting the growth of the number of scientific articles published in recognized international databases and the increase in the number of inventions ;
modernize and integrate the research and education sector by increasing their ability to respond to future challenges in research, technology development and innovation and raising the mobility of the education sector;
123 Ministry of Education and Science, available at http://www.izm.gov.lv/lv/zinatne 124 Communication by the Saeima on the National Development Plan 2014–2020 (Par Latvijas Nacionālo attīstības plānu 2014.-2020.gadam), approved by the Saeima on December 20, 2012, in Latvian, available at https://likumi.lv/doc.php?id=253919 125 The informative report “About the Development of Smart Specialisation Strategy” (Minutes of the meeting of the Cabinet of Ministers on December 17, 2013, No.67, §96), available at http://polsis.mk.gov.lv/documents/4612, Adjusted informative report on the development of the Smart Specialization Strategy, 17.01.2014, available at http://polsis.mk.gov.lv/documents/4608 126 Informative Report on the implementation of the European Research Area Roadmap 2016-2020 in Latvia (Minutes of the meeting of the Cabinet of Ministers of September 13, 2016, No.44, §34) available at http://polsis.mk.gov.lv/documents/5695

170
develop a more effective knowledge transfer environment and strengthen the absorption and innovation capacity of companies by developing demand for new knowledge and the ability of scientific institutions to respond to this growing demand;
optimize management of the STI field, ensuring effective coordination and R&D investment growth ;
create demand for science and innovation, communicating science achievements to the public and promoting innovative activities and technological development.
The scientific activities in Latvia are determined by the Law on Scientific Activity 127 and related legislative documents issued on its basis. In accordance with Section 21 of the Law, a scientific institute shall perform scientific activity, as well as activities related to the acquisition and improvement of scientific qualifications in the scientific research sector specified by the founder or establisher thereof and is registered in the register of scientific institutions. A scientific institute may be: 1) a public agency; 2) a derived public person; 3) a structural unit of an institution of higher education; or 4) a private law legal entity or a structural unit thereof.
A scientific institution must have at least five persons holding a doctoral degree in the field of research in line with the institution’s activities. A State scientific institute may be established as a State agency or a derived public person. The State scientific institute shall be under the supervision of the Minister for Education and Science or the relevant sector minister.
Since 2001, priority directions in science are defined to finance fundamental and applied research in order to purposefully implement the science policy and to use the financial resources effectively.
In 2016, the total number of employees working in research in Latvia, corresponding to the full time equivalent, was 5120 (including 4224 in higher education and state scientific institutes and 896 in the business sector). Of this number, 3152 was scientific personnel and 1968 was scientific technical staff.
Figure 8.1 Number of employees in research work in Latvia, full time equivalent
In order to efficiently use scientific resources, increase their performance, promote the establishment irop integrated and comprehensive research system, Latvia has undertaken a number of reforms and activities since 2013. It is planned to concentrate research in 20 strong scientific institutions by 2020, which would be reliable partners for global research organizations, successfully compete in European research programmes and carry out research in areas important for the Latvian economy and society.
127 Law on Scientific Activity (Zinātniskās darbības likums), approved on 14.04.2015, in Latvian, available at https://likumi.lv/doc.php?id=107337
171
Thus, the institutional framework encourages both the excellence of the research and the compliance with the priorities of national economy123.
8.1.2 Research funding
In Latvia, science funding is granted both institutionally (basic funding of research) and on a competitive basis. Competitive research funding is allocated for projects by the National Research Programme, Fundamental and Applied Research Programme, European International Programmes, bilateral co-operation programmes (including research co-operation projects with Belarus, Ukraine, France, Taiwan and Lithuania) and the European Space Agency’s collaborative project programmes. In 2015, institutional funding amounted to 19.4% and competitive funding 80.6% (including state funding of 13.1% and EU Structural Funds funding 67.5%) of the total funding. The Policy planning document126
emphasizes that both types of funding are critically low for the future research development.
In 2015, the total funding has increased by 40% compared to 2010, and it was ~152 MEUR. State and university funding in 2015 was 35%, funding from enterprises – 20%, foreign funding – 45% of the total research funding. Research funding increased rapidly in 2010 and 2011, and in the period of 2011-2015 it has varied between 141-163 MEUR, an average of about 143 MEUR per year. It should be noted that in 2016, the total research funding was cut down to 110.4 MEUR, although the funding of state and higher education in 2016, compared to 2015, has increased by 5%. The main reason for the decrease in total funding was the reduction of foreign funding for about 2 times, which is largely due to the funding gap caused by launching the new programming period of EU funds for 2014-2020. When assessing the dynamics of various sources of funding, one can see the following:
funding from the state and universities, comparing 2010 and 2016, has increased by about 80%, and the average funding has been 42 MEUR per year;
funding from enterprises during the period of 2010-2016 has varied within the range of 23.8-45.3 MEUR, on average 34.6 MEUR per year,
foreign funding in the period of 2010-2016 has varied within the range of 30.7-73.3 MEUR, on average 60.7 MEUR per year128.
Research funding as a share of GDP in the years 2010-2015 has varied between 0.6% and 0.7%, decreasing in 2016 to 0.44%.
In 2015, the financing of basic research was 52.5 MEUR, which is 53% more than in 2010, the financing of applied research was 67.2 MEUR, which is 67% more than in 2010 and experimental development expenses amounted to 32.5 MEUR, which is 7 % less than in 2010. The year 2016 is characterized by a cut of funding, respectively spending 33.5 MEUR on basic research, 49.9 MEUR on applied research and 27 MEUR on experimental developments129, a total of 110.4 MEUR.
128 Central Statistical Bureau, Data Base ZIG03 “Research Expenditure by sectors and its funding”, http://data.csb.gov.lv/pxweb/lv/zin/zin__zin/?tablelist=true&rxid=cdcb978c-22b0-416a-aacc-aa650d3e2ce0 129 Central Statistical Bureau, Data Base ZIG03 “Research Expenditure by sectors and its funding”, http://data.csb.gov.lv/pxweb/lv/zin/zin__zin/?tablelist=true&rxid=cdcb978c-22b0-416a-aacc-aa650d3e2ce0

172
Figure 8.2 Breakdown of research funding in 2015
Research funding from the state budget of Latvia – the state budget programme “05.Science” in 2017-2019 is planned about 42.5 MEUR annually130.
Latvian State Budget Resources
Most of the state budget funding is allocated for covering the basic needs of research activities. The research institution shall use the allocated basic funding for: (1) the remuneration of scientific staff; (2) the maintenance of a scientific institution; (3) achieving the goals set in the strategy of the research institution, (4) co-financing of European Union structural funds, other foreign and international financial instruments and international scientific research projects. The research basic funding is also allocated for the partial support of the research activities performed by the academic staff of public institutions of higher education, thus improving the involvement of academic staff of these institutions in research.
National Research Programme (NRP), according to the Article 35 of the Law on Scientific Activity127 is a public procurement for the conduct of scientific research and is implemented in a specific field of economic, educational, cultural or other sector of state priority in order to promote the development of this sector. The purpose of the 2014-2017 NRP is to promote the development of science in all branches and to develop the human resources in science in accordance with the provisions of the Smart Specialization Strategy of Latvia for the Guidelines for the Development of Science, Technology and Innovation for 2014-2020 and contribution of science to the transformation of economy producing highest added value products, change of an export structure and increase in labor productivity as well as provisions set out by the European Union (EU) programme Horizon 2020 to address the societal challenges.
The objectives and tasks of the NRP are set by the relevant sectoral ministries jointly with the Latvian Science Council and the Latvian Academy of Sciences. NRPs are implemented in the priority directions in science approved by the Cabinet of Ministers. The following six priority directions in science have been defined for 2014-2017:
1. “Environment, climate and energy (environment, ecosystems and biodiversity, production of
renewable resources, energy independence, technologies to improve security of electricity
supply, development of low-carbon production, climate change mitigation and adaptation to
climate change)”
130 Ministry of Science and Education, available at http://www.izm.gov.lv/lv/zinatne/zinatnes-finansejums

173
2. “Innovative and advanced materials, intelligent technologies (multifunctional materials and
composites, nanotechnologies and photonics, informatics, computer science, information and
communication technologies, signal processing technologies)”
3. “Public health (prevention, diagnosis, treatment, clinical medicine, treatment methods and
technologies, medical products and biomedical technologies)”
4. “Exploration and sustainable use of local resources (subterranean depths, water, agriculture
and forestry resource use technologies and food technologies, biotechnology)”
5. “Sustainable development of the state and society (society, governance, resources, economy,
demography, environment)”
6. “Letonika – History, Languages, Culture, Values of Latvia”.
In December 13, 2017, it has been approved nine priority directions in science for the period 2018-2021, among them the priority direction No.2 “Energy supply safety strengthening, energy sector development, energy efficiency, sustainable transport” and the priority direction No.3 “Climate change, nature protection and environment”, as well as the development of bioeconomics is foreseen within the priority direction No.4.
MES, through a competition, allocates funds to the programmes from the state budget funds earmarked for science. In 2014-2017, in all six research fields, 14 NRPs with total planned funding for the entire period of ~ 25.7 MEUR are under implementation.
In addition to NRPs, priority fundamental and applied research projects are also funded. In the period of 2014-2017, their total annual average funding is approximately 3.6 MEUR.
EU Structural Funds: Research Infrastructure Improvement Programmes
Research infrastructure improvement programmes were actively carried out during the 2007-2013 programming period of the EU Structural Funds and are continued also in the 2014-2020 programming period. Significantly, the improvement of research infrastructure is synergistic with the development of research sector human resources and the creation of synergies with the commercial sector.
In the 2007-2013 programming period, the total allocation of funds for the National Operational Programme “Human Resources and Employment” was ~ 634 MEUR, of which about 20% were allocated to the priority “Higher Education and Science”. Within the framework of this priority, the activity “Involvement of human resources in science” and activities on the development of higher education studies were implemented. In its turn, the total funds allocation for the National Operational Programme “Entrepreneurship and Innovations” was ~ 744 MEUR, of which ~ 60% were allocated to the priority “Science and innovations”. The above mentioned priority included two measures: (1) measure – “Science, Research and Development” (allocation of funds ~ 185 MEUR, including the development of science infrastructure ~ 95.4 MEUR, which included the purchase of world-class scientific equipment, necessary reconstruction and renovation of the buildings and premises for the modernization of the infrastructure of the leading national research centers and the development of a modern material and technical research base; (2) measure – “Innovation” (allocation of funds ~ 260.5 MEUR, of which 88.5 MEUR were earmarked for research development, including science commercialization and technology transfer (competence centers and technology transfer contact points) ~ 45 MEUR, support for the development and introduction of new products and technologies in production ~ 43.5 MEUR.
EU Structural Funds for the scientific sector in the programming period 2014-2020 are in line with the National Operational Programme “Growth and Employment”131. The programme sets out the priority field “Research, Technological Development and Innovation”, which includes 2 investment priorities:
131 EU Structural Funds 2014-2020 planning documents, in Latvian, available at http://www.esfondi.lv/planosanas-dokumenti

174
1. Improving research and innovation infrastructure and capacity to develop excellence in research and innovation, as well as promoting the creation of a centers of excellence, in particular centers of European interest.
2. Promote enterprise investments in R&D and build links and synergies between businesses, research and development centers and the higher education sector.
The total allocation of funds for the whole period is ~ 467.5 MEUR132, which is divided between several measures, see table. Essentially, the entire cycle is covered, from the fundamental research to the introduction of innovations in businesses.
Table 8.1 National Operational Programme “Growth and Employment” 2014-2020
Priority Axes Investment priorities Specific Objectives Actions Attracted funding, thousand, EUR
Research, technological development and innovation
Improve the R&I infrastructure and ability to develop R&I excellence, as well as promote creation of competence centres, especially centres of European importance
Improve research and innovation capacity and the ability of Latvian research institutions to attract external funding, by investing in human capital and infrastructure, attracted funding ~ 279 MEUR
Practical research 65036
Support for post doctoral research
54425
Innovation grants to students
28900
Support for development of R&D infrastructure in areas of smart specialization and institutional capacity building of research institutions
102965
Support for international cooperation projects in research and innovation
27670
Promoting business investments in R&D and creating links and synergies between businesses, research and development centres and the higher education sector.
Increase investments of private sector in R&D, attracted funding ~ 159 MEUR
Support for development of new products and technologies within competence centers
64315
Support for improving the technology transfer system
34500
Support for implementation of new products in production
60000
Facilitate implementation of innovations in enterprises, attracted funding ~ 30 MEUR
Support for the training of persons employed
18000
Innovation motivation programme
4801
Support for ICT and non-technological training as well as training to promote attraction of investors
6908
8.1.3 Research management
In Latvia science and research is coordinated by MES.
Management structure in the field of science, technology development and innovation
The institutions responsible for science, technology development and innovation (STDI) are the MES and the MoE. The MES develops the STDI policy, coordinates its implementation and ensures representation of Latvia in research management institutions of the European Union. In this process, the MES co-operates with the ME and other sectoral ministries, and, where necessary, consults with
132 Progress in the implementation of EU funds, report of July 2017, in Latvian, available at http://www.esfondi.lv/finansu-un-raditaju-plani-to-izpilde,

175
sectoral associations and social partners133. STDI funding is administered by the Study and Science Administration (SSA), the State Education Development Agency (SEDA) and the Latvian Council of Science (LCS). In addition to administration of funding instruments, SSA also provides the work of National Contact Point (NCP) of the European Union Science and Research Framework Programme and performs other delegated tasks of the MES. SEDA provides administration of the EU Structural Funds allocated for the sector. LCS administers the Fundamental and Applied Research Programme and advises the MES on science policy issues. In addition, certain scientific representation and programme coordination functions have been delegated to the Latvian Academy of Sciences (LAS). LAS is a national science center that has been founded as a member organization based on scientific excellence whose main tasks are active participation in the development of science policy, participation in scientific expertise, care for the involvement of young researchers in science, fostering ethics of scientific research, discussion principles and traditions, international contact building and promotion, as well as science communication. ME develops and coordinates the implementation of innovation policy.
Environmental Science
Environmental Protection Law (2006) includes the Chapter VIII: Environmental Science, Environmental Education and Sustainable Development.
In accordance with this chapter MEPRD in co-operation with the MES shall perform the necessary measures for development of the environmental science in order to promote scientific activities in the field of sustainable development, environmental protection and environmental education, ensuring the performance of environmental quality research, development of eco-innovation and environmental technologies, as well as awareness and solving of environmental protection problems (section 40).
The MEPRD in co-operation with other ministries, authorities of higher education and colleges involved in environmental science and environmental education shall establish the Environmental Science and Education Council. Decisions of the Council shall have a recommendatory nature. The Cabinet shall approve the by-laws of the Council. The MEPRD shall ensure financially the operation of the Council (section 41.1)
The Environmental Science and Education Council shall promote the co-operation of authorities related to the environmental science and environmental education development, shall be aware of and solve problems in respect of the environmental science and education for sustainable development, as well as promote the co-operation of authorities involved in the introduction of a policy for a sustainable environment and improvement of the instruments thereof (section 41.2)
According to the Cabinet of Ministers Regulations No. 372 (05.06.2007), the Council consists of three representatives from the University of Latvia, two representatives from the MEPRD, the MES, the Riga Technical University, the Latvia University of Agriculture, one representative from the MoA, the LAS, the University of Liepāja, Rēzekne Academy of Technologies, Daugavpils University, Olaine College of Mechanics and Technology.
National Research Centres and Centres of Competence in Research
The role of National Research Centers (NRC) is the thematic concentration of research resources in Smart Specialization areas and in sectors of high horizontal importance.
During the 2007-2013 planning period of the EU Funds, 6 NRCs were supported by the sub-activity 2.1.1.3.1 “Development of the Science Infrastructure” of the Supplement to the Operational Programme “Entrepreneurship and Innovations”, among them: Energy and Environmental Resources Production and Sustainable Utilization Technology NRC, Forest and Water Resources NRC, Use of Agricultural Resources and Food NRC. In total, 16 projects were supported within the activity, including projects directly related to environmental research, such as the Development of the airborne remote sensing
133 Including the Latvian Employers' Confederation (LDDK), the Latvian Chamber of Commerce and Industry (LRTK), the Council of Rectors (RP), the Association of State Scientific Institutions (VZIA), the LATVIAN TRADE UNION of EDUCATION AND SCIENCE Employees (LIZDA), etc.
176
laboratory for the research of natural resources and environment, Development of the scientific and research infrastructure of the company „Baltijas jūras ģeoloģijas centrs” (the Baltic Sea Geology Center) In turn, in sub-activity 2.1.2.1.1, the aim of which was to increase the competitiveness of businesses by promoting co-operation between the research and industrial sectors in the implementation of industrial research, development of new products and technologies, 6 competence centers were supported that combine scientific research institutions and businesses, of which 2 centers of competence are directly linked to environmental research: Environment, Bioenergetics and Biotechnology Competence Centre and Forest Sector Competence Center.
Currently the planning period 2014-2020 is ongoing. At the moment 8 competence centers, including the Forest Sector Competence Center, Smart Engineering Systems, Transport and Energy Competence Center, Center for Smart Materials and Technology, have been supported within the specific objective 1.2.1 of the Operational Programme “Growth and Employment”. The aim of the specific objective is to support the development of commercialization competence of research results in public research organizations by promoting the commercialization of research results owned by these research organizations both in Latvia and abroad, as well as promoting innovation activities in small (micro), small and medium-sized enterprises by providing support in technology transfer for the development of new or significantly improved products or technologies.
8.1.3.1 Access to research results
Public access to publicly funded projects is provided. It is mandatory for NRPs to create their own websites134 and provide information on them.
Publicly ordered and planned studies are collected in the “Research and Publications Database”, specially developed for this purpose at the Cross-Sectoral Coordination Center. It provides an opportunity to get acquainted with research performed and planned in different fields and by individual institutions with the aim of assisting policy-planners in their daily work in order not to duplicate existing similar research and promote evidence-based policy planning in Latvia, as well as provide an overview to the wider public on public investments in development of activities in specific fields and sectors135.
In addition, sectoral ministries and institutions maintain their websites, which summarize the results of current funded research. Thus, the MEPRD commissioned research in the field of environment and nature are listed altogether on the website “Research in the field of Environment and Nature”136, the MoE maintains the websites “Energy Efficiency and Heat Supply: Statistics and Research”137 and “Renewable Energy and Cogeneration: Statistics and Research”138.
Similarly, funds that provide public funding maintain their publicly available websites. E.g., the results of research funded by the LEPF are available on the “Project Materials”139 website.
Institutions and organizations participating in the implementation of internationally funded projects provide their websites with information on the dissemination of their results.
134 National Research programmes”, available at http://www.izm.gov.lv/lv/valsts-petijumu-programmas-informacija-timekla-vietnes 135 Cross-Sectoral Coordination Center, “Research and Publications Database”, available at http://petijumi.mk.gov.lv/ 136 MEPRD, “ Research in the field of Environment and Nature”, available at http://varam.gov.lv/lat/publ/petijumi/petijumi_vide/?doc=15514 137 EM, “Energy Efficiency and Heat Supply: Statistics and Research”, available at https://em.gov.lv/lv/nozares_politika/energoefektivitate_un_siltumapgade/statistika_un_petijumi/ 138 EM “Renewable Energy and Cogeneration: Statistics and Research, available at https://em.gov.lv/lv/nozares_politika/atjaunojama_energija_un_kogeneracija/statistika_un_petijumi/ 139 Latvian Environmental Protection Fund Administration, website “Project materials”, available at https://www.lvafa.gov.lv/materiali/

177
8.1.4 Climate/energy research in the Latvian research system
8.1.4.1 National research
Climate change mitigation and adaptation research cover a wide range of research from fundamental research to applied research.
Significant research is being carried out within the NRP framework, as well as individual climate change related topics are addressed in research co-operation projects and thematic research projects (Fundamental and Applied Research Programme) as well as in projects funded by the EU Structural Funds for science and research.
The NRP system in Latvia was established and launched in 2005140. NRP programmes in energy and environmental science sectors, launched in 2006, are those most directly linked to the climate change issue.
Currently, in 2014-2017, two programmes directly related to climate change mitigation and adaptation issues are under implementation. In total, funding of these programmes amounts to 17.5% of the total planned NRP funding, so it can be concluded that climate-related research has been designated a proportionally important place in the overall NRP research system.
The planned funding of the NRP “Energy-efficient and low carbon solutions for a secure, sustainable and climate variability reducing energy supply (LATENERGI)” for the period 2014-2017 is 2.25 MEUR. The programme carries out the research on the issues like: (1) sustainable climate policy and innovative, energy-efficient technological solutions, (2) energy and climate policies impact assessment; (3) complex research on innovative technologies for the production and use of renewable energy resources and biogas production potential in the waste treatment industry; (4) innovative technologies for the production of hydrogen and biofuels, their implementation in Latvia, (5) innovative energy electronics technologies for increasing energy efficiency in the Latvian economy, future energy supply networks and the use of renewable energy resources, (6) energy system development planning and energy production, sales and distribution optimization.
The planned funding of the NRP “The value and dynamic of Latvia`s ecosystems under changing climate” (EVIDEnT) for the period 2014-2017 is about 2.25 MEUR. The programme carries out the research on the following issues: (1) elaborated climate scenarios, improved hydro-geological model, including water infiltration measurements; (2) modelling tool and integrated development scenarios are developed for the national sectors in assessing GHG emissions, farms are inspected and GHG emissions estimated in the agricultural sector, integrated forestry effects are evaluated; (3) models of wind fields, waves and currents are adapted/developed, prototypes of current and wave observation sensors have been developed and field measurements have been performed, studies of food chain functioning in the lake-river-sea system have been carried out, (4) studies of introduced species in the freshwater ecosystem (HES reservoir), in ports and adjacent water areas as well as the Baltic Sea coastal zone have been carried out; (5) biodiversity studies and habitat simulations have been carried out, and the value of ecosystem services have been assessed.
Also, the NRP “Innovation and Sustainable Development: Latvia’s Post-crisis Processes in a Global Context (SUSTINNO)” project No.4 “Environmental Diversity and Sustainable Use” is also related to the evaluation of society’s value-behavior-loads change parameters.
In 2010-2014, a single NRP “Innovative technologies of extraction and utilization of energy resources and ensuring low carbon emissions by renewable sources, activities to limit degradation of environmental and climate change” in the priority direction of science “Energy and Environment” was implemented. The programme looked at issues such as: (1) integration of climate change mitigation and
140 Cabinet of Ministers Order No.446 (Par Izglītības un zinātnes ministrijas apakšprogrammas 05.12.00 "Zinātnes konkurētspējas veicināšana" pasākumiem un valsts pētījumu programmu finansēšanu 2005.gadā), in force till 29.05.2010, in Latvian, available at https://likumi.lv/ta/id/113062

178
renewable energy technologies into the Latvian energy system, (2) integrated planning of the Latvian energy system and consumption development, taking into account environmental and economic conditions; (3) exploration and development of technologies for the extraction and use of RES in the energy sector, with respect for biodiversity, (4) research into hydrogen generation, storage and energy release methods and development of prototypes, (5) biomass gasification and fuel production technologies and their practical applicability in Latvian conditions, (6) development of energy electronics technologies for electricity consumption reduction and use of RES in Latvia; (7) analysis of the diversity of local energy resources in the regions of Latvia and the development of measures for the efficient use of energy resources providing sustainable energy supply.
In 2006-2009 2 NRP were implemented:
NRP “Impact of Climate Change on Water Environment in Latvia (KALME)” carried out research on the issues like the impact of climate change on: runoff, nutrient flows and the Baltic Sea regime, the movement of plant nutrients in the catchment area, inland water ecosystems and biodiversity, ecosystems in the Baltic Sea and biodiversity; the impact of run-off extremes due to climate change on flood risk areas; coastal processes; biogeochemical processes and primary production in the Baltic Sea; environmental and sectoral policies adaptation.
NRP “ Research and Elaboration of Modern Methods and High Developed Technologies in the Field of Energy: Environmentally Friendly Energy, Security of Energy Supply and Energy Efficiency” carried out research on the following issues: estimate of the possibilities and technologies of use of different types of RES; optimization of bio-fuel production and utilization methods; research and development of hydrogen production and utilization technologies; ways of enhancing security of energy supply, analysis of technology and their key factors; improvement and management of energy efficient methods and technologies; methods and technologies for planning of sustainable and safe energy supply of Latvia; information systems for the assessment of the sustainability of electricity transmission network and generation system in Latvia.
Energy efficiency, climate adaptation issues, including assessment of socio-economic impacts are also addressed in research co-operation and thematic research projects. For example, thematic research projects141 implemented in 2014-2016 like: changes in the stability of the climate system and their impact on water-quality limiting biogeochemical flows in Latvia, the adaptation potential of forest trees and its raising potential, the impact assessment of the bioenergy industry in Latvia, increase of physiologically active compounds in vegetables grown in Latvia under conditions of changing climate, and others. Several studies explored the challenges of efficient use of various types of renewable energy, as well as efficient energy storage and transformation issues.
An important contribution to the implementation of specific climate-related research is provided by sector studies funded by the MEPRD/LEPF136. Most of these studies address problems to promote the development and introduction of environment and climate friendly management practices in Latvia. Specific studies have addressed, for example, the flood risk management, application of decentralized waste water treatment systems, waste management practices, effective environmental tax systems, and other topics.
An important contribution to the development of applied research was the research into technological development and pilot projects carried out under the National Green Investment Scheme (Climate Change Financial Instrument) for the period 2010-2014. Two open project tenders were carried out:
141 The Latvian Council of Science, in Latvian, available at http://www.lzp.gov.lv/parskati/Fin-2016.htm
179
“Development of greenhouse gas emission reduction technologies”, project implementation took place between July 2010 – June 2013142;
“Development of greenhouse gas emission reduction technologies and pilot Project implementation”, project implementation took place between July 2012 and February 2014143.
Technology development projects covered a broad spectrum of technologies, such as the development of new types of high energy capacity battery prototypes for electric vehicles, innovative technologies for the use of hydrogen and ozone in internal combustion engines, the use of gaseous biofuels, solar panel materials, efficient biomass gasification technologies and biomass combustion chambers, sewerage waste heat recovery, innovative heat pump technologies, small wind power technologies, LED lighting technologies, energy efficiency improvement projects of various types of technologies.
Environmental impact reduction issues are also addressed in research projects supported by EU Structural Funds. Within the framework of the specific objective 1.1.1 “Improve research and innovation capacity and the ability of Latvian research institutions to attract external funding, by investing in human capital and infrastructure” of the 2014-2020 planning period, projects related to energy efficiency and use of energy resources were supported, for example: improvement of energy efficiency in production processes, efficient heat supply, technological problems in the development of electric transport, biodiesel fuel synthesis, hybrid energy systems, biomass and waste efficient incineration and gasification processes, sustainable construction and near-zero energy building smart solutions, and other topics. Climate adaptation related research is also supported, for example, the research “Development of a tool for risk assessment of storm caused damage of the stand on peatland soils”. Similar thematic projects were supported also in the 2007-2013 planning period.
8.1.4.2 EEA and Norway Financial Mechanisms
First of all, it has to be underlined that EEA and Norway Financial Mechanism, 2009-2014 period, within the National Climate Policy programme had provided important contribution both in research on climate change impact and adaptation and in research in support of the national greenhouse gas inventory, details provided below in the sections 8.2.1 and 8.2.3 of the Latvia’s Seventh National Communication report.
The contribution to the development of applied research was provided by pilot projects developed within the framework of the EEA and Norway Financial Mechanisms both in the 2004-2009 period and in the 2009-2014 period within the National Climate Policy programme, both in its Open Competition and the Small Scale Grant Scheme. In the open competition, the project “Elaboration of Innovative Biomass Gasification Technology to Obtain Syngas” and the project “Development of Energy Efficient Technology for Polycrystalline Silicon Production” as well as 5 low energy building construction projects were implemented (low energy building projects, considering their demonstration value, are described in the next chapter 9). In a small scale grant scheme, in support area 2 “Capacity building through applied research on mitigation of climate change” 6 projects concluded during the 2016. Researches were developed on the following issues: how climate change affects specific species and biodiversity in lakes and the Baltic sea; development of bio-economy model for sustainable use of biological resources; GHG reduction potential in household areas; building renovation impact on climate change, as well as researches that analyse impact of different anthropogenic processes on climate change144.
The Norway Financial Mechanism for the period 2009-2014 funded the “Innovation in Green Production” programme. As a predetermined project, the “Green Technology Incubator” was implemented within this
142 Development of greenhouse gas emission reduction technologies, implemented projects, in Latvian, available at http://kpfi.lv/modules/Konkurs/projekti.php?id=12&lang=lv 143 Development of greenhouse gas emission reduction technologies and pilot Project implementation, implemented projects, in Latvian, available at http://kpfi.lv/modules/Konkurs/projekti.php?id=15&lang=lv
144 Annual Programme Report EEA Financial Mechanism 2009-2014 Programme LV02 “National Climate Policy” , Reporting year – 2016, available at http://www.varam.gov.lv/lat/fondi/grants/EEZ_2009_2014/nacionala_klimata_politika/?doc=18186

180
programme. The implementation of the various technologies, promoting waste management, energy efficiency, use of renewable resources, development of new materials and related emission reductions was funded by the Open Competition “Support for the implementation of Green technologies”. In total, 14 projects were supported by the programme145. In turn, 23 projects were funded in the Small Grant Scheme “Support to Businesses in the Development and Implementation of New or Significantly Improved Products, Services and Technologies”, where to the GHG emission reductions issue are directly related projects in such thematic areas as: efficient luminaries, innovative thermal insulation materials, energy-efficient biomass drying solutions, efficient biomass combustion/gasification technologies, bioplastics and composite materials packaging and their manufacturing equipment, electric scooter, energy-efficient communication system technology, and others.
8.1.4.3 EU Programmes
Latvian research institutions and organizations actively participate in EU programmes, both fundamental and applied research (H2020, including ERA-NET) and carrying out research implementation projects through innovative and sustainable improvements in environmental quality and climate change (LIFE programme) and through the use of applied research development of very specific solutions (Interreg programmes).
H2020 Programme
Within the framework of the H2020, Latvian research institutions participate in climate change mitigation and adaptation projects related to climate change, for example146, ERA-NET (Monitoring and Mitigation of Greenhouse Gases from Agri- and Silvi-Culture; Smart Grids Plus; Urbanisation Global Initiative), research infrastructure development projects (including SeaDataCloud, Latvian Institute of Aquatic Ecology; European Long-Term Ecosystem, critical zone and socio-ecological Research Infrastructure, The Institute of Biology of the University of Latvia; Research Infrastructure for Circular Forest Bioeconomy, Latvian State Institute of Wood Chemistry), ODYSSEE-MURE, a decision support tool for energy efficiency policy evaluation (Institute of Physical Energetics). Latvian research institutions participate in research on specific topics, such as: sustainable integrated management for the nexus of water-landfood-energy-climate for a resource-efficient Europe, ecosystem services research, environmental impacts on future forests, growing industrial crops, environment and climate friendly agriculture practices, energy saving contest for public authorities, energy effective renovation practices of buildings, effective district heating systems, technological development and supporting legal environment for renewable energy resources of different kind, and others.
LIFE programme
Currently 15 projects are under implementation in Latvia with the co-financing of the LIFE programme, of which 8 are Nature and Biodiversity Priority Area projects, 3 – Environment and Resource Efficiency Priority Area projects, 3 – Climate Sub-programme Projects and 1 – Capacity Building Project147. The themes of the Climate Sub-programme projects are the protection of coastal habitats in the nature park Piejūra, the restoration of degraded bogs in the Northern European Lowland by reducing CO2 emissions, the integration of adaptation to climate change into the work of local authorities.
8.1.4.4 Main institutions participating in research and directions of their research
Climate-related studies, by their nature, are interdisciplinary and crossdisciplinary.
145 EEA and Norway Grants, available at http://www.eeagrants.lv/?id=70 146 State Education Development Agency, “Horizon2020 supported projects”, available at http://viaa.gov.lv/lat/zinatnes_inovacijas_progr/apvarsnis_2020_red/h2020_atbalstitie_proj/ 147 Administration of Latvian Environmental Protection Fund, available at https://www.lvafa.gov.lv/aktualitates/life-jaunumi/1977-latvija-notiekoso-life-programmas-projektu-tiksanas

181
Thus, in the implementation of the previously described NRP “EVIDEnT”, 13 research organizations – the Latvian Institute of Aquatic Ecology (programme lead partner), the Institute of Physical Energetics, Faculties of the University of Latvia – the Faculty of Biology, the Faculty of Geography and Earth Sciences, the Faculty of Physics and Mathematics, the University of Latvia Institute of Biology, Latvia University of Agriculture, Riga Technical University (RTU) Faculty of Computer Science and Information Technologies, Institute of Electronics and Computer Science, Daugavpils University, Latvian State Forest Research Institute “Silava”, National Botanical Garden, Food Safety, Animal Health and Environment Institute “BIOR”148 – are involved.
In turn, 9 research institutions – RTU (programme lead partner) research institutes – Institute of Energy Systems and Environment, Institute of Energetics, Institute of Industrial Electronics and Electrical Engineering, Institute of Applied Chemistry, Department of Water Engineering and Technology participate in the implementation of NRP “LATENERGI”; as well as Institute of Physical Energetics, University of Latvia Institute of Solid State Physics, University of Latvia Faculty of Geography and Earth Sciences, Latvia University of Agriculture Institute of Energetics149.
The Latvian Institute of Aquatic Ecology is a state scientific institute under the supervision of the Minister of the Environment, which studies fundamental and practical problems related to the Baltic Sea environment and ecology. The Institute’s work focuses mainly on the Gulf of Rīga and the Latvian part of the Baltic Proper, where the Institute is responsible for monitoring the marine environment. Research areas: Marine environmental monitoring, Long-term changes in the Baltic Sea, Seasonal cycles in brackish plankton and benthos, Vertical flow, Benthal and Pelagic association, Coastal biodiversity, Invasive species, Ecological modelling, Toxic algae and algal toxins, Bioassay, Ecological risk assessment150.
Academic staff of the Faculty of Geography and Earth Sciences of the University of Latvia, in collaboration with scientists from many countries, provides the development of science in geography, geology and environmental science. Research in the climate sector relates to the impacts of climate change on aquatic ecosystems, biodiversity, adaptation to climate change. The staff of the Environmental Science Department has many years of experience in researching the nature and impacts of climate change and developing adaptation strategies and actions, as well as analyzing climate policy.
Ecosystem research is crucial in the context of climate change. The Faculty of Biology of the University of Latvia leads the project “Biodiversity and its role among other ecosystem services” within the framework of the NRP “EVIDEnT”. Daugavpils University as one of the leading Latvian freshwater research institutes has a long-term experience in the research of freshwater ecosystems, both at species and habitat level, as well as in research on the spread of alien species. The research activities of the Institute of Biology of the University of Latvia are divided into two main research areas: (1) research on the natural resources of Latvia, their rational use, environmental and ecological problems, nature protection, and (2) research on plant and animal life processes and biological productivity. The Institute for Food Safety, Animal Health and Environment (BIOR) has a long history of working with commercially important fish stocks.
The Faculty of Physics and Mathematics of the University of Latvia has extensive experience in modelling climatic factors and climate scenarios, as well as in modelling marine physical factors (water mass movements).
The Institute of Electronics and Computer Science is the leading provider of electronics research in Latvia. Within the framework of the NRP EVIDEnT, the task of the Institute is to develop prototypes for current and wave measuring in-situ instruments.
148 NRP “EVIDEnT”, available at http://vpp-evident.lv/index.php/lv/ 149 NRP “LATENERGI” , available at http://latenergi.rtu.lv/index.html 150 LHEI, available at http://www.lhei.lv/lv/par-mums

182
The Latvian State Forest Research Institute “Silava” is the Latvian forest research center. The aim of “Silava” is to acquire new knowledge and develop innovative technologies using scientific methods in order to promote the sustainable development and competitiveness of the forestry sector. The Institute is responsible for the national monitoring of forests151. The Institute conducts forestry research in the context of climate change and performs GHG emission and CO2 capture assessments in the LULUCF sector.
The Institute of Physical Energetics (FEI) conducts active and diversified research activities in the field of energy and related engineering sciences that promotes the development and implementation of innovative technologies and solutions in the Latvian energy sector in order to provide faster progress towards the establishment of a sustainable energy supply system. The Institute’s research directions cover the entire energy supply system – energy and environment technological and economic research, energy system infrastructure research and development planning, with particular attention to smart grids and demand management, research into and development of new materials and technologies for energy sector, research into technologies for rational and efficient use of energy resources. Climate change mitigation is directly related to the Institute’s research, such as energy – environment/climate policy analysis, modelling energy-environment system interaction, analysis of the impact of economic development scenarios on environmental and climate indicators, impact assessment on the implementation of renewable energy and energy efficiency policies, GHG and air pollutant emissions calculation and forecasting for the energy and transport sectors152.
Significant research is carried out by the institutes of Riga Technical University. The Institute of Energy Systems and Environment deals with in-depth environmental engineering research on the environmental impacts of human technology in general and of the energy sector in particular. The Institute of Energetics plays a leading role in the safety, stability, efficiency and management studies of large power systems in Latvia and the Baltic States. The staff of the Institute of Industrial Electronics and Electrical Engineering has many years of academic experience in the field of electrical engineering. The Institute of Applied Chemistry is the only scientific institution in Latvia that has an appropriate infrastructure and equipment to study biomass conversion processes using chemical (biodiesel fuel synthesis) and thermochemical (pyrolysis, hydrothermal and solvent thermal liquefaction) methods with the aim of obtaining liquid fuels, as well as carry out the systematic laboratory studies of transport fuel properties.
The University of Latvia Institute of Solid State Physics is the only scientific institution in Latvia, where the Hydrogen Energy Laboratory has been operating since 2007. The laboratory carries out research on materials and technologies in all hydrogen energy sectors – hydrogen production, storage, use for vehicles and stationary generation of electricity. The laboratory brings together scientists and young researchers from various fields. Currently the Institute implements the Excellence Centre of Advanced Material Research and Technology Transfer (CAMART2) supported within the “WIDESPREAD 1-2014: Teaming”, 2nd phase of the H2020 programme.
Latvia University of Agriculture (faculties and institutes) conducts research in blocks of bio sciences, engineering and social sciences153. The following areas can be mentioned as specific research areas in the context of climate change: research on soil and ground as basic agricultural resources, plant and animal productivity studies, forest ecology and forestry studies, forest resource economics and forest management planning, use of sustainable energy in vehicles, production and use of renewable energy, reduction and rational use of production by-products and residues, climate change mitigation and environmental technologies, hydrological and agricultural runoff research, sustainable construction, economics of sustainable development of the bioresources industries, and others. Within the framework of the NRP EVIDenT, the university researchers work on the assessment of the emission reduction
151 LSFRI “Silava”, available at http://www.silava.lv/sakums.aspx 152 FEI, available at http://fei-web.lv/lv/ 153 LUA, available at http://www.llu.lv/lv/petijumu-virzieni

183
potential and costs and benefits in the agricultural sector as one of the most important sectors developing GHG and air polluting emissions in Latvia.
The association “Baltic Environmental Forum Latvia” implements projects in various areas of environmental protection: nature protection, waste management, water resources protection, energy efficiency and climate change, control of chemical substances, reduction of industrial pollution, etc. The association actively participates in international research projects, including H2020 projects.
8.2 Research on climate processes, climate change impacts and adaptation
8.2.1 Research on Climate Change Impact and Adaptation
In Latvia, the Environmental Monitoring Programme for 2015-2020, the Latvian National Fisheries Data Collection Programme for 2017-2019, as well as risk and vulnerability assessments are carried out and appropriate adaptation measures were identified in six sectors154,155,156, 157, 158, 159.
The systematic observation and analysis of observed patterns of climate change elaborated by LEGMC is described in the sections 8.3 and 6.1 of Latvia’s Seventh National Communication.
The updated information on the research for the adaptation is provided in the Chapter 2.3 “Programmes and research conducted in the Republic of Latvia for the identification and implementation of adaptation measures” of the policy document “Latvia’s national climate change adaptation strategy until 2030” (draft) and is laid down as the basis for the information provided below in this section 8.2.
LEGMC has prepared a study on the historical manifestations and the expected future projections and scenarios160 of climate change in Latvia, LEGMC has developed a so called “Climate tool”161, which allows to model possible climate change scenarios in Latvia up to 2100. Similarly, climate change adaptation research is carried out also under the framework of the previously described NRP “The value and dynamic of Latvia’s ecosystems under changing climate” (EVIDEnT), one of the goals of which is to study the environment and natural resources (marine, inland waters, land, marshes and forests) in order to achieve their rational and sustainable use and increase the competitiveness of products based on indigenous natural resources on the global market, as well as research on biodiversity and ecosystem changes and the development of forecasts.
The first climate change risk assessment in sectors and recommendations on the need for adaptation in sectors affected by the climate change “Analysis and preparation of proposals for the development of an information report on adaptation to climate change under the framework of the elaboration of Implementation Report of the Environmental Policy Guidelines for 2009-2015” was completed within the framework of the BaltClim project at the end of 2012162
.
An important contribution to the further analysis of the risks and vulnerabilities of climate change, identification of appropriate adaptation measures, long-term analysis of their benefits and costs was provided by research conducted under the framework of the EEA Financial Mechanism 2009-2014 programme “National Climate Policy” in the project “Development of proposals for the National Climate Change Adaptation Strategy by identifying scientific data and measures for adaptation to climate
154 “Risk and vulnerability assessment and identification of adaptation measures in the field of civil protection and emergency assistance” (2017) 155 “Risk and vulnerability assessment and identification of adaptation measures in the field of construction and infrastructure” (2017), 156 “Risk and vulnerability assessment and identification of adaptation measures in the field of agriculture and forestry” (2016), 157 “Risk and vulnerability assessment and identification of adaptation measures in the field of biodiversity and ecosystem services” (2016), 158 “Risk and vulnerability assessment and identification of adaptation measures in the field of landscape planning and tourism” (2016), 159 “Risk and vulnerability assessment and identification of adaptation measures in the field health and welfare” (2016), 160 LEGMC Climate change scenerios for Latvia, available at http://petijumi.mk.gov.lv/sites/default/files/title_file/VARAM_peti_Kopsavilkums_Klimata_parmain_scenar_par_ietek_un_pielag_scenarij_izstrad_2010_2100_gadam_zinat_datu_noteiks_pielag_monit.pdf 161 Climate tool available at http://www2.meteo.lv/klimatariks/ 162 Bruņeniece I. 2012. Analysis and proposals for the report on adaptation to climate change within the implementation of the Environmental Policy Guidelines 2009-2015 (Analīze un priekšlikumu sagatavošana informatīvā ziņojuma par piemērošanos klimata pārmaiņām izstrādei Vides politikas pamatnostādņu 2009.-2015.gadam īstenošanas ziņojuma ietvaros), in Latvian, available at http://www.varam.gov.lv/lat/darbibas_veidi/Klimata_parmainas/

184
change, as well as impact and cost assessment”, including six major studies in the field of landscape planning and tourism, biodiversity and ecosystem services, health and welfare, agriculture and forestry, construction and infrastructure, and civil protection and emergency planning. They analyze the impacts, risks and vulnerabilities of climate change, appropriate adaptation measures, analysis of their benefits and costs, monitoring systems and indicators.
The Baltic Sea Region Adaptation Strategy and Action Plan163 (2013) analyzed the scenarios of how climate change affects the society and the potentials for the active action. The programme also covered the issue of ever more severe rainfalls, important for the urban environment and the issue of urban planning, as well as practical solutions and recommendations for action, and sets out a set of indicators to measure the effectiveness of implemented adaptation measures. Particular emphasis was placed on the use of modern visual materials that make knowledge on the future climate more understandable. Among the strategy developers there were researchers from the European Environmental Agency, the Swedish Meteorological and Hydrological Institute, the Coast Research Institute, and University of Latvia participated from Latvian side. In line with the EU Strategy “EU Adapting to Climate Change”, the Action Plan sets out actions and guidelines for each objective and emphasizes the importance of international co-operation for successful adaptation to climate change. Systematic work and the implementation of planned funded measures that use monitoring and data modelling are important; the exchange of experience, transfer of working methods and the involvement of partners is necessary. Regular reviews (for example, once every five years) of information and definition of new tasks, as well as parliamentary oversight, are assessed positively.
Remote sensing and derived products are becoming increasingly important in analyzing climate change and in monitoring of extreme hydro-meteorological phenomena. One of the most important sources of monitoring data on climate change is the European Organization for the Exploitation of Meteorological Satellites (Latvia and LEGMC is a member of EUMETSAT), which provides high-resolution (time and space) data to various sectors of the economy. Data provided by EUMETSAT help to assess climate change, impacts from hydrometeorological phenomena, develop adaptation measure plans, and assess their effectiveness. EUMETSAT data is one of the primary sources of data for all COPERNICUS programmes implemented by the European Commission, the results of which are freely available to the public. The LEGMC has also developed digital climatic atlases based on the use of the EUMETSAT satellite observation data for climate data monitoring data sets. For example, the data set used in the Solar Radiation Atlas covers the period 1982-2009, and for the first time provides very high quality (horizontal resolution – 5 km) information164. In turn, from the Climate atlas, one can learn about the amount of clouds and their characteristics, daylight intensity and the Earth’s surface albedo during the period 1982-2009165.
The European Medium-Term Weather Forecast (ECMWF) focuses on a comprehensive study of the climate system, including the atmosphere, land, oceans, sea ice and the carbon cycle, providing data sets for the entire 20th century. Latvia’s membership in the ECMWF provides a unique opportunity for observing data sets to be used in climate studies to help assess meteorological conditions above terrestrial and aquatorium also in areas where there is insufficient ground observation or lack of observation. ECMWF data have been used in the study for updating Latvia Cabinet of Ministers Regulations No.338 (30.06.2015) “Latvian Construction Standard LBN 003-15 “Building Climatology”, recalculating snow loads for the entire territory of Latvia. Besides, the use of ECMWF climatic reanalyses in weather forecasting in Latvia allows assessing the probability and impact of dangerous weather phenomena at the regional level, thus ensuring the possibility to implement adaptation measures to reduce the impact of extreme weather conditions. Examples of the successful use of ECMWF data in Latvia include studies on prediction of extreme weather phenomena.
163The Baltic Sea Region Adaptation Strategy and Action Plan, available at http://www.baltadapt.eu/ 164 Solar Radiation Atlas, available at http://www2.meteo.lv/radiacija/curl_rad.php 165 Climate atlas, available at http://www2.meteo.lv/climate_atlas/curl.php

185
The University of Latvia’s Laboratory for Mathematical Modelling of Environmental and Technological Processes has developed the Climate Products and Parameters webpage 166 , as well as the Meteopage167 . The Climate Products Portal allows to evaluate the fluctuation of the parameter in modern climates and to determine the trends for the near and further future changes. The portal includes information on the air temperature, precipitation, relative humidity, wind speed, cloudiness, solar radiation, as well as parameters important for the national economy, such as wind energy calculations and forecasts, growth degree days and climatic date of plant maturity, as well as important human health issue like a migraine prognosis, which is also influenced by the weather.
In the context of the research already carried out in the field of adaptation, the National Research Programme (NRP) on Climate Change Impact on the Water Environment of Latvia “KALME”168, carried out in 2006-2009, is also important in order to find out how climate change will affect Latvian lakes, rivers and the Baltic Sea and the Gulf of Rīga coastal areas, and to develop scientifically based recommendations for adaptation and mitigation. An important contribution to identifying the impacts of climate change is the “Processes on the Latvian Coast of the Baltic Sea” elaborated and published within the framework of the National Research Programme. Actual research is provided within the 2014-2017 NRP “EVIDEnT”.
2.3.2. Research on Climate Change Mitigation
The general overview of the climate/energy research in the Latvia’s research system is presented above, section 8.1.4 of the given Latvia’s Seventh National Communication report.
This section 8.2.2 characterizes in more details the research particularly related to climate change mitigation policies and measures, especially modelling and assessing of their impacts.
Since 2006 Latvia NRPs on energy and environment include as one of key tasks the development of up-to-date methods, approaches and tools, assessment of GHG emissions developments and related impacts in national economics as well as sectorial development scenarios, analysis of emissions’ mitigation policies and measures. Within the current (2014-2017) NRP “EVIDEnT” the modelling tool and integrated development scenarios are elaborated for the national economics and its sectors in assessing GHG emissions; energy-climate policies impact detailed assessment is studied within the current (2014-2017) NRP “LATENERGI”.
Important tool for GHG emissions reduction policies and measures is the modelling. Since the Latvia’s Sixth National Communication report significant efforts have been paid to further develop and apply advanced research approaches, methods and models that by means of analysing and forecasting the correlations between the parameters, characterising the development of different economic sectors, and related emissions, contributes to the national climate change mitigation policy that is compatible with the EU 2030 framework for climate and energy policies and promotes sustainable development of Latvian economy. The Institute of Physical Energetics (IPE) more than 10 years maintains and develops the national MARKAL-Latvia model, based on general MARKAL model. By its nature, this model is a system analysis model which allows an integrated evaluation of energy demand and consumption development and demand-consumption interaction in situations, when both – demand and consumption – are supplemented with the new factors (new available resources, new technologies, new environment & climate objectives to be achieved, etc.). In order to connect energy sector with agricultural and waste the MARKAL-LV model has been augmented by biofuel and biogas modules. National implementation of EU energy-climate framework strategy are examined. The assessment of general impact of GHG emissions reduction policies and measures, both planned and implemented, in Latvia, identification and evaluation of the critical points for Latvia’s situation, interpreting the sectorial targets set by the GHG emissions mitigation policies are carried out within elaborated relevant (defined on the basis of
166 Climate Products and Parameters, available at www.modlab.lv/klimats 167 Meteopage, available at www.modlab.lv/meteo/ 168 The National Research Programme (NRP) on Climate Change Impact on the Water Environment of Latvia (KALME), available at http://kalme.daba.lv/
186
reasoned macroeconomic development) scenarios of national economics and sectorial development. This specified modeling tool is used also for analyzing the energy sector complex development scenarios and influencing factors in general and its’ individual components and links between them, in particular. IPE maintains and regularly updates the nationally adapted COPERT 5 model for the transport sector as well. The clear link between NRP and applied research projects, financed by MEPRD, is established. Since the Latvia’s Sixth National Communication report, the IPE has carried out the range of applied research projects concerning GHG emission projection calculation and emissions reduction policies and measures impact assessment by applying modelling tool MARKAL-Latvia, the most important are:
“GHG emission projections 2020 – 2030 in Latvia and emission reduction policy cost assessment” (2015)
“Identification of emissions reduction–effective measures for GHG emissions mitigation and evaluation of their cost” (2014, the perspective impacts of the wide range of GHG emissions reduction measures in energy sector have been evaluated and abatement cost curve established),
“The establishment of the set of GHG emissions reduction measures and elaboration of optimal emissions reduction strategy for Latvia non-ETS sector” (2016, emissions calculation for 2020,2030 and 2050 for reference and alternative scenarios, modelling and analysis of emissions reduction strategies, analysis of the impact of GHG emissions reduction policies and measures on the macroeconomic indicators)
Riga Technical University, Institute of Energy Systems and Environment, since 2010-ties has developing system dynamic analysis models for energy-climate studies and successfully apply them for socio-economic, including bioeconomics, studies and policy evaluations. Within the overall research framework it is investigated the sustainability of climate and energy policy and prepared methodology on the mitigation of climate change and the adaptation to climate change in the context of Latvian energy sector’s development, evaluated the role of innovative technological solutions in the energy sector on the mitigation of climate change, the development of sustainable economy and the achievements of environmental protection objectives in Latvia. As a result, it is identified technologically innovative and cost-effective solutions and methods, which can be used to reduce costs and impact on the environment, and to raise competitiveness. The developed solutions and methods will be approbated in enterprises, thus promoting the transfer of knowledge and technologies to the national economics and heading towards the long-term targets for the development of Latvia.
Latvia University of Agriculture is the leading research institution in the GHG mitigation in agriculture sector, Since the Latvia’s Sixth National Communication report efforts have been paid to investigate the agricultural sector more in-depth, in the farm level. Cluster analysis based typology of farms has been used to pick up model farms for survey. The results of study are used to estimate effect of GHG reduction measures under different scenario conditions and taking into account the contribution of identified at farm level main GHG emission sources, e.g., pressing need is to reduce N2O emissions from soils in connection with the use of mineral fertilizers.
Latvian State Forest Research Institute “Silava” is the leading research institution in the LULUCF sector. Within the research programmes since the Latvia’s Sixth National Communication report the further investigation of forestry sector has been commenced. Several potential blocks were assessed, like accumulation and release potential of CO2 in/from fallen timber. Furthermore, it was identified that the recovery of forest melioration system is one of the main issues in relation to GHG emissions and CO2 deposition.
8.2.3 Research in Support of the National Greenhouse Gas Inventory
Within the framework of the “National Climate Policy” programme of the EEA Financial Mechanism in 2014-2017, significant activities have been carried out to improve the system of inventory of GHG emissions. The implemented activities contributed to the improvement of the GHG inventory system and

187
its synergy with air emission data, development of a unified forecasting and modelling system, and expert capacity building: an integrated database for the on-line calculation and summarizing of climate change causing gases and air pollutant emissions and CO2 capture with included forecasting data tools for preparation of international reports has been developed.
Research has been carried out on improving the inventory of greenhouse gases, covering the following topics:
“Promoting Sustainable Land Resources Management by Creating a Digital Soil Database”. Within the framework of the research, historical, manual soil maps available in Latvia were digitized and transformed in to modern format. The area covered by digitized soils maps is 38 787 km2 or 60% of the territory of Latvia.
Digitized soil maps will be used: (1) to improve the accuracy of preparation of the Latvian GHG inventory reports and to ensure sustainable land resource management and planning; (2) inventory of natural resources; (3) environmental management; (4) assessment of land degradation risks; (5) real estate market and cadastral value calculation; (6) assessment of ecosystem services; (7) various environmental and resource reports, etc.
“Improving the methodology of estimating GHG emissions in the agricultural sector and obtaining the necessary data with the development of modelling tools”. The research clarified the calculation of agricultural GHG emissions and improved GHG forecasting in the agricultural sector. The percentage of manure management systems in Latvia for different livestock groups was specified and a methodology for further calculation of distribution of manure management systems was developed.
“Assessment of Soil Carbon Stock in Arable Land and Meadows”. As a result of the study, measurements, calculations and analysis of soil carbon stock in the 0-80 cm deep layer of topsoil in arable lands and perennial grasslands (where land use has not been changed since 1990) have been made. The results of the research can be used to prepare a National Greenhouse Gas Inventory Report.
“Improvement of the quality control and quality assessment system in the field of land use, land use change and forestry”. Within the framework of the research, a quality control and quality assessment system for the mentioned sector was developed and the system description for inclusion in the current GHG inventory report was prepared.
“Research on Improvement of F-gas Reporting in the Latvian Greenhouse Gas Inventory”. Within the framework of the research, information was collected on natural and legal persons, who in 2010-2014 conducted operations with refrigerants and refrigerating appliances, using substances depleting the ozone layer or F-gases as refrigerants, a single operator database was created, which summarizes the contacts of operators and the sectors where F-gases are used in Latvia. In total, 444 businesses have been registered in the F-gas database (they may represent several types of operation), using F-gas refrigeration equipment and air conditioners.
“Recalculation of greenhouse gas emissions from deforestation, including estimation of logging costs from deforestation”. The research resulted in more precise operational data for the characterization of GHG emissions from deforestation and recalculated GHG emissions for deforested areas.
“Development of guidelines for assessing the impact of climate change mitigation policies and measures and sector-by-sector cost-benefit analysis”. Within the framework of the research, ex-ante and ex-post assessment guidelines for climate change mitigation policies and measures have been developed.

188
“Distribution of primary energy statistics of Latvia to activities included and not included in the European Union Emissions Trading System and integration of data in the environment-energy model MARKAL-Latvia.”
The assessment of the composition of municipal, hazardous and industrial waste in waste management regions, the management of certain types of waste and the possibility of reducing the amount of waste to be disposed in landfills assessed the amount and composition of the total composted waste; a forecast for the amount of waste to be composted in the period 2015-2022 has been developed. In order to clarify methane emissions calculations from waste disposal using all available sources of information, information on 420 landfills in Latvia was collected, of which 298 were covered and recultivated.
8.3 Systematic Observations
Since 2009 LEGMC is responsible for systematic observation in Latvia according to Cabinet of Ministers Order No. 448 from 1 July 2009 “On the State agency “Latvian Environment, Geology and Meteorology Agency” and the State Hazardous Waste Management Agency liquidation and the limited liability company” Latvian Environment, Geology and Meteorology Agency” foundation”.
In the climate change field LEGMC collects, stores and analyses long-term observation results. It prepares reports, providing information to the public and to the state and local governments and international organizations, as well as maintains a greenhouse gas emission trading registry.
Main activities of LEGMC:
Development of environmental monitoring system in line with national and European policy needs, international recommendations and guidelines;
Assessment of environmental quality and natural resources;
Report on environment quality, meteorological, hydrological phenomena, warnings of dangerous and natural disasters, weather and hydrological forecasting;
Environment laboratory testing;
Management of environmental data, maintenance of databases on water resources and inland water quality, air emissions, air quality, chemicals, waste management and polluted areas;
Maintenance of GHG emissions trading national scheme;
Supervision of subsoil resources and insurance of rational subsoil use;
The Centre represents the Republic of Latvia within the World Meteorological Organization (WMO), performs executive functions in Latvia implementing international conventions related to meteorology, hydrology and environment. LEGMC is a member of EUMETNET and EurogeoSuvey as well as represents Latvia at EUMETSAT, ECMWF, European Chemicals Agency (ECHA) and acts as the National Focal Point of the European Environment Agency (EEA) within the European environment information and observation network (EIONET).
Environmental monitoring guidelines and program. Environmental monitoring is a tool for environmental policy planning and assessing the effectiveness of the environmental protection measures. It includes the Early Warning System for dangerous change in quality of the environment, which is the basis for emergency actions for the recovery or mitigation. Environmental monitoring program sets parameters, frequency and methods for Latvia’s environmental monitoring network organized by environmental authorities.

189
The Environmental Monitoring Program 2015-2020 was developed on the basis of ”Environmental Policy Guidelines 2014-2020’’, approved by the Cabinet of Ministers Order No.130 of March 26, 2014 “On Environmental Policy Guidance for 2014-2020”.
The main task of Environmental monitoring program is to create a structure for monitoring information system, which ensures:
Requirements of legislative acts of Republic of Latvia;
Requirements of EU directives;
Requirements of International conventions Latvia are involved.
Environmental monitoring program consists of Air monitoring program, Water monitoring program, Earth monitoring program and Biodiversity monitoring program.
Each of the programs is divided into sections according the structure required by Environmental Monitoring program guidelines 2014-2020.
Atmospheric and climate observation systems
LEGMC carry out meteorological observations in 35 observation stations, spread over the entire territory of Latvia. The location of meteorological stations in the territory is optimal to accurately describe the weather conditions and climate variables in Latvia. In 23 weather stations automatic meteorological sensors are used allowing continuous observations of the main meteorological parameters over 24 hours. The observation results of these stations have been entered into the Integrated Meteorological System and MetMan system, which processes the measurements, prepares reports and transmits to a database via the Telecommunication Centre. Observations of the meteorological elements most variable in space – precipitation, snow cover and atmospheric phenomena, are carried out at 26 observation stations. Observation data series from meteorological stations are available for more than 50 years. 50% of all observation series cover at least 80 years but several stations have been operating for more than 100 years. The weather station Rīga-University operates on an on-going basis since 1795.
With the financial support of European Cohesion fund (CF) during 2013-2016 was modernized 10 meteorological stations in Latvia. Within this project was installed new MAWS301 automatic weather stations and new sensor for a visibility, atmospheric phenomena, cloud height, precipitation, sun duration, global radiation and snow depth measurements.
LEGMC operates one upper air station, which makes sounding every second day. The observations of the upper air in the territory of Latvia have been taking place for 72 years.
Doppler’s meteorological radar METEOR 500C was installed in 2005, providing precise and regularly updated information on physical characteristics and processes in the atmosphere including also the higher atmospheric layers. The meteorological radar observation data are stored in the digital database and can be extensively used for climate system research in the future.
Since 2006 Latvia is a member of EUMETSAT, which promotes the use of satellite technologies for atmospheric monitoring above the territory of Latvia. Latvia receives and processes the data from geostationary satellite MGS and polar orbit satellite NOAA.
The long-term metrological observation data from weather stations are widely used for climate change research in Latvia, Baltic countries, Europe and the world. Data from the Latvian meteorological stations are reported through the WMO international data exchange and are sent to the World Data Centre according to standard procedures:
meteorological observation data from Liepāja weather station – to the World Data Centre for Meteorology, Asheville, USA as part of GCOS program „Implementation of the Global Climate Observation System Surface Network”,

190
data of global solar radiation from 3 stations – to the World Radiation Data Centre, St. Petersburg, Russian Federation,
on a regular basis Latvia sends reports „Latvia’s report of activities under the implementation plan for the evolution of the surface and space-based sub-systems of the GOS” to WMO EGOS-IP (Implementation Plan for the Evolution of Global Observing Systems).
Each month meteorological data from all meteorological stations are sent to Global Precipitation Climatology Project (GPCP) and European Centre for Medium-Range Weather Forecasts ( ECMWF).
Each month global radiation data from 5 stations are sent to Copernicus organization.
Real time data are exchanged internationally within the framework of GTS – Global Telecommunication System:
meteorological observation data from 7 weather stations and upper air observations from Skrīveri station – to Regional Basic Synoptic Network (RBSN),
data from 4 weather stations – to Regional Basic Climatic Network (RBCN),
meteorological radar real time data – within the international projects NORDRAD, OPERA and BALTRAD.
Latvia sends the information from 18 weather stations to the Climatology Centre Deutscher Wetterdienst, Offenback, Germany under the WMO World Climate Research Program (WCRP) Global Energy and Water Cycle Experiment (GEWEX) Global Precipitation Climatology Project (GPCP).
Latvia has also contributed to the World Weather Records (WWR) data series (2014-2016) by sending the data from 7 weather stations to this database, which has been widely employed in operational climate monitoring, international climate assessments, and numerous other applications.
Latvia sends the annual information for the WMO issue ”Annual Statement on the Status of the Global Climate” as well as information about annual extreme weather conditions to the Annual Bulletin on the Climate in RA VI (RA VI Bulletin).
Annually LEGMC set up and made freely available report based on long-term data from 4 meteorological stations and from 4 hydrological stations within the national monitoring programme on climate change.
LEGMC provides environmental quality observations in Latvia, including atmospheric air quality monitoring, which are managed in 4 cities - Rīga, Ventspils, Liepāja, Rēzekne (in 7 observation stations) as well as in rural stations Rucava and Zosēni. 30 air and precipitation pollutant parameter analyses are carried out at observation stations.
Air quality monitoring data and information are presented according to prescribed format and forwarded to the European Commission, the European Environment Agency and uploaded in EIONET databases store.
Latvia provides assessment of the impact of air quality on ecosystems and monitoring of the impacts of trans-boundary air pollution on ecosystems within the scope of several international programme:
EMEP (Cooperative Programme for the Monitoring and Evaluation of Long Range Air Pollutants in Europe) – in monitoring stations Rucava and Zosēni;
Regional GAW (Global Atmosphere Watch) - atmospheric air quality monitoring in Rucava and Zosēni and precipitation quality in 4 monitoring stations (Alūksne, Dobele, Rīga and Skrīveri);
ICP Waters (International Cooperative Programme on Assessment and Monitoring Effects of Air Pollution on Rivers and Lakes) in 5 monitoring stations;

191
ICP Vegetation (ICP Vegetation - The International Cooperative Programme on Effects of Air Pollution on Natural Vegetation and Crops) – heavy metal content in mosses are observed in 101 monitoring points.
Monitoring data and information are regularly sent to the WMO, to The World Data Centre for Greenhouse Gases, to the World Data Centre for Aerosols, to the World Data Centre for Precipitation Chemistry, to the Chemical Co-ordinating Centre of EMEP, to the European Environment Agency, to the Institutional Programme Centre for ICP Waters.
Oceanographic observations
Baltic Sea observations are performed by the LEGMC. LEGMC provides regular measurements and data on sea water level, water temperature, water salinity, sea ice conditions and waves from 9 coastal observation stations. 4 coastal observation stations have been collecting observation data series for more than 100 years; observations at other stations cover period of nearly 80 years. Coastal observation monitoring data and information are regularly sent to the international institutions through GTS (Global Telecommunication System) and Regional Basic Synoptic Network (RBSN).
Two coastal observation stations regularly provide data and information exchange within Baltic Operational Oceanographic System (BOOS).
Terrestrial observations
Land Cover monitoring. In accordance with CORINE Land Cover program Latvian Geospatial Information Agency (LGIA) is the responsible institution for land cover monitoring in Latvia. In 2012 LGIA has done the preparatory work for implementation of the land cover monitoring for year 2013.
Modern monitoring of geological processes. In 2009 modern monitoring of geological processes was carried out in 100 monitoring places with the funding of the Latvian Environmental Protection Fund Administration. Risk areas on the shores were identified, coastal erosion places were observed and the extent of erosion risk was evaluated making use of the monitoring data. Modern monitoring of geological processes has not been carried out since 2010 due to reduced public funding.
Monitoring the coastal dynamics in the hydroelectric power station affected territory of river Daugava. The coastal dynamics monitoring in the hydroelectric power station affected territories of river Daugava has started in 1999. Since 2014 coastal dynamic monitoring in the hydroelectric power station affected territories has been responsibility of LEGMC. In annual monitoring affected coastal areas by Rīga, Ķegums and Pļaviņas hydroelectric power stations are included.
Seismic monitoring. The main objective of seismic monitoring is to control seismic processes. The monitoring covers possible regional earthquakes and explosions localization and evaluation of their parameters, control of regional seismic regime and collection of statistical information about seismic events. Information on seismic monitoring can be used to identify seismically active regions, to evaluate their parameters and also to evaluate seismic risk at these regions. In 2006 in Dundaga district at Slītere lighthouse territory broadband seismic station was set up (Slītere seismic observation point). This Slītere station is included in international seismic GEOFON network with its centre at GFZ Potsdam, Germany. Seismic monitoring in Latvia is carried out at two seismic stations – Skuja (SKJA) that is located in Burtnieku district Rencēnu area (NE part of Latvia) and Slītere (SLIT) that is located in Dundaga district, Slītere (W part of Latvia). If requested, seismic information (bulletin) is sent to European-Mediterranean Seismological Centre (EMSC) and also to regional partners (Geological Survey of Estonia and Lithuanian Geological Survey). There is a periodical information exchange with regional partners to specify hypocenter localization.
Hydrogeological monitoring. Hydrogeological observations in the territory of Latvia are ensured by State groundwater observation network which provides groundwater level measurements in 305 wells of 60 observation stations and water quality observation in 206 wells of 51 stations and 30 springs. Network covers whole territory of Latvia and provides observations of all active water exchange zone

192
horizons, focusing on the horizons which are mainly used for water supply. The largest density of network is in Rīga, Jūrmala and Liepāja cities where the largest rate of groundwater extraction is observed and most potential sources of groundwater contamination are identified. 198 wells of 40 observation stations are equipped with automatic level loggers which take measurements every day. In other observation wells the level measurements are taken manually and number of measurements differs from once a month to four times a year depending on aim of the observation station. The annual report about groundwater condition is reported to European Environment Agency and included in the EIONET database.
Surface water observations. LEGMC provides surface hydrological observations. Hydrological observations are carried out in 70 stationary observation stations located near rivers, lakes and reservoirs of Latvia. Water level, flow, water temperature, ice phenomena, ice and snow thickness are monitored. In 2013, 2 new observation stations were opened, as well 5 historical observation stations were restored, stationary acoustic doppler current profile (ADCP) were installed at three observation stations. From 2013, observation stations are started to equip with web cameras for remote observation of ice phenomena in rivers. Modern technical equipment, automatic observation sensors and mobile communication devices provide the possibility to receive water level and temperature data in real time regime and perform operative information follow-up and correction of possible inaccuracies. Two of the terrestrial hydrological observation stations currently operating have been operating for more than 100 years. More than a half of the stations have covered observations of data series for more than 80 years. 4 terrestrial hydrological stations daily runoff data is sent to Global Runoff Data Center, Germany.
Surface water quality observation are caried out in 4 River Basin Districts, 225 river and 263 lake stations in the actual LEGMC state network. Water samples are taken manually with lowest intensity according to monitoring programme 1 year in a 6-year observation cycle; 4 water samples in a year. Under the HELCOM and ICP-Waters international programme, drinking water, cross-border pollution monitoring are performed every year in a 6-year cycle; 12 water samples in a year. Automatic hydrochemical observation station Piedrūja operated on Latvian – Belorussian border since 2014. Multisencor are registred dissolved oxygen, pH, chlorides, nitrate and ammonium nitrogen.
The annual data report about surface water condition is reported to European Environment Agency and included in the EIONET database.
Large part of the long-term meteorological and hydrological data is digitized and together with current systematic observation data are stored in the data base CLIDATA. This database contains data of more than 500 meteorological and hydrological parameters from the beginning of the 19th century. The quality of operative observation data and the homogeneity of historical measurement data series is controlled and analyzed on a regular basis. In 2012 the database CLIDATA has been updated with the new version containing „Clidata Java”, which allows completing, analysing, and quality control of large data array as well as distributing the information via Internet.
All observation data are kept in LEGMC archives – part in digital, part in a paper form. The latest systematic observation data are stored in observation databases. The quality of the operative observation data and the quality and homogeneity of historical measurement data series is controlled and analyzed on a regular basis. Observation data are available without restrictions to all parties of concern. Online information on meteorological, hydrological air pollution as well as monthly analysis are available on the LEGMC’s web page. All historical observation data are available from LEGMC data archives, including digitazed data - on the LEGMC’s web page.
Hydro meteorological information and data are regularly exchanged among appropriate services in the neighboring countries - Lithuania, Estonia, Belarus and Russia, and for cooperation within the framework in international projects and programs (with WMO, ECMWF, ECOMET, EUMETSAT) is taking place.

193
Databases
Until July 2016 LEGMC maintained 16 databases and registers of which 10 were publicly available. In the data bases data and information on meteorology, terrestrial and marine hydrology, environmental quality, emissions, natural resources, chemicals is entered, controlled and revised (see Table 8.2), including summary tables and thematic maps on human-induced environmental load.
Table 8.2 LEGMC databases
Data bases Information stored
On state of environment and natural resources
Mineral Deposit Register
Register of polluted and potentially polluted sites
Database of environmental damage
On environmental load
Europe Union greenhouse gas Emission trading registry
system
Annual Governmental statistical report “2-Air”
Annual Governmental statistical report “3 – Waste”
Annual Governmental statistical report “2 – Water”
EUROPEAN POLLUTANT RELEASE AND TRANSFER
REGISTER (E-PRTR)
Hazardous waste transport registration system
Register of chemical substances and products
Observation data
Air and water quality information processing system
(AGŪNS)
Laboratory Test Result Processing System (STARLIM)
Climatological database (CLIDATA)
Hydrometric data processing system (HYMER)
Summarizing and processing the collected information held in databases, various public reports are developed: “National Report on the State of Environment”, “Report on Environmental and Surface Water Quality in Latvia”; “Air quality annual report” as well as reports to the European Commission and international organizations.
8.4 Action taken to support related capacity-building in developing countries
This section includes information on the provision of capacity-building support to developing countries by Latvia.
Besides indicated financial contributions mentioned in section 7 of the Latvia’s Seventh National Communication report through multilateral channels, there were two projects carried out through bilateral/regional channel – “Raising stakeholder awareness on building energy efficiency in Russia, Belarus, Ukraine” in 2013 providing co-funding of 1888.07 EUR and “Development cooperation project for sustainable environmental engineering education promotion between Urgench State University (Uzbekistan) and Riga Technical University” in 2014 providing funding of 26385 EUR. Both projects are related also with capacity-building issues. The co-operation project with Urgench State University included education & training of staff and students in sustainable environmental engineering, particularly including alternative energy resources, waste-free production, energy efficiency and climate change, in order to be able to carry out such training program further by using their own staff/faculty.

194
EDUCATION, TRAINING AND PUBLIC AWARENESS

195
9 EDUCATION, TRAINING AND PUBLIC AWARENESS
9.1 General Policy Toward Education, Training and Public Awareness
The Ministry of Education and Science (MES) is the leading state administration institution in the field of education and science. The Ministry prepares education policy, co-ordinates its implementation and is responsible for educational matters at all education levels.
Education system in Latvia consists of formal education – general education, vocational education, higher education, and non-formal education (outside of formal education, organized interest and demand-oriented educational activities). After the basic school, secondary education has 2 types of programmes: general secondary and vocational secondary education programmes. There are also inclusive education support measures and programmes and minority education. Teachers in all general education establishments are required to have a higher pedagogical education and hold an appropriate qualification. Vocational education after finishing the basic education can be acquired in vocational secondary education programmes and vocational education and training programmes. Several vocational education institutions offer professional qualifications for those who have finished secondary schools.
The legislative framework is determined by the relevant laws: Education Law169, General Education Law170, Vocational Education Law 171, Law On Institutions of Higher Education 172.
On May 22, 2014, the Saeima approved the Education Development Guidelines for 2014-2020173. The guidelines set the overarching goal of education development policy – qualitative and inclusive education for the development of a personality, human well-being and sustainable development of the state. The sub-goals of the guidelines are set in line with the problems identified in the analysis of the previous programming period and the future challenges: 1. The educational environment: improve the quality of the educational environment by improving the content and developing the appropriate infrastructure; 2. Individual skills: promote the development of the individual’s professional and social skills based on value for the life and competitiveness in the work environment. 3. Effective governance: improve the efficiency of resource management by developing institutional excellence in educational institutions.
An Implementation Plan for 2015-2017 for Education Development Guidelines 2014-2020 has been developed174.
The national operational programme “Growth and Employment 2014-2020” 175 includes the part 8 “Education, skills and lifelong learning” which envisages financial investments to achieve goals such as the development of STEM (science, technology, engineering and mathematics) study programmes, reduction of fragmentation of higher education study programmes, sharing of programme resources and strengthening of academic staff strategic specialization, the development of the educational environment for general education institutions, the development of the content of general education based on the competence approach and support for the development of individual competences of learners, the development of vocational training institutions, the development of work environment based education, career support for learners in general education and vocational training institutions,
169 Law on education (Izglītības likums) (29.10.1998), with amendments, in Latvian, available at https://likumi.lv/doc.php?id=50759 170 Law on general education (Vispārējās izglītības likums) (10.06.1999) with amendments, in Latvian, available at https://likumi.lv/doc.php?id=20243 171 Law on vocational education (Profesionālās izglītības likums) (10.06.1999) with amendments, in Latvian, available at https://likumi.lv/doc.php?id=20244 172 Law On Institutions of Higher Education (Augstskolu likums) (02.11.1995) with amendments, in Latvian, available at https://likumi.lv/doc.php?id=37967 173 Education Development Guidelines for 2014-2020 (Izglītības attīstības pamatnostādnes 2014.-2020.gadam) (22.05.2014), in Latvian, available at https://likumi.lv/doc.php?id=266406 174 Implementation Plan for 2015-2017 for Education Development Guidelines 2014-2020, accepted with order No.331 of Cabinet of Ministers of Latvia (29.06.2015), available at http://polsis.mk.gov.lv/documents/5246 175 Ministry of Finance. Operational Programme “Growth and Employment 2014-2020”. Latvia, available at http://www.esfondi.lv/upload/Planosana/FMProg_270115_OP_ENG_2.pdf

196
the involvement and development of skills among young people not involved in employment, education or training (NEET), reduction of early school leaving, improvement of the professional competence of the employed persons. Improving governance at all levels of the education system and a system for monitoring education quality irop important priority.
9.2 Primary, Secondary and Higher Education
9.2.1 General education
The general educational system is divided into four levels:
pre-school is the first educational level and is intended for children from age of 2 until the age of 7.
Basic education can be acquired in:
primary schools (grades 1−6),
basic schools (grades 1−9) and
upper secondary schools (grades 10–12).
9.2.1.1 Pre-school education
Pre-school education (PSE) is the first level of the general education. Children under the age of 7 are enrolled in the PSE programme176. Pre-school aged children undergo preparation for school since they begin to attend an educational institution that implements the PSE programme. Preparing a child from the age of five for basic education is compulsory. Schoolchildren are educated in PSE institutions and PSE groups at education institutions (schools, interest schools, etc.), registered in the Register of Education Institutions and licensed for running the PSE programmes. The aim of the PSE is to develop the understanding of human, natural and social diversity and unity and development of humane, free and responsible personality. The PSE programme provides for the preparation of children for school, covering the development of individuality, mental, physical and social development, initiative, curiosity, autonomy and creative activity, health promotion, psychological preparedness for the school, as well as the acquisition of basic language skills in the official language. In 2016/2017 (on 01.09.2016) there were 647 pre-school education institutions (~ 94 thsd enrolment)177 in Latvia.
9.2.1.2 Basic education
Basic Education (BE) programmes are implemented at grades 1-9. The obtaining of BE or the continued obtaining of BE until the age of 18 is compulsory. BE programmes are implemented over a period of 9 years. At the BE level, preparation for secondary education or professional activity, the acquisition of basic knowledge and basic skills necessary for life, and the development of value orientation take place. The obtaining of BE starts in the calendar year in which the learner is 7 years old, in special cases170. 1 year earlier or later. The compulsory content of primary education is determined by the National Education Standard178, and the standard also establishes mandatory state tests for obtaining179 of BE. The compulsory content of BE consists of the following areas of education: (1) language, (2) technology and science basis, (3) human beings and society, (4) art. One of the 8 main tasks of the BE programme is to create an understanding of the main processes of natural, social and sustainable development, moral values and ethical values.
176 Depending on children`s state of health and psychological preparedness the acquisition of PSE program can be extended by one year if needed, taking into account parents wish or medical conclusion of the family doctor or psychologist. 177 Central Statistical Bureau. Data base IZG01 “Education institutions and enrolment (at the beginning of the school year)”, available at http://data.csb.gov.lv/pxweb/en/Sociala/Sociala__ikgad__izgl/?tablelist=true&rxid=cdcb978c-22b0-416a-aacc-aa650d3e2ce0 178 Cabinet of Ministers Regulation No.468 (12.08.2014) Regulations Regarding the State Standard in Basic Education, the Subjects of Study Standards in Basic Education and Model Basic Educational Programmes (Noteikumi par valsts pamatizglītības standartu, pamatizglītības mācību priekšmetu standartiem un pamatizglītības programmu paraugiem)), in Latvian, available at https://likumi.lv//doc.php?id=268342 179 Ministry of Education and Science, available at http://www.izm.gov.lv/lv/izglitiba/vispareja-izglitiba/pamatizglitiba
197
9.2.1.3 General Secondary Education
General secondary education (GSE) can be obtained in secondary schools and gymnasiums; it can also be obtained in evening (shift) and extra-curricular schools. Schools can implement four direction general secondary education programmes for grades 10 to 12: (1) general education (determined by a group of education programmes without special emphasis on any particular subjects); (2) mathematical, natural sciences and technical direction; (3) humanitarian and social direction; (4) professional direction (determined by a group of education programmes with a special emphasis on professional orientation such as art, music, commerce, sports). The content of GSE programmes and the compulsory subjects in each programme curriculum are determined by the State General Secondary Education Standard180. At the end of the GSE programme, the learners receive a certificate for the GSE and a statement of achievements, the assessment of the central examination is certified by the GSE certificate. These GSE certifying documents give the right to continue education in any higher education programme181. In 2016/2017 (on 01.09.2016) there were 790 general education institutions (total primary schools, basic schools and secondary schools, ~ 215 thsd enrolment).
9.2.1.4 Inclusive and Special Education. Minority Education 182
The conception of inclusive education is to ensure the respect of the Education Law169 rights – every person has the right to receive education regardless of his/her property and social status, race, nationality, ethnicity, gender, religion or belief, state of health, occupation or residence. Special education is a special type of general education, it can be acquired both in special and general education institutions. Any education institution is authorized to license special education programmes in accordance with the procedure established by the General Education Law170. If there is an appropriate environment and qualified staff for the provision of quality education for students with special needs, in accordance with the relevant Cabinet of Ministers Regulations No.710183 . From September 1, 2012, a new type of support for persons with disabilities was introduced – assistant service in education institutions to support mobility and self-care. There are special education development centers in Latvia aimed at providing counseling and methodological support to parents, children and educators. As of 01.09.2017, 12 special education development centers (mainly specialized boarding schools) operated in Latvia.
Cabinet of Ministers Regulations No. 468178 from August 12, 2014, sets five models of subject and lesson plans for minority education (ME) programmes, which set different proportions for the acquisition of subjects in Latvian language and minority language. An education institution, when developing ME programmes and choosing one of these models, takes into account the Latvian language skills of the learners and the experience of using the Latvian language.
9.2.2 Vocational Education And Training
Vocational education and training after obtaining of basic education can be acquired in:
1. vocational secondary education programmes – the duration of studies is four years, obtaining vocational secondary education and Vocational Qualification Level 3. Upon completion of a vocational secondary education programme, a young person may start working or continue studies at a higher education institution;
180 Cabinet of Ministers Regulation No.281 (21.05.2013) Regulations Regarding the State General Secondary Education Standard, Subject Standards and Sample Education programme (Noteikumi par valsts vispārējās vidējās izglītības standartu, mācību priekšmetu standartiem un izglītības programmu paraugiem), in Latvian, available at https://likumi.lv/doc.php?id=257229 181 Ministry of Education and Science, available at http://www.izm.gov.lv/lv/izglitiba/vispareja-izglitiba/vispareja-videja-izglitiba 182 Ministry of Education and Science, available at http://www.izm.gov.lv/lv/izglitiba/vispareja-izglitiba/ieklaujosa-izglitiba-un-speciala-izglitiba 183 Cabinet of Ministers Regulation No.710(16.10.2012) Regulations regarding provision of general basic education and general secondary educational institutions according to special needs of students (Noteikumi par vispārējās pamatizglītības un vispārējās vidējās izglītības iestāžu nodrošinājumu atbilstoši izglītojamo speciālajām vajadzībām), in Latvian, available at https://likumi.lv/doc.php?id=252163

198
2. vocational education and training programmes – the duration of studies is three years, obtaining partial vocational secondary education and Vocational Qualification Level 2. After completing a vocational education programme, a young person can start working as well as continue the studies to obtain general secondary education.
Several vocational training establishments offer obtaining professional qualifications for holders of secondary schools completion certificates, studying in accordance with the chosen professional qualification level in vocational training programmes, the duration of which lasts from one to two years.
In 2016/2017 (on 01.09.2016) there were 51 vocational education institutions (~ 29 thsd enrolment).
The normative framework regulating work-based learning has been approved. The MES has approved the Guidelines for the organization and implementation of studies based on the Work Environment.
9.2.3 Higher education
There are three levels of higher education programmes in Latvia – Bachelor, Master and Doctoral study programmes. In addition, there are also First Level Professional Higher Education programmes (college programmes). There are, including colleges, accredited 33 public institutions of higher education and 20 private higher education institutions as well as 2 affiliates, in total 55: 6 state universities, 10 state institutions of higher education, 12 state-established colleges, 5 state university-established colleges, 13 private higher education institutions, 7 private colleges, 2 affiliates of foreign universities. A network of higher education institutions covers the whole country.
Total number of higher education students at the beginning of the academic year 2016/2017 was 82914. By levels of education according to ISCED-2011 classification this number was broken down as follows: college study programmes (Level 5) – 17.6%, Bachelors or Professional study programmes (Level 6) – 58.3%, Masters or Professional study programmes (Level 7) – 21.4% and Doctoral study programmes – 2.75%. Unfortunately, due to negative demographic trends, the number of students is decreasing, and compared to 2010/11, the number of students has decreased by 20%. At the same time, it should be noted that there has been an increase in the number of students studying in Master’s programmes, and the number of students in Doctoral studies has been relatively stable during this period177.
On 29 June 2015, the Cabinet of Ministers approved the Conceptual Report “Implementation of New Model of Higher Education Financing in Latvia”. According to it, the structural reforms in higher education sector are progressively put into practice to ensure development of effective and sustainable higher education system. The new financing model, comprising three components (pillars), provides the compliance of the offers of higher education with the needs of national economics development and demand of labour market, qualitative research-based higher education content and results management in higher education institutions, thus contributing to meeting the overall Latvia development goals. The first component of the new model is the reference (basic) funding aimed to provide predictable and credible financing to secure continuity of higher education institutions’ basic functions. This component is put into the practice through the number of study places financed from the State budget (the number of study places financed from the funds of the State budget is established according the Sections 51&52 of the Law on Institutions of Higher Education). The second component is the performance funding aimed to provide financial incentives for the growth and advancing scientific research results. This funding component is assigned based on the research and study results’ indices achieved by particular higher education institution in the previous planning period and is determined according the Cabinet of Ministers Regulations No.994 (2006) “Procedures for Financing Institutions of Higher Education and Colleges from the Funds of State Budget”, section 17.4. The second component was established in 2015 (5.5 MEUR funding in 2015, 6.5 MEUR – in 2016 and further). The third component is development funding aimed to provide incentives for innovation, research (or study) excellence, specialization and profile development of higher education institutions. Currently the work on putting into practice this third component is on-going.

199
9.3 Environmental Education/Education for Sustainable Development
9.3.1 General Policy
The co-operation between MES and MEPRD is important in implementing of environmental education. Environmental Protection Law184 defines both education for sustainable development (Section 1.5) and environmental education (Section 1.21):
education for sustainable development – education which promotes the possibilities of each individual to obtain knowledge, values and skills necessary for the participation in the taking of decision regarding individual or collective activities at the local and world level in order to improve the quality of life at present without causing threats to the needs of the future generations;
environmental education – education within the framework of which the knowledge and awareness regarding the environment and problems of environmental protection are obtained, the abilities and skills required for the solving of environmental protection problems are cultivated, as well as the responsible attitude and motivation for the taking of justified decisions is developed.
The main environmental policy document – Environmental Policy Strategy 2014-2020 185 - pays significant attention to education, training and awareness issues. Improving the environmental education system at all levels and increasing of public involvement in solving environmental issues at national and local municipality levels has been highlighted as one of the priority horizontal issues. Principle of public information and participation states that the institutions shall promote the public education and information, listen to the public opinion and assess it. As one of the topical issues of adaptation to climate change, the strategy indicates that climate change and adaptation information does not correspond to the specific interests and needs of different groups of society, therefore one of the priority measures is to inform and educate the public on climate change and adaptation, as well as public involvement in policy development and implementation, as a result of which society will be able to contribute to climate change mitigation and adapt to their effects well in time and use them in their favour. Besides, as one of the horizontal issues, the strategy indicates the need to provide high-quality environmental communication.
In accordance with the section 41 of the Environmental Protection Law, in May 2004, by an Order of the Minister of Environment, the Latvian Council of Environmental Science and Education – a coordinating and advisory intersectoral institution – was established. One of the main activities of the Council is the regular Environmental Science Awards and organization of international conference “Environmental Science and Education in Latvia and Europe”, which has gained a great popularity. The last of these conferences was held on March 24, 2017, where presentations by professionals and experts of the sector gave insights into the latest scientific research, highlighted the challenges of education for sustainable development, shared their experience and sought solutions for involving experts from various fields in environmental education and science activities at all levels of education.
9.3.2 Environmental Education/Education for Sustainable Development in General and professional Education National curricula
The Environmental Protection Law (2006), section 42.1, states that the matters in respect of environmental education and education for sustainable development shall be included in the mandatory curriculum of the subject or course standard in accordance with the specific character of each subject by
184 Environmental Protection Law (Vides aizsardzības likums) (02.11.2006) with amendments, in Latvian, available at https://likumi.lv/doc.php?id=147917 185 Environmental Policy Strategy 2014-2020 (accepted with order No.330 of Cabinet of Ministers of Latvia 26.03.2014), available at http://polsis.mk.gov.lv/documents/4711
200
co-ordinating and ensuring succession on different education levels. Thus, environmental studies at school are part of many subjects, i.e. nature science, geography, biology, chemistry and physics.
Special provisions relate to vocation schools. The Cabinet of Ministers Regulations No.21 (2000) “Regulations regarding the State Vocational Secondary Education Standard and the State Industrial Education Standard” 186 states that in all educational programmes the subject “Public and human security” shall be included with the following content: (1) health education, (2) environmental education, (3) education in the field of safety in the working environment, (4) education in the field of national defence.
In 2016, with the support of the EEA Financial mechanism 2009-2014, programme “National climate policy” the project “Klimata valoda” (“The Language of the Climate”) was implemented by the NGO “Latvian 4H club” in partnership with Norwegian Institute for Agricultural and Environmental Research “Bioforsk”, University of Latvia and Latvian Fund for Nature. Project included elaboration of school programmes of interdisciplinary practical work in lessons of geography and science considering climate change as well as inclusion of these materials in the professional education programmes for teachers. The book187 “Climate education at school. Practical advice” was developed. Campaign was organized for school children and included experiments (practical work) as measures of informal education with elaboration and publication of corresponding video materials on the internet, inviting young people to explore the nature processes independently. Reporting system of seasonal phenomena in the existing nature observation system (www.dabasdati.lv) and kick-starting the observations as an example of adaptation of the wildlife was done188.
At a primary and secondary school level, the “Environmental Education Fund” under the programme of “Eco-schools” of the international organisation Foundation for Environmental Education works. The Eco-Schools aim to raise students’ awareness of sustainable development issues through classroom study as well as school and community action. It should be emphasized, that this programme does not compete with other environmental education initiatives, but provides a framework for coordinated and successful long-term work with environmental education issues in schools. In Latvia, Eco-Schools can choose from the following topics: Waste, Energy, Water, Transport, Healthy lifestyle. School neighborhood, Climate change, Forests. On the web-site of Environmental Education Fund189 a number of methodological materials is available. In the 2016/2017 school year 125 schools in Latvia were awarded the international Green Flag; The Latvian Eco-School Certificate in the 2016/2017 school year was awarded to 57 education institutions 190 . Besides, „The Young Environmental Reporters” is environmental education programme, co-ordinated by Environmental Education Fund, for young people aged 12 to 21 with the aim of exploring environmental problems and mastering modern media tools for public information. It should be noted, that the memorandum of co-operation between the MEPRD and the Environmental Education Fund on “Implementation of the International Environmental Education Fund Programmes in Latvia” was signed on January 22, 2016.
An important role is played by the Baltic Sea Project within the framework programme of the Baltic 21E, with the active participation of Latvian schools. It is the first regional project within the UNESCO Associated Schools Project to combine environmental education on a specific environmental issue, the Baltic Sea and intercultural learning. The objectives of the project are to increase students’ awareness of the environmental problems of the Baltic Sea area and to give them an understanding of the scientific, social and cultural aspects of the interdependence between man and nature, to develop the ability of the
186 Cabinet of Ministers Regulation No.211 (27.06.2000) regarding the State Vocational Secondary Education Standard and the State Industrial Education Standard (“Noteikumi par valsts profesionālās vidējās izglītības standartu un valsts arodizglītības standartu”) with amendments, in Latvian, available at https://likumi.lv/doc.php?id=8533 187 Gunta Kalvāne, Andris Ģērmanis, Zaiga Tenisone, Kristīne Auziņa, Karina Šcastnaja, Anita Vaivode, Vita Ozola. “Climate language. Climate education at schools: practical recommendations”, Riga, organization “Latvijas mazpulki”, printed in SIA Masterprint, 2016, 100 lpp,, available at http://ldf.lv/sites/default/files/faili/Publikacijas/Gramatas/gramata_klimatavaloda.pdf 188 Annual Programme Report EEA Financial Mechanism 2009-2014 Programme LV02 “National Climate Policy” Reporting year – 2016, available at http://www.varam.gov.lv/lat/fondi/grants/EEZ_2009_2014/nacionala_klimata_politika/?doc=18186 189 Eco-School program, available at http://www.videsfonds.lv/lv/ekoskolas 190 List of awarded education institutions available at http://www.videsfonds.lv/documents/apbalvot-s-izgl-t-bas-iest-des-2016.pdf

201
students to study changes in the environment, and to encourage students to participate in developing a sustainable future. Significantly, the First Baltic School Conference on Education for Sustainable Development took place in Latvia, in February 2013.
With the regard to Global/Development education, the Center for Educational Development offers continuing education programmes for young people and teachers to improve their professional competences, including issues of rational use of resources191.
9.3.3 Environmental Education in Higher Education
The Section 42 of Environmental Protection Law states that Environmental Science should be integrated within the content of various courses, meaning that environmental science is run as an interdisciplinary theme:
the matters in respect of environmental education and education for sustainable development shall be included in the mandatory curriculum of the course standard in accordance with the specific character of each subject,
the environmental protection course shall be included in the mandatory part of all study programmes of authorities of higher education and colleges.
a course regarding sustainable development shall be included in the study programmes of teachers of all authorities of higher education and colleges.
Cabinet of Ministers Regulation No.407 (07/14/2015), Appendix 6 thereof, defines 29 study directions in higher education, including the direction “Environmental protection”. The study direction “Environmental Protection” is accredited in the following higher education institutions of Latvian: University of Latvia, Riga Technical University, Liepaja University, Latvia University of Agriculture, Daugavpils University and Olaine College of Mechanics and Technology. Several study programmes directly related to environmental engineering and environmental protection, implemented at the Latvia University of Agriculture and Rezekne Academy of Technologies, are accredited in the thematic study direction “Other Engineering Sciences”. Totally, as of 18 September1, 2017, 18 study programmes (SP) have been accredited: 4 Doctoral SP, 7 Masters or Professional SP (level 7), 6 Bachelors or Professional SP (level 6), 1 college programme.
An important contribution to the development of the study courses and programmes was given by the Small Grant Scheme “Capacity Building for Research and Measures for Improving the Knowledge of the Society on Climate Change and its Consequences”188, implemented under the EEA Financial Mechanism 2009-2014 Programme “National Climate Policy”. One of the areas of the competition was raising awareness of climate change by Developing educational programme modules and developing and organizing of learning courses. As a result, 5 different education programme modules and 6 study and learning courses were developed and tested in order to improve knowledge on climate change among pupils, students, entrepreneurs, as well as representatives of state institutions and local governments. Several universities – Riga Technical University, Latvia University of Agriculture, University of Latvia and Liepaja University – integrated developed programme modules in their study courses thus expanding number of students who will have possibility to improve knowledge on climate change. As one of the best practice examples, one can mention the project “Development of a training course and study programme module “Socio-economic aspects of the climate technology for bioeconomy sector”, implemented by Riga Technical University’s in partnership with the University of Bergen. Project partners established an innovative training system where social and economic aspects of the climate change are based on the biological economics development analysis, which means that different sectors are studied and analysed together.
191 Education Development Centre, available at http://www.iac.edu.lv/programmas/globala-attistibas-izglitiba/

202
9.4 Public Information Campaigns
Newspapers and magazines
Magazine “Vides Vēstis” („The Environmental News”) – magazine for the Green Lifestyle,
The weekly thematic supplement “Vides Diena” (“The Environment Day”) of the major Latvian newspaper “Diena”,
The weekly thematic supplement “Zaļā Latvija” („Green Latvia”) of one of the major Latvian newspapers “Latvijas Avīze” (2016),
Popular science magazine “Ilustrētā Zinātne” („Illustrated Science”) and electronic magazine “Terra 2.0” (http://www.lu.lv/terra2) – provides a science-based view of global problems, including thematic articles on climate change issues,
Magazine “Iepirkums” („Procurement”) publishes articles on the green procurement, including recommendations for waste management tenders.
Radio programmes: Environmental theme is an important component in radio programmes like:
“Known In The Unknown” (Radio 1) – popular science radio magazine, covering different branches of science,
“In the Crosspoint” (Radio 1) – analysis of current events in Latvia and abroad: political discussions, analysis of economic, social affairs, etc. problems, questioning of officials, research programmes,
“Green Wave” (Radio 1) - Nature related stories, green with tips and information on environmental issues.
TV programmes:
“Environmental facts” (LTV1) – programme produced by Environmental Film Studio
Environmental component plays an important role in the programme “The 4th Studio” (LTV1)
Internet portals:
One of the most popular internet portals, draugiem.lv has an environmental section
videsportals.lv
Campaigns
“European Mobility Week” is celebrated yearly to raise public awareness of the need to take action against the air pollution and climate change caused by the increase in the number of cars in the urban environment. Already traditionally the campaign “Bike to Work” and “A Day without a Car” is organized in Rīga and elsewhere in Latvia.
Since April 22, 1990, the International Earth Day has been celebrated in Latvia. During the Earth Day in 2016, the MEPRD called for an attractive open public discussion on the future of Latvia in the new climate realities. The aim of the discussion was to draw public attention to the significance of the Paris Agreement and the urgency of climate change in the context of the signing of the Paris Agreement, and to discuss whether and how Latvia should relate to the new climate realities.
The Earth Hour is organized every year on March 23, at 20:30 local time when all are asked to switch lights off for an hour. The Earth Hour activities are actively promoted by the WWF in Latvia. People are encouraged to turn off the lights in their rooms, houses, apartments. Companies, institutions, organizations and municipalities are encouraged to switch off the decorative lighting of buildings of facades and significant decorative lighting (monuments, buildings) in their territory, reduce as much as

203
possible the street lighting (subject to safety considerations). In anticipation of Earth Hour 2017, WWF, together with Tetra Pak, announced the “Climate Ambassador 2017” contest, which invited everyone to apply for themselves or to apply for someone else in Latvia who contribute to environmental protection in their daily life and encourage to do so others.
Also, events under the framework of the International Water Day are being organized in Latvia, by a number of Latvian nongovernmental organizations and research institutes.
The Nature Concert hall is a method for public awareness raising which has been tested and practiced in various places in Latvia since 2006 and shows that it is possible, through a specially targeted, interactive and multi-disciplinary approach to attract many thousands of people from different backgrounds, to change perception on the importance of sustainable development and to motivate to introduce change. Audience meets annually in two previously unpublished or little-known places, each year the theme is selected in a way that it ensures that places, emotions and knowledge are different. The Nature Concert Hall is not just a concert – these are nature schools giving scientists the opportunity to communicate complex ideas about the environment to the public192.
The “My Sea” campaign is organized by the Foundation for Environmental Education. The theme of the campaign is marine polluting waste. Expeditions along the Baltic Sea coastline are organized, aiming to promote unique natural values of the Latvia’s coast and to draw attention to the problem of waste193.
Society “Pēdas” (“Footprints”) (founded in 2002) organises annual events popularising the environmental protection aspects, sustainable way of living and consumption, etc. Activities of the society include actions, events and campaigns, including waste collection bees, aimed at explaining environmental and human relationships, causes and cosequences, promoting public education and information on environmental and nature protection issues and public involvement in environmental campaigns.
International Passive House Open Days in Latvia are taking place since 2012. In 2016, on November 11-13, nine buildings were opened in Latvia194.
9.5 Local Activities
There are 119 municipalities in Latvia – 9 republican cities and 110 counties.
According to the information provided on the website of the Covenant of Mayors (CM) (September 2017), there are 21 active local actors of the Covenant in Latvia – 6 republic cities and 15 counties (novadi). These mentioned 21 municipalities together cover 58% of all Latvian inhabitants in the beginning of 2017. All these municipalities (except for Smiltene) have submitted their Sustainable Energy Action Plans to the CM office.
Table 9.1 The Covenant of Mayors signatories in Latvia
Municipality Date of joinig Municipality Date of joinig
Rīga 30 September, 2008 Balvu novads 13 December, 2012
Jēkabpils 18 March, 2009 Saldus novads 18 December, 2012
Jelgava 26 March, 2009 Kārsavas novads 19 December, 2012
Tukuma novads 24 September, 2009 Ludzas novads 20 December, 2012
Salaspils novads 31 August, 2011 Līvānu novads 27 December, 2012
Ikšķiles novads 30 November, 2011 Viļānu novads 17 January, 2013
Ogres novads 22 December, 2011 Jūrmala 21 February, 2013
Lielvārdes novads 28 December, 2011 Valkas novads 28 March, 2013
Ķeguma novads 11 January, 2012 Daugavpils 10 November, 2016
192 Campaign “The Nature Concert hall”, available at http://www.dabaskoncertzale.lv/ 193 Campaign “My sea”, available at http://www.manajura.lv/ 194 Campaign “International Passive House Open Days”, available at http://www.passivehouse.lv/jaunumi/
204
Municipality Date of joinig Municipality Date of joinig
Limbažu novads 25 October, 2012 Smiltenes novads 30 November, 2016
Liepāja 15 November, 2012
Historically, the first strategy of climate change adaptation in Latvia was adopted in Salacgrīva region in 2011195.
The Daugavpils City, Valka county and Smiltene county have joined the new “Adapt” section of the Covenant of Mayors.
9.6 Projects and Training Programmes
In the period since 2010, large-scale public information and training programmes focused on climate issues are implemented with the support of the CCFI and the support of the EEA Financial Mechanism. The annual targeted public information has been provided regularly by the LEPF financed programmes as well.
CCFI programme “Promotion of public understanding on the role and possibilities of GHG emissions reduction” had been implemented by 2 open tenders announced in 2010 and 2012. The activities of the projects were implemented before March 31, 2012 (1st tender) and April 30,2013 (2nd tender) respectively. 22 projects196,197 were supported. Programme included activities like:
development of broadcast programmes for electronic broadcasters registered in the Republic of Latvia on the importance of reducing GHG emissions and possibilities for implementation of energy saving measures or using renewable energy resources. Eight series of programmes were created at both national and regional broadcasters: Latvian Radio, Radio 1, Radio Vidzeme, Latvian Television, Dautkom TV, Vidzeme Television, TV Kurzeme.
publication of materials on the importance and effects of GHG emission reduction measures in printed periodicals and on websites, including materials for professional audiences and municipalities. Material series were published in the magazines “Būvinženieris”, “Latvijas arhitektūra”, “Vides Vēstis” and “Kurzemes Vārds”.
organization of educational projects for pupils of primary schools, secondary schools and vocational education institutions of Latvia to develop awareness of climate change and its potential impact on Latvia and the world as a whole, on the possibilities to save energy at the individual level – at home and at school. 4 projects were implemented: “Through awareness – to active action” (association “Zaļā josta”), Eco-Schools Climate Campaign (“Foundation for Environmental Education”), Promotion of energy efficiency in education institutions in Vidzeme (foundation “Lubāna mitrāja kompleksa fonds”), climate change mitigation informative events in schools (Latvia University of Agriculture).
organization of seminars, training, other informative and educational events for professional audiences, as well as local governments. These activities were implemented by five NGO in Latvia: the Latvian Biogas Association, the Latvian Association of Civil Engineers, the Waste Management Association of Latvia, the Farmers’ Saeima, the Rujiena Forest Owners’ Association.
195 Strategy of climate change adaptation of Salacgrīva region, in Latvian, available at http://www.salacgriva.lv/lat/salacgrivas_novads/zalais_novads/?text_id=6401 196 Latvian Environmental Investment Funds. List of Implemented Projects available at http://kpfi.lv/modules/Konkurs/projekti.php?id=13&lang=lv . 197 Ministry of Environmental Protection and Regional Development (MEPRD. “Informative Report on the Results of the Climate Change Financial Instrument Operation in Year 2015” (Informatīvais ziņojums “Par Klimata pārmaiņu finanšu instrumenta darbību 2015.gadā), June 2016, in Latvian, available at http://www.varam.gov.lv/lat/darbibas_veidi/KPFI/likumd/

205
The official publisher of the Republic of Latvia “Latvijas Vēstnesis” implemented the project “Trusted and informative explanations on the importance of environmental sustainability, energy saving and use of renewable energy resources in Latvian households” in the “Latvijas Vēstnesis” Portal “About the Law and the State”.
In addition to the above, two general public awareness-raising projects were implemented in the CCFI programmes for the development of GHG emission reduction technologies and implementation of pilot projects:
“Informative database for low energy consumption services” (Ltd “Belss”, July 2010-June 2013), the main objective of the project was introduction of energy efficient materials and technologies in the private housing sector with a view to reducing the total amount of CO2 emissions and the costs of private households by educating and motivating the public on energy-efficient solutions. As a result of the project, an energy calculator close to the energy audit was developed.
National power supply company “AS Latvenergo” project “Promoting energy efficiency in households using smart technologies”. The project, which was implemented in July 2012 – April 2013 and is undergoing the project post-monitoring phase, has been aimed at providing households with detailed information about their individual energy consumption and CO2 emissions, as well as achieving at least 10% reduction in energy consumption. A total of 500 households were involved in the project.
Significant contribution was made by projects implemented within the framework of the National Climate Policy of the EEA Financial Mechanism 2009-2014. Previously, the contribution of a Small-scale grants scheme by developing modules for education and study programmes and organizing training, was described. Whereas, within support area “Organizing of educational projects and informative campaigns, to enhance society’s understanding and knowledge on climate change” in total 13 education and information campaigns were organized in 4 projects (which included series of different campaigns). The implementation of the projects was completed in first half of 2016. As one of the best examples, NGO “Homoecos” project was carried out in collaboration with Norwegian environmental organisation “GRID-Arendal”. One of project’s campaigns included promoting of practical methods in which people can get involved in climate change mitigation and adaptation. Another campaign was a travelling photo exhibition about impact of climate change during the years and demonstration of the documentary film in all regions of Latvia. Also, campaign for ensuring wider publicity included environmental ads, TV and radio broadcasts, as well as printed publications. Additionally as e-campaign a digital tool http://www.2gradi.lv/en/ was created, which irop instrument for strengthening the understanding of climate change and its effects. In the final event, a popular Latvian stand-up comedian led discussions about climate change, its causes and consequences, global solutions and individual responsibility. Project attracted a lot of young people’s attention. It should be noted, that within the Contest support area 2 “Capacity building through applied research on mitigation of climate change” six projects concluded during the reporting year 2016, and several of them held an important public information component.
Besides, within the Open Call “Development of Sustainable Buildings, Renewable Energy Technologies and Innovative Emission Reducing Technologies” of the EEA Financial Mechanism for years 2009-2014 programme “National Climate Policy” five demonstration projects of low energy buildings were implemented. Thus, the programme has a significant demonstration value. Contracted level of energy consumption assessed for buildings as a result of implementation of energy saving technologies is lower than 15 kWh/m2/year. Within the framework of the project, the construction of the following low-energy buildings was implemented: (i) new building of Nīca Sports Hall in Nīca county, (ii) construction of sports hall of Ādaži Free Waldorf school, (iii) construction of the science and technology museum “Kurzeme Democentrs” building), (iv) Aloja Regional Business Support Center Library “Sala”, (v) sports hall with rehabilitation facilities for Jelgava Primary Boarding School No. 2.

206
Substantial financial support in the development of education, training and public environmental awareness is provided each year by LEPF. The Administration of LEPF is a direct administration authority subordinated to the MEPRD whose functions and tasks are laid down in the Latvian Environmental Protection Fund Law 198 . The aim of the Fund is to promote the development of sustainable national economy by integrating the environmental protection requirements in all sectors of national economy in order to ensure the right of the people to live in qualitative environment in accordance with environmental policy guidelines, as well as sufficient measures for the preservation of biological diversity and protection of ecosystems. For example, public awareness, education and awareness raising directly relate to the Fund’s project competitions, such as informing and educating the general public about the environmentally friendly lifestyles at the national and regional level, education of specialized (professionals, industries) targeted audiences on environmentally friendly management, support of specialized environmental education media activities, the promotion of environmental education and environmental awareness for future opinion leaders, local environmental initiatives, organization of environmental education camps, and other activities. These programmes are implemented in sections of the LEPF Competitions like Responsible Lifestyles, Environmental Education, and others. Depending on the programme, their implementers can be different – the press, TV, radio, NGOs, education institutions, scientific institutions, municipalities.
The National Development Plan 2014–2020 (NDP2020), which is hierarchically the highest national-level medium-term planning document and is closely related to the Sustainable Development Strategy of Latvia until 2030 and the National Reform Programme for the Implementation of the EU2020 Strategy, has earmarked investments for the improvement of equipment in environmental information and education centres of national importance.
The Latvian Environmental Investment Fund 199 who is supervising the implementation and post-implementation monitoring of projects co-financed by national green green investment schemes (CCFI and EAAI) works also with the awareness raising. The employees of local government and other interested parties have opportunity on regular basis get valuable information from the Fund specialists. In the framework of main activities the Fund on a regular basis organizes regional seminars, including outings to the successfully realized project places and informing the society.
9.7 Resource or Information Centres
Websites of Research Results
a database of national, state budget funded, research and publications, http://petijumi.mk.gov.lv/ , contains relevant research materials
Materials of the projects funded by LEPF administration, https://www.lvafa.gov.lv/materiali/
Websites of Ministries
Climate Change portal (MEPRD) www.klimatam.lv
The Climate Change portal will provide the most up-to-date information on climate change, climate change mitigation and adaptation to climate change elaborated to various target groups. The main target groups are households, municipalities, businesses, pupils and researchers.
The main sections of the page that are still under construction and can be replenished and changed over time:
News – different up-to-date events on climate change
198 Latvian Environmental Protection Fund Law (Latvijas vides aizsardzības fonda likums), (04.01.2006), in Latvian, available at https://likumi.lv/doc.php?id=124956 199 The Fund was established on April 28th, 1997. The MEPRD owns 100% of the Fund’s shares.

207
Calendar of Events
Climate Change analysis tool – http://www2.meteo.lv/klimatariks/
Emission calculator – http://www.pdf.lv/klimats/
Climate change – information on the nature of climate change, adaptation to climate change, climate change mitigation.
Opportunities – Calculation of GHG emissions – approximate estimate (for individuals) and accurate assessment (for inventory), advice to project implementers, reduction of emissions, adaptation to climate change, project development abroad, support for project implementation, investment projects, other projects, EU Emissions Trading Scheme
Information repository – useful links to existing video, policy and legislation, explanation of terms, implemented projects and research, data, educational games
Frequently Asked Questions (FAQ)
The website “Latvijas klimats” (Latvian Climate) of State limited Liability Company “Latvian Environment, Geology and Meteorology Centre” provides information to a wide range of target groups.
Climate change and agriculture (website of the MoA) https://www.zm.gov.lv/lauksaimnieciba/statiskas-lapas/klimata-parmainas-un-lauksaimnieciba?nid=1129#jump
Public Awareness Raising
Emission Calculator http://www.pdf.lv/klimats/ (Pasaules Dabas fonds in cooperation with WWF)
Websites of NGOs
Association “Green Liberty”, http://www.zalabriviba.lv/ . The current main working directions of the association are sustainable development, environmentally friendly consumption and production, climate and energy, chemical substances, development cooperation and fair trade, human rights and freedoms. The association has joined the Climate Action Network-Europe, European Environmental Bureau, European EcoForum, Bankwatch Network. The Association actively participates in various national and international research projects in accordance with the specifics of its activities.
Association “Baltic Environmental Forum”, http://www.bef.lv/ . The Baltic Environmental Forum was established in 1995 as a technical assistance project of the three Baltic Ministries of Environment, Germany and the European Commission. It was aimed at strengthening co-operation and information among the authorities of the Baltic States in the field of environmental protection. In 2004, after the entry into the European Union, technical assistance projects have been completed. In 2003, BEF staff created non-governmental organizations in Latvia, Estonia, Lithuania and Germany to maintain the existing expert networks and implement new projects in the Baltic region. Currently, the association implements projects in different environmental protection areas: nature protection, waste management, water resources protection, energy efficiency and climate change, chemical control, reduction of industrial pollution, etc.
Foundation “Pasaules Dabas Fonds” (World Wildlife Fund), http://www.pdf.lv/ , is a public organization registered in Latvia, which has been operating since 1991. In 2005, the organization was registered as a foundation. In 2005, The WWF signed a co-operation agreement with the world’s most influential nature conservation organization – WWF. To achieve common goals, organizations implement joint campaigns and projects. The Fund regularly implements public information, education and awareness-raising activities; the Fund’s website has a separate section called “Climate”. It provides advice on how to reduce individual’s impact on the climate, information on the Latvian carbon foot, the current events related to climate change, and other information. The Foundation offers climate calculators for site visitors, http://www.pdf.lv/klimats/

208
Association “Environmental Protection Club” is one of the largest environmental grassroots organizations in Latvia, http://www.vak.lv/
The foundation “Environmental Education Foundation”, http://www.videsfonds.lv/lv/ works to promote sustainable development. The Foundation works in the field of environmental education, eco-certification and environmental public initiatives, representing the international organization – Foundation for Environmental Education – in Latvia. The Foundation implements the Eco-School Programme and its Climate Campaign and several other significant education programmes, the methodological materials of which are available on the Foundation’s website.
Association “Homo:ecos”, http://www.homeecos.lv/lat/ , actively works for the public education and environmental awareness raising. A separate section of the association’s website is devoted to the projects implemented by the association, including the climate change sector. The website http://co2.videsfonds.lv/resources provides access to various environmental education materials and publications on climate and energy issues.
The mission of the Foundation “Latvian Fund for Nature”, http://ldf.lv/ is to preserve the diversity of nature in Latvia. The Foundation works in 5 directions: nature conservation policy, society and nature education, biodiversity and ecosystems, protected species and habitats, specially protected nature territories, which are affected by climate change.
Association “Waste Management Association of Latvia”, http://www.lasa.lv/ , addresses issues of efficient waste management system, including reduction of GHG emissions.
9.8 Involvement of the Public and Non-governmental Organizations
In September 2016, 22480 public organizations, their associations, societies and foundations200 were registered and operated in Latvia, about 4% of them201 work in the field of environmental protection. In September 2017, 133 public benefit organizations202 operated in the field of environmental protection.
Advisory Councils is one of the effective tools for public participation and NGO representation.
The Environmental Advisory Council is a consultative coordinating body that aims to promote public participation in the development and implementation of environmental policy. It`s regulations are determined by the Cabinet of Ministers203. The functions of the Council are to facilitate the development of normative acts and policy planning documents on issues concerning environmental policy, promote co-operation and exchange of environmental information between individuals and public as a whole, as well as state institutions and local governments. The Council has the following tasks: (1) in line with the public interest, to submit proposals to the MEPRD and other sectoral ministries on draft legislative acts and draft policy planning documents, as well as projects of the European Union’s international law relating to environmental policy; (2) inform the public about current environmental issues and promote the integration of environmental issues into sectoral policies. Rights of the Council: (1) to request information from the MEPRD and its subordinate institutions as well as from other institutions for the work of the council; (2) to establish working groups to prepare items of meeting agenda and draft documents to be discussed at the Council meetings and to invite experts of the relevant fields; (3) invite officials of the MEPRD and other institutions, sectoral experts and representatives of the society to the meetings of the Council; (4) to authorize the council representative to express the opinion of the council in state and local government institutions; (5) to inform the public about current environmental issues. In
200 Statistics of public organizations, their associations, societies and foundations, available at https://www.lursoft.lv/lursoft_statistika/?&id=50, 201 4.3% of NGOs were engaged in environmental sector in 2015. Organization “Latvijas Pilsoniskā Alianse” “Report of NGO sector in Latvia in 2015”, Figure 5, pp 27, available at http://www.nvo.lv/site/attachments/29/04/2016/NVO_PARSKATS-2015-23.04.pdf 202 State Revenue Service of the Republic of Latvia. Site “Public benefit organisations”, available at https://www6.vid.gov.lv/VID_PDB/SLO 203 Cabinet of Ministers Regulation No.209 (27.03.2007, with amendments 02.12.2008 un 17.12.2013) “Regulation of Environmental Advisory Council” (Vides konsultatīvās padomes nolikums), in Latvian, available at https://likumi.lv/doc.php?id=155225

209
2017, 20 organizations worked in the Council – NGOs and foundations. In 2017, 28 organizations participated in the elections of the Council.
Table 9.2 Participants of Environmental Advisory Council, 2017
Participant name English/Latvian
Association “Homo:ecos” / biedrība “Homo:ecos” Society “Latvian Anglers Association” / Latvijas Makšķernieku asociācija
Foundation „Latvian Fund for Nature” / nodibinājums “Latvijas Dabas fonds”
Latvian Association for Environmental management / Latvijas Vides pārvaldības asociācija
Latvian Ornithological Society / Latvijas Ornitoloģijas biedrība
LATVIAN BOTANICAL SOCIETY / Latvijas Botāniķu biedrība
Foundation „Teiči Fund for Nature” / nodibinājums “Teiču dabas fonds”
Association „Environmental Facts” / Biedrība “Vides fakti”
Association „Baltic Environmental Forum”/ biedrība “Baltijas Vides forums”
Association „Environmental Word”/ biedrība “Vides vārds”
Association „Latvian Green Movement„ / biedrība “Latvijas Zaļā kustība”
ASSOCIATION of LATVIAN ORGANIC AGRICULTURE / Latvijas Bioloģiskās lauksaimniecības asociācija
Foundation „World Wildlife Fund” / nodibinājums “Pasaules Dabas fonds”
Latvian Beekeeping Association / Latvijas Biškopības biedrība
Association “Environmental Protection Club”/ biedrība “Vides aizsardzības klubs”
Foundation for Environmental Education / Nodibinājums “Vides izglītības fonds”
Association “Green Liberty” / biedrība “Zaļā brīvība” Waste Management Association of Latvia / Latvijas Atkritumu saimniecības asociācija
The Advisory Council of CCFI promotes the economic efficiency of utilisation of the resources of the CCFI and the efficiency of environmental protection, and promotes co-operation and the exchange of information among State administrative institutions, individuals and the society on issues related to implementation of the CCFI. Its regulations are determined by the Cabinet of Ministers204. The Council has 10 representatives, including representatives from the related sector ministries – MEPRD, MES, MoE, MoT, MoA, two representatives from the Environment Advisory Council and two representatives, which are rotated for one year by Latvian NGO associations (foundations). In the period of the second quarter of 2015 and the first quarter of 2018, these two representatives on rotation are respectively from the Latvian Biogas Association, the Latvian Chamber of Commerce and Industry, the Association of Agricultural Organizations, the Latvian Peat Producers Association and the Latvian Timber Industry Federation and the Latvian Forest Owners and Managers Confederation.
Due to the interdisciplinary nature of climate change, specific climate change adaptation issues are necessarily included in the agenda of other advisory councils: River Basin Advisory Councils, Marine Environment Council, Water Resources and Technology Council, Council for Coordination of Management Measures in Particularly Vulnerable Areas, Advisory Councils for Particularly Protected Nature Areas. Climate change issues are also linked to the work of the Packaging Management Board and the Information Society Council.
The Administration of LEPF implements specially focused programmes for promoting and strengthening the co-operation between the NGO sector and the state environmental authorities205: in 2017 – the programme “Co-operation projects between environmental institutions and NGOs to ensure a qualitative state of environment”, while in 2014, 2015 and 2016 – the programme “Co-operation projects between NGOs and environmental institutions in order to increase the capacity of environmental protection
204 Cabinet of Ministers Regulation No.312 (28.04.2008, with amendments) “ By-law of the Advisory Council of Climate Change Financial Instrument” (Klimata pārmaiņu finanšu instrumenta konsultatīvās padomes nolikums), in Latvian, available at https://likumi.lv/doc.php?id=174716 205 LEPF site available at https://www.lvafa.gov.lv/citi/1862-jau-notikuso-projektu-konkursu-nolikumi

210
system in solving environmental issues”; in 2014 – the programme “Co-operation projects between NGOs and environmental institutions for ensuring high-quality environmental communication” and “Co-operation projects between NGOs and environmental institutions for conservation and restoration of ecosystems and their natural structure as well as diversity of indigenous wildlife “.
9.9 International Cooperation on Education, Training and Public Awareness
Within the period from the last National Communication Report, Latvia has participated in several international cooperation measures. They are listed in Table 9.3.
Table 9.3 International Cooperation Measures
Recipient country/ region
Mitigation Adaptation Technology
development and transfer
Multiple areas
Programme or project title Description of programme or project
Uzbekistan Multiple areas Development cooperation project
The aim of the project was to train Urgench State University students and staff in sustainable environmental engineering in order to be able to carry out such training program further by using their own staff/faculty. Thus, through raising the level of training of environmental engineering will contribute to the sustainable environmental development, including production of energy, by formation of knowledgeable professionals who will be able to implement their knowledge in practice.
Belarus, Ukraine
Mitigation Awareness raising project The aim of the project was to increase knowledge and understanding of energy saving and building energy efficiency opportunities through a comprehensive approach for the population, non-governmental organizations (NGOs) and future specialists, taking into account socio-economic, technical and environmental aspects. (2013)
Georgia Multiple areas Study visit “Coalition building and networking activities – Implement capacity development measures in the selected CSO”
The aim of the experience exchange visit was to increase knowledge of the NGOs representatives of Georgia on Climate change policy and measures in Latvia and initiatives and support for small and medium-sized enterprises in the context of introducing environmentally friendly measures in business. (2016).
Azerbaijan Multiple areas Twinning Project AZ/15/ENP/EN/43 ‘Upgrading the National Environmental Monitoring System (NEMS) of Azerbaijan on the base of EU best practices’.
The main project beneficiary is the Ministry of Ecology and Natural Resources (MENR). Aim of the project is to propose activities and methodologies for improving of the environmental performance of Azerbaijan with strengthening the environmental monitoring system ensuring provision of the high quality information that supports strategic environmental policy planning and compliance control.

211
SOURCES OF INFORMATION
1. Latvia’s National Reform Programme of Latvia for the Implementation of the “Europe 2020” Strategy.
Approved by the Cabinet of Ministers, 26 April 2011, http://ec.europa.eu/europe2020/pdf/nrp/nrp_latvia_en.pdf
2. Environmental Policy Strategy 2014-2020 (Vides Politikas Pamatnostādnes 2014-2020.gadam)”. Approved by
the Cabinet of Ministers, 26 March 2014, http://polsis.mk.gov.lv/documents/4711, in Latvian
3. Ministry of Environmental Protection and Regional Development (MEPRD, June 2015). “Informative Report on
the Results of the Climate Change Financial Instrument Operation in Year 2015” (Informatīvais ziņojums “Par
Klimata pārmaiņu finanšu instrumenta darbību 2015.gadā), in Latvian,
http://varam.gov.lv/lat/darbibas_veidi/KPFI/likumd/
4. MEPRD. Annual Informative Reports “Use of Auctionings’ Revenues”, years 2012-2015 (ikgadējie
Informativie ziņojumi “Par izsoļu ieņēmumu izmantošanu”, 2012-2015.gadi),
http://varam.gov.lv/lat/fondi/ekii/likumdosana, in Latvian
5. MEPRD. Order No 265 (21 October 2016) “Strategy for the Use of Emissions Quota Auctioning Instrument”
(“Emisijas Kvotu izsolīšanas instrumenta darbības stratēģija”), in Latvian,
http://varam.gov.lv/lat/fondi/ekii/likumdosana/
6. Republic of Latvia National Renewable Energy Action Plan for implementing Directive 2009/28/ES of the
European Parliament and of the Council of 23 April 2009 on the promotion of the use of energy from
renewable sources and amending and subsequently repealing Directives 2001/77/EC and 2003/30/EC by
2020. http://www.ebb-
eu.org/legis/ActionPlanDirective2009_28/national_renewable_energy_action_plan_latvia_en.pdf
7. Electricity Market Law (Elektroenerģijas tirgus likums), http://likumi.lv/doc.php?id=108834
8. Ministry of Finance. Operational Programme “Growth and Employment 2014-2020”. Latvia,
http://www.esfondi.lv/upload/Planosana/FMProg_270115_OP_ENG_2.pdf
9. Ministry of Economics (ME, December 2016). Cabinet of Ministers Regulations (Draft) Regarding Promotion
energy efficiency and use of local RES in District Heating, https:
//www.em.gov.lv/lv/es_fondi/normativo_aktu_projekti/energetika_un_energoefektivitate/
10. (1) Cabinet of Ministers Regulations No 696 Regarding the State and EU financial support for the activity
“Support for business entities establishment and development (including diversification of non- agriculture
related activities)”, sub-activity “Energy production from biomass of agriculture and forestry origin” (adopted 25
August 2008, in force 11 September 2008 – 27 March 2010). http://www.likumi.lv/doc.php?id=180818.
(2) Cabinet of Ministers Regulations No.268 Regarding the State and EU financial support for the activity “Support for business entities establishment and development (including diversification of non- agriculture related activities)”, sub-activity “Energy production from biomass of agriculture and forestry origin”, adopted 16 March 2010, in force 27 March 2010. Amendments of 30 August 2011, adopted as the Cabinet of Ministers Regulations Nr.671, in force 2 September 2011, Consolidated version in Latvian: http://www.likumi.lv/doc.php?id=207116
11. ME. Information regarding mandatory procurement of electricity: Feed-in payments 2015 (Informācija par
izdotajiem lēmumiem par elektroenerģijas obligāto iepirkumu: komersantiem 2015 .gadā obligātā iepirkuma
ietvaros izmaksātās summas), in Latvian,
https://www.em.gov.lv/lv/nozares_politika/atjaunojama_energija_un_kogeneracija/informacija_par_izdotajiem_
lemumiem_par_elektroenergijas_obligato_iepirkumu/.
12. (1) Rural Development Programme for Latvia 2014-2020 (Latvijas Lauku Attīstības Programma 2014-
2020.gadam), in Latvian, actual version of 17.August 2016, https://www.zm.gov.lv/zemkopibas-
ministrija/statiskas-lapas/latvijas-lauku-attistibas-programma-2014-2020-gadam-?id=6426#jump (aktuālā
redakcija), in Latvian, pages 268, 289, 290.
(2) Factsheet on 2014-2020 Rural Development Programme for Latvia, http://ec.europa.eu/agriculture/rural-development-2014-2020/country-files/lv/factsheet_en.pdf

212
13. Latvian Environmental Investment Fund (responsible authority for the implementation of CCFI programmes),
information material, 28 March 2013, in Latvian (Latvijas Vides Investīciju Fonda informatīvais ziņojums
“Noslēgusies projektu ieviešana konkursā “Atjaunojamo energoresursu izmantošana mājsaimniecību
sektorā”), http://www.lvif.gov.lv/?object_id=30643
14. Cabinet of Ministers Regulations No262 (16.03.2010) “Regarding the Production of Electricity Using
Renewable Energy Sources and the Procedures for the Determination of the Price”, actual version
http://likumi.lv/doc.php?id=207458
15. Cabinet of Ministers Regulations No221 (10.03.2009) “Regarding Electricity Production and Price
Determination upon Production of Electricity in Cogeneration”, actual version
(http://likumi.lv/doc.php?id=189260)
16. Subsidized Electricity Tax Law (Subsidētās elektroenerģijas nodokļa likums),
http://likumi.lv/doc.php?id=262304
17. (1) The Cabinet of Ministers Regulations No 444 „The Amendments to the Cabinet of Ministers Regulations
No 262”, adopted 05 July 2015, will be in force after agreeing with the European Commission. In Latvian
http://likumi.lv/ta/id/283555
(2) The Cabinet of Ministers Regulations No 443 „The Amendments to the Cabinet of Ministers Regulations No 221”, adopted 05 July 2015, will be in force after agreeing with the European Commission. In Latvian, http://likumi.lv/ta/id/283554
18. Latvia National Energy Efficiency Action Plans, http://ec.europa.eu/energy/node/84
19. ME (17 March 2014). Information report “On the progress towards the indicative national energy efficiency
targets in 2014 –2016 according to Directive 2012/27/EU of the European Parliament and of the Council of 25
October 2012 on energy efficiency, amending Directives 2009/125/EC and 2010/30/EU and repealing
Directives 2004/8/EC and
2006/32/EC”,https://ec.europa.eu/energy/sites/ener/files/documents/2014_neeap_en_latvia.pdf
20. Latvia’s “Energy Policy Strategy 2014-2020” (Enerģētikas Attīstības Pamatnostādnes 2014.–2020.gadam”),
adopted by the Cabinet of Ministers, 09 February 2016, http://likumi.lv/ta/id/280236 , in Latvian
21. Energy Efficiency Law (Energoefektivitātes likums), http://likumi.lv/doc.php?id=280932
22. Cabinet of Ministers Regulations No 487 (26.07.2016) “Regulations on Enterprise Energy Audit” (Uzņēmumu
energoaudita noteikumi), http://likumi.lv/ta/id/283807)
23. Cabinet of Ministers Regulations No555 (12 July 2011) Regarding the Procedure for Entering into and
Supervision of Energy Efficiency Improvement Agreements” (Noteikumi par kārtību, kādā noslēdz un pārrauga
vienošanos par energoefektivitātes paaugstināšanu), issued pursuant to the Section 12 of the Energy End-
Use Efficiency Law (Enerģijas galapatēriņa efektivitātes likums), in force 15.07.2011-31.10.2016,
http://likumi.lv/doc.php?id=233052
24. Cabinet of Ministers Regulations No 669 (11 October 2016 ) “Procedure for Entering into and Supervision of
Energy Efficiency Improvement Agreements” (Kārtība, kādā noslēdz un pārrauga brīvprātīgu vienošanos par
energoefektivitātes uzlabošanu), , issued pursuant to Section 8.3 of Energy Efficiency Law, in force
01.11.2016, http://likumi.lv/ta/id/285879
25. Law on the Energy Performance of Buildings (recast, Ēku energoefektivitātes likums),
http://likumi.lv/doc.php?id=253635
26. Cabinet of Ministers Regulations No 383 „(09.07.2013) “Regulations Regarding Energy Certification of
Buildings” ( Noteikumi Nr.383 „Par ēku energosertifikāciju”), in force 19 July 2013,
https://m.likumi.lv/saistitie.php?id=258322&saistitie_id=7
27. Cabinet of Ministers Regulations No 907 „Regulations Regarding the Survey, Technical Servicing, Current
Repairs and Minimal Requirements for Energy Efficiency of the Residential House”, Chapter IV
“Requirements for Ensuring the Energy Efficiency of a Residential House” (Noteikumi par dzīvojamās mājas
apsekošanu, tehnisko apkopi, kārtējo remontu un energoefektivitātes minimālajām prasībām, 4.nodaļa
‘Prasības dzīvojamās mājas energoefektivitātes nodrošināšanai), http://likumi.lv/doc.php?id=218831

213
28. the Amendments to the Latvian Construction Standard LBN 002-01 “Thermotechnics of Building Envelopes”
(Grozījumi Ministru Kabineta 2001.gada 27.novembra noteikumos Nr.495 “Noteikumi par Latvijas
būvnormatīvu LBN 002-01 “Ēku norobežojoši konstrukciju siltumtehnika), adopted 8 April 2014 ,
http://likumi.lv/doc.php?id=265703
29. Latvian Construction Standard LBN002-15 “Thermotechnics of Building Envelopes” (Latvijas būvnormatīvs
LBN 002-15 “Ēku norobežojoši konstrukciju siltumtehnika), http://likumi.lv/ta/id/275015
30. Cabinet of Ministers Regulations No 243 (19.04.2016) “Regulations Regarding Requirements of Energy
Efficiency to the District Heating Systems Existent in the Possession of a Licensed or Registered Energy
Supply Merchant and the Procedures for the Inspection of the Conformity Thereof” (Noteikumi Nr.1214
„Noteikumi par energoefektivitātes prasībām licencēta vai reģistrēta energoapgādes komersanta valdījumā
esošām centralizētām siltumapgādes sistēmām un to atbilstības pārbaudes kārtību”), in force 06 May 2016,
http://www.likumi.lv/doc.php?id=281914 , in Latvian
31. Cabinet of Ministers Regulations No 272 (05.04.2011) Regarding the 9th and 10th Open Tender „Improvement
of Heat Insulation of Multi-Apartment Residential Buildings” Financed by the National Operational Programme
“Infrastructure and Services” Activity 3.4.4.1 ( Noteikumi Nr.272 „Noteikumi par darbības programmas
„Infrastruktūra un pakalpojumi” papildinājuma 3.4.4.1. aktivitāti „Daudzdzīvokļu māju siltumnoturības
uzlabošanas pasākumi” projektu iesniegumu atlases devīto un desmito kārtu”), in force 20 April 2011. Actual
consolidated version: http://likumi.lv/doc.php?id=228846 , in Latvian.
32. ME (2016). Report on the progress achieved in 2014 towards implementing national energy efficiency targets
for the year 2020 pursuant to Article 24(1) and Section 1 of Annex XIV to Directive 2012/27/EU,
https://ec.europa.eu/energy/sites/ener/files/documents/Latvia%202016%20Energy%20Efficiency%20Annual%
20Report%20EN.pdf
33. Cabinet of Ministers Regulations No160 (15.03.2016) Regarding the 4.2.1.1. specific target “Energy Efficiency
Measures in Residential Buildings” of the Specific Objective No4.2.1 “To increase energy efficiency in public
and residential buildings” of the Operational Programme “Growth and Employment (Noteikumi “Darbības
programmas “Izaugsme un nodarbinātība” 4.2.1 specifiskā atbalsta mērķa “Veicināt energoefektivitātes
paaugstināšanu valsts un dzīvojamās ēkās” 4.2.1.1. specifiskā atbalsta mērķa “Veicināt energoefektivitātes
paaugstināšanu dzīvojamās ēkās “ īstenošanas noteikumi). In force 06 April 2016,
http://likumi.lv/doc.php?id=281323, in Latvian
34. Cabinet of Ministers Regulations No 590 (06.09.2016) Regarding the 4.1.1. Specific Objective “To Promote
Efficient Use of Energy Resources, Reduction in Energy Consumption and Transfer to Renewable Energy
Sources in the Manufacturing industry” of the Operational Programme “Growth and Employment 2014-2020
(Noteikumi Nr590 “Darbības programmas “Izaugsme un nodarbinātība” 4.1.1 specifiskā atbalsta mērķa
“Veicināt efektīvu energoresursu izmantošanu, enerģijas patēriņa samazināšanu un pāreju uz AER apstrādes
rūpniecības nozarē” īstenošanas noteikumi). In force 09 September 2016, in Latvian,
http://likumi.lv/ta/id/284596
35. Cabinet of Ministers Regulations No 600 (30.09.2014) Regarding the State and EU financial support for the
activity’s “Investments” open tenders” (Noteikumi Nr.600 Kārtība kādā piešķir valsts un Eiropas Savienības
atbalstu atklātu projektu konkursu veidā pasākumam “Ieguldījumi materiālajos aktīvos’), in force 31.10.2014.
Actual consolidated version in Latvian: http://likumi.lv//doc.php?id=269868. For noted Initial values of heat
penetrability coefficients see the Annex 15.
36. Cabinet of Ministers Regulations No 152 (24.03.2016) Regarding the 4.2.2. Specific Objective “To Facilitate
the Increase of Energy Efficiency and Utilisation of Renewable Sources in Municipal Buildings, According to
the Integrated Development Programmes of Municipalities” of the Operational Programme “Growth and
Employment” (Noteikumi Nr152 “Darbības programmas “Izaugsme un nodarbinātība” 4.2.2 specifiskā atbalsta
mērķa “Atbilstoši pašvaldības integrētajām attīstības programmām sekmēt energoefektivitātes
paaugstināšanu un atjaunojamo energoresursu izmantošanu pašvaldību ēkās” īstenošanas noteikumi). In
force 24 March 2016, in Latvian, http://likumi.lv/doc.php?id=281111 .

214
37. Cabinet of Ministers Regulations No 534 (09.08.2016) Regarding the 4.2.1. Specific Objective “To Facilitate
the Increase of Energy Efficiency in State and Residential Buildings” of the Operational Programme “Growth
and Employment 2014-2020”: the First Tender of the Measure 4.2.1.2 “To Facilitate the Increase of Energy
Efficiency in State Buildings” (Noteikumi Nr 534 “Darbības programmas “Izaugsme un nodarbinātība” 4.2.1
specifiskā atbalsta mērķa “Veicināt energoefektivitātes paaugstināšanu valsts un dzīvojamās ēkās” 4.2.1.2.
pasākuma “Veicināt energoefektivitātes paaugstināšanu valsts ēkās” pirmās projektu iesniegumu atlases
kārtas īstenošanas noteikumi). In force 26 August 2016, in Latvian, http://likumi.lv/ta/id/284333
38. MEPRD. Annual Informative Reports “Use of Auctionings’ Revenues”, years 2012-2015 (ikgadējie Informativie
ziņojumi “Par izsoļu ieņēmumu izmantošanu”, 2012-2015.gadi), http://varam.gov.lv/lat/fondi/ekii/likumdosana/
39. Cabinet of Ministers Regulations No 69 (26.01.2016) Regarding the Open Tender “Greenhouse Gas
Emissions Reduction – Low Energy Buildings” for the Projects Financed by the Emissions Quotas Auctioning
Instrument (Noteikumi Nr. 69 (2016) “Emisijas kvotu izsolīšanas instrumenta finansēto projektu atklāta
konkursa “Siltumnīcefekta gāzu emisiju samazināšana – zema enerģijas patēriņa ēkas” nolikums), in force 13
February 2016, http://likumi.lv/ta/id/280234 , in Latvian.
40. Cabinet of Ministers Regulations No35 (12.01.2016) Regarding the Open Tender “Greenhouse Gas
Emissions Reduction in Buildings which are Architectural Monuments of State Significance” for the Projects
Financed by the Emissions Quotas Auctioning Instrument” (Noteikumi Nr. 35 (2016) “ Emisijas kvotu
izsolīšanas instrumenta finansēto projektu atklāta konkursa “Siltumnīcefekta gāzu emisiju samazināšana
valsts nozīmes aizsargājamos arhitektūras pieminekļos), in force 30 January 2016, http://likumi.lv/ta/id/279830,
in Latvian
41. MEPRD. Order No 265 “Strategy for the Use of Emissions Quota Auctioning Instrument” (“Emisijas Kvotu
izsolīšanas instrumenta darbības stratēģija”), in Latvian, http://varam.gov.lv/lat/fondi/ekii/likumdosana/
42. Amendments to the Cabinet of Ministers Regulations No 876 (2008) “Heat Energy Supply and Consumption
Regulations”, adopted as the Cabinet of Ministers Regulations No 628 (3 November 2015), in force 10
November 2015, http://likumi.lv/doc.php?id=277661, in Latvian
43. Cabinet of Ministers Regulations No.941 (06.12.2011) Regarding Ecodesign Requirements for Energy-
Related Products” (Noteikumi Nr.941 “Noteikumi par ekodizaina prasībām ar enerģiju saistītām precēm
(produktiem“), in force 15 December 2011. http://likumi.lv/doc.php?id=241282
44. Cabinet of Ministers Regulations No 480 (21.06.2011) Regarding Labelling of Energy and Other Resources
Consumption Related Products as well as Their Advertisment and Supervision (Noteikumi Nr.480 „Noteikumi
par kārtību, kādā tiek marķētas preces, kas saistītas ar enerģijas un citu resursu patēriņu, kā arī to reklāmu un
uzraudzību”), in force 20 July 2011. http://likumi.lv/doc.php?id=232553 , in Latvian
45. Public Procurement Law (Publisko iepirkumu likums),
(1) in force up to 29.02.2017, http://likumi.lv/doc.php?id=133536
(2) in force from 01.03.2017, http://likumi.lv/ta/id/287760
46. Cabinet of Ministers Regulations No 612 (20.09.2016) Regarding Energy Efficiency Requirements to be
Applied in the Goods’ and Services’ Public Procurement of State Direct Administration Institutions (Noteikumi
“Tiešās pārvaldes iestāžu rīkotajos iepirkumos izvirzāmās preču un pakalpojumu energoefektivitātes
prasības”), http://likumi.lv/ta/id/284894, in Latvian.
47. Amendments to the Law on the Energy Performance of Buildings (entered into force on 5 April 2016),
http://likumi.lv/ta/id/281087
48. Natural Resources Tax Law (Dabas resursu nodokļa likums), http://likumi.lv/doc.php?id=124707
49. Law “On Excise Duties” (Likums “Par akcīzes nodokli”), http://likumi.lv/doc.php?id=81066
50. Electricity Tax Law (Elektroenerģijas nodokļa likums), http://www.likumi.lv/doc.php?id=150692
51. Cabinet of Ministers Regulations No. 648 “Amendments on the Cabinet of Ministers Regulations No332, 26
September 2000, “Requirements for Conformity Assessment of Petrol and Diesel Fuel” ( Noteikumi Nr.648
“Grozījumi Ministru kabineta 2000.gada 26.septembra noteikumos Nr.332 “Noteikumi par benzīna un
dīzeļdegvielas atbilstības novērtēšanu”), adopted 25 June 2009, the articles 8.1 and 9.1 in force from 01
October 2009, http://likumi.lv/doc.php?id=194227

215
52. Law „On the Vehicle Operation Tax and Company Car Tax” (Transportlīdzekļa ekspluatācijas nodokļa un
uzņēmumu vieglo transportlīdzekļu nodokļa likums), latest amendments of the Law adopted in 23 November
2016, http://likumi.lv/ta/id/287291)
53. Law “On Car and Motorcycle Tax” (Likums “Par vieglo automobiļu un motociklu nodokli), in force up to
31.12.2016, http://likumi.lv/doc.php?id=8106,
54. Law on the Procurement of Public Service Providers (Sabiedrisko pakalpojumu sniedzēju iepirkumu likums),
http://m.likumi.lv/doc.php?id=216076
55. Law on Public Transport Services (Sabiedriskā transporta pakalpojumu likums),
http://likumi.lv/doc.php?id=159858
56. Electromobility Development Plan for 2014-2016 (Elektromobilitātes attīstības plāns 2014.-2016.gadam),
viewed by Cabinet of Ministers 04 February 2014, http://tap.mk.gov.lv/mk/tap/?pid=40304985 (in Latvian)
57. Cabinet of Ministers Regulation No 637 (03.11.2015) Regarding the 4.4.1. Specific Objective “To Develop the
Electric Vehicles’ Charging Infrastructure of in Latvia” of the Operational Programme “Growth and
Employment” (Noteikumi Nr152 “Darbības programmas “Izaugsme un nodarbinātība” 4.4.1 specifiskā atbalsta
mērķa “Attīstīt ETL uzlādes infrastruktūru Latvijā” īstenošanas noteikumi), in force 11 November 2015, in
Latvian, http://likumi.lv/doc.php?id=277693
58. Cabinet of Ministers Regulations No281 (03.05.2016) Regarding Development of Environmentally Friendly
Public Transport (Trams) Infrastructure co-financed by the EU Cohesion Fund (Noteikumi “Darbības
programmas “Izaugsme un nodarbinātība” 4.5.1.specifiskā atbalsta mērķa “Attīstīt videi draudzīgu sabiedriskā
transporta infrastruktūru” 4.5.1.1.pasākuma “Attīstīt videi draudzīgu sabiedriskā transporta infrastruktūru
(sliežu transporta)” īstenošanas noteikumi), in force 11.05.2016 http://likumi.lv/doc.php?id=282025 , in Latvian
59. Cabinet of Ministers Regulations No848 (20.12.2016) Regarding Development of Environmentally Friendly
Public Transport (Buses) Infrastructure co-financed by the EU Cohesion Fund (Noteikumi “Darbības
programmas “Izaugsme un nodarbinātība” 4.5.1.specifiskā atbalsta mērķa “Attīstīt videi draudzīgu sabiedriskā
transporta infrastruktūru” 4.5.1.2.pasākuma “Attīstīt videi draudzīgu sabiedriskā transporta infrastruktūru
(autobusi)” īstenošanas noteikumi), in force 24.12.2016, http://likumi.lv/doc.php?id=2876 , in Latvian
59. A. Laurs, Z. Markovics, J. Priekulis, A. Aboltins (2016) Research in farm management technologies using the expert method. Agronomy Research. – No.14 (3), p. 811-820. Available: http://agronomy.emu.ee/wp-content/uploads/2016/05/Vol14-_nr3_Laurs.pdf
60. Agita Gancone et al., “Latvia’s National Inventory Report Submission under UNFCCC and the Kyoto Protocol
Common Reporting Formats (CRF) 1990 – 2014” (Riga: Ministry of Environmental Protection and Regional
Development of the Republic of Latvia, 2016).
61. Andis Lazdiņš and Ainārs Lupiķis, “Hidrotehni
Susinātām Augsnēm” (Salaspils, 2014); Ainārs Lupiķis, Sigita Mūrniece, and Andis Lazdiņš, “Impact of
Reconstruction of Forest Drainage Systems on Increase of Living Woody Biomass in Thinned Middle-Age
Coniferous Stands,” in Forest Ecosystems and Its Management: Towards Understanding in Complexity (Ilgas:
Latvian State Forest Research Institute “Silava,” 2014).
62. Andis Lazdiņš and Juris Zariņš, “Meža Ugunsgrēku Un Mežizstrādes Atlieku Dedzināšanas Radītās
Siltumnīcefekta Gāzu Emisijas Latvijā,” in Referātu Tēzes (Rīga: Latvijas Universitāte, 2013), 133–137.
63.
Emisiju Un Zemes Lietojuma Veida Ietekmes Novērtējums Intensīvi Un Ekstensīvi Kultivētās Aramzemēs,
Daudzgadīgos Zālājos Un Bioloģiski Vērtīgos Zālājos” (Salaspils, 2013).
64. Andis Lazdiņš et al., “Atbalsts Klimata Pētījumu Programmai (Pārskats Par Projekta 2013. Gada Darba
Uzdevumu Izpildi)” (Salaspils, 2013).
65. Andis Lazdiņš et al., “Koksnes Atmiruma Novērtēšana Dažāda Vecuma, Valdošās Sugas Un Meža Tipa
Audzēs Un Vēsturisko CO2 Piesaistes Dzīvajā Biomasā Datu Pārrēķināšana No 1990. Gada” (Salaspils,
2012).
66. Andis Lazdiņš, Ainārs Lupiķis, and Modris Okmanis, “Soil Carbon Stock Change due to Drainage of a Forest
Stand Growing on a Transitional Bog,” in Extended Abstracts of the CAR-ES Network Meeting in Finland 20.–

216
22.10.2014, ed. Leena Finér, Leena Karvinen, and Inge Stupak, vol. 316, Working Papers of the Finnish
Forest Research Institute (Vantaa, Finland: Finnish Forest Research Institute, 2014), 48–50,
http://www.metla.fi/julkaisut/workingpapers/2014/mwp316.htm;
67. Andis Lazdiņš, Forest Data National Modelling Tool in Latvia (Swedish Environmental Protection Agency,
Sweden, Stockholm, Valhallavägen 195, room Sarek, 2012); Andis Lazdiņš, Jānis Donis, and Līga Strūve,
Latvia’s National Methodology for Reference Level of Forest Management Activities (English Summary)
(LSFRI Silava, 2012).
68. Āris Jansons and Imants Baumanis, “Parastās priedes (Pinus sylvestris L.) klonu atlase Kurzemes zonas 2.
kārtas sēklu plantācijas izveidei un sagaidāmais ģenētiskais ieguvums,” Mežzinātne \textbar Forest Science
17, no. 50 (2008): 88–116; Andis Lazdiņš et al., “Mežsaimniecisko Darbību Ietekmes Uz Siltumnīcas Efektu
Izraisošo Gāzu Bilanci Pētījuma Programmas Izstrāde,” Pārskats par pirmā etapa izpildi (Salaspils: LVMI
Silava, 2010); Andis Lazdiņš, “Atbalsts Klimata Pētījumu Programmai (Starpziņojums Par 2012. Gada Darba
Uzdevumu Izpildi)” (Salaspils: LVMI Silava, 2012), https://sites.google.com/site/lvlulucf/research-
projects/atbalstsklimatapetijumuprogrammaistarpzinojumspar2012gadarezultatiem; Andis Lazdiņš et al.,
“Mežsaimniecisko Darbību Ietekmes Uz Siltumnīcefekta Gāzu Emisijām Un CO₂ Piesaisti Novērtējums
(Pārskats Par 2013. Gada Darba Uzdevumu Izpildi)” (Salaspils: LVMI Silava & Meža nozares kompetences
centrs, 2013).
69. https://www.zm.gov.lv/public/files/CMS_Static_Page_Doc/00/00/00/97/47/Ex-
postzinojums_pielikumi_SFC2007.pdf
70. J. Priekulis, A. Aboltins, A. Laurs, L.Melece (2015)Research in manure management in Latvia / 14th
International scientific conference “Engineering for rural development” : proceedings, Jelgava, Latvia, May 20
– 22, 2015 Latvia University of Agriculture. Faculty of Engineering. – Jelgava, 2015. – Vol.14, p.88-93.
Available: http://tf.llu.lv/conference/proceedings2015/Papers/015_Laurs.pdf
71. Jim Penman, ed., Good Practice Guidancefor Land Use, Land-Use Change and Forestry (2108 -11,
Kamiyamaguchi, Hayama, Kanagawa, Japan: Institute for Global Environmental Strategies (IGES), 2003),
http://www.ipcc-nggip.iges.or.jp.
72. Jurģis Jansons and Pēteris Zālītis, “Dabiski Atjaunojamo Lapu Koku Apmežojumu Struktūra Un Kopšanas
Iespējas,” Meža Dzīve Nr.4 (1998): 12–15; Pēteris Zālītis, Sastāva Kopšanas Cirtes (LVMI Silava, 2004);
Pēteris Zālītis and Zane Lībiete, “Kopšanas Ciršu Režīms Egļu Jaunaudzēs,” LLU Raksti 20 (315) (2008): 38–
45; AS “Latvijas valsts meži,” Kvalitātes Prasības Jaunaudžu Kopšanas Ciršu Izpildei (Apstiprināts Ar AS
„Latvijas Valsts Meži” 20.04.2012. Rīkojumu Nr. 3.1-2.1_001a_200_12_12) (AS “Latvijas valsts meži,” 2012),
http://www.lvm.lv/files/text/Jaunaudzu%20kopsanas%20kvalitates%20prasibas.doc.
73. Jüri-Ott Salm et al., “Global Warming Potential of Drained and Undrained Peatlands in Estonia: A Synthesis,”
Wetlands 29, no. 4 (December 2009): 1081–1092, doi:10.1672/08-206.1; Jüri Ott Salm, “Emission of
Greenhouse Gases CO2, CH4, and N2O from Estonian Transitional Fens and Ombrotrophic Bogs: The Impact
of Different Land-Use Practice” (Doctoral thesis, Tartu Ülikooli Kirjastus, 2012),
http://dspace.utlib.ee/dspace/bitstream/handle/10062/25471/salm_jyri_ott.pdf?sequence=1.
74. L.U. Consulting, Augšņu un reljefa izejas datu sagatavošana un Eiropas Komisijas izstrādāto augsnes un
reljefa kritēriju mazā labvēlīgo apvidu noteikšanai piemērošanas simulācija (Projekta kopsavilkuma ziņojums)
(Latvijas Republikas Zemkopības Ministrija, 2010).
75. Latvijas Republikas Ministru Kabinets. Noteikumi Par Atmežošanas Kompensācijas Noteikšanas Kritērijiem,
Aprēķināšanas Un Atlīdzināšanas Kārtību (Ministru Kabineta Noteikumi Nr. 889). Latvijas Vēstnesis, 201
(4804), 2012. http://likumi.lv/doc.php?id=253624.
76. Latvijas Republikas Saeima. Meža Likums (Ar Labojumiem Līdz 01.01.2016). VSIA Latvijas Vēstnesis, 2000.
77. Lazdiņš et al., “Mežsaimniecisko Darbību Ietekmes Uz Siltumnīcefekta Gāzu Emisijām Un CO₂ Piesaisti
Novērtējums (Pārskats Par 2013. Gada Darba Uzdevumu Izpildi),” 2013.
78. Leonards Līpiņš, Assessment of wood resources and efficiency of wood utilization (Koksnes izejvielu resersu
un to izmantošanas efektivitātes novērtējums) (LLU, 2004),
http://www.zm.gov.lv/index.php?sadala=258&id=803.

217
79. Penman, Good Practice Guidancefor Land Use, Land-Use Change and Forestry.
80. Pēteris Zālītis, Mežkopības Priekšnosacījumi (Salaspils: et cetera, 2006); Pēteris Zālītis and Jurģis Jansons,
Mērķtiecīgi Izveidoto Kokaudžu Struktūra (Salaspils: LVMI Silava, 2009); Pēteris Zālītis et al., Četri
Mežzinātņu Motīvi (Salaspils: Daugavpils Universitātes Akadēmiskais apgāds “Saule,” 2014).
81. Reģionālās attīstības un pašvaldību lietu ministrija, Zemes Politikas Pamatnostādnes 2008. – 2014. Gadam
(Informatīvā Daļa) (LR Ministru Kabinets, 2008), http://www.zm.gov.lv/doc_upl/pamatnostadnes.pdf.
82. Sebastian Rüter, “Projection of Net-Emissions from Harvested Wood Products in European Countries”
(Hamburg, 2011).
83. Simon Eggleston et al., eds., “2006 IPCC Guidelines for National Greenhouse Gas Inventories. Agriculture,
Forestry and Other Land Use,” in 2006 IPCC Guidelines for National Greenhouse Gas Inventories, vol. 4
(Japan: Institute for Global Environmental Strategies (IGES), 2006), 678.
84. Takahiro Hiraishi et al., “2013 Supplement to the 2006 IPCC Guidelines for National Greenhouse Gas
Inventories: Wetlands” (Switzerland, 2013), http://www.ipcc-
nggip.iges.or.jp/public/wetlands/pdf/Wetlands_Supplement_Entire_Report.pdf.
85. Zemkopības ministrija, Latvia – Rural Development Programme (National) (Zemkopības ministrija, 2014),
https://www.zm.gov.lv/lauku-attistiba/statiskas-lapas/lauku-attistibas-programma-2014-2020?nid=966#jump.
86. Zemkopības ministrija, Meža Un Saistīto Nozaru Attīstības Pamatnostādnes (Valsts Kanceleja, 2006),
http://polsis.mk.gov.lv/view.do?id=1917
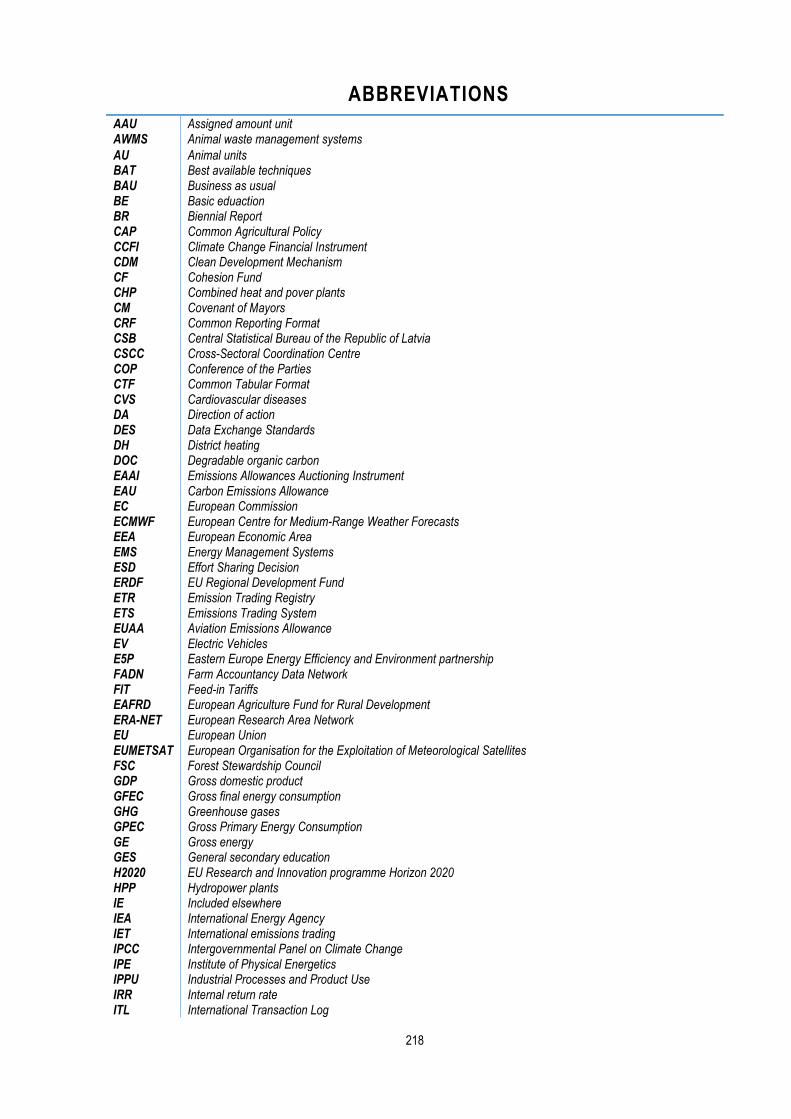
218
ABBREVIATIONS
AAU Assigned amount unit AWMS Animal waste management systems
AU Animal units BAT Best available techniques BAU Business as usual BE Basic eduaction BR Biennial Report CAP Common Agricultural Policy CCFI Climate Change Financial Instrument CDM Clean Development Mechanism CF Cohesion Fund CHP Combined heat and pover plants CM Covenant of Mayors CRF Common Reporting Format CSB Central Statistical Bureau of the Republic of Latvia CSCC Cross-Sectoral Coordination Centre COP Conference of the Parties CTF Common Tabular Format CVS Cardiovascular diseases DA Direction of action DES Data Exchange Standards DH District heating DOC Degradable organic carbon EAAI Emissions Allowances Auctioning Instrument EAU Carbon Emissions Allowance EC European Commission ECMWF European Centre for Medium-Range Weather Forecasts EEA European Economic Area EMS Energy Management Systems ESD Effort Sharing Decision ERDF EU Regional Development Fund ETR Emission Trading Registry ETS Emissions Trading System EUAA Aviation Emissions Allowance EV Electric Vehicles E5P Eastern Europe Energy Efficiency and Environment partnership FADN Farm Accountancy Data Network FIT Feed-in Tariffs EAFRD European Agriculture Fund for Rural Development ERA-NET European Research Area Network EU European Union EUMETSAT European Organisation for the Exploitation of Meteorological Satellites FSC Forest Stewardship Council GDP Gross domestic product GFEC Gross final energy consumption GHG Greenhouse gases GPEC Gross Primary Energy Consumption GE Gross energy GES General secondary education H2020 EU Research and Innovation programme Horizon 2020 HPP Hydropower plants IE Included elsewhere IEA International Energy Agency IET International emissions trading IPCC Intergovernmental Panel on Climate Change IPE Institute of Physical Energetics IPPU Industrial Processes and Product Use IRR Internal return rate ITL International Transaction Log
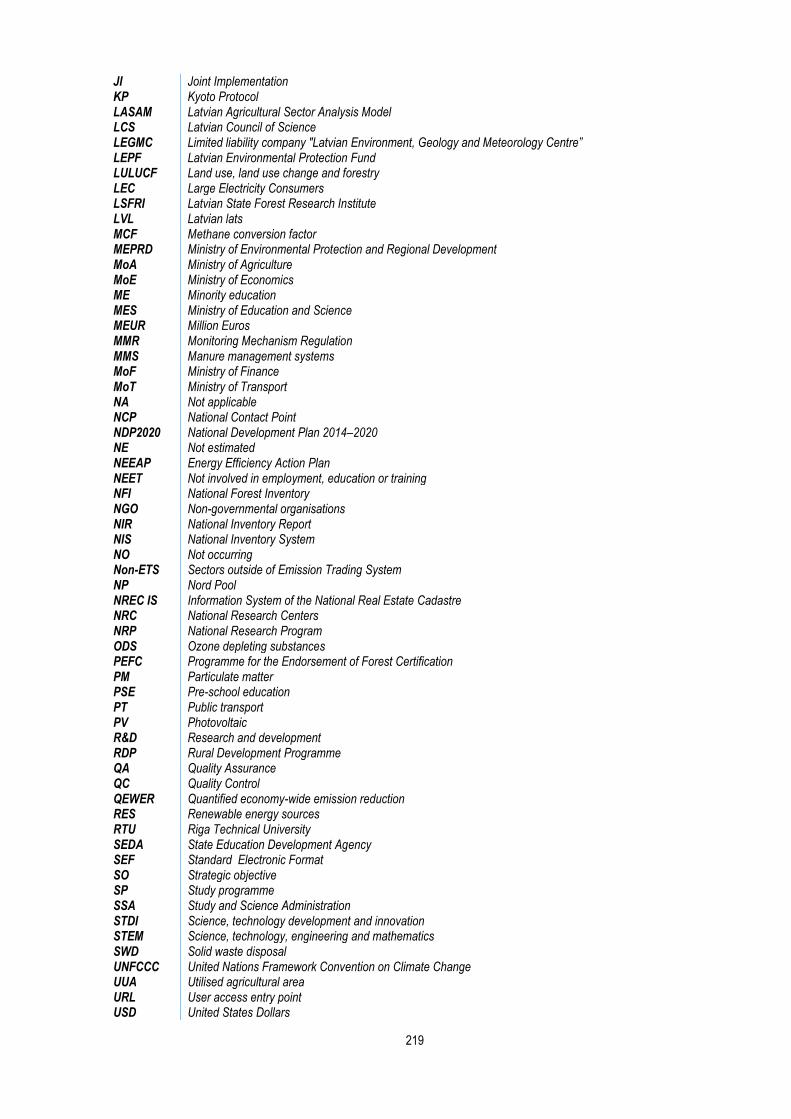
219
JI Joint Implementation KP Kyoto Protocol LASAM Latvian Agricultural Sector Analysis Model LCS Latvian Council of Science LEGMC Limited liability company "Latvian Environment, Geology and Meteorology Centre” LEPF Latvian Environmental Protection Fund LULUCF Land use, land use change and forestry LEC Large Electricity Consumers LSFRI Latvian State Forest Research Institute LVL Latvian lats MCF Methane conversion factor MEPRD Ministry of Environmental Protection and Regional Development MoA Ministry of Agriculture MoE Ministry of Economics ME Minority education MES Ministry of Education and Science MEUR Million Euros MMR Monitoring Mechanism Regulation MMS Manure management systems MoF Ministry of Finance MoT Ministry of Transport NA Not applicable NCP National Contact Point NDP2020 National Development Plan 2014–2020 NE Not estimated NEEAP Energy Efficiency Action Plan NEET Not involved in employment, education or training NFI National Forest Inventory NGO Non-governmental organisations NIR National Inventory Report NIS National Inventory System NO Not occurring Non-ETS Sectors outside of Emission Trading System NP Nord Pool NREC IS Information System of the National Real Estate Cadastre NRC National Research Centers NRP National Research Program ODS Ozone depleting substances PEFC Programme for the Endorsement of Forest Certification PM Particulate matter PSE Pre-school education PT Public transport PV Photovoltaic R&D Research and development RDP Rural Development Programme QA Quality Assurance QC Quality Control QEWER Quantified economy-wide emission reduction RES Renewable energy sources RTU Riga Technical University SEDA State Education Development Agency SEF Standard Electronic Format SO Strategic objective SP Study programme SSA Study and Science Administration STDI Science, technology development and innovation STEM Science, technology, engineering and mathematics SWD Solid waste disposal UNFCCC United Nations Framework Convention on Climate Change UUA Utilised agricultural area URL User access entry point USD United States Dollars

220
VA Value added WAM Scenario with additional measures WEO World Energy Outlook WM Scenario with existing measures WMO World Meteorological Organization WOM Scenarion without measures WWF World Wildlife Fund
Chemical formulas Units of measurement
CH4 Methane CO2 eq Carbon dioxide equivalent CO Carbon monoxide oC Degree Celsius CO2 Carbon dioxide GWh Gigawatt hour HFC Hydrofluorocarbons Ha Hectare N Nitrogen kg yr-1 Kilograms per year N2O NMVOC
Nitrous oxide Non-methane volatile organic compounds
Kha Kilo hectare
NOx Nitric oxide kt Kiloton PFC Perfluorocarbons kWh Kilowatt-hour SF6 Sulphur hexafluoride MJ Mega joule MW Megawatt m/s Meters per second Mm Millimetre % Per cent PJ Peta joule km2 Square kilometre m2 Square metre Mill Millions
221
ANNEXES

222
ANNEX 1 LATVIA’S THIRD BIENN IAL REPORT TO THE UNFCCCC

223
I INTRODUCTION
Third Latvian Biennial report, which has been prepared according to UNFCCC biennial reporting guidelines contained in the Decision 2/CP.17 (FCCC/CP/2011/9/Add.1) adopted by the Conference of the Parties at its 17th session, is presented as a part of the Seventh National Communication report of the Republic of Latvia (according to decision 2/CP.17 (para.15)). This report contains summary information on GHG inventory information for the time period 1990-2015, summary information on quantified economy-wide emission reduction target and Latvia’s progress in achievement of it, as well as summary information on projections until year 2035. Information provided on GHG emissions and trends is consistent with information in Latvia’s GHG inventory submission in 2017206.
The EU and its Member States are committed to a joint quantified economy - wide emission reduction target of 20% by 2020 compared to 1990 level. Therefore, Latvia has not submitted individual economy - wide emission reduction target to the UNFCCC secretariat. The details of the EU joint target under the UNFCCC are explained in the EU’s Third Biennial report under the UNFCCC. Latvia’s Third biennial report provides information on progress made in relation to Latvia’s contribution to the joint EU quantified economy - wide emission reduction target, including information on projected emissions, policies and measures.
The report also includes information on provision of financial, technological and capacity-building support to parties not included in Annex I to the Convention.
Common Tabular Format tables according to the decision 19/CP.18 – Common tabular format for “UNFCCC biennial reporting guidelines for developed country Parties” (FCCC/CP/2012/8/Add.3) – are enclosed as Appendix of Annex1 - Latvia’s Third Biennial Report – and are submitted separately to the UNFCCC using the CTF software.
206 Latvia’s 2017 inventory submission under the UNFCCC available at http://unfccc.int/national_reports/annex_i_ghg_inventories/national_inventories_submissions/items/10116.php

224
II GHG EMISSIONS AND TRENDS
This section presents summary information on the national GHG emissions since 1990. The information is consistent with the most recent – 2017 inventory submission under the UNFCCC where detailed information on GHG emissions and their estimates can be found. Further information is reported in Latvia’s Seventh National Communication report section 3 “Greenhouse Gas Inventory Information” and Table 1 included in Appendix of Latvia’s Third Biennial Report.
II.I Summary information on GHG emissions and trends
Description of emission trends by sector
The emission data presented in this chapter and in CTF table 1 are based on the Latvia’s national greenhouse gas inventory 1990-2015, submitted to the UNFCCC secretariat on 13 April 2017. The inventory is prepared according to the UNFCCC reporting guidelines on annual inventories for Parties
included in Annex I to the Convention207 (Decision 24/CP.19) and with Regulation (EU) No 525/2013.
Figure 1 shows time series of CO2 equivalent emissions by sectors for time period 1990-2015. Total GHG emissions without LULUCF, with indirect CO2 during the time period 1990-2015 have decreased by 56.8% and constituted 11319.4 kt CO2 eq. in 2015.
GHG emissions had considerably decreased during the time period 1990–1995 when the national economy of Latvia transformed from central planning economy to a market economy which affected all sectors of the national economy. Since 2000 GHG emissions have increased relatively less than gross domestic product (GDP) in spite of large annual fluctuations. The relation GHG/GDP which characterizes GHG intensity of Latvia`s economy has decreased by 37%. Decreasing trend was observed till 2008 when it stopped because of the economic recession. A fall of this indicator resumed after 2010.
In 2015 (without LULUCF) the Energy sector caused 62.9% from total GHG emissions, Agriculture – 24.2%, Industrial processes and product use (IPPU) – 6.7% and Waste management – 6.1%. Further information, particularly emissions trends analysis, can be found in section 3.1.1 “Overall greenhouse gas emissions trends” of the Latvia’s Seventh National Communication report.
Figure 1 GHG emission time series for 1990–2015 (kt CO2 eq.)
207 Decision No 24/CP.19 of the Conference of Parties, available at http://unfccc.int/resource/docs/2013/cop19/eng/10a03.pdf

225
Net GHG emissions from Land use, Land use change and forestry (LULUCF) in 2015 were 1377.1 kt CO2 eq. Aggregated net removals of the GHG reduced by 116 % in 2015 in comparison to 1990 mostly due to the increase of harvest rate in mature forests (more than double), increase of natural mortality due to ageing of forest stands and reduction of increment in ageing forests. However considerable role in the increase of the GHG emissions has conversion of forest land to settlements, as well as conversion of naturally afforested lands to cropland and grassland. Although the increment of living biomass in forest land remaining forest and afforested land is still larger than the carbon losses due to commercial felling and natural mortality, the gap between gains and losses is decreasing, causing reduction of the net removals of CO2 in forest land. Hence the total growing stock of living biomass is still increasing in forest lands.
Description of emission trends by gas
The major source of GHG emissions in 2015, including indirect CO2, without LULUCF was CO2 (7256.09 thousand tons), accounting for 64.1% from the total emissions, accordingly methane (CH4)
constituted 16.6%, nitrous oxide (N2O) – 17.2%, and fluorinated gases – 2.1% from total emissions.
In 2015, total CO2 emissions without LULUCF had decreased by approximately 63.4% since 1990. CH4 emissions without and with CH4 from LULUCF had decreased by accordingly 46.8% and 41.3% in 2015 compared to 1990. N2O emissions without and with N2O from LULUCF had decreased by accordingly 31.2% and 22.0% in 2015 compared to 1990. Emissions from HFCs and Sulphur hexafluoride (SF6) consumption are reported for the period 1995-2015. Since 1995 HFCs emissions have increased very significantly due to the increase of activities which contribute emissions - substitution of ozone depleting substances in refrigeration and air conditioning as well as due to the increase of cars, trucks and busses equipped with mobile air conditioners. Since 1995 SF6 emissions also increased significantly, however their total amount, calculated in CO2 eq. tons, is considerably lower (around 5%) compared to HFCs emissions. Emissions of the PFCs and NF3 do not occur in Latvia for all time series. In the period from 1990 to 2015 indirect GHG emissions have decreased: NOx by 61%, CO by 66%, NMVOC by 50% and SO2 by 96%. Further information, particularly emissions trends analysis, can be found in section 3.1.2 “Emission trends by gas” of the Latvia’s Seventh National Communication report.
II.II National Inventory Arrangements
Institutional arrangements
This section provides a summary of National System for preparing Latvia’s GHG inventory. Detailed information of institutional arrangements can be found in Latvia’s 2017 inventory submission under the UNFCCC206. Further information can be found in section 3.2.1 “Institutional Arrangements” of the Latvia’s Seventh National Communication report.
Latvian national GHG inventory system is designed and operated according to the requirements for reporting on national inventory systems under the Kyoto Protocol, European Union Monitoring Mechanism Regulation (EU MMR)208 and UNFCCC reporting guidelines (Decision No 24/CP.19207 of the Conference of Parties).
Latvia’s GHG inventory is compiled according to Cabinet of Ministers Regulation No. 737 “Development and management of national system for greenouse gas inventory and projections”. The schematic model for the national system is shown in the noted section 3.2.1 of the Latvia’s Seventh National Communication report.
Ministry of Environmental Protection and Regional Development (MEPRD) is responsible for national system establishing, coordination of involved institutions, monitoring and coordination of quality assurance and quality control of the GHG inventory, evaluation of prepared reports.
208 Regulation (EU) No 525/2013 of the European Parliament and of the Council of 21 May 2013 on a mechanism for monitoring and reporting greenhouse gas emissions and for reporting other information at national and Union level relevant to climate change and repealing Decision No 280/2004/EC, available at http://eur-lex.europa.eu/legal-content/EN/TXT/PDF/?uri=CELEX:32013R0525&from=LV
226
The institutions involved in the GHG inventory are:
Latvian Environmental, Geology and Meteorology Centre (LEGMC) – GHG inventory compilation (including coordination and information exchange between involved institutions, emission calculation from energy, IPPU and waste sectors), operation of Latvia’s European Union Emissions Trading Registry (ETR), preparation of reports regarding activities in ETR.
Latvian State Forest Research Institute “Silava” – GHG inventory for LULUCF sector,
Institute of Physical Energetics – GHG inventory for transport sector,
Latvian University of Agriculture – GHG inventory in agriculture sector,
natural gas transmission and storage enterprises – natural gas fugitive emissions.
For ensuring the continuity of the functions of the national system, the delegation contracts are signed between the MEPRD and the above mentioned institutions.
According to the above mentioned Cabinet of Ministers Regulation No. 737 (12.12.2017) all institutions involved in inventory process are responsible for implementing quality control procedures.
Activity data source providers are Central Statistical Bureau (main supplier of data) as well as State Forest Service, State Agency of Medicines, Road Traffic Safety Directorate, State Fire and Rescue Service, the merchants of the electricity supply, enterprises (data from national databases: 2-Air, 3-Waste, 2-Water, National Chemicals database), EU ETR operators. Other information sources for activity data are national and international expert researches and EUROSTAT Annual questionnaires.
the following ministries are involved in the GHG inventory review and approving: MEPRD, Ministry of Economics, Ministry of Agriculture, Ministry of Transport, Ministry of Health, Ministry of Education and Science. Based on received comments inventory is corrected accordingly. GHG inventory quality assurance is done by independent experts. The final version of the inventory is publicly available.
Report is submitted to the UNFCCC secretariat and to European Commission.
Further information, including description of responsibilities of involved in the system institutions, can be found in section 3.2.1 “Institutional Arrangements” of the Latvia’s Seventh National Communication report.
Quality Assurance/Quality Control (QA/QC) procedures
The QC procedures comply with the 2006 IPCC Guidelines. General inventory QC checks include routine checks of the integrity, correctness and completeness of data, identification of errors and deficiencies and documentation and archiving of inventory data and quality control actions. QC system includes various activities set to ensure transparent data flow through all inventory process: (i) Assumptions and Criteria for the selection of activity data and emission factors are documented; (ii) Transcription errors in data input and references; (iii) Correctness of calculations of emissions; (iv) Correctness of emission parameters, units, conversion factors; (v) Correctness in use of notation keys; (vi) Integrity of database files; (vi) Consistency in data between source categories. The Latvia QA/QC program prescribed in Cabinet of Ministers Regulation No.737 describes the quality objectives and the inventory quality assurance and quality control plan for the Latvia GHG inventory including responsibilities and the time schedule for the performance of the QA/QC procedures.
The general and category-specific quality control (QC) procedures are performed by sectoral experts during inventory calculation and compilation according to the quality assurance (QA)/quality control (QC) and verification plan.
MEPRD as national entity is responsible for overall QC procedures and quality assurance of national system, including UNFCCC and EU reviews.
227
For 2017 submission, QC activities were carried out at the various stages of the inventory compilation process - processing, handling, documenting, cross checking, and recalculations. These activities are implemented by sectoral experts and quality manager in LEGMC who is responsible for QC procedures before inventory submission for overall QC procedures and final approving in MEPRD. The centralized archiving system (common FTP folder) is created where experts have to upload and download all necessary information for inventory preparation, inter alia spreadsheets which need to be filled for quality control and quality assurance. Instruction for experts how to prepare NIR to ensure comparability of NIR and CRF is prepared and available to experts.
Quality Assurance (QA) activities include a planned system of review procedures conducted by personnel not directly involved in the inventory compilation/development process. According to Cabinet of Ministers Regulation No.737 (12.12.2017) MEPRD is responsible for ensuring QA procedures. The QA reviews are performed after the implementation of QC procedures to the finalised inventory. The inventory QA system comprises reviews to assess the quality of the inventory. A basic review of the draft GHG emission and removal estimates and the draft report takes place before the final submissions to the EU and UNFCCC (January to March) by the involved institutions on GHG inventory preparation process.
Detailed information on activity data and methodologies used can be found in the sectoral chapters, the applied quality control procedures is provided in section 1.2.3 of the Latvia`s National Inventory Report submitted to the UNFCCC secretariat on 13 April 2017.
Further information can be found in section 3.2 “National System” of the Latvia’s Seventh National Communication report.
II.III Changes in National Inventory Arrangements Since Second Biennal Report
Changes in institutional arrangements
On 12th of December 2017 Cabinet of Ministers has approved Regulation No. 737 “Development and management of national system for greenouse gas inventory and projections” which replaces previous national legislation (Regulations of the Cabinet of Ministers No. 217 (27.03.2012) “The National Inventory System of Greenhouse Gas Emission Units”). This legislative act determines the institutions that are responsible for GHG inventory and projections preparation, regulates institutional cooperation for establishment and management of the national GHG inventory and projections system, including data collection mechanism and the reporting procedure. The new regulation includes also the procedures of Quality Assurance/ Quality Control for GHG inventory and projections preparation.
Improvements in inventory process and quality management
Improvements for GHG inventory are compiled based on the findings of the UNFCCC, European Commission, internal reviews and recommendations from third part experts (periodically all sectors are revised by third part experts).
Since the Second Biennal Report Latvia has developed a range of measures to improve the national GHG inventory system and produce more accurate and comprehensive emission estimation. The implemented activities contributed to the improvement of the GHG inventory system and its synergy with air emission data, development of a unified forecasting and modelling system, and expert capacity building: an integrated database for the on-line calculation and summarizing of climate change causing gases and air pollutant emissions and CO2 capture with included forecasting data tools for preparation of international reports has been developed.
Further information, can be found in sections 3.5.1 “Changes since the Sixth National Communication report” and 8.3 “Research on climate change mitigation: research aimed at improving inventory” of the Latvia’s Seventh National Communication report.

228
Quality management of the GHG inventory has been strengthened at various stages of the inventory compilation process.
Emission consistency is ensured in order to meet EU MMR requirements according to European Commission Implementing Regulation (EU) No 749/2014 (MMR IR). GHG emission data are checked with the data used to prepare inventories of air pollutants under EU Directive 2001/81/EC, the actual or estimated allocation of the verified emissions reported by installations and operators under Directive 2003/87/EC, the energy data reported pursuant to Article 4 of, and Annex B to, Regulation (EC) No 1099/2008 and the data reported pursuant to Article 6(1) of Regulation (EC) No 842/2006;
LEGMC quality manager and MEPRD performed cross-checking for all sectors to verify that no mistakes occurred during input/import process. CRF completeness and consistency checks were carried out.
Quality meetings between sectoral experts were held in order to discuss problems and possible improvements in GHG inventory as well as to ensure consistency between activity data used by experts in emission estimation for different sectors.
Detailed QA/QC procedures were done by institutions involved in the GHG inventory preparation (MoA, MEPRD, CSB). Meetings between sectoral experts and involved institutions were held according to comments received and improvements needed in NIR.
Experience exchange seminars with Lithuanian and Estonian GHG expert inventory teams were held within the framework of project Baltic Expert Network for Greenhouse Gas Inventory, Projections and Policies and Measures (PaMs) Reporting (BENGGI) with aim to share experience in reporting of GHG inventories, GHG projections and PaMs as well experience exchange events with Norway GHG inventory experts were held within the project of EEA Financial Mechanism 2009-2014 Programme "National Climate Policy" in purpose to elaborate QA/QC procedures in sectors, improve uncertainty evaluation and improve overall quality of GHG inventory.
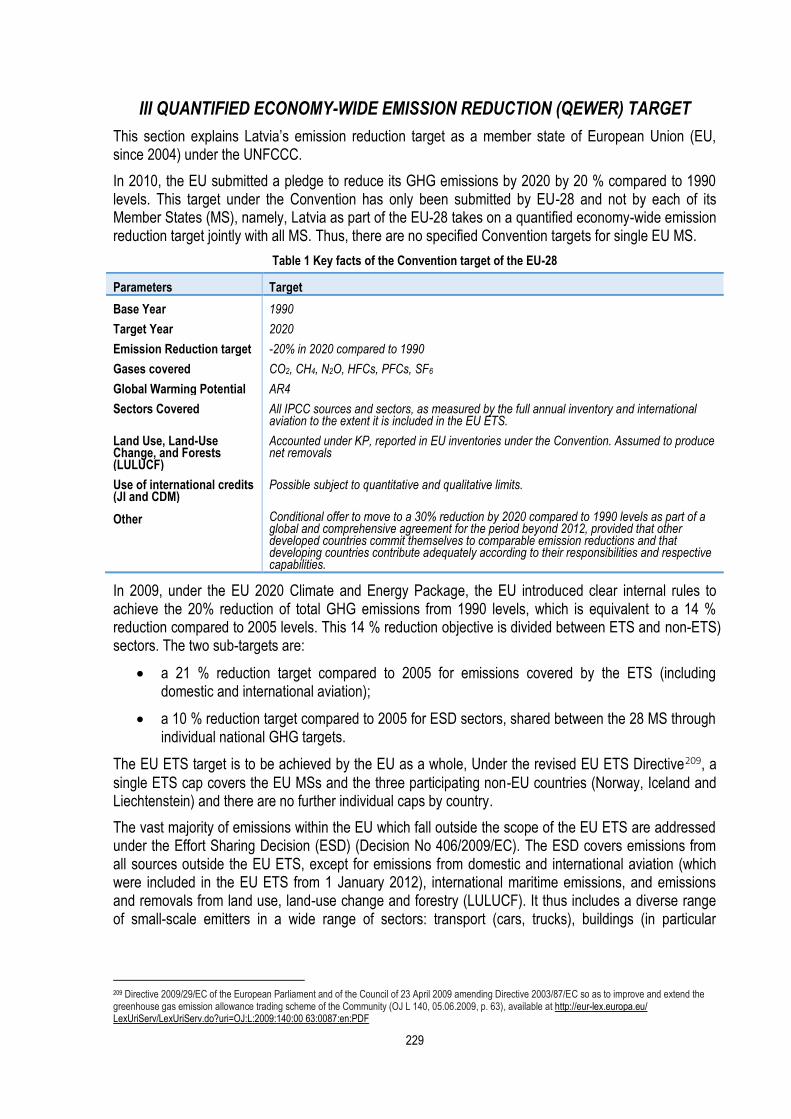
229
III QUANTIFIED ECONOMY-WIDE EMISSION REDUCTION (QEWER) TARGET
This section explains Latvia’s emission reduction target as a member state of European Union (EU, since 2004) under the UNFCCC.
In 2010, the EU submitted a pledge to reduce its GHG emissions by 2020 by 20 % compared to 1990 levels. This target under the Convention has only been submitted by EU-28 and not by each of its Member States (MS), namely, Latvia as part of the EU-28 takes on a quantified economy-wide emission reduction target jointly with all MS. Thus, there are no specified Convention targets for single EU MS.
Table 1 Key facts of the Convention target of the EU-28
Parameters Target
Base Year 1990
Target Year 2020
Emission Reduction target -20% in 2020 compared to 1990
Gases covered CO2, CH4, N2O, HFCs, PFCs, SF6
Global Warming Potential AR4
Sectors Covered All IPCC sources and sectors, as measured by the full annual inventory and international aviation to the extent it is included in the EU ETS.
Land Use, Land-Use Change, and Forests (LULUCF)
Accounted under KP, reported in EU inventories under the Convention. Assumed to produce net removals
Use of international credits (JI and CDM)
Possible subject to quantitative and qualitative limits.
Other Conditional offer to move to a 30% reduction by 2020 compared to 1990 levels as part of a global and comprehensive agreement for the period beyond 2012, provided that other developed countries commit themselves to comparable emission reductions and that developing countries contribute adequately according to their responsibilities and respective capabilities.
In 2009, under the EU 2020 Climate and Energy Package, the EU introduced clear internal rules to achieve the 20% reduction of total GHG emissions from 1990 levels, which is equivalent to a 14 % reduction compared to 2005 levels. This 14 % reduction objective is divided between ETS and non-ETS) sectors. The two sub-targets are:
a 21 % reduction target compared to 2005 for emissions covered by the ETS (including domestic and international aviation);
a 10 % reduction target compared to 2005 for ESD sectors, shared between the 28 MS through individual national GHG targets.
The EU ETS target is to be achieved by the EU as a whole, Under the revised EU ETS Directive209, a
single ETS cap covers the EU MSs and the three participating non-EU countries (Norway, Iceland and Liechtenstein) and there are no further individual caps by country.
The vast majority of emissions within the EU which fall outside the scope of the EU ETS are addressed under the Effort Sharing Decision (ESD) (Decision No 406/2009/EC). The ESD covers emissions from all sources outside the EU ETS, except for emissions from domestic and international aviation (which were included in the EU ETS from 1 January 2012), international maritime emissions, and emissions and removals from land use, land-use change and forestry (LULUCF). It thus includes a diverse range of small-scale emitters in a wide range of sectors: transport (cars, trucks), buildings (in particular
209 Directive 2009/29/EC of the European Parliament and of the Council of 23 April 2009 amending Directive 2003/87/EC so as to improve and extend the greenhouse gas emission allowance trading scheme of the Community (OJ L 140, 05.06.2009, p. 63), available at http://eur-lex.europa.eu/ LexUriServ/LexUriServ.do?uri=OJ:L:2009:140:00 63:0087:en:PDF

230
heating), services, small industrial installations, fugitive emissions from the energy sector, emissions of fluorinated gases from appliances and other sources, agriculture and waste.
While the EU ETS target is to be achieved by the EU as a whole, the ESD target was divided into national targets, expressed as percentage changes from 2005 levels, to be achieved individually by each MS. The target levels have been set on the basis of MSs’ relative GDP per capita. In addition, different levels of development in the EU-28 are taken into account by the provision of several flexibility options.
Latvia’s emission reduction target for 2020 includes the positive limit +17% compared to 2005 established for ESD sector in line with Effort Sharing Decision. By 2013 European Commission Decisions (EC 2013)210+211, these percentage changes have been transferred into binding quantified annual reduction targets for the period from 2013 to 2020, denominated in Annual Emission Allocations (AEAs).
In the year 2015 verified emission of stationary installations covered under the EU-ETS in Latvia summed up to 2.312538 Mt CO2 equivalent. With total GHG emissions of 11.31939 Mt CO2 equivalent (without LULUCF) the share of ETS emissions is 20.4%.
210 Commission decision of 26 March 2013 on determining Member States' annual emission allocations for the period from 2013 to 2020 pursuant to Decision No 406/2009/EC of the European Parliament and of the Council (2013/162/EU), available at http://eur-lex.europa.eu/legal-content/EN/TXT/PDF/?uri=CELEX:32013D0162&from=EN 211 Commission Implementing Decision of 31 October 2013 on the adjustments to Member States' annual emission allocations for the period from 2013 to 2020 pursuant to Decision No 406/2009/ EC of the European Parliament and of the Council (2013/634/EU), available at http://eur-lex.europa.eu/legal-content/EN/TXT/PDF/?uri=CELEX:32013D0634&from=EN

231
IV PROGRESS IN ACHIEVEMENT OF QEWER TARGET
For the quantification of the progress to 2020 targets, the development of GHG emissions is the key indicator. The Convention target of a reduction of emissions by 20% from 1990 to 2020 only refers to the emissions of the EU-28 as a whole. GHG emissions of EU-28 are calculated as the sum of MSs emissions. With this, GHG emissions of Latvia are part of EU-28 emissions with 0.3% from total EU emissions in 2015.
Latvia’s emission trends 1990 – 2015 are reported in detail in CTF Table 1. The development of GHG emissions is reported in CTF Table 4.
Emissions in the sector of LULUCF are not included under the Convention target, therefore they are not included in CTF Tables 4 and 4(a). The latter shall be filled with “NA” for not applicable, with the explanation “Numbers for LULUCF are not reported because this sector is not included under the Convention target”.
The use of flexible mechanisms takes place on the one hand by operators in the EU ETS, on the other hand by governments for the achievement of ESD targets. For information on the use of flexible mechanisms under the EU ETS please see the 3rd BR under the UNFCCC of the European Union.
Latvia met ESD target with national measures in 2013, 2014 and 2015 (see Table 2). This will be the case also for further years till 2020, when ESD targets according to the current projections for 2017-2020 are planned to meet with existing national measures.
Table 2 Annual Latvia’s ESD objectives, actual and projected volumes of GHG emissions in non-ETS (Mt of CO2)
Year 20131 20142 20153 20164 20175 20185 20195 20205 Total:
ESD target6
9,260 9,351 9,442 9,534 9,729 9,817 9,904 9,992 77,030
non-ETS emissions
8,777 9,018 9,005 8,869 9,066 9,119 9,180 9,208 72,241
ESD target fulfillment (surplus)
+0,483 +0,334 +0,437 +0,664 +0,664 +0,698 +0,725 +0,784 +4,789
1 actual surplus in accordance with actual emissions approved by Commission Implementing Decision (EU) 2016/2132 of 5 December 2016 on greenhouse gas emissions for each Member State for the year 2013 covered by Decision No 406/2009/EC of the European Parliament and of the Council;
2 actual surplus in accordance with actual emissions approved by Commission Implementing Decision (EU) 2017/1015 of 15 June 2017 on greenhouse gas emissions covered by Decision No 406/2009/EC of the European Parliament and of the Council for the year 2014 for each Member State;
3 actual surplus in accordance with actual emissions approved by Commission Implementing Decision (EU) 2017/2377 of 15 December 2017 on greenhouse gas emissions covered by Decision No 406/2009/EC of the European Parliament and of the Council for the year 2015 for each Member State;
4 according to the proxy GHG inventory of Latvia for 2016;
5 according to the projections submitted to the Commission on 30 May 2017 in accordance with the report on policies, measures, projections drawn up in accordance with Regulation of the European Parliament and of the Council of 21 May 2013 525/2013 on a mechanism for monitoring and reporting greenhouse gas emissions and for reporting other information at national and Union level relevant to climate change and repealing Decision No 280/2004/EC.
6 Latvia's annual ESD targets for the period from 2013 to 2020 are set by the European Commission's decisions: Commission Decision of 26 March 2013 on determining Member States’ annual emission allocations for the period from 2013 to 2020 pursuant to Decision No 406/2009/EC of the European Parliament and of the Council (2013/162/EU); Commission Decision (EU) 2017/1471 of 10 August 2017 amending Decision 2013/162/EU to revise Member States' annual emission allocations for the period from 2017 to 2020; Commission implementing decision 31 October 2013 on the adjustments to Member States’ annual emission allocations for the period from 2013 to 2020 pursuant to Decision No 406/2009/EC of the European Parliament and of the Council (2013/634/EU).

232
Taking into account that Latvia has met its targets and has not transferred any ESD units to other EU Member State - Latvia used only one flexible mechanism (banking) under the ESD compliance cycles for the year 2013 and 2014 and transferred all the surplus ESD units to 2015.
Other emission reduction targets
In addition to the EU target under the Convention, Latvia as the member of the EU also committed to a legally binding quantified emission limitation reduction commitment for the second commitment period of the Kyoto Protocol (2013-2020).

233
V POLICIES AND MEASURES
The following section describes in short those GHG emissions reduction policies and measures (PAMs) which were not included in the Latvia’s Second Biennial Report, namely, they were started in 2016 and after. Also the changes in the content or time horizon, or financing source of particular PAMs are characterized.
During last years Latvia national climate policy had undergone more integration with the planning and decision making processes in energy production and consumption, transport, agriculture, waste management, forestry and land-use sectors. Further information on the actual sectorial policy planning key documents which have synergy to meet national climate policy objectives see in the section 4.3. “Policies and measures and their effects” of the Latvia’s Seventh National Communication report.
The year 2016 is the boundary year between the implementation of two European Union Funds planning periods: 2007-2013 and 2014-2020. Namely, in 2016 the implementation of programmes approved within the 2007-2013 planning period has been finished and the implementation of programmes of the current, 2014-2020 planning period, in general has started.
Important, for a range of EU Funds co-financed investment programmes, which in the Latvia’s Second Biennial Report was indicated as planned, the relevant governmental regulations have been adopted and they are currently ongoing the implementation, namely these measures are shifted from WAM scenario to the WM scenario.
At the same time, the impact of expired (implemented) investment-related measures, focused to technology change and energy efficiency, will last up to 2025-2030, thus having significant impact on GHG emissions projections.
Further information on the actual sectorial PAMs, including their detailed description, see in the section 4.3. “Policies and measures and their effects” of the Latvia’s Seventh National Communication report. The full list of GHG PAMs is available in the Annex of the BR3, see CTF Table 3.
Taking into account that new, 2014-2020, financial planning period has started, there are change of financing sources for the range of measures and activities keeping the general content of the measure the same (Table 3). For particular PAMs focus point has been specified, at the same time general objectives of the PAMs remain.
Table 3 General policies and their financing sources
General Policy Financing source
2007-2013 planning period
(2009-2015)
2014-2020 planning period
(2016-2020)
Energy
Efficiency of District Heating systems. RES in District Heating Systems
EU Cohesion Fund, National Operational Programme (NOP) “Infrastructure and Services”
EU Cohesion Fund, NOP “Growth and Employment”
Production of Energy from Biomass in Agriculture Sector
EU EAFRD, national Rural Development Programme
EU EAFRD, national Rural Development Programme
Energy Efficiency in Apartment Buildings
EU ERDF, NOP “Infrastructure and Services”
EU ERDF, NOP “Growth and Employment
Energy Efficiency and RES in Industrial (Production) Buildings and Technologiens
National green investment scheme (CCFI)
EU Cohesion Fund, NOP “Growth and Employment”
Energy Efficiency and RES in Public Buildings
National green investment scheme (CCFI)
EU Cohesion Fund, NOP “Growth and Employment”

234
General Policy Financing source
2007-2013 planning period
(2009-2015)
2014-2020 planning period
(2016-2020)
Transport
Electromobility Development National green investment scheme (CCFI), main focus on co-financing purchase of electrical vehicles in public and business sectors
EU ERDF, NOP “Growth and Employment”, focus on charging infrastructure development
In 2015 the national green investment scheme – Climate Change Financial Instrument (revenues from the sale of GHG emissions under procedures pursuant to Article 17 of the UNFCCC Kyoto Protocol) – had been finished. In its turn, the new national green investment scheme - Emissions Quota Auctioning Instrument (revenues of Latvia’s allocated EU ETS quotas auctioning) have started. Currently, the first two programmes of the new scheme are under implementation – (1) GHG emissions reduction by Low Energy Building, and (2) GHG emissions reduction by Energy Efficiency Improvements in Buildings which have the status of Architecture Monuments of State Significance.
In 2015 it was finished such national green investment scheme (CCFI) particular programmes as: Renewable Technologies for Heat and Electricity Production to Reduce GHG emissions, Renewable Energy Technologies in Households, Municipal Public Territories Lightning Infrastructure. Currently there are no adopted continuations of these programmes. On the other hand, the new Strategy of Emissions Quota Auctioning Instrument states as the perspective investment sectors: GHG emissions reduction by applying urban technologies, GHG emissions reduction in production processes, by providing recovering and re-use of energy, GHG emissions reduction by RES utilising microgeneration technologies in households.
In the period since Latvia’s Second Biennial Report changes in GHG emissions related taxation have taken place, among them the most important are:
the tax rate for CO2 emissions (Natural Resources Tax Law, Annex 4) is increased from 3.5 (on
01.01.2015) up to 4.5 (from 01.01.2017) EUR per 1 ton of CO2 emissions212,
the new approach - cars annual taxation based on the specific CO2 emissions - is introduced (Law „On the Vehicle Operation Tax and Company Car Tax”). For the cars registered in the period 01.01.2009-31.12.2016 this approach will be in force from 01.01.2019, for the cars undergoing registration in Latvia after 31.12.2016 – immediately.
The rates of excise tax (Law “On Excise Duties”) in Transport sector are increased. The future rate for gasoline in 2018-2019 is increased by ~16% compared to 2015, for diesel – by ~ 12% compared to 2015. In 2020 it is stated further increase of the rate, by ~24% compared to 1990 (both gasoline and diesel). The future rate for oil gasses and other hydrocarbons in 2018-2019 is increased by ~52% compared to 2015, in 2020 ~ 77% compared to 2015.
The tax rate for disposal of non-hazardous waste (Natural Resources Tax Law, Annex 3) is step-by-step increased and in 2020 will be more than 4 times higher than in 2016 for household
waste and ~2.3 times higher for industrial waste213 . The same – increase of ~ 1,7 times
compared to 2016 - relates to hazardous waste as well.
212 The subject of CO2 taxation is CO2 emitting activities (installations), for which a GHG emission permit is required- if the amount of the activity (installation) is below the limit defined for inclusion in EU Emissions Trading Scheme. The tax shall not be paid for the emissions of CO2 which emerges (i) while using RES and local fuel peat, and (ii) from the installations participating in EU ETS. 213 The Law states the following time plan for the increase: from 12 for household waste and 21.34 for industrial waste (31.12.2016) up to 25 (from 01.01.2017), 35 (from 01.01.2018), 43 (from 01.01.2019) and 50 (from 01.01.2020) EUR per 1 ton of disposed waste.

235
VI PROJECTIONS
The scenarios underlying the emission projections have incorporated new insights with regard to economic and demographic developments, sector developments, fossil fuel prices, the CO2 price and policies when compared with the previous projection of the Second Biennial report.
GHG emissions in Latvia have been projected for the years 2020, 2025, 2030 and 2035. The projections are based on the policies and measures approved by the Latvia parliament and government up to the year 2016, which means that it is a projection “with measures” (WM). In addition to this scenario, there are also projected emissions with planned policies and measures. These are the measures which are principally announced by the high-level strategic development documents but still the implementation of these measures have not been elaborated in details yet and legal regulations have not been adopted but are expected to be adopted and implemented from a specific future year onwards. This is the “scenario with additional measures” (WAM).
Figure 2 Comparison of submitted GHG projections for BR2 and BR3
The GHG projections calculated in 2017 and submitted under the Latvia’s Third Biennial Report differ from the projections submitted in 2015 under the Second Biennial Report. Namely, in the WM scenario’s the GHG emissions projections, calculated in 2017, are lower: respectively per about 8% for 2020 and per about 13.4% for 2030. It should be underlined that the macroeconomic assumptions have not been changed substantially. The main differences have been caused by the fact that the range of policies and measures which have been included, as the planned measures, in the Second Biennial Report in the WAM scenario, currently are ongoing the implementation and thus in the Third Biennial Report are shifted to WM scenario. Quantified analysis of GHG emissions in noted above scenarios confirms this cause as the main one (see Figure 2).
Further detailed information on projections is reported in the section 5 “Projections and the total effects of policies and measures” of the Latvia’s Seventh National Communication report.
Sensitivity analysis
Performing GHG emissions calculations in different sectors, it was taken into account that there are sector-specific key drivers which influence emissions projected amount as well as uncertainties regarding the future trends of parameters, used for GHG emissions projecting, exist. Therefore, the availability of sensitivity analyses around the chosen baseline (WM scenario) was particularly useful to show how changes in key drivers would affect emissions. Four sensitivity analysis regarding GHG emissions projections have been carried out. GDP and population assumptions impacts on projected GHG emissions have been analysed in energy and waste management sector. In energy sector it has

236
been analysed also the impact of imported electricity price and amount. In its turn, sensitivity analysis in agriculture sector has been focused how different values of grain and milk prices may impact GHG projections in this sector. Further detailed information on sensitivity analyses is reported in the section 5 “Projections and the total effects of policies and measures” of the Latvia’s Seventh National Communication report (see chapter 5.3 “Sensitivity analyses”).
Models and methodology
There are no changes to implemented Models or Methodologies compared to Second Biennial Report. Further detailed information on models and methodology is reported in the section 5 “Projections and the total effects of policies and measures” of the Latvia’s Seventh National Communication report (see chapter 5.5 “Methodology”). Summarized information on the implemented Models and Methodologies can be found in Table 4.

237
Table 4 Description of implemented models for GHG projections
Model Gases and/sector
Type of model/approach and characteristics
Original purpose and changes to climate change purposes
Strengths and weaknesses of the model/approach
Overlap or synergies with PAM
MARKAL-Latvia
All GHG and air pollution emissions Energy and Transport
Partial equilibrium, bottom-up, optimization model. It is used Elastic demand approach.
Additional information can be found at: http://www.iea-etsap.org/web/Markal.asp
Original purpose is to describe development of the Latvian energy system over a period of 50 years on the national level.
The model structure is adapted, so that emissions can be calculated and reported not only by the type of fuel, but also by sector and corresponding type of technologies. Model is developed to investigate impact of specific policies (energy efficiency and RES) to GHG emissions.
Strength:
Well understood least-cost modelling paradigm (efficient markets);
Provides a framework to evaluate technologies on the basis of cost assumptions, to check the consistency of results and explore sensitivities to key data and assumptions;
Transparent framework; open assumptions on data, technology pathways, constraints etc;
Interactions within entire energy system (e.g. resource supply curves, competing use for infrastructures and fuels, sectoral technology diffusion);
Ability to track emissions and energy consumption across the energy system, and model the impact of constraints on both;
Weaknesses:
Model is highly data intensive (characterization of technologies and RES);
Limited ability to model consumers‘ behaviour;
Considering that MARKAL model is optimisation model, the impact assessment of defined PAMs might be done without overlapping. The MARKAL model chooses the PaMs according the least cost order (e.g., at first it is chosen the energy efficiency measures having lower costs which are followed by the higher costs’ RES measures). Thus as the result, the integrated evaluation of energy system is performed.
To minimise the risk of overlapping the GHG savings from PaMs a package approach has been adopted when accounting for the impact of policies on emissions.

238
Model Gases and/sector
Type of model/approach and characteristics
Original purpose and changes to climate change purposes
Strengths and weaknesses of the model/approach
Overlap or synergies with PAM
F-gases Excel based accounting model
HFC and SF6
CRF 2.F Product uses as substitutes for ODS;
CRF 2.G Other product manufacture and use.
Accounting model: Top-down accounting model is based on 2006 IPCC guidelines and adjusted for projection estimation incorporating parameters according to macroeconomic forecast.
The F-gases accounting model originally was designed for F-gases emission calculation in annual GHG inventory.
Strength:
As the one model is used for F-gases emission calculation in both GHG inventory and for estimation of projections hence the consistency is ensured
Weakness:
Susceptible to trivial human errors.
In purpose to avoid the overlapping that may exist between different policies and measures (PaMs) the analyse of PaMs is carried out before including them into WEM or WAM scenario. Afterwards measures are grouped and combined by the type of their effect.
IPCC Waste model and Excel based estimation of activity data
All GHG and air pollution emissions CRF 5 Waste
IPCC Waste model: bottom up approach.
Emission projection estimations based on IPCC methodology. Estimations of activity data are based on macroeconomic forecast, existing trends and existing/planned PaMs in the sector.
IPCC Waste model was originally designed for estimation of CH4 emission from solid waste disposal.
Strength:
IPCC Waste model:
Comparability with calculations from other countries.
Excel based estimations: simplicity and flexibility.
Weakness:
IPCC Waste model:
Low flexibility if parameters are changing due to time series.
Excel based estimations:
Susceptible to trivial human errors in interpretation of existing or projected trends in the sector.
Existing and planned PaMs are taken into account in order to estimate relevant activity data for emission projections.
IPCC AFOLU model and Excel or R based estimation of
All GHG and air pollution emissions CRF 3 Agriculture.
IPCC AFOLU model: bottom up approach.
Emission projection estimations are based on IPCC methodology.
IPCC AFOLU model was originally designed for estimation of CH4 and N2O emissions from enteric fermentation, manure and soil management.
Strength:
IPCC AFOLU model:
Comparability of calculations for
Existing PaMs are evaluated in order to estimate relevant emission projections by using IPCC methodology.

239
Model Gases and/sector
Type of model/approach and characteristics
Original purpose and changes to climate change purposes
Strengths and weaknesses of the model/approach
Overlap or synergies with PAM
activity data Estimations of activity data are based on forecast of milk and grain price; as well as on existing trends of agricultural sector activity data.
inventory and providing of calculation consistency.
Weakness:
Regression based estimation of activity data is done by using different sources of macroeconomic indicators, low flexibility in relation to existing PaMs.

240
VI PROVISION OF FINANCIAL, TECHNOLOGICAL AND CAPACITY-BUILDING SUPPORT TO DEVELOPING COUNTRY PARTIES
This section includes information on the provision of financial, technological and capacity-building support to developing countries by Latvia. Further information, can be found in section 7 “Financial resources and transfer of technology” of the Latvia’s Seventh National Communication report.
It should be emphasized that Latvia due to strict budgetary constraints have limited opportunities to participate in the financing of climate change and to support developing countries. As regards of scaling up climate finance, Latvia would like to acknowledge that an essential factor is the leverage of private finance. Private finance and investment will be pivotal to achieving long-term transformation of developing countries into low-carbon, sustainable, and climate-resilient economies.
Latvia is not an Annex II Party therefore the provisions of United Nations Framework Convention on Climate Change Article 4.3, 4.4 and 4.5 are not applicable, but it was decided to report provision of financial support according to EU Regulation No.525/2013 of the European Parliament and of the Council on a mechanism for monitoring and reporting greenhouse gas emissions and for reporting other information at national and Union level relevant to climate change and repealing Decision No.280/2004/EC.
Latvia has fulfilled its obligations under agreement in respect of participation in the Eastern Europe Energy Efficiency and Environment partnership Fund - annually EUR 10 000 for the period 2011-2015. In fact, last instalment for 2015 was carried out in 2016. All these funds are being allocated to energy efficiency projects in Ukraine.
Summarized information on the financial and provision of capacity – building support can be found in the Tables 7 and 9 included in the Annex of Latvia’s Third Biennial Report.
The technology support and transfer were not provisioned.

241
APPENDIX OF ANNEX 1: COMMON TABULAR FORMAT WORKBOOK FOR THE 3RD BIENNIAL REPORT
Contents
CTF Table 1: Emission trends
CTF Table 2: Description of quantified economy-wide emission reduction target
CTF Table 3: Progress in achievement of the quantified economy-wide emission reduction target: information on mitigation actions and their effects
CTF Table 4: Reporting on progress
CTF Table 4(a)II: Progress in achievement of the quantified economy-wide emission reduction targets – further information on mitigation actions relevant to the counting of emissions and removals from the land use, land-use change and forestry sector in relation to activities under Article 3, paragraphs 3 and 4, of the Kyoto Protocol CTF Table 4(b): Reporting on progress
CTF Table 5: Summary of key variables and assumptions used in the projections analysis
CTF Table 6(a)/(c): Information on updated greenhouse gas projections under a ‘with measures’ scenario and under a ‘with additional measures’ scenario
CTF Table 7: Provision of public financial support: summary information
CTF Table 7a: Provision of public financial support: contribution through multilateral channels
CTF Table 9: Provision of capacity-building support

242
CTF Table 1: Emission trends
Table 1
LVA_BR3_v2.0
Emission trends: summary (1)
Source: Submission 2018
v1, LATVIA
(Sheet 1 of 3) #REF!
GREENHOUSE GAS EMISSIONS
Base yeara 1990 1991 1992 1993 1994 1995 1996 1997
kt CO2 eq
CO2 emissions without net CO2 from LULUCF 19,780.53 19,780.53 18,014.36 14,246.67 11,969.34 10,402.29 9,145.17 9,220.45 8,680.28
CO2 emissions with net CO2 from LULUCF 10,113.90 10,113.90 8,059.64 2,841.13 1,435.04 -775.21 -932.34 -1,671.62 -399.01
CH4 emissions without CH4 from LULUCF 3,539.14 3,539.14 3,484.67 2,996.66 2,275.35 2,104.58 2,088.24 2,051.49 2,023.13
CH4 emissions with CH4 from LULUCF 3,842.93 3,842.93 3,783.74 3,380.03 2,580.09 2,407.22 2,400.73 2,367.13 2,341.84
N2O emissions without N2O from LULUCF 2,821.77 2,821.77 2,676.91 2,173.21 1,758.58 1,602.61 1,461.53 1,480.77 1,488.79
N2O emissions with N2O from LULUCF 3,397.51 3,397.51 3,253.90 2,761.87 2,339.72 2,184.78 2,046.73 2,068.20 2,078.80
HFCs NO, NA, NE NO, NA, NE NO, NA, NE NO, NA, NE NO, NA, NE NO, NA, NE 2.50 2.76 3.35
PFCs NO, NA NO, NA NO, NA NO, NA NO, NA NO, NA NO, NA NO, NA NO, NA
Unspecified mix of HFCs and PFCs NO, NA NO, NA NO, NA NO, NA NO, NA NO, NA NO, NA NO, NA NO, NA
SF6 NA, NO NA, NO NA, NO NA, NO NA, NO NA, NO 0.17 0.18 0.37
NF3 NO, NA NO, NA NO, NA NO, NA NO, NA NO, NA NO, NA NO, NA NO, NA
Total (without LULUCF) 26,141.43 26,141.43 24,175.95 19,416.54 16,003.27 14,109.48 12,697.62 12,755.65 12,195.92
Total (with LULUCF) 17,354.34 17,354.34 15,097.29 8,983.02 6,354.85 3,816.79 3,517.79 2,766.65 4,025.35
Total (without LULUCF, with indirect) 26,184.86 26,184.86 24,217.00 19,454.80 16,039.46 14,144.94 12,731.79 12,788.09 12,226.40
Total (with LULUCF, with indirect) 17,397.77 17,397.77 15,138.34 9,021.27 6,391.03 3,852.25 3,551.96 2,799.10 4,055.83
GREENHOUSE GAS SOURCE AND SINK CATEGORIES Base yeara 1990 1991 1992 1993 1994 1995 1996 1997
kt CO2 eq
1. Energy 19,386.62 19,386.62 17,862.27 14,511.48 12,405.30 10,770.85 9,499.55 9,567.70 8,991.97
2. Industrial processes and product use 705.05 705.05 623.70 311.00 150.99 197.15 208.02 217.51 229.64
3. Agriculture 5,370.68 5,370.68 4,978.09 3,918.39 2,841.69 2,546.43 2,383.04 2,355.35 2,340.31
4. Land Use, Land-Use Change and Forestryb -8,787.09 -8,787.09 -9,078.66 -10,433.52 -9,648.42 -10,292.69 -9,179.82 -9,988.99 -8,170.57
5. Waste 679.09 679.09 711.88 675.67 605.29 595.05 607.00 615.09 634.01
6. Other NO NO NO NO NO NO NO NO NO
Total (including LULUCF) 17,354.34 17,354.34 15,097.29 8,983.02 6,354.85 3,816.79 3,517.79 2,766.65 4,025.35
Note: All footnotes for this table are given on sheet 3.
1 The common tabular format will be revised, in accordance with relevant decisions of the Conference of the Parties and, where
applicable, with decisions of the Conference of the Parties serving as the meeting of the Parties to the Kyoto Protocol."

243
Table 1
LVA_BR3_v2.0
Emission trends: summary (1)
(Sheet 2 of 3) #REF!
GREENHOUSE GAS EMISSIONS 1998 1999 2000 2001 2002 2003 2004 2005 2006 2007
CO2 emissions without net CO2 from LULUCF 8,303.08 7,711.82 7,072.96 7,484.26 7,511.84 7,706.77 7,713.19 7,790.92 8,292.90 8,610.90
CO2 emissions with net CO2 from LULUCF 169.91 3,088.00 -557.22 -813.30 662.49 1,374.89 2,799.57 3,439.09 2,745.08 3,707.93
CH4 emissions without CH4 from LULUCF 1,937.81 1,807.06 1,848.12 1,938.36 1,924.59 1,847.00 1,822.43 1,880.66 1,857.38 1,913.67
CH4 emissions with CH4 from LULUCF 2,257.65 2,156.99 2,185.89 2,240.74 2,255.15 2,156.05 2,125.48 2,160.54 2,180.51 2,193.20
N2O emissions without N2O from LULUCF 1,446.64 1,379.66 1,404.85 1,498.28 1,461.60 1,515.18 1,506.99 1,563.25 1,574.14 1,628.75
N2O emissions with N2O from LULUCF 2,038.76 1,976.39 2,002.09 2,093.28 2,062.02 2,115.07 2,108.21 2,163.11 2,183.09 2,232.19
HFCs 5.75 6.96 9.59 12.92 16.44 20.27 36.06 52.06 86.61 112.51
PFCs NO, NA NO, NA NO, NA NO, NA NO, NA NO, NA NO, NA NO, NA NO, NA NO, NA
Unspecified mix of HFCs and PFCs NO, NA NO, NA NO, NA NO, NA NO, NA NO, NA NO, NA NO, NA NO, NA NO, NA
SF6 0.52 0.71 0.88 1.39 2.62 2.76 3.25 3.78 4.07 4.55
NF3 NO, NA NO, NA NO, NA NO, NA NO, NA NO, NA NO, NA NO, NA NO, NA NO, NA
Total (without LULUCF) 11,693.78 10,906.21 10,336.41 10,935.21 10,917.09 11,091.98 11,081.92 11,290.67 11,815.09 12,270.39
Total (with LULUCF) 4,472.58 7,229.05 3,641.24 3,535.03 4,998.72 5,669.04 7,072.58 7,818.58 7,199.35 8,250.38
Total (without LULUCF, with indirect) 11,722.71 10,934.19 10,362.81 10,961.14 10,943.44 11,113.04 11,102.24 11,312.30 11,831.54 12,288.33
Total (with LULUCF, with indirect) 4,501.50 7,257.03 3,667.63 3,560.96 5,025.06 5,690.10 7,092.89 7,840.21 7,215.80 8,268.33
GREENHOUSE GAS SOURCE AND SINK CATEGORIES 1998 1999 2000 2001 2002 2003 2004 2005 2006 2007
1. Energy 8,572.90 7,932.00 7,310.01 7,731.21 7,734.19 7,889.44 7,916.18 8,027.85 8,458.55 8,782.73
2. Industrial processes and product use 237.86 270.43 223.37 245.76 260.95 277.65 309.16 308.25 369.93 394.40
3. Agriculture 2,236.78 2,047.54 2,081.38 2,201.84 2,183.59 2,234.80 2,168.01 2,245.76 2,253.68 2,347.46
4. Land Use, Land-Use Change and Forestryb -7,221.21 -3,677.16 -6,695.18 -7,400.18 -5,918.37 -5,422.94 -4,009.35 -3,472.09 -4,615.74 -4,020.01
5. Waste 646.25 656.24 721.66 756.41 738.36 690.08 688.57 708.80 732.93 745.79
6. Other NO NO NO NO NO NO NO NO NO NO
Total (including LULUCF) 4,472.58 7,229.05 3,641.24 3,535.03 4,998.72 5,669.04 7,072.58 7,818.58 7,199.35 8,250.38
Note: All footnotes for this table are given on sheet 3.

244
Table 1 LVA_BR3_v2.0
Emission trends: summary (1) Sourcubmis
(Sheet 3 of 3) #REF!
GREENHOUSE GAS EMISSIONS 2008 2009 2010 2011 2012 2013 2014 2015
Change from base to latest
reported year
(%)
CO2 emissions without net CO2 from LULUCF 8,174.33 7,438.76 8,529.66 7,799.31 7,519.14 7,350.38 7,151.01 7,239.36 -63.40
CO2 emissions with net CO2 from LULUCF 2,867.05 6,168.00 9,596.39 8,597.88 7,141.96 7,388.80 10,413.46 7,535.34 -25.50
CH4 emissions without CH4 from LULUCF 1,871.00 1,851.99 1,836.19 1,766.80 1,849.78 1,886.41 1,956.93 1,883.88 -46.77
CH4 emissions with CH4 from LULUCF 2,149.75 2,152.00 2,144.65 2,088.33 2,186.14 2,240.46 2,332.89 2,256.72 -41.28
N2O emissions without N2O from LULUCF 1,619.07 1,642.88 1,674.21 1,683.25 1,773.61 1,807.60 1,867.87 1,942.25 -31.17
N2O emissions with N2O from LULUCF 2,224.18 2,268.73 2,317.90 2,345.30 2,454.26 2,507.13 2,572.77 2,650.58 -21.98
HFCs 132.10 142.38 155.01 175.99 181.18 197.21 205.63 227.06 100.00
PFCs NO, NA NO, NA NO, NA NO, NA NO, NA NO, NA NA, NO NA, NO 0.00
Unspecified mix of HFCs and PFCs NO, NA NO, NA NO, NA NO, NA NO, NA NO, NA NA, NO NA, NO 0.00
SF6 5.23 7.33 7.35 7.47 7.78 8.50 8.58 10.12 100.00
NF3 NO, NA NO, NA NO, NA NO, NA NO, NA NO, NA NA, NO NA, NO 0.00
Total (without LULUCF) 11,801.73 11,083.34 12,202.43 11,432.81 11,331.49 11,250.11 11,190.02 11,302.67 -56.76
Total (with LULUCF) 7,378.31 10,738.45 14,221.31 13,214.96 11,971.32 12,342.10 15,533.33 12,679.81 -26.94
Total (without LULUCF, with indirect) 11,818.95 11,099.68 12,218.08 11,443.23 11,343.80 11,265.27 11,210.22 11,319.39 -56.77
Total (with LULUCF, with indirect) 7,395.53 10,754.79 14,236.96 13,225.39 11,983.63 12,357.25 15,553.53 12,696.54 -27.02
GREENHOUSE GAS SOURCE AND SINK CATEGORIES 2008 2009 2010 2011 2012 2013 2014 2015
Change from base to latest
reported year
(%)
1. Energy 8,327.93 7,607.63 8,404.69 7,534.19 7,217.40 7,139.41 6,974.24 7,115.05 -63.30
2. Industrial processes and product use 402.89 405.14 680.25 807.14 881.70 819.79 823.68 760.54 7.87
3. Agriculture 2,325.77 2,353.79 2,376.00 2,395.87 2,506.49 2,570.33 2,663.32 2,739.64 -48.99
4. Land Use, Land-Use Change and Forestryb -4,423.42 -344.89 2,018.88 1,782.15 639.83 1,091.99 4,343.32 1,377.15 -115.67
5. Waste 745.14 716.78 741.48 695.61 725.91 720.59 728.77 687.44 1.23
6. Other NO NO NO NO NO NO NO NO 0.00
Total (including LULUCF) 7,378.31 10,738.45 14,221.31 13,214.96 11,971.32 12,342.10 15,533.33 12,679.81 -26.94
Notes: (1) Further detailed information could be found in the common reporting format tables of the Party’s greenhouse gas inventory, namely “Emission trends (CO2)”, “Emission trends (CH4)”, “Emission trends (N2O)” and
“Emission trends (HFCs, PFCs and SF6)”, which is included in an annex to this biennial report.
(2) 2011 is the latest reported inventory year.
(3) 1 kt CO2 eq equals 1 Gg CO2 eq.
Abbreviation: LULUCF = land use, land-use change and forestry.
a The column “Base year” should be filled in only by those Parties with economies in transition that use a base year different from 1990 in accordance with the relevant decisions of the Conference of the Parties. For these Parties, this different base year is used to calculate the percentage change in the final column of this table.
b Includes net CO2, CH4 and N2O from LULUCF.

245
Table 1 (a) LVA_BR3_v2.0
Emission trends (CO2)
(Sheet 1 of 3) #REF!
GREENHOUSE GAS SOURCE AND SINK CATEGORIES Base yeara 1990 1991 1992 1993 1994 1995 1996 1997
kt
1. Energy 18,713.38 18,713.38 17,163.69 13,902.08 11,816.97 10,205.19 8,940.33 9,006.74 8,455.37
A. Fuel combustion (sectoral approach) 18,713.37 18,713.37 17,163.68 13,902.07 11,816.96 10,205.18 8,940.32 9,006.73 8,455.36
1. Energy industries 6,248.76 6,248.76 5,735.69 4,899.56 3,972.68 3,747.40 3,421.28 3,544.23 3,303.43
2. Manufacturing industries and construction 3,913.61 3,913.61 2,946.73 2,496.76 2,164.25 1,955.31 1,907.37 1,863.83 1,804.04
3. Transport 2,930.56 2,930.56 2,744.72 2,449.46 2,259.68 2,143.90 2,040.68 2,006.32 1,997.58
4. Other sectors 5,620.43 5,620.43 5,736.54 4,056.29 3,420.35 2,358.56 1,570.98 1,592.16 1,350.21
5. Other NO, NE NO, NE NO, NE NO, NE NO, NE NO, NE NO, NE 0.19 0.10
B. Fugitive emissions from fuels 0.01 0.01 0.01 0.01 0.01 0.01 0.01 0.01 0.01
1. Solid fuels NO NO NO NO NO NO NO NO NO
2. Oil and natural gas and other emissions from energy
production 0.01 0.01 0.01 0.01 0.01 0.01 0.01 0.01 0.01
C. CO2 transport and storage NO NO NO NO NO NO NO NO NO
2. Industrial processes 701.73 701.73 620.42 307.75 147.80 194.02 202.27 211.52 222.88
A. Mineral industry 584.35 584.35 526.98 227.31 60.70 106.46 120.32 131.07 127.89
B. Chemical industry NO NO NO NO NO NO NO NO NO
C. Metal industry 69.69 69.69 54.39 43.33 48.06 50.12 45.46 44.23 60.22
D. Non-energy products from fuels and solvent use 47.69 47.69 39.05 37.10 39.04 37.43 36.48 36.23 34.78
E. Electronic industry
F. Product uses as ODS substitutes
G. Other product manufacture and use NO NO NO NO NO NO NO NO NO
H. Other NO, NA NO, NA NO, NA NO, NA NO, NA NO, NA NO, NA NO, NA NO, NA
3. Agriculture 364.84 364.84 229.66 36.23 3.93 2.43 1.91 1.49 1.32
A. Enteric fermentation
B. Manure management
C. Rice cultivation
D. Agricultural soils
E. Prescribed burning of savannas
F. Field burning of agricultural residues
G. Liming 357.13 357.13 223.07 32.36 1.60 0.73 1.24 0.64 0.18
H. Urea application 7.71 7.71 6.59 3.87 2.33 1.70 0.67 0.85 1.14
I. Other carbon-containing fertilizers NO NO NO NO NO NO NO NO NO
J. Other NO NO NO NO NO NO NO NO NO
4. Land Use, Land-Use Change and Forestry -9,666.63 -9,666.63 -9,954.72 -11,405.54 -10,534.30 -11,177.50 -10,077.51 -10,892.07 -9,079.28
A. Forest land -15,041.86 -15,041.86 -15,862.49 -16,355.24 -15,478.67 -15,828.65 -14,374.61 -14,426.37 -11,767.51
B. Cropland 3,298.59 3,298.59 3,320.74 3,345.86 3,369.11 3,390.71 3,413.08 3,065.53 3,067.10
C. Grassland 900.79 900.79 872.77 845.31 812.58 780.65 743.38 702.32 662.91
D. Wetlands 1,213.07 1,213.07 1,742.22 562.79 249.68 382.94 392.50 376.10 425.34
E. Settlements 112.60 112.60 118.79 125.79 135.76 142.64 151.56 121.48 126.65
F. Other land NO NO NO NO NO NO NO NO NO
G. Harvested wood products -149.84 -149.84 -146.75 69.94 377.25 -45.79 -403.42 -731.15 -1,593.77

246
H. Other NO NO NO NO NO NO NO NO NO
5. Waste 0.57 0.57 0.59 0.61 0.63 0.65 0.67 0.69 0.71
A. Solid waste disposal NO, NA NO, NA NO, NA NO, NA NO, NA NO, NA NO, NA NO, NA NO, NA
B. Biological treatment of solid waste
C. Incineration and open burning of waste 0.57 0.57 0.59 0.61 0.63 0.65 0.67 0.69 0.71
D. Waste water treatment and discharge
E. Other NO NO NO NO NO NO NO NO NO
6. Other (as specified in the summary table in CRF) NO NO NO NO NO NO NO NO NO
International bunkers 1,732.87 1,732.87 751.56 659.19 762.92 970.45 558.71 410.81 325.96
Aviation 221.15 221.15 299.01 84.10 84.10 77.87 77.87 99.67 99.67
Navigation 1,511.73 1,511.73 452.55 575.09 678.83 892.58 480.84 311.14 226.29
Multilateral operations NA NA NA NA NA NA NA NA NA
CO2 emissions from biomass 3,024.52 3,024.52 3,547.13 3,537.13 3,941.03 4,085.61 4,631.25 4,841.29 4,852.53
CO2 captured NO NO NO NO NO NO NO NO NO
Long-term storage of C in waste disposal sites NA NA NA NA NA NA NA NA NA
Indirect N2O
Indirect CO2 (3) 43.43 43.43 41.05 38.25 36.18 35.46 34.17 32.45 30.48
Total CO2 equivalent emissions with land use, land-use
change and forestry 10,113.90 10,113.90 8,059.64 2,841.13 1,435.04 -775.21 -932.34 -1,671.62 -399.01
Total CO2 equivalent emissions, including indirect CO2,
with land use, land-use change and forestry 10,157.33 10,157.33 8,100.70 2,879.38 1,471.23 -739.75 -898.17 -1,639.17 -368.52
Note: All footnotes for this table are given at the end of the
table on sheet 6.
Note: All footnotes for this table are given on sheet 3.

247
Table 1 (a) LVA_BR3_v2.0
Emission trends (CO2) Soussion 2018 v1,
LATVIA
(Sheet 2 of 3) #REF!
GREENHOUSE GAS SOURCE AND SINK CATEGORIES
1998 1999 2000 2001 2002 2003 2004 2005 2006 2007
1. Energy 8,070.46 7,447.94 6,855.81 7,251.20 7,252.99 7,428.56 7,443.31 7,537.93 8,012.10 8,328.79
A. Fuel combustion (sectoral approach) 8,070.45 7,447.93 6,855.80 7,251.19 7,252.99 7,428.56 7,443.30 7,537.93 8,012.09 8,328.79
1. Energy industries 3,364.73 2,941.47 2,492.11 2,437.06 2,332.07 2,259.86 2,068.41 2,058.22 2,084.74 1,954.92
2. Manufacturing industries and construction 1,573.19 1,423.72 1,157.22 1,055.88 1,105.24 1,123.83 1,137.28 1,144.07 1,215.46 1,210.78
3. Transport 1,972.66 1,940.63 2,150.24 2,542.53 2,620.07 2,763.52 2,902.76 3,028.34 3,342.60 3,781.36
4. Other sectors 1,159.68 1,141.96 1,056.08 1,215.56 1,188.72 1,275.19 1,325.22 1,299.68 1,361.77 1,378.89
5. Other 0.19 0.15 0.14 0.17 6.88 6.16 9.63 7.62 7.51 2.84
B. Fugitive emissions from fuels 0.01 0.01 0.01 0.01 0.01 0.01 0.01 0.01 0.00 0.00
1. Solid fuels NO NO NO NO NO NO NO NO NO NO
2. Oil and natural gas and other emissions from energy production
0.01 0.01 0.01 0.01 0.01 0.01 0.01 0.01 0.00 0.00
C. CO2 transport and storage NO NO NO NO NO NO NO NO NO NO
2. Industrial processes 228.59 259.77 209.93 228.52 239.01 251.76 267.00 249.60 276.47 274.58
A. Mineral industry 129.46 162.11 112.78 132.55 143.29 150.77 159.64 153.97 184.57 190.21
B. Chemical industry NO NO NO NO NO NO NO NO NO NO
C. Metal industry 62.74 61.45 61.20 60.37 60.43 64.70 68.64 50.09 48.48 44.45
D. Non-energy products from fuels and solvent use 36.40 36.22 35.95 35.61 35.29 36.28 38.72 40.70 38.70 39.91
E. Electronic industry
F. Product uses as ODS substitutes
G. Other product manufacture and use NO NO NO NO NO NO NO NO NO NO
H. Other NO, NA NO, NA NO, NA NO, NA NO, NA NO, NA NO, NA 4.85 4.73 NO, NA
3. Agriculture 3.30 3.36 6.02 2.17 19.54 26.08 2.43 2.94 2.80 6.33
A. Enteric fermentation
B. Manure management
C. Rice cultivation
D. Agricultural soils
E. Prescribed burning of savannas
F. Field burning of agricultural residues
G. Liming 2.15 2.25 4.68 0.32 15.08 24.66 1.01 1.51 1.38 4.90
H. Urea application 1.15 1.11 1.35 1.85 4.46 1.42 1.42 1.43 1.43 1.43
I. Other carbon-containing fertilizers NO NO NO NO NO NO NO NO NO NO
J. Other NO NO NO NO NO NO NO NO NO NO
4. Land Use, Land-Use Change and Forestry -8,133.16 -4,623.82 -7,630.18 -8,297.56 -6,849.35 -6,331.88 -4,913.62 -4,351.83 -5,547.82 -4,902.97
A. Forest land -10,305.06 -6,858.89 -9,510.50 -10,472.61 -9,325.21 -8,660.55 -7,346.69 -6,940.22 -8,319.56 -7,787.38
B. Cropland 3,070.35 3,070.97 3,071.24 3,033.38 3,033.67 3,032.95 3,030.04 3,026.61 3,022.21 3,014.84
C. Grassland 627.40 585.64 547.20 499.58 462.28 426.99 383.32 341.38 302.25 225.74
D. Wetlands 323.83 778.15 550.34 632.05 994.69 845.85 852.73 1,085.72 1,330.61 685.28
E. Settlements 134.25 141.33 147.82 303.40 316.95 330.19 343.10 355.88 367.95 315.02
F. Other land NO NO NO NO NO NO NO NO NO NO
G. Harvested wood products -1,983.93 -2,341.01 -2,436.27 -2,293.35 -2,331.73 -2,307.31 -2,176.13 -2,221.21 -2,251.27 -1,356.47

248
H. Other NO NO NO NO NO NO NO NO NO NO
5. Waste 0.73 0.75 1.19 2.36 0.30 0.37 0.45 0.44 1.53 1.20
A. Solid waste disposal NO, NA NO, NA NO, NA NO, NA NO, NA NO, NA NO, NA NO, NA NO, NA NO, NA
B. Biological treatment of solid waste
C. Incineration and open burning of waste 0.73 0.75 1.19 2.36 0.30 0.37 0.45 0.44 1.53 1.20
D. Waste water treatment and discharge
E. Other NO NO NO NO NO NO NO NO NO NO
6. Other (as specified in the summary table in
CRF) NO NO NO NO NO NO NO NO NO NO
International bunkers 137.49 121.77 106.14 700.23 737.88 718.70 791.78 1,008.53 829.25 813.56
Aviation 90.33 90.33 80.98 80.98 84.10 121.50 147.44 178.76 200.64 244.67
Navigation 47.16 31.44 25.15 619.24 653.78 597.20 644.34 829.77 628.61 568.89
Multilateral operations NA NA NA NA NA NA NA NA NA NA
CO2 emissions from biomass 4,789.23 4,702.89 4,370.68 4,880.83 4,850.23 5,149.69 5,430.64 5,437.83 5,477.51 5,354.97
CO2 captured NO NO NO NO NO NO NO NO NO NO
Long-term storage of C in waste disposal sites NA NA NA NA NA NA NA NA NA NA
Indirect N2O
Indirect CO2 (3) 28.92 27.98 26.40 25.93 26.35 21.06 20.31 21.63 16.45 17.95
Total CO2 equivalent emissions with land use,
land-use change and forestry 169.91 3,088.00 -557.22 -813.30 662.49 1,374.89 2,799.57 3,439.09 2,745.08 3,707.93
Total CO2 equivalent emissions, including
indirect CO2, with land use, land-use change and
forestry
198.84 3,115.98 -530.83 -787.37 688.84 1,395.95 2,819.88 3,460.72 2,761.52 3,725.88
Note: All footnotes for this table are given at the
end of the table on sheet 6.
Note: All footnotes for this table are given on sheet 3.

249
Table 1(a) LVA_BR3_v2.0
Emission trends (CO2) SoLATVIA
(Sheet 3 of 3) #REF!
GREENHOUSE GAS SOURCE AND SINK CATEGORIES
2008 2009 2010 2011 2012 2013 2014 2015 Change from base to latest
reported year
%
1. Energy 7,904.91 7,177.81 8,008.59 7,166.57 6,813.80 6,722.01 6,520.79 6,693.25 -64.23
A. Fuel combustion (sectoral approach) 7,904.91 7,177.81 8,008.59 7,166.57 6,813.80 6,722.00 6,520.78 6,693.23 -64.23
1. Energy industries 1,927.30 1,877.32 2,261.12 2,082.02 1,864.68 1,928.36 1,669.76 1,746.21 -72.06
2. Manufacturing industries and construction 1,103.76 877.11 1,074.68 873.66 918.14 758.95 688.69 638.36 -83.69
3. Transport 3,570.74 3,130.26 3,198.08 2,839.84 2,736.95 2,772.83 2,894.40 3,072.28 4.84
4. Other sectors 1,299.70 1,287.78 1,466.84 1,363.83 1,286.70 1,255.42 1,258.48 1,226.81 -78.17
5. Other 3.41 5.34 7.87 7.22 7.33 6.45 9.44 9.57 100.00
B. Fugitive emissions from fuels 0.00 0.00 0.00 0.01 0.00 0.01 0.01 0.01 12.61
1. Solid fuels NO NO NO NO NO NO NO NO 0.00
2. Oil and natural gas and other emissions from energy
production
0.00 0.00 0.00 0.01 0.00 0.01 0.01 0.01 12.61
C. CO2 transport and storage NO NO NO NO NO NO NO NO 0.00
2. Industrial processes 262.99 252.27 514.76 620.17 689.32 610.62 606.00 519.79 -25.93
A. Mineral industry 188.62 182.85 439.64 567.22 584.38 549.62 568.97 476.21 -18.51
B. Chemical industry NO NO NO NO NO NO NO NO 0.00
C. Metal industry 38.37 39.06 38.74 16.66 64.81 19.60 0.01 1.04 -98.51
D. Non-energy products from fuels and solvent use 36.00 30.36 36.38 36.28 40.13 41.40 37.02 42.55 -10.78
E. Electronic industry
F. Product uses as ODS substitutes
G. Other product manufacture and use NO NO NO NO NO NO NO NO 0.00
H. Other NO, NA NO, NA NO, NA NO, NA NO, NA NO, NA NA, NO NA, NO 0.00
3. Agriculture 5.92 8.34 5.97 12.23 15.69 17.32 23.66 26.15 -92.83
A. Enteric fermentation
B. Manure management
C. Rice cultivation
D. Agricultural soils
E. Prescribed burning of savannas
F. Field burning of agricultural residues
G. Liming 2.75 3.99 1.97 7.98 9.90 13.25 18.93 19.94 -94.42
H. Urea application 3.17 4.35 4.00 4.25 5.79 4.08 4.73 6.21 -19.44
I. Other carbon-containing fertilizers NO NO NO NO NO NO NO NO 0.00
J. Other NO NO NO NO NO NO NO NO 0.00
4. Land Use, Land-Use Change and Forestry -5,307.28 -1,270.76 1,066.72 798.57 -377.18 38.41 3,262.45 295.98 -103.06
A. Forest land -8,878.76 -4,876.59 -2,060.10 -2,172.44 -3,509.44 -3,213.32 125.21 -3,030.25 -79.85
B. Cropland 3,010.30 2,907.35 2,906.56 2,905.42 2,904.33 2,902.45 2,899.81 2,896.99 -12.17
C. Grassland 183.16 180.09 176.76 201.71 226.90 250.37 275.72 301.77 -66.50
D. Wetlands 1,069.43 944.86 985.38 987.19 955.20 999.57 978.60 979.72 -19.24
E. Settlements 328.34 752.37 786.19 818.92 861.52 888.51 912.49 935.77 731.06

250
F. Other land NO NO NO NO NO NO NO NO 0.00
G. Harvested wood products -1,019.74 -1,178.84 -1,728.08 -1,942.23 -1,815.68 -1,789.15 -1,929.40 -1,788.02 1,093.32
H. Other NO NO NO NO NO NO NO NO 0.00
5. Waste 0.51 0.34 0.34 0.34 0.32 0.43 0.56 0.18 -68.76
A. Solid waste disposal NO, NA NO, NA NO, NA NO, NA NO, NA NO, NA NO, NA NA, NO 0.00
B. Biological treatment of solid waste
C. Incineration and open burning of waste 0.51 0.34 0.34 0.34 0.32 0.43 0.56 0.18 -68.76
D. Waste water treatment and discharge
E. Other NO NO NO NO NO NO NO NO 0.00
6. Other (as specified in the summary table in CRF) NO NO NO NO NO NO NO NO 0.00
International bunkers 954.16 1,187.46 1,160.95 1,041.03 1,128.96 1,121.86 1,074.56 1,134.48 -34.53
Aviation 294.17 310.61 356.36 357.45 362.04 373.58 332.82 326.70 47.73
Navigation 659.99 876.85 804.59 683.57 766.93 748.28 741.74 807.78 -46.57
Multilateral operations NA NA NA NA NA NA NA NA 0.00
CO2 emissions from biomass 5,072.54 5,797.79 5,153.64 5,388.82 6,038.43 6,094.47 6,460.21 6,131.57 102.73
CO2 captured NO NO NO NO NO NO NO NO 0.00
Long-term storage of C in waste disposal sites NA NA NA NA NA NA NA NA 0.00
Indirect N2O
Indirect CO2 (3) 17.22 16.34 15.65 10.42 12.31 15.16 20.20 16.72 -61.49
Total CO2 equivalent emissions with land use, land-use
change and forestry
2,867.05 6,168.00 9,596.39 8,597.88 7,141.96 7,388.80 10,413.46 7,535.34 -25.50
Total CO2 equivalent emissions, including indirect CO2,
with land use, land-use change and forestry
2,884.27 6,184.34 9,612.04 8,608.30 7,154.27 7,403.95 10,433.66 7,552.07 -25.65
Note: All footnotes for this table are given at the end of the
table on sheet 6.
Abbreviations: CRF = common reporting format, LULUCF = land use, land-use change and forestry. a The column “Base year” should be filled in only by those Parties with economies in transition that use a base year different from 1990 in accordance with the relevant decisions of the Conference of the Parties. For these Parties, this different base year is used to calculate the percentage change in the final column of this table. b Fill in net emissions/removals as reported in CRF table Summary 1.A of the latest reported inventory year. For the purposes of reporting, the signs for removals are always negative (-) and for emissions positive (+).

251
Table 1(b)
LVA_BR3_v2.0
Emission trends (CH4)
Source: S18 v1,
LATVIA
(Sheet 1 of 3) #REF!
GREENHOUSE GAS SOURCE AND SINK CATEGORIES
Base yeara 1990 1991 1992 1993 1994 1995 1996 1997
kt
1. Energy 19.95 19.95 20.41 18.31 18.47 18.11 18.03 17.96 16.92
A. Fuel combustion (sectoral approach) 10.05 10.05 10.87 9.62 10.15 9.98 10.12 10.34 9.80
1. Energy industries 0.19 0.19 0.17 0.15 0.14 0.15 0.12 0.15 0.19
2. Manufacturing industries and construction 0.23 0.23 0.13 0.11 0.15 0.15 0.14 0.15 0.15
3. Transport 0.79 0.79 0.73 0.69 0.67 0.64 0.58 0.58 0.52
4. Other sectors 8.83 8.83 9.85 8.66 9.19 9.05 9.27 9.45 8.95
5. Other NO, NE NO, NE NO, NE NO, NE NO, NE NO, NE NO, NE 0.00 0.00
B. Fugitive emissions from fuels 9.90 9.90 9.54 8.70 8.32 8.13 7.92 7.63 7.12
1. Solid fuels NO NO NO NO NO NO NO NO NO
2. Oil and natural gas and other emissions from energy
production
9.90 9.90 9.54 8.70 8.32 8.13 7.92 7.63 7.12
C. CO2 transport and storage
2. Industrial processes 0.00 0.00 0.00 0.00 0.00 0.00 0.00 0.00 0.00
A. Mineral industry
B. Chemical industry NO NO NO NO NO NO NO NO NO
C. Metal industry 0.00 0.00 0.00 0.00 0.00 0.00 0.00 0.00 0.00
D. Non-energy products from fuels and solvent use NO, NA NO, NA NO, NA NO, NA NO, NA NO, NA NO, NA NO, NA NO, NA
E. Electronic industry
F. Product uses as ODS substitutes
G. Other product manufacture and use NO NO NO NO NO NO NO NO NO
H. Other NO, NA NO, NA NO, NA NO, NA NO, NA NO, NA NO, NA NO, NA NO, NA
3. Agriculture 96.45 96.45 92.50 76.50 50.24 44.10 42.98 41.14 40.25
A. Enteric fermentation 88.86 88.86 85.25 70.62 46.23 40.42 39.16 37.67 36.83
B. Manure management 7.58 7.58 7.24 5.88 4.01 3.68 3.82 3.47 3.42
C. Rice cultivation NO NO NO NO NO NO NO NO NO
D. Agricultural soils NE NE NE NE NE NE NE NE NE
E. Prescribed burning of savannas NO NO NO NO NO NO NO NO NO
F. Field burning of agricultural residues NO NO NO NO NO NO NO NO NO
G. Liming
H. Urea application
I. Other carbon-containing fertilizers
J. Other NO NO NO NO NO NO NO NO NO
4. Land use, land-use change and forestry 12.15 12.15 11.96 15.33 12.19 12.11 12.50 12.63 12.75
A. Forest land 3.21 3.21 3.03 6.42 3.30 3.24 3.66 3.83 3.99
B. Cropland 5.00 5.00 4.99 4.98 4.97 4.96 4.94 4.92 4.90
C. Grassland 2.80 2.80 2.80 2.79 2.77 2.77 2.75 2.73 2.71
D. Wetlands 1.14 1.14 1.14 1.14 1.14 1.14 1.14 1.14 1.14
E. Settlements NO NO NO NO NO NO NO NO NO
F. Other land NO NO NO NO NO NO NO NO NO
G. Harvested wood products
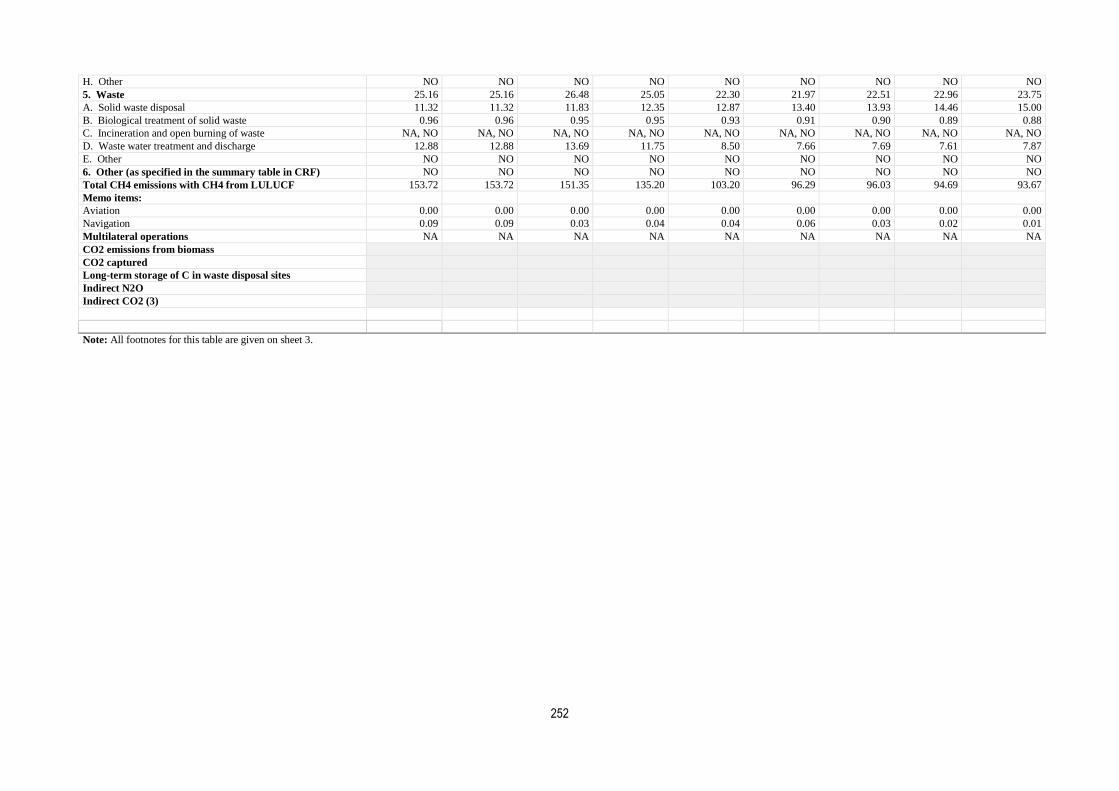
252
H. Other NO NO NO NO NO NO NO NO NO
5. Waste 25.16 25.16 26.48 25.05 22.30 21.97 22.51 22.96 23.75
A. Solid waste disposal 11.32 11.32 11.83 12.35 12.87 13.40 13.93 14.46 15.00
B. Biological treatment of solid waste 0.96 0.96 0.95 0.95 0.93 0.91 0.90 0.89 0.88
C. Incineration and open burning of waste NA, NO NA, NO NA, NO NA, NO NA, NO NA, NO NA, NO NA, NO NA, NO
D. Waste water treatment and discharge 12.88 12.88 13.69 11.75 8.50 7.66 7.69 7.61 7.87
E. Other NO NO NO NO NO NO NO NO NO
6. Other (as specified in the summary table in CRF) NO NO NO NO NO NO NO NO NO
Total CH4 emissions with CH4 from LULUCF 153.72 153.72 151.35 135.20 103.20 96.29 96.03 94.69 93.67
Memo items:
Aviation 0.00 0.00 0.00 0.00 0.00 0.00 0.00 0.00 0.00
Navigation 0.09 0.09 0.03 0.04 0.04 0.06 0.03 0.02 0.01
Multilateral operations NA NA NA NA NA NA NA NA NA
CO2 emissions from biomass
CO2 captured
Long-term storage of C in waste disposal sites
Indirect N2O
Indirect CO2 (3)
Note: All footnotes for this table are given on sheet 3.

253
Table 1(b)
LVA_BR3_v2.0
Emission trends (CH4)
Source:
Submission A
(Sheet 2 of 3) #REF!
GREENHOUSE GAS SOURCE AND SINK CATEGORIES
1998 1999 2000 2001 2002 2003 2004 2005 2006 2007
1. Energy 15.78 15.32 14.21 14.91 14.85 13.71 13.91 14.41 12.59 12.67
A. Fuel combustion (sectoral approach) 8.95 8.81 8.18 9.06 8.75 8.95 9.19 9.08 8.77 8.75
1. Energy industries 0.21 0.19 0.15 0.17 0.18 0.20 0.20 0.17 0.19 0.19
2. Manufacturing industries and construction 0.15 0.15 0.12 0.16 0.16 0.15 0.19 0.23 0.25 0.22
3. Transport 0.49 0.47 0.50 0.55 0.51 0.48 0.45 0.44 0.42 0.39
4. Other sectors 8.09 8.01 7.41 8.19 7.90 8.11 8.35 8.24 7.91 7.96
5. Other 0.00 0.00 0.00 0.00 0.00 0.00 0.00 0.00 0.00 0.00
B. Fugitive emissions from fuels 6.83 6.51 6.03 5.84 6.10 4.76 4.71 5.33 3.82 3.92
1. Solid fuels NO NO NO NO NO NO NO NO NO NO
2. Oil and natural gas and other emissions from
energy production
6.83 6.51 6.03 5.84 6.10 4.76 4.71 5.33 3.82 3.92
C. CO2 transport and storage
2. Industrial processes 0.00 0.00 0.00 0.00 0.00 0.00 0.00 0.00 0.00 0.00
A. Mineral industry
B. Chemical industry NO NO NO NO NO NO NO NO NO NO
C. Metal industry 0.00 0.00 0.00 0.00 0.00 0.00 0.00 0.00 0.00 0.00
D. Non-energy products from fuels and solvent use NO, NA NO, NA NO, NA NO, NA NO, NA NO, NA NO, NA NO, NA NO, NA NO, NA
E. Electronic industry
F. Product uses as ODS substitutes
G. Other product manufacture and use NO NO NO NO NO NO NO NO NO NO
H. Other NO, NA NO, NA NO, NA NO, NA NO, NA NO, NA NO, NA NO, NA NO, NA NO, NA
3. Agriculture 37.46 32.29 32.47 34.31 33.99 33.99 32.90 33.91 34.19 35.77
A. Enteric fermentation 34.18 29.24 29.33 30.69 30.26 30.24 29.21 30.11 30.28 31.64
B. Manure management 3.28 3.05 3.13 3.62 3.72 3.75 3.69 3.80 3.92 4.14
C. Rice cultivation NO NO NO NO NO NO NO NO NO NO
D. Agricultural soils NE NE NE NE NE NE NE NE NE NE
E. Prescribed burning of savannas NO NO NO NO NO NO NO NO NO NO
F. Field burning of agricultural residues NO NO NO NO NO NO NO NO NO NO
G. Liming
H. Urea application
I. Other carbon-containing fertilizers
J. Other NO NO NO NO NO NO NO NO NO NO
4. Land use, land-use change and forestry 12.79 14.00 13.51 12.10 13.22 12.36 12.12 11.20 12.93 11.18
A. Forest land 4.08 5.31 4.86 3.49 4.63 3.79 3.62 2.74 4.41 2.76
B. Cropland 4.89 4.87 4.85 4.82 4.81 4.79 4.77 4.74 4.72 4.69
C. Grassland 2.69 2.68 2.66 2.64 2.64 2.64 2.60 2.57 2.66 2.58
D. Wetlands 1.14 1.14 1.14 1.14 1.14 1.14 1.14 1.14 1.14 1.14
E. Settlements NO NO NO NO NO NO NO NO NO NO
F. Other land NO NO NO NO NO NO NO NO NO NO
G. Harvested wood products
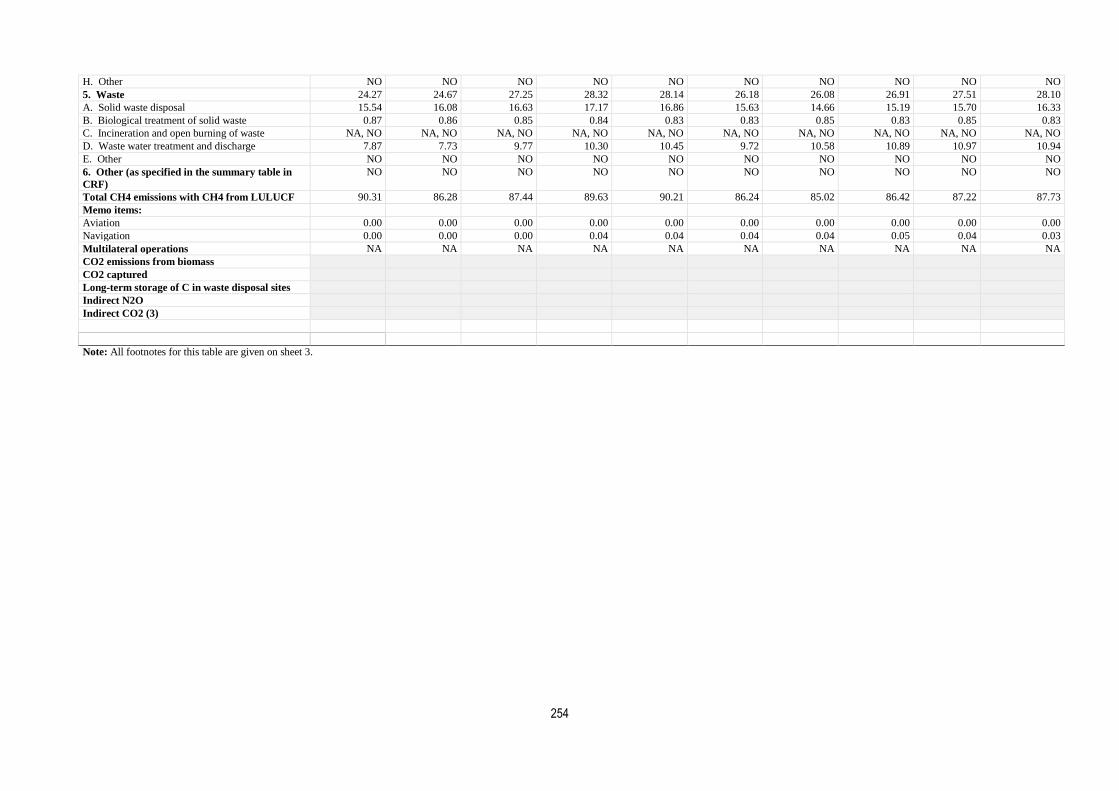
254
H. Other NO NO NO NO NO NO NO NO NO NO
5. Waste 24.27 24.67 27.25 28.32 28.14 26.18 26.08 26.91 27.51 28.10
A. Solid waste disposal 15.54 16.08 16.63 17.17 16.86 15.63 14.66 15.19 15.70 16.33
B. Biological treatment of solid waste 0.87 0.86 0.85 0.84 0.83 0.83 0.85 0.83 0.85 0.83
C. Incineration and open burning of waste NA, NO NA, NO NA, NO NA, NO NA, NO NA, NO NA, NO NA, NO NA, NO NA, NO
D. Waste water treatment and discharge 7.87 7.73 9.77 10.30 10.45 9.72 10.58 10.89 10.97 10.94
E. Other NO NO NO NO NO NO NO NO NO NO
6. Other (as specified in the summary table in
CRF)
NO NO NO NO NO NO NO NO NO NO
Total CH4 emissions with CH4 from LULUCF 90.31 86.28 87.44 89.63 90.21 86.24 85.02 86.42 87.22 87.73
Memo items:
Aviation 0.00 0.00 0.00 0.00 0.00 0.00 0.00 0.00 0.00 0.00
Navigation 0.00 0.00 0.00 0.04 0.04 0.04 0.04 0.05 0.04 0.03
Multilateral operations NA NA NA NA NA NA NA NA NA NA
CO2 emissions from biomass
CO2 captured
Long-term storage of C in waste disposal sites
Indirect N2O
Indirect CO2 (3)
Note: All footnotes for this table are given on sheet 3.

255
Table 1(b) LVA_BR3_v2.0
Emission trends (CH4) Sourc18 v1,
LATVIA
(Sheet 3 of 3) #REF!
GREENHOUSE GAS SOURCE AND SINK CATEGORIES 2008 2009 2010 2011 2012 2013 2014 2015
Change from base to latest
reported year
%
1. Energy 11.83 12.24 10.83 9.57 10.83 11.18 12.43 11.06 -44.56
A. Fuel combustion (sectoral approach) 7.80 8.44 7.16 7.05 7.64 7.14 7.02 6.95 -30.85
1. Energy industries 0.18 0.18 0.20 0.19 0.22 0.32 0.38 0.41 119.37
2. Manufacturing industries and construction 0.23 0.30 0.37 0.43 0.49 0.50 0.57 0.56 141.14
3. Transport 0.31 0.27 0.27 0.24 0.22 0.20 0.19 0.18 -76.93
4. Other sectors 7.07 7.68 6.32 6.19 6.71 6.11 5.88 5.79 -34.46
5. Other 0.00 0.00 0.00 0.00 0.00 0.00 0.00 0.00 100.00
B. Fugitive emissions from fuels 4.03 3.81 3.66 2.52 3.18 4.04 5.41 4.11 -58.48
1. Solid fuels NO NO NO NO NO NO NO NO 0.00
2. Oil and natural gas and other emissions from energy
production 4.03 3.81 3.66 2.52 3.18 4.04 5.41 4.11 -58.48
C. CO2 transport and storage
2. Industrial processes 0.00 0.00 0.00 0.00 0.00 0.00 0.00 0.00 -97.73
A. Mineral industry
B. Chemical industry NO NO NO NO NO NO NO NO 0.00
C. Metal industry 0.00 0.00 0.00 0.00 0.00 0.00 0.00 0.00 -97.73
D. Non-energy products from fuels and solvent use NO, NA NO, NA NO, NA NO, NA NO, NA NO, NA NA, NO NA, NO 0.00
E. Electronic industry
F. Product uses as ODS substitutes
G. Other product manufacture and use NO NO NO NO NO NO NO NO 0.00
H. Other NO, NA NO, NA NO, NA NO, NA NO, NA NO, NA NA, NO NA, NO 0.00
3. Agriculture 34.75 34.66 34.42 34.81 35.59 36.95 38.33 38.37 -60.21
A. Enteric fermentation 30.66 30.56 30.52 30.90 31.91 33.28 34.46 34.33 -61.37
B. Manure management 4.09 4.10 3.90 3.91 3.68 3.67 3.86 4.05 -46.66
C. Rice cultivation NO NO NO NO NO NO NO NO 0.00
D. Agricultural soils NE NE NE NE NE NE NE NE 0.00
E. Prescribed burning of savannas NO NO NO NO NO NO NO NO 0.00
F. Field burning of agricultural residues NO NO NO NO NO NO NO NO 0.00
G. Liming
H. Urea application
I. Other carbon-containing fertilizers
J. Other NO NO NO NO NO NO NO NO 0.00
4. Land use, land-use change and forestry 11.15 12.00 12.34 12.86 13.45 14.16 15.04 14.91 22.73
A. Forest land 2.77 3.62 3.96 4.48 5.07 5.77 6.63 6.51 103.13
B. Cropland 4.67 4.67 4.69 4.70 4.72 4.74 4.75 4.77 -4.67
C. Grassland 2.57 2.57 2.55 2.53 2.52 2.51 2.52 2.49 -11.07
D. Wetlands 1.14 1.14 1.14 1.14 1.14 1.14 1.14 1.14 0.00
E. Settlements NO NO NO NO NO NO NO NO 0.00
F. Other land NO NO NO NO NO NO NO NO 0.00

256
G. Harvested wood products
H. Other NO NO NO NO NO NO NO NO 0.00
5. Waste 28.26 27.17 28.20 26.29 27.57 27.33 27.52 25.92 3.00
A. Solid waste disposal 16.21 16.54 16.75 16.84 16.99 16.55 16.57 15.50 36.89
B. Biological treatment of solid waste 0.82 0.84 0.83 0.84 0.78 0.78 0.90 1.03 8.04
C. Incineration and open burning of waste NA, NO NA, NO NA, NO NA, NO NA, NO NA, NO NA, NO NA, NO 0.00
D. Waste water treatment and discharge 11.23 9.80 10.61 8.62 9.80 9.99 10.05 9.39 -27.15
E. Other NO NO NO NO NO NO NO NO 0.00
6. Other (as specified in the summary table in CRF) NO NO NO NO NO NO NO NO 0.00
Total CH4 emissions with CH4 from LULUCF 85.99 86.08 85.79 83.53 87.45 89.62 93.32 90.27 -41.28
Memo items:
Aviation 0.00 0.00 0.00 0.01 0.00 0.00 0.00 0.00 208.23
Navigation 0.04 0.05 0.05 0.04 0.05 0.05 0.05 0.05 -48.69
Multilateral operations NA NA NA NA NA NA NA NA 0.00
CO2 emissions from biomass
CO2 captured
Long-term storage of C in waste disposal sites
Indirect N2O
Indirect CO2 (3)
Abbreviations: CRF = common reporting format, LULUCF = land use, land-use change and forestry. a The column “Base year” should be filled in only by those Parties with economies in transition that use a base year different from 1990 in accordance with the relevant decisions of the Conference of the Parties. For these
Parties, this different base year is used to calculate the percentage change in the final column of this table.
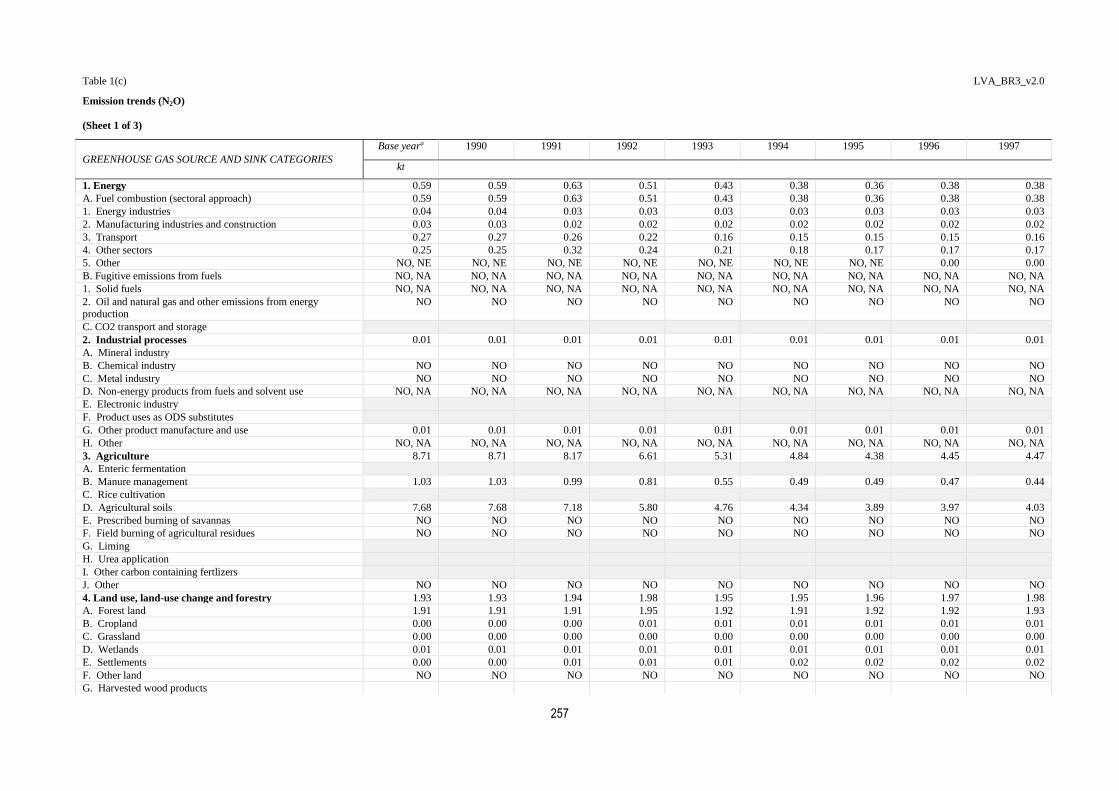
257
Table 1(c) LVA_BR3_v2.0
Emission trends (N2O) bmission 2018
v1, LATVIA
(Sheet 1 of 3) #REF!
GREENHOUSE GAS SOURCE AND SINK CATEGORIES
Base yeara 1990 1991 1992 1993 1994 1995 1996 1997
kt
1. Energy 0.59 0.59 0.63 0.51 0.43 0.38 0.36 0.38 0.38
A. Fuel combustion (sectoral approach) 0.59 0.59 0.63 0.51 0.43 0.38 0.36 0.38 0.38
1. Energy industries 0.04 0.04 0.03 0.03 0.03 0.03 0.03 0.03 0.03
2. Manufacturing industries and construction 0.03 0.03 0.02 0.02 0.02 0.02 0.02 0.02 0.02
3. Transport 0.27 0.27 0.26 0.22 0.16 0.15 0.15 0.15 0.16
4. Other sectors 0.25 0.25 0.32 0.24 0.21 0.18 0.17 0.17 0.17
5. Other NO, NE NO, NE NO, NE NO, NE NO, NE NO, NE NO, NE 0.00 0.00
B. Fugitive emissions from fuels NO, NA NO, NA NO, NA NO, NA NO, NA NO, NA NO, NA NO, NA NO, NA
1. Solid fuels NO, NA NO, NA NO, NA NO, NA NO, NA NO, NA NO, NA NO, NA NO, NA
2. Oil and natural gas and other emissions from energy production
NO NO NO NO NO NO NO NO NO
C. CO2 transport and storage
2. Industrial processes 0.01 0.01 0.01 0.01 0.01 0.01 0.01 0.01 0.01
A. Mineral industry
B. Chemical industry NO NO NO NO NO NO NO NO NO
C. Metal industry NO NO NO NO NO NO NO NO NO
D. Non-energy products from fuels and solvent use NO, NA NO, NA NO, NA NO, NA NO, NA NO, NA NO, NA NO, NA NO, NA
E. Electronic industry
F. Product uses as ODS substitutes
G. Other product manufacture and use 0.01 0.01 0.01 0.01 0.01 0.01 0.01 0.01 0.01
H. Other NO, NA NO, NA NO, NA NO, NA NO, NA NO, NA NO, NA NO, NA NO, NA
3. Agriculture 8.71 8.71 8.17 6.61 5.31 4.84 4.38 4.45 4.47
A. Enteric fermentation
B. Manure management 1.03 1.03 0.99 0.81 0.55 0.49 0.49 0.47 0.44
C. Rice cultivation
D. Agricultural soils 7.68 7.68 7.18 5.80 4.76 4.34 3.89 3.97 4.03
E. Prescribed burning of savannas NO NO NO NO NO NO NO NO NO
F. Field burning of agricultural residues NO NO NO NO NO NO NO NO NO
G. Liming
H. Urea application
I. Other carbon containing fertlizers
J. Other NO NO NO NO NO NO NO NO NO
4. Land use, land-use change and forestry 1.93 1.93 1.94 1.98 1.95 1.95 1.96 1.97 1.98
A. Forest land 1.91 1.91 1.91 1.95 1.92 1.91 1.92 1.92 1.93
B. Cropland 0.00 0.00 0.00 0.01 0.01 0.01 0.01 0.01 0.01
C. Grassland 0.00 0.00 0.00 0.00 0.00 0.00 0.00 0.00 0.00
D. Wetlands 0.01 0.01 0.01 0.01 0.01 0.01 0.01 0.01 0.01
E. Settlements 0.00 0.00 0.01 0.01 0.01 0.02 0.02 0.02 0.02
F. Other land NO NO NO NO NO NO NO NO NO
G. Harvested wood products
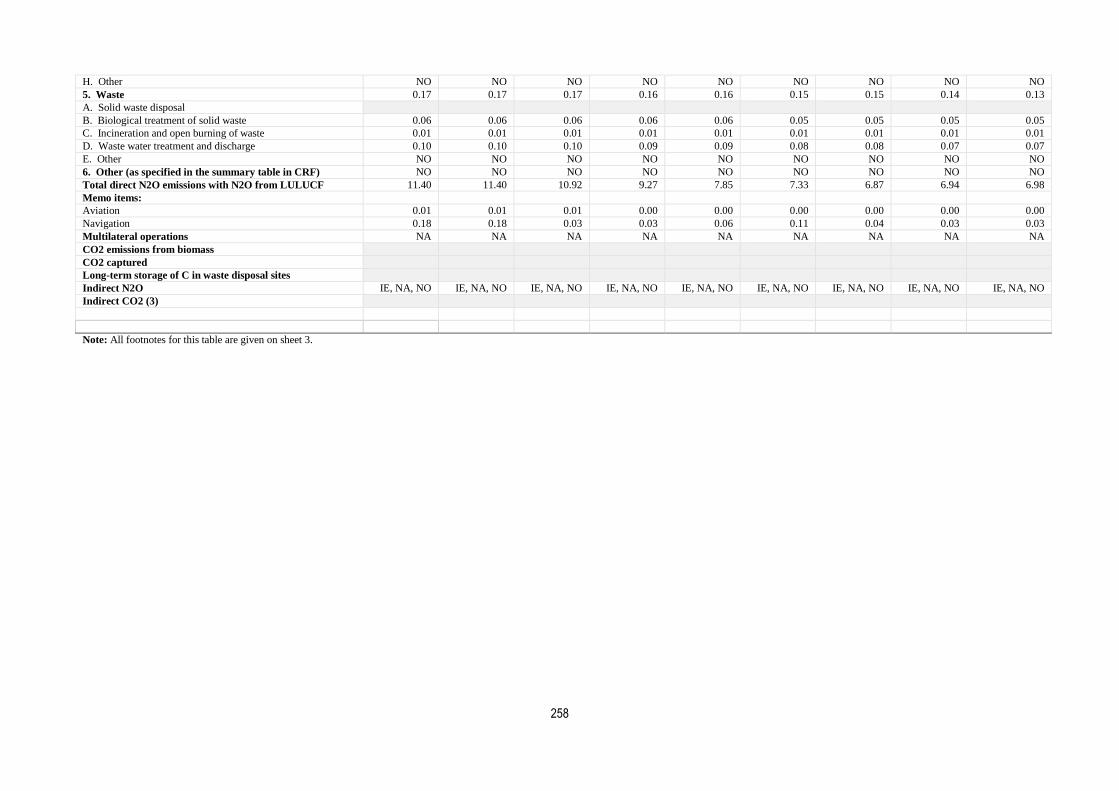
258
H. Other NO NO NO NO NO NO NO NO NO
5. Waste 0.17 0.17 0.17 0.16 0.16 0.15 0.15 0.14 0.13
A. Solid waste disposal
B. Biological treatment of solid waste 0.06 0.06 0.06 0.06 0.06 0.05 0.05 0.05 0.05
C. Incineration and open burning of waste 0.01 0.01 0.01 0.01 0.01 0.01 0.01 0.01 0.01
D. Waste water treatment and discharge 0.10 0.10 0.10 0.09 0.09 0.08 0.08 0.07 0.07
E. Other NO NO NO NO NO NO NO NO NO
6. Other (as specified in the summary table in CRF) NO NO NO NO NO NO NO NO NO
Total direct N2O emissions with N2O from LULUCF 11.40 11.40 10.92 9.27 7.85 7.33 6.87 6.94 6.98
Memo items:
Aviation 0.01 0.01 0.01 0.00 0.00 0.00 0.00 0.00 0.00
Navigation 0.18 0.18 0.03 0.03 0.06 0.11 0.04 0.03 0.03
Multilateral operations NA NA NA NA NA NA NA NA NA
CO2 emissions from biomass
CO2 captured
Long-term storage of C in waste disposal sites
Indirect N2O IE, NA, NO IE, NA, NO IE, NA, NO IE, NA, NO IE, NA, NO IE, NA, NO IE, NA, NO IE, NA, NO IE, NA, NO
Indirect CO2 (3)
Note: All footnotes for this table are given on sheet 3.
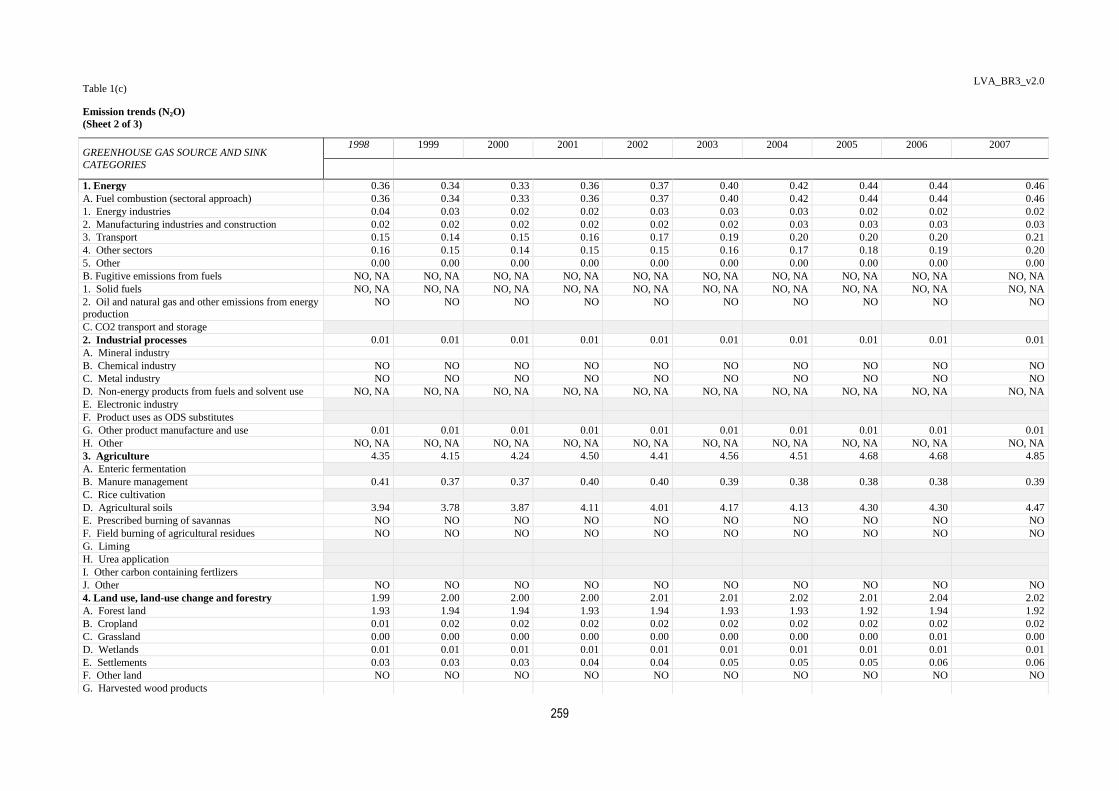
259
Table 1(c)
LVA_BR3_v2.0
Emission trends (N2O)
Sou, LATVIA
(Sheet 2 of 3) #REF!
GREENHOUSE GAS SOURCE AND SINK
CATEGORIES
1998 1999 2000 2001 2002 2003 2004 2005 2006 2007
1. Energy 0.36 0.34 0.33 0.36 0.37 0.40 0.42 0.44 0.44 0.46
A. Fuel combustion (sectoral approach) 0.36 0.34 0.33 0.36 0.37 0.40 0.42 0.44 0.44 0.46
1. Energy industries 0.04 0.03 0.02 0.02 0.03 0.03 0.03 0.02 0.02 0.02
2. Manufacturing industries and construction 0.02 0.02 0.02 0.02 0.02 0.02 0.03 0.03 0.03 0.03
3. Transport 0.15 0.14 0.15 0.16 0.17 0.19 0.20 0.20 0.20 0.21
4. Other sectors 0.16 0.15 0.14 0.15 0.15 0.16 0.17 0.18 0.19 0.20
5. Other 0.00 0.00 0.00 0.00 0.00 0.00 0.00 0.00 0.00 0.00
B. Fugitive emissions from fuels NO, NA NO, NA NO, NA NO, NA NO, NA NO, NA NO, NA NO, NA NO, NA NO, NA
1. Solid fuels NO, NA NO, NA NO, NA NO, NA NO, NA NO, NA NO, NA NO, NA NO, NA NO, NA
2. Oil and natural gas and other emissions from energy production
NO NO NO NO NO NO NO NO NO NO
C. CO2 transport and storage
2. Industrial processes 0.01 0.01 0.01 0.01 0.01 0.01 0.01 0.01 0.01 0.01
A. Mineral industry
B. Chemical industry NO NO NO NO NO NO NO NO NO NO
C. Metal industry NO NO NO NO NO NO NO NO NO NO
D. Non-energy products from fuels and solvent use NO, NA NO, NA NO, NA NO, NA NO, NA NO, NA NO, NA NO, NA NO, NA NO, NA
E. Electronic industry
F. Product uses as ODS substitutes
G. Other product manufacture and use 0.01 0.01 0.01 0.01 0.01 0.01 0.01 0.01 0.01 0.01
H. Other NO, NA NO, NA NO, NA NO, NA NO, NA NO, NA NO, NA NO, NA NO, NA NO, NA
3. Agriculture 4.35 4.15 4.24 4.50 4.41 4.56 4.51 4.68 4.68 4.85
A. Enteric fermentation
B. Manure management 0.41 0.37 0.37 0.40 0.40 0.39 0.38 0.38 0.38 0.39
C. Rice cultivation
D. Agricultural soils 3.94 3.78 3.87 4.11 4.01 4.17 4.13 4.30 4.30 4.47
E. Prescribed burning of savannas NO NO NO NO NO NO NO NO NO NO
F. Field burning of agricultural residues NO NO NO NO NO NO NO NO NO NO
G. Liming
H. Urea application
I. Other carbon containing fertlizers
J. Other NO NO NO NO NO NO NO NO NO NO
4. Land use, land-use change and forestry 1.99 2.00 2.00 2.00 2.01 2.01 2.02 2.01 2.04 2.02
A. Forest land 1.93 1.94 1.94 1.93 1.94 1.93 1.93 1.92 1.94 1.92
B. Cropland 0.01 0.02 0.02 0.02 0.02 0.02 0.02 0.02 0.02 0.02
C. Grassland 0.00 0.00 0.00 0.00 0.00 0.00 0.00 0.00 0.01 0.00
D. Wetlands 0.01 0.01 0.01 0.01 0.01 0.01 0.01 0.01 0.01 0.01
E. Settlements 0.03 0.03 0.03 0.04 0.04 0.05 0.05 0.05 0.06 0.06
F. Other land NO NO NO NO NO NO NO NO NO NO
G. Harvested wood products

260
H. Other NO NO NO NO NO NO NO NO NO NO
5. Waste 0.13 0.13 0.13 0.15 0.12 0.12 0.12 0.12 0.15 0.14
A. Solid waste disposal
B. Biological treatment of solid waste 0.05 0.05 0.05 0.05 0.05 0.05 0.05 0.05 0.05 0.05
C. Incineration and open burning of waste 0.01 0.02 0.02 0.05 0.01 0.01 0.01 0.01 0.03 0.03
D. Waste water treatment and discharge 0.06 0.06 0.06 0.06 0.06 0.06 0.06 0.06 0.06 0.06
E. Other NO NO NO NO NO NO NO NO NO NO
6. Other (as specified in the summary table in
CRF)
NO NO NO NO NO NO NO NO NO NO
Total direct N2O emissions with N2O from
LULUCF
6.84 6.63 6.72 7.02 6.92 7.10 7.07 7.26 7.33 7.49
Memo items:
Aviation 0.00 0.00 0.00 0.00 0.00 0.00 0.00 0.01 0.01 0.01
Navigation 0.02 0.01 0.01 0.14 0.12 0.10 0.11 0.13 0.09 0.09
Multilateral operations NA NA NA NA NA NA NA NA NA NA
CO2 emissions from biomass
CO2 captured
Long-term storage of C in waste disposal sites
Indirect N2O IE, NA, NO IE, NA, NO IE, NA, NO IE, NA, NO IE, NA, NO IE, NA, NO IE, NA, NO IE, NA, NO IE, NA, NO IE, NA, NO
Indirect CO2 (3)
Note: All footnotes for this table are given on sheet 3.
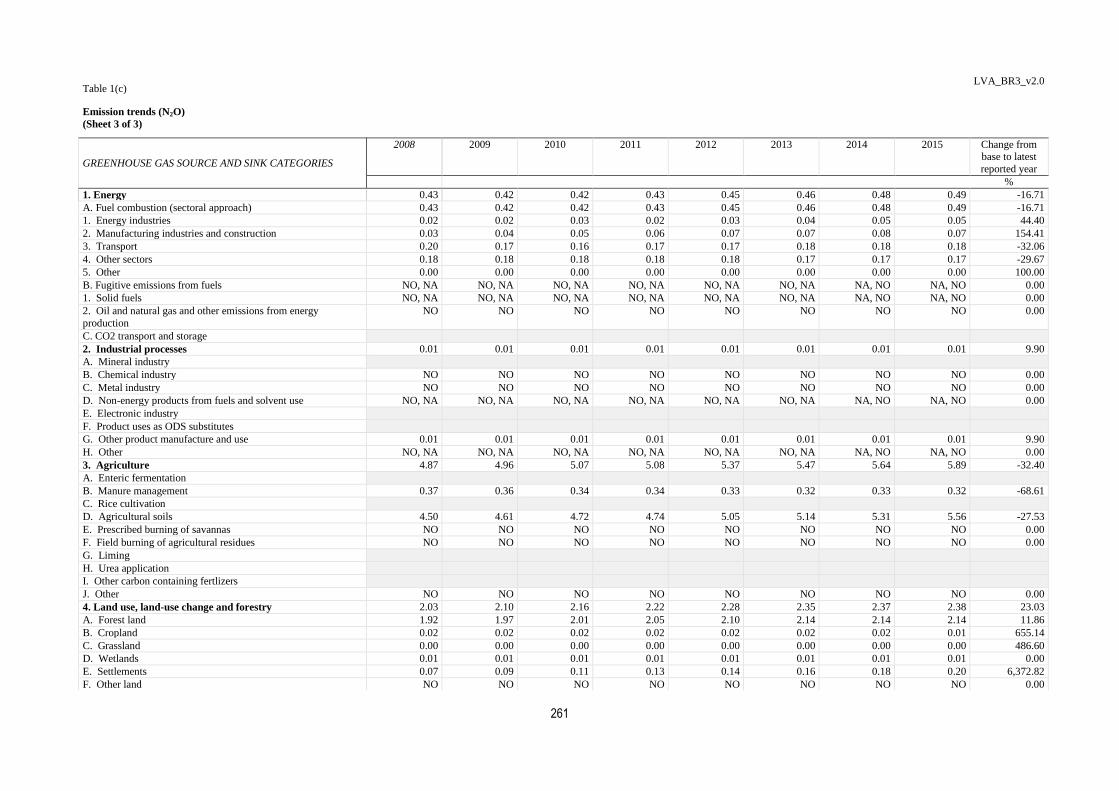
261
Table 1(c)
LVA_BR3_v2.0
Emission trends (N2O)
n 2018TVIA
(Sheet 3 of 3) #REF!
GREENHOUSE GAS SOURCE AND SINK CATEGORIES
2008 2009 2010 2011 2012 2013 2014 2015 Change from base to latest
reported year
%
1. Energy 0.43 0.42 0.42 0.43 0.45 0.46 0.48 0.49 -16.71
A. Fuel combustion (sectoral approach) 0.43 0.42 0.42 0.43 0.45 0.46 0.48 0.49 -16.71
1. Energy industries 0.02 0.02 0.03 0.02 0.03 0.04 0.05 0.05 44.40
2. Manufacturing industries and construction 0.03 0.04 0.05 0.06 0.07 0.07 0.08 0.07 154.41
3. Transport 0.20 0.17 0.16 0.17 0.17 0.18 0.18 0.18 -32.06
4. Other sectors 0.18 0.18 0.18 0.18 0.18 0.17 0.17 0.17 -29.67
5. Other 0.00 0.00 0.00 0.00 0.00 0.00 0.00 0.00 100.00
B. Fugitive emissions from fuels NO, NA NO, NA NO, NA NO, NA NO, NA NO, NA NA, NO NA, NO 0.00
1. Solid fuels NO, NA NO, NA NO, NA NO, NA NO, NA NO, NA NA, NO NA, NO 0.00
2. Oil and natural gas and other emissions from energy
production
NO NO NO NO NO NO NO NO 0.00
C. CO2 transport and storage
2. Industrial processes 0.01 0.01 0.01 0.01 0.01 0.01 0.01 0.01 9.90
A. Mineral industry
B. Chemical industry NO NO NO NO NO NO NO NO 0.00
C. Metal industry NO NO NO NO NO NO NO NO 0.00
D. Non-energy products from fuels and solvent use NO, NA NO, NA NO, NA NO, NA NO, NA NO, NA NA, NO NA, NO 0.00
E. Electronic industry
F. Product uses as ODS substitutes
G. Other product manufacture and use 0.01 0.01 0.01 0.01 0.01 0.01 0.01 0.01 9.90
H. Other NO, NA NO, NA NO, NA NO, NA NO, NA NO, NA NA, NO NA, NO 0.00
3. Agriculture 4.87 4.96 5.07 5.08 5.37 5.47 5.64 5.89 -32.40
A. Enteric fermentation
B. Manure management 0.37 0.36 0.34 0.34 0.33 0.32 0.33 0.32 -68.61
C. Rice cultivation
D. Agricultural soils 4.50 4.61 4.72 4.74 5.05 5.14 5.31 5.56 -27.53
E. Prescribed burning of savannas NO NO NO NO NO NO NO NO 0.00
F. Field burning of agricultural residues NO NO NO NO NO NO NO NO 0.00
G. Liming
H. Urea application
I. Other carbon containing fertlizers
J. Other NO NO NO NO NO NO NO NO 0.00
4. Land use, land-use change and forestry 2.03 2.10 2.16 2.22 2.28 2.35 2.37 2.38 23.03
A. Forest land 1.92 1.97 2.01 2.05 2.10 2.14 2.14 2.14 11.86
B. Cropland 0.02 0.02 0.02 0.02 0.02 0.02 0.02 0.01 655.14
C. Grassland 0.00 0.00 0.00 0.00 0.00 0.00 0.00 0.00 486.60
D. Wetlands 0.01 0.01 0.01 0.01 0.01 0.01 0.01 0.01 0.00
E. Settlements 0.07 0.09 0.11 0.13 0.14 0.16 0.18 0.20 6,372.82
F. Other land NO NO NO NO NO NO NO NO 0.00

262
G. Harvested wood products
H. Other NO NO NO NO NO NO NO NO 0.00
5. Waste 0.13 0.12 0.12 0.13 0.12 0.12 0.14 0.13 -20.49
A. Solid waste disposal
B. Biological treatment of solid waste 0.05 0.05 0.05 0.05 0.05 0.05 0.06 0.06 8.04
C. Incineration and open burning of waste 0.01 0.01 0.01 0.01 0.01 0.01 0.01 0.01 -47.28
D. Waste water treatment and discharge 0.07 0.07 0.06 0.06 0.06 0.06 0.06 0.06 -34.19
E. Other NO NO NO NO NO NO NO NO 0.00
6. Other (as specified in the summary table in CRF) NO NO NO NO NO NO NO NO 0.00
Total direct N2O emissions with N2O from LULUCF 7.46 7.61 7.78 7.87 8.24 8.41 8.63 8.89 -21.98
Memo items:
Aviation 0.01 0.01 0.01 0.01 0.01 0.01 0.01 0.01 103.67
Navigation 0.07 0.10 0.10 0.11 0.12 0.11 0.10 0.17 -6.80
Multilateral operations NA NA NA NA NA NA NA NA 0.00
CO2 emissions from biomass
CO2 captured
Long-term storage of C in waste disposal sites
Indirect N2O IE, NA, NO IE, NA, NO IE, NA, NO IE, NA, NO IE, NA, NO IE, NA, NO NA, NO, IE NO, IE, NA 0.00
Indirect CO2 (3)
Abbreviations: CRF = common reporting format, LULUCF = land use, land-use change and forestry. a The column “Base year” should be filled in only by those Parties with economies in transition that use a base year different from 1990 in accordance with the relevant decisions of the Conference of the Parties. For these
Parties, this different base year is used to calculate the percentage change in the final column of this table.

263
Table 1(d) LVA_BR3_v2.0
Emission trends (HFCs, PFCs and SF6) Source:
SubmissioVIA
(Sheet 1 of 3) #REF!
GREENHOUSE GAS SOURCE AND SINK CATEGORIES Base yeara 1990 1991 1992 1993 1994 1995 1996 1997
kt
Emissions of HFCs and PFCs - (kt CO2 equivalent) NO, NA, NE NO, NA, NE NO, NA, NE NO, NA, NE NO, NA, NE NO, NA, NE 2.50 2.76 3.35
Emissions of HFCs - (kt CO2 equivalent) NO, NA, NE NO, NA, NE NO, NA, NE NO, NA, NE NO, NA, NE NO, NA, NE 2.50 2.76 3.35
HFC-23 NO, NA, NE NO, NA, NE NO, NA, NE NO, NA, NE NO, NA, NE NO, NA, NE 0.00 0.00 0.00
HFC-32 NE, NA, NO NE, NA, NO NE, NA, NO NE, NA, NO NE, NA, NO NE, NA, NO NE, NA, NO NE, NA, NO NE, NA, NO
HFC-41 NO, NA NO, NA NO, NA NO, NA NO, NA NO, NA NO, NA NO, NA NO, NA
HFC-43-10mee NO, NA NO, NA NO, NA NO, NA NO, NA NO, NA NO, NA NO, NA NO, NA
HFC-125 NE, NA, NO NE, NA, NO NE, NA, NO NE, NA, NO NE, NA, NO NE, NA, NO NE, NA, NO NE, NA, NO NE, NA, NO
HFC-134 NO, NA NO, NA NO, NA NO, NA NO, NA NO, NA NO, NA NO, NA NO, NA
HFC-134a NO, NA, NE NO, NA, NE NO, NA, NE NO, NA, NE NO, NA, NE NO, NA, NE 0.00 0.00 0.00
HFC-143 NO, NA NO, NA NO, NA NO, NA NO, NA NO, NA NO, NA NO, NA NO, NA
HFC-143a NE, NA, NO NE, NA, NO NE, NA, NO NE, NA, NO NE, NA, NO NE, NA, NO NE, NA, NO NE, NA, NO NE, NA, NO
HFC-152 NO, NA NO, NA NO, NA NO, NA NO, NA NO, NA NO, NA NO, NA NO, NA
HFC-152a NE, NA, NO NE, NA, NO NE, NA, NO NE, NA, NO NE, NA, NO NE, NA, NO NO, NA, NE NO, NA, NE NO, NA, NE
HFC-161 NO, NA NO, NA NO, NA NO, NA NO, NA NO, NA NO, NA NO, NA NO, NA
HFC-227ea NO, NA, NE NO, NA, NE NO, NA, NE NO, NA, NE NO, NA, NE NO, NA, NE NO, NA, NE NO, NA, NE NO, NA, NE
HFC-236cb NO, NA NO, NA NO, NA NO, NA NO, NA NO, NA NO, NA NO, NA NO, NA
HFC-236ea NO, NA NO, NA NO, NA NO, NA NO, NA NO, NA NO, NA NO, NA NO, NA
HFC-236fa NO, NA NO, NA NO, NA NO, NA NO, NA NO, NA NO, NA NO, NA NO, NA
HFC-245ca NO, NA NO, NA NO, NA NO, NA NO, NA NO, NA NO, NA NO, NA NO, NA
HFC-245fa NO, NA NO, NA NO, NA NO, NA NO, NA NO, NA NO, NA, NE NO, NA, NE NO, NA, NE
HFC-365mfc NO, NA NO, NA NO, NA NO, NA NO, NA NO, NA NO, NA, NE NO, NA, NE NO, NA, NE
Unspecified mix of HFCs(4) - (kt CO2 equivalent) NO, NA NO, NA NO, NA NO, NA NO, NA NO, NA NO, NA NO, NA NO, NA
CF4 NO, NA NO, NA NO, NA NO, NA NO, NA NO, NA NO, NA NO, NA NO, NA
C2F6 NO, NA NO, NA NO, NA NO, NA NO, NA NO, NA NO, NA NO, NA NO, NA
C3F8 NO, NA NO, NA NO, NA NO, NA NO, NA NO, NA NO, NA NO, NA NO, NA
C4F10 NO, NA NO, NA NO, NA NO, NA NO, NA NO, NA NO, NA NO, NA NO, NA
c-C4F8 NO, NA NO, NA NO, NA NO, NA NO, NA NO, NA NO, NA NO, NA NO, NA
C5F12 NO, NA NO, NA NO, NA NO, NA NO, NA NO, NA NO, NA NO, NA NO, NA
C6F14 NO, NA NO, NA NO, NA NO, NA NO, NA NO, NA NO, NA NO, NA NO, NA
C10F18 NO, NA NO, NA NO, NA NO, NA NO, NA NO, NA NO, NA NO, NA NO, NA
c-C3F6 NO, NA NO, NA NO, NA NO, NA NO, NA NO, NA NO, NA NO, NA NO, NA
Unspecified mix of PFCs(4) - (kt CO2 equivalent) NO, NA NO, NA NO, NA NO, NA NO, NA NO, NA NO, NA NO, NA NO, NA
Unspecified mix of HFCs and PFCs - (kt CO2 equivalent) NO, NA NO, NA NO, NA NO, NA NO, NA NO, NA NO, NA NO, NA NO, NA
SF6 NA, NO NA, NO NA, NO NA, NO NA, NO NA, NO 0.00 0.00 0.00
NF3 NO, NA NO, NA NO, NA NO, NA NO, NA NO, NA NO, NA NO, NA NO, NA
Note: All footnotes for this table are given on sheet 3.

264
Table 1(d) LVA_BR3_v2.0
Emission trends (HFCs, PFCs and SF6) Source: Sub8 v1, LATVIA
(Sheet 2 of 3) #REF!
GREENHOUSE GAS SOURCE AND
SINK CATEGORIES
1998 1999 2000 2001 2002 2003 2004 2005 2006 2007
Emissions of HFCs and PFCs - (kt CO2
equivalent)
5.75 6.96 9.59 12.92 16.44 20.27 36.06 52.06 86.61 112.51
Emissions of HFCs - (kt CO2
equivalent)
5.75 6.96 9.59 12.92 16.44 20.27 36.06 52.06 86.61 112.51
HFC-23 0.00 0.00 0.00 0.00 0.00 0.00 NE, NA, NO NE, NA, NO NE, NA, NO NE, NA, NO
HFC-32 NE, NA,
NO
NE, NA, NO NE, NA, NO NE, NA, NO NE, NA, NO NE, NA, NO 0.00 0.00 0.00 0.00
HFC-41 NO, NA NO, NA NO, NA NO, NA NO, NA NO, NA NO, NA NO, NA NO, NA NO, NA
HFC-43-10mee NO, NA NO, NA NO, NA NO, NA NO, NA NO, NA NO, NA NO, NA NO, NA NO, NA
HFC-125 NE, NA,
NO
NE, NA, NO NE, NA, NO NE, NA, NO NE, NA, NO NE, NA, NO 0.00 0.00 0.01 0.01
HFC-134 NO, NA NO, NA NO, NA NO, NA NO, NA NO, NA NO, NA NO, NA NO, NA NO, NA
HFC-134a 0.00 0.00 0.01 0.01 0.01 0.01 0.02 0.02 0.03 0.04
HFC-143 NO, NA NO, NA NO, NA NO, NA NO, NA NO, NA NO, NA NO, NA NO, NA NO, NA
HFC-143a NE, NA,
NO
NE, NA, NO NE, NA, NO NE, NA, NO NE, NA, NO NE, NA, NO 0.00 0.00 0.00 0.01
HFC-152 NO, NA NO, NA NO, NA NO, NA NO, NA NO, NA NO, NA NO, NA NO, NA NO, NA
HFC-152a NO, NA,
NE
NO, NA, NE NO, NA, NE NO, NA, NE NO, NA, NE NO, NA, NE NO, NA, NE NO, NA, NE 0.00 0.00
HFC-161 NO, NA NO, NA NO, NA NO, NA NO, NA NO, NA NO, NA NO, NA NO, NA NO, NA
HFC-227ea NO, NA, NE
NO, NA, NE NO, NA, NE 0.00 0.00 0.00 0.00 0.00 0.00 0.00
HFC-236cb NO, NA NO, NA NO, NA NO, NA NO, NA NO, NA NO, NA NO, NA NO, NA NO, NA
HFC-236ea NO, NA NO, NA NO, NA NO, NA NO, NA NO, NA NO, NA NO, NA NO, NA NO, NA
HFC-236fa NO, NA NO, NA NO, NA NO, NA NO, NA NO, NA NO, NA NO, NA NO, NA NO, NA
HFC-245ca NO, NA NO, NA NO, NA NO, NA NO, NA NO, NA NO, NA NO, NA NO, NA NO, NA
HFC-245fa NO, NA, NE
NE, NA, NO NE, NA, NO NE, NA, NO NE, NA, NO NE, NA, NO 0.00 NO, NA NO, NA NO, NA
HFC-365mfc NO, NA,
NE
NO, NA, NE NO, NA, NE NO, NA, NE NO, NA, NE NO, NA, NE NO, NA, NE NO, NA, NE NO, NA, NE NO, NA, NE
Unspecified mix of HFCs(4) - (kt CO2 equivalent)
NO, NA NO, NA NO, NA NO, NA NO, NA NO, NA NO, NA NO, NA NO, NA NO, NA
CF4 NO, NA NO, NA NO, NA NO, NA NO, NA NO, NA NO, NA NO, NA NO, NA NO, NA
C2F6 NO, NA NO, NA NO, NA NO, NA NO, NA NO, NA NO, NA NO, NA NO, NA NO, NA
C3F8 NO, NA NO, NA NO, NA NO, NA NO, NA NO, NA NO, NA NO, NA NO, NA NO, NA
C4F10 NO, NA NO, NA NO, NA NO, NA NO, NA NO, NA NO, NA NO, NA NO, NA NO, NA
c-C4F8 NO, NA NO, NA NO, NA NO, NA NO, NA NO, NA NO, NA NO, NA NO, NA NO, NA
C5F12 NO, NA NO, NA NO, NA NO, NA NO, NA NO, NA NO, NA NO, NA NO, NA NO, NA
C6F14 NO, NA NO, NA NO, NA NO, NA NO, NA NO, NA NO, NA NO, NA NO, NA NO, NA
C10F18 NO, NA NO, NA NO, NA NO, NA NO, NA NO, NA NO, NA NO, NA NO, NA NO, NA

265
c-C3F6 NO, NA NO, NA NO, NA NO, NA NO, NA NO, NA NO, NA NO, NA NO, NA NO, NA
Unspecified mix of PFCs(4) - (kt CO2
equivalent)
NO, NA NO, NA NO, NA NO, NA NO, NA NO, NA NO, NA NO, NA NO, NA NO, NA
Unspecified mix of HFCs and PFCs -
(kt CO2 equivalent)
NO, NA NO, NA NO, NA NO, NA NO, NA NO, NA NO, NA NO, NA NO, NA NO, NA
SF6 0.00 0.00 0.00 0.00 0.00 0.00 0.00 0.00 0.00 0.00
NF3 NO, NA NO, NA NO, NA NO, NA NO, NA NO, NA NO, NA NO, NA NO, NA NO, NA
Note: All footnotes for this table are given on sheet 3.

266
Table 1(d)
LVA_BR3_v2.0
Emission trends (HFCs, PFCs and SF6)
Source: Submi,
LATVIA
(Sheet 3 of 3) #REF!
GREENHOUSE GAS SOURCE AND SINK CATEGORIES
2008 2009 2010 2011 2012 2013 2014 2015 Change from
base to latest
reported year
%
Emissions of HFCs and PFCs - (kt CO2 equivalent) 132.10 142.38 155.01 175.99 181.18 197.21 205.63 227.06 100.00
Emissions of HFCs - (kt CO2 equivalent) 132.10 142.38 155.01 175.99 181.18 197.21 205.63 227.06 100.00
HFC-23 0.00 0.00 0.00 0.00 0.00 0.00 0.00 0.00 100.00
HFC-32 0.00 0.00 0.00 0.00 0.00 0.00 0.00 0.00 100.00
HFC-41 NO, NA NO, NA NO, NA NO, NA NO, NA NO, NA NA, NO NA, NO 0.00
HFC-43-10mee NO, NA NO, NA NO, NA NO, NA NO, NA NO, NA NA, NO NA, NO 0.00
HFC-125 0.01 0.01 0.01 0.01 0.01 0.02 0.02 0.02 100.00
HFC-134 NO, NA NO, NA NO, NA NO, NA NO, NA NO, NA NA, NO NA, NO 0.00
HFC-134a 0.04 0.04 0.04 0.05 0.05 0.05 0.06 0.06 100.00
HFC-143 NO, NA NO, NA NO, NA NO, NA NO, NA NO, NA NA, NO NA, NO 0.00
HFC-143a 0.01 0.01 0.01 0.01 0.01 0.01 0.01 0.02 100.00
HFC-152 NO, NA NO, NA NO, NA NO, NA NO, NA NO, NA NA, NO NA, NO 0.00
HFC-152a 0.00 0.00 0.00 0.00 0.00 0.00 0.00 0.00 100.00
HFC-161 NO, NA NO, NA NO, NA NO, NA NO, NA NO, NA NA, NO NA, NO 0.00
HFC-227ea 0.00 0.00 0.00 0.00 0.00 0.00 0.00 0.00 100.00
HFC-236cb NO, NA NO, NA NO, NA NO, NA NO, NA NO, NA NA, NO NA, NO 0.00
HFC-236ea NO, NA NO, NA NO, NA NO, NA NO, NA NO, NA NA, NO NA, NO 0.00
HFC-236fa NO, NA NO, NA NO, NA NO, NA NO, NA NO, NA NA, NO NA, NO 0.00
HFC-245ca NO, NA NO, NA NO, NA NO, NA NO, NA NO, NA NA, NO NA, NO 0.00
HFC-245fa NO, NA NO, NA NO, NA NO, NA NO, NA NO, NA NA, NO 0.00 100.00
HFC-365mfc 0.00 0.00 0.00 0.00 0.00 0.00 0.00 0.00 100.00
Unspecified mix of HFCs(4) - (kt CO2 equivalent) NO, NA NO, NA NO, NA NO, NA NO, NA NO, NA NA, NO NA, NO 0.00
CF4 NO, NA NO, NA NO, NA NO, NA NO, NA NO, NA NA, NO NA, NO 0.00
C2F6 NO, NA NO, NA NO, NA NO, NA NO, NA NO, NA NA, NO NA, NO 0.00
C3F8 NO, NA NO, NA NO, NA NO, NA NO, NA NO, NA NA, NO NA, NO 0.00
C4F10 NO, NA NO, NA NO, NA NO, NA NO, NA NO, NA NA, NO NA, NO 0.00
c-C4F8 NO, NA NO, NA NO, NA NO, NA NO, NA NO, NA NA, NO NA, NO 0.00
C5F12 NO, NA NO, NA NO, NA NO, NA NO, NA NO, NA NA, NO NA, NO 0.00
C6F14 NO, NA NO, NA NO, NA NO, NA NO, NA NO, NA NA, NO NA, NO 0.00
C10F18 NO, NA NO, NA NO, NA NO, NA NO, NA NO, NA NA, NO NA, NO 0.00
c-C3F6 NO, NA NO, NA NO, NA NO, NA NO, NA NO, NA NA, NO NA, NO 0.00
Unspecified mix of PFCs(4) - (kt CO2 equivalent) NO, NA NO, NA NO, NA NO, NA NO, NA NO, NA NA, NO NA, NO 0.00
Unspecified mix of HFCs and PFCs - (kt CO2
equivalent)
NO, NA NO, NA NO, NA NO, NA NO, NA NO, NA NA, NO NA, NO 0.00
SF6 0.00 0.00 0.00 0.00 0.00 0.00 0.00 0.00 100.00
NF3 NO, NA NO, NA NO, NA NO, NA NO, NA NO, NA NA, NO NA, NO 0.00

267
Abbreviations: CRF = common reporting format, LULUCF = land use, land-use change and forestry. a The column “Base year” should be filled in only by those Parties with economies in transition that use a base year different from 1990 in accordance with the relevant decisions of the Conference of the Parties. For these Parties, this different base year is used to calculate the percentage change in the final column of this table. cEnter actual emissions estimates. If only potential emissions estimates are available, these should be reported in this table and an indication for this be provided in the documentation box. Only in these rows are the
emissions expressed as CO2 equivalent emissions. dIn accordance with the “Guidelines for the preparation of national communications by Parties included in Annex I to the Convention, Part I: UNFCCC reporting guidelines on annual inventories”, HFC and PFC emissions
should be reported for each relevant chemical. However, if it is not possible to report values for each chemical (i.e. mixtures, confidential data, lack of disaggregation), this row could be used for reporting aggregate
figures for HFCs and PFCs, respectively. Note that the unit used for this row is kt of CO2 equivalent and that appropriate notation keys should be entered in the cells for the individual chemicals.)

268
CTF Table 2: Description of quantified economy-wide emission reduction target
Table 2(a)
LVA_BR3_v2.0
Description of quantified economy-wide emission reduction target: base yeara
Party Latvia
Base year /base period 1990
Emission reduction target % of base year/base period % of 1990 b
20.00% 20.00%
Period for reaching target BY-2020
a Reporting by a developed country Party on the information specified in the common tabular format does not prejudge the position
of other Parties with regard to the treatment of units from market-based mechanisms under the Convention or other market-based
mechanisms towards achievement of quantified economy-wide emission reduction targets.
b Optional.
Table 2(b)
LVA_BR3_v2.0
Description of quantified economy-wide emission reduction target: gases and sectors covereda
Gases covered Base year for each gas (year):
CO2 1990
CH4 1990
N2O 1990
HFCs 1990
PFCs NA
SF6 1990
NF3 NA
Other Gases (specify)
Sectors coveredb Energy Yes
Transportf Yes
Industrial processesg Yes
Agriculture Yes
LULUCF No
Waste Yes
Other Sectors (specify)
Abbreviations: LULUCF = land use, land-use change and forestry.
a Reporting by a developed country Party on the information specified in the common tabular format does not prejudge the
position of other Parties with regard to the treatment of units from market-based mechanisms under the Convention or other market-
based mechanisms towards achievement of quantified economy-wide emission reduction targets.
b More than one selection will be allowed. If Parties use sectors other than those indicated above, the explanation of how these
sectors relate to the sectors defined by the IPCC should be provided.
f Transport is reported as a subsector of the energy sector.
g Industrial processes refer to the industrial processes and solvent and other product use sectors.

269
Table 2(c) LVA_BR3_v2.0
Description of quantified economy-wide emission reduction target: global warming potential values
(GWP)a
Gases GWP values b
CO2 4th AR
CH4 4th AR
N2O 4th AR
HFCs 4th AR
PFCs
SF6 4th AR
NF3
Other Gases (specify)
Abbreviations: GWP = global warming potential a Reporting by a developed country Party on the information specified in the common tabular format does not prejudge the position
of other Parties with regard to the treatment of units from market-based mechanisms under the Convention or other market-based
mechanisms towards achievement of quantified economy-wide emission reduction targets. b Please specify the reference for the GWP: Second Assessment Report of the Intergovernmental Panel on Climate Change (IPCC)
or the Fourth Assessment Report of the IPCC.
Table 2(d)
LVA_BR3_v2.0
Description of quantified economy-wide emission reduction target: approach to counting emissions
and removals from the LULUCF sectora
Role of LULUCF LULUCF in base year level and target Excluded
Contribution of LULUCF is calculated using
Abbreviation: LULUCF = land use, land-use change and forestry. a Reporting by a developed country Party on the information specified in the common tabular format does not prejudge the position
of other Parties with regard to the treatment of units from market-based mechanisms under the Convention or other market-based
mechanisms towards achievement of quantified economy-wide emission reduction targets.
Table 2(e)I LVA_BR3_v2.0
Description of quantified economy-wide emission reduction target: market-based mechanisms under
the Conventiona
Market-based mechanisms Possible scale of contributions
under the Convention (estimated kt CO2 eq)
CERs NA
ERUs NA
AAUsi NA
Carry-over unitsj NA
Other mechanism units under the Convention (specify)d
Abbreviations: AAU = assigned amount unit, CER = certified emission reduction, ERU = emission reduction unit.

270
a Reporting by a developed country Party on the information specified in the common tabular format does not prejudge the position
of other Parties with regard to the treatment of units from market-based mechanisms under the Convention or other market-based
mechanisms towards achievement of quantified economy-wide emission reduction targets.
d As indicated in paragraph 5(e) of the guidelines contained in annex I of decision 2/CP.17 .
i AAUs issued to or purchased by a Party.
j Units carried over from the first to the second commitment periods of the Kyoto Protocol, as described in decision 13/CMP.1 and
consistent with decision 1/CMP.8.
Table 2(e)II
Description of quantified economy-wide emission reduction target: other market-based mechanisms
No information provided in Table 2(e)II.
Table 2(f) Description of quantified economy-wide emission reduction target: any other information
No information provided in table 2(f).

271
CTF Table 3: Progress in achievement of the quantified economy-wide emission reduction target: information on mitigation actions and their effects
Table 3
LVA_BR3_v2.0
Progress in achievement of the quantified economy-wide emission reduction target: information on mitigation actions and their effects
Name of mitigation actiona
Sector(s) affectedb GHG(s) affected
Objective and/or activity affected
Type of instrumentc
Status of implementationd
Brief descriptione Start year of
implementation
Implementing
entity or
entities
Estimate of mitigation impact
(not cumulative, in kt CO2 eq)f
2020 2025 f 2030 f
Investment Support
Programme for District
Heating (DH) Systems: 2007-2013 EU Funds
programming period*
Energy CO2 Increase in renewable
energy; Efficiency
improvement in the energy and transformation
sector
Economic Implemented Increasing the efficiency of heat supply
production, reducing the loss of heat energy in
the DH transmission & distribution systems and fostering the replacement of imported
fossil fuels with RES, including the increase
of both the CHP production utilising the RES and the heat boilers only production utilising
the RES. In financial programming period of
2007-2013 the support was provided by the Cohesion Fund in the frame of National
operational programme "Infrastructure and
services", part „Energy” (activities No 3521 & 3522). Within the framework of the open
tenders it was provided financial support (up
to 50% of project's total eligible costs) for Latvia district heating utilities and comersants
which provide district heating service to
implement the projects focused of noted above objectives.
2010 Ministry of
Economics
390.00 300.00 150.00

272
Name of mitigation
actiona Sector(s) affectedb
GHG(s)
affected
Objective and/or activity
affected
Type of
instrumentc
Status of
implementationd Brief descriptione
Start year of
implementation
Implementing
entity or entities
Estimate of mitigation impact
(not cumulative, in kt CO2 eq)f
2020 2025 f 2030 f
Energy Efficiency
Requirements for District Heating
Systems*
Energy CO2 Reduction of energy
losses
Regulatory Adopted The Governmental Regulations No 1214
(2009, in force 11.11.2009-08.01.2013) had defined the mandatory minimum energy
efficiency for new and reconstructed DH
networks put into operation after 01.01.2010. The minimum requirements were stated: 1)
efficiency of heat production boilers - 92%
(gaseous), 85% (liquid), 75% (solid), 2) efficiency of CHP units - 80% (gaseous &
liquid), 75% (solid), 3) annual maximum heat
loss in DH pipeline network - 22%. In 2016 it was adopted the succeeding Governmental
Regulations No 243 (in force from
06.05.2016) stating the following efficiency coeficients for heat production boilers -
92%(gaseous), 85% (liquid), 75% (solid), 2)
efficiency of CHP units - 80% (gaseous & liquid), 75% (solid), these coefficients shall be
fulfilled from 01.01.2018, annual maximum
heat loss in DH pipeline network is stated - 19% (from 01.01.2018) and 17% (from
01.01.2019).
2018 Ministry of
Economics
NE NE NE
Investment Support in
Industrial Buildings' and
Technologies' Energy
Efficiency to Reduce GHG emissions*
Industry/industrial processes CO2 Efficiency improvement in
industrial end-use sectors;
Efficiency improvements
of buildings; Efficiency improvement in services/
tertiary sector
Economic Implemented Receipts from the sale of GHG emissions
(pursuant to Art.17 of UNFCC Kyoto
protocol) were earmarked as national Climate
Change Financial Instrument (CCFI). Part of them were allocated for CO2 emissions
reduction in industrial/business sector entities.
Eligible investments included energy efficiency investments of different kind both
in buildings and technological equipment;
installation of efficient lightning; heat supply switch from fossils to RES & installation of
RES based heat supply system (up to 3 MW).
Commercial sector entities, which corresponds to certain NACE codes, may apply as well.
2010 Ministry of
Environment
Protection and
Regional Development
38.00 38.00 38.00
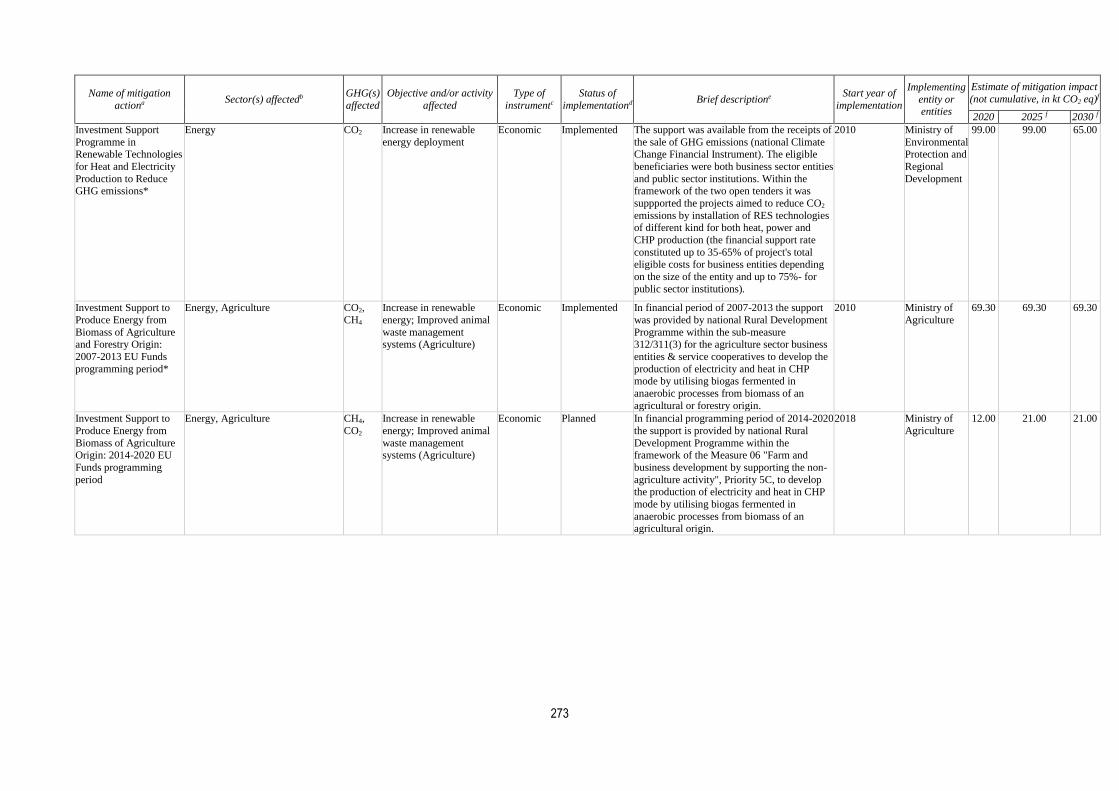
273
Name of mitigation
actiona Sector(s) affectedb
GHG(s)
affected
Objective and/or activity
affected
Type of
instrumentc
Status of
implementationd Brief descriptione
Start year of
implementation
Implementing
entity or entities
Estimate of mitigation impact
(not cumulative, in kt CO2 eq)f
2020 2025 f 2030 f
Investment Support
Programme in Renewable Technologies
for Heat and Electricity
Production to Reduce GHG emissions*
Energy CO2 Increase in renewable
energy deployment
Economic Implemented The support was available from the receipts of
the sale of GHG emissions (national Climate Change Financial Instrument). The eligible
beneficiaries were both business sector entities
and public sector institutions. Within the framework of the two open tenders it was
suppported the projects aimed to reduce CO2
emissions by installation of RES technologies of different kind for both heat, power and
CHP production (the financial support rate
constituted up to 35-65% of project's total eligible costs for business entities depending
on the size of the entity and up to 75%- for
public sector institutions).
2010 Ministry of
Environmental Protection and
Regional
Development
99.00 99.00 65.00
Investment Support to
Produce Energy from
Biomass of Agriculture and Forestry Origin:
2007-2013 EU Funds
programming period*
Energy, Agriculture CO2,
CH4
Increase in renewable
energy; Improved animal
waste management systems (Agriculture)
Economic Implemented In financial period of 2007-2013 the support
was provided by national Rural Development
Programme within the sub-measure 312/311(3) for the agriculture sector business
entities & service cooperatives to develop the
production of electricity and heat in CHP mode by utilising biogas fermented in
anaerobic processes from biomass of an
agricultural or forestry origin.
2010 Ministry of
Agriculture
69.30 69.30 69.30
Investment Support to
Produce Energy from
Biomass of Agriculture Origin: 2014-2020 EU
Funds programming
period
Energy, Agriculture CH4,
CO2
Increase in renewable
energy; Improved animal
waste management systems (Agriculture)
Economic Planned In financial programming period of 2014-2020
the support is provided by national Rural
Development Programme within the framework of the Measure 06 "Farm and
business development by supporting the non-
agriculture activity", Priority 5C, to develop the production of electricity and heat in CHP
mode by utilising biogas fermented in
anaerobic processes from biomass of an agricultural origin.
2018 Ministry of
Agriculture
12.00 21.00 21.00

274
Name of mitigation
actiona Sector(s) affectedb
GHG(s)
affected
Objective and/or activity
affected
Type of
instrumentc
Status of
implementationd Brief descriptione
Start year of
implementation
Implementing
entity or entities
Estimate of mitigation impact
(not cumulative, in kt CO2 eq)f
2020 2025 f 2030 f
Investment Support
Programmes to Increase Energy Efficiency in
Apartment Buildings:
2007-2013 EU Funds Programming Period*
Energy CO2 Efficiency improvements
of buildings
Economic Implemented In financial period of 2007-2013 the
investments in energy efficient building renovation were co-financed from the EU
Regional Development Fund under the Latvia
national operational programme "Infrastructure and Services", activity No.344
"Energy Efficiency in Housing". The measure
had 2 target audiences: 1) apartments owners of multi-apartment residential buildings, and
2) tenants of municipal social residential
buildings. The given PAM has impact on: district heat consumption especially in
residential multi-flat buildings - a large
number of Latvia district heating utilities participate in ETS sector. Thus given PAM
has impact on both ETS and non-ETS (ESD)
sectors.
2010 Ministry of
Economics
43.00 43.00 43.00
Energy Performance of Buildings*
Energy CO2 Efficiency improvements of buildings
Regulatory Implemented The recasted Law on the Energy Performance of Buildings (adopted Dec 2012) recast the
general legal framework of setting the
mandatory minimum energy performance requirements for buildings, the general
principles of mandatory energy efficiency
certification for buildings, verification of
buildings heating and ventilation systems. The
energy efficiency classification system for buildings are introduced by Governmental
Regulations. The given PAM in Latvia case
has impact on: district heat consumption especially in residential multi-flat buildings - a
large number of Latvia district heating utilities
participate in ETS sector. Thus given PAM has impact on both ETS and non-ETS (ESD)
sectors.
2013 Ministry of Economics
IE IE IE

275
Name of mitigation
actiona Sector(s) affectedb
GHG(s)
affected
Objective and/or activity
affected
Type of
instrumentc
Status of
implementationd Brief descriptione
Start year of
implementation
Implementing
entity or entities
Estimate of mitigation impact
(not cumulative, in kt CO2 eq)f
2020 2025 f 2030 f
Energy management
systems (EMS) in commercial and public
sector*
Energy CO2 Efficiency improvement in
industrial, commercial and municipal end-use sectors
Other
(Voluntary Agreement)
Implemented "Energy Efficiency Law" (2016) states the
mandatory implementation of EMS in: (1) state administration institutions which have
buildings with total heating area 10000 m2
and above; (2) municipalities - nine largest Latvia cities as well as other municipalities
whic fulfil certain threshold criteria, (3) large
enterprises (according the definition of Energy Efficiency Directive 2012/27/EU), (4) enties -
large electricity consumers (annual electricity
consumption is above 500 MWh). To co-operate with industrial sector and other actors,
e.g., municipalities, the Government had
adopted in July 2011 the Regulations on the procedure for entering into and supervision of
energy efficiency improvement agreements,
which have been re-casted, after adoption of new Energy Efficiency Law, in October 2016.
2017 Ministry of
Economics
NE NE NE

276
Name of mitigation
actiona Sector(s) affectedb
GHG(s)
affected
Objective and/or activity
affected
Type of
instrumentc
Status of
implementationd Brief descriptione
Start year of
implementation
Implementing
entity or entities
Estimate of mitigation impact
(not cumulative, in kt CO2 eq)f
2020 2025 f 2030 f
Energy Audits of
Residential Multi-apartment buildings*
Energy CO2 Efficiency improvements
of buildings
Other (Fiscal) Implemented The objective of the PAM is more efficient
use of final energy, reducing energy loss and emissions by providing recommendations for
increasing energy efficiency. In years 2009-
2010 the Ministry of Economics had implemented the national support programme
for the improvement of energy performance
for multi-apartment residential buildings, this programme had supported (up to 80% of total
costs) such activities as energy audits,
updating energy efficiency evaluations in accordance with the requirements of actual
legislative acts, preparations of the technical
project and of other documentation necessary for renovation of multi-apartment building.
Afterwards, at the moment the financial
support for preparation of technical documentation related to residential buildings’
energy efficiency is provided by a number of
municipalities; this support is defined by the municipal regulations issued pursuant to the
Section 27.2 “Assistance in the Renovation
and Restoration of Residential Housing” of the Law “On Assistance in Solving Apartment
Matters”. In the 2007-2013 programming
period of EU Structural Funds, the financial support for energy efficient renovation of
multi-apartment buildings had been provided
by the ERDF. Within the framework of the eligible costs provided for renovation works,
the financing had been provided also for
energy audit and preparation of construction works’ technical documentation as the first
stage of full renovation project. The given
PAM has impact on: district heat consumption especially in residential buildings (multi-flat
buildings) - a large number of Latvia district
heating utilities participate in ETS sector.
Thus given PAM has impact on both ETS and
non-ETS (ESD) sectors.
2009 Ministry of
Economics
IE IE IE

277
Name of mitigation
actiona Sector(s) affectedb
GHG(s)
affected
Objective and/or activity
affected
Type of
instrumentc
Status of
implementationd Brief descriptione
Start year of
implementation
Implementing
entity or entities
Estimate of mitigation impact
(not cumulative, in kt CO2 eq)f
2020 2025 f 2030 f
Informing Energy
Consumers of Residential Sector
(Multi-apartment
buildings)*
Energy CO2 Efficiency improvements
of buildings; Efficiency improvement of
appliances
Information Implemented The measure (i) motivates flats’ owners to
renovate them in the frame of the ERDF supported activity of Increasing energy
efficiency in multi-apartment buildings (the
Policies 7 and 33), (ii) informs and consults buildings’ management companies and
societies of the flats’ owners regarding
conditions and benefits of the Policies 7 and 33, (iii) encourages building companies,
building materials producers and traders to
take initiatives regarding renovation of multi-apartment buildings, (iv) raises understanding
on energy efficiency and thus promotes to
reduce heat energy consumption. The measure is continued in 2014-2020 EU Funds
programming period.
2010 Ministry of
Economics
IE IE IE
Financial Support (Grants) for Renewable
Energy Technologies
deployment in Households*
Energy CO2 Increase in renewable energy
Economic Implemented The financial support (particular programme of national Climate Change Financial
Instrument) was available from the revenues
of the sale of GHG emissions (under procedures pursuant to Art. 17 of UNFCCC
Kyoto protocol). Eligible micro-generation
technologies were: solar heat collectors (up to 25 kW), solar electricity (up to 10 kW), wind
(up to 10 kW), wood, wood chips, wood
pellets and straw technologies (up to 50 kW), heat pumps (up to 50 kW) as well as
combined use of above technologies. Both
existing houses and new buildings registered under construction were eligible. The support
for 1 project might be up to 9960 EUR.
2011 Ministry of Environment
Protection and
Regional Development
15.00 15.00 5.00
Investment Support Programmes in Public
Sector Energy
Efficiency*
Energy CO2 Efficiency improvement in services/ tertiary sector;
Increase in renewable
energy
Economic Implemented The financial support (particular programmes of national Climate Change Financial
Instrument) was available from the revenues
of the sale of GHG emissions (under procedure pursuant to Art.17 of UNFCCC
Kyoto protocol). The support was available to
improve heating and lightning energy efficiency as well as to realize fuel switch to
RES in the public buildings. The given PAM
has impact on: district heat consumption especially in public buildings - a large number
of Latvia district heating utilities participate in
ETS sector. Thus given PAM has impact on both ETS and non-ETS (ESD) sectors.
2010 Ministry of Environment
Protection and
Regional Development
54.00 54.00 54.00

278
Name of mitigation
actiona Sector(s) affectedb
GHG(s)
affected
Objective and/or activity
affected
Type of
instrumentc
Status of
implementationd Brief descriptione
Start year of
implementation
Implementing
entity or entities
Estimate of mitigation impact
(not cumulative, in kt CO2 eq)f
2020 2025 f 2030 f
Promotion Public
Understanding on the Importance and
Possibilities of GHG
Emissions Reduction*
Energy CO2 Efficiency improvements
of buildings; Efficiency improvement of
appliances; Demand
management
Other
(Education)
Implemented Years 2010-2013. The financial support
(particular programme of national Climate Change Financial Instrument) was provided
from the revenues of the sale of GHG
emissions (under procedures pursuant to Art.17 of UNFCCC Kyoto protocol). The
support was available for publications in mass
media for both general and targeted audiences, thematic broadcasts, organisation of thematic
workshops and trainings for targeted audience
groups, educational projects for pupils and students of Latvia primary, general and
professional educational establishments. Years
2015-2016. The measure has been supported by the programme "National Climate Policy"
of the EEA Financial Mechanism for years
2009-2014. The following activities have been supported: education/training programmes for
professional audiences, municipal specialists
and teachers; education modules for vocational secondary education programmes
and professional education programmes of
high schools, education activities and actions for pupils of primary, general secondary and
vocational education schools, information
campaigns and public actions in mass media, websites, radio, TV. The given PAM has
impact on: (1) electricity consumption -
electricity production relates to ETS sector, (2) district heat consumption especially in
residential buildings (multi-flat buildings) - a
large number of Latvia district heating utilities participate in ETS sector.
2011 Ministry of
Environment Protection and
Regional
Development

279
Name of mitigation
actiona Sector(s) affectedb
GHG(s)
affected
Objective and/or activity
affected
Type of
instrumentc
Status of
implementationd Brief descriptione
Start year of
implementation
Implementing
entity or entities
Estimate of mitigation impact
(not cumulative, in kt CO2 eq)f
2020 2025 f 2030 f
Energy Labeling on
Household Appliances*
Energy CO2 Efficiency improvement
of appliances
Regulatory Implemented The Governmental Regulations on labeling for
the first time in Latvia had been issued in 2001. The transposition of the requirements of
the Directive 2009/125/EC had been done by
the Cabinet of Ministers Regulations No.941, in force 15 December 2011. The transposition
of the requirements of the Revised Directive
on Labelling and standard product information of Energy Related Products ( 2010/30/EU)
had been done by the Cabinet of Ministers
Regulations No.480, in force 20 July 2011.Thus the legislative framework for the
harmonised national measures on end-user
information, particularly by means of labelling and standard product information, on the
consumption of energy and where relevant of
other essential resources during products’ use, and supplementary information concerning
energy-related products, thereby allowing end-
users to choose more efficient products is established in Latvia. Taking into account that
the requirements stated by the EC Delegated
Regulations shall be implemented directly, to avoid unnecessary overlapping of normative
documents, a number of national legislative
documents regarding labelling of household appliances had been stated as expired.
2002 Ministry of
Economics
NE NE NE

280
Name of mitigation
actiona Sector(s) affectedb
GHG(s)
affected
Objective and/or activity
affected
Type of
instrumentc
Status of
implementationd Brief descriptione
Start year of
implementation
Implementing
entity or entities
Estimate of mitigation impact
(not cumulative, in kt CO2 eq)f
2020 2025 f 2030 f
Biofuel Mix Obligation
Requirement*
Transport CO2 Low carbon fuels/electric
cars ; increase in renewable energy
Regulatory Implemented To ensure efficient growth of the share of RES
in the transport sector, in 01.10.2009 Latvia had introduced the Biofuel Mix Obligation
Requirement (Governmental Regulations
No.648, 25.06.2009, Art. 8.1&9.1). 4.5-5% (volume) bioethanol mix is mandatory for the
gasoline of "95" trademark. 4.5-5% (volume)
biodiesel mix is mandatory for the diesel fuel, including diesels of A-F categories, utilised in
moderate climate conditions, exemption is
made for diesels of 0-4 classes utilised in case of arctic/winter climate conditions.
2010 Ministry of
Economics
81.00 81.00 81.00
Excise Tax – Transport
sector*
Transport CO2 Efficiency improvements
of vehicles; Low carbon
fuels/electric cars; Demand management in
transport
Fiscal Implemented The procedure is established by the Law "On
Excise Duties". The Art.14 determines the
rates of duty for mineral oils and their substitutes. Regarding transport sector the
reduced tax rates currently are applied for
produced in Latvia or imported from EU member states: (1) gasoline with 70-85%
(volume) of ethanol produced from agriculture
origin raw materials, and (2) pure biodiesel is exempted from taxation. The Amendments,
adopted 17 December 2014, had cancelled the
reduced tax rate for the diesel (gas oil) with at
least 30% (volume) mix. To promote the
competitiveness of agriculture sector the
reduced tax rate is applied for certain amount of diesel which is used for agriculture sector
land cultivation and production purposes.
Starting from 2010, the amendments of the Law have introduced the excise tax also for
natural gas used in transport sector.
1993 Ministry of
Finance
NE NE NE

281
Name of mitigation
actiona Sector(s) affectedb
GHG(s)
affected
Objective and/or activity
affected
Type of
instrumentc
Status of
implementationd Brief descriptione
Start year of
implementation
Implementing
entity or entities
Estimate of mitigation impact
(not cumulative, in kt CO2 eq)f
2020 2025 f 2030 f
Annual taxation of
vehicles*
Transport CO2 Efficiency improvements
of vehicles; Modal shift to public transport or non-
motorized transport
Fiscal Implemented The measure is aimed at structural changes of
the car fleet, which will foster a reduction in fuel consumption and the number of
kilometres driven. In addition, the measure
will foster a reduction in the average age of vehicles. The actual legal system is
established by the Law „On the Vehicle
Operation Tax and Company Car Tax”. The law had established the annual taxation system
for cars, which had been registered in Latvia
after 01.01.2005 depending on engine size, maximal power of engine and full mass of
vehicle. For cars, registered before
01.01.2005, tax rate continues to depend on the full mass of the car. The latest
amendments of the Law, adopted 23
November 2016, are introducing the principal new approach - cars annual taxation based on
the specific CO2 emissions of the car. For the
cars registered up to 31.12.2016 the new approach will be applied starting from 2019
(thus, for the cars registered in the period
01.01.2009-31.12.2016 the “old approach” will be continued for years 2017 and 2018).
For the cars undergoing registration in Latvia
after 31.12.2016 – immediately.
2007 Ministry of
Transport
41.00 41.00 41.00
New Passenger Cars Labelling on Fuel
Economy Rating*
Transport CO2 Efficiency improvements of vehicles; Low carbon
fuels/electric cars
Other (Information)
Implemented The labelling of cars regarding fuel consumption (litres per 100 km or km per
litre) and CO2 emissions (grams per km). The
first Governmental Regulations Regarding Consumer Information to be Provided in
Labelling and Promotional Publications on
Fuel Consumption and CO2 Emissions of New Passenger Cars, issued 2002 and in force from
01.01.2003, had transposed the requirements
of the Directive 1999/94/EC. Afterwards, in July 2004 new Governmental Regulations
came into force transposing the requirements
of the Directive 2003/73/EC
2003 Ministry of Economics
56.00 115.00 115.00

282
Name of mitigation
actiona Sector(s) affectedb
GHG(s)
affected
Objective and/or activity
affected
Type of
instrumentc
Status of
implementationd Brief descriptione
Start year of
implementation
Implementing
entity or entities
Estimate of mitigation impact
(not cumulative, in kt CO2 eq)f
2020 2025 f 2030 f
Taxation of Electricity* Energy CO2 Switch to less carbon-
intensive fuels; Efficiency improvement in the
energy and transformation
sector
Fiscal Implemented The procedure is prescribed by the Electricity
Tax Law. Tax shall apply to entities who are engaged in the generation, distribution,
supply, selling of electricity as well as
purchasing electricity in electricity spot exchange. Up to 31.12.2016 the exemptions
were made 1) for the electricity obtained (i)
from renewable energy sources, (ii) in hydro power stations, (iii) in CHP stations
complying with the efficiency criteria
specified in the regulatory enactments; 2) for the electricity used for: (i) electricity
generation, (ii) the generation of heat energy
and electricity in CHP mode, (iii) the carriage of goods and public carriage of passengers,
including rail transport and public transport in
towns, (iv) household users, (v) street lighting services. From 01.01.2017 the exemption list
is shortened and includes only: (i) the carriage
of goods and public carriage of passenges, including on rail transport and in public
carriage of passengers in townsm (ii)
household users and (iii) street lightning services. The exemption is made also for
autonomous producers if they correspond to
certain criteria.
2007 Ministry of
Finance
NE NE NE

283
Name of mitigation
actiona Sector(s) affectedb
GHG(s)
affected
Objective and/or activity
affected
Type of
instrumentc
Status of
implementationd Brief descriptione
Start year of
implementation
Implementing
entity or entities
Estimate of mitigation impact
(not cumulative, in kt CO2 eq)f
2020 2025 f 2030 f
Taxation of CO2
emissions*
Cross-cutting CO2 Efficiency improvement
in public energy production Efficiency
improvement in industrial
end-use sectors, Energy Consumption: Efficiency
improvement in services/
tertiary sector
Fiscal Implemented The procedure is prescribed by the Natural
Resources Tax Law.The implementation of the given PAM started in 2005 as the national
policy to get environmental benefits and to
start to internalise external costs related to GHG emissions, afterwards this policy was
linked with EU GHG policies. The subject of
CO2 taxation is CO2 emitting activities (installations) requiring a GHG emission
permit - if the amount of the activity
(installation) is below the limit defined for inclusion in EU ETS. The tax shall not be paid
(i) for the CO2 emissions which emerges from
the installations participating in the EU ETS, and (ii) while using renewable energy sources
and local peat. The tax rate per 1 ton of CO2
emission is gradually raised up from the starting rate 0.142 EUR up to 4.50 EUR (from
01.01.2017).
2005 Ministry of
Finance
NE NE NE
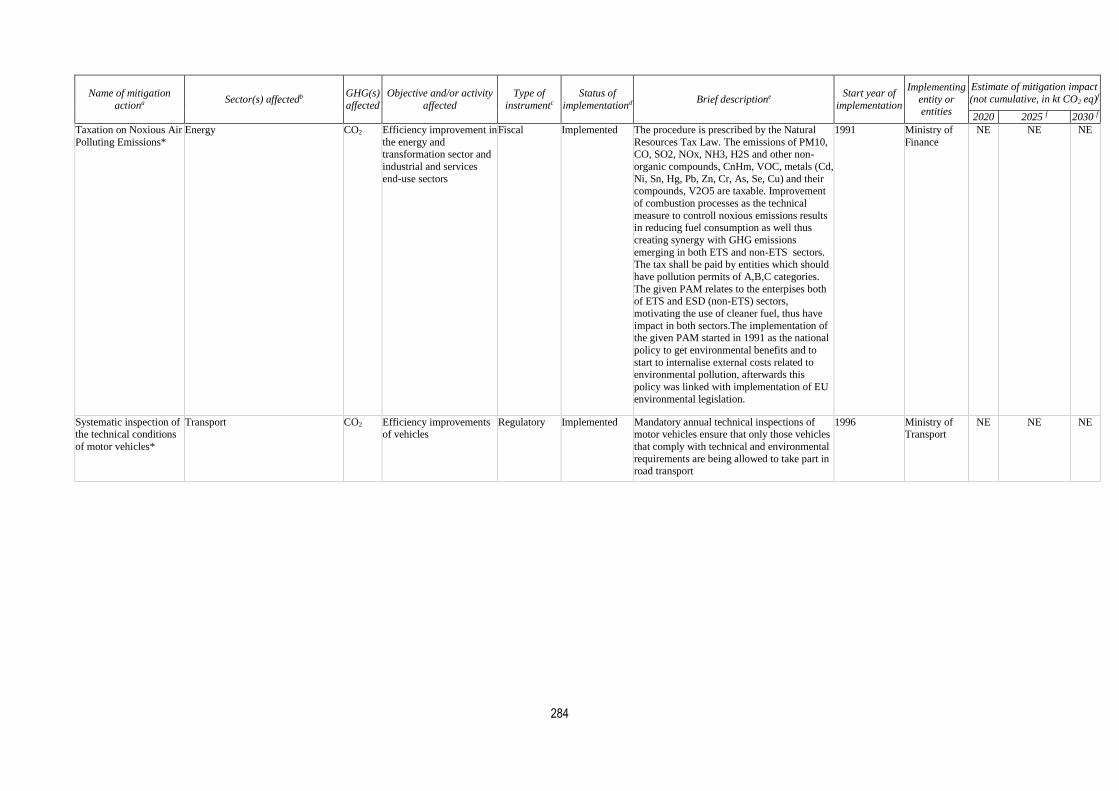
284
Name of mitigation
actiona Sector(s) affectedb
GHG(s)
affected
Objective and/or activity
affected
Type of
instrumentc
Status of
implementationd Brief descriptione
Start year of
implementation
Implementing
entity or entities
Estimate of mitigation impact
(not cumulative, in kt CO2 eq)f
2020 2025 f 2030 f
Taxation on Noxious Air
Polluting Emissions*
Energy CO2 Efficiency improvement in
the energy and transformation sector and
industrial and services
end-use sectors
Fiscal Implemented The procedure is prescribed by the Natural
Resources Tax Law. The emissions of PM10, CO, SO2, NOx, NH3, H2S and other non-
organic compounds, CnHm, VOC, metals (Cd,
Ni, Sn, Hg, Pb, Zn, Cr, As, Se, Cu) and their compounds, V2O5 are taxable. Improvement
of combustion processes as the technical
measure to controll noxious emissions results in reducing fuel consumption as well thus
creating synergy with GHG emissions
emerging in both ETS and non-ETS sectors. The tax shall be paid by entities which should
have pollution permits of A,B,C categories.
The given PAM relates to the enterpises both of ETS and ESD (non-ETS) sectors,
motivating the use of cleaner fuel, thus have
impact in both sectors.The implementation of the given PAM started in 1991 as the national
policy to get environmental benefits and to
start to internalise external costs related to environmental pollution, afterwards this
policy was linked with implementation of EU
environmental legislation.
1991 Ministry of
Finance
NE NE NE
Systematic inspection of the technical conditions
of motor vehicles*
Transport CO2 Efficiency improvements of vehicles
Regulatory Implemented Mandatory annual technical inspections of motor vehicles ensure that only those vehicles
that comply with technical and environmental
requirements are being allowed to take part in road transport
1996 Ministry of Transport
NE NE NE

285
Name of mitigation
actiona Sector(s) affectedb
GHG(s)
affected
Objective and/or activity
affected
Type of
instrumentc
Status of
implementationd Brief descriptione
Start year of
implementation
Implementing
entity or entities
Estimate of mitigation impact
(not cumulative, in kt CO2 eq)f
2020 2025 f 2030 f
Development of public
transport network*
Transport CO2 Modal shift to public
transport or non-motorized transport
Economic Implemented The measure envisages the improvement of
the system of public transport (PT) network; revision of the public transport subsidising
system (to avoid simultaneous subsidising of
parallel functioning regional and intercity buses and railway routes), harmonisation of
traffic schedules; etc. Development of the
infrastructure of PT are supported within the framework of the national Operational
Programme “Growth and Employment" of
2014-2020 EU Funds planning period, the Thematic Objective No4 “Supporting the shift
towards a low-carbon economy in all sectors”,
the Specific Objective 4.5.1. “To develop the infrastructure of environmentally friendly
public transport". The use of PT will be
promoted by increase of number of environmentally friendly vehicles of PT
(trams and buses) and length of tram lines; the
flow of passengers will direct from private transport to PT, decreasing the flow of road
transport in cities. Thus, more effective urban
transport infrastructure will be developed and emissions will be reduced. Investments are
made in accordance with city development
plans. Actions supported: (1) in Rīga, Liepāja, Daugavpils cities – development of
tram route network (extension of existing
lines, construction of new lines and acquisition of related rolling stock; According
03 May 2016 the Cabinet of Ministers
Regulations No281 (Annotation) it is planned to built 5.85 km new tram lines and renovate 7
km of existing tram lines). (2) According 20
December 2016 the Cabinet of Ministers Regulation No848 it is planned to implement
50 new environmentally friendly busses, from
which 46 busses shall be implemented up to
31.12.2018.
2011 Ministry of
Transport
NE NE NE

286
Name of mitigation
actiona Sector(s) affectedb
GHG(s)
affected
Objective and/or activity
affected
Type of
instrumentc
Status of
implementationd Brief descriptione
Start year of
implementation
Implementing
entity or entities
Estimate of mitigation impact
(not cumulative, in kt CO2 eq)f
2020 2025 f 2030 f
Performance of Heat
Generators for Space Heating and the
Production of Hot
Water*
Energy CO2 Efficiency improvement in
services/ tertiary sector energy supply
Regulatory Implemented In 26 September 2013 the Commission
Regulation (EU) No 813/2013 of 2 August 2013, implementing Directive 2009/125/EC,
had come into force. Latvia has used the
transition period. Namely, up to 26 September 2015 the Latvia Governmental Regulations No
416 regarding Hot-Water Boilers (adopted
22.04.2004) were in force.
2004 Ministry of
Economics
NE NE NE
Preferential Feed-in
Tariffs for Renewables*
Energy CO2 Increase in renewable
energy deployment
Economic Implemented The implementation of the given PAM started
in 1996 as the national policy to get both environmental benefits, socio-economic
benefits by contributing in regional
development and benefits in energy security; afterwards this policy was linked with EU
RES policies. Currently only existing plants
may receive the feed-in tariff, no submissions for new plants accepted. Application of RES
feed-in tariffs is in dependence of RES type
and unit capacity. The latest amendments to the Governmental Regulation (in force 01
May 2017) introduce that in case of receiving
feed-in tariff payments, the internal return rate shall not increase 9% for the whole support
period and shall be backwards evaluated for
each plant individually.
1996 Ministry of
Economics
IE IE IE
Preferential Feed-in
Tariffs for Combined
Heat-Power Production*
Energy CO2 Increase in renewable
energy; Efficiency
improvement in the energy and transformation
sector
Economic Implemented The implementation of the given PAM started
in 1996 as the national policy to get both
environmental benefits, socio-economic benefits by contributing in regional
development and benefits in energy
production efficiency and contribution in energy security. Afterwards this policy was
linked with EU energy and environment
policies. Currently only existing CHP plants may receive the feed-in tariff, no submissions
for new plants accepted. Application of CHP
feed-in tariffs is in dependence of fuel type and unit capacity. The amendments to the
Governmental Regulation (in force 01 May
2017) introduce that in case of receiving feed-in tariff payments, the internal return rate shall
not increase 9% for the whole support period
and shall be backwards evaluated for each plant individually.
1996 Ministry of
Economics
IE IE IE

287
Name of mitigation
actiona Sector(s) affectedb
GHG(s)
affected
Objective and/or activity
affected
Type of
instrumentc
Status of
implementationd Brief descriptione
Start year of
implementation
Implementing
entity or entities
Estimate of mitigation impact
(not cumulative, in kt CO2 eq)f
2020 2025 f 2030 f
Energy Certification of
Buildings*
Energy CO2 Efficiency improvements
of buildings
Other
(Information)
Implemented It is introduced six (A-F) energy efficiency
classes for residential and non-residential buildings. In case the specific annual heat
energy consumption for heating is higher than
150 kWh/1m2 (class F), the energy efficiency improvement measures shall be implemented.
Almost zero building is defined having not
higher 40 kWh/1 m2 (residential) or 45 kWh/1m2 (non-residential) heat energy
consumption for heating and 95 kWh/1 m2
total energy consumption. New residential buildings shall correspond to almost zero
buildings starting from 01.01.2021, new
buildings of state administration institutions – from 01.01.2019, other non-residential
buildings – from 01.01.2021.
2013 Ministry of
Economics
NE NE NE
Increased minimum thermal insulation
standards of buildings*
Energy CO2 Efficiency improvements of buildings
Regulatory Implemented The Latvian Construction Standard LBN 002-01 “Thermotechnics of Building Envelopes”
came into force 1st January 2003; the
Amendments, adopted in April 2014, had introduced the requirements of the recast
Directive 2010/31/EU on Energy Performance
of Buildings. The new values are mandatory for the projects which have been developed
starting from the 22th April 2014. Light re-
cast has been performed in 2015 by adopting the new version of the Standard LBN 002-
15.In 30 June 2015 the Government adopted
the new Latvian Construction Standard LBN002-15 “Thermotechnics of Building
Envelopes”, however these regulations,
compared to the previous version, had not been changed in point of fact, only minor
changes were done.
2014 Ministry of Economics
IE IE IE

288
Name of mitigation
actiona Sector(s) affectedb
GHG(s)
affected
Objective and/or activity
affected
Type of
instrumentc
Status of
implementationd Brief descriptione
Start year of
implementation
Implementing
entity or entities
Estimate of mitigation impact
(not cumulative, in kt CO2 eq)f
2020 2025 f 2030 f
Investment Support
Programme for District Heating (DH) Systems:
2014-2020 EU Funds
programming period*
Energy CO2 Increase in renewable
energy; Efficiency improvement in the
energy and transformation
sector
Economic Adopted DH supply is the most energy efficient method
for heat supply. The increasing efficiency and RES share in DH supply systems is supported
within the framework of the National
Operational Programme “Growth and Employment”, Thematic Objective No4
“Supporting the shift towards a low-carbon
economy in all sectors”, Specific Objective 4.3.1. “To promote energy efficiency and use
of local RES in the district heating supply”.
Indicative activities supported:(i) reconstruction for increase of energy
efficiency of heat production sources and use
of RES, (ii) reconstruction and construction of district heat transmission and distribution
systems aimed at reducing heat losses.
2017 Ministry of
Economics
71.50 76.00 76.00

289
Name of mitigation
actiona Sector(s) affectedb
GHG(s)
affected
Objective and/or activity
affected
Type of
instrumentc
Status of
implementationd Brief descriptione
Start year of
implementation
Implementing
entity or entities
Estimate of mitigation impact
(not cumulative, in kt CO2 eq)f
2020 2025 f 2030 f
Investment Support in
Manufacturing Industry sector to promote energy
efficiency and RES use:
2014-2020 EU Funds programming period
Industry/industrial processes, Energy CO2 Efficiency improvement in
industrial end-use sectors; Increase in renewable
energy
Economic Planned Development of new, innovative energy-
saving technology, measures increasing energy efficiency and share of RES is
supported within the framework of the new
national Operational Programme “Growth and Employment”, Thematic Objective No4
“Supporting the shift towards a low-carbon
economy in all sectors”, the Specific Objective 4.1.1. Activities supported: (i)
improvement of energy efficiency of buildings
outer constructions, (ii) improvement of energy efficiency in existing production
equipment, (iii) renovation, reconstruction or
installation of buildings' engineering system, (iv) installation of efficient lightning in inner
premises, (v) acquisition of energy efficient
production to replace existing ones, (vi) use of highly efficient RES (production of heat and
electricity for own consumption), (vii) energy
certification of buildings and preparation of technical documentation. (vii) energy
management systems (SMEs). The project
shall reach the following quantitative energy efficiency indicators: (i) energy efficiency
improvement shall be at least 15% after
implementation of energy efficiency improvement measures, (ii) heat energy
consumption for heating of industrial building
shall not be higher than 110 kWh/1m2/year (not applicable if only improvements of
energy efficiency in production process are
implemented).
2018 Ministry of
Economics
8.00 21.00 21.00

290
Name of mitigation
actiona Sector(s) affectedb
GHG(s)
affected
Objective and/or activity
affected
Type of
instrumentc
Status of
implementationd Brief descriptione
Start year of
implementation
Implementing
entity or entities
Estimate of mitigation impact
(not cumulative, in kt CO2 eq)f
2020 2025 f 2030 f
Investment Support to
Improve Energy Efficiency in Food
Processing Enterprises*
Industry/industrial processes CO2 Efficiency improvement in
industrial end-use sectors
Economic Adopted The support is provided within the framework
of the Measure 04.2 “Investments” of the national Rural Development Programme
2014-2020. The total planned amount of
investment support constitute ~ 80 MEUR, of which 11.388 MEUR public (total public +
private envisaged 28.346 MEUR) is directly
planned to improve energy efficiency of food processing enterprises and agriculture sector
in general. Other investments may bring
energy efficiency improvements indirectly as well. In case of energy efficiency investments
the support rate is defined 30-40%, depending
on annual turnover. The support might be used for implementation of both energy efficient
building (both new buildings and
reconstruction) and new energy efficient equipment (both heating & ventilation
equipment and equipment for production
processes). In case of the building: (i) at least 20% of energy savings (heating and cooling)
shall be reached for existing building, (ii) for
the new buildings the thresholds of heat penetrability shall be at least 20% lower
compared to initial default values defined by
the Governmental Regulations. In case of other energy efficiency improvement
measures energy efficiency shall be increased
by 20% as well compared to the replaced technology.
2016 Ministry of
Agriculture
NE NE NE
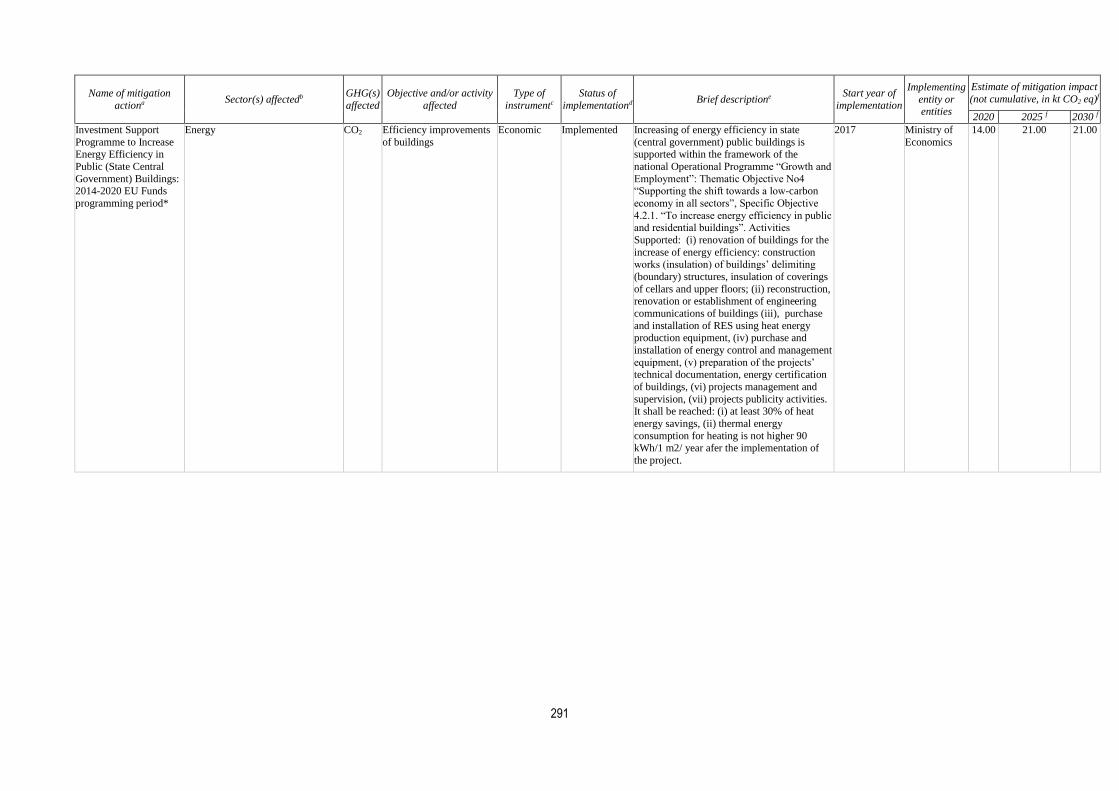
291
Name of mitigation
actiona Sector(s) affectedb
GHG(s)
affected
Objective and/or activity
affected
Type of
instrumentc
Status of
implementationd Brief descriptione
Start year of
implementation
Implementing
entity or entities
Estimate of mitigation impact
(not cumulative, in kt CO2 eq)f
2020 2025 f 2030 f
Investment Support
Programme to Increase Energy Efficiency in
Public (State Central
Government) Buildings: 2014-2020 EU Funds
programming period*
Energy CO2 Efficiency improvements
of buildings
Economic Implemented Increasing of energy efficiency in state
(central government) public buildings is supported within the framework of the
national Operational Programme “Growth and
Employment”: Thematic Objective No4 “Supporting the shift towards a low-carbon
economy in all sectors”, Specific Objective
4.2.1. “To increase energy efficiency in public and residential buildings”. Activities
Supported: (i) renovation of buildings for the
increase of energy efficiency: construction works (insulation) of buildings’ delimiting
(boundary) structures, insulation of coverings
of cellars and upper floors; (ii) reconstruction, renovation or establishment of engineering
communications of buildings (iii), purchase
and installation of RES using heat energy production equipment, (iv) purchase and
installation of energy control and management
equipment, (v) preparation of the projects’ technical documentation, energy certification
of buildings, (vi) projects management and
supervision, (vii) projects publicity activities. It shall be reached: (i) at least 30% of heat
energy savings, (ii) thermal energy
consumption for heating is not higher 90 kWh/1 m2/ year afer the implementation of
the project.
2017 Ministry of
Economics
14.00 21.00 21.00

292
Name of mitigation
actiona Sector(s) affectedb
GHG(s)
affected
Objective and/or activity
affected
Type of
instrumentc
Status of
implementationd Brief descriptione
Start year of
implementation
Implementing
entity or entities
Estimate of mitigation impact
(not cumulative, in kt CO2 eq)f
2020 2025 f 2030 f
Investment Support
Programme to Increase Energy Efficiency in
Apartment Buildings:
2014-2020 EU Funds programming period*
Energy CO2 Efficiency improvements
of buildings
Economic Implemented Increasing of energy efficiency in multi-
apartment buildings is supported within the framework of the national Operational
Programme “Growth and Employment”:
Thematic Objective No4 “Supporting the shift towards a low-carbon economy in all sectors”,
Specific Objective 4.2.1. “To increase energy
efficiency in public and residential buildings”. The annual specific heat energy consumption
for heating after renovation shall not exceed
90kWh/1m2. Indicative activities to be supported: (i) renovation of residential
buildings for the increase of energy
efficiency,(ii) construction works for the increase of energy efficiency – heat insulation
of buildings’ delimiting (boundary) structures,
reconstruction of heat supply and hot water supply systems of buildings, installation of
recuperation, energy control and management
equipment, including smart meters, (iii) energy certification of buildings, (iv) project’s
management and supervision of construction
works. The financial assistance will be provided in the following forms of subsidy
(grant), repayable loan with low interest rate,
guarantee for the loan. Subsidy will apply if the certain required energy efficiency level
after renovation works will be reached.
Important specific condition of Latvia is the high relative share of buildings supplied by
district heating systems.
2017 Ministry of
Economics
26.00 40.00 40.00
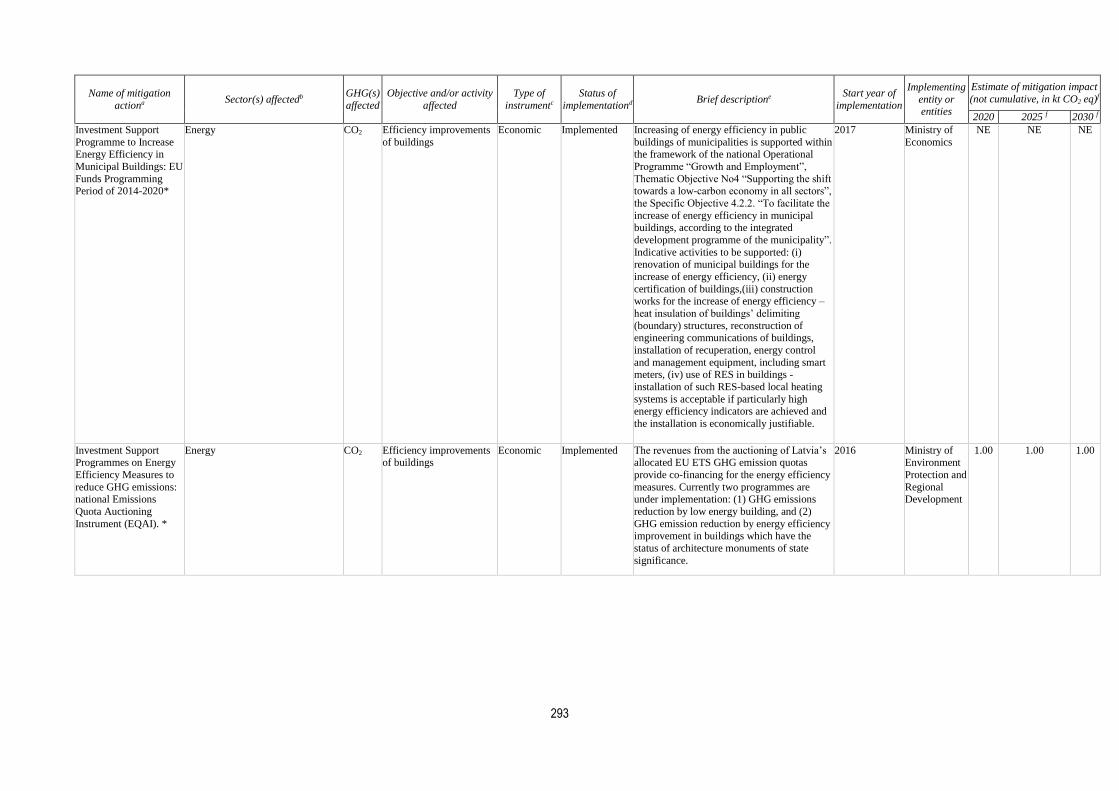
293
Name of mitigation
actiona Sector(s) affectedb
GHG(s)
affected
Objective and/or activity
affected
Type of
instrumentc
Status of
implementationd Brief descriptione
Start year of
implementation
Implementing
entity or entities
Estimate of mitigation impact
(not cumulative, in kt CO2 eq)f
2020 2025 f 2030 f
Investment Support
Programme to Increase Energy Efficiency in
Municipal Buildings: EU
Funds Programming Period of 2014-2020*
Energy CO2 Efficiency improvements
of buildings
Economic Implemented Increasing of energy efficiency in public
buildings of municipalities is supported within the framework of the national Operational
Programme “Growth and Employment”,
Thematic Objective No4 “Supporting the shift towards a low-carbon economy in all sectors”,
the Specific Objective 4.2.2. “To facilitate the
increase of energy efficiency in municipal buildings, according to the integrated
development programme of the municipality”.
Indicative activities to be supported: (i) renovation of municipal buildings for the
increase of energy efficiency, (ii) energy
certification of buildings,(iii) construction works for the increase of energy efficiency –
heat insulation of buildings’ delimiting
(boundary) structures, reconstruction of engineering communications of buildings,
installation of recuperation, energy control
and management equipment, including smart meters, (iv) use of RES in buildings -
installation of such RES-based local heating
systems is acceptable if particularly high energy efficiency indicators are achieved and
the installation is economically justifiable.
2017 Ministry of
Economics
NE NE NE
Investment Support Programmes on Energy
Efficiency Measures to
reduce GHG emissions: national Emissions
Quota Auctioning
Instrument (EQAI). *
Energy CO2 Efficiency improvements of buildings
Economic Implemented The revenues from the auctioning of Latvia’s allocated EU ETS GHG emission quotas
provide co-financing for the energy efficiency
measures. Currently two programmes are under implementation: (1) GHG emissions
reduction by low energy building, and (2)
GHG emission reduction by energy efficiency improvement in buildings which have the
status of architecture monuments of state
significance.
2016 Ministry of Environment
Protection and
Regional Development
1.00 1.00 1.00
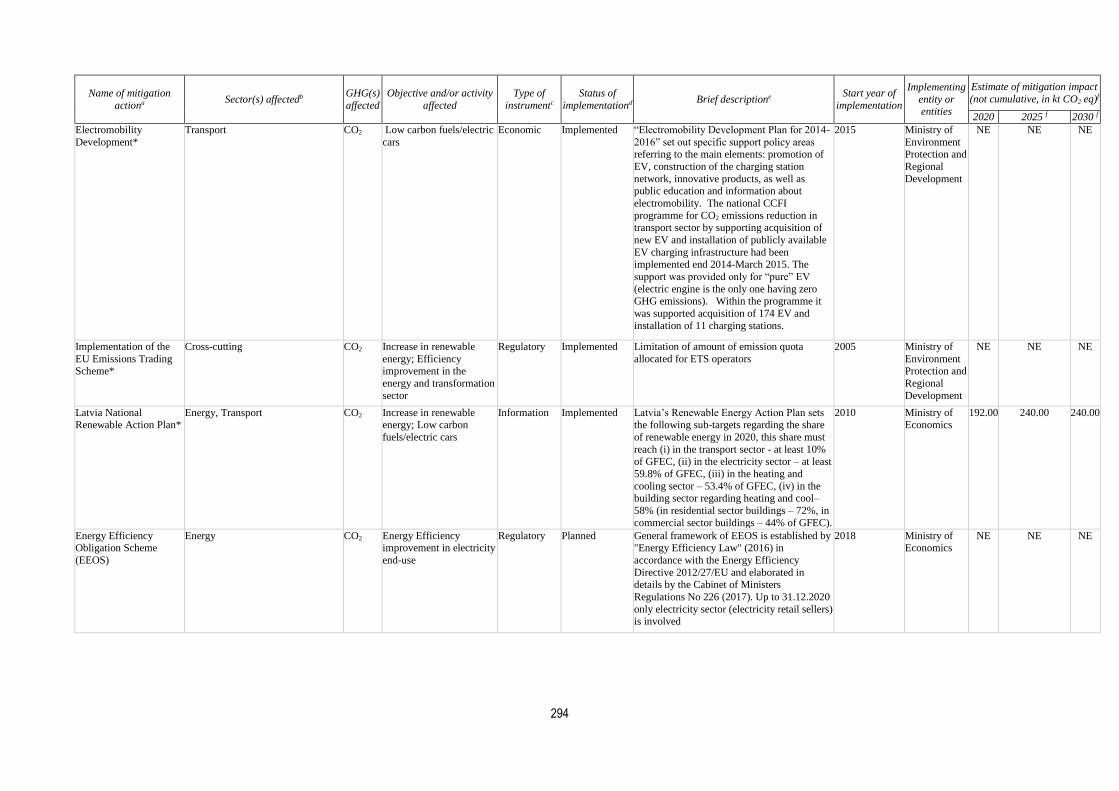
294
Name of mitigation
actiona Sector(s) affectedb
GHG(s)
affected
Objective and/or activity
affected
Type of
instrumentc
Status of
implementationd Brief descriptione
Start year of
implementation
Implementing
entity or entities
Estimate of mitigation impact
(not cumulative, in kt CO2 eq)f
2020 2025 f 2030 f
Electromobility
Development*
Transport CO2 Low carbon fuels/electric
cars
Economic Implemented “Electromobility Development Plan for 2014-
2016” set out specific support policy areas referring to the main elements: promotion of
EV, construction of the charging station
network, innovative products, as well as public education and information about
electromobility. The national CCFI
programme for CO2 emissions reduction in transport sector by supporting acquisition of
new EV and installation of publicly available
EV charging infrastructure had been implemented end 2014-March 2015. The
support was provided only for “pure” EV
(electric engine is the only one having zero GHG emissions). Within the programme it
was supported acquisition of 174 EV and
installation of 11 charging stations.
2015 Ministry of
Environment Protection and
Regional
Development
NE NE NE
Implementation of the
EU Emissions Trading Scheme*
Cross-cutting CO2 Increase in renewable
energy; Efficiency improvement in the
energy and transformation
sector
Regulatory Implemented Limitation of amount of emission quota
allocated for ETS operators
2005 Ministry of
Environment Protection and
Regional
Development
NE NE NE
Latvia National
Renewable Action Plan*
Energy, Transport CO2 Increase in renewable
energy; Low carbon
fuels/electric cars
Information Implemented Latvia’s Renewable Energy Action Plan sets
the following sub-targets regarding the share
of renewable energy in 2020, this share must
reach (i) in the transport sector - at least 10% of GFEC, (ii) in the electricity sector – at least
59.8% of GFEC, (iii) in the heating and
cooling sector – 53.4% of GFEC, (iv) in the building sector regarding heating and cool–
58% (in residential sector buildings – 72%, in
commercial sector buildings – 44% of GFEC).
2010 Ministry of
Economics
192.00 240.00 240.00
Energy Efficiency Obligation Scheme
(EEOS)
Energy CO2 Energy Efficiency improvement in electricity
end-use
Regulatory Planned General framework of EEOS is established by "Energy Efficiency Law" (2016) in
accordance with the Energy Efficiency
Directive 2012/27/EU and elaborated in details by the Cabinet of Ministers
Regulations No 226 (2017). Up to 31.12.2020
only electricity sector (electricity retail sellers) is involved
2018 Ministry of Economics
NE NE NE

295
Name of mitigation
actiona Sector(s) affectedb
GHG(s)
affected
Objective and/or activity
affected
Type of
instrumentc
Status of
implementationd Brief descriptione
Start year of
implementation
Implementing
entity or entities
Estimate of mitigation impact
(not cumulative, in kt CO2 eq)f
2020 2025 f 2030 f
Electrification of railway
network
Transport CO2 Switching from fossil fuel
to low carbon fuel (electricity from
renewables)
Economic Planned The investments will be made within the
framework of Thematic Objective No6 “Sustainable Transportation System” of the
2014-2020 Operational Programme “Growth
and Employment” , co-finaced by EU Cohesion Fund
2018 Ministry of
Transport
45.00 45.00
Increase of land area
under organic farming
relative to total agricultural land*
Agriculture N2O Reduction of
fertilizer/manure use on
cropland; Other activities improving cropland
management
Other
(Information)
Implemented Farming methods with environmentally
friendly influence on nature, reduction of
synthetic nitrate use and leaching, increased biodiversity. The state support for organic
farmers through subsidies. National
Development Plan of Latvia for 2014-2020 (NDP2020) set the plan to increase organic
agriculture area to 15% by 2030 in relation to
total agricultural area. The National Development Plan 2014–2020 is
hierarchically the highest national-level
medium-term planning document.
2016 Ministry of
Agriculture
213.00 292.00 370.00
Support for evolving of
precision agriculture
technologies in crop growing farms to reduce
nitrogen use
Agriculture CH4,
N2O
improving cropland
management
Voluntary
Agreement
Planned Measure is associated with promoting of
nitrogen fertilizer use reduction and
consequently with reduction of nitrogen amount in the run-off. This will reduce N2O
emissions from use of synthetic fertilizers and
indirect N2O emissions from soils. Voluntary/negotiated agreements, because
financial support for farmers is available, if a
farmer develop precision agriculture technologies in the farm with the aim to
reduce GHG emissions.
2018 Ministry of
Agriculture
NE NE NE
Support for evolving of
precision livestock feeding approach in
cattle breeding farms to
develop feeding plans and promote high quality
feed use to increase the
digestibility
Agriculture CH4,
N2O
Improved livestock
management
Voluntary
Agreement
Planned The main aim of measure is to promote high
quality feed use for animals to increase the digestibility and reduce CH4 emissions.
Voluntary/negotiated agreements, because
financial support for farmers is available, if a farmer develop precision livestock feeding
technologies in the farm with the aim to
reduce GHG emissions.
2018 Ministry of
Agriculture
NE NE NE

296
Name of mitigation
actiona Sector(s) affectedb
GHG(s)
affected
Objective and/or activity
affected
Type of
instrumentc
Status of
implementationd Brief descriptione
Start year of
implementation
Implementing
entity or entities
Estimate of mitigation impact
(not cumulative, in kt CO2 eq)f
2020 2025 f 2030 f
Introduction of
leguminous plants on arable land*
Agriculture N2O improving cropland
management
Voluntary
Agreement
Adopted Support to use of legumes as green manure
and fodder in crop rotation. Financial support is defined in Regulations of the Cabinet of
Ministers No. 126 (2015), that establishing
procedures for receiving payments for climate and environmentally friendly farming
practices, including legumes in crop rotation.
Measure is associated with promoting of nitrogen fertilizer use reduction. This will
reduce N2O emissions from use of synthetic
and organic fertilizers.
2017 Ministry of
Agriculture
NE NE NE
Management of nitrate
vulnerable territories*
Agriculture N2O Reduction of
fertilizer/manure use on
cropland
Regulatory Implemented Restriction for nitrogen usage, reduction of
nitrogen leaching. Water protection against
pollution caused by nitrates from agricultural sources. Rules for management of vulnerable
zones.
2014 Ministry of
Agriculture
NE NE NE
Requirements for the
protection of soil and
water from agricultural pollution caused by
nitrates*
Agriculture N2O Reduction of
fertilizer/manure use on
cropland
Regulatory Implemented Restriction for nitrogen usage, reduction of
nitrogen leaching. Reduction of non-direct
N2O emissions
2014 Ministry of
Agriculture
NE NE NE
Crop fertilization plans
in vulnerable zones*
Agriculture N2O Reduction of
fertilizer/manure use on cropland; improving
cropland management
Regulatory Implemented According to Republic of Latvia Cabinet
Regulation No. 834 (2014) "Regarding to Protection of Water and Soil from Pollution
with Nitrates Caused by Agricultural Activity"
in highly vulnerable zones farmers who managing the agricultural land with an area of
20 hectares and more, and grows vegetables,
potatoes, fruit trees or fruit bushes in an area of three hectares and more, are required to
document the field history for each field and
shall keep field history documentation for at least three years and, if using fertilisers; shall
prepare a crop fertilisation plan for each field
not later than until the sowing or planting of a crop, for perennial sowings and plants - until
the start of vegetation.
2012 Ministry of
Agriculture
NE NE NE

297
Name of mitigation
actiona Sector(s) affectedb
GHG(s)
affected
Objective and/or activity
affected
Type of
instrumentc
Status of
implementationd Brief descriptione
Start year of
implementation
Implementing
entity or entities
Estimate of mitigation impact
(not cumulative, in kt CO2 eq)f
2020 2025 f 2030 f
Requirements for
manure storage and spreading*
Agriculture CH4,
N2O
Improved animal waste
management systems
Regulatory Implemented Specify the requirements for storing of
manure outside animal shed Requirements refer to farms with more than 10 AU (animal
units), and 5 AU in vulnerable territories.
2014 Ministry of
Agriculture
NE NE NE
Agricultural land under
integrated farming
practice.*
Agriculture N2O Improving cropland
management
Voluntary
Agreement
Implemented Requirements are included in the Regulations
of the Cabinet of Ministers No. 1056
(2009).The growing of agricultural products utilising environmentally friendly measures,
preserving biological diversity and reducing
risks to human health and the environment, at the same time ensuring plant protection,
animal health and welfare measures. Before to
start the integrated farming, farmers prepare plant rotation plan regarding to vegetable and
potato areas for at least three years. If the field
size exceeds more than 10 hectares, it is required to implement around the field left a
two-meter-wide zone, were fertilizer and plant
protection products use is not available. This leads to reduction of mineral fertilizer use.
Voluntary agreement for farmers in
horticulture branch stimulate to use complex of methods to avoid high rates of nitrogen.
2014 Ministry of
Agriculture
NE NE NE
Cropland drainage* Agriculture CH4,
CO2
Activities improving
cropland management
Economic Implemented Restoration of malfunctioning drainage
systems in cropland. The measure will be
implemented in extensively managed croplands on mineral soils, where high yields
are not possible due to unfavorable conditions
during spring time, which are caused by wearing of existing drainage systems. After
reconstruction of drainage systems fields will
be returned to a conventional production systems with considerable input of organic
material in soil due to higher yields and crop
rotations. Only CO2 is considered due to the fact that country specific methods for
accounting of reduction of CH4 are not
elaborated and use of the default IPCC values might lead to considerable overestimation of
impact of the measure.
2015 Ministry of
Agriculture
6.10 6.10 6.10
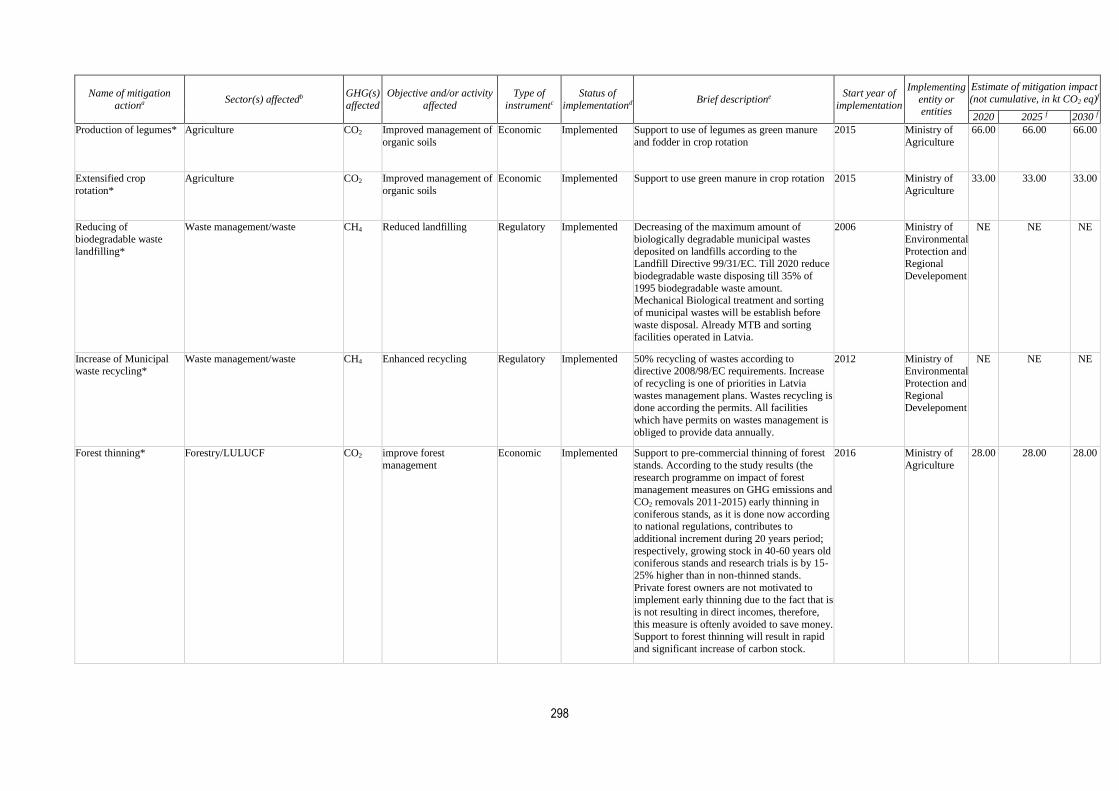
298
Name of mitigation
actiona Sector(s) affectedb
GHG(s)
affected
Objective and/or activity
affected
Type of
instrumentc
Status of
implementationd Brief descriptione
Start year of
implementation
Implementing
entity or entities
Estimate of mitigation impact
(not cumulative, in kt CO2 eq)f
2020 2025 f 2030 f
Production of legumes* Agriculture CO2 Improved management of
organic soils
Economic Implemented Support to use of legumes as green manure
and fodder in crop rotation
2015 Ministry of
Agriculture
66.00 66.00 66.00
Extensified crop
rotation*
Agriculture CO2 Improved management of
organic soils
Economic Implemented Support to use green manure in crop rotation 2015 Ministry of
Agriculture
33.00 33.00 33.00
Reducing of
biodegradable waste
landfilling*
Waste management/waste CH4 Reduced landfilling Regulatory Implemented Decreasing of the maximum amount of
biologically degradable municipal wastes
deposited on landfills according to the Landfill Directive 99/31/EC. Till 2020 reduce
biodegradable waste disposing till 35% of
1995 biodegradable waste amount. Mechanical Biological treatment and sorting
of municipal wastes will be establish before
waste disposal. Already MTB and sorting facilities operated in Latvia.
2006 Ministry of
Environmental
Protection and Regional
Develepoment
NE NE NE
Increase of Municipal waste recycling*
Waste management/waste CH4 Enhanced recycling Regulatory Implemented 50% recycling of wastes according to directive 2008/98/EC requirements. Increase
of recycling is one of priorities in Latvia
wastes management plans. Wastes recycling is done according the permits. All facilities
which have permits on wastes management is
obliged to provide data annually.
2012 Ministry of Environmental
Protection and
Regional Develepoment
NE NE NE
Forest thinning* Forestry/LULUCF CO2 improve forest
management
Economic Implemented Support to pre-commercial thinning of forest
stands. According to the study results (the
research programme on impact of forest management measures on GHG emissions and
CO2 removals 2011-2015) early thinning in
coniferous stands, as it is done now according to national regulations, contributes to
additional increment during 20 years period;
respectively, growing stock in 40-60 years old coniferous stands and research trials is by 15-
25% higher than in non-thinned stands.
Private forest owners are not motivated to implement early thinning due to the fact that is
is not resulting in direct incomes, therefore,
this measure is oftenly avoided to save money. Support to forest thinning will result in rapid
and significant increase of carbon stock.
2016 Ministry of
Agriculture
28.00 28.00 28.00

299
Name of mitigation
actiona Sector(s) affectedb
GHG(s)
affected
Objective and/or activity
affected
Type of
instrumentc
Status of
implementationd Brief descriptione
Start year of
implementation
Implementing
entity or entities
Estimate of mitigation impact
(not cumulative, in kt CO2 eq)f
2020 2025 f 2030 f
Reduce emissions of
fluorinated greenhouse gases.*
Industry/industrial processes HFCs,
PFCs, SF6
Reduction of emissions of
fluorinated gases; Replacement of
fluorinated gases by other
substances
Regulatory Implemented Prevent and minimise emissions of fluorinated
greenhouse gases. Bans on the placing on the market, maintainance and service products
and equipment containing HFCs with high
GWPs.
2015 Ministry of
Environmental Protection and
Regional
Develepoment
NE NE NE
Forest regeneration* Forestry/LULUCF CO2 improving forest
management
Economic Implemented Support to reconstruction and regeneration of
low grade and damaged forest stands
2016 Ministry of
Agriculture
18.00 18.00 18.00
Drainage in forest Forestry/LULUCF CO2 Prevention of drainage or
rewetting of wetlands
Economic Planned Restoration of malfunctioning forest drainage
systems
2018 Ministry of
Agriculture
15.00 15.00 15.00
Afforestation* Forestry/LULUCF CO2 Afforestation and
reforestation
Economic Implemented Support to afforestation of low grade
abandoned farmlands
2016 Ministry of
Agriculture
48.00 48.00 48.00
Note: The two final columns specify the year identified by the Party for estimating impacts (based on the status of the measure and whether an ex post or ex ante estimation is available).
Abbreviations: GHG = greenhouse gas; LULUCF = land use, land-use change and forestry.
a Parties should use an asterisk (*) to indicate that a mitigation action is included in the ‘with measures’ projection.
b To the extent possible, the following sectors should be used: energy, transport, industry/industrial processes, agriculture, forestry/LULUCF, waste management/waste, other sectors, cross-cutting, as appropriate.
c To the extent possible, the following types of instrument should be used: economic, fiscal, voluntary agreement, regulatory, information, education, research, other.
d To the extent possible, the following descriptive terms should be used to report on the status of implementation: implemented, adopted, planned.
e Additional information may be provided on the cost of the mitigation actions and the relevant timescale.
f Optional year or years deemed relevant by the Party.

300
CTF Table 4: Reporting on progress
Table 4
LVA_BR3_v2.0
Reporting on progressa, b
Total emissions excluding
LULUCF
Contribution from
LULUCFd
Quantity of
units from
market based
mechanisms
under the
Convention
Quantity of units from other
market based mechanisms
Yearc (kt CO2 eq) (kt CO2 eq)
(number
of units)
(kt CO2 eq)
(number
of units)
(kt CO2 eq)
Base year/period (1990) 26,184.86*
2010 12,218.08*
2011 11,443.23*
2012 11,343.80*
2013 11,265.27*
2014 11,210.22*
2015 11,319.39* NA, NO
2016 NO, NA
Abbreviation: GHG = greenhouse gas, LULUCF = land use, land-use change and forestry.
a Reporting by a developed country Party on the information specified in the common tabular format does not prejudge the position of
other Parties with regard to the treatment of units from market-based mechanisms under the Convention or other market-based
mechanisms towards achievement of quantified economy-wide emission reduction targets.
b For the base year, information reported on the emission reduction target shall include the following: (a) total GHG emissions,
excluding emissions and removals from the LULUCF sector; (b) emissions and/or removals from the LULUCF sector based on the
accounting approach applied taking into consideration any relevant decisions of the Conference of the Parties and the activities and/or
land that will be accounted for; (c) total GHG emissions, including emissions and removals from the LULUCF sector. For each reported
year, information reported on progress made towards the emission reduction targets shall include, in addition to the information noted in
paragraphs 9(a–c) of the UNFCCC biennial reporting guidelines for developed country Parties, information on the use of units from
market-based mechanisms.
c Parties may add additional rows for years other than those specified below.
d Information in this column should be consistent with the information reported in table 4(a)I or 4(a)II, as appropriate. The Parties for
which all relevant information on the LULUCF contribution is reported in table 1 of this common tabular format can refer to table 1.
Custom Footnotes
Official data for 2016 will be available in April 2018

301
Table 4(a)I
LVA_BR3_v2.0
Progress in achieving the quantified economy-wide emission reduction targets – further information on mitigation actions relevant to the
contribution of the land use, land-use change and forestry sector in 2015 a,b
Net GHG emissions/removals from LULUCF
categories c
Base
year/period or
reference
level value
d
Contribution
from
LULUCF for reported
year
Cumulative contribution
from
LULUCF e
Accounting
approach f
(kt CO2 eq)
Total LULUCF
A. Forest land
1. Forest land remaining
forest land
2. Land converted to forest land
3. Other g
B. Cropland
1. Cropland remaining cropland
2. Land converted to
cropland
3. Other g
C. Grassland
1. Grassland remaining
grassland
2. Land converted to
grassland
3. Other g
D. Wetlands
1. Wetland remaining
wetland
2. Land converted to wetland
3. Other g
E. Settlements
1. Settlements remaining
settlements
2. Land converted to
settlements
3. Other g
F. Other land
1. Other land remaining
other land
2. Land converted to other
land
3. Other g
G. Other
Harvested wood products
Abbreviations: GHG = greenhouse gas, LULUCF = land use, land-use change and forestry.
a Reporting by a developed country Party on the information specified in the common tabular format does not prejudge the position of other Parties
with regard to the treatment of units from market-based mechanisms under the Convention or other market-based mechanisms towards achievement of quantified economy-wide emission reduction targets. b Parties that use the LULUCF approach that is based on table 1 do not need to complete this table, but should indicate the approach in table 2. Parties
should fill in a separate table for each year, namely 2011 and 2012, where 2014 is the reporting year.
c For each category, enter the net emissions or removals reported in the most recent inventory submission for the corresponding inventory year. If a category differs from that used for the reporting under the Convention or its Kyoto Protocol, explain in the biennial report how the value was derived.
d Enter one reference level or base year/period value for each category. Explain in the biennial report how these values have been calculated.
e If applicable to the accounting approach chosen. Explain in this biennial report to which years or period the cumulative contribution refers to.
f Label each accounting approach and indicate where additional information is provided within this biennial report explaining how it was implemented,
including all relevant accounting parameters (i.e. natural disturbances, caps).
g Specify what was used for the category “other”. Explain in this biennial report how each was defined and how it relates to the categories used for reporting under the Convention or its Kyoto Protocol.

302
Table 4(a)I
LVA_BR3_v2.0
Progress in achieving the quantified economy-wide emission reduction targets – further information on mitigation actions relevant to the
contribution of the land use, land-use change and forestry sector in 2016 a, b
Net GHG emissions/removals from LULUCF
categories c
Base
year/period or
reference
level value
d
Contribution
from
LULUCF for reported
year
Cumulative contribution
from
LULUCF e
Accounting
approach f
(kt CO2 eq)
Total LULUCF
A. Forest land
1. Forest land remaining
forest land
2. Land converted to forest
land
3. Other g
B. Cropland
1. Cropland remaining cropland
2. Land converted to
cropland
3. Other g
C. Grassland
1. Grassland remaining
grassland
2. Land converted to grassland
3. Other g
D. Wetlands
1. Wetland remaining wetland
2. Land converted to wetland
3. Other g
E. Settlements
1. Settlements remaining settlements
2. Land converted to
settlements
3. Other g
F. Other land
1. Other land remaining
other land
2. Land converted to other
land
3. Other g
G. Other
Harvested wood products
Abbreviations: GHG = greenhouse gas, LULUCF = land use, land-use change and forestry.
a Reporting by a developed country Party on the information specified in the common tabular format does not prejudge the position of other Parties with regard to the treatment of units from market-based mechanisms under the Convention or other market-based mechanisms towards achievement of
quantified economy-wide emission reduction targets. b Parties that use the LULUCF approach that is based on table 1 do not need to complete this table, but should indicate the approach in table 2. Parties should fill in a separate table for each year, namely 2011 and 2012, where 2014 is the reporting year.
c For each category, enter the net emissions or removals reported in the most recent inventory submission for the corresponding inventory year. If a category differs from that used for the reporting under the Convention or its Kyoto Protocol, explain in the biennial report how the value was derived.
d Enter one reference level or base year/period value for each category. Explain in the biennial report how these values have been calculated.
e If applicable to the accounting approach chosen. Explain in this biennial report to which years or period the cumulative contribution refers to.
f Label each accounting approach and indicate where additional information is provided within this biennial report explaining how it was implemented,
including all relevant accounting parameters (i.e. natural disturbances, caps).
g Specify what was used for the category “other”. Explain in this biennial report how each was defined and how it relates to the categories used for reporting under the Convention or its Kyoto Protocol.

303
CTF Table 4(a)II: Progress in achievement of the quantified economy-wide emission reduction targets – further information on mitigation actions relevant to the counting of emissions and removals from the land use, land-use change and forestry sector in relation to activities under Article 3, paragraphs 3 and 4, of the Kyoto Protocol
Table 4(a)II
LVA_BR3_v2.0
Progress in achievement of the quantified economy-wide emission reduction targets – further
information on mitigation actions relevant to the counting of emissions and removals from the
land use, land-use change and forestry sector in relation to activities under Article 3,
paragraphs 3 and 4, of the Kyoto Protocola,b, c
Source: Submission 2018 v1,
LATVIA
GREENHOUSE GAS SOURCE AND SINK
ACTIVITIES
Base yeard
Net emissions/removalse Accounting parametersh
Accounting quantityi
2013 2014 2015 2016 2017 2018 2019 2020 Totalg
(kt CO2 eq)
A. Article 3.3 activities
A.1. Afforestation/reforestation -69.29 -73.31 -77.09 -219.69 -219.69
Excluded emissions from natural disturbances(5) NA NA NA NA NA
Excluded subsequent removals from land subject
to natural disturbances(6)
NA NA NA NA NA
A.2. Deforestation 1,695.64 1,727.50 1,756.53 5,179.67 5179.67
B. Article 3.4 activities
B.1. Forest management -5,738.44 8057.38
Net emissions/removalse -3,679.00 474.99 -2,534.44 -5,738.44
Excluded emissions from natural disturbances(5) NA NA NA NA NA
Excluded subsequent removals from land subject
to natural disturbances(6)
NA NA NA NA NA
Any debits from newly established forest (CEF-
ne)(7),(8)
NA NA NA NA NA
Forest management reference level (FMRL)(9) -16302.00
Technical corrections to FMRL(10) 11703.39
Forest management capl 7332.51 8057.38
B.2. Cropland management (if elected) NA NA NA NA NA NA
B.3. Grazing land management (if elected) NA NA NA NA NA NA
B.4. Revegetation (if elected) NA NA NA NA NA NA
B.5. Wetland drainage and rewetting (if elected) NA,NO NA, NO NA, NO NO, NA NO, NA NO,NA

304
Note: 1 kt CO2 eq equals 1 Gg CO2 eq.
Abbreviations: CRF = common reporting format, LULUCF = land use, land-use change and forestry. a Reporting by a developed country Party on the information specified in the common tabular format does not prejudge the position of other Parties with regard to the treatment of units from market-based mechanisms under
the Convention or other market-based mechanisms towards achievement of quantified economy-wide emission reduction targets. b Developed country Parties with a quantified economy-wide emission reduction target as communicated to the secretariat and contained in document FCCC/SB/2011/INF.1/Rev.1 or any update to that document, that are Parties to the Kyoto Protocol, may use table 4(a)II for reporting of accounting quantities if LULUCF is contributing to the attainment of that target. c Parties can include references to the relevant parts of the national inventory report, where accounting methodologies regarding LULUCF are further described in the documentation box or in the biennial reports. d Net emissions and removals in the Party’s base year, as established by decision 9/CP.2. e All values are reported in the information table on accounting for activities under Article 3, paragraphs 3 and 4, of the Kyoto Protocol, of the CRF for the relevant inventory year as reported in the current submission and are
automatically entered in this table. f Additional columns for relevant years should be added, if applicable. g Cumulative net emissions and removals for all years of the commitment period reported in the current submission. h The values in the cells “3.3 offset” and “Forest management cap” are absolute values. i The accounting quantity is the total quantity of units to be added to or subtracted from a Party’s assigned amount for a particular activity in accordance with the provisions of Article 7, paragraph 4, of the Kyoto Protocol. j In accordance with paragraph 4 of the annex to decision 16/CMP.1, debits resulting from harvesting during the first commitment period following afforestation and reforestation since 1990 shall not be greater than the credits
accounted for on that unit of land. k In accordance with paragraph 10 of the annex to decision 16/CMP.1, for the first commitment period a Party included in Annex I that incurs a net source of emissions under the provisions of Article 3 paragraph 3, may
account for anthropogenic greenhouse gas emissions by sources and removals by sinks in areas under forest management under Article 3, paragraph 4, up to a level that is equal to the net source of emissions under the
provisions of Article 3, paragraph 3, but not greater than 9.0 megatonnes of carbon times five, if the total anthropogenic greenhouse gas emissions by sources and removals by sinks in the managed forest since 1990 is equal to, or larger than, the net source of emissions incurred under Article 3, paragraph 3. l In accordance with paragraph 11 of the annex to decision 16/CMP.1, for the first commitment period of the Kyoto Protocol only, additions to and subtractions from the assigned amount of a Party resulting from Forest
management under Article 3, paragraph 4, after the application of paragraph 10 of the annex to decision 16/CMP.1 and resulting from forest management project activities undertaken under Article 6, shall not exceed the value inscribed in the appendix of the annex to decision 16/CMP.1, times five.

305
CTF Table 4(b): Reporting on progress
Table 4(b)
LVA_BR3_v2.0
Reporting on progressa, b, c
Units of market based mechanisms
Year
2015 2016
Kyoto Protocol unitsd
Kyoto Protocol units (number of units)
NA,
NO
NO, NA
(kt CO2 eq)
AAUs (number of units) NA NA
(kt CO2 eq)
ERUs (number of units) NA NA
(kt CO2 eq)
CERs (number of units) NA NA
(kt CO2 eq)
tCERs (number of units) NO NO
(kt CO2 eq)
lCERs (number of units) NO NO
(kt CO2 eq)
Other units d,e
Units from market-based mechanisms under the
Convention
(number of units)
(kt CO2 eq)
Units from other market-based mechanisms (number of units)
(kt CO2 eq)
Total (number of units)
NA,
NO
NO, NA
(kt CO2 eq)
Abbreviations: AAUs = assigned amount units, CERs = certified emission reductions, ERUs = emission reduction units, lCERs =
long-term certified emission reductions, tCERs = temporary certified emission reductions.
Note: 2011 is the latest reporting year.
a Reporting by a developed country Party on the information specified in the common tabular format does not prejudge the position
of other Parties with regard to the treatment of units from market-based mechanisms under the Convention or other market-based
mechanisms towards achievement of quantified economy-wide emission reduction targets.
b For each reported year, information reported on progress made towards the emission reduction target shall include, in addition to
the information noted in paragraphs 9(a-c) of the reporting guidelines, on the use of units from market-based mechanisms.
c Parties may include this information, as appropriate and if relevant to their target.
d Units surrendered by that Party for that year that have not been previously surrendered by that or any other Party.
e Additional rows for each market-based mechanism should be added, if applicable.

306
CTF Table 5: Summary of key variables and assumptions used in the projections analysis
Table 5
LVA_BR3_v2.0
Summary of key variables and assumptions used in the projections analysisa
Key underlying assumptions Historicalb Projected
Assumption Unit 1990 1995 2000 2005 2010 2011 2012 2013 2014 2015 2020 2025 2030
Population thousands 2,097.55 2,059.71 2,012.65 NA 1,977.53 1,930.35 1,916.47 1,915.72
Gross domestic product, constant prices MEUR (2010) 18,367.88 19,074.04 20,841.25 NA 21,386.31 25,784.25 31,976.82 37,600.47
Gross value added industry, constant prices MEUR (2010) 2,887.74 2,948.97 2,930.19 NA 3,059.55 3,852.85 4,883.26 5,895.65
EU ETS carbon price EUR(2000)/EUA NA NA NA NA 5.70 11.48 17.22 25.64
Coal import price EUR(2000)/GJ 2.09 2.58 2.49 NA 2.74 2.30 2.55 2.83
Crude oil import price EUR(2000)/GJ 10.58 12.37 11.75 NA 4.62 7.47 9.29 11.56
Natural gas import price EUR(2000)GJ 5.53 6.07 7.60 NA 5.71 6.06 7.47 9.21
Number of passenger-kilometres (all modes) Mpkm 16,195.28 14,938.24 14,612.83 NA 16,883.11 18,869.44 20,800.73 22,083.90
Freight transport tonnes-kilometres (all modes) Mtkm 27,769.00 33,541.00 32,348.00 NA 33,596.00 36,236.02 39,346.43 41,711.17
Number of heating degree days (HDD) count 4,622.25 3,939.94 4,092.00 NA 3,658.00 3,658.00 3,658.00 3,658.00
Number of households thousands 825.60 817.00 823.30 NA 815.84 813.48 824.97 842.36
Household size (inhabitants/Household) count 2.54 2.52 2.44 NA 2.42 2.37 2.32 2.27
Livestock - Dairy cattle 1000 164.10 164.10 165.00 162.40 NA 158.10 161.50 155.19
Livestock - Non-dairy cattle 1000 215.40 216.50 241.50 256.70 NA 309.35 345.06 339.33
Livestock - Sheep 1000 76.80 79.70 84.80 102.30 NA 131.21 160.15 189.08
Livestock - Pig 1000 389.70 375.00 367.50 334.20 NA 345.19 341.09 338.54
Livestock - Poultry 1000 4,948.70 4,417.90 4,985.80 4,532.00 NA 4,690.50 4,690.50 4,690.50
Nitrogen input from application of synthetic fertilizers kt N 59.50 59.80 69.70 75.80 NA 71.65 79.77 86.60
Nitrogen input from application of manure kt N 16.02 16.30 17.42 17.10 NA 17.83 18.91 18.96
Nitrogen in crop residues returned to soils kt N 14.24 16.62 18.54 39.10 NA 46.90 50.88 54.49
Area of cultivated organic soils Ha 126,450.00 126,332.00 126,028.00 138,122.47 NA 123,870.19 122,696.88 121,668.47
Municipal solid waste (MSW) generation 1000t 1,131.00 1,535.00 1,779.00 2,087.51 NA 2,188.77 2,389.70 2,577.05
Municipal solid waste (MSW) going to landfills 1000t 605.36 548.70 533.00 503.88 NA 322.00 322.00 322.00
Share of CH4 recovery in total CH4 generation from landfills % 26.20 27.40 28.20 33.73 NA 40.61 47.20 51.72
Primary energy consumption - Coal PJ 5.75 6.87 5.26 NA 4.26 4.10 7.27 11.07
Primary energy consumption - petroleum products PJ 64.58 59.50 59.27 NA 62.64 62.72 66.12 67.58
Primary energy consumption - Natural gas PJ 61.31 54.03 50.27 NA 46.10 45.39 39.12 36.56
Primary energy consumption - Renewables PJ 61.38 59.34 67.46 NA 67.01 92.30 85.20 79.33
Primary energy consumption - Total PJ 193.03 179.74 182.26 NA 186.57 207.23 203.07 203.25
Gross electricity production - Coal TWh 0.02 0.00 0.00 NA 0.01 0.02 0.00 0.00
Gross electricity production - Oil TWh 0.01 0.00 0.00 NA 0.00 0.00 0.00 0.00
Gross electricity production - Natural gas TWh 2.95 3.01 2.67 NA 2.75 2.74 2.59 2.10
Gross electricity production - Renewables TWh 3.64 3.08 3.53 NA 2.78 4.93 5.08 4.60
Gross electricity production - Total TWh 6.63 6.09 6.21 NA 5.53 7.69 7.67 6.71
Total net electricity imports TWh 0.87 1.25 1.36 NA 1.82 0.76 1.49 2.42
Final energy consumption - Industry PJ 32.47 31.32 32.16 NA 33.04 37.79 40.19 43.73
Final energy consumption - Transport PJ 50.27 45.98 45.32 NA 43.53 45.01 47.72 49.61
Final energy consumption - Residential PJ 59.66 55.54 53.07 NA 46.30 44.22 38.31 38.12
Final energy consumption - Agriculture/Forestry PJ 6.58 6.46 6.48 NA 6.69 7.69 8.55 8.67
Final energy consumption - Services PJ 25.65 23.45 25.26 NA 24.63 25.60 24.76 24.58
Final energy consumption - Total PJ 174.63 162.76 162.28 NA 154.18 160.31 159.53 164.70

307
a Parties should include key underlying assumptions as appropriate. b Parties should include historical data used to develop the greenhouse gas projections reported.
CTF Table 6(a): Information on updated greenhouse gas projections under a ‘with measures’ scenario
Table 6(a)
LVA_BR3_v2.0
Information on updated greenhouse gas projections under a ‘with measures’ scenarioa
GHG emissions and removalsb GHG emission projections
(kt CO2 eq) (kt CO2 eq)
Base year (1990) 1990 1995 2000 2005 2010 2015 2020 2030
Sectord,e
Energy 16,355.77 16,355.77 7,399.78 5,103.56 4,927.59 5,150.79 3,983.55 3,975.64 4,064.10
Transport 3,030.85 3,030.85 2,099.76 2,206.45 3,100.27 3,253.90 3,131.50 3,040.41 3,265.25
Industry/industrial processes 705.05 705.05 208.02 223.37 308.25 680.25 760.54 786.77 816.25
Agriculture 5,370.68 5,370.68 2,383.04 2,081.38 2,245.76 2,376.00 2,739.64 3,098.44 3,385.75
Forestry/LULUCF -8,787.09 -8,787.09 -9,179.82 -6,695.18 -3,472.09 2,018.88 1,377.15 2,666.67 3,373.33
Waste management/waste 679.09 679.09 607.00 721.66 708.80 741.48 687.44 663.81 664.08
Other (specify)
Gas
CO2 emissions including net CO2 from LULUCF 10,113.90 10,113.90 -932.34 -557.22 3,439.09 9,596.39 7,535.34 8,717.38 9,879.39
CO2 emissions excluding net CO2 from LULUCF 19,780.53 19,780.53 9,145.17 7,072.96 7,790.92 8,529.66 7,239.36 7,190.19 7,650.78
CH4 emissions including CH4 from LULUCF 3,842.93 3,842.93 2,400.73 2,185.89 2,160.54 2,144.65 2,256.72 2,409.38 2,464.38
CH4 emissions excluding CH4 from LULUCF 3,539.14 3,539.14 2,088.24 1,848.12 1,880.66 1,836.19 1,883.88 2,021.13 2,083.45
N2O emissions including N2O from LULUCF 3,397.51 3,397.51 2,046.73 2,002.09 2,163.11 2,317.90 2,650.58 2,899.60 3,084.42
N2O emissions excluding N2O from LULUCF 2,821.77 2,821.77 1,461.53 1,404.85 1,563.25 1,674.21 1,942.25 2,148.37 2,320.63
HFCs NO, NA, NE NO, NA, NE 2.50 9.59 52.06 155.01 227.06 196.39 131.72
PFCs NO, NA NO, NA NO, NA NO, NA NO, NA NO, NA NA, NO NA, NO NA, NO
SF6 NA, NO NA, NO 0.17 0.88 3.78 7.35 10.12 9.00 8.83
NF3 NO, NA NO, NA NO, NA NO, NA NO, NA NO, NA NA, NO NA, NO NA, NO
Other (specify)
Total with LULUCFf 17,354.34 17,354.34 3,517.79 3,641.23 7,818.58 14,221.30 12,679.82 14,231.75 15,568.74
Total without LULUCF 26,141.44 26,141.44 12,697.61 10,336.40 11,290.67 12,202.42 11,302.67 11,565.08 12,195.41
Abbreviations: GHG = greenhouse gas, LULUCF = land use, land-use change and forestry. a In accordance with the “Guidelines for the preparation of national communications by Parties included in Annex I to the Convention, Part II: UNFCCC reporting guidelines on national communications”, at a minimum
Parties shall report a ‘with measures’ scenario, and may report ‘without measures’ and ‘with additional measures’ scenarios. If a Party chooses to report ‘without measures’ and/or ‘with additional measures’ scenarios they are
to use tables 6(b) and/or 6(c), respectively. If a Party does not choose to report ‘without measures’ or ‘with additional measures’ scenarios then it should not include tables 6(b) or 6(c) in the biennial report. b Emissions and removals reported in these columns should be as reported in the latest GHG inventory and consistent with the emissions and removals reported in the table on GHG emissions and trends provided in this
biennial report. Where the sectoral breakdown differs from that reported in the GHG inventory Parties should explain in their biennial report how the inventory sectors relate to the sectors reported in this table. c 20XX is the reporting due-date year (i.e. 2014 for the first biennial report). d In accordance with paragraph 34 of the “Guidelines for the preparation of national communications by Parties included in Annex I to the Convention, Part II: UNFCCC reporting guidelines on national communications”,
projections shall be presented on a sectoral basis, to the extent possible, using the same sectoral categories used in the policies and measures section. This table should follow, to the extent possible, the same sectoral categories
as those listed in paragraph 17 of those guidelines, namely, to the extent appropriate, the following sectors should be considered: energy, transport, industry, agriculture, forestry and waste management. e To the extent possible, the following sectors should be used: energy, transport, industry/industrial processes, agriculture, forestry/LULUCF, waste management/waste, other sectors (i.e. cross-cutting), as appropriate. f Parties may choose to report total emissions with or without LULUCF, as appropriate.

308
CTF Table 7: Provision of public financial support: summary information
Table 7
LVA_BR3_v2.0
Provision of public financial support: summary information in 2015a
Allocation channels
Year
European euro - EUR USDb
Core/
generalc, 1
Climate-specificd, 2 Core/
generalc, 1
Climate-specificd, 2
Mitigation Adaptation Cross-
cuttinge Otherf Mitigation Adaptation
Cross-
cuttinge Otherf
Total contributions through multilateral channels: 10,000.00
Multilateral climate change fundsg
Other multilateral climate change fundsh
Multilateral financial institutions, including regional
development banks
10,000.00
Specialized United Nations bodies
Total contributions through bilateral, regional and
other channels
Total 10,000.00
Note: Explanation of numerical footnotes is provided in the documentation box after tables 7, 7(a) and 7(b).
Abbreviation: USD = United States dollars. a Parties should fill in a separate table for each year, namely 2015 and 2016, where 2018 is the reporting year. b Parties should provide an explanation of the methodology used for currency exchange for the information provided in tables 7, 7(a) and 7(b) in the documentation box. c This refers to support to multilateral institutions that Parties cannot specify as being climate-specific. d Parties should explain in their biennial reports how they define funds as being climate-specific. e This refers to funding for activities that are cross-cutting across mitigation and adaptation. f Please specify. g Multilateral climate change funds listed in paragraph 17(a) of the “UNFCCC biennial reporting guidelines for developed country Parties” in decision 2/CP.17. h Other multilateral climate change funds as referred in paragraph 17(b) of the “UNFCCC biennial reporting guidelines for developed country Parties” in decision 2/CP.17.

309
Table 7
LVA_BR3_v2.0
Provision of public financial support: summary information in 2016a
Allocation channels
Year
European euro - EUR USDb
Core/
generalc, 1
Climate-specificd, 2 Core/
generalc, 1
Climate-specificd, 2
Mitigation Adaptation Cross-
cuttinge Otherf Mitigation Adaptation
Cross-
cuttinge Otherf
Total contributions through multilateral channels: 10,000.00
Multilateral climate change fundsg
Other multilateral climate change fundsh
Multilateral financial institutions, including regional
development banks
10,000.00
Specialized United Nations bodies
Total contributions through bilateral, regional and
other channels
Total 10,000.00
Note: Explanation of numerical footnotes is provided in the documentation box after tables 7, 7(a) and 7(b).
Abbreviation: USD = United States dollars. a Parties should fill in a separate table for each year, namely 2015 and 2016, where 2018 is the reporting year. b Parties should provide an explanation of the methodology used for currency exchange for the information provided in tables 7, 7(a) and 7(b) in the documentation box. c This refers to support to multilateral institutions that Parties cannot specify as being climate-specific. d Parties should explain in their biennial reports how they define funds as being climate-specific. e This refers to funding for activities that are cross-cutting across mitigation and adaptation. f Please specify. g Multilateral climate change funds listed in paragraph 17(a) of the “UNFCCC biennial reporting guidelines for developed country Parties” in decision 2/CP.17. h Other multilateral climate change funds as referred in paragraph 17(b) of the “UNFCCC biennial reporting guidelines for developed country Parties” in decision 2/CP.17.

310
CTF Table 7(a): Provision of public financial support: contribution through multilateral channels
Table 7(a)
LVA_BR3_v2.0
Provision of public financial support: contribution through multilateral channels in 2015a
Donor funding
Total amount
Statusb, 3 Funding
sourcef, 4
Financial
instrumentf, 5
Type of
supportf, g, 6 Sectorc, f, 7
Core/generald, 1 Climate-specifice, 2
European euro - EUR USD European euro - EUR USD
Total contributions through multilateral channels 10,000.00
Multilateral climate change funds
1. Global Environment Facility
2. Least Developed Countries Fund
3. Special Climate Change Fund
4. Adaptation Fund
5. Green Climate Fund
6. UNFCCC Trust Fund for Supplementary Activities
7. Other multilateral climate change funds
Multilateral financial institutions, including regional development banks
10,000.00
1. World Bank
2. International Finance Corporation
3. African Development Bank
4. Asian Development Bank
5. European Bank for Reconstruction and Development 10,000.00 Committed ODA Grant Mitigation Energy
6. Inter-American Development Bank
7. Other
Specialized United Nations bodies
1. United Nations Development Programme
2. United Nations Environment Programme
3. Other
Abbreviations: ODA = official development assistance, OOF = other official flows, USD = United States dollars. a Parties should fill in a separate table for each year, namely 2015 and 2016, where 2018 is the reporting year. b Parties should explain, in their biennial reports, the methodologies used to specify the funds as disbursed and committed. Parties will provide the information for as many status categories as appropriate in the following order
of priority: disbursed and committed. c Parties may select several applicable sectors. Parties may report sectoral distribution, as applicable, under “Other”. d This refers to support to multilateral institutions that Parties cannot specify as being climate-specific. e Parties should explain in their biennial reports how they define funds as being climate-specific. f Please specify. g This refers to funding for activities that are cross-cutting across mitigation and adaptation.
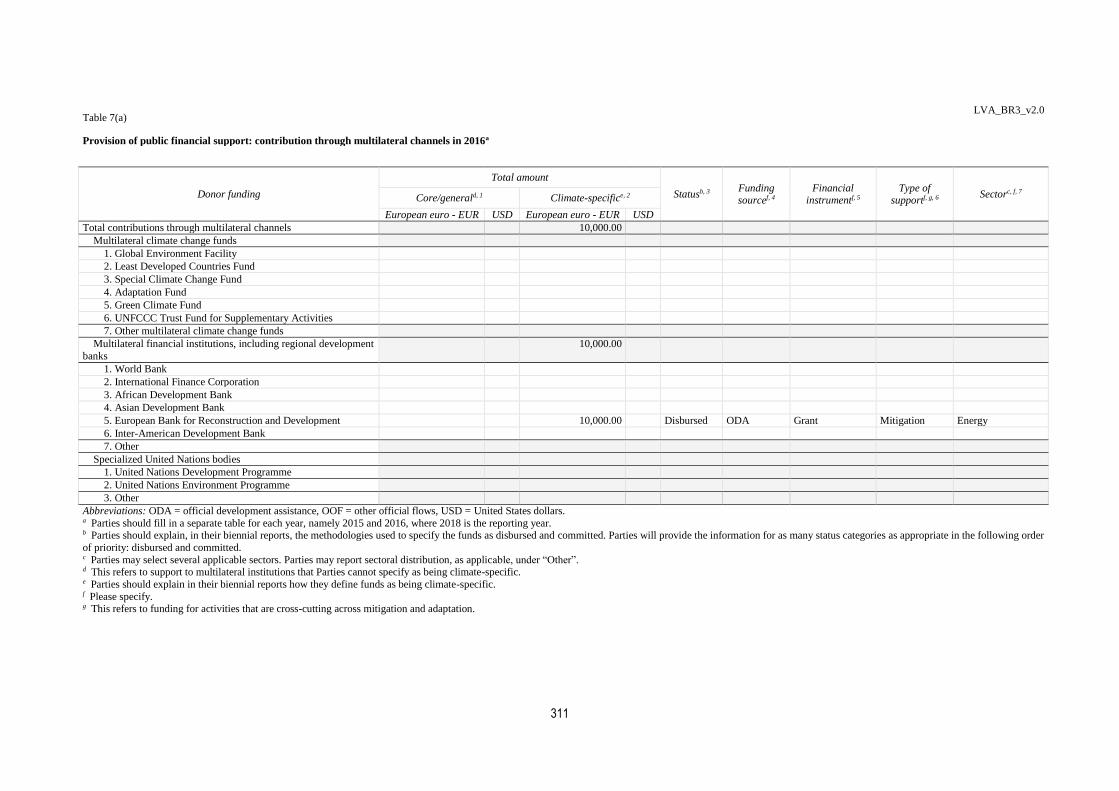
311
Table 7(a)
LVA_BR3_v2.0
Provision of public financial support: contribution through multilateral channels in 2016a
Donor funding
Total amount
Statusb, 3 Funding sourcef, 4
Financial instrumentf, 5
Type of supportf, g, 6
Sectorc, f, 7 Core/generald, 1 Climate-specifice, 2
European euro - EUR USD European euro - EUR USD
Total contributions through multilateral channels 10,000.00
Multilateral climate change funds
1. Global Environment Facility
2. Least Developed Countries Fund
3. Special Climate Change Fund
4. Adaptation Fund
5. Green Climate Fund
6. UNFCCC Trust Fund for Supplementary Activities
7. Other multilateral climate change funds
Multilateral financial institutions, including regional development
banks
10,000.00
1. World Bank
2. International Finance Corporation
3. African Development Bank
4. Asian Development Bank
5. European Bank for Reconstruction and Development 10,000.00 Disbursed ODA Grant Mitigation Energy
6. Inter-American Development Bank
7. Other
Specialized United Nations bodies
1. United Nations Development Programme
2. United Nations Environment Programme
3. Other
Abbreviations: ODA = official development assistance, OOF = other official flows, USD = United States dollars. a Parties should fill in a separate table for each year, namely 2015 and 2016, where 2018 is the reporting year. b Parties should explain, in their biennial reports, the methodologies used to specify the funds as disbursed and committed. Parties will provide the information for as many status categories as appropriate in the following order
of priority: disbursed and committed. c Parties may select several applicable sectors. Parties may report sectoral distribution, as applicable, under “Other”. d This refers to support to multilateral institutions that Parties cannot specify as being climate-specific. e Parties should explain in their biennial reports how they define funds as being climate-specific. f Please specify. g This refers to funding for activities that are cross-cutting across mitigation and adaptation.

312
Table 7(b)
Provision of public financial support: contribution through bilateral, regional and other channels in
2015
No information provided in table 7(b).
Table 7(b)
Provision of public financial support: contribution through bilateral, regional and other channels in
2016
No information provided in table 7(b).
Table 8
Provision of technology development and transfer support
No information provided in table 8.

313
CTF Table 9: Provision of capacity-building support
Table 9
LVA_BR3_v2.0
Provision of capacity-building
supporta
Recipient
country/regi
on
Targeted area Programme or project title Description of programme or project b,c
Uzbekistan Multiple Areas Development cooperation
project
The aim of the project was to train Urgench State University
students and staff in sustainable environmental engineering in
order to be able to carry out such training program further by
using their own staff/faculty. Thus, through raising the level of
training of environmental engineering will contribute to the
sustainable environmental development, including production of
energy, by formation of knowledgeable professionals who will be
able to implement their knowledge in practice.
Belarus,
Ukraine Mitigation Awareness raising project
The aim of the project was to increase knowledge and
understanding of energy saving and building energy efficiency
opportunities through a comprehensive approach for the
population, non-governmental organizations (NGOs) and future
specialists, taking into account socio-economic, technical and
environmental aspects. (2013)
Georgia Multiple Areas Study visit
The aim of the experience exchange visit was to increase
knowledge of the NGOs representatives of Georgia on Climate
change policy and measures in Latvia and initiatives and support
for small and medium-sized enterprises in the context of
introducing environmentally friendly measures in business.
(2016).
Azerbaijan Multiple Areas
Twinning Project
AZ/15/ENP/EN/43
‘Upgrading the National
Environmental Monitoring
System (NEMS) of
Azerbaijan on the base of
EU best practices’.
The main project beneficiary is the Ministry of Ecology and
Natural Resources (MENR).
Aim of the project is to propose activities and methodologies for
improving of the environmental performance of Azerbaijan with
strengthening the environmental monitoring system ensuring
provision of the high quality information that supports strategic
environmental policy planning and compliance control.
a To be reported to the extent possible. b Each Party included in Annex II to the Convention shall provide information, to the extent possible, on how it has provided
capacity-building support that responds to the existing and emerging capacity-building needs identified by Parties not included in
Annex I to the Convention in the areas of mitigation, adaptation and technology development and transfer. c Additional information may be provided on, for example, the measure or activity and co-financing arrangements.

314
ANNEX 2 SUMMARY OF REPORTING OF THE SUPPLEMENTARY INFORMATION UNDER ARTICLE 7, PARAGRAPH 2, OF THE KYOTO PROTOCOL
National systems in accordance with Article 5, paragraph 1
Chapter 3.2.
National registries Chapter 3.3. Supplementarity relating to the mechanisms pursuant to Articles 6, 12 and 17
Chapter 5.3.
Policies and measures in accordance with Article 2 Chapter 4.3.
Domestic and regional programmes and/or legislative arrangements and enforcement and administrative procedures
Chapter 4.2
Information under Article 10 Art 10a Art 10b Art 10c Art 10d Art 10e
Chapter 3.2. Chapter 4.2., 6. NA Chapter 8. Chapter 9.
Copyright © 2022 FDOKUMEN