Fourth National Communication Kingdom of Saudi Arabia
314
-
Upload
khangminh22 -
Category
Documents
-
view
1 -
download
0
Transcript of Fourth National Communication Kingdom of Saudi Arabia

Fourth National Communication Kingdom of Saudi Arabia
Submitted to: The United Nations Framework Convention on Climate Change
(UNFCCC) March 2022

Acknowledgements
KSA Fourth National Communication (NC4) i
Acknowledgements
The Secretariat of the Designated National Authority (DNA) would like to thank and appreciate HRH, the Chairman of the DNA Committee for his guidance, continuous support and encouragement. The Secretariat of the Designated National Authority (DNA) would also like to appreciate all of the National Committee members for their cooperation and coordination in providing relevant information and data during the compilation of this report.
The DNA Secretariat would also like to thank and appreciate the assistance provided by Saudi Aramco, King Fahad University of Petroleum and Minerals (KFUPM) and other entities and stakeholders in the development of this report.
The DNA Secretariat thankfully acknowledges the support of the United Nations Environment Programme (UNEP) and Global Environment Facility (GEF) in the preparation of this report.

NC4 Team
KSA Fourth National Communication (NC4) ii
NC4 Team
Mr. Abdullah N. Alsarhan Supervisor of the NC4 Project Designated National Authority (DNA) Ministry of Energy Dr. Taha M. Zatari Project Manager and Technical Coordinator of the NC4 Project Designated National Authority (DNA) Ministry of Energy
Contributing Experts
Eng. Khalid M. Abuleif
Dr. Tahir Husain
Dr. Abdulbasit S. Sairafi
Dr. Ahsanullah Khan
Dr. George Manful
Dr. Malak T. Al-Nory
Dr. Shakhawat Hossain Chowdhury
Dr. Ioannis E. Alexiou
Dr. Abu Nasser Khondaker
Dr. Syed Masiur Rahman
Dr. Fahad S. Al-Ismail
Eng. Rouf Ahmad Khan
Mr. Mohamad Al-Amin Al-Shaikh

NC4 Team
KSA Fourth National Communication (NC4) iii
Eng. Noorelden SiBaschir Abdullah
Mr. Ali S. Hashem
Ms. Nourah A. AlSudairy
Ms. Aseel A. Al-Harthy
Assistants
Mr. Abdullah S. Aljabr
Mr. Faisal H. Albuqami
Mr. Ali Ibrahim Al-Khelaifi
Mr. Khaled Al-Harmal
Mr. Shafi Alsubaie

Introduction
KSA Fourth National Communication (NC4) iv
Introduction
Saudi Arabia is an arid country characterized by low rainfall, high temperatures and limited water resources. There are no perennial rivers in the country. The main water resources in the country are surface water runoff, shallow and deep groundwater, desalinated seawater and wastewater. surface water is limited to rainfall runoff flowing through valleys. Saudi Arabia consists of a variety of habitats which includes deserts, plains, plateaus, mountains and lava flows. The three major bodies of sand in the Kingdom are the Great Nafud in the north, the Empty Quarter in the south and Ad-Dahna; a crescent-shaped body of sand connecting Nafud and Rub Al-Khali deserts.
The Kingdom is one of the world's largest oil exporters, with a single-source economy heavily reliant on oil income. The Kingdom's primary development agenda, the Saudi Vision 2030, was announced in 2016. This development strategy serves as the main vehicle for diversifying the Kingdom's economy away from reliance on a single source of revenue. For the realization and achievement of the 96 strategic objectives of Saudi Vision 2030, 13 Vision Realization Programs (VRPs) have been established by the Council of Economic and Development Affairs (CEDA). The VRPs aim to develop a diversified economy encompassing all sectors to ensure homogeneous development. The Financial Sector Development Program has the goal of advancing the financial sector of the Kingdom through support provided to the private sector, formation of a state-of-the-art capital market and enabling the diversification of the sources of income and investment. The National Transformation Program (NTP) intends to improve living standards for all in the Kingdom through increasing the ease of access to healthcare and promoting a sustainable approach towards national resources such as food security and access to water. The National Companies Promotion Program is dedicated to promoting 100+ local and regional companies to become global leaders, thereby displaying the economic strength of the Kingdom on the global platform. Through the Fiscal Balance Program, the Kingdom is pursuing its goals of maximizing oil and non-oil revenues through improved efficiency and risk management and mitigation strategies. VRPs are essential to realizing the objectives of Saudi Vision 2030 and ensuring that the Kingdom stays firm upon its path to sustainable development and diversification of its economy. An impressive progress has been reflected for different programs under the Vision Realization Programs in the Vision progress report for the period 2016-2020.
Saudi Vision 2030 provides a roadmap towards achieving sustainable development through social and economic reforms. The roadmap focuses on the development of service sectors like health, education, infrastructure and tourism and therefore increasing employment opportunities and diversifying the economy. Furthermore, despite the major health and economic crisis arising owing to the novel coronavirus pandemic (COVID 19), the Kingdom is committed to its economic diversification initiatives with the continued sustainable development agenda. The Kingdom has embarked upon the mega projects namely NEOM, AMAALA, AL-ULA, Qiddiya, Red Sea Project and Prince Mohammad bin Salman Nature Reserve.
Saudi Arabia, due to its arid environment and sensitive ecosystem is vulnerable to bio-physical impacts of climate change. The socioeconomic impacts of climate change response measures

Introduction
KSA Fourth National Communication (NC4) v
by other countries also make Saudi Arabia vulnerable to climate change due to its reliance mainly on single source.
Saudi Arabia has launched two green initiatives in 2021 namely Saudi Green Initiative (SGI) and Middle East Green Initiative (MGI) under the patronage of HRH Prince Mohammed bin Salman bin Abdulaziz, the Crown Prince, Deputy Prime Minister, Minister of Defense and Chairman of the Saudi Council of Economic and Development Affairs.
The Kingdom of Saudi Arabia submitted its Updated Nationally Determined Contribution (NDC) to the UNFCCC Secretariat in October 2021. The updated NDC is aimed to remove, avoid and reduce GHG emissions by 278 million tons of CO2eq by 2030 which is more than two-fold increase compared to the Kingdom’s previous INDC submitted in November 2015. The updated NDC show a progression and highest possible ambition. These NDC are based on the principles listed in Article 3 of UNFCCC and Articles 4.1, 4.7 and 4.15 of the Paris Agreement and Conference of Parties Decisions 1/CP.19, 1CP.20, 1/CP.21 and 1/CP.24 and the approach specified in the economic diversification initiative adopted as the Conference of Parties Decision 24/CP.18 in 2012 in Doha.
The Saudi Arabian NDC are based on the Dynamic baseline approach, taking into consideration country’s national circumstances.
The dynamic baseline scenarios are based on the ability of the Kingdom to grow and diversify its economy, keeping in mind that the Kingdom is not seeking financial support towards achieving its NDC. The achievement of NDC is also incumbent upon sustainable economic growth and diversification of the Kingdom’s economy, while preserving Kingdom’s leading role in promoting security and stability of global energy markets. The Kingdom will use the best suited technologies to achieve its NDC using Circular Carbon Economy (CCE) approach.
The Saudi Green Initiative (SGI) is a multidimensional initiative which contributes towards achieving the climate ambitions of the Kingdom. The SGI roadmap consisted of over 60 initiatives. The roadmap includes reducing carbon emissions by implementing energy efficiency programs, developing carbon capture, utilization and storage (CCUS) technology, increasing public transportation and increasing renewable energy capacity. The five initiatives which will help the Kingdom achieve its NDC under SGI are; enhance SEEP by 2025, use captured carbon to produce chemicals and synthetic fuels by 2030, changing the energy mix towards a more sustainable one by 2030, become the world’s leading hydrogen producer and exporter by 2030 and waste management transformation in Riyadh by 2035. The other initiatives under SGI are green Saudi Arabia initiative by planting 450 million trees all over the Kingdom by 2030 and protecting land and sea by increasing the terrestrial and marine protected areas to 20% of the Kingdom’s total area by 2030.
Saudi Arabia also announced the Middle East Green Initiative (MGI), a regional initiative to lead and support regional efforts to achieve global climate ambitions, with a focus on actions and cooperation to accomplish climate aspirations. These initiatives include:

Introduction
KSA Fourth National Communication (NC4) vi
(i) Encourage GCC and Middle Eastern countries to implement circular carbon economy projects and activities to boost the usage of clean energy and reduce greenhouse gas emissions in the region.
(ii) Establish a regional center for Carbon Capture, Utilization and Storage (CCUS) in Arabian Gulf States (GCC countries and Iraq).
(iii) Support and facilitate access to clean energy for cooking in the middle east regions and raising the health and lifespan of clean fuel users specially women and children and reduce the GHG emissions.
(iv) Clean Oceans and Rivers Initiative by participating in the cleanup of oceans and rivers of plastic waste in the middle east region.
The Kingdom is providing leadership in the area of circular carbon economy as a vehicle for implementing its updated nationally determined contribution. Saudi Arabia adopted the concept of the circular carbon economy as the framework for its climate policy. The CCE embraces a technology-neutral approach that caters for all possible solutions without prejudice to, or predisposition against, any single option. Circular carbon economy involves a stepwise closure of the carbon cycle via utilization or conversion of CO2 generated from the combustion of fossil fuels leading to significant reduction of carbon emissions. The CCE is based on four R’s; reduce, reuse, recycle and remove for the management of carbon in the CCE. Within the framework of circular carbon economy, three types of carbon have been identified namely the ‘Living Carbon’ which resides in the biosphere and it naturally balances with the atmosphere and is the basis of life. The second is the ‘Durable Carbon’ which resides in the techno-sphere and is used in a range of applications, from long-term infrastructure to recycled plastics. The third is the Fugitive Carbon’ which is released into the environment as excess anthropogenic carbon dioxide in the atmosphere or as plastics in the ocean. All the 4Rs of the circular carbon economy serve to minimize fugitive carbon.
This report, the Fourth National Communication (NC4) of the Kingdom of Saudi Arabia has been prepared by the Designated National Authority (DNA) in close cooperation and coordination of relevant sector ministries, entities and other stakeholders. The report is comprised of ten (10) sections namely:
(i) National Circumstances
(ii) 2016 National Inventory of Anthropogenic Emissions by Sources and Removals by Sinks of Greenhouse Gases Not Controlled by the Montreal Protocol
(iii) Steps Taken to Address Article 12.1(b) of United Nations Framework Convention on Climate Change (UNFCCC) - Role of Economic Diversification to Address Climate Change Issues in Saudi Arabia
(iv) Analysis of Socioeconomic Impacts of Response Measures
(v) Vulnerability Assessment & Adaptation: Impact Analysis of Climate Change on Water Resources and Identification and Appraisal of Appropriate Adaptation Measures

Introduction
KSA Fourth National Communication (NC4) vii
(vi) Vulnerability Assessment & Adaptation: Impact Analysis of Climate Change on Coastal and Marine Ecosystem and Identification and Appraisal of Appropriate Adaptation Measures
(vii) Vulnerability Assessment & Adaptation: Impact Analysis of Climate Change on Desertification and Identification and Appraisal of Appropriate Adaptation Measures
(viii) Vulnerability Assessment & Adaptation: Impact Analysis of Climate Change on Agriculture and Identification and Appraisal of Appropriate Adaptation Measures
(ix) Climate Change Research, Education, Training, Capacity Building and Public Awareness
(x) Constraints and gaps and related financial, technical and capacity-building needs

Table of Contents
KSA Fourth National Communication (NC4) viii
TABLE OF CONTENTS
Section Title Page
1 National Circumstances 1
2 2016 National Inventory of Anthropogenic Emissions by Sources and Removals by Sinks of Greenhouse Gases Not Controlled by the Montreal Protocol
22
3
Steps Taken to Address Article 12.1(b) of the United Nations Framework Convention on Climate Change (UNFCCC) Role of Economic Diversification to Address Climate Change Issues in Saudi Arabia
44
4 Analysis of Socioeconomic Impacts of Response Measures 77
5 Impact Analysis of Climate Change on Water Resources and Identification and Appraisal of Appropriate Adaptation Measures 102
6 Impact Analysis of Climate Change on Coastal and Marine Ecosystem and Identification and Appraisal of Appropriate Adaptation Measures 157
7 Impact Analysis of Climate Change on Desertification and Identification and Appraisal of Appropriate Adaptation Measures 204
8 Impact Analysis of Climate Change on Agriculture and Identification and Appraisal of Appropriate Adaptation Measures 224
9 Climate Change Research, Education, Training, Capacity Building and Public Awareness 255
10 Constraints and Gaps and Related Financial, Technical and Capacity Building needs 264

Section - 1
KSA Fourth National Communication (NC4)
SECTION 1
National Circumstances

Section - 1
KSA Fourth National Communication (NC4) i
TABLE OF CONTENTS
Section Title Page 1 National Circumstances 1 1.1 Location, Topography and Climate 1 1.1.1 Location 1 1.1.2 Topography 1 1.1.3 Climate 2 1.2 Demography and Population Statistics 3 1.3 Directions of Development – Saudi Vision 2030 5 1.3.1 Vision Realization Programs (VRPs) 5 1.4 Education 6 1.5 Health 7 1.6 Energy Profile 9 1.6.1 Oil and Gas 9 1.6.2 Electricity 9 1.7 Industrial and Economic Development 9 1.7.1 Industrial and Economic Cities 9 1.7.1.1 Industrial Cities 9
1.7.1.1.1 Saudi Authority for Industrial Cities and Technology Zones (MODON) 9
1.7.1.1.2 Royal Commission for Jubail and Yanbu (RCJY) 10 1.7.1.2 Economic Cities 10 1.7.1.2.1 King Abdullah Economic City (KAEC), Rabigh 10 1.7.1.2.2 Knowledge Economic City (KEC), Madinah 10 1.7.1.2.3 Jazan Economic City (JEC) 10 1.8 Water Resources 11 1.8.1 Surface Water 11 1.8.2 Groundwater 11 1.8.3 Desalinated Water 12 1.8.4 Reclaimed Wastewater 13 1.8.5 Water Demand by Different Sectors 14 1.8.6 National Water Strategy 14 1.9 Tourism 15 1.9.1 Mega Projects in Development 16 1.10 Coastal and Marine Ecosystem 17 1.11 Agriculture 18
1.12 Nationally Determined Contribution of the Kingdom of Saudi Arabia under the UNFCCC 18
1.13 Institutional Arrangement 18 References 20

Section - 1
KSA Fourth National Communication (NC4) ii
LIST OF FIGURES
Figure Title Page 1.1 Saudi Arabian Geological Settings 2 1.2 Total Population of Saudi Arabia from 1974-2018 4 1.3 Total Number of Higher Education Graduates 7 1.4 Number of “Male and Female” Higher Education Graduates 7 1.5 Health & Social Development Budgets (2016-2021) 8 1.6 Number of Hospitals in Saudi Arabia 8 1.7 Principal Aquifers of the Kingdom of Saudi Arabia 12
1.8 Trend of Desalinated Water Production in the Kingdom of Saudi Arabia 13
1.9 Desalination Capacity by Coast; Share of Different Desalination Technologies and Major Producers of Desalinated Water 13
LIST OF TABLES
Table Title Page 1.1 Age Group-wise Distribution of Saudi Population 4
1.2 Annual Water Demand and Percentage of Water Demand by Sectors in the Kingdom of Saudi Arabia 14
1.3 Brief Description of Mega Projects 16

Section - 1
KSA Fourth National Communication (NC4) 1
Section 1: National Circumstances
1.1 Location, Topography and Climate
1.1.1 Location
Located in the furthermost part of southwest Asia at a latitude of 16.5°N - 32.5°N and a longitude of 33.75°E - 56.25°E, the Kingdom of Saudi Arabia encompasses a total area of approximately 2.25 million square kilometers and occupies about four-fifth of the Arabian Peninsula. The Kingdom is surrounded on the north by Jordan, Iraq and Kuwait; on the south by Sultanate of Oman and Yemen; on the west by Red Sea and on the east by the Arabia Gulf, Bahrain, Qatar and United Arab Emirates.
1.1.2 Topography
The Kingdom of Saudi Arabia is home to a diversity of habitats and embodies five prominent landforms; desert, plain, plateau, mountains and lava flows in addition to terrain features such as valleys, meadows and salt-pans. The Kingdom accommodates four major bodies of sand namely Ar-Rub’ Al Khali (Empty Quarter), the world’s largest continuous sand desert in the south, the Great Nafud in the north, Al Jafurah Desert which lies south of the Gulf of Bahrain, and the crescent-shaped body of sand Ad-Dahna which links Ar Rub’ Al Khali to the Great Nafud through its north-south corridor. Additionally, there are several prominent bodies of sand along the side of Tuwayq escarpment and two smaller sand seas namely Ramlat As-Sab’atayn and the Ramlat Al Wahıbah (Wahiba Sands).
Sand bodies of the Arabian Peninsula cover about 30% of the landmass and possess features which are specific to each body. The lack of oases in the Great Nafud, a very large depression filled up with masses of red sand covering an area of almost 64,000 square kilometers, distinguishes it from the narrow, triangular strip of buff sand Al-Jafurah which extends northwards from the Empty Quarter to east of Hofuf following the coastal plain. While the plains cover the coastal area, the plateaus envelop the central regions of Saudi Arabia. The southwestern regions are home to the mountainous terrains whereas the lava flows span across the west and northwestern regions of the Kingdom.
From a geological outlook, the Kingdom of Saudi Arabia is divided into two recognizable groups of rocky habitats; the Arabian Shield and Arabian Shelf. Spreading across one-third of the Arabian Peninsula, the Arabian Shield is formed of crystalline and metamorphic rocks of Precambrian age uplifted on the entire western sides with volcanic lava flows of tertiary-quaternary age and appears unevenly along the southern coast. Groundwater transpires within valley deposits and a handful of sub-basaltic deposits. On the contrary, the Arabian Shelf envelops two thirds of the surface area of the Kingdom and is composed of a thick sequence of unaltered, younger sedimentary formations ranging in age from Cambrian to recent.

Section - 1
KSA Fourth National Communication (NC4) 2
Figure 1.1: Saudi Arabian Geological Settings (AlTokhais 2018)
1.1.3 Climate
Alterations in the climatic conditions of the Kingdom of Saudi Arabia are present due its inherently varied topographical features. Temperature alterations are the most apparent amongst interior and coastal regions. During the summers, inland temperatures vary seasonally ranging from 27°C - 45°C while the coastal areas record a range between 27°C - 38°C even though summers are hot and dry in the interior regions while the coastal areas experience humid summers. The winters are cold in the inland regions with 8°C - 20°C temperatures and mild in the coastal areas with temperatures 19°C - 29°C (TNC, KSA, 2016). The temperatures in the winter were recorded as low as 2.7°C (min) in Turaif and Guriat and 22.9°C (max) in Jazan in the month of January 2019. In 2019, the maximum temperature range recorded was 31.2°C in Jazan in July and 46.4°C in Al-Ahsa in June. The average humidity range recorded in 2019 was 10% (Madinah and Riyadh in June) and 88% (Arar in January) in different parts of the Kingdom (GASTAT, 2019).
The minimum and maximum temperature varied widely from region to region. The average annual temperature ranges from 11.8°C to 34.5°C in different regions. The monthly averages of minimum and maximum temperatures for different regions are presented in Tables 5.3 and 5.4 respectively in section 5 of this report. These tables show that the maximum and minimum temperature increased gradually from January to the peak values in July and/or August and then decrease gradually till December. The minimum temperature was in the range of 2.6°C in January to 31.6°C in July in the Kingdom while the maximum temperature was in the range of
Section - 1
KSA Fourth National Communication (NC4) 3
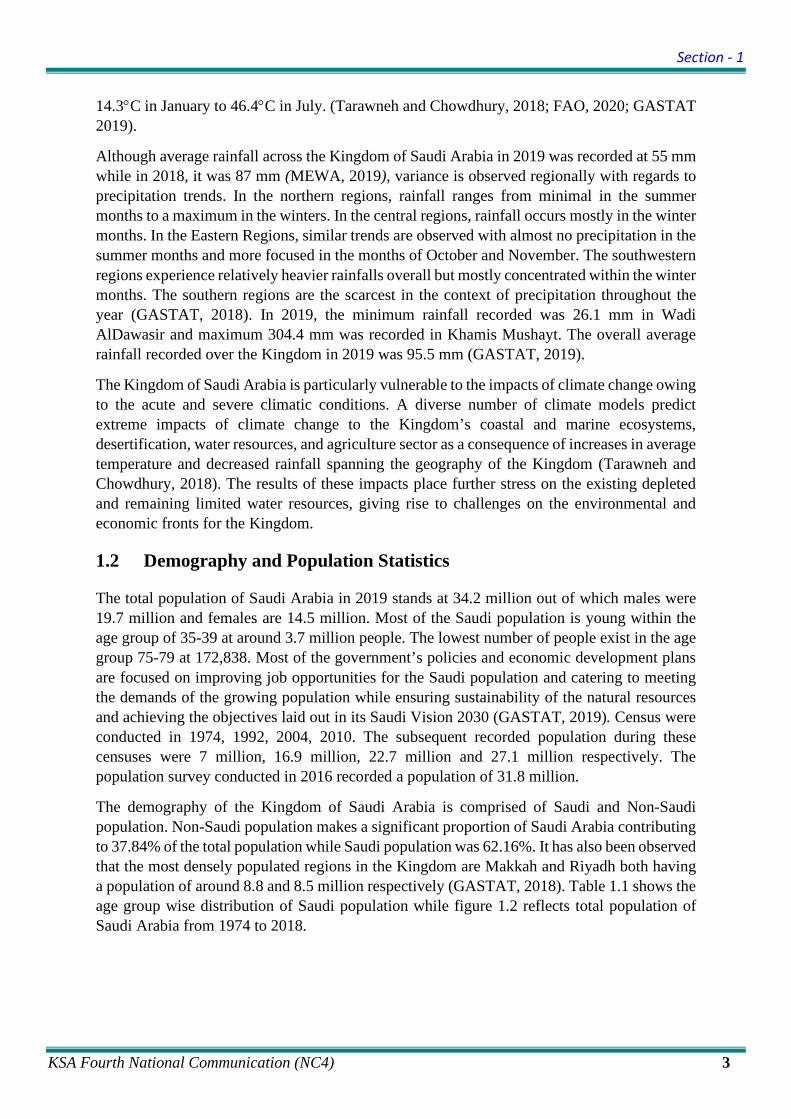
14.3°C in January to 46.4°C in July. (Tarawneh and Chowdhury, 2018; FAO, 2020; GASTAT 2019).
Although average rainfall across the Kingdom of Saudi Arabia in 2019 was recorded at 55 mm while in 2018, it was 87 mm (MEWA, 2019), variance is observed regionally with regards to precipitation trends. In the northern regions, rainfall ranges from minimal in the summer months to a maximum in the winters. In the central regions, rainfall occurs mostly in the winter months. In the Eastern Regions, similar trends are observed with almost no precipitation in the summer months and more focused in the months of October and November. The southwestern regions experience relatively heavier rainfalls overall but mostly concentrated within the winter months. The southern regions are the scarcest in the context of precipitation throughout the year (GASTAT, 2018). In 2019, the minimum rainfall recorded was 26.1 mm in Wadi AlDawasir and maximum 304.4 mm was recorded in Khamis Mushayt. The overall average rainfall recorded over the Kingdom in 2019 was 95.5 mm (GASTAT, 2019).
The Kingdom of Saudi Arabia is particularly vulnerable to the impacts of climate change owing to the acute and severe climatic conditions. A diverse number of climate models predict extreme impacts of climate change to the Kingdom’s coastal and marine ecosystems, desertification, water resources, and agriculture sector as a consequence of increases in average temperature and decreased rainfall spanning the geography of the Kingdom (Tarawneh and Chowdhury, 2018). The results of these impacts place further stress on the existing depleted and remaining limited water resources, giving rise to challenges on the environmental and economic fronts for the Kingdom.
1.2 Demography and Population Statistics
The total population of Saudi Arabia in 2019 stands at 34.2 million out of which males were 19.7 million and females are 14.5 million. Most of the Saudi population is young within the age group of 35-39 at around 3.7 million people. The lowest number of people exist in the age group 75-79 at 172,838. Most of the government’s policies and economic development plans are focused on improving job opportunities for the Saudi population and catering to meeting the demands of the growing population while ensuring sustainability of the natural resources and achieving the objectives laid out in its Saudi Vision 2030 (GASTAT, 2019). Census were conducted in 1974, 1992, 2004, 2010. The subsequent recorded population during these censuses were 7 million, 16.9 million, 22.7 million and 27.1 million respectively. The population survey conducted in 2016 recorded a population of 31.8 million.
The demography of the Kingdom of Saudi Arabia is comprised of Saudi and Non-Saudi population. Non-Saudi population makes a significant proportion of Saudi Arabia contributing to 37.84% of the total population while Saudi population was 62.16%. It has also been observed that the most densely populated regions in the Kingdom are Makkah and Riyadh both having a population of around 8.8 and 8.5 million respectively (GASTAT, 2018). Table 1.1 shows the age group wise distribution of Saudi population while figure 1.2 reflects total population of Saudi Arabia from 1974 to 2018.

Section - 1
KSA Fourth National Communication (NC4) 4
Table 1.1: Age Group-wise Distribution of Saudi Population (GASTAT, 2019)
Population Age Groups Total Female Male
2,844,501 1,394,796 1,449,705 0-4
2,956,437 1,450,289 1,506,148 5 - 9
2,589,025 1,271,948 1,317,077 10 - 14
2,359,981 1,154,954 1,205,027 15 - 19
2,627,694 1,226,566 1,401,128 20 - 24
3,266,711 1,460,587 1,806,124 25 - 29
3,313,375 1,362,914 1,950,461 30 - 34
3,707,231 1,381,077 2,326,154 35 - 39
3,316,507 1,198,365 2,118,142 40 - 44
2,460,559 831,711 1,628,848 45 - 49
1,714,639 539,183 1,175,456 50 - 54
1,183,229 397,103 786,126 55 - 59
779,129 291,415 487,714 60 - 64
1,099,151 518,205 580,946 65 and above
34,218,169 14,479,113 19,739,056 Total
Figure 1.2: Total Population of Saudi Arabia from 1974-2018 (GASTAT, 2018)
0
5
10
15
20
25
30
35
40
1974
1976
1978
1980
1982
1984
1986
1988
1990
1992
1994
1996
1998
2000
2002
2004
2006
2008
2010
2012
2014
2016
2018
Popu
latio
n (M
illio
n)
Year

Section - 1
KSA Fourth National Communication (NC4) 5
1.3 Directions of Development – Vision 2030, KSA
The government of Saudi Arabia announced “Saudi Vision 2030”, the economic blueprint of the Kingdom of Saudi Arabia in April 2016, with the objective of diversifying the Kingdom’s economy to become more sustainable and resilient (Guendouz and Ouassaf, 2020; Saudi Vision 2030). Saudi Vision 2030 provides a roadmap towards achieving sustainable development through social and economic reforms. The roadmap consists of 96 objectives (Saudi Vision 2030) arising from three themes of Saudi Vision 2030 namely; (i) A Vibrant Society; (ii) A Thriving Economy and (iii) An Ambitious Nation. The roadmap focuses on the development of service sectors like health, education, infrastructure and tourism resulting in increasing employment and diversifying the economy. The main goal of Vision 2030 is “to raise the share of non-oil exports in non-oil GDP from 16% to 50%” (Saudi Vision 2030). Furthermore, despite the major health and economic crisis arising owing to the novel coronavirus pandemic, the Kingdom is committed to its economic diversification initiatives with the continued development agenda. The Kingdom has embarked upon the mega projects namely NEOM, AMAALA, AL-ULA, Qiddiya, Red Sea Project and Prince Mohammad bin Salman Nature Reserve (Tricaud, 2020).
1.3.1 Vision Realization Programs (VRPs) For the realization and achievement of the 96 strategic objectives of Vision 2030, 13 Vision Realization Programs (VRPs) have been established by the Council of Economic and Development Affairs (CEDA) (Saudi Vision 2030) which are as follows:
• Quality of Life Program • Financial Sector Development Program • Housing Program • Fiscal Balance Program • National Transformation Program • Public Investment Fund Program • Privatization Program • National Companies Promotion Program • National Industrial Development and Logistics Program • Strategic Partnership Program • Doyof Al Rahman Program (Hajj and Omrah Program) • Human Capital Development Program • National Character Enrichment Program The VRPs are aimed to develop a diversified economy encompassing all sectors to ensure homogeneous development. The Financial Sector Development Program has the goal of advancing the financial sector of the Kingdom through support provided to the private sector, formation of a state-of-the-art capital market and enabling the diversification of the sources of income and investment. The National Transformation Program (NTP) intends to improve living standards for all in the Kingdom through increasing the ease of access to healthcare and promoting a sustainable approach towards national resources such as food security and access to water. The National Companies Promotion Program is dedicated to promoting 100+ local and regional companies to become global leaders, thereby displaying the economic strength of

Section - 1
KSA Fourth National Communication (NC4) 6
the Kingdom on the global platform. Through the Fiscal Balance Program, the Kingdom is pursuing its goals of maximizing oil and non-oil revenues through improved efficiency and risk management and mitigation strategies. VRPs are essential to realizing the objectives of Saudi Vision 2030, KSA and ensuring that the Kingdom stays firm upon its path to sustainable development and diversification of its economy.
A Vision progress reports for the year 2017-1018 has shown an impressive progress for different programs under the Vision Realization Programs.
1.4 Education
Education is the main pillar of human development and has expanded steadily since the start of the Kingdom’s First Development Plan in 1970 due to the sustained support and attention given to education sector by the government. The government of the Kingdom has devoted significant resources to the development of human resources and manpower skills. Government has therefore taken concerted measures in its successive national development planning processes to address its goal of enhancing educational achievement at all levels giving the Ministry of Education the role of supervising all general education; and emphasizing the effective implementation of educational strategies. Another equally important measure has been to enhance the role of the private sector in the planning and provision of educational facilities. However, the public sector remains the main provider of educational services, with a share of 84.2 percent of the total enrolment in all stages of public schooling across primary, intermediate and secondary education in 2018 (GASTAT, 2018). As part of Saudi Vision 2030, the continuous education program aims to eradicate illiteracy within the Kingdom as the literacy rate currently sits at 95% as of 2017.
Moreover, the 13th Goal of the UN 2030 Agenda for Sustainable Development, called for amongst others, the “improvement of education, awareness-raising, human and institutional capacity on climate change mitigation, adaptation, impact reduction and early warning”. Training and capacity building are central to the climate change awareness process and thus requires collaborative efforts from all stakeholders. Saudi Vision 2030 also aims to provide opportunity for both men and women in the field of education in Saudi Arabia. Currently there is an increasing trend in the total number of higher education graduates with around 55% of which are females. Figures 1.3 and 1.4 show total number of higher education graduates and number of “Males and Females” higher education graduates respectively. (GASTAT 2018)

Section - 1
KSA Fourth National Communication (NC4) 7
Figure 1.3: Total Number of Higher Education Graduates (GASTAT 2018)
Figure 1.4: Number of ‘Males and Females’ Higher Education Graduates (GASTAT 2018)
1.5 Health
Saudi Arabia has a well-developed National Health Care System in which the government provides free health care services through a number of government agencies. Saudi Arabia has been ranked 26th best country in providing high quality healthcare (WHO, 2000; Best Healthcare in the World, 2022). Healthcare is one of the main focus areas of the ambitious Saudi Vision 2030 and National Transformation Program 2020 (NTP) that seeks to further improve the quality of healthcare
0
50,000
100,000
150,000
200,000
250,000
300,000
Tota
l Num
ber o
f Stu
dent
s
Academic Year
0
20,000
40,000
60,000
80,000
100,000
120,000
140,000
160,000
Tot
al N
umbe
r of
Stu
dent
s
Academic Year
Total Number of Male GraduatesTotal Number of Female Graduates

Section - 1
KSA Fourth National Communication (NC4) 8
services and facilities across the Kingdom of Saudi Arabia. The allocated budget by the government for health and social development was Saudi Riyal (SAR) 146.5 billion in 2018, 15% of the total budgetary expenditure (SAMA, 2018) while it was increased to Saudi Riyal (SAR) 175 billion in 2021.
Figure 1.5: Health & Social Development Budgets (2016-2021)
Hospitals and healthcare services in the Kingdom have been on an increasing trend since the past four decades. The majority of hospitals are owned and run by the Ministry of Health, while the share of the private sector has also been increasing steadily. Hospitals in Saudi Arabia in 1440H (2018-2019) equaled to a total of 498 Hospitals (334 Government Hospitals and 164 Private Sector Hospitals). Figure 1.6 shows the trend and number of hospitals owned and operated by different sectors in the Kingdom.
Figure 1.6: Number of Hospitals in Saudi Arabia
0
20,000
40,000
60,000
80,000
100,000
120,000
140,000
160,000
180,000
200,000
2016 2017 2018 2019 2020 2021
MSA
R
YearHealth & Social Budget
0
50
100
150
200
250
300
350
1399 1404 1409 1414 1419 1424 1429 1434 1439
Num
ber o
f Hos
pita
ls
Year (Hijri)
Ministry of HealthOther GovernmentPrivate Sector

Section - 1
KSA Fourth National Communication (NC4) 9
1.6 Energy Profile
1.6.1 Oil and Gas
The Kingdom of Saudi Arabia had 267.07 billion Barrels of proven Crude Oil reserves and 49,202 billion cubic meters (BCM) of proven Natural Gas reserves in 2019. The Kingdom produced around 9.8 million barrels of Oil per day in 2019 and 1.32 million barrels of Natural Gas Liquids per day in 2019 (SAMA’s annual statistics 2019).
The Kingdom produced around 924.942 million Barrel of refined products in 2019 and 1,028.298 million Barrel of refined products in 2018 (SAMA’s annual statistics 2019). The Kingdom exported around 2,568.90 million barrels of Crude Oil and 474.41 million barrels of refined products in 2019. The Kingdom consumed around 1,566.118 million Barrel of refined products, Crude Oil and Natural Gas domestically (SAMA’s annual statistics 2019).
1.6.2 Electricity
The Kingdom has 83 power plants with a total generating capacity of 85,185 MW. Out of 85,185 MW generating capacity, Saudi Electricity Company (SEC) contributes 65%, Saline Water Conversion Corporation (SWCC) contributes 7.6%, Marafiq 2.4%, Independent Water and Power Producers (IWPPs) 16.5%, others 7.7% and renewable energy contribution was 0.5% (ECRA statistical book, 2019). In 2019, the percent contribution of different types of power generation technologies were 34.7% by gas turbines, 44.7% by steam turbines, 0.5% each by diesel generators and renewables. The installation of energy efficient combined cycle power plants has been increasing steadily in the Kingdom.
In 2019, the Kingdom’s electricity consumption was around 289 TWh with 44.5% of the consumption by residential category. In 2019, the Kingdom had licensed capacity of 424 MW from Renewable Energy (ECRA statistical book, 2019).
1.7 Industrial and Economic Development
1.7.1 Industrial and Economic Cities
The Kingdom of Saudi Arabia has been developing a number of industrial zones and economic cities to achieve economic development and diversification of the economy, increase competitiveness and attract investors. These industrial cities and economic zones include:
1.7.1.1 Industrial Cities
1.7.1.1.1 Saudi Authority for Industrial Cities and Technology Zones (MODON)
Saudi Arabia established the first three Industrial cities in the cities of Jeddah, Riyadh and Dammam in 1973. The number of industrial cities increased to 12 in 1993. The Saudi Authority for Industrial Cities and Technology Zones (MODON) was established in 2001 to manage these industrial cities. The number of industrial cities across the Kingdom managed by MODON is currently 35. These industrial cities generally have small and medium scale industries such as: food products, beverages, textile, furniture, base metal, electrical equipment, machinery, equipment, computers, motor vehicles, trailers and semi-trailers, electronic and optical products, pharmaceutical industries, wood and wood products, chemicals and its products,

Section - 1
KSA Fourth National Communication (NC4) 10
paper and its products, rubber and plastic-products, building materials, ceramics and glass, printing etc. (MODON 2021)
1.7.1.1.2 Royal Commission for Jubail and Yanbu (RCJY)
Established in 1975, the Royal Commission for Jubail and Yanbu (RCJY) plans, promotes, develops and manages petrochemical and energy intensive industrial cities. These cities are located in Jubail and Yanbu. The RCJY has been additionally tasked to develop and manage mining industries in Ras Al-Khair as well as creating future expansion plans with partners to establish a city for mining industries.
RCJY in the industrial cities of Yanbu on the western coast and Jubail on the eastern coast of Saudi Arabia having industrial complex of primary industries from petrochemical plants to oil refineries and power and desalination plants and the industrial ports. The industrial cities of Jubail and Yanbu are currently undergoing the second phase of development.
1.7.1.2 Economic Cities
1.7.1.2.1 King Abdullah Economic City (KAEC), Rabigh
KAEC is located in Rabigh along the Red Sea Coast. The city targets the sectors of Logistics and Industrial Services, Tourism and Entertainment, Quality of Life, and the Business sector. King Abdullah Port is also located in KAEC. The port is designed to be a major transshipment port and a core commercial gateway for the Kingdom of Saudi Arabia. The city is also connected to the Haramain High-Speed Railway through the station. The “Industrial Valley” located in KAEC aims to serve as the industrial zone of the city. The valley hosts over 2,500 manufacturers and logistics service companies.
KAEC also hosts education and training institutes such as the National Aviation Academy and Prince Mohammad bin Salman College of Business & Entrepreneurship.
1.7.1.2.2 Knowledge Economic City (KEC), Madinah
The Knowledge Economic City located in Madinah focuses on knowledge-based industries and targets the sectors of education, hospitality, tourism, housing, healthcare and many others.
The Knowledge Bureau located in KEC holds knowledge activities in the fields of economy, culture and training. The Madinah Institute for leadership & Entrepreneurship provides high-quality training programs and develop managerial competencies.
1.7.1.2.3 Jazan Economic City (JEC)
JEC is located in the city of Jazan, south of the Kingdom and is currently under development. JEC targets sectors such as Petroleum refineries, Petrochemical industries, mining industries, heavy industries, food processing and packaging and other strategic sectors. A multi-purpose seaport will be built in the city.

Section - 1
KSA Fourth National Communication (NC4) 11
1.8 Water Resources
The Kingdom of Saudi Arabia is one of the world’s most water scarce country with an average rainfall of approximately 100-150 mm/year. There are no perennial rivers in the country. The hot and dry weather during summers with high temperatures soaring around 45°C in some areas further aggravates the situation. As mentioned above, the rainfall is low and vary across the country.
The Kingdom’s water resources are categorized into the following four categories; surface water, groundwater, desalinated water and reclaimed wastewater which are discussed below.
1.8.1 Surface Water
The total estimated runoff as a result of the precipitation in 2018 and 2019 in different parts of the Kingdom was 6,746 MCM and 4,179 MCM respectively. The total amount of water runoff collected in the dams in 2018 was 1,200 MCM and 970 MCM in 2019 (MEWA, 2019). Saudi Arabia has completed the construction of a total of 522 dams in different parts of the country by 2019 while the number of dams in 2018 and 2017 was 512 and 507 with capacities of 2,304 MCM and 2,270 MCM and 2,265 MCM respectively. The number of dams in 2014 was 482 dams across the Kingdom to store an estimated 2,084 MCM of the surface water runoff (Saudi Arabia BUR1, 2018). These dams facilitate storage of surface water runoff, prevent flash floods, reduce surface water evaporation and increase infiltration to recharge shallow aquifers, in addition to irrigation and for storing water for drinking purposes (AlTokhais, 2018, Saudi Arabia BUR1, 2018).
In addition, a total of 8,611 water wells including 3,938 potable water tube wells, 3,336 manual potable water wells, 909 monitoring wells and 528 test wells also existed in 2019 (MEWA, 2019). MEWA also has planned to construct additional 369 wells in 39 areas of the Kingdom with a total water production of 927,804 cubic meter/day by 2020 as part of National Transformation Programme 2020. (MEWA, 2019).
1.8.2 Groundwater
Groundwater sources in the Kingdom of Saudi Arabia are divided into two categories; shallow aquifers and deep aquifers. The shallow aquifers are constituted within alluvium soil while the deep aquifers are formed within sandstone and limestone sediments which stretch across thousands of square kilometers. These deep rock aquifers have inadequate natural recharge and are therefore regarded as non-renewable resource of water formed over thousands of years ago (MoWA, 1984). These aquifers are further divided into principal and secondary aquifers. The principal aquifers are depicted in the figure 1.7.

Section - 1
KSA Fourth National Communication (NC4) 12
Figure 1.7: Principal Aquifers of the Kingdom of Saudi Arabia (Chowdhury and Al-Zahrani, 2015)
1.8.3 Desalinated Water
As the world’s largest producer of desalinated water, the Kingdom of Saudi Arabia has been constantly striving to meet the growing demand for potable water due to increasing population by increasing the amount of desalinated water production. The amount of desalinated water produced in 2018 was 2,541 MCM and as Figure 1.8 below indicates, the amount has been increasing annually since the amount of desalinated water produced was below 1,500 MCM in 2010 (SWCC, 2011). 65% of the Urban sector’s water demand is met through the utilization of desalinated water and 35% through groundwater (MEWA, 2019).

Section - 1
KSA Fourth National Communication (NC4) 13
Figure 1.8: Trend of Desalinated Water Production in Saudi Arabia
Seawater desalination is carried out using a number of technologies. Important among them and used in Saudi Arabia are Multi-Stage Flash (MSF), Multi-effect Distillation (MED), and Reverse Osmosis (RO). In 2019, 32% of the desalinated water was produced by RO, 54% by MSF and 14% by MED (Figure 1.9). Consistent with the increase in the number of desalination plants and water production, the capacity of electricity produced by these desalination plants has also increased simultaneously (ECRA, 2019). The total number of desalination plants as of 2019 was 51 with a total capacity of around 7,765,048 m3/day. The share of desalinated water produced on the eastern coast (Arabian Gulf) in 2019 was 53% and on the western coast (Red Sea) was 47% (Figure 1.9).
Figure 1.9: Desalination Capacity by Coast; Share of Different Desalination Technologies and Major Producers of Desalinated Water in 2019
1.8.4 Reclaimed Wastewater
The number of sewage treatment plants in the country in 2019 was 99 (MEWA, 2019) treating a total of 1.802 BCM of municipal wastewater. As of 2019, 17.2% of the treated wastewater was reused (MEWA, 2019) and remaining treated wastewater is disposed off either into the marine environment (Arabian Gulf or the Red Sea) or on land generally in the valleys (wadis). The National Water Company (NWC) under MEWA is responsible for collecting, treating, recycling and reuse of the municipal wastewater in the Kingdom.
53%
47%
Desalination Capacity By Coasts
Eastern Western
14%
54%
32%
Major Producers of Desalinated Water - By Technology
MED MSF RO
Section - 1
KSA Fourth National Communication (NC4) 14
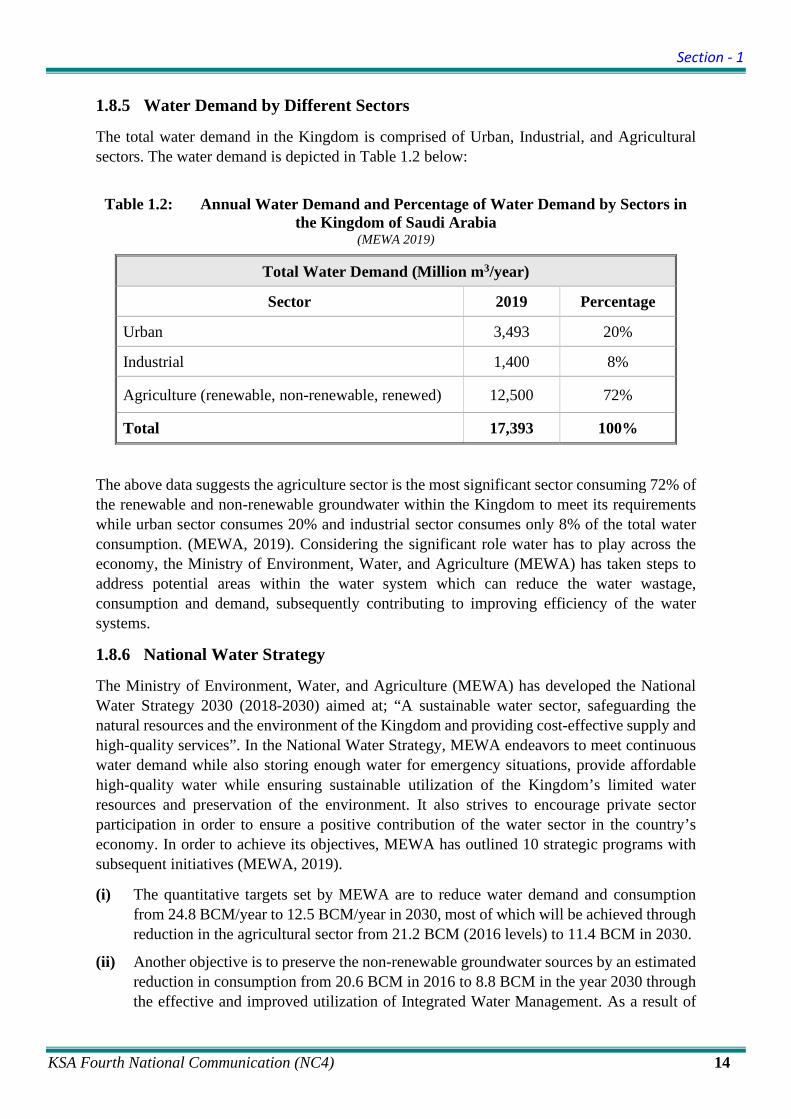
1.8.5 Water Demand by Different Sectors
The total water demand in the Kingdom is comprised of Urban, Industrial, and Agricultural sectors. The water demand is depicted in Table 1.2 below:
Table 1.2: Annual Water Demand and Percentage of Water Demand by Sectors in the Kingdom of Saudi Arabia
(MEWA 2019)
Total Water Demand (Million m3/year)
Sector 2019 Percentage
Urban 3,493 20%
Industrial 1,400 8%
Agriculture (renewable, non-renewable, renewed) 12,500 72%
Total 17,393 100%
The above data suggests the agriculture sector is the most significant sector consuming 72% of the renewable and non-renewable groundwater within the Kingdom to meet its requirements while urban sector consumes 20% and industrial sector consumes only 8% of the total water consumption. (MEWA, 2019). Considering the significant role water has to play across the economy, the Ministry of Environment, Water, and Agriculture (MEWA) has taken steps to address potential areas within the water system which can reduce the water wastage, consumption and demand, subsequently contributing to improving efficiency of the water systems.
1.8.6 National Water Strategy
The Ministry of Environment, Water, and Agriculture (MEWA) has developed the National Water Strategy 2030 (2018-2030) aimed at; “A sustainable water sector, safeguarding the natural resources and the environment of the Kingdom and providing cost-effective supply and high-quality services”. In the National Water Strategy, MEWA endeavors to meet continuous water demand while also storing enough water for emergency situations, provide affordable high-quality water while ensuring sustainable utilization of the Kingdom’s limited water resources and preservation of the environment. It also strives to encourage private sector participation in order to ensure a positive contribution of the water sector in the country’s economy. In order to achieve its objectives, MEWA has outlined 10 strategic programs with subsequent initiatives (MEWA, 2019).
(i) The quantitative targets set by MEWA are to reduce water demand and consumption from 24.8 BCM/year to 12.5 BCM/year in 2030, most of which will be achieved through reduction in the agricultural sector from 21.2 BCM (2016 levels) to 11.4 BCM in 2030.
(ii) Another objective is to preserve the non-renewable groundwater sources by an estimated reduction in consumption from 20.6 BCM in 2016 to 8.8 BCM in the year 2030 through the effective and improved utilization of Integrated Water Management. As a result of
Section - 1
KSA Fourth National Communication (NC4) 15
the efforts, additionally MEWA aims to create 70,000 indirect and direct jobs by 2030 (MEWA, 2019).
(iii) A national program entitled “Qatrah”, (the droplet), has been announced to rationalize water consumption in the Kingdom. The program has set ambitious targets to reduce the potable water consumption by around 43 percent by 2030 (NWC, 2019).
1.9 Tourism
The tourism sector in Saudi Arabia is considered to be one of the important sectors for successful and sustainable growth while focusing on the economic diversification objectives of the Saudi Vision 2030. The tourism industry is immensely supported by the government because of its potential to create job opportunities.
In 2011, 17.5 million international tourists visited Saudi Arabia while domestic tourists accounted for 22.5 million of the total number of tourists (Tourism Information and Research Center, 2012). These numbers have grown significantly to around 61.8 million for domestic tourists and 23.7 million for international tourists in the space of seven years (GASTAT, 2019). The number of jobs generated as a direct result of the tourism sector are 552,556 and recently, a report by the World Economic Forum ranked the Kingdom 69 on a Tourism Competitiveness Index (Tourism Information and Research Center, 2012). Historically, the holy sites of Makkah and Madinah have been the pillar of the tourism industry, but more recently, new cities, festivals and heritage sites have been attracting domestic tourists and contributing positively to the national economy through promoting investment in the industry and creating jobs for the Saudi youth. The historic city of Jeddah, considered as a UNESCO World Heritage Site, AlUla, home to Hegra which is also a UNESCO World Heritage site, Abha and others have varying landscapes, beautiful seasons and oases.
The prioritization of the Saudi Arabian government of many megaprojects underscores its commitment to providing innumerable tourism destinations to attract local and foreign tourists. Larger megaprojects like Neom and Red Sea projects planned to be completed between 2025 and 2031 as part of destinations to attract tourists are expected to drive home significant foreign direct investment and create tens of thousands of jobs for Saudis across different sectors such as tourism, entertainment and construction. With new projects like new hotels and international airport in Tabuk (Amaala project), entertainment city (Red Sea project), world’s tallest building, Jeddah Tower (Jeddah Economic City project), etc. planned for construction.

Section - 1
KSA Fourth National Communication (NC4) 16
1.9.1 Mega Projects in Development
Table 1.3 below provides a brief description of the mage projects under development in the different parts of the Kingdom in order to encourage tourism in the country as part of Saudi Vision 2030.
Table 1.3: Brief Description of Mega Projects
Project Details Province NEOM • Smart, 16-borough, 10,000 sq. mile megacity powered
entirely by renewable energy sources • Intended to serve as a global hub across nine key economic
sectors including media production and entertainment, energy and water and biotechnology and digital sciences.
Tabuk
The Red Sea Project
• Development of 50 islands off the Red Sea coast including an airport, seaport, 12,000 housing units, luxury resorts, sports, retail, and entertainment centers
• Marine sanctuary and eco-tourism destination • Projected to create 70,000 jobs
Tabuk
Qiddiya • Entertainment city 40 km from Riyadh city center containing amusement parks, sports venues, safari and bike-riding locales
• Six Flags Qiddiya planned to open in 2023 • Projected to create 17,000 jobs
Riyadh
Amaala • Branded as “The Riviera of the Middle East”, wellness retreat, wildlife sanctuary, resort
• Construction of hotels providing 2,500 rooms • Construction of new international airport
Tabuk
Al Ula • Restoration of pre-historic Nabatean sites including Mada’in Saleh
• Projected to create 38,000 jobs and attract two million visitors by 2035
Madinah
Jeddah Economic City
• Construction of world’s tallest building, Jeddah Tower • Development of 470,000 sq. meters of commercial area,
800,000 sq. meters of office space, 150,000 sq. meter university campus
Makkah
Souq Okaz City Project
• Heritage tourism project including museums, recreational areas, and convention center
• 18 private sector projects, 5 public sector projects • New international airport handling five million passengers per
year
Taif
Diriyah Gate • New culture and lifestyle destination including eight museums, restoration of historic Wadi Hanifa historical village, 15,000 seat entertainment arena, 20 hotels providing more than 3,100 rooms
Riyadh
SAR: Saudi Riyals

Section - 1
KSA Fourth National Communication (NC4) 17
1.10 Coastal and Marine Ecosystem
Saudi Arabia has two coastlines (i) the Red Sea coastline which is approximately 1,760 km long on the west and (ii) 650 km long Arabian Gulf coastline on the east. Coral Reefs represent the most significant habitat found along the Saudi shores (both Red Sea & Arabian Gulf). These reefs approximately 1,480 sq. km form the basic framework of tropical habitats and provide shelter and food for wide array of marine life. Mangrove forests which cover nearly 35 sq. km. area are another important habitat particularly in the Red Sea.
The Red Sea coast, where the upward tilt is greatest, is often bold and mountainous, with peaks of 3,000 meters. Along the Red Sea coast, there is a narrow coastal strip (Tihama) which broadens out in the Jeddah area and provides access through the highlands to the interior. On the Eastern side of the Kingdom, the Arabian Gulf coast is flat and low-lying. The shallow seas in this region deposited layers of younger sedimentary rock, allowing the creation of the vast oil reserves for which the area is famous. The coast is fringed with extensive coral reefs which make it difficult to approach the shore in many places.
More than 194 species of coral reefs form about 74 genera have been recorded, with the highest coral diversity occurring in the central Saudi Arabian Red Sea area. Coral reef harbours a longstanding and important artisan fishery. Yanbu, Rabigh, Jeddah and Jazan are the main coastal cities along the Red Sea coastline while Khafji, Jubail, Ras Tanura, Dammam and Al Khobar are the main cities along the Saudi coast of Arabian Gulf. The cities are densely populated and have commercial, industrial and agricultural activities.
1.11 Agriculture
Saudi Arabia is a hot and dry country with low precipitation and scarce water resources. The soils are generally sandy with low fertility. Therefore, use of innovative agriculture technologies and practices as well as efficient use of water resources is a challenging task. Sustainable food security is a top priority. With the above-mentioned challenges, Saudi Arabia has large projects in the field of date palm, poultry, dairy products and aquaculture. Although Saudi Arabia is a net importer of food items, it also exports surplus products in the field of dairy, dates, poultry and vegetables (fresh milk 122%, eggs 115% and dates 115%). Agriculture sector provides 30% of required food for consumption, contributes Saudi Riyals 53 billion annually that is 3.4% of non-oil GDP and a total workforce of 910,000 (MEWA, 2019).
Saudi Arabia’s agriculture sector is witnessing major changes to meet its pre-set objectives and achieve sustainable food security in line with Saudi Vision 2030. This is driven by the new directions to develop the aquaculture, organic farming and green houses in the country. The recent national development strategy launched by the Ministry of Environment, Water and Agriculture, and the Agricultural Development Fund is seeking to develop this sector by modernizing aquaculture to increase its contribution to the economy. This plan will help achieve self-sufficiency in seafood products, increase the production capacity to 1 million tons by 2029 in addition to creating more than 400,000 job opportunities for the youth. The main crops grown in the Kingdom are: Cereals; Wheat, millet, maize, corn, sesame etc., Vegetables; tomato, potato, marrow, eggplants, okra, carrot, dry onion, cucumber, melon, water melon etc., Fruits; dates, citrus fruits, grapes etc.

Section - 1
KSA Fourth National Communication (NC4) 18
The total agriculture area cultivated in the Kingdom was estimated to be 857,795 hectares broken down to cereals 237,442 ha, vegetables (open field) 69,528 ha; vegetables (green houses) 2,320 ha, fruits 129,540 ha; and the total production of these crops was: 966,516 tons; 122,4183 tons; 174,207 tons; 7,810,035 tons; 1,737,814 tons respectively.
Ministry of Environment, Water and Agriculture (MEWA) has undertaken a number of initiatives to increase the green cover in the Kingdom. Few important initiatives are (MEWA Statistical Yearbook, 2019):
• Under the National Program for the Development of fish resources in the Kingdom, MEWA planned to raise fish production to 100,000 tons/year in 2020, and 600,000 tons/ year by 2030 through optimum utilization of the Kingdom's natural resources in the field of fish resources.
• The wheat production was banned for a period of three years starting 2016. Also, starting 2018, the Kingdom has decided to stop production of green fodder for a period of no more than 3 years. The aim was to stop the consumption of large amount of irrigation water consumed by production of green fodder.
• Planted 276,735 trees in 2019 in the national parks belonging to the ministry.
• Planted 578,419 seedlings as part of afforestation campaigns through the ministry's branches, associations and memorandum of understanding with government agencies in the year 2019.
• The ministry in cooperation with the National Center for Vegetation Cover, and the public and private sectors, has launched the "Let's Make It Green" campaign. The initiative comes as part of the ministry's efforts to increase vegetation, reduce desertification, restore biodiversity, rehabilitate affected natural areas, promote pro-environmental behaviours, protect the environment and improve the quality of life. The campaign will include 165 sites across all regions of the Kingdom of Saudi Arabia and will include planting several national parks, sowing seeds in different regions, afforestation in Najran and Al-Baha regions, mangrove afforestation project in Makkah and Jazan regions and the cultivation of sabkhas in several locations. (MEWA Green Campaign, 2020)
1.12 Nationally Determined Contribution (NDC) of the Kingdom of Saudi Arabia under the UNFCCC
The Kingdom of Saudi Arabia submitted its Updated Nationally Determined Contribution (NDC) to the UNFCCC Secretariat in October 2021. The updated NDC are aimed to remove, avoid and reduce GHG emissions by 278 million tons of CO2eq by 2030 which is more than two-fold increase compared to the Kingdom’s previous INDC submitted in November 2015. The Saudi Arabian NDCs are based on the Dynamic baseline approach, taking into consideration country’s national circumstances (For details, refer to section 3.4).
1.13 Institutional Arrangement
The Kingdom of Saudi Arabia has over the past years evolved a functional and robust institutional arrangement. This institutional arrangement has been effective in preparing four national communications and a biennial update report. This institutional arrangement has been

Section - 1
KSA Fourth National Communication (NC4) 19
subjected to modifications to meet the growing reporting and other obligations of the Kingdom to the UNFCCC and its Paris Agreement.
The DNA is the implementing authority for addressing all reporting obligations of the Kingdom to the UNFCCC including the National Communications (NCs) and Biennial Update Reports (BURs). Furthermore, preparing and submitting Biennial Transparency Reports (BTRs) and National Inventory Reports (NIRs) to be submitted every two years from 2024 onwards under the Paris Agreement also fall under its responsibilities. (For further details refer to Section 3.9)

Section - 1
KSA Fourth National Communication (NC4) 20
References: 1. AlTokhais, Ali (2018), Water Resources in the Kingdom of Saudi Arabia; Water Tech
Saudi Arabia 2018, 19-20 February 2018, Riyadh, Kingdom of Saudi Arabia.
2. Chowdhury S and Al-Zahrani M, (2015), Characterizing water resources and trends of sector wise water consumptions in Saudi Arabia. Journal of King Saud University – Engineering Sciences 27(1); 68-82
3. Electricity & Co-Generation Regulatory Authority (ECRA) (2019), Statistical Booklet.
4. FAO, (2020), CLIMWAT: A climatic database for irrigation planning and management. http://www.fao.org/nr/water/infores_databases.html
5. First Biennial Update Report of Saudi Arabia (BUR1) (2018), Designated National Authority, Kingdom of Saudi Arabia.
6. General Authority for Statistics (GASTAT) (2018), Statistical Yearbook.
7. General Authority for Statistics, (GASTAT) (2019), Population By Age Groups and Gender: https://www.stats.gov.sa/en/43
8. Guendouz A. A., Ouassaf, S. M. (2020), The Economic Diversification in Saudi Arabia under the strategic vision 2030. J. Academy of Accounting and Financial Studies
9. King Abdullah Economic City (KAEC), Rabigh: https://www.kaec.net/
10. Knowledge Economic City (KEC), Madinah https://www.madinahkec.com/
11. Ministry of Water and Agriculture (MoWA) (1984), Water Atlas of Saudi Arabia
12. Ministry of Environment, Water and Agriculture (MEWA) (2019), Statistical Year Book: https://www.mewa.gov.sa/ar/InformationCenter/Researchs/Reports/Pages/default.aspx
13. Ministry of Environment, Water and Agriculture (MEWA) Green Campaign, (2020) (https://www.mewa.gov.sa/en/mediacenter)
14. Modon (2021) https://www.modon.gov.sa/en/Pages/default.aspx
15. Royal Commission for Jubail & Yanbu
(https://www.rcjy.gov.sa/en-us/pages/default.aspx)
16. Saline Water Conversion Corporation (2011), General Organization of Water Desalination: http://www.swcc.gov.sa/default.asp
17. Saudi Arabian Monetary Authority (SAMA) (2018):

Section - 1
KSA Fourth National Communication (NC4) 21
http://www.sama.gov.sa/en-US/EconomicReports/AnnualReport/Fifty%20Fourth%20Annual%20Report.pdf
18. Saudi Arabian Monetary Authority (2019), Annual Statistics: https://www.sama.gov.sa/en-US/EconomicReports/Pages/YearlyStatistics.aspx
19. Saudi Vision 2030 (2016) https://www.vision2030.gov.sa/
20. Tarawneh Q. Y. and Chowdhury S., (2018), Trends of Climate Change in Saudi Arabia: Implications on Water Resources. Climate 6, 8: 1-19; https://doi.org/10.3390/cli6010008
21. Tourism Information and Research Centre (2012), MAS: Saudi Tourism Outlook.
22. Tricaud, V., (2020), Saudi Arabia Will Push Ahead with Economic Diversification Despite COVID-19. https://www.controlrisks.com/our-thinking/insights/saudi-arabia-will-push-ahead-with-economic-diversification-despite-covid-19
23. World Health Organization (2000). The World Health Report 2000: Health Systems: Improving Performance. Geneva: World Health Organization
24. World Health Organization (2022): Best Healthcare in the World 2022: https://worldpopulationreview.com/country-rankings/best-healthcare-in-the-world

Section - 2
KSA Fourth National Communication (NC4)
SECTION 2
2016 National Inventory of Anthropogenic Emissions by Sources and Removals by Sinks of Greenhouse Gases Not Controlled by the
Montreal Protocol

Section - 2
KSA Fourth National Communication (NC4) i
TABLE OF CONTENTS
Section Title Page 2.1 Introduction 22 2.2 Objectives 22 2.3 Inventory Development Process 22 2.4 Data Collection, Emission Factors and Methodologies 23 2.4.1 Preparation of Questionnaires 23 2.4.2 Selection of Target Organizations/Companies 23 2.4.3 Input Data Sources 24 2.4.4 Input Data Collection and Tabulation 24 2.4.5 Selection of Emission Factors and Calculation Methodologies 24 2.4.6 Uncertainties in Emissions Estimation 24 2.4.6.1 Input Data 25 2.4.6.2 Emission Factors 25 2.4.6.3 Overall Emissions Estimation 25 2.5 Summary of Overall Greenhouse Gas Emissions and Sinks 25
2.5.1 Overview of 2016 National Inventory of Greenhouse Gas Emissions and Sinks 25
2.5.2 Uncertainties in Greenhouse Gas Emission Estimations 29
2.6 Contributions of Major Sectoral Activities to 2016 Greenhouse Gas Emissions 31
2.6.1 Energy Sector 31 2.6.1.1 Emissions from Fuel Combustion 33 2.6.1.2 Fugitive Emissions from Fuels 34 2.6.2 Industrial Processes and Product Use Sector 35 2.6.3 Agriculture, Forestry, and Other Land Use Sector 37 2.6.3.1 Agriculture Sub-Sector 37 2.6.3.2 Forestry and Other Land-Use Sub-Sector 39 2.6.4 Waste Sector 41 References 43

Section - 2
KSA Fourth National Communication (NC4) ii
LIST OF FIGURES
Figure Title Page
2.1 Relative Contributions of Major Source Categories To 2016 CO2 Emissions of 602,816 Gg 28
2.2 Relative Contributions of Major Source Categories to 2016 CH4 Emissions of 1,950.5 Gg 29
2.3 Relative Contributions of Major Source Categories to 2016 N2O Emissions of 38.24 Gg 30
2.4 Activities Considered in the Energy Sector 32 2.5 Relative Contributions of Major Activities to 2016 CO2
Emissions from Energy Sector 34
2.6 Relative Contributions of Major Activities to 2016 CH4 Emissions from Energy Sector 35
2.7 Relative Contributions of Major Activities to 2016 N2O Emissions from Energy Sector 35
2.8 Activities Considered in the Industrial Processes and Product Use Sector 36
2.9 Relative Contributions of Major Activities to 2016 CO2 Emissions from Industrial Processes and Product Use Sector 37
2.10 Activities Considered in the Agriculture Sub-Sector 38 2.11 Relative Contributions of Major Activities to 2016 CH4
Emissions from Agriculture Sub-Sector 39
2.12 Relative Contributions of Major Activities to 2016 N2O Emissions from Agriculture Sub-Sector 39
2.13 Activities Considered in the Forestry and other Land-use Sub-Sector 40
2.14 Relative Contributions of the Major Sinks to 2016 CO2 Emissions from Forestry and other Land-use Sub-Sector 41
2.15 Activities Considered in the Waste Sector 42 2.16 Relative Contributions of Various Activities to 2016 CH4
Emissions from the Waste Sector 42
LIST OF TABLES
Table Title Page
2.1 Summary of 2016 Direct Greenhouse Gas Emissions Inventory for Saudi Arabia 26
2.2 Overview of 2016 National Direct Greenhouse Gas Emissions Inventory for Saudi Arabia 27
2.3 2016 Carbon Dioxide (CO2) Emissions from Major Source Categories 28
2.4 2016 Methane (CH4) Emissions from Major Source Categories 30 2.5 2016 Nitrous Oxide (N2O) Emissions from Major Source
Categories 31

Section - 2
KSA Fourth National Communication (NC4) 22
Section 2: 2016 National Inventory of Anthropogenic Emissions by sources and removals by Sinks of Greenhouse Gases not controlled by the Montreal Protocol
2.1 Introduction
This section presents the National inventory of anthropogenic emissions by sources and removal by sinks of greenhouse gases not controlled by the Montreal Protocol for the year 2016. This inventory has been prepared in response to the Kingdom’s commitment to the United Nations Framework Convention on Climate Change (UNFCCC) to submit its fourth National Communication which would include national inventory of anthropogenic emissions and removals by sinks of greenhouse gases not controlled by Montreal Protocol for Saudi Arabia. It is prepared according to the 2006 Guidelines of the Intergovernmental Panel on Climate Change (IPCC, 2006).
The Kingdom of Saudi Arabia ratified the United Nations Framework Convention on Climate Change in December 1994. This convention aimed to stabilize the greenhouse gas concentrations in the atmosphere at a level that would prevent significant potential changes to the global climate. One effective option that has been adopted by various developed countries to obtain this objective is the stabilization of greenhouse gas emissions by the year 2000 at their 1990 levels. Being a signatory to the UNFCCC, Saudi Arabia has agreed to develop periodic national inventories of greenhouse gas emissions and sinks as a part of its National Communications and Biennial Update Reports. Accordingly, the Kingdom submitted its first, second and third national communications in 2005 (PME, 2005), 2011 (PME, 2011) and 2016 (DNA, 2016) respectively. The Kingdom submitted its first Biennial Update Report in 2018 (DNA, 2018).
The 2016 national inventory of anthropogenic emissions of greenhouse gases by sources and removal by sinks for the Kingdom of Saudi Arabia was developed according to the 2006 IPCC Guidelines. The major findings including a brief description of the inventory development process are presented in the following subsections.
2.2 Objectives
As mentioned above, the main objective of this section is to present a national inventory of anthropogenic emissions of greenhouse gases by sources and removals by sinks for Saudi Arabia for the year 2016 addressing the three direct greenhouse gases (i.e., CO2, CH4 and N2O) as an integral part of the Kingdom’s fourth National Communication to the UNFCCC.
2.3 Inventory Development Process
The inventory development process included the following major steps. • Identification of the types of data to be collected from each emission source category and
sub-sectors (under each category) as proposed in the 2006 IPCC Guidelines;
Section - 2
KSA Fourth National Communication (NC4) 23
• Preparation of a list of government ministries and other governmental, semi-governmental, and private organizations that would be contacted to collect the required information (identification of the inventory data input sources);
• Development of questionnaires or forms to collect the required information from the selected ministries and organizations (development of questionnaires);
• Collection of inventory data from all the selected ministries and organizations (collection of information);
• Tabulation of the collected data; • Estimation of greenhouse gas emissions/sinks based on methodologies recommended by
the 2006 IPCC Guidelines; and • Development of the national inventory report and summary of total anthropogenic
emissions of greenhouse gases and their removals by sinks.
2.4 Data Collection, Emission Factors and Methodologies
2.4.1 Preparation of Questionnaires
The 2006 IPCC Guidelines were utilized in the preparation of questionnaires. These Guidelines are in five volumes. Volume 1: (IPCC, 2006a) consists of general reporting instructions and identifies sectors, sub-sectors, and categories of activities that are considered in developing a greenhouse inventory of sources and sinks. It includes information pertinent to data collection approach, uncertainty analysis approach, methodological choice and identification of key categories, time series consistency, QA & QC and verification, precursors and indirect emissions, and reporting guidance. The remaining four volumes provide sector specific guidance namely Volume 2: Energy (IPCC 2006b), Volume 3: Industrial Processes and Product Use (IPCC 2006c), Volume 4: Agriculture, Forestry and other land use (IPCC 2006d) and Volume 5: Waste (IPCC 2006e).
The 2006 IPCC Guidelines for preparing the greenhouse gas inventory were reviewed thoroughly to identify inventory input data requirements for each of the activities given in the documents. The software and other resources accompanying the 2006 IPCC Guidelines was also checked thoroughly for additional and/or auxiliary information that may be required for calculating emissions of greenhouse gases. Custom-made questionnaires were developed for each targeted organization/company and forwarded to them for their input.
2.4.2 Selection of Target Organizations/Companies
Based on the input data requirements for calculating greenhouse gas emissions for each sector and sub-sector given in the 2006 IPCC Guidelines, a list of potential government departments, private organizations and industrial companies, from which such information should be obtained, was prepared. All relevant information sources were consulted in preparation of this list.

Section - 2
KSA Fourth National Communication (NC4) 24
2.4.3 Input Data Sources
The basic information sources prepared during the development of the first, second and the third national communications, and the first biennial update report for the Kingdom of Saudi Arabia were updated for selection of target organizations to obtain necessary data pertinent to direct greenhouse gas emission sources in the Kingdom. The custom-made questionnaires were prepared and mailed to each of the targeted organizations/companies. The inputs from these organizations/companies were carefully reviewed and analyzed for utilization in the calculations of greenhouse gas emissions. In addition to the questionnaires, various other sources of information were consulted.
2.4.4 Input Data Collection and Tabulation
The data collected through questionnaires and from other accessible sources were sorted for individual activities for which direct greenhouse gas emissions were to be calculated. Information obtained from different sources for a specific activity was combined, as appropriate. Some of the information requested in the questionnaires was not provided by the respondents. In such cases, appropriate assumptions were made to estimate the missing data.
2.4.5 Selection of Emission Factors and Calculation Methodologies
In addition to the basic inventory input data, emission factors were needed to calculate greenhouse gas emissions. These emission factors were mainly adopted from the 2006 IPCC Guidelines. Calculation methodologies in the 2006 IPCC Guidelines were followed in estimating greenhouse gas emissions in this report.
2.4.6 Uncertainties in Emissions Estimation
Due to the unavailability of certain source specific input data including emission factors, uncertainties are unavoidable when any estimate of national emissions or removals is made. It is therefore important to establish and express uncertainties quantitatively and/or with the acceptable confidence interval or range. The 2006 IPCC Guidelines provide detailed information related to uncertainties associated with emission factors and activity data.
Uncertainties in emissions estimation basically come from three major sources: input data, the assumptions used in selecting the emission factors, and adopting extrapolated and/or averaged values in calculations.
Uncertainties related to input data depend mainly on the size and quality of data collection and record keeping. Uncertainties involved in selection of emission factors come from the fact that the default values provided in the 2006 IPCC Guidelines were established for a certain group of activities that comprises several processes. The nature of a group of activities in a particular country may differ from the generalized nature of the group considered in derivation/establishment of the default emission factors. A similar analogy applies to the variation in source and/or sink characteristics in different countries. Therefore, the default emission factors may not exactly represent and characterize the actual conditions of source/sink activities. In such cases, using these factors to calculate the greenhouse gas emissions would result in high uncertainties.
Section - 2
KSA Fourth National Communication (NC4) 25
Uncertainties also appear when the unavailability of input data compels the use of extrapolated and/or averaged values for a particular set of data. Uncertainty of extrapolated or averaged data cannot be quantified precisely because the uncertainties associated with the interpolation and/or averaging procedures also depend on the quality of the relevant data including data accuracy.
2.4.6.1 Input Data
The raw data provided by the government organizations were assumed to be accurate while the raw data supplied by the private sectors were also considered to be accurate in some cases. Mainly, the 2006 IPCC guidelines were consulted for ascertaining the uncertainty associated with the activity data.
2.4.6.2 Emission Factors
The uncertainties associated with the emission factors used in this section were taken from the 2006 IPCC Guidelines (IPCC, 2006).
2.4.6.3 Overall Emissions Estimation
The uncertainty analysis was conducted following the Approach 1 Uncertainty Calculation for each sector based on 2006 IPCC guidelines. The overall uncertainties of the energy sector and the industrial processes and product use sector were less than 10% and 20%, respectively. The uncertainty of the agriculture sub-sector and waste sector could be high due to the high uncertainty of emission factors. Due to the unavailability of relevant information, the uncertainty of the forestry and other land-use sub-sector could not be determined.
2.5 Summary of Overall Greenhouse Gas Emissions and Sinks
2.5.1 Overview of 2016 National Inventory of Greenhouse Gas Emissions and Sinks
The 2016 greenhouse gas emission inventory for Saudi Arabia is summarized in Table 2.1. The details of estimated greenhouse gas emissions from various activities associated with sub-sectors in each sector are presented in Table 2.2. The inventory included the direct greenhouse gases; namely, carbon dioxide (CO2), methane (CH4), and nitrous oxide (N2O). Emissions of these gases were calculated for the energy, industrial processes and product use, agriculture, forestry and other land-use, and waste sectors in the Kingdom. Greenhouse gas emissions from the various uses of paints and solvents have not been recommended by the 2006 IPCC Guidelines, thus, they were not included in this report. The major findings pertaining to individual greenhouse gases are summarized below.
• CO2 emissions in Saudi Arabia in 2016 were 602,816 Gg and CO2 sinks were 9,269.8 Gg. As shown in Table 2.1, the energy sector contributed 87.37% of the total CO2 emissions, followed by the industrial processes and product use sector (12.50%) and the agriculture sub-sector (0.13%). The major source categories contributing to these CO2 emissions (cumulative contributions ≥ 95% of the total emissions) were electricity generation (26.72%), road transport (22.07%), desalination (17.19%), petroleum refining (6.59%), fuel combustion in petrochemical (4.95%), cement production (4.75%), petrochemical

Section - 2
KSA Fourth National Communication (NC4) 26
production (4.10%), fuel combustion in fertilizer industry (2.84%), fuel combustion in cement industry (2.15%), iron and steel production (1.64%), ammonia production (1.53%), and fugitive emission in well testing (0.91%).
Table 2.1: Summary of 2016 Direct Greenhouse Gas Emissions Inventory for Saudi Arabia
Source Sector Or
Sub-Sector
Quantity Emitted (Gg)
CO2 CH4 N2O
Energy* 526,685.8 (87.37)**
458.58 (23.51)
8.90 (23.3)
Industrial Processes 75,366.9 (12.50)
104.08 (5.34)
Agriculture (sub-sector) 762.8 (0.13)
127.07 (6.51)
25.24 (66.0)
Forestry and Other Land-Use (sub-sector)
-9,269.8*** (-1.54)
Waste 1,260.77
(64.64) 4.10
(10.7)
Total Emissions 602,816 1,950.5 38.24
Net Emissions**** 593,546 1,950.5 38.24
* As per the IPCC Guidelines, emissions from International Aviation and Navigation Bunkers were not included in Total Emissions. ** Numerals in brackets are percentages of Total Emissions. *** Minus sign indicates sink. **** Total emissions minus sinks.

Section - 2
KSA Fourth National Communication (NC4) 27
Table 2.2: Overview of 2016 National Direct Greenhouse Gas Emissions Inventory for Saudi Arabia
Source and Sink Categories CO2 (Gg)
CH4 (tons)
N2O (tons)
Total National Emissions 602,816 1,950,500 38,240
Net National Emissions 593,546 1,950,500 38,240
1. Energy* 526,686 458,579.7 8,901.93
A. Fuel combustion 516,162.6 49,575.0 8,452.18
1. Energy industries 200,805.7 5,916.1 1,012.04
2. Manufacturing industries and construction 63,874.1 1,393.9 185.78
3. Transport 139,536.1 38,488.4 6,744.73
4. Other Sub-sectors 111,946.7 3,776.6 509.63
B. Fugitive emissions from fuels 10,523.2 409,004.7 449.75
2. Industrial Processes and Product Use 75,366.9 104,076.4 0.0
A. Mineral products 29,820.6
B. Chemical industry 34,053.5 104,076.4
C. Metal production 11,373.4
D. Lubricant use 119.4
3. Agriculture (Sub-Sector)** 762.77 127,072.57 25,243.81
A. Enteric fermentation 103,613.12
B. Manure management 22,391.35 1,450.34
C. Agricultural soils 23,765.78
D. Field burning of agricultural residues 1,068.10 27.69
E. Lime and urea application 762.77
4. Forestry and Other Land-Use (Sub-Sector)** -9,269.8 0.0 0.0
A. Changes in forest and other woody biomass stocks -9,175.2
B. Forest conversion -61.9
C. CO2 emissions and removal from soil -32.7
5. Waste 1,260,769.3 4,097.6
A. Solid waste disposal on land 531,783.31 -
B. Solid waste composting 1,675.45 251.32
C. Wastewater handling 82,899.69 -
D. Human sewage - 3,846.30
E. Industrial wastewater 644,410.84 -
* As per the IPCC Guidelines, emissions from international aviation and navigation bunkers were not included in energy total
** Agriculture, forestry and other land-use are two sub-sectors of the agriculture, forestry, other land-use sector
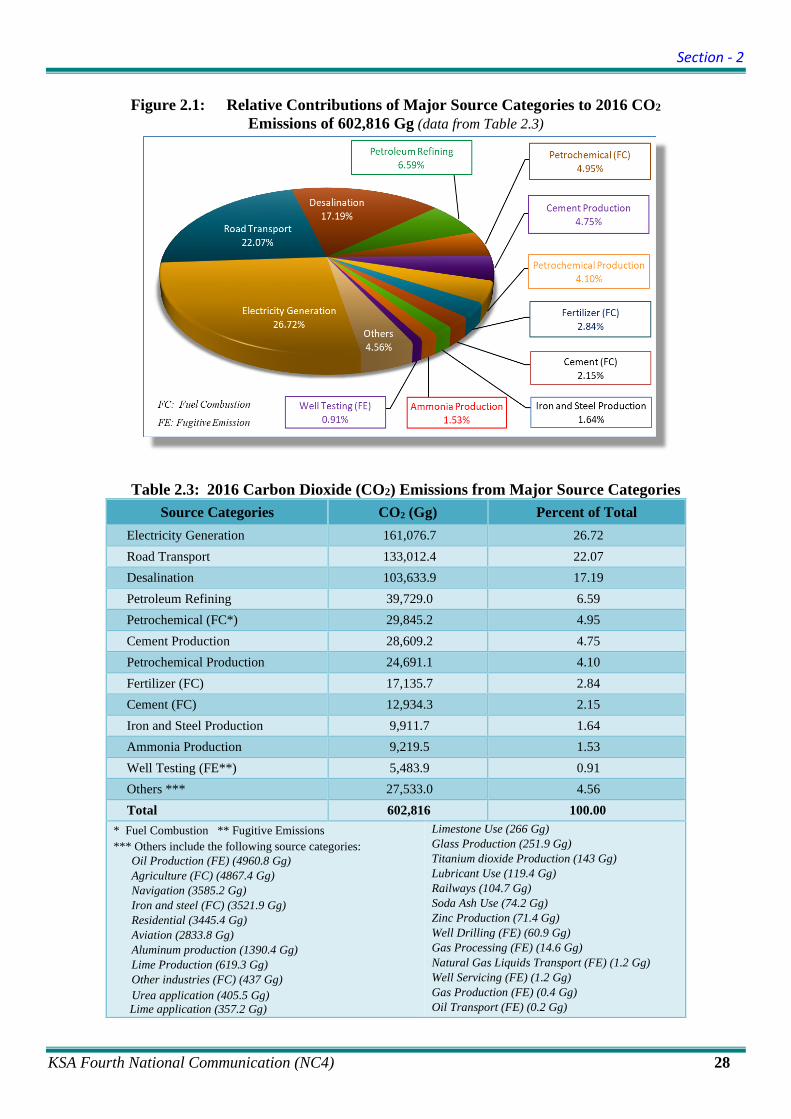
Section - 2
KSA Fourth National Communication (NC4) 28
Figure 2.1: Relative Contributions of Major Source Categories to 2016 CO2 Emissions of 602,816 Gg (data from Table 2.3)
Table 2.3: 2016 Carbon Dioxide (CO2) Emissions from Major Source Categories Source Categories CO2 (Gg) Percent of Total
Electricity Generation 161,076.7 26.72 Road Transport 133,012.4 22.07 Desalination 103,633.9 17.19 Petroleum Refining 39,729.0 6.59 Petrochemical (FC*) 29,845.2 4.95 Cement Production 28,609.2 4.75 Petrochemical Production 24,691.1 4.10 Fertilizer (FC) 17,135.7 2.84 Cement (FC) 12,934.3 2.15 Iron and Steel Production 9,911.7 1.64 Ammonia Production 9,219.5 1.53 Well Testing (FE**) 5,483.9 0.91 Others *** 27,533.0 4.56 Total 602,816 100.00
* Fuel Combustion ** Fugitive Emissions *** Others include the following source categories:
Oil Production (FE) (4960.8 Gg) Agriculture (FC) (4867.4 Gg) Navigation (3585.2 Gg) Iron and steel (FC) (3521.9 Gg) Residential (3445.4 Gg) Aviation (2833.8 Gg) Aluminum production (1390.4 Gg) Lime Production (619.3 Gg) Other industries (FC) (437 Gg) Urea application (405.5 Gg) Lime application (357.2 Gg)
Limestone Use (266 Gg) Glass Production (251.9 Gg) Titanium dioxide Production (143 Gg) Lubricant Use (119.4 Gg) Railways (104.7 Gg) Soda Ash Use (74.2 Gg) Zinc Production (71.4 Gg) Well Drilling (FE) (60.9 Gg) Gas Processing (FE) (14.6 Gg) Natural Gas Liquids Transport (FE) (1.2 Gg) Well Servicing (FE) (1.2 Gg) Gas Production (FE) (0.4 Gg) Oil Transport (FE) (0.2 Gg)

Section - 2
KSA Fourth National Communication (NC4) 29
• CH4 emissions were 1,950.5 Gg as shown in Table 2.1. The waste sector contributed 64.64% of the total CH4 emissions followed by the energy sector (23.51%), the agriculture sub-sector (6.51%), and the industrial processes and product use sector (5.34%). The major source categories contributing to CH4 emissions (≥95% of the total emissions) are shown in Figure 2.2.
Figure 2.2: Relative Contributions of Major Source Categories to 2016 CH4 Emissions of 1,950.5 Gg (data from Table 2.4)
• N2O emissions were 38.24 Gg as shown in Table 2.1. The agriculture sub-sector was the major contributor to N2O emissions with 66.0%, followed by the energy (23.3%), and waste (10.7%) sectors. Major source categories contributing to N2O emissions (≥95% of the total emissions) are shown in Figure 2.3.
2.5.2 Uncertainties in Greenhouse Gas Emission Estimations
In this section, the raw data provided by the government organizations were considered to be accurate. The data reported by the well-known international organizations, which were verified were also considered to be accurate.
The uncertainty analysis was conducted following the Approach 1 Uncertainty Calculation for each sector based on 2006 IPCC guidelines. The overall uncertainties of the energy sector and the industrial processes and product use sector were less than 10% and 20%, respectively. The uncertainty of the agriculture sub-sector and waste sector could be high due to the high uncertainty of emission factors. Due to the unavailability of relevant information, the uncertainty of the forestry and other land-use sub-sector could not be determined.

Section - 2
KSA Fourth National Communication (NC4) 30
Table 2.4: 2016 Methane (CH4) Emissions from Major Source Categories Source Categories CH4 (ton) Percent of Total
Industrial Wastewater 644,410.8 33.04 Solid Waste Disposal on Land 531,783.3 27.26 Oil Production (FE*) 135,857.3 6.97 Petrochemical Production 104,076.4 5.34 Enteric Fermentation 103,613.1 5.31 Gas Distribution (FE) 97,488.5 5.00 Wastewater Handling 82,899.7 4.25 Well Servicing (FE) 67,025.1 3.44 Gas Transmission & Storage (FE) 55,232.0 2.83 Road transport 38,125.6 1.95 Others** 89,986.2 4.61 Total 1,950,498 100.00
* Fugitive emission ** Others include the following source categories: Well Testing (FE) (31075.3 ton) Manure Management (22391.3 ton) Well Drilling (FE) (20107.5 ton) Electricity Generation (5200.4 ton) Desalination (2846.5 ton) Oil Transport (FE) (2015.3 ton) Solid Waste Composting (1675.4 ton) Field Burning of Crop Residues (1068.1 ton) Petroleum Refining (715.8 ton) Agriculture (FC***) (656.9 ton) Petrochemical (FC) (532 ton)
*** Fuel Combustion
Cement (FC) (476.4 ton) Navigation (325.5 ton) Fertilizer (FC) (305.4 ton) Residential (273.2 ton) Gas Production (FE) (129.4 ton) Iron and Steel (FC) (62.8 ton) Gas Processing (FE) (51.6 ton) Aviation (31.5 ton) Natural Gas Liquids Transport (FE) (22.7 ton) Other Industries (FC) (17.3 ton) Railways (5.9 ton)
Figure 2.3: Relative Contributions of Major Source Categories to 2016 N2O Emissions of 38.24 Gg (data from Table 2.5)

Section - 2
KSA Fourth National Communication (NC4) 31
Table 2.5: 2016 Nitrous Oxide (N2O) Emissions from Major Source Categories
Source Categories N2O (ton)
Percent of Total
Agricultural soils (Direct) 15,788.0 41.283
Agricultural soils (Indirect) 7,977.8 20.861
Road transport 6,527.7 17.069
Human sewage 3,846.3 10.057
Manure management 1,450.3 3.792
Electricity generation 939.1 2.456
Others* 1,714.1 4.482
Total 38,243 100.00
* Others include the following source categories: Desalination (464.8 ton) Oil Production (FE**) (390 ton) Solid Waste Composting (251.3 ton) Navigation (93 ton) Cement (FC***) (92.3 ton) Petroleum Refining (72.9 ton) Aviation (83.6 ton)
** Fugitive Emission ***Fuel Combustion
Petrochemical (FC) (53.2 ton) Well Testing (FE) (41.4 ton) Railways (40.4 ton) Agriculture (FC) (39.4 ton) Fertilizer (FC) (30.5 ton) Field Burning of Crop Residues (27.7 ton) Gas Processing (FE) (11.2 ton) Gas Production (FE) (7.1 ton) Iron and Steel (FC) (6.3 ton) Residential (5.5 ton) Other Industries (FC) (3.5 ton)
2.6 Contributions of Major Sectoral Activities to 2016 Greenhouse Gas Emissions
The contributions of major activities associated with the energy, industrial processes and product use, agriculture, forestry and other land-use, and waste sectors in the Kingdom to the 2016 greenhouse gas emission inventory for Saudi Arabia are presented in Table 2.2. The main findings pertaining to individual greenhouse gases are summarized below.
2.6.1 Energy Sector
The energy sector is the most important contributor to greenhouse gas emissions, especially to carbon dioxide (CO2) emissions. Different activities considered in the energy sector are presented in Figure 2.4.
Greenhouse gas emissions from energy-related stationary and mobile combustion source categories were considered in this sector. These sources included electricity generation, petroleum refining, manufacturing industries and construction, and transportation (road transport, civil aviation, navigation, and railways). Residential, desalination, and agriculture were also accounted for. In addition to the combustion sources, fugitive emissions from fuels in the oil and gas industry were also considered.
The emissions of CO2, CH4 and N2O from various activities in this sector were estimated and are summarized in Table 2.2. The total CO2, CH4, and N2O emissions from this sector were 526,685.8 Gg, 458.58 Gg, and 8.90 Gg, respectively.
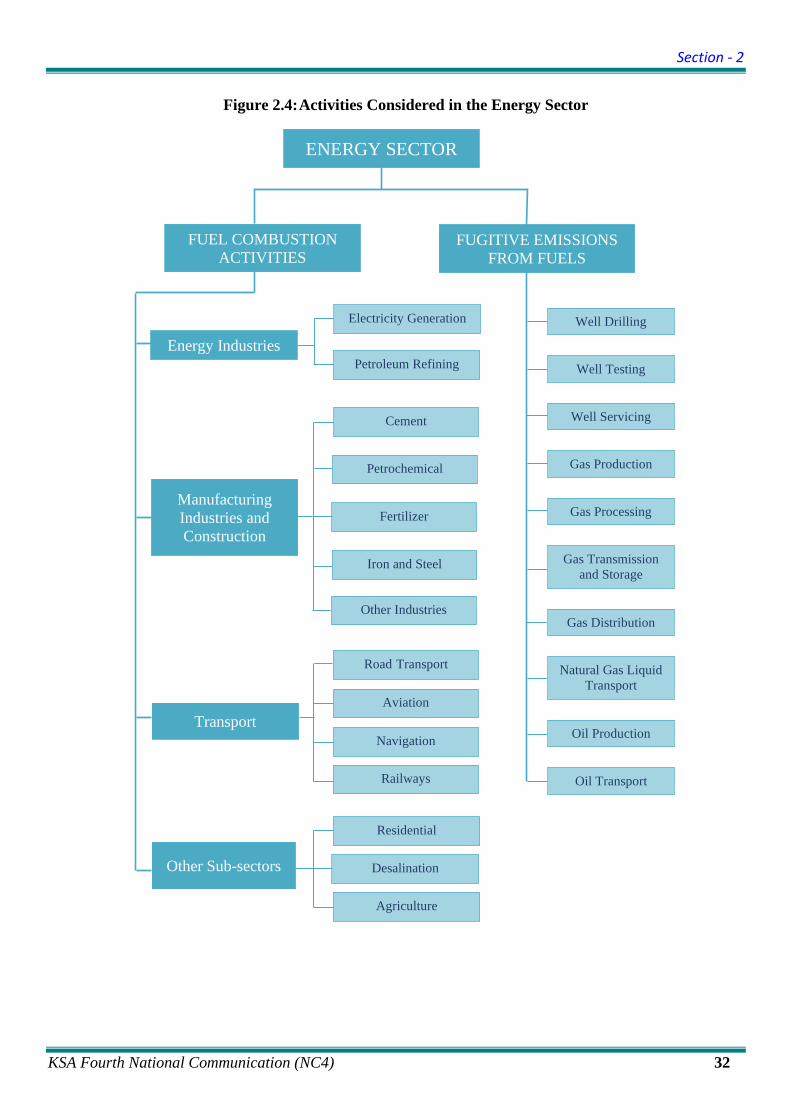
Section - 2
KSA Fourth National Communication (NC4) 32
Figure 2.4: Activities Considered in the Energy Sector
Petrochemical
Fertilizer
ENERGY SECTOR
FUEL COMBUSTION ACTIVITIES
FUGITIVE EMISSIONS FROM FUELS
Manufacturing Industries and Construction
Cement
Iron and Steel
Other Industries
Transport
Road Transport
Aviation
Navigation
Railways
Energy Industries
Electricity Generation
Petroleum Refining
Other Sub-sectors
Residential
Desalination
Agriculture
Well Drilling
Well Testing
Gas Processing
Gas Production
Well Servicing
Gas Transmission and Storage
Gas Distribution
Natural Gas Liquid Transport
Oil Production
Oil Transport

Section - 2
KSA Fourth National Communication (NC4) 33
2.6.1.1 Emissions from Fuel Combustion
• Emissions from the Electricity Generation category were 161,076.7 Gg CO2, 5.20 Gg CH4, and 0.94 Gg N2O. Natural gas combustion accounted for 35.2% of CO2 emissions, followed by crude oil (28.2%), residual fuel oil (20.7%), and diesel oil (15.9%). Combustion of crude oil, residual fuel oil, diesel oil, and natural gas contributed 35.7%, 24.9%, 20.0%, and 19.4% of CH4 emissions, respectively. About 39.6% of N2O emissions were contributed by the combustion of crude oil, followed by the combustion of residual fuel oil (27.6%), diesel oil (22.1%), and natural gas (10.8%).
• The Petroleum Refining category encompasses activities related to oil refining, gas processing, oil and gas production, oil and gas transportation, and oil and gas exploration. Emissions from petroleum refining were 39,729 Gg CO2, 0.72 Gg CH4, and 0.07 Gg N2O. Fuel combustion associated with gas processing activities was the major contributor to CO2 emissions. The gas processing and the oil refining activities were the major contributors to CH4 and N2O emissions.
• The Manufacturing Industries and Construction category consists of activities related to the cement industry, petrochemicals manufacturing, fertilizer industry, iron and steel industry, and other industries. Total emissions from fuel combustion in these activities were 63,874.1 Gg CO2, 1.39 Gg CH4, and 0.19 Gg N2O. Activities related to the petrochemical, fertilizer, cement, and iron & steel industries were the largest contributors to CO2 and CH4 emissions in this category. The cement industry was the major contributor to N2O emissions from the manufacturing industries and construction category followed by petrochemical and fertilizer.
• The Road Transportation category was one of the major sources of greenhouse gas emissions. Automobiles emitted 133,012.4 Gg CO2, 38.13 Gg CH4, and 6.53 Gg N2O. Gasoline combustion was the major contributor to the emissions of the three direct greenhouse gases.
• The Aviation category was divided into national and international aviation combustion sources. The greenhouse gas emissions from national aviation combustion sources were 2,833.8 Gg CO2, 0.03 Gg CH4, and 0.08 Gg N2O. The emissions from international aviation combustion sources were 8,260.49 Gg CO2, 0.05 Gg CH4, and 0.24 Gg N2O. The emissions from the combustion for international aviation category were not included in the 2016 greenhouse gas emissions inventory as per the 2006 IPCC Guidelines.
• The Navigation category was divided into national and international bunker combustion sources. The emissions from national bunker combustion sources (including fisheries activities) were 3,585.2 Gg CO2, 0.33 Gg CH4, and 0.09 Gg N2O. The emissions from international bunker combustion sources were 10,797.4 Gg CO2, 0.98 Gg CH4, and 0.28 Gg N2O. The emissions from the international combustion for navigation category were not included in the 2016 greenhouse gas emissions inventory as per the 2006 IPCC Guidelines.
• The emissions from the Railways Activities relate to the combustion of diesel oil. Emissions from fuel combustion in the railways activities category were 104.7 Gg CO2, small quantities (<0.01 Gg) of CH4, and 0.04 Gg of N2O.

Section - 2
KSA Fourth National Communication (NC4) 34
• The Residential Activities relate to the combustion of liquefied petroleum gas. Emissions from fuel combustion in the residential activities category were 3,445.4 Gg CO2, 0.27 Gg CH4, and <0.01 Gg N2O.
• The Desalination plants combust heavy fuel oil, crude oil, diesel oil, and natural gas. Emissions from fuel combustion in the desalination plants category were 103,633.9 Gg CO2, 2.85 Gg CH4, and 0.46 Gg N2O.
• In the Agricultural category, off-road vehicles (such as tractors, bulldozers, etc.), irrigation, and the activities related to poultry and dairy farms were considered (from fuel combustion only). Emissions from the agricultural category were 4,867.4 Gg CO2, 0.66 Gg CH4, and 0.04 Gg N2O.
2.6.1.2 Fugitive Emissions from Fuels
• The fugitive emissions (non-combustion and non-productive combustion emissions) were the major source of CH4 in the Energy Sector (89.19%) and accounted for about 409.0 Gg CH4. Approximately 88.71% of CH4 emissions in this sector were generated from oil production, gas distribution, well servicing, gas transmission and storage, well testing, and well drilling. Activities related to oil transport, gas production, gas processing, and natural gas liquid transport accounted for about 0.48% of CH4 emissions in this sector. Road transportation account for 8.31%. Total fugitive CO2 emissions is 10,523.2 Gg.
• The relative contributions of the major activities (cumulative contributions ≥ 95% of the sectoral total) to CO2, CH4, and N2O emissions in the energy sector are presented in Figures 2.5, 2.6, and 2.7, respectively.
Figure 2.5: Relative Contributions of Major Activities to 2016 CO2 Emissions from Energy Sector

Section - 2
KSA Fourth National Communication (NC4) 35
Figure 2.6: Relative Contributions of Major Activities to 2016 CH4 Emissions from Energy Sector
Figure 2.7: Relative Contributions of Major Activities to 2016 N2O Emissions from Energy Sector
2.6.2 Industrial Processes and Product Use Sector
Greenhouse gas emissions are produced from a variety of industrial activities which are not related to energy use. The main emission sources are industrial production processes, which chemically or physically transform materials to greenhouse gases. Cement production, lime production, glass production, limestone uses, soda ash uses, ammonia production, titanium dioxide production, petrochemicals production, iron and steel manufacturing, aluminum

Section - 2
KSA Fourth National Communication (NC4) 36
production, zinc production, and lubricant use are some of the important activities of the Saudi industrial sector that are considered in this section. The major source categories in industrial processes from which greenhouse gas emissions have been estimated are presented in Figure 2.8.
Figure 2.8: Activities Considered in the Industrial Processes and Product Use Sector
The emissions of CO2, CH4, and N2O from various industrial processes were estimated and are summarized in Table 2.2. A total of 75,366.9 Gg of CO2 were emitted from chemical industry (45.18%), mineral products (39.57%), metal production (15.09%), and lubricant use (0.16%). Cement production emitted the highest amount of CO2 (37.96%) followed by petrochemical production (32.76%), iron and steel production (13.15%), and ammonia production (12.23%).
Mineral Products
INDUSTRIAL PROCESSES AND PRODUCT USE SECTOR
Petrochemicals Production
Iron and Steel Production
Soda Ash Uses
Titanium Dioxide Production
Cement Production
Limestone Uses
Chemical Industry
Metal Production
Lime Production
Aluminum Production
Zinc Production
Glass Production
Ammonia Production
Lubricant Use

Section - 2
KSA Fourth National Communication (NC4) 37
The chemicals production was the sole contributor to a total of 104.08 Gg of CH4 emissions in this sector. No N2O was emitted from this sector.
The relative contributions of the major activities (cumulative emissions ≥ 95% of the sectoral total) to CO2 emission in the industrial processes and product use sector are presented in Figure 2.9.
Figure 2.9: Relative Contributions of Major Activities to 2016 CO2 Emissions from Industrial Processes and Product Use Sector
2.6.3 Agriculture, Forestry, and Other Land Use Sector
2.6.3.1 Agriculture Sub-Sector
Saudi Arabia is a desert country where irrigation-based agriculture is neither well developed nor extensive. A shortage of good quality irrigation water is the foremost limitation. The 2006 IPCC Guidelines recommended agricultural activities for use in estimating greenhouse gas emissions are presented in Figure 2.10.
Greenhouse gas emissions from livestock (enteric fermentation and manure management), soils, and field burning of agricultural residues are considered in this section. Cattle, sheep, goats, camels, and poultry constituted the livestock population in Saudi Arabia. CH4, and N2O emissions were the most important greenhouse gases emitted by the activities related to livestock.
The estimated greenhouse gas emissions from the agricultural sub-sector are presented in Table 2.2. The total CO2, CH4, and N2O emissions from various activities of the agriculture sector were 762.8 Gg, 127.1 Gg, and 25.2 Gg, respectively.
The CH4 emissions from enteric fermentation, manure management, and field burning of crop residues were estimated at 103.61 Gg, 22.39 Gg, and 1.07 Gg, respectively. The N2O emissions from agricultural soils (direct and indirect), manure management, and field burning of crop
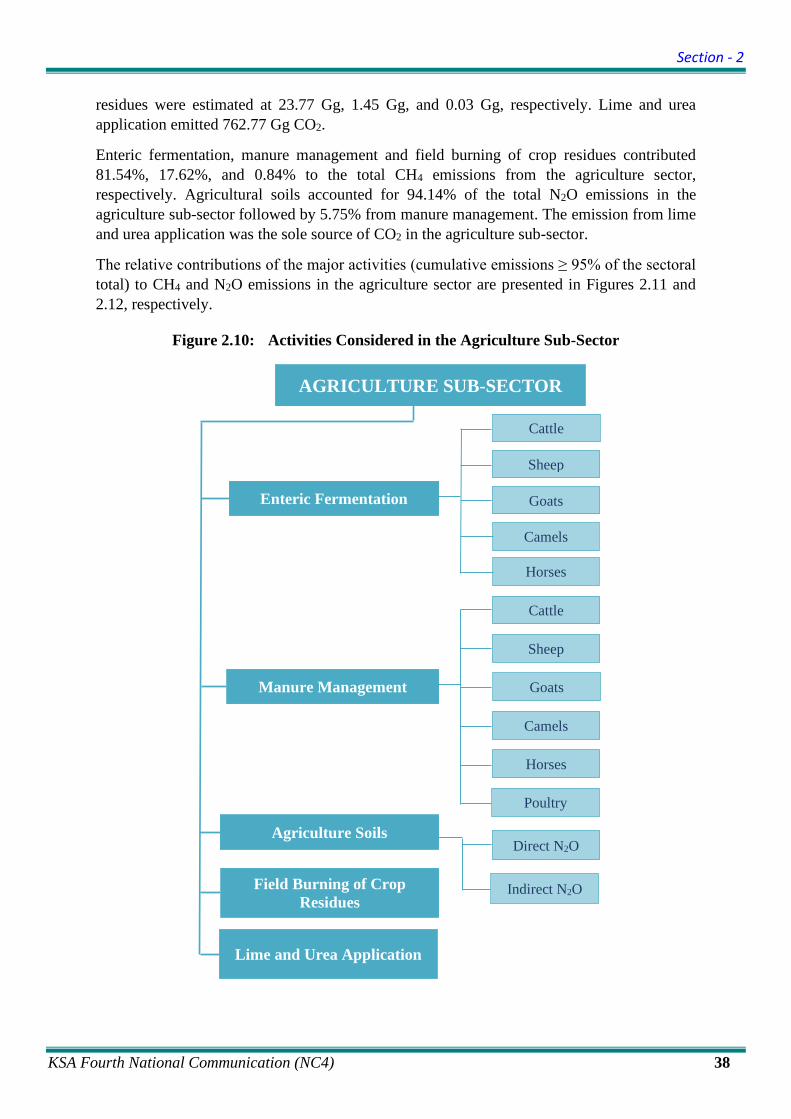
Section - 2
KSA Fourth National Communication (NC4) 38
residues were estimated at 23.77 Gg, 1.45 Gg, and 0.03 Gg, respectively. Lime and urea application emitted 762.77 Gg CO2.
Enteric fermentation, manure management and field burning of crop residues contributed 81.54%, 17.62%, and 0.84% to the total CH4 emissions from the agriculture sector, respectively. Agricultural soils accounted for 94.14% of the total N2O emissions in the agriculture sub-sector followed by 5.75% from manure management. The emission from lime and urea application was the sole source of CO2 in the agriculture sub-sector.
The relative contributions of the major activities (cumulative emissions ≥ 95% of the sectoral total) to CH4 and N2O emissions in the agriculture sector are presented in Figures 2.11 and 2.12, respectively.
Figure 2.10: Activities Considered in the Agriculture Sub-Sector
Field Burning of Crop Residues
Lime and Urea Application
Cattle
Sheep
AGRICULTURE SUB-SECTOR
Manure Management
Camels
Goats
Agriculture Soils Direct N2O
Indirect N2O
Enteric Fermentation
Cattle
Sheep
Goats
Camels
Horses
Poultry
Horses
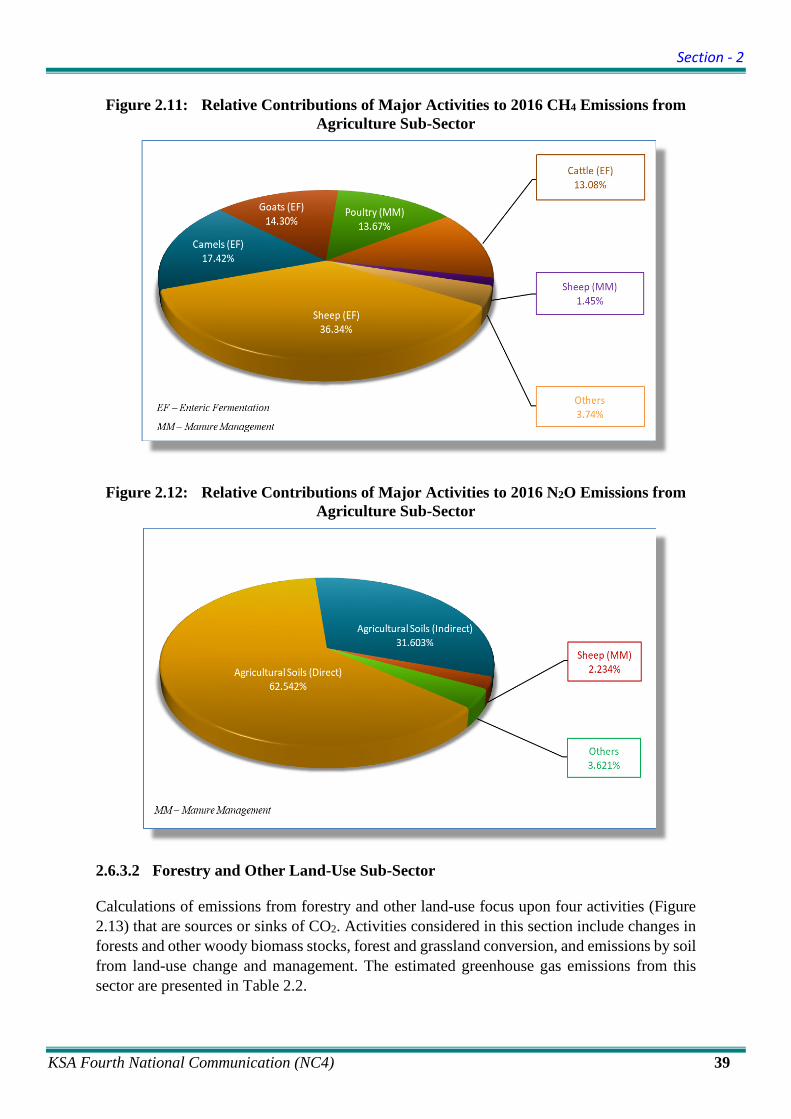
Section - 2
KSA Fourth National Communication (NC4) 39
Figure 2.11: Relative Contributions of Major Activities to 2016 CH4 Emissions from Agriculture Sub-Sector
Figure 2.12: Relative Contributions of Major Activities to 2016 N2O Emissions from Agriculture Sub-Sector
2.6.3.2 Forestry and Other Land-Use Sub-Sector
Calculations of emissions from forestry and other land-use focus upon four activities (Figure 2.13) that are sources or sinks of CO2. Activities considered in this section include changes in forests and other woody biomass stocks, forest and grassland conversion, and emissions by soil from land-use change and management. The estimated greenhouse gas emissions from this sector are presented in Table 2.2.

Section - 2
KSA Fourth National Communication (NC4) 40
Figure 2.13: Activities Considered in the Forestry and other Land-use Sub-Sector
Sinks
• A total of 9,269.8 Gg of CO2 sink was estimated from various activities related to this sector.
• Changes in the forest and other woody biomass provided a sink for 9,175.2 Gg of CO2.
• Forest and grassland conversion captured 61.9 Gg of atmospheric CO2 to plant material (acting as a sink for CO2).
• Due to land-use changes, agricultural soils accumulated (acted as sinks) for 32.7 Gg of atmospheric CO2.
• In general, CO2 exchange (i.e., uptake or release) by oceans are not anthropogenic. Therefore, marine sinks (the Arabian Gulf and the Red Sea) were not included in this inventory.
• The possible intake of atmospheric CO2 by the abandonment of managed land (due to decrease in total cultivated land area) is not considered due to the fact that the regrowth potential of these abandoned areas is expected to be a minimum, particularly under the prevailing harsh weather conditions in the Kingdom.
Emissions
• No significant emissions of CO2 from the forestry and other land-use sub-sector is expected in Saudi Arabia considering that wood is not generally burned for fuel in the Kingdom.
Forestry and other Land-use Sub-Sector
CO2 Emissions from Changes in Forest and Other Woody Biomass Stocks
CO2 Emissions by Soils from Land-use Change and Management
CO2 Emissions from Forest and Grassland Conversion

Section - 2
KSA Fourth National Communication (NC4) 41
The relative contributions of the major CO2 sinks in the forestry and other land-use sub-sector are presented in Figure 2.14.
Figure 2.14: Relative Contributions of the Major Sinks to 2016 CO2 Emissions from Forestry and other Land-use Sub-Sector
2.6.4 Waste Sector
The 2006 IPCC Guidelines recommend consideration of greenhouse gas emissions from landfilling of solid wastes, treatment of liquid wastes (wastewater), and waste incineration activities. Waste incineration activities in Saudi Arabia are prohibited by law and are not addressed. Solid wastes and wastewater disposal practices are considered in this section. The activities considered in the waste sector are shown in Figure 2.15. The emission estimations are summarized in Table 2.2.
The total CH4 and N2O emissions from various activities of this sector were 1,260.77 Gg and 4.10 Gg, respectively. Solid waste management practices emitted 531.8 Gg of CH4. Industrial and municipal wastewater handling emitted 644.4 Gg and 82.9 Gg of CH4, respectively. N2O emissions from human sewage and solid waste composting were estimated to be 3.85 Gg and 0.25 Gg, respectively. Industrial wastewater handling contributed 51.11% of total CH4 in the waste sector followed by solid waste disposal (42.18%) and municipal wastewater handling (6.58%).
The relative contributions of various activities to CH4 emission in the waste sector are presented in Figure 2.16.

Section - 2
KSA Fourth National Communication (NC4) 42
Figure 2.15: Activities Considered in the Waste Sector
Figure 2.16: Relative Contributions of Various Activities to 2016 CH4 Emissions from the Waste Sector
Emissions from Human Sewage
WASTE SECTOR
Emissions from Solid Waste Disposal Sites
Emissions from Municipal Wastewater Handling
Emissions from Solid Waste Composting
Emissions from Industrial Wastewater Handling

Section - 2
KSA Fourth National Communication (NC4) 43
References:
1 DNA (2016). Third National Communication for the Kingdom of Saudi Arabia – submitted to UNFCCC by the Designated National Authority (DNA), Riyadh, Saudi Arabia.
2 DNA (2018). First Biennial Update Report for the Kingdom of Saudi Arabia – submitted to UNFCCC by the Designated National Authority (DNA), Riyadh, Saudi Arabia.
3 IPCC (2006). IPCC Guidelines for National Greenhouse Gas Inventories, 1-5 Volumes Institute for Global Environmental Strategies (IGES), Hayama, Japan
4 IPCC (2006a). Eggleston, S., Buendia, L., Miwa, K., Ngara, T. and Tanabe, K., 2006. 2006 IPCC Guidelines for National Greenhouse Gas Inventories. Volume 1. General Guidance and Reporting. Institute for Global Environmental Strategies (IGES), Hayama, Japan.
5 IPCC (2006b). Eggleston, S., Buendia, L., Miwa, K., Ngara, T. and Tanabe, K., 2006. 2006 IPCC Guidelines for National Greenhouse Gas Inventories. Volume 2. Energy. Institute for Global Environmental Strategies (IGES), Hayama, Japan.
6 IPCC (2006c). Eggleston, S., Buendia, L., Miwa, K., Ngara, T. and Tanabe, K., 2006. 2006 IPCC Guidelines for National Greenhouse Gas Inventories. Volume 3. Industrial Processes and Product Use. Institute for Global Environmental Strategies (IGES), Hayama, Japan.
7 IPCC (2006d). Eggleston, S., Buendia, L., Miwa, K., Ngara, T. and Tanabe, K., 2006. 2006 IPCC Guidelines for National Greenhouse Gas Inventories. Volume 4. Agriculture, Forestry and Other Land Use. Institute for Global Environmental Strategies (IGES), Hayama, Japan.
8 IPCC (2006e). Eggleston, S., Buendia, L., Miwa, K., Ngara, T. and Tanabe, K., 2006. 2006 IPCC Guidelines for National Greenhouse Gas Inventories. Volume 5. Waste. Institute for Global Environmental Strategies (IGES), Hayama, Japan.
9 PME (2005). First National Communication for the Kingdom of Saudi Arabia – submitted to UNFCCC by the Presidency of Meteorology and Environment (PME), Jeddah, Saudi Arabia.
10 PME (2011). Second National Communication for the Kingdom of Saudi Arabia – submitted to UNFCCC by the Presidency of Meteorology and Environment (PME), Jeddah, Saudi Arabia.

Section - 3
KSA Fourth National Communication (NC4)
SECTION 3
Steps Taken to Address Article 12.1(b) of the United Nations Framework Convention on
Climate Change (UNFCCC) Role of Economic Diversification to Address Climate
Change Issues in Saudi Arabia
Section - 3
KSA Fourth National Communication (NC4) i
TABLE OF CONTENTS
Section Title Page 3.1 Introduction 44 3.2 Economic Diversification 44 3.2.1 Economic Diversification in Saudi Arabia 45
3.2.2 Kingdom’s Five-Year Development Plans and Economic Diversification
45
3.3 Saudi Vision 2030 45
3.4 Nationally Determined Contribution (NDC) of The Kingdom of Saudi Arabia
46
3.4.1 Dynamic Baseline 46
3.5 Saudi Green Initiative (SGI) and Middle East Green Initiative (MGI)
48
3.5.1 Saudi Green Initiative (SGI) 48 3.5.2 Middle East Green Initiative (MGI) 49 3.6 Circular Carbon Economy Approach 49 3.7 Economic Diversification Initiatives with Mitigation Co-Benefits 51 3.7.1 Energy Efficiency 51 3.7.1.1 Demand-Side Initiatives and Achievements 51 3.7.1.1.1 Building Sector 51 3.7.1.1.2 Land Transportation Sector 52 3.7.1.1.3 Industrial Sector 52 3.7.1.2 Supply-Side Initiatives and Achievements 53 3.7.1.2.1 Energy Utilities Sector 53 3.7.1.2.1.1 Power Generation, Transmission and Distribution 53 3.7.1.2.1.2 Desalination Sector 54 3.7.1.3 Regulatory Framework for Energy Sources 55 3.7.1.4 Energy Services Company (ESCo) Initiative 55 3.7.1.4.1 National Energy Services Company (Tarshid) 56 3.7.1.5 Support for Economic Diversification and Job Creation 56 3.7.2 Renewable Energy 57
3.7.2.1 National Renewable Energy Initiative: National Renewable Energy Program (NREP)
57
3.7.2.1.1 Renewable Energy Resources (RER) Initiative 57
3.7.2.2 King Abdullah City for Atomic and Renewable Energy (K.A.Care)
57
3.7.2.3 National Renewable Energy Data Center Initiative 58 3.7.2.4 Renewable Energy Technology Localization Initiative 58 3.7.2.5 Human Capacity Building Initiative 58 3.7.2.6 Power Sector Key Programs/Initiatives 58 3.7.2.6.1 Power Sector Energy Mix Program 58 3.7.2.6.2 Liquid Fuel Displacement Program 58 3.7.2.6.3 Smart Meter Project 59 3.7.2.7 Other Renewable Energy Initiatives 59 3.7.2.7.1 Geothermal Energy 59

Section - 3
KSA Fourth National Communication (NC4) ii
Section Title Page 3.7.2.7.2 Waste To Energy Initiative 59 3.7.2.7.3 Hydro Energy 60 3.7.3 Carbon Capture, Utilization and Storage (CCUS) 61 3.7.4 Utilization of Gas 62
3.7.4.1 Increase of Gas in the Domestic Energy Mix of Electricity Generation Initiative
62
3.7.5 Methane Management 62 3.7.5.1 Zero Routine Flaring Initiative 62 3.7.5.2 Global Methane Pledge Initiative 63 3.7.6 Oil And Gas Industry Initiatives 63 3.7.7 Petrochemical Industry Initiatives 64 3.7.8 Smart City Initiative - Neom 64
3.8 Climate Change Adaptation Initiatives with Mitigation Co-Benefits
65
3.8.1 Water And Wastewater Management 66
3.8.1.1 Initiatives of Ministry of Environment, Water and Agriculture (MEWA)
66
3.8.2 Marine Protection 67 3.8.2.1 Blue Carbon Initiatives 67 3.8.2.2 Biodiversity and Marine Ecosystem Initiatives 67 3.8.2.3 Terrestrial and Marine Protected Areas 68 3.8.3 Urban Planning 68 3.8.3.1 Transportation Related Initiatives 68 3.8.3.2 Solid Waste Management Initiatives 69 3.9 Institutional Arrangement 70 3.10 Summary 71 References 72
LIST OF FIGURES
Figure Title Page 3.1 Share of Desalination Technologies with Time 54 3.2 Water Desalination Technology Share in the Kingdom 55 3.3 Total Generated Hydroelectricity in the Kingdom 60 3.4 HydroElectricity in the Kingdom Generated by SWCC 61

Section - 3
KSA Fourth National Communication (NC4) 44
Section 3: Steps Taken to Address Article 12.1(b) of the United Nations Framework Convention on Climate Change (UNFCCC)
Role of Economic Diversification to Address Climate Change Issues in Saudi Arabia
3.1 Introduction
The Kingdom of Saudi Arabia ratified the United Nations Framework Convention on Climate Change (UNFCCC) on 28 December 1994. It also acceded to the Kyoto Protocol on January 31, 2005 (UN, 2017) and ratified the Paris Agreement (PA) on 03 November 2016. As a signatory to the UNFCCC, Saudi Arabia has taken many steps over the years to implement Article 12.1(b) of the Convention. According to the Article, each Party shall communicate to the Conference of the Parties, through the secretariat, the elements of information: “A general description of steps taken or envisaged by the Party to implement the Convention”. The approach adopted in this section to address Article 12.1(b) is mainly developed based on the Nationally Determined Contribution (NDC) of Saudi Arabia. The NDC of the Kingdom is based on the principles listed in Article 3 of the UNFCCC and the approach specified in the economic diversification initiative adopted as UNFCCC decision 24/CP.18 in Doha in 2012. The Kingdom will engage in actions and plans in pursuit of economic diversification that have co-benefits in the form of greenhouse gas (GHG) emission avoidance and adaptation to the impacts of climate change, as well as reducing the impacts of response measures. This will help the Kingdom to move towards achievement of its sustainable development objectives.
Within the framework of the UNFCCC, the NDC concept was defined as contributions “towards achieving the objective of the Convention as set out in its Article 2”. “The ultimate objective of this Convention and any related legal instruments that the Conference of the Parties may adopt is to achieve, in accordance with the relevant provisions of the Convention, the stabilization of GHG concentrations in the atmosphere at a level that would prevent dangerous anthropogenic interference with the climate system. Such a level should be achieved within a time-frame sufficient to allow ecosystems to adapt naturally to climate change, to ensure that food production is not threatened, and to enable economic development to proceed in a sustainable manner".
3.2 Economic Diversification
Economic diversification is the process of transitioning an economy away from a primary resource-based income structure towards a more diverse one which is fueled by multiple sectors and markets (Alhowais and Al-shihri, 2010; Mobarak and Karshenasan, 2012) with the objective of promoting economic growth. Traditionally, economic diversification has been associated with economic growth and creation of jobs, but in the context of climate change adaptation, the strategy takes on a more refined approach transitioning away from vulnerable economic sectors to low-emission, climate resilient ones which promote sustainable economic growth (UNFCCC, 2020).
Section - 3
KSA Fourth National Communication (NC4) 45
In pursuit of promoting resilient economic development, economic diversification is crucial for developing countries (UNDESA, 2017), and has been internationally agreed and recognized in the 2030 Agenda for sustainable development (UNDESA, 2015). There is widespread literature demonstrating increased economic vulnerability for cases where there is a lack of economic diversification (UN-ECLAC, 2017). Additionally, countries that are highly dependent on hydrocarbon production and exports are more vulnerable to global oil price fluctuations and climate change impacts response measures, therefore necessitating economic diversification (Al-Iriani, 2006; Soytas and Sari, 2003).
3.2.1 Economic Diversification in Saudi Arabia
The efforts of the Kingdom of Saudi Arabia to diversify its economic dependance away from oil had started early on. The share of the Mining and Quarrying sector (comprised mainly of oil & gas) in the GDP has been noticeably decreasing from the 1990s. On the other hand, other sectors such as the Services, Manufacturing and Transport, Storage & Communication increased their share in the Kingdom’s GDP composition.
A detailed discussion on different aspects of economic diversification namely theories of economic diversification, drivers and dimensions of economic diversification, determinants of economic diversification and its types such as vertical, horizontal and spatial diversification in reference to Saudi Arabia have been discussed in details in the Kingdom’s First Biennial Update Report (BUR1, 2018).
The role of economic diversification is extremely significant especially in the context of the Kingdom of Saudi Arabia because of heavy reliance of its economy on oil (MoEP, 2014). The oil sector contributes the largest share to the GDP of KSA at 43.2% (GASTAT, 2018).
3.2.2 Kingdom’s Five-Year Development Plans and Economic Diversification:
KSA’s ambitious vision of economic transformation has been planned and implemented since 1970. The five-year Development Plans had the aim to transform the economy and society into a progressive and developed one. A core objective of the five-year Development Plans has always revolved around economic diversification but with the significance of oil being crucial for economic growth. The fluctuating oil prices has huge impacts on the economy of Saudi Arabia. The Plans were designed to be implemented every 5 years; with the First Development Plan initiated from 1970-75 (MEP, 2014). In 2005, coinciding with the Eight Development Plan (2005-2009), a long-term Strategy was adapted by the Kingdom for the period of 2005-2024 (MEP, 2004) as a means of increasing employment opportunities and the quality of life for the Saudi populace. The Ninth Development Plan of the Kingdom (2010-2014) was directed at reducing unemployment, addressing uneven growth in all regions across the country and bringing the Saudi economy to an internationally competitive platform (MEP, 2010). It is in the Tenth Development Plan (2015-2019) that the Kingdom focused on achieving economic diversification across multiple sectors through increasing the non-oil revenues (MEP, 2015).
3.3 Saudi Vision 2030
The government announced “Saudi Vision 2030”, the economic blueprint of the Kingdom in April 2016, with the objective of diversifying the Kingdom’s economy to reduce its dependence on oil exports, and strengthening it to become more sustainable and resilient (Guendouz and Ouassaf, 2020; Vision 2030 Kingdom of Saudi Arabia). Saudi Vision 2030
Section - 3
KSA Fourth National Communication (NC4) 46
provides a roadmap towards achieving sustainable development through social and economic reforms. The roadmap consists of 96 objectives (Vision 2030 Roadmap, KSA) that arises from emphasizing three themes of Saudi Vision 2030 which are; A Vibrant Society; A Thriving Economy and An Ambitious Nation. The roadmap focuses on the development of service sectors like health, education, infrastructure and tourism and therefore increasing employment and diversifying the economy. The main goal of Saudi Vision 2030 is “to raise the share of non-oil exports in non-oil GDP from 16% to 50%” (Vision 2030, KSA). Furthermore, despite the major health and economic crisis arising owing to the novel coronavirus pandemic (COVID 19), the Kingdom is committed to its economic diversification initiatives with the continued sustainable development agenda. The Kingdom has embarked upon the mega projects namely NEOM, AMAALA, AL-ULA, Qiddiya, Red Sea Project and Prince Mohammad bin Salman Nature Reserve (Tricaud, 2020).
3.4 Nationally Determined Contribution (NDC) of the Kingdom of Saudi Arabia:
The Kingdom of Saudi Arabia submitted its Updated Nationally Determined Contribution (NDC) to the UNFCCC Secretariat in October 2021. The updated NDC is aimed to remove, avoid and reduce GHG emissions by 278 million tons of CO2eq by 2030 which is more than two-fold increase compared to the Kingdom’s previous INDC submitted in November 2015. The updated NDC show a progression and highest possible ambition. These NDC are based on the following principles and Decisions.
- Decisions 1/CP.19, 1/CP.20, 1/CP.21, and 1/CP.24 - Article 3 of UNFCCC - Economic Diversification Initiative (Decision 24/CP.18, Doha, 2012 - Paris Agreement Articles 4.1, 4.7, and 4.15
3.4.1 Dynamic Baseline:
The Saudi Arabian NDC are based on the Dynamic baseline approach which is consistent with the Paris Agreement, taking into consideration country’s national circumstances.
The dynamic baseline scenarios are based on the ability of the Kingdom to grow and diversify its economy, keeping in mind that the Kingdom is not seeking financial support towards achieving its NDC. The achievement of NDC is also incumbent upon sustainable economic growth and diversification of the Kingdom’s economy, while preserving the Kingdom’s leading role in promoting security and stability of global energy markets. The Kingdom will use the best suited technologies to achieve its NDC using CCE approach.
The NDC of the Kingdom will have a dynamic baseline depending on two scenarios for the period 2020-2030. Scenario 1 considers that the economy is diversifying with a strong contribution from export revenues of hydrocarbons and its derivatives. To boost economic growth, these funds will be invested in high-value-added industries such as financial services, medical services, tourism, education, renewable energy, and energy efficiency technologies. This scenario is used to set the ambitions specified in this NDC.

Section - 3
KSA Fourth National Communication (NC4) 47
Scenario 2 envisions enhanced domestic industrialization based on sustainable use of nationally produced hydrocarbons. With the use of most appropriate technology, a heavy industrial infrastructure will be developed by using indigenous sources of energy as feedstock enhancing the contributions of the petrochemical, cement, mining, and metal manufacturing industries to the national economy. This NDC will be changed to accommodate for this scenario. The two baseline scenarios mainly differ in the allocation of hydrocarbons produced either for domestic consumption or export. While the domestic consumption of hydrocarbons will contribute to Saudi Arabia's GHG emissions, the export of these hydrocarbons will not add to the Saudi Arabia's GHG emissions.
This NDC will be achieved by the deployment of actions, plans and projects with mitigation co-benefits of (i) economic diversification actions and (ii) adaptation actions.
The main actions and projects outlined in the NDC will generate mitigation co-benefits of economic diversification namely: (i) energy efficiency, (ii) renewable energy in the power sector and green hydrogen, (iii) carbon capture, utilization and storage hubs in the industrial cities of Jubail and Yanbu and blue hydrogen (iv) utilization of gas, and (v) methane management.
Adaptation measures in the NDC expected to contribute to mitigation co-benefits are (i) water and wastewater management (ii) marine protection (iii) reduced desertification/tree planting and (iv) urban planning.
The adaptation actions expected to support Saudi Arabia’s efforts to address climate change and raise resilience to its impacts are; (a) Integrated Coastal Zone Management Planning (ICZMP) (b) Early Warning Systems (EWS) (c) Integrated water management Planning and (d) Infrastructure and Cities’ Designs.
The Saudi energy efficiency program (SEEP) launched in 2012 is aimed at ensuring that Saudi Arabia becomes a highly energy efficient country. There are 100 energy efficiency initiatives at different stages of feasibility, design and execution which include both demand-side and supply-side management. SEEP includes devising, developing and implementing progressively stringent energy efficiency standards in various sectors of the economy namely industry, building and land transport.
The renewable energy in the power sector is planned to have 50% share in the energy mix by 2030. The main objectives of the National Renewable Energy Program are to diversify energy resources in the Kingdom, stimulate economic development and establish the local renewable energy resources supply chain which includes research and development and manufacturing. This will also create employment.
The green hydrogen is one of the renewable forms of energy. The Kingdom has planned to develop the green hydrogen by hydrolysis using renewable energy obtained from solar and wind systems. In the smart city of NEOM, Saudi Arabia plans to produce 650 tons of green hydrogen per day and 1.2 million tons of green ammonia annually.
Saudi Arabia plans to develop the Carbon Capture, Utilization and Storage (CCUS) from its experience of the Enhanced Oil Recovery project and world’s largest CCU plant in Jubail. The Kingdom intends to develop CCUS hubs in the industrial cities of Jubail and Yanbu housing petrochemical, steel, fertilizer and other heavy industries emitting GHG emissions which will

Section - 3
KSA Fourth National Communication (NC4) 48
act as source of CO2 providing opportunity to reducing, reusing, recycling and removing GHG emissions.
Saudi Arabia also plans to develop facilities to produce blue hydrogen due to available natural resources and CCUS technology experience and developing a national hydrogen strategy to work out the mechanism to become a global leader in the hydrogen industry.
3.5 Saudi Green Initiative (SGI) and Middle East Green Initiative (MGI):
Saudi Arabia launched two major initiatives in the year 2021 to address climate change challenges at the national and regional level namely Saudi Green Initiative (SGI) and Middle East Green Initiative (MGI).
3.5.1 Saudi Green Initiative (SGI):
The SGI was announced and launched under the patronage of HRH Prince Mohammed bin Salman bin Abdulaziz, the Crown Prince, the Deputy Prime Minister and the Minister of Defense in October 2021 in Riyadh, Saudi Arabia during the Saudi Green Initiative Forum. The Saudi Green Initiative (SGI), as a national initiative, takes efforts to the next level by unifying all sustainability efforts in the Kingdom to increase reliance on clean energy and combat climate change and contribute towards achieving the climate ambitions of the Kingdom. The first wave of more than sixty initiatives announced under SGI at the SGI Forum would contribute to the growth of green economy. The main initiatives under the SGI included the following:
(i) Updated Nationally Determined Contribution (NDC): Saudi Arabia announced its updated NDC in 2021. The updated NDC is aimed to remove, avoid and reduce GHG emissions by 278 million tons of CO2eq by 2030 which is more than two-fold increase compared to the Kingdom’s previous INDC submitted in November 2015. The updated NDC is based on the dynamic baseline which shows a progression and highest possible ambition (for details, refer to subsection 3.4).
(ii) Global Methane Pledge: Saudi Arabia announced joining the Global Methane Pledge to cut global methane emissions by 30% by 2030 relative to 2020 levels. This also has placed Saudi Arabia at the forefront of climate action.
(iii) Changing the Energy Mix:
• Share of Renewables and Thermal Power: The Kingdom plans to optimize its energy mix use in the power sector to 45-50% renewables and 50-55% thermal power plants running on gas by 2030.
• Displacement of Liquid Fuel by Gas: The plan also includes displacement of all of liquid fuels by gas where possible by 2030 across utilities, industry and agriculture saving a total of approximately one million barrels of oil equivalent per day giving rise to climate, environmental and economic benefits.
(iv) Transforming the Waste Management in Riyadh:
The Kingdom as part of the Saudi Green Initiative has announced 94% diversion of domestic waste in Riyadh from landfills to recycling and composting resulting in

Section - 3
KSA Fourth National Communication (NC4) 49
reduction of GHG emissions and generate electricity. This plan could later be rolled out across the Kingdom.
(v) Greening Saudi Arabia:
Saudi Arabia plans to plant 450 million trees across the country by 2030 under the SGI.
(vi) Terrestrial and Marine Protected Areas:
Under SGI, the Kingdom plans to increase the marine and terrestrial protected areas in the Kingdom to over 20% by 2030 to enhance biodiversity and protect land and sea areas.
The above actions will be realized by adopting circular carbon economy (CCE) approach, engaging actively in international cooperation and with early progress made on technology development and low carbon fuels.
3.5.2 Middle East Green Initiative (MGI)
Saudi Arabia launched a Regional Green Initiative, the Middle East Green Initiative (MGI) last year to lead and support the regional efforts to achieve global climate goals with a focus on actions and collaborations to achieve climate ambitions. Few of these initiatives are:
(i) Promote circular carbon economy projects and initiatives in the GCC and middle eastern countries to increase the role of clean energy and reduce greenhouse gas emissions in the region.
(ii) Establish a regional center for Carbon Capture, Utilization and Storage (CCUS) in Arabian Gulf States (GCC countries and Iraq).
(iii) Support and facilitate access to clean energy for cooking in the middle east regions and raising the health and lifespan of clean fuel users specially women and children and reduce the GHG emissions.
(iv) Clean Oceans and Rivers Initiative by participating in the cleanup of oceans and rivers of plastic waste in the middle east region.
3.6 Circular Carbon Economy Approach:
Saudi Arabia developed and adopted the Circular Carbon Economy (CCE) framework approach as a holistic, inclusive, pragmatic, comprehensive and cost-effective framework to address its long-term strategy for realizing its climate ambitions using four Rs; reduce, reuse, recycle and remove greenhouse gas emissions from atmosphere. This CCE approach was endorsed by the G20 leaders under the Saudi Arabian Presidency in 2020.
The CCE adopts a technology-neutral approach, which means it considers all possible solutions equally. The CCE is required to promote energy market stability, inclusive economic growth, and long-term development goals such as job creation throughout the fossil fuel value chain. The relevant technologies include carbon capture and use/storage (CCUS) to negative emissions technologies (NETs) such as bioenergy with carbon capture and storage (BECCs) and direct air capture and carbon storage (DACCS), as well as nature-based climate solutions such as reforestation and afforestation. The CCE also promotes the efficient use of CO2 in fuels, chemicals, and materials. The circular carbon economy entails a gradual closure of the carbon
Section - 3
KSA Fourth National Communication (NC4) 50
cycle through the use or conversion of CO2 produced by the combustion of fossil fuels, resulting in considerable reductions in carbon emissions (Meyer et. al., 2018). The four Rs of the CCE form the basis for carbon management in the circular carbon economy. Within the framework of circular carbon economy, three types of carbon have been identified namely the ‘Living Carbon’ which resides in the biosphere and it naturally balances with the atmosphere and is the basis of life. The second is the ‘Durable Carbon’ which resides in the techno-sphere and is used in a range of applications, from long-term infrastructure to recycled plastics. The third is the Fugitive Carbon’ which is released into the environment as excess anthropogenic carbon dioxide in the atmosphere. All the 4Rs of the circular carbon economy serve to minimize fugitive carbon (McDonough, 2016).
The CCE is a tool for GHG emission management while ensuring socio-economic development. CCE is an inclusive approach where it focuses on managing GHG emissions rather than targeting the energy sources. The CCE is inclusive of all solutions, technologies and GHGs i.e., all sources of emissions and all sectors of economy.
The circular carbon economy is one of principal mechanisms through which Kingdom’s aspirations as set out in its NDC are currently being implemented in the category of economic diversification with mitigation co-benefits in the areas of Energy Efficiency, Renewable Energy, Carbon Capture, Utilization and Storage (CCUS), Utilization of gas, and Methane Management. Others are the climate change adaptation initiatives with mitigation co-benefits namely water and waste water management, marine protection, reduced desertification/tree planting and (iv) urban planning.
A number of programs and initiatives were already operating within the Kingdom, including the Saudi Energy Efficiency Program (SEEP) and the National Renewable Energy Program (NREP), under the ‘reduce’ pillar of the CCE framework. Under the ‘reuse’ pillar, the Saudi Aramco Carbon Sequestration project in Uthmaniyah captures and stores 800,000 tons of CO2 a year and with United, a SABIC facility capturing and utilizing 500,000 tons worth of CO2 per year. Carbon recycling applications, such as conversion of CO2 into high-end value products, electro-chemicals, and olefins were also being pioneered by the private sector. The Kingdom is developing a national program to implement the CCE approach. This program will consider where the highest level of investment and R&D is needed to identify viable abatement and emissions reduction technologies across over high-emitting sectors.
With the establishment of the Carbon Capture, Utilization and Storage Technology Research Centre (CCUSTRC) in 2020, the Kingdom has underscored its commitment to enhance scientific support to its sustained efforts to reduce GHG emissions. The center aims to work to maximize the local content in the field of CCUS and to provide a research environment to address carbon emissions and convert them into products of economic value and developing national research and development capabilities in cooperation with advanced global centers through technology transfer.

Section - 3
KSA Fourth National Communication (NC4) 51
3.7 Economic Diversification Initiatives with Mitigation Co-benefits
3.7.1 Energy Efficiency:
In 2010, the Saudi Energy Efficiency Center (SEEC) was established followed by launching of the Saudi Energy Efficiency Program (SEEP), which aims to enhance the country’s energy efficiency by designing and implementing initiatives and their enablers. SEEP focuses on the demand-side energy management in three main sectors namely building, transportation, and industry that are responsible for more than 90% of energy consumption in the Kingdom. The committee also included five enablers in the scope of work of the program including regulations, energy services companies, funding, governance, and awareness.
In 2018, a new mandate for SEEC was approved and expanded to cover three new supply side fields namely power generation including electricity transmission and distribution; water desalination and expansion of industrial sector scope by adding efficiency of feedstock use in industry.
The Key initiatives undertaken by the program include:
3.7.1.1 Demand-side Initiatives and Achievements:
The demand-side initiatives included building, land transport and industrial sectors.
3.7.1.1.1 Building Sector
Building sector represent about 29% of the Kingdom’s energy consumption whereas 70 percent of energy consumed in building sector is related to cooling (SEEP, 2017). The program has implemented a series of programs including update of the standard specification for air conditioners, lighting, and other household appliances to reduce electricity consumption in buildings. The program led to the development of 27 energy efficiency standards and regulations including 08 mandatory labels for products such as insulation materials, ACs, white goods and lighting products. There are ongoing efforts to develop and launch energy use intensity (EUI) ecosystem to improve overall building efficiency.
Air conditioners consume a significant portion of the total electrical energy produced in the country due to harsh climate conditions. There is a significant opportunity to reduce energy consumption in this sector. The initial phase of the high-efficiency air-conditioners initiative was launched in 2018, which aimed to promote and support local production of high-efficiency air-conditioners, and to stimulate sales by providing an incentive. The initiative was fully launched in 2019, which covered all regions and lasted for 24 months. The Energy Efficiency Rating (EER) requirements for split AC increased by 57% in 2019 from that in 2012 (SEEP, 2019). In order to significantly reduce energy consumption in buildings, regulations were promulgated.
The Program has developed a set of energy efficiency standards and regulations (seven with mandatory labels) including (i) 14 insulation standards, (ii) small AC EE standard, (iii) large AC EE standard, (iv) refrigerators and freezers EE standard, (v) washing machines EE standard, (vi) water heaters EE standard, (vi) clothes dryers EE standard, (vii) 2 lighting products EE standards, and (viii) 2 Saudi Building Code regulations governing high-rise and low-rise buildings. The program has developed a number of guidelines to rationalize energy

Section - 3
KSA Fourth National Communication (NC4) 52
consumption in buildings focusing on air conditioning, thermal insulation, domestic washing machines, refrigerators and freezers, lighting and heaters (SEEC, 2020b).
3.7.1.1.2 Land Transportation Sector
The transportation sector is responsible for about 21% of energy consumption of the national total (SEEP, 2019). Land transportation namely the light duty vehicles (LDVs) and heavy duty vehicles (HDVs) account for more than 90 percent of the energy consumption of the transportation sector (SEEP, 2017). Initially, the Program placed emphasis on light duty vehicles to enhance the fuel economy of imported vehicles and reduce the fuel consumption of on-the-road vehicles. The program implemented the following initiatives to improve the fuel economy of the imported LDVs:
o Issued the vehicle energy efficiency card (VEEC) in 2013 and applied its first phase in 2014, and second phase in 2018.
o Issued a standard specification related to the requirements for anti-rotation and adhesion on wet surfaces, for tires in 2014, and applied its first phase in 2015 and second phase in 2019.
o Issued “The Saudi Arabia Corporate Average Fuel Economy (CAFÉ) standards for Light Vehicles” in 2014 and applied its first phase in 2016, and second phase in 2021. The first phase led to improve the new fleet fuel economy by 18.4%.
The I standards for LDVs were aimed to improve the rate of vehicle fuel economy in the Kingdom by about 3.5% annually. It also aimed at increasing the fuel economy from twelve and a half kilometers per liter in 2015 to more than nineteen kilometers per liter by 2025. This led to the application of Saudi Corporate Average Fuel Economy (CAFE) standard for Light Vehicles. Moreover, multiple heavy-duty vehicles (HDV) initiatives are currently under analysis including, anti-idling regulations, aerodynamic additives, and retirement programs for old vehicles. LDVs and HDVs were subjected to rolling resistance and wet grip requirements starting from 2015 and 2016 respectively.
3.7.1.1.3 Industrial Sector
The industrial sector of the Kingdom consumes around 44% of the total energy produced within the Kingdom (Raed Al Schneiber, 2018). The Program focuses on the petrochemical, cement, and steel industries, representing roughly 70 percent of industrial energy consumption (SEEP, 2019).
The Program has developed an energy efficiency framework for industrial plants and has been implementing it over three phases focusing on 70% of total energy consumption (Phase I), 5% of total energy consumption (Phase II), and 13% of total energy consumption (Phase III). It has developed an energy efficiency framework for new and existing plants.
The initiatives in this sector have improved the energy intensity (EI) level from 2011 -2019 of the key process industries namely steel by 2% in the electric arc furnace plants, 2.8% in cement plants and 4.2% in the clinker plants and 2.8% in petrochemical industry.

Section - 3
KSA Fourth National Communication (NC4) 53
3.7.1.2 Supply-side Initiatives and Achievements:
o The supply-side initiatives recently added to the SEEC mandate included energy utilities, desalination and feedstock efficiency in the industrial sectors.
3.7.1.2.1 Energy Utilities Sector:
The Kingdom’s energy utilities sectors were included to SEECs organizational structure in 2018. Several initiatives were undertaken in the Utilities Sector which included Power plants and electricity cogeneration, Water desalination plants, and Electricity transmission and distribution. This sector consumes about 38% of the Kingdom’s total primary energy (SEEC, 2020h). Therefore, the objectives in this sector are to (i) reduce electricity loss during electricity transmission and distribution, (ii) rationalize fuel consumption and raising electricity generation efficiency, (iii) comply with highest internationally recognized standards for efficiency within the these sectors, (iv) disseminate successful practices by way of spreading awareness among all relevant stakeholders, (v) establish institutions aiming to rationalize fuel consumption and (vi) contribute to overcome the technical challenges during this initiative (SEEC annual report, 2019).
3.7.1.2.1.1 Power Generation, Transmission and Distribution
In order to enhance energy efficiency, the Kingdom has been looking forward to modernize and upgrade the entire power sector including replacement of aging power plants, upgrading of distribution infrastructures, implementation of smart grid technology, installation of smart meters, and promotion of regional and international grid connectivity (Export, 2017).
Apart from the creation of the national electricity market, the Kingdom recently led a GCC project for linking the power grid of the member countries in order to trade electricity and better cope with peak load demand.
The Saudi Electricity Company (SEC) increased electricity production from the energy efficient combined-cycle power plants from 8.3% in 2010 to 31.0 % in 2019, while the use of the energy intensive single-cycle power plants decreased from 50% in 2010 to 22% in 2019. The total amount of energy produced from the combined cycle reached 59,258 MWh.
The reduction in fuel consumption is achieved through conversion of inefficient, single-cycle gas turbines to combined-cycle plants and by installing new combined-cycle plants (Matar, Murphy, Pierru, Rioux, & Wogan, 2017). The deployment of combined-cycle electricity generation units has been increasing steadily in the Kingdom. The number of combined-cycle electricity generation units increased from 35 in 2007 to 121 in 2018 where their electricity generation capacity increased from 3.1 GW in 2007 to 17.1 GW in 2018 (ECRA, 2015, 2019).
The SEC as part of its digital transformation to improve consumers’ energy efficiency installed 10 million smart meters across the country. The project was completed in three phases: in the first phase the old mechanical meters were replaced with new smart ones; in the second phase, the new meters were connected to a telecommunications grid and in the third phase, they were tied into the company’s billing system and smartphone apps were launched (Saudi Electricity Company, 2020f).

Section - 3
KSA Fourth National Communication (NC4) 54
3.7.1.2.1.2 Desalination Sector:
The Kingdom has 51 desalination plants producing a total of 7.765 million m3 of desalinated water. Saline Water Conversion Corporation (SWCC) produced 55.9%, Marafiq 6.3%, Shoaiba Water and Electricity Company produced 11.4%, Jubail Water and Power Company 10.4% while the remaining 16.0% is produced by 17 other licensees (ECRA annual report, 2019).
The desalination plants generally use three technologies namely multistage flash (MSF), multi-effect desalination (MED) and reverse osmosis (RO). RO is considered to be most energy efficient among the three technologies (Napoli and Rioux, 2015, UNESCWA, 2009). It has been observed that the share of RO technology use in the desalination process in the Kingdom has been on increasing trend as part of policy to encourage energy efficient RO technology. Figure 3.1 shows that the share of energy efficient RO technology has been steadily increasing. In the last 5 years, a total of 1.098 million m3 per day production capacity by RO was added out of a total capacity addition of 1.939 million m3 per day (ECRA Annual Report, 2019). The Kingdom produced 59% desalinated water by MSF, 14% by MED and 27% by RO in 2018. (Figure 3.2).
The integration of solar power, membrane desalination and energy and water storage systems are being tested in Saudi Arabia. For example, a pilot solar desalination plant is being constructed in the town of Al-Khafji in the northeast of Saudi Arabia, designed to provide 60,000 cubic meter per day of desalinated water using reverse osmosis, with a solar photovoltaic plant capable of supplying the power for the desalination process (AWT, 2021).
Figure 3.1: Share of Desalination Technologies with Time (ECRA Annual Report, 2019)
100
992741
888
820308
1420
1098
660
478
250
4
1939
2540
1298
558
1424
0
500
1000
1500
2000
2500
3000
0-5 6-10 11-20 21-30 >30
Thou
sand
m3 /
Day
Age (year)
MED MSF RO

Section - 3
KSA Fourth National Communication (NC4) 55
Figure 3.2: Water Desalination Technology Share in the Kingdom (ECRA, 2020b)
3.7.1.3 Regulatory Framework for Energy Sources
In 2013, the Electricity and Cogeneration Regulatory Authority (ECRA) developed a national strategy for smart meters and smart grids. The Electricity Distribution Code, which is effective since 2008, provides the rules and regulations for distribution of energy which contribute significantly to electricity demand management. The ECRA has taken initiatives to develop regulatory frameworks for the promotion of clean and renewable sources of energy to generate power. ECRA regularly collaborates with other relevant entities to develop appropriate regulatory frameworks for the activities of electricity generation, cogeneration and water desalination production using atomic and renewable energy. Currently, the industry is vertically integrated where the SEC is the only company used for the transmission and distribution of electricity to the customers. The SEC generates the major share of total generated electricity and buys the remaining share from other generators including MARAFIQ, SWCC, and other IPPs.
The Seawater Desalination Code developed by ECRA provides clear guidelines where all concerned parties must adhere to in order to achieve high operational efficiency (ECRA, 2020a). Additionally, the Kingdom has planned to establish a national program to optimize water and energy consumption.
3.7.1.4 Energy Services Company (ESCO) Initiative:
The Program prepares the required environment for service providers and recipients in the Saudi market to ensure the quality of energy service companies. It ensures the capability of the energy service companies by applying the licensing system. It also works on rehabilitating energy service companies by licensing investors who are interested in this sector after meeting the licensing requirement. The license allows companies to practice the commercial activities

Section - 3
KSA Fourth National Communication (NC4) 56
registered in the national guide for commercial activities, in addition to gaining available investment opportunities in executing energy audits and building retrofits in the commercial and private sector and raising the energy efficiencies in industrial facilities. It offers three types of licenses (SEEC, 2020a).
Regarding awareness-raising efforts in this sector, it works periodically to conduct a number of workshops to guide service beneficiaries who are planning to obtain energy efficiency services for their facilities in buildings or industrial sectors. Moreover, it approved the KSA M&V user guide, which is considered as the technical reference for energy efficiency projects in the Kingdom, as it clarifies the basis of measurements & verification of energy savings to guarantee the rights of all parties involved in the project, whether from service providers or beneficiaries. The initiative also opens fast-tracking new markets/industries by establishing super energy services companies that are the catalyst for the industry. Through this initiative, a market will be created for building energy efficient retrofits for the government and commercial buildings. It will create thousands of job opportunities in engineering and project management, and assist the localization of the supply chain (SEEP, 2019).
3.7.1.4.1 National Energy Services Company (Tarshid)
The Public Investment Fund established Tarshid, the National Energy Services Company. The company is mandated to develop, fund and manage impactful energy efficiency projects in government and commercial sectors to achieve significant energy savings.
Tarshid’s objectives and role include:
(i) Reduce the energy consumption of the Kingdom through energy efficient retrofits.
(ii) Accelerate the development of ESCO industry in the Kingdom.
(iii) Localize expertise in energy efficiency and support the emergence of a national champion(s).
The role includes identification of energy efficiency opportunities, manage end-to-end delivery of energy efficiency projects and provide unique financing solutions.
Tarshid manages and funds energy efficiency projects in government and commercial buildings and streetlights.
Since 2018, Tarshid has carried out its retrofit program in the buildings such as offices, schools mosques, universities, medical cities and also changing the streetlights in the central, eastern, western, northern and southern regions of the Kingdom resulting in power conservation and GHG emission reductions.
3.7.1.5 Support for Economic Diversification and Job Creation
The energy efficiency initiatives (i.e., standards, regulations, product testing/control, incentives, ESCOs, district cooling, etc.) of SEEP support economic diversification. The initiatives have been increasing demand and more business opportunities in existing markets including replacement or retrofits of capital stock of inefficient equipment, buildings and industrial plants. The demand in existing markets is increasing due to regulations. The initiatives have been contributing in the creation of new sectors and/or industries and employment opportunities.
Section - 3
KSA Fourth National Communication (NC4) 57
3.7.2 Renewable Energy
The Kingdom of Saudi Arabia launched more than a dozen realization programs to achieve the objectives of the Saudi Vision 2030 (Saudi Vision 2030, 2016c) where most of them considered the ambitious renewable energy goals in their major activities. The programs which proposed relevant guidelines and frameworks to achieve the national renewable energy plan include (i) quality of life program, (ii) national transformation program, (iii) public investment fund program, (iv) privatization program, (v) national companies’ promotion program, (vi) national industrial development & logistics program, and (vii) human capital development program.
3.7.2.1 National Renewable Energy Initiative: National Renewable Energy Program (NREP)
The Kingdom has focused on incorporating renewable energy sources into the energy mix since the launch of its National Renewable Energy Program (NREP) in 2017. The NREP is a long-term program which endeavors to deliver the carbon reduction contributions of the Kingdom as stated in the NDC and achieve diversification of the domestic energy supply mix.
The Kingdom seeks to enhance the share of renewables mainly through solar and wind energy. Furthermore, the Kingdom is also looking to create jobs within this sector by localizing a significant proportion of the manufacturing and research & development of the renewable energy value chain within the local economy.
The NREP was launched by the Ministry of Energy (MoE) (earlier the Ministry of Energy, Industry, and Mineral Resources (MEIM)) working in coherence with the objectives of the National Transformation Program (NTP) and Saudi Vision 2030. The objective is to create a renewable energy industry where public and private entity partnerships are encouraged and the private sector is allowed to invest in the sector to stimulate growth of the industry.
3.7.2.1.1 Renewable Energy Resources (RER) Initiative:
The NREP has set out a systematic and targeted roadmap to rapidly diversify the Kingdom’s domestic power supply (KSA-Climate, 2019; National Renewable Energy Program, 2019; Power Saudi Arabia, 2020).
Saudi Arabia is aiming to increase the RER share to 45 – 50% by 2030 in the national energy mix. The renewable energy projects will be deployed in 35 plus parks by 2030 spread all over the Kingdom to promote regional development.
3.7.2.2 King Abdullah City for Atomic and Renewable Energy (K.A.CARE)
The Kingdom launched the King Abdullah City for Atomic and Renewable Energy (K.A.CARE) in 2010 with the aim of developing a substantial atomic and renewable energy capacity supported by local industries. The entity is mandated to foster scientific research and development, technology localization, coordination of activities among the scientific research institutions and centers, and determination of priorities and policies (K.A.CARE, 2016).
In 2017, as part of its regular activities on atomic energy, the K.A.CARE set plans for atomic energy sector as an energy source, and contribute in providing national development requirement (K.A.CARE, 2017). Atomic energy will be part of energy mix in Saudi Arabia to ensure its pioneering role as an energy-efficient country, which is the ambitious goal of Saudi

Section - 3
KSA Fourth National Communication (NC4) 58
Vision 2030. The main benefits of the project are (i) to enhance energy sources diversity, (ii) to save petroleum sources for a longer time, (iii) to use atomic energy for desalinating seawater, (iii) to create new learning, training, and job opportunities.
3.7.2.3 National Renewable Energy Data Center Initiative
The initiative aims to establish a center to provide information of the renewable energy in the Kingdom which will provide the number of promising locations of renewable energy projects, specialized models and tools. It will also depict the status of the renewable energy sector. The K∙A∙CARE launched its online Renewable Resource Atlas (K.A.CARE, 2020c).
3.7.2.4 Renewable Energy Technology Localization Initiative
The K∙A∙CARE cooperates with international and local institutions and companies to develop and own renewable energy technologies related to solar energy, wind energy, geothermal energy, and waste-to-energy projects, desalination, energy storage, subsoil technologies and concentrated solar thermal technologies (K.A.CARE, 2016). In 2019, the entity launched the second round of technology localization and commercialization (TLC) initiative to reduce the risk in localizing renewable energy technologies which is expected to encourage the private sector to participate in technology localization efforts (K.A.CARE, 2019).
3.7.2.5 Human Capacity Building Initiative
The K.A. CARE in cooperation with various local and international business partners has been exerting efforts to develop and stimulate human capital to meet the job market needs. This initiative will support the development of the educational system, technology localization and knowledge transfer.
3.7.2.6 Power Sector Key Programs/Initiatives:
There are several key initiatives launched in Saudi Arabia under the power sector integration (PSI) which promotes collaboration between the power sector teams and integration between multiple programs and initiatives. These programs and initiatives are:
3.7.2.6.1 Power Sector Energy Mix Program
The Kingdom plans to optimize the power sector energy mix from a 49% gas and 51% liquid fuels in 2019 to 45 - 50% of renewable and 50 – 55% of gas fired thermal power plants in 2030. Renewables include a mixture of photovoltaic (PV), wind and concentrated solar power (CSP) while thermal power plants include efficient gas-fired combined cycle power plants utilizing domestic gas supply and virtually phasing out all liquid fuel where possible.
3.7.2.6.2 Liquid Fuel Displacement Program:
The Kingdom intends to displace use of liquid fuels across the utilities, industry and agriculture by gas by 2030 which will result in better utilization of gas, contribute in reducing the GHGs and enhance overall thermal efficiency. This is going to save approximately one million barrels of oil equivalent per day which can be exported. This is planned to be implemented by (a) converting the liquid fired power and desalination plants to gas fired facilities (b) installing new highly efficient thermal gas fired power plants (c) retiring old liquid fire power plants (d) converting industrial facilities from liquid fuel to gas (e) connecting agriculture farms and industries to grid.

Section - 3
KSA Fourth National Communication (NC4) 59
3.7.2.6.3 Smart Meter Project:
The objective was to install 10 million smart electricity meters in the Kingdom covering all customers. This project was completed in a record time as planned. These smart meters have a number of benefits to both the customers and the electricity company like loss reduction, better load forecasting, reduced power outages, faster power reconnection and customer improved experience and customer empowerment. This also led maximize the local content, creation of jobs and enhance energy efficiency also.
3.7.2.7 Other Renewable Energy Initiatives
3.7.2.7.1 Geothermal Energy
Geothermal energy is generated from natural underground heat. Assessment of a geothermal energy resource requires a collection of a variety of sub-surface data parameters (K∙A∙CARE, 2020a). Based on the available data, Saudi Arabia is amongst the most geothermally active countries in the Middle East and it started exploration of geothermal resources in 1980. A good number of regions in the Kingdom including Al-Lith, Arar, Hail, Harrat, Jazan, Madinah, Riyadh, and Tabuk have good potential for geothermal energy. According to Chandrasekharam et al. (2015), Jazan province is characterized by high heat flow and high geothermal gradient and hosts several thermal and warm springs. It is estimated that the province may generate electricity of the order of 134 × 106 KWh. Geothermal energy can be utilized for direct use, electricity generation, space heating, heat pumps, greenhouse heating, and industrial usage (Demirbas, Alidrisi, Ahmad, & Sheikh, 2016). The expected installed capacity for geothermal energy is 1GW by 2032 (K∙A∙CARE, 2020a) and the Kingdom constructed some refreshment and swimming pools in the Jazan area using geothermal energy (Demirbas et al., 2016).
3.7.2.7.2 Waste to Energy Initiative:
The waste streams, which are of significant quantity in the Kingdom and could be harnessed for renewable energy, consist largely of municipal solid waste (MSW), wastewater treatment plants (WWTP) by-products, and industrial and agricultural organic waste (K∙A∙CARE, 2020d). In 2014, 15.3 million tons of MSW was produced in the Kingdom and the amount is expected to be doubled by 2033. Likewise, significant amounts of industrial and agricultural waste are also generated every year. The MSW practices in the country are simply done by collecting the waste and disposing it in landfill sites that may cause environmental and public health challenges (O. K.M. Ouda et al., 2016). However, the waste-to-energy (WTE) projects in the country can serve a dual purpose, i.e., reducing waste volumes to be treated or stored and producing useful energy in a climate-friendly manner.
The country has tremendous WTE potential due to plentiful availability of good quality MSW. Modern WTE technologies, such as RDF-based incineration, gasification, pyrolysis and anaerobic digestion have the ability to transform the waste by converting it into energy namely electricity, hydrogen, and water (Zafar, 2020a; Hadidi, Ghaithan, Mohammed, & Al-Ofi, 2020; Miandad et al., 2016, Agboola & Saleh, 2016). Therefore, the solid waste is now considered as potential renewable energy source that can contribute to satisfy the electricity demand in the Kingdom (Omar K.M. Ouda, Raza, Al-Waked, Al-Asad, & Nizami, 2017).

Section - 3
KSA Fourth National Communication (NC4) 60
The Kingdom has established a facility to convert waste into energy. The facility has processed around 180 tons of waste to distilled water and generate electricity with volumes of approximately 950 m3 and 6 MW per day respectively (Amran et al., 2020). The Kingdom also has taken many initiatives to ensure sustainability of vital resources as a part of its National Transformation Program (NTP). Among many initiatives, ‘Reuse Wastewater Initiative’ aims to expand the reuse of treated wastewater to conserve water resources through both rehabilitating treated wastewater pump stations and establishing distribution networks (Vision 2030; 2018).
3.7.2.7.3 Hydro Energy
The Kingdom of Saudi Arabia leads the world in the production and consumption of desalinated water with 2,558 million cubic meters produced in 2019 (ECRA, 2020b). The country is using the water of the desalination plants, one of the biggest sources of renewable energy, in producing electricity. Total electricity (i.e., hydroelectricity) generated from desalination plants by all licensed companies including SWCC in 2017 was approximately 151 thousand gigawatt-hour (TGWh) (Figure 3.3). The hydroelectricity generated from SWCC reached more than 45 TGWh in 2017, compared to approximately 23 TGWh in 2012 (GASTAT 2018).
Figure 3.3: Total Generated Hydroelectricity in the Kingdom (GASTAT, 2018)
99,379 104,480 111,875
128,911
145,811 151,298
135,448
0
20,000
40,000
60,000
80,000
100,000
120,000
140,000
160,000
2012 2013 2014 2015 2016 2017 2018
Total Hydroelectricity Generation in the Kingdom G.W.H

Section - 3
KSA Fourth National Communication (NC4) 61
Figure 3.4: Hydroelectricity in the Kingdom generated by SWCC (GASTAT, 2018).
3.7.3 Carbon Capture, Utilization and Storage (CCUS):
The Kingdom of Saudi Arabia views Carbon Capture, Utilization and Storage (CCUS) as an essential tool for economic diversification with mitigation co-benefits to achieve its NDCs. Building on current CCS and CCUS’s development and deployment globally, modelling has been carried out in order to assess the future potential contribution of Carbon Capture and Storage (CCS) and CCUS in reducing emissions of CO2 from economic activities. In fact, CCS has the capacity to enhance the sustainability of the global energy system and is projected to achieve 14% cumulative reduction of CO2 emissions by 2050 (GCCSI, 2017b; IEA, 2016a). According to IPCC’s Fifth Assessment Report (AR5), limiting the CO2-equivalent concentration to 450 parts per million (ppm) in the absence of CCS would incur a 138% increase in mitigation costs and reaching this concentration would then be unfeasible (IPCC 2014).
Introducing CCS and CCUS in fossil fuel-based energy and industrial facilities could substantially reduce CO2 emissions. In fact, the share of low-carbon electricity supply could increase from the current of approximately 30% to more than 80% by 2050, with fossil fuel power generation without CCS phased out almost entirely by 2100 (IPCC 2014). At the recent meetings of the Carbon Sequestration Leadership Forum (CSLF), it was emphasized that CCUS is crucial technology and by 2050 will need to contribute to 12-14% of CO2 emissions avoidance (Romano et al 2013). However, currently the contribution of CCUS is less than 0.1%. This implies that there is a strong sense of urgency in materialization of CCUS.
In addition to significantly reducing environmental impact, CCUS is uniquely placed to support energy security and diversity in power generation and to protect substantial capital investments in existing infrastructure. CCUS is also one of the only solutions for deep emission reductions in the industrial sectors that provide building blocks for modern society, such as steel, cement and chemicals production. Investment in CCUS can also support future employment and economic prosperity in regions that rely on these industries (GCCSI, 2017b; IEA, 2016a).

Section - 3
KSA Fourth National Communication (NC4) 62
The Kingdom has reported the two projects (i) enhanced oil recovery (EOR) and (ii) CO2 to methanol and urea projects in the earlier TNC and BUR1 reports.
The Kingdom sees immense value in the development of CCUS.
(i) Reduce national emissions by deploying carbon capture in sectors with low carbon capture cost (per ton of CO2) to achieve quick wins in emission reduction.
(ii) Improve cost of carbon capture by deploying carbon capture at the biggest emitting sectors (e.g., power plants) to reduce technology cost.
(iii) Generate economic value by deploying carbon capture to produce low carbon products, generating economic value for the Kingdom (e.g., blue hydrogen).
(iv) The Kingdom has the potential for significant geological CO2 storage.
(v) The Kingdom plans to develop one of the largest CCUS hubs in the industrial cities of Jubail and Yanbu by 2035.
3.7.4 Utilization of Gas:
The Kingdom has been keen on increasing the share of natural gas in its domestic energy mix due to the higher energy content and therefore a lower CO2-to-energy content. As energy demand increases in the Kingdom, Saudi Vision 2030 aims to increase the production of natural gas along with building a natural gas distribution network (Kingdom of Saudi Arabia Vision 2030). From 2008 to 2018, the Kingdom has seen an increase in the use of natural gas in its power generation and water desalination fuel mix (Rami Shabaneh, 2020).
3.7.4.1 Increase of Gas in the Domestic Energy Mix of Electricity Generation Initiative:
The Kingdom intends to increase the share of gas in the electricity generation to 50 – 55% by 2030.
3.7.5 Methane Management:
The Kingdom has the world’s largest gas collection system, the master gas collection system which was installed and started its operation in 1982. The main aim of the system was to collect the associated gas instead of venting and flaring. This is a network of gas-gathering facilities and pipelines to capture, process, and utilize gas as fuel and feedstock in gas-based petrochemical industries in Jubail and Yanbu. The gas flaring has been reduced considerably from 2.26% in 2009 to a meagre 0.5% in 2017 significantly increasing the raw gas production to approximately 13,000 MMSCF/day.
3.7.5.1 Zero Routine Flaring Initiative:
As part of its policy to further minimize the gas flaring, the Kingdom has joined, in December 2018, the World Bank’s “Zero Routine Flaring by 2030 Initiative”. By joining this initiative, the Kingdom is demonstrating its seriousness to eliminating the routine gas flaring at its facilities, address climate change and to advance the sustainable economic development of the Kingdom (World Bank, 2015).

Section - 3
KSA Fourth National Communication (NC4) 63
3.7.5.2 Global Methane Pledge Initiative:
Saudi Arabia has announced joining the Global Methane Pledge to cut global methane emissions by 30% by 2030 relative to 2020 levels.
3.7.6 Oil and Gas Industry Initiatives:
As a world-leading energy business, Saudi Aramco is uniquely qualified to make effective contributions to the overall solution. Its contributions to the climate challenge are tangible expressions of its ethos, supported by company policies of conducting business in a way that addresses climate challenge. The challenge is to meet the world’s energy needs while managing emissions. The company is answering this by focusing on (i) carbon intensity (i.e., sustaining low carbon intensity crude oil and flaring reduction), (ii) research and development (i.e., sustaining low carbon intensity crude oil, growing non-fuel applications for crude oil, advancing sustainable transport, and driving high-impact solutions), (iii) emissions to value, and (iv) impactful collaborations.
Upstream carbon intensity in the Kingdom of Saudi Arabia from well to refinery gate is one of the lowest in the world and the methane intensity in the Kingdom last year was just 0.06%, which is also one of the lowest in the industry. Saudi Aramco has been working on a range of technologies with transformative potential including (i) advanced integrated engine-fueled systems of the future, (ii) crude-to-chemicals, (iii) carbon-free hydrogen from oil-based feedstock, (iv) carbon capture, utilization and storage, and (v) advanced materials from oil.
The company has been utilizing cogeneration systems to reduce its dependency on the national electricity grid and the company has achieved more than 70% thermal efficiency through cogeneration. The company generates electricity to run its operations by utilizing the waste heat from its facilities (Saudi Aramco, 2019). The company has been observing a continuous decrease in energy intensity (EI) over the years. In 2014, the EI of Saudi Aramco was 133 thousand British Thermal Units (kBTU) that has been decreased to 118.4 kBTU in 2018. In 2018, the upstream carbon intensity figure was 10.2 kilograms of CO2 equivalent per barrel of oil equivalent that was the lowest globally.
The Peak Summer Production Program of the company provides additional volumes of non-associated gas to reduce the use of liquids in power generation during the summer. In 2017, it displaced 11.5 million barrels of crude oil equivalent, freeing up higher value liquids while reducing emissions. Some other actions were implemented to conserve energy such as replacing 5,198 V8 car engines with V6 engines, converting 2,921 fuel tankers from steel to aluminum, replacing 467,000 incandescent light bulbs and installing 8,000 streetlights with efficient LEDs. It also continued the installation of smart energy meters programs in homes and commercial buildings.
The company has been playing a leading role in advancing Carbon Capture, Utilization and Storage (CCUS). As a founding member of the Oil & Gas Climate Initiative (OGCI), it collaborates with international entities to accelerate the development of CCUS technologies. It has also joined forces with public and private institutions around the world to pioneer new ways to recover and use oil and gas, so that it can continue to empower people and economies while emitting significantly less emissions.

Section - 3
KSA Fourth National Communication (NC4) 64
3.7.7 Petrochemical Industry Initiatives:
Saudi Basic Industries Corporation (SABIC) is a major petrochemical company based in Riyadh. It innovates technologies to improve efficiency and reduce cost and environmental impacts. In addition, by 2025, SABIC aims to reduce greenhouse-gas, energy, water intensities of 2010 by 25%, and material-loss intensity of 2010 by 50%. The company incorporates sustainability in each step of its technological process from generating ideas to commercialization.
The manufacturing affiliates of SABIC are working toward the 2019 Saudi Energy Efficiency Program (SEEP) goals. The entity has achieved a good number of positive results to date by driving a sustainability culture, training employees, and applying operational excellence. A few of them are listed below:
o Energy Intensity Reduction
SABIC reduced its energy intensity by 6.2 percent in 2018 from its baseline year of 2010. The entity has set a goal of 25 percent reduction of energy intensity by 2025 from its base year of 2010.
o Water Intensity Reduction
SABIC measures freshwater intensity performance in cubic meters (m³) per metric ton of product sales. It achieved an 11.16 percent improvement over baseline year of 2010 with a 2.65 percent reduction compared to 2017. The entity has set a goal of 25 percent reduction of water intensity by 2025 from its base year of 2010.
o Material-loss Intensity Reduction
In 2018, SABIC achieved 9.82 percent decrease in material loss intensity over 2017, as measured in metric tons per metric ton of product sales. Material loss intensity of the company has improved 41.54 percent from its 2010 baseline. The entity has set a goal of 50 percent reduction of material-loss intensity by 2025 from its base year of 2010.
o Flaring Emission Reduction
In 2018, SABIC achieved 43.3 percent decrease in flaring emissions from its 2010 baseline. The entity has set a goal of 65 percent reduction of flaring by 2025 from its base year of 2010.
o Global Recognition
SABIC has been recognized as a leader in global sustainability reported by the World Business Council for Sustainable Development (WBCSD), an organization of over 200 major businesses which aims to accelerate the transition to a sustainable world.
3.7.8 Smart City Initiative - NEOM
Smart Cities are at the forefront of innovative climate solutions by adopting a holistic approach to reduce GHG emissions especially in transport, and electricity and heat generation sectors. Generally, a significant portion of energy is wasted before consumption and an ICT-enabled smart grid and smart meters can deliver energy more efficiently in homes and commercial buildings. Similarly, the contributions of ICT to mobility and transport can also be realized by

Section - 3
KSA Fourth National Communication (NC4) 65
autonomous vehicles (AV). Many studies investigated the impacts of the widespread adoption of AV technology on GHG. The adoption of AVs will contribute to increased ridesharing, traffic flow smoothly, platooning, efficient driving and routing, environmental-friendly traffic signals, and less hunting for parking. As a result, energy consumption will be less. The Kingdom of Saudi Arabia has already realized the importance of smart city and has planned to adopt smart city technologies for the development of the NEOM, a city in the Tabuk province.
The NEOM is a new initiative where the literal meaning of the term is new future. It is a centerpiece of Saudi 2030 Vision plan to grow and diversify the Saudi economy. It is being built on the Red Sea in the northwest of Saudi Arabia. It will be the home and workplace for more than a million citizens from around the world.
NEOM’s climate will provide complementary solar and wind profile through competitively priced renewable energy. It will build new industries and drive the energy transition by producing green hydrogen. NEOM plans on developing energy intensive industries by leveraging low-cost clean energy and a carbon-free energy ecosystem. It will build a complete renewable energy system and develop a smart transmission and distribution network and will strive to become one of the global leading entities in commercializing clean energy intensive industries (NEOM, 2018; NEOM Saudi City, 2018).
A key component of NEOM’s livability goals is to use water in a sustainable manner. NEOM’s water will be fully desalinated using renewable energy and zero brine effluent discharge systems. All wastewater will be processed to generate energy, fertilizer, and reusable fresh water for irrigation to achieve zero waste and a full circular economy for water and wastewater. The water distribution network will be completely connected through advanced Internet of Water (IoW) infrastructure to ensure minimal water loss.
NEOM will adopt innovative approaches to provide international, regional and urban connections via sea, air and land. The NEOM Port will be an advanced, sustainable and efficient port and logistics zone. The air connectivity will operate on zero carbon emissions by offset. On land, it is planning for innovation in high-speed transit and on-demand shared mobility, enabled by autonomous solutions and ubiquitous digital infrastructure. It will develop an intelligent and autonomous supply chain to enable the seamless management of goods for residents and industries. NEOM emphasizes on innovation across all modes of transport.
Underpinned by clean and green credentials, NEOM is ideally placed to leverage on the opportunities for new materials and methods creating new possibilities for factories of the future and for the way Industry works. NEOM’s approach to innovation includes nanotechnology, 3D printing, sensors, IoT devices, electrical vehicles, robotics, renewables and others. It is expected that these innovations will generate significant climate change mitigation co-benefits.
3.8 Climate Change Adaptation Initiatives with Mitigation Co-Benefits
The adaptation initiatives with mitigation co-benefits primarily include (i) water and wastewater management, (ii) marine protection (iii) Reduced desertification/tree planting and (iv) urban planning.
Section - 3
KSA Fourth National Communication (NC4) 66
3.8.1 Water and Wastewater Management:
3.8.1.1 Initiatives of Ministry of Environment, Water and Agriculture (MEWA)
The Ministry of Environment, Water and Agriculture (MEWA) is establishing the National Center for Water Efficiency and Rationalization which aims to raise the efficiency of water production, transportation and distribution, rationalize its use, and integrate relevant efforts between governmental and non-governmental agencies. MEWA developed a program to inform and support companies and institutions to audit and rationalize water consumption and detection of leaks. This program will build capabilities in companies and institutions by holding workshops and sessions on the matters related to auditing and rational use of water.
MEWA developed the National Water Strategy 2030 (2018-2030). The vision of this strategy is: “a sustainable water sector, safeguarding the natural resources and the environment of the Kingdom and providing cost-effective supply and high-quality services”. The relevant major strategic objectives include (i) enhance water demand management across all uses, (ii) safeguard and optimize the use of water resources and (iii) ensure water sector competitiveness and positive contribution to the national economy through promoting effective governance, private sector participation and localization of capabilities and innovation. The expected main key outputs of this strategy are provided below.
(i) Demand Management
The water demand will be reduced from 24.8 billion cubic meter/year to 12.5 billion cubic meter/year by 2030 focusing on the agricultural sector (from 21.2 billion cubic meter in 2016 to 11.4 billion cubic meter in 2030).
(ii) Preservation of Non-Renewable Water Resources
These initiatives are aimed at improving resources and improving capabilities of Integrated Water Management. These will significantly limit the use of non-renewable groundwater. The decrease in consumption is estimated from 20.6 billion cubic meters in 2016 to 8.8 billion cubic meters in the year 2030.
(iii) Employment Opportunities
It is expected that 70,000 additional jobs will be directly or indirectly created by 2030.
(iv) Pollution Reduction
The strategy has developed the environmental compliance regulation to monitor and reduce water and air pollution. The strategy prefers membrane-based desalination technologies which is more energy efficient than the conventional MSF and MED technologies.
The national water strategy developed 10 programs which are as follows.
1. Program 1: is the development of water law and resource management regulations.
2. Program 2: water resource management program
3. Program 3: Sector Resilience
4. Program 4: Innovation and Capability Building

Section - 3
KSA Fourth National Communication (NC4) 67
5. Program 5: Supply Chain Efficiency and Service Quality
6. Program 6: Water Services Regulations
7. Program 7: Saline Water Conversion Corporation Reconstructing
8. Program 8: Involvement of private sector in production and treatment of sewage water
9. Program 9: Distribution Restructuring and Privatization and
10. Program 10: Saudi Irrigation Organization Restructuring and Irrigation Improvement
3.8.2 Marine Protection:
The Kingdom’s Saudi Vision 2030 program emphasizes on environmental protection and natural resources. The country is putting significant efforts towards protecting and rehabilitating its beautiful beaches, natural reserves and islands (Saudi Vision 2030, 2016b). It has adopted many measures to protect the biological diversity, maintain wildlife habitats, and develop such areas. Besides, there are many national regulations and strategies as well as international agreements ratified by the Kingdom in the field of wildlife conservation including (i) General Environmental Law, (ii) Wildlife Protected Areas Regulation, (iii) Wildlife Animal and Bird Hunting Regulation, (iv) Regulation on Trafficking of Endangered Wildlife Species and their Products, and (v) United Nations Convention on Biological Diversity (Unified National Platform, 2020a).
3.8.2.1 Blue Carbon Initiatives:
In the coastal areas, carbon is stored as mangroves, seagrasses and organic soils of tidal wetlands which are known as blue carbon. Enhancing blue carbon is one of the most effective mechanisms for climate change mitigation and improving the status of coastal ecosystems. If protected, blue carbon ecosystems sequester and store carbon, on the other hand, if degraded or destroyed, these ecosystems emit carbon (The Blue Carbon Initiative, 2020).
Saudi Arabia identifies increasing sinks for blue carbon as an adaptation action with significant mitigation co-benefits, and highlights implementation of coastal management strategies as a measure through which this can be achieved (Herr & Landis, 2016). The researchers in Saudi Arabia studied 25 sites along the Western Arabian Gulf coast and demonstrated the value of mangrove, saltmarsh and seagrass habitats as carbon sinks (Cusack et al., 2018).
In Saudi Arabia, mangroves in the Red Sea have been increasing at an area of about 30 percent. This is due to efforts from Saudi Arabia implementing conservation and restoration strategies and industry efforts.
3.8.2.2 Biodiversity and Marine Ecosystem Initiatives:
The Kingdom has different climates from region to region, and a variety of habitats, including marine, coastal, desert, valley and mountain ecosystems. The Kingdom has been exerting efforts to protect the biodiversity on land, seas, and coastlines. The Kingdom has coastlines of the Red Sea and Arabia Gulf rich in coral reefs, which serve as habitat for marine life. The Kingdom is continually making efforts to improve its marine ecosystem, as it is important for development and strengthening of the country's food security. The Kingdom also places emphasis on solutions to address problems faced by marine ecosystems and pursues these
Section - 3
KSA Fourth National Communication (NC4) 68
solutions to achieve sustainable development. The National Strategy for Conservation of the Kingdom's Biodiversity includes plans for the study of biodiversity, and it addresses optimal and sustainable use of biodiversity and marine resources. As of 2016, the country has increased its terrestrial protected areas, forest covered lad areas, and protected marine reserves to 85,393, 27,000 and 7,823 square kilometers, respectively (Kingdom of Saudi Arabia, 2018).
MEWA imposed a six-month annual ban on shrimp fishing on the Arabian Gulf coast every year to allow shrimp species to reproduce, conserve shrimp stock and mitigate overfishing. (MEWA, 2020a).
The Kingdom has been taking many initiatives related to biodiversity and ecosystem protection and preservation including planting 15,000 native trees by the end of 2019. Shaybah Wildlife Sanctuary in 637 square kilometer area inhabiting many native plants and animal species was established. Approximately 1,000 tons of artificial reefs were deployed throughout the Arabian Gulf (Safaniyah, Al Khafji, and other sites) to help rebuild marine ecosystems, while also supporting the local fisheries industry. To date, more than 2,700 artificial reefs have been deployed, and that number will continue to rise as more deployments are planned for the southern Red Sea.
3.8.2.3 Terrestrial and Marine Protected Areas:
The Kingdom plans to increase the marine and terrestrial protected areas in the Kingdom to over 20% by 2030 to enhance biodiversity and to protect land and sea areas.
3.8.3 Urban Planning:
3.8.3.1 Transportation Related Initiatives
The use of fuel in the transport sector results in GHG emissions. To reduce the use of private automobiles and meet the transportation demands of Saudi population, nine mega integrated public transport projects were initiated in 2005. The initiatives are described below.
(i) Haramain High Speed Rail (HHR)
It links Mecca and Madinah and passes through three stations: King Abdul Aziz International Airport, Jeddah and King Abdullah Economic City in Rabigh. The project started was opened to the public in 2018. HHR has a capacity of 60 million passengers a year (“Haramain High Speed Rail,” 2018).
(ii) Riyadh Public Transit Network Project
The Metropolitan Development Strategy for Riyadh called MEDSTAR 2030 was adopted in line with Saudi Vision 2030 to ensure safe, reliable, and efficient mobility, which has recently been constructing Riyadh’s Metro and Bus network. The 176 km metro will have to the capacity to carry 1.16 million passengers per day during its initial phase, with a peak of 3.6 million per day in ultimate capacity (“Riyadh City review report : Future of Saudi Cities,” 2017). The Metro will be fed by the Riyadh Bus network.
(iii) Makkah Monorail Project
The Mecca monorail project provides transport for about 3.5 million people who arrive in Mecca annually to perform Hajj. The latest addition to this project was the Al Mashaaer Al

Section - 3
KSA Fourth National Communication (NC4) 69
Mugaddassah Metro Line (MMMP). It is 18.1 km long and has been fully operational. The full capacity of the network is 72,000 passengers per hour in each direction.
(iv) Jeddah Public Transport Program (JPTP)
The JPTP consists of an automated metro (MRT), light rail transportation (LRT), a corniche tram, bus rapid transit (BRT), one commuter rail line, one waterbus network and 11 park and ride facilities. The MRT network consists of 161.1 km of route (Metro Jeddah Company, n.d.). The LRT provides a hop-on/hop-off service and runs in an east-west direction. The commuter rail line serves along the eastern periphery of Jeddah and the waterbus network serves along the coastline (Metro Jeddah Company, n.d.).
(v) Madinah Metro
The Madinah Metro’s total route length will be 95 km among which 25 km will be underground and 48 km will be elevated. The metro will be built in two phases, aiming to open in 2021 (Construction Week, 2013).
(vi) Saudi Arabian Railway (SAR)
The northern line is fully operational since 2017 (Saudi Arabian Railway, 2018). The length of northern line is approximately 2,226 km and it connects Riyadh, Majmaah, Qassim, Hail and Al-Jouf (Saudi Arabian Railway, 2018). SAR has planned to expand the project and connect with the industrial city of Jubail and Ras Al-Khair Mining City. The company will also provide Jubail and Dammam with a 107 km long railway and build a railway network within the Industrial City of Jubail (Saudi Arabian Railway, 2018).
3.8.3.2 Solid Waste Management Initiatives
A number of initiatives have been taken in the Kingdom to reduce GHG emissions in solid waste management which include landfill gas collection and flaring system development and transforming waste materials to organic fuels. A few relevant major projects are discussed below.
The Madinah Landfill Gas Capture Project allows to collect and drain the landfill gas to a flaring system to avoid atmospheric release of the landfill gas. The Jeddah Old Landfill (JOLF) and Jeddah New Landfill (JNLF) Landfill Gas Recovery Bundled Project activities included installation of landfill gas (LFG) recovery and flaring systems. This project has reduced approximately 362,668 tons of CO2eq annually from 2012 to 2021.
The Kingdom has more than forty waste recycling companies working at different levels and with different types of waste. The strategic plans of the major cities are getting inspired by the concept of waste minimization. The strategic plan of Jeddah focuses on the programs concerning waste management to reduce landfill requirements by waste reduction technologies including composting. The waste management initiatives of MEWA aim to organize the integrated waste management process in the Kingdom to reduce waste production, sorting, storing, collecting, transporting and recycling to achieve environmental sustainability and maintain public health and human well-being.

Section - 3
KSA Fourth National Communication (NC4) 70
3.9 Institutional Arrangement:
The Kingdom of Saudi Arabia has over the past years evolved a functional and robust institutional arrangement. This institutional arrangement has been effective in preparing four national communications and a biennial update report. This institutional arrangement has been subjected to modifications to meet the growing reporting and other obligations of the Kingdom to the UNFCCC and its Paris Agreement.
The DNA is the implementing authority for addressing all reporting obligations of the Kingdom to the UNFCCC including the National Communications (NCs) and Biennial Update Reports (BURs). Furthermore, preparing and submitting Biennial Transparency Reports (BTRs) and National Inventory Reports (NIRs) to be submitted every two years from 2024 onwards under the Paris Agreement also fall under its responsibilities.
The DNA is the regulatory entity in the Kingdom for managing Greenhouse Gas (GHG) emissions and carbon management including issuance of credits and approvals of emission reduction projects as well as reviewing and issuing certificates and licenses for the approval of development procedures related to GHG emissions reductions. This also includes methodologies and mechanisms related to the Measurement, Reporting and Verification (MRV) system in order to effectively fulfill Kingdom’s responsibility under UNFCCC and the Paris Agreement.
The DNA is responsible for the preparation, coordination and update of the Kingdom’s Nationally Determined Contribution (NDC) under the Paris Agreement. The DNA prepared the Intended Nationally Determined Contribution (INDC) in coordination with relevant entities and submitted to UNFCCC in 2015 and submitted the updated NDCs in 2021 before COP 26 in Glasgow. The DNA also has the responsibility of preparing, reviewing, updating, and periodically submitting the Nationally Determined Contributions (NDCs) reports on greenhouse gas emission reductions in accordance with the United Nations Framework Convention on Climate Change (UNFCCC) and its Paris Agreement. The DNA is also responsible for the design, preparation and implementation of the domestic measurement, reporting and verification (MRV) system to fulfill Kingdom’s obligations under UNFCCC. The DNA is the regulating entity for carbon management in the Kingdom including issuance of credits and approvals for emission reduction projects.
The DNA has represented the Kingdom at multiple international forums and is a focal point and active member of many international initiatives such as Mission Innovation (MI), Clean Energy Ministerial (CEM), Green Climate Fund (GCF), Climate Technology Centre & Network (CTCN), Global Methane Initiative (GMI), Carbon Sequestration Leadership Forum (CSLF) etc. and participate in international climate change negotiations.
The DNA is chaired and supervised by His Royal Highness the Minister of Energy. The DNA has a strong and effective inter-ministerial and public/private inter-agency national platform for coordinating effective responses to climate change issues in Saudi Arabia. The current membership of the DNA National Committee includes relevant ministries and departments as well as public and private entities. The membership includes (i) Ministry of Energy, (ii) Ministry of Industry and Mineral Resources; (iii) Ministry of Transportation; (iv) Ministry of Municipal and Rural Affairs; (v) Ministry of Health; (vi) Ministry of Environment, Water and Agriculture; (vii) Ministry of Commerce and Investment; (viii) Royal Commission for Jubail

Section - 3
KSA Fourth National Communication (NC4) 71
and Yanbu; (ix) Saline Water Conversion Corporation; (x) Saudi Arabian Oil Company; (xi) Saudi Basic Industries Corporation; (xii) Saudi Electricity Company; (xiii) King Abdulaziz City for Science and Technology; (xiv) King Abdullah City for Atomic and Renewable Energy; (xv) National Center for Environmental Compliance; (xvi) Saudi Arabian Mining Company; (xvii) Saudi Industrial Property Authority; (xviii) Water and Electricity Regulatory Authority; and (xix) NEOM.
3.10 Summary:
The government of Saudi Arabia adopted a holistic approach to address Article 12.1(b) by adopting climate change mitigation-based methodology. The versatile initiatives of the Kingdom with mitigation co-benefits aim to (i) ensure rational and efficient use of energy sources, (ii) develop renewable energy resources, (iii) support demand and supply side management of energy resources, (iv) support R&D activities, (v) develop institutional framework and business models, (vi) use circular carbon economy approach, and (vi) encourage behavioral changes of the public towards energy-efficient lifestyle. The relevant ministries of the Kingdom have been working closely to ensure the success of the relevant initiatives.
The Kingdom has announced the Saudi Green Initiative (SGI) and Middle East Green Initiative (MGI). As part of SGI announced by HRH the Crown Prince, the Deputy Prime Minister and the Minister of Defense, the Kingdom has made a more than two-fold increase in its NDC ambition to 278 million tons of CO2eq annually versus its previous INDC of 130 million tons of CO2eq submitted to UNFCCC Secretariat in 2015.
The Kingdom adopted circular carbon economy framework which will generate new balance by reducing emissions through energy efficiency and use of renewable energy sources, reusing emissions through producing value products, and removing and reducing carbon emissions. It provides a holistic approach to develop a comprehensive technology roadmap on CO2 capture, sequestration, and utilization. The Kingdom has been adopting advanced technologies to control flaring activities and reduce methane emissions. Saudi Arabia has been maintaining its pivotal role in controlling methane emissions from oil and gas operating facilities. Many initiatives have also been taken to reduce greenhouse gas (GHG) emissions in solid waste management which include methane gas collection and flaring system development and transforming waste materials to possible organic fuels. As part of the Saudi Green Initiative, the Kingdom will divert 94% of its solid waste away from landfills by 2030.

Section - 3
KSA Fourth National Communication (NC4) 72
References: 1. Advanced Water Technology (AWT) (2021) Al-Khafji SWRO desalination plant
powered by Solar Energy. http://awatertech.com/en/projects/al-khafji-swro-powered-by-solar/
2. Agboola, P. O., & Saleh, J. (2016). Feasibility of municipal solid waste (MSW) as energy sources for Saudi Arabia’s future Reverse Osmosis (RO) desalination plants. Polish Journal of Chemical Technology, 18(4), 82–89. https://doi.org/10.1515/pjct-2016-0075
3. Alhowais, A., Al-shihri, F., (2010). Economic trends of Saudi Urban system(1992– 2010). J. Eng. Sci. 42(1), 216–225
4. Al-Iriani, M. A. (2006). Energy–GDP relationship revisited: an example from GCC countries using panel causality. Energy policy, 34(17), 3342-3350.
5. Amran, Y. H. A., Amran, Y. H. M., Alyousef, R., & Alabduljabbar, H. (2020, February 20). Renewable and sustainable energy production in Saudi Arabia according to Saudi Vision 2030; Current status and future prospects. Journal of Cleaner Production. Elsevier Ltd. https://doi.org/10.1016/j.jclepro.2019.119602
6. First Biennial Update Report of Saudi Arabia (BUR1) (2018), Designated National Authority, Kingdom of Saudi Arabia.
7. Chandrasekharam, D., Lashin, A., Al Arifi, N., Al Bassam, A., Ranjith, P. G., Varun, C., & Singh, H. K. (2015). Geothermal energy resources of Jazan, SW Saudi Arabia. Journal of African Earth Sciences, 109, 55–67. https://doi.org/10.1016/j.jafrearsci.2015.05.016
8. Construction Week. (2013). Madinah targets mass transit system by 2021. 9. Cusack, M., Saderne, V., Arias-Ortiz, A., Masqué, P., Krishnakumar, P. K., Rabaoui,
L., Duarte, C. M. (2018). Organic carbon sequestration and storage in vegetated coastal habitats along the western coast of the Arabian Gulf. Environmental Research Letters, 13(7), 074007. https://doi.org/10.1088/1748-9326/aac899
10. Demirbas, A., Alidrisi, H., Ahmad, W., & Sheikh, M. H. (2016). Potential of geothermal energy in the Kingdom of Saudi Arabia. Energy Sources, Part A: Recovery, Utilization, and Environmental Effects, 38(15), 2238–2243. https://doi.org/10.1080/15567036.2015.1045999
11. ECRA. (2015). Statistical Booklet 2014. Riyadh, Saudi Arabia. 12. ECRA. (2019). Statistical Booklet 2018. Riyadh, Saudi Arabia. 13. ECRA. (2020a). Codes & Standards. Retrieved May 22, 2020. 14. ECRA. (2020b). Desalination of Sea Water. Retrieved August 31, 2020 15. Export. (2017). Saudi Arabia - Energy. Retrieved June 10, 2018, from
https://www.export.gov/article?id=Saudi-Arabia-Energy 16. General Authority for Statistics. (GASTAT) (2018). Indicators of Renewable Energy
2017. Retrieved from https://www.stats.gov.sa/sites/default/files/indicators_of_renewable_energy_in_saudi_arabia_2017_en_2_0.pdf

Section - 3
KSA Fourth National Communication (NC4) 73
17. Global Carbon Capture and Storage Institute (GCCSI) (2017), Global Status of Carbon Capture and Storage
18. Guendouz, A. and M. Ouassaf, S., 2020. The Economic Diversification in Saudi Arabia Under the Strategic Vision 2030. Academy of Accounting and Financial Studies Journal, [online] 24(5). Available at: https://www.abacademies.org/articles/the-economic-diversification-in-saudi-arabia-under-the-strategicvision-2030-9607.html
19. Hadidi, L. A., Ghaithan, A., Mohammed, A., & Al-Ofi, K. (2020). Deploying Municipal Solid Waste Management 3R-WTE Framework in Saudi Arabia: Challenges and Future. Sustainability, 12(14), 5711. https://doi.org/10.3390/su12145711
20. Harmain High Speed Rail. (2018). https://www.hhr-retail.com
21. Herr, D., & Landis, E. (2016). Coastal blue carbon ecosystems Opportunities for Nationally Determined Contributions. Retrieved from https://www.nature.org/content/dam/tnc/nature/en/documents/BC_NDCs_FINAL.pdf
22. IPCC, (2014): Climate Change 2014: Mitigation of Climate Change. Contribution of Working Group III to the Fifth Assessment Report of the Intergovernmental Panel on Climate Change [Edenhofer, O., R. Pichs-Madruga, Y. Sokona, E. Farahani, S. Kadner, K.
23. K.A.CARE. (2016). Future Energy: Renewable Energy, Kingdom of Saudi Arabia. Retrieved from https://www.kacare.gov.sa/en/futureenergy/renewableenergy
24. K.A.CARE. (2017). Saudi National Atomic Energy Project | King Abdullah City for Atomic and Renewable Energy. Retrieved May 30, 2020, from https://www.energy.gov.sa/en/projects/Pages/atomic.aspx
25. K.A.CARE. (2019). K∙A∙CARE 2019 TLC RFP. Retrieved August 26, 2020, from https://www.kacare.gov.sa
26. K.A.CARE. (2020a). Geothermal. Retrieved August 30, 2020, from https://www.energy.gov.sa/en/FutureEnergy/RenewableEnergy/pages/geoenergy.aspx
27. K.A.CARE. (2020c). Renewable Resource Atlas. Retrieved September 6, 2020, from https://rratlas.energy.gov.sa/RRMMPublicPortal/
28. K.A.CARE. (2020d). Waste to Energy. Retrieved August 31, 2020, from https://rratlas.energy.gov.sa/RRMMPublicPortal/?q=en/WasteToEnergy
29. Kingdom of Saudi Arabia. (2018). First Voluntary National Review Towards Saudi Arabia’s Sustainable Tomorrow. Riyadh. Retrieved from https://sustainabledevelopment.un.org/content/documents/20230SDGs_English_Report972018_FINAL.pdf
30. KSA-Climate. (2019). National Renewable Energy Program. Retrieved May 29, 2020, https://ksa-climate.com/making-a-difference/nrep/
31. Matar, W., Murphy, F., Pierru, A., Rioux, B., & Wogan, D. (2017). Efficient industrial energy use: The first step in transitioning Saudi Arabia’s energy mix. Energy Policy, 105, 80–92. https://doi.org/10.1016/J.ENPOL.2017.02.029

Section - 3
KSA Fourth National Communication (NC4) 74
32. McDonough William, (2016) Carbon is not the enemy, NOVEMBER 2016 | VOL 539 | NATURE | 349
33. Metro Jeddah Company. (n.d.). The Jeddah Public Transport Program. 34. Meyer, B.; Keller, F.; Wolfersdorf, C.; Lee, R.P (2018). A concept for the circular
carbon economy sector coupling of the energy, waste, and chemical industry. Chem. Ing. Tech. 2018, 90, 241–248.
35. Miandad, R., Rehan, M., Ouda, O. K. M., Khan, M. Z., Shahzad, K., Ismail, I. M. I., & Nizami, A. S. (2016). Waste-to-hydrogen energy in saudi arabia: Challenges and perspectives. In Biohydrogen Production: Sustainability of Current Technology and Future Perspective (pp. 237–252). Springer India. https://doi.org/10.1007/978-81-322-3577-4_11
36. Ministry of Environment Water and Agriculture. (2020a). Annual Shrimp Fishing Ban Begins from February in the Arabian Gulf. Retrieved September 10, 2020, from https://www.mewa.gov.sa/en/MediaCenter/News/Pages/News2712020.aspx
37. Ministry of Economy and Planning, (MEP) (2004). Long-Term Strategy for the Saudi Economy: Riyadh: Ministry of Economy and Planning, Kingdom of Saudi Arabia, http://www.mep.gov.sa/wp-content/uploads/2015/10/The-Long-Term-Strategy-en.pdf
38. Ministry of Economy and Planning, (MEP) (2010). Brief Report on the Ninth Development Plan (2010–2014). Riyadh: Ministry of Economy and Planning, Kingdom of Saudi Arabia.
39. Ministry of Economy and Planning (MEP) (2014). The First Development Plan 1970-1975.
40. Ministry of Economy and Planning (MEP) (2015). The Objectives of the 10th National Development Plan (2015-2019). The Kingdom of Saudi Arabia.
41. Mobarak, A. and Karshenasan, A., (2012). The impact of institutional quality on relation between resource abundance and economic growth. Iran. Econ. Rev.16 (32), 95–110.
42. Napoli, Christopher and Rioux Bertrand (2015) A Framework for Comparing the Viability of Different Desalination Approaches, King Abdullah Petroleum Studies and Research Center (KAPSARC), Riyadh, Saudi Arabia
43. National Renewable Energy Program. (2019). Saudi Arabia Renewable Energy Targets and Long Term Visibility. Retrieved October 24, 2019, from https://www.powersaudiarabia.com.sa/web/attach/media/Saudi-Arabia-Renewable-Energy-Targets-and-Long-Term-Visibility.pdf
44. NEOM. (2018). Welcome to NEOM. Retrieved June 4, 2018, from http://www.neom.com/
45. NEOM Saudi City. (2018). NEOM News - The City Of Future. Retrieved June 4, 2018, http://neomsaudicity.net/
46. Ouda, O. K.M., Raza, S. A., Nizami, A. S., Rehan, M., Al-Waked, R., & Korres, N. E. (2016). Waste to energy potential: A case study of Saudi Arabia. Renewable and Sustainable Energy Reviews. Elsevier Ltd. https://doi.org/10.1016/j.rser.2016.04.005
47. Power Saudi Arabia. (2020). National Renewable Energy Program. Retrieved May 29, 2020, from https://www.powersaudiarabia.com.sa/web/index.html

Section - 3
KSA Fourth National Communication (NC4) 75
48. Raed Al-Shneiber (2018), Saudi Energy Efficiency Program; COP 24, Katowice, Poland, December 2018
49. Rami Shabaneh (2020) Fuel Mix for Power Generation and Water Desalination in Saudi Arabia from https://www.kapsarc.org/research/publications/fuel-mix-for-power-generation-and-water-desalination-in-saudi-arabia/
50. Riyadh City Review Report (2017). : Future of Saudi Cities. 51. Saudi Arabian Railway. (2018). Infrastucture. 52. Saudi Aramco. (2019). Efficiency among energy abundance. Retrieved September 2,
2020, from https://www.aramco.com/en/magazine/elements/2019/energy-efficiency#
53. Saudi Electricity Company. (2020f). Smart Metering Project. Retrieved Sept 3, 2020, from https://www.se.com.sa/en-us/customers/Pages/SmartMeters.aspx
54. Saudi Green Initiative (SGI) (2021) https://www.saudigreeninitiative.org/about-saudi-green-initiative/
55. Saudi Energy Efficiency Center (SEEC) (2019) Annual Report. 56. SEEC. (2020a). About Energy Services Companies. Retrieved August 19, 2020, from
https://www.seec.gov.sa/en/energy-services/about-energy-services-companies/# 57. SEEC. (2020b). Buildings sector. Retrieved August 19, 2020, from
https://www.seec.gov.sa/en/energy-sectors/buildings-sector/ 58. SEEP. (2017). Saudi Energy Efficiency Program Overview. Retrieved from
https://www.ief.org/_resources/files/events/2nd-ief-eu-energy-day/naif-al-ragass---saudi-energy-efficiency-center.pdf
59. SEEP. (2019). The Saudi Energy Efficiency Program. Retrieved from https://ksa-climate.com/wp-content/uploads/2018/12/Raed-Al-Schneiber_SEEC.pdf
60. Saudi Vision 2030. (2016a). A renewable energy market. Retrieved May 13, 2018, from http://vision2030.gov.sa/en/node/87
61. Soytas, U., Sari, R., (2003). Energy Consumption and GDP: Causality Relationship in G-7 Countries and Emerging Markets. Energy Economics 25, 33-37.
62. The Blue Carbon Initiative. (2020). Mitigating Climate Change through Coastal Ecosystem Management. Retrieved September 15, 2020, from https://www.thebluecarboninitiative.org/
63. Tricaud, V., (2020). Saudi Arabia Will Push Ahead With Economic Diversification Despite COVID-19. [online] Controlrisks.com. Available at: https://www.controlrisks.com/our-thinking/insights/saudi-arabia-will-push-aheadwith-economic-diversification-despite-covid-19
64. UN. (2017). United Nations. Status of Ratification of the Kyoto Protocol. Retrieved August 19, 2020, from https://unfccc.int/resource/docs/2005/cop11/eng/inf01.pdf
65. Unified National Platform. (2020a). Environmental Protection in KSA. Retrieved September 15, 2020, from: https://www.my.gov.sa/wps/portal/snp/aboutksa/environmentalProtection/!ut/p/z0/04_

Section - 3
KSA Fourth National Communication (NC4) 76
Sj9CPykssy0xPLMnMz0vMAfIjo8zivQIsTAwdDQz9LSw8XQ0CnT0s3JxDfA0M_A30g1Pz9AuyHRUBPXGyKQ!1
66. United Nations Department of Economic and Social Affairs (UNDESA). (2015). Transforming Our World: The 2030 Agenda For Sustainable Development | Department Of Economic And Social Affairs. [online] Available at: https://sdgs.un.org/2030agenda
67. United Nations Department of Economic and Social Affairs (UNDESA) (2017), Economic Diversification: Explaining the pattern of diversification in the global economy and its implications for fostering diversification in poorer countries
68. United Nations - The Economic Commission for Latin America and the Caribbean (ECLAC), (2017). Economic Diversification.
69. UNFCCC. 2020. Available at: https://unfccc.int/topics/resilience/resources/economic-diversification#:~:text=Economic%20diversification%20is%20the%20process,positive%20economic%20growth%20and%20development
70. UNESCWA (2009). Water Development Report 3 of Economic and Social Commission for Western Asia, United Nations Economic and Social Commission for Western Asia, New York, USA.
71. Vision 2030 Kingdom of Saudi Arabia, Retrieved from http://www.vision2030.gov.sa
72. Vision 2030 Roadmap, Kingdom of Saudi Arabia, Retrieved from https://vision2030.gov.sa/en/vision/roadmap
73. Vision 2030. (2016); Kingdom of Saudi Arabia 74. Vision 2030. (2018). The National Transformation Program. Retrieved from
https://vision2030.gov.sa/sites/default/files/attachments/NTP English Public Document_2810.pdf
75. World Bank (2015) Zero Routine Flaring (ZRF) by 2030 https://www.worldbank.org/en/programs/zero-routine-flaring-by-2030
76. Zafar, S. (2020a). Waste-to-Energy in Saudi Arabia. Retrieved August 31, 2020, from https://www.bioenergyconsult.com/waste-to-energy-saudi-arabia/
https://vision2030.gov.sa/sites/default/files/attachments/NTP%20English%20Public%20Document_2810.pdf

Section - 4
KSA Fourth National Communication (NC4)
SECTION 4
Analysis of Socioeconomic Impacts of Response Measures

Section - 4
KSA Fourth National Communication (NC4) i
TABLE OF CONTENTS
Section Title Page 4.1 Introduction 77
4.2 The Climate Change Policy Architectures: Some Relevant Provisions and Decisions Relating to Impacts of Response Measures
78
4.3 Climate Mitigation Policy Impact on Hydrocarbon Markets in Developing Economies 79
4.4 Socio-Economic Vulnerabilities of Saudi Arabia 80 4.4.1 Structural Changes and GDP contribution 81 4.4.2 Saudi Arabia’s Efforts to Mitigate the Adverse Impacts of
Response Measures 82
4.5 Sectoral Policy Instruments to Mitigate the Emissions of Greenhouse Gases 83
4.5.1 The Road Transportation Sector 83 4.5.2 The Shipping Sector 83 4.5.3 The Aviation Sector 84 4.5.4 Subsidies 85 4.5.5 Direct Regulatory Approaches 85 4.5.6 Border Carbon Adjustment (BCA) and Carbon Leakage 85 4.5.7 Information Programmes 86 4.5.8 Government Provision of Public Goods & Services and
Procurement 86 4.5.9 Voluntary Actions 86 4.6 Modelling Approaches 86 4.7 Summary of Information on Economic and Social Consequences
of Response Measures 87 4.8 Enabling Policies 95 4.9 International Cooperation for Technology and Knowledge
Development, Transfer and Diffusion 95 4.10 Summary 96 References 97

Section - 4
KSA Fourth National Communication (NC4) ii
LIST OF FIGURES
Figure Title Page 4.1 Real GDP Per Capita (1995 - 2018) 80 4.2 GDP Growth Rates at Producers' Values at Constant Prices 81 4.3 Contributions of Oil to GDP and Government Revenue (%) 82 4.4 Percentage of Domestic Debt Surpluses and Deficits to GDP 82 4.5 Structural Change and GDP Composition 83
4.6 High-Level Relationship of GHG Mitigation Measures and Economies of States 84
LIST OF TABLES
Table Title Page
4.1 Summary of Information on Economic and Social Consequences of Response Measures 88

Section - 4
KSA Fourth National Communication (NC4) 77
Section 4: Analysis of Socioeconomic Impacts of Response Measures
4.1 Introduction
As a result of the global mixing of greenhouse gases that are released into the atmosphere, anthropogenic climate change is a global common problem, hence reducing or avoiding GHG emissions by any one Party carries with it an economic cost within and outside of its jurisdiction and the benefits of any reductions are however enjoyed globally (WCED, 1987; Kaul et al., 1999, Kaul et al., 2003, Stavins R. N., 2011; Byrne and Glover, 2002). Taking into account the relationship between greenhouse gas mitigation costs and climate benefits, there is insufficient incentives for Parties to reduce greenhouse gas emissions significantly in the absence of international cooperation (Barrett, 2003, 2007; Stewart and Wiener, 2003; Schmalensee, 2010; Brousseau et al., 2012). Multilateral agreement has therefore been recognized as the best platform to deal with climate change, but there are varying interests of different countries as well as issues relating the distribution of responsibilities between developed and developing countries.
Saudi Arabia has over the years consistently upheld the view that international actions to address the challenges posed by climate change, should not undermine the efforts of developing country Parties to achieve their sustainable development goals and aspirations consistent with Article 2 and Article 3 paragraph 5 of the UNFCCC. This approach takes cognizance of national circumstances, equity, cost-effectiveness, efficiency and optimum use of technology-based solutions which are supportive of national development plans and priorities (Sandler, 2004).
In December 2011, Parties adopted the Outcome of the work of the Ad Hoc Working Group on Long-term Cooperative Action under the Convention, and therefore reaffirmed the principle of sovereignty of States in international cooperation to address climate change. In doing so, they agreed that policies and measures put in place to address climate change should be supportive of the economic and social development of developing country Parties. Within the context of the international climate change policy architecture, response measures are understood to mean policies and measures instituted by Parties with the view to limit emissions of greenhouse gases. There are however impacts arising from the implementation of these emission reduction policies, programmes and actions, “within national jurisdictions” and “out-of-national jurisdictions” undertaken by Parties to the UNFCCC, the Kyoto Protocol and the Paris Agreement to combat climate change (UNFCCC, 2020). These response measures often exert profound adverse socio-economic impacts on sustainable development objectives of many developing countries particularly those whose economies are heavily dependent on a single sector or single commodity such as hydrocarbons and tourism.
It is however worth recognizing that the objectives of the Paris Agreement and the Sustainable Development Goals (SDGs) are mutually reinforcing and interdependent: the adverse impacts of climate change pose a risk to economic development, and a successful low-carbon transition depends on robust social, economic and environmental development (Carraro, 2016; Gomez-

Section - 4
KSA Fourth National Communication (NC4) 78
Echeverri, 2018; Hallegatte et al., 2016; von Stechow et al., 2015). These synergies create opportunities for using climate change response measures to achieve SDGs and positive equality outcomes, and to facilitate a ‘just transition’ to a low-carbon economy whilst minimizing the adverse impacts of climate change. Climate change response measures are known to have both positive and negative impacts, but it is the positive impacts of climate change response measures for the SDGs that are increasingly being cited by policymakers as part of the motivation for climate action, especially in developing countries. However, in many cases the basic development needs and aspirations of developing countries often outweigh the importance of climate objectives (Hallegatte et al., 2016; Ürge-Vorsatz et al. 2014; von Stechow et al., 2015). Successful policy integration of climate change response measures and sustainable development aspirations requires a comprehensive understanding of the adverse impacts that may negatively affect countries’ progress towards the SDGs, including SDG-10 (reduced inequalities) (Ekener-Petersen, E., Höglun, J., & Finnveden, G. 2014; Jakob and Steckel, 2014; Marcu and Vangenechten, 2018; IPCC, 2014).
To maximize the benefits and minimize the negative effects of climate change response measures, there is the need of national, regional and international engagements to better understand and mitigate the negative direct and indirect often complex social and economic impacts that these policies may have and the pathways through which these impacts emerge. Better understanding of the distributional and inequality impacts is important to avoid negative social and distributional outcomes as countries ratchet up their climate policy ambition in the post-Paris context. The risk of adverse social outcomes associated with climate change response measures, including worsening international inequality, increases as countries are urged to ratchet up their ambition to meet the goal of the Paris Agreement. Hence many policies that have so far only been piloted will need to be up-scaled. Negative impacts of response measures must be mitigated (and possibly even prevented, but this requires conscious effort, careful planning and multi stakeholder engagement. Best results can be achieved when potential impacts of response measures are taken into consideration in all stages of policy making, including policy planning, development and implementation at the national and international levels.
4.2 The Climate Change Policy Architectures: Some Relevant Provisions and Decisions Relating to Impacts of Response Measures
The United Nations Framework Convention on Climate Change remains the only international climate policy architecture with broad legitimacy, due in part to its virtually universal membership (Karlsson-Vinkhuyzen and McGee, 2013). The principal Articles of the UNFCCC relating to impacts of response measures include Articles 3.5, 4.8 and 4.9 of the Convention. Policies and measures to protect the climate system against human-induced change should be appropriate for the specific conditions of each Party and should be integrated with national development programmes, taking into account that economic development is essential for adopting measures to mitigate climate change. There are several provisions in the UNFCCC and the Paris Agreement as well as numerous decisions of the COP and CMA that acknowledge the fact that the economies of some developing countries adversely affected by the negative impacts of response measures and spill-over effects.
Decision 2/CP.17 addresses the issue of the economic and social consequences of response measures and called for concrete actions including those related to funding, insurance and the

Section - 4
KSA Fourth National Communication (NC4) 79
transfer of technology to mitigate the impacts of the response measures. It acknowledged that the response measures to combat climate change may have negative environmental, social and economic consequences, and that all developing countries face economic and social consequences of response measures to climate change. Annex I Parties should provide information on any economic and social consequences of response measures in their biennial report whilst non-Annex I Parties, were to the extent possible provide information on any economic and social consequences of response measures on their development efforts in their biennial update reports. The COP on the issue of modalities, work programme and functions under the Convention of the forum on the impact of the implementation of response measures adopted its decision 7/CP.24 and alluded to the fact response measures should be understood in the broader context of the transition towards low greenhouse gas emissions and climate-resilient development.
The Paris Agreement is an example of a ‘pledge and review’ policy architecture in which a participating Party voluntarily registers to abide by its stated domestic reduction actions (nationally determined contribution). Parties are required to initiate bottom-up processes to develop and implement cost-effective GHG mitigation abatement policies and actions which are nationally determined in accordance with their respective national circumstances and capabilities. Article 4, paragraph 15 of the Paris Agreement requests that Parties shall take into consideration in the implementation of this Agreement the concerns of Parties with economies most affected by the impacts of response measures, particularly developing country Parties.
On matters relating to the workplan of the forum on the impact of the implementation of response measures and its Katowice Committee of Experts on the Impacts of the Implementation of Response Measures, the CMA adopted the rules of procedure of the Katowice Committee on Impacts and the workplan of the forum on the impact of the implementation of response measures and its Katowice Committee on Impacts as contained in annex II of the decision. It also decided that the forum on the impact of the implementation of response measures, in the context of the implementation of the workplan, may consider, as needed, additional modalities for the workplan activities, consistent with the modalities identified in decision 7/CMA.1 and recommend such additional modalities for the workplan for consideration and adoption by the subsidiary bodies.
4.3 Climate Mitigation Policy Impact on Hydrocarbon Markets in Developing Economies
Distributional equity and fairness are important attributes of climate policy because they exert an impact on human wellbeing (Posner and Weisbach, 2010) and political feasibility (Jacoby et al., 2010; Gupta, 2012). Distributional equity relates to burden-sharing and benefit-sharing across countries and across time. It is for this reason that due consideration should be given to efforts to mitigate the negative consequences of mitigation actions implemented in one jurisdiction on another jurisdiction. This phenomenon, sometimes referred to as ‘response measures’ or as ‘spillover effects’, do lead to unequal distribution of the impacts of climate change mitigation actions themselves. A plausible example of a spill over effect is the impact of emissions reductions in developed countries lowering the demand for fossil fuels and thus decreasing their prices, leading to more use of such fuels and greater emissions in developing nations (Bauer et al., 2013).

Section - 4
KSA Fourth National Communication (NC4) 80
The implementation of climate change policies directed at reducing demand for fossil fuels is expected to have far-reaching adverse impacts on the economies of major oil exporters (Kalkuhl and Brecha, 2013; Bauer et al., 2013 and Kosov, et al., 2017). In the case of Saudi Arabia with large endowments of conventional oil and gas, and having a domestic industrial base for the production and export of non-hydrocarbons based goods and services which is relatively weak, the impacts are significant. It is therefore of paramount importance that the Kingdom’s industrial base is diversified away from fossil fuels so that any important fluctuations in world oil demand as well as excessive price volatilities to not adversely affect government revenues. To address these adverse impacts of response measures, the design and implementation of international climate policies should strike a delicate balance between the benefits of flexibility and the costs of regulatory uncertainty (Goldstein and Martin, 2000; Brunner et al., 2012).
Climate change and trade related issues are intertwined because there is an undeniable link between economic growth, international trade and greenhouse gas emissions (Droege, 2012 and CDKN, 2015). Greenhouse gas pricing policies, such as GHG-emission trading schemes (ETS) and GHG-emission taxes, have been used over the years to address the market externalities associated with mitigation of greenhouse gas emissions (Sumner et al., 2009; IEA, 2010; Lin and Li, 2011).
4.4 Socio-Economic Vulnerabilities of Saudi Arabia
Despite the declining trend in Saudi Arabia’s population growth over the recent years, the annual growth rate of the population of the Kingdom still remains high compared to countries with the similar size in economy. Such population pressure has led to important pressures on real per capita incomes and living standards (figure 4.1). In addition, the figure also reflects the sharp fluctuations in GDP per-capita caused by the oil market ups and downs (figure 4.2). In turn, this further amplifies Saudi Arabia’s vulnerability to oil demand and excessive price volatilities and hence to the implementation of climate change response measures and policies.
Figure 4.1: Real GDP Per Capita (1995 - 2018)
0
5,000
10,000
15,000
20,000
25,000
30,000
US
Dol
lar
Year
GDP per Capita

Section - 4
KSA Fourth National Communication (NC4) 81
Figure 4.2: GDP Growth Rates at Producers' Values at Constant Prices (GOSI, 2019, Saudi Central Bank, 2020)
Concerted efforts have been made to address the above vulnerabilities over the past 21 years. These efforts would be undermined if current volatility of oil market continues and even worsen if mitigation response measures were to be added. From an economic policy perspective, the challenge that the Saudi government currently is facing is whether the Saudi economy can generate sufficient opportunities to diversify its economy and raise its resilience to global climate mitigation policies and actions.
4.4.1 Structural Changes and GDP Contribution
The Kingdom’s oil sector makes a very significant contribution to the country’s Gross Domestic Product and to total government revenue, reflecting the Kingdom’s high dependency on hydrocarbons throughout the past decades. However, the Kingdom of Saudi Arabia’s efforts to diversify its economy away from hydrocarbons becomes more evident since the ratio of Oil/Government revenue has declined by almost 30% during the period 2010-2019 (figure 4.3). Additionally, the oil sector contribution to the Kingdom’s GDP has been on a steady decrease from the early 2000s and has declined by almost 17% during the period 2002-2019. The Kingdom’s reliance away from fossil fuel revenue becomes more conspicuous upon careful analysis of the Kingdom’s Oil Revenue contribution to total government revenue shown in figure 4.3. Since the 1970s, total government revenue of the Kingdom mainly consisted of revenue from the Oil sector. In 2015, the contribution of revenues from the oil sector to total government revenue becomes clearly smaller. In 2018, the Kingdom’s total revenue increases while the revenue from the oil sector actually decreased, illustrating the Kingdom’s Economic diversification efforts to move away from a single-source economy.
-25
-20
-15
-10
-5
0
5
10
15
20
25
30
GD
P G
row
th R
ate
Year

Section - 4
KSA Fourth National Communication (NC4) 82
Figure 4.3: Contributions of Oil to GDP and Government Revenue (%) (SAMA 2019 Annual Statistics)
4.4.2 Saudi Arabia’s Efforts to Mitigate the Adverse Impacts of Response
Measures Oil revenues have historically had a direct impact on Saudi government spending and fiscal policy. The volatility of the world oil markets contributed to the continued unpredictability of the oil revenues and consequently the fiscal budget. The National budget has been running on a deficit between 1995 – 2003 and only after the 2000s rally in oil prices does it shows a surplus (Figure 4.4). This trend continued until the oil crash of 2014 where a deficit is running up to 2019. It is then clear, in the absence of alternative fiscal means or non- hydrocarbons revenues, that such pattern of annual budgetary deficits will be unavoidable would the hydrocarbons sector be exposed to a significant downside risk such as the implementation of climate change mitigation policies (Figure 4.5).
Figure 4.4: Percentage of Domestic Debt Surpluses and Deficits to GDP
0
10
20
30
40
50
60
70
80
90
100
Perc
enta
ge
Year
Oil/GDP (%) Oil/ Gov. Revenue (%)
-30.0
-20.0
-10.0
0.0
10.0
20.0
30.0
40.0
50.0
1969
1971
1973
1975
1977
1979
1981
1983
1985
1987
1989
1991
1993
1995
1997
1999
2001
2003
2005
2007
2009
2011
2013
2015
2017
2019
Perc
enta
ge (%
)
Year
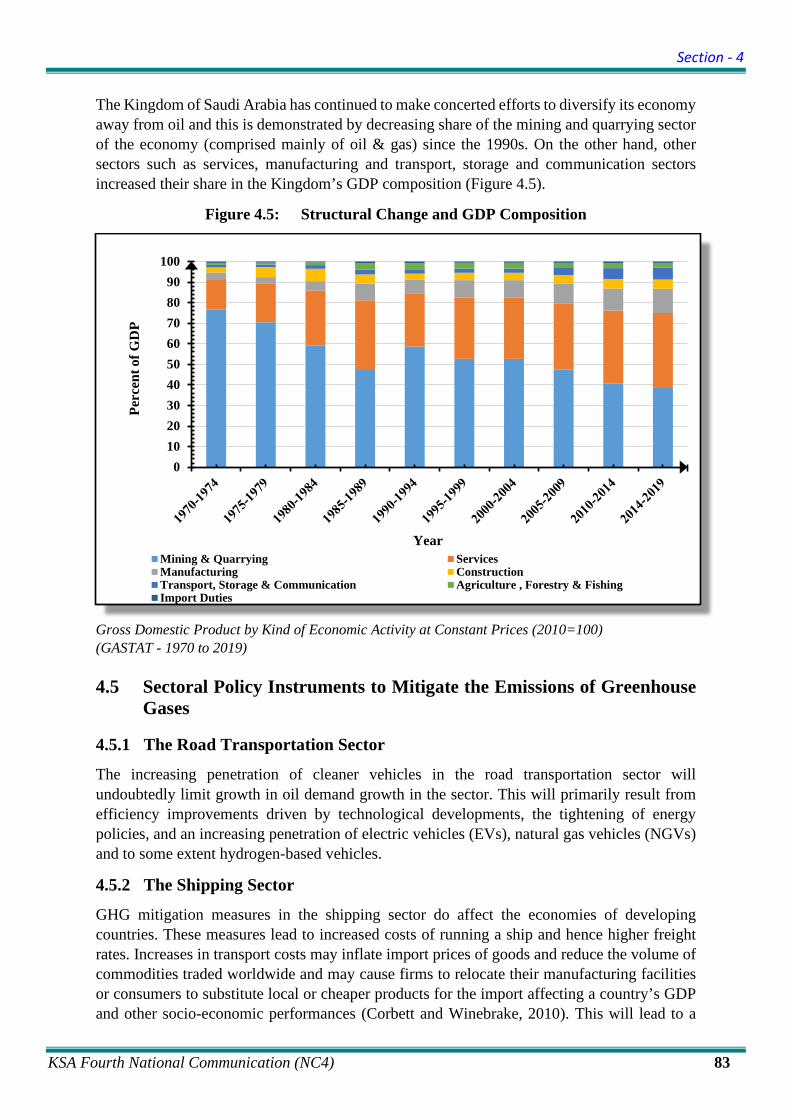
Section - 4
KSA Fourth National Communication (NC4) 83
The Kingdom of Saudi Arabia has continued to make concerted efforts to diversify its economy away from oil and this is demonstrated by decreasing share of the mining and quarrying sector of the economy (comprised mainly of oil & gas) since the 1990s. On the other hand, other sectors such as services, manufacturing and transport, storage and communication sectors increased their share in the Kingdom’s GDP composition (Figure 4.5).
Figure 4.5: Structural Change and GDP Composition
Gross Domestic Product by Kind of Economic Activity at Constant Prices (2010=100) (GASTAT - 1970 to 2019) 4.5 Sectoral Policy Instruments to Mitigate the Emissions of Greenhouse
Gases
4.5.1 The Road Transportation Sector
The increasing penetration of cleaner vehicles in the road transportation sector will undoubtedly limit growth in oil demand growth in the sector. This will primarily result from efficiency improvements driven by technological developments, the tightening of energy policies, and an increasing penetration of electric vehicles (EVs), natural gas vehicles (NGVs) and to some extent hydrogen-based vehicles.
4.5.2 The Shipping Sector
GHG mitigation measures in the shipping sector do affect the economies of developing countries. These measures lead to increased costs of running a ship and hence higher freight rates. Increases in transport costs may inflate import prices of goods and reduce the volume of commodities traded worldwide and may cause firms to relocate their manufacturing facilities or consumers to substitute local or cheaper products for the import affecting a country’s GDP and other socio-economic performances (Corbett and Winebrake, 2010). This will lead to a
0102030405060708090
100
Perc
ent o
f GD
P
YearMining & Quarrying ServicesManufacturing ConstructionTransport, Storage & Communication Agriculture , Forestry & FishingImport Duties

Section - 4
KSA Fourth National Communication (NC4) 84
decrease in global demand for oil and hence a reduction in the overall market share of oil, thereby affecting the socio-economic development of the Kingdom of Saudi Arabia.
In 2018 the International Maritime Organization (IMO) adopted a strategy to evaluate the impacts of measures to reduce GHG emissions from international shipping. The Strategy acknowledges that the implementation of GHG reduction measures will potentially increase maritime transport costs, which contributes to trade costs between States. It therefore calls for an assessment of the impacts of GHG reduction measures on the economy of countries and the need to take into account measures to address the disproportionately negative impacts of mitigation actions. It also noted that substantial increase in maritime transport costs can increase in trade costs and eventually lead to changes in global patterns and volume of international trade (figure 4.6) (Halim et.al., 2019).
Figure 4.6: High-level Relationship of GHG Mitigation Measures and Economies of States (Halim et.al., 2019)
4.5.3 The Aviation Sector
Biofuels for jet aircraft (bio-jet) are the only currently available option to achieve significant reductions in aviation emissions. The Transforming Energy Scenario of the Global Renewables Outlook, projects that liquid biofuel production overall would increase five-fold from 130 billion litres in 2016 to 652 billion litres in 2050, and over 100 billion litres of bio-jet would be consumed in the aviation sector (IRENA, 2017). This, in addition to efficiency and operational improvements, would be the main reasons for the reductions in CO2 emissions in the Transforming Energy Scenario. Although the market for bio-jet is currently very limited, and

Section - 4
KSA Fourth National Communication (NC4) 85
price information is also limited, bio-jet use is likely to grow rapidly in the coming decades. However, its widespread use will depend on a supportive regulatory framework and/or on significant carbon pricing. Widespread use will also require longer-term cost reductions, which are critical to close the gap with conventional jet fuel. Biofuels also tend to require subsidies and other market interventions to compete economically with fossil fuels, which creates deadweight losses in the economy.
4.5.4 Subsidies
Subsidies are often used to correcting market failures in the provision of low-carbon technologies and products, tending to support the introduction of new technologies, since social rates of return on Research & Development are often higher than private rates of return. This is because spill-overs are not fully internalized by industrial entities. They are also used to stimulate energy efficiency and renewable energy production; however, subsidies do not fully correct negative externalities but rather support the alternatives.
4.5.5 Direct Regulatory Approaches
There are approaches that must be complied with by industrial establishments that emit greenhouse gases. Some of them are the performance standards which provides for the maximum allowable emissions from particular processes or activities. Others include technology standards that require the application of pollution abatement technologies or production methods as well as product standards that define the characteristics of potentially polluting products, including labelling of appliances in buildings, industry, and the transport sector (Freeman and Kolstad, 2006).
4.5.6 Border Carbon Adjustment (BCA) and Carbon Leakage
Border carbon adjustment have been proposed to address concerns over competitive losses due to one country introducing a carbon tax while another country does not. They include border tax adjustments, trade tariffs and trade bans which are intended to compel countries to introduce carbon taxes which are detrimental to the interest of oil producing countries. Although border carbon adjustment may reduce emission leakage but it has the ability of BCA to shift cost from OECD to non-OECD countries (Böhringer, Christoph et al., 2012).
The European Commission, in order to meet its climate targets, has proposed plans for the world’s first carbon border tax on imports of some carbon-intensive products including steel, aluminum, cement, fertilizers and electricity. The border carbon tax is going to be imposed from 2026 with a transitional phase from 2023 – 2025. This tax is stated to be designed to protect European industries from competitors abroad whose manufacturers can produce at lower cost because they are not charged for their carbon output. Importers will be required to buy digital certificates representing the tonnage of carbon dioxide emissions embedded in the goods they import.
If carbon tariffs are levied on the full carbon content of traded goods, they can even increase rather than decrease the global cost of emission reduction. The main effect of carbon tariffs is to shift the economic burden of developed‐world climate policies to the developing world (Böhringer, C. et al., 2016). It has also been recognized that unilateral carbon pricing does cause carbon leakage through relocation of emission-intensive and trade-exposed industries to other regions (Böhringer, C. et al., 2019).

Section - 4
KSA Fourth National Communication (NC4) 86
4.5.7 Information Programmes
These include the provision of accurate and comprehensive information to producers and consumers on the costs and benefits of alternative options have the potential to reduce GHG emissions. Information instruments include governmental financing of research and public statistics, and awareness-raising campaigns on consumption and production choices (Mont and Dalhammar, 2005).
4.5.8 Government Provision of Public Goods & Services and Procurement
This policy instrument covers the financing of public goods and services by governments through the provision of energy efficient infrastructures and public transport services as well as the promotion of research and development (R&D) on mitigation approaches and removal of barriers could lead to emission reduction (Creutzig et al., 2011).
4.5.9 Voluntary Actions
These are agreements between governments and private parties on voluntary basis in order to achieve environmental objectives or improve environmental performance beyond compliance with regulatory obligations. They include industry agreements, self-certification, environmental management systems, and self-imposed targets (Borck and Coglianese, 2009).
4.6 Modelling Approaches
Several models are available to conduct the assessments, most of them focus on very specific elements of the global economy, such as production, consumption, international trade, or transport patterns in isolation. Some models are focused on testing the impact of measures on transport costs (UNCTAD, 2010), whereas other models are focused on the impact on transport activities (ITF/OECD, 2017), and future trade flows (Avetisyan, 2018; Cristea et al., 2013; Sheng et al., 2018). Hence, these models are often constrained in their ability to describe broader changes in interlinked systems. Three main models have been used to assess the effects of GHG mitigation measures on countries: economic trade models, transport models, and combined transport and trade models. Economic trade models describe the impact responses including international trade flow values (e.g., financial flows, such as investments), wider economic indicators (e.g., GDP), or both. Economic trade models include regression, input/output, and computable general equilibrium (CGE) models. Regression models are best used when data are limited, and the scope of analysis is focused on the short- and medium-term impacts on a single economic indicator or one particular sector. Transport models describe the responses of a transport system, which include the redistribution effect of trade flows due to changes in transport costs, conversion of trade values to weights, or mode and route choice of shippers. Transport models are best used when GHG mitigation measures are expected to induce changes in shippers’ transport choices, such as mode, route and port choice, next to changes in the patterns of international trade. Combined trade-transport models do provide detailed impact assessments of the major indicators for both transport and economic systems. This integration implies that the impacts of GHG mitigation measures both on transport and trade systems can be examined comprehensively. Combined models are best used when the scope of impact assessments include detailed transport and economic system responses at the global level. They do provide valuable insights when the impact of disruptive/strong GHG mitigation measures do lead to significant increases in transport costs as well as the

Section - 4
KSA Fourth National Communication (NC4) 87
redistribution of international trade. They are also helpful when parameters such as GDP, welfare, and the production/consumption of different sectors are of interest. Changes in shippers ‘behaviour (both choice of modes and routes) could affect the economies of countries that depend mainly on port operations and shipping industry (Halim, et. al., 2019)
Several models have been used to estimate the impact of climate mitigation activities on the economy of oil exporting countries. These include the Dynamic Panel Model (Dike, 2014), the G-cubed model (McKibbin et. al., 2011, McKibbin et. al., 2015), OPEC World Energy model (Ghanem et al., 1999) and MS-MRT model (Bernstein et al., 1999). They all projected that a positive relationship between global crude oil prices and carbon intensity of production and hence the linkages between crude oil prices and climate change mitigation activities both in the shorter and longer-term horizons. The IPCC also alluded to the fact that changes in carbon intensity as a result of CO2 reduction may affect oil prices and oil exporters’ economy (IPCC, 2007). Hence climate change response measures would adversely impact the economy of Saudi Arabia.
4.7 Summary of Information on Economic and Social Consequences of Response Measures
The scope and extent of some of the policies and measures that industrialized countries have pursued with the view to minimize the emissions of greenhouse gases have been summarized in Table 4.1. The table also summarizes the socio-economic impacts of these policy instruments and the assistance needed to address the barriers and challenges to mitigate the adverse effects of these response measures. The policy instruments outlined cover economic (or market) instruments which also include incentives that alter the conditions or behaviour of target groups and lead to a reduction in aggregate emissions of greenhouse gases with varying degree of effectiveness (Hahn and Anthoff, 2009). Others are the regulatory approaches, information programmes government provision of public goods and voluntary agreements which are implemented with the view to mitigate GHG emissions in the energy, transport, buildings, industry, AFOLU, human settlement and infrastructure sectors.
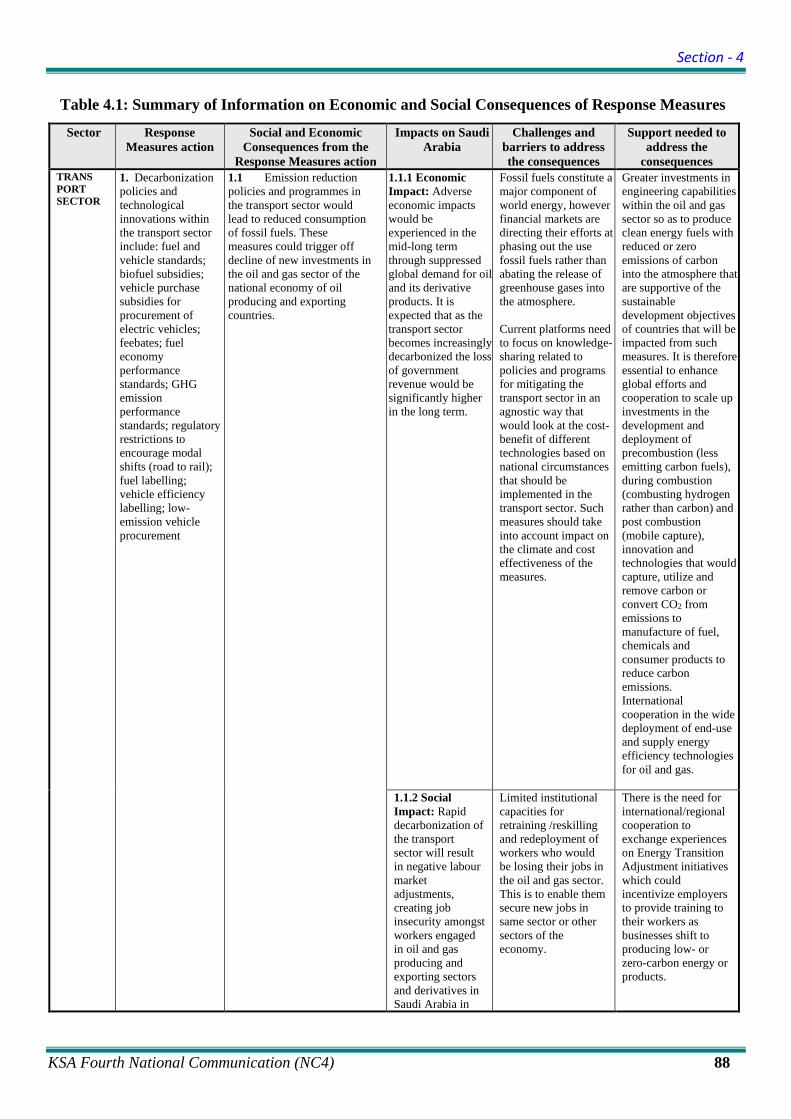
Section - 4
KSA Fourth National Communication (NC4) 88
Table 4.1: Summary of Information on Economic and Social Consequences of Response Measures
Sector Response Measures action
Social and Economic Consequences from the
Response Measures action
Impacts on Saudi Arabia
Challenges and barriers to address the consequences
Support needed to address the
consequences TRANS PORT SECTOR
1. Decarbonization policies and technological innovations within the transport sector include: fuel and vehicle standards; biofuel subsidies; vehicle purchase subsidies for procurement of electric vehicles; feebates; fuel economy performance standards; GHG emission performance standards; regulatory restrictions to encourage modal shifts (road to rail); fuel labelling; vehicle efficiency labelling; low-emission vehicle procurement
1.1 Emission reduction policies and programmes in the transport sector would lead to reduced consumption of fossil fuels. These measures could trigger off decline of new investments in the oil and gas sector of the national economy of oil producing and exporting countries.
1.1.1 Economic Impact: Adverse economic impacts would be experienced in the mid-long term through suppressed global demand for oil and its derivative products. It is expected that as the transport sector becomes increasingly decarbonized the loss of government revenue would be significantly higher in the long term.
Fossil fuels constitute a major component of world energy, however financial markets are directing their efforts at phasing out the use fossil fuels rather than abating the release of greenhouse gases into the atmosphere. Current platforms need to focus on knowledge-sharing related to policies and programs for mitigating the transport sector in an agnostic way that would look at the cost-benefit of different technologies based on national circumstances that should be implemented in the transport sector. Such measures should take into account impact on the climate and cost effectiveness of the measures.
Greater investments in engineering capabilities within the oil and gas sector so as to produce clean energy fuels with reduced or zero emissions of carbon into the atmosphere that are supportive of the sustainable development objectives of countries that will be impacted from such measures. It is therefore essential to enhance global efforts and cooperation to scale up investments in the development and deployment of precombustion (less emitting carbon fuels), during combustion (combusting hydrogen rather than carbon) and post combustion (mobile capture), innovation and technologies that would capture, utilize and remove carbon or convert CO2 from emissions to manufacture of fuel, chemicals and consumer products to reduce carbon emissions. International cooperation in the wide deployment of end-use and supply energy efficiency technologies for oil and gas.
1.1.2 Social Impact: Rapid decarbonization of the transport sector will result in negative labour market adjustments, creating job insecurity amongst workers engaged in oil and gas producing and exporting sectors and derivatives in Saudi Arabia in
Limited institutional capacities for retraining /reskilling and redeployment of workers who would be losing their jobs in the oil and gas sector. This is to enable them secure new jobs in same sector or other sectors of the economy.
There is the need for international/regional cooperation to exchange experiences on Energy Transition Adjustment initiatives which could incentivize employers to provide training to their workers as businesses shift to producing low- or zero-carbon energy or products.

Section - 4
KSA Fourth National Communication (NC4) 89
Sector Response Measures action
Social and Economic Consequences from the
Response Measures action
Impacts on Saudi Arabia
Challenges and barriers to address the consequences
Support needed to address the
consequences the short to medium term. Consequently, a situation arises where the number of job seekers increasingly far exceed the number of available jobs.
1.2 Greenhouse gas emission reduction programmes, policies and measures in the land transportation sector such as infrastructural network improvements and support for the deployment of lower carbon technologies (electric vehicles, railways and mass transit systems) are also expected to lead to decreased demand for fossil fuels.
Economic Impacts: Medium economic impact expected to be experienced in the mid-long term through reduced exports of oil and its derivatives with its attendant loss of fiscal revenue to the Kingdom.
Economic, institutional and social barriers inhibiting agnostic technologies and innovations in market for carbon neutral modes of land transportation consistent with the national circumstances.
International cooperation in Research, development and deployment of EVs, Hydrogen and advanced combustion vehicles while being technology agnostic, nationally compatible and cost effective with a view of maximum impact benefit to climate in the context of sustainable development.
Social Impact: Medium expected social impacts as a result of job losses within the hydrocarbon labour force as they transition to new low GHG emission sectors of the national economy. This often require higher educational level and the acquisition of specialized skills sets.
Inadequate specialized educational and professional institutions capable of retraining workers who lost their jobs in the oil and gas sector to enable them secure new jobs in other sectors of the economy.
ACROSS SECTORS Carbon and energy taxes
2. Carbon and energy tax is a price instrument that uses market mechanisms to pass the cost of emitting GHGs to emitters. Such instruments will constrain demand for energy resources and impact revenues.
2.1 The imposition of carbon and energy taxes do have the effect of generating revenue for governments of jurisdictions in which they are imposed. They also have the tendency to constrain energy resource consumption which leads to loss of revenue for oil producing countries. Economic and labor dislocations caused by the adverse effects of energy transition in the oil and gas sector of the economy.
2.1.1 Economic Impact: The implementation of carbon and energy taxes policies would have significant spillover adverse impacts on Saudi Arabia’s economic diversification agenda in the short term through diminishing global demand for energy resources. This scenario will encourage the Kingdom to utilize such energy resources taking into account best
Impact on the stability of the international oil markets. Reliance on one export product as main source of fiscal revenue. Lack of international cooperation in the development of models for quantitative ex- ante and ex-post analysis of impacts and co-benefits of such measures.
Support for developing appropriate financial risk management tools and approaches to address short- and long-term impacts of carbon tax on various developing countries. Support for conducting rigorous and comprehensive scientific studies to model, predict and evaluate the impacts of carbon tax in various countries that rely heavily on one sector for their development including oil and gas exporters. Technological

Section - 4
KSA Fourth National Communication (NC4) 90
Sector Response Measures action
Social and Economic Consequences from the
Response Measures action
Impacts on Saudi Arabia
Challenges and barriers to address the consequences
Support needed to address the
consequences available technologies in order to diversify its economy vertically in the oil and gas sector. A heavy industrial base will be built to use domestic oil resources as feedstock or energy source. Increasing contributions of petrochemical, cement, reduction in revenues from hydrocarbon exports. This may trigger off a situation where Saudi Arabia having to rely on Scenario 2 outlined in the Kingdom’s submitted first NDC (i.e., accelerated domestic mining and metal production industries to the national economy).
advances in the clean energy abatement for capture and utilization of hydrocarbon energy resources as well as recovery and transformation of greenhouse gas emissions will be required in order to ensure that the usage of these resources will be environmentally sustainable with minimal impact to our environment and our quality of life.
2.1.2 Social Impacts: Medium social impacts are expected in the medium to long term for economic diversification, labour force in oil exporting sectors and its derivatives as they transition to new sectors of the economy.
Cooperate in research and development efforts to remove barriers to the wider deployment of carbon capture and storage and other technologies that can reduce the carbon intensity of Saudi Arabia exports of hydrocarbons.
Implement equivalent measures (mitigation co-benefits of adaptation measures) in Saudi Arabia and seek international cooperation for recognition of equivalent measures
Subsidies to encourage the production or consumption of low-carbon technologie
3 Subsidies (production, consumption and export) are incentives given by the governments to specific industries or businesses in the form of cash,
3.1 These policy instruments tend to decrease the consumption and consequently global energy resources demand. The price of hydrocarbons will both plummets and Saudi Arabia’s market share and the revenue derived from oil and its
3.1.1 Economic Impact: Expected medium economic impact in the medium to long term as these subsidies exerts an adverse impact on the economic
Lack of relevant data and modeling tools and expertise to estimate the extent of the impact of subsidies for the production or consumption of low-carbon technologies or goods on the Saudi
Address all subsidies that are counterproductive to climate action in a manner that would sustain economic growth. Develop methods of post facto evaluation

Section - 4
KSA Fourth National Communication (NC4) 91
Sector Response Measures action
Social and Economic Consequences from the
Response Measures action
Impacts on Saudi Arabia
Challenges and barriers to address the consequences
Support needed to address the
consequences s or goods (including all production processes, products, and services that are conducive to energy conservation and emission reduction)
grants, or tax breaks with the aim of keeping the prices of low-carbon technologies or goods and services low to encourage production, consumption and export.
derivatives will be negatively affected.
diversification initiatives due to reduced demand for oil and derivative products. The loss of government revenue also affects resources available to promote just transition of the work force and their communities in Saudi Arabia.
economy. Impacts on international oil markets. Reliance on single export product as a main source of government revenue stream.
of impacts Support research, innovation, technology development and capacity building for enhancing economic diversification and adaptation initiatives, Low carbon advanced fossil-fuel technologies and for non-energy uses of fossil fuels and crude oil conversion to high-value petrochemical feedstocks.
3.1.2 Social Impacts: Medium adverse impact of the social welfare of the labour force and their respective communities directly or indirectly dependent on the energy and related industries due to loss of jobs and incomes.
Cooperation in establishing favourable international investment environment in the sectors suitable for economic diversification and adaptation initiatives. There is also the need for just transition of the work force and communities in Kingdom of Saudi Arabia.
Renewable Energy Support Schemes.
4 These policy instruments include such as feed-in tariffs, investment programs, direct subsidies, tax breaks and electricity market reforms as well as biofuel production mandates and renewable fuel standards
4.1 Renewable Energy Renewable energy support schemes may limit demand for energy resources and derivatives, but only if they replace or crowd out demand for oil-based energy (for example petroleum-fueled electricity generation). Biofuel and renewable fuels will become more competitive compared to the oil and the oil market share and the revenue streams of Saudi Arabia will be negatively affected.
4.1.1 Economic Impact: Low-to-medium expected economic impact in the medium to long term through reduced exports of oil and its derivatives, due to current low percentage of oil- powered electricity generation in many developed countries.
Lack of modeling of impacts of renewable energy support schemes.
Lack of methods of post facto evaluation of impacts of Response Measures.
Resilience of Renewable Energy support schemes which meet multiple objectives not only aim at climate.
Limited opportunities for international cooperation in sharing experiences on the experiences on the provision of the requisite knowledge and skill needed by the labour force to transition to newer business and job opportunities in the renewable energy sector consistent with the developmental
Ensure compliance with international trade and other agreements.
Promote interaction of Saudi Arabia energy actors in RE support schemes in other jurisdictions
Support for conducting rigorous and comprehensive scientific studies to model, predict and evaluate the impacts of biofuel production mandates and renewable fuel standards for the Kingdom.
4.1.2 Social Impact: Medium social impacts are expected in the short to medium term for labour force in oil exporting sectors and its derivatives as they transition to new sectors of the economy.
Cooperation to exchange experiences on how to provide the labour force with the requisite knowledge and skill needed to enable them secure new business and job opportunities in the renewable energy sector.

Section - 4
KSA Fourth National Communication (NC4) 92
Sector Response Measures action
Social and Economic Consequences from the
Response Measures action
Impacts on Saudi Arabia
Challenges and barriers to address the consequences
Support needed to address the
consequences needs of Saudi Arabia.
Emissions Trading System (ETS), such as cap-and-trade schemes
5 This is a market instrument for reducing emissions of CO2 and other greenhouse gases, to combat climate change. Policymakers establish how many total tonnes of CO2 a group may emit. Any entity belonging to the group and producing GHG emissions is given an emissions allowance for every tonne of GHG emitted. It is a system designed to cost-effectively reduce GHG emissions
5.1 Kingdom of Saudi Arabia industries and consumers that depend on imports of raw materials, processed goods and finished goods from the jurisdictions with emissions trading systems, would be faced with increased prices of imports as carbon costs are incorporated into production costs. The severity of the impact depends strongly on cost containment policies enacted in the jurisdiction implementing emissions trading. Currently, Emissions Trading System (in different jurisdictions cover a variety of sectors such as energy and carbon intensive industries (e.g. glass, steel, chemicals). Free allocation is a measure to address carbon leakage and competitive concerns for industries covered by an ETS. However, under certain conditions, free allocation for an ETS could constitute support for sectors and actors, beyond the costs imposed by emission trading which in this case constitute State support. This gives those sectors and actors, a competitive advantage in the international arena and could affect Saudi Arabia industries, such as the petrochemical industry, which is competing with sectors covered by ETS and which receive free allocation.
5.1.1 Economic Impact: This phenomenon could lead to medium expected economic impact in the short-to-mid-term for the sector due to expected job losses. 5.1.2 Social Impacts: There would be some high expected social impacts for workers in affected sectors, such as oil production and chemical industry.
Unwillingness of countries applying such schemes to transparently share information and expertise on carbon pricing, their negative impacts on the international pricing of raw materials, processed goods and finished goods as it affects Saudi Arabia.
Lack of interest/ motivation on the part of industrialized countries to address the adverse impacts of Response Measures (RM) in ETS in all implementing jurisdictions
Lack of interest from AI Parties to support capacity building activities in developing countries to accurately analyze and identify actions needed to minimize the impact of carbon pricing in other jurisdictions on the economy of Saudi Arabia.
Lack of support and cooperation on the part of developed countries to assist in developing models to verify and quantify both ex-ante and ex- post adverse impacts of RM including free allocation.
Lack of interest of developed countries to share data and information of the impact of free allocation on economic sectors in ETS implementing jurisdictions on developing countries such as Saudi Arabia.
Support to develop the requisite capacity to enable Saudi Arabia to effectively participate in carbon markets consistent with its development priorities and economic diversification initiatives.
Continued support to facilitate investment in and focus on lowering the GHG intensity of the Kingdom of Saudi Arabia products for export and the domestic market.
Cooperate in the development of general tools to address comprehensively, the impacts of identified response measures on the economy of developing countries that have limited diversification of their economies to identify appropriate economic diversification initiatives.
Capacity building to assess the impacts of carbon prices on international pricing of raw materials, processed goods and finished goods for developing countries that have limited economic diversification.

Section - 4
KSA Fourth National Communication (NC4) 93
Sector Response Measures action
Social and Economic Consequences from the
Response Measures action
Impacts on Saudi Arabia
Challenges and barriers to address the consequences
Support needed to address the
consequences Border Carbon Adjustments (BCA) or Embodied Carbon Tariffs (ECT)
6 A border carbon-adjustment tax or destination tax is a carbon tax on goods based on location of final consumption rather than the location of production. The tax could be imposed on imports of carbon-intensive goods such as steel and cement. It is therefore designed to protect carbon-intensive domestic industries from foreign competitors and reduce the rationale for industries to relocate production overseas to avoid higher costs, preserving domestic jobs (carbon leakage). Border adjustments will be immensely complex and costly to implement. For example, it will be very difficult to calculate the carbon content of a car produced overseas, noting that the car will have components produced by a number of suppliers, through a variety of methods and from many source countries.
6.1 Carbon border adjustment mechanisms will shift cost of affected items from developed economies to developing countries making their goods exported to industrialized nations more expensive. This will lead to loss of export earnings and would also result in job losses
6.1.1 Economic Impact: Saudi Arabia has to carry the burden of carbon emission reduction in order to maintain competitiveness of its products. The demand of Saudi products may decrease in the BCA or ECT implementing countries. This will constrain energy resource consumption which may decrease in order to reduce carbon footprints and consequently, the world hydrocarbon demand and price will decrease. This will impact the revenue of Saudi Arabia negatively. In addition, the trade balance will be impacted negatively since the revenues will be reduced and the commodity prices will increase.
Lack of agreement on the correct forum to challenge the legal; and technical basis of a BCA (WTO or UNFCCC)
A better understanding on how to comply technically with BCA specificities, once formulated.
Need for capacity building and transfer of technology to compete in the global marketplace in terms of carbon footprint of product and services.
Support for conducting rigorous and comprehensive scientific studies to model, predict and evaluate the impacts of BCA and ECT on developing countries with limited diversification.
Support for developing appropriate financial risk management tools and approaches to address short- and long-term financial instability focusing on the impacts of BCA and ECT on developing countries with limited diversification.
6.1.2 Social Impacts: The social welfare including employment of the population directly or indirectly dependent on the energy and related industries will be negatively impacted. Due to the compound and spillover impacts, the overall social and economic consequences are expected to be moderate.
Carbon labeling scheme (CLS)
7 Carbon labelling scheme is a policy tool designed to reveal lifecycle-
7.1 The energy resource utilization may decrease in order to reduce carbon footprints and consequently,
7.1.1 Economic Impact: Medium economic impact expected to be
Insufficient scientific studies to model, predict and evaluate the impacts of
Support for developing appropriate financial risk management tools and

Section - 4
KSA Fourth National Communication (NC4) 94
Sector Response Measures action
Social and Economic Consequences from the
Response Measures action
Impacts on Saudi Arabia
Challenges and barriers to address the consequences
Support needed to address the
consequences based carbon emissions of a product or service, with the view to encourage transition of low carbon consumption and production. This policy is being implemented by several developed countries to promote transition to decarbonization Lifecycle-based carbon foot printing is a cornerstone of a carbon labelling scheme, however, the system boundary for a specific product or service is difficult to define, causing uncertainties and decrease the credibility of the CLS.
the world energy resource demand will decrease, and its price will also decrease. As a result of compound and spill over impacts, the overall social and economic consequences are expected. The price of Saudi products will increase in the CLS implementing countries due to costs associated with measuring emissions and verifying measurements. As a result, the demand of Saudi products may decrease as a result of CLS in these jurisdictions.
experienced in the mid to long-term through loss of revenue. 7.1.2 Social Impact: There would be high social impacts are expected in the medium to longer term for the labour force in the oil and gas sector due to loss of employment. These cause involuntary disruption workers' life trajectories as well as adverse impacts on their families and communities, even as the work force transition to new jobs in other sectors of the economy.
CLS on Saudi Arabia. approaches to address short- and long-term financial instability focusing on the impacts of CLS on developing countries with limited diversification.
Cooperate in research into areas such as optimization of life cycle assessment for labeling accreditation, improvement of labeling visualization at a minimum cost and supportive of the development needs of on developing countries with limited diversification.

Section - 4
KSA Fourth National Communication (NC4) 95
4.8 Enabling Policies
The Kingdom of Saudi Arabia, through its King Abdullah Petroleum Studies and Research Center (KAPSARC) has developed an innovative mechanism compatible with Article 6 of the Paris Agreement that creates a carbon storage unit (CSU) as an added financial incentive for the storage end of the carbon capture and storage value chain. Pricing the value of carbon removal provides an additional incentive to commercialize storage technology. It also facilitates a move away from linear thinking about solely reducing emissions toward a frame of thinking where both the value of emissions and removals are priced (Zakkour and Heidug 2019).
With global demand for energy growing into the future, sustainable and responsible energy development is crucial to achieving shared goals. According to main energy outlooks, fossil fuels will continue to play a major role in the future energy mix, and the carbon dioxide (CO2) and other greenhouse gas emissions must be managed appropriately to meet Sustainable Development Goals and keep global warming within acceptable thresholds. Although the adoption of renewable energy technologies and electrification of transport along with associated efficiency efforts are part of the solution towards achieving shared goals, the role of CO2 emissions from oil and gas operations cannot be ignored. One way to absorb such emissions is through Carbon Capture, Utilization and Storage or CCUS which is a set of technologies that capture CO2 emissions at source, preventing them from entering the atmosphere, or capturing them directly from the air. The CO2 emissions are then turned into value-added products and processes or stored underground.
Carbon emissions can be turned into value-added products including plastics, blue hydrogen, fertilizers and used in building materials to reduce emission into the atmosphere (IEA, 2019). Carbon emissions are already reused for enhanced oil and gas recovery and to generate heat and power more optimally or produce synthetic fuels. Recycling CO2 to produce other energy sources (Green hydrogen) and materials while simultaneously removing emissions from the atmosphere through nature-based solutions helps to enhance carbon efficiency and restores the carbon balance of the global economy (WRI, 2020).
4.9 International Cooperation for Technology and Knowledge Development, Transfer and Diffusion
Technology-related policies could play a significant role in an international climate regime (de Coninck et al., 2008). Such policies should incentivize participation in international climate agreements by facilitating access to climate-change-mitigating technologies or funding to cover the additional costs of such technologies. The role of international cooperation in facilitating technological change, including access to, facilitation of, and transfer of technology, is explicitly recognized in Article 4 paragraph (1c) and (1h), Article 4 paragraphs 5, 7, 8, and 4 9 of the UNFCCC. Article 4 paragraph 5 states that “The developed country Parties and other developed Parties included in Annex II shall take all practicable steps to promote, facilitate and finance, as appropriate, the transfer of, or access to, environmentally sound technologies and know-how to other Parties, particularly developing country Parties”.

Section - 4
KSA Fourth National Communication (NC4) 96
4.10 Summary
As international efforts aimed at achieving the goal of the Paris Agreement begins to gain momentum, in the period up to 2024, increasing number of developing countries would be urged to ratchet up their ambitions as contained in their nationally determined contributions submitted to the UNFCCC. This initiative would undoubtedly result in many developing countries experiencing adverse socio-economic impacts associated with the implementation of climate change response measures, including the increase of gap in international inequality. It is essential to minimize the direct and indirect negative effects of these mitigation policies by creating a greater understanding of the complex economic and social aspects in a balanced manner with environmental benefits gained by climate change response while ensuring that inequalities will not exacerbate in a post Paris Agreement era. This is a major concern for many developing countries that have limited diversification and rely on sectors that would be impacted by response measures such as tourism, agriculture and energy resource exports. Additionally, there is a growing set of economic, legal and other policies and measures implemented by developed economies that would have significant adverse impacts on the efforts by developing countries with limited diversification to achieve its sustainable development goals by 2030. It is therefore important for all Parties to the climate change agreements work collaboratively to mitigate if not avoid the negative impacts of response measures particularly on countries whose economies are dependent on the exports of hydrocarbons. Global efforts and cooperation should be directed at scaling up investments to develop and deploy carbon capture and utilization technologies that promote the conversion of carbon dioxide into the manufacture of fuels, chemicals and consumer products to reduce carbon emissions and raise resilience of these countries. The development of appropriate financial risk management tools capable of addressing the challenges posed by climate response measures. Greater cooperation in the development of comprehensive modelling tools to assess the socio-economic impacts of mitigation policies on developing countries would contribute immensely to efforts to mitigate the impacts of response measures. These should include efforts aimed at facilitating the just transition of such countries.
To raise its resilience to mitigate these adverse impacts, Saudi Arabia has embarked on a sustained and rigorous operationalization of its development through a future looking blue print namely the Saudi Vision 2030 which is designed to diversify the Kingdom’s economy away from single resource by focusing on many sectors of the national economy, namely Tourism, Industry, Mining, Energy and Logistics etc. International support, financial flows and cooperation are needed to help developing countries assess the scope and extent of the adverse impacts of climate change response as well as actions to mitigate them. In this way the Kingdom of Saudi Arabia would be able to play its part as member of the international community in addressing the challenges posed by the implementation of the climate change agreement so that it will be able to deliver the expected environmental, social and economic benefits that all Parties to the UNFCCC aspire to achieve.

Section - 4
KSA Fourth National Communication (NC4) 97
References:
1. Avetisyan, Misak. (2018). Impacts of global carbon pricing on international trade, modal choice and emissions from international transport. Energy Economics, 76, 532-548. https://doi.org/10.1016/j.eneco.2018.10.020
2. Barrett S. (2003). Environment and Statecraft: The Strategy of Environmental Treaty-Making. Oxford University Press, Oxford, UK, New York, 427 pp. ISBN: 0199257337.
3. Barrett S. (2007), Why Cooperate? The Incentive to Supply Global Public Goods. Oxford University Press, New York, ISBN: 978-0199211890.
4. Bauer N., I. Mouratiadou, L. Baumstark, R. J. Brecha, O. Edenhofer, and E. Kriegler (2013). Global Fossil Energy Markets and Climate Change Mitigation — An Analysis with ReMIND. Climatic Change, 14. doi: DOI 10.1007 / s1058 4 – 013 – 0901 – 6, ISSN: 1573-1480.
5. Bernstein, P. M., Montgomery, W. D and Rutherford, T. F. “Global impacts of the Kyoto agreement: results from the MS-MRT model,” Resource and Energy Economics, vol. 21, no. 4, pp. 375–413, 1999.
6. Böhringer, Christoph & Balistreri, Edward & Rutherford, Thomas. (2012). The Role of Border Carbon Adjustment in Unilateral Climate Policy: Overview of An Energy Modeling Forum Study (EMF 29). Energy Economics. 34. S97–S110. 10.1016/j.eneco.2012.10.003.
7. Böhringer, Christoph & Carbone, Jared & Rutherford, Thomas. (2016). Embodied Carbon Tariffs. The Scandinavian Journal of Economics. 120. 10.1111/sjoe.12211.
8. Bohringer, Christoph and Rosendahl, Knut Einar and Storrøsten, Halvor Briseid, Smart Hedging against Carbon Leakage (2019). CESifo Working Paper No. 7915: https://ssrn.com/abstract=3480921
9. Borck, Jonathan C. and Coglianese, Cary, Voluntary Environmental Programs: Assessing Their Effectiveness (Nov 2009): https://ssrn.com/abstract=1599088 OR http://dx.doi.org/10.1146/annurev.environ.032908.091450
10. Brousseau E., T. Dedeurwaerdere, P.-A. Jouvet, M. Willinger, and Marc Willinger, (Eds.) (2012). Global Environmental Commons: Analytical and Political Challenges in Building Governance Mechanisms. Oxford University Press, Oxford, ISBN: 978-0199656202.
11. Brunner S., C. Flachsland, and R. Marschinski (2012). Credible commitment in carbon policy. Climate Policy 12, 255 – 271. doi: 10.1080 / 14693062.2011.582327, ISSN: 1469-3062.
12. Byrne J., and L. Glover (2002). A common future or towards a future commons: Globalization and sustainable development since UNCED. International Review of Environmental Strategies 3, 5 – 25. ISSN: 13457594.
13. Carraro, C. (2016). Climate change: Scenarios, impacts, policy, and development opportunities [Supplemental material]. Agricultural Economics, 47, 149–157.
14. CDKN, 2015, Climate Change and Trade; https://cdkn.org/wp-content/uploads/2015/04/Climate-Change-and-Trade.pdf

Section - 4
KSA Fourth National Communication (NC4) 98
15. Corbett, James J., and James J. Winebrake. “The Role of International Policy in Mitigating Global Shipping Emissions.” The Brown Journal of World Affairs, vol. 16, no. 2, 2010, pp. 143–154. JSTOR www.jstor.org/stable/24590915. Accessed 23 Feb. 2021.
16. Creutzig F., E. McGlynn, J. Minx, and O. Edenhofer (2011). Climate policies for road transport revisited (I): Evaluation of the current framework. Energy Policy 39, 2396 – 2406: http://www.sciencedirect.com/science/article/pii/S0301421511000760
17. Cristea, Anca, Hummels, David and Puzzello, Laura & Avetisyan, Misak (2013). Trade and the greenhouse gas emissions from international freight transport. Journal of Environmental Economics and Management, 65(1), 153-173: https://doi.org/10.1016/j.jeem.2012.06.002
18. de Coninck, Heleen & Fischer, Carolyn & Newell, Richard & Ueno, Takahiro. (2008). International technology-oriented agreements to address climate change. Energy Policy. 36. 335-356. 10.1016/j.enpol.2007.09.030.
19. Dike, J. C., (2014) "Does Climate Change Mitigation Activity Affect Crude Oil Prices? Evidence from Dynamic Panel Model", Journal of Energy, vol. 2014, Article ID 514029, 9 pages, 2014. https://doi.org/10.1155/2014/514029
20. Droege, Susanne. (2012). The challenge of reconciliation: climate change, development, and international trade. Climate Policy - CLIM POLICY. 12. 524-526. 10.1080/14693062.2012.688523.
21. Ekener-Petersen, E., Höglun, J., & Finnveden, G. (2014). Screening potential social impacts of fossil fuels and biofuels for vehicles. Energy Policy, 73, 416–426.
22. Freeman J., and C. D. Kolstad (2006). Moving to Markets in Environmental Regulation: Lessons from Twenty Years of Experience. Oxford University Press, Oxford; New York, 488 pp. ISBN: 0195189655.
23. Ghanem, S., Lounnas, R. and Brennand, G (1999). “The impact of emissions trading on OPEC,” OPEC Review June, vol. 23, no. 2, pp. 79–112, 1999.
24. Goldstein J., and L. L. Martin (2000). Legalization, trade liberalization, and domestic politics: A cautionary note. International Organization 54, 603 – 632. doi: 10.1162 / 002081800551226.
25. Gomez-Echeverri, L. (2018). Climate and development: Enhancing impact through stronger linkages in the implementation of the Paris agreement and the sustainable development goals (SDGs). Philosophical Transactions of the Royal Society A: Mathematical, Physical and Engineering Sciences, 376, 20160444.
26. Gupta E. (2012). Global warming and electricity demand in the rapidly growing city of Delhi: A semi-parametric variable coefficient approach. Energy Economics 34, 1407 – 1421. doi: 10.1016 / j.eneco.2012.04.014, ISSN: 0140-9883.
27. Hahn, Robert & Anthoff, David. (2009). Government Failure and Market Failure: On the Inefficiency of Environmental and Energy Policy. Regulation 2 point 0, Working Papers. 26. 10.2139/ssrn.1507149.
28. Halim, Ronald Apriliyanto; Smith, Tristan; Englert, Dominik Paul.2019. Understanding the Economic Impacts of Greenhouse Gas Mitigation Policies on Shipping: What is the

Section - 4
KSA Fourth National Communication (NC4) 99
State of the Art of Current Modeling Approaches? Executive Summary for Policy-Makers in International Maritime Transport (English). Washington, D.C.: World Bank Group. http://documents.worldbank.org/curated/en/718061546900387225/Understanding-the-Economic-Impacts-of-Greenhouse-Gas-Mitigation-Policies-on-Shipping-What-is-the-State-of-the-Art-of-Current-Modeling-Approaches-Executive-Summary-for-Policy-Makers-in-International-Maritime-Transport.
29. Hallegatte, S., Bangalore, M., Bonzanigo, L., Fay, M., Kane, T., Narloch, Ulf, Vogt-Schilb, A. (2016). Shock waves: Managing the impacts of climate change on poverty: Climate change and development. Washington, DC: World Bank: https://openknowledge.worldbank.org/handle/10986/22787
30. IEA (2010). Energy Technology Perspectives 2010: Scenarios and Strategies to 2050. International Energy Agency, Paris, 650 pp: www.iea.org/techno/etp/etp10/English.pdf.
31. IEA (2019) Putting CO2 to Use- Creating value from emissions. https://www.iea.org/reports/putting-co2-to-use
32. IPCC, 2007, Contribution of Working Group III to the Fourth Assessment Report. B. Metz, O.R. Davidson, P.R. Bosch, R. Dave, L.A. Meyer (eds), Cambridge University Press, Cambridge, UK, 2007.
33. IPCC, 2014: Climate Change (2014): Mitigation of Climate Change. Contribution of Working Group III to the Fifth Assessment Report of the Intergovernmental Panel on Climate Change [Edenhofer, O., R. Pichs-Madruga, Y. Sokona, E. Farahani, S. Kadner, K. Seyboth, A. Adler, I. Baum, S. Brunner, P. Eickemeier, B. Kriemann, J. Savolainen, S. Schlömer, C. von Stechow, T. Zwickel and J.C. Minx (eds.)]. Cambridge University Press, Cambridge, United Kingdom and New York, NY, USA
34. IRENA (2017), Biofuels for aviation: Technology brief, International Renewable Energy Agency. https://www.irena.org/-/media/Files/IRENA/Agency/Publication/2017/IRENA_Biofuels_for_Aviation_2017.pdf
35. ITF/OECD. (2017). ITF Transport Outlook 2017. https://www.itf-oecd.org/transport-outlook-2017.
36. Jacoby H. D., M. H. Babiker, S. Paltsev, and J. M. Reilly (2010). Sharing the burden of GHG reductions. In: Post-Kyoto International Climate Policy: Implementing Architectures for Agreement. J. E. Aldy, R. N. Stavins, (eds.), Cambridge University Press, Cambridge, UK, pp. 753 – 785. ISBN: 978-0521137850.
37. Jakob, M., & Steckel, C. (2014). How climate change mitigation could harm development in poor countries. Wiley Interdisciplinary Reviews: Climate Change, 5, 161–168.
38. Kalkuhl M., and R. J. Brecha (2013). The carbon rent economics of climate policy. Energy Economics 39, 89 – 99. doi: 10.1016 /j.eneco.2013.04.008.
39. Karlsson-Vinkhuyzen S. I., and J. McGee (2013). Legitimacy in an Era of Fragmentation: The Case of Global Climate Governance. Global Environmental Politics 13, 56 – 78. doi: 10.1162 / GLEP_a_00183, ISSN: 1526-3800.

Section - 4
KSA Fourth National Communication (NC4) 100
40. Kaul I., I. Grunberg, and M. Stern (Eds.) (1999). Global Public Goods: International Cooperation in the 21st Century. Oxford University Press, New York, ISBN: 978-0195130515.
41. Kaul I., P. Conceicao, K. Le Goulven, and R. Mendoza (Eds.) (2003). Providing Global Public Goods: Managing Globalization. Oxford University Press, New York, ISBN: 978-0195157406.
42. Kosov, M. E., Akhmadeev, R. G., Smirnov, V.M., Popkov, S. Y. and Rycova, I. N. (2017): Hydrocarbon Market in Countries with Developing Economy: Development Scenario, International Journal of Energy Economics and Policy, 2017, 7(6), 128-135
43. Lin, B and Li, Xuehui. (2011). The effect of carbon tax on per capita CO2 emissions. Energy Policy. 39. 5137-5146. 10.1016/j.enpol.2011.05.050.
44. Marcu, A., & Vangenechten, D. (2018). Managing a sustainable transition to a low-carbon society: The socio-economic impacts of mitigation policies. Geneva: International Centre for Trade and Sustainable Development (ICTSD): https://www.ictsd.org/sites/default/files/research/climate_and_energy_-_managing_a_sustainable_transition_to_a_low-carbon_society_final.pdf
45. McDonough, W (2016). Carbon is not the enemy. Nature. 539. 349-351. 10.1038/539349a
46. McKibbin, W., A. Morris, and P. Wilcoxen (2011). Comparing Climate Commitments: A Model-Based Analysis of the Copenhagen Accord. Climate Change Economics, Vol. 2, No. 2, pp.79-103.
47. McKibbin, W. J., Morris, A., and Wilcoxen P. J. (2015). “Pricing Carbon” in COP21 in Paris: What to Expect – The Issues, the Actors, and the Road Ahead on Climate Change, pp. 14-18. The Brookings Institution, Washington DC.
48. Mont, O. and Dalhammar, C. (2005), Sustainable consumption: at the cross-road of environmental and consumer policies, International Journal of Sustainable Development, 8, (4), 258-279
49. Posner E., and D. Weisbach (2010). Climate Change Justice. Princeton University Press, Princeton, ISBN: 978-0691137759.
50. Sandler T. (2004). Global Collective Action. Cambridge University Press, Cambridge, UK, ISBN: 978-0521542548.
51. Schmalensee R. (2010). Epilogue. In: Post-Kyoto International Climate Policy: Implementing Architectures for Agreement. J. E. Aldy, R. N. Stavins, (eds.), Cambridge University Press, Cambridge, UK, pp. 889 – 898. ISBN: 978-0521137850.
52. Sheng, Yu, Shi, Xunpeng Shi and Su, Bin (2018). Re-analyzing the economic impact of a global bunker emissions charge. Energy Economics, 74, 107-119: https://doi.org/10.1016/j.eneco.2018.05.035
53. Stavins R. N. (2011). The problem of the commons: Still unsettled after 100 Years. American Economic Review 101, 81 – 108. doi: 10.1257 / aer.101.1.81.
54. Stewart R., and J. Wiener (2003). Reconstructing Climate Policy: Beyond Kyoto. AEI Press, Washington, D. C., ISBN: 978-0844741864.
55. Sumner J., Bird L. and Dobos H, Clim. Carbon taxes: a review of experience and policy design considerations Policy, 11 (2) (2009), pp. 922-943

Section - 4
KSA Fourth National Communication (NC4) 101
56. UNCTAD. (2010). Oil Prices and Maritime Freight Rates: An Empirical Investigation Technical report by the UNCTAD secretariat. Geneva, Switzerland; https://unctad.org/system/files/official-document/dtltlb20092_en.pdf
57. UNFCCC (2020), Response Measures; https://unfccc.int/topics/mitigation/workstreams/response-measures
58. Ürge-Vorsatz, D., Tirado Herrero, S., Dubash, N., & Lecocq, F. (2014). Measuring the co-benefits of climate change mitigation. Annual Review of Environment and Resources, 39, 549–582.
59. von Stechow, C., McCollum, D., Riahi, K., Minx, J., Kriegler, E., van Vuuren, D., Edenhofer, O. (2015). Integrating global climate change mitigation goals with other sustainability objectives: A synthesis. Annual Review of Environment and Resources, 40, 363–394.
60. World Commission on Environment and Development. (1987). Our common future. Oxford: Oxford University Press.
61. WRI (2010) Six Ways to Remove Carbon Pollution from the Sky https://www.wri.org/blog/2020/06/6-ways-remove-carbon-pollution-sky
62. Zakkour, Paul and Heidug, W., 2019 A Mechanism for CCS in the Post-Paris Era: Doi: 10.30573/KS-2019-DP52; Piloting Results-Based Finance and Supply Side Policy Under Article 6.

Section - 5
KSA Fourth National Communication (NC4)
SECTION 5
Impact Analysis of Climate Change on Water Resources and Identification and Appraisal of
Appropriate Adaptation Measures
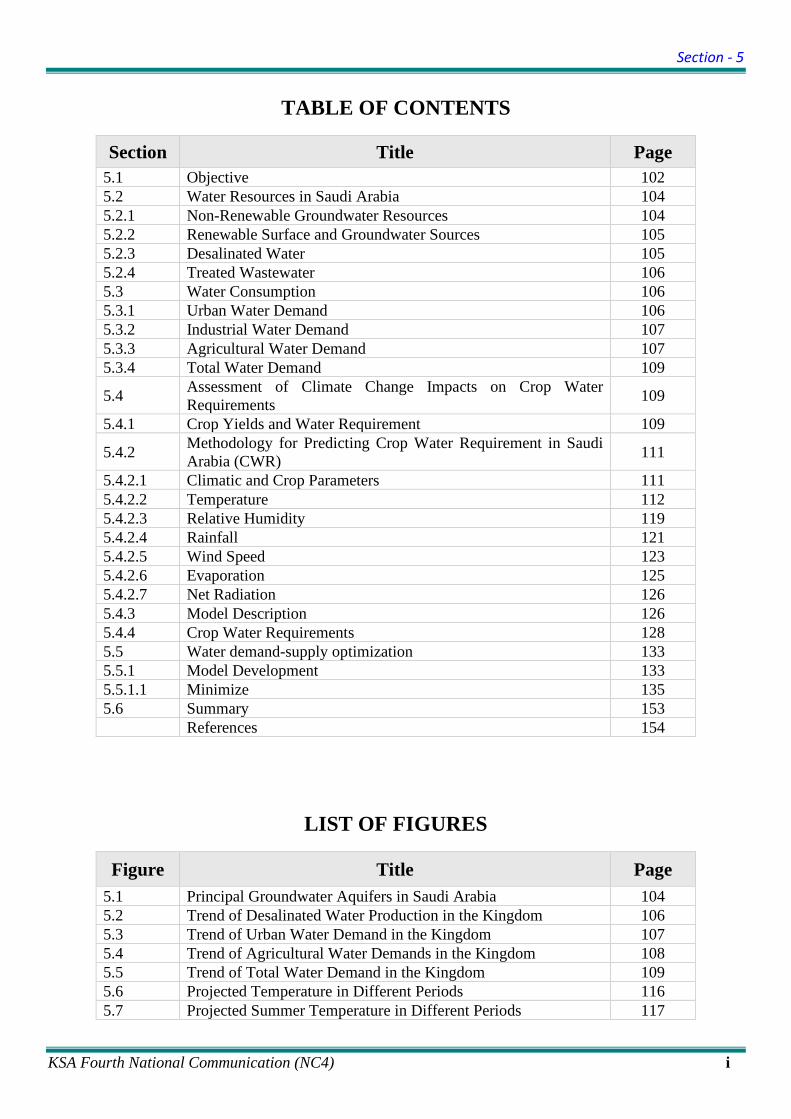
Section - 5
KSA Fourth National Communication (NC4) i
TABLE OF CONTENTS
Section Title Page 5.1 Objective 102 5.2 Water Resources in Saudi Arabia 104 5.2.1 Non-Renewable Groundwater Resources 104 5.2.2 Renewable Surface and Groundwater Sources 105 5.2.3 Desalinated Water 105 5.2.4 Treated Wastewater 106 5.3 Water Consumption 106 5.3.1 Urban Water Demand 106 5.3.2 Industrial Water Demand 107 5.3.3 Agricultural Water Demand 107 5.3.4 Total Water Demand 109
5.4 Assessment of Climate Change Impacts on Crop Water Requirements 109
5.4.1 Crop Yields and Water Requirement 109
5.4.2 Methodology for Predicting Crop Water Requirement in Saudi Arabia (CWR) 111
5.4.2.1 Climatic and Crop Parameters 111 5.4.2.2 Temperature 112 5.4.2.3 Relative Humidity 119 5.4.2.4 Rainfall 121 5.4.2.5 Wind Speed 123 5.4.2.6 Evaporation 125 5.4.2.7 Net Radiation 126 5.4.3 Model Description 126 5.4.4 Crop Water Requirements 128 5.5 Water demand-supply optimization 133 5.5.1 Model Development 133 5.5.1.1 Minimize 135 5.6 Summary 153 References 154
LIST OF FIGURES
Figure Title Page 5.1 Principal Groundwater Aquifers in Saudi Arabia 104 5.2 Trend of Desalinated Water Production in the Kingdom 106 5.3 Trend of Urban Water Demand in the Kingdom 107 5.4 Trend of Agricultural Water Demands in the Kingdom 108 5.5 Trend of Total Water Demand in the Kingdom 109 5.6 Projected Temperature in Different Periods 116 5.7 Projected Summer Temperature in Different Periods 117

Section - 5
KSA Fourth National Communication (NC4) ii
Figure Title Page 5.8 Projected Winter Temperature in Different Periods 118 5.9 Projected Relative Humidity (%) in Different Periods 120 5.10 Projected Monthly Average Rainfall (mm) in Different Periods 122 5.11 Projected Wind speed (km/h) in Different Periods 124 5.12 Projected Evaporation Rate in Different Periods 125
5.13 Overall Projected Crop Water Requirements (CWR) in the Country (Mm3/year) 129
5.14 Crop Water Requirements (CWR) in Different Periods 130 5.15 Projected CWR for Increase of Temperature by 1 to 5°C 131 5.16 Projected Crop-Specific CWR for Different Periods 132 5.17 Sector Wise Water Demand for 2020-2050 142 5.18 Water Demand from Ground Water sources from 2020-2050 142 5.19 Water Demand from Surface Water sources from 2020-2050 143 5.20 Water Demand from Desalinated sources from 2020-2050 143 5.21 Water Demand from Treated wastewater sources from 2020-2050 144 5.22 Sector Wise Water Demand in Riyadh (2020-2050) 146 5.23 Sector wise Water Demand in Makkah (2020-2050) 146 5.24 Sector wise Water Demand in Madinah (2020-2050) 147 5.25 Sector wise Water Demand in Qassim (2020-2050) 147 5.26 Sector wise Water Demand in Eastern Region (2020-2050) 148 5.27 Sector wise Water Demand in Asir (2020-2050) 148 5.28 Sector wise Water Demand in Hail (2020-2050) 149 5.29 Sector wise Water Demand in Tabuk (2020-2050) 149 5.30 Sector wise Water Demand in Al-Baha (2020-2050) 150 5.31 Sector wise Water Demand in Northern Border (2020-2050) 150 5.32 Sector wise Water Demand in Al-Jouf (2020-2050) 151 5.33 Sector wise Water Demand in Jazan (2020-2050) 151 5.34 Sector wise Water Demand in Najran (2020-2050) 152 5.35 Sector wise Water Demand in Saudi Arabia (2020-2050) 152
LIST OF TABLES
Table Title Page 5.1 Planting Dates Periods for Crops in Each Region in Saudi Arabia 112 5.2 Growing Stages and Crop Growth Stage Coefficient (Kc) 113
5.3 Minimum Temperature in Different Regions in the Kingdom during 2018 114

Section - 5
KSA Fourth National Communication (NC4) iii
5.4 Maximum Temperature in Different Regions in the Kingdom during 2018 115
5.5 Relative Humidity (%) in Different Regions in the Kingdom during 2018 119
5.6 Monthly Rainfall (mm) in Different Regions in the Kingdom during 2018 121
5.7 Monthly Average Wind Speed (km/hr) for Each Region in Saudi Arabia 123
5.8 Monthly Average Radiation for Each Region in Saudi Arabia 126
5.9 Approximate Distribution of Cultivated Area in 2018 in Saudi Arabia 128
5.10 Modeling Framework for Multi-sources Multi-users Water Distribution 133
5.11 Projected Water Demands in Different Sectors (Mm3/year) 137
5.12 Source-specific Water Demands for Domestic Supplies (Mm3/year) 138
5.13 Source-specific Water Demands for Agricultural Supplies (Mm3/year) 139
5.14 Source-specific Water Demands for Industrial Supplies (Mm3/year) 140
5.15 Source-specific Estimated Supplies to Satisfy the Demands (Mm3/yr) 141
5.16 Needs for GW supplies (Mm3/year) 144 5.17 Needs for SW supplies (Mm3/year) 145 5.18 Needs for DW supplies (Mm3/year) 145 5.19 Needs for TWW supplies (Mm3/year) 145
Section - 5
KSA Fourth National Communication (NC4) 102
Section 5: Impact Analysis of Climate Change on Water Resources and Identification and Appraisal of Appropriate Adaptation Measures
5.1 Objective:
Saudi Arabia is a semi-arid country with annual rainfall in the range of 100-150 mm/year. The total water demand in 2019 was 17.4 billion m3 (Bm3), in which agricultural, urban and industrial demands were 12.5 Bm3, 3.5 Bm3 and 1.4 Bm3 respectively (MEWA, 2019). The data from the Ministry of Agriculture and Water (currently Ministry of Environment, Water and Agriculture) for the period of 2010 to 2019 showed that the increase of urban, agricultural and industrial water demands were 5.3%, -2.7%, and 8.6% per year respectively (MEWA, 2019), resulting in the decrease of the total water demand by 1.2% per year. The sector wise water demands were satisfied from groundwater (GW), surface water (SW), desalinated water (DW) and treated wastewater (TWW) sources while the non-renewable groundwater (NGW) supplied the most (MEWA, 2019).
In 1984, the Ministry of Agriculture and Water (MAW) reported that the proven, probable and possible reserves of NGW were 253, 405 and 705 Bm3 respectively (MAW, 1984; FAO, 2009). However, significant fraction of the reserves might have been consumed by 2000 (FAO, 1998; FAO, 2009). To conserve GW, Saudi Arabia suspended the domestic wheat production in 2015 and decided to suspend the domestic production of green fodder crop by 2019 (USDA, 2016). Since 2018, small scale production of domestic wheat has been allowed. The country satisfied most of the agricultural water demand from the non-renewable groundwater (NGW) sources. In addition, approximately 30% of the urban water demand was satisfied by the NGW sources.
In 2018, the country produced approximately 2,541 million m3 (Mm3) of desalinated water, which satisfied almost 65% of urban water demand (MEWA, 2019). In 2018 and 2019, total surface water collected in dams was 1,200 and 970 Mm3 respectively (MEWA, 2019). However, the total amounts of flood water in these years were estimated to be 6,746 and 4,179 Mm3 respectively (MEWA, 2019). In 2019, the country treated approximately 1,802 Mm3 of sewage water through 99 wastewater treatment plants from which only 311 Mm3 of treated wastewater was reused (17.2%). The country needs to fully explore and utilize the potential of secondary water sources, such as, rainwater harvesting, flood water conservation and comprehensive reuse of TWW to address the gap in water demand and supply.
The extreme heat and aridity are the characteristics of most parts of Saudi Arabia. It is one of the few places in the world where the summer temperature can be very high (around 50°C) while in winter, frost or snow fall can be seen in the interior and on the higher mountains. The average winter temperature ranges from 8°C to 20°C in January in interior cities, such as Riyadh, and 19°C to 29°C in Jeddah, on the Red Sea coast. The average summer temperature in July ranges from 27°C to 43°C in Riyadh and 27°C - 38°C in Jeddah. Night time temperature in the central deserts can be chilly even in summer, as the sand gives up daytime heat rapidly once the sun has set. Past studies reported an increase in summer temperature and the number of hot days per year in future, due possibly to the combined effects of higher temperature and lower rainfall in this period (Rehman and Al-Hadrami (2012). Using the PRECIS model,

Section - 5
KSA Fourth National Communication (NC4) 103
Almazroui (2013) predicted the increase of temperature by 0.65°C per decade. Chowdhury and Al-Zahrani (2013) showed an increase of temperature by 1.8 – 4.1°C in different regions of Saudi Arabia, which was consistent to the global positive trends (IPCC, 2006).
Annual precipitation is usually sparse (up to 100 mm or 4 inches in most regions), although sudden downpours can lead to violent flash floods in the wadis. The annual rainfall in Riyadh reported the averages of 100 mm (4 inches) and falls almost exclusively between January and May. The average in Jeddah is 54 mm (2.1 inches) and occurs between November and January. Tarawneh and Chowdhury (2018) predicted significant decrease in the rainfall in many regions of the country, which can have implications on the surface water resources, primarily collected using the dams. The policies on agriculture, industry and water resources are greatly affected by the climatic condition. Several studies have reported the effects of climate change on the availability, demand and quality of water resources, increased morbidity and mortality due to thermal extremes, epidemics, malnutrition, geographical and seasonal spread of infectious vector, rodent borne diseases, and cardiovascular and respiratory illness (IPCC, 2006; WHO, 2002). In the past three decades, climate change related diseases were responsible for approximately 150,000 deaths and 5 million disability adjusted life years (DALYs) around the globe (Patz et al., 2005; UNOCHA, 2008).
The Intergovernmental Panel on Climate Change (IPCC) has explained the vulnerability of climate change in terms of exposure to hazards, and the capacity to adapt. Understanding the interaction of climatic parameters and environment is likely to reduce vulnerability, such as growing new crops suitable to climate change and efficient management of water resources (DeNicola et al., 2015). Increase in temperature might decrease dissolved oxygen (DO), and increase dissolved organic matter (DOM) and salinity in ambient water bodies (Chowdhury and Al-Zahrani, 2013). Past studies have reported an increase of agricultural water demand by 5–15% during 2050, which was attributed to increased evapotranspiration (Chowdhury and Al-Zahrani, 2013). An increase of temperature by 1°C might change the thermal limits of crop by 10–30%, which could push the crop over the brink and affect crop yields (Parry and Swaminathan, 1993). In addition, increase in temperature by 1°C might increase the capacity of air to hold water vapor by 7%, resulting in reduced precipitation (Trenberth, 2011). As such, the water resources and soil water balance might be affected further. The global warming will affect rainfall and temperature, which can have effects on groundwater reserves and soil moisture (Kang, et al., 2009). Many countries have incorporated the effects of climate change for strategic water resources management. It is thus important to understand the implications of climate change on water resources.
The main objective of this section is to assess the changes in water demand and supply, and development of possible water resources to achieve the balance between the demands and supplies in the multiple sectors. The objectives can be obtained through achieving the following:
• Predicting crop specific water requirements in 13 different regions of Saudi Arabia namely Riyadh, Makkah, Madinah, Qassim, Eastern Region, Asir, Hail, Tabuk, Al-Baha, Northern borders, Al-Jouf, Jazan and Najran, using the modelled climatic parameters. Identify the strategies to reduce overall crop water requirements through re-scheduling the main crops. The analysis will be performed using the CROPWAT software package approved by the Food and Agriculture Organization (FAO).

Section - 5
KSA Fourth National Communication (NC4) 104
• Optimize the water demand-supply scenarios for ‘multiple sources-multiple users’ environment in 13 regions at 5 years intervals. The optimization study will be performed using the Lingo software package.
This report includes a detailed compilation of data on water supply, demand and crop water requirements in the Kingdom.
5.2 Water Resources in Saudi Arabia
5.2.1 Non-Renewable Groundwater Resources
In Saudi Arabia, the shallow alluvial and deep rock aquifers are the two major sources of groundwater. The deep rock aquifers are sedimentary in origin, usually sandstone and limestone, extending over thousands of square kilometers with poor natural recharge through upland and foothill zones where the rocks have surface outcrops. The aquifers Saq, Wajid, Tabuk, Minjur-Dhurma, Biyadh-Wasia, Um Er Radhuma and Dammam-Neogene are known to be the principal aquifers (MAW, 1984; FAO, 1998). The approximate locations of these aquifers are shown in Figure 5.1.
Figure 5.1: Principal Groundwater Aquifers in Saudi Arabia
Section - 5
KSA Fourth National Communication (NC4) 105
The groundwater in the deep sandstone aquifers is non-renewable or ‘fossil’ water, which was formed approximately 10 to 32 thousand years ago (MAW, 1984). The groundwater reserves in the major aquifers are reported in the Water Atlas and Ministry of Planning (MOP, 1985). The proven, probable and possible groundwater reserves in the major aquifers were reported to be 259.1, 415.6 and 760.6 Bm3 respectively (MAW, 1984; FAO, 1998; Water Atlas, 1995). The estimates of the Ministry of Planning (reported in the Food and Agriculture document) showed that approximately 141.1 Bm3 of groundwater was used from the principal aquifers between 1984 and 1996 (FAO, 1998). The data in the Ninth Development Plan showed that the withdrawals of groundwater from the non-renewable sources were 13.5 and 11.6 Bm3 in 2004 and 2009 respectively (MEP, 2010). As of today, non-renewable ground water sources are the major suppliers of water in the Kingdom (MEWA, 2019).
5.2.2 Renewable Surface and Groundwater Sources
The long-term average annual rainfall in Saudi Arabia was estimated to be less than 70 mm while in the south-western region, up to 500 mm/year of rainfall was reported (Almazroui, 2013). The seasonal runoff is stored in the dam reservoirs and often used as the sources of surface water (SW). The valleys are generally dry in most part of the year. A fraction of seasonal surface runoff percolates through the sedimentary layers in the valleys and recharges groundwater while some is lost through evaporation. The largest quantity of runoff occurs in the western region followed by the south of the western coast (Tihama) (FAO, 2009). The MEWA estimated the total flood water in the Kingdom of 6,746 and 4,179 Mm3 in 2018 and 2019 respectively (MEWA, 2019).
Most of the runoff infiltrates to recharge the shallow aquifers located along the valleys, and beneath the alluvial fans and plains in various areas. These aquifers are generally unconfined, small in area and have water tables that respond rapidly to local precipitations. Some shallow aquifers are Khuf, Tuwail, Aruma, Jouf, Sakaka and Jilh in basalt and alluvial areas. To facilitate storage and recharge of surface runoff, a total of 522 dams across the country stored approximately 1200 and 970 Mm3 of flood water respectively (MEWA, 2019). Most of these dams are used for groundwater recharges and controlling floods. The loss of significant amount of floodwater in 2018 and 2019 indicated that the Kingdom needs more dams to fully capitalize the natural resources. It is anticipated that the intense rainfall in the south and south-westerns regions might provide an opportunity to harvest rainwater and/or collect surface runoff.
5.2.3 Desalinated Water
Desalination of sea water is in practice in many countries. Saudi Arabia produced 7.65 Mm3 of desalinated water in 1980 (SWCC, 2011). In 40 years (1980 – 2018), the production of desalinated water reached 2,541 Mm3 in 2018. The Saline Water Conservation Corporation (SWCC) produced a total of 1,803 Mm3 of desalinated water in 2018 (71%) and the remaining desalinated water was produced by the private and partnership programs (SWCC, 2020; MEWA, 2019). Figure 5.2 shows the trend of desalinated water production.

Section - 5
KSA Fourth National Communication (NC4) 106
Figure 5.2: Trend of Desalinated Water Production in the Kingdom
Refer to Table 6.2 of section 6 “Impact Analysis of climate change on Coastal and Marine Ecosystem” for further details on the location of desalination plants on the Red Sea and Arabian Gulf, desalination technology used and year of plant commissioned.
5.2.4 Treated Wastewater
Reuse of Treated Wastewater (TWW) is in practice in many countries (FAO, 2009). TWW is generally used for agricultural, landscaping and industrial purposes. Saudi Arabia has been using a part of TWW in agriculture and industry. However, major fraction of wastewater remains unused. In 2019, approximately 1,802 Mm3 of wastewater was treated in 99 sewage treatment plants across the country.
5.3 Water Consumption
5.3.1 Urban Water Demand
The MEWA reported the urban water demands in 2019 as 3,493 Mm3. The urban water demand included two components, residential and commercial water demands, which were 2,898 and 595 Mm3 respectively in 2019. During the period of 2010-2019, the urban water demands were satisfied by the desalinated water and groundwater, which shared 55-69% and 31-45% respectively (MEWA, 2019). The total number of subscribers to the municipal water systems were 1.95 million in 2018 (GASTAT, 2020).
0
500
1,000
1,500
2,000
2,500
3,000
2010 2011 2012 2013 2014 2015 2016 2017 2018
Des
alin
ated
wat
er (M
m3 )

Section - 5
KSA Fourth National Communication (NC4) 107
Figure 5.3: Trend of Urban Water Demand in the Kingdom
5.3.2 Industrial Water Demand
In Saudi Arabia, the total industrial water demand is relatively low. The water demand for industrial sector is less than half of the water demand in the urban sector (MEWA, 2019). Industrial water demand was 1,400 Mm3 in 2019. (MEWA, 2019).
5.3.3 Agricultural Water Demand
Agriculture in Saudi Arabia relies on the availability of seasonal water, surface water, valley basins and shallow/deep aquifers (Alkolibi, 2002). The agricultural water demand depends on the extent of agriculture, type of crops and type of irrigation practices. In 2015-2018, the total cultivated land in Saudi Arabia was 1.04, 0.92, 0.92 and 0.91 Mha respectively (GASTAT, 2020). Most of the cultivated lands were used for wheat, fodder crops, fruits, dates and vegetables productions. Different crops are produced through different irrigation practices (surface irrigation, sprinkler irrigation, localized irrigation, non-equipped cultivated wetlands and inland valley bottoms, non-equipped flood recession cropping area, etc.). Water demands are significantly different among various crops and types of irrigation techniques. For example, 1 ha of land for wheat production requires approximately 13,713 m3 of water, while 1 ha of dates producing land requires approximately 9,100 m3 of water (Chowdhury et al., 2016).
The agricultural sector is the major consumer of the non-renewable groundwater. To conserve groundwater, wheat production was suspended for three years during 2015/2016-2017/2018. Based on the government decision to stop the production of green fodder for a period of no more than 3 years starting 2018, a mechanism has been established to implement the guidelines to stop green fodder planting, considering the large amount of irrigation water it consumed. The forage production was reduced by 42.5 percent effective from November 3, 2018. In 2018, wheat production was permitted to provide smaller size forage producers with an alternative field crop. Following this permission, approximately 202,000 tons of wheat production was reported in 2019 (MEWA), which was much lower than the production in 2015 (722,300 tons), the last year of active production of wheat in the Kingdom.
0
500
1,000
1,500
2,000
2,500
3,000
3,500
4,000
2010 2011 2012 2013 2014 2015 2016 2017 2018 2019
Wat
er d
eman
d (M
m3 )
Desalinated water Ground water Total

Section - 5
KSA Fourth National Communication (NC4) 108
The green fodder crops and wheat were the two major consumers of groundwater. Overall, policy on agriculture has significant effects on the agricultural water demand. Based on the data in the MEWA, agricultural water demand for 2010 was 14,410 Mm3, which was increased to 20,831 Mm3 in 2015, and then decreased to 10,500 Mm3 in 2019, due mainly to limiting green fodder crops in 2018 (MEWA, 2019). In 2010, agricultural sector consumed 82.6% of the total water demand, which was reduced to 68.2% in 2019 (MEWA, 2019).
The long-term forecasting of agricultural water demand will have implications from such policies. In addition, past studies predicted overall increase in temperature in the range of 1.8-4.1°C by 2050, while an overall increase in reference evapotranspiration was predicted to be 10.3-27.4% (Chowdhury and Zahrani, 2013). A study showed that increase in temperature by 1°C might increase agricultural water demand by 2-4% in Saudi Arabia (Abderrahman, and Al-Harazin, 2008). For 5°C rise in temperature; the increase in agricultural water demand was estimated to be 8.3-10.5% in summer, and 15.0-18.0% in winter for Madinah, Tabuk and Sulayyil areas (Abderrahman, and Al-Harazin, 2008). Another study reported possible increase in agricultural water demand by 5-15% by 2050. This implies that to achieve the current level of agricultural production, agricultural water demand will be increased from X Mm3/year to 1.05X – 1.15X Mm3/year (Chowdhury and Zahrani, 2015). In understanding the agricultural water demand, it is essential that implications from various factors be adequately addressed, including:
• Policies on reducing agricultural crop productions in future. • Implications of climatic change on crop water demand • Types of crops, effective cultivated area and crop growing seasons • Type of irrigation (e.g., conventional, equipped or advanced)
Through better understanding of the implications of these factors, better management of agricultural water demand can be achieved.
Figure 5.4: Trend of Agricultural Water Demands in the Kingdom (MEWA, 2019)
0
5,000
10,000
15,000
20,000
25,000
2010 2011 2012 2013 2014 2015 2016 2017 2018 2019
Wat
er d
eman
d (M
m3 )
Agriculture

Section - 5
KSA Fourth National Communication (NC4) 109
5.3.4 Total Water Demand
In 2010, the total water demand in the country was 17,450 Mm3, which was increased to 24,800 Mm3 in 2015 and then decreased to 15,400 Mm3 in 2019 (MEWA, 2019). It was a drastic change from 2018 when the country suspended the production of green fodder crop (MEWA, 2019). The sector wise and total water demands for the period of 2010-2019 are presented in Figure 5.5.
Figure 5.5: Trend of Total Water Demand in the Kingdom (MEWA, 2019)
5.4 Assessment of Climate Change Impacts on Crop Water Requirements
5.4.1 Crop Yields and Water Requirement
Climate change is expected to result in increased temperature and reduced rainfall in Saudi Arabia. Several studies have been conducted to assess the possible effects of climate change on agriculture, crop production, food security and irrigation water requirements in the arid and semi–arid regions. Supit et al. (2012) used the output of general circulation model (GCM) and crop growth monitoring system to study the effects of climate change on the yields of wheat, potato, sugar beet and maize, cultivated during autumn, winter, spring and summer respectively. The results indicated that the effects of climate change were different based on the crop type and CO2 emission scenarios. The crops planted in autumn, winter and spring might have the benefits due to the increase in CO2 emission, whereas the crops planted in late spring and summer might suffer from the high temperature and droughts. Past studies reported that precipitation was the main source for agriculture sector in the North African countries except Egypt (Paeth et al., 2009; Schilling et al., 2012).
2010 2011 2012 2013 2014 2015 2016 2017 2018 2019Urban 2284 2423 2527 2731 2874 3025 3130 3150 3428 3493Industrial 753 800 843 890 930 977 1015 1000 1400 1400Agriculture 14410 15970 17514 18639 19612 20831 19789 19200 19000 10500Total 17447 19193 20884 22260 23416 24833 23934 23350 23828 15393
0
5,000
10,000
15,000
20,000
25,000
30,000
Wat
er d
eman
d (M
m3 )
Urban Industrial Agriculture Total

Section - 5
KSA Fourth National Communication (NC4) 110
The temperature is expected to increase in North Africa in the range of 2 to 3°C by 2050 under the balance across all sources scenario (A1B) of IPCC, while the rainfall was predicted to decrease by 10-20% (Paeth et al., 2009; Schilling et al., 2012). The agricultural productions are expected to decrease in the range of 15 - 40% in the 21st century, especially in Morocco (Schilling et al., 2012). However, the IPCC (2006) expected a reduction in agriculture in the range of 0.4 - 1.3% of gross domestic product (GDP) due to the effects of climate change in North Africa by the end of this century. Özdoğan (2011) predicted the impacts of climate change on the yields of winter wheat using the data of GCM model in the semi-arid region in the northwestern Turkey. The results indicated that the yields of winter wheat might be declined in the range of 5 - 35%. This reduction is due to the increase in temperature and decline in precipitation by 2 - 4°C and 10 - 20% respectively (Özdoğan, 2011).
Connor et al. (2012) evaluated the effects of climate change on irrigation, water supply variability and salinity in a semi-arid region of Murray Darling Basin in Australia. Increase in temperature by 1, 2 and 4°C could decrease the rainfall by 5, 15 and 25% respectively. Due to this reduction in rainfall, the runoffs were projected to reduce by 13, 38 and 63% in the basin respectively. This reduction in runoff was expected to decrease the average level of water supply for irrigation, increase salinity in the agriculture areas and result in loss of profit by up to 20% (Connor et al., 2012). Many other studies investigated the effects of climate change on irrigation water requirements. Fischer et al. (2007) investigated the impacts of climate change and its role in global and regional agricultural water demand for irrigation from 1990 to 2080. They used the analysis of the agro-ecological zones modeling framework (AEZ) and the database combined with the basic linked system (BLS) within a new socio-economic and reference scenario (A2r). The study projected an increase of approximately 20% in the global irrigation water requirements in 2080 due to the impacts of climate change. Approximately two-thirds of this increase could occur in the developing countries. The study found that lowering the rate of climate change could reduce the irrigation water requirements by about 40% (Fischer et al., 2007). However, Döll (2002) predicted an increase in the irrigation water requirements in the range of approximately 5 - 8% by 2070 using the GCM model. Mall et al. (2006) reported that the changes in temperature might range between 1° and 4°C in India. While the rise in temperature by 4°C caused a decrease in runoff by 2 - 8%, no significant change in rainfall over India (e.g., decreasing or increasing in some locations) was anticipated. It also projected that the irrigation water requirements could increase in the range of about 3.5 - 5% and 6 - 8% by 2025 and 2075, respectively due to climate impacts. This might cause a decline in groundwater, where about 52% of water supply for irrigation is obtained from groundwater resources. The study conducted by Ghazala and Mahmood (2009) in Pakistan also predicted the crop water requirement (CWR) for wheat under different temperature. Averages of increase in CWR were 11, 19 and 29% for temperature increase of 1, 2 and 3°C respectively.
Data on agricultural water uses and water availability demonstrate that the current state of agricultural activities may not be continued for long-term in Saudi Arabia. For better management of available resources and agricultural productions, it is important to understand CWR, current level of water supplies and possible effects of climate change in future. This report will assist in the efficient use of non-renewable water and minimize water withdrawal from these sources. This will further provide an opportunity in setting rules and procedures for rationalization of water consumption in agricultural areas.

Section - 5
KSA Fourth National Communication (NC4) 111
5.4.2 Methodology for Predicting Crop Water Requirement in Saudi Arabia (CWR)
5.4.2.1 Climatic and Crop Parameters
The CROPWAT software system requires the climatic parameters (e.g., maximum and minimum temperature, wind speed, sunshine, humidity and rainfall), planting and harvesting dates of crops, soil type and cultivation area of crops for estimating CWR. These data were collected from the weather stations as documented in literature (GASTAT, 2019) and were used to project CWR for the current climatic conditions. To project CWR for the future years, values of climatic parameters from the PRECIS model were used. Information on different crops and cropping patterns (e.g., crop name, planting and harvesting date, cultivated area) were obtained from the General Authority for Statistics (GASTAT). Table 8.1 in section 8 summarizes the total cultivated areas and crop productions from 2015 through 2018 (GASTAT, 2019). It shows that the total cultivated area in the Kingdom was about 995,000 hectares in 2018 (GASTAT, 2019). The fodder crops had the largest cultivated area (486,610 hectares) followed by dates production (116,125 hectares) and wheat (89,756 hectares), indicating that these crops might have consumed more water than the other crops (GASTAT, 2019). Further details of cultivated areas are presented in Table 8.1 in section 8. Table 5.1 shows the growing periods and durations for several crops in Saudi Arabia. The crop growth stage coefficients (Kc) were obtained from the FAO database for each crop (Allen et al., 1998; FAO, 2020). The growing stages for different crops and values of Kc at different growing stages for various crops are shown in Table 5.2.
The Kc values for wheat are 0.55, 1.15 and 0.30 at the initial stage, mid-season and the late season respectively. The value of 0.55 remains constant till the end of the 20 days of the initial stage. It increases gradually to 1.15 during the development stage of 30 days. Then it remains constant at 1.15 during the mid-season of 50 days of growing period. It declines to 0.30 during the late season of 30 days. The Kc values for some crops increase to more than unity in the development stage and mid-season indicating that ETc is higher than ETo leading to increased CWR in the development and mid-season stages. Following the predictions of CWR for different crops in different regions of the Kingdom, total water requirements were predicted. Further details on the input data are shown in Tables 5.3 to 5.8.

Section - 5
KSA Fourth National Communication (NC4) 112
Table 5.1: Planting Dates and Periods for Crops in Each Region in Saudi Arabia
Crop Planting dates periods *
Growing periods (days)
Riyadh Makkah Madinah Qassim Eastern Region Asir Tabuk Hail Jazan Najran Al
Baha Al
Jouf
Wheat Nov-Jan Nov- Jan Nov- Jan Nov-
Jan Nov- Jan Nov- Jan
Nov- Jan
Nov- Jan - Nov-
Jan Nov- Jan
Nov- Jan
120-140
Millet (Grains) - Jan-Apr Jan-Apr - - Nov-
Jan - - Jan- Apr - Jan-
Apr - 105
Sorghum Jul-15 Aug Jan-Feb - - - 01-30
Apr - - 01-30 Apr - 01-30
Apr - 125
Maize Mar-Apr
Mar- Apr Mar- Apr
15 Mar-15
Apr Mar-Apr Mar Apr Mar-
Apr Mar-Apr
01-30 Oct - Mar-
Apr 01-30 Aug
125
Barley 01-30 Nov
01-30 Nov
01-30 Nov
01-30 Nov
01-30 Nov
01-30 Nov
01-30 Nov
01-30 Nov
01-30 Nov
01-30 Nov
01-30 Nov
01-30 Nov
120
Tomato Feb-Apr Jan- Apr Feb-Apr Feb-
Apr Feb-Apr Feb-Apr Mar-Apr
Mar-Apr
Jan- Apr Feb-Apr Mar-
May Mar-Apr
145
Potato Jan- Mar Jan-Feb Jan-Feb Jan-
Feb Jan-Feb Jan-Apr Jan-Mar Jan- Mar - Jan-Feb Jan-
Mar Jan-Mar
130
Other vegetables
Jan- Apr Jan-Apr Jan-Apr Jan-
Apr Jan-Apr Jan-Apr Jan-Apr Jan-Apr
Jan-Apr Jan-Apr Jan-
Apr Jan-Apr
95
Clover Oct- Dec Oct- Dec Oct- Dec Oct-
Dec Oct-Dec Oct-Dec Oct- Dec
Oct-Dec - Oct-Dec Oct-
Dec Jan-Mar
365 Date Oct-Jan Aug-Jan Oct- Jan Oct-
Jan Aug-Jan Aug-Jan Oct-Jan Oct-Jan
Oct- Jan Oct-Jan Aug-
Jan Oct-Mar
Citrus Mar-Apr Mar-Apr Mar-Apr Mar-
Apr Mar-Apr Mar-Apr
Mar-Apr
Mar-Apr
Mar-Apr
Mar-Apr
Mar-Apr
Mar- Apr
Grapes Mar-Apr Mar-Apr Mar-Apr Mar-
Apr Mar-Apr Mar-Apr
Mar- Apr
Mar-Apr - Mar-
Apr Mar-Apr
Mar-Apr
Notes: *The growing period for grapes was obtained from CROPWAT software.
5.4.2.2 Temperature The maximum and minimum temperature varied widely from region to region. The average annual temperature ranges from 11.8°C to 34.5°C in different regions. The monthly averages of minimum and maximum temperatures for different regions are presented in Tables 5.3 and 5.4 respectively. These tables show that the maximum and minimum temperature increased gradually from January to the peak values in July and/or August and then decrease gradually till December. The minimum temperature was in the range of 2.6°C in January to 31.6°C in July in the Kingdom (Table 5.3) while the maximum temperature was in the range of 14.3°C in January to 46.4°C in July (Table 5.4). These data were obtained from the recent publications and reports (Tarawneh and Chowdhury, 2018; FAO, 2020). The daily data were for the minimum, maximum and average were obtained from the 26 weather monitoring stations distributed over 13 administrative regions (PME, 2019). The monthly minimum, maximum and average data were calculated from these raw data (PME, 2019). The projected average, summer and winter temperatures in different regions are presented in Figures 5.7 and 5.8.

Section - 5
KSA Fourth National Communication (NC4) 113
Table 5.2: Growing Stages and Crop Growth Stage Coefficient (Kc) (Allen et al., 1998; FAO, 2020).
Crops
Growing Stages (days) Total Stage (days)
Crop Growth Stage Coefficient (Kc)
Initial Develop.
Mid- season
Late season Initial Mid-
season Late
season
Wheat 20 30 50 30 130 0.55 1.15 0.30
Maize 20 35 40 30 125 0.30 1.20 0.35
Millet 15 25 40 25 105 0.30 1.00 0.30
Sorghum 20 35 40 30 125 0.30 1.00 0.55
Barley 15 25 50 30 120 0.30 1.15 0.25
Tomato 30 40 45 30 145 0.60 1.15 0.80
Potato 25 30 45 30 130 0.50 1.15 0.75
Other Vegetables 20 30 30 15 95 0.70 1.05 0.95
Clover 150 30 150 35 365 0.40 0.95 0.90
Dates 140 30 150 45 365 0.90 0.95 0.95
Citrus 60 90 120 95 365 0.70 0.65 0.70
Grapes 150 50 125 40 365 0.30 0.70 0.45

Section - 5
KSA Fourth National Communication (NC4) 114
Table 5.3: Minimum Temperature in Different Regions in the Kingdom during 2018 (Tarawneh and Chowdhury, 2018; FAO, 2020)
Region Station Jan Feb Mar Apr May Jun Jul Aug Sep Oct Nov Dec
Al-Riyadh Riyadh-KKIA 6.8 11.4 16.9 14.8 24.9 28.6 29.5 27.9 26.3 21.1 16 12.3
Wadi Aldawasir 8 13 18.1 21.6 25.3 28.8 28.1 28.4 25 20.9 18.1 12.8
Makkah
Jeddah- KAIA 19.8 21.7 22.9 24.4 27.5 28.8 29.8 30.4 30.1 27.3 23.8 22.4
Makkah 19.1 21.5 23.6 25.5 29 30.9 30.9 28.8 27.3 24.5 21.6 20.3
Taif 7.5 11.4 14.8 16.3 20.8 24.2 24.2 24.5 22.8 17.3 13.5 11.7
Madinah Madinah 12 15.8 20.8 22.6 27.6 30.8 31.6 31.6 31.2 24 17.5 15.7
Yanbu 13.1 17.6 14.5 20.2 26.1 27.7 28.2 27.9 29.1 25.1 19.9 17
Al-Qassim Qassim 6 10.7 16.9 18.7 24.3 27.4 29.6 26.9 25.4 19.2 14 11.2
Eastern Region
Dmmam-KFIA 8.7 12.3 16.1 21.1 24.2 29.1 30.2 29.1 27 23.3 19 14.1
Al-Ahsa 8 12.4 16.9 21.3 24.6 30 31 29.7 27 22.6 17.8 12.8
Qaisumah 7 11 16.4 19.2 24.6 29.2 30.3 28.7 28.4 22.2 14 10.5
Asir
Bisha 6.8 11.5 15.5 17.9 21.5 24.4 25.6 25.2 21.3 17.6 15.3 11.4
Abha 7.5 9.5 12.2 13.9 17.3 20 19.1 18.7 17.8 14.3 11.4 10.1
Khamis Mushait 6.9 9.8 13 14.1 17.4 19.4 18.2 17.6 17.3 14.6 12.4 10.6
Tabuk Tabuk 4.3 9.5 13.7 15.1 21.2 23.8 25.6 24.9 24.4 18.7 12.3 7.4
Wejh 14.1 17.5 19 21.1 26.2 27.2 27.4 27.3 26.7 24.1 20 16.9
Hail Hail 3.8 9 13.7 15.8 20.8 25.2 25.4 24.6 24.9 17.7 12 8.6
Northern Borders
Arar 5.2 8.8 14.2 15.9 21.4 24.8 26.1 25.5 24.1 18.7 11.5 8.1
Turaif 2.6 6.5 10.4 12.5 17.6 20.6 21.9 21.3 20.8 14.6 9.2 5.4
Rafha 6 10 14.8 16.9 22.5 26.3 27.1 26.5 26.4 20.9 15.2 13.4
Jazan Jazan 21.5 22.6 24.7 27.6 29.1 31.2 31.5 30.7 29.7 27.2 25.7 23.9
Najran Najran 7.3 11.3 15 19.6 22.1 25.5 27.1 26.1 21.9 18.2 16.2 11.5
Sharorah 6.9 12 18 25.6 25.9 27.2 27.3 27.2 24.3 20 17.2 13.3
Al-Baha Al-Baha 8.9 12.4 15.1 16.6 20.7 23.8 23.7 23.5 22.6 17.2 14 12
Al-Jouf Al-Jouf 4.4 10 14.8 16.9 22.2 25.9 27.5 26 26.2 20.3 13.1 9.2
Guriat 3.2 6.4 10.2 12.7 17.8 19.7 20.7 20.5 19.4 16.1 9.5 5.9

Section - 5
KSA Fourth National Communication (NC4) 115
Table 5.4: Maximum Temperature in Different Regions in the Kingdom during 2018 (Tarawneh and Chowdhury, 2018; FAO, 2020)
Region Station Jan Feb Mar Apr May Jun Jul Aug Sep Oct Nov Dec
Al-Riyadh Riyadh-KKIA 21.4 26 31.1 32.3 38 42.8 43.3 42.5 41.8 33.8 25.5 22.6
Wadi Aldawasir 24.3 30 34 35.9 40.4 43.5 44.2 43.9 42.8 35.7 31.7 27.3
Makkah
Jeddah- KAIA 28.3 30.6 32.7 33.2 37.6 37.5 38.1 37.9 36.8 35.6 31.7 29.5
Makkah 32.8 35.7 38.6 34 43.2 44 43.6 42.8 42.1 38.8 32.5 31
Taif 22.5 27.2 29.4 30.1 34.4 36.5 35.4 35.8 36.1 30.1 25.2 24.5
Madinah Madinah 23 28.4 33.8 34.7 39.5 42.9 42.3 43.1 43.4 35.9 27.4 25.8
Yanbu 27.6 30.5 34.8 34 .3 39.4 42 40.8 40.9 40.3 36.7 31 29.1
Al-Qassim Qassim 21.4 26.6 32.7 32.5 39 43.3 45.5 44.1 43.4 34.6 23 22.3
Eastern Region
Dmmam-KFIA 23.1 25.7 32.7 34.1 39.7 44.6 45.4 44.6 43.3 36.5 27.5 24.3
Al-Ahsa 23.9 27.5 33.8 35.6 40.5 45.7 46.4 46 44.3 36.8 28.3 25
Qaisumah 21.4 25.4 32.2 32.9 39.2 44.2 45 44.2 45 37 22.8 21.6
Asir
Bisha 24.4 29.4 31.2 33.2 37.1 39.2 39.1 39.4 38.2 32.2 24.3 27.5
Abha 21 24 25.7 25.6 30.4 32.6 32.2 31.8 31.9 26.8 22.2 22.3
Khamis Mushait 22 24.6 25.8 26.4 30.8 33.4 33.8 33 32.1 26.9 24.5 23.9
Tabuk Tabuk 18.7 24.5 30 29.5 35.8 38.4 39.1 34.2 39.9 32.5 23.6 20.1
Wejh 25..6 27.8 29.9 30.2 35.6 35.4 35.8 35.3 34.9 33.5 29.7 26.5
Hail Hail 18.2 23.8 29.2 29 34.1 38.7 39.6 39.4 39.9 32 21.8 20.2
Northern Borders
Arar 18.5 22.1 29.3 29.8 35 40.8 42.7 43.1 41.6 34.6 20.3 18.3
Turaif 14.3 18.4 25 25.7 30.5 34.6 36.8 36.7 35.6 29.5 18.5 15
Rafha 19.2 23.5 30.1 30.5 36.5 41.2 42.6 42.2 42.4 34.9 23.9 23.6
Jazan Jazan 30.3 30.9 33.6 36.2 38.3 38.6 38.7 38.4 38.6 36.6 33.9 31.8
Najran Najran 25 29 32 33.9 37.3 39.5 39.9 39.7 37.9 32.1 24.9 27.4
Sharorah 24.6 29.7 34.6 40 41.2 42.5 43.8 43.8 42.2 36.6 32.3 27.7
Al-Baha Al-Baha 22.8 26.1 28.1 29.1 33.2 35.5 35.3 35.5 34.4 28.4 25.1 24.3
Al-Jouf Al-Jouf 17.5 23 29.2 29.4 34.8 39.4 40.4 40.3 40.3 33.2 21 19
Guriat 16.8 21 27.5 29 33.9 37 38.9 38.2 37 31.2 21.7 18.2

Section - 5
KSA Fourth National Communication (NC4) 116
Figure 5.6: Projected Temperature in Different Periods (2030, 2045-2070 and 2071-2100)
(a). Temperature in 2030
(b). Temperature in 2045-2070
(c). Temperature in 2071-2100

Section - 5
KSA Fourth National Communication (NC4) 117
Figure 5.7: Projected Summer Temperature in Different Periods (2030, 2045-2070 and 2071-2100)
(a). Temperature in 2030
(b). Temperature in 2045-2070
(c). Temperature in 2071-2100

Section - 5
KSA Fourth National Communication (NC4) 118
Figure 5.8: Projected Winter Temperature in Different Periods (2030, 2045-2070 and 2071-2100)
(a). Temperature in 2030
(b). Temperature in 2045-2070
(c). Temperature in 2071-2100

Section - 5
KSA Fourth National Communication (NC4) 119
5.4.2.3 Relative Humidity
The data of Relative Humidity (RH) are presented in Table 5.5 (FAO, 2020). The table shows that the average RH in the Kingdom varies from region to region. The lowest average RH was observed in Madinah (8%) in June while the highest average annual RH was observed in the Northern borders (95%). The details can be found in Table 5.5. The overall RH in the country was projected to be 38.6% (range: 16.7 – 84.3%) in 2030, which were projected to be 39.2% (range: 16.9 – 85.4%) in 2045-2070 and 39.6% (range: 18.5 – 85.6%) in 2070-2100. The contour maps in Figure 5.9 show the RH for the periods of 2030, 2045-2070 and 2071-2100.
Table 5.5: Relative Humidity (%) in Different Regions in the Kingdom during 2018 (FAO, 2020)
Region Station Jan Feb Mar Apr May Jun Jul Aug Sep Oct Nov Dec
Al-Riyadh Riyadh-KKIA 29 30 23 34 16 11 10 11 12 30 61 55
Wadi Aldawasir 51 49 46 49 27 23 22 24 24 37 44 49
Makkah Jeddah- KAIA 47 54 56 52 45 52 51 54 64 59 54 58
Makkah 50 52 45 42 31 32 32 34 53 53 65 64 Taif 48 39 36 44 28 20 23 23 28 46 67 62
Madinah Madinah 27 24 16 16 12 8 10 12 10 22 47 43 Yanbu 50 55 49 54 40 42 50 53 59 60 62 64
Al-Qassim Qassim 51 48 39 53 34 22 20 23 24 40 91 80
Eastern Region
Dmmam-KFIA 46 51 40 41 29 21 24 25 46 53 64 64 Al-Ahsa 33 39 28 32 21 14 14 16 29 46 59 59
Qaisumah 44 45 36 47 33 22 21 20 23 39 79 70
Asir Bisha 38 35 38 51 28 20 25 26 19 43 63 51 Abha 59 52 48 63 44 33 47 56 37 51 62 66
Khamis Mushait 53 42 39 56 38 30 43 52 32 44 59 59
Tabuk Tabuk 41 30 70 26 20 19 20 23 21 31 49 48 Wejh 52 55 63 65 58 66 70 74 80 70 61 57
Hail Hail 45 38 29 41 28 17 17 19 18 32 70 64
Northern Borders
Arar 72 68 46 49 48 34 33 36 35 52 95 95 Turaif 70 59 41 42 40 33 34 38 33 44 84 82 Rafha 40 36 22 33 21 13 12 13 13 24 65 50
Jazan Jazan 70 72 66 63 61 60 57 61 65 66 67 72
Najran Najran 28 27 24 40 23 18 19 21 18 36 40 38
Sharorah 48 40 31 27 24 21 20 20 22 33 33 38 Al-Baha Al-Baha 55 47 45 61 41 31 36 38 28 52 78 69
Al-Jouf Al-Jouf 48 39 23 27 21 16 16 19 17 26 73 61 Guriat 65 52 37 32 32 32 32 40 36 43 66 63

Section - 5
KSA Fourth National Communication (NC4) 120
Figure 5.9: Projected Relative Humidity (%) in Different Periods (2030, 2045-2070 and 2071-2100)
(a). Relative Humidity in 2030
(b). Relative Humidity in 2045-2070
(c). Relative Humidity in 2071-2100

Section - 5
KSA Fourth National Communication (NC4) 121
5.4.2.4 Rainfall
The rainfall distributions were different from region to region. The total annual rainfall varied in the range of 11.4 mm/year in one station in Tabuk region to 292.1 mm/year in Qassim region (Table 5.6), while the average annual rainfall is about 127.2 mm/year. The maximum rainfall was reported for Qassim in Nov (150.3 mm) followed by Makkah in Oct (90.9 mm). These data were obtained from the Presidency of Meteorology and Environment (PME), Saudi Arabia (PME, 2019) and recent publications (Tarawneh and Chowdhury, 2018; FAO, 2020). The daily rainfall data were for the minimum, maximum and average were obtained from the 26 weather monitoring stations in 13 administrative regions (PME, 2019). The monthly minimum, maximum and average rainfall were calculated from these raw data (PME, 2019). Further details can be found in Table 5.6. The projected monthly average rainfall in the country is shown in Figure 5.10.
Table 5.6: Monthly Rainfall (mm) in Different Regions in the Kingdom during 2018
Region Station Jan Feb Mar Apr May Jun Jul Aug Sep Oct Nov Dec Total
Al-Riyadh
Riyadh-KKIA 0 7.2 1 43.5 0.001 0 0 0 0 42.7 35.5 5.3 135.2
Wadi Aldawasir 0 0.001 1 19.2 0 0 0 0 0 0 0 0 20.2
Makkah
Jeddah- KAIA 0 0.001 3 0 1.8 0 0 0 0 8.8 70.8 2 86.4
Makkah 0 0.001 0 1 1.5 0.001 0 10 42.2 90.9 74.5 11.7 231.8
Taif 0.001 2.9 0.001 62.9 24.5 5 1 2 8 70.9 54.3 1.8 233.3
Madinah Madinah 0 15 0 0 0 0 0 0 0 25.3 20 4.2 64.5
Yanbu 0 4.6 0 0 0 0 0 0 0 10.7 67.5 4.1 86.9 Al-
Qassim Qassim 0 21.7 10.8 81.5 18.2 0 0 0 0 2 150.3 7.6 292.1
Eastern Region
Dmmam-KFIA 0 7.8 0 4.2 2.2 0 0 0 0 10.4 78.1 0.001 102.7
Al-Ahsa 0 21.2 0.001 11.8 1.2 0 0 0 0 25.3 20 0.001 79.5
Qaisumah 0.001 0.001 0.001 15.4 0.001 0 0 0 0 12.9 149.1 2.6 180.0
Asir
Bisha 0 2 20.8 21.4 5.8 0 0 0 0 17 6.6 0 73.6
Abha 0.001 0 30.3 84.2 25.6 3 38.7 23.6 0 45.7 0.001 0 251.1
Khamis Mushait 0 2.4 18 36.9 40.8 4 19 23.8 0 9.1 2.5 0 156.5
Tabuk Tabuk 0.001 5.2 0 2.4 0.001 0 0 0 0 3.8 0.001 0 11.4
Wejh 0 6.1 0 0 0.001 0 0 0 0 0 65.2 0.001 71.3
Hail Hail 0 4 0 28.9 16.6 0 0 0 0.001 2.6 32.6 2.5 87.2
Northern Borders
Arar 3.1 23.9 0 9.1 4.2 0 0 0 0 19.4 125 8.1 192.8
Turaif 9.4 17.5 0 13.6 4.9 0 0 0 0 2.7 53.2 8.3 109.6
Rafha 0.001 16.7 0.001 16.5 14.5 0 0 0 0 9 87.5 43 187.2
Jazan Jazan 0.001 30 0 0.001 0 2.5 0 4.5 30 25.5 0 52.1 144.6
Najran Najran 0 0 0 52.9 6.3 0 5.6 8 0 11.5 0.001 0 84.3
Sharorah 0 3.6 0.001 4.7 0 0 0 0.001 0 2 0 0 10.3
Al-Baha Al-Baha 0 4.3 6.7 33.4 22.5 0.001 0.001 1 0 40.4 33.3 1.5 143.1
Al-Jouf Al-Jouf 1.6 18.1 0 8.4 0.001 0 0 0 0 10.3 130.4 16.9 185.7
Guriat 4.7 19.8 0.001 3.1 23.5 0 0 0 0 6.8 27.9 0.001 85.8

Section - 5
KSA Fourth National Communication (NC4) 122
Figure 5.10: Projected Monthly Average Rainfall (mm) in Different Periods (2030, 2045-2070 and 2071-2100)
(a). Monthly Average Rainfall in 2030
(b). Monthly Average Rainfall in 2045-2070
(c). Monthly Average Rainfall in 2071-2100

Section - 5
KSA Fourth National Communication (NC4) 123
5.4.2.5 Wind Speed
Past studies have reported that the changes in wind speed in future might not be significant. The data of current state of wind speed were obtained from FAO database (FAO, 2020). Table 5.7 shows that the average yearly wind speed varied in the range of 7.8 – 14.1 km/hour over the country. However, there is a significant variability in the average monthly and yearly wind speed from region to region. For instance, monthly average wind speeds in the regions of Makkah, Jazan and Al-Jouf are higher (e.g., 9 - 18 km/hour) than those in the other regions such as Riyadh, Madinah, Qassim etc. (e.g., 5.4 - 14 km/hour). The minimum yearly average wind speed was 13.2 km/hour in these regions, while the maximum in the other regions was 10.7 km/hour. The projected wind speed in different periods is shown in Figure 5.11.
Table 5.7: Monthly Average Wind Speed (km/hr) for Each Region in Saudi Arabia
Region Jan Feb Mar Apr May Jun Jul Aug Sep Oct Nov Dec
Riyadh 10.2 10.2 10.2 13.9 12.0 13.9 13.0 11.1 10.2 8.3 6.5 7.4
Makkah 16.2 18.0 14.4 14.4 14.4 14.4 12.6 14.4 18.0 9.0 10.8 12.6
Madinah 7.4 9.3 11.1 13.0 11.1 9.3 11.1 9.3 7.4 7.4 9.3 7.4
Qassim 9.0 9.0 10.8 12.6 12.6 10.8 10.8 9.0 7.2 9.0 9.0 9.0
Eastern Region 6.3 7.8 8.6 7.2 8.4 10.0 9.3 8.3 6.8 6.8 7.0 7.2
Asir 12.6 12.6 12.6 12.6 12.6 9.0 10.8 9.0 10.8 9.0 7.2 9.0
Tabuk 9.0 9.0 10.8 12.6 10.8 10.8 10.8 9.0 9.0 9.0 7.2 7.2
Hail 10.8 10.8 12.6 12.6 10.8 10.8 10.8 9.0 9.0 9.0 9.0 9.0
Jazan 12.6 12.6 12.6 12.6 12.6 14.4 16.2 16.2 12.6 10.8 12.6 12.6
Najran 9.0 9.0 10.8 9.0 10.8 10.8 9.0 9.0 10.8 5.4 9.0 7.2
Al-Baha 7.2 9.0 10.8 10.8 9.0 7.2 9.0 9.0 9.0 9.0 7.2 7.2
Al-Jouf 14.4 14.4 16.2 16.2 12.6 14.4 14.4 12.6 12.6 10.8 12.6 10.8

Section - 5
KSA Fourth National Communication (NC4) 124
Figure 5.11: Projected Wind Speed (km/h) in Different Periods (2030, 2045-2070 and 2071-2100)
(a). Wind speed (km/h) in 2030
(b). Wind speed (km/h) in 2045-2070
(c). Wind speed (km/h) in 2071-2100

Section - 5
KSA Fourth National Communication (NC4) 125
5.4.2.6 Evaporation The projected evaporation rates and changes for different periods are shown in Figure 5.12. The projected average evaporation rates showed an increasing trend from 7.94 mm/day in 2030 to 8.33 mm/day in 2071-2100.
Figure 5.12: Projected Evaporation Rate in Different Periods (2030, 2045-2070 and 2071-2100)
(a). Evaporation in 2030
(b). Evaporation in 2045-2070
(c). Evaporation in 2071-2100

Section - 5
KSA Fourth National Communication (NC4) 126
5.4.2.7 Net Radiation
The net radiation was estimated using the data from FAO database (FAO, 2020). The data of radiation are presented in Table 5.8. These data showed that the radiation in summer (June – August) was higher than those in the other months, varying in the range of 19.1 - 26.2 Mega Joules per square meter per day (MJ/m²/day). In general, the average annual radiation ranged between 18.2 and 19.8 MJ/m²/day in the entire country (FAO, 2020).
Table 5.8: Monthly Average Radiation for Each Region in Saudi Arabia
Region Radiation ((MJ/m²/day)
Jan Feb Mar Apr May Jun Jul Aug Sep Oct Nov Dec Average
Riyadh 13.8 16.5 18.3 20.4 21.7 24.4 24.0 23.4 21.0 17.9 14.9 12.7 19.1
Makkah 14.1 16.9 19.4 22.1 24.1 24.6 24.3 23.4 21.0 18.3 15.5 14.1 19.8
Madinah 13.9 17.1 17.8 19.7 22.5 25.5 25.3 24.4 20.8 18.2 15.7 11.7 19.4
Qassim 13.4 16.7 17.5 19.6 22.4 25.5 25.2 24.2 20.6 17.8 15.2 11.3 19.1
Eastern Region 12.6 15.0 16.9 19.2 22.3 23.8 23.4 22.6 19.9 17.4 13.8 11.8 18.2
Asir 16.4 19.1 21.6 23.2 20.5 21.8 19.6 19.2 20.4 19.3 18.1 15.2 19.5
Tabuk 12.7 15.6 19.2 24.2 21.9 20.2 22.5 24.3 20.2 17.1 13.3 10.1 18.4
Hail 12.6 16.0 18.2 21.7 24.2 25.4 26.0 24.5 20.7 16.7 14.7 11.7 19.4
Jazan 16.7 19.3 21.9 23.2 20.5 21.5 19.4 19.2 20.5 19.3 18.5 15.2 19.6
Najran 16.6 19.3 21.7 23.2 20.4 21.7 19.5 19.2 20.5 19.4 18.4 15.4 19.6
Al-Baha 15.9 18.7 21.4 23.0 20.6 21.9 19.5 19.1 20.3 19.4 17.6 14.4 19.3
Al-Jouf 11.9 15.4 17.8 21.5 24.2 25.4 26.2 24.3 20.3 16.1 14.1 11.1 19.0
5.4.3 Model Description
The CWR depends on climatic conditions, crop area and type, soil type, growing seasons and crop production frequencies (FAO, 2009; George et al., 2000). The CROPWAT software system is a collection of modules following the Penman-Monteith method that integrates several models necessary to predict CWR, irrigation water management and crop scheduling. It follows the FAO approved Penman-Monteith method to predict reference evapotranspiration (ETo), crop evapotranspiration (ETc) and irrigation water management (Allen et al., 1998). It is to be noted that ETc represents the amount of water that crop losses due to evapotranspiration while CWR represents the amount of water to be supplied (Mhashu, 2007). The CWR was estimated for each crop and then added through the irrigation scheme planning to predict the

Section - 5
KSA Fourth National Communication (NC4) 127
total water requirements. The first step in the CROPWAT software is to predict ETc on 10 day basis (e.g., time step = 10 days) as:
coc KETET ×= (1)
Where, ETc = actual evapotranspiration by the crop (mm/day), ETo = reference evapotranspiration (mm/day); Kc = crop coefficient at a specific growth stage. Kc depends on the type of crop (e.g., height of crop, resistance of canopy, albedo), soil and climatic parameters, such as, soil surface, evaporation and wind speed and direction (Allen et al., 1998; Smith and Kivumbi, 2006). Albedo is the fraction of solar radiation reflected by the surface of crop and soil, whereas the canopy means the leaves and branches of crops that make a kind of roof. Resistance of canopy is the resistance of the crop against vapor transfer (Allen et al., 1998). The parameter Kc varies depending on the type of the crop and the growing stage of a crop (e.g., initial stage, crop development, mid-season and late season). On the other hand, ETo depends on climatic data (e.g., temperature, wind speed, sunshine hours and humidity). The Penman-Monteith method has been recommended by the Food and Agriculture Organization (FAO) for its appropriate combinations of relevant climatic parameters for predicting ETo (Allen, 1998; Smith and Kivumbi, 2006; Mhashu, 2007). The basic features of the Penman-Monteith method includes: (i) height of the reference grass of 0.12 m; (ii) surface resistance of 70 s/m; and (iii) albedo of 0.23. These assumptions represent evaporation from the surface of wide range of high standard green grass with enough water and active growth (Allen et al., 1998). The equation can be presented as:
)34.01(
)(273
900)(408.0
2
2
u
eeuT
GRET
asno ++∆
−+
+−∆=
γ
γ (2)
Where, ETo = reference evapotranspiration (mm/day); Rn = net radiation at the crop surface (MJ/m2/day); G = soil heat flux density (MJ/m2/day); T = mean daily air temperature at 2 m height (°C); u2 = wind speed at 2 m height (m/s); es = saturation vapor pressure (kPa); ea = actual vapor pressure (kPa); es-ea = saturation vapor pressure deficit (kpa); ∆ = slope of vapor pressure curve (kPa/°C); and γ = psychrometric constant (kPa/°C). In assessing CWR for a crop, it is essential to understand the effective rainfall over the cultivated area. The effective rainfall can be calculated following Sheng-Feng et al. (2006) and Molua and Lambi (2006) as:
1252.0125 tot
toteffP
PP−
= (3)
Where, Peff = effective rainfall (mm) and Ptot = total rainfall (mm). Equation 3 is valid for a rainfall of Ptot < 250 mm. In Saudi Arabia, major parts of the country have average rainfall less than this value (e.g., Al-Jouf region) (GASTAT, 2019). Following the prediction of CWR for each crop, the monthly agricultural water requirements can be predicted as:

Section - 5
KSA Fourth National Communication (NC4) 128
∑=
×−=n
ieffici PETAQ
110)( (4)
Where, Q = monthly agricultural water requirement of irrigation scheme (m3/day); i = crop index; Ai = crop planted area (hectare); ETci = crop evapotranspiration (mm/day); Peff = the effective rainfall (mm/day) and 10 represents the conversion factor (Sheng-Feng et al., 2006). 5.4.4 Crop Water Requirements
The crop water requirements (CWR) for the current situation and forecasting the CWR for future under the changed climatic conditions are projected. In this report, the data for the major crops in the GASTAT (2019) have been used as a guide to predict the CWR for the current period, and the similar data were used to explain the effects of climate change in future. During this period, the total cultivated areas for all crops were almost constant (only 4.2% reduction as shown in Table 8.1 of section 8). Based on the historical distributions of crop areas in different regions, the approximate cultivated crop areas are shown in Table 5.9.
Table 5.9: Approximate Distribution of Cultivated Area in 2018 in Saudi Arabia Items Riyadh Makkah Madinah Qassim Eastern
Region Asir Tabuk Hail Jazan Najran Al
Baha Al
Jouf
Wheat 14,157 170 89 10,444 14,063 1,446 8,197 10,795 0 350 189 29,858
Millet (Grains) 0 1,638 3 0 0 102 0 0 3,161 0 4 0
Sorghum 613 3,462 0 0 0 1,285 0 0 49,460 0 45 0
Maize 185 52 0 501 24 17 2 1,421 78 0 8 183
Barley 17,692 8,303 326 1,492 6,133 17,909 7,544 9,769 434 895 1,628 21,735
Tomato 3,532 1,645 846 741 1,293 1,247 313 492 984 435 87 558
Potato 3,735 186 2 4,147 146 73 2,539 6,287 0 35 7 1,991
Other vegetables 93,981 20,875 22,60 15,337 11,325 2,625 24,88 8,932 5,715 2,131 577 3,681
Clover 206,570 2,631 10,248 60,977 11,023 5,852 37,149 29,392 0 7,893 214 49,108
Dates 30,958 7,723 13,319 28,180 9,714 3,639 1,612 13,438 206 2,414 1,000 3,922
Citrus 1,056 505 223 594 242 97 551 398 54 541 13 214
Grapes 472 249 1,063 362 61 149 395 390 0 14 66 557
The projected overall CWR in Saudi Arabia for the periods of 2018, 2030, 2045-2070 and 2071-2100 are shown in Figure 5.13. The projections were based on the cultivated areas in Saudi Arabia as reported in the GASTAT for 2018 (GASTAT, 2019). Any change in the policy on the cultivated areas for the major crops (e.g., fodder crops, dates, wheat, etc.) is likely to affect these estimates. In particular, clover was the largest consumer of water (approximately 60%). The recently introduced policy on the curtailment or suspension of clover production will affect the CWR in the coming years (MEWA, 2019; GASTAT, 2019). In 2018, 2030,

Section - 5
KSA Fourth National Communication (NC4) 129
2045-2070 and 2071-2100, the total CWR were projected to be 12,569, 12,889, 13,209 and 13,964 Mm3 per year respectively. In comparison to 2018, the predictions showed an increase of 1,395 Mm3 per year during the 2071-2100 period (11.1%).
Figure 5.13: Overall Projected Crop Water Requirements (CWR) in Saudi Arabia (Mm3/year)
The regional distributions of CWR are shown in Figure 5.14. Riyadh was the highest consumer of CWR (43.7%) followed by Qassim (15.7%), Al-Jouf (9.3%) and Hail (8.3%). These four regions consumed approximately 76.4% of CWR.
12,569
12,889
13,209
13,964
11,500
12,000
12,500
13,000
13,500
14,000
14,500
2018 2030 2045-2070 2071-2100
CWR (Mm3/yr)

Section - 5
KSA Fourth National Communication (NC4) 130
Figure 5.14: Crop Water Requirements (CWR) in Different Periods
(a). CWR in 2018 (Mm3)
(b). CWR in 2030 (Mm3)
(c). CWR in 2045-2070 (Mm3)
(d). CWR in 2071-2100 (Mm3)
5488.4
355.0582.11905.7464.4
163.1780.5
1047.5
358.2227.8 31.6
1164.6RiyadhMakkahMadinahQaseemEastern RegionAseerTaboukHailJazanNajranAl-BahaAl-Jouf
5625.1
365.4594.51949.4
476.9165.6
798.4
1079.6
369.6
230.931.7 1201.9
RiyadhMakkahMadinahQaseemEastern RegionAseerTaboukHailJazanNajranAl-BahaAl-Jouf
5761.9
375.9 607.01993.0
489.5168.0
816.2
1111.7
381.0234.1 31.8
1239.3 RiyadhMakkahMadinahQaseemEastern RegionAseerTaboukHailJazanNajranAl-BahaAl-Jouf
6091.0
397.3641.62106.8
517.4177.6
862.9
1175.2
402.8 247.5 33.61310.1
RiyadhMakkahMadinahQaseemEastern RegionAseerTaboukHailJazanNajranAl-BahaAl-Jouf

Section - 5
KSA Fourth National Communication (NC4) 131
The climatic models predicted increase in temperature in the range of 0.7 to 4.1°C (Tarawneh and Chowdhury, 2018). A sensitivity analysis was performed by increasing temperature from 1 to 5°C. The projected CWR for the increase of temperature are shown in Figure 5.15. The CWR showed an increase of 2.2%/°C. For 5°C increase of temperature, an increase of approximately 1,445 Mm3 of CWR was projected for the similar levels of cultivated areas and productions.
Figure 5.15: Projected CWR for Increase of Temperature by 1 to 5°C
The Crop-Specific CWR for the periods of 2018, 2030, 2045-2070 and 2071-2100 are shown in Figure 5.16. Most of the CWR was attributed to clover production (60%) while the dates production consumed approximately 20% of the CWR. Following the suspension of wheat production during 2016-2018 (MEWA, 2019), the small-scale growers were allowed to produce wheat to limited scales, which has consumed approximately 554 Mm3 of water. Based on decision of Council of Ministers’ to stop production of green fodder for a period of no more than 3 years starting 2018, a mechanism was established to implement guidelines to stop green fodder planting, considering the large amount of irrigation water it consumes (MEWA, 2019). As such, production of the green fodder crops is likely to be substantially curtailed in the next few years, which will reduce the CWR significantly.
12,569
12,856
13,145
13,443
13,727
14,014
11,500
12,000
12,500
13,000
13,500
14,000
14,500
Current 1°C 2°C 3°C 4°C 5°C
CWR (Mm3/yr)
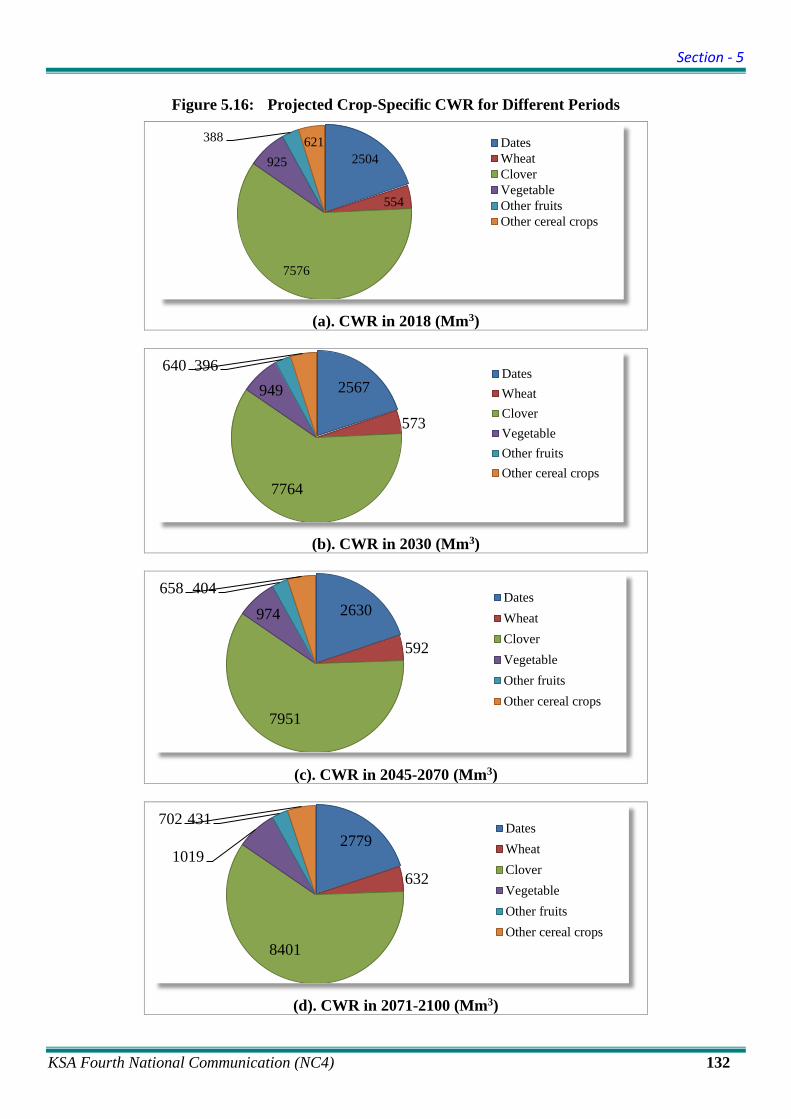
Section - 5
KSA Fourth National Communication (NC4) 132
Figure 5.16: Projected Crop-Specific CWR for Different Periods
(a). CWR in 2018 (Mm3)
(b). CWR in 2030 (Mm3)
(c). CWR in 2045-2070 (Mm3)
(d). CWR in 2071-2100 (Mm3)
2504
554
7576
925
388 621 DatesWheatCloverVegetableOther fruitsOther cereal crops
2567
573
7764
949396640 Dates
WheatCloverVegetableOther fruitsOther cereal crops
2630
592
7951
974404658 Dates
WheatCloverVegetableOther fruitsOther cereal crops
2779
632
8401
1019
431702 DatesWheatCloverVegetableOther fruitsOther cereal crops

Section - 5
KSA Fourth National Communication (NC4) 133
5.5 Water Demand-Supply Optimization
The increase in non-agricultural (urban and industrial water) water demand is evident in Saudi Arabia (MEWA, 2019; GASTAT, 2019). The withdrawal of non-renewable groundwater has become an issue. To protect the groundwater resources, Saudi Arabia has suspended and/or limited cultivation of several major crops (USDA, 2016). In contrast, the non-conventional sources have not been fully utilized, which has increased in-proportionate stress on the non-renewable groundwater sources (MEWA, 2019; GASTAT, 2019). The impact of climate change is likely to affect the available water resources while the non-agricultural (urban and industrial) water demand has been projected to increase in future. Further, the agricultural water demand has been regulated to conserve water resources. The optimal distribution of water resources is likely to assist in better understanding and managing the available water resources.
The Goal Programming (GP) model is one of the commonly used multi-objective optimization techniques for resource allocation under multiple constraints (LINDO, 2014). The GP model allows the decision-makers to incorporate multiple considerations into the model through the determination of aspiration levels and their priorities. It includes a set of constraints and a set of goals, which are prioritized according to their importance. In this report, the linear GP model is adopted for water demand - supply management.
5.5.1 Model Development
The basic framework for developing the multi-objective model in this section is shown in Table 5.10.
Table 5.10: Modeling Framework for Multi-Sources Multi-Users Water Distribution
Water demand sector Domestic (D)
𝑸𝑸𝑫𝑫, 𝑻𝑻𝑫𝑫𝑻𝑻𝑫𝑫
Agricultural (A)
𝑸𝑸𝑨𝑨, 𝑻𝑻𝑫𝑫𝑻𝑻𝑨𝑨
Industrial (I)
𝑸𝑸𝑰𝑰, 𝑻𝑻𝑫𝑫𝑻𝑻𝑰𝑰
Water supply source
Groundwater (GW) 𝑄𝑄𝐺𝐺𝐺𝐺, 𝑇𝑇𝑇𝑇𝑇𝑇𝐺𝐺𝐺𝐺, 𝐶𝐶𝐺𝐺𝐺𝐺
𝑞𝑞𝐷𝐷𝐺𝐺𝐺𝐺 𝑞𝑞𝐴𝐴𝐺𝐺𝐺𝐺 𝑞𝑞𝐼𝐼𝐺𝐺𝐺𝐺
Surface water (SW) 𝑄𝑄𝑆𝑆𝐺𝐺, 𝑇𝑇𝑇𝑇𝑇𝑇𝑆𝑆𝐺𝐺, 𝐶𝐶𝑆𝑆𝐺𝐺
𝑞𝑞𝐷𝐷𝑆𝑆𝐺𝐺 𝑞𝑞𝐴𝐴𝑆𝑆𝐺𝐺 -
Desalinated water (DW) 𝑄𝑄𝐷𝐷𝐺𝐺, 𝑇𝑇𝑇𝑇𝑇𝑇𝐷𝐷𝐺𝐺, 𝐶𝐶𝐷𝐷𝐺𝐺
𝑞𝑞𝐷𝐷𝐷𝐷𝐷𝐷 - -
Treated wastewater (TWW) 𝑄𝑄𝑇𝑇𝐺𝐺𝐺𝐺, 𝑇𝑇𝑇𝑇𝑇𝑇𝑇𝑇𝐺𝐺𝐺𝐺, 𝐶𝐶𝑇𝑇𝐺𝐺𝐺𝐺
- 𝑞𝑞𝐴𝐴𝑇𝑇𝐺𝐺𝐺𝐺 -
𝑄𝑄𝐺𝐺𝐺𝐺 Current extraction of GW (Mm3/year); 𝑄𝑄𝑆𝑆𝐺𝐺 Current capacity of dams for drinking and irrigation (Mm3/year); 𝑄𝑄𝐷𝐷𝐺𝐺 Current supply of DW (Mm3/year); 𝑄𝑄𝑇𝑇𝐺𝐺𝐺𝐺 Predicted generation of domestic wastewater (Mm3/year); 𝑄𝑄𝐷𝐷 Domestic water demand (Mm3/year); 𝑄𝑄𝐴𝐴 Agricultural water demand (Mm3/year); 𝑄𝑄𝐼𝐼
Industrial water demand (Mm3/year);

Section - 5
KSA Fourth National Communication (NC4) 134
𝑇𝑇𝑇𝑇𝑇𝑇𝐺𝐺𝐺𝐺 TDS of GW (ppm); 𝑇𝑇𝑇𝑇𝑇𝑇𝑆𝑆𝐺𝐺 TDS of SW (ppm); 𝑇𝑇𝑇𝑇𝑇𝑇𝐷𝐷𝐺𝐺 TDS of DW (ppm); 𝑇𝑇𝑇𝑇𝑇𝑇𝑇𝑇𝐺𝐺𝐺𝐺 TDS of TWW (ppm); 𝑇𝑇𝑇𝑇𝑇𝑇𝐷𝐷 Required TDS of domestic water (ppm); 𝑇𝑇𝑇𝑇𝑇𝑇𝐴𝐴 Required TDS of agricultural water (ppm); 𝑇𝑇𝑇𝑇𝑇𝑇𝐼𝐼 Required TDS of industrial water (ppm); 𝐶𝐶𝐺𝐺𝐺𝐺 Unit cost of using GW (SR/m3); 𝐶𝐶𝑆𝑆𝐺𝐺 Unit cost of using SW (SR/m3); 𝐶𝐶𝐷𝐷𝐺𝐺 Unit cost of using DW (SR/m3); 𝐶𝐶𝑇𝑇𝐺𝐺𝐺𝐺 Unit cost of reusing TWW (SR/m3); 𝑞𝑞𝐷𝐷𝐺𝐺𝐺𝐺 GW supplied to domestic sector (Mm3/year); 𝑞𝑞𝐴𝐴𝐺𝐺𝐺𝐺 GW supplied to agricultural sector (Mm3/year); 𝑞𝑞𝐼𝐼𝐺𝐺𝐺𝐺 GW supplied to industrial sector (Mm3/year); 𝑞𝑞𝐷𝐷𝑆𝑆𝐺𝐺 SW supplied to domestic sector (Mm3/year); 𝑞𝑞𝐴𝐴𝑆𝑆𝐺𝐺 SW supplied to agricultural sector (Mm3/year); 𝑞𝑞𝐷𝐷𝐷𝐷𝐺𝐺 DW supplied to domestic sector (Mm3/year); 𝑞𝑞𝐴𝐴𝑇𝑇𝐺𝐺𝐺𝐺 TWW reused in agricultural sector (Mm3/year);
The objective function in GP model is always minimized and is composed of deviational variables only. It minimizes the deviations of the optimal solution from target goals, prioritized and weighted. In this section, the objective function was developed to:
• Satisfy domestic, agricultural and industrial water demands in different regions of Saudi Arabia.
• Control quality of water with the desired quality level in terms of total dissolved solids (TDS).
• Maximize reuse of TWW. • Maximize use of SW. • Minimize extraction of GW in order to maximize GW conservation. • Minimize overproduction of DW considering that the DW is completely used. • Minimize the overall cost of using water from different supply sources.
The decision variables represent the sources that supply water to different sectors. These are:
• GW to domestic, agricultural and industrial sectors. • SW to domestic and agricultural sectors. • DW to domestic sector. • TWW to agricultural sector.
The deviational variables can either be positive or negative. The positive deviation indicates an over-achievement of a goal and the negative deviation represents the under-achievement of
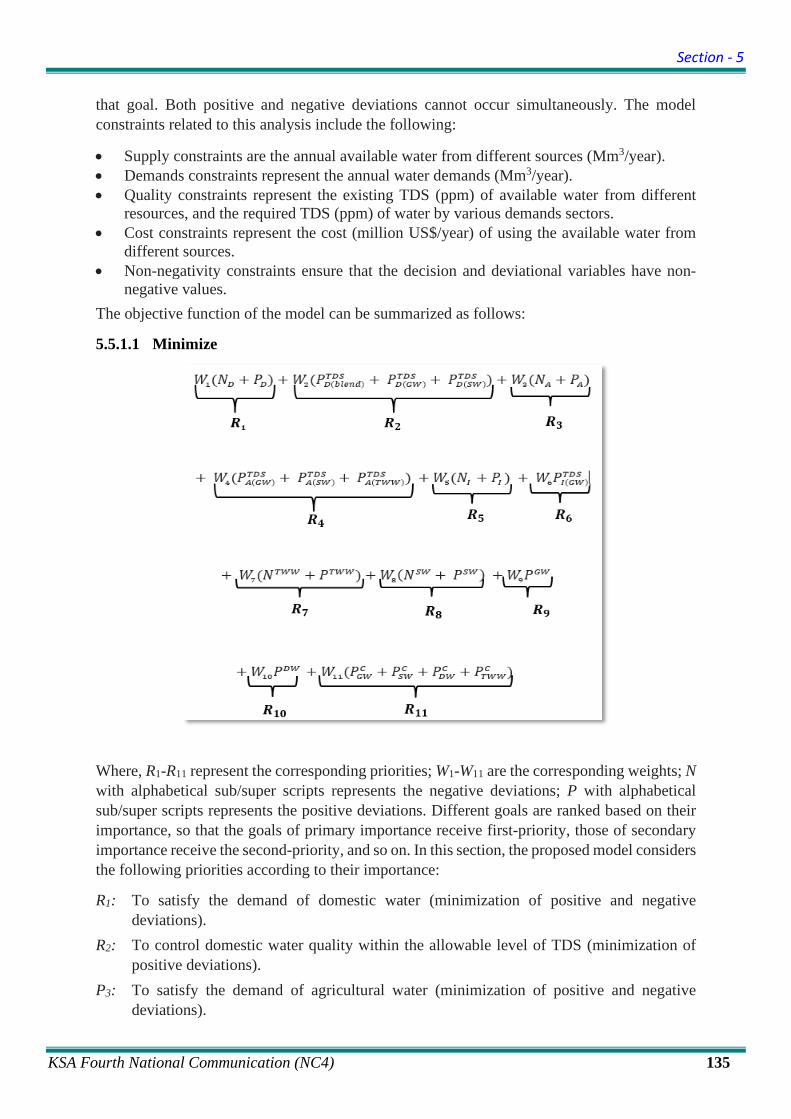
Section - 5
KSA Fourth National Communication (NC4) 135
that goal. Both positive and negative deviations cannot occur simultaneously. The model constraints related to this analysis include the following:
• Supply constraints are the annual available water from different sources (Mm3/year). • Demands constraints represent the annual water demands (Mm3/year). • Quality constraints represent the existing TDS (ppm) of available water from different
resources, and the required TDS (ppm) of water by various demands sectors. • Cost constraints represent the cost (million US$/year) of using the available water from
different sources. • Non-negativity constraints ensure that the decision and deviational variables have non-
negative values.
The objective function of the model can be summarized as follows:
5.5.1.1 Minimize
Where, R1-R11 represent the corresponding priorities; W1-W11 are the corresponding weights; N with alphabetical sub/super scripts represents the negative deviations; P with alphabetical sub/super scripts represents the positive deviations. Different goals are ranked based on their importance, so that the goals of primary importance receive first-priority, those of secondary importance receive the second-priority, and so on. In this section, the proposed model considers the following priorities according to their importance:
R1: To satisfy the demand of domestic water (minimization of positive and negative deviations).
R2: To control domestic water quality within the allowable level of TDS (minimization of positive deviations).
P3: To satisfy the demand of agricultural water (minimization of positive and negative deviations).
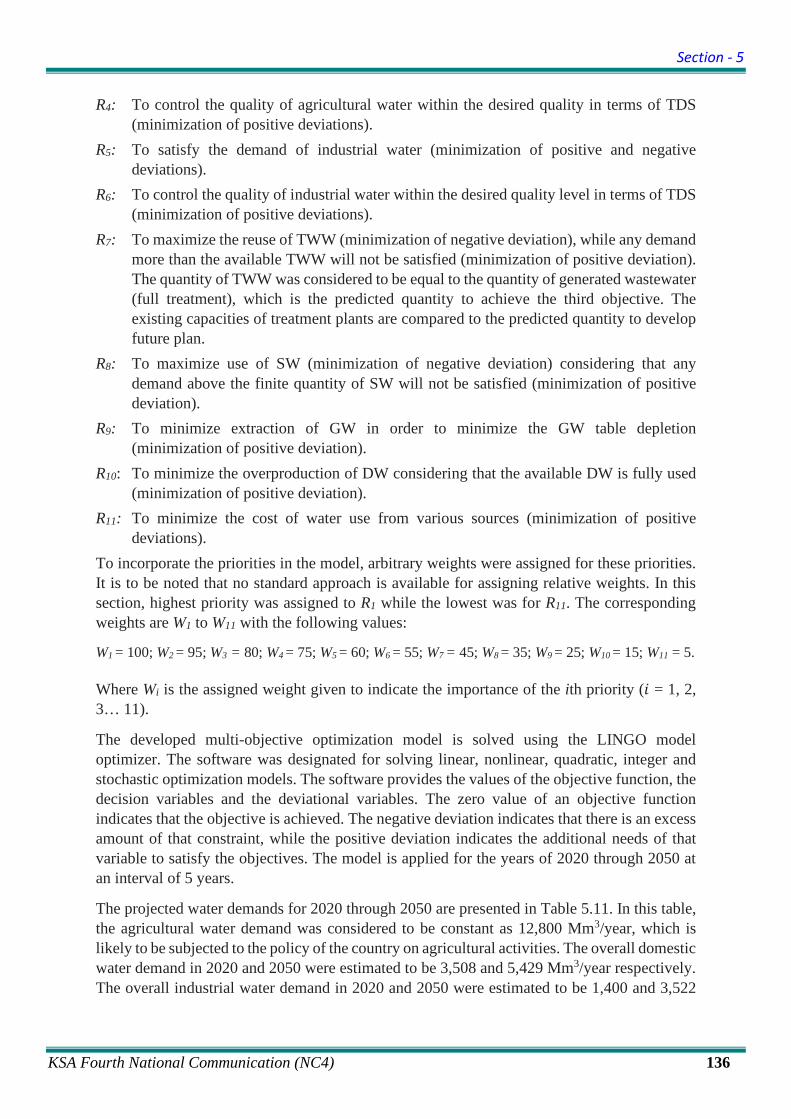
Section - 5
KSA Fourth National Communication (NC4) 136
R4: To control the quality of agricultural water within the desired quality in terms of TDS (minimization of positive deviations).
R5: To satisfy the demand of industrial water (minimization of positive and negative deviations).
R6: To control the quality of industrial water within the desired quality level in terms of TDS (minimization of positive deviations).
R7: To maximize the reuse of TWW (minimization of negative deviation), while any demand more than the available TWW will not be satisfied (minimization of positive deviation). The quantity of TWW was considered to be equal to the quantity of generated wastewater (full treatment), which is the predicted quantity to achieve the third objective. The existing capacities of treatment plants are compared to the predicted quantity to develop future plan.
R8: To maximize use of SW (minimization of negative deviation) considering that any demand above the finite quantity of SW will not be satisfied (minimization of positive deviation).
R9: To minimize extraction of GW in order to minimize the GW table depletion (minimization of positive deviation).
R10: To minimize the overproduction of DW considering that the available DW is fully used (minimization of positive deviation).
R11: To minimize the cost of water use from various sources (minimization of positive deviations).
To incorporate the priorities in the model, arbitrary weights were assigned for these priorities. It is to be noted that no standard approach is available for assigning relative weights. In this section, highest priority was assigned to R1 while the lowest was for R11. The corresponding weights are W1 to W11 with the following values:
W1 = 100; W2 = 95; W3 = 80; W4 = 75; W5 = 60; W6 = 55; W7 = 45; W8 = 35; W9 = 25; W10 = 15; W11 = 5.
Where Wi is the assigned weight given to indicate the importance of the ith priority (𝑖𝑖 = 1, 2, 3… 11).
The developed multi-objective optimization model is solved using the LINGO model optimizer. The software was designated for solving linear, nonlinear, quadratic, integer and stochastic optimization models. The software provides the values of the objective function, the decision variables and the deviational variables. The zero value of an objective function indicates that the objective is achieved. The negative deviation indicates that there is an excess amount of that constraint, while the positive deviation indicates the additional needs of that variable to satisfy the objectives. The model is applied for the years of 2020 through 2050 at an interval of 5 years.
The projected water demands for 2020 through 2050 are presented in Table 5.11. In this table, the agricultural water demand was considered to be constant as 12,800 Mm3/year, which is likely to be subjected to the policy of the country on agricultural activities. The overall domestic water demand in 2020 and 2050 were estimated to be 3,508 and 5,429 Mm3/year respectively. The overall industrial water demand in 2020 and 2050 were estimated to be 1,400 and 3,522

Section - 5
KSA Fourth National Communication (NC4) 137
Mm3/year respectively. The total water demands in 2020 and 2050 were estimated to be 17,708 and 21,751 Mm3/year. The province wise demands can be found in Table 5.11.
Table 5.11: Projected Water Demands in Different Sectors (Mm3/year) Year Items
* Riyadh Makkah Madinah Qassim Eastern
Region Asir Hail Tabuk Al
Baha North
Borders Al
Jouf Jazan Najran Total
2020
D 1,026 897 246 131 521 185 68 103 42 37 58 134 59 3,508
A 3,468 737 777 1,868 735 330 1,099 565 100 6 1,196 1,712 207 12,800
I 464 283 102 41 389 31 14 16 10 6 20 16 10 1,400
2025
D 1,049 904 254 134 525 187 69 106 41 39 59 138 61 3,565
A 3,468 737 777 1,868 735 330 1,099 565 100 6 1,196 1,712 207 12,800
I 584 356 129 52 490 40 17 20 12 7 25 20 12 1,763
2030
D 1,148 975 281 147 566 203 75 117 42 43 64 153 68 3,881
A 3,468 737 777 1,868 735 330 1,099 565 100 6 1,196 1,712 207 12,800
I 727 443 160 65 610 49 22 25 15 9 31 25 15 2,195
2035
D 1,244 1,041 307 159 605 218 81 127 44 47 69 167 76 4,185
A 3,468 737 777 1,868 735 330 1,099 565 100 6 1,196 1,712 207 12,800
I 855 521 188 76 717 58 25 29 18 11 36 29 18 2,582
2040
D 1,313 1,083 328 168 629 228 85 135 45 50 72 178 82 4,394
A 3,468 737 777 1,868 735 330 1,099 565 100 6 1,196 1,712 207 12,800
I 931 568 205 83 781 63 28 32 20 12 39 32 20 2,812
2045
D 1,464 1,190 369 187 691 251 95 151 48 56 79 201 93 4,874
A 3,468 737 777 1,868 735 330 1,099 565 100 6 1,196 1,712 207 12,800
I 1,054 643 232 94 884 72 31 36 22 13 45 36 22 3,185
2050
D 1,639 1,313 417 209 762 279 105 170 51 63 88 227 106 5,429
A 3,468 737 777 ,1868 735 330 1,099 565 100 6 1,196 1,712 207 12,800
I 1,166 711 257 104 978 79 35 40 25 15 49 40 25 3,522
Notes: D: Domestic water demand; A: Agricultural water demand; I: Industrial water demand
Table 5.12 summarizes the needs for domestic water supplies from different sources. The supply of the DW needs to be increased from 2,622 Mm3/year in 2020 to 4,495 Mm3/year in 2050. In 2020, DW satisfies approximately 74.8% of domestic water demand, which is likely to be 82.8% in 2050. During this period, contribution of GW is likely to decrease from 17% to 10.8%. The SW is likely to contribute 6.4 – 7.8% of the domestic water demand during this period. Further details on the source specific demands for domestic water can be found in Table 5.12.

Section - 5
KSA Fourth National Communication (NC4) 138
Table 5.12: Source-Specific Water Demands for Domestic Supplies (Mm3/year) Year Items
* Riyadh Makkah Madinah Qassim Eastern
Region Asir Hail Tabuk Al-
Baha Northern borders
Al-Jouf
Jazan Najran Total
2020
Demand 1,024 896 251 131 520 185 69 103 41 37 58 134 59 3,507
GW 134 108 33 17 68 17 69 13 0 37 58 1 58 613
SW 0 50 0 0 0 54 0 0 41 0 0 127 0 272
DW 891 738 218 114 452 114 0 90 0 0 0 6 0 2,622
2025
Demand 1,047 902 260 134 524 187 69 106 40 39 59 138 61 3,566
GW 137 107 34 17 60 18 69 14 0 39 59 1 61 615
SW 0 48 0 0 0 50 0 0 40 0 0 132 0 271
DW 910 747 226 116 464 119 0 92 0 0 0 6 0 2,681
2030
Demand 1,149 976 281 144 567 203 75 117 42 43 64 153 69 3,884
GW 150 120 37 19 47 20 75 15 1 43 64 1 68 659
SW 0 47 0 0 0 50 0 0 42 0 0 146 0 285
DW 999 810 244 126 520 134 0 102 0 0 0 6 0 2,940
2035
Demand 1,240 1,057 312 159 599 216 80 126 44 46 68 166 75 4,187
GW 162 126 41 21 29 22 80 16 1 46 68 1 75 688
SW 0 43 0 0 0 48 0 0 43 0 0 159 0 293
DW 1,030 848 259 132 544 140 0 105 0 0 0 5 0 3,063
2040
Demand 1,312 1,082 327 172 628 228 85 135 45 50 72 178 81 4,394
GW 166 85 42 22 11 24 85 18 2 50 72 1 81 658
SW 38 0 0 0 46 0 0 43 0 0 172 0 299
DW 1,146 959 285 150 617 158 0 117 0 0 0 5 0 3,438
2045
Demand 1,463 1,189 369 187 690 251 94 151 48 56 79 206 93 4,875
GW 148 35 40 24 2 27 94 20 3 56 79 1 92 621
SW 0 39 0 0 0 46 0 0 44 0 0 200 0 328
DW 1,315 1,116 329 163 688 179 131 5 3,925
2050
Demand 1,658 1,306 415 208 758 277 105 169 51 63 87 226 105 5,429
GW 105 3 33 27 0 30 105 22 5 63 87 1 105 585
SW 0 40 0 0 0 44 0 0 46 0 0 219 0 349
DW 1,554 1,263 382 181 758 203 0 147 0 0 0 6 0 4,495
Notes: GW: Groundwater; SW: Surface water; DW: Desalinated water
Table 5.13 summarizes the needs for agricultural water supplies from different sources. The supply of the GW is likely to be decreased from 10,290 Mm3/year in 2020 to 8,759 Mm3/year in 2050. In 2020, SW satisfied approximately 219 Mm3/year, which has been estimated to decrease to 95 Mm3/year in 2050. In 2020, 2,292 Mm3/year of TWW should have been reused, which has been predicted to be 3,946 Mm3/year in 2050. It is to be noted that this analysis assumed for the domestic wastewater to be fully collected, treated, and recycled for reuse in agriculture. Any deficiency to this assumption must be adjusted through decreasing the agricultural water demand.

Section - 5
KSA Fourth National Communication (NC4) 139
Table 5.13: Source-Specific Water Demands for Agricultural Supplies (Mm3/year)
Year Items Riyadh Makkah Madinah Qassim Eastern Region Asir Hail Tabuk Al
Baha Northern borders
Al Jouf Jazan Najran Total
2020
Demand 3,468 737 777 1,868 735 330 1,099 565 100 6 1,196 1,712 207 12,800
GW 2,790 152 613 1,780 390 207 1,055 497 58 0 1,158 1,423 168 10,290
SW 3 1 15 201 0 219
TWW 679 584 163 87 345 122 45 68 28 6 39 89 39 2,292
2025
Demand 3,468 737 777 1,868 735 330 1,099 565 100 6 1,196 1,712 207 12,800
GW 2,712 110 594 1,790 356 195 1,049 489 58 0 1,154 1,426 163 10,094
SW 0 0 13 187 0 200
TWW 756 627 183 78 379 135 50 77 29 6 43 100 44 2,505
2030
Demand 3,468 737 777 1,868 735 330 1,099 565 100 6 1,196 1,712 207 12,800
GW 2,626 76 570 1,758 318 181 1,044 479 59 0 1,149 1,425 157 9,841
SW 1 0 10 171 0 183
TWW 843 662 206 108 416 149 55 86 31 6 47 116 50 2,776
2035
Demand 3,468 737 777 1,868 735 330 1,099 565 100 6 1,196 1,712 207 12,800
GW 2,528 42 545 1,748 278 165 1,038 469 59 0 917 1,432 150 9,371
SW 3 0 8 153 153 0 318
TWW 940 692 232 120 457 165 61 96 33 6 126 126 57 3,112
2040
Demand 3,468 737 777 1,868 735 330 1,099 565 100 6 1,196 1,712 207 12,800
GW 2,420 22 514 1,734 232 148 1,032 457 58 0 1,139 1,437 142 9,336
SW 6 0 6 134 0 146
TWW 1,048 710 262 134 502 182 68 108 36 6 57 142 65 3,319
2045
Demand 3,468 737 777 1,868 735 330 1,099 565 100 6 1,196 1,712 207 12,800
GW 2,300 10 482 1,718 187 129 1,025 445 58 0 1,134 1,446 133 9,066
SW 5 0 5 106 0 116
TWW 1,168 722 295 149 547 201 76 121 38 6 63 160 74 3,619
2050
Demand 3,468 737 777 1,868 735 330 1,099 565 100 6 1,196 1,712 207 12,800
GW 2,163 4 445 1,701 141 107 1,016 430 57 0 1,127 1,446 123 8,759
SW 4 2 3 87 0 95
TWW 1,305 729 332 167 593 222 84 135 40 6 70 180 84 3,946

Section - 5
KSA Fourth National Communication (NC4) 140
Table 5.14 summarizes the needs for industrial water supplies from groundwater sources. The supply of the GW needs to be increased from 1,400 Mm3/year in 2020 to 3,522 Mm3/year in 2050. Currently, the industries are mostly dependent on the GW sources in the country. Treating the industrial wastewater and reusing the treated industrial/domestic wastewater is likely to minimize the use of GW and conserve the GW sources.
Table 5.14: Source-Specific Water Demands for Industrial Supplies (Mm3/year)
Year Items Riyadh Makkah Madinah Qassim Eastern Region Asir Hail Tabuk Al
Baha Northern Borders
Al Jouf Jazan Najran Total
2020 GW 463 283 102 41 389 31 14 16 10 6 20 16 10 1,400
2025 GW 585 357 124 52 491 40 17 20 12 8 25 20 12 1,763
2030 GW 727 443 160 64 610 49 22 25 15 9 31 25 15 2,195
2035 GW 837 515 186 74 726 61 30 32 20 10 36 34 21 2,582
2040 GW 916 573 206 78 778 65 32 34 22 11 39 36 22 2,812
2045 GW 1,037 648 234 92 880 74 36 39 25 13 44 39 25 3,185
2050 GW 1,139 719 259 102 976 82 40 43 28 14 49 45 28 3,522
Table 5.15 summarizes the needs for water supplies from GW, SW, DW and TWW. For GW, the need was estimated to be 12,303 Mm3/year in 2020, which is likely to be increased to 12,867 Mm3/year in 2050. For SW, the need was estimated to be 491 Mm3/year in 2020, which is likely to be decreased to 444 Mm3/year in 2050. In case of DW, the need was estimated to be 2,622 Mm3/year in 2020, which is likely to be increased to 4,495 Mm3/year in 2050 indicating that the production of DW should be increased by approximately 72% by 2050. In case of TWW, the need was estimated to be 2,292 Mm3/year in 2020, which is likely to be increased to 3,946 Mm3/year in 2050 indicating that the reuse of TWW should be increased by approximately 73% by 2050. It is to be noted that Saudi Arabia is not utilizing its full potential for TWW reuse. It was reported that only 311 Mm3/year of TWW was reused. There is need to increase the capacity to reuse the full potential of TWW in agriculture.

Section - 5
KSA Fourth National Communication (NC4) 141
Table 5.15: Source-Specific Estimated Supplies to Satisfy the Demands (Mm3/yr)
Year Items Riyadh Makkah Madinah Qassim Eastern Region Asir Hail Tabuk Al
Baha Northern Borders
Al Jouf Jazan Najran Total
2020
GW 3,387 543 748 1,838 847 255 1,137 526 68 43 1,235 1,439 236 12,303
SW 0 52 0 0 0 55 0 0 56 0 0 327 0 491
DW 891 738 218 114 452 114 0 90 0 0 0 6 0 2,622
TWW 679 584 163 87 345 122 45 68 28 6 39 89 39 2,292
2025
GW 3,434 574 752 1,860 906 252 1,136 522 71 46 1,237 1,446 236 12,472
SW 0 48 0 0 0 51 0 0 53 0 0 318 0 470
DW 910 747 226 116 464 119 0 92 0 0 0 6 0 2,681
TWW 756 627 183 78 379 135 50 77 29 6 43 100 44 2,505
2030
GW 3,503 639 767 1,841 975 250 1,140 519 74 52 1,244 1,450 240 12,695
SW 0 48 0 0 0 50 0 0 52 0 0 318 0 468
DW 999 810 244 126 520 134 0 102 0 0 0 6 0 2,940
TWW 843 662 206 108 416 149 55 86 31 6 47 116 50 2,776
2035
GW 3,527 684 771 1,842 1,033 248 1,148 517 80 57 1,021 1,467 245 12,640
SW 0 46 0 0 0 48 0 0 51 0 153 313 0 611
DW 1,030 848 259 132 544 140 0 105 0 0 0 5 0 3,063
TWW 940 692 232 120 457 165 61 96 33 6 126 126 57 3,112
2040
GW 3,502 679 762 1,834 1,021 237 1,149 509 82 61 1,249 1,474 245 12,806
SW 0 44 0 0 0 46 0 0 49 0 0 306 0 444
DW 1,146 959 285 150 617 158 0 117 0 0 0 5 0 3,438
TWW 1,048 710 262 134 502 182 68 108 36 6 57 142 65 3,319
2045
GW 3,485 693 756 1,834 1,069 230 1,155 503 86 69 1,257 1,486 251 12,872
SW 0 44 0 0 0 46 0 0 49 0 0 306 0 444
DW 1,315 1,116 329 163 688 179 0 131 0 0 0 5 0 3,925
TWW 1,168 722 295 149 547 201 76 121 38 6 63 160 74 3,619
2050
GW 3,406 726 737 1,830 1,117 219 1,161 495 89 77 1,263 1,492 256 12,867
SW 0 44 0 0 0 46 0 0 49 0 0 306 0 444
DW 1,554 1,263 382 181 758 203 0 147 0 0 0 6 0 4,495
TWW 1,305 729 332 167 593 222 84 135 40 6 70 180 84 3,946

Section - 5
KSA Fourth National Communication (NC4) 142
Figure 5.17 shows the water demand for different sectors. Both the domestic and industrial water demand showed increasing trends while the agricultural water demand was kept constant. Figures 5.18 to 5.21 show the water demand from different sources.
Figure 5.17: Sector Wise Water Demand for 2020-2050
Figure 5.18: Water Demand from Groundwater Sources from 2020-2050
0
5,000
10,000
15,000
20,000
25,000
2020 2025 2030 2035 2040 2045 2050
Wat
er d
eman
d (M
m3 )
Dom Ind Agr Total
12,303
12,472
12,695
12,793 12,80612,872 12,867
12,000
12,100
12,200
12,300
12,400
12,500
12,600
12,700
12,800
12,900
13,000
2020 2025 2030 2035 2040 2045 2050
Wat
er d
eman
d (M
m3 )
GW

Section - 5
KSA Fourth National Communication (NC4) 143
Figure 5.19: Water Demand from Surface Water Sources from 2020-2050
Figure 5.20: Water Demand from Desalinated Sources from 2020-2050
420
430
440
450
460
470
480
490
500
2020 2025 2030 2035 2040 2045 2050
Wat
er d
eman
d (M
m3 )
SW
2,622 2,6812,940 3,063
3,438
3,925
4,495
0
500
1,000
1,500
2,000
2,500
3,000
3,500
4,000
4,500
5,000
2020 2025 2030 2035 2040 2045 2050
Wat
er d
eman
d (M
m3 )
DW

Section - 5
KSA Fourth National Communication (NC4) 144
Figure 5.21: Water Demand from Treated Wastewater Sources from 2020-2050
Tables 5.16 to 5.19 show the province specific detailed supply needed for the period of 2020 through 2050 from different sources. Overall, Riyadh, Makkah and Eastern Region showed the highest demands for GW, DW and TWW.
Table 5.16: Need for GW supplies (Mm3/year) Year Riyadh Makkah Madinah Qassim Eastern
Region Asir Hail Tabuk Al
Baha Northern Borders
Al Jouf
Jazan Najran Total
2020 3387 543 748 1838 847 255 1137 526 68 43 1235 1439 236 12303
2025 3434 574 752 1860 906 252 1136 522 71 46 1237 1446 236 12472
2030 3503 639 767 1841 975 250 1140 519 74 52 1244 1450 240 12695
2035 3527 684 771 1842 1033 248 1148 517 80 57 1174 1467 245 12793
2040 3502 679 762 1834 1021 237 1149 509 82 61 1249 1474 245 12806
2045 3485 693 756 1834 1069 230 1155 503 86 69 1257 1486 251 12872
2050 3406 726 737 1830 1117 219 1161 495 89 77 1263 1492 256 12867
2,2922,505
2,776
3,1123,319
3,619
3,946
0
500
1,000
1,500
2,000
2,500
3,000
3,500
4,000
4,500
2020 2025 2030 2035 2040 2045 2050
Wat
er d
eman
d (M
m3 )
TWW

Section - 5
KSA Fourth National Communication (NC4) 145
Table 5.17: Need for SW Supplies (Mm3/year)
Year Riyadh Makkah Madinah Qassim Eastern Region Asir Hail Tabuk Al
Baha Northern Borders
Al Jouf Jazan Najran Total
2020 0 52 0 0 0 55 0 0 56 0 0 327 0 491
2025 0 48 0 0 0 51 0 0 53 0 0 318 0 470
2030 0 48 0 0 0 50 0 0 52 0 0 318 0 468
2035 0 46 0 0 0 48 0 0 51 0 0 313 0 457
2040 0 44 0 0 0 46 0 0 49 0 0 306 0 444
2045 0 44 0 0 0 46 0 0 49 0 0 306 0 444
2050 0 44 0 0 0 46 0 0 49 0 0 306 0 444
Table 5.18: Need for DW Supplies (Mm3/year)
Year Riyadh Makkah Madinah Qassim Eastern Region
Asir Hail Tabuk Al Baha
Northern Borders
Al Jouf
Jazan Najran Total
2020 891 738 218 114 452 114 0 90 0 0 0 6 0 2622
2025 910 747 226 116 464 119 0 92 0 0 0 6 0 2681
2030 999 810 244 126 520 134 0 102 0 0 0 6 0 2940
2035 1030 848 259 132 544 140 0 105 0 0 0 5 0 3063
2040 1146 959 285 150 617 158 0 117 0 0 0 5 0 3438
2045 1315 1116 329 163 688 179 0 131 0 0 0 5 0 3925
2050 1554 1263 382 181 758 203 0 147 0 0 0 6 0 4495
Table 5.19: Need for TWW Supplies (Mm3/year)
Year Riyadh Makkah Madinah Qassim Eastern Region Asir Hail Tabuk Al
Baha Northern Borders
Al Jouf Jazan Najran Total
2020 679 584 163 87 345 122 45 68 28 6 39 89 39 2292
2025 756 627 183 78 379 135 50 77 29 6 43 100 44 2505
2030 843 662 206 108 416 149 55 86 31 6 47 116 50 2776
2035 940 692 232 120 457 165 61 96 33 6 126 126 57 3112
2040 1048 710 262 134 502 182 68 108 36 6 57 142 65 3319
2045 1168 722 295 149 547 201 76 121 38 6 63 160 74 3619
2050 1305 729 332 167 593 222 84 135 40 6 70 180 84 3946

Section - 5
KSA Fourth National Communication (NC4) 146
The water demands for different regions during 2020 through 2050 are shown in Figures 5.22–5.35.
Figure 5.22: Sector Wise Water Demands in Riyadh (2020-2050) [D: Domestic Water Demand; A: Agricultural Water Demand; I: Industrial Water Demand]
Figure 5.23: Sector Wise Water Demands in Makkah (2020-2050) [D: Domestic Water Demand; A: Agricultural Water demand; I: Industrial Water Demand]
0
1,000
2,000
3,000
4,000
5,000
6,000
7,000
2020 2025 2030 2035 2040 2045 2050
Wat
er D
eman
d (M
m3 )
D A I Total
0
500
1,000
1,500
2,000
2,500
3,000
2020 2025 2030 2035 2040 2045 2050
Wat
er D
eman
d (M
m3 )
D A I Total

Section - 5
KSA Fourth National Communication (NC4) 147
Figure 5.24: Sector Wise Water Demands in Madinah (2020-2050)
[D: Domestic Water Demand; A: Agricultural Water Demand; I: Industrial Water Demand]
Figure 5.25: Sector Wise Water Demands in Qassim (2020-2050) [D: Domestic Water Demand; A: Agricultural Water Demand; I: Industrial Water Demand]
0
200
400
600
800
1,000
1,200
1,400
1,600
2020 2025 2030 2035 2040 2045 2050
Wat
er D
eman
d (M
m3 )
D A I Total
0
500
1,000
1,500
2,000
2,500
2020 2025 2030 2035 2040 2045 2050
Wat
er D
eman
d (M
m3 )
D A I Total

Section - 5
KSA Fourth National Communication (NC4) 148
Figure 5.26: Sector Wise Water Demands in Eastern Region (2020-2050) [D: Domestic Water Demand; A: Agricultural Water Demand; I: Industrial Water Demand]
Figure 5.27: Sector Wise Water Demands in Asir (2020-2050) [D: Domestic Water Demand; A: Agricultural Water Demand; I: Industrial Water Demand]
0
500
1,000
1,500
2,000
2,500
3,000
2020 2025 2030 2035 2040 2045 2050
Wat
er D
eman
d (M
m3 )
D A I Total
0
100
200
300
400
500
600
700
800
2020 2025 2030 2035 2040 2045 2050
Wat
er D
eman
d (M
m3 )
D A I Total

Section - 5
KSA Fourth National Communication (NC4) 149
Figure 5.28: Sector Wise Water Demands in Hail (2020-2050)
[D: Domestic Water Demand; A: Agricultural Water Demand; I: Industrial Water Demand]
Figure 5.29: Sector Wise Water Demands in Tabuk (2020-2050) [D: Domestic Water Demand; A: Agricultural Water Demand; I: Industrial Water Demand]
0
200
400
600
800
1,000
1,200
1,400
2020 2025 2030 2035 2040 2045 2050
Wat
er D
eman
d (M
m3 )
D A I Total
0
100
200
300
400
500
600
700
800
900
2020 2025 2030 2035 2040 2045 2050
Wat
er D
eman
d (M
m3 )
D A I Total

Section - 5
KSA Fourth National Communication (NC4) 150
Figure 5.30: Sector Wise Water Demands in Al-Baha (2020-2050)
[D: Domestic Water Demand; A: Agricultural Water Demand; I: Industrial Water Demand]
Figure 5.31: Sector Wise Water Demands in Northern Border (2020-2050) [D: Domestic Water Demand; A: Agricultural Water Demand; I: Industrial Water Demand]
0
20
40
60
80
100
120
140
160
180
200
2020 2025 2030 2035 2040 2045 2050
Wat
er D
eman
d (M
m3 )
D A I Total
0
10
20
30
40
50
60
70
80
90
2020 2025 2030 2035 2040 2045 2050
Wat
er D
eman
d (M
m3 )
D A I Total

Section - 5
KSA Fourth National Communication (NC4) 151
Figure 5.32: Sector Wise Water Demands in Al-Jouf (2020-2050)
[D: Domestic Water Demand; A: Agricultural Water Demand; I: Industrial Water Demand]
Figure 5.33: Sector Wise Water demands in Jazan (2020-2050) [D: Domestic Water Demand; A: Agricultural Water Demand; I: Industrial Water Demand]
0
200
400
600
800
1,000
1,200
1,400
2020 2025 2030 2035 2040 2045 2050
Wat
er D
eman
d (M
m3 )
D A I Total
0
500
1,000
1,500
2,000
2,500
2020 2025 2030 2035 2040 2045 2050
Wat
er D
eman
d (M
m3 ) D A I Total

Section - 5
KSA Fourth National Communication (NC4) 152
Figure 5.34: Sector Wise Water Demands in Najran (2020-2050)
[D: Domestic Water Demand; A: Agricultural Water Demand; I: Industrial Water demand]
Figure 5.35: Sector Wise Water Demands in Saudi Arabia (2020-2050) [D: Domestic Water Demand; A: Agricultural Water Demand; I: Industrial Water Demand]
0
50
100
150
200
250
300
350
400
2020 2025 2030 2035 2040 2045 2050
Wat
er D
eman
d (M
m3 )
D A I Total
0
5,000
10,000
15,000
20,000
25,000
2020 2025 2030 2035 2040 2045 2050
Wat
er D
eman
d (M
m3 )
D A I Total

Section - 5
KSA Fourth National Communication (NC4) 153
5.6 Summary
Water scarcity has made it difficult for the country to keep pace with water demand. The difficulty associated with water resources management is to provide a balance between water demand and available water resources. To achieve sustainability in water resources, optimal supplies of water from different resources are necessary to satisfy water demand in the domestic, agricultural and industrial sectors.
In this section, the effects of climate change on the agricultural water demands were projected for the periods of 2030, 2045-2070 and 2071-2100 compared to the year 2018. In comparison to 2018, the projections showed an increase of 1,395 Mm3 per year during 2071-2100 period (11.1%) for the same level of cultivated areas and productions. The temperature induced increase in agricultural water demand needs better understanding in developing the sustainable water resources management framework. The three major crops (Green fodder crops, dates and winter wheat) were the main consumers of agricultural water while Riyadh region was the highest consumer. For the protection of groundwater, it is essential to reduce groundwater extraction, which can be achieved through the comprehensive reuse of TWW in agriculture and reducing specific types of crop production. The recent policies of reducing the production of green fodder crops and winter wheat can assist in achieving this objective.
To better explain the water demand-supply scenarios, a multi-objective GP model was developed and applied for water distributions from multiple resources to multiple users in different regions of Saudi Arabia. The model was applied for the period of 2020 through 2050 at an interval of 5 years. The GP model was trained to achieve a set of goals through satisfying a set of constraints. The model identified the combinations of source-wise supplies for satisfying sector-wise demands for the period of 2020 – 2050. The domestic water demands were estimated to increase from 3,508 Mm3/year in 2020 to 5,429 Mm3/year in 2050, which may be satisfied through the combinations of GW, SW and DW in most of the regions. Five regions (Makkah, Eastern Region, Al-Baha, Northern borders and Najran region) may have difficulties in extracting additional GW, both DW and SW may need significant augmentation. Reuse of TWW for agriculture can provide significant support toward achieving essential food sustainability.

Section - 5
KSA Fourth National Communication (NC4) 154
References:
1. Abderrahman, W.A.; Al-Harazin, I.M., (2008). Assessment of climate changes on water resources in the Kingdom of Saudi Arabia, GCC Environment and Sustainable Development Symposium, 28 – 30 January 2008, Dhahran, Saudi Arabia, pp D-1-1 – D-1-13 (2008).
2. Allen, R. G., Pereira, L. S., Raes, D., Smith, M., (1998) “Crop evapotranspiration: Guidelines for computing crop water requirements - FAO Irrigation and Drainage Paper No. 56.” Food and Agricultural Organization of the United Nations, Rome, Italy 300 pp.
3. Alkolibi, F.M. (2002): Possible effects of global warming on agriculture and Water resources in Saudi Arabia: impacts and responses. Climatic Change 54, 225–245
4. Almazroui M. (2013). Simultaion of present and future climate of Saudi Arabia using a regional model (PRECIS). Int. J. Climatol. 33: 2247-2259
5. Chowdhury S. and Zahrani M., (2013). Implications of climate change on water resources in Saudi Arabia. Arab J. Sci. Eng. 38:1959–1971
6. Chowdhury S.* and Al-Zahrani M, (2015). Characterizing water resources and the trends of sector wise water consumptions in Saudi Arabia. J. King Saud Univ. – Eng. Sci. 27: 68-82
7. Chowdhury, S., Al-Zahrani, M. and Abbas, A., (2016). Implications of Climate Change on Crop Water Requirements in Arid Region: An Example of Al-Jouf, Saudi Arabia. J. King Saud Univ.–Eng. Sci. 28: 21-31
8. Connor, J. D., Schwabe, K., King, D., and Knapp, K., (2012). “Irrigated agriculture and climate change: The influence of water supply variability and salinity on adaptation.” Ecological Economics, 77:149–157.
9. DeNicola, E., Aburizaiza, O.S., Siddique, A., Khwaja, H. Carpenter M. D. (2015). Climate Change and Water Scarcity: The case of Saudi Arabia. Annals of Global Health. 81(3): 342-353.
10. Döll, P. (2002), “Impact of climate change and variability on irrigation requirements: a global perspective.” Climatic Change 54: 269–293.
11. FAO (Food and Agriculture Organization), (1998). Proceedings of the second expert consultation on national water policy reform in the Near East, 24–25 November 1997. Cairo, Egypt.
12. FAO (Food and Agriculture Organization), (2009). CROPWAT software, Food and Agriculture Organization, Land and Water Division; http://www.fao.org/nr/water/infores_databases_cropwat.html
13. FAO, (2020). CLIMWAT: A climatic database for irrigation planning and management. http://www.fao.org/nr/water/infores_databases.html
14. Fischer, G., Tubiello, F. N., Van Velthuizen, H., and Wiberg, D., (2007) “Climate change impacts on irrigation water requirements: Effects of mitigation, 1990–2080.” Technological Forecasting and Social Change, 74(7): 1083–1107.

Section - 5
KSA Fourth National Communication (NC4) 155
15. GASTAT, (2019). General Authority for Statistics (GASTAT): https://www.stats.gov.sa/en
16. George, B., Shende, S. and Raghuwanshi, N., (2000). “Development and testing of an irrigation scheduling model.” Agricultural Water Management, 46(2):121-136.
17. Ghazala, N., and A. Mahmood, (2009) “Water requirement for Wheat Crop in Pakistan.” Pakistan Journal of Meteorology 6(11): 89-96.
18. IPCC (Intergovernmental Panel on Climate Change). (2006). Climate change. In The IPCC Second Assessment Report, Houghton JT, Meira Filho LG, Callander BA, Harris N, Kattenberg A, Maskell K (eds). Cambridge University Press: New York.
19. IPCC (Intergovernmental Panel on Climate Change). (2006). Data Distribution Centre: http://www.mad.zmaw.de/IPCC_DDC/html/SRES_TAR/index.html
20. Kang, Y., Khan, S., Maa, X. (2009). Climate change impacts on crop yield, crop water productivity and food security – A review. Progress in Natural Science. 19: 1665-1674
21. LINDO, "LINDO system optimization software. Chicago, USA," (2014): http://www.lindo.com/index.php?option=com_content&view=article&id=28&Itemid=1,
22. MAW (Ministry of Agriculture and Water), (1984). Water Atlas of Saudi Arabia, Riyadh, Saudi Arabia
23. Mhashu, S.V. (2007), “Yield response to water function and simulation of deficit irrigation scheduling of sugarcane at estate in Zimbabwe using CROPWAT 8.0 and CLIMWAT 2.0.” Master thesis, Università degli Studi di Firenze Facoltá di Agraria (University of Florence, Faculty of Agriculture).
24. MEWA (2019). The Ministry of Water, Environment and Agriculture: https://www.mewa.gov.sa/ar/Ministry/Agencies/TheWaterAgency/Topics/Pages/8885478.aspx
25. Molua, E.L. and Lambi, C.M. (2006), “Assessing the impact of climate on crop water use and crop water productivity.” The CROPWAT Analysis of Three Districts in Cameroon, PP 1-44.
26. MOEP (Ministry of Economy and Planning) (2010), Ninth Development Plan of Saudi Arabia, Riyadh.
27. MOP, "Ministry of Planning” (1985), The Fourth Development Plan: 1985 - 1990. Riyadh, Saudi Arabia, 1985.
28. Özdoğan, M. (2011), “Modeling the impacts of climate change on wheat yields in Northwestern Turkey.” Agriculture, Ecosystems & Environment, 141(1-2), 1–12.
29. Parry, M. L., Swaminathan, M. S. (1993). Effect of climatic change on food production. In:Mintzer, I. M. (eds.), Confronting Climatic Change: Risks, Implications, and Responses, Chapter 8, Cambridge University Press, Cambridge.
30. Paeth, H., Born, K., Girmes, R., Podzun, R., and Jacob, J., (2009). “Regional climate change in Tropical and Northern Africa due to greenhouse forcing and land use changes.” Journal of Climate 22:114–132.

Section - 5
KSA Fourth National Communication (NC4) 156
31. Patz, J. A., Lendrum, D. C., Holloway, T., Foley J. A. (2005). Impact of regional climate change on human health. Nature. 438: 310–317
32. PME (Presidency of Meteorology and Environment), Saudi Arabia. (2019): https://www.pme.gov.sa/En/Weather/LocalWeatherInfo/Pages/stationinfo.aspx
33. Rehman, S., Al-Hadhrmi, L. M. (2012). Extreme Temperature Trend on the West Coast of Saudi Arabia. Atmospheric and Climate Sciences 2: 352-361
34. Schilling, J., Freier, K. P., Hertig, E., and Scheffran, J., (2012). “Climate change, vulnerability and adaptation in North Africa with focus on Morocco.” Agriculture, Ecosystems & Environment, 156: 12–26.
35. Sheng-Feng, K., Yi-Wen, C. and Sheng-Hsien, S. (2001), “Study on Soil and Water Resource Management for ChiaNan Irrigation Association in Taiwan.” College of management, Taiwan. PP 90-109.
36. Smith, M. and Kivumbi, D. (2006), “Calculation procedure Use of the FAO CROPWAT model in deficit irrigation studies.” FAO (Food and Agriculture Organization), Rome, Italy; Heng, L. K., Joint FAO/IAEA Division, International Atomic Energy Agency, Vienna, Austria.
37. Supit, I., Van Diepen, C. a., De Wit, a. J. W., Wolf, J., Kabat, P., Baruth, B., and Ludwig, F. (2012), “Assessing climate change effects on European crop yields using the Crop Growth Monitoring System and a weather generator.” Agricultural and Forest Meteorology, 164: 96–111.
38. SWCC (Saline Water Conversion Corporation), (2011): http://www.swcc.gov.sa/english/AboutSWCC/Pages/About.aspx
39. SWCC (Saline Water Conversion Corporation), (2020): http://www.swcc.gov.sa/english/AboutSWCC/Pages/About.aspx
40. Tarawneh Q. Y. and Chowdhury S., (2018). Trends of Climate Change in Saudi Arabia: Implications on Water Resources. Climate 6, 8: 1-19; doi:10.3390/cli6010008
41. Trenberth, K.E. (2011). Changes in precipitation with climate change. Cli. Res. 47: 123-138
42. TVTC (Technical and Vocational Training Corporation), (2004). “Vegetables production, Fodder crops and pastures, Production of field crops.” Saudi Arabia.
43. UNOCHA (United Nations Office for the Coordination of Humanitarian Affairs). (2008). Climatic change and human Vulnerability, Vol. II, Zeneva, Switzerland
44. USDA, (2016). Saudi Arabia: Grain and Feed Annual. GAIN Report No. SA1602, https://gain.fas.usda.gov/Recent GAIN Publications/Grain and Feed Annual_Riyadh_Saudi Arabia_3-14-2016.pdf
45. Water Atlas, (1995). Water Atlas, The Ministry of Water (MOW), Riyadh, Saudi Arabia.
46. WHO (World Health Organization). (2002). Climate Change and Human Health—Risk and Responses, WHO Summary Report.

Section - 6
KSA Fourth National Communication (NC4)
SECTION 6
Impact Analysis of Climate Change on Coastal and Marine Ecosystem and
Identification and Appraisal of Appropriate Adaptation Measures

Section - 6
KSA Fourth National Communication (NC4) i
TABLE OF CONTENTS Section Title Page
6.1 Introduction 157 6.2 Marine Life and Coastal areas in Saudi Arabia 158 6.2.1 Coastal Area in Saudi Arabia 158 6.2.1.1 The Arabian Gulf 158 6.2.1.2 The Red Sea 158 6.2.2 Marine Life in Saudi Arabia 158 6.2.2.1 Flora 158 6.2.2.2 Fauna 159 6.2.2.2.1 Fish, Crustaceans, Molluscs, and Turtles 159 6.2.2.2.2 Mammals 160 6.2.2.2.3 Coral Reefs 160 6.3 Marine Protected Areas in Saudi Arabia 161 6.3.1 Farasan Islands 161 6.3.2 Asir National Park 161 6.3.3 Yanbu Coastal Conservation Area 162 6.4 Desalination in Saudi Arabia 163 6.5 Sea Level Rise 166 6.6 Impacts of Sea-level Rise on Coastal Areas and Marine Life 166 6.6.1 Impacts of Sea-level Rise on Coastal Area 166 6.6.2 Impacts of Sea-level Rise on Marine Life 167 6.6.3 Socioeconomic Impacts 168 6.7 Sea Level Rise Simulation & Shoreline Submergence Study 169 6.7.1 Methodology 169 6.7.2 Date Retrieval Stage 171 6.7.3 Preprocessing Stage 171 6.7.3.1 Shoreline Submergence Study 171 6.7.3.1.1 Geometric Correction 171 6.7.3.1.2 Radiometric Correction 172 6.7.3.1.3 Shoreline Extraction 173 6.7.3.2 SLR Simulation Study 173 6.7.3.2.1 Elevation Contour Map Preparation 173 6.7.3.2.2 Flooded Area Assessment 173 6.7.4 Case Study – Yanbu 175 6.7.4.1 Background 175 6.7.4.2 Retrieved Image Data 175 6.7.4.3 Results and Discussion 177 6.7.4.3.1 Shoreline Submergence Study 177 6.7.4.3.2 SLR Simulation Study 179 6.7.5 Case Study – Ghazlan 182 6.7.5.1 Background 182 6.7.5.2 Retrieved Image Data 182 6.7.5.3 Results and Discussion 184 6.7.5.3.1 Shoreline Submergence Study 184 6.7.5.3.2 SLR Simulation Study 185 6.7.6 Risk Assessment 188

Section - 6
KSA Fourth National Communication (NC4) ii
6.8 Coastal Management 190 6.8.1 Sea Level Rise Response 190 6.8.2 Hard and Sediment Based Protection 191 6.8.3 Ecosystems Based Protection 191 6.9 Policies and Strategies 192 6.9.1 Marine policies under G20 192 6.9.2 National Strategies in Saudi Arabia's 2030 Environment Goals 191 6.9.3 The Red Sea Project 193 6.9.4 Initiatives included In the National Program Plan for 2018- 2020 195 6.10 Summary 195 References 196
LIST OF FIGURES
Figure Title Page 6.1 Fish and Shrimp Production in the Arabian Gulf, Red Sea, and in
Inland Fish Farms in Saudi Arabia 160
6.2 Farasan Island 161 6.3 Asir National Park 162 6.4 Jubail Marine Wildlife Sanctuary 162
6.5 Comparison of Desalinated Water Production and Total Water Demand 163
6.6 Location of Desalination Plants Along the Coasts of Red Sea and Arabian Gulf 163
6.7 Coastal cities along the Red Sea Arabian Gulf 168
6.8 Flowchart Showing the Overall SLR Simulation Process and the Relationships 170
6.9 Geometric Correction Example 172 6.10 Radiometric Correction Example 172 6.11 Presented Shoreline in Band 1 173 6.12 Selected Area not Hydrologically connected to the coastline 174 6.13 Case Study Area – Yanbu 175 6.14 Elevation Contour Map – Yanbu 176 6.15 Shoreline Comparison 178 6.16 Predicted Flooded Area & Land Loss Percentage 179 6.17 Flooded Area Maps and Elevation Maps for Yanbu Al-Bahr 180 6.18 Flooded Area Maps and Elevation Maps for Yanbu Industrial City 181 6.19 Case Study Area – Ghazlan City 182 6.20 Elevation Contour Map – Ghazlan City 183 6.21 Shoreline comparison (1990 and 2020) 184 6.22 Predicted Flooded Area and Land Loss Percentage 185 6.23 Flooded area at SLR 1m 186 6.24 Flooded area at SLR 2m 187 6.25 Flooded area at SLR 3m, 4m and 5m 188 6.26 NOAA GMSL Scenario for 2100 189
6.27 Drone view of the Red Sea project site and Satellite view of the Red Sea project site 194
Section - 6
KSA Fourth National Communication (NC4) iii
Figure Title Page 6.28 Overwater structures in the Sheybarah islands and the Ummahat
Alsaykh island 194
LIST OF TABLES
Table Title Page 6.1 Marine Life Production in 2011 and 2012 160 6.2 Existing Desalination plants in Saudi Arabia with the start of
operation year and Desalination Technology used 165
6.3 SLR Scenario 174 6.4 Retrieved Image Information 176 6.5 Predicted Flooded Areas 179 6.6 Retrieved Image Information 183 6.7 Predicted Flooded Areas 185 6.8 Probability of exceeding GMSL scenarios in 2100 189 6.9 GMSL Rise Scenario Heights 19-year Averages Centered on the
Decade Through 2200 190

Section - 6
KSA Fourth National Communication (NC4) 157
Section 6: Impact Analysis of Climate Change on Coastal and Marine Ecosystem and Identification and Appraisal of Appropriate Adaptation Measures
6.1 Introduction
Red Sea on the west and the Arabian Gulf on the east are two coastal areas of Saudi Arabia. Understanding the effect of climate change on its coastal areas will help to plan, design, and build climate change resilient infrastructure and policies. Therefore, an assessment of the extent of impacts of sea-level rise (SLR) on the coastal areas of Saudi Arabia is very critical.
SLR is caused by the thermal expansion of seawater and loss of glacial mass and icesheets (Kopp et al., 2016). Research into the changes in sea level using six groups of satellite altimetry observations and tide gauge results indicates a rise in global mean sea level from 1.4mm/year to 3.6mm/year between 1901 and 2015 (Oppenheimer et al., 2019). A rise in the sea level increases the rate of coastal flooding, coastal erosion, and soil and groundwater salinization (Oppenheimer et al., 2019). These events pose a threat to both man and aquatic life.
Ministry of Environment, Water, and Agriculture (MEWA) and Saudi Wildlife Authority (SWA) in Saudi Arabia are responsible for assessing, conserving, and protecting marine resources. MEWA is also responsible for preserving the aquatic environment and developing the aquatic industries (trade and rearing aquatic life) (MEWA, 2020), while SWA is responsible for the protection and conservation of terrestrial and marine biodiversity (SWA, 2019).
To ensure that the marine resources are protected and utilized in a sustainable manner, Saudi Arabia is a member of regional organizations for the protection of Red Sea and the Arabian Gulf. These agreements are:
a. Regional Organization for the Conservation of the Environment of the Red Sea and Gulf of Aden (PERSGA): This regional organization includes Djibouti, Egypt, Jordan, Saudi Arabia, Somalia, Sudan, and Yemen (FAO Fisheries & Aquaculture, 2020)
b. Regional Organization for the Protection of Marine Environment (ROPME): This collaboration includes Bahrain, Iraq, Iran, Kuwait, Oman, Qatar, Saudi Arabia, and the United Arab Emirates (ROPME, 2012).
The main objectives of this section include:
1 To assess the impacts of climate change on Saudi Arabian coastal areas, 2 Examine policies and strategies implemented by the Saudi government to tackle sea-level
rise and coastal flooding, and 3 Recommend measures to address the adverse impacts of climate change on the coastal and
marine ecosystem of the Kingdom of Saudi Arabia.

Section - 6
KSA Fourth National Communication (NC4) 158
6.2 Marine Life and Coastal Areas in Saudi Arabia
6.2.1 Coastal Area in Saudi Arabia
The major coastal areas of the Kingdom of Saudi Arabia comprise of the coastlines of the Arabian Gulf and the Red Sea. These coastal areas serve as the source of desalinated water in the Kingdom of Saudi Arabia. They contribute to Saudi Arabia's economic development through the trade of aquatic life (exotic fishes like angelfish and butterflyfish are traded internationally), use of marine life and its products as a food source, and as tourism centers. The presence of large petroleum reserves in both seas has been a significant income source for boosting Saudi Arabia's economy (Abuzinada et al., 2005).
6.2.1.1 The Arabian Gulf
The Arabian Gulf is surrounded by Saudi Arabia, Iran, Iraq, Kuwait, Oman, Bahrain, Qatar, and the United Arab Emirates (UAE). It is a semi-enclosed and relatively shallow sedimentary sea with a depth of between 10m and 93m (Wabnitz et al., 2018) and a total surface area of approximately 239,000 km2 (Kämpf & Sadrinasab, 2006). It has a high maximum salinity of 48psu except in lagoons where salinity can exceed 70psu (Wabnitz et al., 2018). According to the encyclopedia of world coastal landforms, Saudi Arabia has an Arabian Gulf coastline that is 700km long, with an average salinity of 40psu (Bird, 2010a).
6.2.1.2 The Red Sea
According to the International Center for the Environmental Management of Enclosed Coastal Seas (EMECS), the Red Sea is a deep and narrow sea between Africa and Asia. It has a maximum width of 355 km, an average depth of 491m, and a total surface area of approximately 438,000 km2. It has a salinity range of 36psu and 41psu (EMECS, 2016). According to the encyclopedia of world coastal landforms, Saudi Arabia has a Red Sea coastline that is 2,000 km long with a salinity range of 37psu and 40psu and an evaporation rate of 2mm/yr (Bird, 2010b).
6.2.2 Marine Life in Saudi Arabia
6.2.2.1 Flora
Marine flora types present in Saudi Arabia includes palm groves, halophytic communities, mangroves, freshwater reed swamps, algal communities, and seagrass beds (Abuzinada et al., 2005).
Major marine flora in Saudi Arabia:
1. Mangroves Swamps: Mangroves are distributed in Red Sea and the Arabian Gulf coasts. However, mangrove swamps are more concentrated along the Red Sea Coast (Abuzinada et al., 2005). Major mangrove species present in Saudi Arabia includes Avicennia marina and Rhizophora mucronata (Abuzinada et al., 2005). Mangroves are an essential ecosystem for climate change adaptation and carbon dioxide reduction. Each hectare of mangrove sinks an average of about 1000 tonnes of carbon by storing them in mangrove biomass (Duke et al., 2014). Mangrove ecosystems also serve as a feeding system for other marine life, livestock, and humans (Kathiresan, 2012).

Section - 6
KSA Fourth National Communication (NC4) 159
2. Macro-Algae: Saudi Arabia has a large reservoir of macro-algae on its Red Sea and Arabian Gulf coasts. A survey conducted along the Red Sea Coastline of Jazan reported 12 algae species from the classes Chlorophyta, Phaeophyta, and Rhodophyta (Manzelat et al., 2018). Another study carried out on six areas along the coast of the Arabian Gulf between 2003 and 2006 reported 26 algae species from the classes Chlorophyta, Phaeophyta, Rhodophyta, and diatoms (AbdelKareem, 2009). Macroalgae species are harvested for algal oil extraction and phosphorus extraction. They are used in pharmaceuticals, traded, and eaten as seaweed (Manzelat et al., 2018).
3. Seagrass Beds: A study conducted in 2018 reported three (3) popular seagrass species along the Red Sea coast of Saudi Arabia. These include Halophila stipulacea, Thalassia hemprichii, and Halodule uninervis and a total of ten (10) seagrass species along the Red Sea coastline (Qurban et al., 2019). The occurrence of Seagrass beds has been mapped along the Arabian Gulf coast of Saudi Arabia. Seagrass acts as a feeding ground for marine life and harbors many aquatic species, including algae. Seagrass serve as sources for dugong, turtles, fish, and crabs and slow down water current and stabilize seabed.
6.2.2.2 Fauna
The types of marine fauna present in Saudi Arabia’s coastal and marine ecosystem include coral reefs, fish, sea turtles, sharks, rays, dolphins, whales and dugongs.
6.2.2.2.1 Fish, Crustaceans, Molluscs, and Turtles:
There are over 542 fish species recorded in the Arabian Gulf and over 1,280 fish species recorded in the Red Sea. In a survey published in 2014, 98 demersal fish species were identified along the southern Red Sea coastline of Saudi Arabia (Bogorodsky et al., 2014). Some of the species include najil (Saddleback Grouper), hamour (brown-spotted grouper), roving, butterfly fish, and sharks (Abuzinada et al., 2005). There are 56 reported species of sharks and rays in the Asir national park and Farasan island marine sanctuary (DOPA, 2018a; DOPA, 2018b). Crustaceans and mollusks reported in Saudi Arabia's marine areas include crab, squid, octopus, lobster, and clams (Abuzinada et al., 2005). Turtle species found include green turtle, hawksbill, leatherback, loggerhead, and olive ridley (Abuzinada et al., 2005). Aquatic life, such as fish, crustaceans, and mollusks, serves as food and trade source. Figure 6.1 shows the production of fish and shrimps in the Arabian Gulf, Red Sea, and in inland fish farms in Saudi Arabia.
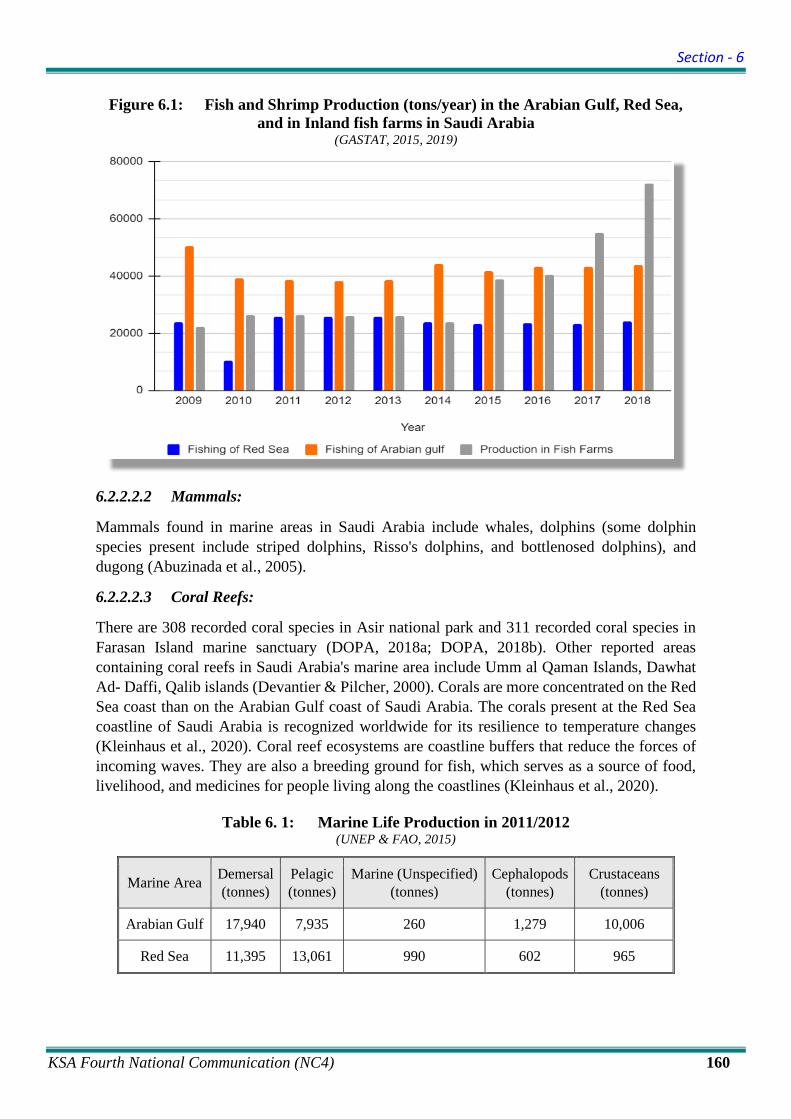
Section - 6
KSA Fourth National Communication (NC4) 160
Figure 6.1: Fish and Shrimp Production (tons/year) in the Arabian Gulf, Red Sea, and in Inland fish farms in Saudi Arabia
(GASTAT, 2015, 2019)
6.2.2.2.2 Mammals:
Mammals found in marine areas in Saudi Arabia include whales, dolphins (some dolphin species present include striped dolphins, Risso's dolphins, and bottlenosed dolphins), and dugong (Abuzinada et al., 2005).
6.2.2.2.3 Coral Reefs:
There are 308 recorded coral species in Asir national park and 311 recorded coral species in Farasan Island marine sanctuary (DOPA, 2018a; DOPA, 2018b). Other reported areas containing coral reefs in Saudi Arabia's marine area include Umm al Qaman Islands, Dawhat Ad- Daffi, Qalib islands (Devantier & Pilcher, 2000). Corals are more concentrated on the Red Sea coast than on the Arabian Gulf coast of Saudi Arabia. The corals present at the Red Sea coastline of Saudi Arabia is recognized worldwide for its resilience to temperature changes (Kleinhaus et al., 2020). Coral reef ecosystems are coastline buffers that reduce the forces of incoming waves. They are also a breeding ground for fish, which serves as a source of food, livelihood, and medicines for people living along the coastlines (Kleinhaus et al., 2020).
Table 6. 1: Marine Life Production in 2011/2012 (UNEP & FAO, 2015)
Marine Area Demersal (tonnes)
Pelagic (tonnes)
Marine (Unspecified) (tonnes)
Cephalopods (tonnes)
Crustaceans (tonnes)
Arabian Gulf 17,940 7,935 260 1,279 10,006
Red Sea 11,395 13,061 990 602 965

Section - 6
KSA Fourth National Communication (NC4) 161
Table 6.1 shows marine life production in 2011/2012 in the Saudi Arabian coast of the Arabian Gulf and the Red Sea classified according to species.
6.3 Marine Protected Areas in Saudi Arabia
6.3.1 Farasan Islands
The Farasan islands is located in the south-west part of Saudi Arabia, off the coast of Jazan city. Figure 6.2 shows a picture of Farasan Islands. It covers part of the Red Sea coast lines of Saudi Arabia. It was designated as a national reserve in 1988, under the control of the Saudi Wildlife Authority (SWA). It has an approximate total surface area of 5,408 km2. It has a total of 436 animal species (DOPA, 2018b). Some of the aquatic life present in Farasan Island includes the green and hawksbill turtle, whales, dugongs, dolphins, sharks, corals, and manta rays (Protected Planet, 2017b).
Figure 6.2: Farasan Island (Google, n.d.-a)
6.3.2 Asir National Park
The Asir National Park is located in the south-west part of Saudi Arabia in the Asir region. Figure 6.3 shows a picture of Asir National Park. It covers both the Asir mountain ranges and part of the Red Sea coast of Saudi Arabia. It was designated as a national park in 1981 and has a total surface area of 6,490.7 km2 (Protected Planet, 2017a). It is managed by the Ministry of Environment, Water and Agriculture (MEWA) and has a total of 610 animal species. Some aquatic life present in Asir National Park includes corals of the family mussidae, acroporidae, and pillow corals, long-head eagle ray, thresher sharks, big nose shark, dolphins, dugongs, and the ferruginous duck (Protected Planet, 2017a).

Section - 6
KSA Fourth National Communication (NC4) 162
Figure 6.3: Asir National Park (DOPA, 2018a)
6.3.3 Yanbu Coastal Conservation Area
This is located on the Red Sea in the western part of Saudi Arabia in the Yanbu region (Madinah province) of Saudi Arabia. It is designated as a reserve and is managed by the Royal Commission for Jubail and Yanbu. It has a total surface area of approximately 10.4 km2 (Protected Planet, 2017a). It is a conservation site for mangroves and sea birds (Devantier & Pilcher, 2000).
Other proposed marine protected areas include Jubail marine wildlife sanctuary (2,369.05 km2), Al Wajh bank (3,857.6 km2), Gulf Island wildlife sanctuary (41.64 km2), Khalij Tarut (346.69 km2), Dawhat Duwaylin (1,223.88 km2), and Ras Al -Qasbah (3,705 km2). Figure 6.4 shows Jubail marine wildlife sanctuary.
Figure 6.4: Jubail Marine Wildlife Sanctuary (Google, n.d.-b)

Section - 6
KSA Fourth National Communication (NC4) 163
6.4 Desalination in Saudi Arabia
The Red Sea and the Arabian Gulf contribute significantly to desalinated water supply for the Saudi Arabian population. It assists in meeting the potable water demand of the Saudi Arabian population.
Figure 6.5: Comparison of Desalinated Water Production and Total Water Demand (million m3)
Figure 6.6: Location of Desalination Plants along the (a) Red Sea coast (Google, n.d.-c), (b) Arabian Gulf coast (Google, n.d.-d)

Section - 6
KSA Fourth National Communication (NC4) 164
Figure 6.5 shows a comparison between water demand in Saudi Arabia (million m3) and desalinated water production (million m3) between 2010 and 2018. The figure shows that as water demand increases over time, the production of desalinated water also increases to meet water demand. Water desalination reduces the stress on groundwater reserves. Over thirty desalination plants are in operation along the Red Sea and Arabian Gulf coasts. Figure 6.6 shows the location of the desalination plants along the Red Sea and the Arabian Gulf along with their technologies.
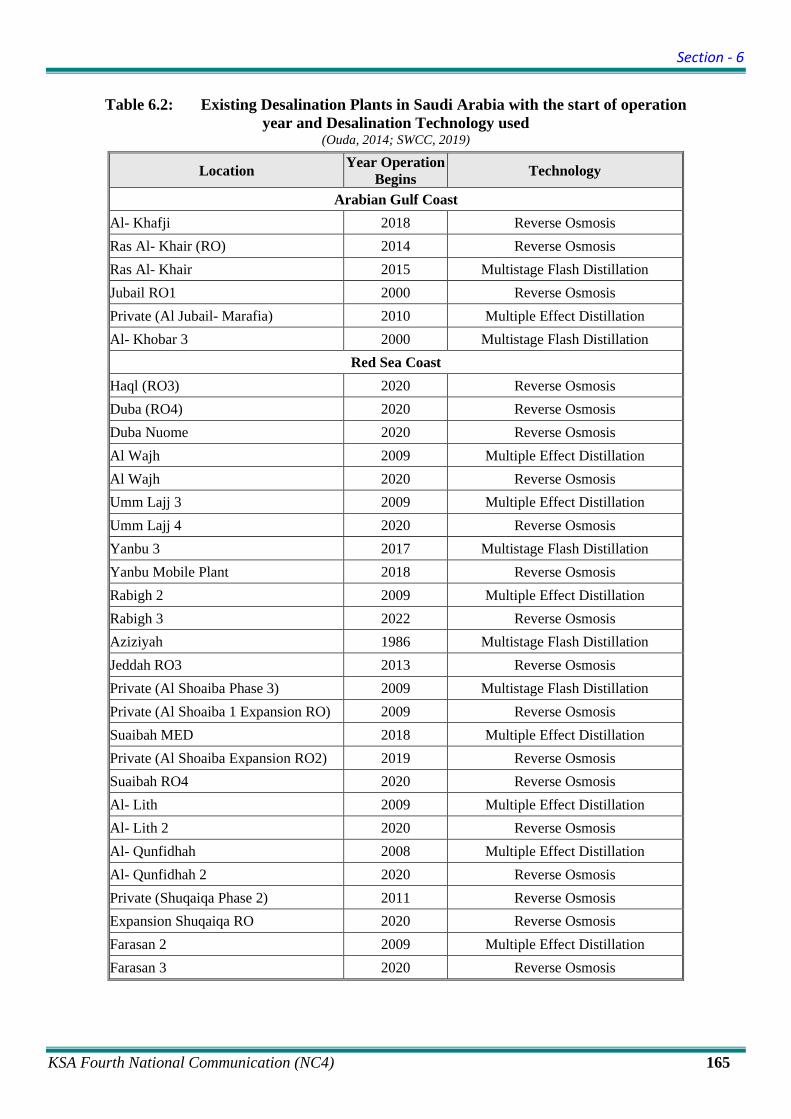
Section - 6
KSA Fourth National Communication (NC4) 165
Table 6.2: Existing Desalination Plants in Saudi Arabia with the start of operation year and Desalination Technology used
(Ouda, 2014; SWCC, 2019)
Location Year Operation Begins Technology
Arabian Gulf Coast Al- Khafji 2018 Reverse Osmosis Ras Al- Khair (RO) 2014 Reverse Osmosis Ras Al- Khair 2015 Multistage Flash Distillation Jubail RO1 2000 Reverse Osmosis Private (Al Jubail- Marafia) 2010 Multiple Effect Distillation Al- Khobar 3 2000 Multistage Flash Distillation
Red Sea Coast Haql (RO3) 2020 Reverse Osmosis Duba (RO4) 2020 Reverse Osmosis Duba Nuome 2020 Reverse Osmosis Al Wajh 2009 Multiple Effect Distillation Al Wajh 2020 Reverse Osmosis Umm Lajj 3 2009 Multiple Effect Distillation Umm Lajj 4 2020 Reverse Osmosis Yanbu 3 2017 Multistage Flash Distillation Yanbu Mobile Plant 2018 Reverse Osmosis Rabigh 2 2009 Multiple Effect Distillation Rabigh 3 2022 Reverse Osmosis Aziziyah 1986 Multistage Flash Distillation Jeddah RO3 2013 Reverse Osmosis Private (Al Shoaiba Phase 3) 2009 Multistage Flash Distillation Private (Al Shoaiba 1 Expansion RO) 2009 Reverse Osmosis Suaibah MED 2018 Multiple Effect Distillation Private (Al Shoaiba Expansion RO2) 2019 Reverse Osmosis Suaibah RO4 2020 Reverse Osmosis Al- Lith 2009 Multiple Effect Distillation Al- Lith 2 2020 Reverse Osmosis Al- Qunfidhah 2008 Multiple Effect Distillation Al- Qunfidhah 2 2020 Reverse Osmosis Private (Shuqaiqa Phase 2) 2011 Reverse Osmosis Expansion Shuqaiqa RO 2020 Reverse Osmosis Farasan 2 2009 Multiple Effect Distillation Farasan 3 2020 Reverse Osmosis

Section - 6
KSA Fourth National Communication (NC4) 166
6.5 Sea Level Rise
The sea-level change chapter in IPCC's fifth Assessment Report (AR5) contains global climate change research that attempts to account for the contributing factors to sea-level rise. Using climate change scenarios, it also projects sea level rise to 2100. By studying global mean sea level rise between 1901 and 2010, it concludes that sea-level rise during the period mentioned is caused by a combination of loss of glacial mass, thermal expansion and the freshwater contribution from Antarctic ice sheet (change in land water storage). However, it was noted that from 1971, global mean temperature became a major contributing factor to sea-level rise. Due to a rise in global mean temperature, there is a significant increase in the loss of ice sheet mass in Greenland and the Antarctic which will cause a maximum estimated global mean sea level rise of about 3m by 2300 using the RCP8.5 climate change scenario. Although the projection of 3m rise will not be consistent in every region, it gives a general picture that forces detailed research into regional sea-level rise projections, especially in areas with coastal cities like Saudi Arabia.
There are over 25 coastal cities in Saudi Arabia, such as Jeddah, Rabigh, Yanbu, Al Wajh, Umluj, Thuwal, Al Jubail, Al Khobar, Al Khafji, Dammam, (El Raey, 2010). Saudi Arabia has about 890 km2 of red sea coastal land within 1m elevation (Hereher, 2016). The Kingdom also has 613.9 km2 at 1 m elevation, 1,401.4 km2 at 2 m elevation and 2216.5 km2 at 3 m elevation of the Arabian Gulf coastal land (Hereher, 2020). Understanding the extent and impact of sea-level rise will help to better protect these cities, its population, coastal areas, and the marine life.
6.6 Impacts of Sea-level Rise on Coastal Areas and Marine Life
Climate change impacts on the coastal areas and marine life cannot be attributed to sea level rise alone but in conjunction with other climate change processes like seawater temperature increase and ocean acidification (Oppenheimer et al., 2019). Ocean acidification occurs due to the ocean absorption of CO2 emitted into the atmosphere. As CO2 absorption by sea water increases, sea water becomes more acidic, which causes a reduction in carbonate ions necessary for coral accretion and seashells (NOAA, 2020). The impact of sea-level rise is discussed under it's impacts on coastal areas, marine life and socioeconomic implications.
6.6.1 Impacts of Sea-level Rise on Coastal Area
The impacts of sea-level rise on coastal areas include soil and surface water salinization, submergence of tidal wetlands, and coastal erosion (Oppenheimer et al., 2019). Soil salinization results in a decrease in soil organic carbon, affecting microbial population and interaction and results in loss of soil fertility (Daliakopoulos et al., 2016). Sea level rise and flooding will result in seawater intrusion into surface water resources like reservoirs, aquifers and estuaries. This increases surface water salinity making the water unsuitable for use without desalination (Oppenheimer et al., 2019). The intrusion of seawater on surface freshwater resources will affect marine life (El Raey, 2010).

Section - 6
KSA Fourth National Communication (NC4) 167
6.6.2 Impacts of Sea-level Rise on Marine Life
Sea level rise affects marine phyto and zoo plankton species in different ways. To provide relevant coverage, this section will cover the impacts of sea-level rise on coral reefs, mangroves, fishes, invertebrates, turtles and mammals.
(i) Impacts on Coral Reefs: Coral reefs ecosystems act as a source of food for marine life. Coral reefs also serve as a natural buffer for wind and storm. It absorbs wave energy by breaking waves before the waves reach the shoreline. Research shows that coral reefs are vulnerable to climate change due to a combination of factors namely sea-level rise, ocean acidification, and rising sea temperature (Brown et al., 2019). Coral reefs in the Arabian Gulf have lower diversity and are less widely distributed than in the Red Sea coast of Saudi Arabia. There are over 300 coral reef species in the Red Sea (DOPA, 2018a; DOPA, 2018b). This is because coral reefs in the Red Sea are more resistant to environmental stressors as they have more natural barriers (Abuzinada et al., 2005). Coral reef biodiversity in the Arabian Gulf was affected by mass bleaching of coral reefs due to the El-Nino event between 1996 and 1998 (Wilson et al., 2002). However, coral reef species in the Arabian Gulf adapted to the temperature increase and are recognized as corals that can withstand and recover from the temperature of 10°C higher than any other coral reefs (Coles & Riegl, 2013). Global research reports further increase in seawater temperature, which will affect coral reef communities in both the Arabian Gulf and the Red Sea coasts of Saudi Arabia (Oppenheimer et al., 2019). As sea level increases faster than coral fish accretion; (which is affected by ocean acidification, reducing coral reef calcification (Eyre et al., 2018)); sedimentation and turbidity will increase (Field et al., 2011). Sea-level rise increases turbidity on the fringing coral reefs, which affects coral reef's access to light and photosynthesis, reducing growth rate and resulting in coral bleaching (Hereher, 2020).
(ii) Impacts on Mangroves: Mangrove ecosystems serve as a source of food, energy, and
carbon dioxide sequestration. They also act as natural barriers that protect coastlines and tidal wetlands from floods, storm surges, and tidal waves (Ellison, 2003; Duke et al., 2014). As sea-level rise exceeds the mangrove soil surface elevation, mangrove will move towards land and mangroves at the land-seawater boundary will die-off due to stress caused by influence of tidal waves (Gilman et al., 2008; McIvor et al., 2013).
(iii) Impacts on Invertebrates and Mammals: Invertebrates, fishes, turtles, and other
mammals are seriously affected by an increase in seawater temperature and ocean acidification, which forces the migration of marine species (Wabnitz et al., 2018). The influence of sea-level rise on marine animal species is indirect. Coral ecosystems serve as a source of food for many marine species. In conjunction with other climate factors, sea-level rise results in the loss of coral ecosystems, which breaks the marine life food chain, leading to the disruption and reduction of marine biodiversity (FAO, 2014).

Section - 6
KSA Fourth National Communication (NC4) 168
6.6.3 Socioeconomic Impact
As the sea level rises, it affects the coastal area population and settlements in coastal cities and available coastal land is lost. There is an increased risk of submergence, which is further exacerbated by flooding incidents. These incidents will result in the loss of life and properties (Hereher, 2016; El Raey, 2010). At a sea-level rise of 1 to 3 m, about 613.9 km2 to 2,216.5 km2 coastal area will be submerged in water (Hereher, 2020), which means the affected region's population would have to be relocated. This will also reduce the amount of available land for agriculture and settlement. Relocation means building new settlements, generating an energy stream, and providing a new source of livelihood, increasing the stress on already stressed natural resources. In a vulnerability study of the impact of climate change on the Saudi Arabian Red Sea coast, Hereher (2020) concluded that three coastal cities, namely Al Wajh, Jeddah, and Jazan, are the major coastal cities in Saudi Arabia vulnerable to sea-level rise.
Figure 6.7: Coastal Cities along the: (a) Red Sea (Google, n.d.-e) (b) Arabian Gulf (Google, n.d.-f)
Another socioeconomic factor is its impacts on tourism. An increase in sea level means the submergence of low-lying coasts, which includes beaches and wetlands. Sea-level rise combined with other factors like acidifications and eutrophication also affects the physical outlook of the sea and seawater quality. Coastal erosion also contributes to degrading coastlines by destroying its original landscape making it less suitable for a tourist attraction (Oppenheimer et al., 2019). Another socioeconomic factor to be considered is the effect of sea-level rise and flooding on agriculture. The major agricultural cities along the Red Sea and Arabian Gulf coast of Saudi Arabia are Jazan, Sehat and Qateef (El Raey, 2010). Rising sea level means seawater intrusion on land, which results in soil salinization (Daliakopoulos et al., 2016). Soil salinization increases salt content, which interacts with the microorganisms, organic carbon, and soil nutrient present in the soil. Soil salinization can result in a reduction of chlorophyll production and reduced nutrient absorption (Daliakopoulos et al., 2016), reduction in organic carbon content (Ruiz-Fernández et al., 2018), reduction in enzyme activity (Zheng et al., 2017). A combination of soil salinization and increased flooding events can affect microbial activity and composition and lead to N2O emission (Sánchez-Rodríguez et al., 2018). All these speak to a reduction in agricultural productivity of coastal lands.

Section - 6
KSA Fourth National Communication (NC4) 169
6.7 Sea Level Rise Simulation & Shoreline Submergence Study
For this section, two cities were selected: Yanbu along the Red Sea coast; and Ghazlan on the Arabian Gulf coast. Both cities are industrial areas with a sizable population that would be affected by sea-level rise. This section aims to study the shoreline submergence for Yanbu and Ghazlan in Saudi Arabia and estimate the flooded areas due to the SLR.
6.7.1 Methodology
The methodology of the SLR simulation in this section include three stages (Al-Buloshi et al., 2014; Nofal & Abboud, 2019): 1) Data retrieving stage, 2) Preprocessing stage, and 3) Analysis stage.
Besides, the three-stage methodology contains two tasks including: a) Shoreline submergence study b) SLR simulation study
The overall SLR simulation process and the relationship between the two stacks are presented in the flowchart in Figure 6.8.

Section - 6
KSA Fourth National Communication (NC4) 170
Figure 6.8: Flowchart Showing the Overall SLR Simulation Process and the Relationships
Data Retrieval Stage
Retrieving Landsat image
Preprocessing stage
1. Geometric Correction
2. Radiometric Correction
3. Shoreline Extraction
Data Retrieval Stage
Retrieving SRTM image
Preprocessing stage
1. Elevation Contour Map
2. Clipping SRTM image
3. Map Algebra
Provide Shoreline Boundary
Shoreline Change Study
SLR Simulation Study
Analysis stage
1 Shapefile of the shoreline in study area
2 Flooded Land area in the study field (1990 to 2020)
Analysis stage
1 Elevation Contour Map
2 Flooded Area Assessment due to SLR

Section - 6
KSA Fourth National Communication (NC4) 171
6.7.2 Date Retrieval Stage
The retrieved data in shoreline submergence and SLR simulation study are obtained from the USGS (United States Geological Survey) Earth Explorer Website.
1. Shoreline Submergence Study: Landsat-8 OLI image is used for shoreline submergence study. As per USGS, the Landsat-8 satellite was launched on February 11, 2013, making it the most recently launched satellite. It carries the Operational Land Imager (OLI) and the Thermal Infrared Sensor (TIRS) instruments to provide different bands of high-quality earth images. The retrieved Landsat-8 image in this study contains 11 bands with 30 m resolution. In order to estimate the shoreline submergence, the Landsat-5 TM image is used as a baseline image with 7 bands, and it was acquired on July 15, 1990. This image is believed to be the most modern topography of the survey of Saudi Arabia (Nofal & Abboud, 2019).
2. SLR Simulation Study: The SRTM (Shuttle Radar Topography Mission) image is used in this study. The SRTM is an international project spearheaded by the U.S. National Geospatial-Intelligence Agency (NGA) and the U.S. National Aeronautics and Space Administration (NASA). The retrieved SRTM images are in 1-arc (30 m) resolution.
6.7.3 Preprocessing Stage
In the shoreline submergence study, the selected tool can conduct the geometric and radiometric corrections (e.g., ENVI). It can extract the shoreline and export it into a shapefile that provides support in identifying the shoreline boundary in the SLR simulation study.
The selected tool in SLR simulation is the Geographic Information System (GIS, e.g., ArcGIS, QGIS). The GIS is used to prepare the elevation contour map and conduct spatial analysis. The spatial analysis provides the results of the flooding area due to the SLR.
6.7.3.1 Shoreline Submergence Study
6.7.3.1.1 Geometric Correction
The geometric correction is important before doing spatial analysis because there could be some inconsistencies between two satellite images due to the geometric distortions. An example (Figure 6.9) shows the shoreline from two different satellite images in Yanbu before and after geometric corrections. Before the correction, there is a slight inconsistency between the shoreline in the background image and the blue shoreline drawing from another image. By collecting the ground control points and setting up the background image as the reference to the correct blue shoreline, the background image's shoreline matches the corrected red shoreline after correction.
The Landsat-8 OLI and Landsat-5 TM are projected in World Geodetic System 1984 (WGS 1984) and the Universal Transverse Mercator (UTM) projection procedure as per their metadata documents. This projection system is selected as the coordinates notation in this study; all the data are converted into this projection system. Then the Landsat-5 TM 1990 is used as the reference for all the selected ground control points, and these selected ground control points are used to geometrically correct other images.

Section - 6
KSA Fourth National Communication (NC4) 172
Figure 6.9: Geometric Correction Example Left (before correction); Right (after correction)
6.7.3.1.2 Radiometric Correction
The Landsat satellite sensor detected characteristics of electromagnetic energy are absorbed or scattered by the particles and other elements present in the atmosphere when the solar radiation goes through the atmosphere (López-Serrano. et al., et al., 2016). This phenomenon will result in the lightness reduction and radiometric properties distortion of the satellite image (Mather & Koch, 2011). Therefore, the radiometric correction is implemented before the land surface parameters quantitative analysis to reduce or eliminate the influence from these absorptions and scattering from the "radiance-at-detector" measurements to retrieve "reflectance-at-surface" values (Yepez. et al., 2018).
The radiometric calibration is to calibrate image data to radiance, reflectance, or brightness temperatures. After radiometric calibration, the FLAASH (Fast Line-of-sight Atmospheric Analysis of Spectral Hypercubes) is used to correct the atmosphere along with the Landsat metadata documents. The MODTRAN4 radiative transfer code provided the first-principles physics-based calculations for the algorithm (Anderson. et al., 2002).
An example presented in Figure 6.10 shows the Landsat-8 image in Yanbu before and after radiometric correction. By doing the radiometric calibration and the FLAASH, the negative atmospheric influences are corrected. The corrected image is brighter and sharper than the uncorrected image.
Figure 6.10: Radiometric Correction Example Left (before correction); Right (after correction)

Section - 6
KSA Fourth National Communication (NC4) 173
6.7.3.1.3 Shoreline Extraction
The characteristics of the shoreline are determined by using different band ratios of the Landsat image. For instance, Figure 6.11 (Left) is presented under the band 1 (wavelength ranges from 0.43 to 0.45 micrometers), which shows a very detailed shoreline for the Yanbu city, including shallow water; however, such area is not counted in the flood area analysis. By increasing the wavelength up to 2.11 to 2.29 micrometers, which refers to the band, the shallow water area disappears. The shoreline position is obvious in the image, as shown in Figure 6.11 (Right).
Figure 6.11: Presented Shoreline in Band 1 (left); Presented Shoreline in Band 7 (right)
The selected band for the Landsat-8 image is Band 6 – SWIR 1 (wavelength ranges from 1.57 to 1.65 micrometers) since this band will provide the most accurate shorelines (Pardo-Pascual. et al., 2018). Meanwhile, the Landsat-5 TM image is used with the ratio of wavebands with Landsat data of B5/B2 (Nofal & Abboud, 2019).
6.7.3.2 SLR Simulation Study
6.7.3.2.1 Elevation Contour Map Preparation
One of the SLR simulation study objectives is to prepare the elevation contours for the study area. The study area could contain more than one SRTM image, so the retrieved SRTM images are merged in one big SRTM image using GIS. After merging, the big SRTM image is clipped and left the study area's elevation data only. During the clipping step, the prepared in shoreline shape data from the shoreline submergence study defines the shoreline boundary of the study area.
6.7.3.2.2 Flooded Area Assessment
Another objective in the SLR simulation study is to assess the flooded area due to the SLR. The simulated scenarios are established based on the studies of the Arabian Gulf and the Red Sea area (Al-Buloshi., et al., 2014; Nofal & Abboud, 2019). The used scenarios for the Arabian Gulf and the Red Sea area are listed in Table 6.3.

Section - 6
KSA Fourth National Communication (NC4) 174
Table 6.3: SLR Scenario
SLR Scenario (m)
0.2 0.5 1.0 2.0 3.0 4.0 5.0
In order to simulate the inundated area from the above 7 scenarios, the prepared elevation data for the study area is analyzed by using the spatial analyst tool, which is map algebra, to estimate the flooded area. Using the map algebra tool, selecting some area that is not hydrologically connected to the coastline is possible. However, it meets the criteria (e.g., elevation lower than 0.2 m), as shown in Figure 6.12. These areas shall not be selected since they are not hydrologically connected to the coastline. Using the spatial selection tool, the selection can be further defined to only select the area that hydrologically connects to the coastline.
Figure 6.12: Selected Area not Hydrologically Connected to the Coastline

Section - 6
KSA Fourth National Communication (NC4) 175
6.7.4 Case Study – Yanbu
6.7.4.1 Background
The Yanbu’ Al Bahr and Yanbu’ Al-Sina'iya are selected as the case study on Red Sea coast. It serves as a major shipping terminal for petrochemical products and has two oil refineries and four desalination plants (Mawani, 2019; SWCC, 2019). Understanding the extent of sea-level rise will help in planning for flood protection and reducing coastal erosion (Nofal and Abboud 2019). The study domain is outlined as a red line in Figure 6.13, and the total area is 606.227 Km2.
Figure 6.13: Case Study Area – Yanbu
6.7.4.2 Retrieved Image Data
The Landsat-5 TM, Landsat-8 OLI, and SRTM data are obtained from the USGS Earth Explorer website.
The information of retrieved data is listed in Table 6.4.

Section - 6
KSA Fourth National Communication (NC4) 176
Table 6.4: Retrieved Image Information
Landsat
Data Type Resolution Path/Row Datum /Zone Time Acquired
Landsat-8 OLI 30 (m) 171/043 1984 WGS84/UTM 37N 2020-10-22, 07:54:53
Landsat-5 TM 30 (m) 171/043 1984 WGS84/UTM 37N 1990-07-16, 07:14:39
SRTM
Data Type Resolution Coordinates Time Updated N E
SRTM 1-arc (30 m) N23 E38
2015-08-06, 09:39:49 N24 E37 N24 E38
The geometric and radiometric corrected Landsat-8 OLI image is presented in Figure 6.13. The treated elevation contour map for the study area is presented in Figure 6.14. The elevation in Yanbu's southeast coastal area is lower than other areas that are considered a potentially vulnerable area. The overall elevation in the study area ranges from -18 m to 44 m.
Figure 6.14: Elevation Contour Map – Yanbu

Section - 6
KSA Fourth National Communication (NC4) 177
6.7.4.3 Results and Discussion
6.7.4.3.1 Shoreline Submergence Study
During the shoreline submergence study, the results show that the shoreline in 2020 (Orange line in Figure 6.15) is increased compared with the shoreline 30 years ago in 1990 (Purple line in Figure 6.15). The main reason in terms of the shoreline increment in 30 years is sea reclamation. By comparing the satellite images, it is concluded that some coastal area is reclaimed from the sea, as shown in Figure 6.15. By doing the spatial analysis, the land area increased around 7.59576 km2 during the past 30 years.

Section - 6
KSA Fourth National Communication (NC4) 178
‘
Figure 6.15: Shoreline Comparison

Section - 6
KSA Fourth National Communication (NC4) 179
6.7.4.3.2 SLR Simulation Study
The predicted flooded areas and percentages for 6 scenarios are summarized in Table 6.5.
Table 6.5: Predicted Flooded Areas
SLR (m) 0.2 0.5 1.0 2.0 3.0 4.0 5.0
Flooded area (Km2) 15.6857 15.6857 90.0903 121.8021 147.5850 183.0730 220.4530
Percentage (%) 2.59 2.59 14.86 20.09 24.34 30.20 36.36
Based on the results, the flooded areas are the same in the SLR 0.2m and SLR 0.5m scenarios which is mainly because the vertical resolution of retrieved data is 1 m. Therefore, the predicted areas for evaluation below 1 m are in the same value. The predicted flooded area and land loss percentage is illustrated in Figure 6.16.
Figure 6.16: Predicted Flooded Area & Land Loss Percentage
When the SLR goes up to 4 m, around 30% of the land will be flooded, which will account for approximately 183 Km2. The flooded area maps and elevation maps are illustrated in Figures 6.17 and 6.18. Based on the results, the south and southeast areas will be adversely impacted and will be submerged by seawater from tides or waves when the SLR reaches 1 m as shown in the yellow areas in Figure 6.18.
0
5
10
15
20
25
30
35
40
0
50
100
150
200
250
0.2 0.5 1 2 3 4 5
Land
Los
s Per
cent
age
(%)
Floo
ded
area
(Km
2 )
SLR (m)

Section - 6
KSA Fourth National Communication (NC4) 180
Figure 6.17 Flooded Area Maps and Elevation Maps for Yanbu Al-Bahr

Section - 6
KSA Fourth National Communication (NC4) 181
Figure 6.18: Flooded Area Maps and Elevation Maps for Yanbu Industrial City

Section - 6
KSA Fourth National Communication (NC4) 182
6.7.5 Case Study – Ghazlan
6.7.5.1 Background
The Ghazlan Steam Turbine Power Plant I and II are located in the Ras Tanura region in the Eastern Province of Saudi Arabia. It has a combined generating capacity of 4,128 MW electricity (ECRA, 2006), making it the largest coastal steam turbine power plant in Saudi Arabia and a major supplier of electricity in the Kingdom of Saudi Arabia. The power plant is located less than 600m from the Arabian Gulf coast and will be affected by coastal changes like flooding and sea-level rise. Understanding the extent of sea-level rise will help in the flood protection and climate adaptation design plans for the power plant. The study area is outlined as a red line in Figure 6.19 and the total area is 234.325 Km2.
Figure 6.19: Case Study Area – Ghazlan City
6.7.5.2 Retrieved Image Data
The Landsat-5 TM, Landsat-8 OLI, and SRTM data are obtained from the USGS Earth Explorer website. The information of retrieved data is listed in Table 6.6.

Section - 6
KSA Fourth National Communication (NC4) 183
Table 6.6 Retrieved Image Information
Landsat
Data Type Resolution Path/Row Datum /Zone Time acquired
Landsat-8 OLI 30 (m) 164/041 1984 WGS84/UTM 37N 2020-11-06, 07:10:47
Landsat-5 TM 30 (m) 164/041 1984 WGS84/UTM 37N 1990-12-22, 06:30:04
SRTM
Data Type Resolution Coordinates
Time updated N E
SRTM 1-arc (30 m)
N26 E49 2015-08-06,
09:39:49 N26 E50
N27 E49 Figure 6.19 shows the Landsat-8 OLI image after geometric and radiometric corrections. The treated elevation contour map for the study area is presented in Figure 6.20. The elevation in the eastern coastal area of Ghazlan city is lower than in other areas. The overall elevation in the study area ranges from-18 m to 96 m.
Figure 6.20: Elevation Contour Map – Ghazlan City

Section - 6
KSA Fourth National Communication (NC4) 184
6.7.5.3 Results and Discussion
6.7.5.3.1 Shoreline Submergence Study
During the shoreline submergence study, the results show that the shoreline in 2020 (Orange line in Figure 6.21) is generally the same as the shoreline 30 years ago in 1990 (Purple line in Figure 6.21). The predicted shoreline length in 2020 was 205.8 km. The predicted shoreline length 30 years ago was 200.72 km in 1990, so the shoreline difference has been found to be 5.08 km. One of the reasons for shoreline increment is the construction work in the south of the study area, which was not there in 1990, as shown in Figure 6.21. This type of construction work is considered in the shoreline since its elevation is very close to the present sea level; namely, it is the SLR's vulnerable area.
Figure 6.21: Shoreline Comparison (1990 and 2020) (ArcGIS and Google Earth Pro)

Section - 6
KSA Fourth National Communication (NC4) 185
6.7.5.3.2 SLR Simulation Study
The predicted flooded areas and percentages for 7 scenarios are summarized in Table 6.7 and illustrated in Figure 6.22.
Table 6.7: Predicted Flooded Areas
SLR (m) 0.2 0.5 1.0 2.0 3.0 4.0 5.0
Flooded area (Km2) 4.0685 4.0685 33.7254 96.0049 154.9001 181.7349 198.5532
Percentage (%) 1.74 1.74 14.39 40.97 66.10 77.56 84.73
Figure 6.22: Predicted Flooded Area and Land Loss Percentage
When the SLR is lower than 1m, the flooded area covers around 4 km2, which takes 1.74% of the total study area. While the SLR level reaches 1m, 14.39% of the area (about 33.73 4 km2) will be lost. Besides, the northwestern and southeast of the Ghazlan power plant will be flooded, as shown in Figure 6.23.
0
10
20
30
40
50
60
70
80
90
0
50
100
150
200
250
0.2 0.5 1 2 3 4
Land
Los
s Per
cent
age
(%
Floo
ded
area
(Km
2 )
SLR (m)
Predicted Flooded Area & Land Loss Percentage

Section - 6
KSA Fourth National Communication (NC4) 186
Figure 6.23: Flooded area when SLR 1m
Where: Red area means flooded area

Section - 6
KSA Fourth National Communication (NC4) 187
Based on the results, the flooded areas are the same in the SLR 0.2 and SLR 0.5 scenarios which is mainly because the vertical resolution of retrieved data is 1 m. Therefore, the predicted areas for evaluation below 1 m are in the same value.
When the SLR up to 2 m, 40.97 % of the area within the study domain will be flooded, as shown in the yellow area in Figure 6.24, and the Ghazlan power plant will be totally flooded.
Figure 6.24 Flooded area when SLR at 2m
When the sea level increases to 3 m and 4 m, 66.1% and 77.56% of the study area will be flooded, respectively. 84.73% of the land in the study area will be lost when the SLR reaches 5 m. The land loss for 3 m, 4 m, and 5 m SLR scenarios are illustrated in Figure 6.25.

Section - 6
KSA Fourth National Communication (NC4) 188
Figure 6.25: Flooded area when SLR to 3m, 4m and 5m
6.7.6 Risk Assessment
In both case studies, the shoreline has increased in 2020 relative to 1990, which is attributed to the sea reclamation and other coastal construction works.
For the Yanbu case study, the identified vulnerable area is in the southeast of Yanbu (Yanbu Al-Sina'iya). Because a significant amount of area will be lost in Yanbu Al-Sina'iya when seal level increases to 1 m and most of the land will be lost in the Yanbu when sea level increases up to 3 m.
In the Ghazlan power plant case study, it is found that the Ghazlan power plant is located in a low-lying area, where there is a higher risk of flooding events caused by seawater from tides or waves. The results confirmed this concern that the Ghazlan power plant area will be totally flooded when SLR is 2 m.
The NOAA CO-OPS Technical Report (2017) provided GMSL (Global Mean Sea Level) scenarios for 2100. In Figure 6.26, the probability of exceeding GMSL scenarios in 2100 is listed in Table 6.8.
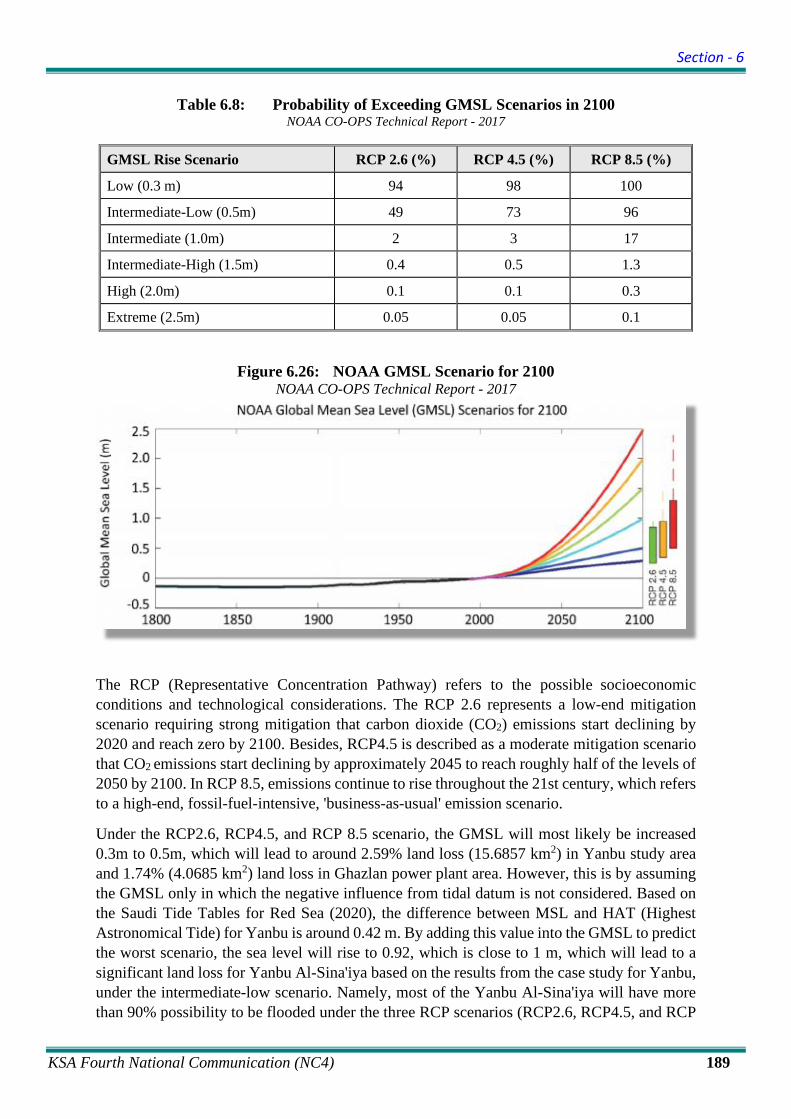
Section - 6
KSA Fourth National Communication (NC4) 189
Table 6.8: Probability of Exceeding GMSL Scenarios in 2100 NOAA CO-OPS Technical Report - 2017
GMSL Rise Scenario RCP 2.6 (%) RCP 4.5 (%) RCP 8.5 (%)
Low (0.3 m) 94 98 100
Intermediate-Low (0.5m) 49 73 96
Intermediate (1.0m) 2 3 17
Intermediate-High (1.5m) 0.4 0.5 1.3
High (2.0m) 0.1 0.1 0.3
Extreme (2.5m) 0.05 0.05 0.1
Figure 6.26: NOAA GMSL Scenario for 2100 NOAA CO-OPS Technical Report - 2017
The RCP (Representative Concentration Pathway) refers to the possible socioeconomic conditions and technological considerations. The RCP 2.6 represents a low-end mitigation scenario requiring strong mitigation that carbon dioxide (CO2) emissions start declining by 2020 and reach zero by 2100. Besides, RCP4.5 is described as a moderate mitigation scenario that CO2 emissions start declining by approximately 2045 to reach roughly half of the levels of 2050 by 2100. In RCP 8.5, emissions continue to rise throughout the 21st century, which refers to a high-end, fossil-fuel-intensive, 'business-as-usual' emission scenario.
Under the RCP2.6, RCP4.5, and RCP 8.5 scenario, the GMSL will most likely be increased 0.3m to 0.5m, which will lead to around 2.59% land loss (15.6857 km2) in Yanbu study area and 1.74% (4.0685 km2) land loss in Ghazlan power plant area. However, this is by assuming the GMSL only in which the negative influence from tidal datum is not considered. Based on the Saudi Tide Tables for Red Sea (2020), the difference between MSL and HAT (Highest Astronomical Tide) for Yanbu is around 0.42 m. By adding this value into the GMSL to predict the worst scenario, the sea level will rise to 0.92, which is close to 1 m, which will lead to a significant land loss for Yanbu Al-Sina'iya based on the results from the case study for Yanbu, under the intermediate-low scenario. Namely, most of the Yanbu Al-Sina'iya will have more than 90% possibility to be flooded under the three RCP scenarios (RCP2.6, RCP4.5, and RCP

Section - 6
KSA Fourth National Communication (NC4) 190
8.5). The risk area may be expanded in the Ghazlan power plant case study by considering the tidal datum, which required the Saudi Tide Tables for Arabian Gulf.
Moreover, the NOAA report (2017) also provided the GMSL (median values only) from 2010 to 2200, as shown in Table 6.9.
Table 6.9: GMSL Rise Scenario Heights 19-year Averages Centered on the Decade Through 2200
(NOAA CO-OPS Technical Report - 2017)
Based on the information from Table 6.9 in NOAA CO-OPS Technical Report (2017), around 24.34% (147.585 km2) of land will be lost in Yanbu under the intermediate scenario; meanwhile, 66.1% of the land, which is about 154.9 km2 of land, will be flooded in the Ghazlan power plant area.
6.8 Coastal Management
6.8.1 Sea Level Rise Response
Sea level rise response includes all actions designed and implemented to mitigate the effect of sea-level rise. Sea level rise response is dependent on each region's goal, available infrastructure, potential losses, and coastal landscape. Sea level rise response can be divided into retreat, accommodation, advance, and protection (Oppenheimer et al., 2019).
1. Retreat: This involves minimizing sea level rise effects by moving people, animals, and ecosystems from areas that could be affected by extreme environmental events (Oppenheimer et al., 2019). This can occur through planned relocation or displacement. Planned relocation occurs before disasters happen like flooding, after flooding assessment is carried out (Mortreux et al., 2018). In some cases, residents are unwilling to move and require incentives like economic opportunities and good resettlement locations (Hino et al., 2017). Displacement refers to people's forced submergence from areas affected by environmental events like sea-level rise and coastal flooding (Oppenheimer et al., 2019). As of 2010, almost 40 million people have been displaced by climate-related events (Black et al., 2013). In a study conducted on the coastal defenses of thirty-five (35) small island developing states (SIDS), seven (7) SIDS in the survey included retreat in their proposed coastal defense adaptation strategy as a final resort. They include Belize, Dominica, Grenada, Guyana, Jamaica, Marshall Island, and St. Lucia (Wong, 2018).
GMSL Rise Scenario (m) 2010 2020 2030 2040 2050 2060 2070 2080 2090 2100 2120 2150 2200
Low 0.03 0.06 0.09 0.13 0.16 0.19 0.22 0.25 0.29 0.30 0.34 0.37 0.39
Intermediate-Low 0.04 0.08 0.13 0.19 0.24 0.29 0.35 0.40 0.45 0.50 0.60 0.73 0.95
Intermediate 0.04 0.10 0.16 0.25 0.34 0.45 0.57 0.71 0.85 1.0 1.3 1.8 2.8
Intermediate-High 0.05 0.10 0.19 0.30 0.44 0.60 0.79 1.0 1.2 1.5 2.0 3.1 5.1
High 0.05 0.11 0.21 0.36 0.54 0.77 1.0 1.3 1.7 2.0 2.8 4.3 7.5
Extreme 0.04 0.1 0.24 0.41 0.63 0.90 1.2 1.6 2.0 2.5 3.6 5.5 9.7

Section - 6
KSA Fourth National Communication (NC4) 191
2. Accommodation: Accommodation involves reducing the effect of environmental events such as sea-level rise, coastal flooding, and coastal erosion by increasing the resilience of the built environment to extreme environmental events (Oppenheimer et al., 2019). Examples include switching to salt-tolerant species in areas prone to salinization (Oppenheimer et al., 2019), flood warning systems (Lee, 2014), building innovations like floating houses and communities in Vietnam (Trang, 2016). The use of elevated buildings is also practiced in Belize, Cooks Island, and Guyana (Wong, 2018).
3. Advance: This strategy entails land reclamation using a combination of hard and sedimentary based protection techniques and the creation of piers. It also utilizes natural coastal buffers like wetlands and marshes in land reclamation (Lee, 2014). Land reclamation is included as an existing sea-level rise strategy in Bahrain, Maldives, and Netherlands (Donchyts et al., 2016; Wong, 2018).
4. Protection: This involves using hard and sedimentary-based protection and ecosystem-based protection techniques to protect the coastline (Oppenheimer et al., 2019). These techniques can be used alone or as an integrated management strategy to maximize the effects of the adaptation techniques (Wong, 2018).
6.8.2 Hard and Sediment Based Protection
This involves the introduction of hard barriers like dykes, levees, seawalls, and storm surge barriers for the protection of coastal land against sea-level rise (Cooke et al., 2012). Hard barriers have been used for sea-level rise adaptation of storm surges in over ten (10) countries, including Canada, China, Germany, Italy, and the Netherlands (Kabat et al., 2009; Oppenheimer et al., 2019). Although hard protection structures like levees, dykes, and seawalls are effective, it can also result in coastal squeeze (which is the shrinkage of coastal habitats like wetlands and marshes (Pontee, 2013)) and reduction of coastal ecosystem and biodiversity (Gittman et al., 2016).
Sediment based protection is the use of sediment deposition for the nourishment of coastal lines and sandy beaches. It is used to protect the coastal shore and mitigates coastal erosion and sea-level rise (Cooke et al., 2012). Nourishment projects occur in Australia, France, Germany, Italy, Netherland, and the USA. Nourishment projects differ based on their use. It can be used for tourism and nourishing areas affected by coastal erosion (Cooke et al., 2012). As a sea-level rise adaptation strategy, sediment nourishment simulates natural dunes for shore protection against sea level rise, storm surges, and tidal waves (Jackson et al., 2010). Although sediment-based protection requires continuous maintenance and sediment replenishment on shorelines, it can allow more ecosystem migration and faunal interaction than using hard barriers (Jackson et al., 2010).
6.8.3 Ecosystems Based Protection
This coastal protection method uses naturally occurring ecosystems such as seagrasses, mangroves, salt marsh canopies, and coral reefs to combat sea-level rise, tidal waves, and storm surges (Oppenheimer et al., 2019). While there is evidence that the efficiency of ecosystem-based adaptation method is dependent on the storm and wave characteristics (Narayan et al., 2017; Oppenheimer et al., 2019), there is also sufficient evidence that links the reduction in storm surges, flooding, wave energy, and coastal erosion with coral reefs, salt marshes, and

Section - 6
KSA Fourth National Communication (NC4) 192
mangrove swamps (Narayan et al., 2017; Reguero et al., 2018; Shepard et al., 2011). (Ferrario et al., 2014) concluded that coral reefs reduce about 94% of wave energy. An added advantage of an ecosystem-based adaptation method is its cost-effectiveness. The use of coastal ecosystems for coastal defenses is cheaper because it requires little or no maintenance (Narayan et al., 2016). Another benefit is that mangrove swamps, coral reefs, and salt marsh canopies serve as a feeding ground for coastal life, providing an avenue for fishing (Carrasquilla-Henao & Juanes, 2017). (Lamb et al., 2017) observed a significant reduction of diseases in corals paired with seagrasses and reduced disease-causing pathogens in areas with seagrasses.
In a study conducted on the coastal defenses of thirty-five (35) SIDS, nine (9) islands (which includes Antigua & Barbuda, Kiribati, Maldives, Mauritius, Micronesia, Palau, Papua New Guinea, Samoa, and the Solomon Islands) use coastal ecosystems for coastal defenses, and twenty-seven (27) proposed the use of coastal ecosystems in the future (Wong, 2018). The proposed adaptation measures include mangrove reforestation and coral restoration to increase coastal defense efficiency.
Saudi Arabia's coastal areas possess seagrasses, mangrove swamps, salt marshes, and a diverse bank of corals, which serve as a natural coastal defense against sea level rise and coastal flooding. (Abuzinada et al., 2005; Mcowen et al., 2017).
6.9 Policies and Strategies
The policies in this section have been divided under international agreements and national initiatives.
6.9.1 Marine Policies under G20
Group of Twenty (G20) is an international framework set up in 1999 by 19 member countries and the European Union to discuss methods for ensuring economic stability and financial growth for its member countries. Since its summit in 2011, G20 has held annual conferences to discuss varying economic issues and promote international cooperation among member countries (G20, 2020). Saudi Arabia took over its presidency in 2019, led by His Majesty King Salman bin Abdulaziz Al Saud (G20, 2020).
In an effort to assist its member countries in achieving the 2020 Aichi biodiversity targets, G20 designed the 'Marine Biodiversity Action Plan' to increase marine protected areas (MPA) to 10% of its entire marine regions of each member country (G20, 2020). This policy proposes the protection of marine protected areas in both national and international jurisdictions. It provides stakeholders with short and long-term policy options. The proposals under this action plan include:
1. Assessing current marine biodiversity agreements and promoting community involvement to increase coverage of marine protected areas: short term policy options include promoting community-based programs that encourage communities to engage in ocean clean up in exchange for certain benefits and assessing the efficiency of past and current marine protection agreements. The long-term policy recommendation supports setting up a legal framework, international discussions, and negotiations between G20 member countries on protecting and conserving MPAs. This discussion should be done to agree on long term MPA protection initiatives (Ganeshan & Souza, 2020).

Section - 6
KSA Fourth National Communication (NC4) 193
2. Increasing private investments and funds for marine biodiversity protection and conservation: short term policy options under this proposal include (Ganeshan & Souza, 2020): a. Introduction of environmental levies for entry into MPAs b. Encouraging private investments and community engagement c. Introduction of conservation-based tourism
The long-term policy option is creating an 'Oceans Fund' for the creation, expansion, and conservation of MPAs, creating programs to raise awareness of the importance of MPAs and building climate change resilience of MPAs (Ganeshan & Souza, 2020).
3. Promoting marine biodiversity research, information distribution, and capacity building: short term policy options include creating a committee that liaisons with other international marine protection agencies and gathering and distributing scientific research on marine conservation and protection. The long-term policy recommendation is creating a framework for shared information and technologies (Ganeshan & Souza, 2020).
6.9.2 National Strategies in Saudi Arabia's 2030 Environment Goals
The national strategies for marine protection and conservation are covered in Saudi Arabia's 2030 environment goals under wildlife conservations, with specific targets that include:
a. An increase in the coverage of Marine Protected Areas to 10% b. An increase in the conservation of genetic species to 75% c. An increase in biodiversity hotspots to 75%
Marine initiatives for Saudi Vision 2030 include:
1. Introduction and development of sustainable conservation-based tourism 2. Improving management performance of marine protected areas 3. Enhancing management and preservation of the coastal area 4. Providing instructions and recommendations for successful management of biological
resources 5. Creating more protected areas
6.9.3 The Red Sea Project
The Red Sea project was announced by Saudi Arabia in 2017 as one of the major projects of Saudi Vision 2030. The Red Sea project is a mega luxury tourism project located on over 90 uninhabited islands (over 28,000 km2) between the city of Um Lujj and Al Wajh along the Red Sea Coast of Saudi Arabia (Hussain, 2017; The Red Sea Development Company, 2020a).

Section - 6
KSA Fourth National Communication (NC4) 194
Figure 6.27: Left- Drone view of the Red Sea project site; Right- Satellite View of the Red Sea project site
(TRSDC Newsroom, 2020) (Google, n.d.-g)
It incorporates Environmental Conservation and sustainability into its design, construction, and operations by introducing green cement, renewable energy, zero single-use plastic commitment, marine spatial planning, and marine life conservation projects like turtle tagging (The Red Sea Development Company, 2020b). It also introduces sea level rise accommodation techniques into its architectural design, like overwater structures in the Sheybarah islands (Figure 6.28) and the Ummahat Alsaykh island (Figure 6.28) (TRSDC Newsroom, 2020).
Figure 6.28: Overwater Structures in the Sheybarah islands and the Ummahat Alsaykh Island
(TRSDC Newsroom, 2020)
Nine Islands have been designated for marine conservation of protection as part of the Red Sea project (The Red Sea Development Company, 2020a).

Section - 6
KSA Fourth National Communication (NC4) 195
6.9.4 Initiatives included In the National Program Plan for 2018- 2020 (MEWA, n.d.).
1. The development of a framework for trading fungal organisms and its products includes set laws, enforcement measures, and licensing provisions.
2. The creation of an agricultural quarantine city and the development of the current quarantine system.
3. The national center's establishment for marketing and promotion of fish product consumption: this initiative is designed to promote local seafood products.
4. The development of fishing harbors to promote tourism and create investment opportunities.
5. Promoting private biodiversity-based investments in marine protected areas.
6.10 Summary
Saudi Arabia has two marine areas, namely, the Red Sea and Arabian Gulf. Global research into sea-level changes indicates a rise in global mean sea level from 1.4mm/year to 3.6mm/year between 1901 and 2015 (Oppenheimer et al., 2019). To understand the regional influence of sea-level rise on coastal areas, Yanbu and Ghazlan were chosen as study areas for sea-level rise simulation.
In both case studies, the shoreline is increased from 1990 till 2020, which is attributed to the sea reclamation and other coastal construction works.
In the Ghazlan power plant case study, it is found that the Ghazlan power plant is in a low elevation area, where there is a higher risk of flooding events caused by seawater from tides or waves. The results confirmed this concern that the Ghazlan power plant will be totally flooded when SLR to 2 m or more.
Based on the information from Tables 6.5 and 6.7, around 24.34 % (147.585 km2) of land will be lost in Yanbu under the intermediate scenario; meanwhile, 66.1% of the land, which is about 154.9 km2of land, will be flooded in the Ghazlan power plant region.
As part of the Kingdom's effort to improve coastal areas' climate change resilience, Saudi Arabia has introduced initiatives like sustainable conservation-based tourism, the Red Sea project development, increase in marine protected areas, and designing a framework for trading fungal organisms and products.
Section - 6
KSA Fourth National Communication (NC4) 196
References:
1. AbdelKareem, M. (2009). New Algal Records from the Arabian Gulf Coast of Saudi Arabia. Bot. Res. Int, 2(4).
2. Abuzinada, A. H., Al-Wetaid, Y. I., & Al-Basyouni, S. Z. M. (2005). The National Strategy for Conservation of Biodiversity in the Kingdom of Saudi Arabia. Prepared and Issued by: The National Commission for Wildlife Conservation and Development. Conservation of Biological Diversity, Riyadh, Saudi Arabia. https://52.16.214.95/doc/world/sa/sa-nbsap-01-en.pdf
3. Aina, Y., & Aleem, K. (2014). Assessing the Vulnerability of an Industrial City to Predicted Sea Level Rise using SRTM and GPS Observations: The Case of Yanbu, Saudi Arabia. International Journal of Geoinformatics, 10, 73–81.
4. Al-Buloshi, A., Al-Hatrushi, S., & Charabi, Y. (2014). GIS-based framework for the simulation of the impacts of sea level rise and coastal flooding on Oman. Journal of Earth Science & Climatic Change, 5(10), 1.
5. Anderson, G.P., Felde, G.W., Hoke, M.L., Ratkowski, A.J., Cooley, T.W., Chetwynd Jr., J.H., Gardner, J., Adler-Golden, S.M., Matthew, M.W., Berk, A., (2002).
6. Bird, E. (2010a). Saudi Arabia, Arabian Gulf coast. In Eric (Ed.), Encyclopedia of the World's Coastal Landforms (pp. 1045–1046). Springer Netherlands. https://doi.org/10.1007/978-1-4020-8639-7₁94
7. Bird, E. (2010b). Saudi Arabia, red sea coast. In Eric (Ed.), Encyclopedia of the World's Coastal Landforms (pp. 1023–1025). Springer Netherlands. https://doi.org/10.1007/978-1-4020-8639-7₁88
8. Black, R., Arnell, N. W., Adger, W. N., Thomas, D., & Geddes, A. (2013). Migration, immobility and displacement outcomes following extreme events. Environmental Science & Policy, 27, S32–S43. https://doi.org/10.1016/j.envsci.2012.09.001
9. Bogorodsky, S., ALPERMANN, T., Mal, A., & Gabr, M. (2014). Survey of demersal fishes from southern Saudi Arabia, with five new records for the Red Sea. Zootaxa, 3852, 401–437. https://doi.org/10.11646/zootaxa.3852.4.1
10. Brown, B. E., Dunne, R. P., Somerfield, P. J., Edwards, A. J., Simons, W. J. F., Phongsuwan, N., Putchim, L., Anderson, L., & Naeije, M. C. (2019). Long-term impacts of rising sea temperature and sea level on shallow water coral communities over a ~40 year period. Scientific Reports, 9(1), 1–12. https://doi.org/10.1038/s41598-019-45188-x
11. Carrasquilla-Henao, M., & Juanes, F. (2017). Mangroves enhance local fisheries catches: a global meta-analysis. Fish and Fisheries, 18(1), 79–93. https://doi.org/10.1111/faf.12168
12. Coles, S. L., & Riegl, B. M. (2013). Thermal tolerances of reef corals in the Gulf: a review of the potential for increasing coral survival and adaptation to climate change through assisted translocation. Marine Pollution Bulletin, 72(2), 323–332. https://doi.org/10.1016/j.marpolbul.2012.09.006

Section - 6
KSA Fourth National Communication (NC4) 197
13. Cooke, B. C., Jones, A. R., Goodwin, I. D., & Bishop, M. J. (2012). Nourishment practices on Australian sandy beaches: a review. Journal of Environmental Management, 113, 319–327. https://doi.org/10.1016/j.jenvman.2012.09.025
14. Daliakopoulos, I. N., Tsanis, I. K., Koutroulis, A., Kourgialas, N. N., Varouchakis, A. E., Karatzas, G. P., & Ritsema, C. J. (2016). The threat of soil salinity: A European scale review. The Science of the Total Environment, 573, 727–739. https://doi.org/10.1016/j.scitotenv.2016.08.177
15. Devantier, L., & Pilcher, N. (2000). The Status of Coral Reefs In Saudi Arabia -2000. https://denix.osd.mil/DENIX/crid/Saudi_Arabia_files/DeVantier%20and%20Pilcher%202000.pdf
16. Donchyts, G., Baart, F., Winsemius, H., Gorelick, N., Kwadijk, J., & van de Giesen, N. (2016). Earth's surface water change over the past 30 years. Nature Climate Change, 6(9), 810–813. https://doi.org/10.1038/nclimate3111
17. DOPA. (2018a). 'Asir National Park | DOPA Explorer. Digital Observatory for Protected Areas. https://dopa-explorer.jrc.ec.europa.eu/wdpa/864
18. DOPA. (2018b). Farasan Islands | DOPA Explorer. Digital Observatory for Protected Areas. https://dopa-explorer.jrc.ec.europa.eu/wdpa/11967
19. Duke, N., Nagelkerken, I., Agardy, T., Wells, S., & Van Lavieren, H. (2014). The importance of mangroves to people: a call to action (J.-W. van Bochove, E. Sullivan, & T. Nakamura (eds.); p. 128). United Nations Environment Programme World Conservation Monitoring Centre (UNEP-WCMC). https://researchonline.jcu.edu.au/35529/
20. ECRA. (2006). Revised Final Report: Updated Generation Planning for The Saudi Electricity Sector. In web.archive.org. Electricity & Cogeneration Regulatory Authority (ECRA). https://web.archive.org/web/20140306172325/http://ecra.gov.sa/pdf/longtermgenerationplanningforsaudielectricitysectorstudy.pdf
21. El Raey, M. (2010). Impact of Sea Level Rise on the Arab Region. https://www.researchgate.net/publication/266454174_Impact_of_Sea_Level_Rise_on_the_Arab_Region
22. Ellison, J. (2003). Climate change and sea level rise impacts on mangrove ecosystems. https://www.researchgate.net/publication/228596763_Climate_change_and_sea_level_rise_impacts_on_mangrove_ecosystems
23. EMECS. (2016). 16 Red Sea. In Environmental Guidebook on Enclosed Coastal Seas of the World 2015. International Center for the Environmental Management of Enclosed Coastal Seas. https://www.emecs.or.jp/en/wp-content/uploads/2019/10/2015_guidebook-16_redsea.pdf

Section - 6
KSA Fourth National Communication (NC4) 198
24. Eyre, B. D., Cyronak, T., Drupp, P., De Carlo, E. H., Sachs, J. P., & Andersson, A. J. (2018). Coral reefs will transition to net dissolving before end of century. Science, 359(6378), 908–911. https://doi.org/10.1126/science.aao1118
25. FAO Fisheries & Aquaculture. (2020). FAO Fisheries & Aquaculture - PERSGA. Fao.org. http://www.fao.org/fishery/rfb/persga/en
26. FAO. (2014). Influence of climate change on fisheries resources in the Arab region. GLOBEFISH: Food and Agriculture Organization of the United Nations. http://www.fao.org/in-action/globefish/fishery-information/resource-detail/en/c/338390/
27. Ferrario, F., Beck, M. W., Storlazzi, C. D., Micheli, F., Shepard, C. C., & Airoldi, L. (2014). The effectiveness of coral reefs for coastal hazard risk reduction and adaptation. Nature Communications, 5, 3794. https://doi.org/10.1038/ncomms4794
28. Field, M. E., Ogston, A. S., & Storlazzi, C. D. (2011). Rising sea level may cause decline of fringing coral reefs. Eos, 92(33), 273–274. https://doi.org/10.1029/2011EO330001
29. G20. (2020). Saudi Arabia. https://g20.org/en/Pages/home.aspx
30. Ganeshan, S., & Souza, F. (2020). G20's Role In Marine Biodiversity-Policy Options And Best Practices For Enhancing Marine Protected Areas (MPA). https://t20saudiarabia.github.io/PolicyBriefs/T20_TF2_PB12.pdf
31. General Authority for Statistics - GASTAT (2015). Statistical Yearbook of 2014 (No. 50). Kingdom of Saudi Arabia. https://www.stats.gov.sa/en/795
32. General Authority for Statistics - GASTAT (2019). Statistical Yearbook of 2018 (No. 54). Kingdom of Saudi Arabia. https://www.stats.gov.sa/en/1006
33. Gilman, E. L., Ellison, J., Duke, N. C., & Field, C. (2008). Threats to mangroves from climate change and adaptation options: A review. Aquatic Botany, 89(2), 237–250. https://doi.org/10.1016/j.aquabot.2007.12.009
34. Gittman, R. K., Scyphers, S. B., Smith, C. S., Neylan, I. P., & Grabowski, J. H. (2016). Ecological Consequences of Shoreline Hardening: A Meta-Analysis. Bioscience, 66(9), 763–773. https://doi.org/10.1093/biosci/biw091
35. Google. (n.d.-a). [Google Earth, Saudi Arabia]. Retrieved November 15, 2020: https://earth.google.com/web/@16.8094834,41.7606472,-0.1885995a,1000. 11848863d,30y,0h,0t,0r/data=MicKJQojCiExNDB3LUpycHpqUkM2dWEycFpGOHU4UVd3U3lkZ0hvNk8

Section - 6
KSA Fourth National Communication (NC4) 199
36. Google. (n.d.-b). [Google Earth, Saudi Arabia]. Retrieved November 15, 2020: https://earth.google.com/web/@27.215798,49.4059435,-0.80658011a,1000.22644745d,30y,0h,0t,0r/data=MicKJQojCiExTUV2bktSeVk5UjVtNGsxSXowX1YxZVlhM2l1QnpDbFU
37. Google. (n.d.-c). [Google Earth, Saudi Arabia]. Retrieved November 15, 2020” https://earth.google.com/web/@22.9912109,38.53391615,8.20518301a,2389688.53133187d,30y,0h,0t,0r/data=MicKJQojCiExUFNnbUxubU5JaFdRcFJsQ2JLV0V0eDh2UXRabTFfcTc
38. Google. (n.d.-d). [Google Earth, Saudi Arabia]. Retrieved November 15, 2020: https://earth.google.com/web/@27.26104095,52.48503859,321.66874287a,1578527.08781853d,30y,0.00000085h,0t,0r/data=MicKJQojCiExbDVsTXRzbEVfZVR1Q2l0a1VNalFjVUVDZkJpLUpEbXY
39. Google. (n.d.-e). [Google Earth, Saudi Arabia]. Retrieved November 15, 2020: https://earth.google.com/web/@22.11755828,39.14743365,19.54043152a,1992720.73997347d,30y,0h,0t,0r/data=MicKJQojCiExMjNJUEhLTmFjdmVJWm15dWppYXFMd1gxMWxRTDk1QUQ
40. Google. (n.d.-f). [Google Earth, Saudi Arabia]. Retrieved November 15, 2020: https://earth.google.com/web/@26.78294693,49.4972155,92.9535489a,432599.23406281d,35y,0h,0t,0r/data=MicKJQojCiExNjk4aWk4em40UkdnVmVfZXVaNEw2bVU1c1FlSEdwNWI
41. Google. (n.d.-g). [Google Earth, Saudi Arabia]. Retrieved November 15, 2020: https://earth.google.com/web/@25.58152538,36.87444609,-0.80653212a,175597.70077319d,30y,0h,60t,0r/data=KAIyJwolCiMKITFWNVpuSm9saTMzLUVrd0h0ZjAxRkhVdEtYMTBRUmpfUw
42. Hereher, M. E. (2016). Vulnerability assessment of the Saudi Arabian Red Sea coast to climate change. Environmental Earth Sciences, 75(1), 1–13. Earth, Atmospheric & Aquatic Science Collection; ProQuest Central; ProQuest One Academic. https://doi.org/http://dx.doi.org/10.1007/s1266501548353
43. Hereher, M. E. (2020). Assessment of Climate Change Impacts on Sea Surface Temperatures and Sea Level Rise—The Arabian Gulf. Climate, 8(4), 50. https://doi.org/10.3390/cli8040050
44. Hino, M., Field, C. B., & Mach, K. J. (2017). Managed retreat as a response to natural hazard risk. Nature Climate Change, 7(5), 364–370. https://doi.org/10.1038/nclimate3252
45. Hussain, Z. (2017). Saudi Arabia's Red Sea Project: Harnessing Tourism for Diversification.
46. Jackson, N. L., Nordstrom, K. F., Saini, S., & Smith, D. R. (2010). Effects of nourishment on the form and function of an estuarine beach. Ecological Engineering, 36(12), 1709–1718. https://doi.org/10.1016/j.ecoleng.2010.07.016
47. Kabat, P., Fresco, L. O., Stive, M. J. F., Veerman, C. P., Alphen, J. S. L. J., Parmet, B. W. A. H., Hazeleger, W., & Katsman, C. (2009). Dutch coasts in transition. Nature Geoscience, 2(7), 450–452. https://doi.org/10.1038/ngeo572
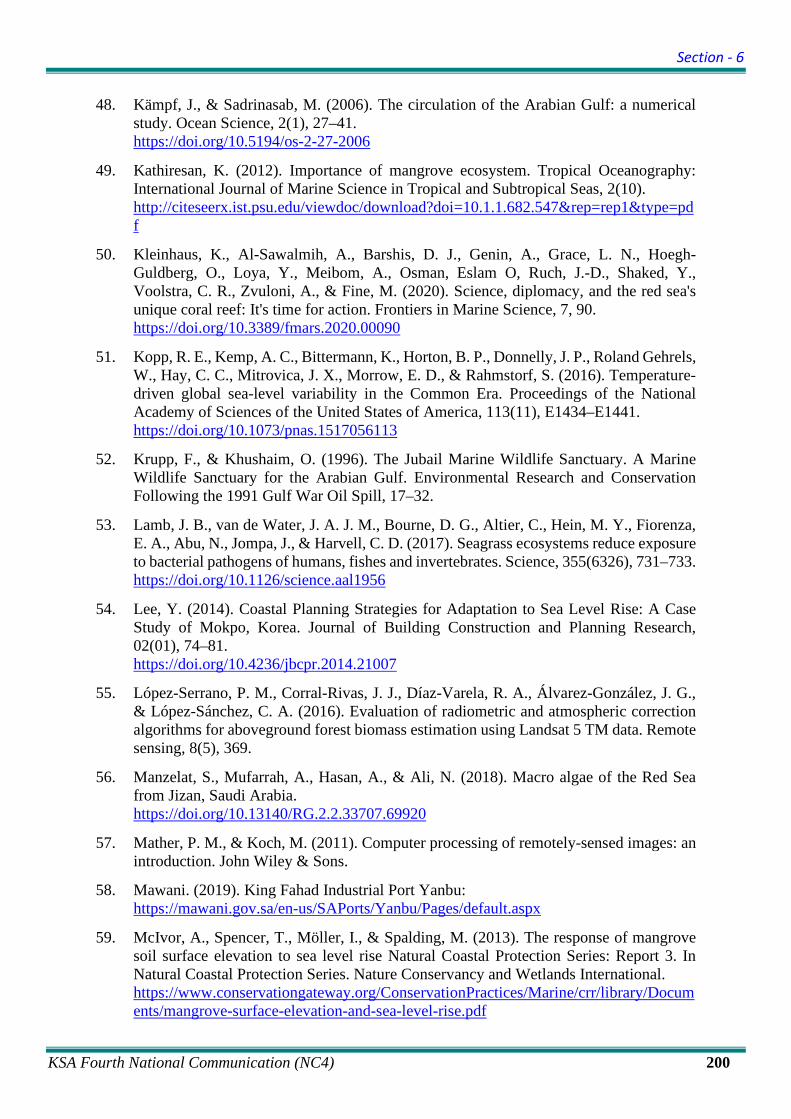
Section - 6
KSA Fourth National Communication (NC4) 200
48. Kämpf, J., & Sadrinasab, M. (2006). The circulation of the Arabian Gulf: a numerical study. Ocean Science, 2(1), 27–41. https://doi.org/10.5194/os-2-27-2006
49. Kathiresan, K. (2012). Importance of mangrove ecosystem. Tropical Oceanography: International Journal of Marine Science in Tropical and Subtropical Seas, 2(10). http://citeseerx.ist.psu.edu/viewdoc/download?doi=10.1.1.682.547&rep=rep1&type=pdf
50. Kleinhaus, K., Al-Sawalmih, A., Barshis, D. J., Genin, A., Grace, L. N., Hoegh-Guldberg, O., Loya, Y., Meibom, A., Osman, Eslam O, Ruch, J.-D., Shaked, Y., Voolstra, C. R., Zvuloni, A., & Fine, M. (2020). Science, diplomacy, and the red sea's unique coral reef: It's time for action. Frontiers in Marine Science, 7, 90. https://doi.org/10.3389/fmars.2020.00090
51. Kopp, R. E., Kemp, A. C., Bittermann, K., Horton, B. P., Donnelly, J. P., Roland Gehrels, W., Hay, C. C., Mitrovica, J. X., Morrow, E. D., & Rahmstorf, S. (2016). Temperature-driven global sea-level variability in the Common Era. Proceedings of the National Academy of Sciences of the United States of America, 113(11), E1434–E1441. https://doi.org/10.1073/pnas.1517056113
52. Krupp, F., & Khushaim, O. (1996). The Jubail Marine Wildlife Sanctuary. A Marine Wildlife Sanctuary for the Arabian Gulf. Environmental Research and Conservation Following the 1991 Gulf War Oil Spill, 17–32.
53. Lamb, J. B., van de Water, J. A. J. M., Bourne, D. G., Altier, C., Hein, M. Y., Fiorenza, E. A., Abu, N., Jompa, J., & Harvell, C. D. (2017). Seagrass ecosystems reduce exposure to bacterial pathogens of humans, fishes and invertebrates. Science, 355(6326), 731–733. https://doi.org/10.1126/science.aal1956
54. Lee, Y. (2014). Coastal Planning Strategies for Adaptation to Sea Level Rise: A Case Study of Mokpo, Korea. Journal of Building Construction and Planning Research, 02(01), 74–81. https://doi.org/10.4236/jbcpr.2014.21007
55. López-Serrano, P. M., Corral-Rivas, J. J., Díaz-Varela, R. A., Álvarez-González, J. G., & López-Sánchez, C. A. (2016). Evaluation of radiometric and atmospheric correction algorithms for aboveground forest biomass estimation using Landsat 5 TM data. Remote sensing, 8(5), 369.
56. Manzelat, S., Mufarrah, A., Hasan, A., & Ali, N. (2018). Macro algae of the Red Sea from Jizan, Saudi Arabia. https://doi.org/10.13140/RG.2.2.33707.69920
57. Mather, P. M., & Koch, M. (2011). Computer processing of remotely-sensed images: an introduction. John Wiley & Sons.
58. Mawani. (2019). King Fahad Industrial Port Yanbu: https://mawani.gov.sa/en-us/SAPorts/Yanbu/Pages/default.aspx
59. McIvor, A., Spencer, T., Möller, I., & Spalding, M. (2013). The response of mangrove soil surface elevation to sea level rise Natural Coastal Protection Series: Report 3. In Natural Coastal Protection Series. Nature Conservancy and Wetlands International. https://www.conservationgateway.org/ConservationPractices/Marine/crr/library/Documents/mangrove-surface-elevation-and-sea-level-rise.pdf

Section - 6
KSA Fourth National Communication (NC4) 201
60. Mcowen, C. J., Weatherdon, L. V., Van Bochove, J.-W., Sullivan, E., Blyth, S., Zockler, C., Stanwell-Smith, D., Kingston, N., Martin, C. S., Spalding, M., & Fletcher, S. (2017). A global map of saltmarshes. Biodiversity Data Journal, 5, e11764. https://doi.org/10.3897/BDJ.5.e11764
61. MEWA (2020): Ministry of Environment Water & Agriculture https://www.mewa.gov.sa/en/Ministry/AboutMinistry/Pages/MinistryBrief.aspx
62. Mortreux, C., Safra de Campos, R., Adger, W. N., Ghosh, T., Das, S., Adams, H., & Hazra, S. (2018). Political economy of planned relocation: A model of action and inaction in government responses. Global Environmental Change: Human and Policy Dimensions, 50, 123–132. https://doi.org/10.1016/j.gloenvcha.2018.03.008
63. Narayan, S., Beck, M. W., Reguero, B. G., Losada, I. J., van Wesenbeeck, B., Pontee, N., Sanchirico, J. N., Ingram, J. C., Lange, G.-M., & Burks-Copes, K. A. (2016). The Effectiveness, Costs and Coastal Protection Benefits of Natural and Nature-Based Defences. PloS One, 11(5), e0154735. https://doi.org/10.1371/journal.pone.0154735
64. Narayan, S., Beck, M. W., Wilson, P., Thomas, C. J., Guerrero, A., Shepard, C. C., Reguero, B. G., Franco, G., Ingram, J. C., & Trespalacios, D. (2017). The Value of Coastal Wetlands for Flood Damage Reduction in the Northeastern USA. Scientific Reports, 7(1), 9463. https://doi.org/10.1038/s41598-017-09269-z
65. Nofal, R. A. E., & Abboud, I. A. (2019). Sea level changes of Sharm Yanbu and its expected impacts on development processes using GIS and remote sensing. Journal of Taibah University for Science, 13(1), 547-558.
66. NOAA. (2020). What is Ocean Acidification? National Ocean Service Website. https://oceanservice.noaa.gov/facts/acidification.html
67. NOAA technical report NOS CO-OPS 083. Global and regional sea level rise scenarios for the United States, 2017.
68. Oppenheimer, M., Glavovic, B. C., Hinkel, J., Van de Wal, R., Magnan, A. K., Abd-Elgawad, A., Cai, R., Cifuentes-Jara, M., DeConto, R. M., Ghosh, T., Hay, J., Isla, F., Marzeion, B., Meyssignac, B., & Sebesvari, Z. (2019). Sea Level Rise and Implications for Low-Lying Islands, Coasts and Communities. In IPCC Special Report on the Ocean and Cryosphere in a Changing Climate [H.-O. Pörtner, D.C. Roberts, V. Masson-Delmotte, P. Zhai, M. Tignor, E. Poloczanska, K. Mintenbeck, A. Alegría, M. Nicolai, A. Okem, J. Petzold, B. Rama, N.M. Weyer (eds.)]. IPCC. https://www.ipcc.ch/srocc/chapter/chapter-4-sea-level-rise-and-implications-for-low-lying-islands-coasts-and-communities/
69. Ouda, O. (2014). Domestic water demand in Saudi Arabia: assessment of desalinated water as strategic supply source. Desalination and Water Treatment, 56, 1–11. https://doi.org/10.1080/19443994.2014.964332
70. Pardo-Pascual, J. E., Sánchez-García, E., Almonacid-Caballer, J., Palomar-Vázquez, J. M., Priego De Los Santos, E., Fernández-Sarría, A., & Balaguer-Beser, Á. (2018). Assessing the accuracy of automatically extracted shorelines on microtidal beaches from Landsat 7, Landsat 8 and Sentinel-2 imagery. Remote Sensing, 10(2), 326.

Section - 6
KSA Fourth National Communication (NC4) 202
71. Pontee, N. (2013). Defining coastal squeeze: A discussion. Ocean & Coastal Management, 84, 204–207. https://doi.org/10.1016/j.ocecoaman.2013.07.010
72. Protected Planet. (2017a). Protected Planet | 'Asir National Park. Protected Planet. https://www.protectedplanet.net/864
73. Protected Planet. (2017b). Protected Planet | Farasan Islands. Protected Planet. https://www.protectedplanet.net/11967
74. Qurban, M., Kandan, M., Krishnakumar, P., GarciasBonet, N., & Duarte, C. (2019). Seagrass Distribution, Composition and Abundance Along the Saudi Arabian Coast of Red Sea. In Oceanographic and Biological Aspects of the Red Sea (pp. 367–385). Springer. https://doi.org/10.1007/9783319994178_20
75. Reguero, B. G., Beck, M. W., Agostini, V. N., Kramer, P., & Boze Hancock. (2018). Coral reefs for coastal protection: A new methodological approach and engineering case study in Grenada. Journal of Environmental Management, 210, 146–161. https://doi.org/https://doi.org/10.1016/j.jenvman.2018.01.024
76. ROPME. (2012). ROPME - Who We are: http://ropme.org/1_WhoWeAre_EN.clx
77. Ruiz-Fernández, A. C., Carnero-Bravo, V., Sanchez-Cabeza, J. A., Pérez-Bernal, L. H., Amaya-Monterrosa, O. A., Bojórquez-Sánchez, S., López-Mendoza, P. G., Cardoso-Mohedano, J. G., Dunbar, R. B., Mucciarone, D. A., & Marmolejo-Rodríguez, A. J. (2018). Carbon burial and storage in tropical salt marshes under the influence of sea level rise. The Science of the Total Environment, 630, 1628–1640. https://doi.org/10.1016/j.scitotenv.2018.02.246
78. Sánchez-Rodríguez, A. R., Chadwick, D. R., Tatton, G. S., Hill, P. W., & Jones, D. L. (2018). Comparative effects of prolonged freshwater and saline flooding on nitrogen cycling in an agricultural soil. Applied Soil Ecology, 125, 56–70. https://doi.org/https://doi.org/10.1016/j.apsoil.2017.11.022
79. Shepard, C. C., Crain, C. M., & Beck, M. W. (2011). The protective role of coastal marshes: a systematic review and meta-analysis. PloS One, 6(11), e27374. https://doi.org/10.1371/journal.pone.0027374
80. SWA. (2019). The Vision and Mission of The Authority: https://www.swa.gov.sa/Ar/AboutUs/Pages/Goals.aspx
81. SWCC. (2019). Desalination Plants: https://www.swcc.gov.sa/english/Projects/DesalinationPlants/Pages/default.aspx
82. The Red Sea Development Company. (2020a). Master Plan | The Red Sea Development Company: https://www.theredsea.sa/en/project/master-plan
83. The Red Sea Development Company. (2020b). Sustainable Tourism | The Red Sea Development Company. https://www.theredsea.sa/en/smart-and-sustainable

Section - 6
KSA Fourth National Communication (NC4) 203
84. Trang, N. T. T. (2016). Architectural Approaches to a Sustainable Community with Floating Housing Units Adapting to Climate Change and Sea Level. World Academy of Science, Engineering and Technology International Journal of Architectural and Environmental Engineering, 10(2). https://publications.waset.org/10003734/pdf
85. TRSDC Newsroom. (2020). The Red Sea Development Company Identifies Optimum Location of Overwater Assets: https://www.theredsea.sa/newsroom/the-red-sea-development-company-identifies-optimum-location-of-overwater-assets
86. UNEP, & FAO. (2015). Marine Resources in the Arab Region. In Arab Sustainable Development Report. https://www.un.org/Depts/los/general_assembly/contributions_2015_2/ESCWA_Contribution.pdf
87. Wabnitz, C. C. C., Lam, V. W. Y., Reygondeau, G., Teh, L. C. L., Al-Abdulrazzak, D., Khalfallah, M., Pauly, D., Palomares, M. L. D., Zeller, D., & Cheung, W. W. L. (2018). Climate change impacts on marine biodiversity, fisheries and society in the Arabian Gulf. PloS One, 13(5), e0194537. https://doi.org/10.1371/journal.pone.0194537
88. Wilson, S., Mohammad, Shokri, M. R., & Claereboudt, M. (2002). Status of coral reefs of the Arabian Gulf and Arabian Sea region. Status of Coral Reefs of the World: 2002.
89. Wong, P. P. (2018). Coastal Protection Measures – Case of Small Island Developing States to Address Sea-level Rise. Asian Journal of Environment & Ecology, 1–14. https://doi.org/10.9734/AJEE/2018/41019
90. Yepez, S., Laraque, A., Martinez, J. M., De Sa, J., Carrera, J. M., Castellanos, B., ... & Lopez, J. L. (2018). Retrieval of suspended sediment concentrations using Landsat-8 OLI satellite images in the Orinoco River (Venezuela). Comptes Rendus Geoscience, 350(1-2), 20-30.
91. Zheng, L., Zhang, M., Xiao, R., Chen, J., & Yu, F. (2017). Impact of salinity and Pb on enzyme activities of a saline soil from the Yellow River delta: A microcosm study. Physics and Chemistry of the Earth. Parts A/B/C, 97, 77–87. https://doi.org/10.1016/j.pce.2016.11.001

Section - 7
KSA Fourth National Communication (NC4)
SECTION 7
Impact Analysis of Climate Change on Desertification and Identification and Appraisal of Appropriate Adaptation
Measures

Section - 7
KSA Fourth National Communication (NC4) i
TABLE OF CONTENTS
Section Title Page 7.1 Introduction 204 7.2 Desertification in Saudi Arabia 204 7.3 Aridity and Aridity Index 205 7.3.1 Background on Aridity Index 205 7.3.1.1 Koppen’s Approach 206 7.3.1.2 De Martonne’s Approach 206 7.3.1.3 Emberger’s Approach 206 7.3.1.4 UNEP Approach 206 7.3.1.5 Erinc’s Approach 207 7.4 Drivers and Effects of Desertification 208 7.4.1 Desertification Drivers 209 7.4.2 Socio-Economic Effects of Desertification 210 7.5 Vulnerability Assessment 211 7.6 Desertification Management 214 7.6.1 Desertification Policies and Initiatives 214 7.6.2 Policy Implementation 215 7.7 Summary 216 References 221
LIST OF FIGURES
Figure Title Page 7.1 Progression of Agricultural Production Between 2009-2018 205 7.2 Dryland distribution using the aridity index drawn using
TerraClimate precipitation and potential evapotranspiration 208
7.3 Annual Aridity Index in 2030 and 2080 212 7.4 Difference in Annual Aridity Index from 2030 to 2080 213 7.5 Trend of Aridity Index from 2030 to 2080 213
LIST OF TABLES
Figure Title Page 7.1 Climate Classification using UNEP’s Aridity Index 207 7.2 Desertification Drivers, Types of Drivers, Pressure and
Consequences 210
7.3 Land Area Covered by Green Spaces 215 7.4 Total Number of Trees & Tree Saplings Planted in 2019 by Region 215

Section - 7
KSA Fourth National Communication (NC4) 204
Section 7: Impact Analysis of Climate Change on Desertification and Identification and Appraisal of Appropriate Adaptation Measures
7.1 Introduction
Over 40% of the earth’s land surface is made up of drylands with over 2 billion people, most of whom live in developing countries. Drylands are characterized by low rainfall and are vulnerable to desertification (D’Odorico et al., 2013). According to the United Nations Convention to Combat Desertification (UNCCD), desertification is estimated to have affected 168 countries with one-quarter of the earth’s land surface (UNCCD, 2013).
The UNCCD is the only international binding agreement dedicated to desertification for those countries experiencing serious droughts and desertification, particularly in Africa. It has 197 member states, including Saudi Arabia (UNCCD, 1996). Since its inception in 1994, UNCCD has organized several programs and initiatives to tackle desertification through research, education, awareness campaigns, and financial aid. Some examples of UNCCD’s initiatives and programs include the ‘drought initiative’ of 2018 and the ‘land for life’ program of 2011 in the Republic of Korea (UNCCD, n.d).
UNCCD also adopts and supports desertification initiatives organized by member countries, like the African led ‘great green wall’ initiative of 2007, the ‘land degradation neutrality’ program of 2015, and the African led ‘sustainability, stability, and security’ initiative of 2016 (UNCCD, n.d).
UNCCD partners with other national and international organizations such as International Union for Conservation of Nature (IUCN), Joint Research Centre of the European Commission (JRCEC), and Food and Agriculture Organization of the United Nations (FAO) (UNCCD, n.d).
7.2 Desertification in Saudi Arabia
Desertification is defined as “any form of land degradation in arid, semi-arid, and dry sub-humid areas caused by both natural and human activities” (UNCCD).
Saudi Arabia predominantly consists of a dry desert climate (Hag-elsafi and El-Tayib, 2016) because it has a land area that is 95 percent desert (Nasa, 2018). The Kingdom of Saudi Arabia has three (3) major deserts: Rub’ al Khali, also called ‘the Empty Quarter’ (the world’s largest sand desert), the great Nafud, and Ad Dahna’. Kingdom of Saudi Arabia consists of about 200 million hectares of land and as of 2018, less than 1% land was used for agriculture. The amount of land used in agricultural production decreases every year, which could be due to the loss of arable land (King Saud University, n.d.).
To conserve groundwater reserves, the Saudi government reduced the cultivation of water-intensive crops, especially wheat. Wheat cultivation was gradually phased out by 2015 (FAO, 2020), and more fruit and vegetable crops are grown to combat desertification. This required an increase in agricultural areas. Figure 7.1 shows both the area and agriculture production between 2009 and 2018. As shown in Figure 7.1, there is a fall in agricultural production between 2009 and 2013 which was caused by the phasing out of wheat. There is an increase in

Section - 7
KSA Fourth National Communication (NC4) 205
agricultural production in 2014 due to government initiatives that encouraged farmers to switch to less water intensive crops (fruits and vegetables) (FAO, 2020). Then, there is a gradual decrease in the area since 2014; which represents the loss of arable land; that does not visually correspond to the rate of the decline in agricultural production. It can be assumed to represent the loss in productivity of available land.
Figure 7.1: Progression of Agricultural Production Between 2009-2018 (GASTAT 2018)
The Kingdom of Saudi Arabia’s ministry of environment, water, and agriculture has identified desertification’s primary cause as the continuous loss of vegetative cover, especially forest. The ministry is making significant efforts to combat desertification by introducing afforestation initiatives, awareness programs, and introducing fines for tree transport and tree logging.
7.3 Aridity and Aridity Index
Drylands and desertification are categorized by the aridity and change in the aridity of a region. The Aridity Index (AI) measures the water deficits in a region over time. AI is an indicator of the extent of dryness of the climate at any given location.
7.3.1 Background on Aridity Index The Aridity Index calculation is a function of temperature, precipitation, and potential evapotranspiration rate. Several aridity index formulas have been proposed in the past which are briefly discussed below:

Section - 7
KSA Fourth National Communication (NC4) 206
7.3.1.1 Koppen’s Approach:
In 1931, Koppen’s approach considered aridity as a function of temperature and precipitation. He developed empirical equations for semi-arid and arid regions as follows (Wallén, 1967..).
(i) For Semi-arid regions:
𝑃𝑃 = 2(𝑇𝑇 + 14) (for areas with summer rainfall) 𝑃𝑃 = 2𝑇𝑇(for areas with winter rainfall)
(ii) For Arid regions:
𝑃𝑃 = 𝑇𝑇 + 14 (for areas with summer rainfall) 𝑃𝑃 = 𝑇𝑇 (for areas with winter rainfall)
Where P = the annual precipitation (cm) and T = the annual mean temperature (℃) 7.3.1.2 De Martonne’s Approach:
In 1926, De Martonne published an aridity formula that was later revised in 1935 to include ‘n’, which represented the number of days for which the data is observed (Wallén, 1967).
𝐼𝐼𝑎𝑎𝑎𝑎𝑎𝑎𝑎𝑎 =𝑛𝑛 ∗ 𝑝𝑝
𝑡𝑡 + 10 (1)
Where n = number of days, 𝒑𝒑= daily mean precipitation (cm), and t = mean monthly temperature (℃). This approach is limited to small areas and should not be used globally and is undefined at mean annual temperatures of 10℃.
7.3.1.3 Emberger’s Approach:
Emberger amended De Martonne’s 1926 approach to include mean temperature and annual temperature variations (Wallén, 1967).
𝐼𝐼𝑎𝑎𝑎𝑎𝑎𝑎𝑎𝑎 = 100𝑝𝑝(𝑀𝑀−𝑚𝑚)(𝑀𝑀+𝑚𝑚)
(2)
Where M = mean maximum temperature of the hottest month (℃), m = mean minimum temperature of the coldest month (℃), and P = annual precipitation (mm). This approach also possessed the same limitations as De Martonne’s approach.
7.3.1.4 UNEP Approach:
In 1992, UNEP proposed the calculation of aridity index using potential evapotranspiration. UNESCO already proposed this method in 1979, but the UNEP’s method required the use of Thornwaite’s formula to calculate potential evapotranspiration (Şarlak and Mahmood, 2018). AI is measured as the ratio of average annual precipitation to the potential evapotranspiration

Section - 7
KSA Fourth National Communication (NC4) 207
(the atmosphere’s capacity for soil water evaporation and transpiration) (United Nations Environmental Program, 1992).
AI = ∑ 𝑃𝑃𝑖𝑖
𝑃𝑃𝑃𝑃𝑇𝑇𝑖𝑖𝑛𝑛𝑖𝑖=1
𝑛𝑛 (3)
Where 𝑷𝑷𝑷𝑷𝑻𝑻𝒊𝒊= potential evapotranspiration (mm) and 𝑷𝑷𝒊𝒊= average annual precipitation (mm) 7.3.1.5 Erinc’s Approach:
In 1996, Erinc proposed aridity index as a ratio of total mean annual precipitation to annual maximum temperature (Şarlak & Mahmood Agha, 2018).
𝐼𝐼𝐸𝐸 = 𝑃𝑃𝑇𝑇𝑚𝑚𝑎𝑎𝑇𝑇
(4)
Where P = annual precipitation (mm) and Tmax = annual mean maximum temperature (℃).
As previously stated in Saudi Arabia’s Third National Communication (NC3), 2016, UNEP’s method was used for this report due to similarities in dimensions and because it is accepted by the Intergovernmental Panel on Climate Change (IPCC) and the Joint Research Centre of the European Commission.
Table 7.1: Climate Classification Using UNEP’s Aridity Index (Cherlet et al. 2018)
Climate Type Aridity Index Range
Hyper-arid < 0.05
Arid 0.05 ≦ AI < 0.20
Semi-arid 0.20 ≦ AI < 0.50
Dry sub-humid 0.50 ≦ AI < 0.65
Humid AI ≧ 0.65
Cold PET < 400mm
Table 7.1 shows the classification of climate types according to the aridity index calculated based on the UNEP’s approach. It is also used as a basis for the distribution of dryland and aridity globally based on climate and weather condition as shown in Figure 7.2.

Section - 7
KSA Fourth National Communication (NC4) 208
Figure 7.2: Dryland Distribution Using the Aridity Index Drawn using TerraClimate Precipitation and Potential Evapotranspiration
(Abatzoglou et al. 2018)
It uses the aridity index range for classification. Some examples of countries based on climate classification by aridity index include most of Italy, Texas, and Oklahoma in the US for humid climate, most of Iraq and Botswana for dry sub-humid climate, India, Nigeria, and Uganda for semi-arid climate. Some areas of Saudi Arabia, South Africa and Namibia for arid climate, and Ethiopia and most of Saudi Arabia and Namibia as arid and hyper-arid regions.
7.4 Drivers and Effects of Desertification:
As stated earlier, desertification is a land degradation that occurs in an area with high aridity. Desertification can occur in many forms. Some of these which apply to Saudi Arabia (Abahussain et al., 2002; Olsson et al., 2019) include:
(i) Wind Erosion: strong winds and dust storms carry fertile topsoil from lands without vegetative cover, the soil is transported to rangelands, water bodies, and urban areas leaving behind gullies (in extreme cases). This process not only threatens agricultural productivity but can also affect human and livestock health. It can also result in the loss of property and equipment (Duniway et al., 2019).
(ii) Coastal Erosion: The coastal erosion is wearing away from the coastal areas primarily caused by sea-level rise and human activities (like the creation of dams upstream) (Allison et al., 2016).
(iii) Salinization: This can occur as an aftereffect of land subsidence and sea-level rise (Mirzabaev et al., 2019). Saltwater enters land, rendering freshwater to brackish water. Dust storms and winds may also transport salt from dunes and coastal areas to fertile land, thereby altering the soil salinity and harming plants (Colombani et al., 2016).
(iv) Land Subsidence: This develops due to continuous reduction of groundwater, natural gas, or oil that results in a gradual or sudden land subsidence. There have been reports of land subsidence in Saudi Arabia’s Qassim region (Othman and Abotalib, 2019).

Section - 7
KSA Fourth National Communication (NC4) 209
(v) Soil Acidification and Pollution: Disposal of waste during waste management activities like landfilling can cause the leaching of toxic chemicals to the soil, contaminating soil and even groundwater. The addition of fertilizers in excess amounts also affects the soil’s chemical composition, making it more acidic (Guo et al., 2010).
(vi) Floods: floods occur due to continuous and heavy downpour of rain. It results in soil erosion, loss of life, livestock, and properties. Saudi Arabia has experienced five major floods between 2018 and 2020 that have destroyed properties, loss of plant species, and nutrient depletion.
7.4.1 Desertification Drivers Desertification drivers are the primary factors that initiate or aggravate the form of desertification. These factors can be directly or indirectly responsible for desertification. The major factors are population growth, urbanization, and climate.
Because desertification occurs in many forms, it is hard to reach a consensus on the extent of desertification in a given region. However, one can quickly identify how the drivers contribute to desertification in any region. Desertification occurs as a combination of natural, anthropogenic, or a combination of both factors.

Section - 7
KSA Fourth National Communication (NC4) 210
Table 7.2: Desertification Drivers, Types of Drivers, Pressure, and Consequences (Abahussain et al. 2002; Amin 2004; Mirzabaev et al. 2019; Olsson et al. 2019)
Driver Type Pressure Consequences
Population Growth and Urbanization
Socio-Economic
An increase in demand for food results in agricultural intensification: increased use of fertilizers & pesticides, increased stress on arable land, intense planting of food crops, which causes an increase in pests and loss of biodiversity.
- Soil acidification & over-fertilization
- Wind erosion - Loss of plant
species - Nutrient depletion
Increase in demand for food results in increased livestock rearing: If rangeland grazing is not adequately managed, it can lead to loss of vegetative cover.
- Wind erosion - Increased
evapotranspiration rate
An increase in water demand results in the gradual depletion of groundwater reserves.
- Land subsidence - Groundwater
depletion
Increase in demand for energy and rural-urban migration: Both will result in deforestation, loss of biodiversity, and land evacuation to generate energy and space for buildings. This will eventually cause depletion of vegetative cover and fertile topsoil breakage.
- Wind erosion - nutrient depletion - loss of plant, animal
species - increased
evapotranspiration rate
Increase in quantity of waste generated: Waste management and disposal affect the environment. Landfilling can result in methane and ammonia leaching into soil and groundwater.
- Soil pollution - Groundwater
pollution
Climate Natural
Drought - Wind erosion - nutrient depletion
Sand and dust storms - Wind erosion - Eutrophication - Salinization
Sea level rise - Coastal erosion - Salinization
Heavy rainfall - Soil erosion - Flooding
7.4.2 Socio-Economic Effects of Desertification 1. Food Insecurity: desertification in the form of wind erosion and nutrient depletion
results in the loss of soil organic carbon (SOC) and other nutrients present in the soil. (Abahussain et al., 2002; Abdalla et al., 2018). Inadequate soil nutrients reduce the area of land favorable to agricultural production (Moussa et al., 2016). However, because the

Section - 7
KSA Fourth National Communication (NC4) 211
demand for food continues to increase (due to the rising population), there is a need to increase the importation of food crops to meet the food demand. Extreme events such as dust storms also cause a decrease in the productivity of food and livestock (Stefanski & Sivakumar, 2009).
2. Poverty and Diseases: For some areas, agriculture acts as a significant source of income. When agricultural productivity reduces, income earned from agriculture reduces, which leads to an increase in the poverty (Kirui, 2016). Soil and water pollution due to chemical leaching will cause the spread of disease (Abahussain et al., 2002).
3. Extinction of Species: Plant species such as the Arabian dragon tree and euphorbia ammak and bird species like the Arabian golden-winged grosbeak and Arabian woodpecker are a few species native to Saudi Arabia currently threatened by extinction due to habitat destruction (EEC, n.d.). Desertification through drought and land-use change makes land inhospitable for native species forcing them to migrate and, in the process, die-off (Wilting et al., 2017).
4. Eutrophication: movement of nutrients; due to dust storms, wind erosions, coastal erosion, and surface run-off; to close water bodies leads to over-enrichment of nutrients (nitrates and phosphates) in water bodies causing eutrophication (Olsson et al., 2019), resulting in the growth of algal blooms, reducing the oxygen content of water, which is harmful to aquatic life and water quality (Khan et al., 2014). Several areas around the Red Sea (Jessen et al., 2013) and the Arabian Gulf (Naser, 2014) have been reported to be eutrophic.
7.5 Vulnerability Assessment:
For this report, the vulnerability assessment method used in NC3, 2016 was adopted and updated. Using baseline climate change data for precipitation, wind speed, temperature, and relative humidity, the PRECIS regional model was used to design future climate change behavior. PRECIS model is preferred because it predicts the spatial distribution of the present-day rainfall and temperature and is more consistent with the observed dataset, and the annual cycle and the interannual variability can be reasonably well reproduced (Almazroui, 2013). Data from the climate change projection was used to calculate future evapotranspiration rates. The Aridity Index for the 28,000 KSA grids was computed using equation (3) above. The annual AI for the first (2030) and the last (2080) years of simulation runs are plotted in Figure 7.3. The difference between the annual values from these first and last years are plotted in Figure 7.4, and the corresponding trend values are presented in Figure 7.5. Seasonal plots covering winter (December to February); spring (March to May); summer (June to August); and fall (September to November) seasons for 2030 and 2080 are presented in Appendix A.
As per Figure 7.3 and as previously stated in NC3 (2016), the aridity indices distributions are usually very low in most areas of Saudi Arabia. The aridity indices in most areas are lower than 0.05, which, according to the classification in Table 7.1, means that these areas are hyper arid. The values of aridity indices in the southwest areas of Saudi Arabia are much higher than the other areas and locations. This relatively high aridity index distribution area in Saudi Arabia will be expanded through 2030 to 2080; however, there is not much difference of the aridity indices distributions in other regions of the Kingdom.

Section - 7
KSA Fourth National Communication (NC4) 212
The highest vulnerability to desertification usually occurs in winter and fall in the southeast of Saudi Arabia (Ash Sharqiyah region) and most of the central to northern regions in the summer as shown in Figure A1 to A4 in Appendix A.
In 2030, winter and summer are two seasons in which the whole country is highly vulnerable to desertification except the southwest region. In spring and fall, vulnerability in some central and northeast regions is reduced. The vulnerability of the southeast mountain area is higher than in other areas.
In 2080, vulnerability in some northeast regions of Saudi Arabia is reduced when compared to the vulnerability of the same areas in 2030, and the same reduction happens in the southwest areas of Saudi Arabia in the summer season. However, the vulnerability in some central areas of Saudi Arabia increases in the spring and fall season.
Figure 7.3: Annual Aridity Index in 2030 (left) and 2080 (right)
As shown in Figure 7.4, the vulnerability in most of the areas of Saudi Arabia will be reduced in 2080 except in some central areas of Saudi Arabia (Hail region), and the southwest corner of Saudi Arabia will have a difference up to 0.15 from 2030 to 2080. The difference in seasonal aridity index from 2030 to 2080 are presented in Figure A5 in Appendix A. The overall vulnerability in winter and summer seasons will be reduced from 2030 to 2080. Still, vulnerability in the central, north and some south regions in the spring and north and northwest areas in the fall will be reduced.

Section - 7
KSA Fourth National Communication (NC4) 213
Figure 7.4: Difference in Annual Aridity Index from 2030 to 2080
Figure 7.5: Trend of Aridity Index from 2030 to 2080
As shown in Figure 7.5, the overall desertification vulnerability trend is about -0.2% to 0.4%, which is insignificant. The decreasing trend is more significant in the south and southeast. In addition to the southwest corner, the east also has a decreasing vulnerability. The trend in the southwest corner can be up to 1.2%, leading to high resistance to desertification.
The seasonal trend of aridity index from 2030 to 2080 is presented in Figure A6 in Appendix A. The trend in the southwest area in the summer season can be up to 2.6%; meanwhile, the

Section - 7
KSA Fourth National Communication (NC4) 214
trend of aridity index in some central, west, and east areas of Saudi Arabia is decreased to -1.8%. The overall trend of the aridity index in other seasons is about -0.2% to 0.4%.
Overall, vulnerability to desertification will remain constant in all other regions of Saudi Arabia and be significantly reduced in the south and southwest. The change in desertification vulnerability in other areas in 50 years (2030 – 2080) will be insignificant due to the currently prevailing hyper arid conditions. As a result, even a negligible difference will have a devastating effect on ecosystems as it has already reached a very fragile situation.
7.6 Desertification Management:
7.6.1 Desertification Policies and Initiatives The Ministry of Environment, Water, and Agriculture (MEWA) published the National Environment Strategy in 2017 with six pillars to achieve Saudi Arabia’s 2030 environment goals (MEWA, n.d.-c).
1. Institutional Robustness and Private Sector Participation 2. Vegetation Cover Conservation and Combating Desertification 3. Wildlife Conservation 4. Environmental Compliance 5. Meteorology 6. Awareness, Education and Innovation To combat desertification, MEWA set a 2030 target that requires the rehabilitation of a range of 18,000 to 300,000 hectares of land. Six strategy initiatives were created to achieve the 2030 environmental Target:
1. Drought Preparedness and Mitigation 2. Revising and Implementing the Rangeland Strategy 3. Implementing the National Forest Strategy 4. Assessing and Remediating Degraded Sites 5. Developing and Implementing a National Plan to Combat Desertification and Reduce Sand
Encroachment 6. Establishing a System for the Development and Sustainable Management of National
Parks Aside from the 2030 target strategy, MEWA also published its 2018-2020 National Transformation Program Delivery Plan. The document includes all desertification targets and programs for 2018-2020 (MEWA, n.d.-b).
Targets: the target is to rehabilitate 80,000 hectares of natural vegetation and provide sandstorm and flood forecasts with at least 80% accuracy three (3) days in advance (MEWA, n.d.-b).
Initiatives included in the National Transformation Program, a plan for 2018 - 2020 are as follows (MEWA, n.d.-b).

Section - 7
KSA Fourth National Communication (NC4) 215
1. Sustainable development and investment management of rangelands and forests, and desertification control with the goal of planting 12 million trees by the end of 2020.
2. Program to increase the green area in the Kingdom by promoting biodiversity. 3. Rehabilitation, development, investment, and sustainable management of national parks. 4. Establish a Climate Change Center to manage climate information and assess the impact
of climate change on all sectors. 5. Develop numerical modeling systems to improve the accuracy of forecasts of weather and
natural hazards.
7.6.2 Policy Implementation In an effort to meet the 2030 desertification target, MEWA created more national parks. As of 2019, the number of national parks has increased to 11, with a total area of 14,496 hectares. Other actions include (MEWA, n.d.-a):
● Creation of green spaces ● Planting trees and tree saplings
Table 7.3: Land Area Covered by Green Spaces (MEWA)
Green Spaces Types Area Covered in 2019 (ha)
Area of Parks and Gardens 11,653 Area of Green Spaces 18,302
Table 7.4: Total Number of Trees & Tree Saplings Planted in 2019 by Region (MEWA, n.d.-a)
Region Total Trees (2019) No. of Planted Saplings
Al Baha - 36,800 Al Jawf - 37,198 Asir 145,000 3,610 Eastern Province 140,735 45,961 Hail - 50,000 Jazan 74,000 56,450 Madinah 50,000 47,000 Makkah - 22,975 Najran - 4,455 Northern borders - 55,000 Qassim 37,000 100,000 Riyadh 46,000 50,000 Tabuk 240,000 68,970 Total 732,735 578,419

Section - 7
KSA Fourth National Communication (NC4) 216
7.7 Summary
This section shows desertification trends in Saudi Arabia for 2030 and 2080 using the PRECIS-RCM projection at 2,800 grid points. This can be used to observe and predict the impact of climate change and the extent of desertification for 50 years. This will provide policymakers with information to design policies and strategies to mitigate the adverse effect of climate change. However, this section can only give a general outlook into the extent of desertification. This is due to simplifying the concept and predictions of climatic parameters by the Hadley model and simplifying the evapotranspiration aridity index across Saudi Arabia.
The results demonstrate that the annual aridity indices distributions are less than 0.05 in most areas of the Kingdom. Such low value, according to the definition of aridity, means that these areas are hyper arid.
According to the model’s future projection, vulnerability to desertification in over 90% of the grids is not aggravated. In some regions like the southwest (central Al Baha, southwest Asir, and Jazan), the desertification situation is not so critical.
The overall trend of desertification vulnerability in fifty years is in the range of -0.2% to 0.4%. The trend in the southwest corner in the summer season can be up to 2.6%, leading to high resistance to desertification. By 2080, vulnerability to desertification will decrease in the southwest areas of Saudi Arabia and slightly increase in the central regions. The change in vulnerability in the other areas will be insignificant.
Desertification in Saudi Arabia is caused by wind erosion, coastal erosion, salinization, land subsidence, soil pollution and floods. Human and climatic factors influence all these factors. The major human factor influencing desertification is population increase and urbanization, resulting in increased water, land, food, and energy demands and increased waste production.
Saudi Arabia’s approach to combating desertification is through tree planting, creation of green spaces, and national parks expansion. As of 2019, Saudi Arabia has successfully planted 732,735 trees in seven regions of the Kingdom.

Section - 7
KSA Fourth National Communication (NC4) 217
Appendix A: Plots for Seasonal Scenarios
Figure A - 1 Aridity Index in Winter 2030 (left) and 2080 (right)
Figure A - 2 Aridity Index in Spring 2030 (left) and 2080 (right)

Section - 7
KSA Fourth National Communication (NC4) 218
Figure A - 3 Aridity Index in Summer 2030 (left) and 2080 (right)
Figure A - 4 Aridity Index in Fall 2030 (left) and 2080 (right)
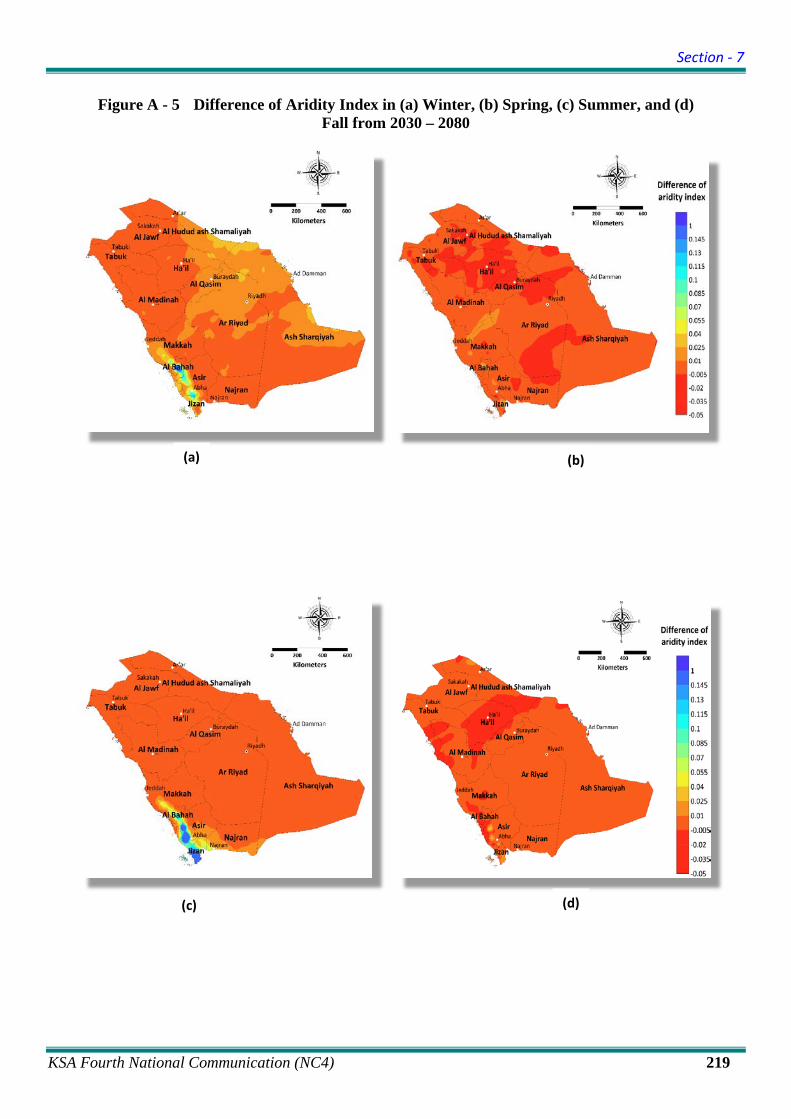
Section - 7
KSA Fourth National Communication (NC4) 219
Figure A - 5 Difference of Aridity Index in (a) Winter, (b) Spring, (c) Summer, and (d) Fall from 2030 – 2080
(b) (a)
(c) (d)

Section - 7
KSA Fourth National Communication (NC4) 220
Figure A - 6 Trend of Aridity Index in (a) Winter, (b) Spring, (c) Summer, and (d) Fall from 2030 – 2080
(b) (a)
(c) (d)

Section - 7
KSA Fourth National Communication (NC4) 221
References:
1. Abahussain, A. A., Abdu, A. S., Al-Zubari, W. K., El-Deen, N. A., & Abdul-Raheem, M. (2002). Desertification in the Arab Region: analysis of current status and trends. Journal of Arid Environments, 51(4), 521–545. https://doi.org/10.1006/jare.2002.0975
2. Abdalla, M., Hastings, A., Chadwick, D. R., Jones, D. L., Evans, C. D., Jones, M. B., Rees, R. M., & Smith, P. (2018). Critical review of the impacts of grazing intensity on soil organic carbon storage and other soil quality indicators in extensively managed grasslands. Agriculture, Ecosystems & Environment, 253, 62–81. https://doi.org/10.1016/j.agee.2017.10.023
3. Allison, M., Yuill, B., Törnqvist, T., Amelung, F., Dixon, T., Erkens, G., Stuurman, R., Jones, C., Milne, G., Steckler, M., Syvitski, J., & Teatini, P. (2016). Global Risks and Research Priorities for Coastal Subsidence. Eos, 97. https://doi.org/10.1029/2016EO055013
4. Colombani, N., Osti, A., Volta, G., & Mastrocicco, M. (2016). Impact of Climate Change on Salinization of Coastal Water Resources. Water Resources Management, 30(7), 2483–2496. https://doi.org/10.1007/s11269-016-1292-z
5. D’Odorico, P., Bhattachan, A., Davis, K. F., Ravi, S., & Runyan, C. W. (2013). Global desertification: Drivers and feedbacks. Advances in Water Resources, 51, 326–344. https://doi.org/10.1016/j.advwatres.2012.01.013
6. Duniway, M. C., Pfennigwerth, A. A., Fick, S. E., Nauman, T. W., Belnap, J., & Barger, N. N. (2019). Wind erosion and dust from US drylands: a review of causes, consequences, and solutions in a changing world. Ecosphere, 10(3), e02650. https://doi.org/10.1002/ecs2.2650
7. EEC. (n.d.). Endangered species search by area: (Saudi Arabia). Earth’s Endangered Creatures. Retrieved August 2020: http://www.earthsendangered.com/search-regions3.asp
8. FAO. (2020, May). Saudi Arabia Brief. Food and Agriculture Organization of The United Nations: Global Information and Early Warning System. http://www.fao.org/giews/countrybrief/country.jsp?code=SAU
9. Guo, J. H., Liu, X. J., Zhang, Y., Shen, J. L., Han, W. X., Zhang, W. F., Christie, P., Goulding, K. W. T., Vitousek, P. M., & Zhang, F. S. (2010). Significant acidification in major Chinese croplands. Science, 327(5968), 1008–1010. https://doi.org/10.1126/science.1182570
10. Hag-elsafi, S., & El-Tayib, M. (2016). Spatial and statistical analysis of rainfall in the Kingdom of Saudi Arabia from 1979 to 2008. Weather, 71(10), 262–266. https://rmets.onlinelibrary.wiley.com/doi/abs/10.1002/wea.2783
11. Jessen, C., Roder, C., Villa Lizcano, J. F., Voolstra, C. R., & Wild, C. (2013). In-Situ Effects of Simulated Overfishing and Eutrophication on Benthic Coral Reef Algae Growth, Succession, and Composition in the Central Red Sea. PloS One, 8(6). https://doi.org/10.1371/journal.pone.0066992

Section - 7
KSA Fourth National Communication (NC4) 222
12. Khan, M. N., Nasir Khan, M., & Mohammad, F. (2014). Eutrophication: Challenges and Solutions. In Eutrophication: Causes, Consequences and Control (pp. 1–15). https://doi.org/10.1007/978-94-007-7814-6_1
13. King Saud University. (n.d.). Deserts of Saudi Arabia. Retrieved October 15, 2020, from http://www.plantdiversityofsaudiarabia.info/Biodiversity-Saudi-Arabia/Vegetation/Deserts%20of%20Saudi%20Arabia.htm#:~:text=30%25%20of%20the%20land%20in,are%20the%20largest%20among%20all
14. Kirui, O. K. (2016). Economics of Land Degradation, Sustainable Land Management and Poverty in Eastern Africa. https://hss.ulb.uni-bonn.de/2016/4355/4355.pdf
15. MEWA, (n.d.-a). Ministry of Environment, Water, and Agriculture: (2019) Statistical Book. Ministry of Environment, Water, and Agriculture. Retrieved 2020, from https://www.mewa.gov.sa/ar/InformationCenter/Researchs/Reports/Pages/default.aspx
16. MEWA, (n.d.-b). National Transformation Program Delivery Plan 2018-2020. Kingdom of Saudi Arabia. https://vision2030.gov.sa/sites/default/files/attachments/NTP%20English%20Public%20Document_2810.pdf
17. MEWA, (n.d.-c). Ministry of Environment, Water, and Agriculture. https://www.mewa.gov.sa/ar/Pages/default.aspx
18. Mirzabaev, A., Wu, J., Evans, J., García-Oliva, F., Hussein, I. A. G., Iqbal, M. H., Kimutai, J., Knowles, T., Meza, F., Nedjraoui, D., Tena, F., Türkeş, M., Vázquez, R. J., & Weltz, M. (2019). Chapter Three: Desertification: Climate Change and Land: an IPCC special report on climate change, desertification, land degradation, sustainable land management, food security, and greenhouse gas fluxes in terrestrial ecosystems [P.R. Shukla, J. Skea, E. Calvo Buendia, V. Masson-Delmotte, H.-O. Pörtner, D.C. Roberts, P. Zhai, R. Slade, S. Connors, R. van Diemen, M. Ferrat, E. Haughey, S. Luz, S. Neogi, M. Pathak, J. Petzold, J. Portugal Pereira, P. Vyas, E. Huntley, K. Kissick, M. Belkacemi, J. Malley, (eds.)] In press. IPCC.
19. Moussa, B., Nkonya, E., Meyer, S., Kato, E., Johnson, T., & Hawkins, J. (2016). Economics of Land Degradation and Improvement in Niger. In Economics of Land Degradation and Improvement – A Global Assessment for Sustainable Development (pp. 499–539). https://doi.org/10.1007/978-3-319-19168-3_17
20. Nasa, M. (2018). NASA’s Aqua satellite: The Moderate Resolution Imaging Spectroradiometer (MODIS): An-Nafud Desert, Saudi Arabia. https://modis.gsfc.nasa.gov/gallery/individual.php?db_date=2018-07-14
21. Naser, H. A. (2014). Marine Ecosystem Diversity in the Arabian Gulf: Threats and Conservation. In O. Grillo (Ed.), Biodiversity - The Dynamic Balance of the Planet. InTech. https://doi.org/10.5772/57425
https://vision2030.gov.sa/sites/default/files/attachments/NTP%20English%20Public%20Document_2810.pdf

Section - 7
KSA Fourth National Communication (NC4) 223
22. Olsson, L., Barbosa, H., Bhadwal, S., Cowie, A., Delusca, K., Flores-Renteria, D., Hermans, K., Jobbagy, E., Kurz, W., Li, D., Sonwa, D. J., & Stringer, L. (2019). Chapter Four: Land Degradation. In: Climate Change and Land: an IPCC special report on climate change, desertification, land degradation, sustainable land management, food security, and greenhouse gas fluxes in terrestrial ecosystems [P.R. Shukla, J. Skea, E. Calvo Buendia, V. Masson-Delmotte, H.-O. Pörtner, D. C. Roberts, P. Zhai, R. Slade, S. Connors, R. van Diemen, M. Ferrat, E. Haughey, S. Luz, S. Neogi, M. Pathak, J. Petzold, J. Portugal Pereira, P. Vyas, E. Huntley, K. Kissick, M. Belkacemi, J. Malley, (eds)]. IPCC.
23. Othman, A., & Abotalib, A. Z. (2019). Land subsidence triggered by groundwater withdrawal under hyper-arid conditions: case study from Central Saudi Arabia. Environmental Earth Sciences, 78(7), 1–8. https://doi.org/10.1007/s12665-019-8254-8
24. Şarlak, N., & Mahmood Agha, O. M. A. (2018). Spatial and temporal variations of aridity indices in Iraq. Theoretical and Applied Climatology, 133(1), 89–99. https://doi.org/10.1007/s00704-017-2163-0
25. Stefanski, R., & Sivakumar, M. V. K. (2009). Impacts of sand and dust storms on agriculture and potential agricultural applications of a SDSWS. IOP Conference Series: Earth and Environmental Science, 7(1), 012016. https://doi.org/10.1088/1755-1307/7/1/012016
26. UNCCD. (n.d). https://www.unccd.int/
27. UNCCD. (2013). Cost of Inaction on Desertification Higher than Cost of Action, Scientists Conclude. United Nations Convention to Combat Desertification. https://www.unccd.int/news-events/cost-inaction-desertification-higher-cost-action-scientists-conclude
28. UNCCD, UN Member States, (1996) United Nations Treaty Collection, https://treaties.un.org/Pages/ViewDetails.aspx?src=TREATY&mtdsg_no=XXVII-10&chapter=27&clang=_en#1
29. United Nations Environmental Program (UNEP). (1992). World atlas of desertification. Edward Arnold, London, 15–45.
30. Wallén, C. C. (1967). Aridity Definitions and Their Applicability. Geografiska Annaler: Series A, Physical Geography, 49(2/4), 367–384. https://doi.org/10.2307/520903
31. Wilting, H. C., Schipper, A. M., Bakkenes, M., Meijer, J. R., & Huijbregts, M. A. J. (2017). Quantifying Biodiversity Losses Due to Human Consumption: A Global-Scale Footprint Analysis. Environmental Science & Technology, 51(6), 3298–3306. https://doi.org/10.1021/acs.est.6b05296
Section - 8
KSA Fourth National Communication (NC4)
SECTION 8
Impact Analysis of Climate Change on Agriculture and Identification and Appraisal
of Appropriate Adaptation Measures

Section - 8
KSA Fourth National Communication (NC4) i
TABLE OF CONTENTS
Section Title Page 8.1 Introduction 224 8.2 Agriculture in Saudi Arabia 224 8.2.1 Major Food Crops in Saudi Arabia 227 8.2.1.1 Wheat 228 8.2.1.2 Dates 228 8.2.1.3 Potatoes 228 8.2.1.4 Watermelon 229 8.2.2 Livestock, Poultry and Fisheries Production 229 8.2.2.1 Livestock 230 8.2.2.2 Fish and Shrimp 230 8.2.2.3 Poultry and Egg Production 230 8.2.2.4 Honey 230 8.3 Vulnerability Assessment 231
8.3.1 The Modelling System for Agricultural Impacts of Climate Change (MOSAICC) 231
8.3.2 CROPWAT Modelling 232 8.3.3 Impact of Climate Change on Agriculture and Food Security 233 8.4 Agriculture and Food Security Policies & Programs 240
8.4.1 Food Crop Development and Food Security Management Initiatives 241
8.4.2 Agricultural Marketing Initiatives 241 8.4.3 Irrigation and Crop Water Initiatives 241 8.4.4 Aquaculture Initiatives 241 8.4.5 Climate Change Effects on Agriculture Response Initiatives 242 8.4.6 Other Agricultural Initiatives: 242 8.5 Policy Implementation 242 8.6 Climate-Smart Agriculture 243 8.6.1 Some CSA Strategies and Technologies 243 8.6.2 Benefits of CSA 244 8.7 Risks of Using Treated Wastewater for Agriculture 244 8.7.1 Possible Contaminants 245 8.7.2 Wastewater Treatment in Saudi Arabia 245 8.7.3 Persistent Organic Pollutants (POPs) 248 8.8 Investment in Agricultural Production Overseas 248 8.9 Summary 248 References: 250

Section - 8
KSA Fourth National Communication (NC4) ii
LIST OF FIGURES
Figure Title Page 8.1 Progression of Agriculture in Saudi Arabia 225 8.2 Progression of Wheat Production over time in Saudi Arabia 227 8.3 Progression of Dates Production over time in Saudi Arabia 227 8.4 Progression of Potatoes Production over time in Saudi Arabia 228 8.5 Progression of Watermelon Production over time in Saudi Arabia 228 8.6 Progression of Livestock Production over time in Saudi Arabia 229
8.7 Progression of Fish and Shrimp production over time in Saudi Arabia 229
8.8 Progression of Broiler Production over time in Saudi Arabia 229 8.9 Progression of Egg Production over time in Saudi Arabia 229 8.10 Progression of Honey Production over time in Saudi Arabia 230 8.11 Progression of Ozone Emission in Saudi Arabia 234
8.12 The difference in the Annual Temperatures between 2030 and 2080 235
8.13 Progression of Carbon Dioxide Emission from Fossil Fuel Combustion in Saudi Arabia 235
8.14 Difference in Winter Temperatures between 2030 and 2080 236 8.15 Difference in the Aridity Index between 2030 and 2080 237
8.16 Difference in the Precipitation and Evapotranspiration between 2030 and 2080 238
8.17 Daily Irrigation Requirement for Wheat Cultivation for CROPWAT Simulation 239
8.18 Total Daily Crop Water Requirement for CROPWAT Simulation 239
LIST OF TABLES
Table Title Page
8.1 Summary of the Crop Production in Saudi Arabia during 2015-2018 225
8.2 Livestock and Fish Production Figures for the Period 2015-2018 227
8.3 Daily Irrigation Requirement for the four scenarios for three Decades 233
8.4 Regional Data for Evapotranspiration, Average Precipitation, and Temperature 238
8.5 US EPA recommended use for Primary, Secondary, and Tertiary Treatment of wastewater 246
8.6 MMRA (2003) and MWE (2006) Water Standard for Irrigation 246

Section - 8
KSA Fourth National Communication (NC4) 224
Section 8: Impact Analysis of Climate Change on Agriculture and Identification and Appraisal of Appropriate Adaptation Measures
8.1 Introduction
In a 2018 report, FAO estimated a 50% increase in the world food demand by 2050 due to population increase (FAO, 2018). In order to prevent insecurity in food, agricultural production will increase, giving rise to deforestation, loss of biodiversity, and greenhouse gas emissions (Mbow et al., 2019). Food insecurity is when people do not have access to sufficient food required for living a healthy life (Mbow et al., 2019). Food security is dependent on its agricultural production. Agricultural production in KSA is limited by environmental conditions like the availability of fertile land, threat of desertification, and availability of a sustainable source of water (Faridi and Sulphey, 2019).
Using desert agriculture and modern farming technologies, Kingdom of Saudi Arabia (KSA) increased its available agricultural area. Saudi government also introduced incentive programs like subsidies on domestically produced food, free land distribution, and credit schemes (Fiaz et al., 2018). This was all done to improve the Kingdom’s agricultural self-sufficiency after the 2007 global commodity crunch (Lippman, 2012). These programs resulted in a rise in cereal production in KSA. However, reports on the decrease in groundwater reserves necessitated KSA to reduce production and phase out the subsidies on water-intensive crops like wheat and barley, introduce water-conserving drip irrigation, and develop agricultural production in Saudi owned farmlands overseas (Lippman, 2012).
The main objective of this section is to assess the impact of climate change on Saudi Arabia’s agriculture and food security, examine policies and strategies implemented by the Saudi government to tackle food insecurities, and to recommend measures to address the adverse impacts of climate change on the agriculture sector.
8.2 Agriculture in Saudi Arabia
As previously mentioned in the desertification chapter, Saudi Arabia uses less than 1% of its total land area for agriculture. As of 2018, agriculture, along with forestry and fishing activities accounts for 2.2% of the Kingdom’s total GDP. According to Saudi Arabia’s Third National Communication (NC3), 2016, agriculture in Saudi Arabia focuses on cereals, livestock, dairy products, eggs, fish, poultry, fruits, vegetables and fodder crops. This section will focus on the progression trends for major crops, livestock, poultry and fishery.
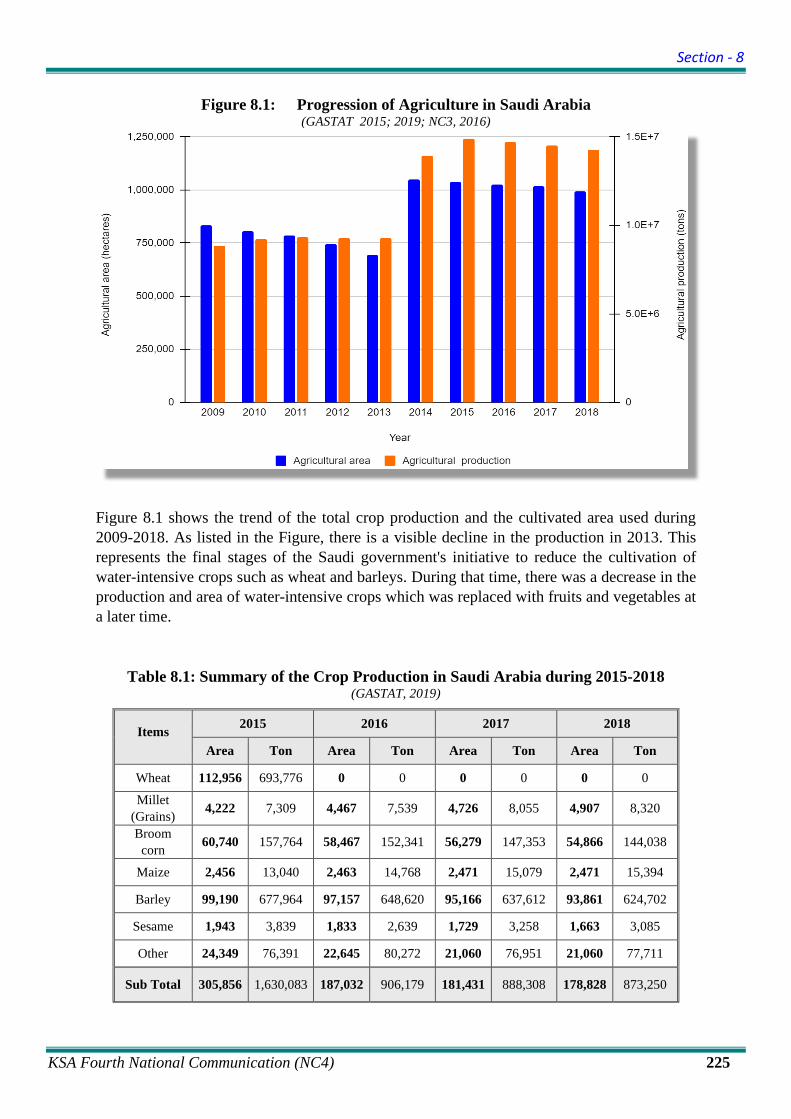
Section - 8
KSA Fourth National Communication (NC4) 225
Figure 8.1: Progression of Agriculture in Saudi Arabia (GASTAT 2015; 2019; NC3, 2016)
Figure 8.1 shows the trend of the total crop production and the cultivated area used during 2009-2018. As listed in the Figure, there is a visible decline in the production in 2013. This represents the final stages of the Saudi government's initiative to reduce the cultivation of water-intensive crops such as wheat and barleys. During that time, there was a decrease in the production and area of water-intensive crops which was replaced with fruits and vegetables at a later time.
Table 8.1: Summary of the Crop Production in Saudi Arabia during 2015-2018 (GASTAT, 2019)
Items 2015 2016 2017 2018
Area Ton Area Ton Area Ton Area Ton
Wheat 112,956 693,776 0 0 0 0 0 0
Millet (Grains) 4,222 7,309 4,467 7,539 4,726 8,055 4,907 8,320
Broom corn 60,740 157,764 58,467 152,341 56,279 147,353 54,866 144,038
Maize 2,456 13,040 2,463 14,768 2,471 15,079 2,471 15,394
Barley 99,190 677,964 97,157 648,620 95,166 637,612 93,861 624,702
Sesame 1,943 3,839 1,833 2,639 1,729 3,258 1,663 3,085
Other 24,349 76,391 22,645 80,272 21,060 76,951 21,060 77,711
Sub Total 305,856 1,630,083 187,032 906,179 181,431 888,308 178,828 873,250

Section - 8
KSA Fourth National Communication (NC4) 226
Items 2015 2016 2017 2018
Area Ton Area Ton Area Ton Area Ton
Tomato 11,816 196,791 11,949 207,524 12,084 207,096 12,175 210,650
Potato 17,622 459,186 18,180 466,402 18,755 476,418 19,149 482,305
Marrow 2,780 52,986 2,483 44,672 2,218 39,107 2,151 38,460
Eggplant 1,875 27,372 1,704 25,844 1,549 23,850 1,453 25,384
Okra 1,927 23,004 1,710 21,499 1,517 20,084 1,401 18,731
Carrot 727 12,796 825 13,750 937 15,617 1,020 17,024
Dry Onion 2,673 66,141 2,694 68,896 2,716 70,992 2,730 71,581
Cucumber 1,812 30,262 2,020 36,755 2,251 39,876 2,420 43,717
Melon 3,230 67,553 2,725 49,933 2,299 45,051 2,053 39,360
Watermelon 26,162 505,722 27,874 574,653 29,699 606,186 30,981 634,491
Other 9,610 174,130 8,621 156,289 7,734 143,010 7,194 133,233
Sub Total 80,234 1,615,943 80,785 1,666,217 81,759 1,687,287 82,727 1,714,936
Tomato 1,176 91,826 1,204 97,679 1,233 99,293 1,253 101,693
Cucumber 875 70,401 865 71,795 855 71,556 858 71,900
Marrow 159 11,911 151 12,231 144 11,504 146 11,864
Other 870 57,013 925 76,671 984 69,720 1,008 74556
Sub Total 3,080 231,151 3,145 258,376 3,216 252,073 3,265 260,013
Clover 432,664 8,925,739 433,195 9,080,758 433,726 8,915,622 421,058 8,644,885
Other 69,059 1,198,932 69,037 1,318,911 69,016 1,231,011 65,552 1,179,799
Sub Total 501,723 10,124,671 502,232 10,399,669 502,742 10,146,633 486,610 9,824,684
Dates 109,427 1,038,530 111,615 1,153,009 113,848 1,224,192 116,125 1,302,859
Citrus 4,663 37,733 4,596 41,263 4,530 40,068 4,487 40,428
Grapes 3,806 42,466 3,796 41,413 3,785 44,505 3,778 44,845
Other 29,326 200,087 29,294 226,150 29,262 210,733 29,241 214,406
Sub Total 147,222 1,318,816 149,301 1,461,835 151,425 1,519,498 153,630 1,602,538
Total 1,038,115 14,920,664 922,495 14,692,276 920,573 14,493,799 905,061 14,275,421

Section - 8
KSA Fourth National Communication (NC4) 227
Table 8.2: Livestock and Fish Production Figures for the Period 2015-2018 (GASTAT, 2019)
Year 2015 2016 2017 2018
Estimated Number of Sheep 9,145,544 9,236,547 9,328,455 9,408,766
Estimated Number of Camels 476,398 481,138 485,926 490,672
Estimated Number of Goats 3,598,471 3,634,277 3,670,440 3,706,798
Estimated Number of Cows 357,801 361,362 364,958 368,428
Fish & Shrimps Production (tons) 103,652 106,818 121,401 140,315
The above table 8.1 shows the information on major agricultural production from 2015 through 2018. Table 8.2 shows information on the livestock and fishery production from 2015 through 2018. The table 8.1 shows that there was no production of wheat between 2016 and 2018 which corresponds with the government ban on the cultivation of wheat between 2016-2018. The data in tables above also shows that KSA produces more sheep than other livestock and is a major producer of dates in the region.
8.2.1 Major Food Crops in Saudi Arabia
Food crops in Saudi Arabia are classified into cereal crops, open field vegetables, greenhouse vegetables and fruits. This section covers major crops selected based on the amount of production which includes wheat, dates, potatoes, and watermelon.
Figure 8.2 Progression of Wheat Production
over time in Saudi Arabia
Figure 8.3 Progression of Dates Production
over time in Saudi Arabia
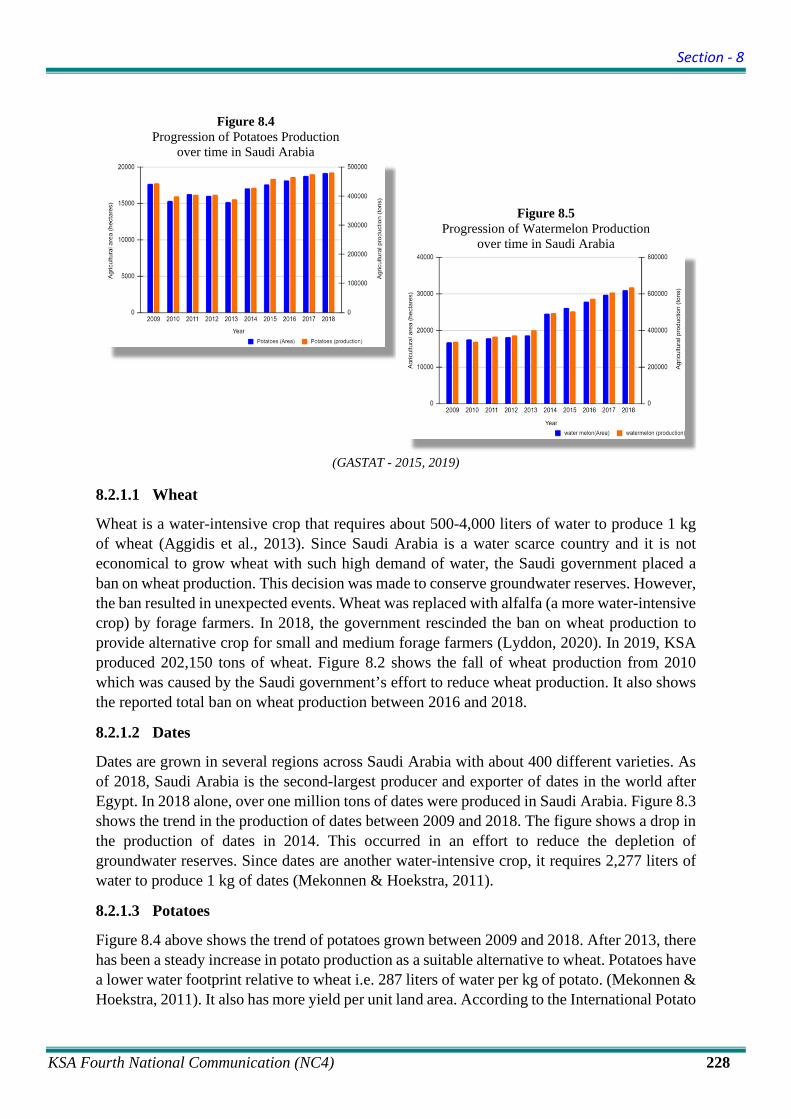
Section - 8
KSA Fourth National Communication (NC4) 228
Figure 8.4
Progression of Potatoes Production over time in Saudi Arabia
Figure 8.5 Progression of Watermelon Production
over time in Saudi Arabia
(GASTAT - 2015, 2019)
8.2.1.1 Wheat
Wheat is a water-intensive crop that requires about 500-4,000 liters of water to produce 1 kg of wheat (Aggidis et al., 2013). Since Saudi Arabia is a water scarce country and it is not economical to grow wheat with such high demand of water, the Saudi government placed a ban on wheat production. This decision was made to conserve groundwater reserves. However, the ban resulted in unexpected events. Wheat was replaced with alfalfa (a more water-intensive crop) by forage farmers. In 2018, the government rescinded the ban on wheat production to provide alternative crop for small and medium forage farmers (Lyddon, 2020). In 2019, KSA produced 202,150 tons of wheat. Figure 8.2 shows the fall of wheat production from 2010 which was caused by the Saudi government’s effort to reduce wheat production. It also shows the reported total ban on wheat production between 2016 and 2018.
8.2.1.2 Dates
Dates are grown in several regions across Saudi Arabia with about 400 different varieties. As of 2018, Saudi Arabia is the second-largest producer and exporter of dates in the world after Egypt. In 2018 alone, over one million tons of dates were produced in Saudi Arabia. Figure 8.3 shows the trend in the production of dates between 2009 and 2018. The figure shows a drop in the production of dates in 2014. This occurred in an effort to reduce the depletion of groundwater reserves. Since dates are another water-intensive crop, it requires 2,277 liters of water to produce 1 kg of dates (Mekonnen & Hoekstra, 2011).
8.2.1.3 Potatoes
Figure 8.4 above shows the trend of potatoes grown between 2009 and 2018. After 2013, there has been a steady increase in potato production as a suitable alternative to wheat. Potatoes have a lower water footprint relative to wheat i.e. 287 liters of water per kg of potato. (Mekonnen & Hoekstra, 2011). It also has more yield per unit land area. According to the International Potato

Section - 8
KSA Fourth National Communication (NC4) 229
Center, potatoes produce food value of more than four times the land area against grain production (CIP, 2017).
8.2.1.4 Watermelon
Figure 8.5 above shows the trend of watermelon grown between 2009 and 2018. Watermelon has always been a staple fruit in the Kingdom. It has a water footprint of 235 liters per kg of watermelon, which is lower than that of potatoes (Mekonnen & Hoekstra, 2011). Its lower water footprint makes it attractive to farmers.
8.2.2 Livestock, Poultry and Fisheries Production
Figure 8.6 Progression of Livestock Production
over time in Saudi Arabia
Figure 8.7 Progression of Fish and Shrimp production
over time in Saudi Arabia
Figure 8.8 Progression of Broiler Production
over time in Saudi Arabia
Figure 8.9 Progression of Egg Production
over time in Saudi Arabia

Section - 8
KSA Fourth National Communication (NC4) 230
Figure 8.10 Progression of Honey Production
over time in Saudi Arabia
(GASTAT – 2015-2019)
8.2.2.1 Livestock
Livestock in KSA predominantly consists of cows, sheep, goats, and camels. The figure 8.6 above shows the progression of livestock production between 2009-2018. In 2005, the Kingdom implemented its first biodiversity strategy that encouraged the conservation and breeding of indigenous livestock (Al-Atiyat et al., 2015). Conservation of indigenous livestock is important because the livestock is already well adapted to the climatic and environmental conditions in the country.
8.2.2.2 Fish and Shrimp
Figure 8.7 shows the trend of fish and shrimp production in the Kingdom between 2009 and 2018. Aquaculture has existed in the Kingdom for over 30 years and started with tilapia rearing in the 1980s and included shrimps only in the year 2000 (FAO, 2015).
8.2.2.3 Poultry and Egg Production
Figures 8.8 and 8.9 above show the growth of broiler chicken and egg production in different regions in the Kingdom during 2016-2018. As of 2016, domestic poultry production can only meet 50.3% of the Kingdom’s poultry demand which resulted in the rise of poultry production and import (Alderiny et al., 2020). There is no production of broilers in the northern region. Similarly, there is no production of eggs in the northern region and in the Jazan region. The Al-Qasim region is the major producer of broilers. Major egg production occurs in the Al-Riyadh, Makkah, and the eastern region of the country.
8.2.2.4 Honey
Figure 8.10 shows the trend of honey production between 2016 and 2018. Bee colonies are mostly found in the Makkah, Asir, Madinah, Jazan, and Al-Baha regions (Al-Ghamdi & Nuru, 2013). Due to the variety of bee species, the Kingdom produces different types of honey including thian, cider, summer, acacia, and majra honey (Al-Ghamdi & Nuru, 2013).

Section - 8
KSA Fourth National Communication (NC4) 231
8.3 Vulnerability Assessment
Changes to temperature and rainfall due to climate change will affect land productivity, the regeneration of pastures, and water availability for human, livestock, and food crops (FAO, 2008). This can trigger livestock migration, which increases the chances of the spread of transboundary diseases among livestock. Climate change also indirectly affects agriculture and food security by impacting existing water resources (Mbow et al., 2019). Assessing the effects of climate change on agriculture and food security will help policymakers make regulations and strategies to prepare for and mitigate the adverse effects of climate change.
To correctly assess the impacts of climate on agriculture in Saudi Arabia, the PRECIS prediction model using data from 28,000 KSA grids was used. The model was used to project future climate parameters like temperature, precipitation, wind speed, and relative humidity and calculate evapotranspiration. CROPWAT simulation software and CLIMWAT database were also used to analyze impacts of climate change on crop water requirements. CLIMWAT and CROPWAT are climate models in the Modelling System for assessing agricultural Impacts of Climate Change (MOSAICC).
8.3.1 The Modelling System for Agricultural Impacts of Climate Change (MOSAICC)
The MOSAICC is an FAO designed platform consisting of several models integrated and tailored to providing information and making predictions about the impact of climate change on agriculture, forestry and hydrology. The models in MOSAICC cover climate, crops, hydrology, economy, and forest. It can simulate climate change impact on agriculture at national level. The model works by downscaling global climate data to regions or countries. MOSAICC is currently being used in climate change impact assessment on a national scale in Malawi, Peru, Morocco, Indonesia, and Zambia (FAO, 2020). MOSAICC is designed to help identify climate change vulnerability areas and simulate possible adaptation strategies (Kuik et al., 2011). MOSAICC platform includes the following models:
1. AQUACROP: This model simulates crop growth and accounts for the significant factors affecting it like crop transpiration, soil water evaporation, canopy expansion, root development, the effect of carbon dioxide on crops, yield calculation, and biomass production. It also provides the options of land management and crop management strategies (FAO, 2014).
2. WABAL: This model uses climate, soil, and crop data to simulate evapotranspiration excess and deficits for different crops and their growth stages (initial, development, middle and late stage) (FAO, 2014).
3. Dynamic Computable General Equilibrium (DCGE) model: This is an economy model under MOSAICC. It is used to study the economic aspect of the impact of climate change on agriculture by considering crop yield and its influence on price, import, export, GDP, taxes, and household income (FAO, 2014; Kuik et al., 2011).
4. CLIMWAT: This is a database that provides climatic data from meteorological stations all over the world. The stations can be grouped based on position (Latitude and longitude) or country. The data is extracted and used in the CROPWAT program. Most of the data covers a period of 1971-2000. The data included daily maximum and minimum

Section - 8
KSA Fourth National Communication (NC4) 232
temperature, relative humidity, wind speed, solar radiation, sunshine hours per day, and monthly rainfall (FAOa).
5. CROPWAT: This is a program used in conjunction with the CLIMWAT database to calculate evapotranspiration, crop water requirement, and irrigation requirement for major food crops. It also allows users to compare water supply schemes for different cropping scenarios. Although CLIMWAT provides most of the data required for simulation in CROPWAT, the software allows for modification and decision making in the absence of data. It uses the USDA Soil Conservation Service formula to calculate effective rainfall and the Penman-Monteith equation to calculate reference evapotranspiration (FAOb). The reference evapotranspiration is calculated using Eq. 1 as follows:
- Eq. 1 where:
ETo = reference evapotranspiration (mm day-1) Rn = net radiation at the crop surface (MJ m-2 day-1) G = soil heat flux density (MJ m-2 day-1) T = air temperature at 2 m height (°C) u2 = wind speed at 2 m height (m s-1) es = saturation vapour pressure (kPa) ea = actual vapour pressure (kPa) es - ea = saturation vapour pressure deficit (kPa) D = slope vapour pressure curve (kPa °C-1) G = psychrometric constant (kPa °C-1)
8.3.2 CROPWAT Modelling
Using data from the CLIMWAT database, which represents data for 1971-2000 and data from the PRECIS prediction model, CROPWAT was used to calculate the irrigation requirement for wheat in the Al Jouf region of Saudi Arabia as a case study. Al Jouf is located in the northern part of Saudi Arabia and is considered a major agricultural region in the Kingdom. Crops grown in this region include wheat, barley, potatoes, tomatoes, dates and other fruits and vegetables.
For this section, four scenarios were used:
Scenario 1- Daily irrigation requirement using data from the CLIMWAT database (mm) Scenario 2- Daily irrigation requirement using data from the CLIMWAT database and
replacing temperature with temperature from 2080 PRECIS data to represent temperature change (mm)
Scenario 3- Daily irrigation requirement for the 2030 PRECIS data (mm) Scenario 4- Daily irrigation requirement for the 2080 PRECIS data (mm)

Section - 8
KSA Fourth National Communication (NC4) 233
Table 8.3: Daily Irrigation Requirement for the four scenarios for three Decades
Month Decade Stage Scenario 1
Scenario 2
Scenario 3
Scenario 4
October 3 Initial 3.9 4 3.5 3.8 November 1 Initial 32.8 33.5 26.1 26.4 November 2 Initial 28.5 29.2 22.9 23.8 November 3 Development 24.1 24.7 18.2 17.7 December 1 Development 19.2 19.7 12.6 10.4 December 2 Development 15.2 15.5 18.2 4.8 December 3 Development 19.5 20 12.6 8.6
January 1 Development 20.4 20.8 8.1 9.1 January 2 Development 22.3 22.7 14 10.3 January 3 Development 30.6 31.3 22.5 20.6
February 1 Development 33.8 34.4 27.2 27.4 February 2 Development 39.8 40.5 33.9 35.7 February 3 Development 36.5 37.2 30.1 30.8
March 1 Development 52.2 53.3 42.7 43.4 March 2 Development 59.3 60.6 48.2 58.9 March 3 Development 75.7 77.4 61.9 63.6 April 1 Development 78.4 80.2 62.3 63.7 April 2 Mid 88.5 90.5 69.9 71.7 April 3 Mid 94.3 96.4 78.3 82.9 May 1 Mid 100.5 102.7 89.6 99.3 May 2 Mid 104.2 106.4 93.6 103.6 May 3 Late 120.1 122.7 107.9 119.6 June 1 Late 91.2 93.1 81.3 89.3 June 2 Late 63.3 64.7 56.1 60.8 June 3 Late 25.1 25.6 22.1 23.4
Total Irrigation Requirement 1,279.6 1,307.1 1,057.3 1,099.6
Effective Rainfall 47.5 47.5 98 175.9
Table 8.3 shows the daily irrigation requirement for the four scenarios for three decades. In all the scenarios, irrigation requirement increases from March to June for the two decades. There was an increase in daily irrigation requirement between scenario 1 and scenario 2 which shows that an increase in temperature increases the rate of evapotranspiration and ultimately crop water requirement.
8.3.3 Impact of Climate Change on Agriculture and Food Security
This section covers the significant climate change factors that affect agriculture and food security in Saudi Arabia as summarized below:
(i) Impact of short-lived contaminants like ground-level ozone and methane on agriculture and food security: Global climate change projections predict an increase in emission of short-lived pollutants like ozone and methane. An increase in population, food, and energy demand are precursors to a rise in ground-level ozone and other

Section - 8
KSA Fourth National Communication (NC4) 234
pollutants concentration. Ground-level ozone (O₃) is affected by atmospheric temperature, precipitation, cloud cover, humidity, atmospheric vertical mixing, and wind trajectory. Climate change represents a change in all the above-listed factors, which means a change in ground-level ozone concentration (Fann et al., 2012). Relevant ozone concentration standards include WHO standard for 8 hours concentration of ozone which is 100µg/m³ (50ppb(v)), US EPA standard for 8 hours concentration of ozone which is 150µg/m³ (75ppb(v)), and Saudi Arabia’s air quality standard for 8 hours concentration of ozone which is 150µg/m³ (75ppb(v)) (Khalil et al., 2018).
Ozone emissions in urban cities are released due to fossil fuel combustion in automobiles, industrial operations, and heavy-duty machinery. Ozone emission is also a product of nitrogen oxide emission (Khalil et al., 2018). There have been reports of ozone emissions in urban cities of Saudi Arabia (Butenhoff et al., 2015; Khalil et al., 2018; Porter et al., 2014).
Figure 8.11: Progression of Ozone Emission in Saudi Arabia (Health Effects Institute, 2019)
The figure 8.11 above shows the trend of ozone emission in Saudi Arabia for a period of (1990-2017). Ground-level ozone reduces plant photosynthesis, carbon assimilation, and the quality and quantity of crop products (Emberson et al., 2018). Lal et al. (2017) reported a loss in the wheat crop’s annual yield due to ground-level ozone accumulation during wheat cropping season in India.
(ii) Impact of Increase in Temperature and Carbon Dioxide (CO₂) Concentration on Agriculture and Food Security: Contours were plotted for temperature projections for 2030 and 2080 using retrieved data from the PRECIS prediction model. PRECIS data projections show an increase in temperature between 2030 and 2080. Figure 8.12 shows the temperature projections contour plot. The increase in temperature is largest at the Qassim, Hail, and Madinah regions and reduces outwards towards the borders with a range of (1.2℃ - 3.4℃). Crops grown in the Qassim, Hail, and Madinah regions include wheat, potatoes, tomatoes and dates.

Section - 8
KSA Fourth National Communication (NC4) 235
Figure 8.12: The Difference in the Annual Temperatures between 2030 and 2080
Global climate change reports project a rise in anthropogenic carbon dioxide (CO₂) emissions due to population increase, loss of vegetative cover, deforestation, increasing food demand, fossil fuel combustion, and other human activities. The effects of temperature and carbon dioxide increase on agriculture and food security include:
a. Effect on C3 crops: In C3 crops, carbon dioxide (CO₂) enters through the stomata and is fixed into sugar by an enzyme called RubisCO. This reaction produces a 3-carbon compound acid (Calvin-Benson cycle). Due to this, C3 crops can only survive in regions with a substantial amount of groundwater and moderate temperature and sunlight. Eighty-five percent (85%) of all plants are C3 crops. Some examples include wheat, rice, alfalfa, cotton, and potatoes (Yamori, 2016).
Figure 8.13: Progression of Carbon Dioxide Emission from Fossil Fuel Combustion in
Saudi Arabia (EDGAR-JRC, 2020)

Section - 8
KSA Fourth National Communication (NC4) 236
Figure 8.13 shows an increase in carbon dioxide (CO₂) emissions from fossil fuel combustion in the Kingdom of Saudi Arabia between 1990 and 2019. Since the Kingdom is not exempt from future projections of rising carbon dioxide levels, one must assess the possible impacts of carbon dioxide (CO₂) on agriculture and food security to plan and design mitigating strategies.
Rising carbon dioxide (CO₂) concentration increases C3 crops production by stimulating photosynthesis, but if carbon dioxide (CO₂) concentration continues to increase, it will reduce stomatal conductance and plant transpiration. This makes crops vulnerable to heat stress. It has also been reported to lead to late-stage biomass decrease in long term (Bisbis et al., 2018), thereby altering plant quality.
b. Food crops and vegetables have a precise range of temperature requirements. An increase in temperature beyond a crop optimum temperature range increases heat stress on the crop. Food crops and vegetables grown in KSA are adapted to the high temperatures, but further increase in temperature puts pressure on the crops. As temperature increases in C3 crops, Ribulose-1,5-bisphosphate carboxylase/oxygenase (Rubisco) accumulates more oxygen, which results in photorespiration that causes the loss of nitrogen and carbon in plants (Yamori, 2016). An example is the winter wheat crop, as previously stated in NC3, 2016, winter wheat will be affected by any further increase in temperature (Alkolibi, 2002). Tian et al. (2014) concluded that climate warming increased winter wheat production by shortening growth periods but reduced nitrogen concentration in the grain.
Figure 8.14: Difference in Winter Temperatures between 2030 and 2080
Figure 8.14 shows the difference in winter temperature projections between 2030 and 2080. Projections show temperature increase in most parts of the Kingdom during the winter seasons with a slight increase in temperature that ranges from 0.8℃ to 2.8℃ with exceptions in the northeast regions (some parts of Qasim, Hail, and Hudud Ash Shamaliyah) with a decrease in temperature of a range of 0.6℃ to 0℃. Temperature changes mean that the winter wheat crop productivity will be affected by climate change. Increased atmospheric temperature increases
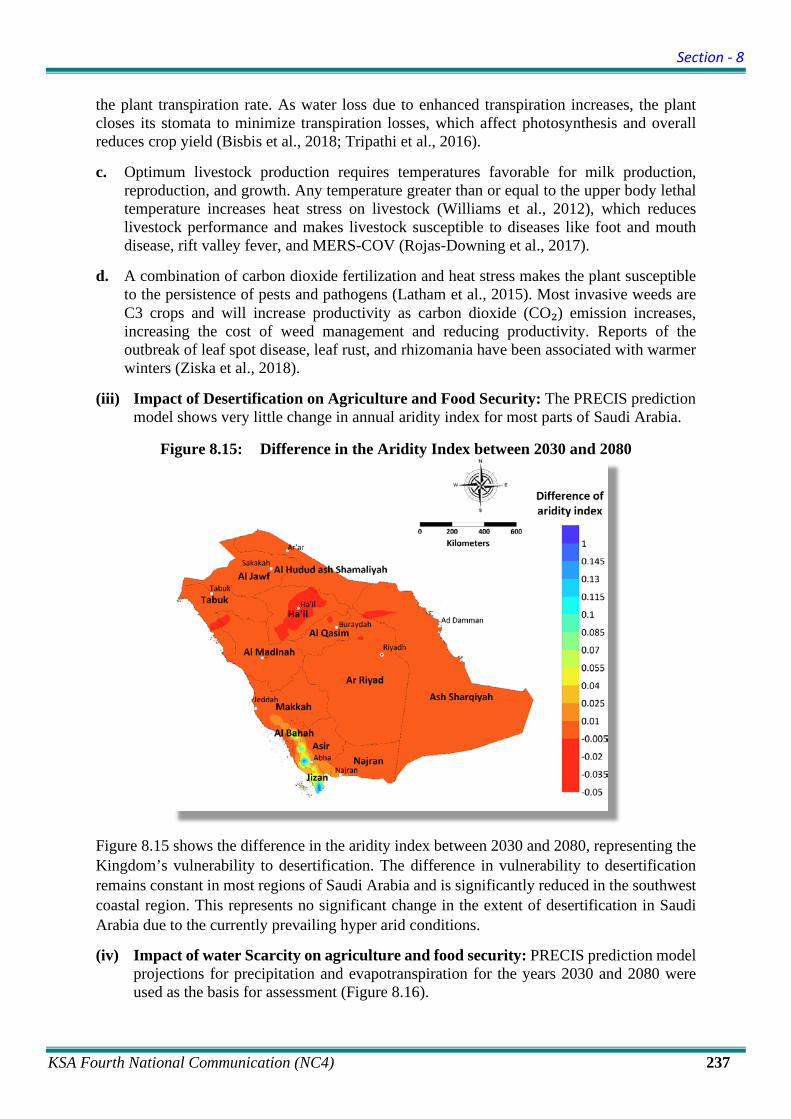
Section - 8
KSA Fourth National Communication (NC4) 237
the plant transpiration rate. As water loss due to enhanced transpiration increases, the plant closes its stomata to minimize transpiration losses, which affect photosynthesis and overall reduces crop yield (Bisbis et al., 2018; Tripathi et al., 2016). c. Optimum livestock production requires temperatures favorable for milk production,
reproduction, and growth. Any temperature greater than or equal to the upper body lethal temperature increases heat stress on livestock (Williams et al., 2012), which reduces livestock performance and makes livestock susceptible to diseases like foot and mouth disease, rift valley fever, and MERS-COV (Rojas-Downing et al., 2017).
d. A combination of carbon dioxide fertilization and heat stress makes the plant susceptible
to the persistence of pests and pathogens (Latham et al., 2015). Most invasive weeds are C3 crops and will increase productivity as carbon dioxide (CO₂) emission increases, increasing the cost of weed management and reducing productivity. Reports of the outbreak of leaf spot disease, leaf rust, and rhizomania have been associated with warmer winters (Ziska et al., 2018).
(iii) Impact of Desertification on Agriculture and Food Security: The PRECIS prediction
model shows very little change in annual aridity index for most parts of Saudi Arabia.
Figure 8.15: Difference in the Aridity Index between 2030 and 2080
Figure 8.15 shows the difference in the aridity index between 2030 and 2080, representing the Kingdom’s vulnerability to desertification. The difference in vulnerability to desertification remains constant in most regions of Saudi Arabia and is significantly reduced in the southwest coastal region. This represents no significant change in the extent of desertification in Saudi Arabia due to the currently prevailing hyper arid conditions.
(iv) Impact of water Scarcity on agriculture and food security: PRECIS prediction model projections for precipitation and evapotranspiration for the years 2030 and 2080 were used as the basis for assessment (Figure 8.16).

Section - 8
KSA Fourth National Communication (NC4) 238
Figure 8.16: Difference in the Precipitation (left) and Evapotranspiration (right) Between 2030 and 2080
There is a slight difference in evapotranspiration projection data, which indicates that the rate of evapotranspiration increased between 2030 and 2080 with a maximum of 1.25mm/day in some parts of Madinah region (some crops grown in this region includes wheat, potatoes, tomatoes, and dates) and maximum decrease of 0.15mm/day along the north and south borders and the coastal region of Jazan (some crops grown in this region includes tomatoes, sesame, maize, and sorghum), Asir (some crops grown in this region includes wheat, sesame, potatoes, tomatoes, and dates), and Al Baha (some crops grown in this region includes wheat, potatoes, maize, tomatoes, and dates). It corresponds with the maximum increase in precipitation in the coastal region of Jazan, Asir, and Al Baha. Most regions of the Kingdom fall between an increase in evapotranspiration range of 0.45 - 1.05 mm/day. It also shows a tiny area in the coastal region of Jazan with a substantial increase in precipitation. Most parts of Saudi Arabia show a difference in precipitation between -4 to 2 mm. Any increase in evapotranspiration means plants need more water to achieve optimum yield.
Table 8.4: Regional Data for Evapotranspiration, Average Precipitation and Temperature
Regions Evapotranspiration
(mm/yr) Average Precipitation
(mm/yr) Temperature
(Degree Celsius) 1971- 2000 2030 2080 1971-
2000 2030 2080 1971- 2000 2030 2080
Makkah (Taif) 1,463.7 2,548.9 2,722.6 9.9 20.1 27.4 22.4 19.8 22.8 Riyadh (Riyadh) 1,328.6 3,067.5 3,227.1 8.4 6.5 4.9 25.7 23.8 26.3
Eastern Province (Qatif) 1,576.8 2,947 3,126.6 6.6 4.4 12.5 25.6 26.8 28.8
Northern Borders (Rafha) 2,390.8 2,732.1 2,960.2 8.8 24.3 23 22.9 21.4 24.2
Asir (Khamis Mushait) 1,817.7 2,170.3 2,674.4 22 17.8 36.6 18.6 16.3 20.9
Jazan (Jazan) 2,208.3 1,922.1 1,942.1 8.7 24.6 105.7 30.3 29.9 31.3
Madinah (Madinah) 1,419.9 3,250.3 3,578.5 4.1 6.4 8.7 27.5 23.4 26.6
Qassim (Qassim) 2,310.5 2,786.4 2,997.4 15.3 20.4 16.2 24 22 25
Tabuk (Tabuk) 2,109.7 2,272 2,434.2 4.8 4.8 3.1 21.3 18.2 20.6
Hail (Hail) 2,138.9 2,626.9 2,919 14.3 36.5 14 21 20.4 23.5
Najran (Najran) 2,317.8 3,454 3,648.9 11.3 14.1 36.2 24.2 22.9 25.4
Al Jouf (Al Jouf) 2,511 2,545 2,751.3 4.8 10.2 18.7 22.1 20.2 22.7

Section - 8
KSA Fourth National Communication (NC4) 239
Table 8.4 above shows the values for evapotranspiration (mm/yr), average precipitation (mm/yr) and temperature (degree Celsius) for 2030, 2080 and a collective period of 1971-2000 for the thirteen regions of Saudi Arabia. This table provides us more insight into the effect of climate change on different regions. This will make climate change assessment more accurate.
Figure 8.17: Daily Irrigation Requirement for Wheat Cultivation for CROPWAT Simulation
Figure 8.18: Total Daily Crop Water Requirement for CROPWAT Simulation
Scenario 1 represents the daily irrigation requirement for the CLIMWAT data in mm/decade for the Al Jouf region of Saudi Arabia and scenario 2 represents the daily irrigation requirement for the CLIMWAT data using 2080 PRECIS data (to represent temperature change) in mm/decade for the Al Jouf region of Saudi Arabia.

Section - 8
KSA Fourth National Communication (NC4) 240
Period 1 - Total daily crop water requirement for the CLIMWAT data (mm/decade) for the Al Jouf region
Period 2 - Total daily crop water requirement for the 2030 PRECIS data (mm/decade) for the Al Jouf region
Period 3 - Total daily crop water requirement for the 2080 PRECIS data (mm/decade) for the Al Jouf region
Figure 8.17 shows the effect of temperature increase on crop irrigation requirements. This Figure shows a slight increase in crop irrigation requirements with an increase in the temperature only. The Figure was plotted from data extracted from the CROPWAT crop water calculation. An increase in crop water demand without a similar rise in precipitation means plants might not have enough water for maximum production yields due to water scarcity. Water shortage also affects forage quality and quantity and the amount of water available to livestock, which reduces livestock productivity (Rojas-Downing et al., 2017).
Figure 8.18 shows a fall in the crop water requirement for wheat between Period 1 and Period 2. Then there is an increase in crop water requirement for wheat between Periods 2 and 3 (a slight increase from December to February and a significant increase from March to May). Precipitation data shows an increase between Periods 2 and 3. This means that irrespective of a rise in precipitation between 2030 and 2080, other factors like temperature and relative humidity contribute to crop water requirement. The high values (precipitation, temperature, humidity, crop water requirement, and irrigation requirement) from scenario 1 and period 1 may be because the data is an average of the parameters for 1971-2000.
8.4 Agriculture and Food Security Policies & Programs
Saudi Arabia’s Ministry of Environment, Water and Agriculture (MEWA) published a document containing two major agricultural programs to achieve Kingdom’s Saudi Vision 2030 goals:
(i) Green Fodder Program: It is officially known as the ‘stop green fodder production’ program. The main aim of the project is to stop green fodder production by 2021. This project is designed to aid in conserving groundwater reserves by stopping the production of green fodder (especially alfalfa), which consumes large amounts of irrigation water. The Saudi Arabian government has reintroduced wheat as an alternative for green fodder (Lyddon, 2020).
(ii) Program for Development of Fish resources: The project’s main aim is to increase fish production to 600,000 tons/year by 2030 by conducting research and supporting methods for fish production optimization in the Kingdom.
Another national program that affects agriculture in the Kingdom of Saudi Arabia is the water sector policies for Saudi Vision 2030. It is called the ‘Saudi Irrigation Organization Restructuring and Irrigation Improvement.’ This policy involves optimizing the use of treated wastewater in agriculture.
Aside from the Saudi Vision 2030 target strategy, MEWA published its 2018-2020 National Transformation Program (NTP) Delivery Plan. The Third theme in the document includes all agricultural and food security targets and programs for 2018-2020 (MEWA, n.d.). In the NTP

Section - 8
KSA Fourth National Communication (NC4) 241
Delivery Plan 2018-2020, the Saudi government highlighted over twenty (20) agricultural and food security initiatives. These initiatives are illustrated below:
8.4.1 Food Crop Development and Food Security Management Initiatives (MEWA, n.d.)
(i) The conservation and sustainable use of the plant genetic resources initiative. (ii) The development and application of agricultural best practices for sustainable
agriculture and food security. (iii) Development of an effective food strategic-reserve program: This program covers
information on agricultural management, an early warning system for food security threats, and protocols for responding to such threats.
(iv) Improvement of the performance of agricultural cooperative societies: This program aims to encourage cooperation between private, public, and donor agricultural institutions.
(v) Reduction of food loss and waste initiative: This program uses best practices, global experiences, and standards to assess and manage the food waste situation of the Kingdom.
(vi) Sustainable delivery of agricultural service initiative: this initiative focuses on creating a state-owned company that caters to sustainable agricultural services.
(vii) Creating and implementing a portal for palm and dates initiative: this initiative is designed to enhance the quality of dates by issuing ‘quality certificates’ registered on the palm and dates portal.
8.4.2 Agricultural Marketing Initiatives (MEWA, n.d.)
(i) The establishment of marketing service centers for small & medium farmers and producers to increase the value of locally sourced products.
(ii) The establishment of an entity for the development and management of wholesale markets for public benefits (vegetables, fruits, cattle, and fish) through infrastructure development and market systems management.
8.4.3 Irrigation and Crop Water Initiatives (MEWA, n.d.)
(i) The rehabilitation of agricultural terraces and application of rainwater harvesting techniques in the Kingdom’s southwestern region.
(ii) Increasing the utilization of dam water for agricultural purposes by adding irrigation networks and channels on dams.
(iii) The reduction of water consumption for agricultural purposes by assessing water consumption in the agricultural sector and increasing irrigation efficiency.
8.4.4 Aquaculture Initiatives (MEWA, n.d.)
(i) Strengthening research into applied agriculture: This initiative is designed to promote and improve local and international investment into the Kingdom’s fish resources optimization.
(ii) Private and public sector aquaculture cooperation: This initiative aims to increase aquaculture production by merging private and public aquaculture institutions.

Section - 8
KSA Fourth National Communication (NC4) 242
(iii) Establishment of an agricultural quarantine city and the development of the current quarantine system.
(iv) Establishment of the national center for marketing and promotion of consumption of fish products: This initiative is designed to promote local seafood products.
(v) Development of fishing harbors to promote tourism and create investment opportunities.
8.4.5 Climate Change Effects on Agriculture Response Initiatives (MEWA, n.d.)
(i) The creation of a Climate Change Center to manage climate information and assess the impact of climate change on all sectors.
(ii) Improving climate monitoring by increasing the number of climate observation stations and remote sensors network to enhance the geographical coverage of the stations.
(iii) The development of numerical modeling systems to improve the accuracy of local weather and natural hazards forecasts.
8.4.6 Other Agricultural Initiatives:
(i) The development of an integrated management system for controlling plant’s epidemics.
(ii) The improvement of sustainable livestock production. (iii) The amendment and creation of laws that allow MEWA to perform all its assigned
tasks. (iv) The development of strategies and implementation plan for responsible Saudi
agricultural investments abroad. (v) The development of a structured, coordination mechanism and governance system for
food security institutions, policies, and legislation.
8.5 Policy Implementation
Some of the plans and strategies discussed above are currently being executed. Examples include:
(i) The introduction of the sustainable agricultural and rural development program in Riyadh: This program focuses on marketing agricultural products for small local businesses in Riyadh in a timeline of seven years (2018-2025).and the agricultural development fund (CIC, 2019).
(ii) The introduction of the ‘Palm tree of the Homeland’ program in 2019: This program is designed to improve the quality of dates produced and increase the export of dates (CIC, 2019).
(iii) Another example is the investment into the development of agriculture to increase total aquaculture production to 600,000 tons by 2025 (FBN, 2020).
(iv) The investment to support farmers switching to organic farming to produce high-quality agricultural products. This investment had a one (1) year timeline (September 2018- August 2019) (Market Research Saudi, 2019).

Section - 8
KSA Fourth National Communication (NC4) 243
8.6 Climate-Smart Agriculture
In 2013, FAO released its first publication on climate-smart agriculture (CSA) in response to global food security concerns. This publication covers the importance of a climate-smart approach to agriculture, climate change impact on livestock, crop production, forestry, and aquaculture, and various tested agricultural strategies (FAO, 2013). In 2017, FAO released its second edition of the climate-smart agriculture sourcebook. The new publication covered new scientific approaches to agriculture, integrated agricultural management, and gender roles in climate-smart agriculture (FAO, 2017).
Climate-smart agriculture involves using current technologies and modern techniques in making mid and long-term plans to ensure sustainable intensification of agriculture and contribute to climate change mitigation.
Climate-smart agriculture recognizes the inevitability of climate change and makes plans using current technologies to ensure food security and combat the negative effect of climate change.
CSA identifies three issues that should be addressed to ensure food security despite alarming climate change projections (FAO, 2013). They include;
1. Increasing agricultural production.
2. Reducing greenhouse gas emissions.
3. Building agricultural climate change resilience.
Due to the rising population, there is a need to increase agricultural production. However, current agricultural intensification methods have led to land degradation, growth of pesticide-resistant pest species, loss of biodiversity and increased greenhouse gas emissions.
Agriculture accounts for one-fifth of global emissions. Implementing climate-smart agriculture strategies provides an opportunity to farm in a more sustainable and environmentally friendly manner.
8.6.1 Some CSA Strategies and Technologies
CSA requires the integrated use of multiple techniques and technologies tailored to suit any given region’s needs and concerns. Some of these strategies include:
(i) Crop diversity in the form of crop rotation, intercropping, and relay cropping: Crop rotation should be done with consideration to soil nutrient need. Crop rotation should be done by rotating between crops with high nitrogen content and high carbon content to prevent continuous loss of nutrients, rendering land with insufficient nutrients. Intercropping should involve mixing of perennial crops and leguminous crops in the same plots and then switching plot rows between perennial crops and legumes. Legumes are essential crops for natural nitrogen fixation (FAO, 2017).
(ii) Introduction of agricultural extensions and capacity building for farmers: Agricultural extension is any formal or informal education given to farmers and agricultural stakeholders on farming technologies and strategies. It also facilitates the availability and accessibility of quality seeds, mechanized equipment, policies, grants, and loans to farmers. Agricultural extensions should also educate farmers on understanding the

Section - 8
KSA Fourth National Communication (NC4) 244
importance of climate forecast and interpreting forecast data to aid local farmers in agricultural planning (FAO, 2017; Fiaz et al., 2018).
(iii) Silvo-pasture: This is an agroforestry technique that combines food crops, trees, forages, and livestock on the same land area. It is intentionally designed to simulate a natural ecosystem. The forest acts as a buffer from extreme weather events. The plant biodiversity and livestock act as a deterrent to pests. The forest also serves as a carbon sequester (FAO, 2017).
(iv) Reduction of soil disturbance by tillage: Reducing soil disturbance prevents the loss of soil nutrients. Mechanized tillage equipment should be replaced with mechanized seeders or digging sticks. Mechanized tillage accounts for a large percentage of agricultural energy use (FAO, 2017).
(v) Improving waste management: Manure retrieved from livestock farming and stored under anaerobic conditions should also contain biogas collectors (FAO, 2017).
(vi) Building a Seed System: The seed system will manage the research and distribution of quality seeds resistant to drought, salinity, and flooding (FAO, 2017).
(vii) Managing more than one livestock species or switching between livestock species. (viii) Planting deep-rooted forages and forage varieties with different growth timetables in
rangelands reduce the risk of overgrazing and desertification and allow for natural regeneration of rangelands (FAO, 2017).
(ix) Allowing crops remains like roots, stalks, and leaves to stay on the soil surface for natural soil nutrients and soil organic carbon replenishment instead of burning (FAO, 2017).
8.6.2 Benefits of CSA
Various benefits of CSA are as follows:
(i) Crop diversity planting acts as natural pest management by building resistance to pests. It also minimizes risks caused by plant disease outbreaks.
(ii) Reduced tillage reduces the energy consumed on tillage, which indirectly reduces total greenhouse gas emissions caused by agricultural activities.
(iii) Agricultural extensions give rise to educated farming, which increases productivity. Farmers can use their understanding of climate forecast and early warning systems to design effective and efficient planting plans.
(iv) Managing more than one livestock species or switching between livestock species minimizes risks in case of a disease outbreak and reduces the stress on one feed source as different species require different feed types.
(v) Waste management of manure can be used for the generation of renewable energy (in the form of biogas) and reduces greenhouse gas emissions.
8.7 Risks of Using Treated Wastewater for Agriculture
In 2019 alone, the agricultural water demand in Saudi Arabia was 12,500 million m³ per year, accounting for 72% of total water demand. The use of treated wastewater provides a sustainable and reliable water source for landscape and agricultural irrigation, groundwater recharge, fire-fighting, and many other recreational purposes (Helmecke et al., 2020).

Section - 8
KSA Fourth National Communication (NC4) 245
Urbano et al. (2017) reported the successful use of treated wastewater for lettuce cultivation and the subsequent improvement of soil conditions (soil organic carbon and soil nutrients), while Paudel et al. (2018) recommended rotation between freshwater and treated wastewater for agricultural irrigation.
Saudi Arabia has invested in wastewater treatment for reuse in the agricultural sector to reduce the stress on existing groundwater reserves. As previously stated in the policy section, the Kingdom has introduced the Saudi Irrigation Organization Restructuring and Irrigation Improvement initiative. This initiative has been incorporated into Saudi Arabia’s 2018-2020 National Transformation Plan with a target of increasing the treated wastewater reuse rate and the percentage of renewable water consumption in the agricultural sector to 35% (MEWA, n.d.). However, one must consider if there are any potential risks and how those risks can be minimized. The potential risks of using treated wastewater are discussed below.
8.7.1 Possible Contaminants
The treated wastewater may contain the following contaminants:
1. Inorganic contaminants: including heavy metals, chlorides, sulfides, sulfates, nitrogen, and ammonia.
2. Organic contaminants: such as phenols, oil and grease, and other organic carbon compounds.
3. Biological pathogens: These include coliforms, intestinal nematodes, salmonella, and enteroviruses.
4. Persistent Organic Pollutants/Contaminants: Recent research into wastewater and wastewater treatment has reported compounds generally known as persistent and pseudo-persistent organic contaminants in low levels in treated wastewater (Grossberger et al., 2014; C. F. Williams & McLain, 2012). Some examples are pharmaceuticals, caffeine, and personal care products.
Wastewater contaminants are dependent on the source of wastewater. Wastewater generated in the urban sector primarily contains personal care products, organic contaminants, and biological pathogens, while wastewater generated in the industrial sector mainly contains inorganic and organic compounds. Wastewater contaminants in the industrial sector are dependent on the industry’s raw materials, product, and by-product.
8.7.2 Wastewater Treatment in Saudi Arabia
According to the regulations in the Kingdom, the wastewater for reuse should be treated using tertiary wastewater treatment methods irrespective of the proposed function (Aburizaiza & Mahar, 2016).

Section - 8
KSA Fourth National Communication (NC4) 246
Table 8.5: US EPA Recommended use for Primary, Secondary, and Tertiary Treatment of Wastewater (US EPA, 2005)
Treatment Type Processes Recommended USEPA Usage
Primary Sedimentation No recommended usage
Secondary Biological
oxidation & disinfection
-Industrial cooling -Groundwater recharge of a non-potable aquifer -Non-food crop irrigation -Surface irrigation of orchards and vineyards -Restricted landscape irrigation
Tertiary
Chemical coagulation, filtration & disinfection
-Landscape & golf course irrigation -Food crop irrigation -Unrestricted recreational use -Groundwater recharge of a potable aquifer -Urban non-drinking use (toilet flushing, car wash)
Table 8.5 shows US EPA’s recommended use for wastewater treated with primary, secondary, and tertiary treatment. This table has given a basis of comparison for Saudi Arabia’s tertiary treatment of wastewater. Tertiary treatment of wastewater in the Kingdom involves the use of one or more of the following: disinfection, sand filtration, activated carbon adsorption, reverse osmosis system, and pressure filtration (Al-Jasser, 2011).
The Kingdom’s Ministry of Municipal and Rural Affairs (MMRA) in 2003 and the Ministry of Water and Electricity (MWE) in 2006 released treated wastewater standards for irrigation purposes. The Table 8.6 below shows MMRA and MWE wastewater standards for irrigation.
Table 8.6 MMRA (2003) and MWE (2006) Water Standard for Irrigation (Al-Jasser, 2011)
Parameters Units 2003 MMRA Standards 2006 MWE Standards
Restricted Irrigation
Unrestricted Irrigation
Restricted Irrigation
Unrestricted Irrigation
General Contaminant Criterion Floatable Material - Absent Absent Absent
pH pH Units - 6 - 8.4 6 - 8.4 6 - 8.4
Turbidity NTU - - 5 5 Oil and grease mg/l - Absent Absent Absent Phenol mg/l - 0.002 0.002 0.002 Total Suspended Solids (TSS) mg/l 40 10 ≥ 40 ≥ 10 Total Dissolved Solids (TDS) mg/l 2,000 2,000 2,500₁ 2,500₁ Total Organic Carbon (TOC) mg/l - 40 - - Biochemical Oxygen Demand (BOD₅) mg/l 40 10 ≥ 40 ≥ 10 Chemical Oxygen Demand (COD) mg/l - 50 - -
Specific Contaminant Criterion

Section - 8
KSA Fourth National Communication (NC4) 247
Parameters Units 2003 MMRA Standards 2006 MWE Standards
Restricted Irrigation
Unrestricted Irrigation
Restricted Irrigation
Unrestricted Irrigation
Arsenic mg/l - 0.1 0.1 0.1 Cadmium mg/l - 0.01 0.01 0.01 Chromium mg/l - 0.01 0.1 0.1 Copper mg/l - 0.2 0.4 0.4 Cyanide mg/l - 0.02 - -
Lead mg/l - 5 0.1 0.1
Mercury mg/l - 0.001 0.001 0.001
Nickel mg/l - 0.02 0.2 0.2
Zinc mg/l - 2 4 4
Aluminum mg/l - 5 5 5
Barum mg/l - 1 - - Manganese mg/l - 0.2 0.2 0.5
Silver mg/l - 0.5 - -
Selenium mg/l - 0.02 0.02 0.02
Molybdenum mg/l - 0.01 0.01 0.01
Boron mg/l - 0.75 0.75 0.75
Vanadium mg/l - 0.1 0.1 0.1
Lithium mg/l - 2.5 2.5 2.5
Beryllium mg/l - 0.1 0.01 0.1
Iron mg/l - 5 5 5
Cobalt mg/l - 0.05 0.05 0.05
Chlorides mg/l - 100 - -
Sulfates (SO₄) mg/l - 600 - -
Ammonia (NH₃-N) mg/l - 5 5 5
Nitrate (NO₃-N) mg/l - 10 10 10
Residual Chlorine mg/l - 0.2 0.5₂ 0.5₂
Fluoride mg/l - - 1 1
Biological Contaminants
Fecal coliform per 100ml 1000 (colonies) ≥ 2.2 ≥ 1,000
(colonies) 2.2₃
Live intestinal nematodes per liter of water No./L - 1 1 1
Notes:
1 Only use if dilution with water is possible or if the crop is not affected by high TDS 2 Should not be less than 0.2mg/l if the chlorine was used as a disinfectant 3 The wastewater effluent shall be considered adequately disinfected for unrestricted irrigation if the average
fecal coliform organisms in the effluent do not exceed MPN 2.2/100 mL (or equivalent) as determined from the bacteriological test results of the last seven days. The number of fecal coliform organisms does not exceed MPN 23/100 mL (or equivalent) in any sample.

Section - 8
KSA Fourth National Communication (NC4) 248
8.7.3 Persistent Organic Pollutants (POPs)
The standards in the Table 8.6 above covers most contaminants, but it does not cover pharmaceuticals, personal care products, and caffeine. Although most pharmaceuticals are biodegraded in the treatment process or degraded in soil (some examples are ibuprofen and diclofenac), but some contaminants are persistent (Grossberger et al., 2014). Examples of POPs are caffeine, carbamazepine, lamotrigine, and sildenafil. Grossberger et al. reported the presence and accumulation of caffeine, carbamazepine, lamotrigine, sildenafil, metoprolol, and sulfamethoxazole in soil (Grossberger et al., 2014). Williams and McLain confirmed the accumulation of caffeine and carbamazepine and its slow degradation in soil.
The danger of the persistence of such contaminants in soil is its potential to contaminate groundwater reserves or be taken up by plants (Grossberger et al., 2014; Helmecke et al., 2020). Significant successes have been reported for the use of an ‘Integrated Membrane System’ in the removal of POPs in wastewater. The Integrated Membrane System combines reverse osmosis or nanofiltration with membrane bioreactor (Wang et al., 2018).
The concentration of POPs in the soil is negligible at best because most of it will be removed by conventional water treatment methods (Helmecke et al., 2020), but should be studied to assess the effects of its accumulation in the long term.
Irrespective of the possible dangers, wastewater and treated wastewater should first be tested to assess the extent of contamination of POPs and whether it poses a reasonable risk. This assessment should be done before any treatment can be recommended to avoid the unnecessary complexity of the wastewater treatment process.
8.8 Investment in Agricultural Production Overseas
Under the ‘King Abdullah Initiative for Saudi Agriculture Investment” in 2009, the Saudi government and private sector began buying affordable farmlands in countries with favorable land and water rights. Updated from the NC3 (2016), Saudi government currently owns lands in Argentina, Ethiopia, Turkey, the Philippines, and the United States of America (Arizona and California). Alfalfa is grown in California, and it is exported to feed the Kingdom’s livestock. The Kingdom has a large sheep farm in Turkey.
8.9 Summary
Food security for any country is dependent on its ability to produce healthy food and make it available. Agricultural production and food security in Saudi Arabia are affected by various climatic factors such as the threat of desertification, rising temperatures, and scarcity of water. Vulnerability of Saudi Arabia in agriculture and food security is discussed in this chapter using PRECIS prediction model projections. This section also gives an insight into the effects of climate change on agriculture in future by using CROPWAT modelling software. CROPWAT was used to simulate the impacts of climate change projections using PRECIS data by determining the total daily crop water requirement and irrigation requirement for wheat cultivation in the Al Jouf region of the Kingdom. This will help policymakers and other stakeholders to plan, prepare strategies, policies, and actions that will increase Saudi Arabia’s resilience to the impacts of climate change on agriculture and food security.

Section - 8
KSA Fourth National Communication (NC4) 249
Initiatives such as the ‘Sustainable Agricultural Rural Development Program,’ the diversion of treated wastewater to agricultural irrigation Networks, and the ‘Palm Tree of the Homeland’ are already in effect. These programs are a part of the Kingdom's effort to improve climate change resilience and food security. Further improvements can be encouraged using FAO’s climate-smart agriculture framework.
In addition, this section gives a good insight into climate change vulnerabilities in the agricultural sector to improve climate change resilience of agricultural and food security facilities, the following measures are recommended:
1. Investments into climate-smart agriculture strategies adapted to the Kingdom's climate change vulnerabilities.
2. Educating farmers on climate-smart agriculture strategies and technology options
3. Investment in agricultural research to develop new varieties of crops in a high salinity environment.
4. Further research into the modeling of the short-term and long-term water use stress in agriculture.
5. A detailed assessment of the long-term effects of using treated wastewater for agriculture.
Section - 8
KSA Fourth National Communication (NC4) 250
References:
1. Aburizaiza, O., & Mahar, G. (2016). Degree of wastewater treatment versus types of reuses: Case study, Saudi Arabia. Global Nest Journal, 18.
2. Aggidis, G., Arbon, I., Brown, C., Clarke, C., Earp, J., Fox, T., Greenway, D., Smith, A., Stannard, B., Warriner, D., & Others. (2013). Global food: waste not, want not. [IMECHE report]. Institution of Mechanical Engineers. https://www.imeche.org/docs/default-source/reports/Global_Food_Report.pdf
3. Al-Atiyat, R. M., Aljumaah, R. S., Abudabos, A. M., Alghamdi, A. A., Alharthi, A. S., AlJooan, H. S., & Alotybi, M. N. (2015). Current situation and diversity of indigenous cattle breeds of Saudi Arabia. Animal Genetic Resources/Resources Génétiques animales/Recursos Genéticos Animales, 57, 39–49. https://doi.org/10.1017/S2078633615000247
4. Alderiny, M. M., Alrwis, K. N., Ahmed, S. B., & Aldawdahi, N. M. (2020). Forecasting Saudi Arabia’s production and imports of broiler meat chickens and its effect on expected self-sufficiency ratio. Journal of Saudi Society of Agricultural Sciences, 19(4), 306–312. https://doi.org/10.1016/j.jssas.2019.09.001
5. Al-Ghamdi, A., & Nuru, A. (2013). Beekeeping in the Kingdom of Saudi Arabia Past and Present Practices. Bee World, 90(2), 26–29. https://doi.org/10.1080/0005772X.2013.11417527
6. Al-Jasser, A. O. (2011). Saudi wastewater reuse standards for agricultural irrigation: Riyadh treatment plants effluent compliance. Journal of King Saud University - Engineering Sciences, 23, 1–8. https://doi.org/10.1016/j.jksues.2009.06.001
7. Alkolibi, F. M. (2002). Possible Effects of Global Warming on Agriculture and Water Resources in Saudi Arabia: Impacts and Responses. Climatic Change, 54(1), 225–245. https://doi.org/10.1023/A:1015777403153
8. Bisbis, M. B., Gruda, N., & Blanke, M. (2018). Potential impacts of climate change on vegetable production and product quality – A review. Journal of Cleaner Production, 170, 1602–1620. https://doi.org/10.1016/j.jclepro.2017.09.224
9. Butenhoff, C. L., Khalil, M. A. K., Porter, W. C., Al-Sahafi, M. S., Almazroui, M., & Al-Khalaf, A. (2015). Evaluation of ozone, nitrogen dioxide, and carbon monoxide at nine sites in Saudi Arabia during 2007. Journal of the Air & Waste Management Association, 65(7), 871–886. https://doi.org/10.1080/10962247.2015.1031921
10. CIC. (2019). King Salman Unveils Major Sustainable Agricultural Rural Development Program. Center for International Communication Saudi Arabia. https://cic.org.sa/2019/01/king-salman-unveils-major-sustainable-agricultural-rural-development-program/
11. CIP. (2017). Why are potatoes important? International Potato Center.

Section - 8
KSA Fourth National Communication (NC4) 251
https://nkxms1019hx1xmtstxk3k9sko-wpengine.netdna-ssl.com/wp-content/uploads/2017/04/Why-are-Potatoes-Important-Eng-2017.pdf
12. EDGAR-JRC. (2020). Fossil CO2 emissions of all world countries, 2020 report - European Commission. European Commission. https://edgar.jrc.ec.europa.eu/overview.php?v=booklet2020&sort=asc1
13. Emberson, L. D., Pleijel, H., Ainsworth, E. A., van den Berg, M., Ren, W., Osborne, S., Mills, G., Pandey, D., Dentener, F., Büker, P., Ewert, F., Koeble, R., & Van Dingenen, R. (2018). Ozone effects on crops and consideration in crop models. European Journal of Agronomy: The Journal of the European Society for Agronomy, 100, 19–34. https://doi.org/10.1016/j.eja.2018.06.002
14. Fann, N., T. Brennan, P. Dolwick, J.L. Gamble, V. Ilacqua, L. Kolb, C.G. Nolte, T. L. Spero, & L. Ziska. (2012). Ch. 3: Air Quality Impacts. In The Impacts of Climate Change on Human Health in the United States: A Scientific Assessment (pp. 69–98). The U.S. Global Change Research Program. https://health2016.globalchange.gov/air-quality-impacts
15. FAO. (2008). Climate Change and Food Security: A Framework Document: http://www.fao.org/docrep/pdf/010/k2595e/k2595e00.pdf
16. FAO. (2013). Climate smart agriculture sourcebook. Food and Agriculture Organization of the United Nations http://www.fao.org/docrep/018/i3325e/i3325e.pdf
17. FAO. (2014). Modelling System for Agricultural Impacts of Climate Change – MOSAICC: http://www.fao.org/climatechange/mosaicc/66705/en/
18. FAO. (2015). National Aquaculture Sector Overview. Kingdom of Saudi Arabia. National Aquaculture Sector Overview Fact Sheets. Text by Odaiby, M. In: FAO Fisheries Division [online]. Food and Agriculture Organization of the United Nations. http://www.fao.org/fishery/countrysector/naso_saudiarabia/en
19. FAO. (2017). Climate Smart Agriculture Sourcebook 2017. Food and Agriculture Organization of the United Nations. http://www.fao.org/climate-smart-agriculture-sourcebook/en/
20. FAO. (2018). The future of food and agriculture—Alternative pathways to 2050. Food and Agriculture Organization of the United Nations Rome, Italy.
21. FAO. (2020). On the ground | MOSAICC | Food and Agriculture Organization of the United Nations: http://www.fao.org/in-action/mosaicc/on-the-ground/en/
22. FAO. (n.d.-a). CLIMWAT | Land & Water | Food and Agriculture Organization of the United Nations | Land & Water | Food and Agriculture Organization of the United Nations: http://www.fao.org/land-water/databases-and-software/climwat-for-cropwat/en/
23. FAO. (n.d.-b). CropWat | Land & Water | Food and Agriculture Organization of the

Section - 8
KSA Fourth National Communication (NC4) 252
United Nations | Land & Water | Food and Agriculture Organization of the United Nations: http://www.fao.org/land-water/databases-and-software/cropwat/en/
24. Faridi, M. R., & Sulphey, M. M. (2019). Food security as a prelude to sustainability: a case study in the agricultural sector, its impacts on the Al Kharj community in The Kingdom of Saudi Arabia. Entrepreneurship and Sustainability Issues, 6(3), 1536–1545. https://ideas.repec.org/a/ssi/jouesi/v6y2019i3p1536-1545.html
25. FBN. (2020). Saudi Vision 2030: KSA’s food security in focus. Food and Beverage Networker. https://www.fandbnetworker.com/feat-iss-1-20-ksas-food-security-in
26. Fiaz, S., Noor, M. A., & Aldosri, F. O. (2018). Achieving food security in the Kingdom of Saudi Arabia through innovation: Potential role of agricultural extension. Journal of the Saudi Society of Agricultural Sciences, 17(4), 365–375. https://doi.org/10.1016/j.jssas.2016.09.001
27. General Authority for Statistics. (2015). Statistical yearbook of 2014 (No. 50). Kingdom of Saudi Arabia. https://www.stats.gov.sa/en/795
28. General Authority for Statistics. (2019). Statistical Yearbook of 2018 (No. 54). Kingdom of Saudi Arabia. https://www.stats.gov.sa/en/1006
29. Grossberger, A., Hadar, Y., Borch, T., & Chefetz, B. (2014). Biodegradability of pharmaceutical compounds in agricultural soils irrigated with treated wastewater. Environmental Pollution, 185, 168–177. https://doi.org/10.1016/j.envpol.2013.10.038
30. Health Effects Institute. (2019). State of Global Air 2019. https://www.stateofglobalair.org/data/#/air/table
31. Helmecke, M., Fries, E., & Schulte, C. (2020). Regulating water reuse for agricultural irrigation: risks related to organic micro-contaminants. Environmental Sciences Europe, 32(1), 4. https://doi.org/10.1186/s12302-019-0283-0
32. Khalil, M., Butenhoff, C., & Harrison, R. (2018). Ozone balances in urban Saudi Arabia. Npj Climate and Atmospheric Science, 1 https://doi.org/10.1038/s41612-018-0034-8
33. Kuik, O., Reynès, F., Delobel, F., & Bernardi, M. (2011). FAO-MOSAICC: The Fao Modelling System For Agricultural Impacts Of Climate Change To Support Decision-Making In Adaptation. http://www.fao.org/3/a-be787e.pdf
34. Lal, S., Venkataramani, S., Naja, M., Kuniyal, J. C., Mandal, T. K., Bhuyan, P. K., Kumari, K. M., Tripathi, S. N., Sarkar, U., Das, T., Swamy, Y. V., Gopal, K. R., Gadhavi, H., & Kumar, M. K. S. (2017). Loss of crop yields in India due to surface ozone: an estimation based on a network of observations. Environmental Science and Pollution

Section - 8
KSA Fourth National Communication (NC4) 253
Research International, 24(26), 20972–20981. https://doi.org/10.1007/s11356-017-9729-3
35. Latham, A. D. M., Latham, M. C., Cieraad, E., Tompkins, D. M., & Warburton, B. (2015). Climate change turns up the heat on vertebrate pest control. Biological Invasions, 17(10), 2821–2829. https://doi.org/10.1007/s10530-015-0931-2
36. Lippman, T. W. (2012). Saudi Arabia on the Edge The Uncertain Future of an American Ally (1st ed..). Washington, D.C.: Potomac Books.
37. Lyddon, C. (2020). Focus on Saudi Arabia: https://www.world-grain.com/articles/13420-focus-on-saudi-arabia
38. Market Research Saudi. (2019). 1.6 Million Saudi Riyal to Support Saudi Farmers Going Organic. Market Research Saudi. https://www.marketresearchsaudi.com/insight/million-riyal-to-support-saudi-farmers-going-organic
39. Mbow, C., Rosenzweig, C., Barioni, L. G., Benton, T. G., Herrero, M., Krishnapillai, M., Liwenga, E., Pradhan, P., Rivera-Ferre, M. G., Sapkota, T., Tubiello, F. N., & Xu, Y. (2019). Chapter Five: Food Security. In: Climate Change and Land: an IPCC special report on climate change, desertification, land degradation, sustainable land management, food security, and greenhouse gas fluxes in terrestrial ecosystems [P.R. Shukla, J. Skea, E. Calvo Buendia, V. Masson-Delmotte, H.-O. Pörtner, D.C. Roberts, P. Zhai, R. Slade, S. Connors, R. van Diemen, M. Ferrat, E. Haughey, S. Luz, S. Neogi, M. Pathak, J. Petzold, J. Portugal Pereira, P. Vyas, E. Huntley, K. Kissick, M. Belkacemi, J. Malley, (eds.)]. In press. IPCC. https://www.ipcc.ch/srccl/chapter/chapter-5/
40. Mekonnen, M. M., & Hoekstra, A. Y. (2011). The green, blue and grey water footprint of crops and derived crop products. Hydrology and Earth System Sciences, 15(5), 1577–1600. https://doi.org/10.5194/hess-15-1577-2011
41. MEWA. (n.d.). National Transformation Program Delivery Plan 2018-2020. Kingdom of Saudi Arabia. https://vision2030.gov.sa/sites/default/files/attachments/NTP%20English%20Public%20Document_2810.pdf
42. Paudel, I., Bar-Tal, A., Levy, G. J., Rotbart, N., Ephrath, J. E., & Cohen, S. (2018). Treated wastewater irrigation: Soil variables and grapefruit tree performance. Agricultural Water Management, 204, 126–137. https://doi.org/10.1016/j.agwat.2018.04.006
43. Porter, W. C., Khalil, M. A. K., Butenhoff, C. L., Almazroui, M., Al-Khalaf, A. K., & Al-Sahafi, M. S. (2014). Annual and weekly patterns of ozone and particulate matter in Jeddah, Saudi Arabia. Journal of the Air & Waste Management Association, 64(7), 817–826. https://doi.org/10.1080/10962247.2014.893931
44. Rojas-Downing, M. M., Nejadhashemi, A. P., Harrigan, T., & Woznicki, S. A. (2017).
https://vision2030.gov.sa/sites/default/files/attachments/NTP%20English%20Public%20Document_2810.pdf

Section - 8
KSA Fourth National Communication (NC4) 254
Climate change and livestock: Impacts, adaptation, and mitigation. Climate Risk Management, 16, 145–163. https://doi.org/10.1016/j.crm.2017.02.001
45. Tian, Y., Zheng, C., Chen, J., Chen, C., Deng, A., Song, Z., Zhang, B., & Zhang, W. (2014). Climatic warming increases winter wheat yield but reduces grain nitrogen concentration in east China. PloS One, 9(4), e95108. https://doi.org/10.1371/journal.pone.0095108
46. Tripathi, A., Tripathi, D. K., Chauhan, D. K., Kumar, N., & Singh, G. S. (2016). Paradigms of climate change impacts on some major food sources of the world: A review on current knowledge and future prospects. Agriculture, Ecosystems & Environment, 216, 356–373. https://doi.org/10.1016/j.agee.2015.09.034
47. Urbano, V. R., Mendonça, T. G., Bastos, R. G., & Souza, C. F. (2017). Effects of treated wastewater irrigation on soil properties and lettuce yield. Agricultural Water Management, 181, 108–115. https://doi.org/10.1016/j.agwat.2016.12.001
48. US EPA. (2005). Water Recycling and Reuse: The Environmental Benefits. In Water Encyclopedia (pp. 610–613). American Cancer Society. https://doi.org/10.1002/047147844X.wr2155
49. Wang, Y., Wang, X., Li, M., Dong, J., Sun, C., & Chen, G. (2018). Removal of Pharmaceutical and Personal Care Products (PPCPs) from Municipal Waste Water with Integrated Membrane Systems, MBR-RO/NF. International Journal of Environmental Research and Public Health, 15(2). https://doi.org/10.3390/ijerph15020269
50. Wataru Yamori. (2016). Chapter 9 - photosynthesis and respiration (Toyoki Kozai, Genhua Niu, & M. Takagaki, Eds.; pp. 141–150). Academic Press. https://doi.org/https://doi.org/10.1016/B978-0-12-801775-3.00009-3
51. Williams, C. F., & McLain, J. E. T. (2012). Soil persistence and fate of carbamazepine, lincomycin, caffeine, and ibuprofen from wastewater reuse. Journal of Environmental Quality, 41(5), 1473–1480. https://doi.org/10.2134/jeq2011.0353
52. Williams, J. B., Shobrak, M., Wilms, T. M., Arif, I. A., & Khan, H. A. (2012). Climate change & animals in Saudi Arabia. Saudi Journal of Biological Science, 19(2), 121–130. https://doi.org/10.1016/j.sjbs.2011.12.004
53. Ziska, L. H., Bradley, B. A., Wallace, R. D., Bargeron, C. T., LaForest, J. H., Choudhury, R. A., Garrett, K. A., & Vega, F. E. (2018). Climate Change, Carbon Dioxide, and Pest Biology, Managing the Future: Coffee as a Case Study. Agronomy, 8(8), 152. https://doi.org/10.3390/agronomy8080152

Section - 9
KSA Fourth National Communication (NC4)
SECTION 9
Climate Change Research, Education, Training, Capacity Building and Public
Awareness

Section - 9
KSA Fourth National Communication (NC4) i
TABLE OF CONTENTS
Section Title Page 9.1 Introduction 255 9.2 Saudi Vision 2030 255 9.3 Educational system of the Kingdom of Saudi Arabia 256
9.4 Climate Change Research, Education, Training, Capacity Building and Public Awareness in Saudi Arabia 256
9.4.1 Universities, Research Centres and Technology Transfer Entities 256 9.4.1.1 Renewable Energy Research Centers 257 9.4.1.1.1 Other Climate Change Related Research 258 9.4.1.2 Educational Programmes in Renewable Energy 260 9.5 Assessment of Capacity Building Needs and Barrier Analysis 261 9.5.1 Education 261 9.5.2 Training 261 9.5.3 Public Awareness 262 9.6 Summary 262 References 263
LIST OF TABLES
Section Title Page
9.1 Renewable Energy Research Centers in the Kingdom of Saudi Arabia 257
9.2 Educational Programs in Renewable Energy Sector in the Kingdom of Saudi Arabia 261

Section - 9
KSA Fourth National Communication (NC4) 255
Section 9: Climate Change Research, Education, Training, Capacity Building and Public Awareness
9.1 Introduction:
The third objective of the Tenth five-year development plan of the Kingdom of Saudi Arabia which outlines the decision to “transition to a knowledge-based economy and a knowledge society”, through the dissemination of knowledge, knowledge utilization, knowledge generation and knowledge management.
Education is identified as a critical component and a catalyst of the nation's overall response to climate change. The relevance of research, education, training, capacity building and public awareness in addressing climate change is internationally acknowledged and recognized in Article 6 of the United Nations Framework Convention on Climate Change ("UNFCCC") which urges Parties to promote (i) the development and implementation of educational and public awareness programmes on climate change and its effects; (ii) public access to information on climate change and its effects; (iii) public participation in addressing climate change and its effects and developing adequate responses; and (iv) training of scientific, technical and managerial personnel. It also encourages Parties to cooperate in and promote, at the international level, and, where appropriate, using existing bodies through: (i) the development and exchange of educational and public awareness material on climate change and its effects; and (ii) the development and implementation of education and training programmes, including the strengthening of national institutions.
Pursuant to Articles 11, 12 and 13 of the Paris Agreement, governments across the world agreed to educate, empower, and engage all stakeholders and major groups in education, training and public awareness programs in the area of climate change. Moreover, the 13th Goal of the UN 2030 Agenda for Sustainable Development, called for amongst others, the “improvement of education, awareness-raising, human and institutional capacity on climate change mitigation, adaptation, impact reduction and early warning”. Training and capacity building are central to the climate change awareness process and thus requires some collaborative efforts from all stakeholders (government, private sector, and non-government bodies).
9.2 Saudi Vision 2030
In April 2016, the government of Saudi Arabia adopted its new transformation plan named "The Saudi Vision 2030" which is an ambitious, yet achievable blueprint for building a vibrant society, a thriving economy and an ambitious nation. In pursuant of its goal of establishing “a vibrant society with fulfilling lives”, Saudi Vision 2030, has an objective of achieving environmental sustainability. This will be done by preserving natural resources and to fulfill Islamic, human and moral duties.
The Saudi 2030 Vision seeks to safeguard environment by increasing the efficiency of waste management, reducing all types of pollution and fighting desertification. It called for the optimal use of water resources by reducing consumption and utilizing treated and renewable water. Efforts will be made to protect and rehabilitate the beautiful beaches, natural reserves and islands, making them open for everyone.

Section - 9
KSA Fourth National Communication (NC4) 256
9.3 Educational system of the Kingdom of Saudi Arabia
The emergence of a structured system of education in the Kingdom dates back to the year 1925, when the Directorate of Knowledge was created. In 1953 the Ministry of Knowledge was formed and entrusted with the responsibility of planning and supervising education for boys. In 1960, the General Presidency for Girls Education was established and annexed to the Ministry of Knowledge in 2002. In 2003, the name of the Ministry of Knowledge was changed to the Ministry of Education.
The Tenth Development Plan (2015-2019) focused on a number of fundamental policy developments that laid the basis for a move toward a knowledge-based economy. The Plan underscores the central role of education in achieving and strengthening human resources development, since education expands the scope of options available to citizens to gain knowledge and acquire skills, thus enabling them to benefit from the capabilities they acquire. It envisages the creation of an integrated, comprehensive educational system that will strive to lay out solid foundations for general education, with the help of well-trained, highly qualified education professionals who can develop students' capabilities and help them acquire different types of skills.
9.4 Climate Change Research, Education, Training, Capacity Building and Public Awareness in Saudi Arabia
Presently, there are research centers attached to the universities which undertake and implement climate change and related research programmes.
9.4.1 Universities, Research Centres and Technology Transfer Entities
To address the limitations and constraints of the traditional technology transfer regime in facilitating knowledge spillovers and technology transfer, three companies were established in the Kingdom: Dhahran Techno Valley (DTV) in King Fahd University of Petroleum and Minerals (KFUPM), Dhahran; Wadi Jeddah in King Abdulaziz University (KAU), Jeddah and Riyadh Techno Valley in King Saud University (KSU), Riyadh. The DTV science park encompasses R&D centers of national and multinational corporations committed to R&D. The Riyadh Techno Valley aims to satisfy the demands of the knowledge-based industries and to commercialize its research findings. The Wadi Jeddah Company focuses on knowledge-based investment to establish and operate an economic model.
The Kingdom has been following continuously increasing engagement in scientific and technological development between Saudi universities and research organizations and international counterparts. The Ministry of Education established many centers of research excellence in Saudi universities in different areas including renewable energy, water desalination, climate change and nanotechnology.
Research and Development (R&D) is specifically critical in helping Saudi Arabia achieve its long-term goals. One of the Kingdom’s goals as stated in the Saudi Vision 2030 is to be among the top 10 countries in Global Competitiveness Index by 2030. In recognition of the importance of strengthening the R&D ecosystem in Saudi Arabia by supporting universities and collaborating with different stakeholders, adequate budget has been allocated to this important program through the Ministry of Education. Renewable energy, energy efficiency, and industry

Section - 9
KSA Fourth National Communication (NC4) 257
in the energy sector are the top most R&D priorities of the country (Ministry of Education, 2020). Besides, the National Science, Technology and Innovation Plan (NSTIP) or the MAARIFAH program for research was initiated by KACST with the strategic objective of promoting a research environment in Saudi universities (Ministry of Education, 2016).
9.4.1.1 Renewable Energy Research Centers:
To facilitate research, and development in the renewable energy sector, the Kingdom established several research centers at different universities (Table 9.1). The KAUST Solar Center (KSC) at King Abdullah University for Science and Technology (KAUST) aims to create new science and technology in the field of solar energy conversion, providing an environment for interdisciplinary research, training and innovation for the benefit of society. It is one of the emerging centers for photovoltaic technologies, from materials design, modeling, and synthesis, characterization to processing and solar cell fabrication, and solar hydrogen production. It hosted several collaborative projects with international research partners, including the University of Toronto, UC Berkeley, North Carolina State University, and the Max Planck Institute for Polymer Research in Germany. The center also facilitates business start-ups in the field of solar energy. The NOMADD Desert Solutions, a KAUST spinout company, is a leading PV cleaning system that enhances the efficiency of PV systems. Another similar spinout company of KAUST is ‘iyris’ that turns any window into solar panels. The Center of Research Excellence in Renewable Energy in King Fahd University of Petroleum & Minerals and Center of Research Excellence in Renewable Energy and Power Systems in King Abdulaziz University, work to develop current and emerging sustainable, renewable energy technologies through distinguished research, in pursuit of Saudi Vision 2030. Furthermore, there are several public and private organizations including the SEC, which work in the area of the renewable energy sector. Almost all the mentioned research centers collaborate with world-renowned renewable energy research and development entities.
Table 9.1: Renewable Energy Research Centers in the Kingdom of Saudi Arabia
S. No. Institution Centre
1 King Abdullah University of Science & Technology
KAUST Solar Center
2 King Fahd University of Petroleum & Minerals
Center of Research Excellence in Renewable Energy
3 King Saud University Sustainable Energy Technologies Center
4 King Abdulaziz University Center of Research Excellence in Renewable Energy and Power Systems
5 Saudi Electricity Company Research Center of Renewable and Energy Storage
6 Mishkat Interactive Center Center for Atomic and Renewable Energy

Section - 9
KSA Fourth National Communication (NC4) 258
9.4.1.1.1 Other Climate Change Related Research:
(i) King Abdullah University for Science and Technology (KAUST)
KAUST strives towards science-based solutions and better understanding of the risks and challenges associated with climate change. KAUST scientists are focusing on synthesizing new and advanced materials that can pave the way for efficient and cost-effective Carbon Capture and Sequestration operations. The University also offers special seminars on Environmental Sustainability where students learn about fundamental aspects of sustainability, energy cycles and carbon cycle, emissions and sequestration (KAUST, 2016).
King Abdullah University of Science and Technology (KAUST) is at the forefront of diversified research and development activities related to some major research areas which support climate change mitigation co-benefits. A cooling system developed by a research team at KAUST has improved the efficiency of a prototype solar PV panel by up to 20 percent and requires no external energy source to operate. The research team used a polymer developed by the same institution that absorbs water from the atmosphere to run PV panels in hot climates (Li, Shi, Wu, Hong, & Wang, 2020).
KAUST Water Desalination and Reuse Research Center worked on anti-fouling materials at their disposal and methods for discouraging the buildup of biofouling species on membranes during desalination as their presence affect freshwater production. A KAUST team developed the 3D solar-steam generator, which works with near-perfect energy efficiency, and could be used in an environmentally friendly way to turn seawater into drinking water, as well as to treat and clean wastewater (Shi, Li, et al., 2018). A multifunctional device that captures the heat shed by solar PV panels has been developed by KAUST and used to generate clean drinking water as a way to simultaneously generate electricity and water using only renewable energy (Wang et al., 2019). A research team at KAUST developed the solar photothermal distillation devices that can convert sunlight into heat. When placed upon a typical sample of liquid brine, these photothermal devices can evaporate water with 90 percent energy efficiency. These new distillation devices can better recycle contaminants produced by a desalination plant to dramatically reduce waste (Shi, Zhang, et al., 2018).
The Clean Combustion Research Center (CCRC) at KAUST is one of the world’s leading combustion research facilities. In response to the growing action to mitigate climate change and reduce the Kingdom's reliance on fossil fuels, combustion research is moving into uncharted territory, e.g., extreme conditions. The center led the way of combustion research by building groundbreaking facilities; recruiting leading researchers and faculty; and creating strong industrial partnerships. The center collaborated the 10-year project, FUELCOM, with Saudi Aramco in 2013. The project aims to develop new hydrocarbon-based fuels for the engines of the future; pollution mitigation and a drive for higher efficiency will demand fuel combustion in increasingly extreme conditions. In 2013, the CCRC introduced a cloud-based cyberinfrastructure, CloudFlame, for managing combustion research and enabling collaborations in order to aid data sharing and promote collaboration. In this regard, the center utilizes the KAUST supercomputer. Among many potential solutions, one possibility is to convert photons to electrons and electrons to fuels. The hydrocarbon molecules are the wonderful energy storage molecules and it is hard to beat the energy density of a hydrocarbon,

Section - 9
KSA Fourth National Communication (NC4) 259
so for the commercial sector, natural gas will continue to dominate. A research team at KAUST developed a technique of modeling the combustion characteristics of gasoline blended with biofuels. Their developed fuels are less polluting and better performing (Lee et al., 2017). The CCRC works on how the carbon dioxide that is emitted can go from a waste to value product. The researchers are putting their efforts in turning waste products into energy sources or creating materials. Advanced modes of combustion that are controlled by plasma discharges to boost combustion efficiency could become key components of the circular carbon economy. Besides, another team of researchers is investigating the control of combustion for reducing emissions (Lacoste, Moeck, Roberts, Chung, & Cha, 2017). The shift to a future marked by carbon-free renewable energy sources as societies seek to end the reliance on fire. In response, the center researchers are researching electrically generated plasmas as the future of chemical synthesis and manufacturing to replace combustion-driven processes. A team of KAUST Catalysis Center recently gained insights that could significantly enhance the performance of catalysts that convert methanol into major chemical feedstock called olefins. Their work is helping to make more efficiently enabled olefin production from coal and natural gas, alleviating a bottleneck in olefin supply (Yarulina, Chowdhury, Meirer, Weckhuysen, & Gascon, 2018).
The researchers of KAUST and the University of South Florida developed metal-organic framework (MOF) material for carbon capture and separation and the Advanced Membranes and Porous Materials Center (AMPMC) at KAUST developed membranes and porous materials for separations in many fields including carbon capture. The Clean Combustion Research Center (CCRC) at KAUST aims to improve conventional processes such as hydrocarbon fuels gasification to obtain hydrogen or hydrogen-rich fuels, while capturing the carbon for sequestration or use in high value-added materials. The center has been conducting research for developing simple, cost-effective processes for supplying clean energy by combustion, partial oxidation, or other means relying on chemical energy conversion.
(ii) King Fahd University of Petroleum & Minerals (KFUPM)
KFUPM established different kinds of research entities which are continuously enhancing the capability of the Kingdom to generate climate change mitigation co-benefits. It has been supporting many research projects pertinent to rational use of energy and renewable energy sources. The Center for Clean Water and Clean Energy was established as a partnership between the Massachusetts Institute of Technology (MIT) and KFUPM and the research resulted in more than 20 intellectual properties and 3 technologies developed in water related developmental activities. KFUPM in collaboration with King Abdulaziz City for Science and Technology (KACST) has been conducting research related to carbon capture, storage, and utilization.
The national R&D on carbon capture, storage, and utilization include: (i) development of carbon capture technologies using biological processes, (ii) utilization of CO2 to produce syngas, (iii) utilization of CO2 as regenerative agent to increase the commercial potential of methane dry reforming, (iv) utilization of CO2 to produce oxygenates and hydrocarbons, (v) development of novel CO2 adsorbent materials in the form of thin-film membranes, (vi) development of O2 carrier for chemical-looping combustion to be used for liquid fuel based power plants and (vii) development of efficient nanocomposite membranes for gas separation in steam at high temperatures.
Section - 9
KSA Fourth National Communication (NC4) 260
(iii) King Abdulaziz University (KAU), Jeddah - Center of Excellence for Climate Change Research (CECCR)
This center is located within King Abdulaziz University, Jeddah and has the mission of conducting research on climate change and its possible impacts on the society and to provide consultations for the decision makers in the Kingdom of Saudi Arabia. The principal research areas of the Center include:
Modeling weather and climate. Assessing coupled interactions between the atmosphere and the oceans. Developing indices for detecting climate change signals. Studying the global climate change and its impacts for Saudi Arabia. Analyzing the extremes of the climate for Arabian Peninsula. The center is working on developing a detailed climate database for Saudi Arabia that can be used to perform applications-oriented studies. Future research activities include the provision of the necessary scientific support and guidance for the domestic and regional policy makers for adaptation to climate change impacts (CECCR, 2016).
(iv) Prince Sultan Institute for Environmental, Water and Desert Research
This institute is attached to King Saud University, Riyadh. The center engages with the vital issues connected with the general aridity of its desert environment. The center's goal is to design and conduct scientific research pertaining to desert development, and combating desertification in the Arabian Peninsula, particularly Saudi Arabia.
(v) King Abdul-Aziz City for Science and Technology ("KACST")
KACST has a Technology and Innovation Center (TIC) for carbon capture and Sequestration. The scientific vision of the KACST-TIC on CCS at King Fahd University of Petroleum and Minerals (KFUPM) is to be regionally recognized center for transforming fundamental research into technology development in the area of CCS for contributing to the technology-based, clean environment of Saudi Arabia.
9.4.1.2 Educational Programmes in Renewable Energy:
There are several educational programs to train and build leaders in renewable energy sector (Table 9.2). For example, Electrical Engineering Department of the King Fahd University of Petroleum & Minerals offers Master of Engineering in Sustainable and Renewable Energy. The objective of the program is to enable professionals and leaders to address the challenges of transforming the electric energy sector of the Kingdom into a highly efficient, sustainable, and reliable entity.

Section - 9
KSA Fourth National Communication (NC4) 261
Table 9.2: Educational Programs in Renewable Energy Sector in the Kingdom of Saudi Arabia
S. No. Program Name Institution
1 Master of Engineering in Sustainable and Renewable Energy
King Fahd University of Petroleum & Minerals
2 Master of Science in Energy Engineering Effat University
3 Master of Science in Renewable Energy King Saud University
4 Master of Science in Renewable Energy Engineering Qassim University
5 Mechanical and Energy Engineering Program
Imam Abdulrahman bin Faisal University
KFUPM graduate students started the development of a remote-controlled solar car (Wahj-1) as part of their graduation project in 2010 that was the first car to be manufactured in the Kingdom of Saudi Arabia. Then, it was updated several times and the third-generation solar car “Wahj-3” participated in a car race in the World Solar Challenge 2015 in Australia. The cruising speed of the vehicle was 80 km/h and the maximum speed was 140 km/h (KFUPM, 2015).
9.5 Assessment of Capacity Building Needs and Barrier Analysis
The Kingdom is making sustained effort to develop and implement educational, training and public awareness programs on climate change and its effects.
9.5.1 Education
The subject of climate change is reflected in the educational system of the Kingdom as a whole, there are some universities and research institutions in the Kingdom that have already started some programmes on climate change impacts on the ecological and socio-economic systems. This underscores the determination of the government to address this issue in a more effective and systematic manner.
9.5.2 Training
The implementation of climate change training activities in the Kingdom is progressing steadily and all efforts are being made to develop training programmes for national experts on climate change issues with special emphasis on impacts of climate change response measures on the economy of the Kingdom, vulnerability and biophysical impacts analysis and adaptation measures for vulnerable sectors of the economy such as water resources, agriculture etc. as well strategies for enhancing mitigation co-benefits of economic diversification programmes and actions.

Section - 9
KSA Fourth National Communication (NC4) 262
9.5.3 Public Awareness
Public access to knowledge considered an important prerequisite for a successful climate change adaptation and mitigation co-benefit programmes and actions. Hence, public awareness is a key component in building national capacity for addressing the opportunities and challenges posed by climate change. However, the creation of sustained public awareness programmes is still in its early stage in the Kingdom and needs continued development and monitoring. There is a need for targeted awareness initiatives such as campaigns, workshops, seminars for specific stakeholders. Moreover, public participation is an effective means for raising public awareness and enhancing the capacity building in the area of climate change and all relevant stakeholders would be engaged to the extent possible. These collaborative initiatives would have a significant impact in achieving better environmental and climate change management practices in the Kingdom.
9.6 Summary
There are sustained efforts by the government bodies and institutions to raise the awareness of energy use and water management related issues in the residential, commercial and industrial sectors that have relevance to climate change.
To enhance the achievement of the economic diversification and national sustainable development priorities of the Kingdom through the implementation of its five-year national development plans and Saudi Vision 2030, the government would continue its stated plans of dedicating adequate resources and attention to raise the quality of education in the Kingdom including climate change education.

Section - 9
KSA Fourth National Communication (NC4) 263
References:
1. CECCR, (2016): Center of Excellence for Climate Change Research of the King Abdulaziz University https://ceccr.kau.edu.sa/Default-902-EN
2. CCRC, (2016): The Clean Combustion Research Center of the King Abdullah University for Science and Technology https://ccrc.kaust.edu.sa/
3. KACST, (2015): Education in Saudi Arabia (Chapter 5) In: Transition to Knowledge Society in Saudi Arabia http://publications.kacst.edu.sa/SystemFiles/Books_Pdf/PDF_635518951661650873.pdf
4. KAUST, (2016): King Abdullah University for Science and Technology http://www.kaust.edu.sa/assets/courses/bese/bese-ense205-enviromental-sustainability-prof-kim-choon-ng-course-description.pdf
5. Ministry of Education, (2016). Research and Development Program. 6. Ministry of Education, (2020). R&D in the Kingdom. Retrieved Sept. 14, 2020:
https://rdo.moe.gov.sa/en/AbouttheProgram/Pages/RandDintheKingdom.aspx
7. Lee, C., Ahmed, A., Nasir, E. F., Badra, J., Kalghatgi, G., Sarathy, S. M., Farooq, A. (2017). Autoignition characteristics of oxygenated gasolines. Combustion and Flame, 186, 114–128. https://doi.org/10.1016/j.combustflame.2017.07.034
8. Li, R., Shi, Y., Wu, M., Hong, S., & Wang, P. (2020). Photovoltaic panel cooling by atmospheric water sorption–evaporation cycle. Nature Sustainability, 3(8), 636–643. https://doi.org/10.1038/s41893-020-0535-4
9. Lacoste, D. A., Moeck, J. P., Roberts, W. L., Chung, S. H., & Cha, M. S. (2017). Analysis of the step responses of laminar premixed flames to forcing by non-thermal plasma. Proceedings of the Combustion Institute, 36(3), 4145–4153. https://doi.org/10.1016/j.proci.2016.06.178
10. Shi, Y., Li, R., Jin, Y., Zhuo, S., Shi, L., Chang, J., Wang, P. (2018). A 3D Photothermal Structure toward Improved Energy Efficiency in Solar Steam Generation. Joule, 2(6), 1171–1186. https://doi.org/10.1016/j.joule.2018.03.013
11. Shi, Y., Zhang, C., Li, R., Zhuo, S., Jin, Y., Shi, L., Wang, P. (2018). Solar Evaporator with Controlled Salt Precipitation for Zero Liquid Discharge Desalination. Environmental Science and Technology. https://doi.org/10.1021/acs.est.8b03300
12. Wang, W., Shi, Y., Zhang, C., Hong, S., Shi, L., Chang, J., Wang, P. (2019). Simultaneous production of fresh water and electricity via multistage solar photovoltaic membrane distillation. Nature Communications, 10(1). https://doi.org/10.1038/s41467-019-10817-6
13. Yarulina, I., Chowdhury, A. D., Meirer, F., Weckhuysen, B. M., & Gascon, J. (2018). Recent trends and fundamental insights in the methanol-to-hydrocarbons process. Nature Catalysis. Nature Publishing Group. https://doi.org/10.1038/s41929-018-0078-5
Section - 10
KSA Fourth National Communication (NC4)
SECTION 10
Constraints and Gaps and Related Financial, Technical and Capacity Building Needs
Section - 10
KSA Fourth National Communication (NC4) i
TABLE OF CONTENTS
Section Title Page
10.1 Introduction 264 10.2 Natural Circumstances 264 10.3 National Inventories of Greenhouse Gases 264 10.3.1 Activity Data and Emission Factor 264 10.3.2 2006 IPCC Guidelines for GHG Inventories 265 10.4 Impact Analysis and Adaptation 265 10.4.1 Climate Change Impact Analysis on Water Resources 265
10.4.2 Climate Change Impact Analysis on Coastal and Marine Ecosystem 266
10.4.3 Climate Change Impact Analysis on Agriculture 266
10.5 Analysis of Socioeconomic Impacts of Response Measures and Policies 266
10.6 Steps to be taken to Address Article 12.1(b) of the UNFCCC and the Role of Economic Diversification to Address Climate Change Issues
267
References 268

Section - 10
KSA Fourth National Communication (NC4) 264
Section 10: Constraints and Gaps and related Financial, Technical and Capacity Building Needs
10.1 Introduction
The Kingdom of Saudi Arabia has made good progress in building its national capacities and capabilities at the individual, institutional and systemic levels in preparing high quality national communications on a sustainable basis. The chapter however provides an overview of some of the constraints and gaps and related financial, technical, and capacity needs that confront the effective implementation of the climate change activities including the preparation of national communications and other climate reports in Saudi Arabia. It is however worth acknowledging that the impacts of global COVID-19 pandemic on work delivery have been an important constraint on pace of work delivery with its resultant delays in finalizing this report.
10.2 National Circumstances
Some difficulties were encountered during the data and information collection and collation phases of writing the section on national circumstances. To address these constraints, the DNA will upgrade its data hub to serve as a repository to store and regularly update information related to all relevant sectors of the national economy of the Kingdom, particularly in areas of such national development priorities and directions like demography, education, health, natural resource management, agriculture, tourism and institutional arrangements.
10.3 National Inventories of Greenhouse Gases
The primary challenge confronting the development of national inventories of greenhouse gases is information and data-related. Specifically, these constraints and gaps include: non-existing or missing activity data; the predominant use of default emission factors, the use of tier 1 IPCC methodology for major categories; incomplete uncertainty assessment and missing sub-categories.
10.3.1 Activity Data and Emission Factors
Activity data for some of the major source categories in the energy sector are available from national and international entities and have been used consistently for estimating emissions using Tier 1 methodology. Currently, the Kingdom of Saudi Arabia has been using default emission factors since no country specific emission factors have been developed. However, activity data are still not sufficient for many source categories to adopt higher tier IPCC methodology. Capacity building support is required to facilitate the development of country specific emission factors for some source categories if higher tier methodology is adopted for all major IPCC disaggregated source categories in the energy sector.
As regards the Industrial Processes and Product Use sector, activity data (especially the production data at the plant level) must be collected as well as the need to develop country specific emission factors. For the Agriculture, Forestry and Other Land Use sector, activity data for some source categories are not available from national and international sources for some years for the estimation of emissions (and removals as appropriate) using Tier 1 methodology. More activity data are required for many source categories to enable the

Section - 10
KSA Fourth National Communication (NC4) 265
Kingdom adopt higher tier IPCC methodology. Appropriate country specific emissions factors have also not been estimated. Capacity building support is required to develop country specific emission factors for some source categories if higher tier methodology is to be adopted for the AFOLU sector, however in the absence of country specific emission factors, updated emission factors available from the IPCC emissions database could be used as appropriate.
For the waste sector, activity data are required for many source categories to enable the Kingdom adopt higher tier IPCC methodology. Country specific emissions factors have not been estimated and technical assistance is required to develop these emission factors for some specific source categories for tier 2 methodology, however it is feasible to use updated emission factors from the emission factors database as appropriate.
The IPCC model for solid waste management requires historical country specific information and data which is mostly not available, and country specific emissions factors are also yet to be developed. Hence capacity building support will be needed for activity data collection and for developing emissions factors for some specific source categories if higher tier methodology is to be adopted. Updated emission factors are also available for use as appropriate.
10.3.2 2006 IPCC Guidelines for GHG Inventories
Some difficulties encountered with regard to the use of the 2006 IPCC guidelines for GHG inventories, when the Kingdom switched over from the use of the 1996 Revised Guidelines to the use of the 2006 IPCC guidelines during this 2016 GHG inventory for NC4. However, these difficulties were largely resolved through the attendance of training workshops, as well as getting assistance from experts. There are still capacity building needs for enhancing the expertise of more national GHG inventory team members to familiarize themselves with the use of the 2006 IPCC Guidelines, particularly as it relates to the selection and application of appropriate methods based on 2006 IPCC Guidelines; reporting the results and documenting and archiving all relevant data and procedures.
Collaborating institutions and entities within the Kingdom of Saudi Arabia that are data providers must be assisted to develop data hubs to collect and collate information and data to submit them to the Designated National Authority (DNA). This is because, the reproducibility of GHG Inventory is a key factor in ensuring timely updating of GHG Inventories and the need to document and archive all information relating to the planning, preparation, and management of inventory activities.
10.4 Impact Analysis and Adaptation
10.4.1 Climate Change Impact Analysis on Water Resources
In analyzing the impact of climate change on agricultural water demands, access to detailed and updated information on the crop specific data and climatic parameters were critical. Data were obtained from the General Authority for Statistics (GASTAT), the Ministry of Environment, Water and Agriculture (MEWA) and published literature. Software-specific input parameter values were obtained from the Food and Agriculture Organization (FAO) database. However only some of these data was recent and most of them were rather historical, in particular, part of the data obtained from FAO reports. Additionally, it is important that detailed and updated information and data provided by GASTAT should be crop specific and cover all relevant regions of the Kingdom.

Section - 10
KSA Fourth National Communication (NC4) 266
To conduct water demand-supply optimization studies for different regions, the data on the domestic, urban and industrial demands, and the source specific supplies were obtained from the MEWA reports, Saline Water Conversion Corporation, published literature and personal communication. It is essential to develop a central hub to regularly collect and collate all relevant data and information to allow for regular updates of these studies thus allowing for preparation of vulnerability and assessment studies on a regular basis to inform decision and policy making in Saudi Arabia.
10.4.2 Climate Change Impact Analysis on Coastal and Marine Ecosystem
As regards the assessment of the impact of climate change (sea level rise) on coastal resources, there is a need for high-resolution satellite images for the coastal areas. Such images would allow for a clear picture of shoreline changes in the Kingdom over time. There was very little information on the coastal protection practices/methods used for coastal areas. For a complete overview of the impact of sea-level rise in the Kingdom, substantial knowledge of the coastal protection practices/methods used on the coastal areas of the kingdom would be required. There is also the need for information on the status and resulting effects of coastal protection practices/methods on sea-level rise, flooding, and the coastal regions and infrastructures. This information is critical in providing a clearer depiction of the possible impacts of climate change on coastal and marine resources and the environment people.
10.4.3 Climate Change Impact Analysis on Agriculture
There is a need for consistent data on agricultural products by type and year. Regarding assessment of the impact of climate change on agriculture and food production, information and data on agricultural production are required for each province/region of the Kingdom.
Climate change impact slightly differs for region to region, which depends on the effect of climate change on the physical properties of soil, water, and other factors that contribute to agricultural growth. Information is needed on agricultural production at the regional levels to enable assessment of climate change impact regionally and nationally. There is a need for information on the crop planting seasons and locations for a comprehensive analysis on the impact of climate change on agriculture based on climate change effect on soil properties of the precise planting location.
10.5 Analysis of Socioeconomic Impacts of Response Measures and Policies
Several models have been used to estimate the impact of climate mitigation activities on the economy of oil exporting countries to varying degrees of success. They include (i) the Dynamic Panel Model (Dike, 2014), (ii) G-cubed model (McKibbin et. al., 2011, McKibbin et. al., 2015), (iii) OPEC World Energy model (Ghanem et al., 1999); and (iv) MS-MRT model (Bernstein et al., 1999). The Multi-Sector Multi-Region Trade (MS-MRT) model has specifically been used to address questions about the economic and trade impacts of climate change policies. The sectoral disaggregation of this model makes it a suitable tool for considering diversification away from fuel-consuming and producing sectors. Therefore, the model is relevant in analyzing the socio-economic impacts of climate change mitigation policies, as well as for analyzing economic diversification. The MS-MRT model along with the other models projected a positive relationship between global crude oil prices and carbon intensity of production and

Section - 10
KSA Fourth National Communication (NC4) 267
hence the linkages between crude oil prices and climate change mitigation activities both in the shorter and longer-term horizons.
However, the data sets required to effectively use these models is such that is quite extensive, hence lack of international cooperation in the development and use of models for quantitative ex-ante and ex-post analysis of impacts and co-benefits of the imposition outside of jurisdiction charges have been of concern to the Kingdom of Saudi Arabia. Efforts must therefore be made to address these concerns. International cooperation is also needed to develop appropriate financial risk management tools and approaches to address short-and long-term financial instability focusing on the impact of carbon tax on developing countries. Other needs of the Kingdom relate to provision of technical assistance to conduct rigorous and comprehensive scientific analysis to help model, predict and evaluate the impacts of carbon tax in countries that rely heavily on one sector for development including oil and gas exporters. Additionally, there is the need for international cooperation in the development and deployment of technological advances in the recovery and transformation of fossil fuels to energy in order to ensure that the usage of these resources will be environmentally sustainable with minimal impact to our environment and quality of life.
10.6 Steps to be taken to Address Article 12.1(b) of the UNFCCC and the Role of Economic Diversification to Address Climate Change Issues
There were some difficulties encountered in preparing the sections on the steps to be taken to address Article 12.1(b) of the UNFCCC and the role of Economic Diversification in addressing climate change issues in Saudi Arabia. The difficulties were essentially related to data and information collection, which were ultimately resolved.

Section - 10
KSA Fourth National Communication (NC4) 268
References:
1. Bernstein, P. M., Montgomery, W. D and Rutherford, T. F. (1999) “Global impacts of the Kyoto agreement: results from the MS-MRT model,” Resource and Energy Economics, vol. 21, no. 4, pp. 375–413.
2. Dike, J. C., (2014) "Does Climate Change Mitigation Activity Affect Crude Oil Prices? Evidence from Dynamic Panel Model", Journal of Energy, vol. 2014, Article ID 514029, 9 pages. https://www.hindawi.com/journals/jen/2014/514029/
3. Ghanem, S., Lounnas, R. and Brennand, G (1999). “The impact of emissions trading on OPEC,” OPEC Review June, vol. 23, no. 2, pp. 79–112.
4. McKibbin, W., A. Morris, and P. Wilcoxen (2011). Comparing Climate Commitments: A Model-Based Analysis of the Copenhagen Accord. Climate Change Economics, Vol. 2, No. 2, pp.79-103.
5. McKibbin, W. J., Morris, A., and Wilcoxen P. J. (2015). “Pricing Carbon” in COP21 in Paris: What to Expect – The Issues, the Actors, and the Road Ahead on Climate Change, pp. 14-18. The Brookings Institution, Washington DC.

Acronyms
KSA Fourth National Communication (NC4) i
ACRONYMS
AEZ Agro Ecological Zones Modeling Framework AFOLU Agriculture, Forestry and other Land Use AMPMC Advanced Membranes and Porous Materials Center AQUACROP A Crop Growth Model Developed by FAO Land and Water Division AR5 IPCC’S Fifth Assessment Report AV Autonomous Vehicles BCA Border Carbon Adjustment BCM Billion Cubic Meters BECC Bioenergy With Carbon Capture and Storage BLS Basic Linked System BM3 Billion Cubic Meters BTR Biennial Transparency Reports BTU British Thermal Units BUR Biennial Update Report CAFE Corporate Average Fuel Economy CCE Circular Carbon Economy CCRC Clean Combustion Research Center CCUS Carbon Capture, Utilization and Storage CCUSTRC Carbon Capture, Utilization and Storage Technology Research Centre CDKN Climate and Development Knowledge Network CDM Clean Development Mechanism CDSI Central Department of Statistics and Information CECCR Center of Excellence for Climate Change Research CEDA Council of Economic and Development Affairs CEM Clean Energy Ministerial CGE Computable General Equilibrium CH4 Methane CLIMWAT A Climatic Database for Irrigation Planning and Management CLS Carbon Labeling Scheme CO2 Carbon Di Oxide CO2eq Carbon Dioxide Equivalent COP Conference of Parties COVID 19 Coronavirus Disease 2019 CP Conference of Parties CROPWAT Software Used to Calculate Evapotranspiration, Crop Water and Irrigation
Requirement for Major Food Crops CSA Climate Smart Agriculture

Acronyms
KSA Fourth National Communication (NC4) ii
CSLF Carbon Sequestration Leadership Forum CSP Concentrated Solar Power CSU Carbon Storage Unit CWR Crop Water Requirement DACCS Direct Air Capture and Carbon Storage DALY Disability Adjusted Life Years DCGE Dynamic Computable General Equilibrium DNA Designated National Authority DO Dissolved Oxygen DOM Dissolved Organic Mater DOPA Dihydroxy Phenylalanine DTV Dhahran Techno Valley DW Desalinated Water ECRA Electricity & Co-Generation Regulatory Authority ECT Embodied Carbon Tariffs EEC European Economic Community EI Energy Intensity EMECS International Center for Environmental Management of Enclosed Coastal Seas
ENVI Software for Processing and Analyzing Geospatial Imagery EOR Enhanced Oil Recovery ESCO Energy Service Companies ETS Emission Trading Schemes EV Electric Vehicles EWS Early Warning Systems FAO Food and Agriculture Organization FLAASH Fast Line-Of-Sight Atmospheric Analysis of Spectral Hypercubes G20 Group of Twenty GAMEP General Authority of Meteorology and Environmental Protection GASTAT General Authority for Statistics GCC Gulf Cooperation Council GCCSI Global CCS Institute GCF Green Climate Fund GCM General Circulation Model GDP Gross Domestic Product GEF Global Environment Facility Gg Giga Gram GHG Greenhouse Gas GIS Geographic Information System

Acronyms
KSA Fourth National Communication (NC4) iii
GMI Global Methane Initiative GMSL Global Mean Sea Level GP Goal Programming Model GW Ground Water HAT Highest Astronomical Tide HDV Heavy Duty Vehicles HHR Haramain High Speed Rail ICTSD International Centre for Trade and Sustainable Development ICZMP Integrated Coastal Zone Management Plan IEA International Energy Agency IFPRI International Food Policy Research Institute IGES Institute For Global Environmental Strategies IMO International Maritime Organization INDC Intended Nationally Determined Contribution IPCC Intergovernmental Panel for Climate Change IRENA International Renewable Energy Agency ISBN International Standard Book Number ISIC4 International Standard Industrial Classification of all Economic Activities,
fourth version ITF International Transport Forum IUCN International Union for Conservation of Nature IWPP Independent Water and Power Producers JEC Jazan Economic City JOLF Jeddah Old Landfill JPTP Jeddah Public Transport Program KAUST King Abdullah University for Science and Technology KACARE King Abdullah City for Atomic and Renewable Energy KACST King Abdulaziz City for Science and Technology KAEC King Abdullah Economic City KAPSARC King Abdullah Petroleum Studies and Research Center KAU King Abdulaziz University KC Crop Growth Stage Coefficients KEC Knowledge Economic City KFUPM King Fahd University of Petroleum and Minerals Km Kilo Meter KSA Kingdom of Saudi Arabia KSC KAUST Solar Center KSU King Saud University LDV Light Duty Vehicles

Acronyms
KSA Fourth National Communication (NC4) iv
LED Light-Emitting Diode LINDO System Optimization Software LRT Light Rail Transportation MARAFIQ Power and Utility Company MAW Ministry of Agriculture and Water MCM Million Cubic Meters MED Multi-Effect Distillation MEIM Ministry of Energy, Industry, and Mineral Resources MEP Ministry of Economy and Planning MERS Middle East Respiratory Syndrome MEWA Ministry of Environment, Water and Agriculture MGI Middle East Green Initiative Mha Million Hectare MI Mission Innovation MIT Massachusetts Institute of Technology MJ Mega Joules MMRA Ministry of Municipal and Rural Affairs MODON Saudi Authority for Industrial Cities and Technology Zones MODTRAN4 Latest Version of MODTRAN for Modeling Atmospheric Radiation
Transport MOF Metal Organic Framework MOP Ministry of Planning MOSAICC The Modelling System for Agricultural Impacts of Climate Change MPA Marine Protected Areas MRT Multi-Region Trade MRV Measurement, Reporting and Verification MSF Multi Stage Flash MSL Mean Sea Level MS-MRT Multi-Sector Multi-Region Trade MW Mega Watt MWE Ministry of Water and Electricity N2O Nitrous Oxide NASA The U.S. National Aeronautics and Space Administration NC National Communication NC3 Third National Communication NC4 Fourth National Communication NDC Nationally Determined Contribution NET Negative Emissions Technologies NGA The U.S. National Geospatial-Intelligence Agency
Acronyms
KSA Fourth National Communication (NC4) v
NGV Natural Gas Vehicles NGW Non-Renewable Groundwater NIDLP National Industrial Development and Logistics Program, Saudi Vision 2030 NIR National Inventory Reports NOAA National Oceanic and Atmospheric Administration, USA NOMADD No Water Mechanical Automated Dusting Device NSTIP National Science, Technology and Innovation Plan NTP National Transformation Program NWC National Water Company OECD Organization For Economic Co-Operation and Development OGCI Oil & Gas Climate Initiative OLI Operational Land Imager OPEC Organization of Petroleum Exporting Countries PA Paris Agreement PERSGA Regional Organization for Conservation of The Environment of The Red
Sea and Gulf of Aden PET Potential Evapotranspiration PME Presidency of Meteorology and Environment POP Persistent Organic Pollutants PRECIS Providing Regional Climates for Impacts Studies (A Regional Climate
Modelling System) PV Photo Voltaic QA Quality Assurance QC Quality Control R&D Research and Development RCJY Royal Commission Jubail and Yanbu RCP Representative Concentration Pathway RER Renewable Energy Resources RH Relative Humidity RM Response Measures ROPME Regional Organization for Protection of Marine Environment SAMA Saudi Arabian Monetary Authority SAR Saudi Arabia Riyal SDG Sustainable Development Goals SEC Saudi Electricity Company SEEC Saudi Energy Efficiency Center SGI Saudi Green Initiative SIDS Small Island Developing States SLR Sea-Level Rise

Acronyms
KSA Fourth National Communication (NC4) vi
SOC Soil Organic Carbon SRTM Shuttle Radar Topography Mission SSYB Saudi Statistical Year Book SW Surface Water SWA Saudi Wildlife Authority SWCC Saudi Arabian Saline Water Conversion Corporation SWIR Short Wave Infrared TDS Total Dissolved Solids TGWh Thousand Gigawatt Hour TIC Technology and Innovation Center TIRS Thermal Infrared Sensor TRSDC The Red Sea Development Company TVTC Technical and Vocational Training Corporation TWh Terra Watt Hour TWW Treated Wastewater UAE United Arab Emirates UN United Nations UNCCD United Nations Convention to Combat Desertification UNCTAD United Nations Conference on Trade and Development UNDESA United Nations Department of Economic and Social Affairs UN-ECLAC United Nations Economic Commission for Latin America and the Caribbean UNEP United Nations Environment Programme UNESCO Un Education, Scientific and Cultural Organization UNESCWA United Nations Economic and Social Commission for Western Asia UNFCCC United Nations Framework Convention on Climate Change UNOCHA United Nations Office for The Coordination of Humanitarian Affairs US EPA United States Environmental Protection Agency USDA United States Department of Agriculture USGS United States Geological Survey UTM Universal Transverse Mercator VEEC Vehicle Energy Efficiency Card VRP Vision Realization Programs WABAL A Crop Specific Water Balance Model WBCSD World Business Council For Sustainable Development WCED World Commission on Environment and Development WGS World Geodetic System WHO World Trade Organization WTE Waste-To-Energy