Kingdom of saudi arabia report - Muhammad Azam Roomi
93
Kingdom of saudi arabia report 2017 - 18
-
Upload
khangminh22 -
Category
Documents
-
view
0 -
download
0
Transcript of Kingdom of saudi arabia report - Muhammad Azam Roomi
Kingdom of saudi arabia report
2017 -18
1.01.11.2
1.31.4
2223
242730
Perception of Societal Attitudes Related to EntrepreneurshipGeneral OverviewPerceptions of societal attitudes related to entrepreneurship by gender, age group, educational level, involvement in business sector, potential entrepreneurship and regionTemporal EvolutionInternational Position
Chapter One 0 1
5.05.15.25.35.45.55.65.75.85.95.10
909191939598
100102104104105
The Characteristics of EntrepreneursIntroductionGenderAge and Senior EntrepreneurshipProvinces and Regions within Saudi ArabiaEducational LevelWork StatusIncomeHouseholdTypical profile of the entrepreneur in Saudi Arabia and its recent evolutionInternational Position
Chapter Five 0 5
6.06.16.26.36.46.56.6
108109109110111113114
Informal Investment ActivityIntroductionEstimated Proportion of adult population acting as informal investorEstimated Amount of Informal InvestmentInformal Investors’ CharacteristicsRelationship Between Informal Investors and BeneficiariesInternational Position
Chapter Six 0 6
7.07.17.27.37.47.57.67.77.8
116117127130132133136138
146
Perception of the Quality of the National Entrepreneurship Framework ConditionsGeneral View of Entrepreneurship Framework ConditionsRecent evolution of the components of the Entrepreneurial Framework ConditionsSynthetic View of the National Entrepreneurial FrameworkRecent Evolution of the Entrepreneurial Framework Conditions for Saudi ArabiaInternational Position of the Saudi Arabian Entrepreneurial EcosystemMain Constraints on, and supports for, Entrepreneurship as determined by Saudi Arabian ExpertsMain Recommendations made by Saudi Arabia’s Experts to Improve the Entrepreneurial Ecosystem.Importance of the 12 entrepreneurial conditions in the status of the national framework, as assigned by Saudi Arabia’s experts
Chapter Seven 0 7
8.08.18.28.3
8.48.5
150151151152
154
158
Entrepreneurship and Family BusinessGeneral OverviewFamily Business In Saudi Arabia’s Entrepreneurial ProcessMain differences between individuals involved in family businesses and those involved in other business models regarding societal attitudes and individual self-perceptions about entrepreneurshipMain Features Of Saudi Arabian Family Businesses Compared To Other Business ModelsMain Features Of Saudi Arabian Family Business Entrepreneurs Compared To Those That Developed Other Business Models
Chapter Eight 0 8
9.09.19.29.39.49.5
160161161163164164
Entrepreneurship and OriginGeneral OverviewForeigners’ perception of societal attitudes related to entrepreneurship Foreigners’ individual self-perceptions about entrepreneurshipForeigners’ entrepreneurial activityMain features of foreigners’ entrepreneurial activity
Chapter Nine 0 9
10.010.110.210.3
166167167169
The Impact of The Dowry on Young Saudi’s Entrepreneurship DevelopmentIntroductionOpinion on the dowry as an obstacle to young entrepreneurshipOpinion on the dowry as an obstacle to young entrepreneurship according to socio-demographic characteristics
Chapter Ten 1 0
2.02.12.2
2.32.4
3233
343740
Individual Self-Perception About EntrepreneurshipGeneral OverviewIndividual self-perceptions about entrepreneurship by gender, age group, educational level, involvement in business sector, potential entrepreneurship and regionTemporal EvolutionInternational Position
Chapter Two 0 2
3.03.13.23.33.43.5
424344485155
Entrepreneurial and Business ActivityIntroductionGeneral OverviewTemporal EvolutionInternational PositionEntrepreneurial Employee Activity
Chapter Three 0 3
4.04.14.24.34.44.54.64.74.84.94.104.114.124.13
5859596364676971737576777981
Characteristics of Entrepreneurial ActivitiesIntroductionMotivation for early-stage entrepreneurial activitySector of ActivityNumber of OwnersNumber of EmployeesJob-Creation ExpectationsInnovation ComponentUsage of TechnologiesCompetitivenessinternationalizationSeed Capital InvestedMain Motive for Business Discontiuation in 2016 and 2017Main indicators for characteristics of early-stage entrepreneurial activities – interna-tional position
Chapter Four 0 4
Co
nt
en
ts 0 4
Dean Forward - A Saudi Arabian Initiative 0 6
Vice Chairman Forward
0 8Authoring and partnering institutions
1 0Introduction
1 4Executive Summary
1 7 2
1 7 5
1 7 8
1 8 2
1 8 4
Epilogue
Funding Organizations
Support Organizations
Technical Annex
Bibliograohy
4Vice-ChairmanForward GEM Report
20185
MBSC Vice-Chairman
Foreword
audi Arabia is going through an exciting transformation – social, cultural and economic.
Since the Babson Global Center for Entrepreneurial Leadership at MBSC first compiled the
GEM Saudi Arabia report last year, the nation has taken huge strides toward the objectives
laid out in Vision 2030. More importantly, the data this year show that the government is not
only talking a good game in terms of supporting new businesses: it is backing up that talk with
concrete action.
Perhaps the most visible impact has been on the leisure and tourism industry, which is being
invigorated through the government’s delivery of an ambitious calendar of entertainment
events, an overhaul of the regulatory framework and the encouragement of new areas of
cultural expression.
Yet this is just one area of economic activity that holds extraordinary potential for today’s
entrepreneurs. Elsewhere in the economy, the private sector is playing an increasingly central
role in bringing Vision 2030 and the whole spectrum of the National Transformation Program to
life with the active support and partnership of the government. This too creates opportunities
for new and young businesses to grow.
Last year we noted the need for improved institutional support to harness the capabilities of the
nation’s young entrepreneurs. We highlighted the need for clearer regulation, improved funding
options, and enhanced education. A year later, our data clearly shows that the regulatory
environment today is much more conducive to entrepreneurs. The Saudi population, and
especially the youth population, remain very positive in their attitude toward entrepreneurship
and their confidence that they can succeed. And improvements in the regulatory environment
have seen the country jump from near the bottom of the global ranking to mid-way up the
field. In future iterations of the study, we hope to see those regulatory improvements filtering
through to drive an increase in the nation’s rankings in financial support and education for
entrepreneurs.
As important as is it is to support entrepreneurs in starting a business, it is perhaps more
important to support them in maintaining and growing the business. The gap between the
number of people who begin their entrepreneurial journey and the number who are still on that
path three years later remains an area of concern. The government has done its part in amending
the regulatory environment and that work continues. It is now the responsibility of the private
sector to step up and do its part to support the aspirations of Saudi Arabia’s entrepreneurs.
Much has been done to improve the entrepreneurial ecosystem in Saudi Arabia. Much
remains to be done. The government cannot and should not be solely responsible for driving
entrepreneurship. Business and academia must now find new and innovative ways not only
to encourage more people to pursue their entrepreneurial ambitions but to provide the
investment, mentoring and education that entrepreneurs need if they are to drive the economy
of the future.
Mr. Fahad AL Rasheed
S
GEM Report6 72018Dean
Forward
The release of this report documents this significant historical era and it enhances its impact further,
especially given that it concedes with the passing of two years on the birth of vision 2030. This vision is
the result of the persistence we had witnessed by Crown Prince Mohammad bin Salman bin Abdulaziz
Al Saud, a vision that transformed the Kingdom over the past two years into a center filled with
economic development, pioneering initiatives, and life. This change was made through continuous hard
work and a steadfast dedication to achieving the goals Vision 2030 was founded on.
Through sound leadership, the Kingdom of Saudi Arabia was able to re-set its priorities in all aspects.
Within its journey towards transformation and development, the Kingdom now aligns its priorities with
the desired outcomes it hopes to achieve. Today, the economy in Saudi Arabia is founded on an outlook
of comprehensiveness, awareness, and sustainability. From another angle, this economy thrives on the
creation of a supportive environment for the entrepreneurial spirit and all what it encompasses.
Many creative initiatives were launched in Saudi Arabia, all of which were guided by sound practices
geared towards achieving sustainable economic development. Business structures were updated in the
kingdom and government practices were re-vamped in an aim to make the market more attractive to
entrepreneurial activities. Some initiatives taken by the Saudi Arabian government included, pumping
a total of SAR 72 million into the private sector and supporting small and medium enterprises (SMEs).
This particular segment is a valuable avenue for creating new jobs, enhancing economic performance,
and supporting innovation. It was this same outlook that strengthened the role of the private sector,
and this particular change was deemed a pivotal turning point serving the growth of the economy.
Aramco, for example, invested SAR 36 million in the support of the SME sector, and from another
angle, many Saudi Banks had launched innovative programs to further support entrepreneurial
activities.
There is no doubt that this report serves to place our Kingdom on the world map of entrepreneurship.
It effectively sheds light on our position amongst our peers. It also illuminates many angles through
which we can support entrepreneurship within our Saudi society and beyond, and it enables us to show
how we work within international standards and practices proven to be the best norms to follow.
Within this positive outlook, and this successful path towards elevating our standards, we strive to
move closer towards building an entrepreneurial ecosystem functioning in line with international
norms. We at the Prince Mohammad Bin Salman College (MBSC) of Business & Entrepreneurship strive
to form a qualitative transformation in this area. We strive to achieve this goal through launching
innovative supportive programs, educational opportunities, and academic experiences all of which
combine accumulated knowledge and practical implementation. From another angle, we strive to
foster an entrepreneurial mindset.
H.E. Dr. Nabeel Koshak
A Saudi Arabian Initiativen line with the birth of a new era in the Kingdom of Saudi Arabia, an era characterized by
monumental achievements and massive projects built on partnerships and new initiatives, and
within the harmonious interaction of all elements forming the pillars that the ambitious vision
of 2030 is founded on, we launch the new edition of the GEM Report for 2017, a report we are
proud to launch for the second consecutive year.
I
Dean of Prince Mohammad
Bin Salman College (MBSC) of Business
& Entrepreneurship
GEM Report2018
8 9Authoring And Partnering Institutions
AUTHORS
Partners
MBSC
MBSC is a new, private higher education
institution for both, men and women,
located in King Abdullah Economic City. It has
been established through an international
partnership between Emaar The Economic City,
Babson Global (a wholly owned subsidiary of
Babson College, USA), Lockheed Martin, and
.the MISK foundation
MBSC aims to develop a new generation of
transformative leaders who think creatively
and act boldly. The Kingdom needs more
job creators and not just job consumers.
MBSC is designed to fill this void by creating
.(®Entrepreneurs of All Kinds (EAK
by BGCEL at MBSC and the Global Entrepreneurship Research Association 2016 ©
The BGCEL at MBSC
The new Saudi Arabia GEM team is located
at BGCEL at MBSC. The Center is owned
and operated by Babson Global and was
established with a gift from Lockheed Martin.
The mission of BGCEL is to create a Saudi-
based international source of research,
entrepreneurship education, case studies,
conferences, outreach programs, and
information about entrepreneurial leadership
that promotes a sustainable entrepreneurial
leadership culture for business, government,
and not-for-profit enterprises in Saudi and the
.surrounding region
Lockheed Martin
Lockheed Martin Corporation, as part of its offset program in the KSA, generously supports the
.activities of BGCEL at MBSC
KAEC
King Abdullah Economic City (KAEC) is the largest privately-funded new city in the world. Situated
square kilometers 181 on the west coast of the Kingdom of Saudi Arabia, KAEC covers an area of
of land, approximately the size of Washington DC. KAEC comprises King Abdullah Port, the Coastal
Communities residential districts, the Industrial Valley and the Hejaz district, which includes the
Haramain high speed rail station. The city is under development by Emaar, The Economic City, a
.2006 publicly listed Saudi joint-stock company established in
DISCLAIMERS
Although GEM data were used in the preparation of this report, their interpretation and use are the sole
responsibility of the authors. The authors would like to express their gratitude to all participating GEM
national teams for their crucial role in conducting the GEM survey in their respective economies. 2016
The usual disclaimer applies. The authors would like to extend special thanks to Jonathan Carmona, Alicia
.Coduras, and Forrest Wright for their contribution to the data-collection procedures and data analysis
Amal Dokhan Director of Babson Global Center for
Entrepreneurial Leadership / Author and Report manager
Osama M. Ashri Director of Development and Strategic Alliances
Mohamed Bin Salman College for Business and Entrepreneurship
Founder of the Saudi Entrepreneurial Ecosystem Lab (SEE-LAB
Dr. Muhammad Azam RoomiVice Dean – Faculty, Research and
Executive Education
Professor of Entrepreneurship
Dr. Alicia CodurasNational Experts Survey Coordinator, GEM
Global Data Team
introduction10
Targeting Tangible Results from Accelerating the Country’s Innovation Agenda
GEM Report2018
11To GEM
From 2010 to 2016, Saudi Arabia witnessed
the initial move to put the life after oil
agenda into the general Saudi Populations’
attention. The knowledge economy debates,
coupled with innovation driven non-oil-based
growth scenarios were introduced to the
general-public and had attracted a lot of
attention. Although these initiatives increased
awareness and created the first wave of high
growth online and scalable entrepreneurship
in the Kingdom, there were structural issues
and regulatory improvements that still
need to take place in order for startups and
innovations to be wide spread.
Recently , various policies and structural
reforms have taken place and most of the
change that started to happen in 2016 will
take effect in the coming years painting a
new picture. Since 2016, a new story began
to unravel, and Saudi Arabia started to push
the boundaries of change and development
in all areas of life, especially in the economic
growth that will impact the ways of doing
business positively.
His Royal Highness the Crown Prince of
Saudi Arabia Prince Mohammed bin Salman,
announced the vision 2030 in 2016 as the
Vice President of the Council of Ministers and
President of the Economic and Development
Council. All the major reforms and initiatives
headed by this holistic strategy started to
impact the public towards innovation and
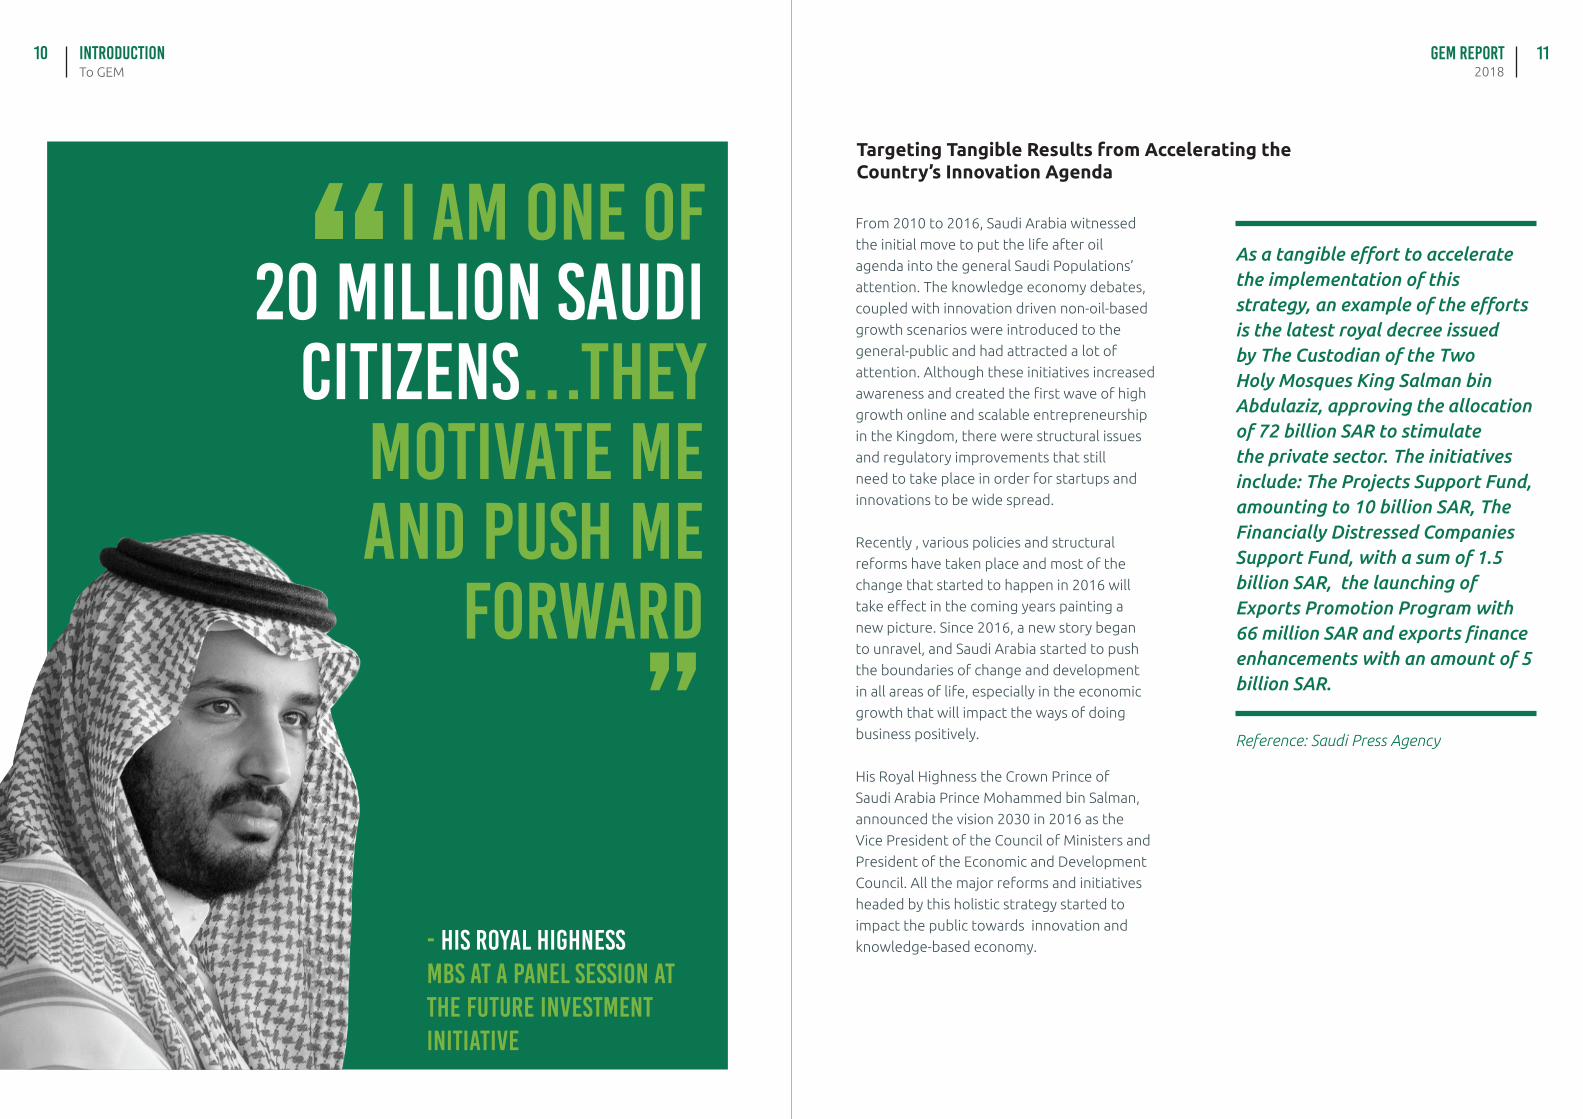
knowledge-based economy.- His Royal Highness MBS at a panel session at the Future investment initiative
Reference: Saudi Press Agency
I am one of 20 million Saudi
citizens…They motivate me and push me
forward
As a tangible effort to accelerate the implementation of this strategy, an example of the efforts is the latest royal decree issued by The Custodian of the Two Holy Mosques King Salman bin Abdulaziz, approving the allocation of 72 billion SAR to stimulate the private sector. The initiatives include: The Projects Support Fund, amounting to 10 billion SAR, The Financially Distressed Companies Support Fund, with a sum of 1.5 billion SAR, the launching of Exports Promotion Program with 66 million SAR and exports finance enhancements with an amount of 5 billion SAR.
GEM Report2018
12 13
Other initiatives focus on boosting
entrepreneurial activities such as Kafalah
program capital with a total sum of 800
million SAR, a 1.6 billion SAR indirect loan for
small and medium enterprises (SMEs) and the
government risk capital initiative for SMEs
with a total amount of 2.8 billion SAR.
The Royal Measure also included 7 billion
SAR worth of government fees in refunding
initiatives for SMEs, a mega investment
program initiative with a sum of 5 billion SAR,
2.56 billion SAR spent on broadband and
optical fiber infrastructure, and an incentive
for building technologies with a total amount
of 13.87 billion SAR. This Royal decree also
included a vast number of incentives that will
act as catalysts for the success of the private
sector.
Last few years leading up to 2016, we
observed a rapid acceleration in the creation
of new programs in the kingdom for startups
and SMEs. Many universities,and almost all
government agencies and public and private
investors launched education programs and
funding initiatives. We believe this is just
the beginning of a new era of growth and
prosperity driven by a knowledge economy in
the kingdom. Changes in startup and tourist
visa regulations, changes in the trade code
and improvements in the level of ease sees in
doing business will start accumulating and this
will represent a significant portion of growth
in our economy.
Knowledge economy driven businesses will
create new models of growth supported by
the grass-root rise of women entrepreneurs,
high growth technology-based startups,
and SME’s. As more SME’s adopt new
technologies and new business models, their
export and revenue shall increase.
As more women are entering the work force
and creating businesses, their impact will
be wide-spread, and a new generation of
internationally connected leaders will create
links and bonds within the global ecosystem.
These young role models will lead the future.
High growth technology companies will be
the main drivers of employment. They will
also power the “Made in Saudi” brand as more
products are used by international audiences.
This will transform not only local old local
business models but it will also drive interest
and investment from abroad.
Our youth are already part of the growing
global trends, and it’s our job to transform
them from consumers to creators of
businesses. Youth is our game changer.
As seen in the chapters of GEM, there are
growing numbers of driven young people
getting ready to unleash their potential to
create their own wealth and control their own
future.
Our growth will not only impact Saudi but
the region at large . Once Saudi Arabia starts
leading an innovation friendly environment,
many countries in the region and abroad will
be taking note and following.
There is a growing hope that we will start
seeing the results of these major changes,
impacting the way of doing business in a
positive way and they are already opening
major opportunities for entrepreneurs in the
kingdom.
introductionTo GEM
Top Regulatory Adjustments:
• The establishment of centralized service
centers to serve investors and establish
unified policies and procedures for all
government sectors to abide by
• Allocating a compulsory percentage for
SMEs to take shares in governmental
contracts
• Reducing the period of import and export
through minimizing the documentation
process from 12 to 4 months for export
and from 9 to 3 months in the import
• Launching the gateway for the National
Center of Documentation by gathering all
needed resources in one platform
• Establishing the ease of doing business
Major Legal Adjustments:
Issuing of the bankruptcy laws
while taking into account all these major
shifts that will impact the ease of doing
business, where different government and
private entities are launching new programs
and initiatives to support SMES and startups
in Saudi. The kingdom is experiencing
some of the most exciting times and that is
encouraging everyone to be part of the well
painted picture of the country.
Reference:
Small and Medium Enterprise Authority
Monshaat
GEM Report2018Summary
EXECUTIVE14 15
EXECUTIVE SUMMARY
The 2017 GEM Saudi Arabia survey
represents the fourth year that GEM has
tracked entrepreneurship across multiple
phases and assessed the characteristics,
motivations, and ambitions of
entrepreneurs. The subsections below
discuss selected major findings from the
report including Saudi societal attitudes
toward entrepreneurship. The GEM Saudi
Arabian national team also collected
opinions about components of the
entrepreneurship ecosystem through a
national experts’ survey (NES).
Societal Attitudes Toward Entrepreneurship
Results for 2017 show a slight increase over
2016 results in terms of 69.2% of the population
believing that starting a new business correlates
with a higher level of social status and
respect. However, regarding the media and its
depiction of entrepreneurship, it is still widely
held — all be it slightly less so compared to
2016 results — that many businesses aim to
solve social problems as their primary focus.
Entrepreneurship is, in fact, viewed as a good
career choice at a higher rate than in the USA.
Self-Perceptions About Entrepreneurship
The population proportion that thinks that
starting a business in Saudi Arabia is a good
professional choice was very similar through the
years 2009, 2010 and 2016. However, in 2017
this indicator fell by 11.6 percentage points.
The percentage of the population knowing
recent entrepreneurs decreased by 0.9
percentage points in 2017. While the results for
perceived opportunities showed an increasing
trend between 2009 and 2016, in 2017 this
indicator fell by 1 percentage point.
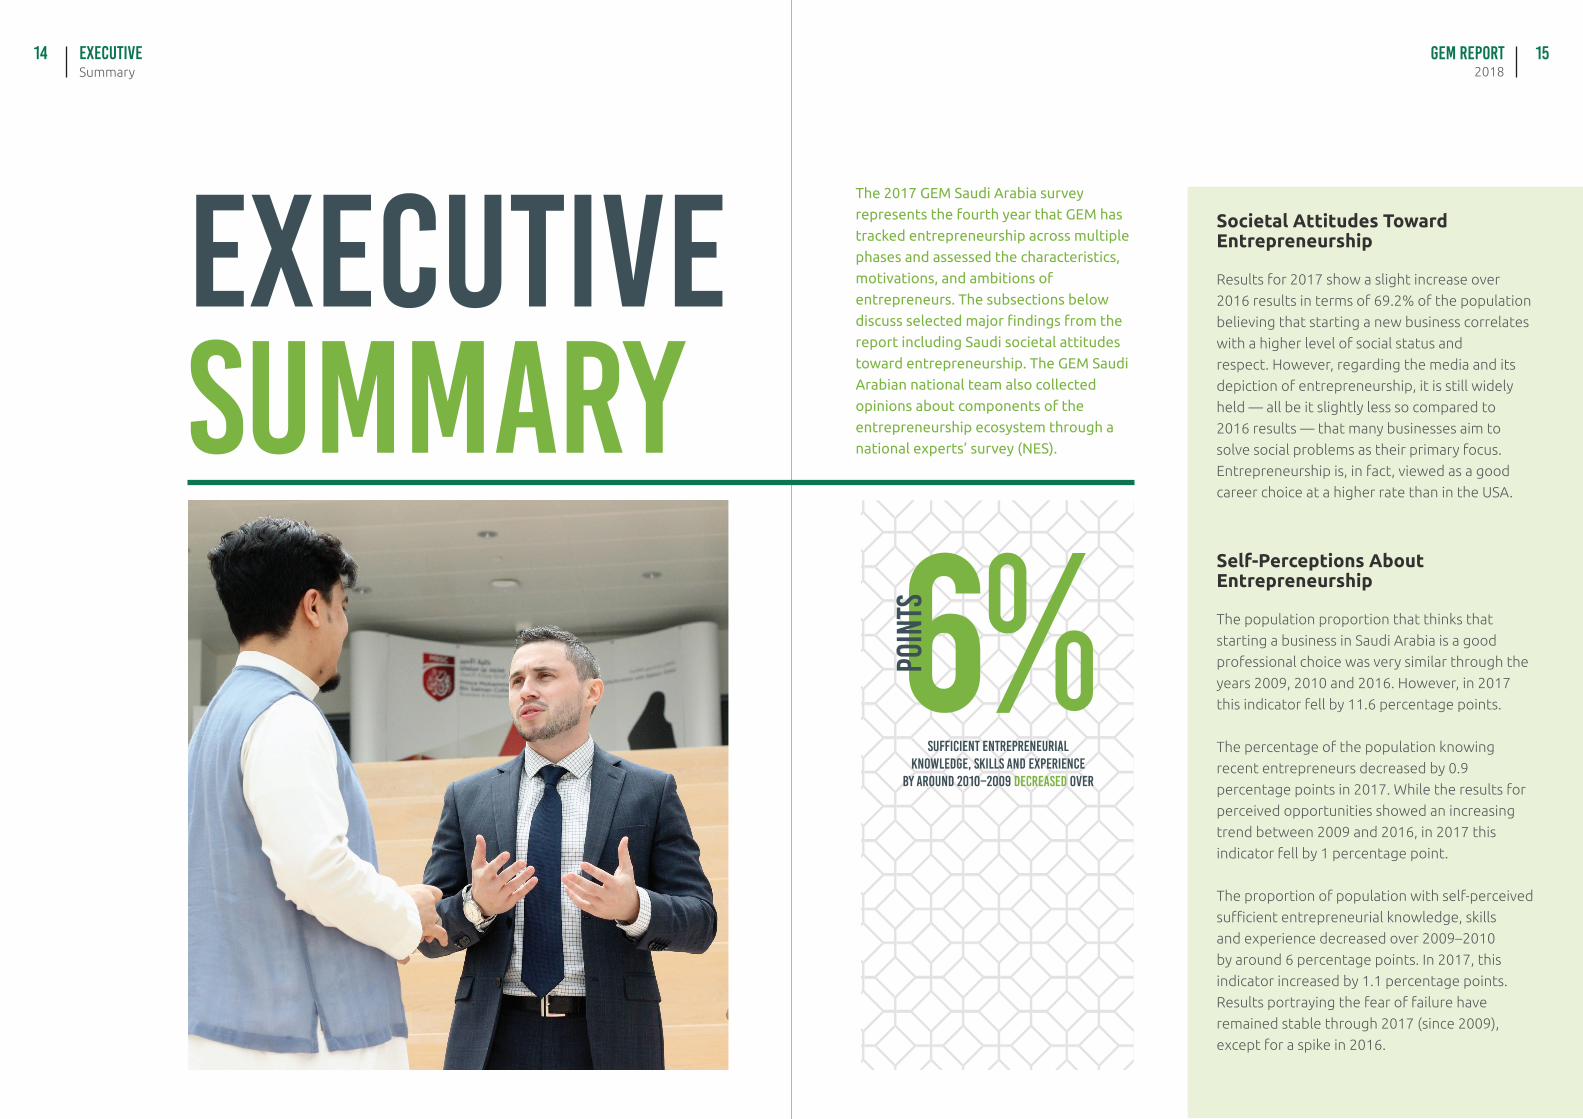
The proportion of population with self-perceived
sufficient entrepreneurial knowledge, skills
and experience decreased over 2009–2010
by around 6 percentage points. In 2017, this
indicator increased by 1.1 percentage points.
Results portraying the fear of failure have
remained stable through 2017 (since 2009),
except for a spike in 2016.
sufficient entrepreneurial knowledge, skills and experience
by around 2010–2009 decreased over
GEM Report2018Summary
EXECUTIVE16 17
Phases of Entrepreneurial Activity
The percent of the Saudi population
considering starting up a business declined to
23.7% in 2017, down from 25.8% in 2016. This
percentage represents the population aged
18 to 64 who are launching a start-up in the
next three years. The Total Entrepreneurial
Activity, or TEA, ratio represents a rough
correlation between entrepreneurial
intentions and activities. The value of this
indicator for Saudi Arabia in 2016 was
0.44 which is relatively low. A higher rate,
closer to 1.0, would indicate more effective
entrepreneurship. The value of this indicator
fell to 0.34 in 2017, suggesting that the
aspirations of an increasing percentage of
potential entrepreneurs are not finding a
receptive context.
For new businesses active in the market (for
3–42 months), the percentage of activity
has dropped from 7.7% in 2016 to 6.7% in
2017. Any implications of this indicator must,
however, include factors such as considering
related TEA indicators, such as how many
firms are actually operating in the market
beyond 42 months. A further breakdown
analysis is provided within the report.
The Saudi Arabian market continues to
see a high proportion of recently created
businesses, but one current challenge appears
to be a high rate of medium-term mortality.
This affects businesses in consolidation as
the net result is a small established business
sector.
Motivation for Early-Stage Entrepreneurship Activity
Entrepreneurs in Saudi Arabia continue to
be opportunity-motivated. The opportunity-
motivated entrepreneurs seeking to improve
their situation through either increased
independence or increased income — as
opposed to simply maintaining their income
— are referred to as improvement-driven
opportunity (IDO) entrepreneurs by GEM.
The motivational index was at 40.8% for Saudi
Arabia in 2016 and fell to 37.3% in 2017. The
drop in oil prices combined with an increase in
national unemployment are plausible reasons
for this noticeable IDO drop from 2016.
Early-Stage Entrepreneur Profile
As the GEM project seeks primary sources
instead of secondary sources in its data, the
profile information is gathered on a detailed
level, thus involving specific characteristics of
the sampling pool.
The typical early-stage entrepreneur is a man
whose age has become moderately higher
over the survey period (from around 31 to
37), who has a university degree, whose
annual income is substantially lower than it
was in 2009 and 2010, who works full-time
in his business, and who lives in a household
comprised of about five persons.
Based on the respective populations of men
and women in Saudi Arabia, the male rate of
participation in TEA decreased slightly in 2017
to 12.4% from 12.9% in 2016. The female
rate increased in 2017 to 10.3% from 9.7% in
2016. The TEA rates of involvement in 2017
reveal that 59.1% of entrepreneurs were
men, narrowing the gap down from 61.4% in
2016. Thus, 2017 saw an increase to 40.9%
for women entrepreneurs, up from 38.6%
in 2016. This indicates a slow continual shift
toward equal opportunity in Saudi Arabia,
regardless of gender. This gender gap has
been closing noticeably since 2009.
The range for potential entrepreneurs is
even wider around a lower mean (almost 35).
Unsurprisingly, established owner-managers
were older than entrepreneurs in 2017, with a
mean age of around 39 years.
The average age of owner-managers who
abandoned a business activity in 2017 was
37.05, indicating that most business exits
were not due to retirement. Comparing the
results of 2017 to 2016, the mean age for
potential entrepreneurs and established
owner-managers has decreased while the
mean age for entrepreneurs of all stages has
increased. The result suggests that potential
entrepreneurs have entered the market
somewhat later than in previous years.
GEM Report2018Summary
EXECUTIVE18 19
Industry-Sector Participation
GEM considers four large sectors to classify
all types of business activities captured
by the monitor: extractive, transforming,
business-oriented service and consumer-
oriented service. Saudi Arabia concentrates
activity in the consumer-oriented service
sector. New entrepreneurial activity has been
progressively increasing the size of this sector
among established businesses since 2010.
Job Creation Projections
With few exceptions, entrepreneurial
activities are initiated by an independent
entrepreneur or by very small entrepreneurial
teams. As observed in previous reports, this
is probably one of the main issues preventing
entrepreneurial activity from having a
significant impact on countries’ economies.
The situation in Saudi Arabia is no different.
New entrepreneurial activity is the category
that shows more favorable rates of
entrepreneurial teams – of four or more
owners – whereas nascent activity shows the
best rates for entrepreneurial teams of two
and three members. But the fact remains that
well over half of all activity is accounted for by
a single individual.
As with the number of owners,
entrepreneurial activity primarily comprises
firms and businesses with few employees.
In Saudi Arabia, however, early-stage
entrepreneurial activity is better positioned
compared with other economies in the region
because the percentage of such activity with
no employees is very low. Currently, 47.1% of
activities have more than five employees, up
from 36.6% in 2016.
Innovation
GEM assesses the presence of an innovation
component in early-stage firms and EBs by
asking owner-managers how many (potential)
customers they think consider the product
or service they offer to be new or unfamiliar.
The lower the percentage of responses for
the category “none”, the higher the presence
of innovative products/services. In 2017,
43.6% of TEA businesses showed some
innovation component, going 8.8 percentage
points up from 2016. Similarly, 32.9% of
EBs (Established Businesses) showed some
innovation component, 20.1 percentage
points up from 2016.
In Saudi Arabia, the innovation component
tends to reflect new products and services
for consumers, as opposed to technological
innovation.
Internationalization
While in 2009 and 2010 export intensity
tended to be low or non-existent, Saudi
Arabia showed an increment in the proportion
of TEA businesses with medium export
intensity in 2016. In 2017, the most relevant
change was the notable growth of the
proportion of TEA businesses with the highest
level of internationalization.
Entrepreneurship Framework
An entrepreneurship framework integrates
the components that shape the national
context in which entrepreneurial activities
take place. GEM assesses the following
entrepreneurship conditions: financing,
government policies, taxes, and bureaucracy,
government programs, school-level
entrepreneurship education and training,
post-school entrepreneurship education and
training, R&D transfer, access to commercial
and professional infrastructure, internal market
dynamics, internal market burdens, access to
physical and services infrastructure, and social
and cultural norms.
Three conditions (internal market dynamics,
social and cultural norms and government
entrepreneurship programs) were perceived
as having improved in 2017, while the other
nine were considered to have deteriorated.
The positive changes are significant, especially
regarding government programs, an area
where several new policies have been enacted
recently.
The country is in the middle of a
transformation toward modernization and
improved competitiveness in several fields,
but experts’ perception of the entrepreneurial
context appears equally affected by the
state of other elements beyond the internal
situation, except in the case of the internal
market reactivation. Year 2017 witnessed
an expected increment in the average
score on physical infrastructure due to the
implementation of high-speed trains and
women being granted permission to drive. The
full impact of these developments, however,
still seems too early to grasp.
GEM experts provide recommendations to
improve the entrepreneurial framework
recommendations with year 2017 compared to
2016 recommendations shown in parenthesis:
focusing on designing and implementing
measures relating to government policies
(more frequently than in 2016), financial
support (less frequently than in 2016),
entrepreneurial education and training
(at the same frequency as in 2016), R&D
transfer (more than in 2016), commercial
infrastructure (almost the same as in 2016),
capacity for entrepreneurship and labor costs
(more than in 2016) and access and regulation
(much more than in 2016).
Entrepreneurship and Family Business
In 2017 it has been of interest to analyze
how many nascent, new and established
businesses are based on a family business
model. Drawing out how many businesses
correspond to this model is relevant because
family businesses are very traditional in Saudi
Arabia; keeping an eye on their evolution and
presence in Saudi entrepreneurial activity
gives an idea of the composition of the sector.
Policy makers are then better prepared to
design measures to support this type of
activity. This is the first GEM Saudi Arabia
report to include such research.
The main and significative difference when
talking about societal attitudes toward
entrepreneurship is that those involved in
family businesses more commonly perceive
businesses as being primarily concerned
with solving problems. Unsurprisingly,
family businesses tend to be somewhat less
competitive. Those involved in them are more
likely to believe that people would prefer
that everyone had a similar standard of living.
Those involved in family business show a
somewhat higher proportion of cases driven
by opportunity.
GEM Report2018Summary
EXECUTIVE20 21
Entrepreneurship and Origin
The Saudi Arabian population is mainly
composed of native Saudis. Thus, GEM’s 2017
adult population survey produced a sample
distribution where 86.8% of the interviewees
were born in Saudi Arabia and 13.2% were
born out of the country.
Foreigners may appear as somewhat less
competitive and less positive than native
Saudis overall regarding the following topics:
entrepreneurship is a good career choice,
those successful in starting new businesses
enjoy a high level of status and respect, media
support entrepreneurs, it is easy to start
a business in the country and businesses’
primary aim is often solving social problems.
However, perceptions among foreigners are,
on the whole, remarkably favorable.
Most of the foreign adults that come to
Saudi Arabia belong to countries where
entrepreneurship has features in common
with those of Saudi Arabia. Their integration,
then, is presumably aligned with the Saudi
process — provided policy makers analyze and
implement steps needed to help realize their
potential contributions.
Dowry Impact on Young Saudi Entrepreneurship
Of the adult population surveyed, 65.3%
believe that it is more true than false that
the dowry is a hindrance to young potential
entrepreneurs, while 63.6% believe it more
true than false that a dowry payment makes it
difficult for parents to give financial support
to sons with aspirations of starting up new
businesses.
The typical Mahr (dowry) ranges from 50,000–
150,000 SAR (approximately 13,500–40,000
USD). Under the present economy, getting
this amount is difficult for many families; thus,
the preservation of tradition impacts the
average age of marriage.
The average responses strongly indicate
that under the current economic framework
and global context, the conditions of the
dowry should be revised to foster marriages
at appropriate ages and professional
development of young people, especially
when a dowry hinges on the investment of
personal or family funds.
GEM Report2018Perception of Societal Attitudes Related to Entrepreneurship
Chapter One22 23
01PERCEPTION OF
SOCIETAL ATTITUDES RELATED TO
ENTREPRENEURSHIP
1.1 General Overview
Societal attitudes indicate how entrepreneurship
is regarded in an economy. A society’s culture,
history, policy and business environment, along
with many other factors, can influence its
view of entrepreneurship – which can, in turn,
affect entrepreneurial ambitions and support
for this activity. GEM assesses the extent to
which people consider entrepreneurship to be
a good career choice, whether they feel that
entrepreneurs are accorded high status, how
positively entrepreneurs are represented in the
media, to what extent residents think that their
society has (or lacks) a preference for competitive
environments, how easy they think it is to start
up a business in their country, and to what extent
they think businesses take solving social problems
as their primary objective.
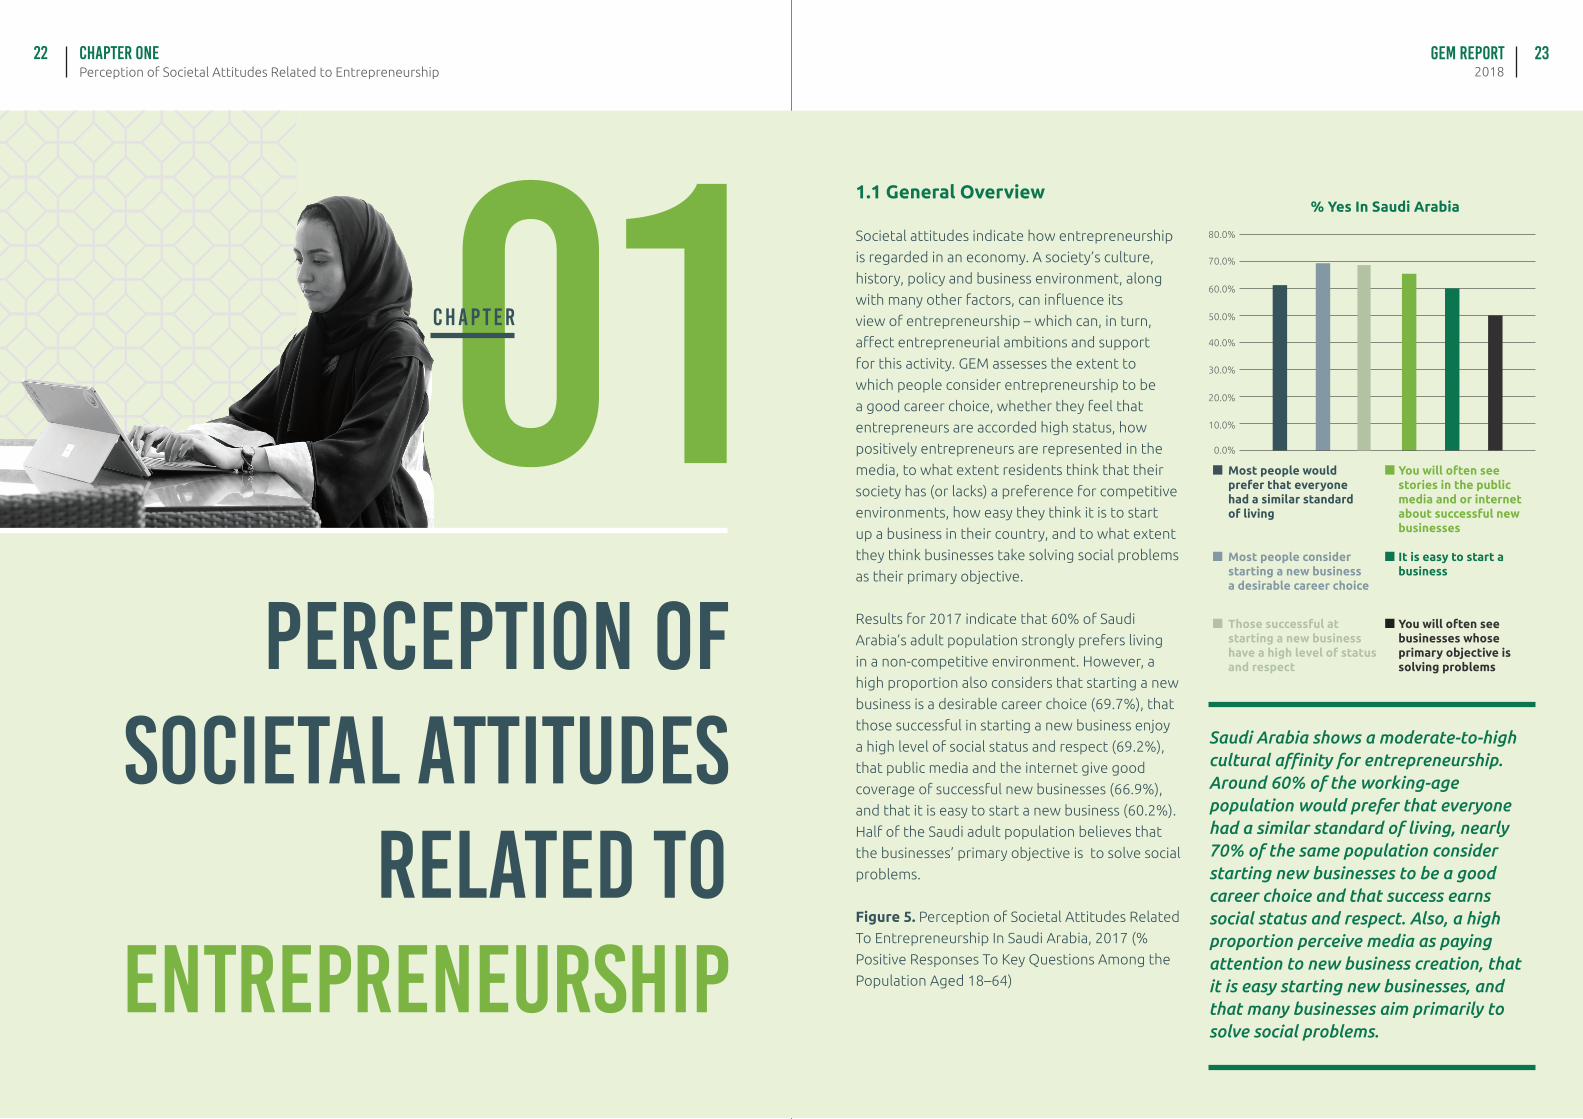
Results for 2017 indicate that 60% of Saudi
Arabia’s adult population strongly prefers living
in a non-competitive environment. However, a
high proportion also considers that starting a new
business is a desirable career choice (69.7%), that
those successful in starting a new business enjoy
a high level of social status and respect (69.2%),
that public media and the internet give good
coverage of successful new businesses (66.9%),
and that it is easy to start a new business (60.2%).
Half of the Saudi adult population believes that
the businesses’ primary objective is to solve social
problems.
Figure 5. Perception of Societal Attitudes Related
To Entrepreneurship In Saudi Arabia, 2017 (%
Positive Responses To Key Questions Among the
Population Aged 18–64)
80.0%
70.0%
60.0%
50.0%
40.0%
30.0%
20.0%
10.0%
0.0%
Most people would prefer that everyone had a similar standard of living
You will often see stories in the public media and or internet about successful new businesses
Most people consider starting a new businessa desirable career choice
It is easy to start a business
Those successful at starting a new business have a high level of status and respect
You will often see businesses whose primary objective is solving problems
Saudi Arabia shows a moderate-to-high cultural affinity for entrepreneurship. Around 60% of the working-age population would prefer that everyone had a similar standard of living, nearly 70% of the same population consider starting new businesses to be a good career choice and that success earns social status and respect. Also, a high proportion perceive media as paying attention to new business creation, that it is easy starting new businesses, and that many businesses aim primarily to solve social problems.
% Yes In Saudi Arabia
C H A P T E R
GEM Report2018Perception of Societal Attitudes Related to Entrepreneurship
Chapter One24 25
1.2 Perceptions Of Societal Attitudes Related To Entrepreneurship By Gender, Age Group, Educational Level, Involvement In Business Sector, Potential Entrepreneurship And Region.
• Women perceive Saudi Arabian society as slightly more competitive than do men.
• Women perceive Saudi Arabian society as somewhat more favorable towards entrepreneurship as a professional choice than do men, and consider that those successful at starting a new business enjoy a higher level of status and respect.
• Women are somewhat more prone than men to think that in Saudi Arabia, one often sees stories in the public media and/or on the internet about successful new businesses.
• People aged 25–44 perceive Saudi Arabian society as more competitive than do people aged 45–64.
• People aged 35–54 are somewhat more inclined to think that entrepreneurship is a good career choice, that in Saudi Arabia those successful at starting new businesses enjoy a high level of status and respect, and that one often sees stories in the public media and/or internet about successful new businesses.
Although the perception of societal attitudes
favorable to entrepreneurship is moderately
high among the adult population of Saudi
Arabia, it is interesting to note several subtle
differences that occur by gender, age,
educational level, involvement in the business
sector, potential entrepreneurship, and
region.
• Individuals with secondary education have a weaker perception of entrepreneurship as a good career choice and of those successful at starting new businesses as enjoying a high level of status and respect.
• Individuals with less than secondary education are more likely to think that one often sees stories in the public media and/or on the internet about successful new businesses.
• As individuals’ educational level increases, so too does the perception (although not in a perfectly linear way) that starting up a new business in Saudi Arabia is easy.
• Individuals with graduate experience are the most sceptical that in Saudi Arabia, one will often see businesses that have the primary objective is solving social problems.
• Those involved in the business sector except for a significantly more likely to agree with the proposed societal attitudes related to entrepreneurship in Saudi Arabia, save for a significantly more common perception that most people would prefer that everyone had a similar standard of living.
• The same diagnostic can be applied to potential entrepreneurs (individuals planning to start up a business within the next three years), who are also significantly more likely to agree with the proposed societal attitudes related
These differences, which are relevant from the standpoint of public policy design and understanding the entrepreneurial ecosystem, are summarised here (also see Table 3):
• Individuals with post-secondary education have a notably stronger perception of Saudi Arabia as a competitive society than people with other educational levels.
• The region where the highest proportion of adults feel that most people would prefer that everyone had a similar standard of living is the Jeddah region, whereas Riyadh shows the lowest proportion. By implication, the latter region is likely to be the most competitive in the country, while the former was the least.
• Jeddah and Riyadh are the cities and regions where the highest proportions of the population think that in Saudi Arabia, most people consider starting a new business to be a desirable career choice and that those successful at starting new businesses enjoy high levels of status and respect. In addition, in these regions significantly higher proportions of people think that one often sees stories in the public media and/or on the internet about successful new businesses and that it is easy to start a business.
• Finally, Dammam and Madinah stand out because a higher percentages of their people affirm that businesses often aim primarily to solve social problems.
to entrepreneurship. The unique big difference is that potential entrepreneurs are in line with the rest of the population in thinking that most people would prefer that everyone had a similar standard of living .
GEM Report2018Perception of Societal Attitudes Related to Entrepreneurship
Chapter One26 27
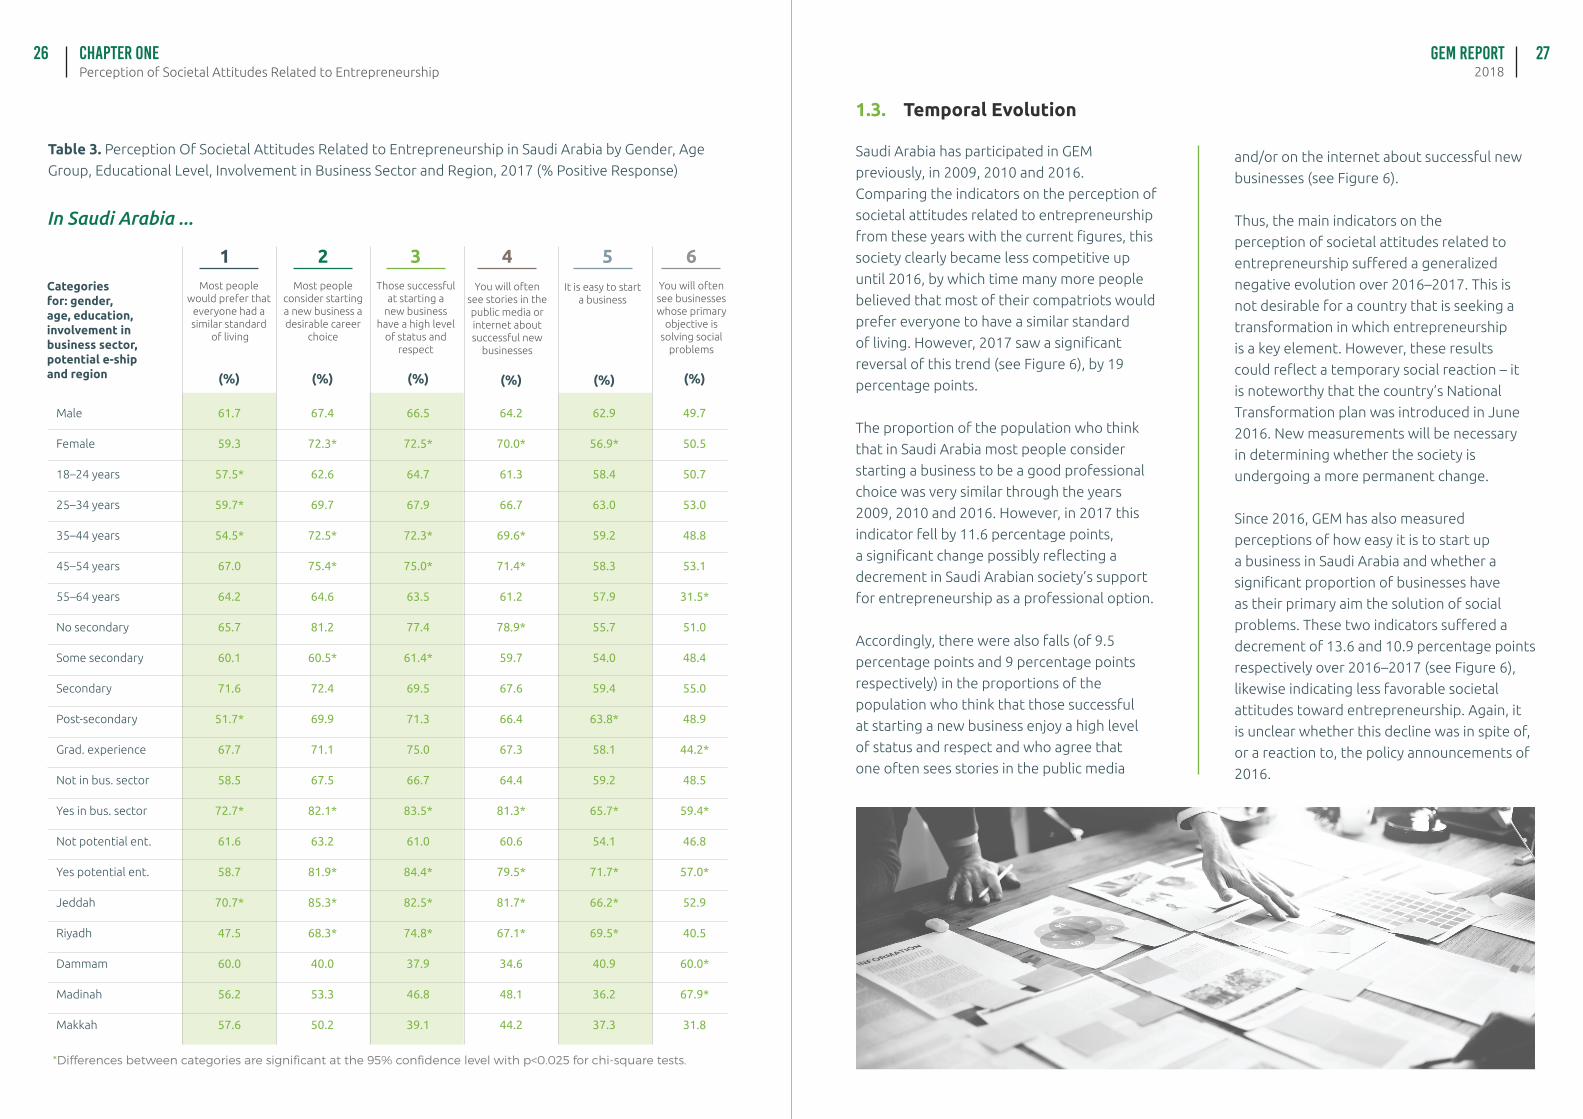
In Saudi Arabia ...
*Differences between categories are significant at the 95% confidence level with p<0.025 for chi-square tests.
Categories for: gender, age, education, involvement in business sector, potential e-ship and region
Male
Female
18–24 years
25–34 years
35–44 years
45–54 years
55–64 years
No secondary
Some secondary
Secondary
Post-secondary
Grad. experience
Not in bus. sector
Yes in bus. sector
Not potential ent.
Yes potential ent.
Jeddah
Riyadh
Dammam
Madinah
Makkah
61.7
59.3
57.5*
59.7*
54.5*
67.0
64.2
65.7
60.1
71.6
51.7*
67.7
58.5
72.7*
61.6
58.7
70.7*
47.5
60.0
56.2
57.6
67.4
72.3*
62.6
69.7
72.5*
75.4*
64.6
81.2
60.5*
72.4
69.9
71.1
67.5
82.1*
63.2
81.9*
85.3*
68.3*
40.0
53.3
50.2
66.5
72.5*
64.7
67.9
72.3*
75.0*
63.5
77.4
61.4*
69.5
71.3
75.0
66.7
83.5*
61.0
84.4*
82.5*
74.8*
37.9
46.8
39.1
64.2
70.0*
61.3
66.7
69.6*
71.4*
61.2
78.9*
59.7
67.6
66.4
67.3
64.4
81.3*
60.6
79.5*
81.7*
67.1*
34.6
48.1
44.2
62.9
56.9*
58.4
63.0
59.2
58.3
57.9
55.7
54.0
59.4
63.8*
58.1
59.2
65.7*
54.1
71.7*
66.2*
69.5*
40.9
36.2
37.3
49.7
50.5
50.7
53.0
48.8
53.1
31.5*
51.0
48.4
55.0
48.9
44.2*
48.5
59.4*
46.8
57.0*
52.9
40.5
60.0*
67.9*
31.8
(%)
Most people would prefer that
everyone had a similar standard
of living
(%)
Most people consider starting a new business a desirable career
choice
(%)
Those successful at starting a
new business have a high level
of status and respect
(%)
You will often see stories in the public media or internet about successful new
businesses
(%)
You will often see businesses whose primary
objective is solving social
problems
(%)
It is easy to start a business
Table 3. Perception Of Societal Attitudes Related to Entrepreneurship in Saudi Arabia by Gender, Age
Group, Educational Level, Involvement in Business Sector and Region, 2017 (% Positive Response)
1 2 3 4 5 6
Saudi Arabia has participated in GEM
previously, in 2009, 2010 and 2016.
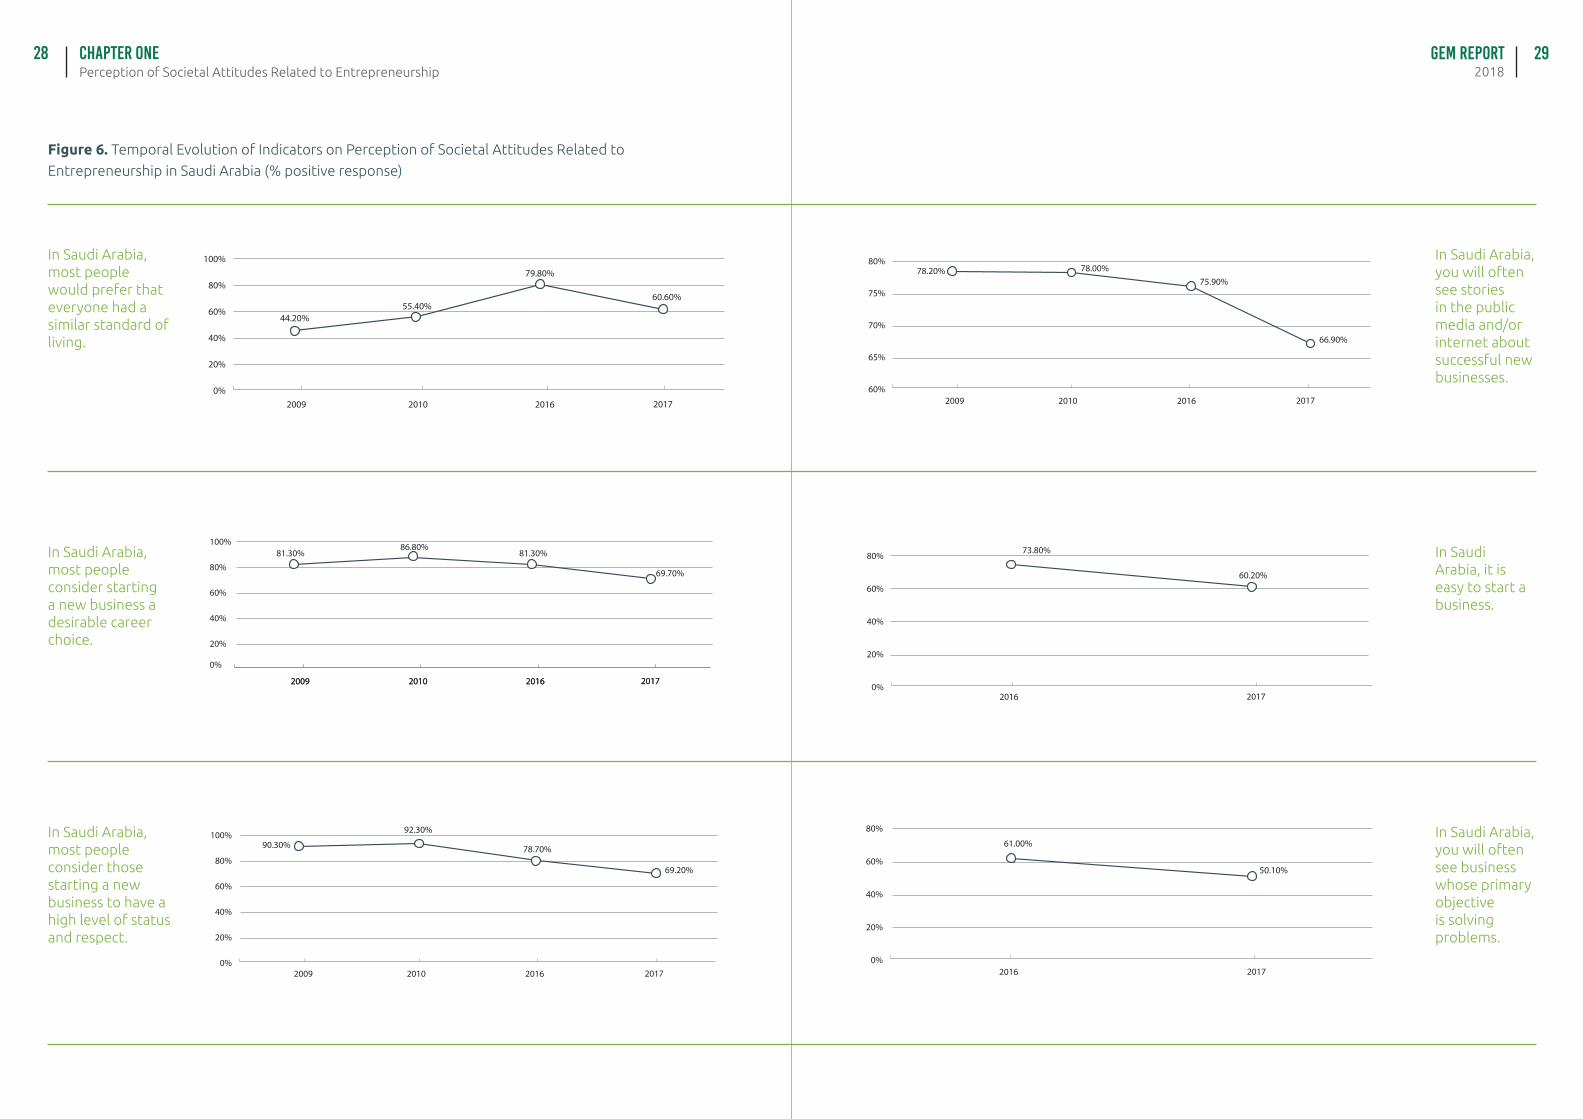
Comparing the indicators on the perception of
societal attitudes related to entrepreneurship
from these years with the current figures, this
society clearly became less competitive up
until 2016, by which time many more people
believed that most of their compatriots would
prefer everyone to have a similar standard
of living. However, 2017 saw a significant
reversal of this trend (see Figure 6), by 19
percentage points.
The proportion of the population who think
that in Saudi Arabia most people consider
starting a business to be a good professional
choice was very similar through the years
2009, 2010 and 2016. However, in 2017 this
indicator fell by 11.6 percentage points,
a significant change possibly reflecting a
decrement in Saudi Arabian society’s support
for entrepreneurship as a professional option.
Accordingly, there were also falls (of 9.5
percentage points and 9 percentage points
respectively) in the proportions of the
population who think that those successful
at starting a new business enjoy a high level
of status and respect and who agree that
one often sees stories in the public media
1.3. Temporal Evolution
and/or on the internet about successful new
businesses (see Figure 6).
Thus, the main indicators on the
perception of societal attitudes related to
entrepreneurship suffered a generalized
negative evolution over 2016–2017. This is
not desirable for a country that is seeking a
transformation in which entrepreneurship
is a key element. However, these results
could reflect a temporary social reaction – it
is noteworthy that the country’s National
Transformation plan was introduced in June
2016. New measurements will be necessary
in determining whether the society is
undergoing a more permanent change.
Since 2016, GEM has also measured
perceptions of how easy it is to start up
a business in Saudi Arabia and whether a
significant proportion of businesses have
as their primary aim the solution of social
problems. These two indicators suffered a
decrement of 13.6 and 10.9 percentage points
respectively over 2016–2017 (see Figure 6),
likewise indicating less favorable societal
attitudes toward entrepreneurship. Again, it
is unclear whether this decline was in spite of,
or a reaction to, the policy announcements of
2016.
GEM Report2018Perception of Societal Attitudes Related to Entrepreneurship
Chapter One28 29
Figure 6. Temporal Evolution of Indicators on Perception of Societal Attitudes Related to
Entrepreneurship in Saudi Arabia (% positive response)
0%
20%
40%
60%
80%
100%
2009 2010 2016 2017
44.20%55.40%
79.80%
60.60%
In Saudi Arabia, most people would prefer that everyone had a similar standard of living.
2009 2010 2016 2017
0%
20%
40%
60%
80%
100%
2009 2010 2016 2017
81.30%86.80%
81.30%
69.70%
In Saudi Arabia, most people consider starting a new business a desirable career choice.
0%
20%
40%
60%
80%
100%
2009 2010 2016 2017
90.30%
92.30%
78.70%
69.20%
In Saudi Arabia, most people consider those starting a new business to have a high level of status and respect.
60%
65%
70%
75%
80%
2009 2010 2016 2017
78.20% 78.00%75.90%
66.90%
In Saudi Arabia, you will often see stories in the public media and/or internet about successful new businesses.
0%
20%
40%
60%
80%
2016 2017
73.80%
60.20%
In Saudi Arabia, it is easy to start a business.
0%
20%
40%
60%
80%
2016 2017
61.00%
50.10%
In Saudi Arabia, you will often see business whose primary objective is solving problems.
GEM Report2018Perception of Societal Attitudes Related to Entrepreneurship
Chapter One30 31
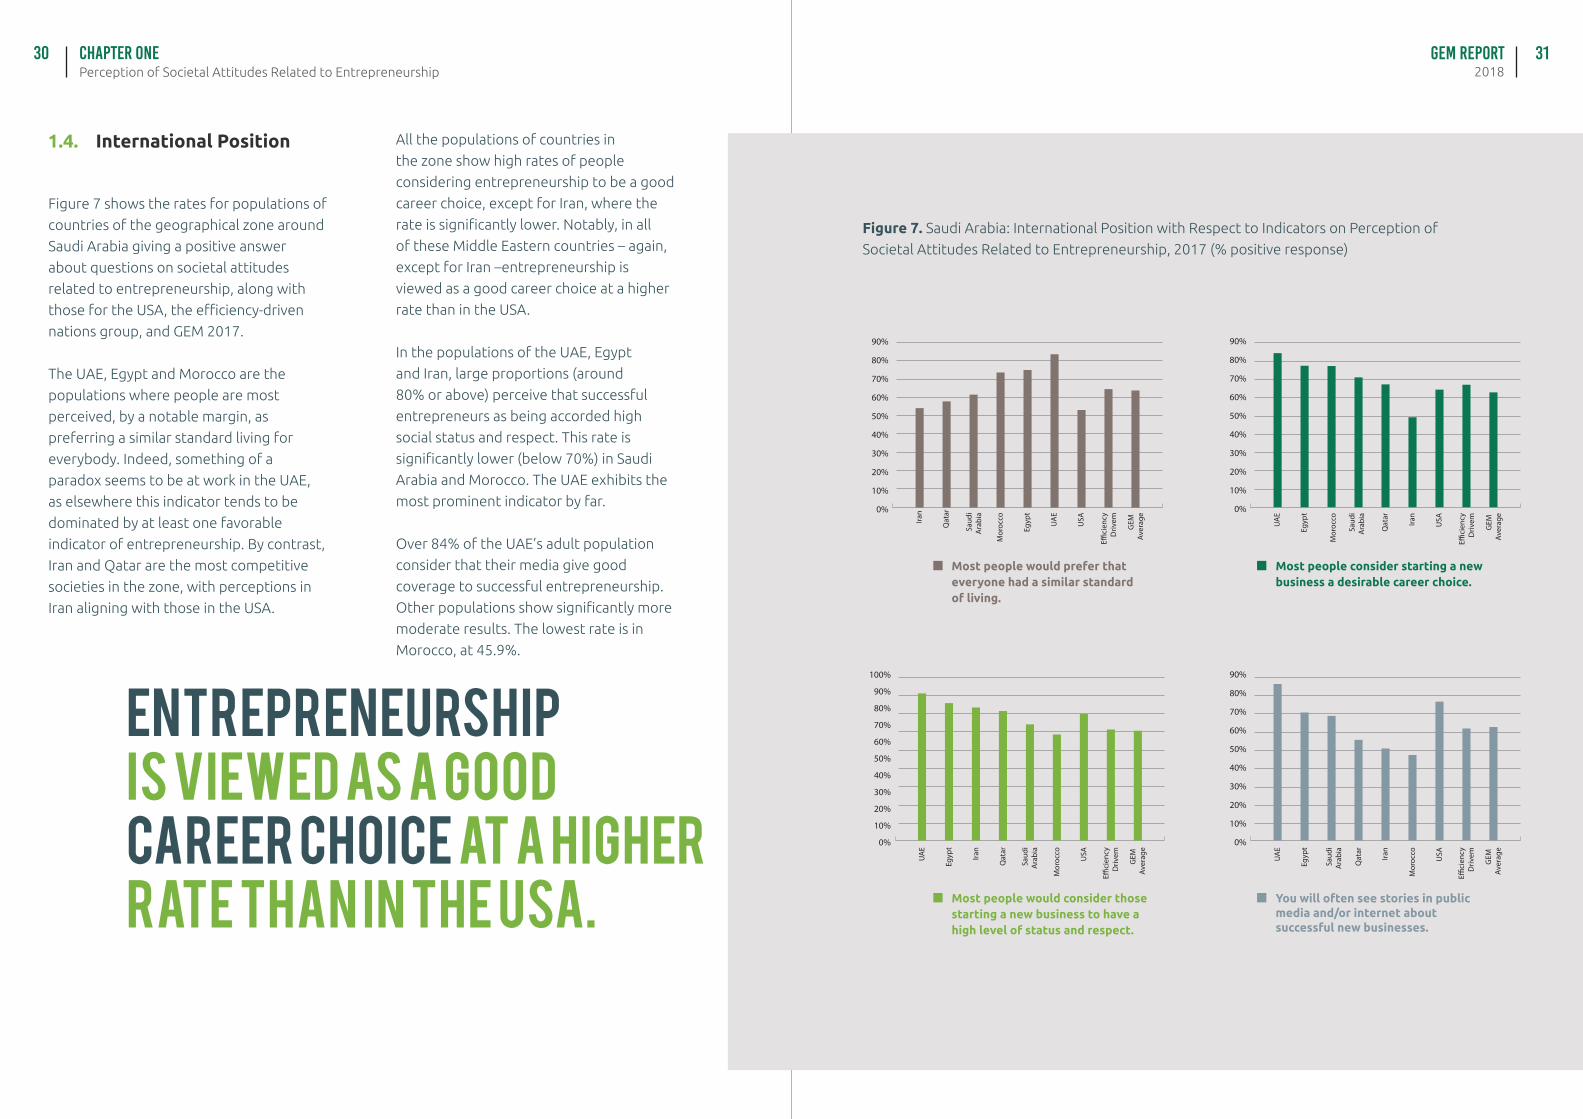
Figure 7 shows the rates for populations of
countries of the geographical zone around
Saudi Arabia giving a positive answer
about questions on societal attitudes
related to entrepreneurship, along with
those for the USA, the efficiency-driven
nations group, and GEM 2017.
The UAE, Egypt and Morocco are the
populations where people are most
perceived, by a notable margin, as
preferring a similar standard living for
everybody. Indeed, something of a
paradox seems to be at work in the UAE,
as elsewhere this indicator tends to be
dominated by at least one favorable
indicator of entrepreneurship. By contrast,
Iran and Qatar are the most competitive
societies in the zone, with perceptions in
Iran aligning with those in the USA.
All the populations of countries in
the zone show high rates of people
considering entrepreneurship to be a good
career choice, except for Iran, where the
rate is significantly lower. Notably, in all
of these Middle Eastern countries – again,
except for Iran –entrepreneurship is
viewed as a good career choice at a higher
rate than in the USA.
In the populations of the UAE, Egypt
and Iran, large proportions (around
80% or above) perceive that successful
entrepreneurs as being accorded high
social status and respect. This rate is
significantly lower (below 70%) in Saudi
Arabia and Morocco. The UAE exhibits the
most prominent indicator by far.
Over 84% of the UAE’s adult population
consider that their media give good
coverage to successful entrepreneurship.
Other populations show significantly more
moderate results. The lowest rate is in
Morocco, at 45.9%.
1.4. International Position
entrepreneurshipis viewed as a good career choice at a higher rate than in the USA.
Figure 7. Saudi Arabia: International Position with Respect to Indicators on Perception of
Societal Attitudes Related to Entrepreneurship, 2017 (% positive response)
0%
10%
20%
30%
40%
50%
60%
70%
80%
90%
Iran
Qat
ar
Saud
i A
rabi
a
Mor
occo
Egyp
t
UA
E
USA
E�ci
ency
Driv
em
GEM
Av
erag
e
0%
10%
20%
30%
40%
50%
60%
70%
80%
90%
100%
UA
E
Egyp
t
Saud
i A
rabi
a
Mor
occo
Qat
ar
Iran
USA
E�ci
ency
Driv
em
GEM
Av
erag
e
0%
10%
20%
30%
40%
50%
60%
70%
80%
90%
UA
E
Egyp
t
Saud
i A
rabi
a
Mor
occo
Qat
ar
Iran
USA
E�ci
ency
Driv
em
GEM
Av
erag
e
0%
10%
20%
30%
40%
50%
60%
70%
80%
90%
UA
E
Egyp
t
Saud
i A
rabi
a
Mor
occo
Qat
ar
Iran
USA
E�ci
ency
Driv
em
GEM
Av
erag
e
Most people would prefer that everyone had a similar standard of living.
Most people would consider those starting a new business to have a high level of status and respect.
Most people consider starting a new business a desirable career choice.
You will often see stories in public media and/or internet about successful new businesses.
33
02INDIVIDUAL SELF-
PERCEPTIONS ABOUT ENTREPRENEURSHIP
C H A P T E R
Individual Self-Perceptions About EntrepreneurshipChapter TWO32
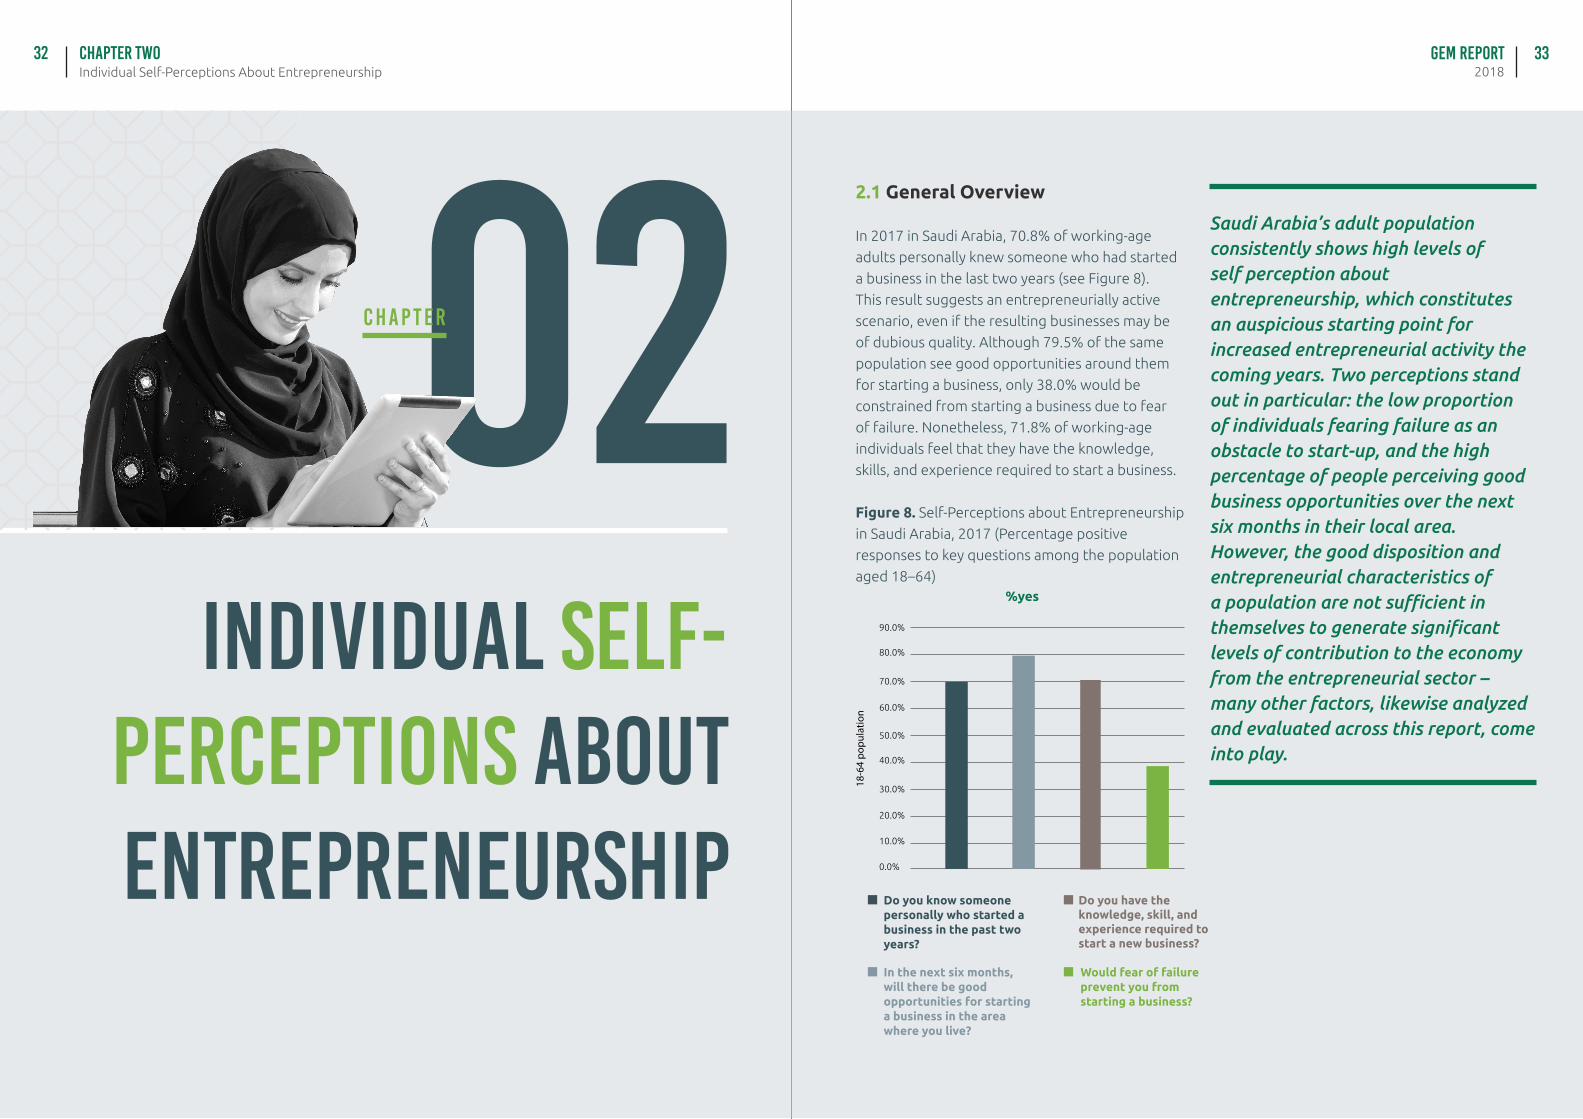
2.1 General Overview
In 2017 in Saudi Arabia, 70.8% of working-age
adults personally knew someone who had started
a business in the last two years (see Figure 8).
This result suggests an entrepreneurially active
scenario, even if the resulting businesses may be
of dubious quality. Although 79.5% of the same
population see good opportunities around them
for starting a business, only 38.0% would be
constrained from starting a business due to fear
of failure. Nonetheless, 71.8% of working-age
individuals feel that they have the knowledge,
skills, and experience required to start a business.
Figure 8. Self-Perceptions about Entrepreneurship
in Saudi Arabia, 2017 (Percentage positive
responses to key questions among the population
aged 18–64)%yes
Do you know someone personally who started a business in the past two years?
18-6
4 po
pula
tion
Would fear of failure prevent you from starting a business?
In the next six months, will there be good opportunities for starting a business in the area where you live?
Do you have the knowledge, skill, and experience required to start a new business?
Saudi Arabia’s adult population consistently shows high levels of self perception about entrepreneurship, which constitutes an auspicious starting point for increased entrepreneurial activity the coming years. Two perceptions stand out in particular: the low proportion of individuals fearing failure as an obstacle to start-up, and the high percentage of people perceiving good business opportunities over the next six months in their local area.However, the good disposition and entrepreneurial characteristics of a population are not sufficient in themselves to generate significant levels of contribution to the economy from the entrepreneurial sector – many other factors, likewise analyzed and evaluated across this report, come into play.
90.0%
50.0%
70.0%
30.0%
80.0%
40.0%
60.0%
20.0%
10.0%
0.0%
GEM Report2018
33
GEM Report2018Individual Self-Perceptions About Entrepreneurship
Chapter TWO34 35
2.2. Individual Self-Perceptions About Entrepreneurship by Gender, Age Group, Educational Level, Involvement in Business Sector, Potential Entrepreneurship and Region
A significantly lower percentage of women
respond positively about knowing recent
entrepreneurs, seeing entrepreneurial
opportunities and feeling they have sufficient
knowledge, skills and experience to start
up small businesses. However, in 2017 they
showed a very similar – the difference is not
statistically significant – rate of fear of failure
as an obstacle to entrepreneurial initiatives.
This latter result is promising and indicates
that a risk-taking culture among women is
progressing fast.
In terms of age, the percentage of positive
responses to knowing recent entrepreneurs is
high and increases with age, except for among
the oldest group. The percentage to positive
responses on seeing opportunities is also
high, and tends to increase smoothly with age.
Individuals aged 35–54 are most likely to see
themselves as having entrepreneurial skills.
Finally, fear of failure tends to increase with
age, except the among oldest group which
shows a low rate. This latter result indicates
that the young and the elderly are those that
least fear failure in Saudi Arabia – probably
those toward the middle of their working lives
feel that they have more to lose.
In 2017, as in 2016, adult populations with
very low and very high levels of education
exhibited higher rates of knowing recent
entrepreneurs, suggesting a split between
necessity- and opportunity-driven
entrepreneurial activities in Saudi Arabia.
This impression is confirmed by similarly
higher rates of perceived opportunities
among people with the lowest and highest
educational attainments, and by higher
rates of self-perceived entrepreneurial
knowledge, skills and experience
among people with lower, secondary
and post-secondary levels of education.
Unsurprisingly, fear of failure diminishes
as educational level increases, except for
among those with a secondary education.
People involved in any stage of
business show significantly higher
rates of positive response on knowing
recent entrepreneurs, on perceived
opportunities, and on self-perception of
entrepreneurial knowledge, skills and
experience. Both groups – those involved
and those not involved in business – show
a similar level of fear of failure as an
obstacle to starting up.
Potential entrepreneurs show higher rates
of self-perception about entrepreneurship
than those who have no intention of
starting up businesses in the short term. In
particular, there is a significant difference
between the rates of fear of failure –
much lower, in the case of potential
entrepreneurs.
Finally, the regional perspective indicates
that the populations of the Riyadh and
Jeddah regions show high percentages
(more than 75%) of people knowing recent
entrepreneurs, perceiving opportunities and
self-perceiving entrepreneurial knowledge,
skills and experience, whereas these rates are
significantly lower (around 60% or less) for
Dammam, Madinah and Makkah. Although
there are significant regional differences
in entrepreneurial attitudes among Saudi
Arabians. It should be borne in mind that all
the regions studied show relatively high rates
of entrepreneurial self-perception compared
to other regions of the globe – it is more that
the populations of Riyadh and Jeddah are
exceptionally entrepreneurially inclined. All
the regions show similar proportions of people
fearing failure except Riyadh, where the rate
is much lower. These results and the previous
ones above are summarized in Table 4.
People involved in any stage of business show significantly higher rates of positive response to knowing recent entrepreneurs,on perceived opportunities, and on self-perception of entrepreneurial knowledge, skills and experience.
GEM Report2018Individual Self-Perceptions About Entrepreneurship
Chapter TWO36 37
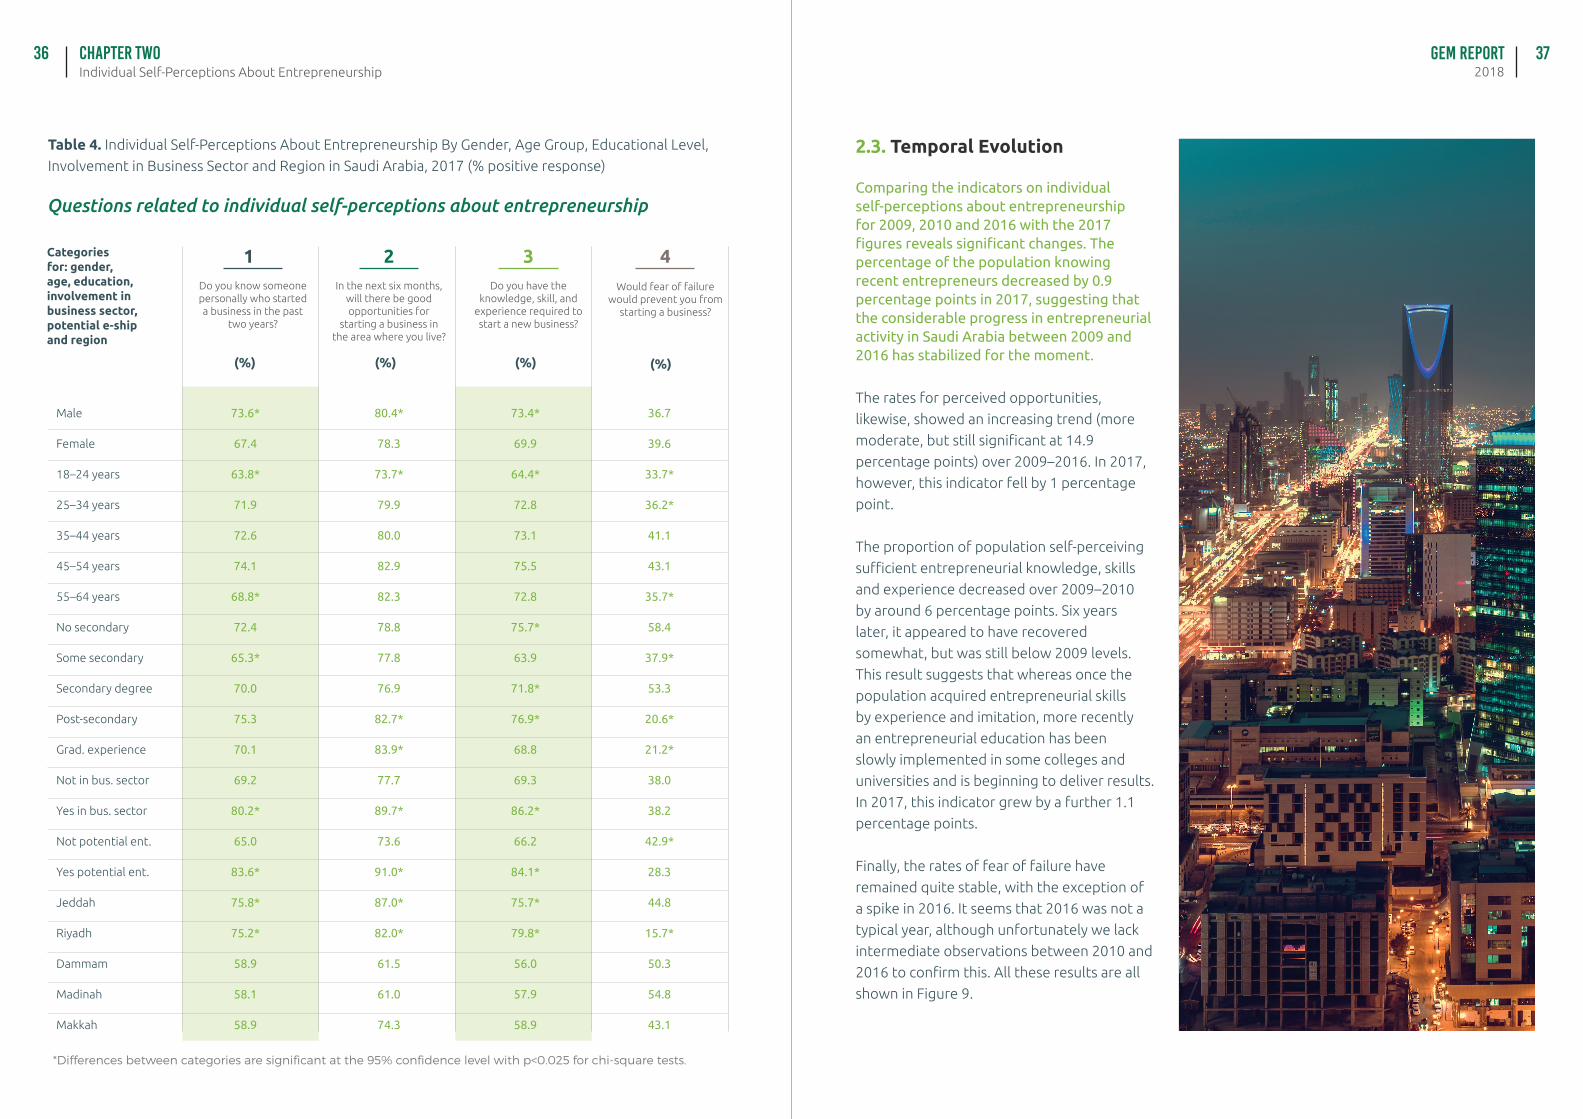
Questions related to individual self-perceptions about entrepreneurship
*Differences between categories are significant at the 95% confidence level with p<0.025 for chi-square tests.
Categories for: gender, age, education, involvement in business sector, potential e-ship and region
Male
Female
18–24 years
25–34 years
35–44 years
45–54 years
55–64 years
No secondary
Some secondary
Secondary degree
Post-secondary
Grad. experience
Not in bus. sector
Yes in bus. sector
Not potential ent.
Yes potential ent.
Jeddah
Riyadh
Dammam
Madinah
Makkah
73.6*
67.4
63.8*
71.9
72.6
74.1
68.8*
72.4
65.3*
70.0
75.3
70.1
69.2
80.2*
65.0
83.6*
75.8*
75.2*
58.9
58.1
58.9
80.4*
78.3
73.7*
79.9
80.0
82.9
82.3
78.8
77.8
76.9
82.7*
83.9*
77.7
89.7*
73.6
91.0*
87.0*
82.0*
61.5
61.0
74.3
73.4*
69.9
64.4*
72.8
73.1
75.5
72.8
75.7*
63.9
71.8*
76.9*
68.8
69.3
86.2*
66.2
84.1*
75.7*
79.8*
56.0
57.9
58.9
36.7
39.6
33.7*
36.2*
41.1
43.1
35.7*
58.4
37.9*
53.3
20.6*
21.2*
38.0
38.2
42.9*
28.3
44.8
15.7*
50.3
54.8
43.1
(%)
Do you know someone personally who started a business in the past
two years?
(%)
In the next six months, will there be good opportunities for
starting a business in the area where you live?
(%)
Do you have the knowledge, skill, and
experience required to start a new business?
(%)
Would fear of failure would prevent you from
starting a business?
Table 4. Individual Self-Perceptions About Entrepreneurship By Gender, Age Group, Educational Level,
Involvement in Business Sector and Region in Saudi Arabia, 2017 (% positive response)
1 2 3 4
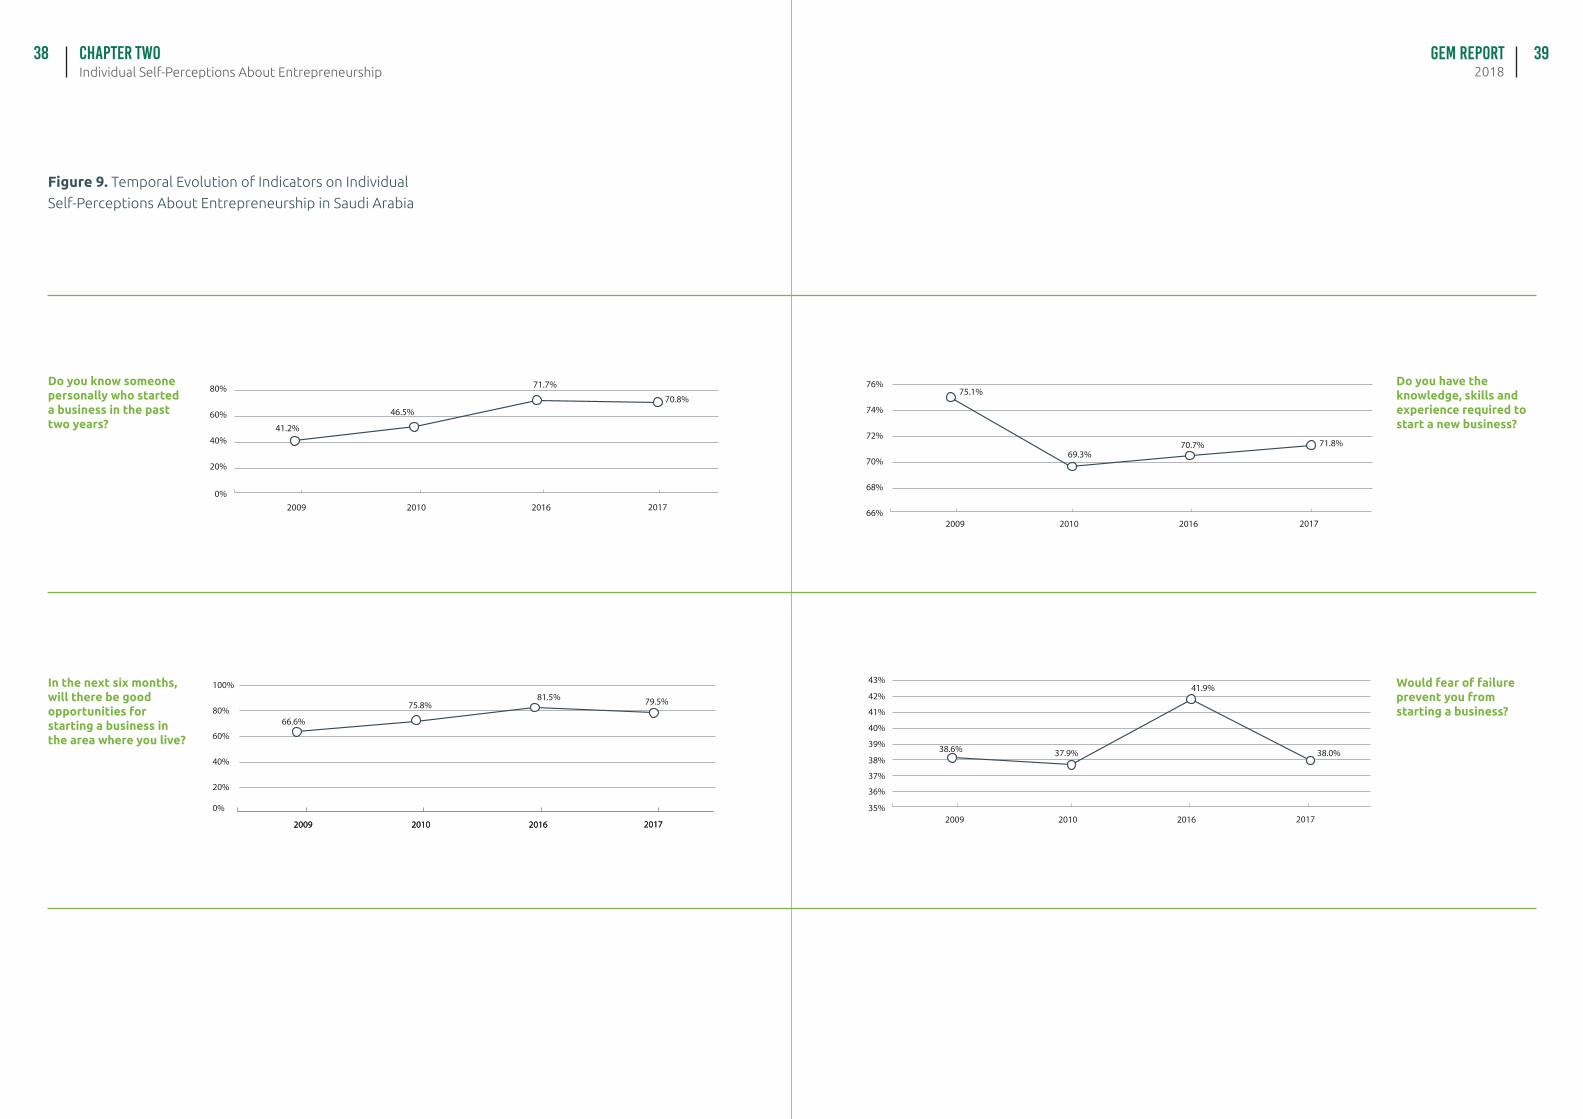
2.3. Temporal Evolution
Comparing the indicators on individual self-perceptions about entrepreneurship for 2009, 2010 and 2016 with the 2017 figures reveals significant changes. The percentage of the population knowing recent entrepreneurs decreased by 0.9 percentage points in 2017, suggesting that the considerable progress in entrepreneurial activity in Saudi Arabia between 2009 and 2016 has stabilized for the moment.
The rates for perceived opportunities,
likewise, showed an increasing trend (more
moderate, but still significant at 14.9
percentage points) over 2009–2016. In 2017,
however, this indicator fell by 1 percentage
point.
The proportion of population self-perceiving
sufficient entrepreneurial knowledge, skills
and experience decreased over 2009–2010
by around 6 percentage points. Six years
later, it appeared to have recovered
somewhat, but was still below 2009 levels.
This result suggests that whereas once the
population acquired entrepreneurial skills
by experience and imitation, more recently
an entrepreneurial education has been
slowly implemented in some colleges and
universities and is beginning to deliver results.
In 2017, this indicator grew by a further 1.1
percentage points.
Finally, the rates of fear of failure have
remained quite stable, with the exception of
a spike in 2016. It seems that 2016 was not a
typical year, although unfortunately we lack
intermediate observations between 2010 and
2016 to confirm this. All these results are all
shown in Figure 9.
GEM Report2018Individual Self-Perceptions About Entrepreneurship
Chapter TWO38 39
Figure 9. Temporal Evolution of Indicators on Individual
Self-Perceptions About Entrepreneurship in Saudi Arabia
2009 2010 2016 2017
0%
20%
40%
60%
80%
100%
2009 2010 2016 2017
66.6%
75.8%81.5% 79.5%
In the next six months, will there be good opportunities for starting a business in the area where you live?
0%
20%
40%
60%
80%
2009 2010 2016 2017
41.2%
46.5%
71.7%
70.8%
Do you know someone personally who started a business in the past two years?
35%
37%
36%
39%
38%
41%
40%
43%
42%
2009 2010 2016 2017
38.6% 37.9%
41.9%
38.0%
Would fear of failure prevent you from starting a business?
66%
68%
70%
72%
74%
76%
2009 2010 2016 2017
75.1%
69.3%70.7% 71.8%
Do you have the knowledge, skills and experience required to start a new business?
GEM Report2018Individual Self-Perceptions About Entrepreneurship
Chapter TWO40 41
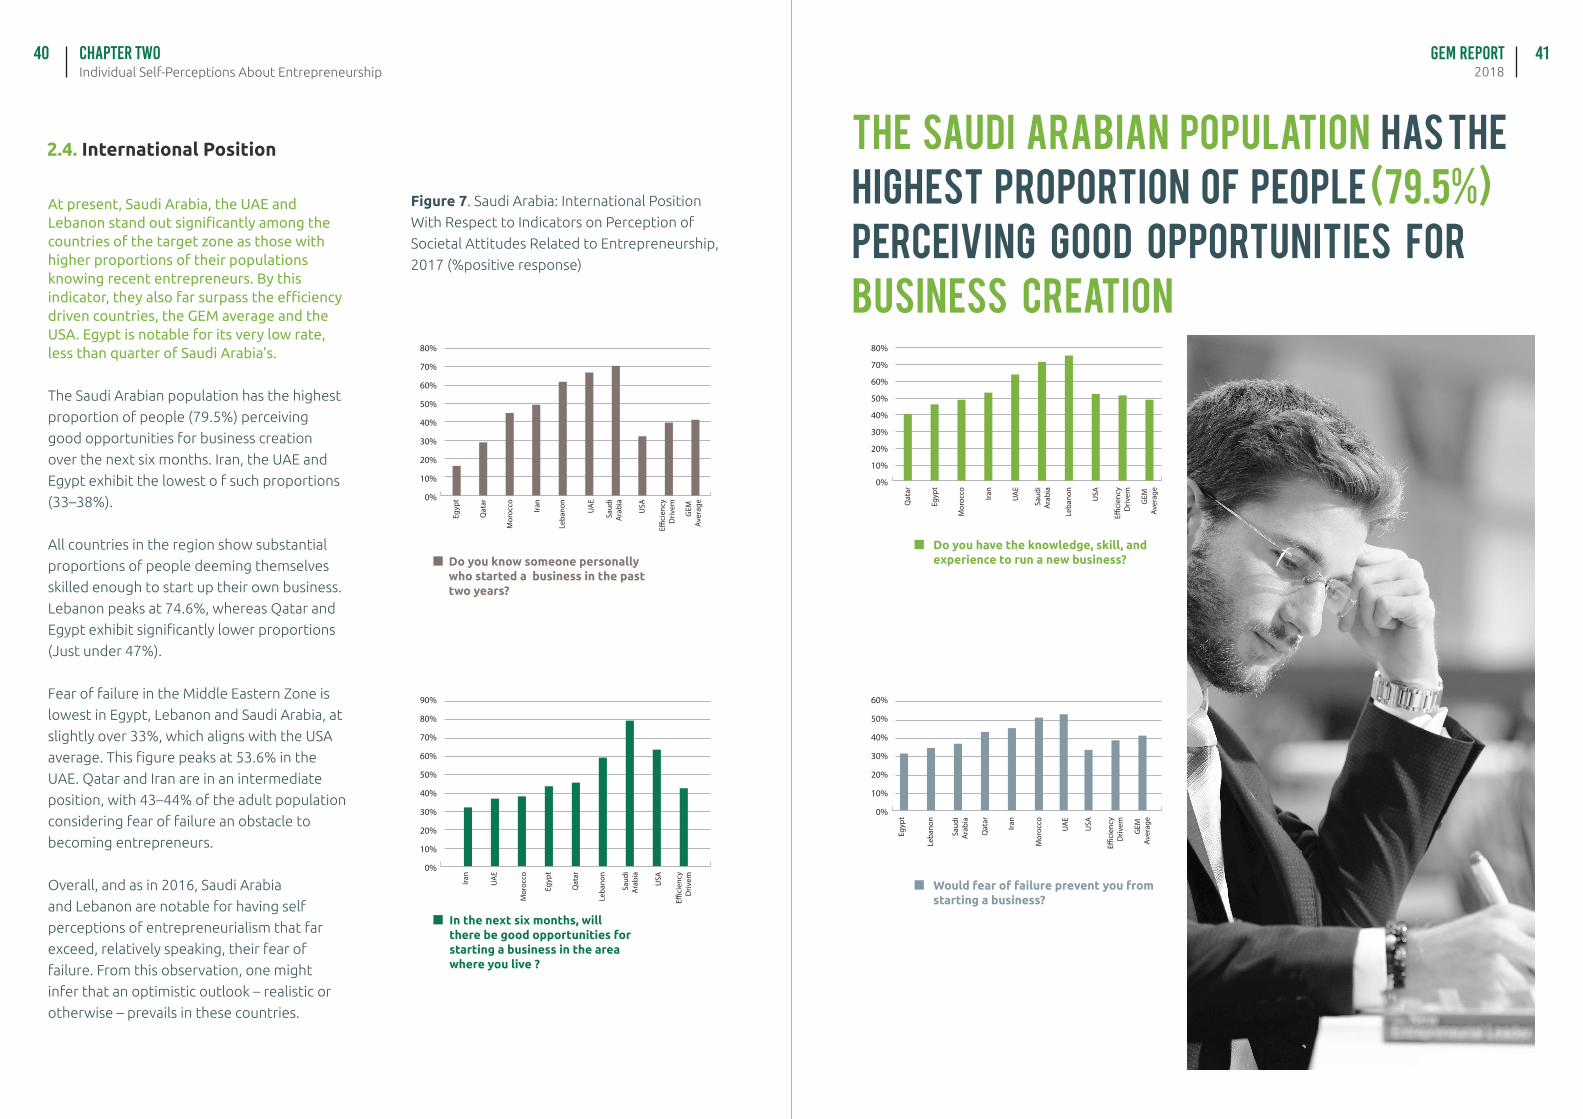
At present, Saudi Arabia, the UAE and Lebanon stand out significantly among the countries of the target zone as those with higher proportions of their populations knowing recent entrepreneurs. By this indicator, they also far surpass the efficiency driven countries, the GEM average and the USA. Egypt is notable for its very low rate, less than quarter of Saudi Arabia’s.
The Saudi Arabian population has the highest
proportion of people (79.5%) perceiving
good opportunities for business creation
over the next six months. Iran, the UAE and
Egypt exhibit the lowest o f such proportions
(33–38%).
All countries in the region show substantial
proportions of people deeming themselves
skilled enough to start up their own business.
Lebanon peaks at 74.6%, whereas Qatar and
Egypt exhibit significantly lower proportions
(Just under 47%).
Fear of failure in the Middle Eastern Zone is
lowest in Egypt, Lebanon and Saudi Arabia, at
slightly over 33%, which aligns with the USA
average. This figure peaks at 53.6% in the
UAE. Qatar and Iran are in an intermediate
position, with 43–44% of the adult population
considering fear of failure an obstacle to
becoming entrepreneurs.
Overall, and as in 2016, Saudi Arabia
and Lebanon are notable for having self
perceptions of entrepreneurialism that far
exceed, relatively speaking, their fear of
failure. From this observation, one might
infer that an optimistic outlook – realistic or
otherwise – prevails in these countries.
2.4. International Position
Figure 7. Saudi Arabia: International Position
With Respect to Indicators on Perception of
Societal Attitudes Related to Entrepreneurship,
2017 (%positive response)
0%
10%
20%
30%
40%
50%
60%
70%
80%
Iran
Qat
ar
Leba
non
Saud
i A
rabi
a
Mor
occo
Egyp
t
UA
E
USA
E�ci
ency
Driv
em
GEM
Av
erag
e
0%
10%
20%
30%
40%
50%
60%
70%
80%
90%
UA
E
Egyp
t
Saud
i A
rabi
a
Mor
occo
Qat
ar
Leba
non
Iran
USA
E�ci
ency
Driv
em
Do you know someone personally who started a business in the past two years?
In the next six months, will there be good opportunities for starting a business in the area where you live ?
0%
10%
20%
30%
40%
50%
60%
70%
80%
UA
E
Egyp
t
Saud
i A
rabi
a
Mor
occo
Leba
non
Qat
ar
Iran
USA
E�ci
ency
Driv
em
GEM
Av
erag
e
Do you have the knowledge, skill, and experience to run a new business?
0%
10%
20%
30%
40%
50%
60%
UA
E
Egyp
t
Leba
non
Saud
i A
rabi
a
Mor
occo
Qat
ar
Iran
USA
E�ci
ency
Driv
em
GEM
Av
erag
e
Would fear of failure prevent you from starting a business?
The Saudi Arabian population has the highest proportion of people (79.5%) perceiving good opportunities for business creation
GEM Report2018Entrepreneurial And Business Activity
Chapter Three42 43
0ENTREPRENEURIAL
AND BUSINESS ACTIVITY
3C H A P T E R
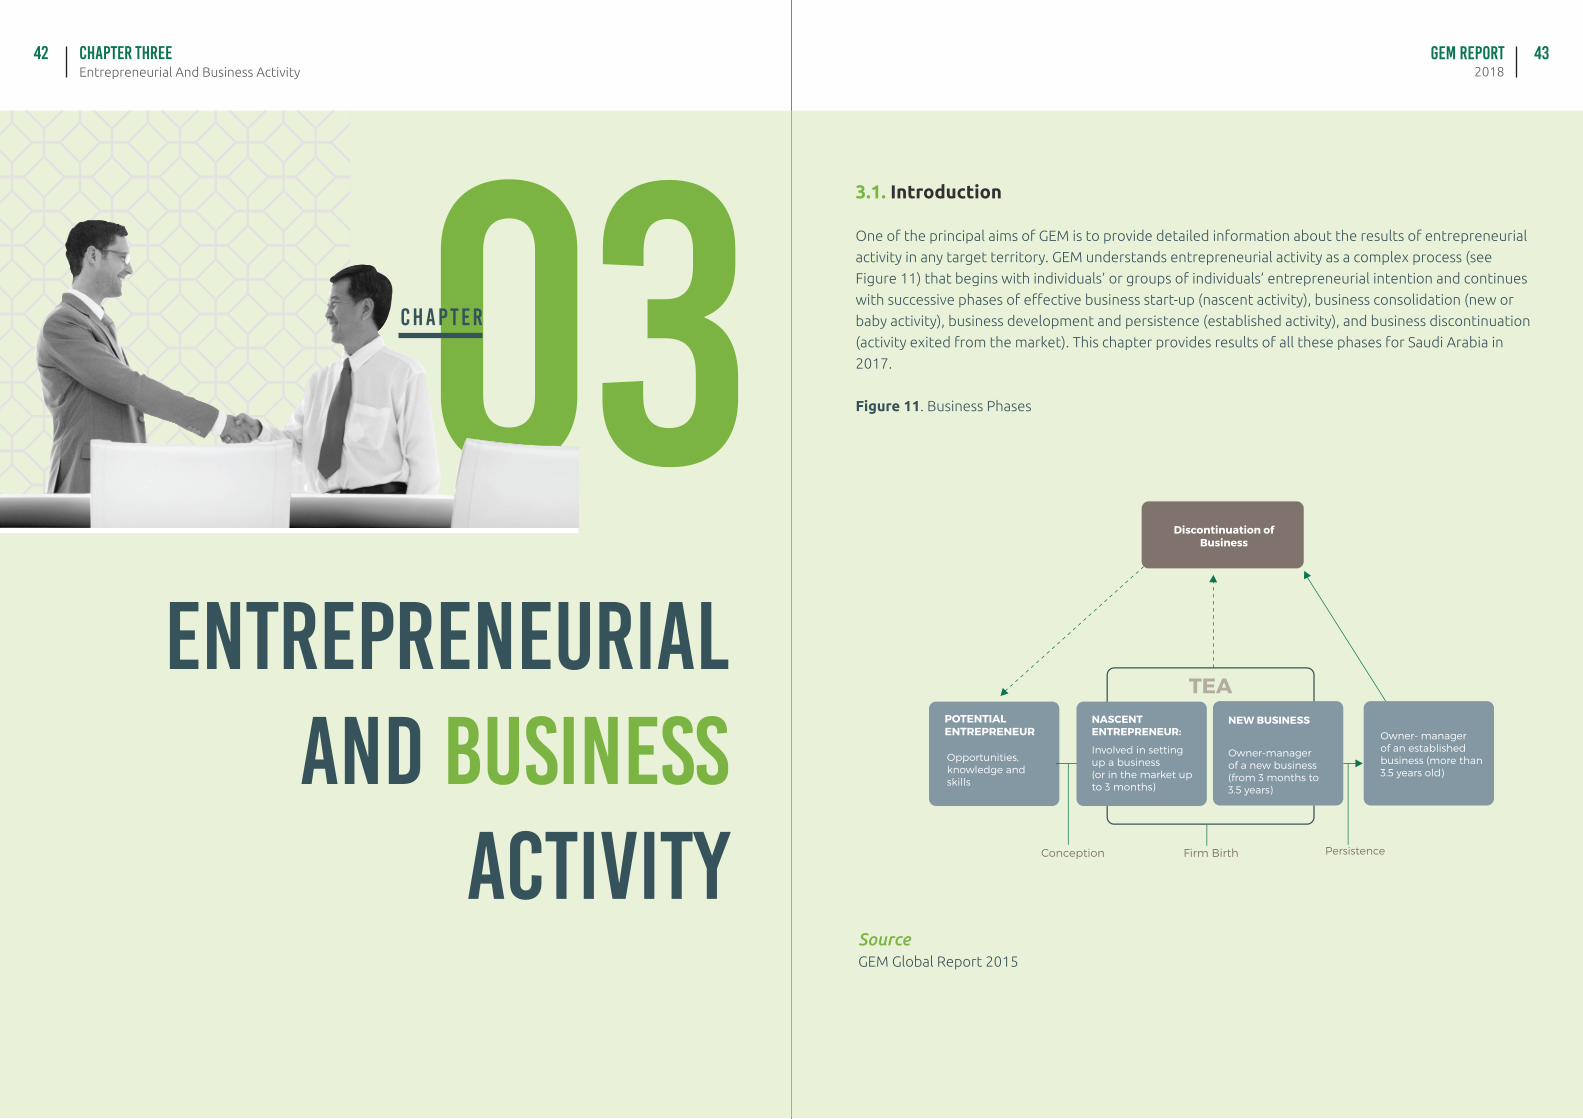
3.1. Introduction
One of the principal aims of GEM is to provide detailed information about the results of entrepreneurial
activity in any target territory. GEM understands entrepreneurial activity as a complex process (see
Figure 11) that begins with individuals’ or groups of individuals’ entrepreneurial intention and continues
with successive phases of effective business start-up (nascent activity), business consolidation (new or
baby activity), business development and persistence (established activity), and business discontinuation
(activity exited from the market). This chapter provides results of all these phases for Saudi Arabia in
2017.
Figure 11. Business Phases
POTENTIAL ENTREPRENEUR
Source GEM Global Report 2015
Discontinuation of Business
GEM Report2018Entrepreneurial And Business Activity
Chapter Three44 45
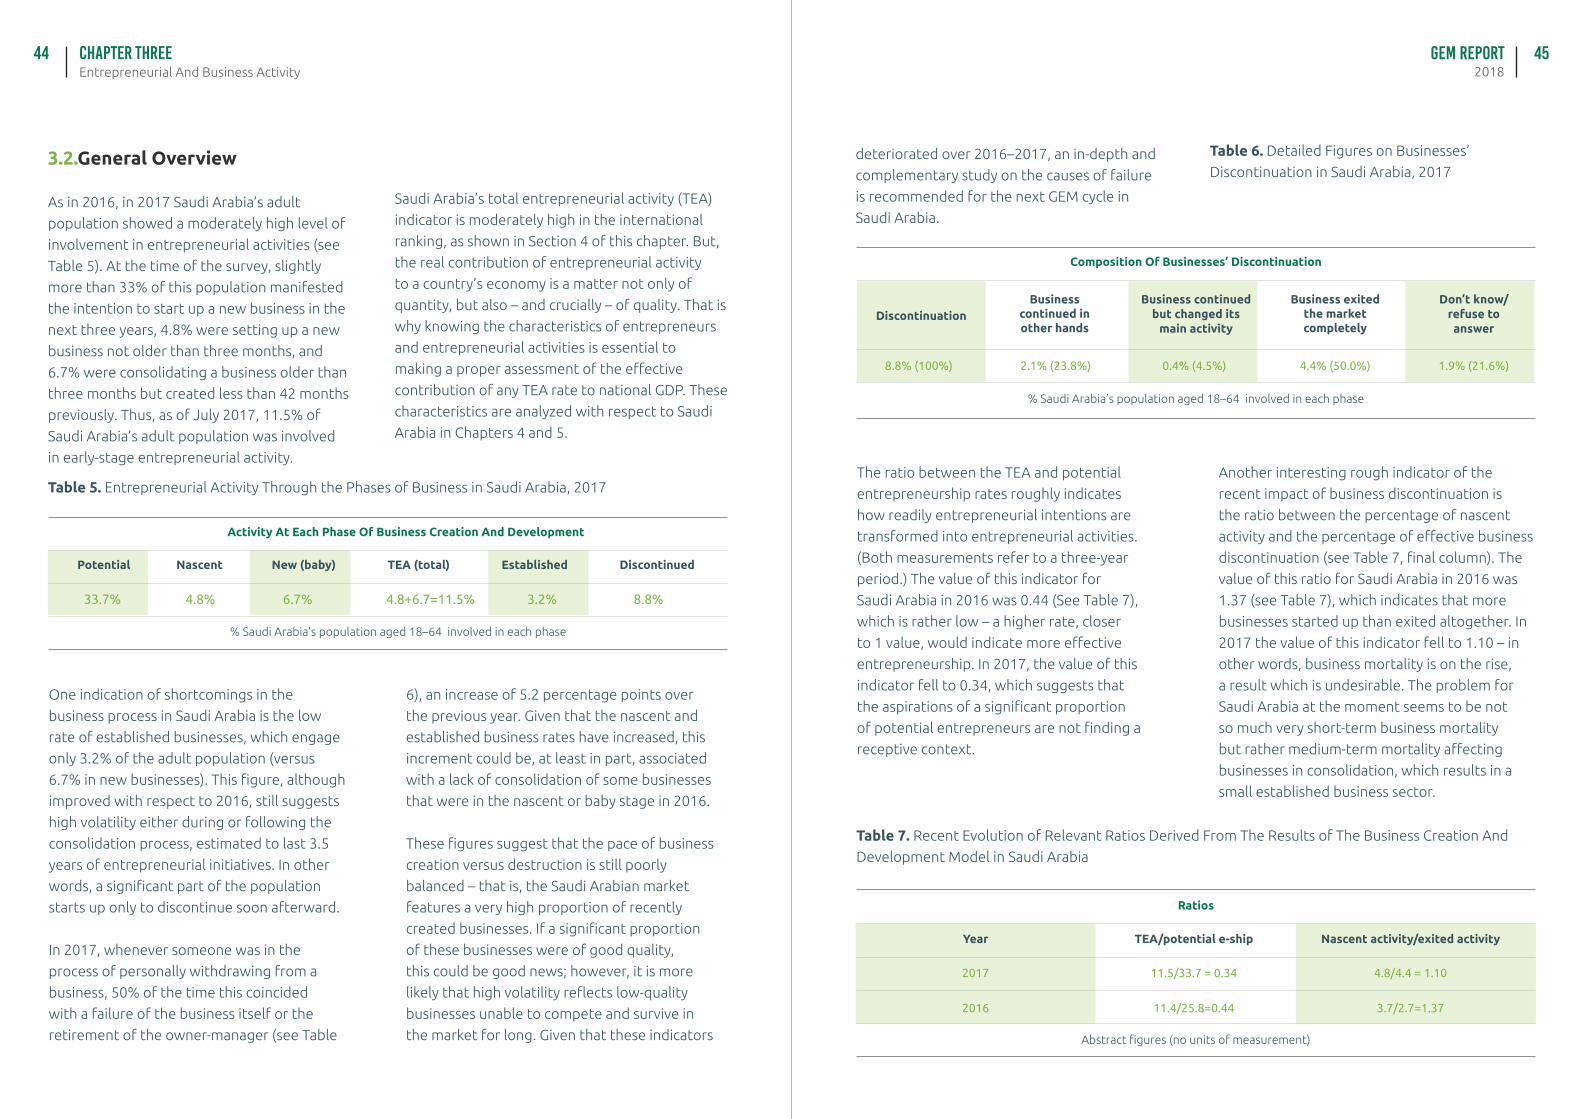
3.2.General Overview
As in 2016, in 2017 Saudi Arabia’s adult
population showed a moderately high level of
involvement in entrepreneurial activities (see
Table 5). At the time of the survey, slightly
more than 33% of this population manifested
the intention to start up a new business in the
next three years, 4.8% were setting up a new
business not older than three months, and
6.7% were consolidating a business older than
three months but created less than 42 months
previously. Thus, as of July 2017, 11.5% of
Saudi Arabia’s adult population was involved
in early-stage entrepreneurial activity.
Table 5. Entrepreneurial Activity Through the Phases of Business in Saudi Arabia, 2017
33.7% 4.8% 6.7% 4.8+6.7=11.5% 3.2% 8.8%
Potential Nascent New (baby) TEA (total) Established Discontinued
Activity At Each Phase Of Business Creation And Development
% Saudi Arabia’s population aged 18–64 involved in each phase
One indication of shortcomings in the
business process in Saudi Arabia is the low
rate of established businesses, which engage
only 3.2% of the adult population (versus
6.7% in new businesses). This figure, although
improved with respect to 2016, still suggests
high volatility either during or following the
consolidation process, estimated to last 3.5
years of entrepreneurial initiatives. In other
words, a significant part of the population
starts up only to discontinue soon afterward.
In 2017, whenever someone was in the
process of personally withdrawing from a
business, 50% of the time this coincided
with a failure of the business itself or the
retirement of the owner-manager (see Table
Saudi Arabia’s total entrepreneurial activity (TEA)
indicator is moderately high in the international
ranking, as shown in Section 4 of this chapter. But,
the real contribution of entrepreneurial activity
to a country’s economy is a matter not only of
quantity, but also – and crucially – of quality. That is
why knowing the characteristics of entrepreneurs
and entrepreneurial activities is essential to
making a proper assessment of the effective
contribution of any TEA rate to national GDP. These
characteristics are analyzed with respect to Saudi
Arabia in Chapters 4 and 5.
6), an increase of 5.2 percentage points over
the previous year. Given that the nascent and
established business rates have increased, this
increment could be, at least in part, associated
with a lack of consolidation of some businesses
that were in the nascent or baby stage in 2016.
These figures suggest that the pace of business
creation versus destruction is still poorly
balanced – that is, the Saudi Arabian market
features a very high proportion of recently
created businesses. If a significant proportion
of these businesses were of good quality,
this could be good news; however, it is more
likely that high volatility reflects low-quality
businesses unable to compete and survive in
the market for long. Given that these indicators
Table 6. Detailed Figures on Businesses’
Discontinuation in Saudi Arabia, 2017
Table 7. Recent Evolution of Relevant Ratios Derived From The Results of The Business Creation And
Development Model in Saudi Arabia
The ratio between the TEA and potential
entrepreneurship rates roughly indicates
how readily entrepreneurial intentions are
transformed into entrepreneurial activities.
(Both measurements refer to a three-year
period.) The value of this indicator for
Saudi Arabia in 2016 was 0.44 (See Table 7),
which is rather low – a higher rate, closer
to 1 value, would indicate more effective
entrepreneurship. In 2017, the value of this
indicator fell to 0.34, which suggests that
the aspirations of a significant proportion
of potential entrepreneurs are not finding a
receptive context.
Another interesting rough indicator of the
recent impact of business discontinuation is
the ratio between the percentage of nascent
activity and the percentage of effective business
discontinuation (see Table 7, final column). The
value of this ratio for Saudi Arabia in 2016 was
1.37 (see Table 7), which indicates that more
businesses started up than exited altogether. In
2017 the value of this indicator fell to 1.10 – in
other words, business mortality is on the rise,
a result which is undesirable. The problem for
Saudi Arabia at the moment seems to be not
so much very short-term business mortality
but rather medium-term mortality affecting
businesses in consolidation, which results in a
small established business sector.
deteriorated over 2016–2017, an in-depth and
complementary study on the causes of failure
is recommended for the next GEM cycle in
Saudi Arabia.
Composition Of Businesses’ Discontinuation
% Saudi Arabia’s population aged 18–64 involved in each phase
DiscontinuationBusiness
continued in other hands
Business continued but changed its
main activity
Business exited the market completely
Don’t know/refuse to answer
8.8% (100%) 2.1% (23.8%) 0.4% (4.5%) 4.4% (50.0%) 1.9% (21.6%)
Ratios
Abstract figures (no units of measurement)
Year TEA/potential e-ship Nascent activity/exited activity
2016
2017
11.4/25.8=0.44
11.5/33.7 = 0.34
3.7/2.7=1.37
4.8/4.4 = 1.10
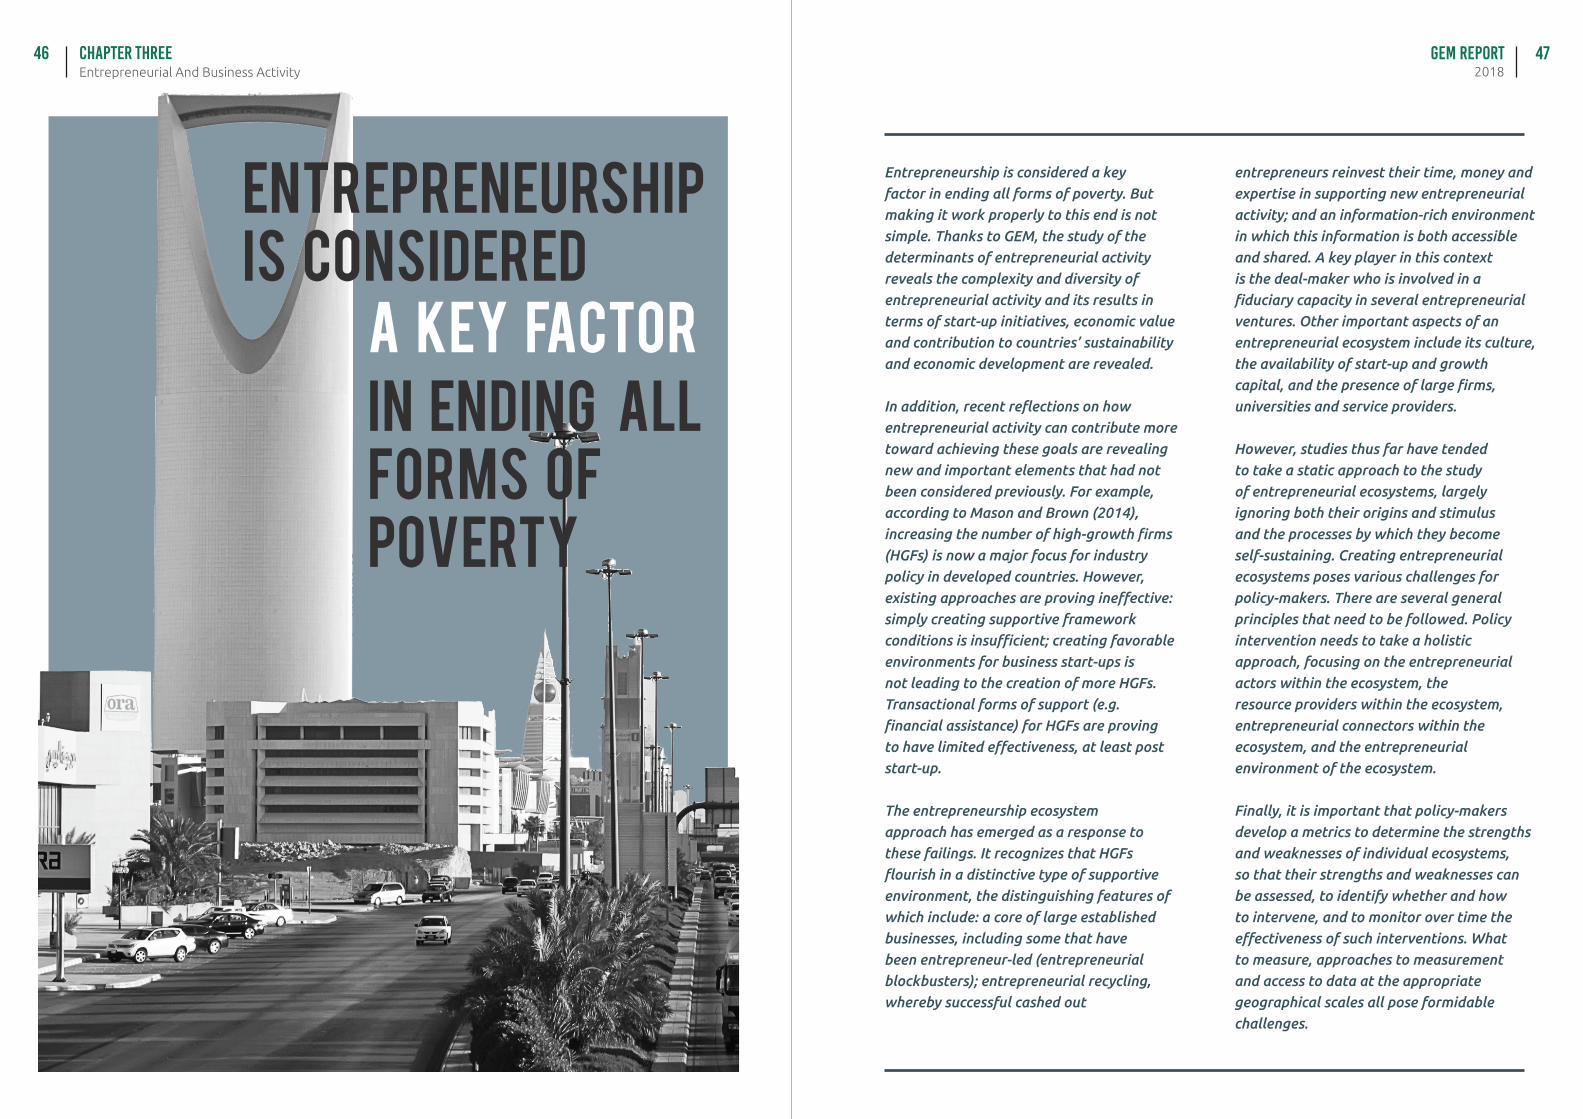
GEM Report2018Entrepreneurial And Business Activity
Chapter Three46 47
Entrepreneurshipis considered
in ending all forms of poverty
a key factor
entrepreneurs reinvest their time, money and expertise in supporting new entrepreneurial activity; and an information-rich environment in which this information is both accessible and shared. A key player in this context is the deal-maker who is involved in a fiduciary capacity in several entrepreneurial ventures. Other important aspects of an entrepreneurial ecosystem include its culture, the availability of start-up and growth capital, and the presence of large firms, universities and service providers.
However, studies thus far have tended to take a static approach to the study of entrepreneurial ecosystems, largely ignoring both their origins and stimulus and the processes by which they become self-sustaining. Creating entrepreneurial ecosystems poses various challenges for policy-makers. There are several general principles that need to be followed. Policy intervention needs to take a holistic approach, focusing on the entrepreneurial actors within the ecosystem, the resource providers within the ecosystem, entrepreneurial connectors within the ecosystem, and the entrepreneurial environment of the ecosystem.
Finally, it is important that policy-makers develop a metrics to determine the strengths and weaknesses of individual ecosystems, so that their strengths and weaknesses can be assessed, to identify whether and how to intervene, and to monitor over time the effectiveness of such interventions. What to measure, approaches to measurement and access to data at the appropriate geographical scales all pose formidable challenges.
Entrepreneurship is considered a key factor in ending all forms of poverty. But making it work properly to this end is not simple. Thanks to GEM, the study of the determinants of entrepreneurial activity reveals the complexity and diversity of entrepreneurial activity and its results in terms of start-up initiatives, economic value and contribution to countries’ sustainability and economic development are revealed.
In addition, recent reflections on how entrepreneurial activity can contribute more toward achieving these goals are revealing new and important elements that had not been considered previously. For example, according to Mason and Brown (2014), increasing the number of high-growth firms (HGFs) is now a major focus for industry policy in developed countries. However, existing approaches are proving ineffective: simply creating supportive framework conditions is insufficient; creating favorable environments for business start-ups is not leading to the creation of more HGFs. Transactional forms of support (e.g. financial assistance) for HGFs are proving to have limited effectiveness, at least post start-up.
The entrepreneurship ecosystem approach has emerged as a response to these failings. It recognizes that HGFs flourish in a distinctive type of supportive environment, the distinguishing features of which include: a core of large established businesses, including some that have been entrepreneur-led (entrepreneurial blockbusters); entrepreneurial recycling, whereby successful cashed out
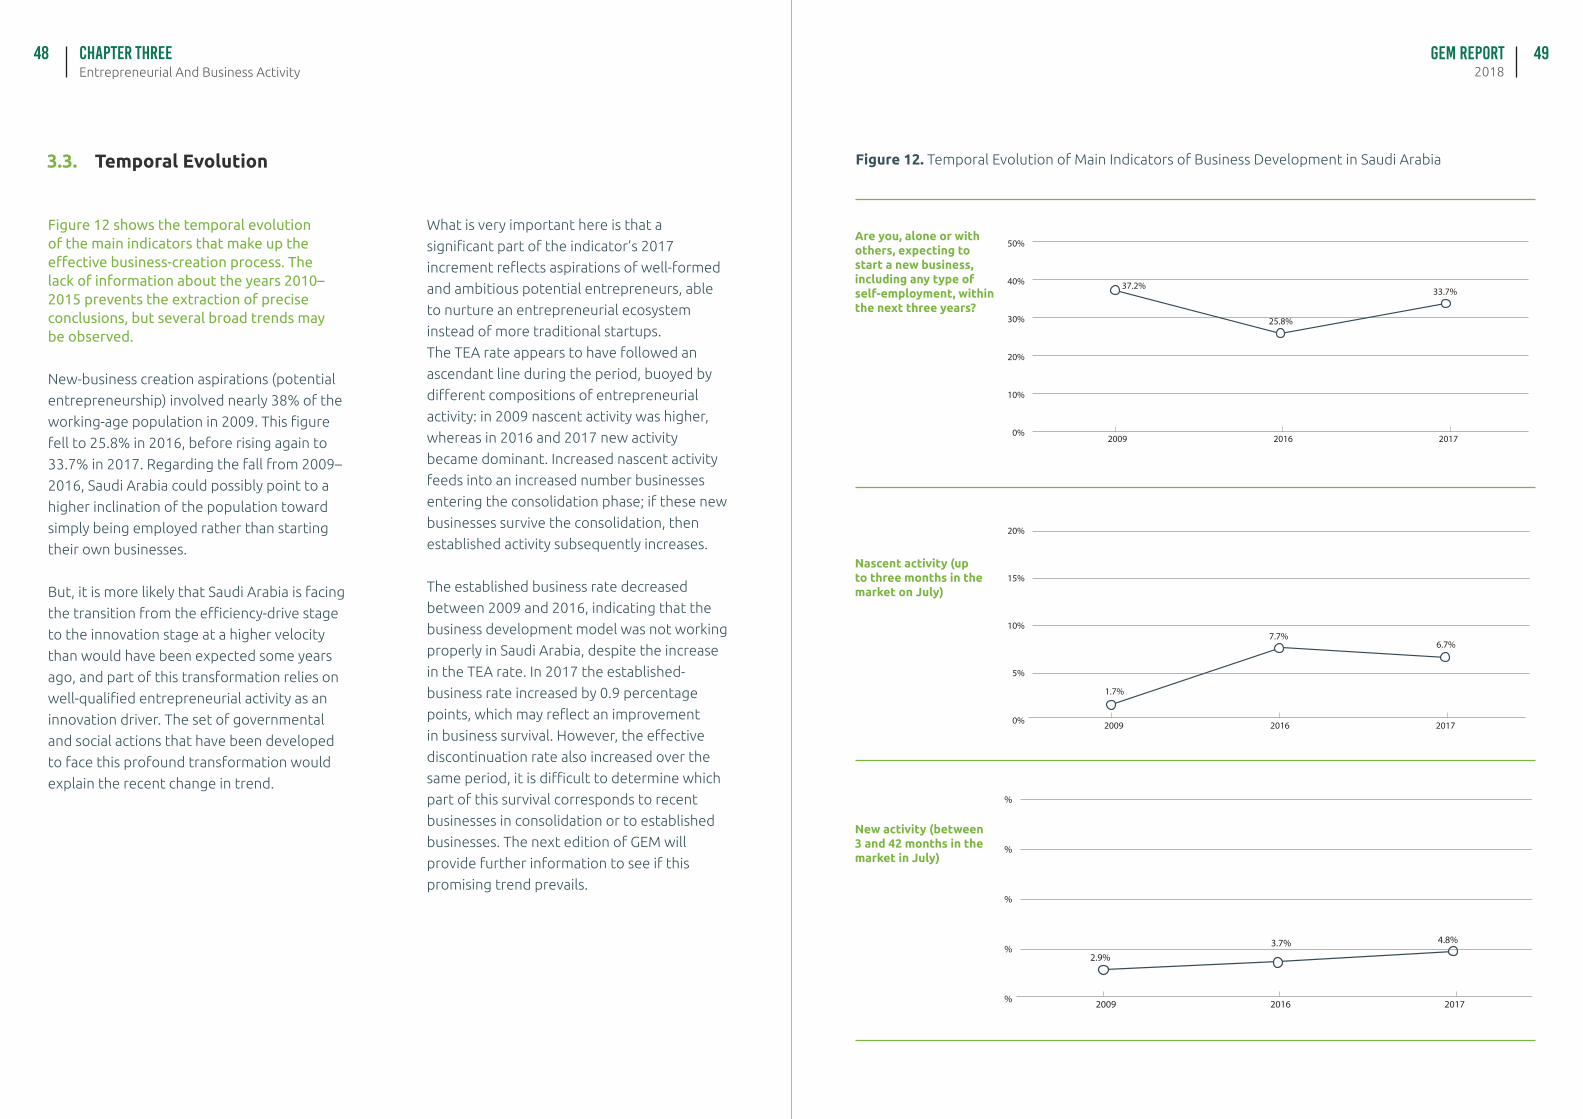
GEM Report2018Entrepreneurial And Business Activity
Chapter Three48 49
Figure 12 shows the temporal evolution of the main indicators that make up the effective business-creation process. The lack of information about the years 2010–2015 prevents the extraction of precise conclusions, but several broad trends may be observed.
New-business creation aspirations (potential
entrepreneurship) involved nearly 38% of the
working-age population in 2009. This figure
fell to 25.8% in 2016, before rising again to
33.7% in 2017. Regarding the fall from 2009–
2016, Saudi Arabia could possibly point to a
higher inclination of the population toward
simply being employed rather than starting
their own businesses.
But, it is more likely that Saudi Arabia is facing
the transition from the efficiency-drive stage
to the innovation stage at a higher velocity
than would have been expected some years
ago, and part of this transformation relies on
well-qualified entrepreneurial activity as an
innovation driver. The set of governmental
and social actions that have been developed
to face this profound transformation would
explain the recent change in trend.
What is very important here is that a
significant part of the indicator’s 2017
increment reflects aspirations of well-formed
and ambitious potential entrepreneurs, able
to nurture an entrepreneurial ecosystem
instead of more traditional startups.
The TEA rate appears to have followed an
ascendant line during the period, buoyed by
different compositions of entrepreneurial
activity: in 2009 nascent activity was higher,
whereas in 2016 and 2017 new activity
became dominant. Increased nascent activity
feeds into an increased number businesses
entering the consolidation phase; if these new
businesses survive the consolidation, then
established activity subsequently increases.
The established business rate decreased
between 2009 and 2016, indicating that the
business development model was not working
properly in Saudi Arabia, despite the increase
in the TEA rate. In 2017 the established-
business rate increased by 0.9 percentage
points, which may reflect an improvement
in business survival. However, the effective
discontinuation rate also increased over the
same period, it is difficult to determine which
part of this survival corresponds to recent
businesses in consolidation or to established
businesses. The next edition of GEM will
provide further information to see if this
promising trend prevails.
3.3. Temporal Evolution Figure 12. Temporal Evolution of Main Indicators of Business Development in Saudi Arabia
2009 2016 20170%
10%
20%
30%
40% 37.2%
25.8%
33.7%
50%Are you, alone or with others, expecting to start a new business, including any type of self-employment, within the next three years?
0%
5%
1.7%
7.7%6.7%
10%
15%
20%
2009 2016 2017
Nascent activity (up to three months in the market on July)
0%
5%2.9%
3.7% 4.8%
10%
15%
20%
2009 2016 2017
New activity (between 3 and 42 months in the market in July)
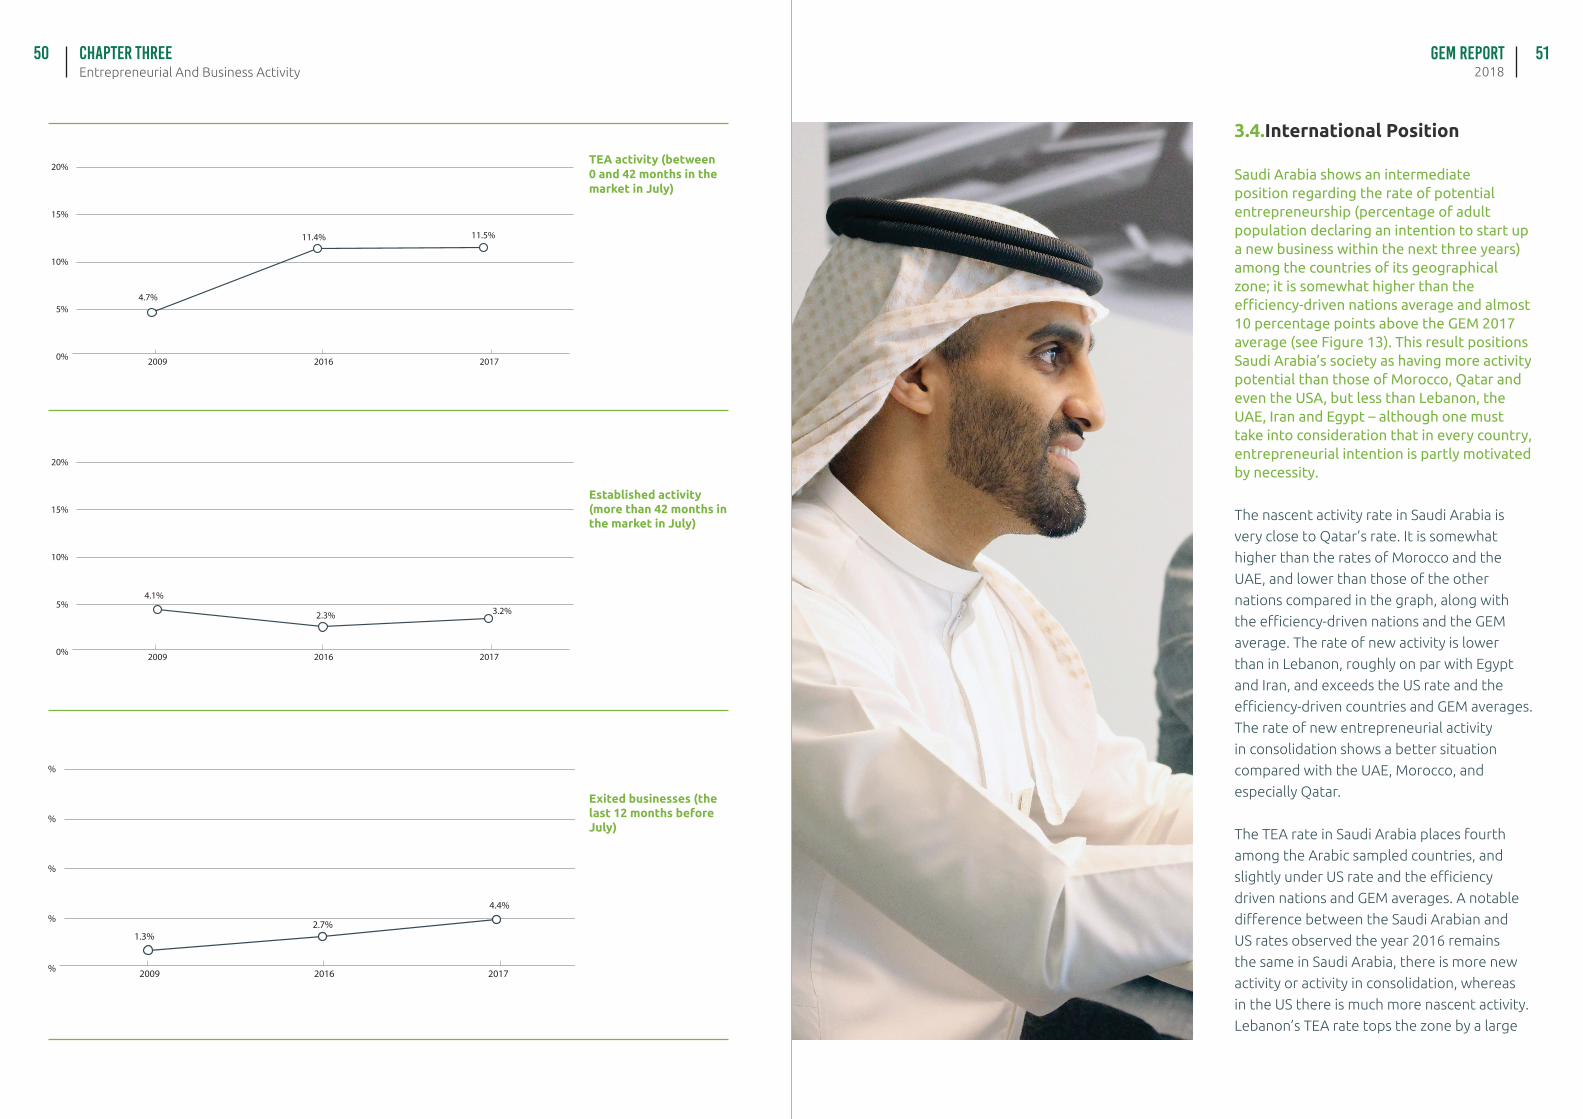
GEM Report2018Entrepreneurial And Business Activity
Chapter Three50 51
0%
5%4.7%
11.4% 11.5%
10%
15%
20%
2009 2016 2017
TEA activity (between 0 and 42 months in the market in July)
0%
5%4.1%
2.3% 3.2%
10%
15%
20%
2009 2016 2017
Established activity (more than 42 months in the market in July)
0%
1.3%2.7%
4.4%5%
10%
15%
20%
2009 2016 2017
Exited businesses (the last 12 months before July)
Saudi Arabia shows an intermediate position regarding the rate of potential entrepreneurship (percentage of adult population declaring an intention to start up a new business within the next three years) among the countries of its geographical zone; it is somewhat higher than the efficiency-driven nations average and almost 10 percentage points above the GEM 2017 average (see Figure 13). This result positions Saudi Arabia’s society as having more activity potential than those of Morocco, Qatar and even the USA, but less than Lebanon, the UAE, Iran and Egypt – although one must take into consideration that in every country, entrepreneurial intention is partly motivated by necessity.
The nascent activity rate in Saudi Arabia is
very close to Qatar’s rate. It is somewhat
higher than the rates of Morocco and the
UAE, and lower than those of the other
nations compared in the graph, along with
the efficiency-driven nations and the GEM
average. The rate of new activity is lower
than in Lebanon, roughly on par with Egypt
and Iran, and exceeds the US rate and the
efficiency-driven countries and GEM averages.
The rate of new entrepreneurial activity
in consolidation shows a better situation
compared with the UAE, Morocco, and
especially Qatar.
The TEA rate in Saudi Arabia places fourth
among the Arabic sampled countries, and
slightly under US rate and the efficiency
driven nations and GEM averages. A notable
difference between the Saudi Arabian and
US rates observed the year 2016 remains
the same in Saudi Arabia, there is more new
activity or activity in consolidation, whereas
in the US there is much more nascent activity.
Lebanon’s TEA rate tops the zone by a large
3.4.International Position
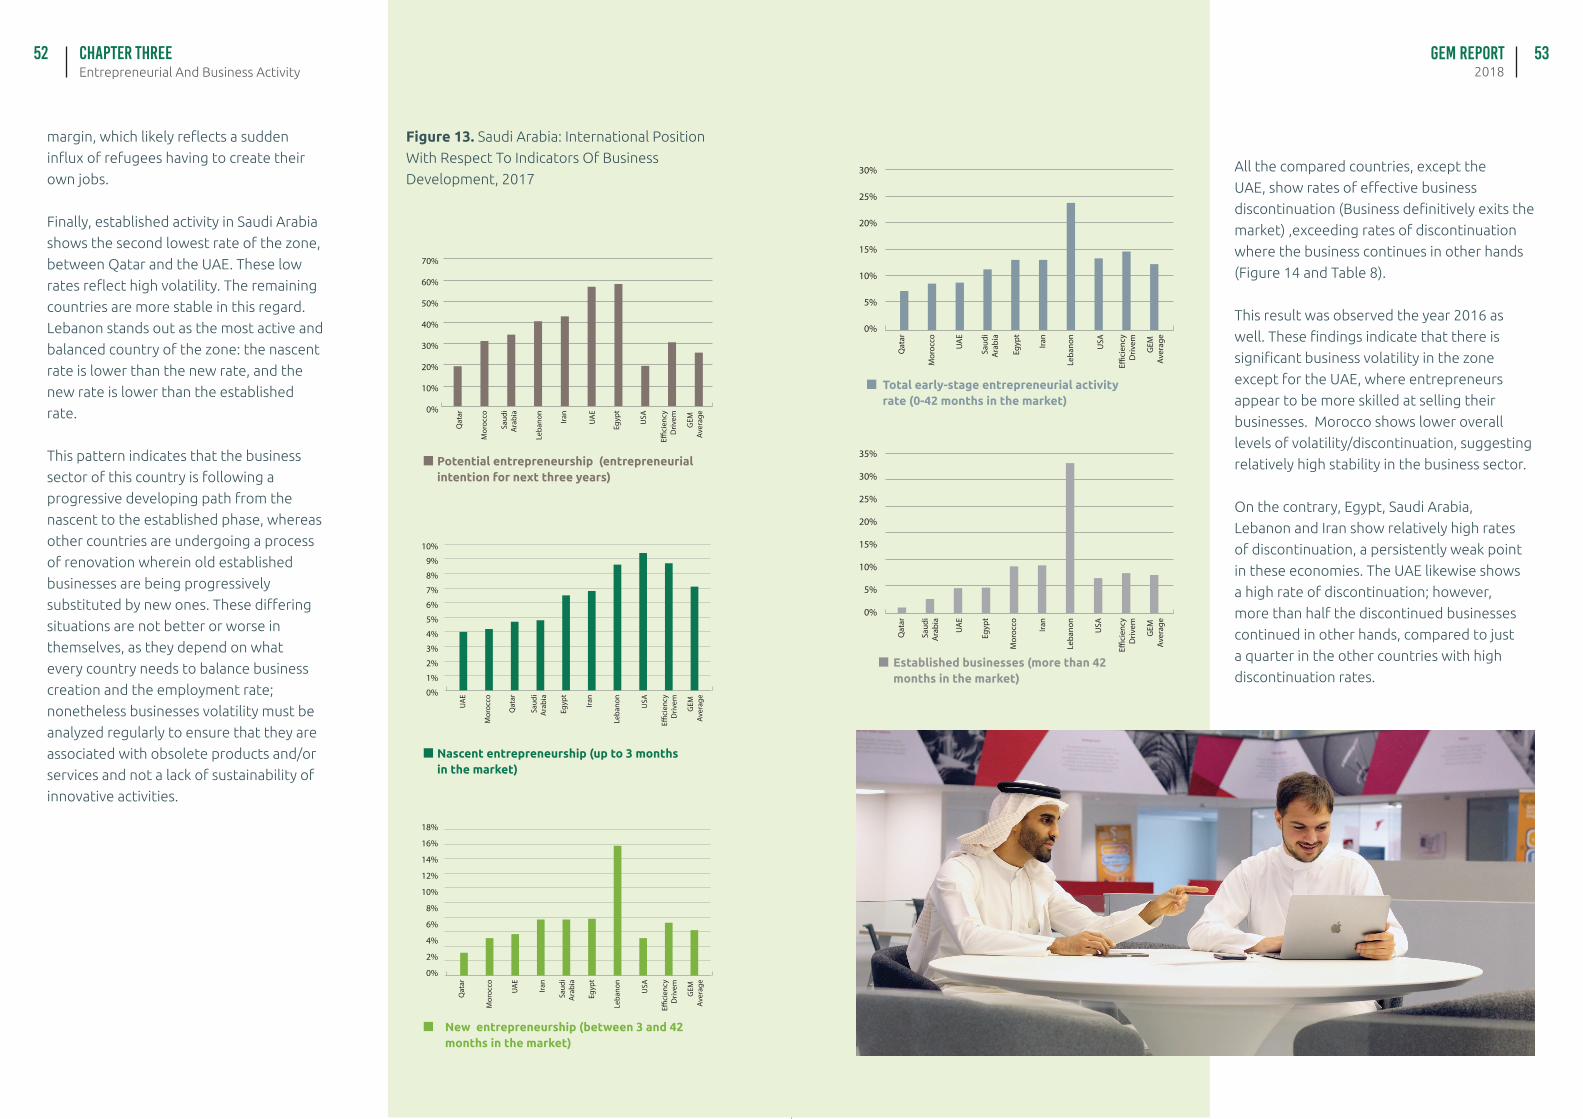
GEM Report2018Entrepreneurial And Business Activity
Chapter Three52 53
margin, which likely reflects a sudden
influx of refugees having to create their
own jobs.
Finally, established activity in Saudi Arabia
shows the second lowest rate of the zone,
between Qatar and the UAE. These low
rates reflect high volatility. The remaining
countries are more stable in this regard.
Lebanon stands out as the most active and
balanced country of the zone: the nascent
rate is lower than the new rate, and the
new rate is lower than the established
rate.
This pattern indicates that the business
sector of this country is following a
progressive developing path from the
nascent to the established phase, whereas
other countries are undergoing a process
of renovation wherein old established
businesses are being progressively
substituted by new ones. These differing
situations are not better or worse in
themselves, as they depend on what
every country needs to balance business
creation and the employment rate;
nonetheless businesses volatility must be
analyzed regularly to ensure that they are
associated with obsolete products and/or
services and not a lack of sustainability of
innovative activities.
Iran
Qat
ar
Leba
non
Saud
i A
rabi
a
Mor
occo
Egyp
t
UA
E
USA
E�ci
ency
Driv
em
GEM
Av
erag
e0%
10%
20%
30%
40%
50%
60%
70%
Iran
Qat
ar
Leba
non
Saud
i A
rabi
a
Mor
occo
Egyp
t
UA
E
USA
E�ci
ency
Driv
em
GEM
Av
erag
e0%
1%
2%
3%
4%
5%
6%
7%
8%
9%
10%
Potential entrepreneurship (entrepreneurial intention for next three years)
Nascent entrepreneurship (up to 3 months in the market)
Iran
Qat
ar
Leba
non
Saud
i A
rabi
a
Mor
occo
Egyp
t
UA
E
USA
E�ci
ency
Driv
em
GEM
Av
erag
e
0%
2%
4%
6%
8%
10%
12%
14%
16%
18%
New entrepreneurship (between 3 and 42 months in the market)
Iran
Qat
ar
Leba
non
Saud
i A
rabi
a
Mor
occo
Egyp
t
UA
E
USA
E�ci
ency
Driv
em
GEM
Av
erag
e
0%
5%
10%
15%
20%
25%
30%
Iran
Qat
ar
Leba
non
Saud
i A
rabi
a
Mor
occo
Egyp
t
UA
E
USA
E�ci
ency
Driv
em
GEM
Av
erag
e
0%
5%
10%
15%
20%
25%
30%
35%
Total early-stage entrepreneurial activity rate (0-42 months in the market)
Established businesses (more than 42 months in the market)
All the compared countries, except the
UAE, show rates of effective business
discontinuation (Business definitively exits the
market) ,exceeding rates of discontinuation
where the business continues in other hands
(Figure 14 and Table 8).
This result was observed the year 2016 as
well. These findings indicate that there is
significant business volatility in the zone
except for the UAE, where entrepreneurs
appear to be more skilled at selling their
businesses. Morocco shows lower overall
levels of volatility/discontinuation, suggesting
relatively high stability in the business sector.
On the contrary, Egypt, Saudi Arabia,
Lebanon and Iran show relatively high rates
of discontinuation, a persistently weak point
in these economies. The UAE likewise shows
a high rate of discontinuation; however,
more than half the discontinued businesses
continued in other hands, compared to just
a quarter in the other countries with high
discontinuation rates.
Figure 13. Saudi Arabia: International Position
With Respect To Indicators Of Business
Development, 2017
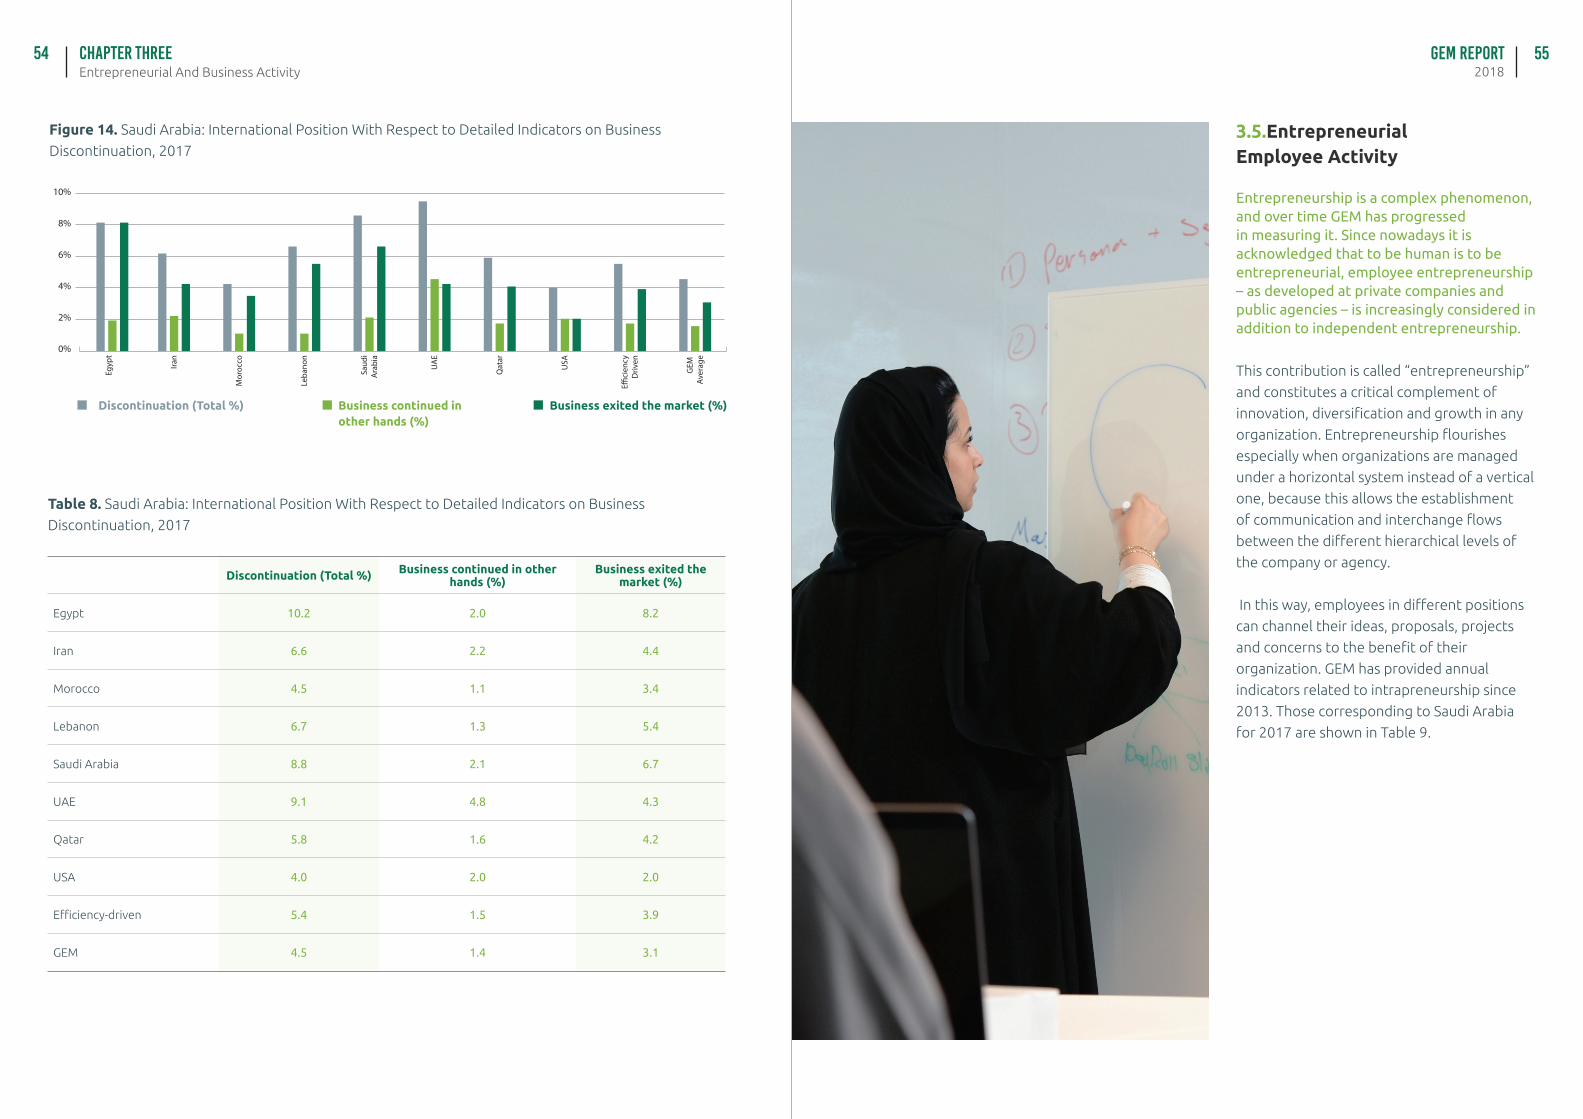
GEM Report2018Entrepreneurial And Business Activity
Chapter Three54 55
Iran
Qat
ar
Leba
non
Saud
i A
rabi
a
Mor
occo
Egyp
t
UA
E
USA
E�ci
ency
Driv
en
GEM
Av
erag
e
0%
2%
4%
6%
8%
10%
Figure 14. Saudi Arabia: International Position With Respect to Detailed Indicators on Business
Discontinuation, 2017
Table 8. Saudi Arabia: International Position With Respect to Detailed Indicators on Business
Discontinuation, 2017
Discontinuation (Total %) Business continued in other hands (%)
Business exited the market (%)
Discontinuation (Total %) Business continued in other hands (%)
Business exited the market (%)
Egypt 10.2 2.0 8.2
Iran 6.6 2.2 4.4
Morocco 4.5 1.1 3.4
Lebanon 6.7 1.3 5.4
Saudi Arabia 8.8 2.1 6.7
UAE 9.1 4.8 4.3
Qatar 5.8 1.6 4.2
USA 4.0 2.0 2.0
Efficiency-driven 5.4 1.5 3.9
GEM 4.5 1.4 3.1
3.5.Entrepreneurial Employee Activity
Entrepreneurship is a complex phenomenon, and over time GEM has progressed in measuring it. Since nowadays it is acknowledged that to be human is to be entrepreneurial, employee entrepreneurship – as developed at private companies and public agencies – is increasingly considered in addition to independent entrepreneurship.
This contribution is called “entrepreneurship”
and constitutes a critical complement of
innovation, diversification and growth in any
organization. Entrepreneurship flourishes
especially when organizations are managed
under a horizontal system instead of a vertical
one, because this allows the establishment
of communication and interchange flows
between the different hierarchical levels of
the company or agency.
In this way, employees in different positions
can channel their ideas, proposals, projects
and concerns to the benefit of their
organization. GEM has provided annual
indicators related to intrapreneurship since
2013. Those corresponding to Saudi Arabia
for 2017 are shown in Table 9.
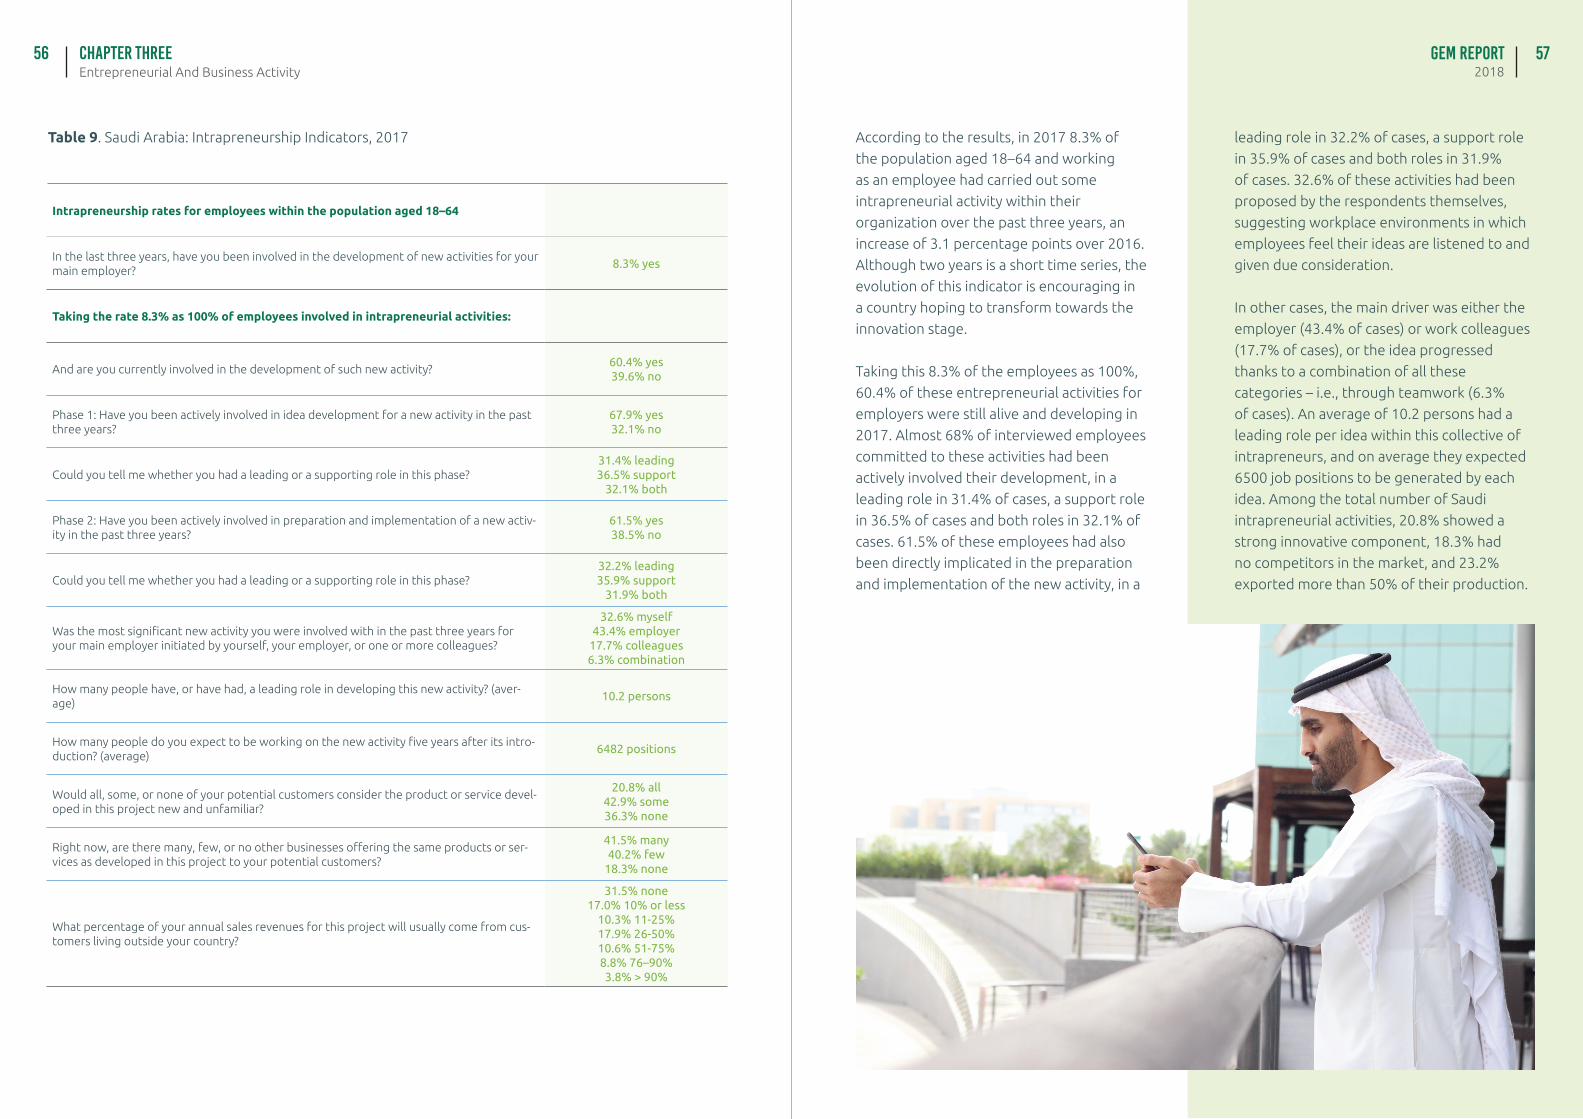
Entrepreneurial And Business ActivityChapter Three56
Table 9. Saudi Arabia: Intrapreneurship Indicators, 2017
Intrapreneurship rates for employees within the population aged 18–64
In the last three years, have you been involved in the development of new activities for your main employer?
8.3% yes
Taking the rate 8.3% as 100% of employees involved in intrapreneurial activities:
And are you currently involved in the development of such new activity?60.4% yes39.6% no
Phase 1: Have you been actively involved in idea development for a new activity in the past three years?
67.9% yes32.1% no
Could you tell me whether you had a leading or a supporting role in this phase?31.4% leading36.5% support
32.1% both
Phase 2: Have you been actively involved in preparation and implementation of a new activ-ity in the past three years?
61.5% yes38.5% no
Could you tell me whether you had a leading or a supporting role in this phase?32.2% leading35.9% support
31.9% both
Was the most significant new activity you were involved with in the past three years for your main employer initiated by yourself, your employer, or one or more colleagues?
32.6% myself43.4% employer
17.7% colleagues6.3% combination
How many people have, or have had, a leading role in developing this new activity? (aver-age)
10.2 persons
How many people do you expect to be working on the new activity five years after its intro-duction? (average)
6482 positions
Would all, some, or none of your potential customers consider the product or service devel-oped in this project new and unfamiliar?
20.8% all42.9% some36.3% none
Right now, are there many, few, or no other businesses offering the same products or ser-vices as developed in this project to your potential customers?
41.5% many40.2% few
18.3% none
What percentage of your annual sales revenues for this project will usually come from cus-tomers living outside your country?
31.5% none17.0% 10% or less
10.3% 11-25%17.9% 26-50%10.6% 51-75%8.8% 76–90%3.8% > 90%
According to the results, in 2017 8.3% of
the population aged 18–64 and working
as an employee had carried out some
intrapreneurial activity within their
organization over the past three years, an
increase of 3.1 percentage points over 2016.
Although two years is a short time series, the
evolution of this indicator is encouraging in
a country hoping to transform towards the
innovation stage.
Taking this 8.3% of the employees as 100%,
60.4% of these entrepreneurial activities for
employers were still alive and developing in
2017. Almost 68% of interviewed employees
committed to these activities had been
actively involved their development, in a
leading role in 31.4% of cases, a support role
in 36.5% of cases and both roles in 32.1% of
cases. 61.5% of these employees had also
been directly implicated in the preparation
and implementation of the new activity, in a
leading role in 32.2% of cases, a support role
in 35.9% of cases and both roles in 31.9%
of cases. 32.6% of these activities had been
proposed by the respondents themselves,
suggesting workplace environments in which
employees feel their ideas are listened to and
given due consideration.
In other cases, the main driver was either the
employer (43.4% of cases) or work colleagues
(17.7% of cases), or the idea progressed
thanks to a combination of all these
categories – i.e., through teamwork (6.3%
of cases). An average of 10.2 persons had a
leading role per idea within this collective of
intrapreneurs, and on average they expected
6500 job positions to be generated by each
idea. Among the total number of Saudi
intrapreneurial activities, 20.8% showed a
strong innovative component, 18.3% had
no competitors in the market, and 23.2%
exported more than 50% of their production.
GEM Report2018
57
GEM Report2018Characteristics of Entrepreneurial Activities
Chapter FOUR58 59
04CHARACTERISTICS
OF ENTREPRENEURIAL ACTIVITIES
C H A P T E R
4.1. Introduction
As discussed in previous sections, it is the quality of entrepreneurial activity, rather than the quantity, that determines its effective contribution to economic and social development.
GEM provides a comprehensive set of
indicators that characterize entrepreneurial
activities captured by the observation.
Analysis allows us to assess their strengths
and weaknesses; it also provides valuable
information for the orientation and design
of public policies, training activities, strategic
plans of the private sector, and of any other
mechanism that may favor the development
of the entrepreneurial sector.
The following sections offer detailed
results on the following characteristics:
entrepreneurship motive; sector of activity;
number of owners; number of employees;
job-creation expectations; innovation
component; use of recent technologies;
competitiveness; internationalization; seed
capital invested; and discontinuation motive
for exited businesses.
4.2. Motivation For Early-Stage Entrepreneurial Activity
Motivation is one of the determinants of the quality of businesses resulting from early stage entrepreneurial activity. GEM classifies early stage entrepreneurial initiative as motivated by necessity, opportunity, or other reasons.
Potential entrepreneurs are driven by
necessity when they have no better choices
of work to develop their professional career
or when they need to survive by creating
their own job activity. By contrast, potential
entrepreneurs are driven by opportunity
when they detect a niche in the market, when
they have and develop an original idea, or
when they are able to develop an innovation.
Potential entrepreneurs are classified as
being motivated by other causes when they
are driven by a mixture of necessity and
opportunity, when they continue a family
business, when they engage in developing
projects, etc.
The literature on this topic indicates that
opportunity entrepreneurship tends to be
more valuable to economies because it usually
makes more relevant contributions in terms of
innovation, productivity and competitiveness.
However, it is premature to draw conclusions
solely on the basis of motivation, because
analysts must also evaluate the market
development level, the sector, the businesses’
size, and many other variables that complete
the picture of early-stage entrepreneurial
activities. What may represent a big
opportunity in the market of a developing
country may not appear so attractive in the
market of a developed country, or in the
global market generally.
Saudi Arabia is a semi-developed country full
of contrasts. Between the years 2009 and
2016, the proportion of opportunity-driven
early-stage entrepreneurship was very high
and followed a positive trend, whereas the
rates of necessity-driven entrepreneurship
and entrepreneurship driven by other motives
decreased (See Figure 15). It is true that the
internal market offers great opportunities
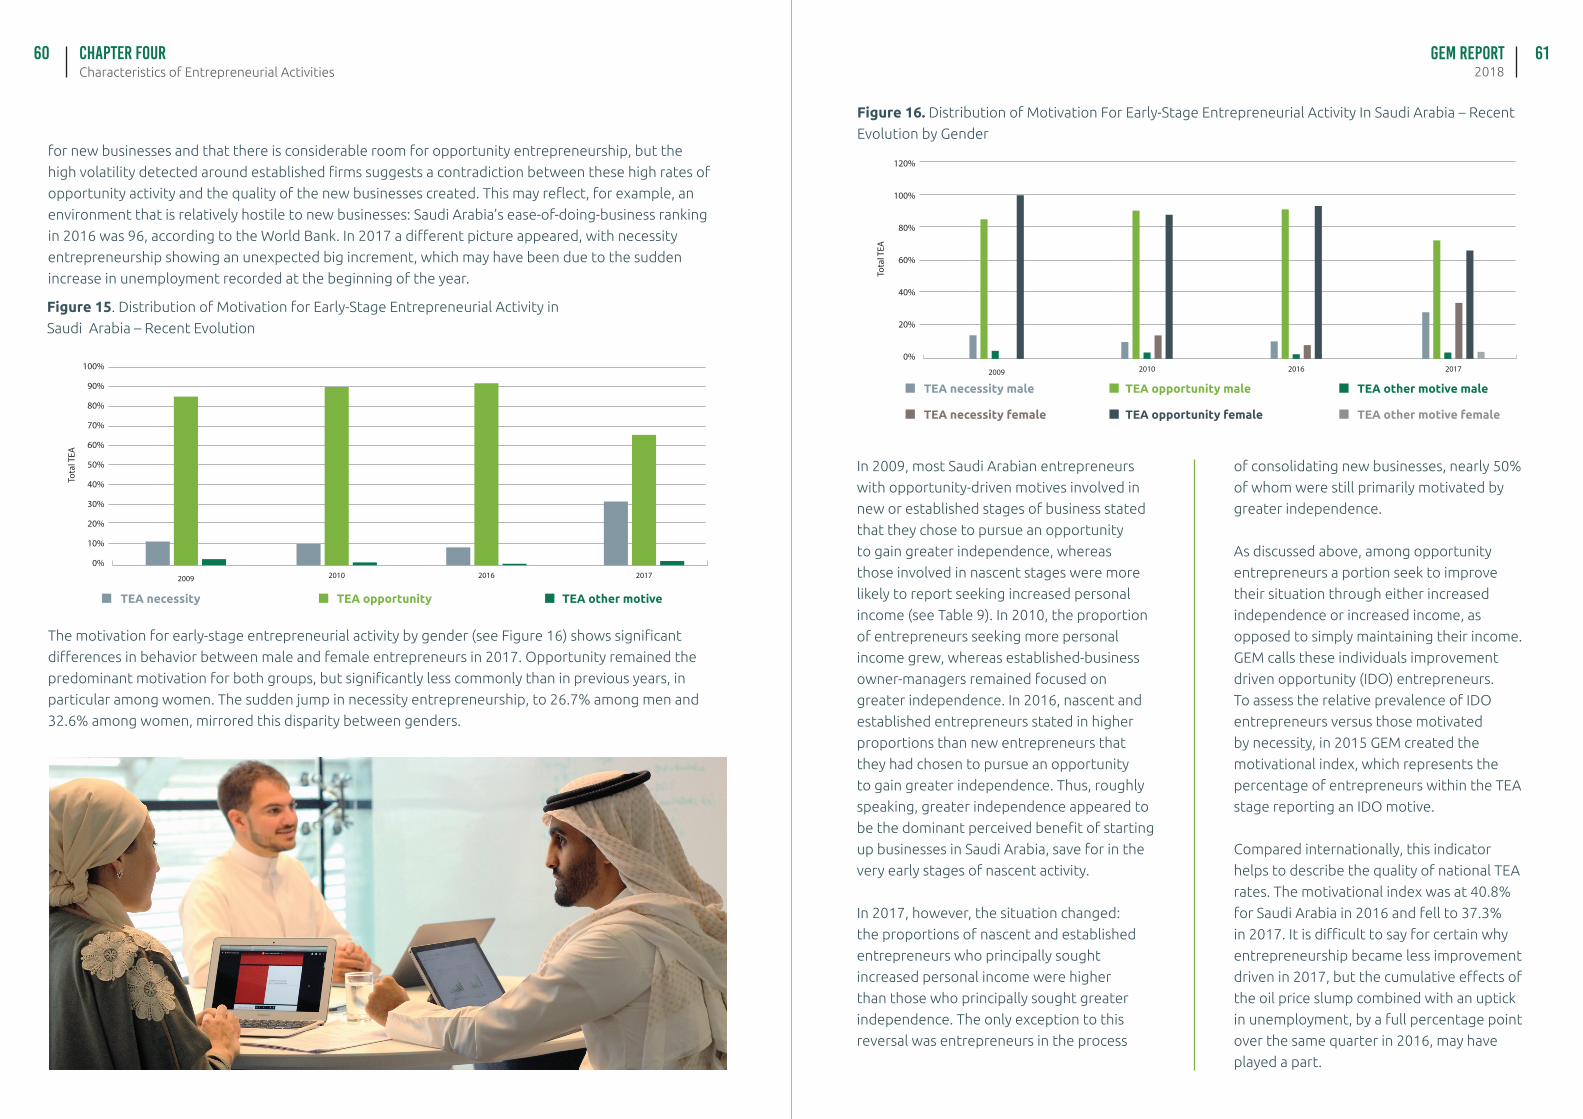
GEM Report2018Characteristics of Entrepreneurial Activities
Chapter FOUR60 61
for new businesses and that there is considerable room for opportunity entrepreneurship, but the
high volatility detected around established firms suggests a contradiction between these high rates of
opportunity activity and the quality of the new businesses created. This may reflect, for example, an
environment that is relatively hostile to new businesses: Saudi Arabia’s ease-of-doing-business ranking
in 2016 was 96, according to the World Bank. In 2017 a different picture appeared, with necessity
entrepreneurship showing an unexpected big increment, which may have been due to the sudden
increase in unemployment recorded at the beginning of the year.
Figure 15. Distribution of Motivation for Early-Stage Entrepreneurial Activity in
Saudi Arabia – Recent Evolution
2017201620102009
0%
10%
20%
Tota
l TEA
30%
40%
50%
60%
70%
80%
90%
100%
TEA necessity TEA opportunity TEA other motive
The motivation for early-stage entrepreneurial activity by gender (see Figure 16) shows significant
differences in behavior between male and female entrepreneurs in 2017. Opportunity remained the
predominant motivation for both groups, but significantly less commonly than in previous years, in
particular among women. The sudden jump in necessity entrepreneurship, to 26.7% among men and
32.6% among women, mirrored this disparity between genders.
201620102009
0%
20%
40%
60%
80%
100%
120%
2017
Tota
l TEA
Figure 16. Distribution of Motivation For Early-Stage Entrepreneurial Activity In Saudi Arabia – Recent
Evolution by Gender
In 2009, most Saudi Arabian entrepreneurs
with opportunity-driven motives involved in
new or established stages of business stated
that they chose to pursue an opportunity
to gain greater independence, whereas
those involved in nascent stages were more
likely to report seeking increased personal
income (see Table 9). In 2010, the proportion
of entrepreneurs seeking more personal
income grew, whereas established-business
owner-managers remained focused on
greater independence. In 2016, nascent and
established entrepreneurs stated in higher
proportions than new entrepreneurs that
they had chosen to pursue an opportunity
to gain greater independence. Thus, roughly
speaking, greater independence appeared to
be the dominant perceived benefit of starting
up businesses in Saudi Arabia, save for in the
very early stages of nascent activity.
In 2017, however, the situation changed:
the proportions of nascent and established
entrepreneurs who principally sought
increased personal income were higher
than those who principally sought greater
independence. The only exception to this
reversal was entrepreneurs in the process
of consolidating new businesses, nearly 50%
of whom were still primarily motivated by
greater independence.
As discussed above, among opportunity
entrepreneurs a portion seek to improve
their situation through either increased
independence or increased income, as
opposed to simply maintaining their income.
GEM calls these individuals improvement
driven opportunity (IDO) entrepreneurs.
To assess the relative prevalence of IDO
entrepreneurs versus those motivated
by necessity, in 2015 GEM created the
motivational index, which represents the
percentage of entrepreneurs within the TEA
stage reporting an IDO motive.
Compared internationally, this indicator
helps to describe the quality of national TEA
rates. The motivational index was at 40.8%
for Saudi Arabia in 2016 and fell to 37.3%
in 2017. It is difficult to say for certain why
entrepreneurship became less improvement
driven in 2017, but the cumulative effects of
the oil price slump combined with an uptick
in unemployment, by a full percentage point
over the same quarter in 2016, may have
played a part.
TEA necessity male
TEA necessity female
TEA opportunity male
TEA opportunity female
TEA other motive male
TEA other motive female
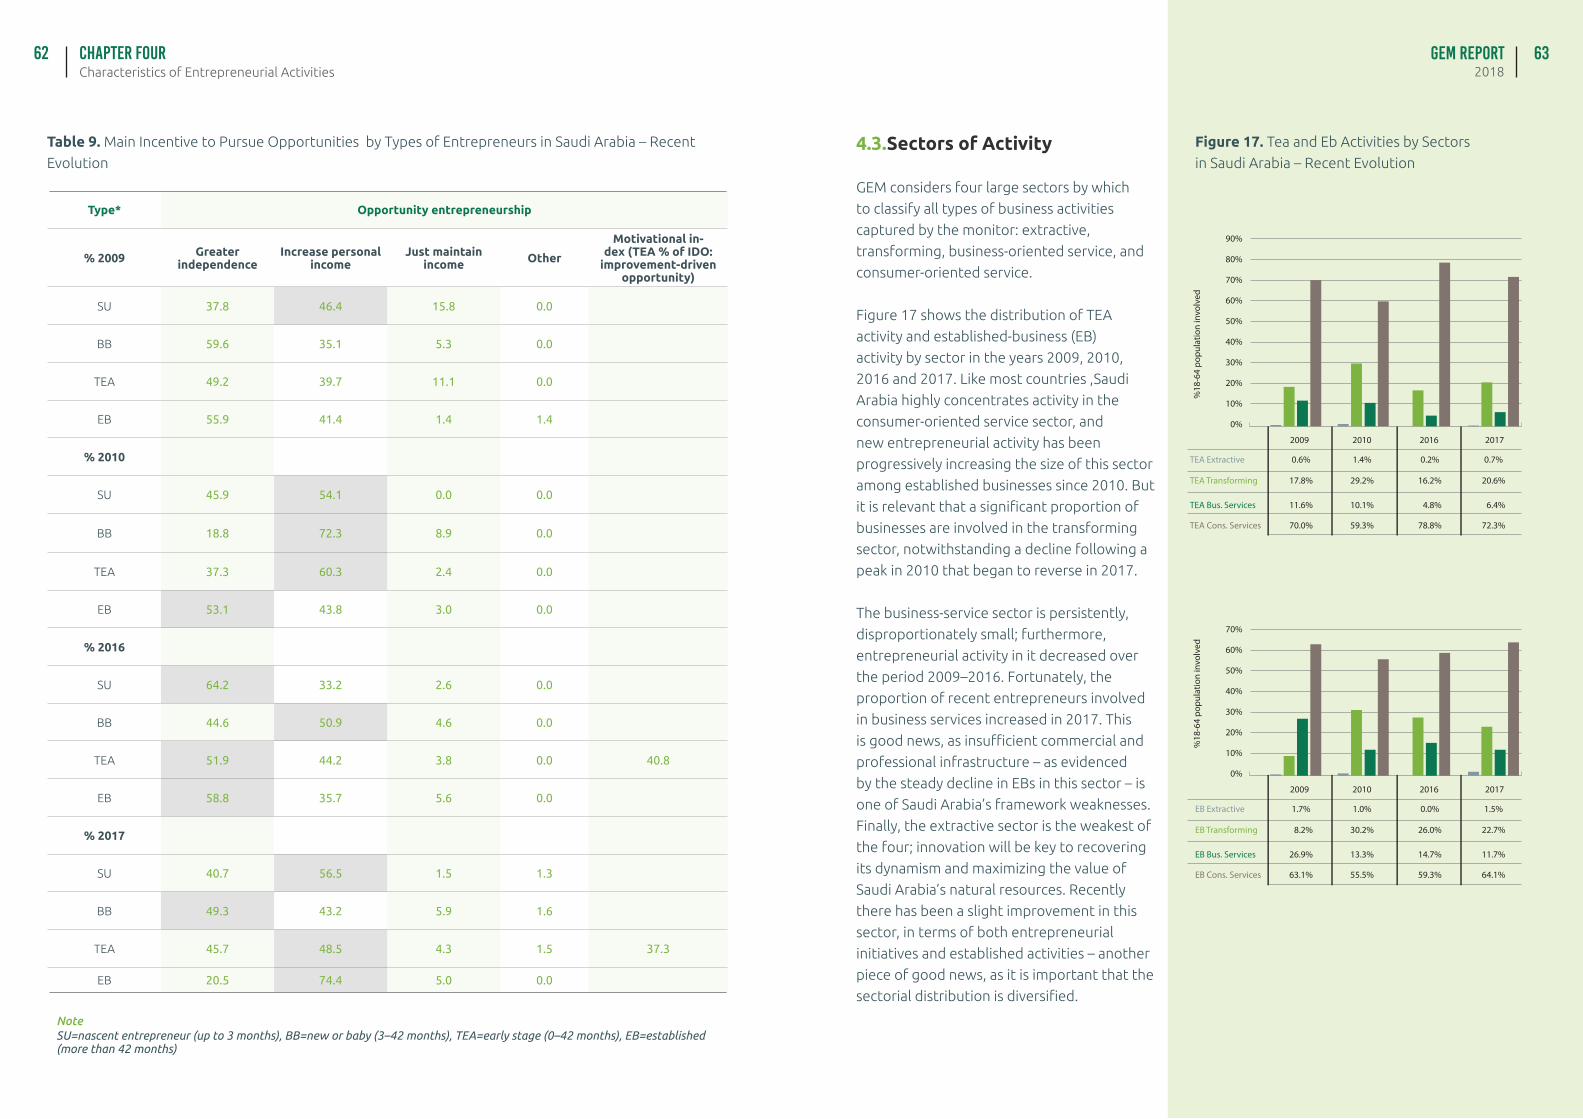
Table 9. Main Incentive to Pursue Opportunities by Types of Entrepreneurs in Saudi Arabia – Recent
Evolution
SU=nascent entrepreneur (up to 3 months), BB=new or baby (3–42 months), TEA=early stage (0–42 months), EB=established (more than 42 months)
Note
Characteristics of Entrepreneurial ActivitiesChapter FOUR62
Type* Opportunity entrepreneurship
% 2009 Greater independence
Increase personal income
Just maintain income Other
Motivational in-dex (TEA % of IDO:
improvement-driven opportunity)
SU 37.8 46.4 15.8 0.0
BB 59.6 35.1 5.3 0.0
TEA 49.2 39.7 11.1 0.0
EB 55.9 41.4 1.4 1.4
% 2010
SU 45.9 54.1 0.0 0.0
BB 18.8 72.3 8.9 0.0
TEA 37.3 60.3 2.4 0.0
EB 53.1 43.8 3.0 0.0
% 2016
SU 64.2 33.2 2.6 0.0
BB 44.6 50.9 4.6 0.0
TEA 51.9 44.2 3.8 0.0 40.8
EB 58.8 35.7 5.6 0.0
% 2017
SU 40.7 56.5 1.5 1.3
BB 49.3 43.2 5.9 1.6
TEA 45.7 48.5 4.3 1.5 37.3
EB 20.5 74.4 5.0 0.0
4.3.Sectors of Activity
GEM considers four large sectors by which
to classify all types of business activities
captured by the monitor: extractive,
transforming, business-oriented service, and
consumer-oriented service.
Figure 17 shows the distribution of TEA
activity and established-business (EB)
activity by sector in the years 2009, 2010,
2016 and 2017. Like most countries ,Saudi
Arabia highly concentrates activity in the
consumer-oriented service sector, and
new entrepreneurial activity has been
progressively increasing the size of this sector
among established businesses since 2010. But
it is relevant that a significant proportion of
businesses are involved in the transforming
sector, notwithstanding a decline following a
peak in 2010 that began to reverse in 2017.
The business-service sector is persistently,
disproportionately small; furthermore,
entrepreneurial activity in it decreased over
the period 2009–2016. Fortunately, the
proportion of recent entrepreneurs involved
in business services increased in 2017. This
is good news, as insufficient commercial and
professional infrastructure – as evidenced
by the steady decline in EBs in this sector – is
one of Saudi Arabia’s framework weaknesses.
Finally, the extractive sector is the weakest of
the four; innovation will be key to recovering
its dynamism and maximizing the value of
Saudi Arabia’s natural resources. Recently
there has been a slight improvement in this
sector, in terms of both entrepreneurial
initiatives and established activities – another
piece of good news, as it is important that the
sectorial distribution is diversified.
0%
2009 2010 2016 2017
10%
%18
-64
popu
latio
n in
volv
ed
TEA Extractive
TEA Transforming
TEA Bus. Services
TEA Cons. Services
0.6%
17.8%
11.6%
70.0%
1.4%
29.2%
10.1%
59.3%
0.2%
16.2%
4.8%
78.8%
0.7%
20.6%
6.4%
72.3%
20%
30%
40%
50%
60%
70%
80%
90%
0%
2009 2010 2016 2017
10%
%18
-64
popu
latio
n in
volv
ed
EB Extractive
EB Transforming
EB Bus. Services
EB Cons. Services
1.7%
8.2%
26.9%
63.1%
1.0%
30.2%
13.3%
55.5%
0.0%
26.0%
14.7%
59.3%
1.5%
22.7%
11.7%
64.1%
20%
30%
40%
50%
60%
70%
Figure 17. Tea and Eb Activities by Sectors
in Saudi Arabia – Recent Evolution
GEM Report2018
63
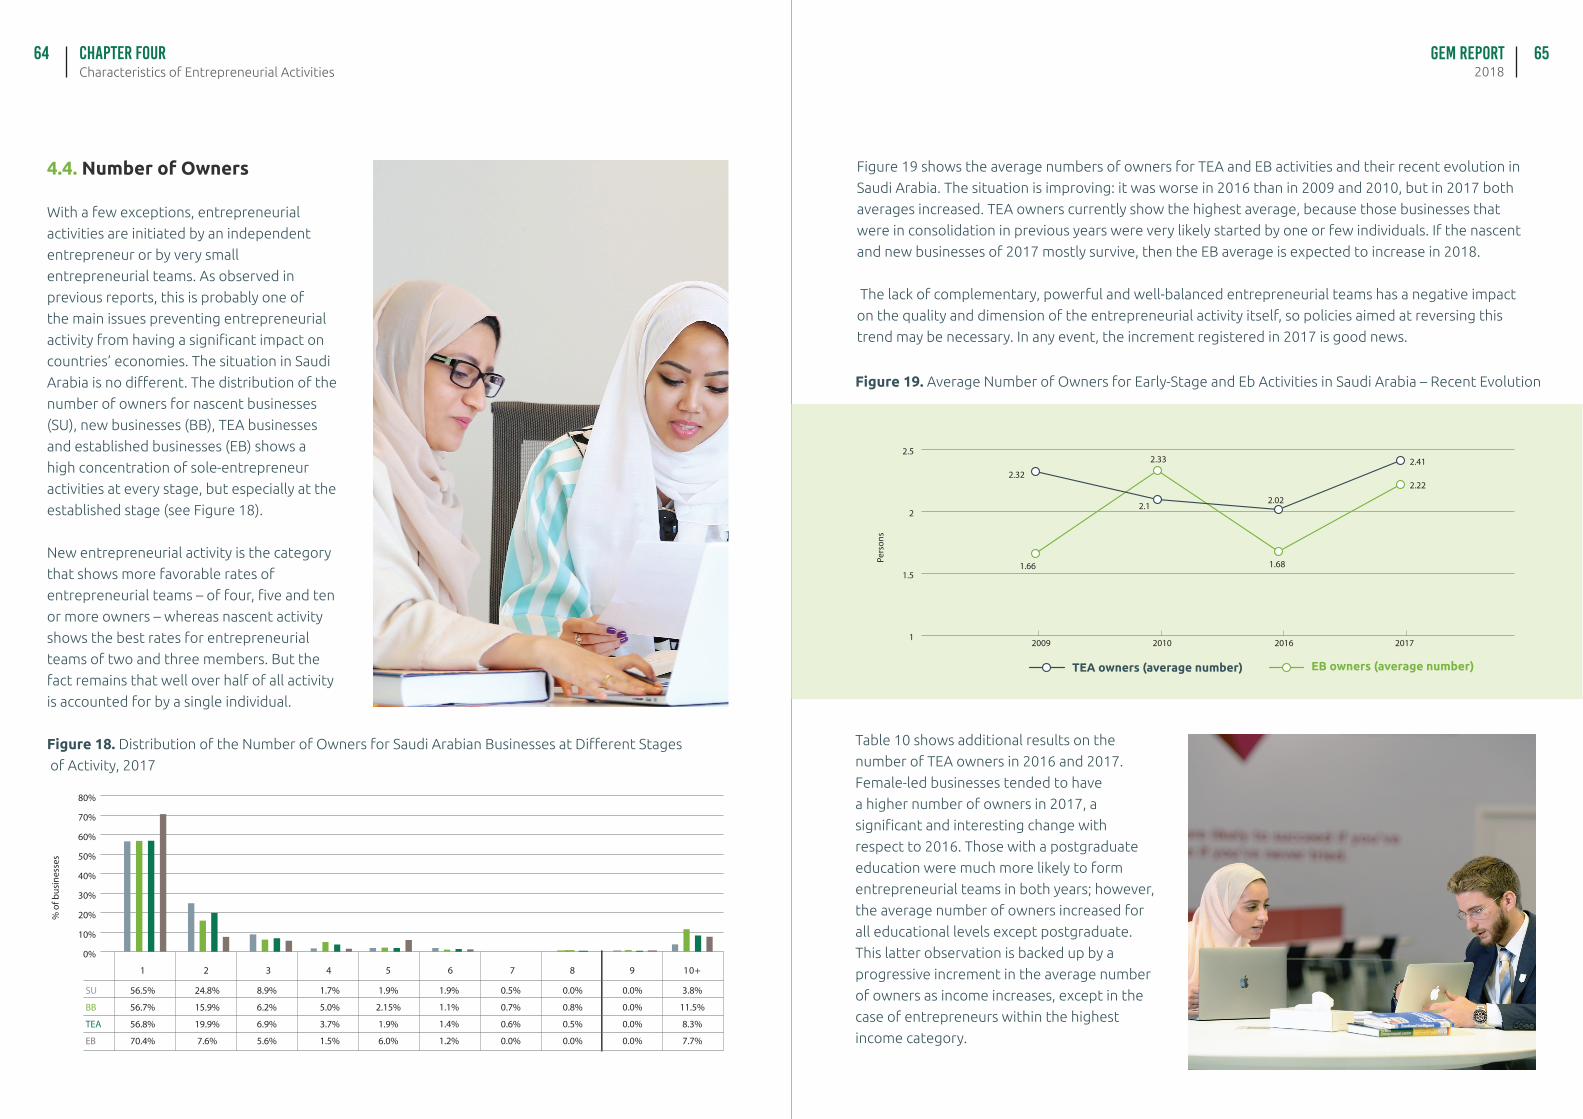
GEM Report2018Characteristics of Entrepreneurial Activities
Chapter FOUR64 65
4.4. Number of Owners
With a few exceptions, entrepreneurial
activities are initiated by an independent
entrepreneur or by very small
entrepreneurial teams. As observed in
previous reports, this is probably one of
the main issues preventing entrepreneurial
activity from having a significant impact on
countries’ economies. The situation in Saudi
Arabia is no different. The distribution of the
number of owners for nascent businesses
(SU), new businesses (BB), TEA businesses
and established businesses (EB) shows a
high concentration of sole-entrepreneur
activities at every stage, but especially at the
established stage (see Figure 18).
New entrepreneurial activity is the category
that shows more favorable rates of
entrepreneurial teams – of four, five and ten
or more owners – whereas nascent activity
shows the best rates for entrepreneurial
teams of two and three members. But the
fact remains that well over half of all activity
is accounted for by a single individual.
Figure 18. Distribution of the Number of Owners for Saudi Arabian Businesses at Different Stages
of Activity, 2017
0%
10%
20%
30%
40%
50%
60%
70%
80%
1
56.5%
56.7%
56.8%
70.4%
SU
BB
TEA
EB
2
24.8%
15.9%
19.9%
7.6%
3
8.9%
6.2%
6.9%
5.6%
4
1.7%
5.0%
3.7%
1.5%
5
1.9%
2.15%
1.9%
6.0%
7
0.5%
0.7%
0.6%
0.0%
8
0.0%
0.8%
0.5%
0.0%
10+
3.8%
11.5%
8.3%
7.7%
9
0.0%
0.0%
0.0%
0.0%
6
1.9%
1.1%
1.4%
1.2%
% o
f bus
ines
ses
Figure 19 shows the average numbers of owners for TEA and EB activities and their recent evolution in
Saudi Arabia. The situation is improving: it was worse in 2016 than in 2009 and 2010, but in 2017 both
averages increased. TEA owners currently show the highest average, because those businesses that
were in consolidation in previous years were very likely started by one or few individuals. If the nascent
and new businesses of 2017 mostly survive, then the EB average is expected to increase in 2018.
The lack of complementary, powerful and well-balanced entrepreneurial teams has a negative impact
on the quality and dimension of the entrepreneurial activity itself, so policies aimed at reversing this
trend may be necessary. In any event, the increment registered in 2017 is good news.
Figure 19. Average Number of Owners for Early-Stage and Eb Activities in Saudi Arabia – Recent Evolution
1
1.5
2
2.5
2009
Pers
ons
2016 20172010
2.32
2.12.02
2.41
2.22
1.68
2.33
1.66
TEA owners (average number) EB owners (average number)
Table 10 shows additional results on the
number of TEA owners in 2016 and 2017.
Female-led businesses tended to have
a higher number of owners in 2017, a
significant and interesting change with
respect to 2016. Those with a postgraduate
education were much more likely to form
entrepreneurial teams in both years; however,
the average number of owners increased for
all educational levels except postgraduate.
This latter observation is backed up by a
progressive increment in the average number
of owners as income increases, except in the
case of entrepreneurs within the highest
income category.
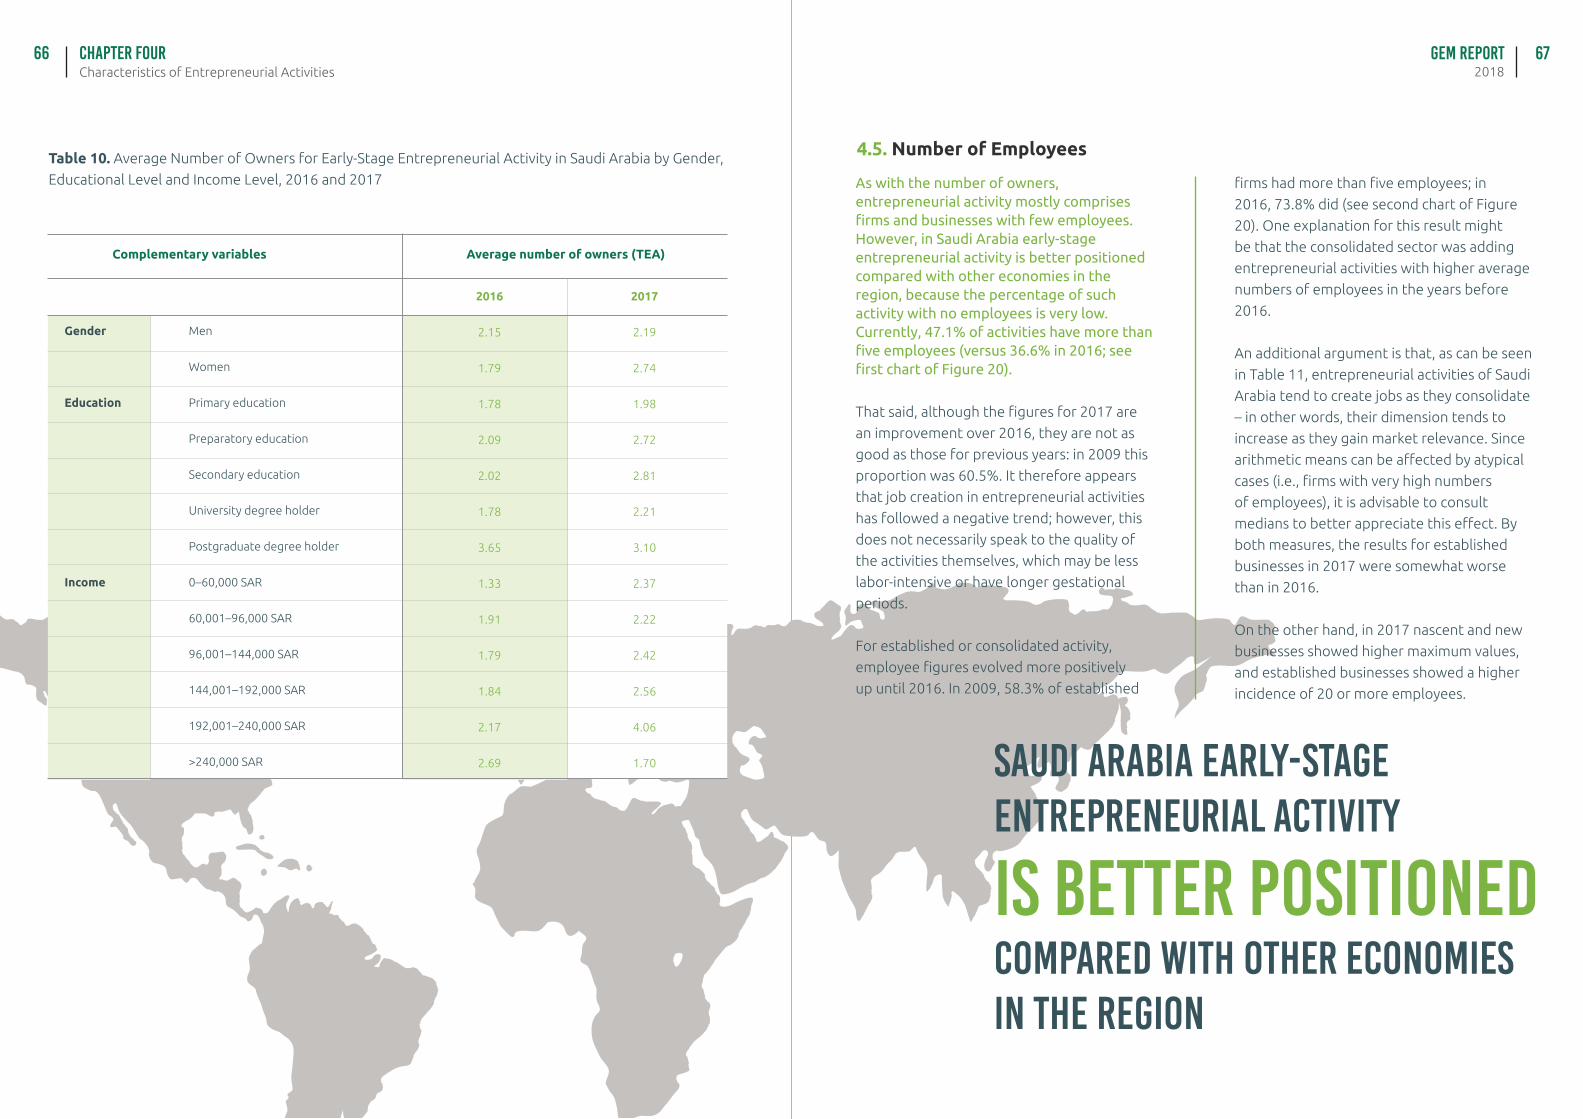
GEM Report2018Characteristics of Entrepreneurial Activities
Chapter FOUR66 67
Table 10. Average Number of Owners for Early-Stage Entrepreneurial Activity in Saudi Arabia by Gender,
Educational Level and Income Level, 2016 and 2017
Complementary variables Average number of owners (TEA)
Men
Women
Primary education
Preparatory education
Secondary education
University degree holder
Postgraduate degree holder
0–60,000 SAR
60,001–96,000 SAR
96,001–144,000 SAR
144,001–192,000 SAR
192,001–240,000 SAR
>240,000 SAR
2016
2.15
1.79
1.78
2.09
2.02
1.78
3.65
1.33
1.91
1.79
1.84
2.17
2.69
2017
2.19
2.74
1.98
2.72
2.81
2.21
3.10
2.37
2.22
2.42
2.56
4.06
1.70
Gender
Education
Income
4.5. Number of Employees
As with the number of owners, entrepreneurial activity mostly comprises firms and businesses with few employees. However, in Saudi Arabia early-stage entrepreneurial activity is better positioned compared with other economies in the region, because the percentage of such activity with no employees is very low. Currently, 47.1% of activities have more than five employees (versus 36.6% in 2016; see first chart of Figure 20).
That said, although the figures for 2017 are
an improvement over 2016, they are not as
good as those for previous years: in 2009 this
proportion was 60.5%. It therefore appears
that job creation in entrepreneurial activities
has followed a negative trend; however, this
does not necessarily speak to the quality of
the activities themselves, which may be less
labor-intensive or have longer gestational
periods.
For established or consolidated activity,
employee figures evolved more positively
up until 2016. In 2009, 58.3% of established
firms had more than five employees; in
2016, 73.8% did (see second chart of Figure
20). One explanation for this result might
be that the consolidated sector was adding
entrepreneurial activities with higher average
numbers of employees in the years before
2016.
An additional argument is that, as can be seen
in Table 11, entrepreneurial activities of Saudi
Arabia tend to create jobs as they consolidate
– in other words, their dimension tends to
increase as they gain market relevance. Since
arithmetic means can be affected by atypical
cases (i.e., firms with very high numbers
of employees), it is advisable to consult
medians to better appreciate this effect. By
both measures, the results for established
businesses in 2017 were somewhat worse
than in 2016.
On the other hand, in 2017 nascent and new
businesses showed higher maximum values,
and established businesses showed a higher
incidence of 20 or more employees.
Saudi Arabia early-stage entrepreneurial activity
is better positionedcompared with other economies in the region
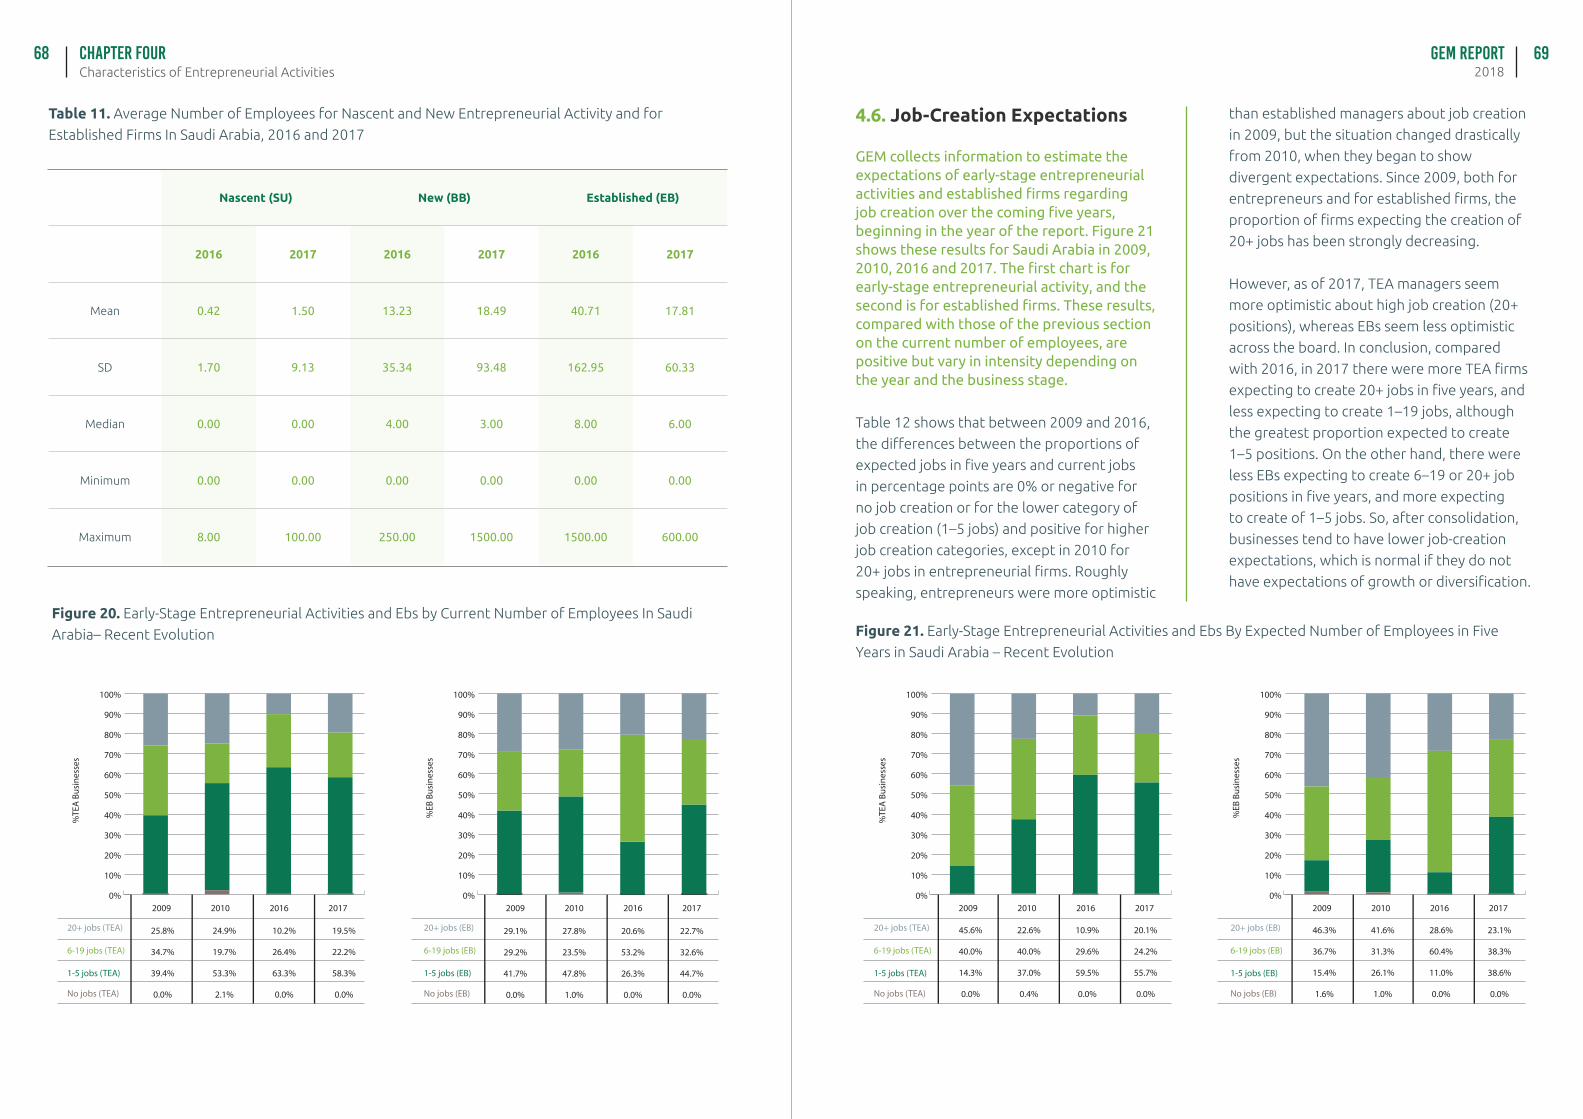
GEM Report2018Characteristics of Entrepreneurial Activities
Chapter FOUR68 69
Nascent (SU) New (BB) Established (EB)
2016 2017 2016 2017 2016 2017
Mean 0.42 1.50 13.23 18.49 40.71 17.81
SD 1.70 9.13 35.34 93.48 162.95 60.33
Median 0.00 0.00 4.00 3.00 8.00 6.00
Minimum 0.00 0.00 0.00 0.00 0.00 0.00
Maximum 8.00 100.00 250.00 1500.00 1500.00 600.00
Table 11. Average Number of Employees for Nascent and New Entrepreneurial Activity and for
Established Firms In Saudi Arabia, 2016 and 2017
Figure 20. Early-Stage Entrepreneurial Activities and Ebs by Current Number of Employees In Saudi
Arabia– Recent Evolution
2009 2010 2016 2017
%TE
A B
usin
esse
s
20+ jobs (TEA)
6-19 jobs (TEA)
1-5 jobs (TEA)
No jobs (TEA)
25.8%
34.7%
39.4%
0.0%
24.9%
19.7%
53.3%
2.1%
10.2%
26.4%
63.3%
0.0%
19.5%
22.2%
58.3%
0.0%
0%
10%
20%
30%
40%
50%
60%
70%
80%
90%
100%
2009 2010 2016 2017
%EB
Bus
ines
ses
20+ jobs (EB)
6-19 jobs (EB)
1-5 jobs (EB)
No jobs (EB)
0%
10%
20%
30%
40%
50%
60%
70%
80%
90%
100%
29.1%
29.2%
41.7%
0.0%
27.8%
23.5%
47.8%
1.0%
20.6%
53.2%
26.3%
0.0%
22.7%
32.6%
44.7%
0.0%
2009 2010 2016 2017
%TE
A B
usin
esse
s
20+ jobs (TEA)
6-19 jobs (TEA)
1-5 jobs (TEA)
No jobs (TEA)
45.6%
40.0%
14.3%
0.0%
22.6%
40.0%
37.0%
0.4%
10.9%
29.6%
59.5%
0.0%
20.1%
24.2%
55.7%
0.0%
0%
10%
20%
30%
40%
50%
60%
70%
80%
90%
100%
2009 2010 2016 2017
%EB
Bus
ines
ses
20+ jobs (EB)
6-19 jobs (EB)
1-5 jobs (EB)
No jobs (EB)
46.3%
36.7%
15.4%
1.6%
41.6%
31.3%
26.1%
1.0%
28.6%
60.4%
11.0%
0.0%
23.1%
38.3%
38.6%
0.0%
0%
10%
20%
30%
40%
50%
60%
70%
80%
90%
100%
4.6. Job-Creation Expectations
GEM collects information to estimate the expectations of early-stage entrepreneurial activities and established firms regarding job creation over the coming five years, beginning in the year of the report. Figure 21 shows these results for Saudi Arabia in 2009, 2010, 2016 and 2017. The first chart is for early-stage entrepreneurial activity, and the second is for established firms. These results, compared with those of the previous section on the current number of employees, are positive but vary in intensity depending on the year and the business stage.
Table 12 shows that between 2009 and 2016,
the differences between the proportions of
expected jobs in five years and current jobs
in percentage points are 0% or negative for
no job creation or for the lower category of
job creation (1–5 jobs) and positive for higher
job creation categories, except in 2010 for
20+ jobs in entrepreneurial firms. Roughly
speaking, entrepreneurs were more optimistic
than established managers about job creation
in 2009, but the situation changed drastically
from 2010, when they began to show
divergent expectations. Since 2009, both for
entrepreneurs and for established firms, the
proportion of firms expecting the creation of
20+ jobs has been strongly decreasing.
However, as of 2017, TEA managers seem
more optimistic about high job creation (20+
positions), whereas EBs seem less optimistic
across the board. In conclusion, compared
with 2016, in 2017 there were more TEA firms
expecting to create 20+ jobs in five years, and
less expecting to create 1–19 jobs, although
the greatest proportion expected to create
1–5 positions. On the other hand, there were
less EBs expecting to create 6–19 or 20+ job
positions in five years, and more expecting
to create of 1–5 jobs. So, after consolidation,
businesses tend to have lower job-creation
expectations, which is normal if they do not
have expectations of growth or diversification.
Figure 21. Early-Stage Entrepreneurial Activities and Ebs By Expected Number of Employees in Five
Years in Saudi Arabia – Recent Evolution
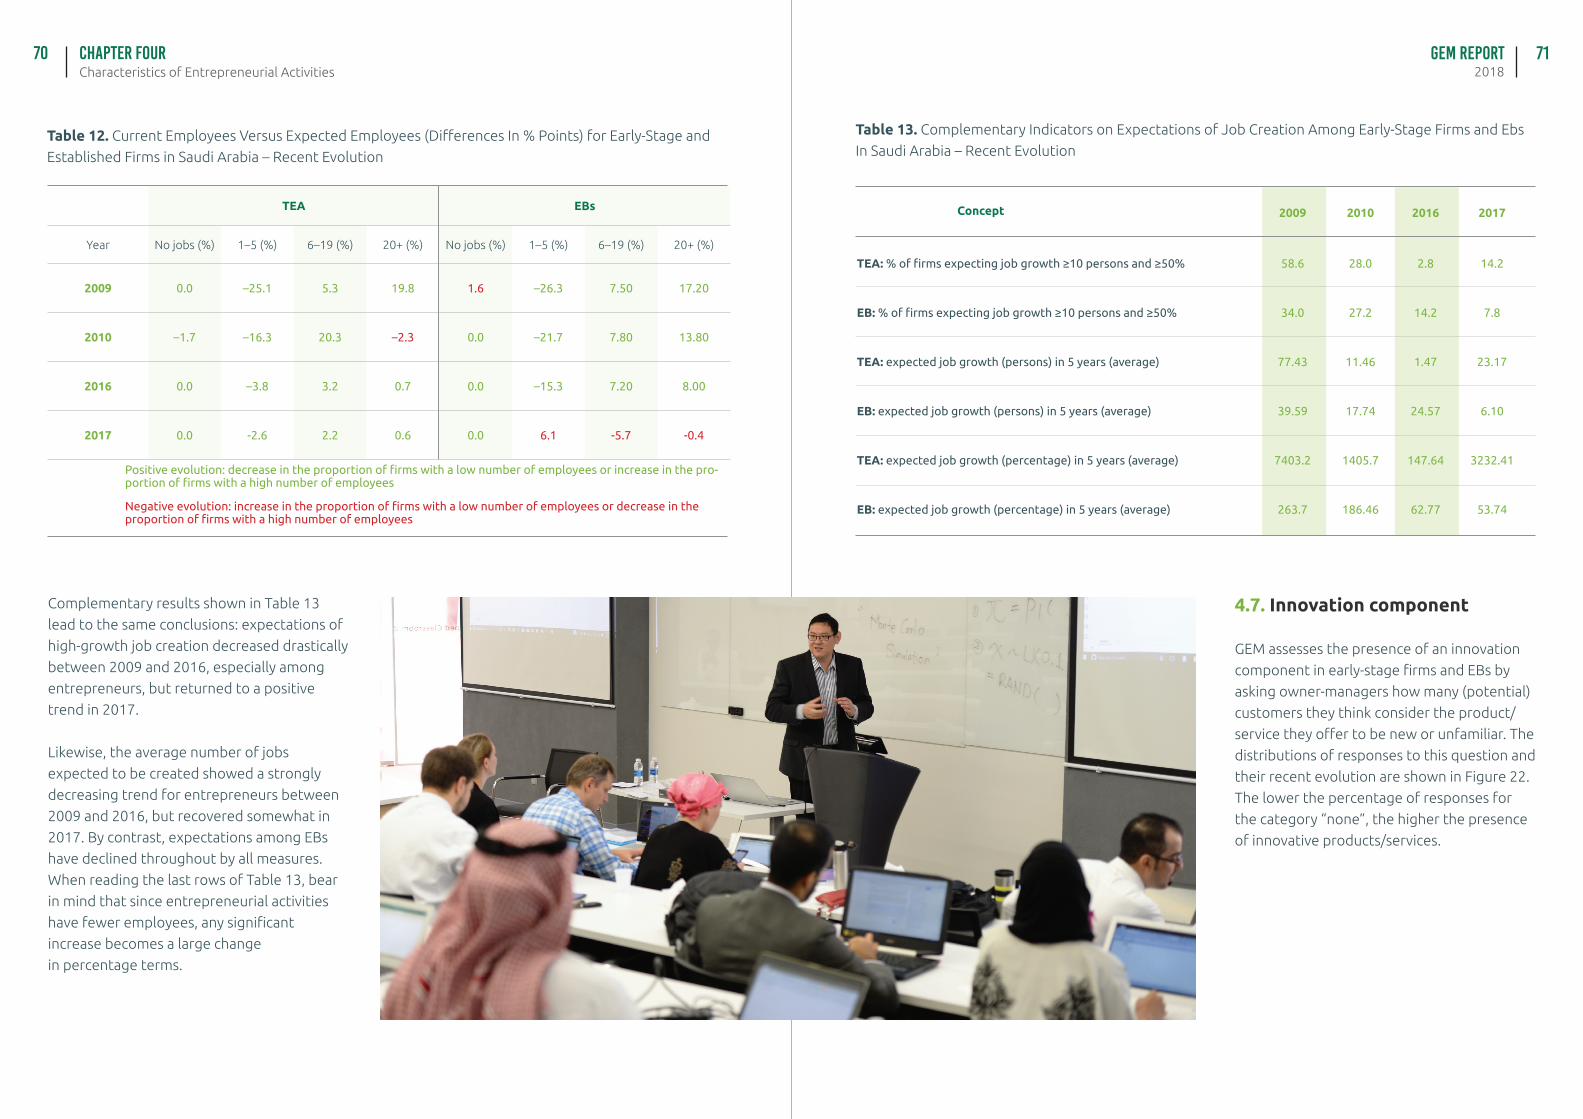
GEM Report2018Characteristics of Entrepreneurial Activities
Chapter FOUR70 71
TEA EBs
Year No jobs (%) 1–5 (%) 6–19 (%) 20+ (%) No jobs (%) 1–5 (%) 6–19 (%) 20+ (%)
2009 0.0 –25.1 5.3 19.8 1.6 –26.3 7.50 17.20
2010 –1.7 –16.3 20.3 –2.3 0.0 –21.7 7.80 13.80
2016 0.0 –3.8 3.2 0.7 0.0 –15.3 7.20 8.00
2017 0.0 -2.6 2.2 0.6 0.0 6.1 -5.7 -0.4
Positive evolution: decrease in the proportion of firms with a low number of employees or increase in the pro-portion of firms with a high number of employees
Negative evolution: increase in the proportion of firms with a low number of employees or decrease in the proportion of firms with a high number of employees
Table 12. Current Employees Versus Expected Employees (Differences In % Points) for Early-Stage and
Established Firms in Saudi Arabia – Recent Evolution
Complementary results shown in Table 13
lead to the same conclusions: expectations of
high-growth job creation decreased drastically
between 2009 and 2016, especially among
entrepreneurs, but returned to a positive
trend in 2017.
Likewise, the average number of jobs
expected to be created showed a strongly
decreasing trend for entrepreneurs between
2009 and 2016, but recovered somewhat in
2017. By contrast, expectations among EBs
have declined throughout by all measures.
When reading the last rows of Table 13, bear
in mind that since entrepreneurial activities
have fewer employees, any significant
increase becomes a large change
in percentage terms.
Table 13. Complementary Indicators on Expectations of Job Creation Among Early-Stage Firms and Ebs
In Saudi Arabia – Recent Evolution
TEA: % of firms expecting job growth ≥10 persons and ≥50%
EB: % of firms expecting job growth ≥10 persons and ≥50%
TEA: expected job growth (persons) in 5 years (average)
EB: expected job growth (persons) in 5 years (average)
TEA: expected job growth (percentage) in 5 years (average)
EB: expected job growth (percentage) in 5 years (average)
Concept 2009
58.6
34.0
77.43
39.59
7403.2
263.7
2010
28.0
27.2
11.46
17.74
1405.7
186.46
2016
2.8
14.2
1.47
24.57
147.64
62.77
2017
14.2
7.8
23.17
6.10
3232.41
53.74
4.7. Innovation component
GEM assesses the presence of an innovation
component in early-stage firms and EBs by
asking owner-managers how many (potential)
customers they think consider the product/
service they offer to be new or unfamiliar. The
distributions of responses to this question and
their recent evolution are shown in Figure 22.
The lower the percentage of responses for
the category “none”, the higher the presence
of innovative products/services.
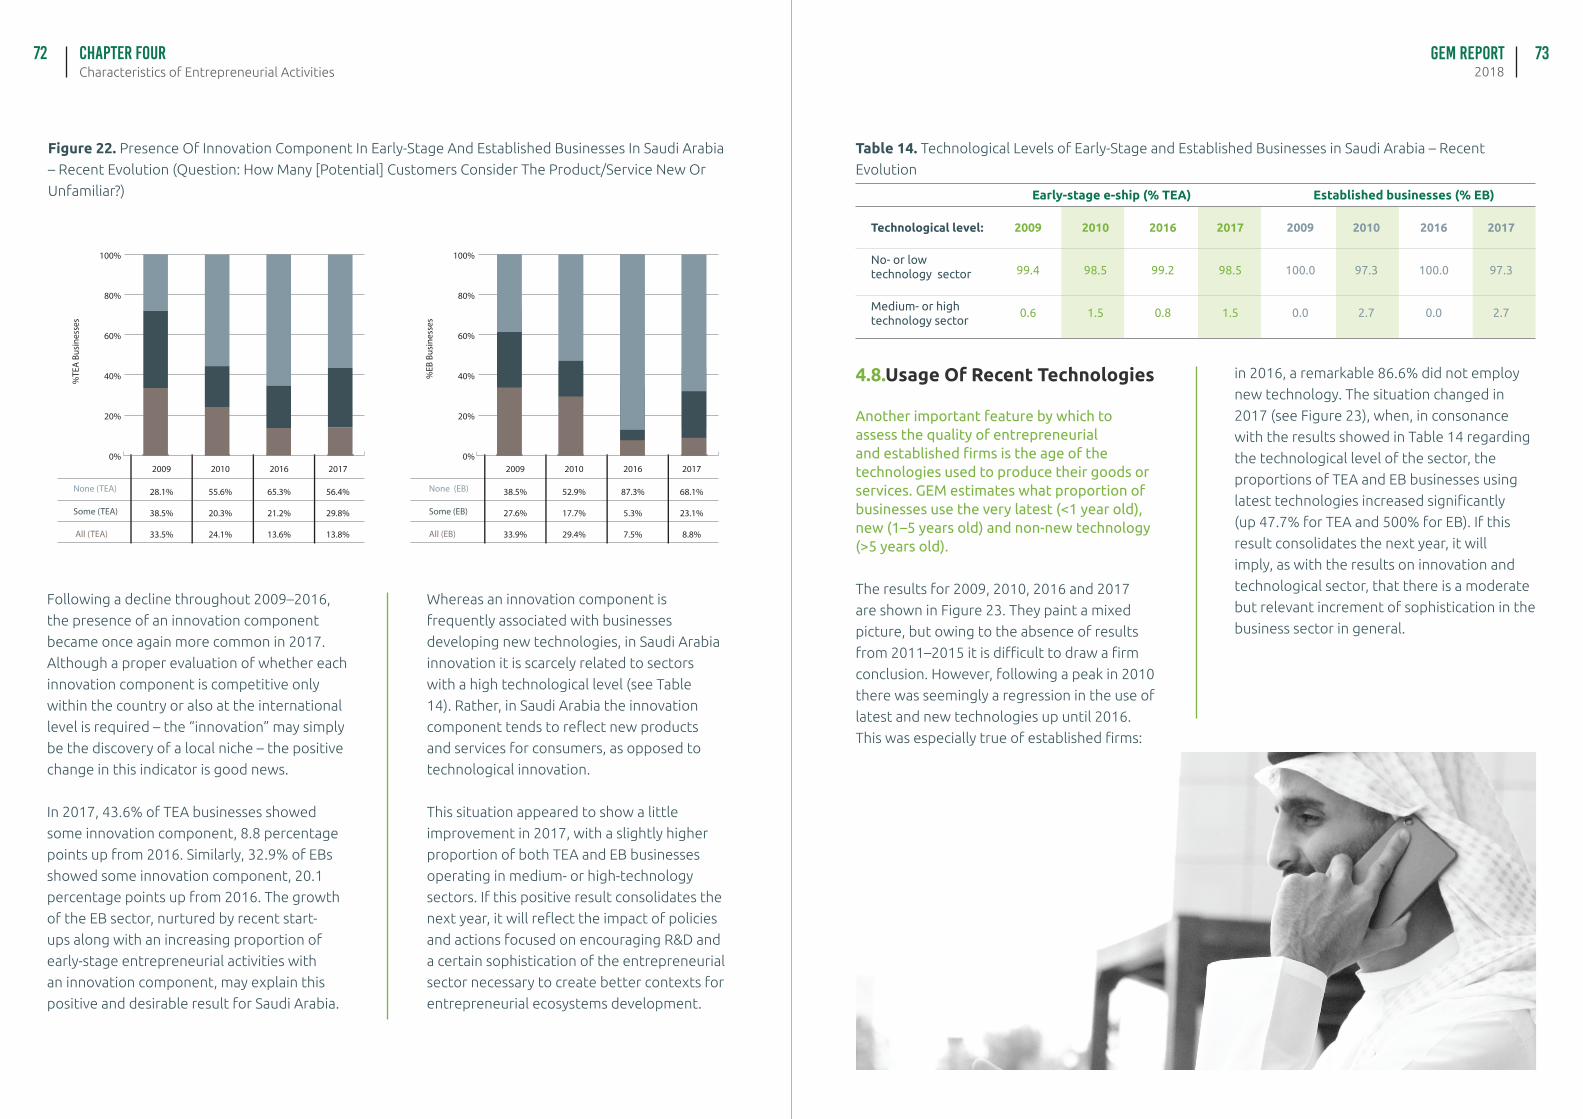
GEM Report2018Characteristics of Entrepreneurial Activities
Chapter FOUR72 73
2009 2010 2016 2017
%EB
Bus
ines
ses
None (EB)
Some (EB)
All (EB)
0%
20%
40%
60%
80%
100%
38.5%
27.6%
33.9%
52.9%
17.7%
29.4%
87.3%
5.3%
7.5%
68.1%
23.1%
8.8%
Following a decline throughout 2009–2016,
the presence of an innovation component
became once again more common in 2017.
Although a proper evaluation of whether each
innovation component is competitive only
within the country or also at the international
level is required – the “innovation” may simply
be the discovery of a local niche – the positive
change in this indicator is good news.
In 2017, 43.6% of TEA businesses showed
some innovation component, 8.8 percentage
points up from 2016. Similarly, 32.9% of EBs
showed some innovation component, 20.1
percentage points up from 2016. The growth
of the EB sector, nurtured by recent start-
ups along with an increasing proportion of
early-stage entrepreneurial activities with
an innovation component, may explain this
positive and desirable result for Saudi Arabia.
Whereas an innovation component is
frequently associated with businesses
developing new technologies, in Saudi Arabia
innovation it is scarcely related to sectors
with a high technological level (see Table
14). Rather, in Saudi Arabia the innovation
component tends to reflect new products
and services for consumers, as opposed to
technological innovation.
This situation appeared to show a little
improvement in 2017, with a slightly higher
proportion of both TEA and EB businesses
operating in medium- or high-technology
sectors. If this positive result consolidates the
next year, it will reflect the impact of policies
and actions focused on encouraging R&D and
a certain sophistication of the entrepreneurial
sector necessary to create better contexts for
entrepreneurial ecosystems development.
2009 2010 2016 2017
%TE
A B
usin
esse
s
None (TEA)
Some (TEA)
All (TEA)
0%
20%
40%
60%
80%
100%
28.1%
38.5%
33.5%
55.6%
20.3%
24.1%
65.3%
21.2%
13.6%
56.4%
29.8%
13.8%
Figure 22. Presence Of Innovation Component In Early-Stage And Established Businesses In Saudi Arabia
– Recent Evolution (Question: How Many [Potential] Customers Consider The Product/Service New Or
Unfamiliar?)
Table 14. Technological Levels of Early-Stage and Established Businesses in Saudi Arabia – Recent
Evolution
Early-stage e-ship (% TEA) Established businesses (% EB)
Medium- or hightechnology sector
2009
99.4
0.6
2010
98.5
1.5
2016
99.2
0.8
2017
98.5
1.5
2009
100.0
0.0
2010
97.3
2.7
2016
100.0
0.0
2017
97.3
2.7
Technological level:
No- or lowtechnology sector
4.8.Usage Of Recent Technologies
Another important feature by which to assess the quality of entrepreneurial and established firms is the age of the technologies used to produce their goods or services. GEM estimates what proportion of businesses use the very latest (<1 year old), new (1–5 years old) and non-new technology (>5 years old).
The results for 2009, 2010, 2016 and 2017
are shown in Figure 23. They paint a mixed
picture, but owing to the absence of results
from 2011–2015 it is difficult to draw a firm
conclusion. However, following a peak in 2010
there was seemingly a regression in the use of
latest and new technologies up until 2016.
This was especially true of established firms:
in 2016, a remarkable 86.6% did not employ
new technology. The situation changed in
2017 (see Figure 23), when, in consonance
with the results showed in Table 14 regarding
the technological level of the sector, the
proportions of TEA and EB businesses using
latest technologies increased significantly
(up 47.7% for TEA and 500% for EB). If this
result consolidates the next year, it will
imply, as with the results on innovation and
technological sector, that there is a moderate
but relevant increment of sophistication in the
business sector in general.
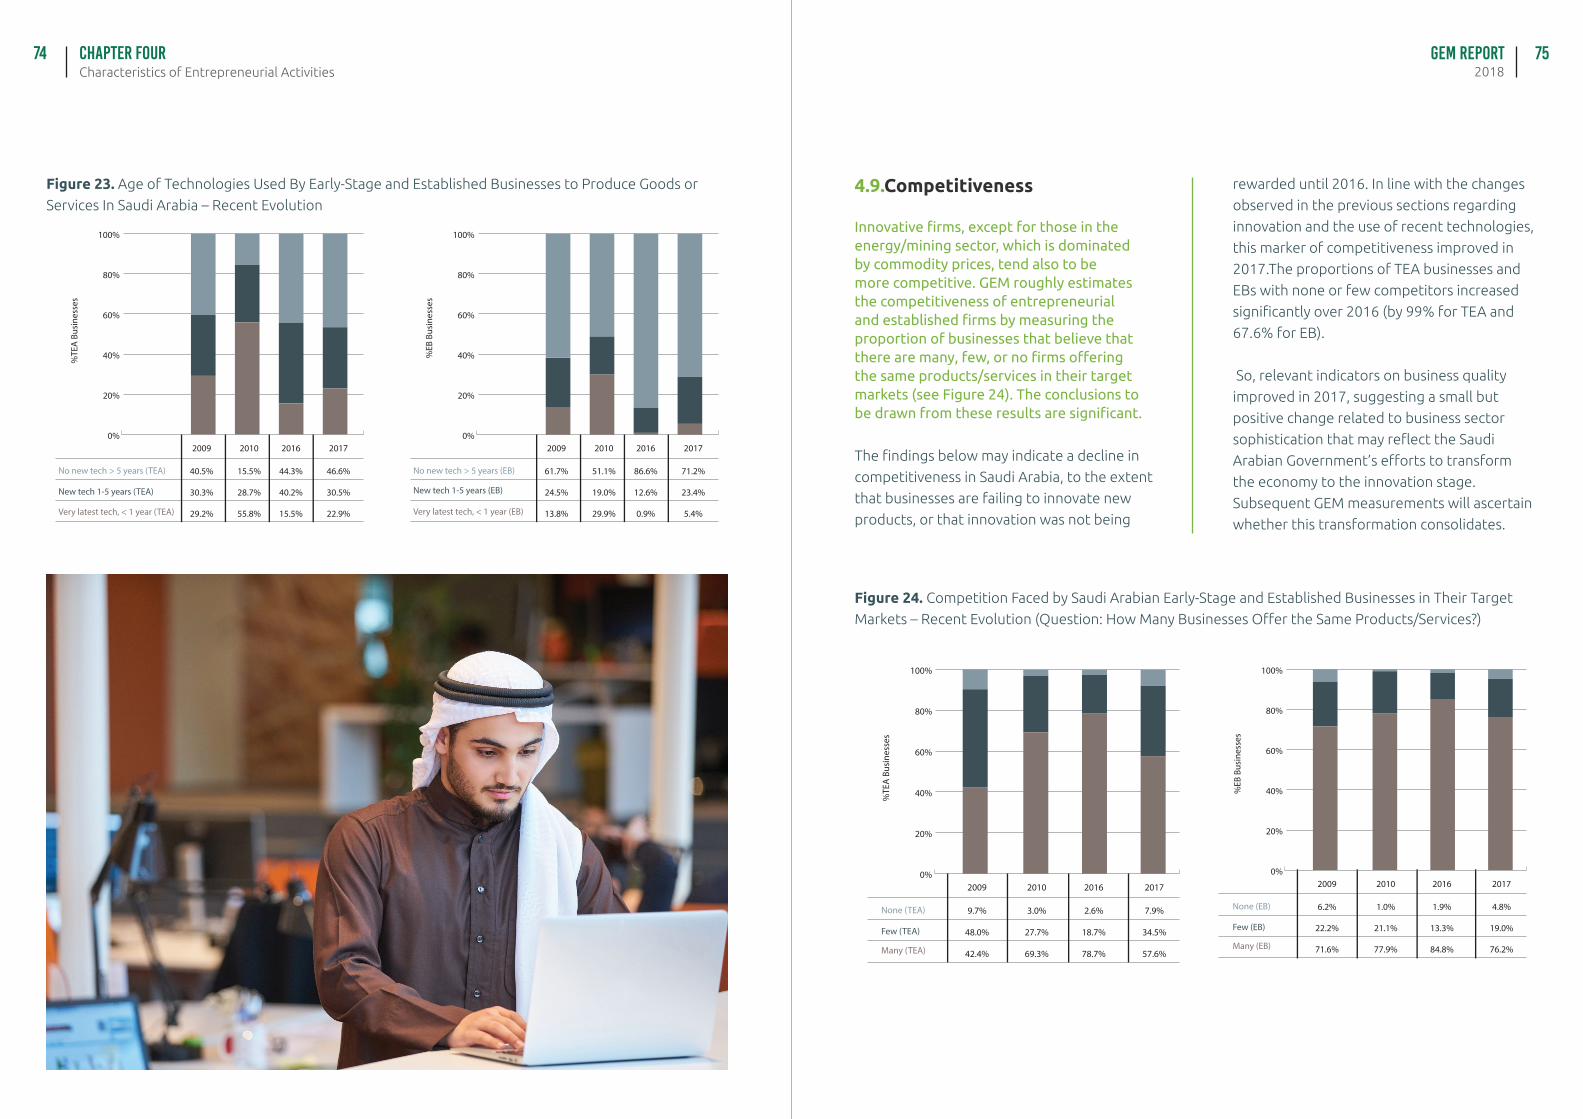
GEM Report2018Characteristics of Entrepreneurial Activities
Chapter FOUR74 75
2009 2010 2016 2017
%TE
A B
usin
esse
s
0%
20%
40%
60%
80%
100%
40.5%
30.3%
29.2%
15.5%
28.7%
55.8%
44.3%
40.2%
15.5%
46.6%
30.5%
22.9%
No new tech > 5 years (TEA)
Very latest tech, < 1 year (TEA)
New tech 1-5 years (TEA)
2009 2010 2016 2017
%EB
Bus
ines
ses
0%
20%
40%
60%
80%
100%
61.7%
24.5%
13.8%
51.1%
19.0%
29.9%
86.6%
12.6%
0.9%
71.2%
23.4%
5.4%
No new tech > 5 years (EB)
Very latest tech, < 1 year (EB)
New tech 1-5 years (EB)
Figure 23. Age of Technologies Used By Early-Stage and Established Businesses to Produce Goods or
Services In Saudi Arabia – Recent Evolution
%EB
Bus
ines
ses
0%
20%
40%
60%
80%
100%
2009
6.2%
22.2%
71.6%
2010
1.0%
21.1%
77.9%
2016
1.9%
13.3%
84.8%
2017
4.8%
19.0%
76.2%
None (EB)
Few (EB)
Many (EB)
%TE
A B
usin
esse
s0%
20%
40%
60%
80%
100%
2009
9.7%
48.0%
42.4%
2010
3.0%
27.7%
69.3%
2016
2.6%
18.7%
78.7%
2017
7.9%
34.5%
57.6%
None (TEA)
Few (TEA)
Many (TEA)
Figure 24. Competition Faced by Saudi Arabian Early-Stage and Established Businesses in Their Target
Markets – Recent Evolution (Question: How Many Businesses Offer the Same Products/Services?)
4.9.Competitiveness
Innovative firms, except for those in the energy/mining sector, which is dominated by commodity prices, tend also to be more competitive. GEM roughly estimates the competitiveness of entrepreneurial and established firms by measuring the proportion of businesses that believe that there are many, few, or no firms offering the same products/services in their target markets (see Figure 24). The conclusions to be drawn from these results are significant.
The findings below may indicate a decline in
competitiveness in Saudi Arabia, to the extent
that businesses are failing to innovate new
products, or that innovation was not being
rewarded until 2016. In line with the changes
observed in the previous sections regarding
innovation and the use of recent technologies,
this marker of competitiveness improved in
2017.The proportions of TEA businesses and
EBs with none or few competitors increased
significantly over 2016 (by 99% for TEA and
67.6% for EB).
So, relevant indicators on business quality
improved in 2017, suggesting a small but
positive change related to business sector
sophistication that may reflect the Saudi
Arabian Government’s efforts to transform
the economy to the innovation stage.
Subsequent GEM measurements will ascertain
whether this transformation consolidates.
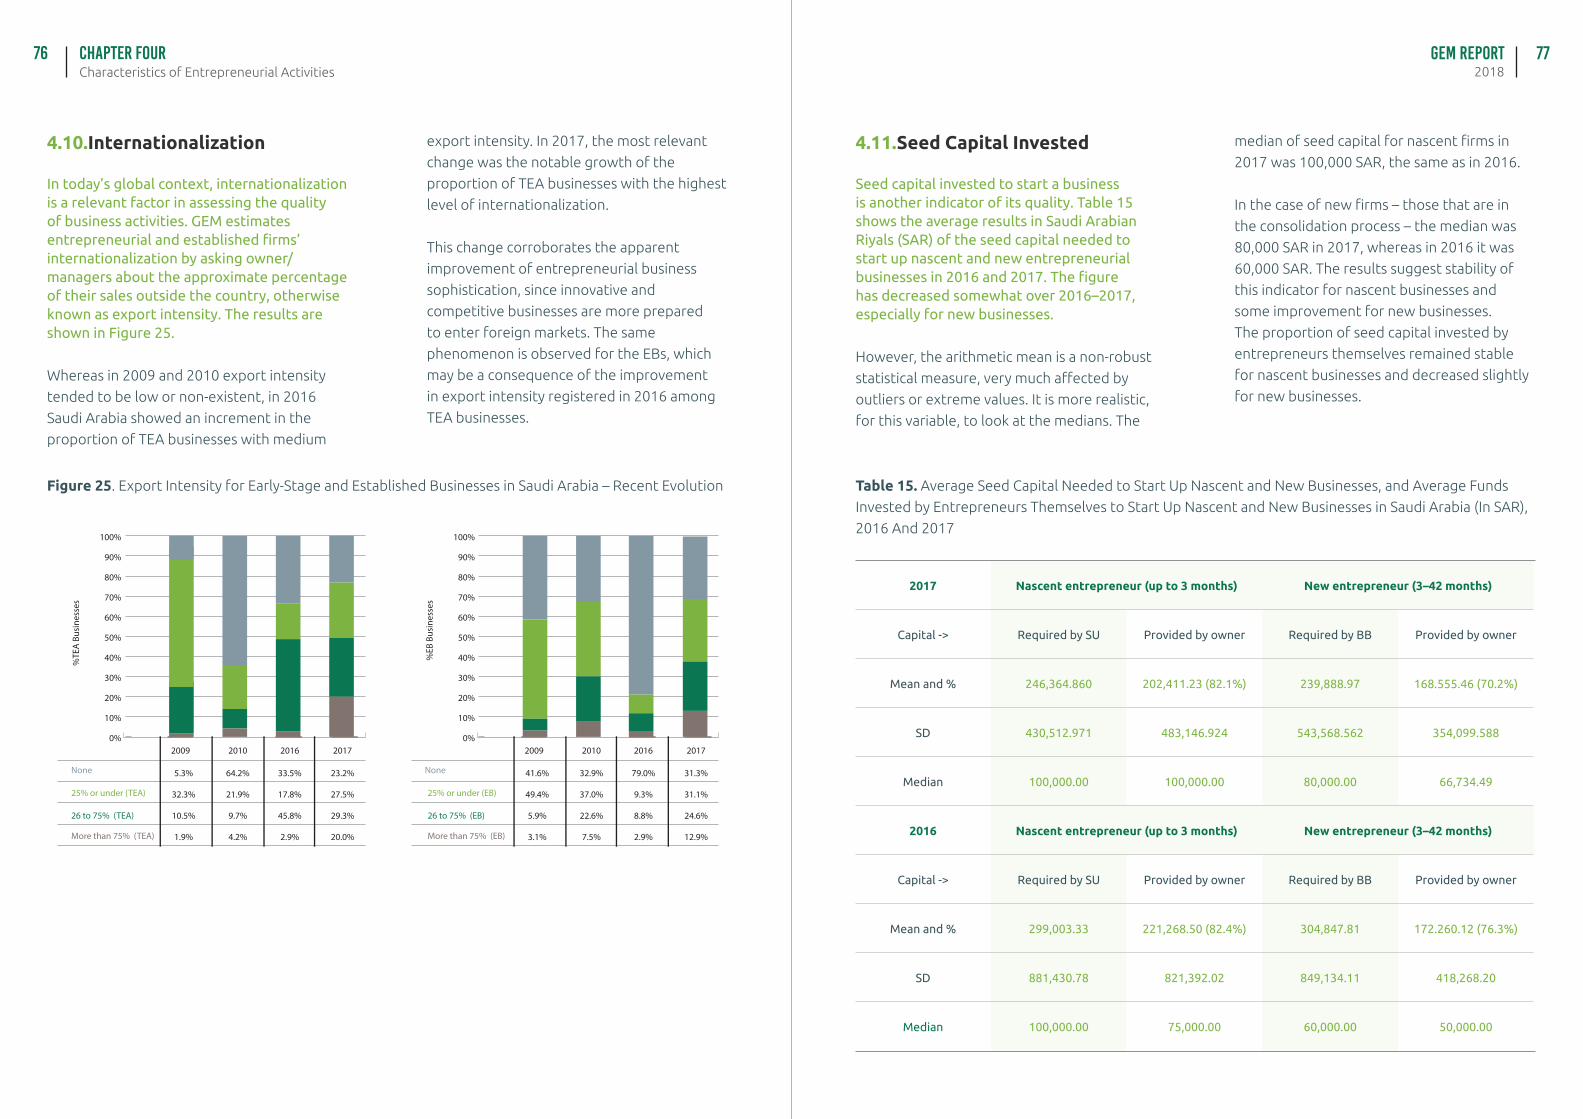
GEM Report2018Characteristics of Entrepreneurial Activities
Chapter FOUR76 77
4.10.Internationalization
In today’s global context, internationalization is a relevant factor in assessing the quality of business activities. GEM estimates entrepreneurial and established firms’ internationalization by asking owner/managers about the approximate percentage of their sales outside the country, otherwise known as export intensity. The results are shown in Figure 25.
Whereas in 2009 and 2010 export intensity
tended to be low or non-existent, in 2016
Saudi Arabia showed an increment in the
proportion of TEA businesses with medium
export intensity. In 2017, the most relevant
change was the notable growth of the
proportion of TEA businesses with the highest
level of internationalization.
This change corroborates the apparent
improvement of entrepreneurial business
sophistication, since innovative and
competitive businesses are more prepared
to enter foreign markets. The same
phenomenon is observed for the EBs, which
may be a consequence of the improvement
in export intensity registered in 2016 among
TEA businesses.
2009 2010 2016 2017
%TE
A B
usin
esse
s
None
25% or under (TEA)
26 to 75% (TEA)
More than 75% (TEA)
5.3%
32.3%
10.5%
1.9%
64.2%
21.9%
9.7%
4.2%
33.5%
17.8%
45.8%
2.9%
23.2%
27.5%
29.3%
20.0%
0%
10%
20%
30%
40%
50%
60%
70%
80%
90%
100%
2009 2010 2016 2017
%EB
Bus
ines
ses
None
25% or under (EB)
26 to 75% (EB)
More than 75% (EB)
41.6%
49.4%
5.9%
3.1%
32.9%
37.0%
22.6%
7.5%
79.0%
9.3%
8.8%
2.9%
31.3%
31.1%
24.6%
12.9%
0%
10%
20%
30%
40%
50%
60%
70%
80%
90%
100%
Figure 25. Export Intensity for Early-Stage and Established Businesses in Saudi Arabia – Recent Evolution
2017 Nascent entrepreneur (up to 3 months) New entrepreneur (3–42 months)
Capital -> Required by SU Provided by owner Required by BB Provided by owner
Mean and % 246,364.860 202,411.23 (82.1%) 239,888.97 168.555.46 (70.2%)
SD 430,512.971 483,146.924 543,568.562 354,099.588
Median 100,000.00 100,000.00 80,000.00 66,734.49
2016 Nascent entrepreneur (up to 3 months) New entrepreneur (3–42 months)
Capital -> Required by SU Provided by owner Required by BB Provided by owner
Mean and % 299,003.33 221,268.50 (82.4%) 304,847.81 172.260.12 (76.3%)
SD 881,430.78 821,392.02 849,134.11 418,268.20
Median 100,000.00 75,000.00 60,000.00 50,000.00
4.11.Seed Capital Invested
Seed capital invested to start a business is another indicator of its quality. Table 15 shows the average results in Saudi Arabian Riyals (SAR) of the seed capital needed to start up nascent and new entrepreneurial businesses in 2016 and 2017. The figure has decreased somewhat over 2016–2017, especially for new businesses.
However, the arithmetic mean is a non-robust
statistical measure, very much affected by
outliers or extreme values. It is more realistic,
for this variable, to look at the medians. The
Table 15. Average Seed Capital Needed to Start Up Nascent and New Businesses, and Average Funds
Invested by Entrepreneurs Themselves to Start Up Nascent and New Businesses in Saudi Arabia (In SAR),
2016 And 2017
median of seed capital for nascent firms in
2017 was 100,000 SAR, the same as in 2016.
In the case of new firms – those that are in
the consolidation process – the median was
80,000 SAR in 2017, whereas in 2016 it was
60,000 SAR. The results suggest stability of
this indicator for nascent businesses and
some improvement for new businesses.
The proportion of seed capital invested by
entrepreneurs themselves remained stable
for nascent businesses and decreased slightly
for new businesses.
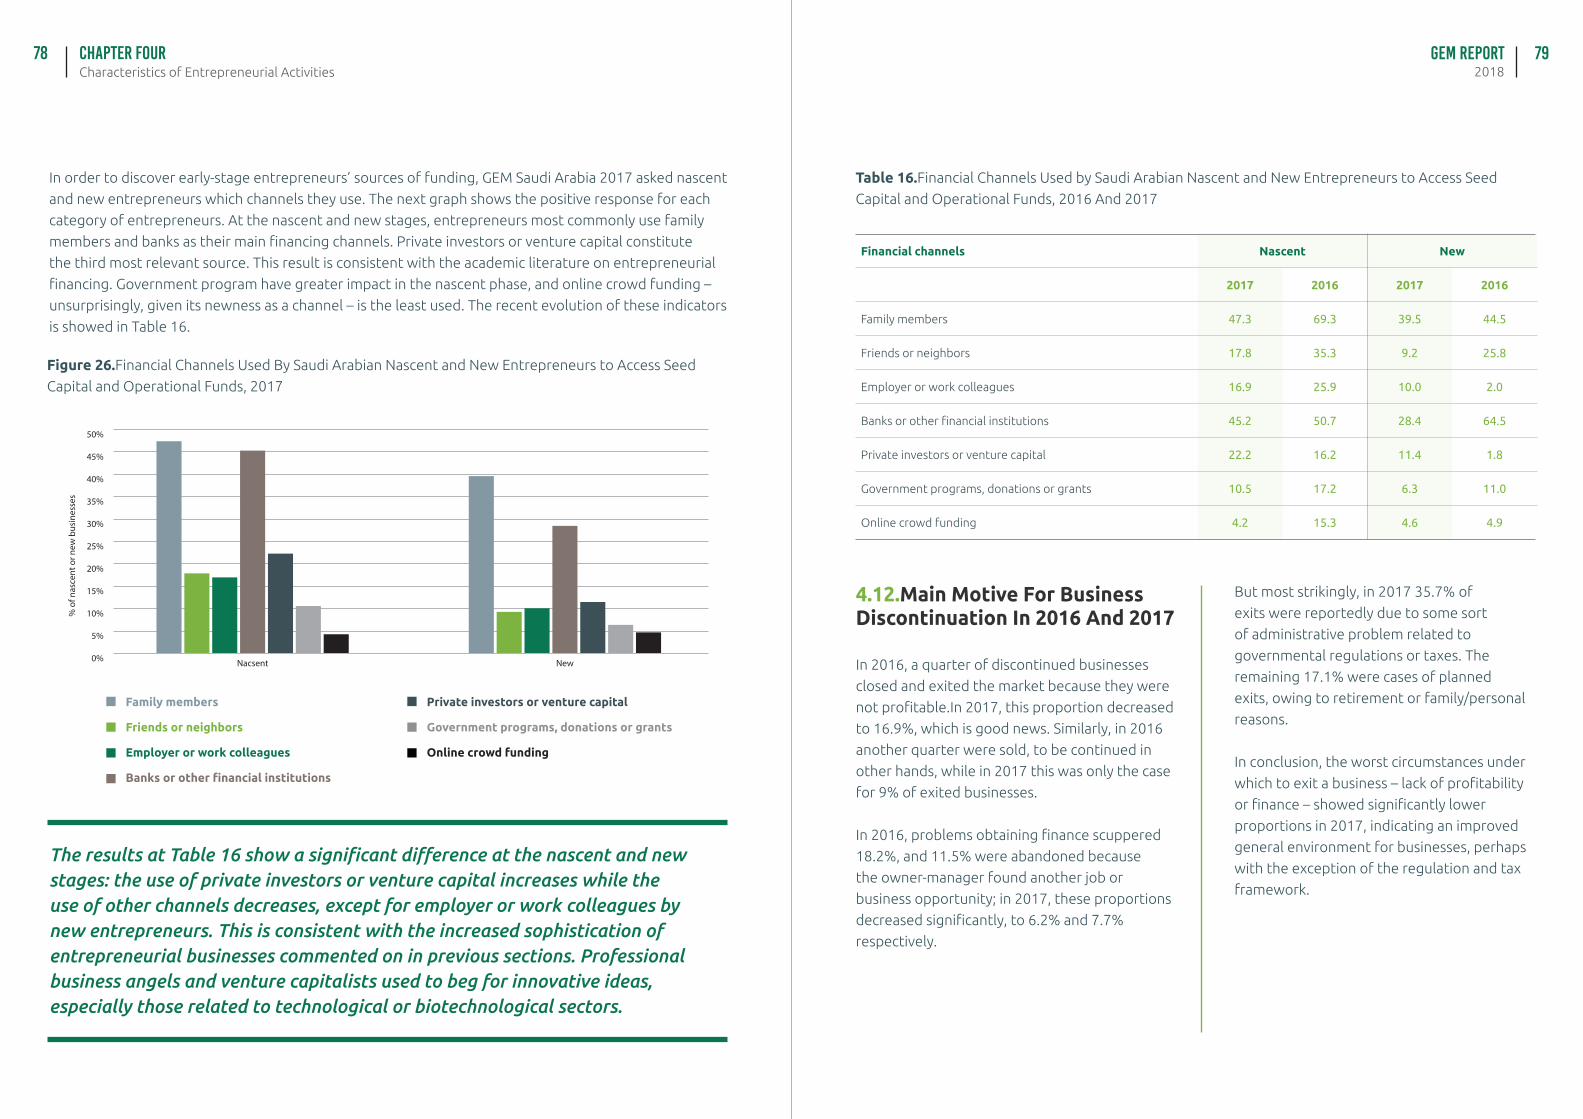
GEM Report2018Characteristics of Entrepreneurial Activities
Chapter FOUR78 79
In order to discover early-stage entrepreneurs’ sources of funding, GEM Saudi Arabia 2017 asked nascent
and new entrepreneurs which channels they use. The next graph shows the positive response for each
category of entrepreneurs. At the nascent and new stages, entrepreneurs most commonly use family
members and banks as their main financing channels. Private investors or venture capital constitute
the third most relevant source. This result is consistent with the academic literature on entrepreneurial
financing. Government program have greater impact in the nascent phase, and online crowd funding –
unsurprisingly, given its newness as a channel – is the least used. The recent evolution of these indicators
is showed in Table 16.
Figure 26.Financial Channels Used By Saudi Arabian Nascent and New Entrepreneurs to Access Seed
Capital and Operational Funds, 2017
0%
5%
10%% o
f nas
cent
or n
ew b
usin
esse
s
Nacsent New
15%
20%
25%
30%
35%
40%
45%
50%
Family members
Friends or neighbors
Employer or work colleagues
Banks or other financial institutions
Private investors or venture capital
Government programs, donations or grants
Online crowd funding
The results at Table 16 show a significant difference at the nascent and new stages: the use of private investors or venture capital increases while the use of other channels decreases, except for employer or work colleagues by new entrepreneurs. This is consistent with the increased sophistication of entrepreneurial businesses commented on in previous sections. Professional business angels and venture capitalists used to beg for innovative ideas, especially those related to technological or biotechnological sectors.
Financial channels Nascent New
2017 2016 2017 2016
Family members 47.3 69.3 39.5 44.5
Friends or neighbors 17.8 35.3 9.2 25.8
Employer or work colleagues 16.9 25.9 10.0 2.0
Banks or other financial institutions 45.2 50.7 28.4 64.5
Private investors or venture capital 22.2 16.2 11.4 1.8
Government programs, donations or grants 10.5 17.2 6.3 11.0
Online crowd funding 4.2 15.3 4.6 4.9
Table 16.Financial Channels Used by Saudi Arabian Nascent and New Entrepreneurs to Access Seed
Capital and Operational Funds, 2016 And 2017
4.12.Main Motive For Business Discontinuation In 2016 And 2017
In 2016, a quarter of discontinued businesses
closed and exited the market because they were
not profitable.In 2017, this proportion decreased
to 16.9%, which is good news. Similarly, in 2016
another quarter were sold, to be continued in
other hands, while in 2017 this was only the case
for 9% of exited businesses.
In 2016, problems obtaining finance scuppered
18.2%, and 11.5% were abandoned because
the owner-manager found another job or
business opportunity; in 2017, these proportions
decreased significantly, to 6.2% and 7.7%
respectively.
But most strikingly, in 2017 35.7% of
exits were reportedly due to some sort
of administrative problem related to
governmental regulations or taxes. The
remaining 17.1% were cases of planned
exits, owing to retirement or family/personal
reasons.
In conclusion, the worst circumstances under
which to exit a business – lack of profitability
or finance – showed significantly lower
proportions in 2017, indicating an improved
general environment for businesses, perhaps
with the exception of the regulation and tax
framework.
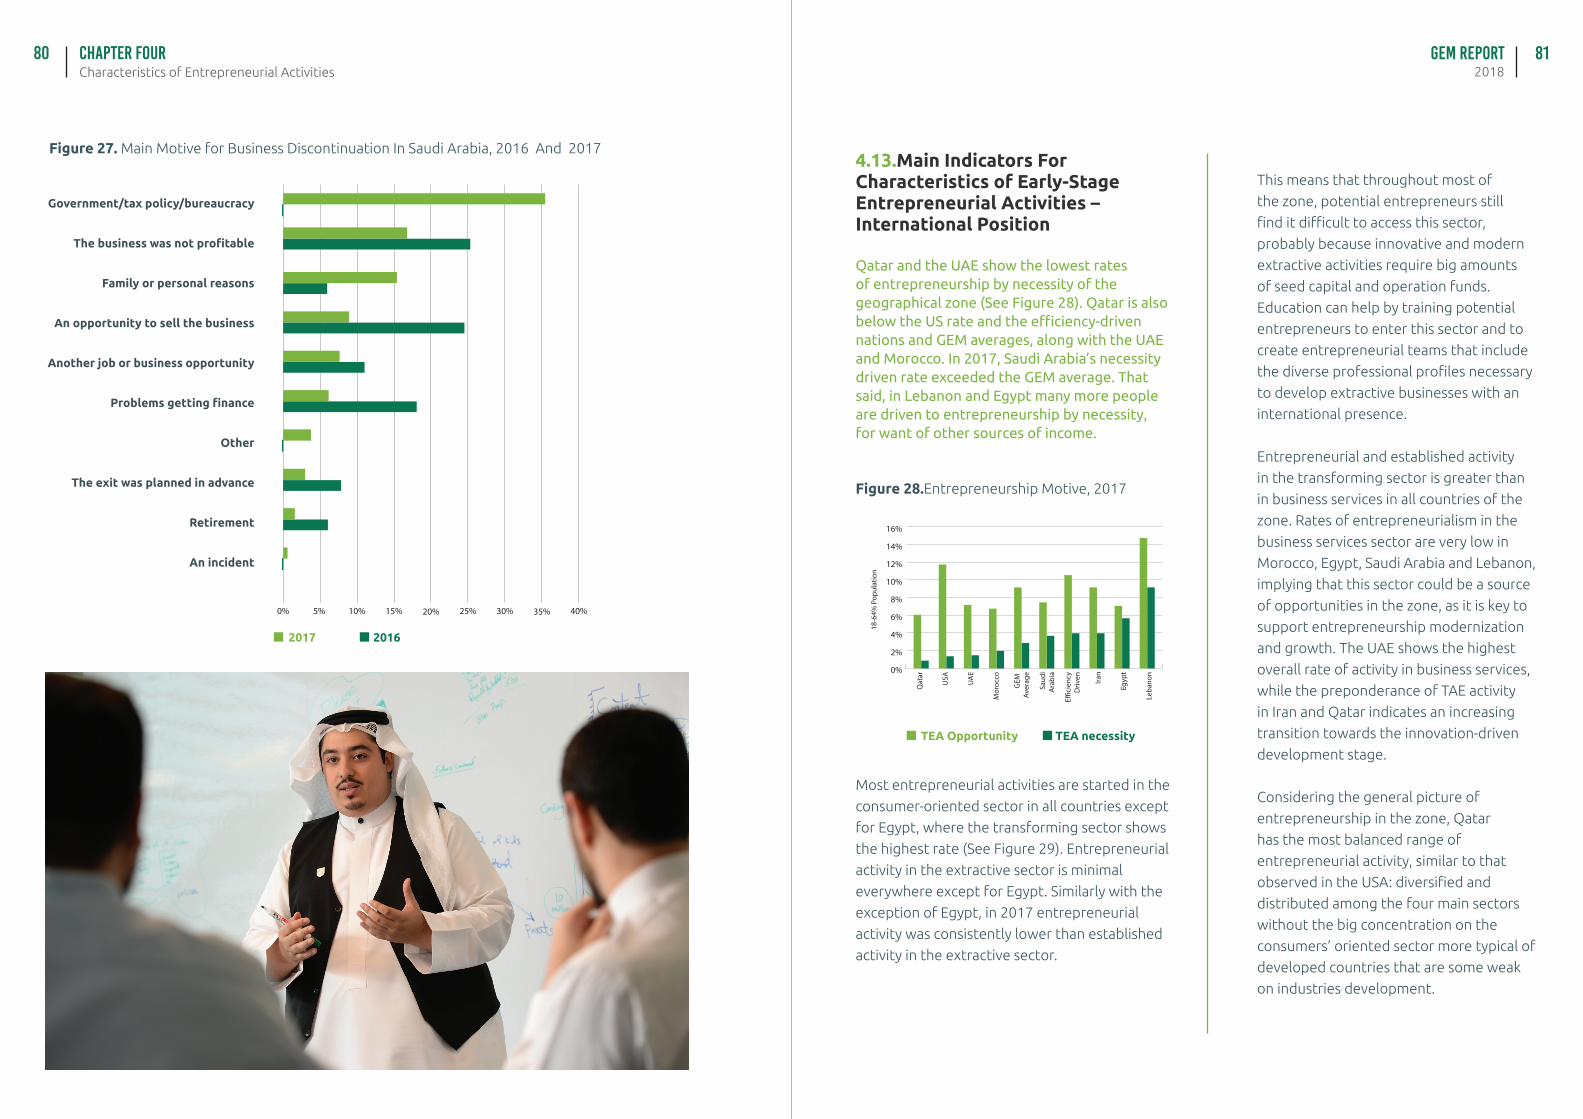
GEM Report2018Characteristics of Entrepreneurial Activities
Chapter FOUR80 81
Figure 27. Main Motive for Business Discontinuation In Saudi Arabia, 2016 And 2017
0% 5% 10% 15% 20% 25% 30% 35% 40%
Government/tax policy/bureaucracy
The business was not profitable
Family or personal reasons
An opportunity to sell the business
Another job or business opportunity
Problems getting finance
Other
The exit was planned in advance
Retirement
An incident
2017 2016
TEA Opportunity TEA necessity
4.13.Main Indicators For Characteristics of Early-Stage Entrepreneurial Activities – International Position
Qatar and the UAE show the lowest rates of entrepreneurship by necessity of the geographical zone (See Figure 28). Qatar is also below the US rate and the efficiency-driven nations and GEM averages, along with the UAE and Morocco. In 2017, Saudi Arabia’s necessity driven rate exceeded the GEM average. That said, in Lebanon and Egypt many more people are driven to entrepreneurship by necessity, for want of other sources of income.
Iran
Qat
ar
Leba
non
Saud
i A
rabi
a
Mor
occo
18-6
4% P
opul
atio
n
Egyp
t
UA
E
USA
E�ci
ency
Driv
en
GEM
Av
erag
e0%
2%
4%
6%
8%
10%
12%
14%
16%
Figure 28.Entrepreneurship Motive, 2017
Most entrepreneurial activities are started in the
consumer-oriented sector in all countries except
for Egypt, where the transforming sector shows
the highest rate (See Figure 29). Entrepreneurial
activity in the extractive sector is minimal
everywhere except for Egypt. Similarly with the
exception of Egypt, in 2017 entrepreneurial
activity was consistently lower than established
activity in the extractive sector.
This means that throughout most of
the zone, potential entrepreneurs still
find it difficult to access this sector,
probably because innovative and modern
extractive activities require big amounts
of seed capital and operation funds.
Education can help by training potential
entrepreneurs to enter this sector and to
create entrepreneurial teams that include
the diverse professional profiles necessary
to develop extractive businesses with an
international presence.
Entrepreneurial and established activity
in the transforming sector is greater than
in business services in all countries of the
zone. Rates of entrepreneurialism in the
business services sector are very low in
Morocco, Egypt, Saudi Arabia and Lebanon,
implying that this sector could be a source
of opportunities in the zone, as it is key to
support entrepreneurship modernization
and growth. The UAE shows the highest
overall rate of activity in business services,
while the preponderance of TAE activity
in Iran and Qatar indicates an increasing
transition towards the innovation-driven
development stage.
Considering the general picture of
entrepreneurship in the zone, Qatar
has the most balanced range of
entrepreneurial activity, similar to that
observed in the USA: diversified and
distributed among the four main sectors
without the big concentration on the
consumers’ oriented sector more typical of
developed countries that are some weak
on industries development.
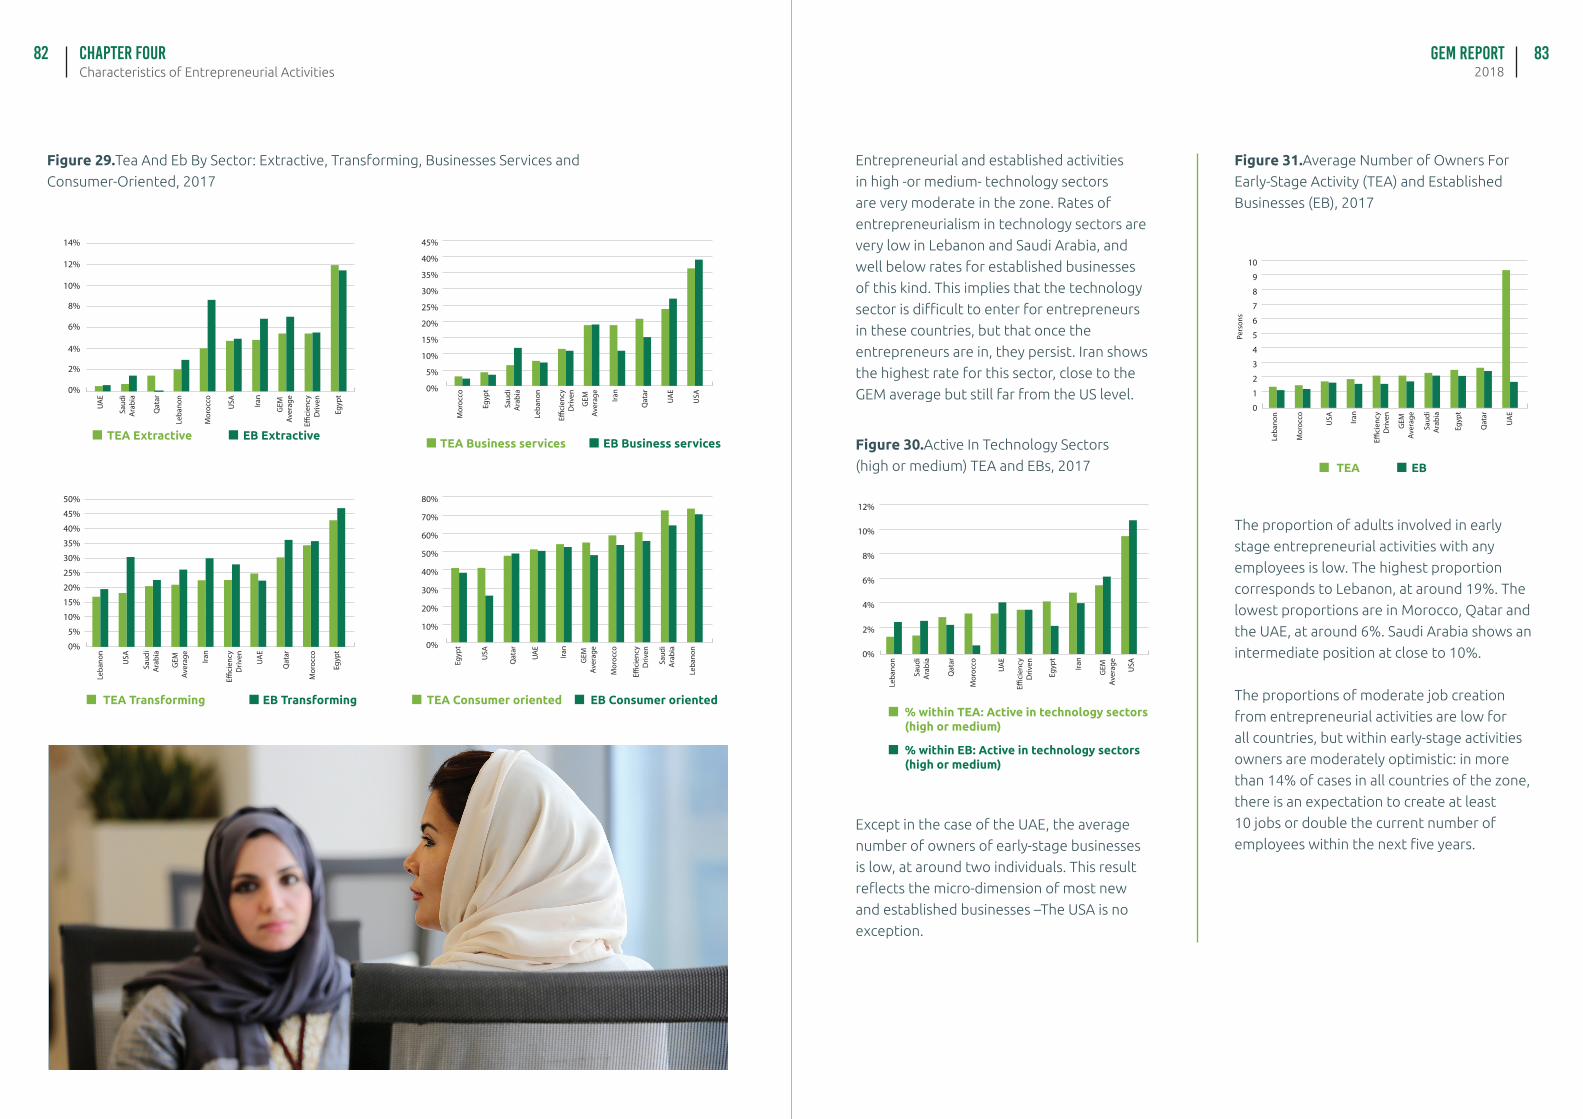
GEM Report2018Characteristics of Entrepreneurial Activities
Chapter FOUR82 83
Figure 29.Tea And Eb By Sector: Extractive, Transforming, Businesses Services and
Consumer-Oriented, 2017
Iran
Qat
ar
Leba
non
Saud
i A
rabi
a
Mor
occo
Egyp
t
UA
E
USA
E�ci
ency
Driv
en
GEM
Av
erag
e
0%
2%
4%
6%
8%
10%
12%
14%
Iran
Qat
ar
Leba
non
Saud
i A
rabi
a
Mor
occo
Egyp
t
UA
E
USA
E�ci
ency
Driv
en
GEM
Av
erag
e
0%
5%
10%
15%
20%
25%
30%
35%
40%
45%
50%
Iran
Qat
ar
Leba
non
Saud
i A
rabi
a
Mor
occo
Egyp
t
UA
E
USA
E�ci
ency
Driv
en
GEM
Av
erag
e0%
5%
10%
15%
20%
25%
30%
35%
40%
45%
Iran
Qat
ar
Leba
non
Saud
i A
rabi
a
Mor
occo
Egyp
t
UA
E
USA
E�ci
ency
Driv
en
GEM
Av
erag
e0%
10%
20%
30%
40%
50%
60%
70%
80%
TEA Extractive EB Extractive
TEA Transforming EB Transforming
TEA Business services EB Business services
TEA Consumer oriented EB Consumer oriented
Entrepreneurial and established activities
in high -or medium- technology sectors
are very moderate in the zone. Rates of
entrepreneurialism in technology sectors are
very low in Lebanon and Saudi Arabia, and
well below rates for established businesses
of this kind. This implies that the technology
sector is difficult to enter for entrepreneurs
in these countries, but that once the
entrepreneurs are in, they persist. Iran shows
the highest rate for this sector, close to the
GEM average but still far from the US level.
Iran
Qat
ar
Leba
non
Saud
i A
rabi
a
Mor
occo
Egyp
t
UA
E
USA
E�ci
ency
Driv
en
GEM
Av
erag
e
0%
2%
4%
6%
8%
10%
12%
Figure 30.Active In Technology Sectors
(high or medium) TEA and EBs, 2017
% within TEA: Active in technology sectors (high or medium)
Iran
Qat
ar
Leba
non
Pers
ons
Saud
i A
rabi
a
Mor
occo
Egyp
t
UA
E
USA
E�ci
ency
Driv
en
GEM
Av
erag
e
0
1
2
3
4
5
6
7
8
9
10
TEA EB
% within EB: Active in technology sectors(high or medium)
Except in the case of the UAE, the average
number of owners of early-stage businesses
is low, at around two individuals. This result
reflects the micro-dimension of most new
and established businesses –The USA is no
exception.
Figure 31.Average Number of Owners For
Early-Stage Activity (TEA) and Established
Businesses (EB), 2017
The proportion of adults involved in early
stage entrepreneurial activities with any
employees is low. The highest proportion
corresponds to Lebanon, at around 19%. The
lowest proportions are in Morocco, Qatar and
the UAE, at around 6%. Saudi Arabia shows an
intermediate position at close to 10%.
The proportions of moderate job creation
from entrepreneurial activities are low for
all countries, but within early-stage activities
owners are moderately optimistic: in more
than 14% of cases in all countries of the zone,
there is an expectation to create at least
10 jobs or double the current number of
employees within the next five years.
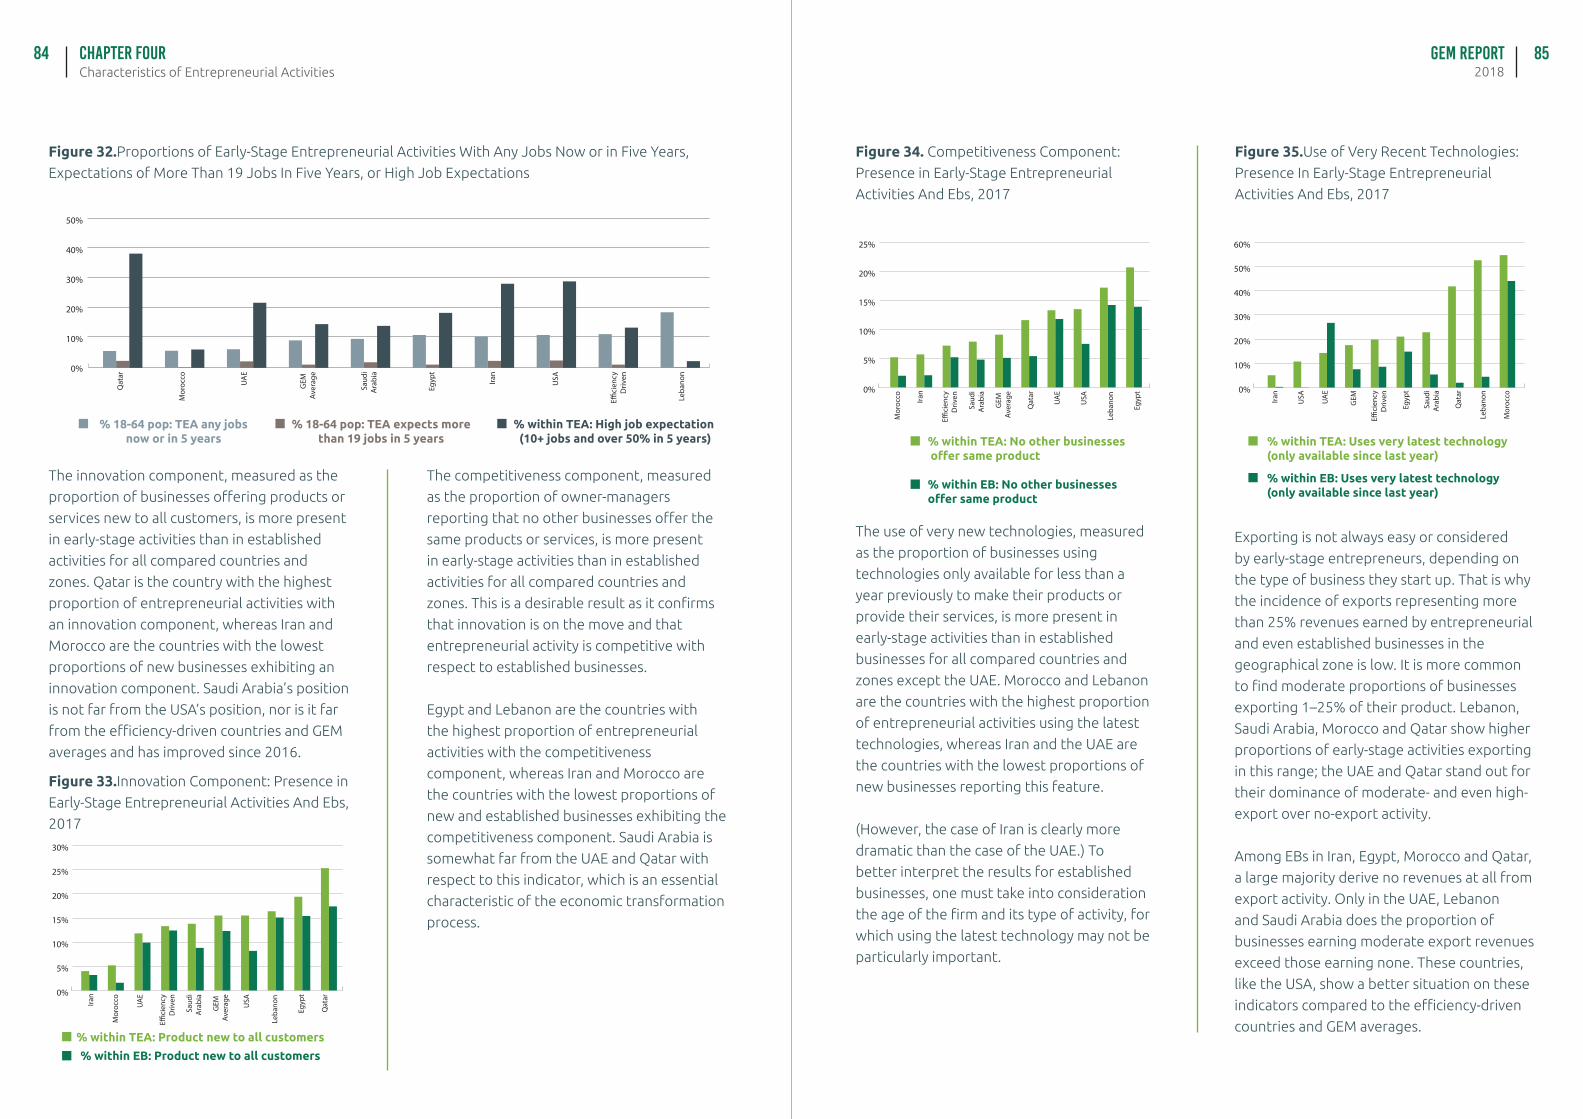
GEM Report2018Characteristics of Entrepreneurial Activities
Chapter FOUR84 85
% within TEA: High job expectation (10+ jobs and over 50% in 5 years)
Figure 32.Proportions of Early-Stage Entrepreneurial Activities With Any Jobs Now or in Five Years,
Expectations of More Than 19 Jobs In Five Years, or High Job Expectations
Iran
Qat
ar
Leba
non
Saud
i A
rabi
a
Mor
occo
Egyp
t
UA
E
USA
E�ci
ency
Driv
en
GEM
Av
erag
e0%
10%
20%
30%
40%
50%
% 18-64 pop: TEA any jobs now or in 5 years
% 18-64 pop: TEA expects more than 19 jobs in 5 years
The innovation component, measured as the
proportion of businesses offering products or
services new to all customers, is more present
in early-stage activities than in established
activities for all compared countries and
zones. Qatar is the country with the highest
proportion of entrepreneurial activities with
an innovation component, whereas Iran and
Morocco are the countries with the lowest
proportions of new businesses exhibiting an
innovation component. Saudi Arabia’s position
is not far from the USA’s position, nor is it far
from the efficiency-driven countries and GEM
averages and has improved since 2016.
The competitiveness component, measured
as the proportion of owner-managers
reporting that no other businesses offer the
same products or services, is more present
in early-stage activities than in established
activities for all compared countries and
zones. This is a desirable result as it confirms
that innovation is on the move and that
entrepreneurial activity is competitive with
respect to established businesses.
Egypt and Lebanon are the countries with
the highest proportion of entrepreneurial
activities with the competitiveness
component, whereas Iran and Morocco are
the countries with the lowest proportions of
new and established businesses exhibiting the
competitiveness component. Saudi Arabia is
somewhat far from the UAE and Qatar with
respect to this indicator, which is an essential
characteristic of the economic transformation
process.
Figure 33.Innovation Component: Presence in
Early-Stage Entrepreneurial Activities And Ebs,
2017
Iran
Qat
ar
Leba
non
Saud
i A
rabi
a
Mor
occo
Egyp
t
UA
E
USA
E�ci
ency
Driv
en
GEM
Av
erag
e0%
5%
10%
15%
20%
25%
30%
% within TEA: Product new to all customers
% within EB: Product new to all customers
Figure 34. Competitiveness Component:
Presence in Early-Stage Entrepreneurial
Activities And Ebs, 2017
Figure 35.Use of Very Recent Technologies:
Presence In Early-Stage Entrepreneurial
Activities And Ebs, 2017
Iran
Qat
ar
Leba
non
Saud
i A
rabi
a
Mor
occo
Egyp
t
UA
E
USA
E�ci
ency
Driv
en
GEM
Av
erag
e0%
5%
10%
15%
20%
25%
Iran
Qat
ar
Leba
non
Saud
i A
rabi
a
Mor
occo
Egyp
t
UA
E
USA
E�ci
ency
Driv
en
GEM
0%
10%
20%
30%
40%
50%
60%
% within TEA: No other businesses offer same product
% within EB: No other businesses offer same product
% within TEA: Uses very latest technology (only available since last year)
The use of very new technologies, measured
as the proportion of businesses using
technologies only available for less than a
year previously to make their products or
provide their services, is more present in
early-stage activities than in established
businesses for all compared countries and
zones except the UAE. Morocco and Lebanon
are the countries with the highest proportion
of entrepreneurial activities using the latest
technologies, whereas Iran and the UAE are
the countries with the lowest proportions of
new businesses reporting this feature.
(However, the case of Iran is clearly more
dramatic than the case of the UAE.) To
better interpret the results for established
businesses, one must take into consideration
the age of the firm and its type of activity, for
which using the latest technology may not be
particularly important.
Exporting is not always easy or considered
by early-stage entrepreneurs, depending on
the type of business they start up. That is why
the incidence of exports representing more
than 25% revenues earned by entrepreneurial
and even established businesses in the
geographical zone is low. It is more common
to find moderate proportions of businesses
exporting 1–25% of their product. Lebanon,
Saudi Arabia, Morocco and Qatar show higher
proportions of early-stage activities exporting
in this range; the UAE and Qatar stand out for
their dominance of moderate- and even high-
export over no-export activity.
Among EBs in Iran, Egypt, Morocco and Qatar,
a large majority derive no revenues at all from
export activity. Only in the UAE, Lebanon
and Saudi Arabia does the proportion of
businesses earning moderate export revenues
exceed those earning none. These countries,
like the USA, show a better situation on these
indicators compared to the efficiency-driven
countries and GEM averages.
% within EB: Uses very latest technology (only available since last year)
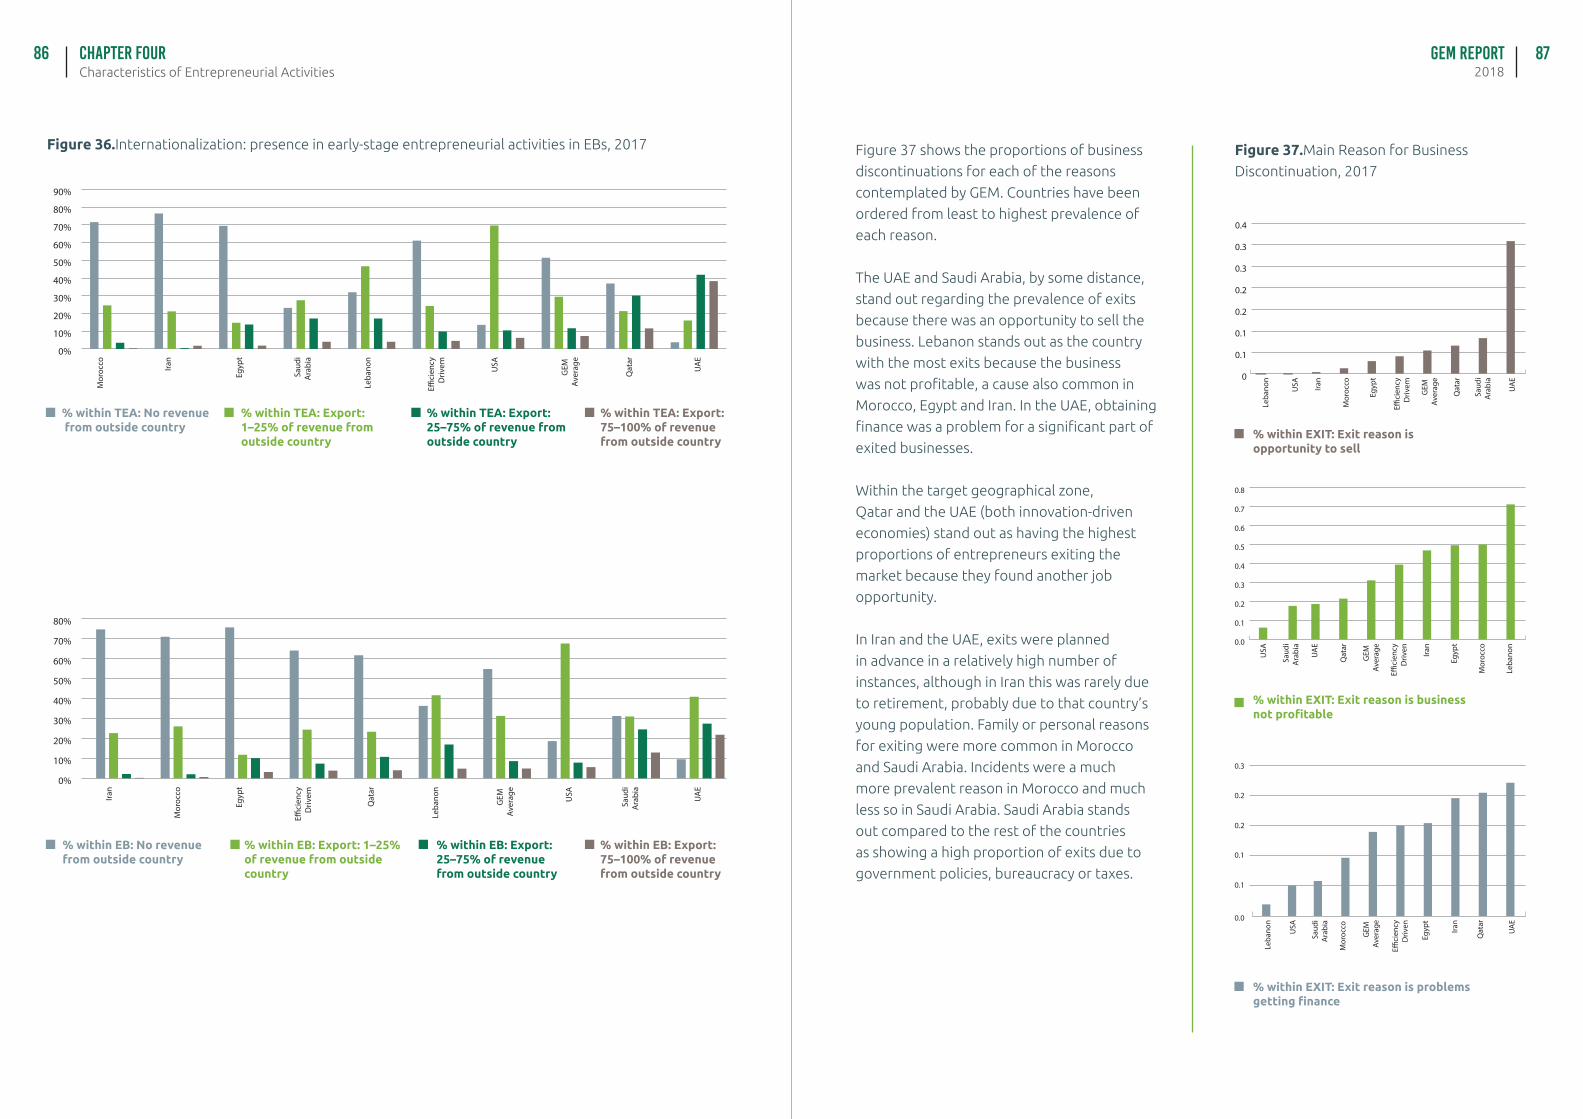
GEM Report2018Characteristics of Entrepreneurial Activities
Chapter FOUR86 87
Figure 36.Internationalization: presence in early-stage entrepreneurial activities in EBs, 2017Ira
n
Qat
ar
Leba
non
Saud
i A
rabi
a
Mor
occo
Egyp
t
UA
E
USA
E�ci
ency
Driv
em
GEM
Av
erag
e
0%
10%
20%
30%
40%
50%
60%
70%
80%
90%
% within TEA: No revenue from outside country
% within TEA: Export: 1–25% of revenue from outside country
% within TEA: Export: 25–75% of revenue from outside country
% within TEA: Export: 75–100% of revenue from outside country
Iran
Qat
ar
Leba
non
Saud
i A
rabi
a
Mor
occo
Egyp
t
UA
E
USA
E�ci
ency
Driv
em
GEM
Av
erag
e
0%
10%
20%
30%
40%
50%
60%
70%
80%
% within EB: No revenue from outside country
% within EB: Export: 1–25% of revenue from outside country
% within EB: Export: 25–75% of revenue from outside country
% within EB: Export: 75–100% of revenue from outside country
% within EXIT: Exit reason is opportunity to sell
% within EXIT: Exit reason is business not profitable
% within EXIT: Exit reason is problems getting finance
Figure 37 shows the proportions of business
discontinuations for each of the reasons
contemplated by GEM. Countries have been
ordered from least to highest prevalence of
each reason.
The UAE and Saudi Arabia, by some distance,
stand out regarding the prevalence of exits
because there was an opportunity to sell the
business. Lebanon stands out as the country
with the most exits because the business
was not profitable, a cause also common in
Morocco, Egypt and Iran. In the UAE, obtaining
finance was a problem for a significant part of
exited businesses.
Within the target geographical zone,
Qatar and the UAE (both innovation-driven
economies) stand out as having the highest
proportions of entrepreneurs exiting the
market because they found another job
opportunity.
In Iran and the UAE, exits were planned
in advance in a relatively high number of
instances, although in Iran this was rarely due
to retirement, probably due to that country’s
young population. Family or personal reasons
for exiting were more common in Morocco
and Saudi Arabia. Incidents were a much
more prevalent reason in Morocco and much
less so in Saudi Arabia. Saudi Arabia stands
out compared to the rest of the countries
as showing a high proportion of exits due to
government policies, bureaucracy or taxes.
Figure 37.Main Reason for Business
Discontinuation, 2017
Iran
Qat
ar
Leba
non
Saud
i A
rabi
a
Mor
occo
Egyp
t
UA
E
USA
E�ci
ency
Driv
em
GEM
Av
erag
e0
0.1
0.1
0.2
0.2
0.3
0.3
0.4
Iran
Qat
ar
Leba
non
Saud
i A
rabi
a
Mor
occo
Egyp
t
UA
E
USA
E�ci
ency
Driv
en
GEM
Av
erag
e0.0
0.1
0.2
0.3
0.4
0.5
0.6
0.7
0.8
Iran
Qat
ar
Leba
non
Saud
i A
rabi
a
Mor
occo
Egyp
t
UA
E
USA
E�ci
ency
Driv
en
GEM
Av
erag
e0.0
0.1
0.1
0.2
0.2
0.3
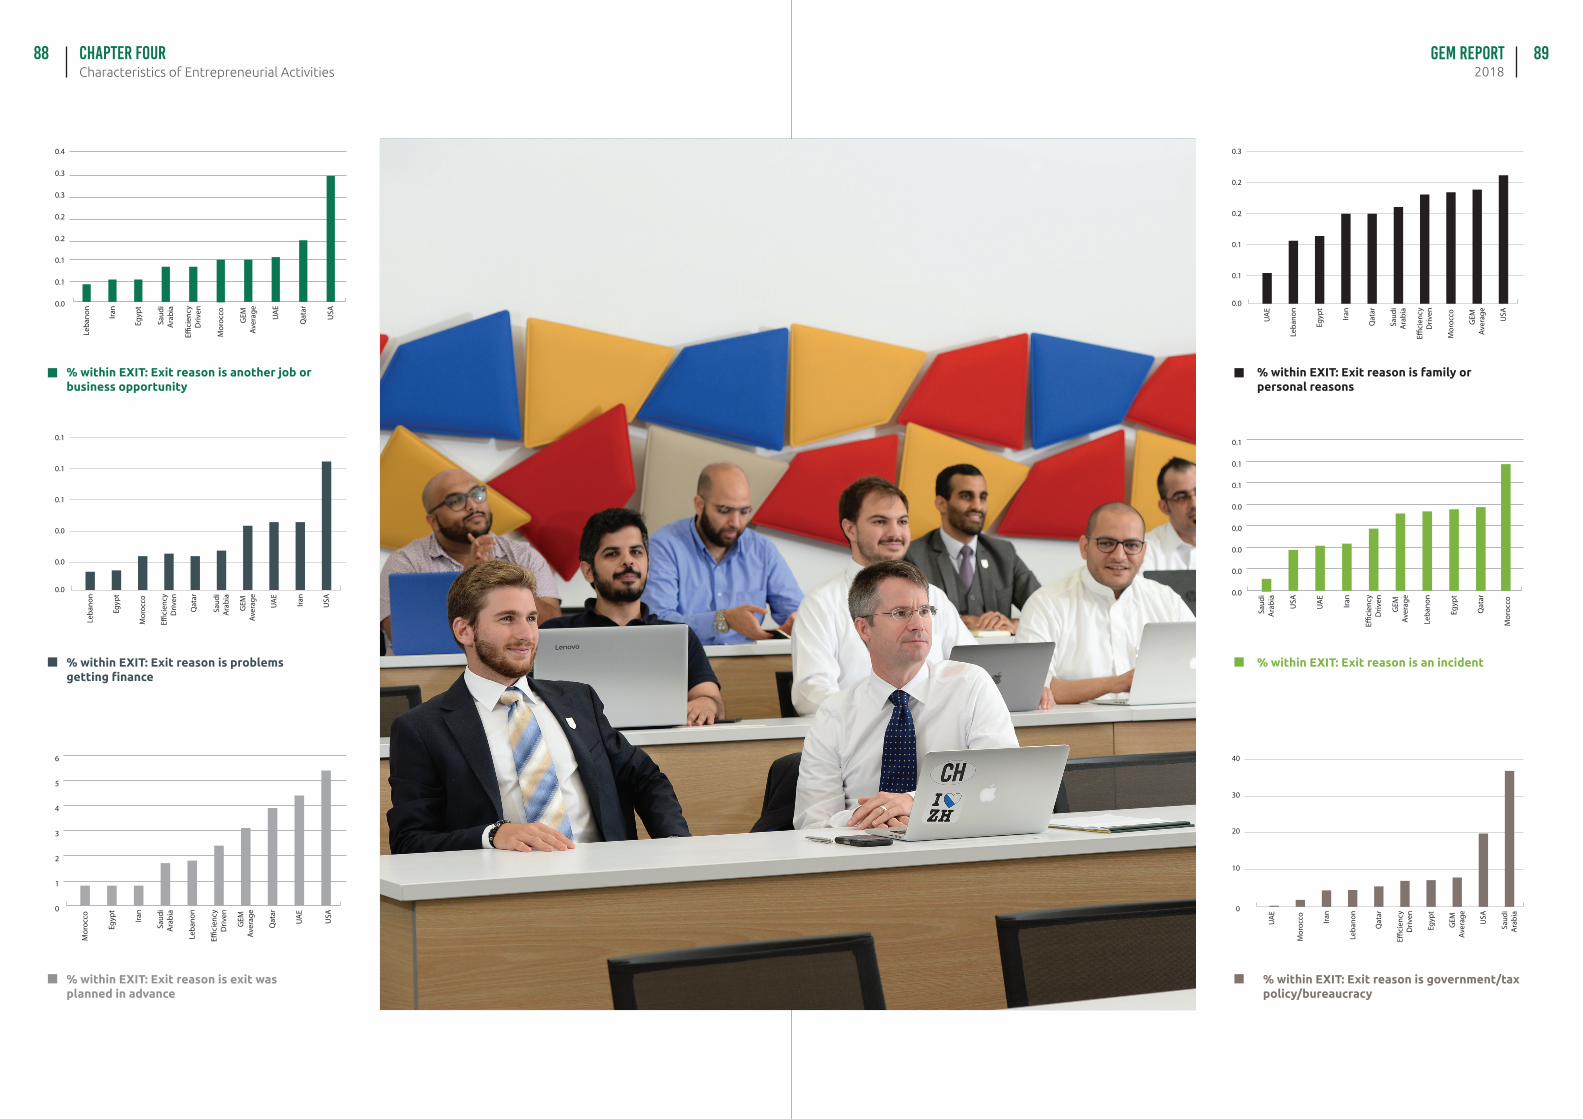
GEM Report2018Characteristics of Entrepreneurial Activities
Chapter FOUR88 89
% within EXIT: Exit reason is another job or business opportunity
% within EXIT: Exit reason is problems getting finance
% within EXIT: Exit reason is exit was planned in advance
Iran
Qat
ar
Leba
non
Saud
i A
rabi
a
Mor
occo
Egyp
t
UA
E
USA
E�ci
ency
Driv
en
GEM
Av
erag
e0.0
0.1
0.1
0.2
0.2
0.3
0.3
0.4
Iran
Qat
ar
Leba
non
Saud
i A
rabi
a
Mor
occo
Egyp
t
UA
E
USA
E�ci
ency
Driv
en
GEM
Av
erag
e
0.0
0.0
0.0
0.1
0.1
0.1
Iran
Qat
ar
Leba
non
Saud
i A
rabi
a
Mor
occo
Egyp
t
UA
E
USA
E�ci
ency
Driv
en
GEM
Av
erag
e0
1
2
3
4
5
6
% within EXIT: Exit reason is family or personal reasons
% within EXIT: Exit reason is an incident
% within EXIT: Exit reason is government/tax policy/bureaucracy
Iran
Qat
ar
Leba
non
Saud
i A
rabi
a
Mor
occo
Egyp
t
UA
E
USA
E�ci
ency
Driv
en
GEM
Av
erag
e
0.0
0.1
0.1
0.2
0.2
0.3
Iran
Qat
ar
Leba
non
Saud
i A
rabi
a
Mor
occo
Egyp
t
UA
E
USA
E�ci
ency
Driv
en
GEM
Av
erag
e0.0
0.0
0.0
0.0
0.0
0.1
0.1
0.1
Iran
Qat
ar
Leba
non
Saud
i A
rabi
a
Mor
occo
Egyp
t
UA
E
USA
E�ci
ency
Driv
en
GEM
Av
erag
e0
10
20
30
40
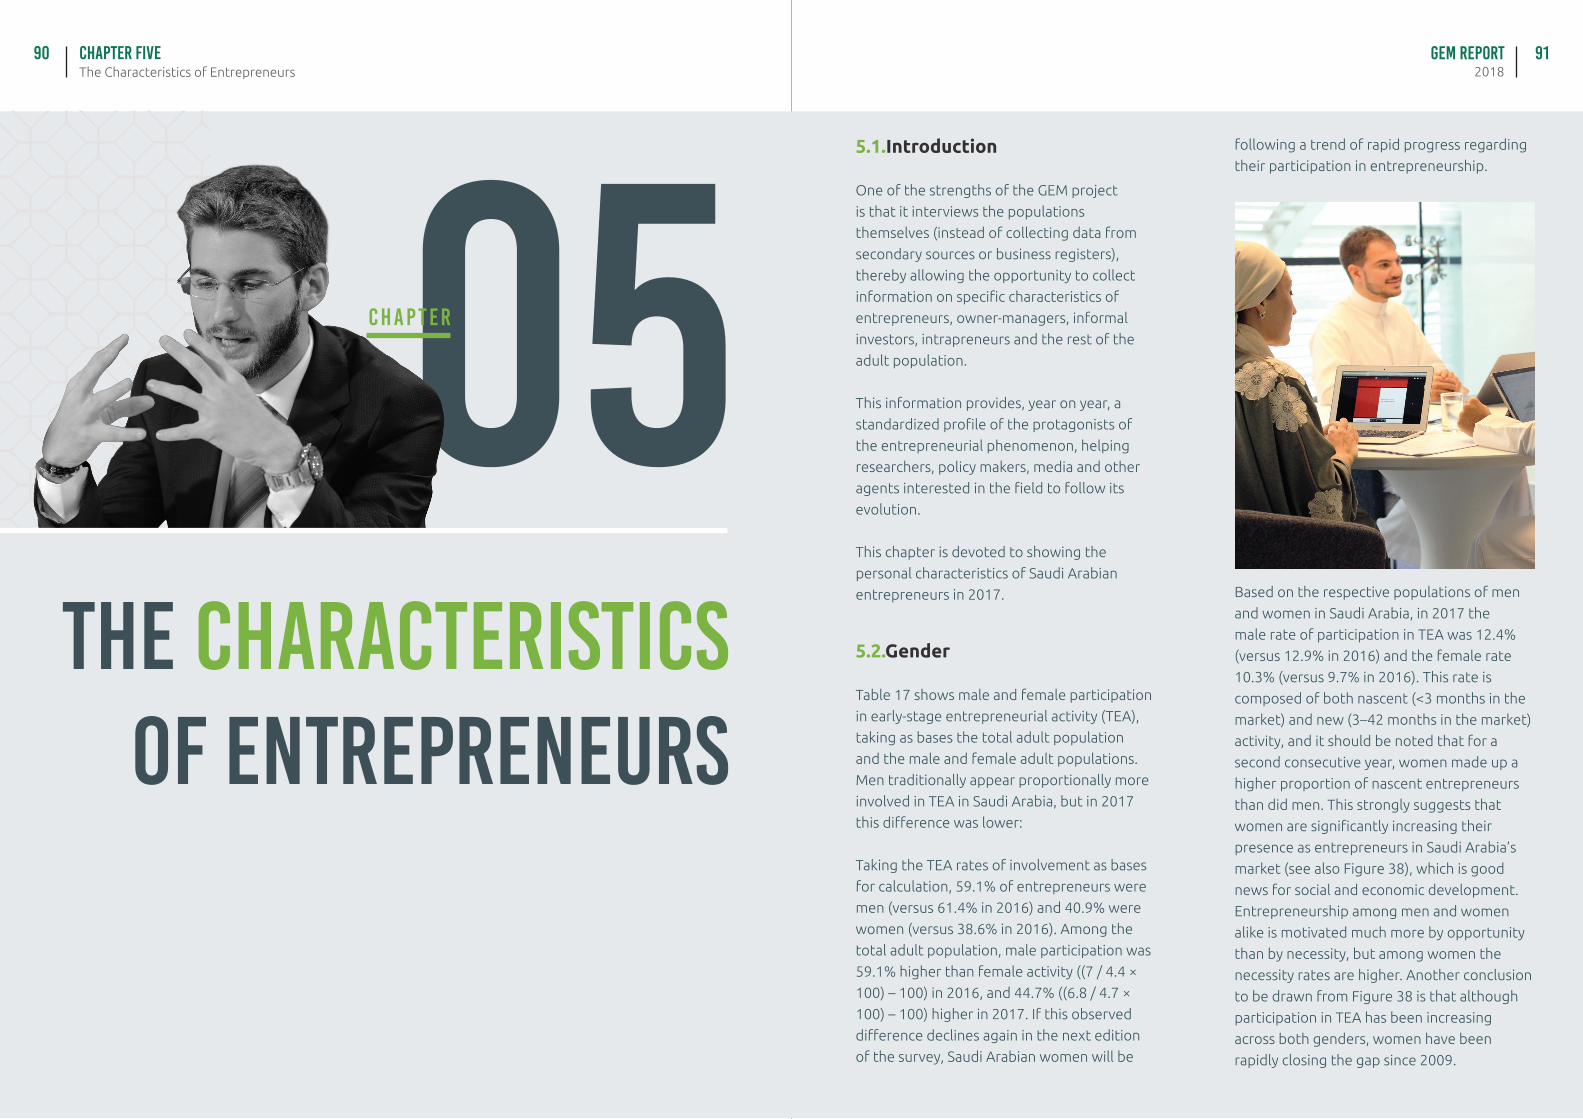
GEM Report2018
90 91The Characteristics of EntrepreneursChapter FIVE
05THE CHARACTERISTICS
OF ENTREPRENEURS
C H A P T E R
5.1.Introduction
One of the strengths of the GEM project
is that it interviews the populations
themselves (instead of collecting data from
secondary sources or business registers),
thereby allowing the opportunity to collect
information on specific characteristics of
entrepreneurs, owner-managers, informal
investors, intrapreneurs and the rest of the
adult population.
This information provides, year on year, a
standardized profile of the protagonists of
the entrepreneurial phenomenon, helping
researchers, policy makers, media and other
agents interested in the field to follow its
evolution.
This chapter is devoted to showing the
personal characteristics of Saudi Arabian
entrepreneurs in 2017. Based on the respective populations of men
and women in Saudi Arabia, in 2017 the
male rate of participation in TEA was 12.4%
(versus 12.9% in 2016) and the female rate
10.3% (versus 9.7% in 2016). This rate is
composed of both nascent (<3 months in the
market) and new (3–42 months in the market)
activity, and it should be noted that for a
second consecutive year, women made up a
higher proportion of nascent entrepreneurs
than did men. This strongly suggests that
women are significantly increasing their
presence as entrepreneurs in Saudi Arabia’s
market (see also Figure 38), which is good
news for social and economic development.
Entrepreneurship among men and women
alike is motivated much more by opportunity
than by necessity, but among women the
necessity rates are higher. Another conclusion
to be drawn from Figure 38 is that although
participation in TEA has been increasing
across both genders, women have been
rapidly closing the gap since 2009.
5.2.Gender
Table 17 shows male and female participation
in early-stage entrepreneurial activity (TEA),
taking as bases the total adult population
and the male and female adult populations.
Men traditionally appear proportionally more
involved in TEA in Saudi Arabia, but in 2017
this difference was lower:
Taking the TEA rates of involvement as bases
for calculation, 59.1% of entrepreneurs were
men (versus 61.4% in 2016) and 40.9% were
women (versus 38.6% in 2016). Among the
total adult population, male participation was
59.1% higher than female activity ((7 / 4.4 ×
100) – 100) in 2016, and 44.7% ((6.8 / 4.7 ×
100) – 100) higher in 2017. If this observed
difference declines again in the next edition
of the survey, Saudi Arabian women will be
following a trend of rapid progress regarding
their participation in entrepreneurship.
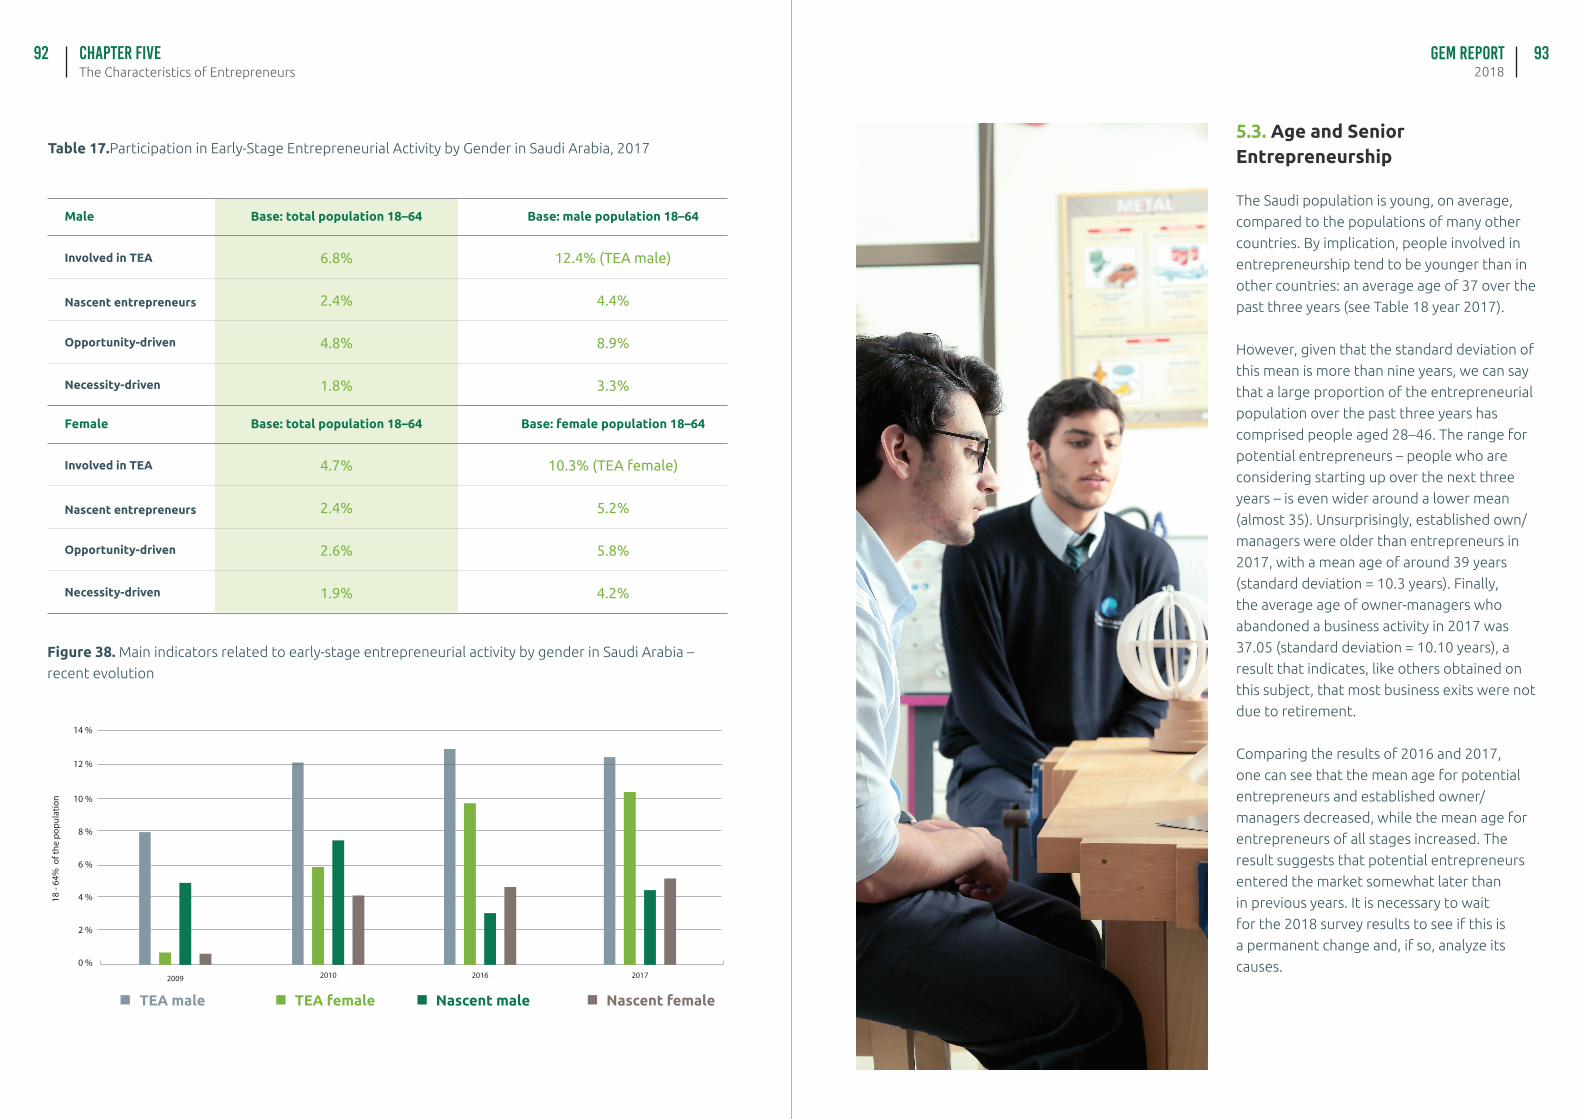
GEM Report2018
92 93The Characteristics of EntrepreneursChapter FIVE
201620100 %
2 %
4 %
6 %
8 %
10 %
2017
12 %
14 %
2009
18 -
64%
of t
he p
opul
atio
n
Table 17.Participation in Early-Stage Entrepreneurial Activity by Gender in Saudi Arabia, 2017
TEA male Nascent femaleTEA female Nascent male
Figure 38. Main indicators related to early-stage entrepreneurial activity by gender in Saudi Arabia –
recent evolution
Base: total population 18–64
Base: total population 18–64
Male
Female
Base: male population 18–64
Base: female population 18–64
6.8%
2.4%
4.8%
1.8%
4.7%
2.4%
2.6%
1.9%
12.4% (TEA male)
4.4%
8.9%
3.3%
10.3% (TEA female)
5.2%
5.8%
4.2%
Involved in TEA
Involved in TEA
Nascent entrepreneurs
Nascent entrepreneurs
Opportunity-driven
Opportunity-driven
Necessity-driven
Necessity-driven
5.3. Age and Senior Entrepreneurship
The Saudi population is young, on average,
compared to the populations of many other
countries. By implication, people involved in
entrepreneurship tend to be younger than in
other countries: an average age of 37 over the
past three years (see Table 18 year 2017).
However, given that the standard deviation of
this mean is more than nine years, we can say
that a large proportion of the entrepreneurial
population over the past three years has
comprised people aged 28–46. The range for
potential entrepreneurs – people who are
considering starting up over the next three
years – is even wider around a lower mean
(almost 35). Unsurprisingly, established own/
managers were older than entrepreneurs in
2017, with a mean age of around 39 years
(standard deviation = 10.3 years). Finally,
the average age of owner-managers who
abandoned a business activity in 2017 was
37.05 (standard deviation = 10.10 years), a
result that indicates, like others obtained on
this subject, that most business exits were not
due to retirement.
Comparing the results of 2016 and 2017,
one can see that the mean age for potential
entrepreneurs and established owner/
managers decreased, while the mean age for
entrepreneurs of all stages increased. The
result suggests that potential entrepreneurs
entered the market somewhat later than
in previous years. It is necessary to wait
for the 2018 survey results to see if this is
a permanent change and, if so, analyze its
causes.
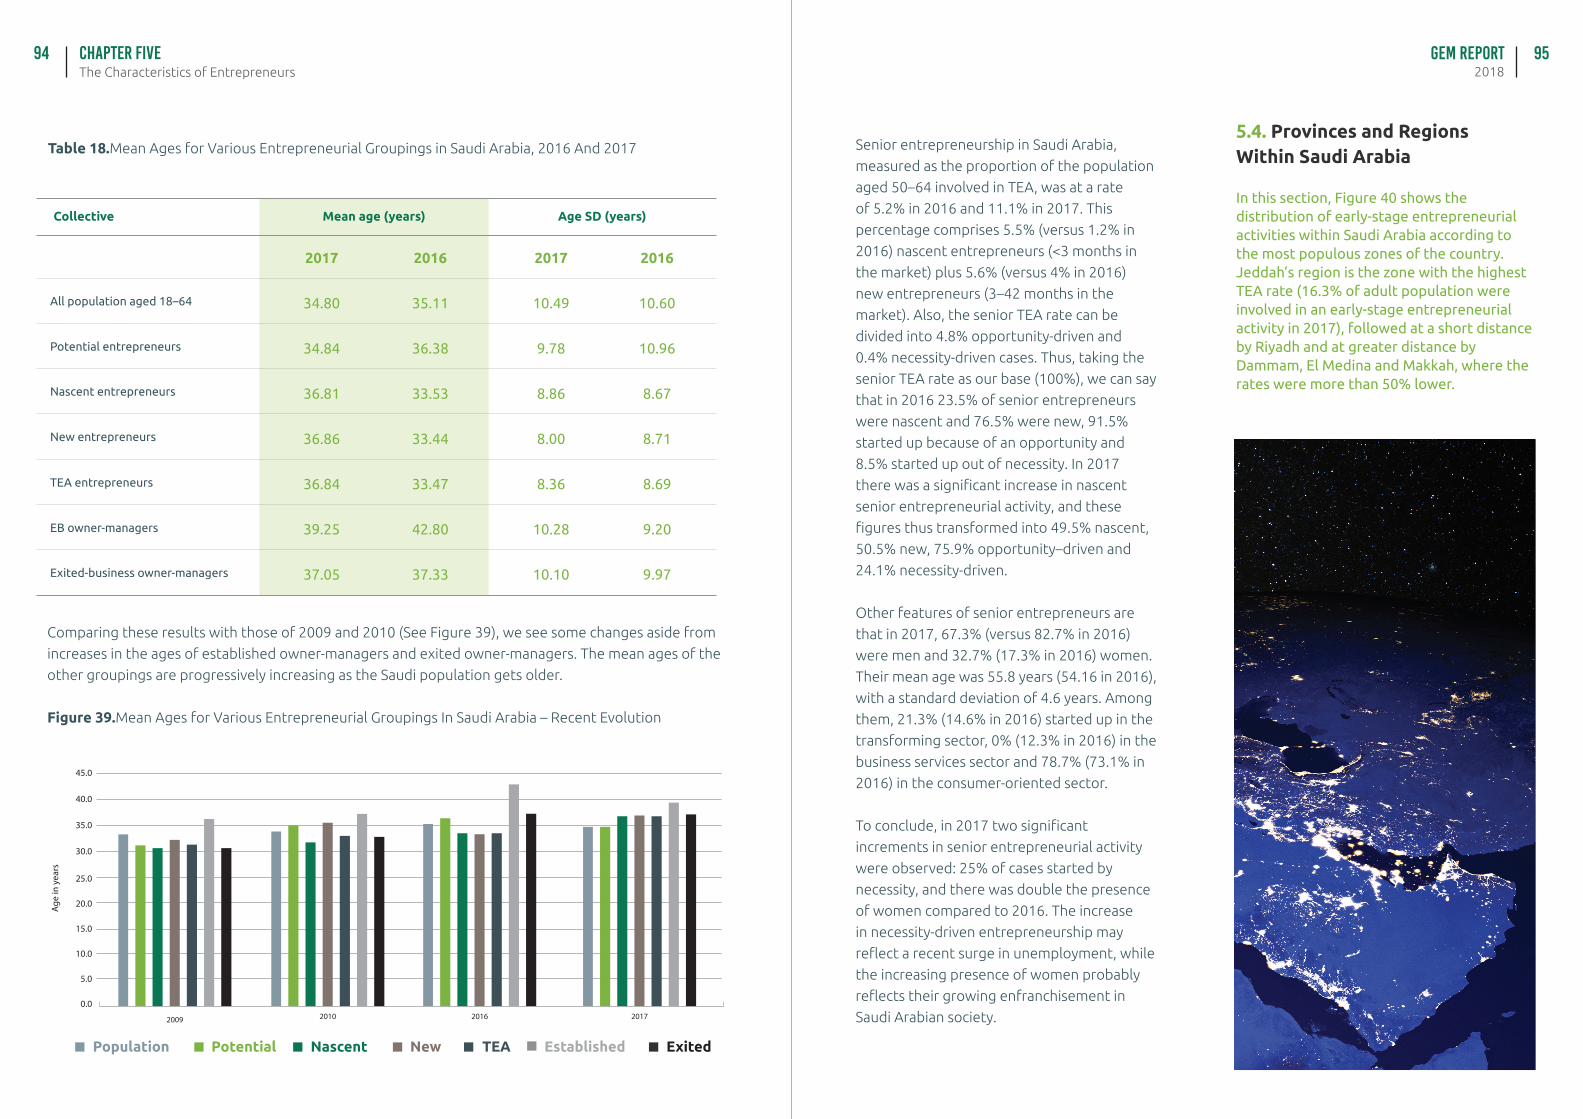
GEM Report2018
94 95The Characteristics of EntrepreneursChapter FIVE
Table 18.Mean Ages for Various Entrepreneurial Groupings in Saudi Arabia, 2016 And 2017
All population aged 18–64
Collective Mean age (years) Age SD (years)
2017
10.49
9.78
8.86
8.00
8.36
10.28
10.10
2016
10.60
10.96
8.67
8.71
8.69
9.20
9.97
Potential entrepreneurs
Nascent entrepreneurs
New entrepreneurs
TEA entrepreneurs
EB owner-managers
Exited-business owner-managers
2016
35.11
36.38
33.53
33.44
33.47
42.80
37.33
2017
34.80
34.84
36.81
36.86
36.84
39.25
37.05
Comparing these results with those of 2009 and 2010 (See Figure 39), we see some changes aside from
increases in the ages of established owner-managers and exited owner-managers. The mean ages of the
other groupings are progressively increasing as the Saudi population gets older.
Figure 39.Mean Ages for Various Entrepreneurial Groupings In Saudi Arabia – Recent Evolution
201620100.0
5.0
10.0
15.0
20.0
25.0
2017
30.0
35.0
40.0
45.0
2009
Age
in y
ears
Population New Established ExitedPotential Nascent TEA
Senior entrepreneurship in Saudi Arabia,
measured as the proportion of the population
aged 50–64 involved in TEA, was at a rate
of 5.2% in 2016 and 11.1% in 2017. This
percentage comprises 5.5% (versus 1.2% in
2016) nascent entrepreneurs (<3 months in
the market) plus 5.6% (versus 4% in 2016)
new entrepreneurs (3–42 months in the
market). Also, the senior TEA rate can be
divided into 4.8% opportunity-driven and
0.4% necessity-driven cases. Thus, taking the
senior TEA rate as our base (100%), we can say
that in 2016 23.5% of senior entrepreneurs
were nascent and 76.5% were new, 91.5%
started up because of an opportunity and
8.5% started up out of necessity. In 2017
there was a significant increase in nascent
senior entrepreneurial activity, and these
figures thus transformed into 49.5% nascent,
50.5% new, 75.9% opportunity–driven and
24.1% necessity-driven.
Other features of senior entrepreneurs are
that in 2017, 67.3% (versus 82.7% in 2016)
were men and 32.7% (17.3% in 2016) women.
Their mean age was 55.8 years (54.16 in 2016),
with a standard deviation of 4.6 years. Among
them, 21.3% (14.6% in 2016) started up in the
transforming sector, 0% (12.3% in 2016) in the
business services sector and 78.7% (73.1% in
2016) in the consumer-oriented sector.
To conclude, in 2017 two significant
increments in senior entrepreneurial activity
were observed: 25% of cases started by
necessity, and there was double the presence
of women compared to 2016. The increase
in necessity-driven entrepreneurship may
reflect a recent surge in unemployment, while
the increasing presence of women probably
reflects their growing enfranchisement in
Saudi Arabian society.
5.4. Provinces and RegionsWithin Saudi Arabia
In this section, Figure 40 shows the distribution of early-stage entrepreneurial activities within Saudi Arabia according to the most populous zones of the country.Jeddah’s region is the zone with the highest TEA rate (16.3% of adult population were involved in an early-stage entrepreneurial activity in 2017), followed at a short distance by Riyadh and at greater distance by Dammam, El Medina and Makkah, where the rates were more than 50% lower.
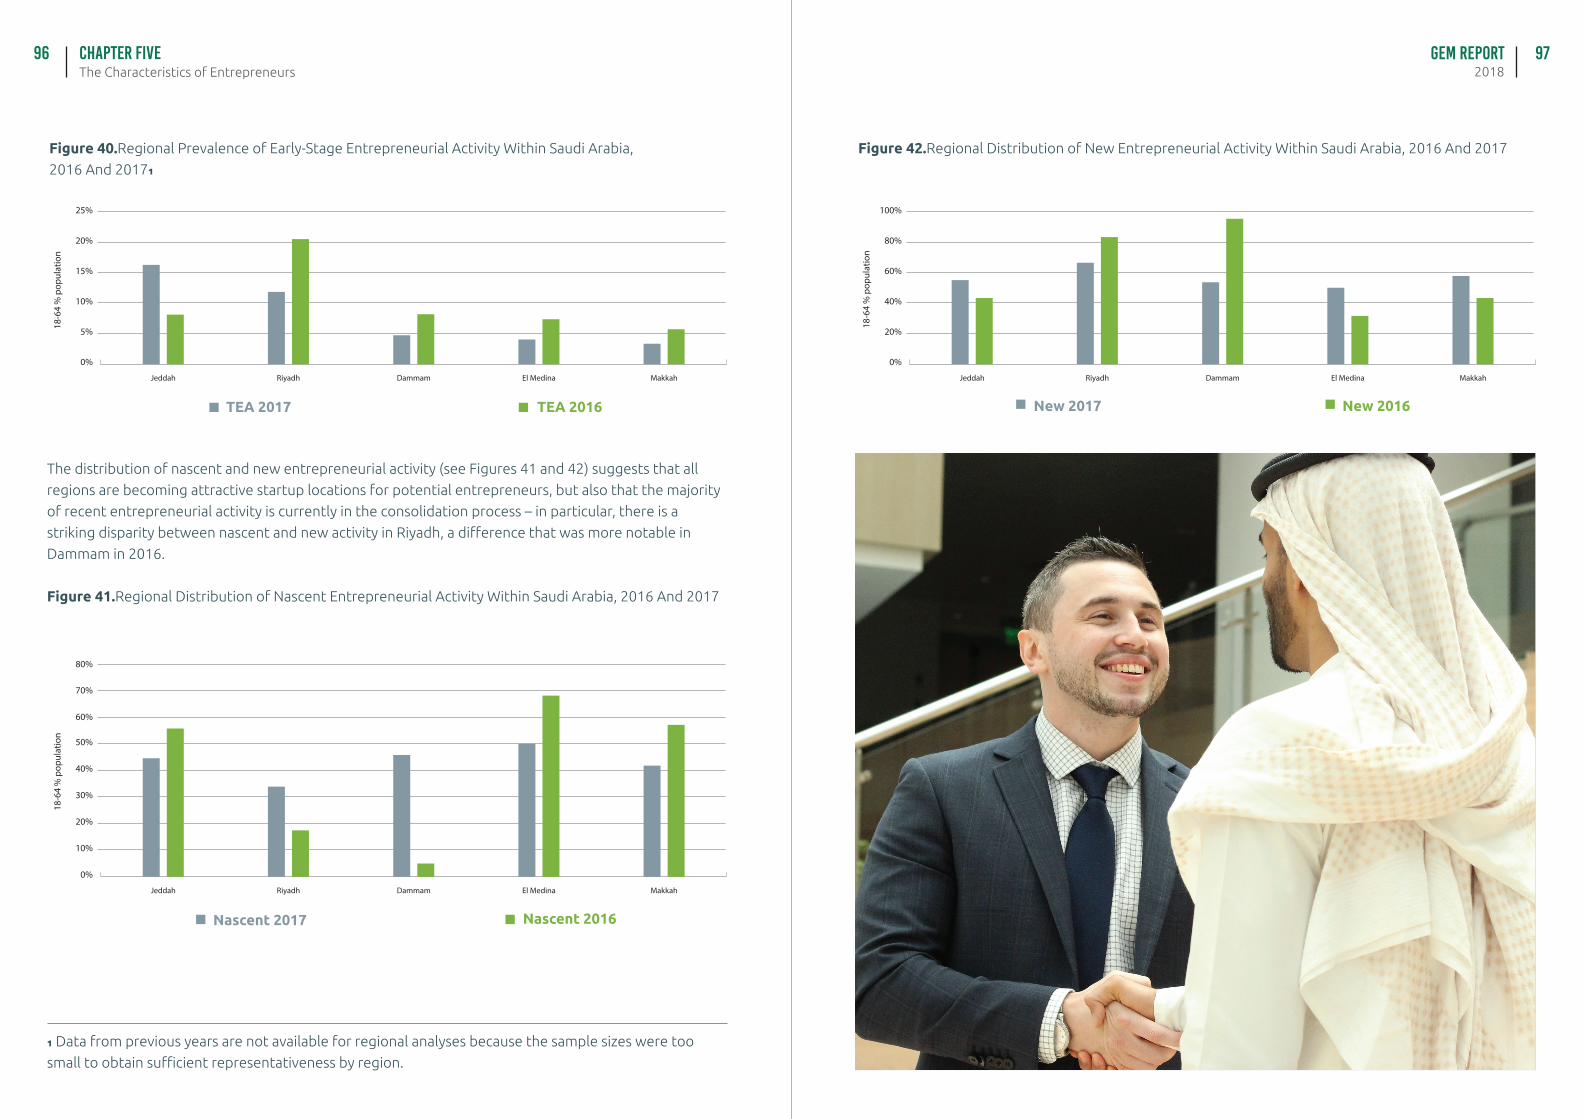
GEM Report2018
96 97The Characteristics of EntrepreneursChapter FIVE
Jeddah Riyadh Dammam El Medina Makkah
0%
5%
10%
15%
20%
25%
18-6
4 %
pop
ulat
ion
Jeddah Riyadh Dammam El Medina Makkah
0%
10%
20%
30%
40%
50%
60%
70%
80%
18-6
4 %
pop
ulat
ion
Figure 40.Regional Prevalence of Early-Stage Entrepreneurial Activity Within Saudi Arabia,
2016 And 2017₁
TEA 2017
Nascent 2017
TEA 2016
Nascent 2016
The distribution of nascent and new entrepreneurial activity (see Figures 41 and 42) suggests that all
regions are becoming attractive startup locations for potential entrepreneurs, but also that the majority
of recent entrepreneurial activity is currently in the consolidation process – in particular, there is a
striking disparity between nascent and new activity in Riyadh, a difference that was more notable in
Dammam in 2016.
Figure 41.Regional Distribution of Nascent Entrepreneurial Activity Within Saudi Arabia, 2016 And 2017
₁ Data from previous years are not available for regional analyses because the sample sizes were too
small to obtain sufficient representativeness by region.
Jeddah Riyadh Dammam El Medina Makkah
0%
20%
40%
60%
80%
100%
18-6
4 %
pop
ulat
ion
Figure 42.Regional Distribution of New Entrepreneurial Activity Within Saudi Arabia, 2016 And 2017
New 2017 New 2016
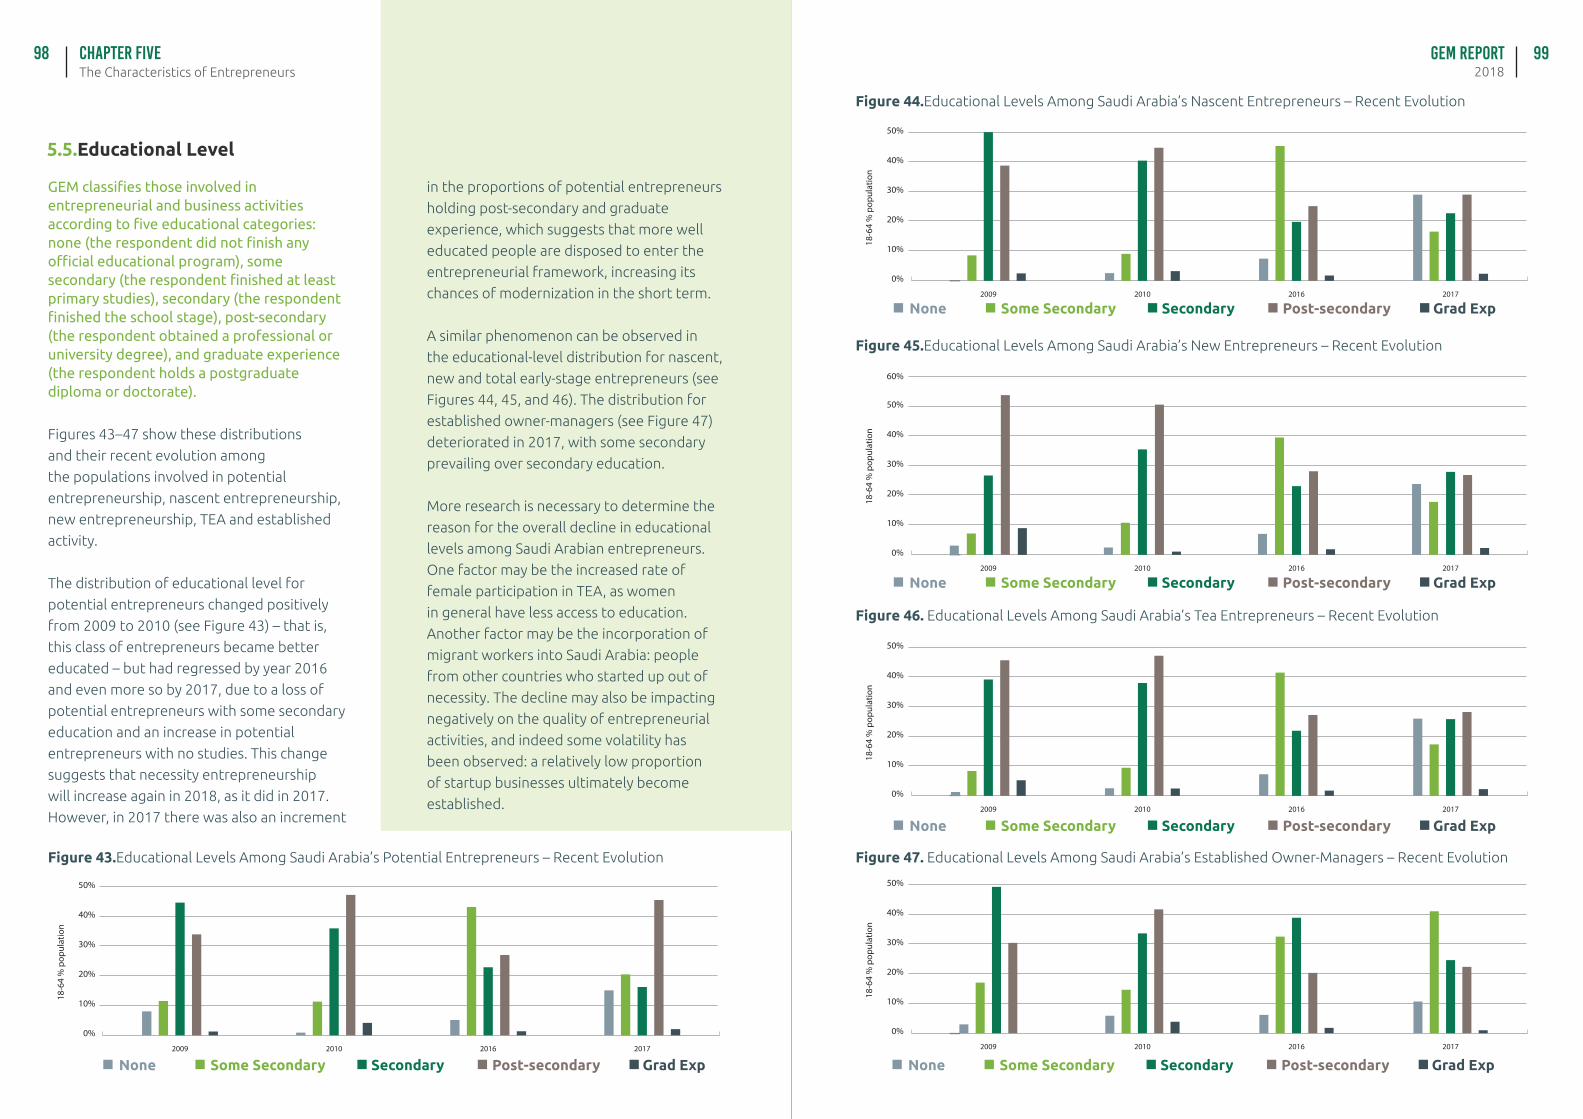
GEM Report2018
98 99The Characteristics of EntrepreneursChapter FIVE
GEM classifies those involved in entrepreneurial and business activities according to five educational categories: none (the respondent did not finish any official educational program), some secondary (the respondent finished at least primary studies), secondary (the respondent finished the school stage), post-secondary (the respondent obtained a professional or university degree), and graduate experience (the respondent holds a postgraduate diploma or doctorate).
Figures 43–47 show these distributions
and their recent evolution among
the populations involved in potential
entrepreneurship, nascent entrepreneurship,
new entrepreneurship, TEA and established
activity.
The distribution of educational level for
potential entrepreneurs changed positively
from 2009 to 2010 (see Figure 43) – that is,
this class of entrepreneurs became better
educated – but had regressed by year 2016
and even more so by 2017, due to a loss of
potential entrepreneurs with some secondary
education and an increase in potential
entrepreneurs with no studies. This change
suggests that necessity entrepreneurship
will increase again in 2018, as it did in 2017.
However, in 2017 there was also an increment
5.5.Educational Level
in the proportions of potential entrepreneurs
holding post-secondary and graduate
experience, which suggests that more well
educated people are disposed to enter the
entrepreneurial framework, increasing its
chances of modernization in the short term.
A similar phenomenon can be observed in
the educational-level distribution for nascent,
new and total early-stage entrepreneurs (see
Figures 44, 45, and 46). The distribution for
established owner-managers (see Figure 47)
deteriorated in 2017, with some secondary
prevailing over secondary education.
More research is necessary to determine the
reason for the overall decline in educational
levels among Saudi Arabian entrepreneurs.
One factor may be the increased rate of
female participation in TEA, as women
in general have less access to education.
Another factor may be the incorporation of
migrant workers into Saudi Arabia: people
from other countries who started up out of
necessity. The decline may also be impacting
negatively on the quality of entrepreneurial
activities, and indeed some volatility has
been observed: a relatively low proportion
of startup businesses ultimately become
established.
0%
10%
20%
30%
40%
50%
18-6
4 %
pop
ulat
ion
2009 2010 2016 2017
Figure 43.Educational Levels Among Saudi Arabia’s Potential Entrepreneurs – Recent Evolution
0%
10%
20%
30%
40%
50%
18-6
4 %
pop
ulat
ion
2009 2010 2016 2017
Figure 44.Educational Levels Among Saudi Arabia’s Nascent Entrepreneurs – Recent Evolution
0%
10%
20%
30%
40%
2009 2010 2016 2017
50%
60%
18-6
4 %
pop
ulat
ion
Figure 45.Educational Levels Among Saudi Arabia’s New Entrepreneurs – Recent Evolution
0%
10%
20%
30%
40%
50%
18-6
4 %
pop
ulat
ion
2009 2010 2016 2017
Figure 46. Educational Levels Among Saudi Arabia’s Tea Entrepreneurs – Recent Evolution
0%
10%
20%
30%
40%
50%
18-6
4 %
pop
ulat
ion
2009 2010 2016 2017
Figure 47. Educational Levels Among Saudi Arabia’s Established Owner-Managers – Recent Evolution
None Some Secondary Secondary Post-secondary Grad Exp None Some Secondary Secondary Post-secondary Grad Exp
None Some Secondary Secondary Post-secondary Grad Exp
None Some Secondary Secondary Post-secondary Grad Exp
None Some Secondary Secondary Post-secondary Grad Exp
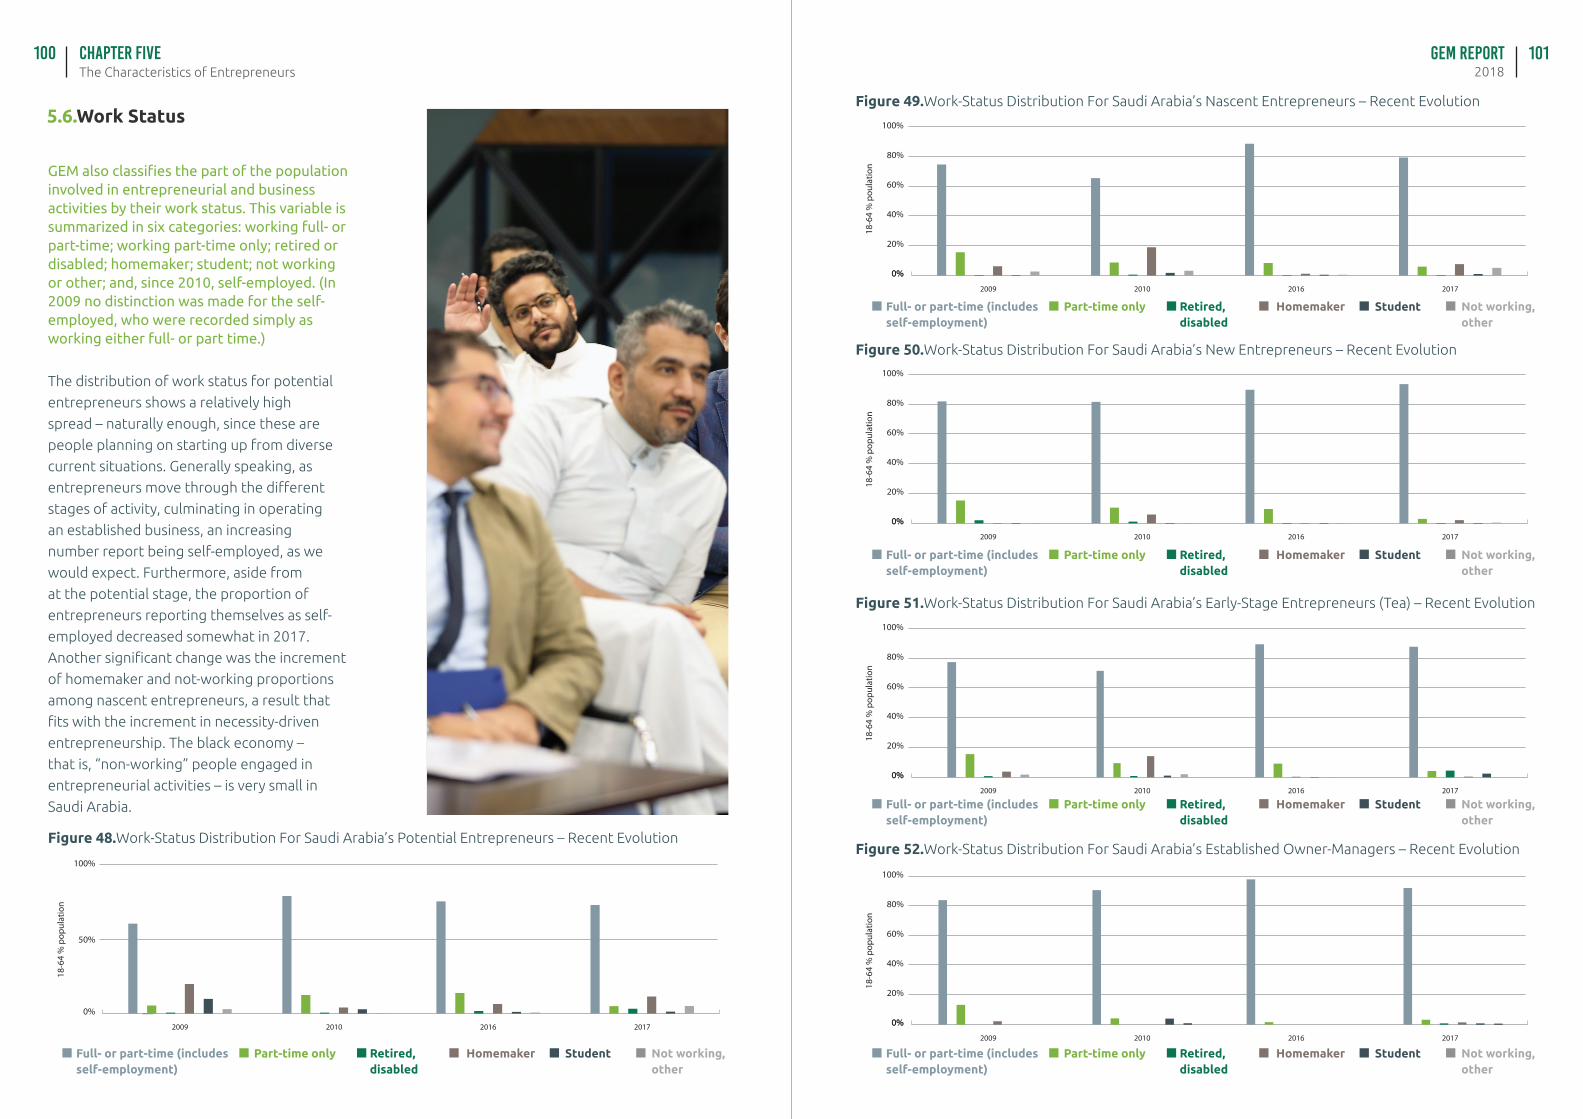
GEM Report2018
100 101The Characteristics of EntrepreneursChapter FIVE
0%
40%
100%
2009 2010 2016 2017
18-6
4 %
pop
ulat
ion
0%
20%
60%
80%
GEM also classifies the part of the population involved in entrepreneurial and business activities by their work status. This variable is summarized in six categories: working full- or part-time; working part-time only; retired or disabled; homemaker; student; not working or other; and, since 2010, self-employed. (In 2009 no distinction was made for the self- employed, who were recorded simply as working either full- or part time.)
The distribution of work status for potential
entrepreneurs shows a relatively high
spread – naturally enough, since these are
people planning on starting up from diverse
current situations. Generally speaking, as
entrepreneurs move through the different
stages of activity, culminating in operating
an established business, an increasing
number report being self-employed, as we
would expect. Furthermore, aside from
at the potential stage, the proportion of
entrepreneurs reporting themselves as self-
employed decreased somewhat in 2017.
Another significant change was the increment
of homemaker and not-working proportions
among nascent entrepreneurs, a result that
fits with the increment in necessity-driven
entrepreneurship. The black economy –
that is, “non-working” people engaged in
entrepreneurial activities – is very small in
Saudi Arabia.
5.6.Work Status
0%
50%
100%
2009 2010 2016 2017
18-6
4 %
pop
ulat
ion
Figure 48.Work-Status Distribution For Saudi Arabia’s Potential Entrepreneurs – Recent Evolution
0%
40%
100%
2009 2010 2016 2017
18-6
4 %
pop
ulat
ion
0%
20%
60%
80%
Figure 52.Work-Status Distribution For Saudi Arabia’s Established Owner-Managers – Recent Evolution
0%
40%
100%
2009 2010 2016 2017
18-6
4 %
pop
ulat
ion
0%
20%
60%
80%
Figure 51.Work-Status Distribution For Saudi Arabia’s Early-Stage Entrepreneurs (Tea) – Recent Evolution
Figure 50.Work-Status Distribution For Saudi Arabia’s New Entrepreneurs – Recent Evolution
0%
40%
100%
2009 2010 2016 2017
18-6
4 %
pou
latio
n
0%
20%
60%
80%
Figure 49.Work-Status Distribution For Saudi Arabia’s Nascent Entrepreneurs – Recent Evolution
Full- or part-time (includes self-employment)
HomemakerPart-time only Retired, disabled
Student Not working, other
Full- or part-time (includes self-employment)
HomemakerPart-time only Retired, disabled
Student Not working, other
Full- or part-time (includes self-employment)
HomemakerPart-time only Retired, disabled
Student Not working, other
Full- or part-time (includes self-employment)
HomemakerPart-time only Retired, disabled
Student Not working, other
Full- or part-time (includes self-employment)
HomemakerPart-time only Retired, disabled
Student Not working, other
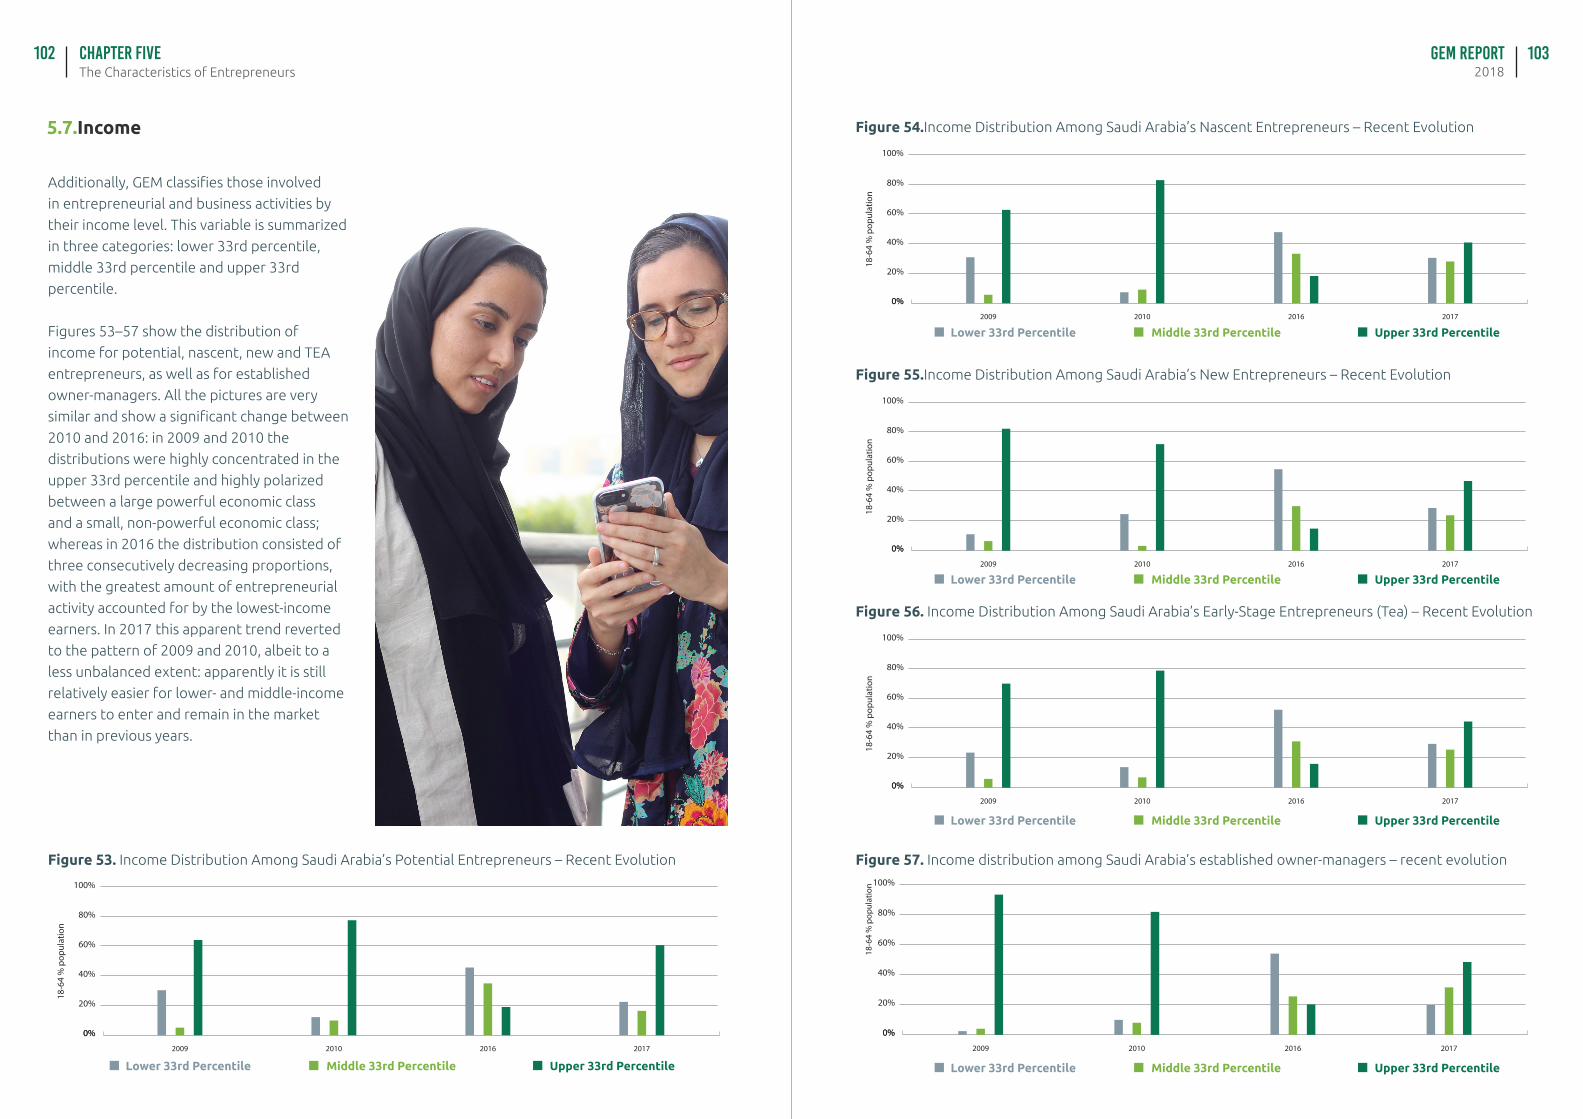
GEM Report2018
102 103The Characteristics of EntrepreneursChapter FIVE
Additionally, GEM classifies those involved
in entrepreneurial and business activities by
their income level. This variable is summarized
in three categories: lower 33rd percentile,
middle 33rd percentile and upper 33rd
percentile.
Figures 53–57 show the distribution of
income for potential, nascent, new and TEA
entrepreneurs, as well as for established
owner-managers. All the pictures are very
similar and show a significant change between
2010 and 2016: in 2009 and 2010 the
distributions were highly concentrated in the
upper 33rd percentile and highly polarized
between a large powerful economic class
and a small, non-powerful economic class;
whereas in 2016 the distribution consisted of
three consecutively decreasing proportions,
with the greatest amount of entrepreneurial
activity accounted for by the lowest-income
earners. In 2017 this apparent trend reverted
to the pattern of 2009 and 2010, albeit to a
less unbalanced extent: apparently it is still
relatively easier for lower- and middle-income
earners to enter and remain in the market
than in previous years.
5.7.Income
0%
40%
100%
2009 2010 2016 2017
18-6
4 %
pop
ulat
ion
0%
20%
60%
80%
Figure 53. Income Distribution Among Saudi Arabia’s Potential Entrepreneurs – Recent Evolution
Lower 33rd Percentile Upper 33rd PercentileMiddle 33rd Percentile
0%
40%
100%
2009 2010 2016 2017
18-6
4 %
pop
ulat
ion
0%
20%
60%
80%
Figure 57. Income distribution among Saudi Arabia’s established owner-managers – recent evolution
0%
40%
100%
2009 2010 2016 2017
18-6
4 %
pop
ulat
ion
0%
20%
60%
80%
Figure 56. Income Distribution Among Saudi Arabia’s Early-Stage Entrepreneurs (Tea) – Recent Evolution
0%
40%
100%
2009 2010 2016 2017
18-6
4 %
pop
ulat
ion
0%
20%
60%
80%
Figure 55.Income Distribution Among Saudi Arabia’s New Entrepreneurs – Recent Evolution
0%
40%
100%
2009 2010 2016 2017
18-6
4 %
pop
ulat
ion
0%
20%
60%
80%
Figure 54.Income Distribution Among Saudi Arabia’s Nascent Entrepreneurs – Recent Evolution
Lower 33rd Percentile
Lower 33rd Percentile
Lower 33rd Percentile
Lower 33rd Percentile
Upper 33rd Percentile
Upper 33rd Percentile
Upper 33rd Percentile
Upper 33rd Percentile
Middle 33rd Percentile
Middle 33rd Percentile
Middle 33rd Percentile
Middle 33rd Percentile
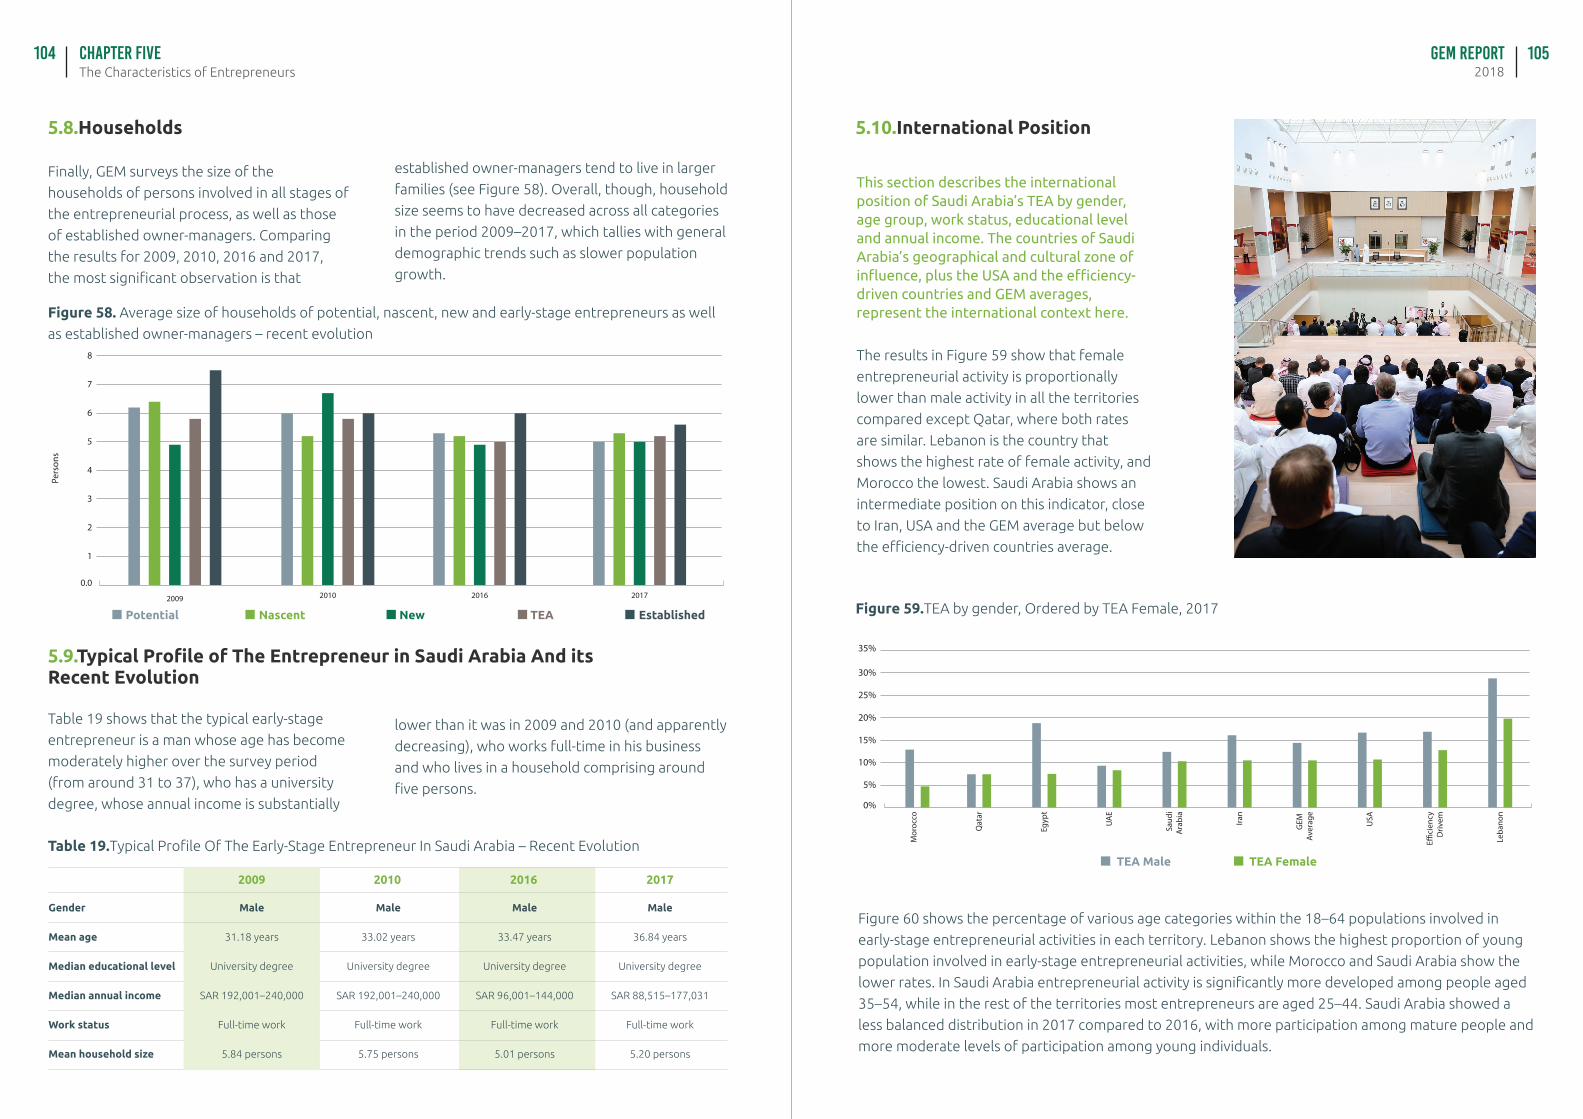
GEM Report2018
104 105The Characteristics of EntrepreneursChapter FIVE
5.8.Households
Finally, GEM surveys the size of the
households of persons involved in all stages of
the entrepreneurial process, as well as those
of established owner-managers. Comparing
the results for 2009, 2010, 2016 and 2017,
the most significant observation is that
established owner-managers tend to live in larger
families (see Figure 58). Overall, though, household
size seems to have decreased across all categories
in the period 2009–2017, which tallies with general
demographic trends such as slower population
growth.
201620100.0
1
2
3
4
5
2017
6
7
8
2009
Pers
ons
Table 19 shows that the typical early-stage
entrepreneur is a man whose age has become
moderately higher over the survey period
(from around 31 to 37), who has a university
degree, whose annual income is substantially
5.9.Typical Profile of The Entrepreneur in Saudi Arabia And its Recent Evolution
lower than it was in 2009 and 2010 (and apparently
decreasing), who works full-time in his business
and who lives in a household comprising around
five persons.
Figure 58. Average size of households of potential, nascent, new and early-stage entrepreneurs as well
as established owner-managers – recent evolution
Table 19.Typical Profile Of The Early-Stage Entrepreneur In Saudi Arabia – Recent Evolution
Gender
Mean age
Median educational level
Median annual income
Work status
Mean household size
2009 2010 2016 2017
Male
31.18 years
University degree
SAR 192,001–240,000
Full-time work
5.84 persons
Male
33.47 years
University degree
SAR 96,001–144,000
Full-time work
5.01 persons
Male
33.02 years
University degree
SAR 192,001–240,000
Full-time work
5.75 persons
Male
36.84 years
University degree
SAR 88,515–177,031
Full-time work
5.20 persons
Potential TEANascent New Established
Figure 60 shows the percentage of various age categories within the 18–64 populations involved in
early-stage entrepreneurial activities in each territory. Lebanon shows the highest proportion of young
population involved in early-stage entrepreneurial activities, while Morocco and Saudi Arabia show the
lower rates. In Saudi Arabia entrepreneurial activity is significantly more developed among people aged
35–54, while in the rest of the territories most entrepreneurs are aged 25–44. Saudi Arabia showed a
less balanced distribution in 2017 compared to 2016, with more participation among mature people and
more moderate levels of participation among young individuals.
This section describes the international position of Saudi Arabia’s TEA by gender, age group, work status, educational level and annual income. The countries of Saudi Arabia’s geographical and cultural zone of influence, plus the USA and the efficiency-driven countries and GEM averages, represent the international context here.
The results in Figure 59 show that female
entrepreneurial activity is proportionally
lower than male activity in all the territories
compared except Qatar, where both rates
are similar. Lebanon is the country that
shows the highest rate of female activity, and
Morocco the lowest. Saudi Arabia shows an
intermediate position on this indicator, close
to Iran, USA and the GEM average but below
the efficiency-driven countries average.
5.10.International Position
Qat
ar
GEM
Av
erag
e
UA
E
Saud
i A
rabi
a
Egyp
t
Mor
occo
Iran
USA
E�ci
ency
Driv
em
Leba
non
0%
5%
10%
15%
20%
35%
25%
30%
Figure 59.TEA by gender, Ordered by TEA Female, 2017
TEA Male TEA Female
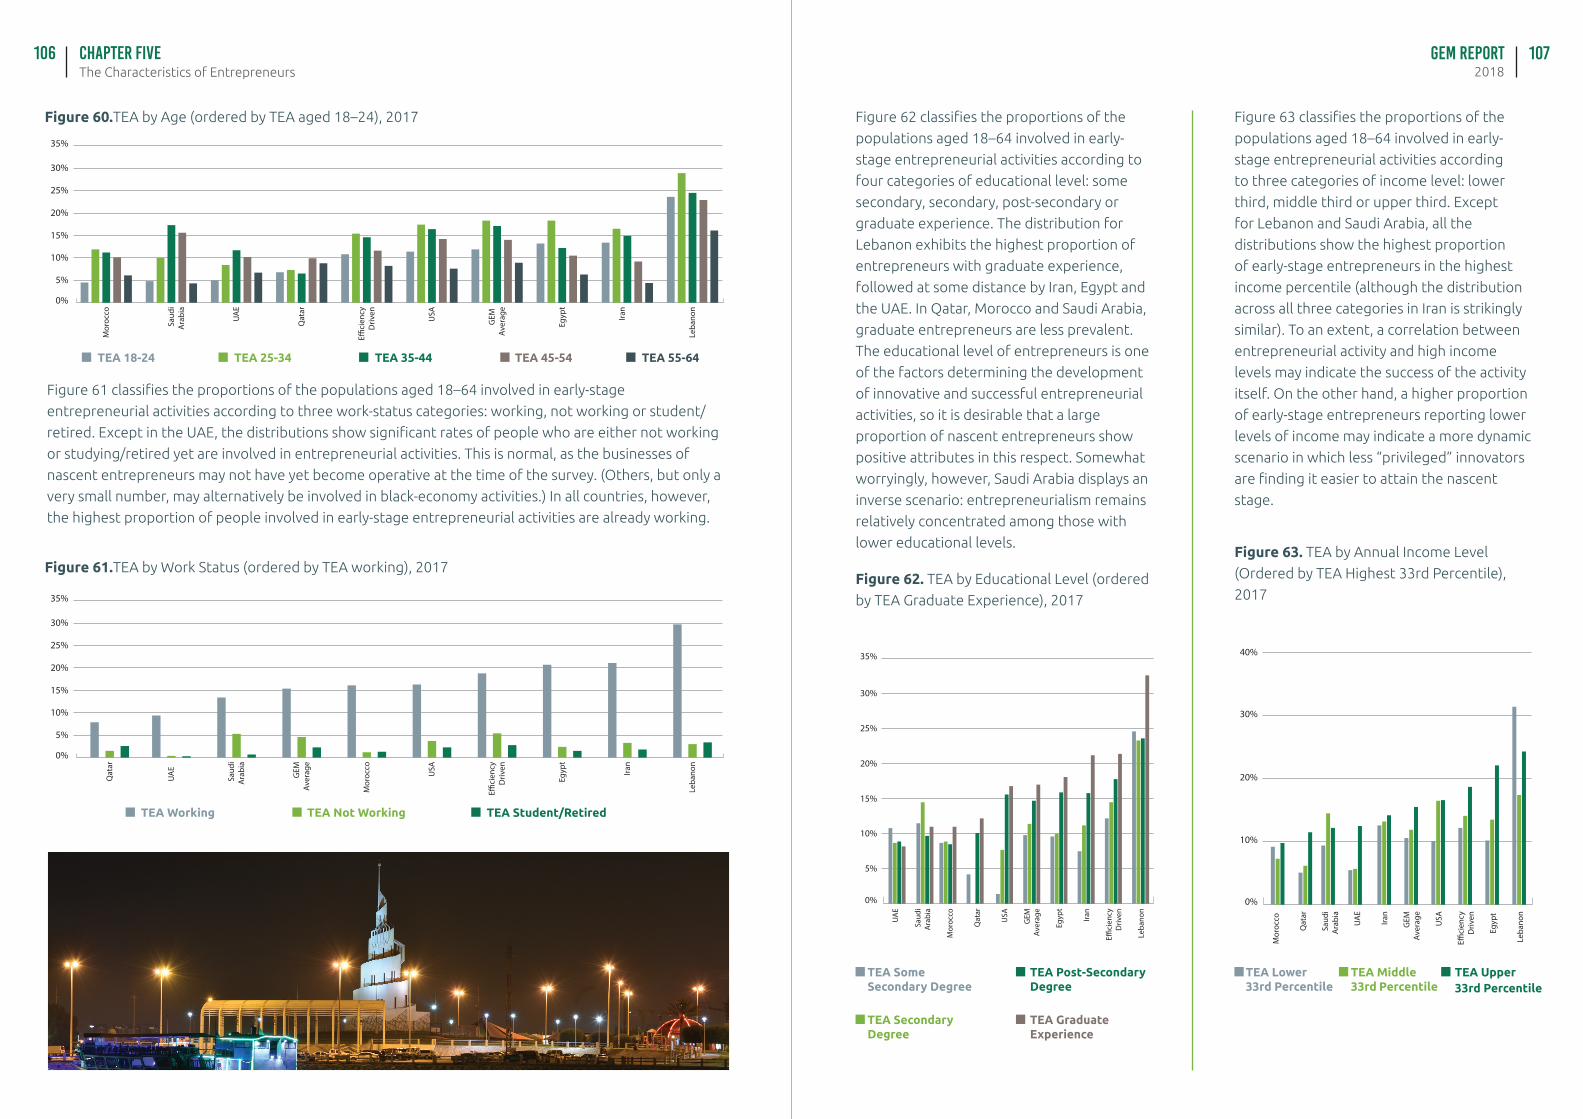
GEM Report2018
106 107The Characteristics of EntrepreneursChapter FIVE
Saud
i A
rabi
a
GEM
Av
erag
e
Qat
ar
E�ci
ency
Driv
en
UA
E
Mor
occo
USA
Egyp
t
Iran
Leba
non
0%
5%
10%
15%
20%
35%
25%
30%
UA
E
E�ci
ency
Driv
en
GEM
Aver
age
Mor
occo
Saud
iA
rabi
a
Qat
ar
USA
Egyp
t
Iran
Leba
non
0%
5%
10%
15%
20%
35%
25%
30%
Figure 61 classifies the proportions of the populations aged 18–64 involved in early-stage
entrepreneurial activities according to three work-status categories: working, not working or student/
retired. Except in the UAE, the distributions show significant rates of people who are either not working
or studying/retired yet are involved in entrepreneurial activities. This is normal, as the businesses of
nascent entrepreneurs may not have yet become operative at the time of the survey. (Others, but only a
very small number, may alternatively be involved in black-economy activities.) In all countries, however,
the highest proportion of people involved in early-stage entrepreneurial activities are already working.
Figure 61.TEA by Work Status (ordered by TEA working), 2017
Figure 60.TEA by Age (ordered by TEA aged 18–24), 2017
TEA Working TEA Not Working TEA Student/Retired
Saud
iA
rabi
a
Egyp
t
Qat
ar
USA
Mor
occo
UA
E
GEM
Aver
age
Iran
E�ci
ency
Driv
en
Leba
non
0%
5%
10%
15%
20%
35%
25%
30%
Qat
ar
USA
UA
E
Iran
Saud
iA
rabi
a
Mor
occo
GEM
Aver
age
Leba
non
Egyp
t
0%
10%
20%
40%
30%
E�ci
ency
Driv
en
Figure 62 classifies the proportions of the
populations aged 18–64 involved in early-
stage entrepreneurial activities according to
four categories of educational level: some
secondary, secondary, post-secondary or
graduate experience. The distribution for
Lebanon exhibits the highest proportion of
entrepreneurs with graduate experience,
followed at some distance by Iran, Egypt and
the UAE. In Qatar, Morocco and Saudi Arabia,
graduate entrepreneurs are less prevalent.
The educational level of entrepreneurs is one
of the factors determining the development
of innovative and successful entrepreneurial
activities, so it is desirable that a large
proportion of nascent entrepreneurs show
positive attributes in this respect. Somewhat
worryingly, however, Saudi Arabia displays an
inverse scenario: entrepreneurialism remains
relatively concentrated among those with
lower educational levels.
Figure 63 classifies the proportions of the
populations aged 18–64 involved in early-
stage entrepreneurial activities according
to three categories of income level: lower
third, middle third or upper third. Except
for Lebanon and Saudi Arabia, all the
distributions show the highest proportion
of early-stage entrepreneurs in the highest
income percentile (although the distribution
across all three categories in Iran is strikingly
similar). To an extent, a correlation between
entrepreneurial activity and high income
levels may indicate the success of the activity
itself. On the other hand, a higher proportion
of early-stage entrepreneurs reporting lower
levels of income may indicate a more dynamic
scenario in which less “privileged” innovators
are finding it easier to attain the nascent
stage.
Figure 63. TEA by Annual Income Level
(Ordered by TEA Highest 33rd Percentile),
2017Figure 62. TEA by Educational Level (ordered
by TEA Graduate Experience), 2017
TEA Lower 33rd Percentile
TEA Upper 33rd Percentile
TEA Middle 33rd Percentile
TEA Some Secondary Degree
TEA Post-Secondary Degree
TEA Secondary Degree
TEA Graduate Experience
TEA 18-24 TEA 25-34 TEA 35-44 TEA 45-54 TEA 55-64
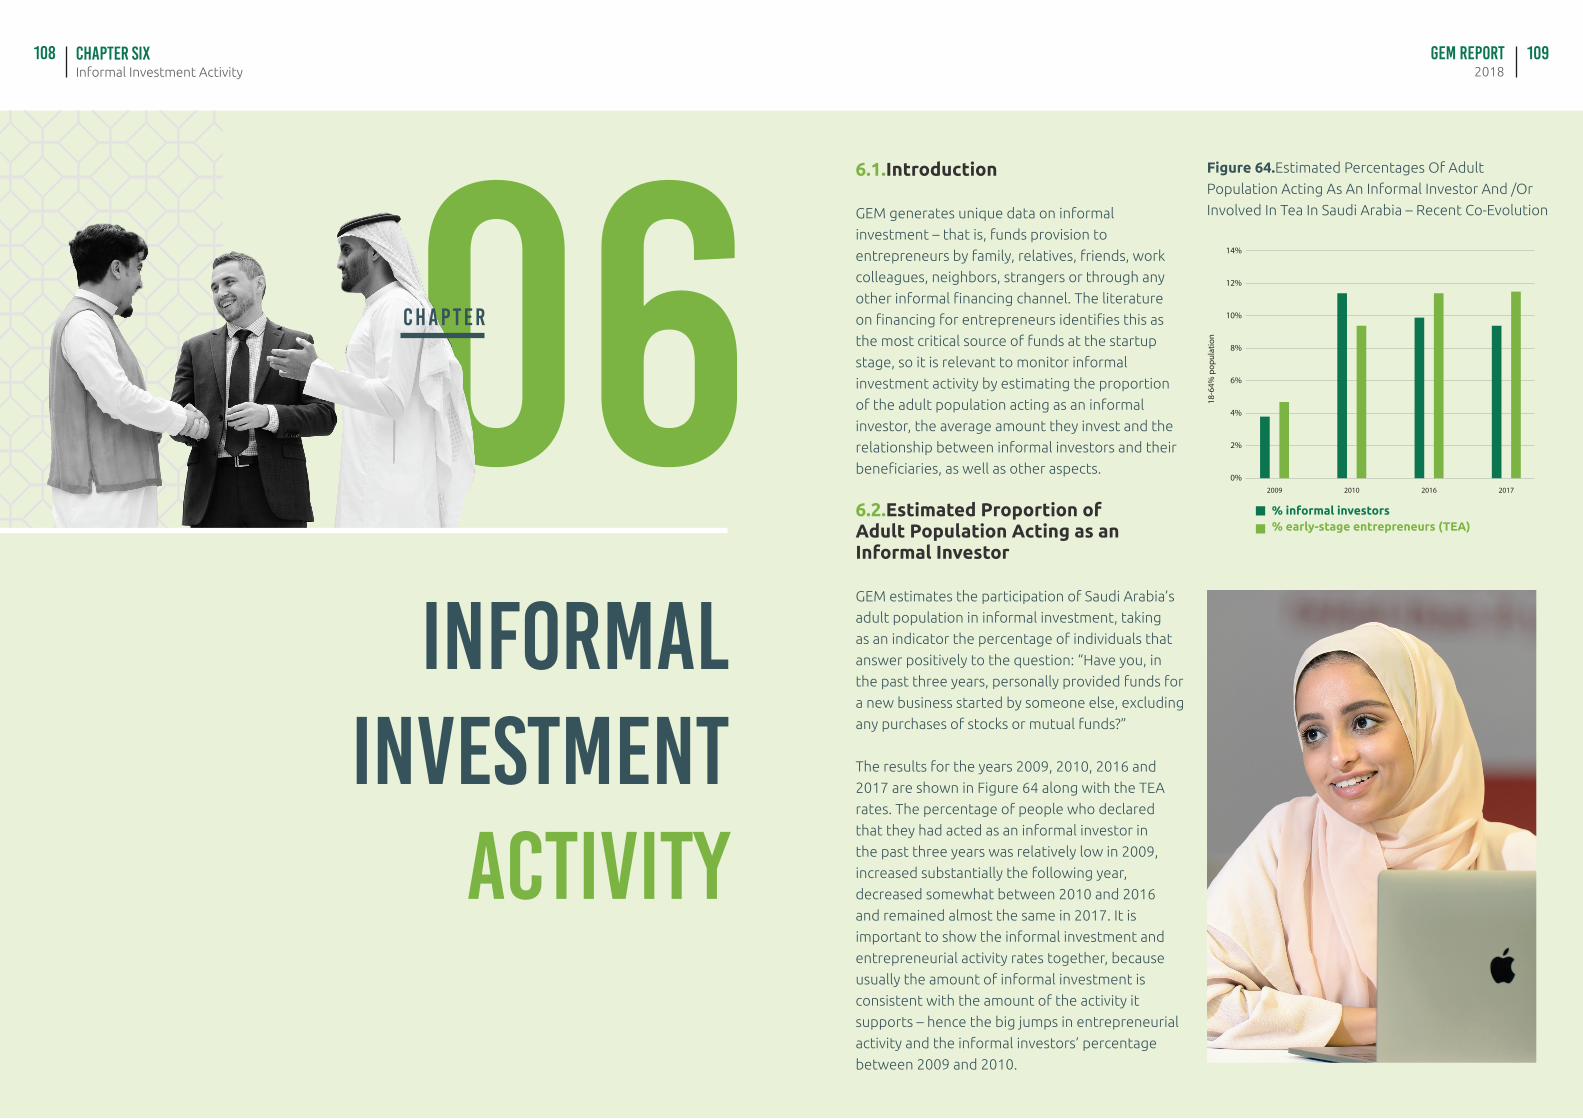
Informal Investment ActivityChapter SIX108
INFORMALINVESTMENT
ACTIVITY
06C H A P T E R
GEM Report2018
109
6.1.Introduction
GEM generates unique data on informal
investment – that is, funds provision to
entrepreneurs by family, relatives, friends, work
colleagues, neighbors, strangers or through any
other informal financing channel. The literature
on financing for entrepreneurs identifies this as
the most critical source of funds at the startup
stage, so it is relevant to monitor informal
investment activity by estimating the proportion
of the adult population acting as an informal
investor, the average amount they invest and the
relationship between informal investors and their
beneficiaries, as well as other aspects.
6.2.Estimated Proportion of Adult Population Acting as an Informal Investor
GEM estimates the participation of Saudi Arabia’s
adult population in informal investment, taking
as an indicator the percentage of individuals that
answer positively to the question: “Have you, in
the past three years, personally provided funds for
a new business started by someone else, excluding
any purchases of stocks or mutual funds?”
The results for the years 2009, 2010, 2016 and
2017 are shown in Figure 64 along with the TEA
rates. The percentage of people who declared
that they had acted as an informal investor in
the past three years was relatively low in 2009,
increased substantially the following year,
decreased somewhat between 2010 and 2016
and remained almost the same in 2017. It is
important to show the informal investment and
entrepreneurial activity rates together, because
usually the amount of informal investment is
consistent with the amount of the activity it
supports – hence the big jumps in entrepreneurial
activity and the informal investors’ percentage
between 2009 and 2010.
0%
2%
4%
6%
8%
10%
12%
14%
2017201620102009
18-6
4% p
opul
atio
n
% informal investors% early-stage entrepreneurs (TEA)
Figure 64.Estimated Percentages Of Adult
Population Acting As An Informal Investor And /Or
Involved In Tea In Saudi Arabia – Recent Co-Evolution
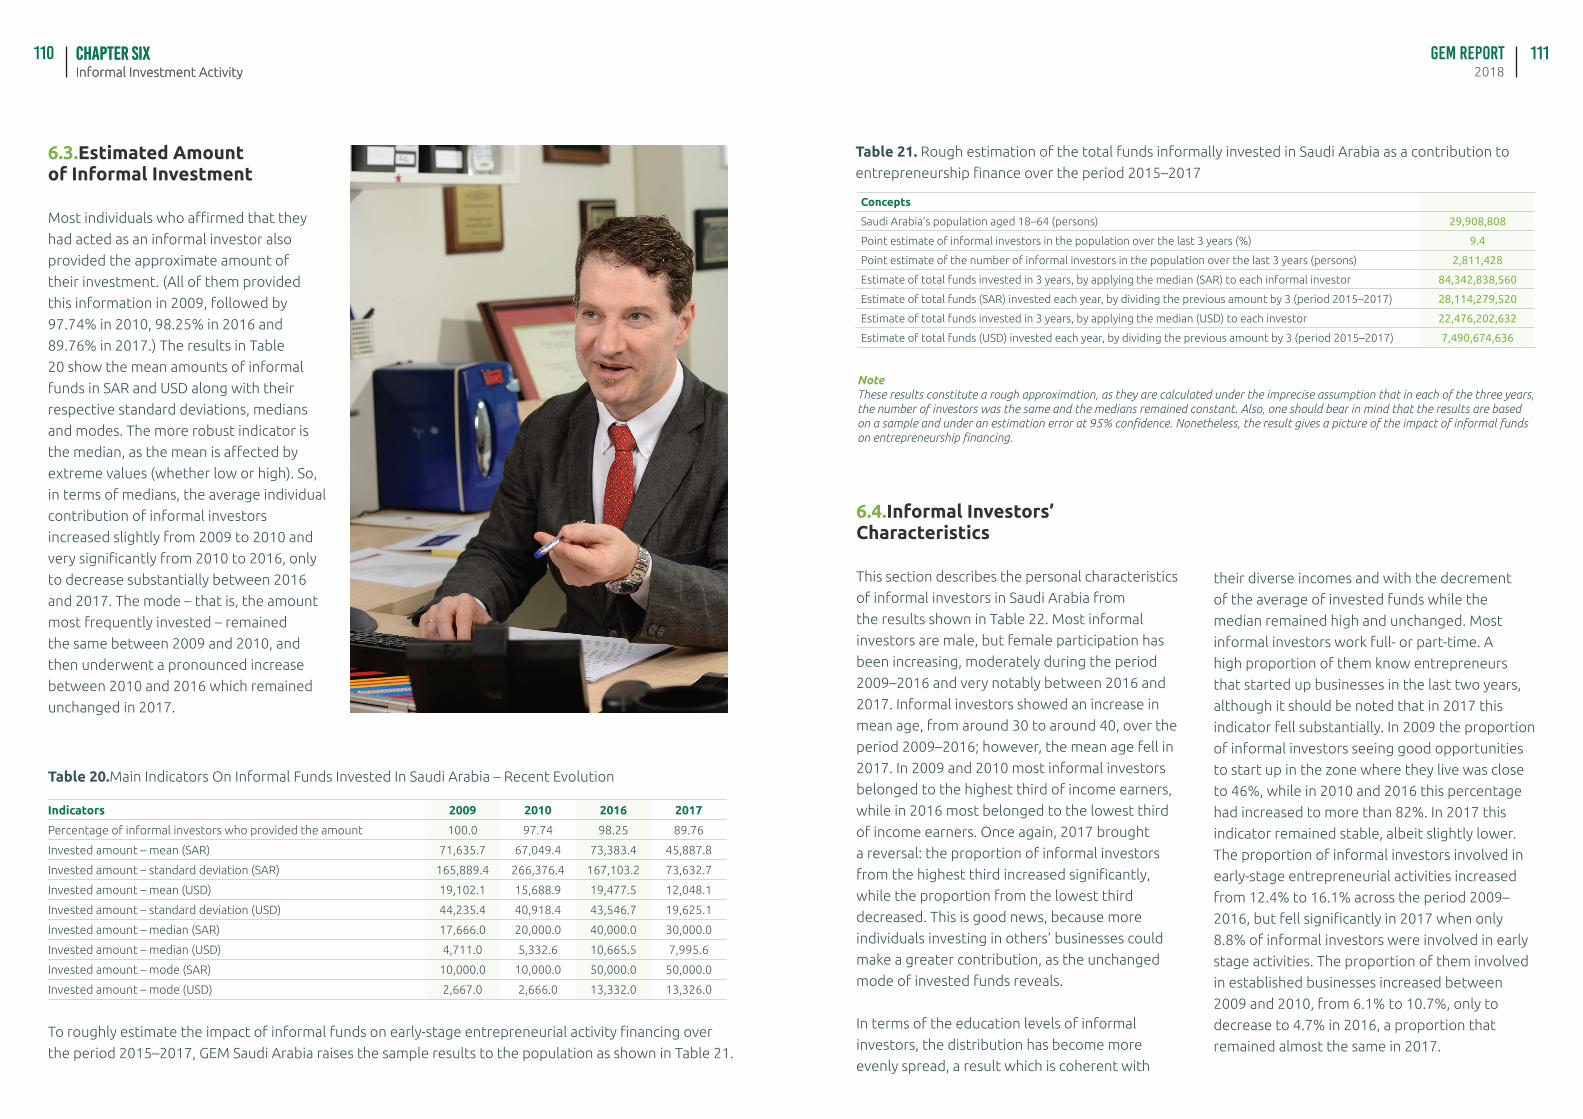
Informal Investment ActivityChapter SIX GEM Report
2018110 111
6.3.Estimated Amount of Informal Investment
Most individuals who affirmed that they
had acted as an informal investor also
provided the approximate amount of
their investment. (All of them provided
this information in 2009, followed by
97.74% in 2010, 98.25% in 2016 and
89.76% in 2017.) The results in Table
20 show the mean amounts of informal
funds in SAR and USD along with their
respective standard deviations, medians
and modes. The more robust indicator is
the median, as the mean is affected by
extreme values (whether low or high). So,
in terms of medians, the average individual
contribution of informal investors
increased slightly from 2009 to 2010 and
very significantly from 2010 to 2016, only
to decrease substantially between 2016
and 2017. The mode – that is, the amount
most frequently invested – remained
the same between 2009 and 2010, and
then underwent a pronounced increase
between 2010 and 2016 which remained
unchanged in 2017.
To roughly estimate the impact of informal funds on early-stage entrepreneurial activity financing over
the period 2015–2017, GEM Saudi Arabia raises the sample results to the population as shown in Table 21.
Table 20.Main Indicators On Informal Funds Invested In Saudi Arabia – Recent Evolution
Indicators 2009 2010 2016 2017
Percentage of informal investors who provided the amount 100.0 97.74 98.25 89.76
Invested amount – mean (SAR) 71,635.7 67,049.4 73,383.4 45,887.8
Invested amount – standard deviation (SAR) 165,889.4 266,376.4 167,103.2 73,632.7
Invested amount – mean (USD) 19,102.1 15,688.9 19,477.5 12,048.1
Invested amount – standard deviation (USD) 44,235.4 40,918.4 43,546.7 19,625.1
Invested amount – median (SAR) 17,666.0 20,000.0 40,000.0 30,000.0
Invested amount – median (USD) 4,711.0 5,332.6 10,665.5 7,995.6
Invested amount – mode (SAR) 10,000.0 10,000.0 50,000.0 50,000.0
Invested amount – mode (USD) 2,667.0 2,666.0 13,332.0 13,326.0
Informal Investment ActivityChapter SIX
Table 21. Rough estimation of the total funds informally invested in Saudi Arabia as a contribution to
entrepreneurship finance over the period 2015–2017
Concepts
Saudi Arabia’s population aged 18–64 (persons) 29,908,808
Point estimate of informal investors in the population over the last 3 years (%) 9.4
Point estimate of the number of informal investors in the population over the last 3 years (persons) 2,811,428
Estimate of total funds invested in 3 years, by applying the median (SAR) to each informal investor 84,342,838,560
Estimate of total funds (SAR) invested each year, by dividing the previous amount by 3 (period 2015–2017) 28,114,279,520
Estimate of total funds invested in 3 years, by applying the median (USD) to each investor 22,476,202,632
Estimate of total funds (USD) invested each year, by dividing the previous amount by 3 (period 2015–2017) 7,490,674,636
NoteThese results constitute a rough approximation, as they are calculated under the imprecise assumption that in each of the three years, the number of investors was the same and the medians remained constant. Also, one should bear in mind that the results are based on a sample and under an estimation error at 95% confidence. Nonetheless, the result gives a picture of the impact of informal funds on entrepreneurship financing.
6.4.Informal Investors’ Characteristics
This section describes the personal characteristics
of informal investors in Saudi Arabia from
the results shown in Table 22. Most informal
investors are male, but female participation has
been increasing, moderately during the period
2009–2016 and very notably between 2016 and
2017. Informal investors showed an increase in
mean age, from around 30 to around 40, over the
period 2009–2016; however, the mean age fell in
2017. In 2009 and 2010 most informal investors
belonged to the highest third of income earners,
while in 2016 most belonged to the lowest third
of income earners. Once again, 2017 brought
a reversal: the proportion of informal investors
from the highest third increased significantly,
while the proportion from the lowest third
decreased. This is good news, because more
individuals investing in others’ businesses could
make a greater contribution, as the unchanged
mode of invested funds reveals.
In terms of the education levels of informal
investors, the distribution has become more
evenly spread, a result which is coherent with
their diverse incomes and with the decrement
of the average of invested funds while the
median remained high and unchanged. Most
informal investors work full- or part-time. A
high proportion of them know entrepreneurs
that started up businesses in the last two years,
although it should be noted that in 2017 this
indicator fell substantially. In 2009 the proportion
of informal investors seeing good opportunities
to start up in the zone where they live was close
to 46%, while in 2010 and 2016 this percentage
had increased to more than 82%. In 2017 this
indicator remained stable, albeit slightly lower.
The proportion of informal investors involved in
early-stage entrepreneurial activities increased
from 12.4% to 16.1% across the period 2009–
2016, but fell significantly in 2017 when only
8.8% of informal investors were involved in early
stage activities. The proportion of them involved
in established businesses increased between
2009 and 2010, from 6.1% to 10.7%, only to
decrease to 4.7% in 2016, a proportion that
remained almost the same in 2017.
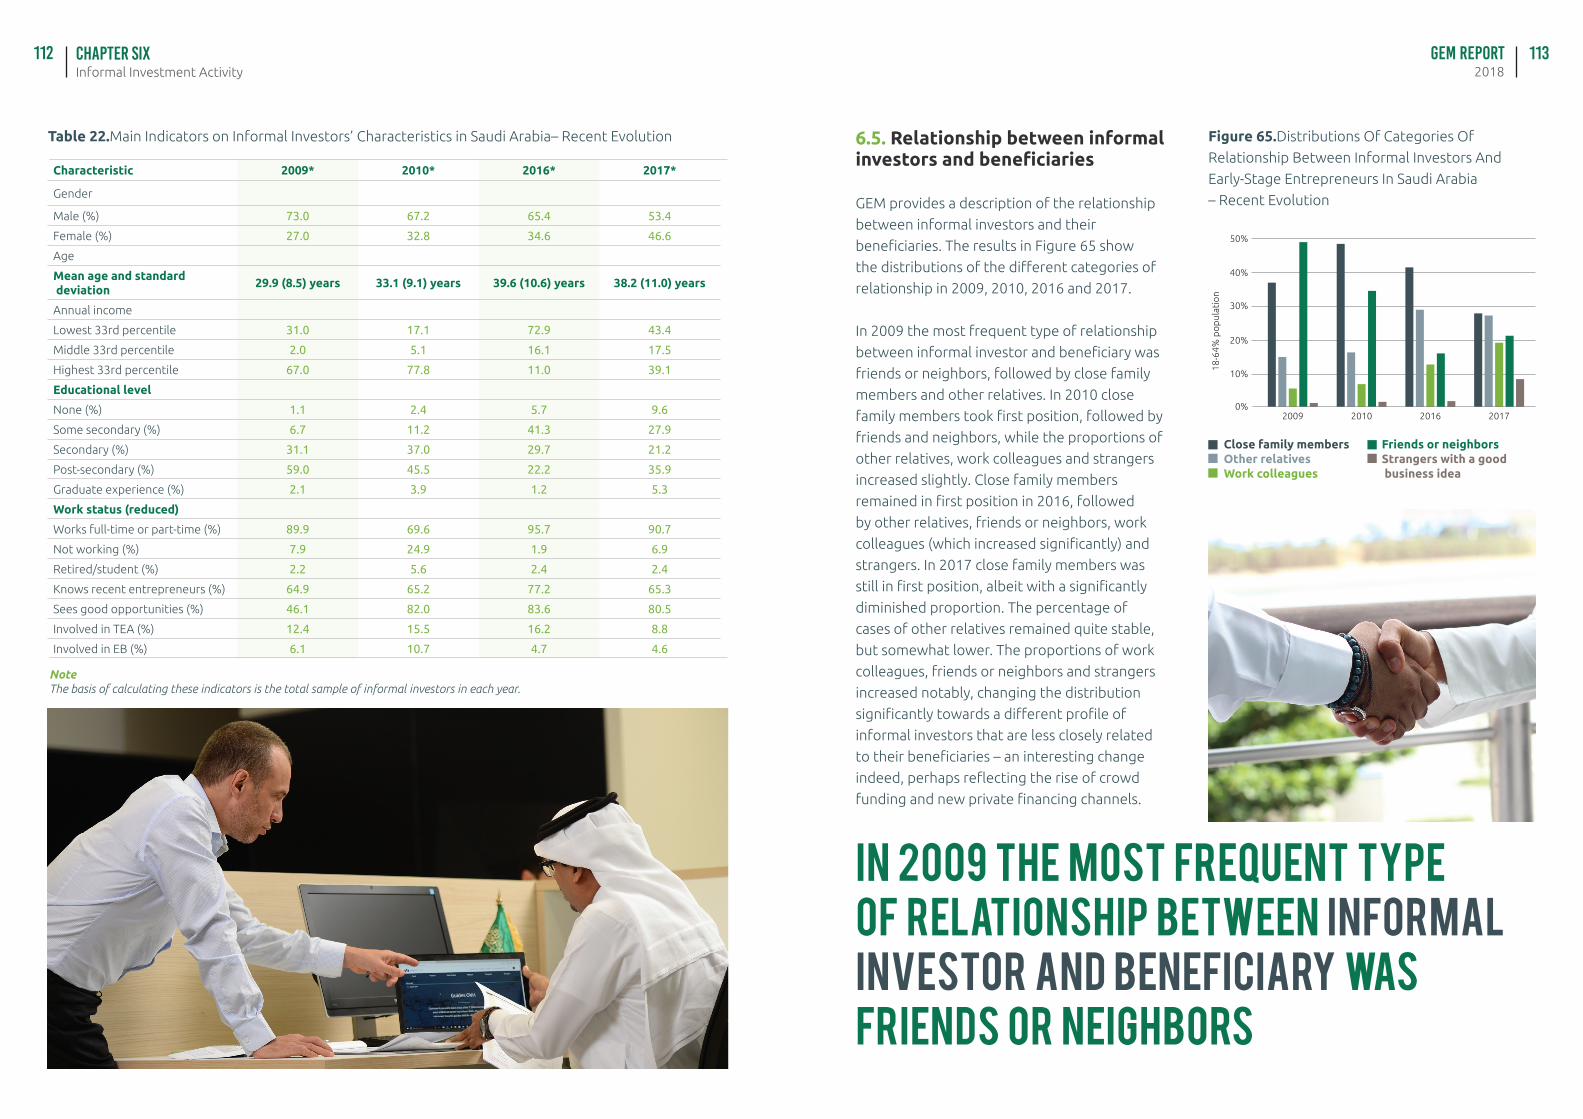
Informal Investment ActivityChapter SIX GEM Report
2018112 113
Table 22.Main Indicators on Informal Investors’ Characteristics in Saudi Arabia– Recent Evolution
Characteristic 2009* 2010* 2016* 2017*
Gender
Male (%) 73.0 67.2 65.4 53.4
Female (%) 27.0 32.8 34.6 46.6
Age
Mean age and standard deviation
29.9 (8.5) years 33.1 (9.1) years 39.6 (10.6) years 38.2 (11.0) years
Annual income
Lowest 33rd percentile 31.0 17.1 72.9 43.4
Middle 33rd percentile 2.0 5.1 16.1 17.5
Highest 33rd percentile 67.0 77.8 11.0 39.1
Educational level
None (%) 1.1 2.4 5.7 9.6
Some secondary (%) 6.7 11.2 41.3 27.9
Secondary (%) 31.1 37.0 29.7 21.2
Post-secondary (%) 59.0 45.5 22.2 35.9
Graduate experience (%) 2.1 3.9 1.2 5.3
Work status (reduced)
Works full-time or part-time (%) 89.9 69.6 95.7 90.7
Not working (%) 7.9 24.9 1.9 6.9
Retired/student (%) 2.2 5.6 2.4 2.4
Knows recent entrepreneurs (%) 64.9 65.2 77.2 65.3
Sees good opportunities (%) 46.1 82.0 83.6 80.5
Involved in TEA (%) 12.4 15.5 16.2 8.8
Involved in EB (%) 6.1 10.7 4.7 4.6
NoteThe basis of calculating these indicators is the total sample of informal investors in each year.
6.5. Relationship between informal investors and beneficiaries
GEM provides a description of the relationship
between informal investors and their
beneficiaries. The results in Figure 65 show
the distributions of the different categories of
relationship in 2009, 2010, 2016 and 2017.
In 2009 the most frequent type of relationship
between informal investor and beneficiary was
friends or neighbors, followed by close family
members and other relatives. In 2010 close
family members took first position, followed by
friends and neighbors, while the proportions of
other relatives, work colleagues and strangers
increased slightly. Close family members
remained in first position in 2016, followed
by other relatives, friends or neighbors, work
colleagues (which increased significantly) and
strangers. In 2017 close family members was
still in first position, albeit with a significantly
diminished proportion. The percentage of
cases of other relatives remained quite stable,
but somewhat lower. The proportions of work
colleagues, friends or neighbors and strangers
increased notably, changing the distribution
significantly towards a different profile of
informal investors that are less closely related
to their beneficiaries – an interesting change
indeed, perhaps reflecting the rise of crowd
funding and new private financing channels.
0%
10%
20%
30%
40%
50%
2017201620102009
18-6
4% p
op
ulat
ion
Figure 65.Distributions Of Categories Of
Relationship Between Informal Investors And
Early-Stage Entrepreneurs In Saudi Arabia
– Recent Evolution
Close family membersOther relativesWork colleagues
In 2009 the most frequent type of relationship between informal investor and beneficiary was friends or neighbors
Friends or neighborsStrangers with a good business idea
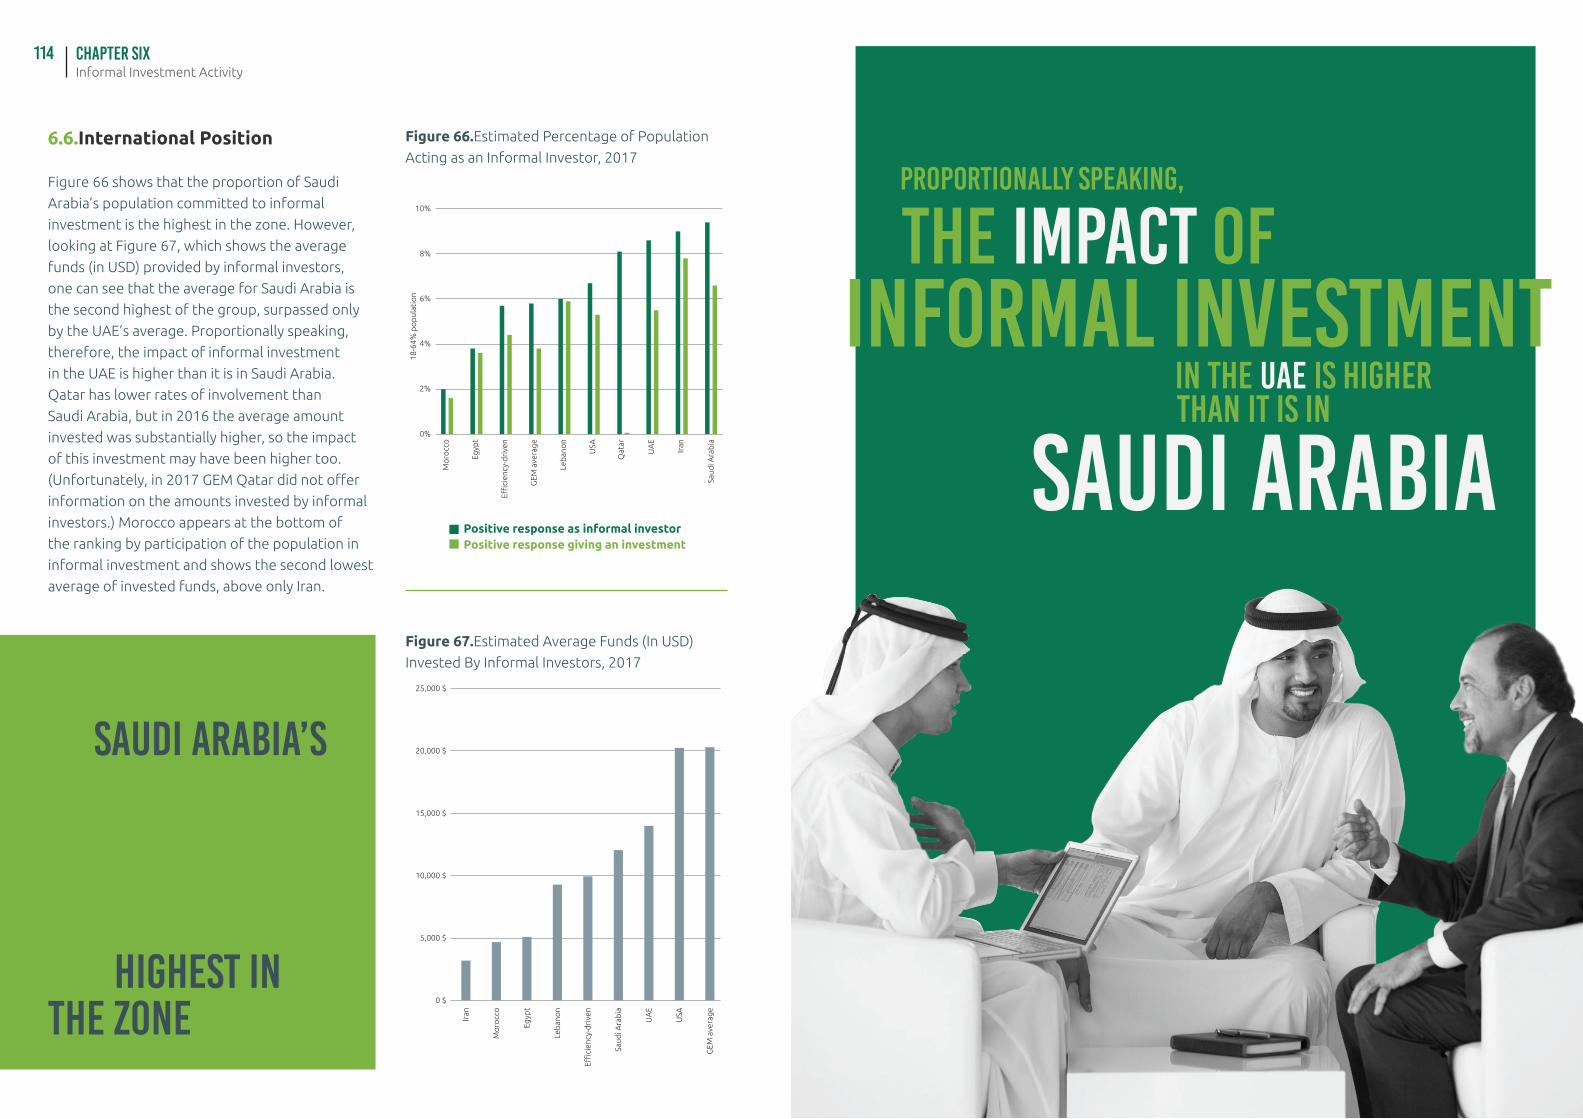
Informal Investment ActivityChapter SIX114
Figure 67.Estimated Average Funds (In USD)
Invested By Informal Investors, 2017
Figure 66.Estimated Percentage of Population
Acting as an Informal Investor, 2017
0 $
5,000 $
10,000 $
15,000 $
20,000 $
25,000 $
GEM
ave
rage
USA
UA
E
Saud
i Ara
bia
Efficiency-driven
Lebanon
Egypt
Morocco
Iran
0%
2%
4%
6%
8%
10%
Saud
i Ara
bia
Iran
UA
E
Qat
ar
USA
Leb
ano
n
GEM
ave
rage
Effici
ency
-dri
ven
Egyp
t
Mo
rocc
o
18-6
4% p
op
ulat
ion
6.6.International Position
Figure 66 shows that the proportion of Saudi
Arabia’s population committed to informal
investment is the highest in the zone. However,
looking at Figure 67, which shows the average
funds (in USD) provided by informal investors,
one can see that the average for Saudi Arabia is
the second highest of the group, surpassed only
by the UAE’s average. Proportionally speaking,
therefore, the impact of informal investment
in the UAE is higher than it is in Saudi Arabia.
Qatar has lower rates of involvement than
Saudi Arabia, but in 2016 the average amount
invested was substantially higher, so the impact
of this investment may have been higher too.
(Unfortunately, in 2017 GEM Qatar did not offer
information on the amounts invested by informal
investors.) Morocco appears at the bottom of
the ranking by participation of the population in
informal investment and shows the second lowest
average of invested funds, above only Iran.
Positive response as informal investorPositive response giving an investment
The proportion of Saudi Arabia’s population committed to informal investment is the highest in the zone
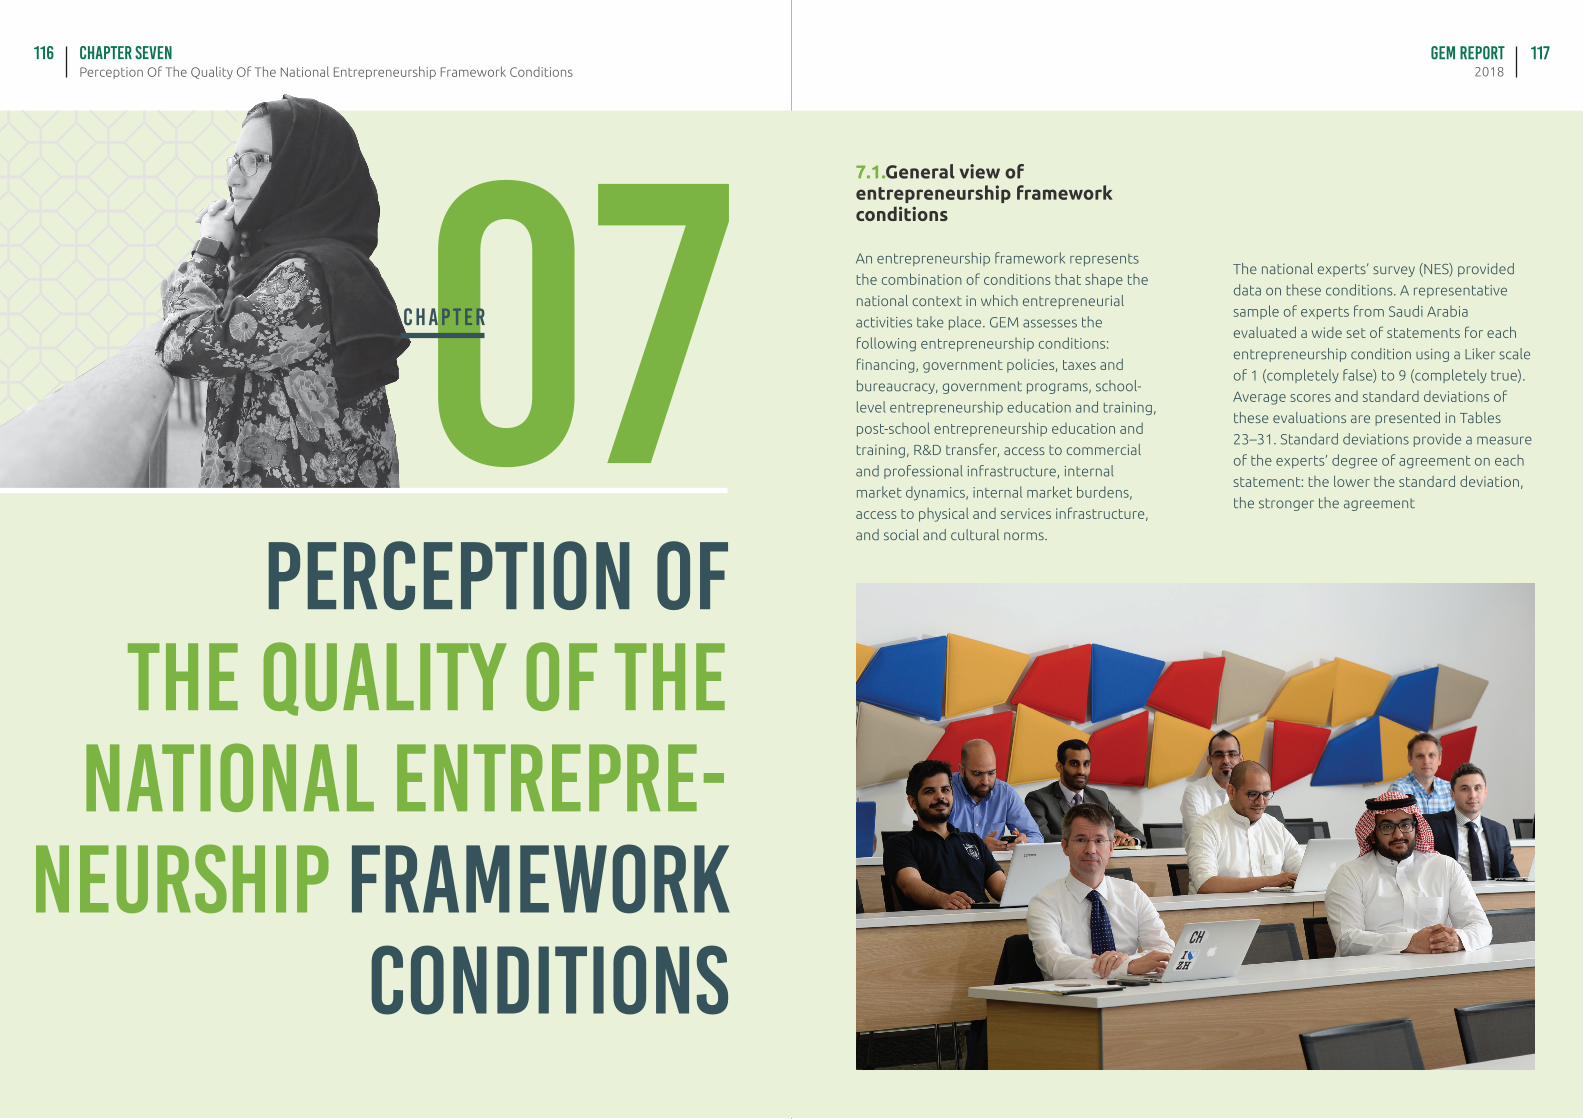
GEM Report2018Perception Of The Quality Of The National Entrepreneurship Framework Conditions
Chapter seven116 117
07PERCEPTION OF
THE QUALITY OF THE NATIONAL ENTREPRE-
NEURSHIP FRAMEWORK CONDITIONS
C H A P T E R
7.1.General view of entrepreneurship framework conditions
An entrepreneurship framework represents
the combination of conditions that shape the
national context in which entrepreneurial
activities take place. GEM assesses the
following entrepreneurship conditions:
financing, government policies, taxes and
bureaucracy, government programs, school-
level entrepreneurship education and training,
post-school entrepreneurship education and
training, R&D transfer, access to commercial
and professional infrastructure, internal
market dynamics, internal market burdens,
access to physical and services infrastructure,
and social and cultural norms.
The national experts’ survey (NES) provided
data on these conditions. A representative
sample of experts from Saudi Arabia
evaluated a wide set of statements for each
entrepreneurship condition using a Liker scale
of 1 (completely false) to 9 (completely true).
Average scores and standard deviations of
these evaluations are presented in Tables
23–31. Standard deviations provide a measure
of the experts’ degree of agreement on each
statement: the lower the standard deviation,
the stronger the agreement
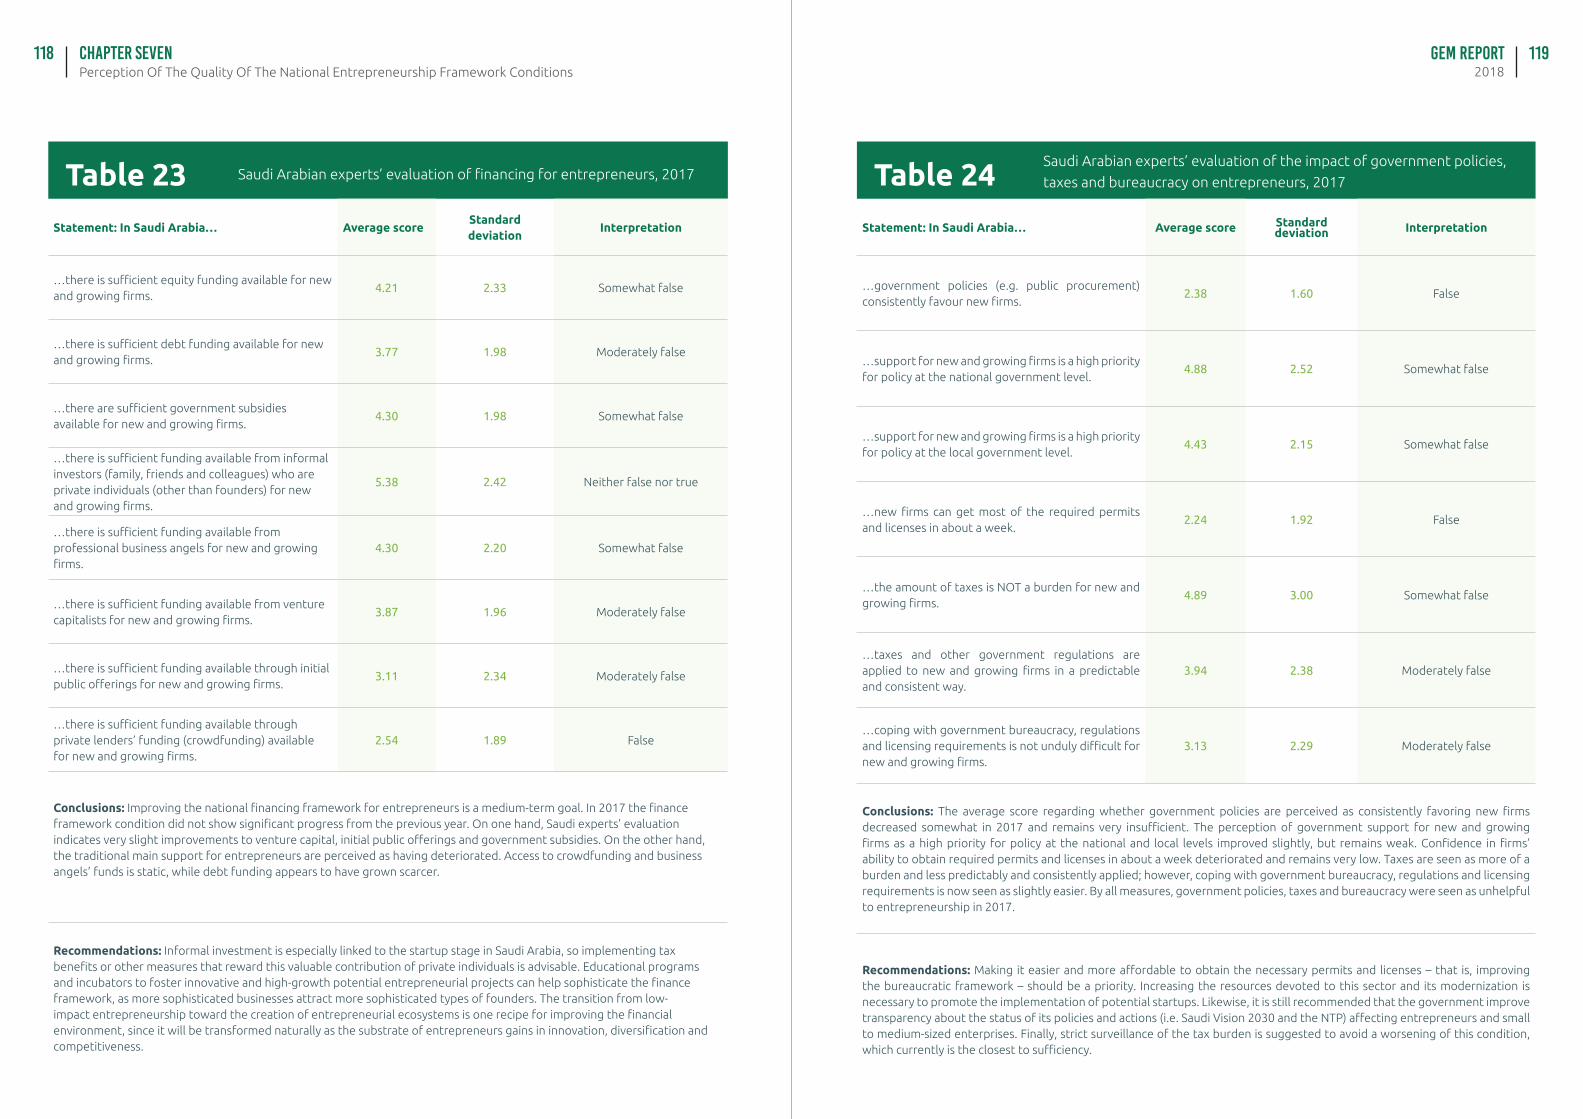
GEM Report2018Perception Of The Quality Of The National Entrepreneurship Framework Conditions
Chapter seven118 119
Table 23 Saudi Arabian experts’ evaluation of financing for entrepreneurs, 2017
Statement: In Saudi Arabia… Average scoreStandard deviation
Interpretation
…there is sufficient equity funding available for new and growing firms.
4.21 2.33 Somewhat false
…there is sufficient debt funding available for new and growing firms.
3.77 1.98 Moderately false
…there are sufficient government subsidies available for new and growing firms.
4.30 1.98 Somewhat false
…there is sufficient funding available from informal investors (family, friends and colleagues) who are private individuals (other than founders) for new and growing firms.
5.38 2.42 Neither false nor true
…there is sufficient funding available from professional business angels for new and growing firms.
4.30 2.20 Somewhat false
…there is sufficient funding available from venture capitalists for new and growing firms.
3.87 1.96 Moderately false
…there is sufficient funding available through initial public offerings for new and growing firms.
3.11 2.34 Moderately false
…there is sufficient funding available through private lenders’ funding (crowdfunding) available for new and growing firms.
2.54 1.89 False
Conclusions: Improving the national financing framework for entrepreneurs is a medium-term goal. In 2017 the finance framework condition did not show significant progress from the previous year. On one hand, Saudi experts’ evaluation indicates very slight improvements to venture capital, initial public offerings and government subsidies. On the other hand, the traditional main support for entrepreneurs are perceived as having deteriorated. Access to crowdfunding and business angels’ funds is static, while debt funding appears to have grown scarcer.
Recommendations: Informal investment is especially linked to the startup stage in Saudi Arabia, so implementing tax benefits or other measures that reward this valuable contribution of private individuals is advisable. Educational programs and incubators to foster innovative and high-growth potential entrepreneurial projects can help sophisticate the finance framework, as more sophisticated businesses attract more sophisticated types of founders. The transition from low-impact entrepreneurship toward the creation of entrepreneurial ecosystems is one recipe for improving the financial environment, since it will be transformed naturally as the substrate of entrepreneurs gains in innovation, diversification and competitiveness.
Table 24Saudi Arabian experts’ evaluation of the impact of government policies,
taxes and bureaucracy on entrepreneurs, 2017
Statement: In Saudi Arabia… Average score Standard deviation Interpretation
…government policies (e.g. public procurement) consistently favour new firms.
2.38 1.60 False
…support for new and growing firms is a high priority for policy at the national government level.
4.88 2.52 Somewhat false
…support for new and growing firms is a high priority for policy at the local government level.
4.43 2.15 Somewhat false
…new firms can get most of the required permits and licenses in about a week.
2.24 1.92 False
…the amount of taxes is NOT a burden for new and growing firms.
4.89 3.00 Somewhat false
…taxes and other government regulations are applied to new and growing firms in a predictable and consistent way.
3.94 2.38 Moderately false
…coping with government bureaucracy, regulations and licensing requirements is not unduly difficult for new and growing firms.
3.13 2.29 Moderately false
Conclusions: The average score regarding whether government policies are perceived as consistently favoring new firms decreased somewhat in 2017 and remains very insufficient. The perception of government support for new and growing firms as a high priority for policy at the national and local levels improved slightly, but remains weak. Confidence in firms’ ability to obtain required permits and licenses in about a week deteriorated and remains very low. Taxes are seen as more of a burden and less predictably and consistently applied; however, coping with government bureaucracy, regulations and licensing requirements is now seen as slightly easier. By all measures, government policies, taxes and bureaucracy were seen as unhelpful to entrepreneurship in 2017.
Recommendations: Making it easier and more affordable to obtain the necessary permits and licenses – that is, improving the bureaucratic framework – should be a priority. Increasing the resources devoted to this sector and its modernization is necessary to promote the implementation of potential startups. Likewise, it is still recommended that the government improve transparency about the status of its policies and actions (i.e. Saudi Vision 2030 and the NTP) affecting entrepreneurs and small to medium-sized enterprises. Finally, strict surveillance of the tax burden is suggested to avoid a worsening of this condition, which currently is the closest to sufficiency.
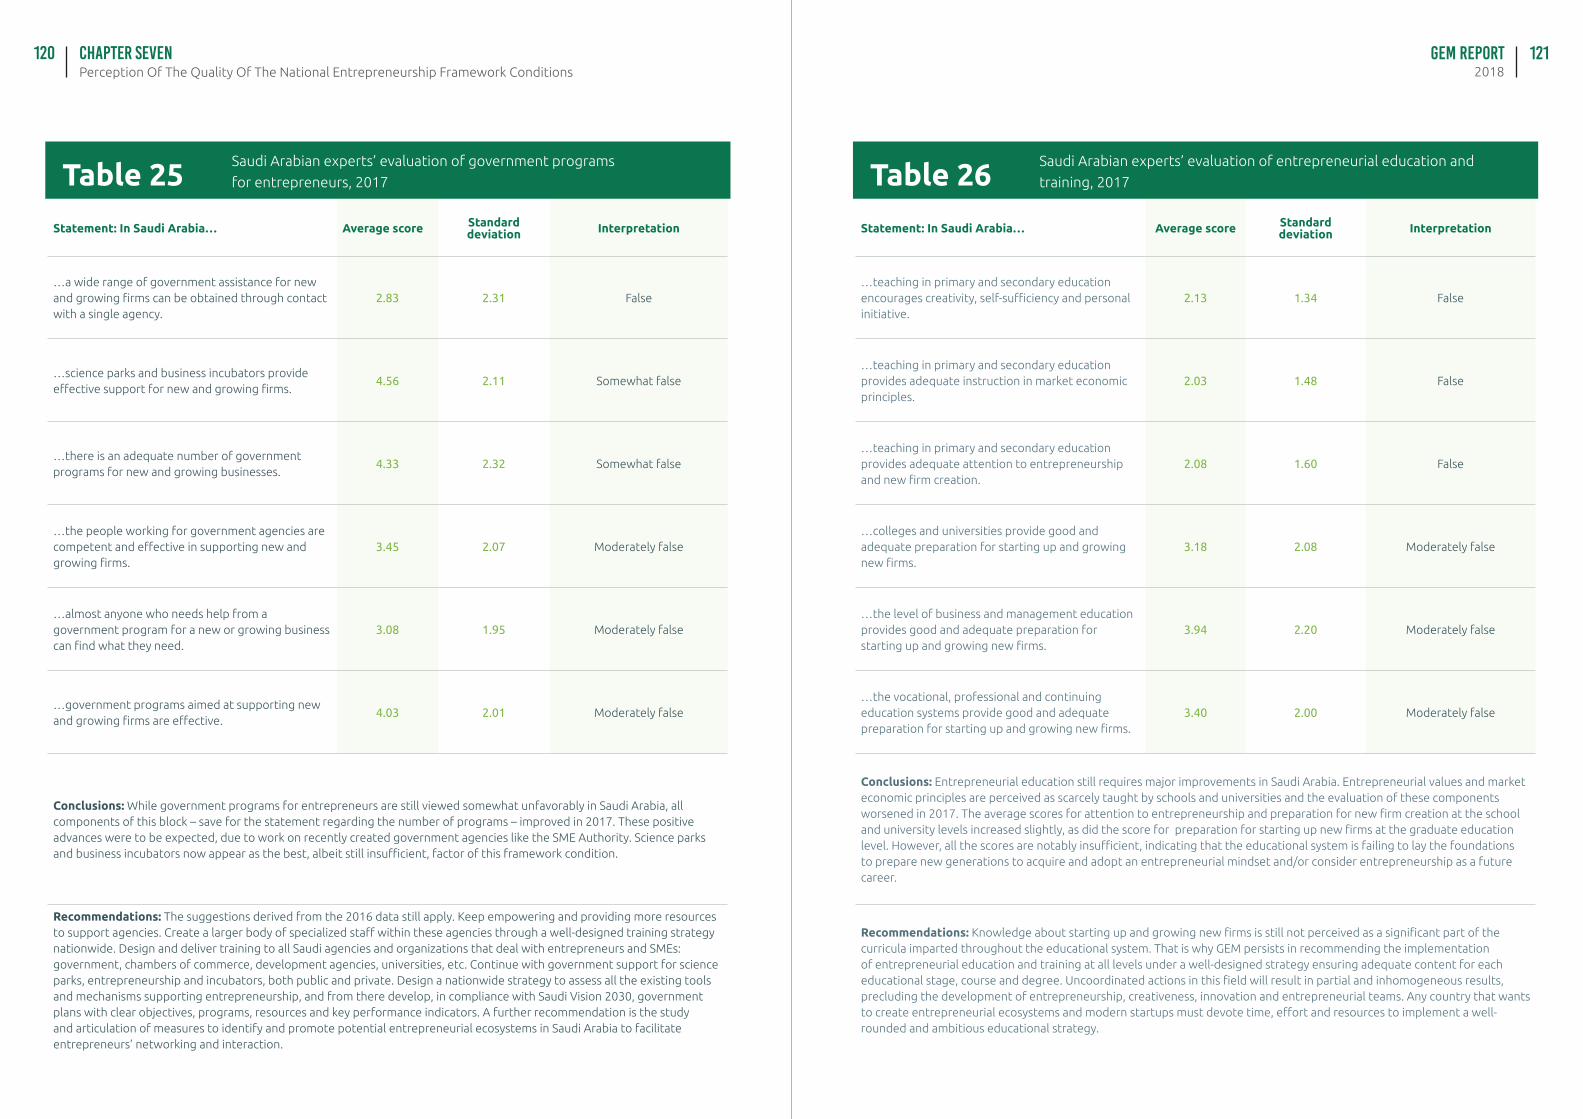
GEM Report2018Perception Of The Quality Of The National Entrepreneurship Framework Conditions
Chapter seven120 121
Table 25Saudi Arabian experts’ evaluation of government programs
for entrepreneurs, 2017
Statement: In Saudi Arabia… Average score Standard deviation Interpretation
…a wide range of government assistance for new and growing firms can be obtained through contact with a single agency.
2.83 2.31 False
…science parks and business incubators provide effective support for new and growing firms.
4.56 2.11 Somewhat false
…there is an adequate number of government programs for new and growing businesses.
4.33 2.32 Somewhat false
…the people working for government agencies are competent and effective in supporting new and growing firms.
3.45 2.07 Moderately false
…almost anyone who needs help from a government program for a new or growing business can find what they need.
3.08 1.95 Moderately false
…government programs aimed at supporting new and growing firms are effective.
4.03 2.01 Moderately false
Conclusions: While government programs for entrepreneurs are still viewed somewhat unfavorably in Saudi Arabia, all components of this block – save for the statement regarding the number of programs – improved in 2017. These positive advances were to be expected, due to work on recently created government agencies like the SME Authority. Science parks and business incubators now appear as the best, albeit still insufficient, factor of this framework condition.
Recommendations: The suggestions derived from the 2016 data still apply. Keep empowering and providing more resources to support agencies. Create a larger body of specialized staff within these agencies through a well-designed training strategy nationwide. Design and deliver training to all Saudi agencies and organizations that deal with entrepreneurs and SMEs: government, chambers of commerce, development agencies, universities, etc. Continue with government support for science parks, entrepreneurship and incubators, both public and private. Design a nationwide strategy to assess all the existing tools and mechanisms supporting entrepreneurship, and from there develop, in compliance with Saudi Vision 2030, government plans with clear objectives, programs, resources and key performance indicators. A further recommendation is the study and articulation of measures to identify and promote potential entrepreneurial ecosystems in Saudi Arabia to facilitate entrepreneurs’ networking and interaction.
Table 26Saudi Arabian experts’ evaluation of entrepreneurial education and
training, 2017
Statement: In Saudi Arabia… Average score Standard deviation Interpretation
…teaching in primary and secondary education encourages creativity, self-sufficiency and personal initiative.
2.13 1.34 False
…teaching in primary and secondary education provides adequate instruction in market economic principles.
2.03 1.48 False
…teaching in primary and secondary education provides adequate attention to entrepreneurship and new firm creation.
2.08 1.60 False
…colleges and universities provide good and adequate preparation for starting up and growing new firms.
3.18 2.08 Moderately false
…the level of business and management education provides good and adequate preparation for starting up and growing new firms.
3.94 2.20 Moderately false
…the vocational, professional and continuing education systems provide good and adequate preparation for starting up and growing new firms.
3.40 2.00 Moderately false
Conclusions: Entrepreneurial education still requires major improvements in Saudi Arabia. Entrepreneurial values and market economic principles are perceived as scarcely taught by schools and universities and the evaluation of these components worsened in 2017. The average scores for attention to entrepreneurship and preparation for new firm creation at the school and university levels increased slightly, as did the score for preparation for starting up new firms at the graduate education level. However, all the scores are notably insufficient, indicating that the educational system is failing to lay the foundations to prepare new generations to acquire and adopt an entrepreneurial mindset and/or consider entrepreneurship as a future career.
Recommendations: Knowledge about starting up and growing new firms is still not perceived as a significant part of the curricula imparted throughout the educational system. That is why GEM persists in recommending the implementation of entrepreneurial education and training at all levels under a well-designed strategy ensuring adequate content for each educational stage, course and degree. Uncoordinated actions in this field will result in partial and inhomogeneous results, precluding the development of entrepreneurship, creativeness, innovation and entrepreneurial teams. Any country that wants to create entrepreneurial ecosystems and modern startups must devote time, effort and resources to implement a well-rounded and ambitious educational strategy.
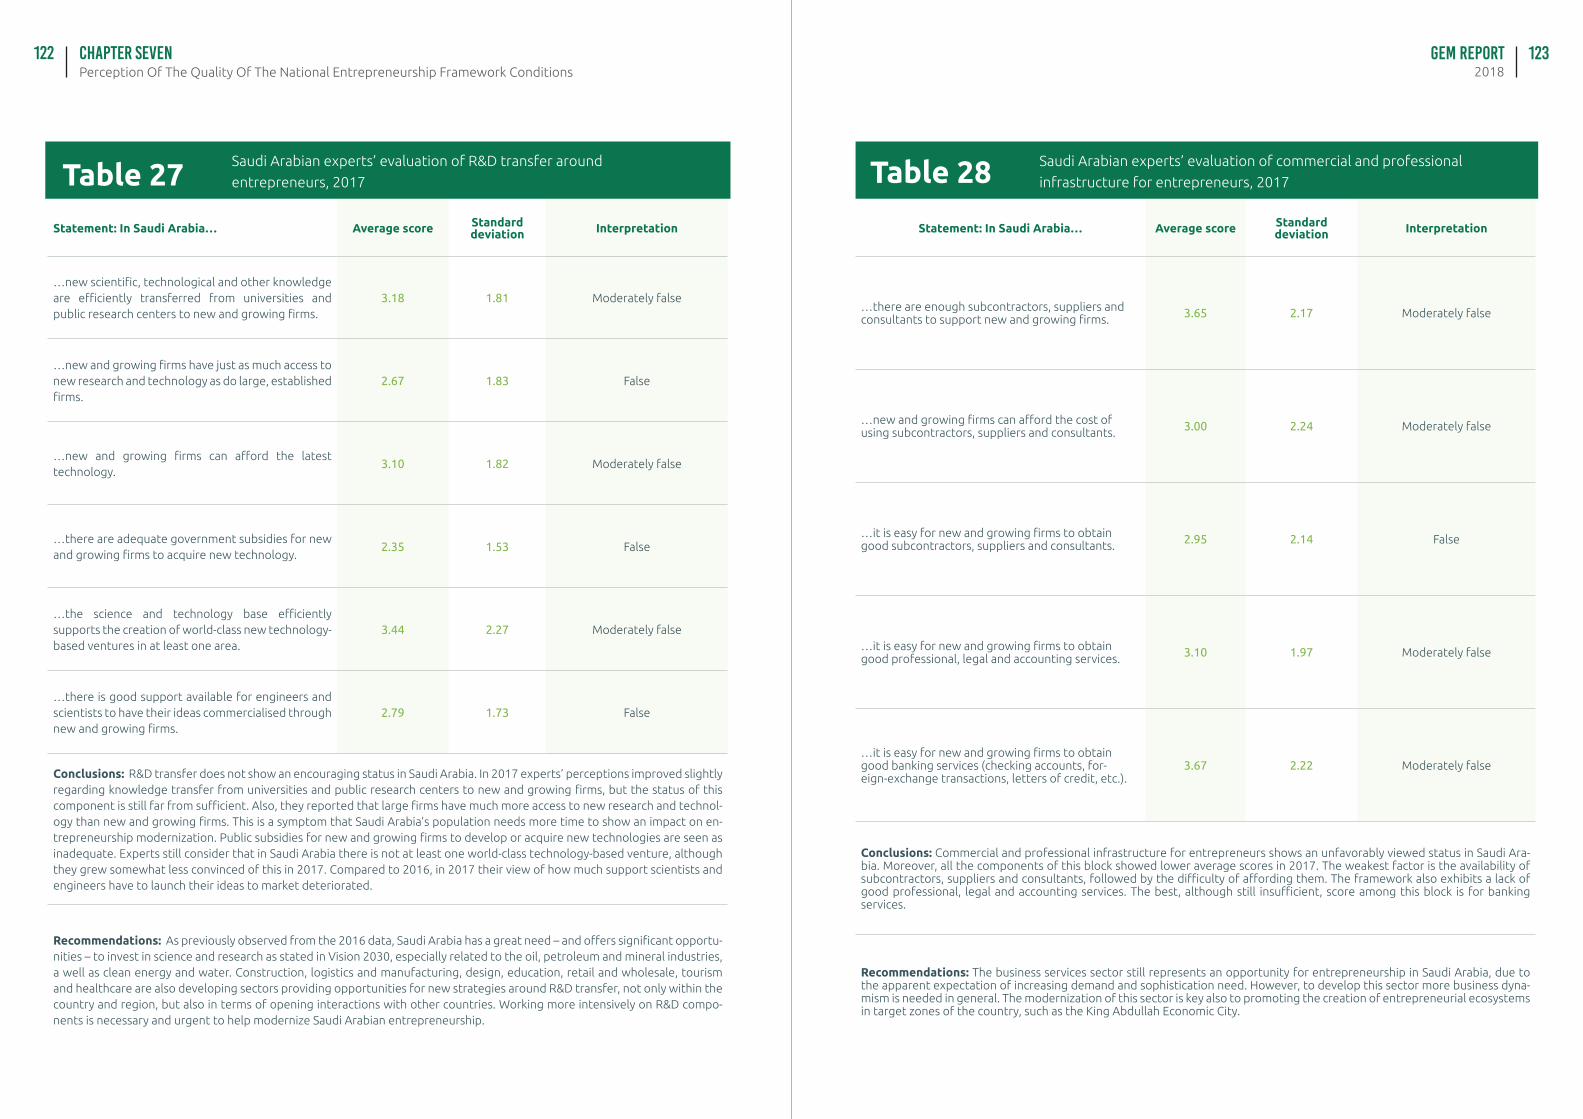
GEM Report2018Perception Of The Quality Of The National Entrepreneurship Framework Conditions
Chapter seven122 123
Table 27Saudi Arabian experts’ evaluation of R&D transfer around
entrepreneurs, 2017
Statement: In Saudi Arabia… Average score Standard deviation Interpretation
…new scientific, technological and other knowledge are efficiently transferred from universities and public research centers to new and growing firms.
3.18 1.81 Moderately false
…new and growing firms have just as much access to new research and technology as do large, established firms.
2.67 1.83 False
…new and growing firms can afford the latest technology.
3.10 1.82 Moderately false
…there are adequate government subsidies for new and growing firms to acquire new technology.
2.35 1.53 False
…the science and technology base efficiently supports the creation of world-class new technology-based ventures in at least one area.
3.44 2.27 Moderately false
…there is good support available for engineers and scientists to have their ideas commercialised through new and growing firms.
2.79 1.73 False
Conclusions: R&D transfer does not show an encouraging status in Saudi Arabia. In 2017 experts’ perceptions improved slightly regarding knowledge transfer from universities and public research centers to new and growing firms, but the status of this component is still far from sufficient. Also, they reported that large firms have much more access to new research and technol-ogy than new and growing firms. This is a symptom that Saudi Arabia’s population needs more time to show an impact on en-trepreneurship modernization. Public subsidies for new and growing firms to develop or acquire new technologies are seen as inadequate. Experts still consider that in Saudi Arabia there is not at least one world-class technology-based venture, although they grew somewhat less convinced of this in 2017. Compared to 2016, in 2017 their view of how much support scientists and engineers have to launch their ideas to market deteriorated.
Recommendations: As previously observed from the 2016 data, Saudi Arabia has a great need – and offers significant opportu-nities – to invest in science and research as stated in Vision 2030, especially related to the oil, petroleum and mineral industries, a well as clean energy and water. Construction, logistics and manufacturing, design, education, retail and wholesale, tourism and healthcare are also developing sectors providing opportunities for new strategies around R&D transfer, not only within the country and region, but also in terms of opening interactions with other countries. Working more intensively on R&D compo-nents is necessary and urgent to help modernize Saudi Arabian entrepreneurship.
Table 28 Saudi Arabian experts’ evaluation of commercial and professional
infrastructure for entrepreneurs, 2017
Statement: In Saudi Arabia… Average score Standard deviation Interpretation
…there are enough subcontractors, suppliers and consultants to support new and growing firms. 3.65 2.17 Moderately false
…new and growing firms can afford the cost of using subcontractors, suppliers and consultants. 3.00 2.24 Moderately false
…it is easy for new and growing firms to obtain good subcontractors, suppliers and consultants. 2.95 2.14 False
…it is easy for new and growing firms to obtain good professional, legal and accounting services. 3.10 1.97 Moderately false
…it is easy for new and growing firms to obtain good banking services (checking accounts, for-eign-exchange transactions, letters of credit, etc.).
3.67 2.22 Moderately false
Conclusions: Commercial and professional infrastructure for entrepreneurs shows an unfavorably viewed status in Saudi Ara-bia. Moreover, all the components of this block showed lower average scores in 2017. The weakest factor is the availability of subcontractors, suppliers and consultants, followed by the difficulty of affording them. The framework also exhibits a lack of good professional, legal and accounting services. The best, although still insufficient, score among this block is for banking services.
Recommendations: The business services sector still represents an opportunity for entrepreneurship in Saudi Arabia, due to the apparent expectation of increasing demand and sophistication need. However, to develop this sector more business dyna-mism is needed in general. The modernization of this sector is key also to promoting the creation of entrepreneurial ecosystems in target zones of the country, such as the King Abdullah Economic City.
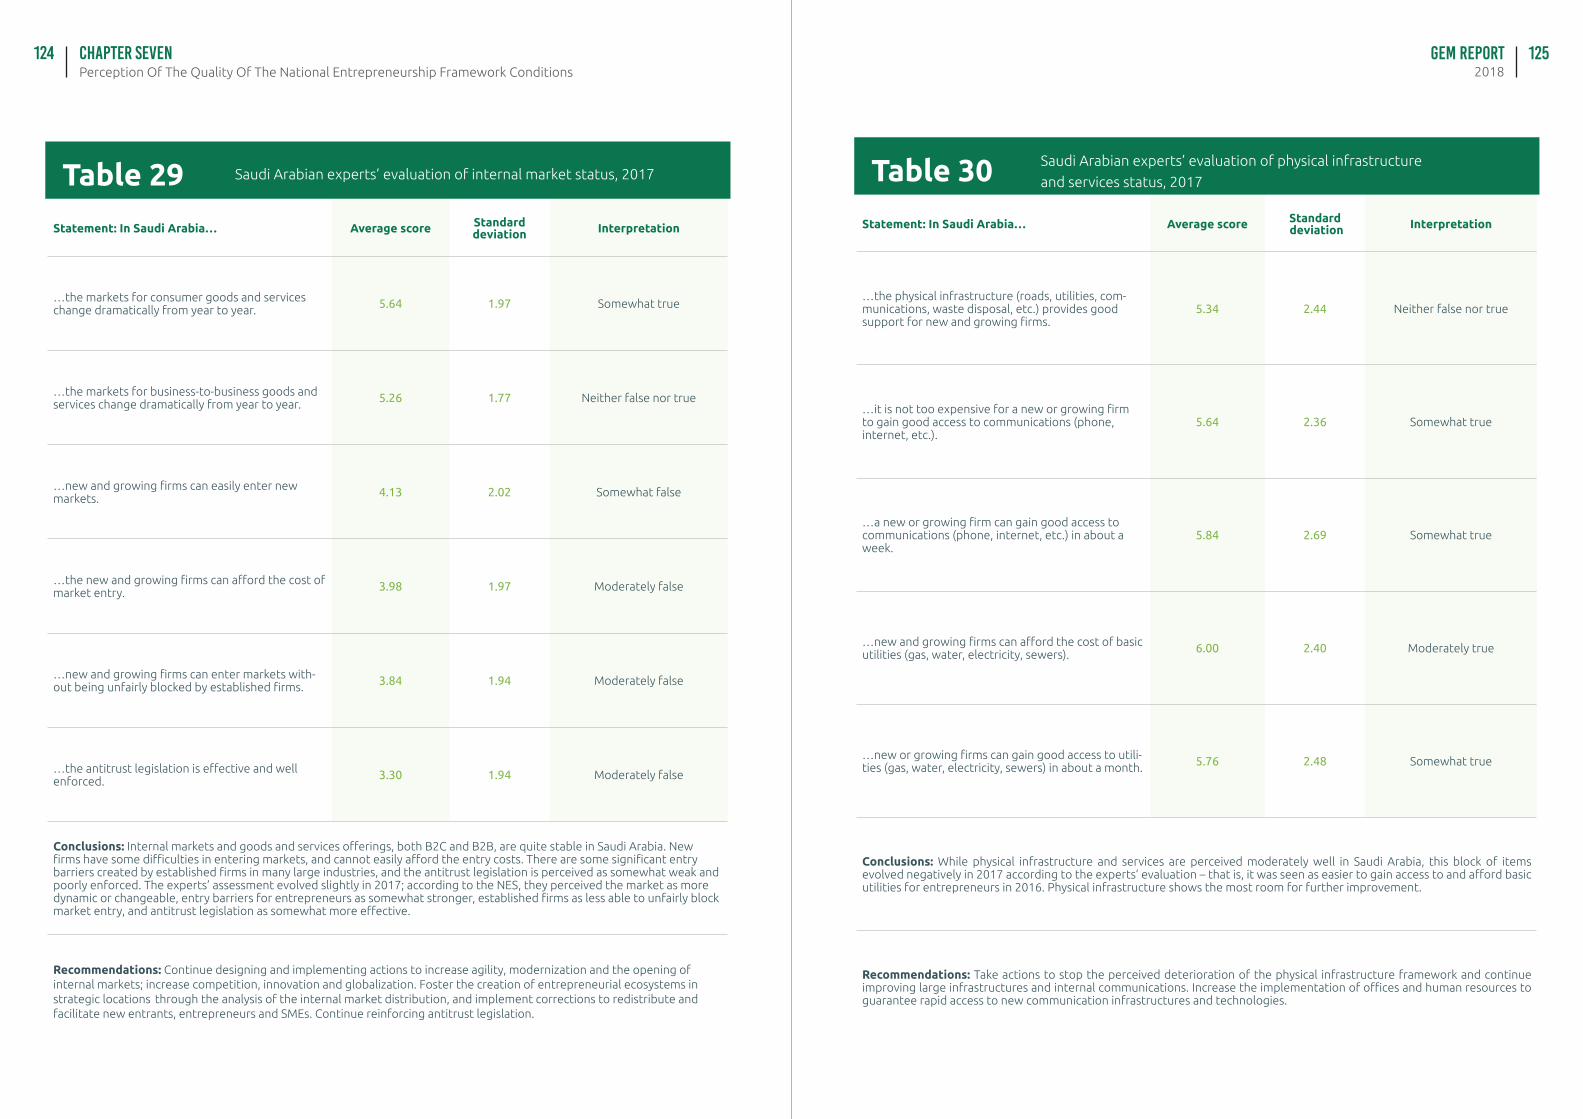
GEM Report2018Perception Of The Quality Of The National Entrepreneurship Framework Conditions
Chapter seven124 125
Table 29 Saudi Arabian experts’ evaluation of internal market status, 2017
Statement: In Saudi Arabia… Average score Standard deviation Interpretation
…the markets for consumer goods and services change dramatically from year to year. 5.64 1.97 Somewhat true
…the markets for business-to-business goods and services change dramatically from year to year. 5.26 1.77 Neither false nor true
…new and growing firms can easily enter new markets. 4.13 2.02 Somewhat false
…the new and growing firms can afford the cost of market entry. 3.98 1.97 Moderately false
…new and growing firms can enter markets with-out being unfairly blocked by established firms. 3.84 1.94 Moderately false
…the antitrust legislation is effective and well enforced. 3.30 1.94 Moderately false
Conclusions: Internal markets and goods and services offerings, both B2C and B2B, are quite stable in Saudi Arabia. New firms have some difficulties in entering markets, and cannot easily afford the entry costs. There are some significant entry barriers created by established firms in many large industries, and the antitrust legislation is perceived as somewhat weak and poorly enforced. The experts’ assessment evolved slightly in 2017; according to the NES, they perceived the market as more dynamic or changeable, entry barriers for entrepreneurs as somewhat stronger, established firms as less able to unfairly block market entry, and antitrust legislation as somewhat more effective.
Recommendations: Continue designing and implementing actions to increase agility, modernization and the opening of internal markets; increase competition, innovation and globalization. Foster the creation of entrepreneurial ecosystems in strategic locations through the analysis of the internal market distribution, and implement corrections to redistribute and facilitate new entrants, entrepreneurs and SMEs. Continue reinforcing antitrust legislation.
Table 30 Saudi Arabian experts’ evaluation of physical infrastructure
and services status, 2017
Statement: In Saudi Arabia… Average score Standard deviation Interpretation
…the physical infrastructure (roads, utilities, com-munications, waste disposal, etc.) provides good support for new and growing firms.
5.34 2.44 Neither false nor true
…it is not too expensive for a new or growing firm to gain good access to communications (phone, internet, etc.).
5.64 2.36 Somewhat true
…a new or growing firm can gain good access to communications (phone, internet, etc.) in about a week.
5.84 2.69 Somewhat true
…new and growing firms can afford the cost of basic utilities (gas, water, electricity, sewers). 6.00 2.40 Moderately true
…new or growing firms can gain good access to utili-ties (gas, water, electricity, sewers) in about a month. 5.76 2.48 Somewhat true
Conclusions: While physical infrastructure and services are perceived moderately well in Saudi Arabia, this block of items evolved negatively in 2017 according to the experts’ evaluation – that is, it was seen as easier to gain access to and afford basic utilities for entrepreneurs in 2016. Physical infrastructure shows the most room for further improvement.
Recommendations: Take actions to stop the perceived deterioration of the physical infrastructure framework and continue improving large infrastructures and internal communications. Increase the implementation of offices and human resources to guarantee rapid access to new communication infrastructures and technologies.
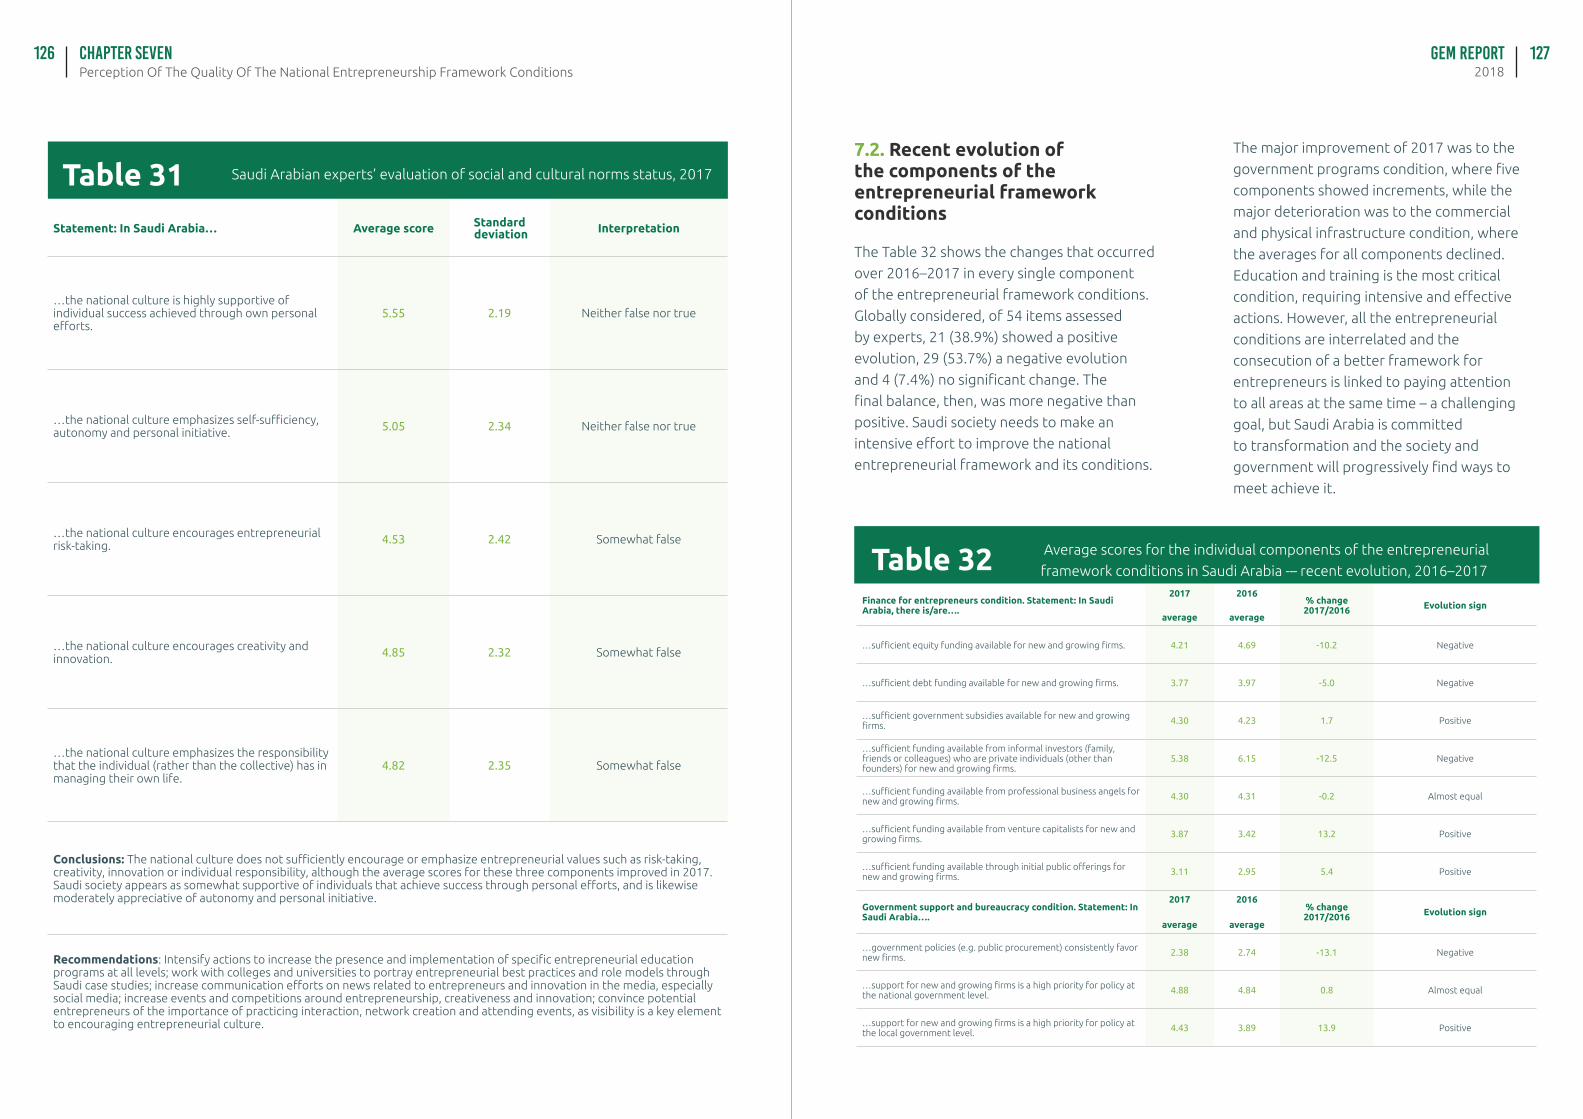
GEM Report2018Perception Of The Quality Of The National Entrepreneurship Framework Conditions
Chapter seven126 127
Table 31 Saudi Arabian experts’ evaluation of social and cultural norms status, 2017
Statement: In Saudi Arabia… Average score Standard deviation Interpretation
…the national culture is highly supportive of individual success achieved through own personal efforts.
5.55 2.19 Neither false nor true
…the national culture emphasizes self-sufficiency, autonomy and personal initiative. 5.05 2.34 Neither false nor true
…the national culture encourages entrepreneurial risk-taking. 4.53 2.42 Somewhat false
…the national culture encourages creativity and innovation. 4.85 2.32 Somewhat false
…the national culture emphasizes the responsibility that the individual (rather than the collective) has in managing their own life.
4.82 2.35 Somewhat false
Conclusions: The national culture does not sufficiently encourage or emphasize entrepreneurial values such as risk-taking, creativity, innovation or individual responsibility, although the average scores for these three components improved in 2017. Saudi society appears as somewhat supportive of individuals that achieve success through personal efforts, and is likewise moderately appreciative of autonomy and personal initiative.
Recommendations: Intensify actions to increase the presence and implementation of specific entrepreneurial education programs at all levels; work with colleges and universities to portray entrepreneurial best practices and role models through Saudi case studies; increase communication efforts on news related to entrepreneurs and innovation in the media, especially social media; increase events and competitions around entrepreneurship, creativeness and innovation; convince potential entrepreneurs of the importance of practicing interaction, network creation and attending events, as visibility is a key element to encouraging entrepreneurial culture.
Table 32Finance for entrepreneurs condition. Statement: In Saudi Arabia, there is/are….
2017
average
2016
average
% change 2017/2016 Evolution sign
…sufficient equity funding available for new and growing firms. 4.21 4.69 -10.2 Negative
…sufficient debt funding available for new and growing firms. 3.77 3.97 -5.0 Negative
…sufficient government subsidies available for new and growing firms. 4.30 4.23 1.7 Positive
…sufficient funding available from informal investors (family, friends or colleagues) who are private individuals (other than founders) for new and growing firms.
5.38 6.15 -12.5 Negative
…sufficient funding available from professional business angels for new and growing firms. 4.30 4.31 -0.2 Almost equal
…sufficient funding available from venture capitalists for new and growing firms. 3.87 3.42 13.2 Positive
…sufficient funding available through initial public offerings for new and growing firms. 3.11 2.95 5.4 Positive
Government support and bureaucracy condition. Statement: In Saudi Arabia….
2017
average
2016
average
% change 2017/2016 Evolution sign
…government policies (e.g. public procurement) consistently favor new firms. 2.38 2.74 -13.1 Negative
…support for new and growing firms is a high priority for policy at the national government level. 4.88 4.84 0.8 Almost equal
…support for new and growing firms is a high priority for policy at the local government level. 4.43 3.89 13.9 Positive
Average scores for the individual components of the entrepreneurial
framework conditions in Saudi Arabia -– recent evolution, 2016–2017
7.2. Recent evolution of the components of the entrepreneurial framework conditions
The Table 32 shows the changes that occurred
over 2016–2017 in every single component
of the entrepreneurial framework conditions.
Globally considered, of 54 items assessed
by experts, 21 (38.9%) showed a positive
evolution, 29 (53.7%) a negative evolution
and 4 (7.4%) no significant change. The
final balance, then, was more negative than
positive. Saudi society needs to make an
intensive effort to improve the national
entrepreneurial framework and its conditions.
The major improvement of 2017 was to the
government programs condition, where five
components showed increments, while the
major deterioration was to the commercial
and physical infrastructure condition, where
the averages for all components declined.
Education and training is the most critical
condition, requiring intensive and effective
actions. However, all the entrepreneurial
conditions are interrelated and the
consecution of a better framework for
entrepreneurs is linked to paying attention
to all areas at the same time – a challenging
goal, but Saudi Arabia is committed
to transformation and the society and
government will progressively find ways to
meet achieve it.
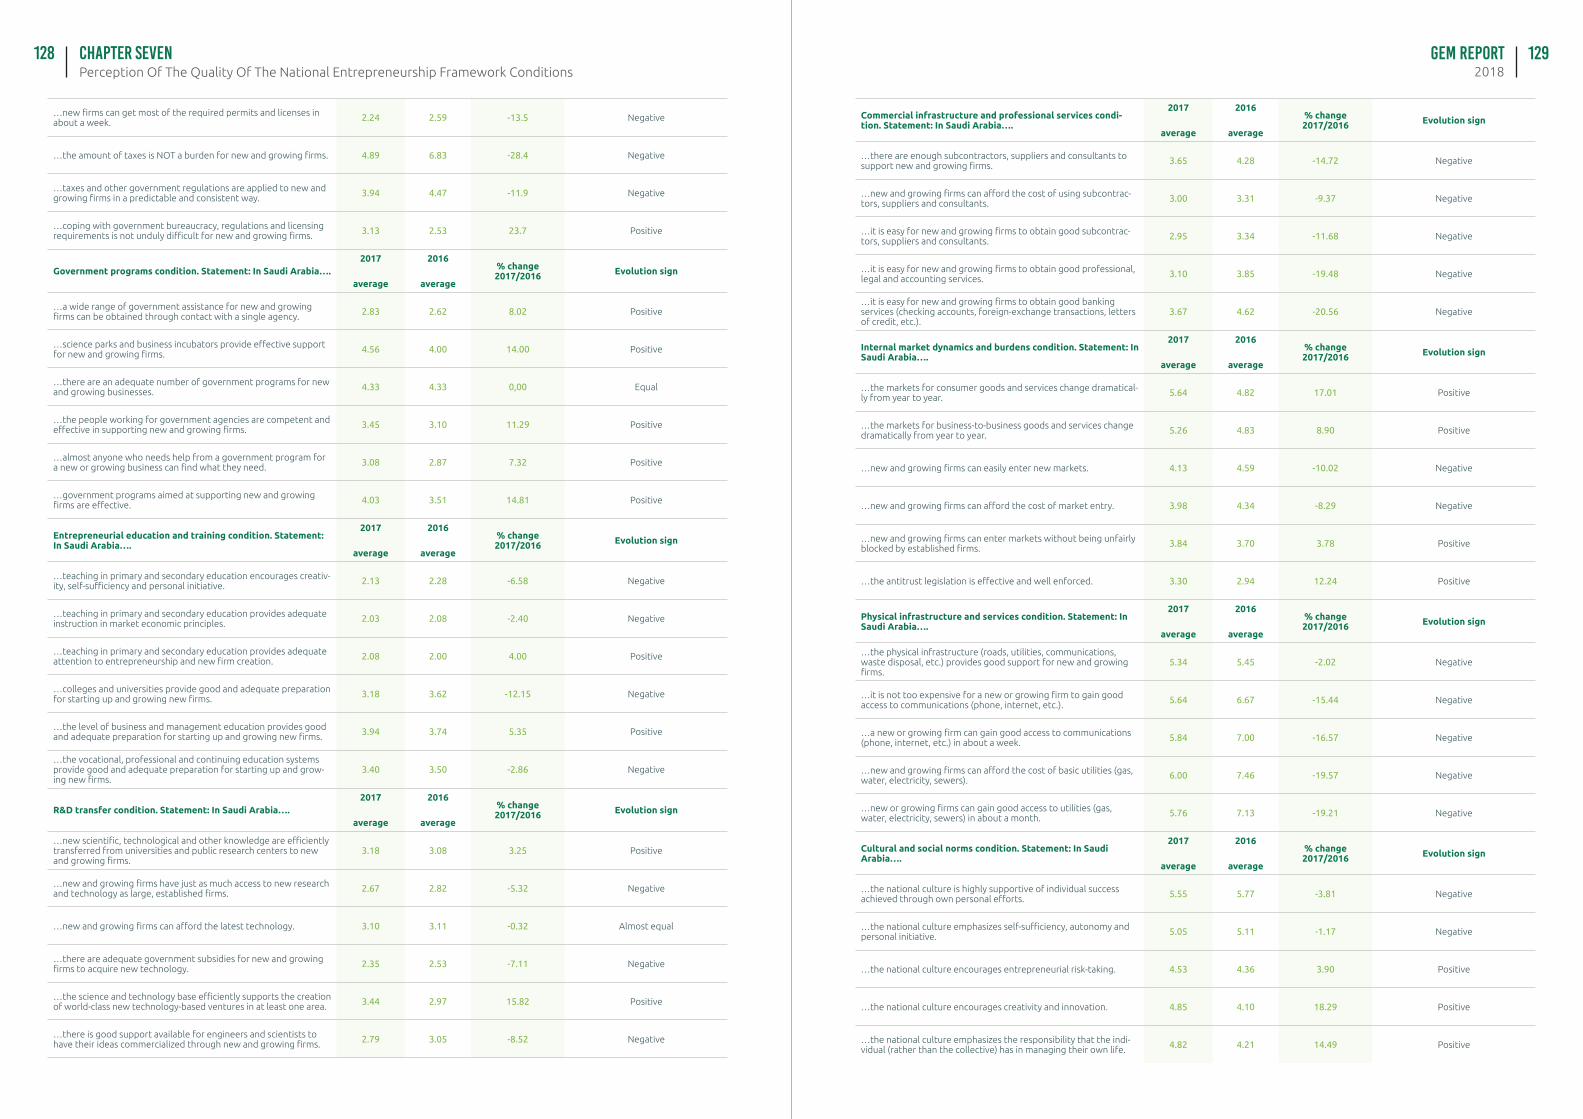
GEM Report2018Perception Of The Quality Of The National Entrepreneurship Framework Conditions
Chapter seven128 129
…new firms can get most of the required permits and licenses in about a week. 2.24 2.59 -13.5 Negative
…the amount of taxes is NOT a burden for new and growing firms. 4.89 6.83 -28.4 Negative
…taxes and other government regulations are applied to new and growing firms in a predictable and consistent way. 3.94 4.47 -11.9 Negative
…coping with government bureaucracy, regulations and licensing requirements is not unduly difficult for new and growing firms. 3.13 2.53 23.7 Positive
Government programs condition. Statement: In Saudi Arabia….2017
average
2016
average
% change 2017/2016 Evolution sign
…a wide range of government assistance for new and growing firms can be obtained through contact with a single agency. 2.83 2.62 8.02 Positive
…science parks and business incubators provide effective support for new and growing firms. 4.56 4.00 14.00 Positive
…there are an adequate number of government programs for new and growing businesses. 4.33 4.33 0,00 Equal
…the people working for government agencies are competent and effective in supporting new and growing firms. 3.45 3.10 11.29 Positive
…almost anyone who needs help from a government program for a new or growing business can find what they need. 3.08 2.87 7.32 Positive
…government programs aimed at supporting new and growing firms are effective. 4.03 3.51 14.81 Positive
Entrepreneurial education and training condition. Statement: In Saudi Arabia….
2017
average
2016
average
% change 2017/2016 Evolution sign
…teaching in primary and secondary education encourages creativ-ity, self-sufficiency and personal initiative. 2.13 2.28 -6.58 Negative
…teaching in primary and secondary education provides adequate instruction in market economic principles. 2.03 2.08 -2.40 Negative
…teaching in primary and secondary education provides adequate attention to entrepreneurship and new firm creation. 2.08 2.00 4.00 Positive
…colleges and universities provide good and adequate preparation for starting up and growing new firms. 3.18 3.62 -12.15 Negative
…the level of business and management education provides good and adequate preparation for starting up and growing new firms. 3.94 3.74 5.35 Positive
…the vocational, professional and continuing education systems provide good and adequate preparation for starting up and grow-ing new firms.
3.40 3.50 -2.86 Negative
R&D transfer condition. Statement: In Saudi Arabia….2017
average
2016
average
% change 2017/2016 Evolution sign
…new scientific, technological and other knowledge are efficiently transferred from universities and public research centers to new and growing firms.
3.18 3.08 3.25 Positive
…new and growing firms have just as much access to new research and technology as large, established firms. 2.67 2.82 -5.32 Negative
…new and growing firms can afford the latest technology. 3.10 3.11 -0.32 Almost equal
…there are adequate government subsidies for new and growing firms to acquire new technology. 2.35 2.53 -7.11 Negative
…the science and technology base efficiently supports the creation of world-class new technology-based ventures in at least one area. 3.44 2.97 15.82 Positive
…there is good support available for engineers and scientists to have their ideas commercialized through new and growing firms. 2.79 3.05 -8.52 Negative
Commercial infrastructure and professional services condi-tion. Statement: In Saudi Arabia….
2017
average
2016
average
% change 2017/2016 Evolution sign
…there are enough subcontractors, suppliers and consultants to support new and growing firms. 3.65 4.28 -14.72 Negative
…new and growing firms can afford the cost of using subcontrac-tors, suppliers and consultants. 3.00 3.31 -9.37 Negative
…it is easy for new and growing firms to obtain good subcontrac-tors, suppliers and consultants. 2.95 3.34 -11.68 Negative
…it is easy for new and growing firms to obtain good professional, legal and accounting services. 3.10 3.85 -19.48 Negative
…it is easy for new and growing firms to obtain good banking services (checking accounts, foreign-exchange transactions, letters of credit, etc.).
3.67 4.62 -20.56 Negative
Internal market dynamics and burdens condition. Statement: In Saudi Arabia….
2017
average
2016
average
% change 2017/2016 Evolution sign
…the markets for consumer goods and services change dramatical-ly from year to year. 5.64 4.82 17.01 Positive
…the markets for business-to-business goods and services change dramatically from year to year. 5.26 4.83 8.90 Positive
…new and growing firms can easily enter new markets. 4.13 4.59 -10.02 Negative
…new and growing firms can afford the cost of market entry. 3.98 4.34 -8.29 Negative
…new and growing firms can enter markets without being unfairly blocked by established firms. 3.84 3.70 3.78 Positive
…the antitrust legislation is effective and well enforced. 3.30 2.94 12.24 Positive
Physical infrastructure and services condition. Statement: In Saudi Arabia….
2017
average
2016
average
% change 2017/2016 Evolution sign
…the physical infrastructure (roads, utilities, communications, waste disposal, etc.) provides good support for new and growing firms.
5.34 5.45 -2.02 Negative
…it is not too expensive for a new or growing firm to gain good access to communications (phone, internet, etc.). 5.64 6.67 -15.44 Negative
…a new or growing firm can gain good access to communications (phone, internet, etc.) in about a week. 5.84 7.00 -16.57 Negative
…new and growing firms can afford the cost of basic utilities (gas, water, electricity, sewers). 6.00 7.46 -19.57 Negative
…new or growing firms can gain good access to utilities (gas, water, electricity, sewers) in about a month. 5.76 7.13 -19.21 Negative
Cultural and social norms condition. Statement: In Saudi Arabia….
2017
average
2016
average
% change 2017/2016 Evolution sign
…the national culture is highly supportive of individual success achieved through own personal efforts. 5.55 5.77 -3.81 Negative
…the national culture emphasizes self-sufficiency, autonomy and personal initiative. 5.05 5.11 -1.17 Negative
…the national culture encourages entrepreneurial risk-taking. 4.53 4.36 3.90 Positive
…the national culture encourages creativity and innovation. 4.85 4.10 18.29 Positive
…the national culture emphasizes the responsibility that the indi-vidual (rather than the collective) has in managing their own life. 4.82 4.21 14.49 Positive
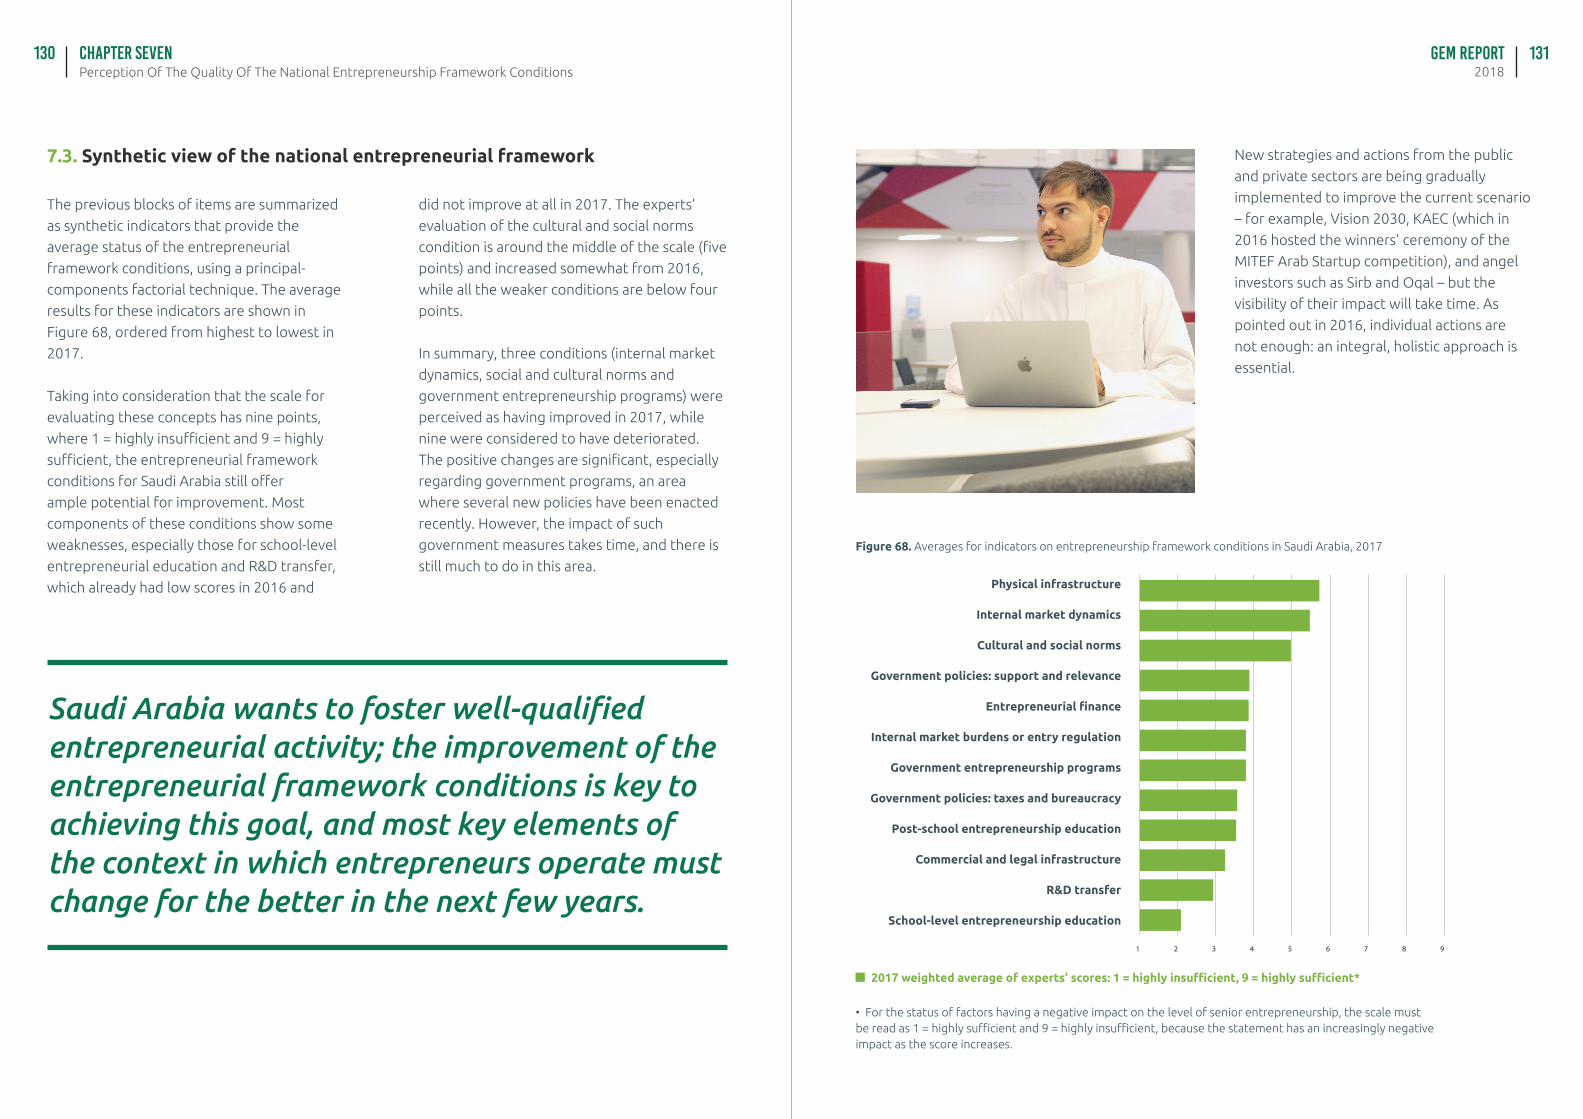
GEM Report2018Perception Of The Quality Of The National Entrepreneurship Framework Conditions
Chapter seven130 131
The previous blocks of items are summarized
as synthetic indicators that provide the
average status of the entrepreneurial
framework conditions, using a principal-
components factorial technique. The average
results for these indicators are shown in
Figure 68, ordered from highest to lowest in
2017.
Taking into consideration that the scale for
evaluating these concepts has nine points,
where 1 = highly insufficient and 9 = highly
sufficient, the entrepreneurial framework
conditions for Saudi Arabia still offer
ample potential for improvement. Most
components of these conditions show some
weaknesses, especially those for school-level
entrepreneurial education and R&D transfer,
which already had low scores in 2016 and
did not improve at all in 2017. The experts’
evaluation of the cultural and social norms
condition is around the middle of the scale (five
points) and increased somewhat from 2016,
while all the weaker conditions are below four
points.
In summary, three conditions (internal market
dynamics, social and cultural norms and
government entrepreneurship programs) were
perceived as having improved in 2017, while
nine were considered to have deteriorated.
The positive changes are significant, especially
regarding government programs, an area
where several new policies have been enacted
recently. However, the impact of such
government measures takes time, and there is
still much to do in this area.
Saudi Arabia wants to foster well-qualified entrepreneurial activity; the improvement of the entrepreneurial framework conditions is key to achieving this goal, and most key elements of the context in which entrepreneurs operate must change for the better in the next few years.
7.3. Synthetic view of the national entrepreneurial framework
Figure 68. Averages for indicators on entrepreneurship framework conditions in Saudi Arabia, 2017
1 2 3 4 5 6 7 8 9
Physical infrastructure
Internal market dynamics
Cultural and social norms
Government policies: support and relevance
Entrepreneurial finance
Internal market burdens or entry regulation
Government entrepreneurship programs
Government policies: taxes and bureaucracy
Post-school entrepreneurship education
Commercial and legal infrastructure
R&D transfer
School-level entrepreneurship education
2017 weighted average of experts’ scores: 1 = highly insufficient, 9 = highly sufficient*
• For the status of factors having a negative impact on the level of senior entrepreneurship, the scale must be read as 1 = highly sufficient and 9 = highly insufficient, because the statement has an increasingly negative impact as the score increases.
New strategies and actions from the public
and private sectors are being gradually
implemented to improve the current scenario
– for example, Vision 2030, KAEC (which in
2016 hosted the winners’ ceremony of the
MITEF Arab Startup competition), and angel
investors such as Sirb and Oqal – but the
visibility of their impact will take time. As
pointed out in 2016, individual actions are
not enough: an integral, holistic approach is
essential.
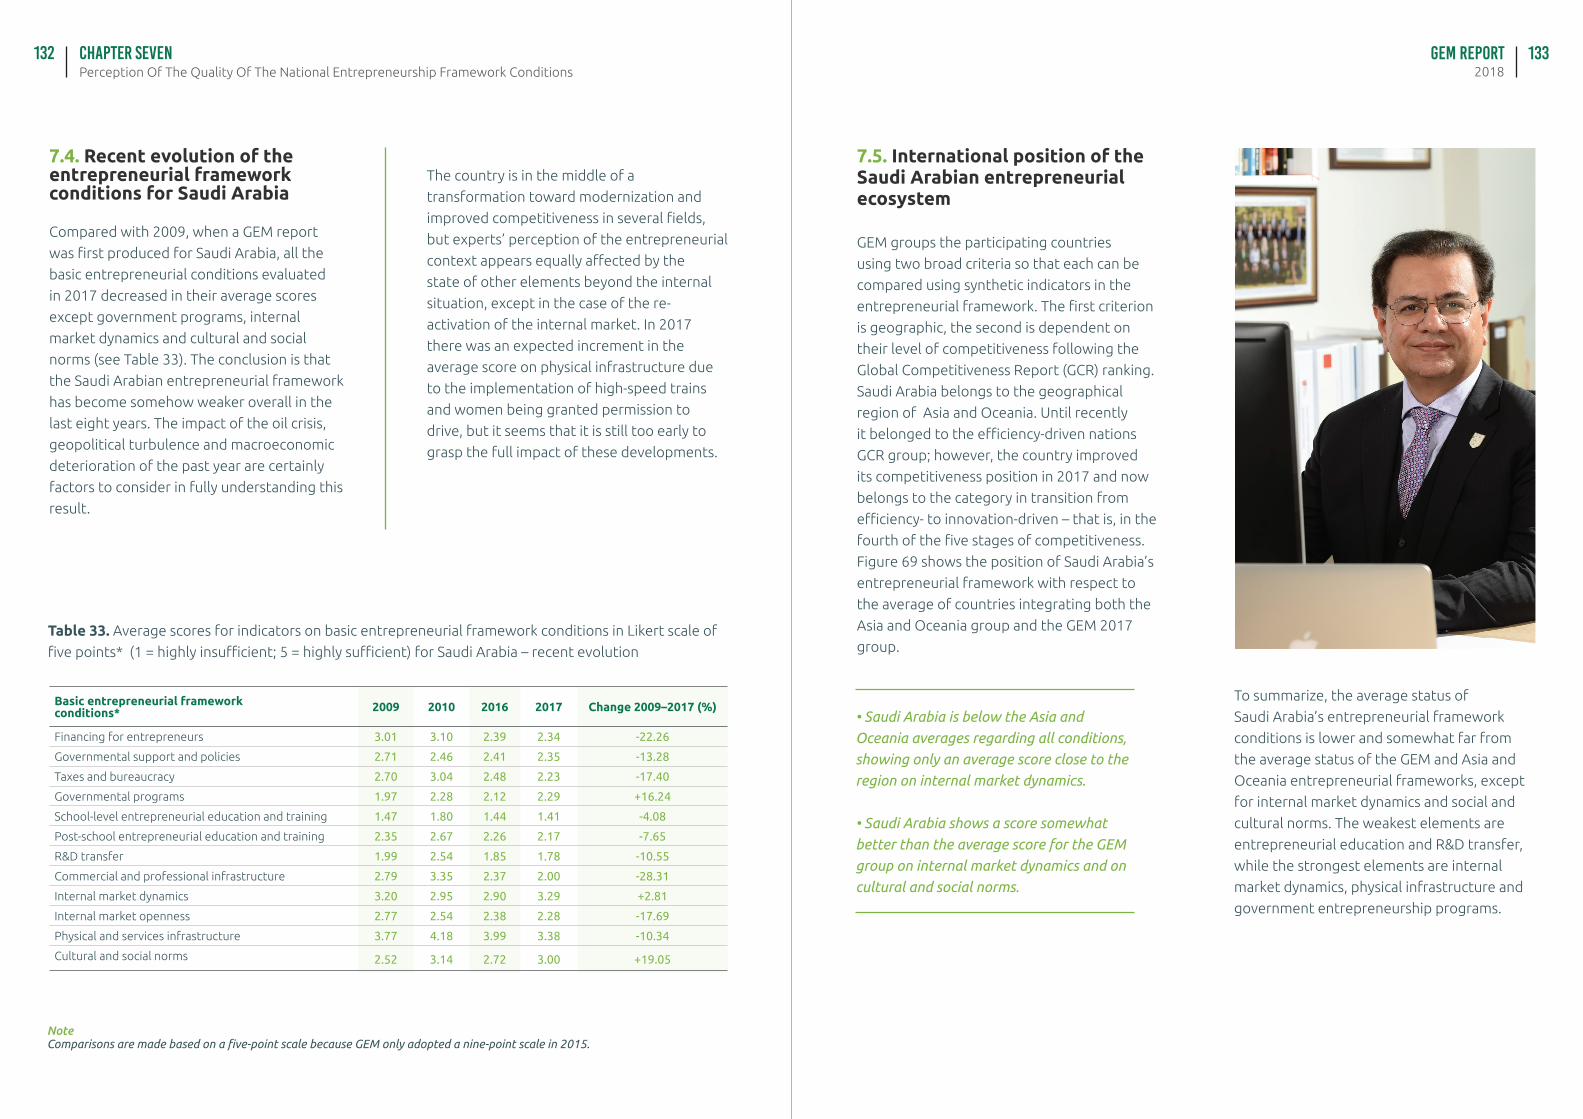
GEM Report2018Perception Of The Quality Of The National Entrepreneurship Framework Conditions
Chapter seven132 133
7.4. Recent evolution of the entrepreneurial framework conditions for Saudi Arabia
Compared with 2009, when a GEM report
was first produced for Saudi Arabia, all the
basic entrepreneurial conditions evaluated
in 2017 decreased in their average scores
except government programs, internal
market dynamics and cultural and social
norms (see Table 33). The conclusion is that
the Saudi Arabian entrepreneurial framework
has become somehow weaker overall in the
last eight years. The impact of the oil crisis,
geopolitical turbulence and macroeconomic
deterioration of the past year are certainly
factors to consider in fully understanding this
result.
Table 33. Average scores for indicators on basic entrepreneurial framework conditions in Likert scale of
five points* (1 = highly insufficient; 5 = highly sufficient) for Saudi Arabia – recent evolution
The country is in the middle of a
transformation toward modernization and
improved competitiveness in several fields,
but experts’ perception of the entrepreneurial
context appears equally affected by the
state of other elements beyond the internal
situation, except in the case of the re-
activation of the internal market. In 2017
there was an expected increment in the
average score on physical infrastructure due
to the implementation of high-speed trains
and women being granted permission to
drive, but it seems that it is still too early to
grasp the full impact of these developments.
Basic entrepreneurial framework conditions* 2009 2010 2016 2017 Change 2009–2017 (%)
Financing for entrepreneurs 3.01 3.10 2.39 2.34 -22.26
Governmental support and policies 2.71 2.46 2.41 2.35 -13.28
Taxes and bureaucracy 2.70 3.04 2.48 2.23 -17.40
Governmental programs 1.97 2.28 2.12 2.29 +16.24
School-level entrepreneurial education and training 1.47 1.80 1.44 1.41 -4.08
Post-school entrepreneurial education and training 2.35 2.67 2.26 2.17 -7.65
R&D transfer 1.99 2.54 1.85 1.78 -10.55
Commercial and professional infrastructure 2.79 3.35 2.37 2.00 -28.31
Internal market dynamics 3.20 2.95 2.90 3.29 +2.81
Internal market openness 2.77 2.54 2.38 2.28 -17.69
Physical and services infrastructure 3.77 4.18 3.99 3.38 -10.34
Cultural and social norms 2.52 3.14 2.72 3.00 +19.05
NoteComparisons are made based on a five-point scale because GEM only adopted a nine-point scale in 2015.
7.5. International position of the Saudi Arabian entrepreneurial ecosystem
GEM groups the participating countries
using two broad criteria so that each can be
compared using synthetic indicators in the
entrepreneurial framework. The first criterion
is geographic, the second is dependent on
their level of competitiveness following the
Global Competitiveness Report (GCR) ranking.
Saudi Arabia belongs to the geographical
region of Asia and Oceania. Until recently
it belonged to the efficiency-driven nations
GCR group; however, the country improved
its competitiveness position in 2017 and now
belongs to the category in transition from
efficiency- to innovation-driven – that is, in the
fourth of the five stages of competitiveness.
Figure 69 shows the position of Saudi Arabia’s
entrepreneurial framework with respect to
the average of countries integrating both the
Asia and Oceania group and the GEM 2017
group.
To summarize, the average status of
Saudi Arabia’s entrepreneurial framework
conditions is lower and somewhat far from
the average status of the GEM and Asia and
Oceania entrepreneurial frameworks, except
for internal market dynamics and social and
cultural norms. The weakest elements are
entrepreneurial education and R&D transfer,
while the strongest elements are internal
market dynamics, physical infrastructure and
government entrepreneurship programs.
• Saudi Arabia is below the Asia and
Oceania averages regarding all conditions,
showing only an average score close to the
region on internal market dynamics.
• Saudi Arabia shows a score somewhat
better than the average score for the GEM
group on internal market dynamics and on
cultural and social norms.
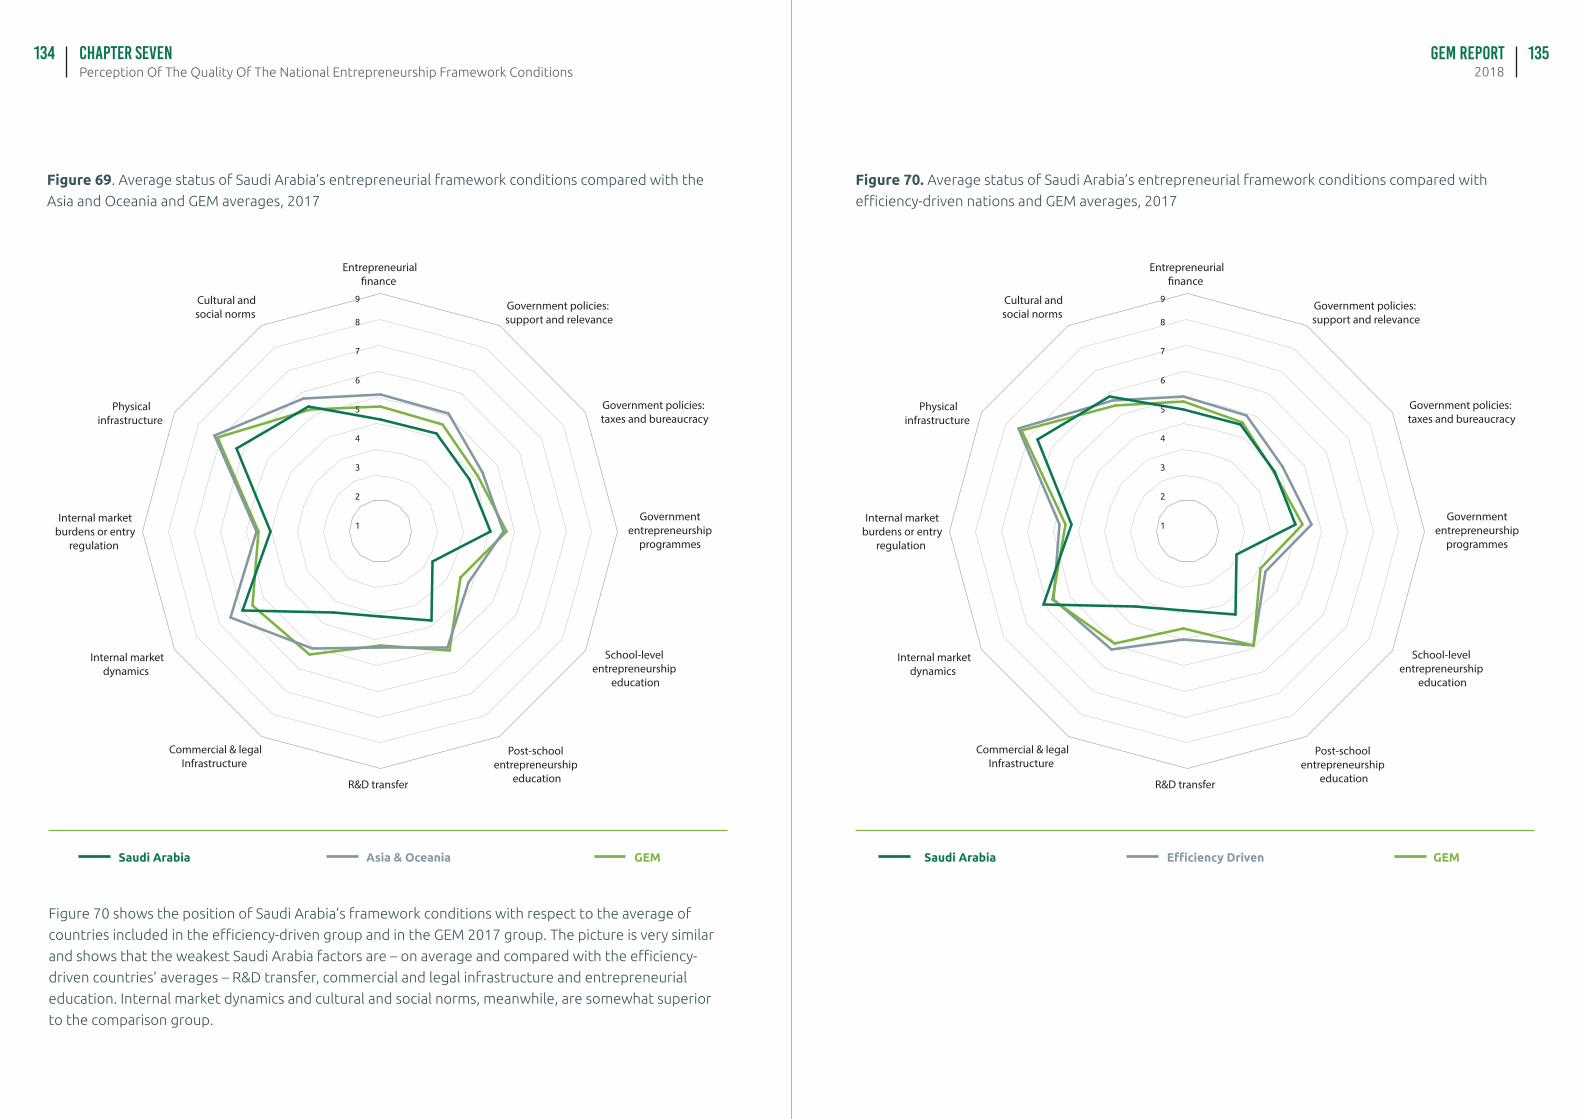
GEM Report2018Perception Of The Quality Of The National Entrepreneurship Framework Conditions
Chapter seven134 135
Figure 69. Average status of Saudi Arabia’s entrepreneurial framework conditions compared with the
Asia and Oceania and GEM averages, 2017
Cultural andsocial norms
Physicalinfrastructure
Internal market burdens or entry
regulation
Internal marketdynamics
Commercial & legalInfrastructure
R&D transfer
Post-school entrepreneurship
education
School-level entrepreneurship
education
Government entrepreneurship
programmes
Government policies: taxes and bureaucracy
Government policies: support and relevance
Entrepreneurial�nance
1
2
3
4
5
6
7
8
9
Figure 70 shows the position of Saudi Arabia’s framework conditions with respect to the average of
countries included in the efficiency-driven group and in the GEM 2017 group. The picture is very similar
and shows that the weakest Saudi Arabia factors are – on average and compared with the efficiency-
driven countries’ averages – R&D transfer, commercial and legal infrastructure and entrepreneurial
education. Internal market dynamics and cultural and social norms, meanwhile, are somewhat superior
to the comparison group.
Saudi Arabia Asia & Oceania GEM
Cultural andsocial norms
Physicalinfrastructure
Internal market burdens or entry
regulation
Internal marketdynamics
Commercial & legalInfrastructure
R&D transfer
Post-school entrepreneurship
education
School-level entrepreneurship
education
Government entrepreneurship
programmes
Government policies: taxes and bureaucracy
Government policies: support and relevance
Entrepreneurial�nance
1
2
3
4
5
6
7
8
9
Figure 70. Average status of Saudi Arabia’s entrepreneurial framework conditions compared with
efficiency-driven nations and GEM averages, 2017
Saudi Arabia Efficiency Driven GEM
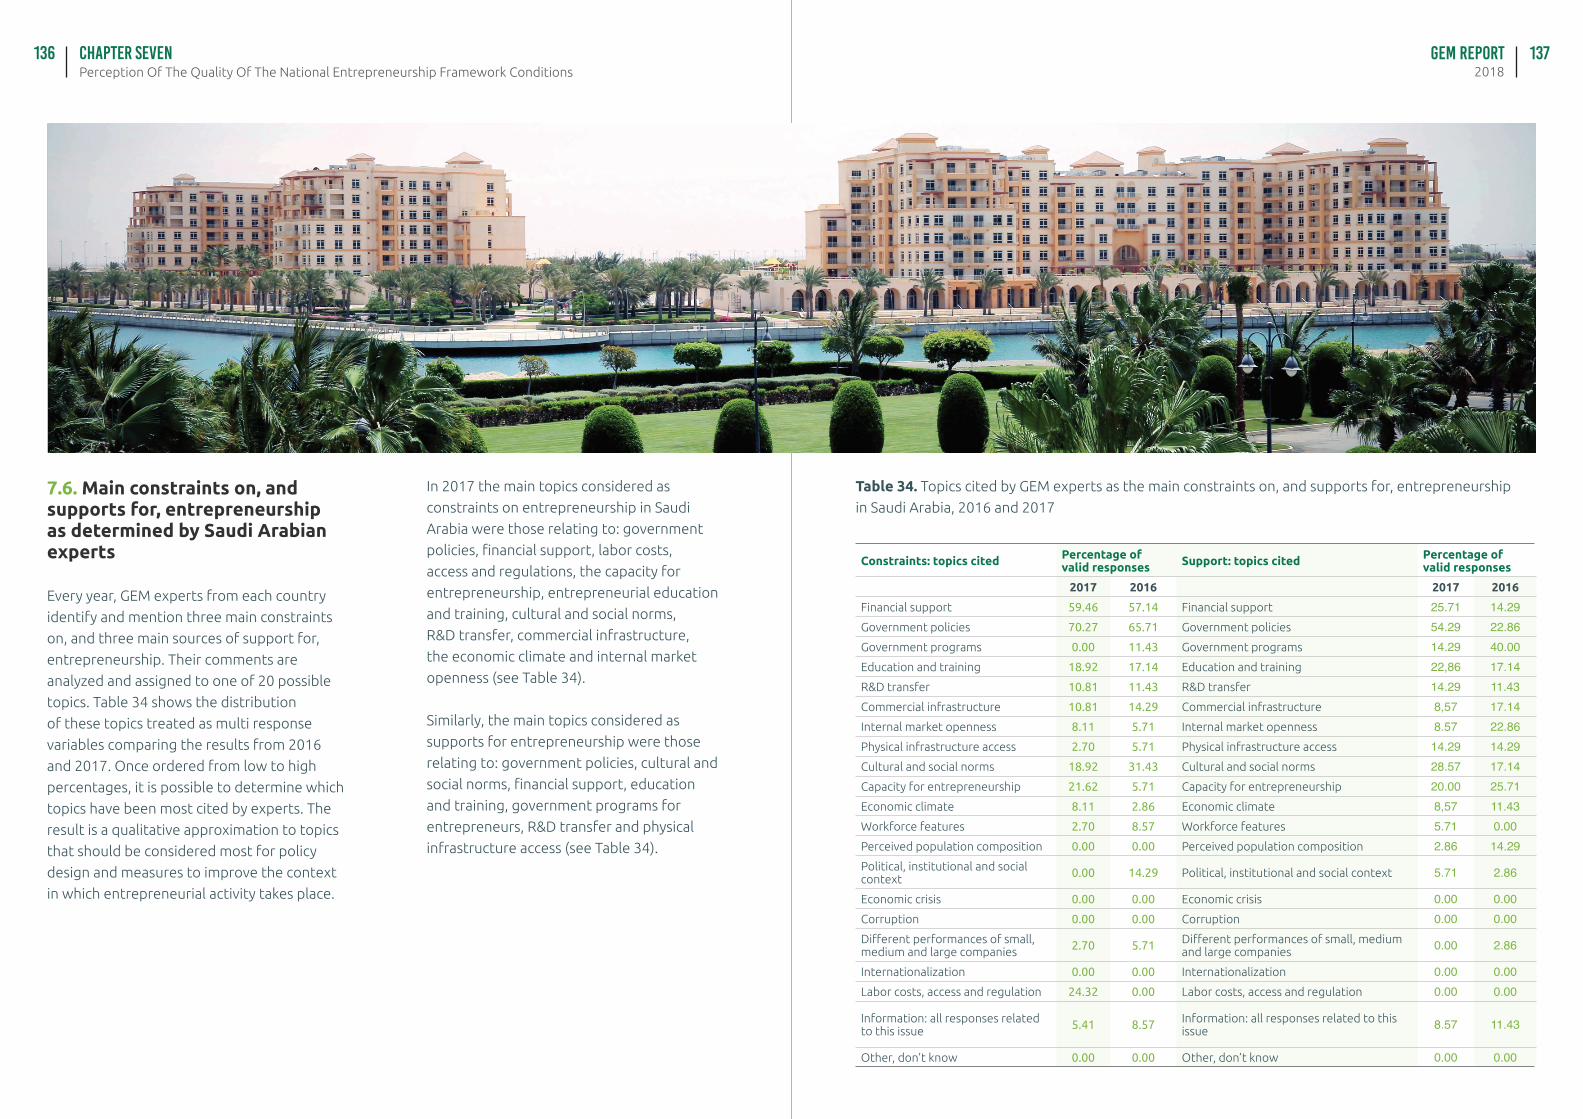
GEM Report2018Perception Of The Quality Of The National Entrepreneurship Framework Conditions
Chapter seven136 137
7.6. Main constraints on, and supports for, entrepreneurship as determined by Saudi Arabian experts
Every year, GEM experts from each country
identify and mention three main constraints
on, and three main sources of support for,
entrepreneurship. Their comments are
analyzed and assigned to one of 20 possible
topics. Table 34 shows the distribution
of these topics treated as multi response
variables comparing the results from 2016
and 2017. Once ordered from low to high
percentages, it is possible to determine which
topics have been most cited by experts. The
result is a qualitative approximation to topics
that should be considered most for policy
design and measures to improve the context
in which entrepreneurial activity takes place.
In 2017 the main topics considered as
constraints on entrepreneurship in Saudi
Arabia were those relating to: government
policies, financial support, labor costs,
access and regulations, the capacity for
entrepreneurship, entrepreneurial education
and training, cultural and social norms,
R&D transfer, commercial infrastructure,
the economic climate and internal market
openness (see Table 34).
Similarly, the main topics considered as
supports for entrepreneurship were those
relating to: government policies, cultural and
social norms, financial support, education
and training, government programs for
entrepreneurs, R&D transfer and physical
infrastructure access (see Table 34).
Table 34. Topics cited by GEM experts as the main constraints on, and supports for, entrepreneurship
in Saudi Arabia, 2016 and 2017
Constraints: topics cited Percentage of valid responses Support: topics cited Percentage of
valid responses
2017 2016 2017 2016
Financial support 59.46 57.14 Financial support 25.71 14.29Government policies 70.27 65.71 Government policies 54.29 22.86Government programs 0.00 11.43 Government programs 14.29 40.00Education and training 18.92 17.14 Education and training 22,86 17.14R&D transfer 10.81 11.43 R&D transfer 14.29 11.43Commercial infrastructure 10.81 14.29 Commercial infrastructure 8,57 17.14Internal market openness 8.11 5.71 Internal market openness 8.57 22.86Physical infrastructure access 2.70 5.71 Physical infrastructure access 14.29 14.29Cultural and social norms 18.92 31.43 Cultural and social norms 28.57 17.14Capacity for entrepreneurship 21.62 5.71 Capacity for entrepreneurship 20.00 25.71Economic climate 8.11 2.86 Economic climate 8,57 11.43Workforce features 2.70 8.57 Workforce features 5.71 0.00Perceived population composition 0.00 0.00 Perceived population composition 2.86 14.29Political, institutional and social context 0.00 14.29 Political, institutional and social context 5.71 2.86
Economic crisis 0.00 0.00 Economic crisis 0.00 0.00Corruption 0.00 0.00 Corruption 0.00 0.00Different performances of small, medium and large companies 2.70 5.71 Different performances of small, medium
and large companies 0.00 2.86
Internationalization 0.00 0.00 Internationalization 0.00 0.00Labor costs, access and regulation 24.32 0.00 Labor costs, access and regulation 0.00 0.00
Information: all responses related to this issue 5.41 8.57 Information: all responses related to this
issue 8.57 11.43
Other, don’t know 0.00 0.00 Other, don’t know 0.00 0.00
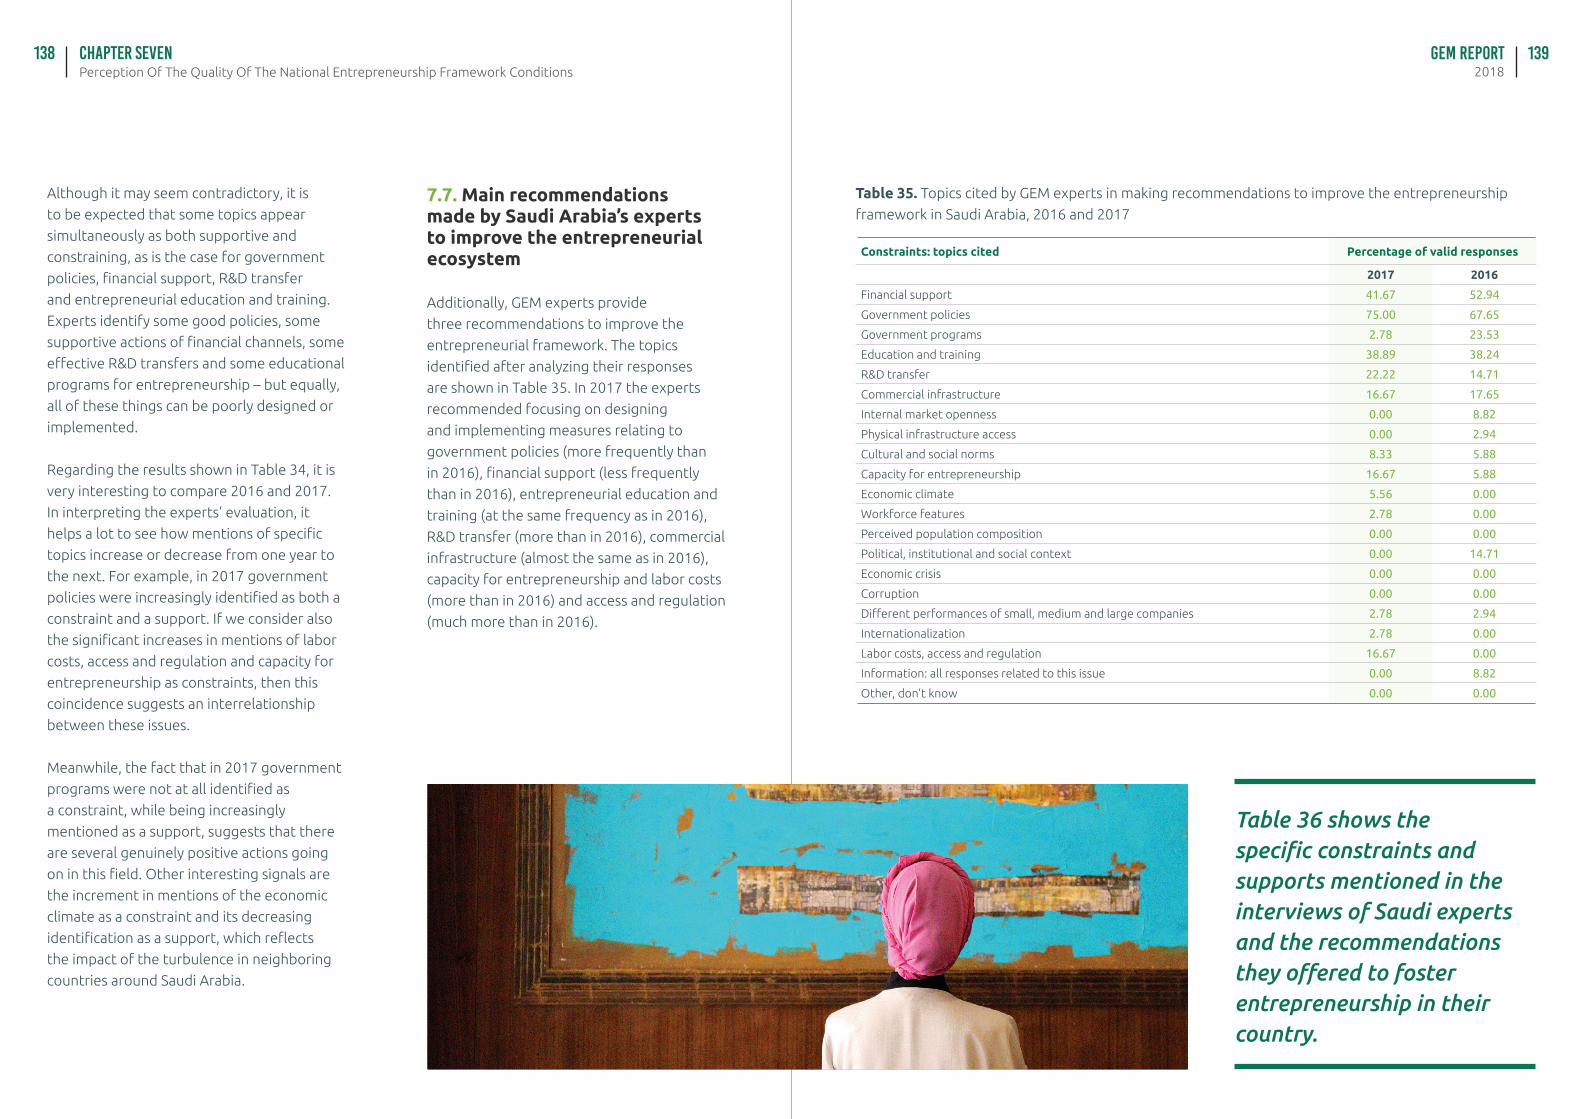
GEM Report2018Perception Of The Quality Of The National Entrepreneurship Framework Conditions
Chapter seven138 139
Although it may seem contradictory, it is
to be expected that some topics appear
simultaneously as both supportive and
constraining, as is the case for government
policies, financial support, R&D transfer
and entrepreneurial education and training.
Experts identify some good policies, some
supportive actions of financial channels, some
effective R&D transfers and some educational
programs for entrepreneurship – but equally,
all of these things can be poorly designed or
implemented.
Regarding the results shown in Table 34, it is
very interesting to compare 2016 and 2017.
In interpreting the experts’ evaluation, it
helps a lot to see how mentions of specific
topics increase or decrease from one year to
the next. For example, in 2017 government
policies were increasingly identified as both a
constraint and a support. If we consider also
the significant increases in mentions of labor
costs, access and regulation and capacity for
entrepreneurship as constraints, then this
coincidence suggests an interrelationship
between these issues.
Meanwhile, the fact that in 2017 government
programs were not at all identified as
a constraint, while being increasingly
mentioned as a support, suggests that there
are several genuinely positive actions going
on in this field. Other interesting signals are
the increment in mentions of the economic
climate as a constraint and its decreasing
identification as a support, which reflects
the impact of the turbulence in neighboring
countries around Saudi Arabia.
7.7. Main recommendations made by Saudi Arabia’s experts to improve the entrepreneurial ecosystem
Additionally, GEM experts provide
three recommendations to improve the
entrepreneurial framework. The topics
identified after analyzing their responses
are shown in Table 35. In 2017 the experts
recommended focusing on designing
and implementing measures relating to
government policies (more frequently than
in 2016), financial support (less frequently
than in 2016), entrepreneurial education and
training (at the same frequency as in 2016),
R&D transfer (more than in 2016), commercial
infrastructure (almost the same as in 2016),
capacity for entrepreneurship and labor costs
(more than in 2016) and access and regulation
(much more than in 2016).
Table 35. Topics cited by GEM experts in making recommendations to improve the entrepreneurship
framework in Saudi Arabia, 2016 and 2017
Constraints: topics cited Percentage of valid responses
2017 2016
Financial support 41.67 52.94
Government policies 75.00 67.65
Government programs 2.78 23.53
Education and training 38.89 38.24
R&D transfer 22.22 14.71
Commercial infrastructure 16.67 17.65
Internal market openness 0.00 8.82
Physical infrastructure access 0.00 2.94
Cultural and social norms 8.33 5.88
Capacity for entrepreneurship 16.67 5.88
Economic climate 5.56 0.00
Workforce features 2.78 0.00
Perceived population composition 0.00 0.00
Political, institutional and social context 0.00 14.71
Economic crisis 0.00 0.00
Corruption 0.00 0.00
Different performances of small, medium and large companies 2.78 2.94
Internationalization 2.78 0.00
Labor costs, access and regulation 16.67 0.00
Information: all responses related to this issue 0.00 8.82
Other, don’t know 0.00 0.00
Table 36 shows the specific constraints and supports mentioned in the interviews of Saudi experts and the recommendations they offered to foster entrepreneurship in their country.
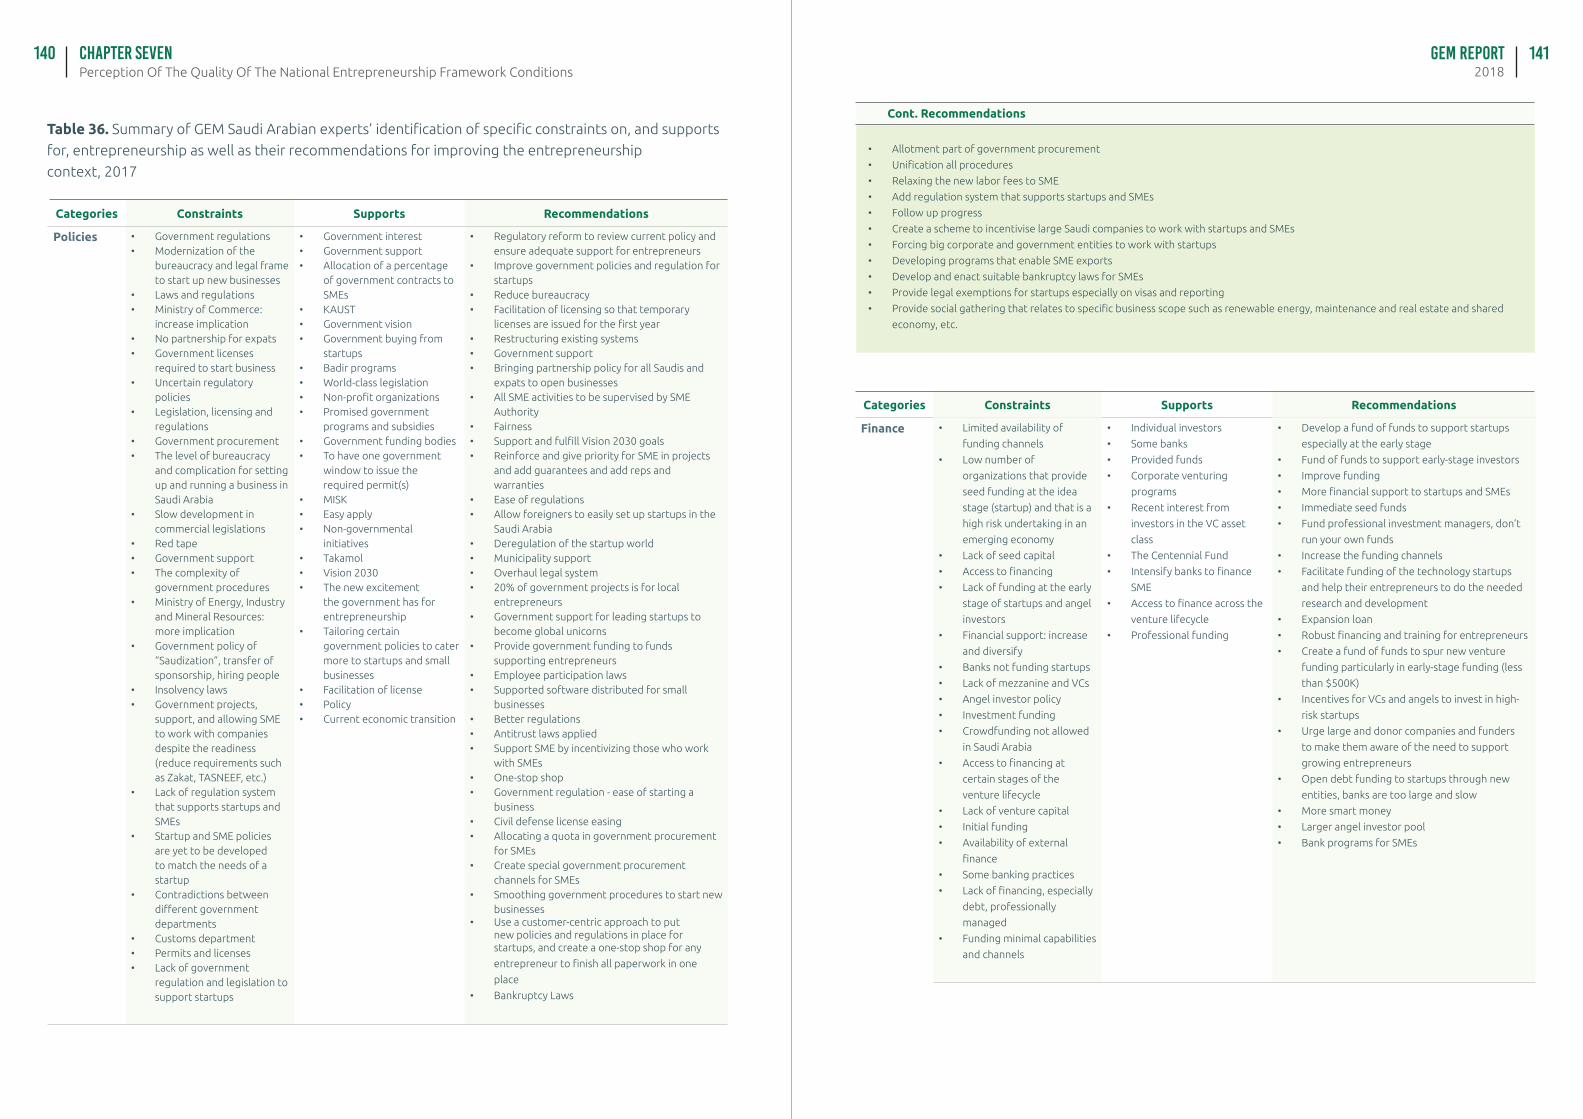
GEM Report2018Perception Of The Quality Of The National Entrepreneurship Framework Conditions
Chapter seven140 141
Table 36. Summary of GEM Saudi Arabian experts’ identification of specific constraints on, and supports
for, entrepreneurship as well as their recommendations for improving the entrepreneurship
context, 2017
Categories Constraints Supports Recommendations
Policies • Government regulations• Modernization of the
bureaucracy and legal frame to start up new businesses
• Laws and regulations• Ministry of Commerce:
increase implication• No partnership for expats• Government licenses
required to start business• Uncertain regulatory
policies• Legislation, licensing and
regulations• Government procurement• The level of bureaucracy
and complication for setting up and running a business in Saudi Arabia
• Slow development in commercial legislations
• Red tape• Government support• The complexity of
government procedures• Ministry of Energy, Industry
and Mineral Resources: more implication
• Government policy of “Saudization”, transfer of sponsorship, hiring people
• Insolvency laws• Government projects,
support, and allowing SME to work with companies despite the readiness (reduce requirements such as Zakat, TASNEEF, etc.)
• Lack of regulation system that supports startups and SMEs
• Startup and SME policies are yet to be developed to match the needs of a startup
• Contradictions between different government departments
• Customs department• Permits and licenses• Lack of government
regulation and legislation to support startups
• Government interest• Government support• Allocation of a percentage
of government contracts to SMEs
• KAUST• Government vision• Government buying from
startups• Badir programs• World-class legislation• Non-profit organizations• Promised government
programs and subsidies• Government funding bodies• To have one government
window to issue the required permit(s)
• MISK• Easy apply• Non-governmental
initiatives• Takamol• Vision 2030• The new excitement
the government has for entrepreneurship
• Tailoring certain government policies to cater more to startups and small businesses
• Facilitation of license• Policy• Current economic transition
• Regulatory reform to review current policy and ensure adequate support for entrepreneurs
• Improve government policies and regulation for startups
• Reduce bureaucracy• Facilitation of licensing so that temporary
licenses are issued for the first year• Restructuring existing systems• Government support• Bringing partnership policy for all Saudis and
expats to open businesses• All SME activities to be supervised by SME
Authority• Fairness• Support and fulfill Vision 2030 goals• Reinforce and give priority for SME in projects
and add guarantees and add reps and warranties
• Ease of regulations• Allow foreigners to easily set up startups in the
Saudi Arabia• Deregulation of the startup world• Municipality support• Overhaul legal system• 20% of government projects is for local
entrepreneurs• Government support for leading startups to
become global unicorns• Provide government funding to funds
supporting entrepreneurs• Employee participation laws• Supported software distributed for small
businesses• Better regulations• Antitrust laws applied• Support SME by incentivizing those who work
with SMEs• One-stop shop• Government regulation - ease of starting a
business• Civil defense license easing• Allocating a quota in government procurement
for SMEs• Create special government procurement
channels for SMEs• Smoothing government procedures to start new
businesses• Use a customer-centric approach to put
new policies and regulations in place for startups, and create a one-stop shop for any
entrepreneur to finish all paperwork in one
place
• Bankruptcy Laws
• Allotment part of government procurement
• Unification all procedures
• Relaxing the new labor fees to SME
• Add regulation system that supports startups and SMEs
• Follow up progress
• Create a scheme to incentivise large Saudi companies to work with startups and SMEs
• Forcing big corporate and government entities to work with startups
• Developing programs that enable SME exports
• Develop and enact suitable bankruptcy laws for SMEs
• Provide legal exemptions for startups especially on visas and reporting
• Provide social gathering that relates to specific business scope such as renewable energy, maintenance and real estate and shared
economy, etc.
Finance • Limited availability of
funding channels
• Low number of
organizations that provide
seed funding at the idea
stage (startup) and that is a
high risk undertaking in an
emerging economy
• Lack of seed capital
• Access to financing
• Lack of funding at the early
stage of startups and angel
investors
• Financial support: increase
and diversify
• Banks not funding startups
• Lack of mezzanine and VCs
• Angel investor policy
• Investment funding
• Crowdfunding not allowed
in Saudi Arabia
• Access to financing at
certain stages of the
venture lifecycle
• Lack of venture capital
• Initial funding
• Availability of external
finance
• Some banking practices
• Lack of financing, especially
debt, professionally
managed
• Funding minimal capabilities
and channels
• Individual investors
• Some banks
• Provided funds
• Corporate venturing
programs
• Recent interest from
investors in the VC asset
class
• The Centennial Fund
• Intensify banks to finance
SME
• Access to finance across the
venture lifecycle
• Professional funding
• Develop a fund of funds to support startups
especially at the early stage
• Fund of funds to support early-stage investors
• Improve funding
• More financial support to startups and SMEs
• Immediate seed funds
• Fund professional investment managers, don’t
run your own funds
• Increase the funding channels
• Facilitate funding of the technology startups
and help their entrepreneurs to do the needed
research and development
• Expansion loan
• Robust financing and training for entrepreneurs
• Create a fund of funds to spur new venture
funding particularly in early-stage funding (less
than $500K)
• Incentives for VCs and angels to invest in high-
risk startups
• Urge large and donor companies and funders
to make them aware of the need to support
growing entrepreneurs
• Open debt funding to startups through new
entities, banks are too large and slow
• More smart money
• Larger angel investor pool
• Bank programs for SMEs
Cont. Recommendations
Categories Constraints Supports Recommendations
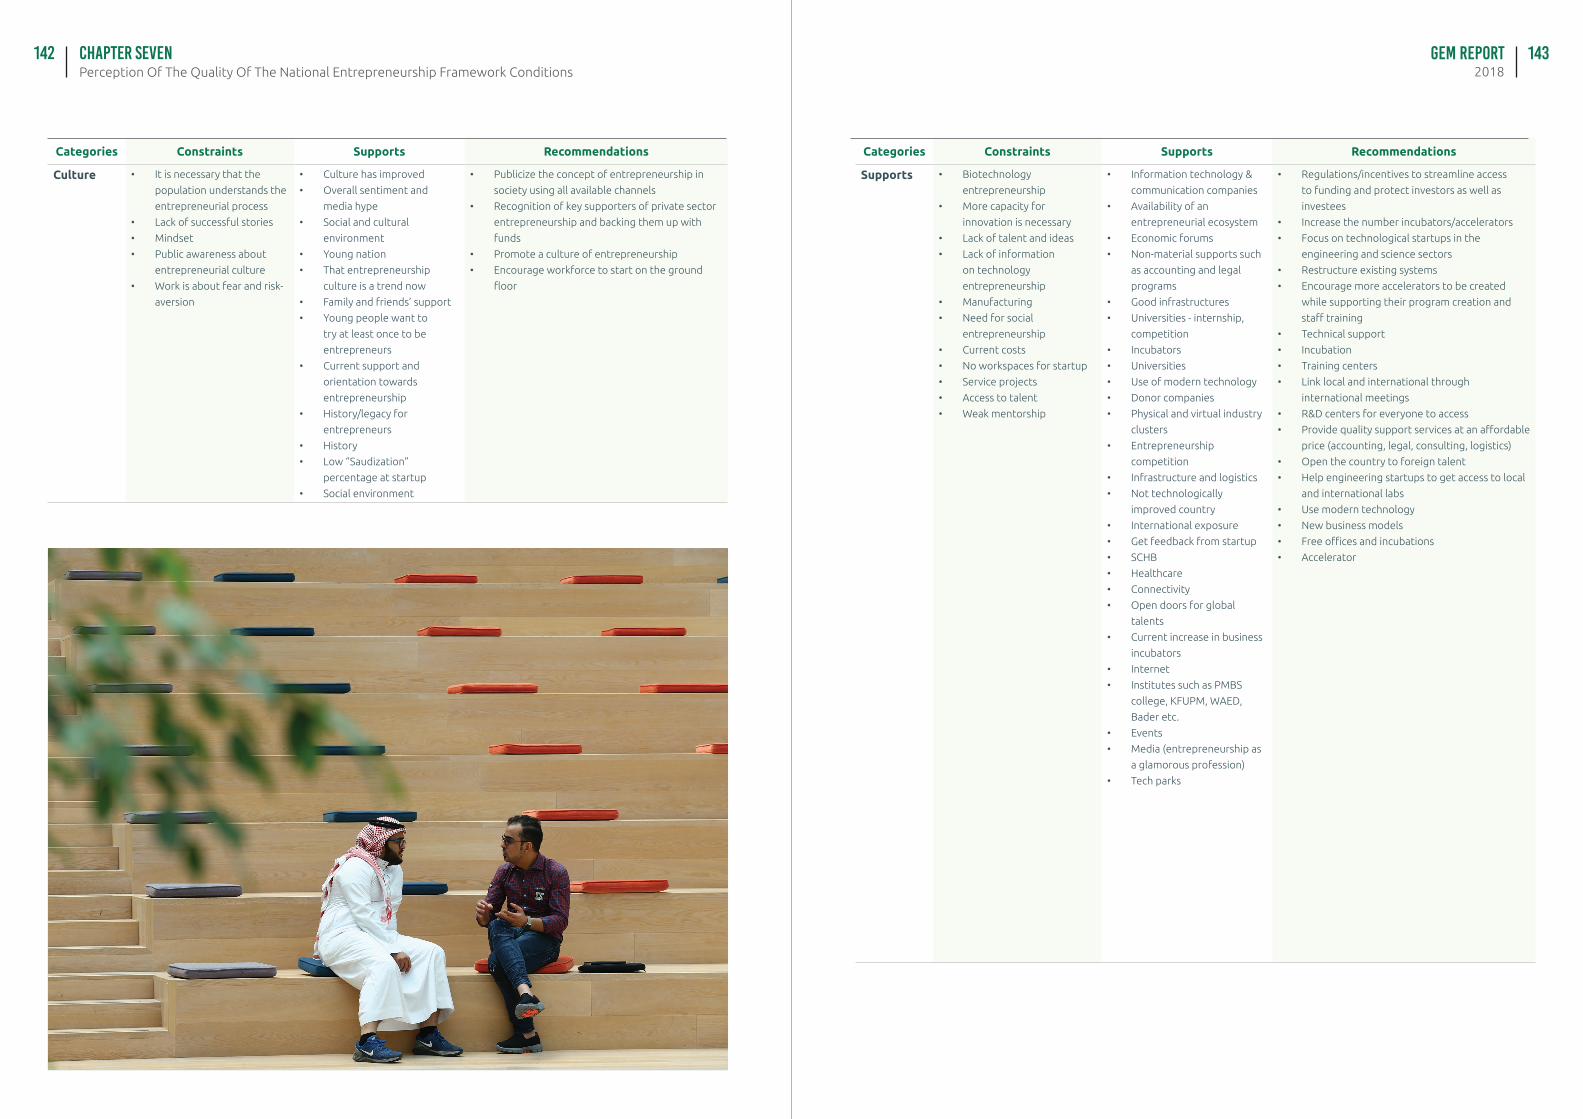
GEM Report2018Perception Of The Quality Of The National Entrepreneurship Framework Conditions
Chapter seven142 143
Culture • It is necessary that the
population understands the
entrepreneurial process
• Lack of successful stories
• Mindset
• Public awareness about
entrepreneurial culture
• Work is about fear and risk-
aversion
• Culture has improved
• Overall sentiment and
media hype
• Social and cultural
environment
• Young nation
• That entrepreneurship
culture is a trend now
• Family and friends’ support
• Young people want to
try at least once to be
entrepreneurs
• Current support and
orientation towards
entrepreneurship
• History/legacy for
entrepreneurs
• History
• Low “Saudization”
percentage at startup
• Social environment
• Publicize the concept of entrepreneurship in
society using all available channels
• Recognition of key supporters of private sector
entrepreneurship and backing them up with
funds
• Promote a culture of entrepreneurship
• Encourage workforce to start on the ground
floor
Supports • Biotechnology
entrepreneurship
• More capacity for
innovation is necessary
• Lack of talent and ideas
• Lack of information
on technology
entrepreneurship
• Manufacturing
• Need for social
entrepreneurship
• Current costs
• No workspaces for startup
• Service projects
• Access to talent
• Weak mentorship
• Information technology &
communication companies
• Availability of an
entrepreneurial ecosystem
• Economic forums
• Non-material supports such
as accounting and legal
programs
• Good infrastructures
• Universities - internship,
competition
• Incubators
• Universities
• Use of modern technology
• Donor companies
• Physical and virtual industry
clusters
• Entrepreneurship
competition
• Infrastructure and logistics
• Not technologically
improved country
• International exposure
• Get feedback from startup
• SCHB
• Healthcare
• Connectivity
• Open doors for global
talents
• Current increase in business
incubators
• Internet
• Institutes such as PMBS
college, KFUPM, WAED,
Bader etc.
• Events
• Media (entrepreneurship as
a glamorous profession)
• Tech parks
• Regulations/incentives to streamline access
to funding and protect investors as well as
investees
• Increase the number incubators/accelerators
• Focus on technological startups in the
engineering and science sectors
• Restructure existing systems
• Encourage more accelerators to be created
while supporting their program creation and
staff training
• Technical support
• Incubation
• Training centers
• Link local and international through
international meetings
• R&D centers for everyone to access
• Provide quality support services at an affordable
price (accounting, legal, consulting, logistics)
• Open the country to foreign talent
• Help engineering startups to get access to local
and international labs
• Use modern technology
• New business models
• Free offices and incubations
• Accelerator
Categories Constraints Supports Recommendations Categories Constraints Supports Recommendations
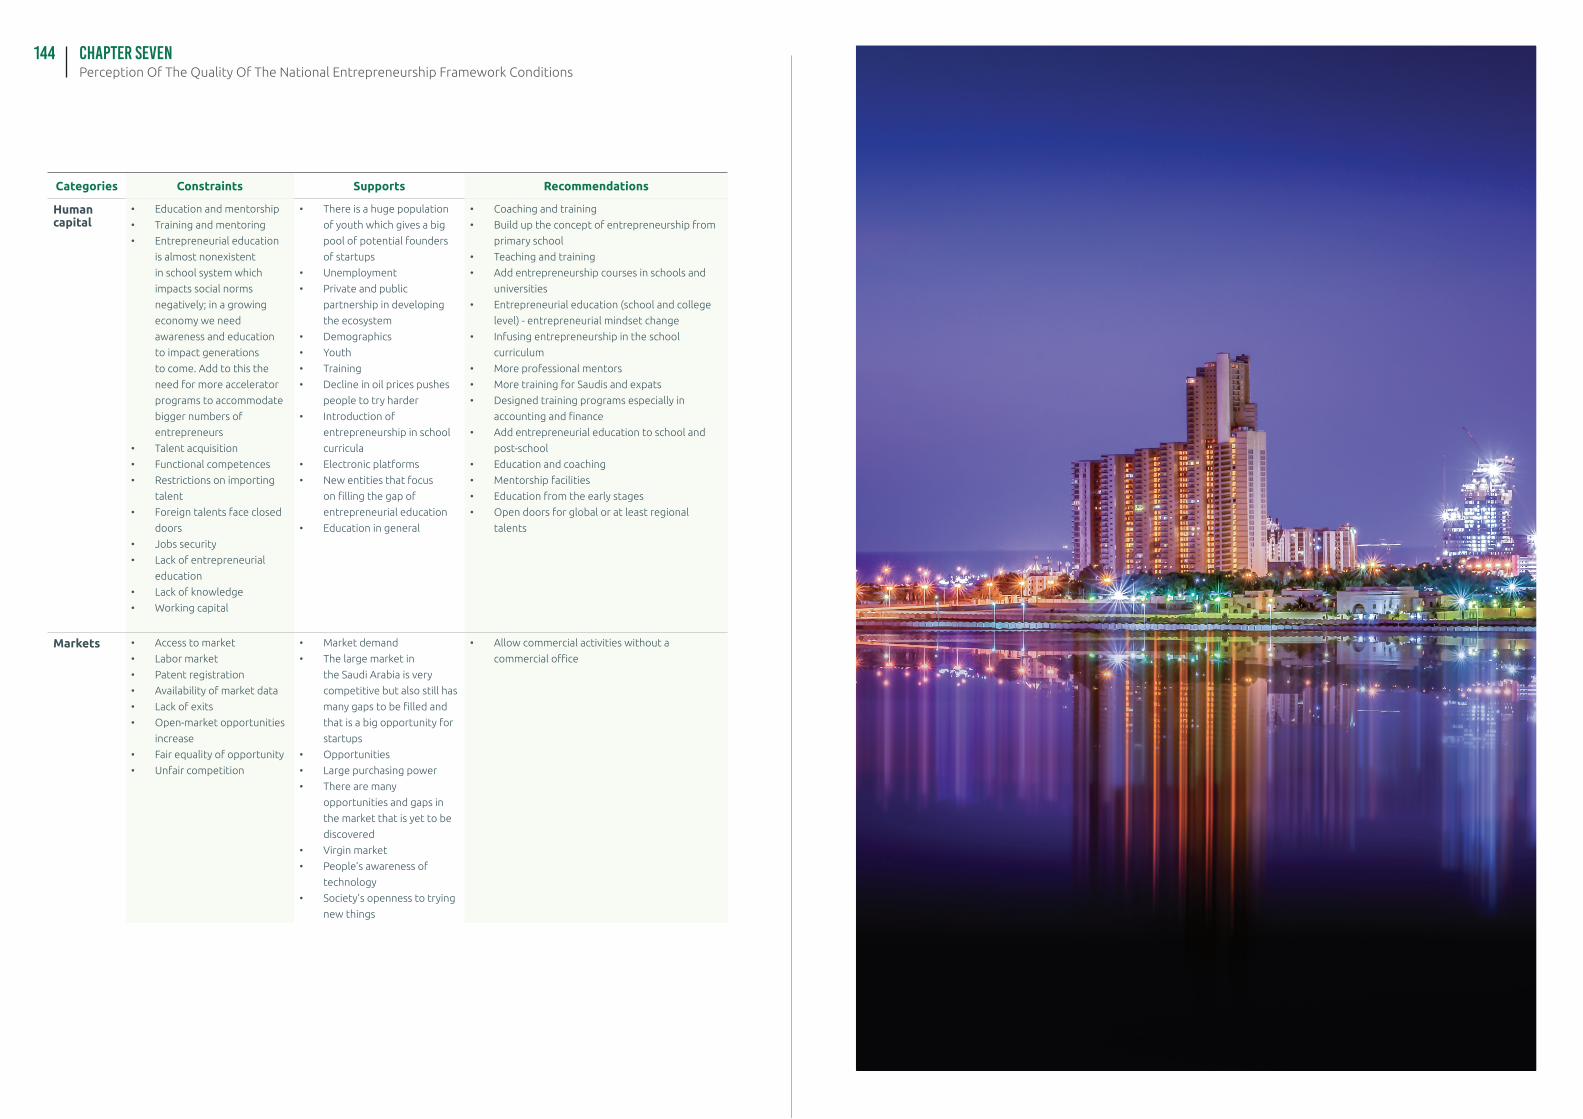
Perception Of The Quality Of The National Entrepreneurship Framework ConditionsChapter seven144
Human capital
• Education and mentorship
• Training and mentoring
• Entrepreneurial education
is almost nonexistent
in school system which
impacts social norms
negatively; in a growing
economy we need
awareness and education
to impact generations
to come. Add to this the
need for more accelerator
programs to accommodate
bigger numbers of
entrepreneurs
• Talent acquisition
• Functional competences
• Restrictions on importing
talent
• Foreign talents face closed
doors
• Jobs security
• Lack of entrepreneurial
education
• Lack of knowledge
• Working capital
• There is a huge population
of youth which gives a big
pool of potential founders
of startups
• Unemployment
• Private and public
partnership in developing
the ecosystem
• Demographics
• Youth
• Training
• Decline in oil prices pushes
people to try harder
• Introduction of
entrepreneurship in school
curricula
• Electronic platforms
• New entities that focus
on filling the gap of
entrepreneurial education
• Education in general
• Coaching and training
• Build up the concept of entrepreneurship from
primary school
• Teaching and training
• Add entrepreneurship courses in schools and
universities
• Entrepreneurial education (school and college
level) - entrepreneurial mindset change
• Infusing entrepreneurship in the school
curriculum
• More professional mentors
• More training for Saudis and expats
• Designed training programs especially in
accounting and finance
• Add entrepreneurial education to school and
post-school
• Education and coaching
• Mentorship facilities
• Education from the early stages
• Open doors for global or at least regional
talents
Markets • Access to market
• Labor market
• Patent registration
• Availability of market data
• Lack of exits
• Open-market opportunities
increase
• Fair equality of opportunity
• Unfair competition
• Market demand
• The large market in
the Saudi Arabia is very
competitive but also still has
many gaps to be filled and
that is a big opportunity for
startups
• Opportunities
• Large purchasing power
• There are many
opportunities and gaps in
the market that is yet to be
discovered
• Virgin market
• People’s awareness of
technology
• Society’s openness to trying
new things
• Allow commercial activities without a
commercial office
Categories Constraints Supports Recommendations
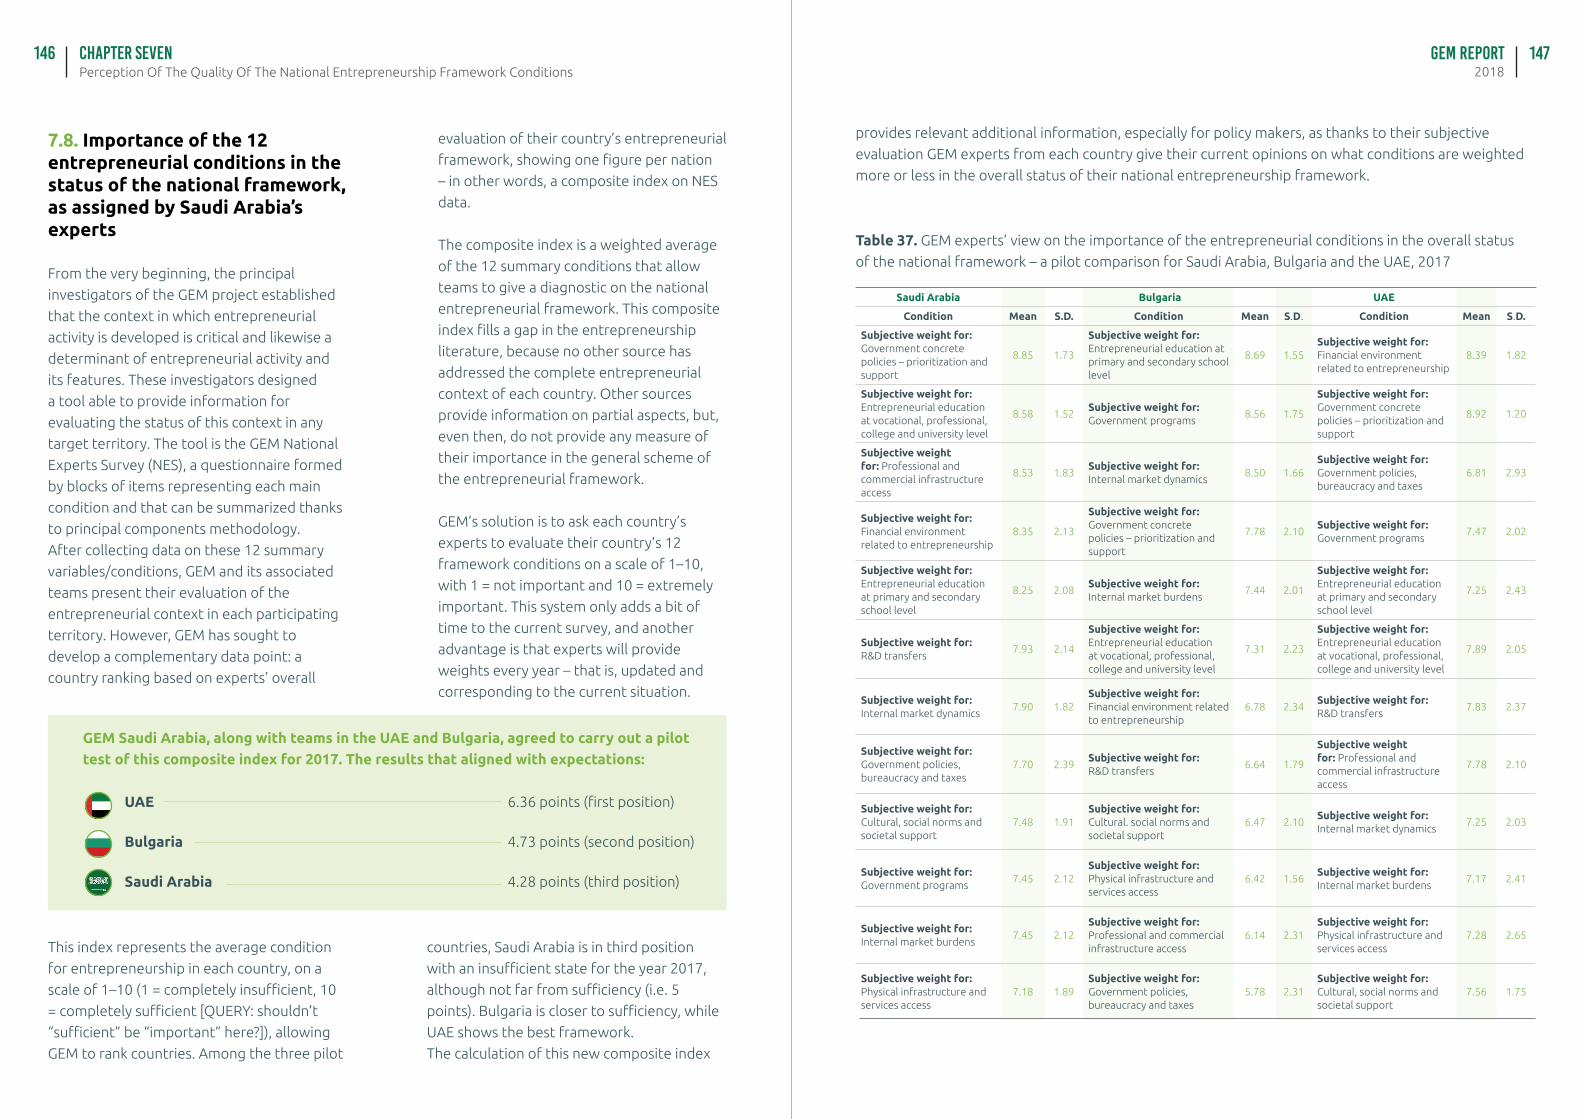
GEM Report2018Perception Of The Quality Of The National Entrepreneurship Framework Conditions
Chapter seven146 147
7.8. Importance of the 12 entrepreneurial conditions in the status of the national framework, as assigned by Saudi Arabia’s experts
From the very beginning, the principal
investigators of the GEM project established
that the context in which entrepreneurial
activity is developed is critical and likewise a
determinant of entrepreneurial activity and
its features. These investigators designed
a tool able to provide information for
evaluating the status of this context in any
target territory. The tool is the GEM National
Experts Survey (NES), a questionnaire formed
by blocks of items representing each main
condition and that can be summarized thanks
to principal components methodology.
After collecting data on these 12 summary
variables/conditions, GEM and its associated
teams present their evaluation of the
entrepreneurial context in each participating
territory. However, GEM has sought to
develop a complementary data point: a
country ranking based on experts’ overall
evaluation of their country’s entrepreneurial
framework, showing one figure per nation
– in other words, a composite index on NES
data.
The composite index is a weighted average
of the 12 summary conditions that allow
teams to give a diagnostic on the national
entrepreneurial framework. This composite
index fills a gap in the entrepreneurship
literature, because no other source has
addressed the complete entrepreneurial
context of each country. Other sources
provide information on partial aspects, but,
even then, do not provide any measure of
their importance in the general scheme of
the entrepreneurial framework.
GEM’s solution is to ask each country’s
experts to evaluate their country’s 12
framework conditions on a scale of 1–10,
with 1 = not important and 10 = extremely
important. This system only adds a bit of
time to the current survey, and another
advantage is that experts will provide
weights every year – that is, updated and
corresponding to the current situation.
Table 37. GEM experts’ view on the importance of the entrepreneurial conditions in the overall status
of the national framework – a pilot comparison for Saudi Arabia, Bulgaria and the UAE, 2017
Saudi Arabia Bulgaria UAE
Condition Mean S.D. Condition Mean S.D. Condition Mean S.D.
Subjective weight for: Government concrete policies – prioritization and support
8.85 1.73
Subjective weight for: Entrepreneurial education at primary and secondary school level
8.69 1.55Subjective weight for: Financial environment related to entrepreneurship
8.39 1.82
Subjective weight for: Entrepreneurial education at vocational, professional, college and university level
8.58 1.52Subjective weight for: Government programs
8.56 1.75
Subjective weight for: Government concrete policies – prioritization and support
8.92 1.20
Subjective weight for: Professional and commercial infrastructure access
8.53 1.83Subjective weight for: Internal market dynamics
8.50 1.66Subjective weight for: Government policies, bureaucracy and taxes
6.81 2.93
Subjective weight for: Financial environment related to entrepreneurship
8.35 2.13
Subjective weight for: Government concrete policies – prioritization and support
7.78 2.10Subjective weight for: Government programs
7.47 2.02
Subjective weight for: Entrepreneurial education at primary and secondary school level
8.25 2.08Subjective weight for: Internal market burdens
7.44 2.01
Subjective weight for: Entrepreneurial education at primary and secondary school level
7.25 2.43
Subjective weight for:R&D transfers
7.93 2.14
Subjective weight for: Entrepreneurial education at vocational, professional, college and university level
7.31 2.23
Subjective weight for: Entrepreneurial education at vocational, professional, college and university level
7.89 2.05
Subjective weight for: Internal market dynamics
7.90 1.82Subjective weight for: Financial environment related to entrepreneurship
6.78 2.34Subjective weight for:R&D transfers
7.83 2.37
Subjective weight for: Government policies, bureaucracy and taxes
7.70 2.39Subjective weight for: R&D transfers
6.64 1.79
Subjective weight for: Professional and commercial infrastructure access
7.78 2.10
Subjective weight for: Cultural, social norms and societal support
7.48 1.91Subjective weight for: Cultural. social norms and societal support
6.47 2.10Subjective weight for: Internal market dynamics
7.25 2.03
Subjective weight for: Government programs
7.45 2.12Subjective weight for: Physical infrastructure and services access
6.42 1.56Subjective weight for: Internal market burdens
7.17 2.41
Subjective weight for: Internal market burdens
7.45 2.12Subjective weight for: Professional and commercial infrastructure access
6.14 2.31Subjective weight for: Physical infrastructure and services access
7.28 2.65
Subjective weight for: Physical infrastructure and services access
7.18 1.89Subjective weight for: Government policies, bureaucracy and taxes
5.78 2.31Subjective weight for: Cultural, social norms and societal support
7.56 1.75
This index represents the average condition
for entrepreneurship in each country, on a
scale of 1–10 (1 = completely insufficient, 10
= completely sufficient [QUERY: shouldn’t
“sufficient” be “important” here?]), allowing
GEM to rank countries. Among the three pilot
countries, Saudi Arabia is in third position
with an insufficient state for the year 2017,
although not far from sufficiency (i.e. 5
points). Bulgaria is closer to sufficiency, while
UAE shows the best framework.
The calculation of this new composite index
provides relevant additional information, especially for policy makers, as thanks to their subjective
evaluation GEM experts from each country give their current opinions on what conditions are weighted
more or less in the overall status of their national entrepreneurship framework.
UAE 6.36 points (first position)
Bulgaria 4.73 points (second position)
Saudi Arabia 4.28 points (third position)
GEM Saudi Arabia, along with teams in the UAE and Bulgaria, agreed to carry out a pilot test of this composite index for 2017. The results that aligned with expectations:
GEM Report2018Perception Of The Quality Of The National Entrepreneurship Framework Conditions
Chapter seven148 149
In Table 37 one can see that in Saudi Arabia the most important
condition determining the current status of the framework
is government’s policies toward supporting and prioritizing
entrepreneurship; in Bulgaria it is entrepreneurial education
at primary and secondary school level; and in the UAE it is the
financial environment related to entrepreneurship. The table
shows the average weight given by experts to each condition
in every country, so it is possible to see what the differences
are among them and what the order of conditions is for each
nation (on a 10-point scale where 1 = not important at all and
10 = extremely important). In future, it will be possible to see
a complete ranking for all GEM participating countries and,
subsequently, the evolution of the ranking and of the importance
of each condition annually.
This information is important for policy makers to analyze in the
national context, as well as in relation to a selected group of
countries. In Saudi Arabia in 2017, all conditions were relevant in
determining the entrepreneurial context, as all them got average
scores of importance above seven points. The most important,
however, were government policies – prioritization and support;
entrepreneurial education at vocational, professional, college
and university level; professional and commercial infrastructure
access; financial environment related to entrepreneurship; and
entrepreneurial education at primary and secondary level.
These clearly reflect the interest of the government in
entrepreneurship and its development, helped by new
generations of graduates that need better access to professional
and commercial infrastructure to implement new models of
businesses, more and new financial channels, and, finally, a sense
of security that future generations will be adequately trained to
pick up, and improve upon, new ways of doing things.
The scale starts at 1 because the use of 0 points would not allow the calculation of the composite
index because a weight of 0 points would eliminate the affected condition from the index
formula. This formula is:
Where SV1 to SV12 represent the scores of experts to the 12 conditions and where W1 to W12
represent the weights assigned by experts to each condition.
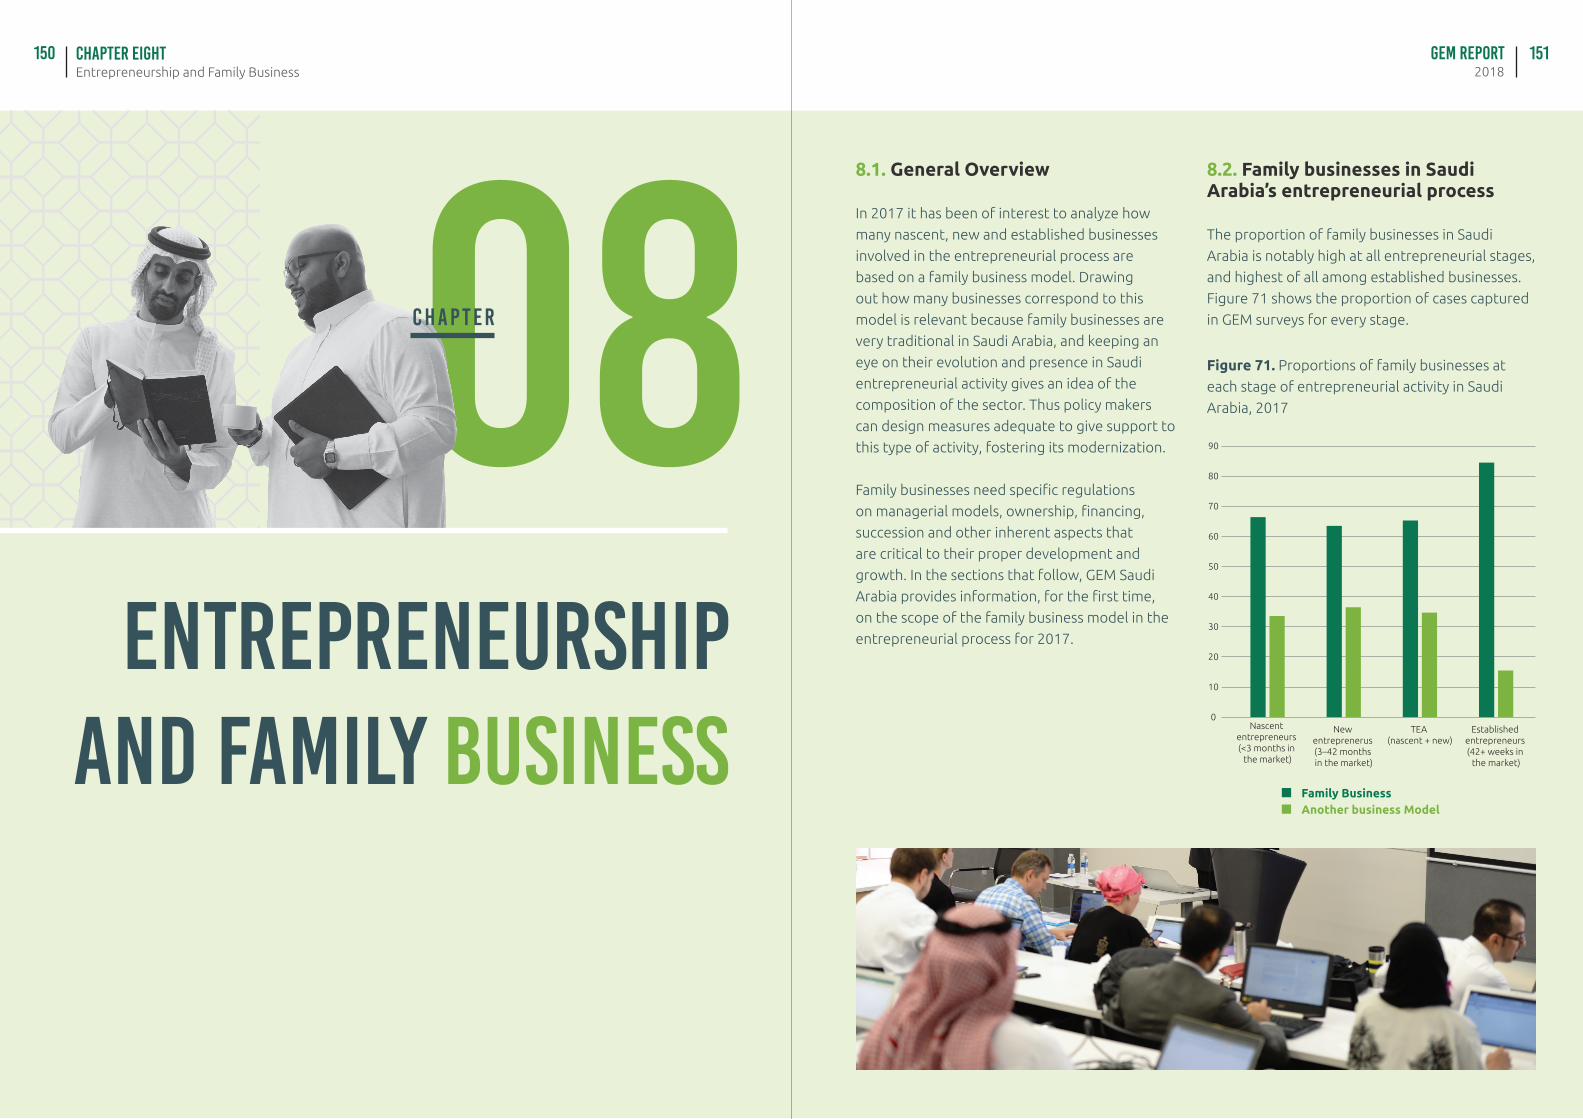
Entrepreneurship and Family BusinessChapter EIGHT GEM Report
2018150 151
08ENTREPRENEURSHIP
AND FAMILY BUSINESS
C H A P T E R
8.1. General Overview
In 2017 it has been of interest to analyze how
many nascent, new and established businesses
involved in the entrepreneurial process are
based on a family business model. Drawing
out how many businesses correspond to this
model is relevant because family businesses are
very traditional in Saudi Arabia, and keeping an
eye on their evolution and presence in Saudi
entrepreneurial activity gives an idea of the
composition of the sector. Thus policy makers
can design measures adequate to give support to
this type of activity, fostering its modernization.
Family businesses need specific regulations
on managerial models, ownership, financing,
succession and other inherent aspects that
are critical to their proper development and
growth. In the sections that follow, GEM Saudi
Arabia provides information, for the first time,
on the scope of the family business model in the
entrepreneurial process for 2017.
8.2. Family businesses in Saudi Arabia’s entrepreneurial process
The proportion of family businesses in Saudi
Arabia is notably high at all entrepreneurial stages,
and highest of all among established businesses.
Figure 71 shows the proportion of cases captured
in GEM surveys for every stage.
Figure 71. Proportions of family businesses at
each stage of entrepreneurial activity in Saudi
Arabia, 2017
0
10
20
30
40
50
60
70
80
90
Established entrepreneurs (42+ weeks in
the market)
TEA (nascent + new)
New entreprenerus (3–42 months in the market)
Nascent entrepreneurs (<3 months in
the market)
Family BusinessAnother business Model
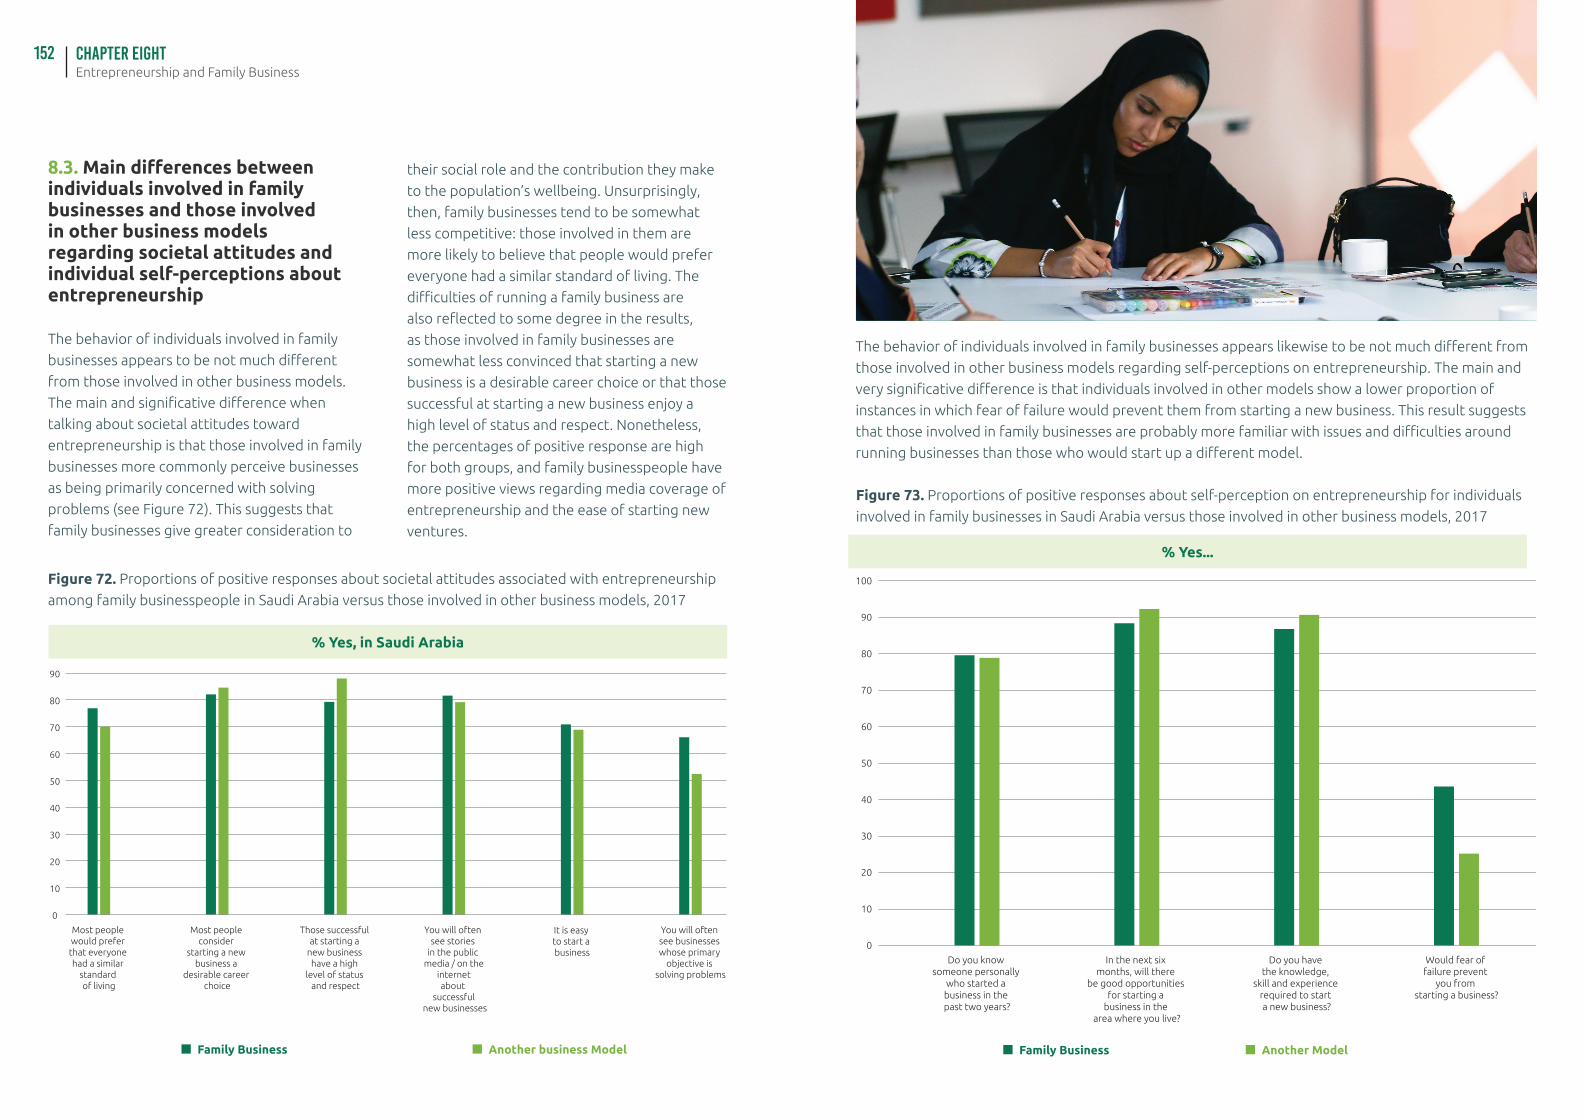
Entrepreneurship and Family BusinessChapter EIGHT152
8.3. Main differences between individuals involved in family businesses and those involved in other business models regarding societal attitudes and individual self-perceptions about entrepreneurship
The behavior of individuals involved in family
businesses appears to be not much different
from those involved in other business models.
The main and significative difference when
talking about societal attitudes toward
entrepreneurship is that those involved in family
businesses more commonly perceive businesses
as being primarily concerned with solving
problems (see Figure 72). This suggests that
family businesses give greater consideration to
their social role and the contribution they make
to the population’s wellbeing. Unsurprisingly,
then, family businesses tend to be somewhat
less competitive: those involved in them are
more likely to believe that people would prefer
everyone had a similar standard of living. The
difficulties of running a family business are
also reflected to some degree in the results,
as those involved in family businesses are
somewhat less convinced that starting a new
business is a desirable career choice or that those
successful at starting a new business enjoy a
high level of status and respect. Nonetheless,
the percentages of positive response are high
for both groups, and family businesspeople have
more positive views regarding media coverage of
entrepreneurship and the ease of starting new
ventures.
Figure 72. Proportions of positive responses about societal attitudes associated with entrepreneurship
among family businesspeople in Saudi Arabia versus those involved in other business models, 2017
0
10
20
30
40
50
60
70
80
90
100
You will often see businesses whose primary
objective is solving problems
It is easy to start a business
You will often see stories
in the public media / on the
internet about
successful new businesses
Most people consider
starting a new business a
desirable career choice
Those successful at starting a
new business have a high
level of status and respect
Most people would prefer that everyone had a similar
standard of living
% Yes, in Saudi Arabia
% Yes...
The behavior of individuals involved in family businesses appears likewise to be not much different from
those involved in other business models regarding self-perceptions on entrepreneurship. The main and
very significative difference is that individuals involved in other models show a lower proportion of
instances in which fear of failure would prevent them from starting a new business. This result suggests
that those involved in family businesses are probably more familiar with issues and difficulties around
running businesses than those who would start up a different model.
Figure 73. Proportions of positive responses about self-perception on entrepreneurship for individuals
involved in family businesses in Saudi Arabia versus those involved in other business models, 2017
0
10
20
30
40
50
60
70
80
90
100
Would fear of failure prevent
you from starting a business?
Do you have the knowledge,
skill and experience required to start a new business?
In the next six months, will there
be good opportunities for starting a
business in the area where you live?
Do you know someone personally
who started a business in the past two years?
Another business Model Another ModelFamily Business Family Business
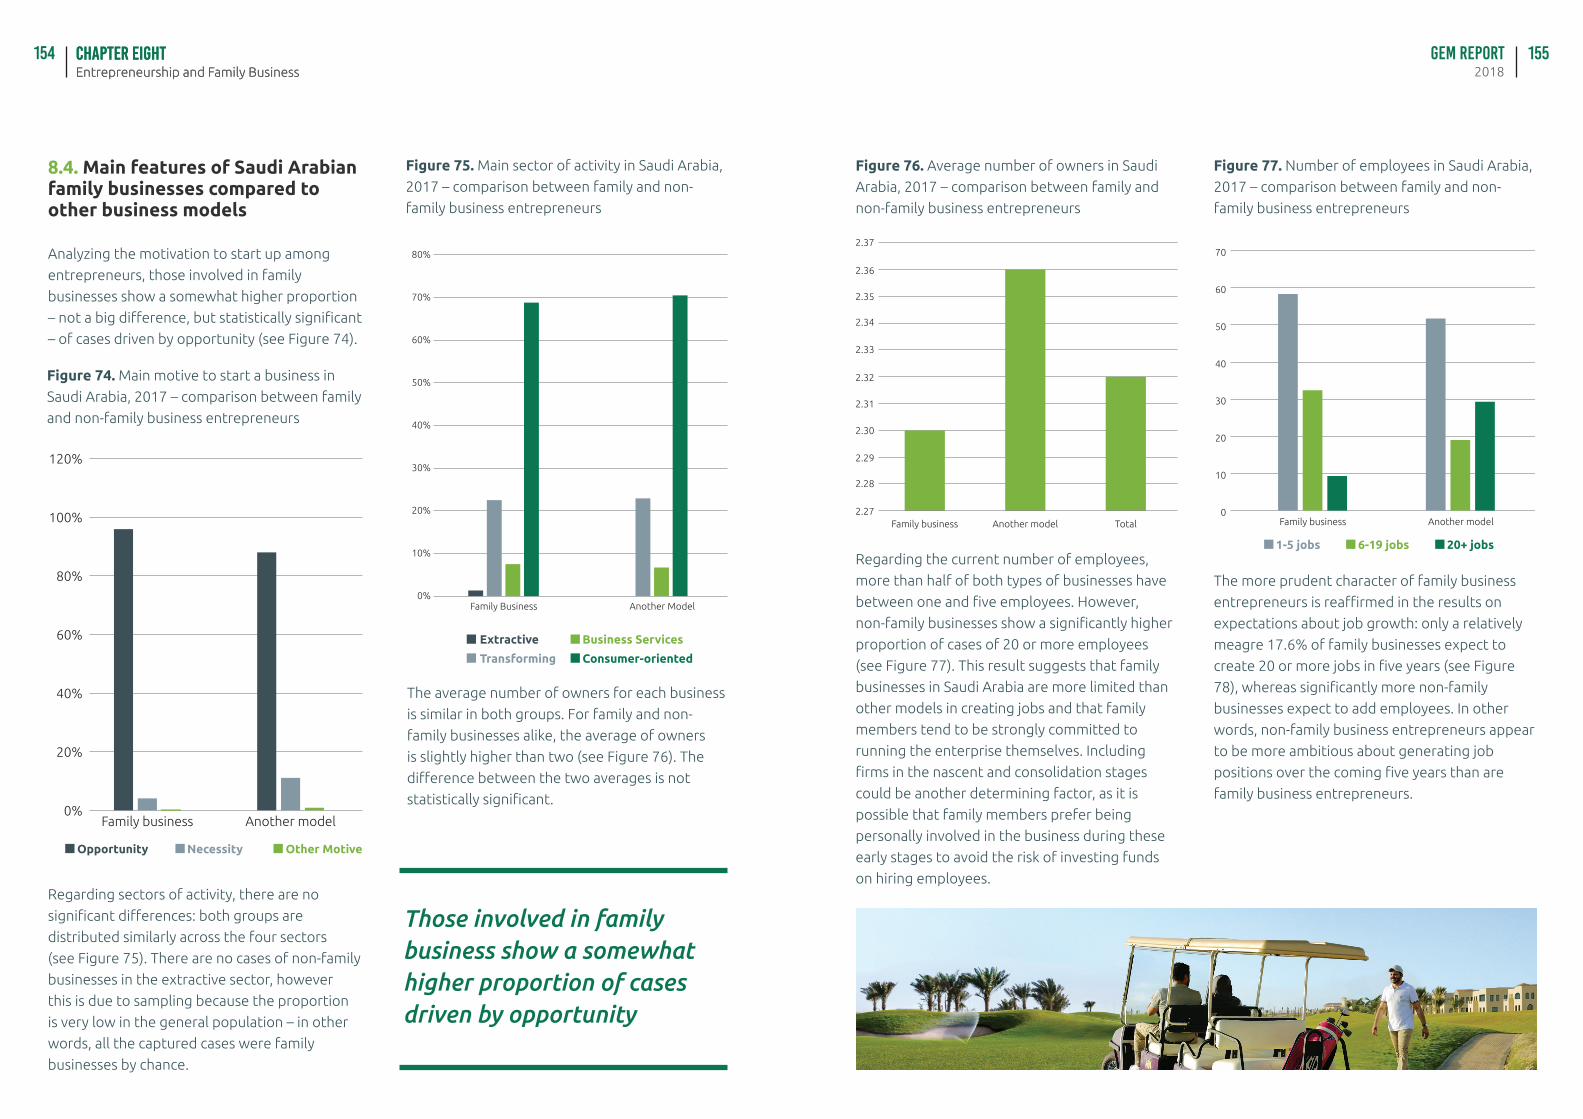
Entrepreneurship and Family BusinessChapter EIGHT GEM Report
2018154 155
8.4. Main features of Saudi Arabian family businesses compared to other business models
Analyzing the motivation to start up among
entrepreneurs, those involved in family
businesses show a somewhat higher proportion
– not a big difference, but statistically significant
– of cases driven by opportunity (see Figure 74).
Regarding sectors of activity, there are no
significant differences: both groups are
distributed similarly across the four sectors
(see Figure 75). There are no cases of non-family
businesses in the extractive sector, however
this is due to sampling because the proportion
is very low in the general population – in other
words, all the captured cases were family
businesses by chance.
The average number of owners for each business
is similar in both groups. For family and non-
family businesses alike, the average of owners
is slightly higher than two (see Figure 76). The
difference between the two averages is not
statistically significant.
Figure 74. Main motive to start a business in
Saudi Arabia, 2017 – comparison between family
and non-family business entrepreneurs
Figure 75. Main sector of activity in Saudi Arabia,
2017 – comparison between family and non-
family business entrepreneurs
0%
20%
40%
60%
80%
100%
120%
Another modelFamily business
Opportunity Necessity
Extractive
Transforming
Other Motive
Business Services
Consumer-oriented
0%
10%
20%
30%
40%
50%
60%
70%
80%
Another ModelFamily Business
Those involved in family business show a somewhat higher proportion of cases driven by opportunity
Entrepreneurship and Family BusinessChapter EIGHT
Regarding the current number of employees,
more than half of both types of businesses have
between one and five employees. However,
non-family businesses show a significantly higher
proportion of cases of 20 or more employees
(see Figure 77). This result suggests that family
businesses in Saudi Arabia are more limited than
other models in creating jobs and that family
members tend to be strongly committed to
running the enterprise themselves. Including
firms in the nascent and consolidation stages
could be another determining factor, as it is
possible that family members prefer being
personally involved in the business during these
early stages to avoid the risk of investing funds
on hiring employees.
The more prudent character of family business
entrepreneurs is reaffirmed in the results on
expectations about job growth: only a relatively
meagre 17.6% of family businesses expect to
create 20 or more jobs in five years (see Figure
78), whereas significantly more non-family
businesses expect to add employees. In other
words, non-family business entrepreneurs appear
to be more ambitious about generating job
positions over the coming five years than are
family business entrepreneurs.
Figure 76. Average number of owners in Saudi
Arabia, 2017 – comparison between family and
non-family business entrepreneurs
Figure 77. Number of employees in Saudi Arabia,
2017 – comparison between family and non-
family business entrepreneurs
TotalAnother modelFamily business2.27
2.28
2.29
2.30
2.31
2.32
2.33
2.34
2.35
2.36
2.37
0
10
20
30
40
50
60
70
Another modelFamily business
1-5 jobs 6-19 jobs 20+ jobs
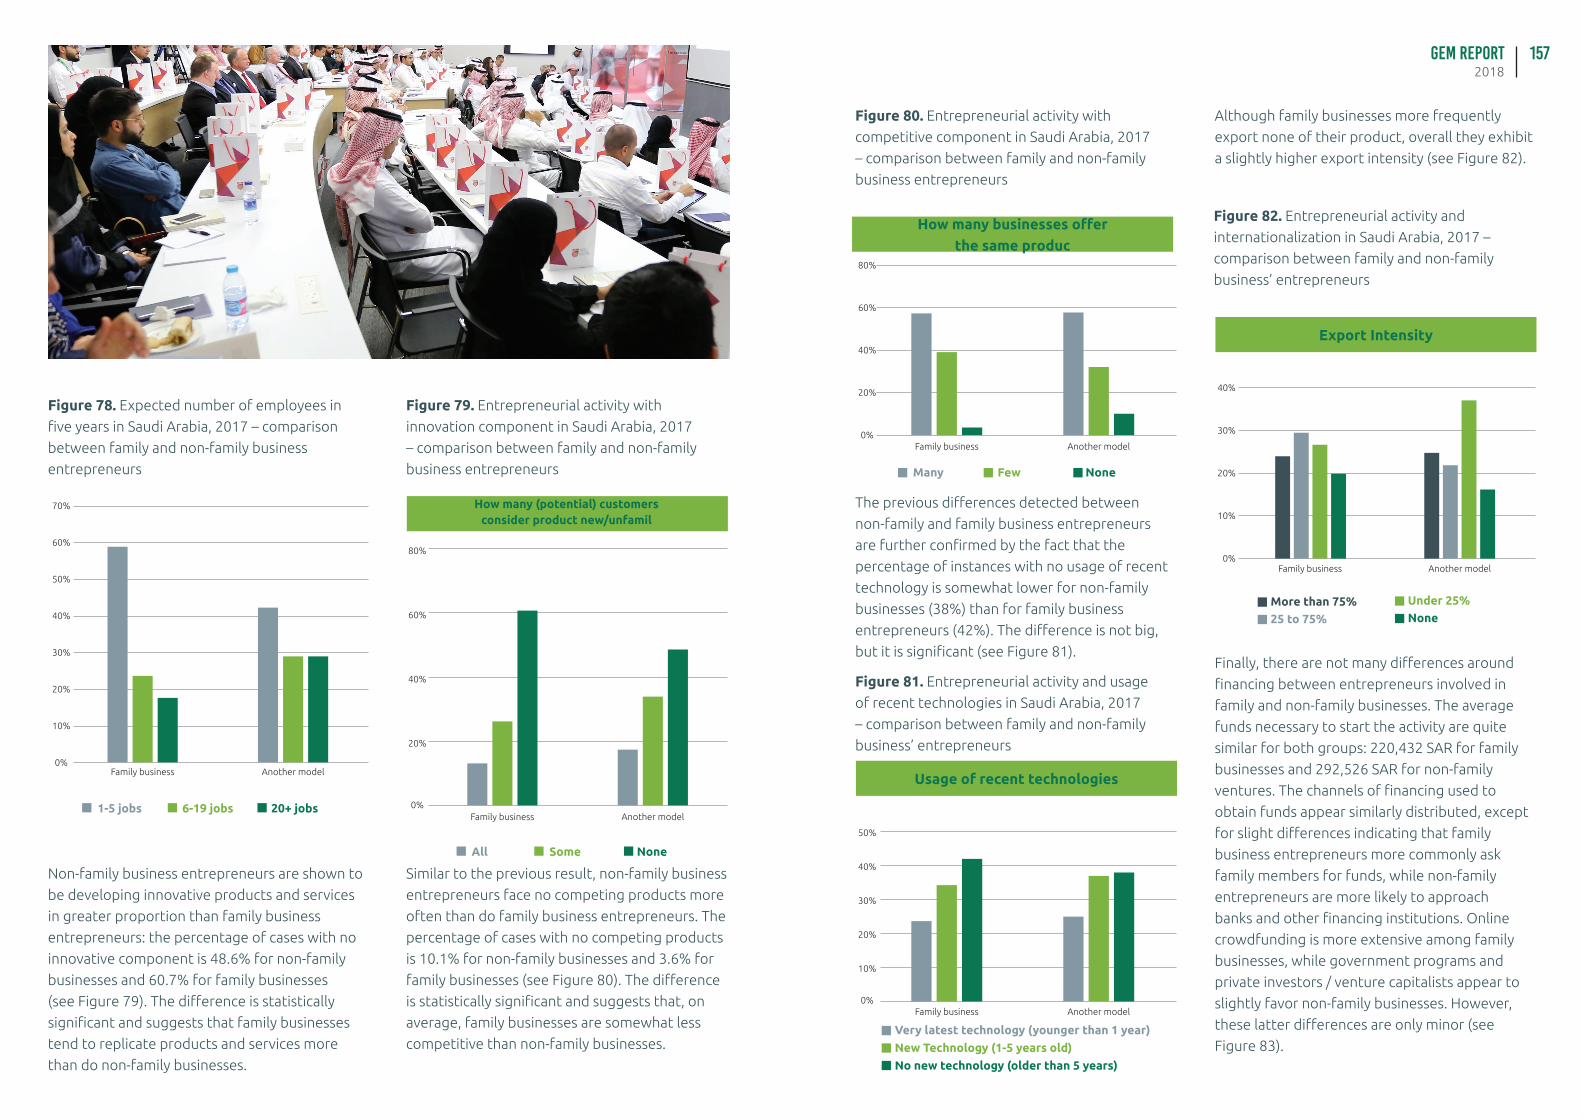
GEM Report2018
157
Non-family business entrepreneurs are shown to
be developing innovative products and services
in greater proportion than family business
entrepreneurs: the percentage of cases with no
innovative component is 48.6% for non-family
businesses and 60.7% for family businesses
(see Figure 79). The difference is statistically
significant and suggests that family businesses
tend to replicate products and services more
than do non-family businesses.
Similar to the previous result, non-family business
entrepreneurs face no competing products more
often than do family business entrepreneurs. The
percentage of cases with no competing products
is 10.1% for non-family businesses and 3.6% for
family businesses (see Figure 80). The difference
is statistically significant and suggests that, on
average, family businesses are somewhat less
competitive than non-family businesses.
Figure 78. Expected number of employees in
five years in Saudi Arabia, 2017 – comparison
between family and non-family business
entrepreneurs
Figure 79. Entrepreneurial activity with
innovation component in Saudi Arabia, 2017
– comparison between family and non-family
business entrepreneurs
0%
10%
20%
30%
40%
50%
60%
70%
Another modelFamily business
0%
20%
40%
60%
80%
Another modelFamily business1-5 jobs 6-19 jobs 20+ jobs
All Some None
The previous differences detected between
non-family and family business entrepreneurs
are further confirmed by the fact that the
percentage of instances with no usage of recent
technology is somewhat lower for non-family
businesses (38%) than for family business
entrepreneurs (42%). The difference is not big,
but it is significant (see Figure 81).Finally, there are not many differences around
financing between entrepreneurs involved in
family and non-family businesses. The average
funds necessary to start the activity are quite
similar for both groups: 220,432 SAR for family
businesses and 292,526 SAR for non-family
ventures. The channels of financing used to
obtain funds appear similarly distributed, except
for slight differences indicating that family
business entrepreneurs more commonly ask
family members for funds, while non-family
entrepreneurs are more likely to approach
banks and other financing institutions. Online
crowdfunding is more extensive among family
businesses, while government programs and
private investors / venture capitalists appear to
slightly favor non-family businesses. However,
these latter differences are only minor (see
Figure 83).
Although family businesses more frequently
export none of their product, overall they exhibit
a slightly higher export intensity (see Figure 82).
Figure 80. Entrepreneurial activity with
competitive component in Saudi Arabia, 2017
– comparison between family and non-family
business entrepreneurs
Figure 82. Entrepreneurial activity and
internationalization in Saudi Arabia, 2017 –
comparison between family and non-family
business’ entrepreneurs
Figure 81. Entrepreneurial activity and usage
of recent technologies in Saudi Arabia, 2017
– comparison between family and non-family
business’ entrepreneurs
0%
20%
40%
60%
80%
Another modelFamily business
0%
10%
20%
30%
40%
50%
Another modelFamily business
0%
10%
20%
30%
40%
Another modelFamily business
Many
Very latest technology (younger than 1 year)
25 to 75%More than 75%
New Technology (1-5 years old)
Under 25%
No new technology (older than 5 years)
None
Few None
Usage of recent technologies
Export Intensity
How many businesses offer the same produc
How many (potential) customers consider product new/unfamil
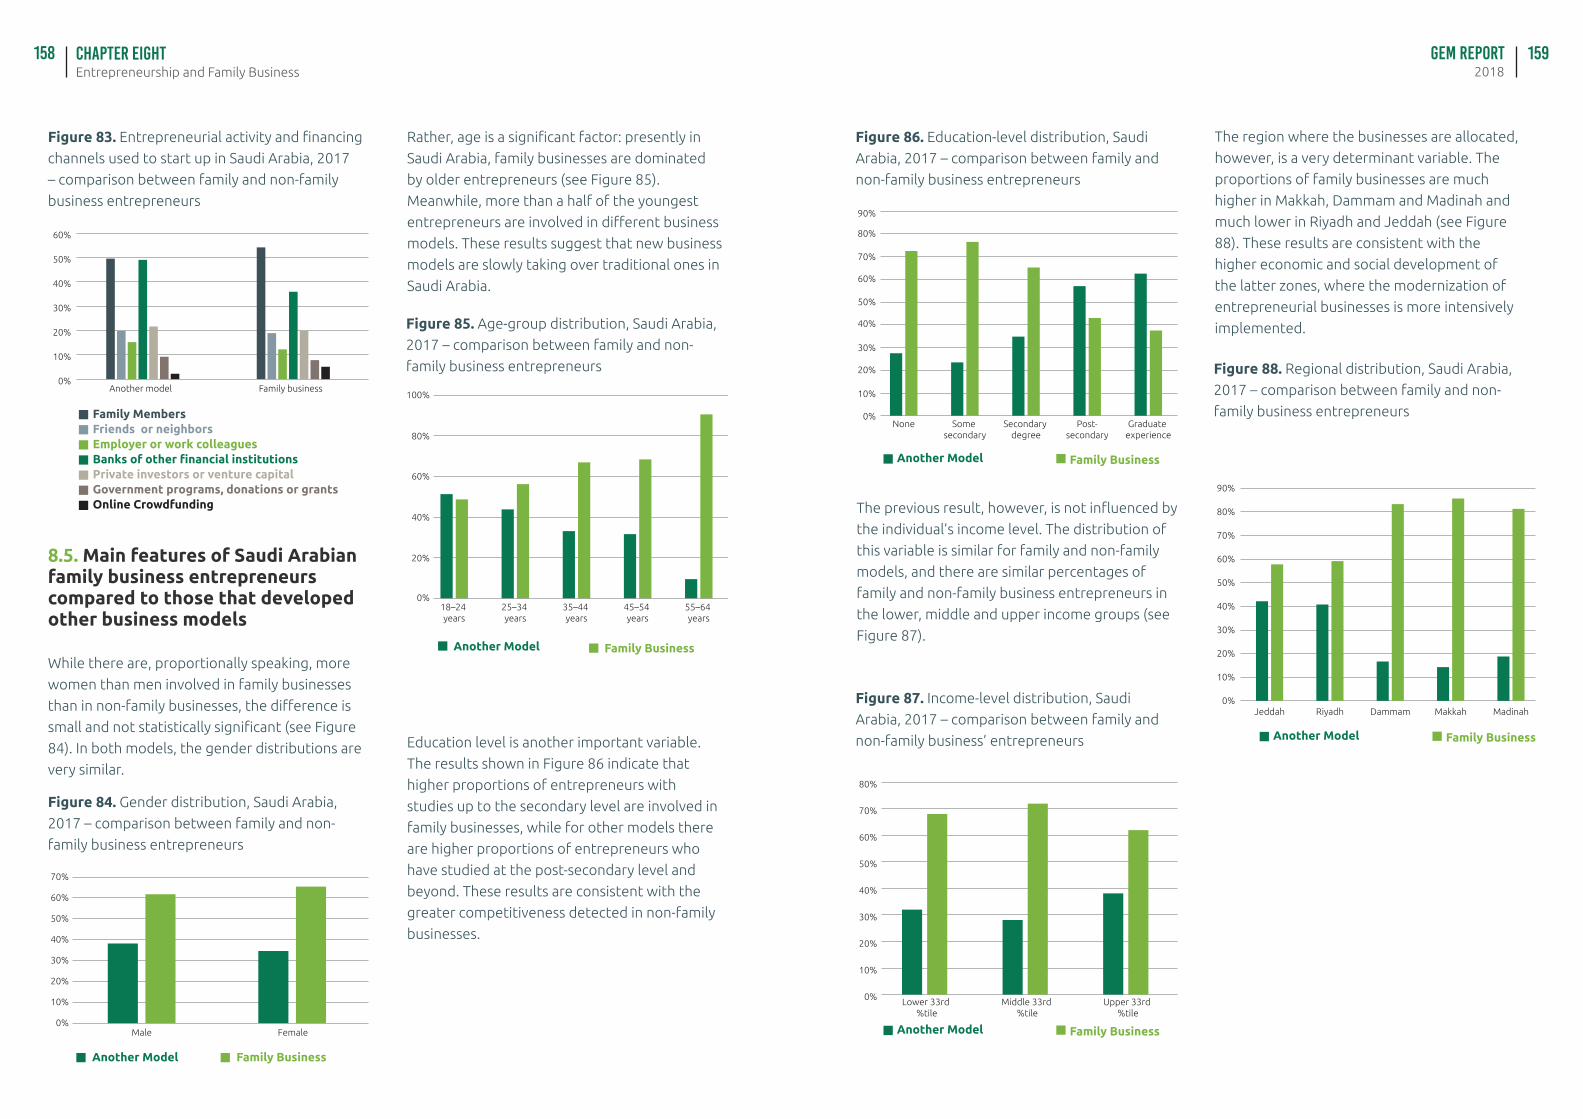
Entrepreneurship and Family BusinessChapter EIGHT GEM Report
2018158 159
Figure 83. Entrepreneurial activity and financing
channels used to start up in Saudi Arabia, 2017
– comparison between family and non-family
business entrepreneurs
Figure 84. Gender distribution, Saudi Arabia,
2017 – comparison between family and non-
family business entrepreneurs
Figure 85. Age-group distribution, Saudi Arabia,
2017 – comparison between family and non-
family business entrepreneurs0%
10%
20%
30%
40%
50%
60%
Family businessAnother model
0%
10%
20%
30%
40%
50%
60%
70%
FemaleMale
Family Members
Family Business
Family Business
Another Model
Another Model
Banks of other financial institutions
Friends or neighbors
Private investors or venture capital
Employer or work colleagues
Government programs, donations or grantsOnline Crowdfunding
8.5. Main features of Saudi Arabian family business entrepreneurs compared to those that developed other business models
While there are, proportionally speaking, more
women than men involved in family businesses
than in non-family businesses, the difference is
small and not statistically significant (see Figure
84). In both models, the gender distributions are
very similar.
Rather, age is a significant factor: presently in
Saudi Arabia, family businesses are dominated
by older entrepreneurs (see Figure 85).
Meanwhile, more than a half of the youngest
entrepreneurs are involved in different business
models. These results suggest that new business
models are slowly taking over traditional ones in
Saudi Arabia.
Education level is another important variable.
The results shown in Figure 86 indicate that
higher proportions of entrepreneurs with
studies up to the secondary level are involved in
family businesses, while for other models there
are higher proportions of entrepreneurs who
have studied at the post-secondary level and
beyond. These results are consistent with the
greater competitiveness detected in non-family
businesses.
0%
20%
40%
60%
80%
100%
55–64 years
45–54 years
35–44 years
25–34 years
18–24 years
Figure 86. Education-level distribution, Saudi
Arabia, 2017 – comparison between family and
non-family business entrepreneurs
Figure 87. Income-level distribution, Saudi
Arabia, 2017 – comparison between family and
non-family business’ entrepreneurs
Figure 88. Regional distribution, Saudi Arabia,
2017 – comparison between family and non-
family business entrepreneurs
Family Business
Family Business
Family Business
Another Model
Another Model
Another Model
The previous result, however, is not influenced by
the individual’s income level. The distribution of
this variable is similar for family and non-family
models, and there are similar percentages of
family and non-family business entrepreneurs in
the lower, middle and upper income groups (see
Figure 87).
The region where the businesses are allocated,
however, is a very determinant variable. The
proportions of family businesses are much
higher in Makkah, Dammam and Madinah and
much lower in Riyadh and Jeddah (see Figure
88). These results are consistent with the
higher economic and social development of
the latter zones, where the modernization of
entrepreneurial businesses is more intensively
implemented.
0%
10%
20%
30%
40%
50%
60%
70%
80%
90%
Graduate experience
Post-secondary
Secondary degree
Some secondary
None
0%
10%
20%
30%
40%
50%
60%
70%
80%
Upper 33rd %tile
Middle 33rd %tile
Lower 33rd %tile
0%
10%
20%
30%
40%
50%
60%
70%
80%
90%
MadinahMakkahDammamRiyadhJeddah
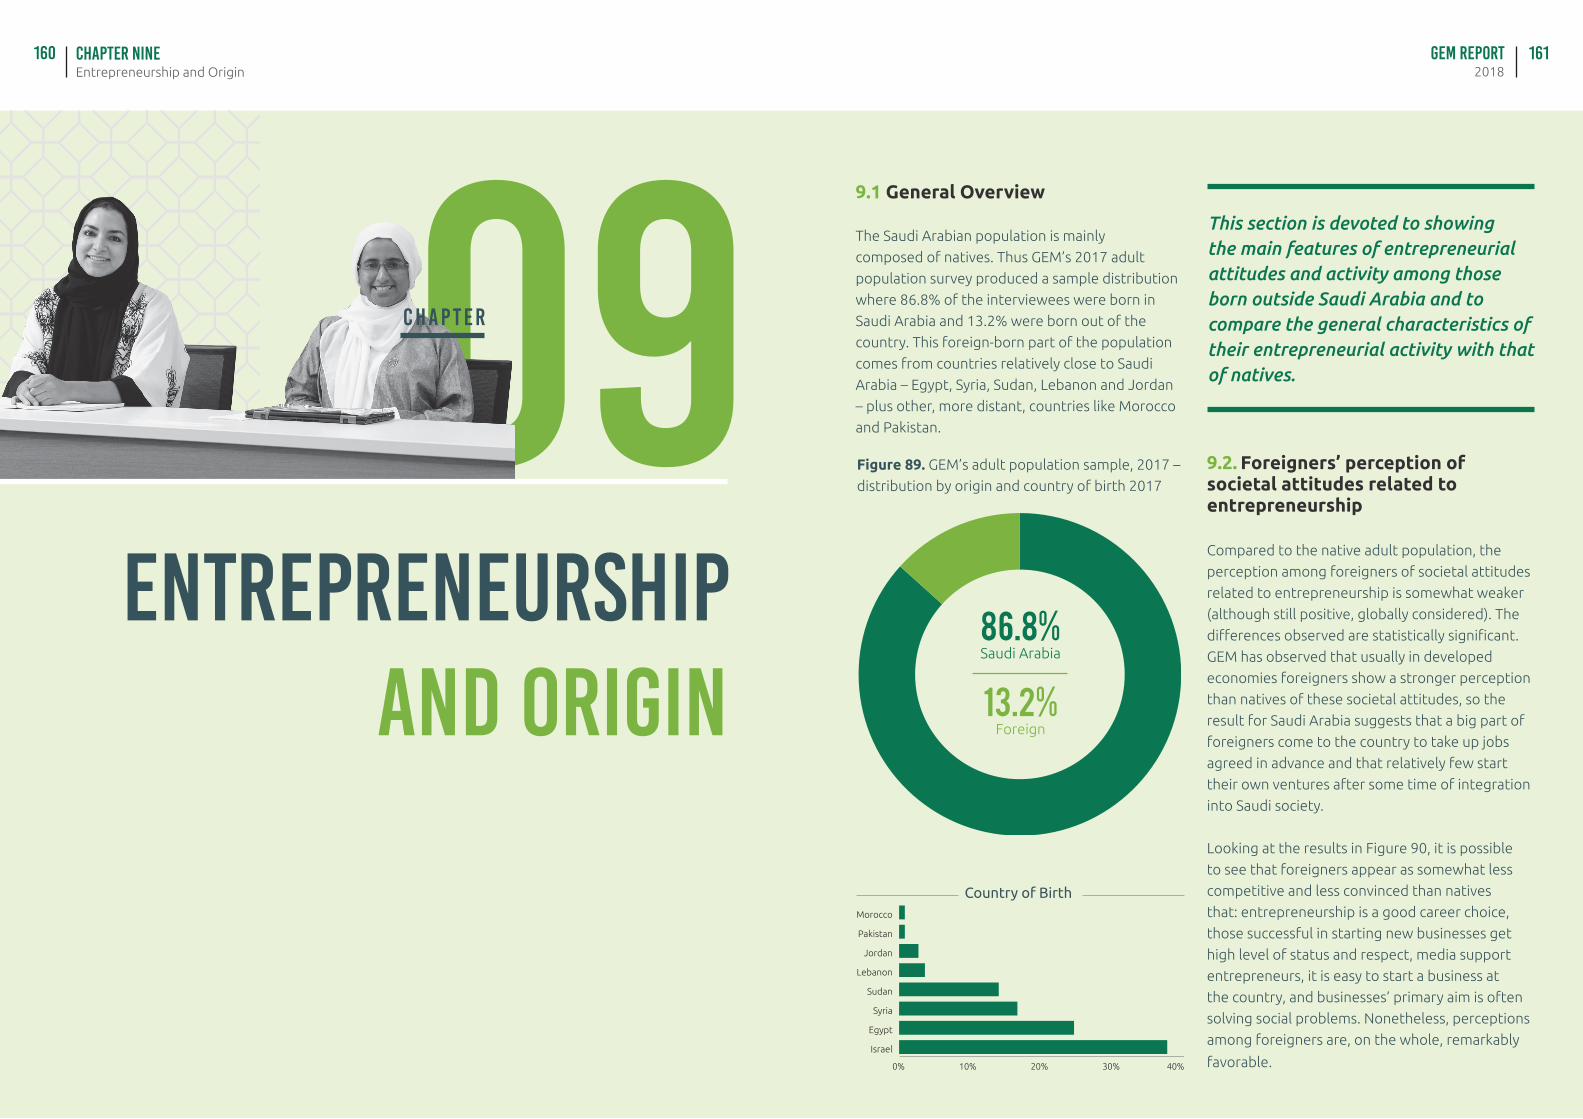
Entrepreneurship and OriginChapter NINE GEM Report
2018160 161
09ENTREPRENEURSHIP
AND ORIGIN
C H A P T E R
9.1 General Overview
The Saudi Arabian population is mainly
composed of natives. Thus GEM’s 2017 adult
population survey produced a sample distribution
where 86.8% of the interviewees were born in
Saudi Arabia and 13.2% were born out of the
country. This foreign-born part of the population
comes from countries relatively close to Saudi
Arabia – Egypt, Syria, Sudan, Lebanon and Jordan
– plus other, more distant, countries like Morocco
and Pakistan.
9.2. Foreigners’ perception of societal attitudes related to entrepreneurship
Compared to the native adult population, the
perception among foreigners of societal attitudes
related to entrepreneurship is somewhat weaker
(although still positive, globally considered). The
differences observed are statistically significant.
GEM has observed that usually in developed
economies foreigners show a stronger perception
than natives of these societal attitudes, so the
result for Saudi Arabia suggests that a big part of
foreigners come to the country to take up jobs
agreed in advance and that relatively few start
their own ventures after some time of integration
into Saudi society.
Looking at the results in Figure 90, it is possible
to see that foreigners appear as somewhat less
competitive and less convinced than natives
that: entrepreneurship is a good career choice,
those successful in starting new businesses get
high level of status and respect, media support
entrepreneurs, it is easy to start a business at
the country, and businesses’ primary aim is often
solving social problems. Nonetheless, perceptions
among foreigners are, on the whole, remarkably
favorable.
This section is devoted to showing the main features of entrepreneurial attitudes and activity among those born outside Saudi Arabia and to compare the general characteristics of their entrepreneurial activity with that of natives.
Figure 89. GEM’s adult population sample, 2017 –
distribution by origin and country of birth 2017
Country of Birth
Saudi Arabia
Foreign
86.8%
13.2%
0% 10% 20% 30% 40%
Israel
Egypt
Syria
Sudan
Lebanon
Jordan
Pakistan
Morocco
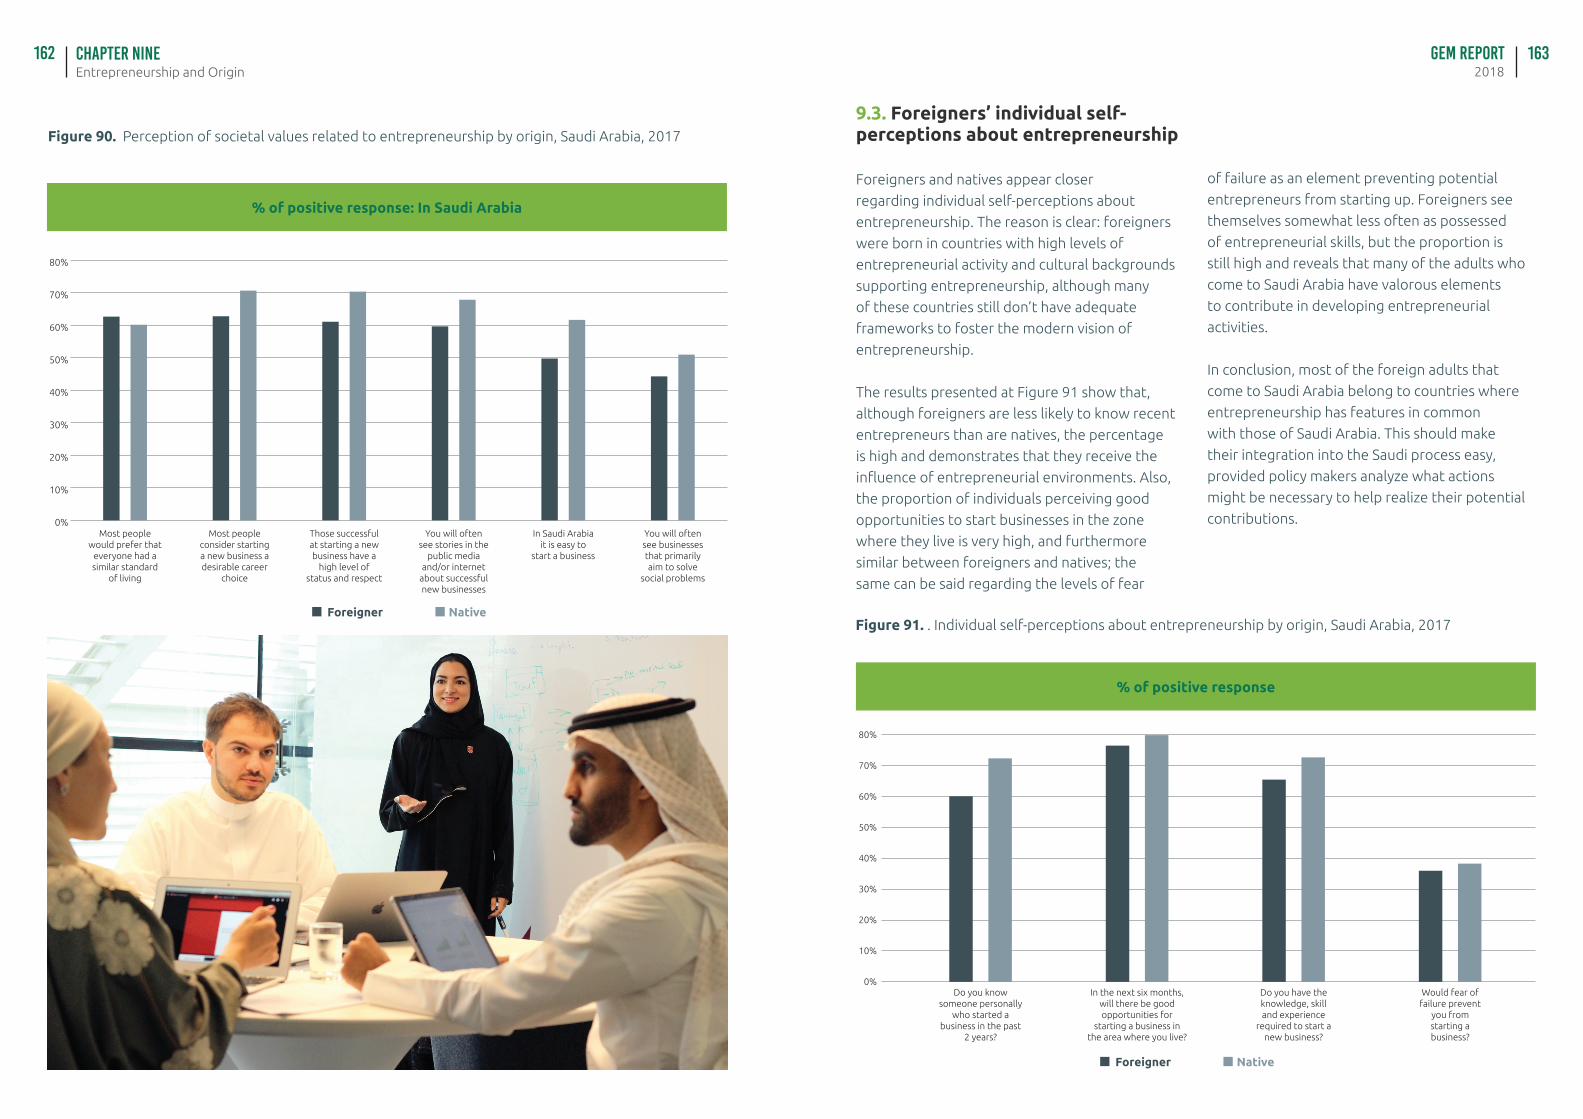
Entrepreneurship and OriginChapter NINE GEM Report
2018162 163
Figure 90. Perception of societal values related to entrepreneurship by origin, Saudi Arabia, 2017
0%
10%
20%
30%
40%
50%
60%
70%
80%
Most people would prefer that
everyone had a similar standard
of living
Most people consider starting a new business a desirable career
choice
Those successful at starting a new business have a
high level of status and respect
You will often see stories in the
public media and/or internet
about successful new businesses
In Saudi Arabia it is easy to
start a business
You will often see businesses that primarily aim to solve
social problems
Figure 91. . Individual self-perceptions about entrepreneurship by origin, Saudi Arabia, 2017
9.3. Foreigners’ individual self-perceptions about entrepreneurship
Foreigners and natives appear closer
regarding individual self-perceptions about
entrepreneurship. The reason is clear: foreigners
were born in countries with high levels of
entrepreneurial activity and cultural backgrounds
supporting entrepreneurship, although many
of these countries still don’t have adequate
frameworks to foster the modern vision of
entrepreneurship.
The results presented at Figure 91 show that,
although foreigners are less likely to know recent
entrepreneurs than are natives, the percentage
is high and demonstrates that they receive the
influence of entrepreneurial environments. Also,
the proportion of individuals perceiving good
opportunities to start businesses in the zone
where they live is very high, and furthermore
similar between foreigners and natives; the
same can be said regarding the levels of fear
of failure as an element preventing potential
entrepreneurs from starting up. Foreigners see
themselves somewhat less often as possessed
of entrepreneurial skills, but the proportion is
still high and reveals that many of the adults who
come to Saudi Arabia have valorous elements
to contribute in developing entrepreneurial
activities.
In conclusion, most of the foreign adults that
come to Saudi Arabia belong to countries where
entrepreneurship has features in common
with those of Saudi Arabia. This should make
their integration into the Saudi process easy,
provided policy makers analyze what actions
might be necessary to help realize their potential
contributions.
0%
10%
20%
30%
40%
50%
60%
70%
80%
Do you know someone personally
who started a business in the past
2 years?
In the next six months, will there be good opportunities for
starting a business in the area where you live?
Do you have the knowledge, skill and experience
required to start a new business?
Would fear of failure prevent
you from starting a business?
Foreigner Native
Foreigner Native
% of positive response: In Saudi Arabia
% of positive response
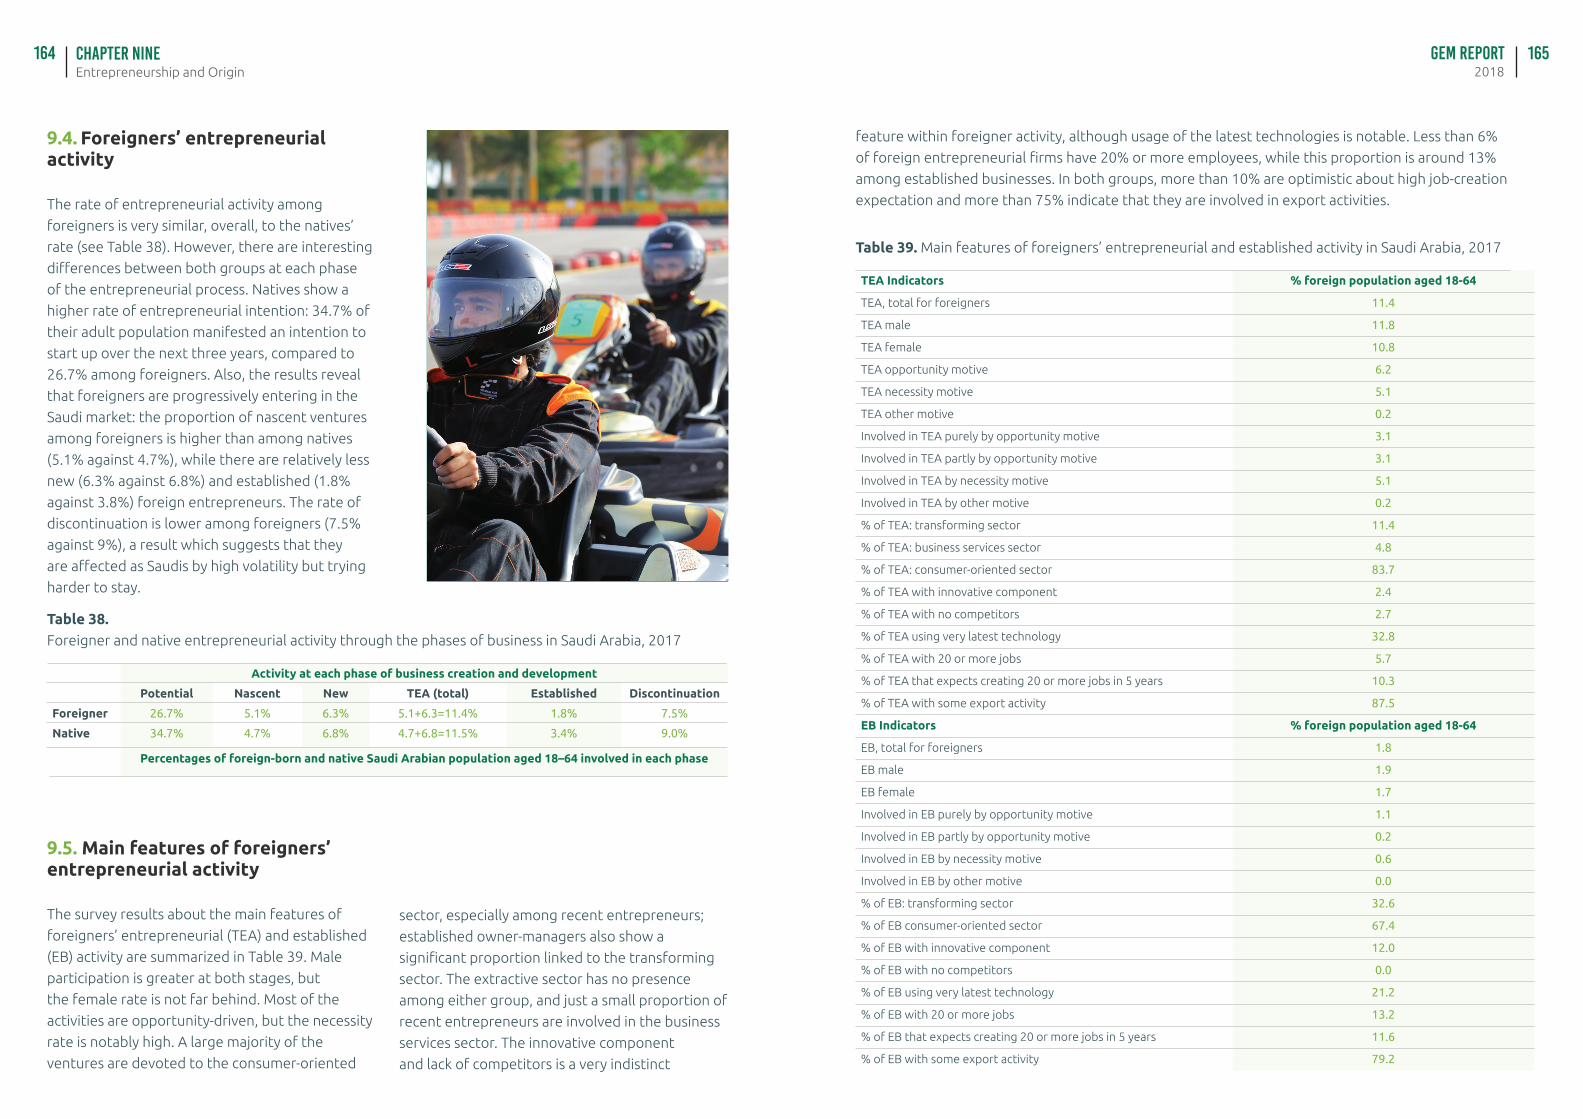
Entrepreneurship and OriginChapter NINE GEM Report
2018164 165
9.4. Foreigners’ entrepreneurial activity
The rate of entrepreneurial activity among
foreigners is very similar, overall, to the natives’
rate (see Table 38). However, there are interesting
differences between both groups at each phase
of the entrepreneurial process. Natives show a
higher rate of entrepreneurial intention: 34.7% of
their adult population manifested an intention to
start up over the next three years, compared to
26.7% among foreigners. Also, the results reveal
that foreigners are progressively entering in the
Saudi market: the proportion of nascent ventures
among foreigners is higher than among natives
(5.1% against 4.7%), while there are relatively less
new (6.3% against 6.8%) and established (1.8%
against 3.8%) foreign entrepreneurs. The rate of
discontinuation is lower among foreigners (7.5%
against 9%), a result which suggests that they
are affected as Saudis by high volatility but trying
harder to stay.
9.5. Main features of foreigners’ entrepreneurial activity
The survey results about the main features of
foreigners’ entrepreneurial (TEA) and established
(EB) activity are summarized in Table 39. Male
participation is greater at both stages, but
the female rate is not far behind. Most of the
activities are opportunity-driven, but the necessity
rate is notably high. A large majority of the
ventures are devoted to the consumer-oriented
sector, especially among recent entrepreneurs;
established owner-managers also show a
significant proportion linked to the transforming
sector. The extractive sector has no presence
among either group, and just a small proportion of
recent entrepreneurs are involved in the business
services sector. The innovative component
and lack of competitors is a very indistinct
Table 38. Foreigner and native entrepreneurial activity through the phases of business in Saudi Arabia, 2017
Activity at each phase of business creation and development
Potential Nascent New TEA (total) Established Discontinuation
Foreigner 26.7% 5.1% 6.3% 5.1+6.3=11.4% 1.8% 7.5%
Native 34.7% 4.7% 6.8% 4.7+6.8=11.5% 3.4% 9.0%
Percentages of foreign-born and native Saudi Arabian population aged 18–64 involved in each phase
Table 39. Main features of foreigners’ entrepreneurial and established activity in Saudi Arabia, 2017
feature within foreigner activity, although usage of the latest technologies is notable. Less than 6%
of foreign entrepreneurial firms have 20% or more employees, while this proportion is around 13%
among established businesses. In both groups, more than 10% are optimistic about high job-creation
expectation and more than 75% indicate that they are involved in export activities.
TEA Indicators % foreign population aged 18-64
TEA, total for foreigners 11.4
TEA male 11.8
TEA female 10.8
TEA opportunity motive 6.2
TEA necessity motive 5.1
TEA other motive 0.2
Involved in TEA purely by opportunity motive 3.1
Involved in TEA partly by opportunity motive 3.1
Involved in TEA by necessity motive 5.1
Involved in TEA by other motive 0.2
% of TEA: transforming sector 11.4
% of TEA: business services sector 4.8
% of TEA: consumer-oriented sector 83.7
% of TEA with innovative component 2.4
% of TEA with no competitors 2.7
% of TEA using very latest technology 32.8
% of TEA with 20 or more jobs 5.7
% of TEA that expects creating 20 or more jobs in 5 years 10.3
% of TEA with some export activity 87.5
EB Indicators % foreign population aged 18-64
EB, total for foreigners 1.8
EB male 1.9
EB female 1.7
Involved in EB purely by opportunity motive 1.1
Involved in EB partly by opportunity motive 0.2
Involved in EB by necessity motive 0.6
Involved in EB by other motive 0.0
% of EB: transforming sector 32.6
% of EB consumer-oriented sector 67.4
% of EB with innovative component 12.0
% of EB with no competitors 0.0
% of EB using very latest technology 21.2
% of EB with 20 or more jobs 13.2
% of EB that expects creating 20 or more jobs in 5 years 11.6
% of EB with some export activity 79.2
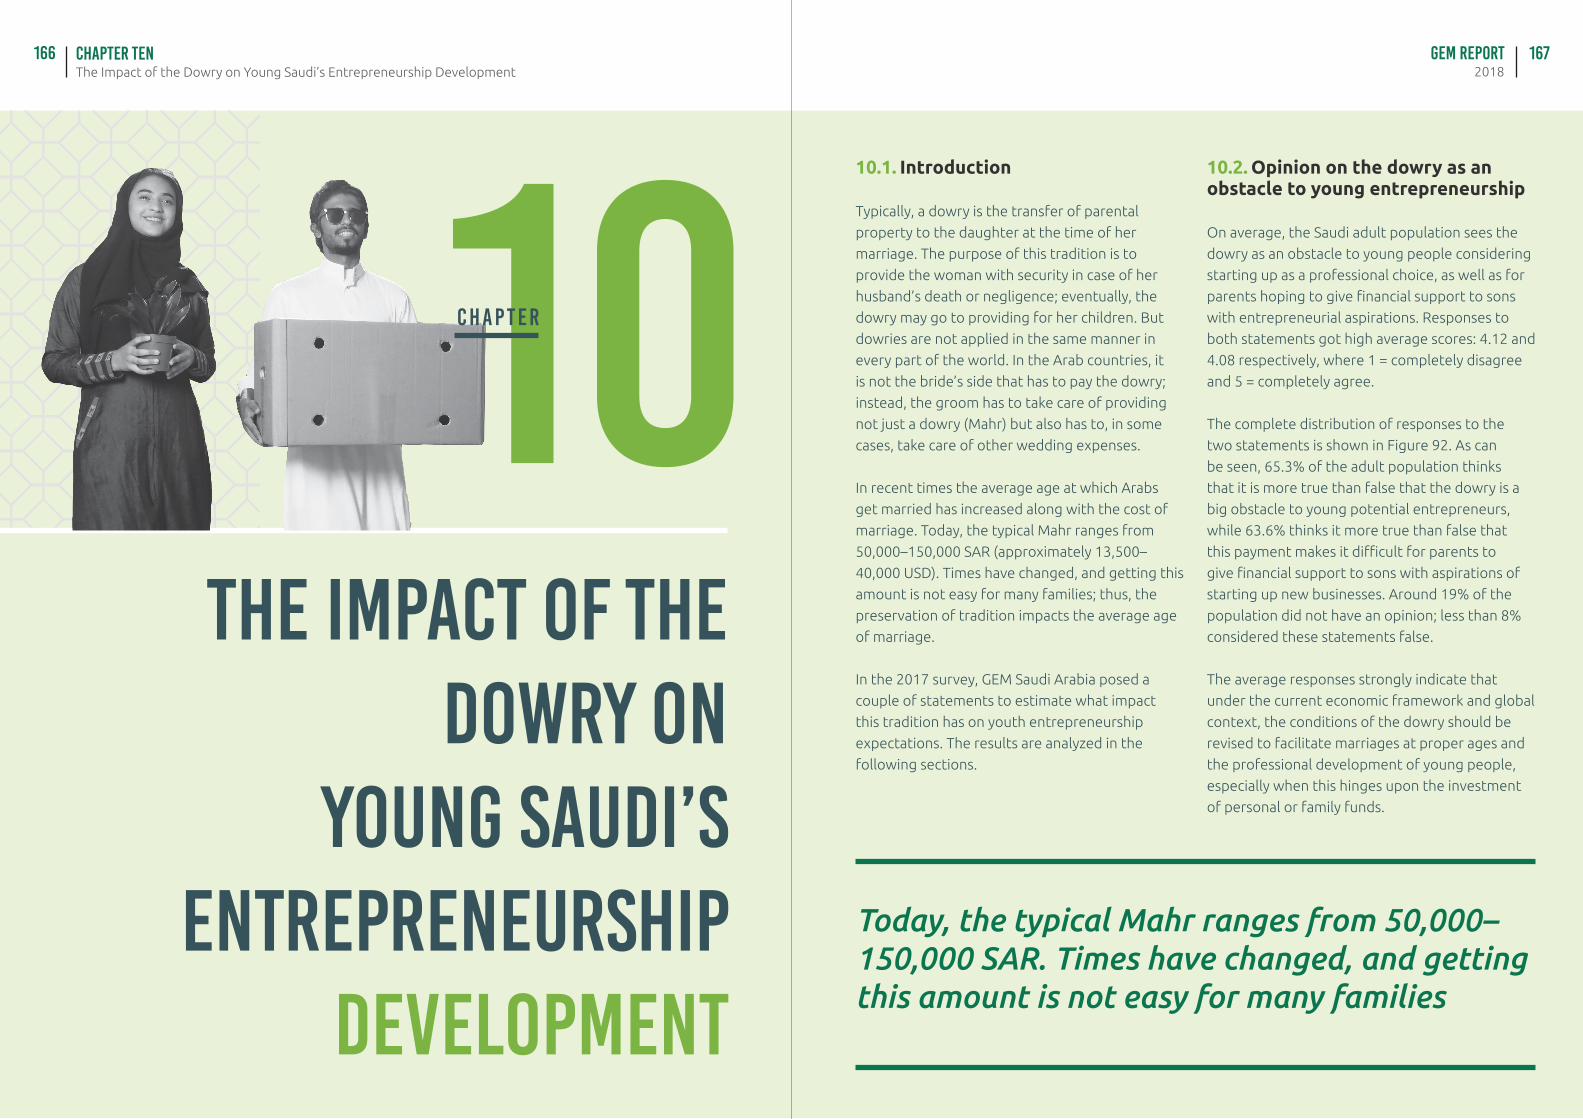
The Impact of the Dowry on Young Saudi’s Entrepreneurship DevelopmentChapter Ten GEM Report
2018166 167
10The impact of the
dowry on young saudi’s
entrepreneurship development
C H A P T E R
10.1. Introduction
Typically, a dowry is the transfer of parental
property to the daughter at the time of her
marriage. The purpose of this tradition is to
provide the woman with security in case of her
husband’s death or negligence; eventually, the
dowry may go to providing for her children. But
dowries are not applied in the same manner in
every part of the world. In the Arab countries, it
is not the bride’s side that has to pay the dowry;
instead, the groom has to take care of providing
not just a dowry (Mahr) but also has to, in some
cases, take care of other wedding expenses.
In recent times the average age at which Arabs
get married has increased along with the cost of
marriage. Today, the typical Mahr ranges from
50,000–150,000 SAR (approximately 13,500–
40,000 USD). Times have changed, and getting this
amount is not easy for many families; thus, the
preservation of tradition impacts the average age
of marriage.
In the 2017 survey, GEM Saudi Arabia posed a
couple of statements to estimate what impact
this tradition has on youth entrepreneurship
expectations. The results are analyzed in the
following sections.
10.2. Opinion on the dowry as an obstacle to young entrepreneurship
On average, the Saudi adult population sees the
dowry as an obstacle to young people considering
starting up as a professional choice, as well as for
parents hoping to give financial support to sons
with entrepreneurial aspirations. Responses to
both statements got high average scores: 4.12 and
4.08 respectively, where 1 = completely disagree
and 5 = completely agree.
The complete distribution of responses to the
two statements is shown in Figure 92. As can
be seen, 65.3% of the adult population thinks
that it is more true than false that the dowry is a
big obstacle to young potential entrepreneurs,
while 63.6% thinks it more true than false that
this payment makes it difficult for parents to
give financial support to sons with aspirations of
starting up new businesses. Around 19% of the
population did not have an opinion; less than 8%
considered these statements false.
The average responses strongly indicate that
under the current economic framework and global
context, the conditions of the dowry should be
revised to facilitate marriages at proper ages and
the professional development of young people,
especially when this hinges upon the investment
of personal or family funds.
Today, the typical Mahr ranges from 50,000–150,000 SAR. Times have changed, and getting this amount is not easy for many families
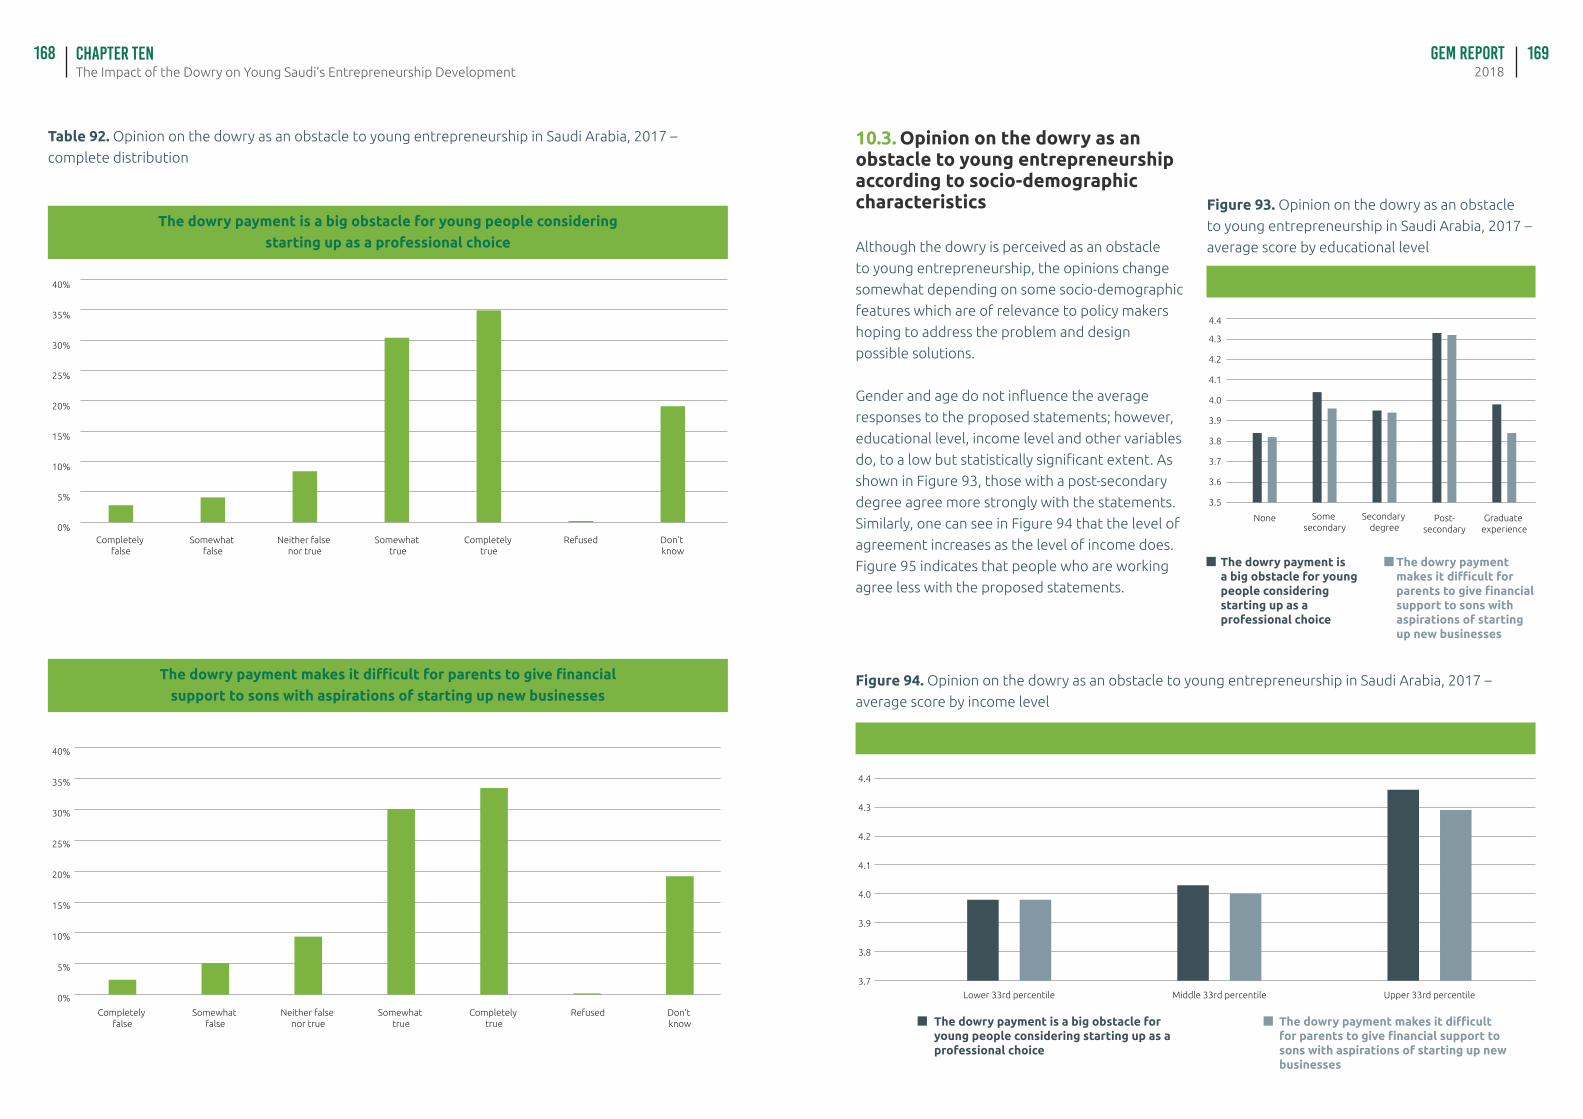
The Impact of the Dowry on Young Saudi’s Entrepreneurship DevelopmentChapter Ten GEM Report
2018168 169
Table 92. Opinion on the dowry as an obstacle to young entrepreneurship in Saudi Arabia, 2017 –
complete distribution
The dowry payment is a big obstacle for young people considering starting up as a professional choice
0%
5%
10%
15%
20%
25%
30%
35%
40%
Don't know
RefusedCompletely true
Somewhat true
Neither false nor true
Somewhat false
Completely false
0%
5%
10%
15%
20%
25%
30%
35%
40%
Don't know
RefusedCompletely true
Somewhat true
Neither false nor true
Somewhat false
Completely false
The dowry payment makes it difficult for parents to give financial support to sons with aspirations of starting up new businesses
Average score for statements on the dowry
Average score for statements on the dowry
10.3. Opinion on the dowry as an obstacle to young entrepreneurship according to socio-demographic characteristics
Although the dowry is perceived as an obstacle
to young entrepreneurship, the opinions change
somewhat depending on some socio-demographic
features which are of relevance to policy makers
hoping to address the problem and design
possible solutions.
Gender and age do not influence the average
responses to the proposed statements; however,
educational level, income level and other variables
do, to a low but statistically significant extent. As
shown in Figure 93, those with a post-secondary
degree agree more strongly with the statements.
Similarly, one can see in Figure 94 that the level of
agreement increases as the level of income does.
Figure 95 indicates that people who are working
agree less with the proposed statements.
Graduate experience
Post-secondary
Secondary degree
Some secondary
None
3.5
3.6
3.7
3.8
3.9
4.0
4.1
4.2
4.3
4.4
The dowry payment is a big obstacle for young people considering starting up as a professional choice
The dowry payment is a big obstacle for young people considering starting up as a professional choice
The dowry payment makes it difficult for parents to give financial support to sons with aspirations of starting up new businesses
The dowry payment makes it difficult for parents to give financial support to sons with aspirations of starting up new businesses
Figure 93. Opinion on the dowry as an obstacle
to young entrepreneurship in Saudi Arabia, 2017 –
average score by educational level
Figure 94. Opinion on the dowry as an obstacle to young entrepreneurship in Saudi Arabia, 2017 –
average score by income level
3.7
3.8
3.9
4.0
4.1
4.2
4.3
4.4
Upper 33rd percentileMiddle 33rd percentileLower 33rd percentile
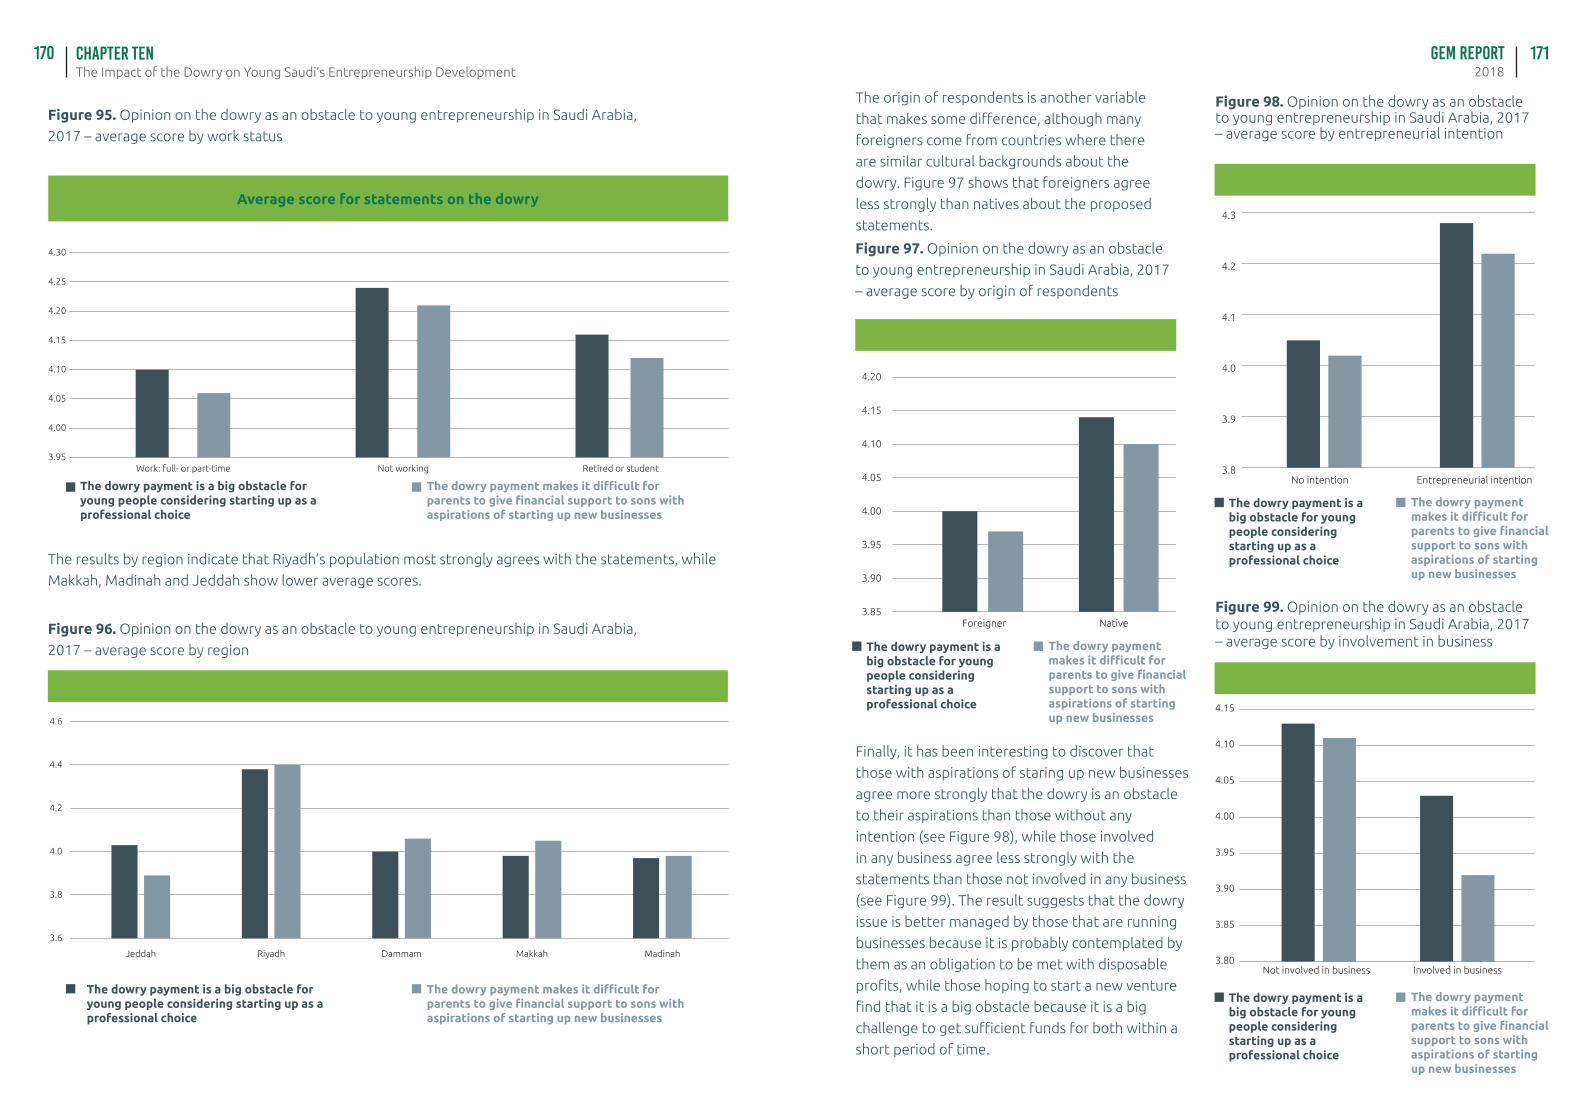
The Impact of the Dowry on Young Saudi’s Entrepreneurship DevelopmentChapter Ten GEM Report
2018170 171
Average score for statements on the dowry
Average score for statements on the dowry
The dowry payment is a big obstacle for young people considering starting up as a professional choice
The dowry payment is a big obstacle for young people considering starting up as a professional choice
The dowry payment makes it difficult for parents to give financial support to sons with aspirations of starting up new businesses
The dowry payment makes it difficult for parents to give financial support to sons with aspirations of starting up new businesses
Figure 95. Opinion on the dowry as an obstacle to young entrepreneurship in Saudi Arabia,
2017 – average score by work status
Figure 96. Opinion on the dowry as an obstacle to young entrepreneurship in Saudi Arabia,
2017 – average score by region
The results by region indicate that Riyadh’s population most strongly agrees with the statements, while
Makkah, Madinah and Jeddah show lower average scores.
3.95
4.00
4.05
4.10
4.15
4.20
4.25
4.30
Retired or studentNot workingWork: full- or part-time
3.6
3.8
4.0
4.2
4.4
4.6
MadinahMakkahDammamRiyadhJeddah
Average score for statements on the dowry
Average score for statements on the dowry
Average score for statements on the dowry
Figure 97. Opinion on the dowry as an obstacle
to young entrepreneurship in Saudi Arabia, 2017
– average score by origin of respondents
Figure 98. Opinion on the dowry as an obstacle to young entrepreneurship in Saudi Arabia, 2017 – average score by entrepreneurial intention
Figure 99. Opinion on the dowry as an obstacle to young entrepreneurship in Saudi Arabia, 2017 – average score by involvement in business
The origin of respondents is another variable
that makes some difference, although many
foreigners come from countries where there
are similar cultural backgrounds about the
dowry. Figure 97 shows that foreigners agree
less strongly than natives about the proposed
statements.
Finally, it has been interesting to discover that
those with aspirations of staring up new businesses
agree more strongly that the dowry is an obstacle
to their aspirations than those without any
intention (see Figure 98), while those involved
in any business agree less strongly with the
statements than those not involved in any business
(see Figure 99). The result suggests that the dowry
issue is better managed by those that are running
businesses because it is probably contemplated by
them as an obligation to be met with disposable
profits, while those hoping to start a new venture
find that it is a big obstacle because it is a big
challenge to get sufficient funds for both within a
short period of time.
NativeForeigner3.85
3.90
3.95
4.00
4.05
4.10
4.15
4.20
3.8
3.9
4.0
4.1
4.2
4.3
Entrepreneurial intentionNo intention
3.80
3.85
3.90
3.95
4.00
4.05
4.10
4.15
Not involved in business Involved in business
The dowry payment is a big obstacle for young people considering starting up as a professional choice
The dowry payment makes it difficult for parents to give financial support to sons with aspirations of starting up new businesses
The dowry payment is a big obstacle for young people considering starting up as a professional choice
The dowry payment makes it difficult for parents to give financial support to sons with aspirations of starting up new businesses
The dowry payment is a big obstacle for young people considering starting up as a professional choice
The dowry payment makes it difficult for parents to give financial support to sons with aspirations of starting up new businesses
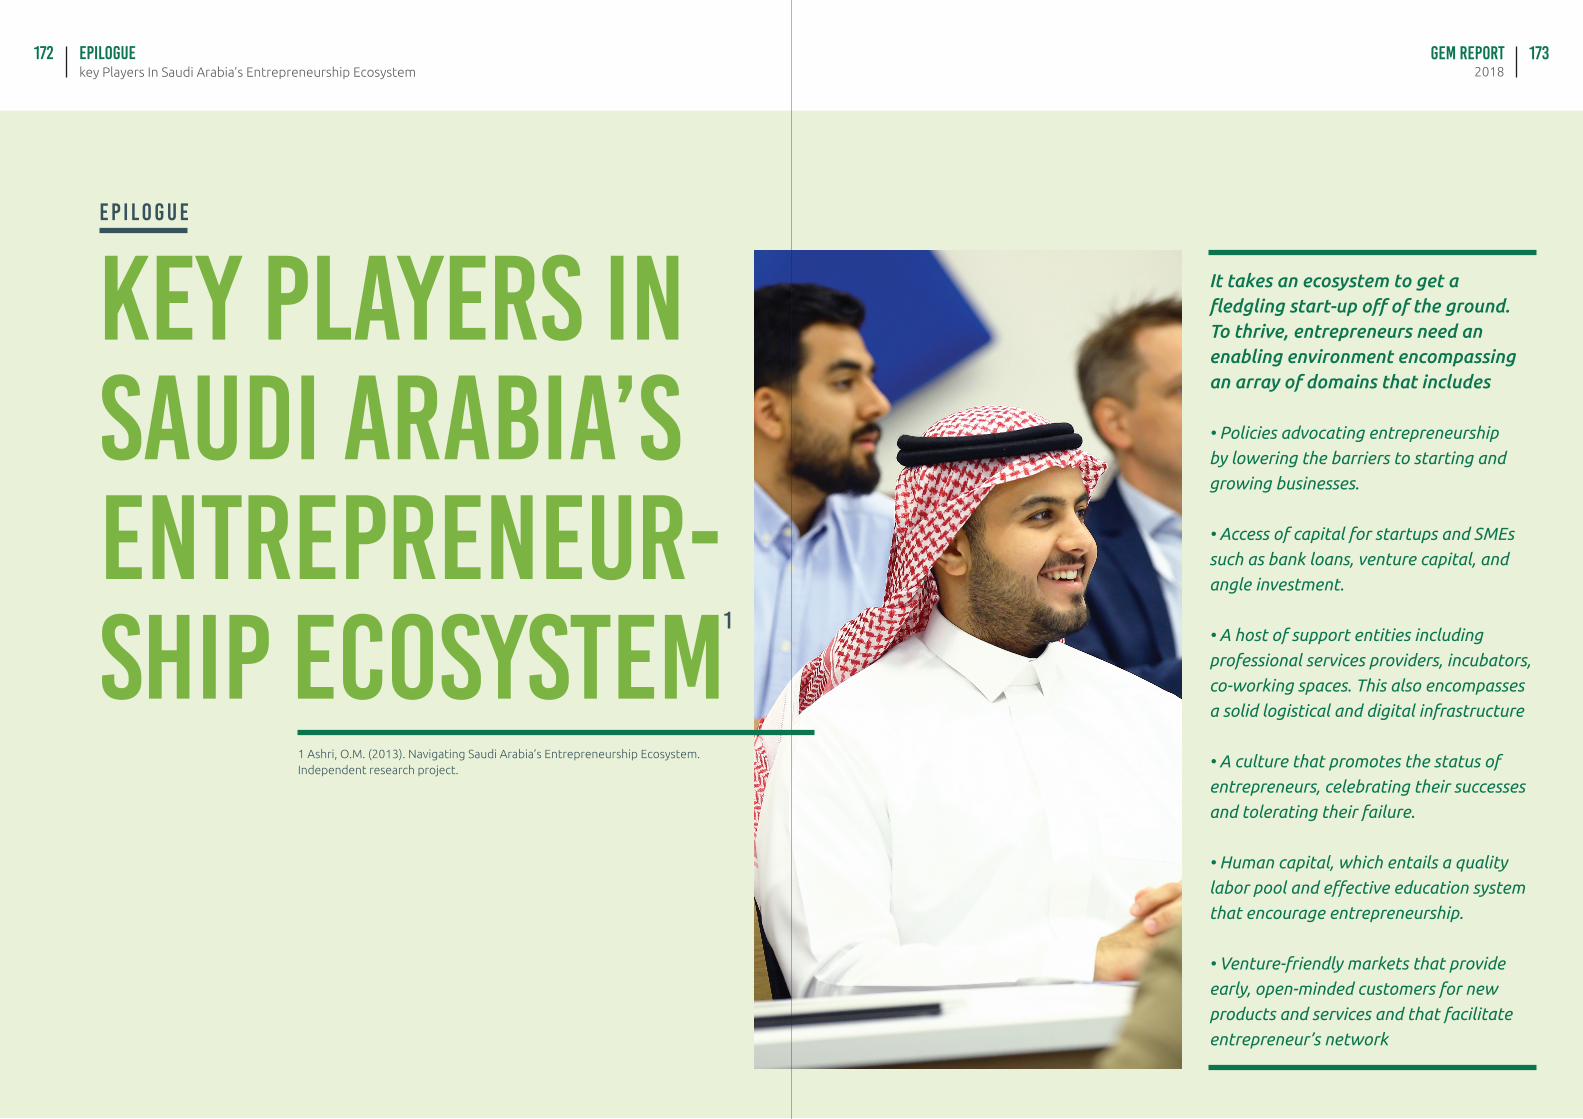
key Players In Saudi Arabia’s Entrepreneurship Ecosystemepilogue172
Key Players in Saudi Arabia’s Entrepreneur-ship Ecosystem
E p i l o g u e
1
1 Ashri, O.M. (2013). Navigating Saudi Arabia’s Entrepreneurship Ecosystem. Independent research project.
GEM Report2018
173
It takes an ecosystem to get a fledgling start-up off of the ground. To thrive, entrepreneurs need an enabling environment encompassing an array of domains that includes
• Policies advocating entrepreneurship
by lowering the barriers to starting and
growing businesses.
• Access of capital for startups and SMEs
such as bank loans, venture capital, and
angle investment.
• A host of support entities including
professional services providers, incubators,
co-working spaces. This also encompasses
a solid logistical and digital infrastructure
• A culture that promotes the status of
entrepreneurs, celebrating their successes
and tolerating their failure.
• Human capital, which entails a quality
labor pool and effective education system
that encourage entrepreneurship.
• Venture-friendly markets that provide
early, open-minded customers for new
products and services and that facilitate
entrepreneur’s network
174
What is an Entrepreneurship Ecosystem?
An entrepreneurship ecosystem could be
perceived as a system whose different
domains (afore-mentioned above) must
interact in a coherent way with the purpose
of creating and enabling environment where
entrepreneurs and thrive and prosper.
Key players in Saudi Arabia’s Entrepreneurship Ecosystem:
Saudi Arabia’s Entrepreneurship Ecosystem
has witnessed a proliferation of entities and
initiatives cultivating its different domains.
While key policy-related initiatives have been
elaborated on in the introduction section
of this report, here we would like highlight
some of the key players contributing to the
progress of entrepreneurship in Saudi Arabia
– namely, funding institutions and support
organizations.
key Players In Saudi Arabia’s Entrepreneurship Ecosystemepilogue GEM Report
2018175
Kafalah program
Kafalah program aims to provide access to
finance for SMEs. Backed by this program,
Saudi banks will be in a position to finance
eligible customers for up to SAR 2 million.
Kafalah is a mutual credit guarantee scheme.
The program is designed for SMEs that have
economically feasible business but don’t have
enough collateral to qualify for bank loans.
The program is a collaboration between the
government and Saudi-based banks whereby
the government guarantee up to 80% in case
the enterprise defaults on the loan.
www.kafalah.gov.sa/Pages/default.aspx
Vision Ventures
Vision Ventures (VV) is a corporate venture
capital firm established in Saudi Arabia and is
one of Sahara Net’s Group of companies.
VV invests in innovative startups in the seed
and early stage helping them realize their
dreams and making a difference.
www.visionvc.co
The Riyadh Taqnia Fund (RTF)
The Riyadh Taqnia Fund (RTF) is a venture
capital fund between two entities: Riyadh
Capital, the investment arm of Riyadh Bank
and TAQNIA, which acts as Technical Advisor
to Riyadh Capital. The involvement of both
entities allows portfolio companies to benefit
from each investor’s strengths and unique
characteristics. RTF focuses on: ICT, Energy
and Sustainability, Advanced Materials
https://www.taqnia.com
Wadi Jeddah ventures
WJ Ventures is a post-MVP seed fund that
invests and provides support to startups,
that work with innovation-based business
models and provide creative products and
services. WJV’s objectives are to: Support
the Saudi startup ecosystem by providing
financial support and mentoring to early stage
innovation-based startups, and Establish best
practices in seed funding in KSA and early
stage support to maximize the success
rate for startups.
http://wj-ventures.com/
FUNDING ORGANIZATIONS
The Angel Investor Network (Sirb)
The Angel Investor Network (Sirb) was
established as an initiative of King Abdul Aziz
City for Science and Technology (KACST) in
line with KACST vision towards a knowledge
economy. Sirb is an Angel Investor Network
with Angel Investors who typically invest
entrepreneurs’ new startup companies at
very early stages. Sirb angel investors play a
critical role to proof the project, and make
it marketable for a large investment round
later on by large Venture Capitalist (VCs). Sirb
contributes to increase the success rates of
small and mid size projects at early stages
through sustainable administrative and
material support offered by angel investors.
www.sirb.sa
Wa’ed Venture Capital (VC)
Wa’ed’s Venture Capital (VC) provides direct
equity investment to companies that are
looking for a venture partner. Investing in a
broad range of early-stage companies through
existing corporations looking to expand,
Wa’ed VC aims to support the development
of small and medium-sized enterprises,
with the overall objective of fostering
economic development in the Kingdom of
Saudi Arabia. Wa’ed VC is comprised of an
eclectic, broad-ranging yet unified group
of individuals who promote an open and
welcoming environment, ripe for prosperity
and innovation.
For a deeper understanding of the
entrepreneurs’ needs, in order to better
support them, Wa’ed VC promotes an
atmosphere that encourages real-time
engagement with entrepreneurs.
Wa’ed VC advocates an approach that differs
from typical Venture Capital functions that
focus exclusively on one objective: profit.
At Wa’ed VC, the focus is not only on profit,
but also on the creation of quality jobs and
economic diversification in Saudi Arabia.
Therefore, it is a VC function with a national
agenda.
www.waed.net/en/venture-capital.html
Inspire Ventures
Founded in 2016, Inspire Ventures is an
emerging Saudi Venture Capital Company
based in Riyadh with the objective to invest in
ideas with high growth potential.
Inspire Ventures founding team is a group of
diversified Saudi entrepreneurial pioneers
with a huge investment background and are
passionate about innovation, technology, and
building solid businesses.
We offer funding to early-growth stage
startups mainly in Saudi Arabia and other GCC
countries with the aim to be a value-added
strategic investor via actively engaging with
portfolio companies and providing them with
guidance, support, access to the right network
in addition to other means to direct their
businesses toward success.
https://inspire.sa/
Raed Ventures
It is a Saudi Arabian corporate venture capital
firm established by Almajdouie Holding LLC
in 2015. It provides funding for the seed and
early stage startups in Saudi Arabia and MENA
region.
RAED Ventures is Almajdouie Holding foray
into the world of tech investing. The primary
goal of the fund is to create substantial
financial and strategic returns to its investors,
while delivering exceptional value to its
portfolio companies.
http://raed.vc
STC Ventures
STC Ventures is an independently managed
venture capital fund whose anchor investor
is the Saudi Telecom Company. Our goal is
to empower entrepreneurs to create market
leading technology businesses. We are
focused on equity investments that will help
to build leading companies in the information
technology, telecommunications, and digital
media/entertainment sectors. One of the
key objectives of our fund is to support
the development of innovative technology
companies in the GCC, wider MENA region
and Turkey, in addition to funding globally
minded international companies seeking
capital and access to the MENA region.
Oqal Group
Oqal Group (combined from the two
Arabic words “Oqool: meaning minds” and
“AmwaL: meaning money”). It is a non-
profit organization, the first angel investor
network in Saudi Arabia with the main
objective of growing the SME sector in the
country. OQAL connects entrepreneurs
with local/regional investors who are
willing to invest in startups, and provides
aid to entrepreneurs through guidance
from members with specific expertise
in knowledge areas such as marketing,
finance, accounting, etc.
Oqal investors search for local early-stage
highly scalable startups with high potential
growth across all sectors. Oqal members
make their own investment decisions
either individually or in groups in the range
of $80,000 to $1.3 million.
www.oqal.org
176key Players In Saudi Arabia’s Entrepreneurship Ecosystemepilogue GEM Report
2018177
178
SUPPORT ORGANIZATIONSEntrepreneurship at KAUST
The Entrepreneurship Center at KAUST offers
training and mentorship to entrepreneurs
both on and off campus, from scientists and
students looking to spin out their inventions
into new companies, to Saudi business owners
interested in adopting an entrepreneurial
approach to business growth.
KAUST helps entrepreneurs at all stages
of the process, from ideation to launch to
funding and beyond. KAUST is particularly
interested in supporting new ventures that
are aligned with the university’s research
activities and that will have local or regional
impacts and create jobs.
https://innovation.kaust.edu.sa/entrepreneurs/
Small and Medium Enterprises General Authority
Small and Medium Enterprises General
Authority is working on reviewing regulations,
removing barriers and facilitating access to
finance. Moreover, helping young people
and innovators in marketing their ideas and
products. At the same time, we will seek to
establish more business incubators, training
institutions and specialized venture capital
funds to help entrepreneurs develop their
skills and innovations. We will also help
small national enterprises to export their
products and services and marketing through
e-marketing support and coordination with
relevant international bodies.
https://smea.gov.sa
key Players In Saudi Arabia’s Entrepreneurship Ecosystemepilogue GEM Report
2018179
Bab Rizq Jameel
Small Business Support is one of the most
important programs offered by Bab Rizq
Jameel. Since it was launched in 2004 the
Small Business Program has provided support
for more than 25,000 small projects of all
kinds
Young people who have good ideas but lack
finance can benefit from this program. Bab
Rizq Jameel offers them interest-free loans
starting from SR 6,500 upto SR 200,000, with
a repayment period that can reach 5 years
http://programs.babrizqjameel.com
Deem Al-Manahil
Deem Al-Manahil Fund is a private non-profit
fund established upon an initiative by Al-
Manahil Company aiming at helping the Saudi
woman to practice free work and owning
small projects in Riyadh.
http://deem-almanahil.org
Prince Sultan Fund for Women Development
Small and medium sized enterprises are one
of the key sectors in building the national
economy, and this is what the Business
Support and Funding Center is working on by
providing a platform for launching women’s
ideas and translating it into reality by starting
their own business or developing existing
ones, in a way that aims on creating valid job
opportunities to ensure their integration
in the society and their transformation into
productive members
http://www.psfw.org
King Salman Youth Center
KSYC is a non-profit organization founded
to support and inspire the youth to build
professional leaders and successful
entrepreneurs. In addition to establish a
platform to connect youth with officials and
organizations
http://www.ksyc.org.sa
BIAC
The Business Incubators and accelerators
company “BIAC” focuses on setup,
operation, maintenance and management
of business incubators and accelerators as
well as entrepreneurship support platforms,
innovation programs and technology
transfer. BIAC provides project management
services, specialized consultations and
training services to enhance human resource
capabilities. BIAC seeks to contribute to the
growth and development of the innovation
and entrepreneurship environment and to
support emerging technology companies,
in line with the vision of the Kingdom 2030
and its objectives which include supporting
entrepreneurship and small and medium
enterprises and increasing their contribution
to GDP.
http://www.biac.com.sa
180
Namaa Al Munawara
Namaa Al Munawara was established as a non-
profit organization for providing the required
support to small and medium enterprises. It
provides several initiatives for supporting the
sector Madinah.
MiSK Foundation
MiSK focuses on the country’s youth and
provides different means of fostering talent,
creative potential, and innovation in a healthy
environment that paves the way toward
opportunities in the arts and sciences.
The Foundation is invested in educating the
youth in three wide fields; Education, Media
& Culture. These pillars of knowledge will
support and advance our country’s future.
Enabling the Saudi people to learn is a means
to develop and drive advances across the
business, technological, literary, cultural, and
social aspects of our nation.
MiSK Foundation, established by HRH Prince
Mohammed bin Salman, pursues these goals
by both establishing programs and partnering
with local and global organizations in diverse
fields. Through a variety of incubators, the
Foundation is helping to develop intellectual
capital and unlock the potential of all Saudi
people.
misk.org/
Aramco - Entrepreneurship Incubation
Wa’ed established its own business incubator,
StartUp Lab, to provide incubation support for
early-stage businesses. StartUp Lab is a space
designed to house startup companies and
provide them with a range of services such as
training and mentorship in addition to office
space and amenities.
Training:Wa’ed offers workshops in several disciplines
designed to provide the know-how and
necessary skill-set sought out by early stage
startups, entrepreneurs, and those with
potential ideas. These workshops include
Business Plan formulation, Pitching, Ideation,
and Business Model Canvas.
Funding:Funding offerings include debt funding in the
form of non-collateral loans, venture capital
funding offering minority equity partnerships,
and non-repayable micro-funding “Seed
Fund” for incubated startups. Whether you’re
an established business owner seeking to
expand or an aspiring entrepreneur seeking to
grow, at Wa’ed you’ll find a funding program
catered to your business.
www.waed.net
key Players In Saudi Arabia’s Entrepreneurship Ecosystemepilogue GEM Report
2018181
Endeavor - Saudi Arabia
ENDEAVOR is leading the global movement
to select, mentor, and accelerate the best
entrepreneurs around the world. High-Impact
Entrepreneurs are those who:
- Possess the biggest most innovative ideas
and the capacity to realize them.
- Scale their businesses creating significantly
more wealth and high quality jobs.
- Reinvest their knowledge, credibility,
and financial gains in the generation of
entrepreneurs.
http://endeavor.sa
Wadi Makkah Company
Wadi Makkah company aims to contribute
effectively in developing a knowledge-based
economy in Saudi Arabia through partnership
between educational and research
institutions, and business communities.
MTVC focuses on technology localization,
development and transfer in order to serve
the national economy and achieve sustainable
development. Wadi Makkah company aims
to provide an attractive and stimulating
environment for local and international
research and development centers to
strengthen collaboration with the university,
develop scientific activities and foster the
commercialization of research and innovation.
Thus, Wadi Makkah company has two main
objectives:
(1) Management and commercialization of
university innovation.
(2) Establishing and managing Makkah Techno
Valley (MTV), a Science and Technology Park
in UQU.
http://wadimakkah.sa/
Flat6Labs Jeddah
Flat6Labs Jeddah fosters and invests in
bright and passionate Saudi entrepreneurs
with cutting-edge ideas. Launched in 2013,
Flat6Labs Jeddah assists and encourages
entrepreneurs throughout the critical first
steps of development. The target for the
accelerator program is to graduate 15
successful and scalable startup businesses
each year.
http://www.flat6labsjeddah.com
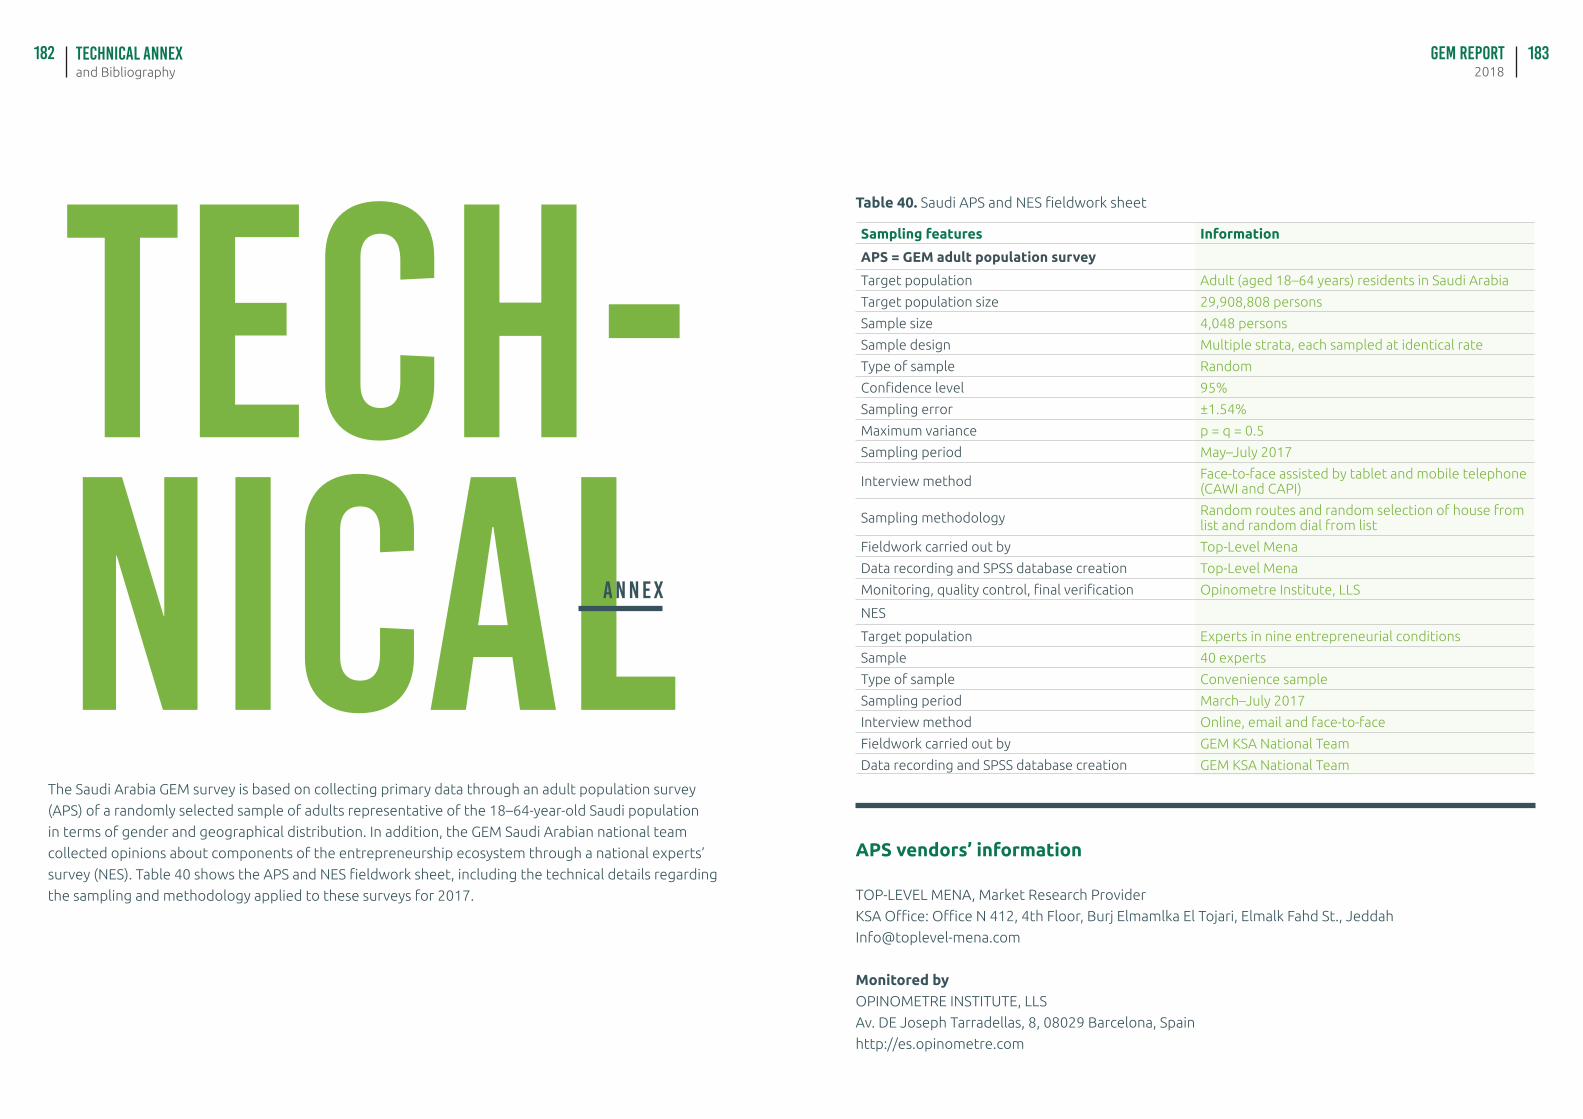
182
The Saudi Arabia GEM survey is based on collecting primary data through an adult population survey
(APS) of a randomly selected sample of adults representative of the 18–64-year-old Saudi population
in terms of gender and geographical distribution. In addition, the GEM Saudi Arabian national team
collected opinions about components of the entrepreneurship ecosystem through a national experts’
survey (NES). Table 40 shows the APS and NES fieldwork sheet, including the technical details regarding
the sampling and methodology applied to these surveys for 2017.
TECH-NICALA N N E X
and BibliographyTechnical annex GEM Report
2018183
Sampling features Information
APS = GEM adult population survey
Target population Adult (aged 18–64 years) residents in Saudi Arabia
Target population size 29,908,808 persons
Sample size 4,048 persons
Sample design Multiple strata, each sampled at identical rate
Type of sample Random
Confidence level 95%
Sampling error ±1.54%
Maximum variance p = q = 0.5
Sampling period May–July 2017
Interview method Face-to-face assisted by tablet and mobile telephone (CAWI and CAPI)
Sampling methodology Random routes and random selection of house from list and random dial from list
Fieldwork carried out by Top-Level Mena
Data recording and SPSS database creation Top-Level Mena
Monitoring, quality control, final verification Opinometre Institute, LLS
NES
Target population Experts in nine entrepreneurial conditions
Sample 40 experts
Type of sample Convenience sample
Sampling period March–July 2017
Interview method Online, email and face-to-face
Fieldwork carried out by GEM KSA National Team
Data recording and SPSS database creation GEM KSA National Team
Table 40. Saudi APS and NES fieldwork sheet
APS vendors’ information
TOP-LEVEL MENA, Market Research Provider
KSA Office: Office N 412, 4th Floor, Burj Elmamlka El Tojari, Elmalk Fahd St., Jeddah
Monitored byOPINOMETRE INSTITUTE, LLS
Av. DE Joseph Tarradellas, 8, 08029 Barcelona, Spain
http://es.opinometre.com
BIBLIOGRAPHYSpies, O. (2012). “Mahr”. In P. Bearman, Th. Bianquis, C.E. Bosworth,
E. van Donzel, W.P. Heinrichs. Encyclopaedia of Islam. Vol. 6 (2nd
ed.). Brill. pp. 78–79.
Fouad, D. (2015). “Saudi Arabia: Women reject a dowry cap”. Arab
News.
Habtor, A. (2015). “Saudi Arabia: Dowry rates fixed to contain
spinsterhood”. Arab News.
Ashri, O.M. (2013). Navigating Saudi Arabia’s Entrepreneurship
Ecosystem. Independent research project.
Doing Business 2017: Equal Opportunity for All. World Bank.
Kelley, D., Singer, S., Herrington, M. (2016). Global
Entrepreneurship Monitor 2015/2016 Global Report. Babson
College, Babson Park, MA, United States; Universidad del
Desarrollo, Santiago, Chile; Universiti Tun Abdul Razak, Malaysia;
Tecnológico de Monterrey, Mexico
Labor Force Survey (2016) (Second Quarter). Saudi Arabia’s General
Authority for Statistics.
Mason, C. and Brown, R. (2014). Entrepreneurial ecosystems and
growth oriented entrepreneurship. Background paper prepared
for the workshop organised by the OECD LEED Program and the
Dutch Ministry of Economic Affairs on Entrepreneurial Ecosystems
and Growth Oriented Entrepreneurship. The Hague, Netherlands,
7th November 2013. OECD.
The Global Competitiveness Report 2016–2017. Geneva: World
Economic Forum.
Relevant web sites and web documents:
http://vision2030.gov.sa/sites/default/files/NTP_En.pdf
vision2030.gov.sa/download/file/fid/417