Noncommunicable Diseases in Saudi Arabia
255
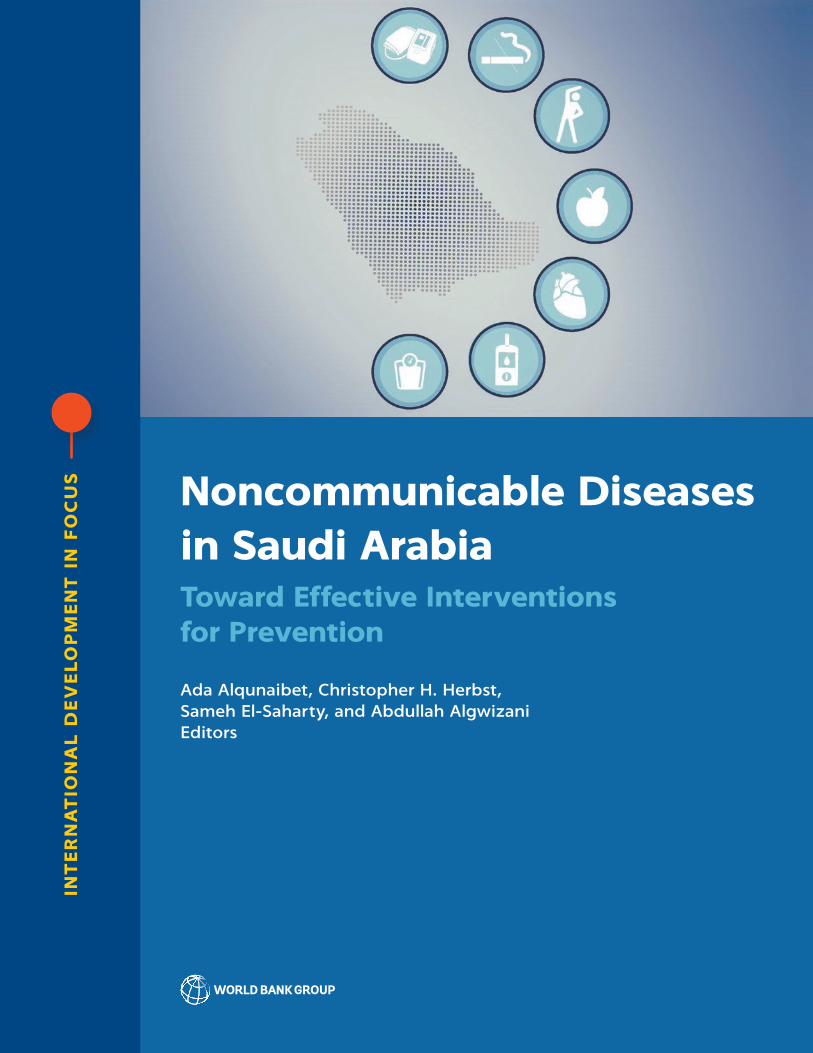
INTERNATIONAL DEVELOPMENT IN FOCUS Noncommunicable Diseases in Saudi Arabia Toward Effective Interventions for Prevention Ada Alqunaibet, Christopher H. Herbst, Sameh El-Saharty, and Abdullah Algwizani Editors
-
Upload
khangminh22 -
Category
Documents
-
view
0 -
download
0
Transcript of Noncommunicable Diseases in Saudi Arabia
INT
ER
NA
TIO
NA
L D
EV
EL
OP
ME
NT
IN
FO
CU
S Noncommunicable Diseases in Saudi ArabiaToward Effective Interventions for Prevention
Ada Alqunaibet, Christopher H. Herbst, Sameh El-Saharty, and Abdullah Algwizani Editors


Noncommunicable Diseases in Saudi ArabiaToward Effective Interventions for Prevention
ADA ALQUNAIBET, CHRISTOPHER H. HERBST, SAMEH EL-SAHARTY, AND ABDULLAH ALGWIZANI, EDITORS
INTERNAT IONAL DE VELOPMENT IN FOCUS

© 2021 International Bank for Reconstruction and Development / The World Bank1818 H Street NW, Washington, DC 20433Telephone: 202-473-1000; Internet: www.worldbank.org
Some rights reserved
1 2 3 4 24 23 22 21
Books in this series are published to communicate the results of World Bank research, analysis, and operational experience with the least possible delay. The extent of language editing varies from book to book.
This work is a product of the staff of The World Bank with external contributions. The findings, interpretations, and conclusions expressed in this work do not necessarily reflect the views of The World Bank, its Board of Executive Directors, or the governments they represent. The World Bank does not guarantee the accuracy, completeness, or currency of the data included in this work and does not assume responsibility for any errors, omissions, or discrepancies in the information, or liability with respect to the use of or failure to use the information, methods, processes, or conclusions set forth. The boundaries, colors, denominations, and other information shown on any map in this work do not imply any judgment on the part of The World Bank concerning the legal status of any territory or the endorsement or acceptance of such boundaries.
Nothing herein shall constitute or be construed or considered to be a limitation upon or waiver of the privileges and immunities of The World Bank, all of which are specifically reserved.
Rights and Permissions
This work is available under the Creative Commons Attribution 3.0 IGO license (CC BY 3.0 IGO) http://creativecommons.org/licenses/by/3.0/igo. Under the Creative Commons Attribution license, you are free to copy, distribute, transmit, and adapt this work, including for commercial purposes, under the following conditions:
Attribution—Please cite the work as follows: Alqunaibet, Ada, Christopher H. Herbst, Sameh El-Saharty, and Abdullah Algwizani, editors. 2021. Noncommunicable Diseases in Saudi Arabia: Toward Effective Interventions for Prevention. Washington, DC: World Bank. doi:10.1596/978-1-4648-1717-5. License: Creative Commons Attribution CC BY 3.0 IGO
Translations—If you create a translation of this work, please add the following disclaimer along with the attribution: This translation was not created by The World Bank and should not be considered an official World Bank translation. The World Bank shall not be liable for any content or error in this translation.
Adaptations—If you create an adaptation of this work, please add the following disclaimer along with the attribution: This is an adaptation of an original work by The World Bank. Views and opinions expressed in the adaptation are the sole responsibility of the author or authors of the adaptation and are not endorsed by The World Bank.
Third-party content—The World Bank does not necessarily own each component of the content contained within the work. The World Bank therefore does not warrant that the use of any third party owned indi-vidual component or part contained in the work will not infringe on the rights of those third parties. The risk of claims resulting from such infringement rests solely with you. If you wish to reuse a component of the work, it is your responsibility to determine whether permission is needed for that reuse and to obtain permission from the copyright owner. Examples of components can include, but are not limited to, tables, figures, or images.
All queries on rights and licenses should be addressed to World Bank Publications, The World Bank Group, 1818 H Street NW, Washington, DC 20433, USA; e-mail: [email protected].
ISBN: 978-1-4648-1717-5DOI: 10.1596/978-1-4648-1717-5
Cover lllustration: © Saudi Public Health Authority. Used with permission of the Saudi Public Health Authority. Further permission required for reuse.Cover design: Debra Naylor, Naylor Design Inc.

iii
Contents
Foreword, Issam Abousleiman and Keiko Miwa xiForeword, Tawfig bin Fawzan AlRabiah xiiiAcknowledgments xvAbout the Editors xviiAbbreviations xix
CHAPTER 1 Overview: Evidence to Understand and Address NCDs in Saudi Arabia 1
Ada Alqunaibet, Christopher H. Herbst, Sameh El-Saharty, and Abdullah Algwizani
Introduction 1Objective and scope of this report 2Organization of the book 3Conclusions 5Notes 6References 6
CHAPTER 2 Prevalence and Risk Factors of NCDs in Saudi Arabia 7
Severin Rakic, Salem Albalawi, Reem Alsukait, and Ada Alqunaibet
Key messages 7Introduction 7Methodology 8Morbidity from NCDs 9Mortality from NCDs 12Tobacco use 14Unhealthy diet 18Physical inactivity 21Overweight and obesity 24Elevated blood glucose 27High blood pressure 32Abnormal blood lipids 35Conclusions 38References 39

iv | NONCOmmUNICABLE DISEASES IN SAUDI ARABIA
CHAPTER 3 Forecasting the Health Burden of NCDs in Saudi Arabia 41
Tim Bruckner, Eileen Lee, Ada Alqunaibet, Eric Finkelstein, Christopher H. Herbst, and Sami Almudarra
Key messages 41Background 41Overview of methods 43Results: Forecasting the health burden of NCDs under various risk
reduction scenarios 47The cost-effectiveness of moderate, aggressive, and ambitious
scenarios for reducing NCD risk factors 53Conclusions 54Annex 3A: Supplementary details for the intervention
assumptions 55Notes 62References 62
CHAPTER 4 Calculating the Economic Burden of NCDs in Saudi Arabia: An Application of Three Common Approaches 65
Eric Finkelstein, Drishti Baid, Sami Almudarra, Ada Alqunaibet, William Msemburi, David Watkins, Di Dong, Abdullah Alfraih, and Christopher H. Herbst
Key messages 65Background 65Economic burden using the cost-of-illness method 67Economic burden using the value of a statistical life method 71Economic burden using the economic growth approach
method 73Summary and conclusions 74Annex 4A: Methodology for estimating the economic impact
of NCDs 75References 75
CHAPTER 5 Estimated and Likely Impact of NCDs on Human Capital in Saudi Arabia 79
Zlatko Nikoloski, William Msemburi, Ada Alqunaibet, Faisal Kattan, Christopher H. Herbst, David Watkins, Eric Finkelstein, Jesse D. Malkin, Abdullah Alfraih, and Sameh El-Saharty
Key messages 79Background 79Quantifying the impact of NCDs on the human capital index 81Pathways of NCD impact beyond the human capital index 84Conclusions 91Annex 5A: Approaches to estimating the economic burden of
NCDs 92Annex 5B: Methodology for estimating the impact of NCDs on
HCI 93References 94
CHAPTER 6 NCD Planning in Saudi Arabia: Existing Strategies and Guiding Policies 101
Ada Alqunaibet, Mariam M. Hamza, and Rehab Alaswad
Key messages 101Background 101Methodology 102Existing strategies and policies for NCD prevention 103

Contents | v
Toward strategies and policies for results 107Conclusions 109Annex 6A: Supplemental tables 110Note 123References 123
CHAPTER 7 Population-Wide Interventions to Prevent NCDs: A Review of the Global Literature and Recommendations for Saudi Arabia 125
Jesse D. Malkin, Ada Alqunaibet, Tit Albreht, Eric Finkelstein, Severin Rakic, and Sameh El-Saharty
Key messages 125Background 126Population-wide interventions and their application
in Saudi Arabia 126Effectiveness of population-wide interventions 131Cost-effectiveness of population-wide interventions 142Policy recommendations for Saudi Arabia 146Generating additional evidence 153Conclusions 153References 153
CHAPTER 8 Screening to Promote Early Detection: A Review of the Global Literature and Recommendations for Saudi Arabia 169
Jesse D. Malkin, Ada Alqunaibet, Severin Rakic, and Reem Alsukait
Key messages 169Background 169Screening in Saudi Arabia 170Effectiveness of screening 173Cost-effectiveness of screening 176Effectiveness of interventions to increase screening uptake 179Cost-effectiveness of screening promotion interventions 182Information gaps, policy recommendations, and future research
priorities 184Conclusions 185References 186
CHAPTER 9 Toward a National Master Plan for Improved Implementation and Monitoring of NCD Prevention 197
Ada Alqunaibet, Tit Albreht, Maximillian De Courten, Christopher H. Herbst, and Severin Rakic
Key messages 197Background 197Existing global and regional commitments 199A master plan to guide implementation 199Which risk factors should be prioritized? 202Which NCDs should be prioritized? 202Prioritizing prevention over treatment 203Adopting a multisectoral approach 205Adopting a life-course approach 207Ensuring equity by targeting settings 208Other features of the proposed master plan 208Conclusions 210References 210

vi | NONCOmmUNICABLE DISEASES IN SAUDI ARABIA
CHAPTER 10 NCD Stakeholders in Saudi Arabia: Mapping Their Relative Importance, Power, Interest, and Opposition 213
Rehab Alaswab, Severin Rakic, Ada Alqunaibet, and Riyad Q. Alghamdi
Key messages 213Introduction 213Methodological approach 214Identification of stakeholders influencing and participating in
NCD prevention activities 216Mapping stakeholders’ power and interest in NCD prevention 217Power of key stakeholders 220Relations of key stakeholders in tackling selected risk
factors for NCDs 222The position of key stakeholders 225Conclusions 226Annex 10A: Supplemental information on stakeholders 229References 231
Boxes
3.1 Years of life lost, years lost due to disability, and healthy life expectancy 423.2 Definition of risk factors for at-risk populations 453.3 Example of a population-attributable risk fraction calculation for 2020 and
2030 479.1 Selection of WHO EMRO strategic interventions concerning actions to
implement the United Nations Political Declaration on Noncommunicable Diseases 200
9.2 Focus on three levels of prevention in the master plan 2049.3 Three categories of NCD actions that can be taken outside of the health
sector 2069.4 Five cornerstones of prevention interventions within the health sector 2079.5 Benefits of targeting settings 209
Figures
2.1 Estimated incidence of selected NCDs in Saudi Arabia, by age, 2019 102.2 Estimated prevalence of selected NCDs in Saudi Arabia, by age, 2019 112.3 Risk factors for developing selected NCDs among the population of
Saudi Arabia, 2019 122.4 Deaths reported to the Ministry of Health’s hospitals in Saudi Arabia, by groups
of diseases, 2016 132.5 Age-standardized NCD mortality rate in Saudi Arabia and GCC countries, by
gender, 2016 132.6 Share of mortality and DALYs attributable to four major NCDs in Saudi Arabia,
by gender, 2019 142.7 Prevalence of tobacco smoking in Saudi Arabia, by age, 2013 and 2019 152.8 Smoking status of adults 15 years and older in Saudi Arabia, by age and gender,
2013 162.9 Use of smokeless tobacco products and electronic cigarettes in Saudi Arabia,
by age, 2019 162.10 Changes in the prevalence of daily smoking in Saudi Arabia, by region, 2013
and 2019 172.11 Age-standardized prevalence of smoking among the population 15 years of age
and older in the GCC countries, 2010–16 182.12 Dietary risks for developing selected NCDs in Saudi Arabia, 2019 192.13 Consumption of vegetables and fruits in Saudi Arabia, by age and gender,
2013 202.14 Share of population with sufficient intake of vegetables and fruits in
Saudi Arabia, 2013 and 2019 21

Contents | vii
2.15 Prevalence of sufficient physical activity in Saudi Arabia, 2017–19 222.16 Reasons given by adults for not engaging in physical activity in Saudi Arabia,
2018–19 232.17 Time spent sitting and watching television daily in Saudi Arabia, by gender,
2013 232.18 Age-standardized prevalence of insufficient physical activity among adults in
the GCC countries, by gender, 2016 242.19 Prevalence of overweight and obesity among adults in Saudi Arabia, by gender,
2010–19 252.20 Crude prevalence of overweight and obesity among children and adolescents
5–19 years old in Saudi Arabia, by gender, 2011–16 262.21 Age-standardized prevalence of overweight and obesity among adults in the
GCC countries, by gender, 2016 262.22 Crude prevalence of obesity among children and adolescents in the GCC
countries, by gender, 2016 272.23 Prevalence of diabetes mellitus in Saudi Arabia, by age and gender, 2013 and
2019 282.24 Prevalence of diabetes and impaired glucose tolerance in Saudi Arabia, by
population group, 2013 and 2019 292.25 Age-adjusted prevalence of impaired glucose tolerance and diabetes in adults
in the GCC countries, 2019 302.26 Proportion of undiagnosed cases of diabetes among diabetic adults in the
GCC countries, 2019 312.27 Status of diagnosis, treatment, and control of high blood sugar in persons with
diabetes in Saudi Arabia, by age and gender, 2013 312.28 Multivariate-adjusted odds ratio for undiagnosed diabetes in Saudi Arabia, by
region, 2013 322.29 Prevalence of hypertension in Saudi Arabia, by age and gender, 2013 and
2019 332.30 Age-standardized prevalence of high blood pressure in adults in the GCC
countries, by gender, 2015 342.31 Status of diagnosis, treatment, and raised blood pressure control in the
population with hypertension in Saudi Arabia, by age and gender, 2013 352.32 Multivariate-adjusted odds ratio for undiagnosed hypertension in Saudi Arabia,
by region, 2013 352.33 Prevalence of hypercholesterolemia in Saudi Arabia, by age and gender, 2013
and 2019 362.34 Status of diagnosis, treatment, and hypercholesterolemia control in the
population with hypercholesterolemia in Saudi Arabia, by age and gender, 2013 37
2.35 Multivariate-adjusted odds ratio for undiagnosed hypercholesterolemia in Saudi Arabia, by region, 2013 38
3.1 Conceptual framework of the influence of modifiable risk factors for key NCDs 43
3.2 Forecasted NCD burden in Saudi Arabia, by gender: Baseline scenario of no change in risk factors, 2020–50 48
3.3 Forecasted HALEs for women in Saudi Arabia: Baseline scenario of no change in risk factors vs. moderate scenario, 2020–50 49
3.4 Forecasted HALEs for men in Saudi Arabia: Baseline scenario of no change in risk factors vs. moderate scenario, 2020–50 50
3.5 Forecasted HALEs for women in Saudi Arabia: Baseline scenario of no change in risk factors vs. aggressive scenario, 2020–50 51
3.6 Forecasted HALEs for men in Saudi Arabia: Baseline scenario of no change in risk factors vs. aggressive scenario, 2020–50 52
3A.1 Forecasted DALYs for women in Saudi Arabia: Baseline scenario of no change in risk factors vs. ambitious scenario, 2020–50 61
3A.2 Forecasted DALYs for men in Saudi Arabia: Baseline scenario of no change in risk factors vs. ambitious scenario, 2020–50 61
5.1 The three main elements used to derive a human capital score 81

viii | NONCOmmUNICABLE DISEASES IN SAUDI ARABIA
5.2 Comparative overview of HCI scores of economies in the Middle East and North Africa 82
5.3 Improvements in adult mortality from eliminating avertable NCD-attributable deaths and risk-attributable deaths in Saudi Arabia 84
5.4 NCDs and human capital: Transmission mechanisms 856.1 Nine voluntary global targets for 2025 1046.2 Alignment of Saudi Arabia’s national vertical strategies with the umbrella Gulf
Plan 1066.3 Number of interventions mapped to behavioral and biological risk factors in
Saudi Arabia 1076.4 Differences in breadth across strategies 1089.1 The master plan as an umbrella document for one or more implementation
plans 2019.2 Approaches and strategies covered in the master plan 20510.1 Number of stakeholders related to or affected by NCD strategies and policies in
Saudi Arabia 21610.2 Stakeholders influencing and participating in tobacco control activities in
Saudi Arabia 21710.3 Stakeholders influencing and participating in the modification of unhealthy
diets in Saudi Arabia 21810.4 Stakeholders influencing and participating in the promotion of physical activity
in Saudi Arabia 21910.5 Stakeholders influencing and participating in the modification of biological risk
factors in Saudi Arabia 22010.6 Relations of the key stakeholders involved in tobacco control interventions in
Saudi Arabia 22210.7 Relations of the key stakeholders involved in reducing the risks related to
unhealthy diets in Saudi Arabia 22310.8 Relations of the key stakeholders involved in reducing the risks related to
insufficient physical activity in Saudi Arabia 22410.9 Relations of the key stakeholders involved in modifying biological risk factors in
Saudi Arabia 22510.10 Current position of key stakeholders in Saudi Arabia 226
Tables
1.1 Behavioral and biological risk factors 33.1 Estimated DALYs for each condition in Saudi Arabia, by gender, 2020 443.2 Forecasted DALYs for women in Saudi Arabia: Baseline scenario of no change in
risk factors vs. the moderate scenario, 2020–50 483.3 Forecasted DALYs for men in Saudi Arabia: Baseline scenario of no change in risk
factors vs. the moderate scenario, 2020–50 483.4 Cumulative DALYs averted if moderate scenario is implemented in Saudi Arabia,
by gender and condition, 2020–50 493.5 Forecasted DALYs for women in Saudi Arabia: Baseline scenario of no change in
risk factors vs. the aggressive scenario, 2020–50 503.6 Forecasted DALYs for men in Saudi Arabia: Baseline scenario of no change in risk
factors vs. the aggressive scenario, 2020–50 513.7 Cumulative DALYs averted, by condition and gender, if the aggressive scenario
is implemented in Saudi Arabia, 2020–50 513.8 Cumulative DALYs averted in Saudi Arabia, by condition and gender: Baseline
scenario of no change in risk factors vs. the ambitious scenario, 2020–50 523.9 Cost-effectiveness of the moderate, aggressive, and ambitious scenarios in
Saudi Arabia, 2020–2050 533A.1 Change in prevalence of cigarette smoking in Saudi Arabia using Turkey’s
change in smoking estimates, by gender and age, 2008–12 553A.2 Adjusted decrease in salt intake and changes to systolic blood pressure in
Saudi Arabia, by gender 563A.3 Prevalence estimates for overweight and obesity in Saudi Arabia, by age and
gender, 2019 57

Contents | ix
3A.4 Estimates for overweight and obesity in Saudi Arabia, by age and gender, using the weighted average formula, 2018 57
3A.5 Estimates for hypertension in Saudi Arabia, by age and gender, using the weighted average formula, 2018 58
3A.6 Estimates for current daily smoking in Saudi Arabia, by age and gender, using the weighted average formula, 2018 58
3A.7 Estimated current and projected female population in Saudi Arabia, by age, 2020–50 58
3A.8 Estimated current and projected male population in Saudi Arabia, by age, 2020–50 59
3A.9 DALYs among the population in Saudi Arabia, by age and condition, 2020 60
3A.10 Prevalence of overweight and obesity in Saudi Arabia, by age and gender, ambitious scenario 60
3A.11 DALYs for women in Saudi Arabia: Baseline scenario of no change in risk factors vs. ambitious scenario, 2020–50 61
3A.12 DALYs for men in Saudi Arabia: Baseline scenario of no change in risk factors vs. ambitious scenario, 2020–50 62
4.1 Direct and indirect costs of NCDs 664.2 Direct costs of select NCDs in Saudi Arabia, by condition 684.3 Disease prevalence in the employed working-age population in
Saudi Arabia 704.4 Economic impact of NCDs and their risk factors in Saudi Arabia, 2017 736.1 Analysis tool 1036.2 National strategies and plans in Saudi Arabia 1056A.1 Reviewed documents 1106A.2 Objectives of Saudi Arabia’s strategies mapped to NCD and risk factors 1126A.3 Policy interventions and programs in Saudi Arabia, by risk factor 1186A.4 Translated and interpreted excerpts of the Gulf Plan for the Prevention of
Noncommunicable Diseases 1217.1 Smoking-related interventions implemented to reduce NCDs in
Saudi Arabia 1287.2 Implemented and proposed diet-related interventions to reduce NCDs in
Saudi Arabia 1297.3 Product reformulation interventions implemented to reduce NCDs in
Saudi Arabia 1307.4 Implemented and proposed physical activity–related interventions to reduce
NCDs in Saudi Arabia 1317.5 Evidence of effectiveness of tobacco tax policies 1317.6 Evidence of effectiveness of e-cigarette tax 1327.7 Other effective policies to reduce the demand for tobacco products and
e-cigarettes 1337.8 Relatively ineffective policies designed to reduce the demand for tobacco
products and e-cigarettes 1347.9 Effectiveness of excise taxes on beverages and food 1347.10 Evidence on effectiveness of BOP and FOP labeling 1357.11 Examples of FOP nutrition labels 1367.12 Evidence on effectiveness of labeling calories in restaurant menus 1367.13 Evidence on effectiveness of setting nutrition standards 1377.14 Evidence on effectiveness of product reformulation interventions 1387.15 Evidence on effectiveness of public awareness campaigns 1387.16 Evidence on cost-effectiveness of tobacco control interventions 1437.17 Evidence on cost-effectiveness of diet-related interventions 1447.18 Cost-effectiveness and effectiveness of recommended tobacco-related
interventions 1467.19 Cost-effectiveness and effectiveness of recommended diet-related
interventions 1497.20 Illustration of the structure of a nutritional scoring system 1507.21 Effectiveness and cost-effectiveness of recommended physical activity–related
interventions 152

x | NONCOmmUNICABLE DISEASES IN SAUDI ARABIA
7.22 Examples of evaluations that could be conducted in Saudi Arabia 1528.1 Screening uptake for breast and colorectal cancer in Saudi Arabia and the
United States 1718.2 Undiagnosed type 2 diabetes, hypertension, and lipid disorders in Saudi Arabia
and comparative countries 1728.3 Recommendations regarding screening in comparative countries 1748.4 Estimated incidence and prevalence rates of colorectal cancer in Saudi Arabia,
the United States, and the United Kingdom, 2017 1778.5 Estimated rates of incidence and prevalence of breast cancer among women in
Saudi Arabia, the United States, and the United Kingdom, 2017 1788.6 Cost-effectiveness of screening 1808.7 Cost-effectiveness of screening promotion interventions 1838.8 Policy and research recommendations for Saudi Arabia 1859.1 Behavioral and biological risk factors in focus 20210.1 Power sources of the key nonhealth stakeholders in Saudi Arabia 22110.2 Power sources of the key health stakeholders in Saudi Arabia 22110A.1 Stakeholders influencing and participating in the prevention of NCDs in
Saudi Arabia 229

xi
Foreword
Over the past few decades, Saudi Arabia has experienced a major shift in disease burden, away from communicable diseases and maternal and perinatal illnesses, toward noncommunicable diseases (NCDs). As in many richer economies, today’s leading causes of death and morbidity in Saudi Arabia are linked to cardiovascular disease, diabetes, cancer, and chronic respiratory dis-eases. Aside from the devastating impact on population and individual health, NCDs threaten progress toward the 2030 Agenda for Sustainable Development, which includes a target of reducing premature deaths from NCDs by one-third by 2030. They threaten the achievement of one of the goals of Saudi Vision 2030 of increasing life expectancy from 75 to 80 by 2030. They threaten the financial health of individuals and governments by squeezing valuable household and government budgets and resources. And they threaten the formation of human capital, the knowledge, skills, and health that people accumulate throughout their lives, enabling them to realize their potential as productive members of society.
The good news is that NCDs are preventable by investing in solutions that target the behav-ioral and biological risk factors of NCDs. This includes interventions that address unhealthy diet, inadequate physical activity, and tobacco consumption. And it includes interventions that address the major downstream metabolic risk factors—including obesity, high blood pressure, and high cholesterol—that result in NCD mortality and morbidity. The health sector reforms being implemented in Saudi Arabia, including the development of a patient-centered integrated model of care, with a focus on scaling up primary care, are a huge step in setting the foundations to tackle NCDs head on.
This book, produced by the Saudi Public Health Authority with World Bank support, empha-sizes the need for evidence-based planning, the focus on prevention and multisectoral action, and the adoption of a life-course approach that promotes health in younger individuals to max-imize healthy aging. It argues for the need for a master plan for the prevention of NCDs, designed to minimize the health and economic burden of NCDs and to provide strategic direction on how to translate a selected set of high-impact and realistically attainable interventions into actions that, if implemented and monitored, will show concrete results on the ground. We are very grate-ful for the opportunity to have been able to contribute toward this book and for the policy dia-logue this is already generating. We look forward to continuing our collaboration and seeing its impact on the health of the population in Saudi Arabia.
Issam Abousleiman Regional DirectorGulf Cooperation Council Countries The World Bank
Keiko MiwaDirector for Human Development
middle East and North Africa Region The World Bank


xiii
One of Saudi Arabia’s Vision 2030 goals is to protect the health and enhance the quality of life of the population, which aligns with the global health agenda of the United Nations Sustainable Development Goals. To achieve our strategic goals and provide a prosperous life for our population, the Public Health Authority (PHA) was established. One of the main objectives of the PHA is to reduce the burden of noncommunicable diseases (NCDs) and their determinants on population health, the health care system, and the economy.
The PHA’s rigorous work directed toward understanding the current status and situation of NCDs in the Kingdom led to the development of this book. Noncommunicable Diseases in Saudi Arabia: Toward Effective Interventions for Prevention, was a collaborative effort between the PHA and the World Bank to provide a comprehensive view of NCDs in the Kingdom. The effort included assessing the biological and behavioral risk factors of NCDs, the health and economic impact of NCDs, the current and proposed interventions, and a mapping of the multisectoral stakeholders who are key to implementation.
Noncommunicable Diseases in Saudi Arabia is one of the few books of its kind in the Kingdom that provides evidence-based analysis on a national scale. The methodology used provides robust, data-driven, and high-quality information on Saudi Arabia, and draws on global best practice approaches to maximize the outlook and quality of various policies and interdisciplinary programs on NCDs. The book highlights essential areas that need improvement in order to effectively address NCDs in the Kingdom, and it will ultimately serve as a guide for decision-makers to collaboratively take action and meet the objectives outlined in Vision 2030.
We hope that this book will trigger many useful discussions and promote evidence-based decision-making to improve the health of the population in the Kingdom and beyond.
Tawfig bin Fawzan AlRabiah Chairman of the Public Health Authority
minister of Health, Kingdom of Saudi Arabia
Foreword


xv
This report was produced by the Public Health Authority (PHA) with technical support from the World Bank. It is an output of the 2021 Reimbursable Advisory Services program between the World Bank and Saudi Arabia.
The book is edited jointly by individuals from the PHA and the World Bank: Ada Alqunaibet (PHA), Christopher H. Herbst (World Bank), Sameh El-Saharty (World Bank), and Abdullah Algwizani (PHA).
The chapters were written collaboratively by PHA and World Bank staff, as well as select noncommunicable disease stakeholders from Saudi Arabia. Contributing authors from the PHA include Ada Alqunaibet, Rehab Alaswad, Sami Almudarra, Rasha Alfawaz, Salem Albalawi, and Abdullah Algwizani. Key stakeholder authors include Riyad Q. Alghamdi, Abdullah Alfraih, and Faisal Kattan. Coauthors from the World Bank, both staff and consultants, include Christopher H. Herbst, Sameh El-Saharty, Di Dong, mariam Hamza, Tit Albreht, maximillian De Courten, Severin Rakic, Jesse D. malkin, William msemburi, David Watkins, Eric Finkelstein, Zlatko Nikoloski, Tim Bruckner, Eileen Lee, Reem Alsukait, and Drishti Baid.
Peer review comments were provided by Jeremy Veillard, Xiaohui Hou, Zelalem Debebe, mansour Alrumayyan, Yi Zhang, and Zara Shubber of the World Bank. Administrative support was provided by Fatima mansouri (World Bank). Editorial services were provided by Hope Steele (World Bank).
Throughout this work, the PHA and the World Bank team benefited from the guidance and support from Issam Abousleiman (country director, GCC Countries, World Bank), Rekha menon (practice manager, mENA Health, Nutrition, and Population, World Bank), and Larisa marquez (operations officer, World Bank).
The World Bank and the PHA do not guarantee the accuracy of the data included in this work. The findings, interpretations, and conclusions expressed in this work are those of the authors and do not necessarily reflect the views of the PHA and the World Bank, their Boards of Directors, or the governments they represent.
Acknowledgments


xvii
About the Editors
Dr. Abdullah Algwizani is the founding Chief Executive Officer of the Public Health Authority since 2018. Reporting to and advising His Excellency, the minister of Health, he is responsible for achieving the organization’s mission to protect and improve the health of Saudi Arabia’s population. He advises other ministries on matters pertaining to national public health with the aim of improving social and environmental determinants impacting health. Recently, he successfully led the national public health response for COVID-19 (Coronavirus) and is a leading member on the National Co-ordinating Committee for COVID-19 response. As a published researcher with a medical background in infectious diseases and a practicing medical Consultant, he has held key leadership positions. He is a member of the Board of Directors of the Saudi National Institute and of the Saudi Health Council, and he is Deputy Chair of the National Committee for Public Health Protection. He has repre-sented the country on the international level: he was elected as a Board member at the International Association National Public Health Institutes, was the Saudi Arabian Senior Focal Point in the Global Health Security Agenda, was a representative at the World Health Assembly, and was the Anti-microbial Resistance Champion for Saudi Arabia in the G-20.
Dr. Ada Alqunaibet is the Chief Officer of Public Health Intelligence at the Public Health Authority (PHA) in Riyadh, Saudi Arabia. She is also its lead epi-demiologist and one of the focal persons on Public Health and Data Science. Ada currently leads the PHA’s work on longevity and premature mortality and is a key person in its work program on noncommunicable diseases. Before this posi-tion, Ada led the work program of the population health department and the National Saudi Biobank at King Abdullah International medical Research Center in Riyadh, where she led the redesign of the National Biobank Study, applying international standards to increase data quality and to expand the catchment area leading to increased participation. Ada has been key in designing and launching several large-scale epidemiological studies in Saudi Arabia, and her research interests focus on cardiovascular disease and its risk factors. Her aca-demic background includes bachelor’s degrees in medicine and surgery (mBBS) from King Saud University, a master’s degree in medical education from King

xviii | NONCOmmUNICABLE DISEASES IN SAUDI ARABIA
Saud bin Abdulaziz University for Health Sciences, and a PhD from the University of North Carolina at Chapel Hill, United States.
Dr. Sameh El-Saharty is Lead Health Specialist at the World Bank. He has been responsible for leading policy dialogue and strategy development, as well as pre-paring and managing programs and projects in more than 30 countries in Africa, Asia, and the middle East, as well as in the United States. His recent work has focused on human capital formation in the Gulf Cooperation Council countries, as well as noncommunicable diseases, population policy, health financing, health policy reform, service delivery, and implementation science. Before joining the World Bank in 1998, he held several positions with the World Health Organization, the United States Agency for International Development, the United Nations Population Fund, and Harvard University. He also was an assis-tant professor of international health at Georgetown University, Washington, DC. He has authored more than 50 publications, including journal articles, books, book chapters, analytical reports, and policy briefs. He is a member of distinguished boards including the Dean’s Leadership Council of Harvard T. H. Chan School of Public Health and Chair of the Advisory Committee of the mENA Health Policy Forum. He is a medical doctor who graduated from Cairo University and holds master’s degrees in public health and epidemiology from the military medical Academy in Egypt and in international health policy and management from Harvard University.
Dr. Christopher H. Herbst is a Senior Health Specialist in the World Bank’s Health, Nutrition, and Population Global Practice. He is based in Saudi Arabia, where he leads the World Bank’s engagement in the health sector, providing sup-port in the areas of noncommunicable diseases, health financing, human resources for health, pharmaceutical systems, and other areas. At the World Bank, he has worked in more than 25 low-, middle-, and high-income countries in Africa, Asia, and the middle East. He is one of the World Bank’s focal persons on Human Resources for Health. His research and publications focus on health systems strengthening and health workforce issues. His academic background is in political science, economics, and public health, with a specialization in health labor markets. Christopher holds a BA from King’s College London, an mSc from the London School of Economics, and a PhD from Lancaster University, United Kingdom.

xix
ACO accountable care organization AOR adjusted odds ratio BOP back of package BmI body mass index CBAHI Central Board for Accreditation of Healthcare InstitutionsCCHI Council of Cooperative Health InsuranceCI confidence interval CITC Communication and Information Technology CommissionCOm Council of ministersCOPD chronic obstructive pulmonary disease CSO civil society organizationCT computed tomography DALY disability-adjusted life yearEmRO Regional Office for the Eastern mediterranean FOP front of package GASTAT General Authority for Statistics GAZT General Authority for Zakat and TaxGBD Global Burden of Disease GCC Gulf Cooperation Council GDP gross domestic product HALE healthy life expectancy HbA1c blood hemoglobin A1c HCI human capital index HiAP Health in All Policies CommitteeICER incremental cost-effectiveness ratio IDF International Diabetes Federation IHmE Institute for Health metrics and Evaluation KSA WHS Kingdom of Saudi Arabia World Health Survey LDL low-density lipoprotein mEP ministry of Economy and PlanningmHRSD ministry of Human Resources and Social Developmentmmol/l millimoles per liter mmHG millimeters of mercury mOC ministry of Culture
Abbreviations

xx | NONCOmmUNICABLE DISEASES IN SAUDI ARABIA
mOCOm ministry of CommercemOD ministry of DefensemOE ministry of EducationmOF ministry of FinancemOH ministry of Health mOI ministry of InteriormOIA ministry of Islamic Affairs, Dawah, and GuidancemOm ministry of mediamOmRA ministry of municipal and Rural Affairs and HousingmOS ministry of SportsmRI magnetic resonance imaging NCD noncommunicable diseaseNCTC National Committee for Tobacco ControlNIP nutritional information panel NTP National Transformation Program OECD Organisation for Economic Co-operation and Development PAF population-attributable risk fraction PHA Public Health AuthorityPHAP Program for Health Assurance and PurchasingQALY quality-adjusted life year RR relative riskSBP systolic blood pressure SEP socioeconomic positionSFDA Saudi Food and Drug Authority SHIS Saudi Health Interview Survey SSB sugar-sweetened beverageTFA trans fatty acids UN United NationsUNDP United Nations Development Programme UNICEF United Nations Children’s Fund VAT value added tax VRP vision realization program VSL value of a statistical life WHO World Health Organization YLD years lost due to disability YLL years of life lost

1
INTRODUCTION
Saudi Arabia is at an early stage of its demographic transition to an older popu-lation and thus has an opportunity to prepare early for a rising epidemic of noncommunicable diseases (NCDs), including cancers, cardiovascular diseases, diabetes, and chronic respiratory diseases. NCDs and their associated behav-ioral risk factors (tobacco use, an unhealthy diet, and physical inactivity) are a growing economic and public health challenge in Saudi Arabia. Life expectancy has increased to 75 years, and fertility has declined to 2.5 births per woman (in 2018), which is still above the average of 2.1 for Gulf Cooperation Council (GCC) countries and 1.6 for high-income countries. In 2020, Saudi Arabia had a popu-lation of almost 35 million, with a third under the age of 20 and less than 4 percent older than 60. By 2050, this older age group is expected to constitute roughly 20 percent of the population. As the population ages, the prevalence of NCDs and demand for costly health care services are expected to rise signifi-cantly. Interventions and reforms to prevent NCDs and minimize current and future treatment costs are needed now.
Reform to prioritize prevention
In recent years, Saudi Arabia has embarked on a sweeping set of reforms to diversify and strengthen its economy and improve the efficiency of its public sector, including the public health sector. These reforms are outlined in the gov-ernment’s Vision 2030. An overarching goal of Vision 2030 is to increase life expectancy at birth by 6 years, from 74 years to 80 years, over the period 2016–30. Several vision realization programs (VRPs) detail the series of initiatives and delivery plans designed to guide and achieve the objectives of Vision 2030.1 Several, including the Quality of Life VRP and the Human Capital VRP, focus on promoting healthier lifestyles. The National Transformation Program (NTP)—the most relevant VRP to the health sector—identifies three priorities for health reform: (1) improve access to health care, (2) improve the quality and efficiency
OverviewEVIDENCE TO UNDERSTAND AND ADDRESS NCDs IN SAUDI ARABIA
ADA ALQUNAIBET, CHRISTOPHER H. HERBST, SAMEH EL-SAHARTY, AND ABDULLAH ALGWIZANI
1

2 | NoNCommuNICABLe DISeASeS IN SAuDI ARABIA
of the health system, and (3) strengthen prevention against health threats. Scaling up interventions to prevent NCDs by improving lifestyles is thus central to the country’s vision for health.
In order to improve life expectancy and meet the NTP’s triple aim of being more efficient, effective, and patient centered, Saudi Arabia is changing how its health services are organized and delivered. The public sector is adopting a new model of care that is centered on the patient, on the population, and on primary health care. under this new model of care, health services are being reorganized into clusters of health providers—similar to accountable care organizations (ACos), which tie provider reimbursement to quality and efficiency metrics. The model is designed to provide more coordinated and integrated care while maximizing quality and efficiency.
The clusters or ACos under the new model of care will incentivize preven-tion over expensive curative care. To date, close to 70 percent of government health expenditure is spent on hospital care and administration, substantially more than the organisation for economic Co-operation and Development (oeCD) average of 45 percent, leaving little for preventive care. The plan to change the focus from hospital care to prevention in the public health care sector is encouraging. Further, efforts to integrate the private health care sector, which is still hospital centric and funded on a fee-for-service basis, into the new model of care will be important to remove any remaining fragmentation in service delivery.
From an efficiency and cost perspective, it is almost always more costly to treat NCDs than to prevent them from developing in the first place or from pro-gressing to more advanced stages. Beyond that, prevention has been recognized as the cornerstone of the global response to NCDs, including by the united Nations (uN) “Political Declaration of the Third High-Level meeting of the General Assembly on the Prevention and Control of Non-Communicable Diseases” (uN 2018).
of critical importance to preventing NCDs are efforts to reduce the exposure of individuals and populations to the behavioral risk factors for NCDs while strengthening the capacity of individuals and populations to make healthier choices and adopt lifestyles that foster good health. This means that, although scaling up screening uptake and health promotion—particularly at the primary care level—is important, the most effective NCD interventions lie outside the health sector, with finance, taxation, education, and industry interventions designed to curb smoking, improve diet, and encourage exercise. This is not sur-prising: worldwide, the production of health is attributed to the results of inter-ventions outside the health sector; only 20 percent of health is attributed to the health sector itself (Institute for Clinical Systems Improvement 2014).
OBJECTIVE AND SCOPE OF THIS REPORT
This report seeks to generated evidence to support government efforts to plan the strategic introduction and implementation of effective and cost-effective interventions on NCDs. It assesses the latest evidence on NCD prevalence and risk factors in Saudi Arabia, explores the health and economic burden of NCDs as well as their impact on human capital, identifies key gaps in existing efforts to prevent NCDs, and recommends ways to address these gaps for Saudi Arabia to consider. The report discusses the need for a national master plan on NCD

Overview | 3
prevention—one that is selective and targeted, with a particular focus on improv-ing implementation and achieving results. This focus includes taking into account and identifying the roles of different stakeholders and their likely responsibility in implementation.
The book focuses primarily on NCDs linked to three major behavioral risk factors: tobacco use, an unhealthy diet, and insufficient physical activity. Reducing risk by controlling tobacco use, improving diet, and increasing physical activity would help to reduce the biological risk factors (table 1.1) and the incidence of four main NCDs: cardiovascular diseases, diabetes, chronic respiratory diseases, and some cancers. These NCDs are among the leading causes of death in Saudi Arabia. It is beyond the scope of this report to discuss NCDs other than those affected by the three behavioral risk fac-tors. Factors such as mental health and environmental health—both critical in Saudi Arabia—should not be ignored, but they will require separate atten-tion, analysis, and review.
Cancers are a major NCD in Saudi Arabia, as elsewhere, but this report focuses only on cancers that are linked to the three behavioral risk factors listed in table 1.1. Approximately 50 percent of cancer cases can be attributed to dietary habits in oeCD countries, and the figure in Saudi Arabia is estimated to be similar. epidemiological evidence suggests that the consumption of veg-etables, fruits, and a fiber-rich diet can prevent certain types of cancer (colon, rectum, stomach, esophagus), while fat-rich diets (especially those rich in animal fat) increase the risk of other types of cancer (breast, prostate, endome-trial, ovarian, colon) (Bojková, Winklewski, and Wszedybyl-Winklewska 2020; La Vecchia 1992).
ORGANIZATION OF THE BOOK
The report is organized into book format, and it has nine chapters in addition to this overview. Chapter 2 conducts a detailed, comprehensive situational analysis of NCDs in the context of prevalence and risk factors. The main contributors to mortality and morbidity in Saudi Arabia are cardiovascular diseases, some can-cers, diabetes, and chronic respiratory diseases. These groups of diseases also bear the bulk of the burden of preventable disease, which can be mitigated by appropriately addressing and promoting preventive measures. This mitigation is possible especially for health-promoting activities related to lifestyles and for early detection and screening. In view of the situational analysis and its main messages, it is clear that tackling obesity and dietary interventions, which are closely linked to most of the NCDs and other biological risk factors, is of partic-ular relevance to Saudi Arabia. Given the importance of obesity, in particular, more in-depth analysis on obesity is warranted.
TABLE 1.1 Behavioral and biological risk factors
BEHAVIORAL RISK FACTORS BIOLOGICAL RISK FACTORS
Tobacco use High blood pressure
Unhealthy diet Hyperglycemia and diabetes
Insufficient physical activity Elevated blood cholesterol
Overweight and obesity

4 | NoNCommuNICABLe DISeASeS IN SAuDI ARABIA
Chapter 3 examines the health burden of NCDs in Saudi Arabia in the future, particularly the impact that the demographic transition will have on the burden of NCDs. The forecasting study focuses on three causes of disability and death: cardiovascular diseases, cancer, and diabetes. Cardiovascular diseases have an especially important impact on middle-age adults, with ischemic heart disease and stroke accounting for one-sixth of all disability-adjusted life years (DALYs).2 The chapter shows how the health burden could more than double in the next three decades if nothing is done and how modest changes in smoking, diet, and exercise can reduce the DALY burden due to NCDs by 3–5 percent. The chapter then calculates the cutoff cost at which reductions would be cost-effective.
Chapter 4 models the economic burden of NCDs in Saudi Arabia and explains the methodologies used to capture the direct and indirect costs of NCDs. It cal-culates the estimated direct costs of NCDs to be 23 percent of current health expenditure. The presence of chronic conditions, moreover, accounts for 2.7 absent days from work, on average, at a direct cost of uS$22.5 billion, or 1.12 percent of gross domestic product (GDP) (2018 data). The chapter finds that the indirect costs of NCDs, when considering all aspects of productivity losses, may reduce GDP by nearly 7 percent. Such costs can be prevented and mini-mized through high-impact, cost-effective interventions to reduce the risk fac-tors of NCDs.
Chapter 5 reviews the global literature on how NCDs affect human capital and then quantifies the impact of Saudi Arabia’s avertable mortality on the human capital index (HCI).3 The chapter, culminating in a framework outlining the pathways of how NCDs affect human capital, shows that NCDs affect human capital directly by leading to early death or retirement and loss of productivity as well as by affecting the learning and schooling of children. But NCDs also affect human capital indirectly, by diverting resources toward treatment of disease and by lowering labor market participation because people who might otherwise be employed are caring for the ill. The quantitative modeling and impact of NCDs on the HCI is seen mainly in their impact on adult survival (to age 60). The chap-ter finds that if all NCD-related deaths could be averted, Saudi Arabia’s HCI score would increase by 5 percent. moreover, the country would achieve the first part of the uN Sustainable Development Goal 3 target of reducing NCD mortal-ity by one-third by 2030.
Saudi Arabia has already initiated several activities in the field of NCD pre-vention, and chapter 6 summarizes the country’s current strategies and policies. Several international, regional, and national strategies exist to guide the preven-tion and control of NCDs in Saudi Arabia. These strategies include the National Plan of Action of the World Health organization (WHo)’s Regional office for the eastern mediterranean NCD Strategy, several vertical strategies (the mental Health Strategy, Cancer Strategy), and both the Gulf Plan for Prevention and Control of NCDs 2014/2025 and the master Plan on environmental Health cur-rently being developed. Together, these strategies outline a direction and moni-toring framework for the prevention and control of NCDs in Saudi Arabia. The ministry of Health (moH) regularly reports to agencies, such as the WHo, that monitor progress on NCDs at regional and global levels. While such commit-ment is commendable, the moH and the Saudi Public Health Authority have expressed a need for more to be done to guide implementation and improve the monitoring and evaluation of existing efforts.
Chapter 7 reviews the global literature on population-wide interventions to prevent NCDs and the underlying evidence of their effectiveness and

Overview | 5
cost-effectiveness. Based on the evidence, the chapter recommends interven-tions to complement or, in some cases, to reconstitute the country’s existing pol-icies related to tobacco, diet, and physical activity. It suggests that additional evidence is needed on what works and what does not work in Saudi Arabia and recommends that the government consider undertaking a combination of small-scale randomized control trials, secondary data analyses using scanner data or food-purchasing data, and large-scale evaluations such as the ones that Chile is undertaking to inform the design and implementation of interventions.
Chapter 8 reviews the global literature on screening to promote early detec-tion of NCDs. The chapter provides an overview of screening programs that either are or could be implemented in Saudi Arabia and presents evidence of the effectiveness and cost-effectiveness of these programs, together with interven-tions to increase their uptake. Screening is a core function of the health sector in the prevention of NCDs, and the chapter reviews both supply-side interventions (focusing on scaling up screening capacity and on financing and incentivizing screening) and demand-side interventions (focusing on increasing population demand for and use of screening programs). Despite the gaps in the literature, the chapter offers some recommendations that are particularly relevant as the new model of care takes form.
Chapter 9 reflects on the previous chapters and argues that Saudi Arabia needs a master plan for the multisectoral prevention of NCDs. Such an effort should seek to strengthen the sector-led implementation and monitoring of existing strategies and policies. The objective would be to provide a strategic direction to control the current and reduce the prospective burden of NCDs. The chapter argues that such a master plan should prioritize prevention (promotion) activities focusing on three determinants of health: tobacco consumption, an unhealthy diet, and insufficient physical activity. The focus should be on a set of targeted and realistically implementable interventions to address these determi-nants and the biological risk factors that arise from them. These interventions can be expanded as Saudi Arabia sees results and as capacity in monitoring improves. Central to the master plan should be a set of implementation plans that lay out clear roles and responsibilities for the health and nonhealth sectors whose role it will be to operationalize it.
Finally, chapter 10 offers a comprehensive assessment of the key stakehold-ers in NCDs. one of the most important requirements for a comprehensive NCD prevention strategy to work is the involvement of a broad range of stakeholders with similar interests. The chapter presents an exhaustive mapping of stake-holders in NCDs, including their position, power, influence, and achievements. For each of the interventions proposed, the chapter recommends producing a separate stakeholder analysis to be taken into account during government design or implementation efforts.
CONCLUSIONS
This book is the first published and publicly available comprehensive assess-ment of NCDs in Saudi Arabia. It reflects a strong commitment by the Saudi gov-ernment to address the rising problem of unhealthy lifestyles in the country—particularly those behaviors leading to the (premature) development of NCDs. Together with early detection and screening for risk factors, a focus on effective and cost-effective implementation and monitoring of interventions to

6 | NoNCommuNICABLe DISeASeS IN SAuDI ARABIA
reduce tobacco use, an unhealthy diet, and lack of exercise is critical for reducing the health and economic burden of NCDs and thus the overall burden on human capital in Saudi Arabia. Without effective coordination and implementation of interventions, both within and outside the health sector, the goals of Vision 2030 and the many vision realization programs are unlikely to be fully realized. In efforts to tackle the risk factors and the resulting burden of disease early in the rising curve of incidence and prevalence, careful attention should be directed toward the political economy and the stakeholders who can help to make scaled-up NCD prevention in Saudi Arabia a reality.
NOTES
1. To learn more about Vision 2030, visit https://www.vision2030.gov.sa/en/programs.2. DALYs are a measure of overall disease burden, expressed as the number of years lost due
to ill health, disability, or early death.3. The World Bank’s HCI ranks countries according to a human capital score, which quanti-
fies the contribution of health and education to the productivity of the next generation of workers. Countries can use the HCI to assess how much income they are forgoing because of gaps in human capital and how much faster they can turn these losses into gains if they act now.
REFERENCES
Bojková, B., P. J. Winklewski, and m. Wszedybyl-Winklewska. 2020. “Dietary Fat and Cancer—Which Is Good, Which Is Bad, and the Body of evidence.” International Journal of Molecular Sciences 21 (11): 4114. https://doi.org/10.3390/ijms21114114.
Institute for Clinical Systems Improvement. 2014. “Going Beyond Clinical Walls: Solving Complex Problems.” Institute for Clinical Systems Improvement and the Robert Wood Johnson Foundation, Princeton, NJ, october 2014. https://www.nrhi.org/uploads /going-beyond-clinical-walls-solving-complex-problems.pdf.
La Vecchia, C. 1992. “Cancers Associated with High-Fat Diets.” Journal of the National Cancer Institute Monographs 12: 79–85. PmID: 1616815.
uN (united Nations). 2018. “Resolution Adopted by the General Assembly on 10 october 2018.” Resolution A/ReS/73/2, united Nations, New York. https://www.un.org/en/ga/search /view_doc.asp?symbol=A/ReS/73/2.

7
KEY MESSAGES
• Demographic and epidemiological transitions have increased significantly the incidence and prevalence of noncommunicable diseases (NCDs) in the population of Saudi Arabia.
• NCDs are currently the leading cause of death and disability-adjusted life years (DALYs) in Saudi Arabia, accounting for 73.2 percent of deaths. The top cause of death is cardiovascular disease.
• Both behavioral and biological risk factors contribute to mortality and mor-bidity from NCDs. Three leading modifiable behavioral risk factors are tobacco use, an unhealthy diet, and lack of physical activity. The four main biological risk factors are overweight and obesity, elevated blood glucose, high blood pressure, and abnormal blood lipids.
• Whereas smoking prevention efforts have started to halt the rise in tobacco use, prevention efforts to address unhealthy diets, insufficient physical activ-ity, and obesity need to be prioritized and tackled simultaneously.
• Aside from population-wide interventions, screening efforts are needed to detect borderline and undiagnosed diabetes, hypertension, and hypercholes-terolemia at early stages.
INTRODUCTION
This chapter establishes a clear and realistic picture of the prevalence of selected NCDs and their risk factors in Saudi Arabia. The latest available data are used to assess the morbidity and mortality of four categories of noncom-municable diseases: cardiovascular diseases, cancers, diabetes, and chronic respiratory diseases. The prevalence of three behavioral factors (tobacco use,
Prevalence and Risk Factors of NCDs in Saudi Arabia SEVERIN RAKIC, SALEM ALBALAWI, REEM ALSUKAIT, AND ADA ALQUNAIBET
2

8 | NoNCommuNiCABLe DiSeASeS iN SAuDi ArABiA
an unhealthy diet, and physical inactivity) and four biological risk factors (overweight or obesity, elevated blood glucose, high blood pressure, and abnormal blood lipids) in the population of Saudi Arabia is presented, together with recent trends and comparisons with other Gulf Cooperation Council (GCC) countries, where available. Descriptive analysis and regressions on available data are used to identify the socioeconomic and demographic predic-tors for these risk factors.
Situational analysis is a critical component in developing national policies, plans, and programs. A starting point in developing a master plan for the multisectoral prevention of NCDs is a good understanding of the country’s pre-vailing health needs, risks, and context. A situational analysis is essentially an information-gathering process to understand the specifics of the NCD burden, along with the nature and extent of any activities that might be in place to deal with it.
This chapter reports on the results of a situational analysis in which each of the behavioral and biological risk factors is analyzed separately. The chapter describes the methodology and data sources used, analyzes the morbidity and mortality of selected NCDs, and presents relevant data on behavioral factors and the prevalence of diagnosed and undiagnosed biological factors. A final section concludes.
METHODOLOGY
The situational analysis is based on secondary data from international databases and recent nationally representative surveys in Saudi Arabia. Annually pub-lished health statistics are of limited use because they do not cover NCDs in sufficient detail. For this reason, several international databases are used both for Saudi Arabia and for the GCC countries:
• The World Bank Health, Nutrition, and Population Statistics database: prev-alence of smoking among the adult population
• The World Health organization (WHo) Global Health observatory data repository: NCD mortality rates, prevalence of insufficient physical activity, prevalence of hypertension, and prevalence of overweight and obesity
• The international Diabetes Federation (iDF) online Diabetes Atlas: prevalence of impaired glucose tolerance and prevalence of diagnosed and undiagnosed diabetes
• The institute for Health metrics and evaluation (iHme) Global Burden of Disease Compare tool: incidence and prevalence of NCDs, association of NCDs with various risk factors, and DALYs attributable to the four NCDs of interest.
The situational analysis also uses data collected through surveys conducted within the last eight years:
• The 2019 Kingdom of Saudi Arabia World Health Survey (2019 KSA WHS): tobacco use, intake of fruits and vegetables, physical activity level, prevalence of overweight and obesity, and prevalence of diabetes, hypertension, and hypercholesterolemia among adults (moH 2020)
• Household Health Surveys from 2017 and 2018: prevalence of hypertension, smoking, and diabetes (GASTAT 2017b, 2018b)

Prevalence and Risk Factors of NCDs in Saudi Arabia | 9
• Household Sports Practice Surveys from 2017, 2018, and 2019: physical activ-ity (GASTAT 2017a, 2018a, 2019)
• The 2013 Saudi Health interview Survey (2013 SHiS): smoking status, dietary habits, physical activity level, prevalence of overweight and obesity, and sta-tus of diagnosis and prevalence of diabetes, hypertension, and hypercholes-terolemia among the adult population (moH and iHme n.d.).
The analysis relies heavily on descriptive reports from the 2019 KSA WHS and the 2013 SHiS. The surveys collected anthropometric measurements, blood pressure measurements, and biochemical measurements, allowing comparisons to be made and trends to be identified. Whenever possible, the 2019 KSA WHS data are used for descriptive purposes. However, lack of access to the survey database prevented the use of the most recent data for regression analysis. other studies have used data from the 2013 SHiS to develop several multivariate logistic regression models, and these results are used where available in the academic literature; otherwise, the 2013 SHiS database (made available to the team) is used here to develop additional multivariate logistic regression models. These models are adjusted for survey weight design in order to analyze regional differences in the prevalence of behavioral and biological risks among the population, which have not been addressed previously in the literature.
MORBIDITY FROM NCDs
New cases of cardiovascular diseases, cancers, diabetes, and chronic respira-tory diseases among adults contribute significantly to the burden of NCDs in Saudi Arabia. The iHme estimates that there were 2.1 million new cases of cancer (of all types); 185,500 new cases of cardiovascular disease; 303,500 new cases of chronic respiratory disease; and 176,000 new cases of diabetes in Saudi Arabia in 2019 (iHme 2020) (figure 2.1). Comparing the iHme’s 2019 data with its data for 2009 indicates that demographic and epidemio-logical transitions have increased the incidence of diabetes in Saudi Arabia by 94 percent (from 90,400 to 176,000 new cases annually), cardiovascular diseases by 54 percent, all types of cancers by 50 percent, and chronic respi-ratory diseases by 48 percent. The majority of new cases have been registered among the working-age population. The incidence of selected NCDs increases with age, and these NCDs appear to be slightly more prevalent among women than men.
The prevalence of cardiovascular diseases, cancers, diabetes, and chronic respiratory diseases among adults increased between 2009 and 2019 (iHme 2020). The increase was highest for diabetes (99 percent), rising from 1.4 million to 2.7 million cases. The prevalence of cardiovascular dis-eases increased by 58 percent, the prevalence of cancers (all types of cancer) increased by 52 percent, and the prevalence of chronic respiratory diseases increased by 51 percent. in 2019, Saudi Arabia had an estimated 93.7 cases of cancer (all types), 75.7 cases of diabetes, 44.7 cases of cardiovascular disease, and 35.9 cases of chronic respiratory disease per 1,000 population (figure 2.2). Diabetes and cardiovascular disease were slightly more prevalent among men than among women, while cancer and chronic respiratory disease were more

10 | NoNCommuNiCABLe DiSeASeS iN SAuDi ArABiA
400
350
300
250
200
150
100
50 7
<1 ye
ar
Num
ber
of
new
cas
es (
thousa
nd
s)
Age
b. Rate per 1,000 population
a. Number of new cases
1–4
5–9
10–1
4
15–1
9
20–2
4
25–2
9
30–3
4
35–3
9
40–4
4
45–4
9
50–5
4
55–5
9
60–6
4
65–6
9
70–7
4
75–7
9
80–8
4
85–8
9
90–9
495
+
67 83 89 105
152
214
290
338355
323
251
197
144
99
6029 14 7 4 1
0
1,600
1,400
1,200
1,000
800
600
400
200
<1 ye
ar
Cas
es p
er 1
,00
0 p
op
ula
tion
Age
1–4
5–9
10–1
4
15–1
9
20–2
4
25–2
9
30–3
4
35–3
9
40–4
4
45–4
9
50–5
4
55–5
9
60–6
4
65–6
9
70–7
4
75–7
9
80–8
4
85–8
9
90–9
495
+0
7 63 84 95 98 109 139 177 224 264404
550719
904
1,0921,251
1,366
1,435 1,478
1,5201,575
Cancers DiabetesCardiovascular diseases Chronic respiratory diseases
Source: IHME 2020.Note: NCDs= noncommunicable diseases.
FIGURE 2.1
Estimated incidence of selected NCDs in Saudi Arabia, by age, 2019
prevalent among women than among men. Ambient particulate matter, high body mass index (Bmi), and secondhand smoke are driving the higher prevalence of chronic respiratory diseases in women. most cases of NCDs affect the working-age population, and the prevalence of selected NCDs increases with age. The population age 65 and older often has more than one NCD at the same time.
Both behavioral and biological risk factors contribute to the development of NCDs. Three behavioral risk factors (tobacco use, an unhealthy diet, and physical inactivity) and four biological risk factors (obesity, elevated blood glucose, raised blood pressure, and abnormal blood lipids) all contribute significantly to the bur-den of the four major NCDs in Saudi Arabia (figure 2.3). using DALYs as a

Prevalence and Risk Factors of NCDs in Saudi Arabia | 11
<1 ye
ar
1,200
1,000
800
600
400
2003
115200
228256
357
535
771
952
1,0721,013
884
781
638
480
317
16988
45 22 50
1–4
5–9
10–1
4
15–1
9
20–2
4
25–2
9
30–3
4
35–3
9
40–4
4
45–4
9
50–5
4
55–5
9
60–6
4
65–6
9
70–7
4
75–7
9
80–8
4
85–8
9
90–9
495
+
b. Rate per 1,000 population
a. Number of cases
1,600
1,400
1,200
1,000
800
600
400
200
<1 ye
ar
Cas
es p
er 1
,00
0 p
op
ula
tion
Age
Age
1–4
5–9
10–1
4
15–1
9
20–2
4
25–2
9
30–3
4
35–3
9
40–4
4
45–4
9
50–5
4
55–5
9
60–6
4
65–6
9
70–7
4
75–7
9
80–8
4
85–8
9
90–9
495
+0
7 63 84 95 98 109 139 177 224 264404
550719
904
1,0921,251
1,3661,4351,478
1,5201,575
Cancers DiabetesCardiovascular diseases Chronic respiratory diseases
Num
ber
of
new
cas
es (
thousa
nd
s)
Source: IHME 2020.Note: NCDs= noncommunicable diseases.
FIGURE 2.2
Estimated prevalence of selected NCDs in Saudi Arabia, by age, 2019
measure of burden of disease indicates the impact that changing risk factors would have on reducing the burden of disease. elevated blood glucose, over-weight, and an unhealthy diet are the main risk factors contributing to the bur-den of diabetes, while tobacco use, high Bmi, and an unhealthy diet are the main risk factors contributing to the burden of cancer. The majority of the burden of cardiovascular diseases can be linked to high blood pressure, high Bmi, an unhealthy diet, and a high level of low-density lipoprotein (LDL). Tobacco use, air pollution, and high Bmi are the leading risk factors contributing to the bur-den of chronic respiratory diseases.

12 | NoNCommuNiCABLe DiSeASeS iN SAuDi ArABiA
Source: IHME 2020.Note: DALYs = disability-adjusted life years. LDL = low-density lipoprotein. NCDs = noncommunicable diseases.
0
High body mass index 993768
703645
610602
511217
200110
49188
31
High blood pressureDietary risks
High fasting plasma glucoseHigh LDL
Air pollutionTobacco
Low physical activityKidney dysfunction
Nonoptimal outside temperatureOther environmental risks
Occupational risksUnsafe sex
Alcohol useDrug use
100
Ris
k fa
ctors
200 300 400 500
DALYs per 100,000 population (thousands)
600 700 800 900 1,000
Cancers DiabetesCardiovascular diseases Chronic respiratory diseases
FIGURE 2.3
Risk factors for developing selected NCDs among the population of Saudi Arabia, 2019
MORTALITY FROM NCDs
Annually published mortality data do not provide sufficient insight into the bur-den of NCDs in Saudi Arabia. each year the ministry of Health publishes the number of deaths reported to the ministry’s hospitals in its Statistical Yearbook. No data are collated and published on deaths determined by other types of facil-ities. The quality of the most recent set of mortality data is questionable, as about a third of the hospital deaths are not classified into one of the disease groups but instead are classified as symptoms, signs, or abnormal findings (figure 2.4). An unknown share of the unclassified deaths are certainly attributable to NCDs. Some of the groups include both communicable and noncommunicable diseases—for example, respiratory diseases do not distinguish between chronic pulmonary diseases and pneumonias. All of the limitations make the currently available data unusable for assessing the importance of NCDs as a cause of death in Saudi Arabia. it is expected that the mortality data will improve in the future, as efforts are being made to address the issue of mortality reporting.
mortality from NCDs in Saudi Arabia is among the highest of GCC countries. Age-adjusted comparative mortality rates, estimated by the World Health organization (WHo 2020), are used to compare the NCD mortality rates between countries. With an age-standardized NCD mortality rate of 562 per 100,000 population, Saudi Arabia’s rate was 10 percent higher than the average of the GCC countries in 2016 (figure 2.5). World Bank (2020) estimates that 73.2 percent of all deaths in Saudi Arabia in 2016 were caused by NCDs, including cancers, diabetes mellitus, cardiovascular diseases, digestive diseases, skin diseases, musculoskeletal diseases, and congenital anomalies.
The probability of dying from one of four major NCDs between the age of 30 and 70 is estimated to be 16.4 percent. The WHo prepares estimates of pre-mature mortality from cardiovascular diseases, cancer, diabetes, and chronic respiratory diseases. it calculates the percentage of 30-year-old people who will

Prevalence and Risk Factors of NCDs in Saudi Arabia | 13
Source: MOH 2019.
Symptoms, signs, and abnormalclinical and laboratory findings,not elsewhere classified,29.9%
Diseases of the circulatory system,15.4%
External causes of morbidity and mortality,13.4%
Certain condions originangin the perinatal period,
9.8%
Diseases of the respiratory system,5.1%
Injury, poisoning, and certain otherconsequences of external causes,
4.6%
Neoplasms, 4.6%
Certain infecous and parasicdiseases,
3.5%
Diseases of the genitourinary system, 3.3%
Congenital malformaons, deformaons,and chromosomal abnormalies,
3.7%
Endocrine, nutrional, and metabolic diseases, 2.6%Other diseases, 4.1%
FIGURE 2.4
Deaths reported to the Ministry of Health’s hospitals in Saudi Arabia, by groups of diseases, 2016
Source: WHO 2020.Note: GCC = Gulf Cooperation Council. NCD = noncommunicable disease.
600
550
500
450
400
350
300Bahrain
Mort
alit
y p
er 1
00
,00
0 p
op
ula
tion
440
430
450
488
426405
460
529 517
465 469 499 502
462
533
610
562
509
579
541
604
Qatar Oman United ArabEmirates
GCCaverage
Saudi Arabia Kuwait
650
Both genders Women Men
FIGURE 2.5
Age-standardized NCD mortality rate in Saudi Arabia and GCC countries, by gender, 2016
die before their 70th birthday from any of the four major NCDs, assuming that they experience current mortality rates at every age and do not die from any other cause. At the current level of prevention and control of NCDs, an estimated 14.2 percent of women and 17.8 percent of men in Saudi Arabia will die between the age of 30 and 70 from these four diseases (WHo 2020).
The majority of NCD deaths in Saudi Arabia are caused by cardiovascular diseases. The iHme estimates that 51 percent of all deaths in Saudi Arabia in 2019 were caused by four NCDs (iHme 2020) (figure 2.6). The share was higher

14 | NoNCommuNiCABLe DiSeASeS iN SAuDi ArABiA
for women (57.5 percent) than for men (48 percent). Cardiovascular diseases caused 35.7 percent of deaths, followed by various types of cancer (10.2 percent), chronic respiratory diseases (2.9 percent), and diabetes (2.3 percent).
more than a quarter (28.1 percent) of DALYs in Saudi Arabia are attributable to four major NCDs. As the metric that combines the burden of mortality and morbidity, DALYs capture all health costs caused by a disease. The share of total DALYs attributable to NCDs was similar for men and women in 2019. most of the DALYs were attributable to cardiovascular diseases (figure 2.6).
TOBACCO USE
The prevalence of daily and occasional tobacco smoking among the population age 15 years and older has decreased to 11.6 percent. The latest nationally repre-sentative data on tobacco consumption come from the 2019 KSA WHS (moH 2020). According to the survey, the weighted prevalence of tobacco smoking in Saudi Arabia was 11.6 percent (9.4 percent were daily smokers and 2.2 percent were occasional smokers) in 2019. The percentage of current smok-ers was highest in the group 30–44 years of age. Current tobacco smoking was more prevalent among urban populations and increased with education level. The highest percentage of daily smokers was in the lowest wealth quintile (11.7 percent), while the richest quintile had the highest prevalence of occasional smoking (3.8 percent). The prevalence of smoking declined in the period between the 2013 SHiS and the 2019 KSA WHS (figure 2.7). According to the 2013 SHiS, the weighted prevalence of smoking was 12.2 percent in 2013 (moH and iHme n.d.). The 2017 Household Health Survey covers the use of any tobacco product (manufactured cigarettes, hand-rolled cigarettes, pipe tobacco, cigars, smokeless tobacco, shisha, narghile, midwakh, and electronic cigarettes), by any known method (smoking, chewing, or inhaling). The results are presented in an aggre-gated form only, showing the crude prevalence of smoking to be 14.1 percent in the total population (GASTAT 2017b).
All recent surveys confirm that men are more likely to use tobacco prod-ucts than women. The 2013 SHiS found a prevalence of current daily and nondaily smoking of 22.7 percent in Saudi men and 1.5 percent in Saudi
Source: IHME 2020.Note: DALYs = disability-adjusted life years. NCDs = noncommunicable diseases.
Cardiovascular diseases Cancers Chronic respiratory diseases Diabetes
Women
Men
0 10 20
Share of total deaths (%)
30 40 50 60
3.6
38.0 13.4 2.6
2.6
34.7 8.6 2.2
a. Share of mortality
Women
Men
0 5 10
Share of total DALYs (%)
15 20 25 30
15.9 6.7 2.5 3.2
18.1 4.8 2.03.2
b. Share of DALYs
FIGURE 2.6
Share of mortality and DALYs attributable to four major NCDs in Saudi Arabia, by gender, 2019

Prevalence and Risk Factors of NCDs in Saudi Arabia | 15
women (moH and iHme n.d.). The mean age of smoking initiation was 18.7 years, with 29.7 percent of smokers starting before the age of 15 years. on average, Saudi men started smoking at the age of 19 and women at the age of 21.6 (moH 2014b). The highest rate of smoking was among men in the age group of 35–44 years (figure 2.8). Around 23.3 percent of the population (32.3 percent of men and 13.5 percent of women) were exposed to secondhand smoke for at least one day during the past seven days at home, work, or school. The 2019 KSA WHS not only found the prevalence of current tobacco smoking to be significantly higher among men (20.4 percent) than among women (1.9 percent), but also that smokeless tobacco and electronic cigarettes were used more by men than by women (moH 2020). The difference between men’s and women’s tobacco consumption indicates that it is crucial for Saudi Arabia to prevent an increase in smoking among women and—equally important—to continue implementing smoking cessation programs to reduce lung cancer mortality among men. With smokeless tobacco and e-cigarettes being strongly promoted among women worldwide, it is important to avoid an increase such as that observed in europe and North America.
The prevalence of smoking is higher among non-Saudis than among Saudis. According to the 2017 Household Health Survey (GASTAT 2017b), the percentage of smokers in 2017 was greater among non-Saudis (16.6 percent) than among Saudis (12.2 percent). The prevalence of smoking was slightly higher among Saudis than among non-Saudis in the age group of 15–29, while non-Saudis smoked more than Saudis at ages 30 and older. The highest percentage of Saudi smokers in 2017 was in Tabouk (19.9 percent) and in Northern Borders (17.7 percent). According to the 2019 KSA WHS (moH 2020), the prevalence of current smoking was significantly higher among men (20.4 percent) than among women (1.9 percent) and was higher among non-Saudis (14.6 percent) than among Saudis (11.2 percent).
Smokeless tobacco products and electronic cigarettes are used more among younger age groups. According to the 2019 KSA WHS (moH 2020), in 2019, both smokeless tobacco and electronic cigarettes were used mainly by persons between the ages of 15 and 44 (figure 2.9). The total prevalence of smokeless tobacco (0.7 percent) and electronic cigarette use (0.5 percent) was far below the prevalence of tobacco smoking. more Saudis used electronic cigarettes, while
Sources: MOH 2020; 2013 SHIS database.Note: KSA WHS = Kingdom of Saudi Arabia World Health Survey. SHIS = Saudi Health Interview Survey.
Daily smoker Occasional smoker Former smoker
Prevalence of smoking (% of population)
80+ 6.8
6.8
9.1
14.8
14.3
9.4
70–79
60–69
45–59Ag
e
30–44
15–29
0 5 10 15 20 25
6.9
12.2
10.1
6.2
1.6
0.880+
70–79
60–69
45–59Ag
e
30–44
15–29
0 5 10
Prevalence of smoking (% of population)
15 20 25
a. 2013 SHIS b. 2019 KSA WHS
FIGURE 2.7
Prevalence of tobacco smoking in Saudi Arabia, by age, 2013 and 2019

16 | NoNCommuNiCABLe DiSeASeS iN SAuDi ArABiA
more non-Saudis used smokeless tobacco. urban populations used both types of tobacco products more than rural ones. The highest share of daily users of smokeless tobacco products was in Aseer, Jazan, and Tabouk, while the highest share of electronic cigarette use was in eastern region, Hail, and Aseer.
Shisha smoking became more widespread among both genders between 2005 and 2013, with 4.3 percent of the population reporting daily shisha smoking in 2013 (moradi-Lakeh et al. 2015). Between 2005 and 2013, the prevalence of shi-sha smoking increased from 3.3 percent to 7.4 percent among men and from 0.5 percent to 1.3 percent among women. Around 1.4 percent of Saudis (2.6 percent of men and 0.1 percent of women) were daily smokers of cigarettes or cigars and shisha in 2013. Shisha smoking became more frequent among all age groups, as it is socially more acceptable than other kinds of smoking, particularly at social gatherings, for women and younger people. There is a common misconception about the health effects of shisha, as many individuals believe that the water used in the hookah reduces the harmful effects of the tobacco. The forthcoming results of the 2019 Global Adults Tobacco Survey might help to establish more precisely the current rate of shisha smoking in Saudi Arabia.
Never smoked Former smoker Current daily smoker Current nondaily smoker
a. Women
Ag
e
65+
55–64
45–54
35–44
25–34
15–24
0 20
Share of female Saudi population (%)
40 60 80 100
b. Men
Share of male Saudi population (%)
65+
55–64
45–54
35–44Ag
e
25–34
15–24
0 20 40 60 80 100
98
95
97
98
99
99
75
62
64
61
62
81
Source: MOH and IHME n.d.
FIGURE 2.8
Smoking status of adults 15 years and older in Saudi Arabia, by age and gender, 2013
Source: MOH 2020.
Daily user Occasional user Formal user
Ag
e
70+
60–69
45–59
30–44
15–29
0 1
Share of population (%)
2
0.3 1.7
0.3 0.3 0.4
0.3 0.70.8
0.4 0.80.1
a. Smokeless tobaccoA
ge
70+
60–69
45–59
30–44
15–29
0 1
Share of population (%)
2
0.10.5
0.2 0.4 1.3
0.2 0.4 0.7
b. Electronic cigarettes
FIGURE 2.9
Use of smokeless tobacco products and electronic cigarettes in Saudi Arabia, by age, 2019
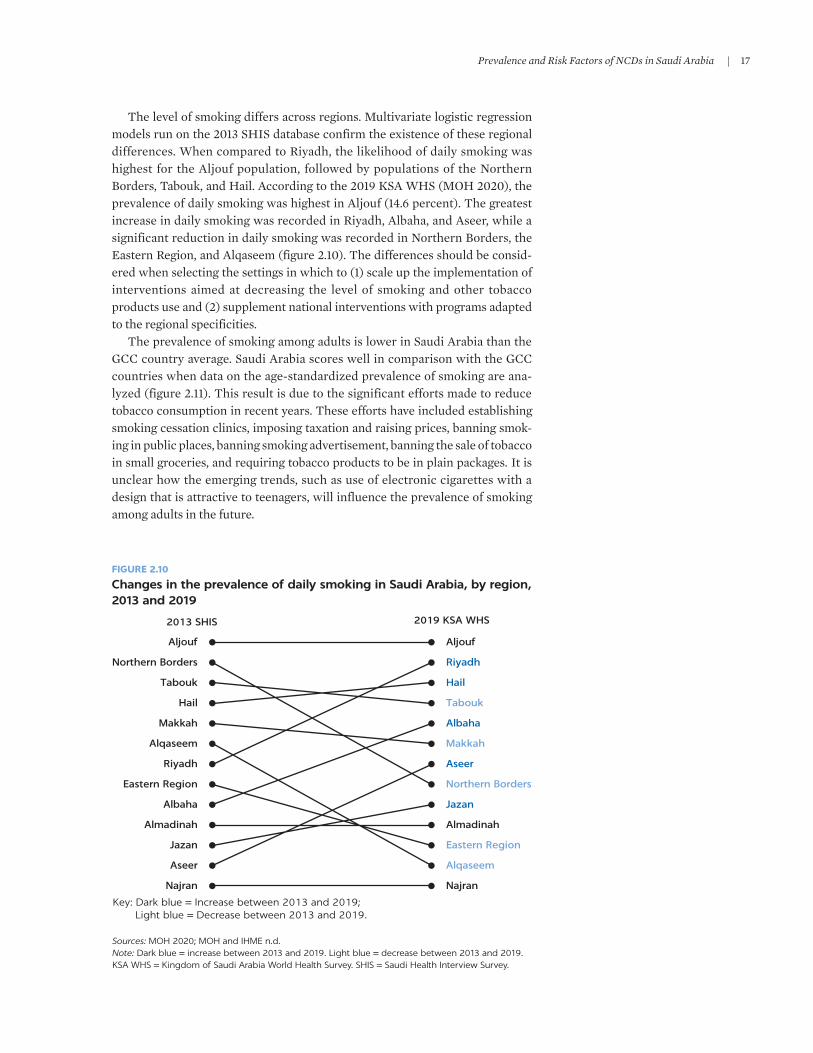
Prevalence and Risk Factors of NCDs in Saudi Arabia | 17
The level of smoking differs across regions. multivariate logistic regression models run on the 2013 SHiS database confirm the existence of these regional differences. When compared to riyadh, the likelihood of daily smoking was highest for the Aljouf population, followed by populations of the Northern Borders, Tabouk, and Hail. According to the 2019 KSA WHS (moH 2020), the prevalence of daily smoking was highest in Aljouf (14.6 percent). The greatest increase in daily smoking was recorded in riyadh, Albaha, and Aseer, while a significant reduction in daily smoking was recorded in Northern Borders, the eastern region, and Alqaseem (figure 2.10). The differences should be consid-ered when selecting the settings in which to (1) scale up the implementation of interventions aimed at decreasing the level of smoking and other tobacco products use and (2) supplement national interventions with programs adapted to the regional specificities.
The prevalence of smoking among adults is lower in Saudi Arabia than the GCC country average. Saudi Arabia scores well in comparison with the GCC countries when data on the age-standardized prevalence of smoking are ana-lyzed (figure 2.11). This result is due to the significant efforts made to reduce tobacco consumption in recent years. These efforts have included establishing smoking cessation clinics, imposing taxation and raising prices, banning smok-ing in public places, banning smoking advertisement, banning the sale of tobacco in small groceries, and requiring tobacco products to be in plain packages. it is unclear how the emerging trends, such as use of electronic cigarettes with a design that is attractive to teenagers, will influence the prevalence of smoking among adults in the future.
Sources: MOH 2020; MOH and IHME n.d.Note: Dark blue = increase between 2013 and 2019. Light blue = decrease between 2013 and 2019. KSA WHS = Kingdom of Saudi Arabia World Health Survey. SHIS = Saudi Health Interview Survey.
2013 SHIS 2019 KSA WHS
Riyadh
Hail
Tabouk
Albaha
Makkah
Aseer
Northern Borders
Jazan
Almadinah
Eastern Region
Alqaseem
Najran
Northern Borders
Tabouk
Hail
Makkah
Alqaseem
Riyadh
Eastern Region
Albaha
Almadinah
Jazan
Aseer
Najran
Key: Dark blue = Increase between 2013 and 2019;Light blue = Decrease between 2013 and 2019.
Aljouf Aljouf
FIGURE 2.10
Changes in the prevalence of daily smoking in Saudi Arabia, by region, 2013 and 2019

18 | NoNCommuNiCABLe DiSeASeS iN SAuDi ArABiA
There is a gap in data on current tobacco use among youth in Saudi Arabia. Data on tobacco use, cigarette smoking, daily cigarette smoking, and use of smokeless tobacco are collected worldwide through school-based surveys. The last nationally representative school-based survey in Saudi Arabia is 10 years old (WHo and CDC 2012). it showed that 14.9 percent of adolescents 13–15 years of age used some form of tobacco in 2010. it is uncertain whether the findings of the survey are still valid, as the recent increase in the use of electronic cigarettes has driven a worldwide increase in the use of tobacco products among youth. A new nationally representative school-based survey on the use of tobacco products among youth is needed in Saudi Arabia.
UNHEALTHY DIET
The latest comprehensive set of national data on the dietary habits of the population in Saudi Arabia is from 2013. The 2013 SHiS used a diet history ques-tionnaire to determine the amount of consumption of 18 food or beverage items in a typical week (moH and iHme n.d.). respondents were also asked about the type of oil or fat used most often to prepare meals and about the usual type of dairy products and bread consumed in the household. The collected data were used to estimate energy intake and energy-adjusted daily food and beverage consumption. The 2017 Household Health Survey (GASTAT 2017b) and the 2019 World Health Survey (moH 2020) are of limited value, as they included only one question on vegetable and fruit intake.
only a small percentage of the Saudi population meets the dietary recom-mendations. The 2013 SHiS found that dietary guidelines, developed by the ministry of Health (moH 2012), were met by only 5.2 percent of respondents for fruits, 7.5 percent for vegetables, 31.4 percent for nuts, and 44.7 percent for fish (moradi-Lakeh et al. 2016). Consumption of fruit, red meat, other processed foods, eggs, and sugar-sweetened beverages was higher among men than women, while yogurt and cheese consumption was higher among women than men.
Ag
e-st
and
ard
ized
pre
vale
nce
(%
) 30
25
20
15
10
52010
15.1 15.3 15.2 15.3 15.5 15.6 15.6
2012 20142011 2013 2015 2016
GCC averageUnited Arab Emirates
Qatar
Bahrain
Saudi Arabia
Kuwait
Oman
Source: World Bank 2020. Note: GCC = Gulf Cooperation Council.
FIGURE 2.11
Age-standardized prevalence of smoking among the population 15 years of age and older in the GCC countries, 2010–16

Prevalence and Risk Factors of NCDs in Saudi Arabia | 19
Higher consumption of fruit, shrimp, labneh, and cheese was associated with higher education levels. Consumption of some foods (fruit, shrimp, red meat, and labneh) was higher among individuals in higher-income households, while consumption of sugar-sweetened beverages was higher among individuals in lower-income households. Based on a backward elimination multivariate logis-tic regression model, the likelihood of meeting the dietary recommendations increased with age and was higher among women, among persons who said they consumed at least two servings of meat or chicken per day, among persons who had visited a health care facility for a routine medical exam within the last three years, and among persons who had been diagnosed with hypertension (el Bcheraoui et al. 2015).
Low consumption of whole grains, nuts, seeds, fruits, and vegetables is related to the development of four main groups of NCDs. The iHme estimates that low consumption of certain types of food contributes significantly to the develop-ment of NCDs in Saudi Arabia (figure 2.12). According to the 2013 SHiS, white bread was the most commonly consumed type of bread (79.1 percent). most of the respondents (77.6 percent) reported using full-fat dairy products. Vegetable oils were the most common type of oil or fat used to prepare food (84.5 percent), while olive oil was used by just 5.3 percent of respondents. The consumption of processed meat and sugar-sweetened beverages was considerably higher than recommended, particularly among younger age groups. more than 80 percent of Saudis consumed fewer than three servings of fruits and vegetables per day.
All age groups and both genders have low consumption of fruit and vege-tables. Because of the climate, Saudi Arabia traditionally did not produce fruits and vegetables and the population did not consume many fruits and vegetables, except for dates. Low consumption of fruits and vegetables was evident among all segments of the Saudi population in 2013 (figure 2.13). A minor gender difference existed in groups 15–24 and 65+ years of age, with
0
Die
tary
ris
ks
Diet low in whole grain 244153
9182
64
62
5854
473835
2918
96
Diet low in legumesDiet low in fruits
Diet low in nuts and seedsDiet high in red meatDiet low in vegetables
Diet high in sugar-sweetened beveragesDiet high in trans fatty acids
Diet low in polyunsaturated fatty acidsDiet low in seafood omega-3 fatty acids
Diet high in sodiumDiet low in fiber
Diet high in processed meatDiet low in milk
Diet low in calcium
50 100 150 200 250
Cancers DiabetesCardiovascular diseases Chronic respiratory diseases
DALYs per 100,000 population (thousands)
FIGURE 2.12
Dietary risks for developing selected NCDs in Saudi Arabia, 2019
Source: IHME 2020Note: DALY = disability-adjusted life year. NCDs = noncommunicable diseases.

20 | NoNCommuNiCABLe DiSeASeS iN SAuDi ArABiA
men consuming fewer vegetables than women. There was little or no improvement between 2005 and 2013, leading to the conclusions that (1) the importance of a healthy diet rich in fruits and vegetables should be empha-sized in all schools and child care facilities, (2) educating women on the ben-efits of a healthy diet may lead to better uptake of fruits and vegetables at home and perhaps outside the home, and (3) educating women about healthy behaviors and disease prevention would be very helpful to inform them of the benefits of fruits and vegetables and ways to prepare them to the taste of the community (el Bcheraoui et al. 2015). The findings are confirmed by the 2017 Household Health Survey, which found that only 10.4 percent of the population consumed vegetables and fruits sufficiently, with no significant differences between men and women.
The share of the population with sufficient intake of fruits and vegetables decreased between 2013 and 2019. According to the 2019 KSA WHS, the already low consumption of fruits and vegetables has declined even further in recent years (figure 2.14). only 6.9 percent of the population (7.2 percent of men and 8.0 percent of women) consumed five or more servings of fruits or vegetables in a typical day in 2019 (moH 2020). insufficient intake of fruits and vegetables was not related to residence, marital status, wealth, or education. Saudi respon-dents consumed fruits and vegetables slightly less than non-Saudis.
The level of exposure to dietary risks varies across regions of Saudi Arabia. Low consumption of fruits and vegetables is an indicator of exposure to dietary risks. According to the 2019 KSA WHS, consumption of fruits and vegetables
<1 1 2–4 5 and moreNumber of daily servings of fruits/vegetables:
65+ 57.5 22.9
25.4
25.2
25.5
25.9
26.8
57.5
57.3
58.7
57.7
52.6
67.5 17.1
28.3
23.5
24.0
24.3
22.3
56.3
57.8
59.7
65.7
54.8
77.0 14.7
10.9
13.0
14.7
11.2
10.3
78.0
74.0
81.0
84.0
76.0
73.4 15.4
13.0
15.6
14.3
13.4
11.7
67.7
73.9
77.0
81.6
75.3
Ag
eA
ge
Ag
eA
ge
55–64
45–54
35–44
25–34
15–24
65+
55–64
45–54
35–44
25–34
15–24
65+
55–64
45–54
35–44
25–34
15–24
65+
55–64
45–54
35–44
25–34
15–24
Share of female population (%)
a. Women’s vegetable intake b. Men’s vegetable intake
c. Women’s fruit intake d. Men’s fruit intake
Share of male population (%)
Share of female population (%) Share of male population (%)
0 20 40 60 80 100 0 20 40 60 80 100
0 20 40 60 80 100 0 20 40 60 80 100
Source: MOH and IHME n.d.
FIGURE 2.13
Consumption of vegetables and fruits in Saudi Arabia, by age and gender, 2013

Prevalence and Risk Factors of NCDs in Saudi Arabia | 21
was lowest among the populations in Hail (2.0 percent of respondents had suffi-cient intake), Najran (3.0 percent), and Alqaseem (3.7 percent) and highest in Aljouf (17.5 percent), Almadinah (14.6 percent), and Tabouk (12.7 percent). The differences should be considered when selecting the settings in which to (1) scale up the implementation of interventions aimed at decreasing the level of dietary risks and (2) supplement national interventions with programs adapted to the regional specificities.
PHYSICAL INACTIVITY
Data on physical activity levels in Saudi Arabia are collected through regular surveys. The Household Sport Practice Survey, conducted by the General Authority for Statistics (GASTAT 2017a, 2018a, 2019), provides up-to-date indi-cators on sports activity associated with the Vision 2030 goal of increasing the percentage of individuals who engage in sports at least once a week from 13 percent to 40 percent. Additional data on sedentary habits (time spent watch-ing television and time spent sitting daily) are available from the 2013 SHiS. All of these surveys were conducted among individuals 15 years of age and older and used the same threshold of 150 metabolic-equivalent minutes per week to classify physical activity level as sufficient.
A small percentage of the Saudi population engages in regular physical activ-ity. The 2019 KSA WHS found that 19.7 percent of the population (18.4 percent of women and 20.8 percent of men) had sufficient levels of physical activity per week (moH 2020). The level of physical activity was highest among the 15–29 age group (21.1 percent) and decreased with age. Persons living in urban areas reported a slightly higher level of physical activity than persons living in rural areas. The level of physical activity increased with education. The results of the Household Sport Practice Survey indicate that Saudis were more physi-cally active than non-Saudis in 2019.
Both genders and all age groupsMen Both genders Women
16 a. 2013 SHIS b. 2019 KSA WHS
5.1 6
.4 7.9 10
.09
.48
.8
7.3 8.19
.411.4
Shar
e of
resp
ond
ents
wit
hsu
ffici
ent
inta
ke o
f fr
uit
san
d v
eget
able
s (%
)
Shar
e of
resp
ond
ents
wit
hsu
ffici
ent
inta
ke o
f fr
uit
san
d v
eget
able
s (%
)
14
12
10
7.6 6.98
6
4
2
0
Age groups Age groups
15–2
9
30–4
4
45–5
9
60–6
9
70–7
980
+
16
14
12
10
8
6
4
2
0
15–2
9
30–4
4
45–5
9
60–6
9
70–7
980
+7.
26
.5
10.4 12
.615
.9
5.9 7.
4 8.2
6.3
5.9
3.04
.5 6.6
2.9
Sources: MOH 2020; 2013 SHIS database.Note: Sufficient intake is defined as consuming five or more servings of fruits or vegetables on a typical day. Data disaggregated by gender are not available for 2019. KSA WHS = Kingdom of Saudi Arabia World Health Survey. SHIS = Saudi Health Interview Survey.
FIGURE 2.14
Share of population with sufficient intake of vegetables and fruits in Saudi Arabia, 2013 and 2019

22 | NoNCommuNiCABLe DiSeASeS iN SAuDi ArABiA
The share of the population that is physically active is increasing, but the increase is insufficient to achieve the Vision 2030 goal. Findings from the Household Sport Practice Survey indicate that the prevalence of sufficient physical activity has been increasing steadily among both Saudis and non-Saudis (figure 2.15). The gradual increase is encouraging, but it is insufficient to reach the goal of having 40 percent of the population exercising at least once a week within the next 10 years. Additional interventions are needed to reach the desired level of physical activity by 2030.
Walking at public facilities is the most popular form of physical activity in Saudi Arabia. According to the 2019 Household Sport Practice Survey, almost two-thirds (62.5 percent) of persons considered to engage in a sufficient level of physical activity took walks and about one-fifth (20.6 percent) played foot-ball, while others engaged in body building, Swedish exercises, swimming, running, bicycle riding, or other types of sport activities (GASTAT 2019). People engaged in physical activity mostly to enhance their health (34.3 percent of physically active respondents), for recreation (27.2 percent), and for physi-cal fitness purposes (24.1 percent). About a fifth of physically active respon-dents used modern phone applications while exercising. most of them exercised at public facilities (59.0 percent), sport centers (15.1 percent), or home (14.8 percent) three or four times per week (GASTAT 2017a). Lack of desire and lack of time were the main reasons given for not engaging in suffi-cient physical activity (figure 2.16).
Lifestyle factors, including long commutes, sedentary office jobs, and vari-ous sedentary habits, contribute to physical inactivity. According to the 2013 SHiS, most Saudis spent two to four hours or more per day watching television and sitting in 2013 (figure 2.17). The results were similar for both genders, with a slightly higher share of women spending more time being inactive. The weather, culture, lack of time, and lack of exercising facilities are among other factors making it difficult for Saudis to be physically active. interventions to encourage and promote workplace physical activities as well as to make exer-cise facilities more available to the general population are needed in Saudi Arabia.
16.5 19.022.3
14.9 17.4 20.4
11.5 13.917.0
0
5
10
15
20
25
30
35
40
45
2017
Shar
e of
pop
ula
tion t
hat
pra
ctic
essp
ort
s ac
tivi
ties
for
15
0 m
inute
sor
more
per
wee
k (%
)
2018 2019
Saudis Total population Non-Saudis Vision 2030 goal Linear (total population)
FIGURE 2.15
Prevalence of sufficient physical activity in Saudi Arabia, 2017–19
Sources: GASTAT 2017a, 2018a, 2019.

Prevalence and Risk Factors of NCDs in Saudi Arabia | 23
Sources: GASTAT 2018a, 2019.Note: Data are only partially comparable because the 2018 and 2019 surveys grouped motives differently.
1.6
13.1
10.8
44.7
29.7
0 10 20 30
Share of respondents who do notengage in sports (%)
a. 2018 b. 2019
Share of respondents who do notengage in sports (%)
40 50
Other reasons
Lack of facilities in the area
Injury or impairment
Unwillingness to engage insports
Lack of time
1.8
10.3
10.8
36.2
40.9
0 10 20 30 40 50
Other reasons
Lack of facilities in the area
Health reasons
Lack of desire
Lack of time
FIGURE 2.16
Reasons given by adults for not engaging in physical activity in Saudi Arabia, 2018–19
Differences in the level of physical activity are evident across regions of Saudi Arabia. All of the recent surveys (2019 KSA WHS; 2017, 2018 and 2019 Household Sport Practice Survey) find that the prevalence of physical inactivity differs among the regions, with the likelihood of being physically inactive highest among individuals from Hail, Alqaseem, and Almadinah regions. The differ-ences should be considered when selecting the settings in which to (1) scale up the implementation of interventions aimed at increasing the level of physical activity and (2) supplement national interventions with those adapted to the regional specificities.
5.5
18.3
42.0
20.3
13.9
6.7
19.7
40.4
19.2
14.0
0
5
10
15
20
25
30
35
40
45
0.8
9.8
38.8
25.5 25.1
1.0
10.2
35.8
26.6 26.3
0
5
10
15
20
25
30
35
40
45
a. Time spent sitting b. Time spent watching television
None
Less
than
2 h
ours
2-4
hour
s
4-6
hour
s
6 ho
urs a
nd m
ore
None
Less
than
2 h
ours
2-4
hour
s
4-6
hour
s
6 ho
urs a
nd m
ore
Shar
e of
resp
ond
ents
(%
)
Shar
e of
resp
ond
ents
(%
)
Men Women
FIGURE 2.17
Time spent sitting and watching television daily in Saudi Arabia, by gender, 2013
Source: MOH and IHME n.d.

24 | NoNCommuNiCABLe DiSeASeS iN SAuDi ArABiA
Source: WHO 2020.Note: Data for Bahrain are not available. Bahrain is excluded from the GCC average. GCC = Gulf Cooperation Council.
0Oman
32.9 36.8 41.4 46.2 53.1 67.0
39.0 41.744.9
61.3
30.033.2
40.248.7 49.3
55.6
65.1
74.6
Qatar UnitedArab Emirates
Pre
vale
nce
of
insu
ffici
ent
acti
vity
(%
)
GCC average Saudi Arabia Kuwait
10
20
30
40
50
60
70
80
Both genders Women Men
FIGURE 2.18
Age-standardized prevalence of insufficient physical activity among adults in the GCC countries, by gender, 2016
The prevalence of insufficient physical activity among adults is higher than the average of GCC countries. Age-standardized estimates of the prevalence of insufficient physical activity among adults for the majority of GCC countries are available from the Global Health observatory (WHo 2020). The estimates can be used for international comparisons (figure 2.18). With an age-standardized prevalence of insufficient physical activity of 53.1 percent (65.1 percent among women and 44.9 percent among men) in 2016, Saudi Arabia is above the average of the GCC countries (46.2 percent). Data for Saudi Arabia on the prevalence of insufficient physical activity among adolescents 11–17 years of age and attending school are missing in the Global Health observatory data. The average crude prevalence of insufficient physical activity among adolescents attending school in the GCC countries was 83.8 percent (89.0 percent for girls and 79.4 percent for boys) in 2016. Assuming that the level of physical inactivity among adolescents is the same in Saudi Arabia, the prevalence of physical inactivity among adults will increase as the population of Saudi Arabia ages.
OVERWEIGHT AND OBESITY
The crude prevalence of both overweight and obesity is high among the adult population of Saudi Arabia. The 2019 KSA WHS is the latest nationally represen-tative survey that includes anthropometric measurements of adults (moH 2020). The survey found the overall prevalence of overweight to be 58.4 percent and the prevalence of obesity to be 20.2 percent. The observed gender gap confirms pre-vious findings that obesity is higher among women than among men (figure 2.19). Similar to the results of 2013 SHiS, the prevalence of obesity increased with age in 2019, reaching the highest level among the population 55–64 years of age. According to estimates of the prevalence of overweight and obesity in Saudi Arabia, developed by the WHo (2020), the prevalence of overweight and obesity increased about 1 percent annually from 2010 to 2016.

Prevalence and Risk Factors of NCDs in Saudi Arabia | 25
The prevalence of overweight and obesity is rising among children. The latest estimates of the crude prevalence of overweight and obesity among children in Saudi Arabia are for 2016. The overall crude prevalence of over-weight among children and adolescents 5–19 years of age was 35.6 percent, and the prevalence of obesity was 17.4 percent (figure 2.20). The WHo estimates indicate a gender gap that is the reverse of the gender gap for adults, with both overweight and obesity being higher among boys than among girls. From 2011 to 2016, the prevalence of obesity increased 2.6 percent, the prevalence of overweight increased 3.4 percent, and the increase was higher among boys.
The age-standardized prevalence of overweight and obesity among adults is higher in Saudi Arabia than the GCC average. estimates of the age-standardized prevalence of overweight and obesity among adults produced by the WHo (2020) show that the prevalence in Saudi Arabia was close to, but still higher than, the GCC average in 2016 (figure 2.21). The age-standardized prevalence of obesity among adults reached 35.4 percent in 2016, and Saudi Arabia ranked 14 among the most obese countries in the world. only 10 small island states, Kuwait, the united States, and Jordan had higher prevalence of obesity among adults than Saudi Arabia.
The prevalence of obesity among children is comparable in Saudi Arabia and the GCC countries. The age-standardized prevalence of obesity was 18.5 percent for children 5–9 years of age in 2016, which was lower than in other GCC coun-tries (WHo 2020). The prevalence of obesity among children and adolescents 10–19 years of age in 2016 (16.7 percent) was in the middle of range of the preva-lence in the GCC countries (figure 2.22). The crude prevalence of obesity among children and adolescents 5–19 years of age was 17.4 percent in 2016. Saudi Arabia ranked 15 in the world by share of children who are obese. only 10 small island states, Kuwait, the united States, Qatar, and the Arab republic of egypt had a higher prevalence of obesity among children than Saudi Arabia.
Sources: MOH 2020; MOH and IHME n.d.; WHO 2020. Note: Estimates for crude prevalence of overweight and obesity are for 2010, 2012, 2014, and 2016 (WHO estimates). Estimates for weighted prevalence of overweight and obesity are for 2013 and 2019. Overweight prevalence includes obesity. KSA WHS = Kingdom of Saudi Arabia World Health Survey. SHIS = Saudi Health Interview Survey. WHO = World Health Organization.
Prevalence of overweight (%) Prevalence of obesity (%)
63.2
64.9
57.5
66.6
68.3
61.9 25.9
27.6
24.1
29.3
31.0
19.2
2010 (WHO)
2012(WHO)
2013(SHIS)
2016(WHO)
2019(WHS)
2014 (WHO)
64.9
66.6
61.4
68.4
70.2
54.1
35.9
37.5
33.5
39.4
41.2
21.4
2010 (WHO)
a. Women
2012(WHO)
2013(SHIS)
2016(WHO)
2019(WHS)
2014 (WHO)
63.9
65.6
59.4
67.3
69.0
58.430.0
31.6
28.7
33.3
35.0
20.2
2010 (WHO)
b. Both genders c. Men
2014 (WHO)
2012(WHO)
2013(SHIS)
2016(WHO)
2019(WHS)
FIGURE 2.19
Prevalence of overweight and obesity among adults in Saudi Arabia, by gender, 2010–19

26 | NoNCommuNiCABLe DiSeASeS iN SAuDi ArABiA
FIGURE 2.20
Crude prevalence of overweight and obesity among children and adolescents 5–19 years old in Saudi Arabia, by gender, 2011–16
Source: WHO 2020.
Prevalence of overweight (%) Prevalence of obesity (%)
a. Girls b. Both genders c. Boys
2011
2012
20132015
2016
2014
30.1
30.6
31.0
31.4
31.9
32.3 12.4
12.8
13.2
13.6
14.0
14.4
2011
2012
20132015
2016
2014
32.2
32.9
33.6
34.3
35.0
35.6 14.8
15.3
15.8
16.4
16.9
17.4
2011
2012
20132015
2016
2014
34.1
35.0
35.8
36.7
37.5
38.3 17.0
17.5
18.1
18.7
19.3
19.8
FIGURE 2.21
Age-standardized prevalence of overweight and obesity among adults in the GCC countries, by gender, 2016
Source: WHO 2020.Note: GCC = Gulf Cooperation Council.
Oman
Unite
d Ara
b
Emira
tes
Bahr
ain
Saud
i Ara
bia
GCC aver
age
Qatar
Kuwait
Oman
Unite
d Ara
b
Emira
tes
Bahr
ain
Saud
i Ara
bia
GCC aver
age
Qatar
Kuwait
Both genders Women Men
a. Overweight b. Obesity
62.6 65.8 67.8 68.5 69.7 71.7 73.4
65.7 68.5 71.1 70.9 71.8 73.3 75.1
60.6 64.0 66.3 67.1 68.3 71.0 72.4
0
10
20
30
40
50
60
70
80
Pre
vale
nce
of
ove
rwei
gh
t (%
)
0
10
20
30
40
50
60
70
80
Pre
vale
nce
of
ob
esit
y (%
)
27.0
22.9
29.8 31.7 32.8 35.1 35.4 37.9
33.7 36.841.0 40.4 43.1 42.3 45.6
25.5 27.5 28.832.5 30.8 33.3
The determinants of adult obesity differ for men and women in Saudi Arabia. A multivariate logistic regression model using 2013 SHiS data reveals that obesity among men is associated with marital status, diet, physical activ-ity, and diagnoses of diabetes, hypercholesterolemia, and hypertension (memish et al. 2014). Among women, obesity is associated with marital sta-tus, education, history of chronic conditions, and hypertension. risk of obe-sity is lower among men who reported high levels of physical activity than among inactive men. men who were previously married, who consume three or more servings of meat per day, who have been diagnosed with diabetes or hypercholesterolemia, and who have elevated blood pressure are more likely

Prevalence and Risk Factors of NCDs in Saudi Arabia | 27
FIGURE 2.22
Crude prevalence of obesity among children and adolescents in the GCC countries, by gender, 2016
Source: WHO 2020.Note: GCC = Gulf Cooperation Council.
a. Children 5–9 years of age b. Adolescents 10–19 years of age
18.2 18.5 20.2 20.4 20.6 22.9 23.1
16.1 15.418.3 18.1 18.1 19.2
21.2
20.2 21.3 22.0 22.7 22.926.2 24.8
0
5
10
15
20
25
30
Pre
vale
nce
of
ob
esit
y (%
)
0
5
10
15
20
25
30
Pre
vale
nce
of
ob
esit
y (%
)
12.8 14.8 15.5 16.7 16.7 17.6 22.8
11.9 13.1 14.5 13.6 14.6 14.5
19.713.616.3 16.4
19.0 18.5 19.9
25.7
Oman
Unite
d Ara
b
Emira
tes
Bahr
ain
Saud
i Ara
bia
GCC aver
age
Qatar
Kuwait
Oman
Unite
d Ara
b
Emira
tes
Bahr
ain
Saud
i Ara
bia
GCC aver
age
Qatar
Kuwait
Both genders Girls Boys
to be obese. Among women, the risk of obesity increases with age, with being married or previously married, with having been diagnosed with a chronic condition, and with having prehypertension or hypertension. Women with more than a high school education are less likely to be obese than those with a primary school education or less.
The level of adult obesity varies across regions of Saudi Arabia. The 2019 KSA WHS found that the prevalence of obesity was highest in Najran, Albaha, Alqaseem, and eastern region—all with a prevalence of obesity above 25 percent. The differences should be considered when selecting the settings in which to (1) implement interventions aimed at preventing obesity and (2) supplement national interventions with those adapted to regional specificities.
ELEVATED BLOOD GLUCOSE
Comprehensive data on the incidence and prevalence of diabetes mellitus are not routinely collected or reported at the country level. Periodic surveys are the main source of prevalence data in Saudi Arabia, while incidence data are missing. The most recent data on diabetes prevalence are from the 2019 KSA WHS (moH 2020), which used actual measurements of nonfasting blood glucose to determine the prevalence of diabetes and impaired glucose tolerance. Impaired glucose tolerance (also called prediabetes) is defined as having blood glucose levels above the normal range and below the recom-mended threshold for diagnosing diabetes. Two household health surveys conducted by the GASTAT (2017b, 2018b) collected self-reported data on the prevalence of diagnosed diabetes among the population age 15 years and older. They counted only those individuals who had previously been diag-nosed with diabetes by a specialist. The 2013 SHiS used actual measurements of blood hemoglobin A1c (HbA1c) to establish the prevalence of elevated blood glucose in the population (moH 2014a).

28 | NoNCommuNiCABLe DiSeASeS iN SAuDi ArABiA
The 2019 KSA WHS showed a high prevalence of diabetes. individuals were considered to have diabetes if they had a nonfasting glucose level higher than or equal to 11.1 millimoles per liter (mmol/l) and to have prediabetes if the level was between 7.8 and 11.1 mmol/l (moH 2020). The prevalence of diabetes was very high in 2019: 21.7 percent of the population had prediabetes (22.3 percent of men and 21.0 percent of women), while 29.1 percent of the population had impaired glucose tolerance. moreover, diabetes prevalence rose significantly between 2013 and 2019. The increase in national prevalence is driven by increases among the population 15–45 years of age. The increase among younger adults could be related to the three-decades-long rise in the prevalence of over-weight and obesity among children and adolescents (WHo 2020). According to both the 2019 KSA WHS and the 2013 SHiS, the prevalence of diabetes increases with age (figure 2.23). in 2019, the prevalence of diabetes was highest in Tabouk (34.9 percent), makkah (29.4 percent), and Hail (27.6 percent) and was higher in the wealthier income quintiles than in the lower income quintiles.
The Saudi population suffers more from diabetes than the general population in the country. According to the 2017 Household Health Survey (GASTAT 2017b), 8.5 percent of individuals had been diagnosed with diabetes in the total population age 15 years and older. The prevalence of diabetes was higher among Saudis (10.1 percent) and among both Saudi men (10.4 percent) and Saudi women (9.8 percent). The percentage of individuals diagnosed with diabetes increased with age and increased significantly for individuals above age 40. The preva-lence of diabetes was highest among persons 65 years of age and older, with 46.3 percent of Saudi men and 48.7 percent of Saudi women in that age range having diabetes. The highest percentage of Saudis diagnosed with diabetes was in makkah and Tabouk (10.7 percent), followed by Aseer, Hail, and Albaha (10.6 percent). According to the 2019 KSA WHS (moH 2020), the prevalence of diabetes was higher among Saudis (22.1 percent) than among non-Saudis (19.3 percent). Diabetes was more prevalent among urban populations than among rural ones (figure 2.24). multivariate logistic regression modeling, based on 2013 SHiS data, confirms that age, sex, and diagnosis history of hypertension
FIGURE 2.23
Prevalence of diabetes mellitus in Saudi Arabia, by age and gender, 2013 and 2019
Sources: MOH 2020; 2013 SHIS database.Note: KSA WHS = Kingdom of Saudi Arabia World Health Survey. SHIS = Saudi Health Interview Survey.
a. 2013 SHIS b. 2019 KSA WHS
19
.4
18
.7 20
.0
28
.8 33
.3
25
.8
19
.9
20
.5 25
.2 32
.2
32
.3
35
.4
20
.5
21
.8
22
.7
35
.7
31
.3 40
.421.7
0
10
20
30
40
50
60
15–29 30–44 45–59 60–69 70–79 80+
Pre
vale
nce
of
dia
bet
es (
%)
Age groups
4.9
13
.5
29
.4
47
.4
51
.2
40
.0
4.2
11
.8
31
.0
48
.0
49
.9
37
.0
3.5 9.9
32
.5
48
.5
48
.9
34
.7
13.4
0
10
20
30
40
50
60
15–29 30–44 45–59 60–69 70–79 80+
Pre
vale
nce
of
dia
bet
es (
%)
Age groups
Prevalence among men Prevalence for both genders Prevalence among women Both genders and all age groups

Prevalence and Risk Factors of NCDs in Saudi Arabia | 29
and hypercholesterolemia are associated with diabetes (el Bcheraoui et al. 2013). The risk of having diabetes is lower among women, but increases with age and with a previous diagnosis of hypertension and hypercholesterolemia.
The prevalence of diabetes is expected to continue rising as the population ages. The demographic structure of the country’s population changed between 2013 and 2019, and these changes were associated with a rise in the prevalence of diabetes and prediabetes. According to data from the 2013 SHiS, 29.7 percent of the population had either diabetes or prediabetes in 2013. The share increased to 50.8 percent in 2019 (figure 2.24). iDF (2019) estimates that 4.2 million adults (20–79 years of age) in Saudi Arabia had diabetes in 2019 (iDF 2019). in the absence of additional diabetes prevention interventions, this number is expected to reach 6.1 million by 2030 and 7.9 million by 2045.
The age-adjusted prevalence of diabetes in Saudi Arabia was among the highest in the GCC countries in 2019 (figure 2.25). To compare diabetes prev-alence between countries, the international Diabetes Foundation prepared age-adjusted comparative estimates, standardizing each country’s estimated prevalence to the age structure of the world population (iDF 2019). The iDF projects that the age-adjusted prevalence of diabetes in Saudi Arabia will continue to rise over the next two decades, eventually reaching 18 percent by 2045. it also projects that the small rise in age-adjusted prevalence will increase the number of people with diabetes in Saudi Arabia from 4.3 million to 7.9 million. mean diabetes-related health expenditures per person were uS$1,173, and total diabetes-related health expenditures were about uS$5.0 million in 2019. The total annual diabetes-related costs in Saudi Arabia are expected to rise to uS$6.8 million by 2030 and to uS$7.8 million by 2045. Complications of diabetes increase the costs further. Neuropathies are cur-rently the most frequent microvascular complication (15.8 percent); coro-nary artery disease is the most frequent macrovascular complication (7.3 percent), followed by cerebrovascular disease (3.1 percent) and heart fail-ure (1.5 percent of diabetes cases).
FIGURE 2.24
Prevalence of diabetes and impaired glucose tolerance in Saudi Arabia, by population group, 2013 and 2019
Sources: For 2013, MOH and IHME n.d.; El Bcheraoui et al. 2014. For 2019, MOH 2020.Note: KSA WHS = Kingdom of Saudi Arabia World Health Survey. SHIS = Saudi Health Interview Survey.
a. 2013 SHIS b. 2019 KSA WHS
22.3
21.0
22.1
19.3
22.0
20.0
30.0
28.2
29.0
30.0
28.6
32.4
0 10 20 30 40 50 60 70
Men
Women
Saudis
Non-Saudis
Urban
Rural
Respondents (%)
14.8
11.7
49.6
10.8
47.8
11.2
17.0
15.5
16.2
15.1
14.4
15.2
0 10 20 30 40 50 60 70
Men
Women
Hypertensive
Not hypertensive
Hypercholesterolemic
Not hypercholesterolemic
Respondents (%)
Prevalence of diabetes Prevalence of impaired glucose tolerance
Total prevalence of diabetes and impaired glucose tolerance

30 | NoNCommuNiCABLe DiSeASeS iN SAuDi ArABiA
The number of people with impaired glucose tolerance in Saudi Arabia is also expected to rise over the next two decades. impaired glucose tolerance signifies a risk of the future development of type 2 diabetes and denotes an already height-ened risk of cardiovascular disease. its detection opens the door to preventing type 2 diabetes. iDF (2019) estimates that 3.6 million people had impaired glu-cose tolerance in Saudi Arabia in 2019 (iDF 2019). in the absence of additional diabetes prevention interventions, the number of adults with impaired glucose tolerance in Saudi Arabia is expected to reach 4.7 million in 2030 and 6.1 million in 2045.
The proportion of undiagnosed diabetes among adults is higher in Saudi Arabia than the GCC average. early detection of diabetes is of crucial impor-tance, since prolonged undiagnosed diabetes can have multiple negative effects, such as a higher risk of complications and increased use of health care and related costs. iDF (2019) estimates that 39 percent of people with diabetes in Saudi Arabia (1.7 million out of 4.3 million) were undiagnosed in 2019 (figure 2.26). According to the 2013 SHiS, a significant share of the population (48.4 percent of women and 40.2 percent of men) who were found to have diabetes according to their blood HbA1c measurements were not aware of it (figure 2.27). The 2019 KSA WHS found that only 8.2 percent of respondents indicated ever having been diagnosed with diabetes, while 21.7 percent of the respondents had an elevated blood sugar level when measured. The findings indicate that screening for undi-agnosed diabetes, particularly among persons 35 years of age and older, could be an important intervention in a wider approach to preventing and controlling NCDs.
Source: IDF 2019.Note: The estimates of diabetes prevalence are for the population 20–79 years of age with type 1 or type 2 diabetes. GCC = Gulf Cooperation Council.
10.112.2
15.6 15.6 15.8 16.3
9.99.3
12.7 12.7 12.714.1
0
5
10
15
20
25
30
Pre
vale
nce
of
imp
aire
d g
luco
se t
ole
rance
and
dia
bet
es (
%)
Age-adjusted comparative prevalence of impaired glucose tolerance
Age-adjusted comparative prevalence of diabetes
Oman Kuwait Bahrain Qatar SaudiArabia
UnitedArab Emirates
FIGURE 2.25
Age-adjusted prevalence of impaired glucose tolerance and diabetes in adults in the GCC countries, 2019
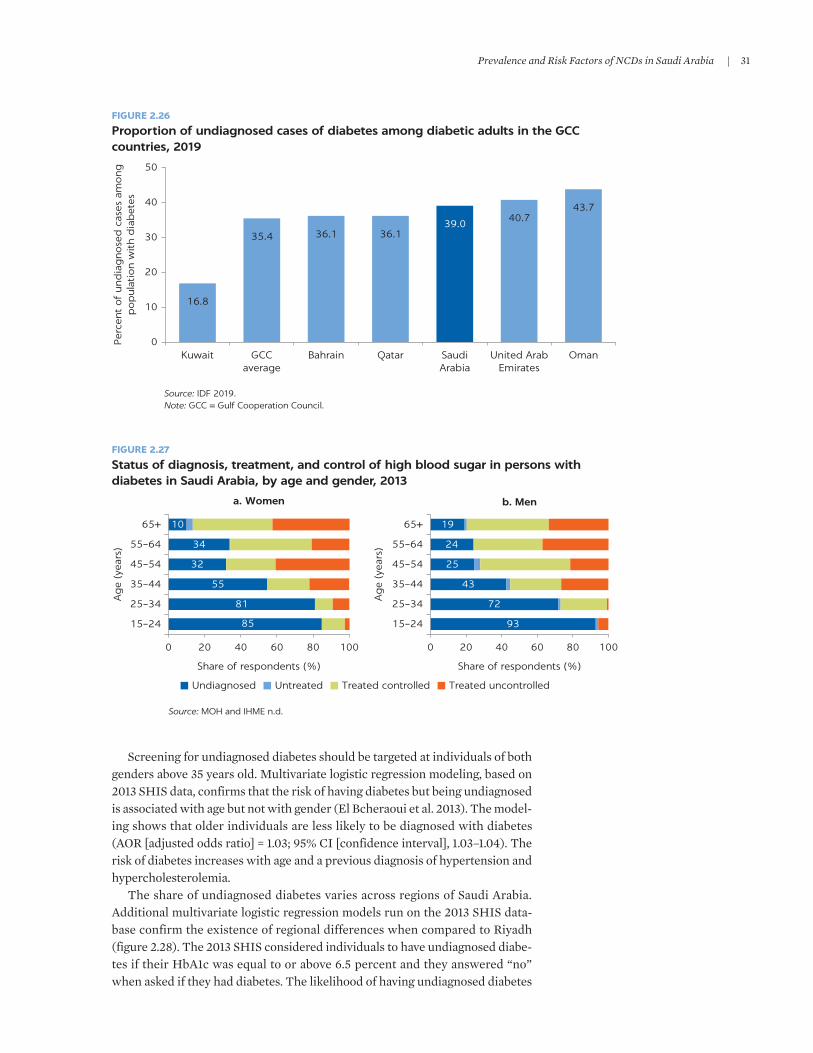
Prevalence and Risk Factors of NCDs in Saudi Arabia | 31
Screening for undiagnosed diabetes should be targeted at individuals of both genders above 35 years old. multivariate logistic regression modeling, based on 2013 SHiS data, confirms that the risk of having diabetes but being undiagnosed is associated with age but not with gender (el Bcheraoui et al. 2013). The model-ing shows that older individuals are less likely to be diagnosed with diabetes (Aor [adjusted odds ratio] = 1.03; 95% Ci [confidence interval], 1.03–1.04). The risk of diabetes increases with age and a previous diagnosis of hypertension and hypercholesterolemia.
The share of undiagnosed diabetes varies across regions of Saudi Arabia. Additional multivariate logistic regression models run on the 2013 SHiS data-base confirm the existence of regional differences when compared to riyadh (figure 2.28). The 2013 SHiS considered individuals to have undiagnosed diabe-tes if their HbA1c was equal to or above 6.5 percent and they answered “no” when asked if they had diabetes. The likelihood of having undiagnosed diabetes
Source: IDF 2019.Note: GCC = Gulf Cooperation Council.
16.8
35.4 36.1 36.139.0 40.7
43.7
0
10
20
30
40
50
Per
cent
of
und
iag
nose
d c
ases
am
ong
pop
ula
tion w
ith
dia
bet
es
Kuwait GCCaverage
Bahrain Qatar SaudiArabia
United ArabEmirates
Oman
FIGURE 2.26
Proportion of undiagnosed cases of diabetes among diabetic adults in the GCC countries, 2019
FIGURE 2.27
Status of diagnosis, treatment, and control of high blood sugar in persons with diabetes in Saudi Arabia, by age and gender, 2013
Undiagnosed Untreated Treated controlled Treated uncontrolled
a. Women b. Men
85
81
55
32
34
10
0 20 40 60 80 100
15–24
25–34
35–44
45–54
55–64
65+
15–24
25–34
35–44
45–54
55–64
65+
Share of respondents (%)
Ag
e (y
ears
)
Ag
e (y
ears
)
93
72
43
25
24
19
0 20 40 60 80 100
Share of respondents (%)
Source: MOH and IHME n.d.

32 | NoNCommuNiCABLe DiSeASeS iN SAuDi ArABiA
was highest for the populations of Hail, Aseer, and Jazan. The differences should be considered when selecting the settings in which to (1) scale up the implemen-tation of screening interventions for elevated blood glucose and (2) supplement national interventions with those adapted to the regional specificities.
HIGH BLOOD PRESSURE
The measured prevalence of high blood pressure among the population 15 years of age and older is 13.5 percent. Periodic surveys are the main source of data on hypertension prevalence in Saudi Arabia, but incidence data are missing. The internationally preferred approach for estimating hypertension prevalence is to use calculations of blood pressure measured in population-based surveys. The 2019 KSA WHS used actual measurements of blood pressure to indicate the prevalence of hypertension in Saudi Arabia (moH 2020), finding that 13.5 percent of the population age 15 and older had hypertension. The prevalence decreased by 1.6 percent between 2013 and 2019 (figure 2.29). The data on self-reported prevalence of diagnosed hypertension were collected as part of the recent Household Health Surveys conducted by the GASTAT (2017b, 2018b). only indi-viduals who had previously been diagnosed with hypertension by a doctor were counted. The 2017 Household Health Survey found hypertension in 7.4 percent of the population age 15 and above, while the 2018 survey found hypertension in 7.6 percent of this population.
According to the 2019 KSA WHS, the prevalence of hypertension was 14.7 percent among men and 12.2 percent among women. Hypertension was defined as a measured systolic blood pressure of 140 millimeters of mercury (mmHg) or higher or measured diastolic blood pressure 90 mmHg or higher. The prevalence of hypertension increased with age, reaching 46.7 percent among
Source: Regression analysis using 2013 SHIS data (MOH and IHME n.d.).Note: Riyadh is not included in the figure because it was used as a basis for comparisons. SHIS = Saudi Health Interview Survey.
FIGURE 2.28
Multivariate-adjusted odds ratio for undiagnosed diabetes in Saudi Arabia, by region, 2013
0 0.5 1.0 1.5 2.0 2.5 3.0 3.5 4.0
Makkah
Najran
Northern Borders
Alqaseem
Albaha
Aljouf
Eastern Region
Tabouk
Almadinah
Jazan
Aseer
Hail
Adjusted odds ratios

Prevalence and Risk Factors of NCDs in Saudi Arabia | 33
respondents 60–69 years of age and 56.0 percent among those 80 years of age and older. The prevalence of hypertension was higher among men than women and higher among rural populations, persons who had been married, and persons who had less education. The highest prevalence of measured hypertension was found in Alqaseem (26.2 percent), Aseer (22.1 percent), and Almadinah (20.6 percent).
The Saudi population suffers slightly more from hypertension than the total population of Saudi Arabia. The 2019 KSA WHS found that 13.6 of Saudis and 13.0 percent of non-Saudis had hypertension. The 2018 Household Health Survey (GASTAT 2018b) found that 9.2 percent of Saudis had been diagnosed with hypertension compared with 7.6 percent of the total population of Saudi Arabia. Hypertension was more prevalent among both Saudi men and Saudi women when compared with the total population of Saudi Arabia, and the dif-ference between Saudis and the total population becomes evident after the age of 35. The highest prevalence of self-reported hypertension among Saudis in 2018 was in makkah (10.2 percent), Almadinah (9.6 percent), and riyadh (9.5 percent), while the lowest was in Najran (6.0 percent) and Tabouk (7.0 percent).
Age-standardization brings the prevalence of hypertension in Saudi Arabia above the GCC average. The WHo (2020) estimates that the crude prevalence of raised blood pressure in the population 18 years of age and older in Saudi Arabia was 19.1 percent (21.0 percent among men and 16.2 percent among women) in 2015. To compare the prevalence of hypertension between countries, the WHo (2020) prepared age-standardized estimates. The latest estimates for Saudi Arabia are for 2015 (figure 2.30). Age standardization increased the prevalence for Saudi Arabia to 23.3 percent (24.7 percent among men and 20.8 percent among women).
The proportion of undiagnosed hypertension in Saudi Arabia was high in 2013. Having hypertension diagnosed and properly treated leads to fewer complications such as heart failure, peripheral vascular disease, retinal
FIGURE 2.29
Prevalence of hypertension in Saudi Arabia, by age and gender, 2013 and 2019
Sources: MOH 2020; 2013 SHIS database.Note: SHIS = Saudi Health Interview Survey. KSA WHS = Kingdom of Saudi Arabia World Health Survey.
a. 2013 SHIS b. 2019 KSA WHS
0
10
20
30
40
50
60
70
Pre
vale
nce
of
hyp
erte
nsi
on (
%)
Age groups
0
10
20
30
40
50
60
70
15–29 30–44 45–59 60–69 70–79 80+ 15–29 30–44 45–59 60–69 70–79 80+
Pre
vale
nce
of
hyp
erte
nsi
on (
%)
Age groups
Prevalence among men Prevalence for both genders Prevalence among women Both genders and all age groups
6.2
16
.3
33
.0
50
.9
48
.7 58
.1
5.2 1
3.5
28
.9
45
.3
44
.8 51
.5
4.2 10
.8
24
.7
38
.6
39
.0
42
.5
15.1
6.1 8.9
26
.9 38
.3
38
.4 48
.1
6.2 10
.2
27
.2
46
.7
48
.0 56
.0
6.4 11
.2
27
.4
54
.7
57
.9
60
.1
13.5

34 | NoNCommuNiCABLe DiSeASeS iN SAuDi ArABiA
hemorrhage, and visual impairment. The 2013 SHiS showed that 57.8 percent of the population (61.2 percent of men and 52.9 percent of women) who were considered to have hypertension by the results of blood pressure measure-ments were not aware of it (figure 2.31). multivariate logistic regression mod-eling shows that the likelihood of having undiagnosed hypertension is lower among women (Aor = 0.54; 95% Ci, 0.44–0.67), but increases with age (Aor = 1.05; 95% Ci, 1.05–1.06) and diagnosed diabetes (Aor = 1.46; 95% Ci, 1.09–1.94) (el Bcheraoui et al. 2014).
The 2019 KSA WHS confirms that the proportion of undiagnosed hyperten-sion in the country is high. it found that only 8.2 percent of the respondents had ever been diagnosed with hypertension, but 13.5 percent of the respondents had hypertension when measured. Almost 40 percent of the population with hyper-tension was undiagnosed in 2019, with the highest share of undiagnosed hyper-tension among persons 30–59 years of age. The high rate of undiagnosed hypertension calls for early detection and health education interventions, par-ticularly among men, persons older than 35 years, and persons living with diabetes.
Differences are seen in the proportion of undiagnosed hypertension across regions of Saudi Arabia. An additional multivariate logistic regression model run on the 2013 SHiS database confirms the existence of the regional differences when compared to riyadh (figure 2.32). The 2013 SHiS defined undiagnosed hypertension as having a high mean systolic or diastolic blood pressure (above 139/89 mmHg) and answering “no” when asked if they have hypertension. The likelihood of having undiagnosed hypertension was highest for the population of Aljouf, followed by the eastern region, Najran, and Jazan. The differences should be considered when selecting the settings in which to (1) scale up the implementation of screening interventions for high blood pressure and (2) sup-plement national interventions with those adapted to the regional specificities.
FIGURE 2.30
Age-standardized prevalence of high blood pressure in adults in the GCC countries, by gender, 2015
Source: WHO 2020.Note: GCC = Gulf Cooperation Council.
21.2 21.4 22.4 22.8 23.3 23.6 24.8
18.3 19.1 19.1 20.0 20.8 20.322.5
22.1 22.5 23.0 23.9 24.7 25.5 25.7
0
5
10
15
20
25
30
United Arab Emirates
Bahrain Qatar GCCaverage
SaudiArabia
Kuwait Oman
Pre
vale
nce
of
hig
h b
lood
pre
ssure
(%
)
Both genders Women Men

Prevalence and Risk Factors of NCDs in Saudi Arabia | 35
ABNORMAL BLOOD LIPIDS
The prevalence of hypercholesterolemia in Saudi Arabia is high. Periodic sur-veys are the main source of data on the prevalence of hypercholesterolemia in Saudi Arabia. The 2019 KSA WHS is the latest survey that used actual measure-ments of cholesterol level to establish the prevalence of the hypercholesterol-emia in the population (moH 2020). Defining hypercholesterolemia as a level of total nonfasting blood cholesterol higher than 5 mmol/l, the survey found the prevalence of hypercholesterolemia to be 42.6 percent. The difference between prevalence in men (42.3 percent) and in women (42.9 percent) was negligible.
FIGURE 2.31
Status of diagnosis, treatment, and raised blood pressure control in the population with hypertension in Saudi Arabia, by age and gender, 2013
Source: MOH and IHME n.d.
0
15–24
25–34
35–44
Ag
e (y
ears
)
45–54
55–64
65+
20 40 60Respondents (%)
a. Women
80 100 0
15–24
25–34
35–44
Ag
e (y
ears
)
45–54
55–64
65+
20 40 60Respondents (%)
b. Men
80 100
Undiagnosed Untreated Treated controlled Treated uncontrolled
96
85
64
45
45
32
98
77
75
62
42
39
FIGURE 2.32
Multivariate-adjusted odds ratio for undiagnosed hypertension in Saudi Arabia, by region, 2013
Source: Regression analysis using 2013 SHIS data (MOH and IHME n.d.).Note: Riyadh is not included in the figure because it was used as a basis for comparison. SHIS = Saudi Health Interview Survey.
0.5 1.0 1.5 2.0 2.5 3.0 3.5 4.0 4.5 5.0 5.5 6.0
Aseer
Almadinah
Albaha
Hail
Northern Borders
Makkah
Alqaseem
Tabouk
Jazan
Najran
Eastern Region
Aljouf
Adjusted odds ratios

36 | NoNCommuNiCABLe DiSeASeS iN SAuDi ArABiA
The prevalence of hypercholesterolemia was higher in rural areas, while decreasing with education and household wealth. The highest prevalence was in the Northern Borders (63.5 percent), Aseer (60.0 percent), and Jazan (54.4 percent).
The prevalence of hypercholesterolemia increases as the Saudi population ages. The demographic structure of the country’s population changed between 2013 and 2019. The population 65 years of age and older increased by 22.2 percent (from 0.9 million to 1.1 million), while the population 15–64 years of age increased by 4.9 million—a growth of 24.5 percent—from 19.8 million to 24.7 million (GASTAT 2020). As blood cholesterol levels rise with age, the changes in popu-lation structure are associated with the rise of hypercholesterolemia prevalence. Data from the 2013 SHiS showed that 28.5 percent of the population (29.0 percent of men and 27.9 percent of women) had total blood cholesterol higher than 5.18 mmol/l (moH and iHme n.d.). elevated cholesterol was associated with obe-sity, high blood pressure, and diabetes. The prevalence of hypercholesterolemia was 42.6 percent in 2019, ranging from 39.3 percent among persons 15–29 years of age to 67.5 percent among persons 80 years and older (figure 2.33).
The proportion of undiagnosed hypercholesterolemia is high. early detec-tion of elevated blood cholesterol level is important because prolonged undiag-nosed hypercholesterolemia is associated with a high risk of atherosclerosis and cardiovascular diseases. The 2013 SHiS showed that a very high share of the population (68.9 percent of women and 62.6 percent of men) who were consid-ered to have hypercholesterolemia when using blood test results were not aware of it (figure 2.34). The 2019 KSA WHS found that only 7.5 percent of respondents had ever been diagnosed with hypercholesterolemia and other dyslipidemia, while 42.6 percent of respondents had hypercholesterolemia when measured.
a. 2013 SHIS b. 2019 KSA WHS
40
.1
42
.8
48
.7
48
.3
44
.5
74
.0
39
.3
43
.1
46
.3
48
.3
52
.1 67
.5
38
.3
43
.4
44
.0
48
.3 60
.4
63
.2
42.6
0
10
20
30
40
50
60
70
80
15–29 30–44 45–59 60–69 70–79 80+
Pre
vale
nce
of
hyp
erch
ole
ster
ole
mia
(%
)
Age groups
14
.4 26
.8 43
.4 50
.1
50
.7
53
.6
16
.9 28
.1 34
.3 42
.9
49
.5
47
.9
15
.5 27
.4
38
.7 46
.7 50
.2
51
.5
28.5
0
10
20
30
40
50
60
70
80
15–24 25–34 35–44 45–54 55–64 65+
Pre
vale
nce
of
hyp
erch
ole
ster
ole
mia
(%
)
Age groups
Prevalence among men Prevalence for both genders Prevalence among women Both genders and all age groups
FIGURE 2.33
Prevalence of hypercholesterolemia in Saudi Arabia, by age and gender, 2013 and 2019
Sources: MOH 2020; MOH and IHME n.d.Note: The 2019 KSA WHS defined hypercholesterolemia as a level of total nonfasting blood cholesterol greater than 5 mmol/l (millimoles per liter). To make 2013 SHIS data comparable with 2019 KSA WHS data, both hypercholesterolemia (defined as the total blood cholesterol level greater than 6.2 mmol/l) and pre-hypercholesterolemia (total blood cholesterol between 5.18 and 6.2 mmol/l) were added together for 2013 SHIS. SHIS = Saudi Health Interview Survey. KSA WHS = Kingdom of Saudi Arabia World Health Survey.

Prevalence and Risk Factors of NCDs in Saudi Arabia | 37
The high rate of undiagnosed hypercholesterolemia, as well as the lack of com-pliance with medical treatment, calls for early detection and health education interventions, particularly among persons 35–54 years of age.
Screening for hypercholesterolemia should be targeted to individuals of both genders older than 35 years. multivariate logistic regression modeling, based on 2013 SHiS data, confirms that age, type of fat mostly consumed, obesity, and his-tory of hypertension and diabetes are associated with hypercholesterolemia (Basulaiman et al. 2014). The risk of having hypercholesterolemia increases with age and is higher among individuals with obesity, hypertension, and diabetes. The risk of having undiagnosed hypercholesterolemia is only associated with age (Aor = 1.02; 95% Ci, 1.01–1.03). older individuals are more likely to be undi-agnosed while having hypercholesterolemia. Gender, marital status, education, and history of diagnosis with diabetes or hypertension are not associated with having undiagnosed hypercholesterolemia. individuals older than 35 years should be targeted for early detection and encouraged to change their lifestyle or seek treatment. Screening for hypercholesterolemia should also be prioritized among patients with diabetes and hypertension, who are at higher risk of serious complications.
The share of undiagnosed hypercholesterolemia differs across regions of Saudi Arabia. Additional multivariate logistic regressions run on the 2013 SHiS database confirm the existence of regional differences, when compared with riyadh (figure 2.35). The 2013 SHiS defined undiagnosed hypercholesterolemia as having a total blood cholesterol level equal to or higher than 6.2 mmol/l and answering “no” when asked if they have raised blood lipids. The likelihood of having undiagnosed hypercholesterolemia was highest for the population of Alqaseem, followed by those in Almadinah, makkah, and the eastern region. The differences should be considered when selecting the settings in which to (1) scale up the implementation of screening interventions for raised levels of blood cholesterol and (2) supplement national interventions with those adapted to regional specificities.
Source: MOH and IHME n.d.
0
15–24
25–34
35–44
Ag
e (y
ears
)
45–54
55–64
65+
20 40
100 100
93
63
54
39
17
95
74
63
33
36
60Share of women (%)
a. Women
80 100 0
15–24
25–34
35–44
Ag
e (y
ears
)
45–54
55–64
65+
20 40 60Share of men (%)
b. Men
80 100
Undiagnosed Untreated Treated controlled Treated uncontrolled
FIGURE 2.34
Status of diagnosis, treatment, and hypercholesterolemia control in the population with hypercholesterolemia in Saudi Arabia, by age and gender, 2013

38 | NoNCommuNiCABLe DiSeASeS iN SAuDi ArABiA
CONCLUSIONS
Noncommunicable diseases are the main driver of mortality and morbidity in Saudi Arabia. Demographic and epidemiological transitions have significantly increased both the incidence and the prevalence of NCDs among the country’s population. mortality from NCDs in Saudi Arabia is among the highest of all GCC countries. NCDs are currently the leading cause of death and DALYs in Saudi Arabia, accounting for 73.2 percent of deaths. The top cause of death in Saudi Arabia is cardiovascular disease. Population growth and longer life expec-tancy are expected to increase the number of older individuals in Saudi Arabia in the future. Since NCDs disproportionately affect older age groups, the burden of the NCDs is expected to continue rising.
Preventing NCDs is a priority for Saudi Arabia. Both behavioral and biological risk factors contribute to the development of NCDs in Saudi Arabia. The three leading modifiable behavioral risk factors are tobacco use, an unhealthy diet, and lack of physical activity. Prevention efforts should be extended to the four main biological risk factors (overweight and obesity, elevated blood glucose, high blood pressure, and abnormal blood lipids) that are contributing to the develop-ment of the four NCDs of focus here.
Smoking prevention efforts have started to halt the rise of tobacco use, and the prevalence of smoking has started to decline. Smoking is not as significant a problem in Saudi Arabia as it is in large parts of eastern Asia and europe. With significantly higher rates of smoking among men than among women, it is cru-cial to keep the prevalence of smoking low by preventing an increase in smoking among women. Smoking prevention interventions also should target youth because preventing the use of tobacco products by youth is critical to reducing the prevalence of tobacco use among adults in the future. Prevention efforts need to include a wide range of interventions for both target groups, including
FIGURE 2.35
Multivariate-adjusted odds ratio for undiagnosed hypercholesterolemia in Saudi Arabia, by region, 2013
0 0.5 1.0 1.5 2.0 2.5 3.0 3.5 4.0 4.5
Tabouk
Northern Borders
Aljouf
Najran
Aseer
Jazan
Hail
Albaha
Eastern Region
Makkah
Almadinah
Alqaseem
Adjusted odds ratios
Source: Regression analysis using 2013 SHIS data (MOH and IHME n.d.).Note: Riyadh is not included in the figure because it was used as a basis for comparison. SHIS = Saudi Health Interview Survey.

Prevalence and Risk Factors of NCDs in Saudi Arabia | 39
efforts intended to prevent and encourage quitting the use of shisha, electronic cigarettes, and smokeless tobacco.
An unhealthy diet, insufficient physical activity, and obesity are interlinked risk factors that need to be tackled simultaneously. only a small percentage of Saudi Arabia’s population meets dietary recommendations. Low consumption of whole grains, nuts, seeds, fruits, and vegetables is related to the development of NCDs. The share of Saudis who engage in any type of regular physical activity is small. Lifestyle factors—including long commutes, sedentary office jobs, and various sedentary habits—have contributed to physical inactivity. All of these factors have contributed to the increase in the prevalence of overweight and obe-sity among both children and adults. Saudi Arabia currently has one of the most obese populations in the world. overweight and obesity are among the most sig-nificant health determinants in Saudi Arabia and need to be strongly targeted. Cultural and weather-appropriate, multiple-level interventions to increase physical activity and improve dietary habits should target both the general pop-ulation and specific high-risk groups.
Screening efforts are needed to detect borderline and undiagnosed diabe-tes, hypertension, and hypercholesterolemia at early stages. elevated blood glucose, high blood pressure, and abnormal blood lipids often remain undi-agnosed in Saudi Arabia. regardless of their expected increase with age, it is important to diagnose these conditions and start treatment early in life. Prolonged undiagnosed diabetes, hypertension, and hypercholesterolemia can have multiple negative effects, including complications, increased use of health care, and related costs. The population older than 35 years of age is at higher risk of having undetected biological risk factors, which makes it pos-sible to target a single group and maximize benefits by simultaneously screening for the three risk factors. The screening campaigns need to be cou-pled with intensive programs to control diabetes, hypertension, and hyper-cholesterolemia as well as with programs to monitor adherence to treatment at primary health care facilities.
REFERENCES
Basulaiman, m., C. el Bcheraoui, m. Tuffaha, m. robinson, F. Daoud, S. Jaber, S. mikhitarian, et al. 2014. “Hypercholesterolemia and its Associated risk Factors: Kingdom of Saudi Arabia, 2013.” Annals of Epidemiology 24 (11): 801–08. doi: 10.1016/j.annepidem.2014.08.001.
el Bcheraoui, C., m. Basulaiman, m. A. Al-mazroa, m. Tuffaha, F. Daoud, S. Wilson, m. Y. Al Saeedi, et al. 2015. “Fruit and Vegetable Consumption among Adults in Saudi Arabia, 2013.” Nutrition and Dietary Supplements 7 (February): 41–49. doi: 10.2147/NDS.S77460.
el Bcheraoui, C., m. Basulaiman, m. Tuffaha, F. Daoud, m. robinson, S. Jaber, S. mikhitarian, et al. 2013. “Status of the Diabetes epidemic in the Kingdom of Saudi Arabia, 2013.” International Journal of Public Health 59 (6): 1011–21. doi: 10.1007/s00038-014-0612-4.
el Bcheraoui, C., Z. A. memish, m. Tuffaha, F. Daoud, m. robinson, S. Jaber, S. mikhitarian, et al. 2014. “Hypertension and its Associated risk Factors in the Kingdom of Saudi Arabia, 2013: A National Survey.” International Journal of Hypertension 2014: Art. 564679. doi: 10.1155/2014/564679.
GASTAT (General Authority for Statistics). 2017a. Bulletin of Household Sports Practice Survey. riyadh: GASTAT. https://www.stats.gov.sa/sites/default/files/bulletin_of_household _sports_practice_survey_2017_en.pdf.
GASTAT (General Authority for Statistics). 2017b. Household Health Survey. riyadh: GASTAT. https://www.stats.gov.sa/sites/default/files/household_health_survey_2017_1.pdf.
40 | NoNCommuNiCABLe DiSeASeS iN SAuDi ArABiA
GASTAT (General Authority for Statistics). 2018a. Bulletin of Household Sport Practice Survey. riyadh: GASTAT. https://www.stats.gov.sa/sites/default/files/household_sport_practice _survey_2018_en.pdf.
GASTAT (General Authority for Statistics). 2018b. Household Health Survey. riyadh: GASTAT. https://www.stats.gov.sa/sites/default/files/household_health_survey_2018.pdf.
GASTAT (General Authority for Statistics). 2019. Household Sport Practice Survey Bulletin. riyadh: GASTAT. https://www.stats.gov.sa/sites/default/files/nshr_msh_mmrs_lsr _ llryd_2019m-english.pdf.
GASTAT (General Authority for Statistics). 2020. Population by Age Groups and Gender: Mid-Year 2019. riyadh: GASTAT. https://www.stats.gov.sa/sites/default/files/population _by_age_groups_and_gender_en.pdf.
iDF (international Diabetes Federation). 2019. IDF Diabetes Atlas, 9th ed. Brussels: iDF. https://www.diabetesatlas.org/data/en.
iHme (institute for Health metrics and evaluation). 2020. GBD Compare/Viz Hub (database). Seattle, WA: university of Washington. https://vizhub.healthdata.org/gbd-compare.
memish, Z. A., C. el Bcheraoui, m. Tuffaha, m. robinson, F. Daoud, S. Jaber, S. mikhitarian, et al. 2014. “obesity and Associated Factors: Kingdom of Saudi Arabia, 2013.” Preventing Chronic Disease 11 (10): e174. doi: 10.5888/pcd11.140236.
moH (ministry of Health). 2012. Dietary Guidelines for Saudis: The Healthy Food Plan. riyadh: moH, General Directorate of Nutrition.
moH (ministry of Health). 2014a. Diabetes at-a-Glance. Saudi Health Information Survey for Non-Communicable Diseases in Kingdom of Saudi Arabia 2013. riyadh: moH. https://www .moh.gov.sa/ministry/Statistics/Documents/diabetes.pdf.
moH (ministry of Health). 2014b. Smoking in the Kingdom of Saudi Arabia: Findings from the Saudi Health Information Survey. riyadh: moH. https://www.moh.gov.sa/ministry / Statistics/Documents/smoking.pdf.
moH (ministry of Health). 2019. Statistical Yearbook 2018. riyadh: moH. https://www.moh .gov.sa/en/ministry/Statistics/book/Documents/book-Statistics.pdf.
moH (ministry of Health). 2020. Kingdom of Saudi Arabia World Health Survey 2019. riyadh: moH.
moH (ministry of Health) and iHme (institute for Health metrics and evaluation). n.d. Saudi Health Interview Survey Results. Seattle, WA: university of Washington. http://www . healthdata.org/sites/default/files/files/Projects/KSA/Saudi-Health-interview-Survey -results.pdf.
moradi-Lakeh, m., el Bcheraoui, A. Afshin, F. Daoud, m. A. Almazroa, m. Al Saeedi, m. Basulaiman, et al. 2016. “Diet in Saudi Arabia: Findings from a Nationally representative Survey.” Public Health Nutrition 20 (6): 1075–81. doi: 10.1017/S1368980016003141.
moradi-Lakeh, m., C. el Bcheraoui, m. Tuffaha, F. Daoud, m. Al Saeedi, m. Basulaiman, Z. A. memish, et al. 2015. “Tobacco Consumption in the Kingdom of Saudi Arabia, 2013: Findings from a National Survey.” BMC Public Health 15 (July 5): 611. doi: 10.1186/s12889 -015-1902-3.
WHo (World Health organization). 2020. The Global Health observatory (database). Geneva: WHo. https://www.who.int/data/gho.
WHo (World Health organization) and CDC (Centers for Disease Control and Prevention). 2012. Global Youth Tobacco Survey 2010—Saudi Arabia. Cairo: World Health organization, regional office for the eastern mediterranean.
World Bank. 2020. DataBank—Health Nutrition and Population Statistics (database). Washington, DC: World Bank. https://databank.worldbank.org/source/health -nutrition-and-population-statistics.

41
KEY MESSAGES
• The disability-adjusted life years (DALYs) lost due to noncommunicable diseases (NCDs) are substantial in Saudi Arabia. In 2020, Saudi Arabia will lose an estimated 5,964,386 DALYs—years of healthy life—due to NCDs. This figure represents 65.2 percent of all DALYS (estimated at 9,151,937).
• If risk factors remain unchanged, the overall health burden will continue to rise over time. For women, DALYs per 100,000 are expected to increase from 3,550 in 2020 to 8,628 in 2050. For men, they are expected to increase from 5,073 to 12,198.
• Modifying key behavioral risk factors has the potential to improve overall health substantially and to reduce the NCD burden. Modest changes in smok-ing, diet, and exercise could reduce the DALY burden from NCDs in Saudi Arabia by between 4.2 percent and 4.9 percent by 2050. More ambitious changes in risk factors could reduce the DALY burden by between 5.8 percent and 7.5 percent by 2050.
• If these reductions can be achieved at costs below Int$26.35, Int$37.95, and Int$78.28 for the moderate, aggressive, and ambitious scenarios, respectively, they would be considered very cost-effective.
• Reducing body mass index (BMI) has the largest potential to lower the bur-den of disease and premature death.
BACKGROUND
The disability-adjusted life years lost due to NCDs in Saudi Arabia are substan-tial. A DALY metric quantifies a population’s morbidity and mortality burden, with one DALY equal to one year of healthy life that is lost (WHO 2020). DALYs provide a summary measure for national and international health statistics and are used by governments to prioritize the allocation of health resources. In 2010, NCDs accounted for 58.3 percent of all-cause DALYs, of which 40.9 percent was due to disability and 59.0 percent was due to life years lost. Between 2010 and 2015, the NCD burden increased by 5.8 percent to reach 61.7 percent of all-cause
Forecasting the Health Burden of NCDs in Saudi Arabia TIM BRUCKNER, EILEEN LEE, ADA ALQUNAIBET, ERIC FINKELSTEIN, CHRISTOPHER H. HERBST, AND SAMI ALMUDARRA
3

42 | NONCOMMuNICABLe DISeASeS IN SAuDI ARABIA
DALYs (45.2 percent due to disability and 54.8 percent due to life years lost). In 2020, Saudi Arabia lost an estimated 5,964,386 DALYs due to NCDs.1 This figure represents 65.2 percent of all DALYs (9,151,937), with 45.8 percent due to disabil-ity and 54.2 percent due to life years lost prematurely.
Cardiovascular diseases, cancers, and diabetes account for approximately one-third of the NCD burden. The eight major causes of disability and death are ischemic heart disease, stroke, type 2 diabetes, chronic obstructive pulmonary disease (COPD), breast cancer, colon cancer, stomach cancer, and lung cancer. Of these, ischemic heart disease and stroke are the top two contributors to NCD-attributable DALYs (17.0 percent). These conditions affect both men and women and, more recently, even people as young as in their 40s.
Longer life expectancy and lower fertility rates are changing the age distribu-tion of the country’s population. These changes are expected to exacerbate the overall burden of NCDs and the portion of DALYs attributable to them. The pro-portion of the population over 50 years of age is projected to increase more than twofold, from 15.1 percent of the total population in 2020 to 36.6 percent in 2050. In 2020, the top eight contributors to NCD-attributed DALYs constituted 25.9 percent of all NCD-attributed DALYs in the country. This proportion is expected to rise to 37.9 percent by 2050 as the population ages.
Much of the NCD burden due to these eight conditions can be reduced by modifications to smoking, diet, and exercise. Research over the last 50 years strongly supports the health benefits of reducing NCDs and of modifying behav-ior in these three key areas. Policy interventions aimed at reducing smoking and lowering salt consumption have been shown to produce lasting long-term effects (Brinsden et al. 2013; Kostova et al. 2014). In addition, the peer-reviewed litera-ture has shown that policy interventions to modify BMI via exercise produce short-term effects (Mitchel et al. 2014).
This chapter calculates the health burden from NCDs in Saudi Arabia over the next 30 years by quantifying disability-adjusted life years lost due to NCDs from 2020 to 2050, calculating reductions in premature death and disability as a gain in healthy years lived (box 3.1), and applying several estimates of reductions
Years of life lost, years lost due to disability, and healthy life expectancy
Noncommunicable diseases (NCDs) cause not only premature death (years of life lost [YLLs]) but also disability (years lost due to disability [YLDs]). When summed, these two measures form the disability- adjusted life year (DALY). This measure quantifies the health gap between an ideal health state—a theo-retical state in which mortality is caused only by old age—and years of life spent disabled or injured and in subpar health due to disease. DALYs are often used as a basis for making health policies as well as for set-ting intervention priorities. The DALY is calculated as follows:
DALY = YLL + YLD. (B3.1.1)
Minimizing premature death and disability is the equivalent of maximizing healthy life years. Healthy life expectancy (HALe) is defined as the average years of life that a person can expect to live in “full health” (GBD 2017 DALYs and HALe Collaborators 2018). This summary measure is adjusted for years that are lived with disease and injury. HALe represents an intuitive way to think about reducing disability and premature mortality. These reductions can be inter-preted as a gain in healthy years lived (or a gain in HALe):
HALE = ex0 − YLD, (B3.1.2)
where ex0 = life expectancy at birth.
BOX 3.1

Forecasting the Health Burden of NCDs in Saudi Arabia | 43
in NCD risk factors to the country’s health and demographic situation. These estimates are then used to forecast to 2050 several scenarios of life expectancy, DALYs, and healthy life expectancy (HALe) arising from changes in NCD burdens.
The remainder of this chapter is organized as follows. After providing an overview of the methods applied, it presents the results of analyses projecting the health burden of NCDs under various scenarios to 2050 and then briefly discusses the cost-effectiveness of the risk factor reduction scenarios. A final section concludes.
OVERVIEW OF METHODS
The conceptual model in figure 3.1 indicates this chapter’s focus on specific NCDs. The figure illustrates the three modifiable risk factors (smoking, BMI, and blood pressure via salt intake) and their relationship to the primary NCDs investigated. The chapter focuses on the following high-priority NCDs: ischemic heart disease, stroke, type 2 diabetes, COPD, breast cancer, colon cancer, stom-ach cancer, and lung cancer. Successful population-level changes in these risk factors could yield a concordant decrease in morbidity and mortality across mul-tiple diseases. For example, reduced smoking, lower BMI, and lower salt intake all would lower disability and death from stroke and ischemic heart disease. The NCD burden of type 2 diabetes would also fall with a lower prevalence of smok-ing and obesity (defined as BMI greater than 30 kilograms per square meter) (Patja et al. 2005). This conceptual model assumes additive risks of the various
FIGURE 3.1
Conceptual framework of the influence of modifiable risk factors for key NCDs
Source: Assumptions for models are from Global Burden of Disease estimates of risk for key NCDs (IHME 2018a).Note: BMI = body mass index. COPD = chronic obstructive pulmonary disease. NCDs = noncommunicable diseases.
Key NCDs
COPD
Breast cancer
Colon cancer
Stomach cancer
Lung cancer
Ischemic stroke
Ischemic heart disease
Type 2 diabetes
Modifiable risk factors
Smoking
Blood pressure
Salt intake
BMI

44 | NONCOMMuNICABLe DISeASeS IN SAuDI ARABIA
health behaviors for disease outcome (that is, the interaction is not multiplicative).2
Baseline estimates of NCD burden in 2020 for women and men in Saudi Arabia are from the 2017 Global Burden of Disease database (IHMe 2018b). Next, a baseline scenario is assumed in which the DALY burden remains unchanged from 2020 to 2050—save for population aging. The estimated size and age structure of the population in 2020, 2030, 2040, and 2050 are based on united Nations (uN) population estimates for Saudi Arabia (uN DeSA 2019). This population projection, combined with data from the 2017 Global Burden of Disease database, is then used to forecast the DALY burden by NCD, gender, and age group to 2050 (table 3.1).
Demographic life tables are used to calculate baseline (2020) life expectancy and HALe. Demographers use life tables to quantify mortality and life expec-tancy at various ages. Life tables are calculated separately for men and women because of their different patterns of mortality. Life expectancy at birth, which is often used to summarize a country’s overall health, refers to the average number of years that an infant who is born today is expected to live. There are two con-ceptual frameworks for the life table method: the period life table and the cohort life table. The cohort life table follows the actual mortality experience (as quan-tified by exact age at death) of a cohort of individuals throughout their lifetime until their eventual death. By contrast, the period life table takes a cross section of the current population and combines the experiences of multiple birth cohorts to quantify age-specific mortality rates.
The more commonly used method of summarizing life expectancy is the period life table, which has two advantages over the cohort life table. First, cohort life tables are complete only for cohorts that are already extinct (that is, persons born in or before 1920). estimates of period life expectancy, however, can occur for contemporary populations who have not yet died. The assumption here is that births in, say, 2020 will be subject over their entire lifetime to the age- specific mortality rates of the population in 2020. Second, period life expec-tancy uses up-to-date data and health statistics combined with current health knowledge to estimate future life expectancy. Whereas period life expectancy
TABLE 3.1 Estimated DALYs for each condition in Saudi Arabia, by gender, 2020
CONDITION WOMEN MEN TOTAL
Ischemic heart disease 203,178 535,065 738,243
Stroke 108,833 167,593 276,426
Type 2 diabetes 91,111 162,535 253,646
COPD 48,583 67,459 116,042
Colon cancer 15,279 36,468 51,747
Lung cancer 8,253 35,803 44,056
Breast cancer 40,193 814 41,007
Stomach cancer 5,860 15,585 21,445
Total 521,290 1,021,322 1,542,611
Sources: Calculations using population data (UN DESA 2019) and DALY rates (GBD 2017 DALYs and HALE Collaborators 2018).Note: Ischemic heart disease, stroke, and diabetes are the three leading causes of DALYs attributed to NCDs in Saudi Arabia. DALYs = disability-adjusted life years. COPD = chronic obstructive pulmonary disease. NCDs = noncommunicable diseases.

Forecasting the Health Burden of NCDs in Saudi Arabia | 45
tends to underestimate cohort life expectancy, its two practical advantages make it the predominant choice among demographers in describing life expectancy (Guillot 2011). In Saudi Arabia, the average period life expectancy at birth (ex0) is 76.51 years for women and 73.71 years for men. By 2050, this is projected to increase to 80.93 years for women and 78.22 years for men. This projection assumes no change in the NCD profile. Rather, these estimates come directly from uN population forecasts (uN DeSA 2019).
Current estimates of NCD burden associated with the three risk factors are applied to the life tables to arrive at the forecasts of NCD-attributable premature mortality and disability in 2030, 2040, and 2050. This initial forecast assumes no change in risk factors in that no interventions have occurred (that is, there have been no government interventions and no increase in prevalence). Age-specific risks of disease are applied for the key NCD conditions as a function of exposure to smoking, high BMI, and salt intake. These age-specific risks are derived from the best estimates from the peer-reviewed epidemiologic literature (IHMe 2018a) and then used to determine DALYs, HALe, and ex0 by gender. This initial forecast assumes decreasing fertility trends, an aging population, and decreasing mortality and morbidity from disease for all age groups.
Next, NCD disability is forecasted to 2050 using different assumptions about modification in risk factors. In order to model a realistic scenario with mildly to moderately successful policy interventions, two scenarios are considered: a moderate intervention (Model 2) and an aggressive intervention (Model 3). Policy interventions would be targeted toward the most at-risk populations (box 3.2). The effects of various policy interventions are estimated by carefully reviewing previous policy initiatives reported in the peer-reviewed literature. Some of these interventions include comprehensive policies regarding environ-mental tobacco smoke in Turkey (Kostova et al. 2014) as well as salt in packaged products in the united Kingdom (Brinsden et al. 2013). Details are provided in annex 3A.
Model 2 (moderate intervention) assumes that Saudi Arabia will adopt some policy changes and that these changes will be mildly successful. Moderate suc-cess is classified as a 14.6 percent reduction in smoking, a 10.0 percent reduction
Definition of risk factors for at-risk populations
Persons with the following risk factors are the target population:
• Hypertension, defined as systolic blood pressure above 140 millimeters of mercury (mmHg). Systolic blood pressure was chosen as the key risk factor for hypertension because it has been shown to be a better indicator of cardiovascular events than other measures (Gu et al. 2008).
• Overweight, defined as body mass index (BMI) of 25.0–29.9 kilograms per square meter.
• Obesity, defined as BMI equal to or greater than 30.0 kilograms per square meter.
• Current daily smoking, defined as smoking an average of 15.1 cigarettes per day (Moradi-Lakeh et al. 2015).
BOX 3.2

46 | NONCOMMuNICABLe DISeASeS IN SAuDI ARABIA
in overweight and obesity, and a 9.2 percent reduction in hypertension every 10 years. For example, in Saudi Arabia in 2020, an estimated 17.1 percent of men smoked (MOH 2020). Assuming a 14.4 percent reduction in smoking prevalence every 10 years, a moderate intervention scenario forecasts the smoking preva-lence among men as follows:
• 2030: 17.1 percent × 0.856 = 14.6 percent• 2040: 17.1 percent × (0.856 × 0.856) = 12.5 percent• 2050: 17.1 percent × (0.856 × 0.856 × 0.856) = 10.7 percent.
Model 3, the aggressive scenario, assumes that policy interventions will address all key risk factors, placing greater focus (that is, more aggressive policy interventions) on risk factors that contribute the most to the DALY burden among the priority NCDs. In Saudi Arabia, the priority risk factor is high BMI. using Global Health Survey estimates, more than 60 percent of the population over 45 years of age is overweight (MOH 2020). In addition, high BMI contrib-utes substantially to the burden of heart disease, stroke, and diabetes. The high prevalence of overweight and obesity makes reducing population-level BMI a top priority for intervention scenarios in Saudi Arabia.
The aggressive scenario of Model 3 assumes a 20 percent reduction in the overweight and obese population every 10 years. Because of the widespread prevalence of overweight and obesity among the population in Saudi Arabia and the high relative risks for NCDs, reducing BMI is expected to have the largest impact on DALYs. In addition, Model 3 assumes a 14.6 percent reduction in smoking and 9.3 percent reduction in hypertension in the population every 10 years.
For key conditions (by age and gender), the population-attributable risk frac-tion (PAF) is calculated for all risk factors to project years of life lost (YLL) and years lost due to disability (YLD) to 2050. The population-attributable risk sum-marizes the fraction of YLL and YLD due to the prevalence of the risk factor. Relative risks and adjustments for overlapping risk factors are from the 2017 Global Burden of Disease estimates (IHMe 2018a). Age-specific relative risks (five-year groupings) are from the Global Burden of Disease estimates for the relative risks for conditions. Increased exposure to the risk factors (that is, hav-ing high blood pressure, smoking, and being overweight or obese) results in additive risk for each increase in level of exposure. Levels of exposure are mea-sured in increments of 5 kilograms per square meter for overweight and obesity, 10 mmHg (millimeters of mercury) for systolic blood pressure, and number of cigarettes, packs, and pack-years for smoking.
Changes in the PAF (observed via changes in age- and gender-specific risk factors) are used to calculate changes in mortality (for the life table) and YLD. Box 3.3 provides an example of a PAF calculation (for 2020 and 2030). PAFs are calculated for all risk factors by condition. For conditions for which overweight or obesity and high blood pressure are both risk factors, both PAFs are adjusted by a factor of 0.35 for overweight or obesity and 0.65 for high blood pressure.
The Kingdom of Saudi Arabia World Health Survey (KSA WHS) estimates are used to calculate the baseline prevalence of smoking, overweight and obesity, and hypertension (MOH 2020; see annex 3A). To estimate the gains in HALe, the calculations of YLD averted in box 3.3 are used to derive the gender- and age-specific YLD avoided and the concordant reduction in mortality. The pro-portion of mortality attributable to the key NCDs is then calculated. For each
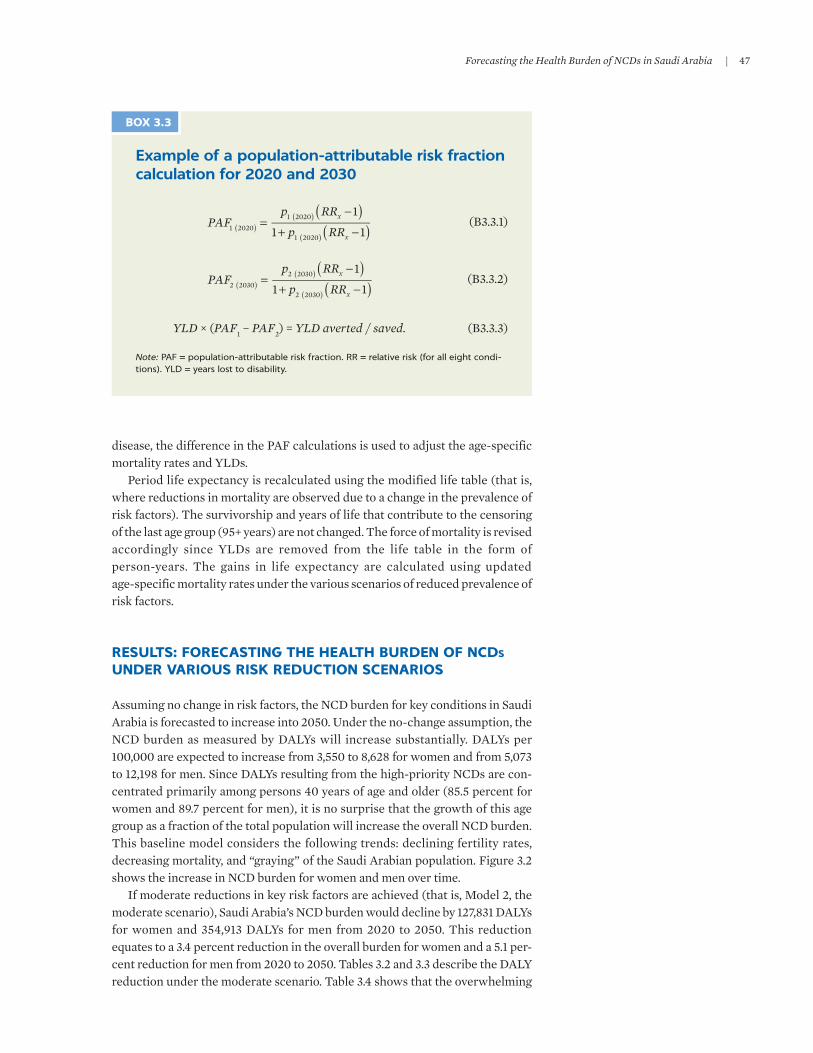
Forecasting the Health Burden of NCDs in Saudi Arabia | 47
disease, the difference in the PAF calculations is used to adjust the age-specific mortality rates and YLDs.
Period life expectancy is recalculated using the modified life table (that is, where reductions in mortality are observed due to a change in the prevalence of risk factors). The survivorship and years of life that contribute to the censoring of the last age group (95+ years) are not changed. The force of mortality is revised accordingly since YLDs are removed from the life table in the form of person-years. The gains in life expectancy are calculated using updated age-specific mortality rates under the various scenarios of reduced prevalence of risk factors.
RESULTS: FORECASTING THE HEALTH BURDEN OF NCDs UNDER VARIOUS RISK REDUCTION SCENARIOS
Assuming no change in risk factors, the NCD burden for key conditions in Saudi Arabia is forecasted to increase into 2050. under the no-change assumption, the NCD burden as measured by DALYs will increase substantially. DALYs per 100,000 are expected to increase from 3,550 to 8,628 for women and from 5,073 to 12,198 for men. Since DALYs resulting from the high-priority NCDs are con-centrated primarily among persons 40 years of age and older (85.5 percent for women and 89.7 percent for men), it is no surprise that the growth of this age group as a fraction of the total population will increase the overall NCD burden. This baseline model considers the following trends: declining fertility rates, decreasing mortality, and “graying” of the Saudi Arabian population. Figure 3.2 shows the increase in NCD burden for women and men over time.
If moderate reductions in key risk factors are achieved (that is, Model 2, the moderate scenario), Saudi Arabia’s NCD burden would decline by 127,831 DALYs for women and 354,913 DALYs for men from 2020 to 2050. This reduction equates to a 3.4 percent reduction in the overall burden for women and a 5.1 per-cent reduction for men from 2020 to 2050. Tables 3.2 and 3.3 describe the DALY reduction under the moderate scenario. Table 3.4 shows that the overwhelming
Example of a population-attributable risk fraction calculation for 2020 and 2030
( )
( )=−
+ −( )( )
( )PAF
p RR
p RRx
x
1
1 11 20201 2020
1 2020
(B3.3.1)
( )
( )=−
+ −( )( )
( )PAF
p RR
p RRx
x
1
1 12 20302 2030
2 2030
(B3.3.2)
YLD × (PAF1 − PAF2) = YLD averted / saved. (B3.3.3)
Note: PAF = population-attributable risk fraction. RR = relative risk (for all eight condi-tions). YLD = years lost to disability.
BOX 3.3

48 | NONCOMMuNICABLe DISeASeS IN SAuDI ARABIA
3,000
4,000
5,000
6,000
7,000
8,000
9,000
10,000
11,000
12,000
13,000
2020 2030 2040 2050
DA
LYs
per
10
0,0
00
Males Females
FIGURE 3.2
Forecasted NCD burden in Saudi Arabia, by gender: Baseline scenario of no change in risk factors, 2020–50
Sources: Calculations using population data (UN DESA 2019) and DALY rates (GBD 2017 DALYs and HALE Collaborators 2018).Note: DALYs = disability-adjusted life years. NCD = noncommunicable disease.
TABLE 3.2 Forecasted DALYs for women in Saudi Arabia: Baseline scenario of no change in risk factors vs. the moderate scenario, 2020–50
SCENARIO 2020 2030 2040 2050
Baseline 521,291 818,154 1,240,452 1,728,887
Moderate 521,291 789,447 1,197,878 1,672,338
Averteda n.a. 28,707 42,575 56,549
% change n.a. 3.51 3.43 3.27
Sources: Calculations for baseline data using population data (UN DESA 2019) and DALY rates (GBD 2017 DALYs and HALE Collaborators 2018). Calculations for DALYs averted using the estimates of relative risk (IHME 2018a) and calculations of the population-attributable risk fraction.Note: DALYs = disability-adjusted life years. n.a. = not applicable. a. DALYs averted are not cumulative and represent the DALYs averted within the decade.
TABLE 3.3 Forecasted DALYs for men in Saudi Arabia: Baseline scenario of no change in risk factors vs. the moderate scenario, 2020–50
SCENARIO 2020 2030 2040 2050
Baseline 1,021,320 1,622,548 2,333,855 2,991,871
Moderate 1,021,320 1,530,661 2,212,629 2,850,072
Averteda n.a. 91,887 121,226 141,800
% change n.a. 5.66 5.19 4.74
Sources: Calculations for baseline data using population data (UN DESA 2019) and DALY rates (GBD 2017 DALYs and HALE Collaborators 2018). Calculations for DALYs averted using the estimates of relative risk (IHME 2018a) and calculations of the population-attributable risk fraction.Note: DALYs = disability-adjusted life years. n.a. = not applicable. a. DALYs averted are not cumulative and represent the DALYs averted within the decade.
majority (60.7 percent) of DALYs averted among the target NCDs would be in ischemic heart disease.
HALe would also increase under the moderate scenario. Figures 3.3 and 3.4 plot forecasts of HALe to 2050 under the moderate scenario for women and men, respectively. Women would gain an additional 0.16 year of healthy life, and

Forecasting the Health Burden of NCDs in Saudi Arabia | 49
men would gain an additional 0.24 year (above the forecasted projections, assuming no change). Mortality and morbidity from ischemic heart disease and stroke decline the most. Men contribute to a larger total number of DALYs averted because they are starting from a higher baseline (in 2020) for risk factors; in the moderate scenario, they would experience larger declines in the preva-lence of risk factors over time. This gender difference is notable when consider-ing tobacco use, where women in Saudi Arabia smoke at a significantly lower rate than men: 0.9 percent versus 17.1 percent, respectively. When summing DALYs averted as a result of a decline in smoking prevalence, women account for 3,707 DALYs averted by 2050, whereas men account for 71,392 DALYs averted.
74
75
76
77
78
79
2020 2030 2040 2050
HA
LEs
Moderate scenario Baseline scenario
FIGURE 3.3
Forecasted HALEs for women in Saudi Arabia: Baseline scenario of no change in risk factors vs. moderate scenario, 2020–50
Sources: Calculations for baseline data using population data (UN DESA 2019) and DALY rates (GBD 2017 DALYs and HALE Collaborators 2018). Calculations for HALE using the estimates of relative risk (IHME 2018a) and calculations of the population-attributable risk fraction.Note: HALE = healthy life expectancy. HALEs averted are not cumulative and represent HALEs averted within the decade.
TABLE 3.4 Cumulative DALYs averted if moderate scenario is implemented in Saudi Arabia, by gender and condition, 2020–50
CONDITION WOMEN MEN TOTAL
Ischemic heart disease 68,528 224,630 293,158
Stroke 25,369 57,689 83,058
Type 2 diabetes 27,630 47,914 75,544
Breast cancer 3,658 — 3,658
Colon cancer 1,976 7,605 9,581
COPD 469 8,106 8,575
Lung cancer 188 8,222 8,410
Stomach cancer 13 746 759
Total 127,831 354,912 482,743
Sources: Calculations for baseline data using population data (UN DESA 2019) and DALY rates (GBD 2017 DALYs and HALE Collaborators 2018). Calculations for DALYs averted using the estimates of relative risk (IHME 2018a) and calculations of the population-attributable risk fraction.Note: COPD = chronic obstructive pulmonary disease. DALYs = disability-adjusted life years. — = not available.

50 | NONCOMMuNICABLe DISeASeS IN SAuDI ARABIA
Other scenarios of a modest reduction in key risk factors also correspond to a forecasted reduction in NCD burden. Model 3 simulates a moderate reduction in population-level smoking (−14.4 percent) and hypertension (−9.2 percent) as well as a larger decrease in overweight and obesity (−20.0 percent), assuming an increased policy focus on BMI reduction. The overall NCD burden would decline by 203,137 DALYs for women and 492,052 for men from 2020 to 2050. This decline equates to a 5.36 percent reduction in the overall burden for women and a 7.08 percent reduction for men from 2020 to 2050. Tables 3.5 and 3.6 describe the DALY reduction under the aggressive scenario. Table 3.7 shows the break-down of DALYs by condition. Once again, the majority (57.8 percent) of DALYs averted among the target NCDs would be in ischemic heart disease.
HALes are projected to increase under the aggressive scenario. Figure 3.5 shows the gains in HALes for women. Women gain an additional 0.23 year of healthy life in 2050. Figure 3.6 shows the gains for men. Men gain an additional
71
72
73
74
75
76
77
2020 2030 2040 2050
HA
LEs
Moderate scenario Baseline scenario
FIGURE 3.4
Forecasted HALEs for men in Saudi Arabia: Baseline scenario of no change in risk factors vs. moderate scenario, 2020–50
Sources: Calculations for baseline data using population data (UN DESA 2019) and DALY rates (GBD 2017 DALYs and HALE Collaborators 2018). Calculations for HALE using the estimates of relative risk (IHME 2018a) and calculations of the population-attributable risk fraction.Note: HALE = healthy life expectancy. HALEs averted are not cumulative and represent HALEs averted within the decade.
TABLE 3.5 Forecasted DALYs for women in Saudi Arabia: Baseline scenario of no change in risk factors vs. the aggressive scenario, 2020–50
SCENARIO 2020 2030 2040 2050
Baseline 521,291 818,154 1,240,452 1,728,887
Aggressive 521,291 769,042 1,171,603 1,643,712
Averteda n.a. 49,112 68,849 85,175
% change n.a. 6.00 5.55 4.93
Sources: Calculations for baseline data using population data (UN DESA 2019) and DALY rates (GBD 2017 DALYs and HALE Collaborators 2018). Calculations for DALYs averted using the estimates of relative risk (IHME 2018a) and calculations of the population-attributable risk fraction.Note: DALYs = disability-adjusted life years. n.a. = not applicable. a. DALYs averted are not cumulative and represent the DALYs averted within the decade.
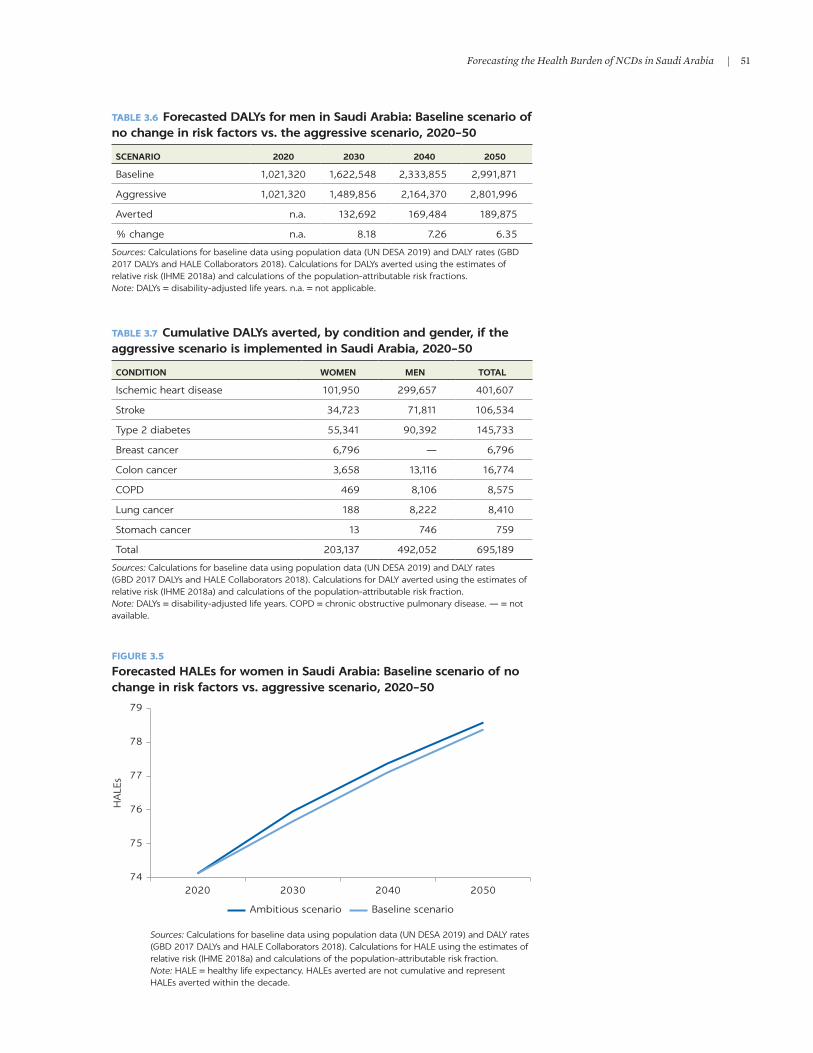
Forecasting the Health Burden of NCDs in Saudi Arabia | 51
74
75
76
77
78
79
2020 2030 2040 2050
HA
LEs
Ambitious scenario Baseline scenario
FIGURE 3.5
Forecasted HALEs for women in Saudi Arabia: Baseline scenario of no change in risk factors vs. aggressive scenario, 2020–50
Sources: Calculations for baseline data using population data (UN DESA 2019) and DALY rates (GBD 2017 DALYs and HALE Collaborators 2018). Calculations for HALE using the estimates of relative risk (IHME 2018a) and calculations of the population-attributable risk fraction.Note: HALE = healthy life expectancy. HALEs averted are not cumulative and represent HALEs averted within the decade.
TABLE 3.6 Forecasted DALYs for men in Saudi Arabia: Baseline scenario of no change in risk factors vs. the aggressive scenario, 2020–50
SCENARIO 2020 2030 2040 2050
Baseline 1,021,320 1,622,548 2,333,855 2,991,871
Aggressive 1,021,320 1,489,856 2,164,370 2,801,996
Averted n.a. 132,692 169,484 189,875
% change n.a. 8.18 7.26 6.35
Sources: Calculations for baseline data using population data (UN DESA 2019) and DALY rates (GBD 2017 DALYs and HALE Collaborators 2018). Calculations for DALYs averted using the estimates of relative risk (IHME 2018a) and calculations of the population-attributable risk fractions.Note: DALYs = disability-adjusted life years. n.a. = not applicable.
TABLE 3.7 Cumulative DALYs averted, by condition and gender, if the aggressive scenario is implemented in Saudi Arabia, 2020–50
CONDITION WOMEN MEN TOTAL
Ischemic heart disease 101,950 299,657 401,607
Stroke 34,723 71,811 106,534
Type 2 diabetes 55,341 90,392 145,733
Breast cancer 6,796 — 6,796
Colon cancer 3,658 13,116 16,774
COPD 469 8,106 8,575
Lung cancer 188 8,222 8,410
Stomach cancer 13 746 759
Total 203,137 492,052 695,189
Sources: Calculations for baseline data using population data (UN DESA 2019) and DALY rates (GBD 2017 DALYs and HALE Collaborators 2018). Calculations for DALY averted using the estimates of relative risk (IHME 2018a) and calculations of the population-attributable risk fraction.Note: DALYs = disability-adjusted life years. COPD = chronic obstructive pulmonary disease. — = not available.

52 | NONCOMMuNICABLe DISeASeS IN SAuDI ARABIA
0.31 year of healthy life in 2050 (using the forecasted projections and assuming no change). Mortality and morbidity due to ischemic heart disease and stroke would see the largest reductions in mortality and morbidity.
Most of the reductions in the NCD burden under the various scenarios occur because of reductions in overweight and obesity. If the prevalence of overweight and obesity in Saudi Arabia could be reduced by 40.7 percent and 84.4 percent, respectively, over 30 years—that is, to achieve the estimates of overweight and obesity in China in 2012 (Reynolds et al. 2012)—then DALYs would be reduced 13.8 percent (from baseline forecasts) by 2050 (table 3.8). This ambitious
71
72
73
74
75
76
77
2020 2030 2040 2050
HA
LEs
Ambitious scenario Baseline scenario
FIGURE 3.6
Forecasted HALEs for men in Saudi Arabia: Baseline scenario of no change in risk factors vs. aggressive scenario, 2020–50
Sources: Calculations for baseline data using population data (UN DESA 2019) and DALY rates (GBD 2017 DALYs and HALE Collaborators 2018). Calculations for HALE using the estimates of relative risk (IHME 2018a) and calculations of the population-attributable risk fraction.Note: HALE = healthy life expectancy. HALEs averted are not cumulative and represent HALEs averted within the decade.
TABLE 3.8 Cumulative DALYs averted in Saudi Arabia, by condition and gender: Baseline scenario of no change in risk factors vs. the ambitious scenario, 2020–50
CONDITION WOMEN MEN TOTAL
Ischemic heart disease 205,980 593,967 799,947
Stroke 109,612 201,850 311,462
Diabetes type II 90,362 169,821 260,183
Breast cancer 12,641 — 12,641
Colon cancer 6,615 25,604 32,219
COPD 469 8,106 8,575
Lung cancer 188 8,222 8,410
Stomach cancer 13 746 759
Total 425,880 1,008,318 1,434,197
Sources: Calculations for baseline data using population data (UN DESA 2019) and DALY rates (GBD 2017 DALYs and HALE Collaborators 2018). Calculations for DALYs averted using the estimates of relative risk (IHME 2018a) and calculations of the population-attributable risk fraction.Note: DALYs = disability-adjusted life years. COPD = chronic obstructive pulmonary disease. — = not available.

Forecasting the Health Burden of NCDs in Saudi Arabia | 53
scenario of extreme reduction in prevalence is described in more detail in the tables and figures in annex 3A.
THE COST-EFFECTIVENESS OF MODERATE, AGGRESSIVE, AND AMBITIOUS SCENARIOS FOR REDUCING NCD RISK FACTORS
The government could aim to achieve both the moderate interventions (Model 2) and the more ambitious interventions (Model 3). As discussed above, Model 2 (moderate intervention) assumes that Saudi Arabia will adopt some policy changes and that these changes will be mildly successful, such as a 14.6 percent reduction in smoking, 10.0 percent reduction in overweight and obe-sity, and 9.2 percent reduction in hypertension every 10 years. Model 3 (ambi-tious scenario) assumes that policy interventions will address all key risk factors and achieve a 20 percent reduction in overweight and obesity, a 14.6 percent reduction in smoking, and a 9.3 percent reduction in hypertension every 10 years.
The cost-effectiveness of the moderate, aggressive, and ambitious reduc-tion scenarios is presented in table 3.9. The World Health Organization (WHO) considers interventions to be cost-effective if they can reduce DALYs at less than three times gross domestic product (GDP) per capita per DALY saved and very cost-effective if they cost less than one times GDP per capita per DALY saved (Marseille et al. 2014). In Saudi Arabia, GDP per capita was Int$56,912, and the total population was 34,813,867 in 2020 (uN DeSA 2019). Given the 30-year DALY savings described above and these cost-effectiveness thresholds, if Saudi Arabia could achieve the moderate, aggressive, and ambitious scenarios via intervention strategies at annual costs per capita below Int$79.02, Int$113.84, and $234.85, respectively, they would be consid-ered cost-effective based on WHO thresholds. If respective costs were below Int$26.35, Int$37.95, and Int$78.28, they would be considered very cost-effective.
TABLE 3.9 Cost-effectiveness of the moderate, aggressive, and ambitious scenarios in Saudi Arabia, 2020–2050
INDICATORMODERATE SCENARIO
AGGRESSIVE SCENARIO
AMBITIOUS SCENARIO
Total DALYs averted over 30 years (from tables 3.4, 3.7, and 3.8) 482,744 695,189 1,434,197
30-year cost to be cost-effective based on 3 × GDP per DALYs saved (Int$) 82,421,779,584 118,693,789,104 244,869,058,992
30-year cost to be very cost-effective based on GDP per DALYs saved (Int$) 27,473,926,528 39,564,596,368 81,623,019,664
Average annual cost to be cost-effective based on 3 × GDP per DALYs saved (row 2 divided by 30 years) (Int$)
2,747,392,653 3,956,459,637 8,162,301,966
Average annual cost to be very cost-effective based on GDP per DALYs saved (row 3 divided by 30 years) (Int$)
915,797,551 1,318,819,879 2,720,767,322
Average annual per capita cost to be cost-effective (divided by population size) (Int$)
79.05 113.84 234.85
Average annual per capita cost to be very cost-effective (divided by population size) (Int$)
26.35 37.95 78.28
Source: World Bank calculations. Note: DALYs = disability-adjusted life years. GDP = gross domestic product.

54 | NONCOMMuNICABLe DISeASeS IN SAuDI ARABIA
CONCLUSIONS
This chapter has sought to estimate the health burden of NCDs in Saudi Arabia now and in the future. NCDs are the focus because they account for more than 65 percent of DALYs in Saudi Arabia. Much of the burden due to the high- priority NCDs, however, is amenable to changes in smoking, diet, and exercise habits. Modifying these risk factors, in turn, would reduce the burden of diseases related to hypertension, overweight and obesity, and tobacco exposure.
If risk factors do not change, the overall health burden will continue to rise over time. As the population ages, an older age structure will produce a larger burden of disability and death from NCDs. This circumstance also reflects the fact that population growth and fertility are forecasted to decline in Saudi Arabia. These baseline estimates are based on the demographic life table method, which applies age-specific morbidity and mortality rates from 2020 to 2050.
Modifying key behavioral risk factors has the potential to improve overall health substantially and to reduce the NCD burden, allowing Saudi Arabia to make important strides in reducing morbidity and mortality from the eight high-priority NCDs. This chapter has applied several scenarios in which reduc-tions in smoking and improvements in diet and exercise reduce gender- and age-specific mortality rates and overall morbidity. These scenarios are grounded in empirical estimates of documented reductions in NCD risk following behav-ioral changes, as well as reductions in age-specific mortality rates following declines in prevalence of NCDs.
The forecasts indicate that, under a scenario of modest changes in smoking, diet, and exercise, Saudi Arabia could reduce the DALY burden from NCDs by between 4.2 percent and 4.9 percent by 2050. Men have the potential to realize greater DALY reductions owing to their much higher prevalence of smoking rel-ative to women. As such, men have the greatest potential health gains to make in this area. In addition, this DALY reduction by 2050, while appearing modest at first, represents a substantial gain in health given the demographic backdrop in which population aging will occur over the next 30 years. In addition, more ambitious changes in risk factors have the potential to achieve between 5.8 per-cent and 7.5 percent reductions in the DALY burden.
The chapter has shown that if these reductions can be achieved at costs below Int$26.35, Int$37.95, and Int$78.28 for the moderate, aggressive, and ambitious scenarios, respectively, they would be considered very cost-effective. As shown in the WHO best buys and the literature review in chapter 9, many cost-effective interventions can be implemented at costs well below these thresholds, suggest-ing that these outcomes are both achievable and affordable.
The forecasts in this chapter, while potentially useful for public health plan-ning and national policy making, rely on several assumptions. The reduction in smoking and improvement in diet and exercise all represent noteworthy targets for policy and public health intervention. However, the forecasts to 2050 of HALe gains and DALY reductions assume that the health gains due to changes in risk factors are additive. In addition, they assume that implementing these interventions retains the same impact on NCDs in Saudi Arabia as in other countries (for example, as in China for the very ambitious reductions in obe-sity). Furthermore, the forecasts rely on the sustained, consistent impact of interventions over time (that is, no fade-out or noncompliance). These caveats notwithstanding, substantial reductions in the burden of disease due to NCDs—ischemic heart disease, stroke, and diabetes, in particular—may be realized with concerted efforts to reduce smoking and improve diet and exercise.

Forecasting the Health Burden of NCDs in Saudi Arabia | 55
ANNEX 3A: SUPPLEMENTARY DETAILS FOR THE INTERVENTION ASSUMPTIONS
Challenges to reducing population-level BMI: Comments on unhealthy diet as a risk factor
unhealthy diet is a key risk factor for raised BMI and consequently for NCDs. While it is possible to reduce BMI via diet, the focus here is on successful population-level interventions that have been shown to have a substantial long-term impact. Australia, Canada, and the united States have initiated population-level interventions aimed at reducing overweight and obesity (Crespo et al. 2012; Millar et al. 2011; Raine et al. 2013). Not all interventions have succeeded in reducing the prevalence of obesity. Participants in Australia’s inter-vention achieved a 740-gram average weight loss; however, there was no signifi-cant reduction in the prevalence of obesity (Millar et al. 2011). The community-level intervention in the united States was successful in changing behaviors in children (for example, increased consumption of fruits and vegetables), but not in changing BMI.
Population-level smoking intervention
In 2010, the Turkish government implemented a series of policies and programs aimed at reducing tobacco consumption. These measures included raising the tobacco consumption tax (increasing the average price of cigarettes by 42.1 percent), banning tobacco advertising, requiring graphic health warnings on tobacco packages, and prohibiting smoking in public places. Data gathered from the Global Adult Tobacco Survey in 2008 and 2012, before and after the mea-sures were implemented, reveal that the prevalence of smoking decreased by 14.6 percent during this time period (Kostova et al. 2014). The age- and gender- specific decreases shown in table 3A.1 are used for Model 2 (moderate interven-tion) and Model 3 (ambitious intervention).
TABLE 3A.1 Change in prevalence of cigarette smoking in Saudi Arabia using Turkey’s change in smoking estimates, by gender and age, 2008–12% change
DEMOGRAPHICS
CURRENT SMOKER
CHANGE FROM 2008 TO 20122008 2012
Gender
Women 14.9 12.6 −15.7
Men 45.8 39.2 −14.4
Age group (years)
15–24 24.5 19.1 −22.0
25–44 38.8 34.4 −11.3
45–64 27.9 23.8 −14.8
≥65 9.2 8.0 −13.7
Source: Kostova et al. 2014.Note: The largest decrease in smoking prevalence was observed in ages 15–24.
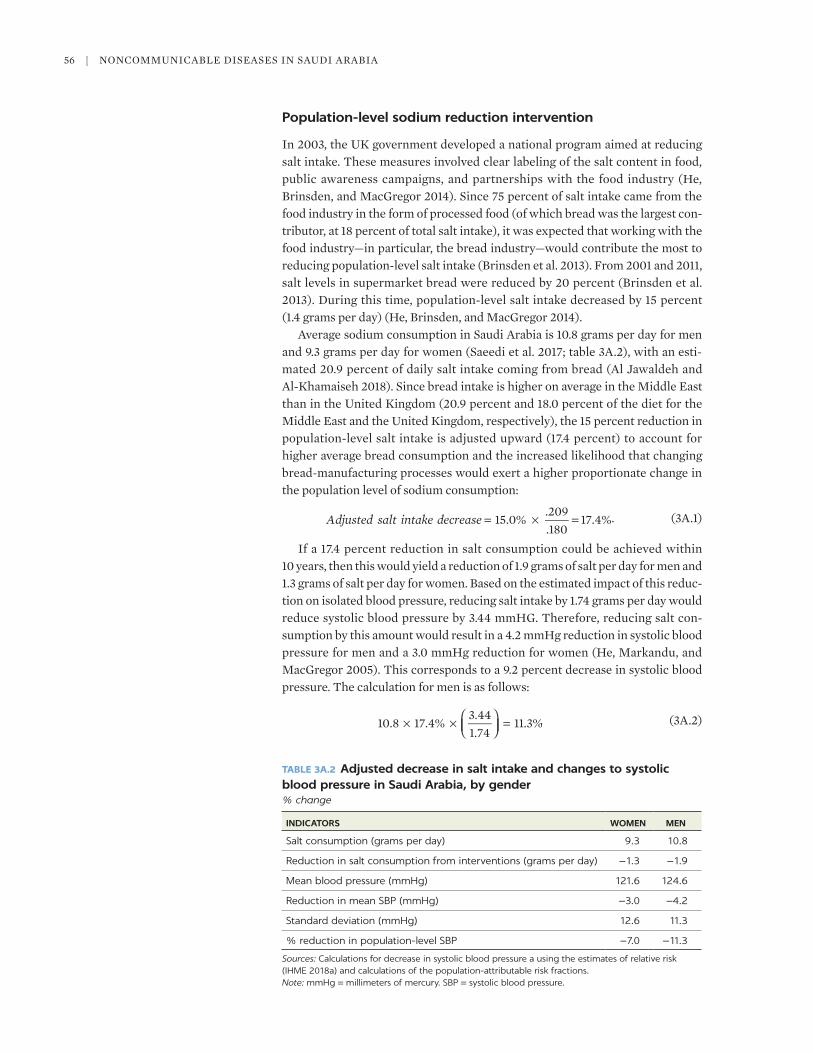
56 | NONCOMMuNICABLe DISeASeS IN SAuDI ARABIA
Population-level sodium reduction intervention
In 2003, the uK government developed a national program aimed at reducing salt intake. These measures involved clear labeling of the salt content in food, public awareness campaigns, and partnerships with the food industry (He, Brinsden, and MacGregor 2014). Since 75 percent of salt intake came from the food industry in the form of processed food (of which bread was the largest con-tributor, at 18 percent of total salt intake), it was expected that working with the food industry—in particular, the bread industry—would contribute the most to reducing population-level salt intake (Brinsden et al. 2013). From 2001 and 2011, salt levels in supermarket bread were reduced by 20 percent (Brinsden et al. 2013). During this time, population-level salt intake decreased by 15 percent (1.4 grams per day) (He, Brinsden, and MacGregor 2014).
Average sodium consumption in Saudi Arabia is 10.8 grams per day for men and 9.3 grams per day for women (Saeedi et al. 2017; table 3A.2), with an esti-mated 20.9 percent of daily salt intake coming from bread (Al Jawaldeh and Al-Khamaiseh 2018). Since bread intake is higher on average in the Middle east than in the united Kingdom (20.9 percent and 18.0 percent of the diet for the Middle east and the united Kingdom, respectively), the 15 percent reduction in population-level salt intake is adjusted upward (17.4 percent) to account for higher average bread consumption and the increased likelihood that changing bread-manufacturing processes would exert a higher proportionate change in the population level of sodium consumption:
15.0%.209.180
17.4%Adjusted salt intake decrease = × = . (3A.1)
If a 17.4 percent reduction in salt consumption could be achieved within 10 years, then this would yield a reduction of 1.9 grams of salt per day for men and 1.3 grams of salt per day for women. Based on the estimated impact of this reduc-tion on isolated blood pressure, reducing salt intake by 1.74 grams per day would reduce systolic blood pressure by 3.44 mmHG. Therefore, reducing salt con-sumption by this amount would result in a 4.2 mmHg reduction in systolic blood pressure for men and a 3.0 mmHg reduction for women (He, Markandu, and MacGregor 2005). This corresponds to a 9.2 percent decrease in systolic blood pressure. The calculation for men is as follows:
× ×
=10.8 17.4%3.441.74
11.3%. (3A.2)
TABLE 3A.2 Adjusted decrease in salt intake and changes to systolic blood pressure in Saudi Arabia, by gender% change
INDICATORS WOMEN MEN
Salt consumption (grams per day) 9.3 10.8
Reduction in salt consumption from interventions (grams per day) −1.3 −1.9
Mean blood pressure (mmHg) 121.6 124.6
Reduction in mean SBP (mmHg) −3.0 −4.2
Standard deviation (mmHg) 12.6 11.3
% reduction in population-level SBP −7.0 −11.3
Sources: Calculations for decrease in systolic blood pressure a using the estimates of relative risk (IHME 2018a) and calculations of the population-attributable risk fractions.Note: mmHg = millimeters of mercury. SBP = systolic blood pressure.

Forecasting the Health Burden of NCDs in Saudi Arabia | 57
Estimating age- and gender-specific changes using the KSA WHS 2019 data
Age- and gender-specific prevalence estimates of risk factors are from the 2019 KSA WHS report (MOH 2020). Since the estimates are available only by gender or by age group, a weighted-average calculation is used to calculate age- and gender-specific prevalence (table 3A.3).
TABLE 3A.3 Prevalence estimates for overweight and obesity in Saudi Arabia, by age and gender, 2019 prevalence of overweight and obesity (%)
INDICATOR OVERWEIGHT OBESITY
Gender
Women 42.7 19.2
Men 32.7 21.4
Age group (years)
18–29 30.4 10.2
30–44 43.2 22.3
45–59 40.1 32.7
60–69 38.2 32.5
70–79 47.0 29.1
≥ 80 41.0 22.0
Source: MOH 2020.Note: Overweight is defined as body mass index (BMI) of 25.0–29.9 kilograms per square meter. Obesity is defined as BMI of 30.0 kilograms per square meter or greater.
Weighted average formula: Calculations and supplemental tables
=+
×( )−−Overweight
OverweightOverweight Overweight
OverweightFemaleMale Female
Female%(% * 2)
% %%18 29
18 29
(3A.3)
( )( )=
+34.4%
30.4%* 232.7% 42.7%
* 42.7% (3A.4)
TABLE 3A.4 Estimates for overweight and obesity in Saudi Arabia, by age and gender, using the weighted average formula, 2018 prevalence (%)
AGE GROUP (YEARS)
WOMEN MEN
OVERWEIGHT OBESITY OVERWEIGHT OBESITY
18–29 34.4 9.6 26.4 10.8
30–44 48.9 21.1 37.5 23.5
45–59 45.4 30.9 34.8 34.5
60–69 43.3 30.7 33.1 34.3
70–79 53.2 27.5 40.8 30.7
≥ 80 46.4 20.8 35.6 23.2
Sources: Calculations using the estimates of relative risk (IHME 2018a) and calculations of the population-attributable risk fraction.Note: Overweight is defined as body mass index (BMI) of 25.0–29.9 kilograms per square meter. Obesity is defined as BMI of 30.0 kilograms per square meter or greater.

58 | NONCOMMuNICABLe DISeASeS IN SAuDI ARABIA
TABLE 3A.6 Estimates for current daily smoking in Saudi Arabia, by age and gender, using the weighted average formula, 2018 prevalence (%)
AGE GROUP (YEARS) WOMEN MEN
18–29 0.7 13.1
30–44 1.2 23.2
45–59 1.0 19.2
60–69 0.6 11.8
70–79 0.2 3.0
≥ 80 0.1 1.5
Sources: Calculations using the estimates of relative risk (IHME 2018a) and calculations of the population-attributable risk fraction.
TABLE 3A.5 Estimates for hypertension in Saudi Arabia, by age and gender, using the weighted average formula, 2018 prevalence (%)
AGE GROUP (YEARS) WOMEN MEN
18–29 2.4 2.6
30–44 4.3 4.6
45–59 18.1 19.5
60–69 34.7 37.5
70–79 33.5 36.2
≥ 80 40.5 43.8
Sources: Calculations using the estimates of relative risk (IHME 2018a) and the population-attributable fraction calculations.Note: Hypertension is defined as systolic blood pressure above 140 millimeters of mercury (mmHG).
Population projections, 2020–50
TABLE 3A.7 Estimated current and projected female population in Saudi Arabia, by age, 2020–50population (thousands)
AGE GROUP (YEARS) 2020 2030 2040 2050
0–4 1,467,625 1,268,792 1,182,144 1,201,286
5–9 1,467,381 1,377,065 1,198,480 1,198,258
10–14 1,300,660 1,453,228 1,267,715 1,181,950
15–19 1,089,822 1,453,330 1,370,178 1,192,927
20–24 1,105,071 1,306,934 1,456,716 1,272,652
25–29 1,357,837 1,141,580 1,487,990 1,406,059
30–34 1,417,027 1,194,180 1,365,245 1,515,367
35–39 1,332,808 1,409,684 1,182,519 1,528,308
40–44 1,283,693 1,397,485 1,187,639 1,358,713
45–49 969,318 1,282,971 1,373,895 1,151,070
(Continued)

Forecasting the Health Burden of NCDs in Saudi Arabia | 59
TABLE 3A.7, continued
AGE GROUP (YEARS) 2020 2030 2040 2050
50–54 606,771 1,226,417 1,356,255 1,152,625
55–59 426,374 916,062 1,235,320 1,328,554
60–64 286,771 562,436 1,154,745 1,287,152
65–69 239,327 381,549 826,611 1,132,075
70–74 142,030 236,020 474,286 998,856
75–79 99,235 169,917 284,294 640,797
80–84 56,036 79,854 142,934 305,570
85–89 24,394 37,972 72,448 132,912
90–94 8,321 11,999 19,769 40,160
95+ 2,058 2,881 5,230 11,405
Source: Calculations using population data (UN DESA 2019).
TABLE 3A.8 Estimated current and projected male population in Saudi Arabia, by age, 2020–50population (thousands)
AGE GROUP (YEARS) 2020 2030 2040 2050
0–4 1,510,712 1,305,993 1,216,901 1,236,901
5–9 1,510,498 1,417,282 1,233,350 1,233,464
10–14 1,340,839 1,495,259 1,304,136 1,216,204
15–19 1,128,960 1,491,637 1,406,322 1,224,616
20–24 1,228,060 1,448,606 1,561,693 1,325,750
25–29 1,663,792 1,539,815 1,765,995 1,551,184
30–34 2,020,910 1,777,969 1,875,086 1,856,995
35–39 2,209,618 2,015,546 1,814,774 2,012,770
40–44 2,293,870 1,988,073 1,767,998 1,885,700
45–49 1,861,908 1,915,334 1,867,161 1,685,073
50–54 1,284,975 1,891,528 1,755,181 1,604,644
55–59 898,452 1,542,430 1,646,314 1,689,762
60–64 532,166 1,123,975 1,652,164 1,583,502
65–69 315,257 751,925 1,309,012 1,440,904
70–74 151,011 397,191 866,573 1,327,276
75–79 101,580 193,260 491,151 906,049
80–84 50,137 71,436 205,176 485,815
85–89 20,619 32,558 69,474 196,963
90–94 6,603 9,829 15,973 52,202
95+ 1,341 2,334 4,182 10,014
Source: Calculations using population data (UN DESA 2019).

60 | NONCOMMuNICABLe DISeASeS IN SAuDI ARABIA
TABLE 3A.9 DALYs among the population in Saudi Arabia, by age and condition, 2020
AGE (YEARS) STROKE
ISCHEMIC HEART
DISEASETYPE II
DIABETESBREAST CANCER
COLON CANCER LEUKEMIA
0–4 816 0 0 0 0 7,855
5–9 702 0 0 0 0 2,100
10–14 946 0 446 0 0 1,919
15–19 1,897 2,040 1,651 25 148 2,692
20–24 2,955 3,387 4,062 88 308 2,405
25–29 4,773 6,508 8,878 514 773 2,565
30–34 7,834 13,990 14,798 2,362 1,717 2,928
35–39 13,172 27,680 21,768 5,092 2,950 3,410
40–44 23,866 62,029 31,565 7,965 5,109 3,977
45–49 28,723 96,291 36,155 8,428 7,606 4,113
50–54 30,209 107,368 33,029 5,858 7,758 3,461
55–59 33,402 110,233 31,310 4,179 7,623 3,192
60–64 30,587 92,421 24,226 2,538 5,864 2,374
65–69 29,471 79,260 19,074 1,773 4,797 1,887
70–74 22,646 52,320 11,178 911 2,667 1,072
75–79 19,864 40,651 8,340 749 2,317 957
80–84 13,948 25,146 4,505 364 1,398 523
85–89 7,645 13,015 1,938 124 564 193
90–94 2,576 5,027 609 33 132 46
95+ 395 876 114 3 17 4
Total 276,426 738,242 253,646 41,007 51,747 47,671
Source: Calculations using 2017 Global Burden of Disease estimates.Note: DALYs = disability-adjusted life years.
The ambitious scenario for reducing overweight and obesity
TABLE 3A.10 Prevalence of overweight and obesity in Saudi Arabia, by age and gender, ambitious scenarioprevalence (%)
AGE GROUP (YEARS)
WOMEN MEN
OVERWEIGHT OBESITY OVERWEIGHT OBESITY
35–44 22.6 4.1 25.5 2.9
45–54 30.4 5.5 26.0 3.1
55–64 28.4 6.2 21.3 1.9
65–74 23.4 4.5 19.9 2.8
Sources: Reynolds et al. 2012; calculations using estimates of relative risk (IHME 2018a) and the population-attributable fraction calculations.Note: Overweight is defined as body mass index (BMI) of 25.0–29.9 kilograms per square meter. Obesity is defined as BMI of 30 kilograms per square meter or more.

Forecasting the Health Burden of NCDs in Saudi Arabia | 61
TABLE 3A.11 DALYs for women in Saudi Arabia: Baseline scenario of no change in risk factors vs. ambitious scenario, 2020–50 number of DALYs per 100,000
SCENARIO 2020 2030 2040 2050
Baseline 3,550 4,838 6,653 8,629
Ambitious 3,550 4,550 6,284 8,203
Averted n.a. 290 369 425
Sources: Calculations using population data (UN DESA 2019) and DALY rates (GBD 2017 DALYs.Note: DALY = disability-adjusted life year. n.a. = not applicable.
3,000
4,000
5,000
6,000
7,000
8,000
9,000
2020 2030 2040 2050
DA
LYs
per
10
0,0
00
Baseline scenario Ambitious scenario
FIGURE 3A.1
Forecasted DALYs for women in Saudi Arabia: Baseline scenario of no change in risk factors vs. ambitious scenario, 2020–50
Sources: Calculations using population data (UN DESA 2019) and DALY rates (GBD 2017 DALYs.Note: DALY = disability-adjusted life year.
3,000
4,000
5,000
6,000
7,000
8,000
9,000
10,000
11,000
12,000
2020 2030 2040 2050
DA
LYs
per
10
0,0
00
Baseline scenario Ambitious scenario
FIGURE 3A.2
Forecasted DALYs for men in Saudi Arabia: Baseline scenario of no change in risk factors vs. ambitious scenario, 2020–50
Sources: Calculations using population data (UN DESA 2019) and DALY rates (GBD 2017 DALYs.Note: DALY = disability-adjusted life year.

62 | NONCOMMuNICABLe DISeASeS IN SAuDI ARABIA
TABLE 3A.12 DALYs for men in Saudi Arabia: Baseline scenario of no change in risk factors vs. ambitious scenario, 2020–50 number of DALYs per 100,000 population
SCENARIO 2020 2030 2040 2050
Baseline 5,073 7,240 9,794 12,199
Ambitious 5,073 6,648 9,083 11,424
Averted n.a. 592 711 774
Sources: Calculations using population data (UN DESA 2019) and DALY rates (GBD 2017 DALYs.Note: DALY = disability-adjusted life year. n.a. = not applicable.
NOTES
1. DALYs were calculated using 2017 Global Burden of Disease estimates, which use a prevalence- based approach (Mitchell et al. 2014).
2. Global Burden of Disease estimates account for comorbidities in the estimation of DALYs (GBD 2017 DALYs and HALe Collaborators 2018).
REFERENCES
Al Jawaldeh, A. A., and M. Al-Khamaiseh. 2018. “Assessment of Salt Concentration in Bread Commonly Consumed in the eastern Mediterranean Region.” Eastern Mediterranean Health Journal 24 (1): 18–24.
Brinsden, H., F. J. He, K. H. Jenner, and G. A. MacGregor. 2013. “Surveys of the Salt Content in uK Bread: Progress Made and Further Reductions Possible.” BMJ Global Health 3 (6): e0002936. http://dx.doi.org/10.1136/bmjopen-2013-002936.
Crespo, N. C., J. P. elder, G. X. Ayala, D. J. Slymen, N. R. Campbell, J. F. Sallis, T. L. McKenzie, B. Baquero, and e. M. Arredondo. 2012. “Results of a Multi-Level Intervention to Prevent and Control Childhood Obesity among Latino Children: The Aventuras Para Niños Study.” Annals of Behavioral Medicine 43 (1): 84–100.
GBD 2017 DALYs and HALe Collaborators. 2018. “Global, Regional, and National Disability-Adjusted Life-Years (DALYs) for 359 Diseases and Injuries and Healthy Life expectancy (HALe) for 195 Countries and Territories, 1990–2017: A Systematic Analysis for the Global Burden of Disease Study 2017.” The Lancet 392 (10159): 1859–922. https://ww0w.thelancet .com/journals/lancet/article/PIIS0140-6736(18)32335-3/fulltext.
Gu, D., T. Kelly, X. Wu, J. Chen, X. Duan, J. F. Huang, J. C. Chen, P. K. Whelton, and J. He. 2008. “Blood Pressure and the Risk of Cardiovascular Disease in Chinese Men and Women.” American Journal of Hypertension 21 (3): 265–72.
Guillot, M. 2011. “Period Versus Cohort Life expectancy.” International Handbook of Adult Mortality, edited by R. G. Rogers and e. M. Crimmins, 533–50. Dordrecht: Springer.
He, F. J., H. C. Brinsden, and G. A. MacGregor. 2014. “Salt Reduction in the united Kingdom: A Successful experiment in Public Health.” Journal of Human Hypertension 28 (6): 345–54.
He, F. J., N. D. Markandu, and G. A. MacGregor. 2005. “Modest Salt Reduction Lowers Blood Pressure in Isolated Systolic Blood Pressure and Combined Hypertension.” Hypertension 46 (1): 66–70.
IHMe (Institute for Health Metrics and evaluation). 2018a. “Burden by Risk 1990–2017.” In Global Burden of Disease Study 2017. Seattle, WA: IHMe.
IHMe (Institute for Health Metrics and evaluation). 2018b. “Results.” In Global Burden of Disease Study 2017. Seattle, WA: IHMe. http://ghdx.healthdata.org/gbd-results-tool.
Kostova, D., L. Andes, T. erguder, A. Yurekli, B. Keskinkiliç, S. Poltat, G. Culha, et al. 2014. “Cigarette Prices and Smoking Prevalence after a Tobacco Tax Increase: Turkey, 2008 and 2012.” Morbidity and Mortality Weekly Report 63 (21): 457–61.
Forecasting the Health Burden of NCDs in Saudi Arabia | 63
Marseille, e., B. Larson, D. S. Kazi, J. G. Kahn, and S. Rosen. 2014. “Thresholds for The Cost–effectiveness of Interventions: Alternative Approaches.” Bulletin of the World Health Organization 93: 118–24.
Millar, L., P. Kremer, A. de Silva-Sanigorski, M. P. McCabe, H. Mavoa, M. Moodie, J. utter, et al. 2011. “Reduction in Overweight and Obesity from a 3-Year Community-Based Intervention in Australia: The “It’s Your Move!” Project.” Obesity Reviews 12 (s2): 20–28. https://doi .org/10.1111/j.1467-789X.2011.00904.x.
Mitchell, B. L., N. R. Lewis, A. e. Smith, A. V. Rowlands, G. Parfitt, and J. Dollman. 2014. “Rural environments and Community Health (ReACH): A Randomized Controlled Trial Protocol for an Online Walking Intervention in Rural Adults.” BMJ Public Health 14 (969). https://doi .org/10.1186/1471-2458-14-969.
MOH (Ministry of Health). 2020. Kingdom of Saudi Arabia World Health Survey 2019 Report. Riyadh: Ministry of Health.
Moradi-Lakeh, M., C. el Bcheraoui, M. Tuffaha, F. Daoud, M. Al Saeedi, M. Basulaiman, Z. A. Memish, et al. 2015. “Tobacco Consumption in the Kingdom of Saudi Arabia, 2013: Findings from a National Survey.” BMC Public Health 15 (611). https://doi.org/10.1186 /s12889 -015-1902-3.
Patja, K., P. Jousilahti, G. Hu, T. Valle, Q. Qiao, and J. Tuomilehto. 2005. “effects of Smoking, Obesity, and Physical Activity on the Risk of Type 2 Diabetes in Middle-Aged Finnish Men and Women.” Journal of Internal Medicine 258 (4): 356-62. doi: 10.1111/j.1365-2796 .2005.01545.x.
Raine, K. D., R. Plotnikoff, D. Schopflocher, e. Lytvyak, C. I. J. Nykiforuk, K. Storey, A. Ohinmaa, et al. 2013. “Healthy Alberta Communities: Impact of a Three-Year Community-Based Obesity and Chronic Disease Prevention Intervention.” Preventive Medicine 57 (6): 955–62.
Reynolds, K., D. Gu, P. K. Whelton, X. Wu, X. Duan, J. Mo, and J. He. 2012. “Prevalence and Risk Factors of Overweight and Obesity in China.” Obesity 15 (1): 10–18.
Saeedi, M. Y., A. J. AlMadani, Y. H. Alsafi, S. H. Arif, S. M. Mustafa, A. I. Jamo, F. G. Alrewally, and A. B. AlBaraka. 2017. “estimation of Sodium and Potasium Intake in 24-Hours urine, Aljouf Region, Northern Saudi Arabia.” Chronic Diseases—International 4 (1): 1026.
uN (united Nations) DeSA (Department of economic and Social Affairs). 2019. “Annual Population by Age Groups.” In World Population Prospects 2019. New York: uN Population Division, DeSA. https://population.un.org/wpp/Download/Standard/Population/.
WHO (World Health Organization). 2020. Health Statistics and Information Systems. Geneva: WHO. https://www.who.int/healthinfo/global_burden_disease/metrics_daly/en/.


65
KEY MESSAGES
• Noncommunicable diseases (NCDs) impose a tremendous economic burden that consists of both direct costs to the health care sector and indirect costs to human capital.
• This chapter considers three approaches to quantifying the economic burden of NCDs in Saudi Arabia: (1) cost of illness (COI) method, (2) value of a statis-tical life (VSL) method, and (3) economic growth modeling.
• Using the COI method, and focusing on seven main NCDs, the direct costs of NCDs are equal to 11 percent of total annual health expenditures. When con-sidering all aspects of productivity losses, these costs may reduce gross domestic product (GDP) by nearly 7 percent.
• Policy makers should especially consider scaling up efforts to address diabetes (including dietary interventions), given the large economic burden of diabetes relative to other NCDs.
• Moreover, addressing diabetes would also benefit other NCDs, given that the underlying risk factors are the same.
BACKGROUND
NCDs pose a tremendous economic burden that can be felt far beyond the health sector. Quantifying this burden from multiple sectors and perspectives will help to galvanize support for NCD interventions and to determine appropriate levels of investment to reduce rising rates of NCDs. Governments, communities, and private industries are all affected by the high costs of premature death and dis-ability as well as the costs of treatment and care for persons living with NCDs, and they all have a vested interest in understanding this burden. The burden is so great because of the large numbers of people affected, especially men and
Calculating the Economic Burden of NCDs in Saudi Arabia AN APPLICATION OF THREE COMMON APPROACHES
ERIC FINKELSTEIN, DRISHTI BAID, SAMI ALMUDARRA, ADA ALQUNAIBET, WILLIAM MSEMBURI, DAVID WATKINS, DI DONG, ABDULLAH ALFRAIH, AND CHRISTOPHER H. HERBST
4

66 | NONCOMMUNICAbLe DISeASeS IN SAUDI ArAbIA
women of working age who are not able to secure productive employment. According to the World economic Forum’s annual risk report (WeF 2020), global business leaders and decision-makers consider NCDs to be a severe risk, on par with underinvestment in infrastructure, fiscal crises, and unemployment.
The economic burden of NCDs is composed of both direct and indirect costs. Direct costs include the medical costs for diagnosis and treatment and ancillary costs such as transportation and home help. Indirect costs often focus on human capital. These costs may include the value of productivity lost because of absen-teeism (work days missed because of illness or injury), presenteeism (reduced productivity while working), reduced labor force participation of the individual or caregivers, and premature mortality. Other, less tangible, costs include the monetary value of pain and suffering and the opportunity costs resulting from lower economic output. These costs are summarized in table 4.1.
The costs of NCDs are often quantified using a prevalence-based approach. This approach uses metrics such as the per capita or total cost incurred from all NCDs in the population, regardless of the stage of disease. The prevalence-based approach should be interpreted as presenting how much less economic burden would be incurred if the condition(s) never existed. Although this approach is often interpreted as determining how much money can be saved by reducing the burden of disease, it assumes that all costs are fully reversible, which is not nec-essarily the case for NCDs. For example, a former smoker is unlikely to have the same disease profile, and therefore the same cost profile, of a never smoker. regardless, the prevalence-based approach is useful for understanding how resources are allocated and for drawing attention to the economic burden imposed by a condition or risk factor. It is less relevant for economic evaluations of interventions aimed at reducing the NCD burden. For these, an incidence-based approach is appropriate.
The incidence-based approach quantifies the economic burden of new (or incident) cases. This approach typically takes a longitudinal perspective and can be used to quantify, for example, the lifetime costs of new cases of diabetes in 2020 or the value of current and future lost output resulting from new NCD
TABLE 4.1 Direct and indirect costs of NCDs
DIRECT COSTS INDIRECT COSTS INTANGIBLE COSTS OPPORTUNITY COSTS
• Medical
• Medications
• Lab tests
• Radiology
• Inpatient hospitalization
• Durable medical equipment
• Physician fees
• Personnel fees
• Medical supplies
• Nonmedical
• Transportation
• Food
• Home help
• Lost wages
• Lost income due to premature death
• Loss of livelihood
• Loss of life
• Loss of productivity
• Pain
• Suffering
• Grief
• Inconvenience
• Lost opportunity
• Revenue forgone
Source: World Bank.Notes: NCDs = noncommunicable diseases.

Calculating the Economic Burden of NCDs in Saudi Arabia | 67
cases or deaths in a given year. This approach is more appropriate for economic evaluations of NCD interventions because the costs are often immediate or ongoing, but the benefits of the interventions accrue well into the future. For this reason, the lifetime perspective is recommended for evaluating the cost- effectiveness of NCD interventions. economic growth models tend to take this perspective.
broadly, three methods are used here to quantify the economic burden of diseases: the cost-of-illness method, value of a statistical life method ( incidence-based costs only), and dynamic economic growth modeling. This chapter discusses how to calculate the economic burden of NCDs using each of these methods, summarizes existing evidence, and generates new evidence where possible. A final section concludes with a brief summary.
ECONOMIC BURDEN USING THE COST-OF-ILLNESS METHOD
One common method for estimating both prevalence- and incidence-based costs is the static cost-of-illness method. This methodology can take one of several forms. For medical costs, a bottom-up approach for quantifying the burden of NCDs entails identifying the NCDs of interest, estimating the unit costs for treat-ing each condition from claims data or other sources, multiplying prevalence (or incidence) times unit costs times population estimates, and, finally, summing across diseases to generate total costs.
Using this method, the economic burden of seven major NCDs is analyzed for Saudia Arabia. The seven NCDs considered are coronary heart disease, stroke, diabetes mellitus, breast cancer, colon cancer, chronic obstructive pulmonary disease (COPD), and asthma. These seven NCDs are the most costly and preva-lent NCDs in Saudia Arabia (UN Interagency Task Force on NCDs 2017) and thus also where data are most readily available. As shown in table 4.2, assuming a population size of 34,268,528 in 2019 (World Population review 2020) and based on the unit cost estimates extrapolated from publicly available sources, a prevalence-based approach reveals the following:
• The annual direct medical cost for seven NCDs in Saudia Arabia totals Int$9.7 billion (2019 international dollars) (WHO n.d.).
• This cost represents 11 percent of annual health expenditures in Saudi Arabia or 0.6 percent of GDP (World bank 2018).
These results are somewhat lower than previous estimates for Saudi Arabia and globally. A 2011 World Health Organization (WHO) study compares costs across multiple Western countries for cardiovascular diseases, cancers, endocrine and metabolic diseases, and respiratory diseases and reports estimated costs for these diseases ranging from 19 percent of total annual health expenditures for Canada to 44 percent for estonia (Garg and evans 2011). A 2015 study using National Health Accounts data for Saudi Arabia estimates that these four dis-eases account for 21 percent of total health expenditures or roughly 1 percent of GDP (UN Interagency Task Force on NCDs 2017).
There is large uncertainty in both the unit cost data and the prevalence data used in this analysis. Prevalence data are from the Institute for Health Metrics and evaluation’s Global burden of Disease database (IHMe 2017). Cost data for coronary heart disease, stroke, diabetes mellitus, breast cancer, and colon cancer are from Ding et al. (2016). Cost data for COPD are from the United States (Dalal et al. 2010), Germany (Wacker et al. 2016), and Greece (Souliotis et al. 2017).

68 |
NO
NC
OM
MU
NIC
Ab
Le
DISe
ASe
S IN SA
UD
I Ar
Ab
IA
TABLE 4.2 Direct costs of select NCDs in Saudi Arabia, by condition
COST CATEGORYCORONARY
HEART DISEASE STROKEDIABETES MELLITUS
BREAST CANCER COLON CANCER COPD ASTHMA TOTAL
Estimated annual health care cost per case (2019 Int$)a,b
958 2,331 1,936 891 2,655 5,854 376
Prevalence rate in 2019 (%)c 2.43 1.40 7.23 0.14 0.05 1.26 2.48
Total annual cases (population × prevalence rate)d
832,725 479,759 2,477,615 47,976 17,134 431,783 849,859
Total annual cost by disease (total cases × cost per case; 2019 Int$)
797,720,686 1,118,451,375 4,795,817,529 42,740,651 45,489,279 2,527,502,138 319,483,424
Total annual cost (all diseases; 2019 Int$)b
9,647,205,082
Current health expenditure as % of GDP in 2017e
5.2
GDP in 2019 (2019 Int$, billions)f 1,676
Current health expenditure (2019 Int$, millions)
87,152
NCD burden as a % of current health expenditure
11
NCD burden as a % of 2018 GDP 0.6
Source: Original compilation for this publicationNote: COPD = chronic obstructive pulmonary disease. GDP = gross domestic product. NCDs = noncommunicable diseases. WHO = World Health Organization. Int$ = international dollars.a. Prevalence data are from the Institute for Health Metrics and Evaluation’s Global Burden of Disease database (IHME 2020). Cost data for coronary heart disease, stroke, diabetes mellitus, breast cancer, and colon cancer are from Ding et al. 2016. Cost data for COPD are from the United States (Dalal et al. 2010), Germany (Wacker et al. 2016), and Greece (Souliotis et al. 2017). Cost data for asthma are from Abu Dhabi in the United Arab Emirates (Alzaabi, Alseiari, and Mahboub 2014).b. Monetary figures in local curreny are updated to 2019 figures using country-specific annual inflation rates from the World Bank database and then converted to 2019 Int$ by dividing the estimate by the puchasing power parity exchange rate reported in the World Bank DataBank, https://data.worldbank.org/indicator/PA.NUS.PPP?locations=SA.c. Prevalence data are from the Institute for Health Metrics and Evaluation’s Global Disease Burden database (IHME 2020).d. Total annual cases are calculated using population estimates from World Population Review (2020).e. Current health expenditure estimates are from WHO, Global Health Observatory data repository, https://apps.who.int/gho/data/node.main.GHEDCHEGDPSHA2011?lang=en. f. GDP (current purchasing power parity international dollars) estimates are from World Bank DataBank, https://data.worldbank.org/indicator/NY.GDP.MKTP.PP.CD?end=2019&locations=SA&start=2011.

Calculating the Economic Burden of NCDs in Saudi Arabia | 69
Cost data for asthma are from Abu Dhabi in the United Arab emirates (Alzaabi, Alseiari, and Mahboub 2014). Changes in these parameters—particularly assumptions about diabetes mellitus—have large effects on the results. For example, if the figures for diabetes prevalence are replaced with estimates of higher prevalence from the International Diabetes Foundation (IDF 2019), the estimated annual direct medical cost for the seven NCDs increases to Int$13.1 billion (2019 international dollars), or 0.8 percent of GDP, bringing the results of this analysis closer to those of previous estimates. If the per unit cost of diabetes is replaced by the higher estimate of Mokdad et al. (2015), the total cost of the seven NCDs increases to Int$27.2 billion (2019 international dollars) or 1.6 per-cent of GDP. Conversely, if the per unit cost of diabetes is replaced by the lower estimate of Almutairi and Alkharfy (2013), the total cost of these seven NCDs declines to Int$8.8 billion or 0.5 percent of GDP.
regardless of which method is used, NCDs clearly impose a substantial eco-nomic burden on Saudi Arabia. Given that the median age in Saudi Arabia is only 27.5 years (World Population review 2020) and persons at highest risk of most NCDs are middle-age and elderly adults, spending on NCDs is likely to increase in the future.
An alternative cost-of-illness strategy for estimating annual burden is to use an econometric, or regression-based, approach. This approach uses individu-al-level data on both the outcome of interest and the presence or absence of NCDs to estimate the differential between persons with and persons without specific NCDs, while controlling for other factors that may influence outcomes, such as age or health insurance. This approach provides an estimate of the incre-mental cost of a disease incurred by a person who has it relative to a person who does not have it, after controlling for other factors that may influence costs. Compared with the epidemiological approach described above, the regression-based approach relies on fewer assumptions but requires more gran-ular data. This approach can apply to multiple categories of direct and indirect burden, from different types of medical expenditures to various aspects of human capital losses, such as absenteeism or presenteeism.
Large data sets would be needed to carry out a regression-based approach in Saudi Arabia. Although the econometric approach has been used to quantify the economic burden of specific NCDs in many countries, published estimates gen-erated from this approach using data from Saudi Arabia could not be found. It would be possible to do so using the 2019 Kingdom of Saudi Arabia World Health Survey (2019 KSA WHS), but these data sets were not accessible at the time of the writing of this report (MOH 2020).
The 2019 KSA WHS contains individual-level data on the prevalence of common chronic conditions as well as the amount and costs of inpatient and outpatient medical visits and prescription drugs. Therefore, using these data and the regression-based approach at the individual level, it is possible to quantify the per capita incremental inpatient, outpatient, and prescription drug use and the incremental out-of-pocket costs for persons with selected NCDs. As most Saudis do not pay for their medical treatment, it is possible to combine use data with costing data from the Ministry of Health or other sources to generate total inpatient and outpatient costs.
As an example of what is possible, using the older 2013 Saudi Health Interview Survey (IHMe n.d.), the regression-based approach is applied to esti-mate the increase in absenteeism (that is, work days missed because of illness or injury) resulting from the following NCDs: cardiovascular diseases (including

70 | NoNcommuNicable Diseases iN sauDi arabia
stroke, myocardial infarction, atrial fibrillation, cardiac arrest, and congestive heart failure), coPD or asthma, diabetes, renal failure, and cancer (all types).
The 2013 saudi Health interview survey (saudi nationals only) includes questions on the prevalence and history of common chronic conditions as well as questions regarding days missed from work because of illness or injury over the past 12 months. These questions are used to quantify absenteeism. The ques-tion that comes closest to presenteeism is a single question that asks, “During the past 30 days, how difficult was it to perform your work or home activities?” using responses to these questions as the dependent variables in an individual-level regression analysis, it is possible to quantify (1) the increase in days missed from work and (2) the incremental difficulty of performing work or home activities for persons with NcDs relative to those without.
as an example, a linear regression model (ordinary least squares or ols) is used to estimate the incremental days missed at work per year by respondents who have a certain disease relative to respondents who do not have that disease, controlling for demographics. This analysis relies on self-reported history of dis-ease and self-reported estimates of days missed at work due to illness or injury in the past 12 months. The findings are presented in table 4.3. using these data and the regression-based approach yields the following findings:
• The average individual with no chronic conditions reported missing 1.94 days per year due to illness or injury.
• The presence of a chronic condition increased reported annual absenteeism by 2.7 days on average (between 0.4 and 29.6 days), with the greatest increase due to cancer.
TABLE 4.3 Disease prevalence in the employed working-age population in Saudi Arabia
DISEASE
PREVALENCE (N = 4,030)
INCREMENTAL DAYS MISSED, ADJUSTED (OLS ESTIMATES)b (N = 3,268)D
INDIRECT COST ASSOCIATED WITH DISEASE CATEGORY (2018 INT$) (N = 3,268)D
N % COEFFICIENT 95% CIANNUAL COST PER
CASE (INT$)ANNUAL TOTAL COST
(INT$)f
Cardiovascular diseasesa,b 46 1.1 8.4*** 4.8 11.9 1,790 6,285,671,670
COPD or asthmab 155 3.9 0.4 −1.45 2.3 89 1,057,714,390
Diabetesb,c 339 8.4 2.3*** 0.9 3.7 486 12,587,447,030
Renal failureb 13 0.3 6.3 −0.32* 13.0 1,358 1,339,148,780
Cancer (all kinds) b 9 0.2 29.6*** 21.7 37.6 6,340 4,297,055,900
Any of the above 519 12.9 2.7*** 1.5 3.8 568 22,558,328,600
None of the above 3,509 87.07 Reference categorye Reference categorye
Sources: 2013 Saudi Health Interview Survey (IHME n.d.). Wage data reported by the General Authority of Statistics (GASTAT 2019); country-specific inflation rates and purchasing power parity exchange rates reported by the World Bank, https://data.worldbank.org/indicator/PA.NUS.PPP?locations=SA.Note: COPD = chronic obstructive pulmonary disease. Int$ = international dollars. OLS = ordinary least squares.a. Cardiovascular diseases include stroke, cardiac arrest, atrial fibrilation, myocardial infarction, and congestive heart failure.b. Adjusted models include the covariates age, gender, education level, and marital status. c. Cases of gestational diabetes are excluded.d. The analytic sample is N = 3,268 because of missing responses for the question regarding number of days missed due to illness or injury at work in the past 12 months.e. The reference category is the group of people who do not have the disease specified in each category.f. The average wage of full-time workers is estimated to be Int$214 per day for Saudi nationals (2018 international dollars). *p<.10; ***p<.01.

Calculating the Economic Burden of NCDs in Saudi Arabia | 71
Although these estimates are based on fairly small sample sizes, they are con-sistent with data from the United States, which reveal that men with chronic disease work 6.1 percent fewer hours and women work 3.9 percent fewer hours than healthy workers (Stuckler et al. 2006). Monetizing absenteeism estimates based on the average wage of full-time workers (estimated to be Int$214 per day for Saudi nationals in 2018 international dollars) (GASTAT 2019) with one or more NCDs listed above reveals the following:
• The total annual costs due to absenteeism in Saudi Arabia are Int$22.5 billion (2018 international dollars), which represent 1.21 percent of GDP in 2018.
• This estimate does not take into account presenteeism, inability to have bet-ter paid jobs, early retirement, or productivity losses due to time spent caring for someone with NCDs.
Only one study is available for Saudi Arabia that uses a bottom-up approach and assumptions regarding productivity loss from select NCDs, rate of population aging, incidence rate for each disease, and labor market projections (rasmussen, Sweeny, and Sheehan 2015). It estimates that NCDs reduced GDP by at least 6.7 percent in Saudi Arabia in 2015 and predicts that NCDs will reduce GDP by 9.7 percent in 2030. Predictions for 2030 for other countries are similar: Singapore (6.7 percent), Japan (8.5 percent), and the United States (8.5 percent) (rasmussen, Sweeny, and Sheehan 2015).
ECONOMIC BURDEN USING THE VALUE OF A STATISTICAL LIFE METHOD
Cost-of-illness studies such as those described above tend to use market rates for health services and wages to quantify the burden. An alternative paradigm is the value of a statistical life, defined as the marginal rate of substitution between income (or wealth) and mortality risk. Using the VSL method, the value of pre-mature death is inferred from real or hypothetical trade-offs that people will-ingly make (how much individuals are willing to pay to reduce the risk of death). These trade-offs typically entail taking on greater health risks in exchange for something of value, such as working in a smoke-filled bar or on an Alaskan fish-ing vessel, both risky occupations, in exchange for a higher salary. This higher salary can be interpreted as a risk premium and can be used to estimate the value of a statistical life.
The main advantage of this approach is that it is most consistent with eco-nomic theory (that is, with utility maximization). The cost-of-illness approach accurately quantifies the burden of disease from an accounting perspective, but it does not take into account the changes in utility (value) that individuals may accrue from, say, not having to diet and exercise or the intrinsic value that people place on being alive. An additional advantage is that, unlike the cost-of-illness approach, the VSL approach can be used to generate unique estimates that each individual or set of individuals places on a particular risky scenario. These esti-mates, if aggregated across individuals, can be interpreted as the total statistical value of the loss due to a condition (for example, diabetes) and may include all direct, indirect, and intangible costs not easily measured, such as pain and suf-fering and premature mortality.
This approach proceeds as follows (US ePA n.d.). Suppose that 100,000 peo-ple are asked how much they would be willing to pay to reduce their individual

72 | NONCOMMUNICAbLe DISeASeS IN SAUDI ArAbIA
risk of dying by 1 in 100,000, or 0.001 percent, over the next year. Since this reduction means that there would be one fewer death expected among the sample over the next year, this is sometimes described as “one statistical life saved.” Now suppose that the average response to this hypothetical question is US$100. Then the total dollar amount that the group would be willing to pay to save one statistical life in a year would be US$100 per person × 100,000 people, or US$10 million. This is an estimate of the value of a statistical life.
Although this approach is intuitively appealing and has been used in policy analyses in a range of fields, from environment to transportion to health, it has several limitations. Primary weaknesses include problems with stated prefer-ence questions, such as the one posed above, where responses suffer from peo-ple’s inability to differentiate between small changes in risks for rare events as well as from framing issues, hypothetical bias, and oversimplification. revealed preference results often suffer from possible selection bias and the variation in risk perceptions across individuals. For these reasons, results of the VSL vary greatly across studies, with estimates ranging between US$45,000 and US$18.3 million (Viscusi and Masterman 2017).
Studies in other countries apply data from the United States and provide a VSL estimate for Saudi Arabia of US$4.05 million (2015 US dollars) (Viscusi and Masterman 2017). The 2017 Global burden of Diseases study reports 31,682 pre-mature deaths due to NCDs among persons 15–64 years of age in Saudi Arabia (IHMe 2018). Multiplying these two figures values the loss of statistical lives due to premature deaths from NCDs in 2017 at US$128 billion (2015 US dollars). For comparison, a similar calculation for Morocco, which has a slightly larger population, suggests a loss equivalent to only US$30 billion (2015 US dollars).
To produce something more specific to Saudi Arabia, the value of premature mortality due to NCDs in Saudi Arabia is quantified using the VSL method. Using the VSL approach, following the method of Jamison et al. (2013), and defining a standardized mortality unit as a 10−4 increase in the risk of death, the value of this mortality unit is estimated at 1.8 percent of GDP per capita. The VSL estimates are compared with a different method commonly used in the NCD community, wherein healthy life years gained are valued at GDP per capita. The latter approach is referred to as the human capital approach. To implement these two approaches, “avertable” (rather than total) NCD deaths and mortality rates are used, and in the case of the human capital approach, avertable mortality rates are converted into avertable NCD-attributable disability-adjusted life years (DALYs) using predefined empirical relationships. Avertable DALYs are then monetized using GDP estimates. results are presented in table 4.4. The methodology is described briefly in annex 4A.
because these methods use different approaches to dealing with the age dis-tribution of avertable deaths and the age distribution of deaths differs for men and for women, the gender differential in the value of avertable mortality also differs between the two methods. The following summarizes the main findings:
• The value of avertable NCD mortality in Saudi Arabia ranges from US$66 billion to US$96 billion using the cause-level analysis focusing on 34,000 avertable NCD deaths.
• The value of avertable NCD mortality in Saudi Arabia ranges between US$30 billion and US$49 billion using the risk-factor-level analysis focusing on the 28,000 avertable risk-attributable deaths.
• As a share of GDP in Saudi Arabia, these values represent 8.3–12.0 percent and 3.8–6.2 percent of GDP, respectively.

Calculating the Economic Burden of NCDs in Saudi Arabia | 73
ECONOMIC BURDEN USING THE ECONOMIC GROWTH APPROACH METHOD
A third, and complementary, approach to valuing the economic burden of NCDs is to look at their effects on economic growth. This dynamic approach extends the static cost-of-illness and VSL methodologies by also considering how NCDs deplete the labor supply—not just through absenteeism, presenteeism, and pre-mature mortality, but also through lower labor force participation. Dynamic models consider how current and future NCDs affect all of these factors over time and thus how they affect the available mix of labor and capital in the econ-omy and, ultimately, economic output. Two such dynamic models are the ePIC model of the WHO (Abegunde and Stanciole 2006) and the OneHealth tool of the United Nations Children’s Fund (UNICeF) and the United Nations Development Programme (UNDP) (WHO Global Health Observatory database).
The WHO’s ePIC model has been used to simulate the macroeconomic consequences of NCDs by linking these diseases and subsequent morbidity and mortality to economic output (Abegunde and Staniciole 2006). This simu-lation is done by modeling changes in labor and capital requirements as a func-tion of changes in the incidence of NCDs (bloom et al. 2011). In total, ePIC estimates that global economic output lost as a result of five cancers, cardiovas-cular disease, chronic respiratory diseases, diabetes, and mental health over the period 2011–30 is nearly US$47 trillion (bloom et al. 2011). For high- income countries only, this estimate is US$25.5 trillion (bloom et al. 2011). This model also has been used to estimate the impact of five NCDs (cardiovascular disease, cancers, chronic respiratory disease, diabetes, and mental health) in China and India over the period 2012–30. bloom et al. (2013) report losses of US$27.8 trillion for China and US$6.2 trillion for India (in 2010 US dollars) over this time period as a result of NCDs. These losses would account for an average loss of US$1.46 trillion per year and US$0.32 trillion in China and India, which is approximately 14 percent and 11 percent, respectively, of each country’s GDP in 2018. In another paper using the model, bloom, Chen, and McGovern (2018) estimate the economic burden associated with NCDs in Costa rica, Jamaica, and Peru. Their findings indicate total losses associated with all NCDs and mental health conditions over the period 2015–30 of US$81.96 billion
TABLE 4.4 Economic impact of NCDs and their risk factors in Saudi Arabia, 2017
Valuation (2018 US dollars, billions)
APPROACH WOMEN MEN BOTH GENDERS
Cause-level analysis
VSL method 39 57 96
Human capital approach 31 35 66
Risk factor-level analysis
VSL method 21 28 49
Human capital approach 15 15 30
Sources: Estimates of cause-specific mortality and DALYs are from the 2017 Global Burden of Disease database (IHME 2017), http://ghdx .healthdata.org/gbd-2017. Estimates of GDP per capita for Saudi Arabia are from the World Bank data repository, https://data.worldbank .org/. Note: DALYs = disability-adjusted life years. NCDs = noncommunicable diseases. VSL = value of a statistical life.

74 | NONCOMMUNICAbLe DISeASeS IN SAUDI ArAbIA
(2015 US dollars) for Costa rica, US$18.45 billion for Jamaica, and US$477.33 billion for Peru. These two published studies are the only ones found using this model, which suggests that it may have a limited reach, perhaps because of the difficulty of accessing the model and underlying documentation.
A more popular economic growth model is the UNICeF/UNDP OneHealth tool (WHO n.d.). This tool can be used to quantify the burden of disease resulting from the status quo, but it is most appropriate for evaluating interventions. The tool is intended primarily to inform strategic planning purposes, as it aims to answer the following questions: (1) What health system resources would be needed to implement strategic health plans, which may include a combination of policy initiatives, prevention, screening, and treatment programs? (2) How much would the strategic plan cost, by year, by input, and by health system level? (3) What is the estimated health impact of a group of NCD interventions (including pubic health, policy, and medical intervention)? (4) How do costs compare with estimated available financing?
This model provides health care planners with a non-disease-specific frame-work for costing, impact analysis, budgeting, and financing for major diseases and health system components. Such a model can ultimately be used to estimate the direct and indirect costs of NCDs and to derive return on health system investments.
This tool is used to analyze the return on investment of select NCD interven-tions in Saudi Arabia (UN Interagency Task Force on NCDs 2017). In addition to presenting return-on-investment estimates, use of the OneHealth tool, com-bined with locally available data, shows that the indirect costs of diabetes and cardiovascular dieases alone cost the Saudi economy US$13.0 billion annually or 2 percent of GDP. Presenteeism is responsible for 1.2 percent of the total, replace-ment costs account for 0.6 percent, and absenteeism accounts for 0.2 percent.
SUMMARY AND CONCLUSIONS
This chapter presents three methods of quantifying the economic burden of NCDs: the cost-of-illness method, the VSL method, and the application of eco-nomic growth models such as WHO’s ePIC and UNICeF/UNDP’s OneHealth. each takes a different perspective, includes different components of cost, focuses on different time frames, and uses different data and assumptions. Therefore, results are not directly comparable nor are they completely independent. However, each approach can provide a different picture of the economic burden that NCDs impose.
This chapter shows that the direct costs of NCDs equal 11 percent of total annual health expenditures, and—when considering all aspects of productivity losses—may reduce GDP by nearly 7 percent. The disease-specific estimates sug-gest that the direct and indirect costs of diabetes are much greater than the bur-den of other NCDs considered in this chapter, accounting for slightly more than half of both the annual direct and indirect burden. These costs are estimated with great uncertainty due to incomplete data and many assumptions. better estimates can be made available through greater access to the most recent 2019 World Health Survey and other local data sources, such as databases with infor-mation on health care use and claims. The VSL approach would benefit from Saudi Arabia–specific estimates of the value of a statistical life and from up-to-date estimates of premature mortality resulting from NCDs.

Calculating the Economic Burden of NCDs in Saudi Arabia | 75
Although having better data would improve these estimates, it would not change the primary conclusion that NCDs, without interventions, will continue to take a significant health and economic toll on the people of Saudi Arabia and the broader economy. Policy makers should especially consider scaling up efforts to address diabetes, given its high burden relative to other NCDs. Interventions to reduce the overall economic burden are sorely needed because rising health care costs are imposing a heavy burden on government and private sector budgets, economic growth, productivity, and the welfare of citizens. Saudi Arabian–specific economic growth and other models that allow for quantifying the health and economic benefits of these interventions will help to make the business case for implementing the most promising interventions.
ANNEX 4A: METHODOLOGY FOR ESTIMATING THE ECONOMIC IMPACT OF NCDs
The VSL approach looks at the welfare losses resulting from avertable deaths, with welfare defined in willingness-to-pay terms. Jamison et al. (2013) summa-rize the VSL literature within a global context and provide a flexible method for applying the VSL while accounting for differences in the age at death. They define a standardized mortality unit as a 10−4 increase in the risk of death—the level of mortality risk typically analyzed in revealed preference studies—and estimate the value of this mortality unit at about 1.8 percent of GDP per capita in the United States. Assuming an income elasticity of 1, this valuation can be applied to Saudi Arabia by looking at the age and gender pattern of avertable mortality.
The human capital approach looks at the direct impact that avertable deaths have on economic output. This method relies on an estimation of avertable deaths as well as disability, valuing an avertable healthy life year lost with reference to a country’s GDP per capita. This analysis estimates avertable DALYs by converting avertable deaths into avertable DALYs using empirical relationships (which vary by age and gender) between the two outcomes for NCDs on the whole.
These two approaches are applied to epidemiological data from Saudi Arabia to estimate the economic impact of “avertable” NCDs and risk-attributable NCDs. As explained further in chapter 5, annex 5B, a counterfactual approach is also used to estimate avertable mortality in 2017 using the Global Burden of Disease data for Saudi Arabia and comparing death rates by age, gender, and cause to rates in other countries.
REFERENCES
Abegunde, D., and A. Stanciole. 2006. “An Estimation of the Economic Impact of Chronic Noncommunicable Diseases in Selected Countries.” Working Paper, Department of Chronic Diseases and Health Promotion, World Health Organization, Geneva. https://www.who.int /chp/working_paper_growth%20model29may.pdf.
Almutairi, N., and K. M. Alkharfy. 2013. “Direct Medical Cost and Glycemic Control in Type 2 Diabetic Saudi Patients.” Applied Health Economics and Health Policy 11 (6): 671–75. doi: 10.1007/s40258-013-0065-6.
Alzaabi, A., M. Alseiari, and B. Mahboub. 2014. “Economic Burden of Asthma in Abu Dhabi: A Retrospective Study.” ClinicoEconomics and Outcomes Research 6 (October): 445–50. doi: 10.2147/CEOR.S68920.

76 | NONCOMMUNICAbLe DISeASeS IN SAUDI ArAbIA
bloom, D. e., e. T. Cafiero, e. Jané-Llopis, S. Abrahams-Gessel, L. r. bloom, S. Fathima, A. b. Feigl, et al. 2011. The Global Economic Burden of Noncommunicable Diseases. Geneva: World economic Forum.
bloom, D. e., e. T. Cafiero, M. e. McGovern, K. Prettner, A. Stanicole, J. Weiss, S. bakkila, and L. rosenberg. 2013. The Economic Impact of Non-communicable Disease in China and India: Estimates, Projections, and Comparisons. IZA Discussion Paper 7563. bonn: IZA.
bloom, D. e., S. Chen, and M. e. McGovern. 2018. “The economic burden of Noncommunicable Diseases and Mental Health Conditions: results for Costa rica, Jamaica, and Peru.” Pan American Journal of Public Health 42: e18. doi: 10.26633/rPSP.2018.18.
Dalal, A. A., L. Christensen, F. Liu, and A. A. riedel. 2010. “Direct Costs of Chronic Obstructive Pulmonary Disease among Managed Care Patients.” International Journal of Chronic Obstructructuve Pulmonary Disease 5 (October 5): 341–49. doi: 10.2147/COPD.S13771.
Ding, D., K. D. Lawson, T. L. Kolbe-Alexander, e. A. Finkelstein, P. T. Katzmarzyk, W. van Mechelen, and M. Pratt for the Lancet Physical Activity Series 2 executive Committee. 2016. “The economic burden of Physical Inactivity: A Global Analysis of Major Non-Communicable Diseases.” The Lancet 288 (10051): 1311–24. http://dx.doi.org/10.1016 /S0140-6736(16)30383-X.
Garg, C. C., and D. b. evans. 2011. What Is the Impact of Non-Communicable Diseases on National Health Expenditures: A Synthesis of Available Data. Discussion Paper 3. Geneva: WHO.
GASTAT (General Authority of Statistics). 2019. Labour Market Bulletin Q1 2019. riyadh: GASTAT. www.stats.gov.sa/sites/default/files/labour_market_q1_2019_en.pdf.
IDF (International Diabetes Federation). 2019. IDF Diabetes Atlas. 9th ed. brussels: International Diabetes Federation. https://www.diabetesatlas.org/data/en.
IHMe (Institute for Health Metrics and evaluation). 2017. Global burden of Disease 2017 (data-base). Seattle, WA: University of Washington. https://gbd2017.healthdata.org/gbd-search/.
IHMe (Institute for Health Metrics and evaluation). 2018. Global Burden of Disease Study 2017. Seattle, WA: University of Wahsington.
IHMe (Institute for Health Metrics and evaluation). 2020. GbD Compare/Viz Hub (database). Seattle, WA: University of Washington. https://vizhub.healthdata.org/gbd-compare (accessed November 5, 2020).
IHMe (Institute for Health Metrics and evaluation). n.d. The 2013 Saudi Health Interview Survey (Saudi Nationals only) (database). Seattle, WA: University of Washington. http://www.healthdata.org/ksa/projects/saudi-health-interview-survey.
Jamison, D. T., L. H. Summers, G. Alleyne, K. J. Arrow, S. berkley, A. binagwaho, F. bustreo, et al. 2013. “Global Health 2035: A World Converging within a Generation.” The Lancet 382 (9908): 1898–955.
MOH (Ministry of Health). 2020. Kingdom of Saudi Arabia World Health Survey 2019. riyadh: Ministry of Health.
Mokdad, A. H., A. Tuffaha, M. Hanlon, C. el bcheraoui, F. Daoud, M. Al Saeedi, A. A. lrasheedy, et al. 2015. “Cost of Diabetes in the Kingdom of Saudi Arabia, 2014.” Journal of Diabetes & Metabolism 6 (8): 575. doi: 10.4172/2155-6156.1000575.
rasmussen, b., K. Sweeny, and P. Sheehan. 2015. Economic Costs of Absenteeism, Presenteeism, and Early Retirement due to Ill Health: A Focus on Saudi Arabia. report to the US Chamber of Commerce. Melbourne: Victoria Institute of Strategic economic Studies.
Souliotis, K., H. Kousoulakou, G. Hillas, N. Tzanakis, M. Toumbis, and T. Vassilakopoulos. 2017. “The Direct and Indirect Costs of Managing Chronic Obstructive Pulmonary Disease in Greece.” International Journal of Chronic Obstructructive Pulmonary Disease 12: 1395–400. doi: 10.2147/COPD.S132825.
Stuckler, D., L. rocco, M. Suhrcke, and r. A. Nugent. 2006. Chronic Disease: An Economic Perspective. London: Oxford Health Alliance.
UN (United Nations) Interagency Task Force on NCDs. 2017. The Investment Case for Noncommunicable Disease Prevention and Control in the Kingdom of Saudi Arabia: Return on Investment Analysis & Institutional and Context Analysis. Geneva: World Health Organization.

Calculating the Economic Burden of NCDs in Saudi Arabia | 77
US (United States) ePA (environmental Protection Agency). n.d. “Mortality risk Valuation.” US ePA, Washington, DC. https://www.epa.gov/environmental-economics/mortality-risk -valuation#:~:text=ePA%20recommends%20that%20the%20central,population%20until%20revised%20guidance%20becomes.
Viscusi, W. K., and C. J. Masterman. 2017. “Income elasticities and Global Values of a Statistical Life.” Journal of Benefit-Cost Analysis 8 (2): 226–50. doi: 10.1017/bca.2017.12.
Wacker, M. e., r. A. Jörres, H. Schulz, J. Heinrich, S. Karrasch, A. Karch, A. Koch, et al. 2016. “Direct and Indirect Costs of COPD and Its Comorbidities: results from the German COSYCONeT Study.” Respiratory Medicine 111 (February): 39–46. doi: 10.1016/j.rmed .2015.12.001.
WeF (World economic Forum). 2020. The Global Risks Report 2020, 15th ed. Geneva: WeF. http://www3.weforum.org/docs/WeF_Global_risk_report_2020.pdf.
WHO (World Health Organization). Global Health Observatory (database). Geneva: WHO. https://apps.who.int/gho/data/node.main.GHeDCHeGDPSHA2011?lang=en.
WHO (World Health Organization). “Cost effectiveness and Strategic Planning (WHO-CHOICe), OneHealth Tool.” WHO, Geneva. https://www.who.int/choice/onehealth tool /en/.
World bank. 2018. World bank Databank (database). Washington, DC: World bank. https://data.worldbank.org/indicator/PA.NUS.PPP?locations=SA.
World Population review. 2020. Saudi Arabia Population 2020 (database). Walnut, CA: World Population review. https://worldpopulationreview.com/countries/saudi-arabia -population (accessed October 28, 2020).


79
KEY MESSAGES
• Noncommunicable diseases (NCDs) negatively affect a country’s human capital index (HCI) score by affecting the indicator for adult survival (that is, the fraction of 15-year-olds who survive to age 60).
• If NCD deaths could be averted in Saudi Arabia, the country’s HCI score could increase by 5 percent, helping it to achieve the United Nations (UN) Sustainable Development Goal (SDG) target of reducing premature mortality from NCDs by one-third by 2030.
• NCDs have an impact on human capital both directly and indirectly and in both the short term as well as the long term. The direct impact is effectuated the most by loss of productivity, which takes two forms: presenteeism and absenteeism. The indirect impact includes higher out-of-pocket (OOP) payments in households caring for someone with an NCD, which drains household budgets and moves resources away from other activities (for example, investing in the education of the next generation).
BACKGROUND
Although some progress has been made in reducing the overall burden of NCDs, key challenges remain globally. One of the core targets of SDG 3 is Target 3.4, which aims to reduce premature mortality from noncommunicable diseases by one-third by 2030 through prevention and treatment. To date, some progress has been made in meeting this target. Nevertheless, the most recent data suggest that NCDs accounted for 71.2 percent of total deaths worldwide in 2016 (World Bank 2019). In addition, the prevalence of some NCDs (diabetes, cardiovascular dis-eases) has been increasing. For example, the worldwide prevalence of diabetes jumped from 6.4 percent in 2010 to 8.8 percent in 2019 (World Bank 2019).
The global NCD pandemic has taken a toll on the Gulf countries and on Saudi Arabia. Cardiovascular diseases, cancers, and diabetes have been the three most dominant NCDs in the region, both in prevalence and in total number of deaths
Estimated and Likely Impact of NCDs on Human Capital in Saudi Arabia ZLATKO NIKOLOSKI, WILLIAM MSEMBURI, ADA ALQUNAIBET, FAISAL KATTAN, CHRISTOPHER H. HERBST, DAVID WATKINS, ERIC FINKELSTEIN, JESSE D. MALKIN, ABDULLAH ALFRAIH, AND SAMEH EL-SAHARTY
5

80 | NONCOmmUNICABle DISeASeS IN SAUDI ArABIA
(WHO 2018). moreover, Whiting et al. (2011) project that five Gulf countries (Bahrain, Kuwait, Qatar, Saudi Arabia, and the United Arab emirates) will be among the top 10 countries for diabetes prevalence by 2030. The rising preva-lence of NCDs increases the pressure on national health care systems (Nikoloski 2020). As more and more people are diagnosed with NCDs, direct medical costs associated with the diseases are increasing (for example, outpatient costs, inpa-tient costs, and costs for medications) (Nikoloski 2020). Furthermore, the rising prevalence of NCDs has an indirect effect on the overall economic burden of disease through its impact on human capital (Seuring, Archangelidi, and Suhrcke 2015). Finally, the ongoing COVID-19 pandemic is exacerbating the situation. evidence points to a strong link between NCDs and the probability of dying from COVID-19 (see Nikoloski 2021 for a recent review of the literature). moreover, even people without an NCD before contracting COVID-19 might develop life-long afflictions limiting their ability to contribute productively to society and to the economy.
Human capital consists of the knowledge, skills (both cognitive and noncog-nitive), and health that people accumulate over their lives, enabling them to real-ize their potential as productive members of society. The literature suggests that there is a significant link between earnings and investments in one’s schooling, learning, and skills, both in advanced and emerging economies (Psacharopoulos and Patrinos 2018). In addition to education, health is an important element of human capital. Simply put, people are much more productive when they are healthier (Ahuja et al. 2015).
The literature points to complementarities between the elements of human capital as well as the spillover effects of human capital across gener-ations. existing evidence, for example, points to a significant link between health and nutrition and the development of cognitive skills (Dillon et al. 2017; Sandjaja et al. 2013). moreover, improvement in human capital has generational spillover effects. For example, in the context of eastern and Southern Africa, maternal education is found to be a significant determinant of child survival (Nikoloski 2017). Finally, a study in Zambia finds that mater-nal education is one of the main determinants of the probability of a child being vaccinated (Nikoloski 2018).
By increasing productivity and private returns, investment in human capital has a cumulative effect on the overall level and rate of economic growth. Indeed, existing empirical research considers human capital to be a key deter-minant of long-term economic growth. Barro and lee (1993), for example, were among the first to start using variables related to education, health, and human capital in their modeling efforts. This is especially important because the first generation of endogenous growth theories emphasized the role of human capital as the main (or at least one of the main) engines of growth (Barro and lee 1993). more specifically, Barro and lee (1993) find a return to schooling of 7 percent per year.
Human capital is a particularly important engine of economic growth in Saudi Arabia, given its ongoing diversification efforts. Cognizant of the need to reduce its reliance on hydrocarbons, authorities have, over the past few years, embarked on an ambitious diversification program under the auspices of Vision 2030 (KSA 2017). Human capital constitutes a cornerstone of the government’s Vision 2030. For example, the King Salman Program for Human Capital Development, among other things, envisages investing in the human capital of

Estimated and Likely Impact of NCDs on Human Capital in Saudi Arabia | 81
government employees in order to improve their productivity and performance (KSA 2017).
This chapter has two aims: (1) to compute the potential impact of NCDs on Saudi Arabia’s HCI, an index used to rank countries globally according to their human capital status, and (2) to distill the main mechanisms from the global lit-erature through which NCDs affect human capital, directly and indirectly, beyond the indicators captured in the HCI. The chapter starts by exploring the impact of NCD-related deaths on adult survival and the impact of adult survival on the HCI score. It then distills the global literature on the direct and indirect pathways by which NCDs can affect human capital and summarizes the findings in a compact conceptual framework. A final section concludes.
QUANTIFYING THE IMPACT OF NCDs ON THE HUMAN CAPITAL INDEX
The World Bank’s HCI ranks countries globally according to their human capital status. The HCI measures the amount of human capital that a child born today can expect to attain by age 18. Figure 5.1 summarizes the key ingredients in cal-culating the human capital score—mainly indicators of survival, schooling, and health. Specifically, the index is made up of five indicators: probability of survival to age 5, a child’s expected years of schooling, harmonized test scores (synchro-nized results drawn from major international and regional student achievement testing programs) as a measure of quality of learning, adult survival rate (fraction of 15-year-olds who will survive to age 60), and proportion of children who are not stunted (World Bank 2018). These indicators are used to calculate the HCI score, which reflects the productivity of the next generation of workers to a benchmark of fully educated, healthy workers.
Saudi Arabia ranks 73 out of 157 countries on the HCI (World Bank 2018), lower than many of its Gulf Cooperation Council (GCC) neighbors. Saudi Arabia’s HCI score is 0.58 (figure 5.2), which means that a child born in Saudi Arabia today will only be 58 percent as productive as an adult as a child who has received a complete education and enjoyed full health. Bahrain, Oman, Qatar, and the United Arab emirates all score higher than Saudi Arabia, and Kuwait is on par with Saudi Arabia, at the bottom of the GCC countries.
FIGURE 5.1
The three main elements used to derive a human capital score
SURVIVAL
Children whodon’t survive
don't grow upto become
future workers
SCHOOL
Contribution ofquality-adjustedyears of schoolto productivity
of future workers
HEALTH
Contribution ofhealth (averageof adult survival
rate and stunting)to productivity of
future workers
HCI
Productivity of afuture worker
(relative tobenchmark of
completeeducation and
full health)
X X =
Source: World Bank.Note: HCI = human capital index.

82 | NONCOmmUNICABle DISeASeS IN SAUDI ArABIA
Health is not the main driver of this low ranking, which is attributed largely to educational outcomes. In Saudi Arabia, 99 percent of children born today will survive to school age, 91 percent of children 15 years of age will survive to 60, and stunting is not much of an issue (World Bank 2018). Instead, a low level of learning is slowing human capital formation in Saudi Arabia. A four-year-old child in Saudi Arabia can expect to complete 12.4 years of preprimary, primary, and secondary school by age 18. However, when years of schooling are adjusted for quality of learning—that is, how much children actually learn—the 12.4 years of schooling is equivalent to only 8.1 years, a learning gap of 4.3 years (World Bank 2018).
At the same time, it would be flawed to suggest that health does not affect human capital outcomes in Saudi Arabia. The HCI does not include NCDs as key indicators per se. It does, however, include adult survival (until 60) as an indica-tor that is likely to be affected directly by NCDs. This rate refers to the probabil-ity that persons who have reached age 15 will die before reaching age 60 (shown per 1,000 persons).
In order to estimate the impact of NCDs on the HCI score in Saudi Arabia, this section estimates the impact of avertable mortality and risk-attributable mortality (that is, rates that exceed the rates observed in best-performing coun-tries worldwide) on adult survival in Saudi Arabia. Counterfactual patterns of mortality (described further in annex 5A) are used to generate alternative life tables for Saudi Arabia in 2017 using the cause-deleted life table approach (Beltran-Sanchez, Preston, and Canudas-romo 2008). These alternative life tables make it possible to compute the probability of dying between the ages of 15 and 60 (45q15), an input to the HCI. Both a cause-level analysis and a risk factor–level analysis are conducted. The cause-level analysis uses estimates of mortality rates from specific NCD causes, whereas the risk factor–level analysis uses estimates of NCD mortality linked to specific risk factors such as tobacco use and obesity. risk factors account for about two-thirds of NCD deaths in Saudi Arabia, so the burden of risk factor–attributable deaths is the fraction of total avertable deaths. For both the cause-level analysis and the risk factor–level
FIGURE 5.2
Comparative overview of HCI scores of economies in the Middle East and North Africa
0.37 0.40.49 0.5
0.51 0.52 0.54 0.55 0.56 0.58 0.58 0.59 0.61 0.620.66 0.67 0.7
0
0.1
0.2
0.3HC
I sco
re
0.4
0.5
0.6
0.7
0.8
Yem
en, R
ep.
Iraq
Egyp
t, Ara
b Re
p.
Mor
occo
Tuni
sia
Alger
ia
Leba
non
Wes
t Ban
k an
d Gaz
a
Jord
an
Kuwait
Saud
i Ara
bia
Iran, Is
lamic
Rep.
Qatar
Oman
Unite
d Ara
b Em
irate
s
Bahr
ainM
alta
Source: World Bank 2018.Note: HCI = human capital index.

Estimated and Likely Impact of NCDs on Human Capital in Saudi Arabia | 83
analysis, these values are compared with the observed 45q15 for Saudi Arabia in 2017 (described further in annex 5B).
For Saudi Arabia, the impact of eliminating avertable NCD deaths and risk-attributable deaths on 45q15 is substantial. For the cause-level analy-sis, reducing NCD mortality to counterfactual levels would result in a 38 percent reduction in 45q15, with a 48 percent reduction for women and a 33 percent reduction for men. For the risk factor–level analysis, reducing NCD mortality to counterfactual levels would result in a 22 percent reduc-tion in 45q15, with a 29 percent reduction for women and an 18 percent reduction for men.
eliminating avertable NCD deaths and risk-attributable deaths would improve the HCI values for Saudi Arabia by 5 percent and 3 percent, respectively. reducing NCD mortality to the counterfactual level used in this analysis would increase the HCI value from 0.58 to 0.61, a 0.03-unit absolute improvement or a 5 percent relative improvement. likewise, reducing risk-attributable mortality would increase the HCI value to 0.60, a 0.02-unit absolute improvement or a 3 percent relative improvement. These modest improvements undersell the benefits of NCD prevention and control and are a result of how the HCI is constructed.
eliminating avertable NCD deaths and risk-attributable deaths would ensure that Saudi Arabia would achieve the SDG Target 3.4 for NCDs. The 40q30 indicator (the probability of dying between the ages of 30 and 70) cap-tures cross-country differences in NCD mortality better than 45q15 and is used in SDG Target 3.4, reducing NCD mortality by one-third between 2015 and 2030 (UN 2016). The impact of lower NCD mortality and risk-attributable mortality on 40q30 in Saudi Arabia is estimated using a method similar to the one used for 45q15. For the cause-level analysis, reducing NCD mortality to counterfactual levels would result in a 48 percent reduction in 40q30, with a 57 percent reduction for women and a 44 percent reduction for men. For the risk factor–level analysis, reducing NCD mortality to counterfactual levels would result in a 31 percent reduction in 40q30, with a 40 percent reduction for women and a 26 percent reduction for men. These findings suggest that Saudi Arabia could achieve the SDG Target 3.4 or even exceed it by wide margins by aggressively tackling risk factors (such as smoking) and fully implementing clinical interventions (such as drug therapy for secondary prevention of cardiovascular disease) that can reduce case-fatality in a cost- effective manner and reduce age-specific mortality rates to levels observed in high-performing countries.
Figure 5.3 shows the improvements in adult mortality from eliminating avert-able NCD-attributable deaths and risk-attributable deaths in Saudi Arabia. The figure shows 45q15 and 40q30, disaggregated by gender, at both the cause level and the risk factor level. The height of each bar is the observed value for Saudi Arabia. For each bar, the light shading (change) reflects the share of 45q15 or 40q30 that could be eliminated if counterfactual mortality levels are achieved (that is, if 45q15 or 40q30 is reduced to counterfactual levels, represented by the height of the dark shading in each bar). The observed values for 45q15 and 40q30 are slightly different in this analysis than those used by the World Bank because this analysis uses the Global Burden of Disease estimates (IHme 2018), while the World Bank uses the World Population Prospects 2019 revision estimates (UN DeSA 2019).

84 | NONCOmmUNICABle DISeASeS IN SAUDI ArABIA
PATHWAYS OF NCD IMPACT BEYOND THE HUMAN CAPITAL INDEX
Human capital is a concept that extends beyond the indicators captured in the HCI. In Saudi Arabia as elsewhere, NCDs affect human capital through both direct and indirect pathways beyond the HCI. Figure 5.4 illustrates the link between NCDs and human capital.
The most common impact of NCDs on human capital is direct, by, for exam-ple, causing early retirement (or a complete drop out of the labor market) or increasing the productivity loss, because workers with chronic illnesses tend to be absent (absenteeism) or not as productive when present (presenteeism). In other words, NCDs have a direct impact on the individual who has the condition and a longer-term direct effect on human capital. This effect is seen mainly through education, as chronic illnesses have an impact on academic achieve-ment and educational attainment, which in turn feeds into the NCD–labor mar-ket nexus.
The indirect impact of NCDs on human capital is effectuated through two channels: (1) the presence of NCDs in a household tends to reduce investments in educating the next generation as resources are diverted away from education and toward treatment of the chronic illness; and (2) caregivers need to perform unpaid work (caring for the chronically ill) and thus forgo investing in their own education or human capital. In other words, the indirect impact of NCDs occurs to persons who are providing care to the patient or are affected by the realloca-tion of resources toward patient care.
FIGURE 5.3
Improvements in adult mortality from eliminating avertable NCD-attributable deaths and risk-attributable deaths in Saudi Arabia
30
25
20
Pro
bab
ility
of
dea
th (
%)
15
10
5
045q15 40q30
a. Cause-level analysis: Effect of avertable deaths on 45q15 and 40q30
Female change
Male counterfactual
Female counterfactual
Both change
Male change
Both counterfactual
30
25
20
Pro
bab
ility
of
dea
th (
%)
15
10
5
045q15 40q30
b. Risk-level analysis: Effect of avertable deaths on 45q15 and 40q30
Source: Based on Global Burden of Disease estimates (IHME 2018). Note: 45q15 = probability of dying between ages 15 and 60. 40q30 = probability of dying between ages 30 and 70. NCD = noncommunicable disease.

Estimated and Likely Impact of NCDs on Human Capital in Saudi Arabia | 85
The following section discusses the global evidence on each of the direct and indirect pathways in greater detail.
Direct impact on human capital
most commonly, the literature shows NCDs to have a direct impact on human capital, both in the short and in the longer terms. The literature, for example, suggests that chronic conditions reduce the supply of labor in the short term through mortality, early retirement (Dwyer and mitchell 1999; Jones, rice, and roberts 2010; lindeboom and Kerkhofs 2009), and reduced productivity, either through absenteeism or presenteeism (Jäckle and Himmler 2010; lópez-Casasnovas, rivera, and Currais 2005). Absenteeism implies that people with a chronic illness are absent more from work than those who are healthy, while presenteeism suggests that people with a chronic illness (or poor health) are at work but are not as productive as people in good health. In addition, the litera-ture points to the longer-term impact of NCDs on human capital, mainly effec-tuated through school performance (for example, attendance, school outcomes). This section begins by presenting the evidence for the short-term impacts (retirement, absenteeism, presenteeism, productivity), followed by the longer-term direct impact (educational attainment).
Early retirement robust evidence, particularly from high-income countries, establishes a link between health status and early retirement. most of the literature on this front has focused on disentangling the methodological aspects of the self-rated health-retirement nexus (for example, people who are not happy with their job might exaggerate their self-rated health status). The assumption here is that self-rated health is also a proxy for NCDs. For example, an early analysis by Chirikos and Nestel (1984) compares the labor supply effects of a self-reported disability measure to that of a more objective impairment index and concludes that self- reported health problems exaggerate the impact of poor health on work poten-tial. Similarly, a study by Anderson and Burkhauser (1985) uses early mortality to
NCDs
Absenteeism Presenteeism
Earlyretirement
Productivityloss Intergenerational
loss in educationinvestment by
divertingresources
toward diseasetreatment
Lowerinvestment inhuman capital
and labormarket
participationby doing
unpaid workcaring for thechronically ill
Academicachievement and
educationalattainment
Indirect impactDirect impact
FIGURE 5.4
NCDs and human capital: Transmission mechanisms
Source: Original figure for this publication.Note: NCDs = noncommunicable diseases.

86 | NONCOmmUNICABle DISeASeS IN SAUDI ArABIA
proxy health problems; they find that the more objective measure has a smaller effect on labor supply than the self-rated health measure. Finally, Bazzoli (1985) analyzes this topic in a different context—by comparing retirees’ self-assessed health before and after retirement. She finds that the same individuals reported poorer health after retirement than they did earlier.
When using the existence of an NCD as a proxy, the literature establishes a clear link between health status and early retirement. A study by Yassin, Beckles, and messonnier (2002) finds that the proportion of individuals who stopped working because of diabetes was 7.2 percent among men and 12.8 percent among women (while 2.2 percent of men and 3.3 percent of women without diabetes stopped working). moreover, not only do more people with NCDs retire, but they also retire earlier. For example, a study on the link between diabetes and retire-ment reveals that individuals with diabetes retire 0.7 year earlier than those without diabetes (Herquelot et al. 2011). Similar findings emerge from a compar-ative study between european Union countries and the United States (Alavinia and Burdorf 2008).
The robust link between NCDs and labor market participation also is found in the emerging economies (middle- and low-income countries). For example, in Brazil and Chile, persons affected by NCDs reduce their labor force participation rates by an estimated 5 percentage points (Bonilla-Chacin 2014), reducing their personal earnings, consumption, and welfare in general (Suhrcke and Urban 2006; WHO 2009). Similarly, Keogh-Brown et al. (2016) analyze the impact of Alzheimer’s disease on the Chinese economy and estimate that the labor- supply-decreasing effects of dementia account for 10 percent of the global economic effects of the disease. They argue that the labor-supply-decreasing effect of Alzheimer’s disease is associated not only with patients but also with informal caregivers. They estimate the combined patient-caregiver labor-reducing effect to be 34 percent and the patient-specific labor-reducing effects to be 28 percent. Similarly, cardiovascular diseases are estimated to have cost the russian Federation 2.1 million working years in 2006 and 1.7 million in 2009, or a total cost of €24.5 billion in 2006 and €24.4 billion in 2009 (Kontsevaya, Kalinina, and Oganov 2013).
Loss of productivity When examining the link between NCDs and productivity, the literature has been grappling with methodological issues similar to the ones presented here. Among other things, these methodological issues include the simultaneous cau-sality between health, on the one hand, and wages and productivity, on the other (that is, healthier people tend to be more productive, and higher wages could also improve health and productivity). In that respect, the impact of health on wages has been studied using a variety of econometric approaches that account for the so-called endogeneity problems. For example, Gambin (2005) investigates the relationship between health and wages for 14 european countries employing fixed and random effects estimations. Her findings sug-gest that self-reported health has a greater effect for men than for women, while the opposite holds true for chronic diseases. Furthermore, lee (1982) suggests using an econometric model that accounts for the simultaneous effects of health and wages in a structural multiple-equation system. His approach is based on a generalized version of Heckman’s treatment model (Heckman 1978). Using a cross-sectional sample of male US citizens, he finds that health and wages are strongly interrelated—that is, wages positively affect health and vice versa.

Estimated and Likely Impact of NCDs on Human Capital in Saudi Arabia | 87
In a similar vein, Cai (2007) estimates a multiple-equation system using cross- sectional Australian data and finds health to have a positive effect on wages once endogeneity is taken into account. Haveman et al. (1994) estimate a multiple- equation system for working time, wages, and health, employing gen-eralized method of moments techniques on panel data. They find that, in the male US population, poor health affects wages negatively. Finally, the effect of self- assessed general and psychological health on wages is at the core of a study using the British Household Panel Survey and applying fixed effects and ran-dom effects instrumental variable estimators (Contoyannis and rice 2001). Contonyannis and rice (2001) conclude that poor psychological health decreases wages for men, while positive self-assessed health increases hourly wages for women.
The link between chronic illness (or any other objective measure of health status) and loss of productivity is well documented. It is effectuated through two mechanisms: (1) absenteeism and (2) presenteeism. Chronic illness results in absenteeism—which occurs when people with a chronic illness are absent from work more often than those who are healthy. Persons with a chronic illness or poor health also frequently go to work but are not as productive as people in good health, which is termed presenteeism.
Higher levels of absenteeism have been found in patients with NCDs, espe-cially those with diabetes. The existing literature suggests that individuals with diabetes are more likely to be absent from work than those without diabetes, with odds ratios ranging between 1.5 and 3.3 (De Backer et al. 2006; Vamos et al. 2009). moreover, when absent, individuals with diabetes tend to be absent longer. The existing evidence suggests that individuals with diabetes lost between 0.9 and 5.7 more work days in the previous year than individuals with-out diabetes (Anesetti-rothermel and Sambamoorthi 2011; Cawley, rizzo, and Haas 2008; Fu et al. 2009; mayfield, Deb, and Whitecotton 1999; Tunceli et al. 2005). Occasionally, the effects of absenteeism can be compounded by the over-all lower quality of life of chronically ill workers. A study by Vamos et al. (2009) on the absenteeism rates of people with diabetes concludes that the number of days lost from work due to illness among individuals with both diabetes and depression is much higher (78.5 days per year) than the number of days lost among individuals with only diabetes or those without diabetes. Finally, a semi-nal study of patients with diabetes and related complications (Stewart et al. 2007), following adjustment for potential confounders, finds individuals with diabetes and neuropathic symptoms to be 18 percent more likely to lose 2 hours of work per week from illness than individuals without diabetes. Occasionally, the literature suggests that this loss of productivity does not always translate into a significant loss of income, simply because diabetes tends to be a condition of poorer socioeconomic groups (lavigne et al. 2003).
High levels of absenteeism are also found among patients with cardiovascular diseases. The productivity loss due to cardiovascular diseases in the United States is estimated to be US$8,539 per person per year (Zhao and Winget 2011), with an estimated average loss of 4.7 working days per person per year (Short, Vasey, and Belue 2008). Similarly, total absenteeism-related costs in Australia are estimated at US$5.69 billion and mortality-related costs at US$23 million (Zheng, ehrlich, and Amin 2010). Finally, in the US context, the odds of experi-encing limited amounts of paid work due to illness are significantly higher for persons with cardiovascular diseases, with an odds ratio of 2.9 for women and 2.3 for men.
88 | NONCOmmUNICABle DISeASeS IN SAUDI ArABIA
In addition to absenteeism, presenteeism associated with NCDs (both diabe-tes and cardiovascular diseases) significantly reduces the overall productivity of workers. An estimated 7.2 days per person per year are lost due to diabetes in the United States as a result of both absenteeism and presenteeism (Alavinia and Burdorf 2008; Anesetti-rothermel and Sambamoorthi 2011; Dall et al. 2009; Genova-maleras et al. 2012; Holden et al. 2011; Klarenbach et al. 2002; lavigne et al. 2003; Short, Vasey, and Belue 2008). In fact, some studies suggest that the overall cost of presenteeism is higher than that of absenteeism. For example, in the US context, the proportion of productivity loss caused by premature mortal-ity (49 percent) and presenteeism (44 percent) is much larger than that caused by absenteeisim (4 percent) (Adepojou et al. 2014).
Impact on educational attainmentlonger-term effects of NCDs on human capital are effectuated through the education process. Understanding how NCDs affect education outcomes is important, as the process of skills formation and preparation for the labor mar-ket usually happens through the process of education. Understanding this long-term impact of NCDs is an imperative for Saudi Arabia, given the rising prevalence of some NCD risk factors among the country’s adolescent population.
Children diagnosed with NCDs often experience both physical and social dis-advantages. Child patients face both acute stress from the illness itself (Clarke and eiser 2004) and chronic and systemic stress from managing complicated treatment regimens and medical schedules, missing school, and feeling different from their peers (Shaw and mcCabe 2008). As a result of these complications, approximately 50 percent of children with NCDs are absent from school for a significant amount of time, often for periods lengthy enough to require educa-tional adaptations such as tutoring, grade repetition, or placement in special education (Geist, Grdisa, and Otley 2003; Kaffenberger 2006; Shiu 2001). School performance often suffers as a result of these attendance issues. A third of children with an existing chronic condition experience a medical complication serious enough to disrupt their schooling (Newacheck and Halfon 1998; Thompson and Gustafson 1996). Along with lower performance related to school absenteeism, disease activity and aggressive forms of treatment also contribute to cognitive delays in children with chronic illnesses (Compas 2012). Given Saudi Arabia’s age demographics, these deficits might have an even more pro-found effect in Saudi Arabia than in other countries.
Overall, NCDs reduce school performance, which in turn has an impact on subsequent labor market performance. moreover, the relationship between edu-cation and health is bidirectional: not only do NCDs have a negative impact on educational outcomes, but, conversely, poor educational outcomes might put people at risk of developing NCDs later in life. NCDs are associated with poorer school attendance (Crump et al. 2013; reuben and Pastor 2013), lower academic achievement (Duquette et al. 2007; martinez and ercikan 2009; Pinquart and Teubert 2011), higher rates of grade repetition (Gerhardt et al. 2007), greater need for special education (mitby et al. 2003; reuben and Pastor 2013), and lower levels of educational attainment (Champaloux and Young 2015; lancashire et al. 2010; maslow et al. 2012). Once the children affected by NCDs are old enough to join the labor market, all of these shortcomings feed into some of the pathways described above. For example, poorer school experiences and out-comes can contribute to higher rates of unemployment (maslow et al. 2012; murray et al. 2014) and depression (Zebrack et al. 2002) among adults with

Estimated and Likely Impact of NCDs on Human Capital in Saudi Arabia | 89
childhood-onset chronic illness. murray et al. (2014) find that only two-thirds of high school leavers who are on dialysis are employed.
Indirect impact on human capital
The literature also shows that NCDs have an indirect or intergenerational impact on human capital. As evidenced by the literature search, the existence of NCDs among household members increases out-of-pocket payments, which in turn drain household budgets and move resources away from other activities (such as investing in the education of the next generation). In other words, the costs asso-ciated with NCDs in the current generation reduce human capital investment in the next generation. In addition, there is some weak evidence of a link between engaging in unpaid domestic work and caring for extremely sick NCD patients (for example, amputees). The rest of this section discusses the evidence from the literature on (1) loss of educational investments and (2) loss of labor market participation.
Loss in educational investments NCDs can drain household budgets and deplete resources that could be invested in building human capital (including investments in education). Although, to date, there is little evidence of the actual shift from spending on education to spending on NCD treatment, one study in the context of Pakistan finds that spending on NCDs (high blood pressure and diabetes) crowds out spending on additional domestic budget items (Datta, Husain, and Fatehin 2020). As in the cases of productivity loss, the literature on the effect of NCDs on OOP spending and income loss revolves mostly around two categories of disease: cardiovascu-lar diseases and diabetes.
In the context of cardiovascular diseases, numerous studies suggest that spending on treatment places a burden on domestic budgets. The existing evi-dence suggests that 14.3 percent of high-income families in China, for example, have experienced some form of household income loss as a result of disease- related hospitalization; this share rises to 26.3 percent in India, 63.5 percent in Tanzania, and 67.5 percent in Argentina (Huffman et al. 2011). This impact is patterned by socioeconomic position, as greater cardiovascular disease– attributable losses of household income are reported for lower-income groups than for higher-income ones (Huffman et al. 2011). Similarly, in the US context, 10.4 percent of patients with cardiovascular disease reported that OOP spending exceeded 20 percent of family income (Banthin and Bernard 2006). Furthermore, cardiovascular disease patients in India spent 30 percent of their annual family income on direct health care, and mean OOP per hospitalization increased from US$364 in 1995 to US$575 in 2004 (engelgau, Karan, and mahal 2012; rao, Bhatnager, and murphy 2011). The same studies find that the risk of impoverish-ment due to cardiovascular diseases is 37 percent greater than for communicable diseases (engelgau, Karan, and mahal 2012). While the studies do not explicitly examine the crowding out effect of high OOP, higher OOP spending may lead households to reduce expenditures on everything else, including education of the next generation.
Spending on diabetes treatment places a similar burden on domestic budgets. For example, in the United States, the mean annual OOP cost of diabetes care was US$1,237 in 2005, an increase of 23 percent from 2002 to 2005 (Campbell et al. 2011; rodbard et al. 2010). Nearly 40 percent of diabetes cases in the United States experience catastrophic spending (using the threshold of

90 | NONCOmmUNICABle DISeASeS IN SAUDI ArABIA
10 percent of household income); 13 percent experience catastrophic spending even above the 20 percent threshold (Banthin and Bernard 2006). Furthermore, OOP—particularly the impoverishing effects of OOP—are particularly pro-nounced in low- and middle-income countries. In India, mean OOP expenditure per in-patient hospital stay for diabetes increased from US$134 to US$211 between 1995 and 2004, and direct total OOP spending per year was estimated at US$262–US$280 (engelgau, Karan, and mahal 2012; Grover et al. 2005; rayappa et al. 1999). As a percentage of household consumption, OOP spending in India is found to range between 7.7 percent and 17.5 percent (rao, Bhatnager, and murphy 2011; Shobhana et al. 2000). Finally, a cross-country analysis per-formed by Niens et al. (2010) quantifies the impoverishing effects of purchasing medicines for different diseases, including diabetes. Buying the lowest-price generic or originator brand glibenclamide would plunge either 2 million (5 percent) or 3 million (10 percent) chronic patients below the US$1.25 a day poverty line, respectively. When stratifying across 16 countries, these percent-ages range between 0 percent and 58 percent (Niens et al. 2010). Although the studies do not explicitly study the crowding out effect of high OOP, higher OOP spending may lead households to reduce expenditures on everything else, including education of the next generation.
Loss of labor market participationNCDs may amplify their effect on household budgets since some family mem-bers are involved in unpaid work caring for the chronically ill. There is nascent evidence that, worldwide, girls and women provide home health care for family members, friends, and neighbors who are acutely or chronically ill or disabled and cannot or will not access health services (Shaji and reddy 2012). This care most often takes place in the home or community, but it also can include chari-table work for an institution or advocacy to promote rights to health care (Stenberg et al. 2014). most of this care is provided by girls and women who do not have access to education, employment, recreation, or socializing because of their caregiving (marphatia and moussié 2013). For example, an International labour Organization study in 23 countries reports that girls who spend 28 hours or more on domestic chores a week attend school 25 percent less often than girls who spend less than 14 hours on chores per week. This inability to access educa-tion disempowers women in many ways and contributes to long-term gender discrimination and suffering (IlO 2009).
Ultimately, the involvement of family members in caring for the chronically ill (by doing unpaid work) results in a loss of potential gross domestic product (GDP) per capita. For high-income countries, the annual value of unpaid work in health care per woman is about US$1,650. This value is more than four times the value in upper-middle-income countries and almost eight times the value in lower- middle-income countries, even though women in these countries spend more time on unpaid health-related work than their counterparts in high- income countries (langer et al. 2015).
Some clear policy implications stem from this review of the literature on NCDs and human capital. First, there is a need to safeguard productivity and reduce presenteeism. Productivity can be raised both by accelerating the move-ment of workers from low- to higher-productivity sectors as well as by boosting human capital. Key policies in this area typically include incentivizing labor force participation among persons capable of working, pursuing structural transformation for better jobs, and maintaining or deepening human capital to improve the productivity of everyone in the workforce. Second, focusing further

Estimated and Likely Impact of NCDs on Human Capital in Saudi Arabia | 91
on the link between NCDs and educational attainment could prevent children and adolescents with NCDs from falling behind and thus would have a positive impact on their lifelong earnings. Furthermore, social protection policies could reduce OOP expenditures on NCDs and help to redirect household resources toward human capital development. Finally, focusing on long-term care could reduce the gendered impact of NCDs on the labor market.
CONCLUSIONS
This chapter has sought to identify the impact of NCDs on human capital in Saudi Arabia, first, by estimating the impact of NCDs on the HCI score and on adult survival and, second, by reviewing the global literature on the pathways beyond those captured in the HCI, distilling the likely direct and indirect impact of NCDs on human capital in Saudi Arabia.
The quantified impact of NCDs on HCI values in Saudi Arabia appears to be relatively modest, but this result is largely due to how the HCI is constructed. Saudi Arabia already performs relatively well on adult survival compared with global benchmarks that include low- and middle-income countries. The contri-bution of NCDs to 45q15 and the contribution of 45q15 to the HCI undersell the benefits of reduced NCD mortality when assessed through the lens of the HCI, because the HCI focuses on the next generation rather than on the avoidable depletion of existing human capital (that is, the economic burden of disease). SDG Target 3.4 for reduced NCD mortality uses the quantity 40q30 (specific to NCDs) rather than 45q15 (from all causes); when the impact of NCDs in Saudi Arabia is estimated using NCD-specific 40q30, larger (albeit relative) reductions could be achieved, exceeding SDG Target 3.4. The estimated gains in 40q30 (from avertable NCD deaths) that could be achieved in Saudi Arabia are substan-tial and complement the HCI analysis by illustrating the magnitude of human capital growth and preservation in this economically active age group.
NCDs are likely to exert significant pressure on Saudi Arabia’s human capital beyond the quantifiable impact of NCDs in the human capital index, however. The literature is rich with examples covering the direct impact of NCDs on human capital, and a growing strand of the literature focuses on the link between NCDs and educational outcomes. As skills are formed during the education pro-cess, NCDs can have a tremendous effect by, for example, increasing school dropouts and reducing educational outcomes. Doing so is particularly important for Saudi Arabia, given the rising rates of some NCDs among its adolescent pop-ulation. In addition, as the evidence from the literature suggests, NCDs among household members increase OOP payments, which in turn drain household budgets and move resources away from other activities (for example, investing in the education of the next generation).
Overall, policy considerations that aim to protect or harness human capital need to look beyond interventions that affect the indicators reflected in the index. A life-cycle approach is needed to reduce the impact of NCDs on human capital and the labor market. The rising burden of NCDs is a threat to human capital, which is a critical determinant of economic success. A wide-ranging, sweeping approach is needed, one that is tailored to and includes actions across the life course of individuals. Such actions should aim to build human capital (ensuring that children are well nourished and healthy), protect human capital (ensuring that adults are minimally affected by NCDs), and utilize human capital (providing an environment in which human capital can

92 | NoNcommuNicable Diseases iN sauDi arabia
be fully used). While the analysis of Hci and 45q15 speaks to the importance of building human capital in future generations, the 40q30 analysis speaks to the importance of protecting and using human capital now.
ANNEX 5A: APPROACHES TO ESTIMATING THE ECONOMIC BURDEN OF NCDs
This annex briefly discusses existing methods for calculating the economic burden of NcDs and provides information about how these costs can relate to overall human capital costs. as mentioned in the introduction to this chapter, the economic burden of NcDs is both direct (by increasing medical expenses) and indirect (by, among other things, affecting human capital, morbidity, and prema-ture mortality). The chapter provides a taste of how the human capital costs figure into calculations of the total economic costs of NcDs.
Various approaches exist to estimating the economic burden of NcDs. approaches to estimating the economic effects of health conditions include the cost-of-illness method, which calculates the direct and indirect costs associated with a disease; the value of a statistical life (Vsl) approach, which infers costs from willingness-to-pay studies or observed avoidance behavior for risky occu-pations or scenarios; econometric estimates taken from cross-country growth regressions; and macroeconomic models (such as a production function–based approach or a general-equilibrium framework), which simulate output trajecto-ries for different scenarios.
The cost-of-illness approach is an easy-to-understand method that summa-rizes the burden of a certain disease over a particular time period in a single number. This number is defined as the sum of all costs of personal medical care (inpatient and outpatient hospital costs), personal nonmedical care (transporta-tion and relocation expenses), and nonpersonal activities (research) as well as loss of income due to absenteeism, early retirement, or premature death. altogether, the medical costs, the nonmedical costs, and the research costs are referred to as direct costs, while loss of income is referred to as an indirect cost. The advantage of this method is that the outcome is easily interpreted as the monetary value of the resources that could be saved by avoiding a particular disease. The main drawbacks are that no economic adjustment mechanisms are considered (for example, the substitution of labor lost due to an illness with cap-ital or other workers) and that the effect of diseases on physical capital and human capital accumulation is disregarded in studies of illness (for a general debate on the usefulness of the cost-of-illness approach, see currie et al. 2000; rice 2000; WHo 2009).
an alternative method is the Vsl approach. indeed, one way to estimate the costs of health conditions is to reconstruct people’s valuation of their own life by estimating their willingness to accept premiums for risky occupations via wage regressions or by estimating their willingness to pay for reduced risks via hedonic price regressions (Viscusi and aldy 2003). The monetary value that a person assigns to his or her own life can be inferred from the parameter estimates in these regressions. The main advantage of this approach is that it delivers a single number that, if multiplied by the number of cases, can be interpreted as the total statistical value of the loss due to an illness. While the cost-of-illness approach focuses more on the objective costs of an illness, the Vsl approach also implic-itly covers the costs of pain and suffering via the revealed preferences of the

Estimated and Likely Impact of NCDs on Human Capital in Saudi Arabia | 93
consumers or workers who are studied. Seminal papers by Murphy and Topel (2006) and Lakdawalla et al. (2010) apply the VSL methodology to calculate the value of advances against cardiac disease and cancer. The main drawback is that the VSL approach yields an estimate of the statistical loss due to an illness that strongly depends on the age and income level of workers. Consequently, the esti-mates vary widely for different countries. Furthermore, economic adjustment mechanisms are typically not considered.
Another method for assessing the economic costs of an illness is to estimate a cross-country growth regression in the vein of Barro (1991) and Islam (1995), in which the main regressors of interest contain the prevalence of the illness under consideration. The impact of an illness on growth can be inferred directly from the parameter estimate associated with its prevalence (see, for example, Suhrcke and Urban 2006). The advantage of this approach is that, when the regression is specified appropriately, the estimated growth effect is readily apparent from the final result, which already incorporates economic adjustment mechanisms. Consequently, this method overcomes a crucial shortcoming of the cost-of- illness and VSL approaches. However, growth regressions are very data inten-sive, requiring a wide range of precisely measured control variables for all countries in the sample (Durlauf, Johnson, and Temple 2005; Eberhardt and Teal 2011; Sala-i-Martin 1997; Sala-i-Martin, Doppelhofer, and Miller 2004). Furthermore, the result is an average of the growth effect over all countries included in the regression, which does not account for specific country charac-teristics or potential heterogeneity in the impact of chronic conditions across countries. Additionally, this approach allows only for an assessment of severe diseases that affect many people (such as cardiovascular diseases). Detecting a significant growth effect for less impactful diseases is difficult given the small sample sizes that typically confront growth regressions (Durlauf, Johnson, and Temple 2005). Finally, attempts to deal with reverse causality and omitted variable bias are contentious in the literature (Weil 2014).
To date, these various approaches have been applied more widely to estimat-ing the economic burden of NCDs. Bloom et al. (2011) use both the cost-of-illness and VSL approaches to estimate the losses due to diabetes, cardiovascular dis-eases, chronic respiratory diseases, and cancer for a group of 169 countries. They find that, for those countries classified as low and middle income, approximately 14 percent (0.7 percent per year) of GDP will be lost over the period 2011–30. Results of the cost-of-illness approach indicate that the direct and indirect costs associated with diabetes in 2010 amounted to US$500 billion worldwide, with high-income countries bearing 90 percent of this cost. These costs are projected to mushroom to US$745 billion by 2030 (Bloom et al. 2011). However, middle- income countries will bear a rapidly increasing share of the bill by 2030, as diabetes-related disability costs will quadruple. They estimate that Brazil will lose almost US$72 billion in medication costs and productivity decline as a result of diabetes, coronary heart diseases, stroke, and hypertension (Bloom et al. 2011).
ANNEX 5B: METHODOLOGY FOR ESTIMATING THE IMPACT OF NCDs ON HCI
This analysis uses a method for estimating the impact of NCDs that constructs counterfactual scenarios and calculates avertable mortality. A counterfactual analysis is a type of analysis that explores what might have occurred under
94 | NONCOmmUNICABle DISeASeS IN SAUDI ArABIA
different circumstances—for example, “If I had not driven to work today, I would not have gotten into this car accident.” This type of analysis is different from an ex ante projection of future scenarios that remain to be determined or observed. It looks specifically at avertable mortality—that is, deaths that can be prevented using existing technologies or approaches. In the context of this chapter, avert-able mortality refers to the difference between observed mortality rates in Saudi Arabia and observed mortality rates in countries that perform better on NCD mortality (and thus have lower rates).
The analysis uses estimates from the Global Burden of Disease study for Saudi Arabia and other countries to estimate mortality that is avertable from specific NCDs and specific NCD risk factors (IHme 2018). For each of the top seven NCD causes and top six NCD risk factors, the Global Burden of Disease database was searched to find the country with the lowest age-standardized death rate from that cause or risk factor in 2017. That country’s mortality pattern (by age and gender) is used to construct a counterfactual mortality pattern for Saudi Arabia. The difference between observed deaths in Saudi Arabia (by age and gender) and counterfactual deaths (in the reference country) is calculated to generate estimates of avertable deaths. A similar approach is used to estimate avertable deaths that can be attributed to NCD risk factors.
The following presents the formulas for 45q15 and 40q30. 45q15 is the prob-ability of death between the exact ages of 15 and 60. It is more commonly called the adult mortality rate in the public health literature, although it is a probability, not a rate. Similarly defined, 40q30 is the probability of death between the exact ages of 30 and 70. To calculate these probabilities requires a few computational steps. First, the ratios of the age-specific death numbers to the corresponding population numbers provide mortality rates grouped by quinquennial ages for age groups 15–19, 20–24, . . ., 70–74. mortality rates are converted to probabilities for the same age groups using the following equation:
=+
nqxnmx
nmx5*
1 2.5*, (5B.1)
where n is the length of the age interval, nmx is the mortality rate for ages x to x + n, and nqx is the estimated probability for the same age group. The probability of death between the exact ages of 15 and 60 is then determined using the age-specific probabilities according to the following equation:
∏ ( )= − −
( )=
q nqxx
45 15 100* 1 1 ,15 5
55
(5B.2)
where the bracketed 5 denotes the quinquennial age grouping, and the 100 scalar indicates that the probability is expressed as a percentage. A similar equation defines the probability of death between the exact ages of 30 and 70—that is,
∏ ( )= − −
( )=
q nqxx
40 30 100* 1 1 ,30 5
65
(5B.3)
REFERENCES
Adepoju, O. e., J. N. Bolin, r. l. Ohsfeldt, C. D. Phillips, H. Zhao, m. G. Ory, and S. N. Forjuoh. 2014. “Can Chronic Disease management Programs for Patients with Type 2 Diabetes reduce Productivity-related Indirect Costs of the Disease? evidence from a randomized Controlled Trial.” Population Heath Management 17 (2): 112–20.

Estimated and Likely Impact of NCDs on Human Capital in Saudi Arabia | 95
Ahuja, A., S. Baird, J. H. Hicks, m. r. Kremer, e. miguel, and S. Powers. 2015. “When Should Governments Subsidize Health? The Case of mass Deworming.” The World Bank Economic Review 29 (Suppl. 1): S9–S24.
Alavinia, S. m., and A. Burdorf. 2008. “Unemployment and retirement and Ill-Health: A Cross-Sectional Analysis across european Countries.” International Archive of Occupational and Environmental Health 82 (1): 39–45.
Anderson, K. H., and r. V. Burkhauser. 1985. “The retirement-Health Nexus: A New measure of an Old Puzzle.” Journal of Human Resources 20 (3): 315–30.
Anesetti-rothermel, A., and U. Sambamoorthi. 2011. “Physical and mental Illness Burden: Disability Days among Working Adults.” Population Heath Management 14 (5): 223–30.
Banthin, J. S., and D. m. Bernard. 2006. “Changes in Financial Burdens for Health Care: National estimates for the Population Younger Than 65 Years, 1996 to 2003.” JAMA 296 (22): 2712–19.
Barro, r. J. 1991. “economic Growth in a Cross Section of Countries.” Quarterly Journal of Economics 106 (2): 407–43.
Barro, r. J., and H.-W. lee. 1993. “losers and Winners in economic Growth.” NBer Working Paper w4341, National Bureau of economic research, Cambridge, mA. https://ssrn.com /abstract=420297.
Bazzoli, G. J. 1985. “The early retirement Decision: New empirical evidence on the Influence of Health.” Journal of Human Resources 20 (2): 215–34.
Beltran-Sanchez, H., S. H. Preston, and V. Canudas-romo. 2008. “An Integrated Approach to Cause-of-Death Analysis: Cause-Deleted life Tables and Decompositions of life expectancy.” Demographic Research 19 (35): 1323–50.
Bloom, D. e., D. Chisholm, e. Jan-llopis, K. Prettner, A. Stein, and A. Feigl. 2011. “From Burden to Best Buys: reducing the economic Impact of Non-Communicable Disease in low- and middle-Income Countries.” WHO executive Summary and Switzerland Technical report, World Health Organization, Geneva.
Bonilla-Chacín, maría eugenia, ed. 2014. Promoting Healthy Living in Latin America and the Caribbean: Governance of Multisectoral Activities to Prevent Risk Factors for Noncommunicable Diseases. Directions in Development. Washington, DC: World Bank. doi:10.1596/978-1-4648-0016-0.license: Creative Commons Attribution CC BY 3.0.
Cai, l. 2007. “effects of Health on Wages of Australian men.” Working Paper 2007/02, Institute of Applied economic and Social research, University of melbourne, melbourne.
Campbell, r. S., V. Patel, m. Gleeson, B. m. Calimlim, m. J. Zagari, and S. m. Curkendall. 2011. “Out-of-Pocket Healthcare expenditures and Caps in Patients with Chronic Conditions.” American Journal of Pharmacy Benefits 3 (2): 98–105.
Cawley, J., J. A. rizzo, and K. Haas. 2008. “The Association of Diabetes with Job Absenteeism Costs among Obese and morbidly Obese Workers.” Journal of Occupational and Environmental Medicine 50 (5): 527–34.
Champaloux, S. W., and D. r. Young. 2015. “Childhood Chronic Health Conditions and educational Attainment: A Social ecological Approach.” Journal of Adolescent Health 56 (1): 98–105.
Chirikos, T. N., and G. Nestel. 1984. “economic Determinants and Consequences of Self-reported Work Disability.” Journal of Health Economics 3 (2): 117–36.
Clarke, S. A., and C. eiser. 2004. “The measurement of Health-related Quality of life (QOl) in Paediatric Clinical Trials: A Systematic review.” Health and Quality of Life Outcomes 2 (66).
Compas, B. e. 2012. “Coping with Chronic Illness in Childhood and Adolescence.” Annual Review of Clinical Psychology 8 (April): 455–80.
Contoyannis, P., and N. rice. 2001. “The Impact of Health on Wages: evidence from the British Household Panel Survey.” Empirical Economics 26 (4): 599–622.
Crump, C., D. rivera, r. london, m. landau, B. erlendson, and e. rodriguez. 2013. “Chronic Health Conditions and School Performance among Children and Youth.” Annals of Epidemiology 23 (4): 179–84.

96 | NONCOmmUNICABle DISeASeS IN SAUDI ArABIA
Currie, G., K. D. Kerfoot, C. Donaldson, and C. macarthur. 2000. “Are Cost of Injury Studies Useful?” Injury Prevention 6 (3): 175–76.
Dall, T. m., S. e. mann, Y. Zhang, W. W. Quick, r. F. Seifert, J. martin, e. A. Huang, and S. Zhang. 2009. “Distinguishing the economic Costs Associated with Type 1 and Type 2 Diabetes.” Population Health Management 12 (2): 103–10.
Datta, B. K., m. J. Husain, and S. Fatehin. 2020. “The Crowding Out effect of Out-of-Pocket medication expenses of Two major Non-Communicable Diseases in Pakistan.” International Health 12 (1): 50–59. https://doi.org/10.1093/inthealth/ihz075.
De Backer, G., F. leynen, D. De Bacquer, e. Clays, m. moreau, and m. Kornitzer. 2006. “Diabetes mellitus in middle-Aged People Is Associated with Increased Sick leave: The BelSTreSS Study.” International Journal of Occupational and Environmental Health 12 (1): 28–34.
Dillon, m. r., H. Kannan, J. T. Dean, e. S. Spelke, and e. Duflo. 2017. “Cognitive Science in the Field: A Preschool Intervention Durably enhances Intuitive but Not Formal mathematics.” Science 357 (6346): 47–55.
Duquette, P. J., S. r. Hooper, C. e. Wetherington, P. F. Icard, and D. S. Gipson. 2007. “Brief report: Intellectual and Academic Functioning in Pediatric Chronic Kidney Disease.” Journal of Pediatric Psychology 32 (8): 1011–17.
Durlauf, S. N., P. A. Johnson, and J. r. Temple. 2005. “Growth econometrics.” In Handbook of Economic Growth. Vol. 1, edited by P. Aghion and S. N. Durlauf, 555–677. Amsterdam: North Holland.
Dwyer, D. S., and O. S. mitchell. 1999. “Health Problems as Determinants of retirement: Are Self-rated measures endogenous?” Journal of Health Economics 18 (2): 173–93.
eberhardt, m., and F. Teal. 2011. “econometrics for Grumblers: A New look at the literature on Cross-Country Growth empirics.” Journal of Economic Surveys 25 (1): 109–55.
engelgau, m. m., A. Karan, and A. mahal. 2012. “The economic Impact of Non-Communicable Diseases on Households in India.” Global Health 8 (9).
Fu, A. Z., Y. Qiu, l. radican, and B. J. Wells. 2009. “Health Care and Productivity Costs Associated with Diabetic Patients with macrovascular Comorbid Conditions.” Diabetes Care 32 (12): 2187–92.
Gambin, l. 2005. “The Impact of Health on Wages in europe—Does Gender matter?” HeDG Working Paper 05/03, Health econometrics and Data Group, University of York.
Geist, r., V. Grdisa, and A. Otley. 2003. “Psychosocial Issues in the Child with Chronic Conditions.” Best Practice & Research Clinical Gastroenterology 17 (2): 141–52.
Genova-maleras, r., e. Alvarez-martin, C. morant-Ginestar, N. Fernandez de larrea-Baz, and F. Catala-lopez. 2012. “measuring the Burden of Disease and Injury in Spain Using Disability-Adjusted life Years: An Updated and Policy-Oriented Overview.” Public Health 126 (12): 1024–31.
Gerhardt, C. A., m. Dixon, K. miller, K. Vannatta, K. S. Valerius, J. Correll, and r. B. Noll. 2007. “educational and Occupational Outcomes among Survivors of Childhood Cancer during the Transition to emerging Adulthood.” Journal of Developmental and Behavioral Pediatrics 28 (6): 448–55.
Grover, S., A. Avasthi, A. Bhansali, S. Chakrabarti, and P. Kulhara. 2005. “Cost of Ambulatory Care of Diabetes mellitus: A Study from North India.” Postgraduate Medical Journal 81 (956): 391–95.
Haveman, r., B. Wolfe, B. Kreider, and m. Stone. 1994. “market Work, Wages, and men’s Health.” Journal of Health Economics 13 (2): 163–82.
Heckman, J. J. 1978. “Dummy endogenous Variables in a Simultaneous equation System.” Econometrica 46 (4): 931–60.
Herquelot, e., A. Guéguen, S. Bonenfant, and r. Dray-Spira. 2011. “Impact of Diabetes on Work Cessation: Data from the GAZel Cohort Study.” Diabetes Care 34 (6): 1344–49.
Holden, l., P. A. Scuffham, m. F. Hilton, r. S. Ware, N. Vecchio, and H. A. Whiteford. 2011. “Which Health Conditions Impact on Productivity in Working Australians?” Journal of Occupational and Environmental Medicine 53 (3): 253–57.

Estimated and Likely Impact of NCDs on Human Capital in Saudi Arabia | 97
Huffman, m. D., K. D. rao, A. Pichon-riviere, D. Zhao, S. Harikrishnan, K. ramaiya, V. S. Ajay, et al. 2011. “A Cross-Sectional Study of the microeconomic Impact of Cardiovascular Disease Hospitalization in Four low- and middle-Income Countries.” PLoS One 6 (6): e20821. doi: 10.1371/journal.pone.0020821.
IHme (Institute for Health metrics and evaluation). 2018. Global Burden of Disease Study 2017. Seattle, WA: IHme.
IlO (International labour Organization). 2009. “Gender equality at the Heart of Decent Work.” Paper presented at the International labour Conference, 98th session, IlO, Geneva, June 15–17, 2009.
Islam, N. 1995. “Growth empirics: A Panel Data Approach.” Quarterly Journal of Economics 110 (4): 1127–70.
Jäckle, r., and O. Himmler. 2010. “Health and Wages: Panel Data estimates Considering Selection and endogeneity.” Journal of Human Resources 45 (2): 364–406.
Jones, A. m., N. rice, and J. roberts. 2010. “Sick of Work or Too Sick to Work? evidence on Self-reported Health Shocks and early retirement from the BHPS.” Economic Modelling 27 (4): 866–80.
Kaffenberger, C. J. 2006. “School reentry for Students with a Chronic Illness: A role for Professional School Counselors.” Professional School Counseling 9 (3): 223–30.
Keogh-Brown, m. r., H. T. Jensen, H. m. Arrighi, and r. D. Smith. 2016. “The Impact of Alzheimer’s Disease on the Chinese economy.” EBioMedicine 4 (February): 184–90.
Klarenbach, S., T. Stafinski, T. longobardi, and P. Jacobs. 2002. “The effect of renal Insufficiency on Workforce Participation in the United States: An Analysis Using National Health and Nutrition examination Survey III Data.” American Journal of Kidney Diseases 40 (6): 1132–37.
Kontsevaya, A., A. Kalinina, and r. Oganov. 2013. “economic Burden of Cardiovascular Diseases in the russian Federation.” Value in Health Regional Issues 2 (2): 199–204.
KSA (Kingdom of Saudi Arabia). 2017. Vision 2030. riyadh: KSA. https://vision2030.gov.sa.
lakdawalla, D. N., e. C. Sun, A. B. Jena, C. m. reyes, D. P. Goldman, and T. J. Philipson. 2010. “An economic evaluation of the War on Cancer.” Journal of Health Economics 29 (3): 333–46.
lancashire, e., C. Frobisher, r. reulen, D. Winter, A. Glaser, and m. Hawkins. 2010. “educational Attainment among Adult Survivors of Childhood Cancer in Great Britain: A Population-Based Cohort Study.” Journal of the National Cancer Institute 102 (4): 254–70.
langer, A., A. meleis, F. m. Knaul, r. Atun, m. Aran, H. Arreola-Ornelas, Z. A. Bhutta, et al. 2015. “Women and Health: The Key for Sustainable Development.” The Lancet Commissions 386 (9999): 1165–210.
lavigne, J. e., C. e. Phelps, A. mushlin, and W. m. lednar. 2003. “reductions in Individual Work Productivity Associated with Type 2 Diabetes mellitus.” Pharmacoeconomics 21 (15): 1123–34.
lee, l.-F. 1982. “Health and Wage: A Simultaneous equation model with multiple Discrete Indicators.” International Economic Review 23 (1): 199–221.
lindeboom, m., and m. Kerkhofs. 2009. “Health and Work of the elderly: Subjective Health measures, reporting errors and endogeneity in the relationship between Health and Work.” Journal of Applied Econometrics 24 (6): 1024–46.
lópez-Casasnovas, G., B. rivera, and l. Currais. 2005. Health and Economic Growth: Findings and Policy Implications. Cambridge, mA: mIT Press.
marphatia, A. A., and r. moussié. 2013. “A Question of Gender Justice: exploring the linkages between Women’s Unpaid Care Work, education, and Gender equality.” International Journal of Educational Development 33 (6): 585–94.
martinez, Y. J., and K. ercikan. 2009. “Chronic Illnesses in Canadian Children: What Is the effect of Illness on Academic Achievement, and Anxiety and emotional Disorders?” Child Care Health and Development 35 (3): 391–401.
maslow, G. r., A. A. Haydon, A. l. mcree, and C. T. Halpern. 2012. “Protective Connections and educational Attainment among Young Adults with Childhood-Onset Chronic Illness.” Journal of School Health 82 (8): 364–70.

98 | NONCOmmUNICABle DISeASeS IN SAUDI ArABIA
mayfield, J. A., P. Deb, and l. Whitecotton. 1999. “Work Disability and Diabetes.” Diabetes Care 22 (7): 1105–09.
mitby, P. A., l. l. robison, J. A. Whitton, m. A. Zevon, I. C. Gibbs, J. m. Tersak, A. T. meadows, et al. 2003. “Utilization of Special education Services and educational Attainment among long-Term Survivors of Childhood Cancer.” Cancer 97 (4): 1115–26.
murphy, K. m., and r. H. Topel. 2006. “The Value of Health and longevity.” Journal of Political Economy 114 (4, August): 871–904.
murray, P. D., F. Dobbels, D. C. lonsdale, and P. N. Harden. 2014. “Impact of end-Stage Kidney Disease on Academic Achievement and employment in Young Adults: A mixed methods Study.” Journal of Adolescent Health 55 (4): 505–12.
Newacheck, P. W., and N. Halfon. 1998. “Prevalence and Impact of Disabling Chronic Conditions in Childhood.” American Journal of Public Health 88 (4): 610–17.
Niens, l. m., A. Cameron, e. Van de Poel, m. ewen, W. B. F. Brouwer, and r. laing. 2010. “Quantifying the Impoverishing effects of Purchasing medicines: A Cross-Country Comparison of the Affordability of medicines in the Developing World.” PLoS Med 7 (8): e1000333.
Nikoloski, Z. 2017. “multi-Country Study on Determinants of Child mortality in eastern and Southern Africa.” A report prepared for UNICeF regional Office for eastern and Southern Africa, Nairobi.
Nikoloski, Z. 2018. “equity of Immunization in Zambia.” A report prepared for the UNICeF Country Office in Zambia, lusaka, July 2018.
Nikoloski, Z. 2020. “Determinants of Diabetes in Kuwait: evidence from the World Health Survey.” Kuwait Programme Paper Series 6, lSe middle east Centre, london.
Nikoloski, Z. 2021. “Covid-19 and Non-Communicable Diseases: evidence from a Systematic literature review.” Unpublished mss. Saudi Public Health Authority, riyadh; World Bank, Washington, DC.
Pinquart, m., and D. Teubert. 2011. “Academic, Physical, and Social Functioning of Children and Adolescents with Chronic Physical Illness: A meta-Analysis.” Journal of Pediatric Psychology 37 (4): 376–89.
Psacharopoulos, G., and H. A. Patrinos. 2018. “returns to Investment in education: A Decennial review of the Global literature.” Policy research Working Paper 8402, World Bank, Washington, DC.
rao, K. D., A. Bhatnagar, and A. murphy. 2011. “Socio-economic Inequalities in the Financing of Cardiovascular & Diabetes Inpatient Treatment in India.” Indian Journal of Medical Research 133 (1): 57–63.
rayappa, P. H., K. N. m. raju, A. Kapur, S. Bjork, C. Sylvest, and K. m. Dilip Kumar. 1999. “economic Cost of Diabetes Care: The Bangalore Urban District Diabetes Study.” International Journal of Diabetes in Developing Countries 9: 87–97.
reuben, C. A., and P. N. Pastor. 2013. “The effect of Special Health Care Needs and Health Status on School Functioning.” Disability and Health Journal 6 (4): 325–32.
rice, D. P. 2000. “Cost of Illness Studies: What Is Good about Them?” Injury Prevention 6 (3): 177–79.
rodbard, H. W., A. J. Green, K. m. Fox, and S. Grandy. 2010. “Impact of Type 2 Diabetes mellitus on Prescription medication Burden and Out-of-Pocket Healthcare expenses.” Diabetes Research and Clinical Practice 87 (3): 360–65.
Sala-i-martin, X. 1997. “I Just ran Two million regressions.” American Economic Review 87 (2): 178–83.
Sala-i-martin, X., G. Doppelhofer, and r. I. miller. 2004. “Determinants of long-Term Growth: A Bayesian Averaging of Classical estimates (BACe) Approach.” American Economic Review 94 (4): 813–35.
Sandjaja, B. K. P., N. rojroonwasinkul, B. K. le Nyugen, B. Budiman, l. O. Ng, K. Soonthorndhada, H. T. Xuyen, et al. 2013. “relationship between Anthropometric Indicators and Cognitive Performance in Southeast Asian School-Aged Children.” British Journal of Nutrition 110 (Suppl. 3): S57–S64.

Estimated and Likely Impact of NCDs on Human Capital in Saudi Arabia | 99
Seuring, T., O. Archangelidi, and m. Suhrcke. 2015. “The economic Costs of Type 2 Diabetes: A Global Systematic review.” Pharmacoeconomics 33 (8): 811–31.
Shaji, K. S., and m. S. reddy. 2012. “Caregiving: A Public Health Priority.” Indian Journal of Psychological Medicine 34 (4): 303–05.
Shaw, S. r., and P. C. mcCabe. 2008. “Hospital-to-School Transition for Children with Chronic Illness: meeting the New Challenges of an evolving Health Care System.” Psychology in the Schools 45 (1): 74–87.
Shiu, S. 2001. “Issues in the education of Students with Chronic Illness.” International Journal of Disability, Development, and Education 48 (3): 269–81.
Shobhana, r., P. rama rao, A. lavanya, r. Williams, V. Vijay, and A. ramachandran. 2000. “expenditure on Health Care Incurred by Diabetic Subjects in a Developing Country—A Study from Southern India.” Diabetes Research and Clinical Practice 48 (1): 37–42.
Short, P. F., J. J. Vasey, and r. Belue. 2008. “Work Disability Associated with Cancer Survivorship and Other Chronic Conditions.” Psycho-Oncology 17 (1): 91–7.
Stenberg, K., H. Axelson, P. Sheehan, I. Anderson, A. m. Gülmezoglu, m. Temmerman. e. mason, et al. 2014. “Advancing Social and economic Development by Investing in Women’s and Children’s Health: A New Global Investment Framework.” The Lancet 383 (9925): 1333–54.
Stewart, W. F., J. A. ricci, e. Chee, A. G. Hirsch, and N. A. Brandenburg. 2007. “lost Productive Time and Costs due to Diabetes and Diabetic Neuropathic Pain in the US Workforce.” Journal of Occupational and Environmental Medicine 49 (6): 672–79.
Suhrcke, m., and D. m. Urban. 2006. “Are Cardiovascular Diseases Bad for economic Growth?” CeSifo Working Paper 1845, CeSifo, munich. https://www.ifo.de/DocDl/cesifo1_wp1845 . pdf.
Thompson, r. J. Jr., and K. e. Gustafson. 1996. Adaptation to Chronic Childhood Illness. Washington, DC: American Psychological Association Press.
Tunceli, K., C. J. Bradley, D. Nerenz, l. K. Williams, m. Pladevall, and J. e. lafata. 2005. “The Impact of Diabetes on employment and Work Productivity.” Diabetes Care 28 (11): 2662–67.
UN (United Nations). 2016. “Sustainable Development Goals: 17 Goals to Transform Our World. Goal 3: ensure Healthy lives and Promote Well-being for All at All Ages.” United Nations, New York. https://sdgs.un.org/goals/goal3.
UN (United Nations) DeSA (Department of economic and Social Affairs). 2019. World Population Prospects 2019. New York: UN Population Division, DeSA.
Vamos, e. P., I. mucsi, A. Keszei, m. A. Kopp, and m. Novak. 2009. “Comorbid Depression Is Associated with Increased Healthcare Utilization and lost Productivity in Persons with Diabetes: A large Nationally representative Hungarian Population Survey.” Psychosomatic Medicine 71 (5): 501–07.
Viscusi, W. K., and J. e. Aldy. 2003. “The Value of a Statistical life: A Critical review of market estimates throughout the World.” Journal of Risk and Uncertainty 27 (1): 5–76.
Weil, D. N. 2014. “Health and economic Growth.” In The Handbook of Economic Growth, vol. 2, edited by P. Aghion and S. N. Durlauf. Amsterdam: North Holland.
Whiting, D. r., l. Guariguata, C. Weil, and J. Shaw. 2011. “IDF Diabetes Atlas: Global estimates of the Prevalence of Diabetes for 2011 and 2030.” Diabetes Research and Clinical Practice 94(3): 311–21. doi: 10.1016/j.diabres.2011.10.029.
WHO (World Health Organization). 2009. WHO Guide to Identifying the Economic Consequences of Disease and Injury. Geneva: WHO.
WHO (World Health Organization). 2018. “KSA NCD Profile.” WHO, Geneva. https://www .who.int/nmh/countries/2018/sau_en.pdf?ua=1.
World Bank. 2018. Human Capital Project (database). Washington, DC: World Bank. https://www.worldbank.org/en/publication/human-capital (accessed July 3, 2020).
World Bank. 2019. World Development Indicators (database). Washington, DC: World Bank. https://databank.worldbank.org/source/world-development-indicators.

100 | NONCOmmUNICABle DISeASeS IN SAUDI ArABIA
Yassin, A. S., G. l. Beckles, and m. l. messonnier. 2002. “Disability and Its economic Impact among Adults with Diabetes.” Journal of Occupational and Environmental Medicine 44 (2): 136–42.
Zebrack, B. J., l. K. Zeltzer, J. Whitton, A. C. mertens, l. Odom, r. Berkow, and l. l. robison. 2002. “Psychological Outcomes in long-Term Survivors of Childhood leukemia, Hodgkin’s Disease, and Non-Hodgkin’s lymphoma: A report from the Childhood Cancer Survivor Study.” Pediatrics 110 (1, pt. 1): 42–52.
Zhao, Z., and m. Winget. 2011. “economic Burden of Illness of Acute Coronary Syndromes: medical and Productivity Costs.” BMC Health Services Research 11: Art. 35.
Zheng, H., F. ehrlich, and J. Amin. 2010. “Productivity loss resulting from Coronary Heart Disease in Australia.” Applied Health Economics and Health Policy 8 (3): 179–89.
101
KEY MESSAGES
• While Saudi Arabia has a rich inventory of strategies and guiding policies to address noncommunicable diseases (NCDs), several gaps are evident, partic-ularly related to the monitoring and evaluation of interventions. Addressing these gaps would help to strengthen efforts to prevent NCDs in Saudi Arabia.
• Many of the existing strategies target the same goals, and no strategy has an adequate accountability framework. Objectives, targets, and implementation approaches need to be consolidated across agencies.
• Saudi Arabia does not need additional strategies. Instead, the country needs strategic direction to guide implementation of the existing strategies and policies.
• Multisectoral collaboration will be key to effective implementation. In addi-tion, the generation of local evidence needs to be strengthened to ensure that the design of policies is based on local evidence and contexts.
BACKGROUND
Saudi Arabia is committed to combating the problem of NCDs and has developed several strategies and policies to tackle them and their risk factors, both behav-ioral and biological. One of the goals of Vision 2030 is to increase the percentage of the population above 15 years of age who exercise regularly, underscoring the importance placed on NCD prevention and reform efforts (Vision Realization Office 2016). Additionally, the National Transformation Program seeks to con-trol NCDs like cardiac issues, diabetes, and cancer by improving awareness of, research on, and national records of these diseases (Vision Realization Office 2018). Tackling NCD risk factors is a very high priority, and multiple programs have been launched to raise awareness and decrease the short-term and long-term impacts of NCDs and their associated risk factors.
NCD Planning in Saudi Arabia EXISTING STRATEGIES AND GUIDING POLICIES
ADA ALQUNAIBET, MARIAM M. HAMZA, AND REHAB ALASWAD
6

102 | NONCOMMuNICAble DISeASeS IN SAuDI ARAbIA
This chapter reviews the existing strategies and policies that focus on NCD prevention in Saudi Arabia. A strategy is a general direction that is set for the sector and its various components to achieve a desired state in the future. A policy is a deliberate system of principles to guide decisions and achieve rational outcomes. It is a statement of intent and is implemented as a procedure or protocol. Policies are generally adopted by a governance body within an organization. This chapter reviews the existing strategies and pol-icies on NCD prevention in Saudi Arabia, summarizes their goals and key performance indicators, and presents a set of recommendations to make the operationalization and implementation of policy more effective. A final sec-tion concludes, followed by an annex listing the documents reviewed (table 6A.1), mapping strategies and interventions to address biological and behavioral risk factors (tables 6A.2 and 6A.3), and presenting translated and interpreted excerpts of the Gulf Plan for the Prevention and Control of Noncommunicable Diseases
METHODOLOGY
This chapter is based on a review of existing documents and websites as well as input from stakeholders and consultations. A thorough review of official docu-ments and government entity websites was conducted to identify the strategies and programs currently in place. In addition, the chapter benefited from in-depth information provided by the School Health team within the Ministry of education, the Healthy Food and Tobacco teams within the Saudi Food and Drug Authority (SFDA), and the Model of Care team within the Vision Realization Office. To ensure comprehensiveness, the reviewed documents were presented during a multisectoral workshop, which included participants from diverse sectors.
Inclusion and exclusion criteria used to select strategies and policies for this review were jointly agreed. The inclusion criteria for strategies and pol-icies are as follows: (1) strategies that were designed by a specific agency; (2) strategies that identified a specific monitoring agency; and (3) policies that were being implemented or that were fully designed and pending imple-mentation. Some clinical guidelines were also taken into account if they included actions that relate directly to NCD risk factors—for example, the Saudi Asthma Pocket Guidelines and the Saudi Guidelines on Prevention and Management of Obesity.
Following similar analyses conducted by Chimeddamba et al. (2015) and Murphy et al. (2019), this study designed an analytical tool to extract relevant information about Saudi Arabia’s existing strategies and policies. Table 6.1 provides an overview of this tool and the areas of information that were collected on each strategy and policy. The strategies and policies were analyzed collectively based on three key domains of evidence-based policy: (1) process, which is used to understand approaches to enhance the likelihood of policy adoption; (2) content, which is used to identify specific policy elements that are likely to be effective; and (3) outcomes, which are used to document the potential impact of policy (brownson, Chriqui, and Stamatakis 2009).
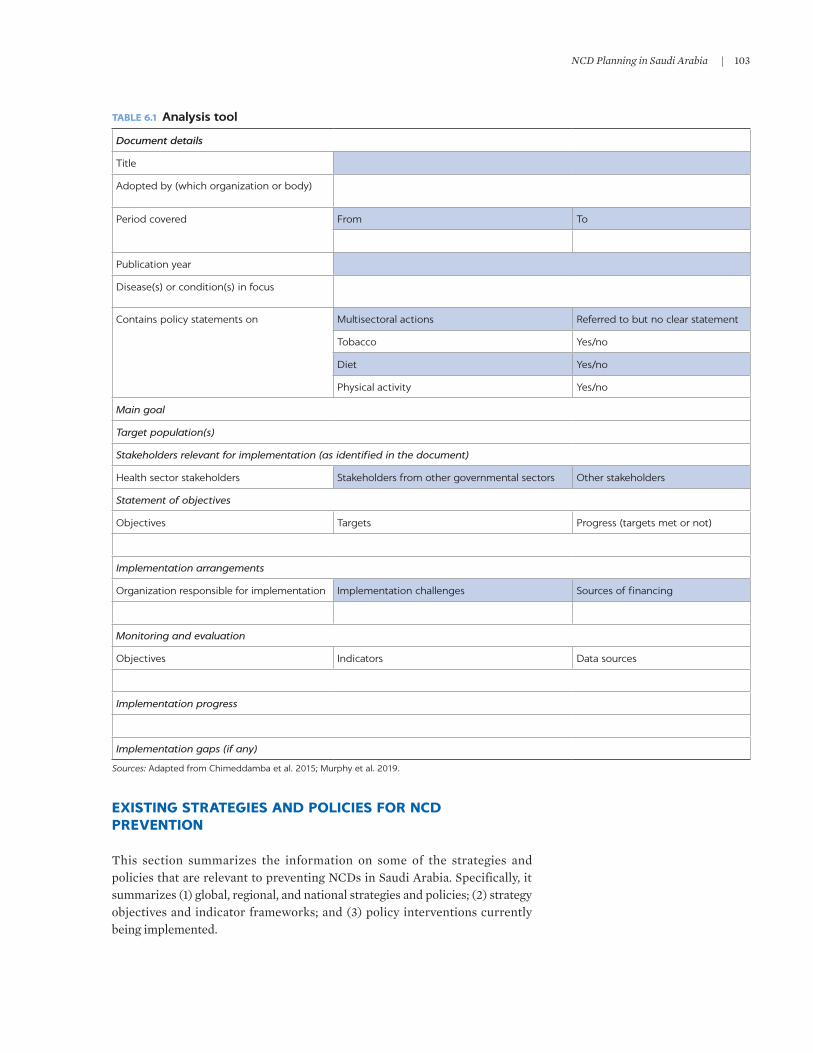
NCD Planning in Saudi Arabia | 103
TABLE 6.1 Analysis tool
Document details
Title
Adopted by (which organization or body)
Period covered From To
Publication year
Disease(s) or condition(s) in focus
Contains policy statements on Multisectoral actions Referred to but no clear statement
Tobacco Yes/no
Diet Yes/no
Physical activity Yes/no
Main goal
Target population(s)
Stakeholders relevant for implementation (as identified in the document)
Health sector stakeholders Stakeholders from other governmental sectors Other stakeholders
Statement of objectives
Objectives Targets Progress (targets met or not)
Implementation arrangements
Organization responsible for implementation Implementation challenges Sources of financing
Monitoring and evaluation
Objectives Indicators Data sources
Implementation progress
Implementation gaps (if any)
Sources: Adapted from Chimeddamba et al. 2015; Murphy et al. 2019.
EXISTING STRATEGIES AND POLICIES FOR NCD PREVENTION
This section summarizes the information on some of the strategies and policies that are relevant to preventing NCDs in Saudi Arabia. Specifically, it summarizes (1) global, regional, and national strategies and policies; (2) strategy objectives and indicator frameworks; and (3) policy interventions currently being implemented.

104 | NONCOMMuNICAble DISeASeS IN SAuDI ARAbIA
Global, regional, and national strategies and policies
At the global level, the World Health Organization (WHO) NCD Global Monitoring Framework sets the strategic direction for NCD prevention efforts in Saudi Arabia. The NCD Global Monitoring Framework was developed follow-ing the Political Declaration on Noncommunicable Diseases adopted by the united Nations General Assembly in 2011 to enable the global tracking of prog-ress on preventing and controlling major NCDs—cardiovascular diseases, can-cers, chronic lung diseases, and diabetes—and their key risk factors (WHO 2013). This framework set nine targets to be achieved by 2025 (figure 6.1).
NCD prevention in Saudi Arabia is guided by the regional Gulf Plan for Prevention and Control of NCDs 2014–2025, which is closely aligned with the global framework (Gulf Health Council 2019). The Gulf Plan evolved from the Al-Manama Document, which was part of the unified Gulf Plan for Control of Noncommunicable Diseases. In line with the global framework, the Gulf Plan seeks to reduce the preventable and avoidable burden of morbidity, mortality,
FIGURE 6.1
Nine voluntary global targets for 2025
Source: Based on WHO 2013.Note: NCDs = noncommunicable diseases.
10% Reductionin physicalinactivity
10% Reductionin harmful
use of alcohol
30%Reduction in
salt and sodiumintake
Risk factors for NCDs
Mortality and morbidity
National systems response
30%Reduction intobacco use
25% Reductionin raised
blood pressure
0% Increase indiabetes and
obesity
50% Coverageof drug
therapy andcounseling
80% Coverageof essential NCDmedicines andtechnologies
25% Reductionin premature
mortalityfrom NCDs

NCD Planning in Saudi Arabia | 105
and disability due to NCDs through multisectoral collaboration and cooperation at national, regional, and global levels (Gulf Health Council 2019; WHO 2013). The Gulf Plan includes seven broad objectives (figure 6.2) and many objectives and monitoring indicators for tackling NCDs within the plan are identical to those in the NCD Global Monitoring Framework (see tables 6A.2 and 6A.4).
In addition, national strategies provide strategic guidance on NCD prevention—both horizontal strategies (comprehensive strategies that seek to treat all of the underlying issues in a population that cause various diseases and health problems) and vertical strategies (disease-specific top-down strategies that make it easier to obtain funding and measure results). At the macro level, guidance is provided under Vision 2030, which has the broad and ambitious objective of achieving a vibrant society, a thriving economy, and a prosperous nation. Specifically, Vision 2030 aims to optimize and better use the capacity of hospitals and health care centers and to enhance the quality of preventive and therapeutic health care services. Within Vision 2030, the Health Care Transformation Strategy focuses on chronic conditions: helping patients to man-age these conditions by providing integrated care, facilitating patient flow between care settings, and promoting care in the appropriate setting (Vision Realization Office 2016). This improvement is envisioned as being achieved through screening, case coordination, and continuity of care—ensuring the coherence and interconnection of health care events over time.
In addition, the National Strategy for Prevention of NCDs 2014–2025 (MOH 2014b) adopts the Gulf Plan (Gulf Health Council 2019) plus five vertical strate-gies on obesity and healthy diet, one strategy on diabetes control, one on tobacco control, and one specifically on the prevention of cardiovascular disease (table 6.2). Many of the strategies also include some of the same objectives and indicators. The source column in table 6A.2 in annex 6A displays the plans that include each indicator, showing the extent of overlap.
TABLE 6.2 National strategies and plans in Saudi Arabia
NATIONAL STRATEGIES AND PLANS AGENCY OWNERSHIP IMPLEMENTATION PERIOD SOURCE OR REFERENCE
Vision 2030 Vision Realization Office 2016–30 Vision Realization Office 2016
National Strategy for Prevention of NCDs Ministry of Health 2014–25 MOH 2014b
Obesity Control and Prevention Strategy Saudi Public Health Authority
2020–30 SCDC 2019a
Obesity Control Program Strategy Ministry of Health 2014–25 MOH 2014d
Saudi Guidelines on the Prevention and Management of Obesity
Ministry of Health 2016–present MOH 2016
Diet and Physical Activity Strategy (DAPS) Ministry of Health 2014–25 MOH 2014a
Healthy Food Strategy Saudi Food and Drug Administration
2018–30 SFDA 2018
National Executive Plan for Diabetes Control Ministry of Health 2014–25 MOH 2014c
National Strategy for Prevention of Cardiovascular Disease
Ministry of Health 2010–20 MOH 2010
National Plan for Tobacco Control Ministry of Health 2015–30 MOH 2015
Source: Original compilation for this publication.

106 | NONCOMMuNICAble DISeASeS IN SAuDI ARAbIA
Strategy objectives and indicator frameworks
The many vertical national strategies are closely aligned with the objectives and indicators of the regional Gulf Plan (and hence the Global Monitoring Framework). The national strategies—including the tobacco control plan, the hypertension strategy, the obesity strategy, and the diabetes strategy— encompass the same broad objectives that are in the Gulf Plan, tailored to their specific NCD and behavioral risk factors. The Gulf Plan has seven broad objec-tives and many indicators to tackle NCDs, obesity, diabetes, hypertension, and cancer as well as behavioral risk factors such as physical inactivity, unhealthy diet, and tobacco use (Gulf Health Council 2019).
Figure 6.2 illustrates this mapping and how their goals are intertwined. The seven circles represent the seven goals of the Gulf Plan, and each strategy is shown in a different colored box. each line connects the strategy’s goals to the Gulf Plan goals. For example, the diabetes strategy is connected to all seven goals, which means that it includes all seven goals of the Gulf Plan, tailored to diabetes. Taking the first goal of primary prevention of NCDs as an example, the diabetes strategy focuses on the primary prevention of diabetes by (1) fostering awareness of risk factors, (2) encouraging proper diet and sufficient physical activity, (3) reducing tobacco consumption, and (4) enacting legislation that reduces diabetes risk factors (MOH 2014c).
FIGURE 6.2
Alignment of Saudi Arabia’s national vertical strategies with the umbrella Gulf Plan
Source: Original figure for this publication.Note: NCDs = noncommunicable diseases.
National planfor tobacco
control
Hypertensionstrategy
Obesitystrategy
6. Communitypartnership
for NCDcontrol
GulfStrategy
1. Primaryprevention
7. StrengthenNCD monitoring and evaluation
tools
2. Seondaryprevention
Diabetesstrategy
3. Improvethe quality of
health services atthe three levels
provided toNCD patients
4. Conductand strengthen
research andstudy tools
for NCDs
5. Enablepatients and
their families inmanaging and
controllingNCDs

NCD Planning in Saudi Arabia | 107
Policy interventions
In addition to existing strategies, Saudi Arabia is either already implement-ing or preparing to implement many policies and programs that directly or indirectly affect NCDs and their risk factors. As shown in table 6A.3, all of the behavioral and biological risk factors are covered by many policies, highlight-ing the great efforts that the country is making to prevent NCDs and their risk factors. The vast majority of policies and interventions address obesity and diet (figure 6.3).
TOWARD STRATEGIES AND POLICIES FOR RESULTS
based on a review of the gaps and overlaps in existing strategies and policies, this section reflects on how the strategic planning and policy landscape in Saudi Arabia can be strengthened further. To identify these issues, gaps, and overlaps, the objectives and indicators for policies and strategies are mapped to the three behavioral risk factors of smoking, diet, and level of exercise (tables 6A.2 and 6A.3). Only those objectives that fall within the scope of the behavioral and bio-logical risk factors identified in chapter 1 of this document are mapped.1 The following discussion considers the current inventory of strategies and policies that are relevant to NCD prevention.
First, the design of policies needs to be based on local evidence and contexts. It is critical that strategies and policies be tailored and adapted to what works in Saudi Arabia. Public policy making is a continuous, recursive process that relies heavily on scientific evidence and other information (brownson, Chriqui, and Stamatakis 2009). Policy makers can use both quantitative and qualitative data to determine the appropriate policy intervention, with initial information
FIGURE 6.3
Number of interventions mapped to behavioral and biological risk factors in Saudi Arabia
Source: Original compilation for this publication.
2
5
11
12
15
26
30
0 5 10 15 20 25 30 35
Activity
Tobacco use
Hypertension
Hypercholesterolemia
Hyperglycemia
Diet
Obesity
Number of interventions

108 | NONCOMMuNICAble DISeASeS IN SAuDI ARAbIA
possibly being gathered from systematic reviews and other scientific research (brownson, Chriqui, and Stamatakis 2009). experimental studies, such as hypo-thetical impact studies, can be employed to determine whether an intervention is appropriate and likely to succeed in Saudi Arabia. In addition, before they are scaled up fully, interventions can be piloted and key lessons can be learned.
Second, objectives, targets, and implementation approaches need to be con-solidated to prevent duplication in implementation and skewed reporting. Different strategies define objectives, targets, and implementation approaches differently, resulting in overlaps and gaps. For example, some strategies identify one indicator as a target, while another strategy identifies it as an implementa-tion approach. Figure 6.4 shows the use of terms in a strategy to address obesity and overweight. In this case, one strategy might identify reducing the prevalence of overweight and obesity by 10 percent as a target, while another strategy might identify it as the goal or objective.
Third, realistic and achievable plans are needed to guide implementation. While the strategies and policies in place seem to be sufficient to prevent and manage NCDs, the extent to which policies are actually implemented or enforced is not clear. Many of the strategies or policies do not have realistic, implementable plans to operationalize them or sufficient incentives to implement them. even when introduced, without sufficient oversight and enforcement, these plans are likely to fail. In addition, the focus of implementation should be in line with the capacity to implement, which means that not everything can always be addressed at once. In contexts where capacity is limited, implementation can prioritize those high-impact and cost-effective interventions that can be implemented and show results.
Fourth, there is a need to detail accountability and to focus on monitoring and evaluation. As shown in table 6A.2, a great many of the indicators and objectives overlap across different strategies, which each sit with different agencies. The result is a lack of accountability for one organization to meet or even monitor a specific target. Furthermore, although each strategy includes monitoring and evaluation indicators and has many stakeholders, it is not clear which stake-holder is responsible for the implementation and monitoring of which specific objectives.
FIGURE 6.4
Differences in breadth across strategies
Source: Original figure for this publication.Note: NCDs = noncommunicable diseases.
Strategies
Goal
Implementcampaigns to
encouragewalking in the
community
Number ofcampaigns per
year
Primaryprevention
of NCDs
Halt increasesin the rate
of overweightand obesity
Reduce theprevalence of
overweight andobesity by 10%
Objective Target Implementation
approach
Monitoringand evaluation
indicator

NCD Planning in Saudi Arabia | 109
Fifth, there is a need to evaluate impact and use data to ascertain effective-ness. even when strategies and policies are implemented, very little information exists to identify whether they are successful. This dearth of information is due to the lack of data collected to evaluate these policies. Most of the strategies and policies are not linked to any studies or systems that monitor and evaluate effec-tiveness and impact.
Sixth, there is a need for multisectoral coordination in implementation. While the strategies developed and adopted by Saudi Arabia identify many stakehold-ers, a lack of coordination is apparent, especially between health and other stakeholders. None of the strategies clearly mentions how sectors should coor-dinate with one another. The following stakeholders are identified for Saudi Arabia’s strategies and programs:
• Health sector stakeholders – Health practitioners – Ministry of Health – Saudi Public Health Authority – Saudi Food and Drug Authority
• Other government stakeholders – Communications and Information Technology Commission – General Authority for Zakat and Taxation – General Commission for Audiovisual Media – King Abdulaziz City for Science and Technology – Ministry of Commerce and Investment – Ministry of Culture and Information – Ministry of education – Ministry of Finance – Ministry of Interior – Ministry of Islamic Affairs – Ministry of Media – Ministry of Municipal and Rural Affairs – Saudi Customs
• Other stakeholders – Scientific associations – Sports clubs – universities and research centers
CONCLUSIONS
Saudi Arabia has a rich and ambitious inventory of strategies and policies in place to guide NCD prevention. This chapter has shed light on the ambitious comprehensive strategies and policies that delve into the behavioral and biolog-ical risk factors that need to be addressed to prevent NCDs in Saudi Arabia. On paper, the country has many policies to support its strategies.
However, several challenges and concerns remain. One key concern is the lack of information—both evidence generated before implementing a policy and evidence generated after implementation. Such evidence is needed to measure impact. Another concern is the lack of information and evidence that strategies and policies are being implemented or enforced. limited country capacity,

110 | NoNcommuNicable Diseases iN sauDi arabia
moreover, may mean quality over quantity, implying that implementing a few targeted high-impact policies may be more effective than trying to tackle every-thing at once. another issue is the lack of accountability of stakeholders to imple-ment, monitor, and evaluate certain targets. While saudi arabia strategically covers all global objectives, it is not clear which party is responsible for ensuring that progress is occurring. Furthermore, while strategies mention stakeholders, it is not clear whether or how coordination will occur across different sectors to ensure implementation and monitoring and evaluation.
The focus now should be on helping to guide the implementation of existing strategies and policies in order to achieve results. To maximize implementation success, attention needs to be placed on interventions that can realistically be implemented, monitored, and reported on. such interventions need to take into account the unique context of saudi arabia in implementation as well as its existing capacity constraints. The interventions need to be linked to thorough monitoring and implementation frameworks, strategies for generating evidence and learning, and clear accountability frameworks. multisectoral collaboration will be key, as will dedicated commitment to translate the numerous strategies and policies in saudi arabia into results.
ANNEX 6A: SUPPLEMENTAL TABLES
TABLE 6A.1 Reviewed documents
DOCUMENT TITLE SOURCEDOCUMENT TYPE
ARABIC TITLE (IF TRANSLATED)
INCLUDES SPECIFIC TARGETS
BASED ON OTHER
REGIONAL OR GLOBAL
STRATEGIES
SIMILAR TARGETS AS
OTHER REGIONAL OR
GLOBAL STRATEGIES
General Authority of Zakat and Tax Excise Tax Implementation
GAZT 2017 Health policy No No No
Gulf Plan for the Prevention and Control of Noncommunicable Diseases 2014–2025
Gulf Health Council 2019
Regional plan Yes Yes Yes
MOH Dietary Guidelines for Saudis (2012)
MOH 2012 Health policy No No No
National Strategy for Prevention of NCDs 2014–2025
MOH 2014b Health strategy الخطة الوطنية للوقاية من األمراض غير السارية ومكافحتها2014-2025
Yes Yes Yes
National Strategy for Prevention of Cardiovascular Disease
MOH 2010 Health strategy الخطة الوطنية للوقاية من األمراض القلبيةوالوعائية
Yes Yes Yes
Diet and Physical Activity Strategy (DAPS) 2014–2025
MOH 2014a Health strategy Yes Yes Yes
National Plan for Tobacco Control
MOH 2015 Health plan Yes Yes Yes
National Reference of Clinical Guidelines for Care of Diabetic Patients (2014)
MOH 2014e Guidelines No No No
Rashaqa Initiative MOE 2018 Program No No No
(continued)

NCD Planning in Saudi Arabia | 111
TABLE 6A.1, continued
DOCUMENT TITLE SOURCEDOCUMENT TYPE
ARABIC TITLE (IF TRANSLATED)
INCLUDES SPECIFIC TARGETS
BASED ON OTHER
REGIONAL OR GLOBAL
STRATEGIES
SIMILAR TARGETS AS
OTHER REGIONAL OR
GLOBAL STRATEGIES
Health Requirements for School Canteens
MOE and MOH 2013
Health policy االشتراطات الصحيةللمقاصف المدرسية
No No No
Operational Plan for the School Health Administration (2019–2020)
MOE and MOH 2019
Operational plan for all programs
الخطة التشغيلية إلدارة الشؤون الصحيةالمدرسية
للعام الدراسي 2019–2020م1441/1440 ه
Yes (process
indicators only)
No No
Standard Guide for Supervising School Canteens
MOE and MOH 2017
Health policy الدليل الموحد اللشراف على المقاصف المدرسية من وزارة الصحةووزارة التعليم
No No No
National Executive Plan for Diabetes Control
MOH 2014c Health plan الخطة الوطنية التنفيذية لمكافحة داء السكري
Yes Yes Yes
National Transformation Program Delivery Plan 2018–2020
Vision Realization Office 2018
National multisectoral strategy
No No No
Saudi Guidelines on the Prevention and Management of Obesity (2016)
MOH 2016 Health plan No No Yes
Obesity Control Program Strategy
MOH 2014d Health strategy البرنامج الوطني لمكافحة السمنة
Yes Yes Yes
Asthma Pocket Guidelines (2013) Saudi National Committee on Asthma 2013
Guidelines No No No
Obesity Control and Prevention Strategy 2020–2030
SCDC 2019a Health strategy Yes Yes No
National Tobacco Control Strategy
SCDC 2019b Health strategy Yes Yes Yes
Healthy Food Strategy SFDA 2018 Health strategy No Yes No
Proper Labeling of Mixed Oils Food (2016)
SFDA 2016 Health and other sector policy
No No No
Draft Regulation: Added Sugar Upper Limit in Some Food Products
SFDA n.d. Health and other sector policy
No No No
KSA Vision 2030 Vision Realization Office 2016
National multisectoral strategy
Yes Yes No
WHO NCD Global Monitoring Framework (Including Voluntary Targets)
WHO 2013 Global strategy Yes Yes Yes
Source: Original compilation for this publication.Note: KSA = Kingdom of Saudi Arabia. NCDs = noncommunicable diseases. WHO = World Health Organization.

112 |
NO
NC
OM
Mu
NIC
Ab
le
DISe
ASe
S IN SA
uD
I AR
Ab
IA
TABLE 6A.2 Objectives of Saudi Arabia’s strategies mapped to NCD and risk factors
OBJECTIVE OR INDICATOR
BIOLOGICAL RISK FACTORS BEHAVIORAL RISK FACTORS
STRATEGY OR PLAN HYPERTENSIONHYPER-
CHOLESTEROLEMIA HYPERGLYCEMIA OBESITY DIET ACTIVITYTOBACCO
USE
Halt the increase in prevalence of overweight and obesity measured through body mass index (BMI):• Reduce the prevalence of
overweight and obesity by 10% (Diabetes Plan)
• Lower the prevalence of moderate obesity (waist-to-hip ratio) (Diabetes Plan)
• Lower the prevalence of moderate obesity (waist circumference) (Diabetes Plan)
• Halt the increase in obesity in children and adolescents (Rashaqa Initiative)
Gulf Plan for the Prevention and Control of Noncommunicable Diseases 2014–2025
Obesity Control and Prevention Strategy 2020–2030
National Strategy for Prevention of NCDs 2014–2025
World Health Organization (WHO) NCD Global Monitoring Framework
National Strategy for Prevention of Cardiovascular Disease
National Executive Plan for Diabetes Control 2014–2025
Stop the increase in the prevalence of high blood glucose
Gulf Plan for the Prevention and Control of Noncommunicable Diseases 2014–2025
National Strategy for Prevention of NCDs 2014–2025
WHO NCD Global Monitoring Framework
Achieve a 10% relative decrease in the prevalence of inadequate physical activity: • Diabetes Plan and Obesity Plan
(20%)
Gulf Plan for the Prevention and Control of Noncommunicable Diseases 2014–2025
National Strategy for Prevention of NCDs 2014–2025
WHO NCD Global Monitoring Framework
National Strategy for Prevention of Cardiovascular Disease
National Executive Plan for Diabetes Control 2014–2025
Obesity Control Program Strategy 2014–2025
Saudi Guidelines on the Prevention and Management of Obesity
(continued)

NC
D Planning in Saudi A
rabia |
113
TABLE 6A.2, continued
OBJECTIVE OR INDICATOR
BIOLOGICAL RISK FACTORS BEHAVIORAL RISK FACTORS
STRATEGY OR PLAN HYPERTENSIONHYPER-
CHOLESTEROLEMIA HYPERGLYCEMIA OBESITY DIET ACTIVITYTOBACCO
USE
Achieve a 30% relative decrease in the prevalence of tobacco use among individuals 15 years of age or older• 5% (Diabetes Plan)• Reduce the rate of exposure to
secondhand smoke by 80% (Diabetes Plan)
Gulf Plan for the Prevention and Control of Noncommunicable Diseases 2014–2025
National Strategy for Prevention of NCDs 2014–2025
WHO NCD Global Monitoring Framework
National Strategy for Prevention of Cardiovascular Disease
National Executive Plan for Diabetes Control 2014–2025
Achieve a 25% relative decrease in the prevalence of hypertension
Gulf Plan for the Prevention and Control of Noncommunicable Diseases 2014–2025
National Strategy for Prevention of NCDs 2014–2025
WHO NCD Global Monitoring Framework
National Strategy for Prevention of Cardiovascular Disease
Achieve a 30% relative decrease in the average salt and sodium intake of the population
Gulf Plan for the Prevention and Control of Noncommunicable Diseases 2014–2025
National Strategy for Prevention of NCDs 2014–2025
WHO NCD Global Monitoring Framework
Saudi Guidelines on the Prevention and Management of Obesity
Lower the intake of saturated fats and foods rich in monosaccharides by 10%
Obesity Control Program Strategy 2014–2025
Saudi Guidelines on the Prevention and Management of Obesity
(continued)

114 |
NO
NC
OM
Mu
NIC
Ab
le
DISe
ASe
S IN SA
uD
I AR
Ab
IA
TABLE 6A.2, continued
OBJECTIVE OR INDICATOR
BIOLOGICAL RISK FACTORS BEHAVIORAL RISK FACTORS
STRATEGY OR PLAN HYPERTENSIONHYPER-
CHOLESTEROLEMIA HYPERGLYCEMIA OBESITY DIET ACTIVITYTOBACCO
USE
Increase the rate of vegetable consumption per capita to three daily servings by 20%
Gulf Plan for the Prevention and Control of Noncommunicable Diseases 2014–2025
Healthy Food Plan
National Strategy for Prevention of NCDs 2014–2025
WHO NCD Global Monitoring Framework
National Executive Plan for Diabetes Control 2014–2025
Obesity Control Program Strategy 2014–2025
Saudi Guidelines on the Prevention and Management of Obesity
Reduce the expenditures for advanced clinical care of overweight and obesity
Obesity Control and Prevention Strategy 2020–2030
Achieve a given % of the target population meeting both daily nutrition and physical activity:• Achieve 20% of persons over
age 15 who meet physical activity goals
• Increase the % of persons who engage in sports at least once a week from 13% to 40%
Obesity Control and Prevention Strategy 2020–2030
Vision 2030
Rashaqa Initiative
Reduce national consumption of sugar
Obesity Control and Prevention Strategy 2020–2030
Achieve a given % of target population who know their body weight status
Obesity Control and Prevention Strategy 2020–2030
Achieve a given % of at-risk and diagnosed individuals who use first-line weight management
Obesity Control and Prevention Strategy 2020–2030
(continued)

NC
D Planning in Saudi A
rabia |
115
TABLE 6A.2, continued
OBJECTIVE OR INDICATOR
BIOLOGICAL RISK FACTORS BEHAVIORAL RISK FACTORS
STRATEGY OR PLAN HYPERTENSIONHYPER-
CHOLESTEROLEMIA HYPERGLYCEMIA OBESITY DIET ACTIVITYTOBACCO
USE
Achieve a given % of target population who report having the information, skills, and confidence to make healthy choices on diet and physical activity
Obesity Control and Prevention Strategy 2020–2030
Increase the packaged food options that have reduced salt, sugar, and fats
Obesity Control and Prevention Strategy 2020–2030
Increase formal or informal options for sports and recreational activity
Obesity Control and Prevention Strategy 2020–2030
Achieve a given % of target population who know where to get screened for overweight and obesity, nutrition, and physical activity
Obesity Control and Prevention Strategy 2020–2030
Achieve a given % of clusters that have both clinic- and community-based screening for overweight and obesity
Obesity Control and Prevention Strategy 2020–2030
Reduce the prevalence of high triglycerides
National Strategy for Prevention of Cardiovascular Disease
Reduce the prevalence of high cholesterol by 5%a
National Strategy for Prevention of Cardiovascular Disease
WHO NCD Global Monitoring Framework
National Executive Plan for Diabetes Control 2014–2025
Raise population awareness of diabetes by 50%
National Executive Plan for Diabetes Control 2014–2025
Increase the number of early detection programs for cases of diabetes, metabolic syndrome, and risk factors
National Executive Plan for Diabetes Control 2014–2025
(continued)

116 |
NO
NC
OM
Mu
NIC
Ab
le
DISe
ASe
S IN SA
uD
I AR
Ab
IA
TABLE 6A.2, continued
OBJECTIVE OR INDICATOR
BIOLOGICAL RISK FACTORS BEHAVIORAL RISK FACTORS
STRATEGY OR PLAN HYPERTENSIONHYPER-
CHOLESTEROLEMIA HYPERGLYCEMIA OBESITY DIET ACTIVITYTOBACCO
USE
Increase the % of diabetes cases detected in the targeted groups in early detection programs
National Executive Plan for Diabetes Control 2014–2025
Raise population awareness of obesity by 50%
Obesity Control Program Strategy 2014–2025
Increase health awareness to improve nutritional and physical behavior by 50%
Diet and Physical Activity Strategy (DAPS) 2014–2025
Increase the % of the population who are aware of the dangers of tobacco use and change the behavior of members of the community by 10% every five years
National Plan for Tobacco Control
Reduce the % of young people 13–15 years of age who use tobacco by 30% from the current situation
National Plan for Tobacco Control
Increase the impact of applying health warnings on tobacco products on members of the community
National Plan for Tobacco Control
Increase the % of smoking-free areas
National Plan for Tobacco Control
Reduce the % of tobacco emissions in the air in enclosed public places
National Plan for Tobacco Control
Increase the % of quitters of tobacco use
National Plan for Tobacco Control
Increase the number of smoking cessation clinics for the population
National Plan for Tobacco Control
Provide a hotline or modern communication techniques for quitting tobacco use
National Plan for Tobacco Control
(continued)

NC
D Planning in Saudi A
rabia |
117
TABLE 6A.2, continued
OBJECTIVE OR INDICATOR
BIOLOGICAL RISK FACTORS BEHAVIORAL RISK FACTORS
STRATEGY OR PLAN HYPERTENSIONHYPER-
CHOLESTEROLEMIA HYPERGLYCEMIA OBESITY DIET ACTIVITYTOBACCO
USE
Improve the average ratio of saturated fatty acids to total energy intake in persons 18 years of age or older
Gulf Plan for the Prevention and Control of Noncommunicable Diseases 2014–2025
WHO NCD Global Monitoring Framework
Reduce the impact on children of marketing foods and nonalcoholic beverages high in saturated fats, trans fatty acids, free sugars, or salt
WHO NCD Global Monitoring Framework
Achieve the adoption of national policies that limit saturated fatty acids and virtually eliminate partially hydrogenated vegetable oils in the food supply, as appropriate, within the national context and national programs
WHO NCD Global Monitoring Framework
Source: Original compilation for this publication.a. Cholesterol is measured through the prevalence of raised total cholesterol among persons 18 years of age and older. High cholesterol is defined as total cholesterol that is 5.0 millimoles per liter (mmol/l) or greater or 190 milligrams per deciliter (mg/dl), and mean concentration of total cholesterol, which is also monitored in the Gulf Plan and the WHO Global Monitoring Framework with no specific reduction targets.

118 |
NO
NC
OM
Mu
NIC
Ab
le
DISe
ASe
S IN SA
uD
I AR
Ab
IA
TABLE 6A.3 Policy interventions and programs in Saudi Arabia, by risk factor
POLICY OR PROGRAM
BIOLOGICAL RISK FACTORS BEHAVIORAL RISK FACTORS
HYPERTENSIONHYPER-
CHOLESTEROLEMIA HYPERGLYCEMIA OBESITY DIET ACTIVITY TOBACCO USE
100% VAT on tobacco products• Includes e-cigarettes• Includes liquids and other e-cigarette needs
50% VAT on sodasa
100% VAT on energy drinks
50% VAT on added-sugar drinksb
Ban energy drink and soda sales in hospitals and public health facilities
Place an upper limit on added sugar in some food products, including bread, juices, energy drinks, sodas, candy, baked goods, breakfast cereals, peanut butter, jams, fruit snacks, ketchupc
Require plain tobacco packaging
Prohibit smoking in some indoor workplaces and public places, including government, education, health, and cultural facilities and all means of public transport
Enforce a ban on tobacco advertising, promotion, and sponsorship; establish a department to ban advertising
Reduce added table salt in baking flour
Enforce the display of caloric information in restaurants and coffee shops
Develop guidelines for food manufacturers and importers to reduce sugar, salt, and saturated and trans fat in food products
Organize workshops for food manufacturers and importers addressing issues to reduce sugar, salt, and saturated and trans fat content in food products
(continued)

NC
D Planning in Saudi A
rabia |
119
TABLE 6A.3, continued
POLICY OR PROGRAM
BIOLOGICAL RISK FACTORS BEHAVIORAL RISK FACTORS
HYPERTENSIONHYPER-
CHOLESTEROLEMIA HYPERGLYCEMIA OBESITY DIET ACTIVITY TOBACCO USE
Encourage manufacturers to reduce the portion size of their food products
Adopt standardized nutrient analyses
Ensure that SFDA labs as well as private labs are competent enough to carry out the necessary tests to fulfill the objectives of the strategy
Require “added sugar” to be included on nutritional labels
Put nutritional information as traffic light labeling
Identify food types with high sugar content and look for ways to reduce sugar content gradually in such products
Identify food types with high salt content and look for ways to reduce salt content gradually in such products
Encourage manufacturers to replace saturated with unsaturated fat in their food products
Prohibit gradually the use of partially hydrogenated oils in food manufacturing
Ban artificial additives in milk, yoghurt, and fruit juices served in school canteens
Set a maximum amount of 22 grams of sugar in milk and yoghurt served in school canteens
Set a minimum of 30% fruit juice content in juices served in school canteens
Encourage school canteens to use whole wheat bread in the sandwiches they serve
Require other baked goods, like cookies and mamoul, to satisfy the following:• Less than 200 calories • Less than 35% of calories from fat • Less than 10% from saturated fats • Less than 200 milligrams of sodium • At least 1.5 grams of fiber• Free of hydrogenated or trans fats
(continued)

120 |
NO
NC
OM
Mu
NIC
Ab
le
DISe
ASe
S IN SA
uD
I AR
Ab
IA
TABLE 6A.3, continued
POLICY OR PROGRAM
BIOLOGICAL RISK FACTORS BEHAVIORAL RISK FACTORS
HYPERTENSIONHYPER-
CHOLESTEROLEMIA HYPERGLYCEMIA OBESITY DIET ACTIVITY TOBACCO USE
Ban the following in school canteens:• Processed meats • Falafel• Baked goods that include vanilla, chocolate, toffee,
or custard• Ice cream • Fried popcorn • Candy made from sugar • Gum • Nuts with added salt• All fried foods including chips• Pickles• Mayonnaise• Any food with added monosodium glutamate• Products with main ingredient being fat or sugar
Enforce proper labeling of foods containing mixed oils, including the name and percentage of each oil included
Avoid smoking and exposure to secondhand smoking to prevent asthma triggers
Food and Drug Awareness Program (School Health)
Walk for Health Program (School Health)
Checkup Program (School Health)
Fitness Screening Program (School Health)
Healthy Food and Breakfast
Diabetes Awareness Program
Obesity Prevention Awareness Program
Source: Compiled from government documents.Note: SFDA = Saudi Food and Drug Authority. VAT = value added tax.a. The European Union, Switzerland, and the United States have complained about this excise tax at the World Trade Organization, arguing that it is discriminatory because it is based only on the retail price and is not imposed on noncarbonated drinks that contain sugar (Cornwell 2018).b. Starting on December 1, 2019, drinks are taxed at 50% of their retail sale price in line with Gulf Cooperation Council regulations issued in June 2017. The tax applies to any sweetened beverage that consists of water and sugar, sweeteners, concentrated liquids, powders, or extracts converted to beverages.c. In 2019, Saudi Arabia notified the World Trade Organization about Technical Regulation G/TBT/N/SAU/1108. Because of complaints, Saudi Arabia has agreed to review this technical regulation. It will not come into force until further notice.

NCD Planning in Saudi Arabia | 121
TABLE 6A.4 Translated and interpreted excerpts of the Gulf Plan for the Prevention of Noncommunicable Diseases
GOAL OBJECTIVE INDICATORS IMPLEMENTATION APPROACHES
Goal 1: Address the primary prevention of NCDs
Halt increase in the rates of overweight and obesity
Prevalence of overweight and obesity among adolescents
Implement field and media awareness programs and campaigns on risk factors and ways to avoid them
Develop and implement the national strategy on food, physical activity, and health (in light of World Health Organization’s global strategy)
Include and intensify physical activity as a basic subject in schools
Implement campaigns to encourage walking in the community
Encourage the establishment of more walking paths and public parks within a reasonable distance of residents
Improve the quality of food provided in school canteens
Develop a proposal for legislation that reduces risk factors such as:• Labeling laws for foods, drinks,
salt, and trans fats• Advertising for fast food• Tobacco control laws• Public health laws• National policies to limit the
consumption of saturated fatty acids and effectively end the use of partially hydrogenated vegetable oils in food supplies, as appropriate within the national context and national programs
• Policies to reduce the vulnerability of children to the marketing of foods and nonalcoholic drinks high in saturated fats, free sugars, or salt
Age-standardized prevalence rate of overweight and obesity among adults 18 years of age or older;a for adolescents, this identifier is determined according to growth reference criteria
Halt increase in the prevalence of diabetes
Age-standardized prevalence rate for high blood glucose or blood sugar levels among people 18 years of age or olderb
Achieve a 10% relative decrease in the prevalence of inadequate physical activity
Age-standardized prevalence of adults with little physical activity 18 years of age or olderc
Prevalence of inadequate physical activity among adolescentsd
Achieve a 30% relative decrease in the prevalence of tobacco use among individuals 15 years of age or older
Standardized prevalence of tobacco among adolescents
Standardized prevalence of tobacco use among adults 18 years or older
Achieve a 25% relative decrease in the prevalence of hypertension
Age-standardized prevalence of hypertension among adults 18 years of age or oldere
Achieve a 30% relative decrease in the average salt or sodium intake of the population
Standard mean salt intake by age per day in population groups 18 years of age or older
Lower fat intake Average ratio of saturated fatty acids to total energy intake by age in adults 18 years of age or older
Age-standardized prevalence rate of elevated total cholesterol level among adults ages 18 years or olderf
Increase the rate of vegetable consumption per capita
Age-standardized prevalence rate of adults 18 years of age or older who consume inadequate portions of fruits and vegetables dailyg
Prevent cancer % of children 1 year of age who are vaccinated with three doses of hepatitis B vaccination
Availability of human papillomavirus infection vaccination if economically feasible according to national policies
Goal 2: Enhance the secondary prevention of NCDs
Detect NCDs and risk factors early
% of individuals surveyed to detect risk factors from target groups
Enhance the role of primary health care in early detection
Implement a comprehensive and integrated program for early detection of chronic diseases and risk factors in primary health care (opportunistic screening or systematic screening)
(continued)

122 | NONCOMMuNICAble DISeASeS IN SAuDI ARAbIA
TABLE 6A.4, continued
GOAL OBJECTIVE INDICATORS IMPLEMENTATION APPROACHES
Goal 3: Improve the quality of health services provided at the three levels to patients with NCDs and their complications
Ensure that at least 80% of public and private sector facilities have available modern technologies and affordable basic medicines, including generic medicines, necessary to treat major NCDs
% of primary health care centers in the public and private sector in which basic medicines and essential technology are availableh
Establish (or complete) NCD clinics in primary health care
Establish smoking cessation clinics
Provide diagnostic and laboratory services to primary health care centers
Provide necessary medicines to treat NCDs in all primary health care centers
Ensure availability of human resources for health to treat NCDs in primary and secondary care
Provide continued professional development in the field of care and control of NCDs for all health workers
Establish diabetes units in reference hospitals
Establish specialized centers for treating cardiovascular diseases and their complications and rehabilitating patients
Establish cancer treatment centers in reference hospitals
Ensure the availability of services for palliative treatment for cancer
Ensure that at least 50% of people eligible for drug therapy to prevent heart attacks and strokes receive medication and medical advice (including blood sugar control)
% of eligible persons (adults 40 years of age or older) who receive treatment and medical advice, including advice about how to control blood sugar, to prevent heart attacks and strokesi
Find and update guides for health workers in the field of NCDs on a regular basis
Presence of updated national guidelines for the clinical practice of NCDs based on evidence
Extend the application of the guidelines according to the indicators
% of physicians applying the guidelines for workers in the treatment of NCDs
Enact a clear policy for the referral system from primary care to secondary and specialist care
Presence of an effective referral system between primary and secondary care
Goal 4: Conduct and strengthen research and study tools for NCDs
Promote studies and research of national health systems related to NCDs
Number of studies on NCDs related to national health systems research
Conduct research and surveys such as:• A national survey for NCDs and
risk factors every five years• Studies on the economic burden
of diabetes• Tobacco research• Nutrition research• Lifestyle research
Goal 5: Enable patients and their families to manage and control NCDs
Involve patients and their families in taking responsibility for managing their health
% of patients who are able to control NCDs, among all health service attendees
Provide patient training in self-care
Implement individual and group educational programs for patients and their families within the primary care services
Provide the necessary diagnostics, treatment, and rehabilitation
Goal 6: Community partnership for NCD control
Activate partnerships with government and nongovernment institutions, the private sector, and civil society in assuming national responsibility to confront NCDs
Establish a national council or national multisectoral committee to promote health and control NCDs
Establish joint programs and activities between the relevant authorities
(continued)
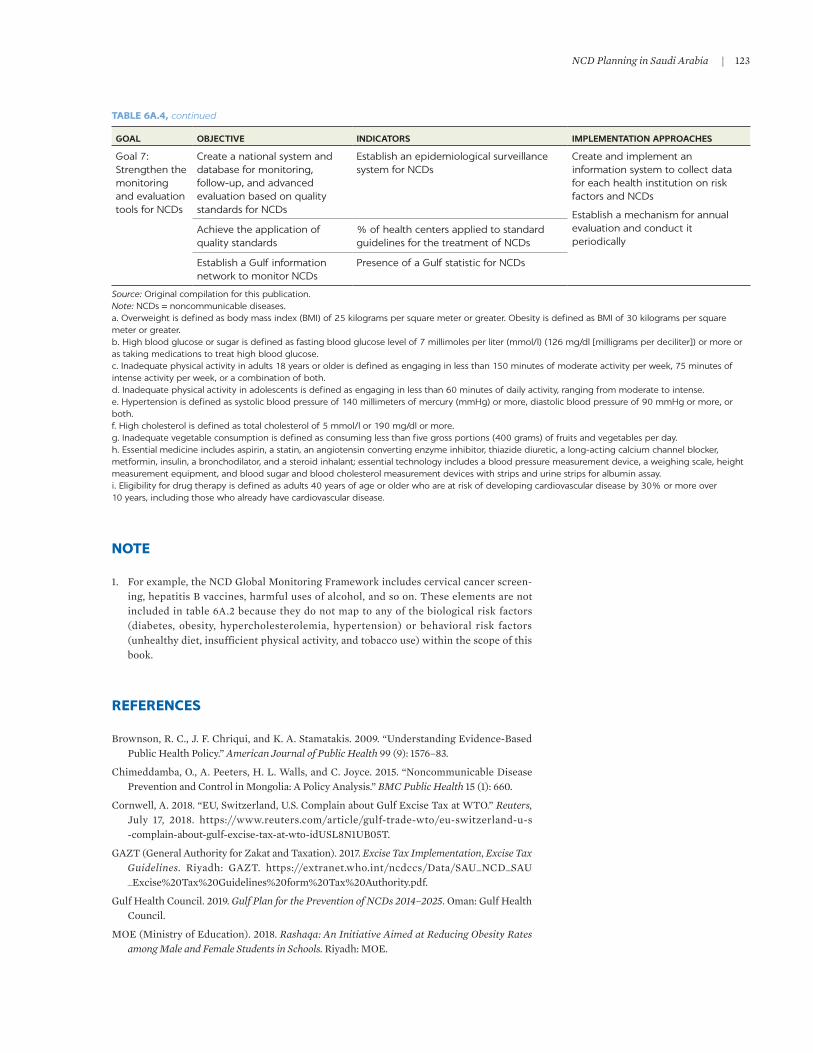
NCD Planning in Saudi Arabia | 123
NOTE
1. For example, the NCD Global Monitoring Framework includes cervical cancer screen-ing, hepatitis b vaccines, harmful uses of alcohol, and so on. These elements are not included in table 6A.2 because they do not map to any of the biological risk factors (diabetes, obesity, hypercholesterolemia, hypertension) or behavioral risk factors (unhealthy diet, insufficient physical activity, and tobacco use) within the scope of this book.
REFERENCES
brownson, R. C., J. F. Chriqui, and K. A. Stamatakis. 2009. “understanding evidence-based Public Health Policy.” American Journal of Public Health 99 (9): 1576–83.
Chimeddamba, O., A. Peeters, H. l. Walls, and C. Joyce. 2015. “Noncommunicable Disease Prevention and Control in Mongolia: A Policy Analysis.” BMC Public Health 15 (1): 660.
Cornwell, A. 2018. “eu, Switzerland, u.S. Complain about Gulf excise Tax at WTO.” Reuters, July 17, 2018. https://www.reuters.com/article/gulf-trade-wto/eu-switzerland-u-s -complain-about-gulf-excise-tax-at-wto-iduSl8N1ub05T.
GAZT (General Authority for Zakat and Taxation). 2017. Excise Tax Implementation, Excise Tax Guidelines. Riyadh: GAZT. https://extranet.who.int/ncdccs/Data/SAu_NCD_SAu _ excise%20Tax%20Guidelines%20form%20Tax%20Authority.pdf.
Gulf Health Council. 2019. Gulf Plan for the Prevention of NCDs 2014–2025. Oman: Gulf Health Council.
MOe (Ministry of education). 2018. Rashaqa: An Initiative Aimed at Reducing Obesity Rates among Male and Female Students in Schools. Riyadh: MOe.
TABLE 6A.4, continued
GOAL OBJECTIVE INDICATORS IMPLEMENTATION APPROACHES
Goal 7: Strengthen the monitoring and evaluation tools for NCDs
Create a national system and database for monitoring, follow-up, and advanced evaluation based on quality standards for NCDs
Establish an epidemiological surveillance system for NCDs
Create and implement an information system to collect data for each health institution on risk factors and NCDs
Establish a mechanism for annual evaluation and conduct it periodically
Achieve the application of quality standards
% of health centers applied to standard guidelines for the treatment of NCDs
Establish a Gulf information network to monitor NCDs
Presence of a Gulf statistic for NCDs
Source: Original compilation for this publication.Note: NCDs = noncommunicable diseases.a. Overweight is defined as body mass index (BMI) of 25 kilograms per square meter or greater. Obesity is defined as BMI of 30 kilograms per square meter or greater. b. High blood glucose or sugar is defined as fasting blood glucose level of 7 millimoles per liter (mmol/l) (126 mg/dl [milligrams per deciliter]) or more or as taking medications to treat high blood glucose.c. Inadequate physical activity in adults 18 years or older is defined as engaging in less than 150 minutes of moderate activity per week, 75 minutes of intense activity per week, or a combination of both. d. Inadequate physical activity in adolescents is defined as engaging in less than 60 minutes of daily activity, ranging from moderate to intense.e. Hypertension is defined as systolic blood pressure of 140 millimeters of mercury (mmHg) or more, diastolic blood pressure of 90 mmHg or more, or both. f. High cholesterol is defined as total cholesterol of 5 mmol/l or 190 mg/dl or more. g. Inadequate vegetable consumption is defined as consuming less than five gross portions (400 grams) of fruits and vegetables per day. h. Essential medicine includes aspirin, a statin, an angiotensin converting enzyme inhibitor, thiazide diuretic, a long-acting calcium channel blocker, metformin, insulin, a bronchodilator, and a steroid inhalant; essential technology includes a blood pressure measurement device, a weighing scale, height measurement equipment, and blood sugar and blood cholesterol measurement devices with strips and urine strips for albumin assay.i. Eligibility for drug therapy is defined as adults 40 years of age or older who are at risk of developing cardiovascular disease by 30% or more over 10 years, including those who already have cardiovascular disease.

124 | NONCOMMuNICAble DISeASeS IN SAuDI ARAbIA
MOe (Ministry of education) and MOH (Ministry of Health). 2013. Health Requirements for School Canteens. Riyadh: MOe.
MOe (Ministry of education) and MOH (Ministry of Health). 2017. Standard Guide for Supervising School Canteens. Riyadh: MOH.
MOe (Ministry of education) and MOH (Ministry of Health). 2019. Operational Plan for the School Health Administration (2019–2020). Riyadh: MOe.
MOH (Ministry of Health). 2010. National Strategy for Prevention of Cardiovascular Disease. Riyadh: MOH.
MOH (Ministry of Health). 2012. Dietary Guidelines for Saudis: The Healthy Food Plan. Riyadh: MOH.
MOH (Ministry of Health). 2014a. “Diet and Physical Activity Strategy (DAPS).” MOH, Riyadh.
MOH (Ministry of Health). 2014b. KSA National Strategy for Prevention of NCDs. Riyadh: MOH.
MOH (Ministry of Health). 2014c. National Executive Plan for Diabetes Control. Riyadh: MOH.
MOH (Ministry of Health). 2014d. Obesity Control Program Strategy 2014–2025. Riyadh: MOH.
MOH (Ministry of Health). 2014e. Saudi Natonal Reference of Clinical Guidelines for Care of Diabetic Patients: Quick Guide. Riyadh: MOH.
MOH (Ministry of Health). 2015. The National Plan for Tobacco Control. Riyadh: MOH.
MOH (Ministry of Health). 2016. Saudi Guidelines on the Prevention and Management of Obesity. Riyadh: MOH.
Murphy, M. M., N. unwin, T. Samuels, T. A. Hassell, l. bishop, and C. Guell. 2019. “evaluating Policy Responses to Noncommunicable Diseases in Seven Caribbean Countries: Challenges to Addressing unhealthy Diets and Physical Inactivity.” Revista Panamericana de Salud Pública 42: e174. https://doi.org/10.26633/RPSP.2018.174.
Saudi National Committee on Asthma. 2013. “Asthma Pocket Guidelines.” Saudi National Committee on Asthma, Riyadh.
SCDC (Saudi Center for Disease Prevention and Control). 2019a. “Obesity Control and Prevention Strategy 2020–2030.” unpublished document, SCDC, Riyadh.
SCDC (Saudi Center for Disease Prevention and Control). 2019b. “National Tobacco Control Strategy.” unpublished document, SCDC, Riyadh.
SFDA (Saudi Food and Drug Authority). 2016. “Proper labeling of Mixed Oils Food.” SFDA, Riyadh.
SFDA (Saudi Food and Drug Authority). 2018. “Healthy Food Strategy.” SFDA, Riyadh. https://old.sfda.gov.sa/ar/awareness/Documents/SFDA-HealthyFoodStrategy.pdf.
SFDA (Saudi Food and Drug Authority). n.d. “Draft Regulation: Added Sugar upper limit in Some Food Products.” SFDA, Riyadh.
Vision Realization Office. 2016. Caring for Our Health: Vision 2030. Riyadh: Visualization Realization Office. https://vision2030.gov.sa/en/node/68.
Vision Realization Office. 2018. National Transformation Program Delivery Plan 2018–2020. Riyadh: Vision Realization Office.
WHO (World Health Organization). 2013. “NCD Global Monitoring Framework.” WHO, Geneva. https://www.who.int/nmh/global_monitoring_framework/en/.

125
KEY MESSAGES
• Based on the available evidence, some effective and cost-effective (or cost- saving) interventions are recommended to improve diets, reduce e-cigarette initiation and smoking, and increase the physical activity of Saudi Arabia’s population.
• The recommended interventions build on a comprehensive suite of policies that have already been implemented in Saudi Arabia.
• The recommended dietary interventions include excise taxes on all unhealthy foods and beverages, food and beverage warning labels, a ban on targeted advertising of unhealthy foods and beverages, a ban on their sale in schools, hospitals, and public health facilities, and interventions to reduce salt consumption.
• Because Saudi Arabia has already implemented a comprehensive suite of antismoking policies, focusing on reducing e-cigarette initiation among young nonsmokers is recommended.
• The recommended interventions regarding physical activity include well- designed school-based programs that appear to boost physical activity in a cost-effective manner.
• A combination of small-scale randomized control trials, secondary data anal-yses using scanner data or food-purchasing data, and large-scale evaluations is also recommended to provide information about which policies are work-ing in Saudi Arabia and which are not.
Population-Wide Interventions to Prevent NCDsA REVIEW OF THE GLOBAL LITERATURE AND RECOMMENDATIONS FOR SAUDI ARABIA
JESSE D. MALKIN, ADA ALQUNAIBET, TIT ALBREHT, ERIC FINKELSTEIN, SEVERIN RAKIC, AND SAMEH EL-SAHARTY
7

126 | NoNcommuNicABle DiSeASeS iN SAuDi ArABiA
BACKGROUND
The health and economic burden of noncommunicable diseases (NcDs) in Saudi Arabia is large and growing. chapter 2 finds a high prevalence of chronic respi-ratory diseases, cardiovascular diseases, and cancers as well as a high prevalence of behavioral and biological risk factors. moreover, the prevalence of both NcDs and risk factors has been rising rapidly (Althubiti and Nour eldein 2018; Bdeir, Farah, and conboy 2014; Herzallah et al. 2019; Saudi Health council 2013). As shown in chapter 3, the NcD burden, as measured by disability-adjusted life years (DAlYs), is expected to increase in Saudi Arabia between 2020 and 2050 from 3,550 to 8,628 per 100,000 for women and from 5,073 to 12,198 per 100,000 for men. The negative impact on health, in turn, has a negative impact on human capital (see chapter 5) and ultimately on economic growth (see chapter 4).
Saudi Arabia has implemented or proposed a set of multipronged interven-tions intended to reduce the prevalence of NcDs. most NcDs can be prevented or delayed through modifiable behavioral risk factors: primarily avoiding tobacco, consuming a healthy diet, and engaging in regular physical activity. The population-wide interventions to reduce NcDs in Saudi Arabia largely aim to address these risk factors. excise taxes and other tobacco control interventions have been introduced to reduce tobacco use. To address poor diet and physical inactivity, Saudi Arabia is relying on excise taxes, product reformulation, nutri-tion labeling and standards, public awareness campaigns, and improvements in urban design.
This chapter reviews these interventions and others that have shown promise elsewhere, assesses the literature on both effectiveness and cost- effectiveness, and offers evidence-based recommendations on interventions that could be adopted moving forward. Although alcohol-related interventions have been shown to be effective in reducing NcDs, they are not discussed here because the sale and consumption of alcohol are illegal in Saudi Arabia.
The remainder of this chapter is organized as follows. Following an overview of the three groups of population-wide interventions often considered and the relevant policies that currently exist in Saudi Arabia, the chapter considers the literature regarding the effectiveness of these interventions, examines their cost-effectiveness, and discusses the policy recommendations for Saudi Arabia. The final section identifies additional evidence needed to support implementation.
POPULATION-WIDE INTERVENTIONS AND THEIR APPLICATION IN SAUDI ARABIA
Tobacco control interventions
There is very strong evidence that smoking tobacco causes NcDs. Physicians, epidemiologists, and public health researchers agree that smoking causes cancer, especially lung cancer. Studies have also established an association between smoking and other NcDs, including cataracts, chronic obstructive pulmonary disorder (coPD), coronary heart disease, oral health problems, stroke, and type 2 diabetes mellitus (uS DHHS 1989, 2014). exposure to secondhand tobacco smoke is associated with NcDs such as asthma in children (uS DHHS 2014).

Population-Wide Interventions to Prevent NCDs | 127
in a short period of time, electronic cigarettes (e-cigarettes) have become widely used. e-cigarettes (including e-pens, e-pipes, e-hookahs, and e-cigars) are cigarette-like electronic devices that use a battery to heat up a liquid, creating an aerosol that users inhale. e-cigarettes have both pros and cons. They have the potential to benefit nonpregnant adult smokers who switch from conventional cigarettes (cDc 2020b). However, this benefit needs to be traded off against the increased uptake of e-cigarettes by persons who might not have smoked at all in their absence.
evidence regarding the use of e-cigarettes as a smoking cessation aid is mixed. in a systematic review and meta-analysis, rahman et al. (2015) find that e- cigarette use is associated with smoking cessation and reduction. in a subse-quent review and meta-analysis, however, Kalkhoran and Glantz (2016) come to the opposite conclusion: e-cigarettes are associated with less quitting among smokers. A third review concludes that a majority of studies have demonstrated a positive relationship between e-cigarette use and smoking cessation, but the evidence overall is inconclusive because of the low quality of published studies (malas et al. 2016). A fourth review concludes that e-cigarettes may be moder-ately effective in achieving cessation, at least in the short run (Franks, Sando, and mcBane 2018). The reasons for the discrepancies between these reviews are not clear.
e-cigarettes are probably less harmful than cigarettes, but they are not harm-less. A review of the evidence published by Public Health england, a uK govern-ment agency, concludes that e-cigarettes are 95 percent less harmful than smoking (mcNeill et al. 2015). However, the aerosol produced by e-cigarettes usually contains nicotine and other potentially dangerous substances such as formaldehyde and acrolein. Nicotine is addictive and can affect brain develop-ment in adolescents (uS DHHS 2014). e-cigarettes may also be a gateway to conventional cigarettes (morgenstern et al. 2018). Their long-term effects on respiratory health are unknown and may not be known for decades (Gotts et al. 2019). From a public health perspective, there is widespread consensus that both tobacco products and e-cigarettes should be targeted for intervention as part of a comprehensive approach to improving health and reducing the burden of NcDs (cDc 2020a).
Shisha is widely used in Saudi Arabia. Shisha (also known as hookah or waterpipe) is a device used to burn wood or charcoal to heat up and vaporize specially prepared flavored tobacco; the vapor or smoke passes through a glass-bottom waterpipe before being inhaled. Studies suggest that shisha has the same health risks as cigarettes, and shisha smokers may inhale more smoke in a single session than cigarette smokers (Primack et al. 2016). in the Arab world, shisha parlors and cafes—which are popular places to socialize—have existed for many years. There is evidence that the use of shisha is “alarmingly high” among teenagers and young adults (Akl et al. 2011). A study of male medical college students in Saudi Arabia’s eastern region reports that the prevalence of shisha smoking is 12.6 percent (Taha et al. 2010). Another study in eastern region finds that 22.8 percent of university students had smoked shisha within the past 30 days and that shisha use is more prevalent than either cigarette use or e-cigarette use (Alshayban and Joseph 2019). A study of students at Taibah university in medina reports that current shisha use is 24.2 percent despite a citywide ban on the sale of tobacco products (Daradka et al. 2019). Nationally, it has been reported that 4.3 percent of Saudis age 15 years and older smoke shisha every day (moradi-lakeh et al. 2015).

128 | NoNcommuNicABle DiSeASeS iN SAuDi ArABiA
Saudi Arabia has undertaken sweeping measures to reduce the consumption of tobacco products—both conventional tobacco products and e-cigarettes (table 7.1). The country initiated a national tobacco control program in 2002 and expanded those efforts in 2005 when it joined the World Health organization (WHo) Framework convention for Tobacco control. Today, Saudi Arabia pro-hibits cigarette smoking in many indoor workplaces and in most public places, including airports, universities, hospitals, public transportation, and govern-ment buildings. Although shisha cafes are abundant, smoking is allowed only in designated smoking rooms in restaurants, cafes, and similar outlets. moreover, cigarettes must be sold in plain packaging with a large health warning label. Since June 2017, all smoked tobacco products have been subject to a 100 percent value added tax (VAT). Since may 2019, e-cigarettes and e-liquids have also been subject to a 100 percent VAT. The sale of tobacco and related products to minors is prohibited. most e-cigarette flavors—cocoa, vanilla, coffee, tea, spices, candy, chewing gum, and alcohol—are banned. Saudi Arabia has taken part in WHo campaigns to increase public awareness of the risks that tobacco poses to health.
Some of the existing tobacco control laws in Saudi Arabia do not apply to e-cigarettes. The sale of smoked tobacco products over the internet is prohib-ited, but the ban does not include internet sales of e-cigarettes. Advertising and promotion of smoked tobacco products is illegal, but advertising of e-cigarettes is legal. There are no data on minors’ exposure to e-cigarette advertising in Saudi Arabia. in the united States, such exposure is substantial (cDc 2017). exposure to e-cigarette advertising increases positive attitudes toward e-cigarettes (Pokhrel et al. 2016) and is associated with subsequent e-cigarette use (chen-Sankey et al. 2019).
Despite the implementation of tobacco control initiatives in Saudi Arabia as far back as 2002, smoking prevalence among individuals 15 years of age and older rose from 2000 to 2016 and has only recently started to decline. By contrast, smoking has been declining in many Western countries. in the united States, for example, the rate of smoking among adults declined 67 percent in the past half century, from 42.6 percent in 1965 to 14.0 percent in 2017, while the rate of smok-ing among youths declined 68 percent, from 27.5 percent in 1991 to 8.8 percent in 2017 (American lung Association n.d.). A similar decline occurred in europe (cancer research uK 2019). However, a 100 percent excise tax on tobacco prod-ucts was implemented in Saudi Arabia only as recently as 2017. A tax of that size
TABLE 7.1 Smoking-related interventions implemented to reduce NCDs in Saudi Arabia
INTERVENTION DESCRIPTION
Excise taxes • 100% VAT on tobacco products
• 100% VAT on e-cigarettes and e-cigarette liquids
Other tobacco and e-cigarette control measures
• Smoke-free workplaces and public places
• Plain packaging and labeling
• Bans on tobacco advertising, promotion, and sponsorship
• E-cigarette regulations, such as a ban on some flavored e-liquids
• Public awareness campaigns
Source: Original compilation for this publication.Note: NCDs = noncommunicable diseases. VAT = value added tax.

Population-Wide Interventions to Prevent NCDs | 129
is likely to reduce smoking substantially. in a survey of Jeddah residents by Alghamdi et al. (2020), 22.6 percent of respondents said they smoked less after the tax went into effect. Findings from the 2019 World Health Survey in Saudi Arabia (moH 2020) indicate that some smokers reduced their consumption in response to the tax and other interventions, with the prevalence of smoking in Saudi Arabia declining by 0.6 percentage point between 2013 and 2019.
Diet interventions
There is a strong link between unhealthy diet and NcDs. it is well established that an unhealthy diet—particularly excess consumption of highly processed foods, fast food, and sugar-sweetened beverages (SSBs) and inadequate intake of fiber—cause weight gain (Hall 2019), obesity (mendonça et al. 2016), and numerous NcDs, including diabetes mellitus (malik et al. 2010; Nseir, Nassar, and Assy 2010), metabolic disease (malik et al. 2010), coronary heart disease (mente et al. 2009; mozaffarian et al. 2006), nonalcoholic fatty liver disease (Nseir, Nassar, and Assy 2010), stroke (Spence 2019), and several cancers (Fiolet et al. 2018). excessive dietary sodium can lead to high blood pressure (Takase et al. 2015). Prepackaged foods, fast food, and SSBs are available in virtually every community in Saudi Arabia. combined with aggressive marketing of these prod-ucts, this availability has reduced the quality of the population’s diet (AlFaris et al. 2015; Khabaz et al. 2017).
Saudi Arabia has already implemented or proposed many interventions to steer consumers toward healthier dietary choices (table 7.2). A multitiered VAT is imposed on beverages, including a 100 percent tax on energy drinks and a 50 percent tax on all SSBs. Saudi Arabia also introduced added-sugar labeling on the back of food and beverage packaging. A front-of-package traffic light labeling system for food and beverages has been proposed; this labeling would use red, amber, and green lights to depict high, medium, and low levels of des-ignated nutrients of concern. Some jurisdictions require restaurants or fast food outlets (or both) to show the calories of meals on their menus. Saudi Arabia also has nutrition standards governing what foods and beverages may be served in
TABLE 7.2 Implemented and proposed diet-related interventions to reduce NCDs in Saudi Arabia
INTERVENTION DESCRIPTION
Excise taxes • 100% VAT on energy drinks• 50% VAT on some SSBs
Nutrition labels • Packaging Added sugar displayed on back-of-package nutrition facts label Front-of-package traffic light nutrition labelsa
• Restaurants and cafes Mandated calorie menu labeling
Nutrition standards • Limits on what foods and beverages schools can provide in their canteens• Ban on energy and soft drink sales in hospitals and public health facilities• Restrictions on advertisements for unhealthy food and drinksa directed at children• Public awareness campaigns
Source: Original compilation for this publication.Note: NCDs = noncommunicable diseases. SSB = sugar-sweetened beverages. VAT = value added tax.a. Proposed interventions.

130 | NoNcommuNicABle DiSeASeS iN SAuDi ArABiA
school cafeterias. The nutrition standards in Saudi schools, however, are not enforced consistently. According to a survey by Aldubayan and murimi (2019), most boys’ public high schools in riyadh allow the sale of highly processed energy-dense snacks, including muffins, sweets, biscuits, cookies, and chips. Saudi Arabia has also implemented a ban on energy drinks and soft drinks in hospitals and public health facilities and proposed restrictions on the market-ing of unhealthy foods and drinks to children via media channels. All of these interventions have been accompanied by public awareness campaigns to encourage healthier eating.
Saudi Arabia has also implemented some mandatory and voluntary prod-uct reformulation interventions (table 7.3). These interventions encourage or require the reformulation of products that makes them healthier or discour-age reformulation of products that makes them less healthy. The mandatory interventions include (1) mandating limits on the use of sodium and salt in baked bread (a popular food in Saudi Arabia) to 1/100th gram of sodium per gram of final product, (2) mandating an upper limit for trans fats of 2 percent in butter, margarine, and oils and 5 percent in other food products, (3) ban-ning the use of polyhydrogenated oils, and (4) prohibiting food establish-ments from serving fresh juices that have been supplemented with sugar or artificial sweeteners. The voluntary interventions include (1) encouraging manufacturers to replace saturated fat with unsaturated fat, (2) encouraging manufacturers to reduce portion sizes for their packaged food products, (3) encouraging manufacturers to replace saturated fat with unsaturated fat, and (4) encouraging manufacturers to limit the amount of salt in products other than baked bread.
Saudi Arabia does not currently implement any workplace interventions. Some countries, such as Singapore, subsidize workplace interventions designed to reduce obesity and NcDs. if such programs are determined to be cost- effective, Saudi Arabia could consider subsidizing them or requiring employers to adopt them.
Physical activity interventions
Globally, there is strong evidence that insufficient physical activity increases the risk of many NcDs, including coronary heart disease, type 2 diabetes, and breast and colon cancers. Physical inactivity also shortens life expectancy. compared with the populations of neighboring countries, relatively few Saudi Arabians are
TABLE 7.3 Product reformulation interventions implemented to reduce NCDs in Saudi Arabia
INTERVENTION DETAIL
Mandatory • Upper limits on sodium and salt in baked bread
• Upper limit for trans fats of 2% in butter, margarine, and oils and 5% in other food products
• Ban on polyhydrogenated oils
• Ban on serving fresh fruit juices that have been supplemented with sugar or artificial sweeteners
Voluntary • Encourage manufacturers to replace saturated fat with unsaturated fat in food manufacturing
• Encourage manufacturers to reduce the portion size of their packaged food products
• Encourage manufacturers to limit the amount of salt in products other than baked bread
Source: Original compilation for this publication.Note: NCDs = noncommunicable diseases.

Population-Wide Interventions to Prevent NCDs | 131
physically active. The age-adjusted prevalence of inadequate physical activity is higher in Saudi Arabia than in oman, Qatar, or united Arab emirates, but lower than in Kuwait, according to WHo’s Global Health observatory data (WHo 2020).
in Saudi Arabia, various interventions have been introduced and proposed to encourage physical activity (table 7.4). The main interventions already intro-duced are physical education classes for schoolgirls and public awareness cam-paigns. Saudi Arabia’s Vision 2030 has expressed support for increasing participation in sports, increasing the proportion of Saudis who exercise regu-larly, and undertaking urban design reforms that facilitate physical activity. The Vision 2030 document envisions more pedestrian paths, bicycle paths, parks, recreation centers, and sports courts.
EFFECTIVENESS OF POPULATION-WIDE INTERVENTIONS
This section discusses the literature on the effectiveness of these and additional interventions, summarizing the evidence on tobacco control interventions, diet-related interventions, and, finally, physical activity–related interventions.
Effectiveness of tobacco control interventions
There is strong, consistent evidence that tobacco taxes are effective in reducing cigarette consumption (table 7.5). This effect is particularly strong among low- income people and teenagers (Bader, Boisclair, and Ferrence 2011; chaloupka, Straif, and leon 2010; Guindon, Paraje, and chaloupka 2015; Jha and chaloupka 2000). However, the evidence of the effects on smoking initiation is ambiguous (Bader, Boisclair, and Ferrence 2011; Jha and chaloupka 1999).
The effectiveness of tobacco taxes depends in part on the degree of passthrough. The theory behind excise taxes is that the tax will be passed along
TABLE 7.4 Implemented and proposed physical activity–related interventions to reduce NCDs in Saudi Arabia
INTERVENTION DETAIL
Implemented • Physical education classes for girls
• Public awareness campaigns to increase physical activity
Proposed • Urban design to encourage active lifestyles (walking, bicycling, recreational sports)
Source: Original compilation for this publication.Note: NCDs = noncommunicable diseases.
TABLE 7.5 Evidence of effectiveness of tobacco tax policies
INTERVENTION RESEARCH FINDINGS REFERENCES
Tobacco tax A 10% increase in price reduces demand for cigarettes by about 4% for the general adult population in high-income countries. Low-income people and individuals in their late teens are more price sensitive than the general population, whereas young teens (that is, those more likely to be experimental smokers) are not price responsive. The impact of tax increases on smoking initiation is unclear.
Bader, Boisclair, and Ferrence 2011; Chaloupka, Straif, and Leon 2010; Guindon, Paraje, and Chaloupka 2015; Jha and Chaloupka 1999, 2000
Source: Original compilation for this publication.

132 | NoNcommuNicABle DiSeASeS iN SAuDi ArABiA
to consumers in the form of higher prices, and consumers will respond by con-suming less of the taxed good. However, manufacturers may decide that they can make more profit by paying some of the tax themselves than by raising prices for consumers. As a result, not all of the tax is necessarily passed along to consum-ers. in some cases, manufacturers pass along a greater portion of the tax for some products than for others. For example, tobacco companies may pass through a high proportion of an excise tax on higher-priced cigarettes while passing through a lower proportion of the tax on lower-priced cigarettes (Gilmore et al. 2013). in doing so, they hope to encourage price-insensitive consumers who were already buying higher-priced cigarettes to continue doing so, while encour-aging price-sensitive consumers to shift to relatively inexpensive cigarettes rather than quit smoking altogether. This switching may have happened to some extent in Saudi Arabia. in the survey conducted in Jeddah, 29.8 percent of smok-ers said they switched to cheaper brands after the 100 percent tobacco excise tax was implemented (Alghamdi et al. 2020).
A large economic literature has consistently shown that tobacco taxes are regressive, meaning that low-income people pay a greater percentage of their income in tobacco taxes than high-income people. This is a common objection to tobacco taxes. However, the health effects and long-term economic effects of these taxes should be considered as well as their immediate financial impact. A modeling study in colombia finds that the largest health gains resulting from a tobacco tax would accrue to the bottom two income quintiles (James et al. 2019). A modeling study in ukraine concludes, “Although tobacco taxes are often criticized for being regressive in the short run, [taking into account] a more com-prehensive scenario that includes medical expenses and working years, the ben-efits of tobacco taxes far exceed the increase in tax liability, benefitting in large measure lower income households” (Fuchs and meneses 2017). The short-term financial regressivity of tobacco taxes can be ameliorated by dedicating some of the revenue to “targeted programs that help low-income smokers quit” and “other programs targeting the poor” (Farrelly, Nonnemaker, and Watson 2012).
e-cigarette taxes reduce the use of e-cigarettes but may raise the consump-tion of standard cigarettes (Pesko, courtemanche, and maclean 2019; Pesko et al. 2018; Saffer et al. 2020) (table 7.6). This finding creates a challenge for public health authorities: the long-term health effects of e-cigarettes are unknown, and there is widespread agreement that their use should not be encouraged. However, e-cigarettes appear to be substitutes for conventional cigarettes, which are likely more harmful. The dilemma for policy makers is how to devise interventions that discourage the initiation of e-cigarette use without simultaneously disin-centivizing veteran smokers from switching to e-cigarettes.
Studies have shown that other tobacco control programs are also effective (table 7.7). Smoking restrictions in workplaces, comprehensive bans on tobacco advertising and promotion, smoking cessation programs, and school-based
TABLE 7.6 Evidence of effectiveness of e-cigarette tax
INTERVENTION RESEARCH FINDINGS REFERENCES
E-cigarette tax E-cigarette taxes reduce the use of e-cigarettes (with greater effects on youth than on older adults) but may increase consumption of traditional cigarettes.
Levy et al. 2017b; Pesko, Cortemanche, and Maclean 2019; Pesko et al. 2018; Saffer et al. 2020
Source: Original compilation for this publication.

Population-Wide Interventions to Prevent NCDs | 133
educational programs, as well as public awareness campaigns all appear to reduce smoking, discourage smoking initiation, or both (Farrelly et al. 2009; Holtgrave et al. 2009; Hurley and matthews 2008; Jha and chaloupka 2000; Kenkel and chen 2000; Ngo et al. 2018; Saffer and chaloupka 2000; Secker-Walker et al. 1997; Wakefield et al. 2003).
The effectiveness of several other tobacco-related interventions is more mixed (table 7.8). increasing the minimum legal age to purchase tobacco prod-ucts from 18 to 21 has been shown to work in some contexts, but not in others (especially if enforcement is weak). restrictions on the sale of cigarettes to youth have had little impact (DiFranza 2012; rigotti et al. 1997), and evidence regard-ing the effectiveness of graphic warning labels is mixed (Ngo et al. 2018; Shadel et al. 2019).
Effectiveness of dietary interventions
The literature suggests that taxes on unhealthy drinks and food work if taxes are set high enough. Table 7.9 provides an overview of the evidence, suggesting that taxation on unhealthy foods and drinks reduces their consumption. in addition, imposing excise taxes on unhealthy foods and drinks has a potentially large impact on reducing NcDs. of 51 public health interventions evaluated by van der Vliet et al. (2020), a modest 10 percent tax on junk food and drinks in just seven
TABLE 7.7 Other effective policies to reduce the demand for tobacco products and e-cigarettes
INTERVENTION RESEARCH FINDINGS REFERENCES
Smoking restrictions in the workplace
Smokers who work for employers that do not permit smoking consume fewer cigarettes per day and quit smoking at a higher rate than smokers who work for employers that allow smoking. Restrictions on smoking in workplaces also reduce exposure to secondhand smoke.
Brownson, Hopkins, and Wakefield 2002; Chapman et al. 1999; Hopkins et al. 2001
Comprehensive bans on tobacco advertising and promotion
A comprehensive ban on tobacco advertising and promotion can reduce tobacco consumption, whereas a limited ban has little or no effect.
Saffer and Chaloupka 2000
School-based educational programs
School-based tobacco control policies are effective in reducing both smoking prevalence and smoking initiation. School-based educational programs are also effective in curtailing e-cigarettes use.
Dobbins et al. 2008; Levy et al. 2017b
Smoking cessation programs A randomized control trial of people with mild lung disease finds that people who enroll in a smoking cessation program are more likely to quit smoking and less likely to die than people receiving usual care. Cessation programs appear to be even more effective if they include pharmacotherapy.
Anthonisen et al. 2005; Hagimoto et al. 2010; Nakamura et al. 2014; Ranney et al. 2006
Public awareness campaigns Well-designed, high-exposure public awareness campaigns can reduce the risk of smoking initiation, particularly if combined with other effective tobacco control interventions. There is evidence that such campaigns can reduce the use of e-cigarettes as well as conventional cigarettes. A meta-analysis, however, concludes that mass media public health campaigns generally have modest effects.
Bala, Strzeszynski, and Cahill 2008; Durkin, Brennan, and Wakefield 2012; Farrelly et al. 2009; Holtgrave et al. 2009; Hurley and Matthews 2008; Levy et al. 2017b; McAfee et al. 2013; Secker-Walker et al. 1997; Snyder et al. 2004; Wakefield et al. 2003; Wakefield et al. 2006
Source: Original compilation for this publication.

134 | NoNcommuNicABle DiSeASeS iN SAuDi ArABiA
categories (biscuits, cakes, pastries, pies, snack foods, confectionaries, and soft drinks) is ranked the highest for disability-adjusted life years saved—nearly five times as effective as a package of tobacco control interventions that included a 10 percent tax increase on tobacco.
Where excise taxes on SSBs have been ineffective, this result is likely due to the relatively low level of the tax. more than 40 countries and cities have imple-mented taxes on SSBs. An SSB tax of uS$0.015 per ounce in Philadelphia gener-ated a 26 percent reduction in sales of taxed beverages. However, the decline in sales was partially offset by an increase in purchases in nearby cities (roberto et al. 2019). chile raised the tax on SSBs with more than 6.25 grams of added sugar per 100 milliliters from 13 percent to 18 percent and reduced the tax on SSBs below this threshold from 13 percent to 10 percent. Although the volume of
TABLE 7.8 Relatively ineffective policies designed to reduce the demand for tobacco products and e-cigarettes
INTERVENTION RESEARCH FINDINGS REFERENCES
Increasing the minimum legal age to purchase tobacco products
Increasing the minimum age to purchase tobacco products (for example, from 18 to 21) is associated with significant reductions in smoking among the targeted group. The effects of such an intervention in New Zealand, however, were negligible because of weak enforcement.
Farber, Pakhale, and Neptune 2016; Kessel Schneider et al. 2016; Marsh et al. 2012; Millett et al. 2011
Local ordinances designed to eliminate youth smoking
Observational studies show an association between local ordinances and reduced rates of smoking initiation, but the effects of various interventions are mostly disappointing, possibly because of poor enforcement.
Chen and Forster 2006; DiFranza 2012; Lazovich et al. 2007; Rigotti et al. 1997; Siegel, Biener, and Rigotti 1999
Graphic warning labels An association exists between countries with graphic warning labels and lower rates of tobacco consumption. A randomized control trial, however, showed no effect.
Ngo et al. 2018; Shadel et al. 2019
Source: Original compilation for this publication.
TABLE 7.9 Effectiveness of excise taxes on beverages and food
INTERVENTION RESEARCH FINDINGS REFERENCES
Excise taxes on unhealthy drinks
More than 40 countries and cities have implemented taxes on SSBs, with the literature showing that taxes on SSBs led to around 10%–20% reductions in sales of SSBs in Berkeley and Philadelphia (United States), Catalonia (Spain), Chile, and Mexico. Moreover, in Mexico, purchases of healthy beverages such as bottled water were 5% higher than what would be expected without the tax. Some studies, however, have also found no effect of SSB prices on consumption, such as taxes in Maine and Oakland, likely because of their relatively low level of tax (around 5%). Saudi Arabia’s 50% tax on carbonated drinks (implemented in 2017) was followed by a 35% decline in soft drink consumption compared to other Gulf Cooperation Council countries.
Alsukait et al. 2020; Cawley et al. 2020; Colantuoni and Rojas 2015; Colchero et al. 2016; Falbe et al. 2016; Nakamura et al. 2018; Powell, Chriqui, and Chaloupka 2009; Roberto et al. 2019; Sturm et al. 2010; Vall Castelló and Lopez Casasnovas 2020
Excise taxes on unhealthy foods
An 8% tax on calorie-dense foods in Mexico led to a 5.1% decline in purchases of these foods. Denmark’s tax on saturated fats led to a 4% decline in consumption of products high in saturated fats. Hungary’s taxes on prepackaged nonessential foods led to a decline in consumption of all processed foods by 3.4%, whereas unprocessed food consumption was left unchanged.
Batis et al. 2016; Bíró 2015; Smed et al. 2016
Source: Original compilation for this publication.Note: SSB = sugar-sweetened beverage.

Population-Wide Interventions to Prevent NCDs | 135
all SSBs purchased did not change substantially, the purchase of the higher-taxed SSBs declined by 22 percent (Nakamura et al. 2018). mexico’s SSB tax of mex$1 per liter led to a 6 percent to 12 percent decline in SSB consumption relative to what would have been expected in the absence of the tax (colchero et al. 2016). catalonia, Spain, imposed a €0.08 per liter tax on SSBs with less than 8 grams of sugar and €0.12 per liter for products with 8 grams of sugar or more. The tax reduced SSB purchases by 8 percent, partly due to a shift toward the purchase of zero- and low-sugar drinks (Vall castelló and lopez casasnovas 2020). Some studies, however, find no effect of small increases in SSB prices on consumption (Powell, chriqui, and chaloupka 2009; Sturm et al. 2010). A 5.5 percent sales tax on soft drinks implemented by maine in 1991 and a 5 percent sales tax on soft drinks imposed by ohio in 2003 had no effect on consumption (colantuoni and rojas 2015). An SSB tax in oakland, california, of uS$0.01 per ounce did not reduce the consumption of SSBs (cawley et al. 2020).
The regressivity of SSB taxes, like tobacco taxes, is a common concern. A sys-tematic literature review, however, finds that the degree of regressivity of SSB taxes is small. Backholer et al. (2016) report, “A tax on SSB will deliver similar population weight benefits across socioeconomic strata or greater benefits to lower SeP [socioeconomic position] groups.” They conclude that their findings “[challenge] the relevance of the argument pertaining to financial regressivity” (Backholer et al. 2016).
evidence on nutrition labeling has generally shown front-of-package (FoP) traffic light and warning labels to be more effective than back-of-package (BoP) nutrition labeling (table 7.10). overall, with the exception of a modeling study by Huang et al. (2019), the literature suggests that back-of-package labeling is not effective because it is often difficult for consumers to understand. Therefore, it also seems likely that minor changes to the label—such as adding a line for added sugar—will have little or no effect. Because of the deficiencies of BoP nutritional information panels (NiPs), increased attention has been devoted to
TABLE 7.10 Evidence on effectiveness of BOP and FOP labeling
INTERVENTION RESEARCH FINDINGS REFERENCES
Back-of-package nutrition labeling
Many countries either mandate or recommend the inclusion of a nutritional information panel (NIP) on the back of prepackaged foods and beverages to assist consumers in making healthier food choices. However, the NIP is difficult for many consumers to understand, and there is little evidence to suggest that this strategy has positively influenced dietary outcomes.
Cha et al. 2014; Helfer and Shultz 2014; Huang et al. 2019; Khandpur, Rimm, and Moran 2020; Variyam 2008
Front-of-package nutrition labeling
Many countries are now mandating specific FOP labels. Five countries—Canada, Chile, Israel, Peru, and Uruguay—require that unhealthy products display warning logos placed inside black stop signs. Several Western European countries use Nutri-Score, a label developed in France that assigns a single score to each product based on the product’s overall healthfulness. Singapore is soon to adopt a similar approach. Many studies—both randomized and unrandomized—indicate that warning labels, traffic light labels, and Nutri-Score labels induce small improvements in the healthfulness of consumers’ purchases, even in the presence of the NIP. Greater effectiveness may be realized if FOP labels are combined with taxes and other interventions.
Borgmeier and Westenhoefer 2009; Finkelstein et al. 2019; Gorski Findling et al. 2018; Hawley et al. 2013; Maubach, Hoek, and Mather 2014
Source: Original compilation for this publication.Note: BOP = back-of-package. FOP = front-of-package. NIP = nutritional information panel.

136 | NoNcommuNicABle DiSeASeS iN SAuDi ArABiA
supplementing NiPs with easier-to-understand FoP nutrition labels. These labels tend either to promote the consumption of healthier products or to dis-courage the consumption of less healthy products by specifically targeting these products with a unique label or message or by applying a rating scheme to all foods. FoP labeling is an important part of a multicomponent obesity prevention strategy, but these labels alone are likely to have only modest effects.
The evidence regarding which FoP label to use is inconclusive, although warning labels may be most effective. A wide range of countries use different types of FoP labels (table 7.11). No FoP label clearly outperforms any other (Acton et al. 2019; Arrúa et al. 2017a; Arrúa et al. 2017b; crosetto et al. 2017; Ducrot et al. 2016; egnell et al. 2019; egnell et al. 2020; Finkelstein et al. 2019; Gorski Findling et al. 2018). However, there is some evidence that if the goal is to reduce consumption of the least healthy products and encourage reformulation, warning labels are likely to be most effective (Arrúa et al. 2017a; Temple 2020).
mandatory calorie labeling on restaurant menus is generally found to be less effective than FoP warning labels (table 7.12). With the exception of one study by Bleich et al. (2017), most studies—especially those conducted in real-world
TABLE 7.11 Examples of FOP nutrition labels
TYPE OF LABEL WHERE USED EXAMPLE
FOP traffic lights Ecuador, Republic of Korea, United Kingdom
Fat
Saturated fat
2 g
PER 2/3 CUP
0 g
105 g
6 g
120
Salt
Sugars
Calories
MED
MED
LOW
HIGH
FOP warning labels Canada, Chile, Israel, Peru, UruguayMinisteriode Salud
ALTO ENAZÚCARES
Ministeriode Salud
ALTO ENGRASAS
SATURADAS
Ministeriode Salud
ALTO ENSODIO
Ministeriode Salud
ALTO ENCALORÍAS
FOP Nutri-Score Belgium, France
A B C D E
NUTRI-SCORE
FOP positive labels Many countries throughout the world
Source: Original compilation for this publication.Note: FOP = front-of-package.
TABLE 7.12 Evidence on effectiveness of labeling calories in restaurant menus
INTERVENTION RESEARCH FINDINGS REFERENCES
Calorie labeling in restaurant menus
Mandatory calorie labeling in restaurant menus has largely been shown not to be effective. A systematic review of the literature by Swartz, Braxton, and Viera (2011) concludes that calorie labeling likely does not have the intended effect of decreasing calorie purchases or consumption.
Bleich et al. 2017; Cantu-Jungles et al. 2017; Finkelstein et al. 2011; Kiszko et al. 2014; Long et al. 2015b; Petimar et al. 2019; Swartz, Braxton, and Viera 2011
Source: Original compilation for this publication.

Population-Wide Interventions to Prevent NCDs | 137
settings—have found no beneficial effect and no reduction in calories purchased due to calorie labeling on restaurant menus. The lack of effectiveness may be because consumers are not clear about what to do with calorie information. This is similar to the problem raised by the NiP. Therefore, instead of calorie labeling, simple FoP symbols indicating which foods to consume or avoid may be more effective. one randomized control trial compared restaurant menus with either no sodium label (control) or 1 of 13 simple sodium warning labels that varied the text, icons, and colors used. The results suggest that logos—both traffic lights and red stop signs—significantly reduce sodium ordered compared to the controls (musicus et al. 2019).
Whereas the literature suggests that the introduction of nutrition standards in schools is effective, little is known about the impact of banning unhealthy foods and beverages from hospitals and public health facilities (table 7.13). Setting nutrition standards in schools has been shown to reduce the sale of unhealthy foods and drinks and to decrease the consumption of high-sugar drinks and unhealthy snacks. little evidence exists on setting nutrition stan-dards in hospitals and public facilities. Small pilot programs and citywide pro-grams encouraging hospitals to implement nutrition standards have been implemented, but no major national efforts have been evaluated as yet.
evidence suggests that product reformulation—both voluntary and manda-tory—can be effective in improving the nutritional quality of the food supply (table 7.14). After labeling requirements for trans fatty acids (TFAs) went into effect in the united States, some food manufacturers reduced or removed TFAs from packaged foods (otite et al. 2013). A reformulation program in canada that imposed voluntary TFA limits on vegetable oils and margarine was associated with a decline in TFA consumption (ratnayake et al. 2009). A mandate limiting TFA content in take-out food restaurants in New York city was associated with lower TFA intake per purchase (Angell et al. 2012). in response to pressure from governments and public health organizations such as the WHo, food manufac-turers—including Kellogg’s, Nestlé, and unilever—voluntarily reduced the amount of sodium in their products (Kloss et al. 2015). A voluntary sodium
TABLE 7.13 Evidence on effectiveness of setting nutrition standards
INTERVENTION RESEARCH FINDINGS REFERENCES
Setting nutrition standards in schools
Seven years after Brazil implemented its first national law regulating the sale of unhealthy foods in schools, nearly 70% of school vendors had stopped selling fried snacks, sodas, highly processed popcorn, candies, lollipops, chewing gum, and packaged snacks. A districtwide policy that banned all sugary drink sales in public schools in Boston, Massachusetts, led to a significant reduction in students’ total consumption of sugary drinks. In 2012, Massachusetts implemented nutrition standards for food sold in schools statewide that have been associated with significant decreases in students’ sugar consumption both during and after school hours.
Cradock et al. 2011; Gabriel et al. 2009; Micha et al. 2018
Setting nutrition standards in hospitals and public facilities
A local program, the Healthy Hospital Food Initiative, was created by the New York City Department of Health and Mental Hygiene to improve the healthfulness of food served in hospitals. Most of the participating private hospitals introduced healthy value meals, removed unhealthy items from entrances and checkouts, increased whole grains to at least half of all grains served, and reduced calories in pastries and desserts. It is unknown whether the program was effective in reducing the body weight of patients or employees.
Moran et al. 2016
Source: Original compilation for this publication.

138 | NoNcommuNicABle DiSeASeS iN SAuDi ArABiA
reduction program in Brazil was associated with a significant reduction in the average sodium content of many foods (Nilson et al. 2017).
A salt reduction program in the united Kingdom that included reformulation as one component of a multicomponent strategy seems to have been remarkably effective. The components of the program included establishing targets for dif-ferent categories of food, with an explicit time frame for industry to achieve those targets; clear nutritional labeling; and a consumer awareness campaign. After the program was implemented in 2003/04, food manufacturers reformu-lated their products to reduce sodium (Brinsden et al. 2013), and average salt intake dropped by 1.4 grams per day (from 9.5 grams per day in 2003 to 8.1 grams per day in 2011). over the same period of time, blood pressure declined by 3.0/1.4 millimeters of mercury (mmHg); cholesterol declined by 0.4 millimoles per liter (mmol/l); stroke mortality decreased by 42 percent; and ischemic heart disease mortality declined by 40 percent (He, Pombo-rodrigues, and macGregor 2014). The united Kingdom’s salt reduction program is often described as voluntary, but it included strong government pressure backed by the threat of mandates (laverty et al. 2019).
Voluntary product reformulation goes only so far (table 7.15). Voluntary inter-ventions in Denmark reduced TFA consumption from 4.5 grams per day in 1976 to 1.5 grams per day in 1995, but TFAs were virtually eliminated after a law ban-ning TFAs in manufactured food was implemented in 2004 (Hyseni et al. 2017a). A uK modeling study estimates that labeling is only about half as effective as a total ban on TFAs in terms of health and socioeconomic benefits (Allen et al. 2015). The Brazilian study concluded that voluntary interventions were effec-tive, but “regulatory approaches may still be necessary in the future in order to
TABLE 7.14 Evidence on effectiveness of product reformulation interventions
INTERVENTION RESEARCH FINDINGS REFERENCES
Product reformulation Both voluntary and mandatory product reformulation interventions have been associated with reductions in TFAs and sodium. Mandatory product reformulation is more effective than voluntary approaches.
Allen et al. 2015; Angell et al. 2012; Brinsden et al. 2013; Hyseni et al. 2017a; Kloss et al. 2015; Nilson et al. 2017; Otite et al. 2013; Ratnayake et al. 2009
Source: Original compilation for this publication.Note: TFA = trans fatty acid.
TABLE 7.15 Evidence on effectiveness of public awareness campaigns
INTERVENTION RESEARCH FINDINGS REFERENCES
Public awareness campaigns to improve diet
A mass media campaign in West Virginia (United States) encouraged consumers to switch from whole or 2% milk to low-fat or fat-free milk. A mass media campaign in England encouraged children to reduce consumption of sugar. Mass media campaigns in Australia and the United States targeting SSBs had generally modest short-term success, which were not sustained in the longer run. The effects of mass media salt reduction campaigns have been generally modest.
Barragan et al. 2014; Boles et al. 2014; Bradley et al. 2020; Collins et al. 2014; Gillespie et al. 2015; Hyseni et al. 2017a; Kite et al. 2018; Morley et al. 2019; Nghiem et al. 2015; Reger, Wootan, and Booth-Butterfield 2000; Shankar et al. 2013
Source: Original compilation for this publication.Note: SSBs = sugar-sweetened beverages.

Population-Wide Interventions to Prevent NCDs | 139
reach all food producers and to allow stronger enforcement to meet more strin-gent regional targets” (Nilson et al. 2017).
evidence suggests that the effectiveness of public awareness campaigns to improve diets is generally low (table 7.15). The benefits of diet-related mass media campaigns appear to have small to modest effects, and those effects are often not sustained in the long run (Walls et al. 2011). A systematic review of adult-targeted obesity prevention mass media campaigns concludes that such campaigns can have a positive impact on intermediate outcomes, such as knowl-edge, but finds limited evidence regarding behavioral change (Kite et al. 2018). Similarly, mass media campaigns to reduce salt consumption appear to have had modest effects, according to a literature review (Hyseni et al. 2017a).
The evidence on the effectiveness of workplace interventions to improve diet suggests that the effects are small. A systematic review by Ni mhurchu, Aston, and Jebb (2010) concludes that worksite health promotion programs are associ-ated with “moderate improvements in dietary uptake” and that “effect sizes are variable but generally small.” The authors also note that many of the studies reviewed were methodologically weak. For example, most studies used self- reported dietary outcomes, which can cause bias since many of these studies provided dietary education to the intervention subjects, and dietary education can increase dietary reporting. Similarly, most workplace interventions designed to reduce obesity have produced only modest weight loss (Anderson et al. 2009). A diabetes prevention program for patients with prediabetes was spectacularly successful in a clinical setting (Knowler et al. 2002), but it has proven to be much less effective when implemented in workplaces (Hafez et al. 2017). A systematic review finds that worksite interventions designed to increase consumption of healthy foods led to an increase in salt consumption (Hyseni et al. 2017b).
evidence of the effectiveness of interventions to limit the advertising of unhealthy food and drink to children is limited. There are indications that restrictions that are codified in law may be more effective than voluntary pledges from industry. regulatory approaches have emerged in an attempt to reduce the marketing of unhealthy products to children. one approach—used in chile; costa rica; ecuador; Hungary; ireland; the republic of Korea; mexico; Norway; Poland; Quebec, canada; Spain; Sweden; Taiwan, china; Turkey; united Kingdom; and uruguay—is to enact laws or regulations limiting the marketing of unhealthy foods to children. For example, the united Kingdom prohibits the advertising of unhealthy foods and beverages during children’s television shows (mytton et al. 2020). Korea bans airing television ads for unhealthy foods before, during, and after programs aired between 5 p.m. and 7 p.m. and during children’s programs (Kim et al. 2012). Another approach is to rely on voluntary industry pledges regarding marketing to children. The effectiveness of industry self- regulation, however, is questionable at best. Provisions are often weak, participa-tion is voluntary, and enforcement and penalties are not strong enough to ensure compliance (Kelly et al. 2019). Studies have found that countries with voluntary industry self-regulation have more advertising of unhealthy foods during chil-dren’s peak television viewing times than countries with no policy at all (Kelly et al. 2019).
Effectiveness of physical activity interventions
A massive literature exists on interventions to promote physical activity. Because of the size and breadth of the literature—thousands of studies covering a wide

140 | NoNcommuNicABle DiSeASeS iN SAuDi ArABiA
array of interventions—a review of each study was not feasible. instead, meta-analyses and systematic literature reviews are used here to assess the effectiveness of various interventions in increasing physical activity.
overall, there is weak evidence of effectiveness of community interventions for increasing physical activity. A meta-analysis evaluates a broad range of inter-ventions that included one or more of the following components: mass media campaigns, smaller-scale public awareness strategies (for example, posters, fly-ers, informational booklets, websites), individual counseling by health profes-sionals, programs encouraging participation in community walking groups and other physical activities, and urban design strategies such as pedestrian paths. of the 33 studies in the meta-analysis, the researchers find that 19 had high risk of bias, 10 had unclear risk of bias, and only 4 had low risk of bias. No evidence of effectiveness is found in three of the four studies with low risk of bias (Kamada et al. 2013; Phillips et al. 2014; Solomon et al. 2014). one of the four studies with low risk of bias finds no effect on moderate-to-vigorous physical activity but reports a positive effect on walking (Wilson et al. 2015). overall, the researchers find “no consistent evidence to support the effectiveness of multicomponent community-wide interventions to increase population levels of physical activity, with the weight of the evidence indicating no increase in physical activity levels” (Baker et al. 2015, 24).
Similarly, there appears to be limited evidence of the effectiveness of community interventions targeting women. A systematic review assesses nine women-only studies. Again, the interventions employed a broad range of strategies. The strategies included one or more of the following: group classes for women, one-on-one counseling, telephone counseling by a professional, peer counseling, mailed newsletters, contracts committing participants to engage in physical activity, walking groups, and mass media campaigns. most of the studies had methodological limitations such as small sample size, baseline differences between control and intervention groups, lack of a control group, or poor adherence. The researchers conclude that evidence is insufficient to assess the effectiveness of the interventions (Farahani et al. 2015).
The literature suggests that urban design interventions are modestly effec-tive, with only limited or no effect on health outcomes, although the evidence is very sparse. Several studies report no increase in the frequency of cycling due to the construction of new bike paths (evenson, Herring, and Huston, 2005; rissel et al. 2015; Shu et al. 2014). Attempts to increase walking among sedentary peo-ple through changes in urban design have also been largely unsuccessful (Shephard 2008). Better urban design may well be worthwhile but should not be expected to reduce NcDs.
The literature suggests that stand-alone mass media campaigns have mixed, modest, or minimal effects. Two systematic reviews report that mass media cam-paigns had either no effect or a negligible effect (cavill and Bauman 2004; marcus et al. 1998). Another systematic review reports a significant effect but does not specify the size of effect or the types of activity that were affected (leavy et al. 2011). A meta-analysis finds that mass media campaigns boosted moderate-intensity walking by 53 percent but neither reduced sedentary behav-ior nor led to the recommended levels of overall physical activity (Abioye, Hajifathalian, and Danaei 2013).
reviews of workplace intervention studies have reported small, mixed, or inconclusive effects on physical activity. A systematic review finds strong

Population-Wide Interventions to Prevent NCDs | 141
evidence of a positive effect on physical activity, but no effect on physical fitness, general health, blood serum lipids, or blood pressure (Proper et al. 2003). A meta-analysis of workplace health promotion interventions—not just physical activity but also smoking cessation and healthy nutrition inter-ventions—reports only modest effects, particularly in high-quality random-ized control trials (rongen et al. 2013). A meta-analysis of workplace pedometer interventions concludes that there is insufficient evidence to assess their effectiveness (Freak-Poli et al. 2013). A systematic review focus-ing on environmental modifications in the workplace finds that the effect on physical activity is inconclusive (engbers et al. 2005). A meta-analysis eval-uating workplace-based interventions targeting women reports mixed results (reed et al. 2017). Another meta-analysis concludes that some work-place physical activity interventions have positive effects on health outcomes (conn et al. 2009), but a subsequent study that tracked long-term outcomes—total cholesterol, low-density lipoprotein, P-selectin, cD40 ligand, and monocyte chemoattractant protein—finds that initial improvements were not sustained (Skogstad et al. 2018).
evidence suggests that school-based interventions can have positive effects on in-school physical activity. Three systematic reviews find that school-based programs are likely effective in increasing the number of chil-dren engaged in in-school physical activity as well as the amount of time they spend engaged in these activities (Dobbins et al. 2013; Salmon et al. 2007; van Sluijs, mcminn, and Griffin 2007). one successful school-based program used a comprehensive, intensive intervention that consisted of school curriculum changes, printed education materials, greater time spent engaged in physical activity during the school day, audiovisual materials, and community-based strategies. After six months, the proportion of inter-vention adolescents not engaged in organized physical activity declined by 50 percent, while it was unchanged among control students (Simon et al. 2004). Another successful school-based intervention provided children with printed education materials and game equipment for children to play on. Three months later, children’s activity levels were measured during their lunch break and recess. The children who received game equipment became significantly more active, whereas the controls became less active (Verstraete et al. 2006).
By contrast, the evidence supporting after-school physical activity programs appears to be weak. A systematic review concludes that most studies are poor quality and lack statistical power. in addition, some of the programs had prob-lems with implementation, limiting their effectiveness. The researchers con-sider such programs to be promising and deserving of further research (Atkin et al. 2011). Along the same lines, a systematic review of interventions to increase girls’ participation in sports concludes that such interventions can encourage girls to try new sports, but evidence is limited with regard to sustained participa-tion (Allison, Bird, and mcclean 2017).
The evidence in support of interventions encouraging active transportation (walking, biking) to school also appears to be weak. A systematic review reports that half of the studies reviewed report only a slight increase in active transpor-tation. most of the studies were of low quality (chillón et al. 2011). moreover, active transportation may not be feasible year-round in some parts of Saudi Arabia, due to hot weather.
142 | NoNcommuNicABle DiSeASeS iN SAuDi ArABiA
COST-EFFECTIVENESS OF POPULATION-WIDE INTERVENTIONS
The so-called “best-buys” interventions to address NcDs appear to be cost- saving, meaning that the up-front costs of implementation are more than offset by lower health care costs and increased worker productivity. Taking into con-sideration the available evidence, the WHo (2017) issued recommendations on implementation of the most cost-effective interventions. The WHo guidance is supplemented here with other evidence.
Cost-effectiveness of tobacco control programs
many tobacco control programs appear to be cost-effective. Tax and price increases; smoke-free workplaces, public places, and public transport; plain packaging and health information and warnings; comprehensive bans on tobacco advertising, promotion, and sponsorship; and public awareness cam-paigns are recognized as the most cost-effective interventions and recom-mended by the WHo (2017) to reduce tobacco use. Additionally, school-based tobacco control programs, smoking cessation programs, and stepped-up enforcement all appear to be cost-effective or cost-saving in certain circum-stances (table 7.16).
The extent to which these interventions can be undertaken cost-effectively in Saudi Arabia is unclear. Saudi Arabia has already implemented such policies to varying extents (including antismoking clinics, a mobile antismoking caravan, and an online smoking cessation campaign) (Al-lehiany and Stanley 2009). A detailed assessment of the country’s current policies—beyond the scope of this book—would be needed to assess whether further efforts would be incremen-tally cost-effective.
The cost-effectiveness of adolescent-targeted e-cigarette control pro-grams has not been assessed. At least one study has shown that school-based e-cigarette control programs and mass media anti-e-cigarette campaigns are effective (levy et al. 2017a; milicic et al. 2018), but apparently the cost- effectiveness of such programs has not been evaluated.
Cost-effectiveness of dietary interventions
The WHo recognizes interventions to reduce salt intake as cost-effective and recommends that they be implemented. The recommended interventions include reformulating food products, setting target levels for salt in food, estab-lishing a supportive environment in public institutions, communicating infor-mation about behavioral changes, implementing FoP labeling, and conducting mass media campaigns (WHo 2017). A review by Hyseni (2017b), however, con-cludes that mass media campaigns have had only a modest impact on salt reduction.
A substantial body of literature suggests that salt reduction reformulation can be both effective and cost-saving (table 7.17). These studies examine mandated or voluntary reductions of sodium levels in processed foods, including bread, pro-cessed meats, and sauces (collins et al. 2014; Nghiem et al. 2015; Nghiem et al. 2016; rubinstein et al. 2009; Wang and labarthe 2011; Wilson et al. 2016; Wilcox et al. 2015).

Population-Wide Interventions to Prevent NCDs | 143
A salt reduction program in the united Kingdom that included reformulation as one component of a multicomponent strategy seems to have been cost- effective. The components of the program included establishing targets for different categories of food, with an explicit time frame for industry to achieve those targets, clear nutritional labeling, and a consumer awareness campaign. A modeling study based on this intervention finds it to be cost-saving (Smith-Spangler et al. 2010). However, it is impossible to disentangle the effects of reformulation from other aspects of the program such as nutrition labeling.
At least two modeling studies suggest that voluntary reformulation of high-salt products is both effective and cost-saving, but less so than mandates. A study in Australia finds that a voluntary salt reduction program would be cost- effective, but that health benefits would be 20 times greater with government legislation (cobiac, Vos, and Veerman 2010). A study in the united Kingdom finds that both voluntary and mandatory reformulation to reduce salt are cost-saving, but mandatory reformulation is even more cost-saving (collins et al. 2014).
mass media salt reduction campaigns may be cost-effective or cost-saving. As noted above, the efficacy of such campaigns is thought to be modest (Hyseni 2017b), but several modeling studies have reported that they are, in fact, cost- saving (collins et al. 2014; Nghiem et al. 2015).
TABLE 7.16 Evidence on cost-effectiveness of tobacco control interventions
INTERVENTION RESEARCH FINDINGS REFERENCES
School-based tobacco control programs
School-based tobacco-use prevention programs are highly cost-effective, compared with other widely accepted prevention interventions. A program in the United States, which cost US$16,403, prevented 34.9 students from becoming established smokers and resulted in savings of $13,316 per life year saved and savings of US$8,482 per QALY saved. A program in India cost US$2,057 per QALY saved, even without accounting for medical costs averted. A systematic review of smoking prevention policies and programs among adolescents concludes that they were greatly worth their costs.
Brown et al. 2013; Dino et al. 2008; Leão, Kunst, and Perelman 2018; Wang et al. 2001
Smoking cessation programs
Implementation of current smoking cessation services in Spain has a lifetime benefit-cost ratio of 5 compared with no such provision. It would be cost-effective to expand current service provision by providing proactive telephone support and reimbursing the cost of smoking cessation medication for smokers trying to stop. The lifetime benefit-cost ratios were 1.87 (proactive telephone calls), 1.17 (prescription nicotine replacement therapy), 2.40 (varenicline-standard duration), and bupropion (2.18).
The cost of text-based support per 1,000 enrolled smokers in the United Kingdom was £16,120, which, given an estimated 58 additional quitters at six months, equates to £278 per quitter. However, when the future UK National Health Service costs saved (as a result of reduced smoking) are included, text-based support would be cost-saving. Providing text-based support to smokers trying to quit gained an estimated 18 life years (0.3 life year per quitter) and 29 QALYs (0.5 QALY per quitter) per 1,000 smokers.
Introducing a social marketing campaign in Hungary resulted in an increase of 0.3 additional quitter per 1,000 smokers, translating to health care cost savings of €0.65 per smoker compared with current practice. When the value of QALY gains is considered, cost savings increase to €14.16 per smoker.
Guerriero et al. 2013; Levy et al. 2017a; Németh et al. 2018; Popp et al. 2018; Trapero-Bertran et al. 2018
Stepped-up enforcement
Enforcement of tobacco sales laws is inexpensive, typically paid for by license fees, and very efficient in terms of cost per year of life saved; it could be fully funded with a US$0.01 per pack tax on cigarettes, with no need to divert resources from other programs.
DiFranza et al. 2001
Source: Original compilation for this publication.Note: QALY = quality-adjusted life year.

144 | NoNcommuNicABle DiSeASeS iN SAuDi ArABiA
There is evidence that other diet-related interventions are cost-effective (table 7.17). A large number of modeling studies have found excise taxes on unhealthy foods and beverages to be cost-saving. The economic benefits of such taxes are even stronger if worker productivity gains are taken into consideration (carter et al. 2019). Taxes on salt also have been found to be cost-saving (Nghiem et al. 2015; Smith-Spangler et al. 2010). indirect evidence suggests that FoP warning labels are cost-saving. Since warning labels are at least as effective as traffic light labels in encouraging healthy purchasing decisions (if not more so) (Arrúa et al. 2017a; Temple 2020), it is reasonable to infer that FoP warning labels are also likely to be cost-saving. indirect evidence suggests that menu warning labels are more cost-effective than menu calorie labels (musicus et al 2019). Assuming that these two types of labels have the same costs, menu warn-ing labels appear to be more cost-effective than menu calorie labels. The latter
TABLE 7.17 Evidence on cost-effectiveness of diet-related interventions
INTERVENTION RESEARCH FINDINGS REFERENCES
Excise taxes on unhealthy foods and beverages
Modeling studies find excise taxes on unhealthy foods and beverages to be cost-saving.
Andreyeva, Chaloupka, and Brownell 2011; Basto-Abreu et al. 2018; Briggs et al. 2013a; Briggs et al. 2013b; Gortmaker et al. 2015; Lal et al. 2017; Long et al. 2015a; Manyema et al. 2014; Sacks et al. 2011; Saxena et al. 2019a; Saxena et al. 2019b; Veerman et al. 2016; Wang et al. 2012; Wilde et al. 2019
FOP warning labels FOP warning labels are both effective and cost-saving. FOP traffic light labeling appears to be cost saving.
Sacks et al. 2011
Menu warning labels Warning labels on restaurant menus are more effective than calorie labels.
Musicus et al. 2019
Ban on child-targeted advertising of unhealthy foods and beverages
Child-targeted television advertising of unhealthy foods and beverages appear to be cost-effective or cost-saving. Though the studies of effectiveness are based on low-quality data, there is little doubt that child-centered advertising affects food preferences. Indirect evidence suggests that such effects eventually lead to increases in obesity and obesity-related NCDs.
Brown et al. 2018; Cecchini et al. 2010; Magnus et al. 2009
Nutrition standards and bans on unhealthy foods and beverages in schools, hospitals, and public health facilities
One modeling study concludes that nutrition standards in schools are either cost-effective or cost-saving, but the underlying evidence of effectiveness is weak.
Gortmaker et al. 2015
Limits on industrial trans fats
A modeling study finds that limits on industrial trans fats in England and Wales are cost-saving.
Pearson-Stuttard et al. 2017
Salt and sodium reformulation interventions
Mandated and voluntary reductions of sodium or salt are cost-effective or cost-saving.
Barton et al. 2011; Collins et al. 2014; Nghiem et al. 2015; Nghiem et al. 2016; Rubinstein et al. 2009; Wang and Labarthe 2011; Wilcox et al. 2015; Wilson et al. 2016
Mass media campaigns to reduce salt consumption
Effects are modest, but two modeling studies conclude that they are cost-saving.
Collins et al. 2014; Nghiem et al. 2015
Mandated limits on portions in packaged goods
An Australian modeling study finds that a 375-milliliter limit on the size of packaged SSBs is cost-saving.
Crino et al. 2017
Source: Original compilation for this publication.Note: FOP = front-of-package. SSB = sugar-sweetened beverage.
Population-Wide Interventions to Prevent NCDs | 145
are already mandated in Saudi Arabia. restrictions on child-targeted television advertising of unhealthy foods and beverages appear to be either cost-effective or cost-saving. eliminating the tax deductibility of child-targeted television advertising for unhealthy foods also would likely be cost-saving (Sonneville et al. 2015). mandated limits on trans fatty acids and beverage packaging may be cost-saving (crino et al. 2017; Pearson-Stuttard et al. 2017). cost-effectiveness evaluations of interventions that ban unhealthy foods and beverages from schools, hospitals, and public health facilities are almost nonexistent.
Some evidence exists on the cost-effectiveness of workplace interventions to promote weight loss, although the results are mixed. Fitzgerald et al. (2018) calculate that a workplace dietary modification program was highly cost- effective—€101 per QAlY gained—but caution that their estimate of effective-ness is uncertain. corso et al. (2018) report that an adapted version of the Diabetes Prevention Program is a cost-effective weight management interven-tion if implemented via self-study (uS$10,600 per QAlY gained) or in small study groups (uS$22,400 per QAlY gained). A cost-effectiveness analysis by robroek et al. (2012) finds that an internet-delivered worksite health promotion program had no effect on physical activity, fruit and vegetable consumption, obe-sity, blood pressure, or self-perceived health.
Cost-effectiveness of physical activity interventions
There is a discrepancy between the effectiveness literature and the cost-effectiveness literature with regard to physical activity interventions. As noted earlier, the evidence regarding the effectiveness of community-wide inter-ventions is weak. However, a systematic review of cost-effectiveness studies concludes, “Available evidence for the cost-effectiveness of physical activity interventions is scattered, but points towards the cost-effectiveness of certain interventions” (Abu-omar et al. 2017, 72). Among the most cost-effective inter-ventions listed are many of the same interventions that lack strong evidence of effectiveness, such as the construction of community rail trails (multiuse trails built on top of abandoned railroad tracks) (Stokes, macDonald, and ridgeway 2008). if the underlying evidence of effectiveness is weak, mixed, inconsistent, or inconclusive, then a modeling study that assumes effectiveness should be viewed with skepticism.
School-based programs are an exception, as they appear to be both effective and cost-effective. As discussed earlier, evidence consistently shows such pro-grams to be effective at increasing in-school physical activity, according to mul-tiple systematic reviews. Wu et al. (2011) review the literature to assess the cost of these programs per metabolic equivalent of task hours gained per child per day. These cost-effectiveness ratios, however, are not easily interpreted for pol-icy purposes. moreover, spending more time on physical activity in schools has opportunity costs for other subjects unless the length of the school day is extended. Finally, it is not clear whether such programs would be cost-effective in schools that already offer physical education classes.
The most cost-effective school-based intervention in both reviews is a health and nutrition program for first-grade schoolchildren in crete, Greece. The inter-vention, known as the cretan Health and Nutrition education Program, was based on the Know Your Body health promotion program of the American Health Foundation. it was effective in increasing moderate-to-vigorous physical activity during classes that used noncompetitive and cooperative activities.

146 | NoNcommuNicABle DiSeASeS iN SAuDi ArABiA
it also increased out-of-school physical activity. The program lasted six years, and it followed the same cohort of children from first to sixth grade. A follow-up conducted several years after the intervention ended showed that the effects of the intervention had been sustained (manios and Kafatos 2006). The interven-tion cost an estimated uS$534,300, producing a cost-effectiveness ratio of uS$0.056 per metabolic equivalent of task hours gained per child per day (Wu et al. 2011)—a finding that provides unclear guidance for policy makers. There is no way of knowing whether a program developed in the 1970s that worked well in crete in the 1990s would work equally well in a country that already offers physical education classes in the present day.
POLICY RECOMMENDATIONS FOR SAUDI ARABIA
Based on the evidence, the following section lists interventions to complement or, in some cases, reconstitute Saudi Arabia’s existing policies.
Tobacco-related policy recommendations
Because Saudi Arabia has already implemented a comprehensive suite of anti-smoking policies, focusing on reducing e-cigarette initiation among youth non-smokers is recommended. The following interventions are recommended:
1. School-based programs that discourage nonsmoking youths from initiating e-cigarette use
2. Public awareness campaigns that discourage nonsmoking youths from initi-ating e-cigarette use
3. Policies that minimize youth exposure to e-cigarette marketing (for example, prohibiting e-cigarette advertising on television channels, websites, or apps that are popular among adolescents)
4. A higher tax on tobacco products and consideration of an outright ban. each of these interventions is discussed in the paragraphs that follow. Table 7.18 summarizes the effectiveness and cost-effectiveness of the
TABLE 7.18 Cost-effectiveness and effectiveness of recommended tobacco-related interventions
INTERVENTION COST-EFFECTIVENESSSTRENGTH OF UNDERLYING EFFECTIVENESS EVIDENCE REFERENCES
School-based programs to discourage e-cigarette initiation
Unknown Low Levy et al. 2017b
Public awareness campaigns to discourage e-cigarette initiation among youths
Unknown Low Levy et al. 2017b
Restrictions on e-cigarette advertising that may appeal to youths
Unknown Low Chen-Sankey et al. 2019; Pokhrel et al. 2016
Tax increases on smoked tobacco products or tax reductions on e-cigarettes or both
Unknown Low Pesko et al. 2018; Pesko, Courtemanche, and Maclean 2019; Saffer et al. 2020
Ban on smoked tobacco products Unknown None None
Source: Original compilation for this publication.

Population-Wide Interventions to Prevent NCDs | 147
proposed interventions. overall, there is currently no evidence on the effec-tiveness or cost-effectiveness of many of the e-cigarette interventions.
School-based programs on e-cigarettes Developing and implementing school-based education programs are recom-mended to increase knowledge, influence attitudes, and decrease the likelihood of using e-cigarettes among youth. Given the amount of time that youth spend in school, this environment is an important domain for advancing tobacco control policies among youth. Discouraging youth from initiating e-cigarette use, even just in experimentation, is important, as e-cigarette use is associated with the subsequent uptake of combustible cigarettes. To maintain the effects of school-based programs, the intervention needs to be implemented continuously over a prolonged period, providing booster sessions across different age groups. The school-based programs should be implemented nationally, targeting boys and girls simultaneously with peer involvement and programs tailored specifically to each gender and age group.
Public awareness campaigns about e-cigarettes Developing and implementing public awareness campaigns are recommended to inform the public about the risks of e-cigarette use and their relative harms, to promote cessation, and to counter tobacco industry marketing tactics. The main messages in the campaigns should be targeted to youth who have not initiated smoking and should be formulated in such a way as to build on the achievements of school-based programs. To maintain the effect, campaigns need to be imple-mented nationally over a prolonged period. campaign messages should be deliv-ered primarily online as online video ads, youth-targeted websites, and social media content. Additionally, national television, out-of-home advertisements, and other media channels might be used to reach and motivate at-risk youth.
Policies designed to minimize youth exposure to e-cigarettes Saudi Arabia should consider prohibiting e-cigarette advertising on television channels, websites, or apps that are popular among adolescents. Tobacco com-panies use various marketing approaches to sell their products. exposure to e-cigarette marketing promotes e-cigarette experimentation by forging positive perceptions about such behavior in the minds of youth and young adults, who are increasingly vulnerable to tobacco industry marketing tactics (chen-Sankey at al. 2019). The restrictions on marketing, applied to all media—including digital media—help to minimize the exposure of youth to e-cigarette marketing mes-sages. Because every ad that appears in Saudi Arabia must be preapproved by the government, such a ban should be straightforward to administer for Saudi tele-vision channels and websites.
Increased tax on tobacco products and outright ban Finally, a higher tax on smoked tobacco products as well as an outright ban should be considered. it is recommended that Saudi Arabia increase its excise tax on smoked tobacco products. it is further recommended that e-cigarettes and conventional cigarettes be taxed differentially to reflect their differential health risks; a higher tax on smoked tobacco products might encourage smokers to switch to e-cigarettes.
Saudi Arabia has banned the sale and consumption of alcohol. if public health authorities want to reduce tobacco consumption as much as possible, it is natural

148 | NoNcommuNicABle DiSeASeS iN SAuDi ArABiA
to ask whether Saudi Arabia should simply ban tobacco products too. A ban would have costs and benefits. it would reduce consumption—yielding health benefits—but would also increase illicit sales, reduce tax revenue, destroy jobs (for example, shisha cafes would close), and increase retirement costs (because premature deaths would decline).
Would smokers be made worse off? According to the standard economic model, smokers are fully rational actors who carefully weigh the costs and ben-efits of smoking—including the cost of addiction—before choosing whether to start. in this framework, smokers would be unequivocally worse off as a result of a ban. Gruber and Köszegi (2001), however, argue that standard consumer choice assumptions do not apply in the case of highly addictive products. They cite evi-dence that smokers are “time inconsistent,” meaning that they are unable to achieve their desired future levels of smoking. laux (2000) discusses other fail-ures of the conventional model, such as myopia among youths who initiate smoking. The bottom line is that most smokers say they want to quit but cannot do so; a ban that helps them to quit may make them better off.
one option worth considering is banning smoked tobacco products while allowing e-cigarettes to remain legal. Such an approach would mitigate many of the negative effects of the ban while retaining most of the health benefits. To the extent that smokers switch to e-cigarettes, the demand for conventional ciga-rettes would decline, thus reducing the growth of the black market for such products. Since e-cigarettes are taxed at the same rate as conventional cigarettes, the loss of tax revenue may be minimal. Shisha cafes would close. Perhaps they could be replaced by vaping cafes, which are popular in the united Kingdom. Since e-cigarettes are likely less harmful than conventional cigarettes, life expec-tancy and the cost of retirement programs would rise. in view of the alternative, this seems like a good problem to have.
Diet-related policy recommendations
Diet-related interventions also are recommended:
1. excise taxes on all unhealthy foods and beverages, possibly a multitiered sys-tem based on products’ Nutri-Score grades or an equivalent grading system (for example, NuVal, a shelf nutrition label that rates the nutritional quality of foods on a scale of 1 to 100) (Finkelstein et al. 2018)
2. mandated FoP warning labels for unhealthy foods and beverages
3. mandated warning labels for unhealthy foods on restaurant menus
4. Public awareness campaigns to reduce salt consumption
5. mandated reformulation of high-salt products other than baked bread, which has already been reformulated
6. Ban on child-targeted ads for unhealthy foods and drinks
7. Ban on unhealthy foods and beverages in schools, hospitals, and public health facilities.
Table 7.19 summarizes the evidence on the likely cost-effectiveness of these interventions. overall, most of them are cost-effective or cost-saving, with the strength of the evidence of effectiveness being moderate to low. The latter does not necessarily point to limited effectiveness, just a lack of rigorous evidence.

Population-Wide Interventions to Prevent NCDs | 149
Excise taxation Saudi Arabia’s excise tax on SSBs—50 percent—is among the highest in the world and is likely to be highly effective in reducing consumption. Saudi Arabia should consider imposing excise taxes on all unhealthy products—packaged and unpackaged—regardless of where they are sold. A multitiered system in which the unhealthiest products are taxed at a higher rate than moderately unhealthy products, which in turn are taxed at a higher rate than healthy products, which may even receive a subsidy, may be preferred.
if desired, Saudi Arabia could use a system such as France’s Nutri-Score to assign a grade to every food and beverage product and then use those grades as the basis for a tiered excise tax system. Saudi Arabia’s policy makers would have to set the optimal tax rates, but the structure could look something like the one proposed in table 7.20. once grades have been assigned, the multitiered system would probably be administratively straightforward.
TABLE 7.19 Cost-effectiveness and effectiveness of recommended diet-related interventions
INTERVENTION COST-EFFECTIVENESS
STRENGTH OF UNDERLYING EFFECTIVENESS EVIDENCE REFERENCES
Excise taxes on unhealthy foods and beverages
Cost-saving Moderate Andreyeva, Chaloupka, and Brownell 2011; Basto-Abreu et al. 2018; Briggs et al. 2013a; Briggs et al. 2013b; Carter et al. 2019; Gortmaker et al. 2015; Lal et al. 2017; Long et al. 2015a; Manyema et al. 2014; Sacks et al. 2011; Saxena et al. 2019a; Saxena et al. 2019b; Veerman et al. 2016; Wang et al. 2012; Wilde et al. 2019
FOP warning labels Cost-saving (indirect evidence from a traffic light label study)
Moderate Arrúa et al. 2017b; Sacks et al. 2011; Temple 2020
Menu warning labels At least as cost-effective as menu calorie labels (indirect evidence from a salt warning label study)
Moderate Musicus et al. 2019
Public awareness campaign to reduce salt consumption
Cost-saving Low Collins et al. 2014; Nghiem et al. 2015
Mandated reformulation to reduce salt intake in high-salt products other than baked bread
Cost-saving Low Collins et al. 2014; Nghiem et al. 2015; Nghiem et al. 2016; Wilcox et al. 2015; Wilson et al. 2016
Ban on child-targeted advertising of unhealthy foods and beverages
Cost-saving in two studies; incremental cost-efficiency ratio of A$3.70 per DALY in one study (Note: These studies only assess television advertising)
Low Brown et al. 2018; Cecchini et al. 2010; Magnus et al. 2009
Nutrition standards and banning of unhealthy foods and beverages in schools, hospitals, and public health facilities
Nutrition standards for school meals: US$53 per BMI unit change
Nutrition standards for school snack food and drinks: cost-saving
Low Gortmaker et al. 2015
Source: Original compilation for this publication.Note: BMI = body mass index. DALY = disability-adjusted life year. FOP = front-of-package.

150 | NoNcommuNicABle DiSeASeS iN SAuDi ArABiA
A multitiered system based on Nutri-Score (or a similar system) would present both consumers and producers with better incentives than the current system. Assuming that excise taxes are passed through to consumers, consumers would have an incentive to avoid the unhealthiest products—not just energy drinks and certain SSBs, but all unhealthy foods and beverages. equally import-ant, producers would have an incentive to reformulate their products so that they obtain better grades, thereby receiving more favorable tax treatment. Such an incentive is not present in systems where all products within a particular food category are taxed at the same rate, even if some of those products are healthier than others.
A possible drawback is that Saudi Arabia has different food and beverage items than France, where Nutri-Score was developed. Additional research would be needed to determine how simple or difficult it would be to adapt Nutri-Score for use in Saudi Arabia. Nutri-Score has been used in several Western european countries (Johnston 2019; Szabo de edelenyi et al. 2019), but not in a non-Western country. However, other scoring systems, such as NuVal (Finkelstein et al. 2018), could also be adopted and would serve the same purpose.
The impact on total revenue would be at the discretion of policy makers. in a multitiered system such as the one described above, Saudi Arabia would have the option of simultaneously lowering taxes on healthy products (the current tax is 5 percent) and raising taxes on unhealthy products so that total revenue would not change. revenue neutrality is not a requirement, but it would mitigate poten-tial harm to low-income consumers.
Mandated FOP warning labels making further changes to BoP labeling is not recommended. instead, imple-menting FoP warning labels is recommended, as currently used in canada, chile, israel, Peru, and uruguay. To ensure that Saudi Arabia’s NcD-related interventions are mutually reinforcing, the foods and beverages subjected to excise taxes should be identical to the foods and beverages that have to display warning labels. The combination of excise taxes and warning labels should have synergistic effects that increase the impact on both producer and consumer behavior.
Mandated warning labels for unhealthy foods on restaurant menus Applying the same type of warning labels to both restaurant menus and prepack-aged foods is recommended. There is little evidence that printing calories on menus is effective, as is currently required in some Saudi Arabia jurisdictions. By contrast, there is some evidence that simple logos on menus such as red stop
TABLE 7.20 Illustration of the structure of a nutritional scoring system
FOOD AND BEVERAGE NUTRI-SCORE VALUE ADDED TAX (%)
E (unhealthiest products) 50
D 15
C 5
B 0
A (healthiest products) 0
Source: Original for this publication.

Population-Wide Interventions to Prevent NCDs | 151
signs are effective in reducing the amount of sodium ordered. To reduce the cog-nitive burden on consumers, using the same FoP warning labels on both pack-aging and restaurant menus is recommended.
Salt reduction public awareness campaigns mass media salt reduction campaigns appear to be both effective and cost-saving but are likely to cause only modest changes in consumer behavior. Pursuing salt reduction public awareness campaigns as a minor component of a multipronged NcD reduction strategy is recommended.
Mandated reformulation of high-salt products other than baked bread Saudi Arabia should consider imposing limits on salt in foods that contribute significantly to salt intake in the Saudi diet. Saudi Arabia has already imple-mented such a mandate for baked breads; expanding the mandate to other food categories should be administratively feasible. The experience of the united Kingdom suggests that even modest reductions in salt intake can lead to impres-sive reductions in cardiovascular mortality.
like any intervention, product reformulation may have unintended effects, which should be monitored closely. manufacturers are likely to replace targeted nutrients with ingredients that have minimal negative impact on a product’s fla-vor, preservation qualities, texture, and cost. Sometimes, as Scrinis and montero (2017) note, the substitute ingredients may be just as harmful as the original ingredient. in the 1960s, manufacturers replaced fats derived from animal fats with partially hydrogenated oils. And in the 1980s, manufacturers replaced fat with sugar. At the time, low-fat diets were common. Today, manufacturers often replace sugar with artificial sweeteners whose long-term health effects are not known. Salt is often replaced with salt substitutes—usually potassium chloride. many people are deficient in potassium—and would likely benefit from such substitution—but increased potassium intake can harm people with type 1 diabe-tes and several other illnesses. Thus any policy to encourage or mandate salt reduction should be accompanied by monitoring of potassium-sensitive individuals.
Ban on child-targeted ads Saudi Arabia should consider implementing its proposal to ban child-centered advertising of unhealthy foods and beverages. The ban should apply to all media, including digital media. The list of unhealthy products subject to the ban should align with the list of products that are taxed, labeled, and banned in schools and hospitals. Because every ad that appears in Saudi Arabia must be preapproved by the government, such a ban should be straightforward to administer.
Ban on unhealthy foods from schools, hospitals, and public health facilities Despite the low quality of evidence on cost-effectiveness, banning the unhealth-iest food and beverage products in schools, hospitals, and other health care facil-ities is recommended. These products are the same ones that are subject to the highest excise taxes, warning labels, and youth-targeted advertising restrictions. it is important for Saudi Arabia’s schools and health care facilities to provide healthy environments for students and patients. increased enforcement of Saudi Arabia’s school nutrition standards to ensure consistent compliance is also recommended.
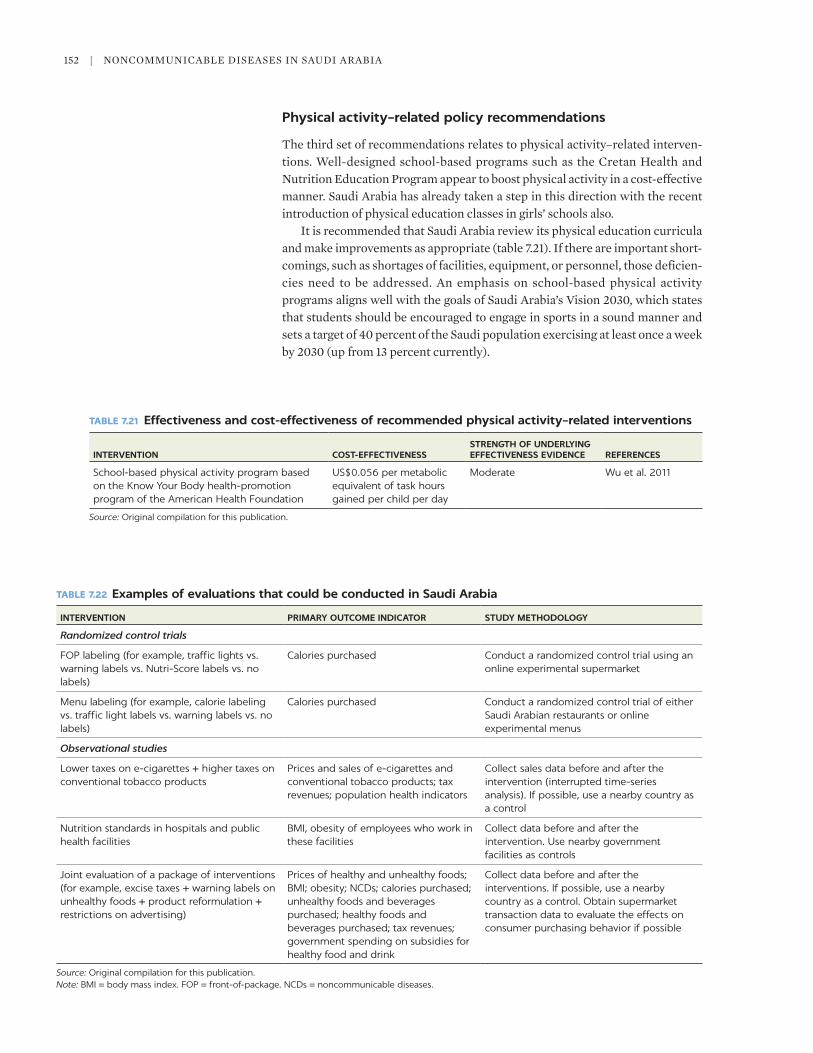
152 | NoNcommuNicABle DiSeASeS iN SAuDi ArABiA
Physical activity–related policy recommendations
The third set of recommendations relates to physical activity–related interven-tions. Well-designed school-based programs such as the cretan Health and Nutrition education Program appear to boost physical activity in a cost-effective manner. Saudi Arabia has already taken a step in this direction with the recent introduction of physical education classes in girls’ schools also.
it is recommended that Saudi Arabia review its physical education curricula and make improvements as appropriate (table 7.21). if there are important short-comings, such as shortages of facilities, equipment, or personnel, those deficien-cies need to be addressed. An emphasis on school-based physical activity programs aligns well with the goals of Saudi Arabia’s Vision 2030, which states that students should be encouraged to engage in sports in a sound manner and sets a target of 40 percent of the Saudi population exercising at least once a week by 2030 (up from 13 percent currently).
TABLE 7.21 Effectiveness and cost-effectiveness of recommended physical activity–related interventions
INTERVENTION COST-EFFECTIVENESSSTRENGTH OF UNDERLYING EFFECTIVENESS EVIDENCE REFERENCES
School-based physical activity program based on the Know Your Body health-promotion program of the American Health Foundation
US$0.056 per metabolic equivalent of task hours gained per child per day
Moderate Wu et al. 2011
Source: Original compilation for this publication.
TABLE 7.22 Examples of evaluations that could be conducted in Saudi Arabia
INTERVENTION PRIMARY OUTCOME INDICATOR STUDY METHODOLOGY
Randomized control trials
FOP labeling (for example, traffic lights vs. warning labels vs. Nutri-Score labels vs. no labels)
Calories purchased Conduct a randomized control trial using an online experimental supermarket
Menu labeling (for example, calorie labeling vs. traffic light labels vs. warning labels vs. no labels)
Calories purchased Conduct a randomized control trial of either Saudi Arabian restaurants or online experimental menus
Observational studies
Lower taxes on e-cigarettes + higher taxes on conventional tobacco products
Prices and sales of e-cigarettes and conventional tobacco products; tax revenues; population health indicators
Collect sales data before and after the intervention (interrupted time-series analysis). If possible, use a nearby country as a control
Nutrition standards in hospitals and public health facilities
BMI, obesity of employees who work in these facilities
Collect data before and after the intervention. Use nearby government facilities as controls
Joint evaluation of a package of interventions (for example, excise taxes + warning labels on unhealthy foods + product reformulation + restrictions on advertising)
Prices of healthy and unhealthy foods; BMI; obesity; NCDs; calories purchased; unhealthy foods and beverages purchased; healthy foods and beverages purchased; tax revenues; government spending on subsidies for healthy food and drink
Collect data before and after the interventions. If possible, use a nearby country as a control. Obtain supermarket transaction data to evaluate the effects on consumer purchasing behavior if possible
Source: Original compilation for this publication.Note: BMI = body mass index. FOP = front-of-package. NCDs = noncommunicable diseases.

Population-Wide Interventions to Prevent NCDs | 153
GENERATING ADDITIONAL EVIDENCE
This review has identified limitations with the base of evidence. it is suggested that Saudi Arabia consider a combination of small-scale randomized control tri-als, secondary data analyses using scanner data or food-purchasing data, and large-scale evaluations such as the ones that chile is doing (Nakamura et al. 2018) (table 7.22). The Saudi government should consider carrying out or fund-ing such studies.
CONCLUSIONS
This chapter has summarized the evidence on the effectiveness and cost- effectiveness of population-wide interventions to prevent NcDs. Based on the available evidence, some effective and cost-effective (or cost-saving) interventions are recommended to reduce the initiation of e-cigarette use and smoking, to improve diets, and to increase the physical activity of the country’s population. if implemented, these interventions have the potential to reduce substantially the incidence of NcDs in Saudi Arabia. The study has also identi-fied the sparse evidence base on effectiveness and cost-effectiveness of some interventions. conducting rigorous evaluations to provide information about which policies are working and which are not is critical.
REFERENCES
Abioye, A. i., K. Hajifathalian, and G. Danaei. 2013. “Do mass media campaigns improve Physical Activity? A Systematic review and meta-Analysis.” Archives of Public Health 71 (1): 20. doi: 10.1186/0778-7367-71-20.
Abu-omar, K., A. rutten, i. Burlacu, V. Schätzlein, S. messing, and m. Suhrcke. 2017. “The cost-effectiveness of Physical Activity interventions: A Systematic review of reviews.” Preventive Medicine Reports 8 (December): 72–78. doi: 10.1016/j.pmedr.2017.08.006.
Acton, r. B., A. c. Jones, S. i. Kirkpatrick, c. A. roberto, and D. Hammond. 2019. “Taxes and Front-of-Package labels improve the Healthiness of Beverage and Snack Purchases: A randomized experimental marketplace.” International Journal of Behavioral Nutrition and Physical Activity 16: 46. https://doi.org/10.1186/s12966-019-0799-0.
Akl, e. A., S. K. Gunukula, S. Aleem, r. obeid, P. Jaoude, r. Honeine, and J. irani. 2011. “The Prevalence of Waterpipe Tobacco Smoking among the General and Specific Populations: A Systematic review.” BMC Public Health 11 (1): 244. doi: 10.1186/1471-2458-11-244.
Aldubayan, K., and m. murimi. 2019. “compliance with School Nutrition Policy in Saudi Arabia: A Quantitative Study.” Eastern Mediterranean Health Journal 25 (4): 230–38.
AlFaris, N. A., J. Z. Al-Tamimi, m. o. Al-Jobair, and N. m. Al-Shwaiyat. 2015. “Trends of Fast Food consumption among Adolescent and Young Adult Saudi Girls living in riyadh.” Food & Nutrition Research 59: Art. 26488. doi: 10.3402/fnr.v59.26488.
Alghamdi, A., A. Fallatah, F. okal, T. Felemban, m. eldigire, and H. Almodaimegh. 2020. “Smoking Behaviour after enforcement of a 100% Tax on Tobacco Products in Saudi Arabia: A cross-Sectional Study.” Eastern Mediterranean Health Journal 26 (1): 39–46.
Al-lehiany, o., and D. Stanley. 2009. “Smoking cessation Program Targeting Adolescents: Saudi Arabia.” Journal of Smoking Cessation 4 (1): 3–9.
Allen, K., J. Pearson-Stuttard, W. Hooton, P. Diggle, S. capewell, and m. o’Flaherty. 2015. “Potential of Trans Fats Policies to reduce Socioeconomic inequalities in mortality from coronary Heart Disease in england: cost effectiveness modelling Study.” BMJ 351: h4593. h4583.10.1136/bmj.h4583.

154 | NoNcommuNicABle DiSeASeS iN SAuDi ArABiA
Allison. r., e. l. Bird, and S. mcclean. 2017. “is Team Sport the Key to Getting everybody Active, every Day? A Systematic review of Physical Activity interventions Aimed at increasing Girls’ Participation in Team Sport.” AIMS Public Health 4 (2): 202–20. doi: 10.3934/publichealth.2017.2.202
Alshayban, D., and r. Joseph. 2019. “A call for effective interventions to curb Shisha Tobacco Smoking among university Students in eastern Province, Saudi Arabia: Findings from a cross-Sectional Study.” Asian Pacific Journal of Cancer Prevention 20 (10): 2971–77. doi: 10.31557/APJcP.2019.20.10.2971.
Alsukait, r., P. Wilde, S. N. Bleich, G. Singh, and S. c. Folta. 2020. “evaluating Saudi Arabia’s 50% carbonated Drink excise Tax: changes in Prices and Volume Sales.” Economics & Human Biology 38: Art. 100868. doi: 10.1016/j.ehb.2020.100868.
Althubiti, m. A., and m. m. Nour eldein. 2018. “Trends in the incidence and mortality of cancer in Saudi Arabia.” Saudi Medical Journal 39 (12): 1259–62. doi: 10.15537/smj.2018.12.23348.
American lung Association. n.d. “Trends in cigarette Smoking rates.” American lung Association, chicago, il. https://www.lung.org/research/trends-in-lung-disease/tobacco -trends-brief (accessed April 10, 2020).
Anderson, l. m., T. A. Quinn, K. Glanz, G. ramirez, l. c. Kahwati, D. B. Johnson, l. r. Buchanan, et al. 2009. “The effectiveness of Worksite Nutrition and Physical Activity interventions for controlling employee overweight and obesity: A Systematic review.” American Journal of Preventive Medicine 37 (4): 340–57.
Andreyeva, T., F. J. chaloupka, and K. D. Brownell. 2011. “estimating the Potential of Taxes on Sugar-Sweetened Beverages to reduce consumption and Generate revenue.” Preventive Medicine 52 (6): 413–16.
Angell, S. Y., l. K. cobb, c. J. curtis, K. J. Konty, and l. D. Silver. 2012. “change in Trans Fatty Acid content of Fast-Food Purchases Associated with New York city’s restaurant regulation: A Pre-Post Study.” Annals of Internal Medicine 157 (2): 81–86. 10.7326/0003-4819-157-2-201207170-00004.
Anthonisen, N. r., m. A. Skeans, r. A. Wise, J. manfreda, r. e. Kanner, and J. e. connett for the lung Health Study research Group. 2005. “The effects of a Smoking cessation intervention on 14.5-Year mortality: A randomized clinical Trial.” Annals of Internal Medicine 142 (4): 233–39. doi: 10.7326/0003-4819-142-4-200502150-00005.
Arrúa, A., m. r. curutchet, N. rey, P. Barreto, and G. Ares. 2017a. “impact of Front-of-Pack Nutrition information and label Design on children’s choice of Two Snack Foods: comparison of Warnings and the Traffic-light System.” Appetite 116: 139–46.
Arrúa, A., l. machín, m. r. curutchet, J. martínez, l. Antúnez, F. Alcaire, A. Giménez, and G. Ares. 2017b. “Warnings as a Directive Front-of-Pack Nutrition labelling Scheme: comparison with the Guideline Daily Amount and Traffic-light Systems.” Public Health Nutrition 20 (13): 2308–17.
Atkin, A. J., T. Gorely, S. J. Biddle, N. cavill, and c. Foster. 2011. “interventions to Promote Physical Activity in Young People conducted in the Hours immediately after School: A Systematic review.” International Journal of Behavioral Medicine 18 (3): 176–87. doi: 10.1007/s12529-010-9111-z.
Backholer, K., D. Sarink, A. Beauchamp, c. Keating, V. loh, K. Ball, J. martin, and A. Peeters. 2016. “The impact of a Tax on Sugar-Sweetened Beverages According to Socio-economic Position: A Systematic review of the evidence.” Public Health Nutrition 19 (17): 3070–84. doi: 10.1017/S136898001600104X.epub2016may16.PmiD:27182835.
Bader, P., D. Boisclair, and r. Ferrence. 2011. “effects of Tobacco Taxation and Pricing on Smoking Behavior in High risk Populations: A Knowledge Synthesis.” International Journal of Environmental Research and Public Health 8 (11): 4118–39.
Baker, P. r. A., D. P. Francis, J. Soares, A. l. Weightman, and c. Foster. 2015. “community Wide interventions for increasing Physical Activity.” Cochrane Database of Systemic Reviews 1: Art. cD008366. doi: 10.1002/14651858.cD008366.pub3.
Bala, m., l. Strzeszynski, and K. cahill. 2008. “mass media interventions for Smoking cessation in Adults.” Cochrane Database of Systemic Reviews 1: Art. cD004704.

Population-Wide Interventions to Prevent NCDs | 155
Barragan, N. c., A. J. Noller, B. robles, l. N. Gase, m. S. leighs, S. Bogert, P. A. Simon, and T. Kuo. 2014. “The ‘Sugar Pack’ Health marketing campaign in los Angeles county, 2011–2012.” Health Promotion Practice 15 (2): 208–16. https://doi.org/10.1177/1524839913507280.
Barton, P., l. Andronis, A. Briggs, K. mcPherson, and S. capewell. 2011. “effectiveness and cost effectiveness of cardiovascular Disease Prevention in Whole Populations: modelling Study.” BMJ 343: d4044. doi: 10.1136/bmj.d4044.
Basto-Abreu, A., A. Braverman-Bronstein, D. camacho-García-Formentí, r. Zepeda-Tello, m. m. Popkin, J. rivera-Dommarco, m. Hernández-Ávila, and T. Barrientos-Gutiérrez. 2018. “expected changes in obesity after reformulation to reduce Added Sugars in Beverages: A modeling Study.” PLoS Medicine 15 (10): e1002664. Published correction appears in PLoS Medicine [January 24, 2019] 16 (1): e1002743.
Batis, c., J. A. rivera, B. m. Popkin, and l. Smith Taillie. 2016. “First-Year evaluation of mexico’s Tax on Nonessential energy-Dense Foods: An observational Study.” PLoS Medicine 13 (7): e1002057.
Bdeir, B., i. Farah, and T. conboy. 2014. “managing cardiovascular Disease: model of care in Saudi Arabia.” European Heart Journal Supplements 16 (Suppl.): B96–B98. doi: 10.1093 / eurheartj/suu013.
Bíró, A. 2015. “Did the Junk Food Tax make the Hungarians eat Healthier?” Food Policy 54 (July): 107–15.
Bleich, S. N., c. D. economos, m. l. Spiker, K. A. Vercammen, e. r. Vanepps, J. P. Block, B. elbel, m. Story, and c. A. roberto. 2017. “A Systematic review of calorie labeling and modified calorie labeling interventions: impact on consumer and restaurant Behavior.” Obesity (Silver Spring) 25 (12): 2018–44.
Boles, m., A. Adams, A. Gredler, and S. manhas. 2014. “Ability of a mass media campaign to influence Knowledge, Attitudes, and Behaviors about Sugary Drinks and obesity.” Preventive Medicine 67 (Suppl. 1): S40–S45.
Borgmeier, i., and J. Westenhoefer. 2009. “impact of Different Food label Formats on Healthiness evaluation and Food choice of consumers: A randomized-controlled Study.” BMC Public Health 9: Art. 184.
Bradley, J., G. Gardner, m. K. rowland, m. Fay, K. mann, r. Holmes, e. Foster, et al. 2020. “impact of a Health marketing campaign on Sugars intake by children Aged 5–11 Years and Parental Views on reducing children’s consumption.” BMC Public Health 20 (1): 331. doi: 10.1186/s12889-020-8422-5.
Briggs, A. D. m., o. T. mytton, A. Kehlbacher, r. Tiffin, m. rayner, and P. Scarborough. 2013a. “overall and income Specific effect on Prevalence of overweight and obesity of 20% Sugar Sweetened Drink Tax in uK: econometric and comparative risk Assessment modelling Study.” BMJ 347: f6189. doi: 10.1136/bmj.f6189.
Briggs, A. D., o. T. mytton, D. madden, D. o’Shea, m. rayner, and P. Scarborough. 2013b. “The Potential impact on obesity of a 10% Tax on Sugar-Sweetened Beverages in ireland, an effect Assessment modelling Study.” BMC Public Health 13: 860. doi: 10.1186 /1471 -2458-13-860.
Brinsden, H. c., F. J. He, K. H. Jenner, and G. A. macgregor. 2013. “Surveys of the Salt content in uK Bread: Progress made and Further reductions Possible.” BMJ Open 3 (6): e002936. doi: 10.1136/bmjopen-2013-002936.
Brown, H. S. iii, m. Stigler, c. Perry, P. Dhavan, m. Arora, and K. S. reddy. 2013. “The cost-effectiveness of a School-Based Smoking Prevention Program in india.” Health Promotion International 28 (2): 178–86. doi: 10. 1093/heapro/dar095.
Brown, V., J. Ananthapavan, l. Veerman, G. Sacks, A. lal, A. Peeters, K. Backholer, and m. moodie. 2018. “The Potential cost-effectiveness and equity impacts of restricting Television Advertising of unhealthy Food and Beverages to Australian children.” Nutrients 10 (5): 622.
Brownson, r. c., D. P. Hopkins, and m. A. Wakefield. 2002. “effects of Smoking restrictions in the Workplace.” Annual Review of Public Health 23: 333–48.

156 | NoNcommuNicABle DiSeASeS iN SAuDi ArABiA
cancer research uK. 2019. “lung cancer incidence Statistics.” cancer research uK, oxford. https://www.cancerresearchuk.org/health-professional/cancer-statistics / statistics -by-cancer-type/lung-cancer/incidence (accessed April 19, 2020).
cantu-Jungles, T. m., l. A. mccormack, J. e. Slaven, m. Slebodnik, and H. A. eicher-miller. 2017. “A meta-Analysis to Determine the impact of restaurant menu labeling on calories and Nutrients (ordered or consumed) in u. S. Adults.” Nutrients 9 (10): 1088. doi: 10.3390 / nu9101088.
carter, H. e., D. J. Schofield, r. Shrestha, and l. Veerman. 2019. “The Productivity Gains Associated with a Junk Food Tax and Their impact on cost-effectiveness.” PLoS One 14 (7): e0220209.
cavill, N., and A. Bauman. 2004. “changing the Way People Think about Health-enhancing Physical Activity: Do mass media campaigns Have a role?” Journal of Sports Sciences 22 (8): 771–90. doi: 10.1080/02640410410001712467.
cawley, J., D. Frisvold, A. Hill, and D. Jones. 2020. “oakland’s Sugar-Sweetened Beverage Tax: impacts on Prices, Purchases and consumption by Adults and children.” Economics & Human Biology 37 (may): 100865.
cDc (centers for Disease control and Prevention). 2017. “e-cigarette Ads and Youth.” Vital Signs (blog), march 23, 2017. https://www.cdc.gov/vitalsigns/ecigarette-ads/index.html.
cDc (centers for Disease control and Prevention). 2020a. “About electronic cigarettes (e-cigarettes).” Smoking and Tobacco Use (blog), November 16, 2020. https://www.cdc.gov /tobacco/basic_information/e-cigarettes/about-e-cigarettes.html.
cDc (centers for Disease control and Prevention). 2020b. “outbreak of lung injury Associated with e-cigarette use, or Vaping.” Smoking and Tobacco Use (blog), November 27, 2020 https://www.cdc.gov/tobacco/basic_information/e-cigarettes/severe-lung-disease.html.
cecchini, m., F. Sassi, J. A. lauer, Y. Y. lee, V. Guajardo-Barron, and D. chisholm. 2010. “Tackling of unhealthy Diets, Physical inactivity, and obesity: Health effects and cost-effectiveness.” The Lancet 376 (9754): 1775–84. doi: 10.1016/S0140-6736(10)61514-0.
cha, e., K. H. Kim, H. m. lerner, c. r. Dawkins, m. K. Bello, G. umpierrez, and S. B. Dunbar. 2014. “Health literacy, Self-efficacy, Food label use, and Diet in Young Adults.” American Journal of Health Behavior 38 (3): 331–39.
chaloupka, F. J., K. Straif, and m. e. leon. 2010. “effectiveness of Tax and Price Policies in Tobacco control.” Tobacco Control 20 (3): 235–38.
chapman, S., r. Borland, m. Scollo, r. c. Brownson, A. Dominello, and S. Woodward. 1999. “The impact of Smoke-Free Workplaces on Declining cigarette consumption in Australia and the united States.” American Journal of Public Health 89 (7): 1018–23.
chen, V., and J. l. Forster. 2006. “The long-Term effect of local Policies to restrict retail Sale of Tobacco to Youth.” Nicotine and Tobacco Research 8 (3): 371–77. https://doi.org/10.1080/14622200600670249.
chen-Sankey, J. c., J. B. unger, m. Bansal-Travers, J. Niederdeppe, e. Bernat, and K. choi. 2019. “e-cigarette marketing exposure and Subsequent experimentation among Youth and Young Adults.” Pediatrics 144 (5): e20191119. doi: 10.1542/peds.2019-1119.
chillón, P., K. r. evenson, A. Vaughn, and D. S. Ward. 2011. “A Systematic review of interventions for Promoting Active Transportation to School.” International Journal of Behavioral Nutrition and Physical Activity 8: 10. doi: 10.1186/1479-5868-8-10.
cobiac, l. J., T. Vos, and J. l. Veerman. 2010. “cost-effectiveness of interventions to reduce Dietary Salt intake.” Heart 96 (23): 1920–25. doi: 10.1136/hrt.2010.199240.
colantuoni, F., and c. rojas. 2015. “The impact of Soda Sales Taxes on consumption: evidence from Scanner Data.” Contemporary Economic Policy 33 (4): 714–34.
colchero, m. A., B. m. Popkin, J. A. rivera, and S. W. Ng. 2016. “Beverage Purchases from Stores in mexico under the excise Tax on Sugar Sweetened Beverages: observational Study.” BMJ 352: h6704 10.1136/bmj.h6704. https://doi. org/10. 1136/bmj.h6704.
collins, m., H. mason, m. o’Flaherty, m. Guzman-castillo, J. critchley, and S. capewell. 2014. “An economic evaluation of Salt reduction Policies to reduce coronary Heart Disease in england: A Policy modeling Study.” Value in Health 17 (5): 517–24. 10.1016/j.jval.2014.03.1722.

Population-Wide Interventions to Prevent NCDs | 157
conn, V. S., A. r. Hafdahl, P. S. cooper, l. m. Brown, and S. l. lusk. 2009. “meta-Analysis of Workplace Physical Activity interventions.” American Journal of Preventive Medicine 37 (4): 330–39. doi: 10.1016/j.amepre.2009.06.008.
corso, P. S., J. B. ingels, H. m. Padilla, H. Zuercher, D. DeJoy, r. Vandenberg, and m. Wilson. 2018. “cost effectiveness of a Weight management Program implemented in the Worksite: Translation of Fuel Your life.” Journal of Occupational and Environmental Medicine 60 (8): 683–87. doi: 10.1097/Jom.0000000000001343.
cradock, A. l., A. mcHugh, H. mont-Ferguson, l. Grant, J. l. Barrett, S. l. Gortmaker, and c. Wang. 2011. “effect of School District Policy change on consumption of Sugar-Sweetened Beverages among High School Students, Boston, massachusetts, 2004–2006.” Preventing Chronic Disease 8 (4): A74.
crino, m., A. m. m. Herrera, J. Ananthapavan, J. H. Y. Wu, B. Neal, Y. Y. lee, m. Zheng, A. lal, and G. Sacks. 2017. “modelled cost-effectiveness of a Package Size cap and a Kilojoule reduction intervention to reduce energy intake from Sugar-Sweetened Beverages in Australia.” Nutrients 9 (9): 983. doi: 10.3390/nu9090983.
crosetto, P., A. lacroix, l. muller, and B. ruffiux. 2017. “modification des achats alimentaires en réponse à cinq logos nutritionnels.” Cahiers de Nutrition et de Diététique 52 (3): 129–33.
Daradka, H., o. Khabour, K. Alzoubi, r. Nakkash, and T. eissenberg. 2019. “Tobacco and Waterpipe use among university Students in Saudi Arabia: impact of Tobacco Sales Ban.” Eastern Mediterranean Health Journal 25 (2): 111–18. doi: 10.26719/emhj.18.021.
DiFranza, J. r. 2012. “Which interventions against the Sale of Tobacco to minors can Be expected to reduce Smoking?” Tobacco Control 21 (4): 436–42.
DiFranza, J. r., r. m. Peck, T. e. radecki, and J. A. Savageau. 2001. “What is the Potential cost-effectiveness of enforcing a Prohibition on the Sale of Tobacco to minors?” Preventive Medicine 32 (2): 168–74.
Dino, G., K. Horn, A. Abdulkadri, i. Kalsekar, and S. Branstetter. 2008. “cost-effectiveness Analysis of the Not on Tobacco Program for Adolescent Smoking cessation.” Prevention Science: The Official Journal of the Society for Prevention Research 9 (1): 38–46.
Dobbins, m., K. Decorby, S. manske, and e. Goldblatt. 2008. “effective Practices for School-Based Tobacco use Prevention.” Preventive Medicine 46 (4): 289–97.
Dobbins, m., H. Husson, K. Decorby, and r. l. larocca. 2013. “School-Based Physical Activity Programs for Promoting Physical Activity and Fitness in children and Adolescents Aged 6 to 18.” Cochrane Database of Systemic Reviews 2: Art. cD007651. doi: 10.1002/14651858 .cD007651.pub2.
Ducrot, P., c. Julia, c. mejean, e. Kesse-Guyot, m. Touvier, l. K. Fezeu, S. Hercberg, and S. Péneau. 2016. “impact of Different Front-of-Pack Nutrition labels on consumer Purchasing intentions: A randomized controlled Trial.” American Journal of Preventive Medicine 50 (5): 627–36.
Durkin, S., e. Brennan, and m. Wakefield. 2012. “mass media campaigns to Promote Smoking cessation among Adults: An integrative review.” Tobacco Control 21 (2): 127–38.
egnell, m., i. Boutron, S. Péneau, P. Ducrot, m. Touvier, P. Galan, c. Buscail, et al. 2019. “Front-of-Pack labeling and the Nutritional Quality of Students’ Food Purchases: A 3-Arm randomized controlled Trial.” American Journal of Public Health 109 (8): 1122–29.
egnell, m., P. Galan, N. J. Farpour-lambert, Z. Talati, S. Pettigrew, S. Hercberg, and c. Julia. 2020. “compared to other Front-of-Pack Nutrition labels, the Nutri-Score emerged as the most efficient to inform Swiss consumers on the Nutritional Quality of Food Products.” PLoS One 15 (2): e0228179.
engbers, l. H., m. N. van Poppel, A. m. J. chin Paw, and W. van mechelen. 2005. “Worksite Health Promotion Programs with environmental changes: A Systematic review.” American Journal of Preventive Medicine 29 (1): 61–70.
evenson, K. r., A. H. Herring, and S. l. Huston. 2005. “evaluating change in Physical Activity with the Building of a multi-use Trail.” American Journal of Preventive Medicine 28 (Suppl. 2): 177–85.

158 | NoNcommuNicABle DiSeASeS iN SAuDi ArABiA
Falbe, J., H. r. Thompson, c. m. Becker, N. rojas, c. e. mcculloch, and K. A. madsen. 2016. “impact of the Berkeley excise Tax on Sugar-Sweetened Beverage consumption.” American Journal of Public Health 106 (10): 1865–71.
Farahani, A. l., m. Asadi-lari, e. mohammadi, S. Parvizy, A. A. Haghdoost, and Z. Taghizadeh. 2015. “community-Based Physical Activity interventions among Women: A Systematic review.” BMJ Open 5 (4): e007210. doi: 10.1136/bmjopen-2014-007210.
Farber, H. J., S. Pakhale, and e. r. Neptune. 2016. “Tobacco 21: An important Public Policy to Protect our Youth.” Annals of the American Thoracic Society 13 (12): 2115–18.
Farrelly, m. c., J. Nonnemaker, K. c. David, and A. Hussin. 2009. “The influence of the National Truth campaign on Smoking initiation.” American Journal of Preventive Medicine 36 (5): 379–84. doi: 10.1016/j.amepre.2009.01.019.
Farrelly, m. c., J. m. Nonnemaker, and K. A. Watson. 2012. “The consequences of High cigarette excise Taxes for low-income Smokers.” PLoS One 7 (9): e43838. https://doi.org/10.1371 / journal.pone.0043838.
Finkelstein, e. A., F. J. l. Ang, B. Doble, W. H. m. Wong, and r. m. van Dam. 2019. “A randomized controlled Trial evaluating the relative effectiveness of the multiple Traffic light and Nutri-Score Front of Package Nutrition labels.” Nutrients 11 (9): 2236. doi: 10.3390 / nu11092236.
Finkelstein, e. A., W. li, G. melo, K. Strombotne, and c. Zhen. 2018. “identifying the effect of Shelf Nutrition labels on consumer Purchases: results of a Natural experiment and consumer Survey.” American Journal of Clinical Nutrition 107 (4): 647–51. doi: 10.1093/ajcn / nqy014.
Finkelstein, e. A., K. l. Strombotne, N. l. chan, and J. Krieger. 2011. “mandatory menu labeling in one Fast-Food chain in King county, Washington.” American Journal of Preventive Medicine 40 (2): 122–27.
Fiolet, T., B. Srour, l. Sellem, e. Kesse-Guyot, B. Allès, m. Deschaseaux, P. Fassier, et al. 2018. “consumption of ultra-Processed Foods and cancer risk: results from NutriNet-Santé Prospective cohort.” BMJ 360: k322. doi: https://doi.org/10.1136/bmj.k322.
Fitzgerald, S., A. murphy, A. Kirby, F. Geaney, and i. J. Perry. 2018. “cost-effectiveness of a complex Workplace Dietary intervention: An economic evaluation of the Food choice at Work Study.” BMJ Open 8 (3): e019182. doi: 10.1136/bmjopen-2017-019182.
Franks, A. S., K. Sando, and e. mcBane. 2018. “Do electronic cigarettes Have a role in Tobacco cessation?” Pharmacotherapy 38 (5): 555–68. doi: 10.1002/phar.2103.
Freak-Poli, r. l. A., m. cumpston, A. Peeters, and S. A. clemes. 2013. “Workplace Pedometer interventions for increasing Physical Activity.” Cochrane Database of Systematic Reviews 4: Art. cD009209. doi: 10.1002/14651858.
Fuchs, A., and F. meneses. 2017. “regressive or Progressive? The effect of Tobacco Taxes in ukraine.” World Bank, Washington, Dc.
Gabriel, c. G., F. de A. Vasconcelos, D. F. Andrade and B. de Abreau Soares Schmitz. 2009. “First law regulating School canteens in Brazil: evaluation after Seven Years of implementation.” Archivos LatinoAmericanos de Nutrición 59 (2): 128–38.
Gillespie, D. o. S., K. Allen, m. Guzman-castillo, P. Bandosz, P. moreira, r. mcGill, e. Anwar, et al. 2015. “The Health equity and effectiveness of Policy options to reduce Dietary Salt intake in england: Policy Forecast” PLoS One 10 (7): e0127927. doi: 10.1371/journal .pone.0127927. Published correction appears in PLoS One [2015] 10 (7): e0134064.
Gilmore, A. B., B. Tavakoly, G. Taylor, and H. reed. 2013. “understanding Tobacco industry Pricing Strategy and Whether it undermines Tobacco Tax Policy: The example of the uK cigarette market.” Addiction 108 (7): 1317–26. doi: 10.1111/add.12159.
Gorski Findling, m. T., P. m. Werth, A. A. musicus, m. A. Bragg, D. J. Graham, B. elbel, and c. A. roberto. 2018. “comparing Five Front-of-Pack Nutrition labels’ influence on consumers’ Perceptions and Purchase intentions.” Preventive Medicine 106 (January): 114–21. doi: 10.1016/j.ypmed.2017.10.022.
Gortmaker, S. l., Y. c. Wang, m. W. long, c. m. Giles, Z. J. Ward, J. l. Barrett, e. l. Kenney, et al. 2015. “Three interventions That reduce childhood obesity Are Projected to Save more

Population-Wide Interventions to Prevent NCDs | 159
Than They cost to implement.” Health Affairs (Millwood) 34 (11): 1932–39. doi: 10.1377/hlthaff.2015.0631.
Gotts, J. e., S. e. Jordt, r. mcconnell, and r. Tarran. 2019. “What Are the respiratory effects of e-cigarettes?” BMJ 366: l5275. doi: 10.1136/bmj.l5275. Published correction appears in BMJ [october 15, 2019] 15 (367): l5980.
Gruber, J., and B. Köszegi. 2001. “is Addiction ‘rational’? Theory and evidence.” Quarterly Journal of Economics 116 (4, November): 1261–303.
Guerriero, c., J. cairns, i. roberts, A. rodgers, r. Whittaker, and c. Free. 2013. “The cost-effectiveness of Smoking cessation Support Delivered by mobile Phone Text messaging: Txt2stop.” European Journal of Health Economics 14 (5): 789–97. doi: 10.1007/s10198 -012-0424-5.
Guindon, G., G. Paraje, and F. chaloupka. 2015. “The impact of Prices and Taxes on the use of Tobacco Products in latin America and the caribbean.” American Journal of Public Health 105 (3): e9–e19.
Hafez, D., A. Fedewa, m. moran, m. o’Brien, r. Ackermann, and J. T. Kullgren. 2017. “Workplace interventions to Prevent Type 2 Diabetes mellitus: A Narrative review.” Current Diabetes Reports 17 (2): 9. doi: 10.1007/s11892-017-0840-0.
Hagimoto, A., m. Nakamura, T. morita, S. masui, and A. oshima. 2010. “Smoking cessation Patterns and Predictors of Quitting Smoking among the Japanese General Population: A 1-Year Follow-up Study.” Addiction 105 (1): 164–73. doi: 10.1111/j.1360-0443.2009.02735.x.
Hall, K. D. 2019. “ultra-Processed Diets cause excess calorie intake and Weight Gain: A one-month inpatient randomized controlled Trial of Ad Libitum Food intake.” Cell Metabolism 30 (1): 66–77.
Hawley K. l., c. A. roberto, m. A. Bragg, P. J. liu, m. B. Schwartz, and K. D. Brownell. 2013. “The Science on Front-of-Package Food labels.” Public Health Nutrition 16 (3): 430–39. doi: 10.1017/S1368980012000754.
He, F. J., S. Pombo-rodrigues, and G. A. macGregor. 2014. “Salt reduction in england from 2003 to 2011: its relationship to Blood Pressure, Stroke, and ischaemic Heart Disease mortality.” BMJ Open 4: e004549. doi: 10.1136/bmjopen-2013-004549.
Helfer, P., and T. r. Shultz. 2014. “The effects of Nutrition labeling on consumer Food choice: A Psychological experiment and computational model.” Annals of the New York Academy of Sciences 1331 (December): 174–85.
Herzallah, H. K., B. r. Antonisamy, m. H. Shafee, and S. T. Al-otaibi. 2019. “Temporal Trends in the incidence and Demographics of cancers, communicable Diseases, and Non-communicable Diseases in Saudi Arabia over the last Decade.” Saudi Medical Journal 40 (3): 277–86. doi: 10.15537/smj.2019.3.23585.
Holtgrave, D. r., K. A. Wunderink, D. m. Vallone, and c. G. Healton. 2009. “cost–utility Analysis of the National Truth® campaign to Prevent Youth Smoking.” American Journal of Preventive Medicine 36 (5): 385–88.
Hopkins, D. P., P. A. Briss, c. J. ricard, c. G. Husten, V. G. carande-Kulis, J. e. Fielding, m. o. Alao, et al. 2001. “reviews of evidence regarding interventions to reduce Tobacco use and exposure to environmental Tobacco Smoke.” American Journal of Preventive Medicine 20 (2, Suppl. 1): 16– 66.
Huang, Y., c. Kypridemos, J. liu, Y. lee, J. Pearson-Stuttard, B. collins, P. Bandosz, et al. 2019. “cost-effectiveness of the uS Food and Drug Administration Added Sugar labeling Policy for improving Diet and Health.” Circulation 139 (23): 2613–24. doi: 10.1161 / circulATioNAHA.118.036751.
Hurley, S. F., and J. P. matthews. 2008. “cost-effectiveness of the Australian National Tobacco campaign.” Tobacco Control 17 (6): 379–84.
Hyseni, l., A. elliot-Green, F. lloyd-Williams, c. Kypridemos, m. o’Flaherty, r. mcGill, l. orton, et al. 2017a. “Systematic review of Dietary Salt reduction Policies: evidence for an effectiveness Hierarchy?” PLoS One 12 (5): e0177535. doi: 10.1371/journal.pone.0177535.
Hyseni, l., H. Bromley, c. Kypridemos, m. o’Flaherty, F. lloyd-Williams, m. Guzman-castillo, J. Pearson-Studdard, and S. capewell. 2017b. “Systematic review of Dietary Trans-Fat

160 | NoNcommuNicABle DiSeASeS iN SAuDi ArABiA
reduction interventions.” Bulletin of the World Health Organization 95 (12): 821–30G. doi: 10.2471/BlT.16.189795.
James, e. K., A. Saxena, c. Franco restrepo, B. llorente, A. i. Vecino-ortiz, m. Villar uribe, r. F. lunes, and S. Verguet. 2019. “Distributional Health and Financial Benefits of increased Tobacco Taxes in colombia: results from a modelling Study.” Tobacco Control 28 (4): 374–80. doi: 10.1136/tobaccocontrol-2018-054378.
Jha, P., and F. J. chaloupka. 1999. Curbing the Epidemic: Governments and the Economics of Tobacco Control. Development in Practice. Washington, Dc: World Bank.
Jha, P., and F. J. chaloupka. 2000. “The economics of Global Tobacco control.” BMJ 321 (7257): 358–61.
Johnston, J. 2019. “The Nutri-Score System Takes off in Belgium.” Brussels Times, April 2, 2019.
Kalkhoran, S., and S. A. Glantz. 2016. “e-cigarettes and Smoking cessation in real-World and clinical Settings: A Systematic review and meta-Analysis.” The Lancet Respiratory Medicine 4 (2): 116–28. doi: 10.1016/S2213-2600(15)00521-4.
Kamada, m., J. Kitayuguchi, S. inoue, Y. ishikawa, H. Nishiuchi, S. okada, K. Harada, H. Kamioka, and K. Shiwaku. 2013. “A community-Wide campaign to Promote Physical Activity in middle-Aged and elderly People: A cluster randomized controlled Trial.” International Journal of Behavioral Nutrition and Physical Activity 10: Art. 44.
Kelly, B., S. Vandevijvere, S. Ng, J. Adams, l. Allemandi, l. Bahena-espina, S. Barquera, et al. 2019. “Global Benchmarking of children’s exposure to Television Advertising of unhealthy Foods and Beverages across 22 countries.” Obesity Reviews 20 (Suppl. 2): 116–28. https://doi .org/10.1111/obr.12840.
Kenkel, D., and l. chen. 2000. “consumer information and Tobacco use.” in Tobacco Control in Developing Countries, edited by P. Jha and F. J. chaloupka, 177–214. oxford: oxford university Press.
Kessel Schneider, S., S. l. Buka, K. Dash, J. P. Winickoff, and l. o’Donnell. 2016. “community reductions in Youth Smoking after raising the minimum Tobacco Sales Age to 21.” Tobacco Control 25 (3): 355–59.
Khabaz, m. N., m. A. Bakarman, m. Baig, T. m. Ghabrah, m. A. Gari, N. S. Butt, F. Alghanmi, et al. 2017. “Dietary Habits, lifestyle Pattern and obesity among Young Saudi university Students.” Journal of the Pakistan Medical Association 67 (10): 1541–46.
Khandpur, N., e. B. rimm, and A. J. moran. 2020. “The influence of the New uS Nutrition Facts label on consumer Perceptions and understanding of Added Sugars: A randomized controlled experiment.” Journal of the Academy of Nutrition and Dietetics 120 (2): 197–209. doi: 10.1016/j.jand.2019.10.008.
Kim, S., Y. lee, J. Yoon, S-J. chung, S-K. lee, and H. Kim. 2012. “restriction of Television Food Advertising in South Korea: impact on Advertising of Food companies.” Health Promotion International 28 (1): 17–25. doi: 10.1093/heapro/das023.
Kiszko, K. m., o. D. martinez, c. Abrams, and B. elbel. 2014. “The influence of calorie labeling on Food orders and consumption: A review of the literature.” Journal of Community Health 39 (6): 1248–69.
Kite, J., A. Grunseit, e. Bohn-Goldbaum, B. Bellow, T. carroll, and A. Bauman. 2018. “A Systematic Search and review of Adult-Targeted overweight and obesity Prevention mass media campaigns and Their evaluation: 2000–2017.” Journal of Health Communication 23 (2): 207–32. doi: 10.1080/10810730.2018.1423651.
Kloss, l., J. D. meyer, l. Graeve, and W. Vetter. 2015. “Sodium intake and its reduction by Food reformulation in the european union—A review.” NFS Journal 1 (June): 9–19.
Knowler, W. c., e. Barrett-connor, S. e. Fowler, r. F. Hamman, J. m. lachin, e. A. Walker, D. m. Nathan, and the Diabetes Prevention Program research Group. 2002. “reduction in the incidence of Type 2 Diabetes with lifestyle intervention or metformin.” New England Journal of Medicine 346: 393–403.
lal, A., A. m. mantilla-Herrera, l. Veerman, K. Backholer, G. Sacks, m. moodie, m. Siahpush, r. carter, and A. Peeters. 2017. “modelled Health Benefits of a Sugar-Sweetened Beverage Tax across Different Socioeconomic Groups in Australia: A cost-effectiveness and equity Analysis.” PLoS Medicine 14 (6): e1002326.

Population-Wide Interventions to Prevent NCDs | 161
laux, F. l. 2000. “Addiction as a market Failure: using rational Addiction results to Justify Tobacco regulation.” Journal of Health Economics 19 (4): 421–37.
laverty, A. A., c. Kypridemos, P. Seferidi, e. P. Vamos, J. Pearson-Stuttard, B. collins, S. capewell, et al. 2019. “Quantifying the impact of the Public Health responsibility Deal on Salt intake, cardiovascular Disease and Gastric cancer Burdens: interrupted Time Series and microsimulation Study.” Journal of Epidemiology & Community Health 73 (9): 881–87. doi: 10.1136/jech-2018-211749.
lazovich, D., J. Forster, r. Widome, and P. Vancoevering. 2007. “Tobacco Possession, use, and Purchase laws and Penalties in minnesota: enforcement, Tobacco Diversion Programs, and Youth Awareness.” Nicotine & Tobacco Research 9 (Suppl. 1): S57–S64.
leão, T., A. e. Kunst, and J. Perelman. 2018. “cost-effectiveness of Tobacco control Policies and Programmes Targeting Adolescents: A Systematic review.” European Journal of Public Health 28 (1): 39–43. doi: 10.1093/eurpub/ckx215.
leavy, J. e., F. c. Bull, m. rosenberg, and A. Bauman. 2011. “Physical Activity mass media campaigns and Their evaluation: A Systematic review of the literature 2003–2010.” Health Education Research 26 (6): 1060–85. doi: 10.1093/her/cyr069.
levy, D. e., e. V. Klinger, J. A. linder, e. W. Fleeger, N. A. rigotti, e. r. Park, and J. S. Haas. 2017a. “cost-effectiveness of a Health System-Based Smoking cessation Program.” Nicotine & Tobacco Research 19 (12): 1508–15. doi: 10.1093/ntr/ntw243.
levy, D. T., D. mays, r. G. Boyle, J. Tam, and F. l. chaloupka. 2017b. “The effect of Tobacco control Policies on uS Smokeless Tobacco use: A Structured review.” Nicotine & Tobacco Research 20 (1): 3–11. doi: 10.1093/ntr/ntw291.
long, m. W., S. l. Gortmaker, Z. i. Ward, S. c. resch, m. l. moodie, G. Sacks, B. A. Swinburn, r. c. carter, and Y. c. Want. 2015a. “cost effectiveness of a Sugar-Sweetened Beverage excise Tax in the u. S.” American Journal of Preventive Medicine 49 (1): 112–23.
long, m. W., D. K. Tobias, A. l. cradock, H. Batchelder, and S. l. Gortmaker. 2015b. “Systematic review and meta-Analysis of the impact of restaurant menu calorie labeling.” American Journal of Public Health 105 (5): e11–e24.
magnus, A., m. m. Haby, r. carter, and B. Swinburn. 2009. “The cost-effectiveness of removing Television Advertising of High-Fat and/or High-Sugar Food and Beverages to Australian children.” International Journal of Obesity 33 (10): 1094–102.
malas, m., J. van der Tempel, r. Schwartz, A. minichiello, c. lightfoot, A. Noormohamed, J. Andrews, l. Zawertailo, and r. Ferrence. 2016. “electronic cigarettes for Smoking cessation: A Systematic review.” Nicotine & Tobacco Research 18 (10): 1926–36. doi: 10.1093/ntr/ntw119.
malik, V. S., B. m. Popkin, G. A. Bray, J. -P. Després, W. c. Willett, and F. B. Hu. 2010. “Sugar-Sweetened Beverages and risk of metabolic Syndrome and Type 2 Diabetes: A meta-Analysis.” Diabetes Care 33 (11): 2477–83.
manios, Y., and A. Kafatos for the Preventive medicine and Nutrition clinic university of crete research Team. 2006. “Health and Nutrition education in Primary Schools in crete: 10 Years Follow-up of Serum lipids, Physical Activity and macronutrient intake.” British Journal of Nutrition 95 (3): 568–75.
manyema, m., l. J. Veerman, l. chola, A. Tudendhaft, B. Sartorius, D. labadarios, and K. J. Hofman. 2014. “The Potential impact of a 20% Tax on Sugar-Sweetened Beverages on obesity in South African Adults: A mathematical model.” PLoS One 9 (8): e105287.
marcus, B. H., N. owen, l. H. Forsyth, N. A. cavill, and F. Fridinger. 1998. “Physical Activity interventions using mass media, Print media, and information Technology.” American Journal of Preventive Medicine 15 (4): 362–78. doi: 10.1016/S0749-3797(98)00079-8.
marsh, l., A. Gray, r. mcGee, r. Newcombe, and r. Patterson. 2012. “Access to cigarettes by Young New Zealand Smokers: little change from 2000 to 2008.” Australian and New Zealand Journal of Public Health 36 (5): 415–20. doi: 10.1111/j.1753-6405.2012.00909.x.
maubach, N., J. Hoek, and D. mather. 2014. “interpretive Front-of-Pack Nutrition labels: comparing competing recommendations.” Appetite 82 (November): 67–77.
mcAfee, T., K. c. Davis, r. l. Alexander Jr., T. F. Pechacek, and r. Bunnel. 2013. “effect of the First Federally Funded uS Anti-Smoking National media campaign.” The Lancet 382 (9909): 2003–11.

162 | NoNcommuNicABle DiSeASeS iN SAuDi ArABiA
mcNeill, A., B. S. Brose, r. calder, S. c. Hitchman, P. Hajek, and H. mcrobbie. 2015. E-Cigarettes: An Evidence Update. london: Public Health england.
mendonça, r. de D., A. m. Pimenta, A. Gea, c. de la Fuenta-Arrillaga, m. A. martinez-Gonzalez, A. c. Souza lopes, and m. Bes-rastrollo. 2016. “ultraprocessed Food consumption and risk of overweight and obesity: The university of Navarra Follow-up (SuN) cohort Study.” American Journal of Clinical Nutrition 104 (5): 1433–40.
mente, A., l. de Koning, H. S. Shannon, and S. S. Anand. 2009. “A Systematic review of the evidence Supporting a causal link between Dietary Factors and coronary Heart Disease.” Archives of Internal Medicine 169 (7): 659–69.
micha, r., D. Karageorgou, i. Bakogianni, e. Trichia, l. P. Whitsel, m. Stolry, J. l. Peñalvo, and D. mozaffarian. 2018. “effectiveness of School Food environment Policies on children’s Dietary Behaviors: A Systematic review and meta-Analysis.” PLoS One 13 (3): e0194555.
milicic, S., P. Decicca, e. Pierard, and S. T. leatherdale. 2018. “An evaluation of School-Based e-cigarette control Policies’ impact on the use of Vaping Products.” Tobacco-Induced Diseases 16 (August): 35. doi: 10.18332/tid/93594.
millett, c., J. T. lee, D. c. Gibbons, and S. A. Glantz. 2011. “increasing the Age for the legal Purchase of Tobacco in england: impacts on Socio-economic Disparities in Youth Smoking.” Thorax 66 (10): 862–65. doi: 10.1136/thx.2010.154963.
moH (ministry of Health). 2020. Kingdom of Saudi Arabia World Health Survey 2019 Report. riyadh: ministry of Health.
moradi-lakeh, m., c. el Bcheraoui, m. Tuffaha, and F. Daoud. 2015. “Tobacco consumption in the Kingdom of Saudi Arabia, 2013: Findings from a National Survey.” BMC Public Health 15 (1): 611. doi: 10.1186/s12889-015-1902-3.
moran, A., e. m. Krepp, c. Johnson curtis, and A. lederer. 2016. “An intervention to increase Availability of Healthy Foods and Beverages in New York city Hospitals: The Healthy Hospital Food initiative, 2010–2014.” Preventing Chronic Disease 13: 150541. http://dx.doi .org/10.5888/pcd13.150541.
morgenstern, m., A. Nies, m. Goecke, and r. Hanewinkel. 2018. “e-cigarettes and the use of conventional cigarettes.” Deutsches Arzteblatt International 115 (14): 243–48. doi: 10.3238 / arztebl.2018.0243.
morley, B., P. Niven, H. Dixon, m. Swanson, m. Szybial, T. Shilton, i. S. Pratt, T. Slevin, and m. Wakefield. 2019. “Association of the LiveLighter mass media campaign with consumption of Sugar-Sweetened Beverages: cohort Study.” Health Promotion Journal of Australia 30 (Suppl. 1): 34–42. doi: 10.1002/hpja.244.
mozaffarian, D., m. B. Katan, A. Ascherio, m. J. Stampfer, and W. c. Willett. 2006. “Trans Fatty Acids and cardiovascular Disease.” New England Journal of Medicine 354 (15): 1601–13.
musicus, A. A., A. J. moran, H. G. lawman, and c. A. roberto. 2019. “online randomized controlled Trials of restaurant Sodium Warning labels.” American Journal of Preventive Medicine 57 (6): e181–e193. doi: 10.1016/j.amepre.2019.06.024.
mytton, o. T., e. Boyland, J. Adams, B. collins, m. o’connel, S. J. russel, K. Smith, et al. 2020. “The Potential Health impact of restricting less-Healthy Food and Beverage Advertising on uK Television between 05.30 and 21.00 Hours: A modelling Study.” PLoS Medicine 17 (10): e1003212.
Nakamura, m., A. oshima, m. ohkura, c. Arteaga, and K. Suwa. 2014. “Predictors of lapse and relapse to Smoking in Successful Quitters in a Varenicline Post Hoc Analysis in Japanese Smokers.” Clinical Therapeutics 1 (36): 918–27.
Nakamura, r., A. J. mirelman, c. cuadrado, N. Silva-illanes, J. Dunstan, and m. Suhrcke. 2018. “evaluating the 2014 Sugar-Sweetened Beverage Tax in chile: An observational Study in urban Areas.” PLoS Medicine 15 (7): e1002596.
Németh, B., J. Józwiak-Hagymásy, G. Kovács, A. Kovács, T. Demjén, m. B. Huber, K. -l. cheung, et al. 2018. “cost-effectiveness of Possible Future Smoking cessation Strategies in Hungary: results from the eQuiPTmoD.” Addiction 113 (Suppl. 1): 76–86. doi: 10.1111/add.14089.
Nghiem, N., T. Blakely, l. J. cobiac, c. l. cleghorn, and N. Wilson. 2016. “The Health Gains and cost Savings of Dietary Salt reduction interventions, with equity and Age Distributional Aspects.” BMC Public Health 16: Art. 423. doi: 10.1186/s12889-016-3102-1.

Population-Wide Interventions to Prevent NCDs | 163
Nghiem, N., T. Blakely, l. J. cobiac, A. l. Pearson, and N. Wilson. 2015. “Health and economic impacts of eight Different Dietary Salt reduction interventions.” PLoS One 10 (4): e0123915. doi: 10.1371/journal.pone.0123915.
Ngo, A., K. W. cheng, c. Shang, J. Huang, and F. J. chaloupka. 2018. “Global evidence on the Association between cigarette Graphic Warning labels and cigarette Smoking Prevalence and consumption.” International Journal of Environmental Research and Public Health 15 (3): 421. doi: 10.3390/ijerph15030421.
Nilson, e. A. F., A. m. Spaniol, V. S. S. Goncalves, i. moura, S. A. Silva, m. l’Abbé, and P. c. Jaime. 2017. “Sodium reduction in Processed Foods in Brazil: Analysis of Food categories and Voluntary Targets from 2011 to 2017.” Nutrients 9 (7): 742.
Ni mhurchu, c., l. m. Aston, and S. A. Jebb. 2010. “effects of Worksite Health Promotion interventions on employee Diets: A Systematic review.” BMC Public Health 10: 62. doi: 10.1186/1471-2458-10-62.
Nseir, W., F. Nassar, and N. Assy. 2010. “Soft Drinks consumption and Nonalcoholic Fatty liver Disease.” World Journal of Gastroenterology 16 (21): 2579–88. doi: 10.3748/wjg.v16 .i21.2579.
otite, F. o., m. F. Jacobson, A. Dahmubed, and D. mozaffarian. 2013. “Trends in Trans Fatty Acids reformulations of uS Supermarket and Brand-Name Foods from 2007 through 2011.” Preventing Chronic Disease 10: e85. doi: 10.5888/pcd10.120198.
Pearson-Stuttard, J., W. Hooton, J. critchley, S. capewell, m. collins, H. mason, m. Guzman-castillo, and m. o’Flaherty. 2017. “cost-effectiveness Analysis of eliminating industrial and All Trans Fats in england and Wales: modelling Study.” Journal of Public Health 39 (3): 574–82. doi: 10.1093/pubmed/fdw095.
Pesko, m. F., c. J. courtemanche, and J. c. maclean. 2019. “The effects of Traditional cigarette and e-cigarette Taxes on Adult Tobacco Product use.” Working Paper 26017, National Bureau of economic research, cambridge, mA. https://www.nber.org/papers/w26017.
Pesko, m. F., J. Huang, l. D. Johnston, and F. J. chaloupka. 2018. “e-cigarette Price Sensitivity among middle- and High-School Students: evidence from monitoring the Future.” Addiction 113 (5): 896–906. doi: 10.1111/add.14119.
Petimar, J., m. ramirez, S. l. rifas-Shiman, S. linakis, J. mullen, c. A. roberto, and J. P. Block. 2019. “evaluation of the impact of calorie labeling on mcDonald’s restaurant menus: A Natural experiment.” International Journal of Behavioral Nutrition and Physical Activity 16 (1): 99.
Phillips, G., c. Bottomley, e. Schmidt, P. Tobi, S. lais, G. Yu, r. lynch, et al. 2014. “Well london Phase-1: results among Adults of a cluster randomised Trial of a community engagement Approach to improving Health Behaviours and mental Well-Being in Deprived inner-city Neighbourhoods.” Journal of Epidemiology and Community Health 68 (7): 606–14.
Pokhrel, P., P. Fagan, T. A. Herzog, Q. chen, N. muranaka, l. Kehl, and J. B. unger. 2016. “e-cigarette Advertising exposure and implicit Attitudes among Young Adult Non-Smokers.” Drug and Alcohol Dependence 163: 134–40. doi: 10.1016/j.drugalcdep .2016.04.008.
Popp, J., J. A. Nyman, X. luo, J. Bengtson, K. lust, l. An, J. S. Ahluwalia, and J. l. Thomas. 2018. “cost-effectiveness of enhancing a Quit-and-Win Smoking cessation Program for college Students.” European Journal of Health Economics 19 (9): 1319–33. doi: 10.1007/s10198 -018-0977-z.
Powell, l. m., J. F. chriqui, and F. J. chaloupka. 2009. “Associations between State-level Soda Taxes and Adolescent Body mass index.” Journal of Adolescent Health 45 (3): S57–63.
Primack, B. A., m. V. carroll, P. m. Weiss, A. l. Shihadeh, A. Shensa, S. T. Farley, m. J. Fine, T. eissenberg, and S. Nayak. 2016. “Systematic review and meta-Analysis of inhaled Toxicants from Waterpipe and cigarette Smoking.” Public Health Reports 131 (1): 76–85.
Proper, K. i., m. Koning, A. J. van der Beek, V. H. Hildebrandt, r. J. Bosscher, and W. van mechelen. 2003. “The effectiveness of Worksite Physical Activity Programs on Physical Activity, Physical Fitness, and Health.” Clinical Journal of Sport Medicine 13 (2): 106–17.
164 | NoNcommuNicABle DiSeASeS iN SAuDi ArABiA
rahman, m. A., N. Hann, A. Wilson, G. mnatzaganian, and l. Worrall-carter. 2015. “e-cigarettes and Smoking cessation: evidence from a Systematic review and meta-Analysis.” PLoS One 10 (3): e0122544. doi: 10.1371/journal.pone.0122544.
ranney, l., c. melvin, l. lux, e. mcclain, and K. N. lohr. 2006. “Systematic review: Smoking cessation intervention Strategies for Adults and Adults in Special Populations.” Annals of Internal Medicine 5 (145): 845–56.
ratnayake, W. m. N., m. r. l’Abbe, S. Farnworth, l. Dumais, c. Gagnon, B. lampi, V. casey, et al. 2009. “Trans Fatty Acids: current contents in canadian Foods and estimated intake levels for the canadian Population.” Journal of AOAC International 92 (5): 1258–76.
reed, J. l., S. A. Prince, c. G. elliott, K. -A. mullen, H. e. Tulloch, S. Hiremath, l. m. Gotie, A. l. Pipe, and r. D. reid. 2017. “impact of Workplace Physical Activity interventions on Physical Activity and cardiometabolic Health Among Working-Age Women: A Systematic review and meta-Analysis.” Circulation: Cardiovascular Quality and Outcomes 10 (2): e003516. doi: 10.1161/circouTcomeS.116.003516.
reger, B., m. G. Wootan, and S. Booth-Butterfield. 2000. “A comparison of Different Approaches to Promote community-Wide Dietary change.” American Journal of Preventive Medicine 18 (4): 271–75.
rigotti, N. A., J. r. DiFranza, Y. chang, T. Tisdale, B. Kemp, and D. e. Singer. 1997. “The effect of enforcing Tobacco-Sales laws on Adolescents’ Access to Tobacco and Smoking Behavior.” New England Journal of Medicine 337 (15): 1044–51.
rissel, c., S. Greaves, l. m. Wen, m. crane, and c. Standen. 2015. “use of and Short-Term impacts of New cycling infrastructure in inner-Sydney, Australia: A Quasi-experimental Design.” International Journal of Behavioral Nutrition and Physical Activity 12: Art. 129.
roberto, c. A., H. G. lawman, m. T. leVasseur, N. mitra, A. Peterhans, B. Herring, and S. N. Bleich. 2019. “Association of a Beverage Tax on Sugar-Sweetened and Artificially Sweetened Beverages with changes in Beverage Prices and Sales at chain retailers in a large urban Setting.” JAMA 321 (18): 1799–810.
robroek, S. J., S. Polinder, F. J. Bredt, and A. Burdorf. 2012. “cost-effectiveness of a long-Term internet-Delivered Worksite Health Promotion Programme on Physical Activity and Nutrition: A cluster randomized controlled Trial.” Health Education Research 27 (3): 399–410. doi: 10.1093/her/cys015.
rongen, A., S. J. W. robroek, F. J. van lenthe, and A. Burdorf. 2013. “Workplace Health Promotion: A meta-Analysis of effectiveness.” American Journal of Preventive Medicine 44 (4): 406–15. doi: 10.1016/j.amepre.2012.12.007.
rubinstein, A., S. Garcia marti, A. Souto, D. Ferrante, and F. Augustovski. 2009. “Generalized cost-effectiveness Analysis of a Package of interventions to reduce cardiovascular Disease in Buenos Aires, Argentina.” Cost Effectiveness and Resource Allocation 7 (1): 10. doi: 10.1186 /1478-7547-7-10.
Sacks, G., J. l. Veerman, m. moodie, and B. Swinburn. 2011. “‘Traffic-light’ Nutrition labelling and ‘Junk-Food’ Tax: A modelled comparison of cost-effectiveness for obesity Prevention.” International Journal of Obesity 35 (7): 1001–09.
Saffer, H. and F. chaloupka. 2000. “The effect of Tobacco Advertising Bans on Tobacco consumption.” Journal of Health Economics 19 (6): 1117–37.
Saffer, H., m. Grossman, D. Dench, and D. Dhaval. 2020. “e-cigarettes and Adult Smoking: evidence from minnesota.” Journal of Risk Uncertainty 60 (3): 207–28.
Salmon, J., m. l. Booth, P. Phongsavan, N. murphy, and A. Timperio. 2007. “Promoting Physical Activity Participation among children and Adolescents.” Epidemiologic Reviews 29 (1): 144–59.
Saudi Health council. 2013. Cancer Incidence Report. National Saudi cancer registry, riyadh.
Saxena, A., A. D. Koon, l. lagrada-rombaua, i. Angeles-Agdeppa, B. Johns, and m. capanzana. 2019a. “modelling the impact of a Tax on Sweetened Beverages in the Philippines: An extended cost-effectiveness Analysis.” Bulletin of the World Health Organization 97 (2): 97–107.
Saxena, A., N. Stacey, P. D. r. Puech, c. mudara, K. Hofman, and S. Verguet. 2019b. “The Distributional impact of Taxing Sugar-Sweetened Beverages: Findings from an extended

Population-Wide Interventions to Prevent NCDs | 165
cost-effectiveness Analysis in South Africa.” BMJ Global Health 4 (4): e001317. Published correction appears in BMJ Global Health [2019] 4 (5): e001317corr1.
Scrinis, G., and c. A. montero. 2017. “ultra-Processed Foods and the limits of Product reformulation.” Public Health Nutrition 21 (1): 247–52.
Secker-Walker, r. H., J. K. Worden, r. r. Holland, B. S. Flynn, and A. S. Detsky. 1997. “A mass media Programme to Prevent Smoking among Adolescents: costs and cost effectiveness.” Tobacco Control 6 (3): 207–12. doi: 10.1136/tc.6.3.207.
Shadel, W. G., S. c. martino, c. m. Setodji, m. Dunbar, D. Scharf, and K. G. creswell. 2019. “Do Graphic Health Warning labels on cigarette Packages Deter Purchases at Point-of-Sale? An experiment with Adult Smokers.” Health Education Research 34 (3): 321–31. doi: 10.1093/her/cyz011.
Shankar, B., J. Brambila-macias, B. Traill, m. mazzocchi, and S. capacci. 2013. “An evaluation of the uK Food Standards Agency’s Salt campaign.” Health Economics 22 (2): 243–50.
Shephard, r. J. 2008. “is Active commuting the Answer to Population Health?” Sports Medicine 38 (9): 751–58.
Shu, S., D. c. Quiros, r. Wang, and Y. Zhu. 2014. “changes of Street use and on-road Air Quality before and after complete Street retrofit: An exploratory case Study in Santa monica, california.” Transportation Research Part D: Transport and Environment 32 (october): 387–96.
Siegel, m., l. Biener, and N. A. rigotti. 1999. “The effect of local Tobacco Sales laws on Adolescent Smoking initiation.” Preventive Medicine 29 (5): 334–42.
Simon, c., A. Wagner, c. DiVita, e. rauscher, c. Klein-Platat, D. Arveiler, B. Schweitzer, and e. Triby. 2004. “intervention centred on Adolescents’ Physical Activity and Sedentary Behaviour (icAPS): concept and 6-month results.” International Journal of Obesity 8 (Suppl. 3): S96–S103.
Skogstad, m., l. K. lunde, B. ulvestad, H. c. D. Aass, T. clemm, A. mamen, and Ø. Skare. 2018. “The effect of a leisure Time Physical Activity intervention Delivered via a Workplace: 15-month Follow-up Study.” International Journal of Environmental Research and Public Health 15 (2): 264. doi: 10.3390/ijerph15020264.
Smed, S., P. Scarborough, m. rayner, and J. D. Jensen. 2016. “The effects of the Danish Saturated Fat Tax on Food and Nutrient intake and modelled Health outcomes: An econometric and comparative risk Assessment evaluation.” European Journal of Clinical Nutrition 70 (6): 681–86.
Smith-Spangler, c. m., J. l. Juusola, e. A. enns, D. K. owens, and A. m. Garber. 2010. “Population Strategies to Decrease Sodium intake and the Burden of cardiovascular Disease.” Annals of Internal Medicine 152 (8): 481–87. doi: 10.7326/0003-4819-152-8-201004200-00212.
Snyder, l. B., m. A. Hamilton, e. W. mitchell, J. Kiwanuka-Tondo, F. Fleming-milici, and D. c. Proctor. 2004. “A meta-Analysis of the effect of mediated Health communication campaigns on Behavior change in the united States.” Journal of Health Communication 9 (Suppl. 1): 71–96.
Solomon, e., T. rees, o. c. ukoumunne, B. metcalf, and m. Hillsdon. 2014. “The Devon Active Villages evaluation (DAVe) Trial of a community level Physical Activity intervention in rural South-West england: A Stepped Wedge cluster randomised controlled Trial.” International Journal of Behavioral Nutrition and Physical Activity 11 (94).
Sonneville, K. r., m. W. long, Z. J. Ward, S. c. resch, Y. c. Want, J. l. Pomeranz, m. l. moodie, et al. 2015. “Bmi and Healthcare cost impact of eliminating Tax Subsidy for Advertising unhealthy Food to Youth.” American Journal of Preventive Medicine 49 (1): 124–34.
Spence, J. D. 2019. “Nutrition and risk of Stroke.” Nutrients 11 (3): 647. doi: 10.3390/nu11030647.
Stokes, r. J., J. macDonald, and G. ridgeway. 2008. “estimating the effects of light rail Transit on Health care costs.” Health and Place 14 (1): 45–58.
Sturm, r., l. m. Powell, J. F. chriqui, and F. J. chaloupka. 2010. “Soda Taxes, Soft Drink consumption, and children’s Body mass index.” Health Affairs 29 (5): 1052–58.
Swartz, J. J., D. Braxton, and A. J. Viera. 2011. “calorie menu labeling on Quick-Service restaurant menus: An updated Systematic review of the literature.” International Journal of Behavioral Nutrition and Physical Activity 8 (1): 135.

166 | NoNcommuNicABle DiSeASeS iN SAuDi ArABiA
Szabo de edelenyi, F., m. egnell, P. Galan, N. Druesne-Pecollo, S. Hercberg, and c. Julia. 2019. “Ability of the Nutri-Score Front-of-Pack Nutrition label to Discriminate the Nutritional Quality of Foods in the German Food market and consistency with Nutritional recommendations.” Archives of Public Health 77: 28. doi: 10.1186/s13690-019-0357-x.
Taha, A. Z., A. A. Sabra, Z. Z. Al-mustafa, H. r. Al-Awami, m. A. Al-Khalaf, and m. m. Al-momen. 2010. “Water Pipe (Shisha) Smoking among male Students of medical colleges in the eastern region of Saudi Arabia.” Annals of Saudi Medicine 30 (3): 222. doi: 10.4103/0256-4947.62838.
Takase, H., T. Sugiura, G. Kimura, N. ohte, and Y. Dohi. 2015. “Dietary Sodium consumption Predicts Future Blood Pressure and incident Hypertension in the Japanese Normotensive General Population.” Journal of the American Heart Association 4 (8): e001959. doi: 10.1161 /JAHA.115.001959.
Temple, N. J. 2020. “Front-of-Package Food labels: A Narrative review.” Appetite 144: 104485.
Trapero-Bertran, m., c. muñoz, K. coyle, D. coyle, A. lester-George, r. leidl, B. Németh, et al. 2018. “cost-effectiveness of Alternative Smoking cessation Scenarios in Spain: results from the eQuiPTmoD.” Addiction 113 (Suppl. 1): 65–75. doi: 10.1111/add.14090.
uS DHHS (united States Department of Health and Human Services). 1989. Reducing the Health Consequences of Smoking: 25 Years of Progress. A Report of the Surgeon General. rockville, mD: uS Department of Health and Human Services, Public Health Service, centers for Disease control, National center for chronic Disease Prevention and Health Promotion, office on Smoking and Health.
uS DHHS (united States Department of Health and Human Services). 2014. The Health Consequences of Smoking—50 Years of Progress: A Report of the Surgeon General. rockville, mD: u. S. Department of Health and Human Services, centers for Disease control and Prevention, National center for chronic Disease Prevention and Health Promotion, office on Smoking and Health.
Vall castelló, J. and G. lopez casasnovas. 2020. “impact of SSB Taxes on Sales.” Economics & Human Biology 36 (January): 100821. doi: 10.1016/j.ehb.2019.100821.
van der Vliet, N., A. W. m. Suijkerbuijk, A. T. de Blaeij, G. A. de Wit, P. F. van Gils, B. A. m. Staatsen, r. maas, and J. J. Polder. 2020. “ranking Preventive interventions from Different Policy Domains: What Are the most cost-effective Ways to improve Public Health?” International Journal of Environmental Research and Public Health 17 (6): 2160. doi: 10.3390 /ijerph17062160.
van Sluijs, e. m. F., A. m. mcminn, and S. Griffin. 2007. “effectiveness of interventions to Promote Physical Activity in children and Adolescents: Systematic review of controlled Trials.” BMJ 335: 703–07.
Variyam, J. N. 2008. “Do Nutrition labels improve Dietary outcomes?” Health Economics 17 (6): 695–708.
Veerman, J. l., G. Sacks, N. Antonopoulos, and J. martin. 2016. “The impact of a Tax on Sugar-Sweetened Beverages on Health and Health care costs: A modelling Study.” PLoS One 11 (4): e0151460.
Verstraete, S. J., G. m. cardon, D. l. De clercq, and i. m. m. De Bourdeaudhuij. 2006. “increasing children’s Physical Activity levels during recess Periods in elementary Schools: The effects of Providing Game equipment.” European Journal of Public Health 16 (4): 415–19.
Wakefield, m., B. Flay, m. Nichter, and G. Giovino. 2003. “effects of Anti-Smoking Advertising on Youth Smoking: A review.” Journal of Health Communication 8 (3): 229–47.
Wakefield, m., Y. Terry-mcelrath, S. emery, H. Saffer, F. J. chaloupka, G. Szczypka, B. Flay, P. m. o’malley, and l. D. Johnston. 2006. “effect of Televised, Tobacco company-Funded Smoking Prevention Advertising on Youth Smoking-related Beliefs, intentions, and Behavior.” American Journal of Public Health 96 (12): 2154–60.
Walls, H. l., A. Peeters, J. Proietto, and J. J. mcNeil. 2011. “Public Health campaigns and obesity: A critique.” BMC Public Health 11 (136). https://doi.org/10.1186/1471-2458-11-136.
Wang, G., and D. labarthe. 2011. “The cost-effectiveness of interventions Designed to reduce Sodium intake.” Journal of Hypertension 29 (9): 1693–99. doi: 10.1097/HJH .0b013e328349ba18.

Population-Wide Interventions to Prevent NCDs | 167
Wang, l. Y., l. S. crossett, r. lowry, S. Sussman, and c. W. Dent. 2001. “cost-effectiveness of a School-Based Tobacco-use Prevention Program.” Archives of Pediatrics & Adolescent Medicine 155 (September): 1043–50.
Wang, Y. c., P. coxson, Y. m. Shen, l. Goldman, and K. Bibbins-Domingo. 2012. “A Penny-per -ounce Tax on Sugar-Sweetened Beverages Would cut Health and cost Burdens of Diabetes.” Health Affairs (Millwood) 31 (1): 199–207.
WHo (World Health organization). 2017. “Tackling NcDs: Best Buys’ and other recommended interventions for the Prevention and control of Noncommunicable Diseases.” WHo, Geneva. https://apps.who.int/iris/bitstream/handle/10665/259232/WHo-NmH-NVi -17.9-eng. pdf?sequence=1.
WHo (World Health organization). 2020. The Global Health observatory (database). Geneva: World Health organization. https://www.who.int/data/gho.
Wilcox, m. l., H. mason, F. m. Fouad, S. rastam, r. al Ali, T. F. Page, S. capewell, m. o’Flaherty, and W. maziak. 2015. “cost-effectiveness Analysis of Salt reduction Policies to reduce coronary Heart Disease in Syria, 2010–2020.” International Journal of Public Health 60 (Suppl. 1): S23–S30. doi: 10.1007/s00038-014-0577-3.
Wilde, P., Y. Huang, S. Sy, S. Abahams-Gessel, T. V. Jardim, r. Paarlberg, D. mozaffarian, r. micha, and T. Gaziano. 2019. “cost-effectiveness of a uS National Sugar-Sweetened Beverage Tax with a multistakeholder Approach: Who Pays and Who Benefits.” American Journal of Public Health 109 (2): 276–84.
Wilson, D. K., m. l. Van Horn, e. r. Siceloff, K. A. Alia, S. m. St. George, H. G. lawman, N. N. Trumpeter, et al. 2015. “The results of the ‘Positive Action for Today’s Health’ (PATH) Trial for increasing Walking and Physical Activity in underserved African-American communities.” Annals of Behavioral Medicine 49 (3): 398–410. doi: 10.1007/s12160 -014-9664-1.
Wilson, N., N. Nghiem, H. eyles, c. Ni mhurchu, e. Shields, l. J. cobiac, c. l. cleghorn, and T. Blakely. 2016. “modeling Health Gains and cost Savings for Ten Dietary Salt reduction Targets.” Nutrition Journal 15: Art. 44. doi: 10.1186/s12937-016-0161-1.
Wu, S., D. cohen, Y. Shi, m. Pearson, and r. Sturm. 2011. “economic Analysis of Physical Activity interventions.” American Journal of Preventive Medicine 40 (2): 149–58.


169
KEY MESSAGES
• Screening rates are lower in Saudi Arabia than in other countries, and individ-uals with high blood glucose, high blood pressure, or abnormal blood lipids often remain undiagnosed, largely due to demand- and supply-side barriers.
• The quality of global evidence supporting expanded screening is mixed. Some types of screening have been shown to be cost-effective in Western countries, but it is not known whether these results can be generalized to Saudi Arabia. Other types of screening are not cost-effective, or the evidence is inconclusive.
• If policy makers want to expand certain types of screening in Saudi Arabia, some interventions could potentially increase uptake in a cost-effective fash-ion. However, the global literature on cost-effectiveness for many of these programs is too sparse to allow definitive conclusions.
• Overall, there are significant gaps in knowledge related to screening. Definitive evidence of both effectiveness and cost-effectiveness for many of the programs is lacking, and more research is needed.
BACKGROUND
This chapter provides an overview of screening programs that either are being implemented in Saudi Arabia now or could be implemented in the future and presents evidence on the effectiveness and cost-effectiveness of both these pro-grams and interventions to increase their uptake. This chapter focuses on screening for conditions identified in chapter 2 as being associated with an unhealthy diet, tobacco use, or physical inactivity. Specifically, screening for the
Screening to Promote Early DetectionA REVIEW OF THE GLOBAL LITERATURE AND RECOMMENDATIONS FOR SAUDI ARABIA
JESSE D. MALKIN, ADA ALQUNAIBET, SEVERIN RAKIC, AND REEM ALSUKAIT
8

170 | NONcOmmuNIcAble DISeASeS IN SAuDI ArAbIA
following eight conditions is addressed: colorectal, breast, and lung cancers; childhood obesity; gestational diabetes and abnormal blood glucose; high blood pressure; and lipid disorders. both supply-side interventions (which focus on scaling up, financing, and incentivizing screening) and demand-side interven-tions (which focus on increasing demand for and use of screening programs among the population) are considered.
The chapter only covers cancers that are strongly linked to behavioral factors for which effective screening exists. Dietary risks, high body mass index (bmI), tobacco use, high blood glucose levels, and inadequate physical activity all con-tribute to the burden of colorectal cancer in Saudi Arabia (IHme 2020). Tobacco use, high blood glucose, and inadequate physical activity are among the main risk factors for breast cancer. morbidity and mortality from lung cancer are par-tially attributable to tobacco use, dietary risks, and high blood glucose and par-tially to air pollution and occupational and environmental risks. Smoking also increases the risk of cervical cancer, and there are cost-effective interventions to screen for cervical cancer; however, this disease is excluded from the analysis because of its communicable nature.
Various screening policies and approaches are available for the eight selected conditions. Primary and secondary prevention of risk factors, including screen-ing, are key components of a successful strategy for mitigating chronic disease. Screening policies differ across several dimensions, such as targeted population (breast cancer screening for high-risk women only or for all women), frequency of screening (breast cancer screening every three years versus every two years), type of screening (colonoscopy versus flexible sigmoidoscopy versus fecal immunochemical tests for colorectal cancer), treatment of persons who test pos-itive for a condition (lifestyle interventions versus metformin for glucose abnor-malities), where such screenings should take place (health facilities versus malls or mosques for screening glucose abnormalities), and who should be responsible for administering the tests (blood pressure measurement by a health profes-sional versus self-measured blood pressure).
The remainder of this chapter is organized as follows. After providing an overview of current screening programs in Saudi Arabia, the chapter assesses the effectiveness and cost-effectiveness of screening programs and the effective-ness and cost-effectiveness of interventions to increase screening uptake. It then discusses gaps in the literature and offers policy recommendations for Saudi Arabia to consider. A final section concludes.
SCREENING IN SAUDI ARABIA
Screening uptake
Where data exist, evidence suggests that screening rates are lower in Saudi Arabia than in other countries. This is true for colorectal and breast cancer screening, where data on uptake are available from nationally representative surveys. Table 8.1 compares cancer screening uptake in Saudi Arabia and the united States. uptake rates of screening for childhood obesity, gestational diabe-tes, high blood sugar, high blood pressure, and lipid disorder in Saudi Arabia are unknown.
many Saudi Arabians with high blood glucose, high blood pressure, or abnor-mal blood lipids do not know they have the condition. In 2013, 15.2 percent of

Screening to Promote Early Detection | 171
persons 15 years of age and older had high blood pressure, with 58 percent undi-agnosed (el bcheraoui et al. 2014a); 13 percent had high blood sugar, with 58 percent undiagnosed (el bcheraoui et al. 2014b); and 9 percent had hypercho-lesterolemia, with 65 percent undiagnosed (basulaiman et al. 2014). The rate of undiagnosed type 2 diabetes is similar in Saudi Arabia and the united States, whereas the rates of undiagnosed hypertension and lipid disorders are some-what higher in Saudi Arabia than in the united States (table 8.2). The 2019 Kingdom of Saudi Arabia World Health Survey confirms that the rates of undiagnosed hypertension, diabetes, and hypercholesterolemia remain high (mOH 2020).
Supply-side determinants of screening uptake
Generally, screening in Saudi Arabia is not conducted in a systematic manner. clinical guidelines exist for some types of screening (for example, Al-mandeel et al. 2016), but government agencies and facilities have done little to promote screening. The most prominent efforts to increase the uptake of mammography have been spearheaded by nonprofit groups, not government agencies or health care providers (Abulkhair et al. 2010; Al mulhim et al. 2015).
basic information about how and where to get screened for cancer is limited. According to Gosadi (2019, 613), researchers in Saudi Arabia “found difficulties finding information related to the availability of screening tests for breast cancer and colon cancer, and this may explain the low utilization of screening services.” It is unclear to what extent cancer screening is available throughout the country. According to el bcheraoui et al. (2015a, 5), mammography has been available in all regions of the country since 2005. However, english-language internet searches using multiple search terms and multiple search engines found little information about mammography in Saudi Arabia.
One survey finds that most physicians do not prescribe colorectal cancer screening. A survey at a riyadh clinic finds that physicians are knowledgeable
TABLE 8.1 Screening uptake for breast and colorectal cancer in Saudi Arabia and the United States
uptake (% of population)
TYPE OF SCREENING SAUDI ARABIA UNITED STATES REFERENCES
Colorectal cancer screening
15% of the population ages 18–78% have ever been screened for colorectal cancer
63% of the population ages 50–75 have had one of the following:
(1) A fecal occult blood test in the past year
(2) A flexible sigmoidoscopy in the past five years plus a fecal occult blood test within the past three years
(3) A colonoscopy within the past 10 years
Almadi and Alghamdi 2019; Hall et al. 2018
Breast cancer screening 8% of women ages 50–74 have ever had a mammogram (2013)
9.9% of ever-married women ages 30–69 have ever had a mammogram (2019)
72% of women ages 50–64 years have had a mammogram within the last two years
El Bcheraoui et al. 2015a; Hall et al. 2018; MOH 2020
Source: Original compilation for this publication.

172 | NONcOmmuNIcAble DISeASeS IN SAuDI ArAbIA
about colorectal cancer screening and have a positive attitude toward it, with 95 percent calling it an effective strategy. Yet 56 percent of these physicians said they do not prescribe colorectal cancer screening to their own asymptomatic average-risk patients (Demyati 2014). About 70 percent of the physicians who do not prescribe screening said they think that their patients do not want to discuss colorectal cancer. It is not clear whether this perception is based in reality (for example, the patient said, “I don’t want to discuss colorectal cancer”) or whether it is mere speculation. Physicians also cited other barriers to screening such as a lack of understanding by patients (63 percent), not having enough time to dis-cuss colorectal cancer screening (70 percent), and not having a reminder system (86 percent). The extent to which physicians are screening for other conditions, such as diabetes, hypertension, and high cholesterol, is not known.
evidence on the effectiveness of offering financial incentives to promote partic-ipation in cancer screening programs is mixed. In a systematic review, researchers review the evidence on the effect of financial incentives in general practice (that is, pay-for-performance for providers) on the rates of cancer screening and find min-imal or no effects on breast cancer screening, but some effect on colorectal cancer screening (mauro, rotundo, and Giancotti 2019). Another study among general practitioners in France investigates financial versus nonfinancial screening incen-tives, such as a compensated training, finding that these practitioners are more responsive to financial incentives for colorectal cancer screening than for breast cancer screening (Sicsic, Kurcien, and Franc 2016).
Demand-side determinants of screening uptake
many Saudi Arabians have infrequent physical exams. Although the network of primary health clinics is large (including mobile clinics in rural areas), more than
TABLE 8.2 Undiagnosed type 2 diabetes, hypertension, and lipid disorders in Saudi Arabia and comparative countries
CONDITION SAUDI ARABIA COMPARATOR COUNTRIES REFERENCES
Type 2 diabetes 39% of the population ages 20–70a
Japan: 47%
Kuwait: 17%
Oman: 44%
United States: 38%
United Kingdom: 19%
IDF 2019
Hypertension 58% of the population ages 15 and older
Bahrain: 38%
Ireland: 23%
Oman (ages 18 and older): 52%
United Arab Emirates: 48%
United Kingdom: 23%
United States (ages 20 and older): 50%
Akl et al. 2020; El Bcheraoui et al. 2014a; Nadar et al. 2020; Park et al. 2018
Lipid disorders 65% of the population ages 15 and older
Germany: 38%
United States: 71% of uninsured nonelderly adults and 51% of insured nonelderly adults
Ayanian et al. 2003; Basulaiman et al. 2014; Scheidt-Nave et al. 2013
Source: Original compilation for this publication.a. Respondents did not report taking drugs for diabetes, and their measured HbA1c blood level was between 5.7 percent (35.3 mmol/l) and less than 6.5 percent (48.5 mmol/l). HbA1c = blood hemoglobin A1c. mmol/l = millimoles per liter.
Screening to Promote Early Detection | 173
three-quarters of persons do not receive regular checkups (el bcheraoui et al. 2015b). Physical exams often include both screening, such as blood pressure checks, and referrals for screening that takes place elsewhere, such as mammog-raphy and colonoscopy. The low uptake of screening may be caused in part by the generally low uptake of physical exams. It is not known, however, whether per-sons who do not receive regular checkups at primary care clinics get screened at other health facilities.
many Saudi Arabians know little about screening. In a survey of healthy indi-viduals in riyadh, a significant share of respondents (43 percent) said that screening for colon cancer should begin only after symptoms are evident (which is incorrect, as screening should be done before symptoms are evident) (Zubaidi et al. 2015). Fewer than 20 percent of respondents knew that polyps are a risk factor for colorectal cancer. Only 35 percent of respondents knew that individu-als with a family history of colorectal cancer are at increased risk of colorectal cancer.
Some persons have an aversion to cancer screening. Fear of pain, fear of dis-comfort, and fear of discovering disease all appear to be factors suppressing the uptake of colorectal cancer screening (Teixeira et al. 2018).
EFFECTIVENESS OF SCREENING
evidence supporting the implementation of screening programs varies in qual-ity. Some types of colorectal cancer screening, including fecal occult blood tests and flexible sigmoidoscopy, have been shown to improve health outcomes in large randomized control trials (rcTs)—the gold standard of evidence (lindholm, brevinge, and Haglind 2008). low-dose computed tomography (cT) screening is not recommended for the population as a whole, but rcTs in high-risk smokers and former smokers have found that cT screening reduces lung cancer mortality by 20 percent or more (de Koning et al. 2020; National lung Screening Trial research Team 2011). Observational studies have shown that other types of screening, such as colonoscopies (baxter et al. 2012; Zauber et al. 2012), reduce mortality dramatically. There are no rcTs showing that screening for high blood glucose, high blood pressure, or abnormal blood lipids improves long-term health outcomes (Dyakova et al. 2016; Schmidt et al. 2020; Waugh et al. 2013), but it is widely accepted that these screenings increase the likelihood of early diagnosis and that early treatment can improve intermediate outcomes, which in turn should reduce the long-term risk of cardiovascular dis-ease (Gillies et al. 2008; Herman et al. 2015; Kahn et al. 2010; musini et al. 2019; Siu and uS Preventive Services Task Force 2015a, 2015b). Similarly, there is no direct evidence that screening for gestational diabetes improves health outcomes (Fitria, van Asselt, and Postma 2019). However, screening increases early diagnosis and treatment, and rcTs have shown that treatment (diet modifica-tion, glucose monitoring, and insulin if needed) reduces the risk of preeclampsia, shoulder dystocia, and macrosomia (crowther et al. 2005; landon et al. 2009; uS Preventive Services Task Force 2013), suggesting that screening for gestational diabetes is effective.
evidence of screening effectiveness is strongest for colorectal cancer, high blood sugar, and abnormal blood lipids. Table 8.3 summarizes the recommenda-tions from the united States and other countries for the screenings that are the focus of this chapter. A grade of A indicates that there is high certainty of

174 | NONcOmmuNIcAble DISeASeS IN SAuDI ArAbIA
TABLE 8.3 Recommendations regarding screening in comparative countries
CONDITIONMAIN SCREENING TESTS
US PREVENTIVE SERVICES TASK FORCE RECOMMENDATION
US PREVENTIVE
SERVICES TASK FORCE
GRADEaRECOMMENDATIONS IN COMPARATIVE COUNTRIES
Colorectal cancer Colonoscopy, flexible sigmoidoscopy, fecal occult blood tests, fecal immunochemi-cal tests
Screening for colorectal cancer using fecal occult blood tests, sigmoidosco-py, or colonoscopy in adults beginning at age 50 and continuing until age 75
A Cancer Council Australia (2017) recom-mends immunochemical fecal occult blood tests every two years, starting at age 50 and continuing to age 74.
The Canadian Task Force on Preventive Health Care (2016a) recommends screening adults ages 50–74 with fecal occult blood tests every two years or flexible sigmoidoscopy every 10 years. It recommends not using colonoscopy as a screening test.
Japan recommends fecal occult blood tests. It does not recommend colonoscopy for use in population-wide screening but allows colonoscopy to be used on an individualized basis (Hamashima 2018).
The Netherlands invites individuals to be screened using a fecal immunochemical home testing kit between the ages of 55 and 75 (Netherlands National Institute for Public Health and the Environment 2020).
Breast cancer Mammography, MRI Biennial screening for breast cancer with mammography in average-risk women ages 50–74
B The Canadian Task Force on Preventive Health Care recommends screening every two to three years in average-risk women ages 50–74 conditional on the relative value that a woman places on possible benefits and harms from screening (very low- certainty evidence) (Klarenbach et al. 2018).
The Breast Cancer Screening Program in Ontario, Canada, screens high-risk women ages 30–69 annually with both a mammo-gram and an MRI (Warner et al. 2018).
Japan recommends mammography for women ages 40–74 supplemented by clinical breast exams for women ages 40–64 (Hamashima et al. 2016).
The Netherlands invites women to have a mammogram every two years between ages 50 and 75 (Netherlands National Institute for Public Health and the Environment 2020).
Lung cancer (screening in high-risk smokers and former smokers)
Low-dose CT Annual screening for lung cancer with low-dose CT in adults ages 55–80 who have a history of smoking 30 packs per year and who currently smoke or have quit within the past 15 years
B The recommendation of the Canadian Task Force on Preventive Health Care (2016b) is identical to that of the US Preventive Services Task Force.
Cancer Council Australia (n.d.) does not recommend low-dose CT screening in people at high risk of lung cancer, citing the lack of local evidence of cost-effectiveness.
Japan does not recommend low-dose CT in population-wide screening, but allows it on an individualized basis (Hamashima et al., 2016).
(Continued)

Screening to Promote Early Detection | 175
TABLE 8.3, continued
CONDITIONMAIN SCREENING TESTS
US PREVENTIVE SERVICES TASK FORCE RECOMMENDATION
US PREVENTIVE
SERVICES TASK FORCE
GRADEaRECOMMENDATIONS IN COMPARATIVE COUNTRIES
Childhood and adolescent obesity
Measurement of height and weight and calculation of age- and sex- adjusted BMI at each primary care visit
Screening for obesity in children older than age 6 and, if clinically indicated, referral for moderate- to high- intensity comprehen-sive behavioral interven-tions
B The Canadian Task Force on Preventive Health Care (2015) recommends growth monitoring at all appropriate primary care visits. Overweight or obese children should be referred to structured behavioral interventions aimed at healthy weight management.
Gestational diabetes mellitus
50 grams oral glucose challenge test, oral glucose tolerance test
After 24 weeks of gestation
B The Royal Women’s Hospital Clinical Guidelines, widely accepted in Australia, recommend routine screening of all pregnant women (except those with preexisting diabetes) at 26–28 weeks (Royal Women’s Hospital 2020).
The College of Obstetricians and Gynaecologists, Singapore (2018) recommends universal screening at 24–28 weeks gestation.
High blood glucose
Hemoglobin A1C test, oral glucose tolerance test
Screening for abnormal blood glucose as part of cardiovascular risk assessment in adults ages 40–70 who are overweight or obese
B The Canadian Task Force on Preventive Health Care (2012) recommends screening high-risk people with an A1C test every three to five years and screening very high-risk people annually. Screening of low- and moderate-risk people is not recommended.
High blood pressure
Blood pressure measurement
Screening for high blood pressure in adults ages 18 and older
Screening for high blood pressure in adults ages 40 or older and persons at increased risk for high blood pressure annually
Screening for high blood pressure in adults ages 18–39 with normal blood pressure (below 130/85 mmHG) who do not have other risk factors every three to five years
A The Canadian Task Force on Preventive Health Care recommends blood pressure measurement at all appropriate primary care visits (strong recommendation; moderate quality of evidence) (Lindsay et al. 2013).
The United Kingdom recommends screening all adults for hypertension at least once every five years (UK National Institute for Health Care Excellence 2019b)
Lipid disorders Lipid panel Screening for lipid disorders in men ages 35 and older
Screening for lipid disorders in women ages 45 and older if they are at increased risk for coronary heart disease; the optimal interval for screening is uncertain
A A panel of Canadian experts recommends testing asymptomatic men every five years starting at age 40 and asymptomatic women every five years starting at age 50 (Allan et al. 2015)
Source: Original compilation for this publication.Note: BMI = body mass index. CT = computed tomography. mmHG = millimeters of mercury. MRI = magnetic resonance imaging.a. Indicates strength of evidence, determined by the US Preventive Services Task Force.

176 | NONcOmmuNIcAble DISeASeS IN SAuDI ArAbIA
substantial net benefit, whereas a grade of b indicates that there is either (1) a high certainty of moderate net benefit or (2) a moderate certainty of moderate to substantial net benefit.
Given the current state of evidence, there is weak justification for mammog-raphy in average-risk, asymptomatic women. A large, well-designed 25-year-long rcT finds no effect of mammography on mortality (miller et al. 2014), with virtually the same findings for women ages 40–49 and 50–59. moreover, there is little or no evidence that mammography has a beneficial effect on breast cancer mortality rates (Gøtzsche and Jørgensen 2013). For this reason, a panel of experts appointed by the Swiss government has recommended stopping mammography in Switzerland (biller-Andorno and Jüni 2014). A review of systematic reviews finds no consistent conclusion regarding the effectiveness of mammography (raichand et al. 2017). It is possible that a newer type of mammogram called digital breast tomosynthesis (also known as three-dimensional mammography) is superior to the standard version, but the available evidence is insufficient to draw any conclusions.
co-testing with both mammography and magnetic resonance imaging (mrI) has high sensitivity (Warner et al. 2008). As a result, co-testing has been incor-porated into the breast cancer screening guidelines for women who are at high risk, such as those with a known brcA1 or brcA2 gene mutation (see, for exam-ple, Saslow et al. 2009; uK National Institute for clinical excellence 2019a; Warner et al. 2018).
Screening for and treatment of childhood obesity can reduce bmI slightly in the short run, but it is unclear whether this small reduction is clinically significant and whether it would be sustained and have longer-term benefits. The uS Preventive Services Task Force (2017) states that comprehensive, intensive behavioral interventions in children and adolescents who are obese can reduce weight for up to 12 months. According to a review by Kumar and Kelly (2017, 251), “lifestyle interventions have shown only modest effect on weight loss, particu-larly in children with severe obesity,” and there is limited information on the long-term efficacy and safety of weight loss medications and bariatric surgery in children. Similarly, a review of diet, physical activity, and behavioral interventions for the treatment of overweight or obese children concludes that such interven-tions “may be beneficial in achieving small, short-term reductions in bmI,” but the small reduction “may not be sufficient to improve or prevent obesity-related comorbidities” and the quality of the evidence overall is “low or very low.” The researchers cite the need for longer-term follow-up (mead et al. 2017).
using only screen-and-treat policies for high blood sugar is unlikely to have a substantial impact on type 2 diabetes. In a systematic review of 49 studies of screening tests, researchers find that screening for high blood sugar using HbA1c is likely neither specific nor sensitive for detecting prediabetes, whereas fasting glucose is specific but not sensitive (barry et al. 2017). Despite the inaccuracy of screenings, interventions in people identified through screening as having pre-diabetes have shown some efficacy in preventing or delaying type 2 diabetes.
COST-EFFECTIVENESS OF SCREENING
In Western countries, population-wide colorectal cancer screening is regarded as cost-effective in adults ages 50 and older. A review conducted for the uS Preventive Services Task Force concludes that the cost-effectiveness of

Screening to Promote Early Detection | 177
colorectal cancer screening with any of the commonly used methods is uS$10,000–uS$25,000 (Srl 37,500–Srl 93,750) per life year saved relative to no screening (Pignone et al. 2002). In a systematic review of the literature, 32 out of 32 studies conclude that colorectal cancer screening is cost-effective or cost- saving (lansdorp-Vogelaar, Knudsen, and brenner 2011). Similarly, systematic reviews by maciosek et al. (2006), Patel and Kilgore (2015), and ran et al. (2019) conclude that all commonly used colorectal cancer screening strategies are cost-effective relative to no screening.
It is unclear whether these findings can be generalized to Saudi Arabia. As shown in table 8.4, colorectal cancer is much less common in Saudi Arabia than in the united States and the united Kingdom. Nevertheless, it is still the second most frequent cancer among the entire population and the most frequent cancer among men. colorectal cancer screening surely helps to reduce premature mor-tality, but it may be much less cost-effective in Saudi Arabia than in the united States or the united Kingdom, even after taking lower labor costs into account. Thus it is not possible to conclude, based on the available evidence, whether colorectal cancer screening is cost-effective in Saudi Arabia.
Numerous modeling studies have reported that population-wide mammogra-phy is highly cost-effective for women ages 50 and older, but the underlying evi-dence of effectiveness is weak. A systematic review by rashidian et al. (2013) reports that biennial screening of women between the ages of 50 and 70 is the most cost-effective option (uS$2,685 or Srl 10,069 per life year gained). Along similar lines, mandrik et al. (2019) report that mammography is cost-effective in women ages 50–69, but not in older or younger women. The models used by these cost-effectiveness studies assume that screening reduces mortality. This assump-tion is controversial, and models purporting to demonstrate the cost- effectiveness of universal mammography for low- and average-risk women should be viewed with skepticism. Simply put, if population-wide mammography in low- and average-risk asymptomatic women is not effective, it cannot be cost-effective. moreover, even if mammography is cost-effective in Western countries, it is not necessarily cost-effective in countries such as Saudi Arabia where the reported incidence and prevalence rates of breast cancer are relatively low (table 8.5).
limiting breast cancer screening to high-risk women may or may not be cost-effective. A combination of mammography and mrI screening for high-risk women ages 30 and older (for example, those with a known brcA1 or brcA2 gene mutation) appears to be more cost-effective than any population-wide one-size-fits-all program (Trentham-Dietz et al. 2016; Vilaprinyo et al. 2014). It remains unclear, however, whether high-risk screening is cost-effective relative to no screening. cost-effectiveness studies have compared mrI to
TABLE 8.4 Estimated incidence and prevalence rates of colorectal cancer in Saudi Arabia, the United States, and the United Kingdom, 2017
rate per 100,000 population
COUNTRY ESTIMATED INCIDENCE ESTIMATED PREVALENCE
Saudi Arabia 8.71 47.86
United States 64.41 365.91
United Kingdom 78.53 431.90
Source: IHME 2020.

178 | NONcOmmuNIcAble DISeASeS IN SAuDI ArAbIA
mammography (see, for example, moore et al. 2009), but have not compared the cost-effectiveness of mammography and mrI co-screening to that of no screening.
The cost-effectiveness of childhood obesity screening and treatment is unclear. A recent study in Poland reports that a one-year-long weight loss inter-vention cost Zl 23,601 (uS$6,235 or Srl 23,383) per child who was no longer in the obese group (bandurska et al. 2020). Other cost-effectiveness studies have reported difficult-to-interpret cost-effectiveness ratios such as cost per 0.1 decrease in standardized bmI.
low-dose cT screening for lung cancer in high-risk individuals is neither clearly cost-effective nor clearly cost-ineffective. A systematic review by Puggina et al. (2016) finds that seven out of nine studies report an incremental cost- effectiveness ratio of less than uS$100,000 (Srl 375,000) per quality- adjusted life year (QAlY) gained. Another systematic review, by raymakers et al. (2016), reports results ranging from uS$27,756 to uS$243,077 (Srl 104,085 to Srl 911,539) per QAlY gained. The researchers conclude, “The cost- effectiveness of a lung cancer screening program using lDcT [low-dose cT] remains to be conclusively resolved” (raymakers et al. 2016, 409).
The evidence suggests that universal screening for gestational diabetes is not cost-effective. A study in Singapore reports that universal screening costs uS$10,630 (Srl 39,863) per QAlY gained, which is cost-effective (chen et al. 2015). A systematic review of cost-effectiveness studies, however, reports that treatment for gestational diabetes is likely to be effective, but that “neither screening nor treating GDm [gestational diabetes mellitus] seems to be convinc-ingly cost-effective from the studies reviewed.” Of six studies included in the review, two report favorable cost-effectiveness ratios and four do not (Fitria, van Asselt, and Postma 2019, 407).
Targeted screening for high blood sugar, combined with appropriate therapy, probably is cost-effective. estimated incremental cost-effectiveness ratios (Icers) vary widely, but most studies report that screening for type 2 diabetes is cost-effective (einarson et al. 2017; Najafi et al. 2016). Screening appears to be much more cost-effective in high-risk individuals (for example, individuals who are obese, hypertensive, or both) than in the population at-large (Waugh et al. 2007). Hoerger et al. (2004), for example, report that, at 55 years of age, the cost per QAlY for targeted screening for type 2 diabetes compared with no screening is uS$34,375 (Srl 128,906), whereas the cost per QAlY for universal screening compared with targeted screening is uS$360,966 (Srl 1,353,623). For optimal cost-effectiveness, einarson et al. (2017) recommend screening for glucose
TABLE 8.5 Estimated rates of incidence and prevalence of breast cancer among women in Saudi Arabia, the United States, and the United Kingdom, 2017
rate per 100,000 population
COUNTRY ESTIMATED INCIDENCE ESTIMATED PREVALENCE
Saudi Arabia 35.92 314.88
United States 150.72 1,396.34
United Kingdom 171.04 1,533.81
Source: IHME 2020.

Screening to Promote Early Detection | 179
abnormalities starting at around age 45–50, with repeated tests every five years. This is similar to the current recommendation of the canadian Task Force on Preventive Health care (2012).
community-based screening interventions to control hypertension appear to be cost-effective. Gu et al. (2015) develop a model to assess the cost-effectiveness of hypertension screening, coupled with pharmacotherapy, in china. They report that the program has the potential to prevent about 800,000 cardiovascu-lar events annually at a cost of Int$13,000 (Srl 20,020) per QAlY gained. Yosefy et al. (2003) report favorable results for an outreach program in Ashkelon, Israel, that screened residents for hypertension, obesity, smoking, and hypercholester-olemia in clinics, community centers, places of employment, and homes. Any individual who was deemed high risk was referred to a treatment center. The program was associated with declines in blood pressure, weight, and mortality from acute myocardial infarction, cardiovascular disease, and hypertension at an estimated cost of uS$506 (Srl 1,898) per life year saved. The program also increased smoking cessation but had no effect on total cholesterol. A systematic review of the literature by Zhang, Wang, and Joo (2017) concludes that community-wide hypertension screening initiatives cost from uS$21,734 to uS$56,750 (Srl 81,503 to Srl 212,813) per QAlY in the united States; uS$613 to uS$5,637 (Srl 2,299 to Srl 21,139) per QAlY in Australia; and uS$7,000 to uS$18,000 (Srl 26,250 to Srl 67,500) per QAlY in china. even in a low-resource rural area of Nepal, screening coupled with effective treatment appears to be very cost- effective (Krishnan et al. 2019). Another study concludes that screen-ing for and treatment of hypertension in the united States cost uS$48,500 (Srl 181,875) per QAlY (Dehmer et al. 2017).
Only one recent study in a high-income country has assessed the cost- effectiveness of cholesterol screening and treatment. It reports a cost- effectiveness ratio of uS$33,800 (Srl 126,750) per QAlY (Dehmer et al. 2017). because of patent expirations, the prices of top-selling statins have declined since the study was conducted. All other things equal, cholesterol screening could become more cost-effective.
Overall, the cost-effectiveness of screening varies widely by the condition being screened for; even within a given condition, there is sometimes wide vari-ation in cost-effectiveness estimates (table 8.6).
EFFECTIVENESS OF INTERVENTIONS TO INCREASE SCREENING UPTAKE
Screening is distinct from interventions designed to increase screening uptake. This section summarizes studies evaluating interventions designed to boost screening uptake. Supply-side interventions (which focus on scaling up, financ-ing, and incentivizing screening) are summarized first. Demand-side interven-tions (which focus on increasing the demand for and use of screening programs) can be targeted toward either an individual patient or a community.
Supply-side interventions
Interventions targeting providers may have small to moderate effects, but the evi-dence is mixed. educational outreach visits to health care professionals (termed academic detailing) are found to induce “small to moderate changes” in the

180 | NONcOmmuNIcAble DISeASeS IN SAuDI ArAbIA
TABLE 8.6 Cost-effectiveness of screening
CONDITION TYPE OF SCREENING ICER RELATIVE TO NO SCREENING COMMENTS REFERENCES
Lung cancer Annual low-dose CT in high-risk smokers and former smokers
US$27,756 to US$243,077 (SRl 104,085 to SRl 911,539) per QALYa
Raymakers et al. 2016
Colorectal cancer Commonly used screening methods
US$10,000 to US$25,000 (SRl 37,500 to SRl 93,750) per life yearb
Generalizability to Saudi Arabia is unclear.
Pignone et al. 2002
Breast cancer Biennial mammography for women ages 50–70
US$2,685 (SRl 10,069) per life yearb
Evidence of underly-ing effectiveness is weak.
Rashidian et al. 2013
Annual mammography and MRI co-testing in high-risk women
Unknown
Childhood obesity Age- and gender- adjusted BMI
Zl 23,601 (SRl 23,383) per individual who is no longer obese
€168 (SRl 690) per 0.1 decrease in standardized BMI; €65 (SRl 267) per family
£108 (SRl 496) to £1,317 (SRl 3,234) per individual
Only short-term, modest effects have been documented.
Bandurska et al. 2020; Bryant et al. 2011; Coppins et al. 2011; Hughes et al. 2008; Kalavainen, Korppi, and Nuutinen 2007; McCallum et al. 2007; Reinehr et al. 2010; Wake et al. 2009
Gestational diabetes mellitus
Initial glucose challenge test, oral glucose tolerance test
US$20,414 (SRl 76,553) per QALY (both cost-additive and less effective than no screening)a
Fitria, van Asslet, and Postma 2019
High blood sugar Hemoglobin A1C test, oral glucose tolerance test (high-risk population only)
US$516 to US$126,236 (SRl 1,935 to SRl 473,385) per QALYb
Wide variation reflects differences in population, age of initiating screening, cutoff point for diagnosis, and screen-ing interval. Targeting high-risk individuals seems to be much more cost-effective than universal screening.
Najafi et al. 2016
High blood pressure Blood pressure test (community-based hypertension screening programs)
US$21,734 to US$56,750 (SRl 81,503 to SRl 212,813) per QALY in the United States
US$613 to US$5,637 (SRl 2,299 to SRl 21,139) per QALY in Australia
US$7,000 to US$18,000 (SRl 26,250 to SRl 67,500) per QALY in Chinab
Zhang, Wang, and Joo (2017)
Lipid disorders Lipid panel US$33,800 (SRl 126,750) per QALYb
Recent literature is very limited; medication costs have dropped since the study was done.
Dehmer et al. 2017
Source: Original compilation for this publication.Note: BMI = body mass index. CT = computed tomography. ICER = incremental cost-effectiveness ratio. MRI = magnetic resonance imaging. QALY = quality-adjusted life year.a. Neither clearly cost-effective nor clearly cost-ineffective at conventional thresholds.b. Likely cost-effective at conventional thresholds.

Screening to Promote Early Detection | 181
provision of screening tests (Dougherty et al. 2018; O’brien et al. 2007). Auditing and giving feedback to health professionals may have a beneficial effect (when the person responsible for the audit and feedback is a supervisor or colleague), and the feedback is provided multiple times, both verbally and in writing, and includes clear goals, particularly if the health professionals are not performing well to start with (Ivers et al. 2012). A systematic review of interventions to improve antibiotic prescribing practices, however, concludes that audit and feedback have minimal effects on prescribing (Arnold and Straus 2005). Handing reminders to physicians about to examine a patient likely improves quality of care slightly, although studies find that reminders have no measurable effect on blood pressure, glycated hemo-globin, or cholesterol levels (Arditi et al. 2017).
The evidence on provider-targeted financial incentives is inconclusive. A sys-tematic review of the literature concludes, “There is insufficient evidence to support or not support the use of financial incentives to improve the quality of primary health care. Implementation should proceed with caution” (Scott et al. 2011, 2). However, in the united States, recent legislation introduced account-able care organizations (AcOs)—a new payment model that is intended to incen-tivize managed care organizations to control costs and improve quality of care. If health care costs fall below a specific target, AcOs receive a share of the savings. The amount the AcO receives depends in part on the provision of preventive services, including screening for colorectal cancer, breast cancer, and blood pres-sure. To incentivize providers to comply with screening guidelines, most AcOs tie a portion of physicians’ compensation to their adherence to those guidelines (mansour et al. 2017). The incentives seem to be working. The prevalence of breast cancer screening is significantly higher among persons enrolled in an AcO than among persons not enrolled (meyer et al. 2017).
The method of screening may affect uptake. A study in the Netherlands sug-gests that a glycated hemoglobin test—which uses a single blood sample—induces greater participation in type 2 diabetes screening than the more time-consuming oral glucose tolerance test (van Valkengoed et al. 2015). A systematic review and meta-analysis of interventions intended to increase colorectal cancer screening in the united States concludes that fecal blood test outreach—including sending kits to eligible patients’ homes—should be incorporated into population-based screening programs (Dougherty et al. 2018).
The location of screening may affect uptake. Screening can be provided with-out physician referral at dental clinics (Hadlaq et al. 2017), malls (rasooldeen 2016), laboratories (Gronowski and budelier 2020), pharmacies (lancaster et al. 2018; Willis et al. 2014), workplaces (bali et al. 2018; Neumann et al. 2015; Padwal et al. 2017; Tarride et al. 2018; Wang et al. 2019), and mosques (Davachi, Flynn, and edwards 2005). A mosque in Qatar hosted a diabetes event in which 3,150 worshippers underwent screening. The event, sponsored by the Hamad medical corporation, included 15 screening stands staffed by trained diabetes nurses and educators (Hamad medical corporation 2017). However, a literature review of screening at special events such as health fairs, parties, cultural events, and plays finds insufficient evidence of an increase in uptake of cancer screening (escoffery et al. 2014).
Demand-side interventions
Interventions aimed at individuals seem to be effective at increasing uptake. Such interventions include appointment invitations, letters, text messages, and

182 | NONcOmmuNIcAble DISeASeS IN SAuDI ArAbIA
telephone calls; telephone counseling; and removal of financial barriers—for example, transportation and postage costs (Allgood et al. 2016; Arcas et al. 2014; camilloni et al. 2013; Dougherty et al. 2018; everett et al. 2011; Jepson et al. 2000; Kerrison et al. 2017; Offman et al. 2014; Shusted et al. 2019; Tsiachristas et al. 2018; uy et al. 2017). There is some evidence that providing patients with a navigator—someone to shepherd them through the cancer screening process—can improve uptake (molina et al. 2018; muliira and D’Souza 2016; ritvo et al. 2015). A growing body of research has found that mailing fecal immunochemical tests to patients’ homes increases the uptake of colorectal cancer screening (charlton et al. 2014; Davis et al. 2018).
community-oriented interventions can reach people who do not have routine contact with the health care system. In 2007, the Saudi cancer Society, a nonprofit organization, established a major breast cancer screening center in riyadh (Abulkhair et al. 2010). A public-awareness campaign (including a well-publicized visit from uS former first lady laura bush) encouraged women to get screened at the center. between September 2007 and April 2008, 1,215 women were screened and 16 cases of cancer were diagnosed. The same year, Zahra breast cancer Association was founded in riyadh to promote awareness and screening. Today, Zahra operates in six regions across Saudi Arabia (Zahra Association 2020). Another breast cancer screening program—run by a local health department and the King Abdulaziz Women’s charity committee in the eastern region—used a mobile mammography van to reach remote areas (Al mulhim et al. 2015). The pro-gram screened 8,061 women, detecting 47 cancers. In both programs, all of the women who were screened were self-referred. A systematic review of mobile screening units used to screen for breast, cervical, and colon cancer in 20 countries finds that they expand access (Greenwald et al. 2017).
mass media campaigns to raise public awareness and allay fears about screen-ing may be effective, although the quality of the evidence is weak. A meta- analysis that considered the effects of mass media campaigns on various types of health care use (not just screening) concludes that such campaigns can be effective. The results should be interpreted with caution, however, because most of the studies reviewed were of low quality (Grilli, ramsay, and minozzi 2002).
COST-EFFECTIVENESS OF SCREENING PROMOTION INTERVENTIONS
Numerous studies have assessed the cost-effectiveness of various types of screening promotion interventions. These studies are summarized in table 8.7, organized by the domain of the intervention (patient-targeted, physician- targeted, and community-wide interventions) and type of targeting (supply or demand). Some studies report the cost per QAlY gained, while others report cost-effectiveness ratios in some other form, such as the cost per an additional screening.

Screening to Promote Early Detection | 183
TABLE 8.7 Cost-effectiveness of screening promotion interventions
DOMAIN AND TYPE OF INTERVENTION INTERVENTION
STRENGTH OF EVIDENCE OF EFFECTIVENESSa ICER REFERENCES
Demand-side intervention
Patient-targeted intervention
Appointment letter (notifying the patient that an appointment for screening has been scheduled at a certain date and time)
High £9,070 (SRl 41,714) per QALYb
Jepson et al. 2000; Tsiachristas et al. 2018
Reminder letter or postcard sent to patients whose screening is overdue
High US$1 to US$52 (SRl 4 to SRl 195) per additional patient patient
Allgood et al. 2016; Fishman et al. 2000; Ishikawa et al. 2012; Jepson et al. 2000; Kerrison et al. 2017; Paulauskiene et al. 2019; Wagner 1998
Automated text messages or phone calls to patients whose screening is overdue
High Below €8,171 (below SRl 33,574) per QALYb
Arcas et al. 2014; Firmino-Machado, Soeteman, and Lunet 2019; Jepson et al. 2000; Kerrison et al. 2015; Offman et al. 2014; Posadzki et al. 2016
Reminder telephone calls to patients whose screening is overdue
High Effective and “unlikely to be cost-generating”
US$92 (SRl 378) per additional screened patient
Broberg et al. 2013; Fishman et al. 2000, respectively
Educational leaflet or printed brochure to patients whose screening is overdue
Low Cost-saving Jepson et al. 2000; Quaife et al. 2020; Tsiachristas et al. 2018
Online booking system for patients whose screening is overdue
Low £12,121 (SRl 55,741) per QALYb
Tsiachristas et al. 2018
Patient navigation program (nurse navigators)
Moderate Cost-saving US$9,800 (SRl 36,750) per QALYb
Bernardo et al. 2019; Ladabaum et al. 2015; Li et al. 2017; Li et al. 2019; Molina et al. 2018; Muliira and D’Souza 2016; Tsiachristas et al. 2018
Self-sampling kits sent (or offered) to patients whose screening is overdue
Moderate £6,565 to £11,033 (SRl 30,191 to SRl 50,738) per QALYb
Madzima, Vahabi, and Lofters 2017; Tsiachristas et al. 2018; Vassilakos et al. 2019; Winer et al. 2019; Yeh et al. 2019
Door-to-door visits by lay workers to patients whose screening is overdue
LowUS$30,015 (SRl 112,556) per QALYb
Jepson et al. 2000
Fecal occult blood test or fecal immunochemical test kits sent (or offered) to patients whose screening is overdue
Moderate US$94 (SRl 352) per additional screened patient
US$40 (SRl 150) per additional screened patient
US$9,200 (SRl 34,500) per QALYb
Kemper et al. 2018; Sequist, Franz, and Ayanian 2010; Somsouk et al. 2020, respectively
(Continued)

184 | NONcOmmuNIcAble DISeASeS IN SAuDI ArAbIA
INFORMATION GAPS, POLICY RECOMMENDATIONS, AND FUTURE RESEARCH PRIORITIES
There are large gaps in the literature. This overview of screening programs has identified the following important gaps in knowledge:
• limited or inconclusive evidence regarding the effectiveness or cost- effectiveness of many common screening programs
• limited evidence regarding the effectiveness or cost-effectiveness of many common programs to increase screening uptake
• lack of information about the availability and uptake of many screening ser-vices in Saudi Arabia
• lack of information on consumer demand for screening services and the fac-tors influencing demand
• An almost complete absence of Saudi Arabian–specific cost-effectiveness studies for both screening programs and strategies to increase screening uptake.
Despite the many gaps in knowledge, based on what is available, table 8.8 lists recommendations for Saudi Arabia to consider, along with a rationale for each.
TABLE 8.7, continued
DOMAIN AND TYPE OF INTERVENTION INTERVENTION
STRENGTH OF EVIDENCE OF EFFECTIVENESSa ICER REFERENCES
Community-wide interventions
Public awareness campaigns Low £13,496 (SRl 62,050) per QALYb
Grilli, Ramsay, and Minozzi 2002; Jepson et al. 2000; Schliemann et al. 2020; Whyte and Harnan 2014
Supply-side interventions
Physician-targeted interventions
Academic detailing ModerateCost-ineffective compared to a mail-based prescribing feedback service
Dougherty et al. 2018; Jepson et al. 2000; Naughton, Feely, and Bennett 2009; O’Brien et al. 2007
Audit and feedback Low Unknown Arnold and Straus 2005; Ivers et al. 2012; Jepson et al. 2000
Reminders prompting physicians either to perform a screening test or to encourage eligible individuals to have a test performed at a future date
Moderate Unknown Arditi et al. 2017; Jepson et al. 2000
Financial incentives (for example, bonuses for hitting a screening uptake target)
Low Unknown Janz et al. 1997; Meyer et al. 2017
Community-wide interventions
Mobile screening units High Unknown Greenwald et al. 2017
Screening provided at special events
Low Unknown Escoffery et al. 2014
Source: Original compilation for this publication.Note: ICER = incremental cost-effectiveness ratio. QALY = quality-adjusted life year.a. A subjective assessment based on the effectiveness literature. b. Cost-effective based on conventional thresholds.
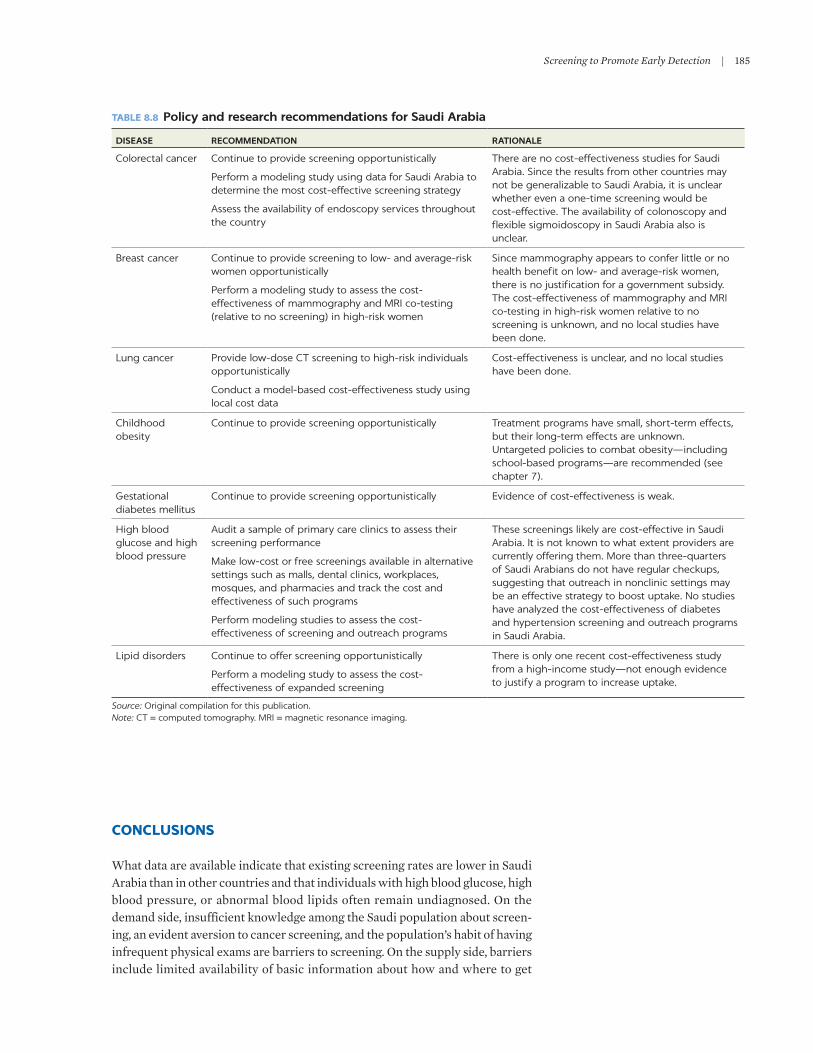
Screening to Promote Early Detection | 185
CONCLUSIONS
What data are available indicate that existing screening rates are lower in Saudi Arabia than in other countries and that individuals with high blood glucose, high blood pressure, or abnormal blood lipids often remain undiagnosed. On the demand side, insufficient knowledge among the Saudi population about screen-ing, an evident aversion to cancer screening, and the population’s habit of having infrequent physical exams are barriers to screening. On the supply side, barriers include limited availability of basic information about how and where to get
TABLE 8.8 Policy and research recommendations for Saudi Arabia
DISEASE RECOMMENDATION RATIONALE
Colorectal cancer Continue to provide screening opportunistically
Perform a modeling study using data for Saudi Arabia to determine the most cost-effective screening strategy
Assess the availability of endoscopy services throughout the country
There are no cost-effectiveness studies for Saudi Arabia. Since the results from other countries may not be generalizable to Saudi Arabia, it is unclear whether even a one-time screening would be cost-effective. The availability of colonoscopy and flexible sigmoidoscopy in Saudi Arabia also is unclear.
Breast cancer Continue to provide screening to low- and average-risk women opportunistically
Perform a modeling study to assess the cost- effectiveness of mammography and MRI co-testing (relative to no screening) in high-risk women
Since mammography appears to confer little or no health benefit on low- and average-risk women, there is no justification for a government subsidy. The cost-effectiveness of mammography and MRI co-testing in high-risk women relative to no screening is unknown, and no local studies have been done.
Lung cancer Provide low-dose CT screening to high-risk individuals opportunistically
Conduct a model-based cost-effectiveness study using local cost data
Cost-effectiveness is unclear, and no local studies have been done.
Childhood obesity
Continue to provide screening opportunistically Treatment programs have small, short-term effects, but their long-term effects are unknown. Untargeted policies to combat obesity—including school-based programs—are recommended (see chapter 7).
Gestational diabetes mellitus
Continue to provide screening opportunistically Evidence of cost-effectiveness is weak.
High blood glucose and high blood pressure
Audit a sample of primary care clinics to assess their screening performance
Make low-cost or free screenings available in alternative settings such as malls, dental clinics, workplaces, mosques, and pharmacies and track the cost and effectiveness of such programs
Perform modeling studies to assess the cost- effectiveness of screening and outreach programs
These screenings likely are cost-effective in Saudi Arabia. It is not known to what extent providers are currently offering them. More than three-quarters of Saudi Arabians do not have regular checkups, suggesting that outreach in nonclinic settings may be an effective strategy to boost uptake. No studies have analyzed the cost-effectiveness of diabetes and hypertension screening and outreach programs in Saudi Arabia.
Lipid disorders Continue to offer screening opportunistically
Perform a modeling study to assess the cost- effectiveness of expanded screening
There is only one recent cost-effectiveness study from a high-income study—not enough evidence to justify a program to increase uptake.
Source: Original compilation for this publication.Note: CT = computed tomography. MRI = magnetic resonance imaging.

186 | NONcOmmuNIcAble DISeASeS IN SAuDI ArAbIA
screened for cancer and failure on the part of many physicians to refer at-risk patients for screening.
The quality of evidence supporting expanded screening is mixed. Some types of screening have been shown to be cost-effective in Western countries, but it is not clear whether these results can be generalized to Saudi Arabia. Other types of screening, such as breast cancer screening in low- and average-risk women, probably are not cost-effective. Still other types of screening have mixed or inconclusive evidence of cost-effectiveness.
If policy makers want to expand certain types of screening, various interven-tions potentially could increase uptake in a cost-effective fashion. Such interven-tions include reminder letters, postcards, text messages, and phone calls; patient navigation programs (for example, programs run by nurses to assist patients through the screening process); and the direct provision of self-sampling kits to consumers. The cost-effectiveness literature for many of these programs, how-ever, is too sparse to allow definitive conclusions.
Overall, there are significant gaps in knowledge. Definitive evidence of both effectiveness and cost-effectiveness for many of the programs described in this chapter is lacking. cost-effectiveness analyses specific to Saudi Arabia are almost nonexistent, and additional research is recommended.
REFERENCES
Abulkhair, O. A., F. m. Al Tahan, S. e. Young, S. m. musaad, and A.-r. m. Jazieh. 2010. “The First National Public breast cancer Screening Program in Saudi Arabia.” Annals of Saudi Medicine 30 (5): 350–57.
Akl, c., c. Akik, H. Ghattas, and c. m. Obermeyer. 2020. “The cascade of care in managing Hypertension in the Arab World: A Systematic Assessment of the evidence on Awareness, Treatment, and control.” BMC Public Health 20 (1): 835. doi: 10.1186/s12889-020-08678-6.
Allan, m. G., A. J. lindblad, A. comeau, J. coppola, b. Hudson, m. mannarino, c. mcminis, et al. 2015. “Simplified lipid Guidelines.” Canadian Family Physician 61 (October): 857–67.
Allgood, P. c., A. J. maxwell, S. Hudson, J. Offman, G. Hutchinson, c. beattie, r. Tuano-Donnelly, et al. 2016. “A randomised Trial of the effect of Postal reminders on Attendance for breast Screening.” British Journal of Cancer 114 (2): 171–76. doi: 10.1038/bjc.2015.451.
Almadi, m. A., and F. Alghamdi. 2019. “The Gap between Knowledge and undergoing colorectal cancer Screening using the Health belief model: A National Survey.” Saudi Journal of Gastroenterology 25 (1): 27–39.
Al-mandeel, H. m., e. Sagr, K. Sait, H. m. latifah, A. Al-Obaid, I. A. Al-badawi, A. O. Alkushi, et al. 2016. “clinical Practice Guidelines on the Screening and Treatment of Precancerous lesions for cervical cancer Prevention in Saudi Arabia.” Annals of Saudi Medicine 36 (5): 313–20. doi: 10.5144/0256-4947.2016.313.
Al mulhim, F. A., A. Syed, W. A. bagatadah, and A. F. Al muhanna. 2015. “breast cancer Screening Programme: experience from eastern Province, Saudi Arabia.” Eastern Mediterranean Health Journal 21 (2): 111–19.
Arcas, m. m., A. buron, O. ramis, m. esturi, c. Hernández, and F. macià. 2014. “¿Puede un men-saje de teléfono móvil incrementar la participación en programas de cribado poblacional de cáncer de mama? [can a mobile Phone Short message Increase Participation in breast cancer Screening Programmes?].” Revista de Calidad Asistencial 29 (4): 188–96. doi: 10.1016/j .cali.2014.02.003.
Arditi, c., m. rège-Walther, P. Durieux, and b. burnand. 2017. “computer-Generated reminders Delivered on Paper to Healthcare Professionals: effects on Professional Practice and Healthcare Outcomes.” Cochrane Database of Systematic Reviews 7: Art. cD001175. doi: 10.1002/14651858.cD001175.pub4.

Screening to Promote Early Detection | 187
Arnold, S. r., and S. e. Straus. 2005. “Interventions to Improve Antibiotic Prescribing Practices in Ambulatory care.” Cochrane Database Systemic Review 4: Art. cD003539. doi: 10.1002/14651858.cD003539.pub2.
Ayanian, J. Z., A. m. Zaslavsky, J. S. Weissman, e. c. Schneider, and J. A. Ginsburg. 2003. “undiagnosed Hypertension and Hypercholesterolemia among uninsured and Insured Adults in the Third National Health and Nutrition examination Survey.” American Journal of Public Health 93 (12): 2051–54. doi: 10.2105/ajph.93.12.2051.
bali, V., I. Yermilov, A. Koyama, and A. P. legorreta. 2018. “Secondary Prevention of Diabetes through Workplace Health Screening.” Occupational Medicine 68 (9): 610–16. doi: 10.1093 /occmed/kqy138.
bandurska, e., m. brzeziński, P. metelska, and m. Zarzeczna-baran. 2020. “cost-effectiveness of an Obesity management Program for 6- to 15-Year-Old children in Poland: Data from Over Three Thousand Participants.” Obesity Facts 13 (5): 487–98. doi: 10.1159/000509130.
barry, e., S. roberts, J. Oke, S. Vijayaraghavan, r. Normansell, and T. Greenhalgh. 2017. “efficacy and effectiveness of Screen and Treat Policies in Prevention of Type 2 Diabetes: Systematic review and meta-Analysis of Screening Tests and Interventions.” BMJ 356: i6538. doi: 10.1136/bmj.i6538.
basulaiman, m., c. el bcheraoui, m. Tuffaha, m. robinson, F. Daoud, S. Jaber, S. mikhitarian, et al. 2014. “Hypercholesterolemia and Its Associated risk Factors: Kingdom of Saudi Arabia.” Annals of Epidemiology 24 (11): 801–08. doi: 10.1016/j.annepidem.2014.08.001.
baxter, N., J. Warren, m. barrett, T. Stukel, and V. Doria-rose. 2012. “Association between colonoscopy and colorectal cancer mortality in a uS cohort According to Site of cancer and colonoscopist Specialty.” Journal of Clinical Oncology 30 (21): 2664–69.
bernardo, b. m., X. Zhang, c. m. b. Hery, r. J. meadows, and e. D. Paskett. 2019. “The efficacy and cost-effectiveness of Patient Navigation Programs across the cancer continuum: A Systematic review.” Cancer 125 (16): 2747–61. doi: 10.1002/cncr.32147.
biller-Andorno, N., and P. Jüni. 2014. “Abolishing mammography Screening Programs? A View from the Swiss medical board.” New England Journal of Medicine 370: 1965–67.
broberg, G., J. m. Jonasson, J. ellis, D. Gyrd-Hansen, b. Anjemark, A. Glantz, l. Söderberg, et al. 2013. “Increasing Participation in cervical cancer Screening: Telephone contact with long-Term Non-Attendees in Sweden; results from rAcOmIP, a randomized controlled Trial.” International Journal of Cancer 133 (1): 164–71. doi: 10.1002/ijc.27985.
bryant, m., A. Farrin, D. christie, S. A. Jebb, A. r. cooper, and m. rudolf. 2011. “results of a Feasibility randomised controlled Trial (rcT) for WATcH IT: A Programme for Obese children and Adolescents.” Clinical Trials 8 (6): 755–56.
camilloni, l., e. Ferroni, b. J. cendales, A. Pezzarossi, G. Furnari, P. borgia, G. Guasticchi, and P. Giorgi rossi, and the methods to Increase Participation Working Group. 2013. “methods to Increase Participation in Organised Screening Programs: A Systematic review.” BMC Public Health 13: 464.
canadian Task Force on Preventive Health care. 2012. “recommendations on Screening Type 2 Diabetes in Adults.” CMAJ 184 (15): 1687–96. doi: 10.1503/cmaj.120732.
canadian Task Force on Preventive Health care. 2015. “recommendations for Growth monitoring and Prevention and management of Overweight and Obesity in children and Youth in Primary care.” CMAJ 187 (6): 411–21. doi: 10.1503/cmaj.141285.
canadian Task Force on Preventive Health care. 2016a. “recommendations on Screening for colorectal cancer in Primary care.” CMAJ 188 (5): 340–48. doi: 10.1503/cmaj.151125.
canadian Task Force on Preventive Health care. 2016b. “recommendations on Screening for lung cancer.” CMAJ 188 (6): 425–32. doi: 10.1503/cmaj.151421.
cancer council Australia. 2017. Clinical Practice Guidelines for the Prevention, Early Detection, and Management of Colorectal Cancer. Approved October 27, 2017. cancer council Australia, Sydney. https://wiki.cancer.org.au/australia/Guidelines:colorectal_cancer.
cancer council Australia. n.d. “cT Screening.” cancer council Australia, Sydney. https://wiki .cancer.org.au/australia/Guidelines:lung_cancer/Prevention_and_diagnosis/cT _Screening.

188 | NONcOmmuNIcAble DISeASeS IN SAuDI ArAbIA
charlton, m. e., m. A. mengeling, T. r. Halfdanarson, N. m. makki, A. malhotra, J. S. Klutts, b. T. levy, and P. J. Kaboli. 2014. “evaluation of a Home-based colorectal cancer Screening Intervention in a rural State.” Journal of Rural Health 30 (3): 322–32. doi: 10.1111/jrh.12052.
chen, P. Y., e. A. Finkelstein, m. J. Ng, F. Yap, G. S. H. Yeo, V. S. rajadurai, Y. S. chong, et al. 2015. “Incremental cost-effectiveness Analysis of Gestational Diabetes mellitus Screening Strategies in Singapore.” Asia Pacific Journal of Public Health 28 (1): 15–25. doi: 10.1177/1010539515612908.
college of Obstetricians and Gynaecologists, Singapore. 2018. Guidelines for the Management of Gestational Diabetes Mellitus. college of Obstetricians and Gynaecologists, Singapore. https://www.ams.edu.sg/view-pdf.aspx?file=media%5c4163_fi_430.pdf&ofile =cOGS+GDm+Guidelines+2018.pdf.
coppins, D. F., b. m. margetts, J. l. Fa, m. brown, F. Garrett, and S. Huelin. 2011. “effectiveness of a multi-Disciplinary Family-based Programme for Treating childhood Obesity (the Family Project).” European Journal of Clinical Nutrition 65 (8): 903–09. doi: 10.1038 /ejcn.2011.43.
crowther, c. A., J. e. Hiller, J. r. moss, A. J. mcPhee, W. S. Jeffries, J. S. robinson, and the Australian carbohydrate Intolerance Study in Pregnant Women (AcHOIS) Trial Group. 2005. “effect of Treatment of Gestational Diabetes mellitus on Pregnancy Outcomes.” New England Journal of Medicine 352 (24): 2477–86.
Davachi, S., m. Flynn, and A. edwards. 2005. “A Health region/community Partnership for Type 2 Diabetes risk Factor Screening in Indo-Asian communities.” Canadian Journal of Diabetes 29 (2): 87–94.
Davis, m. m., m. Freeman, J. Shannon, and G. D. coronado. 2018. “A Systematic review of clinic and community Intervention to Increase Fecal Testing for colorectal cancer in rural and low-Income Populations in the united States: How, What, and When?” BMC Cancer 18 (1): 40. doi: 10.1186/s12885-017-3813-4
Dehmer, S. P., m. V. maciosek, A. b. laFrance, and T. J. Flottemesch. 2017. “Health benefits and cost-effectiveness of Asymptomatic Screening for Hypertension and High cholesterol and Aspirin counseling for Primary Prevention.” Annals of Family Medicine 15 (1): 23–36.
de Koning, H. J., c. m. van der Aalst, P. A. de Jong, e. T. Scholten, K. Nackaerts, m. A. Heuvelmans, J.-W. J. lammers, et al. 2020. “reduced lung-cancer mortality with Volume cT Screening in a randomized Trial.” New England Journal of Medicine 382 (6): 503–13. doi: 10.1056 /NeJmoa1911793.
Demyati, e. 2014. “Knowledge, Attitude, Practice, and Perceived barriers of colorectal cancer Screening among Family Physicians in National Guard Health Affairs, riyadh.” International Journal of Family Medicine 4: Art. 457354.
Dougherty, m. K., A. T. brenner, S. D. crockett, S. Gupta, S. b. Wheeler, m. coker-Schwimmer, l. cubillos, T. malo, and D. S. reuland. 2018. “evaluation of Interventions Intended to Increase colorectal cancer Screening rates in the united States: A Systematic review and meta-Analysis.” JAMA Internal Medicine 178 (12): 1645–58. doi: 10.1001/jamainternmed .2018.4637.
Dyakova, m., S. Shantikumar, J. l. colquitt, c. m. Drew, m. Sime, J. macIver, N. Wright, A. clarke, and K. rees. 2016. “Systematic Versus Opportunistic risk Assessment for the Primary Prevention of cardiovascular Disease.” Cochrane Database of Systematic Reviews 1: Art. cD010411. doi: 10.1002/14651858.cD010411.pub2.
einarson, T. r., b. G. bereza, A. Acs, and r. Jensen. 2017. “Systematic literature review of the Health economic Implications of early Detection by Screening Populations at risk for Type 2 Diabetes.” Current Medical Research and Opinion 33 (2): 331–58. doi: 10.1080 /03007995.2016.1257977.
el bcheraoui, c., m. basulaiman, m. Tuffaha, F. Daoud, m. robinson, S. Jaber, S. mikhitarian, et al. 2014a. “Status of the Diabetes epidemic in the Kingdom of Saudi Arabia, 2013.” International Journal of Public Health 59 (6): 1011–21. doi: 10.1007/s00038-014-0612-4.
el bcheraoui, c., Z. A. memish, m. Tuffaha, F. Daoud, m. robinson, S. Jaber, S. mikhitarian, et al. 2014b. “Hypertension and Its Associated risk Factors in the Kingdom of Saudi Arabia, 2013: A National Survey.” International Journal of Hypertension 2014: Art. 564679. doi: 10.1155/2014/564679.

Screening to Promote Early Detection | 189
el bcheraoui, c., m. basulaiman, S. Wilson, F. Daoud, m. Tuffaha, m. A. Almazroa, Z. A. memish, m. Al Saeedi, and A. H. mokda. 2015a. “breast cancer Screening in Saudi Arabia: Free but Almost No Takers.” PLoS One 10 (3): e0119051. doi: 10.1371/journal.pone.0119051. Published correction appears in PLoS One [2015] 10 (4): e0124850.
el bcheraoui, c., m. Tuffaha, F. Daoud, m. A. Almazroa, m. Al Saeedi, Z. A. memish, m. basulaiman, A. A. Al rabeeah, and A.H mokdad. 2015b. “low uptake of Periodic Health examinations in the Kingdom of Saudi Arabia, 2013.” Journal of Family Medicine and Primary Care 4 (3): 342–46. doi: 10.4103/2249-4863.161313.
escoffery, c., K. c. rodgers, m. c. Kegler, r. Haardörfer, D. H. Howard, S. liang, e. Pinsker, et al. 2014. “A Systematic review of Special events to Promote breast, cervical, and colorectal cancer Screening in the united States.” BMC Public Health 14: 274. doi: 10.1186/1471-2458-14-274.
everett, T., A. bryant, m. F. Griffin, P. P. martin-Hirsch, c. A. Forbes, and r. G. Jepson. 2011. “Interventions Targeted at Women to encourage the uptake of cervical Screening.” Cochrane Database of Systematic Reviews 5: Art. cD002834. doi: 10.1002/14651858.cD002834.pub2.
Firmino-machado, J., D. I. Soeteman, and N. lunet. 2019. “cost-effectiveness of a Stepwise Intervention to Promote Adherence to cervical cancer Screening.” European Journal of Public Health 30 (3): 543–52. doi: 10.1093/eurpub/ckz222.
Fishman, P., S. Taplin, D. meyer, and W. barlow. 2000. “cost-effectiveness of Strategies to enhance mammography use.” Effective Clinical Practice 3 (5): 213–20.
Fitria, N., A. D. J. van Asselt, and m. J. Postma. 2019. “cost-effectiveness of controlling Gestational Diabetes mellitus: A Systematic review.” European Journal of Health Economics 20 (3): 407–17. doi: 10.1007/s10198-018-1006-y.
Gillies, c. l., P. c. lambert, K. r. Abrams, A. J. Sutton, N. J. cooper, r. T. Hsu, m. J. Davies, and K. Khunti. 2008. “Different Strategies for Screening and Prevention of Type 2 Diabetes in Adults: cost-effectiveness Analysis.” BMJ 336 (7654): 1180–85. doi: 10.1136/bmj .39545.585289.25.
Gosadi, I. m. 2019. “National Screening Programs in Saudi Arabia: Overview, Outcomes, and effectiveness.” Journal of Infection and Public Health 12 (5): 608–14. doi: 10.1016/j.jiph .2019.06.001.
Gøtzsche, P. c., and K. J. Jørgensen. 2013. “Screening for breast cancer with mammography.” Cochrane Database of Systematic Reviews 6: Art. cD001877. doi: 10.1002/14651858.cD001877 .pub5.
Greenwald, Z. r., m. el-Zein, S. bouten, H. ensha, F. l. Vazquez, and e. l. Franco. 2017. “mobile Screening units for the early Detection of cancer: A Systematic review.” Cancer Epidemiology, Biomarkers & Prevention 26 (12): 1679–94. doi: 10.1158/1055-9965 .ePI-17-0454.
Grilli, r., c. ramsay, and S. minozzi. 2002. “mass media Interventions: effects on Health Services utilisation.” Cochrane Database of Systematic Reviews 1: Art. cD000389.
Gronowski, A. m., and m. m. budelier. 2020. “The ethics of Direct-to-consumer Testing.” Clinics in Laboratory Medicine 40 (1): 93–103. doi: 10.1016/j.cll.2019.11.001.
Gu, D., J. He, P. G. coxson, P. W. rasmussen, c. Huang, A. Thanataveerat, K. Y. Tzong, et al. 2015. “The cost-effectiveness of low-cost essential Antihypertensive medicines for Hypertension control in china: A modelling Study.” PLoS Medicine 12 (8): e1001860. doi: 10.1371/journal.pmed.1001860.
Hadlaq, e. m., Z. T. Faraj, F. m. Al Gamdi, F. A. Al Obathani, m. F. Abuabat, and K. H. Awan. 2017. “early Screening of Diabetes and Hypertension in Primary care Dental clinics at King Saud university in riyadh, Kingdom of Saudi Arabia.” Journal of Contemporary Dental Practice 18 (8): 652–59.
Hall, I. J., F. K. l. Tangka, S. A. Sabatino, T. D. Thompson, b. I. Graubard, and N. breen. 2018. “Patterns and Trends in cancer Screening in the united States.” Preventing Chronic Diseases 15: Art. 170465. doi: 10.5888/pcd15.170465.
Hamad medical corporation. 2017. “Thousands to be Tested during Diabetes Screening and education events at mosques.” Hamad medical corporation, Doha, June 7, 2017. https://www.hamad.qa/eN/news/2017/June/Pages/Thousands-to-be-Tested-during-Diabetes -Screening-and-education-events-at-mosques.aspx.

190 | NONcOmmuNIcAble DISeASeS IN SAuDI ArAbIA
Hamashima, c. 2018. “cancer Screening Guidelines and Policy making: 15 Years of experience in cancer Screening Guideline Development in Japan.” Japanese Journal of Clinical Oncology 48 (3): 278–86. doi: 10.1093/jjco/hyx190.
Hamashima, c., et al., on behalf of the Japanese research Group for the Development of breast cancer Screening Guidelines. 2016. “The Japanese Guidelines for breast cancer Screening.” Japanese Journal of Clinical Oncology 46 (5): 482–92.
Herman, W. H., W. Ye, S. J. Griffin, r. K. Simmons, m. J. Davies, K. Khunti, G. e. H. m. rutten, et al. 2015. “early Detection and Treatment of Type 2 Diabetes reduce cardiovascular morbidity and mortality: A Simulation of the results of the Anglo-Danish-Dutch Study of Intensive Treatment in People with Screen-Detected Diabetes in Primary care (ADDITION-europe).” Diabetes Care 38 (8): 1449–55. doi: 10.2337/dc14-2459.
Hoerger, T. J., r. Harris, K. A. Hicks, K. Donahue, S. Sorensen, and m. engelgau. 2004. “Screening for Type 2 Diabetes mellitus: A cost-effectiveness Analysis.” Annals of Internal Medicine 140 (9): 689–99.
Hughes, A. r., l. Stewart, J. chapple, J. H. mccoll, m. D. Donaldson, c. J. Kelnar, m. Zabihollah, F. Ahmed, and J. J. reilly. 2008. “randomized, controlled Trial of a best-Practice Individualized behavioral Program for Treatment of childhood Overweight: Scottish childhood Overweight Treatment Trial (ScOTT).” Pediatrics 121 (3): e539–46.
IDF (International Diabetes Federation). 2019. IDF Diabetes Atlas, 9th ed. brussels: IDF. https://diabetesatlas.org/en/.
IHme (Institute for Health metrics and evaluation). 2020. “GDb results Tool.” IHme, Seattle, WA. http://ghdx.healthdata.org/gbd-results-tool.
Ishikawa, Y., K. Hirai, H. Saito, J. Fukuyoshi, A. Yonekura, K. Harada, A. Seki, D. Shibuya, and Y. Nakamura. 2012. “cost-effectiveness of a Tailored Intervention Designed to Increase breast cancer Screening among a Non-Adherent Population: A randomized controlled Trial.” BMC Public Health 12: 760. doi: 10.1186/1471-2458-12-760.
Ivers, N., G. Jamtvedt, S. Flottorp, J. m. Young, J. Odgaard-Jensen, S. D. French, m. A. O’brien, et al. 2012. “Audit and Feedback: effects on Professional Practice and Healthcare Outcomes.” Cochrane Database of Systematic Reviews (6): Art. cD000259. doi: 10.1002/14651858.cD000259.pub3.
Janz, N. K., D. Schottenfeld, K. m. Doerr, S. m. Selig, r. l. Dunn, m. Strawderman, and P. A. levine. 1997. “A Two-Step Intervention of Increase mammography among Women Aged 65 and Older.” American Journal of Public Health 87 (10): 1683–86.
Jepson, r., A. clegg, c. Forbes, r. l. Weis, A. Sowden, and J. Kleijnen. 2000. “The Determinants of Screening uptake and Interventions for Increasing uptake: A Systematic review.” Health Technology Assessment 4 (14): 1–133.
Kahn, r., P. Alperin, D. eddy, K. borch-Johnsen, J. buse, J. Feigelman, e. Gregg, et al. 2010. “Age at Initiation and Frequency of Screening to Detect Type 2 Diabetes: A cost-effectiveness Analysis.” The Lancet 375 (9723): 1365–74. doi: 10.1016/S0140-6736(09)62162-0.
Kalavainen, m. P., m. O. Korppi, and O. m. Nuutinen. 2007. “clinical efficacy of Group-based Treatment for childhood Obesity compared with routinely Given Individual counseling.” International Journal of Obesity 31 (10): 1500–08. doi: 10.1038/sj .ijo.0803628.
Kemper, K. e., b. l. Glaze, c. l. eastman, r. c. Waldron, S. Hoover, T. Flagg, F. K. l. Tangka, and S. Subramanian. 2018. “effectiveness and cost of multilayered colorectal cancer Screening Promotion Interventions at Federally Qualified Health centers in Washington State.” Cancer 124 (21): 4121–29. doi: 10.1002/cncr.31693.
Kerrison, r. S., H. Shukla, D. cunningham, O. Oyebode, and e. Friedman. 2015. “Text-message reminders Increase uptake of routine breast Screening Appointments: A randomised controlled Trial in a Hard-to-reach Population.” British Journal of Cancer 112 (6): 1005–10. doi: 10.1038/bjc.2015.36.
Kerrison, r. S., l. m. mcGregor, S. marshall, J. Isitt, N. counsell, c. J. rees, and c. von Wagner. 2017. “Improving uptake of Flexible Sigmoidoscopy Screening: A randomized Trial of Nonparticipant reminders in the english Screening Programme.” Endoscopy 49 (1): 35–43. doi: 10.1055/s-0042-118452.

Screening to Promote Early Detection | 191
Klarenbach, S., N. Sims-Jones, G. lewin, H. Singh, G. Thériault, m. Tonelli, m. Doull, et al. 2018. “recommendations on Screening for breast cancer in Women Aged 40–74 Years Who Are Not at Increased risk for breast cancer.” CMAJ 190 (49): e1441–51. doi: 10.1503/cmaj.180463.
Krishnan, A., e. A. Finkelstein, P. Kallestrup, A. Karki, m. H. Olsen, and D. Neupane. 2019. “cost-effectiveness and budget Impact of the community-based management of Hypertension in Nepal Study (cObIN): A retrospective Analysis.” Lancet Global Health 7 (10): e1367–74. doi: 10.1016/S2214-109X(19)30338-9.
Kumar, S., and A. S. Kelly. 2017. “review of childhood Obesity: From epidemiology, etiology, and comorbidities to clinical Assessment and Treatment.” Mayo Clinic Proceedings 92 (2): 251–65. doi: 10.1016/j.mayocp.2016.09.017.
ladabaum, u., A. mannalithara, l. Jandorf, and S. H. Itzkowitz. 2015. “cost-effectiveness of Patient Navigation to Increase Adherence with Screening colonoscopy among minority Individuals.” Cancer 121 (7): 1088–97. doi: 10.1002/cncr.29162.
lancaster, K., l. Thabane, J. e. Tarride, G. Agarwal, J. S. Healey, r. Sandhu, and l. Dolovich. 2018. “Descriptive Analysis of Pharmacy Services Provided after community Pharmacy Screening.” International Journal of Clinical Pharmacology 40 (6): 1577–86. doi: 10.1007 /s11096-018-0742-5.
landon, m. b., c. Y. Spong, e. Thom, m. W. carpenter, S. m. ramin, b. casey, r. J. Wapner, et al. 2009. “A multicenter, randomized Trial of Treatment for mild Gestational Diabetes.” New England Journal of Medicine 361 (14): 1339–48. doi: 10.1056/NeJmoa0902430.
lansdorp-Vogelaar, I., A. b. Knudsen, and H. brenner. 2011. “cost-effectiveness of colorectal cancer Screening.” Epidemiologic Reviews 33 (1): 88–100. doi: 10.1093/epirev/mxr004.
li, Y., e. carlson, D. A. Hernández, b. Green, T. calle, T. Kumaresan, K. madondo, et al. 2019. “Patient Perception and cost-effectiveness of a Patient Navigation Program to Improve breast cancer Screening for Hispanic Women.” Health Equity 3 (1): 280–86. doi: 10.1089 /heq.2018.0089.
li, Y., e. carlson, r. Villarreal, l. meraz, and J. A. Pagán. 2017. “cost-effectiveness of a Patient Navigation Program to Improve cervical cancer Screening.” American Journal of Managed Care 23 (7): 429–34.
lindholm, e., H. brevinge, and e. Haglind. 2008. “Survival benefit in a randomized clinical Trial of Faecal Occult blood Screening for colorectal cancer.” British Journal of Surgery 95 (8): 1029–36. doi: 10.1002/bjs.6136.
lindsay, P., S. connor Gorber, m. Joffres, r. birtwhistle, D. mcKay, and l. cloutier. 2013. “recommendations on Screening for High blood Pressure in canadian Adults.” Canadian Family Physician 59 (9): 927–33.
maciosek, m. V., l. I. Solberg, A. b. coffield, N. m. edwards, and m. J. Goodman. 2006. “colorectal cancer Screening: Health Impact and cost effectiveness.” American Journal of Preventive Medicine 31 (1): 80–89.
madzima, T. r., m. Vahabi, and A. lofters. 2017. “emerging role of HPV Self-Sampling in cervical cancer Screening for Hard-to-reach Women: Focused literature review.” Canadian Family Physician 63 (8): 597–601.
mandrik, O., O. I. ekwunife, F. meheus, J. l. (Hans) Severens, S. lhachimi, c. A. uyl-de Groot, and r. murillo. 2019. “Systematic reviews as a ‘lens of evidence’: Determinants of cost-effectiveness of breast cancer Screening.” Cancer Medicine 8 (18): 7846–58. doi: 10.1002 /cam4.2498.
mansour, m., N. Favini, m. A. carome, S. Wolfe, S. Woolhandler, and D. u. Himmelstein. 2017. “Accountable care Organizations’ Payments to Physicians: Patients Should Have the right to Know.” American Journal of Public Health 107 (8): 1251–52. doi: 10.2105/AJPH.2017.303918.
mauro, m., G. rotundo, and m. Giancotti. 2019. “effect of Financial Incentives on breast, cervical, and colorectal cancer Screening Delivery rates: results from a Systematic literature review.” Health Policy 123 (12): 1210–20. doi: 0.1016/j.healthpol.2019.09.012.
mccallum, Z., m. Wake, b. Gerner, l. A. baur, K. Gibbons, l. Gold, J. Gunn, et al. 2007. “Outcome Data from the leAP (live, eat, and Play) Trial: A randomized controlled Trial of a Primary care Intervention for childhood Overweight/mild Obesity.” International Journal of Obesity 31 (4): 630–36.

192 | NONcOmmuNIcAble DISeASeS IN SAuDI ArAbIA
mead, e., T. brown, K. rees, l. b. Azevedo, V. Whittaker, D. Jones, J. Olajide, et al. 2017. “Diet, Physical Activity, and behavioural Interventions for the Treatment of Overweight or Obese children from the Age of 6 to 11 Years.” Cochrane Database of Systematic Reviews 6: Art. cD012651. doi: 10.1002/14651858.cD012651.
meyer, c. P., A. Krasnova, J. D. Sammon, S. r. lipsitz, J. S. Weisman, m. Sun, and Q.-D. Trinh. 2017. “Accountable care Organizations and the use of cancer Screening.” Preventive Medicine 101: 15–17.
miller, A. b., c. Wall, c. J. baines, P. Sun, T. To, and S. A. Narod. 2014. “Twenty Five Year Follow-up for breast cancer Incidence and mortality of the canadian National breast Screening Study: randomised Screening Trial.” BMJ 348: g366. doi: 10.1136/bmj.g366.
mOH (ministry of Health). 2020. Kingdom of Saudi Arabia World Health Survey 2019 Report. riyadh: ministry of Health.
molina, Y., S. J. Kim, N. berrios, A. e. Glassgow, Y. San miguel, J. S. Darnell, H. Pauls, et al. 2018. “Patient Navigation Improves Subsequent breast cancer Screening after a Noncancerous result: evidence from the Patient Navigation in medically underserved Areas Study.” Journal of Women’s Health 27 (3): 317–23. doi: 10.1089/jwh.2016.6120.
moore, S. G., P. J. Shenoy, l. Fanucchi, J. W. Tumeh, and c. r. Flowers. 2009. “cost-effectiveness of mrI compared to mammography for breast cancer Screening in a High risk Population.” BMC Health Services Research 9: 9 (2009). doi: 10.1186/1472-6963-9-9.
muliira, J. K., and m. S. D’Souza. 2016. “effectiveness of Patient Navigator Interventions on uptake of colorectal cancer Screening in Primary care Settings.” Japan Journal of Nursing Science 13 (2): 205–19. doi: 10.1111/jjns.12102.
musini, V. m., A. m. Tejani, K. bassett, l. Puil, and J. m. Wright. 2019. “Pharmacotherapy for Hypertension in Adults 60 Years or Older.” Cochrane Database of Systematic Reviews 6: Art. cD000028.
Nadar, S. K., H. Al-riyami, A. Al-riyami, H. Al-lawati, b. Panakkal, S. mohammed, G.b. Nagaraju, et al. 2020. “may measurement month 2018: An Analysis of blood Pressure Screening results from Oman.” European Heart Journal Supplements 22 (Suppl. H): H100–03. doi: 10.1093/eurheartj/suaa039.
Najafi, b., F. Farzadfar, H. Ghaderi, and m. Hadian. 2016. “cost effectiveness of Type 2 Diabetes Screening: A Systematic review.” Medical Journal of the Islamic Republic of Iran 30 (1): 122–30.
National lung Screening Trial research Team. 2011. “reduced lung-cancer mortality with low-Dose computed Tomographic Screening.” New England Journal of Medicine 365 (5): 395–409. doi: 10.1056/NeJmoa1102873.
Naughton, c., J. Feely, and K. bennett. 2009. “A rcT evaluating the effectiveness and cost-effectiveness of Academic Detailing versus Postal Prescribing Feedback in changing GP Antibiotic Prescribing.” Journal of Evaluation in Clinicial Practice 15 (5): 807–12. doi: 10.1111/j.1365-2753.2008.01099.x.
Netherlands National Institute for Public Health and the environment. 2020. “colorectal cancer Screening Programme.” Netherlands National Institute for Public Health and the environment, biltoven. https://www.rivm.nl/en/colorectal-cancer-screening-programme.
Neumann, S., S. Webendörfer, S. lang, c. Germann, and c. Oberlinner. 2015. “Diabetes Screening and Prevention in a large chemical company.” Deutsche Medizinische Wochenschrift 140 (10): e94–e100. doi: 10.1055/s-0041-101873.
O’brien, m. A., S. rogers, G. Jamtvedt, A. D. Oxman, J. Odgaard-Jensen, D. T. Kristoffersen, l. Forsetlund, et al. 2007. “educational Outreach Visits: effects on Professional Practice and Health care Outcomes.” Cochrane Database of Systematic Reviews 4 (October 17, 2007).
Offman, J., J. myles, S. Ariyanayagam, Z. colorado, m. Sharp, m. cruice, b. V. North, et al. 2014. “A Telephone reminder Intervention to Improve breast Screening Information and Access.” Public Health 128 (11): 1017–22. doi: 10.1016/j.puhe.2014.09.007.
Padwal, r., m. rashead, J. Snider, l. morrin, A. lehman, and N. r. campbell. 2017. “Worksite-based cardiovascular risk Screening and management: A Feasibility Study.” Vascular Health and Risk Management 13: 209–13. doi: 10.2147/VHrm.S138800.
Park, S., c. Gillespie, J. baumgardner, Q. Yang, A. l. Valderrama, J. Fang, F. loustalot, and Y. Hong. 2018. “modeled State-level estimates of Hypertension Prevalence and undiagnosed

Screening to Promote Early Detection | 193
Hypertension among uS Adults during 2013–2015.” Journal of Clinical Hypertension 20 (10): 1395–410. doi: 10.1111/jch.13388.
Patel, S. S., and m. l. Kilgore. 2015. “cost effectiveness of colorectal cancer Screening Strategies.” Cancer Control 22 (2): 248–58.
Paulauskiene, J., m. Stelemekas, r. Ivanauskiene, and J. Petkeviciene. 2019. “The cost-effectiveness Analysis of cervical cancer Screening using a Systematic Invitation System in lithuania.” International Journal of Environmental Research and Public Health 16 (24): 5035. doi: 10.3390/ijerph16245035.
Pignone, m., S. Saha, T. Hoerger, and J. mandelblatt. 2002. “cost-effectiveness Analyses of colorectal cancer Screening: A Systematic review for the uS Preventive Services Task Force.” Annals of Internal Medicine 137 (2): 96–104. doi: 10.7326/0003-4819-137-2 -200207160-00007.
Posadzki, P., N. mastellos, r. ryan, l. H. Gunn, l. m. Felix, Y. Pappas, m.-P. Gagnon, et al. 2016. “Automated Telephone communication Systems for Preventive Healthcare and management of long-Term conditions.” Cochrane Database Systematic Review 12 (12): Art. cD009921. doi: 10.1002/14651858.cD009921.pub2.
Puggina, A., A. broumas, W. ricciardi, and S. boccia. 2016. “cost-effectiveness of Screening for lung cancer with low-Dose computed Tomography: A Systematic literature review.” European Journal of Public Health 26 (1): 168–75. doi: 10.1093/eurpub/ckv158.
Quaife, S. l., m. ruparel, J. l. Dickson, r. J. beeken, A. mcewen, D. r. baldwin, A. bhowmik, et al. 2020. “lung Screen uptake Trial (lSuT): randomized controlled clinical Trial Testing Targeted Invitation materials.” American Journal of Respiratory and Critical Care Medicine 201 (8): 965–75. doi: 10.1164/rccm.201905-0946Oc.
raichand, S., A. G. Dunn, m. S. Ong, F. T. bourgeois, e. coiera, and K. D. mandl. 2017. “conclusions in Systematic reviews of mammography for breast cancer Screening and Associations with review Design and Author characteristics.” Systematic Reviews 6 (1): 105. doi: 10.1186 /s13643-017-0495-6.
ran, T., c. Y. cheng, b. misselwitz, H. brenner, J. ubels, and m. Schlander. 2019. “cost-effectiveness of colorectal cancer Screening Strategies: A Systematic review.” Clinical Gastroenterology and Hepatology 17 (10): 1969–81.e15. doi: 10.1016/j.cgh.2019.01.014.
rashidian, A., e. barfar, H. Hosseini, S. Nosratnejad, and e. barooti. 2013. “cost effectiveness of breast cancer Screening using mammography: A Systematic review.” Iranian Journal of Public Health 42 (4): 347–57.
rasooldeen, m. 2016. “centers Set up in malls to Detect breast cancer.” Arab News, June 27, 2016.
raymakers, A. J. N., J. mayo, S. lam, J. m. FitzGerald, D. G. T. Whitehurst, and l. D. lynd. 2016. “cost-effectiveness Analyses of lung cancer Screening Strategies using low-Dose computed Tomography: A Systematic review.” Applied Health Economics and Health Policy 14 (4): 409–18. doi: 10.1007/s40258-016-0226-5.
reinehr, T., A. Schaefer, K. Winkel, e. Finne, A. m. Toschke, and P. Kolip. 2010. “An effective lifestyle Intervention in Overweight children: Findings from a randomized controlled Trial on ‘Obeldicks light.’ ” Clinical Nutrition 29 (3): 331–36.
ritvo, P. G., r. e. myers, l. F. Paszat, J. m. Tinmouth, J. mccoleman, b. mitchell, m. Serenity, and l. rabeneck. 2015. “Personal Navigation Increases colorectal cancer Screening uptake.” Cancer Epidemiology Biomarkers & Prevention 24 (3): 506–11. doi: 10.1158/1055 -9965.ePI-14-0744.
royal Women’s Hospital. 2020. “Diabetes mellitus: management of Gestational Diabetes. Guideline.” royal Women’s Hospital, melbourne. https://www.thewomens.org.au/images /uploads/downloadable-records/clinical-guidelines/diabetes-mellitus-management -of-gestational-diabetes_280720.pdf.
Saslow, D., c. boetes, W. burke, S. Harms, m. O. leach, c. D. lehman, e. morris, et al. 2009. “American cancer Society Guidelines for breast Screening with mrI as an Adjunct to mammography.” CA: A Cancer Journal for Clinicians 57 (2): 75–89. doi: 10.3322/canjclin .57.2.75.
Scheidt-Nave, c., Y. Du, H. Knopf, A. Schienkiewitz, T. Ziese, e. Nowossadeck, A. Gößwald, and m. A. busch. 2013. “Verbreitung von Fettstoffwechselstörungen bei erwachsenen in

194 | NONcOmmuNIcAble DISeASeS IN SAuDI ArAbIA
Deutschland: ergebnisse der Studie zur Gesundheit erwachsener in Deutschland (DeGS1) [Prevalence of Dyslipidemia among Adults in Germany: results of the German Health Interview and examination Survey for Adults (DeGS 1)].” Bundesgesundheitsblatt Gesundheitsforschung Gesundheitsschutz 56 (5-6): 661–67. doi: 10.1007/s00103-013-1670-0 . PmID: 23703484.
Schliemann, D., D. Paramasivam, m. Dahlui, c. cardwell, S. Somasundaram, N. S. b. I. Tamin, c. connelly, T. T. Su, and m. Donnelly. 2020. “change in Public Awareness of colorectal cancer Symptoms Following the be cancer Alert campaign in the multi-ethnic Population of malaysia.” BMC Cancer 20: 252. doi: 10.1186/s12885-020-06742-3.
Schmidt, b. m., S. Durao, I. Toews, c. m. bavuma, A. Hohlfeld, e. Nury, J. J. meerpohl, and T. Kredo. 2020. “Screening Strategies for Hypertension.” Cochrane Database of Systematic Reviews 5: Art. cD013212. doi: 10.1002/14651858.cD013212.pub2.
Scott, A., P. Sivey, D. Ait Ouakrim, l. Willenberg, l. Naccarella, J. Furler, and D. Young. 2011. “The effect of Financial Incentives on the Quality of Health care Provided by Primary care Physicians.” Cochrane Database of Systematic Reviews 9: Art. cD008451. doi: 10.1002 /14651858.cD008451.pub2.
Sequist, T. D., c. Franz, and J. Z. Ayanian. 2010. “cost-effectiveness of Patient mailings to Promote colorectal cancer Screening.” Medical Care 48 (6): 553–57. doi: 10.1097 /mlr .0b013e3181dbd8eb.
Shusted, c. S., J. A. barta, m. lake, r. brawer, b. ruane, T. e. Giamboy, b. Sundaram, et al. 2019. “The case for Patient Navigation in lung cancer Screening in Vulnerable Populations: A Systematic review.” Population Health Management 22 (4): 347–61. doi: 10.1089/pop .2018.0128.
Sicsic, J., N. Kurcien, and c. Franc. 2016. “What Are GPs’ Preferences for Financial and Non-Financial Incentives in cancer Screening? evidence for breast, cervical, and colorectal cancers.” Social Science & Medicine 167 (October): 116–27. https://pubmed.ncbi.nlm.nih .gov/27619755/.
Siu, A. l., and uS Preventive Services Task Force. 2015a. “Screening for Abnormal blood Glucose and Type 2 Diabetes mellitus: uS Preventive Services Task Force recommendation Statement.” Annals of Internal Medicine 163: 861–68. doi: https://doi.org/10.7326/m15 -2345.
Siu, A. l., and uS Preventive Services Task Force. 2015b. “Screening for High blood Pressure in Adults: uS Preventive Services Task Force recommendation Statement.” Annals of Internal Medicine 163 (10): 778–86. doi: 10.7326/m15-2223.
Somsouk, m., c. rachocki, A. mannalithara, D. Garcia, V. laleau, b. Grimes, r. b. Issaka, et al. 2020. “effectiveness and cost of Organized Outreach for colorectal cancer Screening: A randomized, controlled Trial.” Journal of the National Cancer Institute 112 (3): 305–13. doi: 10.1093/jnci/djz110.
Tarride, J. e., A. Smofsky, P. Nykoliation, S. Allain, l. lewis-Daly, D. Satok, J. Schwartz, et al. 2018. “effectiveness of a Type 2 Diabetes Screening Intervention in the canadian Workplace.” Canadian Journal of Diabetes 42 (5): 493–99.e1. doi: 10.1016/j.jcjd.2017.12.008.
Teixeira, c., c. martins, D. Trabulo, S. ribeiro, c. cardoso, J. mangualde, r. Freire, et al. 2018. “colorectal cancer Screening: What Is the Population’s Opinion?” GE Portuguese Journal of Gastroenterology 25 (2): 62–67. doi: 10.1159/000480705.
Trentham-Dietz, A., K. Kerlikowske, N. K. Stout, D. l. miglioretti, c. b. Schechter, m. A. ergun, J. J. van den broek, et al. 2016. “Tailoring breast cancer Screening Intervals by breast Density and risk for Women Aged 50 Years or Older: collaborative modeling of Screening Outcomes.” Annals of Internal Medicine 165 (10): 700–12. doi: 10.7326/m16-0476.
Tsiachristas, A., m. Gittins, H. Kitchener, and A. Gray. 2018. “cost-effectiveness of Strategies to Increase cervical Screening uptake at First Invitation (STrATeGIc).” Journal of Medical Screening 25 (2): 99–109. doi: 10.1177/0969141317704679.
uK National Institute for clinical excellence. 2019a. “Familial breast cancer: classification, care, and managing breast cancer and related risks in People with a Family History of breast cancer.” uK National Institute for clinical excellence, london. https://www.nice .org.uk/guidance/cg164/chapter/recommendations.

Screening to Promote Early Detection | 195
uK National Institute for Health care excellence. 2019b. “Hypertension in Adults: Diagnosis and management.” uK National Institute for clinical excellence, london. https://www .nice.org.uk/guidance/NG136.
uS Preventive Services Task Force. 2013. “Gestational Diabetes mellitus, Screening.” uS Preventive Services Task Force, rockville, mD, may 28, 2013. https://www .uspreventiveservicestaskforce.org/uspstf/document/treatment-evidence-summary /gestational -diabetes-mellitus-screening#bootstrap-panel--11.
uS Preventive Services Task Force. 2017. “Screening for Obesity in children and Adolescents: uS Preventive Services Task Force recommendation Statement.” JAMA 317 (23): 2417–26. doi: 10.1001/jama.2017.6803.
uy, c., J. lopez, c. Trinh-Shevrin, S. c. Kwon, S. e. Sherman, and P. S. liang. 2017. “Text messaging Interventions on cancer Screening rates: A Systematic review.” Journal of Medical Internet Research 19 (8): e296. doi: 10.2196/jmir.7893.
van Valkengoed, I. G., e. m. Vlaar, V. Nierkens, b. J. middelkoop, and K. Stronks. 2015. “The uptake of Screening for Type 2 Diabetes and Prediabetes by means of Glycated Hemoglobin versus the Oral Glucose Tolerance Test among 18- to 60-Year-Old People of South Asian Origin: A comparative Study.” PLoS One 10 (8): e0136734. doi: 10.1371/journal.pone.0136734.
Vassilakos, P., A. Poncet, r. catarino, m. Viviano, P. Petignat, and c. combescure. 2019. “cost-effectiveness evaluation of HPV Self-Testing Offered to Non-Attendees in cervical cancer Screening in Switzerland.” Gynecologic Oncology 153 (1): 92–99. doi: 10.1016/j .ygyno.2019.01.021.
Vilaprinyo, e., c. Forné, m. carles, m. Sala, r. Pla, X. castells, l. Domingo, m. rue, and the Interval cancer (INcA) Study Group. 2014. “cost-effectiveness and Harm-benefit Analyses of risk-based Screening Strategies for breast cancer.” PLoS One 9 (2): e86858. doi: 10.1371 /journal.pone.0086858.
Wagner, T. H. 1998. “The effectiveness of mailed Patient reminders on mammography Screening: A meta-Analysis.” American Journal of Preventive Medicine 14 (1): 64–70.
Wake, m., l. A. baur, b. Gerner, K. Gibbons, l. Gold, J. Gunn, P. levickis, et al. 2009. “Outcomes and costs of Primary care Surveillance and Intervention for Overweight or Obese children: The leAP 2 randomised controlled Trial.” BMJ 339: b3308.
Wang, Y., S. W. buchholz, m. murphy, and A. m. moss. 2019. “A Diabetes Screening and education Program for chinese American Food Service employees Delivered in chinese.” Workplace Health & Safety 67 (5): 209–17. doi: 10.1177/2165079918823218.
Warner, e., H. messersmith, P. causer, A. eisen, r. Shumak, and D. Plewes. 2008. “Systematic review: using magnetic resonance Imaging to Screen Women at High risk for breast cancer.” Annals of Internal Medicine 148: 671–79. doi: 10.7326/0003-4819-148-9 -200805060-00007.
Warner, e., H. messersmith, P. causer, A. eisen, r. Shumak, and D. Plewes. 2018. “magnetic resonance Imaging Screening of Women at High risk for breast cancer.” cancer care Ontario. www.cancercareontario.ca/en/guidelines-advice/types-of-cancer/2051.
Waugh, N., G. Scotland, P. mcNamee, m. Gillett, A. brennan, e. Goyder, r. Williams, and A. John. 2007. “Screening for Type 2 Diabetes: literature review and economic modelling.” Health Technology Assessment 11 (17).
Waugh, N. r., D. Shyangdan, S. Taylor-Phillips, G. Suri, and b. Hall. 2013. “Screening for Type 2 Diabetes: A Short report for the National Screening committee.” Health Technology Assessment 17 (35): 1–90. doi: 10.3310/hta17350.
Whyte, S., and S. Harnan. 2014. “effectiveness and cost-effectiveness of an Awareness campaign for colorectal cancer: A mathematical modeling Study.” Cancer Causes & Control 25 (6): 647–58.
Willis, A., P. rivers, l. J. Gray, m. Davies, and K. Khunti. 2014. “The effectiveness of Screening for Diabetes and cardiovascular Disease risk Factors in a community Pharmacy Setting.” PLoS One 9 (4): e91157. doi: 10.1371/journal.pone.0091157.
Winer, r. l., J. lin, J. A. Tiro, D. l. miglioretti, T. beatty, J. Gao, K. Kimbel, c. Thayer, and D. S. m. buist. 2019. “effect of mailed Human Papillomavirus Test Kits vs. usual care reminders on cervical cancer Screening uptake, Precancer Detection, and Treatment:

196 | NONcOmmuNIcAble DISeASeS IN SAuDI ArAbIA
A randomized clinical Trial.” JAMA Network Open 2 (11): e1914729. doi: 10.1001 /jamanetworkopen.2019.14729.
Yeh, P. T., c. e. Kennedy, H. de Vuyst, and m. Narasimhan. 2019. “Self-Sampling for Human Papillomavirus (HPV) Testing: A Systematic review and meta-Analysis.” BMJ Global Health 4 (3): e001351. doi: 10.1136/bmjgh-2018-001351.
Yosefy, c., D. Dicker, J. r. Viskoper, T. H. Tulchinsky, G. m. Ginsberg, e. leibovitz, and D. Gavish. 2003. “The Ashkelon Hypertension Detection and control Program (AHDc Program): A community Approach to reducing cardiovascular mortality.” Preventive Medicine 37 (6, Pt. 1): 571–76.
Zahra Association. 2020. “About Zahra.” Zahra Association, riyadh. https://www.zahra.org.sa /topic/about.
Zauber, A., S. Winawer, m. O’brien, I. lansdorp-Vogelaar, m. van ballegooijen, b. Hankey, W. Shi, et al. 2012. “colonoscopic Polypectomy and long-Term Prevention of colorectal-cancer Deaths.” New England Journal of Medicine 366: 687–96.
Zhang, D., G. Wang, and H. Joo. 2017. “A Systematic review of economic evidence on community Hypertension Interventions.” American Journal of Preventive Medicine 53 (6, Suppl. 2): S121–30. doi: 10.1016/j.amepre.2017.05.008.
Zubaidi, A. m., N. m. AlSubaie, A. A. AlHumaid, S. A. Shaik, K. A. AlKhayal, and O. A. AlObeed. 2015. “Public Awareness of colorectal cancer in Saudi Arabia: A Survey of 1070 Participants in riyadh.” Saudi Journal of Gastroenterology 21 (2): 78–83. doi: 10.4103/1319-3767.153819.

197
KEY MESSAGES
• A national master plan for the multisectoral prevention of noncommunicable diseases (NCDs) is needed to provide strategic direction for NCD prevention in Saudi Arabia.
• The master plan should draw on many of the existing strategies and plans and focus on improving the implementation and monitoring of high-impact inter-ventions to address NCDs.
• The plans need to be owned and implemented by various sectors and moni-tored effectively through a single monitoring and evaluation framework.
• The master plan should prioritize prevention over treatment and provide guidance for the implementation of interventions on tobacco use, unhealthy diet, lack of physical activity, and associated biological risk factors.
• The majority of the interventions should occur outside the health sector, while the health sector should lead screening and early detection programs.
BACKGROUND
Vision 2030 outlines several strategic objectives to improve life expectancy and realize economic potential in Saudi Arabia, including through the prevention of health risks. Vision 2030 sets the goal of increasing the country’s average life expectancy from 74 years to 80 years by 2030 and outlines four strategic objec-tives by which to achieve this improvement: enhancing traffic safety, improving access to health services, improving the quality and efficiency of health services, and promoting the prevention of health risks (Vision Realization Office 2017). Unhealthy lifestyles in particular—including tobacco use, lack of physical activ-ity, and unhealthy diet—are all prevalent in Saudi Arabia, as outlined in chapter 2. These behaviors pose a major risk to the goals of improving life expectancy and
Toward a National Master Plan for Improved Implementation and Monitoring of NCD PreventionADA ALQUNAIBET, TIT ALBREHT, MAXIMILLIAN DE COURTEN, CHRISTOPHER H. HERBST, AND SEVERIN RAKIC
9

198 | NONCOmmUNiCAble DiSeASeS iN SAUDi ARAbiA
maximizing the economic potential of the country, especially in the context of the COViD-19 pandemic.
Saudi Arabia is committed to addressing the growing challenge of NCDs and the burden they place on health, human capital, and the economy. Chapter 2 illustrates the high prevalence of NCDs and risk factors in the country, and chap-ters 3–5 discuss their detrimental impact on health, the economy, and human capital if they are not adequately addressed. moreover, NCDs are imposing an increasing burden on the health system by overstretching existing capacities and sapping the bulk of health care resources (financial, human, and technological). The COViD-19 pandemic is aggravating NCDs and contributing to excess mor-tality from them. it is clearly necessary to undertake actions to manage this bur-den better and reduce it prospectively, primarily in the current workforce. To do so, the Saudi government is committed to improving strategic planning on NCDs with an emphasis on improving the implementation and monitoring of a select set of targeted, high-impact interventions.
Several international, regional, and national strategies exist to guide the prevention and control of NCDs in Saudi Arabia. As discussed in chapter 6, these strategies include the Plan of Action of the World Health Organization (WHO) Regional Office for the eastern mediterranean (emRO), the NCD strategy, several vertical strategies (including one for mental health and one for cancer), and the Gulf Plan and the master plan on environmental health cur-rently being developed. All of these strategies outline a direction and deter-mine part of the monitoring framework for preventing and controlling NCDs in Saudi Arabia. The ministry of Health (mOH) regularly reports these indica-tors to agencies, such as the WHO, that monitor progress on NCDs at the regional and global levels. While such commitment is commendable, the mOH and the Public Health Authority (PHA) have also expressed the need to do more to guide implementation and improve the monitoring and evaluation of existing efforts.
indeed, key priority efforts need to be directed toward strengthening the implementation and monitoring of high-impact interventions on NCDs. The PHA and key stakeholders in Saudi Arabia have argued for the need to develop one or more realistically achievable, sector-specific implementation plans that are sufficiently owned and implemented by the various sectors and monitored effectively through a single monitoring and evaluation framework. Such an implementation plan (or plans) would be under an umbrella master plan for the multisectoral prevention of NCDs and would focus on a set of interventions that can be implemented realistically, be monitored effectively, and achieve results. Devising a comprehensive approach to NCD prevention and control is critical. basing such a plan on the latest national and global evidence on NCDs, as presented in this book, will provide in-depth strategic direction to inform the implementation, monitoring, and evaluation of a set of high-impact interven-tions for maximum results.
This chapter summarizes the outcomes of consultations held between October 2019 and march 2020 in which key stakeholders discussed the scope and focus of priority actions on NCDs in Saudi Arabia to be highlighted in a new national master plan on NCD prevention. Consultations were led by the PHA and held with representatives from both inside and outside the health sector prior to the COViD-19 pandemic. Overall consensus was reached that a master plan on NCDs should be multisectoral in nature but also focused and imple-mentable in both scope and ambition. it was agreed that the immediate priority

Toward a National Master Plan for Improved Implementation and Monitoring of NCD Prevention | 199
for action should be high-impact interventions that prevent extensive increases in the incidence of NCDs and contribute to their decline by taking a comprehen-sive approach to prevention. The COViD-19 pandemic has not changed the pri-orities for action.
The remainder of this chapter is organized as follows. After summarizing Saudi Arabia’s global and regional commitments, it provides an overview of the nature and scope of a proposed master plan on NCD prevention, outlines the risk factors and main NCDs to be prioritized, discusses the rationale for prioritizing prevention over treatment, and emphasizes the need to adopt a multisectoral approach while implementing interventions within and outside the health sec-tor. A discussion of the importance of adopting a life-course approach and ensur-ing equity follows as well as a description of additional features of the master plan. A final section concludes.
EXISTING GLOBAL AND REGIONAL COMMITMENTS
Saudi Arabia is bound by the global commitments made at the United Nations to address NCDs. At a high-level meeting of the United Nations General Assembly (2014), member states agreed to multiple time-bound commitments to be achieved by 2015/2016, including commitments to (1) set national targets for 2025 and process indicators based on the national situation, (2) develop or strengthen national multisectoral policies and plans, (3) reduce risk factors for NCDs and underlying social determinants through the implementation of inter-ventions and policy options to create health-promoting environments, and (4) strengthen and orient health systems to address the prevention and control of NCDs and their underlying social determinants throughout the life cycle. The commitments were reaffirmed at another high-level meeting of the United Nations General Assembly (2018), emphasizing the need to implement, accord-ing to country-led prioritization, a set of cost-effective, affordable, and evidence-based interventions and good practices, including those recommended by the WHO.
Saudi Arabia is actively committed to regional strategies, such as those endorsed for WHO emRO. The commitments were previously based on the WHO emRO Plan of Action for the Prevention and Control of Noncommunicable Diseases in the eastern mediterranean Region, which had six objectives for improving the performance of NCD programs and reducing the burden of NCDs and mortality (WHO emRO 2011). more recent commitments have been based on the regional resolution to scale up implementation of the Political Declaration of the United Nations General Assembly (WHO emRO 2014) and the Framework for Action to implement the Political Declaration (WHO 2019). The four groups of strategic interventions agreed for the region (box 9.1) are related to monitoring and evaluation indicators, which the Saudi mOH reports on regularly.
A MASTER PLAN TO GUIDE IMPLEMENTATION
Stakeholders agreed on the need for a master plan on NCDs designed to advance the implementation and monitoring of key NCD targets. Such a master plan would build on the targets of existing strategies and policies and provide

200 | NONCOmmUNiCAble DiSeASeS iN SAUDi ARAbiA
Selection of WHO EMRO strategic interventions concerning actions to implement the United Nations Political Declaration on Noncommunicable Diseases
Improve governance
• integrate the prevention and control of NCDs into national poli-cies and development plans
• establish a multisectoral strategy or plan and a set of national targets and indicators for 2025 based on the national situation and WHO guidance
• Develop a national investment case on the prevention and control of NCDs
• increase budgetary allocations for NCD prevention and control including through innovative financing mechanisms such as taxation of tobacco, alcohol, and other unhealthy products.
Prevent and reduce risk factors
• Accelerate implementation of the WHO Framework Convention on Tobacco Control and ratify the Protocol to eliminate illicit Trade in Tobacco Products
• ensure healthy nutrition in early life and childhood, including regulating the marketing of foods and nonalcoholic beverages to children
• Reduce the average intake of salt in line with WHO recommendations
• Virtually eliminate the intake of trans fats and reduce the intake of saturated fatty acids
• Promote physical activity through a life-course approach.
Strengthen surveillance, monitoring, and evaluation
• implement or strengthen the WHO global monitoring frame-work, which monitors mortality and morbidity, risk factors and determinants, and health system capacity and response
• integrate the three components of the surveillance framework into the national health information system
• Strengthen human resources and institutional capacity for surveillance, monitoring, and evaluation.
Improve health care provision
• implement the best buys in health care for NCDs• improve access to early detection and management of major
NCDs and related risk factors by including them in the essential package of primary health care in stable and emergency settings.
Note: EMRO = Regional Office for the Eastern Mediterranean. NCDs = noncommunicable diseases. WHO = World Health Organization.
BOX 9.1

Toward a National Master Plan for Improved Implementation and Monitoring of NCD Prevention | 201
strategic, focused, and realistic guidance on implementation, both within but mostly outside the health sector. The new master plan on NCDs would not replace existing, more comprehensive strategies, plans, and policies. instead, it would provide in-depth guidance on how to translate a selected set of high- impact, realistically attainable interventions into actions that are implemented and monitored and that show results on the ground.
The master plan itself will be designed as an umbrella document spanning one or more sector-specific implementation plans (figure 9.1), which will them-selves focus on targeted, achievable results. Whereas the master plan will sum-marize the stakeholders that implement the plan in various sectors as well as provide a framework for monitoring and evaluation, each sector could have its own in-depth implementation plan. Alternatively, one implementation plan could be developed for all sectors. either way, the implementation plan (or plans) needs to be fully owned and implemented by its respective sector, be linked clearly to existing sector-specific monitoring and evaluation frameworks, and provide clarity about why the particular sector should address NCDs. The imple-mentation plan (or plans) needs to provide clear justifications for how a focus on a selected set of interventions and indicators can lead toward improvements in sector-specific outcomes.
Stakeholders agreed that, in line with existing capacity constraints and to maximize success, the master plan will be focused, targeted, and implementable. many countries are struggling to move from commitments to action because “progress in the prevention and control of NCDs was insufficient and highly uneven, due in part to their complexity and challenging nature” (Alwan 2017). This insufficiency highlights the complexity and advanced requirements of implementing a comprehensive NCD strategy, adding to the reasons that prog-ress in prevention and control of NCDs often does not meet expectations. On average, countries implemented just under half of the WHO-recommended NCD policies in 2017 (Allen et al. 2019), highlighting the importance of initially choosing a limited number of high-impact NCD interventions, in line with exist-ing capacity to implement and monitor them. The scope of NCD interventions can be expanded later as successes materialize.
FIGURE 9.1
The master plan as an umbrella document for one or more implementation plans
Source: Original figure for this publication.
Implementation plan 1
Health sector
Imp
lem
enta
tio
n p
lan
Mas
ter
pla
n
Implementation plan 3
Nonhealth sectors
Implementation plan 2

202 | NONCOmmUNiCAble DiSeASeS iN SAUDi ARAbiA
WHICH RISK FACTORS SHOULD BE PRIORITIZED?
Stakeholders agreed that the master plan will focus on providing guidance for the implementation of interventions on tobacco use, unhealthy diet, and lack of physical activity as key risk factors for NCDs. Saudi Arabia is already implement-ing strict policies on alcohol control. These policies should be maintained and mentioned in the master plan. The behavioral risk factors of focus are closely associated with the biological risk factors (WHO 2014) (table 9.1). A key justifi-cation in selecting these risk factors is that they are associated with a series of best-buy interventions—a set of feasible and cost-effective interventions target-ing the major risk factors (see chapters 7 and 8). Such interventions are also evi-dence based, high impact, and affordable, and they can be implemented in a variety of health systems and settings.
biological risk factors are sometimes treated as NCDs but, in the master plan, they will be treated as risk factors. Obesity, for example, is considered an inter-mediary and biological risk factor standing between the behavioral risk factors of an unhealthy diet and insufficient physical activity and NCDs such as diabetes and cardiovascular disease, among others. This treatment is very similar to treat-ing hypertension or high blood pressure and high blood glucose or cholesterol level as intermediary and biological risk factors. As long as the biological risk factors are not treated as separate diseases, prevention in its broader meaning will encompass activities taken to reduce their contribution to the development of NCDs.
Responses to COViD-19, including physical distancing and self-isolation, may increase the exposure to some risk factors. NCD Alliance (2020) notes that increased tobacco use has been a coping mechanism and a barrier to physical activity during the COViD-19 pandemic. Due to the disruption of NCD screening services, aftershocks are expected in some health systems, where people present later with symptoms of more advanced disease. The COViD-19 lockdown in Saudi Arabia has had a negative impact on blood glucose levels and body mass index (bmi), which are correlated with lack of physical activity, increased con-sumption of carbohydrates and fast food, and mood deterioration (Al Agha et al. 2021).
WHICH NCDs SHOULD BE PRIORITIZED?
Stakeholders agreed that the emphasis of the proposed master plan will be on NCDs linked to the three major behavioral risk factors: tobacco use, an unhealthy diet, and insufficient physical activity. Reducing risks by controlling tobacco use,
TABLE 9.1 Behavioral and biological risk factors in focus
BEHAVIORAL RISK FACTORS BIOLOGICAL RISK FACTORS
Tobacco use High blood pressure
Unhealthy diet Hyperglycemia and diabetes
Physical inactivity High blood cholesterol
Overweight and obesity
Source: Original compilation for this publication.

Toward a National Master Plan for Improved Implementation and Monitoring of NCD Prevention | 203
improving diet, and increasing physical activity helps to reduce the biological risk factors (table 9.1) and the incidence of four main NCDs: cardiovascular dis-eases, diabetes, chronic respiratory diseases, and some cancers. These NCDs are not only among the leading causes of death in Saudi Arabia (iHme 2020), but also the main focus of the WHO Global Action Plan for the Prevention and Control of Noncommunicable Diseases 2013–2020 (WHO 2013). COViD-19 has shown that tackling NCDs also is fundamental to health security (NCD Alliance 2020).
Only those cancers that are linked to the three behavioral risk factors should be prioritized. epidemiological evidence suggests that consuming vegetables, fruits, and a fiber-rich diet can prevent certain types of cancer (colon, rectum, esophagus), while fat-rich diets (especially diets rich in red and processed meats) increase the risk of other specific types of cancer (breast, colon, rectum) (iHme 2020). The master plan therefore will provide guidance on how to reduce several important cancers in the long term. When setting the overarching strategic goal of the multisectoral prevention of NCDs in the country, the time lag for cancers should be taken into account. For cancers with strong risk modifiers, trends of risk factors are followed by trends of cancer incidence with a lag of 20–30 years (Gelband et al. 2015). Smoking-related interventions, in the same way as diet- and physical activity–related ones, take more than a decade to affect the inci-dence and prevalence of lung cancer (Tindle et al. 2018).
many other conditions of public health importance are closely associated with the four major NCDs; however, not all can be addressed at once. The WHO Global Action Plan (WHO 2013) lists these other conditions as mental disorders, disabilities (including blindness and deafness), violence and injuries, and other NCDs (renal, endocrine, neurological, hematological, gastroenterological, hepatic, musculoskeletal, skin, and oral diseases as well as genetic disorders) without recommending that this extended list of conditions should necessarily be the target of a national NCD strategy. it also recognizes that NCDs and their risk factors have strategic links to health system–related initiatives and universal health coverage; environmental, occupational, and social determinants of health; communicable diseases; maternal, child, and adolescent health; reproductive health; and aging. Despite these close links, the WHO’s Global Action Plan cau-tions against developing NCD implementation plans addressing all of these issues in equal detail, as doing so would make the plans unwieldy and unlikely to be implemented successfully (WHO 2013). Saudi Arabia’s master plan, with its focus on a narrow, implementable scope of prevention interventions, will not initially cover these additional NCDs, since its sole aim will be to achieve high-impact, measurable outcomes.
PRIORITIZING PREVENTION OVER TREATMENT
The master plan will focus on prevention over treatment. The Political Declaration of the United Nations General Assembly (2012) recognizes preven-tion as the cornerstone of the global response to NCDs. Reducing the exposure of individuals and populations to the behavioral risk factors for NCDs while strengthening their capacity to make healthier choices and adopt lifestyles that foster good health are critically important in the prevention of NCDs. The liter-ature identifies which NCD prevention interventions are the most effective and cost-effective (see chapter 7). in addition, focusing on prevention rather than
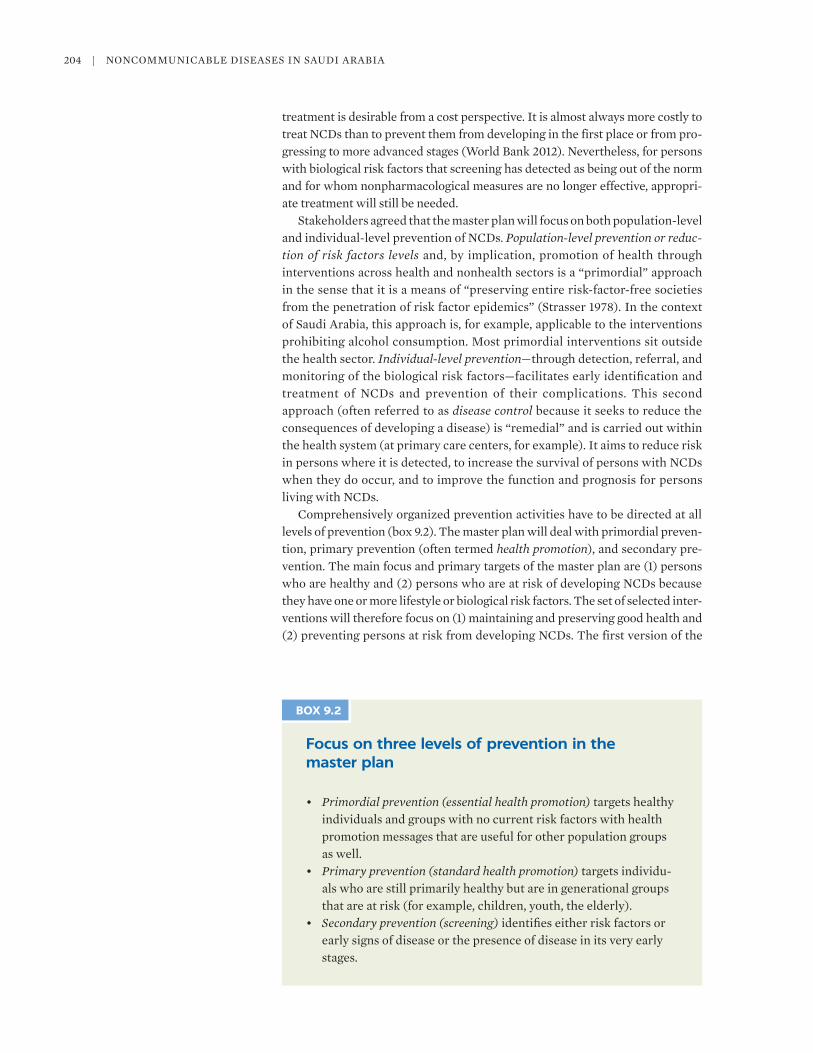
204 | NONCOmmUNiCAble DiSeASeS iN SAUDi ARAbiA
treatment is desirable from a cost perspective. it is almost always more costly to treat NCDs than to prevent them from developing in the first place or from pro-gressing to more advanced stages (World bank 2012). Nevertheless, for persons with biological risk factors that screening has detected as being out of the norm and for whom nonpharmacological measures are no longer effective, appropri-ate treatment will still be needed.
Stakeholders agreed that the master plan will focus on both population-level and individual-level prevention of NCDs. Population-level prevention or reduc-tion of risk factors levels and, by implication, promotion of health through interventions across health and nonhealth sectors is a “primordial” approach in the sense that it is a means of “preserving entire risk-factor-free societies from the penetration of risk factor epidemics” (Strasser 1978). in the context of Saudi Arabia, this approach is, for example, applicable to the interventions prohibiting alcohol consumption. most primordial interventions sit outside the health sector. Individual-level prevention—through detection, referral, and monitoring of the biological risk factors—facilitates early identification and treatment of NCDs and prevention of their complications. This second approach (often referred to as disease control because it seeks to reduce the consequences of developing a disease) is “remedial” and is carried out within the health system (at primary care centers, for example). it aims to reduce risk in persons where it is detected, to increase the survival of persons with NCDs when they do occur, and to improve the function and prognosis for persons living with NCDs.
Comprehensively organized prevention activities have to be directed at all levels of prevention (box 9.2). The master plan will deal with primordial preven-tion, primary prevention (often termed health promotion), and secondary pre-vention. The main focus and primary targets of the master plan are (1) persons who are healthy and (2) persons who are at risk of developing NCDs because they have one or more lifestyle or biological risk factors. The set of selected inter-ventions will therefore focus on (1) maintaining and preserving good health and (2) preventing persons at risk from developing NCDs. The first version of the
Focus on three levels of prevention in the master plan
• Primordial prevention (essential health promotion) targets healthy individuals and groups with no current risk factors with health promotion messages that are useful for other population groups as well.
• Primary prevention (standard health promotion) targets individu-als who are still primarily healthy but are in generational groups that are at risk (for example, children, youth, the elderly).
• Secondary prevention (screening) identifies either risk factors or early signs of disease or the presence of disease in its very early stages.
BOX 9.2

Toward a National Master Plan for Improved Implementation and Monitoring of NCD Prevention | 205
master plan will not address tertiary prevention, which is targeted toward chronic patients who have experienced any type of acute event or whose chronic disease has worsened.
The often-held assumption that the treatment of cardiovascular diseases is more effective than their prevention no longer holds. This assumption was underpinned by the argument that recent decreases in mortality from cardiovascular disease were largely due to progress made in the treatment of these diseases. Recent modeling using the imPACT coronary heart disease mortality model shows that about 50 percent of the reduction in coronary heart disease can be attributed to changes in risk factors, such as tobacco consump-tion, cholesterol levels, and blood pressure, and less than 40 percent can be attributed to treatments—many of which (such as those used in secondary prevention) are relatively low cost (björck et al. 2009). Therefore, much is to be gained in countries where salt is consumed at high levels, where the effective detection and treatment of high blood pressure are not the norm in primary care, and where acute responses to myocardial infarction and stroke are deficient.
ADOPTING A MULTISECTORAL APPROACH
Prevention means that most behavioral risk factors can be addressed primarily outside of the health sector. most interventions to prevent behavioral risk factors occur outside the health sector, possibly, but not necessarily, in collaboration with the health sector. These interventions include actions taken within and between sectors, at the local, regional, and national levels, to influence the risk factors for NCDs. Figure 9.2 illustrates the scope of the master plan with regard to the different intervention approaches on NCDs as well as to the content of
FIGURE 9.2
Approaches and strategies covered in the master plan
Source: Original figure for this publication.Note: NCDs = noncommunicable diseases. The blue shaded area illustrates the scope of the proposed master plan. Aspects beyond the blue shaded area are not covered in the proposed master plan.
Health sector
Nonhealth sector
Policy andenvironmental
change
Behavioralchange
Screening forrisk factorsand control
NCDcase
management
Rehabilitation andcomplicationmanagement
End-of-lifecare
Integrated approaches
Prevention ofrisk factors
Reductionof riskfactors
Confirmationand
diagnosisand referral
policies
Integrated NCD prevention and control strategies
Earlydetection
andmanagement
guidelines
Clinicalguidelines for
preventionof recurrentevents and
complications
Palliativecare
policies

206 | NONCOmmUNiCAble DiSeASeS iN SAUDi ARAbiA
existing, integrated, and comprehensive NCD prevention and control strategies. As figure 9.2 shows, most of the scope of the master plan lies outside of the health sector.
Actions outside the health sector
Three general categories of possible actions can be taken outside of the health sector. They include expanding delivery platforms, NCD-specific actions, and NCD-sensitive actions (UNDP 2013), which are summarized in box 9.3. All three categories of actions should be considered in developing Saudi Arabia’s master plan. Although different sectors need to participate in developing this plan (see chapter 10), stakeholders from other sectors, including from education, munici-pal and rural affairs, finance, sports, agriculture, media, urban planning, and trade, need to be involved as well.
Three categories of NCD actions that can be taken outside of the health sector
1. Expanding delivery platforms involves using settings outside the health system (schools, workplaces, public sector institutions) to deliver conventional biomedical and behavioral interventions to individuals and groups. Actors outside the health sector often have unique positions within communities, which can help to extend the reach of services and information to some popula-tions.
2. NCD-specific actions, such as enacting laws and implementing policies and programs, involve changing the conditions of daily life by promoting physical activity and limiting the production, advertising, and consumption of tobacco, alcohol, and unhealthy foods (for example, taxes on tobacco, restrictions on “junk food” advertising to children, provision of smoke-free areas, limits on trans fats in food).
3. NCD-sensitive actions are actions that touch on the core business of actors outside the health sector, such as regulating employ-ment and labor conditions, increasing access to education, challenging harmful gender norms, promoting a rights-enhancing legal environment, setting urban development policies, or devel-oping social protection programs. These actions are intended to make actors outside the health sector more sensitive to NCDs, to maximize the positive impacts on NCD prevention and control, and to minimize the potential negative NCD-related conse-quences.
Note: NCDs = noncommunicable diseases.
BOX 9.3

Toward a National Master Plan for Improved Implementation and Monitoring of NCD Prevention | 207
Actions within the health sector
The health system needs to address biological risk factors, which can be diag-nosed and monitored to prevent more serious complications. The failings that limit a health system’s performance in tackling NCDs result primarily from the failure to apply what is already known rather than a lack of knowledge or lack of resources. A comprehensive, aligned health system response to NCDs is some-times seen as having five cornerstones, as outlined in box 9.4.
ADOPTING A LIFE-COURSE APPROACH
The master plan will focus on a life-course approach that focuses on genera-tional groups to stratify preventive measures and tailors them to the needs of the targeted group (Hayman et al. 2011). The master plan will target interventions focusing on four main generational groups: (1) children and adolescents; (2) young adults, including expecting mothers and fathers; (3) middle-age persons who bear risks but show no signs of disease; and (4) the elderly, even those who are not undergoing medical treatment but are frail or have known NCD risk factors and already established disease.
Actions that target children, adolescents, and youth, including their parents, will be prioritized because they are investments in the future. These investments will be positive if current youth have a healthier lifestyle than their parents or the previous generation or, in turn, will be negative if their lifestyle is signifi-cantly worse. Poorly controlled risk factors in youth will have a greater impact
Five cornerstones of prevention interventions within the health sector
1. Information solutions include monitoring of population risk fac-tors, screening in primary care, referral and coordination across providers for seamless care, and self-management.
2. Health promotion and outreach include integrated primary health care that proactively manages community health and well-being.
3. A health financing system is designed to prioritize prevention and primary care and to minimize costly tertiary care (for example, through accountable care organizations).
4. A fit-for-purpose health workforce, in particular primary health care providers, delivers people-centered interventions and ser-vices based on evidence.
5. Strengthened governance ensures coherent policy frameworks and sustainable intersectoral action on noncommunicable diseases, connecting national, regional, and local levels.
BOX 9.4
208 | NONCOmmUNiCAble DiSeASeS iN SAUDi ARAbiA
earlier in life than later, starting in their late 30s and into their mid-40s (see chapter 2). moreover, parenthood is often a milestone period in which priorities shift to giving additional care and energy to children. This period of reflection is a good moment in which to encourage parents to make lifestyle changes (for example, give up smoking, improve their diet, and lose weight) or to increase their level of preparedness for future health (for example, increasing their phys-ical activity).
ENSURING EQUITY BY TARGETING SETTINGS
The master plan will aim to ensure an equitable approach to addressing the activities that promote health by targeting settings rather than people. This tar-geting is of particular importance since the distribution of risk factors is not equal by social strata. in order to avoid stigmatizing one group over another, focusing on a setting rather than on a group can open up access to others who temporarily or permanently face the same issue. Settings can be categorized as (1) family settings, (2) educational settings, (3) workplace settings, (4) commu-nity settings (interest groups, sports, religious, retirees, and so on), (5) healthy cities, and (6) online settings.
Targeting settings through innovative approaches can support equity goals. Applying tiered approaches to the different settings is a mixed approach between an individual intervention and an intervention that is incentivized and promoted by the community setting—where people live, work, and spend their spare time. box 9.5 summarizes the benefits that can be brought about by approaches target-ing each setting (Newman et al. 2015). Such approaches can take the form of partnerships with health and welfare organizations that can improve the oppor-tunities for people who are less advantaged, organizational strategies and part-nerships that can provide safe transport and no-smoking policies, and governance structures and committees that can be broadened to include representatives from a wide range of socioeconomic and demographic groups.
At the same time, when applying such targeting, some possible limitations should be considered. making certain resources available only to targeted groups can be stigmatizing; locality-based approaches only address equity if the area receives sufficient resources to undertake more action than areas with higher levels of advantage; locality-based initiatives may overlook more disadvantaged minorities who live in more advantaged areas; initiatives may miss the more dis-advantaged groups or even increase inequity if more advantaged groups respond; persons who are less able to respond may miss out or feel unable to participate if explicit attention is not given to inclusivity; and governance and stakeholders may reflect more powerful groups in the area (Newman et al. 2015).
OTHER FEATURES OF THE PROPOSED MASTER PLAN
Governance
The Political Declaration of United Nations General Assembly (2012) recognizes that effective NCD prevention requires leadership and multisectoral approaches for health at the government level, including health in all policies and whole-of-government approaches across sectors (health, education, energy,

Toward a National Master Plan for Improved Implementation and Monitoring of NCD Prevention | 209
agriculture, sports, transport, communication, urban planning, environment, labor, employment, industry and trade, finance, and social and economic development).
Reaching subnational levels
multilevel interventions need to reach all administrative levels and places where people live and work (national, regional, and local levels, including local commu-nities and municipalities). Working at all levels requires adapting interventions to different settings, as indicated by the Ottawa Charter on Health Promotion (WHO 1986).
Monitoring and evaluation at all phases and levels
The master plan will need to be monitored and evaluated at all stages and phases of its implementation. The monitoring and evaluation framework will be an inte-gral part of the master plan and could be based on three dimensions (structure,
Benefits of targeting settings
• Focusing on the setting can provide a good basis for promoting health equity in all policies.
• Focusing intensively on people living in less-advantaged circum-stances within a setting can contribute to leveling up the health gradient.
• Providing additional resources to lower socioeconomic areas can contribute to leveling up the health gradient.
• Focusing on an issue within a setting, rather than on a group, can both avoid stigmatizing one group and open up access to others who temporarily or permanently face the same issue.
• making changes such as increasing green space, improving public transport, and increasing the healthy food supply can make healthier choices more available and affordable. Such changes may be beneficial for people’s health.
• Focusing on settings also can address some socioeconomic factors and increase the likelihood that all groups will adopt healthy behaviors.
• Combining healthy settings approaches with other approaches (for example, environmental initiatives) can provide wins for all sectors that are working together.
Note: Based on Newman et al. 2015.
BOX 9.5

210 | NONCOmmUNiCAble DiSeASeS iN SAUDi ARAbiA
processes, and outcomes) and indicators for different levels. The evaluation pro-cess will be used to inform policy makers of the need for modifications and adap-tations in this longitudinal process, should they become warranted.
CONCLUSIONS
Saudi Arabia needs to have a national master plan for the multisectoral preven-tion of NCDs that primarily seeks to strengthen sector-led implementation and monitoring of existing strategies and policies. Having a strategic direction will make it easier to control the current burden of NCDs following the COViD-19 pandemic and to reduce the prospective one. The master plan will prioritize pre-vention (promotion) activities on three health determinants: tobacco consump-tion, an unhealthy diet, and insufficient physical activity. Given the link between behavioral factors and NCD outcomes, most of the interventions will lie outside of the health sector. Apart from that, a secondary preventive program for screen-ing and early detection of biological risk factors will be launched or scaled up. The master plan will provide actions and interventions through different levels and sectors by taking into account the life-course approach. An implementation plan (or plans) will encompass the need to ensure the equity of prevention activ-ities in all settings and environments.
REFERENCES
Al Agha, A. e., R. S. Alharbi, O. A. Almohammadi, S. Y. Yousef, A. e. Sulimani, and R. A. Alaama. 2021. “impact of COViD-19 lockdown on Glycemic Control in Children and Adolescents.” Saudi Medical Journal 42 (1): 44–48.
Allen, l. W., b. D. Nicholson, b. Y. T. Yeung, and F. Goiana-da-Silva. 2019. “implementation of Non-Communicable Disease Policies: A Geopolitical Analysis of 151 Countries.” The Lancet Global Health 8 (1): Pe50-8.
Alwan, A. 2017. The NCD Challenge: Progress in Responding to the Global NCD Challenge and the Way Forward. Discussion Paper. Geneva: WHO. https://www.who.int/nmh/events/2017 /discussion-paper-for-the-ncd-who-meeting-final.pdf.
björck, l., A. Rosengren, K. bennet, G. lappas, and S. Capewell. 2009. “modelling the Decreasing Coronary Heart Disease mortality in Sweden between 1986 and 2002.” European Heart Journal 30 (9): 1046–56.
Gelband, H., P. Jha, R. Sankaranarayanan, and S. Horton. 2015. Disease Control Priorities, 3rd ed. Vol. 3: Cancer. Washington, DC: World bank.
Hayman, l. l., l. Helden, D. A. Chyun, and l. T. braun. 2011. “A life Course Approach to Cardiovascular Disease Prevention.” Journal of Cardiovascular Nursing 26 (4): S22–S34.
iHme (institute for Health metrics and evaluation). 2020. GbD Compare/Viz Hub (database). Seattle, WA: University of Washington. https://vizhub.healthdata.org/gbd-compare.
NCD Alliance. 2020. “impacts of COViD-19 on People living with NCDs.” briefing Note, NCD Alliance, Geneva. https://ncdalliance.org/resources/briefing-note-impacts-of-covid-19 -on-people-living-with-ncds.
Newman, l., F. baum, S. Javanparast, K. O’Rourke, and l. Carlon. 2015. “Addressing Social Determinants of Health inequities through Settings: A Rapid Review.” Health Promotion International 30 (Suppl. 2): ii126–43.
Strasser, T. 1978. “Reflections on Cardiovascular Diseases.” Interdisciplinary Science Review 3 (3): 225–30.

Toward a National Master Plan for Improved Implementation and Monitoring of NCD Prevention | 211
Tindle, H. A., m. Stevenson Duncan, R. A. Greevy, R. S. Vasan, S. Kundu, P. P. massion, and m. S. Freiberg. 2018. “lifetime Smoking History and Risk of lung Cancer: Results from the Framingham Heart Study.” JNCI: Journal of the National Cancer Institute 110 (11): 1201–07.
UNDP (United Nations Development Programme). 2013. Addressing the Social Determinants of Noncommunicable Diseases. Discussion Paper. New York: UNDP.
United Nations General Assembly. 2012. “Political Declaration of the High-level meeting of the General Assembly on the Prevention and Control of Non-Communicable Diseases.” Resolution A/ReS/66/2, United Nations, New York.
United Nations General Assembly. 2014. “Outcome Document of the High-level meeting of the General Assembly on the Comprehensive Review and Assessment of the Progress Achieved in the Prevention and Control of Non-Communicable Diseases.” Resolution A/ReS/68/300, United Nations, New York.
United Nations General Assembly. 2018. “Political Declaration of the Third High-level meeting of the General Assembly on the Prevention and Control of Non-Communicable Diseases—Time to Deliver: Accelerating our Response to Address Non-Communicable Diseases for the Health and Well-being of Present and Future Generations.” Resolution A/ReS/73/2, United Nations, New York.
Vision Realization Office. 2017. Vision 2030. Riyadh: Vision Realization Office. https://vision2030.gov.sa/sites/default/files/report/Saudi_Vision2030_eN_2017.pdf.
WHO (World Health Organization). 1986. “The Ottawa Charter for Health Promotion.” WHO, Geneva.
WHO (World Health Organization). 2013. “Global Action Plan for the Prevention and Control of Noncommunicable Diseases 2013–2020.” WHO, Geneva.
WHO (World Health Organization). 2014. “Noncommunicable Diseases Global monitoring Framework: indicator Definitions and Specifications.” WHO, Geneva.
WHO (World Health Organization). 2019. “Framework for Action to implement the United Nations Political Declaration on Noncommunicable Diseases (NCDs), including indicators to Assess Country Progress by 2030.” WHO emRO, Cairo.
WHO (World Health Organization) emRO (Regional Committee for the eastern mediterranean). 2011. “Plan of Action for the Prevention and Control of Noncommunicable Diseases in the eastern mediterranean Region.” WHO Regional Committee for the eastern mediterranean (emRO), Cairo.
WHO (World Health Organization) emRO (Regional Committee for the eastern mediterranean). 2014. “Noncommunicable Diseases: Scaling Up implementation of the Political Declaration of the United Nations General Assembly.” Resolution em/RC61/R.3, WHO emRO, Cairo.
World bank. 2012. The Economic Costs of Noncommunicable Diseases in the Pacific Islands: A Rapid Stocktake of the Situation in Samoa, Tonga, and Vanuatu. Washington, DC: World bank. https://www.worldbank.org/content/dam/Worldbank/document/the-economic -costs-of-noncommunicable-diseases-in-the-pacific-islands.pdf.


213
KEY MESSAGES
• Stakeholders from outside the health sector play important roles in efforts to reduce the risk factors for noncommunicable diseases (NCDs) in Saudi Arabia. The process of developing a master plan for the multisectoral preven-tion of NCDs therefore requires obtaining commitment and consensus among multiple sectors and stakeholders.
• Existing relations and alliances between stakeholders have been built through the joint implementation of NCD prevention efforts and health interventions. These relations need to be maintained and strengthened to ensure implemen-tation of the master plan, and new alliances need to be formed in order to set up a system for monitoring and evaluation.
• Enabling the Public Health Authority (PHA) to become a national public health authority would support the coordination, simultaneous implementa-tion, monitoring, and evaluation of prevention activities across multiple sectors.
INTRODUCTION
This chapter identifies key stakeholders from diverse sectors that influence NCD prevention activities and describes their relations and roles in preventing NCDs in Saudi Arabia. Stakeholder analysis is defined here as a process of sys-tematically gathering and analyzing qualitative information to determine whose interests should be considered when developing and implementing a master plan for the multisectoral prevention of NCDs.
Policy makers can use stakeholder analysis to identity key actors and assess their knowledge, interests, positions, alliances, and importance in relation to a
NCD Stakeholders in Saudi ArabiaMAPPING THEIR RELATIVE IMPORTANCE, POWER, INTEREST, AND OPPOSITION
REHAB ALASWAB, SEVERIN RAKIC, ADA ALQUNAIBET, AND RIYAD Q. ALGHAMDI
10

214 | NoNCommuNiCAblE DiSEASES iN SAuDi ArAbiA
particular strategy or policy. Stakeholder analysis enables policy makers to inter-act more effectively with key stakeholders and to increase their support for a particular strategy or policy (Schmeer 1999). The analysis also helps to detect potential misunderstandings about the strategy or policy and to identify actions to prevent opposition to it. international experience shows that the develop-ment of multisectoral national plans requires building and implementing cross-sectoral and multistakeholder networks that can provide a synergistic, concerted, and coherent approach to preventing NCDs and their risk factors (Hunter et al. 2019). A major challenge in the process is to ensure that diverse organizations, agencies, and groups develop meaningful partnerships to tackle shared goals—this effort is necessary because, traditionally, organizations are used to working within a single sector rather than across sectors.
METHODOLOGICAL APPROACH
Eight broad steps in the analytical process, suggested by Schmeer (1999), were followed in preparing and conducting the stakeholder analysis.
Step 1. Plan the analysis process
The first step entailed (1) defining the purpose of the analysis (to inform setting up a participatory, consensus-building process for developing the master plan and its implementation); (2) identifying the intended uses of the results of the analysis (to conceive approaches for engaging stakeholders and increasing their support of the master plan, to identify alliances among stakeholders and build on them, and to guide the identification of sectors for which implementation plans are required); and (3) establishing a timeline for the analysis (from october 2019 to April 2020). Two consultative workshops were held to involve representatives of various stakeholders in the analysis process.
Step 2. Select the focus of the master plan
The analysis focused on the three behavioral risk factors and four biological ones, presented in chapter 9 of this book.
Step 3. Identify stakeholders
Stakeholders were initially identified from the results of a stakeholder analysis recently conducted as part of the process of developing a public health strategy (SCDC 2019). The list of stakeholders identified during the review of existing strategies, policies, and programs (chapter 6) was then used to narrow down the analysis and focus it on the stakeholders with a mandate or interest in influenc-ing or participating in tackling selected NCD risk factors, regardless of the sector to which they belong. The comprehensive list of stakeholders was discussed with participants at a consultative workshop held in February 2020 and refined on the basis of the feedback received.
Step 4. Select three mapping tools
The comprehensive mapping table (annex 10A) was used to identify stakehold-ers’ interest in modifying selected behavioral and biological risk factors.

NCD Stakeholders in Saudi Arabia | 215
Then, the power-interest matrix (DFiD 2003) was adapted to consider the advantages or disadvantages that implementation of the master plan might bring to them. Determining the stakeholders’ vested interest helps in understanding their position and addressing their concerns about the master plan. Power was examined by looking at the ability of a stakeholder to affect implementation of the plan. based on the degree of power and intensity of interest, stakeholders were divided into four groups, which were mapped to four fields in the power-interest matrix. Finally, the power table was used to map the power sources of key stakeholders (Heydari et al. 2018).
Five sources of power were analyzed for key stakeholders in health and other sectors: (1) stakeholders’ ability to affect mobilization of financial resources needed to implement the master plan (financial power); (2) stakeholders’ ability to influence political decisions affecting development or implementation of the master plan (political power); (3) in-house availability of technical knowledge needed to develop, implement, monitor, and evaluate the master plan (knowl-edge power); (4) stakeholders’ ability to affect the enacting or enforcement of regulations relevant to NCD prevention (legal power); and (5) stakeholders’ mandate to lead or participate in making decisions that could facilitate or block implementation of the master plan (decision-making power).
Step 5. Collect information on stakeholders
The information previously collected by the Saudi Public Health Authority (SCDC 2019), as part of the public health strategy development process, was supplemented with information contained in existing strategies, official docu-ments, regulations, and official websites. information was collected on four major attributes: the stakeholders’ position on NCD prevention, the level of power they hold, the level of interest they have in NCD prevention, and the existence of their alliances and dependencies with other stakeholders. As PHA staff proved to be knowledgeable about many stakeholders, it was not necessary to conduct structured interviews with each of the stakeholders iden-tified. instead, meetings were held with some of the key stakeholders to obtain missing information on their position or on ongoing and planned NCD preven-tion activities.
Step 6. Use the information collected to fill in the mapping tools
While mapping the stakeholders’ interests to the risk factors, the approach of the Foundation for Advanced Studies on international Development was used to categorize stakeholders into decision-makers, funding agencies, implementing agencies, potential opponents, and likely supporters (FASiD 2008). The power-interest matrix was applied separately to stakeholders interested in efforts to modify unhealthy diet, tobacco use, insufficient physical activities, and biological risk factors (as a group). The power-interest matrix provided the basis for identifying key health and nonhealth stakeholders and completing the power tables for them.
Step 7. Analyze the information about stakeholders
The analysis of stakeholder information was used to develop conclusions about stakeholders’ relative importance, power, interest, position, and possible

216 | NoNCommuNiCAblE DiSEASES iN SAuDi ArAbiA
opponents and allies for the PHA in developing, implementing, monitoring, and evaluating the master plan. The alliances and relations among stakeholders were visualized using maps of their dependencies.
Step 8. Present results of the analysis to policy makers
results of the analysis were presented in a way that allows policy makers to use the information. Key stakeholders were classified on the basis of their current attitude toward NCD prevention (supportive, neutral or not sufficiently engaged, or opposed). recommendations were provided on how to engage with various stakeholders in developing the master plan and how to cluster stakeholders into groups to ensure that the master plan is implemented and monitored.
IDENTIFICATION OF STAKEHOLDERS INFLUENCING AND PARTICIPATING IN NCD PREVENTION ACTIVITIES
both nonhealth and health stakeholders play important roles in the prevention of NCDs in Saudi Arabia. Stakeholders are defined as the organizations (or groups of organizations) with a declared or conceivable interest in NCD-related strategies, policies, and plans in Saudi Arabia. The initial identification of stake-holders resulted in a comprehensive list of 57 stakeholders (annex 10A). These stakeholders were categorized by type (government or nongovernment), sector (health or nonhealth), and level (local, regional, national, or international). many nonhealth, government, and national-level stakeholders were included on the list (figure 10.1), as they play important roles in efforts to prevent NCDs in Saudi Arabia.
FIGURE 10.1
Number of stakeholders related to or affected by NCD strategies and policies in Saudi Arabia
Source: Original figure for this publication.Note: Various civil society organizations were counted as a one group of nongovernment stakeholders. NCDs = noncommunicable diseases.
Government
a. Type of stakeholder b. Sector c. Level
Nongovernment
National
Regional or local
International
Health
Nonhealth
41
18
38
6
13
39
16

NCD Stakeholders in Saudi Arabia | 217
MAPPING STAKEHOLDERS’ POWER AND INTEREST IN NCD PREVENTION
Stakeholders’ power and interest were mapped for all of the risk factors of focus here. The four power-interest matrixes presented in figures 10.2–10.5 display the stakeholders interested in reducing tobacco use, encouraging a healthy diet, increasing physical activities, and modifying the four biological risk factors in Saudi Arabia.
members of the National Committee for Tobacco Control are largely from outside of the health sector. members of the committee and related organi-zations already have a high level of interest in reducing tobacco use in Saudi Arabia and also have the power to implement interventions related to this risk factor. Efforts should be invested in (1) maintaining their support for tobacco control interventions and (2) increasing their interest in, and elicit-ing their support for, the implementation of tobacco control interventions among the emerging health sector stakeholders (that is, the Program for
FIGURE 10.2
Stakeholders influencing and participating in tobacco control activities in Saudi Arabia
Source: Original figure for this publication.Note: CBAHI = Central Board for Accreditation of Healthcare Institutions. CCHI = Council of Cooperative Health Insurance. CITC = Communication and Information Technology Commission. COM = Council of Ministers. CSOs = civil society organizations. GASTAT = General Authority for Statistics. GAZT = General Authority for Zakat and Tax. GCC = Gulf Cooperation Council. HiAP = Health in All Policies Committee. MEP = Ministry of Economy and Planning. MHRSD = Ministry of Human Resources and Social Development. MOC = Ministry of Culture. MOCOM = Ministry of Commerce. MOD = Ministry of Defense. MOE = Ministry of Education. MOF = Ministry of Finance. MOH = Ministry of Health. MOI = Ministry of Interior. MOIA = Ministry of Islamic Affairs, Dawah, and Guidance. MOM = Ministry of Media. MOMRA = Ministry of Municipal and Rural Affairs and Housing. MOS = Ministry of Sports. NCTC = National Committee for Tobacco Control. PHA = Public Health Authority. PHAP = Program for Health Assurance and Purchasing. SFDA = Saudi Food and Drug Authority. SHC = Saudi Health Council. UNDP = United Nations Development Programme. WB = World Bank. WHO = World Health Organization.
Meet their needs
Low
Low
Interest
Po
wer
an
d in
flu
ence
High
Hig
h
Work closely with champions
Keep them informed Engage with key players
• HiAP
• MOD
• COM
• MOC
• MEP
• UNDP
• Local media
• SaudiBroadcastingAuthority
• King FaisalFoundation
• King KhalidFoundation
• Private health carefacilities
• Universities and schools
• Saudi customs
• Tobacco importers
• Health Council of GCC
• CSOs
• WB
• WHO
• Internationaltobaccocompanies
• PHA• NCTC• MOH• MOE• SFDA• Non-MOH
governmenthealth carefacilities
• GASTAT
• MOMRA
• MOI
• MOF
• GAZT
• MOS
• MOIA
• MHRSD
• MOCOM
• MOM
• Health clusters
• Health HoldingCompany
• CBAHI
• CCHI
• PHAP
• SHC
• CITC
• Saudi Aramco

218 | NoNCommuNiCAblE DiSEASES iN SAuDi ArAbiA
Health Assurance and Purchasing, Health Holding Company, and health clusters shown in figure 10.2).
Various interventions for the modification of unhealthy diets are being implemented with the participation of various nonhealth and health stakehold-ers. Stakeholders from other sectors (education, labor, media, local government, trade, and industry) play more important roles in implementation than stakeholders from the health sector. The Saudi Food and Drug Authority has legislative and enforcement functions and a leadership role in implementation, although overall coordination among multiple sectors is weak. Efforts should be invested in (1) eliciting finance sector and private sector support for implemen-tation and (2) increasing interest among emerging stakeholders from the health sector (Program for Health Assurance and Purchasing, Health Holding Company, and health clusters shown in figure 10.3) for implementing interventions that reduce the contribution of unhealthy diets to the development of NCDs.
Fewer stakeholders are highly interested in promoting physical activity than in modifying other risk factors for NCDs. The champions in this area come from
FIGURE 10.3
Stakeholders influencing and participating in the modification of unhealthy diets in Saudi Arabia
Source: Original figure for this publication.Note: CBAHI = Central Board for Accreditation of Healthcare Institutions. CCHI = Council of Cooperative Health Insurance. CITC = Communication and Information Technology Commission. CSOs = civil society organizations. GASTAT = General Authority for Statistics. GAZT = General Authority for Zakat and Tax. GCC = Gulf Cooperation Council. HiAP = Health in All Policies Committee. KACND = King Abdulaziz Center for National Dialogue. MEP = Ministry of Economy and Planning. MEWA = Ministry of Environment, Water, and Agriculture. MHRSD = Ministry of Human Resources and Social Development. MOC = Ministry of Culture. MOCOM = Ministry of Commerce. MOD = Ministry of Defense. MOE = Ministry of Education. MOF = Ministry of Finance. MOH = Ministry of Health. MOI = Ministry of Interior. MOM = Ministry of Media. MOMRA = Ministry of Municipal and Rural Affairs and Housing. PHA = Public Health Authority. PHAP = Program for Health Assurance and Purchasing. SFDA = Saudi Food and Drug Authority. SHC = Saudi Health Council. UNDP = United Nations Development Programme. UNICEF = United Nations Children’s Fund. WB = World Bank. WHO = World Health Organization.
Meet their needs
Low
Low
Interest
Po
wer
an
d in
flu
ence
High
Hig
h
Work closely with champions
Keep them informed Engage with key players
• MEWA
• MOD
• MOC
• MEP
• MOI
• UNICEF
• UNDP
• KACND
• Local media
• SaudiBroadcastingAuthority
• King FaisalFoundation
• King KhalidFoundation
• Private health carefacilities
• Universities and schools
• Saudi customs
• Local soda, beverages,and food industry
• CSOs
• WB
• WHO
• PHA
• MOH
• MOE
• SFDA
• GASTAT
• MOMRA
• MHRSD
• MOCOM
• MOM
• MOF
• GAZT
• CBAHI
• CCHI
• HiAP
• CITC
• Saudi Aramco• Non-MOH
governmenthealth carefacilities
• Health clusters
• Health HoldingCompany
• SHC
• PHAP
• Health Councilof GCC

NCD Stakeholders in Saudi Arabia | 219
the sports, education, labor, and health sectors. Efforts should be invested in (1) engaging transportation, local government, environment, trade, and media sectors and eliciting their support for implementation and (2) increasing the interest of emerging stakeholders from the health sector (Program for Health Assurance and Purchasing, Health Holding Company, and health clusters in figure 10.4) for implementing interventions that reduce the contribution of physical inactivity to the development of NCDs.
biological risk factors are considered as a group of factors. one power- interest matrix was created for the biological factors, instead of creating four similar matrixes (figure 10.5). Although efforts to modify the biological risk factors fall mostly under health sector responsibilities, some nonhealth stakeholders could contribute more to it by (1) providing prevention activities through their subsystems of the health sector and (2) participating in the organization of screening activities at workplaces and schools. Efforts should be invested in eliciting financial and private sector support for developing and implementing the master plan.
FIGURE 10.4
Stakeholders influencing and participating in the promotion of physical activity in Saudi Arabia
Source: Original figure for this publication.Note: CBAHI = Central Board for Accreditation of Healthcare Institutions. CCHI = Council of Cooperative Health Insurance. CITC = Communication and Information Technology Commission. COM = Council of Ministers. CSOs = civil society organizations. GASTAT = General Authority for Statistics. GCC = Gulf Cooperation Council. HiAP = Health in All Policies Committee. KACND = King Abdulaziz Center for National Dialogue. MEP = Ministry of Economy and Planning. MEWA = Ministry of Environment, Water, and Agriculture. MHRSD = Ministry of Human Resources and Social Development. MOC = Ministry of Culture. MOD = Ministry of Defense. MOE = Ministry of Education. MOF = Ministry of Finance. MOH = Ministry of Health. MOI = Ministry of Interior. MOINV = Ministry of Investment. MOM = Ministry of Media. MOMRA = Ministry of Municipal and Rural Affairs and Housing. MOS = Ministry of Sports. MOT = Ministry of Transportation. PHA = Public Health Authority. PHAP = Program for Health Assurance and Purchasing. SHC = Saudi Health Council. UNDP = United Nations Development Programme. UNICEF = United Nations Children’s Fund. WB = World Bank. WHO = World Health Organization.
Meet their needs
Low
Low
Interest
Po
wer
an
d in
flu
ence
High
Hig
h
Work closely with champions
Keep them informed Engage with key players
• Private health care facilities
• Universities and schools
• Health Council of GCC
• CSOs
• WB
• WHO
• PHA
• MOH
• MOE
• MOS
• GASTAT
• MHRSD
• MOT
• MOMRA
• MEP
• CCHI
• PHAP
• CBAHI
• SHC
• Sports clubs
• Saudi Aramco
• Non-MOHgovernmenthealth carefacilities
• Health clusters
• Health HoldingCompany
• UNICEF
• UNDP
• CITC
• KACND
• Local media
• SaudiBroadcastingAuthority
• King FaisalFoundation
• King KhalidFoundation
• MEWA
• MOD
• MOC
• MOI
• MOINV
• MOM
• COM
• MOF
• HiAP

220 | NoNCommuNiCAblE DiSEASES iN SAuDi ArAbiA
POWER OF KEY STAKEHOLDERS
Nine nonhealth stakeholders were recognized as key stakeholders. Key stake-holders are those that, overall, have a significant degree of power and a high interest in more than one of the risk factors under consideration. These key stakeholders need to be engaged directly in developing the master plan, as their participation or support will be critically important for its implementation. The key nonhealth stakeholders are (1) the ministry of Education, (2) the ministry of municipal and rural Affairs and Housing, (3) the ministry of Sports, (4) the ministry of Finance, (5) the General Authority for Zakat and Tax, (6) the ministry of Human resources and Social Development, (7) the ministry of islamic Affairs, Dawah, and Guidance, (8) the ministry of media, and (9) the ministry of Commerce. Sources of their power are presented in table 10.1. Additionally, the General Authority for Statistics should be engaged, due to its current and pro-spective roles in the collection of monitoring data through periodic surveys.
Nine organizations or groups of organizations are key stakeholders in the health sector: (1) the Saudi Public Health Authority, (2) the ministry of Health, (3) the Saudi Health Council, (4) a group of non–ministry of Health government health facilities (including facilities established by the National Guard, the ministry of interior, the ministry of Defense, and the ministry of Education), (5) the Saudi Food and Drug Authority, (6) the Program for Health Assurance and Purchasing, (7) the Health Holding Company, (8) health clusters, and (9) the National Committee for Tobacco Control. Sources of their power are presented in table 10.2. The PHA currently does not have a high level of financial, political,
FIGURE 10.5
Stakeholders influencing and participating in the modification of biological risk factors in Saudi Arabia
Source: Original figure for this publication.Note: CBAHI = Central Board for Accreditation of Healthcare Institutions. CCHI = Council of Cooperative Health Insurance. CSOs = civil society organizations. GASTAT = General Authority for Statistics. HiAP = Health in All Policies Committee. MEP = Ministry of Economy and Planning. MOE = Ministry of Education. MOH = Ministry of Health. PHA = Public Health Authority. PHAP = Program for Health Assurance and Purchasing. SHC = Saudi Health Council. UNICEF = United Nations Children’s Fund. WB = World Bank. WHO = World Health Organization.
Meet their needs
Low
Low
Interest
Pow
er a
nd
in
flu
ence
High
Hig
h
Work closely with champions
Keep them informed Engage with key players
• Private health care facilities
• CSOs
• WB
• WHO
• PHA
• MOH
• SHC
• PHAP
• GASTAT
• MOE• CCHI
• CBAHI
• Saudi Aramco
• Non-MOHgovernmenthealth carefacilities
• Health clusters
• Health HoldingCompany
• UNICEF
• Council of Ministers
• MEP
• HiAP

NCD Stakeholders in Saudi Arabia | 221
legal, or decision-making power. If it would have national authority, it would have more power and be able to coordinate the implementation of prevention activities across multiple sectors.
Additional efforts are needed to increase the interest of other stakeholders in supporting and participating in the prevention of NCDs. These other stakehold-ers are (1) the Health in All Policies Committee, (2) the Ministry of Transportation, (3) the Ministry of Economy and Planning, (4) the Council of Cooperative Health Insurance, (5) the Central Board for Accreditation of Healthcare Institutions, (6) Saudi Aramco, (7) the Communication and Information Technology Commission, and (8) sports clubs. All of these stakeholders have a lot of power
TABLE 10.1 Power sources of the key nonhealth stakeholders in Saudi Arabia
NONHEALTH STAKEHOLDER
POWER SOURCE
FINANCIAL POWER
POLITICAL POWER KNOWLEDGE LEGAL POWER
DECISION-MAKING POWER
Ministry of Education High Very high High Very high Very high
Ministry of Municipal and Rural Affairs and Housing
High Very high Moderate Moderate High
Ministry of Sports Moderate Very high Very high Moderate High
Ministry of Finance Very high Very high Moderate Very high Very high
General Authority for Zakat and Tax Very high Moderate Low Low Very high
Ministry of Human Resources and Social Development
High Very high Moderate Very high High
Ministry of Islamic Affairs, Dawah, and Guidance
Moderate Very high Low High High
Ministry of Media Moderate Very high Low Very high High
Ministry of Commerce High Very high Low High High
Source: Original compilation for this publication.Note: Dark blue = very high level of power. Blue = high level of power. Pale blue = moderate level of power. Very pale blue = low level of power.
TABLE 10.2 Power sources of the key health stakeholders in Saudi Arabia
HEALTH STAKEHOLDER
POWER SOURCE
FINANCIAL POWER
POLITICAL POWER KNOWLEDGE LEGAL POWER
DECISION-MAKING POWER
Saudi Public Health Authority Low Moderate Very high Moderate Moderate
Ministry of Health High Very high Very high Very high Very high
Saudi Health Council Low Very high Moderate Moderate High
Government health facilities other than those of the Ministry of Health
Very high Moderate High Low Very high
Saudi Food and Drug Authority Low Moderate Very high Very high Moderate
Program for Health Assurance and Purchasing Very high Moderate Low Low Low
Health Holding Company Moderate Moderate Moderate Low Moderate
Health clusters High Low Moderate Low Very high
National Committee for Tobacco Control Moderate High High Moderate High
Source: Original compilation for this publication.Note: Dark blue = very high level of power. Blue = high level of power. Pale blue = moderate level of power. Very pale blue = low level of power.

222 | NoNCommuNiCAblE DiSEASES iN SAuDi ArAbiA
but little interest. involving them in development of the master plan and in future consultative workshops could be helpful in eliciting their interest in NCD prevention.
RELATIONS OF KEY STAKEHOLDERS IN TACKLING SELECTED RISK FACTORS FOR NCDs
A visual representation of the relations among stakeholders is helpful for under-standing their networks. it also helps to identify actions to make the networks and alliances more robust and collaborative (for example, identifying areas where relationships can be established between disconnected stakeholders and areas where new stakeholders need to be recruited). Figures 10.6–10.9 provide visual representations for groups of stakeholders involved in tackling selected NCD risk factors.
FIGURE 10.6
Relations of the key stakeholders involved in tobacco control interventions in Saudi Arabia
Source: Original figure for this publication.Note: CBAHI = Central Board for Accreditation of Healthcare Institutions. CCHI = Council of Cooperative Health Insurance. GAZT = General Authority for Zakat and Tax. MHRSD = Ministry of Human Resources and Social Development. MOCOM = Ministry of Commerce. MOD = Ministry of Defense. MOE = Ministry of Education. MOF = Ministry of Finance. MOH = Ministry of Health. MOI = Ministry of Interior. MOIA = Ministry of Islamic Affairs, Dawah, and Guidance. MOM = Ministry of Media. MOMRA = Ministry of Municipal and Rural Affairs and Housing. MOS = Ministry of Sports. NGHA = National Guard Health Affairs. PHA = Public Health Authority. PHAP = Program for Health Assurance and Purchasing. SFDA = Saudi Food and Drug Authority. SHC = Saudi Health Council.
Health, decision-maker
Nonhealth, decision-maker
Health, implementing agency
Nonhealth, implementing agency
MOM
MOMRAMOS
National committee fortobacco control
MOF GAZT
Saudi customs
Employers
Schools
Universities
CBAHI
Government health care facilities
Health clusters
Health Holding Company
Privatehealth care
facilities
MOIMOH
PHA
PHAP
MOD
CCHI
NGHA
MOIA
Tobaccoimporters
Ris
k fa
ctor: T
ob
acco
use
MOCOM
MOE
MHRSD
SFDA
SHC

NCD Stakeholders in Saudi Arabia | 223
The National Committee for Tobacco Control is currently coordinating implementation and monitoring of tobacco control interventions (figure 10.6). members of the committee should participate in the consideration and selection of tobacco control interventions to be included in the master plan. once respon-sibility for the committee’s work is reallocated from the ministry of Health to the Saudi Public Health Authority, the PHA will be responsible for overseeing monitoring and evaluation and be empowered to act as a national authority for public health.
Some of the champions have undoubtedly taken responsibility for imple-menting specific interventions to reduce the risks related to an unhealthy diet (figure 10.7). The Saudi Food and Drug Authority, the ministry of Health, and the ministry of Education are among the champions. However, there is no clear mechanism for coordinating their implementation efforts, even though over-weight and obesity are important risk factors. Although the Saudi Health Council could ensure coordination among different subsystems of the health sector,
FIGURE 10.7
Relations of the key stakeholders involved in reducing the risks related to unhealthy diets in Saudi Arabia
Source: Original figure for this publication.Note: CBAHI = Central Board for Accreditation of Healthcare Institutions. CCHI = Council of Cooperative Health Insurance. CITC = Communication and Information Technology Commission. GAZT = General Authority for Zakat and Tax. HiAP = Health in All Policies Committee. MHRSD = Ministry of Human Resources and Social Development. MOCOM = Ministry of Commerce. MOD = Ministry of Defense. MOE = Ministry of Education. MOF = Ministry of Finance. MOH = Ministry of Health. MOI = Ministry of Interior. MOM = Ministry of Media. MOMRA = Ministry of Municipal and Rural Affairs and Housing. NGHA = National Guard Health Affairs. PHA = Public Health Authority. PHAP = Program for Health Assurance and Purchasing. SFDA = Saudi Food and Drug Authority. SHC = Saudi Health Council.
Health, decision-maker
Nonhealth, decision-maker
Health, implementing agency
Nonhealth, implementing agency
Risk factor: Unhealthy diet
HiAP
PHAP
MOI
Government health care facilities Private health care facilities
NGHA MOD
MOMRA
Local industry
MOCOM
GAZT
Employers
MHRSD
MOE
Saudi customs
MOM CITC
Health clusters
Health HoldingCompany
CBAHI
MOF
Schools
Universities
CCHI
SHC
SFDA
PHA
MOH
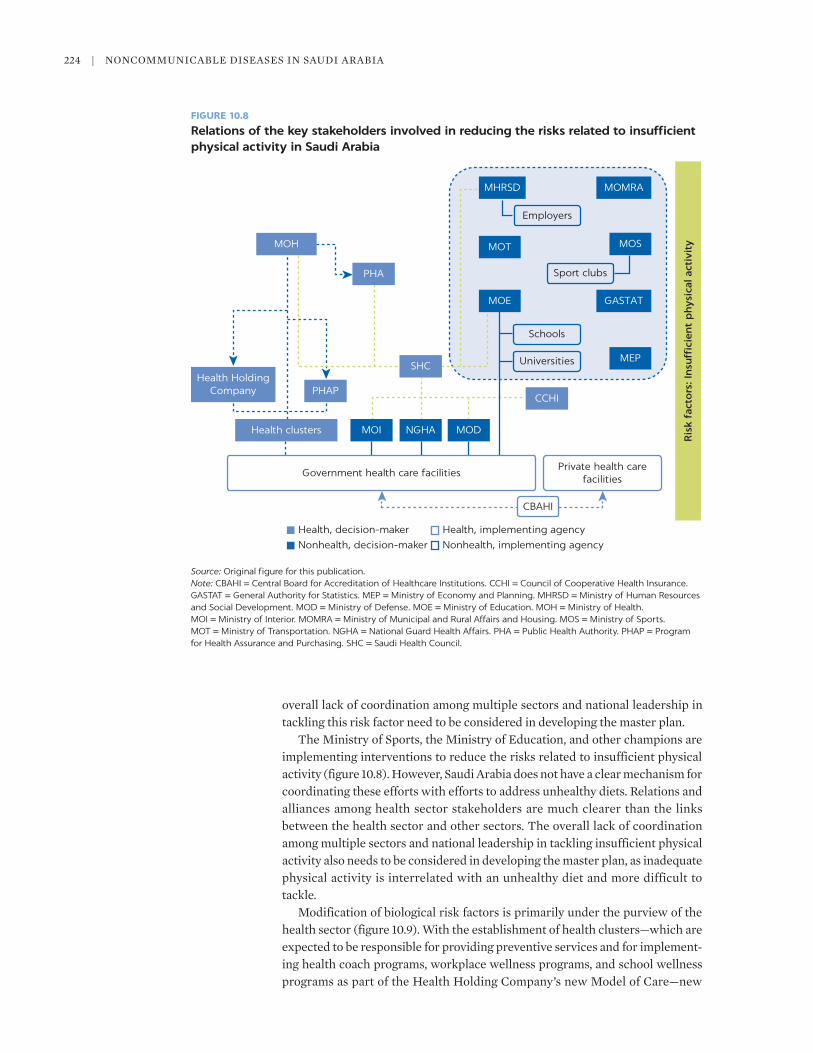
224 | NoNCommuNiCAblE DiSEASES iN SAuDi ArAbiA
overall lack of coordination among multiple sectors and national leadership in tackling this risk factor need to be considered in developing the master plan.
The ministry of Sports, the ministry of Education, and other champions are implementing interventions to reduce the risks related to insufficient physical activity (figure 10.8). However, Saudi Arabia does not have a clear mechanism for coordinating these efforts with efforts to address unhealthy diets. relations and alliances among health sector stakeholders are much clearer than the links between the health sector and other sectors. The overall lack of coordination among multiple sectors and national leadership in tackling insufficient physical activity also needs to be considered in developing the master plan, as inadequate physical activity is interrelated with an unhealthy diet and more difficult to tackle.
modification of biological risk factors is primarily under the purview of the health sector (figure 10.9). With the establishment of health clusters—which are expected to be responsible for providing preventive services and for implement-ing health coach programs, workplace wellness programs, and school wellness programs as part of the Health Holding Company’s new model of Care—new
FIGURE 10.8
Relations of the key stakeholders involved in reducing the risks related to insufficient physical activity in Saudi Arabia
Source: Original figure for this publication.Note: CBAHI = Central Board for Accreditation of Healthcare Institutions. CCHI = Council of Cooperative Health Insurance. GASTAT = General Authority for Statistics. MEP = Ministry of Economy and Planning. MHRSD = Ministry of Human Resources and Social Development. MOD = Ministry of Defense. MOE = Ministry of Education. MOH = Ministry of Health. MOI = Ministry of Interior. MOMRA = Ministry of Municipal and Rural Affairs and Housing. MOS = Ministry of Sports. MOT = Ministry of Transportation. NGHA = National Guard Health Affairs. PHA = Public Health Authority. PHAP = Program for Health Assurance and Purchasing. SHC = Saudi Health Council.
MOH
PHA
Health HoldingCompany PHAP
SHC
Health clusters MOI NGHA MOD
Government health care facilities
CBAHI
Private health carefacilities
CCHI
MEP
Ris
k fa
cto
rs: I
nsu
ffici
ent
ph
ysic
al a
ctiv
ity
Universities
Schools
MOE
MOT
Sport clubs
GASTAT
MOS
Employers
MHRSD MOMRA
Health, decision-maker
Nonhealth, decision-maker
Health, implementing agency
Nonhealth, implementing agency

NCD Stakeholders in Saudi Arabia | 225
arrangements and relations between the stakeholders are expected to emerge and to strengthen the position of public health and prevention efforts. Holding financial power, the Program for Health Assurance and Purchasing and the Council of Cooperative Health insurance are in a position to support scaling up of screening for biological risk factors.
THE POSITION OF KEY STAKEHOLDERS
The current position of key stakeholders can range from support to opposition. Figure 10.10 maps stakeholders’ positions on a continuum that moves from sup-portive to neutral (or insufficiently engaged) and then to opposing positions regarding NCD prevention efforts in Saudi Arabia. Stakeholders are grouped into two categories (health and nonhealth stakeholders). The closer a stakehold-er’s position is toward the right side of figure 10.10, the stronger its support for ongoing NCD prevention efforts.
Having no key stakeholders openly opposing the NCD prevention efforts pro-vides a good starting point for developing the master plan. many stakeholders are already participating in and supporting ongoing NCD prevention efforts. Some of them are not equally engaged with all of the risk factors, and additional efforts are needed to increase the interest of these stakeholders. A challenge is to
FIGURE 10.9
Relations of the key stakeholders involved in modifying biological risk factors in Saudi Arabia
Source: Original figure for this publication.Note: CBAHI = Central Board for Accreditation of Healthcare Institutions. CCHI = Council of Cooperative Health Insurance. MEP = Ministry of Economy and Planning. MOD = Ministry of Defense. MOE = Ministry of Education. MOH = Ministry of Health. MOI = Ministry of Interior. NGHA = National Guard Health Affairs. PHA = Public Health Authority. PHAP = Program for Health Assurance and Purchasing. SHC = Saudi Health Council.
MOH
MOE
Schools
Employers
Universities
Government health care facilities
CBAHI
Biological risk factors
Private health carefacilities
Health HoldingCompany
PHA
PHAP
NGHA MOI MOD
SHC
MEP
Clusters
CCHI
Health, decision-maker
Nonhealth, decision-maker
Health, implementing agency
Nonhealth, implementing agency

226 | NoNCommuNiCAblE DiSEASES iN SAuDi ArAbiA
ensure that stakeholders who are opposed to certain measures participate and that opposition to an action is mitigated—for example, the ministry of Finance might oppose an excise tax because of the potential loss of income if the tax significantly reduces consumption.
CONCLUSIONS
National-level government stakeholders from nonhealth sectors are important in the efforts to reduce the risk factors for NCDs in Saudi Arabia. The majority of stakeholders identified through the mapping come from outside of the health sector. They play important roles in the control of tobacco, promotion of physical activity, and shifting of diets toward healthier choices and are starting to enter the field of screening for biological risk factors, which had been the exclusive responsibility of the health sector.
FIGURE 10.10
Current position of key stakeholders in Saudi Arabia
Source: Original figure for this publication.Note: CBAHI = Central Board for Accreditation of Healthcare Institutions. CCHI = Council of Cooperative Health Insurance. CITC = Communication and Information Technology Commission. GASTAT = General Authority for Statistics. GAZT = General Authority for Zakat and Tax. HiAP = Health in All Policies Committee. MEP = Ministry of Economy and Planning. MHRSD = Ministry of Human Resources and Social Development. MOCOM = Ministry of Commerce. MOD = Ministry of Defense. MOE = Ministry of Education. MOF = Ministry of Finance. MOH = Ministry of Health. MOI = Ministry of Interior. MOIA = Ministry of Islamic Affairs, Dawah, and Guidance. MOM = Ministry of Media. MOMRA = Ministry of Municipal and Rural Affairs and Housing. MOS = Ministry of Sports. MOT = Ministry of Transportation. NCTC = National Committee for Tobacco Control. NGHA = National Guard Health Affairs. PHA = Public Health Authority. PHAP = Program for Health Assurance and Purchasing. SFDA = Saudi Food and Drug Authority. SHC = Saudi Health Council.
Opposed
HiAP
CBAHI
CCHIH
ealth
sta
keh
old
ers
SHC
NCTC
SFDA
PHA
MOHPHAP
Health clusters
Health Holding Company
Non-MOH government health facilities
MOF
Nonh
ealth
sta
keh
old
ers
GAZT
MEP
MOT
CITC
GASTAT
MOIA
Saudi customs
Saudi Aramco MOCOM
MOM
NGHA
MOD
MOI
MOE
MOS
MOMRA
MHRSD
Not sufficiently engaged Supportive

NCD Stakeholders in Saudi Arabia | 227
Empowering the Saudi Public Health Authority to take the role of a national public health authority could ensure coordination, implementation, monitor-ing, and evaluation of prevention activities across multiple sectors. Clear lead-ership and effective coordination mechanisms have been established in the area of tobacco control. The National Committee for Tobacco Control involves a broad group of relevant health and nonhealth stakeholders. However, a mechanism is needed to coordinate interventions related to other risk factors. it is not practical to have separate committees dealing with different risk factors, as doing so would dilute both resources and the attention of key stake-holders. A better option is to empower the PHA to take over tasks and respon-sibilities for coordinating activities across all of the risk factors and among different sectors.
The process of developing the master plan requires ensuring the participa-tion of and building consensus among multiple stakeholders. The stakeholder analysis identified 18 key stakeholders that need to participate in developing the master plan even though not all of them will be equally interested in interven-tions to reduce every risk factor. With additional stakeholders, whose participa-tion in developing a master plan is required to stimulate interest in NCD prevention, the core working group might grow to 25–30 representatives of dif-ferent stakeholders. Such a large group could become inefficient. Development of the master plan could be facilitated by dividing key and other stakeholders into four subgroups, each focusing on one risk factor. An alternative option would be to form one core group and a broader group, with the core group lead-ing technical discussions of all risk factors and preparing proposals for consider-ation by the broader group.
Existing relations and alliances between stakeholders should be maintained and strengthened. it takes time to establish cooperation and to prepare stake-holders to join forces in implementation efforts. Developing both the master plan and subsequent sectoral implementation plans should maintain, strengthen, and build up the joint implementation of existing NCD prevention interventions (such as cooperation between the ministry of Education and the ministry of Health on the implementation of school health programs and initiatives). The number of implementation plans and their scope still need to be agreed, but the following sectors should be considered when making the decision:
1. The health sector, with the ministry of Health as the lead agency. The imple-mentation plan needs to cover the Program for Health Assurance and Purchasing, Health Holding Company, and health clusters with the associ-ated health facilities.
2. other government sectors that have established and operate health facilities, perhaps with separate implementation plans for the ministry of Defense, the National Guard, and the ministry of interior.
3. The education and childcare sector, with the ministry of Education as the lead agency. The implementation plan needs to cover schools, universities, and health facilities established by the ministry.
4. The food and agriculture sector, with the Saudi Food and Drug Authority as the lead agency. The implementation plan needs to cover the ministry of Environment, Water, and Agriculture.
5. The sports sector, with the ministry of Sports as the lead agency.

228 | NoNCommuNiCAblE DiSEASES iN SAuDi ArAbiA
6. The finance sector, with the ministry of Finance as the lead agency.
7. The labor sector, with the ministry of Human resources and Social Development as the lead agency.
8. The local governance sector, with the ministry of municipalities and rural Affairs and Housing as the lead agency.
9. The media sector, with the ministry of media as the lead agency.
10. The commerce, trade, and industry sector, with the ministry of Commerce and the ministry of investment as the lead agencies.
Deciding on the number of implementation plans is highly dependent on the choice of interventions to be included in the master plan.
New alliances among stakeholders need to be formed in order to set up a sys-tem for monitoring and evaluating the master plan. Existing relations and reporting requirements are insufficient to ensure that implementation of the master plan is monitored. Additional information flows need to be set up, and responsibility for the central collection of monitoring data needs to be allocated. Positioning the Saudi Public Health Authority as a national authority would enable it to take over the coordination of monitoring and evaluation activities and the continuous collation of monitoring information.

NCD Stakeholders in Saudi Arabia | 229
ANNEX 10A: SUPPLEMENTAL INFORMATION ON STAKEHOLDERS
TABLE 10A.1 Stakeholders influencing and participating in the prevention of NCDs in Saudi Arabia
STAKEHOLDER
BEHAVIORAL RISK FACTORS
TOBACCO USE
UNHEALTHY DIET
PHYSICAL INACTIVITY
BIOLOGICAL RISK FACTORS
TYPE OF STAKEHOLDER SECTOR LEVEL
Saudi Public Health Authority D D D D Government Health National
Saudi Health Council D D D D, I Government Health National
Saudi Food and Drug Authority
D, I D, I n.a. n.a. Government Health National
Ministry of Health D D D D Government Health National
Health Holding Company (with health clusters)
D, I D, I D, I D, I Government Health National
National Committee for Tobacco Control
D, I n.a. n.a. n.a. Government Health National
Health in All Policies Committee
S S S n.a. Government Health National
Ministry of Health health care facilities
I I I I Government Health Local, regional
Non–Ministry of Health government health care facilities
I I I D, I Government Health Regional, local
Private health care facilities I I I I Nongovernment Health Local, regional
Program for Health Assurance and Purchasing
F, S F, S F, S F, S Government Health National
Central Board for Accreditation of Healthcare Institutions
I I I I Government Health National
Council of Cooperative Health Insurance
F, S F, S F, S F, S Government Health National
Council of Ministers S S S S Government Nonhealth National
Ministry of Municipal and Rural Affairs and Housing
D, I D, I D, I n.a. Government Nonhealth National
Ministry of Commerce D, I D, I D, I n.a. Government Nonhealth National
Ministry of Investment D, I D, I D, I n.a. Government Nonhealth National
General Authority for Zakat and Tax
D, I D, I n.a. n.a. Government Nonhealth National
Ministry of Environment, Water, and Agriculture
n.a. I I n.a. Government Nonhealth National
Ministry of Human Resources and Social Development
I I I n.a. Government Nonhealth National
Ministry of Finance F F F n.a. Government Nonhealth National
Ministry of Finance, Center for Spending Efficiency
F F F n.a. Government Nonhealth National
Ministry of Transportation n.a. n.a. D, I n.a. Government Nonhealth National
Ministry of Education I D, I D, I n.a. Government Nonhealth National
Public universities I D, I D, I n.a. Government Nonhealth National, local
(continued)

230 | NoNCommuNiCAblE DiSEASES iN SAuDi ArAbiA
TABLE 10A.1, continued
STAKEHOLDER
BEHAVIORAL RISK FACTORS
TOBACCO USE
UNHEALTHY DIET
PHYSICAL INACTIVITY
BIOLOGICAL RISK FACTORS
TYPE OF STAKEHOLDER SECTOR LEVEL
Private universities I D, I D, I n.a. Nongovernment Nonhealth Local
Public schools I I I n.a. Government Nonhealth Regional, local
Private schools I I I n.a. Nongovernment Nonhealth Regional, local
Saudi Data and Artificial Intelligence Authority
S S S n.a. Government Nonhealth National
Ministry of Islamic Affairs, Dawah, and Guidance
I n.a. n.a. n.a. Government Nonhealth National
Ministry of Media I I I n.a. Government Nonhealth National
General Commission for Audiovisual Media
I I I n.a. Government Nonhealth National
Local media I I I n.a. Government, nongovernment
Nonhealth Local
Ministry of Culture S S S n.a. Government Nonhealth National
Ministry of Economy and Planning
F, S F, S F, S n.a. Government Nonhealth National
General Authority for Statistics
S S S n.a. Government Nonhealth National
Ministry of Sports I n.a. D, I n.a. Government Nonhealth National
Sport clubs I, S I, S I, S n.a. Nongovernment Nonhealth Regional, local
Saudi Customs I I n.a. n.a. Government Nonhealth National
Communications and Information Technology Commission
I I I n.a. Government Nonhealth National
King Faisal Foundation, King Faisal Center for Research and Islamic Studies
S S S n.a. Nongovernment Nonhealth National
King Khalid Foundation S S S n.a. Nongovernment Nonhealth National
King Abdulaziz Center for National Dialogue
S S S n.a. Government Nonhealth National
Saudi Aramco F, I F, I F, I n.a. Nongovernment Nonhealth National
International tobacco companies
O n.a. n.a. n.a. Nongovernment Nonhealth International
Tobacco importers O n.a. n.a. n.a. Nongovernment Nonhealth Local
Local soda and beverage industry
n.a. O n.a. n.a. Nongovernment Nonhealth Local
Local food industry n.a. O n.a. n.a. Nongovernment Nonhealth Local
Civil society organizations I, S I, S I, S n.a. Nongovernment Nonhealth Local, regional, national
Health Council of the Gulf Cooperation Council
D D D n.a. Government Health International
World Health Organization S S S S Nongovernment Health International
(continued)

NCD Stakeholders in Saudi Arabia | 231
REFERENCES
DFiD (Department for international Development). 2003. Tools for Development: A Handbook for Those Engaged in Development Activity. Version 15.1. london: Department for international Development.
FASiD (Foundation for Advanced Studies on international Development). 2008. Project Cycle Management: Management Tool for Development Assistance (Participatory Planning), 7th ed. Tokyo: FASiD.
Heydari, m., H. Seyedin, m. Jafari, and D. Dehnavieh. 2018. “Stakeholder Analysis of iran’s Health insurance System.” Journal of Education and Health Promotion 7: Art. 135. doi: 10.4103/jehp.jehp_69_18.
Hunter, r. F., K. Wickramasinghe, T. Ergüder, A. bolat, H. o. Ari, H. H. Yildirim, P. ursu, et al. 2019. “National Action Plans to Tackle NCDs: role of Stakeholder Network Analysis.” BMJ 365: l1871. doi: 10.1136/bmj.l1871.
SCDC (Saudi Center for Disease Prevention and Control). 2019. Technical Advisory: Kingdom of Saudi Arabia’s Public Health Strategy: Current State Assessment. riyadh: Palladium.
Schmeer, K. 1999. Guidelines for Conducting a Stakeholder Analysis. bethesda, mD: Partnership for Health reform, Abt Associates.
TABLE 10A.1, continued
STAKEHOLDER
BEHAVIORAL RISK FACTORS
TOBACCO USE
UNHEALTHY DIET
PHYSICAL INACTIVITY
BIOLOGICAL RISK FACTORS
TYPE OF STAKEHOLDER SECTOR LEVEL
World Bank S S S S Nongovernment Health, nonhealth
International
United Nations Development Programme
S S S n.a. Nongovernment Health, nonhealth
International
United Nations Children’s Fund
S S S S Nongovernment Health, nonhealth
International
Source: Original compilation for this publication.Note: D = decision-maker. F = funding agency. I = implementing agency. n.a. = not applicable. NCDs = noncommunicable diseases. O = potential opponent. S = likely supporter.

ECO-AUDIT
Environmental Benefits Statement
The World Bank Group is committed to reducing its environmental footprint. In support of this commitment, we leverage electronic publishing options and print-on-demand technology, which is located in regional hubs worldwide. Together, these initiatives enable print runs to be lowered and shipping distances decreased, resulting in reduced paper consumption, chemical use, greenhouse gas emissions, and waste.
We follow the recommended standards for paper use set by the Green Press Initiative. The majority of our books are printed on Forest Stewardship Council (FSC)–certified paper, with nearly all containing 50–100 percent recycled content. The recycled fiber in our book paper is either unbleached or bleached using totally chlorine-free (TCF), processed chlorine–free (PCF), or enhanced elemental chlorine–free (EECF) processes.
More information about the Bank’s environmental philosophy can be found at http://www.worldbank.org/corporateresponsibility.

Saudi Arabia is at an early stage of its demographic transition to an older population, and so it has an opportunity to prepare early for a
rising noncommunicable disease (NCD) epidemic. NCDs, such as cancers, cardiovascular diseases, diabetes, and chronic respiratory diseases and their associated behavioral risk factors—tobacco use, unhealthy diet, and physical inactivity—are an increasing economic and public health challenge. An aging population is expected to significantly increase the prevalence of NCDs and the related demand for costlier health care services.
Interventions and reforms to prevent NCDs, and to minimize current and future treatment costs, are needed now, particularly if Saudi Arabia is to achieve the Vision 2030 goal of increasing life expectancy from 75 years in 2021 to 80 years in 2030. To support strategic planning efforts, Noncommunicable Diseases in Saudi Arabia: Toward Effective Interventions for Prevention assesses the latest evidence on the prevalence and risk factors; explores the health and economic burden of NCDs, as well as their impact on human capital; and identifies key gaps in prevention efforts and ways to address these gaps.
The book discusses the need for a national master plan for NCD prevention—one that is selective and targeted, with a particular focus on improving the implementation of cost-effective interventions and achieving results. To be successful, the national master plan will need to take into account the roles of the different stakeholders and their likely responsibilities in implementation.
The book will be of interest to all those who work on NCDs in Saudi Arabia and beyond.
ISBN 978-1-4648-1717-5
SKU 211717