The Second National Communication of Malta to the United ...
388
THE SECOND COMMUNICATION OF MALTA TO THE UNITED NATIONS FRAMEWORK CONVENTION ON CLIMATE CHANGE May 2010 The Second Communication of Malta to the United Nations Framework Convention on Climate Change Ministry for Resources and Rural Affairs University of Malta THE SECOND COMMUNICATION OF MALTA TO THE UNITED NATIONS FRAMEWORK CONVENTION ON CLIMATE CHANGE May 2010 THE SECOND COMMUNICATION OF MALTA TO THE UNITED NATIONS FRAMEWORK CONVENTION ON CLIMATE CHANGE May 2010
-
Upload
khangminh22 -
Category
Documents
-
view
1 -
download
0
Transcript of The Second National Communication of Malta to the United ...

THE SECOND COMMUNICATION OF MALTA TO THE UNITED NATIONS FRAMEWORK CONVENTION ON CLIMATE CHANGE
May 2010
TThhee SSeeccoonndd CCoommmmuunniiccaattiioonn ooff MMaallttaa ttoo tthhee UUnniitteedd NNaattiioonnss FFrraammeewwoorrkk CCoonnvveennttiioonn oonn CClliimmaattee CChhaannggee MMiinniissttrryy ffoorr RReessoouurrcceess aanndd RRuurraall AAffffaaiirrss UUnniivveerrssiittyy ooff MMaallttaa
THE SECO
ND
COM
MU
NICA
TION
OF M
ALTA
TO TH
E UN
ITED N
ATIO
NS FRA
MEW
ORK CO
NV
ENTIO
N O
N CLIM
ATE CH
AN
GE M
ay 2010 TH
E SECON
D CO
MM
UN
ICATIO
N O
F MA
LTA TO
THE U
NITED
NA
TION
S FRAM
EWO
RK CON
VEN
TION
ON
CLIMA
TE CHA
NG
E May 2010

TThhee SSeeccoonndd NNaattiioonnaall CCoommmmuunniiccaattiioonn ooff
MMaallttaa ttoo tthhee UUnniitteedd NNaattiioonnss FFrraammeewwoorrkk
CCoonnvveennttiioonn oonn CClliimmaattee CChhaannggee
MMaayy 22001100

ii
PPuubblliisshheerr Ministry for Resources and Rural Affairs
EEddiittiinngg Alfred Micallef Charles V Sammut
CCooppyy EEddiittiinngg Noel Aquilina
CCoovveerr IImmaaggee Rene Rossignaud
PPrriinntteerr Caxton Printshop Limited

iii
PPrroojjeecctt CCoooorrddiinnaattiioonn
Ray Piscopo, National Project Director
Godwin Cassar, former National Project Director
Charles V Sammut, National Project Manager
Alfred Micallef, National Expert
LLeeaadd AAuutthhoorrss
Alfred Micallef
Charles V Sammut
CCoonnttrriibbuuttiinngg AAuutthhoorrss
Saviour Vassallo, Michelle Borg, Joanne Attard Baldacchino, Christopher Camilleri,
Robert Ghirlando, Joseph Cachia, Edward A Mallia, Aldo Drago, Gordon Cordina,
Kevin Gatt, Adrian Mallia, Rachel Xuereb, Yury Zammit, Simone Borg

iv
AAcckknnoowwlleeddggeemmeennttss
The Project Team acknowledges the support of numerous individuals, Government and non‐Government officials and organisations, without whose support this Project would not have been completed successfully within. Particular reference is made to the Project Streering Committee and the MEPA climate change unit, led by Michelle Borg and including Miraine Rizzo and Stephen Saliba, whose help and advice were instrumental in ensuring a high quality report on vulnerability and adaptation to climate change. This document could not have reached this stage without widespread consultation with stakeholders. This was achieved through direct consultation and also through the three workshops held during project execution. The Project Team is grateful for the feedback received from participants in these events. The Project team acknowledges the patronage of the Honourable Perit George Pullicino, Minister for Resources and Rural Affairs. Financial support of the Global Environment Facility made possible execution of the Project, whilst support of the United Nations Development Programme was instrumental. The Project Team is particularly indebted to Klara Tothova of the UNDP Country Office in Bratislava, who provided continuous support and invaluable advice throughout the Project.

1
CCOONNTTEENNTTSS
CONTENTS .......................................................................................................................... 1
LIST OF FIGURES .................................................................................................................. 9
LIST OF TABLES .................................................................................................................. 16
INTRODUCTORY NOTE ....................................................................................................... 21
PREFACE ............................................................................................................................ 23
EXECUTIVE SUMMARY ....................................................................................................... 25
NATIONAL CIRCUMSTANCES .............................................................................................. 40
1.0 Introduction ............................................................................................................. 40
1.1 Geography ................................................................................................................ 40
1.2 Climate ..................................................................................................................... 40
1.3 Demography ............................................................................................................. 41
1.4 Economy ................................................................................................................... 43 1.4.1 Productive Activties ............................................................................................. 45 1.4.2 Expenditure Patterns ........................................................................................... 49 1.4.3 Long Term Economic Trends ............................................................................... 52 1.4.4 Long Term Policy Orientations ............................................................................ 53
1.5 Education and Health ............................................................................................... 54
1.6 Environmental Vulnerability and Concerns ............................................................. 54
1.7 Towards Sustainable Development ......................................................................... 55
1.8 Institutional Framework for the Preparation of National Communications............ 56
1.9 Malta’s Status vis‐à‐vis the UNFCCC ........................................................................ 56
PART I: GREENHOUSE GAS EMISSION ................................................................................. 57
NATIONAL GREENHOUSE GAS EMISSIONS INVENTORY FOR MALTA 1990 ‐ 2007 ................ 58
2.0 Executive Summary .................................................................................................. 58
2.1 Introduction ............................................................................................................. 59 2.1.1 Climate Change Obligations ................................................................................. 59 2.1.2 GHG Emissions Inventories in Malta ................................................................... 59
2.2 General Trends in GHG Emissions ............................................................................ 60
2.3 GHG Emissions by Sector ......................................................................................... 63 2.3.1 Energy .................................................................................................................. 63
2.3.1.1 Electric Power Generation .......................................................................... 63 2.3.1.2 Transport ..................................................................................................... 64 2.3.1.3 Manufacturing and Construction ................................................................ 65 2.3.1.4 Fuel Combustion in Commercial, Industrial and Residential Categories .... 66
2.3.2 Industrial Processes and Solvent Use .................................................................. 66

2
2.3.3 Agriculture ........................................................................................................... 66 2.3.4 Land use, Land‐use Change and Forestry ............................................................ 67 2.3.5 Waste ................................................................................................................... 68
2.4 Data Collection Issues .............................................................................................. 71
GREENHOUSE GAS ABATEMENT ANALYSIS ......................................................................... 72
3.0 Executive Summary .................................................................................................. 72
3.1 Introduction ............................................................................................................. 73
3.2 The National Greenhouse Gas Inventory ................................................................. 74
3.3 Energy Production as the Main Source of Greenhouse Gas Emissions ................... 74
3.4 Basis for Abatement Strategies Related to Energy .................................................. 74
3.5 Fuel Imports ............................................................................................................. 74
3.6 National Allocation Plans in Relation to Other Documents ..................................... 78
3.7 Energy Industries ..................................................................................................... 79 3.7.1 Conventional Electricity Generation .................................................................... 79
3.7.1.1 Energy Conservation ................................................................................... 79 3.7.1.2 Efficient Conversion of Energy .................................................................... 80 3.7.1.3 Major Fuel Switch to Natural Gas ............................................................... 81 3.7.1.4 The Inter‐connector .................................................................................... 83
3.7.2 Renewable Sources of Energy ............................................................................. 84 3.7.3 Efficient Distribution of Electricity ....................................................................... 85 3.7.4 Domestic (and Possibly Commercial) Lighting and Street Lighting ..................... 87 3.7.5 Use of Electrical Energy for Water Production and Extraction ........................... 88 3.7.6 Energy Use in Industry ......................................................................................... 89
3.8 Use of Alternative Fuels in Industry ......................................................................... 91 3.8.1 Switching to Cleaner Fossil Fuels ......................................................................... 91 3.8.2 Bio‐Fuels .............................................................................................................. 91
3.9 Use of Energy in Hotels, Hospitals and in Homes .................................................... 92 3.9.1 Heating and Cooling ............................................................................................. 92 3.9.2 Mitigation Potential of EU 2006 Provisions for Energy Efficiency in the Building Fabric .................................................................................................................. 94 3.9.3 Air Infiltration in Buildings ................................................................................... 95 3.9.4 New Developments: Mater Dei Hospital and Smart City at Ricasoli ................... 95 3.9.5 Use of Renewable Energy in Hotels, Public Buildings and Private Houses .......... 97
3.10 Energy in Transport .................................................................................................. 99
3.11 Industrial Processes ............................................................................................... 101
3.12 Solvent and Other Product Use ............................................................................. 102
3.13 Agriculture .............................................................................................................. 102
3.14 Land‐Use, Land‐Use Change and Forestry ............................................................. 103
3.15 Waste: Sources for Current and Future Projects ................................................... 103
3.16 Projections ............................................................................................................. 104
3.17 Emissions Trading ................................................................................................... 109
3.18 Financial and Economic Considerations ................................................................. 109

3
PART II: THE CLIMATE ...................................................................................................... 111
HISTORICAL TRENDS IN METEO‐MARINE INDICATORS OF CLIMATE CHANGE .................... 112
4.0 Executive Summary ................................................................................................ 112
4.1 Introduction ........................................................................................................... 114
4.2 Meteorological Indicators ...................................................................................... 115 4.2.1 Air Temperature and Precipitation .................................................................... 115 4.2.2 Wind Magnitude ................................................................................................ 127 4.2.3 Other Weather Parameters ............................................................................... 131
4.3 Marine Indicators ................................................................................................... 131 4.3.1 Sea Level Change ............................................................................................... 131 4.3.2 Sea Surface Temperature .................................................................................. 136
FUTURE CLIMATE SCENARIOS .......................................................................................... 139
5.0 Executive Summary ................................................................................................ 139
5.1 Objectives of the Study .......................................................................................... 140
5.2 What is MAGICC/SCENGEN? .................................................................................. 140
5.3 Procedural Scheme for the Generation of Global Climate Scenarios using MAGICC ............................................................................................................................... 142
5.3.1 Emission Scenarios ............................................................................................. 143 5.3.2 Climate Models .................................................................................................. 143 5.3.3 Model Parameters ............................................................................................. 144 5.3.4 Model Runs ........................................................................................................ 147
5.4 Sample Results from MAGICC and Some Observations ......................................... 147 5.4.1 Projections of Global‐mean Atmospheric Concentrations of Greenhouse Gases ........................................................................................................................... 148 5.4.2 Global Scenarios for Change in Temperature .................................................... 149 5.4.3 Global Scenarios for Sea Level Change .............................................................. 154
5.5 Procedural Scheme for the Generation of Regional Scenarios using SCENGEN .... 160 5.5.1 Atmospheric‐Ocean General Circulation Models .............................................. 162 5.5.2 Diagnostic Analysis of the Atmosphere‐Ocean General Circulation Models for the Central Mediterranean ....................................................................................... 164
5.6 Sample Results from SCENGEN and Some Observations with a Discussion on Uncertainties ....................................................................................................................... 168
5.6.1 Regional Scenarios for Change in Temperature, its Variability and Associated Uncertainties ................................................................................................ 169 5.6.2 Regional Scenarios for Change in Precipitations, its Variability and Associated Uncertainties ................................................................................................ 174 5.6.3 Regional Scenarios for Change in Mean Sea Level Pressure, Its Variability and Associated Uncertainties ......................................................................................... 177 5.6.4 Regional Scenarios for Sea Level Change .......................................................... 181
5.7 Summary of the Main Results and Conclusions ..................................................... 183
PART III: VULNERABILITY AND ADAPTATION .................................................................... 185
WATER RESOURCES ......................................................................................................... 186

4
6.0 Executive Summary ................................................................................................ 186
6.1 Introduction ........................................................................................................... 187
6.2 Climate Trends and Scenarios ................................................................................ 188
6.3 Vulnerability and Adaptation ................................................................................. 191 6.3.1 Adaptation Strategy ........................................................................................... 197
6.3.1.1 Governance (Legislation, Policy, Regulation and Institutions) ................. 200 6.3.1.2 Capacity Building ....................................................................................... 204 6.3.1.3 Research and Monitoring .......................................................................... 204 6.3.1.4 Education and Communications ............................................................... 206 6.3.1.5 Acceptance of Certain Impacts ................................................................. 207 6.3.1.6 Prevention ................................................................................................. 208
LAND USE ........................................................................................................................ 211
7.0 Executive Summary ................................................................................................ 211
7.1 Introduction ........................................................................................................... 211 7.1.1 Land Cover and Land Use Issues in the Maltese Islands.................................... 212 7.1.2 Summary of Malta’s First National Communication to the UNFCCC ................ 213
7.2 Climate Change Scenarios ...................................................................................... 213
7.3 Climate Change Impacts......................................................................................... 215 7.3.1 Increase in Sea‐level and Coastal Inundation (including from storm surges) ... 215 7.3.2 Increase in Rainfall Intensity .............................................................................. 220 7.3.3 Drought Stresses on Agriculture from Reduced Annual Precipitation .............. 220 7.3.4 High Wind Impacts on Structures and Infrastructure from Increased Frequency of Extreme Weather Events. ......................................................................... 221 7.3.5 Secondary Impacts on Property Values and Insurance ..................................... 222
7.4 Adaptation Measures ............................................................................................. 222 7.4.1 General Measures .............................................................................................. 223 7.4.2 Adapting to Sea‐Level Rise ................................................................................ 225 7.4.3 Adapting to Increased Rainfall Intensity and Flooding Events .......................... 226 7.4.4 Adapting to Drought Stress and Classification .................................................. 227 7.4.5 Adapting to High Winds and Extreme Weather Events ..................................... 228 7.4.6 Adapting Buildings to Climate Change ‐ Property Values and Insurance .......... 228
INFRASTRUCTURE ............................................................................................................ 229
8.0 Executive Summary ................................................................................................ 229
8.1 Introduction ........................................................................................................... 230
8.2 Infrastructure in Malta ........................................................................................... 230 8.2.1 Energy ................................................................................................................ 230 8.2.2 Fuel Storage ....................................................................................................... 231 8.2.3 Transport ........................................................................................................... 231 8.2.4 Telecommunications ......................................................................................... 231 8.2.5 Waste ................................................................................................................. 233 8.2.6 Buildings ............................................................................................................. 233 8.2.7 Heritage Protection ........................................................................................... 234 8.2.8 The Coast ........................................................................................................... 235
8.3 Summary of Climate Change Scenarios ................................................................. 235

5
8.4 Impacts of Climate Change on Infrastructure ........................................................ 237 8.4.1 Energy ................................................................................................................ 237 8.4.2 Transport ........................................................................................................... 238 8.4.3 Telecommunications ......................................................................................... 239 8.4.4 Buildings ............................................................................................................. 239 8.4.5 Waste ................................................................................................................. 240
8.5 Adaptation ............................................................................................................. 241 8.5.1 Energy ................................................................................................................ 242 8.5.2 Transport ........................................................................................................... 242 8.5.3 Telecommunication ........................................................................................... 243 8.5.4 Buildings ............................................................................................................. 243 8.5.5 Waste ................................................................................................................. 244
8.6 Discussion and Conclusions ................................................................................... 245
TERRESTRIAL AND MARINE ECOSYSTEMS ......................................................................... 246
9.0 Executive Summary ................................................................................................ 246
9.1 Introduction ........................................................................................................... 247
9.2 Maltese Terrestrial Ecosystems ............................................................................. 247
9.3 Maltese Freshwater and Marine Ecosystems ........................................................ 248
9.4 Current Status of Terrestrial and Marine Biodiversity ........................................... 248
9.5 Climate Change Scenarios ...................................................................................... 248
9.6 General Climate Change Impacts on Biodiversity .................................................. 250
9.7 Consequences of Climate Change on Terrestrial Ecosystems ............................... 251 9.7.1 Loss of Biodiversity and Increased Risk of Extinction ........................................ 251 9.7.2 Shift in the Distribution of Species .................................................................... 252 9.7.3 Sea Level Rise ..................................................................................................... 253 9.7.4 Temperature Increase ....................................................................................... 254 9.7.5 Decrease in Rainfall ........................................................................................... 257 9.7.6 Effects of Carbon Dioxide Emissions on Terrestrial Ecosystems ....................... 258
9.8 Consequences of Climate Change on Marine Ecosystems .................................... 259 9.8.1 Temperature Increase ....................................................................................... 260 9.8.2 Changes in Coastal Hydrodynamics ................................................................... 262 9.8.3 Changes in Deep Water Circulation ................................................................... 262 9.8.4 Increase in Sea‐Level ......................................................................................... 263 9.8.5 Increase in the Intensity of Rainfall Events ........................................................ 263 9.8.6 Increase in Carbon Dioxide ................................................................................ 264
9.9 Adaptation Measures ............................................................................................. 264
9.10 Conservation Strategies ......................................................................................... 266 9.10.1 Short‐term Goals ............................................................................................... 266 9.10.2 Longer‐term Goals ............................................................................................. 267 9.10.3 Managing Stresses on the Environment ............................................................ 267 9.10.4 Facilitating Migration ......................................................................................... 268 9.10.5 Habitat Restoration ........................................................................................... 269 9.10.6 Natural Resources Management ....................................................................... 269 9.10.7 Expanding Reserves and Other Protected Areas ............................................... 270 9.10.8 Environmental Monitoring ................................................................................ 270

6
9.10.9 Increase Knowledge Base .................................................................................. 271
FISHERIES AND AQUACULTURE ........................................................................................ 272
10.0 Executive Summary ................................................................................................ 272
10.1 Introduction ........................................................................................................... 273
10.2 The Maltese Fisheries Sector ................................................................................. 273 10.2.1 Fish Stocks .......................................................................................................... 274 10.2.2 Landings from Marine Capture Fisheries ........................................................... 276 10.2.3 The Aquaculture Industry .................................................................................. 277
10.3 Climate Change Scenarios ...................................................................................... 278
10.4 Impacts ................................................................................................................... 279
10.5 Adaptation ............................................................................................................. 281 10.5.1 Fisheries ............................................................................................................. 283 10.5.2 Aquaculture ....................................................................................................... 284
10.6 Discussion and Conclusions ................................................................................... 284
AGRICULTURE .................................................................................................................. 286
11.0 Executive Summary ................................................................................................ 286
11.1 Introduction ........................................................................................................... 287
11.2 Summary of Malta’s First National Communication to the UNFCCC ..................... 287
11.3 Agriculture in Malta ............................................................................................... 287
11.4 Climate Change Scenarios ...................................................................................... 290
11.5 Impacts of Climate Change on Agriculture ............................................................ 291 11.5.1 Impact on Soils ................................................................................................... 292 11.5.2 Impact on Potato ............................................................................................... 293 11.5.3 Impact on Vineyards .......................................................................................... 294 11.5.4 Impact on Livestock ........................................................................................... 295 11.5.5 Impact on Agriculture Infrastructure ................................................................. 295 11.5.6 Alteration of Insect and Disease Distribution .................................................... 296
11.6 Adaptation ............................................................................................................. 296 11.6.1 Planning Policy ................................................................................................... 296 11.6.2 Code of Good Agricultural Practices .................................................................. 297 11.6.3 Rural Development Plans .................................................................................. 297 11.6.4 Proposals for Adaptation Measures .................................................................. 299 11.6.5 Preserving Soil ................................................................................................... 300
11.7 Adaptation Measures ............................................................................................. 301 11.7.1 Potato Cultivation .............................................................................................. 301 11.7.2 Vines .................................................................................................................. 302 11.7.3 Livestock ............................................................................................................ 302
11.8 Discussion and Conclusions ................................................................................... 302
MIGRATION ..................................................................................................................... 304
12.0 Executive Summary ................................................................................................ 304
12.1 Introduction ........................................................................................................... 305

7
12.2 Climate Change Scenarios ...................................................................................... 307 12.2.1 The Local Dimension .......................................................................................... 308
12.3 Vulnerability and Adaptation ................................................................................. 310 12.3.1 Adaptation Strategy ........................................................................................... 310
12.3.1.1 Governance (Legislation, Policy, Regulation and Institutions) ................. 312 12.3.1.2 Capacity Building ....................................................................................... 313 12.3.1.3 Research and Monitoring .......................................................................... 314 12.3.1.4 Education and Communications ............................................................... 314 12.3.1.5 Acceptance of Certain Impacts ................................................................. 315
HEALTH ............................................................................................................................ 317
13.0 Executive Summary ................................................................................................ 317
13.1 Introduction ........................................................................................................... 318
13.2 Climate Change Scenarios ...................................................................................... 319
13.3 Impacts on and Vulnerability of the Health Sector ................................................ 320 13.3.1 Increased Temperature Impacts ........................................................................ 320 13.3.2 Impacts of Changes in Precipitation .................................................................. 322
13.4 Adaptation ............................................................................................................. 323 13.4.1 Current Setup ..................................................................................................... 323 13.4.2 Recommendations ............................................................................................. 324
13.5 Discussion and Conclusions ................................................................................... 325
ECONOMY ....................................................................................................................... 327
14.0 Executive Summary ................................................................................................ 327
14.1 Introduction ........................................................................................................... 328
14.2 The Maltese Economy and Society ........................................................................ 330
14.3 Vulnerability and Adaptation to Climate Change of Small Island States ............... 330
14.4 Malta’s Economic Vulnerability and Adaptation to Climate Change ..................... 331 14.4.1 Vulnerability ....................................................................................................... 331 14.4.2 Vulnerability of the Production Sector .............................................................. 332
14.4.2.1 Agriculture ................................................................................................ 332 14.4.2.2 Fisheries .................................................................................................... 333 14.4.2.3 Manufacturing .......................................................................................... 334 14.4.2.4 Market Services ......................................................................................... 334
14.4.3 Vulnerability of Expenditure Activities .............................................................. 337 14.4.4 Potential for Adaptation .................................................................................... 340
14.5 Conclusions and Recommendations ...................................................................... 342
PART IV: CONCLUSION ..................................................................................................... 343
GAPS AND CONSTRAINTS IN ADDRESSING CLIMATE CHANGE ISSUES ............................... 344
15.0 Executive Summary ................................................................................................ 344
15.1 Introduction ........................................................................................................... 345
15.2 Gaps and constraints related to mitigation measures ........................................... 346 15.2.1 Institutional Organization .................................................................................. 346

8
15.2.2 Methodology ..................................................................................................... 348 15.2.3 Technical Gaps and Constraints ......................................................................... 349 15.2.4 Capacity Building ............................................................................................... 349
15.3 Gaps and constraints related to adaptation measures .......................................... 350 15.3.1 Institutional Organization .................................................................................. 351 15.3.2 Methodology ..................................................................................................... 352 15.3.3 Technical gaps in the implementation of adaptation measures ....................... 352 15.3.4 Capacity building ............................................................................................... 353
15.4 Recommendations ................................................................................................. 353 15.4.1 Institutional Organization .................................................................................. 354 15.4.2 Methodology ..................................................................................................... 354 15.4.3 Technical Needs ................................................................................................. 355 15.4.4 Capacity building ............................................................................................... 356
15.5 Conclusions ............................................................................................................ 357
REFERENCES .................................................................................................................... 360
LIST OF WEBSITES ............................................................................................................ 379
9
LLIISSTT OOFF FFIIGGUURREESS
Figure 1.1: Economic Growth in Malta [235, 278]. 44
Figure 2.1: Emissions per capita (in ktonnes CO2) & population [7]. 60
Figure 2.2: Emissions per unit GDP and GDP [7]. 61
Figure 2.3: Electricity generated & attendant CO2 emissions [7]. 62
Figure 2.4: Electricity generated & Efficiency [7]. 63
Figure 2.5: Transport CO2 emissions [7]. 64
Figure 2.6: Number of licensed vehicles & Road Transport CO2 emissions [7]. 65
Figure 2.7: Agriculture sector emissions in equivalent CO2 [7]. 68
Figure 2.8: Total annual CO2 removals [7]. 69
Figure 2.9: Emissions from the waste sector [7]. 69
Figure 2.10: Emissions & Quantities of Waste Treated at Sant’Antnin [7]. 70
Figure 3.1: Fossil fuel imports for 2007 [19]. 77
Figure 3.2: Re‐categorisation of fossil fuel imports for 2007. 78
Figure 3.3: Allowances for emission of CO2 according to the First [20 ] and Second [21] National Allocation Plans. 79
Figure 3.4: Conversion (thermal) efficiency of Enemalta Corporation’s generating plants for 2005‐2006, together with the nominal power, electrical energy generated and demand on the individual plants. 80
Figure 3.5: Electricity demand for the period 2005‐2020 (adapted from [17]). 105
Figure 3.6: Annual increase in electricity generation over the period 2002‐2008. 106
Figure 3.7: Projection of electricity demand for the period 2005‐2025. 107
Figure 3.8: Projection of CO2 emissions for the period 2005‐2025. 108
Figure 3.9: Actual (2001‐2008) and projected (2009‐2025) electricity generation. 108
Figure 4.1: Seasonality of air temperature at Luqa over the period 1922‐2005. The central curve gives the average for each month. 116

10
Figure 4.2: Seasonality of precipitation calculated from monthly total precipitation at Luqa over the period 1929‐2005. 117
Figure 4.3: Time series of annually averaged monthly mean temperatures at Luqa. (y=0.0071x+18.488; R2=0.13). 117
Figure 4.4: Annual trends in surface air temperature, for the period 1901‐2000, based on instrumental measurements. Black outlining surrounds those regions with statistically significant trends (at the 95% confidence level) [54]. 118
Figure 4.5: Time series of temperature anomaly averaged globally (dashed line) and in Luqa (full line) with respect to the climatological mean over the period 1961‐1990 [251]. 119
Figure 4.6: Seasonal trends in air temperature over the period 1922‐2005 from observations in Luqa. 120
Figure 4.7: Comparison of the recorded highest and lowest temperatures with the mean monthly air temperature at Luqa over the period 1922‐2006. 120
Figure 4.8: Time series of observed instantaneous temperature maxima in Luqa for years 1922‐2005. (y=0.0298x+35.864; R2=0.0894). 121
Figure 4.9: Time series of observed instantaneous temperature minima in Luqa for years 1922‐2005. (y=–0.0154x+4.8404; R2=0.0793). 121
Figure 4.10: Annual occurrence of observed 3‐hour temperature maxima above set thresholds in Luqa for years 1979‐2006. 122
Figure 4.11: Comparison of instantaneous temperature maxima in Luqa over the periods 1981‐1990 and 1991‐2000. 123
Figure 4.12: Comparison of instantaneous temperature minima in Luqa over the periods 1991‐2000 and 2001‐2006. 123
Figure 4.13: Average, Minimum and Maximum total precipitation by month in Luqa over the period 1929‐2005. 124
Figure 4.14: Spatial distribution of annual precipitation trends (mm/decade) in Europe for the period 1961‐2006; Data are in mm per decade, blue means an increase, red a decrease. (Source: The climate dataset is from [252] and the data providers in [253]. 125
Figure 4.15: Deviation of precipitation in Luqa from the mean over the period 1929‐2005. 126
Figure 4.16: Deviation of precipitation at Malta Drydocks from the mean over the period 1851‐1966. 126
Figure 4.17: Time series of yearly total number of days with rain from observations at Luqa over the period 1948‐2005. (y=–0.141x+87.953; R2=0.0351). 127

11
Figure 4.18: Time series of annual highest precipitation over 24 hours from observations at Luqa over the period 1922‐2005. (y=0.2474x+53.4277; R2=0.0403). 128
Figure 4.19: Extremes of total precipitation over 24 hours from observations at Luqa over the period 1929‐2005. 128
Figure 4.20: Seasonality of wind magnitude calculated from monthly means at Luqa over the period 1948‐2005. 129
Figure 4.21: Comparison of mean wind speed at Luqa over successive 10‐year periods from 1946‐2005; values are compared on a monthly and annual basis. 129
Figure 4.22: Highest maximum wind gust at Luqa over the period 1955‐2005. 130
Figure 4.23: Time series of days with gusts ≥ 34 knots in Luqa over the period 1961‐ 2005. 130
Figure 4.24: Map of the variation in SLT trends in the Mediterranean (1992‐2007) based on satellite altimeter data. 133
Figure 4.25: Monthly averaged sea level observations on the northern coastline of the Maltese Islands for the period May 1993‐December 2006. The figure includes a linear and a polynomial fit. [Source PO‐Unit, Malta, 2008]. 134
Figure 4.26: Globally averaged sea level trends from observations since 1870 [57]. The reconstructed sea level fields are represented in red, tide gauge measurements in blue and satellite altimetry measurements are in black. 135
Figure 4.27: Seasonality of sea surface temperature from the mean monthly SST in the Maltese coastal waters over the period 1977‐2005. 136
Figure 4.28: Time series of annually averaged sea surface temperature observations in Delimara over the period 1978‐2005. (y=0.0496x+19.109; R2=0.6108). 137
Figure 4.29: Map of changes in the sea surface temperature in the European Regional Seas in the period 1982‐2006. [Source: [62] compiled for EEA by the Istituto Nazionale di Geofisica e Vulcanologia (INGV) based on datasets made available by the Hadley Center [254]. 137
Figure 5.1: A schematic diagram depicting the main modules of the two models MAGICC and SCENGEN, their coupling, inputs and possible outputs. 142
Figure 5.2: A schematic listing the six climate models and the two emission scenarios in MAGICC, which were used in the study, and the obtained outputs from model runs. 144
Figure 5.3: Time series of global‐mean carbon dioxide atmospheric concentration (in parts per million) with the associated possible range, for the
period 1990‐2100, for climate sensitivities (a) 1.5 (b) 3.0 and (c) 6.0 C,

12
generated using the HadCM3 climate model with the SRES no‐climate‐policy emission scenario A1T‐MES. 150
Figure 5.4: Time series of global‐mean methane atmospheric concentration (in parts per billion) with the associated possible range, for the period 1990‐2100, generated using the HadCM3 climate model with the SRES no‐climate‐policy emission scenario A1T‐MES. The same result is obtained for each of the three
climate sensitivities: 1.5, 3.0 and 6.0 C. 151
Figure 5.5: Time series of global‐mean nitrous oxide atmospheric concentration (in parts per billion), for the period 1990‐2100, generated using the HadCM3 climate model with the SRES no‐climate‐policy emission scenario A1T‐MES. The same result is obtained for each of the three climate sensitivities: 1.5, 3.0 and
6.0 C. 151
Figure 5.6: Time series of global‐mean carbon dioxide atmospheric concentration (in parts per million) with the associated possible range, for the
period 1990‐2100, for climate sensitivities (a) 1.5 (b) 3.0 and (c) 6.0 C, generated using the HadCM3 climate model with the emission stabilisation scenario WRE550. 152
Figure 5.7: Time series of global‐mean methane atmospheric concentration (in parts per million) with the associated possible range, for the period 1990‐2100, generated using the HadCM3 climate model with the emission stabilisation scenario WRE550. The same result is obtained for each of the three climate
sensitivities: 1.5, 3.0 and 6.0 C. 153
Figure 5.8: Time series of global‐mean nitrous oxide atmospheric concentration (in parts per billion), for the period 1990‐2100, generated using the HadCM3 climate model with the emission stabilisation scenario WRE550. The same
result is obtained for each of the three climate sensitivities: 1.5, 3.0 and 6.0 C. 153
Figure 5.9: Time series of global‐mean temperature increase (in C) for the period 1990‐2100, for climate sensitivities 1.5, 3.0 and 6.0 C, generated using the HadCM3 climate model with the (a) SRES no‐climate‐policy emission scenario A1T‐MES and (b) emission stabilisation scenario WRE550. 155
Figure 5.10: Average and associated minimum and maximum of the global‐
mean temperature increase (in C) generated by the six climate models for
various years within the period 2020‐2100, for climate sensitivity of 3.0 C, for the (a) SRES no‐climate‐policy emission scenario A1T‐MES and (b) emission stabilisation scenario WRE550. 156
Figure 5.11: Percentage difference between each of the six climate models and the mean of all six models for the global‐mean temperature increase in 2100,
for a climate sensitivity of 3.0 C, for each of the two scenarios considered i.e. the emission stabilisation scenario WRE550 and the SRES no‐climate‐policy emission scenario A1T‐MES. 157
Figure 5.12: Time series of global‐mean sea level rise (in cm) for the period
1990‐2100, for climate sensitivities 1.5, 3.0 and 6.0 C, generated using the

13
HadCM3 climate model with the (a) SRES no‐climate‐policy emission scenario A1T‐MES and (b) emission stabilisation scenario WRE550. 158
Figure 5.13: Average and associated minimum and maximum of the global‐mean sea level rise (in cm) generated by the six climate models for various
years within the period 2020‐2100, for climate sensitivity of 3.0 C, for the (a) SRES no‐climate‐policy emission scenario A1T‐MES and (b) emission stabilisation scenario WRE550. 159
Figure 5.14: Percentage difference between each of the six climate models and the mean of all six models for the global‐mean sea level rise in 2100, for a
climate sensitivity of 3.0 C, for each of the two scenarios considered i.e. the emission stabilisation scenario WRE550 and the SRES no‐climate‐policy emission scenario A1T‐MES. 160
Figure 5.15: A schematic showing the outputs of SCENGEN, together with the climate model and emission scenario adopted for regional scale modelling. Explanatory notes are included. 162
Figure 5.16: Projections of annual and seasonal average increase in
temperature (in C) for the region of the Maltese Islands for the years 2025, 2050, 2075 and 2100. Note that the scenario year is the central year for a climate averaging interval of 30 years. 170
Figure 5.17: Projections of monthly average increase in temperature (in C) for the region of the Maltese Islands for the years 2025, 2050, 2075 and 2100. Note that the scenario year is the central year for a climate averaging interval of 30 years. 170
Figure 5.18: Projections of percentage change in annual and seasonal temperature variability for the region of the Maltese Islands for the years 2025, 2050, 2075 and 2100. The temporal standard deviation is taken as a measure of variability. Note that the scenario year is the central year for a climate averaging interval of 30 years. 171
Figure 5.19: Error (model result less the corresponding observed data for the present day climate i.e. base year 2000) in annual and seasonal average
increase in temperature (in C) for the region of the Maltese Islands. 172
Figure 5.20: Uncertainty in annual and seasonal average increase in temperature expressed as the inter‐model signal‐to‐noise ratio (see text for definition) for temperature results, for the years 2025, 2050, 2075 and 2100. Note that the scenario year is the central year for a climate averaging interval of 30 years. 173
Figure 5.21: Uncertainty in change in temperature variability expressed as the inter‐model signal‐to‐noise ratio (see text for definition) for results of temperature variability i.e. temporal standard deviation, for the years 2025, 2050, 2075 and 2100. Note that the scenario year is the central year for a climate averaging interval of 30 years. 173

14
Figure 5.22: Projections of annual and seasonal average percentage change in precipitation for the region of the Maltese Islands for the years 2025, 2050, 2075 and 2100. Note that the scenario year is the central year for a climate averaging interval of 30 years. 174
Figure 5.23: Projections of monthly average percentage change in precipitation for the region of the Maltese Islands for the years 2025, 2050, 2075 and 2100. Note that the scenario year is the central year for a climate averaging interval of 30 years. 175
Figure 5.24: Projections of percentage change in annual and seasonal precipitation variability for the region of the Maltese Islands for the years 2025, 2050, 2075 and 2100. The temporal standard deviation is taken as a measure of variability. Note that the scenario year is the central year for a climate averaging interval of 30 years. 175
Figure 5.25: Percentage error (model result less the corresponding observed value for the present day climate i.e. base year 2000, divided by the observed data and then expressed as a percentage) in annual and seasonal average percentage change in precipitation for the region of the Maltese Islands. 176
Figure 5.26: Uncertainty in annual and seasonal average change in precipitation expressed as the inter‐model signal‐to‐noise ratio (see text for definition) for precipitation results, for the years 2025, 2050, 2075 and 2100. Note that the scenario year is the central year for a climate averaging interval of 30 years. 177
Figure 5.27: Uncertainty in change in precipitation variability expressed as the inter‐model signal‐to‐noise ratio (see text for definition) for results of precipitation variability i.e. temporal standard deviation, for the years 2025, 2050, 2075 and 2100. Note that the scenario year is the central year for a climate averaging interval of 30 years. 178
Figure 5.28: Times more chance of decrease in annual and seasonal average precipitation for the region of the Maltese Islands for the years 2025, 2050, 2075 and 2100. Note that the scenario year is the central year for a climate averaging interval of 30 years. 178
Figure 5.29: Projections of annual and seasonal average change in mean sea level pressure (in hPa) for the region of the Maltese Islands for the years 2025, 2050, 2075 and 2100. Note that the scenario year is the central year for a climate averaging interval of 30 years. 179
Figure 5.30: Projections of monthly average change in mean sea level pressure (in hPa) for the region of the Maltese Islands for the years 2025, 2050, 2075 and 2100. Note that the scenario year is the central year for a climate averaging interval of 30 years. 180
Figure 5.31: Projections of percentage change in annual and seasonal mean sea level pressure variability for the region of the Maltese Islands for the years 2025, 2050, 2075 and 2100. The temporal standard deviation is taken as a measure of variability. Note that the scenario year is the central year for a climate averaging interval of 30 years. 180

15
Figure 5.32: Error (model result less the corresponding observed data for the present day climate i.e. base year 2000) in annual and seasonal average change in mean sea level pressure (in hPa) for the region of the Maltese Islands. 181
Figure 5.33: Uncertainty in annual and seasonal average change in mean sea level pressure expressed as the inter‐model signal‐to‐noise ratio (see text for definition) for pressure results, for the years 2025, 2050, 2075 and 2100. Note that the scenario year is the central year for a climate averaging interval of 30 years. 182
Figure 5.34: Uncertainty in change in mean sea level pressure variability expressed as the inter‐model signal‐to‐noise ratio (see text for definition) for results of pressure variability i.e. temporal standard deviation, for the years 2025, 2050, 2075 and 2100. Note that the scenario year is the central year for a climate averaging interval of 30 years. 182
Figure 5.35: Probability of increase (see text for definition) in annual and seasonal average mean sea level pressure for the region of the Maltese Islands for the years 2025, 2050, 2075 and 2100. Note that the scenario year is the central year for a climate averaging interval of 30 years. 183
Figure 7.1: Digital elevation model of Mellieħa Bay today and with a sea‐level rise of 0.5m. 218
Figure 7.2: Digital elevation model of Salina Bay today and with a sea‐level rise of 0.5m. 219
Figure 8.1: Density of development within one kilometre buffer from the coast (Year 2004) [111]. 236
Figure 8.2: Generated electrical power: 2000‐2006 [115]. 238
Figure 10.1: State of commercial fish stocks in the Mediterranean Sea up to 2005 [191]. 275
Figure 11.1: Number of holdings by class size [212]. 288
Figure 11.2: The composition of the Utilised Agricultural Areas (in hectares) [212]. 289
Figure 13.1: Pathway by which climate change affects health [217]. 318
Figure 13.2: Schematic diagram of climate change impacts on health [283]. 320

16
LLIISSTT OOFF TTAABBLLEESS
Table 1.1: Maltese Demography [233]. 43
Table 1.2: The composition of GDP in Malta [235]. 45
Table 1.3: Public Sector Output: 2004‐2007 [235]. 47
Table 1.4: The Composition of the Manufacturing Sales: 2004‐2007 [236]. 48
Table 1.5: The Composition of Expenditure in Malta [235]. 50
Table 1.6: The Composition of Private Consumption [235]. 51
Table 2.1: Livestock type and animal number [7]. 67
Table 3.1: Malta’s National Greenhouse Gas Inventory for 2007 [18] according to categories as defined by the IPCC. 75
Table 3.2: Malta’s greenhouse gas emissions for 2007 in categories other than those listed in Table 3.1, including international bunkering, aviation and marine. 76
Table 3.3: Greenhouse gas emission sources and sinks in descending order of emissions, for Malta in 2007. 76
Table 3.4: End‐use by sector of electrical energy generated on annual basis from 2001 to 2008. 80
Table 3.5: Scenarios from the report on Malta’s “Technology Needs for Greenhouse Gas Emission Reduction” [28]. 82
Table 3.6: CO2 emissions associated with electricity generation (actual and modelled) assuming fuel burning patterns in 2000 [28]. 83
Table 3.7: Differences in CO2 emissions between the normal operative scenario (1) and the other scenarios. 83
Table 3.8: Renewable energy source/technology potential for Malta. 86
Table 3.9: Water production by reverse osmosis from August 2006 to July 2007. 88
Table 3.10: Specific energy consumption for the production and distribution of desalinated sea water at the individual reverse osmosis plants [40]. 89
Table 3.11: The effect of a building’s external surface on CO2 emissions (roof U‐value for the local case: 2.46 W/m2K and an operation spanning 120 days). 94
Table 3.12: The effect of a building’s external surface on CO2 emissions (roof U‐value for the EU case: 0.59 Wm/2K and an operation spanning 120 days). 94

17
Table 3.13: Data relating to the impact that changes in the indoor set temperature and unwanted air infiltration have on electricity consumption and related CO2 emissions in summer. 96
Table 3.14: Data relating to the impact that changes in the indoor set temperature and unwanted air infiltration have on electricity consumption and related CO2 emissions in winter. 96
Table 3.15: Projected increases in energy demand by new on‐going or planned developments. 98
Table 3.16: CO2‐equivalent emissions from industrial processes by source. 101
Table 3.17: CO2‐equivalent emissions from agriculture by source. 102
Table 3.18: CO2‐equivalent emissions from waste by source. 103
Table 3.19: Anticipated electrical energy demand [16]. 104
Table 3.20: Comparison of projected and actual values for electrical energy generated for the period 2006‐2008. 105
Table 3.21: Projection of electricity demand and associated CO2 emissions for the period 2005‐2025. 107
Table 4.1: Comparison of mean temperature at Luqa over successive 10‐year periods from 1926‐2005; values are compared on a monthly and annual basis. 119
Table 5.1: List of climate models available in MAGICC and used in the study with a brief description. 145
Table 5.2: List of the main forcing control parameters in MAGICC and the associated settings. 146
Table 5.3: List of the main climate model parameters in MAGICC and the associated settings. 146
Table 5.4: List of atmosphere‐ocean general circulation models, which form part of the CMIP3 database and utilised in SCENGEN. The last six in the list were not used in the present study. 163
Table 5.5: Cosine‐weighted statistics for each of the 14 AOGCMs used when running the SCENGEN model for the year 2000, for annual mean temperature. The mean value for all models, for each of the statistics, is given in the last row. The region considered in the analysis is defined by coordinates 35° 00΄ to 37° 30΄ North (latitude) and 12° 30΄ to 15° 00΄ East (longitude), consisting of nine grid cells, that includes Malta located at 35° 50΄ North (latitude) and 14° 35΄ East (longitude). 166
Table 5.6: Cosine‐weighted statistics for each of the 14 AOGCMs used when running the SCENGEN model for the year 2000, for annual mean precipitation.

18
The mean value for all models, for each of the statistics, is given in the last row. The region considered in the analysis is defined by coordinates 35° 00΄ to 37° 30΄ North (latitude) and 12° 30΄ to 15° 00΄ East (longitude), consisting of nine grid cells, that includes Malta located at 35° 50΄ North (latitude) and 14° 35΄ East (longitude). 167
Table 5.7: Cosine‐weighted statistics for each of the 14 AOGCMs used when running the SCENGEN model for the year 2000, for annual average mean sea level pressure. The mean value for all models, for each of the statistics, is given in the last row. The region considered in the analysis is defined by coordinates 35° 00΄ to 37° 30΄ North (latitude) and 12° 30΄ to 15° 00΄ East (longitude), consisting of nine grid cells, that includes Malta located at 35° 50΄ North (latitude) and 14° 35΄ East (longitude). 168
Table 5.8: The main model results generated using MAGICC/SCENGEN version 5.3 applicable to the region of the Maltese Islands for the years 2025, 2050, 2075 and 2100. Note that the scenario year is the central year for a climate averaging interval of 30 years. 184
Table 6.1: Observed and Projected Changes in Climatic Conditions. [Adapted from [191]) 189
Table 6.2: Possible Vulnerabilities of Water Resources from Global/Regional Climate Change Scenarios [adapted from [255]. 194
Table 6.3: Observed and Projected Changes in Climatic Conditions ‐ Level of Vulnerabilities and Opportunities. 198
Table 7.1: Coastal land uses and length of coastline that may be affected by a sea‐level rise of 0.5 m. 217
Table 8.1: Power distribution infrastructure. 230
Table 9.1: Current status of selected groups of species [122, 126, 131, 132, 153, 157, 160]. 249
Table 9.2: List of types and extent of habitats that may be affected by a sea‐level rise of 0.5 m. Sites indicated by an * are protected. 255
Table 10.1: Key for column numbers listed in Figure 10.1. 274
Table 10.2: Landings by key species [197]. 277

19
Table 10.3: Aquaculture Annual Production [197]. 278
Table 11.1: Number of agricultural Holdings by size class [212]. 288
Table 11.2: Utilised Agricultural Areas (UAA) (hectares) for different crops [212]. 289
Table 12.1: Possible Impacts of Climate Change on Migration [200]. 306
Table 12.2: Recognised Refugees in Malta [200]. 306
Table 12.3: Possible impacts of climate change on migration. Adapted from [255]. 311
Table 14.1: Vulnerability of the Production Sector. 333
Table 14.2: A qualitative assessment of climate change vulnerability of production activities. 336
Table 14.3: Vulnerability of Expenditure Activities. 338
Table 14.4: A qualitative assessment of climate change vulnerability of expenditure activities. 339

20

21
IINNTTRROODDUUCCTTOORRYY NNOOTTEE The First National Communication was presented to the Secretariat of the UNFCCC in April 2004, on the eve of Malta’s accession to the European Union. As predicted this was a step that transformed Malta’s political future. Malta has since its accession worked hard with its partners in the Union to develop policies that are ambitious enough to match the severity of the climate challenges we face. Notwithstanding our inherent limitations, Malta has always supported initiatives aimed at minimizing the impacts of Climate Change. As far back as 1988, Malta recognised the importance of dealing with climate as a global issue as apparent in its efforts to place the issue of Climate Change on the agenda of the UN General Assembly. The importance that Malta attributes to Climate Change is evident even today in the support that Malta gives to both EU and other international Climate Change initiatives. While all too conscious of the difficulties it will face in reaching the various EU targets, Malta fully supported the so‐called EU Climate and Energy package agreed on last December. We have done so because we understand the need for immediate drastic action to salvage not only our future but the future of the next generations. Moreover, during the UNFCCC’s Conference of the Parties (COP) 14, which was held in December 2008 in Poznan, Poland, I had the honour of announcing Malta’s intention to join Annex I to the UNFCCC. To this effect, Malta has submitted a formal proposal to amend Annex I for consideration and action at the COP 15 in Copenhagen, December 2009. The rationale behind this action is sui generis. Malta does not seek to differentiate itself from others. Rather, Malta seeks to put itself on the same legal footing as its fellow Member states in a collective and responsible commitment to continue reducing emissions of greenhouse gases after 2012. This Government is aware of the challenges our country faces and has embarked on a variety of projects and initiatives that are all aimed at preparing our country as best as possible to meet and satisfy its various international obligations whether at EU and UN level. The ‘National Strategy for Policy and Abatement Measures relating to the reduction of Greenhouse Gas Emissions’ was recently finalized and delineates a number of mitigation measures to be embarked or continued upon. The Government has moreover recently appointed a new Climate Change Committee to draw up a National Strategy for Adaptation to Climate Change. As in the case of the First Communication, formal responsibility for the preparation of this Communication was vested in the Malta Environment and Planning Authority. My gratitude goes to the University of Malta and in particular Professor Charles Sammut (Project Manager) and Professor Alfred Micallef (National Expert) for their invaluable work and the various actors and stakeholders involved in the

22
consultations. Once again the Government of Malta thanks the Global Environment Facility for contributing towards the preparation of its second Communication. The preparation of the First National Communication eventually led to the setting up of permanent structures aimed at monitoring and assessing greenhouse gas emissions and which have proved indispensable in shaping national climate change policies. I believe that the present Communication will likewise prove beneficial in providing the necessary impetus in strengthening Malta’s climate change policies.
George Pullicino
Minister for Resources and Rural Affairs October 2009

23
PPRREEFFAACCEE The Second National Communication is the product of joint efforts between the University of Malta, the Malta Environment Planning Authority and the Ministry for Resources and Rural Affairs. Since the submission of the First Communication and following its accession into the European Union, Malta has been building its capacity to address Climate Change especially on the mitigation front, for the preparation of the National Greenhouse Gas Inventory and in setting up the National Emissions Inventory System. To‐date these processes are within the Competency of the Malta Environment and Planning Authority. The Second National Communication was able to build on that national capacity and the project focused its efforts mainly on work related to addressing the data gaps and adaptation issues highlighted in the First National Communication. The project by its very nature required information on different sectors and MEPA was able to facilitate that by informing the project team with updated information on processes that are currently being undertaken to address thematic issues in Malta. Stakeholder participation was inherent and two workshops were carried out between 2008 and 2009. Whilst serving as an opportunity to gain updated information and views from members of the public, research institutions and regulatory bodies these workshops provided a forum to increase awareness on climate change issues and how Malta needs to act not only to carry out its role in combating it but also in terms of how it is to adapt. The process in preparing the Second National Communication has also been an opportunity to strengthen communication amongst different partners that should set the ground work for additional national action. I wish to thank Professor Charles Sammut (Project Manager) and Professor Alfred Micallef (National Expert) for their expert contribution and collaboration with all persons involved in the preparation of this document. I also thank all expert contributors and to the GEF for funding this project.
Ray Piscopo National Project Director
Director of Corporate Services Malta Environment and Planning Authority

24

25
EEXXEECCUUTTIIVVEE SSUUMMMMAARRYY Introduction The First National Communication of Malta to the UNFCCC was submitted in June 2004, following which, technology needs assessments of mitigation and adaptation have been carried out. A climate change programme was also compiled. In 2006, a National Capacity Assessment was carried out which culminated in a project proposal for compilation of the Second National Communication, which is presented in this document. The following is an executive summary highlighting the work carried out over the past two years by a number of experts in diverse fields. The structure of this summary follows that of the document, from where more detailed information and data is available. These studies were all financed by the Global Environment Facility through the United Nations Development Programme.
Part I National Greenhouse Gas (GHG) emissions inventories were compiled under the revised 1996 and 2006 Intergovernmental Panel on Climate Change (IPCC) guidelines and consider the following direct GHG: carbon dioxide, methane, nitrous oxide, perfluorocarbons, hydrofluorocarbons and sulphur hexafluoride, and indirect GHG: nitrogen oxides, carbon monoxide, non‐methane volatile organic compounds (NMVOC), sulphur dioxide. The sectors considered were: energy, industrial processes, solvent and other product use, agriculture, land use, land‐use change and forestry (LULUCF) and waste. The major contributor to direct GHG emissions was the energy sector which comprises electricity generation, transport, commercial, institutional, residential and manufacturing industries. The main contributor to emissions and their increasing trend and driver is electrical power generation. Land transport emissions appear to be levelling off, probably as a result of the number of cars approaching saturation levels. Some of these effects may be observed from Figure 1. Industrial processes and solvent use have remained minor contributors to GHG emissions but sources have changed in the last decade, with hydrofluorocarbons and sulphur hexafluoride becoming more prominent because of their very high global warming potential. Waste management and agriculture, animal husbandry in particular, have remained the principal sources of methane; the same sources were responsible for almost all of the nitrous oxide emissions. The future evolution of these two gases will be

26
heavily influenced by plans for sewage treatment plants, bio‐digestion plants and waste incineration.
0
500
1000
1500
2000
2500
1990
1991
1992
1993
1994
1995
1996
1997
1998
1999
2000
2001
2002
2003
2004
2005
2006
2007
Year
Carbon Dioxide Emissions (Gg)
‐
50
100
150
200
250
300
350
Total N
umber of Licensed
Vehicles (x1000)
Electricity Generation Land Transport Total Number of Licensed Vehicles
0
Figure 1: Time series of emissions from energy generation and transport, and number of licensed vehicles. LULUCF provided a net sink, as had been reported in the First National Communication but its effectiveness has been reduced by about 50% as a result of a recalculation using a new emission factor. Of the indirect GHG, oxides of nitrogen and carbon monoxide showed only small fluctuations during the inventory period. There was greater variability for NMVOC, while in the case of sulphur dioxide the fluctuations are associated with the sulphur content of the residual fuel oil used in the power stations. Data acquisition and quality have continued to improve under the impetus of EU obligations and major developments of institutional structures at the Malta Environment and Planning Authority (MEPA) and the National Statistics Office (NSO). The recent liberalisation of the fuel import market may lead to temporary setbacks. Abatement strategies must therefore target the most significant sectors. Mitigations in carbon dioxide emissions have been set against the ceilings proposed in the second National Allocation Plan and beyond. A detailed breakdown of efficiency of electrical power generation led to estimates of savings. More can be achieved by a change in fuel used in generation. Several scenarios, mainly ones that involve both change of fuel and the acquisition of new equipment were proposed which would deliver significant cuts in carbon dioxide

27
emissions. The projected inter‐connector to the grid in Sicily, assumed to be powered by a natural gas‐fired station, was also considered. The local potentials for renewable energy from wind, solar photo‐voltaic panels and solar water heaters indicated that wind offers the best and quickest carbon dioxide offset. Widespread use of more efficient lighting in domestic, street, institutional and factory environments is predicted to yield significant cutbacks in carbon emission. For the built environment, a number of case studies involving household equipment lighting, control of external surfaces, cooling and heating loads were presented, while for large public buildings with a heavy hot water demand, the potential of large solar water heating installations was explored. All showed prospect of useful carbon emission mitigation. Effective mitigations for land transport involve restrictions on car size and intensity of use and a switch to alternative sources of motive power. Bio‐fuels from local sources and hydrogen in fuel cells or internal combustion engines, if widely taken up, will reduce carbon emission. In this respect, electric and hybrid cars can have potential which is however partially offset by power generation with high specific carbon emission. Agriculture is a major source of methane and mitigation requires more complete treatment of human and animal sewage. The carbon dioxide sinking capacity of LULUCF can be increased by sustained tree planting. Recent carbon prices in the Emissions Trading Scheme were considered in order to estimate the pertinent costs of joining the scheme.
Part II
Climate Trends The Mediterranean atmosphere‐ocean system is characterised by high internal variability and influenced by external phenomena that render its sensitivity to natural and anthropogenic forcings somewhat complicated to assess. The position, small territorial extent and proximity to the sea of the Maltese Islands further render a higher margin of uncertainty in climate‐related studies, and in many aspects constrain vulnerability and impact assessments to be somewhat subjective. In such a context extrapolations from numerical global and even regional climate models have considerable margins of error, while the importance of long term direct observations of key meteo‐marine indicators becomes indispensable to monitor local climate change trends in relation to global and regional averages, and thus permitting to identify anomalous or accelerated changes. Observations collected by the Meteorological Office of the Malta International Airport and the Physical Oceanography Unit of the International Ocean Institute‐Malta Operational Centre at the University of Malta are used, together with the dataset for Malta from the

28
European Centre for Medium‐Range Weather Forecasts Meteorological Archival and Retrieval System. The overall trend in air temperature over the period 1923‐2005 indicates an increase
at the rate of 0.71 C every 100 years. This is comparable to the global average
temperature increase of almost 0.8 C above that at pre‐industrial times. The post‐
1970 period has a clearly exacerbated rate of warming at around 1.5 C over 30 years, especially in the last two decades of the twentieth century when the temperature anomaly with respect to the climatological mean temperature over the period 1961‐1990 was around twice the anomaly on a global average. The overall
rate of warming is by far strongest in the summer period at around 1.5 C every 100 years. The warming trend can also be traced from the incidence and magnitude of extreme temperature events. Yearly recorded maximum temperatures have gone
up by about 3 C over 100 years, while minimum temperatures have tended to overall lower temperatures, although the absolute lowest temperatures occurred
before 1980 and the coldest days in recent years have not gone below 2 C. Events of extreme high temperature are on the increase and tend to be more intense, but the assessment is biased by the anomalous period in the late 1990s. Despite the small extent of the territory, rainfall patterns show a relatively high spatial and temporal variability over the Maltese Islands; even the wettest months can be very dry in particular years. However, there is no definite trend in the observed precipitation. Over the last 85 years there has been no significant change in rainfall during winter and summer, whereas there has been a decrease of 0.14 mm per year during spring and an increase of 0.8 mm per year during autumn. During the rainy season, the increasing number of days with thunderstorm (an upward trend of 7 days over 55 years) implies that convective type rainfall is on the increase. This type of rainfall is of short duration and often quite intense. This is corroborated by the positive trend in the daily maximum rainfall between 1923 and 2000, notwithstanding the fact that over a full year the absolute number of days with rainfall in the range 1‐50 mm is decreasing. Further considerations from other meteorological parameters point to a very consistent drop of about 1 knot in wind intensity in the last 40 years. In the period 1996‐2005 the drop, most evident during winter, is around 3.5% with respect to the overall mean over the full period since 1946. An overall positive trend in atmospheric pressure implies reduced frontal activity on a yearly basis and more frequent anti‐cyclonic situations which often enhance subsidence, thereby restricting convection, cloud formation and hence rainfall. This is corroborated by the recorded decrease in
the mean annual cloud cover over the Maltese Islands amounting to 0.34 oktas in 45 years. The number of daily sunshine hours declined by 0.6 hours over 77 years and is mainly attributed to changes in atmospheric composition, predominantly due to the higher atmospheric loading by suspended particles. Two important marine climatic indicators are sea level and sea temperature. According to the IPCC Special Report on Emissions Scenarios (SRES), sea level rise on a global scale by the end of the 21st century is expected to be in the range of 0.18‐

29
0.59 m above the reference level corresponding to the decade 1980‐1999. On the basis of satellite observations, the rate of global sea level rise in the last 15 years has been 3.1 mm per year, which is almost double the rate of sea level rise in the last century. This leads to an expected future sea level rise that may actually exceed the IPCC limit. Sea level changes depend on several factors which are characterised by strong geographical differences, and critically dictated by internal climatic influences and external signals like the North Atlantic Oscillation. This is especially true for the Mediterranean basin. After an overall decline in the basin sea level of 2‐3 cm in the period 1960‐1990, sea level in the eastern Mediterranean started to rise again after 1993, with a very rapid rate which is around 10 times the global rate. On the other hand, negative trends are observed in the northern Ionian Sea including the area near the Maltese Islands. In Malta, sea level measurements conducted by the Physical Oceanography Unit show that, in spite of alternating intermediate trends, the sea level has on average actually declined in the last 15 years. This is believed to be linked to transient effects which warrant sustained monitoring of sea level changes on the local scale. This situation does not guarantee against a future menace of sea level rise and it is prudent to adopt a precautionary approach. Projections on the basis of the sea level trend in the more recent four years (2002‐
2006) during which the sea level experienced an average rise of 0.45 0.15 cm per year, are necessary. From measurements at Delimara, sea surface temperature of the coastal waters has been steadily increasing at an average rate of 0.05 ºC per year in the last 40 years. This rise is most evident during summer and is comparable to Mediterranean averages, which are well above the global average of 0.01 ºC per year. Climate Projections Using MAGICC/SCENGEN version 5.3 it was possible to come up with projections for the Central Mediterranean extending over the next one‐hundred years for important climate parameters. The model performance statistical analysis undertaken as part of the study indicates that in some cases the model results are sufficiently reliable. This is especially true for the increase in temperature, the change in precipitation on a regional level, and the global‐average sea level change. Projections of variability in temperature, precipitation and mean sea level pressure are not very reliable, and the conclusions drawn from these model results should be viewed with caution. It was not possible to estimate sea level change for the Central Mediterranean through the use of numerical models, and the reader is referred to the published scientific peer‐reviewed literature. Points of interest emerging from the study include the possibility of a shift and prolonging of the summer season, and a shifting of precipitation events to shorter time windows with other time periods becoming drier.

30
Table 1 gives the main model results for the region of the Maltese Islands for the years 2025, 2050, 2075 and 2100. These are based on the no‐climate‐policy emission scenario A1T‐MES and were generated using the 14 selected atmosphere‐ocean general circulation models. The climate model used for the associated global
projections is HadCM3 with a climate sensitivity of 3 C per carbon dioxide concentration doubling. Results of the uncertainty analysis indicate that these projections are quite reliable and any model artefact that they may carry is minimal. Hence, their use in vulnerability and adaptation studies for the Maltese Islands is recommended. The problem with the results relates to resolution.
2025 2050 2075 2100 Comments
Increase in Temperature (C) 1.1 2.0 2.6 2.8 Regional Mean
Change in Precipitation (%) 2.4 4.4 3.7 1.8 Regional Mean
Sea Level Rise (cm) 7 14 23 30 Global‐mean
Table 1: The main model results generated using MAGICC/SCENGEN version 5.3 applicable to the region of the Maltese Islands for the years 2025, 2050, 2075 and 2100. Note that the scenario year is the central year for a climate averaging interval of 30 years.
The spatial resolution of the SCENGEN component is 2° 30΄ (latitude) 2° 30΄ (longitude), which is too coarse for impact assessments and, vulnerability and adaptation studies since the Maltese Islands cover an area which is less than 0.5% of that for a single grid cell. Tools for the downscaling of MAGICC/SCENGEN scenarios to finer scale do exist, but their use is not advisable since the remaining area of the grid cell containing the Maltese Islands is mostly covered by sea. The best, and most probably the only logical, solution to the problem is to actually employ a numerical atmosphere‐ocean general circulation model for the desired region, even if this proves to be very computationally intensive, requiring a large computer cluster and substantial computer‐time. In this regard, research in regional climate modelling and analysis that focuses on the Central Mediterranean is sorely needed. Nevertheless, it should be noted that currently there does not exist any model that is capable of generating very reliable scenarios for very fine grid cells. This is especially true for cases where the region is a complex combination of land and sea. The Department of Physics at the University of Malta has research plans in the direction mentioned here, but further work will surely depend on the availability of the tools needed, notably a substantial computer cluster on which appropriate numerical solvers can run, and experts in the field.
Part III In preparing the adaptation analysis it was necessary to identify those sectors, systems, areas or components that are vulnerable to climate change, and to examine the scope of increasing their coping capacity and therefore their resilience which will
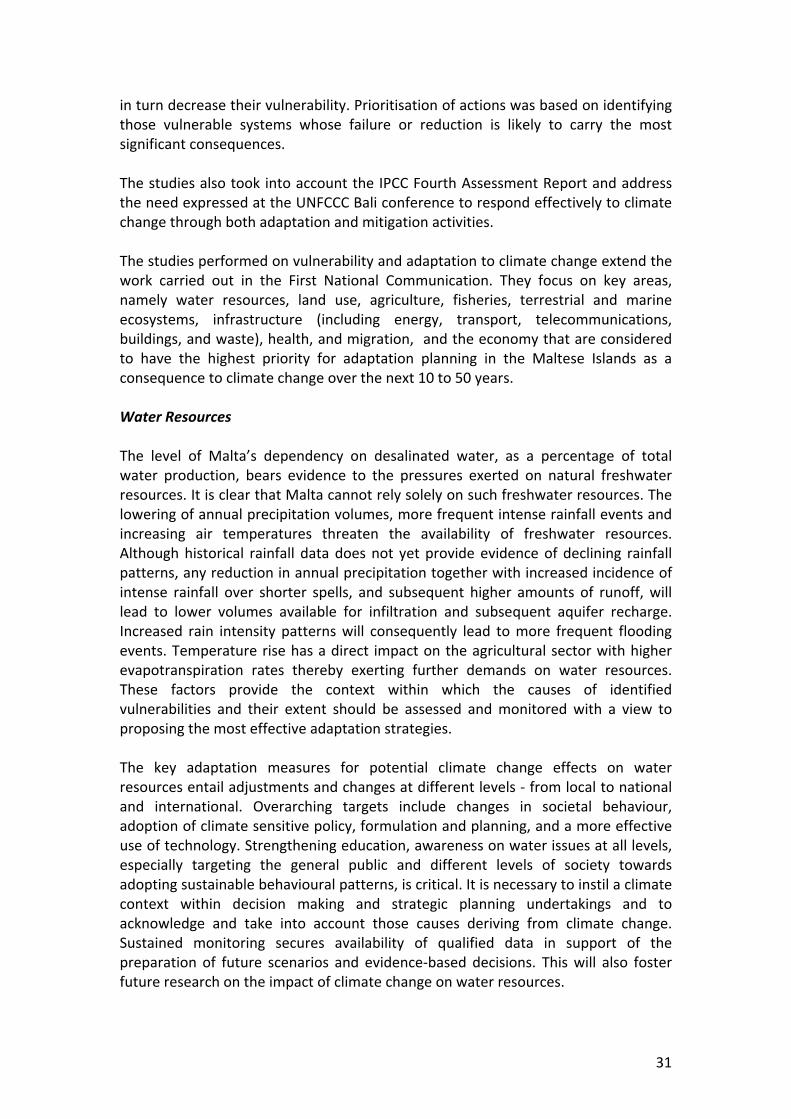
31
in turn decrease their vulnerability. Prioritisation of actions was based on identifying those vulnerable systems whose failure or reduction is likely to carry the most significant consequences. The studies also took into account the IPCC Fourth Assessment Report and address the need expressed at the UNFCCC Bali conference to respond effectively to climate change through both adaptation and mitigation activities. The studies performed on vulnerability and adaptation to climate change extend the work carried out in the First National Communication. They focus on key areas, namely water resources, land use, agriculture, fisheries, terrestrial and marine ecosystems, infrastructure (including energy, transport, telecommunications, buildings, and waste), health, and migration, and the economy that are considered to have the highest priority for adaptation planning in the Maltese Islands as a consequence to climate change over the next 10 to 50 years. Water Resources The level of Malta’s dependency on desalinated water, as a percentage of total water production, bears evidence to the pressures exerted on natural freshwater resources. It is clear that Malta cannot rely solely on such freshwater resources. The lowering of annual precipitation volumes, more frequent intense rainfall events and increasing air temperatures threaten the availability of freshwater resources. Although historical rainfall data does not yet provide evidence of declining rainfall patterns, any reduction in annual precipitation together with increased incidence of intense rainfall over shorter spells, and subsequent higher amounts of runoff, will lead to lower volumes available for infiltration and subsequent aquifer recharge. Increased rain intensity patterns will consequently lead to more frequent flooding events. Temperature rise has a direct impact on the agricultural sector with higher evapotranspiration rates thereby exerting further demands on water resources. These factors provide the context within which the causes of identified vulnerabilities and their extent should be assessed and monitored with a view to proposing the most effective adaptation strategies. The key adaptation measures for potential climate change effects on water resources entail adjustments and changes at different levels ‐ from local to national and international. Overarching targets include changes in societal behaviour, adoption of climate sensitive policy, formulation and planning, and a more effective use of technology. Strengthening education, awareness on water issues at all levels, especially targeting the general public and different levels of society towards adopting sustainable behavioural patterns, is critical. It is necessary to instil a climate context within decision making and strategic planning undertakings and to acknowledge and take into account those causes deriving from climate change. Sustained monitoring secures availability of qualified data in support of the preparation of future scenarios and evidence‐based decisions. This will also foster future research on the impact of climate change on water resources.

32
Priority measures include improved governance and water usage practices, coupled with an enhanced capacity to handle the prevailing issues, and to better research the dynamics of climate‐induced effects on the water cycle and recharge of natural storage. Specific initiatives include the promotion of the use of locally generated storm water within building envelopes, designing higher efficiency buildings within a water resource context, promoting the use of treated water effluent and a change in agricultural practices to exert lower demands on water resources. Flood risk planning should occur within the broader approach of a storm water management plan for Malta. Land Use Due to Malta’s high population density, limited land area and an upward trend in land and property values, competition over the use of land in the Islands is substantial. Urbanisation, together with agriculture, recreation and quarrying, has the highest impacts on the Maltese countryside. Agriculture has long been the predominant land use in the Maltese Islands, with multifunctional roles including maintaining rural landscapes and biodiversity as well as providing food and sustaining rural livelihoods. A large percentage of the land in Malta falls within the coastal zone, with a significant fraction devoted to recreation and tourism. Assuming the current climate change scenarios and predictions are realised, an increase in sea level and the associated problems of coastal inundation, erosion and migration of beaches will be the most significant impacts of climate change on land use. The land uses that will be mostly affected by this impact are discontinuities in urban fabric, protected areas, port areas and beaches. However, local scenarios on this phenomenon are associated with a high degree of uncertainty. An increase in soil erosion, desertification and flooding may cause problems in agricultural and urban areas. Secondary impacts on property values and insurance may also follow. All statutory land use plans should be reviewed with a view to updating policies and proposals in the light of the climate change challenges facing Malta. It may be opportune that a topic paper on climate change is prepared. Adaptation of existing resources to impacts of climate change is essential. Land use strategies and plans should contribute to Malta’s obligations and targets for climate change adaptation and mitigation. Sustainable transport options are to be encouraged and actively supported so as to minimise the impact on land use. No coastal strategies directly related to coastal defences have been adopted in Malta to date. A coastal defence strategy should be prepared that identifies priority areas and costs to implement the required defence structures. It should ideally form part of a wider Integrated Coastal Zone Management Plan for the Maltese Islands. Adaptation measures on low‐lying coasts have to address the problem of sediment loss from marshes, beaches and dunes, mainly as a result of construction that

33
isolates such coastal systems from the hinterland. Action is necessary to reverse the trend that led to the loss of the vast majority of our small beaches over past years, not only for climate change purposes but to sustain the tourism industry. Infrastructure Infrastructure is vulnerable to climate change in different ways and to different degrees; this depends on the state of its development, resilience and adaptability. In the energy sector, climate change will have a direct effect on the production, supply and demand of energy. An increased frequency and range in summer peaks will increase demand and require further investments on the production side. Warmer climates pose technical challenges to maintaining high efficiency, such as in the cooling process of thermal power plants. Increased frequency and severity of extreme weather events could threaten electricity transmission and distribution infrastructure especially that located in exposed areas on the coast and in flood‐prone areas. Damage to power and telecommunications infrastructure from extreme events can disrupt emergency response when it is most needed. Extreme climate events cause economic and social impacts. A more strategic and long‐term approach to spatial planning is necessary, both on land and in marine areas, including in transport, regional development, industry, tourism and energy policies. Increasing awareness of climate change impacts within the government, industry and community sectors will support cultural change transitions that are required for the adoption of more climate change friendly technologies in the development and maintenance of the nation’s infrastructure. Vulnerability of infrastructure to climate change should feature prominently in national policy. As a short‐term measure, stakeholders should organise awareness campaigns on the impact of climate change on the infrastructure. Increased awareness among civil engineers and architects should result in more eco‐friendly designs and more resilient buildings, which not only have lower carbon emissions, but are more resistant to floods and storms. Considering that information and communication technology is a priority for the country, it must be ensured that the associated infrastructure being developed takes into consideration the possible impacts of climate change. Terrestrial and Marine Ecosystems The Maltese Islands are characterised by a rich natural heritage of rare and indigenous species that are threatened or in decline. Scientific evidence from the Mediterranean region has shown that climate change could result in several potential impacts on terrestrial ecosystems in Malta. Among the expected impacts are shifts in the distribution of species, obliteration of habitats, increased salinisation of soils and groundwater resources, changes in species composition, richness and

34
phenology, reduction of groundwater resources, increased risk of desertification and fires and a potential fertilising effect. All terrestrial flora and fauna groups are vulnerable to these impacts, particularly minor and freshwater communities. The potential impacts on the marine ecosystems include changes in faunal and floral diversity and distribution, spread of alien species, disease outbreaks, changes in coastal hydrodynamics and deep water circulation, coastal erosion and ocean acidification. The most vulnerable groups of marine species to these impacts are Posidonia oceanica meadows and the littoral and sub‐littoral species although all flora and fauna groups are vulnerable to some extent. The proposed adaptation measures include conservation strategies, management of stress on the environment, facilitation of migration, habitat restoration, natural resources management, expansion of reserves and environmental monitoring. These measures need to be supported by the appropriate research and training to increase the knowledge base on which the adaptation options depend. Existing policies need to be reviewed to ensure that they are sensitive to climate change issues and new policies need to be devised to cater for adaptation requirements. Management of conservation resources in response to climate variability is the most beneficial way of preparing for climatic changes by increasing ecosystem resilience. Ecosystem‐based approaches are particularly relevant and should be adopted in preference to measures targeting single species or habitat types. For this reason, pro‐active approaches towards such management are strongly recommended. Fisheries Climate change can potentially have both direct and indirect impacts on commercial fish stocks. Direct effects act on the physiology and behaviour of fish and alter their growth, development, reproductive capacity, mortality and distribution. Indirect effects concern alterations in ecosystem productivity, structure and composition on which fish depend for food and shelter. Marine biodiversity in local waters is likely to follow the general trend for the rest of the Mediterranean, with expected higher occurrence of both subtropical Atlantic species and Lessepsian immigrants. This may however still occur for other reasons apart from a general warming of the sea. The vulnerability of the aquaculture industry arises from stress due to increased temperature and oxygen demand, acidification, extreme weather events with the consequent destruction of facilities, loss of stock, mass scale escape, potentially impacting biodiversity. Increased frequency of diseases and toxic events, sea level rise and conflicts with coastal defence systems, an uncertain future supply of fishmeal and oils from capture fisheries also threaten the sector. Climate change may however also result in positive impacts such as increased growth rate and food conversion efficiencies, increased length of growing season and an expanded range.

35
The local fisheries sector is experiencing subtle changes in the catch composition which merits further investigation. The management of fisheries requires continuous data gathering and analysis. Other adaptation measures applicable to fisheries are related to catch size and effort. Sustainable fishing will benefit fish stocks that are sensitive to climate variability. Adaptation measures for aquaculture include encouraging uptake of individual/cluster insurance, improving the siting and design to minimize damage, loss and mass escapes, encouraging the use of indigenous species to minimize impacts on biodiversity and using non‐reproducing stock in farming systems. While these measures need to be taken up by the private sector, planning policy should take into account potential impacts of climate change when assessing development applications for fish farms. Agriculture The most significant climate change impact on Maltese agriculture will be the predicted shortening of the rainy season and intense rainfall events which increase the risk of damage to crops. This will lead to soil erosion, soil structural damage, water clogging, increased nutrient leaching and direct damage to both crops and infrastructure such as greenhouses. A higher proportion of water will be lost as surface run‐off and soils will be further exposed to erosion. The increase in air temperature is likely to increase the temperature stress on animals. Other stresses to local agriculture include fragmentation of landholdings, pressure to develop agricultural land and an ageing farming community. Coupled with loss of biodiversity, all these effects are expected to reduce resilience in the sector. Effective adaptation necessitates that farmers and policy makers react early and systematically. Funding will be needed to aid farmers restructure their operations so as to adopt more modern and climate proof methods of operation. Farmers should adopt new techniques in soil and water conservation as these resources will be the most limiting factors to agricultural production. Education and awareness on how the predicted climate changes will affect agricultural operations should be promoted. Information about the latest crop species and varieties that yield better production should be disseminated. Adapting to drought effects requires a long‐term view of the impacts and detailed analysis. A systematic soil erosion/desertification survey for the Maltese Islands is one important step and should be followed by an erosion/desertification control management and planning scheme to identify remedial measures and recommendations for the conservation, rehabilitation and protection of the local soil resources. One obvious action relates to the introduction of drought resistant crop plants, trees and shrubs for landscaping, especially varieties that can help to reduce soil erosion and the impacts of desertification.

36
Diversification of the sector should be sought as described in the Rural Development Plan for 2007‐2013. The production of unique high‐value niche products such as Maltese food specialties (cheeselets, carob products, capers, honey, etc.) together with the market potential of 1.2 million tourists that visit Malta annually can help to sustain this local production. Climate Migration Most asylum seekers reach Malta mainly not by choice but because of the country’s geographical position. In their vast majority, they are in search of better quality and standards of living and consequently, Malta is vulnerable to eventual migratory effects resulting from climate change. The 2006 UNHCR Statistical Yearbook clearly states that, on the basis of its size, Malta is currently hosting the second largest number of refugees, a clear indication of Malta’s vulnerability to this form of migration. The issue of climate migrants needs to be seen from three main aspects; internal migration, external migration as part of the Maltese population seeks new temperate climates and external migration as a result of an influx of foreign immigrants seeking more sustainable living patterns. In developing a proper adaptation strategy for climate migration, an assessment should be made of the country’s potential carrying capacity as a result of potential fluxes of people seeking better climatic conditions. Social, economic and environmental policies, practices and actions by all stakeholders need to be taken into account. A possible larger population will primarily pose pressures in terms of additional development, more demand on fresh water and food resources. These factors would in turn experience negative impacts from changing climatic conditions. Health Direct impacts on health mainly result from increasing temperatures and extreme events. Indirect impacts arise from changes in quality and quantity of water and food, as well as vector born diseases. The most vulnerable are the elderly, disabled, children, ethnic minorities and people on low income. Cold‐related morbidity and mortality are expected to decline but heat‐related increases are expected. Higher temperatures coupled with decreasing precipitation will affect water quality and availability, with a concomitant increased risk of contamination of public and private water supplies. Higher seawater temperatures can lead to deterioration of seawater quality and increased risk of harmful algal blooms. Higher temperatures also threaten food safety, such as in the transmission of salmonellosis, which is known to be temperature sensitive. The increased occurrence and severity of storms, with associated heavy rains, sea surges and strong winds, will pose a higher risk of death and injury, especially from flash floods which are of particular concern in several parts of the Maltese Islands,

37
notably in the Birkirkara‐Msida basin. Flooding events may also have an indirect effect on health by causing damage to hospitals, clinics and pharmacies. Health is a cross‐cutting issue that needs to be considered throughout all sectors. Adaptation measures should focus on health risk assessments that quantify the local population’s exposure, sensitivity and ability to adapt. Early warning systems that are already in place (for potential floods and heat waves) should be developed further by giving the public easy access to information on how to react to certain events. Other measures, mainly related to the expected warmer temperatures, include prevention of vector born diseases, improved microbiological standards of food at all stages in the food chain, better urban planning to promote cooler environments and shifting of work patterns and leisure activities. The Maltese Economy The extent of economic vulnerability of a country or region to climate change and the potential for adaptation depend amongst other things on the geographical and resource characteristics, the structure of the production activities and consumption patterns, as well as demographic and social factors. Productive activities in Malta have not expanded in climate‐sensitive areas during the last five years and vulnerability can be considered to moderate, an assessment similar to that presented in the First National Communication. Activities that can be impacted by climate, such as agriculture and construction, have decreased their relative economic importance. Manufacturing has been in trend decline with the only growth being registered in pharmaceutical production, which is relatively not vulnerable to climate change. The relevance of the services sector to the Maltese economy has experienced a strong increase but the more climate‐sensitive tourism sector has been in relative decline. The vulnerability of expenditure activities remains in the range from just under moderate to moderate‐high. Consumption activities are tending to shift towards areas with an increased vulnerability to climate change. The persistence of fiscal and external deficits in the Maltese economy may imply increased difficulty to mobilize saving resources to undertake investments towards climate change adaptation and mitigation activities, especially in cases which do not provide an immediate and tangible financial rate of return. On the other hand, the widespread provision of health and education services by the public sector at zero or low cost to the final user facilitates national efforts aimed at climate change adaptation to reach the wider public spectrum. This requires further investment in such services and implies further burdens on public expenditure. The long‐term development path envisaged for Malta features a mixed outlook in terms of the country’s overall vulnerability to climate change. The country plans to develop or maintain levels of activity in vulnerable sectors, primarily tourism and the associated services, education and health, fisheries and aquaculture, cruise liner industry, etc. However, the expansion of sectors which are not as sensitive to climate

38
change issues, including high value‐adding manufacturing, financial services and information and communications technology will partially offset vulnerability. From an aggregate perspective, the future development of the economy is likely to increase the Island’s vulnerability to climate change. Among a number of win‐win adaptation measures, the most evident include diversification of energy sources, improvements in the road and water networks and flood protection systems. Such measures are expected to entail significant financial costs and call for a re‐direction of future economic activities. The country’s ability to effectively implement these adaptation measures is likely to be hampered by the scarcity of natural, physical and human resources, its relative isolation together with the existence of more urgent socio‐economic development goals. This situation is actually being worsened by the current global recessionary conditions, from which small developing states are likely to suffer disproportionately.
Part IV The main commitments Malta has under the UNFCCC and the Kyoto Protocol are: adopting mitigation measures to address anthropogenic green house gas emissions and implementing adaptation measures to mitigate the negative effects of climate change. This chapter provides an analysis of gaps, constraints and other information relevant to Malta’s achievement of these obligations and focuses on a cross sectoral approach, thereby complementing the gaps and constraints highlighted in the preceding chapters. This is achieved under four main headings; the institutional/regulatory, methodological, technological aspects and capacity‐building. These gaps and constraints are subsequently classified as mitigation or adaptation measures or both. A comprehensive assessment is achieved by considering the legal obligations which Malta has under international, European and national law to demonstrate existing gaps and constraints that are preventing and obstructing the implementation of both mitigation and adaptation measures to climate change. However, logistical and practical difficulties relative to the local circumstances that hinder compliance with the same are identified. Consideration is taken of the fact that Malta is a state with no target to reduce emissions under the UNFCCC and the Kyoto Protocol but which, nonetheless is legally bound by the European Community regime on climate change that is formulated on the pretext of capping and trading GHG emissions. The main gaps and constraints, which emerge are: the lack of mainstreaming of climate change issues, the non existence of a national adaptation strategy and the absence of a regulatory and administrative framework, which ensures that both mitigation and adaptation measures are being adopted and complied with by all sectors. Emphasis is made upon the need to ensure the compilation and exchange of reliable and comparable data, of promoting research and empowering the capacity of national human resources to meet the challenges and the opportunities resulting from climate change across all sectors.

39
Recommendations are made on how to integrate climate change into socio‐economic and environmental policies in Malta. These recommendations take into consideration Malta’s role to identify the relationship between the eight Millennium Development Goals and climate change. The recommendations also aim at facilitating participation by civil society and non‐governmental organizations to play a more active role in decision making, education and public awareness activities on the subject. A holistic approach is highlighted since gaps and constraints in adopting mitigation and adaptation measures to climate change are interrelated. Addressing gaps and constraints is a symptom of good governance, which itself depends upon optimum coordination between the various sectors that constitute society.

40
NNAATTIIOONNAALL CCIIRRCCUUMMSSTTAANNCCEESS 11..00 IInnttrroodduuccttiioonn The following chapter briefly describes those national circumstances that in some way or another may be linked directly or indirectly with climate change. These national circumstances are broadly described to serve as basis for expositions and discussions elsewhere in the document. Very thorough and clear quantitative and qualitative descriptions of the national circumstances have been compiled by the National Statistics Office (NSO)[1].
11..11 GGeeooggrraapphhyy Location: The Maltese Archipelago consists of six islands namely Malta, Gozo, Comino, Cominotto, Filfla and St. Paul’s Islands. The latter three are uninhabited. The Archipelago is located in the centre of the Mediterranean Sea, 100 km to the south of Sicily and 290 km north of the African continent. Area and Perimeter: Malta, Gozo and Comino cover a total land area of approximately 320 km2 and a 140 km coastline. Malta, which is the largest of the three islands, has an area of 245 km2 (and a coastline of approximately 100 km), while Gozo and Comino have an area of 67 km2 and 3 km2 respectively. Topography: The general topography of Malta and Gozo can be described as a series of low hills in the northern areas with terraced slopes and plains on the southern aspect. There are no mountains or rivers. The southern coastline is dominated by cliffs, while the northern side consists of low‐lying shore. A north‐south cross sectional view of Malta and Gozo resemble a wedge, with the higher end lying towards the south.
11..22 CClliimmaattee Seasonal Variation: The climate of the Maltese Archipelago is typically Mediterranean, with distinct winter and summer season i.e. mild, rainy winters and dry, hot summers. High pressure conditions dominate during most of the time especially in the summer season.
Air Temperature: The mean monthly temperature for the summer season was 35 C over the past century. The hottest month is July with the highest monthly average
temperature ever recorded being 36 C. It is not unusual for the temperature to exceed this value for short periods during the hottest month. Temperatures have never reached freezing point. The lowest monthly average temperature for the past

41
century was 11 C, in the winter months (January and February). There were
instances when air temperatures dropped below 11 C, but only for short periods of time. Exceptional extremes of 1.4 C and 43.8 C have been recorded. On average, for the past century, air temperature has tended to increase. Sea Temperature: The sea temperature varies in conformity with the air
temperature, with a yearly mean of 20 C. From September to April the mean sea temperature is higher than that of the air and lower from May to August. Precipitation: Rainfall in the Maltese Islands is unpredictable and the rainfall pattern fluctuates; but the highest precipitation rates occur between November and February. The average annual precipitation stands at approximately 530 mm. During the past century, the average monthly rainfall was highest for December (approximately 94 mm) and lowest in July (practically no rain at all). On average, precipitation has decreased over the years. Wind: North‐westerly and north‐easterly winds are the most common and the strongest. The north‐easterly wind blows directly into the two main harbours on Malta, at times impeding marine operations. South‐westerly winds are less common but are generally hot and accompanied by desert dust from North Africa. Sunshine: Data gathered over the past century shows that the average number of daily sunshine hours was eight. The highest number of daily sunshine hours occurs in July (approximately 11.5 hours) and the least in December (approximately 5.1 hours) partly due to cloud cover at this time of the year. Humidity: Humidity tends to be high on the Maltese Islands, with little seasonal variation. The daily average humidity ranges from 65 to 80% and rarely falls below 40%. Temperature variations are accentuated by the relative high humidity.
11..33 DDeemmooggrraapphhyy Table 1.1 below summarises salient demographic trends in Malta over the past decade. The main characteristics of the Maltese population may be succinctly described as:
a) an EU Member State, with a per capita income of just under 77% of the EU average, whereby Malta is part of the EU Single Market and of the eurozone and benefits from funding and other opportunities associated with EU membership, but would also need to comply with EU Directives including those forming part of the EU acquis;
b) one of the smallest national populations worldwide, amounting to just over 410, 290 in 2007 of which close to 15,460 were residents of foreign nationality ‐ smallness often results in vulnerability in various respects, including climate change;

42
c) a very high population density rate, amounting to over 1,250 inhabitants per km2, making Malta one of the most densely populated countries in the world where land is a scarce and precious resource and its diminution or impoverishment arising out of climate change could have significant effects;
d) a high impact of visiting tourist population, amounting to over 1.2 million visitors in 2007, with an average length of stay of 8.9 nights which raises the effective population by over 29,000 (7.9%) on average during the year and by a peak of 43,000 (10.4%) during the summer months ‐ tourism activity is especially susceptible to climate change and can potentially dent adaptation efforts by imposing pressures on available infrastructure and resources;
e) demographic characteristics of a developed country with the population growing slowly at an average of 0.654% per annum, very low birth and death rates and a fertility rate of around 1.67, which is below replacement, as shown in Table 1.1;
f) an ageing population, with the proportion of population aged 60 and over rising from 17.0% in 2001 to 20.24% in 2007, consistent with a high and increasing life expectancy ‐ a higher population average age may exacerbate the socio‐demographic vulnerability to climate change and the costs of adaptation;
g) an increasing phenomenon of irregular immigration, with Malta being at the cross‐roads between Northern Africa and Southern Europe and with the stock of irregular immigrants approaching 5% of the population ‐ this phenomenon has overshadowed the hitherto negligible migration flows averaging 0.1% of the population and which consisted mainly of returned migrants;
h) a culturally homogenous population albeit characterised by a dualism that is typical in post‐colonial countries;
i) a stable parliamentary democracy with a party political system operating from centrist platforms ‐ this implies a degree of consensus on policy‐making regarding issues of national importance such as climate change;
j) a relatively low incidence of social problems, albeit these are on the increase, and limited absolute material poverty;
k) a United Nations human development index ranking that puts Malta within the top 40 countries of the world in terms of income, education and health.

43
Persons
2001 2003 2005 2007
Total Population: 394,641 399,867 404,364 410,290 Maltese 386,938 390,669 392,560 394,830 Foreign 7,703 9,198 11,804 15,460 Gender distribution:
Males 49.50% 49.54% 49.62% 49.70% Females 50.50% 50.46% 50.38% 50.30% Age structure: 0‐14 19.25% 18.23% 17.13% 16.56% 15‐59 63.75% 64.41% 64.10% 63.20% 60 and over 17.00% 17.36% 18.77% 20.24% Population growth
0.68% 0.64% 0.42% 0.60%
Immigration 472 518 NA NA Emigration 73 40 NA NA Net Immigration 399 478 NA NA Total Fertility Rate 1.72 1.48 1.37 1.67 Total Death Rate 7.65 7.92 7.75 7.6
Life expectancy at birth:
– Males 76.07 76.4 77.67 77.2
– Females 80.07 80.4 81.39 81.8
Table 1.1: Maltese Demography [233].
11..44 EEccoonnoommyy The Maltese economy is a small and very open economy with strong trade ties to the EU. Malta has joined the EU in May 2004. Before accession, a sizeable budget deficit was a major concern, but various schemes implemented by the local government have radically changed the economy’s situation, enough for the country to be

44
admitted into the Eurozone as of 1st January 2008. The Maltese economy registered a real growth rate of 3.8% in 2007, thus sustaining the economic growth exhibited over the preceding two years. In nominal terms GDP grew by 6.4%. In 2008, the effects of the international recession have impacted significantly on Malta’s small and very open economy. Real economic growth has slowed down to just over 2%, while growth in 2009 is expected at a negative 0.9%, as shown in Figure 1.1. The Maltese economy is expected to return to a minimal level of growth in 2010.
‐2
‐1
0
1
2
3
4
5
2001 2002 2003 2004 2005 2006 2007 2008 2009 2010
%
Figure 1.1: Economic Growth in Malta [235, 278].
In view of the absence of natural resources and the smallness of the domestic markets, Malta depends heavily on imports and exports. Over the past years, one of Government’s main concerns was to assure a sustainable fiscal position. This is reflected in the fiscal consolidation programme implemented in recent years. Indeed, the general Government deficit followed a downward path, declining below the 3.0% reference value in 2006. This downward trend was sustained in 2007 as the general Government deficit declined further to 1.8% of GDP. In 2008, however, the fiscal deficit increased substantially to 4.7% of GDP, on account of outlays to shelter the economy from the effects of increasing international oil prices, termination payments on account of the winding down of a major public sector ship‐repair entity, as well as a slowdown in Government revenues on account of difficulties in the economic situation. Further macroeconomic restructuring is deemed as necessary to continue improving the long term sustainability of the economy. This is to be accompanied by a microeconomic reform intended to improve the country’s competitiveness. The

45
decline in the general Government deficit‐to‐GDP ratio in 2007 reflected a drop in the expenditure ratio that outweighed the decrease in the revenue ratio. Currently, the outlook for the global economy is characterised by a high degree of uncertainty given that US, the EU and other major economies are going through a recession. The current and expected turmoil in global financial markets as well as increasing oil and commodity prices present economic challenges and threats that are more immediate and certain, and perhaps more costly in the short term, than those associated with climate change.
11..44..11 PPrroodduuccttiivvee AAccttiivvttiieess
The Maltese economy is highly dependent on foreign trade services. Human resource remains the most important asset in the island’s economy. In spite of the lack of natural resources except for temperate climate, and historical and landscape features, over the past three decades the Maltese economy has transformed itself into a developed economy that is competing in the international market. Table 1.2 gives details of the contribution of different productive sectors to GDP in Malta from 2001 to 2007. The agriculture and fishing sector is relatively small, at around 2.5% of GDP, and in long term decline. This reflects mainly the unattractiveness for younger people to pursue an agricultural career because of the unsuitability of Maltese land and sea territory to allow for relatively large undertakings where new technology can be competitively applied. Industry and construction accounted for over a quarter of Maltese GDP up to 2003. However, as from 2004, the relative contribution of these sectors started to decline due to the expansion of the services sector. Service activities include distributive trades, financial services, transport, communication, and personal services. Taken together, services activities accounted for more than three quarters of the GDP since 2006.
2001 2002 2003 2004 2005 2006 2007
Agriculture and fishing 2.6 2.5 2.5 2.5 2.4 2.8 2.5
Industry (Production) 21.7 21.6 21.2 19.4 18.6 17.7 17.1
Construction 4.4 4.4 4.5 4.7 4.8 3.9 3.8
Services 71.4 71.5 71.8 73.5 74.1 75.6 76.6
Table 1.2: The composition of GDP in Malta [235]. Permeating all these economic activities in an important manner is the tourism industry. In this analysis it is not singled out because it is not a distinct productive category for the purposes of statistical compilation, because tourism expenditure is spread on a number of activities including services, manufacturing and agriculture. In

46
2008, there were almost 1.3 million tourist visitors to Malta, who spent €1 billion in Malta. The direct impact of this expenditure on the value added of the Maltese economy is estimated at €427 million, or around 8.4% of the total. Considering indirect and induced multiplier effects, the contribution of the tourism sector in Malta would rise to around 20.7% of total economic activity. Tourism in Malta is mainly attracted by favourable climatic conditions and the availability of recreational coastal zones. The presence of historical and cultural assets is increasingly being promoted to attract tourism, but has not yet become a major driver of tourism activity in Malta. While tourism remains an important pillar of the Maltese economy, its contribution has experienced a relative decline in recent years. Its overall contribution to economic activity, estimated at 20.7% of economic activity in 2008, compares with 25.4% in 2004. Malta’s tourism product is in general facing competition from other countries with a potential to offer a lower cost base. It is thus important to appreciate that the growth in the contribution of the services sector to the economy in recent years, as shown in Table 1.2 has not originated from the tourism sector but rather from other, “new economy” activities in which Malta is developing a competitive advantage. These include ICT‐based services, including remote betting, as well as the provision of financial services. It may be construed that these activities are in general less vulnerable than tourism to the effects of climate change. Further statistical detail on the nature of the growth of the services activities in Malta is needed. For the purposes of this study, some further reference to the agricultural sector is essential, as it may face important consequences from climate change. Although there has been a degree of restructuring and amelioration in recent years, the agricultural sector in Malta has not reversed its long term decline nor does it appear to be on a path towards sustainability. This is reflected in a dearth of investment in viable and sustainable areas of activity, in part attributable to structural and geographical features of the territory, but also due to issues of policy, market and production arrangements. The effects of increasing competition and insufficient competitiveness has had adverse effects on output and activity in the sector, which were to an extent lessened but not offset by rural development efforts. Environmental management is rapidly becoming a priority in Malta with the advent of EU Regulations and funding. However, the link between environmental and financial sustainability in agriculture and agri‐processing is still not well‐established and needs to be addressed, especially in view of agricultural practices that have developed over the past few decades. The development of activities that are complementary to agriculture and agri‐processing with environmental compatibility in Malta, most notably tourism, is not sufficient and there remains significant untapped potential in this area. The effort to promote rural areas for recreation, culture and to enhance Malta’s international tourist effort is very recent and as yet needs to take root and develop at all levels of decision‐making and implementation. The effects of climate change on agriculture may present an additional constraint to the further development of the sector and

47
to its fulfilling its potential multifunctional role. This may imply that rural development activities would need to be increasingly oriented towards adaptation issues. The public sector share of output decreased from just over one‐fifth of GDP in 2004 to 19.5% in 2007. This has occurred due to the privatization of various activities. Table 1.3 provides estimates of the composition of services provided by public sector activities. Chief amongst these is the provision of health services, which amounted to an average of 5% of GDP over the period taken into consideration. Education is another important aspect, as the public sector plays a leading role in the provision of this service without charging user costs in Malta.
Government Expenditure: 2004 2005 2006 2007
(%) (%) (%) (%)
General Public Services 2.60 2.20 2.30 2.30
Defence 0.68 0.70 0.70 0.70
Public Order Safety 1.50 1.30 1.30 1.30
Economic Affairs 3.70 3.50 3.10 3.00
Environmental Protection 0.75 0.94 1.20 1.00
Housing and Community Amenities 0.12 0.29 0.27 0.26
Health 5.30 5.00 5.00 5.10
Recreation, Culture and Religion 0.37 0.38 0.35 0.34
Education 4.50 4.40 4.30 4.10
Social Protection 1.30 1.20 1.40 1.40
Total 20.82 19.91 19.92 19.50
Table 1.3: Public Sector Output: 2004‐2007 [235]. A more detailed insight into the nature of manufacturing activities in Malta, which accounted for some 17% of the Maltese GDP in 2007, is warranted to obtain a better understanding of potential vulnerability to climate change. This can be obtained through an analysis of manufacturing sales data, as presented in Table 1.4. Maltese manufacturing is well diversified, especially when considering the small size of the economy. Table 1.4 reveals the predominance of hi‐tech firms involved mainly in the production of semi‐conductor chips and medical equipment. The share of this sector has however been decreasing over the years, and was the one which was affected in the most significant manner with the onset of the global recessionary tendencies in 2008. The production of food, beverages and tobacco traditionally occupied another substantial share of manufacturing sales, which has recently declined due to the closure of the tobacco industry on account of insufficient cost competitiveness. As will be elaborated upon further, it is considered that these two sectors, which were hitherto of major importance to economic activity in Malta but which are now in relative decline, are comparatively vulnerable to climate change.

48
2004 2005 2006 2007
(%) (%) (%) (%)
Food, beverages and tobacco 13.30 14.00 12.20 1.20
Textiles 4.90 4.40 3.10 2.80
Leather 0.71 0.52 0.24 0.21
Wood and Furniture 0.15 0.18 0.14 0.16
Paper and Printing 5.80 5.80 5.40 6.10
Chemical 3.20 3.90 4.20 5.80
Rubber and Plastic 2.60 2.80 2.50 3.10
Non‐metallic mineral products 2.20 2.70 2.40 2.50
Metals 2.20 2.80 2.80 2.60
Machinery and Equipment 1.20 1.50 1.40 1.50
Electrical and Optical equipment 58.30 53.30 57.20 54.80
Transport Equipment 1.80 3.10 4.20 3.80
Manufacturing n.e.c 4.60 4.90 4.40 4.60
Table 1.4: The Composition of the Manufacturing Sales: 2004‐2007 [236]. The sub‐sector which has experienced the largest growth in recent years was the chemical production sector, as Malta became increasingly attractive to producers in the pharmaceutical sector owing to favourable legal production arrangements with respect to generic pharmaceutical products. Pharmaceutical production, which operates under stringent environmental conditions, may be viewed to be relatively less susceptible to climate change effects, because environmental controls on the production setup would have to be effected irrespective of marginal and gradual changes in the climate in which the setup is located. An assessment of energy and water production in Malta is also interesting within this context. In terms of contribution to GDP, these sectors contribute relatively little, around 1.2%, owing to the fact that they are subsidized by Government and have only started to move towards market prices at the end of 2008. However, they are of an obvious strategic importance to the economy and society as a whole. Their implications for climate change mitigation effects are not considered in this study, which focuses on vulnerability and adaptation. Energy production in Malta relies almost exclusively on the importation of fossil fuels to generate electricity solely for domestic consumption. In future, this is expected to be complemented by a link to the European grid as well as by the installation of renewable energy facilities, most probably wind turbines, to contribute towards the EU target of 10% of electricity production through renewable sources by 2020. Climate change effects are not expected to disrupt current and expected future patterns of energy production in Malta to any appreciable extent. However, it must be ensured that any technologies used to enhance energy efficiency, energy

49
production and mitigation of climate change effects are themselves resilient to climatic changes such as an increase in temperature. Water production relies on a mix of groundwater extraction and desalination of sea water, a pattern which is expected to continue in future. As the quality of the groundwater table is tending to decline, there is an increasing shift towards desalination activities, with a consequent increase in the cost of water production, whose principal component is electricity. Climate change effects may further contribute to these tendencies. On a prima facie basis, it may be concluded that over the past five years, vulnerability to climate change from the production side in Malta appears to have been diminishing. Climate‐sensitive activities such as agriculture and construction are reducing in relative economic importance. Manufacturing is in trend decline with the only growth being registered in pharmaceuticals, which is relatively not vulnerable to climate change. The importance of the services sector to the Maltese economy is strongly on the increase, but the more climate‐sensitive tourism sector is relatively declining.
11..44..22 EExxppeennddiittuurree PPaatttteerrnnss
The counterpart of the output in an economy is the expenditure that is devoted towards acquiring it. Expenditure patterns reveal the consumption activities taking place, from which an assessment of vulnerability to climate change can be obtained, as well as the resources being dedicated to investment, which provide a potential source from which adaptation measures can be effected. They also reveal the extent to which the economy’s output is exported as opposed to being domestically used, and hence the extent of dependence on developments abroad, which in turn could also be affected by climate change effects. Table 1.5 gives a breakdown of total final expenditure in Malta for 2004 and 2007. Private consumption accounts for one third of all expenditure in Malta and is on a decreasing trend. The effects of climate change on this variable will therefore be of significance in future. Similar considerations can be made for government consumption, which occupies less than 10% of expenditure in Malta. Investment is on an increasing trend, which is encouraging in terms of the country’s future growth prospects. On the other hand, it appears that the role of exports is decreasing in the economy, rendering it less dependent on developments abroad. As exports are significant but decreasing, Malta continues to suffer from a deficit on its external transactions, which may curtail its ability to continue attracting capital in future. This would be especially so in the case of effecting investment which does not have a visible and immediate financial rate of return, such as that associated with climate change mitigation and adaptation issues.

50
2004 2007 Change
(%) (%) (%)
Private Consumption 34.08 32.73 1.35
Government Consumption 9.84 9.41 0.43
Investment 8.37 10.75 –2.38
Exports 47.72 47.11 0.61
Total 100 100 0
Memorandum Item
Net Exports:GDP –5.7 –5.9 –0.2
Table 1.5: The Composition of Expenditure in Malta [235]. In order to assess the potential effects of climate change on the expenditure side of the economy, it is useful to analyse the composition of private consumption expenditure. This analysis is presented in Table 1.6. Changes in consumption patterns are typical of those of a developing economy with a rapidly decreasing share of expenditure devoted to basic needs such as food and clothing. On the other hand, there is an increasing expenditure on housing, partly reflecting an increase in property values in a densely inhabited country. Transport and communication and recreation have also occupied larger shares of consumption expenditure. The increase in the transport share reflects a strong increase in the use of private and commercial vehicles. This represents an inefficient and unsustainable use of transport resources, which is placing an excessive strain on road infrastructure and has obvious consequences for climate change mitigation issues. It is to be noted that the recreation enjoyed by the Maltese is probably larger than that revealed in consumption statistics, because the population enjoys environmental amenities at zero financial cost, that is, outside the market transactions falling under the purview of official statistics. These amenities and/or their enjoyment may be at risk from climate change issues, thereby introducing a potential source of vulnerability to household consumption and welfare. These amenities relate in good part, though by no means exclusively, to bathing sites, other coastal areas and country‐side locations. Two dissertations carried out at a post graduate level at the University of Malta attempted to value the beaches at Pretty Bay in Birżebbuġa [229] and Ramla Bay in Gozo [227], in part by means of survey exercises aimed at deriving the willingness of respondents to pay for the use of the beaches. These studies reported a willingness to pay averaging €1.5 per visit.

51
2004 2007 Change
(%) (%) (%)
Food and Non‐Alcoholic Beverages 16.06 15.33 0.73
Alcoholic Beverages, Tobacco 3.30 2.82 0.48
Clothing and Footwear 5.95 4.44 1.51
Housing, Water, Electricity, Gas and other fuels 10.70 11.72 –1.02
Furnishings, Household Equipment and RoutineHousehold Maintenance
8.79 8.38 0.41
Health 2.47 2.29 0.18
Transport 13.42 13.63 –0.21
Communication 4.84 4.85 –0.01
Recreation and Culture 10.69 11.37 –0.68
Education 1.22 1.27 –0.05
Restaurants and Hotels 13.64 13.37 0.27
Miscellaneous Goods and Services 8.30 8.84 –0.54
Total 100.00 100.00 0.00
Table 1.6: The Composition of Private Consumption [235]. Considering the shore length of each of these two beaches in relation to the total shore length used for bathing in Malta, and taking into account the limitations and assumptions above, the total annual value generated by the willingness to pay to visit bathing areas in the country would be estimated at around €6 million per annum. This estimate reflects the fact that the shorelines of Ramla Bay and Pretty Bay constitute 14% of the total shoreline length of bathing areas in Malta. There are no available studies on the potential value of recreational sites used outside the summer period, including the countryside and beaches enjoyed by the Maltese population. An estimate of this is derived by using the willingness to pay per visit to beaches during the peak summer period as a basis. In estimating the value of environmental amenities visited outside summer months, this study uses a high level assumption, that such recreational sites are visited 8 months during a year (as opposed to 4 months in the case of bathing areas) with a once a week frequency (as opposed to a daily frequency for bathing areas). Based on these assumptions, and that the population’s total willingness to pay for each day of beach and countryside visits is equal, the total annual value generated by the willingness to pay can be estimated at €1.7 million. The total annual value generated by the willingness by households for recreational purposes outside market arrangements, considering beach and countryside visits, would thus be estimated at around €7.7 million. This is equivalent to 0.2% of total household consumption, and to 1.8% of household consumption spent on recreation. On a prima facie basis, it may therefore be concluded that consumption activities are tending to shift towards areas with an increased vulnerability to climate change.

52
Furthermore, the persistence of fiscal and external deficits in the Maltese economy may imply that it may in future be difficult to mobilize saving resources to effect investment climate change adaptation and mitigation activities, especially if these do not provide any immediate and tangible financial rate of return. On the other hand, the widespread provision of health and education services by the public sector at zero or low cost may facilitate national efforts aimed at climate change adaptation. This would nevertheless require further investment in health services to ensure preparedness in the face of climate change impacts. A further economic challenge relates to the extent to which health and other public services can in the medium term continue to be provided free of charge, especially in view of the increasing pressures which may potentially be exercised on them, not least through climate change effects.
11..44..33 LLoonngg TTeerrmm EEccoonnoommiicc TTrreennddss
Two major factors conditioning the long run development of the Maltese economy are:
a) the demographic shift towards older populations. This is expected to happen not only in Malta, where the proportion of population aged 60 and over is expected to rise from 20% in 2007 to almost one quarter by 2020, but also in Malta’s trading partner countries.
b) the continuing process of globalisation. Hence, the need for the Maltese economy to be increasingly competitive and attractive to foreign investment especially since it became an EU member as Malta had to align itself with international economic systems.
These considerations point to the likelihood of the following trends in Malta’s future economic development:
a) a shift away from manufacturing into service activities, particularly in financial and IT services, tourism within specific niches such as cultural, historic, religious and sports, as well as in export‐oriented education and health services;
b) a restructuring of manufacturing activities away from the wide diversification of outputs currently being produced and towards the hi‐tech area where Malta remains cost‐competitive;
c) a reduction in the role of the public sector; d) an increase in investment expenditure as Malta catches up with the
infrastructure and income levels of the EU, later to be followed by higher consumption particularly on health and recreation, also in view of the ageing population.
These development trends and orientations are encapsulated in Malta’s vision 2015 initiative, which is a call to action to promote excellence in six major areas of activity within the context of sustainable development. The sectors include Health Services,

53
Education, Manufacturing and Related Services, Tourism, Financial Services, and Communication and Information Technology. Within the latter, it is interesting to note the incipient investment in SmartCity Malta, which is intended to host international ICT activities in a world‐class facility and would be expected to contribute around 7% of Malta’s GDP once it becomes fully operational. It may thus be concluded that the long‐term development path envisaged for Malta features a mixed outlook in terms of the country’s overall vulnerability to climate change. On one hand, the country plans to develop in sectors which may feature heightened vulnerability to climate change, including tourism, education and health. On the other hand, development is also expected through the expansion of sectors which are not as sensitive to climate change issues, including high value added manufacturing, financial services and information and communications technology.
11..44..44 LLoonngg TTeerrmm PPoolliiccyy OOrriieennttaattiioonnss
Malta’s long term policy orientations are spelled out in a number of documents, and in particular in the National Strategic Reference Framework Operational Programmes submitted to the EU Commission for the purposes of management of funding resources, as well as in the National Reform Programme compiled for the purposes of the EU Lisbon Agenda. In the National Strategic Reference Framework, there is a specific focus on Malta’s topography which tends to give rise to flash flooding due to the heavy storms during the autumn and winter months. This leads to damages to the physical environment, economic disruption and, occasionally, to loss of human life. Thus, the Government’s aim in this regard is to implement risk prevention solutions such as better storm water management though advanced technology mechanisms. This is a clear identification of an issue of vulnerability to climate change and the formulation of an adaptation measure. The issue of renewable energy sources is also mentioned in the document, but this is a mitigation issue. Climate change has been identified as a key issue. The effects of changes in climate vary the demands made upon regional infrastructure and the level of regional economic growth. These effects could be reduced through several schemes that encourage sustainable travel, use of renewable energy sources and reduction of emissions from disused landfills. Thus, interventions contemplated under this document are focusing more on mitigation rather than on adaptation issues. Similarly, The National Reform Programme deals with the main contributors of climate change, that is, greenhouse gas emissions which occur from electricity generation and transport. Since Malta became an EU member, several measures have been undertaken to address climate change, amongst which are appropriate disposal of waste and the better utilisation of energy sources. In this context, Malta’s National Reform Programme proposes to capture methane from waste disposal and treatment; replace existing uncontrolled landfill with alternative engineered landfills

54
and further improve upon the treatment of Municipal Solid Waste; promote the increased use of bio‐fuels; and encourage greater utilisation of non‐conventional sources of water, namely treated sewage effluent and surface water run‐off. Therefore, the emphasis is once again on mitigation rather than on adaptation issues. In the same spirit, the taxation system on motor vehicles was in 2009 reformed to strengthen economic instruments to disincentivise the use of more polluting vehicles. It may thus be concluded that long‐term policy orientations in Malta are envisaging efforts towards climate change mitigation. Issues of vulnerability and adaptation are accorded a secondary importance.
11..55 EEdduuccaattiioonn aanndd HHeeaalltthh Educational System: In Malta, education is compulsory between the ages of 5 and 16. Children within this age bracket attend primary, followed by secondary school. School education is provided free by the state and the Roman Catholic Church. There is also an increasing number of private schools operating in Malta. All schools follow an agreed national curriculum as a minimum. The state provides post‐secondary education at its colleges and tertiary level of education at its University. Students in post‐secondary education and beyond are paid maintenance grants by the Government. The number of foreign universities that are setting up their own local branches is on the increase. Opportunities for adult education are available and affordable. Literacy: Adult literacy in Malta is estimated to be approximately 86%. Health: Malta has been ranked consistently high in the World Health Organisation’s Overall Health System Performance. It is no surprise that the health of the Maltese is comparable with that of other Europeans.
11..66 EEnnvviirroonnmmeennttaall VVuullnneerraabbiilliittyy aanndd CCoonncceerrnnss Environmental Vulnerability: The current high population density poses a threat to the environment and makes it vulnerable. The main environmental problems associated with high population density include waste, and water storage and supply. Other associated problems include pollution resulting from the burning of fossil fuels. The islands are vulnerable due to their high susceptibility to soil and coastal erosion. In the past, the Island’s fragile ecosystems were continuously being disturbed by construction and development. Nowadays, potential environmental impact is taken into account during the planning and development stage of major infrastructural projects. Nevertheless, the use of land for development remains a major problem.

55
Specific Environmental Concerns: Air quality, freshwater and marine environment, biodiversity, waste and land use have become major environmental concerns. The major contributors to air pollution are energy generation and transport. Natural freshwater resources are very limited and considered important. The aquifer is among these resources and is at risk from over‐extraction and certain agricultural practices. The marine and coastal environments serve the Maltese economy well. The biggest threat to the coast is erosion while the marine environment is at risk from contamination. The islands’ biodiversity is affected by pollution and land use. A number of habitats such as woodlands, saline marshlands, coastal wetlands, sand dunes and some springs and caves are threatened. Waste remains a major problem given the size and relatively large population. The problem has been accentuated by a better standard of living which was accompanied by increased consumerism. Environmental awareness has increased but at a much slower pace than economic development.
11..77 TToowwaarrddss SSuussttaaiinnaabbllee DDeevveellooppmmeenntt There have been concerted efforts on a national scale in order to achieve sustainable development through the introduction of suitable legislation and setting up of the necessary institutional framework. With regards to legislation, the Environment Protection Act of 2001, whose precursor was that of 1991, was instrumental in giving more powers to the legislator with regards to matters affecting the environment. In particular, it provided for the National Commission for Sustainable Development (NCSD). Furthermore, Malta’s EU membership necessitated the introduction of new legislation that brought Malta in line with European Union directives on the environment among other sectors. For legislation to be effective, the need for adequate institutional framework was necessary. The setting up of the Malta Environment and Planning Authority (MEPA) was a major contribution in this direction. The Environment Protection Directorate within MEPA is the regulatory entity primarily concerned with the protection of environment but also for the implementation of the Environment Protection Act and for the formulation of environmental policies and regulations. The NCSD plays are more conceptual role at a higher level. The institutional framework for the preparation of national communication to the United Framework Convention on Climate Change (UNFCCC) is discussed in the following section. It is a recognised fact that sustainable development can only be achieved through wide participation. Several national authorities have been set up to ensure success. Nevertheless, much more needs to be done to ensure sustainability. An important ingredient for success is to weave the basic concept of sustainability through educational curricula at all levels, which is different from, and far more effective than having the same concept placed as an item in relevant syllabi.

56
Despite the legislation, institutional framework and commitment towards achieving sustainable development, there is the need of capacity building. Given the limited human resource, this issue is likely to remain the most challenging hurdle.
11..88 IInnssttiittuuttiioonnaall FFrraammeewwoorrkk ffoorr tthhee PPrreeppaarraattiioonn ooff NNaattiioonnaall
CCoommmmuunniiccaattiioonnss Malta ratified the UNFCCC on 17th March 1994 and at the time, as non‐Annex I country was committed to preparing its First National Communication, as required under Article 12 of the Convention. Malta’s First National Communication was submitted in 2006. Funds for the associated project were provided by the Global Environment Facility (GEF) through the United Nations Development Programme (UNDP). In recent years, MEPA was entrusted with the task of maintaining the national greenhouse gas inventory and subsequent reporting to international bodies. Furthermore, it is the current executing agency of the enabling activity for the preparation of the Second National Communication to the UNFCCC. Over the past several years, MEPA has established a synergistic link with the Department of Physics at the University of Malta, which have made possible the compilation of the First, as well as the current (Second) National Communication.
11..99 MMaallttaa’’ss SSttaattuuss vviiss‐‐àà‐‐vviiss tthhee UUNNFFCCCCCC On 11th December 2008, in his statement at the UNFCCC Conference of Parties (CoP), Minister George Pullicino, announced that Malta, as a result of acceding to the European Union, seeks to move into Annex I [243]; thus changing its status from Non‐annex. To achieve this, Malta will submit a formal proposal for consideration and action at CoP 15 to be held in Copenhagen, during December 2009.
57
PPAARRTT II:: GGRREEEENNHHOOUUSSEE GGAASS EEMMIISSSSIIOONN

58
NNAATTIIOONNAALL GGRREEEENNHHOOUUSSEE GGAASS EEMMIISSSSIIOONNSS IINNVVEENNTTOORRYY
FFOORR MMAALLTTAA 11999900 ‐‐ 22000077 22..00 EExxeeccuuttiivvee SSuummmmaarryy
National Greenhouse Gas (GHG) emissions inventories were compiled under the revised 1996 and 2006 Intergovernmental Panel on Climate Change (IPCC) guidelines and consider the following direct GHG: carbon dioxide, methane, nitrous oxide, perfluorocarbons, hydrofluorocarbons, sulphur hexafluoride, and indirect GHG: nitrogen oxides, carbon monoxide, non‐methane volatile organic compounds (NMVOC), sulphur dioxide. The sectors considered were: energy, industrial processes, solvent and other product use, agriculture, land use, land‐use change and forestry (LULUCF), waste. The major contributor to direct GHG emissions was the energy sector which comprises electricity generation, transport, commercial, institutional, residential and manufacturing industries. The main contributor to emissions and their increasing trend and driver of is electrical power generation. Land transport emissions appear to be levelling off, probably as a result the number of cars approaching saturation levels. Industrial processes and solvent use have remained minor contributors to GHG emissions but sources have changed in the last decade, with hydrofluorocarbons and sulphur hexafluoride becoming more prominent because of their very high global warming potential. Waste management and agriculture, animal husbandry in particular, have remained the principal sources of methane; the same sources were responsible for almost all of the nitrous oxide emissions. The future evolution of these two gases will be heavily influenced by plans for sewage treatment plants, bio‐digestion plants and waste incineration. LULUCF provided a net sink, as had been reported in the First national Communication but its effectiveness has been reduced by about 50% as a result of a recalculation using a new emission factor. Of the indirect GHG, oxides of nitrogen and carbon monoxide showed only small fluctuations during the inventory period; there was greater variability for NMVOC, while in the case of sulphur dioxide, the fluctuations are associated with the sulphur content of the residual fuel oil used in the power stations. Data acquisition and quality have continued to improve under the impetus of EU obligations and major developments of institutional structures at the Malta

59
Environment and Planning Authority (MEPA) and the National Statistics Office (NSO). The recent liberalisation of the fuel import market may lead to temporary setbacks.
22..11 IInnttrroodduuccttiioonn Inventory compilation is a resource intensive process, where the inventory quality improves with time. Malta submitted the first National Inventory Report (NIR), pursuant to obligations under the United Nations Framework Convention on Climate Change (UNFCCC) and Decision 280/2004/EC concerning the monitoring of Community greenhouse gas emissions in March 2008 [5]. A second NIR was published in March 2009 [6]. In view of the fact that there were some significant differences between the two reports, due in large part to improved data and to revised emission factors, this review is focussed on the March 2009 NIR, but makes some reference to the March 2008 NIR.
22..11..11 CClliimmaattee CChhaannggee OObblliiggaattiioonnss
The Republic of Malta ratified the United Nations Framework Convention on Climate Change (UNFCCC) on 17th March 1994 as a non‐Annex I country, and went on to sign the Kyoto Protocol on 11th November 2001, with the same status. Under the UNFCCC, the main obligation of non‐Annex I countries is the periodic submission of National Communications to the Conference of Parties to the Convention. In fact Malta sent its First National Communication to the UNFCCC in April 2004 [6]. Malta became a member state of the European Union (EU) on 1st May 2004; as such it is bound to comply with EU legislation. Decision 280/2004/EC sets out the obligation of every member state to report GHG emissions and removals in a NIR. Aggregated EU data is then transmitted by the EC to the UNFCCC.
22..11..22 GGHHGG EEmmiissssiioonnss IInnvveennttoorriieess iinn MMaallttaa
The Malta First National Communication to UNFCCC contained a NIR covering the period 1990‐2000, prepared by the University of Malta. When MEPA took over the task of compiling national GHG inventories, one ad hoc update to the 1990‐2000 inventory was made, extending it to 2003 [7]. The exercise served to seed appropriate structural and human resources in MEPA intended to establish and operate a standardised system of inventory reporting required to meet climate change and air quality obligations. The core group of the system is the National Emissions Inventory System (NEIS) team.

60
22..22 GGeenneerraall TTrreennddss iinn GGHHGG EEmmiissssiioonnss An indication of trends in energy production and use can be obtained from the variations in emissions per capita and emissions per unit GDP. The first reflects habits in energy use, while the second is more sensitive to features of economic development. The trends in these two parameters are shown in Figure 2.1 and Figure 2.2 below. Population has shown a slow if steady growth. Emissions per capita, in going from 5.47 tonnes in 1990 to 7.25 tonnes CO2 in 2007, fluctuated rather more. After the 1994 peak there was a drop, clearly connected with the removal of coal as a fuel, to a level which is constant up to 2002, i.e. the second year for which summer peak demand exceeded the winter peak [5]. After 2002, there was a very perceptible move upwards as the summer/winter demand excess became clearly established.
0.000
0.001
0.002
0.003
0.004
0.005
0.006
0.007
0.008
330000
340000
350000
360000
370000
380000
390000
400000
410000
420000
1990
1991
1992
1993
1994
1995
1996
1997
1998
1999
2000
2001
2002
2003
2004
2005
2006
2007
Emissio
ns p
er C
apita
Population
Year
Population Emissions per capita
Figure 2.1: Emissions per capita (in ktonnes CO2) & population [7]. Emissions per unit GDP also responded to the removal of coal as a generating fuel in 1995. The subsequent down turn to year 2000 pointed to an approach to the much‐desired decoupling of emissions from economic development. But then a series of very hot summers, culminating in summer 2003 seem to have reversed the trend. Since 2003, the gentle drift downwards has resumed; it was modified but not eliminated by the very hot summer of 2007.

61
0
100
200
300
400
500
600
700
800
900
0
0.5
1
1.5
2
2.5
3
3.5
4
4.5
5
1990
1991
1992
1993
1994
1995
1996
1997
1998
1999
2000
2001
2002
2003
2004
2005
2006
2007
Emissio
ns p
er G
ross D
omestic P
roduct (G
g Carb
on Dioxid
e Eq
uivale
nt/B
illion Eu
ros 2
000)
Gross Domestic Product (B
illion Euros 2000)
Year
GDP (billion Euro 2000) Emissions per unit GDP
Figure 2.2: Emissions per unit GDP and GDP [7].
The pressure from increased summer demand has a less obtrusive but still marked effect on evolution of GDP and emissions. The summer of 2007 saw peak demand rising to 434 MW. With a total effective generating capacity of 520 MW [8], the reserve margin is very small. For peak demand to be met usually requires the use of open‐cycle gas turbines burning gas‐oil (diesel) with a rather low efficiency [9]. This makes their peak‐lopping function costly in emission terms and in money terms. Increased emissions can be seen in Figure 2.3. The general trend in emissions of two of the three main greenhouse gases, CO2 and CH4 has been inexorably upwards, while N2O has shown only a small increase. The case for CO2 with a 1990‐2007 increase of 45.3% is well established, not least because of the good quality data sets relating to the main sources. CO2 sinks, on the other hand, were re‐dimensioned in [7] compared to [6], but have remained constant over the whole period 1990‐2007. The apparent increase in CH4 emissions may have been influenced by the changes in waste treatment practice and in data collection after 1999 [5]. Future evolution of CH4 emissions is going to depend on modes of operation of the new sewage treatment plants, as well as on the ability to extract and use CH4 from the managed landfill at Ta’ Żwejra; and on the success of proposed schemes to treat animal waste [10]. N2O emissions, however, are heavily dependent on agricultural practices by conservative farmers.

62
0
500
1000
1500
2000
2500
0
500000
1000000
1500000
2000000
2500000
1990
1992
1994
1996
1998
2000
2002
2004
2006
Carb
on Dioxid
e (G
g)Electricity Generated (M
Wh)
Year
Electricity Generated (MWh) C02 (Gg)
Figure 2.3: Electricity generated & attendant CO2 emissions [7].
The emissions of fluorinated gases (HFCs and SF6) have undergone a significant revision between [6] and [7], principally because of the recent availability of quantitative import data. While the quantities of these two materials involved is small, their very large Global Warming Potential (GWP) potential [11], gives them a noticeable effect: some 2.3% of overall CO2 emissions in 2007. Of the so‐called indirect greenhouse gases (CO, NOx, NMVOC ) and SO2, NMVOC and NOx have shown a small drop over 1990‐2007, and both show a sharp decrease between 1999 and 2000 which is difficult to explain; while CO is strongly correlated with total petrol sales. However, the calculated CO emissions may well be an upper limit, as no account has been taken of the impact of catalytic converters on the composition of car exhausts. This consideration may also apply to transport NOx and NMVOC emissions. On the other hand, SO2 is strongly correlated with the sulphur content of the Residual Fuel Oil (RFO) burnt in power stations; the sulphur content of gas‐oil used in transport has never been higher than 0.5% in the inventory period and is now much lower. So a switch to use of low‐sulphur RFO is immediately reflected in the SO2 emissions.

63
22..33 GGHHGG EEmmiissssiioonnss bbyy SSeeccttoorr
22..33..11 EEnneerrggyy
The Energy Sector contains the major sources of CO2 emissions: power generation and transport. In the latter category, land transport is by far the highest contributor, due to the large number of private cars.
22..33..11..11 EElleeccttrriicc PPoowweerr GGeenneerraattiioonn The Energy Sector contains the major sources of CO2 emissions: power generation and land transport. In the case of electricity generation, the CO2 emissions closely track the continuously increasing demand on the power stations, with an overall increase of 94% in generation resulting in a 49% of CO2 emissions during the inventory period. There are, however, ripples on the general curve, which reflect changes in fuel mix, the installation of new generating equipment and shifts in peak demand. The immediate effect of the 1995 elimination of coal pushed down emissions and improved efficiency in terms of tonnes CO2/MWh generated (see Figure 2.4).
0
0.2
0.4
0.6
0.8
1
1.2
0
500000
1000000
1500000
2000000
2500000
1990
1991
1992
1993
1994
1995
1996
1997
1998
1999
2000
2001
2002
2003
2004
2005
2006
2007
Tonnes o
f Carb
on Dioxid
e per M
Wh
Electricity Generated (M
Wh)
Year
Electricity Generated (MWh) tC02/MWh
Figure 2.4: Electricity generated & Efficiency [7].

64
However total emissions soon started to increase again as demand, while moderating its 1990‐1995 rate of increase, kept rising. Efficiency continued to improve, with a step change when the Combined Cycle Gas Turbine (CCGT) was fully commissioned in 1999. Since then, emissions and efficiency have remained fairly stable because of restricted use of the CCGT; emission fluctuations have tended to follow the severity of the summer peak demand. Incidentally, the CCGT influence on efficiency should be noted; it points to a possible way to achieve a fairly rapid cut‐back in CO2 emissions by transferring some of the steam turbine load, fuelled by RFO, to the CCGT fuelled by diesel, at some increase in the cost of fuel, of course [9].
22..33..11..22 TTrraannssppoorrtt As can be seen from Figure 2.5, road transport dominates CO2 transport emissions; national (maritime) navigation has supplied small, slowly increasing amounts, while national aviation only appears in a very marginal fashion in 2003. Both these last sources would move upwards if they could include the results of our maritime Search and Rescue (SAR) efforts, but no data on fuel use in boats and aircraft could be obtained from the appropriate source.
0
100
200
300
400
500
600
1990
1991
1992
1993
1994
1995
1996
1997
1998
1999
2000
2001
2002
2003
2004
2005
2006
2007
Emissions (Gg Carbon Dioxide
Equivalent)
Year
Road Transport National Navigation Domestic Navigation (insignificant)
Figure 2.5: Transport CO2 emissions [7]. There are some puzzling details in the correlation of emissions with number of vehicles on the road. This latter shows a steady rise between 1990 and 2003 (see Figure 2.6). Yet emissions level out by 2001 at a value that shows only small fluctuations out to 2007. Certainly the early part of this time span, when gas‐oil was heavily subsidized compared to gasoline, saw a good rise in diesel car numbers [11]. Given the greater

65
efficiency of diesel engines, one can suggest a plausible scenario where the increasing fraction of diesel cars would, if not subjected to increased use, lead to a levelling off of emissions. But from 2005 onwards, there has been a fairly rapid equalisation of diesel and gasoline prices, yet it does not seem as if there was a return to gasoline cars. That is perhaps not too surprising as the rate of replacement of the local fleet is known to be rather low [11].
0
100
200
300
400
500
600
0
50000
100000
150000
200000
250000
300000
350000
1990
1991
1992
1993
1994
1995
1996
1997
1998
1999
2000
2001
2002
2003
2004
2005
2006
2007
Emissions (Gg Carbon Dioxide Eq
uivalen
t)
Total number of veh
icles
Year
Total no.of vehicles Road Transport C02 equivalence
Figure 2.6: Number of licensed vehicles & Road Transport CO2 emissions [7].
22..33..11..33 MMaannuuffaaccttuurriinngg aanndd CCoonnssttrruuccttiioonn Emissions from manufacturing and construction showed a strong decline over 1900‐2007. Intuitively, this gives cause for concern about the quality of the data used. The decade 1995‐2005 saw a strong surge in construction activity, including start and completion of some major projects. As a consequence, the amount of construction waste generated rose rapidly [10], helped by planning policies requiring the provision of underground garage space for apartment blocks. The energy required to dig out and then transport such waste is considerable. These considerations do not make a decline in fuel use, and so of emissions, very likely. Of course, the likeliest source of the “missing” fuel is one that does not feature in the GHG emissions account ‐ hidden transfers from bunkering operations is the likeliest.

66
22..33..11..44 FFuueell CCoommbbuussttiioonn iinn CCoommmmeerrcciiaall,, IInndduussttrriiaall aanndd RReessiiddeennttiiaall
CCaatteeggoorriieess The first two categories use a fuel mix which is shared in roughly equal proportions between Liquid Petroleum Gas (LPG), Thin Fuel Oil (TFO), diesel and Light Heating Oil (LHO). Domestic fuel combustion, particularly since the price equalisation of kerosene and diesel, uses almost exclusively LPG, generally supplied in cylinders to individual households. Future domestic use of LPG may be influenced by privatisation, which has already produced a significant price rise, but in fact there no convenient alternative for the households. The sector contributes a little over 3% of total equivalent CO2 emissions.
22..33..22 IInndduussttrriiaall PPrroocceesssseess aanndd SSoollvveenntt UUssee
The range of industrial processes which lead to direct and indirect GHG emissions in Malta is limited. Looking at direct emission processes first, [7] sets some precedents. Of the processes with actual CO2 emissions, lime production has now been ruled out as no longer present locally. But the “filling in” exercise in the [6] for HFCs and SF6 has been partially replaced by calculations based on actual imports and use. The end result is that HFCs and SF6, with their very large GWP have come to contribute most of the total GHG emissions (2.3% of the national emissions in 2007) in this category. Indirect GHG emissions via NMVOC release from asphalt road paving (drastically revised downwards in the [7] submission) and from food and drink manufacture, contribute small and highly variable amounts. In the Solvent Use section, there are two improvements over the previous submission. Nitrous Oxide (N2O) emissions arising from medical use of the gas are included, and actual annual solvent import figures from the NSO have been used to update a year 2000 publication [243]. The general effect on NMVOC emissions have been minor cut‐backs of some 5‐10%.
22..33..33 AAggrriiccuullttuurree
Despite the limited land area under agricultural uses of various types, the agricultural sector is a significant contributor to national GHG emissions. The three processes of Enteric Fermentation, Manure Management and bacterial action on soils treated with artificial fertiliser, produce a total of 5% of national CO2 equivalent emissions, with the first two processes predominant. Activity data for Enteric Fermentation and Manure Management consists of animal numbers, with the final result depending on emission factors specific to animal type and to process. The activity data contains an apparent ambiguity in the cattle section: the sudden appearance in year 2000 of a non‐dairy herd of such size that combined dairy and non‐dairy cattle numbers for that year amount to almost twice

67
cattle numbers in 1999 (see Table 2.1). The inevitable peak in CO2 equivalent emissions from Enteric Fermentation is present but is not too prominent, simply because the dairy cow emission factor is twice that for non‐dairy cows.
Livestock type and animal numbers
Year Dairy Cows Other Cattle Sheep Goats Horses Swine Poultry Rabbits
1990 12891 ‐ 4623 3429 944 61607 1500000 29213
1991 12891 ‐ 4623 3429 944 53549 1500000 29213
1992 12891 ‐ 6000 5300 860 54794 1500000 29213
1993 12891 ‐ 6200 5300 840 57748 1500000 29213
1994 12891 ‐ 5600 5000 760 55726 1500000 29213
1995 12891 ‐ 14773 10169 740 52578 1500000 29213
1996 12891 ‐ 12330 8436 700 58027 1500000 29213
1997 12891 ‐ 14980 6407 650 62460 1500000 29213
1998 12891 ‐ 12590 5738 640 56887 1500000 29213
1999 12891 ‐ 11840 5110 600 59229 1500000 29213
2000 8796 10584 12490 4599 600 80074 1500000 29213
2001 8338 10085 10376 3930 853 81841 1565629 55254
2002 8033 10737 12253 5163 853 78303 1529100 55254
2003 7607 10333 14861 5374 853 73067 1381544 55254
2004 7835 11573 14130 5635 853 46853 1381544 55254
2005 7832 11910 14642 6272 853 73025 1052013 55254
2006 7494 11739 12172 5828 853 73683 1052013 55254
2007 7545 11897 12315 6227 853 76900 1224267 55254
Table 2.1: Livestock type and animal number [7]. This discontinuity apart, there is a good consolidation of animal numbers in this submission, mainly due to the copious and much‐improved data now coming from the NSO [13]. The action of certain bacteria in the soil on artificial fertiliser produces GHG emissions as N2O. Even though the absolute amounts are small, the high GWP of N2O results in a non‐negligible effect on the equivalent CO2 scale. The contributions from the three processes mentioned above are shown in Figure 2.7 below.
22..33..44 LLaanndd uussee,, LLaanndd‐‐uussee CChhaannggee aanndd FFoorreessttrryy
This sector deals with CO2 removals rather than with emissions. The three sinks discussed are Forest Land, for which there has been no change in area covered but a change in methodology of computation; Crop Land, by which is meant land under permanent rather than annual crops; and Settlements which includes trees in an urban setting. However, some 55,000 trees planted between 2005 and 2008 have not been included as “in early development stages….carbon emissions and removals are very difficult to estimate reliably” [5]. On the other hand, it is well known that

68
trees have maximum rates of biomass accumulation in the first 5 to 10 years of life ‐ a fact that governs the technique of coppicing as a source of renewable energy. A rough estimate for these trees suggests a removal capacity of some 10 Gg CO2 per annum, a quantity which would be easily noticeable in the total sink effect shown in Figure 2.8.
0
5
10
15
20
25
30
35
40
1990
1991
1992
1993
1994
1995
1996
1997
1998
1999
2000
2001
2002
2003
2004
2005
2006
2007
Emissions (Gg Carbon Dioxide
Equivalent)
Year
Enteric Fermentation Manure Management Agriculture Soils
Figure 2.7: Agriculture sector emissions in equivalent CO2 [7].
22..33..55 WWaassttee
Over the period under review, solid and liquid waste treatment has undergone many changes in all aspects of the processes involved. As a result, quality and quantity of data, to mention just one point, have varied considerably. There have also been major changes in waste treatment plant, with the closure of all unmanaged landfills, the opening of engineered landfills at Ta’ Żwejra and Għallis, and the coming on stream of two new sewage treatment plants to supplement the long‐standing Sant’Antnin plant. As the actual start of operations of the new sewage treatment plants falls outside this inventory period, no emissions from them are considered. The emissions from the Waste sector are shown in Figure 2.9. Overall they reach 6.2% of total national emissions, with the solid waste sector providing the major part (79%) of that. By the end of this inventory period, waste incineration was contributing less than 1% of the sector total; but this fraction will eventually increase because of the coming on stream of the Marsa Abattoir Incinerator in October 2008.

69
‐60
‐50
‐40
‐30
‐20
‐10
0
1990
1991
1992
1993
1994
1995
1996
1997
1998
1999
2000
2001
2002
2003
2004
2005
2006
2007
Removals (G
g Carbon Dioxide)
Year
Cropland Forest Land Settlements Total
Figure 2.8: Total annual CO2 removals [7].
0
50
100
150
200
250
1990
1991
1992
1993
1994
1995
1996
1997
1998
1999
2000
2001
2002
2003
2004
2005
2006
2007Em
issions (Gg Carbon Dioxide Equivalent)
Year
Solid Waste Liquid Waste Waste Incineration Composting
Figure 2.9: Emissions from the waste sector [7]. Trends in waste generation have varied over the period 1990‐2007. Aside from the ever‐increasing quantities of construction waste, of no relevance to waste sector emissions, Municipal Solid Waste per capita has practically doubled. A downward excursion after 2004 was succeeded by a strong spurt after 2006. Improvements in waste collection and treatment practice put in place particularly after year 2000, have not stemmed the rising tide. In fact, a recent revision of the Solid Waste

70
Management Strategy [10] has insisted that large scale waste incineration, to be incorporated in Delimara power station, is unavoidable. Equivalent CO2 emissions from liquid waste are divided between methane (60‐70%) and nitrous oxide (30‐40%). Only one treatment plant was in operation, and that only during part of the inventory period. Taking into account recalculations for methane only, emissions have fluctuated between 27Gg and 32Gg CO2 equivalent. Deliberate solid waste incineration has been carried out in disparate situations, which had one feature in common: a complete lack of abatement measures in the incinerators. Over the period 1990‐2003, shipboard kitchen waste was incinerated at the Malta Shipyards. Over the whole of the inventory period, emissions from three other sites were considered. For the incinerators at St. Luke’s Hospital and Gozo General Hospital, both taking clinical waste, CH4 and CO2 emissions were calculated. The third source, producing CO2 and N2O, was an industrial establishment burning paper waste. The total average annual contribution to sector CO2 from incineration has remained well below 1%. The Sant’Antnin Solid Waste treatment plant started operations in 1993 and was shut down for upgrading in early 2007. Methane and nitrous oxide emissions from the composting process, reported for 1993 to 2006, fluctuated rather strongly in response to the quantities of biological solid waste accepted by the plant (see Figure 2.10).
0
0.5
1
1.5
2
2.5
3
3.5
4
4.5
0
5
10
15
20
25
1993
1994
1995
1996
1997
1998
1999
2000
2001
2002
2003
2004
2005
2006 Emission
s (Gg Carbon
Dioxide
Equ
ivalen
t)
Waste Treated
(Gg)
Year
Waste Treated Emissions
Figure 2.10: Emissions & Quantities of Waste Treated at Sant’Antnin [7]. These quantities tended to be conditioned by the success or otherwise of efforts to keep odour emissions under control. Repeated failure of the aerating equipment for the maturing compost lines resulted in objectionable odours reaching the near‐by housing estate. Such events were understandably followed by protests from

71
residents; the plant managers usually responded by cutting down the intake. This effect can be seen quite clearly after 1997, when there was a major improvement in the compost lines. Throughout the operating period, composting contributed less than 2% of the total emissions from the waste sector.
22..44 DDaattaa CCoolllleeccttiioonn IIssssuueess Data provision has seen a number of major improvements since the First National Communication was published in 2004. Among the most effective changes has been the radical reorganisation of the NSO, required to enable the country to meet its international reporting obligations to the UNFCCC and the EU. The advent of EU membership has also placed an obligation on Enemalta, until recently in a monopoly position in this field, to provide certified returns of its fuel imports. As these imports cover the most important sources of GHG emissions, energy generation and land transport, the quality of basic data has risen markedly. On the other hand, the on‐going process of liberalisation of the fuel import market can lead to temporary setbacks in this area. Private firms may plead commercial sensitivity when asked to supply information; and from the aspect of quality, they may take some time to develop expertise in providing information of the quality required by the compilers of GHG inventories. While the need for a standardised Quality Assurance/Quality Control (QA/QC) system has been recognised [4], it is not yet in place. In all fairness, the NEIS team cannot be expected to undertake this task on its own. An approach can be made by careful selection of data and, in the longer term, by a sustained interaction with data providers with a view to improving data quality; but the NSO, as the body most likely to administer a QA/QC system and one with legal powers to ‘command’ data, needs to supply much help while the system is being put together. Such a course of action will have repercussions on other properties of data such as completeness and uncertainties.

72
GGRREEEENNHHOOUUSSEE GGAASS AABBAATTEEMMEENNTT AANNAALLYYSSIISS
33..00 EExxeeccuuttiivvee SSuummmmaarryy
The Greenhouse House Gas (GHG) emissions inventory for 1990‐2007 shows clearly that the major sources is the energy sector, principally electrical power generation and land transport. Waste treatment is the second major contributor. Abatement strategies must therefore target these sectors. Mitigations in carbon dioxide emissions are set against the ceilings proposed in the second National Allocation Plan and beyond. A detailed breakdown of efficiency of electrical power generation led to estimates of savings. More can be achieved by a change in fuel used in generation. Several scenarios, mainly ones that involve both change of fuel and the acquisition of new equipment were proposed which would deliver significant cuts in carbon dioxide emissions. The projected inter‐connector to the grid in Sicily, assumed to be powered by a natural gas‐fired station was also considered. The local potentials for renewable energy from wind, solar photo‐voltaic panels and solar water heaters indicated that wind offers the best and quickest carbon dioxide offset. Widespread use of more efficient lighting in domestic, street, institutional and factory environments is predicted to yield significant cutbacks in carbon dioxide emission. For the built environment, a number of case studies involving household equipment lighting, control of external surfaces, cooling and heating loads were presented, while for large public buildings with a heavy hot water demand, the potential of large solar water heating installations was explored. All showed prospect of useful carbon emission mitigation. Effective mitigations for land transport involve restrictions on car size and intensity of use and a switch to alternative sources of motive power. Bio‐fuels from local sources and hydrogen in fuel cells or internal combustion engines, if widely taken up, will yield useful cutbacks in carbon dioxide. In this respect, electric and hybrid cars can have potential which is however partially offset by power generation with high specific carbon emission. Agriculture is a major source of methane and mitigation requires more complete treatment of human and animal sewage. The carbon dioxide sinking capacity of Land Use and Land Use Change and Forestry (LULUCF) can be increased by sustained tree planting. Recent carbon prices in the Emissions Trading Scheme were considered in order to estimate the pertinent costs of joining the scheme.

73
33..11 IInnttrroodduuccttiioonn This chapter addresses the following:
(a) A survey of possible strategies applicable to the Maltese Islands, for the abatement of greenhouse gas (GHG) emissions. The proposed abatement strategies are based on careful analysis of the local scenarios. The scientific basis for each of the proposed strategies is explained. In most cases, the technologies involved are either on the market or close to it, but some room was allowed for emergent technologies to enable an estimate of CO2 emissions to 2025.
(b) The main sectors considered in the analysis include Energy Production, Industrial Processes, Solvent and Other Product Use, Agriculture, Land‐Use Change and Forestry, Waste and any other significant anthropogenic source or sink of GHG not referred to in these specific sectors.
(c) The analysis takes into account the National GHG Emissions Inventory for the period 1990‐2006.
(d) GHG emission projections for the period 2007‐2025 were accomplished. The methodologies used are those approved by the United Nations Framework Convention on Climate Change (UNFCCC). Forecasted changes in GHG emissions are related to climate change and consequently to socio‐economic factors.
(e) Identified are the possible uncertainties in the effectiveness of the proposed strategies. Some points mentioned below will render this work more difficult and/or increase uncertainties in the estimated size of mitigations.
A number of relevant but as yet uncertain elements exist. For instance, currently there is no agreed general energy policy or even a more restricted renewable energy policy. There are draft documents which have been open to public consultation but the results of such processes have not been distilled, and no final versions of these documents have been published. Another document of relevance to this chapter is the Enemalta Generation Plan 2006‐2015 [16]. The published version carries optional lines of development on which no final decision has been taken. In this plan, there are crucial elements for future GHG emissions. For instance, a possible switch of generation fuel from oil to natural gas (NG) is one such element. It is also a fact that the Ministry for Resources and Rural Affairs has set up a Climate Change Committee whose work coincides with that in this chapter [17]. This Committee has published its report which is now open to public comments.

74
33..22 TThhee NNaattiioonnaall GGrreeeennhhoouussee GGaass IInnvveennttoorryy The latest available figures for Malta’s GHG emissions are those of 2007 and are given in Table 3.1. The National Greenhouse Gas Emissions Inventory Report for Malta, 1990‐2007 [18] also lists a number of sources of GHG emissions for the Maltese Islands which, with minor exceptions, were not taken into account when drawing up the inventory for Malta. Subject to minor amendments, these are listed in Table 3.2. Reorganising Table 3.1, by putting the various sources and sinks in descending order of emissions and ignoring those sources for which there are no quantities, gives Table 3.3.
33..33 EEnneerrggyy PPrroodduuccttiioonn aass tthhee MMaaiinn SSoouurrccee ooff GGrreeeennhhoouussee GGaass
EEmmiissssiioonnss As can be seen from Table 3.3, the main cause of GHG emissions in Malta is the burning of fossil fuels for the generation of energy in different sectors as follows:
(a) power stations for the generation of electricity (b) industry for the production of heat (furnaces) and steam (boilers) (c) hotels, commercial establishments and homes for heating and other
purposes (d) internal combustion engines for transport
33..44 BBaassiiss ffoorr AAbbaatteemmeenntt SSttrraatteeggiieess RReellaatteedd ttoo EEnneerrggyy Since most of our GHG emissions are due to the burning of fossil fuels for conversion to energy, then clearly any abatement strategy must be based on reducing the amount of fossil fuels that are burnt. The means to achieve this include:
(a) energy conservation (b) efficient conversion of energy (c) efficient use of energy (d) utilisation of renewable sources of energy (e) use of alternative fuels (including fuels derived from renewable sources)
33..55 FFuueell IImmppoorrttss Inland fuel importation and distribution in Malta were, until recently, a monopoly in the hands of Enemalta Corporation. Aviation fuel and marine bunkering services have been liberalised since 2004 and 1995 respectively. In general, the emissions from shipping and aviation industry are not taken into account in the country’s GHG inventory; but there are two minor exceptions to this rule.

75
GHG Source and Sink Categories CO2‐equivalent (Gg)
1. Energy 2691.86
A. Fuel combustion (sectorial approach) 26391.86
1. Energy industries 2020.30
2. Manufacturing industries & construction 51.04
3. Transport 528.98
4. Other sectors 91.53
5. Other NA
B. Fugitive emissions from fuels NA, NE
1. Solid fuels NA
2. Oil and natural gas NA, NE
2. Industrial processes 69.31
A. Mineral products 0.06
B. Chemical industry 0.10
C. Metal production NA, NO
D. Other production NA
E. Production of halocarbons and SF6 NA, NO
F. Consumption of halocarbons and SF6 69.14
G. Other NA
3. Solvent and other product use 2.71
4. Agriculture 70.01
A. Enteric fermentation 35.97
B. Manure management 31.70
C. Rice cultivation NA, NO
D. Agricultural soils 2.34
E. Prescribed burning of savannas NA
F. Field burning of agricultural residues NA, NE, NO
G. Other NA
5. Land use, land use change and forestry (LULUCF) –60.79
A. Forest land –48.68
B. Cropland –10.18
C. Grassland NE, NO
D. Wetlands NO
E. Settlements –1.92
F. Other land NE, NO
G. Other NO
6. Waste 200.07
A. Solid waste disposal on land 171.84
B. Waste‐water handling 28.14
C. Waste incineration 0.09
D. Other NA, NO
7. Other NA
Total CO2‐equivalent emissions without LULUCF 3033.96
Total CO2‐equivalent emissions with LULUCF 2973.17 Key: NO (not occurring – activities or processes in a particular source or sink category that do not occur in the country)
NE (not estimated – for existing emissions by sources or removal by sinks of greenhouse gases which have not been estimated) NA (not applicable – for activities in a given source or sink category that do not result in emissions or removals of a specific gas)
Table 3.1: Malta’s National Greenhouse Gas Inventory for 2007 [18] according to categories as defined by the IPCC.

76
Other categories CO2‐equivalent (Gg)
International bunkers 2742.52
Aviation (international only) 48.78
Marine (international only) 2693.74
Multilateral operations NA
CO2 emissions from biomass 3.91
Table 3.2: Malta’s greenhouse gas emissions for 2007 in categories other than those listed in Table 3.1, including international bunkering, aviation and marine.
GHG source and sink categories CO2‐equivalent
(Gg)
CO2‐equivalent as a percentage of the total (excluding LULUCF) (%)
Fuel combustion in the energy industries
2020.30 66.58
Fuel combustion in transport 528.98 17.44
Solid waste disposal on land 171.84 5.66
Fuel combustion in other sectors (aviation/maritime)
91.53 3.02
Industrial consumption of halocarbons and SF6
69.14 2.28
Fuel combustion in manufacturing and construction
51.04 1.68
Agriculture: Enteric fermentation 35.97 1.19
Agriculture: Manure management 31.70 1.04
Waste‐water handling 28.14 0.93
Solvent and other product use 2.71 0.09
Agricultural soils 2.34 0.08
Industrial processes: Chemical industry
0.10 0.00
Waste incineration 0.09 0.00
Industrial processes: Mineral products
0.06 0.00
Forest land –48.68 –1.60
Cropland –10.18 –0.34
Settlements –1.92 –0.06
Total CO2‐equivalent emissions without LULUCF
3033.96 100.0
Total CO2‐equivalent emissions with LULUCF
2973.17 ‐‐‐‐‐‐
Table 3.3: Greenhouse gas emission sources and sinks in descending order of emissions, for Malta in 2007.

77
The first relates to fuel used in territorial waters, principally by the Gozo ferries and to a minor extent by the Armed Forces of Malta (AFM) patrol boats. The other sector is that of aviation gasoline, which is essentially all used by the country’s armed forces, as well as small quantities of Jet A‐1 fuel going to the same user. In this chapter it is assumed that all imported aviation gasoline is used in local aviation and that 0.5% of imported Jet A‐1 goes to local helicopter flights. There is the possibility, however, that some fuel from the bunkering market leaks into the inland market, notwithstanding efforts by Customs to prevent this, as bunkering fuel is mainly duty‐free. It should be noted that commercial boats, other than local fishing boats, that do not leave territorial waters are not entitled to duty‐free fuel. There is also another fuel, biodiesel that was never under Enemalta Corporation’s control. The volume produced is small, but as it is not carbon‐neutral, the source not being grown on national territory, some account must be taken of it in this analysis. So to analyse what can be done to abate Malta’s GHG emissions, one should start by analysing Malta’s fuel imports and the local production of bio‐diesel. Fossil fuel imports in metric tonnes for the year 2007 are shown in Figure 3.1 [19].
Gas oil6%
Diesel (low sulphur)10%
Unleaded petrol7%
Kerosene0%
Jet A‐19%
Aviation gasoline0%
Fuel oil65%
Light heating oil1%
Liquid petroleum gas2%
Propane0%
Figure 3.1: Fossil fuel imports for 2007 [19]. The data of Figure 3.1 has can be recalculated to take into account the following:
(a) exclusion of most of the Jet A‐1 fuel since the main aviation industry does not as yet feature in a country’s GHG inventory
(b) all gas oil and fuel oil were used in the power stations for the gas turbines and steam boilers respectively
(c) all the diesel (low‐sulphur) sales i.e. 70,340 tonnes from the service stations went to transport, and the rest, 28,848 tonnes was sold through “jobbers” to factories and hotels (to a total of 99,188 tonnes)

78
Note that the above assumptions may not be precise but they should give a good indication of the true picture. For example, some fuel sold from service stations may be put to uses other than transport, but on the other hand some diesel sold by jobbers may be used for transport. Figure 3.2 is obtained from a recalculation of Figure 3.1 based on the assumptions listed above.
Energy Generation,
80.6%
Transport, 15.7%
Heating etc., 3.8%
Figure 3.2: Re‐categorisation of fossil fuel imports for 2007.
33..66 NNaattiioonnaall AAllllooccaattiioonn PPllaannss iinn RReellaattiioonn ttoo OOtthheerr DDooccuummeennttss Figure 3.3 gives the allowances for emission of CO2 in tonnes according to the First and Second National Allocation Plans. The European Commission decision of 29th November 2006 states that “the annual average total quantity of allowances of 2.143061 million tonnes to be allocated by Malta according to its national allocation plan to installations listed therein and to new entrants shall not be exceeded." [22] Enemalta Corporation reported that the total carbon dioxide emission for 2004 was 1,145,744 tonnes from Marsa Power Station and 875,503 tonnes from Delimara Power Station (provisional figures) that is a total of 2,021,247 tonnes. The total carbon dioxide emission for 2006 for Marsa Power Station was 1,175,288 tonnes and 810,477 tonnes from Delimara Power Station that is a total of 1,985,765 tonnes. During 2006, 2,261,189 MWh were generated at the power stations, hence 0.878 kg of CO2 were emitted for every kWh generated [245]. The Malta GHG Inventory 2009 report gives a total of 1,979,430 tonnes of CO2 for 2006 [18].

79
0
500,000
1,000,000
1,500,000
2,000,000
2,500,000
2005 2006 2007 2008 2009 2010 2011 2012
Carbon Dioxide Emissions (tonnes)
Year
Marsa Power Station Delimara Power Station Annual Total
Figure 3.3: Allowances for emission of CO2 according to the First [20 ] and Second [21] National Allocation Plans.
33..77 EEnneerrggyy IInndduussttrriieess Table 3.3 shows that fuel combustion in the energy industries i.e. burning fuel oil and gas oil to generate electricity, accounts for 66.58% of Malta’s GHG emissions. It is therefore clear that serious efforts to reduce GHG emissions must be directed at the generation, distribution and use of electricity. Fuel combustion in manufacturing and construction accounts for 1.68% and in other industry sectors for another 3.02%. This section deals with measures to abate GHG emissions from the energy industries, except for transport. The latter is discussed in a separate section since it is a significant contributor (17.44%).
33..77..11 CCoonnvveennttiioonnaall EElleeccttrriicciittyy GGeenneerraattiioonn
Table 3.4 shows where the electrical energy generated ended up by sector. The table was compiled from information available in the reports of Enemalta Corporation [24], NSO [19] and a private communication [26].
22..33..11..55 EEnneerrggyy CCoonnsseerrvvaattiioonn Energy conservation is directed towards the identification of energy‐consuming activities that are either not required or can be done without.

80
Table 3.4 shows that around 6% of the electrical generated is used in the power stations themselves for lighting, heating and to drive pumps, fans, control systems, etc. With the conservative assumption that half of this energy is used by pumps and fans, and taking a saving of 40% to be obtained from speed control of these devices [24] a saving of 26,000 MWh and 23,000 tonnes of CO2 can be achieved.
Year Total (GWh)
Power Station (GWh)
% of Total
Industrial (GWh)
% of Total
Commercial (GWh)
% of Total
Domestic (GWh)
% of Total
Street Lighting (GWh)
% of Total
Unaccounted (GWh)
% of Total
2001 1943.4 117.7 6.1 482.9 26.5 503.7 27.6 540.3 29.6 42.7 2.3 256.1 14.0
2002 2055.1 124.0 6.0 504.8 26.1 501.6 26.0 561.9 29.1 44.9 2.3 317.9 16.5
2003 2208.0 125.1 5.7 499.2 24.0 553.8 26.6 623.7 29.9 35.2 1.7 371.0 17.8
2004 2214.9 127.8 5.8 505.5 24.2 563.1 27.0 623.7 29.9 29.1 1.4 365.8 17.5
2005 2263.1 131.0 5.8 518.1 24.3 577.5 27.1 669.5 31.4 29.2 1.4 337.8 15.8
2006 2260.8 131.0 5.8 530.2 24.9 635.8 29.9 658.2 30.9 28.8 1.4 276.9 13.0
2007 2266.1 132.6 5.9 558.4 24.6 650.5 28.7 645.0 28.5 ‐‐‐‐ ‐‐‐‐ 279.5 12.3
2008 2312.1 127.1 5.5 574.6 24.9 666.4 28.8 659.8 28.5 ‐‐‐‐ ‐‐‐‐ 286.2 12.4
Table 3.4: End‐use by sector of electrical energy generated on annual basis from 2001 to 2008.
33..77..11..11 EEffffiicciieenntt CCoonnvveerrssiioonn ooff EEnneerrggyy The conversion (thermal) efficiency of Enemalta Corporation’s generating plants for 2005‐2006 is as shown in Figure 3.4 [23].
Steam Units Marsa, 52.8%Steam Units
Delimara, 36.7%
OCGT Marsa, 0.1%
OCGT Delimara,
0.2%
CCGT Delimara, 10.1%
Figure 3.4: Conversion (thermal) efficiency of Enemalta Corporation’s generating plants for 2005‐2006, together with the nominal power, electrical energy generated and demand on the individual plants. From Figure 3.4, it can be seen that the more inefficient open cycle gas turbines are used for short periods only; required for peak lopping purposes. The steam units, on the other hand, provide the “spinning reserve” required for operation during periods

81
of low demand, generally at night. The efficiency of steam turbines drops off with decreasing load [25]. In fact the steam turbines are run at about 60% of maximum efficiency under conditions of low load as occur frequently at night [26] as 60% is just the threshold value at which the efficiency begins to fall off rapidly. The weighted average thermal efficiency for Marsa steam units works out at 26.8%. If the 110 MW, smaller steam units were to be replaced by a new plant running at 40% efficiency, a significant reduction in CO2 emissions would be achieved. Of interest is to estimate the benefit of replacing the group of smaller steam turbines (efficiency 26%) burning heavy fuel oil by 110 MW combined cycle gas turbines (CCGT) with an efficiency of 40%, burning gas oil. Over the period 2005‐2006 the small Marsa steam turbines generated 597,280 MWh at an efficiency of 26%, emitting 526,800 tonnes of CO2. The 110MW CCGT, generating the same quantity of energy at 40% efficiency would emit 293,660 tonnes of CO2. This gives rise to a saving of 233,140 tonnes of CO2 at a fuel cost increase of 14% (considering fuel prices as at February 2009). This switch from the least efficient steam turbines to CCGT can be used with existing generating sets. The CCGT run for about a quarter of the time at present. If the fraction were to be increased to 85% of the time, again substituting the smaller Marsa steam turbines using heavy fuel oil, there would be a gain of 230,000 tonnes of CO2.
33..77..11..22 MMaajjoorr FFuueell SSwwiittcchh ttoo NNaattuurraall GGaass Of the two possible sources of natural gas, the Sicily pipeline option would involve a capital expense that may only be justified by consumption of significantly larger quantities of NG than we need. Use of liquid natural gas (LNG) brought in by tanker allows a more ‘modular’ approach, with level of supply and storage facilities being comfortably variable. LNG, at a temperature of −112oC, requires special storage facilities and re‐gasification apparatus, but the capital expense will be less than that of the pipeline. Operational costs, on the other hand could be greater. Enemalta Corporation is in possession of a proposal from Statoil [27], the Norwegian state company, for supply of LNG from Egypt. The emission factors for the fuels currently in use for generation are: 77 tonnes of CO2 per TJ for heavy fuel oil and 73 tonnes of CO2 per TJ for gas oil. NG has an emission factor of 55 tonnes of CO2 per TJ. Scenarios from the report on Malta’s “Technology Needs for Greenhouse Gas Emission Reduction” [28] are given in Table 3.5. It should be noted that there cannot have been much change in fuel burning patterns during 2000‐2008, as no new electrical generating equipment has been installed in this period, and the proportion of time the CCGT were running has been kept quite low.
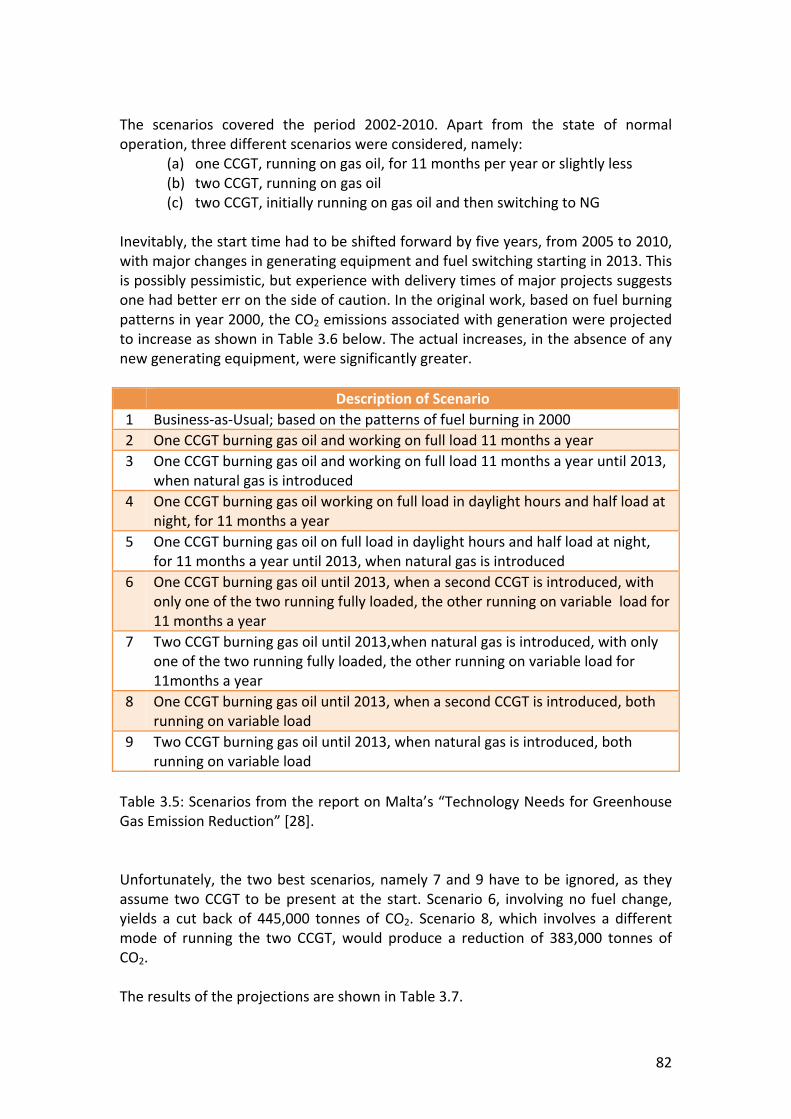
82
The scenarios covered the period 2002‐2010. Apart from the state of normal operation, three different scenarios were considered, namely:
(a) one CCGT, running on gas oil, for 11 months per year or slightly less (b) two CCGT, running on gas oil (c) two CCGT, initially running on gas oil and then switching to NG
Inevitably, the start time had to be shifted forward by five years, from 2005 to 2010, with major changes in generating equipment and fuel switching starting in 2013. This is possibly pessimistic, but experience with delivery times of major projects suggests one had better err on the side of caution. In the original work, based on fuel burning patterns in year 2000, the CO2 emissions associated with generation were projected to increase as shown in Table 3.6 below. The actual increases, in the absence of any new generating equipment, were significantly greater.
Description of Scenario
1 Business‐as‐Usual; based on the patterns of fuel burning in 2000
2 One CCGT burning gas oil and working on full load 11 months a year
3 One CCGT burning gas oil and working on full load 11 months a year until 2013, when natural gas is introduced
4 One CCGT burning gas oil working on full load in daylight hours and half load at night, for 11 months a year
5 One CCGT burning gas oil on full load in daylight hours and half load at night, for 11 months a year until 2013, when natural gas is introduced
6 One CCGT burning gas oil until 2013, when a second CCGT is introduced, with only one of the two running fully loaded, the other running on variable load for 11 months a year
7 Two CCGT burning gas oil until 2013,when natural gas is introduced, with only one of the two running fully loaded, the other running on variable load for 11months a year
8 One CCGT burning gas oil until 2013, when a second CCGT is introduced, both running on variable load
9 Two CCGT burning gas oil until 2013, when natural gas is introduced, both running on variable load
Table 3.5: Scenarios from the report on Malta’s “Technology Needs for Greenhouse Gas Emission Reduction” [28]. Unfortunately, the two best scenarios, namely 7 and 9 have to be ignored, as they assume two CCGT to be present at the start. Scenario 6, involving no fuel change, yields a cut back of 445,000 tonnes of CO2. Scenario 8, which involves a different mode of running the two CCGT, would produce a reduction of 383,000 tonnes of CO2. The results of the projections are shown in Table 3.7.

83
Table 3.6: CO2 emissions associated with electricity generation (actual and modelled) assuming fuel burning patterns in 2000 [28].
Difference in Emission Scenario X and Scenario 1 (Gg)
Year 2 3 4 5 6 7 8 9
2010 229 229 167 167 229 229 167 167
2011 228 228 165 165 228 228 165 165
2012 227 227 164 164 227 227 164 164
2013 226 338 163 251 449 648 386 561
2014 225 337 162 250 448 647 385 560
2015 224 336 161 249 447 646 384 559
2016 223 335 161 248 446 645 383 558
2017 223 335 159 247 445 645 383 557
2018 222 334 159 247 445 644 382 557
Table 3.7: Differences in CO2 emissions between the normal operative scenario (1) and the other scenarios. The single CCGT scenarios, namely 2, 3, 4 and 5 are at their best with a change of fuel in 2013, but even scenario 2, which involves no change of fuel but 11 month a year running of one CCGT, yields a respectable reduction in CO2 emissions.
33..77..11..33 TThhee IInntteerr‐‐ccoonnnneeccttoorr When considering the inter‐connector (power rating of 200 MW and an average capacity factor of 60%) e.g. from Sicily, the following issues emerge:
The average capacity factor is likely to be fixed by contract with the supplier.
The level agreed is influenced by low demand periods in the diurnal cycle.
Year Actual CO2 Emissions
(Gg)
Percentage Increase of Actual CO2 Emissions Over 1990 (%)
Model‐Predicted CO2 Emissions (Gg)
Percentage Increase of
Model‐Predicted CO2 Emissions Over 1990 (%)
1990 1354 ‐‐‐ ‐‐‐ ‐‐‐
2004 1949 42.0 1799 32.9
2005 1964 45.0 2848 33.7
2006 1979 46.2 2893 34.4
2007 1994 47.3 2937 35.1
2008 2034 50.2 2996 35.7
84
The capacity factor of 60% was chosen so that the inter‐connector could displace almost all of the Marsa steam turbine electricity generation in 2006.
The inter‐connector shall be supplied by NG fired stations works at 55% efficiency. Nevertheless, there is no information about the prevalent generation fuel used in Sicily. However, the main power plant supplying Syracuse does run on NG.
Consider a displacement of 1,051,200 MWh, produced by 30% efficient steam turbines burning heavy fuel oil at Marsa (emitting 927,160 tonnes of CO2) by an equal amount of energy produced by a 55% efficient gas turbine burning NG (through the inter‐connector). Losses associated with the inter‐connector reduce the overall efficiency to 50%. CO2 emissions work out to be 391,350 tonnes; resulting in a saving of 535,800 tonnes of CO2.
33..77..22 RReenneewwaabbllee SSoouurrcceess ooff EEnneerrggyy
The principal renewable sources of energy considered for electricity generation are wind, solar radiation and waste. These all have well‐developed technologies on the market. In view of current technological developments, a first estimate of the potential of wave energy is also considered. As the major part of domestic water heating uses electricity, the solar water heating substitution potential is also assessed. Whilst there has been much debate on the potential and sites of wind generators, there has been no tangible action so far. The Government initially dismissed land‐based generation, preferring to go offshore. The initial preference was for placing turbines at depths for which the technology is still not tried and tested. However, there has now been a change of mind in this matter, in the direction of land based and shallow water sites. The total wind potential given here will include a number of such sites as well as at least one on‐shore site. An issue which does have an influence on the wind power that can be safely connected to a grid is related to the variability of wind speeds. How much wind‐generated electricity can be safely fed to a grid before it gets to the point where sudden drops in wind could destabilise the grid, causing widespread breakdowns? This problem may be rather acute as our wind farms are likely to be under a single wind speed regime, given the limited extent of national territory and of territorial waters. Recent work related to the UK [29] grid shows that a 10% contribution from the wind, grid stability starts to suffer, while at a contribution of 20%, instability would impose significant costs for its cure. In the case of Malta, for a 10% contribution from a source under a single wind regime, it was found that almost as much stand‐by capacity is required as that provided by wind, in order to avoid grid instabilities. That would offset most of the benefits of wind generation.

85
Locally, the view is that before the planned off‐shore wind farm on Sikka l‐Bajda, designed to produce about 4% of the present electricity generation, can come on stream, the Sicily inter‐connector must be in place, to ensure that the local grid is part of a bigger and therefore more robust and stable system. Nevertheless, it is not clear that this will in fact be the case. Taking the present power limit to be 520 MW, a new CCGT (100 MW) and a 100 or 200 MW inter‐connector, the closure of the 240 MW of Marsa by 2015 will leave the nation with 480 or 580 MW available, which is not much more than that at present. As pointed out previously, the actual CO2 saving produced by the wind farms is determined by the size of the “spinning reserve” required. The other side of the problem namely that of overproduction by a wind farm, will be theoretically solved by the inter‐connector, as the excess energy can be sent to the Italian grid. The potential problems with this solution have not as yet been examined. An alternative method, which will also avoid energy dumping, using hydrogen generation as a buffer, has been explored by [30] for an 18 MW wind farm on shore of the north of Gozo, using actual wind speeds and the power station output for 2003. The use of photo‐voltaic (PV) panels remains a very expensive way of generating electricity and also requires large surface areas. In fact, probably the only feasible use of PV panels in a situation where land is scarce is to utilise suitably oriented roofs of houses, public buildings and industrial establishments, rather than large PV farms. However, with peak electricity demand occurring in summer around the middle hours of the day, when wind, even in the best sites, has been found to make a limited contribution, it is clear that the role of PV would be crucial in a “peak lopping” role. Some actual values for wind and PV panel contributions to demand in the three peak periods of summer 2007 have been worked out by Fsadni and Mallia [31] using actual wind speeds and radiation fluxes. The wind contribution, while not negligible, is inferior to that of PV panels, in magnitude, and very inferior in coincidence of peak output with peak demand. Table 3.8 gives upper limits for renewable energy generation and displacement potential (adapted from [32]).
33..77..33 EEffffiicciieenntt DDiissttrriibbuuttiioonn ooff EElleeccttrriicciittyy
From Enemalta Corporation’s annual report for 2006 [23] 17.5% of the electricity generated over 2003‐2004, and 15.8% of that generated over 2004‐2005 was unaccounted for. These “missing” units arise from a number of causes:
technical losses, i.e. units that are wasted in the distribution system, e.g. in grid transformers;
metering problems, such as unread meters, wrong readings, etc.; deliberate theft of electricity

86
Renewable Energy
Technology or Resource
Installation Site Capacity as a
Percentage of the
Electricity Generated in 2007 (%)
Reduction in CO2
Emissions (tonnes)
Remarks
Photo‐voltaic panels
Location on house roofs, industrial buildings, hospitals, schools, retirement homes, hotels
7 145,000 The Committee for Climate Change reports [2] that Government has accepted that Malta will aim for an output from photo‐voltaic panel installations amounting to 4% of the generation of an unspecified year by 2020.
Wind On‐shore 4 83,000 The CO2 reduction is an upper limit as extra CO2 is emitted from the power stations because of the need for increased “spinning reserve”.
Wind Off‐shore at Sikka l‐Bajda, Munxar ta’ San Tumas and on the north shore of Gozo
5 104,000 Same as above
Waste ‐‐‐‐ 5 Does not include the potential contribution of the two bio‐digestion plants mentioned in the 2008 revision of the Waste Treatment Strategy [19]. In addition, utilization of methane from the Ta’ Żwejra landfill is expected to provide about 1% of the 2007 electricity generated [20] from 2010 onwards for about 5 years.
Solar Water Heating
4 83,000
Waves The best area for the capture of wave energy is on the west of Malta, out to sea from the reverse osmosis plant at Għar Lapsi [21].
1,250(conservative estimate)
It was assumed that the generator is an 80% efficient linear device coupled to a surface buoy of 2 m diameter [22]. With a significant wave height of 1.5 m and an energy period of 6 s, the rated power would be 10.8 kW. Over 1 year, with a capacity factor of 0.15, a farm of 100 such devices would generate 1420 MWh.
Table 3.8: Renewable energy source/technology potential for Malta.

87
Studies [37] have shown that the technical losses should be around 5%. There is probably little that can be done to sort out the problem, but proper maintenance of equipment, replacement of meters with more efficient ones, if and when they become available and possibly improved design of the system, may help to keep the losses under control. Improved metering will not only help to reduce the losses and increase the revenue of the Corporation, but may also help consumers to improve the management of their energy demand. In this respect, the announced near‐future introduction of smart meters should remove most of the uncertainties. Smart meters will have an effect on electricity theft arising from tampered meters. Theft of electricity by direct tapping of supply lines will not be caught out. For such cases area metering is required to make sure that all supply that enters an area is shown on the dispersed meters.
33..77..44 DDoommeessttiicc ((aanndd PPoossssiibbllyy CCoommmmeerrcciiaall)) LLiigghhttiinngg aanndd SSttrreeeett LLiigghhttiinngg
The electricity figures published by the National Statistics Office show that electricity consumption for street lighting has gone down from 42,733 MWh in 2000‐2001 to 28,796 MWh in 2005‐2006. This has happened notwithstanding that the amount of street lighting has actually increased. The reduction in consumption is due to the use of more efficient lamps by Enemalta Corporation, which is currently investigating possibilities of dimming street lights and switching off road lighting during the late evening. Equipment under test offers around 35% energy saving [18] and this factor applied to all the 2005‐2006 street lighting consumption leads to reduction of about 8,900 tonnes of CO2. Domestic lighting is reckoned to take up to 15% of household electricity, if standby consumption is included. That corresponds to 104,000 MWh of energy annually. A complete elimination of standby consumption plus a verified large scale substitution of filament lamps by compact fluorescent lamps could produce a saving of 30% on energy and up to 30,000 tonnes of CO2. In the case of industrial lighting estimates of consumption are more difficult to come up with as there is no breakdown of industrial use of electricity. There are good estimates of savings to be obtained from individual elements [18, 38]. One particular instance of savings from improved lighting is the case of the University of Malta library. Light sources were changed from T8 fluorescent tubes, with or without electronic ballast, to T5 tubes with electronic ballast. Consumption over the period July‐November 2008 was 19,700 kWh less than that for July‐November 2007. This represents an annual saving of 47,000 kWh and 40 tonnes of CO2.

88
33..77..55 UUssee ooff EElleeccttrriiccaall EEnneerrggyy ffoorr WWaatteerr PPrroodduuccttiioonn aanndd EExxttrraaccttiioonn
As Malta uses a substantial amount of energy for desalination, the production, use and distribution of water is an important item in the energy budget. The Water Services Corporation (WSC) is the largest single user of electricity. In 1995, the total volume of sea water that was desalinated by reverse osmosis (RO) plants was 32 million m3, consuming 312 GWh in electrical energy produced by burning fossil fuels, equivalent to 19% of the electricity generated in 1995. This was a peak year in the production of water by RO. In 2007, the total volume of sea water that was desalinated by RO plants was 17 million m3, consuming 99 GWh or 4% of the electricity generated in 2007. The amount of water produced in 2007 by the RO plants of the WSC is shown in Table 3.9.
Location of Reverse Osmosis Plant
Production of Desalinated Water (m3)
Percentage of Total (%)
Lapsi 4,365,178 26
Ċirkewwa 2,501,192 15
Pembroke 10,103,426 60
Total 16,969,796 100
Table 3.9: Water production by reverse osmosis from August 2006 to July 2007. Table 3.10 gives the specific energy consumption for the production and distribution of desalinated sea water at the individual reverse osmosis plants. If the Lapsi and Ċirkewwa RO plants could be operated as efficiently as Pembroke, then the electricity consumed would be 80,267,135 kWh rather than 86,714,494 kWh which is actually consumed, which translates to an effective reduction of 7.4% in electricity consumption, and a reduction of 5,700 tonnes of CO2. It should be noted that the RO plant at Ċirkewwa alone claims 5900 tonnes of CO2. According to a recent WSC claim [39], Ċirkewwa may be down to less than 3.8 kWh per m3 after an improvement drive financed by the EU. The new RO demand from the Gozo polishing plant with a specific energy consumption of 1.38 kWh per m3, will result in 800 tonnes of CO2 emissions (on the basis of a desalinated water production of 30% of 2.16 million m3). A further point that should be investigated is the possibility of shifting more RO water production to night time or at least away from peak demand time in summer. This would offer Enemalta Corporation more flexibility in shifting significant loads away from peak demand times, particularly in summer. The water storage capacity is 400,000 m3, which at a production rate of 83,000 m3 of water per day, represents 4.7 days of supply. This provides some leeway in varying production rates throughout one day.

89
Electricity Consumption (kWh)
Production of Desalinated Water (m3)
Specific Energy Consumption (kWh/m3)
Production
Lapsi 22,742,577 4,365,178 5.21
Ċirkewwa 16,182,712 2,501,192 6.47
Pembroke 47,789,205 10,103,426 4.73
Subtotal 86,714,494 16,969,796
Distribution
Lapsi 2,619,107 4,365,178 0.60
Ċirkewwa 1,825,870 2,501,192 0.73
Pembroke 5,859,987 10,103,426 0.58
Subtotal 10,304,964 16,969,796
Total 97,019,458 16,969,796 5.72
Table 3.10: Specific energy consumption for the production and distribution of desalinated sea water at the individual reverse osmosis plants [40]. The average combined power demand by all the three RO plants is around 11 MW. A look at the daily demand curves during summer suggests that the RO plants be turned off between 11:00 and 15:00. This would allow a peak load decrease of 10 MW. To make up for this break, the RO plants will then have to be run with an increased number of trains (compared to the present) for the remaining part of the day.
33..77..66 EEnneerrggyy UUssee iinn IInndduussttrryy
The old Enemalta Corporation tariff system classified consumers of electricity into three categories, namely: domestic, industrial and commercial. The latter included not only strictly commercial consumers but also other consumers that could not be classified as domestic or industrial; chief among which would be ecclesiastical buildings and the University of Malta. In 2007, industrial consumers consumed 23.5% of the electricity generated. The new tariff system is less informative, as there are only two classes of consumer, namely: residential and non‐residential. There are no detailed surveys of how industry in general consumes electricity. However, it is possible to make some general comments. Depending on the nature of the industry involved, broad categories of use could be:
air conditioning (A/C) and lighting water heating pumps with variable load transformers electric motors

90
electric process heating, e.g. in plastic injection molding machines Energy savings from A/C and lighting are treated elsewhere in this report. Water heating is unlikely to involve direct use of electricity. The most common practice is to have boilers burning a fossil fuel. Attempts at CO2 savings can take at least two directions. The first is to pre‐heat water using solar water heaters, provided the establishment has a significant area of south‐facing roof space. The other method would be to use combined heat and power (CHP) systems, where the core equipment could be standby electricity generators with their thermal output going to heat up water. Pumps with variable load would generally benefit from inverter speed control. Work on Water Services Corporation pumps [24] showed that an energy saving of up to 50% was possible. Heavy users of electricity can impose extra costs on the generator if they have a low power factor with respect to the mains supply. The quality of the present grid supply is generally good, with an intrinsic power factor of about 92%. However, the nature of the load at the user end ‐ and the modern industrial establishment generally has a high proportion of the load coming from electric motors ‐ may produce a poor power factor. The fact that reactive loads consistently peak in summer, during periods of high ambient temperatures, points to A/C equipment as the source. This forces the generator to provide a reactive component to power (measured in VA) which is demanded at the user end. The smaller the power factor, the larger is this reactive component of power compared to the real power (measured in W), which is the only power that does work on the grid. Enemalta Corporation meters the primaries on transformers connecting the grid with the consumer and so it foots the bill for its own inefficiencies (part of the 5% distribution losses). The customer has to pay for inefficiencies (e.g. low power factor) in the secondary circuits. So it is in everybody’s interest to improve power factors. A tariff structure that provides strong encouragement of energy conservation and efficiency has only just come into being. It needs backing up by provisions for thorough energy audits and subsequent incentives for improved energy efficiency. For instance, an investigation of the real potential of an off‐peak tariff to shift some loads away from peak demand times is urgently required. The 2009 national budget had a generous capital incentive to industry for the installation of PV panel systems, with a grant of up to 60% of the system cost without any threshold. However, on the feed‐in tariff, the situation remained unchanged, with a barter system in operation. Requests for a more favourable feed‐in tariff were turned down, despite the fact that the national budget contained provisions for the creation of an eco‐fund from fuel taxes which could have served to buffer an improved feed‐in tariff. The boost that a good feed‐in tariff had had on the German PV market was not taken into account.

91
In one particular industrial establishment, with an installed capacity of 17 kW peak, 10,100 kWh were generated in the six month period September‐February [41]. This translates to 25,000 kWh per year, or 2.8% of the total factory consumption, and a CO2 saving of 20 tonnes.
33..88 UUssee ooff AAlltteerrnnaattiivvee FFuueellss iinn IInndduussttrryy Fuel combustion in the manufacturing and construction industries accounts for 1.68% of the national CO2 emissions.
33..88..11 SSwwiittcchhiinngg ttoo CClleeaanneerr FFoossssiill FFuueellss
NG and liquid petroleum gas (LPG) will provide a reduced carbon footprint if used instead of diesel or light heating oil. NG and LPG produce around 75% and 80‐85% of CO2 emissions as compared to that from diesel for the same energy generated. Currently, NG is not available locally, but small quantities may come on stream in the short term in the form of methane from Ta’ Żwejra landfill [1] and in the medium‐term, if NG is imported as a fuel for electricity generation [42].
33..88..22 BBiioo‐‐FFuueellss
To date, as regards bio‐fuels, only bio‐diesel has been sold on the local market either produced locally from local sources that is used cooking oil and tallow from slaughter‐house waste, or from imported virgin oil. The potential for producing bio‐diesel from local sources was determined by Ghirlando in a report for the Malta Resources Authority [43]. It was estimated that 2,500 tonnes of bio‐diesel from used cooking oil and another 240 tonnes from tallow could be produced. The local potential for growing crops is very limited due to shortage of land and water resources, although recent work elsewhere with a plant called Jatropha are so encouraging that it is worth reconsidering [248]. According to the report for 2007 submitted by the Malta Resources Authority [44] to the EU Commission, “during 2007, three companies were active in the Maltese bio‐fuel market. Two companies produced bio‐diesel, one from recycled spent cooking oil and the other from imported raw material, whilst a third company recycled spent cooking oil for use as pure vegetable oil, being marketed as a substitute for fossil fuel.” During 2007, the total sales of bio‐diesel and pure vegetable oil to the transport and industrial sector amounted to 2.26 million litres, equivalent approximately to 2,000 tonnes. This means that during 2007, the volume of bio‐diesel and pure vegetable oil used in the transport sector amounted to about 1.1% of the petrol and diesel sales, by energy content. One local source of bio‐diesel that could prove useful is algae; the technology is known [247] but the commercial feasibility of producing bio‐diesel from algae still needs to be worked out.

92
Bio‐fuels are not low or carbon free as far as their use for energy generation is concerned. Their actual CO2 emissions must be added to the national account if the source of fuel does not represent substitution. Only bio‐fuels derived from locally grown organisms, e.g. algae, can be considered as low carbon or carbon free. Algae offer a chance to fix significant quantities of power station emitted CO2. One technology predicts a consumption of 500 tonnes CO2 per hectare of farm [247]. The main product is algal oil, which can be turned into bio‐diesel; by‐products include animal feedstock. A cheap, low‐energy process for obtaining methanol out of the glycerol left from bio‐diesel production has just been patented [45].
33..99 UUssee ooff EEnneerrggyy iinn HHootteellss,, HHoossppiittaallss aanndd iinn HHoommeess
33..99..11 HHeeaattiinngg aanndd CCoooolliinngg
It is estimated that the energy generated through burning of fossil fuels, which was used in hotels to provide hot water for showers from November 2007 to April 2008 was 5.76 GWh, releasing 1,498 tonnes of CO2. From May to October 2008, 7.880
GWh were used, releasing 2,047 tonnes of CO2. The total amount of CO2 emitted during the two consecutive periods was 3,545 tonnes. Energy (from burning of fossil fuels) used at Mater Dei Hospital to provide hot water over a period of one year was 11.8 GWh, with an emission of 3,100 tonnes of CO2 [46]. In many local households, the domestic hot water supply for bathrooms, kitchens and washing is provided by electric water heaters. In the case of a four‐person household with an electric water heater that is left permanently on, 4.03 kWh per day is consumed, which translate to an emission of 1.3 tonnes per year of CO2 [47]. Assuming that there are 30,000 four‐person households (in accordance with the 2005 national census), 38,800 tonnes of CO2 are emitted per year. As the switch of peak demand from winter to summer has been almost certainly caused by a large increase in installed A/C over the period 1999‐2007, it is important to examine the trends involved and look at possible ways to restrict the energy consumption. The calculations below refer to a private house situation. There are, at least the same number of A/C in factories, public buildings and offices as there are in private houses, so that the calculations given below are also valid for these cases. From the estimates of energy consumption in the case of the two studies which follow, each A/C could develop 2 kW, so that the power demand in the middle hours of the summer day may be as high as 80 MW. Considering that the summer peaks which occurred in the late 1990s were around 310 MW, and taking into account the underlying increase in the total generation from the year 2000 onwards, the summer peaks (over 400 MW) reached in the last couple of years present no surprise.

93
Measured operation of two A/C units in July consumed 10 kWh per day, generating 8.8 kg of CO2 per day. Hence the total amount of CO2 generated in this case, from June to September (i.e. summer period), for every household works out to be one tonne [47] 20,000 households with similar equipment will produce 20,000 tonnes of CO2 during the same period. The following are estimates of energy savings in the case of two studies, namely:
(a) four‐person household and (b) University of Malta Library.
(a) Four‐person Household [47] Measures included:
placing the electric water heater on timer to work for two three‐hour periods during the day;
deactivation (not switch‐off) of desk computer; use of class A washing machine; no equipment left on stand‐by; one roof and one west wall treated with reflecting paint; major use of compact fluorescent lighting.
For the period June to September CO2 saving by “reflecting paint” through decreased use of A/C amounted to about 440 kg of CO2. A first estimate of overall annual energy saving gave a value of 3000 kWh, with consumption going down from 11,500 kWh to 8,500 kWh. The associated reduction in CO2 reached 2.64 tonnes. (b) University of Malta Library: Central A/C System and Lighting [48]
The measures taken included:
A/C operation changed from 24/7 to 12 hours on and 12 hours off, with consumption measured directly
light sources were changed from T8 fluorescent tubes, with or without electronic ballast, to T5 tubes with electronic ballast
Energy savings from July to November 2007 and July to November 2008 were 55,300 kWh on the A/C and 19,700 kWh on the lighting. The combined annual CO2
emission savings amount to about 160 tonnes. As far as the A/C system is concerned, there are further substantial savings to be made by optimizing its operation, particularly in summer. Efficiency programmes for the University of Malta library may include the following:
optimisation of the performance of the centralised A/C system; retrofitting to improve insulation of the building fabric; reflecting coatings on roofs and exposed walls and restoration of the
building screen for external shading of east, west and south facing facades
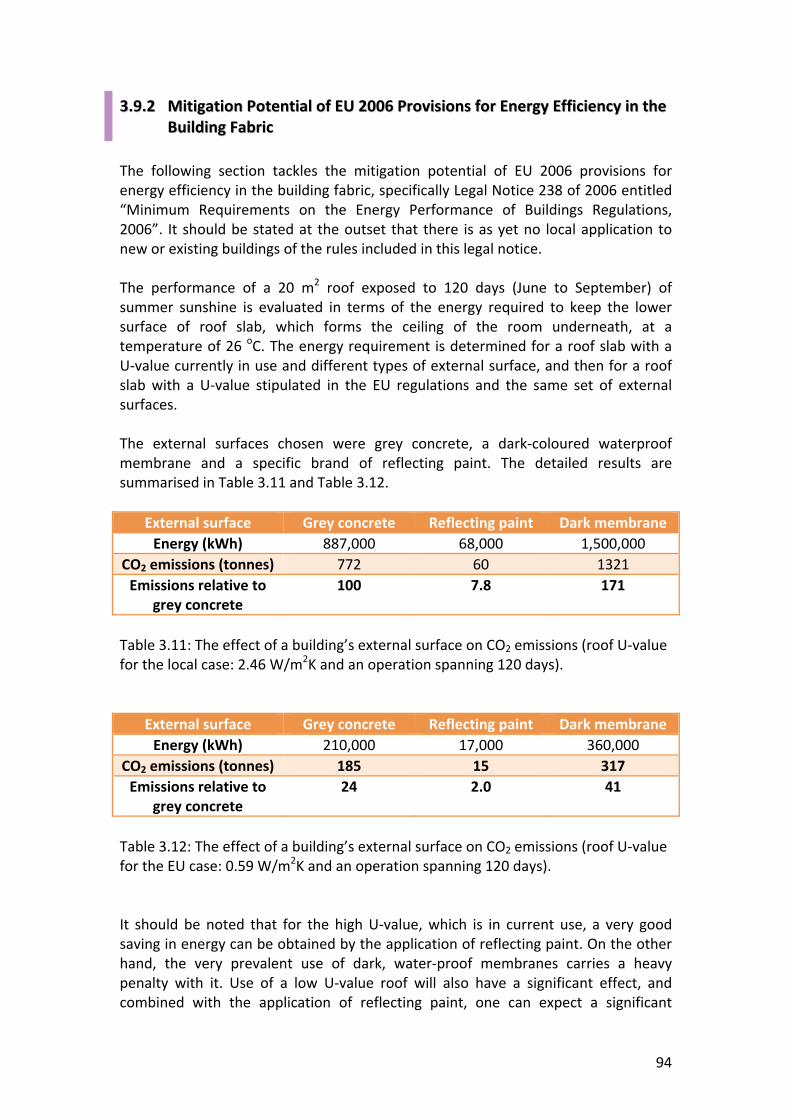
94
33..99..22 MMiittiiggaattiioonn PPootteennttiiaall ooff EEUU 22000066 PPrroovviissiioonnss ffoorr EEnneerrggyy EEffffiicciieennccyy iinn tthhee
BBuuiillddiinngg FFaabbrriicc
The following section tackles the mitigation potential of EU 2006 provisions for energy efficiency in the building fabric, specifically Legal Notice 238 of 2006 entitled “Minimum Requirements on the Energy Performance of Buildings Regulations, 2006”. It should be stated at the outset that there is as yet no local application to new or existing buildings of the rules included in this legal notice. The performance of a 20 m2 roof exposed to 120 days (June to September) of summer sunshine is evaluated in terms of the energy required to keep the lower surface of roof slab, which forms the ceiling of the room underneath, at a temperature of 26 oC. The energy requirement is determined for a roof slab with a U‐value currently in use and different types of external surface, and then for a roof slab with a U‐value stipulated in the EU regulations and the same set of external surfaces. The external surfaces chosen were grey concrete, a dark‐coloured waterproof membrane and a specific brand of reflecting paint. The detailed results are summarised in Table 3.11 and Table 3.12.
External surface Grey concrete Reflecting paint Dark membrane
Energy (kWh) 887,000 68,000 1,500,000
CO2 emissions (tonnes) 772 60 1321
Emissions relative to grey concrete
100 7.8 171
Table 3.11: The effect of a building’s external surface on CO2 emissions (roof U‐value for the local case: 2.46 W/m2K and an operation spanning 120 days).
External surface Grey concrete Reflecting paint Dark membrane
Energy (kWh) 210,000 17,000 360,000
CO2 emissions (tonnes) 185 15 317
Emissions relative to grey concrete
24 2.0 41
Table 3.12: The effect of a building’s external surface on CO2 emissions (roof U‐value for the EU case: 0.59 W/m2K and an operation spanning 120 days). It should be noted that for the high U‐value, which is in current use, a very good saving in energy can be obtained by the application of reflecting paint. On the other hand, the very prevalent use of dark, water‐proof membranes carries a heavy penalty with it. Use of a low U‐value roof will also have a significant effect, and combined with the application of reflecting paint, one can expect a significant

95
reduction of CO2 emissions. From the economic point of view of rapid return, it is clear that reflecting paint is the best option.
33..99..33 AAiirr IInnffiillttrraattiioonn iinn BBuuiillddiinnggss
It is an established fact that unwanted air infiltration in a building can account for as much as 40% of a building’s heat loss. This is particularly the case in older buildings. Unwanted air infiltration occurs via:
door and window seals electrical and plumbing intrusions connections between different building elements heating, ventilation and air‐conditioning systems and fire places
Minimising unwanted air infiltration reduces electricity demand in air‐conditioned buildings. Table 3.13 and Table 3.14 summarise the impact that changes in the indoor set temperature and unwanted air infiltration have on electricity consumption and related CO2 emissions.
33..99..44 NNeeww DDeevveellooppmmeennttss:: MMaatteerr DDeeii HHoossppiittaall aanndd SSmmaarrtt CCiittyy aatt RRiiccaassoollii
The second national allocation plan [21] identified the following new developments: (a) Mater Dei Hospital The Mater Dei Hospital started its operations in the middle of 2007. It was reported, in the second national allocation plan, to have an installed capacity of 20 MW. It has a standby capacity of three 2.5 MW generators [46]. The expectation in the second national allocation plan that the hospital operation will lead to an increase in demand of 91 GWh per annum has not been borne out with respect to electrical energy. Only one of the three main feeders has been in regular use. The average power used over the first 16 months of operation (4.3 MW) is equivalent to 37.8 GWh per annum, which is a little over a third of that forecasted. If one includes the thermal energy used by the boiler then the value climbs up to 49.6 GWh. From figures for daily consumption of diesel oil by the boiler, it seems that around 8% of water used goes into the supply of hot water. It should be pointed out that the hospital is very well equipped with energy‐saving devices as regards lighting, heat recovery systems and treatment and re‐use of grey water.

96
Summer
Air exchange rate (m3h–1) 240 180 120 60
Indoor set temperature (C) 19 19 19 19
Outdoor temperature (C) 33 33 33 33
Hours in use per day 5 5 5 5
Number of households 20000 20000 20000 20000
CO2 generated in 90 days (tonnes) 2520 1890 1260 840
Air exchange rate (m3h–1) 240 180 120 60
Indoor set temperature (C) 27 27 27 27
Outdoor temperature (C) 33 33 33 33
Hours in use per day 5 5 5 5
Number of households 20000 20000 20000 20000
CO2 generated in 90 days (tonnes) 1081 811 540 270 Note: With a large difference (14 oC) between the set indoor and outdoor temperatures, even small air leak rates can give rise significant CO2 penalties (840 tonnes) over 90 days. If the temperature difference is reduced to 6 oC, keeping the indoor temperature at 27 oC, the CO2 penalty is cut down to a third.
Table 3.13: Data relating to the impact that changes in the indoor set temperature and unwanted air infiltration have on electricity consumption and related CO2 emissions in summer.
Winter
Air exchange rate (m3h–1) 240 180 120 60
Indoor set temperature (C) 19 19 19 19
Outdoor temperature (C) 12 12 12 12
Hours in use per day 5 5 5 5
Number of households 20000 20000 20000 20000
CO2 generated in 90 days (tonnes) 1260 945 630 420
Air exchange rate (m3h–1) 240 180 120 60
Indoor set temperature (C) 18 18 18 18
Outdoor temperature (C) 12 12 12 12
Hours in use per day 5 5 5 5
Number of households 20000 20000 20000 20000
CO2 generated in 90 days (tonnes) 1081 811 540 270 Note: A change of 1 oC in the indoor set temperature nearly halves the CO2 penalty at low air leak rates, whereas there is comparatively little effect at high leak rates. Simple measures such as weather stripping doors and windows can be easily applied to existing buildings. However, precautions need to be taken to avoid build‐up of humid air, particularly in the vicinity of kitchens, as this could lead to fungal growths on walls.
Table 3.14: Data relating to the impact that changes in the indoor set temperature and unwanted air infiltration have on electricity consumption and related CO2 emissions in winter.

97
A CHP scenario for Mater Dei Hospital would have two of the 2.5 MW standby generators running at an efficiency of 33%. These need to be supplied with 15 MW (thermal) and will deliver 5 MW (electrical) and 10 MW (thermal); the latter to go into producing the hot water requirements of the hospital. From the point of view of CO2 emissions, the existing set up, with 4.3 MW from the power stations and a maximum of 6 tonnes of diesel per day used by the boiler, a total of 110 tonnes of CO2 is emitted per day. A CHP system using two on‐site 2.5 MW generators to satisfy both demands, will emit 95 tonnes of CO2 per day, with overall fuel saving. Adverse factors of this set up include generator noise as well as increased emissions on the hospital site. (b) Smart City at Ricasoli Smart City is a major new industrial development due for completion in 2012. The second national allocation plan assigned an increase in power demand of 20 MW by 2010 and a further 20 MW by 2012. Annual demand is expected to be about 44 GWh in 2010, rising to 88 GWh in 2012, an increase of around 2% and 4% respectively in overall electricity generation for the nation.
In addition, a number of new commercial and housing developments may be completed during the period 2008‐2012. Since this represents a very significant increase in the rate of development (in terms on ‘new’ floor space) compared to the projected increase in gross domestic product, a small additional allowance is included to cover these developments, specifically 5,000 MWh in 2008, increasing by the same amount each year. The total allowance of 25,000 MWh by 2012 is less than 1% of the total demand. The projected increases in energy demand are shown in Table 3.15. In section 3.16, these projections are revisited and more realistic estimates are produced in order to arrive at an overall estimate of Malta’s electricity demand and greenhouse gas emissions for the period 2005‐2025.
33..99..55 UUssee ooff RReenneewwaabbllee EEnneerrggyy iinn HHootteellss,, PPuubblliicc BBuuiillddiinnggss aanndd PPrriivvaattee
HHoouusseess
For a hotel, hot water provision discussed earlier, a total of 1000 m2 of 75% efficient solar water heaters will displace 11% (i.e. 380 tonnes) of CO2 emissions on an annual basis. An integrated approach to heating, which is of potential interest to hotels is that applied by Vassallo [49] to the University of Malta swimming pool. With a careful optimization of heating plant efficiency and water temperature, use of pool covers and auxiliary solar water heating, a 90% saving in energy requirement is possible, with avoidance of 1380 tonnes of CO2 emissions per year.

98
Note: The only actual value available is for Mater Dei Hospital in 2008, all the other values are projected.
Table 3.15: Projected increases in energy demand by new on‐going or planned developments. One type of system that does not seem to have had any impact locally is solar‐assisted A/C. The size of units on the market is too large for individual households, and the degree of solar contribution (about 30%) is not too attractive given the market price of the equipment. In the last year or so, a couple of 10 kW machines based on water‐ammonia vapour absorption and driven by solar heat have been imported into Malta. Their performance is currently being monitored. The very large solar air conditioning installation designed for the terminal building at the airport seems to have been dropped because of financial problems. Earth‐coupling systems, favoured in central and northern Europe have not been installed here either. While it is probably the case that local surface geology does not provide a very good heat sink or source, there must be specific situations where the ground offers good prospects for coupling, particularly close to the coast. The annual energy bill for the Mater Dei Hospital boiler is 11.8 GWh, with an associated emission of 3100 tonnes of CO2 per year. An area of 2000 m
2 of 75% efficient solar water heaters will displace about a quarter of the annual CO2 emissions i.e. 775 tonnes. For 50,000 households, each with 2 m2 of 70% efficient solar water heaters, a total of 66000 tonnes of CO2 will be displaced per year. The current estimate of solar water heater installations is 10,000 [32] but this may increase rapidly in response to the latest government incentives. Possible contributions from micro and small wind turbines in urban or sub‐urban areas cannot be determined as planning regulations for such installations have not been addressed to date.
Projected Increases in Energy Demand (GWh)
Project Annual Load (GWh)
2008 2009 2010 2011 2012
Mater Dei Hospital 91.1 39.4 45.0 60.0 60.0 65.0
Smart City and Environs (Phase 1)
43.8 0.0 21.9 43.8 43.8 43.8
Smart City and Environs
43.8 ‐‐‐ ‐‐‐ 43.8 43.8 43.8
Other Projects 5 per annum
5.0 10.0 15.0 20.0 25.0
Total 44.4 77.0 192.6 167.7 177.6

99
33..1100 EEnneerrggyy iinn TTrraannssppoorrtt The second highest source of GHG, after fuel used in electricity generation, is fuel combustion in transport, with a 17.44% contribution of the total (see Table 3.3). The major contributors to transport GHG are private cars, where numbers have been climbing steadily over the last two decades. By the end of December 2008, there were 222,775 private cars out of 294,658 licensed motor vehicles on the road [50] an increase of 20,300 cars in 5 years. The number of vehicles on the road is nearing saturation, although the number predicted in the MEPA Transport Topic Paper is 290,000 by 2020 [51]; with 250 km of main roads, there is scarcely a metre space for every car. This means that hopefully CO2 cut‐backs would not be too difficult to achieve. The following are the main possibilities for reducing the amount of GHG emissions from transport: Improvement of the efficiency of transport Improvement of the efficiency of transport can be achieved by encouraging a shift from private to public transport, and more car sharing. The CO2 per passenger per km of an efficient bus carrying 20 passengers is put at more than five times less than that of a medium‐sized car carrying only the driver. Smaller factors apply to a taxi‐journey with driver and passenger, or to a hired car with driver and three passengers. Use of smaller and more efficient cars The recent fiscal measures to curb numbers of large, high consumption vehicles are a start in the right direction. The range of CO2 emitted per km of a 1000 cc and a 2500 cc car could be anywhere between 120 and 250 gkm–1 respectively. The EU is introducing legislation for improved fuel consumption and reduction in CO2 emissions. Such measures will only lead to reduced overall CO2 emissions if they are not accompanied by large increases in car numbers (hardly possible in our near‐saturation condition) and in distances travelled. Other measures include stipulation of low rolling resistance tyres and tyre‐pressure monitoring systems. Such features are reckoned to improve fuel consumption by 5%. A slightly greater saving is expected to come from automatic engine switch off when stopped at traffic lights. Better road design and surfaces Poor road surfaces of the type commonly found locally are estimated to lead to 1‐3% increase in fuel consumption, not to mention increased vehicle maintenance costs. They also discourage the use of motorcycles, mopeds and bicycles. Real encouragement to bicycle use needs good surfaces, cycle lanes and low levels of pollution from car exhaust.

100
Better traffic management Better traffic management to reduce traffic jams and slow traffic that is very wasteful on fuel is essential. Synchronised traffic lights have been found to have a noticeable effect on fuel consumption. The current tendency to install large numbers of sleeping policemen should be discouraged, except in village and town cores. On the other side, there is need for driver education in more efficient driving. The recent launch of software for real‐time analysis of driving style should help [231]. Switch to cleaner fuels In the context of this chapter, cleaner fuels refer to such fuels as compressed natural gas (CNG), LPG and bio‐fuels. The production and current situation regarding bio‐fuels, basically bio‐diesel, has been discussed earlier in this report, where it was shown that already over 1% of the fuel used in transport comes from bio‐diesel. However, bio‐fuels are not low or carbon free as far as their use (for energy generation through burning) is concerned. Their actual CO2 emissions must be added to the national account if the source of fuel does not represent local removals of CO2. Only bio‐fuels derived from locally grown organisms, e.g. algae, can be considered as low carbon or carbon‐free. As regards the other fuels (LPG and CNG), the Malta Resources Authority has stated that it “will seek to actively promote the use of auto‐gas since this fuel will contribute to reduction of harmful emissions.” [52] Switching to LPG and CNG as transport fuels is possible. LPG is readily available on the local market, but it has still to get past an as‐yet‐incomplete regulatory framework. However, as a number of European and Japanese carmakers are including LPG options among their models, this fuel is likely to appear fairly quickly on the local market. As LPG requires a spark ignition system, it should be compared to unleaded petrol as an automobile fuel. With a switch to LPG, current engines can go from 172 gkm–1 to 130 gkm–1 in CO2 emissions [232], taking into account that LPG is about 80% as efficient as gasoline (unleaded petrol). The impact on transport emissions expected from a switch of 10,000 cars running on unleaded petrol covering 15,000 km annually to LPG is a reduction of 6,300 tonnes of CO2. CNG, which tends to be used in the larger diesel engines, will lead to a decrease in CO2 emissions over vehicle diesel, when used in trucks and buses, though the major gain will be in much reduced particulate emissions. If a quarter of the transport diesel used in 2006 is assumed to have gone into trucks and buses, and this is substituted by CNG, there would be a decrease of 15,800 tonnes in emitted CO2. CNG is not yet available on the local market.

101
Encourage the use of electric vehicles If charged from the electrical mains, electric vehicles do not offer much gain in reducing CO2 emissions as our power station emissions of CO2 per kWh are rather high (0.97 kg per kWh for power delivered to a car battery). If wholly or partly charged from (or offset by) carbon‐free sources e.g. photo‐voltaic panels, then there is a reduction in CO2 emissions. The transferred (from vehicle to power station) CO2 emissions for a small electric vehicle that has been extensively tested [249] amount to 100 gkm–1 for a daily distance of 25 km, which was found to be the average distance covered by a sample of over 350 conventional private cars. The latter, however, emitted close to 200 gkm–1 of CO2. If the effect of large capacity cars (engine capacity of 1600 cc or more) is removed from the sample, the figure drops to 160 gkm–1 of CO2, which is about the present EU average. It should be noted that 100 gkm–1 for an electric vehicle is better than what the EU has set for Euro 5 and Euro 6 standards, projected to come into play in 2012. It is rather pointless to try and work out specific effects of electric vehicles on GHG emissions, as rates of take‐up of electric vehicles are not easily predictable. Nevertheless, a situation where 1000 electric vehicles emitting 100 gkm–1 replace a similar number of internal combustion engine cars emitting 180 gkm–1, saves 800 tonnes of CO2 for an annual travel coverage of 10,000 km. A fuel switch to NG at the power stations, will double this figure. Three advantages of the electric vehicle in local conditions are the following:
at slow speeds its energy consumption goes down; there is no energy use when the car is stationary in traffic jams, etc; no noise or exhaust pollution is produced
33..1111 IInndduussttrriiaall PPrroocceesssseess Table 3.1 and Table 3.3 show that, aside from CO2 emissions from electricity use and fuel burning, industrial processes contribute 69.30 Gg of CO2‐equivalent, amounting to 2.28% of the total CO2 emissions. The breakdown by source is given in Table 3.16.
Industrial Source CO2‐equivalent Emission (Gg)
Mineral products 0.06
Chemical Industry 0.10
Halocarbons and SF6 69.14
Table 3.16: CO2‐equivalent emissions from industrial processes by source.
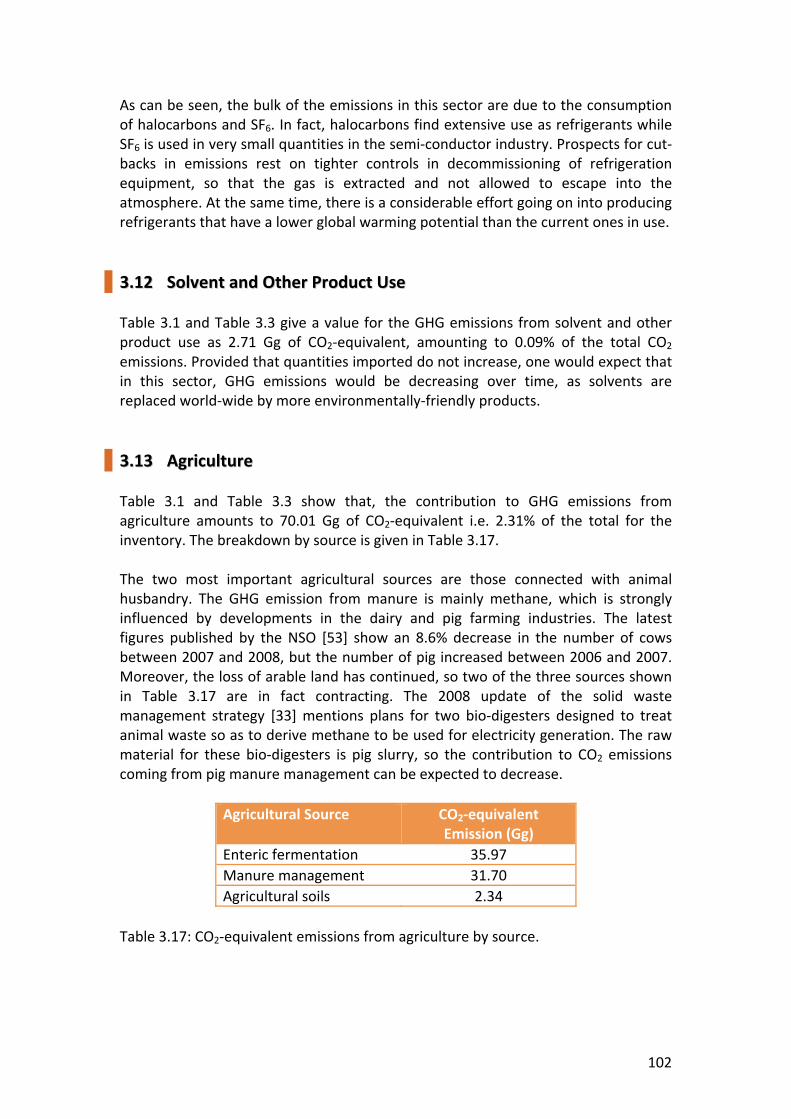
102
As can be seen, the bulk of the emissions in this sector are due to the consumption of halocarbons and SF6. In fact, halocarbons find extensive use as refrigerants while SF6 is used in very small quantities in the semi‐conductor industry. Prospects for cut‐backs in emissions rest on tighter controls in decommissioning of refrigeration equipment, so that the gas is extracted and not allowed to escape into the atmosphere. At the same time, there is a considerable effort going on into producing refrigerants that have a lower global warming potential than the current ones in use.
33..1122 SSoollvveenntt aanndd OOtthheerr PPrroodduucctt UUssee Table 3.1 and Table 3.3 give a value for the GHG emissions from solvent and other product use as 2.71 Gg of CO2‐equivalent, amounting to 0.09% of the total CO2 emissions. Provided that quantities imported do not increase, one would expect that in this sector, GHG emissions would be decreasing over time, as solvents are replaced world‐wide by more environmentally‐friendly products.
33..1133 AAggrriiccuullttuurree
Table 3.1 and Table 3.3 show that, the contribution to GHG emissions from agriculture amounts to 70.01 Gg of CO2‐equivalent i.e. 2.31% of the total for the inventory. The breakdown by source is given in Table 3.17. The two most important agricultural sources are those connected with animal husbandry. The GHG emission from manure is mainly methane, which is strongly influenced by developments in the dairy and pig farming industries. The latest figures published by the NSO [53] show an 8.6% decrease in the number of cows between 2007 and 2008, but the number of pig increased between 2006 and 2007. Moreover, the loss of arable land has continued, so two of the three sources shown in Table 3.17 are in fact contracting. The 2008 update of the solid waste management strategy [33] mentions plans for two bio‐digesters designed to treat animal waste so as to derive methane to be used for electricity generation. The raw material for these bio‐digesters is pig slurry, so the contribution to CO2 emissions coming from pig manure management can be expected to decrease.
Agricultural Source CO2‐equivalent Emission (Gg)
Enteric fermentation 35.97
Manure management 31.70
Agricultural soils 2.34
Table 3.17: CO2‐equivalent emissions from agriculture by source.

103
33..1144 LLaanndd‐‐UUssee,, LLaanndd‐‐UUssee CChhaannggee aanndd FFoorreessttrryy
Table 3.1 and Table 3.3 show that, the overall effect of activities connected with land‐use, land‐use change and forestry have a positive effect on GHG emissions as they act as a sink, absorbing about 60.79 Gg of CO2 or 2.00% of the total GHG emissions for the nation. This is not so insignificant percentage shows that more ought to be done to increase tree cover. The present strength of this sink must be somewhat greater than that given in the 2008 GHG inventory, where it was found that the CO2 absorbed, and so the number of trees and the area given as woodland (2.2 km2) has not changed since 1990. However, the wooded land area in 2001 has been given as 13.7 km2 [1], so one would be justified in putting the sink capable of 560 Gg of CO2. In future, the availability of considerable amounts of second‐class water from sewage treatment should encourage tree planting. Trees also help to shade buildings and to cool their surroundings by trans‐evaporation.
33..1155 WWaassttee:: SSoouurrcceess ffoorr CCuurrrreenntt aanndd FFuuttuurree PPrroojjeeccttss Table 3.1 and Table 3.3 show that, waste contributes to GHG emissions, 200.07 Gg of CO2‐equivalent. The breakdown by source is given in Table 3.18.
Waste Source CO2‐equivalent Emission (Gg)
Solid waste disposal (Magħtab) 171.84
Waste water treatment 28.14
Waste incineration 0.09
Table 3.18: CO2‐equivalent emissions from waste by source. These figures were calculated when the landfill at Magħtab was not being managed at all. It has since been closed down and sealed with a heavy cover of construction waste. Gas, mainly CO2 with a small proportion (about 3%) of methane, is being extracted from the still smouldering lower layers and is being burnt in a thermal oxidiser. The current contribution of Magħtab must be down to a quarter of that shown in Table 3.18. Currently, landfill management by Wasteserv Malta Ltd has curtailed emissions from the engineered landfill at Ta’ Żwejra. Methane‐rich (40%) gas is being extracted, to be used to generate electricity. It is estimated that this gas supply could produce some of the electricity over years [34]. On the negative side, it should be pointed out that the Ta’ Żwejra landfill has only another five years of life.
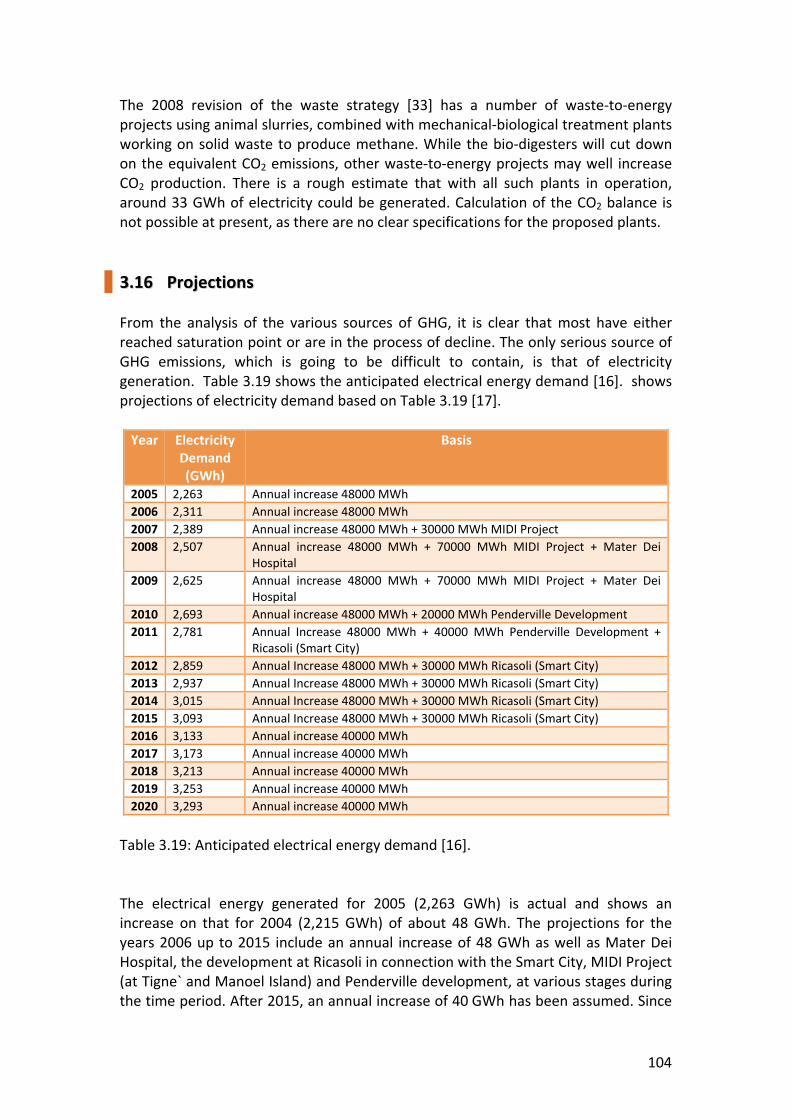
104
The 2008 revision of the waste strategy [33] has a number of waste‐to‐energy projects using animal slurries, combined with mechanical‐biological treatment plants working on solid waste to produce methane. While the bio‐digesters will cut down on the equivalent CO2 emissions, other waste‐to‐energy projects may well increase CO2 production. There is a rough estimate that with all such plants in operation, around 33 GWh of electricity could be generated. Calculation of the CO2 balance is not possible at present, as there are no clear specifications for the proposed plants.
33..1166 PPrroojjeeccttiioonnss From the analysis of the various sources of GHG, it is clear that most have either reached saturation point or are in the process of decline. The only serious source of GHG emissions, which is going to be difficult to contain, is that of electricity generation. Table 3.19 shows the anticipated electrical energy demand [16]. shows projections of electricity demand based on Table 3.19 [17]. Year Electricity
Demand (GWh)
Basis
2005 2,263 Annual increase 48000 MWh
2006 2,311 Annual increase 48000 MWh
2007 2,389 Annual increase 48000 MWh + 30000 MWh MIDI Project
2008 2,507 Annual increase 48000 MWh + 70000 MWh MIDI Project + Mater Dei Hospital
2009 2,625 Annual increase 48000 MWh + 70000 MWh MIDI Project + Mater Dei Hospital
2010 2,693 Annual increase 48000 MWh + 20000 MWh Penderville Development
2011 2,781 Annual Increase 48000 MWh + 40000 MWh Penderville Development + Ricasoli (Smart City)
2012 2,859 Annual Increase 48000 MWh + 30000 MWh Ricasoli (Smart City)
2013 2,937 Annual Increase 48000 MWh + 30000 MWh Ricasoli (Smart City)
2014 3,015 Annual Increase 48000 MWh + 30000 MWh Ricasoli (Smart City)
2015 3,093 Annual Increase 48000 MWh + 30000 MWh Ricasoli (Smart City)
2016 3,133 Annual increase 40000 MWh
2017 3,173 Annual increase 40000 MWh
2018 3,213 Annual increase 40000 MWh
2019 3,253 Annual increase 40000 MWh
2020 3,293 Annual increase 40000 MWh
Table 3.19: Anticipated electrical energy demand [16]. The electrical energy generated for 2005 (2,263 GWh) is actual and shows an increase on that for 2004 (2,215 GWh) of about 48 GWh. The projections for the years 2006 up to 2015 include an annual increase of 48 GWh as well as Mater Dei Hospital, the development at Ricasoli in connection with the Smart City, MIDI Project (at Tigne` and Manoel Island) and Penderville development, at various stages during the time period. After 2015, an annual increase of 40 GWh has been assumed. Since

105
the publication of this plan, more actual data has become available. This has been compared with the projections, as shown in Table 3.20.
0
500
1,000
1,500
2,000
2,500
3,000
3,500
2005
2006
2007
2008
2009
2010
2011
2012
2013
2014
2015
2016
2017
2018
2019
2020
Electrical Energy (GWh)
Year
Figure 3.5: Electricity demand for the period 2005‐2020 (adapted from [17]).
Table 3.20: Comparison of projected and actual values for electrical energy generated for the period 2006‐2008. The projected increase of 244 GWh between 2005 and 2008 (refer to Table 3.19) did not materialise. In fact the increase was only of 48,926 MWh (refer to Table 3.20), just a little over what was being allowed in the projections for the annual increase excluding any large‐scale projects. Much of the difference can probably be explained by the late start of the MIDI Project and Mater Dei Hospital. In fact Mater Dei Hospital started its operations in July 2007, and this is reflected in the figures for 2008. Between 1st November 2007 and that of 2008, the hospital consumed 39,290 MWh [46] which make up only about 44% of the 91 GWh that were assigned to it in the Second National Allocation Plan.
Electricity Generation (MWh)
Year Projected Actual Projected increase over previous year
Actual increase over previous year
2006 2,311,145 2,260,762 48,000 −2383
2007 2,389,145 2,266,103 78,000 5341
2008 2,507,145 2,312,071 118,000 45,968

106
It would seem that the projected annual increase of 48 GWh (around 2% of 2005) has not materialised in 2006‐2008. The increase in 2007 over that in 2006 was certainly influenced by the very hot summer of 2007 and by the start‐up of Mater Dei Hospital in July 2007. For a better understanding of the annual increase, it is worth looking at what happened over the period 2002‐2008 (refer to Figure 3.6).
‐1
0
1
2
3
4
5
6
7
82002
2003
2004
2005
2006
2007
2008
Percentage Change
in Electricity
Generation (%
)
Year
Figure 3.6: Annual increase in electricity generation over the period 2002‐2008. Figure 3.6 shows that after 2005, there has been a very slow growth in demand, possibly due to the introduction of a surcharge on unit prices as from 1st January 2005. This growth could slow down even further, due to the new tariff structure and energy efficiency campaigns. In the projections for electricity demand shown in Table 3.21, an annual growth rate of 0.3% is being assumed. If the projections for the other large‐scale projects follow the same trend as Mater Dei Hospital, i.e. of overstating their electricity requirements by 100% (experience shows that developers tend to overestimate their electricity requirements), assuming an annual increase of 0.3% and a MIDI Project start in 2009 rather than 2007, projections of electricity demand would be as shown in Table 3.21. Figure 3.7 and Figure 3.8 are based on Table 3.21.

107
Year Electricity Demand (GWh)
Basis CO2 Emissions (Gg)
2005 2,263 Actual 1,991
2006 2,261 Actual 1,989
2007 2,266 Actual 1,994
2008 2,312 Actual (includes a 40,000 MWh increase for Mater Dei Hospital) 2,035
2009 2,345 0.3% increase + 15,000 MWh MIDI Project + 20,000 MWh Mater Dei Hospital
2,064
2010 2,377 0.3% increase + 15,000 MWh MIDI Project + 10,000 MWh Penderville Development
2,092
2011 2,419 0.3% increase + 15,000 MWh MIDI Project + 10,000 MWh Penderville Development + 10,000 MWh Ricasoli (Smart City)
2,129
2012 2,441 0.3% increase + 15,000 MWh Ricasoli (Smart City) 2,148
2013 2,464 0.3% increase + 15,000 MWh Ricasoli (Smart City) 2,168
2014 2,486 0.3% increase + 15,000 MWh Ricasoli (Smart City) 2,188
2015 2,509 0.3% increase + 15,000 MWh Ricasoli (Smart City) 2,208
2016 2,516 0.3% increase 2,214
2017 2,524 0.3% increase 2,221
2018 2,531 0.3% increase 2,227
2019 2,539 0.3% increase 2,234
2020 2,546 0.3% increase 2,241
2021 2,554 0.3% increase 2,248
2022 2,562 0.3% increase 2,254
2023 2,569 0.3% increase 2,261
2024 2,577 0.3% increase 2,268
2025 2,585 0.3% increase 2,275
Note: The CO2 emissions have been derived with the current emission factor of 880 kg per MWh. Up to the end of 2012 they are just inside the limit set by the EU for the Second National Allocation Plan. Any exceeding of this limit will be subject to fines or covered by the purchase of Green Certificates. But even a switch from heavy fuel oil to gas oil could make a significant difference on two counts: the (slightly) lower CO2 emission factor of gas oil as compared to heavy fuel oil and, more important, the use of gas oil in a CCGT operating at 40% efficiency instead of heavy fuel oil used in 26% efficient steam turbines. For such a switch, the emission factor for the CCGT units would go down to 500 kg per MWh. If these units provide at least 30% of the total electricity generation, then the emission factor is bound to register a significant drop.
Table 3.21: Projection of electricity demand and associated CO2 emissions for the period 2005‐2025.
2,000
2,100
2,200
2,300
2,400
2,500
2,600
2,700
2005
2006
2007
2008
2009
2010
2011
2012
2013
2014
2015
2016
2017
2018
2019
2020
2021
2022
2023
2024
2025
Electrical Energy (GWh)
Year
Figure 3.7: Projection of electricity demand for the period 2005‐2025.

108
1,800
1,850
1,900
1,950
2,000
2,050
2,100
2,150
2,200
2,250
2,300
2005
2006
2007
2008
2009
2010
2011
2012
2013
2014
2015
2016
2017
2018
2019
2020
2021
2022
2023
2024
2025
Carbon Dioxide Emissions (Gg)
Year
Figure 3.8: Projection of CO2 emissions for the period 2005‐2025. Figure 3.9 shows the actual (2001‐2008) and projected (2009‐2025) electricity generation for Malta.
0
500
1,000
1,500
2,000
2,500
3,000
3,500
2001
2003
2005
2007
2009
2011
2013
2015
2017
2019
2021
2023
2025
Electrical Energy (GWh)
Year
Actual Current Work Enemalta Corporation
Figure 3.9: Actual (2001‐2008) and projected (2009‐2025) electricity generation.

109
33..1177 EEmmiissssiioonnss TTrraaddiinngg Until 2012, a country which exceeds its emission allowance established in its current national allocation plan could resort to one of the mechanisms introduced in the Kyoto protocol ‐ the Emissions Trading Scheme, whereby countries are allowed to purchase certificates (allowances) to emit CO2 if they exceed the quantity established in the national allocation plan, or to sell certificates if they fall short of the limit. Through this mechanism, reduction of CO2 emissions should occur in the most economical way. The mechanism would also eventually lead to establishing a price for the carbon dioxide emission certificates, which in turn would reflect the cost of eliminating the emission of a tonne of CO2. As of 25th November 2008, market price of one tonne of CO2 was €15.7. It has been as low as €0.60 and as high as €30. The price for the current round of national allocation plans was expected to be around €15‐17. The current economic downturn has meant that companies are emitting less CO2 and have more certificates to sell. This has led to a fall in the price to as low as €7.9 in recent weeks (10th February 2009). The price as at 11th March 2009 was €11.3. The point of quoting these prices is to put in perspective the costs involved in exceeding our quota. At 2.1 million tonnes of emitted CO2, exceeding that by 0.05% would mean an extra 1000 tonnes. At the certificate price quoted above, that would cost under €20,000 to remedy. Beyond 2012, new provisions for CO2 allowances up to 2020 have been discussed at the European Parliament. A major change of method has been proposed [250], with the EU issuing one overall cap for CO2 emissions every year between 2013 and 2020. The linear envelope for this cap will be determined by the need to reach a 20% cut in GHG emissions compared to 1990 by 2020. The EU will then allocate country allowances based on fully harmonised rules, again with a change of emphasis away from free allowances towards ones mainly purchased by auction. Malta has been allowed some derogation from what would otherwise be a very onerous scheme, particularly if the intention to include aviation emissions does go through. However, the various proposals presented in this chapter for mitigation of CO2 emissions by action at the generation stage, are almost all designed to lower the present emission factor. Taking the most radical one, that is of complete change of generation fuel from the present heavy fuel oil and gas oil to natural gas, the emission factor would go down to 400 kg per MWh. That would more than halve the annual CO2 emissions listed in Table 3.21.
33..1188 FFiinnaanncciiaall aanndd EEccoonnoommiicc CCoonnssiiddeerraattiioonnss One problem of financing energy efficiency projects is that traditional commercial banks do not understand the technical risks involved, and are therefore reluctant to provide the necessary finance even when a project looks, at least on paper, to have a
110
good chance of having a reasonable payback. Some Eastern European countries have solved this problem by separating the commercial risk of a project from the technical risk. The former is well understood by traditional commercial banks that are therefore prepared to deal with it, whereas the latter is taken on by a specialised Government agency that guarantees the risk to the commercial banks after that it has carried out a proper technical evaluation of the project and analysed the risks and rewards involved.

111
PPAARRTT IIII:: TTHHEE CCLLIIMMAATTEE

112
HHIISSTTOORRIICCAALL TTRREENNDDSS IINN MMEETTEEOO‐‐MMAARRIINNEE IINNDDIICCAATTOORRSS
OOFF CCLLIIMMAATTEE CCHHAANNGGEE
44..00 EExxeeccuuttiivvee SSuummmmaarryy This chapter builds upon the climate trends analysis carried out within the First National Communication to UNFCCC, but with the introduction of new metrics and the use of extended and new datasets. The overall goal is to use long term direct observations of key meteo‐marine indicators to monitor local climate change trends in relation to global and regional averages, and hence to identify any anomalous or accelerated changes. The main findings are summarised according to the respective parameters: Temperature – The air temperature over the period 1923‐2005 showed an overall rate of increase of 0.71 oC/100years; this is comparable to the global average
temperature increase of almost 0.8 oC above pre‑industrial levels. The highest rate of warming at around 1.5 oC over 30 years occurred in the post‐1970 period, especially in the last two decades of the twentieth century when the temperature anomaly with respect to the climatological mean temperature over the period 1961‐1990 was around twice the anomaly on a global average. The overall rate of warming is by far strongest in the summer period at around 1.5 oC/100 years. The warming trend can also be traced from the incidence and magnitude of extreme temperature events. Yearly recorded maximum temperatures have gone up by close to 3 oC over 100 years while minimum temperatures have tended to overall cooler temperatures, although the absolute lowest temperatures occurred earlier to 1980 and the coldest days in recent years have not gone below the 2 oC threshold. Events of extreme high temperature are on the increase and tend to be more intense, but the assessment is biased by the anomalous period in the late 90s. Precipitation – Rainfall patterns over the Maltese Islands are characterized by a relatively high spatial and temporal variability. Even the average wettest months can be very dry in particular years. There is however no definite trend in the observed precipitation. Over the last 85 years there has been no significant change in rainfall during winter and summer, whereas there has been a decrease of 0.14 mm/year during spring, and an increase of 0.8 mm/year during autumn. During the rainy season, the increasing number of days with thunderstorm (with an upward trend of +7 days over 55 years) implies that convective type rainfall is on the increase. This type of rainfall is of short duration and often quite heavy. This is corroborated by the positive trend in the daily maximum rainfall between 1923 and 2000, notwithstanding the fact that over a full year the absolute number of days with rainfall in the range 1‐50 mm is decreasing.

113
Wind – A very consistent drop of about 1 knot is noted in wind intensity in the last 40 years. In the period 1996‐2005 the drop, most evident during winter, is around 3.5% with respect to the overall mean over the full period since 1946. Atmospheric pressure and other meteorological parameters – The overall positive trend in atmospheric pressure is indicative of reduced frontal activity on a yearly basis and more frequent anticyclonic situations which often enhance subsidence, thereby restricting convection, cloud formation and hence rainfall. This is corroborated by the recorded decrease in the mean annual cloud cover over the Maltese Islands amounting to –0.34 oktas in 45 years. The duration of bright sunshine showed a downward trend in the number of daily sunshine hours (–0.6h over 77 years) and is mainly attributed to changes in atmospheric composition, predominantly due to the higher atmospheric loading by suspended particles. Sea level – According to the SRES scenarios, sea level rise on a global scale by the end of the 21st century is expected to be in the range of 0.18‐0.59 m above the reference level corresponding to the decade 1980‐1999. On the basis of recent satellite observations, global sea level trends in the last 15 years are about 3.1 mm/year which is actually almost double the rate of sea level rise in the last century. This leads to an expected future sea level rise that may actually exceed the IPCC limit. Sea level changes express an integration of several factors and are, especially in the Mediterranean, characterised by strong geographical differences, and critically dictated by internal climatic influences and external signals like the North Atlantic Oscillation. Changes in sea level in the Mediterranean have been far from regular in recent times. While trends in the Eastern Mediterranean are definitely high and positive, negative trends are observed in the northern Ionian Sea including in the proximity to the Maltese Islands. In Malta, sea level measurements conducted by the Physical Oceanography Unit show that, in spite of alternating intermediate trends, the sea level has on average actually declined in the last 15 years. This is believed to be linked to transient effects which warrant sustained monitoring of sea level changes on the local scale. This situation does not guarantee against a future menace of sea level rise and it is prudent to thus adopt a precautionary approach and at the most moderate level make projections on the basis of the sea level trend in the more recent four years (2002‐2006) during which the sea level experienced an
average rise of 0.45 0.15 cm/year. Sea temperature – Measurements of sea surface temperature at Delimara show a steady increase at a hefty average rate of close to +0.05 oC/year in the last 40 years. This rise is most evident during summer and is comparable to Mediterranean averages, which are well above the global average of +0.01 oC/year. The warming of the sea and that of the air has a direct influence on the biodiversity and functioning of many marine ecosystems that respond both physically and biologically to changes in climate.

114
44..11 IInnttrroodduuccttiioonn
Climatic changes on a global scale cannot be easily extrapolated to the Mediterranean basin which is beset by specific characteristics linked to intricate interactions between the atmosphere, land and sea. The response of the Mediterranean geophysical and biochemical systems to natural and anthropogenic forcing is complicated by the high internal variability in time and space, and its short response time, such as in the case of the Eastern Mediterranean Transient, that renders the systems even more vulnerable to strong or even irreversible impacts. The region is moreover known to be externally influenced by interconnections to remote phenomena in the Atlantic Ocean, the Indian Monsoon [71], the Tropics as well as the Saharian desert. The geographical position of the Maltese Islands within the Mediterranean, and their small territorial extent and propinquity to the sea further render a higher margin of uncertainty in climate‐related predictions at the local scale, and in many aspects render vulnerability and impact assessments to be rather subjective. In this context extrapolations from numerical global and even regional climate models become less relevant, while the importance of long term direct observations of key indicators becomes indispensable. This report presents an assessment of trends for a number of meteo‐marine indicators of climatic changes in the Maltese Islands. The study is based on the longest available sets of observations collected by the Malta Meteorological Office and the Physical Oceanography Unit of the IOI‐Malta Operational Centre at the University of Malta. It is an update on the First National Report in the sense that it deals with existing datasets with a more in‐depth analysis using a wider set of metrics to identify statistically significant trends, cycles and seasonal patterns. The study further deals with extreme event analysis and comparisons between different time windows. The key weather parameters used in this report include: rainfall (Drydocks: 1842 to 2005 and Luqa Met. Office: 1929 to 2005), air temperature (Luqa: 1922 to 2005), atmospheric pressure, number of days with thunderstorms, hail, wind intensity and wind gusts, mean daily cloud cover, and mean daily hours of bright sunshine (Luqa: starting from 1929 or later up to 2005). The longest records are those of rainfall and temperature over a span of 100‐150 years. Records of other parameters cover a period of about 50 years. In addition the ECMWF MARS (Meteorological Archival and Retrieval System) dataset for Malta, consisting of 3‐hourly sampled time series of wind magnitude and direction, air temperature, dew point, visibility and cloudiness starting from 1979, are also referenced. This indicator‐based assessment serves to identify the past and more recent trends in key variables that shed light on the extent to which the Maltese Islands are impacted by climatic changes in comparison to levels in Europe and to global averages, and permit to identify anomalous or accelerated changes. Such an analysis is critical to quantify responses from climate forcing, and to correlate effects in sub‐

115
systems. This is essential to informed mitigation strategies, and to accordingly adopt fitting adaptation measures. The climate data show considerable temporal variations due to changing environmental conditions and natural processes. Long‐term trends are often masked by the rather large inter‐annual variability. The length of data sets thus dictates the extent to which it is possible to resolve with some certainty the short term signals from the longer term variability and tendencies, as well as to decipher the inter‐relationships between various parameters.
44..22 MMeetteeoorroollooggiiccaall IInnddiiccaattoorrss
44..22..11 AAiirr TTeemmppeerraattuurree aanndd PPrreecciippiittaattiioonn The climate of the Maltese Islands is typically Mediterranean and is essentially bi‐seasonal. The ‘warm season’ from June to September is governed by the high of the Azores anticyclones and by the North‐East depressions. This period is hot, dry and predominantly cloudless with an average of 11.8 daily sunshine hours and an overall average temperature in July and August of about 26.5 oC, and with little or no rain in June and July as shown by the climatological charts in Figure 4.1 and Figure 4.2. These charts show the seasonality of the air temperature and rainfall at Luqa worked out on the basis of monthly means over a period of 84 and 77 years respectively. During the ‘cool season’, from October to May, the pressure trough over the Mediterranean separates the Azores depression to the west and south, from the Eurasian thermal highs to the east and north; the winter airflow is thus strongly convergent and gives rise to rainy and windy periods, with on average 5.1 hours of sunshine in December and January, and average temperatures of 14 oC in December and 12.5 oC in January and February. The wettest months are January, October and November with over 80 mm of rain each month and over 100 mm on average in December. The band between the maximum and minimum curves in Figure 4.1 shows the range of the monthly temperature means over the years. It gives a measure of the inter‐annual variability which spans the range of approximately ±2.5 oC about the overall mean, and is uniform across all the months. The time series of annually averaged values of air temperature calculated from monthly means of observations made in Luqa over the period 1922‐2005, plotted in Figure 4.3, give a first level indication of temporal changes in the recent past. The overall trend calculated over the whole period (1923 to 2005) gives an increase in temperature at the rate of 0.71 oC/100years. However the trace exhibits a very marked inter‐annual variability and very consistent longer term oscillations. The most remarkable feature is the higher temperatures especially in the 90s. Up to 1970 the trend was actually negative, but the post‐1970 period has a clearly exacerbated

116
rate of warming at around 1.5 oC over 30 years although the more recent years show sensible cooling. The warmest years were 2001 (19.94 oC), 1999 (19.92 oC), 1994 (19.83 oC) and 1990 (19.68 oC). The overall warming trend in the Maltese Islands follows the global average temperature increase of almost 0.8 oC above
pre‑industrial levels, mainly towards the end of the twentieth century. Figure 4.4 shows that even higher increases have been experienced in Europe, especially over the Iberian Peninsula, while the Mediterranean had a somewhat milder increase in temperature towards the eastern longitudes.
5
10
15
20
25
30
Jan Feb Mar Apr May Jun Jul Aug Sep Oct Nov Dec
Air Temperature/ oC
Month
Average Minimum Maximum
Figure 4.1: Seasonality of air temperature at Luqa over the period 1922‐2005. The central curve gives the average for each month. The warming phase in the last two decades of the twentieth century and the comparison with global scale changes in temperature is better expressed in terms of the anomaly with respect to the climatological mean temperature over the period 1961‐1990 as shown in Figure 4.5. The global averaged anomalies are elaborated by the University of East Anglia in collaboration with the Hadley Centre and are described in [55]. These anomalies take into account all the known observations made both on the continents and at sea; the anomaly for the Maltese Islands is based on observations made in Luqa. Starting from the mid‐80s the temperature anomaly over the Maltese Islands has been consistently higher than the global average except for the very recent years when the Mediterranean is apparently undergoing a relatively cooler period. During the four hottest years mentioned above, the anomaly was around twice the global average, indicating that in these particular years the regional scale variability is much more intense.

117
0
20
40
60
80
100
120
Jan Feb Mar Apr May Jun Jul Aug Sep Oct Nov Dec
Rainfall /m
m
Month
Figure 4.2: Seasonality of precipitation calculated from monthly total precipitation at Luqa over the period 1929‐2005.
y = 0.0071x + 18.488R² = 0.1299
17.5
18.0
18.5
19.0
19.5
20.0
1923
1925
1927
1929
1931
1933
1935
1937
1939
1941
1943
1945
1947
1949
1951
1953
1955
1957
1959
1961
1963
1965
1967
1969
1971
1973
1975
1977
1979
1981
1983
1985
1987
1989
1991
1993
1995
1997
1999
2001
2003
2005
Air Temperature /oC
Year
Figure 4.3: Time series of annually averaged monthly mean temperatures at Luqa. (y=0.0071x+18.488; R2=0.13).

118
Figure 4.4: Annual trends in surface air temperature, for the period 1901‐2000, based on instrumental measurements. Black outlining surrounds those regions with statistically significant trends (at the 95% confidence level) [54]. Further analysis consisted in splitting the data series into successive time windows of 10 year periods: 1926‐1935; 1936‐1945; 1946‐1955; 1956‐1965; 1966‐1975; 1976‐1985; 1986‐1995; 1996‐2005. The results are summarised in Table 4.1 and the adjoining table which lists the means on both the 10‐year annual and monthly averages. The mean over the decade centred on 1970 is lowest at 18.44 oC and 0.35 oC below the overall mean. In the subsequent periods the decadal mean rose steadily by about 1 oC in 30 years. It is noted that this pattern of higher temperature means is evident over all the months (except for a cooler mean for February, August, September and October in the last decade). This is a clear indication of a general shift to a warmer climate over the Maltese Islands. This is corroborated by the positive trend in temperature at all the seasons as shown in Figure 4.6. The overall rate of warming is by far strongest in the summer period at around 1.5 oC/100years, being some three times higher than that in winter and twice that in spring. The warming during autumn is in comparison insignificant. The warming trend can also be traced from the incidence and magnitude of extreme temperature events. The overall lowest and highest instantaneous temperatures for each month over the period 1922‐2006 are compared with the monthly mean temperature in Figure 4.7. Temperature minima are on average 10 oC lower with respect to monthly mean temperatures, while temperature maxima are about 15 oC

119
higher. Events of extreme high temperature are on the increase and tend to be more intense.
‐1.0
‐0.5
0.0
0.5
1.0
1.51961
1963
1965
1967
1969
1971
1973
1975
1977
1979
1981
1983
1985
1987
1989
1991
1993
1995
1997
1999
2001
2003
2005
Temperature Anomaly / oC
Year
Figure 4.5: Time series of temperature anomaly averaged globally (dashed line) and in Luqa (full line) with respect to the climatological mean over the period 1961‐1990 [251]. Jan Feb Mar Apr May Jun Jul Aug Sep Oct Nov Dec Year 1926‐1935 12.15 11.92 13.71 15.74 18.63 23.01 25.77 25.93 24.30 21.34 18.08 14.31 18.74
1936‐1945 12.49 12.57 13.42 15.58 18.80 22.54 25.47 26.08 24.17 21.19 17.44 13.89 18.64
1946‐1955 12.27 12.48 13.50 15.67 19.11 23.60 25.97 26.35 24.57 20.92 17.09 13.90 18.79
1956‐1965 12.43 11.93 13.45 15.30 18.97 23.01 25.87 26.40 24.20 20.65 17.37 13.94 18.63
1966‐1975 12.29 12.50 13.12 15.35 19.21 22.67 25.43 26.28 23.93 20.14 16.71 13.65 18.44
1976‐1985 12.28 12.50 13.55 15.24 18.89 23.03 25.70 25.90 23.70 20.66 16.75 13.89 18.51
1986‐1995 12.62 12.76 13.92 15.92 19.39 23.41 26.49 27.41 25.13 21.88 17.55 14.09 19.21
1996‐2005 12.77 12.41 14.07 16.20 20.09 24.51 26.86 27.31 24.54 21.78 17.92 14.31 19.40
1922‐2005 12.37 12.39 13.57 15.63 19.14 23.20 25.94 26.44 24.34 21.07 17.38 13.97 18.79
Table 4.1: Comparison of mean temperature at Luqa over successive 10‐year periods from 1926‐2005; values are compared on a monthly and annual basis. Yearly recorded maximum temperatures in Figure 4.8 show a steady positive trend of very close to 3 oC over 100 years. This trend is evident in all the months, but is significant mainly in the summer months. The highest temperature of 43.8 oC was registered in August 1999. In the post‐1970 period the inter‐annual variability in the maximum observed temperatures has become more evident with sharper changes from year to year, and with a variance generally 50% higher. Yearly recorded minimum temperatures in Figure 4.9 show an overall trend towards colder temperatures, even though in the more recent years the coldest days have not gone below the 2 oC threshold, and the absolute lowest temperatures occurred earlier in the years 1980, 1965, 1961 and 1955.

120
0.000
0.002
0.004
0.006
0.008
0.010
0.012
0.014
0.016
Winter Spring Summer Autumn
Temperature/ oC
Season
+ 0.0048 oC/yr
+ 0.0081 oC/yr
+ 0.015 oC/yr
+ 0.0019 oC/yr
Figure 4.6: Seasonal trends in air temperature over the period 1922‐2005 from observations in Luqa.
0
5
10
15
20
25
30
35
40
45
50
Jan Feb Mar Apr May Jun Jul Aug Sep Oct Nov Dec
Air Temperature/ oC
Month
Average of Monthly Mean Minimum Recorded Maximum Recorded
Figure 4.7: Comparison of the recorded highest and lowest temperatures with the mean monthly air temperature at Luqa over the period 1922‐2006. An analysis on the incidence and magnitude of high temperatures is important also in view of health implications. Figure 4.10 shows the number of 3‐hour averaged observations each year when temperatures reached higher than set thresholds indicated in the key that are derived from the 3‐hourly averaged meteorological observations in the ECMWF MARS dataset. The number of actual high temperature events is reported in the accompanying table since one event usually comprises a number of successive 3‐hour observations. It is important to note that around 80% of the recorded heat spells with temperatures over 35 oC since 1979 were observed

121
in the last ten years, namely from 1995. In this period temperatures higher than 40 oC and persisting for more than three hours were recorded in 1988 (July), 1998 (July) and 1999 (August).
y = 0.0298x + 35.864R2 = 0.0894
30
31
32
33
34
35
36
37
38
39
40
41
42
43
44
45
1922
1924
1926
1928
1930
1932
1934
1936
1938
1940
1942
1944
1946
1948
1950
1952
1954
1956
1958
1960
1962
1964
1966
1968
1970
1972
1974
1976
1978
1980
1982
1984
1986
1988
1990
1992
1994
1996
1998
2000
2002
2004
Air Te
mpe
rature / o C
Year
Figure 4.8: Time series of observed instantaneous temperature maxima in Luqa for years 1922‐2005. (y=0.0298x+35.864; R2=0.0894).
y = ‐0.0154x + 4.8404
R² = 0.0793
0
1
2
3
4
5
6
7
8
9
10
1922
1924
1926
1928
1930
1932
1934
1936
1938
1940
1942
1944
1946
1948
1950
1952
1954
1956
1958
1960
1962
1964
1966
1968
1970
1972
1974
1976
1978
1980
1982
1984
1986
1988
1990
1992
1994
1996
1998
2000
2002
2004
Air Temperature / oC
Year
Figure 4.9: Time series of observed instantaneous temperature minima in Luqa for years 1922‐2005. (y=–0.0154x+4.8404; R2=0.0793). The maximum temperature in every month between the periods covering 1981‐1990 and 1991‐2000 are compared in Figure 4.11, and the tendency for almost every month is that of higher temperature extremes in the last ten year period. The

122
comparison of the periods 1991‐2000 and 2001‐2006 for the lowest temperature minima (Figure 4.12) again confirms the tendency of a gradually warming climate.
Figure 4.10: Annual occurrence of observed 3‐hour temperature maxima above set thresholds in Luqa for years 1979‐2006. YEAR 82 83 84 85 86 87 88 89 90 91 92 93 94 95 96 97 98 99
*Events T≥35oC 3 2 1 1 1 2 1 ‐ 1 ‐ 1 2 2 ‐ 3 1 3 3
*Events T≥40oC ‐ ‐ ‐ ‐ ‐ ‐ 1 ‐ ‐ ‐ ‐ ‐ ‐ ‐ ‐ ‐ 1 1
YEAR 00 01 02 03 04 05 06
*Events T≥35oC 2 2 1 4 1 2 2
*Events T≥40oC ‐ ‐ ‐ ‐ ‐ ‐ ‐
* Table and plot indicate only the events persisting for at least three hours. Precipitation is another important parameter to consider in climate studies since it is a major component of the hydrological cycle. An increase in the average global temperature is very likely to lead to changes in precipitation and atmospheric moisture as a result of changes in atmospheric circulation and increases in evaporation and water vapor content in the atmosphere. Given the limited skill of numerical models to deal with precipitation, especially in resolving regional scales in space and seasonal patterns in time, consistent and reliable observations become even more important. Moreover spatial patterns of precipitation are known to have considerable dependence on the local geographical details and characteristics. In spite of the limited extent of the Maltese Islands, rainfall patterns show a relatively high spatial and temporal variability over the Maltese territory.

123
15
20
25
30
35
40
45
50
Jan Feb Mar Apr May Jun Jul Aug Sep Oct Nov Dec
Temperature / oC
Month
Temperature Maxima 1981 ‐ 1990 Temperature Maxima 1990 ‐ 2000
Figure 4.11: Comparison of instantaneous temperature maxima in Luqa over the periods 1981‐1990 and 1991‐2000.
0
2
4
6
8
10
12
14
16
18
20
Jan Feb Mar Apr May Jun Jul Aug Sep Oct Nov Dec
Temperature / oC
Month
Temperature Minima 1981 ‐ 1990 Temperature Minima 1991 ‐ 2000
Figure 4.12: Comparison of instantaneous temperature minima in Luqa over the periods 1991‐2000 and 2001‐2006. Figure 4.13 shows the large inter‐annual variance in monthly total precipitation rates which can reach up to 4.5 times the mean values in October. On the other hand all months can be very dry in particular years. The wetter October occurred in 1951 with

124
a record total rainfall of 476.5 mm (compared to a mean of 89.6 mm), while the driest October had simply 7.4 mm of rain throughout the month way back in 1933. On the European scale there are considerable differences in precipitation trends between regions (refer to Figure 4.14); the patchy results depicted in the map implies that trends in the observed precipitation have to be mainly treated at least on the sub‐regional scale. Moreover trends must be calculated over sufficiently long time periods otherwise results may be completely divergent. In the Mediterranean, trends are generally towards a drier climate especially in the extreme west, northern Italy and over the lower Balkans. In the Central Mediterranean, trends are actually reversed with a tendency of more rain over Sicily, Tunisia and Malta in the last forty years. The longest rainfall observations in Malta are those observed in Luqa (since 1929) and Drydocks (1851‐1966). Figure 4.15 and Figure 4.16 are time series plots of yearly total precipitation at the respective stations. Values are plotted as anomalies with respect to the overall mean for each series so as to bring out better the wetter from the drier years.
0
50
100
150
200
250
300
350
400
450
500
Jan Feb Mar Apr May Jun Jul Aug Sep Oct Nov Dec
Monthly Rainfall / mm
Month
Average Minimum Maximum
Figure 4.13: Average, Minimum and Maximum total precipitation by month in Luqa over the period 1929‐2005. The observations indicate that there is no distinct sign of any definite trend in precipitation; wet years can be preceded and followed by a dry year, and viceversa. The tendency of a decadal scale variability related to the equivalent variability in atmospheric circulation anomalies [62] is often interrupted by more local scale variations. Both series show a slight positive trend (3.6 mm/decade in Luqa and 7.3 mm/decade at Drydocks), but in both cases the statistical significance is low. The
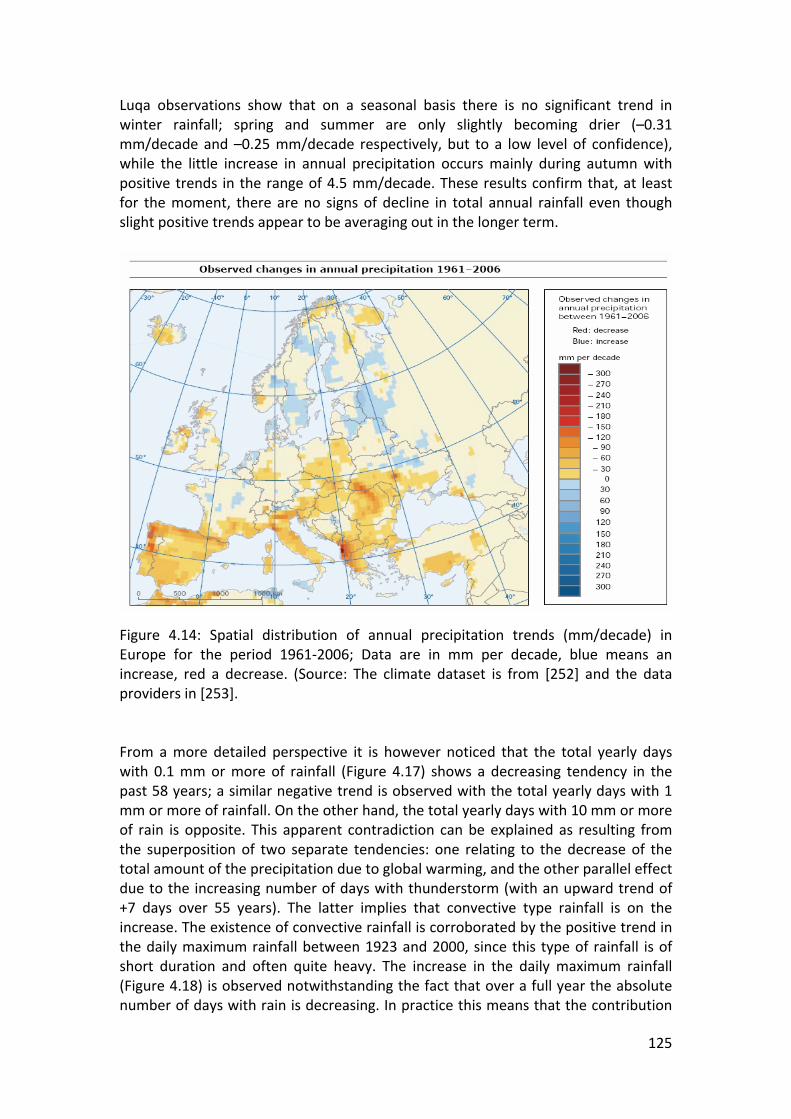
125
Luqa observations show that on a seasonal basis there is no significant trend in winter rainfall; spring and summer are only slightly becoming drier (–0.31 mm/decade and –0.25 mm/decade respectively, but to a low level of confidence), while the little increase in annual precipitation occurs mainly during autumn with positive trends in the range of 4.5 mm/decade. These results confirm that, at least for the moment, there are no signs of decline in total annual rainfall even though slight positive trends appear to be averaging out in the longer term.
Figure 4.14: Spatial distribution of annual precipitation trends (mm/decade) in Europe for the period 1961‐2006; Data are in mm per decade, blue means an increase, red a decrease. (Source: The climate dataset is from [252] and the data providers in [253]. From a more detailed perspective it is however noticed that the total yearly days with 0.1 mm or more of rainfall (Figure 4.17) shows a decreasing tendency in the past 58 years; a similar negative trend is observed with the total yearly days with 1 mm or more of rainfall. On the other hand, the total yearly days with 10 mm or more of rain is opposite. This apparent contradiction can be explained as resulting from the superposition of two separate tendencies: one relating to the decrease of the total amount of the precipitation due to global warming, and the other parallel effect due to the increasing number of days with thunderstorm (with an upward trend of +7 days over 55 years). The latter implies that convective type rainfall is on the increase. The existence of convective rainfall is corroborated by the positive trend in the daily maximum rainfall between 1923 and 2000, since this type of rainfall is of short duration and often quite heavy. The increase in the daily maximum rainfall (Figure 4.18) is observed notwithstanding the fact that over a full year the absolute number of days with rain is decreasing. In practice this means that the contribution

126
of heavy rain to total precipitation has increased. This situation is in general also corroborated on a European scale.
‐400
‐300
‐200
‐100
0
100
200
300
400
500
1929
1931
1933
1935
1937
1939
1941
1943
1945
1947
1949
1951
1953
1955
1957
1959
1961
1963
1965
1967
1969
1971
1973
1975
1977
1979
1981
1983
1985
1987
1989
1991
1993
1995
1997
1999
2001
2003
2005
Annual Rainfall deviation /mm per year
Year
Figure 4.15: Deviation of precipitation in Luqa from the mean over the period 1929‐2005.
‐400
‐300
‐200
‐100
0
100
200
300
400
500
1851
1854
1857
1860
1863
1866
1869
1872
1875
1878
1881
1884
1887
1890
1893
1896
1899
1902
1905
1908
1911
1914
1917
1920
1923
1926
1929
1932
1935
1938
1941
1944
1947
1950
1953
1956
1959
1962
1965
Ann
ual Rainfall deviation /m
m per year
Year
Figure 4.16: Deviation of precipitation at Malta Drydocks from the mean over the period 1851‐1966. The historical datasets of precipitation do not allow a detailed analysis for extreme events. Data is only available in the form of monthly maxima of daily precipitation. Low precipitation extremes can be measured in terms of consecutive days without rain leading to intensification of drought periods, but this would necessitate long

127
time series on a daily basis. Similarly high precipitation extremes can be assessed from the number of wet days, consecutive wet days, and the frequency and intensity of heavy precipitation. Such an analysis would be useful to quantify the associated risks such as from fast flash floods and sewerage system failures. Given that only monthly maxima of daily precipitation are available, these can be used to at least get some indication on the patterns of extreme rain events. Figure 4.19 presents for each month the strongest of these 24‐hour total precipitation maxima measured in Luqa over the period 1929‐2005. The monthly maxima of daily precipitation are also organised into a number of discrete intensity bins; 26 of these maxima carry a value in excess of 80 mm implying that since 1929 there were at least this number of events with a total precipitation of more than 80 mm in 24 hours. The matrix below lists these 26 values according to their temporal stamp by month and period. It is this evident that the period September‐December carries the highest risk of strong rain events. The extreme precipitations in August (occurring in 1964) and February (occurring in 1938) were anomalous events. The absolute highest precipitation occurred in 1988 with a total of 162.5 mm of rain on 10th November.
y = ‐0.141x + 87.953R² = 0.0351
05101520253035404550556065707580859095100105110115120
1948
1951
1954
1957
1960
1963
1966
1969
1972
1975
1978
1981
1984
1987
1990
1993
1996
1999
2002
2005
Number of Days
Year
Figure 4.17: Time series of yearly total number of days with rain from observations at Luqa over the period 1948‐2005. (y=–0.141x+87.953; R2=0.0351).
44..22..22 WWiinndd MMaaggnniittuuddee
The average wind speeds by month, calculated from mean monthly observations at Luqa, over the period 1948‐2005 are used as a basis to determine the baseline climatology of wind intensity as shown in Figure 4.20. On the local scale, station wind data vary considerably with position and highly depend on location, but the observations at Luqa are taken to be representative of the general surface wind conditions over the Maltese Islands. Wind strength is consistent throughout the year with an average of around 8 knots and a relative attenuation in summer. The windy

128
months are mainly February, March and April with an average of around 10 knots. The wind climatology is also important because it highly dictates the seasonal intensity of sea waves and can intensify storm surges.
y = 0.2474x + 53.4277R² = 0.0403
0
20
40
60
80
100
120
140
160
1801922
1926
1930
1934
1938
1942
1946
1950
1954
1958
1962
1966
1970
1974
1978
1982
1986
1990
1994
1998
2002
Total Preci[pitation /mm
Year
Figure 4.18: Time series of annual highest precipitation over 24 hours from observations at Luqa over the period 1922‐2005. (y=0.2474x+53.4277; R2=0.0403).
0
20
40
60
80
100
120
140
160
180
Jan Feb Mar Apr May Jun Jul Aug Sep Oct Nov Dec
Rainfall /m
m
Month Figure 4.19: Extremes of total precipitation over 24 hours from observations at Luqa over the period 1929‐2005. PERIOD JAN FEB MAR APR MAY JUN JUL AUG SEP OCT NOV DEC TOTAL
1922‐1944 1 2 1 1 5
1945‐1960 1 1 2
1961‐1974 1 2 1 1 2 7
1975‐1990 3 2 5
1991‐2005 1 3 1 2 7
TOTAL ‐ 1 2 1 ‐ ‐ ‐ 1 5 7 5 4 26

129
0
2
4
6
8
10
12
Jan Feb Mar Apr May Jun Jul Aug Sep Oct Nov Dec
Wind Speed / Knots
Month Figure 4.20: Seasonality of wind magnitude calculated from monthly means at Luqa over the period 1948‐2005. The wind observations at Luqa indicate a very consistent drop in wind intensity of just under 1 knot in the last 40 years. Figure 4.21 compares the wind intensity over successive 10‐year periods. The mean wind intensity in the period 1996‐2005 is around 3.5% lower than the overall mean of 8.7 knots over the full period since 1946. The reduction in wind intensity is noted at practically all the months although it is less evident during summer; the tendency to milder winds is most accentuated during the winter winds. The changes in wind conditions are difficult to explain, but they are certainly related to changes in atmospheric circulation patterns that are conditioned by large scale influences.
4
5
6
7
8
9
10
11
12
13
Jan Feb Mar Apr May Jun Jul Aug Sep Oct Nov Dec
Wind Speed / Knots
Month
1946 ‐ 1955 1956 ‐ 1965 1966 ‐1975 1976 ‐1985 1986 ‐1995 1996 ‐ 2005 1946 ‐ 2005
Figure 4.21: Comparison of mean wind speed at Luqa over successive 10‐year periods from 1946‐2005; values are compared on a monthly and annual basis.

130
Observations of wind gusts provide further insight on changes in atmospheric circulation patterns. The highest maximum gusts (measured in Luqa from 1951‐2005) follow the same seasonal fluctuation as that for wind intensity (refer to Figure 4.22). The highest gusts generally occur in the period October‐March, but strong winds can practically occur throughout the whole year. A record wind gusting of 72 knots occurred in October 1982. The general temporal trend can be quantified in terms of the yearly number of gusts equal or above 34 knots in the period 1961‐2005 as shown in Figure 4.23. Except for the strong peaking on a seemingly 20‐year cycle, there is an evident decreasing tendency in wind gusting intensity of the order of 50% in half a century.
0
10
20
30
40
50
60
70
80
Jan Feb Mar Apr May Jun Jul Aug Sep Oct Nov Dec
Speed / Knots
Month
Figure 4.22: Highest maximum wind gust at Luqa over the period 1955‐2005.
0
10
20
30
40
50
60
70
80
1961
1965
1969
1973
1977
1981
1985
1989
1993
1997
2001
2005
Number of Days
Year Figure 4.23: Time series of days with gusts ≥ 34 knots in Luqa over the period 1961‐ 2005.

131
44..22..33 OOtthheerr WWeeaatthheerr PPaarraammeetteerrss Several other meteorological parameters relevant to climatic studies are regularly observed by the Meteorological Office in Luqa. Tendencies of change in these parameters are noted to ascertain compatibilities in trends of different inter‐related factors. Certain parameters can furthermore give indirect indications on changes in storm intensity and frequency. Annually averaged observations indicate an overall positive trend in atmospheric pressure implying a reduced frontal activity on a yearly basis, and more frequent anticyclonic situations which often enhance subsidence, thereby restricting convection, cloud formation and hence rainfall. This is corroborated by the recorded decrease in the mean annual cloud cover over the Maltese Islands amounting to –0.34 oktas in 45 years. Hail is connected to thunderstorm events and it is one of the important extreme weather elements. The number of days with hail from 1961 to 2005 shows an initial decreasing tendency, but subsequently followed a positive trend. On the other hand the number of days with thunderstorm between 1951 and 2005 followed a more consistent trend with an average annual increase of 7 days over 55 years. Fog and poor visibility is a dangerous element for land and sea transportation and is related to extremes of humidity. The number of days with fog in the period 1961‐2005 decreased in general by 2.5 days over the 45 year period. The duration of bright sunshine showed a downward trend in the number of daily sunshine hours (−0.6h over 77 years). This is mainly attributed to changes in atmospheric composition and predominantly due to the higher atmospheric loading by suspended particles.
44..33 MMaarriinnee IInnddiiccaattoorrss
44..33..11 SSeeaa LLeevveell CChhaannggee
Changes in sea level are undoubtedly a very critical factor in determining potential impacts on the coastal environment due to climate change. An increase in sea level can lead to higher risk of flooding, enhance coastal erosion, increase the saline intrusion in underground water aquifers, cause loss of coastal habitats and weaken the effective protection of coastal defence structures. All these impacts have considerable societal significance and heavy economic consequences. Accurate and long term predictions of sea level changes are thus very much in demand yet not easy to estimate in consequence of the fact that sea level variations are an expression of a number of interlinked factors that basically involve all the climate system components.

132
Sea Level Total (SLT) trends are mainly the combination of two effects, namely (i) the thermosteric component which accounts for the expansion of water (Sea Level Volume, SLV) due to global warming and the reverse effect of a compacted water column due to a more saline sea, and (ii) mass variations (Sea Level Mass, SLM) which can be produced by a number of effects such as melting of glacier ice, changing circulation patterns and changes in water storage in land. Sea level change is thus a result of changes in the ocean effective volume in response to variations in sea water temperature and salinity at all depths, and changes of the ocean mass as a result of exchanges of water with the other surface reservoirs (atmosphere, continental waters, glaciers and ice sheets). Modeling these effects is difficult because it involves complex physical processes that are still poorly understood. On a global scale, sea level in the last century is estimated to have increased in the range between 1‐2 mm/year [57,60,65]. About 0.4‐0.5 mm/year of this rise is attributed to thermal expansion of the sea water [68, 70]; the melting of the polar ice on Greenland is estimated to have contributed 0.05 ± 0.12 mm/year since 1960, while glaciers and Antarctica have contributed 0.5 ± 0.3 and 0.1 ± 0.4 mm/year respectively [66]. On top of this, one has to add the effect of land motions caused by post‐glacial rebound, tectonics and changes in water reservoirs [64]. In the Mediterranean, sea level has been increasing up to 1960 in line with the estimated global value of 1.8 mm/year [58]. In the period between 1960 and the beginning of the 1990s the overall basin sea level has however dropped by 2‐3 cm [72] in spite of the general rising trends in atmospheric temperature. Part of this reduction is attributed to the direct atmospheric pressure increases linked with the North Atlantic Oscillation, while cooling of the upper waters in the Aegean and the Adriatic Seas must have also played a part [73]. After 1993, sea level in the Eastern Mediterranean started to increase again, with very rapid rates some 10 times that of global sea level rise [56,63]. These increases appear to be temperature related, as it corresponds to an increase of the observed sea surface temperature [63], and connected to the reduction of the transport of Atlantic Water to the Eastern Mediterranean possibly resulting from changes in the wind stress. Satellite altimetric missions such as from the ERS‐1 and Topex/Poseidon platforms, have since 1992 provided a new technology to monitor sea level change, and permit variations to be followed not only in time but also in space by providing a 2D view of the variability that has revealed considerable geographical differences worldwide and in the Mediterranean. Figure 4.24 shows the large spatial differences which show the large positive trends observed in the Levantine Sea while negative trends are observed in the northern Ionian Sea including the proximity to the Maltese Islands. Notwithstanding these sub‐basin differences there is an overall increasing trend in the Mediterranean average sea level as a whole of around 2 mm/year which is mainly driven by steric effects (SLV = 1.3 mm/year) and to a lesser effect by mass‐induced components (SLM = 0.7 mm/year) [67]. In the period from 2001 onwards, the basin trend in SLT is even negative and this is more evident in the thermosteric effect.

133
Figure 4.24: Map of the variation in SLT trends in the Mediterranean (1992‐2007) based on satellite altimeter data. The in situ measurements from sea level gauges in the Mediterranean gives similar results. From measurements in the period 1990‐2005 [69] conclude that the mean
trend is 0.0 0.4 mm/year; the atmospherically‐induced trends are spatially very homogeneous over the basin, varying between –0.5 and –0.8 mm/year, mainly due to an increase in atmospheric pressure in the region during the last decades of the 20th century. Thus the meteorologically‐corrected series show increasing trends with
a mean value of +0.7 0.4 mm/year. A further correction of the residual sea level
trends for post‐glacial rebound gives +0.9 0.4 mm/year. With the consideration of steric effects the resulting mean trend is around 1.2 mm/year. In Malta, sea level measurements are conducted by the Physical Oceanography Unit (PO‐Unit) of the University of Malta in Mellieħa Bay (in delayed mode) and Portomaso (in real time) on the St. Julians shoreline, and by the Hydrographic Office of the Malta Maritime Authority in the Grand Harbour. The PO‐Unit has dedicated great effort to provide high quality digitized sea level data for the Maltese Islands since 1993 with ancillary automatic recording meteorological stations and short‐term deployments of bottom pressure gauges in the open sea. These measurements have provided important information over a wide spectrum of sea level signals including tidal constituents and non‐tidal factors (such as the high frequency seiche oscillations, known as the ‘milgħuba’ by local fishermen, which occur in the coastal area of the Maltese Islands with periods of the order of a few minutes) as well as on the strong seasonal non‐eustatic fluctuations in the mean sea level [61]. The dependence of the low frequency signal on meteorological factors in terms of both direct and non‐local forcing mechanisms has also been studied. The seasonal signal in the sea level is found to be quite strong and is actually larger in size than other

134
effects on the sea level (refer Figure 4.25). Such seasonality is typical of the whole Mediterranean Sea. In the case of Malta, a sea level maximum generally occurs in October while a minimum occurs in March. The sharp lowering in the mean sea level after October is usually interrupted by a second maximum in December/January while the increase after March is temporarily halted by a secondary minimum in late spring. The maximum range between the extreme levels is in the order of tens of centimetres, but this varies greatly from year to year. Both the size and phase of the fluctuations as well as the occurrence of fast variations are indicative of considerable interannual variability.
Figure 4.25: Monthly averaged sea level observations on the northern coastline of the Maltese Islands for the period May 1993‐December 2006. The figure includes a linear and a polynomial fit. [Source PO‐Unit, Malta, 2008]. The merged data series from observations in Mellieħa Bay and Portomaso in Figure 4.25 provide the best local available sea level recordings to assess sea level trends in the Maltese Islands. The analysis made for this report spans the period June 1993 to December 2006. Although the temporal length of this dataset is not sufficiently long to bring out the full characterisation of the longer term sea level signals, it however suffices to give a clear indication of the most recent trends. Contrary to the general expectations, the overall trend over a window of 13.5 years of data is that of a fall in
sea level at an average rate of 0.50 0.15 cm/year. This corroborates the satellite‐induced trends mentioned earlier in this section, but the fall is far from monotonic. The sea level experienced a hefty rise of several centimetres in the period 1993 to 1996; this was followed by a rapid decrease till the end of 2001 when the sea level
reached an average of 9.0 0.4 cm below that in 1993; in the following years the sea started to recover back to slightly higher levels at a rate of less than 0.5 cm/year. This general decreasing trend in the sea level in recent years does not however refute the impact of climatic changes in the Maltese Islands. Sea level is only one of

135
several indicators of climate change. The anomalous behaviour of sea level in this area of the Mediterranean is believed to be linked to both local effects, such as the intensity of the Atlantic Ionian Stream which is a sea current incident from the Western Mediterranean and crossing the Sicilian Channel in close proximity to Malta before proceeding into the Ionian Sea, as well as to more remote signals such as the variability of the Mediterranean circulation patterns and the more distant North Atlantic Oscillation which impacts the atmospheric pressure regime in the Mediterranean. Such a complex situation definitely rules out any sturdy prediction on how the sea level around the Maltese Islands will evolve in the future. What is certain is that a sustained commitment to local observations is necessary; this is a clear message that we cannot realistically assess climatic impacts without a local capacity to monitor important parameters. This part of the Mediterranean has experienced a buffer period that has attenuated any imminent menace of sea level rise, but there is no guarantee that this will persist in the future. According to the SRES scenarios, sea level rise on a global scale by the end of the 21st century is expected to be in the range of 0.18‐0.59 m above the reference level corresponding to the decade 1980‐1999. On the basis of the more recent satellite datasets, global sea level trends in the last 15 years are about 3.1 mm/year which is actually almost double the rate of sea level rise in the last century. This may lead one to assume that future sea level rise may actually exceed the IPCC limit.
Figure 4.26: Globally averaged sea level trends from observations since 1870 [57]. The reconstructed sea level fields are represented in red, tide gauge measurements in blue and satellite altimetry measurements are in black. In the case of the Mediterranean it is even harder to make concrete predictions. In the case of the Maltese Islands we may adopt a precautionary approach and at the

136
most moderate level make projections on the basis of the sea level trend in the more recent four years (2002‐2006) during which the sea level experienced an average rise
of 0.45 0.15 cm/year.
44..33..22 SSeeaa SSuurrffaaccee TTeemmppeerraattuurree
The sea surface temperature (SST) around the Maltese Islands is another important indicator to detect climatic changes. Measurements are made at a constant single point (in the open sea outside Delimara point) and at the same level of about 1 m below the sea surface, and have been conducted for these last 28 consecutive years. As expected the seasonal variability is very much dictated by that of the overlying air temperature and wind, but the sea is generally warmer by a few degrees Celsius; the lowest sea temperature is on average 15 oC towards February (with an overall low of 13 oC) whereas it reaches 26 oC on average in August (with a peak of 28 oC).
10
12
14
16
18
20
22
24
26
28
30
Jan Feb Mar Apr May Jun Jul Aug Sep Oct Nov Dec
Sea Surface Temperature / oC
Month
Average Minimum Maximum
Figure 4.27: Seasonality of sea surface temperature from the mean monthly SST in the Maltese coastal waters over the period 1977‐2005. The mean SST in the coastal waters of the Maltese Islands has been steadily increasing at a hefty average rate of close to +0.05 oC per year since the late 70s. The trend is calculated from the annual averaged observations of sea surface temperatures at Delimara, as shown in Figure 4.28, and follows the parallel trend in air temperature. This trend is higher than that reported by Coppini & Pinardi in [62] where the average trend in the Mediterranean for the last 25 years (1982‐2006) is probably underestimated at +0.03 oC/year. The rise in SST in the Mediterranean is

137
well above the global average of +0.01 oC/year; other parts of European seas have experienced even more drastic changes as shown in Figure 4.29. These changes in the sea temperature are the largest ever measured in comparison to observations in any previous 25 year period [62].
y = 0.0496x + 19.109
R² = 0.6108
18.0
18.5
19.0
19.5
20.0
20.5
21.0
21.5
1978
1980
1982
1984
1986
1988
1990
1992
1994
1996
1998
2000
2002
2004
Sea Surface Temperature / oC
Year
Figure 4.28: Time series of annually averaged sea surface temperature observations in Delimara over the period 1978‐2005. (y=0.0496x+19.109; R2=0.6108).
Figure 4.29: Map of changes in the sea surface temperature in the European Regional Seas in the period 1982‐2006. [Source: [62] compiled for EEA by the Istituto Nazionale di Geofisica e Vulcanologia (INGV) based on datasets made available by the Hadley Center [254].

138
The increase in SST in Malta is most evident during summer, in agreement with the equivalent larger seasonal trend in the air temperature; it is however also high in autumn and to some extent in winter, which is clear evidence that the sea temperature depends also on non‐local larger scale phenomena. The warming of the sea and that of the air has a direct influence on the biodiversity and functioning of many marine ecosystems that respond both physically and biologically to changes in climate. The recently published CIESM Workshop Monograph [59] deals with some of the most evident impacts including the increasing number and abundance of alien species in the Mediterranean, the northward extension of thermophilic species and the increased vulnerability of cold‐water species, and the proliferation of jelly‐fish swarms that we know from experience have become a more common summer plague even in the Maltese coastal waters. On the other hand warmer sea waters appear to favour the flowering of Posidonia meadows which could be used as a macro‐indicator of climate warming.

139
FFUUTTUURREE CCLLIIMMAATTEE SSCCEENNAARRIIOOSS
55..00 EExxeeccuuttiivvee SSuummmmaarryy Using MAGICC/SCENGEN version 5.3 it was possible to come up with projections for the Central Mediterranean extending over the next one‐hundred years for important climate parameters. The model performance statistical analysis undertaken as part of the study indicates that in some cases the model results are quite robust. This is especially true for increase in temperature and change in precipitation on a regional level, and global‐average sea level change. Projections of variability in temperature, precipitation and mean sea level pressure are not very reliable and the conclusions drawn from these model results should be viewed with caution. Using the suite of models it was not possible to estimate sea level change for the Central Mediterranean and the reader is referred to the published scientific peer‐reviewed literature. Points of interest emerging from the study include the possibility of a shift and prolonging of the summer season and a shifting of precipitation events to shorter time windows with other time periods becoming drier. The table below gives the main model results for the region of the Maltese Islands for the years 2025, 2050, 2075 and 2100. These are based on the no‐climate‐policy emission scenario A1T‐MES and were generated using the 14 selected atmosphere‐ocean general circulation models. The climate model used for the associated global
projections is HadCM3 with a climate sensitivity of 3 C per carbon dioxide concentration doubling. Results of the uncertainty analysis indicate that these projections are quite reliable and any model artefact that they may carry is minimal. Hence, their use in vulnerability and adaptation studies for the Maltese Islands is recommended. The only problem with the results relates to resolution.
2025 2050 2075 2100 Comments
Increase in
Temperature (C) 1.1 2.0 2.6 2.8 Regional
Mean
Change in Precipitation (%)
–2.4 –4.4 –3.7 –1.8 Regional Mean
Sea Level Rise (cm) 7 14 23 30 Global‐mean
Table 5: The main model results generated using MAGICC/SCENGEN version 5.3 applicable to the region of the Maltese Islands for the years 2025, 2050, 2075 and 2100. Note that the scenario year is the central year for a climate averaging interval of 30 years.

140
The spatial resolution of the SCENGEN component is 2° 30΄ (latitude) 2° 30΄ (longitude), which is too coarse for impact assessments and, vulnerability and adaptation studies since the Maltese Islands cover an area which is less than 0.5% of that for a single grid cell. Tools for the downscaling of MAGICC/SCENGEN scenarios to finer scale do exist but are not advisable since the remaining area of the grid cell containing the Maltese Islands is mostly covered by sea. The best, and most probably the only logical, solution to the problem is to actually employ a numerical atmosphere‐ocean general circulation model for the desired region, even if this proves to be very computationally intensive, requiring a large computer cluster and substantial computer‐time. In this regard, research in regional climate modelling and analysis that focuses on the Central Mediterranean is sorely needed. Nevertheless, it should be noted that currently there does not exist any model that is capable of generating very reliable scenarios for very fine grid cells. This is especially true for cases where the region is a complex combination of land and sea. The Department of Physics at the University of Malta has research plans in the direction mentioned here but further work will surely depend on the availability of the tools needed, notably a substantial computer cluster on which appropriate numerical solvers can run, and experts in the field.
55..11 OObbjjeeccttiivveess ooff tthhee SSttuuddyy The study had three main objectives, which are listed hereunder:
(a) Generate future climate scenarios for the Maltese Islands using readily available computer models that are approved and supported by the National Communications Support Programme (NCSP) of the United Nations Framework Convention on Climate Change (UNFCCC);
(b) Undertake an uncertainty analysis of the model results; (c) Propose improvements to the current study for possible adoption during
the compilation of the third and subsequent National Communications.
55..22 WWhhaatt iiss MMAAGGIICCCC//SSCCEENNGGEENN?? MAGICC (Model for the Assessment of Greenhouse‐gas Induced Climate Change), which is an upwelling‐diffusion, energy‐balance model, has been one of the primary models used by the Intergovernmental Panel on Climate Change (IPCC) since 1990 to produce projections of future global‐mean temperature and sea level rise. Furthermore, the MAGICC climate model is coupled interactively with a range of gas‐cycle models that give projections for the concentrations of the key greenhouse gases so that climate feedbacks on the carbon cycle are accounted for. It should be noted that MAGICC version 5.3 (latest at the time of publication of this report) is in very good agreement with the IPCC Fourth Assessment Report (FAR) (available online [255]. For instance, while minor discrepancies exist between the forcings of
141
individual components (aerosols and greenhouse gas atmospheric concentrations) of the two, the component sums are almost in perfect agreement. Hence, while the MAGICC values are slightly above the best estimate of the IPCC FAR, the differences are insignificant relative to the overall forcing uncertainty and have virtually no effect on projections of temperature or sea level change. Furthermore, initialisations of the forcings in MAGICC are such that they tally with those in the IPCC FAR. Nevertheless, in the IPCC FAR it is stated that MAGICC has a slight warm bias in projections of global‐mean temperature. This is partly due to individual forcing differences between those used in MAGICC and the Atmosphere‐Ocean General Circulation Models (AOGCMs) employed in IPCC FAR, making a true, stringent comparison very difficult. MAGICC is coupled with the model known as SCENGEN (SCENario GENerator), in that the global projections of temperature and sea level change generated by MAGICC are fed to SCENGEN, which produces spatially detailed information on future changes in temperature, precipitation and mean sea level pressure (MSLP) and changes in the variability of these climate parameters (variables) using a version of the pattern scaling method described in [76] to produce spatial patterns of change. Figure 5.1 gives a conceptual representation of MAGICC and SCENGEN, and their coupling with their inputs and outputs. SCENGEN makes use of data sets generated using the ensemble of AOGCMs used by the IPCC, collectively referred to as Coupled Model Inter‐comparison Project Phase 3 (CMIP3). In essence, version 5.3 of the software is consistent with the IPCC Third Assessment Report (TAR) (available online [256]). Further details are given in sub‐section 5.5.1. Apart from CMIP3 data sets, SCENGEN contains observed temperature data sets that come from the European Centre for Medium‐range Weather Forecasting (ECMWF), specifically the data set from the Forty‐Year European Re‐Analysis project known as ERA40, which is spatially complete. The same data set is used for the MSLP.
In the case of precipitation, the latest 2° 30΄ (latitude) 2° 30΄ (longitude) resolution version of the Climate Prediction Centre Merged Analysis of Precipitation (CMAP) data set was used (available online [257]). The coupled interactive software MAGICC/SCENGEN [78] was used to investigate climate change and its uncertainties at both the global level and around the Maltese Islands. The latest version (5.3) has an improved spatial resolution, currently at 2°
30΄ (latitude) 2° 30΄ (longitude) resolution.

142
INPUT
MAGICC
Algorithm for Spatial Resolution
GHG Cycle Model
Atmospheric Composition
Emission Scenario
Global Climate Model Changes in Global‐mean
Temperature and Sea Level
Feedback
OUTPUT
AOGCM Data Sets
Observed Data Sets
SCENGEN
Spatially‐resolved Changes in Global‐mean Temperature, Precipitation and Mean Sea
Level Pressure
INPUT
INPUTOUTPUT
Global‐mean Concentration of Carbon Dioxide, Methane
and Nitrous Oxide
INPUT
MAGICC
Algorithm for Spatial Resolution
GHG Cycle Model
Atmospheric Composition
Emission Scenario
Global Climate Model Changes in Global‐mean
Temperature and Sea Level
Feedback
OUTPUT
AOGCM Data Sets
Observed Data Sets
SCENGEN
Spatially‐resolved Changes in Global‐mean Temperature, Precipitation and Mean Sea
Level Pressure
INPUT
INPUTOUTPUT
Global‐mean Concentration of Carbon Dioxide, Methane
and Nitrous Oxide
Figure 5.1: A schematic diagram depicting the main modules of the two models MAGICC and SCENGEN, their coupling, inputs and possible outputs. The output of MAGICC/SCENGEN is partly controlled by user‐specified settings that mainly include the following:
greenhouse gas and sulphur dioxide emission scenarios
model parameters that have bearing on the carbon cycle (including feedbacks), aerosols forcing, ocean mixing rate and climate sensitivity
future time period
choice of AOGCMs from the CMIP3 ensemble
grid region MAGICC/SCENGEN was developed at the National Centre for Atmospheric Research (NCAR), part of the University Corporation for Atmospheric Research (UCAR), USA.
55..33 PPrroocceedduurraall SScchheemmee ffoorr tthhee GGeenneerraattiioonn ooff GGlloobbaall CClliimmaattee
SScceennaarriiooss uussiinngg MMAAGGIICCCC The following sub‐sections explain the salient points involved in running MAGICC as a standalone module for the construction of global climate scenarios. Particular attention is given to the selections made and sub‐modules that were switched on.

143
55..33..11 EEmmiissssiioonn SScceennaarriiooss
The user begins by selecting a pair of emissions scenarios, referred to as a ‘Reference’ scenario and a ‘Policy’ scenario. The labels ‘Reference’ and ‘Policy’ are arbitrary, and are simply used to distinguish between the two chosen emission scenarios. The emissions library from which these selections are made contains no‐climate‐policy scenarios based on the IPCC Special Report on Emissions Scenarios (SRES) (available online ‐ [258]. It also includes scenarios that assume stabilisation in the greenhouse gas atmospheric concentration following the year 2100. These scenarios are customarily referred to as stabilisation scenarios. Most emissions scenarios in the library run only to 2100 except for the stabilisation scenarios which run to 2400. The MAGICC emissions library includes two sets of stabilisation scenarios, labelled
WRE and NFB where gives the associated stabilization level for carbon
dioxide in parts per million (ppm). In the study, the WRE scenarios were used since climate feedbacks on the carbon cycle were switched on for all runs (which is the normal situation in nature). These scenarios, leading to a stabilisation in carbon dioxide atmospheric concentration, are compatible with the associated non‐carbon
dioxide gas emissions. The WRE scenarios are due to T M L Wigley and S Raper
[77]. The NFB scenarios were not used since these find application when feedbacks are turned off. In the study, a no‐climate‐policy emission scenario, namely A1T‐MES from the SRES report and an emission scenario that incorporates stabilisation of greenhouse gas atmospheric concentration, namely WRE550, were chosen. The latter assumes that atmospheric concentration of carbon dioxide stabilises at 550 ppm. It should be noted that MAGICC does not account for future natural emission changes, since the possible effects of global warming on natural emissions are not known. Even a simple modelling approach is not possible at present.
55..33..22 CClliimmaattee MMooddeellss
The employed climate models (available to the software user) and the chosen emission scenarios from the emission library, together with the corresponding output, are shown in Figure 5.2. Table 5.1 gives a brief description of each of the climate models available in MAGICC. Each of these models was used to generate global‐mean scenarios.

144
Figure 5.2: A schematic listing the six climate models and the two emission scenarios in MAGICC, which were used in the study, and the obtained outputs from model runs.
55..33..33 MMooddeell PPaarraammeetteerrss
The main forcing control parameters and climate model parameters in MAGICC, and the associated settings used in the study are given in Table 5.2 and Table 5.3 respectively. There are a total of six parameters which are discussed in some detail in the following paragraphs. The global carbon cycle is the most important factor that determines the greenhouse gas atmospheric concentrations. It was set at mid‐level. Global warming or an increase in temperature caused by greenhouse gases alters the reaction rate of various chemical reactions making up the global carbon cycle, which reflects on the concentration of greenhouse gases in the atmosphere. It was then only logical to include climate feedbacks on the global carbon cycle, which is really a complex set of different feedbacks operating on a global and regional scale, some of which are positive and others negative. However, the net effect is that these climate feedbacks are positive leading to significantly higher concentrations than would be the case if they were absent. Atmospheric aerosols influence climate in two main ways, referred to as direct forcing and indirect forcing. In the direct forcing mechanism, aerosols reflect sunlight back to space, thus cooling the planet, although aerosol particles such as soot, from processes such as biomass burning, absorb some of this solar energy, leading to a local atmospheric heating which may alter stability and convection patterns.
Climate Models:
Time series (1990‐2100) on an annual basis of the following:
Emission Scenarios:
WRE550 – Carbon Dioxide stabilisation scenario of Tom Wigley and Sarah Raper
A1T‐MES from SRES Report (no‐climate‐policy scenario)
MAGICC
HadCM3
CSIRO
GFDL
CSM
PCM
Global‐mean Sea Level Rise
Global‐mean Increase in Temperature
Global‐mean Concentration of Carbon Dioxide, Methane and Nitrous Oxide and possible
ranges (seperately)
OUTPUT
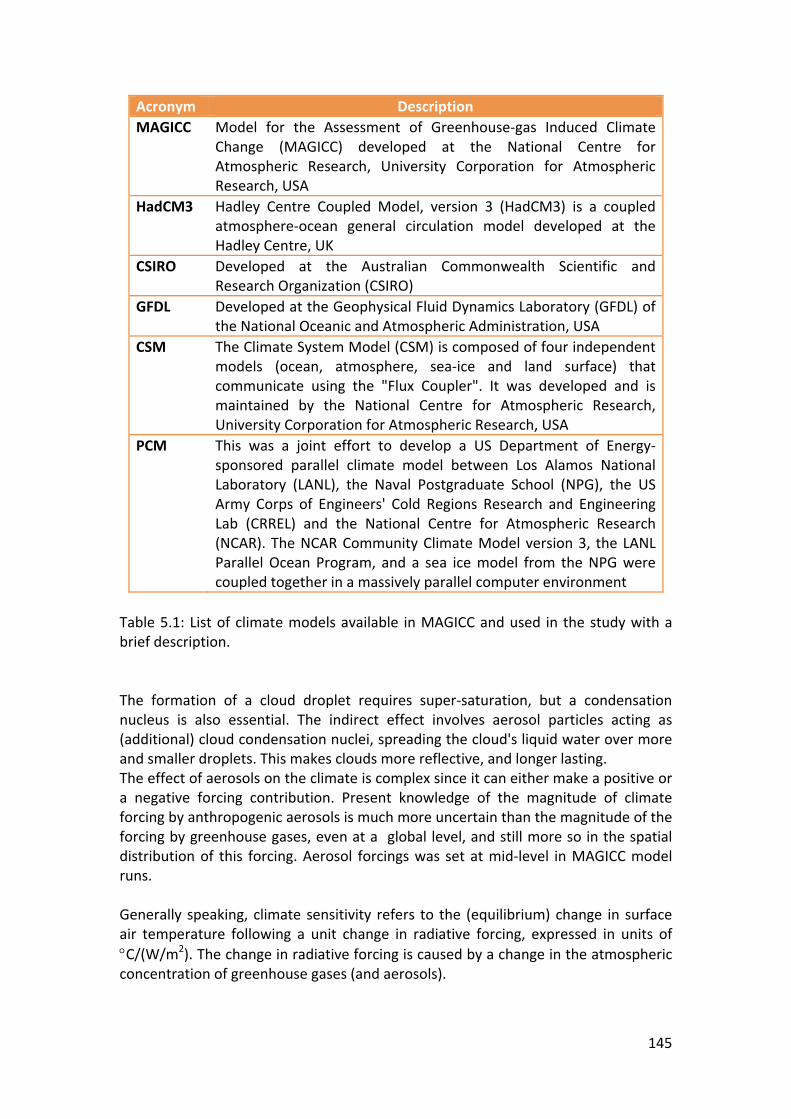
145
Acronym Description
MAGICC Model for the Assessment of Greenhouse‐gas Induced Climate Change (MAGICC) developed at the National Centre for Atmospheric Research, University Corporation for Atmospheric Research, USA
HadCM3 Hadley Centre Coupled Model, version 3 (HadCM3) is a coupled atmosphere‐ocean general circulation model developed at the Hadley Centre, UK
CSIRO Developed at the Australian Commonwealth Scientific and Research Organization (CSIRO)
GFDL Developed at the Geophysical Fluid Dynamics Laboratory (GFDL) of the National Oceanic and Atmospheric Administration, USA
CSM The Climate System Model (CSM) is composed of four independent models (ocean, atmosphere, sea‐ice and land surface) that communicate using the "Flux Coupler". It was developed and is maintained by the National Centre for Atmospheric Research, University Corporation for Atmospheric Research, USA
PCM This was a joint effort to develop a US Department of Energy‐sponsored parallel climate model between Los Alamos National Laboratory (LANL), the Naval Postgraduate School (NPG), the US Army Corps of Engineers' Cold Regions Research and Engineering Lab (CRREL) and the National Centre for Atmospheric Research (NCAR). The NCAR Community Climate Model version 3, the LANL Parallel Ocean Program, and a sea ice model from the NPG were coupled together in a massively parallel computer environment
Table 5.1: List of climate models available in MAGICC and used in the study with a brief description. The formation of a cloud droplet requires super‐saturation, but a condensation nucleus is also essential. The indirect effect involves aerosol particles acting as (additional) cloud condensation nuclei, spreading the cloud's liquid water over more and smaller droplets. This makes clouds more reflective, and longer lasting. The effect of aerosols on the climate is complex since it can either make a positive or a negative forcing contribution. Present knowledge of the magnitude of climate forcing by anthropogenic aerosols is much more uncertain than the magnitude of the forcing by greenhouse gases, even at a global level, and still more so in the spatial distribution of this forcing. Aerosol forcings was set at mid‐level in MAGICC model runs. Generally speaking, climate sensitivity refers to the (equilibrium) change in surface air temperature following a unit change in radiative forcing, expressed in units of
C/(W/m2). The change in radiative forcing is caused by a change in the atmospheric concentration of greenhouse gases (and aerosols).

146
Main Forcing Control Parameters
Carbon Cycle Model Mid‐level
Carbon Cycle Climate Feedbacks Included
Aerosol Forcings Mid‐level
Table 5.2: List of the main forcing control parameters in MAGICC and the associated settings.
Climate Model Parameters
Climate Sensitivity 1.5, 3.0 and 6.0 C Thermohaline Circulation Variable
Oceanic Vertical Diffusivity 2.3 cms–1
Ice Melt Mid‐level
Table 5.3: List of the main climate model parameters in MAGICC and the associated settings. For practical purposes, climate sensitivity refers to the (equilibrium) change in global‐mean surface temperature following a doubling of the atmospheric (equivalent) carbon dioxide concentration. Uncertainties in climate scenarios arise from our relatively poor knowledge of the magnitude of the climate sensitivity, among other factors.
The IPCC TAR gives a range of 1.5 to 4.5 C with a best estimate of about 2.6 C (available online [256]) for climate sensitivity. The most recent estimate is that in the
IPCC FAR and is likely to be in the range 2.0 to 4.5 C (66% confidence interval) with a best estimate of about 3.0 C, and is very unlikely to be less than 1.5 C. Values substantially higher than 4.5 C are not excluded but agreement of models with observations is not as good for these values. Nevertheless, according to the IPCC
FAR, 95th percentile results from 12 studies range from 4.4 to 9.2 C, while the probability of the climate sensitivity being higher than 6.0 C ranges from near zero to 0.38 (on a traditional scale of 0‐1). Assuming a log‐normal distribution, the range given in the IPCC FAR translates to a
90% confidence interval of about 1.5 to 6 C. In the study, three very different climate sensitivities (1.5, 3.0 and 6.0 C) were used when running MAGICC as a standalone module to generate global‐mean scenarios. The term thermohaline circulation refers to that part of the large‐scale ocean circulation which is thought to be driven by density gradients. These density gradients are created by surface heat and variation in salinity due to freshwater fluxes e.g. rivers. Thermohaline circulation gives rise to extensive mixing of the oceans, to an extent of partly being an upwelling process. Furthermore, it is a global ocean phenomenon making the Earth's ocean a macro system. As such, the state of
147
the circulation has a large impact on the climate of the Earth. It is for this reason that the thermohaline circulation module in MAGICC was switched on and set to vary. The oceanic vertical diffusivity is variable. MAGICC provides for a single fixed value. The one used in the study is the default i.e. 2.3 cms–1. Sea level rise in MAGICC has three main contributions, all arising from an increase in global‐mean temperature:
(a) Thermal expansion of the ocean is the main contributor to sea level rise;
(b) Ice melt is not taken into account in the IPCC FAR, whereas it was set at mid‐level when running MAGICC;
(c) Contributions from thawing of permafrost (perennially frozen sub‐soil in the Artic and sub‐Arctic regions), deposition of ocean sediment and ongoing contributions from ice sheets as a result of climate change from the Last Glacial Maximum, are taken into account in MAGICC. The central estimate for this factor is a rise of 4 cm over the time period 1990 to 2095, with uncertainty bounds of 0 to 8 cm. In the study, the central estimate (4 cm) was adopted since a mid‐level ice melt (see (b) above) was assumed.
There are uncertainties associated with each of the three mechanisms. Note that the possible effects of accelerated ice flow in Greenland and/or Antarctica are not taken into account. In the IPCC FAR this is judged to increase the upper bound for projections to 2100 by 9 to 17 cm. The same range of values may be considered applicable to the MAGICC projections.
55..33..44 MMooddeell RRuunnss
For each possible combination of climate model (six climate models), emission scenario (two emission scenarios) and climate sensitivity (three values for the climate sensitivity), a time series from 1990 to 2100, on an annual basis, for five parameters namely, global‐mean of sea level rise, temperature increase and concentration of carbon dioxide, methane and nitrous oxide, together with their possible ranges, were constructed. Only a sample, albeit carefully selected, of the generated results are shown in this report. The chosen sample is a good representative of the entire data set.
55..44 SSaammppllee RReessuullttss ffrroomm MMAAGGIICCCC aanndd SSoommee OObbsseerrvvaattiioonnss This section presents a sample of the model results obtained from runs of the MAGICC software in standalone mode. Most of the results are presented in graphical form and are hence self‐explanatory. A brief discussion is included where appropriate.

148
55..44..11 PPrroojjeeccttiioonnss ooff GGlloobbaall‐‐mmeeaann AAttmmoosspphheerriicc CCoonncceennttrraattiioonnss ooff
GGrreeeennhhoouussee GGaasseess
Figure 5.3 to Figure 5.5 show time series of global‐mean atmospheric concentration for three main greenhouse gases namely carbon dioxide (in parts per million), methane and nitrous oxide (both in parts per billion), for the period 1990‐2100. In
each case, three climate sensitivities were considered: (a) 1.5 (b) 3.0 and (c) 6.0 C. The climate model used to generate the results is HadCM3 (accessible from the MAGICC software) with the SRES no‐climate‐policy emission scenario A1T‐MES. Figure 5.6 to Figure 5.8 show results for the same conditions and model but with the emission stabilisation scenario WRE550. Note that each plot includes the associated possible range of atmospheric concentration except in the case of nitrous oxide (Figure 5.5 and Figure 5.8) where sufficient knowledge of the relevant atmospheric chemistry is lacking. The ranges are associated with uncertainties in ocean uptake and carbon dioxide fertilisation (enhanced atmospheric concentrations of carbon dioxide essentially "fertilize" plant growth on land). The uncertainty ranges neither account for parameter uncertainties, nor for uncertainties associated with the effects of climate sensitivity on the magnitude of climate feedbacks. Hence, the uncertainties shown are conservative and in reality are substantially larger. The best estimate results include the effects of climate feedbacks on the carbon cycle. Atmospheric concentration of carbon dioxide is dependent on climate sensitivity. The higher the climate sensitivity is, the higher the atmospheric concentration. Considering the results for the SRES no‐climate‐policy emission scenario A1T‐MES (Figure 5.3), carbon dioxide concentration in the year 2100 is 554 ppm for a climate
sensitivity of 1.5 C. For the same year, the concentration rises to 583 and 633 ppm
for climate sensitivities of 3.0 and 6.0 C respectively. Effectively, there is an increase of 15% in concentration for the highest as compared to the lowest climate sensitivity. Repeating the same analysis with the model results for the emission stabilisation scenario WRE550 (Figure 5.6), the concentration in the year 2100 is 524,
546 and 582 ppm for climate sensitivities of 1.5, 3.0 and 6.0 C respectively. Going from a climate sensitivity of 1.5 to 6.0 C leads to an 11% increase in concentration. It is immediately evident that the concentrations for the year 2100 and the associated increase with an increase in climate sensitivity for the WRE550 emission scenario are lower than those for the A1T‐MES (no‐climate‐policy scenario). It should be noted that this becomes more evident following the year 2100 (data not shown in the figures) when in the case of WRE550, the carbon dioxide concentration starts to decline and eventually stabilises at 550 ppm. In the A1T‐MES case, the concentration will continue to increase, albeit at a slower rate.

149
Prior to the year 2100, the general increase in concentration with an increase in climate sensitivity is expected and is the result of climate feedbacks on the carbon cycle, which were switched on for all the model runs. The net effect is an additional increase in temperature (and sea level rise). To complete the cycle, this additional warming that occurs when a higher sensitivity is selected leads to a larger climate feedback on the carbon cycle, and hence, larger concentrations. Using the HadCM3 climate model with the A1T‐MES emission
scenario, results in a warming in 2100 of 2.8 C and 5.0 C for climate sensitivities of
3.0 C and 6.0 C respectively (Figure 5.9(a)). The corresponding carbon dioxide concentrations are 583 ppm (Figure 5.3(b)) and 633 ppm (Figure 5.3(c)) respectively ‐
an increase of 50 ppm for a warming increase of 2.2 C i.e. 14% increase in carbon dioxide atmospheric concentration over that in 1990 (354 ppm) due to climate feedbacks. Repeating the analysis for the same set of conditions but using the
WRE550 emission scenario, one obtains a warming in 2100 of 2.2 C and 4.0 C for climate sensitivities of 3.0 C and 6.0 C respectively (Figure 5.9(b)). The corresponding carbon dioxide concentrations are 546 ppm (Figure 5.6(b)) and 582 ppm (Figure 5.6(c)) respectively ‐ an increase of 36 ppm (10% of the carbon dioxide
atmospheric concentration in 1990) for a warming increase of 1.8 C. Climate sensitivity does not seem to have much effect on the atmospheric concentration of the other two greenhouse gases i.e. methane and nitrous oxide (refer to Figure 5.4, Figure 5.5, Figure 5.7, Figure 5.8). Note that plots similar to those shown in Figure 5.3 to Figure 5.8 were generated not only with HadCM3 but using each of the other five climate models in MAGICC (see Table 5.1). Conclusions drawn from the associated analyses are similar to those arrived at in the case of HadCM3.
55..44..22 GGlloobbaall SScceennaarriiooss ffoorr CChhaannggee iinn TTeemmppeerraattuurree
Figure 5.9 shows the time series of global‐mean temperature increase (in C) for the period 1990‐2100, for climate sensitivities 1.5, 3.0 and 6.0 C, generated using the HadCM3 climate model for each of the two emission scenarios considered: (a) SRES no‐climate‐policy emission scenario A1T‐MES and (b) emission stabilisation scenario WRE550. An immediate observation from Figure 5.9 is that the rate of increase in temperature increase starts to decrease around the year 2050. This is especially true for low climate sensitivities. Hence it is expected that low climate sensitivities not only give rise to a lesser effect on the climate but the effect occurs at a slower pace.

150
350
400
450
500
550
600
650
1990
2000
2010
2020
2030
2040
2050
2060
2070
2080
2090
2100
Year
Carbon Dioxide (ppm)
(a)
350
400
450
500
550
600
650
1990
2000
2010
2020
2030
2040
2050
2060
2070
2080
2090
2100
Year
Carbon Dioxide (ppm)
(b)
350
400
450
500
550
600
650
700
1990
2000
2010
2020
2030
2040
2050
2060
2070
2080
2090
2100
Year
Carbon Dioxide (ppm)
(c)
Figure 5.3: Time series of global‐mean carbon dioxide atmospheric concentration (in parts per million) with the associated possible range, for the period 1990‐2100, for
climate sensitivities (a) 1.5 (b) 3.0 and (c) 6.0 C, generated using the HadCM3 climate model with the SRES no‐climate‐policy emission scenario A1T‐MES.

151
1600
1800
2000
2200
2400
2600
2800
1990
2000
2010
2020
2030
2040
2050
2060
2070
2080
2090
2100
Year
Methane (ppb)
Figure 5.4: Time series of global‐mean methane atmospheric concentration (in parts per billion) with the associated possible range, for the period 1990‐2100, generated using the HadCM3 climate model with the SRES no‐climate‐policy emission scenario A1T‐MES. The same result is obtained for each of the three climate sensitivities: 1.5,
3.0 and 6.0 C.
300
310
320
330
340
350
360
370
380
1990
2000
2010
2020
2030
2040
2050
2060
2070
2080
2090
2100
Year
Nitrous Oxide (ppb)
Figure 5.5: Time series of global‐mean nitrous oxide atmospheric concentration (in parts per billion), for the period 1990‐2100, generated using the HadCM3 climate model with the SRES no‐climate‐policy emission scenario A1T‐MES. The same result
is obtained for each of the three climate sensitivities: 1.5, 3.0 and 6.0 C. Referring to Figure 5.9, in the case of the no‐climate‐policy (A1T‐MES) scenario,
temperature is expected to increase by something in the range of 1.4 to 4.9 C with a mid‐value of 2.8 C, by the year 2100. The range is implied by the different climate sensitivities considered. The emission stabilisation scenario predicts lower values in line with the fact that it assumes lower atmospheric concentrations of greenhouse gases. The range of
temperature increase is 1.2 to 4.0 C with a mid‐value of 2.2 C, by the year 2100 for the WRE550 scenario.

152
350
400
450
500
550
600
1990
2000
2010
2020
2030
2040
2050
2060
2070
2080
2090
2100
Year
Carbon Dioxide (ppm)
(a)
350
400
450
500
550
600
1990
2000
2010
2020
2030
2040
2050
2060
2070
2080
2090
2100
Year
Carbon Dioxide (ppm)
(b)
350
400
450
500
550
600
650
1990
2000
2010
2020
2030
2040
2050
2060
2070
2080
2090
2100
Year
Carbon Dioxide (ppm)
(c)
Figure 5.6: Time series of global‐mean carbon dioxide atmospheric concentration (in parts per million) with the associated possible range, for the period 1990‐2100, for
climate sensitivities (a) 1.5 (b) 3.0 and (c) 6.0 C, generated using the HadCM3 climate model with the emission stabilisation scenario WRE550.

153
1400
1500
1600
1700
1800
1900
2000
1990
2000
2010
2020
2030
2040
2050
2060
2070
2080
2090
2100
Year
Methane (ppb)
Figure 5.7: Time series of global‐mean methane atmospheric concentration (in parts per million) with the associated possible range, for the period 1990‐2100, generated using the HadCM3 climate model with the emission stabilisation scenario WRE550. The same result is obtained for each of the three climate sensitivities: 1.5, 3.0 and
6.0 C.
300
310
320
330
340
350
360
370
380
1990
2000
2010
2020
2030
2040
2050
2060
2070
2080
2090
2100
Year
Nitrous Oxide (ppb)
Figure 5.8: Time series of global‐mean nitrous oxide atmospheric concentration (in parts per billion), for the period 1990‐2100, generated using the HadCM3 climate model with the emission stabilisation scenario WRE550. The same result is obtained
for each of the three climate sensitivities: 1.5, 3.0 and 6.0 C. Temperature increase due to global warming caused by greenhouse gases very much depends on climate sensitivity. In each case, the temperature increase by the year 2100 is more than three times as much for the highest climate sensitivity than that for the lowest value. By the year 2050, the range of temperature increase is 0.8 to
2.3 C with a mid‐value of 1.4 C, for the WRE550 scenario, while for the A1T‐MES
scenario the range is 1.1 to 3.0 C with a mid‐value of 1.9 C. It is a natural conclusion that knowledge of climate sensitivity is essential for reliable
predictions. Adopting a mid‐level climate sensitivity of 3.0 C is reasonable.

154
Plots similar to those shown in Figure 5.9 were generated with each of the other five climate models within MAGICC (see Table 5.1). These plots are not included in this report for the sake of being concise. Nevertheless, the plots and their associated analyses lead to conclusions similar to those stated in the previous paragraphs. This is seen from Figure 5.10 which gives the average, minimum and maximum of the
global‐mean temperature increase (in C) generated by the six climate models for
various years within the period 2020‐2100, for a climate sensitivity of 3.0 C, for both emission scenarios. For the given climate sensitivity, the smallest possible increase in
temperature by the year 2040 and 2100 is 1.0 and 2.0 C respectively (both with the CSIRO climate model and the WRE550 scenario). Hence, even the most conservative model and scenario considered predicts an effectively significant temperature increase. As a matter of interest, from Figure 5.10 one notices that the discrepancies between model results increases with time. Figure 5.11 gives the percentage difference between each of the six climate models and the mean of all six models for projections of the global‐mean temperature
increase in 2100, for a climate sensitivity of 3.0 C, for each of the two scenarios considered. The value of each of the six models is within less than 8% of the models’ average, indicating that on a global level, climate models are in very good agreement when estimating temperature change.
55..44..33 GGlloobbaall SScceennaarriiooss ffoorr SSeeaa LLeevveell CChhaannggee
Similar work to that presented in sub‐section 5.4.2 was carried out for sea level change. A close look at Figure 5.12 and Figure 5.13 indicates that sea level rise follows a similar pattern to that of temperature increase primarily because the three main mechanisms giving rise to a change in sea level are dependent on an increase in temperature. The three mechanisms are discussed towards the end of sub‐section 5.3.3. Figure 5.12 gives the time series of global‐mean sea level rise (in cm) for the period
1990‐2100, for climate sensitivities 1.5, 3.0 and 6.0 C, generated using the HadCM3 climate model with the (a) SRES no‐climate‐policy emission scenario A1T‐MES and (b) emission stabilisation scenario WRE550. Referring to Figure 5.12, in the case of the no‐climate‐policy (A1T‐MES) scenario, sea level is expected to rise by 9 to 67 cm with a mid‐value of 30 cm, by the year 2100. The range is implied by the different climate sensitivities considered. The emission stabilisation scenario predicts lower values in line with the fact that it predicts a smaller temperature increase since it assumes lower atmospheric concentrations of greenhouse gases. The range of sea level rise is 7 to 56 cm with a mid‐value of 25 cm, by the year 2100 for the WRE550 scenario. Assuming that the two emission scenarios considered are equally probable, the average mid‐value for sea level rise is 27.5 cm by the year 2100. From 1990, this works out at about 2.5 mm per year rise in sea level. This value tallies reasonably well with what the IPCC FAR suggests, namely

155
a rate of 1.8 and 3.1 mm per year rise in sea level for the periods 1961‐2003 and 1993‐2003 respectively.
0
1
2
3
4
5
6
1990
2000
2010
2020
2030
2040
2050
2060
2070
2080
2090
2100
Year
Increase in
Global‐m
ean Tem
perature (deg C)
CS=1.5 deg C
CS=3.0 deg C
CS=6.0 deg C
(a)
0
0.5
1
1.5
2
2.5
3
3.5
4
4.5
1990
2000
2010
2020
2030
2040
2050
2060
2070
2080
2090
2100
Year
Increase in Global‐mean
Tem
perature (deg C)
CS=1.5 deg C
CS=3.0 deg C
CS=6.0 deg C
(b)
Figure 5.9: Time series of global‐mean temperature increase (in C) for the period 1990‐2100, for climate sensitivities 1.5, 3.0 and 6.0 C, generated using the HadCM3 climate model with the (a) SRES no‐climate‐policy emission scenario A1T‐MES and (b) emission stabilisation scenario WRE550.

156
0.00
0.40
0.80
1.20
1.60
2.00
2.40
2.80
2000
2020
2040
2060
2080
2100
2120
Year
Model A
verage
of Increase in
Global‐
mean
Temperature (deg C)
(a)
0.00
0.40
0.80
1.20
1.60
2.00
2.40
2000
2020
2040
2060
2080
2100
2120
Year
Model A
verage
of Increase in
Global‐
mean
Temperature (deg C)
(b)
Figure 5.10: Average and associated minimum and maximum of the global‐mean
temperature increase (in C) generated by the six climate models for various years
within the period 2020‐2100, for climate sensitivity of 3.0 C, for the (a) SRES no‐climate‐policy emission scenario A1T‐MES and (b) emission stabilisation scenario WRE550.

157
0.00
2.00
4.00
6.00
8.00
CSIRO
CSM
GFD
L
HadC
M3
MAGICC
PCM
Climate Model
Percentage
Difference in
Global‐m
ean
Temperature Increase betw
een
Model and M
odels' M
ean
WRE550
A1TMES
Figure 5.11: Percentage difference between each of the six climate models and the mean of all six models for the global‐mean temperature increase in 2100, for a
climate sensitivity of 3.0 C, for each of the two scenarios considered i.e. the emission stabilisation scenario WRE550 and the SRES no‐climate‐policy emission scenario A1T‐MES. Sea level rise due to global warming caused by greenhouse gases very much depends on climate sensitivity. For each of the two emission scenarios considered in the study, sea level rise by the year 2100 is between 7 and 8 times as much for the highest climate sensitivity than that for the lowest value, so that rates of about 2 cm per year are possible even if highly improbable. By the year 2050, the range of sea level rise is 5 to 24 cm with a mid‐value of 12 cm, for the WRE550 scenario, while for the A1T‐MES scenario the range is 5 to 27 cm with a mid‐value of 14 cm. Given that sea level rise very much depends on climate sensitivity, a mid‐level value
i.e. 3.0 C was adopted. Plots similar to those shown in Figure 5.12 were generated with each of the other five climate models within MAGICC (see Table 5.1). These plots are not included in this report. Nevertheless, the plots and their associated analyses lead to conclusions similar to those stated in the previous paragraphs. This is seen from Figure 5.13 which gives the average and associated range of the global‐mean sea level rise (in cm) generated by the six climate models for various years within the period 2020‐
2100, for a climate sensitivity of 3.0 C, for both emission scenarios. For the given climate sensitivity, the smallest possible sea level rise by the year 2040 and 2100 is 9 and 25 cm respectively (both with the PCM climate model and the WRE550 scenario).

158
An important observation, albeit not from the plots shown in this report, is that even when the temperature starts to stabilise (following 2100), sea level continues to rise hinting at the large inertia in the climate components that contribute to this climate parameter. Note that this observation relates to the emission stabilisation scenarios only for the simple reason that temperature stabilisation corresponds to stabilisation in the carbon dioxide atmospheric concentration. Furthermore, projections beyond 2100 were only possible with the emission stabilisation scenarios, since the SRES no‐climate‐policy scenarios e.g. A1T‐MES extend to 2100 and not beyond.
0
10
20
30
40
50
60
70
80
1990
2000
2010
2020
2030
2040
2050
2060
2070
2080
2090
2100
Year
Global‐m
ean
Sea Level R
ise (cm
) CS=1.5 deg C
CS=3.0 deg C
CS=6.0 deg C
(a)
0
10
20
30
40
50
60
1990
2000
2010
2020
2030
2040
2050
2060
2070
2080
2090
2100
Year
Global‐m
ean
Sea Level R
ise (cm
) CS=1.5 deg C
CS=3.0 deg C
CS=6.0 deg C
(b)
Figure 5.12: Time series of global‐mean sea level rise (in cm) for the period 1990‐
2100, for climate sensitivities 1.5, 3.0 and 6.0 C, generated using the HadCM3 climate model with the (a) SRES no‐climate‐policy emission scenario A1T‐MES and (b) emission stabilisation scenario WRE550.

159
0.00
5.00
10.00
15.00
20.00
25.00
30.00
35.00
40.00
2000
2020
2040
2060
2080
2100
2120
Year
Model A
verage
of Global‐m
ean
Sea Level
Rise (cm
)
(a)
0.00
5.00
10.00
15.00
20.00
25.00
30.00
35.00
2000
2020
2040
2060
2080
2100
2120
Year
Model A
verage
of Global‐m
ean
Sea Level
Rise (cm
)
(b)
Figure 5.13: Average and associated minimum and maximum of the global‐mean sea level rise (in cm) generated by the six climate models for various years within the
period 2020‐2100, for climate sensitivity of 3.0 C, for the (a) SRES no‐climate‐policy emission scenario A1T‐MES and (b) emission stabilisation scenario WRE550. Figure 5.14 gives the percentage difference between each of the six climate models and the mean of all six models for the global‐mean sea level rise in 2100, for a
climate sensitivity of 3.0 C, for each of the two scenarios considered. The value of

160
each of the six models is within less than 14% of the models’ average, indicating that on a global level, climate models are in good agreement when estimating sea level change.
0.00
3.00
6.00
9.00
12.00
15.00
CSIRO
CSM
GFD
L
HadCM3
MAGICC
PCM
Climate Model
Percentage
Difference in
Global‐m
ean
Sea Level R
ise betw
een M
odel and
Models' M
ean
WRE550
A1TMES
Figure 5.14: Percentage difference between each of the six climate models and the mean of all six models for the global‐mean sea level rise in 2100, for a climate
sensitivity of 3.0 C, for each of the two scenarios considered i.e. the emission stabilisation scenario WRE550 and the SRES no‐climate‐policy emission scenario A1T‐MES.
55..55 PPrroocceedduurraall SScchheemmee ffoorr tthhee GGeenneerraattiioonn ooff RReeggiioonnaall SScceennaarriiooss
uussiinngg SSCCEENNGGEENN The following and subsequent sub‐sections explain the salient points involved in running SCENGEN for the construction of regional climate scenarios. In this report, regional refers to the Central Mediterranean (around the Maltese Islands).
The spatial resolution of SCENGEN is currently 2° 30΄ (latitude) 2° 30΄ (longitude), so that each square grid cell works out to be of side length approximately equal to 280 km. In order to be able to perform basic statistical tests (see sub‐section 5.5.2) and since ‘smoothed’ averages (see next paragraph for definition) were considered, the chosen region consisted of nine grid cells (a square of side length approximately equal to 840 km) with the Maltese Islands lying well within it. The coordinates for Malta are 35° 50΄ North (latitude) and 14° 35΄ East (longitude). The coordinates for the chosen region were 35° 00΄ to 37° 30΄ North (latitude) and 12° 30΄ to 15° 00΄ East

161
(longitude). Due to restrictions imposed by the software, it was not possible to set the grid cells so that the Maltese Islands coincide with its geometric centre. ‘Smoothed’ averages or simply ‘smoothing’ are/is obtained/done simply by area averaging the data associated with the eight grid cells surrounding a grid cell of interest and the data of the latter itself. The average of the nine grid cells is assigned to the grid cell of interest, which is central to the nine grid cell cluster. The ‘smoothed’ average for an individual grid cell can be quite different from its ‘unsmoothed’ data. For vulnerability and adaptation studies, and impact assessments, the use of averaging over nine grid cells produces less spatially noisy results as compared to ‘unsmoothed’ data for individual grid cells. It should be noted that SCENGEN requires as input, the output of MAGICC. It cannot run in standalone mode since it mainly consists of an algorithm for resolving spatially the global‐mean values using the incorporated AOGCM data sets and a database consisting of long‐term observed data. The climate model in MAGICC which was used for the coupled runs is HadCM3 developed at the Hadley Centre in the UK. The chosen emission scenario was the no‐climate‐policy scenario from the SRES set, namely A1T‐MES. HadCM3 and A1T‐MES in MAGICC produced global‐mean results that were fed to SCENGEN. The global‐mean values were scaled using data from the AOGCM data library in SCENGEN according to region. The climate variables investigated were mean temperature, mean precipitation and MSLP. Regional means for these variables were calculated for 2025, 2050, 2075 and 2100 on an annual, seasonal and monthly basis. Figure 5.15 shows the outputs of SCENGEN, together with the climate model and emission scenario adopted for regional scale modelling, with explanatory notes. The model results are essentially projected changes in the climate parameters (and their variability). SCENGEN has two options (or definitions) for change, which use the difference respectively between:
a) the start and end of a perturbation experiment and
b) the perturbed state and the control climate.
The advantage of using the second definition is that if a model has any spatial drift (and most models do), it is a way of removing this drift, assuming that the drift is approximately common to both the perturbed and control runs (which is normally the case). In the study, the second definition was used. Particular attention was given to the selections made especially with regards to the choice of AOGCMs. The following sub‐section gives the essential details for the choice of AOGCMs.

162
Climate Model:
HadCM3
Emission Scenarios:
A1T‐MES from SRES Report (no‐climate‐policy scenario)
Regional Means for 2025, 2050, 2075 and 2100 (annual,
seasonal and monthly):
Increase in Mean Temperature
Change in Mean Sea Level Pressure
Change in Mean PrecipitationNOTE: mean of physical parameter = temporal mean for the specified period
NOTE: regional mean = spatial mean of nine grid cells 32.5 ‐40.0 deg latitude, 12.5 ‐ 20.0 deg longitude (‘smoothing’)
OUTPUT
AOGCMs:
14 (out of 20) ‘models used’
NOTE: CMIP3 = Coupled Model Intercomparison Project phase 3 (essentially IPCC TAR) – 24 AOGCMs but 20 in MAGICC/SCENGEN and 14 models used in the study
Figure 5.15: A schematic showing the outputs of SCENGEN, together with the climate model and emission scenario adopted for regional scale modelling. Explanatory notes are included.
55..55..11 AAttmmoosspphheerriicc‐‐OOcceeaann GGeenneerraall CCiirrccuullaattiioonn MMooddeellss
To produce spatially detailed information on future changes in temperature, precipitation and MSLP, as well as changes in the variability of these variables, SCENGEN makes use of its AOGCM database constructed from model runs. It must be stressed that SCENGEN does not incorporate the actual AOGCMs but recent data sets generated by state‐of‐the‐art numerical solvers which are used in the pattern downscaling from global values. SCENGEN offers two types of scaling namely, linear and exponential. Exponential scaling was used for precipitation otherwise linear scaling was employed. Other than for precipitation, exponential scaling is recommended when global‐mean warming is very large [78]. The same AOGCM data sets used in SCENGEN are housed at the Program for Climate Model Development and Inter‐comparison (PCMDI) at the United States Department of Energy, Lawrence Livermore National Laboratory (LLNL). These data sets are now referred to as the CMIP3 data base as already mentioned in section 5.22 (available online ‐ see [259]) and are the same ones used in the IPCC TAR. There are currently 24 models in the CMIP3 data base, but only 20 have the full set of data required for use in SCENGEN. Table 5.4 lists the 20 models with their CMIP3 designation and the 8‐character code used by the SCENGEN software, together with the country of origin. Note that currently SCENGEN does not incorporate the models used in the IPCC FAR.

163
CMIP3 Designator Country of Origin SCENGEN Designator
BCCR‐BCM2.0 Norway BCCRBCM2
CCSM3 USA CCSM‐30
CGCM3.1 (T47) Canada CCCMA‐31
CNRM‐CM3 France CNRM‐CM3
CSIRO‐Mk3.0 Australia CSIRO‐30
ECHAM5/MPI‐OM Germany MPIECH‐5
GFDL‐CM2.0 USA GFDLCM20
GFDL‐CM2.1 USA GFDLCM21
IPSL‐CM4 France IPSL‐CM4
MIROC3.2 (hires) Japan MIROC‐HI
MIROC3.2 (medres) Japan MIROCMED
MRI‐CGCM2.3.2 Japan MRI‐232A
UKMO‐HadCM3 UK UKHADCM3
UKMO‐HadGEM1 UK UKHADGEM
ECHO‐G Germany/Korea ECHO‐G
FGOALS‐g1.0 China FGOALS1G
GISS‐EH USA GISS‐EH
GISS‐ER USA GISS‐ER
INM‐CM3.0 Russia INMCM‐30
PCM USA NCARPCM1
Table 5.4: List of atmosphere‐ocean general circulation models, which form part of the CMIP3 database and utilised in SCENGEN. The last six in the list were not used in the present study. SCENGEN provides an interface for users to undertake multiple analyses on the performances of different AOGCMs for a particular region of the globe, a particular variable and a specific season. This analysis and assessment were carried out for the Central Mediterranean region through appropriate multiple model runs and the subsequent examination of the relevant statistics and visual inspection of the generated data maps. By evaluating the performances of AOGCMs for the relevant region, one could make more informed decisions on which models to work with and which to eliminate. This was particularly helpful in selecting appropriate AOGCMs prior to generating future climate scenarios for the Maltese Islands. The net result of the evaluation exercise was that out of the available 20 models, six were eliminated in the actual model runs. The six models that were not used are listed towards the end of Table 5.4. All the AOGCMs in the CMIP3 database have a resolution that is finer than the one of SCENGEN version 5.3, with the exception of ECHO‐G, GISS‐EH, GISS‐ER and INM‐CM3.0. Since the Maltese Islands occupy a very tiny part of the area of a grid cell, resolution is an issue hence these four AOGCMs were not used. Furthermore, the

164
scenarios generated by GISS‐ER differ markedly from those generated by the other models. There might be errors in the associated model data set in the CMIP3 archive. GISS‐ER was considered to be an outlier. The same holds true for PCM, apart from the fact that this AOGCM does not simulate well the present day scenario. FGOALS‐g1.0 has a serious problem with modelling sea level change. Model data generated by FGOALS‐g1.0 are suitable for tropical and subtropical studies, but not for mid‐latitude regions.
MIROC3.2 (hires) has a high (equilibrium) climate sensitivity, estimated at 5.6 C for a doubling in carbon dioxide atmospheric concentration. SCENGEN uses normalized data files, thereby removing the direct influence of climate sensitivity. Hence, the high climate sensitivity exhibited by MIROC3.2 (hires) was not considered to be of concern. Apart from its high sensitivity, the model appears to be quite consistent with the other models that are in the database of SCENGEN version 5.3. For this reason, it was used in the study. The 14 selected models were not employed individually but in tandem to produce a multi‐model average. It should be noted that the use of a multi‐model average has two advantages. First of all, multi‐model averages are less spatially noisy, and secondly they are often better than any individual model at simulating the present day climate. Of particular importance to mention is the fact that averages across models are based on normalized results to ensure that each model pattern of change in the climate parameter of interest receives equal weight and the average is not biased towards models with a high climate sensitivity (yielding large changes). There is one main drawback when using multi‐model averages which is the cancelling effect when individual models give projections that are opposite in sign. The latter also affects the probability of a type of change occurring as discussed towards the end of sub‐section 5.5.2.
55..55..22 DDiiaaggnnoossttiicc AAnnaallyyssiiss ooff tthhee AAttmmoosspphheerree‐‐OOcceeaann GGeenneerraall CCiirrccuullaattiioonn
MMooddeellss ffoorr tthhee CCeennttrraall MMeeddiitteerrrraanneeaann
A range of diagnostic tools are available to the software user. These are basically sophisticated statistical tools that enable detailed statistical analysis of the model results. These tools were used to evaluate AOGCMs for the Central Mediterranean region and to check the robustness, or otherwise, of the obtained model results. In the study, by error is understood the difference between the calculated value for a given climate parameter and the corresponding observed value for the grid cell of interest for the present day climate (base year 2000). Calculations are carried out for each of the 14 AOGCMs. The mean error is then the average of the associated 14 differences. The error and mean error are also seen as the bias and mean bias respectively.

165
This formulation of the error was employed in the case of temperature and MSLP. In the case of precipitation, it is the percentage error that was used, which is the error, divided by the relevant observed value, and then expressed as a percentage. Other simple statistics used in the study include the mean of the squared error, or simply the mean square error, and the square‐root of the latter i.e. the root mean square error (RMSE). The latter is corrected for the bias to obtain the bias‐corrected RMSE which is essentially the square root of the difference between the mean square error and the square of the mean bias. If the two data sets being compared have very different spatial means, then this can lead to inflated RMSE. The bias‐corrected RMSE is an important statistic in that it eliminates this problem. The square of the error for a given climate parameter, AOGCM and specific grid cell is divided by the spatial standard deviation of all model values generated by that same AOGCM, associated with the grid cells over the area of interest, for the time period being considered. The mean of this ratio over all grid cells for the area yields the RK Index or RK Error, after Reichler and Kim in [75]. A small RK Index is desirable. Nevertheless, not too much importance should be given to the RK Index, as this is very dependent on the normalizing term. Small local variances can lead to a large value for a grid‐cell that can have an unduly large influence on area averages. The bias‐corrected RMSE and, to some extent, the RK Index were used to evaluate the ability of AOGCMs by checking how accurately they simulate the present day climate for the region of interest i.e. 35° 00΄ to 37° 30΄ North (latitude) and 12° 30΄ to 15° 00΄ East (longitude). The base year was taken to be 2000 and annual mean temperature was the preferred climate parameter of choice for the evaluation. Cosine‐weighting was taken into account, in other words, a grid cell was not assumed to be a simple flat square but its curvature, arising from that of the Earth, was taken into account in the calculations, where appropriate. Table 5 gives the results of the analysis in the case of temperature. Table 5.5 consists of cosine‐weighted statistics for each of the 14 AOGCMs used when running the SCENGEN model for the year 2000 (present day climate for the intents and purposes of the study), for annual mean temperature. The mean value for all models, for each of the statistics, is given in the last row. The region considered in the analysis is defined by coordinates 35° 00΄ to 37° 30΄ North (latitude) and 12° 30΄ to 15° 00΄ East (longitude), consisting of nine grid cells, that includes Malta. As explained in sub‐section 5.5.1, the first round of evaluation of model performance resulted in 14 AOGCMs being selected. To check for any model outliers within this group, data from each of the AOGCMs was correlated with corresponding (mean) data for the rest of the AOGCMs, for the same set of conditions. The idea was to eliminate models whose projections are inconsistent with those of other models. The associated correlation coefficients are given in column 2 of Table 5.5. All 14 models correlate well.

166
Other than correlation coefficients, Table 5.5 lists the bias‐corrected RMSE (column 5) and the RK Index (column 6). These data indicate that all 14 models are good at simulating the annual mean temperature for the present day climate, which may be taken as an indicator that the same ensemble is good at constructing future climate scenarios for the region of interest. Note that on average the models are bias cold since the mean bias is negative. Hence, the projections for temperature increase in the study could very well be underestimated. Table 5.6 and Table 5.7 are similar to Table 5.5 but for annual mean precipitation and annual average MSLP respectively. Similar conclusions can be drawn from these tables of relevant statistics. In particular, in the case of precipitation (Table 5.6), the fact that the mean bias is negative implies that on average the 14 AOGCMs are bias dry. Climate parameters e.g. temperature, precipitation and MSLP exhibit variability. A measure of variability used in the study is the inter‐annual temporal standard deviation of the model results for the climate parameter of interest; in this case, calculated over a period of twenty years. The change in the inter‐annual standard deviation for the given climate parameter, between two chosen years, gives an indication of the extent of the variability exhibited by that same parameter between the two years of interest. SCENGEN facilitates the analyses of changes in inter‐annual variability.
Model Correlation Coefficient
Root Mean Square Error
Bias Bias‐corrected Root Mean Square Error
RK Index
BCCRBCM2 0.90 1.52 –1.43 0.51 3.02
CCCMA‐31 0.94 1.29 –1.24 0.37 2.56
CCSM‐30 0.88 1.05 –0.92 0.49 1.79
CNRM‐CM3 0.90 2.92 –2.87 0.49 6.93
CSIR0‐30 0.63 3.29 –3.19 0.79 7.87
GFDLCM20 0.86 2.48 –2.42 0.54 5.77
GFDLCM21 0.97 1.36 –1.33 0.30 2.80
IPSL‐CM4 0.96 2.50 –2.48 0.33 5.87
MIROC‐HI 0.95 0.47 0.22 0.42 1.37
MIROCMED 0.97 0.61 –0.57 0.24 0.99
MPIECH‐5 0.87 1.45 –1.37 0.49 3.14
MRI‐232A 0.91 0.70 –0.50 0.50 0.89
UKHADCM3 0.97 1.02 –0.98 0.29 2.07
UKHADGEM 0.87 0.88 –0.68 0.56 2.00
Models’ Mean 0.94 1.46 –1.41 0.36 3.36
Table 5.5: Cosine‐weighted statistics for each of the 14 AOGCMs used when running the SCENGEN model for the year 2000, for annual mean temperature. The mean value for all models, for each of the statistics, is given in the last row. The region considered in the analysis is defined by coordinates 35° 00΄ to 37° 30΄ North (latitude) and 12° 30΄ to 15° 00΄ East (longitude), consisting of nine grid cells, that includes Malta located at 35° 50΄ North (latitude) and 14° 35΄ East (longitude).

167
Model Correlation Coefficient
Root Mean Square Error
Bias Bias‐corrected Root Mean Square Error
RK Index
BCCRBCM2 0.91 0.50 0.46 0.19 2.79
CCCMA‐31 0.94 0.41 0.40 0.11 2.48
CCSM‐30 0.98 0.17 –0.16 0.06 0.66
CNRM‐CM3 0.90 0.15 –0.07 0.14 0.79
CSIR0‐30 0.98 0.35 –0.35 0.06 1.82
GFDLCM20 0.95 0.20 0.09 0.18 0.84
GFDLCM21 0.89 0.26 –0.20 0.17 1.09
IPSL‐CM4 0.81 0.62 –0.57 0.24 2.98
MIROC‐HI 0.98 0.33 0.27 0.19 1.53
MIROCMED 0.98 0.17 –0.15 0.06 0.70
MPIECH‐5 0.96 0.42 –0.41 0.09 2.17
MRI‐232A 0.98 0.21 –0.17 0.11 0.91
UKHADCM3 0.97 0.16 0.14 0.08 1.03
UKHADGEM 0.78 0.62 0.54 0.31 3.25
Models’ Mean 0.99 0.07 –0.01 0.06 1.65
Table 5.6: Cosine‐weighted statistics for each of the 14 AOGCMs used when running the SCENGEN model for the year 2000, for annual mean precipitation. The mean value for all models, for each of the statistics, is given in the last row. The region considered in the analysis is defined by coordinates 35° 00΄ to 37° 30΄ North (latitude) and 12° 30΄ to 15° 00΄ East (longitude), consisting of nine grid cells, that includes Malta located at 35° 50΄ North (latitude) and 14° 35΄ East (longitude). The confidence level of estimates of change in variability for a given climate parameter, between two chosen years, was assessed through the use of the inter‐model signal‐to‐noise ratio. The inter‐model signal‐to‐noise ratio for changes in variability is defined as the models’ average of the normalized changes in temporal standard deviation of the climate parameter of interest, between the two chosen years, divided by the inter‐model standard deviation of the changes in the temporal standard deviation of the given climate parameter. This ratio shows the uncertainty in projections of the changes in variability relative to inter‐model differences in these projections. The inter‐model signal‐to‐noise ratio was also used to establish the confidence level of estimates of change in a climate parameter, between two chosen years. The inter‐model signal‐to‐noise ratio for changes is defined as the models’ average of the normalized changes in the climate parameter of interest, between the two chosen years, divided by the inter‐model standard deviation of the climate parameter for the later year. This quantity shows the uncertainty in projections of the changes in the climate parameter relative to inter‐model differences in these projections. As will be discussed in section 5.6, values for the signal‐to‐noise ratio turn out to be small in the case when the climate parameter is variability, showing that projections of variability changes are within the range of model differences and hence highly uncertain. On the other hand, values of the ratio are relatively high for climate

168
parameters other than variability. This is especially true for temperature, implying that projections of changes in temperature are less uncertain.
Model Correlation Coefficient
Root Mean Square Error
Bias Bias‐corrected Root Mean Square Error
RK Index
BCCRBCM2 0.91 0.34 0.27 0.21 0.42
CCCMA‐31 0.96 1.88 1.86 0.30 2.35
CCSM‐30 0.96 4.26 4.24 0.42 5.35
CNRM‐CM3 0.96 0.19 0.08 0.17 0.30
CSIR0‐30 0.86 2.87 2.85 0.36 3.60
GFDLCM20 0.84 0.70 0.59 0.38 0.78
GFDLCM21 0.90 1.86 1.85 0.20 2.33
IPSL‐CM4 0.97 2.23 2.22 0.23 2.78
MIROC‐HI 0.97 0.20 0.12 0.16 0.32
MIROCMED 0.97 1.73 1.71 0.28 2.16
MPIECH‐5 0.96 1.04 1.02 0.17 1.28
MRI‐232A 0.92 0.85 0.84 0.15 1.04
UKHADCM3 0.99 0.50 –0.49 0.06 0.65
UKHADGEM 0.98 1.10 1.09 0.11 1.36
Models’ Mean 0.97 1.32 1.30 0.19 1.76
Table 5.7: Cosine‐weighted statistics for each of the 14 AOGCMs used when running the SCENGEN model for the year 2000, for annual average mean sea level pressure. The mean value for all models, for each of the statistics, is given in the last row. The region considered in the analysis is defined by coordinates 35° 00΄ to 37° 30΄ North (latitude) and 12° 30΄ to 15° 00΄ East (longitude), consisting of nine grid cells, that includes Malta located at 35° 50΄ North (latitude) and 14° 35΄ East (longitude). SCENGEN was used to explore the probability of an increase/decrease in annual and seasonal averages of temperature, precipitation and MSLP for future time periods. This was achieved by calculating the ratio of the number of AOGCMs projecting positive (or negative) change to the total number of AOGCMs employed in the model runs (14 models in the study). It should be noted that this is not probability in the mathematical sense since the models are neither random nor were chosen at random. It is however particularly helpful in informing decisions for adaptation assuming that the chosen AOGCMs perform well for the region in question. The latter was ensured through the performance evaluation of AOGCMs mentioned earlier on.
55..66 SSaammppllee RReessuullttss ffrroomm SSCCEENNGGEENN aanndd SSoommee OObbsseerrvvaattiioonnss wwiitthh aa
DDiissccuussssiioonn oonn UUnncceerrttaaiinnttiieess Knowledge of global‐mean scenarios is not sufficient for impact assessments, and vulnerability and adaptation studies. Knowledge of regional and local changes is essential for this purpose.

169
SCENGEN takes the global projections of temperature generated by MAGICC to produce spatially detailed information on future changes in temperature, precipitation and MSLP and changes in the variability of these climate parameters. This was accomplished for the region of the Maltese Islands defined in sub‐section 5.2. The results presented in the following sub‐sections are for the years 2025, 2050, 2075 and 2100. Note that in the study, a scenario year is always the central year for a climate averaging interval of 30 years. For instance, the projected value for a given climate parameter in the year 2050, is the average over the period 2035‐2065. Resolved results bring about the issue of uncertainty. Chapter 13 of the IPCC TAR [256] mentions the following five key sources of uncertainty associated with the construction of climate scenarios for use in impact assessments, and vulnerability and adaptation studies:
(a) future emissions of greenhouse gases; (b) conversion of emissions to greenhouse gas atmospheric concentrations; (c) conversion of greenhouse gas atmospheric concentrations to radiative
forcing; (d) modelling of climate response to a given forcing; (e) conversion of climate model response into inputs (economic, social, etc)
for impact studies Furthermore, given the unpredictability of the climate system, it is not possible for any climate model to provide accurate predictions of future climate state, particularly at a regional, and even more so, at a local scale. The good practice for climate change impact and vulnerability assessors is to develop and apply a range of climate scenarios. In the study, this could only be partly achieved due to the large number of factors involved making the whole exercise very time consuming. Another hindrance was the limited computing capability. Nevertheless, choices were made with care to try and achieve scenarios that are likely. Despite this, uncertainties in the results remain since they are intrinsic to the modelling process. The following sub‐section not only presents and discusses the results of the regional sub‐study but discusses on equal grounds the uncertainties and errors in the model results.
55..66..11 RReeggiioonnaall SScceennaarriiooss ffoorr CChhaannggee iinn TTeemmppeerraattuurree,, iittss VVaarriiaabbiilliittyy aanndd
AAssssoocciiaatteedd UUnncceerrttaaiinnttiieess
Figure 5.16 shows projections of annual and seasonal average increase in
temperature (in C), according to which, the rate of temperature increase is higher between now and the year 2050, as compared to the second half of the 21st century.
The annual average temperature is projected to increase by 2 C and 2.8 C by 2050 and 2100 respectively. The increase in temperature is not the same for all seasons.
The largest temperature increase is expected in the quarter June‐August (3.1 C and 3.5 C by 2050 and 2100 respectively). A more resolved picture is given in Figure

170
5.17, which gives projections of monthly average increase in temperature (in C) for the same years as in Figure 5.16. All months will experience a significant increase in
temperature. The highest increase is in September. Temperature increases of 2.5 C and 3.6 C are expected by 2050 and 2100 respectively in the month of September, which essentially may be interpreted as a shift in the summer season.
0.00
0.50
1.00
1.50
2.00
2.50
3.00
3.50
4.00
Annual
Average
DJF MAM JJA SON
Time Period
Average In
crease in Temperature (deg C)
2025
2050
2075
2100
Figure 5.16: Projections of annual and seasonal average increase in temperature (in
C) for the region of the Maltese Islands for the years 2025, 2050, 2075 and 2100. Note that the scenario year is the central year for a climate averaging interval of 30 years.
0.00
0.50
1.00
1.50
2.00
2.50
3.00
3.50
4.00
jan feb mar apr may jun jul aug sep oct nov dec
Month
Average
Increase in Tem
perature (deg C)
2025
2050
2075
2100
Figure 5.17: Projections of monthly average increase in temperature (in C) for the region of the Maltese Islands for the years 2025, 2050, 2075 and 2100. Note that the scenario year is the central year for a climate averaging interval of 30 years.

171
Associated with climate parameters, there is variability. As defined in sub‐section 5.2, the temporal standard deviation is taken as a measure of variability, and once again, the scenario year is the central year for a climate averaging interval of 30 years. Figure 5.18 shows the projections of percentage change in annual and seasonal temperature variability. On average there is going to be an increase in temperature variability throughout the year except for the period September‐November, which exacerbates the highest temperature increase associated with September. Nevertheless, the uncertainty analysis discussed further on in this sub‐section indicates that these results are not robust since they carry a lot of uncertainty.
‐40.0
‐20.0
0.0
20.0
40.0
60.0
80.0
100.0
Annual
Average
DJF MAM JJA SON
Time Period
Percentage Change in Tem
perature Variab
ility
(Percentage Change in Tem
poral Standard
Deviation for Temperature) (%
)
2025
2050
2075
2100
Figure 5.18: Projections of percentage change in annual and seasonal temperature variability for the region of the Maltese Islands for the years 2025, 2050, 2075 and 2100. The temporal standard deviation is taken as a measure of variability. Note that the scenario year is the central year for a climate averaging interval of 30 years. Another important issue addressed by the study is the performance of the selected ensemble of the AOGCMs in simulating the present day climate for the various climate parameters considered, notably temperature. One of the employed statistics is the (model) error as defined in sub‐section 5.2. The errors in the annual and seasonal average temperature for the region of the Maltese Islands for the base year (2000) are shown in Figure 5.19. The errors are comparable to the projected temperature increase, only that they are negative, which in effect enhances the projected increase. The study addressed the question of how likely it is that the temperature will increase (irrespective by how much). The likelihood of an event is normally quantified by assigning to the event a probability. The method used for assigning probabilities is discussed in sub‐section 5.2. The probability of experiencing an increase in temperature over the next one‐hundred years is 1 i.e. it is certain that the

172
region of the Central Mediterranean surrounding the Maltese Islands will experience warming. The values given in Figure 5.16 and Figure 5.17 assume a mid‐level climate
sensitivity of 3 C. Hence, it is logical to assume that the projected increase in temperature is very likely, and although small, is significant enough to bring about substantial changes in all aspects of life as we know it.
‐2.50
‐2.00
‐1.50
‐1.00
‐0.50
0.00
Annual
Average
DJF MAM JJA SON
Time Period
Error in Average
Increase in
Temperature (deg C)
Figure 5.19: Error (model result less the corresponding observed data for the present day climate i.e. base year 2000) in annual and seasonal average increase in
temperature (in C) for the region of the Maltese Islands. The uncertainty in the results for temperature increase is quantified in terms of the associated inter‐model signal‐to‐noise ratio. The smaller the value of this statistic, the more uncertain the model results are. As a rule of thumb, values greater than 3 imply robustness in the results. An inter‐model signal‐to‐noise ratio that is less than unity implies that the noise is of the same magnitude as, or greater than, the signal. Figure 5.20 gives the values of the inter‐model signal‐to‐noise ratio for the annual and seasonal average increase in temperature for the years 2025, 2050, 2075 and 2100. All values have a magnitude which is greater than 3.0 so that the model results can be considered robust. This is in contrast with change in temperature variability. Figure 5.21 gives values for the inter‐model signal‐to‐noise ratio for change in temperature variability. They are less than unity for both the annual and seasonal averages irrespective of the scenario year. Hence, the projected change in temperature variability shown in Figure 5.18 carry a lot of uncertainty since the projected change in temperature variability is the same or even less than the variability introduced by the ensemble of AOGCMs.

173
0.00
0.50
1.00
1.50
2.00
2.50
3.00
3.50
4.00
4.50
5.00
Annual
Average
DJF MAM JJA SON
Time Period
Uncertainty in Average
Increase in
Tem
perature (Inter‐model Signal‐to‐Noise
Ratio for Temperature)
2025
2050
2075
2100
Figure 5.20: Uncertainty in annual and seasonal average increase in temperature expressed as the inter‐model signal‐to‐noise ratio (see text for definition) for temperature results, for the years 2025, 2050, 2075 and 2100. Note that the scenario year is the central year for a climate averaging interval of 30 years.
0.00
0.50
1.00
1.50
2.00
2.50
3.00
3.50
4.00
4.50
5.00
Annual
Average
DJF MAM JJA SON
Time Period
Uncertainty in Average
Increase in
Tem
perature (Inter‐model Signal‐to‐Noise
Ratio for Temperature)
2025
2050
2075
2100
Figure 5.21: Uncertainty in change in temperature variability expressed as the inter‐model signal‐to‐noise ratio (see text for definition) for results of temperature variability i.e. temporal standard deviation, for the years 2025, 2050, 2075 and 2100. Note that the scenario year is the central year for a climate averaging interval of 30 years.

174
55..66..22 RReeggiioonnaall SScceennaarriiooss ffoorr CChhaannggee iinn PPrreecciippiittaattiioonnss,, iittss VVaarriiaabbiilliittyy aanndd
AAssssoocciiaatteedd UUnncceerrttaaiinnttiieess
It must be stressed from the outset that model results for precipitation other than annual averages should be viewed with a certain caution due to the uncertainties involved as will be discussed further on in this sub‐section. The projections of annual and seasonal average percentage change in precipitation for the region of the Maltese Islands for the years 2025, 2050, 2075 and 2100 are shown in Figure 5.22. On an annual basis, precipitation is projected to decrease by about 4% by 2050 but then the loss is partly recovered during subsequent years. By 2100, the decrease is projected to be about 2%. This decrease in precipitation is not significant. Looking at seasonal averages, the percentage decrease associated with the periods March‐May and June‐August seems striking but in absolute terms it turns out to be insignificant since during these periods precipitation is not substantial. A resolved picture of the projections is given in Figure 5.23, which shows the projections of monthly average percentage change in precipitation. By 2100, the period October‐February (excluding December), may in fact experience an increase in precipitation by as much as 22% which augurs well since during these months significant precipitation is generally recorded. The other months will get substantially drier especially March‐September. In essence, this boils down to a shifting of precipitation events to shorter time windows, which is problematic for a country with limited water reservoirs. In time, water harvesting will become more important than ever.
‐45.00
‐40.00
‐35.00
‐30.00
‐25.00
‐20.00
‐15.00
‐10.00
‐5.00
0.00
5.00
10.00
Annual
Average
DJF MAM JJA SON
Time Period
Average
Percentage Change in Precipitation
(%)
2025
2050
2075
2100
Figure 5.22: Projections of annual and seasonal average percentage change in precipitation for the region of the Maltese Islands for the years 2025, 2050, 2075 and 2100. Note that the scenario year is the central year for a climate averaging interval of 30 years.

175
‐100.00
‐80.00
‐60.00
‐40.00
‐20.00
0.00
20.00
40.00
jan feb mar apr may jun jul aug sep oct nov dec
Month
Average Percentage Change
in Precipitation
(%)
2025
2050
2075
2100
Figure 5.23: Projections of monthly average percentage change in precipitation for the region of the Maltese Islands for the years 2025, 2050, 2075 and 2100. Note that the scenario year is the central year for a climate averaging interval of 30 years.
‐40.00
‐20.00
0.00
20.00
40.00
60.00
80.00
Annual
Average
DJF MAM JJA SON
Time Period
Percen
tage Change in Precipitation Variability
(Percen
tage Change in Temporal Standard
Deviation for Precipitation) (%
)
2025
2050
2075
2100
Figure 5.24: Projections of percentage change in annual and seasonal precipitation variability for the region of the Maltese Islands for the years 2025, 2050, 2075 and 2100. The temporal standard deviation is taken as a measure of variability. Note that the scenario year is the central year for a climate averaging interval of 30 years. Significant changes in precipitation variability may occur during the period July‐November. The decrease in variability during the first three months of this period
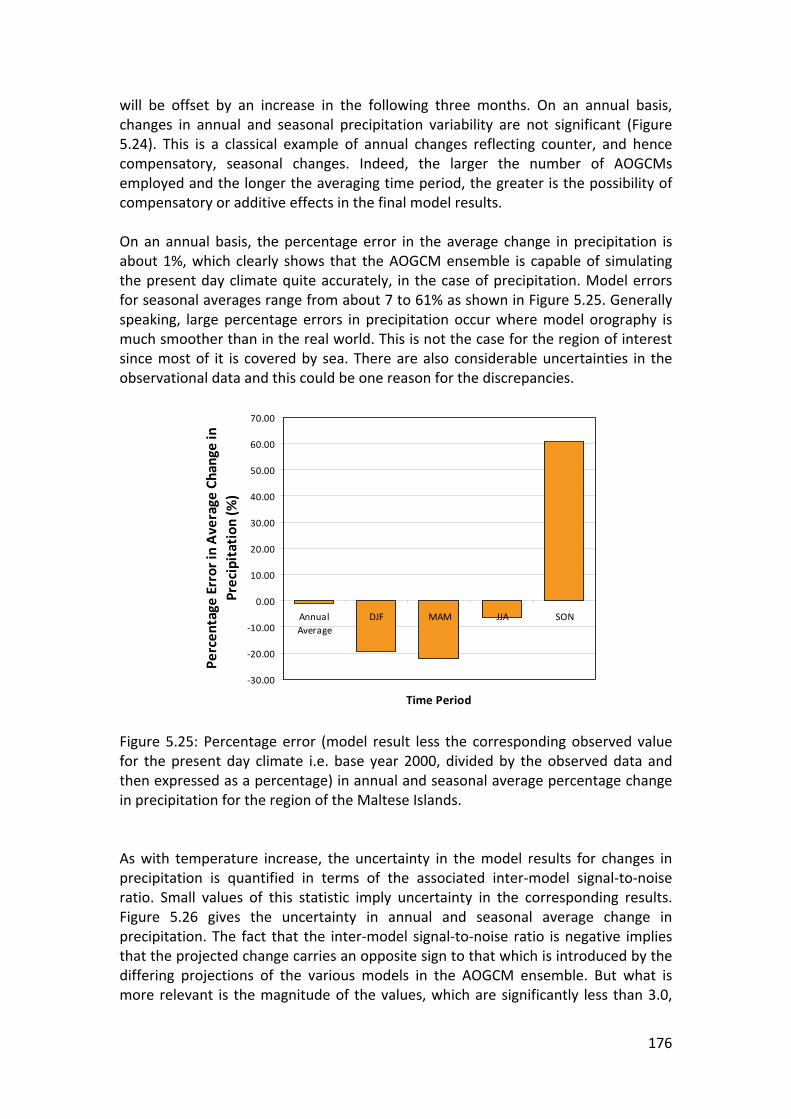
176
will be offset by an increase in the following three months. On an annual basis, changes in annual and seasonal precipitation variability are not significant (Figure 5.24). This is a classical example of annual changes reflecting counter, and hence compensatory, seasonal changes. Indeed, the larger the number of AOGCMs employed and the longer the averaging time period, the greater is the possibility of compensatory or additive effects in the final model results. On an annual basis, the percentage error in the average change in precipitation is about 1%, which clearly shows that the AOGCM ensemble is capable of simulating the present day climate quite accurately, in the case of precipitation. Model errors for seasonal averages range from about 7 to 61% as shown in Figure 5.25. Generally speaking, large percentage errors in precipitation occur where model orography is much smoother than in the real world. This is not the case for the region of interest since most of it is covered by sea. There are also considerable uncertainties in the observational data and this could be one reason for the discrepancies.
‐30.00
‐20.00
‐10.00
0.00
10.00
20.00
30.00
40.00
50.00
60.00
70.00
Annual
Average
DJF MAM JJA SON
Time Period
Percentage
Error in Average
Change
in
Precipitation (%)
Figure 5.25: Percentage error (model result less the corresponding observed value for the present day climate i.e. base year 2000, divided by the observed data and then expressed as a percentage) in annual and seasonal average percentage change in precipitation for the region of the Maltese Islands. As with temperature increase, the uncertainty in the model results for changes in precipitation is quantified in terms of the associated inter‐model signal‐to‐noise ratio. Small values of this statistic imply uncertainty in the corresponding results. Figure 5.26 gives the uncertainty in annual and seasonal average change in precipitation. The fact that the inter‐model signal‐to‐noise ratio is negative implies that the projected change carries an opposite sign to that which is introduced by the differing projections of the various models in the AOGCM ensemble. But what is more relevant is the magnitude of the values, which are significantly less than 3.0,

177
and less than unity for the seasonal averages. Clearly, for the annual average, the projected changes are similar in magnitude to the discrepancies between models, and even less for the seasonal averages. This is the reason why projected changes in precipitation should be viewed with some caution. The case of uncertainty in change in precipitation variability is even worse (Figure 5.27) and it is for this reason that robust conclusions cannot be drawn. It is worth noting that inter‐model discrepancies associated with precipitation may be due to differences in simulations of the El Niño Southern Oscillation.
‐1.40
‐1.20
‐1.00
‐0.80
‐0.60
‐0.40
‐0.20
0.00
Annual
Average DJF MAM JJA SON
Time Period
Uncertainty in Average
Change in
Precipitation (Inter‐model Signal‐to‐Noise
Ratio for Precipitation)
2025
2050
2075
2100
Figure 5.26: Uncertainty in annual and seasonal average change in precipitation expressed as the inter‐model signal‐to‐noise ratio (see text for definition) for precipitation results, for the years 2025, 2050, 2075 and 2100. Note that the scenario year is the central year for a climate averaging interval of 30 years. Nevertheless, as shown in Figure 5.28, there is a good chance that precipitation decreases during the 21st century. Throughout this century it is at least twice more likely that precipitation decreases. On an annual basis, the probability of a decrease in precipitation is very significant.
55..66..33 RReeggiioonnaall SScceennaarriiooss ffoorr CChhaannggee iinn MMeeaann SSeeaa LLeevveell PPrreessssuurree,, IIttss
VVaarriiaabbiilliittyy aanndd AAssssoocciiaatteedd UUnncceerrttaaiinnttiieess
According to the employed ensemble of AOGCMs, emission scenario and conditions, the annual average of the MSLP is projected to increase for the region of the Maltese Islands during the 21st century as indicated in Figure 5.29. An increase in MSLP of about 70 Pa and 100 Pa by 2050 and 2100 respectively is expected. As a percentage
of standard atmospheric pressure (1.013 105 Pa), these values translate to an average which is less than 0.1%. Although not significant, these changes may affect the local weather system. Larger increases are projected for the period January‐May

178
and a decrease for the summer months. These observations are more evident from Figure 5.30, which gives the projections in the monthly average of MSLP.
‐0.80
‐0.60
‐0.40
‐0.20
0.00
0.20
0.40
0.60
0.80
Annual
Average
DJF MAM JJA SON
Time Period
Uncertainty in Change in Precipitation
Variability (Change in Temporal Standard
Deviation Inter‐model Signal‐to‐Noise Ratio
for Precipitation)
2025
2050
2075
2100
Figure 5.27: Uncertainty in change in precipitation variability expressed as the inter‐model signal‐to‐noise ratio (see text for definition) for results of precipitation variability i.e. temporal standard deviation, for the years 2025, 2050, 2075 and 2100. Note that the scenario year is the central year for a climate averaging interval of 30 years.
0.0
1.0
2.0
3.0
4.0
5.0
6.0
7.0
Annual
Average
DJF MAM JJA SON
Time Period
Tim
es M
ore Chan
ce of Decrease in
Average
Precipitation
2025
2050
2075
2100
Figure 5.28: Times more chance of decrease in annual and seasonal average precipitation for the region of the Maltese Islands for the years 2025, 2050, 2075 and 2100. Note that the scenario year is the central year for a climate averaging interval of 30 years.

179
More striking are not the projected changes in MSLP but the change in the associated variability shown in Figure 5.31. Projections of percentage change in annual MSLP variability for 2100 indicate that about 37% increase is possible, with larger changes for the seasonal averages. For instance, the summer months may experience a 50% increase in variability by 2100. Decrease in variability to as much as 21% is projected for the period September‐February. Changes in MSLP may reflect changes in variability in the El Niño Southern Oscillation. Substantial increases in variability of MSLP may be interpreted as an increase in unsettled weather.
‐1.00
‐0.50
0.00
0.50
1.00
1.50
2.00
2.50
Annual
Average
DJF MAM JJA SON
Time Period
Average Chan
ge in M
ean Sea Level Pressure
(hPa)
2025
2050
2075
2100
Figure 5.29: Projections of annual and seasonal average change in mean sea level pressure (in hPa) for the region of the Maltese Islands for the years 2025, 2050, 2075 and 2100. Note that the scenario year is the central year for a climate averaging interval of 30 years. The MSLP model data are reduced to sea level. Discrepancies between model and corresponding observed data can arise because of this reduction. This is especially true considering that model orography is considerably smoothed relative to real‐world orography. Nevertheless, this should not have been such a big problem over the region of interest since it consisted mainly of sea. There are also differences in the way different models reduce surface data to sea level, and these methods may differ from the reduction method employed in the ERA40 observed data base used in SCENGEN. The net result is substantial model errors in the case of MSLP as evident from Figure 5.32. Figure 5.32 gives the model error i.e. model result less the corresponding observed data for the present day climate (base year 2000) in annual and seasonal average change in MSLP for the region of the Maltese Islands. These values are comparable with the projected changes and carry the same sign, which to some extent weaken the robustness of the conclusions drawn.

180
‐1.50
‐1.00
‐0.50
0.00
0.50
1.00
1.50
2.00
2.50
3.00
3.50
4.00
jan feb mar apr may jun jul aug sep oct nov dec
Month
Average
Change in
Mean
Sea Level Pressure
(hPa)
2025
2050
2075
2100
Figure 5.30: Projections of monthly average change in mean sea level pressure (in hPa) for the region of the Maltese Islands for the years 2025, 2050, 2075 and 2100. Note that the scenario year is the central year for a climate averaging interval of 30 years.
‐30.00
‐20.00
‐10.00
0.00
10.00
20.00
30.00
40.00
50.00
60.00
Annual
Average
DJF MAM JJA SON
Time Period
Percentage Change in M
ean Sea Level
Pressure Variability (Percentage Chan
ge in
Temporal Standard Deviation for Mean Sea
Level Pressure) (%
)
2025
2050
2075
2100
Figure 5.31: Projections of percentage change in annual and seasonal mean sea level pressure variability for the region of the Maltese Islands for the years 2025, 2050, 2075 and 2100. The temporal standard deviation is taken as a measure of variability. Note that the scenario year is the central year for a climate averaging interval of 30 years. This is further confirmed from the uncertainty in annual and seasonal average change in MSLP expressed as the inter‐model signal‐to‐noise ratio for pressure results (Figure 5.33). Practically all uncertainty values are very close to unity implying

181
that the projected changes are similar in magnitude to the discrepancies between models. Uncertainty in change in MSLP variability expressed as the inter‐model signal‐to‐noise ratio for results of pressure variability indicate that the magnitude of projected changes is smaller than the discrepancies between models (Figure 5.34). Hence as far as changes in MSLP and its associated variability are concerned, the conclusions drawn here should be viewed with great caution, since the projections may carry a significant artefact of the AOGCM ensemble. Nevertheless, Figure 5.35 indicates that there is a very high probability (almost unity i.e. certainty) of an increase in MSLP except for the summer months where the probability of an increase is 0.15 implying a higher probability of a decrease. In other words, models are quite consistent in their projections with regards to the type of changes in MSLP and its associated variability.
0.00
0.50
1.00
1.50
2.00
2.50
Annual
Average
DJF MAM JJA SON
Time Period
Error in Average
Change
in M
ean
Sea
Level Pressure (hPa)
Figure 5.32: Error (model result less the corresponding observed data for the present day climate i.e. base year 2000) in annual and seasonal average change in mean sea level pressure (in hPa) for the region of the Maltese Islands.
55..66..44 RReeggiioonnaall SScceennaarriiooss ffoorr SSeeaa LLeevveell CChhaannggee
Knowledge of local sea level change is essential for impact assessments and, vulnerability and adaptation studies. This is especially true for the Maltese Islands since they are a coastal zone, and in such cases there is often a difference between local and global‐mean sea level. As a first order estimate, projections of local sea level change may be obtained by adjusting the global‐mean estimate from MAGICC using the difference between the observed local sea level change and the observed global‐mean. Nevertheless, this

182
requires a certain minimum amount of data. There are ongoing efforts to collect climate‐related (including meteorological‐marine) data but currently there is not yet enough available that will allow a meaningful statistical analysis. In time, a sufficient corpus of data will be available that will prove to be adequate.
‐1.50
‐1.00
‐0.50
0.00
0.50
1.00
1.50
2.00
Annual
Average
DJF MAM JJA SON
Time Period
Uncertainty in Average Change in M
ean Sea
Level Pressure (Inter‐model Signal‐to‐Noise
Ratio for Mean
Sea Level Pressure)
2025
2050
2075
2100
Figure 5.33: Uncertainty in annual and seasonal average change in mean sea level pressure expressed as the inter‐model signal‐to‐noise ratio (see text for definition) for pressure results, for the years 2025, 2050, 2075 and 2100. Note that the scenario year is the central year for a climate averaging interval of 30 years.
‐0.3
‐0.2
‐0.1
0
0.1
0.2
0.3
0.4
0.5
0.6
0.7
Annual
Average
DJF MAM JJA SON
Time Period
Uncertainty in Change
in M
ean Sea Level
Pressure Variability (Change
in Tem
poral
Standard Deviation In
ter‐model Signal‐to‐
Noise Ratio for Mean
Sea Level Pressure)
2025
2050
2075
2100
Figure 5.34: Uncertainty in change in mean sea level pressure variability expressed as the inter‐model signal‐to‐noise ratio (see text for definition) for results of pressure variability i.e. temporal standard deviation, for the years 2025, 2050, 2075 and 2100. Note that the scenario year is the central year for a climate averaging interval of 30 years.

183
0.00
0.10
0.20
0.30
0.40
0.50
0.60
0.70
0.80
0.90
1.00
Annual
Average
DJF MAM JJA SON
Time Period
Probab
ility of Increase in Average M
ean
Sea
Level Pressure
2025
2050
2075
2100
Figure 5.35: Probability of increase (see text for definition) in annual and seasonal average mean sea level pressure for the region of the Maltese Islands for the years 2025, 2050, 2075 and 2100. Note that the scenario year is the central year for a climate averaging interval of 30 years.
55..77 SSuummmmaarryy ooff tthhee MMaaiinn RReessuullttss aanndd CCoonncclluussiioonnss Using MAGICC/SCENGEN version 5.3 it was possible to come up with projections extending over the next one‐hundred years for important climate parameters. The model performance statistical analysis undertaken as part of the study indicates that in some cases the model results are quite robust. This is especially true for increase in temperature and change in precipitation on a regional level, and global‐average sea level change. Projections of variability in temperature, precipitation and MSLP are not very reliable and the conclusions drawn from these model results should be viewed with caution. Using the suite of models it was not possible to estimate sea level change for the Central Mediterranean and the reader is referred to the published scientific peer‐reviewed literature. Points of interest emerging from the study include the possibility of a shift and prolonging of the summer season and a shifting of precipitation events to shorter time windows with other time periods becoming drier. Table 5.8 gives the main model results for the region of the Maltese Islands for the years 2025, 2050, 2075 and 2100. These are based on the no‐climate‐policy emission scenario A1T‐MES and were generated using the 14 selected AOGCMs listed in Table 5.4 (all excluding the last six). The climate model used for the associated global
projections is HadCM3 with a climate sensitivity of 3 C per carbon dioxide concentration doubling. Results of the uncertainty analysis indicate that these projections are quite reliable and any model artefact that they may carry is minimal.

184
Hence, their use in vulnerability and adaptation studies for the Maltese Islands is recommended. The only problem with the results relates to resolution.
2025 2050 2075 2100 Comments
Increase in
Temperature (C) 1.1 2.0 2.6 2.8 Regional Mean
Change in Precipitation (%)
–2.4 –4.4 –3.7 –1.8 Regional Mean
Sea Level Rise (cm) 7 14 23 30 Global‐mean
Table 5.8: The main model results generated using MAGICC/SCENGEN version 5.3 applicable to the region of the Maltese Islands for the years 2025, 2050, 2075 and 2100. Note that the scenario year is the central year for a climate averaging interval of 30 years. It has already been mentioned that the spatial resolution of the SCENGEN
component is 2° 30΄ (latitude) 2° 30΄ (longitude), which is too coarse for impact assessments and, vulnerability and adaptation studies since the Maltese Islands cover an area which is less than 0.5% of that for a single grid cell. Tools for the downscaling of MAGICC/SCENGEN scenarios to finer scale do exist but are not advisable since the remaining area of the grid cell containing the Maltese Islands is mostly covered by sea. The best, and most probably the only logical, solution to the problem is to actually employ a numerical atmosphere‐ocean general circulation model for the desired region, even if this proves to be very computationally intensive, requiring a large computer cluster and substantial computer‐time. In this regard, research in regional climate modelling and analysis that focuses on the Central Mediterranean is sorely needed. Nevertheless, it should be noted that currently there does not exist any model that is capable of generating very reliable scenarios for very fine grid cells. This is especially true for cases where the region is a complex combination of land and sea. The Department of Physics at the University of Malta has research plans in the direction mentioned here but further work will surely depend on the availability of the tools needed, notably a substantial computer cluster on which appropriate numerical solvers can run, and experts in the field.

185
PPAARRTT IIIIII:: VVUULLNNEERRAABBIILLIITTYY AANNDD AADDAAPPTTAATTIIOONN

186
WWAATTEERR RREESSOOUURRCCEESS
66..00 EExxeeccuuttiivvee SSuummmmaarryy The IPCC FAR observes that between 1900 to 2005 precipitation quantities declined in the Mediterranean with the global area affected by drought likely to have increased since the 1970s. It is also very likely that over the past 50 years: cold days, cold nights and frosts have become less frequent over most land areas, and hot days and hot nights have become more frequent. It is also likely that heat waves have become more frequent over most land areas, the frequency of heavy precipitation events has increased over most areas, and since 1975 the incidence of extreme high sea level has increased worldwide. Average Northern Hemisphere temperatures during the second half of the 20th century were very likely higher than during any other 50‐year period in the last 500 years and likely the highest in at least the past 1300 years. Lowering of annual volumes, high rainfall intensity events and increased temperatures will all tend to exert additional pressures on the strains currently experienced by Malta’s water resources. Lower annual precipitation volumes contribute to lower capacity volumes whilst higher rainfall intensity events generate greater amounts of runoff and lower volumes available for percolation and subsequent recharge. Temperature rises in themselves lead to increased transpiration and evaporation rates thereby pronouncing losses. It is in this context that vulnerability, which is defined as the effects of shocks emanating out of climate change on human welfare, needs to be seen as well as to attempt to establish the degree and causes of identified vulnerabilities with a view to proposing adaptation strategies. A proper adaptation strategy is one which takes climate change considerations into account, to the extent feasible, in social, economic and environmental policies, practices and actions by all stakeholders. Adaptation will be required to reduce the costs and disruptions, alter behavioural patterns and give an additional context to decision making to acknowledge those causes derived from climate change, particularly from extreme weather events like storms, floods and heat waves. In this sense, due important is associated with the availability of the right data to ensure monitoring and modelling of future scenarios in order to enable a number of potential scenarios to be identified and addressed accordingly. Adaptation measures will entail adjustments and changes at every level ‐ from local to national and international. These include changes in behaviour, in design consideration, in policy formulation, in public and private initiatives and service delivery and in the development and use of technology. This is the essence of adaptation planning. Government has, over the past years, shown a commitment towards improving the water resources of the Maltese Islands as evidenced in various strategic documents that have been published. Adaptation to the potential effects of climate change on water resources is proposed to be addressed through improved governance, building

187
capacity to handle the prevailing issues, increased research and development efforts, strengthening education and communications and looking at ways to prevent certain impacts by adapting our behaviours.
66..11 IInnttrroodduuccttiioonn Climate change may influence the hydrological cycle in a way that it will impact water availability and water quality. This is of particular concern to the Maltese Islands in view of the already limited water resource which make the country dependent on desalinated water for around 57% of its total water production.
The impacts of climate change on water resources were preliminary analysed in Malta’s First National Communication (FNC) in 2004. The FNC concluded that the Maltese Islands are expected to experience a decrease in the natural water resources mainly due to increased evapotranspiration rates, alteration in subsurface water movements and sea level rise. Malta’s FNC described the climate of the Maltese Islands as being typically Mediterranean, with a mild wet winter invariably followed by a long dry summer. In fact the main parametric differences which were identified and which consequently have an impact on the availability of water resources were summarised as follows:
an increase in the mean annual air temperature of about 0.5 °C in 77 years in line with the regional value over the Mediterranean during the last century. The maximum local temperature increased by 1.5 °C, while the minimum decreased by 0.8 °C over the same period. Observed extremes in the maximum and minimum temperatures are typical of desert regions;
rainfall patterns show a relatively high spatial variability over the Maltese territory and no definite trend in the observed precipitation. Since 1923, there has been little change in rainfall during winter and summer, whereas there has been a decrease of 0.14 mm per year during spring and an increase of 0.8 mm per year during autumn;
during the rainy season, the number of days per year with thunderstorms has increased by nine since 1950;
the existence of convective rainfall is corroborated by the positive trend in the daily maximum rainfall between 1923 and 2000, since this type of rainfall is of short duration and often heavy;
an increase in the daily maximum rainfall is observed notwithstanding the fact that, over a full year, the absolute number of days with rainfall in the range 1‐50 mm is decreasing;
the recorded decrease in the mean annual cloud cover over Malta amounts to –0.3 oktas since 1965;
188
the duration of bright sunshine has decreased by an average of 0.6 hours per day since 1923. This decrease is attributed to changes in atmospheric composition, predominantly due to the higher atmospheric loading by suspended particles. The trapping of pollutants and dust in the lower atmosphere is favoured by anti‐cyclonic situations that are accompanied by lower level inversions and slack pressure gradients, thereby lacking sufficiently strong air currents that could disperse particles. This would necessarily increase the incidence of haze, especially at low elevations of the sun.
66..22 CClliimmaattee TTrreennddss aanndd SScceennaarriiooss The IPCC FAR [255] clearly states that warming of the climate system is unequivocal as evidenced from observations of increases in global average air and ocean temperatures and average sea level amongst other parameters. The report states that eleven of the last twelve years (1995‐2006) rank among the twelve warmest years in the instrumental record of global surface temperature (since 1850) with a one‐hundred year linear trend (1906‐2005) of 0.74 [0.56 to 0.92] °C which is larger than the corresponding trend of 0.6 [0.4 to 0.8] °C (1901‐2000) given in the IPCC TAR. Global average sea level has risen since 1961 at an average rate of 1.8 [1.3 to 2.3] mm/yr and since 1993 at 3.1 [2.4 to 3.8] mm/yr, with contributions from thermal expansion, melting glaciers and ice caps, and the polar ice sheets. Whether the faster rate for 1993 to 2003 reflects decadal variation or an increase in the longer‐term trend is unclear. The FAR observes that between 1900 to 2005 precipitation quantities declined in the Mediterranean with the global area affected by drought likely to have increased since the 1970s. It is also very likely that over the past 50 years: cold days, cold nights and frosts have become less frequent over most land areas, and hot days and hot nights have become more frequent. It is also likely that heat waves have become more frequent over most land areas, the frequency of heavy precipitation events has increased over most areas, and since 1975 the incidence of extreme high sea level has increased worldwide. Average Northern Hemisphere temperatures during the second half of the 20th century were very likely higher than during any other 50‐year period in the last 500 years and likely the highest in at least the past 1300 years. Using MAGICC/SCENGEN version 5.3 it was possible to come up with projections extending over the next one‐hundred years for important climate parameters. Without delving too deeply into the uncertainty associated with the results (which are described elsewhere described in Chapter 5) it is interesting to note the following results which are summarised in Table 5.8. It can be pointed out very briefly that while models for temperature increase are quite robust, those for precipitation and sea level rise are associated with high degrees of uncertainties.

189
Climate Variable
Observed Change Projected change (without mitigation)
Temperature Global: increase 0.76 °C in last 100 years 1990s warmest decade for 150 years; 1998 and 2005 warmer than any individual year since 1850 Europe: increase 1.1°C, winters increase more than summer, largest increase over Iberian Peninsula, south‐east Europe and Baltic States
Global: Best estimated increase 1.8‐4.0°C during this century (range 1.1‐6.4°C ) Europe: mean increase 2.1‐4.4°C by 2080 (range 2.0‐6.2°C) with larger increases in eastern and southern Europe
Precipitation Global: trends highly variable in space and time have been observed during the last century Northern Europe: 10‐40% more precipitation South and East Europe: 20% less precipitation
Northern Europe: annual precipitation increase 1‐2% per decade. Decrease in summer precipitation Southern Europe: Overall decrease in annual precipitation, 5% decrease in summers
Extremes Temperature extremes are more intense and more frequent than some decades ago Globally more intense, and longer dry periods Significantly more wet days in mid and northern Europe, fewer wet days in southern Europe More heavy rain events in most parts of Europe, strongly linked to North Atlantic Oscillation
Heat waves are expected to increase in frequency and severity in a warmer world More frequent extreme precipitation events in entire Europe Northern Europe: more frequent summer droughts, despite more intense precipitation events during these periods Southern Europe: More droughts in all seasons
Sea Level Seal level rose by 0.17m during the 20th century 1.8 mm/year 1961‐2003 3.3 mm/year 1993‐2003
0.2‐0.6m by 2100, increased Greenland‐Antartic melt may add 0.1‐0.2m to this Larger values can not be excluded (due to factors not yet sufficiently understood)
Table 6.1: Observed and Projected Changes in Climatic Conditions. [Adapted from [191])

190
Table 6.1 above summarises the observed and projected changes in climatic conditions [191] which, in a nutshell captures and crystallizes how the main climatic parameters are expected to change and provides an ideal background for assessing vulnerabilities and determining ways of adaptation. On a local scale, the trends analysis carried out as part of the Second National Communication as well as that carried out by the Physical Oceanography Unit of the University of Malta confirms the trends in the climate parameters as identified in the First National Communication:
in respect of temperature, the rise in annual average temperature will be in the range 0.53‐1.32 oC by 2030 which is in the main greater that the global mean change. This is expected to result in less cold winters and warmer summers.
the change in annual mean precipitation is projected to be around –5.5% per oC global mean warming which can be translated into a drop from the current observed value of 568 mm/yr to 552 mm/yr by 2030 and 507 mm/yr by 2100.
winds are projected to be slightly weaker during autumn and winter and slightly stronger during spring and summer thereby contributing to higher evaporation rates in the higher incidence of drought periods;
cloud cover is expected to decrease by about 3% over current annual values resulting in more cloudless skies during winter and autumn;
in respect of sea level, contrary to expectations Maltese waters have experienced a fall at an average rate of 0.5 + 0.15 cm/yr. However to maintain a precautionary approach, projections should be made on the 2002‐2006 period during which sea level rise averaged 0.45 + 0.15 cm/yr whilst still maintaining appropriate levels of observations in order to determine any changes in trends and the resulting projections into the future that might result therefrom.
It is important to note that, with regards to precipitation, the models put forward scenarios which are associated with high degrees of uncertainties. The observed data (or trends analysis) implies that total rainy days with 0.1 mm or more of rainfall are decreasing while total yearly days with 10 mm or more of rain is increasing. This may be interpreted as a decrease in the total amount of volumetric precipitation but an increasing trend for convective type rainfall or heavy rainfall intensities which in itself characterizes impacts on water resources. Whilst the uncertainties with respect to predictions on precipitation still prevail, the trends identified from data observations are in line with regional scenarios (vide IPCC) with regards to both decrease in precipitation and increase in extreme weather events for the Mediterranean region. In terms of sea level rise the uncertainties are also high and it is to be noted that for the purposes of this report, although there has been no sea level rise in Malta since the last 15 years, a precautionary approach has been adopted by choosing to use global sea level rise rates or the more recent rates observed in Malta.

191
Despite the variations that might exist between various sets of projections there is still a justification to start thinking in terms of the realities that might prevail if these parameters were to materialise. In the context of water resources in Malta, where there is a high dependency on desalination for water production, all measures which are climate change friendly and which synergise with the attempt to protect freshwater resources bring with them a symbiosis which is warranted. All this needs to be placed in the context of continued monitoring of climatological parameters as well as the ensuing forecasting which needs to be maintained in order to obtain early warning signals of trends which may prevail and for which long term action needs to be catered for in order to guard against the predicted outcomes.
66..33 VVuullnneerraabbiilliittyy aanndd AAddaappttaattiioonn Vulnerability is defined as the effects of shocks emanating out of climate change on human welfare. This section will attempt to establish the degree and causes of identified vulnerabilities with a view to proposing adaptation strategies to assess such. Climate change can be a driver to alter the quantitative and qualitative status of water resources. Through climate change phenomena, the hydrological cycle can be altered to cause a change in:
the intensity and frequency of extreme rainfall events (floods and droughts);
the amount of water available and the demand exerted thereon;
water quality (e.g. temperature and nutrient content).
Malta’s Water Resources Review [80] makes some interesting observations. It warns that whilst there is no compelling statistical evidence of climate change affecting the water resources of the Maltese Islands, there is a risk that climate change will become a serious issue in the future. This comprehensive review states that in a scenario where the sea level of the Mediterranean Sea is expected to rise by up to 96 cm by 2100 a consequential rise in the freshwater lens will occur which will have a negative effect on the abstraction stations in the sea‐level aquifers. The climate modelling exercise undertaken as part of this second communication presents further data to reinforce, or otherwise, these claims and further modelling will be required over time to keep the situation under close scrutiny in order to direct Malta’s responses to the evolving consequence arising out of climatological changes. It is to be noted that for the purposes of this report, although there has been no sea level rise in Malta since the last 15 years, a precautionary approach has been adopted by choosing to use global sea level rise rates or the more recent rates observed in Malta. A recent paper by [79] identifies Malta as one of those countries that will suffer mostly from climate change. It makes the case for the potential economic loss that Malta might have to bear as a result of climate sensitive tourists who might shy away from the prevailing conditions. This research also foresees a strong potential for the

192
decrease of water resources which, although linked to the tourism potential, continues to reinforce the sensitivity of water resources to the onset of climate change. The Malta Resources Authority which is the competent authority in Malta for water resources has undertaken an initial characterization of Malta’s groundwater bodies in line with the provisions of the Water Framework Directive (WFD). In respect of the Malta Main Mean Sea Level Aquifer, this Groundwater Body is at risk of failing to achieve the Environmental Objectives of the Regulations both from the point of view of criteria related to the achievement of the quantitative and qualitative status. It should be noted that the groundwater body is also at risk of failing to achieve the objectives set in the Nitrates Regulations. This also applies to other aquifers such as the Rabat‐Dingli Perched, Mġarr‐Wardija Perched, Pwales Coastal, Mellieħa Perched Groundwater Body, Gozo Mean Sea Level Groundwater Body, Għajnsielem Perched Groundwater Body.
The Miżieb Mean Sea Level Aquifer shows a ’water balance’ estimate that has a slightly positive outcome, whilst recorded nitrate levels are lower than the 50 mgl–1 parametric limit and saline intrusion is limited. Further in‐depth investigations are needed to determine current and future trends with respect to the attainment of good 'status' as required by the WFD. As regards the Mellieħa Coastal groundwater body, owing to the fact that no chemical data exists for the Mellieha coastal groundwater body, the condition of the body should be assessed on the basis of similar groundwater bodies such as that at Pwales. These considerations lead the groundwater body to be considered as ‘probably at risk’ of failing to achieve the WFD’s objectives. Similar methodologies are required for the Marfa Coastal Groundwater Body. The Mqabba‐Żurrieq perched groundwater body has been found to be probably at risk of failing to achieve the objectives related to its qualitative status, particularly due to the high nitrate content, most probably arising from the agricultural activities in its catchment area. The characteristics of the groundwater body should however be further investigated and if necessary verified with results obtained from chemical analyses on the groundwater. In Gozo, the Nadur perched groundwater body is probably at risk of failing to achieve the environmental objectives of the Water Framework Directive particularly those concerning its qualitative status. The Xagħra perched groundwater body is probably at risk of failing to achieve the environmental objectives of the Water Framework Directive related to its qualitative status due to an expected high nitrate content due to the two main land‐use types. This also generally applied to the Żebbug Perched and Victoria‐Kerċem Perched groundwater bodies. The Comino (which is barely inhabited and has limited activity upon it) Mean Sea Level groundwater body is probably not at risk of failing to achieve the environmental objectives of the Water Framework Directive both from the view of the achievement of criteria related to its quantitative and qualitative status. The groundwater body is however prone to

193
localized seawater intrusion in response to abstraction from wells, even at low abstraction rates. Further details on this initial characterisation can be found in [260] from which the above assessments have been reproduced. Therefore it is also very clear that the vulnerability of our water bodies is also dependent on the current state of water resources. Changes in these variables have a potential impact on socio‐economic and environmental goods and services that depend on these variables directly or indirectly (health, agriculture, biodiversity, public safety and industry). Examples of possible impacts of climate change on water resources due to changes in extreme weather and climate events, based on projections to the mid‐ to late 21st century are summarized hereunder. These do not take into account any changes or developments in adaptive capacity. It is in this context that the potential outcomes that might prevail are to be seen to have the following potential effects on water resources in Malta namely:
a) any lowering in annual rainfall volumes will mean a decreased contribution to volumes of freshwater resources thus consolidating Malta’s dependence on desalinated water;
b) variability in inter‐annual and intra‐annual rainfall will have corresponding effects on demand as well on the amount of water potentially available for recharge;
c) seasonal scarcity of precipitation when the water requirements of the agriculture and tourism sectors are highest (normally from June to August) could contribute to increased pressures on freshwater resources;
d) high rainfall intensity events, with shorter durations, will have a lower contributing effect to recharging groundwater resources;
frequent occurrence of low rainfall years when groundwater recharge is likely to be low;
frequent occurrence of high rainfall years when runoff is likely to be high;
e) increased demand for water resources to combat the effects of higher temperatures;
f) higher evapotranspiration rates that will demand increased water volumes for cultivated areas;
g) a potential increase in the salinity of groundwater resources if sea water levels rise with salty water replacing freshwater sources.

194
Phenomenon and direction of trend
Likelihood of future trends based on
projections for 21st century
Impact
Over most land areas, warmer and fewer cold days and nights, warmer and more frequent hot days and nights.
Virtually certain Effects on some water supplies
Warm spells/heat waves. Frequency increases over most land areas.
Very likely Increased water demand; water quality problems, e.g. algal blooms
Heavy precipitation events. Frequency increases over most areas.
Very likely Adverse effects on quality of surface and groundwater; contamination of water supply; water scarcity may be relieved
Area affected by drought increases
Likely More widespread water stress
Increased incidence of extreme high sea level
Likely Decreased freshwater availability due to saltwater intrusion and higher levels of seawater infiltration in freshwater and sewage galleries
Table 6.2: Possible Vulnerabilities of Water Resources from Global/Regional Climate Change Scenarios [adapted from [255]. The problems that are envisaged to cause water shortages as a result of changes related to climate are identified hereunder. Lower Annual Rainfall Volumes The total amount of annual rainfall is a measure of the total potential annual water resources that may be derived from precipitation. Hence, any changes to annual rainfall amounts will have a direct effect on the amount of water that is subsequently directed towards the recharge of groundwater aquifers hence consolidating desalinated water as an important resource for Malta’s water production. Despite the capacity that Malta has in terms of producing desalinated water one must bear in mind that this kind of production method has a higher emission level than that produced from groundwater. Lower annual rainfall volumes will alter the water budget with the consequent result that there will be lower volumes of water available for recharge thus lowering the overall contribution of groundwater resources to potable water production, this apart from the potential alteration of existing ecosystems as a result of changing freshwater patterns.

195
High Rainfall Intensity A shift towards less frequent and more intense storms is likely to have a twofold negative effect on natural freshwater supplies. As the intensity of a storm increases, the amount of water percolated through pervious areas decreases. This occurs as a result of both the quicker satisfying of any soil moisture deficits as well as a result of the compaction of the upper permeable soil portions through the force generated by the impact of rainfall. From a hydrological perspective such phenomena will in turn lead to an increase in storm water runoff volumes. This will in turn result in lower groundwater recharge volumes and hence lower harvesting volumes. At the same time, high intensity rainfall would increase the risks associated with flooding and civil protection measures. Moreover, increased intensities will automatically lead to increases in peak discharges consequently demanding the need for larger infrastructure to handle such volumes if these are to be in any way harnessed. Higher rainfall intensities will also give rise to a quicker exhaustion of saturation deficits leading to increased runoff and consequently erosion of the topsoil layers that could cause a cumulative soil loss to the agricultural community. Changes in Meteorological Parameters Changes in climate will undoubtedly have a knock on effect on the demand for water both in terms of consumption as well as for supporting agriculture and animal husbandry for the purpose of food production. A simple increase in temperature alone will be responsible for an increase in water demand from the current estimated levels of around 70‐80 litres per capita per day. For example, an increase of 5 litres per capita per day, in terms of demand, would translate into an additional 2000 m3 of production per annum from the domestic sector only. Similarly, such condition would also affect tourists who consume around 150 litres per capita per day excluding water sources derived from beyond public water supplies, as well as animals reared in the animal husbandry sector. Losses of water through evapotranspiration are usually related to a number of climatic parameters. Evapotranspiration generally increases with increases in temperature, sunshine and wind speed and with a decrease in humidity with a close relationship existing between net solar radiation and evapotranspiration. Actual evapotranspiration rates for Malta have been calculated at 63% of precipitation, which indicates that over half of our potential natural freshwater resources from precipitation are eventually returned to the atmosphere. Climate change scenarios which predict increases in temperature are likely to fuel an increase in evapotranspiration rates. This would mean that more water would be required in order to sustain current agricultural practices. Sea Water level Rise A rise in sea water level of over 40 cm by 2100 will make water’s groundwater supplies more vulnerable to salinization as the degree of saltwater intrusion is

196
directly dependent on the distance between the bottom of the well and the freshwater‐saltwater interface. The Water Resources Review [80] quotes recent results as having shown that in the central regions of the Islands, particularly around major pumping stations, the freshwater‐seawater interface has reached levels close to the mean sea level. This means that any relative future change in sea level will have more pronounced effects in these regions in terms of deteriorating the quality of water extracted from groundwater sources. The expected annual reduction in rainfall, which may amount to between 10 to 40% by 2100 over much of Africa and southeast Spain, with smaller but significant changes in other places, will do little to maintain the current sea water‐freshwater interface with potential increased salinization of the freshwater aquifer. This is because the degree of saltwater upconing is directly dependent on the distance between the bottom of the well and the freshwater‐saltwater interface. The rainfall pattern is also expected to change, resulting in a shorter rainy season with shorter but higher‐intensity storms. The materialisation of these projections on a local level for these two factors are most likely to cause a decrease in the amount of water infiltrating to recharge groundwater systems and a potential increase in flooding due to higher storm water volumes generated. Conductivity logs for the Ta’ Kandja and Mrieħel GBH show the interface standing at –10 m for the Ta’ Kandja GBH, located near the Ta’ Kandja pumping station and at –80 m for the Mrieħel GBH, which is not located particularly close to any pumping station. The state of the aquifer in the Ta’ Kandja region makes it more prone to adverse effects from sea‐level changes [80]. This situation would affect both aquifer types but would be expected to have a drastic and immediate effect on the perched aquifers where the annual recharge forms a large percentage of the aquifer storage. This can have a knock on effect on the principal users of such perched aquifers with a major impact on farmers. In the case of the mean sea‐level aquifer, a reduction in precipitation coupled with a sea‐level rise would not only cause a decrease in the volume of freshwater available but would also be expected to reduce the groundwater storage capability of the freshwater lens. This is basically because the height of the piezometric head at any point in the island is proportionally dependent on the amount of infiltrating recharge; and the storage capability of the groundwater body for a given set of geological conditions depends exclusively on the hydraulic head. Sea water level rises would also give rise to a further salinization of our water resources. In the case of water supplies from groundwater, a rise in sea level would have a negative effect on the galleries and pumping stations as these will be subject to increased infiltration of seawater as a result of its consequent rise. Therefore the balance required from reverse osmosis production needs to be greater in order to retain the same blend, or ‘desalinization treatment’ would have to be applied to extracted water or significant investment would be required in order to modify the existing infrastructure. Similarly for sewage, parts of the system which are channelled through galleries cut in rock will experience greater seawater intrusion unless any infrastructural

197
interventions are undertaken. This would lead to increased salinity of wastewaters and deterioration in the quality of the treated effluent which would have to be polished in order to eliminate its excessive salt content. The aforementioned vulnerabilities also need to be seen in the context of other work, of an environmental dimension, which Malta is pursuing. This is particular in respect of the impact of water resources on biodiversity as well as the impact of agriculture on water resources in particular where the use of nitrates as fertiliser is concerned. Similarly, the actions being taken by Malta also need to be seen in the light of what it is achieving through the transposition of the environment acquis into local legislation.
66..33..11 AAddaappttaattiioonn SSttrraatteeggyy
A proper adaptation strategy is one which takes climate change considerations into account, to the extent of being feasible, in social, economic and environmental policies, practices and actions by all stakeholders. Adaptation will be required to reduce the costs and disruptions, alter behavioural patterns and give an additional context to decision making to acknowledge those causes derived from climate change, particularly from extreme weather events like storms, floods and heat waves. We are witnessing a variety of climatic phenomena which are working in tandem to potentially impact water resources. A fall in annual rainfall volumes coupled by more intense events augment the losses of freshwater and therefore impinge upon the recharge potential of groundwater aquifers; lower rainfall amounts coupled with higher temperature not only make water scarce but also increase the demands from human consumption and evapotranspiration; lower rainfall volumes coupled with seawater level rises contribute to lower groundwater volumes. Many a time the thought of reducing GHGs has stemmed as a frontrunner towards solving climate change and associated phenomena. Whilst all efforts to mitigate against GHG emissions are to be fully supported there is strong evidence that even if GHG levels were to be contained at current levels, increases in temperature and related impacts will persist for years to come. Hence it is important to focus, in parallel, on adaptation measures that will entail adjustments and changes at every level ‐ from local to national and international. These include changes in behaviour, in engineering designs, in policy formulation, in public and private initiatives and service delivery and in the development and use of technology. This is the essence of adaptation planning.

198
Climate Change Risks
Potential Risks and Opportunities
Freshwater resources Wastewater Land‐related Processes
Increase in summer temperatures increased demand for potable water (M)increased pressures on groundwater (H) increased demand on reverse osmosis plants (M) increased evapotranspiration rates (H) potential public health and hygiene issues (L)
increased sewer dry weather flow (M)increased dry weather treatment volumes (M) increased treated effluent volumes (M)
reduction in groundwater recharge (H)more aggressive regime for agriculture (H) ground shrinkage (M)
Increasing winter temperatures increased demand for potable water (M)increased pressures on groundwater (H) increased demand on reverse osmosis plants (M) increased evapotranspiration rates (M)
increased sewer dry weather flow (M)increased dry weather treatment volumes (M) increased treated effluent volumes (M)
productive regime for agriculture with opportunities for premium products maturing early (L)
Higher winter rainfall increased volumes for recharge (M)existing water storage volumes might be insufficient (H) increased stormwater runoff (H)
higher volume of stormwater generated which may exceed infrastructure capacity (H) higher volumes of stormwater entering sewers – surcharge events increase (H) increased volumes of wastewater to treat at sewage treatment plants (M) increased volumes of treated effluent may remain unutilised (H)
increased flooding instances (H)increased damage to infrastructure (H) increase in soil erosion (M)
Lower summer rainfall lower recharge volumes (H)increase in demand from agricultural sector (H)
lower sewage volumes and consequent treated effluent volumes (M)
ground shrinkage (M)
Higher intensity of rainfall
higher proportion of total rainfall might end up as runoff and not contribute to recharge volumes (H) higher level of pollutants in stormwater (H)
higher peak flows in sewers (H)increased possibility of sewer surcharge and overflows (H)
increased incidences of flooding (H)damage to infrastructure increases (H) increased soil erosion (M)
Sea level rise
reduced volumes of groundwater (H)increased salinity of groundwater (H)
increased seawater infiltration volumes (M) more saline wastewater and hence treated effluent (M)
loss of land (L)increased flooding of coastal areas (M) increased need for flood defences (M) new methods of construction (H) insurance premiums may increase (M)
Table 6.3: Observed and Projected Changes in Climatic Conditions ‐ Level of Vulnerabilities and Opportunities.

199
Table 6.3 presents a Water Resources Impact Matrix that shows how the various changes in climatic parameters are expected to effect water resources. Notwithstanding it is important to consider Malta’s ongoing developments in the water sector. The WFD aims to establish a framework for the protection of inland surface waters, transitional waters, coastal waters and groundwater. In terms of the obligations under the WFD, Malta is currently working on assessing the status of water bodies (groundwater, terrestrial and coastal) and develop River Basin Management Plans including Programmes of Measures safeguarding the water bodies. The WFD provides an opportunity for climate change adaptation through the RBMPs and Malta should take into consideration climate change impacts in the implementation of the WFD [260]. The Government is currently working upon a Storm Water Master Plan which is aimed to address a number of issues related to the two paramount and juxtaposed issues of flood relief and water conservation. The Plan is intended to identify priorities to be adopted as policy, and projects for their implementation and is to include the results of an investigation and evaluation of the feasibility of the identified policies and actions, for:
a) management of the various impacts associated with storm water including flooding, road infrastructure deterioration and traffic management, civil protection and valley management in general and also with reference to particular flood prone areas and localities;
b) utilisation of storm water to augment the water resources of the Maltese Islands through harvesting, storage, use, re‐use, recycling, distribution of storm water and proper disposal of excess.[262]
From an agriculture perspective, Malta’s National Rural Development Strategy for the Programming Period 2007‐2013 identified water resources as an important aspect for this sector and provides a thorough scenario of the resource implications as well as the climate change implications resulting from the sector (refer to Chapter 11). Moreover it puts forward eligible actions that aim to improve the impact of the agricultural dimension on water quality both in terms of surface and groundwater. Equally important is Malta’s current programme aimed at treating all sewage prior to disposal. At present two sewage treatment plants have been constructed, in Gozo (having a capacity of 6000 m3 per day) and to the North of Malta (having a capacity of 7000 m3 per day), with work underway on Malta’s largest sewage treatment plan in the South of Malta which will have a capacity of 60000 m3 per day. Malta’s Operational Programme I ‐ Investing in Competitiveness for a Better Quality of Life also identifies water resources as one of the areas of intervention and cites the areas of intervention for the stormwater masterplan as well as for sewage

200
treatment in the south of Malta as permitted interventions to achieve the targets set out for this Programme. The importance of water resources in connection with energy requirements is also evidenced in the Legal Notice 238/2006 "Minimum Requirements on the Energy Performance of Building Regulations, 2006" and its Technical Guidance (F) which provides for the conservation of rainwater from buildings by stating that this should not be allowed to drain into sewers but collected within cisterns within the area of the building. It also suggests that such water is reused for irrigation and toilet flushing with a view to maximising the demand side management of this resource. It is therefore evident that Government recognises the problems it is facing in the sector as well as the high level areas of intervention which are required. Climate change scenarios with respect to water resources can synergise with other strategies aimed at improving the water status of the Maltese Islands and it is these synergies which make a cohesive approach towards addressing Malta’s vulnerabilities, obligations, mitigation and adaptive stances in respect of water resources. This section aims to put forward an adaptation strategy for the Maltese Islands that is based on the country’s characteristics and which takes into account its main vulnerabilities with a view to embarking upon a process which, despite all other mitigation efforts, will ensure that the population and its visitors may be able to adapt to those changes which, irrespective of all other efforts, are likely to manifest themselves and effect all members of society.
66..33..11..11 GGoovveerrnnaannccee ((LLeeggiissllaattiioonn,, PPoolliiccyy,, RReegguullaattiioonn aanndd IInnssttiittuuttiioonnss)) Good governance for climate change needs to be factored as an integral part of policy making. It is important to ensure that the country is sensitised to the challenges that are being faced by ongoing changes in climatic conditions and to safeguard the population against such phenomena as far as possible. Adaptation measures include: Revise Existing Regulations Existing planning regulations should be revised to factor in the likely effects of climate change. These would include the delineation of areas which might become prone to flooding with a view to ensure that development of such areas takes these factors into consideration and provides adaptive measures that combat such phenomena. It is important that this would be combined with extensive sea level monitoring and forecasting techniques such that no unnecessary action is taken particularly in the light of the variations in data that exist for the region including Malta. One must bear in mind that the collection and treatment of storm water that is generated from urban developments presents a very high costs to make it economically and financially viable. This points towards an increased relevance of

201
demand side management practices aimed to integrate water conservation and reuse features at the point of generation. The minimum requirements on the Energy Performance of Building Regulations, 2006 already stipulate the need for cisterns as well as the need to have a draw off point for use for toilets and landscaping. Consideration should be given to amplify building regulations that stipulate mandatory requirements or that support good practice for new developments. These would include the obligation to foster the use of dual flush toilets and water conservation fittings in all public buildings amongst other initiatives. Moreover, existing and future plans, policies and projects should seek to integrate adaptation measures as an integral component of their environmental dimension. Integrated Water Management Plans Government should task the Malta Resources Authority to develop Integrated Water Management Plans that amongst other issues would tackle climate change induced reduction in water availability and analyses the effects of such reductions on the environment and society. This is in line with the provisions of Subsidiary Legislation 423.20 ‐ Water Policy Framework Regulations ‐ and which transposes the provisions of the WFD, which obliges the competent authority to develop water catchment management plans. Local legislation already stipulates that water catchment management plans are to be published by the end of November 2009 and reviewed and updated by the end of November 2015 every six years thereafter. Provision of Fiscal Measures Amongst the provisions of the Water Policy Framework Regulations is that the competent authority shall ensure that measures are taken to prevent the deterioration of the status of all bodies of groundwater, and to take the necessary measures to protect, enhance and restore all bodies of groundwater, ensure a balance between abstraction and recharge of groundwater, with the aim of achieving good groundwater status by the end of November of the year 2015. In order to encourage energy efficiency and renewable energy initiatives, Government had issued schemes which offered financial incentives on such initiatives. The recent scheme that offered a 50% rebate on PV panels, 66% rebate on solar water heaters and a 33% rebate on certain other energy saving materials such as roof insulation are all steps in the right direction to instill an adaptive cultural change. On the same lines, fiscal incentives such as tax credits or VAT waiving on works or fittings that permit water conservation should be considered. These could be aimed at both existing and new dwellings. Similarly, fiscal penalties should be in place for those abusing of water resources. The value of the water resource should be actively analysed in order to make the full wealth of our water resources appreciated by the whole of society and to legislate in

202
favour of metering authorised boreholes in order to ensure that abstraction is effectively controlled. This requires a national consensus with targets for cost recovery set accordingly. In this context a pricing regime for the promotion of safe uses for second class water is advisable as this would otherwise end up discharged to the marine environment. Lessons learnt from the wastewater treatment experience which has prevailed since the early nineties could prove of value together with increased research on the issue. Green Government Government has a duty to lead by example. The Green Leader concept that was introduced by Government was a first step in sensitising the public administration towards the need for a greener approach towards the use of resources. It is perhaps time to step up a gear by securing that the Green Leader concept is strengthened to ensure that an Adaptation Plan for the Public Administration is drawn up and implemented and contributes towards our national targets. This plan should be subject to consultation, made available to all public employees and monitored for results. This plan should be publicised as a best practice model for other organisations to be enticed into adopting similar initiatives. Furthermore, Government is in a unique position to use its status of being the single largest procurer of goods and services to send a strong message that promotes the sustainability of resources by entrenching green public procurement concepts within its procurement systems. A draft of the Green Public Procurement document had been produced by Government and it is advisable that this issue is revived and brought to fruition. Water Governance Water Governance is the key to sustainable use of water resources. Water Governance refers to the range of political, social, economic and administrative systems that are in place to develop and manage water resources and the delivery of water services, at different levels of society (UNDP definition). It is in this sense that Malta would have to develop abstraction and permitting schemes which together with other regulatory measures would improve the sustainability of the resource which has been deteriorating as a result of the prevailing abstraction practices and which have a knock on effect on the sustainability of the groundwater resource. In the context of Government’s declared moratorium for the drilling of new boreholes there is a call for the introduction of a complementary dedicated and strict enforcement regime aimed at tackling unauthorised extraction of groundwater.

203
Awards Government should introduce a system of rewards which is subsequently linked to a remuneration as well as publicity on Malta’s efforts abroad be they of a tourism or enterprise nature. Data Data regarding water resources and climatic parameters are collected by different entities. Often enough the lack of the availability of such data, in its raw format, does not encourage research in this field. The setting up of a Climate Change Observatory would be able to collate all data inputs and make them available for researchers whilst at the same time it would liaise with the competent authorities with a view to producing national databases with reliable data on water use. A special mention goes to the uncertainties of the rise or fall of Maltese waters which show the need for monitoring in greater detail to ascertain trends. The NSO is Malta’s central competent authority responsible for statistics. Notwithstanding there are other entities who collect data. Within the business and citizen environment, data sharing concepts are promoted as part of Malta’s better regulation agenda. The creation of an inventory of data collecting sources and the consolidation of such data in a manner that can be accessed from a single platform is called for. This would facilitate research as well as provide useful information for those wishing to embark upon climate and water related projects and research. Furthermore Malta’s experience in the MEDHYCOS project warrants the potential investigation of the proposed Observatory to form part of a wider Mediterranean based Observatory in order to foster research amongst the Mediterranean partners as well as to ensure that climate and desertification modelling may be carried out on a sizeable catchment. Insurance Directive 2007/60/EC on the assessment and management of flood risks obliges Member States to undertake preliminary flood risk assessments as well as to subsequently prepare flood hazard maps and flood risk maps. Any rise in sea water level, whether it results in the forecast modelled by MAGICC/SCENGEN or even if it is worse as suggested by other sources, could have a potential knock on effect on low lying areas. With a preamble of ensuring that there is sufficient evidence that indicates the certainty of loss of land as a result of such phenomena, it is important that, in collaboration with the financial services sector, the issue of insurance implications of properties/activities in flood prone areas should be explored with a view to determining whether there is cause for differentiating between various zones whilst at the same time offering protection to those who may still wish to operate in vulnerable areas.
204
Land Value Linking on to the aforementioned issue of insurance, land value is another issue that needs to be looked into. The construction sector in Malta has always been very active with the industry itself having a significant effect on the Maltese economy both in terms of its contribution to GDP as well as its direct and indirect employment creation potential. Any area that risks fulfilling its full development potential would be accompanied by a revaluation. This could have a significant effect on the investment returns of individuals. Through sustained monitoring and forecasting techniques, it is important at this stage to assess the extent of the likelihood of such scenarios with a view to determine potential scenarios and impacts for the construction and real estate sectors in this respect. The revision of the Structure Plan for the Maltese Islands is also seen as an enabler towards policy making in this area.
66..33..11..22 CCaappaacciittyy BBuuiillddiinngg Strengthening Public Capacity The competent authority responsible for water resources should be strengthened with a view to enable it to develop the capacity to research, act and educate on the need to adapt to a scenario of limited freshwater resources. This also needs to be complemented with the attraction of specialists to study and subsequently work in the sector and hence the educational dimension needs to ensure such results. Development of Schemes for the Unemployed Government had undertaken a project whereby some people who were on the unemployment register were trained in waste management and subsequently deployed to train households in this area. Malta’s human resources are one of its main assets and such initiatives should be replicated with a view to utilise such resources whilst at the same time enriching their learning experience. Schemes could be developed for persons currently on the unemployment register to be trained to understand the pressures of climate change on water resources and to tour the various commercial and residential premises in order to offer free advice on how to adapt to anticipated scenarios.
66..33..11..33 RReesseeaarrcchh aanndd MMoonniittoorriinngg Encourage Research Initiatives Research into the variation of various parameters in response to climate change needs to be encouraged. For this purpose, it is vital that Government, through its research institutions, gives priority to such actions. The University should try and attract various students to undertake their dissertations in this area whilst EU funding instruments should, where possible, place climate change initiatives at the

205
forefront of national priorities. This is also in line with Malta’s R&I Strategy which places great emphasis on popularising and incentivising Science and Technology disciplines.
Undertake Research for Adaptation
Adaptation is not an option ‐ hence establishing ways and means of adapting to phenomena beyond our control as quickly as possible is imperative. As climate change will undoubtedly exert an influence on water resources, one of the areas which may be suitable for research relates to research for agriculture wherein, the best economic‐financial‐water use matrix that results in win‐win strategies and solutions could be identified.
In line with Malta’s R&I Strategy, research on areas such as drought occurrence and the maximisation of the recharge potential of our aquifers need to be encouraged in order to be able to better adapt to the upcoming circumstances.
Similarly, research into crop tolerance to drought and increased salinization is required in order to offer the local agricultural sector concrete advice on potential diversification to less water demanding crops and crops which can better adapt to foreseen climatic condition thereby ensuring the sustainability of this sector.
Monitoring The setting up of a Climate Change Observatory which would have access to all data that is required and that is currently collected through national resources has already been referred to. This observatory could be formed in conjunction with the support of the Meteorological Office, the Agricultural, Water, Environmental and Energy authorities. It should however have a separate persona from these entities in order to enable it to conduct audits of performance by private and public stakeholders. Treated effluent As part of Malta’s obligations under the Urban Wastewater Regulations which transpose the Urban Wastewater Directive, three new sewage treatment plans are required in order to treat all of Malta’s sewage prior to disposal. The two plants at Ras il‐Ħobż and at iċ‐Ċumnija already generate around 13,000 m3/day of treated effluent whilst the new treatment plant at Ta’ Barkat will have a capacity of about 60000 m3/day. These are substantial volumes of a water resource which could spell a new opportunity for Malta’s water resources.
Research into possible utilisation of treated effluent should be encouraged. This could extend to as many sectors as possible with construction, agriculture and tourism being possibly the prime candidates for intervention. Malta’s experience in the use of treated effluent dates back to the early eighties. Additional research that explores possible safe use of this resource should be considered.

206
66..33..11..44 EEdduuccaattiioonn aanndd CCoommmmuunniiccaattiioonnss National Minimum Curriculum The current revision of Malta’s National Minimum Curriculum should seek to combine the emergence of environmental issues in a more holistic manner taking into account the need to learn about the management of our environment in a sustainable manner throughout all the stages of compulsory education.
Strengthening Environmental Studies
Environmental Studies should not be dominated by the environmental issue of the day but should seek to integrate aspects such as climate change, sustainable development, water, energy, waste, biodiversity and the like into an integrated curriculum. Moreover, great importance should be attached to this subject with due consideration being given to the possibility of making this subject a compulsory requirement for progression on to higher education as it is a cross cutting subject that will effect each and every individual throughout his/her life independent of the career chosen. Educate and Communicate
Education should not be limited to compulsory education or to the formal education system. The environment is our heritage and we have an obligation to manage it in a sustainable manner such that we may bestow it in a similar or better state to our successors. Therefore it is important for the competent authority to identify the various target groups that form our entire society and to target educational campaigns in order to raise their awareness. Such campaigns could include courses, adverts, brochures, onsite visits and demonstrations possibly in conjunction with stakeholder representatives ‐ constituted bodies, local councils and NGOs.
Outreach activities should be designed with a view to targeting those sectors or groups which are at greatest risk from the changes resulting from climate change. A particular group is farmers and those involved in the agricultural sector. This sector has turned out to potentially be that which exerts the highest demand on groundwater resources and as such an outreach programme would transmit the educational knowledge of the best adaptation measures for the sustainability of the sector which could include crop diversification strategies, improved irrigation methods and the like.
Within the communications dimension, Government has a role to play. Through its horizontal role in society it can send key messages to all actors in favour of behaviours which are in synch with climate change good practice. This needs to be done creatively and in a manner that it uses the right message to reach out to the various audiences that characterise society.

207
Changes in Behaviour
The sensitisation of people towards better behaviour in their use of water needs to be embarked upon. This involves informing people about the water consumption properties of everyday life such as showering instead of bathing; dishwashing against washing crockery in a basin or under running water; the non potable potential of certain activities to replace that currently satisfied through potable supplies. Efficient appliances such as dual flush toilets should also be promoted. This level of education needs to be transmitted to all strata of society with a tailored message.
The same applies to those involved in the commercial or public administration sector that needs to be ‘educated’ into making their enterprises more efficient.
A ‘Water Wisdom’ initiative would be opportune with the aim of helping the Maltese make informed and wise decisions about their own water resources. Such an initiative needs to be independent from Government with no political allegiance but only with the best water interests at heart. The main aim of this initiative would be to provide objective information about water resources and how they are being used, at the same time providing conclusions and consequences based upon objective evidence, on the consequences of change or status quo scenarios. This initiative would also serve to communicate water resource information in an effective and timely manner and to show its presence in an active manner in the appropriate fora.
Efficiency in Design Buildings that house people or activities in themselves lead to the consumption of water. The Minimum Requirements on the Energy Performance of Building Regulations, 2006 are a step in the right direction to foster the use of runoff from the building’s footprint for secondary uses. Moreover, courses being organised for assessors are in themselves a complementary positive initiative to secure the greener performance of buildings. It is therefore paramount to ‘educate’ professionals into adopting efficient design practices. These include initiatives such as water supply systems with short runs of pipes from water heaters to avoid long lengths of ‘cold water’ being wasted particularly in the cooler months as well as the use of water efficient fittings. Such training needs to be targeted at architects and civil engineers; building services engineers and plumbers and electricians in particular.
66..33..11..55 AAcccceeppttaannccee ooff CCeerrttaaiinn IImmppaaccttss Coastal Areas There is still an amount of uncertainty on the outcome of sea water rise vis‐à‐vis how this will impact, if at all, Malta. Notwithstanding, it is important to understand the potential scenarios that might result. In this respect Malta may need to develop scenarios that identify those coastal areas which are likely to be subject to constant

208
flooding as a result of various climate change outcomes. This would give an indication of the extent of areas which could be earmarked for redevelopment. This would offer the opportunity for specialists in planning, architecture and engineering to develop proposals and concepts for such areas which in turn employ design and engineering methods that adapt to such phenomena. These might include, but not be limited to, raised building levels that can accommodate a degree of flooding without rendering the site wasteland.
Notwithstanding, Malta is obliged under Directive 2007/60/EC on the assessment and management of flood risks to undertake preliminary flood risk assessments as well as to subsequently prepare flood hazard maps and flood risk maps. The synergies between the impacts of climate change on land use as well as the provisions of the Floods Directive are considered synergistic and contribute to reinforce each other.
Increase of Treated Effluent Volumes Treated effluent volumes are bound to increase and will amount to around 73000 m3/day. The fact that Malta’s sewage is not yet fully treated is in itself already a catalyst for change as significantly higher volumes of treated effluent are expected in 2009 which are far beyond those experienced currently. The use of treated effluent within the groundwater protection zone is to be avoided and hence it is worth studying the possibility of reclaiming disused land outside the groundwater protection zone for the development of controlled agricultural parks which would be able to benefit from plentiful quantities of treated effluent and which possibly, in a controlled environment, can offer a premium organic product that will increase the country’s competitiveness in the sector. All this would have to be undertaken taking into account all health and safety guidelines that have been developed and recommended so far by leading institutions such as WHO and others.
66..33..11..66 PPrreevveennttiioonn Leakages from Infrastructure
The WSC is looked upon as a “Best Practice” example of leakage control by other water companies. Apparent water losses include both the actual leakages from the distribution infrastructure as well as the water being consumed but which is unaccounted for due to inaccuracies in the billing system. Total apparent water losses in 2005 stood at 47.65% of total water production whilst total actual losses (leakages) stood at 21.59% of total water production. Actual leakages were reduced from 2002 to 2005 with the leakage amount of 2005 standing at 32.87% less than the amount of 2002. Whilst recognising that water supply systems have an economically viable leakage index one should ensure that levels are maintained as close as possible to such benchmarks whilst focusing on securing the reduction of unaccounted for water.

209
Improving Infiltration Potential Ground water recharge depends entirely on the ability of the terrain to percolate sufficient water before it is lost through evaporation or surface runoff. Prevention of fresh water losses are multidimensional and include proper demand side management where storm water generated at a local level would be retained and reused instead of being discharged as runoff. Subsequently the improvement of soil infiltration needs to be studied ‐ this includes the preservation of permeable surfaces and the enhancement of other surfaces.
Irrigation Systems
The introduction of drip irrigation systems has contributed towards the water efficiency of the agricultural sector. However, a proper understanding of crop water requirements is required to ensure that farmers are well aware of the correct amount of water to direct to the various species and that water usage is determined as much as possible on scientific grounds to assist the farmer in optimising his crop.
Any changes in volumetric or intensity characteristics of rainfall will undoubtedly have a knock on effect on the water available for irrigation. Whatever the outlook and whatever changes may occur, the situation today is already at critical levels with a considerable amount of groundwater being abstracted directly for agricultural purposes. If the current situation is afflicted by the changes in precipitation, temperature and sea water level rise, the demand versus availability balance is sure to become even tighter as increased crop water requirements become necessary but with lower amounts of groundwater and storm water available to satisfy such increases in demand.
Cognisance must also be given to the types of landscaping that is used to embellish public areas. Central and local government must be aware of the landscaping demands exerted by certain plant types (e.g. turf, certain flowering plants etc) and to move towards a more indigenous form of landscaping which could optimise on current irrigation water consumption volumes.
Infrastructure
Existing infrastructure is bound to suffer from increased volumes of water to handle during flash floods. Consequently, where possible, the existing systems should be modified to take into account such phenomena. Practical examples include the construction of, or the use of existing infrastructure to act as, detention basins in order to protect sewerage infrastructure against flooding with the resultant contamination to land. Moreover, new infrastructure should already factor into the loading calculations the impact of climate change.
The use of dams to prolong retention times of stormwater in valleys should also be considered so as to enhance the recharge potential to groundwater.
210
It is expected that the Storm Water Master Plan currently being formulated will address these issues but should also take into account climate change perspectives in developing its proposals.
Water supply systems should be designed as intelligent water distribution systems with pressure balancing to improve water efficiency and reduce the amount of losses from the system.

211
LLAANNDD UUSSEE
77..00 EExxeeccuuttiivvee SSuummmmaarryy Due to Malta’s high population density, its limited land area and the increasing land and property values, competition over the use of land in the Islands is substantial. Urbanisation, together with agriculture, recreation and quarrying, are the most significant pressures on the Maltese countryside. Agriculture has long been the predominant land use in the Maltese Islands, with multifunctional roles including maintaining rural landscapes and biodiversity as well as providing food and sustaining rural livelihoods. A large percentage of the land in Malta falls within the coastal zone. This zone is under significant development pressure, mainly from recreation and tourism, with 35% of the coastal zone in Malta and 19% in Gozo being tourism‐dominated. Like other uses, land use too will be impacted by climate change. Assuming the current climate change scenarios and predictions are realised, an increase in sea level and the associated problems of coastal inundation, erosion and migration of beaches will be the most significant impact of climate change on land use. However, local scenarios on this phenomenon are associated with high degrees of uncertainties. The land uses that will be mostly affected by this impact are discontinuous urban fabric, protected areas, port areas, and all the beaches. An increase in soil erosion, desertification and flooding may be a problem in agricultural and urban areas. Secondary impacts on property values and insurance may be related to these climate change impacts. Various adaptation measures, ranging from long‐term resource‐based land use planning to hands‐on maintenance programmes for infrastructure, have been suggested as ways of countering some of the impacts of climate change. Adaptation of existing resources, including buildings, to impacts of climate change is also suggested.
77..11 IInnttrroodduuccttiioonn
Climate change refers to the variation in the Earth’s atmospheric environment through natural processes and the impacts by humans on our global climate due to the release of greenhouse gases [265]. Most climate change scientists agree that it is the unnatural increase in greenhouse gas (GHG) from human activity that is the cause of today’s climate change.

212
Planners are concerned with “the scientific, aesthetic and orderly disposition of land and resources and the location of facilities, buildings and services over a given territory” [263]. These could include:
promoting safe and healthy living conditions;
conversion of land from its natural state to development; protection of natural, cultural, and heritage resources; infrastructure development; social and community services; economic community vitality; and emergency measures.
Climate change can be a challenge to these issues [81], including:
flooding of coastal and inland development; drought stresses on agriculture; high wind impacts on structures and infrastructure; secondary impacts on property values and insurance; impacts on terrestrial and aquatic plants and vegetation; and threats to human health and life.
77..11..11 LLaanndd CCoovveerr aanndd LLaanndd UUssee IIssssuueess iinn tthhee MMaalltteessee IIssllaannddss The latest land cover map for the Maltese Islands was prepared in 2004 [88]. The following paragraphs give an indication of the land‐cover in the Maltese Islands. Agriculture accounts for almost half of Malta’s land area (49%) while forests make up only 0.8%. Natural vegetation accounts for 22% of land cover, most of which is in coastal areas, while urban fabric covers 23%, mainly in the form of a conurbation around the Grand Harbour. Industrial and commercial uses account for 2% of the land area. The major change in land cover over the past few decades has been the conversion of substantial tracts of arable land to urban areas. Part of the reason for this urban sprawl is the high population density (approximately 1,274 persons/km2 in 2005), increased mobility, improved standards of living, and technological development. The lack of planning laws up until the early 1990s is also to blame, and although the new planning laws managed to slow down the loss of agricultural land initially, the lack of a holistic strategy and largely ad hoc decisions on single development applications has taken its toll in recent years, with further substantial losses being reported [95]. Due to Malta’s high population density, its limited land area and the increasing land and property values, competition over the use of land in the islands is substantial.

213
Urbanisation, together with agriculture, recreation and quarrying, are the most significant pressures on the Maltese countryside. Agriculture has long been the predominant land use in the Maltese Islands, with multifunctional roles including maintaining rural landscapes and biodiversity as well as providing food and sustaining rural livelihoods. A large percentage of the land in Malta falls within the coastal zone. The major coastal uses identified in the Maltese Islands by MEPA [96] include:
tourism and recreation; settlements; agriculture; aquaculture; fisheries; shipping; mineral Extraction; infrastructure; and industrial estates.
The coastal zone is under significant development pressure, mainly from recreation and tourism. Between 1990 and 2004 the developed portion of Malta’s 1 km coastal buffer area grew by approximately 5%, and stood at 26% built‐up in 2004. Today, according to MEPA [97], 35% of the coastal zone in Malta and 19% in Gozo are tourism‐dominated. These trends are also affecting undeveloped areas, especially sensitive coastal habitats; in some cases they also limit public access and use and undermine landscape quality.
77..11..22 SSuummmmaarryy ooff MMaallttaa’’ss FFiirrsstt NNaattiioonnaall CCoommmmuunniiccaattiioonn ttoo tthhee UUNNFFCCCCCC Land‐use issues in Malta’s First National Communication to the UNFCCC were only considered from a mitigation point of view. This chapter delves into the impacts of climate change on the land‐use sector and its vulnerability, and puts suggests possible measures to adapt to these impacts.
77..22 CClliimmaattee CChhaannggee SScceennaarriiooss Climatic changes can be beneficial (e.g. longer growing seasons for certain crops), but most, such as more frequent and severe weather extremes, more variability in weather, and a rise in sea level, are generally harmful. Such climate changes are expected to increase in the foreseeable future and land use planners need to be prepared for the impacts on their communities [81].

214
The major climatic changes that are expected to affect land‐use planning include increase in temperature, changes in rainfall, sea level rise and increase in the frequency of extreme events. The locally generated regional scenarios (see Section 5.6) predict an increase in
annual average temperature of 2 C and 2.8 C by 2050 and 2100 respectively (see Table 5.8). The model results of such projections are considered to be robust and the trends in observed temperature corroborate this projection. Such increase in temperature is also in line with the predictions of the IPCC FAR. Models for precipitation and temperature variability however are associated with more uncertainties. Although a decrease in precipitation is being predicted, projected changes in precipitation should be viewed with some caution. The trends analysis implies that total rainy days with 0.1 mm or more of rainfall are decreasing while total yearly days with 10 mm or more of rain is increasing. This may be interpreted as a decrease in the total amount of precipitation but an increasing trend for convective type rainfall or heavy rainfall. While the uncertainties still prevail, the trends identified from data observations are in line with regional scenarios (found in the IPCC FAR) with regards to both decrease in mean annual precipitation and increase in extreme weather events (increase in the intensity of daily precipitation events) for the Mediterranean region. The IPCC report notes that there will be a higher incidence of drought and heat waves in summer. In this context, while this report will focus on the more certain increase in temperature, as also verified by locally generated scenarios, other impacts associated with the decrease in precipitation and increase in extreme events will be addressed based on regional scenarios. With regards to sea level rise, real‐time data is available from [87]. This data shows that contrary to the general expectations the overall trend over a window of 13.5
years of data is that of a fall in sea level at an average rate of 0.50 0.15 cm/yr. The sea level experienced a hefty rise of several centimetres in the period 1993 to 1996; this was followed by a rapid decrease till the end of 2001 when the sea level reached
an average of 9.0 0.4 cm below that in 1993; in the following years the sea started to recover back to slightly higher levels at a rate of less than 0.5 cm/yr”. The report further states that “this general decreasing trend in the sea level in recent years does not however refute the impact of climatic changes in the Maltese Islands. Sea level is only one of several indicators of climate change”. It explains this potentially anomalous behaviour of sea level in this area. The report concludes that “This part of the Mediterranean has experienced a buffer period that has attenuated any imminent menace of sea level rise, but there is no guarantee that this will persist in the future. To maintain a precautionary approach one should thus base projections mainly on the moderate sea level trend of the four years (2002‐2006) during which
the sea level experienced an average rise of 0.45 0.15 cm/yr”. With regards to sea level rise both reports note the uncertainties associated with the predictions. However, an estimate of a rise of 30 cm until the year 2100 appears to be agreed to by both studies.

215
77..33 CClliimmaattee CChhaannggee IImmppaaccttss Land use is a cross‐cutting issue that affects and is affected by several sectors. Therefore, in considering land use impacts it is important to consider the synergies involved with the various sectors. In this Report, wherever relevant, cross references to other sectoral reports has been included.
The impacts of climate change on land use include the following:
flooding of coastal and inland development as a result of sea level rise and increased rainfall intensity;
drought stresses on agriculture from reduced annual precipitation; high wind impacts on structures and infrastructure from increased
frequency of extreme weather events; secondary impacts on property values and insurance as a result of
increasingly unfavourable weather and impacts thereof; impacts on terrestrial and aquatic plants and vegetation from increase in
temperature, reduced rainfall, increased storm intensity, and general change in climate characteristics (see Chapter 12); and
threats to human health and life, especially from changes in climate that may facilitate migration of disease‐causing organisms and increases in temperature (see Chapter 13).
The following sections address each of the above impacts.
77..33..11 IInnccrreeaassee iinn SSeeaa‐‐lleevveell aanndd CCooaassttaall IInnuunnddaattiioonn ((iinncclluuddiinngg ffrroomm ssttoorrmm
ssuurrggeess)) Low‐lying coastlines with high population densities and small tidal ranges are the most vulnerable to sea‐level rise [92] and storm surges. The impacts range from coastal inundation, coastal erosion (particularly beach erosion), inland migration of beaches [98], increase in the potential damage from storm surges and tsunamis [91], and a reduction in slope stability where Blue Clay formation outcrops at sea level. Sea level rise and storm surges can put coastal communities at risk, necessitating expensive adaptation or reactive measures, which may include the relocation of whole communities to safer locations. Recent data for Malta and the Central Mediterranean show a reversal of trend, in that sea level has actually fallen (see also section on Climate Change Scenarios above). This is thought to be a transient phenomenon that depends on the atmospheric pressure increases linked with the North Atlantic Oscillation and the cooling of the upper waters in the Aegean and the Adriatic Seas [87]. More recent data for Malta (2002‐2006), however indicate that the sea level has started to rise again. Indeed, predictions by [87] are that sea level will rise by 0.45 ± 0.15 cm/year. In chapter 5, it is indicated that a global mean sea level rise of 7 cm (2025), 14 cm (2050), 23 cm (2075) and 30 cm (2100). This divergence in predictions, coupled with

216
the limitations of the models (see section 5.6) clearly points to the need for long time series data to identify trends with a fair degree of certainty. Vulnerability
While taking into consideration the uncertainties associated with sea level rise predictions for the Maltese Islands, vulnerabilities associated with this phenomenon pertain to coastal land‐uses including discontinuous urban fabric, protected areas, and port areas and coastal infrastructure, including coastal roads. Sea level rise would affect commercial and industrial activity in the Maltese Islands located along the eastern low‐lying coastal areas. The transport infrastructure that may be affected by sea level rise includes roads along Mellieħa Bay, Xemxija Bay and Salina Bay. Sea level rise and the increase in frequency in storm surges may also jeopardise plans for coastal developments including future land reclamation projects. However, since land reclamation as a principle is still being assessed, government is still in time to take note of the potential impact of climate change on such projects. A number of localities (e.g. St George’s Bay, Balluta, Xlendi, many areas around the Grand Harbour and Marsamxett Harbour, Marsaxlokk Bay, Mġarr in Gozo) would have been subject to much flooding had they been left in their pristine state, mainly in view of their low‐lying topography. However, infrastructural works undertaken over the past 40‐50 years have so radically changed the coastline or its approaches at these localities that, as long as the change in sea level is as predicted [87], little or no flooding would occur here. Ironically, these once ill‐conceived constructions may now actually become useful to protect inland areas from inundation. Some of these constructions (especially the roads) may however be prone to inoperability from increased frequencies of storm surges. The coastal areas in Malta that could be affected by a rise in sea level and increase in the frequency of storms are classified in Table 7.1. These include the north‐eastern coast of Malta, the north and south‐eastern coast of Gozo, and the northern coast of Comino. The total area of land that will be affected is 1.11 km2, or 0.36% of the total surface area of the Maltese Islands. It should be noted, however, that a substantial part of this land is boulder scree or cliff, so that the impact of sea level rise here will be restricted. Consideration should also be given to protected coastal areas, many of which are also located along low‐lying coastlines. These natural areas are extremely vulnerable to sea level rise and increased storm surge events and policies for the designation and management of such lands needs to take into consideration the changing climate scenario.

217
Vulnerability of Beaches All the beaches in the Maltese Islands may be obliterated or reduced in size by flooding and erosion (Figure 7.1 and Figure 7.2). Recent beach replenishment projects that may be affected include those at Pretty Bay and St George’s Bay. This will result in costly (or impossible) replenishment works, since in most locations the inland migration of beaches is constrained by coastal infrastructure (e.g. roads) and buildings.
Land use Coastline length (km)
Malta
Discontinuous urban fabric 24.63
Continuous urban fabric 10.67
Green urban areas 1.65
Agriculture 5.69
Port areas 16.35
Industrial or commercial units 5.47
Mineral extraction 1.08
Area of Ecological Importance Level 2 7.10
Area of Ecological Importance Level 3 8.60
Special Protection Areas 5.10
Natura 2000 14.40
Important ornithological areas 0.80
Beaches 2.20
Gozo
Discontinuous urban fabric 2.16
Agriculture 1.40
Port areas 0.84
Mineral extraction 1.19
Area of Ecological Importance Level 2 6.90
Special Protection Areas 0.60
Natura 2000 3.10
Important ornithological areas 2.30
Beaches 0.67
Comino
Area of Ecological Importance Level 3 0.55
Special Protection Areas 1.60
Natura 2000 1.60
Important ornithological areas 0.68
Beaches 0.10
Note: some AEIs, SPAs and Natura 2000 sites overlap and therefore may cover the same length of coastline Table 7.1: Coastal land uses and length of coastline that may be affected by a sea‐level rise of 0.5 m.

218
Figure 7.1: Digital elevation model of Mellieħa Bay today and with a sea‐level rise of 0.5m. Note: The flooding shown in the Bird Sanctuary is due to below surface infiltration. The accuracy of this projection is not confirmed as the infiltration may be restricted by existing infrastructure in the reserve itself.

219
Note: The impacts at the salt pans themselves are likely to be less pronounced in view of the height of the outer boundary walls. Figure 7.2: Digital elevation model of Salina Bay today and with a sea‐level rise of 0.5m.

220
77..33..22 IInnccrreeaassee iinn RRaaiinnffaallll IInntteennssiittyy Although climate change predictions for Malta include a drop in the annual precipitation of around 60 mm, they also predict that the intensity of rainfall would increase, so that the Islands would be subjected to short but more intense rain events and more regular extreme weather conditions (see also section 7.2). An increase in the intensity of rainfall as predicted in the ‘trends analysis’ may lead to increased flooding in some urban areas and may require relocation of existing land uses or the modification of existing infrastructure or the construction of new special infrastructure to alleviate this problem. Extreme rainfall events may also result in flooding of sewerage systems in places, which may cause contamination of water supplies (see also [102]). Intense rainfall on fields can result in rapid water logging, ponding, and surface scour, which increases the likelihood of soil erosion, especially through gullying. Water logging also negatively affects agricultural land, especially if prolonged (see [103]). A further, less noticeable impact, is sheet wash, whereby heavy rain removes the surface layers of the soil (often the most productive), leaving behind a less fertile soil and one with reduced amounts of finer particles. Vulnerability The localities in the Maltese Islands that are most vulnerable to a higher risk of flooding are those associated with wide valleys having large water catchment areas, such as Marsa, Qormi, Msida, B’Kara, Burmarrad, Birżebbuġa and Marsaskala in Malta, and Marsalforn and Xlendi in Gozo. Most agricultural land is subject to intense rainfall effects unless structures such as rubble walls, ponds, dams, which were traditionally used to prevent soil erosion, control water flows and intercept rainwater, are regularly maintained, culverts cleaned, etc. Lack of maintenance of such traditional structures would exacerbate the vulnerability of agricultural land to heavy rainfall.
77..33..33 DDrroouugghhtt SSttrreesssseess oonn AAggrriiccuullttuurree ffrroomm RReedduucceedd AAnnnnuuaall PPrreecciippiittaattiioonn A reduction in rainfall, especially if prolonged, will affect the moisture content in soil potentially leading to drought stress in crops. As plants consist of 80 to 95% water, restrictions in the availability of water severely affects plant growth. In agricultural production systems water is the largest input, whether supplied by natural precipitation or irrigation. With the onset of drought, the first agricultural land to be affected is that under dryland production. However, as a drought becomes more severe, the effects move from dry‐farmed land to irrigated land. Eventually, water flows (e.g. in watercourses, streams, etc) are reduced, reservoirs dry up and ground water levels drop. Unusually

221
high temperatures and low precipitation may also push irrigation systems to their limits or beyond, so that drought stress occurs even when the system is operating at full capacity ([82]). Drought is defined by its duration, and is separated into three stages:
a) meteorological drought ‐ reduced precipitation from long term averages; b) agricultural drought ‐ reduced soil moisture stresses plants and reduces
biomass; and c) hydrologic drought ‐ reduced water levels in streams, lakes, wells.
Increased drought period can lead to desertification. Desertification has been defined in the UN Convention to Combat Desertification (UNCCD) as ”the degradation of land in arid, semi‐arid and dry sub‐humid areas caused by climatic changes and human activities” [100]. Vulnerability Soil erosion and desertification may lead to changes in agricultural practices, land abandonment, depletion of groundwater sources, and changes in land use. This can lead to impacts on rural economy of the Maltese Islands. All agricultural land in the Maltese Islands would be prone to such impacts, with dry farmed land being impacted first and eventually irrigated land, especially in prolonged dry events. This is dealt with in more detail in Chapter 11.
77..33..44 HHiigghh WWiinndd IImmppaaccttss oonn SSttrruuccttuurreess aanndd IInnffrraassttrruuccttuurree ffrroomm IInnccrreeaasseedd
FFrreeqquueennccyy ooff EExxttrreemmee WWeeaatthheerr EEvveennttss.. While the trends analyses indicate that there is an evident decreasing tendency in wind gusting intensity of the order of 50% in half a decade, the possibility of higher winds from extreme weather events may also have an impact on existing high‐rise structures and on their neighbouring uses, as well as on infrastructure (see [102]). As new constructions in the Maltese Islands tend towards high‐rise constructions (i.e. more than 10 floors), impacts of wind (both on the structure itself and on the neighbouring uses as a result of downwash from the high‐rise building) are becoming increasingly relevant, even if the tendency for gusting may decrease, as indicated. Other impacts on infrastructure and buildings are mainly related to extreme weather events, including heavy rainfall, which may affect road surfaces, rubble walls, retaining walls, etc., increased incidences of heavy hailstorms and thunderstorms and high winds, which may impact power lines (see [102]).

222
Vulnerability All areas of Malta are prone to such impacts. High‐rise buildings will be subject to pressures from wind forces and their planning and design needs to focus on these issues.
77..33..55 SSeeccoonnddaarryy IImmppaaccttss oonn PPrrooppeerrttyy VVaalluueess aanndd IInnssuurraannccee Climate change will have major impacts across Europe, and hail storms and windstorms will be a particular problem [89]. Depending on the location and the building type, these climatic events can have a greater or lesser impact on existing buildings. The Braer storm in 1993 in Shetland, Scotland1, showed that if buildings are sufficiently resilient, they need not suffer damage from storms. The question is whether architects, the construction industry and Government can be persuaded of the need to consider more resilient construction methods [85]. The insurance industry is very well placed to use financial penalties and incentives to architects, builders and property owners to produce buildings which help to mitigate GHG emissions. Furthermore, the location and type of construction will not only help to reduce emissions but are equally important in reducing the impacts of climate change on the building itself, for example, through climate change sensitive design (which allows for natural ventilation in buildings, effective insulation of buildings, and incorporation of photovoltaic solar panels for electricity generation on site). As climate change impacts become progressively more severe, impacts on buildings (e.g. from flooding events) may increase, impacting property values; this would in turn affect property insurance premiums. Together, companies in the financial sector have much bigger assets than the combined might of the fossil fuel industry and they control over 30% of the world’s stocks and shares. Most major banks and insurance companies now recognise that whatever the fossil fuel companies might say, climate change is here, and its impacts are happening now. European insurers are already geared up to underwrite emission trading contracts, derivatives and hedging products, wind and biofuel crop guarantee covers for renewable energy, and other new financial products [85].
77..44 AAddaappttaattiioonn MMeeaassuurreess The impacts of climate change are already being felt, and irrespective of the level of impact that will be achieved and the accuracy of predictions further impacts are inevitable. The decisions that are made today on infrastructure, biodiversity,
1 This storm was very severe, approximating a hurricane and lasted 22 days. Despite its severity, the buildings in Shetland are constructed so well that there was very little damage. If such a storm were to hit highly populated areas of England and Wales, there would be widespread devastation and loss of life, due to much lower building standards.
223
agriculture, water management, etc., will have lasting consequences. It is therefore important to start planning now for these changes to achieve the required adaptation. Climate change is expected to increase the existing need to bridge the gap between science and land use planning. Thus, although there is still much uncertainty regarding climate change projections, policies that take a conservative approach are ‘policies of no regrets', since there is already a need for better resource‐based land use planning [81]. Adaptation to climate change can take many forms. The following sections explore adaptation measures to climate change impacts that can be taken within the ambit of land use planning.
77..44..11 GGeenneerraall MMeeaassuurreess Land use planning has an important role to play in assisting a country to adapt to the effects of climate change. Land use or spatial planning needs to be geared up and sensitive to the predicted changes and all planning needs to take these into consideration. Used positively, spatial planning can help build communities with lower carbon emissions and increased resilience to climate change. The land use planning system in Malta is based on the British town planning system. The legal framework is set out in the Development Planning Act, which governs the land use planning system in Malta and sets up a Competent Authority ‐ the MEPA, which is also the competent environment authority and carries out its environmental functions under the Environment Protection Act. The general planning guidance is provided through a series of hierarchical planning policy documents ‐ The Structure Plan for the Maltese Islands, a set of seven Local Plans, which set out in more detail the planning regime for specific regions of the country, Subject Plans, which deal with specific topic subjects (e.g. waste management, minerals, coastal zone, yachting, etc) as well as Action Plans (which deal with various aspects affecting an area) and other supporting/guiding documents such as Development Briefs and policy guidance notes or similar. Traditionally, climate change issues were not taken into account during the formulation of such planning policy/guidance documents, although there is nowadays increasing awareness that such documents need to consider the effects of climate change. The importance of these land‐use documents as a tool for implementation of adaptation measures and to increase resilience to climate change cannot be over‐emphasised. As stated in [264] on the economics of climate change: “Development itself is key to adaptation. Much adaptation should be an extension of good development practice and reduce vulnerability by:
promoting growth and diversification of economic activity; investing in health and education;

224
enhancing resilience to disasters and improving disaster management; promoting risk‐pooling, including social safety nets for the poorest.”
To ensure that such important land use planning guidance is sensitive to the needs of a changing climate, all statutory land use plans (Structure Plan, Local Plans, Action Plans, and Subject Plans) should be reviewed with a view to update policies and proposals in the light of the climate change challenges facing Malta. Such a review should be based on impact and vulnerability assessments, including local impact scenarios. Of particular relevance is the 1990 Structure Plan for the Maltese Islands that is currently undergoing review. Several Topic Papers have been prepared on a number of subjects; it may be opportune that a Topic Paper on climate change is prepared. The Topic Paper would evaluate current Structure Plan policies, comb through the various Topic Papers already prepared with a view to identify areas where climate change impacts could result, and finally propose policies that should be included in the new Structure Plan and/or propose changes to the existing policies. Even though climate change impacts may happen in 50 or 100 years from now, these spatial plans need to be formulated as though the impacts are here and now. Land use strategies/plans need to ensure that they contribute to Malta’s obligations and targets for climate change adaptation and mitigation, increase energy efficiency in and reduce carbon emissions from buildings and spaces, encourage and actively support sustainable transport options, facilitate an increase in the resilience of buildings and spaces to climate change, sustain biodiversity, encourage technological innovation, and help communities to contribute effectively to tacking climate change impacts. Though often not directly a result of climate change response, a number of measures have been implemented or are currently underway. These include:
formulation of a storm water management plan for Malta (see also [90]), which has been also subjected to a Strategic Environmental Assessment process and is currently undergoing EIA and a CBA. The Plan aims to identify ways of alleviating flooding in flood‐prone areas and, where possible, also harvest some of the rainwater.
designation of protected areas (see also [94]), which though successful needs to also consider the effects of climate change so that any expected changes in the habitats being protected is catered for in the original designation to avoid having areas that are protected but then so drastically change that the features they were set up to protect no longer exist.
formulation of the Rural Development Plan for Malta (first for the period 2004‐2006 and now for the period 2007‐2013). This plan includes a number of agri‐environmental measures which aim to sustain and diversify agricultural activity in full respect for the environment. A number of the measures supported will also have a direct or indirect effect in counteracting the impacts of climate change on the agricultural

225
resource (see [103]). A series of measures have recently been launched and proposals received are being processed.
the Draft National Strategy on Sustainable Development was prepared in 2006.
implementation of the Floods Directive (including through measures that also implement the Water Framework Directive).
77..44..22 AAddaappttiinngg ttoo SSeeaa‐‐LLeevveell RRiissee Possibly, the climate change effect with the highest probability of affecting land use is sea level rise, even though the scenarios for such a phenomenon are not very robust. Many countries in north‐western Europe have adopted the approach of developing detailed shoreline management plans that link adaptation measures with shoreline defence, accommodation and retreat strategies [83]. Protection of the coastline from sea level rise may be achieved using ‘hard’ protection measures, such as sea walls, levees, groins and breakwaters, or ‘soft’ protection measures such as flood‐proofing of buildings, beach nourishment and the enhancement of natural coastal ecosystems. These would allow development to continue to occupy coastal areas. No coastal strategies directly related to coastal defences have been adopted in Malta to date. MEPA has formulated a Coastal Strategy Topic Paper [96] as part of the Structure Plan Review, but this does not address sea level rise and the need for a coastal defence strategy in any detail. A coastal defence strategy would need to be prepared to identify priority areas and costs to implement the required defence structures. Ideally such a strategy would be part of a wider Integrated Coastal Zone Management Plan for the Islands. The upcoming National Strategy on Adaptation should also address this. The Government should also allocate a budget for the training of personnel. Adaptation measures on low‐lying coasts have to address the problem of sediment loss from marshes, beaches and dunes. An issue of concern is the fact that several of our former sandy beaches have been completely obliterated due to construction of infrastructure (especially roads and seawalls) passing very close to them. These have completely eliminated the flow of sand and other sediment, starving the beach of its much required annual input of sediment. Over the past years this has resulted in the loss of the vast majority of our small beaches. A number of plans and ideas have been put forward in recent years to try to reverse this trend, not only for climate change purposes, but to sustain the tourism industry. The main solution has been in the form of beach replenishment projects, recreated using imported sand with a larger grain size than the original, which helped to increase the resilience of these

226
beaches to climate change impacts2. The removal of coastal structures that impede the movement of beaches inwards should also be considered when enough space exists in the hinterland to allow such movement without affecting other important uses. Relocation of coastal roads to a more inland location should be considered, where such relocation is possible. Such interventions would need to be backed up by detailed scientific/ecological studies and engineering analysis to ensure that the project would be successful, the beach dynamics are retained or re‐established, and any other (inland) protected areas are not affected negatively. For example, as shown in Figure 7.1, the loss at Mellieħa Bay could be substantial, but the relocation of the road further inland is possible here. Such a move would, however, need to be carefully planned and designed to ensure against negative impacts on the nearby bird sanctuary. A coastal zone management plan should be devised to identify areas of risk and to designate no building zones; permitting only protective engineering structures against inundation and coastal erosion, where necessary. New development should be located outside of the inundation areas. A key element of adaptation strategies for coastlines is the development of new laws and institutions for managing coastal land [86]. For example, no EU Directive exists yet for coastal management, although EU member governments were required (under the EU Integrated Coastal Zone Management Strategy) to develop and publish coastal policy statements by 2006. The lack of a Directive reflects the complexity of socio‐economic issues involved in coastal land use and the difficulty of defining acceptable management strategies for the different residents, users and interest groups involved with the coastal region [99]. A continuous monitoring programme of sea‐level rise is essential to understand this impact on a local scale, especially in view of the apparent anomalies in the central Mediterranean [87].
77..44..33 AAddaappttiinngg ttoo IInnccrreeaasseedd RRaaiinnffaallll IInntteennssiittyy aanndd FFllooooddiinngg EEvveennttss A storm water management plan for Malta is currently being devised. This aims to alleviate flooding problems in vulnerable localities. The plan will include an assessment of the existing infrastructure’s ability to cope with increase incidences of rainfall, as well as identification of ways of alleviating flooding through water by‐pass systems (e.g. tunnels and culverts). Where possible, harvesting of rainwater will be attempted, although this may be less possible in extreme situations.3 As in the case of sea level rise, land use planning needs to be sensitive to the impacts of climate change. Flood risk planning is one way of addressing the impacts of increased rainfall intensity. Through flood risk planning, areas that are prone to
2 This allows for greater stability and lower erosion rates. 3 An EIA and a Cost Benefit Analysis for the proposed stormwater plan are currently underway, through which various options will be considered and assessed.

227
flooding are identified and development therein constrained. These plans can be accompanied by other long‐term plans to relocate unnecessary development in these areas and replacing them with appropriate flood relief zones as well as implementation of obligations under the Floods Directive (see also [90]). Regular maintenance programmes for infrastructure (e.g. retaining walls, roads, bridges, etc) as well as rural structures (e.g. rubble walls, field terraces), and in particular flood relief infrastructure or water courses (e.g. cleaning of culverts, dredging of dams, repair of retaining walls and maintenance on pumps, levees, etc) are important to minimise the effects of flooding and increased rainfall intensity in both urban and rural locations. These maintenance measures need to take different site‐specific factors (e.g. location, aspect, terracing, landscape issues, etc) into consideration, especially when the vulnerability of different regions of the Maltese Islands is taken into consideration.
77..44..44 AAddaappttiinngg ttoo DDrroouugghhtt SSttrreessss aanndd CCllaassssiiffiiccaattiioonn Adapting to drought/desertification effects requires a long‐term view of the impacts and detailed analysis. As recommended in the CAMP (Malta) project [99], a systematic soil erosion/desertification survey should be undertaken for the Maltese Islands. This would entail mapping of activities at different levels and assessment of the actual and potential erosion balance. This mapping exercise would be followed by an erosion/desertification control management and planning scheme, which would identify remedial measures and recommendations for the conservation/rehabilitation/protection of the local soil resources and elaboration of a detailed action plan, as also recommended by the UNCCD, of which Malta is a party. The first step to address this was made in the collation of information on Maltese soils through the creation of a Maltese Soils Information System (MalSIS) [84]. In addition, other measures need to start to be considered, including consideration to the introduction of drought resistant crop plants and trees and shrubs for landscaping, especially varieties that can help to reduce soil erosion and the impacts of desertification (see also [103]). Potential impacts of the introduction of such species on the local biodiversity need also to be considered. Other measures involve the formulation of drought plans and irrigation management for specific areas, through which irrigators can plan ahead based on the water availability in the previous season, data on existing water sources, and land characteristics. Where possible, such plans and management strategies should be incorporated within the UNCCD Action Plans to combat desertification.

228
77..44..55 AAddaappttiinngg ttoo HHiigghh WWiinnddss aanndd EExxttrreemmee WWeeaatthheerr EEvveennttss High wind and extreme weather events can have their toll on infrastructure and especially high rise buildings. All planning and design of such structures need to take into consideration the effects of climate change. This should include eco‐friendly designs (see below), as well as wind studies for high rise buildings and wind‐prone infrastructure such as bridges to take into consideration not only the current wind regime but also predicted increases in intensity as a result of climate change. Impacts to be considered should not be limited to impacts on the structure itself but also on how the structure can affect surrounding uses.
77..44..66 AAddaappttiinngg BBuuiillddiinnggss ttoo CClliimmaattee CChhaannggee ‐‐ PPrrooppeerrttyy VVaalluueess aanndd IInnssuurraannccee Eco‐friendly design of buildings is becoming more mainstream in Europe, with various examples of eco‐homes and eco‐towns being added each year. Much work has been carried out in Europe to re‐educate architects to design more eco friendly and more resilient buildings, which not only have lower carbon emissions, but are more resistant to floods and storms [85]. In land use planning, the first priority must concern the location and design of future buildings and cities. Locations should be in areas least exposed to severe weather and sea level rise, and buildings should be designed to minimise carbon emissions and vulnerability to the elements, including damage to infrastructure such as transport and power supplies. If this were done now, then there would be fewer problems for future generations. Architects and the construction industry in general should also consider various measures in the design and construction of buildings, such as [85]:
integrating solar photovoltaics in every new building; reduce glazing on walls and fit external shades (or construct loggias
where feasible) to reduce solar heat gain and hence the need for air conditioning the building;
properly insulate the building to reduce artificial heating and cooling costs;
use low energy cool running light fittings, which save power and reduce fire risks; and
make building resilient to floods and storms.
Some of the above can also be retro‐fitted on existing buildings.
229
IINNFFRRAASSTTRRUUCCTTUURREE
88..00 EExxeeccuuttiivvee SSuummmmaarryy Infrastructure is vulnerable to climate change in different ways and to different degrees. This depends on the state of its development, resilience, and adaptability. Most climate change impacts on infrastructure are likely to have indirect impacts on other aspects of society. Damage to power and telecommunications infrastructure can disrupt emergency response. Infrastructure may suffer from indirect impacts of climate change, such as increasing energy demands, which would require an increase in power generation capacity, as a result of rising temperatures. The prominent adaptation measures for infrastructure are a regular and preventive maintenance regime and ensuring that adequate materials are used that can withstand the changing climate conditions. In the energy sector, climate change will have a direct effect on both the supply and demand of energy. Decreased precipitation and heat waves are also expected to influence negatively the cooling process of thermal power plants. On the demand side, increasing summer peaks for cooling and impacts from extreme weather events will affect in particular electricity distribution. The increased frequency and severity of extreme weather events could threaten electricity transmission and distribution infrastructure especially that located in exposed areas, on the coast, and in flood‐prone areas. Extreme climate events cause huge economic and social impacts. Infrastructure (buildings, transport, energy and water supply) is affected, posing a specific threat to densely populated areas. A more strategic and long‐term approach to spatial planning will be necessary, both on land and on marine areas, including in transport, regional development, industry, tourism and energy policies. Increasing awareness of climate change impacts within the government, infrastructure, industry, and community sectors will support cultural change transitions that are required for the adoption of more climate change friendly technologies, designs, and operations by public and private operators. At a national policy level, while climate change is a consideration in some sectors, such as the energy sector, most policies do not consider the vulnerability of infrastructure to climate change. In the short‐term, therefore, awareness campaigns on the impact of climate change on the infrastructure sector should be on the Government’s agenda. Considering that ICT is now a priority for the country, it must be ensured that the new infrastructure being built and set up takes into consideration the possible impacts of climate change.

230
88..11 IInnttrroodduuccttiioonn Infrastructure is vulnerable to climate change in different ways and to different degrees. This depends on the state of its development, resilience, and adaptability. This Report considers the following sectors: energy, transport, telecommunications, buildings, and waste. The First National Communication did not consider infrastructure. However, it analysed waste from the GHG emissions angle. GHG emissions from waste management were estimated and mitigation measures were proposed to reduce such emissions. The following sections describe the current infrastructure in Malta.
88..22 IInnffrraassttrruuccttuurree iinn MMaallttaa
88..22..11 EEnneerrggyy The Maltese national grid is isolated with all the electricity requirements generated locally. Electricity generation is the responsibility of Enemalta Corporation that operates two power plants: the Marsa and Delimara power stations. The power plants have a nominal installed capacity of 571 MW. A planned 100 MW extension to the Delimara plant is in the pipeline as the Marsa power station is scheduled to be decommissioned within the next 2‐3 years. At the Delimara power station the steam units burn 1% sulphur fuel oil, while the gas turbines and the Combined Cycle, burn distillate fuel oil. At Marsa all the steam units presently burn 1% sulphur fuel oil and the gas turbine burns distillate fuel oil [266]. The electricity is distributed throughout Malta using a network of 132 kV, 33 kV and 11 kV cables. Most of the current power transmission infrastructure is located underground, see Table 8.1. Furthermore, it is Enemalta’s policy that future installations of 33 kV and 11 kV circuits are also installed underground. This is done for two reasons: to safeguard the environment and to enhance the reliability of the system. There are also 1,075 indoor substations and 132 pole mounted transformers. These are used to step down the voltage from 11 kV to 400/230 V [266].
Cable capacity (kV) Underground cables (km) Overhead cables (km)
132 8 nil
33 154 60
11 1,041 159
Table 8.1: Power distribution infrastructure.

231
88..22..22 FFuueell SSttoorraaggee The Petroleum Division of Enemalta is responsible for the running of the following installations:
31st March 1979 at Birżebbuġa; Wied Dalam Depot; Ħas‐Saptan underground installation (150,000 tonnes of gasoil and jet‐A1
fuel); Ras Ħanżir underground installation; and Aviation installation at Malta International Airport.
A new installation to replace the 31st March 1979 at Birżebbuġa is currently being planned.
88..22..33 TTrraannssppoorrtt
The Maltese Islands are highly urbanised. The urban fabric covers 23% of the land [111]. The road network has an estimated total length of 2,300 km, including 190 km of arterial and distributor roads. The total number of vehicles equals 280,000 licensed vehicles [270]. Malta has three major gateway terminals that are vital for the transportation of goods and people in/out of the country. The Malta International Airport is located in the southwestern side of Malta. The present terminal was constructed between 1989 and 1991. Two runways serve the airport: runway 13‐31 is 3,554 m long and runway 05‐23 (located almost perpendicular to it) is 2,377m long. The airport has nine dedicated aircraft parking areas and approximately 50,000 m2 of car, coach, taxi, and car‐hire parking space. The other two main international gateways are the Grand Harbour and the Malta Freeport. The Mġarr Harbour in Gozo is also an essential gateway that links the island to Malta via the Ċirkewwa or Marsamxett harbours. A number of small harbours are found in various places along the coastline. Many are used by fishing vessels and/or for the mooring of pleasure craft. The main ones are located at Birżebbuġa, Marsaxlokk, Marsaskala, Marsamxett, and San Pawl il‐Baħar. Other minor ports include Wied iż‐Żurrieq, St. Julian’s, St Thomas Bay, and Salini. 88..22..44 TTeelleeccoommmmuunniiccaattiioonnss Currently, there are three main mobile phone operators that together offer an extensive coverage with the help of over 400 base stations; other recently launched

232
service providers (or new ones that will commence operations in the near future) will be utilising the infrastructure owned by one of the main operators. In addition to these, telecommunications infrastructure includes ‘Public Land Mobile Antennas’, microwave links, and TV repeaters [106]. There are over 200,000 landlines with the main network being underground; however users are still connected to the network via overhead cables [110]. The Internet has revolutionised the telecommunications sector. The Asymmetrical Digital Subscriber Loop (ADSL) enables users to access the Internet through the fixed telephony network while cable Internet is conveyed to users through the same infrastructure serving cable television. Internet Services Providers (ISPs) use servers that run continuously. These servers consume large quantities of electricity and are vulnerable to spikes and surges that may interrupt processing, damage stored files, and possibly hardware. MEPA’s Utilities Topic Paper notes that there needs to be cooperation between the energy provider (Enemalta) and ISPs in order for the former to provide the latter with an uninterrupted and reliable power supply. Broadband wireless access is a technology aimed at providing wireless access to data networks, with high data rates, by replacing the fixed access portion of the telecommunications network. This technology eliminates the requirement for physical cable transmission, reducing the “last mile” barrier for customer access. Wireless LAN technology (W‐LAN) is also gaining popularity in Malta. It allows users to connect to a network from anywhere in the close proximity of a hot spot without having to be physically connected to the network. Offices have adopted and implemented this technology as it provides mobility within a building. A number of operators are installing Wi‐Fi (wireless fidelity) access points (hot spots) in public places, permitting users to access the Internet even when not at home or in the office. Enemalta Corporation has recently awarded a contract for an automated meter reading system, deploying power line communications technology, to provide the required information for the management of the low voltage networks. This will increase tariff effectiveness, responsiveness and energy market trends and support the dispatching of Malta’s generation plant and distributed core electrical infrastructure through an integrated system. Deployment of meters as an initial pilot will begin in 2009 and the system is expected to be fully operational within 4 years (by 2013) [113]. Malta has four terrestrial television stations, 1 cable station, and 2 cable companies (Melita Cable and Go). Prior to the introduction of cable television, households received free‐to‐air television broadcasts through roof‐top aerials. TV and radio broadcasting is transmitted through fixed radio links from relay stations. There are two such stations in Malta; Għargħur and Iklin. The former is the most important and includes a tower that is 70 m high. Melita Cable owns a hybrid fibre/coaxial cable system that runs alongside the Enemalta power lines. This aerial infrastructure

233
comprises over 1,000 km of linear cabling, electronic equipment, and pole or wall bracket attachments. Developments in this sector are very rapid.
88..22..55 WWaassttee In terms of waste, there is some debate as to whether waste management is affected by climate change. An analysis of international literature, (like the IPCC reports) shows that waste management is mostly considered as a source of greenhouse gases. Most studies related to waste are performed to identify ways and means of improving waste management to reduce emissions. Malta’s waste infrastructure consists of an engineered landfill (Għallis), a waste treatment plant (Sant’ Antnin), a thermal treatment facility (Marsa), over 200 bring‐in sites (set to increase to 400 in the near future), and three civic amenity sites for bulky waste. Sewage treatment plants are located in Gozo (Għajnsielem), and Mellieħa. Another one is proposed in the south of Malta. There is also a transfer station to transfer waste (organic, reject and Refuse Derived Fuel) generated in Gozo to Malta.
88..22..66 BBuuiillddiinnggss
Malta owes much of its architecture to the soft globigerina limestone from which most of the island's buildings are constructed4. Aside from the modern bricks made from imported cement, globigerina limestone is the only vernacular stone suitable for construction; the clay available in Malta expands, shrinks, and cracks in response to seasonal temperature fluctuations while the upper coralline limestone is an unyieldingly hard mineral. Globigerina limestone weathers to the colour of natural sandstone, and its plasticity allows it to be sculpted well. Where environments are very hostile to local stone, as in the case of buildings close to the sea and exposed to sea spray, globigerina limestone, was in the past considered to be inadequate and was supplanted by upper coralline limestone as the main dimension stone, e.g. Scamp’s Palace in Vittoriosa. Type 2N stone (a type of globigerina limestone) has also been used in local constructions of the 17th and 18 th century in environments that are conducive to rapid weathering of stone e.g. Forni Stores. In localities where capillarity rise of solutes is significant, Coralline Limestone has been used as masonry for the lower courses (e.g., in Mdina). However, in
4 The mid‐tertiary succession of the Maltese Islands comprises five Formations, including the fine‐grained sediments of the globigerina limestone Formation that outcrop extensively. Constructions from the Neolithic to the advent of concrete have mostly used certain facies of this Formation, which is characterised by high purity (>90% CaCO3), fine grain size and small pore size. Some fine‐grained facies are also found in both coralline limestone Formations.

234
Valletta (where Coralline Limestone is not readily available) this has been replaced (possibly deliberately) by type 2P stone (a type of globigerina limestone), where dissolution seams act as inhibitors to capillarity rise [108]. Traditional vernacular architecture such as farmhouses and townhouses, were originally a quarry and building site. Stone for the house was derived by excavating a small quarry in the centre of a large courtyard extending beneath the ground floor rooms, typically used for livestock. Stone off‐cuts and loose residual stone chippings were also used as infill material between the two skins resulting in a monolithic 760 mm wall with a high thermal mass (zero waste). An added benefit was that the same quarry was trimmed and often used as a water cistern collecting rainwater (water conservation). This also served as a thermal sink enhancing comfort in both summer and winter [105]. The thick walls, small windows, and internal courtyards for ventilation in the old houses of Maltese villages have been gradually lost with the introduction of concrete roofs and bricks in outer walls.
88..22..77 HHeerriittaaggee PPrrootteeccttiioonn Buildings, monuments, and sites are protected through the Cultural Heritage Act and the Development Planning Act. The latter allows MEPA to schedule culturally important buildings and sites. The MEPA Scheduling List contains sites and monuments. The Antiquities List compiled in 1946/47 contains sites of historical and antiquarian significance from before the 1900’s. In addition, 3 sites, namely the city of Valletta, the Ħal Saflieni Hypogeum, and the megalithic temples (6 sites) are UNESCO World Heritage Sites. Heritage Malta, the Government Agency responsible for the protection of local heritage embarked on a project to cover the temples of Mnajdra and Ħaġar Qim. The two important sites date back to the late Neolithic period, approximately between 3,600 BC and 2,500 BC. The area designated as the Ħaġar Qim and Mnajdra Heritage Park consists of a piece of land measuring around 40 hectares. The temporary protective shelters for the temple structures will be for a 30‐year period. The tent over Hagar Qim will be 11.55 m high while that over Mnajdra will be 9.10 m high. It has been reported that the need to protect the temples has long been felt, because the material used for their construction has been ravaged by the elements, especially direct rainfall and solar radiation. The debate on the conservation of the megalithic temples is an old one. The vulnerability of the sites has long been acknowledged, at least since the 19th century, and this awareness has increased during the 20th century. In 2000, a Scientific Committee for the Conservation of the Megalithic Temples was set up and began studying the threats with a view to recommending solutions to government. After careful consideration, one of the recommendations was that the most prudent and most urgently required intervention to mitigate the problem was the installation of temporary protective shelters, while research on other treatments and solutions continues. Direct material

235
intervention on the structures themselves is more risky and, if possible, should be avoided because any mistakes are likely to be irreparable. Further research is required to define safe and reliable methods of preserving these structures without the need for protective shelters. In the case of the shelters, the worst‐case scenario is that if their performance is not satisfactory, and if the protection they provide does not justify the visual intrusion, they can be dismantled and removed. In order to better understand the processes that are damaging the prehistoric structures, a project for the intensive environmental monitoring of the sites has been launched. The Institute of Atmospheric Sciences and Climate (ISAC), which forms part of Italy's National Research Council (CNR) is carrying out the studies. The information that is being gathered in this project will help define the conservation needs of the site and the detailed design of the protective shelters, and eventually will also help in the assessment of the shelters' performance [268].
88..22..88 TThhee CCooaasstt The coastal zone in Malta is designated in the Coastal Strategy Topic Paper [96]. Most of the land near the coast is intensively developed: the built up area within one km inland from the sea increased from 5 to 26% between 1990 and 2004. Such developments were mainly aimed at the tourism and recreation sectors, see Figure 8.1. Resources in coastal areas are mainly exploited by fisheries, transportation and recreation. The increasing rate of development has also led to conflicts between the various uses in the coastal zone. It is recognised that there exists a gross imbalance between the income generated from the exploitation of coastal and marine resources, especially by the tourism industry, and funds allocated to protect such resources.
88..33 SSuummmmaarryy ooff CClliimmaattee CChhaannggee SScceennaarriiooss The locally generated regional scenarios predict an increase in annual average
temperature of 2.0 C and 2.8 C by 2050 and 2100 respectively. The model results of such projections are considered to be robust and the trends in observed temperature corroborate the gradually warming climate (see Chapter 4). Such increase in temperature is also in line with the predictions of the IPCC FAR. Models for precipitation and temperature variability however are associated with more uncertainties. Although a decrease in precipitation is being predicted, projected changes in precipitation should be viewed with some caution. The trends analysis implies that total rainy days with 0.1 mm or more of rainfall are decreasing while total yearly days with 10 mm or more of rain is increasing. This may be interpreted as a decrease in the total amount of precipitation but an increasing trend for convective type rainfall or heavy rainfall. While the uncertainties still prevail, the trends identified from data observations are in line with regional scenarios (found in

236
the IPCC FAR) with regards to both decrease in mean annual precipitation and increase in extreme weather events (increase in the intensity of daily precipitation events) for the Mediterranean region. The IPCC report notes that there will be a higher incidence of drought and heat waves in summer.
Figure 8.1: Density of development within one kilometre buffer from the coast (Year 2004) [111]. With regards to the mean sea surface temperature (SST) in the coastal waters of the Maltese Islands, in Chapter 4 it was shown that this has been steadily increasing at an average rate of close to +0.05 oC per year since the late 1970s. The increase in SST in Malta is most evident during summer, in agreement with the equivalent larger seasonal trend in air temperature; it is however also high in autumn and to some extent in winter, which is clear evidence that the sea temperature depends also on non‐local larger scale phenomena. In this context, while this chapter will focus on the more certain increase in temperature, as also verified by locally generated scenarios, other impacts associated with the decrease in precipitation and increase in extreme events will be addressed based on regional scenarios.

237
88..44 IImmppaaccttss ooff CClliimmaattee CChhaannggee oonn IInnffrraassttrruuccttuurree Most climate change impacts on infrastructure are likely to have indirect impacts on other aspects of society. Damage to power and telecommunications infrastructure can disrupt emergency response. Infrastructure may suffer from indirect impacts of climate change, such as increasing energy demands, which would require an increase in power generation capacity, as a result of rising temperatures. The prominent adaptation measures for infrastructure are a regular and preventive maintenance regime and ensuring that adequate materials are used that can withstand the changing climate conditions. The following sections describe the vulnerability to climate change of infrastructure.
88..44..11 EEnneerrggyy In the energy sector, climate change will have a direct effect on both the supply and demand of energy. Decreased precipitation and heat waves are also expected to influence negatively the cooling process of thermal power plants. On the demand side, increasing summer peaks for cooling and impacts from extreme weather events will affect in particular electricity distribution [107]. As of 2002, the local peak electricity generation has shifted from winter to summer with July replacing January in terms of peak load, see Figure 8.2. This mainly came about as a result of the increasing use of air conditioning for cooling. Power failures were experienced as a result of the increased load [269]. With the expected higher temperatures and longer summer season, it is most likely that the energy demand for air cooling will increase further. It is noted that buildings are the major energy consumer, with 40% of the total energy consumed in EU countries. Two‐thirds of this energy is devoted to residential buildings and the rest to commercial premises. Almost 70% of this energy is allocated to the heating and cooling of our homes, showing the inefficiency of our buildings [105]. Hence, the current energy peak in summer can be expected to increase. As a result of infrastructure limitations, peak demand can go beyond the maximum capacity of the transmission system [116] and power failures may increase in frequency. Enemalta is responding to the increased demand by seeking to increase the capacity of the Power Station and exploring possibilities of connecting to the European grid. Concurrently the Government is exploring ways to exploit renewable energy. Although there is a draft Energy Policy for Malta, the document does not discuss vulnerability and adaptation: in terms of climate change it focuses on emissions and mitigation.

238
100,000
120,000
140,000
160,000
180,000
200,000
220,000
240,000
January
February
March
April
May
June
July
August
September
October
November
Decem
ber
MWh
2000 2001 2002 2003 2004 2005 2006
Figure 8.2: Generated electrical power: 2000‐2006 [115]. The increased frequency and severity of extreme weather events could threaten electricity transmission and distribution infrastructure especially that located in exposed areas, on the coast, and in flood‐prone areas. Furthermore, high temperatures significantly reduce the efficiency of transmission lines [109]. However, transmission lines are not expected to be greatly affected in Malta since most of the distribution network is located underground. At the extreme end however, increasing power cuts may result in deaths as the most vulnerable may not be able to find relief from heat stress [109]. The gradual rise in the temperature of the sea especially in the later summer months (August and September) could also have an impact on the use of the sea as cooling water for the power stations. Fuel storage sites are vulnerable to extreme weather events (heavy rainfall), especially those located in valleys such as Ħas‐Saptan.
88..44..22 TTrraannssppoorrtt The transport infrastructure may be affected as a result of the increased frequency and intensity of extreme weather events, namely increased precipitation as discussed above. Harbours and the airport may be temporarily closed and related infrastructure critical to trade may suffer damages. Coastal infrastructure and

239
distribution facilities are vulnerable to inundation and flood damage. Similarly, more intense rainfall events have the potential of causing significant flood damage to roads. A general increase in temperature and a higher frequency of hot summers are likely to result in an increase in buckled and rutted roads due to thermal expansion [116]. Additionally, the life of asphalt on road surfaces and airport tarmacs could be reduced. Increased temperature will also cause additional expansion of concrete joints, protective cladding, coatings and sealants on bridges and airport infrastructure [109]. It is noted that roads are already severely affected by heavy downpours. This problem is expected to be exacerbated when such events are more intense. The accelerated degradation of transport infrastructure has the potential to reduce its life expectancy, involve substantial disruption and repair costs, and lead to potential structural failure during extreme events [109]. The current Structure Plan was formulated in 1990; at this time climate change impacts on the transport sector were not considered. While Local Plans were approved in 2006, these also did not consider climate change impacts.
88..44..33 TTeelleeccoommmmuunniiccaattiioonnss Telecommunication infrastructure in the form of transmission masts is vulnerable to high winds but resilient when buried underground. Extreme weather events may cause damage to telecommunications exchange stations. This will reduce the level of services provided and increase maintenance costs [109, 116]. Moreover, its disruption can seriously hinder the emergency response to an extreme event. Power failures/surges/spikes could also impact ISPs and damage software and hardware. 88..44..44 BBuuiillddiinnggss Buildings are expected to suffer from an increase in the frequency and intensity of extreme events, in particular as a result of flooding. Coastal buildings are also vulnerable when storm surges are combined with sea level rise. Increased temperature and solar radiation could reduce the life of building elements due to temperature causing increased expansion and materials degradation of concrete joints, steel, asphalt, protective cladding, coatings, sealants, and masonry [109]. The accelerated degradation of materials has the potential to reduce the life expectancy of buildings, structures, and facilities, also increasing maintenance costs and leading to potential structural failure during extreme events. Such degradation in turn increases the probability that extreme weather events will result in structural

240
failure [109]. This situation is further exacerbated in older buildings and structures such as the Neolithic Temples, fortifications, churches, etc that are already susceptible to damage from the elements. Maltese globigerina limestone, which is a fine‐grained limestone, is subjected to more damage by salt crystallization and less affected by washing of salts by rain. This problem becomes acute in the maritime and seasonal climatic conditions of the Maltese Islands. The predicted sea level rise (see above) and potential occurrence of extreme events could negatively affect the limestone. In terms of building construction a very relevant piece of legislation concerning energy efficiency of buildings is Legal Notice 238 of 206 Minimum Requirements on the Energy Performance of Buildings Regulations, 2006 that also includes a Technical Guidance document. Part 13 of MEPA’s Policy & Design Guidance 2007 [112] entitled Energy and Infrastructure contains a number of policies related to the design of energy efficient buildings, provision of solar water heaters and photovoltaic modules, and provision of a rainwater cistern for all developments (in accordance with the Code of Police Laws). For major developments MEPA may also request an Energy Performance Prediction Audit. Environmental Impact Assessments for major projects are also required to include an energy assessment.
88..44..55 WWaassttee Climate change has the potential of impacting on waste management in a number of ways. Some of these impacts are specifically on waste management facilities. Others are more general and could affect waste management indirectly. These include [104]:
a) changes to site hydrology and temperature, which in turn could affect waste management processes, e.g. landfill degradation rates, leachate production, and composition;
b) increased site disamenity from odour, vermin, dust, and litter; c) increased disruption to supporting infrastructure (such as roads) that
could also affect some onsite facilities, e.g. weighbridges and gas and leachate collection systems; and
d) increased disruption to transport infrastructure due to flooding and hence the delivery of waste.
The impacts are dependent on site specific issues related to its location such as geology, topography, and closeness to the sea. It is noted that none of the waste management facilities such as the Għallis landfill or the thermal facility at Marsa are located close to the sea such that they would be impacted by sea level rise. With regards to elevated temperatures in summer, it is noted that Malta already suffers

241
high temperatures; these considerations have been taken into account when developing landfills. The draft Solid Waste Management Strategy for the Maltese Islands [12] considers all aspects of solid waste management including implementation of the waste hierarchy and an increase in awareness. The vulnerability of the waste sector to climate change is not considered.
88..55 AAddaappttaattiioonn Extreme climate events cause huge economic and social impacts. Infrastructure (buildings, transport, energy and water supply) is affected, posing a specific threat to densely populated areas. The situation could be exacerbated by the rise in sea level. A more strategic and long term approach to spatial planning will be necessary, both on land and on marine areas, including in transport, regional development, industry, tourism and energy policies [107]. The European Commission recognises that while protecting existing and future infrastructure from the impact of climate change will be predominantly a Member State responsibility, the EU still has an important role in promoting best practice, via support for infrastructure development and also in developing standards for construction (for example through the Eurocodes ‐ a set of unified international codes of practice for designing buildings and civil engineering structures, which will eventually replace national codes). At a European level recommendations emerging from the White Paper on Adaptation include requiring infrastructure projects which receive EU funding to take climate‐proofing into account based on methodologies to be developed. These methodologies would then be incorporated into the TEN‐T (Trans‐European Network for Transport) Programme. The vulnerability of the TEN‐T to climate change and the need for potential adaptation measures is part of the debate launched by the European Commission with the adoption on 4th February 2009 of the Green Paper on 'TEN‐T: A policy review'. Similarly for Trans‐European Energy Networks, TEN‐E, there is a Green Paper "Towards a secure, sustainable and competitive European energy network". The Commission will explore the implications of making a climate impact assessment a condition for public and private investment, as will the feasibility of incorporating sustainability criteria ‐ including taking into account climate change ‐ into harmonised standards for construction, with for example a possible widening or extension of the existing Eurocodes. In addition, the Commission will work with Member States and stakeholders setting guidelines and exchanging good practice, to ensure that account is taken of climate change impacts when implementing the Environmental Impact Assessment (EIA) and Strategic Environmental Assessment (SEA) Directives and spatial planning policies. The following actions at EU and Member State level are proposed by the White Paper:

242
a) take account of climate change impacts in the Strategic Energy Review process;
b) develop methodologies for climate‐proofing infrastructure projects and consider how these could be incorporated into the TEN‐T and TEN‐E guidelines and guidance on investments under Cohesion policy in the current period;
c) explore the possibility of making climate impact assessment a condition for public and private investment;
d) assess the feasibility of incorporating climate impacts into construction standards, such as Eurocodes; and
e) develop guidelines by 2011 to ensure that climate impacts are taken into account in the EIA and SEA Directives.
It is noted that in Malta the Terms of Reference for EIA issued by MEPA for major developments do require an assessment of climate change impacts and the SEA regulations require consideration of the impacts of “climatic factors”.
88..55..11 EEnneerrggyy In order to adapt to the expected impacts of climate change on energy infrastructure, a number of measures need to be taken. These include providing extra power generation capacity to cope with the increasing demand. Enemalta is aware of this and is in the process of installing an addition 100 MW to its existing plant. Furthermore, the possibility of establishing a Sicily‐Malta grid link is being evaluated and Government has recently embarked on environmental impact assessments to develop off shore and on shore wind farms. It is recognised that providing additional energy is not the only solution and it must also be viewed in conjunction with the proposed mitigation strategy described elsewhere in the Second National Communication. The shift from fossil fuels to renewable energy use is considered to be a medium to long term adaptive measure. The siting of energy infrastructure should be considered with respect to climate change [116]. Siting must consider the potential sea level rise (see scenarios above). Spatial planning policy must therefore take climate change factors into consideration. Other factors such as the impact of the increase in sea temperature and how this will affect the cooling water used by Enemalta needs to be assessed.
88..55..22 TTrraannssppoorrtt Most of the transport infrastructure adaptations can be made gradually in the course of routine maintenance, for instance by the use of more heat‐resistant grades of road materials when resurfacing. However, it should be noted that transport infrastructure is more vulnerable to the effects of extreme local climatic events than

243
to changes in the mean [116]. It must be noted that the problems Malta faces with respect to construction of roads and the poor quality of some of Malta’s roads first needs to be resolved through quality control and regular maintenance. Planning of new roads should take into consideration local issues of flooding and climate and also consider future climate scenarios where weather is expected to get warmer. The same considerations apply to existing roads that are being re‐surfaced or re‐designed. Again the importance of considering future climate scenarios in land use planning would reduce this sector’s vulnerability to potential climate change impacts. Consideration of impacts at planning and design stage would make adaptation less costly by avoiding “retro‐fitting” measures.
88..55..33 TTeelleeccoommmmuunniiccaattiioonn
Telecommunication infrastructure needs to be well maintained with a regular and preventive maintenance programme in order to reduce disruptions and downtime.
88..55..44 BBuuiillddiinnggss Of all the infrastructure sectors dealt with in this report, the building sector has the most diversity in ownership, and the greatest number of individual owners. This presents challenges regarding communication of the risks to owners, and ensuring that the risks are incorporated into decision making. The maintenance regime for buildings will need to be stepped up in order to adapt to the accelerated degradation of materials and structures. Traditional practices and design of typical Maltese houses with thick walls, small windows, and internal courtyards for ventilation are good examples of how to adapt to climate change. The current building design standards should be reviewed and adapted to accommodate the changing weather conditions especially the potential increase in temperatures. While such standards do exist (see above), they are not always applied to the design of new buildings. The climate scenarios and potential impacts on buildings indicate that in order to adapt to these changes Government should start considering mainstreaming climate change in its policy. For example Government may consider issuing permits that are subject to such conditions so that designing energy efficient buildings is not optional but a legal requirement. This could be gradually integrated into local policy since a strong planning framework already exists. According to [105] almost any building can be re‐designed to use between 50 to 70% less energy than a typical building of its type, if the method in which building systems interact and the way it functions as a whole are considered at the early concept

244
design stage. The key approach in energy‐efficient design is that the building is considered to be more than just structure and cladding, but all the elements contribute to the overall performance of the building, particularly in terms of its interaction with the climate. By utilising natural resources of lighting, heating, and cooling, additional energy for these requirements is minimised. Dwellings can be enhanced with energy efficiency principles to allow for day lighting, solar winter heating, summer cooling and natural ventilation through proper orientation, thermal storage, insulation, appropriate glazing, cross‐ventilation or stack effect, external shading, and internal zoning [105]. The proper implementation of the Energy Performance Building Directive (EPBD), Directive 2002/91/EC in Malta should also assist in the improvement of the energy efficiency of our buildings. The purpose of the Directive “is to promote the improvement of the energy performance of buildings within the community, taking into account outdoor climatic and local conditions, as well as indoor climate requirements and cost‐effectiveness”. The study in [108] concludes that the mode of salt weathering is related to the level of physical heterogeneity of fine‐grained pure limestone. This factor is fundamental to conservation and intervention and can be used to address the following problems, amongst others, which are endemic to the Maltese Islands:
in cases where badly weathered stone needs to be replaced, a similar stone should be selected and
constructions in hostile environmental conditions require the selection of specific stone types that respond adequately to adverse conditions.
The type of stone used for masonry should therefore be studied so that future buildings are resistant to the impact of climate change especially in low‐lying areas. Land use planning should also ensure that development in low lying areas in vulnerable areas considers impacts of climate change.
88..55..55 WWaassttee The risk of climate change on existing as well as former waste facilities should be assessed and should also include the related processes such as waste transportation. This will help to increase capacity that will help policy makers and regulators to propose adequate measures in this regard. Hence, policies and regulatory activities should be proposed that respond to climate change issues that could affect waste management. The development of a robust set of climate change indicators for waste management (e.g. temperature, precipitation, disamenity complaints, and occupational health and safety related to climate change) will help to monitor climate change at site level and to assess possible consequences [104]. It is noted that through the Environmental Impact Assessment and the Integrated Pollution Prevention & Control (IPPC) processes consideration of such waste management indicators are already given.

245
Landfill operators, for example, are required to monitor and report on disamenity complaints (such as odour) regularly. Therefore it is relatively straightforward to regulate waste management facilities even with respect to climate change impacts.
88..66 DDiissccuussssiioonn aanndd CCoonncclluussiioonnss The impacts of climate change on infrastructure are related to extreme weather events and higher temperatures. This may cause physical degradation to facilities on which several services rely. In the energy sector, climate change will have a direct effect on both the supply and demand of energy. Decreased precipitation and heat waves are also expected to influence negatively the cooling process of thermal power plants. On the demand side, increasing summer peaks for cooling and impacts from extreme weather events will affect in particular electricity distribution Increasing awareness of climate change impacts within the Government, infrastructure, industry, and community sectors will support cultural change transitions that are required for the adoption of more climate change friendly technologies, designs, and operations by public and private operators [109]. The policy review has indicated that while climate change is a consideration in some sectors, such as the energy sector, most policies do not consider the vulnerability of infrastructure to climate change. In the short‐term, therefore, awareness campaigns on the impact of climate change on the infrastructure sector should be on the Government’s agenda. Considering that ICT is now a priority for the country, it must be ensured that the new infrastructure being built and set up takes into consideration the possible impacts of climate change. Climate change impacts are not currently the foremost consideration in the siting and design of infrastructure in Malta. Consideration of climate change impacts should be included in national policy, both at a strategic level and in land use plans.

246
TTEERRRREESSTTRRIIAALL AANNDD MMAARRIINNEE EECCOOSSYYSSTTEEMMSS
99..00 EExxeeccuuttiivvee SSuummmmaarryy The Maltese Islands are characterised by a rich natural heritage of rare and indigenous species that are threatened or in decline. Scientific evidence from the Mediterranean region has shown that climate change could result in the following potential impacts on terrestrial ecosystems in Malta: loss of biodiversity and increased risk of extinction, shift in the distribution of species, obliteration of habitats, increased salinisation of soils and groundwater resources, changes in species composition, richness and phenology, reduction of groundwater resources, increased risk of desertification and fires, and a potential fertilising effect. All terrestrial flora and fauna groups are vulnerable to these impacts, particularly minor and freshwater communities. The potential impacts on the marine ecosystems include changes in faunal and floral diversity and distribution, spread of alien species, epidemiological outbreaks, changes in coastal hydrodynamics and deep water circulation, coastal erosion and loss of habitat, and ocean acidification. The most vulnerable groups of marine species to these impacts are Posidonia oceanica meadows and the littoral and sub‐littoral species, although all flora and fauna groups are vulnerable to some extent. The proposed adaptation measures include conservation strategies, management of stress on the environment, facilitation of migration, habitat restoration, natural resources management, expansion of reserves, and environmental monitoring. These adaptation measures need to be supported by the appropriate research and training to increase the knowledge base, on which the adaptation options depend. Existing policies need to be reviewed to ensure that they are sensitive to climate change issues and new policies need to be devised to cater for adaptation requirements under a changing climatic scenario. This includes policies for the designation of protected habitats. Techniques that allow the management of conservation resources in response to climate variability may ultimately prove to be the most beneficial way of preparing for possible abrupt climate change by increasing ecosystem resilience. Ecosystem‐based approaches are particularly relevant and should be adopted in preference to measures targeting single species or habitat types. For this reason, pro‐active approaches towards such management are strongly suggested rather than waiting for the impacts of climate change to set in ‐ at that stage it may be too late and implementation much more expensive.

247
99..11 IInnttrroodduuccttiioonn
The Maltese Islands are located in the central Mediterranean. With a surface area of just 315.4 km2 and a high point measuring just 253 m above mean sea level [95], most of the archipelago is under the influence of marine processes and activities. The Islands are also exposed to strong winds, especially the north‐westerlies and north‐easterlies, which entrain sea spray and carry it long distances inshore. The climate of the Maltese Islands, which is typically Mediterranean with a bimodal pattern of hot dry summers and mild wet winters, is one of the main factors moulding its geomorphology, soils, and vegetation. The soils of the Islands are characteristically poor. They are all calcareous in nature, having a pH of between 7.0 and 8.5. The action of the wind and the low altitude of the Islands contribute to increase the salinity of the soils while subjecting the vegetation to stresses resulting from the increased salinity, wind action, high temperatures, and low water availability. The natural vegetation of the Islands has evolved to withstand these conditions although changes in climate patterns will most probably affect the natural vegetation in favour of other, better‐suited (and possibly introduced) species. Summary of Malta’s First National Communication to the UNFCCC The vulnerability of terrestrial and marine ecosystems was assessed in Malta’s First National Communication (FNC) to the UNFCCC, which identified a reduction in soil water availability due to the expected increased temperature and sea level rise as the most significant climate change impacts on terrestrial ecosystems. The FNC also made a preliminary assessment of the effects of climate change on the marine environment.
99..22 MMaalltteessee TTeerrrreessttrriiaall EEccoossyysstteemmss Despite their small size, the natural heritage of the Maltese Islands is particularly rich. For example, considering flowering plants alone, the Maltese Islands are home to some 1,000 different species, a good number of which are endemic. Schembri et al. in [172] grouped Malta’s terrestrial habitats and biocoenoses5 into three categories as follows:
a) major communities that are part of the successional sequence towards the climatic climax, i.e. steppic communities, garrigue, maquis, and Mediterranean sclerophyllous woodland;
b) minor communities that are either specialised to occupy particular habitats, or occupy habitats that are rare in the Islands (e.g. saline marshlands, sand dunes, transitional coastal wetlands, the maritime
5 Biocoenoses are varied communities of organisms living in the same area.

248
fringe), or are relics from a previous ecological regime, now surviving in a few refugia; and
c) biocoenoses that owe their existence to anthropic activities (e.g. communities of disturbed ground, afforestation areas).
99..33 MMaalltteessee FFrreesshhwwaatteerr aanndd MMaarriinnee EEccoossyysstteemmss The Maltese Islands are characteristically dry with limited freshwater sources. Rivers, lakes and streams do not occur. The permanent springs that exist are limited and have largely been tapped for agricultural and other uses, so that very few still flow out perennially and drain into their associated watercourses. Most of these, in turn, only carry water during the wet season. For this reason, the few freshwater habitats that do exist on the Islands are themselves scarce and, consequently, support extremely rare and often specialised (and occasionally endemic) biota. These habitats include watercourses, temporary rainwater rock pools, permanent ponds, subterranean waters and underground springs. Marine ecosystems can be divided into the littoral (those parts of the rocky or sandy shores that are regularly covered and uncovered by sea water as a result of wave action) and the sub‐littoral (or the permanently submerged portion). The most important marine biocoenoses in the Maltese Islands are undoubtedly the Posidonia oceanica meadows, which occur between 5 and 45 m depth of water.
99..44 CCuurrrreenntt SSttaattuuss ooff TTeerrrreessttrriiaall aanndd MMaarriinnee BBiiooddiivveerrssiittyy Many rare and indigenous species in the Maltese Islands are threatened and continue to decline (Table 9.1). The principal threats to Malta’s biodiversity are development in rural and marine areas, the introduction of alien (non‐native) species that may compete with native biota, polluting discharges/waste impacts, and the exploitation of wildlife. These threats arise out of prosperous lifestyles, a high population density and urban sprawl that have limited the natural land cover to only 22% of the total surface area of the Maltese Islands.
99..55 CClliimmaattee CChhaannggee SScceennaarriiooss The locally generated regional scenarios (see Section 5.5) predict an increase in
annual average temperature of 2.0 C and 2.8 C by 2050 and 2100 respectively (see Table 5.8). The model results of such projections are considered to be robust and the trends in observed temperature corroborate this projection. Such increase in temperature is also in line with the predictions of the IPCC FAR.

249
Groups of
species
Current status
Amphibians and
reptiles
Populations appear to be stable although many species are still
vulnerable; snakes appear to be increasing.
Birds Increase in breeding pairs of some species (e.g. Tree Sparrow);
drastic decrease in the numbers of other species (e.g. Corn
Bunting).
Fish Stocks of tuna and swordfish are diminishing, whereas those of
dolphin fish are unaffected.
Fungi A decline in mycoflora and the confinement of many species in
a few areas.
Invertebrates A general decline in terrestrial and aquatic habitats.
Mammals Bats are generally declining, rats and wild rabbit populations
are increasing.
Plants A significant reduction in species has been observed since the
1980s and some species may have become extinct. An increase
in species diversity has been noted in disturbed habitats due to
the introduction of alien species.
Table 9.1: Current status of selected groups of species [122, 126, 131, 132, 153, 157, 160]. Models for precipitation and temperature variability however are associated with more uncertainties. Although a decrease in precipitation is being predicted, projected changes in precipitation should be viewed with some caution. The trends analysis implies that total rainy days with 0.1 mm or more of rainfall are decreasing while total yearly days with 10 mm or more of rain is increasing. This may be interpreted as a decrease in the total amount of precipitation but an increasing trend for convective type rainfall or heavy rainfall. While the uncertainties still prevail, the trends identified from data observations are in line with regional scenarios (found in the IPCC FAR) with regards to both decrease in mean annual precipitation and increase in extreme weather events (increase in the intensity of daily precipitation events) for the Mediterranean region. The IPCC report notes that there will be a higher incidence of drought and heat waves in summer. In this context, while this report will focus on the more certain increase in temperature, as also verified by locally generated scenarios, other impacts associated with the decrease in precipitation and increase in extreme events will be addressed based on regional scenarios. Referring to Table 5.8 as regards to sea level rise, real‐time data is available from [87]. This data shows that “contrary to the general expectations the overall trend over a window of 13.5 years of data is that of a fall in sea level at an average rate of
0.50 0.15 cm/yr. Also it is shown that the sea level experienced a hefty rise of

250
several centimetres in the period 1993 to 1996; this was followed by a rapid
decrease till the end of 2001 when the sea level reached an average of 9.0 0.4 cm below that in 1993; in the following years the sea started to recover back to slightly higher levels at a rate of less than 0.5 cm/yr”. Drago in [87] further states that “this general decreasing trend in the sea level in recent years does not however refute the impact of climatic changes in the Maltese Islands. Sea level is only one of several indicators of climate change”. It explains this potentially anomalous behaviour of sea level in this area. The report concludes that “This part of the Mediterranean has experienced a buffer period that has attenuated any imminent menace of sea level rise, but there is no guarantee that this will persist in the future. To maintain a precautionary approach one should thus base projections mainly on the moderate sea level trend of the four years (2002‐2006) during which the sea level experienced
an average rise of 0.45 0.15 cm/yr”. With regards to sea level rise both reports note the uncertainties associated with the predictions. However, an estimate of a rise of 30 cm until the year 2100 appears to be agreed to by both studies.
99..66 GGeenneerraall CClliimmaattee CChhaannggee IImmppaaccttss oonn BBiiooddiivveerrssiittyy The direct effects of climate change on biodiversity around the world have been categorised by [139] as changes in:
timing of natural events (phenological changes); the range or distribution of species; the abundance of species; the composition of communities and habitats; and ecosystem processes.
The vulnerability of an ecosystem to climate change depends on the tolerance of its constituent species to change, the degree of change, and the other stresses already affecting it. Since many terrestrial and marine species in the Maltese Islands are rare, under stress, and/or their populations are in decline, the impact of climate change on biodiversity may be exacerbated. While there are a number of casual speculations, there is no scientific work on the impact of climate change on the ecosystems of the Maltese Islands. Our knowledge of local ecosystems is rudimentary, and the effect of climate change needs to be teased out from the many other effects, natural and anthropogenic, that affect local biodiversity, as well as the impacts of climate change on Mediterranean biodiversity in general. The following analysis is therefore based on current best available knowledge on local biodiversity and professional judgement on the potential impacts from the expected climatic changes on the biota and habitats. Local research is required in

251
order to understand the ecosystem dynamics and to confirm or otherwise such assumptions/predictions.
99..77 CCoonnsseeqquueenncceess ooff CClliimmaattee CChhaannggee oonn TTeerrrreessttrriiaall EEccoossyysstteemmss The currently available predictions on climate change (see section 9.5) indicate a number of possible changes in meteorological parameters that are expected to have varying impacts on terrestrial ecosystems. Impacts can be of two types:
a) those that result from more than one effect of climate change (including an integration of effects), such as loss of biodiversity and increased extinction potential or species distribution shifts; or
b) those resulting from a direct influence by a specific change in a climate parameter, such as an increase in temperature or decrease in rainfall.
99..77..11 LLoossss ooff BBiiooddiivveerrssiittyy aanndd IInnccrreeaasseedd RRiisskk ooff EExxttiinnccttiioonn The impact of climate change on biodiversity in the Mediterranean region is generally expected to involve a reduction in the populations of plants, amphibians, reptiles, marine mammals, low‐lying coastal birds and freshwater biodiversity [142]. A Europe‐wide assessment of the future distribution of 1,350 plant species (nearly 10% of the European flora) under various climate change scenarios indicated that more than half of the modelled species could become vulnerable, endangered, critically endangered or committed to extinction by 2080 if unable to disperse [179]. In southern Europe, species composition change may be high under a range of scenarios [179]. Range size reductions increase species’ extinction risks, with up to 30 to 40% of species facing increased extinction probabilities beyond 2050 [178]. Populations of many species in Malta and the Mediterranean are already small, and further loss of habitat and stress associated with severe climate change may push many taxa to extinction. There may also be complex dynamics from a changing climate as a result of different responses from interacting species. Species that closely interact or compete may have different responses to climate change, influencing the outcome of their interactions. Endemic plants and vertebrates in the Mediterranean Basin have been found to be particularly vulnerable to climate change [152].

252
Vulnerability All terrestrial flora and fauna groups are vulnerable, in particular amphibians, reptiles, fungi, invertebrates, birds and plants in minor communities and freshwater environments.
99..77..22 SShhiifftt iinn tthhee DDiissttrriibbuuttiioonn ooff SSppeecciieess The most obvious impact of climate change is the effect that flooding, sea level rise and temperature changes will have on ecosystem boundaries, allowing some ecosystems to expand into new areas, while others diminish in size. Many valuable ecosystems could be lost as species fail to keep up with the shift in climate boundaries and/or find their migration paths blocked by human activities. This is especially so in the case of small and specialised coastal (occasionally transitional) habitats (e.g. wetlands, sand dunes, freshwater pools, saline marshlands), which may be impeded from migrating inland due to man‐made infrastructure (e.g. roads, sea walls, embankments, etc), blocking potential migration routes. As well as shifting ecosystem boundaries, climate change may also cause changes in natural habitat, such as habitat fragmentation, the outcome of which will have a knock‐on effect on species survival, especially since many such habitats are already small in nature. For Europe, only minor biome‐level shifts are projected for Mediterranean vegetation types [164]. This contrasts with the projection of between 60 and 80% of current species not persisting in the southern European Mediterranean region for a global mean temperature increase of 1.8 oC [120]. Regional mean increase in temperature for the periods 2025, 2050, 2075, and 2100 have been reported in a separate paper prepared for this second national communication as being 1.1 oC, 2.0 oC, 2.6 oC and 2.8 oC, respectively; this suggests that the loss of species in this region could be higher. The impact that floods, sea level rise and changes in climate are likely to have on natural habitats means also that some protected areas may no longer be appropriate for the species they were designed to conserve. Vulnerability All terrestrial coastal flora and fauna groups, particularly those located in minor coastal communities, are vulnerable to these impacts that may result in distributional shifts. These will be further exacerbated in locations where the existing natural communities cannot migrate inland.

253
99..77..33 SSeeaa LLeevveell RRiissee Arguably the change that is potentially most far reaching is the expected rise in sea level. Current predictions put this change at anything between 0.1 m and 0.87 m by 2100, with the most representative average scenario being 0.13‐0.70 m, with an average of 0.38 m [144]. Recent data for Malta and the Central Mediterranean show a reversal of trend (see section 9.5) in that sea level has actually fallen. This is thought to be a transient phenomenon that depends on the atmospheric pressure increases linked with the North Atlantic Oscillation and the cooling of the upper waters in the Aegean and the Adriatic Seas [87]. More recent data for Malta (2002‐2006), however indicate that the sea level has started to rise again. Indeed, predictions in [87] are that sea level will rise by 0.45 ± 0.15 cm/year. Climate scenarios reported in Chapter 5 indicate a global mean sea level rise of 7 cm (2025), 14 cm (2050), 23 cm (2075) and 30 cm (2100). This divergence in predictions, coupled with the limitations of the models (see Chapter 5) clearly points to the need for long time series data to identify trends with a greater degree of certainty. This gradual inundation of low‐lying areas can impact terrestrial ecosystems in several ways:
Obliteration: The inundation of the areas currently supporting these habitats will lead to their permanent obliteration, although by time new ones may be formed further inland.
Migration: Inward migration of these habitats will only be possible if sea level rise is a slow process, if enough sediment input is available to replenish the substrate, and if no permanent human infrastructure blocks the migration.
Increased salinisation: Higher concentration of salts in the soils means that the sea‐level aquifer and air will favour halophytic vegetation.
Sea level rise is predicted to threaten marshes, wetlands, and coastal systems (beaches and dunes), particularly where these are backed by agricultural or urban land, which prevent their natural retreat. Vulnerability Without doubt, the habitats most under threat of sea‐level rise are the coastal habitats on low‐lying shores, most of which are rare and specialised (e.g. salt marshes, sand dunes, coastal wetlands and coastal garrigue). Some of these are also protected, either as Area of Ecological Importance (AEI) or Sites of Scientific Importance (SSI); some have also an international designation as Special Areas of Conservation (SAC), Specially Protected Areas (SPA), or Natura 2000 sites. The areas prone to inundation as a result of sea level rise include most bays along l‐Aħrax peninsula, Mellieħa, Xemxija, Salina, Ramla l‐Ħamra, Marsalforn, Dwejra, Marsaskala, St Thomas Bay, Pretty Bay, Ġnejna, Golden Bay, Għajn Tuffieħa, and areas around Marsaxlokk Harbour. Table 9.2 lists the types and extent of habitats in

254
locations that are prone to inundation by a sea level rise of 0.5 m. The potential for inland migration at each of these sites is also indicated. Note that although recent data from Malta and the central Mediterranean indicate a lowering of sea level, this is considered to be a transient phenomenon and an increase in sea level is still considered to be a reality over the longer‐term, as the past few years have started to indicate [74]. Definitely, the outlook for the central Mediterranean to 2100 is expected to confirm such an upward trend (Chapter 5).
99..77..44 TTeemmppeerraattuurree IInnccrreeaassee Another important aspect of climate change is the expected increase in temperature. Current predictions put the increase in global temperatures at 1.4‐5.8 oC and in the Maltese Islands at anything between 0.8 oC in spring and 1.1 oC in summer for every 1 oC rise in global temperatures [163]. Such an increase in temperature is expected to have certain impacts on the structure and functioning of terrestrial ecosystems, both directly as well as indirectly. As reported in Chapter 5 the Regional mean increase in temperature as 1.1 oC (2025), 2.0 oC (2050), 2.6 oC (2075), and 2.8 oC (2100). Species composition and richness Temperature increases can affect species and species compositions in a number of ways. The increase in temperature is expected to favour species with a higher affinity to subtropical climates. A number of these “alien” species already exist on the Islands; several having become naturalised after escaping from gardens, whereas some have over‐run entire valleys and watercourses and ousted local species in the process [173]. Apart from the xerophilic species, other species tolerant of high temperature levels are also expected to increase in numbers as conditions change. Warming and drying trends are likely to induce substantial species‐range shifts, and the migration rates may exceed the capacity of many endemic species to do so. Land use, habitat fragmentation and intense human pressures will further limit natural adaptation responses. Vegetation structural change driven by dominant, common, or invasive species may also threaten rare species. Overall, a loss of biodiversity and carbon sequestration services may occur. Higher temperatures are predicted to lead to decreased species richness in freshwater ecosystems in parts of south‐western Europe [139]. This is likely to be experienced locally as well, especially since local freshwater ecosystems are small in nature and most are already under the effect of other stresses (e.g. pollution, over‐abstraction, etc). Other species that may spread as a result of an increase in temperature include pests and disease‐causing organisms.

255
Habitat Extent (km) Potential for migration
Malta
Mellieħa Bay* 0.63 No
Mellieħa steppe 0.17 No
St Paul’s Islands garrigue* 1.00 No
Xemxija Bay 0.30 No
Fra Ben garrigue 0.92 No
Salini salt marsh* 0.05 Yes
Magħtab coastal steppe 1.30 Yes
Magħtab valley community 0.15 Yes
Magħtab wetland 0.20 Yes
Qalet Marku coastal
community*
0.30 Yes
Pembroke maritime
garrigue*
2.12 Yes
Xgħajra maritime garrigue 4.20 Yes
Marsascala salt marsh* 0.14 Yes
Marsascala garrigue 1.70 No
Delimara maritime
garrigue*
0.84 Yes
Pretty Bay 0.25 No
Ġnejna Bay* 0.32 Yes
Għajn Tuffieħa Bay* 0.28 Yes
Golden Bay* 0.25 No
Il‐Prajja garrigue* 0.30 Yes
Gozo
Ramla l‐Ħamra coastal
communities*
1.40 Yes
Ramla l‐Ħamra Bay and
sand dunes*
0.50 Yes
Daħlet Qorrot coastal
communities
0.60 Yes
Dwejra Inland Sea beach* 0.10 Yes
Mġarr ix‐Xini beach* 0.07 Yes
Comino
Santa Marija Bay* 0.10 Yes
Comino coastal
community*
0.80 Yes
Table 9.2: List of types and extent of habitats that may be affected by a sea‐level rise of 0.5 m. Sites indicated by an * are protected. Note: Wherever agricultural land is present behind an endangered habitat, the potential for migration was considered to be positive.

256
Phenology Phenology is the timing of seasonal activities and life cycle events. Warming temperatures are expected to impact phenological events, such as flowering and fruiting in plants or larval stages in insects. Global warming is also causing shifts in the reproductive cycles and growing seasons of certain species. Some species, for example, require a decrease in air and ground temperatures for them to shift their biological cycle into the dormancy stage. If the changes in weather conditions result in milder winters, some of these species may not be able to enter the dormant stage or else experience a shift and/or shortening of their dormancy period. This change in meteorological conditions may be one of the reasons why there has been a noticeable decline in deciduous trees6 on the Maltese Islands [118], a trend that may worsen in future years as a result of changing weather conditions. Water availability An increase in temperature will result in a greater demand for water and a consequent decrease in its availability which would further exacerbate the impacts from the projected reduction in precipitation ‐ see below and Chapter 5. This decrease in the amount of water available will result in an increase in the salinity of the soil leading to a higher incidence of abandonment of agricultural land, especially at the fringes. This, in turn, could lead to soil erosion and desertification processes settling in. The reduction in the availability of water would also impact habitats and hydrophilic species, especially where the limited water sources are tapped for other uses (e.g. for irrigation purposes on agricultural land). A new study by the European Commission DG Environment [138] suggests that the impact of climate change on the Mediterranean region will change precipitation (23% decrease in the dry season and 10% decrease in the wet season) and evaporation rates (12% decrease mostly during dry season) over land and sea, creating even drier conditions. A greater amount of atmospheric moisture will be lost from the region. Agriculture will suffer and the salinity of the Mediterranean Sea would increase. This latest study indicates that many of the projected changes will have started by 2020‐2049 and an overall increase of 24% in the freshwater deficit of the region [154], (see also Chapter 6). Desertification An increase in the severity and extent of desertification and soil erosion is expected. Threats from desertification are projected due to expansion of adjacent semi‐arid and arid systems under relatively minor warming and drying scenarios. Fires Climate change is likely to increase fire frequency and fire extent. Greater fire frequencies are noted in Mediterranean Basin regions, with some exceptions [165]. Double CO2 climate scenarios increase wildfire events by 40‐50% in California [140],
6 Deciduous trees require a high level of water availability and low salinity for optimal growth.

257
favouring fire‐tolerant shrub dominance in the Mediterranean Basin and reducing productivity and carbon sequestration [161]. Fire‐regime shifts may threaten specific species and plant functional types. Vulnerability All terrestrial flora and fauna groups are vulnerable to impacts from temperature increases, in particular amphibians, reptiles, fungi, invertebrates, birds and plants in minor communities and freshwater environments. Temperature increases can also impact habitats through salinisation and desertification processes, which in turn affect their constituent species. Wetlands also face the threat of drying up, reduction of species diversity, and eutrophication. Different habitats will be affected to different extents by the above impacts. Some habitats will be more heavily affected by grass fire impacts than by desertification or water availability; however, these various impacts can also interact to create a synergistic effect on habitats.
99..77..55 DDeeccrreeaassee iinn RRaaiinnffaallll Water Availability Together with an increase in temperature, a decrease in rainfall will result in a decrease in water availability. A reduction in water availability, combined with human‐induced impacts of deforestation, increase in hard surfacing and run‐off and increase in erosion are expected to have considerable effects unless mitigation measures are put in place. Decreasing water availability (see above and [154] is expected to result in a further loss of hydrophilic species as well as an increase in soil salinity. This will in turn favour the establishment/growth of halophilic species to the detriment of salt‐intolerant plant species. These changes can therefore result in a floristic shift in the terrestrial ecosystems of the Maltese Islands, from Mediterranean‐type vegetation to vegetation more characteristic of desert conditions. Droughts Increased frequency of water shortages and decline in water quality is predicted. Projected rainfall changes are, however, spatially complex ([170], [177], [182]). Rainfall frequency reductions projected for some Mediterranean regions [128] will exacerbate drought conditions, and have now been observed in the eastern Mediterranean [150]. Mariotti et al. suggest that land areas in the Mediterranean region will become progressively drier as rainfall decreases leading to a decrease in soil moisture, water runoff and flow of water from rivers to the Mediterranean Sea [154]. Although drier land surfaces mean lower rates of evaporation, the higher temperatures will counter this leading to increased evaporation rates, which will exacerbate the drought problem. Soil water content controls ecosystem water and CO2 flux in the Mediterranean Basin system, and reductions are very likely to reduce ecosystem carbon and water flux [168]. Chapter 5, reports a varying decrease in the

258
regional mean precipitation as follows: −2.4% (2025), −4.4% (2050), −3.7% (2075), and −1.8% (2100).
Reduction in groundwater resources Lowered water tables and increased anthropogenic use and abstraction of groundwater are likely to cause serious problems of salt water intrusion into groundwater and may also affect populations of migratory birds residing in inland wetlands. Vulnerability All terrestrial flora and fauna groups are vulnerable to this decrease in rainfall, in particular amphibians, reptiles, fungi, invertebrates and plants in freshwater environments and minor communities. The lack of water resources in Malta and the problems faced by natural communities would be exacerbated in such a scenario such that the current stresses would increase the vulnerability of these habitats and species even with a small change in the climate regime. It should also be noted that some of the natural habitats designated as SSI or SAC have been designated for their wetland/freshwater habitat characteristics and these would be particularly vulnerable in such a scenario.
99..77..66 EEffffeeccttss ooff CCaarrbboonn DDiiooxxiiddee EEmmiissssiioonnss oonn TTeerrrreessttrriiaall EEccoossyysstteemmss Of particular relevance to the natural environment is the potential presence of increased levels of carbon dioxide in the atmosphere. Different studies seem to be pointing to a potential “fertilising” effect in such a scenario. This is because a higher level of carbon dioxide, one of the essential constituents for photosynthesis, may actually stimulate plant growth, which would in turn provide a sink for some of the excess CO2. This is not only relevant for tropical forests; the role of certain “low‐profile” ecosystems (such as grasslands) in this buffering effect may actually be underestimated. In a case study of the Mediterranean region, and Cheddadi et al., in [128] have actually shown that in a high CO2 concentration world, and assuming that precipitation does not increase, rather than desertification of the region we should expect a greening of the area with a southward shift of Mediterranean vegetation. More specifically, “an evergreen forest spreads in the eastern Mediterranean and a conifer forest in Turkey”, while the current xerophytic woodlands would become “restricted to Southern Spain and Southern Italy”. The Mediterranean xerophytic vegetation would also proliferate in western North Africa to occupy a larger expanse than it does today, with a consequent shift of the desert boundary further south. An increase in the concentration of CO2 in the atmosphere (as well as other pollutants such as SOx and NOx) may also lead to increased acid precipitation, with the consequent impacts of acidification of surface waters and leaching of soil nutrients/mobilisation of heavy metals in soil [158]. Nonetheless, the latter is not expected to be very important in the Maltese Islands, seeing that the limestone

259
nature of the islands and the consequent alkaline nature of the soils act as an effective buffer against acidification. (Although surface layers may still be impacted, possibly for short periods, from such acidification). Vulnerability All terrestrial flora groups may be affected by increases in carbon dioxide levels in the atmosphere.
99..88 CCoonnsseeqquueenncceess ooff CClliimmaattee CChhaannggee oonn MMaarriinnee EEccoossyysstteemmss Climate change can impact marine ecosystems through ocean warming [183], by increasing thermal stratification and reducing upwelling [133], sea level rise [147], increases in wave height and frequency [159], increased risk of diseases in marine biota [143] and decreases in the pH and carbonate ion concentration of the surface oceans [125]. The Mediterranean Sea is characterised by its depth (on average about 1,450 m), rapid deep‐water turnover time (40‐50 years), and the presence of many endemic species (about 25% of the species are restricted to the Mediterranean). Due to these factors, it is expected that the impacts of climate change may be amplified, with changes in biodiversity occurring earlier than in other seas. This is particularly worrying since, on the basis of a moderate climate change scenario, a recent estimation anticipates an extinction of 15‐37% of the species that today occupy this area by 2050. The Mediterranean is one of the regions, most sensitive to climate change and shelters 4‐18% of the world marine biodiversity [180]. Generally, modelling results indicate that [139]:
mediterranean sea fauna is highly vulnerable to climate change; both structural and functional biodiversity of continental margins are
significantly affected by very small temperature changes; and the impact of climate change on marine biodiversity might be
irreversible. Moreover, models indicate that not only coastal ecosystems but also continental‐margin ecosystems may experience abrupt climate‐driven temperature shifts, which reflect changes in the prevailing climate conditions occurring on a regional scale [139]. Since there are close interactions between deep‐sea and coastal ecosystems, the vulnerability of deep‐sea ecosystems to climatic changes may have important implications on the biodiversity and functioning of continental shelf ecosystems. Seawater parameters such as salinity, water temperature, nutrient levels and turbidity, as well as substratum type affect the distribution and abundance of shallow water and near‐shore marine environments. Activities taking place on land in turn affect these same marine environmental parameters through freshwater run‐off, sediment transport and nutrient inputs into coastal waters. The interactions

260
between these various activities and environmental media are complex, making their prediction and modelling very difficult. Mariotti predicts that the salinity of the Mediterranean Sea could increase as a result of the impact of climate change, which will restrict the flow of water from rivers to the sea [154]. The long‐term changes projected in the decrease in precipitation in the Mediterranean region, coupled with an equal increase in evaporation over the Mediterranean Sea will result in an
increase in the freshwater deficit of about 24% (around 1.54108 m3) at the sea
surface by 2100 [154]. Less water flowing from the rivers to the sea (2.54107 m3) will contribute to further freshwater losses, possibly making the sea increasingly saline (the degree of salinity increase will depend on the inflow of fresh water from the Atlantic Ocean through the Straits of Gibraltar [137]. Conclusions could be limited by the current IPCC‐AR4 climate models, which do not sufficiently capture the exchange of waters between the Atlantic Ocean and the Mediterranean Sea at the Straits of Gibraltar. It is hoped that the next generation models will address this. The predicted climate changes resulting in a rise in the mean sea level and in surface water temperatures, coupled with increased rain storms and a prolonged dry summer season, are all expected to augment the fluctuations in the physico‐chemical characteristics of the near‐shore marine waters, especially in the various semi‐enclosed bays dotting the coastline. Nonetheless, it is difficult to assess or predict the magnitude of these impacts, which may include wider fluctuations in the salinity levels, increased turbidity during autumn and winter, higher nutrient levels and more pronounced water stratification in summer [118]. The increased sea temperature conditions, especially in semi‐enclosed bays, and the increased stratification can result in lower oxygen availability, which, with the higher nutrient levels, could result in a greater risk of eutrophication events. These can also occur during the autumn months as a result of increased freshwater run‐off from land loaded with phosphate, inducing higher primary productivity and therefore algal blooms.
99..88..11 TTeemmppeerraattuurree IInnccrreeaassee It is evident that temperature anomalies, even of short duration, can dramatically change Mediterranean faunal diversity. Once a species disappears, other species, pre‐adapted to the new conditions, can replace them, thus hampering the ecosystem resilience to pre‐impact conditions. High thermal anomalies can also impact the fauna inhabiting marine caves, replacing endemic species by warm water species [129]. Higher sea temperatures also facilitate the spread of alien species. The Mediterranean Sea is the regional sea with the highest percentage of non‐indigenous marine species. The current tropicalisation of the Mediterranean Sea would facilitate the influx of and colonisation by, marine species typical of warmer seas (Lessepsian migrants). An increased occurrence of such species in Maltese waters can be expected.

261
The invasion of non‐indigenous species in the Mediterranean has resulted in the dislocation of other species and possibly cascade effects on food webs [130]. The increase in surface temperatures does not only facilitate migration of alien species; changes in fisheries have also been noted in recent years, with southern Mediterranean species (e.g. Barracuda, Coryphenes) being recorded in increasing numbers in the north. Indeed, the migrations of southern species were the first signs of the biological effects of warming in the Mediterranean Sea [180]. Extreme climate events are experienced as acute stress that disturbs the normal functioning of a biological system. Today, heat stress is widely recognized as the main factor in triggering diseases at sea, with a visible tendency for these events to become increasingly frequent in the Mediterranean. The species affected by these events are vital elements of the underwater landscapes, mostly sponges and gorgonians [180]. Climate change in the Mediterranean also favours epidemiological outbreaks, as most pathogens are temperature sensitive. Temperature anomalies could trigger the virulence and/or condition the propagation of pathogenic agents (Vibrio) for sponges, cnidaria or echinoderms. Furthermore, the action of pathogenic agents could be facilitated by an inhibition of the defence capacities of organisms subjected to heat stress [180]. Studies performed on the coral Oculina patagonica identified the coral‐bleaching bacteria Vibrio shiloi as an agent involved in the Mediterranean mass mortalities of coral [151]. Mass mortalities of the gorgonian Paramuricea clavata, scleractinian corals, zooanthids, and sponges observed in 1999 in the Ligurian Sea were indeed promoted by a temperature shift, in conjunction with the growth of opportunistic pathogens (including some fungi and protozoans) [127]. Furthermore, viral life strategies may be promoted by rising temperatures. Although data are limited, morbilliviruses that cause disease epidemics in seals have been identified in Mediterranean monk seals [181], potentially impacting the survival of this very rare and endangered species. Documented consequences of increasing temperature on marine biodiversity include the following:
during the past 30 years in the Adriatic Sea, the thermophilic species of ichthyofauna have increased [135];
lower dolphin fish catches have been reported in recent years, as well as an anomalous presence of swordfish in the northern Mediterranean, allegedly as a result of higher sea temperatures;
in the Western Mediterranean, climate changes during the 1980s altered plankton assemblages and food webs with high positive temperature anomalies favouring jellyfish outbreaks, which resulted in a strong decrease in the copepod abundance; and
changing water temperature also has an effect on the reproduction of cetaceans and pinnipeds, indirectly through prey abundance, either through extending the time between individual breeding attempts, or by reducing breeding condition of the mother [184].

262
Vulnerability For the marine environment around the Maltese Islands, the prospects are a bit better than for terrestrial ecosystems, given that the sea is a much more homogeneous environment than the land, and marine biodiversity in local waters is likely to follow the general trend for the rest of the Mediterranean, which is that of a tropicalisation of the sea: indigenous thermophilic species will expand their range, less thermophilic species will contract their range and there will be an increasing influx of warm water alien species from both the Atlantic and the Levantine Sea towards the central Mediterranean [171]. The trend in Maltese waters is for both subtropical Atlantic species and Lessepsian immigrants to increase their occurrence with time, although this may be due to other reasons apart from a general warming of the sea [174]. All marine flora and fauna groups are vulnerable to this impact (temperature increase). Jellyfish and organisms with a similar habit may show a population increase. Seagrass meadows are also known to be sensitive to ambient temperature levels [175]. A rise in water temperature may also result in an increased growth of these species so that an increase in the seawater temperature may also have a beneficial effect on them.
99..88..22 CChhaannggeess iinn CCooaassttaall HHyyddrrooddyynnaammiiccss Changes in climatic conditions may also result in changes to coastal currents and, therefore, long‐shore sediment transport; although no information is available on the effect of climate change on local current direction and speed. However, any changes in coastal hydrodynamics are expected to affect the assimilative and dispersive capacities of local inshore waters with respect to coastal pollutants. Vulnerability All marine flora and fauna groups, particularly littoral and sub‐littoral communities and Posidonia oceanica meadows, are vulnerable to this impact.
99..88..33 CChhaannggeess iinn DDeeeepp WWaatteerr CCiirrccuullaattiioonn Climate change may alter deep‐water circulation, which may strongly reduce spring phytoplankton blooms and export production to the deep layers. Increased surface temperatures, altered circulation, and precipitation changes causing increased stratification have been invoked to explain the increased frequency of bottom water hypoxia (low oxygen) or anoxia in coastal areas of the northern Adriatic. These phenomena, often associated with mass mortalities of fish and benthic fauna, alter food webs and may have important cascade effects on biodiversity. Although the central Mediterranean has different physical characteristics to the Adriatic Sea, similar conditions may exist in bays and inlets, which could experience the same effects described above.

263
Vulnerability Sub‐littoral communities, sea‐fir communities, coral banks, maerl communities, and algal bank communities are vulnerable to this impact.
99..88..44 IInnccrreeaassee iinn SSeeaa‐‐LLeevveell Sea level and temperature changes in coastal waters may also affect the distribution of benthic and pelagic organisms. Inundation will definitely result in an upward shift of the typical rocky shore zonation patterns, though the extent of this shift will depend mostly on the gradient of the shore. The increased inundation of areas of coast that are currently only periodically submerged will result in the gradual displacement of the various specialised organisms along a gradient from mean sea level. Such an upward shift of zones and coastal habitats will only be possible if enough suitable land is available. Man‐made infrastructure close to the shore may act as a barrier, hindering such landward movement of habitats. Sea level rise may also affect seagrass meadows by exposing them to more wave action and swell leading to erosion and loss of habitat [175]. Vulnerability All littoral marine flora and fauna groups and coastal habitats are vulnerable to this impact.
99..88..55 IInnccrreeaassee iinn tthhee IInntteennssiittyy ooff RRaaiinnffaallll EEvveennttss Higher intensity rainfall events may result in increased sea water turbidity and a decrease in salinity. Increased storm incidence will have its own (though largely localised) effects mainly resulting from a lowering of salinity in run‐off areas and a possible establishment of a salinity gradient. However, it must be noted that climate change models for Malta predict a decrease in annual rainfall of around 60 mm by 2100, which may have the opposite effect to that described here. Vulnerability Posidonia oceanica (L.) Delile is especially prone to reduced water transparency and increased sediment deposition. An increase in turbidity will affect the photosynthetic processes in this important species resulting in reduced growth, increased epiphytic growth and increased stress [121]. These conditions, combined with an increased sediment deposition rate, result in death of the meadows [123, 124] their general

264
retreat to offshore waters. Plumes formed following heavy rains are normally transient in nature and short‐lived so that their effects are not expected to be high (although cumulative impacts may be important). Human‐induced turbidity resulting from coastal projects, on the other hand can have more drastic and far‐reaching impacts due to their longer duration and potentially different particulate characteristics [119]. The Posidonia oceanica meadows most likely to be affected by an increase in water turbidity are located in areas offshore Marsalforn, San Blas, Ramla l‐Ħamra, Mellieħa Bay, St Paul’s Bay and Salina Bay. Sea‐fir communities and coral banks are also vulnerable to this impact.
99..88..66 IInnccrreeaassee iinn CCaarrbboonn DDiiooxxiiddee Marine ecosystems will be affected not only by an increase in sea temperature and changes in ocean circulation, but also by ocean acidification, as the concentration of dissolved carbon dioxide (carbonic acid) rises. In fact, it is predicted that by 2050 the oceans will be more acidic than they were in the last 20 million years [139]. This is expected to negatively affect organisms that have calcium carbonate structures, such as corals, most molluscs and sea urchins. These organisms face greater prospects of erosion and some researchers warn of catastrophic results. On the other hand, an international team of scientists led by the UK’s National Oceanography Centre, Southampton, and the University of Oxford, have shown that the increased carbon dioxide in the Earth’s atmosphere is causing microscopic ocean plants to produce greater amounts of calcium carbonate ‐ with potentially wide ranging implications for predicting the cycling of carbon in the oceans and climate modelling [145]. This impact is therefore still unclear. Vulnerability All shell‐forming organisms, in particular corals, mussels, snails and sea urchins will be affected.
99..99 AAddaappttaattiioonn MMeeaassuurreess Adaptation measures for the terrestrial and marine biodiversity sector cover a range of options, including conservation strategies, facilitation of migration, habitat restoration, natural resources management, expansion of reserves, environmental monitoring, reduction of existing stresses on the environment, and an increase in the knowledge base. A number of measures have already been implemented by Maltese authorities (others are in the process of being implemented) and although not all have been designed to specifically target climate change, significant progress is being made. These include:

265
implementation of the Water Framework Directive (WFD) (see also Chapter 6), which, among other aspects includes programmes of measures required by the WFD that seek to achieve the environmental objectives set for protected areas. Malta is currently drafting its River Basin Management Plan, which is expected to be launched in the coming months.
the designation of various types and levels of protected areas under the Environment Protection Act and the Development Planning Act (Nature Reserve, AEI, SSI, etc) (see also Chater 7) as well as in terms of the EU Habitats and Birds Directives (SAC, SPA, N2000). The protection of species and habitats would contribute to enhance and/or safeguard the resilience of species and habitats to climate change impacts. Malta has designated 27 Special Areas of Conservation in terms of the Habitats Directive and 12 Special Protection Areas in terms of the Birds Directive (79/409/EEC).
formulation and implementation of agri environmental measures under Malta’s Rural Development Plan 2007‐2013. (See also Chapter 11). The various measures under the RDP have been agreed and launched and a call for proposals issued for implementation of specific projects under the various measures.
the European Commission Communication [136] tackles “Biodiversity and Climate Change” as one of the policy areas. This communication states that policies will be needed to help biodiversity adapt to changing temperature and water regimes. This requires in particular securing coherence of the Natura 2000 network. Care must also be taken to prevent, minimise and offset any potential damages to biodiversity arising from climate change adaptation and mitigation measures. Malta’s endeavours in the protection of biodiversity (Terrestrial and Marine) are also guided but this Communication.
furthermore, as a contracting party to the Convention on Biological Diversity, Malta is required to protect its biological diversity from the impacts of climate change.
it should be noted that Malta is currently drafting the National Biodiversity Strategy and Action Plan which also tackle biodiversity and climate change.
The draft Sustainable Development Strategy for Malta includes a number of strategic recommendations (or directions) with regard to nature and biodiversity. A number of these strategic directions are also relevant from a climate change point of view and can themselves be adaptation measures. The following sections review the potential adaptation measures for terrestrial and marine biodiversity, building on the draft Sustainable Development Strategy and other measures mentioned above, and, where possible, identifying short term and longer term goals.

266
99..1100 CCoonnsseerrvvaattiioonn SSttrraatteeggiieess The priority of conservation strategies is to conserve threatened/endemic species and habitats. Conservation strategies relevant to climate change can take at least two forms:
In situ strategies, involving the selection, design and management of conservation areas (protected areas, nature reserves, NATURA 2000 sites, etc.); and
Ex situ strategies, involving conservation of organisms or their germplasm, seeds, DNA, etc in botanical gardens, herbaria, gene banks, museums, zoos, and similar set‐ups.
99..1100..11 SShhoorrtt‐‐tteerrmm GGooaallss
The need to protect existing biodiversity resources within protected sites should be reinforced through appropriate measures in land use planning documents as well as through the formulation of Biodiversity Action Plans. All existing plans are to be reviewed with a view to consider their policies’ impacts on biodiversity and all new spatial plans must undergo a strategic environmental assessment process, which should especially consider the impacts on biodiversity and natural resources, with a view to conserve the genetic pool of populations, hence enhancing resilience to climate change impacts. In particular, the new Structure Plan for the Maltese Islands should include policies aimed at the protection of local biodiversity through the appropriate spatial planning mechanisms. All policies, including those stemming from EU obligations, should consider climate change effects and any new policies aimed at the designation, management, and monitoring of protected sites should ensure that climate change is considered in these processes. As advocated by the draft Sustainable Development Strategy, all rare and/or threatened and/or endemic species should be monitored and legally protected also through protection of their habitats. (This is already an obligation under certain national/international legislation). All obligations under existing international environmental treaties concerning biodiversity should be fulfilled, and local agencies should be equipped with the necessary resources, personnel, and administrative machinery to implement these treaties. Wherever relevant, implementation of these obligations should take into consideration climate change issues. The development of a coastal zone management plan is urgently required. The existing Coastal Strategy Topic Paper by MEPA [156] was a good first step, but falls short of a proper CZM Plan. A more holistic, focused, and updated Plan with targets and implementation schedules is required.

267
As recommended by the draft Sustainable Development Strategy, a nature warden service should be set up, and fines for infringement of regulations should be introduced or increased. An official policy on the introduction of alien species, including genetically modified organisms, should be adopted [162]. Marine conservation areas that protect marine habitats should be designated and effectively managed through the establishment of specific management agencies that will be properly funded and adequately staffed and resourced. EAGGF funding for Natura 2000 sites under Malta’s Rural Development Programme for 2007‐2013 should be exploited to the maximum possible for the application of such measures.
99..1100..22 LLoonnggeerr‐‐tteerrmm GGooaallss Viable, widely dispersed, and genetically diverse populations of individual species should be maintained to minimise the probability of significant negative effects due to localised catastrophic events. Small, isolated populations are often more prone to local extinction than larger, more widespread populations [134]. A mixed strategy, involving the protection of existing populations together with the translocation of species into new regions or habitats, should be actively studied. Species dispersal should be facilitated by reducing habitat fragmentation and developing linkages between protected sites. This is to include the removal, where possible, of infrastructure close to the coast that does not allow for inland migration of specialised and small coastal habitats. Protective buffer areas around important habitat types should not act solely as areas where development is controlled (and therefore avoiding direct impacts on the habitats) but also opportunities for the future expansion of the same habitats. The Government should set up a research fund for research work on local biodiversity so that the current lack of knowledge on the population dynamics and general ecological resources of the islands is addressed. MEPA is to step up its efforts in establishing and publishing a national inventory/database of the biodiversity of the Maltese Islands and re‐publish the Red Data Book. Furthermore, long‐term funds should be made available to ensure that the inventorying programme is continued in the long term and kept updated.
99..1100..33 MMaannaaggiinngg SSttrreesssseess oonn tthhee EEnnvviirroonnmmeenntt An important adaptation strategy to climate change is to reduce and manage other stresses on species and ecosystems, such as habitat fragmentation and destruction,

268
over‐exploitation, eutrophication, desertification and acidification [146, 185]. Such measures will enhance the resilience of ecosystems to climate change. Robinson et al suggest that this may be the only practical large‐scale adaptation policy available for marine ecosystems [169]. Managing (and avoiding) such stresses on local ecosystems are crucial since several of the Maltese habitats and ecosystems are already bearing the brunt of other impacts (e.g. development pressure, human pressures, trampling, pollution, fly‐tipping, habitat destruction/fragmentation, etc). Adding to these the impacts of climate change will push a number of species and habitats further towards obliteration. While the mitigation of climate change impacts may be a harder goal to reach, especially for a small country like Malta, it is definitely easier to address and successfully mitigate the effects of the other human‐induced stresses. In order to effectively address these issues, the MEPA should take into consideration the need to undertake a country‐wide assessment of the threats and stresses affecting natural habitats, categorise these, and formulate an Action Plan (possibly part of a Biodiversity Action Plan) for implementation over a 5‐10 year period. The implementation of the Biodiversity Action Plans would need to be regularly monitored to ensure effectiveness and to fine tune where necessary.
99..1100..44 FFaacciilliittaattiinngg MMiiggrraattiioonn Migration of species should be facilitated by establishing dispersal ecological corridors. Appropriate land use planning and management would also be effective in this regard. This is also stated in the EU White paper “Adapting to climate change: towards a European Framework for Action” [138]; the impact of climate change must also be factored into the management of Natura 2000 sites to ensure the continuing diversity and connectivity between natural areas and to allow for species migration and survival when climate conditions change. In future it may be necessary to consider establishing a permeable landscape in order to enhance the interconnectivity of natural areas. Longer‐term goals
Where infrastructural works constrain such a movement, radical approaches, such as inland relocation of roads backing beaches, should be considered, especially where such infrastructure does not allow the inland migration of important habitats and popular beaches, such as at Mellieħa Bay and White Tower Bay. In some cases, other solutions that could allow migration without disrupting the infrastructure could be considered (e.g. installing bridges rather than solid walls). All such interventions would need to be properly studied to ensure that they do not cause more problems than they solve.

269
99..1100..55 HHaabbiittaatt RReessttoorraattiioonn Habitat restoration would help to increase the chances of survival of local specialised habitats (e.g. coastal wetlands, sand dunes, etc) from climate change impacts. Short‐term goals
The restoration of habitats currently under serious threat, e.g. sand dunes, saline marshlands, freshwater pools/wetlands, etc., and the creation of new habitats in areas where natural colonisation is unlikely to occur, should be promoted.
99..1100..66 NNaattuurraall RReessoouurrcceess MMaannaaggeemmeenntt Natural resources management techniques can be applied to increase the resilience of ecosystems. This measure is consistent with the ‘ecosystem approach’ developed by the Convention on Biological Diversity (CBD), which is a “strategy for the management of land, water and living resources that promotes conservation and sustainable use in an equitable way” [176]. It ensures restoration of ecosystems to ensure that they continue to provide the services that enable people to adapt to the impacts of climate change [149]. Ecosystem based approaches to adaptation include:
management of coastal ecosystems to reduce flooding during storm surges;
management of agricultural lands using local knowledge of specific crop and livestock varieties, applying integrated water resources management approaches and conserving mosaic agricultural landscapes to secure food supply in changing and erratic local climatic conditions;
upland and watershed management maintaining and enhancing the resilience of ecosystems at the landscape
scale [149]. Short‐term goals Malta should actively embrace natural resources management as a central pillar in its spatial planning exercises; whether terrestrial or marine. Existing plans that may have an impact on biodiversity should be re‐assessed for compatibility with these principles. Establishment of detailed management plans for all protected areas (and especially Natura 2000 sites) within a reasonable time frame, also taking into consideration climate change impacts.

270
99..1100..77 EExxppaannddiinngg RReesseerrvveess aanndd OOtthheerr PPrrootteecctteedd AArreeaass Expansion of reserves, carried out with consideration of long‐term shifts in plant and animal distribution, can potentially reduce the vulnerability of ecosystems to climate change [155]. It would be more cost effective to expand protected areas proactively rather than waiting for climate change impacts to occur and then acting reactively. Nonetheless, due to the small size of the island and constraints in expanding reserves in some cases, other adaptation options might need to be considered. Short‐term goals
MEPA should assess the current network of protected areas and reserves to determine whether any additional land merits protection under one of the various protective designations available. All existing managed nature reserves should be assessed with a view to establish their degree of vulnerability to climate change impacts. Longer‐term goals
Assessment of nature reserves to determine the possibility of extending their boundaries to include additional land and other habitat types.
99..1100..88 EEnnvviirroonnmmeennttaall MMoonniittoorriinngg An effective response to climate change depends on an understanding of likely regional climatic and ecological changes. Monitoring environmental change, including climate, and associated ecosystem responses, is vital to allow for adjustments in management strategies [117]. Short‐term goals
Rigorous monitoring of the quality of coastal and marine waters, as well as the status and population trends of threatened and endemic terrestrial and marine species, is important. Hence, indicators need to be identified that will allow monitoring of climate change effects; possibly using existing monitoring parameters and indicators required by other legislative tools such as the Water Framework Directive. Furthermore, monitoring of freshwater ecosystems to identify trends that may be attributable to climate change impacts should also be instituted.
271
Longer‐term goals A national environmental monitoring programme should be set up to include, among other things, the effects of climate change.
99..1100..99 IInnccrreeaassee KKnnoowwlleeddggee BBaassee Protection and conservation of biodiversity requires a sound knowledge base on local ecosystem dynamics, which is currently lacking. Effective monitoring (see above) and stakeholder engagement are crucial tools, which require adequate staffing, resources, and a general increase in public awareness of biodiversity issues. Short‐term goals
Habitats should be designated based on sound scientific information to protect the habitats from incompatible development. In Malta, the knowledge of ecosystem interactions and species requirements is lacking. Collection of information on the terrestrial and marine environment should be promoted by allocating resources for an extensive monitoring and research programme. A national inventory/database of biodiversity should be formally established and published. Various such initiatives have been started by different organisations in the past (e.g. Malta Council for Science and Technology (MCST), Department of Biology at the University of Malta and MEPA). The status of these projects is unknown and the data collected through these efforts has never been published. A Maritime Geographic Information System should be established to integrate data related to coastal zone management and Maltese territorial waters to aid designation of conservation zones and resource management (as suggested in the Structure Plan for the Maltese Islands [166, 167]). Schemes should be devised to improve awareness on local biodiversity, including the involvement of Local Councils and NGOs.

272
FFIISSHHEERRIIEESS AANNDD AAQQUUAACCUULLTTUURREE
1100..00 EExxeeccuuttiivvee SSuummmmaarryy
Climate change potentially has both direct and indirect impacts on commercial fish stocks. Direct effects act on physiology and behavior and alter growth, development, reproductive capacity, mortality, and distribution. Indirect effects change the ecosystem on which fish depend for food and shelter by altering ecosystem productivity, structure, and composition [187]. Marine biodiversity in local waters is likely to follow the general trend for the rest of the Mediterranean. The trend in Maltese waters is for both subtropical Atlantic species and Lessepsian immigrants to increase their occurrence with time, although this may be due to other reasons apart from a general warming of the sea. The aquaculture industry is vulnerable to climate change impacts mainly from threats that arise from [203]:
stress due to increased temperature and oxygen demand and decreased pH;
extreme weather events with the consequent destruction of facilities, loss of stock, loss of business, and mass scale escape with the potential to impact on biodiversity;
increased frequency of diseases and toxic events; sea level rise and conflicts of interest with coastal defence systems; and an uncertain future supply of fishmeal and oils from capture fisheries.
Climate change may also result in positive impacts such as [203]:
increased growth rate and food conversion efficiencies; increased length of growing season; and range expansion.
Although the local fisheries sector is seeing subtle changes in the catch composition with certain species becoming more abundant in catches, this still needs to be studied. Data regarding catch is available however the analysis of the data is still to be carried out. It is therefore important to strengthen this arm of the fisheries management in Malta as without data we cannot know how to tackle potential effects of climate change on fisheries. Other adaptation measures applicable for fisheries are related to catch size and effort. Reductions in fishing levels are required to sustain yields that may also benefit fish stocks that are sensitive to climate variability. Adaptation measures for aquaculture include encouraging uptake of individual/cluster insurance; improve siting and design to minimize damage, loss and mass escapes; encourage use of indigenous species to minimize impacts on

273
biodiversity, and use non‐reproducing stock in farming systems. While these measures need to be taken up by the private sector (operators) planning policy can consider the potential impacts of climate change when assessing development applications for fish farms.
1100..11 IInnttrroodduuccttiioonn Wild capture fisheries are different from other food production systems in their linkages and responses to climate change and in the food security outcomes. Aquaculture also has strong links to capture fisheries (e.g. for inputs), and both feed into distinct and specialized post‐harvest and market chains. Conclusions on food supply and security based on terrestrial contexts usually cannot be applied directly to the sector, indicating that special consideration is needed to ensure policy and management responses are effective. For example, most fishing depends on wild populations whose variability depends on environmental processes governing the supply of young stock, and feeding and predation conditions through the life cycle. Open water populations cannot be enhanced by simply adding fertilizers as in agriculture, nor can effects of environmental change be quickly observed. Many fish populations migrate over long distances, passing through multiple territorial waters and high seas. This creates issues of transboundary management, high seas (straddling fish stocks‐ governed under United Nations Convention on the Law of the Sea (UNCLOS) control and utilization, driven by natural environmental factors [195].
1100..22 TThhee MMaalltteessee FFiisshheerriieess SSeeccttoorr Maltese capture fisheries are mainly of a typical Mediterranean artisanal type and are not generally species selective. They are frequently described as multi‐species and multi‐gear fisheries, with fishers switching from one gear to another several times throughout the year. There are no inland fisheries in Malta. The Maltese fishing industry is small, by local and international standards, and its economic contribution to the national economy is negligible, accounting for approximately €9.3 million or approximately 0.10% of Malta’s Gross Domestic Product (GDP) or less: the industry’s direct contribution to GDP is actually estimated at around two‐thirds of this figure when the cost of imported inputs, such as fuel, is considered. The proportion of the working population that depends, to varying extents, on this industry for its livelihood, is around 1.0%. The fisheries industry provides direct employment to around 1,400 people in the primary and secondary sectors including aquaculture [197]. According to available data, as at 2004 there were 553 males and 14 females officially registered as fishers with the Employment and Training Corporation (ETC). These comprise both part‐time as well as full‐time fishers although no official data on the actual distribution between the two categories is available. The aquaculture industry employs 84 full‐time and 22 part‐time persons.

274
1100..22..11 FFiisshh SSttoocckkss Although data are collected for a number of species, many commercial fish stocks in the Mediterranean Sea are still not monitored. Figure 10.1 illustrates fish stocks in the Mediterranean by species and for each nation. Table 10.1 identifies the country each column number represents. Malta is represented by row 15.
Column Number Area
1 Northern Alboran
2 Alboran Island Sea
3 Southern Alboran Sea
4 Algeria
5 Balearic Island
6 Northern Spain
7 Gulf of Lions
8 Corsica
9 Ligurian and North Tyrrhenian Sea
10 South and Central Tyrrhenian Sea
11 Sardinia
12 Northern Tunisia
13 Gulf of Hammamet
14 Gulf of Gabes
15 Maltese Islands
16 South of Sicily
17 Northern Adriatic
18 Southern Adriatic
19 Western Ionian Sea
20 Eastern Ionian Sea
21 Libya
22 Aegean Sea
23 Crete
24 South of Turkey
25 Cyprus
26 Egypt
27 Levant
28 Marmara Sea
29 Black Sea
30 Azov Sea
Table 10.1: Key for column numbers listed in Figure 10.1.
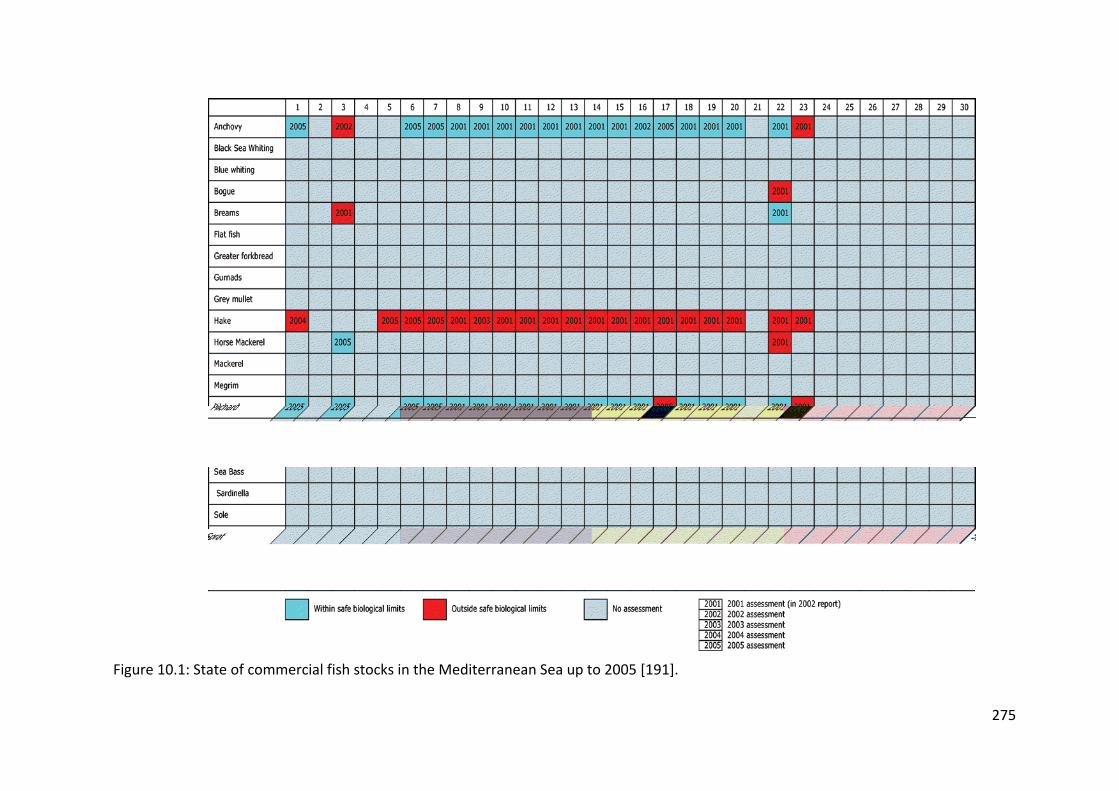
275
Figure 10.1: State of commercial fish stocks in the Mediterranean Sea up to 2005 [191].

276
Figure 10.1 illustrates that there is a general trend in the Mediterranean that is also experienced in Malta, i.e. that hake, red mullet, and bluefin tuna (Thunnus thynnus) stocks are under threat, whilst stocks of anchovy, pilchard, and swordfish (Xiphias gladius) are within safe biological limits. Data is not gathered for 80% of species of commercial importance. An important fish species for Malta, not listed in Figure 10.1 is the dolphin fish (Coryphaena hippurus). Malta’s State of the Environment Report [196] reports that dolphin fish stocks are not under pressure from fishing activity. This is related to the biology of this fish, which has a long spawning season during which time both males and females spawn regularly. Moreover, sexual maturity is reached at 4‐5 months as opposed to the bluefin tuna, which reaches maturity at about 10‐11 years. As reported by the European Environment Agency, the latest assessment by the International Commission for the Conservation of Atlantic Tunas (ICCAT) reports that efforts made over recent years have rendered the exploitation of swordfish sustainable [271]. However, concern remains on the over‐exploitation of bluefin tuna and catches continue to exceed the sustainable rate. Malta’s Fisheries Operational Programme (2007‐2013) states that in the case of blue fin there was a decision to adopt the ICCAT Recommendation establishing a multi‐annual recovery plan for Blue fin tuna in the Eastern Atlantic and Mediterranean. This plan has established a 20% reduction of fishing quotas by 2010 to help this stock to recover. 1100..22..22 LLaannddiinnggss ffrroomm MMaarriinnee CCaappttuurree FFiisshheerriieess Landings from marine capture fisheries are dominated by tuna, lampuki (dolphin fish) and swordfish in decreasing order of importance. Over 65% of the annual landings (about 1,000 tonnes) originate from the tuna and dolphin fish fisheries and contribute to almost 56% of the value of annual landings (about €2.6 million). The actual percentage attributed to any one of these three species depends on the actual volume of landings and market price for each particular species in a given period. The price of lampuki and swordfish varies enormously and the percentage importance attributed to them will therefore change in different time periods. Between the months of April and July the market is dominated by landings of blue fin tuna with swordfish being the second most available species. Both these species are targeted by the same method i.e. pelagic drifting long‐lines [197]. Landings of lampuki occur mainly between August and December mostly by the Fish Aggregating Devices (FAD) fishery, but the season can be extended into January when unfavourable weather conditions occur during the initial part of the season. Other major species associated with the dolphin fish fishery are pilot fish and amberjack, which are caught as secondary species found in considerable concentrations using FADs. Swordfish is the third most landed species annually in terms of weight and it is the only species with landings of more than 1 metric tonne for each month of the year.

277
It is targeted throughout the year: during the winter months (December‐April) most boats target lucrative demersal species prior to reverting to tuna long‐lining which catches swordfish and albacore as a secondary species. The peak fishing period for swordfish is between May and August. Landings of small gregarious pelagic and demersal species are generally not seasonal except in the case of mackerel. The species in these groups are landed in quantities of less than 5 metric tonnes per month. Bogue is the most landed small pelagic species, and is caught mostly by traditional traps made out of cane strips, followed by mackerel. The landings of prawns originate exclusively from trawling which takes place throughout the year with quantities decreasing in winter months due to unfavourable weather. Landings of other demersal species originate from trawling, long‐lining and fixed net operations (see Table 10.2).
Year / species 2004 2005 2006
Dolphin Fish 472,700 447,095 559,098
Blue‐Fin Tuna 227,774 301,443 227,008
Swordfish 174,342 323,314 239,181
Prawns 26,179 30,146 32,123
Stone Bass 23,675 17,005 19,224
Dog Fish 20,361 18,610 19,618
Bogue 15,629 21,088 17,286
Table 10.2: Landings by key species [197].
1100..22..33 TThhee AAqquuaaccuullttuurree IInndduussttrryy The aquaculture industry in Malta started in the late 1980’s with the culture of marine finfish in offshore cages. The annual aquaculture production increased during the 1990's from 60 tonnes in 1991 to a peak of 2,300 tonnes in 1999. This was composed mainly of sea bream and sea bass and was produced through the operation of 4 commercial farms. By the year 2000, production dropped to about 1,000 tonnes with most farms switching to tuna penning operations due to a fall in prices for sea bass and sea bream. Current annual production stands at around 1,000 tonnes, and this is expected to continue increasing in the coming years. Maltese aquaculture produce is almost entirely exported to European and Asian markets. There are no commercial marine hatcheries in Malta and fingerlings are imported from hatcheries in other Member States. The production of blue fin tuna (Thunnus thynnus) through penning has been increasing over the past few years. The fattening of this species around the Maltese Islands started in the year 2000 with one farm producing 300 tonnes. Production reached a peak of 3,550 tonnes in 2003 with four farms in operation (see Table

278
10.3). An aquaculture zone in the south east of Malta has been established; the aim of the zone is to relocate tuna penning farms off‐shore. The zone is operational. The live tuna are exclusively imported from foreign purse seiners fishing in the Mediterranean. Once harvested, the fattened fish are re‐exported mainly to Asian markets.
Species 2004 (in kg) 2005 (in kg) 2006 (in kg)
Fin Fish 913,000 772,000 1,075,000
Tuna penning 3,069,000 3,065,000 5,215,000
Table 10.3: Aquaculture Annual Production [197]. Summary of the First National Communication to the UNFCCC with respect to Fisheries Some species are expected to enjoy the positive effects of climate change, such as longer growing seasons, lower natural winter mortality and faster growth rates. Other species may be offset by negative factors such as changes in established reproductive patterns, migration routes and ecosystem relationships. Climate change is also expected to contribute to changes in the Mediterranean biota creating competition between indigenous and exotic or newly established species, subsequently affecting existing fisheries. Adaptation to climate change in fisheries should focus on environmental considerations in fisheries management. The ecosystem‐based fisheries management approach that has started to be implemented on a global scale, actually takes environmental variability into consideration.
1100..33 CClliimmaattee CChhaannggee SScceennaarriiooss
The locally generated regional scenarios (see Chapter 5, sub‐section 5.5 and 5.6)
predict an increase in annual average temperature of 2 C and 2.8 C by 2050 and 2100 respectively (see Table 5.8). The model results of such projections are considered to be robust and the trends in observed temperature corroborate this projection. Such increase in temperature is also in line with the predictions of the IPCC FAR. Models for precipitation and temperature variability however are associated with more uncertainties. Although a decrease in precipitation is being predicted, projected changes in precipitation should be viewed with some caution. The trends analysis implies that total rainy days with 0.1 mm or more of rainfall are decreasing while total yearly days with 10 mm or more of rain is increasing. This may be interpreted as a decrease in the total amount of precipitation but an increasing trend for convective type rainfall or heavy rainfall. While the uncertainties still prevail, the

279
trends identified from data observations are in line with regional scenarios (found in the IPCC FAR) with regards to both decrease in mean annual precipitation and increase in extreme weather events (increase in the intensity of daily precipitation events) for the Mediterranean region. The IPCC report notes that there will be a higher incidence of drought and heat waves in summer. In this context, while this report will focus on the more certain increase in temperature, as also verified by locally generated scenarios, other impacts associated with the decrease in precipitation and increase in extreme events will be addressed based on regional scenarios. With regards to sea level rise, real‐time data is available from [87] and shows that “contrary to the general expectations the overall trend over a window of 13.5 years
of data is that of a fall in sea level at an average rate of 0.50 0.15 cm/yr. The sea level experienced a hefty rise of several centimetres in the period 1993 to 1996; this was followed by a rapid decrease till the end of 2001 when the sea level reached an
average of 9.0 0.4 cm below that in 1993; in the following years the sea started to recover back to slightly higher levels at a rate of less than 0.5 cm/yr”. The report further states that “this general decreasing trend in the sea level in recent years does not however refute the impact of climatic changes in the Maltese Islands. Sea level is only one of several indicators of climate change”. It explains this potentially anomalous behaviour of sea level in this area. The report concludes that “This part of the Mediterranean has experienced a buffer period that has attenuated any imminent menace of sea level rise, but there is no guarantee that this will persist in the future. To maintain a precautionary approach one should thus base projections mainly on the moderate sea level trend of the four years (2002‐2006) during which
the sea level experienced an average rise of 0.45 0.15 cm/yr”. With regards to sea level rise both reports note the uncertainties associated with the predictions in sea‐level rise. However an estimate of a rise of 30 cm until the year 2100 appears to be agreed to by both studies.
1100..44 IImmppaaccttss The extent to which people and systems are affected by climate change (their vulnerability) is determined by three factors: their exposure to specific change, their sensitivity to that change, and their ability to respond to impacts or take advantage of opportunities. The non‐linear interactions of these factors mean that vulnerability is unevenly distributed. It is important to understand patterns of vulnerability to specify and prioritize adaptation interventions. Coastal communities and small island states without proper extreme weather adaptation programmes, in terms of infrastructure design, early warning systems and knowledge of appropriate behaviour, will also be at high risk [195]. Considering climatic trends and the uncertainties over impacts, the current fishing trends are exposing most fishing stocks to a high risk of collapse. Climate change has both direct and indirect impacts on commercial fish stocks. Direct effects act on

280
physiology and behavior and alter growth, development, reproductive capacity, mortality, and distribution. Indirect effects change the ecosystem on which fish depend for food and shelter by altering ecosystem productivity, structure, and composition [187]. As stated in Chapter 9, marine biodiversity in local waters is likely to follow the general trend for the rest of the Mediterranean, which is that of a tropicalisation of the sea: indigenous thermophilic species will expand their range, less thermophilic species will contract their range and there will be an increasing influx of warm water alien species from both the Atlantic and the Levantine Sea towards the central Mediterranean. The trend in Maltese waters is for both subtropical Atlantic species and Lessepsian immigrants to increase their occurrence with time, although this may be due to other reasons apart from a general warming of the sea. Climate change has been implicated in mass mortalities of several aquatic species. However, the lack of standard epidemiological data and information on pathogens generally makes it difficult to attribute causes. Furthermore, there is an increasing possibility that local extinctions occur where fish species are located at the edge of their ranges [189]. The spread of competitors and pathogens to new areas is also an increasing possibility [187]. Aquaculture The aquaculture industry is vulnerable to climate change impacts mainly from threats that arise from [203]:
stress due to increased temperature and oxygen demand and decreased pH;
extreme weather events with the consequent destruction of facilities, loss of stock, loss of business, and mass scale escape with the potential to impact on biodiversity;
increased frequency of diseases and toxic events; sea level rise and conflicts of interest with coastal defence systems; and an uncertain future supply of fishmeal and oils from capture fisheries.
The increased physiological stress on cultured stock would not only affect productivity but also increase vulnerability to diseases and, in turn, impose higher risks and reduce returns to farmers. Interactions of fisheries and aquaculture subsectors could create other impacts. For example, extreme weather events could result in escapes of farmed stock and contribute to reductions in genetic diversity of the wild stock, affecting biodiversity more widely [195]. Climate change may also result in positive impacts such as [203]:
increased growth rate and food conversion efficiencies; increased length of growing season; and range expansion.

281
1100..55 AAddaappttaattiioonn The Veterinary Affairs and Fisheries Division (VAFD) within the Ministry for Resources and Rural Affairs regulates and manages both the fisheries and the aquaculture industries together with all other related activities. The VAFD is also involved in scientific monitoring, research and development through the Malta Centre for Fisheries Sciences (MCFS) and offers technical advice to the industry. The main goal of the VAFD is to implement sound fisheries management ensuring the sustainability of living marine resources. In particular the management of the unique Maltese 25‐mile Fisheries Management Zone is of highest priority for the effective conservation of local and sub‐regional fisheries resources [198]. Malta’s accession to the EU in May 2004 demanded extensive changes in the Maltese Fisheries Legislation and compliance with EC regulations related to the Common Fisheries Policy (CFP). The results of the Malta‐EU negotiations on the 25 mile Fisheries Management Zone have also been transposed into a new Council Regulation (EC 813/2004) which lays down detailed conservation measures in connection with the management regime of the Zone. Essentially, it limits the number, size and power of fishing vessels allowed in the zone depending on the type of fishing activities in which they are engaged. In addition to the main Maltese Legal Act (Act II of 2001, Chapter 425) dealing with the conservation and management of fisheries, a number of subsidiary regulations have been drawn up, including one on the registration and operations of fishing vessels (L.N. 407 of 2004). The fishing fleet register was closed on 15th September 2003 through a notice in the Government Gazette (dated 10th September 2003) in order to prohibit an increase in fishing capacity and effort in line with the management policy reflected in EC 813/2004 [198]. Malta has adopted management measures compliant with the Common Fisheries Policy of the European Union and is currently participating in discussions in connection with the revision of EC legislation on management measures for the conservation and sustainable exploitation of fisheries resources in the Mediterranean Sea. Through the Malta Centre for Fisheries Sciences, Malta conducts a scientific data collection programme, in line with the Commission Regulation (EC) No 1581/2004, the results of which are essential for the national and regional fisheries management processes. United Nations fisheries agreements and the FAO Code of Conduct for Responsible Fisheries are reflected in Maltese fisheries policy and a Maltese version of the Code has recently been published. Malta is complying with the various International Plans of Actions in support the Code of Conduct and is addressing the issues contained in the FAO Strategy to improve the status and trends in capture fisheries as well as those of the Reykjavik Declaration on responsible fisheries in the marine ecosystem.
282
Malta became a member of the General Fisheries Commission for the Mediterranean on 29th April 1965 and ratified the amendments to the Agreement on 23rd December 1999. Since 1998 Malta attends all GFCM Scientific Advisory Committee meetings and took up a key role in the scientific activities of the FAO sub‐regional projects COPEMED, MedSudMed and MedFiSIS. Malta also became a member of the International Commission for the Conservation of Atlantic Tunas in 2003. In addition to Council Regulations relating to conservation of fisheries of relevance is also Maltese planning policy. The National Policy on Aquaculture (NPA) was formulated in 2004 in response to the rapid development of the local aquaculture industry. The Document has two objectives:
to formalise Government’s policy with respect to this emerging industry, and
to provide a holistic national strategy with respect to aquaculture development in Malta.
The NPA gives an overview of the development of aquaculture in Malta, identifies the requirements of the industry and the environmental constraints/impacts, and emphasis the need for the proper conduct of operations. The NPA’s Strategy is based on procedural matters, development, and management of installations. Of relevance is the location of marine installations that will be located in designated areas depending on the species being farmed, namely:
installations for the culture of large fish (hence occupying large areas of sea) shall be located as far out from the coast as the species and the technology will allow,
installations for the culture of small fish that necessitate sheltered waters (and small areas) shall be located so as to minimise visual impacts and to make best use of the available areas, and
installations for filter‐feeding organisms, algae, and invertebrates, will be given priority on the use of inshore sites.
The potential impacts of climate change on aquaculture are not considered. The Coastal Strategy Topic Paper was prepared by MEPA [156] to identify issues affecting the coastal zone that required addressing as part of the Structure Plan Review process. MEPA in [156] provides a strategic direction towards sustainable development within the Maltese coast, within the broader concept of Coastal Zone Management. This is the holistic process that aims to promote and maintain the sustainable development of a defined coastal area. The Topic Paper’s strategy for the marine environment states: “The primary objectives of the coastal strategy for the marine environment are to safeguard the natural and cultural heritage present; to safeguard legitimate marine uses, and to minimise existing and potential conflicts”. It advocates the designation of the MCAs identified in the Structure Plan, with the seaward boundary extending to the –50m

283
depth contour, establishment of new aquaculture units beyond the –50m depth contour, and calls for a precautionary approach to development and for the application of Environmental Impact Assessment procedures. It identifies aquaculture and fisheries among the major coastal uses. The planning concerns with regards to the fisheries sector do not address potential climate change issues, as this is mainly a land use document and therefore does not focus on catch and on fisheries as such. The Topic Paper deals with aquaculture in a comprehensive manner, outlining its requirements, the development of the industry in Malta, environmental considerations and economic viability of the industry. The main issue identified by the Topic Paper is that related to location and space requirements, emphasising the need for detailed environmental assessments before farm locations are decided. The Topic Paper further states that although decisions on the future of the industry are not the remit of the Planning Authority, the decision on where to locate aquaculture units and their associated facilities is. The conclusion was that “the ecological and geomorphologic characteristics and the presence of other users within such a limited coastline make it practically difficult for this industry to expand unless the cage units are taken further offshore within sites primarily zoned for this type of activity”. 1100..55..11 FFiisshheerriieess Although the local fisheries sector is seeing subtle changes in the catch composition with certain species becoming more abundant in catches, this still needs to be studied. Data regarding catch is available however the analysis of the data is still to be carried out [189]. It is therefore important to strengthen this arm of the fisheries management in Malta as without data we cannot know how to tackle potential effects of climate change on fisheries. Of relevance to the fisheries sector are those adaptation measures discussed in Chapter 9 including establishment of marine conservation areas, and review of the Structure Plan that include policies aimed at the protection of local biodiversity. Other adaptation measures applicable for fisheries are related to catch size and effort. Reductions in fishing levels are required to sustain yields that may also benefit fish stocks that are sensitive to climate variability. To sustain the resilience of fish populations, in particular when they are confronted by additional pressures such as climate change, their age and geographic structure must be preserved rather than relying only on management of their biomass [187]. Fish mortality reductions are required in the majority of fisheries that are currently fully exploited or overexploited. This is considered as the most feasible means of reducing the impacts of climate change [187].

284
However, it must be considered that capture fisheries are used to temporal variability of their catches. With effective management, fishery systems have developed adaptive strategies where fishing effort and catches are regularly modified according to the state of the stock [194]. Hence, adapting to alternative fishery resources can be considered as a possible adaptation measure. Moreover, investments in flexible technologies (such as multi‐purpose boats) should be promoted, also in line with the Draft Sustainable Development Strategy for Malta. However, it is important to note that increasing fishing effort or using alternative techniques and technology to exploit the remaining fish stocks may be considered as a mal‐adaptation as it will continue to deplete endangered populations. Even the shift to alternative fish resources must be well studied before being adopted, as one must recognise the fact that the population of a species is part of a whole ecosystem that must be safeguarded in its entirety. 1100..55..22 AAqquuaaccuullttuurree As discussed above extreme weather events have the potential to destroy aquaculture units. Adaptation measures include encouraging uptake of individual/cluster insurance; improve siting and design to minimize damage, loss and mass escapes; encourage use of indigenous species to minimize impacts on biodiversity, and use non‐reproducing stock in farming systems. While these measures need to be taken up by the private sector (operators) planning policy can consider the potential impacts of climate change when assessing development applications for fish farms. Planning policy should also take into account climate change.
1100..66 DDiissccuussssiioonn aanndd CCoonncclluussiioonnss Because of the considerable uncertainty in a number of parameters that control fish stocks, there is very low confidence on current predictions of future fish production. However, regional and local forecasts may be more reliable. Further studies are required to understand the characteristics of other species as well as the impact of climate change on them. Finally, it must be taken into consideration that the fishing industry is quite adaptable to changes in fishing populations. Over history, fishing fleets have changed their target capture species on the basis of the economic value of the fish themselves. Hence, although migratory shifting of species may change and make currently fished species unviable, existing non‐commercial or new species may become attractive for the fishing industry. It noted that further research is required in this regard. We need to monitor such shifts in species and be fully aware of which species are invading the Maltese coastal waters and the associated implications on the ecosystems/fisheries sector. The current data that is being collected by the Fisheries Division could be assessed with a view to establish how such monitoring can be utilised to assess climate change impacts.

285
Where aquaculture could be looked as an adaptation strategy careful consideration must be given to minimizing incentives that could lead to over capacity, over fishing, excessive environmental impacts, and other harmful practices. Positive incentives should be defined to meet sustainable development goals. In terms of this adaptation strategy it is noted that two of the objectives of Malta’s Fisheries Operational Programme 2007‐2013 are to achieve a sustainable balance between fishing capacity and fishing opportunities and to develop aquaculture by stabilising production and diversifying. The target for the first objective is to reduce by 15% the fishing capacity of the Maltese fleet for declining species ‐ mainly blue fin tuna and swordfish ‐ by 2013. The target of the aquaculture measure is to increase by at least one species the commercially produced fish.

286
AAGGRRIICCUULLTTUURREE
1111..00 EExxeeccuuttiivvee SSuummmmaarryy
The agricultural system is dependent on climate; heat, light and water drive crop growth. Multiple stresses, such as limited availability of water resources, loss of biodiversity, and air pollution are increasing sensitivity to climate change and reducing resilience in the agricultural sector. Other stresses to local agriculture include fragmentation of landholdings, pressure to develop agricultural land, and an aging farming community.e nt M The largest effect of climate change on Maltese agriculture will be felt with the predicted shortening of the rainy season. Rain that will fall in the future will be more intense and damaging. This will lead to problems such as soil erosion, soil structural damage, soil waterlogging, increased nutrient leaching and direct damage to both crops and infrastructure such as greenhouses. In addition to the above negative effects, a higher proportion of water will be lost as surface run‐off than that being lost today. Soils will be eroded. The increase in air temperatures is likely to increase the temperature stress on animals. To mitigate these effects, farmers and policy makers will need to react early and in a systematic way if future problems in agriculture are to be avoided. Funding will be needed to aid farmers restructure their operations so as to adopt more modern and climate proof ways of operation. Farmers will have to adopt new techniques in soil and water conservation as these resources will be the most limiting factors to agricultural production. Farmers will also need to be educated on how the predicted climate changes will affect their agricultural operations, and information given about the latest crop species and varieties that will in the future be more suitable for production. The task ahead for the Maltese farmer is challenging. There needs to be a joint effort between the farming community and the Government to assist this sector, otherwise the current trends of the decreasing size of the farming community will continue. In the long run, it is anticipated that diversification of the sector should be sought as described in the Rural Development Program (RDP) 2007‐2013 [211]. The production of unique high‐value niche products such as Maltese food specialties (cheeselets, carob products, capers, honey, etc) together with the market potential encapsulated in the 1.2 million tourists that visit Malta annually can help to sustain this local production.

287
1111..11 IInnttrroodduuccttiioonn The agricultural system is dependent on climate; heat, light and water drive crop growth. The supply and demand for irrigation water, plant diseases, and pest infestations are also dependent on climate. The predicted changes in the climatic pattern for Malta are complex and far‐reaching. Nonetheless, certain deductions can be made as to how Maltese agriculture may be affected by the predicted weather changes. This will help to provide adaptation measures for the agricultural sector.
1111..22 SSuummmmaarryy ooff MMaallttaa’’ss FFiirrsstt NNaattiioonnaall CCoommmmuunniiccaattiioonn ttoo tthhee
UUNNFFCCCCCC Changing weather patterns are expected to affect fruit abundance and crop production with the largest effect being due to the predicted shortening of the rainy season. Potential impacts include soil erosion, soil structural and composition damage, soil water clogging, increased nutrient leaching and direct damage to both crops and infrastructure, such as greenhouses. Proposed mitigation measures include adoption of new techniques in soil and water conservation; education programmes to address the impact and mitigation of climatic changes on agriculture; and introduction of more tolerant crop varieties that are less vulnerable to new pests. Better adaptation to changes in seasonal climatic patterns and an enhanced reliance and response to improved short term forecasts for optimisation of crop yields would also be required. The following adaptation measures were proposed:
reduction of harsh (e.g. rotary) cultivation techniques; replacement of artificial inorganic fertilisers by organic matter; increased use of organic mulches to provide soil protective cover; increased cultivation of perennial crops, e.g. fruit trees; improvement in water and alkalinity levels; construction of larger reservoirs and improved water conservation
practices; regular monitoring of soil salinity; repair and maintenance of rubble walls; and farmer education programmes focusing on climate change adaptation
strategy.
1111..33 AAggrriiccuullttuurree iinn MMaallttaa Maltese agriculture is viewed to serve an important environmental function by having the potential to maintain the islands’ limited and declining agricultural area. According to Malta’s State of the Environment Report [208], agriculture accounts for almost half of Malta’s land area while forests account for less than 1%. Agricultural

288
holdings for 2007 amounted to 11,018, and a total of 10,326 hectares of utilised agricultural area were registered, as shown in Figure 11.1. From 2003 to 2007, the number of holdings increased by 0.28%, but the hectares of utilised agricultural area declined by 4.3% [212].
Year Total 0‐<1ha 1‐<2ha ≥2ha
2003 10,987 7,802 1,767 1,418
2005 11,071 7,982 1,782 1,197
2007 11,018 7,990 1,923 1,105
Table 11.1: Number of agricultural Holdings by size class [212].
0
2000
4000
6000
8000
10000
12000
20032005
2007
Num
ber o
f Holdings
Year
0‐<1ha 1‐<2ha ≥2ha
Figure 11.1: Number of holdings by class size [212]. There was a shift in the way agricultural land was exploited between 2003 and 2007, as shown in Figure 11.2 and Table 11.2.

289
0
2,000
4,000
6,000
8,000
10,000
12,000
20032005
2007
Utilised Agricultural A
reas (ha)
Year
Forage Potatoes Permanent Cropping excluding Vineyards Vineyards Market Gardening Kitchen Gardens Other Areas Fallow Land
Figure 11.2: The composition of the Utilised Agricultural Areas (in hectares) [212].
Type of Crop Growth 2003‐2007 (%)
Forage –10.8
Potatoes –69.5
Permanent Cropping excluding Vineyards 18.4
Vineyards 18.1
Market Gardening –12.5
Kitchen Gardens 57.1
Other Areas –20.2
Fallow Land –3.0
TOTAL –4.5
Table 11.2: Utilised Agricultural Areas (UAA) (hectares) for different crops [212].
Table 11.2 shows that between 2003 and 2007 there were significant declines in areas used for forage, potatoes, market gardening, and other areas. On the other hand, permanent cropping (excluding vineyards), vineyards and kitchen gardening increased significantly, although in the case of kitchen gardening the growth can in good part be attributed to better systems of monitoring and recording such activity.

290
Employment in the agriculture sector is dominated by part‐time farmers: 1,546 persons are employed full‐time and 16,423 are engaged on a part‐time basis. Traditionally Malta is self‐sufficient with regards to fresh vegetables, potatoes, process tomatoes, eggs, poultry, dairy, pork, and dairy products. It imports cereals, fruit, sugar, vegetable oil, rice, butter, cheese and beef. From 2004 upon Malta’s accession into the European Union, the level of local production and imports has changed and in some industries (such as poultry and swine) local production has declined while imports have increased. Over the past years the major change in land use has been conversion of agricultural land into urban areas. The most important critical land issues for agriculture as identified in [208] are abandonment of agricultural land, farm intensification, and fragmentation of land ownership. Of direct relevance to the impacts of climate change on agriculture are those factors that could lead to land abandonment. The assessment of the impact of climate change on agriculture needs to take into account this background of social economic factors that have shaped the sector over the years.
1111..44 CClliimmaattee CChhaannggee SScceennaarriiooss The locally generated regional scenarios (see Chapter 5) predict an increase in annual
average temperature of 2 C and 2.8 C by 2050 and 2100 respectively (see Table 5.8). The model results of such projections are considered to be robust and the trends in observed temperature corroborate this projection. Such increase in temperature is also in line with the predictions of the IPCC FAR [255]. Models for precipitation and temperature variability however are associated with more uncertainties. Although a decrease in precipitation is being predicted, projected changes in precipitation should be viewed with some caution. The trends analysis implies that total rainy days with 0.1 mm or more of rainfall are decreasing while total yearly days with 10 mm or more of rain is increasing. This may be interpreted as a decrease in the total amount of precipitation but an increasing trend for convective type rainfall or heavy rainfall. While the uncertainties still prevail, the trends identified from data observations are in line with regional scenarios (found in the IPCC FAR) with regards to both decrease in mean annual precipitation and increase in extreme weather events (increase in the intensity of daily precipitation events) for the Mediterranean region. The IPCC report notes that there will be a higher incidence of drought and heat waves in summer. In this context, while this report will focus on the more certain increase in temperature, as also verified by locally generated scenarios, other impacts associated with the decrease in precipitation and increase in extreme events will be addressed based on regional scenarios.

291
Section 4.3 on sea‐level rise shows that “contrary to the general expectations the overall trend over a window of 13.5 years of data is that of a fall in sea level at an
average rate of 0.50 0.15 cm/yr. The sea level experienced a hefty rise of several centimetres in the period 1993 to 1996; this was followed by a rapid decrease till the
end of 2001 when the sea level reached an average of 9.0 0.4 cm below that in 1993; in the following years the sea started to recover back to slightly higher levels at a rate of less than 0.5 cm/yr”. The report further states that “this general decreasing trend in the sea level in recent years does not however refute the impact of climatic changes in the Maltese Islands. Sea level is only one of several indicators of climate change”. It explains this potentially anomalous behaviour of sea level in this area. The report concludes that “This part of the Mediterranean has experienced a buffer period that has attenuated any imminent menace of sea level rise, but there is no guarantee that this will persist in the future. To maintain a precautionary approach one should thus base projections mainly on the moderate sea level trend of the four years (2002‐2006) during which the sea level experienced an average rise
of 0.45 0.15 cm/yr”. With regards to sea level rise both reports note the uncertainties associated with the predictions in sea‐level rise. However an estimate of a rise of 30 cm until the year 2100 appears to be agreed to by both studies.
1111..55 IImmppaaccttss ooff CClliimmaattee CChhaannggee oonn AAggrriiccuullttuurree Multiple stresses, such as limited availability of water resources, loss of biodiversity, and air pollution are increasing sensitivity to climate change and reducing resilience in the agricultural sector [203]. Other stresses to local agriculture include fragmentation of landholdings, which results because of the traditional pattern of inheritance of farmland that involves the division of land equally amongst all the heirs. As a result, the average farm size now stands at 0.92 hectares and 48.1% of farms are between 0.1 and 0.5 hectare. These figures contrast sharply with the EU 25 average of 15.8 hectares. Other stressors include pressure to develop agricultural land, an aging farming community, and insufficient capital investment. Maltese agriculture is likely to be adversely affected by the predicted changes. It must be noted that the quantification of the impacts is not possible because of lack of data on the sector. Findings from other countries especially in the Mediterranean have been used to draw conclusions for Malta. It is recognised that farmers already face some of the problems discussed below; however, it is anticipated that these issues will be exacerbated in the future. Crop yield reductions are expected in the Mediterranean because of climate change effects. The increase in climate variability and extreme weather events will increase yield variability and reduce average yield. Spring‐sown crops are expected to have lower yields (e.g. legumes). Other crops such as the potato will require more water. Autumn‐sown crops are also expected to have lower yields because of the increase in climate variability and extreme weather events. Increased frequency of extreme

292
weather events during specific crop development stages, together with higher rainfall intensity and longer dry spells are likely to reduce the yield of summer crops [186]. Cereal production may be particularly at risk of significant climate‐induced effects. If the current trends in population growth, land transformation, and water use persist, cereal production in the southern Mediterranean may be increasingly unable to satisfy internal food demand, while soil quality and water availability may continue to deteriorate. The predicted rise in sea water levels associated with global warming would have a direct effect on Maltese agriculture. The further deterioration of water quality in Malta’s aquifer is expected due to sea water intrusion. The state of Malta’s aquifers is already severely threatened by excessive and uncontrolled abstraction resulting in sea water intrusion while pollution from land based sources is also a threat to the quality of groundwater. The use of such water on agricultural land will harm crops and increase soil salinity levels. On the other hand, the forecasted rise in sea levels is not expected to inundate much of the low lying agricultural land. Of particular relevance to agriculture is the impact of climate change on fresh water resources. This is discussed in detail in Chapter 6. The following sections describe the impact of climate change on a number of important components of agriculture including soil, certain important crops for Malta, agriculture infrastructure, livestock and also the potential impact on crop disease.
1111..55..11 IImmppaacctt oonn SSooiillss The State of the Environment Report [208] states that one of the main threats to soil in Malta is soil erosion. It acknowledges that there is no information on rates of erosion. The predicted increase in the intensity of rainfall may mean increased amounts of soil erosion in the form of sheet and gully erosion. The amount of soil erosion will vary according to various factors such as the state of repair of rubble walls, the structure and physicochemical characteristics of the soil, and the vegetative cover on the soil. The risk to soil erosion was identified for the north‐west of Malta in the CAMP Project [99]. The maintenance state and length of breaches of rubble walls were used as indicators for soil erosion risk. Soil fertility could be affected because of the impact of large raindrops on soils that results in the shattering of soil peds (crumbs). The predicted increase in heavy downpours, possibly even hail, would mean a gradual loss of soil structure and hence fertility.

293
As reported in the First National Communication, the predicted increase in heavy showers may also mean periodical water logging of soils, especially in valleys and other low‐lying areas. This water logging of soils would have disastrous consequences such as die‐back and death to annual (vegetable) and perennial (trees), as well as causing the salinity levels of such soils to rise dramatically. Parts of low‐lying areas could be rendered useless to agriculture by this predicted regular and periodical water logging. In areas where soil is of sandy texture and/or has good structure, thereby allowing good rates of water drainage, the predicted rise in the number of heavier showers would result in increased leaching of plant nutrients from soils. This means that more fertiliser would need to be added to avert acute losses in crop production. In such a scenario, and assuming that the present over‐use of inorganic nitrogen‐rich fertilisers would still be occurring in the future, further pollution of the aquifers will be evident.
1111..55..22 IImmppaacctt oonn PPoottaattoo The three types of photosynthesis are C3, C4, and CAM. C3 photosynthesis is the typical photosynthesis that most plants use. C4 and CAM photosynthesis are both adaptations to arid conditions because they result in better water use efficiency. In addition, CAM plants can "idle," saving energy and water during harsh times, and C4 plants can photosynthesize faster under the desert's high heat and light conditions than C3 plants because they use an extra biochemical pathway and special anatomy to reduce photorespiration. In C3 plants, such as potato, an increase in atmospheric concentrations of carbon dioxide leads to a higher rate of photosynthesis. Experiments on potato have shown that increasing CO2 concentrations have little effect on production of biomass above ground, but below ground biomass is significantly enhanced through increased tuber number and size. The yield increases by about 10% for every extra 100 ppm. Experiments also indicate that with increasing levels of ozone, there is an overall reduction of photosynthetic efficiency and a significant decrease in tuber starch content, but an increase in the ascorbic acid concentration. Since potato's
tuberization rate declines above a temperature of 17 C, increasing temperature may lead to reduced yields in potato varieties now cultivated close to the upper climatic limits of the crop that would not be recovered by higher levels of carbon dioxide. On the other hand, a simulation study has shown that in northern European countries a warmer climate would bring a longer growing season and big increases in yields. Areas that are now too cold for potato ‐ for example, parts of Canada, Siberia and Scandinavia ‐ may become viable, as would highland areas such as the altopiano in Peru and Bolivia. Worldwide research shows that, without adaptation, higher temperatures will reduce the yield by 10 to 19% in 2010‐2039 and 18 to 32% in 2040‐2069. A crop growth simulation experiment on an EU scale reported that, under the present climate change scenario, yields under rain‐fed conditions were strongly affected by water shortages, with reductions of 50%. In arid regions, where drought

294
is expected to become more frequent and more intense, there will clearly be a drop in productivity. Could climate change also lead to an increase in potato pests and diseases? Given
the thermal limit for late blight −22 C ‐ increases above that temperature threshold in Europe may prevent infections. Increasing quantity and frequency of rainfall would also create conditions more favourable to viral disease vectors. Researchers have predicted an increase in the Colorado potato beetle's area of diffusion in Europe, as well as in the area infested by potato cyst nematode [272]. While there are no specific studies for Malta, noting the evidence for southern Europe, this important cash crop is likely to be negatively affected by climate change. It is noted from Table 11.2 that UAA dedicated to the potato has been on the decline since 2003.
1111..55..33 IImmppaacctt oonn VViinneeyyaarrddss It is likely that the most significant impact of climate change on viticulture will result from an increase in temperature and from the evolution of rainfall distribution and efficiency. The possible consequences of elevated temperatures are multiple: increased transpiration and plant water consumption in addition to a modification of canopy and/or bunch microclimate by leaf fall in the bunch zone, for example. These modifications of plant functioning and vigour can lead to:
a) an inhibition of photosynthesis; b) a partial or total inhibition of berry development and biosynthesis of its
principal components, notably during vegetative growth of the berry; c) inhibition of ripening; d) loss of fruit volume with resulting consequences for yields and harvest
concentration; e) a possible increase in alcohol content of wines produced in such “warm”
areas due to the concentration in sugars (loss of water by evapo‐transpiration and limited water entering the berry or back flow of water from the berry to the plant).
Some farms are buying land upslope at higher elevations, or are moving toward cooler microclimates near coastlines in order to adapt to warming trends [275, 276]. Accelerated ripening has serious consequences for precocious varieties in that they enter into the final phase of ripening under increasingly warmer conditions. This has potential implications in that high temperatures, especially if associated with drought, can inhibit certain biochemical pathways or physiological processes essential for the production of quality grapes. One of the immediate effects on vine culture in Mediterranean areas, and therefore also likely in Malta, is the management of drought and of water resources for the purposes of irrigation. [273].

295
1111..55..44 IImmppaacctt oonn LLiivveessttoocckk The increase in air temperatures is likely to increase the temperature stress on animals. Animals need to be situated within an optimal zone for production. This is a range of temperatures for which the animal does not need to significantly alter its behaviour or physiological functions to maintain a constant core temperature. Air temperature is the most important determinant of the optimal zone; another factor is humidity [205]. Although animals are able to adapt to higher temperatures, production losses are most likely to occur. According to the European Environmental Agency [204], summer livestock production in the Mediterranean will experience adverse effects. Increased surrounding air temperatures will lead to depressed voluntary feed intake (VFI), reduced weight gains, and lower milk production especially during the hotter periods [205]. Maltese farms are susceptible to such ambient temperature changes as most are not equipped with cooling devices. Maltese livestock units are typically small land‐based units that have given rise to the evolution of a highly intensive livestock production system. There are some impacts of climate change that indirectly affect livestock production. These are changes in the availability, quality and prices of grains for feeding, changes in forage crop productivity and changes in the distribution of livestock diseases [204]. These changes are expected to affect Maltese livestock directly as Malta imports much of its animal feed ingredients (“ġwies”) from overseas. Local production of cereals (4,500ha) is limited to the production of wheat and barley. Livestock farmers lack adequate land base to produce their own feed and/or fodder.
1111..55..55 IImmppaacctt oonn AAggrriiccuullttuurree IInnffrraassttrruuccttuurree As discussed above heavy rainfall could have an impact on rubble walls further exacerbating the problem for soil erosion. The precipitation of large quantities of water in the form of large rain drops and hail may also result in increasing incidences of damage to greenhouses. With a precipitation pattern characterised by heavy rain showers falling in a relatively short rainy season, the existing smaller wells and reservoirs will quickly fill up and overflow. As the period of heavy rainfall coincides with the period of low irrigation requirements, the full wells and reservoirs will not be able to hold any further rainwater. In addition, soils which may also be considered as water reservoirs will only be capable of holding a finite amount of water (i.e. their field capacity) that falls during the wet season. The remaining rain will be lost as surface run‐off, collected in aquifers or lost through evapotranspiration. The predicted lengthening of the typical Mediterranean dry period will mean a greater dependence by farmers and gardeners on irrigation for satisfying the plant’s watering requirements. Unless reservoirs of a large enough capacity are constructed
296
and second class water is made available for farmers at a reasonable cost, water shortages for irrigation can be expected. This, combined with the increasing competition from other land uses (residential, industry, tourism etc), could exacerbate the current problem of illegal groundwater extraction from boreholes.
1111..55..66 AAlltteerraattiioonn ooff IInnsseecctt aanndd DDiisseeaassee DDiissttrriibbuuttiioonn Pests are organisms that affect agricultural plants and animals in ways considered unfavourable. They include weeds, and certain insects, arthropods, nematodes, bacteria, fungi, and viruses. Because climate variables (especially temperature, wind and humidity) control the geographic distribution of pests, climate change is likely to alter their ranges [213]. Milder winters could increase the incidence of outbreaks of, for example, powdery mildew, brown leaf rust of barley, strip rust of cereals, while also reducing incidence of most fungal diseases. Higher temperatures could also cause a proliferation of insect pests as warmer and longer growing seasons provide time for pests to reproduce more often. Ironically, responses to such outbreaks, could actually damage agricultural production in the long term. For example, an increased use of pesticides will enhance soil degradation and thus soil erosion [274].
1111..66 AAddaappttaattiioonn
Other than the Rural Development Programme 2007‐2013 [211] there is no agriculture policy as such; there are a number of land use policies that do address agriculture in Malta. These are summarised below.
1111..66..11 PPllaannnniinngg PPoolliiccyy
The strategy of the Structure Plan (adopted in 1992) for agriculture, in acknowledging the constraints on production, seeks to protect and support the agricultural industry by encouraging agriculture and recognising particular agricultural structures and buildings, including dwellings for farmers, as normal and legitimate in the countryside, whilst aiming to mitigate the potential environmental and other impacts of agricultural development. Local Plans build on this policy direction. While climate change and adaptation do not feature as issues in these Plans, the protection of agricultural land from development is seen as positive in terms of reducing the vulnerability of the sector. MEPA’s Rural Topic Paper [206] notes that agriculture is considered to be a multifunctional activity in terms of contribution towards food production, landscape enhancement, protection of the environment and countryside recreation. The pressures on agriculture include large‐scale developments and the cumulative impact of numerous small‐scale developments. Issues related to soil erosion are significant, particularly due to the construction of impermeable surfaces, improper

297
field management techniques and land abandonment. The main implications connected with animal farms include generation of waste, pollution to water resources, incompatibility with adjacent land uses and impacts on the scenic value of rural areas. The Topic Paper does not address the impacts climate change directly although water resources and the need to achieve sustainable development of rural areas is emphasised. MEPA’s guidance document Agriculture, Farm Diversification, and Stables [209] provides detailed guidance on the type of development that is allowed in the countryside and that related to agriculture. Of relevance is the protection of good quality agricultural land, limiting development in valleys and watercourses, the implementation of environmental legislation relevant to agriculture such as the Habitats Directive, Water Framework Directive and the Nitrates Directive.
1111..66..22 CCooddee ooff GGoooodd AAggrriiccuullttuurraall PPrraaccttiicceess The Code of Good Agricultural Practices (CoGAP) and the Action Programme were prepared mainly as part of Malta’s implementation obligations under Council Directive 91/676/EEC of 12th December 1991 concerning the protection of waters against pollution caused by nitrates from agricultural sources (the EC Nitrates Directive). The CoGAP contains a set of codes of good practices on animal husbandry, manure handling, application of fertilisers, irrigation practices and plant protection. A substantial part of the Code is obligatory for farmers, either because the listed practices are obligatory under the EC Nitrates Directive or because their implementation is requested by other legislation. Moreover, compliance with the provisions of the Action Programme is a legal requirement within the whole territory of Malta: given that the whole of Malta was declared as a Nitrates Vulnerable Zone (NVZ), the Action Programme is obligatory for all Maltese farmers. The requirements of the CoGAP and the Action Programme form part of the verifiable standards on the basis of which farmers applying for CAP assistance will be inspected and checked as part of the cross‐compliance mechanism. Again while climate change is not directly discussed as an issue, measures to safeguard water resources and agricultural land are seen as helping the sector be less vulnerable to the potential impacts of climate change.
1111..66..33 RRuurraall DDeevveellooppmmeenntt PPllaannss In the 2004‐2006 Rural Development Plan for Malta [210], climate change was identified as a threat to the local agricultural sector in relation to the increasing pressure on water resources. Nonetheless, there were no direct measures in this regard other than rubble wall restoration. Although not considered within the context of climate change, the 2004‐2006 RDP provided funds that could be used for rubble wall restoration and hence the reduction of soil erosion. The RDP declared 367,445 m2 of rubble walls that required

298
restoration; 158,683 m2 were restored up to 2008. These were restored under the Restoration of Rubble Walls sub‐measure that fell under the Agri‐environmental Measure within Axis 2 of the RDP. During 2004, 300 participants took part in rubble wall construction programme offered by the Building Industry Consultative Council (BICC) [208]. These courses continued in 2005, 2006 and 2007. While the rest of the measures in the 2004‐2006 Plan were aimed at assisting farmers maintain their economic activity including support for addressing waste management, the Plan is still considered to have assisted in reducing the vulnerability of the sector by supporting it. The 2007‐2013 RDP went a step further. It identifies the need for an educational and an awareness programme, together with training for farmers. A key priority of Axis 2 (Improving the environment and countryside) is increasing the environmental and ecological sustainability of farming through encouraging management practices that address the adaptation measures required for climate change mitigation that lead to the sustainable use of natural resources particularly water and soil. Measure 212 provides for assistance in areas with natural handicaps. Natural handicaps include low soil productivity and poor climatic conditions. These payments will be used to contribute to ensure the continued use of agricultural land and the maintenance of that land in good agricultural and environmental condition. The take‐up of such measures by farmers will be assessed once the funding is allocated. A number of soil conservation measures are also proposed in the 2007‐2013 RDP, including actions that rely on the use of traditional low‐input crops, such as sulla (Hedysarum coronarium), and support for low‐input farming. Other measures, such as support to suppress the use of herbicides in vineyards and fruit orchards and support for a reduction in fertiliser use in protected cropping systems primarily aim to achieve a reduction in the chemical inputs, and contribute to reduce the potential for soil degradation through diffuse contamination. A condition of aid during this funding period is cross‐compliance. This effectively means that farmers must comply with Good Agricultural and Environmental Conditions (GAEC) and with various European legal obligations (known as the Statutory Management Requirements ‐ SMRs) on:
the protection of the environment, animal welfare, and public, animal and plant health.
Of relevance to the preservation of agricultural land include prevention of soil erosion measures, enhancing soil organic matter and soil structure, and good fertilization and pesticide use practices.

299
The RDP 2007‐2013 [211] also lists a number of pre‐conditions to aid that farmers must satisfy. There are a number of Good Farming Practices that are relevant to climate change. These include measures for soil conservation such as:
always ploughing parallel to the contours, not mechanising soil during windy days and maintenance of rubble walls. efficient use of water is promoted by advising farmers to refrain from any
furrow irrigation between 11:00 and 15:00 in winter, refraining from any irrigation in the same time period in summer, and
registering boreholes. The conservation of biodiversity and rational use of pesticides, fertilizers, manure and slurry is also required. In terms of animal health and welfare farmers are required to keep livestock, buildings, feed and drink facilities clean and provide adequate bedding under housed conditions. In addition to the above all farmers joining agri‐environment schemes must also comply with the Maltese action programme according to the Nitrate Directive 91/676/EEC.
1111..66..44 PPrrooppoossaallss ffoorr AAddaappttaattiioonn MMeeaassuurreess The First National Communication (FNC) had proposed a number of adaptation measures for the agricultural sector. Most of these required training, increasing awareness and funding provided by Government. The actual take up of the recommendations of the FNC is difficult to quantify because there has been no exercise to quantify this issue. The adaptation measures proposed in this report build on the on‐going work in the sector as described above and on those measures proposed in the FNC. These proposals are in line with the Draft Sustainable Development Strategy for Malta [162]. In summary, the main strategic directions with regards to agriculture in Malta are achieving financial viability using environmentally sound methods and infrastructure and upgrading and modernising machinery. As discussed above there is no agriculture policy as such, although the Rural Development Programme 2007‐2013 [211] does give some strategic direction for the sector; this is however tied up to funding. It is therefore recommended that a national agriculture policy is formulated that would also take into account climate change adaptation strategies. Climate change and the impact of climate change on agriculture is not a direct consideration of local policy. While land use policy addresses issues related to the sustainability of the agricultural sector there is no reference to climate change. The impact of climate change on agriculture must therefore be put on the Government’s policy agenda. Land use plans should also be considering the vulnerability of the sector and potential adaptation measures.

300
It is evident from the above that the Maltese rural community is in need of education and leadership. Both are essential ingredients for a sustainable and economical viable rural economy. The measures contemplated in [211] are:
Farm Advisory Services, Producers Organisations, and the Local Action Groups,
which when fully setup and working will have a crucial role for the successful implementation of the RDP. Together they form the pivots through which the rural economy could be addressed in a unified manner. The three bodies will operate concurrently to overcome the main weaknesses of Maltese agriculture, namely lack of competencies and adequate skills and lack of cooperation within the stakeholders. These measures include a component on environmental education that should also address climate change, among other issues. The effectiveness of such measures will obviously depend on take up and whether climate change is actually tackled as an issue.
1111..66..55 PPrreesseerrvviinngg SSooiill A number of ways to mitigate the predicted increase in soil erosion would be to:
keep rubble walls in a good state of repair; maintain soil structure by increasing levels of organic matter, proper
cultivation techniques etc.; and maintain vegetative cover as much as possible, preferably using organic
mulch whenever and wherever possible. As discussed above, the RDP 2007‐2013 [211], goes some way to prevent soil erosion. An effective way to mitigate damage to soil structure is to grow perennial crops such as fruit trees in order to leave as much cover over the soil as possible. This would also help to reduce soil erosion. Cultivation practices such as the over‐use of rotary cultivators will also have to be reduced, with minimal‐till practices replacing current techniques. In addition, the use of organic mulches on soil surfaces will further mitigate loss of soil structure by heavy rainfall. A culture change in managing fertiliser application should be sought whereby fertiliser would be applied in smaller amounts, more frequently and preferably in organic form. This would avoid leaching and contamination of run‐off by excess fertiliser. Using an organic form would improve soil structure and reduce chemical contamination. There are many ways that farmers and gardeners can mitigate the effects of increased soil salinity and alkalinity. These are:
growing salt‐tolerant crops and plants;

301
careful and regular monitoring of soil and water salinity and alkalinity levels;
neutralisation of alkaline water with mild organic acids; installation of small reverse osmosis units; replacing inorganic fertilisers with slow‐release organic fertilisers; extensive use of organic mulches on soil surfaces; and changes in irrigation and cultivation practices.
The good farming practices together with the requirements to satisfy the Nitrates Directive described above also address some of these adaptation strategies. In order to adapt to the predicted changes in rainfall pattern, farmers will need to construct larger wells and reservoirs so as to collect as much of the rain that falls in autumn and winter. This will then be used to cater for the irrigation needs during the predicted longer drought period. As non‐irrigated soils will experience drought for a longer period of the year than is experienced today, the demands for irrigation in the future will increase. Consequently, it is envisaged that farmers and home gardeners will in the future have to invest more in water‐saving irrigation systems (e.g. drip and leaky hose irrigation systems) in order to meet their crop and garden water requirements. Such adaptation measures should be mainstreamed in policies. The use of second class water for irrigation should also be considered. Currently sewage treatment plants are being built that will treat all of Malta’s sewage. There are no plans to treat the sewage to a level that can be suitable for use in agriculture. Government should explore the feasibility of re‐using such water also keeping in mind climate change considerations and future climate scenarios for Malta. In this respect, projects such as the Government’s National Flood Relief Project should be aimed at both assisting flood relief but also creating an infrastructure that can hold water for reuse in agriculture. The project’s primary objective is to manage the impacts of storm water in flood‐prone urban areas. A secondary objective is to promote options for storm water harvesting [200].
1111..77 AAddaappttaattiioonn MMeeaassuurreess 1111..77..11 PPoottaattoo CCuullttiivvaattiioonn Anticipating the planting date, using different potato varieties and improving soil water supply, might be useful ‐ by one calculation, these strategies could cut by half the expected decrease in global yields due to climate change [272]. In southern Europe, earlier planting increases potato yields and reduces water requirements in both present and future climate scenarios. In practice, adaptation options may not be so simple. The planting season also depends on factors such as the preceding crop, water availability, pests and diseases, and markets. Cultivars better adapted to a different climate exist, but may not be available to farmers in some regions.

302
1111..77..22 VViinneess Adaptation measures discussed above that could be applied in the case of vines include:
storage of water ‐ even though this could be an issue as most farmers have small plots of land; and
research and induction of vine varieties that are drought tolerant. In the case of grapes the issue is not so simple as the varieties chosen depend on the type of wine produced, the region and the standards governing different types of wine.
1111..77..33 LLiivveessttoocckk Projected economic losses resulting from temperature‐induced reductions in production may justify mitigation of these temperature increases through changes in management practices, such as installation of shades or sprinklers in feedlots or evaporative cooling of barns. The RDP 2007‐2013 [211] contains a measure for the modernization of agricultural holdings that would, in theory fund such measures as described above. The issue remains whether beneficiaries would spend the aid they receive on temperature control measures.
1111..88 DDiissccuussssiioonn aanndd CCoonncclluussiioonnss
The largest effect of climate change on Maltese agriculture will be felt with the predicted shortening of the rainy season. Rain that will fall in the future will be more intense and damaging. This will lead to problems such as soil erosion, soil structural damage, soil waterlogging, increased nutrient leaching and direct damage to both crops and infrastructure such as greenhouses. In addition to the above negative effects, a higher proportion of water will be lost as surface run‐off than that being lost today. Soils will be eroded. To mitigate these effects, farmers and policy makers will need to react early and in a systematic way if future problems in agriculture are to be avoided. Funding from government will be needed to aid farmers restructure their operations so as to adopt more modern and climate proof ways of operation. Farmers will have to adopt new techniques in soil and water conservation as these resources will be the most limiting factors to agricultural production. Farmers will also need to be educated on how the predicted climate changes will affect their agricultural operations, and information given about the latest crop species and varieties that will in the future be more suitable for production. The task ahead for the Maltese farmer is challenging. There needs to be a joint effort between the farming community and the Government to assist this sector, otherwise the current trends of the decreasing size of the farming community will

303
continue. The limiting space, soil and water resources available to agriculture will mean that such operations will become even less profitable than they are today. In the long run, it is likely that for the agriculture to be sustainable even in the face of future climatic and socio‐economic changes is to diversify into the production of unique high‐value niche products. The latter is one of the objectives of the Rural Development Programme 2007‐2013 and was also described as a medium term objective in the 2004‐2006 RDP. Existing food niches include Maltese food specialties such cheeselets, carob products, capers, sun‐dried tomatoes, honey, rabbit, and orange blossom water. The market potential encapsulated in the 1.2 million tourists that visit Malta on an annual basis has started to be exploited, thanks to the provision of specific aids to sustain and market local production. For example, the assistance to strategic sectors like tomatoes for processing and wine has recorded significant important performances and is now making visitors associate these products with the Maltese Archipelago. Continued assistance and aid to these niche sectors will help this market grow.

304
MMIIGGRRAATTIIOONN
1122..00 EExxeeccuuttiivvee SSuummmmaarryy
The climate of the Maltese Islands can be best described as being typically Mediterranean, with a mild wet winter invariably followed by a long dry summer. The IPCC FAR [255] clearly states that warming of the climate system is unequivocal as evidenced from observations of increases in global average air and ocean temperatures and average sea level amongst other parameters. The last twelve years (1995‐2006) have ranked among the twelve warmest years in the instrumental record of global surface temperature (since 1850) with a one‐hundred year linear
trend (1906‐2005) of 0.74 [0.56 to 0.92] C which is larger than the corresponding trend of 0.6 [0.4 to 0.8] C (1901‐2000) given in the Third Assessment Report (TAR) [256]. This evidence clearly manifests that temperature will be one of the key factors which will change the human landscape and which could lead to certain areas becoming too hot to support sustainable lifestyles. The issue of climate migrants needs to be seen from three main aspects namely:
internal migration; external migration as part of the Maltese population seeks new
temperate climates; external migration as a result of an influx of foreign immigrants seeking
more sustainable living patterns. Malta's role in the experience of asylum seekers is emerging as ever more significant by the year. Although currently due to political circumstances, it is clear that Malta is a likely destination for migrants seeking refuge, mainly due to its geographical situation. Hence its vulnerability to migratory effects resulting from climate change cannot be ignored and a focus is needed on the assessment of the country’s potential carrying capacity as a result of potential climatic outcomes. Vulnerability is defined as the effects of shocks emanating out of climate change on human welfare. The 2006 UNHCR Statistical Yearbook clearly states that Malta is now hosting the second largest number of refugees compared to its national size, a clear indication of Malta’s vulnerability to other forms of migration. A proper adaptation strategy is one which takes climate change considerations into account, to the extent feasible, in social, economic and environmental policies, practices and actions by all stakeholders. Adaptation will be required to reduce the costs and disruptions, alter behavioural patterns and give an additional context to decision making to acknowledge those causes derived from climate change, particularly from extreme weather events. In particular the outlook for Malta’s carrying capacity needs to be studied in terms of the ability of the land to support:

305
existing development : which may be at risk due to increased flooding of low lying areas due to sea level rise;
abstraction of current fresh water resources : which as a result of modified rainfall patterns may give rise to lower volumes of good quality water;
crop yields : which may be adversely effected from higher temperatures and hence evapotranspiration rates;
livestock yield : where growth may be compromised under modified conditions.
Adaptation to the potential effects of climate change on water resources is proposed to be addressed through improved governance, building capacity to handle the prevailing issues, increased research and development efforts, strengthening education and communications and looking at ways to prevent certain impacts by adapting our behaviours.
1122..11 IInnttrroodduuccttiioonn The 2006 UNHCR Statistical Yearbook clearly states that with 4,500 refugees per 1000 square kilometres, Malta is now hosting the second largest number of refugees compared to its national size, followed by The Netherlands (3,600 per 1,000 km2), the latter having ranked second in 2006. As at the end of year Malta had 2,404 refugees with 211 asylum seekers having pending cases. This brings the total population of concern up to 2,615 [214]. With the exception of Malta, in the first two quarters of 2007 compared to the last two quarters of 2006, all countries of Southern Europe (Cyprus, Greece, Portugal and Spain) experienced a significant increase in asylum applications [214]. During 2006, the origin of asylum applications was forthcoming, in the main, from the following countries: Eritrea 393 Somalia 208 Sudan 181 Ethiopia 123 It is also worth reiterating that whilst Malta ranked second (2nd) in the number of refugees 2002‐2006 per square kilometre, it ranked fortieth (40th) and one‐hundred and thirteenth (113th) in terms of the number of refugees 2002‐2006 per 100 inhabitants and to GDP (PPP) per capita respectively. It is also worth concluding this analysis by providing supplementary statistics that characterize irregular immigrants in Malta. These figures are based on the News Release 135/2006 [200].

306
Irregular immigrants arrive on Maltese shores by boat and as such arrive in significant group. Table 12.2 hereunder summarises the number of boats arriving in Malta between 2002 and mid‐2006 and the number of people on board.
Year Number of boats arriving
Number of people on board
Average number of people on board
per boat
2002 21 1,686 80
2003 12 502 42
2004 52 1,388 27
2005 48 1,822 38
Up to mid‐2006 9 378 42
Table 12.1: Possible Impacts of Climate Change on Migration [200]. Refugees in Malta are not a new phenomenon ‐ in fact statistics from 1995 clearly show that the possibility of reaching Malta cannot be discounted. This means that although current refugees tend to be of a political orientation, future refugees of a climatic orientation remain possible. Table 12.2 shows the number of refugees arriving in Malta.
Year Number of Refugees …of whom Children
1995 698 200
1996 538 162
1997 448 140
1998 450 125
1999 378 64
2000 277 48
2001 244 55
Table 12.2: Recognised Refugees in Malta [200]. Inadequate preparation for climate change scenarios could result in a decrease in the human carrying capacity of the most affected regions. This is due to associated declines in water resources which in turn will give rise to lower abilities to sustain food and animal production. Similarly, rises in temperatures and an increase in extreme events are associated with making certain regions inhabitable as would the phenomenon of sea water level rises. When one considers the setting in those areas which already have a dry climate of a subtropical nature, often overpopulated and economically poor, there is a potential of around 400 million people being effected [278]. Africa has been identified as one of the areas at risk with a potential 184 million people in danger of death before the end of the 21st century as a result of climate change through floods, famine, drought and the resulting conflict [215].

307
Additionally, hundreds of millions could suffer hunger, water shortages and coastal flooding [381]. Examples of possible impacts of climate change on migration due to changes in extreme weather and climate events, based on projections to the mid‐ to late 21st century are summarized hereunder. These do not take into account any changes or developments in adaptive capacity. The issue of climate migrants needs to be seen from three main aspects namely:
internal migration as a result of the potential restricted accessibility of low lying coastal areas as a result of any potential sea level rise or intermittent flooding due to increased heavy spells of rainfall restricting the business as usual utility of these areas with the consequent search for areas for alternative accommodation which are not prone to such scenarios;
external migration as part of the Maltese population seeks more temperate climate north of Malta, and who have, as a result of climate change phenomena acquired climatic conditions similar to those Malta enjoyed previously;
external migration as a result of an influx of foreign immigrants fleeing their home country in search for more sustainable living patterns.
1122..22 CClliimmaattee CChhaannggee SScceennaarriiooss Climate change can be a driver to alter the quality of life. As temperatures rise, fresh water quantities could be under increased pressure and taken in combination with any sea water level rises, the carrying capacity of the land may be reduced. Carrying capacity refers to the ability of the land to support:
the existing development: which may be restricted through the potential permanent flooding of low lying areas due to any potential sea level rise or intermittent flooding due to increased heavy spells of rainfall;
the extraction of current water resources: decreased quantities of rainfall, more intense rainfall patterns and any rise in sea level rises contributing to the increased salinization of the freshwater lens give rise to lower volumes of good quality groundwater and contribute towards a potential decrease the overall quality of the same water;
the yield of crops: which may be adversely effected from higher temperatures and reduced water supplies
the yield of animals: who’s growth may be compromised under adverse conditions.
The climate of the Maltese Islands can be best described as being typically Mediterranean, with a mild wet winter invariably followed by a long dry summer. The IPCC FAR [380] clearly states that warming of the climate system is unequivocal as evidenced from observations of increases in global average air and ocean

308
temperatures and average sea level amongst other parameters. The last twelve years (1995‐2006) have ranked among the twelve warmest years in the instrumental record of global surface temperature (since 1850) with a one‐hundred year linear
trend (1906‐2005) of 0.74 [0.56 to 0.92] C which is larger than the corresponding trend of 0.6 [0.4 to 0.8] C (1901‐2000) given in the TAR [380]. This evidence clearly manifests that temperature will be one of the key factors which will change the human landscape and which could lead to certain areas becoming too hot to support sustainable lifestyles. Global average sea level has risen since 1961 at an average rate of 1.8 [1.3 to 2.3] mm/yr and since 1993 at 3.1 [2.4 to 3.8] mm/yr, with contributions from thermal expansion, melting glaciers and ice caps, and the polar ice sheets. Whether the faster rate for 1993 to 2003 reflects decadal variation or an increase in the longer‐term trend is unclear. Notwithstanding, sea level rise can, through consequential flooding of existing land areas and salinization of water resources force communities to abandon their territory in search for more sustainable grounds. The FAR observes that between 1900 to 2005 precipitation quantities declined in the Mediterranean with the global area affected by drought likely to have increased since the 1970s. Precipitation is crucial towards the sustainability of freshwater resources be they surface or groundwaters. Declines in precipitation quantities can cause severe water resource pressures that could pose a threat to health and human life as well as to the carrying capacity of food production. This would in itself be a stimulus for the mass exodus of populations from such areas in search for better pastures.
1122..22..11 TThhee LLooccaall DDiimmeennssiioonn Malta's role in the experience of asylum seekers is emerging as ever more significant by the year. The cause of this migration is of a political nature but still it is very clear that Malta is a likely destination for migrants fleeing from Northern Africa in particular. This is mainly due to its geographical situation, which means that every year a number of irregular immigrants reach Maltese shores. In 2005, 48 boats brought a total of 1,822 irregular immigrants to Malta. When compared to figures for the previous year, this translates into an increase of 434 irregular immigrants. Statistics available up till the 14th June 2006 show that the total number of boats reaching Malta was nine, which corresponds to 378 irregular immigrants [280]. The previous section has examined the potential impact that might result on the Maltese Islands as a result of climate change impacts on foreign territories. This section deals with the impact that climate change may have on internal and external migration as a result of climate change impacts on the Maltese Islands. Before entering into further discussions, it must be pointed out that migration in the Maltese contexts is far different from migration in an international context. With the island of Malta being 27 km long, and 14.5 km wide, displacements are only relative

309
when compared to international displacements. Notwithstanding, for a group of islands 316 km2 in area, land restrictions represent a potential problem. Low lying areas, below the 1 m contour, are those most at risk and which merit closer monitoring, should a rise in sea water levels occur. Moreover, areas close to the 1 m contour, in the eventuality of an actual rise in sea water level, are also likely to be at risk of serving their current use as they will become the subject of increased flooding. Similarly, low lying areas below the one metre contour, and which are inland (eg. valleys) may also experience losses. It must be emphasized that such projections are based on regional scenarios and that local projections are still unclear as to the specific effects that might result specifically in the case of Malta. It has already been pointed out that for the purposes of this report, although there has been no sea level rise in Malta since the last 15 years, a precautionary approach has been adopted by choosing to use global sea level rise rates or the more recent rates observed in Malta. Hence the need for long time‐series recordings of sea levels in order to establish trends which might give rise to more accurate forecasting of the projected sea level rise associated with climate change. Monitoring would also be required to any areas that are developed in the proximity of clay slopes, in the case that increased rainfall intensities coupled by increased drying and wetting could lead to slippages which could affect the sanity of such developments. Should any such losses materialize, these could have the potential to force an inward, internally based, shift in demographics as people move away from these newly flooded areas to seek better shelter. These losses could also mean a loss of certain agricultural properties as well as businesses. It could also mean a more increased flooding return period for development located in valleys. The dense nature of our urbanized areas will undoubtedly call for a re‐adjustment of demographics and an assessment of the suitability of the current infrastructure to service such demographic changes needs to be analysed. It is also interesting to note that recent research from the Deutsche Bank [79] places Malta as a country which risks suffering considerably due to climate change. The physical and economic characteristics are strongly linked giving strength to the hypothesis being put forward in this report and, by comparison, also strengthening predictions for the superlative heating that would be expected in certain areas which could lead to climate migration to more temperate areas. Reverse trends cannot be neglected either. It is a possibility, albeit potentially remote, that the rise in local temperatures would cause a shift whereby previous temperate climates that characterized areas of the Mediterranean including Malta might migrate northwards towards countries that are currently not experiencing such temperatures. This might induce a movement outwards from Malta (in a scenario where temperature rises would characterise it as a hot, arid climate) to the newly temperate climates. This would cause a potential drain of resources similar to the ‘brain drain’ that is being experienced in certain sectors. Careful monitoring of such conditions would need to be kept in view.

310
1122..33 VVuullnneerraabbiilliittyy aanndd AAddaappttaattiioonn Climate change can be a driver to alter the well being of a community. Through climate change phenomena, the well being of a community may be altered by changes in:
the intensity and frequency of extreme rainfall events (floods and droughts);
the amount of water available and the demand exerted thereon; water quality; and temperature
Changes in these variables have a potential impact on the tolerance a community can have to prevailing climatic conditions as well as to the carrying capacity of the land. Vulnerability is defined as the effects of shocks emanating out of climate change on human welfare. This section will attempt to establish the degree and causes of identified vulnerabilities with a view to proposing adaptation strategies to assess such. The problems that are envisaged to cause water shortages as a result of changes related to climate are identified hereunder. Malta’s Water Resources Review (FAO, 2006) makes some interesting observations. It warns that whilst there is no compelling statistical evidence of climate change affecting the water resources of the Maltese Islands, there is a risk that climate change will become a serious issue in the future. This comprehensive Review states that in a scenario where the sea level of the Mediterranean Sea is expected to rise by up to 96 cm by 2100 a consequential rise in the freshwater lens will occur which will have a negative effect on the abstraction stations in the sea‐level aquifers. It is to be noted that for the purposes of this report, although there has been no sea level rise in Malta since the last 15 years, a precautionary approach has been adopted by choosing to use global sea level rise rates or the more recent rates observed in Malta. Using MAGICC/SCENGEN version 5.3 it was possible to come up with projections extending over the next one‐hundred years for important climate parameters. Without delving too deeply into the uncertainty associated with the results (which are described in Chapter 5) it is interesting to note the following results which are summarised in Table 5.8. It can be pointed out very briefly that while models for temperature increase are quite robust, those for precipitation and sea level rise are associated with high degrees of uncertainties.
1122..33..11 AAddaappttaattiioonn SSttrraatteeggyy A proper adaptation strategy is one which takes climate change considerations into account, to the extent feasible, in social, economic and environmental policies, practices and actions by all stakeholders. Adaptation will be required to reduce the costs and disruptions, alter behavioural patterns and give an additional context to

311
decision making to acknowledge those causes derived from climate change, particularly from extreme weather events like storms, floods and heat waves. In respect of climate migration, an adaptation strategy must give due consideration to factors such as the potential carrying capacity of the land to support a re‐dimensioned population.
Phenomenon and direction of trend
Likelihood of future trends based on projections for 21st century
Impact
Increased frequency of hot days and nights.
Virtually certain Living conditions deteriorate as a lack of water resources, health and hygiene and tolerance to temperature.
Warm spells/heat waves. Frequency increases over most land areas.
Very likely Living conditions deteriorate as a lack of water resources, health and hygiene and tolerance to temperature. Pressure on natural water resources accentuate and permeate such conditions.
Heavy precipitation events. Frequency increases over most areas with overall declining annual precipitation quantities.
Very likely Adverse effects on quality of surface and groundwater; contamination of water supply; water scarcity may be relieved. Disease may be more pronounced and health and hygiene may be compromised.
Area affected by drought increases
Likely Carrying capacity of food production decreases leading to famine or an increased cost in food imports.
Increased incidence of extreme high sea level
Likely Decreased freshwater availability due to saltwater intrusion and flooding of low lying areas
Table 12.3: Possible impacts of climate change on migration. Adapted from [255]. Carrying capacity refers in general to the potential of the land to sustain the economic, social and environmental pressures that may result (e.g. the ability to provide sufficient food, water, shelter and employment and to financially support such).

312
1122..33..11..11 GGoovveerrnnaannccee ((LLeeggiissllaattiioonn,, PPoolliiccyy,, RReegguullaattiioonn aanndd IInnssttiittuuttiioonnss)) Good governance for climate change needs to be factored as an integral part of policy making. It is important to ensure that the country is sensitised to the challenges that are being faced by ongoing changes in climatic conditions and to safeguard the population against such phenomena as far as possible. Adaptation measures include: Modelling and Data
Data regarding climatic parameters are collected by different entities. Often enough, the lack of the availability of such data, in its raw format, does not encourage research in this field. The setting up of a Climate Change Observatory would be able to collate all data inputs and make them available for researchers. This Observatory could form part of a wider Mediterranean based Observatory in order to foster research amongst the Mediterranean partners as well as to ensure that climate and desertification modelling may be carried out on a sizeable catchment. The NSO is Malta’s central competent authority responsible for statistics. Notwithstanding there are other entities who collect data. Within the business and citizen environment, data sharing concepts are promoted as part of Malta’s better regulation agenda. The creation of an inventory of data collecting sources and the consolidation of such data in a manner that can be accessed from a single platform is called for. This would facilitate research as well as provide useful information for those wishing to embark upon climate and water related projects and research. Metrics should be created to understand further Malta’s vulnerability to the impacts of climate change including climatic impact on existing agricultural, water and mineral resources; technical capability; social cohesion and adaptability.
Land Use Policy Directive 2007/60/EC on the assessment and management of flood risks obliges Member States to undertake preliminary flood risk assessments as well as to subsequently prepare flood hazard maps and flood risk maps. Any rise in sea water level, whether it results in the forecast modelled by MAGICC/SCENGEN or even if it is worse as suggested by other sources, could have a potential knock on effect on low lying areas. With a preamble of ensuring that there is sufficient evidence that indicates the certainty of loss of land as a result of such phenomena, land use planning should take into account the potential effects of climate change in that zones at risk are identified immediately with a view to preventing or highlighting the risk of their development as well as to undertake an educational campaign for those areas which are already developed. The competent authority for planning should constantly monitor sea levels with a view to be in a position to monitor the development of any flooding scenarios.

313
The revised version of the Structure Plan for the Maltese Islands could easily factor such considerations.
Insurance Taking the provisions outlined in respect of land use into account, any rise in sea water level could have a potential knock on effect on low lying areas. With a preamble of ensuring that there is sufficient evidence that indicates the certainty of loss of land as a result of such phenomena, it is important that, in collaboration with the financial services sector, the issue of insurance implications of properties/activities in flood prone areas should be explored with a view to determining whether there is cause for differentiating between various zones whilst at the same time offering protection to those who may still wish to operate in vulnerable areas.
Identify No‐Regrets Strategies No‐Regrets strategies are ones taken in response to the threat of climate change which argues that energy‐saving measures should be undertaken immediately to help reduce global warming and climate change. Even if the threat of climate change is not as pronounced as we now fear, there should not be any regrets because society would have benefited from saving the energy. In this context one should take into account the projects and initiatives which Government is taking in this respect. Other no regret strategies could include proper water management to lower the overall demand as much as possible with a view towards sanitising further groundwater resources. Similarly, the abandonment of cultivation of water intensive crops should be considered and replaced by more water tolerant species that would however maintain food supplies as close to current levels as possible.
1122..33..11..22 CCaappaacciittyy BBuuiillddiinngg Strengthening Public Capacity A response team should be identified, possibly reporting to the Civil Protection Authorities, in order to assess, address and prepare for climate change scenarios which could include the need to respond to increased migration pressures; increased risk of disease; food and water shortages; and potentially conflict ‐ contingency planning for a range of potential scenarios. The public administration should also have a contingency plan with a view to determine in such eventualities the migrants’ entitlements in terms of the country’s immigration policies but also taking into account the socio‐economic fabric. Malta should also place this problem at the forefront of the international community’s agenda with a view to ensure that it is supported by the international community in these endeavours.

314
Risk Assessment A risk assessment should be conducted in order to determine the population growth that the current infrastructure can support ‐ electricity, water, sanitation, economic and social services. Moreover the potential risk of integration needs to be properly evaluated on the experience of the current responses to political migrants. The current legal framework needs to be tested against potential immigration scenarios.
1122..33..11..33 RReesseeaarrcchh aanndd MMoonniittoorriinngg Encourage Research Initiatives Research into the variation of various parameters in response to climate change needs to be encouraged. For this purpose, it is vital that Government, through its research institutions, gives priority to such actions. The University should try and attract various students to undertake their dissertations in this area whilst EU funding instruments should, where possible, place climate change initiatives at the forefront of national priorities. This is also in line with Malta’s R&I Strategy which places great emphasis on popularising and incentivising Science and Technology disciplines. Undertake Research for Adaptation Adaptation is not an option ‐ hence establishing ways and means of adapting to phenomena beyond our control as quickly as possible is imperative. Undertaking research for adaptation across the whole spectrum of life is important as the impact of new migrants will effect the whole framework upon which Maltese governance. Monitoring The setting up of a Climate Change Observatory which would have access to all data that is required and that is currently collected through national resources has already been referred to. This observatory could also focus upon a wider geographical spread that could delineate threats of extensive climate migration.
1122..33..11..44 EEdduuccaattiioonn aanndd CCoommmmuunniiccaattiioonnss National Minimum Curriculum The current revision of Malta’s National Minimum Curriculum should seek to combine the emergence of environmental issues in a more holistic manner taking into account the need to learn about the management of our environment in a sustainable manner throughout all the stages of compulsory education. This becomes more evident once the need to generate a new culture within upcoming generations becomes a must with focus on the social, economic and environmental

315
impacts of climate change being presented in a tangible and understandable manner. Educate and Communicate Education should not be limited to compulsory education or to the formal education system. The potential of coastal area flooding should be communicated effectively both to existing owners of immovable property as well as to potential developers. Care must be taken to understand the impact of climate change over the wider Mediterranean basin and the possibility of intercontinental migration becoming the result of both political and climate reasons. Within the communications dimension, Government has a role to play. Through its horizontal role in society it can send key messages to all actors in favour of behaviours which are in synch with climate change good practice. This needs to be done creatively and in a manner that it uses the right message to reach out to the various audiences that characterise society. Changes in Behaviour The sensitisation of people towards better behaviour in their use of resources in a more sustainable manner would be profitable. The attitudes would increase the resilience of such resources from the effects of climate change. The dependence on government efforts is not enough and the message that every single person can contribute towards minimising the effects of climate change needs to be spread.
1122..33..11..55 AAcccceeppttaannccee ooff CCeerrttaaiinn IImmppaaccttss Coastal Areas There is still an amount of uncertainty on the outcome of sea water rise vis‐à‐vis how this will impact, if at all, Malta. Notwithstanding, it is important to understand the potential scenarios that might result. In this respect Malta may need to identify scenarios that identify those coastal areas which are likely to be subject to increased flooding as a result of various climate change outcomes. This would give an indication of the extent of areas which might need to be earmarked for redevelopment which befits the revised use of such areas. Malta’s eventual implementation of the Floods Directive will also serve to integrate this aspect into policy making. Changes in Crop Cultivation Patterns Even the agricultural community will need to adapt with current practices having to be altered to take into account the potential scenario of higher salinity levels, lower fresh water volumes and the loss of agricultural land to flooded areas. Such

316
developments and scenarios need to be studied ahead of any onset of such phenomena. Any changes in volumetric or intensity characteristics of rainfall will undoubtedly have a knock on effect on the water available for irrigation. Whatever the outlook and whatever changes may occur, the situation today is already at critical levels with a considerable amount of groundwater being abstracted directly for agricultural purposes. If the current situation is afflicted by the changes in precipitation, temperature and sea water level rise, the demand versus availability balance is sure to become even tighter as more crop water requirements become necessary but with lower amounts of groundwater and stormwater available to satisfy such increases in demand.

317
HHEEAALLTTHH
1133..00 EExxeeccuuttiivvee SSuummmmaarryy Many concerns over climate change can be linked to the health and well‐being of humans. Well‐being is intimately tied to the state of our environment, to the resource base, and to social conditions. The overall direct impacts of climate change on human health and well‐being in Malta is expected to come as a result of intense storms and increasing temperatures. Other, indirect impacts affect the health and well‐being of humans, for example changes in quality and quantity of water and food and vector born diseases. As expected, the most vulnerable are the elderly, disabled, children, ethnic minorities, and people on low income. Although cold‐related deaths will decline, heat‐related deaths are likely to increase. A local unpublished study on the relationship between temperature and mortality has confirmed the finding that as temperatures increase mortality increases. Changes in temperature coupled with a decrease in precipitation will also affect the natural and built environment which may ultimately affect human health. Such effects include changes to the water quality and quantity, and hence the risk of contamination of public and private water supplies. Higher seawater temperatures can lead to deterioration of seawater quality and increased risk of algal blooms that release toxins. Higher temperatures have implications for food safety, as transmission of salmonellosis is temperature sensitive. Another health impact from climate change results from the increased occurrence and severity of storms. A higher risk of deaths and injury will result from intense weather events associated with heavy rains and high winds. Flash floods are of particular concern to several parts of the Maltese Islands, especially the Birkirkara‐Msida basin. Flooding events may also have an indirect effect on health by causing damage to hospitals, clinics, pharmacies, and general practices. It is recognised that health is a cross‐cutting issue that needs to be considered throughout all sectors. Adaptation measures should be focused on carrying out a health risk assessment that assesses the local population’s exposure, sensitivity, and ability to adapt. Early warning systems that are already in place (for potential floods and heat waves) should be developed further including giving the public easy access to information on how to react to certain events. Other measures include improving the microbiological standards of food at all stages in the food chain and implementing other measures related to the changing temperatures such as better urban planning, shifting work patterns and leisure activities and so.

318
1133..11 IInnttrroodduuccttiioonn Many concerns over climate change can be linked to the health7 and well‐being of humans. Well‐being is intimately tied to the state of our environment, to the resource base, and to social conditions. The gradual warming of the planet and resultant extreme weather events will affect the determinants of health: air, water, food, shelter, and freedom from disease. In addition to these environmental conditions, climate change affects health through other pathways such as social and health system conditions. These conditions influence social and economic disruption as well as our exposure to the impacts of climate change (see Figure 13.1).
The First National Communication addressed the effects of climate change on public
health with the greatest impacts associated with extreme events, in particular more severe heat waves. This chapter builds on the FNC and provides a more comprehensive assessment of the climate change impacts as predicted for the Maltese Islands on the health sector.
Figure 13.1: Pathway by which climate change affects health [217].
The World Health Organisation identifies five major global health consequences of climate change. These are [283]:
malnutrition as a result of the decline in agriculture; death and injury caused by extreme weather events (storms and floods).
Flooding can also lead to the outbreak of diseases; lack of hygiene due to water scarcity and diarrhoeal disease as a result of
excess water (spread through contaminated food and water);
7 The World Health Organisation (WHO) defines health as ‘a state of complete physical, mental and social well‐being and not merely the absence of disease or infirmity’.

319
death and injury caused by heatwaves, especially in urban heat islands; and
spread of infectious diseases such as malaria and dengue fever.
As expected, the most vulnerable are the elderly, disabled, children, ethnic minorities, and people on low income.
1133..22 CClliimmaattee CChhaannggee SScceennaarriiooss Most of the direct impacts of climate change on health are caused by higher temperatures and extreme weather events. Extreme weather events include heat waves, torrential rains and flooding, droughts, and storms. Other, indirect impacts affect the health and well‐being of humans, for example changes in quality and quantity of water and food and vector born diseases. Climate change may lead to regional weather changes that impact on the health and well‐being of populations, see Figure 13.2. The IPCC FAR predicts that over the coming century, heatwaves will increase in both number and severity. However, Malta may be spared as a result of the influence of the Mediterranean Sea [219]. Droughts (days without any rainfall) are expected to be longer and occur earlier [216] while the percentage of yearly extremely hot days is expected to double [216]. Heat stress risk is likely to dramatically increase [218]. The locally generated regional scenarios (see Scenarios Section of SNC) predict an
increase in annual average temperature of 2 C and 2.8 C by 2050 and 2100 respectively. The model results of such projections are considered to be robust and the trends in observed temperature corroborate this projection. Such increase in temperature is also in line with the predictions of the IPCC FAR. Models for precipitation and temperature variability however are associated with more uncertainties. Although a decrease in precipitation is being predicted, projected changes in precipitation should be viewed with some caution. The trends analysis implies that total rainy days with 0.1 mm or more of rainfall are decreasing while total yearly days wth 10 mm or more of rain is increasing. This may be interpreted as a decrease in the total amount of precipitation but an increasing trend for convective type rainfall or heavy rainfall. While the uncertainties still prevail, the trends identified from data observations are in line with regional scenarios [255] with regards to both decrease in mean annual precipitation and increase in extreme weather events (increase in the intensity of daily precipitation events) for the Mediterranean region. The IPCC report notes that there will be a higher incidence of drought and heat waves in summer. In this context, while this report will focus on the more certain increase in temperature, as also verified by locally generated scenarios, other impacts associated with the decrease in precipitation and increase in extreme events will be addressed based on regional scenarios.

320
Figure 13.2: Schematic diagram of climate change impacts on health [283].
1133..33 IImmppaaccttss oonn aanndd VVuullnneerraabbiilliittyy ooff tthhee HHeeaalltthh SSeeccttoorr 1133..33..11 IInnccrreeaasseedd TTeemmppeerraattuurree IImmppaaccttss A study by [221] in 2008 has shown that mortality from respiratory and cardiovascular diseases as well as from external causes (traffic accidents, falls, and drowning) increased with higher temperatures. Although cold‐related deaths will decline, heat‐related deaths are likely to increase. This is a concern primarily for the elderly; however, infants and young children are at greater risk than the average adult from heat stroke and death under extreme temperature conditions. Very young children are vulnerable because they do not have fully developed temperature regulation mechanisms and are unable to change their environments independently. Older children and adolescents spend more time in vigorous activity outdoors and thus have higher exposures. In the US, however, the incidence of heat‐related mortality is declining despite increasing temperatures, probably because of the widespread availability of air conditioning. This adaptive technology requires higher energy use and comes at a cost when the energy derives from more fossil fuel combustion.

321
At high temperatures mortality increases substantially at temperatures over 35 C. It is noted that at temperatures above 35 C, the Department of Public Health in Malta issues warnings for people to stay inside between 11:00 and 15:00, to stay cool, to hydrate themselves and so forth. These preliminary results indicate that the Maltese population may be more adapted to high temperatures rather than to lower temperatures. This study could fine tune predictions or projections of mortality following particularly cold days during the Winter or hot days during the Summer, consolidating further early warning systems. People living in urban environments are at greater risk than those in non‐urban regions [223]. This is of particular concern in the local context. Changes in temperature coupled with a decrease in precipitation will also affect the natural and built environment which may ultimately affect human health. This branch of the health sector known as ‘environmental health’ is gaining increasing importance. Such effects include changes to the water quality and quantity, and hence the risk of contamination of public and private water supplies. Higher seawater temperatures can lead to deterioration of seawater quality and increased risk of algal blooms that release toxins. This can be a hazard to public health and a potential threat to marine life, including aquaculture. Higher temperatures have implications for food safety, as transmission of salmonellosis is temperature sensitive. The effect of warmer summers on food‐borne disease incidence will depend on future food hygiene behaviour and the relative contribution of different pathogens, as well as changes in temperature. There is very little evidence that infectious diseases have been increasing in Malta due to climate change; an analysis regarding salmonella is underway. Preliminary results show that approximately 25% of reported cases of salmonellosis are related to increased temperatures8. It is expected that the seasonal changes may result in an earlier onset and extension of the allergenic pollen seasons that is likely to affect some allergenic diseases. A general increase in ambient temperature will also favour the spread of some vector borne diseases such as malaria, which was endemic in Malta in the past, as well as leishmaniasis, cholera, and food borne diseases. However, with regards to the possibility of the emergence of endemic malaria in Europe, this is very unlikely to occur as a result of climate change [186]. Of particular relevance to Malta is the West Nile Fever of which vector (Culex sp.) is already present locally. In general the density of these vectors would increase with increasing temperature, but possibly decrease with decreasing precipitation. With regards to Leishmannia which vector is also present in Malta, increasing temperatures would result in increased duration of the vector’s season, however the vector’s density can also be affected by a reduction in humidity. Therefore the impact of climate change on vector‐borne diseases is uncertain and each vector would be affected in a different way. It is also noted that
8 Dr Anthony Gatt (Infectious Disease Prevention and Control Unit of the Public Health Regulation Division) during the National Seminar on Health Effects of Climate Change ‐ Raising Awareness and Building Capacity held in Malta in April 2009.

322
the risk of introduction of vectors is currently mainly due to travel and trade9. Some work is being done by entomologists and public health experts with help from the European Centre for Disease Control including studying mosquitoes in Malta. It is acknowledged that there is a need for more surveillance for vectors (to determine which vectors are present) and improving response through early identification of imported illness and contingency plans for new vectors. Further assessment of the impact of climate change on individual vectors is also required.
1133..33..22 IImmppaaccttss ooff CChhaannggeess iinn PPrreecciippiittaattiioonn Another health impact from climate change results from the increased occurrence and severity of storms. A higher risk of deaths and injury will result from intense weather events associated with heavy rains and high winds. Coastal flooding and flash floods are also a concern. Flash floods are of particular concern to several parts of the Maltese Islands, especially the Birkirkara‐Msida basin. In the UK, two reviews of the epidemiological literature have described the range of health effects: drowning, injuries, mental illness, and infectious diseases. A study following the flooding in Lewes in 2002 found that people whose houses were flooded experienced a range of illnesses. Notwithstanding, there are still gaps in information and knowledge regarding the impact of flood events on long‐term anxiety and depression, and indirect effects on mortality and use of health services in the months following a flood event. Qualitative studies following flood events in Oxfordshire have shown that impacts on quality of life can be severe and long‐lasting [220]. Flooding events may also have an indirect effect on health by causing damage to hospitals, clinics, pharmacies, and general practices. Changes in climate will have impacts on occupational health and safety. Heat stress due to high temperature and humidity is an occupational hazard. Based on data from the USA, the most at risk from heatstroke are persons working in the construction, agriculture, and fisheries industries [217]. Children, particularly very young ones, are at increased risk of death and injury from these extreme events in part because they are totally dependent. The World Health Organization estimated that 34% of all childhood illness in the world (compared to 24% of all age illness) and 36% of deaths in children under the age of 14 are due to modifiable environmental factors. Because of physical, physiologic, and cognitive immaturity, children are more sensitive than adults to harm from environmental hazards. Climate change increases these hazards by worsening air quality, stimulating more extreme weather events, creating conditions
9 Dr Gianfranco Spiteri (Infectious Disease Prevention and Control Unit of the Public Health Regulation Division) during the National Seminar on Health Effects of Climate Change ‐ Raising Awareness and Building Capacity held in Malta in April 2009

323
that favour increases in food‐, water‐ and vector‐borne infections, and enhancing heat stress conditions [280]. Air quality is threatened via at least three mechanisms: heat‐driven increases in ground‐level ozone, energy production‐driven increases in particulates and other fossil fuel‐related air pollutants, and changes in aeroallergens. Ozone exposure increases the rate and severity of asthma attacks and may play a causal role in asthma onset when exposures are high and prolonged. Studies clearly show that childhood exposure to specific air pollutants is related to decreased lung growth and permanent decrements in pulmonary function as well as increases in respiratory infection, asthma, infant mortality and all age mortality, miscarriages, preterm delivery, and low birth weight. Climate change could result in changes in the quantity, quality, and distribution of pollens and other aeroallergens [280].
1133..44 AAddaappttaattiioonn
1133..44..11 CCuurrrreenntt SSeettuupp It is recogised that health is a cross‐cutting issue that needs to be considered throughout all sectors. Hence any action that is addressing climate change impacts in other sectors would also be applicable to health. In this context, policies and measures targeted towards the protection of natural resources or the natural environment are indirectly also targeting health issues. While specific environmental policies and measures are discussed in relevant chapters (such as storm water management plans, protection of water resources, agriculture, fisheries, and so on) environmental health issues are addressed through the Department for Environmental Health within the Public Health Regulation Division in the Ministry of Social Policy. The latter is currently carrying out a detailed environment and health performance review (EHPR) with the WHO Regional Office for Europe. This review provides country‐based analytical descriptions of the environment and health situation in Malta. One of the areas considered is climate change. The Health Promotion and Disease Prevention Department is responsible for preventing illness and promoting health in order to improve the health and well‐being of the Maltese population. It is working in partnership with other ministries and external stakeholders to tackle the determinants of illness, particularly to reduce the disease burden caused by non‐communicable disease. The department is also in charge of prevention, field investigation and control of communicable diseases. In specific cases however joint campaigns and initiatives are organized in cooperation with the environmental health department, e.g. on climate change. Under the WHO Bilateral Collaborative Agreement a joint seminar on climate change took place in April 2009. The coordination of activities with regard to climate change prevention, promotion and information among the sectors is not yet fully operational.

324
Heat warnings fall under the responsibility of the environmental health department. The Malta International Airport does meteorological monitoring and calculates the UV index and heat index that are communicated to the public. In terms of health policy the National Environmental Health Action Plan (NEHAP) was launched in 1997. The NEHAP is currently being revised. NEHAP 2006‐2010 is intended as a policy framework document for implementation across government departments and major sectors. The NEHAP process is led by the Environmental Health Department in close cooperation with MEPA. As temperatures increase in summer the Department of Public Health issues warnings and advice in the form of leaflets that are available at Health Centres. In areas that are flood‐prone such as Birkirkara, early warning systems for flooding are in place. In cases of extreme events (heavy rainfall, high temperatures) the Department for Public Health, the Meteorological Office and the Civil Protection Department liaise providing each other with information. 1133..44..22 RReeccoommmmeennddaattiioonnss Adaptation should start with a health risk assessment that assesses the local population’s exposure, sensitivity, and ability to adapt. In this way, the potential health impacts from climate change can be assessed and adaptation measures proposed. Some adaptation measures found in the literature and applicable to Malta are given below. A primary adaptation measure to several of the foreseeable health impacts from climate change is the development of early warning systems. In particular for heatwaves and intense storms, early warning systems can disseminate vital information to the public that will help prevent or reduce the risk of injury and/or death. It is noted that early warning systems for floods in some localities where flooding is a problem is already undertaken; warnings during heat waves are also given. It is, however, recommended that the leaflets distributed by the Health Department on precautionary measures to be taken during hot weather are made more widely available, for example, at local council premises, distribution by carers to patients, etc. Other media such as radio and television could also be used. These systems should be supplemented by preventive emergency plans. These emergency plans may include details such as providing assistance to the people at risk, designating ‘safe’ areas, distributing water in the case of heat wave episodes, and evacuations from flood risk areas. These emergency plans should also take into consideration the large number of tourists who visit the Maltese Islands. This is of greater importance in summer when the peak tourist season coincides with the highest temperatures. Emergency plans should also focus on schoolchildren and their daily outdoor activities that expose them to high temperatures.

325
Vulnerability to the effects of climate change could be reduced by continuing efforts to improve the microbiological standards of food at all stages in the food chain, including production, distribution, storage, and preparation through adoption of standards such as Hazard Analysis Critical Control Points (HACCP) and enforcement of legislation. It is noted that the Department for Environmental Health published a guidance document entitled “Food Safety Legislation Explained” [284]. Other measures related to the changing temperatures include mitigating the heat island effects through better urban planning, adapting the housing design to minimise heat gains and maximise cool indoor environments (as discussed in the Report on Vulnerability and Adaptation ‐ Infrastructure), shifting work patterns and leisure activities, monitoring mortality and food hygiene. Programmes are required to educate parents, teachers, child care providers, and children about using the heat index and air quality index. Impacts from extreme weather events are also being addressed in other sectors including infrastructure, agriculture, water, biodiversity and land‐use. The implementation of the National Flood Relief Project and the implementation of the EU Water Framework Directive, the long‐term protection of ecosystems and biodiversity and the consideration of climate change impacts in land‐use planning will all contribute towards a healthy environment and less risks to the human population from climate change impacts, thus greater resilience of the health sector. Institutional building is an important consideration when advocating the above. While efforts are being made by the Department for Environmental Health and other departments within the Health Division to address climate change, there is only so much that can be done with limited staff. Research, education, awareness campaigns, etc can only be carried out if there are the resources.
1133..55 DDiissccuussssiioonn aanndd CCoonncclluussiioonnss The overall direct impacts of climate change on human health and well‐being in Malta is expected to come as a result of intense storms and increasing temperatures. The frequency and severity of storms is likely to increase and hence those lying in the floodplains will be increasingly vulnerable. Storm water flood relief should become a priority. The Government is currently carrying out an Environmental Impact Assessment for an extensive flood relief project that includes channelling stormwater into tunnels in flood prone areas such as Birkirkara, Msida and Qormi. The project has not yet commenced. Higher temperatures are expected to impact the local population although the Maltese population is used to high temperatures. The impact of extremely hot days cannot be ignored as they have an impact on mortality. Other effects of climate change can indirectly affect health and well‐being. The saltwater intrusion into the freshwater aquifer as a result of sea level rise and lower
326
agricultural yields may affect the quality and supply of basic food and drink. The resultant higher prices could negatively impact the poorer sector of society and its well‐being. Attention must be given to the most vulnerable in society. The young, elderly, and disabled are likely to suffer the most from climate change health impacts. Other sectors of society should not be ignored such as people who earn a living by spending most of their time outdoors, as well as tourists who may not be accustomed to the local climate regime. Adaptation measures should be focused on carrying out a health risk assessment that assesses the local population’s exposure, sensitivity, and ability to adapt. Early warning systems that are already in place (for potential floods and heat waves) should be developed further including giving the public easy access to information on how to react to certain events. Other measures include improving the microbiological standards of food at all stages in the food chain and implementing other measures related to the changing temperatures such as better urban planning, shifting work patterns and leisure activities, etc. It is important to stress the cross‐cutting nature of the health sector ‐ impacts on other sectors will have an impact on health.

327
EECCOONNOOMMYY
1144..00 EExxeeccuuttiivvee SSuummmmaarryy The extent of economic vulnerability to climate change and the potential for adaptation depend on, amongst other things, the geographical and resource characteristics of the country or region, the structure of production and consumption, as well as demographic and social considerations. The principal aims of this study are to study these issues within the context of the present and future scenarios characterising the Maltese economy and society, in order to update Malta’s FNC. In qualitative terms, the vulnerability of productive activities in Malta to the effects of climate change appears to be moderate. This is in line with the main findings of the First National Communication. Over the past five years, vulnerability to climate change from the production side in Malta appears to have been diminishing. Climate‐sensitive activities such as agriculture and construction are reducing in relative economic importance. Manufacturing is in trend decline with the only growth being registered in pharmaceuticals, which is relatively not vulnerable to climate change. The importance of the services sector to the Maltese economy is strongly on the increase, but the more climate‐sensitive tourism sector is relatively declining. The vulnerability of expenditure activities in the Maltese economy to climate change is expected to range from just under moderate to moderate‐high. These values are in line with those presented in the First National Communication. Consumption activities are tending to shift towards areas with an increased vulnerability to climate change. Furthermore, the persistence of fiscal and external deficits in the Maltese economy may imply that it may in future be difficult to mobilize saving resources to effect investment in climate change adaptation and mitigation activities, especially if these do not provide any immediate and tangible financial rate of return. On the other hand, the widespread provision of health and education services by the public sector at zero or low cost may facilitate national efforts aimed at climate change adaptation. This would nevertheless require further investment in health services to ensure preparedness in the face of climate change impacts. A further economic challenge relates to the extent to which health and other public services can in the medium term continue to be provided free of charge, especially in view of the increasing pressures which may potentially be exercised on them, not least through climate change effects. The long‐term development path envisaged for Malta features a mixed outlook in terms of the country’s overall vulnerability to climate change. On one hand, the country plans to develop in sectors which may feature heightened vulnerability to
328
climate change, including tourism, education and health. On the other hand, development is also expected through the expansion of sectors which are not as sensitive to climate change issues, including high value added manufacturing, financial services and information and communications technology. Furthermore, it appears that long‐term policy orientations in Malta are envisaging efforts towards climate change mitigation. Issues of vulnerability and adaptation are accorded a secondary importance. Overall, however, the future development of the economy is likely to increase the Island’s vulnerability to climate change. A number of adaptation measures to climate change that are more relevant for Malta and which are in themselves environmentally sustainable can be identified. The more important of these, including diversification of energy sources, improvements in the road and water networks and flood protection systems, are expected to impinge significant costs on the economy and call for a re‐direction of present and likely future economic activities. The country’s ability to effectively implement these adaptation measures is likely to be hampered by the scarcity of natural, physical and human resources, its relative isolation together with the existence of more urgent socio‐economic development goals. This situation is actually being worsened by the current global recessionary conditions, from which small developing states are likely to suffer more than proportionately.
1144..11 IInnttrroodduuccttiioonn The phenomenon of climate change is associated with potential wide‐ranging effects, not least on human welfare. Climate change is the source of a wide range of social, economic and environmental threats facing the planet. Increasing mean temperatures, rising sea‐water levels, more pronounced temperature extremes, lower rainfall with nonetheless more intense precipitations accompanied by an increase in days of thunderstorms, increased atmospheric pollution and a reduction in daylight hours can be expected to have important economic influences as they affect production decisions and consumption patterns. The extent of economic vulnerability to climate change and the potential for adaptation depend on, amongst other things, the geographical and resource characteristics of the country or region involved the structure of production and consumption, as well as demographic and social considerations. Human activities have been contributing to global warming over the last fifty years. The main activities that contribute to climate change include the burning of fossil fuels, agriculture and land‐use changes such as deforestation. These cause emissions of carbon dioxide (CO2), the main gas responsible for climate change, as well as of other GHGs.

329
The principal aims of this chapter are to:
provide an update on Malta’s First Communication of 2003; explain to international fora Malta’s vulnerability to climate change in
terms of the country’s proneness to adverse shocks arising from this source, as well as the likely impacts of such shocks;
explore Malta’s potential for adaptation to climate change in terms of implementable measures and behavioural changes and derive a high level assessment of their likely costs.
Another important result of this kind of study could be an increased sensitivity of domestic policy makers and the general public to climate change issues in Malta.
The climate change projections assumed in this paper are those developed for the purposes of the National Communication. It is conducted at a high, strategic level, with the aim of conveying results at macroeconomic and main sectoral levels. Detailed sectoral analyses and policy prescriptions are outside the mandate of the study. An assessment of the current state of the Maltese Islands in terms of their demographic and economic characteristics, together with a discussion of their likely future development is referred to in Section 14.2. Consideration of future scenarios are important because it is considered that a baseline scenario through which the effects of future climate changes are to be assessed should as much as possible consider the future pattern of economic activities rather than the present one. For instance, vulnerability to climate change would be high if the future development of the economy depends on the growth of a climate‐sensitive sector, even though that sector may currently account for a relatively small share of economic activity. Section 14.3 reviews the potential vulnerability and possibilities of adaptation to climate change of small islands states in general. This is interesting because smallness and insularity are perhaps among the most important characteristics defining the Maltese economy in its relation to climate change. The IPPC TAR concluded that small island states are insignificant contributors to greenhouse emissions, and yet they are the most likely to experience the higher impacts of sea level rise. Section 14.4 brings together the findings of Sections 14.2 and 14.3 to focus the discussion of vulnerability and adaptation to climate change on Malta. From an analytical viewpoint, an assessment of the economic effects of climate change can take place through two approaches. One is the evaluation of the loss of economy’s output and income due to climate change. The other is based on adaptation costs, associated with attempts to eliminate the negative effects of climate change, and would therefore focus on the costs of adaptation. Based on these considerations, this paper presents a qualitative assessment of the key long term climatic impacts and effects on the Maltese economy, discussing their potential severity and possibilities for adaptation.

330
1144..22 TThhee MMaalltteessee EEccoonnoommyy aanndd SSoocciieettyy An economy is viewed as a society of people engaged in producing, consuming, saving and thereby investing to permit their production possibilities to grow. The main demographic characteristics of the Maltese society, its production and consumption patterns and hence, the constraints and possibilities for future growth and development have been discussed in detail in sections 1.3 and 1.4. This forms a baseline scenario against which the effects of climate change can be assessed.
1144..33 VVuullnneerraabbiilliittyy aanndd AAddaappttaattiioonn ttoo CClliimmaattee CChhaannggee ooff SSmmaallll IIssllaanndd
SSttaatteess Working Group II to the IPCC TAR within UNEP focused on the special issues facing Small Island States in terms of their vulnerability and adaptation [238]. Small island states do not face an identical set of challenges with respect to climate change, yet they share a number of features that increase their vulnerability and reduce their adaptation capacity. Among the factors that increase vulnerability to climate change are:
a) high susceptibility to natural phenomena and hazards, often as a result of the significant presence of socio‐economic activities in coastal areas;
b) extreme openness and high sensitivity to external market shocks, such that small island states would be highly susceptible to climate changes that influence not only them but also other countries;
c) high dependence on tourism, a sector that is especially susceptible to climate change;
d) high population densities, implying more extreme socio‐economic effects over limited areas;
e) poorly developed infrastructure, which reduces the scope for mitigation and adaptation;
f) relatively thin water lenses that are easily disturbed by changes in climatic conditions;
The areas of socio‐economic activity where this vulnerability is most evident include tourism, coastal housing and related activities, water production and human health. The major features of small island states that inhibit their capacity for adaptation include [225]:
a) limited physical size, which reduces the scope for options such as retreat from sea level rise or relocation to areas with milder climatic conditions;
b) limited natural resources, which would often be already heavily stressed by human activities;
c) relative isolation and long distance from major markets and concentrations of human activity, precluding from enjoying fully any external benefits of adaptation put in place by other countries;

331
d) limited human and financial resources, implying a reduced capability to adapt to climate change;
e) more urgent economic growth and development targets that would not only reduce the amount of resources that can be devoted to adaptation to climate change, but also increase the delay in taking the necessary measures.
Compared to other countries, small island states face heightened challenges from climate change in spite of the fact that they contribute relatively marginally to the phenomenon through pollution and other adverse by‐products of economic activity, accounting for less than 1% of global greenhouse emissions. At the same time, they face the challenge of growth and development to converge to economic activity levels of larger trading partner countries. It is thus clear that climate change imposes an equity issue between those countries that are chiefly responsible for the phenomenon and yet less vulnerable and more easily adaptable to it, and those countries which are more vulnerable to its effects in spite of their marginal contribution to it, and whose state of development inhibits adaptation. This may indicate that it may be more economically efficient, from the national as well as the global perspectives, for small states to concentrate mainly on adaptation to rather than the mitigation of climate change effects.
1144..44 MMaallttaa’’ss EEccoonnoommiicc VVuullnneerraabbiilliittyy aanndd AAddaappttaattiioonn ttoo CClliimmaattee
CChhaannggee From a synthesis of the arguments presented in Sections 14.2 and 14.3, it is evident that the Maltese economy and society share a number of characteristics with other small island states with respect to the challenges they face from climate change. This section explores in further detail the areas of major vulnerability and possibilities for adaptation for Malta. It builds and extends on, inter alia, Malta’s First Communication to the United National on Climate Change as well as a 1996 study [224] that presented a description of a number of major impacts of climate change, analysed here through an approach that has been adapted from the IPCC technical guidelines for assessing climate change impacts [228].
1144..44..11 VVuullnneerraabbiilliittyy The assessment of the vulnerability of the Maltese economy to climate change is based on the analysis of the economy presented in Section 14.2, thus distinguishing between the effects on the production sector and those on expenditure activities.

332
1144..44..22 VVuullnneerraabbiilliittyy ooff tthhee PPrroodduuccttiioonn SSeeccttoorr Table 14.1 details potential long‐term impacts of climate change on the production activities of major sectors in the Maltese economy together with an assessment of their likely strength. It analyses the impacts on the supply side of production operations, as distinguished from the potential effects on the demand side that are presented under the discussion on expenditure activities. The extent of the strength of the effects was derived on the basis of a qualitative evaluation involving expert opinion considering:
a) the magnitude of the initial impact; b) the degree of certainty of the realization of the impact ‐ in this respect,
the precautionary principle giving a relatively large weight to the significant consequences of worst case scenarios is adopted [226];
c) the extent to which such impact is already present in the baseline scenario, to assess the net effects of future climate change; and
d) the degree to which the impact can be easily mitigated or its effects reduced through substitute activities or autonomous adaptation (as opposed to planned or anticipated adaptation measures which are discussed in the next section).
1144..44..22..11 AAggrriiccuullttuurree The agriculture sector in Malta is expected to be significantly impacted by climate change phenomena. It is currently in a state of long term decline, but this can be expected to be halted in the medium term through restructuring, improvement in quality and marketing efforts, and rural development measures aimed at diversifying agricultural activities, and exploiting its externalities. Climate change is however expected to exert a number of negative impacts on the sector, among which an impoverishment and aridification of soil. Although a major consideration, this effect is already taking hold to a significant extent in Malta, such that the relative contribution of future global warming is in this respect deemed to be moderate. Warmer temperatures are also expected to engender an increase in the incidence of pests, an effect that can be relatively mitigated through the use of pesticides, albeit not without undesirable side effects. The effects of sea level changes on agriculture are subject to considerable uncertainty and in any case are likely to be marginal, with its effect on the Maltese economy being judged to be only negligible, also given the relatively low contribution of agricultural production to overall output. This said, and subject to the uncertainty inherent in sea level change projections, it is to be commented that from an economic perspective, any loss of land in Malta is bound to have significant costs in a country where land is such a scarce resource.

333
1144..44..22..22 FFiisshheerriieess In the fisheries sector, the major impacts of climate change are likely to be related to the shifts in migratory patterns of the most‐intensively fished species, such as tuna, as well as the emergence of new species that are better suited to the new climate conditions and which threaten those currently providing economic value. Fish migration is already being influenced to an extent by warmer sea temperatures, at present to the benefit of Maltese fishermen as migration routes are moving southwards. The continuation of this trend could however mean a loss of potential catches in future. The notable degree of uncertainty in regarding the impact of these effects on final economic activity results in their strength being judged as moderate. A similar impact on the fisheries sector arising out of climate change is the disruption to fish farming activities due to the damage to equipment and gear.
Sector
Effects Strength
Agriculture More arid, less fertile soil Moderate (already relevant)
Increase in pests Moderate
Land inundation Negligible
Fisheries Change in fish migration Moderate
Disruption to fish‐farming Strong
Industry Higher costs of production environment control for hi‐tech and food sectors
Moderate
Deteriorating working conditions in other sectors, especially in construction
Negligible
Disruption due to flooding Moderate
Compliance to pollution standards Moderate to strong
Transport and communication
Infrastructural damage Indeterminate
Road flooding Moderate (already relevant)
Increased discomfort Strong (already relevant)
Disruption to maritime transport Moderate
Thunderstorm disruption to air transport Negligible
Disruption to wireless communication Negligible
Compliance to pollution standards Moderate to strong
Distribution Higher costs due to transport disruption Moderate
Higher costs of storage and service environment control
Moderate
Service activities
Higher costs of service environment control Moderate
Utilities Acquifers affected by sea‐water intrusion and lower precipitation
Moderate (already relevant)
Flooding of sewerage network Strong
Disruption to energy production due to high peak demands and higher investment costs
Strong (already relevant)
Compliance to pollution standards Strong
Disruption to renewable energy production Moderate
Table 14.1: Vulnerability of the Production Sector.

334
1144..44..22..33 MMaannuuffaaccttuurriinngg In the manufacturing sector, there are activities where climate change could increase the costs of environmental control within their production processes, such as in food‐processing. In other relatively high‐tech sectors, the nature of environmental control would be such that gradual and marginal changes to the climate would have no appreciable effects to the costs of climate control. Thus, the overall effect of climate change on these sectors is judged to be moderate. Another effect on the industrial sector is that climate change would cause a deterioration in working environment conditions for persons, especially in the relatively labour‐intensive and exposed construction and quarrying sector. This effect is already being mitigated to a significant extent by increased mechanization, such that any increase in future costs in this respect arising out of climate change in judged to be negligible. Another potential effect is the flooding of industrial areas due to excessively concentrated rainfall with which drainage systems would be unable to cope. This phenomenon is already to an extent present and is judged to have a moderate impact on industry.
1144..44..22..44 MMaarrkkeett SSeerrvviicceess Due to Malta’s economic openness and the dependence of its industry on developments abroad, it is very likely that Malta will have to increasingly comply with international pollution standards. This is a concern that extends to other sectors such as transport as well as the utilities. It is already expected that with the prospect of EU membership and the adoption of the environmental acquis, Malta will have to make significant adjustments in this respect, the costs of which will be partly borne by the EU. In this event, it is probable that further international restrictions on pollution emissions would have only a moderate effect on Maltese industry. The negative effects could be stronger should Malta opt to fully bear the costs of environmental compliance and the longer it postpones the adoption of the necessary measures. Productive activity in the transport and communication sector in Malta is expected to be affected by climate change in various ways. An extent of infrastructural damage can be expected, depending on the prevalence of extreme meteorological conditions. Road flooding, which is already somewhat prevalent in Malta, can be expected to increase. The effect of climate change in this factor is judged to be moderate because it is expected that Malta will have in any case to effect significant investment to upgrade its road network in the short to medium term irrespective of climate change considerations. Another important consideration is the increased discomfort in travel produced by climate change. It is expected that this is to have strong effects, in the form of costs to air‐condition private and public means of transport. This, within the context of a relatively inefficient public transport system in Malta that is protected by state regulation, using obsolete vehicles and facing a significant downward trend in demand. A liberalization and restructuring of this sector is however expected in the near term.

335
Other effects of climate change on the transport and communication sector in Malta include disruption to maritime activities due to wind force, problems to air transport due to increased thunderstorms, and interference in wireless communication. These effects can be relatively mitigated through technological means and logistical adjustments to transport systems. They would also require investments to improve port infrastructures. The disruption of maritime activities is however expected to have more important effects due to the dependence on sea transport in Malta, particularly for communication between the two main islands. The distribution sector in the Maltese economy is expected to be influenced in two major ways by climate change. Firstly, it will have to bear higher costs due to the disruption of transport. Secondly, it will have to shoulder increased costs of environmental control for storage environments and service provision. The impacts of these effects as emanating from future climate change are judged to be moderate because the distribution sector is likely to an extent face these effects in a baseline scenario in any case. This is due to the poor state of the road network in Malta, as well as the need for business to upgrade their operations in view of competitive pressures. Similar considerations apply to all other services activities in Malta, which will have to bear the increased costs of environmental control of working and service activities, although this effect is not expected to be strong. The utilities sector involved in the production and provision of energy, fuel, water and sewerage services are expected to be influenced by climate changes in a number of important ways. Water production, which relies significantly on groundwater extraction, will be disrupted by sea water intrusion due to the rising sea‐water levels together with the lower rain precipitation. This effect is judged to be moderate as it is already relevant in current conditions. Sewerage services could be disrupted by over‐flowing. However the implementation of sewage treatment plants in the near term should reduce sensitivity to other issues, such as sea level rise. Electricity production is expected to be disrupted by peak demands in extreme temperature conditions that are expected to be exacerbated by climate change. This will not only increase the frequency of power‐outs with significant costs for the entire economy, but will cause an increase in operating costs and replacement investment for the electricity provider. Further additional costs to the energy sector will be imposed by the need to comply to international pollution standards in view of climate change, as discussed earlier on. Finally, climate change may impose difficulties for Malta to exploit renewable energy sources because of an increase in extreme meteorological conditions. At present, Malta makes only a minimal use of such sources, but it is believed that a potential for more profitable exploitation exists and is being actively explored. This qualitative appraisal of the vulnerability of the Maltese economy to climate change can be summarized by means of a numerical evaluation exercise of the strength of effects on the individual major production sectors with the aim of deriving a vulnerability score for productive activities for the economy. This analysis is presented in Table 14.2.

336
The derivation of the vulnerability score depends on the production of the vulnerability score of individual sectors with the weight that the sectors occupy in the economy. Table 14.2 details the vulnerability scores and economic weights as they apply at present and as they would be perceived to be in a future long‐term steady state scenario. Current economic weights relate to the share contributed by each sector of activity to GDP in 2000. Future economic weights were derived on the basis of the discussion presented in Section 1.4.3, broadly featuring declining shares of activity in the primary, secondary and distribution sectors and an increase in service activities with the exception of the public sector. Within the manufacturing sector, high tech industries are expected to increase their share significantly, while utilities are expected to increase in importance in public sector operations. Sector vulnerability scores are derived as a weighted average of the different impacts and effects presented in Table 14.1, with the magnitude of effects being given a score ranging from 0 to 3, as indicated in Table 14.2. Changes in sector vulnerability scores from the present to the future scenario reflect structural shifts that would be expected to autonomously take place within those sectors. In the agriculture and fishing sector, the relatively high vulnerability at present would be expected to decline marginally due to the diversification of activities that is expected to take place. In the manufacturing sector, the costs of compliance to international standards of emissions are likely to be a source of vulnerability. In the public sector, the increased share of the utilities as a result of the scaling down of other areas of public sector intervention is expected to increase the average vulnerability score in the future scenario.
Current Future
Economic weight (%)
Sector Vulnerability*
Economic weight (%)
Sector Vulnerability*
Agriculture and fishing 2.5 2.4 2.0 2.3
Industry 20.9 1.6 17.5 2.4
Distribution 11.5 2.3 9.0 2.3
Transport & Communication 10.0 2.5 10.0 2.7
Financial 4.5 1.4 10.0 1.4
Private Services 31.7 1.4 34.0 1.3
Public Sector (incl. Utilities) 18.9 2.2 17.5 2.7
Overall Production Vulnerability
100.0 1.8 100.0 2.0
* Index of Sector Vulnerability: 0 = None; 1 = Negligible; 2 = Moderate; 3 = Strong
Table 14.2: A qualitative assessment of climate change vulnerability of production activities. Based on these considerations, the overall production vulnerability to climate change of the Maltese economy is estimated at 1.8 in the current scenario and expected to increase to 2.0 in the future scenario. Thus, in qualitative terms, the

337
vulnerability is expected to be moderate. The comparable figures obtained out of the same methodology used for Malta’s first National Communication were 1.9 for the current scenario and 2.2 for the future scenario. It therefore appears that the vulnerability of Malta’s productive activity to climate change is tending to decrease somewhat.
1144..44..33 VVuullnneerraabbiilliittyy ooff EExxppeennddiittuurree AAccttiivviittiieess An analysis with regards to the vulnerability to climate change similar to that presented in the previous section is here undertaken for the expenditure activities in the Maltese economy. The results are presented in Table 14.3. Private consumption activities are expected to be influenced through a greater share of resources being diverted towards meeting the effects of climate change. These include expenditures on climate control in houses and cars, with an attendant increase in expenditure on energy. Moreover, the amount of consumption resources devoted towards acquiring water of good quality can be expected to increase. The strength of these effects is judged to be moderate, mainly because they are already present irrespective of the effects of climate change. Climate change can be expected to have a number of health effects that are to be met by resources being defrayed from consumption activities. Adverse health effects will emanate from disruptions to the sewage system, the reduced quality of potable water, temperature extremes, and a greater incidence of tropical diseases together with those associated with skin, eyes and the immune system. It is expected that there will be a strong response of consumption expenditure to these factors, not only via private consumption but also on public consumption, as government is a major provider of health services in Malta. The ageing population tendency will exacerbate the adverse effects of climate change on health. Inundations through sea‐water rise can be expected to affect buildings, including dwellings, and other structures in coastal areas. This effect is expected to be strong, affecting around 4% of the population and an equivalent proportion of units of housing stock. This is also bound to be a chief consideration in Malta, given the scarcity of land. Residents in inundation‐risk areas could also be expected to experience a significant drop in wealth levels over time, as the value of property in these areas would be expected to diminish. There are also equity considerations involved in this issue, because the more socio‐economically disadvantaged groups in Malta tend to live closer to the harbour regions. A similar consideration is the risk of flooding through excessively concentrated precipitation. Inundations and similar climate change phenomena are also expected to aversely affect entertainment and transport and communication activities, especially when considering the extent of entertainment obtained through activities on the coast including summer residences.

338
Activity
Effects Strength
Private consumption
Increased expenditure on environmental control in houses and cars, and consequently on energy, crowding out other consumption Increased expenditure on water of good quality Increased expenditure on health Disruption to housing in coastal areas Disruption to housing due to rainwater flooding Disruption to entertainment associated with natural amenities Disruption to transport and communication
Moderate (already relevant) Moderate (already relevant) Strong Strong Moderate Moderate Moderate
Public consumption
Increased expenditure on health services Strong
Investment
Resources diverted to climate change adaptation crowd out other activities
Moderate
Tourism exports
Lower demand due to: - disruption to coastal activities and environment
- warmer climate in home countries - health hazards
Strong
Other exports
Reduction in competitiveness due to increased costs to adapt to climate change
Moderate
Table 14.3: Vulnerability of Expenditure Activities. A measure of disruption to investment expenditure in Malta can be expected to take place due to climate change, mainly as resources are diverted towards adaptation and mitigation measures. The negative effects of this factor are expected to be compounded by the ageing population and a consequent drop in the saving rate, together with the fact that Malta needs to invest relatively more in order to catch up with the standards of living within the EU. A strong effect of climate change on tourism export activity in Malta is expected. This would result from a lower demand for Malta as a resort, due mainly to the disruption in coastal activity and environment, the harsher temperature extremes in

339
Malta, the warmer climate in tourist source countries as well as the increased incidence of health hazards. Other important effects would include the disruption to transport as well as to power and sewage systems. The effects of climate change in other exports is judged to be more moderate, arising mainly from a reduction in competitiveness due to the increased costs associated with climate adaptation. It is expected that Malta will face higher costs due to the invisibility of expenditures on infrastructural developments, and due to the fact that the ratio of the coastal area to land mass is much higher in Malta than in competitor and client countries. In addition, larger economies may be in a better position to absorb adaptation costs than is the case of Malta. A climate change vulnerability score for expenditure activities for Malta is derived on through the same approach adopted for analyzing the vulnerability of productive activities, and is presented in Table 14.4. Current economic weights reflect year 2008 data, and are in future projected to change due to changing consumption patterns associated with the ageing population, a reduced role for public sector expenditure, the need for more investment to converge to international economic standards, a stronger reliance on tourism exports and allied activities, and a reduced share of expenditure on other exports. The vulnerability score of consumption expenditure is bound to increase in the future scenario, because economic development will bring an increasing share of expenditure on activities that are more vulnerable to climate change effects, such as entertainment, transport and health. Other items of expenditure have relatively low vulnerability coefficients, reflecting the considerations made earlier on.
Current Future
Economic weight (%)
Sector Vulnerability*
Economic weight (%)
Sector Vulnerability*
Private Consumption 33.9 1.7 35.0 2.3
Public Consumption 11.1 1.5 7.0 1.5
Investment 11.0 2.0 10.0 2.0
Tourism Exports 10.0 3.0 9.0 3.0
Other Exports 34.1 1.5 39.0 1.5
Overall Expenditure Vulnerability
100.0 1.8 100.0 2.1
* Index of Expenditure Vulnerability: 0 = None; 1 = Negligible; 2 = Moderate; 3 = Strong
Table 14.4: A qualitative assessment of climate change vulnerability of expenditure activities.

340
The overall expenditure vulnerability to climate change score of the Maltese economy is found at 1.8 at present, rising to 2.1 in the future scenario. It is comparable to, if somewhat lower than, the production vulnerability score. This reinforces the qualitative evaluation that the vulnerability of expenditure activities in the Maltese economy to climate change is expected to range from just under moderate to moderate‐high. These values are unchanged from those presented in the First National Communication.
1144..44..44 PPootteennttiiaall ffoorr AAddaappttaattiioonn In line with [241], the potential for adaptation of the Maltese economy is viewed in terms of the required “adjustments in behaviour or economic structure that reduce the vulnerability of society to changes in the climate system.” The issues that arise in this context include the degree to which such adaptation is possible, its costs, and whether it is autonomous or planned given the degree of foresight required to forestall the effects of climate change. The extent to which technological advances are required in order to implement adaptation measures and their impacts on the relative costs is another important consideration. For the purposes of this section, the need for planned adaptation measures is discussed. Following [231], it is argued that planned adaptation aimed at reducing the vulnerability to climate change can have four objectives:
increasing robustness of vulnerable activities and infrastructure to changes in climatic conditions, by for example, increasing the range of temperature or precipitation a system can withstand;
increasing the flexibility of vulnerable activities and infrastructure to be able to better respond to changes in climatic conditions by, for example, developing industry with shorter economic lifetimes or that can be more easily relocated;
enhancing adaptability of vulnerable systems by removing other stressors, such as excessive traffic pressures on the road network which accelerates its deterioration and potential vulnerability to flooding;
reversing the trends that increase vulnerability by, for example, halting further development in coastal areas.
Adaptation measures on these fronts involve a mix of instruments, including economic, legal, institutional and technological, the latter featuring knowledge as well as infrastructure. Technological measures are particularly relevant in the context of the first two of the above goals. It is furthermore imperative that adaptation measures would in themselves be environmentally sustainable, that is, they would not contribute to worsen the effects of climate change. Thus, for example, energy‐intensive air‐conditioning cannot be considered to be a viable adaptation measure due to its environmental unsustainability.

341
A number of adaptation measures relevant to reduce the vulnerability of the Maltese economy to climate change are here considered out of the plethora of measures listed in the literature. This discussion is however by no means intended to be exhaustive or comprehensive but merely illustrative of the type of measures likely to be required in Malta and indicative of the relative costs. It is furthermore to be noted that his chapter deals with the overall economic systems and dynamics of Malta and as such, does not delve into a signle particular aspect which is covered by other reports in this exercise. For this reason, the adaptation measures considered here are limited to those of a macro and systemic effect. Relevant adaptive measures for Malta in this regard could include:
Diversified energy production and more reliance on renewable sources. While this may prima facie appear as a mitigation measure, it can be viewed to be necessary to reduce the vulnerability of the energy sector itself to say, disruptions to maritime transportation of fossil fuels. These measures are likely to entail significant investment costs for Malta, which may amount to close to 20% of GDP.
Constructing and converting buildings to improve energy efficiency and climate control. A number of changes to current construction practices towards this end have been identified in Malta [239], which are likely to be costly but provide a positive net financial return in the long run, apart from reducing vulnerability to climate change.
Improving early warning systems of extreme meteorological conditions and upgrading disaster preparedness. Given Malta’s smallness and geographical characteristics, improved collaboration with other Mediterranean countries would be desirable.
Improved transport systems and infrastructure so as to have better mobility for the eventuality of evacuation. The road network in Malta calls for particular attention.
Improved water run‐off facilities so as to reduce possibilities of flooding. Directing more resources to primary health care and health surveillance
in the areas where climate change is imposing the more severe threats to human health.
Improved water production and distribution systems, with the aim of reducing inefficiencies and promoting a more rational use of water resources in a sustainable manner.
Improved farming methods and infrastructure, including the use of brackish and treated effluent water, dormant season irrigation, crop rotation, etc.
Implementing afforestation, and wetland conservation, to be based on sound knowledge and data on climate change impacts.
Fostering an economic environment necessary for the further development of the less vulnerable sectors of activity. In this respect, it is however to be commented that there are more pressing and urgent pressures which dictate the patterns of sectoral development of the Maltese economy other than climate change. It is unlikely that climate

342
change issues, which are of a long run nature, would dictate the type of sectoral development in the economy, where a successful sector would typically have a life‐cycle of between fifteen and thirty years before it is supplanted by a new form of economic activity. The issue to highlight is that whatever sectors are developed on account of prevailing economic and social forces, policy‐making must ensure that sufficient resilience and adaptive capabilities are built into the activities of such sectors for them to endure any adverse climate change effects over their foreseeable lifetime.
1144..55 CCoonncclluussiioonnss aanndd RReeccoommmmeennddaattiioonnss It is to be appreciated that this study represents merely an overview of the principal considerations involved in the vulnerability of the Malta to climate change and the required adaptation measures. Each of the sources of vulnerability requires more detailed study in terms of its magnitude, certainty, likely impact and economic cost. Similarly, more detailed investigation in each adaptation measure, on a cost‐benefit basis, is required to identify the best mix of measures to undertake within the context of the socio‐economic fabric of the Maltese Islands. From an economic perspective, climate change is akin to a negative supply shock that disturbs productive activities and absorbs resources away from alternative consumption and investment activities. Subject to the uncertainties and incomplete information inherent in this type of study, this paper confirms the findings of Malta’s First National Communication to the United Nations on Climate Change, in that there are bound to be important effects of climate change on the Maltese economy and society. These are similar to those applicable for other small island states, but are in the case of Malta compounded by the effects of a high population density and an ageing population. The future development of the economy is likely to increase the Island’s vulnerability to climate change. A number of adaptation measures to climate change that are more relevant for Malta are identified. The more important of these, including improvements in the road network, water and electricity production and flood protection systems, are expected to impinge significant costs on the economy and call for a re‐direction of present and likely future economic activities. The country’s ability to effectively implement these adaptation measures is likely to be hampered by the scarcity of natural, physical and human resources, its relative isolation together with the existence of more urgent socio‐economic development goals. This situation is actually being worsened by the current global recessionary conditions, from which small developing states are likely to suffer more than proportionately. A conclusion of a study of this nature, which is detached from diplomatic realities which may invalidate its practical relevance, is that Malta and countries in a similar condition would be expected to benefit from international assistance in averting the threats of climate change for which other countries that are less vulnerable are chiefly responsible for creating.

343
PPAARRTT IIVV:: CCOONNCCLLUUSSIIOONN

344
GGAAPPSS AANNDD CCOONNSSTTRRAAIINNTTSS IINN AADDDDRREESSSSIINNGG CCLLIIMMAATTEE
CCHHAANNGGEE IISSSSUUEESS
1155..00 EExxeeccuuttiivvee SSuummmmaarryy The main commitments Malta has under the UNFCCC and the Kyoto Protocol are: adopting mitigation measures to address anthropogenic green house gas emissions and implementing adaptation measures to mitigate the negative effects of climate change. This chapter provides an analysis of gaps, constraints and other information relevant to Malta’s achievement of these obligations and focuses on a cross sectoral approach, thereby complementing the gaps and constraints highlighted in the preceding chapters. This is achieved under four main headings; the institutional/regulatory, methodological, technological aspects and capacity‐building. These gaps and constraints are subsequently classified as mitigation or adaptation measures or both. A comprehensive assessment is achieved by considering the legal obligations which Malta has under international, European and national law to demonstrate existing gaps and constraints that are preventing and obstructing the implementation of both mitigation and adaptation measures to climate change. However, logistical and practical difficulties relative to the local circumstances that hinder compliance with the same are identified. Consideration is taken of the fact that Malta is a state with no target to reduce emissions under the UNFCCC and the Kyoto Protocol but which, nonetheless is legally bound by the European Community regime on climate change that is formulated on the pretext of capping and trading GHG emissions. The main gaps and constraints, which emerge are: the lack of mainstreaming of climate change issues, the non existence of a national adaptation strategy and the absence of a regulatory and administrative framework, which ensures that both mitigation and adaptation measures are being adopted and complied with by all sectors. Emphasis is made upon the need to ensure the compilation and exchange of reliable and comparable data, of promoting research and empowering the capacity of national human resources to meet the challenges and the opportunities resulting from climate change across all sectors. Recommendations are made on how to integrate climate change into socio‐economic and environmental policies in Malta. These recommendations take into consideration Malta’s role to identify the relationship between the eight Millennium Development Goals and climate change. The recommendations also aim at facilitating participation by civil society and non‐governmental organizations to play a more active role in decision making, education and public awareness activities on the subject. A holistic approach is highlighted since gaps and constraints in adopting mitigation and adaptation measures to climate change are interrelated. Addressing

345
gaps and constraints is a symptom of good governance, which itself depends upon optimum coordination between the various sectors that constitute society.
1155..11 IInnttrroodduuccttiioonn This report provides a cross sectoral analysis of gaps, constraints and other information relevant to Malta’s achievement of its obligations under the United Nations Framework Convention on Climate Change (UNFCCC) and the Kyoto Protocol (KP). The objectives of these two International legal instruments ramify into two main commitments: adopting mitigation measures to address anthropogenic green house gas emissions (GHG) and taking adaptation measures to meet with the negative effects of climate change. In its first part, the report will review the constraints and gaps of a regulatory, institutional, methodological, technical and capacity nature identified in previous studies. These include Malta’s First National Communication (INC) to the UNFCCC and the Technology Needs Assessment for Mitigation and Adaptation to Climate Change. Emphasis is mainly given to the cross‐sectoral gaps identified in the INC, as updated in conformity with the prevailing national circumstances. This chapter also considers gaps and constraints identified in the studies carried out as part of the preparation of Malta’s Second National Communication, which comprise vulnerability and adaptation reports of the individual sectors. This report however focuses on a cross sectoral approach thereby supplementing the gaps and constraints highlighted in the individual sectors by assessing them from a holistic perspective. In the second part, this chapter will make recommendations, which propose how to integrate climate change into socio‐economic and environmental policies in Malta. These recommendations take into consideration Malta’s role to identify the relationship between the eight Millennium Development Goals and climate change. The recommendations also aim at facilitating participation by civil society and Non‐Governmental Organizations to play a more active role in decision making, education and public awareness activities on the subject. The first national communication and the preparatory work leading to the second national communication, expose various gaps and constraints that hamper public and private entities from adopting mitigation and adaptation measures related to climate change in Malta. Furthermore, the draft national climate change strategy, which was drawn by a group of experts appointed by the Ministry for Resources and Rural Affairs, makes a number of recommendations, albeit focusing on mitigation, which address existing gaps and constraints. The gaps and constraints will be grouped under four main headings: the institutional (which includes also the regulatory aspect), methodological, technological aspects and capacity‐building. In turn, these gaps and constraints will be classified as being required either as mitigation or adaptation measures. It needs to be stressed

346
however that gaps and constraints are interrelated. For instance, gaps in the administrative set up and the legal framework influence both scientific and technical capacity building and vice versa. Furthermore addressing these gaps and constraints may fulfill both mitigation and adaptation measures. Research and data collection, for example are essential elements and common requirements to fill in gaps and overcome constraints in all the various sectors, serving both mitigation and adaptation. In summary, addressing gaps and constraints is symptomatic of good governance, which itself depends upon optimum coordination between the various sectors that constitute society. To identify these gaps and constraints in a comprehensive manner, this chapter will assess them from a cross‐sectoral perspective. The legal obligations, which Malta has under International, European and National law serve as a basis to demonstrate existing gaps and constraints, which are preventing and obstructing the implementation of both mitigation and adaptation measures to climate change. This chapter however, adopts a wider approach and identifies also logistical and practical difficulties that are hindering compliance with the same.
1155..22 GGaappss aanndd ccoonnssttrraaiinnttss rreellaatteedd ttoo mmiittiiggaattiioonn mmeeaassuurreess
1155..22..11 IInnssttiittuuttiioonnaall OOrrggaanniizzaattiioonn Regulatory Framework The government has carried out the Initial and the Second National Communication and various other reports and studies on climate change including the launching of a draft strategy on mitigation measures and is currently considering the proposal to formulate a strategy on adaptation measures. However, there is no legal national instrument, which specifically stipulates that the government should establish and periodically update national programmes to mitigate climate change. Fragmentation exists at the regulatory level. Climate change is specifically identified as a distinct topic in the portfolio the Ministry for Resources and Rural Affairs, whilst a unit within the Environment Protection Directorate of the Malta Environment and Planning Authority, monitors and regulates the implementation of Malta’s obligations under the UNFCCC and the Kyoto Protocol. Given the cross‐sectoral nature of mitigation and adaptation measures to climate change however, various sources of legislation stipulate legal obligations that fall under the responsibility of different competent authorities. Neither the Ministry nor MEPA however are enabled by law to regulate and secure compliance when other public authorities do not provide data and information or fail to adopt climate change mitigation and adaptation measures. This regulatory gap is mainly due to the absence of an entity that has over‐arching legal responsibility for mainstreaming climate change and for ensuring compliance with mitigation and adaptation obligations on a cross‐sectoral level.

347
Legislation to take mitigation measures by addressing GHG emissions does not target all sectors. It is developed with respect to limiting GHG emissions mainly from energy generation but the UNFCCC refers to other sectors that have to be regulated in this respect, namely transport, industry, agriculture and waste management. All activities that emit GHG from anthropogenic sources from these sectors should be regulated. There are few linkages with existing regulatory instruments that incidentally limit GHG emissions from anthropogenic activities in these sectors, particularly via laws relating to air and water quality, the use of chemicals and the conservation of natural resources. The regulatory framework to enhance sinks of GHG is not developed as a mitigation measure to climate change. Legislation to enhance sinks exists incidentally as an obligation for the conservation of natural habitats and biodiversity. There are also no linkages in these regulatory instruments with climate change mitigation measures. There is a gap in legislation stipulating obligations upon public and private entities to collect and provide data on emissions of GHG for the updating of the GHG inventory. There are no regulatory instruments that stipulate legal obligations for data collection procedures relating to climate change mitigation. Administrative Set Up The governance of climate change law and policy is fragmented and sectoral. There is no entity, which has executive power to mainstream and implement climate change mitigation policies and strategies from a cross sectoral perspective. This constrains the adoption of a holistic approach when it comes to:
formulating national policy measures to mitigate climate change monitoring and securing compliance across all sectors assessing the environmental and socio economic impacts of mitigation
measures that are considered for adoption or disregarded. ensuring that the burden of mitigation measures is shared in an
adequate and equitable manner. The above also applies to adaptation. The role of this entity should be to coordinate and oversee mainstreaming of both mitigation and adaptation issues in existing policies, rather than creating new policies ‐ since implementation of both mitigation and adaptation should ideally be carried out through existing sectoral policies. Therefore the gap lies mainly in the lack of an enabling environment for such mainstreaming in view of the absence of a coordinating entity, which would be in a position to ensure such mainstreaming actually takes place throughout all sectors, to promote synergies, collaboration with regards to data sharing and research. In other words it would basically oversee implementation of national strategies on mitigation and adaptation. The current administrative set‐up is not adequately organized to promote ownership of climate change mitigation measures across all the sectors involved. This constrains

348
adequate forward planning with respect to mitigation obligations both on a horizontal and sectoral level. The current administrative setup is inadequate to facilitate in the most expedient manner possible:
the adoption of national positions relating to climate change mitigation to ensure an integrated approach
to provide systematic observation of the effects of climate change on a national level and the development of data archives related thereto;
to assess best options available when taking national mitigation measures;
to provide a steady flow of information to civil society relating to mitigation measures that may be adopted and how they are being implemented.
1155..22..22 MMeetthhooddoollooggyy The foremost gap lies in mainstreaming climate change to instil ownership of mitigation measures by public and private entities via consistent education and awareness building campaigns to ensure successful implementation. This also applies to adaptation measures. Unless there is national mainstreaming of the implications of mitigation and adaptation measures and an assessment of the consequences of doing nothing, there cannot be the appropriate forward planning to address socio‐economic repercussions, to facilitate burden‐sharing and to tap opportunities. There is a critical need for overall high‐level ownership of Malta’s clear, quantified obligations which have to be integrated into any decision‐making that takes place. An equally important gap that must be addressed and which, closely relates to the above, involves lack of synergy between different sectoral public plans, programmes and policies that affect mitigation measures either due to their contribution to GHG emissions or because they have an impact on sinks of GHG. Linkages must be ensured to overcome constraints caused by fragmentation, which lead sectoral policies, plans and programmes to be at times in conflict with the objectives of mitigation measures that are to be adopted. Fragmentation of the administrative set‐up, does not guarantee that all options are considered when choosing, which mitigation measures Malta should adopt to meet its obligations under the UNFCCC and the KP, especially when taking commitments in this respect within EU fora.

349
1155..22..33 TTeecchhnniiccaall GGaappss aanndd CCoonnssttrraaiinnttss There are constraints in the exchange of scientific, technical and other type of information, both within the public sector and with civil society due to other shortcomings in this respect referred to under the regulatory and institutional framework. Although there has been a notable improvement amongst the general public in the adoption of cleaner technology through the introduction of incentives by the government in this respect, gaps still persist in the promotion, development and appropriate diffusion of transfer of cleaner technology. This is because the promotion of cleaner technology seems to have been restricted to energy efficiency and consumption from renewable sources, rather than it being adopted across all sectors in holistic manner. There are financial constraints that hamper investing in research:
to promote technological response strategies and tools that are tailor made for the local scenario when adopting mitigation measures:
to provide on a national level best available scientific data on calculating GHG emissions by sources and removal by sinks.
This impinges upon public authorities when they need to identify the best options for mitigation measures that have the least negative impact on a socio‐economic and environmental level. This also results in loss of important opportunities, which may not necessarily be “mainstream” funding/technical opportunities: such as for example co‐financing of innovative RES technologies through the Emissions Trading Scheme. There is the need to improve the quality of activity data and/or models used for the preparation and periodic updating of national inventories of anthropogenic emissions by sources and removals by sinks of all GHG. The MEPA has overall responsibility for the annual compilation of the national emissions inventory, while also taking responsibility for the coordination and compilation of the policies and measures reports and estimation of emission projections. However, these reporting obligations necessarily require the involvement of many other entities, both public and private. This input is required in terms of provision of quantitative data for different sectors and activities for the calculation of emissions and removals and estimation of projections, and information on policies and measures implemented, adopted or planned.
1155..22..44 CCaappaacciittyy BBuuiillddiinngg There is a major gap in research on a national level relating to the impacts which mitigation measures would have on a socio‐economic as well as environmental level. This is probably due to a lack of cost‐benefit assessments, which would hinder appropriate allocation of resources for the implementation of mitigation (and also

350
adaptation) measures. This handicaps both policy and decision making as it restricts information on the availability of mitigation options that would suit in the best manner possible the local scenario. Lack of human resources constrains public and private entities from availing themselves of training opportunities that exist, which aim at facilitating compliance with mitigation measures or to encourage investment opportunities in cleaner technology and better management of sinks of GHG. Access and availability to relevant regional data has improved through Malta’s membership in the European Environmental Agency but this does not substitute the collection and compilation of local data in a coordinated manner. There are gaps in providing a steady flow of information to keep stakeholders and civil society aware on compliance with mitigation measures. Access to information promotes compliance and public participation facilitating ownership of mitigation issues. There is a gap between the workload of the competent authorities responsible for compliance with climate change mitigation measures in the individual sectors. There is also a gap in the local capacity‐building requirements to ensure better monitoring, implementation and compliance. This affects negatively not only the regulating entities but also the operators and stakeholders in general, as it often leads to crisis management and allows little time to forward planning in order to meet with the challenges and tap opportunities related to climate change.
1155..33 GGaappss aanndd ccoonnssttrraaiinnttss rreellaatteedd ttoo aaddaappttaattiioonn mmeeaassuurreess In many cases the above mentioned gaps and constraints regarding mitigation measures may also apply mutatis mutandis with respect to adaptation measures. Nevertheless the latter type of gaps and constraints are often even more severe since Malta does not have as yet an Adaptation Strategy to Climate Change. Furthermore there are various types of adaptation measures, namely anticipatory and reactive adaptation, autonomous and planned adaptation. Adaptation involves both the public and private sector. The preparatory work for the Second National Communication has for the very first time identified various vulnerability and adaptation issues in individual sectors such as health, water resources, migration and demographic changes, biodiversity conservation, waste management, the built environment, telecommunications and transport. These reports on individual sectors supplement an earlier report on Technology Needs for Adaptation to Climate Change. The link between vulnerability and adaptation is very strong since basically the degree of adaptation required is directly related to the extent of vulnerability or risks Malta is exposed to as a result of climate change. Just as is the case with mitigation measures, the need for awareness on adaptation to climate change and the instilling of a sense of ownership across all sectors to facilitate the implementation of such measures is indispensable. It is to be stressed

351
however, that it is counter productive to aim at comprehensive adaptation measures and policies from the outset. Identifying adaptation measures and the required methodologies to implement them is a learning curve process. Preparedness however is essential and it must be tailor made to suit the local scenario since the subjective character of adequate adaptation measures causes them to differ from one nation to another.
1155..33..11 IInnssttiittuuttiioonnaall OOrrggaanniizzaattiioonn Regulatory Framework Gaps in the regulatory framework cannot be assessed at face value. It is improbable that legal instruments would establish obligations to take adaptation measures much in advance. Legal obligations must impose specific obligations upon natural and legal persons. So gaps in the regulatory framework with respect to adaptation are identifiable only as reactive adaptation measures or at best as preventive and precautionary measures when sufficient information exists. An efficient regulatory framework dealing with adaptation measures depends upon the provision of information that specifies who needs to adapt to what, by when, to what extent and which are the reasons behind adaptation. At any rate as discussed above with respect to mitigation measures, the mainstreaming of adaptation to climate change across all sectors should be the principle underlying the motive behind any legal instrument that would seek to address this gap. One can say that the regulatory framework however has at present, a major gap in being unable to provide even for reactive adaptation or planned adaptation because there is no legal instrument, which bestows enabling powers to regulate such a situation as the need arises. The provisions of the Environment Protection Act allow the Minister for Environment to publish regulations to provide for environmental emergencies but this is inadequate for the purpose of establishing adaptation measures to climate change since adaptation measures are not the same as environmental emergencies. On the contrary they need to prevent such emergencies. To sum up, unless there is proper mainstreaming and ownership across the board any new legal instruments would be futile. In many cases it is a proper regulatory/procedural framework that is necessary. Any legal instrument should target empowerment of an entity, to ensure that all sectors are considering adaptation in their policies and be guided by a National Strategy on Adaptation. Administrative Framework The gaps in the administrative set up identified with respect to mitigation measures have negative repercussions even when it comes to the adaptation process. The absence of an authority with executive powers to ensure the reduction of Malta’s

352
vulnerability to climate change on a cross‐sectoral level neither minimizes Malta’s exposure nor improves its adaptive capacity to climate change. Such gaps also constrain the formulation and adoption of anticipatory adaptation measures, which may include increasing the robustness of infrastructure and investments, enhancing flexibility of vulnerable managed systems and operations, allowing flexibility for adaptation of vulnerable natural systems, reversing trends that increase vulnerability and improving awareness building and preparedness at all levels. These issues must be addressed within the Framework of a National Strategy on Adaptation. The fragmented administrative set up does not facilitate reactive measures, which are the type of adaptation measures that are likely to apply to natural ecosystems when confronted with climate change. The absence of an authority, which has executive power to ensure coordination amongst the different sectors constrains the development of benchmarks, which guarantee that adaptation measures are being pursued both on a sectoral and cross sectoral level.
1155..33..22 MMeetthhooddoollooggyy The gap in providing for linkages between the different sectors increases the risk of maladaptation to climate change or to conflicting adaptation measures that prevent natural and human systems in Malta to adjust and respond to climate change by moderating harm. Failure to mainstream the need to take adaptation measures leads Malta to miss out on beneficial opportunities that arise as a result of climate change. Adaptation measures include also the exploitation of such opportunities. Lack of clear policy direction and procrastination in adopting adaptation strategies are likely to reduce the chances of available adaptation options that may be successfully utilized on a local level.
1155..33..33 TTeecchhnniiccaall ggaappss iinn tthhee iimmpplleemmeennttaattiioonn ooff aaddaappttaattiioonn mmeeaassuurreess There is a gap in the identification of criteria for assessment when selecting key technologies that should facilitate adaptation to climate change. There are gaps related to the transfer of and access to environmentally sound technologies and know‐how that would facilitate adaptation to climate change.

353
Gaps are predominant in research and systematic observation systems relevant to adaptation to climate change. There are also technological constraints with respect to the development of local climate change impact scenarios. There are gaps in providing ongoing technical programs and projects relevant to adaptation to climate change. Lack of funding for research in technical adaptation measures and for building scientific data bases relating to adaptation of natural and managed ecosystems as well as human adaptation to climate change in Malta, will constrain any attempt to address the gaps referred to above under this section.
1155..33..44 CCaappaacciittyy bbuuiillddiinngg Gap in research aimed at improving knowledge of Malta’s capacity‐building requirements to adapt to climate change. Gap in motivating the private sector to adopt adaptation measures or to pursue research in investment opportunities relating to climate change. Gap in awareness building and access to information on adaptation measures due to lack of research on the subject. Existing gap in providing for organized public participation (that would include access to free technical advice on adaptation measures) constrains capacity building at the grass roots level. This gap restricts public participation because of there is a lack of opportunities for civil society and the constituted bodies to educate and train themselves in adaptation measures. Lack of synergy between national adaptation needs and the promotion of job opportunities and training in adaptation measures. The lack of adaptation measures will exacerbate negative socio‐economic implications, hinder changes in behavioural patterns and fail to boost awareness in policy and decision making, on Malta’s increased vulnerability as a result of climate change, particularly from extreme weather events.
1155..44 RReeccoommmmeennddaattiioonnss The recommendations provided in this section of the report, are only those that rank highest in order of priority when it comes to the elimination of cross‐sectoral gaps and constraints in formulating mitigation and adaptation measures. They are organized according to the four types of gaps and constraints discussed in this report.

354
1155..44..11 IInnssttiittuuttiioonnaall OOrrggaanniizzaattiioonn Regulatory Framework A law on climate change should first and foremost establish the executive powers of an entity with over arching responsibilities and powers. Since the various sectors are answerable to different competent authorities one must find a solution to ensure integration without causing fragmentation or creating a supra national institution that becomes a bottle neck. Different competent authorities responsible for the different sectoral policies and obligations should remain, but these must be answerable to an institution that has executive powers to ensure compliance and to coordinate long term and short term planning with respect to climate change targets and impacts. By way of recommendation therefore, a legal instrument of this sort should seek to intervene as little as possible in the daily running of the sectoral policies and only bestow powers in situations of emergency when non compliance by the different sectors stalls the fulfilment of Malta’s obligations. Its main role should be to ensure implementation of a National Strategy on Mitigation and Adaption. This would ensure for example that such a law would not duplicate the role of public entities that are regulators for various sectors on climate change. It would however empower the entity to take enforcement measures against the said institutions if they fail to do so. The implementation and enforcement of existing legislation that regulates the various sectors to rationalize their sustainable use and provide for conservation measures. This would benefit both the implementation of mitigation and adaptation measures. Administrative Set Up An entity entrusted with the overall responsibility for climate change law and policy, must be legally empowered to ensure the implementation of national adaptation programmes. It must also coordinate the various sectors to carry out the necessary research to adopt and implement mitigation and adaptation measures. It must necessarily be supported by a parallel capacity building process in the various entities that run the day‐to‐day implementation functions. On an administrative level memoranda of understanding and stakeholder dialogue are indispensable tools to ensure cooperation without resorting to legal measures. This will facilitate reaching mitigation and adaptation targets within the stipulated time frames.
1155..44..22 MMeetthhooddoollooggyy The mainstreaming of climate change impacts in national policies ensures the adoption of mitigation and adaptation measures and guarantees synergy and linkages amongst various public plans and programmes. Mainstreaming into national

355
policy making, response to climate change should take place at a strategic level to assess beforehand the socio‐economic impacts of any mitigation and adaptation measures adopted as a consequence. Ensuring effective monitoring and stakeholder engagement, particularly the involvement of NGOS and Local Councils increases public awareness on climate change issues. Maltese authorities should promote pro‐active adaptation measures such as for example in development planning, rather than take reactive adaptation measures. National security issues relating to climate change should also be addressed when formulating mitigation and adaptation strategies.
1155..44..33 TTeecchhnniiccaall NNeeeeddss There is the need to keep conducting scenarios to eliminate as far as possible existing gaps on the possible impacts of climate change upon Malta and how this would affect Malta’s vulnerability. There is the need for data and observation systems; improvement in data modeling including emission scenarios and climate change impacts scenarios at a local scale as well as monitoring systems. This should be preferably addressed via the development of a research programme for climate change. The change from non Annex I to an Annex I status provides Malta with the opportunity to participate in technology transfer projects between Annex I Parties themselves. It also provides the opportunity to participate in CDM projects as an investor vis‐à‐vis a non Annex I country. This means that in return for providing the other country with cleaner technology, it may acquire for itself, certified reductions in its national GHG emissions equivalent to the abatement of GHGs in the beneficiary country. Malta has also the potential to team up with other EU Member States and Annex I parties under the UNFCCC and the Kyoto Protocol to benefit from Joint Implementation. In so doing the benefits should be assessed according to how the CDM and JI may be used to:
reduce further our GHG emissions, promote the development of local industry, including the generation of
jobs, facilitate access to cleaner technology purchase certified emission reduction units from the market, without
necessarily investing in the projects have local entities, including financial institutions, participate actively in
trading. Investing in research and development in all sectors is vital. It will provide local industry with the necessary technology that will drive it to reduce its carbon footprint and possibly neutralize it. Furthermore, it will generate specialized local

356
expertise in a rapidly growing sector that is assuming a tremendous economic potential. Procrastination is detrimental on two main fronts. First because Malta will miss out in securing a place in this niche‐market and second because we will keep relying upon foreign technology operators to meet with our obligations to develop into a low carbon economy. As Malta can rely on the scientific and technical advice, of the European Environmental agency, which it can pool from, it is best to concentrate in investing in scientific and technical research that addresses the local scenario. This should be earmarked as a priority for EU funded projects and care should be taken not to duplicate research conducted by EU agencies to which Malta has access, but rather to build upon it and apply it at the local level. It is also essential to transmit any type of information acquired as a result of research conducted at the EU level or carried out locally to civil society. Ensure that all sectors surmount the constraints due to the lack of a sound knowledge base on local ecosystem dynamics. Filling such a gap would serve to build local scientific evidence that would identify to what extent marine, terrestrial and aquatic flora and fauna groups are vulnerable to the impacts of climate change. Emphasis should be placed on minor and already vulnerable groups. All sectors should ensure the maintaining of a Geographic Information System to integrate data related to climate change, and any other data required apart from spatial information.
1155..44..44 CCaappaacciittyy bbuuiillddiinngg Adopting and implementing the recommendations suggested by the National Sustainable Development Strategy for Malta would greatly enhance the implementation of mitigation and adaptation measures relating to climate change, both on a cross‐sectoral and sectoral level. The necessary capacity building for compliance with reporting requirements both in terms of human resources as well as an adequate legal and administrative framework are a priority. So are the requirements to carry out a cost assessment of both mitigation and adaptation measures in order to ensure a proper allocation of human and financial resources and the creation of an adequate enabling environment for implementation of both mitigation and adaptation measures. Malta should endeavour to promote more regional cooperation in the Mediterranean under the Barcelona Convention framework and Euro Med, to identify the adaptation needs of Mediterranean littoral to the impacts of climate change.

357
Maltese authorities should set up and strengthen the information base on the resulting benefits of climate change to address any constraints that hamper opportunities for investment and human resources. National authorities should ensure the necessary capacity building at all levels to fulfil all obligations and recommendations mentioned above. A more consistent campaign with more information at the grass root level could help in changing behavioural patterns. There is the need of a systematic and sustained awareness building programmes to educate all. This will intensify awareness and promote a change in behavioural patterns to improve both mitigation and adaptation to climate change. Increasing awareness of climate change impacts within the government, industry, and community sectors will support cultural change transitions that are required for the adoption of more climate change friendly technologies, designs, and operations by public and private operators. There is the need to commence studies to formulate contingency plans. This serves to address the negative impacts envisaged as a result of climate change particularly upon vulnerable groups. The assessment of socio‐economic implications, which increased insurance covers for risks resulting from the likely impacts of climate change, must be addressed to identify financial guarantees and incentives amongst the various stakeholders in all sectors. Authorities should initiate immediately, even at the regional Mediterranean level, studies to assess vulnerability due to climate change, how new opportunities may be tapped, how to meet with the negative consequences of climate change in the sector, how to ensure that local operators adapt to the shift in tourism trends as a result of climate change.
1155..55 CCoonncclluussiioonnss As a small island State, Malta is considered under the UNFCCC and the KP to have increased vulnerability compared to other States. The constraints of small island States in meeting with the challenges of adaptation to climate change and their restrictions to increased options in the taking of mitigation and adaptation measures is a reality, which cannot be ignored. The gaps and constraints identified in this report need to be addressed to ensure better coordination and forward planning based on a proper understanding of the environmental as well as socio‐economic impacts of any measures that should be adopted. Each of the mitigation or adaptation measures to be taken requires more detailed study in terms of its magnitude, certainty, likely impact and economic cost. This is required to identify the best mix of measures to undertake, within the context of the socio‐economic fabric

358
of the Maltese Islands. This assessment however must also take into consideration business‐as‐usual scenarios and what the cost of doing nothing involves. The islands must prepare themselves to avoid, as far as possible, from having to face climate change as “a negative supply shock,” as referred to by Dr Gordon Cordina, in his assessment of Malta’s economic vulnerability in relation to climate change. Malta should brace itself, against anything that disturbs productive activities or which, absorbs resources away from alternative consumption and investment activities. If, according to this same paper by Dr Cordina, Malta’s current economic trends are likely to increase Malta’s vulnerability to climate change, urgent action is required to review and reverse these trends altogether. The tapping of EU funds in this respect should be given priority. The mitigation measures Malta is obligated to adopt, should be seen as a measure that lessens our vulnerability arising from the importation of fossil fuels and our sole dependency on these resources for power generation. Additionally, this would lead to better air quality and a cleaner environment. A more efficient and cleaner transport system would definitely improve upon our quality of life and severely reduce incidence of respiratory complaints in congested areas. Adaptation measures that target a stronger and better maintained infrastructure would reduce the negative impacts of extreme weather events, relieve congestion in highly populated areas and render Malta more attractive to tourists and residents alike. Adaptation measures targeting the built environment would promote reduced costs in heating and cooling, protect the built heritage and render the general public more aware on the need to change behavioural patterns to enjoy a healthier environment. Measures to promote the conservation of biological diversity as well as other non living resources serve to ensure sustainability and preserve the islands’ natural heritage. A sound water policy is in itself an indispensable measure that safeguards above all food security and hygiene. Malta’s small size and relative isolation could also serve to help policy makers to identify better the threats posed by climate change and to provide more or less a thorough and comprehensive adaptation plan that is harder to achieve in bigger countries forming part of the continental land mass. Malta’s size and its limited human and financial resources have always been a reality, which the Maltese have managed, at times, to exploit to their advantage. This should be the underlying objective of Malta’s climate change law and policy. To do so all the sectors must be both well informed and well organized. All in all, the adoption of sound climate change law and policies should benefit Malta in attaining sustainable development as this is primarily an exercise of integrating environment concerns into socio‐economic policies. A sound climate change policy is based on rational use of natural resources and better governance of the environment with all the intrinsic benefits on our quality of life that this entails. Malta needs to take vital policy and legal decisions that require cross‐sectoral concerted action. The mitigation and adaptation measures that need to be adopted in some cases entail heavy investment and in most cases must be carried out within

359
specific and relatively short time frames. Nevertheless these measures will be beneficial for the islands’ resilience and competitiveness, besides guaranteeing a better quality of life and leading to sustainable development.

360
RREEFFEERREENNCCEESS 1. National Statistics Office, Malta (2008), Malta in Figures 2008.
2. National Statistics Office, Malta (2007), Labour Force Survey 2006.
3. IPCC (1996) Revised 1996 IPCC Guidelines for National Greenhouse Gas Inventories, in three volumes, Intergovernmental Panel on Climate Change.
4. IPCC (2000) Good Practice Guidance and Uncertainty Management in National Greenhouse Gas Inventories, Intergovernmental Panel on Climate Change.
5. IPCC (2006) IPCC Guidelines for National Greenhouse Gas Inventories, Inter‐ Governmental Panel on Climate Change.
6. MEPA (2008) National Greenhouse Gas Emissions Inventory Report for Malta 1990‐2006, Malta Environment and Planning Authority, Malta.
7. MEPA (2009) National Greenhouse Gas Emissions Inventory Report for Malta 1990‐2007, Malta Environment and Planning Authority, Malta.
8. MRAE (2004) First Communication of Malta to the United Nations Framework Convention on Climate Change.
9. MEPA (2004) National Greenhouse Gas Emissions Inventory Report for Malta 1990‐2003, Malta Environment and Planning Authority, Malta.
10. Climate Change Committee (2009), National Strategy for Policy and Abatement Measures Relating to the Reduction of Greenhouse Gas Emissions, MRRA, Malta.
11. MRRA (2009) Second Communication of Malta to the United Nations Framework Convention on Climate Change. GHG Abatement Analysis. (To be published).
12. MRRA (2009) A Solid Waste Management Strategy for the Maltese Islands, First Update: Consultation Document.
13. MRAE (2007) A Study on an Electrical Transportation System for Malta, Ministry for Rural Affairs & Environment, Malta.
14. Micallef, L. (2000) Report on the Implementation of EU Council Directive 999/13/EC, The Ministry of Environment, Malta.
15. National Statistics Office (2009a), Agriculture and Fisheries. Malta, 2007.
16. Enemalta Corporation, Enemalta Corporation: Electricity Generation Plan 2006‐2015, Malta.

361
17. Climate Change Committee (2009), National Strategy for Policy and Abatement Measures Relating to the Reduction of Greenhouse Gas Emissions, Malta.
18. Malta Environment and Planning Authority, (2009), National Greenhouse Gas Emissions Inventory Report for Malta, 1990‐2007, National Emissions Inventory System Team.
19. National Statistics Office, Malta, (2008), News Release: Energy Consumption in Malta 2000‐2007.
20. Malta Environment and Planning Authority, (2004), National Allocation Plan for Malta, 2005‐2007. Submission to the EU Commission, under the EU Emissions Trading Scheme, Directive 2003/87/EC.
21. Malta Environment and Planning Authority, (2007), National Allocation Plan for Malta, 2008‐2012. Submission to the EU Commission, under the EU Emissions Trading Scheme, Directive 2003/87/EC.
22. Malta Environment and Planning Authority, (2007), EU Commission Decision of 29 November 2006 concerning the national allocation plan for the allocation of greenhouse gas emission allowances notified by Malta in accordance with Directive 2003/87/EC of the European Parliament and of the Council.
23. Enemalta Corporation Malta, Annual Report 2006 and Financial Statements 2005.
24. Cilia J and Rizzo A, (2003), Inverter Control of Motor Driven Pumps to Manage the Water Distribution Network. Institute of Water Technology 10th Anniversary Conference, Water Services Corporation.
25. Fsadni M, (2009), private communication.
26. Grima P, (2009), private communication.
27. Bard M‐K, (2004), Presentation to Malta Resources Authority.
28. Ministry for Rural Affairs and the Environment, (2005), Technology Needs for Greenhouse Gas Emission Reduction, Malta.
29. Sinden G, (2004), Internal Report, Environmental Change Institute, Oxford University, UK.
30. Borg A, Fsadni M and Mallia E A, (2005), Hydrogen Production by Renewable Energy. Proceedings, Institute for Energy Technology Seminar.
31. Fsadni M and Mallia E A, (2009), unpublished work.
32. Farrugia R N, Fsadni M, Mallia E A and Yousif, C, (2005), The renewable energy potential of the Maltese Islands. Xjenza, 10, 32.

362
33. Ministry of Resources and Rural Affairs,(2009), A Solid Waste Management Strategy for the Maltese Islands. First Update: Consultation Document.
34. Ghirlando R and Mallia E A, (2006), The Possible Uses of Landfill Gas from Ta’ Żwejra Landfill, Wasteserv Malta Ltd., unpublished report.
35. Dales D and Wilson S, (2002), Significant Wave Height Study, Malta Maritime Authority, unpublished.
36. VigourTech, (2008), Wave Energy in Malta, presentation, Malta.
37. Ministry for Rural Affairs and the Environment, (2004), Malta’s First National Communication to United Nations Framework Convention on Climate Change, Chapter 3, Malta.
38. Micallef J, (2009a), private communication.
39. Zerafa S, Letter to the Editor, The Sunday Times of Malta, 17August 2008.
40. Water Services Corporation, (2008), Annual Report 2006‐2007, Malta.
41. Cilia J, (2009), private communication.
42. Gatt A, Report on the Parliamentary Debate on Climate Change Held on 15 January 2009, The Times, 17 January 2009.
43. Ghirlando R, (2005), Bio‐fuels in Malta, Malta Resources Authority, unpublished report.
44. Malta Resources Authority, (2007), Report on the Present State of Bio‐diesel in Malta and Measures for Its Promotion, Malta.
45. Tsang E, (2009), Science Findings, Oxford Today, 21(2), 21.
46. Psaila N, (2009), private communication.
47. Micallef J, (2009), Electrical energy characteristics of household appliances, Engineering, (in press).
48. Micallef J, (2009b), private communication.
49. Vassallo P, (1998), The Effectiveness of an Energy Conservation and Renewable Source Scheme for a Heated Outdoor Pool, Thesis, University of Brunel.
50. National Statistics Office, (2009), News Release: Motor Vehicles Q4, 2008, Malta.
51. Malta Environment and Planning Authority, (2001), Transport Topic Paper, Malta.

363
52. Malta Resources Authority, (2006), Liberalisation of the Inland Fuel Market, Consultation Paper, Malta.
53. National Statistics Office, (2009), News Release: Cattle Survey, December 2008, Malta.
54. Bradley, R S, Briffa K R, Cole J, Hughes M K, and Osborn T J, (2003), The climate of the last millennium. Paleoclimate, Global Change and the Future, K. Alverson, R. S. Bradley, and T. F. Pedersen, Eds., Springer‐Verlag, 105‐141.
55. Brohan P, Kennedy J J, Harris I, Tett S F B and Jones P D, (2006), Uncertainty estimates in regional and global observed temperature changes: a new dataset from 1850. J. Geophys. Res, 111, D12106.
56. Cazenave A, Cabanes C, Dominh K and Mangiarotti S, (2001), Recent sea level changes in the Mediterranean Sea revealed by TOPEX/POSEIDON satellite altimetry. Geophys. Res. Let.,28(8), 1607‐1610.
57. Church J A, and White N J, (2006), A 20th century acceleration in global sea level rise, Geophys. Res. Lett., 33, L01602, doi:10.1029/2005GL024826.
58. Church J A, Gregory J M, Huybrechts P, Kuhn M, Lambeck K, Nhuan N T, Qin D and Woodworth P L, (2001), Changes in sea level. Chapter 11 of the Intergovernmental Panel on Climate Change Third Assessment Report, Cambridge University Press.
59. CIESM, 2008, Climate warming and related changes in Mediterranean marine biota, Workshop Monograph 34, pp152.
60. Douglas B C, Kearney M S, and Leatherman SP, (2001), Sea Level Rise: History and Consequences, Academic, New York.
61. Drago A, (1999). A study on the sea level variations and the ‘Milgħuba’ phenomenon in the coastal waters of the Maltese Islands, Ph.D Thesis, School of Ocean and Earth Science, University of Southampton.
62. European Environment Agency, (2008), Impacts of Europe's changing climate ‐ 2008 indicator‐based assessment, EEA Report No 4.
63. Fenoglio‐Marc L, (2002), Long‐term sea level change in the Mediterranean Sea from multimission satellite altimetry and tide gauge stations, Physics and Chemistry of the Earth, 27, 1419‐1431.
64. Gornitz V, (1995) A comparison of differences between recent and late Holocene sea level trends from Eastern North America and other selected regions, J. Coastal Res., 17, 287‐297.

364
65. Holgate S J, (2007), On the decadal rates of sea level change during the twentieth century, Geophys. Res. Lett., 33, L01602, doi:10.1029/2006GL028492.
66. Intergovernmental Panel on Climate Change (IPCC), (2007), Climate Change 2007: The physical science basis, summary for policymakers, Worl Meteorol. Organ., Geneva, Switzerland.
67. Jorge Del Rio V, Garcia‐Lafuente J, Aldeanueva F C, Garcia D, Cordoba A S, Fong Chao B(4), and Vigo Aguiar I, (2007) , Mediterranean Sea Level Analysis from 1992 to 2005, Paper 838 in Symposium on "15 Years of Progress in Radar Altimetry", 13‐18th March 2006, in Venice, Italy.
68. Lombard A, Cazanave A, Le Traon P‐Y, and Ishii M, (2005), Contribution of thermal expansion to present‐day sea level change revisited, Global Planet Change, 47, 1‐16.
69. Marcos M and Tsimplis M, (2007), Variations of the seasonal sea level cycle in Southern Europe (abstract of paper presented at: 38th CIESM Congress, (Istanbul, Turkey, 9‐13 April 2007) Rapports de la Commissions Internationales de Mer Mediterranean, 38, 2007, p.167.
70. Miller L, and Douglas B C, (2004), Mass and volume contributions to twentieth century global sea level rise, Nature, 428, 406‐409, doi:10:1038/nature02309.
71. Raicich F, Pinardi N and Navarra A, (2001), Teleconnections between Indian Monsoon and Sahel rainfall and the Mediterranean, Archivio di Oceanografia e Limnologia, 22, 9‐14.
72. Tsimplis M N and Baker T F, (2000), Sea level drop in the Mediterranean Sea: An indicator of deep water salinity and temperature changes? Geophys. Res. Let. , 27(12), 1731‐1734.
73. Tsimplis M N and Rixen M, (2002), Sea level in the Mediterranean Sea: The contribution of temperature and salinity changes. Geophys. Res. Let. 29(3) art. no. 2136.
74. Drago A, (2008), Revisiting the Future Climate Scenario Estimates for the Maltese Islands. Draft version of a report contributing to Malta’s compilation of Its Second National Communication. Physical Oceanography Unit, IOI‐Malta Operational Centre, University of Malta, Msida, Malta, 17 pp (available in electronic format).
75. Reichler T and Kim J, (2008), How well do coupled models simulate today’s climate? Bulletin of the American Meteorological Society 89, 303‐11 (available in electronic format).

365
76. Santer B D, Wigley T M L, Schlesinger M E and Mitchell J F B, (1990), Developing Climate Scenarios from Equilibrium GCM Results. Max‐Planck‐Institut für Meteorologie Report No. 47, Hamburg, Germany, 29 pp (available in electronic format).
77. Wigley T M L, Richels R and Edmonds J A, (1996), Economic and environmental choices in the stabilization of atmospheric CO2 concentrations. Nature 379, 240‐243 (available in electronic format).
78. Wigley T M L, (2008), MAGICC/SCENGEN 5.3: User Manual (version 2). National Centre for Atmospheric Research, University Corporation for Atmospheric Research, Boulder, Colorado, USA, 77 pp (available in electronic format).
79. Ehmer P, Heymann E, (2008), Climate Change and Tourism: Where will the Journey Lead?, Germany: Deutsche Bank Research
80. Food and Agricultural Organisation of the United Nations, (2006), Malta Water Resources Review, Rome: FAO
81. Birch Hill GeoSolutions, (2006). Climate Change Adaptations for Land Use Planners. Canada; 173pp.
82. British Columbia Ministry of Agriculture and Land Office, (2005). Drought Management Factsheet No. 1: Managing irrigated forage crops during drought ‐ An introduction. October 2005; 2pp.
83. Cooper J A G, and Pilkey O H, (2004). Sea‐level rise and shoreline retreat: Time to abandon the Bruun Rule. Global Planetary Change 43, 157‐171.
84. Cranfield University, (2003), MALSIS ‐ Maltese Soils Information System. Project prepared for the Government of Malta and financed by the European Union LIFE ‐ Third Countries.
85. Crichton D, (2005), Insurance and Climate Change. Conference on Climate Change, Extreme Events, and Coastal Cities: Houston & London. Houston, Texas February 2005; 28pp.
86. de Groot T A M and Orford J D, (2000). Implications for coastal zone management. In "Sea Level Change and Coastal Processes: Implications for Europe." (D. E. Smith, S. B. Raper, S. Zerbini, and A. Sánchez‐Arcilla, Eds.), pp. 214‐242. Office for Official Publications of the European Communities, Luxembourg.
87. Drago A, (2008). Revisiting the future climate scenario estimates for the Maltese Islands. Draft paper prepared as part of Malta's Second National Communication to the UNFCCC. 17pp.
88. European Environment Agency, (2004a), Corine Land Cover 2000 Mapping a Decade of Change. European Environment Agency, Copenhagen.

366
89. European Environment Agency, (2004b), “Impacts of Europe's changing climate” EEA (European Environment Agency) OPOCE (Office for Official Publications of the European Communities). ISBN: 92‐9167‐692‐6.
90. Gatt K, (2009). Vulnerability and Adaptation Report ‐ Water Resources. Report presented as part of Malta's Second National Communication to the United Nations Framework Convention on Climate Change. May 2009; ii + 21pp.
91. Gregory J M, Church J E, Boer G J, Dixon K W, Flato G M, Jackett D R, Lowe J A, O'Farrell S P, Roekner E, Russell G L, Stouffer R J, and Winton M, (2001), Comparison of results from several AOGCMs for global and regional sea‐level change 1900‐2100. Climate Dynamics 18, 225‐240.
92. Kundzewicz Z W and Takeuchi K, (1999), Flood protection and management ‐ quo vadimus? Hydrological Sciences Journal 44, 417‐432.
93. IPCC, (2008). Climate Change 2007 ‐ Impacts, Adaptation and Vulnerability. Working Group II contribution to the Fourth Assessment Report of the IPCC.
94. Mallia, A, (2009), Vulnerability and Adaptability – Terrestrial and Marine Ecosystems. Report presented as part of Malta's Second National Communication to the United Nations Framework Convention on Climate Change. May 2009; 28pp.
95. Mallia A, Briguglio M, Ellul A and Formosa S, (2002), Physical Background, Demography, Tourism, Mineral Resources and Land‐Use. In "State of the Environment Report for Malta, 2001." pp. 202. Environment Protection Department, Ministry of the Environment, Government of Malta; Valletta, Malta.
96. Malta Environment and Planning Authority, (2002), Coastal Strategy Topic Paper (Malta Environment and Planning Authority, Ed.), Floriana.
97. Malta Environment and Planning Authority, (2006), State of the Environment Report. Malta, 2005.
98. Sánchez‐Arcilla A, Hoekstra P, Jiménez J E, Kaas E, and Maldonado A, (2000), Climate implications for coastal processes. In "Sea Level Change and Coastal Processes: Implications for Europe." (D. E. Smith, S. B. Raper, S. Zerbini, and A. Sánchez‐Arcilla, Eds.), pp. 173‐213. Office for Official Publications of the European Communities, Luxembourg.
99. Tanti C, Role A, Borg A, Calleja I, (2002), MAP Coastal Area Management Programme: Malta Project. Activity 5: Soil Erosion/Desertification Control Management. Final Activity Document. Malta; 123pp.
100. UNCCD, (1994), United Nations Convention to Combat Desertification in those countries experiencing serious drought and/or desertification, particularly in Africa. Paris, October 1994.

367
101. Vermaat J E, Ledoux L, Turner K, Salomons W, and Bouwer L, (2005), "Managing European Coast: Past, Present and Future”. Springer, Berlin
102. Xuereb R, (2009a), Vulnerability and Adaptability – Infrastructure. Report presented as part of Malta's Second National Communication to the United Nations Framework Convention on Climate Change. May 2009; 21pp.
103. Xuereb R, (2009b), Vulnerability and Adaptability – Agriculture. Report presented as part of Malta's Second National Communication to the United Nations Framework Convention on Climate Change. May 2009; 21pp.
104. Bebb J, and Kersey J, (2003), Potential Impacts of Climate Change on Waste Management. Bristol: Environment Agency.
105. Buhagiar V, (2005), Sustainable Development and Building Design in Malta.
106. Camilleri C (2006), Electromagnetic Fields: Risk Communication Experiences in Malta.
107. European Commission, (2009), White Paper: Adapting to climate change: Towards a European Framework for Action. Retrieved 2 June 2009, from http://eur‐lex.europa.eu/LexUriServ/LexUriServ.do?uri=COM:2009:0147:FIN:EN:DOC
108. Gatt P, (2006), Model of limestone weathering and damage in masonry: Sedimentological and geotechnical controls in the Globigerina Limestone Formation (Miocene) of Malta in Xjenza 11, 2006.
109. Holper P, Lucy S, Nolan M, Senese C and Hennessy K, (2007), Infrastructure and climate change risk assessment for Victoria. Victoria: CSIRO.
110. MEPA, (2003), Utilities Topic Paper Final Draft. Floriana: Malta Environment and Planning Authority.
111. MEPA, (2006), State of the Environment Report 2005, Sub‐report 4: Land. Floriana: Malta Environment and Planning Authority.
112. MEPA, (2007), Development Control Policy & Design Guidance. Floriana: Malta Environment and Planning Authority.
113. Ministry for Resources and Rural Affairs, (2008), National Energy Efficiency Action Plan 2008. Valletta.
114. Ministry for Resources and Rural Affairs, (2009), A Solid Waste Management Strategy for the Maltese Islands First Update. Consultation Document. Valletta.
115. National Statistics Office, Malta, (2007), News Release ‐ Electricity generation in Malta.

368
116. Wilbanks T J, Romero Lankao P, Bao M, Berkhout F, Cairncross S, Ceron J‐P, Kapshe M., Muir‐Wood R and Zapata‐Marti R, (2007), Industry, settlement and society. In M.L. Parry, O.F. Canziani, J.P. Palutikof, P. J. v. d. Linden & C. E. Hanson (Eds.), Climate Change 2007: Impacts, Adaptation and Vulnerability. Contribution of Working Group II to the Fourth Assessment Report of the Intergovernmental Panel on Climate Change. Cambridge: Cambridge University Press.
117. Adger W N, Huq S, Brown K, Conway D and Hulme M, (2003), Adaptation to climate change in the developing world. Prog. Dev. Stud. 3, 179‐195.
118. Attard D J, Axiak V, Borg S, Borg S F, Cachia J, Debono G, Lanfranco E, Micallef R E and Mifsud J, (1996), Implications of Expected Climate Changes for Malta. In "Climate Change and the Mediterranean. Environmental and societal impacts of climate change and sea level rise in the Mediterranean region" (L. Jeftic, S. Keckes, and J. C. Pernetta, Eds.). United Nations Environment Programme.
119. Axiak V, Vella A, Borg J A, Micallef S A and Lanfranco E, (1998), Hilton Redevelopment Project, Marine Environmental Monitoring Programme – Fifth Report: January ‐ July 1998 (M. U. S. Ltd, Ed.), pp. 39. University of Malta, Msida.
120. Bakkenes M, Alkemade J R M, Ihle F, Leemans R and Latour J B, (2002), Assessing effects of forecasted climate change on the diversity and distribution of European higher plants for 2050. Global Change Biology 8, 390‐407.
121. Ben Maiz N, (1993), The Posidonia oceanica Ecosystem. In "Second Traiing Session on Mediterranean Marine Vegetation." Msida, Malta.
122. Bertrand J, Gil de Sola L, Papaconstantiou C, Relini G and Souplet A, (2000), An international bottom trawl survey in the Mediterranean: the MEDITS programme. In "Demersal Resources in the Mediterranean." (J. A. Bertrand, and G. Relni, Eds.), pp. 76‐93. IFREMER, Actes de Colloques.
123. Boudouresque C F and Jeudy de Grissac A, (1983), L'herbier a' Posidonia oceanica and Méditerranée: les interactions entre la plante et le sédiment. J. Rech. Océanogr., France 8, 99‐122.
124. Boudouresque C F, Jeudy de Grissac A and Meinesz A, (1984), Relations entre le sedimentation et l’allongement des rhizomes orthotropes de Posidonia oceanica dans la Baie d’Elbu (Corse). In "International Workshop on Posidonia oceanica beds." (C. F. Boudouresque, A. Jeudy de Grissac, and J. Olivier, Eds.), pp. 185‐191. France: GIS Posidonie.
125. Caldeira K and Wickett M E, (2003), Anthropogenic carbon and ocean pH. Nature 425, 365‐368.

369
126. Camilleri M, (2002), The fishing effort distribution of Demersal gear in Maltese waters and the relative abundance of Demersal resources in the area. In "International workshop on stock assessment and production of Demersal resources ", Rome.
127. Cerrano C, Bavestrello G, Bianchi C N, Cattaneovietti R, Bava S, Morganti C, Morri C, Picco P, Sara G, Schiaparelli S, Siccardi A and Sponga F, (2000), A catastrophic mass‐mortality episode of gorgonians and other organisms in the Ligurian Sea (North‐western Mediterranean), summer 1999. Ecology Letters 3, 284‐293.
128. Cheddadi R, Guiot J and Jolly D, (2001), The Mediterranean vegetation: What if the atmospheric CO2 increased? Landscape Ecology 16, 667‐675.
129. Chevaldonné P and Lejeusne C, (2003), Regional warming‐induced species shift in north‐west Mediterranean marine caves. Ecology Letters 6, 371‐379.
130. CIESM, (2002), Alien species introduced by ships in the Mediterranean and Black Sea. In "CIESM Workshop Monographs." pp. 136, Monaco.
131. Coleiro C, (2002). Breeding Birds Report. In "Is‐Simar Nature Reserve."
132. Coleiro C, (2003). Breeding Birds Report. In "Is‐Simar Nature Reserve."
133. Cox P M, Betts R A, Jones C D, Spall S A and Totterdell I J, (2000), Acceleration of global warming due to carbon‐cycle feedbacks in a coupled climate model. Nature 408, 184‐187.
134. Davis M B, Shaw R G, and Etterson J R, (2005), Evolutionary responses to changing climate. Ecology 86, 1704‐1714.
135. Dulcic J and Grbec B, (2000), Climate change and Adriatic ichthyofauna. Fisheries Oceanography 9, 187‐191.
136. European Commission, (2006), Communication of 22 May 2006 "Halting the loss of biodiversity by 2010 ‐ and beyond ‐ Sustaining ecosystem services for human well‐being" [COM(2006) 216 final].
137. European Commission, (2009a), Science for Environment Policy: European Commission DG Environment News Alert Service, edited by SCU, The University of the West of England, Bristol.
138. European Commission, (2009b), Adaptation to Climate change: Towards a European Framework for Action. White Paper. [COM (2009) 147 final]. Brussels, April 2009; 16pp.

370
139. Fischlin A, Midgley G F, Price J T, Leemans R, Gopal B, Turley C, Rounsevell M D A, Dube O P, Tarazona J and Velichko A A, (2007), Ecosystems, their properties, goods and services. In "Climate Change 2007: Impacts, Adaptation and Vulnerability: Contribution of Working Group II to the Fourth Assessment Report of the Intergovernmental Panel on Climate Change." (M. L. Parry, O. F. Canziani, J. P. Palutikof, P. J. van der Linden, and C. E. Hanson, Eds.), pp. 211‐272. Cambridge University Press, Cambridge.
140. Fried J S, Torn M S and Mills E, 2004, The impact of climate change on wildfire severity: a regional forecast for Northern California. Climatic Change 64, 169‐191.
141. Gatt K, (2009), Vulnerability and Adaptation Report ‐ Water Resources. Report presented as part of Malta's Second National Communication to the United Nations Framework Convention on Climate Change. May 2009; ii + 21pp.
142. Gitay H, Suarez A, Watson R T and Dokken D J, (2002), Climate change and biodiversity (Intergovernmental Panel on Climate Change, Ed.), pp. 77.
143. Harvell C D, Mitchell C E, Ward J R, Altizer S, Dobson A P, Ostfeld R S and Samuel M D, (2002), Climate warming and disease risks for terrestrial and marine biota. Science 296, 2158‐2162.
144. Houghton J T, Ding Y, Griggs D J, Noguer M, van der Linden P J and Xiaosu D, (2001), Climate Change 2001: The Scientific Basis. Contribution of Working Group I to the Third Assessment Report of the Intergovernmental Panel on Climate Change (IPCC), pp. 944. Cambridge University Press, Cambridge.
145. Iglesias‐Rodriguez M D, Halloran P R, Rickaby R E M, Hall I R, Colmenero‐Hidalgo E, Gittins J R, Green D R H, Tyrrell T, Gibbs S J, von Dassow P, Rehm E, Armbust E V and Boessenkool K P, (2008), Phytoplankton calcification in a high CO2 world. Science 320, 336‐340.
146. Inkley D B, Anderson M G, Blaustein A R, Burkett V R, Felzer B, Griffith B, Price J and Root T L, (2004), Global Climate Change and Wildlife in North America. In "The Wildlife Society." pp. 34, Bethesda, Maryland.
147. IPCC, (2001), Climate Change 2001: The Scientific Basis. Contribution of Working Group 1 to the Third Assessment Report of the Intergovernmental Panel on Climate Change (J. T. Houghton, Y. Ding, D. J. Griggs, M. Noguer, P. J. Van der Linden, X. Dai, K. Maskell, and C. A. Johnson, Eds.), pp. 881. Cambridge University Press, Cambridge.
148. IPCC, (2008), Climate Change 2007 ‐ Impacts, Adaptation and Vulnerability. Working Group II contribution to the Fourth Assessment Report of the IPCC.

371
149. IUCN, (2009), Ecosystem‐based Adaptation (EbA). Position Paper presented by IUCN at the UNFCCC Climate change Talks in Bonn, Germany; 1st ‐ 12th June 2009. Text drawn from the draft Report of the Convention on Biological Diversity's Ad‐Hoc Technical Expert Group (AHTEG) on climate change and biodiversity; 2pp.
150. Körner C, Sarris D and Christodoulakis D, (2005), Long‐term increase in climatic dryness in the East Mediterranean as evidenced for the island of Samos. Reg. Environ. Change 5, 27‐36.
151. Kushmaro A, Rosenberg E, Fine M, Ben Haim Y and Loya Y, (1998), Effects of temperature on the bleaching of the coral Oculina patagonica by the Vibrio AK‐1. Mar. Ecol. Prog. Ser. 171, 131‐137.
152. Malcolm J R, Liu C R, Neilson R P, Hansen L and Hannah L, (2006), Global warming and extinctions of endemic species from biodiversity hotspots. Conservation Biology 20, 538‐548.
153. MaLIRA Group, (2004), La campagna MEDITS 2004 nello Stretto di Sicilia (Mar Mediterraneo), Sub Area Geografica 15: Rapporto finale, pp. 19. MaLIRA Group, IAMC‐CNR, Sezione Territoriale di Mazara del Vallo (TP), Italy.
154. Mariotti A, Zeng N, Yoon J‐H, (2008), Mediterranean water cycle changes: transition to drier 21st century conditions in observations and CMIP3 simulations. Environmental Research Letters: 3: 044001 (8 pages)
155. McNeely J A and Schutyser F, (2003), Protected Areas in 2023: Scenarios for an Uncertain Future. In "IUCN: The World Conservation Union." pp. 51, Gland.
156. MEPA, (2002), Coastal Strategy Topic Paper. Floriana, Malta: 126pp + Appendices A ‐ E.
157. MEPA Nature Protection Unit, (2005), Background Note on the Status of Selected Taxonomic Groups.
158. Middleton N, (1995), "The Global Casino." Edward Arnold, London.
159. Monahan A H, Fyfe J C and Flato G M, (2000), A regime view of Northern Hemisphere atmospheric variability and change under global warming. Geophysical Research Letters 27, 1139‐1142.
160. Mosteiro A and Camilleri A, (2005), Pilot Study on Dolphin‐fish 2004 ‐ Malta. FAO‐COPEMED.
161. Mouillot F, Rambal S and Joffre R, (2002), Simulating climate change impacts on fire frequency and vegetation dynamics in a Mediterranean‐type ecosystem. Global Change Biology 8, 423‐437.

372
162. National Commission for Sustainable Development, (2006), A Sustainable Development Strategy for the Maltese Islands 2007‐2016.
163. Palutikof J P and Wigley T M L, (1996), Developing climate change scenarios for the Mediterranean region. In "Climatic Change and the Mediterranean." (L. Jeftic, S. Keckes, and J. C. Pernetta, Eds.), pp. 27‐56. Edward Arnold, London.
164. Parry M L, (2000). Assessment of potential effects and adaptations to climate change in Europe: The Europe Acacia Project. In "Report of concerted action of the environment programme of the Research Directorate General of the Commission of the European Communities." pp. 320. Jackon Environmental Institute, University of East Anglia, Norwich.
165. Pausas J G and Abdel Malak D, (2004), Spatial and temporal patterns of fire and climate change in the eastern Iberian Peninsula (Mediterranean Basin). In "International Conference on Mediterranean Climate Ecosystems." (M. Arianoutsou, and V. P. Papanastasis, Eds.), pp. 1‐6. Millpress, Rhodes, Greece.
166. Planning Services Division, (1990a), Structure Plan for the Maltese Islands: Report of Survey Volume 1, Ministry for Development of Infrastructure, Government of Malta.
167. Planning Services Division, (1990b), Structure Plan for the Maltese Islands: Report of Survey Volume 2, Ministry for Development of Infrastructure, Government of Malta
168. Reichstein M, Tenhunen J D, Roupsard O, Ourcival J M, Rambal S, Miglietta F, Peressotti A, Pecchiari M, Tirone G and Valentini R, (2002), Severe drought effects on ecosystem CO2 and H20 fluxes at three Mediterranean evergreen sites: Revision of current hypotheses? Global Change Biology 8, 999‐1017.
169. Robinson R A, Learmonth, J A, Hutson A M, Macleod C D, Sparks T H, Leech D I, Pierce G J, Rehfisch M M and Crick H Q P, (2005), Climate change and migratory species. In "BTO Research Report, Department of Environment and Rural Affairs (Defra)." pp. 414, London.
170. Sanchez E, Gallardo C, Gaertner M A, Arribas A and Castro M, 2004, Future climate extreme events in the Mediterranean simulated by a regional climate model: a first approach. Global Planet. Change 44, 163‐180.
171. Schembri P J, (2008), personal communication.
172. Schembri P J, Baldacchino A E, Camilleri A, Mallia A, Rizzo Y, Schembri T, Stevens D T and Tanti C M, (1999). Living resources, fisheries and agriulture (S. o. t. e. r. f. M. 1998, Ed.). Environment Protection Department, Government of Malta, Valletta.

373
173. Schembri P J and Lanfranco E, (1996), Introduced species in the Maltese Islands. In "Introduction of aliean species of flora and fauna." (A. E. Baldacchino, and A. Pizzuto, Eds.), pp. 29‐54. Environment Protection Department, Malta, Qawra, Malta.
174. Sciberras M and Schembri P J, (2007), A critical review of records of alien marine species from the Maltese Islands and surrounding waters (Central Mediterranean). Mediterranean Marine Science 8(1), 41‐66.
175. Short F T, Coles R G and Short C A, (2001), "Global Seagrass Research Methods." Elsevier, London.
176. Smith R D and Malthby E, (2003), "Using the Ecosystem Approach to Implement the Convention on Biological Diversity: Key Issues and Case Studies." Island Press, Chicago.
177. Sumner G N, Romero R, Hornar V, Ramis C, Alonso S and Zorita E, (2003), An estimate ofthe effects of climate change on the rainfall of Mediterranean Spain by the late twenty‐first century. Clim. Dynam. 20, 789‐805.
178. Thomas C D, Cameron A, Green R E, Bakkenes M, Beaumont L J, Collingham Y C, Erasmus B F N, de Siqueira M F, Grainger A, Hannah L, Hughes L, Huntley B, van Jaarsveld A S, Midgley G F, Miles L, Ortega‐Huerta M A, Peterson A T, Phillips O L and Williams S E, (2004), Extinction risk from climate change. Nature 427, 145‐148.
179. Thuiller W, Lavorel S, Araujo M B, Sykes M T and Prentice I C, (2005), Climate change threats to plant diversity in Europe. P. Natl. Acad. Sci. USA 102, 8245‐8250.
180. UNEP‐MAP‐RAC/SPA, (2008), Impact of climate change on biodiversity in the Mediterranean Sea. By T. Perez, .RAC/SPA Edit, Tunis: 1‐61.
181. van de Bildt M W G, Vedder E J, Martina B E E, Abou Sidi B, Bent Jiddou A, Ould Barham M E, Androukaki E, Komnenou A, Niesters H G M and Osterhaus A D M E, (1999), Morbilliviruses in Mediterranean monk seals. Veterinary Microbiology 69, 19‐21.
182. Vicente‐Serrano S M, Gonzalez‐Hidalgo J C, de Luis M and Raventos J, (2004), Drought patterns in the Mediterranean area: the Valencia region (eastern Spain). Climate Res. 26, 5‐15.
183. Wang X L L, Zwiers F W and Swail V. R, (2004), North Atlantic Ocean wave climate change scenarios for the twenty‐first century. J. Climate 17, 2368‐2383.
184. Whitehead H, (1997), Sea surface temperature and the abundance of sperm whale calves off the Galapagos Islands: Implications for the effects of global warming. Report of the International Whaling Commission 47, 941‐944.

374
185. Worm B, Barbier E B, Beaumont N, Duffy J E, Folke C, Halpern B S, Jackson J B C, Lotze H K, Micheli F, Palumbi S R, Sala E, Selkoe K A, Stachowicz J J and Watson R, (2006), Impacts of biodiversity loss on ocean ecosystem services. Science 314, 787‐790.
186. Alcamo J, Moreno J M, Nováky B, Bindi M, Corobov R, Devoy R J N, (2007), Climate Change 2007: Impacts, Adaptation and Vulnerability. Contribution of Working Group II to the Fourth Assessment Report of the Intergovernmental Panel on Climate Change. In M.L. Parry, O.F. Canziani, J.P. Palutikof, P.J. van der Linden & C.E. Hanson (Eds.), (pp. 541‐580). Cambridge, UK: Cambridge University Press.
187. Brander K M, (2007), Climate Change and Food Security Special Feature: Global fish production and climate change. Proceedings of the National Academy of Sciences, 104(50), 6.
188. Christensen J H, Hewitson B, Busuioc A, Chen A, Gao X, Held I, et al., (2007), Regional Climate Projections. In S. Solomon, D. Qin, M. Manning, Z. Chen, M. Marquis, K. B. Averyt, M. Tignor & H. L. Miller (Eds.), Climate Change 2007: The Physical Science Basis. Contribution of Working Group I to the Fourth Assessment Report of the Intergovernmental Panel on Climate Change (pp. 847‐940). Cambridge and New York: Cambridge University Press.
189. Dimech M, (2009), personal communication.
190. Easterling W E, Aggarwal P K, Batima P, Brander K M, Erda L, Howden S M, et al., (2007), Food, fibre and forest products. In M.L. Parry, O.F. Canziani, J.P. Palutikof, P. J. v. d. Linden & C. E. Hanson (Eds.), Impacts, Adaptation and Vulnerability. Contribution of Working Group II to the Fourth Assessment Report of the Intergovernmental Panel on Climate Change, (pp. 273‐313). Cambridge Cambridge University Press,.
191. European Environmental Agency, (2006), Vulnerability and adaptation to climate change in Europe, EEA Technical Report, No 7/2005. Copenhagen.
192. Everett J T, (1996), Fisheries; Climate change 1995 ‐ Impacts, adaptations and mitigation of climate change: scientific ‐ technical analysis. In R. T. Watson, M. C. Zinyowera & R. H. Moss (Eds.), (pp. 511‐537). New York: Cambridge University Press.
193. Everett J T, (1997). Fisheries and climate change: the IPCC second assessment. Developing and sustaining world fisheries resources. In D. A. Hancock, D. C. Smith, A. Grant & J. P. Beumer (Eds.), The state of science and management (pp. 109‐115). Collingwood CSIRO.

375
194. FAO, (2007), Adaptation to Climate Change in Agriculture, Forestry and Fisheries. Rome.
195. FAO, (2008), Climate Change for Fisheries and Aquaculture Technical Background Document from the Expert Consultation held on 7 to 9 April 2008. ROME Retrieved from ftp://ftp.fao.org/docrep/fao/meeting/013/ai787e.pdf
196. MEPA, (2006), State of the Environment Report 2005, Sub‐report 9:Biodiversity. Floriana.
197. Ministry for Rural Affairs and the Environment, (2007), Fisheries Operational Programme for Malta 2007‐2013.
198. Ministry for Rural Affairs and the Environment, (2009), National Data Collection Programme In line with Council Regulation (EC) 199/2008. 2009 ‐ 2010 National Programme Proposal.
199. Nellemann C, Hain S and Alder J (eds.), (2008), In Dead Water ‐ Merging of climate change with pollution, over‐harvest, and infestations in the world’s fishing grounds. Norway: United Nations Environment Programme, GRID‐Arendal.
200. National Statistics Office, Malta, (2006), News Release 135/2006. World Refugee Day ‐ Special Observances.
201. Putzulu Caruana H, (2008), personal communication.
202. Adi Associates Environmental Consultants Ltd, (2008), Water Services Corporation An Integrated Water Management Approach to Flood Relief (IWMAFR): Project Description Statement
203. Burkett V, Codignotto J O, Forbes D L, Mimura N, Beamish R J and Ittekkot V, (2001), Coastal Zones and Marine Ecosystems. In L. Bijlsma & I. Sanchez‐Arevalo (Eds.), Climate Change 2001: Impacts, Adaptation and Vulnerability. Cambridge: Cambridge University Press.
204. Easterling W E, Aggarwal, P K, Batima P, Brander K M, Erda L, Howden S M, Kirilenko A, Morton J, Soussana J‐F, Schmidhuber J and Tubiello F N, (2007), Food, fibre and forest products. Climate Change 2007: Impacts, Adaptation and Vulnerability. Contribution of Working Group II to the Fourth Assessment Report of the Intergovernmental Panel on Climate Change, M.L. Parry, O.F. Canziani, J.P. Palutikof, P.J. van der Linden and C.E. Hanson, Eds., Cambridge University Press, Cambridge, UK, 273‐313.
205. European Environmental Agency, (2006), Vulnerability and adaptation to climate change in Europe, EEA Technical Report, No 7/2005. Copenhagen.

376
206. Frank K L, Mader T L, Harrington J A and Hahn G L. Potential Climate Change Effects on Warm‐Season Livestock Production in the Great Plains: University of Nebraska.
207. MEPA, Rural Strategy Topic Paper, Volume 1 Final Draft, (2003), Floriana: Malta Environment and Planning Authority.
208. MEPA, (2006), State of the Environment Report 2005, Sub‐report 5: Soil. Floriana: Malta Environment and Planning Authority.
209. MEPA, (2007), Policy & Design Guidance Agriculture, Farm Diversification, and Stables. Floriana: Malta Environment and Planning Authority.
210. MRAE, (2004), Rural Development Programme for Malta 2004‐2006.
211. MRAE, (2007), Rural Development Programme for Malta 2007‐2013.
212. National Statistics Office, Malta, (2004), News release No: 150/2004 of the 13th August 2004.
213. Rosenzweig C and Tubiello F N, (1996), Impacts of Global Climate Change on Mediterranean Agriculture: Current Methodologies and Future Directions. An Introductory Essay.
214. UNHCR, (2007), Statistical Yearbook 2006 ‐ Trends in Displacement, Protection and Solutions, Geneva: UNHCR.
215. Gleditsch et al, (2007), Climate Change and Conflict: The Migration Link ‐ Coping with Crisis, New York: International Peace Academy.
216. Beniston M, Stephenson D B, Christensen O B, Ferro C A T, Frei C, Goyette S, et al., (2007), Future extreme events in European climate: an exploration of regional climate model projections. Climatic Change, 81(1), 71‐95.
217. Confalonieri U, Menne B, Akhtar R, Ebi K L, Hauengue M, Kovats R S, et al., (2007), Human health. In M.L. Parry, O.F. Canziani, J.P. Palutikof, P.J. van der Linden & C.E. Hanson (Eds.), Climate Change 2007: Impacts, Adaptation and Vulnerability. Contribution of Working Group II to the Fourth Assessment Report of the Intergovernmental Panel on Climate Change (pp. 391‐431). Cambridge, UK,: Cambridge University Press.
218. Diffenbaugh N S, Pal J S, Giorgi F, Gao X, (2007), Heat stress intensification in the Mediterranean climate change hotspot. Geophysical Research Letters, 34(11).

377
219. Giannakopoulos C and LeSager P, (2005), Climate change impacts in the Mediterranean resulting from a 2°C global temperature rise. In C. Giannakopoulos, M. Bindi, M. Moriondo & T. Tin (Eds.), Climate change impacts in the Mediterranean resulting from a 2 ºC global temperature rise (pp. 2‐53): WWF.
220. Health Protection Agency (UK), (2008), Health Effects of Climate Change in the UK: An update of the Department of Health Report 2001/2002.
221. Ishigami A, Hajat S, Kovats R S, Bisanti L, Rognoni M, Russo A, Paldy A, (2008), An ecological time‐series study of heat‐related mortality in three European cities. Environmental Health, 7(5).
222. Massa A, (2008), Summer is no time for Sun Worship in the Times of Malta dated Saturday 5th July 2008.
223. Smoyer K E, Rainham D G and Hewko J N, (2000), Heat‐stress‐related mortality in five cities in Southern Ontario: 1980‐1996. International Journal of Biometeorology, 44(4), 190‐197.
224. Attard D J, V Axiak, S Borg, S F Borg, J Cachia, G De Bono, E Lanfranco, R Ellul Micallef and J Mifsud, “Implications of Expected Climatic Changes for Malta,” in Climatic Change and the Mediterranean, edited by Jeftic L, S Keckes and J C Pernetta, 1996.
225. Briguglio L, “Small Island States and the Economic Vulnerabilities,” World Development, vol. 23, 1995.
226. Burton I and M van Aalst, Come Hell or High Water ‐ Integrating Climate Change Vulnerability and Adaptation into Bank Work, The World Bank, October 1999.
227. Camilleri Rolls, C. (2006). Economic Valuation of Ramla Bay, Unpublished Dissertation, Institute of Islands and Small States Studies, University of Malta.
228. Carter T R, M L Parry, H Harasawa, S Nishioka, IPCC Technical Guidelines for Assessing Climate Change Impacts and Adaptations, Intergovernmental Panel on Climate Change, 1994.
229. Caruana, C. (2005). An Economic Valuation of a Beach on the Island of Malta: Pretty Bay B’Bugia, Unpublished Dissertation, Institute of Islands and Small States Studies, University of Malta.
230. Feenstra J F, Burton I, Smith J B and Tol R S J (eds), (1998), Handbook on Methods for Climate Change Impact Assessment and Adaptation Strategies, United Nations Environment Programme, Nairobi, and Institute for Environmental Studies, Vrije Universiteit, Amsterdam.

378
231. Klein R and Tol R, (1997), Adaptation to Climate Change: Options and Technologies, Overview Paper, Amsterdam.
232. Ministry for Home Affairs and the Environment, Malta, (2002), National Report on Sustainable Development.
233. National Statistics Office, Malta, (2001‐2007), Demographic Review News Release, Various Issues.
234. National Statistics Office, Malta, (2001), Household Budgetary Survey.
235. National Statistics Office, Malta, (2001‐2007), Gross Domestic Product News Release, Various Issues.
236. National Statistics Office, Malta, (2001‐2007), Manufacturing Survey News Release, Various Issues.
237. National Statistics Office, Malta, (2001), National Accounts of the Maltese Islands.
238. Nurse L A and Sem G, (2001), “Small Island States,” in Climate Change 2001: Impacts, Adaptation and Vulnerability, Working Group II to the Third Assessment Report of the Intergovernmental Panel on Climate Change (UNEP).
239. MacIver D C (ed), (1998), Adaptation to Climate Vulnerability and Change.
240. Pace M, (1999), Long Term Savings Through Design, Housing Affordability in Malta, Building Industry Consultative Council, Malta.
241. Smith J B, Bhatti N, Menzhulin G, Benioff R, Budyko M I, Campos M, Jallow B, Rijsberman F (eds), (1996), Adapting to Climate Change: Assessments and Issues.

379
LLIISSTT OOFF WWEEBBSSIITTEESS
242. Central Intelligence Agency World Fact Book
Website: https://www.cia.gov/library/publications/the-world-factbook/
243. Ministry for Resources and Rural Affairs
Website: http://mrra.gov.mt/newsitem.asp?id=1921
244. UNFCCC—Global Warming Potentials
Website: http://unfccc.int/ghg_data/items/3825.php
245. Enemalta accessed on 20th August 2008
Website: http://unfccc.int/ghg_data/items/3825.php
246. Jatropha World ‐ Growing diesel fuel plant, accessed on 20th March 2009
Website: http://www.jatrophabiodiesel.org
247. University of New Hampshire, accessed on 10th February 2009
Website: http://thefraserdomain.typepad.com/energy/2005/06/university_of_newhampshire
248. Fiat ‐ Ecodrive, accessed on 22nd March 2009
Website: http://www.fiat.com/ecodrive
249. The Australian Greenhouse Office, Comparison of Transport Fuels, Australia, 2004,
Website: http://www.greenhouse.gov.au/transport/comparison/index.html
250. Europa Press Releases RAPID, accessed on 23rd January 2008
Website: http://europa.eu/rapid/pressReleasesAction.do?reference
251. Climate Research Unit ‐ Temperature Data
Website: http://www.cru.uea.ac.uk/cru/data/temperature/
252. ENSEMBLES Project
Website: http://www.ensembles-eu.org

380
253. European Climate Assessment & Dataset
Website: http://eca.knmi.nl
254. Hadley Centre Data ‐ HADISST1
Website: http://hadobs.metoffice.com/hadisst/data/ download.html
255. The Intergovernmental Panel on Climate Change’s Fourth Assessment Report (Climate Change 2007) and its synthesis are available online from
Website: http://www.ipcc.ch/index.htm
256. The Intergovernmental Panel on Climate Change’s Third Assessment Report (Climate Change 2001) and its synthesis are available online from
Website: http://www.grida.no/publications/other/ipcc_tar/?src=/CLIMATE/IPCC_TAR/WG1/index.htm
257. The Climate Prediction Centre (CPC) Merged Analysis of Precipitation (CMAP) data set is available online from
Website: http://www.cpc.ncep.noaa.gov/products/global_precip/html/wpage.cmap.html
258. The Intergovernmental Panel on Climate Change’s Special Report on Emissions Scenarios and is available online from
Website: http://www.grida.no/publications/other/ipcc_sr/?src=/climate/ipcc/emission/
259. The data sets generated by various atmosphere‐ocean general circulation models, which are housed at the Program for Climate Model Development and Inter‐comparison (PCMDI) at the United States Department of Energy, Lawrence Livermore National Laboratory (LLNL) and now referred to as the CMIP3 data base can be accessed online from
Website: http://www-
cmdi.llnl.gov/ipcc/model_documentation/ipcc_model_documentation.php
260. Malta Resources Authority ‐ Implementation of European Union Water Framework Directive
Website: http://www.mra.org.mt/wfd_gwb_initial_charcaterisation.shtml
261. Malta Resources Authority ‐ Implementation of European Union Water Framework Directive
Website: http://www.mra.org.mt/wfd_gwb_initial_charcaterisation.shtml

381
262. Water Services Corporation
Website: http://www.wsc.com.mt/
263. Canadian Institute of Planners
Website: http://www.cip-icu.ca
264. Stern, N. (2007) Stern Review on The Economics of Climate Change. HM Treasury, London
Website: http://www.hm-treasury.gov.uk/sternreview_index.htm
265. United Nations Framework on Climate Change, 2006
Website: http://unfccc.int/2860.php
266. Enemalta. Electricity Distribution. Retrieved 2nd June 2008 from
Website: http://www.enemalta.com.mt/page.asp?p=927&l=1
267. Enemalta. Electricity Generation. Retrieved 2nd June 2008 from
Website: http://www.enemalta.com.mt/page.asp?p=926&l=1
268. Heritage Malta
Website: http://www.heritagemalta.org/eu_regional_dev_fund.html
269. MEEREA. (2007) Energy Profile for Malta. Retrieved 2nd June 2008 from
Website: http://www.geocities.com/meereamalta/Malta_Energy_Profile.pdf
270. MITC. (2008). ADT. Retrieved 2nd June 2008, from
Website: http://www.miti.gov.mt/Pages/Policy/ADT.aspx
271. European Environment Agency ‐ Indicator Management Service
Website: http://ims.eionet.europa.eu/
272. Bindi, M (2008) International Year of the Potato, Gains, Losses as the Climate Changes. Retrieved on 13th December 2008 from
Website: http://www.potato2008.org/en/perspectives/bindi.html

382
273. Deloire, A (2006) Climate Trends In A Specific Mediterranean Viticultural Area Between 1950 and 2006: Climate and Viticulture in the South of France. Retrieved from
Website: http://knol.google.com/k/alain-deloire/climate-trends-in-a-
specific/2rmh6zvf1o8hc/12# 274. Karas, J. (2000). Climate Change and the Mediterranean Region. Retrieved 30th
June 2008, from: Website: http://www.greenpeace.org/international/press/reports/climate-change-and-the-
mediter
275. Lalasz, R. (2008) Climate Change, Wine Growing and Mediterranean Habitats. Retrieved from
Website: http://www.nature.org/tncscience/misc/art25819.html
276. Morales, A (2007) Spaniard shifts vineyards uphill in response to climate change. Internal Herald Tribune. Retrieved online from
Website: http://www.iht.com/articles/2007/09/25/bloomberg/bxwine.php
277. Rosenzweig, C., and D. Liverman. 1992. Predicted effects of climate change on agriculture: A comparison of temperate and tropical regions. In Global climate change: Implications, challenges, and mitigation measures, ed. S. K. Majumdar, 342‐61. PA: The Pennsylvania Academy of Sciences. Retrieved from
Website: http://www.ciesin.columbia.edu/docs/004-145/004-145.html
278. Eurostat (2009). Real GDP Growth Rate.
Website: http://epp.eurostat.ec.europa.eu/tgm/table.do?tab=table&init=1&plugin=1&language=en&pcode=tsieb020
279. Schwartz P, Randall D, (2003), An Abrupt Climate Change Scenario and Its Implications for United States National Security, downloaded on February 2008.
Website: http://www.gbn.com/articles/pdfs/Abrupt%20Climate%20Change%20February%202004.pdf
280. National Statistics Office, (2006), World Refugee Day ‐ News Release dated 19 June 2006, Malta: NSO (downloaded February 2008):
Website: http://www.nso.gov.mt/statdoc/document_file.aspx?id=1785

383
281. Shea, K.M., & Balk, S.J. (2007) Climate Change and Children’s Health: What Health Professionals Need to Know and What We Can Do About It. Retrieved on 30th June 2008 from
Website: http://www.healthandenvironment.org/?module=uploads&func=download&fileId=418
282. World Health Organisation (2008). The impact of climate change on human health ‐ Statement by WHO Director‐General Dr Margaret Chan. Retrieved on 15th May 2008 from
Website: http://www.who.int/mediacentre/news/statements/2008/s05/en/index.html
283. World Health Organisation (2009). Climate Change and Human Health ‐ Global Environmental Change.
Website: http://www.who.int/globalchange/climate/en/
284. Department for Environmental Health Malta (2008). Food Safety Legislation ‐ Explained
Website: http://www.sahha.gov.mt/showdoc.aspx?id=760&filesource=4&file=FSLegENG.pdf