Blood Pressure Regulation Evolved from Basic Homeostatic ...
Upload
independentCategory
view
1download
0
arX
iv:1
001.
2599
v2 [
astr
o-ph
.SR
] 21
Jan
201
0
SDSS J123813.73-033933.0, a cataclysmic variable evolved beyond the period
minimum.
A. Aviles1, S. Zharikov1, G. Tovmassian1, R. Michel1, M. Tapia1,
Instituto de Aatronomıa, Universidad Nacional Autonoma de Mexico, Apartado Postal 877,
22800, Ensenada, BC, Mexico
M. Roth2,
Las Campanas Observatory, Carnegie Instututio of Washington, Casilla 601, La Serena, Chile
V. Neustroev3,
Centre for Astronomy, National University of Ireland, Galway, Newcastle Rd., Galway, Ireland
C. Zurita4,
Instituto de Astrofisica de Canarias, c/ via Lactea s/n, La Laguna, E38200, Tenerife, Spain
M. Andreev5, A. Sergeev5,
Institute of Astronomy, Russian Academy of Sciences, Terskol, Russia
E. Pavlenko6,
Crimean Astrophysical Observatory, Nauchny, Ukraine
V. Tsymbal7,
Tavrian National University, Dep. Astronomy, Simferopol, Ukraine
G.C. Anupama8, U.S. Kamath8, D.K. Sahu8
Indian Institute of Astrophysics – CREST, Bangalore 560 034, India
1Instituto de Aatronomıa, Universidad Nacional Autonoma de Mexico, Apartado Postal 877, 22800, Ensenada,
BC, Mexico
2Las Campanas Observatory, Carnegie Instututio of Washington, Casilla 601, La Serena, Chile
3Centre for Astronomy, National University of Ireland, Galway, Newcastle Rd., Galway, Ireland
4Instituto de Astrofisica de Canarias, c/ via Lactea s/n, La Laguna, E38200, Tenerife, Spain
5Institute of Astronomy, Russian Academy of Sciences, Terskol, Russia
6Crimean Astrophysical Observatory, Nauchny, Ukraine
7Tavrian National University, Dep. Astronomy, Simferopol, Ukraine
8Indian Institute of Astrophysics, II Block Koramangala, Bangalore 560034, India

– 2 –
ABSTRACT
We present infrared JHK photometry of the cataclysmic variable SDSSJ123813.73-
033933.0 and analyze it along with optical spectroscopy, demonstrating that the binary
system is most probably comprised of a massive white dwarf with Teff = 12000±1000 K
and a brown dwarf of spectral type L4. The inferred system parameters suggest that
this system may have evolved beyond the orbital period minimum and is a bounce-back
system.
SDSSJ123813.73-033933.0 stands out among CVs by exhibiting the cyclical vari-
ability that Zharikov et al. (2006) called brightenings. These are not related to specific
orbital phases of the binary system and are fainter than dwarf novae outbursts, that
usually occur on longer timescales. This phenomenon has not been observed extensively
and, thus, is poorly understood. The new time-resolved, multi-longitude photometric
observations of SDSSJ123813.73-033933.0 allowed us to observe two consecutive bright-
enings and to determine their recurrence time. The period analysis of all observed
brightenings during 2007 suggests a typical timescale that is close to a period of ∼ 9.3
hours. However, the brightenings modulation is not strictly periodic, possibly maintain-
ing coherence only on timescales of several weeks. The characteristic variability with
double orbital frequency that clearly shows up during brightenings is also analyzed.
The Doppler mapping of the system shows the permanent presence of a spiral arm
pattern in the accretion disk. A simple model is presented to demonstrate that spiral
arms in the velocity map appear at the location and phase corresponding to the 2:1
resonance radius and constitute themselves as a double-humped light curves. The long-
term and short-term variability of this CV is discussed together with the spiral arm
structure of an accretion disk in the context of observational effects taking place in
bounce-back systems.
Subject headings: stars: novae, cataclysmic variables — stars: dwarf novae — stars:
brown dwarfs — stars: individual: SDSS J123813.73-033933.0
1. Introduction
The object catalogued as SDSS J123813.73-033933.0 (hereafter SDSS1238) was identified with
a faint (r = 17.82 mag) short-period cataclysmic variable (CV) by Szkody et al. (2003). The optical
spectrum of SDSS1238 shows a blue continuum with broad absorption features originating in the
photosphere of a white dwarf surrounding double-peaked Balmer emission lines, formed in a high
inclination accretion disk. The orbital period of the system is Porb = 0.05592(35)d = 1.34(1)h,
based on spectroscopic data (Zharikov et al. 2006). The orbital period and the spectral features
match those of WZ-Sge-type systems, but with this, similarities practically end. A number of
observed aspects of the system differ from the majority of short period CVs. The most intriguing

– 3 –
characteristic, which we found in this system, is a sudden and fast rise in brightness up to∼ 0.45 mag
during a short time, of about half of the orbital period. After reaching its peak, the brightness slowly
decreases, lasting ∼ 3 − 4 hours, down to the quiescence level. We call these events brightenings
in order to distinguish them from the more common outbursts, humps, flickering and other types
of variability documented in short period CVs. These brightenings seemed to happen cyclically
about every 8-12 hours. In addition to brightenings, a nearly permanent sinusoidal variability was
detected in the light curve of SDSS1238 with a period half that of the spectroscopic orbital period
P = Porb/2 = 40.25min (hereafter, the double-humped light curve). The amplitude of the double-
hump variability depends on the phase of the brightenings. It increases with a total rise in brightness
of up to ∼ 0.2 mag and decreases until almost disappears during the quiescence (Zharikov et al.
2006). A similar behavior was found later by Szkody et al. (2006) in another short period CV,
SDSSJ080434.20+510349.2 (hereafter SDSS0804) which has an identical spectral appearance to
SDSS1238 in quiescence. Zharikov et al. (2006, 2008) advanced the hypothesis that the double-
humped light curve is a signature of 2:1 resonance in the accretion disks of these systems. In order
for the accretion disk to reach permanently the 2:1 resonance radius, the mass ratio of the binary
component must be extreme (q ≤ 0.1), and as such these objects could qualify as bounce-back
systems, e.g. CVs, which are old enough to reach the period minimum and leap toward slightly
longer orbital periods, as predicted by Paczynski (1981). It is supposed that accretion disks of WZ
Sge systems reach 2:1 resonance radius during super-outburst, when some of them have been noted
to show double-humped light curves (Patterson et al. 2002). The super-outbursts of WZ Sge type
systems are infrequent and happen every two dozen or more years. Oddly enough, SDSS0804 went
into the super-outburst in 2006 (Pavlenko et al. 2007) and exhibited all necessary attributes of a
classical WZ Sge-type object. Regrettably, the brightenings disappeared from the light curves of
SDSS0804 after the super-outburst, although the double-hump light curve persists (Zharikov et al.
2008). Thus, the SDSS1238 remains the only object that still shows brightenings. Intrigued by the
new photometric phenomenon observed in these two systems, we conducted a new time-resolved
photometric study of SDSS1238 to establish the reasons behind their common nature, understand
the origin of the cyclic brightenings and its relation to the amplitude of the double-humped light
curve. Meanwhile, we discovered that SDSS1238 was marginally detected as an infrared source by
2MASS survey, and secured accurate near-IR photometry of the object. In Sect.2 we describe our
observations and data reductions. The data analyses and the results are presented in Sects.3,4,5,
while a general discussion and conclusions are given in Sect.6.
2. Observations and data reduction
The object is listed in the 2MASS1 Point Source Catalogue with J = 16.65(13), H = 16.49(23),
K ∼ 16.42 magnitudes. These magnitudes are close to the detection limits of 2MASS, particu-
1http://www.ipac.caltech.edu/2mass/

– 4 –
larly in the K-band. In order have more accurate photometry, we obtained new observations of
SDSSJ123813.73-033933.0 in J H Ks on 17 June 2009 with the near-infrared camera PANIC (Mar-
tini et al. 2004) attached to the 6.5 m Baade/Magellan Telescope at Las Campanas Observatory
(LCO). PANIC provides an image scale of 0.125′′ pixel−1 on a Hawaii HgCdTe 1024 × 1024 array
detector. The FWHM of the point-spread function was between 0.55′′ and 0.60′′ during our observa-
tions. For each filter, 9 dithered frames spaced by 10′′ were taken, with total on-source integration
times of 540 s in each of the three filters. The nine frames were shifted and averaged to produce the
final images. Standard sky-subtraction and flat-field correction procedures were applied. Aperture
(1.2′′) photometry was performed with DAOPHOT within IRAF in the standard way. Flux calibra-
tion was performed using standard stars SJ 9146 and SJ 9157 from the list of Persson et al. (1998)
and the total errors are estimated to be less than 0.05 magnitudes. The resulting magnitudes of
SDSS1238 are J = 17.07(5), H = 16.65(5), K = 16.42(5) and corresponding colors J −H = 0.42,
H −Ks = 0.23 and J −Ks = 0.65.
In order to investigate whether flux variations in the near-IR occur in this system in timescales
of a few minutes, we measured the J , H and Ks fluxes from each of the nine short-exposure (60 s)
frames in each filter. In the ∼ 15min that lasted each series, we did not detect any variability within
the ∼ 0.15 mag photometric uncertainty associated with each single frame. Note, that in longer
timescales (comparable to the orbital period), the system is expected to show some variability in
the near-IR, mostly due to the elliptical shape of Roche-lobe filling secondary, but these could be
missed in a 15 min time series. The ellipsoidal variability of the secondary can be calculated and
it has been taken into account in further considerations of IR magnitudes.
The objective of our optical photometry of SDSS1238 was to study of phenomenon of bright-
enings. Taking into account the long duration of the brightenings and the uncertainty of the cycle
period (Zharikov et al. 2006), we planned and executed a multi-longitude observational campaign
of this object. Time-resolved CCD photometry was obtained at several facilities: the 1.5 m tele-
scope at the Observatorio Astronomico Nacional at San Pedro Martir in Mexico; the 0.8 m IAC80
telescope at the Observatorio del Teide in the Canary Islands, Spain; the 2.1 m telescope at the
Bohyunsan Optical Astronomy Observatory (BOAO) in South Korea; the 2m telescope at the
Terskol Astrophysical Observatory in the Northern Caucasus, Russia, the 2m Himalayan Chan-
dra Telescope of the Indian Astronomical Observatory (IAO), Hanle, India. The data reduction
was performed using both ESO-MIDAS and IRAF software. The images were bias-corrected and
flat-fielded before aperture photometry was carried out. The log of photometric observations is
presented in Table.1.
The long-slit observations have been obtained with the Boller & Chivens spectrograph2 on
the 2.1-m telescope at the SPM site with a resolution of 3.03 A pixel−1. The spectra span the
wavelength range 4000-7100 A. In order to improve the signal-to-noise ratio, we obtained a series
of phase-locked spectra: 10 spectra were taken at equal phase intervals over a single orbital period
2www.astrossp.unam.mx

– 5 –
Porb = 80.5min with an exposure time of 486 sec per spectrum. This sequence of spectra was
repeated at exactly the same phase intervals for subsequent periods and subsequent nights. This
allows us to calculate the phase-averaged spectra, summarizing the spectra of the same orbital
phase obtained during one night and the whole set of observations without further decreasing the
time resolution. The log of spectroscopic observations is presented in Table.2.
3. Spectral energy distribution: system parameters and distance to the object
The spectral energy distribution (SED) of the object in the range of 4000-25000A is shown in
Fig.1. The detailed description of the SDSS1238 optical spectrum was given in our previous paper
(Zharikov et al. 2006). The overall appearance of the spectrum has not changed, but we detect a
significant variability of the equivalent widths of Balmer emission lines from epoch to epoch. The
Balmer lines are about two times weaker in the 2009 observations compared to the 2004 spectra
(Fig.2). The continuum, however, has not changed during the last five years, as we compare V-
band magnitudes in quiescence between brightenings. The average quiescence magnitude3 between
brightenings remains constant at around V ∼= 17.8 ± 0.1.
The present near-IR measurements demonstrated that there is significant IR excess emission
to that expected from the Rayleigh–Jeans tail of the optical spectrum for a white dwarf (WD). In
fact, neither a WD nor a power-law flux from the accretion disk, nor their combination, can explain
the observed IR excess. The most probable source of IR excess is the radiation from the secondary
star. To determine the spectral type of the secondary and the distance to the system we fitted the
observed optical-infrared spectral energy distribution of the object with a simple model: the total
flux F ∗(λ) is the sum of contributions from a WD with a hydrogen atmosphere, FWD(Teff , λ) (DA
type WDs), an accretion disk with FAD ∼ λ−7
3 (Lynden-Bell 1969), and a red/brown dwarf with
FBD(λ):
F ∗(λ) = FWD(Teff , λ) + FAD(λ) + F SpTBD (λ) (1)
Brown dwarf fluxes were taken from the literature (McLean et al. 2003, 2007) and on-line sources4.
The white dwarf spectra with a mass range of MWD = 0.6 − 1.1M⊙ were used with a 0.1M⊙ step
and the radii were calculated using the white dwarf radius-mass relation of
RWD = 1.12 × 10⁹(
1−MWD
1.44M⊙
)3
5
from Nauenberg (1972) and Warner (1995). Spectra of WDs in the 4000-25000A range with pure
hydrogen atmosphere were obtained using ATLAS9 (Kurucz 1993) and SYNTH (Piskunov 1992)
3 Secondary photometric standards were established in the field of SDSS 1238, by calibrating them using reference
star S2003313360 from GSC-II www.gsss.stsci.edu/Catalogs/GCS/GSC2/GSC2.html
4see http://web.mit.edu/ajb/www/browndwarfs/

– 6 –
codes for an appropriate range of temperatures. Although our previous temperature estimate was
TWD = 15600 ± 1 000K based on fits to the absorption portion of Balmer lines (Zharikov et al.
2006), in the present fitting procedure we allowed a wider temperature range from Teff =11 000 to
18 000K, because of the larger number of free parameters. The calculations were performed with
a 1 000K step and with the surface gravity g = γMWD
R2
WD
. The spectra are normalized to λ0 = 5500A
and the contribution of the WD is
FWD(Teff , λ) = C1(δ) ∗ FnormWD (Teff , λ),
where C1(δ) = 10−0.4∗(V +δ+M0V), V = 17.8 is the object’s magnitude in quiescence, and δ is a
parameter, determining the contribution of the flux from the WD in the V band. Finally, the
M0V = 21.109 - is the constant to convert magnitudes into flux (in ergs/cm2/s/A) in the V band.
The spectra of the accretion disk was assumed to be a simple power law
FAD(λ) = (C1(0)− C1(δ)) ×
(
λ
λ0
)−7
3
,
where (C1(0)−C1(δ)) determines the contribution from the accretion disk in the V band, assuming
that the WD and the accretion disk are the only contributors in that wavelength as the only other
contributor is the brown dwarf, which has a negligible flux in V.
The distance to the object is estimated to be
d = RWD
√
F bb(Teff , 5500A)
FWD(5500A),
where F bb(Teff ; 5500A) is the black body flux at λ = 5500A with effective temperature Teff .
Observed SEDs of red/brown dwarfs of spectral types between M6 to L5 normalized to fit the
observed flux in J were used. The bolometric correction to the J magnitude for each spectral type
was taken from Tinney et al. (2003).
The free parameters of the three-component model are: the white dwarf effective temperature,
Teff , the mass of the white dwarf, MWD, the spectral type of the secondary star, SpT, and the
parameter δ (in magnitudes). The best fit model to the observed SDSS1238 spectrum in the 0.4-
2.5µm range achieved for the following set of parameters (Fig.1) is: TWD = 12000K, SpT = L4,
MWD = 1.0M⊙ and δ = 0.1. The deduced distance to the object is 110 pc. We studied the behavior
of χ2 vs a single fit parameter, when the other three are fixed to their corresponding best values.
Fig.3 presents χ2 plots for various parameters with marked confidence levels corresponding to 95,
80 and 60%. We can state that χ2 tends to the minimum value always, when TWD = 12000K
and δ = 0.05 — 0.15 regardless of the value of the other parameters. At the same time, there is
a dependence between the mass of the WD and the spectral type of the secondary: the lower the
mass, the larger the radius of WD, and thus, the larger the distance to the system, resulting in an
earlier spectral type of the secondary. The best fit to the optical part of the spectrum is reached

– 7 –
with the mass of the WD of MWD = 1.0M⊙, leading to the cited distance of, 110 pc, and spectral
type of the secondary, L4. The entire range of secondary from SpT = M9 at MWD = 0.6M⊙ and
d = 160pc to SpT = L4 at MWD = 1.0M⊙, d = 110pc was considered. However, a pronounced
minimum in χ2 for rather massive WD strongly suggests the presence of brown dwarf in this system.
The indication of a massive WD is not accidental, a CV with a brown dwarf secondary, supposed
to have evolved beyond minimum orbital period limit, has an age ∼ 3 − 5 × 10⁹ years and a long
history of accretion. A priori, the bounce-back CVs are assumed to harbor a massive WD, although
the distribution of known masses of all WDs in eclipsing systems does not show any trend (Knigge
2006). But when considering only the short-period end of that distribution as Littlefair et al. (2008)
did, then it becomes apparent that evolved systems systematically have more massive WDs. The
upper limit for the mass of the secondary is MBD ≤ 0.09M⊙ for SpT = M9 or MBD ≤ 0.07M⊙ for
SpT = L4 (Close et al. 2003). But it is also a well known fact that the secondaries of CVs tend
to show systematically an earlier spectral class and a larger radius with secondaries of lower mass
than the corresponding single stars on the main sequence (Littlefair et al. 2008). So we expect that
the mass of the secondary in SDSS1238 hovers around the lower edge of the above mentioned range
of masses.
Note, that due the high galactic latitude of this object (b = 59.5) and the inferred small
distance, the interstellar extinction is negligible. We also would like to emphasize that in the
above calculations we took into account the fact that the state of the system was unknown at the
moment of acquiring the IR data. Therefore, we conducted the fitting for both cases, considering
that the system might have been at the maximum of the brightenings during the IR observations
or at the bottom. That introduced only a minor change, basically decreasing the distance to the
system by ∼ 15pc and not affecting our conclusions regarding the spectral type of the secondary.
Finally, we would like to comment on the discrepancy in the temperature determination of the
WD, which is larger than we would like as compared to that of Zharikov et al. (2006). In the latter
the temperature and gravity could not be determined simultaneously, and one parameter had to
be fixed in order to calculate the other, which always introduces ambiguity, as none of these two
parameters could be estimated independently. In this paper we take a more complex approach:
not only profiles of the lines are being fitted, but the continuum is taken into consideration as well.
Also, the presence of the secondary, adding additional restraints on the distance and thus, on the
size of the WD. The SED of the accretion disk, which may not necessarily obey the canonical power
law index is the source of the largest uncertainty in our analysis. Since the contribution of the disk
is limited to only ≤ 20 %, so is the accuracy of our estimates. With all that in mind, we still end
up with a range of spectral classes for the secondary that implies that SDSS1238 is a bounce-back
system.

– 8 –
4. Doppler tomography of SDSS1238
The Hα emission line originating in the accretion disk is the least affected by the absorption
from the underlying white dwarf. Therefore, we constructed Doppler maps (Marsh & Horne 1988)
of Hα using all our data obtained in 2004 and 2009 (Fig.4, top). The individual maps of separate
nights resemble each other so much, that combining all available data did not smooth out details,
but made them much more convincing. In order to over-plot contours of the secondary star, the
location of the WD, the trajectory of the stream and resonance radius of the disk, we used the best
fit parameters to the SED (see previous section). Thus, the white dwarf mass ofMWD = 1.0M⊙ was
adopted. Due to the ambiguity in determining precise masses of brown dwarfs, we adopted a mass
ratio of q = 0.05. This value is typical for systems considered as bounce-back (Knigge 2006) and
it is the same mass ratio which was obtained for SDSS0804, a twin of SDSS1238, from the super-
hump period observed during the super-outburst in 2006 (Pavlenko et al. 2007; Zharikov et al.
2008). Before SDSS0804 underwent a WZ-Sge type super-outburst, it showed similar peculiar
photometric variability to SDSS1238. In addition, it shares every other characteristic of a WZ
Sge-type object, and was also proposed as a candidate to the bounce back system (Zharikov et al.
2008).
As already noted, the structure of the accretion disk did not change between the two epochs
of our observations. There is a bright spot at the expected place where the stream of matter from
the secondary collides with the accretion disk, but it overlaps with a much larger and prolonged
structure, too extended to be a part of the spot. Another extended bright region of similar size can
be seen at velocity coordinates (≈ 700 km s−1, ≈ 0 km s−1) as well as a less bright structure at
(≈ −200 km s−1, ≈ −800 km s−1). Similar Doppler maps were obtained for WZ Sge during super-
outburst in 2001 (Baba et al. 2002; Howell et al. 2003; Steeghs 2004) and in quiescence for bounce
back candidates SDSS1035 (Southworth et al. 2006) and SDSS0804 (Aviles et al. in preparation).
Such brightness distribution in the Doppler map can be interpreted as evidence of spiral waves
in the disk (see for example, Steeghs & Stehle (1999) and Steeghs (2001) and reference therein).
The formation of a spiral structure in an accretion disk of a close binary system was predicted
by Lin & Papaloizou (1979) and explored by various authors (Matsuda et al. (1990); Heemskerk
(1994); Stehle (1999); Kunze & Speith (2005); Truss (2007) and reference therein). Sawada et al.
(1986a,b) demonstrated from high resolution numerical calculations that spirals will always formed
in accretion disks under tidal forces from the secondary. They actually used q = 1 in their models,
but observationally, such spirals were detected in a number of systems only during outbursts of
dwarf novae. The careful examination of quiescent disks of the same systems did not reveal any
spiral structures in longer period DNe. Steeghs & Stehle (1999) argued that little evidence of spiral
arms in the emission lines is expected in systems with low values of viscosity.
On the other hand, spiral arms related to 2:1 resonance can be found in systems with extremely
low mass ratio q < 0.1 as originally was predicted by Lin & Papaloizou (1979). The bounce-back
systems and related to them, WZSge stars, are examples of such objects. The long outburst recur-

– 9 –
rence time in WZSge systems is probably explained by a very low viscosity in their accretion disks,
yet spiral arms can be observed permanently in quiescent bounce-back systems in which, on one side
there is a massive WD, which gained mass during a long accretion history, and on another side there
is a late-type brown dwarf, providing a mass ratio of ≤ 0.06. Fig.4 (bottom, left) depicts a synthetic
Doppler map constructed from a model accretion disk that is shown on the bottom right panel. The
latter was calculated with the binary system parameters derived above by using smooth particle
hydrodynamics according to Murray (1996); Kunze et al. (1997, and references therein). The arti-
ficial doppler map reproduces the observed map in a case when there is a brightness excess within
spiral arms. Most of the disk particles are on periodic orbits, which are most favorable from the
point-of-view of viscosity. However, the resonance dispatches some particles onto aperiodic orbits
creating viscosity perturbations, which will create excess of heat. A slightly different interpretation
of spiral arm brightness is offered by Ogilvie (2002). The mechanism is not very well established,
but it is natural to assume that in these regions there will be excess emission.
5. Cyclic brightenings.
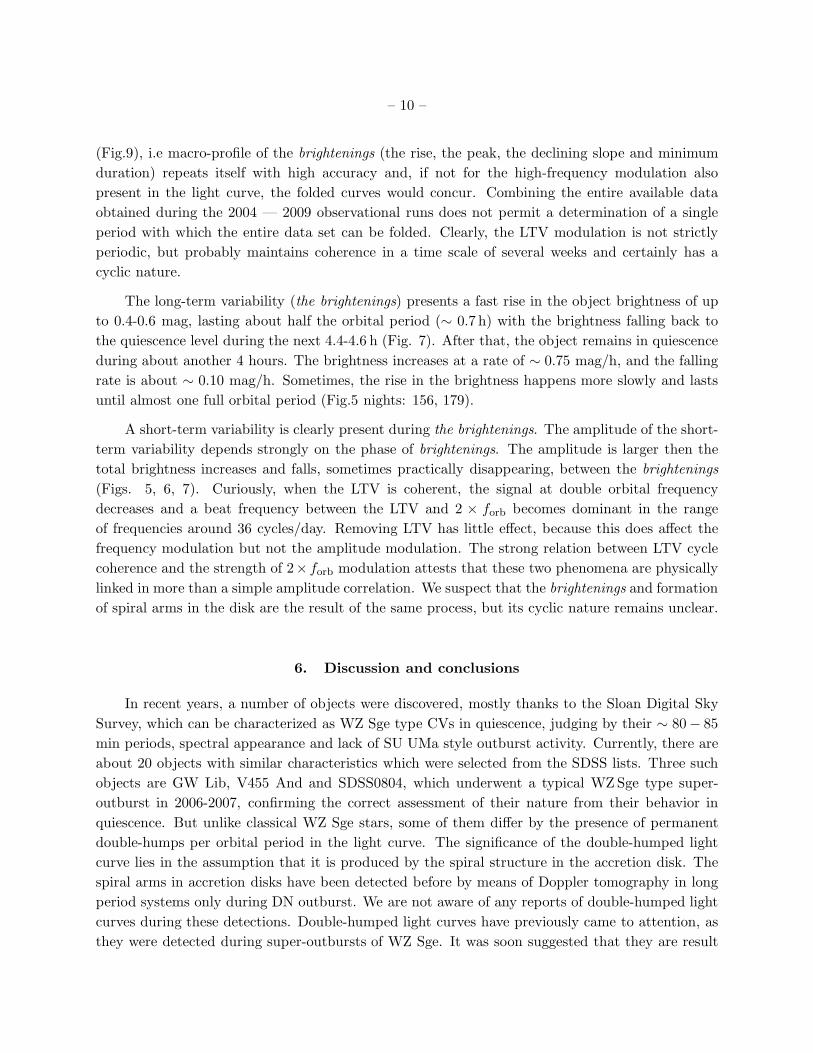
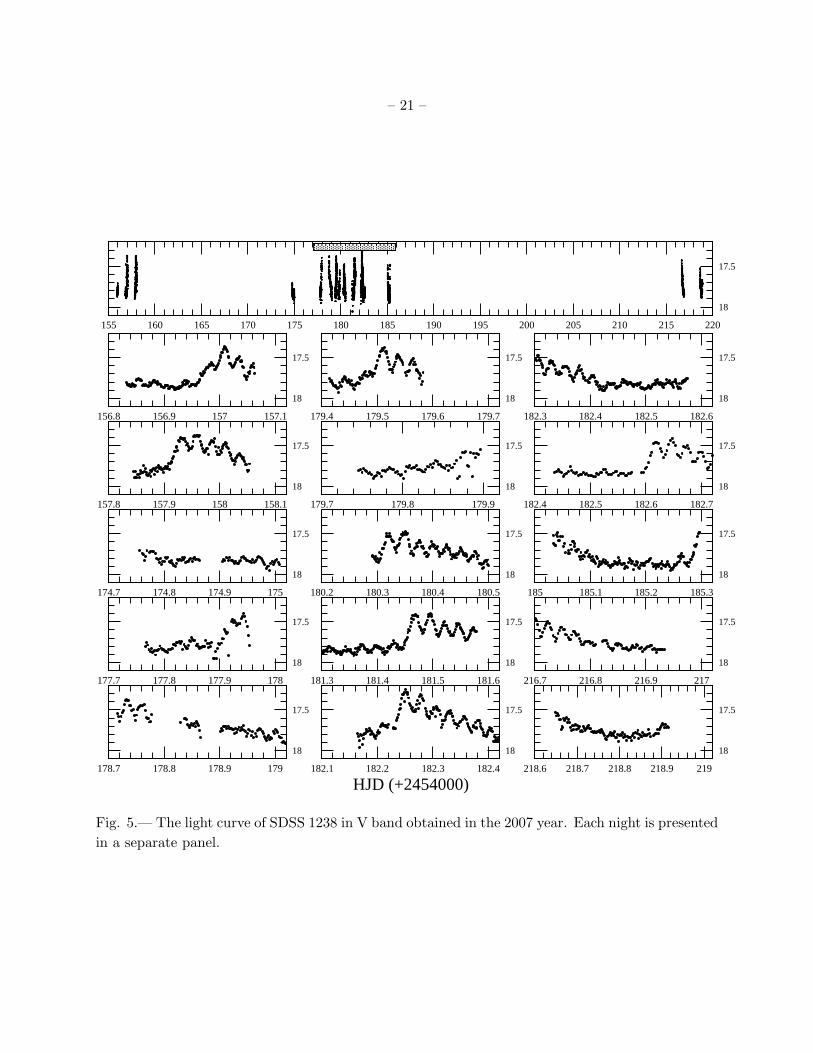
Figure 5 displays the light curve of SDSS1238 obtained in 2007. In general, the object shows an
identical behavior to previous years, as described by Zharikov et al. (2006). There are two distinct
types of variability: a long-term variability (LTV), lasting more than 8h, and a short-term variability
with a period corresponding to half the orbital period. Follow-up observations during 2008 and
2009 confirm a steady presence of both types of variability in the light curve (Fig.6). Continuous
observations during about 15 hours obtained on 22/03/2007 (HJD 2454182.15-2544182.60, Fig.7)
allowed us to observe two consecutive brightenings and, thus to determine their recurrence time
directly (∼ 9h). Zharikov et al. (2006) demonstrated that brightenings occurred cyclically with
periods in between 8 and 12 hours, however it was not possible to establish if the phenomenon
was strictly periodic or not. Armed with more data, and the advantage of detecting consecutive
events by employing multi-longitude observations, we performed a simple period search. The period
analysis of all data obtained during 2007, based on a discrete Fourier transform method (Deeming
1975), results in a strong peak at a frequency fLTV = 2.59 day−1 with FWHM of 0.1. This conforms
with the period of PLTV = 9.28±0.36h ≈ 7Porb (Fig.8). However, the data folded with this period
looks messy because, apparently, some re-brightenings happen with a different cycle period. It
shows that the large uncertainty in the period value is not just a result of a scarce amount of data,
or its uneven distribution, but that the brightenings are not strictly periodic in long timescales.
The peak 2×forb = 35.76 day−1, corresponding to the half of the orbital period, Porb/2 = 40.3 min,
is also present in the power spectrum. There are some additional peaks which are one-day aliases
or a combination of high harmonics of fLTV with 2 × forb. We have repeated the same analysis
for the data obtained only within HJD 2454177.1-2544185.6, when we observed the object with
small observational gaps. The result of the analysis of periodicity for this selection is presented
in Fig.9. The strongest peak in the power spectrum appears at a frequency corresponding to
P ∗
LTV = 9.34(26)h. The light curve folded with this period is coherent during the considered time
– 10 –
(Fig.9), i.e macro-profile of the brightenings (the rise, the peak, the declining slope and minimum
duration) repeats itself with high accuracy and, if not for the high-frequency modulation also
present in the light curve, the folded curves would concur. Combining the entire available data
obtained during the 2004 — 2009 observational runs does not permit a determination of a single
period with which the entire data set can be folded. Clearly, the LTV modulation is not strictly
periodic, but probably maintains coherence in a time scale of several weeks and certainly has a
cyclic nature.
The long-term variability (the brightenings) presents a fast rise in the object brightness of up
to 0.4-0.6 mag, lasting about half the orbital period (∼ 0.7 h) with the brightness falling back to
the quiescence level during the next 4.4-4.6 h (Fig. 7). After that, the object remains in quiescence
during about another 4 hours. The brightness increases at a rate of ∼ 0.75 mag/h, and the falling
rate is about ∼ 0.10 mag/h. Sometimes, the rise in the brightness happens more slowly and lasts
until almost one full orbital period (Fig.5 nights: 156, 179).
A short-term variability is clearly present during the brightenings. The amplitude of the short-
term variability depends strongly on the phase of brightenings. The amplitude is larger then the
total brightness increases and falls, sometimes practically disappearing, between the brightenings
(Figs. 5, 6, 7). Curiously, when the LTV is coherent, the signal at double orbital frequency
decreases and a beat frequency between the LTV and 2 × forb becomes dominant in the range
of frequencies around 36 cycles/day. Removing LTV has little effect, because this does affect the
frequency modulation but not the amplitude modulation. The strong relation between LTV cycle
coherence and the strength of 2× forb modulation attests that these two phenomena are physically
linked in more than a simple amplitude correlation. We suspect that the brightenings and formation
of spiral arms in the disk are the result of the same process, but its cyclic nature remains unclear.
6. Discussion and conclusions
In recent years, a number of objects were discovered, mostly thanks to the Sloan Digital Sky
Survey, which can be characterized as WZ Sge type CVs in quiescence, judging by their ∼ 80− 85
min periods, spectral appearance and lack of SU UMa style outburst activity. Currently, there are
about 20 objects with similar characteristics which were selected from the SDSS lists. Three such
objects are GW Lib, V455 And and SDSS0804, which underwent a typical WZSge type super-
outburst in 2006-2007, confirming the correct assessment of their nature from their behavior in
quiescence. But unlike classical WZ Sge stars, some of them differ by the presence of permanent
double-humps per orbital period in the light curve. The significance of the double-humped light
curve lies in the assumption that it is produced by the spiral structure in the accretion disk. The
spiral arms in accretion disks have been detected before by means of Doppler tomography in long
period systems only during DN outburst. We are not aware of any reports of double-humped light
curves during these detections. Double-humped light curves have previously came to attention, as
they were detected during super-outbursts of WZ Sge. It was soon suggested that they are result
– 11 –
of 2:1 resonance (Osaki & Meyer 2002; Patterson et al. 2002), as one of the possibilities. Also
spirals arms are formed in the accretion disk of the WZ Sge undergoing super-outburst (Steeghs
2004), because, according to our hypothesis WZ Sge accretion disk reaches the resonance radius
only during super-outburst. Nevertheless, the spiral structure has been observed persistently along
with the double-humped light curve in two similar short-period systems, SDSS 0804 and SDSS1238
in quiescence. We assume that the spiral structure formed in low viscosity, quiescent disks is a
result of distortion of the disk by the 2:1 resonance. The 2:1 resonance may happen only in the
accretion disk of a system with extreme mass ratio of q ≤ 0.1. Such mass ratio is achieved only
in systems known as bounce-backed or, in other words, systems which have reached a minimum
period of ≈ 80 min and have turned to slightly longer periods according to Paczynski (1981). It
is expected that bounce-back systems are numerous (Kolb & Baraffe 1999), but until recently very
few candidates have been found. The SDSS helped to uncover a large number of new CVs, with new
interesting features (Gansicke et al. 2009). Among them, there is a number of short period systems,
some of which turned out to belong to the long-sought bounce-back systems (Littlefair et al. 2008;
Mennickent & Diaz 2002).
We have unveiled a brown dwarf secondary in SDSS1238, probably as late as L4, thus providing
strong evidence that this object is a real bounce-back system. We also estimated parameters of the
WD. The best fit to the SED converges if the primary is a massive MWD ≈ 1.0M⊙ white dwarf
with a TWD = 12000K temperature. Both numbers seem plausible since the system is very old
and the WD is expected to be relatively massive and cool. These findings provide further support
to our claim that by simply observing a permanent double humped light curves one can identify
an evolved, bounce-back systems instead of using other complicated methods.
It is important to note that SDSS1238 has another peculiarity, which Zharikov et al. (2006)
termed as brightenings. There was only one other system known to exhibit brightenings, namely
SDSS0804, but since it underwent a super-outburst in 2006, its photometric behavior has drastically
changed. The brightenings shortly detected by Szkody et al. (2006) in SDSS0804 before the super-
outburst have been replaced by: a) the mini-outburst activity with permanent presence of the
double-humped light curve of constant amplitude (Zharikov et al. 2008) and by: b) a 12.6 min
period, probably corresponding to pulsation activity of the WD (Pavlenko et al. 2007). Therefore,
at present, SDSS1238 is the only object known to show brightenings. It greatly complicates the
study of this phenomenon. Based on new multi-longitude continuous monitoring, we demonstrated
here that the brightenings are of cyclic nature with a recurrence time of ≈ 9 hours and they are
probably coherent over several cycles. There seem to be strong correlation between brightenings
cycles and the amplitude of double-hump periodic variability. This is believed to be the result of
spiral arms in the accretion disk of bounce-back systems with an extreme mass ratio, in which
accretion disk extends beyond a 2:1 resonance radius. The tomogram of a simulated accretion disk
in the regime of resonance, closely resembles the observed one and supports this hypothesis. The
formation of a spiral structure in the disk can be accounted by the appearance of double humps in
the light curve, but it can not be the reason of increased brightness of the disk. The disk brightness

– 12 –
directly depends on the mass transfer rate and its change should probably reflect change in mass
transfer. No readily explanation is available as to why that rate can be variable and cyclical, but
possible speculations include counteraction: a) to the heating of the secondary by brightenings, or
b) to tidal interaction between the secondary with the resonance attaining accretion disk.
This work was supported in part be DGAPA/PAPIIT projects IN109209 and IN102607.
REFERENCES
Aviles, A., Zharikov, S., Tovmassian, G., et al., 2010, in preparation.
Baba, H., et al. 2002, PASJ, 54, L7
Close L.M., et al., 2003, ApJ, 587, 407
Deeming, T. J. 1975, Ap&SS, 36, 137
Gansicke, B. T., et al. 2009, MNRAS, 397, 2170
Heemskerk, M. H. M. 1994, A&A, 288, 807
Howell, S. B., Adamson, A., & Steeghs, D. 2003, A&A, 399, 219
Knigge, C. 2006, MNRAS, 373, 484
Kolb, U., & Baraffe, I. 1999, MNRAS, 309, 1034
Kunze, S., Speith, R., & Riffert, H. 1997, MNRAS, 289, 889
Kunze, S., & Speith, R. 2005, The Astrophysics of Cataclysmic Variables and Related Objects ,
330, 389
Kurucz, R. 1993, ATLAS9 Stellar Atmosphere Programs and 2 km/s grid. Kurucz CD-ROM
No. 13. Cambridge, Mass.: Smithsonian Astrophysical Observatory, 1993., 13
Lin, D. N. C., & Papaloizou, J. 1979, MNRAS, 186, 799
Littlefair, S. P., Dhillon, V. S., Marsh, T. R., Gansicke, B. T., Southworth, J., Baraffe, I., Watson,
C. A., & Copperwheat, C. 2008, MNRAS, 388, 1582
Lynden-Bell, D. 1969, Nature, 223, 690
Matsuda, T., Sekino, N., Shima, E., Sawada, K., & Spruit, H. 1990, A&A, 235, 211
Martini, P., Persson, S. E., Murphy, D. C., Birk, C., Shectman, S. A., Gunnels, S. M., & Koch, E.
2004, Proc. SPIE, 5492, 1653

– 13 –
Marsh, T.R., Horne, K. 1988, MNRAS, 235, 269
McLean, I. S., McGovern, M. R., Burgasser, A. J., Kirkpatrick, J. D., Prato, L., & Kim, S. S. 2003,
ApJ, 596, 561
McLean, I. S., Prato, L., McGovern, M. R., Burgasser, A. J., Kirkpatrick, J. D., Rice, E. L., &
Kim, S. S. 2007, ApJ, 658, 1217
Mennickent, R. E., & Diaz, M. P. 2002, MNRAS, 336, 767
Murray, J. R. 1996, MNRAS, 279, 402
Nauenberg, M. 1972, ApJ, 175, 417
Osaki, Y., & Meyer, F. 2002, A&A, 383, 574
Ogilvie, G. I. 2002, MNRAS, 330, 937
Paczynski, B. 1981, Acta Astronomica, 31, 1
Patterson, J., et al. 2002, PASP, 114, 721
Patterson, J., et al. 2002, PASP, 114, 1364
Pavlenko, E., et al. 2007, 15th European Workshop on White Dwarfs, 372, 511
Persson, S. E., Murphy, D. C., Krzeminski, W., Roth, M., & Rieke, M. J. 1998, AJ, 116, 2475
Piskunov, N. E. 1992, Stellar Magnetism, 92
Sawada, K., Matsuda, T., & Hachisu, I. 1986a, MNRAS, 221, 679
Sawada, K., Matsuda, T., & Hachisu, I. 1986b, MNRAS, 219, 75
Steeghs, D., & Stehle, R. 1999, MNRAS, 307, 99
Steeghs, D. 2001, Astrotomography, Indirect Imaging Methods in Observational Astronomy, 573,
45
Steeghs, D. 2004, Revista Mexicana de Astronomia y Astrofisica Conference Series, 20, 178
Stehle, R. 1999, MNRAS, 304, 687
Szkody, P., et al. 2003, AJ, 126, 1499
Szkody, P., et al. 2006, AJ, 131, 973
Tinney, C.G., Burgasser, A. J., Kirkpatrick. J. D. 2003, AJ, 126, 975
Truss, M. R. 2007, MNRAS, 376, 89
– 14 –
Southworth, J., Gansicke, B. T., Marsh, T. R., de Martino, D., Hakala, P., Littlefair, S., Rodrıguez-
Gil, P., & Szkody, P. 2006, MNRAS, 373, 687
Warner, B. 1995, Cambridge Astrophysics Series, 28
Zharikov, S. V., Tovmassian, G. H., Napiwotzki, R., Michel, R., & Neustroev, V. 2006, A&A, 449,
645
Zharikov, S. V., et al. 2008, A&A, 486, 505
This preprint was prepared with the AAS LATEX macros v5.2.

– 15 –
Table 1: Log of time-resolved observations of SDSS J123813.73-033933.0 in V band
Date HJD Start+ Telescope Exp.Time Duration
2454000 Num. of Integrations
Photometry
25 Feb. 2007 156.832 1.5m/SPM/Mexico 120s×160 5.3h
26 Feb. 2007 157.845 1.5m/SPM/Mexico 120s×144 4.8h
15 Mar. 2007 174.756 1.5m/SPM/Mexico 220s×95 5.8h
18 Mar. 2007 177.767 1.5m/SPM/Mexico 170s×91 4.3h
19 Mar. 2007 178.716 1.5m/SPM/Mexico 240s×108 7.2h
20 Mar. 2007 179.414 2m/Terksol/Russia 120s×118 3.9h
20 Mar. 2007 179.746 1.5m/SPM/Mexico 160s×77 3.4h
20 Mar. 2007 180.290 2m/Terksol/Russia 120s×152 5.1h
21 Mar. 2007 181.169 2m/IAO/India 120s×135 7.5h
21 Mar. 2007 181.286 2m/Terksol/Russia 120s×210 7h
22 Mar. 2007 182.164 2m/IAO/India 120s×198 6.9h
22 Mar. 2007 182.302 2m/Terksol/Russia 120s×195 6.5h
22 Mar. 2007 182.435 0.8m.IAC80/Spain 270s×98 7.4h
25 Mar. 2007 185.032 2.1m/BOAO/Korea 135s×107 4.0h
25 Apr. 2007 216.696 0.8m/IAC80/Spain 200s×101 5.6h
27 Apr. 2007 218.648 0.8m/IAC80/Spain 200s×116 6.4h
09 Mar. 2008 535.904 1.5m/SPM/Mexico 60s×150 2.5h
10 Mar. 2008 536.882 1.5m/SPM/Mexico 60s×200 3.3h
11 Mar. 2008 537.889 1.5m/SPM/Mexico 60s×170 2.8h
27 Feb. 2009 890.826 1.5m/SPM/Mexico 60s×184 3.1h
28 Feb. 2009 891.814 1.5m/SPM/Mexico 60s×227 3.8h
01 Mar. 2009 892.851 1.5m/SPM/Mexico 60s×218 3.6h

– 16 –
Table 2: Log of time-resolved spectroscopic observations of SDSS J123813.73-033933.0
Date HJD Start+ Telescope Exp.Time Duration
2454000 Num. of Integrations
Spectroscopy
24 Jan. 2009 855.99 2.1m/SPM/Mexico 486s×7 0.52h
25 Jan. 2009 856.96 2.1m/SPM/Mexico 486s×17 2.43h
26 Jan. 2009 857.90 2.1m/SPM/Mexico 486s×20 2.69h
27 Jan. 2009 856.96 2.1m/SPM/Mexico 486s×10 1.2h

– 17 –
3.6 3.7 3.8 3.9 4 4.1 4.2 4.3
Log λ (Å)
-17.5
-17
-16.5
-16
-15.5
-15
Log
F (
ergs
cm
s
Å
) SDSS1238
L4WD 12000K M=1.0MAccretion DiscModel
-2
-1
-1 O.
3.62 3.63 3.64 3.65 3.66
-15.5
-15.4
-15.3
-15.2
Log
F (
ergs
cm
s
Å
)
3.68 3.69 3.7
Log λ (Å)
-15.6
-15.5
-15.4
-15.3
3.8 3.85
-15.9
-15.8
-15.7
-15.6
-15.5
-15.4
-15.3
-2
-1
-1
HHγ Hαδ
Fig. 1.— The spectral energy distribution of SDSS 1238 and the result of the model fit (top).
Spectrum fragments around Hγ , Hδ and Hα lines are shown in bottom panels.

– 18 –
4000 4500 5000 5500 6000 6500 7000
λ (Å)
2.0
4.0
6.0
Flu
x ×
10
(er
gs c
m s
Å
)
SPM Apr. 2004
SDSS Apr.2001
SPM Feb. 2009
-16
-
2 -
1
-1
Fig. 2.— The low-resolution time-average spectra of SDSS1238 obtained in different epochs.

– 19 –
6 8 10 12 14 16SpT
0
10
20
30
40
50
12000 14000 16000 18000Teff (K)
0
50
100
150
0 0.1 0.2 0.3 0.4 0.5δ (mag)
0
10
20
30
40
50
0.6 0.8 1M (M )
0
10
20
30
40
50
χ2
WD O.
95%
80%
60%
Fig. 3.— χ2 vs parameters of the fit, where Teff is an effective temperature of the primary
WD, MWD is a mass of the WD, SpT is a spectral type of the secondary (from M6V/SpT=6 to
L6/SpT=16) and δ is a ratio between accretion disk and WD contribution in the continuum flux of
the SDSS1238 in the V band. The formal confidence levels by the fit are presented by dashed lines.
The numbers at the dashed lines are a probability to reject a model with χ2 above corresponding
line.

– 20 –
-1000 0 1000Vx
-1000
0
1000
Vy
-1000 0 1000
-1000
0
1000
-1000 0 1000Vx
-1000
0
1000
Vy
-1000 0 1000
-1000
0
1000
-0.4 -0.2 0 0.2 0.4 0.6 0.8x
-0.6
-0.4
-0.2
0
0.2
0.4
0.6
y
-0.4 -0.2 0 0.2 0.4 0.6 0.8x
-0.6
-0.4
-0.2
0
0.2
0.4
0.6
y
-1000 0 1000Vx
-1000
0
1000
Vy
-1000 0 1000
-1000
0
1000
Fig. 4.— top) Hα Doppler maps constructed on all data obtained in the 2004 (left) and 2009 (right)
yy. The circle show the velocity at 2:1 resonance radius. bottom) The synthetic Doppler map (left)
obtained from a model accretion disk (right) for the system with MWD = 1.0M⊙ and q = 0.05.
The circles correspond to 2:1 and 3:1 resonance radiuses.
– 21 –
156.8 156.9 157 157.1
17.5
18
179.4 179.5 179.6 179.7
17.5
18
182.3 182.4 182.5 182.6
17.5
18
157.8 157.9 158 158.1
17.5
18
179.7 179.8 179.9
17.5
18
182.4 182.5 182.6 182.7
17.5
18
174.7 174.8 174.9 175
17.5
18
180.2 180.3 180.4 180.5
17.5
18
185 185.1 185.2 185.3
17.5
18
177.7 177.8 177.9 178
17.5
18
181.3 181.4 181.5 181.6
17.5
18
216.7 216.8 216.9 217
17.5
18
178.7 178.8 178.9 179
17.5
18
182.1 182.2 182.3 182.4
HJD (+2454000)
17.5
18
218.6 218.7 218.8 218.9 219
17.5
18
155 160 165 170 175 180 185 190 195 200 205 210 215 220
17.5
18
Fig. 5.— The light curve of SDSS 1238 in V band obtained in the 2007 year. Each night is presented
in a separate panel.

– 22 –
535.85 535.9 535.95 536
17.5
18
890.8 890.9 891 891.1
17.5
18
536.85 536.9 536.95 537
17.5
18
891.8 891.9 892 892.1
17.5
18
537.85 537.9 537.95 538
17.5
18
892.8 892.9 893 893.1
17.5
18
HJD (+2454000)
2008yr 2009yr
Fig. 6.— The light curve of SDSS 1238 in V band obtained in 2008 and 2009 yy. Each night is
presented in a separate panel.

– 23 –
182.2 182.4 182.6 182.8HJD (+2454000)
17.2
17.4
17.6
17.8
18
V
~4.4h ~3.8h
-0.11mag/h +0.75mag/h
~0.67h
Fig. 7.— The light curve of SDSS 1238 in V band obtained during about 15 hours continuos obser-
vations in HJD 2454182. Vertical dashed lines select different phases of the long-term variability
(LTV). The numbers in the top of the figure are approximately durations for each marked phase
of LTV and the numbers in the bottom are corresponding rates of the magnitude change during
fading and increasing of the object brightness.
-1 -0.8 -0.6 -0.4 -0.2 0 0.2 0.4 0.6 0.8 1Phase (P = 9.28 h)
17.2
17.4
17.6
17.8
18
V
0 5 10 15 20Frequency (1/day)
0.005
0.01
Pow
er
20 25 30 35 40 45 500
0.0005
0.001f = 2.5858LTV
2f = 35.76orb
2f - fLTVorb 2f + 2fLTVorb 2f + forb LTV2f - f -1
LTV
Fig. 8.— top) The power spectrum of the all photometric data presented in the top panel of Fig.6.
bottom) The light curve comprised of the all data folded on P = 9.28h. The open color points
show brightenings with maximal displacment in the light curve folded on P = 9.28h.

– 24 –
-1 -0.8 -0.6 -0.4 -0.2 0 0.2 0.4 0.6 0.8 1Phase (P = 9.34 h)
17.2
17.4
17.6
17.8
18
V
0 5 10 15 20
Frequency (1/day)
0
0.005
0.01
0.015
0.02
0.025
Pow
er
20 25 30 35 40 45 500
0.0005
0.001
0.0015
0.002f = 2.5696
orb LTV2f - f - 12f = 35.76orb
2f - forb LTV
2f + fLTV
LTVorb
Fig. 9.— top) The power spectrum of the data obtained in the period of HJD 2454177.1-2454185.6
(see Fig.6). bottom) The light curve comprised of the selected data from the period of HJD
2454177.1-2454185.6 folded on P = 9.34h period.
Copyright © 2022 FDOKUMEN