The Sixth Data Release of the Sloan Digital Sky Survey
21
arXiv:0707.3413v2 [astro-ph] 19 Oct 2007 Draft version February 1, 2008 Preprint typeset using L A T E X style emulateapj v. 10/09/06 THE SIXTH DATA RELEASE OF THE SLOAN DIGITAL SKY SURVEY Jennifer K. Adelman-McCarthy, Marcel A. Ag¨ ueros , , Sahar S. Allam , , Carlos Allende Prieto, Kurt S. J. Anderson , , Scott F. Anderson, James Annis, Neta A. Bahcall, C.A.L. Bailer-Jones, Ivan K. Baldry , , J. C. Barentine, Bruce A. Bassett , , Andrew C. Becker, Timothy C. Beers, Eric F. Bell, Andreas A. Berlind, Mariangela Bernardi, Michael R. Blanton, John J. Bochanski, William N. Boroski, Jarle Brinchmann, J. Brinkmann, Robert J. Brunner, Tam´ as Budav´ ari, Samuel Carliles, Michael A. Carr, Francisco J. Castander, David Cinabro, R. J. Cool, Kevin R. Covey, Istv´ an Csabai , , Carlos E. Cunha , , James R. A. Davenport, Ben Dilday , , Mamoru Doi, Daniel J. Eisenstein, Michael L. Evans, Xiaohui Fan, Douglas P. Finkbeiner, Scott D. Friedman, Joshua A. Frieman ,, , Masataka Fukugita, Boris T. G¨ ansicke, Evalyn Gates, Bruce Gillespie, Karl Glazebrook, Jim Gray, Eva K. Grebel , , James E. Gunn, Vijay K. Gurbani , , Patrick B. Hall, Paul Harding, Michael Harvanek, Suzanne L. Hawley, Jeffrey Hayes, Timothy M. Heckman, John S. Hendry, Robert B. Hindsley, Christopher M. Hirata, Craig J. Hogan, David W. Hogg, Joseph B. Hyde, Shin-ichi Ichikawa, ˇ Zeljko Ivezi´ c, Sebastian Jester, Jennifer A. Johnson, Anders M. Jorgensen, Mario Juri´ c, Stephen M. Kent, R. Kessler, S. J. Kleinman, G. R. Knapp, Richard G. Kron , , Jurek Krzesinski , , Nikolay Kuropatkin, Donald Q. Lamb , , Hubert Lampeitl, Svetlana Lebedeva, Young Sun Lee, R. French Leger, S´ ebastien L´ epine, Marcos Lima , , Huan Lin, Daniel C. Long, Craig P. Loomis, Jon Loveday, Robert H. Lupton, Olena Malanushenko, Viktor Malanushenko, Rachel Mandelbaum , , Bruce Margon, John P. Marriner, David Mart´ ınez-Delgado, Takahiko Matsubara, Peregrine M. McGehee, Timothy A. McKay, Avery Meiksin, Heather L. Morrison, Jeffrey A. Munn, Reiko Nakajima, Eric H. Neilsen, Jr., Heidi Jo Newberg, Robert C. Nichol, Tom Nicinski , , Maria Nieto-Santisteban, Atsuko Nitta, Sadanori Okamura, Russell Owen, Hiroaki Oyaizu , , Nikhil Padmanabhan , , Kaike Pan, Changbom Park, John Peoples Jr., Jeffrey R. Pier, Adrian C. Pope, Norbert Purger, M. Jordan Raddick, Paola Re Fiorentin, Gordon T. Richards, Michael W. Richmond, Adam G. Riess, Hans-Walter Rix, Constance M. Rockosi, Masao Sako , , David J. Schlegel, Donald P. Schneider, Matthias R. Schreiber, Axel D. Schwope, Uroˇ s Seljak , , Branimir Sesar, Erin Sheldon , , Kazu Shimasaku, Thirupathi Sivarani, J. Allyn Smith, Stephanie A. Snedden, Matthias Steinmetz, Michael A. Strauss, Mark SubbaRao , , Yasushi Suto, Alexander S. Szalay, Istv´ an Szapudi, Paula Szkody, Max Tegmark, Aniruddha R. Thakar, Christy A. Tremonti, Douglas L. Tucker, Alan Uomoto, Daniel E. Vanden Berk, Jan Vandenberg, S. Vidrih, Michael S. Vogeley, Wolfgang Voges, Nicole P. Vogt, Yogesh Wadadekar, David H. Weinberg, Andrew A. West, Simon D.M. White, Brian C. Wilhite , , Brian Yanny, D. R. Yocum, Donald G. York , , Idit Zehavi, Daniel B. Zucker Draft version February 1, 2008 ABSTRACT This paper describes the Sixth Data Release of the Sloan Digital Sky Survey. With this data release, the imaging of the Northern Galactic Cap is now complete. The survey contains images and parameters of roughly 287 million objects over 9583 deg 2 , including scans over a large range of Galactic latitudes and longitudes. The survey also includes 1.27 million spectra of stars, galaxies, quasars and blank sky (for sky subtraction) selected over 7425 deg 2 . This release includes much more extensive stellar spectroscopy than previously, and also includes detailed estimates of stellar temperatures, gravities, and metallicities. The results of improved photometric calibration are now available, with uncertainties of roughly 1% in g, r, i, and z , and 2% in u, substantially better than the uncertainties in previous data releases. The spectra in this data release have improved wavelength and flux calibration, especially in the extreme blue and extreme red, leading to the qualitatively better determination of stellar types and radial velocities. The spectrophotometric fluxes are now tied to point spread function magnitudes of stars rather than fiber magnitudes. This gives more robust results in the presence of seeing variations, but also implies a change in the spectrophotometric scale, which is now brighter by roughly 0.35 mags. Systematic errors in the velocity dispersions of galaxies have been fixed, and the results of two independent codes for determining spectral classifications and redshifts are made available. Additional spectral outputs are made available, including calibrated spectra from individual 15-minute exposures and the sky spectrum subtracted from each exposure. We also quantify a recently recognized under-estimation of the brightnesses of galaxies of large angular extent due to poor sky subtraction; the bias can exceed 0.2 mag for galaxies brighter than r = 14 mag. Subject headings: Atlases—Catalogs—Surveys 1 Fermi National Accelerator Laboratory, P.O. Box 500, Batavia, IL 60510. 2 Columbia Astrophysics Laboratory, 550 West 120th Street, New York, NY 10027. 3 NSF Astronomy and Astrophysics Postdoctoral Fellow. 4 Department of Physics and Astronomy, University of Wyoming, Laramie, WY 82071. 5 McDonald Observatory and Department of Astronomy, The University of Texas, 1 University Station, C1400, Austin, TX 78712-0259. 6 Apache Point Observatory, P.O. Box 59, Sunspot, NM 88349.
-
Upload
boundlesscareers -
Category
Documents
-
view
5 -
download
0
Transcript of The Sixth Data Release of the Sloan Digital Sky Survey

arX
iv:0
707.
3413
v2 [
astr
o-ph
] 1
9 O
ct 2
007
Draft version February 1, 2008Preprint typeset using LATEX style emulateapj v. 10/09/06
THE SIXTH DATA RELEASE OF THE SLOAN DIGITAL SKY SURVEY
Jennifer K. Adelman-McCarthy, Marcel A. Agueros,, Sahar S. Allam,, Carlos Allende Prieto, Kurt S. J.Anderson,, Scott F. Anderson, James Annis, Neta A. Bahcall, C.A.L. Bailer-Jones, Ivan K. Baldry,, J. C.Barentine, Bruce A. Bassett,, Andrew C. Becker, Timothy C. Beers, Eric F. Bell, Andreas A. Berlind,
Mariangela Bernardi, Michael R. Blanton, John J. Bochanski, William N. Boroski, Jarle Brinchmann, J.Brinkmann, Robert J. Brunner, Tamas Budavari, Samuel Carliles, Michael A. Carr, Francisco J. Castander,
David Cinabro, R. J. Cool, Kevin R. Covey, Istvan Csabai,, Carlos E. Cunha,, James R. A. Davenport, BenDilday,, Mamoru Doi, Daniel J. Eisenstein, Michael L. Evans, Xiaohui Fan, Douglas P. Finkbeiner, Scott D.Friedman, Joshua A. Frieman,,, Masataka Fukugita, Boris T. Gansicke, Evalyn Gates, Bruce Gillespie, KarlGlazebrook, Jim Gray, Eva K. Grebel,, James E. Gunn, Vijay K. Gurbani,, Patrick B. Hall, Paul Harding,Michael Harvanek, Suzanne L. Hawley, Jeffrey Hayes, Timothy M. Heckman, John S. Hendry, Robert B.
Hindsley, Christopher M. Hirata, Craig J. Hogan, David W. Hogg, Joseph B. Hyde, Shin-ichi Ichikawa, ZeljkoIvezic, Sebastian Jester, Jennifer A. Johnson, Anders M. Jorgensen, Mario Juric, Stephen M. Kent, R.
Kessler, S. J. Kleinman, G. R. Knapp, Richard G. Kron,, Jurek Krzesinski,, Nikolay Kuropatkin, Donald Q.Lamb,, Hubert Lampeitl, Svetlana Lebedeva, Young Sun Lee, R. French Leger, Sebastien Lepine, MarcosLima,, Huan Lin, Daniel C. Long, Craig P. Loomis, Jon Loveday, Robert H. Lupton, Olena Malanushenko,Viktor Malanushenko, Rachel Mandelbaum,, Bruce Margon, John P. Marriner, David Martınez-Delgado,Takahiko Matsubara, Peregrine M. McGehee, Timothy A. McKay, Avery Meiksin, Heather L. Morrison,
Jeffrey A. Munn, Reiko Nakajima, Eric H. Neilsen, Jr., Heidi Jo Newberg, Robert C. Nichol, Tom Nicinski,,Maria Nieto-Santisteban, Atsuko Nitta, Sadanori Okamura, Russell Owen, Hiroaki Oyaizu,, Nikhil
Padmanabhan,, Kaike Pan, Changbom Park, John Peoples Jr., Jeffrey R. Pier, Adrian C. Pope, NorbertPurger, M. Jordan Raddick, Paola Re Fiorentin, Gordon T. Richards, Michael W. Richmond, Adam G. Riess,Hans-Walter Rix, Constance M. Rockosi, Masao Sako,, David J. Schlegel, Donald P. Schneider, Matthias R.
Schreiber, Axel D. Schwope, Uros Seljak,, Branimir Sesar, Erin Sheldon,, Kazu Shimasaku, ThirupathiSivarani, J. Allyn Smith, Stephanie A. Snedden, Matthias Steinmetz, Michael A. Strauss, Mark SubbaRao,,Yasushi Suto, Alexander S. Szalay, Istvan Szapudi, Paula Szkody, Max Tegmark, Aniruddha R. Thakar,
Christy A. Tremonti, Douglas L. Tucker, Alan Uomoto, Daniel E. Vanden Berk, Jan Vandenberg, S. Vidrih,Michael S. Vogeley, Wolfgang Voges, Nicole P. Vogt, Yogesh Wadadekar, David H. Weinberg, Andrew A.
West, Simon D.M. White, Brian C. Wilhite,, Brian Yanny, D. R. Yocum, Donald G. York,, Idit Zehavi, DanielB. Zucker
Draft version February 1, 2008
ABSTRACT
This paper describes the Sixth Data Release of the Sloan Digital Sky Survey. With this datarelease, the imaging of the Northern Galactic Cap is now complete. The survey contains imagesand parameters of roughly 287 million objects over 9583 deg2, including scans over a large range ofGalactic latitudes and longitudes. The survey also includes 1.27 million spectra of stars, galaxies,quasars and blank sky (for sky subtraction) selected over 7425 deg2. This release includes muchmore extensive stellar spectroscopy than previously, and also includes detailed estimates of stellartemperatures, gravities, and metallicities. The results of improved photometric calibration are nowavailable, with uncertainties of roughly 1% in g, r, i, and z, and 2% in u, substantially better than theuncertainties in previous data releases. The spectra in this data release have improved wavelengthand flux calibration, especially in the extreme blue and extreme red, leading to the qualitativelybetter determination of stellar types and radial velocities. The spectrophotometric fluxes are now tiedto point spread function magnitudes of stars rather than fiber magnitudes. This gives more robustresults in the presence of seeing variations, but also implies a change in the spectrophotometric scale,which is now brighter by roughly 0.35 mags. Systematic errors in the velocity dispersions of galaxieshave been fixed, and the results of two independent codes for determining spectral classifications andredshifts are made available. Additional spectral outputs are made available, including calibratedspectra from individual 15-minute exposures and the sky spectrum subtracted from each exposure.We also quantify a recently recognized under-estimation of the brightnesses of galaxies of large angularextent due to poor sky subtraction; the bias can exceed 0.2 mag for galaxies brighter than r = 14mag.
Subject headings: Atlases—Catalogs—Surveys
1 Fermi National Accelerator Laboratory, P.O. Box 500, Batavia, IL 60510.2 Columbia Astrophysics Laboratory, 550 West 120th Street, New York, NY 10027.3 NSF Astronomy and Astrophysics Postdoctoral Fellow.4 Department of Physics and Astronomy, University of Wyoming, Laramie, WY 82071.5 McDonald Observatory and Department of Astronomy, The University of Texas, 1 University Station, C1400, Austin, TX 78712-0259.6 Apache Point Observatory, P.O. Box 59, Sunspot, NM 88349.
2 Adelman-McCarthy et al.
1. INTRODUCTION
The Sloan Digital Sky Survey (SDSS; York et al. 2000) is a comprehensive imaging and spectroscopic survey of theoptical sky using a dedicated 2.5-meter telescope (Gunn et al. 2006) at Apache Point Observatory in southern NewMexico. The telescope has a 3◦ diameter field of view, and the imaging uses a drift-scanning camera (Gunn et al.1998) with 30 2048 × 2048 CCDs at the focal plane which image the sky in five broad filters covering the range from3000A to 10,000A (Fukugita et al. 1996; Stoughton et al. 2002). The imaging is carried out on moonless and cloudlessnights of good seeing (Hogg et al. 2001), and the resulting images are calibrated photometrically (Tucker et al. 2006;Padmanabhan et al. 2007) to a series of photometric standards around the sky (Smith et al. 2002). After astrometriccalibration (Pier et al. 2003) the properties of detected objects in the five filters are measured in detail (Lupton et
7 Department of Astronomy, MSC 4500, New Mexico State University, P.O. Box 30001, Las Cruces, NM 88003.8 Department of Astronomy, University of Washington, Box 351580, Seattle, WA 98195.9 Department of Astrophysical Sciences, Princeton University, Princeton, NJ 08544.10 Max-Planck-Institut fur Astronomie, Konigstuhl 17, D-69117 Heidelberg, Germany.11 Astrophysics Research Institute, Liverpool John Moores University, Twelve Quays House, Egerton Wharf, Birkenhead CH41 1LD,
UK.12 Center for Astrophysical Sciences, Department of Physics and Astronomy, Johns Hopkins University, 3400 North Charles Street,
Baltimore, MD 21218.13 South African Astronomical Observatory, Observatory, Cape Town, South Africa.14 University of Cape Town, Rondebosch, Cape Town, South Africa.15 Dept. of Physics & Astrophysics, CSCE: Center for the Study of Cosmic Evolution, and JINA: Joint Institute for Nuclear Astrophysics,
Michigan State University, E. Lansing, MI 48824, USA.16 Center for Cosmology and Particle Physics, Department of Physics, New York University, 4 Washington Place, New York, NY 10003.
17 Department of Physics and Astronomy, University of Pennsylvania, 209 South 33rd Street, Philadelphia, PA 19104.18 Centro de Astrofısica da Universidade do Porto, Rua das Estrelas - 4150-762 Porto, Portugal.19 Department of Astronomy, University of Illinois, 1002 West Green Street, Urbana, IL 61801.20 Institut de Ciencies de l’Espai (IEEC/CSIC), Campus UAB, E-08193 Bellaterra, Barcelona, Spain.21 Department of Physics and Astronomy, Wayne State University, Detroit, MI 48202.22 Steward Observatory, 933 North Cherry Avenue, Tucson, AZ 85721.23 Harvard-Smithsonian Center for Astrophysics, 60 Garden Street, Cambridge MA 02138.24 Department of Physics of Complex Systems, Eotvos Lorand University, Pf. 32, H-1518 Budapest, Hungary.25 Department of Astronomy and Astrophysics, University of Chicago, 5640 South Ellis Avenue, Chicago, IL 60637.26 Kavli Institute for Cosmological Physics, The University of Chicago, 5640 South Ellis Avenue, Chicago, IL 60637.27 Department of Physics, University of Chicago, 5640 South Ellis Avenue, Chicago, IL 60637.28 Institute of Astronomy, Graduate School of Science, The University of Tokyo, 2-21-1 Osawa, Mitaka, 181-0015, Japan.29 Space Telescope Science Institute, 3700 San Martin Drive, Baltimore, MD 21218.30 Institute for Cosmic Ray Research, The University of Tokyo, 5-1-5 Kashiwa, Kashiwa City, Chiba 277-8582, Japan.31 Department of Physics, University of Warwick, Coventry CV4 7AL, United Kingdom.32 Centre for Astrophysics & Supercomputing, Swinburne University of Technology, P.O. Box 218, Hawthorn, VIC 3122, Australia.33 Microsoft Research, 455 Market Street, Suite 1690, San Francisco, CA 94105.34 Astronomical Institute, Department of Physics and Astronomy, University of Basel, Venusstrasse 7, CH-4102 Binningen, Switzerland.
35 Astronomisches Rechen-Institut, Zentrum fur Astronomie, University of Heidelberg, Monchhofstrasse 12-14, D-69120 Heidelberg,Germany.
36 Bell Laboratories, Alcatel-Lucent, 2701 Lucent Lane, Rm. 9F-546, Lisle, Illinois 60532.37 Dept. of Physics & Astronomy, York University, 4700 Keele St., Toronto, ON, M3J 1P3, Canada38 Department of Astronomy, Case Western Reserve University, Cleveland, OH 44106.39 Lowell Observatory, 1400 W Mars Hill Rd, Flagstaff AZ 86001.40 Institute for Astronomy and Computational Sciences, Physics Department, Catholic University of America, Washington DC 2006441 Code 7215, Remote Sensing Division, Naval Research Laboratory, 4555 Overlook Avenue SW, Washington, DC 20392.42 Institute for Advanced Study, Einstein Drive, Princeton, NJ 08540.43 National Astronomical Observatory, 2-21-1 Osawa, Mitaka, Tokyo 181-8588, Japan.44 Department of Astronomy, Ohio State University, 140 West 18th Avenue, Columbus, OH 43210.45 Electrical Engineering Department, New Mexico Institute of Mining and Technology, 801 Leroy Place, Socorro, NM 87801.46 Enrico Fermi Institute, University of Chicago, 5640 South Ellis Avenue, Chicago, IL 60637.47 Gemini Observatory, 670 N. A’ohoku Place, Hilo, HI 96720, USA48 Obserwatorium Astronomiczne na Suhorze, Akademia Pedogogiczna w Krakowie, ulica Podchorazych 2, PL-30-084 Kracow, Poland.49 Department of Astrophysics, American Museum of Natural History, Central Park West at 79th Street, New York, NY 1002450 Astronomy Centre, University of Sussex, Falmer, Brighton BN1 9QH, UK.51 Hubble Fellow.52 Department of Astronomy & Astrophysics, University of California, Santa Cruz, CA 95064.53 Instituto de Astrofisica de Canarias, La Laguna, Spain.54 Department of Physics and Astrophysics, Nagoya University, Chikusa, Nagoya 464-8602, Japan.55 IPAC, MS 220-6, California Institute of Technology, Pasadena, CA 91125.56 Department of Physics, University of Michigan, 500 East University Avenue, Ann Arbor, MI 48109.57 SUPA, Institute for Astronomy, Royal Observatory, University of Edinburgh, Blackford Hill, Edinburgh EH9 3HJ, UK.58 US Naval Observatory, Flagstaff Station, 10391 W. Naval Observatory Road, Flagstaff, AZ 86001-8521.59 Department of Physics, Applied Physics, and Astronomy, Rensselaer Polytechnic Institute, 110 Eighth Street, Troy, NY 12180.60 Institute of Cosmology and Gravitation (ICG), Mercantile House, Hampshire Terrace, Univ. of Portsmouth, Portsmouth, PO1 2EG,
UK.61 CMC Electronics Aurora, 84 N. Dugan Rd. Sugar Grove, IL 60554.62 Department of Astronomy and Research Center for the Early Universe, Graduate School of Science, The University of Tokyo, 7-3-1
Hongo, Bunkyo, Tokyo 113-0033, Japan.63 Lawrence Berkeley National Laboratory, One Cyclotron Road, Berkeley, CA 94720.64 Korea Institute for Advanced Study, 207-43 Cheong-Nyang-Ni, 2 dong, Seoul 130-722, Korea65 Institute for Astronomy, 2680 Woodlawn Road, Honolulu, HI 96822.

SDSS DR6 3
al. 2001; Stoughton et al. 2002). Subsets of these objects are selected for spectroscopy, including galaxies (Strauss etal. 2002; Eisenstein et al. 2001), quasars (Richards et al. 2002), and stars. The spectroscopic targets are assigned toa series of plates containing 640 objects each (Blanton et al. 2003), and spectra are measured using a pair of doublespectrographs, each covering the wavelength range 3800–9200A with a resolution λ/∆λ which varies from 1850 to2200. These spectra are wavelength- and flux-calibrated, and classifications and redshifts, as well as spectral types forstars, are determined by a series of software pipelines (Subbarao et al. 2002). The data are then made available boththrough an object-oriented database (the Catalog Archive Server, hereafter “CAS”), and as flat data files (the DataArchive Server, hereafter “DAS”).
The SDSS telescope saw first light in May 1998, and entered routine operations in April 2000. We have issueda series of yearly public data releases, which have been described in accompanying papers (Stoughton et al. 2000,hereafter the Early Data Release, or EDR paper; Abazajian et al. 2003, 2004, 2005; hereafter the DR1, DR2, and DR3papers respectively, and Adelman-McCarthy et al. 2006, 2007; hereafter the DR4 and DR5 papers, respectively). Thecurrent paper describes the Sixth Data Release (DR6), which includes data taken through June 2006. Access to thedata themselves may be found on the DR6 website85. This website includes links to both the CAS and DAS websites,which contain extensive documentation on how to access the data.
When the SDSS started routine operations, the budget funded operations for five years, i.e., through summer2005. Additional funding from the National Science Foundation, the Alfred P. Sloan Foundation, and the memberinstitutions secured another three years of operations, and the present data release includes data from the first yearof this extended period, termed SDSS-II. SDSS-II has three components: Legacy, which aims to complete the imagingand spectroscopy of a contiguous ∼ 7700 deg2 region in the Northern Galactic Cap, SEGUE (Sloan Extension forGalactic Understanding and Exploration), which is carrying out an additional 3500 deg2 of imaging and spectroscopyof 240,000 stars to study the structure of our Milky Way, and Supernovae (Frieman et al. 2007), which repeatedlyimages a ∼ 300 deg2 equatorial stripe in the Southern Galactic Cap to search for supernovae in the redshift range0.05 < z < 0.35 for measurement of the redshift-distance relation.
DR6 is cumulative, in the sense that it includes all data that were included in previous data releases. However, as wedescribe in detail in this paper, we have incorporated into this data release a number of improvements and additionsto the software. These include:
• Improved photometric calibration, using overlaps between the imaging scans;
• Improved wavelength and flux calibration of the spectra;
• Improved velocity dispersion measurements for galaxies;
• Results of an independent determination of galaxy and quasar redshifts and stellar radial velocities;
• Effective temperatures, surface gravities and metallicities for many stars with spectra.
All DR6 data, including those included in previous releases, have been reprocessed with the new software.In § 2, the sky coverage of the data included in DR6 is presented. Section 3 describes new features of the imaging data,
including extensive low-latitude imaging, target selection of the SEGUE plates, improved photometric calibration, anda recently recognized systematic error in sky subtraction which affects the photometry of bright galaxies. Section 4describes the extensive reprocessing we have done of our spectra, including improved flux and wavelength calibration,the determination of surface temperatures, metallicities and gravities of stars with spectra, the availability of twoindependent determinations of object redshifts, and improved velocity dispersions of galaxies. We summarize DR6 in§ 5.
66 Department of Physics, Drexel University, 3141 Chestnut Street, Philadelphia, PA 19104.67 Department of Physics, Rochester Institute of Technology, 84 Lomb Memorial Drive, Rochester, NY 14623-5603.68 UCO/Lick Observatory, University of California, Santa Cruz, CA 95064.69 Kavli Institute for Particle Astrophysics & Cosmology, Stanford University, P.O. Box 20450, MS29, Stanford, CA 94309.70 Department of Astronomy and Astrophysics, 525 Davey Laboratory, Pennsylvania State University, University Park, PA 16802.71 Universidad de Valparaiso, Departamento de Fisica y Astronomia, Valparaiso, Chile.72 Astrophysical Institute Potsdam, An der Sternwarte 16, 14482 Potsdam, Germany.73 Joseph Henry Laboratories, Princeton University, Princeton, NJ 08544.74 Institute for Theoretical Physics, University of Zurich, Zurich 8057 Switzerland.75 Department of Physics and Astronomy, Austin Peay State University, P.O. Box 4608, Clarksville, TN 37040.76 Adler Planetarium and Astronomy Museum, 1300 Lake Shore Drive, Chicago, IL 60605.77 Department of Physics and Research Center for the Early Universe, Graduate School of Science, The University of Tokyo, 7-3-1
Hongo, Bunkyo, Tokyo 113-0033, Japan.78 Dept. of Physics, Massachusetts Institute of Technology, Cambridge, MA 02139.79 Observatories of the Carnegie Institution of Washington, 813 Santa Barbara Street, Pasadena, CA 91101.80 Institute of Astronomy, University of Cambridge, Madingley Road, Cambridge CB3 0HA, UK.81 Max-Planck-Institut fur extraterrestrische Physik, Giessenbachstrasse 1, D-85741 Garching, Germany.82 Astronomy Department, 601 Campbell Hall, University of California, Berkeley, CA 94720-3411.83 Max Planck Institut fur Astrophysik, Postfach 1, D-85748 Garching, Germany.84 National Center for Supercomputing Applications, 1205 West Clark Street, Urbana, IL 61801.85 http://www.sdss.org/dr6

4 Adelman-McCarthy et al.
TABLE 1Coverage and Contents of DR6
Imaging
Imaging area in CAS 9583 deg2
Imaging catalog in CAS 287 million unique objectsLegacy footprint area 8417 deg2 (5% increment over DR5)Legacy imaging catalog 230 million unique objectsSEGUE footprint area, available in DASa 1592 deg2
SEGUE footprint area, available in CAS 1166 deg2
SEGUE imaging catalog 57 million unique objectsM31, Perseus scan area ∼ 26 deg2
Southern Equatorial Stripe with > 50 repeat scans ∼ 300 deg2
Commissioning (“Orion”) data 832 deg2
Spectroscopy
Spectroscopic footprint area 7425 deg2 (20% increment over DR5)Legacy 6860 deg2
SEGUE 565 deg2
Total number of plate observations (640 fibers each) 1987Legacy survey plates 1520SEGUE plates 162Special program plates 226Repeat observations of plates 79
Total number of spectra 1,271,680Galaxiesb 790,860Quasars 103,647Stars 287,071Sky 68,770Unclassifiable 21,332
Spectra after removing skies and duplicates 1,115,971
a Includes regions of high stellar density, where the photometry is likely to be poor. Seetext for details.b Spectral classifications from the spectro1d code; numbers include duplicates.The complete MAIN sample (Strauss et al. 2002) includes 585,719 galaxies after duplicatesare removed, while the luminous red galaxy sample (Eisenstein et al. 2001) contains 79,891galaxies.
2. THE SKY COVERAGE OF THE SDSS DR6
In the Spring of 2006, the imaging for the SDSS Legacy survey was essentially completed. The Northern GalacticCap in DR6 is now contiguous, with the exception of 10 deg2 spread among several holes in the survey; these havesince been imaged, and will be included in the Seventh Data Release. The Northern Galactic Cap imaging surveycovers 7668 deg2 in DR6; the additional Legacy scans in the Southern Galactic Cap bring the total to 8417 deg2. Thesky coverage of the imaging data is shown in Figure 1, and is tabulated in Table 1. The images, spectra, and resultingcatalogs are all available from the DAS; with a few exceptions noted below, all the catalogs are available from the CASas well.
The imaging data are the union of three data sets:
• Legacy data, which includes the large contiguous region in the Northern Galactic Cap, as well as three 2.5◦ widestripes in the Southern Galactic Cap. These are shown in gray. The lighter gray indicates those regions new toDR6, containing 417 deg2; the entire Legacy area available in DR6 is 8417 deg2.
• Imaging stripes (also 2.5◦ wide) as part of the SEGUE survey. These do not aim to cover a contiguous area,but are separated by roughly 20◦ and are designed to sparsely sample the large-scale distribution of stars inthe Galactic halo. These cover just under 1600 deg2, and are all available in the DAS. Notice that many ofthese stripes go to quite low Galactic latitude, and some cross the Galactic Plane. As we describe in § 3.1, theSDSS photometric pipeline is not optimized for crowded fields, and thus the photometry of objects at the lowestGalactic latitudes is not reliable. Of these data, 1166 deg2 are available in the CAS in a separate database fromthe Legacy imaging; these are the regions in which the outputs of the photometric pipeline are most reliable, andwhich have been used for spectroscopic targeting (§ 3.2). The SEGUE imaging that is available in both CASand DAS is indicated in red; purple indicates the area only available in the DAS.
• Additional imaging taken as part of various auxiliary programs as part of the SDSS, including scans of the regionaround M31 and Perseus (see the description in the DR5 paper), and adding up to roughly 26 deg2. These scansare indicated in blue. These data are not included in the CAS, but are available in the DAS.
In addition, the 2.5◦ wide Equatorial Stripe (“Stripe 82”) in the Southern Galactic Cap has been imaged multipletimes through the course of the SDSS, and again as part of the Supernova component of SDSS-II (Frieman et al. 2007).Sixty-five scans of Stripe 82 observed through Fall 2004 are of survey quality, i.e., they were taken under moonless and

SDSS DR6 5
Fig. 1.— The distribution on the sky of the data included in DR6 (upper panel: imaging; lower panel: spectra), shown in an Aitoffequal-area projection in J2000 Equatorial Coordinates. The Galactic Plane is the sinuous line that goes through each panel. The centerof each panel is at α = 120◦ ≡ 8h, and that the plots cut off at δ = −20◦. The Legacy imaging survey covers the contiguous area of theNorthern Galactic Cap (centered roughly at α = 200◦, δ = 30◦), as well as three stripes (each of width 2.5◦) in the Southern Galactic Cap.The regions new to DR6 are shown in lighter shading than the rest in both panels. In addition, several stripes (indicated in blue in theimaging data) are auxiliary imaging data in the vicinity of M31 and the Perseus Cluster, while the SEGUE imaging scans are availablein the DAS and CAS (red) and DAS only (purple). The green scans are additional runs as described in Finkbeiner et al. (2004). In thespectroscopy panel, special plates (in the sense of the DR4 paper) are indicated in blue, while SEGUE plates are in red. Note that manyplates overlap; for example, there are SEGUE plates in the contiguous area of the Northern Galactic Cap, and the Equatorial Stripe in theSouthern Galactic Cap, which appears solid blue, is also completely covered by the Legacy survey.
cloudless skies in good seeing. As in DR5, we make the calibrated object catalogs and the images corrected for bias,flatfield, and image defects available through the DAS. There were an additional 171 supernova runs taken in the Fallseasons of 2005 and 2006. Much of these data were taken under non-photometric conditions, poor seeing, or duringbright moon, and thus the photometry is not reliable at face value (although Ivezic et al. 2007 have demonstrated thatit can be calibrated quite well after the fact). The images and the uncalibrated object catalogs for these runs are madeavailable through the DAS as well. Stripe 82 is composed of two overlapping strips (York et al. 2000), and Figure 2shows the number of times each right ascension of the two strips is covered in the data through 2004 and as part ofthe Supernova survey.
Finkbeiner et al. (2004) made available 470 deg2 of imaging on the Southern Equatorial Stripe taken early in thesurvey but not included in either the DAS or the CAS. With DR6, we release an additional 362 deg2 of imaging data;these runs are indicated in green in Figure 1.
The DR6 spectroscopy contains 1,271,680 spectra over 1987 plate observations. Of these, 1520 plates are from themain Legacy survey, and there are 64 repeat observations (“extra plates”) of 55 distinct Legacy plates. In addition,

6 Adelman-McCarthy et al.
Fig. 2.— Stripe 82, the Equatorial stripe in the South Galactic Cap, has been imaged multiple times. The lower pair of curves in blackshow the number of scans covering a given right ascension in the North and South strip through Fall 2004 (these data were also included inDR5); these data are available through the DAS. Since that time, Stripe 82 has been covered many more times as part of a comprehensivesurvey for 0.05 < z < 0.35 supernovae, although often in conditions of poor seeing, bright moon, and/or clouds; the number of additionalscans at each right ascension in the North and South strip is indicated in red. These latter data have not been flux-calibrated.
there are 234 observations of 226 distinct “special” plates of the various programs described in the DR5 paper86,indicated in blue in Figure 1, and 169 observations of 162 distinct special plates taken as part of SEGUE (see §3.2)(indicated in red). In total, these plates cover 7425 deg2 (not including overlaps). Thirty-two fibers (64 fibers forthe SEGUE plates) are dedicated to background sky subtraction on each plate, about 0.7% of spectra are repeatobservations on overlapping plates for quality assurance (and science; see e.g., Wilhite et al. 2005) and roughly 1%of spectra are too low in signal-to-noise ratio (S/N) for unambiguous classification, so there are roughly 1.1 milliondistinct objects with useful spectra in the DR6. This represents a roughly 20% increase over DR5. The areas of skynew to DR6 are represented in lighter gray in Figure 1. We plan to complete the spectroscopy of the contiguous areaof the Northern Galactic Cap in the Spring of 2008.
The average seeing (see Figure 4 of the DR1 paper) and limiting magnitude of the imaging data, as well as thetypical S/N of the main survey spectra, are essentially unchanged from previous data releases; see the summary ofsurvey characteristics in Table 1 of the DR5 paper.
3. CHARACTERIZATION AND USE OF THE IMAGING DATA
The SDSS photometric processing pipeline has been stable since DR2, and thus the quantities measured for allobjects included in DR5 have been copied wholesale into DR6. This version of the pipeline has been used for the smallamount of Northern Galactic Cap data new to DR6, as well as the SEGUE imaging scans shown in Figure 1. The
86 An updated special-plate list is at http://www.sdss.org/dr6/products/spectra/special.html .

SDSS DR6 7
magnitudes quoted in the SDSS archives are asinh magnitudes (Lupton et al. 1999).
3.1. SEGUE data at low Galactic latitudes
The SEGUE imaging survey is designed to explore the structure of the Milky Way at both high and low Galacticlatitudes, and thus extends to lower latitudes than did the Legacy survey. This extension gives us better leverage onthe spatial distribution of stars in the disk components of the Milky Way, and on the three-dimensional shape of thestellar halo. Eighty-six of the 162 SEGUE plates were targeted off SEGUE imaging, while the remainder were targetedoff Legacy imaging. The SEGUE imaging scans are made available in a separate database, termed “SEGUEDR6”,within the CAS.
The SEGUE imaging data close to the Galactic plane have regions of higher dust extinction and object densitythan does the high-latitude SDSS. The SDSS imaging reduction pipelines used to reduce the data for DR6 were notdesigned for optimal performance in crowded fields, and are known to fail for some of these data. In particular:
• When the images are sufficiently crowded, the code has trouble finding suitable isolated stars from which to mea-sure the point spread function (PSF). Without a suitable determination of the PSF, the brightness measurementsby the pipeline (Stoughton et al. 2002) are inaccurate.
• The pipeline attempts to deblend objects with overlapping images, but the deblend algorithm fails when thenumber of overlapping objects gets too large, such as happens in sufficiently crowded fields. In such fields, thenumber of detected objects reported by the pipeline can be a dramatic underestimate.
• At low latitudes, the dust causing Galactic extinction (as measured by Schlegel, Finkbeiner & Davis 1998,hereafter SFD) cannot be assumed to lie completely in front of the stars in the sample. This has an effect onthe interpretation of quality assurance tools based on the position of the stellar locus, as we describe below.
Therefore, it is necessary to check that the quality of the reductions in any area of the sky of interest is adequate toaddress a particular science application of the data.
As Ivezic et al. (2004) and the DR3 paper explain, we use a series of automated quality checks on the imaging datato determine whether the data meet our science requirements; the results of these tests are made available in the CAS.These checks are available for the SEGUE imaging as well. The best indicator of bad PSF photometry is the differencebetween PSF and large aperture magnitudes for stars brighter than 19th magnitude. If the median difference betweenthe two is greater than 0.03 mag, the PSF photometry will not make the survey requirement of 2% calibration errorin g, r, or i. About 2.3% of the fields of the SEGUE imaging data loaded into the CAS in DR6 fail this criterion87.For comparison, about 1.6% of all fields in the SDSS Legacy footprint in DR6 fail this criterion.
The automated overall measurement of the quality in a given field also takes into account the location of the stellarlocus in the ugr and gri color-color diagrams, and how it differs in each field from the average value over the entiresurvey (see the discussion in Ivezic et al. 2004). These color-color diagrams are made with SFD extinction-correctedmagnitudes, so even for very good photometry they may vary from the survey average if that extinction correctionis not valid for any reason. The user should apply appropriate caution in interpretation of the stellar locus locationdiagnostics in the quality assurance for these data.
Finally, the photometric pipeline performs poorly for a stellar density greater than ∼ 5000 objects brighter than thedetection limit per 10′ × 13′ field, or about 140, 000 objects deg−2, a density roughly ten times the density at highlatitudes. The outputs of the photometric pipeline are quite incomplete (and indeed, confusingly, can fall well below5000 objects per field) and can be unreliable for more crowded fields. Almost all the SEGUE data affected by thisproblem are in the DAS only; the SEGUE imaging in the CAS (which is the subset used for SEGUE target selection;see below) largely avoids these crowded areas of the sky.
3.2. SEGUE target selection
SEGUE has as one of its goals a kinematic and stellar population study of the high-latitude thick disk and halo ofthe Milky Way. The halo is sampled sparsely with a series of tiles each of seven deg2 in both the SEGUE imagingstripes and the main Legacy survey area, with centers separated by roughly 10 deg. Each such tile is sampled withtwo pointings, one plate for stars brighter than r = 17.8 (approximately the median target magnitude), and oneplate, which typically gets double the standard exposure time, for fainter stars. The target selection categories andcriteria are summarized in Table 2 (listed roughly in order from bluest to reddest targets); see the DR4 paper for adescription of an earlier version of SEGUE targeting. Most of the target selection categories are sparsely sampled,with a sampling rate that depends on magnitude; see the on-line documentation for more details. The target selectionbits in the PrimTarget flag are indicated in the table. Spectra with target selection bits set by the SEGUE targetselection algorithm have PrimTarget bit 0x80000000 and SecTarget bit 0x40000000 set.
Half of the science targets on each line of sight are selected using color-color and color-magnitude cuts designed tosample at varying densities across the main sequence from g− r = 0.75 (K dwarfs at Teff < 5000K). To this sample weadd metal-poor main sequence turnoff stars selected by their blue ugr colors, essentially an ultraviolet excess cut thatis highly efficient at separating the halo from the thick disk near the turnoff. At the faint end, r = 19.5, the averagestar that makes this selection is at a heliocentric distance of 10 kpc for [Fe/H] = −1.54. To reach to greater distances,
87 Of course, a much larger fraction of the additional SEGUE data available in the DAS also fail this criterion.

8 Adelman-McCarthy et al.
TABLE 2SEGUE targeting algorithms
Category Bit (Hex) Color cuts #/tile
White dwarf 0x80080000 g < 20.3,−1 < g−r < −0.2,−1 < u−g < 0.7, u−g+2(g−r) < −0.1 25A, BHB stars 0x80020000 g < 20.5, 0.8 < u − g < 1.5, −0.5 < g − r < 0.2 ≤155Metal-poor MS turnoff 0x80100000 g < 20.3, −0.7 < P1 < −0.25, 0.4 < u − g < 1.4, 0.2 < g − r < 3.0 200F/G stars 0x80000200 14.0 < g < 20.2, 0.2 < g − r < 0.48 50G stars 0x80040000 14.0 < r < 20.2, 0.48 < g − r < 0.55 375Cool white dwarf 0x80020000 14.5 < r < 20.5, −2 < g − i, Hg > max[17.5, 16.05 + 2.9(g − i)],
g − i <
0.12 neighbor with g < 22 within 7′′
1.7 otherwise
10
Low metallicity 0x80010000 r < 19.5, −0.5 < g − r < 0.75, 0.6 < u − g < 3.0, l > 0.135 150K giant 0x80040000 r < 20.2, 0.7 < u − g < 4.0, 0.5 < g − r < 0.9, 0.15 < r − i < 0.6,
l > 0.07, µ < 0.011′′/yr95
K dwarf 0x80008000 14.5 < r < 19.0, 0.55 < g − r < 0.75 95MS/WD pairs 0x80001000 15 < g < 20, u − g < 2.25, −0.2 < g − r < 1.2, 0.5 < r − i < 2.0,
−19.78(r − i) + 11.13 < g − r < 0.95(r − i) + 0.5,
i − z >
0.5 if r − i > 1.00.68(r − i) − 0.18 otherwise
5-10
M subdwarf 0x80400000 14.5 < r < 19.0, g − r > 1.6, 0.95 < r − i < 1.3 5High µ M subdwarf 0x80400000 µ > 0.04′′/yr, r − z > 1.0, 15 + 3.5(g − i) > Hr > 12 + 3.5(r − z) 60Brown dwarf 0x80200000 z < 19.5, u > 21, g > 22, r > 21, i − z > 1.7 <5AGB 0x80800000 14.0 < r < 19.0, 2.5 < u − g < 3.5, 0.9 < g − r < 1.3, s < −0.06 10
Note. — This table describes Version 4 2 of the SEGUE target selection algorithm. The hex bit in the second columnis set in the PrimTarget flag. All magnitudes above are PSF magnitudes which have been corrected for Galactic extinctionfollowing SFD. The one exception is the MS/WD pair algorithm, which uses PSF magnitudes without extinction correction.The quantity l ≡ −0.436u + 1.129g − 0.119r − 0.574i + 0.1984 is a metallicity indicator following Lenz et al. (1998). Thequantities s ≡ −0.249u + 0.794g − 0.555r + 0.234 and P1 ≡ 0.91(u − g) + 0.415(g − r) − 1.280 are defined by Helmi et al.(2003). The proper motion µ is in units of arcsec/yr, and the reduced proper motion is defined as Hg ≡ g + 5 log µ + 5 andsimilarly for Hr . The fourth column lists the typical number of targets selected in each category per spectroscopic tile.
we use the strength of the Balmer jump to select field blue horizontal branch (BHB) stars in the ugr color-colordiagram (Lenz et al. 1998, Sirko et al. 2004; Clewley et al. 2004). The halo BHB sample extends to distances of 40kpc at g = 19 (corresponding to the S/N limit we use for detailed spectroscopic classification; see § 4.3). We select allavailable BHB candidates in our high-latitude fields, and all candidates with g − r < 0 irrespective of latitude.
We select distant halo red giant candidates by the photometric offset in the ugr color-color diagram, as quantified bythe l color (Lenz et al. 1998; see the notes to Table 2). This offset is caused by their ultraviolet excess and weak Mg Iband MgH at at 5175A relative to foreground disk dwarfs (Morrison et al. 2001, Helmi et al. 2003). This is augmentedby a 3σ proper motion cut using a recalibrated version of the USNO-B catalog (Munn et al. 2004). Spectroscopicidentification of true giants using the methodology in Morrison et al. (2003) has shown that the giant selection isroughly 50% efficient at g < 17, the current limit to which we can reliably distinguish giants from dwarfs in thespectra. The halo giant sample identified in this way reaches distances of 40 kpc from the Sun. We select candidatelow-metallicity stars using a more extreme l-color cut, and without any proper motion cut.
The spectroscopic selection also includes smaller categories of rare but interesting objects. These include cool whitedwarfs selected with the recalibrated USNO-B reduced proper motion diagram, which can be used to date the age ofthe Galactic disk (Gates et al. 2004; Harris et al. 2006), high proper motion targets from the SUPERBLINK catalog(Lepine & Shara 2005), which have uncovered some of the most extreme M subdwarfs known (Lepine et al. 2007)and have aided in the calibration of their metallicity scale using common proper motion pairs, and white dwarf/mainsequence binaries containing cool white dwarfs, which are predicted to be the dominant population among this type ofbinaries (Schreiber & Gansicke 2003). These rare object categories also include color-only selections for cool subdwarfs,brown dwarfs (using cuts similar to those employed by Chiu et al. 2006), and the SEGUE “AGB” category that selectsmetal-rich, cool giants that separate readily from the ugr stellar locus.
Table 2 describes Version 4 2 of the SEGUE target selection algorithms. The algorithms have evolved throughoutthe survey, and users wishing to understand the detailed selection associated with each target category should examinethe SEGUE documentation off the DR6 survey page. The user should also know that SEGUE target selection hasbeen run only on those chunks used to design SEGUE plates, and has not yet been run on the bulk of the Legacysurvey imaging.
3.3. A caveat on high proper motion stars
As described in the DR2 paper, the proper motions of stars in the SDSS are taken from the measurements of theUSNO-B1.0 (Monet et al. 2003), based primarily on the POSS-I and POSS-II. However, this catalog is incompleteat the highest proper motions, greater than 100 milli-arcsec per year. Confusingly, objects with no proper motionmeasurement in the USNO-B1.0 catalog have their proper motion listed as 0.0 in the CAS ProperMotions table,

SDSS DR6 9
meaning that a query for low proper motion stars will be contaminated by a small number of the highest propermotion stars. The best available catalog of high proper motion stars can be found in the SUPERBLINK catalog ofLepine & Shara (2005) and references therein; we hope to incorporate this catalog into the proper motion data in theSDSS in future data releases.
3.4. Low Galactic latitude SDSS commissioning data
During commissioning and subsequent tests of the SDSS observing system, additional data were obtained outside ofthe nominal survey region. These data consist of 28 runs (see Finkbeiner et al. 2004, Table 1) at low Galactic latitude,mostly in the star-forming regions of Orion, Cygnus, and Taurus. There are 832 deg2 of data, 470 deg2 of which havebeen previously released88 as flat files. There are three types of files: calibrated images (one calibImage per field),calibrated object files (one calibObj per field), and condensed “sweep” files (one star or galaxy file per run/camcol).
The remaining 362 deg2 are hereby released in the same format, but they are not available in the DAS or CAS.These data have been photometrically calibrated using the ubercalibration algorithm (§ 3.5)89. Ubercalibration takesadvantage of the Apache Wheel calibration scans (not shown in Figure 1) to tie the photometry of disjoint regionsof the sky together; nevertheless, because the overlap with other runs is less than in the main survey area, theircalibration may not be quite as good.
3.5. Improved photometric calibration
Photometric calibration in SDSS has been carried out in two parallel approaches. The first uses an auxiliary 20′′
photometric telescope (PT) at the site, which continuously surveys a series of US Naval Observatory standard starswhich are used to define the SDSS u′g′r′i′z′ photometric system (Smith et al. 2002). Transformations between theu′g′r′i′z′ and native SDSS 2.5-meter ugriz photometric systems and zeropoints for stars in patches surveyed by the2.5-meter telescope are determined with these data (Tucker et al. 2006, Davenport et al. 2007). These secondarypatches are spaced roughly every 15◦ along the imaging stripes. This approach has allowed the SDSS photometry toreach its goals of calibration errors with an rms of 2% in g, r, and i, and 3% in u and z (Ivezic et al. 2004), as measuredfrom repeat scans (see the discussion in Ivezic et al. 2007). This is the calibration process that has been used in alldata releases to date. However, it is not ideal for several reasons:
• The u′g′r′i′z′ filter system of the PT camera is subtly different from the ugriz system on the 2.5-meter;
• There are persistent problems with the flat-fielding of both the PT and 2.5-meter cameras, especially in u′;
• No use is made of overlap data in the 2.5-meter scans to tie the zeropoints together.
A second approach, termed “ubercalibration” (Padmanabhan et al. 2007) does not use information from the PTto calibrate individual runs, but rather uses the overlaps between the 2.5-meter imaging runs to tie the photometriczeropoints of individual runs together and measure the 2.5m flatfields, and to determine the extinction coefficients oneach night. Unlike the standard PT calibrations, ubercalibration explicitly assumes that the photometric calibrationparameters – a zeropoint for each CCD, and atmospheric extinction linear with airmass – are constant through aphotometric night.This assumption appears justified, as the resulting calibration has errors of ∼ 1% in g, r, i andz, and 2% in u, roughly a factor of two below those of the standard processing, as determined from the overlapsthemselves, and from the measurement of the “principal colors” of the stellar locus (see the discussion in Ivezic et al.2004 and the DR3 paper). This scatter is dominated by unmodelled variations in the atmospheric conditions in thesite, including changes in the atmospheric extinction through a night.
The relative calibration of the photometric scans via overlaps does not determine the photometric zeropoints in thefive filters. The zeropoints are constrained in practice by forcing the ubercalibrated photometry of bright stars toagree in the mean with that calibrated in the standard way (Tucker et al. 2006). Thus this work does not represent animprovement in the calibration of the SDSS photometry to a true AB system (in which magnitudes can be translateddirectly into physical flux units); see the discussion in the DR2 paper, Eisenstein et al. (2006), and Holberg & Bergeron(2006). Moreover, there are subtle differences between the response of the six filters in each row of the SDSS camera,especially in z (see the discussion in Ivezic et al. 2007); these differences have not been corrected.
Both versions of SDSS photometry are now made available through the CAS in DR6. The PT-calibrated photometryfor each detected object is stored in the database in the same tables and columns as in DR5, and both the offset betweenPT and ubercalibration, as well as the ubercalibrated magnitudes, are stored in the UberCal table of the CAS. Databasefunctions are available to apply these offsets and output ubercalibrated photometry. The distribution of these offsetsis shown in Figures 15 and 16 of Padmanabhan et al. (2007); the improvements are subtle, changing magnitudes ofmost individual objects by 0.02 mag or less.
3.6. The photometry of bright galaxies
88 At http://photo.astro.princeton.edu .89 The current ubercalibration has yielded calibrations typically 0.02 mag different from those previously released, but some runs/camera
columns show differences as large as 0.05 mag. The variance within each field is also somewhat reduced by correcting flatfield errors at the0.01 or 0.02 mag level.
10 Adelman-McCarthy et al.
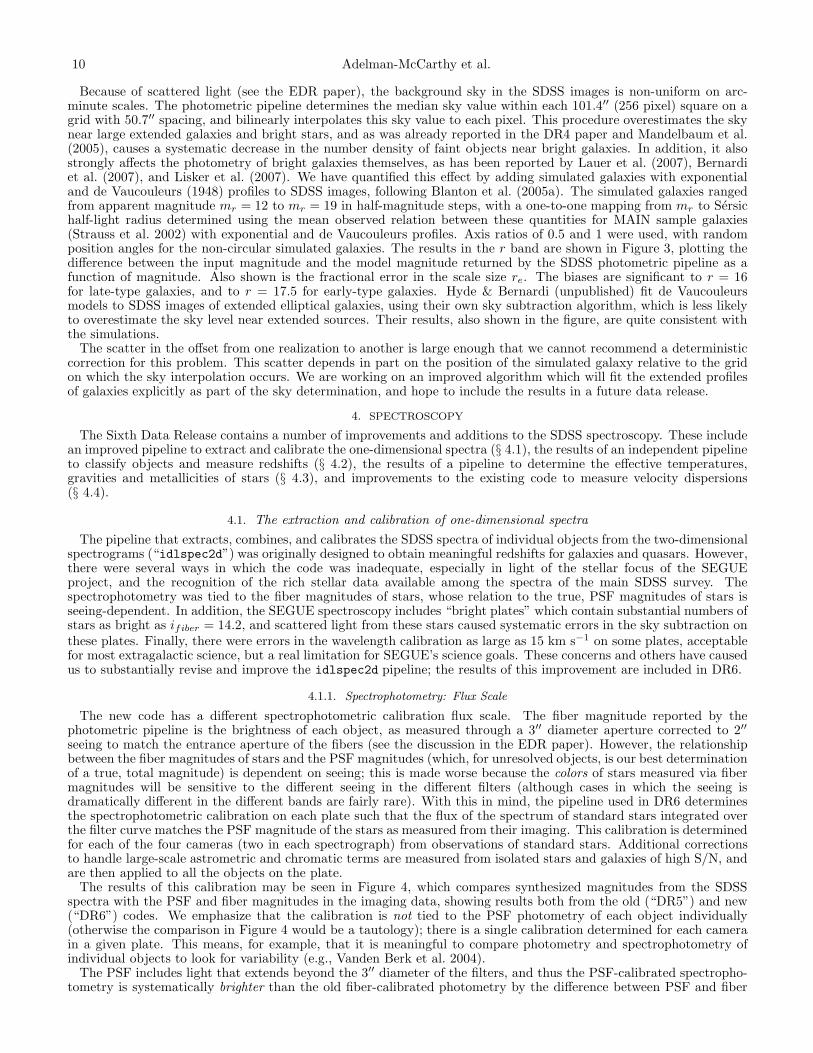
Because of scattered light (see the EDR paper), the background sky in the SDSS images is non-uniform on arc-minute scales. The photometric pipeline determines the median sky value within each 101.4′′ (256 pixel) square on agrid with 50.7′′ spacing, and bilinearly interpolates this sky value to each pixel. This procedure overestimates the skynear large extended galaxies and bright stars, and as was already reported in the DR4 paper and Mandelbaum et al.(2005), causes a systematic decrease in the number density of faint objects near bright galaxies. In addition, it alsostrongly affects the photometry of bright galaxies themselves, as has been reported by Lauer et al. (2007), Bernardiet al. (2007), and Lisker et al. (2007). We have quantified this effect by adding simulated galaxies with exponentialand de Vaucouleurs (1948) profiles to SDSS images, following Blanton et al. (2005a). The simulated galaxies rangedfrom apparent magnitude mr = 12 to mr = 19 in half-magnitude steps, with a one-to-one mapping from mr to Sersichalf-light radius determined using the mean observed relation between these quantities for MAIN sample galaxies(Strauss et al. 2002) with exponential and de Vaucouleurs profiles. Axis ratios of 0.5 and 1 were used, with randomposition angles for the non-circular simulated galaxies. The results in the r band are shown in Figure 3, plotting thedifference between the input magnitude and the model magnitude returned by the SDSS photometric pipeline as afunction of magnitude. Also shown is the fractional error in the scale size re. The biases are significant to r = 16for late-type galaxies, and to r = 17.5 for early-type galaxies. Hyde & Bernardi (unpublished) fit de Vaucouleursmodels to SDSS images of extended elliptical galaxies, using their own sky subtraction algorithm, which is less likelyto overestimate the sky level near extended sources. Their results, also shown in the figure, are quite consistent withthe simulations.
The scatter in the offset from one realization to another is large enough that we cannot recommend a deterministiccorrection for this problem. This scatter depends in part on the position of the simulated galaxy relative to the gridon which the sky interpolation occurs. We are working on an improved algorithm which will fit the extended profilesof galaxies explicitly as part of the sky determination, and hope to include the results in a future data release.
4. SPECTROSCOPY
The Sixth Data Release contains a number of improvements and additions to the SDSS spectroscopy. These includean improved pipeline to extract and calibrate the one-dimensional spectra (§ 4.1), the results of an independent pipelineto classify objects and measure redshifts (§ 4.2), the results of a pipeline to determine the effective temperatures,gravities and metallicities of stars (§ 4.3), and improvements to the existing code to measure velocity dispersions(§ 4.4).
4.1. The extraction and calibration of one-dimensional spectra
The pipeline that extracts, combines, and calibrates the SDSS spectra of individual objects from the two-dimensionalspectrograms (“idlspec2d”) was originally designed to obtain meaningful redshifts for galaxies and quasars. However,there were several ways in which the code was inadequate, especially in light of the stellar focus of the SEGUEproject, and the recognition of the rich stellar data available among the spectra of the main SDSS survey. Thespectrophotometry was tied to the fiber magnitudes of stars, whose relation to the true, PSF magnitudes of stars isseeing-dependent. In addition, the SEGUE spectroscopy includes “bright plates” which contain substantial numbers ofstars as bright as ifiber = 14.2, and scattered light from these stars caused systematic errors in the sky subtraction onthese plates. Finally, there were errors in the wavelength calibration as large as 15 km s−1 on some plates, acceptablefor most extragalactic science, but a real limitation for SEGUE’s science goals. These concerns and others have causedus to substantially revise and improve the idlspec2d pipeline; the results of this improvement are included in DR6.
4.1.1. Spectrophotometry: Flux Scale
The new code has a different spectrophotometric calibration flux scale. The fiber magnitude reported by thephotometric pipeline is the brightness of each object, as measured through a 3′′ diameter aperture corrected to 2′′
seeing to match the entrance aperture of the fibers (see the discussion in the EDR paper). However, the relationshipbetween the fiber magnitudes of stars and the PSF magnitudes (which, for unresolved objects, is our best determinationof a true, total magnitude) is dependent on seeing; this is made worse because the colors of stars measured via fibermagnitudes will be sensitive to the different seeing in the different filters (although cases in which the seeing isdramatically different in the different bands are fairly rare). With this in mind, the pipeline used in DR6 determinesthe spectrophotometric calibration on each plate such that the flux of the spectrum of standard stars integrated overthe filter curve matches the PSF magnitude of the stars as measured from their imaging. This calibration is determinedfor each of the four cameras (two in each spectrograph) from observations of standard stars. Additional correctionsto handle large-scale astrometric and chromatic terms are measured from isolated stars and galaxies of high S/N, andare then applied to all the objects on the plate.
The results of this calibration may be seen in Figure 4, which compares synthesized magnitudes from the SDSSspectra with the PSF and fiber magnitudes in the imaging data, showing results both from the old (“DR5”) and new(“DR6”) codes. We emphasize that the calibration is not tied to the PSF photometry of each object individually(otherwise the comparison in Figure 4 would be a tautology); there is a single calibration determined for each camerain a given plate. This means, for example, that it is meaningful to compare photometry and spectrophotometry ofindividual objects to look for variability (e.g., Vanden Berk et al. 2004).
The PSF includes light that extends beyond the 3′′ diameter of the filters, and thus the PSF-calibrated spectropho-tometry is systematically brighter than the old fiber-calibrated photometry by the difference between PSF and fiber

SDSS DR6 11
Fig. 3.— The effects of sky subtraction errors on the photometry of bright galaxies. Upper panel: The error in the r band modelmagnitude of simulated galaxies with an n = 1 (exponential) profile (blue hexagons) and an n = 4 (de Vaucouleurs) profile (red crosses) asdetermined by the photometric pipeline, as a function of magnitude. Fifteen galaxies are simulated at each magnitude for each profile. Alsoshown are the analogous results from Hyde & Bernardi (unpublished) for three early-type galaxy samples: 54 nearby (z < 0.03) early-typegalaxies from the ENEAR catalog (da Costa et al. 2000) in black; 280 brightest cluster galaxies from the C4 catalog (Miller et al. 2005) ingreen; and 9000 early-type galaxies from the Bernardi et al. (2003a) analysis in magenta. Lower panel: The fractional error in the scalesize re as a function of magnitude from the simulations and the Hyde & Bernardi analysis.
magnitudes, which is roughly 0.35 magnitudes (albeit dependent on seeing). Again, because the PSF photometryrepresents an accurate measure of the brightness of stars, this calibration means that the spectrophotometry matchesthe PSF photometry for stars to an rms of 4%. This distribution does show an extended tail presumably caused byblended and variable objects90, but the distribution is substantially more symmetric than for the previous version ofthe pipeline. Interestingly, for galaxies, the rms difference between spectroscopic photometry and the fiber magnitudesis also 4%. The previous code shows a similarly narrow distribution, albeit with larger tails. The distribution of thedifference of the g− r and r− i colors between PSF photometry and as synthesized from the spectrophotometry againshows a narrow core in both DR5 and DR6, but again with less extensive non-Gaussian outliers with the new code.
Due to errors in the processing step, there are 28 plates, listed in Table 3, that were calibrated using fiber magnitudesrather than PSF magnitudes. Therefore, objects on these plates have a spectroscopic flux scale systematically lowerby 0.35 mag than the rest of the survey. These will be processed correctly in a subsequent data release.
4.1.2. Spectrophotometry: Wavelength Dependence
90 Indeed, the fiber magnitudes include light from overlapping blended objects, thus the tails are less extensive in the fiber magnitudecomparison.

12 Adelman-McCarthy et al.
Fig. 4.— The distribution of differences between r-band photometry synthesized from SDSS spectra (labelled “SPECTRO”), and PSFand fiber magnitudes, for stars and galaxies; results are shown for DR6 (left-hand panel) and the previous version of the calibration availablein DR5 (right-hand panel). Only objects with PSF magnitude brighter than 19 are shown. The most important difference is the offsetof 0.35 magnitudes between the two, due to the change in calibration from fiber to PSF photometry. Each panel includes the mean andstandard deviation of the best-fit Gaussian, as well as the number of objects lying beyond 3σ (as a measure of the non-Gaussianity of thetails). Results are shown for r band, but g and i band results are very similar.
As discussed in the DR2 paper, each plate includes observations of a number of spectrophotometric standards,typically F subdwarfs. Their observed spectra are fit to and calibrated against the models of Gray & Corbally (1994),as updated by Gray et al. (2001). We can compare the spectrophotometric calibration between DR5 and DR6 byplotting the ratio of the summed spectra of these standard stars on each plate as determined by the two versions of

SDSS DR6 13
TABLE 3Spectroscopic plates calibrated with fiber magnitudes
plate MJD plate MJD plate MJD plate MJD
269 51910 345 51690 460 51924 683 52524270 51909 349 51699 492 51955 730 52466277 51908 353 51703 543 52017 830 52293284 51943 367 51997 554 52000 872 52339309 51666 394 51913 556 51991 1394 53108324 51666 403 51871 616 52374 1414 53135336 51999 446 51899 616 52442 1453 53084
Note. — The second column lists the Modified Julian Date(MJD) on which each plate was observed.
Fig. 5.— The ratio of the summed spectra of standard stars on each plate as determined by the DR6 and DR5 versions of spectropho-tometry, rescaled to unity at 6200A. The solid line is the median ratio spectrum over 1278 plates, the dotted lines enclose 68.3% of theplates (corresponding to 1σ for a Gaussian distribution), and the dashed lines enclose 95.4% of the plates (corresponding to 2σ). Thedistribution at each wavelength is in fact close to Gaussian.
the pipeline. The 0.35 mag overall flux scale between the two calibrations has been taken out by forcing all the curvesthrough unity at 6200A. The median ratio (as determined from 1278 plates), and the 68.3% and 95.4% outliers, areshown in Figure 5. The median ratio differs from unity by less than 5% at all wavelengths, but a small fraction of theplates have differences as large as 30% at the far blue end.
Do these changes represent an improvement scientifically? Figure 4 of the DR2 paper quantified the uncertainties in

14 Adelman-McCarthy et al.
Fig. 6.— The median ratio of observed flux-calibrated spectra of luminous red elliptical galaxies to their averaged spectra (after takingevolution into account), for the previous (DR5) and current (DR6) spectroscopic reductions. This quantifies the wavelength dependenceof systematic errors in the spectrophotometric calibration; the amplitude of these features, already small in the previous reductions, havebeen reduced further in DR6, especially in the blue. The features at Ca H and K and at Na D are probably due to absorption from theinterstellar medium. The strong features at the sky lines at 5577A and 4358A marked with the ⊕ symbol are related to the S/N of thespectra; a similar analysis with quasar spectra shows these features to have substantially lower amplitude.
the spectrophotometric calibration used at that time by looking at the mean fractional offset between observed spectraof white dwarfs and best-fit models for them. Figure 6 shows a similar analysis with the old and new reductions.The curves show the median fractional difference between a sample of 128,000 calibrated luminous red galaxy (LRG,Eisenstein et al. 2001) spectra, and a model based on averaged observed LRG spectra that is allowed to evolve smoothlywith redshift (see the discussion in § 3 of the DR5 paper). Because the LRGs have a broad range of redshifts, oneexpects no feature specific to the LRGs to appear in this plot as a function of observed wavelength, and deviationsfrom unity are a measure of the small-scale errors in the spectrophotometry. There are systematic oscillations at the2% level in the DR5 reductions. These wiggles correspond to positions of strong absorption lines in the standard stars,especially in the vicinity of the 4000A break in the blue. This is now handled by not fitting the instrumental responseto any residual non-telluric features finer than 25-50A, as the response is not expected to vary on those scales. Thisreduces the amplitude of the wiggles by a factor of two in the DR6 reductions, especially at the blue end. Redwardof 4500A, 50% of the spectra fall within 3% of the median value; this increases to 7% at 3800A. The features at CaK and H (3534 and 3560A) and Na D (5890 and 5896A) are probably due to absorption from the interstellar medium(although the latter probably has a contribution from sky line residuals). The sky line residuals (marked with the ⊕symbol) are a function of S/N; a similar analysis with higher S/N quasars shows substantially smaller residuals at thestrong sky lines.
The effect of this improvement in the spectrophotometric calibration becomes clear if we examine the spectra of

SDSS DR6 15
Fig. 7.— The blue part of the spectrum of an A0 blue horizontal branch star, SDSS J004037.41+240906.5, as given by the old (reddotted curve) and new (black solid curve) versions of idlspec2d. The old curve has been scaled up to reflect the difference in the calibrationof the two reductions. The synthetic spectrum, shown in green, is generated from a model with parameters matching those derived fromthe SSPP (Teff = 8500 K, log g = 3.25, [Fe/H] = −2.00). The continuum between the absorption lines is much smoother, and matchesthe synthetic spectrum much better for the new reductions than for the old. The synthetic spectrum has been normalized to match theobserved spectrum at 4500 A. Neither the model nor the spectra have been corrected for Galactic reddening (which is E(B − V ) = 0.036in this line of sight).
individual stars. Figure 7 shows the blue part of the spectrum of an A0 blue horizontal branch star as calibrated withthe old code (dotted) and the new (solid), together with a synthetic spectrum based on the atmospheric parametersestimated by the SEGUE Stellar Parameter Pipeline (§ 4.3; Teff = 8446 K, log g = 3.15, [Fe/H] = −1.96). The newreductions are clearly smoother between the absorption lines; the match between the DR6 calibrated spectrum andthe synthetic spectrum is also superior.
4.1.3. Radial velocities
In order to measure the dynamics of the halo of the Milky Way, SEGUE requires stellar radial velocities accurateto 10 km s−1, significantly more demanding than the original SDSS requirements of 30 km s−1. The previous versionof idlspec2d had systematic errors of 10–15 km s−1 in the wavelength calibration because of a dearth of strong linesat the blue end of the spectrum in the calibration lamps and in the nighttime sky. The sky-line fits for the blue sidewavelength corrections now use a more robust algorithm allowing less freedom in the fits, and these problems arelargely under control.
We monitor the systematic and random errors in the radial velocities in the SEGUE data by comparing repeatobservations on the bright and faint plates of each SEGUE pointing. The duplicate observations consist of roughly20 “quality assurance” objects selected at the median magnitude of the SEGUE data, as well as a similar numberof spectroscopic calibration objects that are observed on both plates. The mean difference in the measured radial

16 Adelman-McCarthy et al.
velocities between the two observations of the quality assurance objects depends on stellar type, with a standarddeviation of 9 km s−1 for A and F stars and 5 km s−1 for K stars91. The mean radial velocity offset between thetwo plates in each pointing, as measured using all the duplicate observations, suggests systematic velocity errors fromplate to plate of only 2 km s−1 rms.
We have checked the zeropoint of the overall radial velocity scale (as measured using the ELODIE templates inthe specBS code; see the discussion below in § 4.2) by carrying out high-resolution observations of 150 SEGUE stars.This has revealed a systematic error of 7.3 km s−1 (in the sense that the SpecBS velocities are too low) due to subtlydifferent algorithms in the line fits to arc and sky lines. This has been fixed in the output files of the SSPP (§ 4.3below), but has not yet been fixed elsewhere in the CAS.
The improved wavelength calibration leads to smaller sky subtraction residuals for many objects, especially noticeablein the far red of the spectrum.
4.1.4. Additional outputs
Under good conditions, a typical spectroscopic plate is observed three times in exposures of 15 minutes each; moreexposures are added in poor conditions to reach a target S/N in the spectra. The idlspec2d pipeline stitches togetherthe resulting individual spectra to determine the final spectrum of a given object. However, for the most accuratedetermination of the noise characteristics of the spectra (for example, in detailed analyses of the Lyman α forest ofquasars; see the discussion in McDonald et al. 2006), or to determine whether a specific unusual feature in a spectrumis real, it is desirable to go back to the uncombined spectra. These uncombined spectra are now made available forevery plate in the so-called spPlate files through the DAS.
The published spectra have had a determination of the spectrum of the foreground sky subtracted from them. Thesky is measured in 32 fibers (64 fibers for the faint SEGUE plates) placed in regions where no object has been detectedto 5σ in the imaging data, interpolated (both in amplitude and in wavelength, allowing for some undersampling) toeach object exposure, and subtracted. However, it is often useful to see the sky spectrum that has been subtracted fromeach object, for example to study the nature of extended foreground emission-line objects in the data (for example,see Hewett et al. 2003 for the discovery of a 2◦ diameter planetary nebula in the SDSS data). The sky spectrumsubtracted from each object spectrum is now available through both the DAS and the CAS.
4.1.5. The treatment of objects with very strong emission lines
There is a known problem, which is not fixed with the current version of idlspec2d, whereby the code that combinesthe individual 15-minute exposures will occasionally mis-interpret the peaks of particularly strong and narrow emissionlines as cosmic rays and remove them. All pixels affected by this have the inverse variance (i.e., the inverse square ofthe estimated error at this pixel) set to zero, indicating that the code recognizes that the pixel in question is not valid.A diagnostic of this problem is unphysical line ratios in the spectra of dwarf starburst galaxies, as the tops of thestrongest lines are artificially clipped. This is a rare problem, affecting less than 1% of galaxies with rest equivalentwidth in the Hβ line greater than 25A, but users investigating the properties of galaxies with strong emission linesshould be aware of it. We hope to fix this problem in the next data release.
4.2. An independent determination of spectral classifications and redshifts
As described in the EDR paper and Subbarao et al. (2002), the spectral classifications and radial velocities availablein the data releases have been based on a code (spectro1d), that cross-correlates the observed spectra with a varietyof templates in Fourier space to determine absorption-line redshifts and fits Gaussians to emission lines to determineemission-line redshifts. A completely separate code, termed specBS and written by D. Schlegel (in preparation) insteadcarries out χ2 fits of the spectra to templates in wavelength space (in the spirit of Glazebrook et al. 1998), allowinggalaxy and quasar spectra to be fit with linear combinations of eigenspectra and low-order polynomials. Stellar radialvelocities are fit both to SDSS-derived stellar templates, and to templates drawn from the high-resolution ELODIE(Prugniel & Soubiran 2001) library. The spectro1d outputs give the default spectroscopic information availablethrough the CAS, but the specBS outputs are made available through the CAS for the first time with DR692. Whilespectro1d uses manual inspection to correct the redshifts and classifications of a small fraction of its redshifts, specBSis completely automated.
Tests show that the two pipelines give impressively consistent results. At high S/N, the rms difference betweenthe redshifts of the two pipelines is of order 7 km s−1 for stars and galaxies, although the spectro1d redshifts aresystematically higher by 12 km s−1 due to differences in the templates. The difference distribution has non-Gaussiantails, but as a test of catastrophic errors, we find that 98% of all objects with spectra (after excluding the blank skyfibers) have consistent classification (star, quasar, galaxy) and redshifts agreeing within 300 km s−1 for galaxies andstars, and 3000 km s−1 for quasars.
Half of the remaining 2% are objects of very low S/N, and the other half are a mixture of a variety of unusualobjects, including BL Lacertae objects (Collinge et al. 2005; their lack of spectral features makes it unsurprising thatthe two pipelines come to different conclusions), unusual white dwarfs, including strong magnetic objects and metal-rich systems (Schmidt et al. 2003; Eisenstein et al. 2006; Dufour et al. 2007), unusual broad absorption line quasars
91 Thus the error on a single star is√
2 less than these values.92 The outputs of specBS have also been made publically available through the NYU Value-Added Galaxy Catalogue; see Blanton et al.
(2005b).
SDSS DR6 17
TABLE 4Redshift warning flags from specBS
Bit Name Comments
0 SKY FIBER Fiber is used to determine sky; there should be no object here.1 SMALL LAMBDA COVERAGE Because of masked pixels, less than half of the full wavelength range is reliable
in this spectrum.2 CHI2 CLOSE The second best-fitting template had a reduced χ2 within 0.01 of the best fit
(common in low S/N spectra).3 NEGATIVE TEMPLATE Synthetic spectrum is negative (only set for stars and QSOs).4 MANY 5SIGMA More than 5% of pixels lie more than 5 σ from the best-fit template.5 CHI2 AT EDGE χ2 is minimized at the edge of the redshift-fitting region (in this circumstance,
Z ERR is set to −1).6 NEGATIVE EMLINE A quasar emission line (C IV, C III], Mg II, Hβ, or Hα) appears in absorption
with more than 3 σ significance due to negative eigenspectra.
TABLE 5Outputs of the specBS pipeline made available in the DR6 CAS.
Parameter Comments
CLASS STAR, GALAXY, or QSOSUBCLASS Stellar subtype, galaxy type (starforming, etc)Z Heliocentric redshiftZ ERR Error in redshiftRCHI2 Value of reduced χ2 for template fit to spectrumDOF Degrees of freedom in χ2 fitVDISP Velocity Dispersion for galaxies (km s−1)VDISP ERR Error in Velocity Dispersion (km s−1)ZWARNING Set if the classification or redshift are uncertain; see Table 4ELODIE SPTYPE Spectral type of best-fit ELODIE templateELODIE Z Redshift determined from best-fit ELODIE templateELODIE Z ERR Error in redshift determined from best-fit ELODIE template
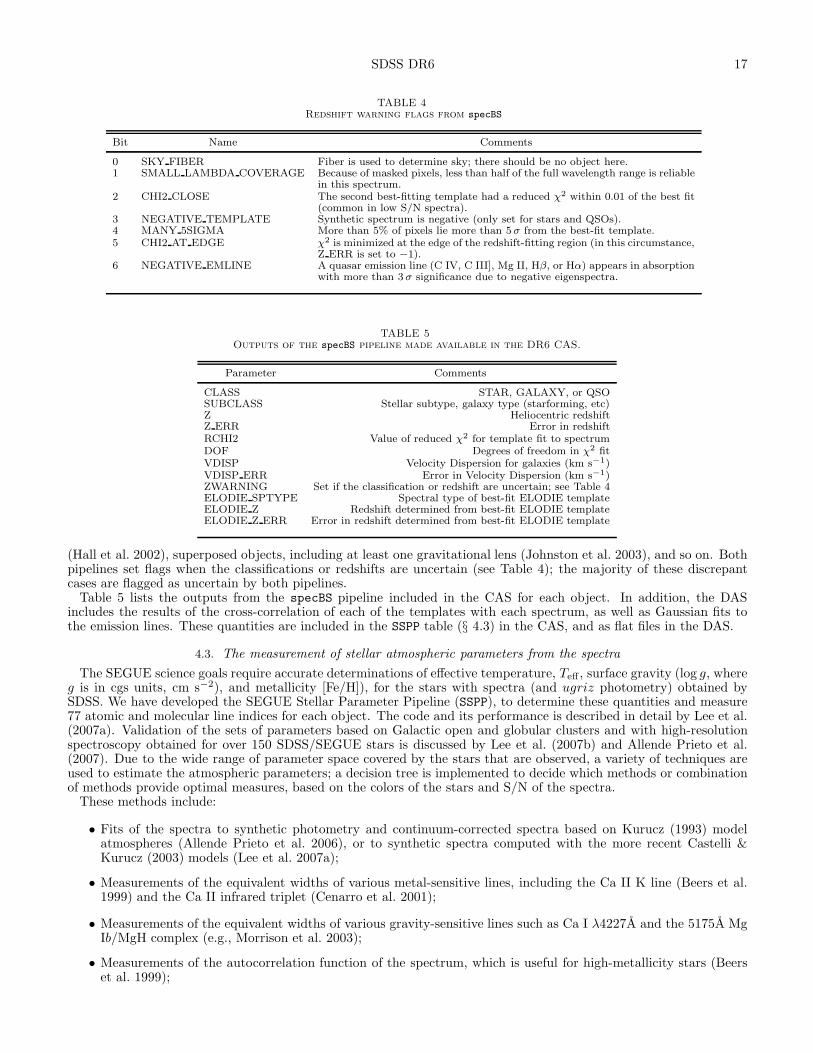
(Hall et al. 2002), superposed objects, including at least one gravitational lens (Johnston et al. 2003), and so on. Bothpipelines set flags when the classifications or redshifts are uncertain (see Table 4); the majority of these discrepantcases are flagged as uncertain by both pipelines.
Table 5 lists the outputs from the specBS pipeline included in the CAS for each object. In addition, the DASincludes the results of the cross-correlation of each of the templates with each spectrum, as well as Gaussian fits tothe emission lines. These quantities are included in the SSPP table (§ 4.3) in the CAS, and as flat files in the DAS.
4.3. The measurement of stellar atmospheric parameters from the spectra
The SEGUE science goals require accurate determinations of effective temperature, Teff , surface gravity (log g, whereg is in cgs units, cm s−2), and metallicity [Fe/H]), for the stars with spectra (and ugriz photometry) obtained bySDSS. We have developed the SEGUE Stellar Parameter Pipeline (SSPP), to determine these quantities and measure77 atomic and molecular line indices for each object. The code and its performance is described in detail by Lee et al.(2007a). Validation of the sets of parameters based on Galactic open and globular clusters and with high-resolutionspectroscopy obtained for over 150 SDSS/SEGUE stars is discussed by Lee et al. (2007b) and Allende Prieto et al.(2007). Due to the wide range of parameter space covered by the stars that are observed, a variety of techniques areused to estimate the atmospheric parameters; a decision tree is implemented to decide which methods or combinationof methods provide optimal measures, based on the colors of the stars and S/N of the spectra.
These methods include:
• Fits of the spectra to synthetic photometry and continuum-corrected spectra based on Kurucz (1993) modelatmospheres (Allende Prieto et al. 2006), or to synthetic spectra computed with the more recent Castelli &Kurucz (2003) models (Lee et al. 2007a);
• Measurements of the equivalent widths of various metal-sensitive lines, including the Ca II K line (Beers et al.1999) and the Ca II infrared triplet (Cenarro et al. 2001);
• Measurements of the equivalent widths of various gravity-sensitive lines such as Ca I λ4227A and the 5175A MgIb/MgH complex (e.g., Morrison et al. 2003);
• Measurements of the autocorrelation function of the spectrum, which is useful for high-metallicity stars (Beerset al. 1999);

18 Adelman-McCarthy et al.
• A neural network technique which takes the observed spectrum as input, trained on previously available param-eters from the SSPP (Re Fiorentin et al. 2007).
For stars with temperatures between 4500 K and 7500 K and with average S/N per spectral pixel greater than 15,the typical formal errors returned by the code are σ(Teff) = 150 K, σ(log g) = 0.25 dex, and σ([Fe/H]) = 0.20 dex.Comparison with 150 stars with high S/N high resolution spectra (and therefore reliable stellar parameters) validatesthese error estimates, at least for those stars with the highest quality SDSS spectra.
The SSPP assumes solar abundance ratios when quoting metallicities, with the caveat that several of the individualtechniques (those that involve the Ca and Mg line strengths) adopt a smoothly increasing [α/Fe] ratio, from 0.0 to+0.4, as inferred metallicity decreases from solar to [Fe/H] = −1.5. Other techniques, which are based on regions ofthe spectra dominated by lines from unresolved Fe-peak elements, do not assume such relationships.
The S/N limit for acceptable estimated stellar parameters varies with each individual method employed by the SSPP.As a general rule, the SSPP sets a conservative criterion that the average S/N per pixel over the wavelength range3800-6000A must be greater than 15 for stars with g − r < 0.3, and greater than 10 for stars with g − r ≥ 0.3. Starsof low S/N do not have their parameters reported by SSPP. Table 5 of Lee et al. (2007a) describes the valid ranges ofeffective temperature, g − r color, and S/N for each method used in the SSPP.
The SSPP values are combined with the outputs of specBS (§ 4.2) and are loaded as a single table into the CAS,with entries for every object with a spectrum.
For the coolest stars, measuring precise values of Teff , log g, and [Fe/H] from spectra dominated by broad molecularfeatures becomes extremely difficult (e.g., Woolf & Wallerstein 2006). As a result, the SEGUE SSPP does not estimateatmospheric parameters for stars with Teff < 4500 K, but instead estimates the MK spectral type of each star usingthe Hammer spectral typing software developed and described by Covey et al. (2007)93. The Hammer code measures 28spectral indices, including atomic lines (H, Ca I, Ca II, Na I, Mg I, Fe I, Rb, Cs) and molecular bandheads (G band,CaH, TiO, VO, CrH) as well as two broad-band color ratios. The best-fit spectral type of each target is assigned bycomparison to the grid of indices measured from more than 1000 spectral type standards derived from spectral librariesof comparable resolution and coverage (Allen & Strom 1995; Prugniel & Soubiran 2001; Hawley et al. 2002; Bagnuloet al. 2003; Le Borgne et al. 2003; Valdes et al. 2004; Sanchez-Blazquez et al. 2006). These indices, and the best-fittype from the Hammer code, are available for stars of type F0 and cooler in DR6.
Tests of the accuracy of the Hammer code with degraded (S/N ∼ 5) STELIB (Le Borgne et al. 2003), MILES(Sanchez-Blazquez et al. 2006) and SDSS (Hawley et al. 2002) dwarf template spectra reveal that the Hammer codeassigns spectral types accurate to within ±2 subtypes for K and M stars. The Hammer code can return results forwarmer stars, but as the index set is optimized for cool stars, typical uncertainties are ±4 subtypes for A–G stars atS/N ∼ 5; in this temperature regime, SSPP atmospheric parameters are a more reliable indicator of Teff .
Given SEGUE’s science goals, we emphasize two limitations to the accuracy of spectral types derived by the Hammercode:
• The Hammer code uses spectral indices derived from dwarf standards; spectral types assigned to giant stars willlikely have larger, and systematic, uncertainties.
• The Hammer code was developed in the context of SDSS’ high latitude spectroscopic program; the use of broad-band color ratios in the index set will likely make the spectral types estimated by the Hammer code particularlysensitive to reddening. Spectral types derived in areas of high extinction (i.e., low-latitude SEGUE plates) shouldbe considered highly uncertain until verified with reddening-insensitive spectral indices.
4.4. Correction of biases in the velocity dispersions
Both specBS and spectro1d measure velocity dispersions (σ) for galaxies. specBS does so, as described above,by including it as a term in the direct χ2 fit of templates to galaxies. The velocity dispersion in spectro1d wascomputed as the average of the Fourier- and direct-fitting methods (Appendix B of Bernardi et al. 2003b; hereafterB03). However, due to changes in the spectroscopic reductions from the EDR to later releases, a bias appeared in therecent values available in the CAS. As shown in Appendix A of Bernardi (2007), σ values in the DR5 do not match thevalues used by B03. The difference is small but systematic, with spectro1d DR5 larger than B03 at σ ≤ 150 km s−1.A similar bias is seen when comparing spectro1d DR5 with measurements from the literature (using the HyperLedadatabase; Paturel et al. 2003). Simulations similar to those in B03 show that the discrepancy results from the factthat the Fourier-fitting method is biased by ∼ 15% at low dispersions (∼ 100 km s−1), whereas the direct-fittingmethod is not. We therefore use only the direct-fitting method in DR6. Figure 8 shows comparisons of the spectro1dDR6 velocity dispersions with those from B03, DR5 and the specBS measurements. There is good agreement betweenspectro1d DR6 and B03 (rms scatter ∼ 7.5%), and between spectro1d DR6 and specBS (rms scatter ∼ 6.5%),whereas spectro1d DR5 is clearly biased high at σ ≤ 150 km s−1. The agreement between spectro1d DR6 andspecBS is not surprising, since both are now based only on the direct-fitting method. The specBS measurements tendto be slightly smaller than DR6 at σ ≤ 100 km s−1; specBS is similarly smaller than HyperLeda, whereas DR6 agreeswith HyperLeda at these low dispersions.
93 The Hammer code has been made available for community use: the IDL code can be downloaded fromhttp://www.cfa.harvard.edu/∼kcovey/thehammer .

SDSS DR6 19
Fig. 8.— Top panels: velocity dispersion measurements from B03 (left), DR5 (middle) and specBS (right) versus the spectro1d DR6values for the sample of elliptical galaxies used in Bernardi et al. (2003a). Bottom panels: The ratio of DR6 values to the other threesamples (i.e. B03, DR5, and specBS) versus the mean value (e.g. left panel 〈σ〉 = (σDR6 + σB03)/2). The median value at at each value of〈σ〉 is shown as a solid line; the values including 68% and 95% of the points are given as the dashed and dotted lines, respectively.
Figure 9 shows the distribution of the error on the measured velocity dispersions. The direct-fitting method usedby spectro1d gives slightly larger errors than does the Fourier-fitting method, peaking at ∼ 10%. The figure showsthat this error distribution is consistent with that found by comparing the velocity dispersions of ∼ 300 objects fromDR2 which had been observed more than once.
Finally, HyperLeda reports substantially larger velocity dispersions than SDSS at σ ≥ 250 km s−1. The excellentagreement between three methods (direct fitting, cross-correlation, and Fourier-fitting) applied to the SDSS spectra atthe high velocity dispersion end gives us confidence in our velocity dispersions (Bernardi 2007), although it is unclearwhy the literature values are higher.
4.5. Linking SEGUE imaging and spectroscopy
For the Legacy imaging, there exist simple links between the spectroscopic and imaging data, but these links are notyet in place between all the SEGUE spectroscopy and imaging. In particular, to obtain BEST or ubercalibrated stellarphotometry of SEGUE spectroscopic objects within CAS, one must perform an “SQL join” command between thespectroscopic specobjall or sppParams tables in the CAS with the corresponding photometric tables (photoobjall,seguedr6.photoobjall, or ubercal). Sample queries on how to do this are provided on the SDSS web site. We planto simplify this procedure in future data releases.
5. CONCLUSIONS AND THE FUTURE
We have presented the Sixth Data Release of the Sloan Digital Sky Survey. It includes 9583 deg2 of imaging data,including a contiguous area of 7668 deg2 of the Northern Galactic Cap. The data release includes almost 1.3 millionspectra selected over 7425 deg2 of sky, representing a 20% increment over the previous data release. This data releaseincludes the first year of data from the SDSS-II, and thus includes extensive low-latitude imaging data, and a greatdeal of stellar spectroscopy. New to this data release are:
• 1592 deg2 of imaging data at lower Galactic latitudes, as part of the SEGUE survey, of which 1166 deg2 are insearchable catalogs in the CAS;
• Revised photometric calibration for the imaging data, with uncertainties of 1% in g, r, i and z, and 2% in u;
• Improved wavelength and flux calibration of spectra;
• Detailed surface temperatures, metallicities, and gravities for stars.
The SDSS-II will end operations in Summer 2008, at which point the Legacy project will have completed spectroscopyfor the entire contiguous area of the Northern Cap region now covered by imaging, and SEGUE will have obtainedspectra for 240,000 stars. The supernova survey (Frieman et al. 2007) has discovered 327 spectroscopically confirmedSNIa to date in its first two seasons, and has one more season to go.
Funding for the SDSS and SDSS-II has been provided by the Alfred P. Sloan Foundation, the Participating In-stitutions, the National Science Foundation, the U.S. Department of Energy, the National Aeronautics and Space

20 Adelman-McCarthy et al.
Fig. 9.— Error distribution of the velocity dispersion measurements from spectro1d DR6 (thin black solid line), spectro1d DR5 (dottedred line), specBS (dashed blue line), and B03 (dotted-dashed green line). The thick solid line was obtained by comparing the velocitydispersions of ∼ 300 galaxies which had been observed two or more times; it is thus an empirical estimate of the true error.
Administration, the Japanese Monbukagakusho, the Max Planck Society, and the Higher Education Funding Councilfor England. The SDSS Web Site is http://www.sdss.org/.
The SDSS is managed by the Astrophysical Research Consortium for the Participating Institutions. The Participat-ing Institutions are the American Museum of Natural History, Astrophysical Institute Potsdam, University of Basel,University of Cambridge, Case Western Reserve University, University of Chicago, Drexel University, Fermilab, theInstitute for Advanced Study, the Japan Participation Group, Johns Hopkins University, the Joint Institute for NuclearAstrophysics, the Kavli Institute for Particle Astrophysics and Cosmology, the Korean Scientist Group, the ChineseAcademy of Sciences (LAMOST), Los Alamos National Laboratory, the Max-Planck-Institute for Astronomy (MPIA),the Max-Planck-Institute for Astrophysics (MPA), New Mexico State University, Ohio State University, University ofPittsburgh, University of Portsmouth, Princeton University, the United States Naval Observatory, and the Universityof Washington.
REFERENCES
Abazajian, K. et al. 2003, AJ, 126, 2018 (DR1 paper)Abazajian, K. et al. 2004, AJ, 128, 502 (DR2 paper)Abazajian, K. et al. 2005, AJ, 129, 1755 (DR3 paper)Adelman-McCarthy, J. K. et al. 2006, ApJS, 162, 38 (DR4 paper)Adelman-McCarthy, J. K. et al. 2007, ApJS, 172, 634 (DR5 paper)Allen, L. E., & Strom, K. M. 1995, AJ, 109, 1379Allende Prieto, C. et al. 2006, ApJ, 636, 804Allende Prieto, C. et al. 2007, in preparationBagnulo, S., Jehin, E., Ledoux, C., Cabanac, R., Melo, C.,
Gilmozzi, R., & the ESO Paranal Science Operations Team 2003,The Messenger, 114, 10
Beers, T. C., Rossi, S., Norris, J. E., Ryan, S. G., & Shefler, T.1999, ApJ, 506, 892
Bernardi, M. 2007, AJ, 133, 1954Bernardi, M. et al. 2003a, AJ, 125, 1817Bernardi, M. et al. 2003b, AJ, 125, 1882 (B03)Bernardi, M., Hyde, J. B., Sheth, R. K., Miller, C. J., & Nichol, R.
C. 2007, AJ, 133, 1741Blanton, M.R., Eisenstein, D., Hogg, D.W., Schlegel, D.J., &
Brinkmann, J, 2005a, ApJ, 629, 143Blanton, M.R. et al. 2005b, AJ, 129, 2562Blanton, M.R., Lin, H., Lupton, R.H., Maley, F.M., Young, N.,
Zehavi, I., & Loveday, J. 2003, AJ, 125, 2276Castelli, F. & Kurucz, R. L. 2003, IAU Symposium, 210, A20Cenarro, A. J., Gorgas J., Cardiel N., Pedraz S., Peletier R.F., &
Vazdekis, A. 2001, MNRAS, 326, 981

SDSS DR6 21
Chiu, K., Fan, X., Leggett, S.K., Golimowski, D.A., Zheng, W.,Geballe, T.R., Schneider, D.P., & Brinkmann, J. 2006, AJ, 131,2722
Clewley, L., Warren, S.J., Hewett, P.C., Norris, J.E., & Evans,N.W. 2004, MNRAS, 352, 285
Collinge, M. et al. 2005, AJ, 129, 2542Covey, K.R. et al. 2007, AJ, in press (arXiv:0707.4473v2)da Costa, L. N., Bernardi, M., Alonso, M. V., Wegner, G., Willmer,
C. N. A., Pellegrini, P. S., Rite, C., Maia, M. A. G., 2000, 120,95
Davenport, J.R.A., Bochanski, J.J., Covey, K.R., Hawley, S.L., &West, A.A. 2007, preprint
de Vaucouleurs, G. 1948, Annales d’Astrophysique, 11, 247Dufour, P. et al. 2007, ApJ, 663, 1291Eisenstein, D.J. et al. 2001, AJ, 122, 2267Eisenstein, D.J. et al. 2006, AJ, 132, 676Finkbeiner, D.P. et al. 2004, AJ, 128, 2577Frieman, J. et al. 2007, AJ, submitted (arXiv:0708.2749)Fukugita, M., Ichikawa, T., Gunn, J.E., Doi, M., Shimasaku, K.,
& Schneider, D.P. 1996, AJ, 111, 1748Gates, E. et al. 2004, ApJ, 612, L129Glazebrook, K., Offer, A.R., & Deeley, K. 1998, ApJ, 492, 98Gray, R.O. & Corbally, C.J. 1994, AJ, 107, 742Gray, R.O., Graham, P.W., & Hoyt, S.R. 2001, AJ, 121, 2159Gunn, J.E. et al. 1998, AJ, 116, 3040Gunn, J.E. et al. 2006, AJ, 131, 2332Hall, P.B. et al. 2002, ApJS, 141, 267Harris, H.C. et al. 2006, AJ, 131, 571Hawley, S. L. et al. 2002, AJ, 123, 3409Helmi, A. et al. 2003, ApJ, 586, 195Hewett, P.C., Irwin, M.J., Skillman, E.D., Foltz, C.B., Willis, J.P.,
Warren, S.J., & Walton, N.A. 2003, ApJ, 599, L37Hogg, D.W., Finkbeiner, D.P., Schlegel, D.J., & Gunn, J.E. 2001,
AJ, 122, 2129Holberg, J.B. & Bergeron, P. 2006, AJ, 132, 1221Holtzman, J. et al. 2007, in preparationIvezic, Z. et al. 2004, Astronomische Nachrichten, 325, 583Ivezic, Z. et al. 2007, AJ, 134, 973Johnston, D.E. et al. 2003, AJ, 126, 2281Kurucz, R. L. 1993, private communicationLauer, T.R. et al. 2007, ApJ, 662, 808Le Borgne, J.-F., et al. 2003, A&A, 402, 433Lee, Y.S. et al. 2007a, preprintLee, Y.S. et al. 2007b, preprintLenz, D., Newberg, H., Rosner, R., Richards, G.T., & Stoughton,
C. 1998, ApJS, 119, 121Lepine, S, Rich, R.M., Shara, M.M., Cruz, K.L., & Skemer, A.
2007, ApJ, 668, 507
Lepine, S. & Shara, M.M. 2005, AJ, 129, 1483Lisker, T., Grebel, E.K., Binggeli, B., & Glatt, K. 2007, ApJ, 660,
1186Lupton, R.H., Gunn, J.E., Ivezic, Z., Knapp, G.R., Kent, S., &
Yasuda, N. 2001, in Astronomical Data Analysis Software andSystems X, edited by F. R. Harnden Jr., F. A. Primini, and H.E. Payne, ASP Conference Proceedings, 238, 269
Lupton, R.H., Gunn, J.E., & Szalay, A.S. 1999, AJ, 118, 1406Mandelbaum, R. et al. 2005, MNRAS, 361, 1287McDonald, P. et al. 2006, ApJS, 163, 80Miller, C. J. et al. 2005, AJ, 130, 968Monet, D.G. et al. 2003, AJ, 125, 984Morrison, H.L. et al. 2001, AJ, 121, 283Morrison, H. L., Norris, J., Mateo, M., Shectman, S. A., Dohm-
Palmer, R. C., Helmi, A., & Freeman, K. 2003, AJ, 125, 2502Munn, J.A., et al. 2004, AJ, 127, 3034Padmanabhan, N. et al. 2007, ApJ, in press (astro-ph/0703454)Paturel, G., Petit, C., Prugniel, Ph., Theureau, G., Rousseau, J.,
Brouty, M., Dubois, P., & Cambresy, L. 2003, A&A, 412, 45Pier, J.R., Munn, J.A., Hindsley, R.B., Hennessy, G.S., Kent, S.M.,
Lupton, R.H., & Ivezic, Z. 2003, AJ, 125, 1559Prugniel, P., & Soubiran, C. 2001, A&A, 369, 1048Re Fiorentin, P. et al. 2007, A&A, 467, 1373Richards, G.T. et al. 2002, AJ, 123, 2945Sanchez-Blazquez, P. et al. 2006, MNRAS, 371, 703Schlegel, D.J, Finkbeiner, D.P., & Davis, M. 1998, ApJ, 500, 525
(SFD)Schmidt, G.D. et al. 2003, ApJ, 595, 1101Schreiber, M.R. & Gansicke, B.T. 2003, A&A, 406, 305Sirko, E. et al. 2004, AJ, 127, 899
Smith, J.A. et al. 2002, AJ, 123, 2121Stoughton, C. et al. 2002, AJ, 123, 485 (EDR paper)Strauss, M.A. et al. 2002, AJ, 124, 1810Subbarao, M., Frieman, J., Bernardi, M., Loveday, J., Nichol, B.,
Castander, F., & Meiksin, A. 2002, SPIE, 4847, 452Tucker, D. et al. 2006, AN, 327, 8212Valdes, F., Gupta, R., Rose, J. A., Singh, H. P., & Bell, D. J. 2004,
ApJS, 152, 251Vanden Berk, D.E. et al. 2004, ApJ, 601, 692Wilhite, B.C., Vanden Berk, D.E., Kron, R.G., Schneider, D.P.,
Pereyra, N., Brunner, R.J., Richards, G.T., & Brinkmann, J.V.2005, ApJ, 633, 638
Woolf, V. M. & Wallerstein, G. W. 2006, PASP, 118, 218York, D.G. et al. 2000, AJ, 120, 1579