A survey of z> 5 7 quasars in the Sloan Digital Sky Survey. IV. discovery of seven additional...
16
arXiv:astro-ph/0512080v1 4 Dec 2005 AJ in press A Survey of z> 5.7 Quasars in the Sloan Digital Sky Survey IV: Discovery of Seven Additional Quasars 1,2 Xiaohui Fan 3,4 , Michael A. Strauss 5 , Gordon T. Richards 5,6 , Joseph F. Hennawi 7 , Robert H. Becker 8,9 , Richard L. White 10 , Aleksandar M. Diamond-Stanic 3 , Jennifer L. Donley 3,4 , Linhua Jiang 3,4 , J. Serena Kim 3 , Marianne Vestergaard 3 , Jason E. Young 3,4 , James E. Gunn 5 , Robert H. Lupton 5 , Gillian R. Knapp 5 , Donald P. Schneider 11 , W. N. Brandt 11 , Neta A. Bahcall 5 , J.C. Barentine 12 , J. Brinkmann 12 , Howard J. Brewington 12 , Masataka Fukugita 13 , Michael Harvanek 12 , S.J. Kleinman 12 , Jurek Krzesinski 12,14 , Dan Long 12 , Eric H. Neilsen, Jr. 15 , Atsuko Nitta 12 , Stephanie A. Snedden 12 and Wolfgang Voges 16 1 Based on observations obtained with the Sloan Digital Sky Survey, and with the Apache Point Observatory 3.5- meter telescope, which is owned and operated by the Astrophysical Research Consortium; with the MMT Observatory, a joint facility of the University of Arizona and the Smithsonian Institution; with the University of Arizona 2.3-meter Bok Telescope; with the Kitt Peak National Observatory 4-meter Mayall Telescope, with the 6.5-meter Walter Baade Telescope at the Las Campanas Observatory, a collaboration between the Observatories of the Carnegie Institution of Washington, University of Arizona, Harvard University, University of Michigan, and Massachusetts Institute of Technology, and at the W.M. Keck Observatory, which is operated as a scientific partnership among the California Institute of Technology, the University of California and the National Aeronautics and Space Administration, made possible by the generous financial support of the W.M. Keck Foundation. 2 This paper is dedicated to the memory of John N. Bahcall. 3 Steward Observatory, The University of Arizona, Tucson, AZ 85721 4 Visiting Astronomer, Kitt Peak National Observatory, National Optical Astronomy Observatory, which is operated by the Association of Universities for Research in Astronomy, Inc. (AURA) under cooperative agreement with the National Science Foundation. 5 Princeton University Observatory, Princeton, NJ 08544 6 Department of Physics and Astronomy, The Johns Hopkins University, Baltimore, MD 21218 7 Department of Astronomy, University of California, Berkeley, CA, 94720; Hubble Fellow 8 Physics Department, University of California, Davis, CA 95616 9 IGPP/Lawrence Livermore National Laboratory, Livermore, CA 94550 10 Space Telescope Science Institute, Baltimore, MD 21218 11 Department of Astronomy and Astrophysics, The Pennsylvania State University, University Park, PA 16802 12 Apache Point Observatory, P. O. Box 59, Sunspot, NM 88349-0059 13 Institute for Cosmic Ray Research, University of Tokyo, Midori, Tanashi, Tokyo 188-8502, Japan 14 Mt. Suhora Observatory, Cracow Pedagogical University, ul. Podchorazych 2, 30-084 Cracow, Poland 15 Fermi National Accelerator Laboratory, P. O. Box 500, Batavia, IL 60510 16 Max-Planck-Institut f¨ ur extraterrestrische Physik, Postfach 1603, 85750 Garching, Germany
Transcript of A survey of z> 5 7 quasars in the Sloan Digital Sky Survey. IV. discovery of seven additional...

arX
iv:a
stro
-ph/
0512
080v
1 4
Dec
200
5
AJ in press
A Survey of z > 5.7 Quasars in the Sloan Digital Sky Survey IV: Discovery of
Seven Additional Quasars1,2
Xiaohui Fan3,4, Michael A. Strauss5, Gordon T. Richards5,6, Joseph F. Hennawi7, Robert H.
Becker8,9, Richard L. White10, Aleksandar M. Diamond-Stanic3, Jennifer L. Donley3,4, Linhua
Jiang3,4, J. Serena Kim3, Marianne Vestergaard3, Jason E. Young3,4, James E. Gunn5, Robert H.
Lupton5, Gillian R. Knapp5, Donald P. Schneider11, W. N. Brandt11, Neta A. Bahcall5, J.C.
Barentine12, J. Brinkmann12, Howard J. Brewington12, Masataka Fukugita13, Michael
Harvanek12, S.J. Kleinman12, Jurek Krzesinski12,14, Dan Long12, Eric H. Neilsen, Jr.15, Atsuko
Nitta12, Stephanie A. Snedden12 and Wolfgang Voges16
1Based on observations obtained with the Sloan Digital Sky Survey, and with the Apache Point Observatory 3.5-
meter telescope, which is owned and operated by the Astrophysical Research Consortium; with the MMT Observatory,
a joint facility of the University of Arizona and the Smithsonian Institution; with the University of Arizona 2.3-meter
Bok Telescope; with the Kitt Peak National Observatory 4-meter Mayall Telescope, with the 6.5-meter Walter Baade
Telescope at the Las Campanas Observatory, a collaboration between the Observatories of the Carnegie Institution
of Washington, University of Arizona, Harvard University, University of Michigan, and Massachusetts Institute of
Technology, and at the W.M. Keck Observatory, which is operated as a scientific partnership among the California
Institute of Technology, the University of California and the National Aeronautics and Space Administration, made
possible by the generous financial support of the W.M. Keck Foundation.
2This paper is dedicated to the memory of John N. Bahcall.
3Steward Observatory, The University of Arizona, Tucson, AZ 85721
4Visiting Astronomer, Kitt Peak National Observatory, National Optical Astronomy Observatory, which is
operated by the Association of Universities for Research in Astronomy, Inc. (AURA) under cooperative agreement
with the National Science Foundation.
5Princeton University Observatory, Princeton, NJ 08544
6Department of Physics and Astronomy, The Johns Hopkins University, Baltimore, MD 21218
7Department of Astronomy, University of California, Berkeley, CA, 94720; Hubble Fellow
8Physics Department, University of California, Davis, CA 95616
9IGPP/Lawrence Livermore National Laboratory, Livermore, CA 94550
10Space Telescope Science Institute, Baltimore, MD 21218
11Department of Astronomy and Astrophysics, The Pennsylvania State University, University Park, PA 16802
12Apache Point Observatory, P. O. Box 59, Sunspot, NM 88349-0059
13Institute for Cosmic Ray Research, University of Tokyo, Midori, Tanashi, Tokyo 188-8502, Japan
14Mt. Suhora Observatory, Cracow Pedagogical University, ul. Podchorazych 2, 30-084 Cracow, Poland
15Fermi National Accelerator Laboratory, P. O. Box 500, Batavia, IL 60510
16Max-Planck-Institut fur extraterrestrische Physik, Postfach 1603, 85750 Garching, Germany

– 2 –
ABSTRACT
We present the discovery of seven quasars at z > 5.7, selected from ∼ 2000 deg2
of multicolor imaging data of the Sloan Digital Sky Survey (SDSS). The new quasars
have redshifts z from 5.79 to 6.13. Five are selected as part of a complete flux-limited
sample in the SDSS Northern Galactic Cap; two have larger photometric errors and
are not part of the complete sample. One of the new quasars, SDSS J1335+3533
(z = 5.93), exhibits no emission lines; the 3-σ limit on the rest-frame equivalent width
of Lyα+NV line is 5 A. It is the highest redshift lineless quasar known, and could
be a gravitational lensed galaxy, a BL Lac object or a new type of quasar. Two new
z > 6 quasars, SDSS 1250+3130 (z = 6.13) and SDSS J1137+3549 (z = 6.01), show
deep Gunn-Peterson absorption gaps in Lyα. These gaps are narrower the complete
Gunn-Peterson absorption troughs observed among quasars at z > 6.2 and do not have
complete Lyβ absorption.
Subject headings: quasars: general; quasars: emission line; quasars: absorption lines
1. Introduction
This paper is the fourth in a series presenting i-dropout z ∼> 5.7 quasars selected from the
multicolor imaging data of the Sloan Digital Sky Survey (SDSS; York et al. 2000, Stoughton et al.
2002). In Fan et al. (2000) and in the first three papers of this series (Fan et al. 2001b, Paper
I; Fan et al. 2003, Paper II; Fan et al. 2004, Paper III), we presented the discovery of twelve
luminous quasars at z = 5.74 − 6.42, selected from ∼ 4600 deg2 of SDSS imaging in the Northern
Galactic Cap. In this paper, we describe the discovery of seven new quasars at z = 5.79 − 6.13,
selected from ∼ 2000 deg2 of new SDSS imaging data. The scientific objectives, photometric
data reduction, candidate selection and additional photometric and spectroscopic observation
procedures are described in detail in Paper I and will not be repeated here. We present the
photometric observations of the i-dropout candidates in the new area in §2. The spectroscopic
observations and the photometric and spectroscopic properties of the newly-discovered quasars
are described in §3. SDSS J133550.81+353315.817 (z = 5.93, SDSS J1335+3533 for brevity) is a
quasar without detectable emission lines; we discuss the properties of this unusual object in §4.
Following the previous papers in this series, we use two cosmologies to present our results: (1)
H0 = 50 km s−1 Mpc−1, ΩΛ = 0 and ΩM = 1 (Ω-model); (2) H0 = 71 km s−1 Mpc−1, ΩΛ = 0.73
and ΩM = 0.27 (Λ-model, Spergel et al. 2003).
17The IAU naming convention for SDSS sources is SDSS JHHMMSS.SS±DDMMSS.S, and the positions are
expressed in J2000.0 coordinates. The astrometry is accurate to better than 0.1′′ in each coordinate.

– 3 –
2. Candidate Selection and Identification
The Sloan Digital Sky Survey is using a dedicated 2.5m telescope (Gunn et al. 2005) and a
large format CCD camera (Gunn et al. 1998) at the Apache Point Observatory in New Mexico to
obtain images in five broad bands (u, g, r, i and z, centered at 3551, 4686, 6166, 7480 and 8932
A, respectively; Fukugita et al. 1996, Stoughton et al. 2002) of high Galactic latitude sky in the
Northern Galactic Cap. About 7400 deg2 of sky have been imaged at the time of this writing
(August 2005). The imaging data are processed with a series of pipelines (Lupton et al. 2001,
Pier et al. 2003), resulting in astrometric calibration errors of < 0.1′′ rms per coordinate, and
photometric calibration to better than 0.03 mag (Hogg et al. 2001, Smith et al. 2002, Ivezic et al.
2004, Tucker et al. 2005). These data have been made publicly available in a series of data releases
(EDR: Stoughton et al. 2002; DR1 – DR4: Abazajian et al. 2003, 2004, 2005, Adelman-McCarthy
et al. 2005).
Quasars at redshifts larger than 5.7 have i − z > 2.2 in the SDSS filter system, and become
i-dropout objects with weak or no detection in all but the reddest (z) band. In Papers I - III, we
presented results from a survey of i-dropout quasar candidates selected from ∼ 4600 deg2 of high
Galactic latitude sky in the SDSS Main Survey area, observed in the Springs of 2000 - 2003. In the
Springs of 2004 and 2005, we continued the search in 92 new SDSS imaging runs. These imaging
data were taken between May 2003 (Run 3926) and April 2005 (Run 5237), and cover ∼ 2400 deg2
of the sky. We applied the same color selection criteria as in Paper II (see Figures 1 and 2 in Paper
II) to the new SDSS imaging data to select z > 5.7 quasar candidates. A total of ∼ 230 i-dropout
candidates that satisfy the color selection criteria (with z-band photometric error σ(z) < 0.10)
were selected in the main survey area. These candidates were selected as part of a flux-limited
complete sample (Paper III). We have also selected a number of fainter candidates with larger
z-band photometric error σ(z) = 0.10 − 0.12, although they are not part of the complete sample.
The photometric and spectroscopic observations were carried out over a number of nights
between January 2004 and June 2005. A total of 198 candidates (85% of those selected) from
the complete sample were observed; thus the effective area of this sample is ∼ 2000 deg2. In
addition, data on about thirty fainter candidates with σ(z) = 0.10 − 0.12 were also acquired. We
first obtained independent z photometry to eliminate false detections due to cosmic rays and to
improve the i − z color measurement, using the Seaver Prototype Imaging Camera (SPICAM) on
the ARC 3.5m telescope at the Apache Point Observatory. Unfortunately, poor weather limited
the number of objects we were able to observe in the z band.
Additional J-band photometry allows separation of z ∼ 6 quasars from L/T dwarfs, which
have similar i − z colors but much redder z − J colors (e.g. Paper I). J-band observations
were carried out using a number of IR imagers: (1) the 256 × 256 NICMOS imager on Steward
Observatory’s 2.3m Bok Telescope at Kitt Peak; (2) GRIM II (the near infrared GRIsm
spectrometer and IMager), on the ARC 3.5m, which we used through December 2004; (3)
NIC-FPS (the Near-Infrared Camera/Fabry-Perot Spectrometer), also on the ARC 3.5m, which

– 4 –
replaced GRIM II in December 2004; and (4) PANIC (Persson’s Auxiliary Nasmyth Infrared
Camera, Martini et al. 2004) on the 6.5m Baade Telescope at Las Campanas Observatory.
Spectroscopic observations were carried out over a number of observing runs between January
2004 and June 2005 using: (1) the Red-Channel Spectrograph on the MMT 6.5-m telescope on
Mt. Hopkins, (2) the Multi-Aperture Red Spectrograph (MARS) on the 4-m telescope on Kitt
Peak, and (3) the Echellette Imaging Spectrograph (ESI, Epps & Miller 1998) on the Keck II
telescope on Mauna Kea, Hawaii.
3. Discovery of Seven New Quasars at z > 5.7
Among the 198 i-dropout candidates with σ(z) < 0.10 that we have observed, 52 are
false z-band only detections which are most likely cosmic rays; 129 are M or L dwarfs (mostly
classified photometrically based on their red z − J colors); and 12 are likely T dwarfs (Chiu et
al. 2005). Several objects still lack proper infrared spectroscopy, so the T dwarf classification is
still preliminary. We have not yet obtained J-band photometry for the remaining candidates.
Therefore the quasars reported in this paper do not form a complete sample. Among the faint
(σ(z) > 0.10) candidates that are not identified as quasars, roughly half are likely cosmic rays and
half are late-type stars, although the larger photometric error does not allow accurate typing.
Five of the i-dropout candidates with σ(z) < 0.10 and two faint candidates with
0.10 < σ(z) < 0.12 are identified as quasars at z = 5.79− 6.13. The finding charts of the seven new
quasars are presented in Figure 1. Their spectra are flux-calibrated to match the observed z-band
photometry and are shown in Figure 2. Table 1 presents the photometric properties of the new
quasars, and Table 2 presents the measurements of their continuum properties. Following Papers
I-III, the quantity AB1280 is defined as the AB magnitude of the continuum at rest-frame 1280 A,
after correcting for interstellar extinction using the map of Schlegel, Finkbeiner & Davis (1998).
We extrapolate the continuum to rest-frame 1450 A, assuming a continuum shape fν ∝ ν−0.5,
to calculate AB1450. None of the seven quasars is detected in the FIRST (Becker, White &
Helfand 1995) or NVSS (Condon et al. 1998) radio surveys. FIRST survey has typical 5-σ flux
limit of ∼ 1mJy at 20cm. Assuming a power law continuum of fν ∝ ν−0.5 in both radio and UV
wavelengths, we find that quasars in this paper have radio loudness parameter R = F5GHz/F4400
smaller than 10, the usual division between radio-loud and radio-quiet objects (e.g. White et al.
2000). We have checked the publicly available archival X-ray coverage of these seven quasars,
focusing on observations made by sensitive X-ray imaging detectors. SDSS J0927+2001 and
SDSS J1250+3130 lie within pointed X-ray observations made by the Einstein IPC (1.7 ks) and
ROSAT PSPC (0.7 ks), respectively, but no X-ray detections were obtained. The relatively
short exposures and significant off-axis angles of these two quasars do not allow physically tight
constraints to be placed upon their X-ray-to-optical flux ratios (see Strateva et al. 2005). The other
five quasars only have imaging X-ray coverage in the ROSAT All-Sky Survey, and no detections
were obtained, indicating 3-σ upper limits of X-ray flux of ∼ 3.1 − 5.7 × 10⁻¹³ erg cm−2s−1 in

– 5 –
the 0.1 – 2.4 keV band. Results from a recent Chandra observation of SDSS J0840+5624 will be
reported in O. Shemmer et al., in preparation. The discovery of these seven new quasars brings
the total number of z > 5.7 quasars from the SDSS to nineteen.
3.1. Notes on Individual Objects
SDSS J081827.40+172251.8 (z = 6.00 ± 0.02). This quasar was discovered using the Keck
II telescope on April 12, 2005. Figure 2 shows a spectrum with 20 minute exposure time using
Keck/ESI, smoothed to a resolution of 1800. SDSS J0818+1722 has very weak emission lines:
the rest-frame equivalent width of Lyα+NV is ∼ 10 A, compared to an average of ∼ 75 A for
high-redshift quasars (Schneider et al. 1991, Fan et al. 2001a, Paper III). The current spectrum
has moderate S/N; Lyα+NV is the only detected line. The redshift is determined from the fit to
the Lyα+NV complex. The uncertainty in this redshift comes from two sources. The first is due
to absorption in the blue end of the line due to absorption from the Lyα forest. The second is
the offset in the redshift determined from Lyα and from high ionization lines such as CIV on one
hand, and that from low ionization lines such as MgII on the other. Richards et al. (2002b) use
a large sample of SDSS quasars to show that CIV is blueshifted from MgII by 824 ± 511 km s−1,
corresponding to an uncertainty of ∼ 0.02 at z ∼ 6. Following Papers I-III, we adopt an error bar
of 0.02 in the quasar redshift to reflect these uncertainties.
There is also a strong absorption line at ∼ 8870 A which is resolved into a doublet in the
full resolution spectrum. We tentatively identify this feature as the CIVλλ1548,1551 doublet at a
redshift of 4.726.
SDSS J084035.09+562419.9 (z = 5.85 ± 0.02). This object was discovered on January 13,
2004 using the MMT. Figure 2 shows a spectrum with 60 minute exposure time using the MMT
Red Channel Spectrograph. The signal-to-noise ratio (S/N) of the spectrum is relatively low. The
redshift is estimated by the best-fit Lyα+NV emission.
SDSS J092721.82+200123.7 (z = 5.79 ± 0.02). This quasar was discovered on May 6, 2005
using the Kitt Peak 4-m telescope. Figure 2 shows a spectrum with 220 minute exposure time
with the MARS spectrograph on the Kitt Peak 4-meter. The redshift is estimated by the best-fit
Lyα+NV emission.
SDSS J113717.73+354956.9 (z = 6.01 ± 0.02). This quasar was discovered on April 27, 2004
using the MMT. Figure 2 shows a 40 minute Keck/ESI spectrum taken on January 6, 2005. The
spectrum shows clear detections of Lyα+NV, OI and SiIV emission. We adopt the average of the
best-fit values of these lines as the quasar redshift. A strong and marginally resolved absorption
feature is detected at 9180 A; we are not able to unambiguously identify this feature.
The absorption spectrum shows a dark absorption gap in Lyα transition immediately
blueward of the emission line, where no flux is detected. Following Becker et al. (2001), Fan et al.
– 6 –
(2002) and White et al. (2003), we define the transmitted flux ratio as:
T (zabs) ≡⟨
f obsν /f con
ν
⟩
, (1)
where f conν is the continuum level extrapolated from the red side of the Lyα emission line. We find
an average transmitted flux T = −0.005 ± 0.004 for zabs between 5.83 and 5.90. The effective Lyα
optical depth in this dark gap is τeff > 5.5, comparable to the limits measured in the complete
Gunn-Peterson (1965) troughs detected in quasars at z > 6.1 (Becker et al. 2001, Fan et al.
2002, White et al. 2003, Paper III, see also Songaila 2004). The redshift extent of this dark
gap is considerably narrower than those seen in quasars at z > 6.1. Furthermore, flux is clearly
detected in the Lyβ transition over the same redshift range, with an average transmitted flux of
Tβ = 0.013 ± 0.003, indicating that IGM is still highly ionized in this region, although the mean
optical depth has increased substantially from lower redshift. In a subsequent paper (X. Fan, et
al. in preparation), we present a full analysis of the Gunn-Peterson absorption in the spectra of
this and the other 18 z > 5.7 SDSS quasars.
SDSS J125051.93+313021.9 (z = 6.13 ± 0.02). This quasar was discovered on April 24, 2004
using the MMT. We did not carry out J-band photometry; the red i− z color and lack of detection
(J > 16.5) in 2MASS (Skrutskie et al. 1997) suggested that it was likely to be a high-redshift
quasar. Figure 2 shows a 60 minute Keck/ESI spectrum taken on January 6, 2005. The spectrum
shows clear detections of Lyα+NV, Lyβ+OVI, OI and SiIV emission lines. We adopt the average
of the best-fit values of these lines as the quasar redshift. It is the highest redshift object presented
in this paper, and the fifth most distant quasar yet discovered. On the blue wing of the OI
emission line, a MgII doublet at zabs = 2.29 is clearly detected, with a total rest-frame equivalent
width of 4.5 A.
In the absorption spectrum of this quasar, we detect a deep Gunn-Peterson absorption gap
at 5.69 < zabs < 5.95 in Lyα transition. The average transmitted flux, T = 0.005 ± 0.003,
indicates a lower limit of the Gunn-Peterson optical depth τeff > 5.3. Similar to the case of
J1137 + 3549, residual flux is clearly detected over the same redshift range in the Lyβ transition,
with a transmitted flux of Tβ = 0.008 ± 0.002.
SDSS J133550.81+353315.8 (z = 5.93 ± 0.04). This quasar was discovered on June 13, 2005
using the MMT. Figure 2 shows a 120 minute MMT/Red Channel spectrum. This object has a
z-band photometric error σ(z) = 0.11, therefore it is not part of the complete flux-limited sample
of z ∼ 6 quasars. SDSS J1335+3533 is the most unusual object presented in this paper: it does not
have a detectable Lyα+NV emission line. We discuss its properties and possible interpretations in
§4.
SDSS J143611.74+500706.9 (z = 5.83 ± 0.02). This object was discovered on April 28, 2004,
using the Kitt Peak 4-m Telescope. Figure 2 shows a spectrum with 60 minute exposure time using
the MMT/Red Channel Spectrograph. This object has a z-band photometric error σ(z) = 0.12,
and therefore will not be part of the complete flux-limited sample of z ∼ 6 quasars. The redshift
is estimated by the best-fit Lyα+NV line.

– 7 –
4. SDSS J1335+3533, a Lineless Quasar at z = 5.93
Figure 3 shows the MMT spectrum of SDSS J1335+3533. This object is clearly at high
redshift: it exhibits a sharp Lyα break at λ < 8410 A, and a sharp Lyβ break at λ < 7130
A, indicating a redshift z > 5.92. However, no strong Lyα emission line is detected. Although
there is a hint of excess flux at the edge of the Lyα break, the spectrum is consistent with a
pure power-law continuum. Fitting a power-law plus emission line model to the spectral region
redward of the Lyα break, we find the 3-σ limit on the rest-frame equivalent width of Lyα+NV
line to be 5 A. Most high-redshift quasars are characterized by the presence of strong Lyα and NV
emission lines, and the rest-frame equivalent width of Lyα+NV is 70± 15A for z ∼ 4 quasars (e.g.
Schneider, Schmidt & Gunn 1991, Vanden Berk et al. 2001, Fan et al. 2001a, 2004). Figure 3 also
displays the composite spectrum of 16 non-BAL quasars at z > 5.7 (excluding SDSS J1335+3533),
constructed following the procedure described in Paper III. The lack of Lyα is striking. The
current observations do not have sufficient S/N to place strong constraints on the presence of
OI and SiIV lines; another strong emission line, CIV, is now beyond 1µm and will require new
infrared spectroscopy. We base our estimate of the redshift of SDSS J1335+3533 on the size of
the proximity effect zone in the Lyα forest close to the Lyα emission line. Details of calculating
the size of proximity zone around luminous quasars at z ∼ 6 are described in a subsequent paper
(X. Fan et al. in preparation). Briefly, in regions of the IGM close to the quasar, transmitted flux
is enhanced due to increased ionizing flux from the quasar itself. The transmitted flux declines to
that in the average IGM at large discance; at z > 5.7, T < 0.05. Fluxes in the 16 other z > 5.7
non-BAL quasars from the SDSS drop to 20% of the continuum level at a redshift ∆z = 0.11±0.04
blueward of the Lyα emission line. This value is a function of luminosity and redshift. SDSS
J1335+3533 is close to the median redshift and luminosity of our sample. Including these effects
does not change our redshift estimate. For this quasar, the transmitted flux falls to 20% of the
extrapolation of the long-wavelength flux at zabs = 5.82, implying that the true redshift of the
quasar is z = 5.93 ± 0.04. We obtain a similar redshift using the onset of the Lyβ forest in the
spectrum. Note that this redshift determination depends somewhat on the assumed size of the
HII region around SDSS J1335+3533.
Lineless quasars are very rare at high redshift. This is unlikely to be a selection effect. The
SDSS color selection of high-redshift quasars is mostly based on the presence of a strong Lyman
break. It does not strongly select against quasars with small Lyα emission line equivalent widths
(Fan et al. 1999, Richards et al. 2002a). The first lineless quasar found at high redshift was SDSS
J1532–0030 (z = 4.62, Fan et al. 1999); its spectrum is very similar to that of SDSS J1335+3533.
Since then, the SDSS has so far discovered about a dozen quasars at 3 < z < 5 with rest-frame
Lyα equivalent width smaller than 5 A (e.g., Anderson et al. 2001; Collinge et al. 2005). They
appear to form a distinct class of high-redshift lineless quasars. SDSS J1335+3533 represents the
most distant member of this class of objects.
The nature of these lineless quasars remains a mystery. They could be ultra-luminous or
lensed galaxies, high-redshift BL Lac objects, or a new class of quasar with very weak or absent
– 8 –
broad emission lines. The absolute AB magnitude of SDSS J1335+3533 at 1450 A (rest-frame)
is M1450 = −26.81 (Λ-model). Thus, although the S/N of our optical spectrum is probably not
sufficient to rule out the presence of stellar absorption lines, this object is much too luminous to
be an ordinary galaxy unless it is strongly lensed. There is no indication that SDSS J1335+3533
is extended beyond the point spread function of the 1.3′′ FWHM SDSS image; this is not yet a
strong constraint on the lensing hypothesis.
BL Lac objects, by definition, show no or very weak emission lines. They are also characterized
by strong radio and X-ray emission, optical variability, and strong and variable optical polarization
due to synchrotron radiation from the relativistic jet (e.g. Urry & Padovani 1995). The highest
redshift BL Lac in the literature is at z < 2 (Laurent-Muehleisen et al. 1999). SDSS J1335+3533
is not detected in the FIRST radio survey; the 4σ upper limit of 0.8 mJy/beam at this position,
including CLEAN bias (White et al. 1997). This implies a radio-to-optical spectral index in the
observed frame of αro < 0.26 (4-σ). Classical radio-selected BL Lacs have αro > 0.3 (Stocke et
al. 1990), while X-ray selected BL Lacs can have αro as small as ∼ 0.1 (Laurent-Muehleisen et
al. 1999). Collinge et al. (2005) present a sample of 386 BL Lac candidates identified from the
SDSS by their lack of emission lines. Most of them are at low redshift (z < 1), and only ∼ 3%
of these optically-selected candidates have αro < 0.2. SDSS J1335+3533 is also not detected on
the ROSAT full-sky pixel images (Voges et al. 1999), implying a 3σ upper limit of X-ray flux
of ∼ 3.7 × 10⁻¹³ erg cm−2s−1 in the 0.1 – 2.4 keV band, and an optical-to-X-ray index in the
observed frame αox > 1.1 at 3-σ. This limit does not yet place strong constraints on the BL Lac
hypothesis, as it is in the middle of αox distribution for X-ray selected BL Lacs (Stocke et al.
1990, Sambruna et al. 1996).
The current observations cannot yet place strong constraints on the nature of SDSS
J1335+3533: whether it is a lensed galaxy, a very high redshift BL Lac, or a new type of quasar
with no or a very weak emission line region. Further observations, including high-resolution
imaging to test the lensing hypothesis, optical monitoring for variability, deep radio and X-ray
observations (e.g. Schneider et al. 2003), and optical polarimetric measurements to test the BL
Lac hypothesis, are needed. Spitzer observations of such objects in the mid-infrared will probe the
presence of hot dust in the vicinity of the object, differentiating the hypotheses that the source is
AGN-powered, star-formation powered, or beamed (A. M. Diamond-Stanic, et al. in preparation).
Stalin & Srianand (2005) suggest that such objects could be explained by microlensing of the
continuum source that only boosts the continuum; if this were the case, long-term monitoring
would show a decreasing continuum and a detectable Lyα emission line after the lensing event
passes.
5. Future Observations
Combining the seven new quasars presented in this paper with those reported in Papers
I-III, we have a sample of 19 quasars at z > 5.7. Among them, fourteen are selected using a
– 9 –
uniform set of color selection criteria from an effective area of ∼ 6600 deg2, forming a flux-limited
sample. Because the spectroscopic observations of i-dropout candidates have not been completed,
we do not derive statistical properties of the sample in this paper. In Spring 2005, the SDSS
essentially completed its imaging survey in the Northern Galactic Cap, with a total area of ∼ 7550
deg2 In Spring 2006, we will continue to search for i-dropout quasar candidates in the remaining
new area, as well as observe additional candidates in the previously studied area that meet the
selection criteria because of improved photometric calibrations. Combining current data with
these planned observations, we will be able to define a sample of z > 5.7 quasars covering the
entire SDSS Northern Galactic Cap area, and use it to refine the measurements of the evolution
of the luminosity function and emission line properties of the highest redshift quasars.
Funding for the creation and distribution of the SDSS Archive has been provided by the
Alfred P. Sloan Foundation, the Participating Institutions, the National Aeronautics and Space
Administration, the National Science Foundation, the U.S. Department of Energy, the Japanese
Monbukagakusho, and the Max Planck Society. The SDSS Web site is http://www.sdss.org/.
The SDSS is managed by the Astrophysical Research Consortium (ARC) for the Participating
Institutions. The Participating Institutions are The University of Chicago, Fermilab, the Institute
for Advanced Study, the Japan Participation Group, The Johns Hopkins University, the Korean
Scientist Group, Los Alamos National Laboratory, the Max-Planck-Institute for Astronomy
(MPIA), the Max-Planck-Institute for Astrophysics (MPA), New Mexico State University,
University of Pittsburgh, University of Portsmouth, Princeton University, the United States Naval
Observatory, and the University of Washington. We thank the staffs at Apache Point Observatory,
the MMT, the Bok Telescope, Kitt Peak, Keck and Magellan for their expert help. We acknowledge
support from NSF grant AST-0307384, a Sloan Research Fellowship and a Packard Fellowship for
Science and Engineering (X.F.), and NSF grants AST-0071091 and AST-0307409 (M.A.S.).

– 10 –
REFERENCES
Abazajian, K., et al. 2003, AJ, 126, 2081
—— 2004, AJ, 128, 502
—— 2005, AJ, 129, 1755
Adelman-McCarthy, J., et al. 2005, ApJS, in press (astro-ph/0507711)
Anderson, S. F., et al. 2001, AJ, 122, 503
Becker, R. H., White, R. L., & Helfand, D. J. 1995, ApJ, 450, 559
Becker, R. H. et al. 2001, AJ, 122, 2850
Chiu, K. et al., 2005, AJ, submitted
Collinge, M. J., et al. 2005, AJ, 129, 2542
Condon, J. J., Cotton, W. D., Greisen, E. W., Yin, Q. F., Perley, R. A., Taylor, G. B., &
Broderick, J. J., 1998, AJ, 115, 1693
Epps, H.W., & Miller, J.S. 1998, Proc. SPIE, 3355, 48
Fan, X. et al. 1999, ApJ, 526, L57
—— 2000, AJ, 120, 1167
—— 2001a, AJ, 121, 31
—— 2001b, AJ, 122, 2833 (Paper I)
—— 2002, AJ, 123, 1247
—— 2003, AJ, 125, 1649 (Paper II)
—— 2004, AJ, 128, 515 (Paper III)
Fukugita, M., Ichikawa, T., Gunn, J.E., Doi, M., Shimasaku, K., & Schneider, D.P. 1996, AJ, 111,
1748
Gunn, J. E., & Peterson, B. A. 1965, ApJ, 142, 1633
Gunn, J.E., et al. 1998, AJ, 116, 3040
Gunn, J.E., et al. 2005, AJ, submitted
Hogg, D., et al. 2001, AJ, 122, 2129
– 11 –
Ivezic, Z., et al. 2004, Astronomische Nachrichten, 325, 583
Laurent-Muehleisen, S. A., Kollgaard, R.. I., Feigelson, E. D., Brinkmann, W., & Siebert, J. 1999,
ApJ,525, 127
Lupton, R.H., Gunn, J.E., & Szalay, A. 1999, AJ, 118, 1406
Lupton, R. H., Gunn, J. E., Ivezic, Z., Knapp, G. R., Kent, S. M., & Yasuda, N., 2001, ASP
Conf. Ser. 238: Astronomical Data Analysis Software and Systems X, 10, 269
Martini, P., Persson, S.E. Murphy, D.C., Birk, C., Shectman, S.A., Gunnels, S.M., & Koch, E.
2004, Proc. SPIE, 5492, 1653
Pier, J. et al. 2003, AJ, 125, 1559
Richards, G. T., et al. 2002a, AJ, 123, 2925
Richards, G. T., Vanden Berk, D. E., Reichard, T. A., Hall, P. B., Schneider, D. P., SubbaRao,
M., Thakar, A. R., & York, D. G. 2002b, AJ, 124, 1
Sambruna, R. M., Maraschi, L., & Urry, C. M. 1996, ApJ, 463, 444
Schlegel, D.J, Finkbeiner, D.P., & Davis, M. 1998, ApJ, 500, 525
Schneider, D. P., Schmidt, M., & Gunn, J.E. 1991, AJ, 101, 2004
Schneider, D. P., et al. 2003, AJ, 126, 2579
Skrutskie, M. F., et al., 1997, The Impact of Large-Scale Near-IR Sky Surveys, ed. F. Garzon, N.
Epchtein, A. Omont, B,. Burton, & P. Persei (Dordrecht: Kluwer), 25
Smith, J., et al. 2002, AJ, 123, 2121
Songaila, A., 2004, AJ, 127, 2598
Spergel, D. N. et al. 2003, ApJS, 148, 175
Stalin, C. S., & Srianand, R. 2005, MNRAS, 359, 1022
Strateva, I.V., Brandt, W.N., Schneider, D.P., Vanden Berk, D.G., & Vignali, C. 2005, AJ, 130,
387
Stocke, J. T., Morris, S. L., Gioia, I. M., Maccacaro, T., Schild, R., & Wolter, A. 1990, ApJ, 348,
141
Stoughton, C. et al. 2002, AJ, 123, 485
Tucker, D., et al. 2005, AJ, submitted

– 12 –
Vanden Berk, D. E., et al. 2000, AJ, 122, 549
Urry, C. M., & Padovani, P. 1995, PASP, 107, 803
Voges, W., et al. 1999, A&A, 349, 389
White, R. L., Becker, R. H., Helfand, D. J., & Gregg, M. D. 1997, ApJ, 475, 479
White, R. L., et al. 2000, ApJS, 126, 133
White, R. L., Becker, R. H., Fan, X., & Strauss, M. A., 2003, AJ, 126, 1
York, D. G., et al. 2000, AJ, 120, 1579
This preprint was prepared with the AAS LATEX macros v4.0.

– 13 –
Fig. 1.— SDSS z-band images of the seven new z > 5.7 quasars. Each side of the finding chart is
120′′. North is up and East is left.
– 14 –
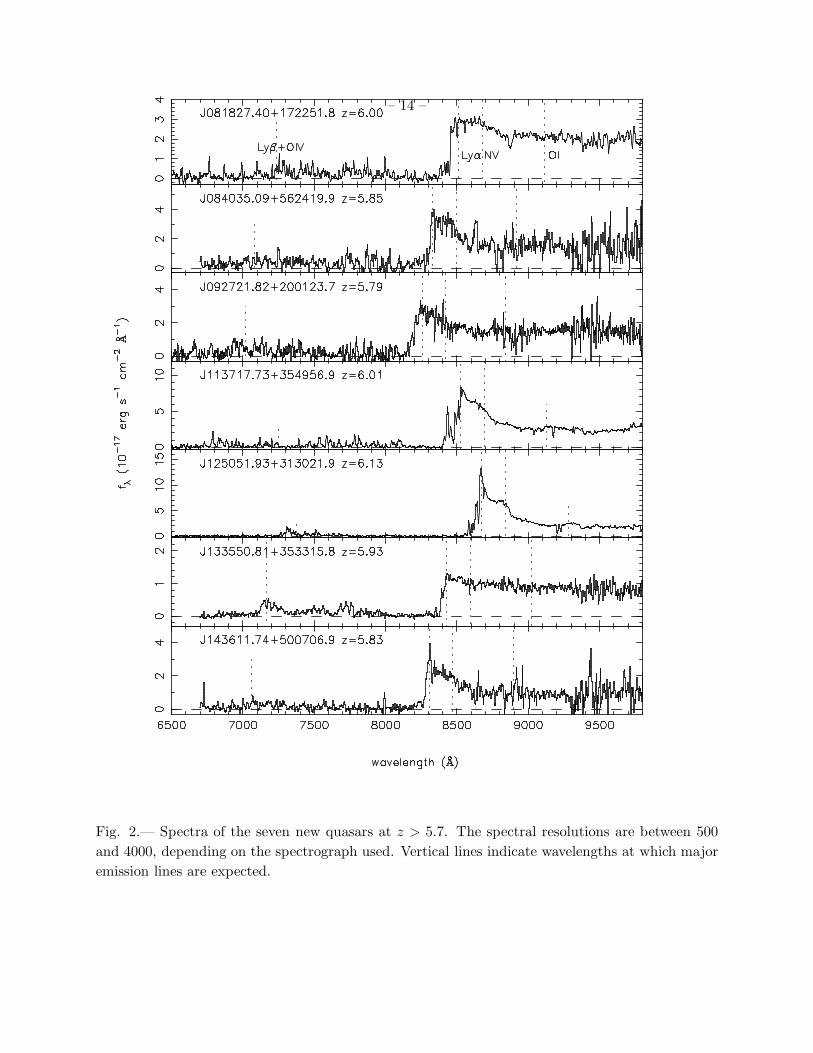
Fig. 2.— Spectra of the seven new quasars at z > 5.7. The spectral resolutions are between 500
and 4000, depending on the spectrograph used. Vertical lines indicate wavelengths at which major
emission lines are expected.

– 15 –
Fig. 3.— Spectrum of the lineless quasar SDSS J1335+3533 (z = 5.93). The shaded area around
zero flux shows the 1-σ error array. The dashed line is the best-fit power law. The absolute value of
power-law index is uncertain by ∼ 0.3 due to possible error in the spectrophotometric calibration.
The dotted line shows the composite spectrum of 16 quasars at z > 5.7 (arbitrary normalization).
The Lyα+NV emission line has an average rest-frame equivalent width of ∼ 70 A at z > 4, while
for SDSS J1335+3533, it has a 3-σ upper limit of 5 A.

– 16 –
Table 1. Photometric Properties of Seven New z > 5.7 Quasars
Quasar redshift i z J SDSS run
(SDSS)
J081827.40+172251.8 6.00 ± 0.02 22.19 ± 0.22 19.60 ± 0.08 18.54 ± 0.05 5045
J084035.09+562419.9 5.85 ± 0.02 22.43 ± 0.34 19.76 ± 0.10 19.00 ± 0.10 4204
J092721.82+200123.7 5.79 ± 0.02 22.12 ± 0.17 19.88 ± 0.08 19.01 ± 0.10 5138
J113717.73+354956.9 6.01 ± 0.02 22.57 ± 0.30 19.54 ± 0.07 18.41 ± 0.05 4392
J125051.93+313021.9 6.13 ± 0.02 22.14 ± 0.18 19.53 ± 0.08 > 16.5 4623
J133550.81+353315.8 5.93 ± 0.04 22.67 ± 0.99 20.10 ± 0.11 18.97 ± 0.05 4470
J143611.74+500706.9 5.83 ± 0.02 22.76 ± 0.28 20.00 ± 0.12 19.04 ± 0.10 3180
The SDSS photometry (i, z) is reported in terms of asinh magnitudes on the AB system. The
asinh magnitude system is defined by Lupton, Gunn & Szalay (1999); it becomes a linear scale in
flux when the absolute value of the signal-to-noise ratio is less than about 5. In this system, zero
flux corresponds to 24.4 and 22.8, in i, and z, respectively. The J magnitude is on a Vega-based
system.
Table 2. Continuum Properties of new z > 6 Quasars
Quasar redshift AB1280 AB1450 M1450 M1450 E(B − V )
(SDSS) (Λ-model) (Ω-model) (Galactic)
J081827.40+172251.8 6.00 19.41 19.34 −27.37 −27.14 0.04
J084035.09+562419.9 5.85 20.10 20.04 −26.64 −26.40 0.04
J092721.82+200123.7 5.79 19.94 19.87 −26.78 −26.55 0.03
J113717.73+354956.9 6.01 19.70 19.63 −27.08 −26.85 0.02
J125051.93+313021.9 6.13 19.71 19.64 −27.11 −26.87 0.02
J133550.81+353315.8 5.93 19.96 19.89 −26.81 −26.58 0.01
J143611.74+500706.9 5.83 20.23 20.16 −26.51 −26.28 0.02