Impaired balancing ability in dyslexic children
11
RESEARCH ARTICLE Catherine J. Stoodley Angela J. Fawcett Roderick I. Nicolson John F. Stein Impaired balancing ability in dyslexic children Received: 25 January 2005 / Accepted: 20 April 2005 / Published online: 26 July 2005 Ó Springer-Verlag 2005 Abstract Children with developmental dyslexia struggle to learn to read and spell despite adequate intelligence and educational opportunity. Several lines of research are attempting to establish the neurobiological basis of dyslexia, and low-level sensory and motor deficits have been found in dyslexic populations; furthermore, behavioural and imaging data point to cerebellar dysfunction in dyslexia. To investigate this, normal readers (n=19) and children with developmental dys- lexia (n=16) were asked to perform various cognitive, literacy, and balancing tasks. Children balanced on the left or right foot, with eyes open or closed, for a period of 10 s during which their movements were recorded with a motion-tracking system. Dyslexic children were less stable than the control children in both eyes-open conditions (left foot P=0.02, right foot P=0.012). While there were no group differences during the eyes-closed conditions, the dyslexic children dropped a foot to correct balance significantly more often than control children (P<0.05). Incidence ana- lysis showed that 50% of the dyslexic group fell into the ‘impaired’ category on the eyes-open balancing tasks; when the mean balancing scores and the foot drops were considered, only three of our dyslexic children showed no evidence of balancing difficulties. There were strong correlations between reading and spelling scores and the mean eyes-open balancing score (r=0.52 and 0.44, respectively). Thus, while not all children with developmental dyslexia show im- paired balancing skills, low-level motor dysfunction may be associated with impaired literacy development. This could be due to several factors, including the involvement of the cerebellum, the magnocellular sys- tem, or more general developmental immaturity. Keywords Developmental dyslexia Balance Cerebellum Magnocellular Introduction Developmental dyslexia affects between 3 and 10% of children (Rutter and Yule 1975). It is currently defined as deficient literacy acquisition despite adequate intel- lectual ability and sufficient educational provision. This definition is contentious however, and a major goal of current research is to find out what neuro- logical abnormalities underlie these educational prob- lems. Difficulty with literacy acquisition is only one of the symptoms of this complex disorder; others may exist in visual, auditory and motor domains (see Stein et al. 2001; Talcott and Witton 2002; Talcott et al. 2000; Nicolson et al. 2001). Dyslexics can suffer from clumsiness and delayed motor milestones, temporal sequencing problems (telling time, remembering the months of the year), and poor spatial sequencing (map reading, differentiating left and right—Stein and Walsh 1997). Dyslexia can be co-morbid with other neurodevelopmental disorders, such as dyspraxia and attention deficit disorder (see Pennington et al. 1991). The significant heterogeneity among dyslexics has made the determination of its cause extremely difficult. Some dyslexics also experience motor coordination and balance problems (see Fawcett and Nicolson 1999); such motor difficulties are characteristic of subjects with cerebellar damage (Holmes 1939). Furthermore, recent research suggests that the processing power and exten- sive cortical and sub-cortical connections of the cere- bellum may be used not only for motor but also for cognitive tasks (for examples see Schmahmann and C. J. Stoodley (&) J. F. Stein University Laboratory of Physiology, University of Oxford, Oxford, OX1 3PT, UK E-mail: [email protected] Tel.: +44-1865-272540 Fax: +44-1865-272469 A. J. Fawcett R. I. Nicolson Department of Psychology, Sheffield University, Sheffield, UK Exp Brain Res (2005) 167: 370–380 DOI 10.1007/s00221-005-0042-x
Transcript of Impaired balancing ability in dyslexic children

RESEARCH ARTICLE
Catherine J. Stoodley Æ Angela J. Fawcett
Roderick I. Nicolson Æ John F. Stein
Impaired balancing ability in dyslexic children
Received: 25 January 2005 / Accepted: 20 April 2005 / Published online: 26 July 2005� Springer-Verlag 2005
Abstract Children with developmental dyslexia struggleto learn to read and spell despite adequate intelligenceand educational opportunity. Several lines of researchare attempting to establish the neurobiological basis ofdyslexia, and low-level sensory and motor deficits havebeen found in dyslexic populations; furthermore,behavioural and imaging data point to cerebellardysfunction in dyslexia. To investigate this, normalreaders (n=19) and children with developmental dys-lexia (n=16) were asked to perform various cognitive,literacy, and balancing tasks. Children balanced on theleft or right foot, with eyes open or closed, for aperiod of 10 s during which their movements wererecorded with a motion-tracking system. Dyslexicchildren were less stable than the control children inboth eyes-open conditions (left foot P=0.02, rightfoot P=0.012). While there were no group differencesduring the eyes-closed conditions, the dyslexic childrendropped a foot to correct balance significantly moreoften than control children (P<0.05). Incidence ana-lysis showed that 50% of the dyslexic group fell intothe ‘impaired’ category on the eyes-open balancingtasks; when the mean balancing scores and the footdrops were considered, only three of our dyslexicchildren showed no evidence of balancing difficulties.There were strong correlations between reading andspelling scores and the mean eyes-open balancingscore (r=0.52 and 0.44, respectively). Thus, while notall children with developmental dyslexia show im-paired balancing skills, low-level motor dysfunctionmay be associated with impaired literacy development.
This could be due to several factors, including theinvolvement of the cerebellum, the magnocellular sys-tem, or more general developmental immaturity.
Keywords Developmental dyslexia Æ Balance ÆCerebellum Æ Magnocellular
Introduction
Developmental dyslexia affects between 3 and 10% ofchildren (Rutter and Yule 1975). It is currently definedas deficient literacy acquisition despite adequate intel-lectual ability and sufficient educational provision.This definition is contentious however, and a majorgoal of current research is to find out what neuro-logical abnormalities underlie these educational prob-lems.
Difficulty with literacy acquisition is only one ofthe symptoms of this complex disorder; others mayexist in visual, auditory and motor domains (see Steinet al. 2001; Talcott and Witton 2002; Talcott et al.2000; Nicolson et al. 2001). Dyslexics can suffer fromclumsiness and delayed motor milestones, temporalsequencing problems (telling time, remembering themonths of the year), and poor spatial sequencing (mapreading, differentiating left and right—Stein andWalsh 1997). Dyslexia can be co-morbid with otherneurodevelopmental disorders, such as dyspraxiaand attention deficit disorder (see Pennington et al.1991). The significant heterogeneity among dyslexicshas made the determination of its cause extremelydifficult.
Some dyslexics also experience motor coordinationand balance problems (see Fawcett and Nicolson 1999);such motor difficulties are characteristic of subjects withcerebellar damage (Holmes 1939). Furthermore, recentresearch suggests that the processing power and exten-sive cortical and sub-cortical connections of the cere-bellum may be used not only for motor but also forcognitive tasks (for examples see Schmahmann and
C. J. Stoodley (&) Æ J. F. SteinUniversity Laboratory of Physiology, University of Oxford,Oxford, OX1 3PT, UKE-mail: [email protected].: +44-1865-272540Fax: +44-1865-272469
A. J. Fawcett Æ R. I. NicolsonDepartment of Psychology, Sheffield University,Sheffield, UK
Exp Brain Res (2005) 167: 370–380DOI 10.1007/s00221-005-0042-x

Sherman 1997; Schmahmann 1997). Fawcett andNicolson (1999) describe the hallmarks of dyslexia asdeficits in phonological skill, in motor skills, in auto-matisation (Nicolson and Fawcett 1990; Yap and Vander Leij 1994), and in information-processing speed(Wolf 1991; Nicolson and Fawcett 1994). The latterthree characteristics suggest that cerebellar dysfunctionmay contribute to dyslexics’ problems; hence, the cere-bellar theory of dyslexia has been put forward (Nicolsonet al. 1995, 2001).
Further evidence for a link between the cerebellumand dyslexia comes from a wide range of studies.Anatomical differences found in the cerebella of dys-lexic as compared to control subjects provide a po-tential anatomical substrate for cerebellar dysfunctionin dyslexia (Finch et al. 2002; Brown et al. 2001; Raeet al. 2002; Leonard et al. 2001; Eckert et al. 2003).Neuroimaging studies using both positron emissiontomography (PET) and functional magnetic resonanceimaging (fMRI) have found significant differences inbrain activation between dyslexic and control subjects(Nicolson et al. 1999; Berry et al. 1998), and a reviewof neuroimaging studies on word reading reported thatbilateral regions in the cerebellum are active duringword reading (Fiez and Petersen 1998). Implicit motorlearning, a task thought to reflect cerebellar function,has been found to be deficient in children with dys-lexia (Vicari et al. 2003).
Patients who suffer cerebellar damage also acquirelanguage deficits and verbal problems (Fiez et al. 1992;Gasparini et al. 1999; Silveri et al. 1994). In the pho-nological domain, Leggio et al. (2000) found that cere-bellar patients have specific problems with phonologicalgrouping and phonological-related retrieval, while per-formance on semantic tasks was unimpaired. Scott et al.(2001) reported that two of three children who had focalright cerebellar damage at a very young age (<5 years)presented with developmental dyslexia. Finally, patientswith cerebellar vermis lesions suffer from reading prob-lems (Moretti et al. 2002).
The cerebellum could affect reading in a variety ofways. It is involved in the control of eye movements,visuospatial attention, and peripheral vision, all ofwhich are important to visual aspects of reading (seeStein and Walsh 1997). Some cerebellar patients sufferfrom oculomotor problems that could lead to difficultieswith fixation of visual (e.g., letter) stimuli or withmaking appropriate saccades for quick and fluentreading. In its role as an important timing structurelinking the sensory and motor regions of the brain, thecerebellum may therefore contribute to the sensorimotorproblems found in dyslexia.
Fawcett et al. (1996) proposed that cerebellar dys-function in dyslexic children may be present frombirth. This would cause difficulties in the acquisitionand automatisation of basic articulatory and auditoryskills and of visual skills such as eye movement andletter recognition. These difficulties could lead to thecharacteristic phonological and orthographic difficul-
ties experienced by dyslexics. Fawcett and Nicolson(1999) reason that reading depends critically on thefluent and coordinated interplay of a range of subs-kills, requiring both the execution of these skills andthe cumulative improvement in skills. The cerebellumis involved in both these functions.
The cerebellar theory is not incompatible with theother major theories of dyslexia. Those that proposethat a phonological deficit is the cause of developmentaldyslexia may be persuaded that cerebellar dysfunctionmay underlie these difficulties in phonological knowl-edge acquisition. It is possible that the rate and fluencydeficits described by the double deficit theory of dyslexia(Wolf and Obregon 1992) could be due to the failure ofthe cerebellum to act as the brain’s autopilot. Finally,the magnocellular theory (Stein and Walsh 1997) ofdyslexia would in fact predict subtle cerebellar deficits indyslexia due to abnormal input from the visual andauditory sensory systems included in the cerebro-cere-bellar loop.
While Nicolson and Fawcett have conducted exten-sive research in this area, the results of replications havebeen mixed. Automatic balance, both undisturbed anddisturbed, has been used to assess cerebellar function inboth children and adults with developmental dyslexia(see Ito 1984 for the role of the cerebellum in balanceand postural control). Balance impairments have beenfound in 50% or more of participants in studies by Yapand van der Leij (1994), Moe-Nilssen et al. (2003),Wimmer et al. (1999) and Ramus et al. (2003a, b).However, when assessing adult dyslexics Ramus et al.(2003a, b) found no impairment. Furthermore, a studyin children with reading disability and/or attention def-icit disorder (ADHD) by Raberger and Wimmer (2003)found that balancing difficulties were only associatedwith ADHD rather than reading disability. For thesereasons, both Wimmer and Ramus interpret their bal-ance impairment results in terms of a dual dyslexia/ADHD subtype. Other criticisms include doubts as towhether cerebellar dysfunction acts as a primary causeof dyslexia; cerebellar dysfunction may be related todyslexia, but in a non-causal manner (see commentariesby Zeffiro and Eden 2001; Ivry and Justus 2001; Bishop2002).
Even given the above contradictory results, there issufficient evidence of cerebellar dysfunction in dyslexiato warrant further investigation. Conflicting results maystem from the fact that the majority of the balance testsused in previous studies with dyslexic and control sub-jects were clinical tests which may not be sensitive en-ough to reveal the subtle abnormalities that mightunderlie reading difficulties. Hence more rigorous ‘cer-ebellar’ tests need to be conducted, both to attempt toreplicate previous results and to acquire data that can-not be dismissed as due to experimenter bias. We havetherefore used more objective techniques to obtainquantitative measurements of the degree of ‘wobble’while conducting the balancing test in control and dys-lexic children.
371
Methods
Subjects
The subjects were 35 children. All children were givenwritten parental consent to take part in the study, andeach child gave verbal consent to each of the tasks. Thesubjects were recruited from a primary school in Oxford,children attending clinics for reading difficulties inReading and Oxford, and children who were part of along-term research programme in the Department ofPsychology, University of Sheffield. There were 22 boysand 13 girls (controls: 11 boys, 8 girls; dyslexics: 11 boys,5 girls). Their average age was 10 years, 8 months (range92–163 months). Sixteen children were classified asdyslexic on the basis of either prior diagnosis by aneducational psychologist or a discrepancy of >1.5standard deviations between their reading and spellingability and their performance on standardised cognitivetests. The average age of the dyslexic group was11 years, 4 months (range 92–163 months) and thecontrol group were 9 years, 4 months on average (range99–133 months). The age difference between groups wassignificant and thus has been considered in later analysesof the data. Six of the dyslexic children were screened forADHD using the Connors questionnaire and all scored1 or lower on the checklist; the other dyslexic children,while not specifically screened for ADHD, had neither aprevious diagnosis nor overt indications of attentiondisorder. The remaining 19 children were classified ascontrols on the basis of a lack of discrepancy betweenliteracy and cognitive performance. In order to avoidconfounds due to handedness, only right-handed chil-dren were included in the study.
Psychometric and literacy tasks
The children were given either the matrices, similarities,digit span, reading and spelling subtests of the BritishAbilities Scales II (BAS-II) or the block design, simi-larities, and digit span subtests of the Wechsler Intelli-gence Scales for Children-Revised (WISC-R). Thechildren tested using the WISC-R also received the sin-gle word reading and spelling subtests of the WechslerObjective Reading Dimension (WORD) test. Thesesubtests sampled non-verbal (matrices, block design)and verbal (similarities) cognitive ability, and verbalshort-term memory (digit span). The reading and spell-ing subtests assessed literacy skills. All the tests are age-scaled, standardised tests; hence comparisons betweenthe groups can be made.
The children also completed component literacy tasksto assess orthographic and phonological ability. Bothtasks were computerised, and the child was asked torespond as quickly and accurately as possible. The OlsonOrthographic test was a word-pseudohomophonediscrimination task (Olson et al. 1994). The task is
programmed using SuperlabPro (version 1.04, Cedrus).A two-alternative forced-choice paradigm was used, inwhich two letter strings were presented side by side onthe computer. One was a correctly spelled real word(e.g., ‘rain’), and the other was a pseudohomophone ofthe word (e.g., ‘rane’). The subjects had to decide whichwas the ‘real’ word (i.e., spelt correctly) and were askedto press the appropriate button on a button-box asquickly as possible without making unnecessary errors.Stimuli remained on the screen until the subject re-sponded. The letter strings were in 18 point Geneva font.Feedback (‘Correct’ or ‘Incorrect’) was given during thetask. The subjects started with an 8-item practice sessionfollowed by 80 experimental items. This task is stronglyorthographic, since the visual form of the word must beknown to solve it; sounding out the letters cannot yieldthe correct answer (Olson et al. 1994). Percent correctfor the 80 test items and mean response time (RT) werecalculated offline.
The phonological choice task was administered usingthe same software and procedure as the orthographictask. Three nonwords were presented in a three-alter-native forced-choice paradigm. The subject was askedwhich of the three (e.g., nite dite hote) sounded like a realword, working as quickly and accurately as possible.Feedback (‘Correct’ or ‘Incorrect’) was given as thesubject worked through the 5 practice and 60 experi-mental trials. Percent correct and the mean responsetime were calculated offline as with the orthographicchoice task.
Balancing task
The Polhemus motion tracking system has been vali-dated in patient populations for screening and distin-guishing between different tremors (e.g., Parkinsonian,multiple sclerosis, and essential tremor—Spyers et al.1999). The system tracks the 3-D movement of a receiverwith reference to a static transmitter. The data weresampled at 12 points per millisecond and outputted as atext file, which was then analysed using Matlab version6.1. Figure 1 shows a schematic of the Polhemus set-upfor the recording of the children’s balancing ability.
For the balancing task, the subjects wore a cap towhich the Polhemus receiver was attached by a velcrostrip in order to record the amount of head movementduring the balancing tasks. The subjects stood �90 cmfrom the transmitter and were instructed to balance asbest they could during the recording period of 10 s. Thefour experimental conditions were balancing on the rightand the left foot with eyes open and closed (e.g., rightfoot, eyes open; left foot, eyes open; right foot, eyesclosed; left foot, eyes closed). Each condition was re-peated three times with a break in between trials, and themean of the three trials is reported for each condition.Any dropping of the raised foot was recorded. Thenecessity of placing a foot down in order to remainupright also was reflected in the degree of ‘wobble’, as
372

the subjects were encouraged to keep the foot up as longas possible. Thus, a fairly large amount of movementoccurred before the foot was dropped completely.
The score obtained is a measure of the pathlength persecond (cm/s), which gives a quantitative measure ofthe velocity of the movement of the child. Because therecording time was constant (10 s) for each trial, thepathlength per second is proportional to the totalpathlength through which the child moved during thetrial.
Data analysis
Data analyses were performed using SPSS version 11.0.For the standardised cognitive, reading and spellingtests, the scores were converted into standard scoresbased on the age of the subjects. These test scores, whichwere either based on a mean of 10 with a standarddeviation of 3 (cognitive tests) or a mean of 100 with astandard deviation of 15 (reading and spelling tests)were converted into z-scores (mean 0, standard deviation1) to ease data interpretation.
Effect sizes for each task were calculated based on themean and standard deviation of the control group. Theeffect size was then calculated as (dyslexic groupmean—control group mean)/control group standarddeviation.
Results
Descriptive statistics and group differences
Table 1 lists the cognitive and literacy scores for thecontrol and dyslexic children. The standard test scoreshave been converted into z-scores for ease of compari-son. T-tests were used to compare the control and dys-lexic groups.
The groups did not differ significantly on cognitivemeasures, with the exception of digit span, which is
generally lower in dyslexic populations. Literacy scoreswere all significantly lower in the dyslexic group, as ex-pected. There were also significant group differences onthe number of errors on the orthographic and phono-logical choice tasks. The response time scores on thosetasks, however, did not differ significantly between thegroups.
Table 2 gives the scores for control and dyslexicchildren on the balancing tasks, including the number oftimes a foot was dropped during the trials. The groupswere compared using independent t-tests. Significantvalues are flagged.
The dyslexic group performed significantly worsewhen balancing on the right foot and the left foot withthe eyes open. Indeed, the effect size for the group dif-ference is �1.75. There were no significant differencesbetween the groups when balancing with the eyes closed;however, the dyslexic children dropped a foot signifi-cantly more often during the eyes-closed conditions thanthe control children, an indicator of poorer balance. Theoverall balance score tended to be worse for the dyslexicchildren, although this difference was not statisticallysignificant. Figure 2a–f shows the boxplots for the dif-ferent balance conditions.
Impairment analysis
It is evident from the boxplots that there was consider-able overlap between the control and the dyslexicgroups. Using group means for comparison can oftenobscure individual data; so, we calculated the z-scoresfor the balancing tasks based on the control mean andstandard deviation scores. Using these scores, childrenwho had a z-score of greater than �1 (that is, no morethan one standard deviation below the control mean)were classified as ‘non-impaired’ on a given task, whilechildren with z-scores of less than �1 were classified as‘impaired’. Table 3 gives the outcome of this scoringsystem. As the literacy tests were standardised, based ona very large sample of children, we used the scores ob-
Fig. 1 Motion-tracking systemset-up. The transmitter sendssignals in three dimensions,which are received by thereceiver on the child’s cap. Theposition of the receiver relativeto the transmitter is recordedwhile the child balances
373

tained by the test to set the ‘impaired’ cutoff point ratherthan the scores of the control group. For the ortho-graphic and phonological choice tasks, the control meanand standard deviation scores were used to convert thescores into z-scores.
Based on the standardised norms given by thereading and spelling tasks, half of the dyslexic groupfell into the ‘impaired’ category on the literacy tasks.The dyslexic group was considerably more impaired onthe orthographic and phonological choice tasks thanthe control group, with �92% classified as impairedon the phonological choice task. Roughly half of thedyslexic group were impaired on the balancing mea-sures. It is important to note that the dyslexic group is,on average, 2 years older than the control group.Thus, it is actually surprising that group differencesemerge on the balancing tasks, given that motormaturity should be better in the dyslexic group as awhole.
Table 4 shows the pattern of deficits across the dys-lexic subjects. Most dyslexics were impaired on literacy/phonological processing and one or more of the bal-
ancing tasks. Only three dyslexics (D2, D11 and D15)showed no evidence of balancing impairment on eitherthe balancing scores or foot drop scores; of these, onewas impaired neither on literacy nor phonological choicetasks.
Correlation analysis
While the mean comparisons and impairment analysesindicate that a proportion of dyslexic children showevidence of balancing difficulties, it is not clear howperformance on this low-level balancing task may relateto reading ability. Therefore, in order to investigate howthe balancing tasks related to the cognitive and literacytasks, Spearman rank-order correlation coefficients werecalculated. It should be noted that a better score on thebalancing tasks is a lower score (i.e., less wobble);therefore a negative correlation between a balance scoreand a cognitive score, for example, signifies that thosewith higher cognitive scores were better performers onthe balancing tasks (Table 5).
Table 1 Cognitive and literacy scores
Task Control n=19 Range Dyslexic n=16 Range P-value
Age (months) 111.6±9.8 99.0–133.0 135.9±23.2 92.0–163.0 0.001*Non-verbal 0.90±0.72 �0.9–2.0 0.77±0.85 �1.1–1.7 NSVerbal 0.74±1.04 �2.0–2.4 0.46±0.71 �1.0–1.8 NSDigit 0.48±0.68 �1.3–1.5 �0.94±0.65 �2.0–0.10 <0.001**Cog 0.82±0.74 �1.4–1.7 0.62±0.40 �0.2–1.55 NSReading 0.87±0.54 �0.47–1.7 �0.95±0.76 �2.13–0.2 <0.001**Spelling 0.59±0.79 �0.67–2.2 �1.10±0.77 �2.2–0.2 <0.001**Literacy 0.73±0.61 �0.57–1.9 �0.95±0.76 �2.13–0.2 <0.001**Orth % 83.4±8.7 59.0–95.0 75.8±11.8 48.75–88.8 0.048*Orth RT 2037.2±874.7 1238.2–4720.4 2270.7±1017.6 1142.8–4916.9 NSPhon % 72.4±12.0 43.0–92.0 53.9±8.2 38.3–65.0 <0.001**Phon RT 4369.6±1738.7 1628.3–10164.8 4531.1±2520.5 1736.8–10948.3 NS
All scores are given as mean ± SD. All scores unless otherwisenoted are in z-scores (mean 0, SD 1)Non-verbalmatrices and/or block design score on BAS-II or WISC-R; Verbal similarities score from BAS-II or WISC-R; Digit digit
span score; Cog mean of non-verbal and verbal scores; Orthorthographic task; RT response time (ms); Phon phonologicalchoice task; NS not significant*P<0.05; **P<0.001
Table 2 Balancing scores
Task Control n=19 Range Dyslexic n=16 Range Effect size P-value
R open 0.023±0.009 0.01–0.04 0.038±0.02 0.01–0.08 �1.7 0.012*R open, foot drop 0.0±0.0 0.0–0.0 0.0±0.0 0.0–0.0 0 NSL open 0.023±0.010 0.01–0.04 0.036 ±0.017 0.02–0.07 �1.3 0.020*L open, foot drop 0.05±0.23 0.0–1.0 0.19±0.75 0.0–3.0 NSR closed 0.066±0.044 0.02–0.21 0.089±0.049 0.03–0.21 �0.5 NSR closed, foot drop 0.32±0.82 0.0–3.0 1.4±1.0 0.0–3.0 <0.01**L closed 0.077±0.04 0.03–0.19 0.086±0.047 0.03–0.19 �0.2 NSL closed, foot drop 0.63±1.11 0.0–4.0 1.7±1.5 0.0–4.0 0.015*Balance eyes open 0.023±0.008 0.01–0.04 0.037±0.018 0.02–0.08 �1.75 0.012*Balance eyes closed 0.047±0.023 0.02–0.12 0.062±0.028 0.03–0.10 �0.7 NS
All scores are given as mean ± SD. Values are in cm/s, which rep-resents the path length moved per second. In all cases, higher valuessignify a greater degree of movement, and thus a worse performanceR right foot; L left foot; Open eyes open; closed eyes closed; footdrop number of times the child’s foot was dropped during the task;
NS not significant. Balance mean of R, L eyes open and eyes closedconditions*P<0.05; **P<0.01
374
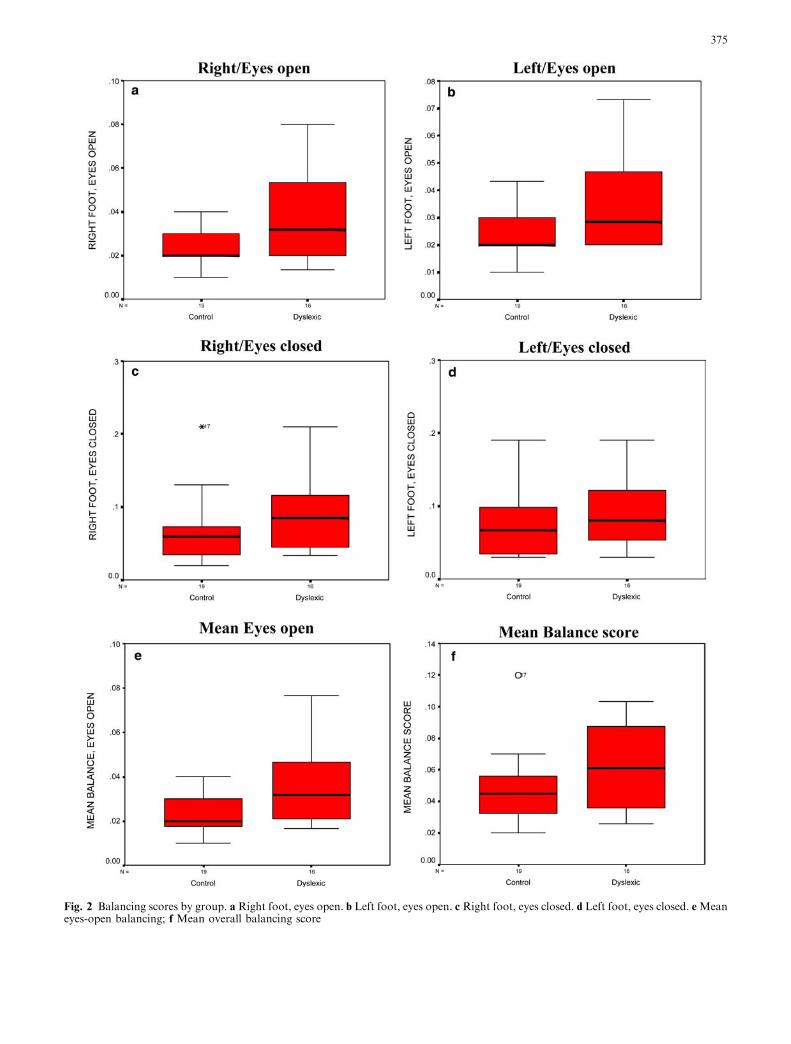
Fig. 2 Balancing scores by group. a Right foot, eyes open. b Left foot, eyes open. c Right foot, eyes closed. d Left foot, eyes closed. eMeaneyes-open balancing; f Mean overall balancing score
375
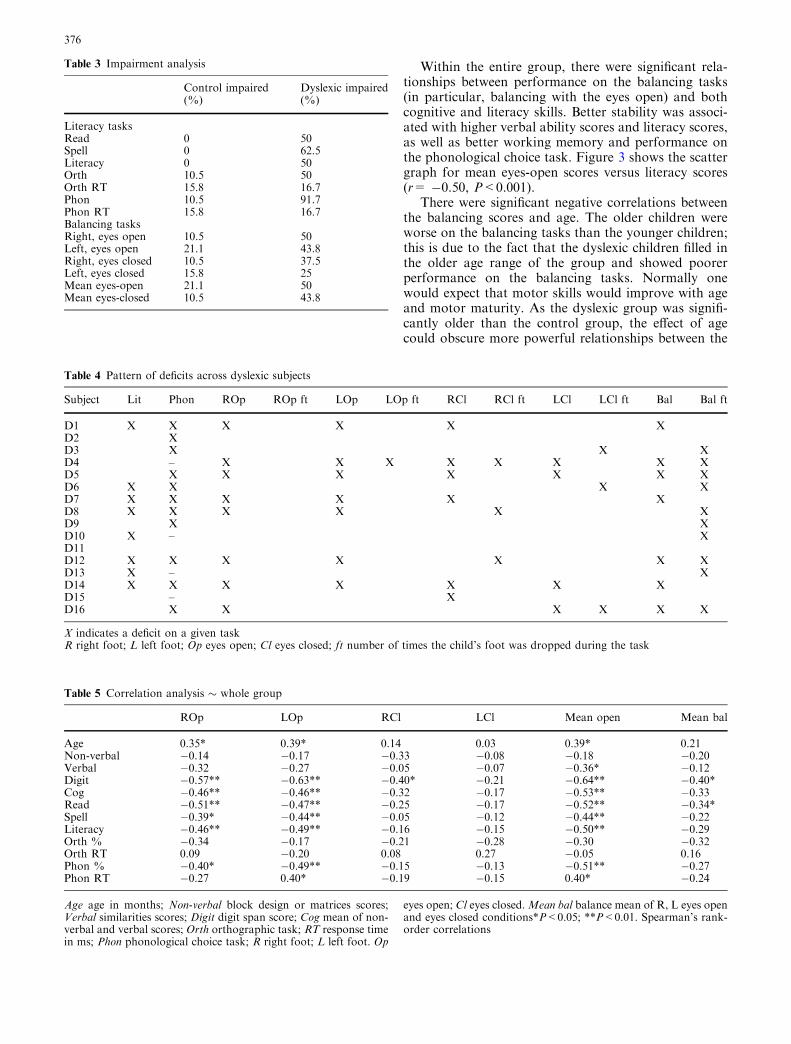
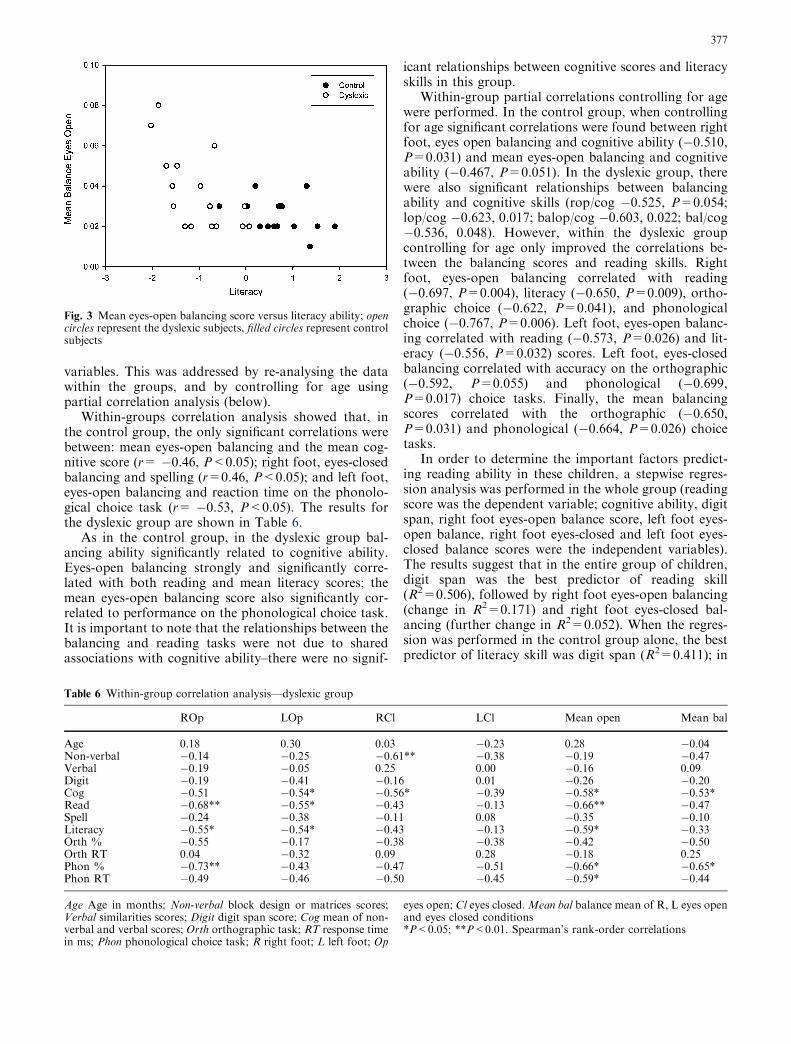
Within the entire group, there were significant rela-tionships between performance on the balancing tasks(in particular, balancing with the eyes open) and bothcognitive and literacy skills. Better stability was associ-ated with higher verbal ability scores and literacy scores,as well as better working memory and performance onthe phonological choice task. Figure 3 shows the scattergraph for mean eyes-open scores versus literacy scores(r= �0.50, P<0.001).
There were significant negative correlations betweenthe balancing scores and age. The older children wereworse on the balancing tasks than the younger children;this is due to the fact that the dyslexic children filled inthe older age range of the group and showed poorerperformance on the balancing tasks. Normally onewould expect that motor skills would improve with ageand motor maturity. As the dyslexic group was signifi-cantly older than the control group, the effect of agecould obscure more powerful relationships between the
Table 4 Pattern of deficits across dyslexic subjects
Subject Lit Phon ROp ROp ft LOp LOp ft RCl RCl ft LCl LCl ft Bal Bal ft
D1 X X X X X XD2 XD3 X X XD4 – X X X X X X X XD5 X X X X X X XD6 X X X XD7 X X X X X XD8 X X X X X XD9 X XD10 X – XD11D12 X X X X X X XD13 X – XD14 X X X X X X XD15 – XD16 X X X X X X
X indicates a deficit on a given taskR right foot; L left foot; Op eyes open; Cl eyes closed; ft number of times the child’s foot was dropped during the task
Table 5 Correlation analysis � whole group
ROp LOp RCl LCl Mean open Mean bal
Age 0.35* 0.39* 0.14 0.03 0.39* 0.21Non-verbal �0.14 �0.17 �0.33 �0.08 �0.18 �0.20Verbal �0.32 �0.27 �0.05 �0.07 �0.36* �0.12Digit �0.57** �0.63** �0.40* �0.21 �0.64** �0.40*Cog �0.46** �0.46** �0.32 �0.17 �0.53** �0.33Read �0.51** �0.47** �0.25 �0.17 �0.52** �0.34*Spell �0.39* �0.44** �0.05 �0.12 �0.44** �0.22Literacy �0.46** �0.49** �0.16 �0.15 �0.50** �0.29Orth % �0.34 �0.17 �0.21 �0.28 �0.30 �0.32Orth RT 0.09 �0.20 0.08 0.27 �0.05 0.16Phon % �0.40* �0.49** �0.15 �0.13 �0.51** �0.27Phon RT �0.27 0.40* �0.19 �0.15 0.40* �0.24
Age age in months; Non-verbal block design or matrices scores;Verbal similarities scores; Digit digit span score; Cog mean of non-verbal and verbal scores; Orth orthographic task; RT response timein ms; Phon phonological choice task; R right foot; L left foot. Op
eyes open; Cl eyes closed.Mean bal balance mean of R, L eyes openand eyes closed conditions*P<0.05; **P<0.01. Spearman’s rank-order correlations
Table 3 Impairment analysis
Control impaired(%)
Dyslexic impaired(%)
Literacy tasksRead 0 50Spell 0 62.5Literacy 0 50Orth 10.5 50Orth RT 15.8 16.7Phon 10.5 91.7Phon RT 15.8 16.7Balancing tasksRight, eyes open 10.5 50Left, eyes open 21.1 43.8Right, eyes closed 10.5 37.5Left, eyes closed 15.8 25Mean eyes-open 21.1 50Mean eyes-closed 10.5 43.8
376
variables. This was addressed by re-analysing the datawithin the groups, and by controlling for age usingpartial correlation analysis (below).
Within-groups correlation analysis showed that, inthe control group, the only significant correlations werebetween: mean eyes-open balancing and the mean cog-nitive score (r= �0.46, P<0.05); right foot, eyes-closedbalancing and spelling (r=0.46, P<0.05); and left foot,eyes-open balancing and reaction time on the phonolo-gical choice task (r= �0.53, P<0.05). The results forthe dyslexic group are shown in Table 6.
As in the control group, in the dyslexic group bal-ancing ability significantly related to cognitive ability.Eyes-open balancing strongly and significantly corre-lated with both reading and mean literacy scores; themean eyes-open balancing score also significantly cor-related to performance on the phonological choice task.It is important to note that the relationships between thebalancing and reading tasks were not due to sharedassociations with cognitive ability–there were no signif-
icant relationships between cognitive scores and literacyskills in this group.
Within-group partial correlations controlling for agewere performed. In the control group, when controllingfor age significant correlations were found between rightfoot, eyes open balancing and cognitive ability (�0.510,P=0.031) and mean eyes-open balancing and cognitiveability (�0.467, P=0.051). In the dyslexic group, therewere also significant relationships between balancingability and cognitive skills (rop/cog �0.525, P=0.054;lop/cog �0.623, 0.017; balop/cog �0.603, 0.022; bal/cog�0.536, 0.048). However, within the dyslexic groupcontrolling for age only improved the correlations be-tween the balancing scores and reading skills. Rightfoot, eyes-open balancing correlated with reading(�0.697, P=0.004), literacy (�0.650, P=0.009), ortho-graphic choice (�0.622, P=0.041), and phonologicalchoice (�0.767, P=0.006). Left foot, eyes-open balanc-ing correlated with reading (�0.573, P=0.026) and lit-eracy (�0.556, P=0.032) scores. Left foot, eyes-closedbalancing correlated with accuracy on the orthographic(�0.592, P=0.055) and phonological (�0.699,P=0.017) choice tasks. Finally, the mean balancingscores correlated with the orthographic (�0.650,P=0.031) and phonological (�0.664, P=0.026) choicetasks.
In order to determine the important factors predict-ing reading ability in these children, a stepwise regres-sion analysis was performed in the whole group (readingscore was the dependent variable; cognitive ability, digitspan, right foot eyes-open balance score, left foot eyes-open balance, right foot eyes-closed and left foot eyes-closed balance scores were the independent variables).The results suggest that in the entire group of children,digit span was the best predictor of reading skill(R2=0.506), followed by right foot eyes-open balancing(change in R2=0.171) and right foot eyes-closed bal-ancing (further change in R2=0.052). When the regres-sion was performed in the control group alone, the bestpredictor of literacy skill was digit span (R2=0.411); in
Fig. 3 Mean eyes-open balancing score versus literacy ability; opencircles represent the dyslexic subjects, filled circles represent controlsubjects
Table 6 Within-group correlation analysis—dyslexic group
ROp LOp RCl LCl Mean open Mean bal
Age 0.18 0.30 0.03 �0.23 0.28 �0.04Non-verbal �0.14 �0.25 �0.61** �0.38 �0.19 �0.47Verbal �0.19 �0.05 0.25 0.00 �0.16 0.09Digit �0.19 �0.41 �0.16 0.01 �0.26 �0.20Cog �0.51 �0.54* �0.56* �0.39 �0.58* �0.53*Read �0.68** �0.55* �0.43 �0.13 �0.66** �0.47Spell �0.24 �0.38 �0.11 0.08 �0.35 �0.10Literacy �0.55* �0.54* �0.43 �0.13 �0.59* �0.33Orth % �0.55 �0.17 �0.38 �0.38 �0.42 �0.50Orth RT 0.04 �0.32 0.09 0.28 �0.18 0.25Phon % �0.73** �0.43 �0.47 �0.51 �0.66* �0.65*Phon RT �0.49 �0.46 �0.50 �0.45 �0.59* �0.44
Age Age in months; Non-verbal block design or matrices scores;Verbal similarities scores; Digit digit span score; Cog mean of non-verbal and verbal scores; Orth orthographic task; RT response timein ms; Phon phonological choice task; R right foot; L left foot; Op
eyes open; Cl eyes closed.Mean bal balance mean of R, L eyes openand eyes closed conditions*P<0.05; **P<0.01. Spearman’s rank-order correlations
377

the dyslexic group the best predictor of literacy skill wasright foot, eyes-open balancing (R2=0.459).
In summary, dyslexic children were worse than con-trols when required to balance on one foot with theireyes open and dropped a foot down to correct theirbalance more often than controls when balancing withthe eyes closed. When this was examined on a case-by-case basis using incidence analysis, we found thatroughly half of our dyslexic sample showed clear balancedeficits and 75% showed some evidence of a balancedeficit. Note that using the same criterion for other tests,only one-half of the dyslexic children showed deficits onstandardised literacy tests. Furthermore, there was asignificant relationship between balancing and literacyability in these children. Finally, right-foot eyes-openbalancing was a significant predictor of reading skill(R2=0.171) in the entire group of children, and the bestpredictor of reading skill in the dyslexic group(R2=0.459).
Discussion
Dyslexic children performed significantly worse thancontrol children when balancing with the eyes open.While there was a group trend that dyslexics wobbledmore when balancing with the eyes closed, this differencewas not significant; however, the dyslexic childrendropped a foot down to steady themselves more oftenthan control children during the eyes-closed conditions.When the pattern of impairments was looked at withinthe groups, half of the dyslexic group (and none of thecontrol group) were impaired on literacy skills (mean ofreading and spelling scores; orthographic choice). Fur-thermore, 92% of the dyslexic group (compared to 11%of the control group) were impaired on the phonologicalchoice task. Similar to the literacy scores, 50% of thedyslexic group were impaired when balancing with theeyes open (on the right foot, compared to 11% of thecontrol group); for the overall balancing score, 44% ofthe dyslexic group were impaired, compared to 11% ofthe control group. When we looked at the pattern ofdeficits across the balancing tasks, only four dyslexicchildren showed no impairment at all; half of the dys-lexic children in this sample had difficulties maintainingstable balance on more than one of the balancing tasks.
Moe-Nilssen et al. (2003) found similar results: dys-lexic children were similar to control children on tests ofpostural stability with the eyes closed, but the dyslexicchildren were worse on eyes-open balancing. In thatstudy, the eyes-open balancing task correctly classified70–77.5% of the subjects into their respective groups.The incidence of balance difficulties and the pattern oftheir group differences are consistent with the results ofthe current study. Both of these studies utilised motion-tracking systems, which eliminate experimenter bias andyield quantitative data. Other studies that have investi-gated balance in children with dyslexia have used clini-cal- or video-based assessment and scoring (e.g.,
Nicolson and Fawcett 1990; Raberger and Wimmer2003); the use of motion tracking systems is a stepforward in the analysis of motor skills in developmentaldisorders.
Wimmer et al. (1999) and Raberger and Wimmer(2003) propose that Nicolson and Fawcett’s finding ofautomaticity and balance deficits in dyslexic childrenwas due to ADHD co-morbidity within the dyslexicgroup. Anatomical abnormalities of the cerebellum havealso been found in children with ADHD, which mayindicate the existence of balancing difficulties within thisgroup (Berquin et al. 1998; Mostofsky et al. 1998; Hillet al. 2003; Durston et al. 2004). While we do not havedefinitive measures of ADHD co-morbidity within ourentire dyslexic group, half of the children scored only 0–1 on the Connor’s questionnaire, and the other dyslexicchildren had neither a prior history of ADHD nor re-ported ADHD symptoms. Further research will benecessary to completely separate ADHD and dyslexia;indeed, it may not be possible to do so in all children. Itis possible, however, that similar symptoms at abehavioural level could be due to different neurologicalmechanisms. Finally, within our subjects digit span didnot correlate with balancing ability in the dyslexicgroup, which may be taken as evidence against anADHD confound within this sample.
Why are the dyslexic children worse than controls oneyes-open balancing but not eyes-closed? This may besimply the effect of the larger variation in the controlgroup on the eyes-closed balancing tasks, which reducesthe statistical power of the group comparison. Further-more, it is possible that balancing with the eyes closedwas so difficult for all of the children that there was nodiscernable difference between the groups—in otherwords, there was a floor effect. The dyslexic children did,however, drop the raised foot significantly more oftenthan the control children during the eyes-closed bal-ancing conditions. It is also possible that the eyes-openbalancing of dyslexic children is hampered by poor vi-sual information, which is not a factor when the eyes areclosed. Segregating the last two factors will require afurther study in which the balance is monitored whilevisual input is manipulated.
When the relationships between the balancing scoresand literacy skills were examined, there were significantcorrelations between the balancing scores and literacyability in the whole group. However, when the groupswere examined separately, there were no significantrelationships between the balance scores and literacyskills in the control group. Why are the significantrelationships between the balancing tasks and literacyskills restricted to the dyslexic group? Does the fact thatthe same relationships are not present in the controlgroup tell us something about the relationship betweenmotor skills and literacy ability? Our results wouldsuggest that there is something fundamentally differentabout the relationship between motor and literacy skillsbetween dyslexic and control children. Whether or notmotor ability restricts or affects the acquisition of liter-
378

acy skills remains to be seen. It is possible that poorbalancing is a symptom of a delayed or abnormallydeveloping nervous system, which is further reflected inliteracy difficulties.
A lower percentage (�50%) of our dyslexic groupwas impaired on the balancing tasks compared to the78% found in Fawcett and Nicolson’s study (1999) (al-though, if the foot drops are included in this analysis,75% of the dyslexics had difficulty with one or morebalancing task). The greater sensitivity afforded bythe use of the motion tracking system may have yieldedthe different result, coupled with the task differences (thechildren in the previous studies balanced with their armssuspended out and for a longer period of time); or per-haps Fawcett and Nicolson’s overall subject sample hada higher proportion of children with motor symptoms.Our balancing tasks were only performed for a very briefperiod of time (10 s for each trial; the entire balancingparadigm involved only 120 s of recording) and it ispossible that with more extensive testing, or a moredifficult task, more of the dyslexic children would showimpairments. The dyslexic group, on average, was nearly2 years older than the control group, so that we wouldexpect their greater maturity to improve their balance.Instead they were worse. Had the control subjects beenof a closer age-match, the dyslexics’ balancing difficultieswould probably have appeared even more pronounced.
Our findings are consistent with the general vari-ability found in performances of any sensorimotor taskin the dyslexic population (for example, see Ramus et al.2003a, b). Given that our subjects were not selected formotor, phonological, orthographic, visual or auditorydeficits, our results suggest that only a subset of dys-lexics have motor difficulties. The variation seen indevelopmental disorders and implications for theoriesabout dyslexia are discussed below.
Some might argue that because not all the dyslexicsshowed any evidence of balancing difficulties, the resultsare not relevant to dyslexia. But there is probably not asingle mechanism underlying dyslexia; symptoms differfrom dyslexic to dyslexic. A number of different mech-anisms may therefore be postulated, each leading (bydifferent routes) to poor reading in the presence ofnormal IQ. Even if there is a single underlying cause ofdyslexia, it is entirely possible that the behaviouralsymptoms may not be the same in each individual.Goswami (2003) reminds us that dyslexia is a develop-mental condition, so that the interplay of genetic andpre- and post-natal environmental influences (see Fran-cks et al. 2002 for review) can give rise to a variety ofdifferent types of structural alteration in the brain, evenif their fundamental genetic basis is the same.
For these reasons, it is not at all surprising that wedo not find 100% incidence on a very low-level pro-cessing task in all of our subjects; we also did not findthat all the children were similarly reading-impaired.Cerebellar dysfunction in dyslexia is quite mild, maynot be present in all dyslexics, and requires specifictasks to detect it. However, the balance tests described
here are quick to administer and are independent ofliteracy skill or experience. Thus, they may provideuseful for testing the dyslexia phenotype that isbecoming broader and more biologically defined. Italso is possible that cerebellar dysfunction may be amore general marker of developmental disorder, giventhat the cerebellum has been implicated in a wide rangeof disorders, including autism and William’s syndrome(see Allen and Courchesne 2003; Jones et al. 2002). Itmay be that the cerebellum is more susceptible to earlybrain insult or environmental influences pre-natally(e.g., very low birthweight children, see Johnsen et al.2002; Kern 2003).
Finally, in terms of causal attribution, it is possiblethat a dysfunctional cerebellum may not be the primarycause of dyslexia, but the cerebellum may be part of amore generalised malfunctioning system, so that it re-ceives compromised input, which leads to imperfectoutput (for commentary, see Zeffiro and Eden 2001;Bishop 2002). More work will be necessary to investigatethese issues further, and to determine whether poormuscle tone, visual attention, or other factors maycontribute to the balance problems found in some dys-lexics.
The goal of these theories is to elucidate the causes ofdyslexia at a biological level. These may ultimately befruitful in yielding good early screening tests that do notdepend on literacy skills. A better understanding of thedisorder will allow us to intervene early and hopefully inthis way to prevent reading problems from ever occur-ring in the first place.
Acknowledgement C.J. Stoodley was funded by the GoodgerScholarship / Schorstein Research Fellowship from the Universityof Oxford. We would like to thank Prof. Chris Miall for assistancewith the Polhemus system.
References
Allen G, Courchesne E (2003) Differential effects of developmentalcerebellar abnormality on cognitive and motor functions in thecerebellum: an fMRI study of autism. Am J Psychiatry160:262–273
Berquin PC, Giedd JN, Jacobsen LK, Hamburger SD, Krain AL,Rapoport JL, Castellanos FX (1998) Cerebellum in attention-deficit hyperactivity disorder: a morphometric MRI study.Neurology 50:1087–1093
Berry EL, Jenkins IH, Nicolson RI, Fawcett AJ, Dean P, BrooksDJ (1998) Cerebellar function is impaired in dyslexia: a PETactivation study. Neurology 50:1005
Bishop DVM (2002) Cerebellar abnormalities in developmentaldyslexia: cause, correlate or consequence? Cortex 38:491–498
Brown WE, Eliez S, Menon V, Rumsey JM, White CD, Reiss A(2001) Preliminary evidence of widespread morphologicalvariations in the brain in dyslexia. Neurology 56:781–783
Durston S, Hulshoff Pol HE, Schnack HG, Buitelaar JK, SteenhuisMP, Minderaa RB, Kahn RS, van Engeland H (2004) Magneticresonance imaging of boys with attention-deficit/hyperactivitydisorder and their unaffected siblings. J Am Acad Child AdolPsychiatry 43:332–340
Eckert MA, Leonard CM, Richards TL, Aylward EH, Thomson J,Berninger VW (2003) Anatomical correlates of dyslexia: frontaland cerebellar findings. Brain 126:482–494
379
Fawcett AJ, Nicolson RI (1999) Performance of dyslexic childrenon cerebellar and cognitive tests. J Motor Behav 31:68–78
Fawcett AJ, Nicolson RI, Dean P (1996) Impaired performance ofchildren with dyslexia on a range of cerebellar tasks. AnnDyslexia 46:259–283
Fiez JA, Petersen SE (1998) Neuroimaging studies of word reading.PNAS 95:914–921
Fiez JA, Petersen SE, Cheney MK, Raichle ME (1992) Impairednon-motor learning and error detection associated with cere-bellar damage: a single case study. Brain 115:155–178
Finch AJ, Nicolson RI, Fawcett AJ (2002) Evidence for a neuro-anatomical difference within the olivo-cerebellar pathway ofadults with dyslexia. Cortex 38:529–539
Francks C, MacPhie IL, Monaco AP (2002) The genetic basis ofdyslexia. Lancet Neurol 1:483–490
Gasparini M, DiPieroV, Ciccarelli O, Cacioppo MM, Pantano P,Lenzi GL (1999) Linguistic impairment after right cerebellarstroke: a case report. Eur J Neurol 6:353–356
Goswami U (2003) Why theories about developmental dyslexiarequire developmental designs. TICS 7:534–540
Hill DE, Yeo RA, Campbell RA, Hart B, Vigil J, Brooks W (2003)Magnetic resonance imaging correlates of attention-deficit/hyperactivity disorder in children. Neuropsychology 17:496–506
Holmes G (1939) The cerebellum of man. Brain 62:1–30Ito M (1984) The cerebellum and neural control. Raven Press,
BaltimoreIvry RB, Justus TC (2001) A neural instantiation of the motor
theory of speech perception. TINS 24:513–515Johnsen S, Tarby T, Lewis K, Bird R, Prenger E (2002) Cerebellar
infarction: an unrecognized complication of very low birth-weight. J Child Neurol 17:320–324
Jones W, Hesselink J, Courchesne E, Duncan T, Matsuda K,Bellugi U (2002) Cerebellar abnormalities in infants and tod-dlers with Williams syndrome. Dev Med Child Neurol 44:688–694
Kern JK (2003) Purkinje cell vulnerability and autism: a possibleetiological connection. Brain Devel 25:377–382
Leggio MG, Silveri MC, Petrosini L, Molinari M (2000) Phono-logical grouping is specifically affected in cerebellar patients: averbal fluency study. J Neurol Neurosurg Psychiatry 69:102–106
Leonard CM, Eckert MA, Lombardino LJ, Oakland T, Kranzler J,Mohr CM, King WM, Freeman A (2001) Anatomical riskfactors for phonological dyslexia. Cereb Cortex 11:148–157
Moe-Nilssen R, Helbostad JL, Talcott JB, Toennessen FE (2003)Balance and gait in children with dyslexia. Exp Brain Res150:237–244
Moretti R, Bava A, Torre P, Antonello RM, Cazzato G (2002)Reading errors in patients with cerebellar vermis lesions. JNeurol 249:461–468
Mostofsky SH, Reiss AL, Lockhart P, Denckla MB (1998) Eval-uation of cerebellar size in attention-deficit/hyperactivity dis-order. J Child Neurol 13:434–439
Nicolson RI, Fawcett AJ (1990) Automaticity: a new frameworkfor dyslexia research?. Cognition 35:159–182
Nicolson RI, Fawcett AJ (1994) Reaction times and dyslexia. Q JExp Psych 47A:29–48
Nicolson RI, Fawcett AJ, Dean P (1995) Time estimation deficits indevelopmental dyslexia: evidence for cerebellar involvement.Proc R Soc Lond B Biol Sci 259:43–47
Nicolson RI, Fawcett AJ, Berry EL, Jenkins IH, Dean P, BrooksDJ (1999) Association of abnormal cerebellar activation withmotor learning difficulties in dyslexic adults. Lancet 353:1662–1667
Nicolson RI, Fawcett AJ, Dean P (2001) Developmental dyslexia:the cerebellar deficit hypothesis. TINS 24:508–511
Olson R, Forsberg H, Wise B, Rack J (1994) Measurement of wordrecognition, orthographic, and phonological skills. In: Lyon G(ed) Frames of reference for the assessment of learning dis-abilities: new views on measurement issues. Paul H. BrookesPublishing Co, Baltimore, pp 243–277
Pennington BF, Gilger JW, Pauls D, Smith SA, Smith SD, DeFriesJC (1991) Evidence for major gene transmission of develop-mental dyslexia. JAMA 266:1527–1534
Raberger T, Wimmer H (2003) On the automaticity/cerebellardeficit hypothesis of dyslexia: balancing and continuous rapidnaming in dyslexics and ADHD children. Neuropsychologia41:1493–1497
Rae C, Harasty JA, Dzendrowskyj TE, Talcott JB, Simpson JM,Blamire AM, Dixon RM, Lee MA, Thompson CH, Styles P,Richardson AJ, Stein JF (2002) Cerebellar morphology indevelopmental dyslexia. Neuropsychologia 40:1285–1292
Ramus F, Pidgeon E, Frith U (2003) The relationship betweenmotor control and phonology in dyslexic children. J ChildPsych Psychiatry 44:712–722
Ramus F, Rosen S, Dakin SC, Day BL, Castellote JM, White S,Frith U (2003) Theories of developmental dyslexia: insightsfrom a multiple case study of dyslexic adults. Brain 126:841–865
Rutter M, Yule W (1975) The concept of specific reading retar-dation. J Child Psych Psychiatry 16:181–197
Schmahmann J (1997) The cerebellum and cognition. Academic,San Diego
Schmahmann JD, Sherman JC (1997) Cerebellar cognitive affectivesyndrome. Intl Rev Neurobiol 41:433–440
Scott RB, Stoodley CJ, Anslow P, Paul C, Stein JF, Sugden EM,Mitchell CD (2001) Lateralized cognitive deficits in childrenfollowing cerebellar lesions. Dev Med Child Neurol 43:685–691
Silveri MC, Leggio MG, Molinari M (1994) The cerebellum con-tributes to linguistic production: a case of agrammatic speechfollowing a right cerebellar lesion. Neurology 44:2047–2050
Spyers A, Stokes M, Bain P, Roberts S (1999) Classification ofnormal and pathological tremors using a multidimensionalelectromagnetic system. Med Eng Phys 21:713–723
Stein J, Walsh V (1997) To see but not to read: the magnocellulartheory of dyslexia. TINS 20:147–152
Stein JF, Talcott JB, Witton C (2001) The sensorimotor basis ofdevelopmental dyslexia. In: Fawcett A (ed) Dyslexia: theoryand good practice. Whurr Publishers, London, pp 65–88
Talcott JB, Witton C (2002) A sensory linguistic approach to thedevelopment of normal and dysfunctional reading skills. In:Witruk E, Friederici A, Lachmann T (eds) Basic functions oflanguage, reading and reading disability. Kluwer, Boston, pp213–240
Talcott JB, Witton C, McLean MF, Hansen PC, Rees A, GreenGG, Stein JF (2000) Dynamic sensory sensitivity and children’sword decoding skills. PNAS 97:2952–2957
Vicari S, Marotta L, Menghini D, Molinari M, Petrosini L (2003)Implicit learning deficit in children with developmental dyslexia.Neuropsychologia 41:108–114
Wimmer H, Mayringer H, Raberger T (1999) Reading and Dual-Task Balancing: evidence against the automatization deficitexplanation of developmental dyslexia. J Learn Disabil 32:473–478
Wolf M (1991) Letter naming, reading and the contribution of thecognitive neurosciences. Read Res Q 26:123–141
Wolf M, Obregon M (1992) Early naming deficits, developmentaldyslexia, and a specific deficit hypothesis. Brain Lang 42:219–247
Yap RL, van der Leij A (1994) Testing the automatization deficithypothesis of dyslexia via a dual-task paradigm. J Learn Disabil27:660–665
Zeffiro T, Eden G (2001) The cerebellum and dyslexia: perpetratoror innocent bystander?. TINS 24:512–513
380