Indoor Navigation System for the Visually Impaired with User

Department of Media Arts and Communications
MA Programme in Professional Communications
__________________________________________________
MA in Technical Communication
Master’s Dissertation
Title: Internet Access for the Visually Impaired
Author: Victor Diacono
Date: January 2015

Internet Access for the Visually Impaired
Victor Diacono
MA in Technical Communication
Sheffield Hallam University
January 2015

i
Acknowledgments
There are many people I am indebted to for their support during this Master's
programme. My heartfelt gratitude goes out, in particular, to my partner Lu. She has
made this all possible with her selflessness in gladly being the homemaker, and in
allowing everything and anything to come second to my studies and itinerary.
Special thanks also go to the survey respondents whose collaboration went into the
findings that have sustained the analysis upon which much of the discussion and
recommendations has revolved.
Another thank you goes to the staff at Sheffield Hallam University whose feedback
and support has always been meaningful and strong. Geff Green and Hilary Cunliffe-
Charlesworth for their invaluable support in the dissertation, as well as Claire Rayner
and all the rest I have had the pleasure of being tutored or assisted by in the First and
Second years.
I am also indebted to those at work who have had a role in enabling contact with the
initial handful of visually impaired questionnaire respondents who in turn referred me
to others. And I am equally thankful to those who have made time for the dissertation
available at the time most needed, even during the busiest periods.
But finally, an acknowledgment and dedication entwined: to Mum and Dad! They
have been off for a better place for many, many years now. But one of the most
precious lessons they left behind was that aspirations are a fine thing, but only
application and hard work brings them to fruition. For your example and much more,
this study is dedicated to you.

ii
Contents
Abstract iv
1. Introduction 1
1.1 Overview 1
1.2 The workplace context 1
1.3 Aims and objectives 2
1.4 The dissertation's structure 4
1.5 Review 5
2. Literature Review 6
2.1 Overview 6
2.2 Is Braille being eclipsed by electronic speech? 6
2.3 Transfer of technology 8
2.4 Incentivisation for equal access 9
2.5 A one-size-fits-all information structure 10
2.6 Risk of emargination 12
2.7 Review 12
3. Methodology 14
3.1 Overview 14
3.2 The paradigm 14
3.3 Research approach and method 15
3.4 Ethics 18
3.5 Data analysis 20
3.6 Review 21
4. Findings and Discussion 22
4.1 Overview 22
4.2 The findings 23
Question 1: Respondent particulars 23
Question 2: Visual disability 28
Question 3: Age of impairment 29
Question 4: Level of education 30
Question 5: Training in reading media 31
Question 6: Use of reading aids 32
Question 7: Use of computer software 41
Question 8: Internet connection ratio 45
Question 9: Reasons for no Internet connection 46
Question 10: Internet usage, user proficiency, and its effects 47
Question 11: Learning to use the Internet 51
Question 12: Support in using the Internet 52
Question 13: Hardware for connecting to the Internet 53
Question 14: Choice of Internet browsers 54
Question 15: Activities pursued on the Internet 55
Question 16: Why is no social networking, information seeking or other activity pursued? 56
Question 17: Which social media do you use? 57
4.3 Review 59
5. Conclusion 60

iii
6. Recommendations 63
Bibliography 66
Appendices 68
Appendix 1: Survey Information Sheet 68
Appendix 2: Survey Consent Form 69
Appendix 3: Ethics Form 70
Appendix 4: The Questionnaire 76
Appendix 5: The survey response coding 83
List of Tables
Question 1.1 Sex 23
Question 1.2 Age 24
Question 1.3 Location 25
Question 1.4 Occupation 26
Question 1.5 Accompanying disabilities 27
Question 2 Visual disability 28
Question 3 Age of onset of impairment 29
Question 4 Level of education 30
Question 5 Training in reading media 31
Question 6.1 Braille 33
Question 6.2 Large Print 34
Question 6.3 Videos 35
Question 6.4 CCTV 36
Question 6.5 Computers 38
Question 6.6 Phone Apps 39
Question 6.7 Others 40
Question 7.1 Screen-reader 41
Question 7.2 Speech-to-text 42
Question 7.3 Scanner-to-speech 43
Question 7.4 Screen-magnifier 44
Question 8 Internet connection ratio 45
Question 9 If no Internet connection, why 46
Question 10.1 How many hours weekly on Internet 47
Question 10.2 Are you a proficient Internet user 48
Question 10.3 Any negative effects from Internet usage 49
Question 10.4 If yes, what are they 50
Question 11 How have you learned to use the Internet 51
Question 12 Where do you find support when stuck on the Internet 52
Question 13 How do you connect to the Internet 53
Question 14 With which browser do you connect to the Internet 54
Question 15 Do you use the Internet for any of the following activities 55
Question 16 If you pursue none of the above activities, why not 56
Question 17 Which of the following social media services do you use 58

iv
Abstract
This study sets out to discover the extent to which online participation and access to
information for the visually disadvantaged is comparable to that enjoyed by the able-
sighted. It treats access to information of whatever nature or origin as a universal
right.
Facts, behaviours and respondent preference in Internet usage, the assistive
technology utilised, and the accessibility barriers experienced by the visually impaired
community in Malta have been gathered by means of a survey. The survey’s sample
has been compiled from a small convenience sample which in turn set in motion a
process of snowball recruitment.
The findings collected from a combination of blind and sight-impaired respondents
provide a snapshot of Internet usage patterns among the visually disabled
community. The paper also discusses the barriers in the way of the community’s full
and proficient use of the Internet.
The survey questions have at times provided thought-provoking findings. The
occupational picture, for instance, is one of preparedness for the visually
disadvantaged rarely reaching beyond the clerical level. But there are then the few
respondents who accept their vision-deprived fate stoically and do not find the need
to re-open doors to the world of reading they have left behind. And among the
Internet-connected, the browsing time disparity is large with anything from 15 hours
weekly to an astounding 70 hours reported at the top end.
This dissertation finally carries a short chapter of recommendations mostly
concerning derivative angles of reflection meriting more in-depth investigation. Its key
recommendation is however that of an assistive-ware driven reading mode framework
residing alongside the default website architectures designed for the able-sighted. It is
the study’s motivation and hope that the infant steps in this direction will embed
respect for a universal right of access in the design philosophies of information
diffusion.

1
1. Introduction
1.1 Overview
This is an age when both public and commercial services are migrating to online
media. As a result, accessible online communication has become a critical need if the
functional independence of the blind and visually impaired is not to fall even further
behind the levels borne prior to digital dissemination. This study considers the extent
to which Internet access to information and online participation is accessible to the
visually impaired. Inquiry will not distinguish between governmental and commercial
diffusion of information but will view access to information, of whatever nature or
origin, as a universal right.
1.2 The workplace context
Little technological attention had been given to the accessibility of printed knowledge
and information for the visually disadvantaged until the early 19th century. In 1829,
Louis Braille developed a tactile means of reading that came to carry his name. It
opened up a world of print to the blind and visually impaired, but it cannot be
considered a universal solution for a number of reasons. Converting the printed word
to Braille is costly in terms of both expense and time, with the number of available
texts consequently limited. There is a steep learning curve, and it is inaccessible to
those also suffering from diseases that diminish the sense of touch.
A third human sense, hearing, was harnessed for reading with the arrival of
inexpensive sound recording in the form of the Koninklijke Philips N.V. company’s
audio cassette in 1962. The audio cassette significantly reduced the cost and time of
text conversion. It also eliminated the need for learning a communication medium
such as Braille by the blind or visually impaired reader not wishing or unable to
engage with it. Drawbacks however persist insofar as spontaneity of communication
is concerned, with time-sensitive information becoming obsolete or less relevant by
time of dissemination.
In 1976, the Kurzweil Reading Machine, brainchild of inventor and scientist Raymond
Kurzweil, employed digital technology in the scanning of the printed word for
conversion into synthetic speech for aural assimilation by the reader. ‘Audio cassette

2
mode’ thereby gained the benefit of potentially instantaneous turnaround time for text-
to-speech conversion as it was no longer necessary to have text converted to sound
by human readers. But the disadvantage with speech synthesis per se lies in current
technology sounding unnatural. And, for the English-speaking world outside the North
American continent, also in the American twang of the converted text (Hersh and
Johnson. 2008, p.418).
Apart from computer software that speaks out screen content or enlarges text, this is
partly where the current state of assistive reading technology for the blind and visually
impaired lies. The technology, being electronically driven, will indubitably go through
further refinement and tweaking in the short term, as it is in the nature of computer
science to advance in leaps and bounds. However, a fuller emancipation of the
visually impaired in the reading world will only occur if aural ‘reading’ can become a
reading option alongside the default visual mode on Internet sites and pages.
1.3 Aims and objectives
This study aims to discover the level of effectiveness of access to online information
for the visually impaired, viewing as a measure the levels of access and participation
enjoyed by the visually able. It investigates how the visually impaired surf the Internet,
what assistive technology they use, which activities they pursue, and the access
difficulties they encounter. It outlines thought, observation and recommendations on
accessibility issues from literature treating the matter, and it presents findings from
empirical research of its own.
Online participation is essential also because it allows access to vital real world
services which are increasingly migrating to the Internet. Gerber (2003. In: Goudiras
et al. 2009, p.112) believes that “computer use and AT [Assistive Technology] can
make a meaningful difference in the lives of individuals with visual impairments –
improving educational and employment opportunities, enhancing social networks, and
facilitating independence of education, healthcare and purchasing which are
increasingly going online”.
A dearth of study appears to exist on how the visually impaired can be thoroughly
assimilated into online social media usage. There is however a sufficiently sizable

3
body of literature on the access for the visually impaired to other online activities. This
corpus has formed the literary resource from where observation of Internet usage and
academic thought on the topic is being considered for its relevance to this study.
This work attempts to establish the extent to which the barriers of sight have come
down for the ocularly disadvantaged part of humanity that aspires and is capable of
partaking fully in the receipt and impartation of information. It recommends the
adoption of ocular assistive technology and digital speech-to-text conversion by
governments and commerce in a new reading mode residing in parallel to the default
visual mode. The rationale behind this recommendation is that access to virtual sites
hosting the published word and online participation is to be considered a right. In the
same way that access to bricks-and-mortar sites is a now universally accepted right
of those suffering from physical immobility.
In the commercial sphere, accessibility can either to be mandated or, as this study
strongly suggests, incentivised. One incentive towards the construction of disability-
compliant information structures can come about through the promise of new
advertising niches. The strongest incentivisation may however lie in the potential for
assistive implementations for the visually impaired being marketed as a convenient
and time-saving software application for the able-sighted. Speech-to-text and text-to-
sound technology are two particularly promising spheres in this regard as the
emergence of a dual reading mode (ocular and aural) can serve as an enjoyable
reading experience for the able-sighted. It also offers benefits in resting one sense by
engaging the other, thereby leading to a reduction of cognitive fatigue. If this dual
reading mode materialises, the visually impaired will gain through social inclusion,
increased educational and employment opportunities and access to information and
services. And the profit of commerce lies in more revenue coming in from higher
Internet traffic, through increased advertising income or sales.
Limitations ensuing from time and cost constraints limit the scope of this study.
Moreover, no study can claim focus if not narrowly directed. Limitations that arise in
this paper include geographical ones as the findings will present a picture of Internet
usage patterns and accessibility limitations as experienced by the blind and visually
impaired in Malta. However, the possibility is discussed in Chapter 4 (Findings and

4
Discussion) of extrapolating the findings to the United Kingdom and possibly other
Commonwealth countries too.
The sample size is also a small one, as is in the nature of a small-scale study. And
both Internet usage per se and the survey questions' orientation towards social media
and assistive software denote a bias towards the technologically adept. The topic of
study inherently excludes those without the financial means to afford computer
hardware or the recurrent cost of Internet service. Those falling outside these
boundaries are, therefore, not represented in the study when they are at greater risk
of being left behind in the online migration of essential information. Additionally, the
sample excludes minors and those incapable of giving informed consent.
1.4 The dissertation’s structure
This study comprises the following six chapters.
- The Introduction establishes the general field of study, its workplace context, and
the aims and objectives.
- A Literature Review discusses pertinent theory and concepts from a body of
literature identified through an Internet search.
- The Methodology chapter explains the research paradigm and survey design, also
describing the approach and method employed in the collection of the data and its
analysis.
- The Findings and Discussion chapter analyses the data collected from the survey
and relates it to the topic under review. It presents the findings in a number of views
categorised by fundamental demographic characteristics, principal strains of theory
stemming from the literature, and the resulting differences within categories. The
chapter also discusses the dissertation’s strengths and constraints, and it examines
issues of validity and reliability.
- The Conclusion weighs the degree and adequacy to which the findings have
addressed the research question. It also makes recommendations on the general
direction best followed in future Internet accessibility strategies for the visually
impaired.
- A Recommendations chapter suggests a model of information dissemination
accessible to all, irrespective of sight ability. It also delves into areas deriving from the
topic under examination that merit further investigation, possibly even as a dedicated
research question.

5
1.5 Review
This introduction has reviewed the study’s sphere of research, its context, and the
aims and objectives. It outlines the breadth of the investigation and discloses its
limitations. It also introduces recommendations on accessibility design strategy
discussed in more depth in Chapter 4 (Findings and Discussion).

6
2. Literature Review
2.1 Overview
This chapter establishes the background to the question under investigation by
means of an evaluation of the relevant literature regarding Internet access for the
blind and visually impaired, the barriers in its way, and how inaccessibility may be
surmounted. It assesses the bibliographic content in this regard and weighs its
relevance to the aims of this study and the problem under review.
2.2 Is Braille being eclipsed by electronic speech?
In a short history of the Kurzweil Reading Machine, Hazan and Hunt (Summer 1990,
p.45) state that “to ‘make the printed word talk’ has been a long sought after goal”.
The Kurzweil Reading Machine, a reading system that scans documents and renders
them into electronic speech, was commercially launched in November 1976. Hazan
and Hunt document what was the first breakthrough in the conversion of the printed
word into synthetic speech.
Braille was the first reading method to make text readable by the blind. It stood alone
and unchallenged for close to a century and a half between its inception in 1829 and
the arrival of the Kurzweil Reading Machine. It has since been increasingly eclipsed
by text-to-speech technology and enhanced display (Goudiras et al. May 2009,
pp.124-125; Stein et al. 2011, p.462). The advent of the microchip computer enabled
optical character recognition (OCR), which in turn made possible the reading out
aloud of OCR-scanned text by a computer once the KRM’s technology coupled OCR
with text-to-speech technology. Goudiras et al. (May 2009, p.112) in fact find
“computer enhancement of the information that is displayed is a promising area for
improvement in low vision reading devices”.
This new technology has a number of notable advantages over Braille, which is
burdened with a steep learning curve (Hersh and Johnson. 2008, pp.143, p.498). The
principal advantage lies in the user needing only to listen, but Braille also suffers from
inaccessibility to users suffering from particular medical conditions. Diabetes, for
instance, reduces the sufferer’s sense of touch as Braille is a tactile form of

7
communication. Moreover, tactile acuity is also in itself a sense that diminishes with
the onset of age irrespective of prevailing health conditions (Stevens, Folke and
Patterson. 1996). And, unlike Braille, listening to speech-synthesised text suffers from
no learning curve or limitations of accompanying tactility-reducing disability.
Additionally, it does not become harder to follow with the onset of age when learning
curves get steeper and disease, including the ocular, is more likely to set in.
The aural reading mode is being boosted further with video increasingly becoming a
predominant medium in home entertainment and the pursuit of personal enrichment.
YouTube alone claims to enjoy 6 billion viewing hours monthly with traffic from 61
countries, 80% of which originating from outside the United States (YouTube. 2014).
Most video comes accompanied by an analogue soundtrack and analogue enjoys the
advantage of sounding more natural than digital sound. It does not suffer from poor
quality synthesis or the North American twang presently predominant in digital
synthesis, and there are initiatives being pursued which enrich video content (albeit
by digital means) through additional soundtracks.
Lyon University’s ACAV project (Collaborative Annotation for Video Accessibility) has
for the past few years been working on the development of free Web applications for
the hosting of accessible video for the blind. ACAV seeks to enrich video content
through the additional parallel tracks of speech synthesis and the non-verbal audio
medium known as ‘earcons’. Earcons are an aural message on computer software
interfaces for the recognition of objects and interaction and are an example of how
transfer of technology can benefit the visually impaired while being of benefit to all the
reading public. Earcons do however have to be learned and memorised with the
result of an increased cognitive load (Putz. Oct 2004, p.27).
Braille text is also costly to produce (Stein et al. 2011, p.462; Hersh and Johnson.
2008, pp.478, 537). And the value of news-oriented texts is obsolete by the time it is
transferred to Braille-readable form: “The information may often be out-of-date by the
time it is made available” and “by the time a news bulletin is brailled, it’s yesterday’s
news” (Williamson et al. 2006). Text-to-speech technology and enhanced display
enjoy the benefits of making information available to the visually impaired
concurrently with dissemination to the able-sighted. However, the biggest advantage
of text-to-speech technology is possibly that, unlike Braille, its benefits are

8
transferable to the able-sighted. This transfer of technology makes it an attractive and
commercially viable proposition for the producers of websites and social media
applications to adopt as a standard feature.
2.3 Transfer of technology
The benefits that the able-sighted can enjoy from the electronic rendering of text is a
critical factor in making built-in assistive technology an attractive proposition for
website and social media owners. Legislation cannot go any further than obliging
owners to take cognisance of disability needs as far as that same legislation
prescribes. In addition, comprehensive legislative suites of this nature do not only
take much research, time and consultation with stakeholders to build but also need to
be kept abreast of the frequent development in technology and new barriers. Clear
commercial benefits, on the other hand, are an incentive strong enough to drive not
only the assimilation of assistive technology by Internet media but also further
innovation and investment in text scanning and text-to-speech technology. This
potential transfer of technology can be an important factor in boosting development of
electronic assistive technology because Web design has very often only kept the
able-sighted in mind. This lack of consideration for the disabled took root in web
design in spite of early direction from the World Wide Web's inventor Tim Berners-Lee
that “access by everyone regardless of disability is an essential aspect” of the Web
(World Wide Web Consortium. 1997).
Hersh and Johnson (2008, p.497) place emphasis on the multi-modality of human
communication. They state that “people use a number of different types of
communication, including images, text, gestures, oral speech, sign languages, touch,
mime, body language, facial expressions and music, to communicate with each
other”. The able-sighted mainly employ three of these modes of assimilation when
reading information, with text and image the predominant ones but aided by sound
when watching video or documentary. The introduction of a text-to-speech tier in
websites and social media would thereby not be an alien concept for the able-sighted.
It is an added function with the potential of rapid development into a mainstream
mode of online communication for both the impaired and the sighted, with the user
toggling between ‘read’, ‘hear’ or ‘read and hear’ modes. Speech technology has, in
fact, already found its way into everyday commercial activity, albeit in areas
previously reserved for phone communication in the call centre and telephone

9
banking industries. Such has been the impact of speech input/output systems that it is
likely they will find adoption in other media and industries and keep growing. G. Sohn
(2004) estimates “the turnover in business applications of speech technology will
grow from $ 540 millions currently worldwide to $ 1600 millions in the year 2007”.
Hazan and Hunt (1990, p.46) claim that “there are very few instances – especially in
the field of computer technology – where a device which was originally conceived and
developed for the disabled has been used as the template to create a commercially
viable product for general use by individuals or organisations”. One such instance
was the Kurzweil DISCOVER application which found widespread use as a faster
means of data entry by the sighted user, through ‘reading’ (rather than typing)
information into computer databases (ibid, p.47). The Kurzweil Reading Machine was
the first breakthrough in the transfer of technology from applications for the blind in
the direction of the able-sighted. With the exponential growth Sohn’s figures (2004)
must have registered since 2007, it will, hopefully, not be long before the quest for
profit identifies a sufficiently strong mainstream consumer need for text-to-speech
converter formats to become standard fixtures in documents and other text.
Text-to-speech can also be a reading mode physically benefitting the sighted in that it
rests the tired eye of avid readers, or of those who read for pleasure after having to
read and write throughout their working day. One can thus extrapolate a further
benefit to the sighted, namely that of preserving their eyesight and consequently
reducing the potential of their progressively coming in need of assistive reading
technology themselves in future years.
2.4 Incentivisation for equal access
The cardinal point that has to be made here is that transfer of technology is vital not
only for accessibility to the visually impaired, but also to provide added value for the
able-sighted when accessing the same text if the commercial world is to be
incentivised towards accessibility-compliant information structures. Leuthold, Bargas-
Avila and Lewis (2007, p.259) observe that a substantial amount of work goes into
developing accessible websites and Perrett (1995, p. 41. In: Williamson et al. 2006)
found that “many companies… considered disabled customers as a niche market at
best, and an unwanted intrusion at worst”. Should the benefits of assistive technology

10
become transferable to the able-sighted as a useful and value-added function, the
technology will become an attractive and commercially viable proposition for the
producers of websites and social media applications to adopt as a standard feature.
If this argument can gain widespread recognition and acceptance in the Internet
industry, social networking and the dissemination of information will have reached a
new plane of participation. The barriers of visual impairment will be felt less acutely by
the impaired, and it is also of relevance that their handicap will become less
noticeable. At present, accessibility solutions for the visually impaired can often be
obtrusive. Williamson et al. (June 2006) found in a survey that “adaptive technology is
usually conspicuous and users feel embarrassed, particularly in the workplace. The
helpful equipment has the unintended side effect of accentuating difference”. And “I
don't like to broadcast the fact that I can't see very well” was how one participant felt
in their survey.
2.5 A one-size-fits-all information structure
The logical extension of the above argument is a one-size-fits-all structure of websites
and news portals. One default orthodox structure will have to be in place which can
however alternate between the three modes of read, hear, and read-and-hear
proposed earlier.
This concept of universal accessibility finds support in the reviewed literature and
Jennifer Sutton (2002) recommends that site designers “apply the concepts of
universal design so that pages will be accessible to everyone, regardless of whether
site visitors have a disability”. She even makes the point that the aural rendering of
text is a form the visually impaired may be familiar with from cassette-based
publications, and that “this medium may be the best ‘one size fits all’ choice”.
Goudiras et al. (2009) go a step further in unequivocally attributing the popularity of
cassettes to the “participants’ view that cassettes are perceived through the auditory
sense, without much effort or training being required”. We will have gone a long way
towards assimilation of the visually impaired into the reading universe when the
barriers of learning curves and technology-specific training, and the cognitive
distraction accompanying them, can be pulled down. And a much wider definition of

11
‘reading’ will have been attained when information can be widely accessed not only
visually both also aurally, or in a combination of both modes.
Jaeger, Bertot and Shilton (2012, p.219) also argue in favour of the validity of
providing a universal design accessible across levels of ability, and having “its roots in
making commercial products and architecture more inclusive, taking focus away from
the traditional design approach of creating things for an imagined ‘average’ user”. A
cross-ability information product is also more attractive to developers on the strength
of the larger market it reaches. It will consequently reach that market at a price
affordable to the many, not the few (Hersh and Johnson. 2008, p.548).
The case for a one-size-fits-all model of electronic communication is an extension of
the universal accessibility of other, much older, models of communication.
“Established information technologies – postal services, telephones, television –
successfully provide universal usability; that is, the vast majority of the population has
access to, can use, and regularly does use the technology” (Snyder. 2009. In: Jaeger,
Bertot and Shilton. 2012, p.219). But “universal usability focuses on... technologies to
be accessed and used by most” (ibid; my italics) and so it is not an all-encompassing
net, and there will inevitably be the few who fall through it too.
One-size-fits-all will naturally also impose a common model among the visually
impaired, as against accessibility solutions catering for varying degrees of visual
impairment. In a comment on assistive devices that is equally applicable to assistive
software technology, Hersh and Johnson (2008, p.83) state that “there may be
benefits in developing sets of related devices... having [different] features that are
appropriate for particular groups of blind and visually impaired people”. In an ideal
world without economic barriers there certainly would be a greater benefit to a more
finely targeted approach. However, with the accessibility market already being a niche
rendering dedicated products unaffordable to most, a universal solution will in any
case have to be one targeted to the ‘average user’. While acknowledging this
necessary limitation the authors (ibid, p.392) conclude that a compromise has to be
struck even if visually impaired readers have different requirements. Adoption of the
one-size-fits-all approach emerging from this compromise is the principal
recommendation of this study.

12
Yet there are a number of user groups which still cannot be drawn into the information
world by this universal accessibility model by nature of their physical disability,
economic circumstances, digital ineptitude or illiteracy, among other conditions and
circumstances (Knobel and Bowker. 2011. In: Jaeger, Bertot and Shilton. 2012,
p.219). Disabilities or inability of participation outside the barrier of visual impairment
is however beyond the scope of this study, even if it may be a challenge of far greater
dimensions for universal accessibility. This study concentrates solely on how barriers
to information and social networking can be brought down for the visually impaired
even if this user set does share risks and barriers with other disadvantaged groups.
2.6 Risk of emargination
One such shared risk is that of the onset of digital dissemination inflicting further
emargination on the visually impaired. This risk is particularly critical in the sphere of
public services, with the essential services of government departments and
institutions increasingly opting for the cheaper and faster medium of the Internet in
the dissemination of public information (Williamson et al. 2006; Jaeger, Bertot and
Shilton. 2012, p.219).
The risk of the Internet inflicting further emargination is mitigated by the emergence of
sound synthesis as Braille, particularly when applied to the Internet, isolates the
visually impaired community even further. Apart from the disadvantages of a learning
curve, accompanying diseases, and the onset of old age, the cost of Braille computer
hardware is also prohibitive for most blind and visually impaired. The community
suffers from low employability, and it will suffice to note that the entry level cost for a
Braille computer display and printer is a combined $5300 (American Foundation for
the Blind. 2014).
2.7 Review
This chapter has appraised and discussed the literature pertinent to the focus of
study. It has examined the matter of how transfer of technology can further open up
reading to the blind and partially sighted in ways that add value for the able-sighted
reader, as a means of incentivising the world of commerce towards dissemination
frameworks supportive of equal access. A solution put forward is a one-size-fits-all
website framework with default able-sighted mode, switchable to an assistive ‘read-

13
and-hear’ structure at the press of a key. It has also looked into whether the electronic
nature of present-day assistive-ware is driving the Braille reading code into
obsolescence. The final section considers the risk of further emargination posed by
the increasingly digital nature of information diffusion for those deprived of sight.

14
3. Methodology
3.1 Overview
This chapter describes the theory, instruments, rules and procedures followed in
testing the research question. Research can prove meaningful, or fail, on the
soundness of its methodology, and this section of the study presents a
comprehensive description of the methodology employed. The approach has been an
exploratory one owing to a dearth of extant literature on the subject. It however still
provides an independently valid picture of how blind and visually impaired Internet
users access it for their everyday needs. It also sets the framework for possible
replication in a more exhaustive investigation of accessibility, online participation, and
the state of current assistive technology.
3.2 The paradigm
Patton (1990) describes the paradigm as “a way of breaking down the complexity of
the real world”. This paper offers a break-down of how Internet usage (often
simplistically viewed as one holistic ‘real world’ activity) is practised by a small-scale
sample of visually impaired and blind individuals for their educational, employability,
entertainment and information purposes.
Educational research is broadly built upon three paradigms: normativism,
interpretivism, and critical theory. Critical theory assumes a judgment or preference
on the researcher’s part which has not been one of this study’s motivating factors.
The motivation behind the research question has been to discover how the blind and
visually impaired use the Internet (the ‘why’ and ‘what if’ have not been motivating
factors). The research question has been developed with a normative approach in
mind and Douglas (1973. In: Cohen, Manion and Morrison. 2007, p.21) found that
one significant notion in the normative paradigm is that human behavior is essentially
rule-governed, and as a consequence it is scientifically ascertainable. This study’s
approach is one of a normative nature that is scientifically verifiable or subjectable to
logical or mathematical proof. In this viewpoint, the stark contrast with the
interpretative paradigm’s concern for the individual emerges as the point of
investigative departure. It is an assumption of a common bottom tier of the reviewed
subjects’ behavior during observation.

15
Dills and Romiszowski (1997, p.11) describe one of the paradigm’s functions as
defining “how the world works, how knowledge is extracted from this world, and how
one is to think, write, and talk about this knowledge”. This study presents a
generalized explanation, derived from the questionnaire response, of how the
participants pursue Internet usage. The categorization of questionnaire replies by
personal attributes such as age, education and occupation adds a causal view to this
description, with usage patterns identifiable as belonging to particular demographic
groups. The focus of interest is in the extraction of an Internet usage pattern by the
blind and visually impaired that is general, average, and representative, and free of
researcher-applied values or context. This focus is a positivist one assuming that
"there are patterns and regularities, causes and consequences in the social world...
having their own existence – they are real” (Denscombe 2003, p.299).
3.3 Research approach and method
This survey has employed a questionnaire to gather straightforward facts and
behavioural patterns concerning Internet use by the blind and visually impaired. The
questionnaire is an instrument suited to social research where an empirical stress is
necessary for the collection of the real-world observation required by the Internet
usage patterns and barriers being investigated.
The study is a primarily quantitative one and findings consequently do not claim to be
a thoroughly in-depth and detailed study. Their value lies in the insight generated,
possibly even serving as a platform for a second more detailed qualitative
investigation built upon a more representative sample of the blind and sight-impaired
community. The data collection process has however sought a limited qualitative
input where the opportunity and relevance have arisen.
The sample base is the product of the pragmatic approach often inherent in small-
scale study, and while the target was a minimum response rate of 15, the response
achieved was of 18 participants. It is an exploratory sample built upon a very small
convenience sampling method and the snowball effect of respondents inviting
members of their community to participate and spread the word among visually
impaired acquaintances of their own. The resulting findings are more at risk of bias
than those of larger scale investigations as a consequence of the small participant

16
numbers. Nevertheless, they focus on the extraction of an informative picture of
Internet usage (and the barriers to it) which an exploratory sample permits.
The opening contact with respondents was made by phone to introduce the
researcher and the motivation behind this study. Most respondents took the survey
upon initial phone contact whereupon the survey's Information Sheet and Consent
Form (Appendices 1 and 2) were read out. The researcher then read out each survey
question, marking the answers according to the interviewees' response. Interviewees
were however still offered the option of having all the survey documentation emailed
to them for them to read at their convenience prior to marking of the questionnaire. An
appointment was set for the actual phone interview with those preferring this option.
The Consent Form, filled in by the interviewer on the interviewees’ behalf, was later
mailed to the respondents for signing and return. Follow-up ensued by a second
phone call where qualitative input obtained in the form of comments pointing the
researcher towards new fields for reflection, was not immediately evident during the
phone interview.
The survey questionnaire was of a quantitative design as straightforward facts and
usage preferences were required to establish a clear numeric picture of Internet
usage in the visually impaired community, the barriers encountered and the assistive
technology utilized. Moreover, the survey questionnaire lends itself to the generation
of quantitative data sufficiently voluminous in size to enable statistical analysis. This
data was complemented with the respondents’ personal attributes to attempt to
discover how Internet usage patterns and barriers (such as age, occupation, level of
education, and level of disability) can be conditioned by one’s personal attributes.
Minor qualitative input has however been recorded by means of clarification or remark
where the respondent offered it, or where the answer has suggested elicitation of it.
The questionnaire method was also deemed the most practical to implement because
of the limited resources available to this study, like in any small-scale research
project. It tends to provide a data load sufficiently large to produce meaningful results
and conclusions, and in a reasonably short time-span. Coupling the questionnaire
with snowball sampling (even though this sampling technique can occasionally fall
victim to unpredictable completion timeframes) produced most of the response within
a fortnight. This rapid turnaround was achieved through a number of factors. A

17
referral-and-contact approach was adopted whereby respondents were asked to
invite a few acquaintances to take up the survey. Most accepted, and they were
promptly contacted and requested to nominate acquaintances of their own. The trust
gained through referral-by-acquaintance generates a response faster than the cold-
contact nature of other techniques, and the visually impaired community was found to
be a closely-knit one with the nominee’s trust more easily won with community-
generated referrals. Moreover, most respondents were pleased with their disability
being the subject of interest, and they took the survey eagerly.
The survey questions principally derive from the literature reviewed in Chapter 2. The
examined theory contributed to a mental formulation of what everyday life can be like
for the blind and partially sighted, with their information-seeking needs and the
complementary barriers consequently emerging in harsher clarity. In addition to
questions on needs and barriers prompted by this mental portrait, querying was
necessary on demographics such as age, occupation and severity of sight impairment
to enable a categorisation of the data collected. Other sets of questions were
motivated by the extraction of what assistive tools the sufferers and their
demographic sub-groups employ in attaining Internet accessibility.
The questionnaire combines a variety of means for the collection of data. One
recording method is a three-point Likert scale (e.g. for the scoring of how often the
respondent uses reading aids, on a scale of a little, a lot or not at all). Another elicits
single-line entry for qualitative input such as for establishing which negative effects
the contributor encounters with Internet usage. A third provides for one or more
answers to a question (such as for which Internet browser or browsers used), with a
final method providing for mutually exclusive answer options such as with the
contributor’s gender (either male or female).
A limited release of the questionnaire among the first four recruited respondents, the
ones also responsible for setting in motion the snowball sampling technique, served
to check the questions’ appropriateness and effectiveness. The questionnaire’s
distribution was planned as an email attachment for the response to be taken over the
phone as already explained earlier in this section. Tweaking of the questionnaire was
intended as an iterative process with these four respondents upon identification of
need of improvement, but no such necessity arose. Questionnaire design was given

18
sufficient consideration both from the literature perused as well as in the form of
suggestions emerging from an email discussion with Natalie Swiderska at Action for
Blind People (www.actionforblindpeople.org.uk). As a result, the questionnaire was
sufficiently clear and of a holistic form upon the first iteration.
Surveys are an efficient tool both in terms of time and in the volume of data they
generate. This productive efficiency shows in this study in the wealth of data
produced by just 18 respondents. However, while the survey does create a rich
picture of the sphere under investigation, prudence has to be exercised when reading
deeper into the findings. It is in the quantitative survey’s nature to veer in the direction
of numerics to the expense of the theory in which the core field of study is grounded.
So while the data collected has been described comprehensively, attention has also
been paid to the extraction of the meaning lying hidden between the rows and
columns of the raw data set.
3.4 Ethics
Ethical consideration is a crucial component of any study, particularly so when the
subjects are more vulnerable such as by reason of disability. This study being an
investigation of Internet usage by a disabled community, conduction of the
questionnaire and reporting of its findings necessitated a thorough ethical check to
ensure observation of the community's interests. The richness that can come out of
the questionnaire’s raw data set has consequently undergone balancing against the
rights, feelings and dignity of the participants. As “researchers have no privileged
position in society that justifies them pursuing their interests at the expense of those
they are studying – no matter how valuable they hope the findings might be”
(Denscombe 2003, p.135). The Ethics Form approved by the Chair at the supervisory
body (Sheffield Hallam University) appears as Appendix 3.
The beneficence of this study lies in establishing the extent to which the Internet,
complemented by assistive implementations such as screen magnifiers and text-to-
sound conversion, is enabling the emancipation of the blind and visually impaired into
the world of the visually able reader and writer. It also offers a vision of an assistive
implementation that will enable the blind and visually impaired user to participate fully
in communication.
19
Consideration has been taken of the potential of negative consequences for the
respondents at an early stage. However, no particular issues arise in this regard,
other than respect for anonymity as, with anonymity ensured, no risk of physical
vulnerability through disclosure of identity, location, or both can ensue. Anonymity
also ensures against the risk of psychological harm as a result of stress or
embarrassment emanating from matching of respondent identity with the appertaining
disability. And the subjects’ identity has been protected as it will rest solely with the
investigator. Where individual replies have had to be referred to in the study,
reference has taken the form of Respondent 1, Respondent 2, etc.
Participants' consent has been obtained by means of a Consent Form emailed prior
to the phone interview. It was read out again to the respondent at the start of the
interview, filled in as per participant's instructions, and signed by the respondent at a
later date. The sample has excluded minors or others incapable of providing informed
consent. The respondent’s right of withdrawal has been granted on both the
Information Sheet and Consent Form (see Appendices 1 and 2 respectively),
accompanied by a withdrawal deadline of 31 December 2014 as a result of the study
planned for closure by the following week. Moreover, unnecessary contact details
have not been recorded anywhere in the documentation. Contact details have been
restricted to email address and phone number for use by the author only, and solely
for the purposes authorised by the subjects on the Form.
Where individual replies to the numeric content or individual qualitative input are
being communicated, respondent identity has been disguised as Respondent N.
Participant identity will rest solely with the author of this study and questionnaire
replies will be held by him until such time as this study has been marked by the
supervisory body. An anonymised summary of the participants' responses will be
retained for record purposes and also for future use, with the latter purpose enjoying
respondents’ approval on the Consent Form.
No survey questions have been set which are redundant to the topic of investigation
or its complementary angles. Moreover, attention has been paid to reporting of the
individual respondents’ data elements where they produce a risk of identification
through the matching of two or more individually-reported items such as age, sex or
occupation.

20
3.5 Data analysis
The data analysis consists of numeric summarisation of the collective response to the
individual survey questions, comparison between the results of the individual
questions where the content of one question directly feeds into that of another, and of
a discussion considering the result, conclusions and recommendations to be
garnered from reflection on the complete raw data set. Spreadsheet views and pie
charts present the results and comparison between them, followed by a discussion
comparing the findings to the theory emanating from the literature perused. Coding of
the survey response was performed through input of all the collected data elements
into an Excel spreadsheet (Appendix 5) in tabulated form, with a table and pie chart
view extracted for the individual questions’ response in Chapter 4 (Findings and
Discussion).
Data collection employs a quantitative method because of its numeric nature, as the
aim of the study is a result based on a firm numeric foundation for a generalisation as
objective as possible of Internet usage by the sight impaired and the accessibility
barriers encountered. This approach contributes to the reliability of the research even
if Cohen, Manion and Morrison (2007, p.133) do hold that quantitative research
possesses a degree of inbuilt error. And quantitativity’s numeric nature presents a
solid basis for an objective analysis and description of the study’s aims and questions
in spite of a measure of subjectivity inevitably setting in, both during formulation of the
questionnaire and upon categorization of the raw data. The rigid pigeon-holing of the
data elements however enhances the consistency and dependability of the survey,
thus augmenting its potential replicability for future investigations. If reliability is
present in sufficient measure, an acceptable degree of validity ensues “through
careful sampling, appropriate instrumentation and statistical treatments of the data”
(ibid).
The respondent anonymity discussed earlier has dictated that their occupations are
broadly categorized for reasons of non-identification of participant. The first five
occupational categories below have been adopted from the ISCO-08 standard
classification of economic occupations (International Labour Organization. 2008). The
last two have been added by the author to label respondents outside of economic
activity.

21
- Legal, social and cultural professionals
- Information and communication technicians
- Teaching professionals
- General and keyboard clerks
- Cleaners and helpers
- Unemployed
- Retired
So while ethical constraint may have contributed to a generalization broader than the
study topic would have otherwise enjoyed, a hazier view is the price of the ethical
integrity governing modern research. This study can however still be considered a top
level view of a paradigm a more in-depth inspection of which is achievable by the
examination of a larger sample of the sight-impaired community. Higher respondent
numbers will allow for a narrowed-down description that does not compromise on
ethical concern.
3.6 Review
This section has described the paradigm governing the study, the research approach
and the instruments employed in the gathering of the raw data. It has discussed how
this data is analysed and presented in the next chapter (Findings and Discussion),
and also considered issues of reliability and validity, and considerations of research
ethics.

22
4. Findings and Discussion
4.1 Overview
This chapter describes the survey’s findings by setting the response to each question
in table format and reporting on the collated data. It then proceeds to discuss the
picture portrayed by the collated data. It comprises 33 tables illustrating the response
to each of the survey’s 17 questions and their sub-questions, with a pie chart
depicting the summarised percentage for each answer set where applicable.
The survey sample was built by means of the snowball sampling technique which was
largely set in motion by two blind and visually impaired contributors who are in
employment. As a result, there is a possibility that acquaintances they recommended
as respondents may be more likely to be in employment than not. Caution is thereby
recommended when applying the study’s findings to other research settings as the
ratio for employed and unemployed sufferers may hold slight bias towards the former
category.

23
4.2 The findings
Question 1: Respondent particulars
1.1 Sex
The male-to-female respondent ratio of 5:4 is a chance product of the snowball
sampling method’s referral-by-respondent approach. The survey sample’s selection
not being based on demographic attributes may explain why this ratio is not precisely
representative of Malta’s gender ratio in which the female share exceeds that for
males by 0.5% (National Statistics Office, Malta. 2014). Moreover, the possible bias in
favour of employed sufferers noted in the overview on the previous page may be a
contributor towards this sample characteristic because of gender imbalance at the
workplace. Malta’s last national census (ibid) reported a female workforce
participation rate of 38% in 2011.
Question 1.1:
SexMale Female
Respondent 10 8 < Occurrences
R1 √
R2 √
R3 √
R4 √
R5 √
R6 √
R7 √
R8 √
R9 √
R10 √
R11 √
R12 √
R13 √
R14 √
R15 √
R16 √
R17 √
R18 √

24
1.2: Age
Participant age has been collected as at date of survey completion but subsequently
grouped into the four age brackets in the table below. Actual age was requested in
the questionnaire so as to leave open the possibility of emergence of any particular
age grouping of particular significance. However, the respondents’ ages did not
produce results meriting specific or unexpected attention and categorisation has been
established upon a 4-point rating scale starting from 18 as minors have been
excluded from this study. The exclusion of minors has contributed to no occurrence of
respondents in the 18- to 24-year-old age bracket as it has reduced further what
would already have been an age band narrower than the two twenty-year intervals
that follow.
Question 1.2:
Age18 - 24 25 - 44 45 - 64 65 +
Respondent 0 6 11 1 < Occurrences
R1 √
R2 √
R3 √
R4 √
R5 √
R6 √
R7 √
R8 √
R9 √
R10 √
R11 √
R12 √
R13 √
R14 √
R15 √
R16 √
R17 √
R18 √

25
1.3: Town/City
This table provides a summary of participants’ location in Malta. The town or city of
residence is of no real demographic importance to this study, so the data collected
has been restricted to the island of residence, i.e. either the mainland or the second
island of Gozo. Interisland distinction has however not been deemed of any
significance to this study. In fact, the high percentage of Gozitan respondents (22%)
in relation to their 7.5% share of the total Maltese population (National Statistics
Office. 2014, p.xiii) has not been considered a relevant bias.
Question 1.3:
LocationMalta Gozo
Respondent 14 4 < Occurrences
R1 √
R2 √
R3 √
R4 √
R5 √
R6 √
R7 √
R8 √
R9 √
R10 √
R11 √
R12 √
R13 √
R14 √
R15 √
R16 √
R17 √
R18 √

26
1.4: Occupation
Participant occupation is classified across seven labels. The first five in Table 1.4
below are selected from the ISCO-08 classification of economic activity (International
Labour Organization. 2008). The last two have been added to classify the non-
economic activity arising from the sample base.
The unemployed account for a third of respondents, predictably so given the barriers
or lack of sight they are burdened with when conducting even mundane routines, let
alone in employment. However, the 2:1 ratio of respondents in employment (or having
been until retirement) denotes a reasonable level of emancipation of the blind and
visually impaired in the labour market. But it can also be construed that the level of
educational opportunity and preparedness for employment are still largely directed
towards the clerical job markets, when considering that 27% of all participants fall
under the employment category of General & Keyboard Clerks.
Question 1.4:
Occupation
Legal, Social &
Cultural
Professionals
Information &
Communication
Technicians
Teaching
Professionals
General &
Keyboard
Clerks
Cleaners &
HelpersUnemployed Retired
Respondent 2 1 1 5 1 6 2 < Occurrences
R1 √
R2 √
R3 √
R4 √
R5 √
R6 √
R7 √
R8 √
R9 √
R10 √
R11 √
R12 √
R13 √
R14 √
R15 √
R16 √
R17 √
R18 √

27
1.5: Accompanying disabilities
Three-fourths of respondents did not have other disabilities in addition to blindness or
low vision that further hindered reading. Four of the 18 respondents did however
suffer from diabetes, arthritis or, in one case, a combination of diabetes and deformity
of one hand. This figure indicates that close to a quarter of blind and visually impaired
readers will experience above-average difficulty (possibly even unachievability) in the
use of the tactile reading media of Braille. As, as already discussed in the Introduction
and Literature Review sections of this dissertation, diabetics suffer from a severely
reduced sense of touch as do arthritics too.
Add to this the decline in the sense of touch that comes as a result of age itself
(Stevens, Folke and Patterson. 1996) , discussed earlier in the Literature Review
chapter, and the long-term non-feasibility of learning Braille for 67% of the
respondents becomes apparent. This 67% comprises the 45-year and older age
bracket whose tactile sense has already started, or will start, diminishing in a number
of years.
Question 1.5:
Accompanying
disabilities
None Diabetes Arthritis Hand Deformity
Respondent 14 3 1 1 < Occurrences
R1 √
R2 √
R3 √
R4 √
R5 √
R6 √
R7 √
R8 √
R9 √
R10 √
R11 √
R12 √
R13 √
R14 √
R15 √
R16 √
R17 √ √
R18 √

28
Question 2: Visual disability
The visual disability of participants has been classified according to the three levels of
impairment in the table below. Almost a half (8 of 18) suffers from total blindness, and
another seven individuals have described themselves as severely sight impaired. The
percentage of respondents most at risk of Internet inaccessibility (those not rating
themselves as just ‘sight impaired’) therefore amount to 83% of the participating
sample.
Question 2:
Visual disabilitySight Impaired
Severely Sight
ImpairedBlind
Respondent 3 7 8 < Occurrences
R1 √
R2 √
R3 √
R4 √
R5 √
R6 √
R7 √
R8 √
R9 √
R10 √
R11 √
R12 √
R13 √
R14 √
R15 √
R16 √
R17 √
R18 √

29
Question 3: Age of impairment
This survey question has produced a largely even spread of age of onset of visual
impairment between zero to 64 years of age. The raw unsummarised findings in
Appendix 5 show the actual ages of onset standing between 7 and 40 for blindness,
and between 12 and 62 for severe sight impairment (with one occurrence of severe
impairment from birth). This even spread, coupled with the risk of other sight-
restricting illnesses setting in for the 65+ age bracket in spite of no occurrences
showing up at onset, appears to strengthen this study’s argument in Chapter 2,
Section 2.5 (A one-size-fits-all information structure) for a one-size-fits-all solution.
This recommendation suggests a move away from Braille towards aural reading as
the practical and all-encompassing way forward.
Question 3:
Age of onset of
impairment
Birth 0 - 14 15 - 24 25 - 44 45 - 64 65 +
Respondent 1 5 5 4 3 0 < Occurrences
R1 √
R2 √
R3 √
R4 √
R5 √
R6 √
R7 √
R8 √
R9 √
R10 √
R11 √
R12 √
R13 √
R14 √
R15 √
R16 √
R17 √
R18 √

30
Question 4: Level of education
The level of education attained by the survey participants is either secondary or
tertiary, at 61% and 39% respectively. This result, in spite of the questionnaire still
providing for a primary school level exit or no education at all, is not unexpected
because education up to a secondary level is compulsory in Malta. It has been since
1946 which is before the school entry age of all survey participants.
Question 4:
Level of education None Primary Secondary Tertiary
Respondent 0 0 11 7 < Occurrences
R1 √
R2 √
R3 √
R4 √
R5 √
R6 √
R7 √
R8 √
R9 √
R10 √
R11 √
R12 √
R13 √
R14 √
R15 √
R16 √
R17 √
R18 √

Question 5: Training in reading media
A third (6) of those taking the survey underwent formal training in at least one form of
assistive reading media. One of them (Respondent 4) self
after being tutored in Braille. Two of the 12 not reporting undergoing training have
self-taught themselves in the media they use, while Respondent 12 had begun Braille
training but “I dropped it as it wasn’t easy and I lacked motivation too [and] I
to the little sight I had and the assistive technology I learned by myself was sufficient
That Respondent 12 did not find Braille easy to learn is no surprise when keeping in
mind she is 59 years old. What Stevens, Folke and Patterson (1996) ha
about the sense of touch with which Braille operates diminishing the older one grows
was touched upon in Chapter 2, Section 2.
speech?).
Question 5:
Training in
reading media
Yes
Respondent 6
R1
R2
R3
R4 √
R5
R6 √
R7
R8
R9
R10 √
R11 √
R12 √
R13
R14 √
R15
R16
R17
R18
31
Training in reading media
A third (6) of those taking the survey underwent formal training in at least one form of
One of them (Respondent 4) self-taught himself other
after being tutored in Braille. Two of the 12 not reporting undergoing training have
taught themselves in the media they use, while Respondent 12 had begun Braille
I dropped it as it wasn’t easy and I lacked motivation too [and] I
to the little sight I had and the assistive technology I learned by myself was sufficient
That Respondent 12 did not find Braille easy to learn is no surprise when keeping in
mind she is 59 years old. What Stevens, Folke and Patterson (1996) ha
about the sense of touch with which Braille operates diminishing the older one grows
was touched upon in Chapter 2, Section 2.2 (Is Braille being eclipsed by electronic
No
12 < Occurrences
√
√
√
√
√
√
√
√
√
√
√
√
A third (6) of those taking the survey underwent formal training in at least one form of
taught himself other media
after being tutored in Braille. Two of the 12 not reporting undergoing training have
taught themselves in the media they use, while Respondent 12 had begun Braille
I dropped it as it wasn’t easy and I lacked motivation too [and] I held on
to the little sight I had and the assistive technology I learned by myself was sufficient".
That Respondent 12 did not find Braille easy to learn is no surprise when keeping in
mind she is 59 years old. What Stevens, Folke and Patterson (1996) have to say
about the sense of touch with which Braille operates diminishing the older one grows
Is Braille being eclipsed by electronic
32
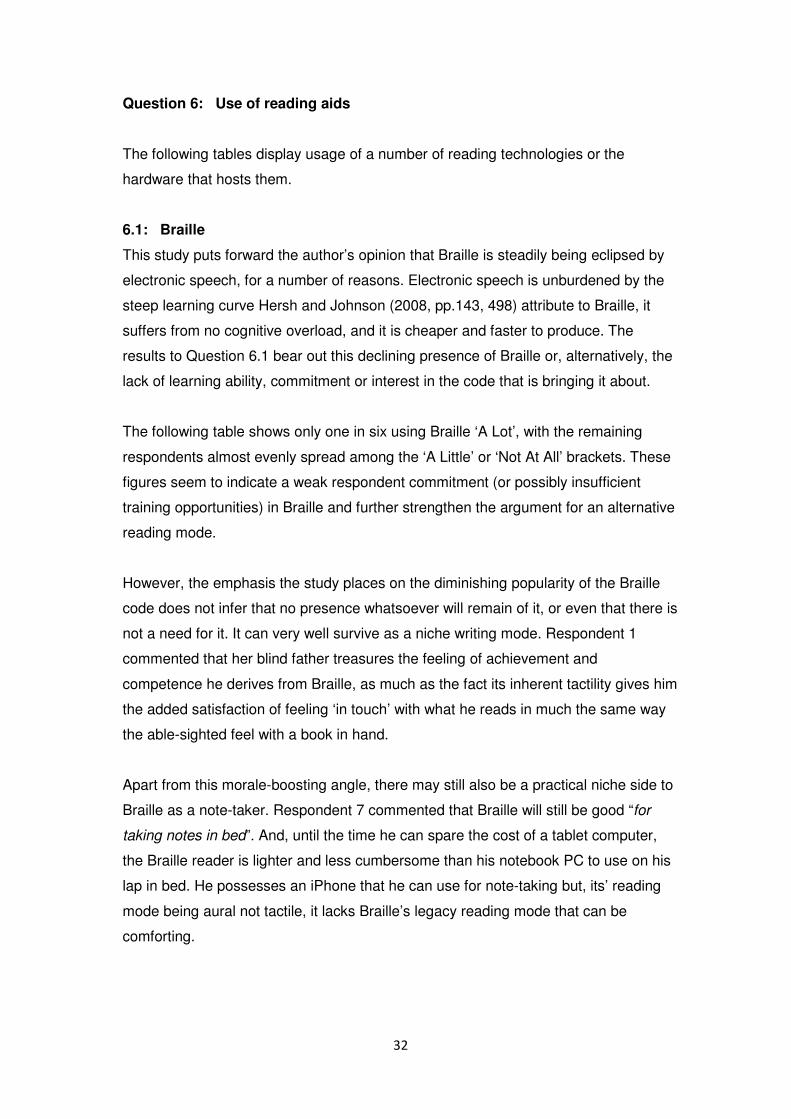
Question 6: Use of reading aids
The following tables display usage of a number of reading technologies or the
hardware that hosts them.
6.1: Braille
This study puts forward the author’s opinion that Braille is steadily being eclipsed by
electronic speech, for a number of reasons. Electronic speech is unburdened by the
steep learning curve Hersh and Johnson (2008, pp.143, 498) attribute to Braille, it
suffers from no cognitive overload, and it is cheaper and faster to produce. The
results to Question 6.1 bear out this declining presence of Braille or, alternatively, the
lack of learning ability, commitment or interest in the code that is bringing it about.
The following table shows only one in six using Braille ‘A Lot’, with the remaining
respondents almost evenly spread among the ‘A Little’ or ‘Not At All’ brackets. These
figures seem to indicate a weak respondent commitment (or possibly insufficient
training opportunities) in Braille and further strengthen the argument for an alternative
reading mode.
However, the emphasis the study places on the diminishing popularity of the Braille
code does not infer that no presence whatsoever will remain of it, or even that there is
not a need for it. It can very well survive as a niche writing mode. Respondent 1
commented that her blind father treasures the feeling of achievement and
competence he derives from Braille, as much as the fact its inherent tactility gives him
the added satisfaction of feeling ‘in touch’ with what he reads in much the same way
the able-sighted feel with a book in hand.
Apart from this morale-boosting angle, there may still also be a practical niche side to
Braille as a note-taker. Respondent 7 commented that Braille will still be good “for
taking notes in bed”. And, until the time he can spare the cost of a tablet computer,
the Braille reader is lighter and less cumbersome than his notebook PC to use on his
lap in bed. He possesses an iPhone that he can use for note-taking but, its’ reading
mode being aural not tactile, it lacks Braille’s legacy reading mode that can be
comforting.

Question 6.1:
BrailleA Lot
Respondent 3
R1
R2
R3
R4
R5
R6
R7 √
R8 √
R9
R10
R11
R12
R13
R14
R15
R16
R17
R18 √
33
A Little Not At All
8 7 < Occurrences
√
√
√
√
√
√
√
√
√
√
√
√
√
√
√

6.2: Large Print
That only 6% of the surveyed participants use large print ‘A Lot’ and 72% ‘Not At All’
may appear a surprising find, particularly with the relative ease the computer screen’s
content can be enlarged on the ubiqui
platforms. One has however to keep in mind Table 2 (
respondents almost evenly split between the blind and visually impaired.
With enlarged text of no help for the eight respondents who have
maximum number from the sample for whom large print is helpful is reduced to
Deducting from that number the four respondents using computers a little or not at all
(see Table 6.5: Computers
these six, four read in large print ‘A Lot’, with the remaining two populating the ‘A
Little’ and ‘Not At All’ bands (Respondents 6 and 17 respectively). No amplification
emerges from the data for non
assistance by these two participants.
Question 6.2:
Large PrintA Lot
Respondent 4
R1 √
R2
R3
R4
R5
R6
R7
R8 √
R9 √
R10
R11
R12 √
R13
R14
R15
R16
R17
R18
34
That only 6% of the surveyed participants use large print ‘A Lot’ and 72% ‘Not At All’
may appear a surprising find, particularly with the relative ease the computer screen’s
content can be enlarged on the ubiquitous Microsoft Windows operating system
platforms. One has however to keep in mind Table 2 (Visual Disability
respondents almost evenly split between the blind and visually impaired.
With enlarged text of no help for the eight respondents who have no sight at all, the
maximum number from the sample for whom large print is helpful is reduced to
Deducting from that number the four respondents using computers a little or not at all
Computers) leaves six non-blind users using compute
these six, four read in large print ‘A Lot’, with the remaining two populating the ‘A
Little’ and ‘Not At All’ bands (Respondents 6 and 17 respectively). No amplification
emerges from the data for non-usage of the simplest form of computer
assistance by these two participants.
A Little Not At All
1 13 < Occurrences
√
√
√
√
√
√
√
√
√
√
√
√
√
√
That only 6% of the surveyed participants use large print ‘A Lot’ and 72% ‘Not At All’
may appear a surprising find, particularly with the relative ease the computer screen’s
tous Microsoft Windows operating system
Visual Disability) with
respondents almost evenly split between the blind and visually impaired.
no sight at all, the
maximum number from the sample for whom large print is helpful is reduced to 10.
Deducting from that number the four respondents using computers a little or not at all
rs regularly. Of
these six, four read in large print ‘A Lot’, with the remaining two populating the ‘A
Little’ and ‘Not At All’ bands (Respondents 6 and 17 respectively). No amplification
usage of the simplest form of computer-based reading

6.3: Videos
The video tutorial can be a very effective instrument for the acquisition of knowledge,
or of instruction on anything from vocational training to the use of domestic
appliances. For the blind and visually impaired it replaces reading text with aural
assimilation and visual enactment of actions, at times even complemented with a
track of large text.
It is a result meriting further examination that the majority of respondents (56%) o
reported ‘A Little’ use of video, with a further 22% on ‘Not At All’.
Question 6.3:
VideosA Lot
Respondent 4
R1 √
R2 √
R3
R4 √
R5
R6
R7
R8 √
R9
R10
R11
R12
R13
R14
R15
R16
R17
R18
35
The video tutorial can be a very effective instrument for the acquisition of knowledge,
or of instruction on anything from vocational training to the use of domestic
or the blind and visually impaired it replaces reading text with aural
assimilation and visual enactment of actions, at times even complemented with a
It is a result meriting further examination that the majority of respondents (56%) o
reported ‘A Little’ use of video, with a further 22% on ‘Not At All’.
A Little Not At All
10 4 < Occurrences
√
√
√
√
√
√
√
√
√
√
√
√
√
√
The video tutorial can be a very effective instrument for the acquisition of knowledge,
or of instruction on anything from vocational training to the use of domestic
or the blind and visually impaired it replaces reading text with aural
assimilation and visual enactment of actions, at times even complemented with a
It is a result meriting further examination that the majority of respondents (56%) only

36
6.4: CCTV
CCTV has resulted to be by far the least popular reading tool with only Respondent 1
reporting using it at all. This may be attributable to the price of the hardware that may
cost up to USD 3,000 on the price list of one supplier (The Visual-Tech Connection.
2014). With a number of other assistive needs requiring attention from a community
largely in no or lowly-paid employment, this can be a considerable outlay unless
funded by the employer for office use.
Question 6.4:
CCTVA Lot A Little Not At All
Respondent 1 0 17 < Occurrences
R1 √
R2 √
R3 √
R4 √
R5 √
R6 √
R7 √
R8 √
R9 √
R10 √
R11 √
R12 √
R13 √
R14 √
R15 √
R16 √
R17 √
R18 √

37
6.5: Computers
The computer is the platform for the assistive software technology discussed in this
study, so this band is a critical component of the survey. Seventy-two percent report
using computers a lot and 17% a little.
The two respondents reporting no computer use at all are effectively cut off from all
assistive technology bar Braille (which they cannot use anyway owing to
complementary illnesses affecting tactility) but, representing 11% of the sample, their
presence cannot be discarded as insignificant. Respondent 5 is a 67-year-old male
pensioner with severe sight impediment setting in at age 62, while Respondent 16 is
an unemployed female of 49 with sight impairment having set in at the age of 22. So
while one has suffered sight impairment for the last five years, the other has already
lived with it for over half her lifetime. These two participants’ histories are very
different so there are no common factors that can identify an explanation of their not
being computer users, particularly since none indicated that obtaining one would be
too large a financial burden.
Having said the above, keeping the world of reading open may not be the be-all and
end-all of a happy life for all who suffer blindness or visual impairment. There may
very well be the one-in-ten who find acceptance of their reduced senses and
fulfilment nonetheless in the limited activity they can pursue. Respondent 16 did in
fact remark, when being asked upon the reading aids she uses (none at all, as
recorded in this section’s tables below), that “my biggest concern is mobility, more
than reading”. The priorities the visually impaired make in adjusting to a life of sight
deprivation, and the extent to which the printed word forms part of that prioritisation, is
a field of enquiry that can merit dedicated research in its own right.

Question 6.5:
ComputersA Lot
Respondent 13
R1 √
R2 √
R3 √
R4 √
R5
R6 √
R7 √
R8 √
R9 √
R10
R11 √
R12 √
R13
R14 √
R15
R16
R17 √
R18 √
38
A Little Not At All
3 2 < Occurrences
√
√
√
√
√

6.6: Phone Apps
Two-thirds of respondents report not using smartphone apps at all. The collected data
does not go into the ‘why’ of non
additional cost over a normal cell phone is one, though the price difference has come
down considerably, apart from smartphones also frequently being packaged into
fixed-term phone contract deals offered by mobile telephony service providers. A
bigger obstacle to taking up smartphone usage by the blind and visually impaired may
be the prospect of learning new software applications,
curve of phone apps usual
smartphone with typical screen sizes of five inches.
Four of the respondents however reported using phone apps a lot, with another two
‘A Little’. All of these six also report using from six to eigh
and technologies listed in Questions 6 and 7. This technological aptitude and
exposure, possibly a result of five of the respondents being in employment in
professional and white collar occupations, may explain their confidence in
a technological layer in addition to the average assistive portfolio in use by the survey
respondents.
Question 6.6:
Phone AppsA Lot
Respondent 4
R1
R2 √
R3
R4
R5
R6 √
R7 √
R8
R9
R10
R11 √
R12
R13
R14
R15
R16
R17
R18
39
thirds of respondents report not using smartphone apps at all. The collected data
go into the ‘why’ of non-usage, but a number of reasons come to mind. The
additional cost over a normal cell phone is one, though the price difference has come
down considerably, apart from smartphones also frequently being packaged into
contract deals offered by mobile telephony service providers. A
bigger obstacle to taking up smartphone usage by the blind and visually impaired may
ing new software applications, however short the learning
curve of phone apps usually is. Or possibly even that of operating and reading a
smartphone with typical screen sizes of five inches.
Four of the respondents however reported using phone apps a lot, with another two
‘A Little’. All of these six also report using from six to eight of the 10 reading media
and technologies listed in Questions 6 and 7. This technological aptitude and
exposure, possibly a result of five of the respondents being in employment in
professional and white collar occupations, may explain their confidence in
a technological layer in addition to the average assistive portfolio in use by the survey
A Little Not At All
2 12 < Occurrences
√
√
√
√
√
√
√
√
√
√
√
√
√
√
thirds of respondents report not using smartphone apps at all. The collected data
usage, but a number of reasons come to mind. The
additional cost over a normal cell phone is one, though the price difference has come
down considerably, apart from smartphones also frequently being packaged into
contract deals offered by mobile telephony service providers. A
bigger obstacle to taking up smartphone usage by the blind and visually impaired may
however short the learning
ly is. Or possibly even that of operating and reading a
Four of the respondents however reported using phone apps a lot, with another two
reading media
and technologies listed in Questions 6 and 7. This technological aptitude and
exposure, possibly a result of five of the respondents being in employment in
professional and white collar occupations, may explain their confidence in employing
a technological layer in addition to the average assistive portfolio in use by the survey

40
6.7: Others
No use of software aids or hardware other than the five specifically listed in Question
6 has been reported.
Question 6.7:
OthersA Lot A Little Not At All
Respondent 0 0 0 < Occurrences
R1
R2
R3
R4
R5
R6
R7
R8
R9
R10
R11
R12
R13
R14
R15
R16
R17
R18
No other use of reading media or hardware
has been reported by respondents

Question 7: Use of computer software
Respondent usage of the software assistive technology most commonly used by the
blind and sight impaired is presented in the tables below.
7.1: Screen-reader
The screen-reader is the most frequentl
indicating its’ usage, 83% of which (
respondents in employment use it (together with one unemployed participant and a
pensioner). The six remaining participants (five unemplo
make use of the screen-reader.
The above usage pattern appears to indicate a low reading rate among the
unemployed with only 25% of the unemployed and pensioners (two of eight) finding
any need for it.
Question 7.1:
Screen-readerA Lot
Respondent 10
R1
R2 √
R3 √
R4 √
R5
R6 √
R7 √
R8 √
R9
R10
R11 √
R12 √
R13
R14 √
R15
R16
R17
R18 √
41
Use of computer software
Respondent usage of the software assistive technology most commonly used by the
blind and sight impaired is presented in the tables below.
reader is the most frequently employed aid with 89% of participants
indicating its’ usage, 83% of which (10 of 12) report using it ‘A Lot’. All
respondents in employment use it (together with one unemployed participant and a
pensioner). The six remaining participants (five unemployed and a pensioner) do not
reader.
The above usage pattern appears to indicate a low reading rate among the
unemployed with only 25% of the unemployed and pensioners (two of eight) finding
A Little Not At All
2 6 < Occurrences
√
√
√
√
√
√
√
√
Respondent usage of the software assistive technology most commonly used by the
y employed aid with 89% of participants
) report using it ‘A Lot’. All 10
respondents in employment use it (together with one unemployed participant and a
yed and a pensioner) do not
The above usage pattern appears to indicate a low reading rate among the
unemployed with only 25% of the unemployed and pensioners (two of eight) finding

7.2: Speech-to-text
This technology does not enjoy a high take
78% not utilising it at all. Those employing it are in employment, two in the role of
clerk and one as a disability trainer.
Question 7.2:
Speech-to-textA Lot
Respondent 3
R1
R2 √
R3
R4
R5
R6 √
R7 √
R8
R9
R10
R11
R12
R13
R14
R15
R16
R17
R18
42
This technology does not enjoy a high take-up rate among the survey sample with
78% not utilising it at all. Those employing it are in employment, two in the role of
clerk and one as a disability trainer.
A Little Not At All
1 14 < Occurrences
√
√
√
√
√
√
√
√
√
√
√
√
√
√
√
up rate among the survey sample with
78% not utilising it at all. Those employing it are in employment, two in the role of a

7.3: Scanner-to-speech
Scanner-to-speech also suffers from low usage with only 33% indicating any level of
use. The two participants reporting much usage are a solicitor and a disability trainer,
with the four users using the technology a little working as a clerk, phone operato
in ICT.
Question 7.3:
Scanner-to-
speech
A Lot
Respondent 2
R1
R2
R3
R4
R5
R6
R7 √
R8
R9
R10
R11 √
R12
R13
R14
R15
R16
R17
R18
43
speech
speech also suffers from low usage with only 33% indicating any level of
use. The two participants reporting much usage are a solicitor and a disability trainer,
with the four users using the technology a little working as a clerk, phone operato
A Little Not At All
4 12 < Occurrences
√
√
√
√
√
√
√
√
√
√
√
√
√
√
√
√
speech also suffers from low usage with only 33% indicating any level of
use. The two participants reporting much usage are a solicitor and a disability trainer,
with the four users using the technology a little working as a clerk, phone operator or

7.4: Screen-magnifier
As with the technologies in the two previous tables (Speech
speech), screen magnification has not resulted in a high take
respondents reporting utilisin
between screen magnification and use of large print technology with four in five users
of the former not having reported any use of the latter in Table 6.2 (
This finding appears to sugges
there is a choice between two technologies performing the same basic function, by
either adopting one or the other.
Question 7.4:
Screen-magnifierA Lot
Respondent 2
R1 √
R2
R3
R4
R5
R6
R7
R8
R9 √
R10
R11
R12
R13
R14
R15
R16
R17
R18
44
As with the technologies in the two previous tables (Speech-to-text and Scanner
speech), screen magnification has not resulted in a high take-up rate with only 28% of
respondents reporting utilising it at all. There however seems to be a correlation
between screen magnification and use of large print technology with four in five users
of the former not having reported any use of the latter in Table 6.2 (Large Print
This finding appears to suggest that users avoid duplication of assistive aids where
there is a choice between two technologies performing the same basic function, by
either adopting one or the other.
A Little Not At All
3 13 < Occurrences
√
√
√
√
√
√
√
√
√
√
√
√
√
√
√
√
text and Scanner-to-
up rate with only 28% of
g it at all. There however seems to be a correlation
between screen magnification and use of large print technology with four in five users
Large Print).
t that users avoid duplication of assistive aids where
there is a choice between two technologies performing the same basic function, by

Question 8: Internet connection ratio
The ratio of respondents wi
5:1 which is higher than Malta’s broadband ratio per household of 4:1 (Eurostat
2014). This ratio may be indicative of how critical a service it is considered by the
blind and sight impaired commun
information and knowledge are negligible. It has nonetheless to be borne in mind that
not all those suffering the isolation of sight impairment feel the need of a direct
connection to the Internet. Respondent 1
below, but he finds a substitute for the Internet in family when in need of the
occasional bit of information: “
Internet".
Question 8:
Internet
connection
Yes
Respondent 15
R1 √
R2 √
R3 √
R4 √
R5
R6 √
R7 √
R8 √
R9 √
R10 √
R11 √
R12 √
R13
R14 √
R15 √
R16
R17 √
R18 √
45
Internet connection ratio
The ratio of respondents with an Internet connection to those without one is that of
5:1 which is higher than Malta’s broadband ratio per household of 4:1 (Eurostat
2014). This ratio may be indicative of how critical a service it is considered by the
blind and sight impaired community whose alternative resources for accessing
information and knowledge are negligible. It has nonetheless to be borne in mind that
not all those suffering the isolation of sight impairment feel the need of a direct
connection to the Internet. Respondent 13 is one of the unconnected in the table
below, but he finds a substitute for the Internet in family when in need of the
occasional bit of information: “my children help whenever I need anything on the
No
3 < Occurrences
√
√
√
th an Internet connection to those without one is that of
5:1 which is higher than Malta’s broadband ratio per household of 4:1 (Eurostat.
2014). This ratio may be indicative of how critical a service it is considered by the
ity whose alternative resources for accessing
information and knowledge are negligible. It has nonetheless to be borne in mind that
not all those suffering the isolation of sight impairment feel the need of a direct
3 is one of the unconnected in the table
below, but he finds a substitute for the Internet in family when in need of the
my children help whenever I need anything on the

Question 9: Reasons for no Internet connection
The three participants without Internet connectivity have cited four reasons for this,
with two naming at least one reason not outside his or her control.
Respondent 5, a 67-year-
Most of his needs such as banking are seen to by family. He moreover finds the
remnant of sight his severe sight impairment leaves him with to be sufficient for
pursuing an interest in the cable TV documentaries and other information,
entertainment or knowledge needs he habitually follows.
Respondent 13, an unemployed 45
while Respondent 16 (unemployed and 49) believes
training will not be easy but adds that
either.
It is surprising that a number of those denied full sight, and consequently also full
mobility, do not find the need for a medium that brings the world to their desktop.
However, the proviso put for
those visually impaired who accept their condition and find fulfilment nonetheless,
may apply in this case too.
Question 9:
If no Internet
connection, why
I don't
need itCost
Difficulty in
finding
training
Respondent 2 0
R1 - -
R2 - -
R3 - -
R4 - -
R5 √ -
R6 - -
R7 - -
R8 - -
R9 - -
R10 - -
R11 - -
R12 - -
R13 - -
R14 - -
R15 - -
R16 √ -
R17 - -
R18 - -
46
Reasons for no Internet connection
The three participants without Internet connectivity have cited four reasons for this,
with two naming at least one reason not outside his or her control.
-old pensioner, states that he has no need for the Internet.
Most of his needs such as banking are seen to by family. He moreover finds the
remnant of sight his severe sight impairment leaves him with to be sufficient for
pursuing an interest in the cable TV documentaries and other information,
entertainment or knowledge needs he habitually follows.
Respondent 13, an unemployed 45-year-old, cites a difficulty with using technology,
while Respondent 16 (unemployed and 49) believes her finding the necessary
training will not be easy but adds that she does not really need the Internet that much
It is surprising that a number of those denied full sight, and consequently also full
mobility, do not find the need for a medium that brings the world to their desktop.
However, the proviso put forward in Table 6.5 (Computers), that there may well be
who accept their condition and find fulfilment nonetheless,
may apply in this case too.
Difficulty in
finding
training
Difficulty in
using
technology
Fear of
technologyOther
1 1 0 0 < Occurrences
- - - -
- - - -
- - - -
- - - -
- - - -
- - - -
- - - -
- - - -
- - - -
- - - -
- - - -
- - - -
- √ - -
- - - -
- - - -
√ - - -
- - - -
- - - -
The three participants without Internet connectivity have cited four reasons for this,
eed for the Internet.
Most of his needs such as banking are seen to by family. He moreover finds the
remnant of sight his severe sight impairment leaves him with to be sufficient for
pursuing an interest in the cable TV documentaries and other information,
old, cites a difficulty with using technology,
finding the necessary
she does not really need the Internet that much
It is surprising that a number of those denied full sight, and consequently also full
mobility, do not find the need for a medium that brings the world to their desktop.
), that there may well be
who accept their condition and find fulfilment nonetheless,

Question 10: Internet usage,
This question set elicits the respondents’ weekly time span on the Internet, and it
seeks an answer as to whether the sight impaired, like the able
also has an intrusive or overbearing effect on their lives.
10.1: Hours spent weekly on the Internet
Five of the eight participants not in employment (a mix of unemployed individuals and
pensioners) state they spend an average 18½ hours (between 5 and 40) weekly on
the Internet. The remaining
double that time at an average 41 hours weekly (anything between 15 and 70 hours).
The difference in durations can be attributable to the employed respondents finding
more use for the Internet, when considering both work and private purpose.
The average weekly hours of Internet use for all 15 connected respondents is 33½
hours.
Question 10.1:
How many hours
weekly on Internet
Less than 7 7 - 14
Respondent 1 2
R1
R2
R3
R4
R5 - -
R6
R7
R8
R9
R10
R11
R12
R13 - -
R14 √
R15 √
R16 - -
R17 √
R18
47
Internet usage, user proficiency, and its effects
t elicits the respondents’ weekly time span on the Internet, and it
seeks an answer as to whether the sight impaired, like the able-sighted, may feel it
also has an intrusive or overbearing effect on their lives.
Hours spent weekly on the Internet
Five of the eight participants not in employment (a mix of unemployed individuals and
pensioners) state they spend an average 18½ hours (between 5 and 40) weekly on
the Internet. The remaining 10 of the sample, those in employment, spend more than
that time at an average 41 hours weekly (anything between 15 and 70 hours).
The difference in durations can be attributable to the employed respondents finding
more use for the Internet, when considering both work and private purpose.
hours of Internet use for all 15 connected respondents is 33½
15 - 28 29 - 42 43 - 56 57 - 64 65 +
4 3 2 2 1 < Occurrences
√
√
√
√
- - - - -
√
√
√
√
√
√
√
- - - - -
- - - - -
√
t elicits the respondents’ weekly time span on the Internet, and it
sighted, may feel it
Five of the eight participants not in employment (a mix of unemployed individuals and
pensioners) state they spend an average 18½ hours (between 5 and 40) weekly on
of the sample, those in employment, spend more than
that time at an average 41 hours weekly (anything between 15 and 70 hours).
The difference in durations can be attributable to the employed respondents finding
more use for the Internet, when considering both work and private purpose.
hours of Internet use for all 15 connected respondents is 33½

10.2: Internet usage proficiency
Two-thirds (10) of the 15 respondents possessing an Internet connection rate
themselves a proficient Internet user, a reasonably high ratio
assistive technology lying in between the user and the software interface. Eight of the
10 proficient participants are in employment, with the five non
over three unemployed persons and two in employment.
The five non-proficient users average an 11½ hours’ weekly time span on the
Internet. This duration is just a third of the average weekly duration for all
respondents (see Section 10.1 above,
it is a case of little usage contributing to a low Internet proficiency or the other way
round, with non-proficiency causing low usage, is possibly one point for discussion
where both can emerge as cause and effect in equal proportion.
Question 10.2:
Are you a
proficient Internet
user
Yes
Respondent 10
R1 √
R2 √
R3 √
R4 √
R5 -
R6 √
R7 √
R8 √
R9
R10
R11 √
R12 √
R13 -
R14
R15
R16 -
R17
R18 √
48
Internet usage proficiency
thirds (10) of the 15 respondents possessing an Internet connection rate
themselves a proficient Internet user, a reasonably high ratio given the layer of
assistive technology lying in between the user and the software interface. Eight of the
proficient participants are in employment, with the five non-proficient users spread
over three unemployed persons and two in employment.
proficient users average an 11½ hours’ weekly time span on the
Internet. This duration is just a third of the average weekly duration for all
respondents (see Section 10.1 above, Hours spent weekly on the Internet
usage contributing to a low Internet proficiency or the other way
proficiency causing low usage, is possibly one point for discussion
where both can emerge as cause and effect in equal proportion.
No
5 < Occurrences
-
√
√
-
√
√
-
√
thirds (10) of the 15 respondents possessing an Internet connection rate
given the layer of
assistive technology lying in between the user and the software interface. Eight of the
proficient users spread
proficient users average an 11½ hours’ weekly time span on the
Internet. This duration is just a third of the average weekly duration for all
Hours spent weekly on the Internet). Whether
usage contributing to a low Internet proficiency or the other way
proficiency causing low usage, is possibly one point for discussion

10.3: Does Internet use have negative effects?
Much has been said and researched on the negative effects of excessive time on the
Internet. For the blind and visually impaired, it is a particularly critical and delicately
balanced issue. The benefits of a medium helping the
a world designed around the needs of the able
added isolation that medium may bring, as the visually impaired already suffer
isolation by the very nature of their disability. By way of i
Officer in the next section (10.4:
excessive time he spends on the Net exacerbates the human detachment that comes
with sightlessness.
The extent to which excessive Internet use
impaired as a result of their higher need for Internet browsing is another question
warranting further investigation. And the amount of free time available to them as a
result of reduced employment opportunity may be
question's concern in this study is limited to the affirmation or rejection of a negative
effect and a description of it.
The following table shows that two (13%) of the 15 respondents with access to the
Internet have indicated deleterious effects. Table 10.4 (
next page describes the identified effects.
Question 10.3:
Any negative
effects from
Internet usage
Yes
Respondent 2
R1
R2
R3 √
R4
R5 -
R6
R7
R8
R9
R10
R11
R12 √
R13 -
R14
R15
R16 -
R17
R18
49
use have negative effects?
Much has been said and researched on the negative effects of excessive time on the
Internet. For the blind and visually impaired, it is a particularly critical and delicately
balanced issue. The benefits of a medium helping the sight impaired keep abreast of
a world designed around the needs of the able-sighted has to be weighed against the
added isolation that medium may bring, as the visually impaired already suffer
isolation by the very nature of their disability. By way of illustration, the blind ICT
Officer in the next section (10.4: The negative effects of Internet use) feels the
excessive time he spends on the Net exacerbates the human detachment that comes
The extent to which excessive Internet use is present among the blind and visually
impaired as a result of their higher need for Internet browsing is another question
warranting further investigation. And the amount of free time available to them as a
result of reduced employment opportunity may be yet another cause. However, the
question's concern in this study is limited to the affirmation or rejection of a negative
effect and a description of it.
The following table shows that two (13%) of the 15 respondents with access to the
icated deleterious effects. Table 10.4 (If yes, what are they
next page describes the identified effects.
No
13 < Occurrences
√
√
√
-
√
√
√
√
√
√
-
√
√
-
√
√
Much has been said and researched on the negative effects of excessive time on the
Internet. For the blind and visually impaired, it is a particularly critical and delicately
sight impaired keep abreast of
sighted has to be weighed against the
added isolation that medium may bring, as the visually impaired already suffer
llustration, the blind ICT
) feels the
excessive time he spends on the Net exacerbates the human detachment that comes
is present among the blind and visually
impaired as a result of their higher need for Internet browsing is another question
warranting further investigation. And the amount of free time available to them as a
yet another cause. However, the
question's concern in this study is limited to the affirmation or rejection of a negative
The following table shows that two (13%) of the 15 respondents with access to the
If yes, what are they) on the

50
10.4: The negative effects of Internet use
Two of the sample respondents have indicated a negative effect stemming from their
time on the Internet. Respondent 3 is a blind ICT Officer reporting spending 70 hours
weekly on the Net, and he finds that it has “a tendency to further isolate me from
humans”. His is the highest Internet time span that emerges from the survey, and his
occupation may be a principal contributor to this high usage particularly if the ICT
support he provides is largely online.
On the other hand, Respondent 12 (unemployed) states that “I spend too much time
on it” in spite of being, at 20 hours weekly, well below the sample’s average Internet
use of 33½ hours. She further explained that the family and her role of homemaker
keep her busy in spite of her severe impairment.
The case of Respondent 12 is a clear indicator that there is no such thing as the right
number of hours spent on the Internet. The ideal time span can be very relative, and
dependent on the rest of the user’s day and activities.
Question 10.4:
If yes, what
are they
Respondent
R1
R2
R3
R4
R5
R6
R7
R8
R9
R10
R11
R12
R13
R14
R15
R16
R17
R18
"I spend too much time on it"
Effects
"A tendency to further isolate me from humans"

Question 11: Learning to use the Internet
This table displays the methods by which the su
access have learned to use the Internet. Five of the 15 users have gained instruction
through one way, such as family help, with the remaining
of modes.
Formal training and through trial and e
at a combined 78%, followed by family help (15%) and through the assistance of
friends (7%). The table rows for survey contributors without an Internet connection
appear in this table, as in the others below, fil
Question 11:
How have you
learned to use
the Internet
Trial and error Family help
Respondent 11 4
R1 √
R2
R3 √
R4
R5 - -
R6 √ √
R7 √
R8 √ √
R9
R10 √
R11 √
R12 √ √
R13 - -
R14 √
R15 √
R16 - -
R17 √
R18 √
51
Learning to use the Internet
This table displays the methods by which the survey’s contributors having Internet
access have learned to use the Internet. Five of the 15 users have gained instruction
through one way, such as family help, with the remaining 10 enlisting a combination
Formal training and through trial and error are the most frequently employed modes
at a combined 78%, followed by family help (15%) and through the assistance of
friends (7%). The table rows for survey contributors without an Internet connection
appear in this table, as in the others below, filled-in with a dash (-).
Other
Family help Training Through friends
10 2 < Occurrences
√
√
√
- -
√
√
√
√
√
√
- -
√
- -
√
√
rvey’s contributors having Internet
access have learned to use the Internet. Five of the 15 users have gained instruction
enlisting a combination
rror are the most frequently employed modes
at a combined 78%, followed by family help (15%) and through the assistance of
friends (7%). The table rows for survey contributors without an Internet connection

Question 12: Support in using the Internet
This question seeks to discover where the blind and visually impaired turn for support
when they encounter difficulty surfing the Internet. None of the means of assistance
the table below stands out as a predominant one, though
highest recourse at 20% (4 occurrences). Five respondents employ a combination of
methods for support by opting for the one closer at hand.
Question 12:
Where do you find
support when
stuck on the
Internet
On the
Internet
Family
help
Respondent 3 3
R1
R2
R3 √
R4
R5 - -
R6
R7
R8 √
R9
R10
R11 √
R12 √
R13 - -
R14
R15 √
R16 - -
R17
R18 √
52
Support in using the Internet
This question seeks to discover where the blind and visually impaired turn for support
when they encounter difficulty surfing the Internet. None of the means of assistance
the table below stands out as a predominant one, though Support group
highest recourse at 20% (4 occurrences). Five respondents employ a combination of
methods for support by opting for the one closer at hand.
Family Support
groupA friend
A sighted
colleagueThe wife
Visually
impaired
friends
By trial
and error
4 3 2 1 1 1
√ √
√
√
√ √
- - - - - -
√
√
- - - - - -
√ √
- - - - - -
√
√
Other
This question seeks to discover where the blind and visually impaired turn for support
when they encounter difficulty surfing the Internet. None of the means of assistance in
Support group registers the
highest recourse at 20% (4 occurrences). Five respondents employ a combination of
By trial
and error
I have no
support
1 2 < Occurrences
- -
√
√
- -
√
- -

Question 13: Hardware for connecting to the Internet
Ten of the 15 connected contributors indicate a combination of hardware devices with
which they access the Internet and they are all employed bar two. This is possibly a
significant factor in their having more than o
disposal, as they enjoy a level of disposable income and possibly different hardware
at the workplace to access the Internet for work. The fact that the desktop and laptop
computers are predominant in almost equal n
given that they more or less offer a similar computing experience not strictly
necessary as a complementary resource.
The desktop and laptop computers together account for three
cited. The smartphone, increasingly becoming a necessity for the ultimate degree of
portability it provides, is next in frequency of use with a 1:4 usage ratio with all the
other devices cited.
Question 13:
How do you
connect to the
Internet
Desktop
computer
Laptop
computer
Respondent 11 10
R1 √
R2 √ √
R3 √ √
R4 √ √
R5 - -
R6 √
R7 √ √
R8 √
R9 √
R10 √
R11 √ √
R12 √
R13 - -
R14 √
R15 √
R16 - -
R17 √
R18 √ √
53
ardware for connecting to the Internet
Ten of the 15 connected contributors indicate a combination of hardware devices with
which they access the Internet and they are all employed bar two. This is possibly a
significant factor in their having more than one piece of electronic hardware at their
disposal, as they enjoy a level of disposable income and possibly different hardware
at the workplace to access the Internet for work. The fact that the desktop and laptop
computers are predominant in almost equal numbers seems to bear out this fact,
given that they more or less offer a similar computing experience not strictly
necessary as a complementary resource.
The desktop and laptop computers together account for three-fourths of the gadgets
hone, increasingly becoming a necessity for the ultimate degree of
portability it provides, is next in frequency of use with a 1:4 usage ratio with all the
Laptop
computer
Tablet
computerSmart TV Smartphone
Games
consoleOther
1 1 5 0 0 < Occurrences
√
√ √
- - - - -
√
√
√
√
- - - - -
- - - - -
Ten of the 15 connected contributors indicate a combination of hardware devices with
which they access the Internet and they are all employed bar two. This is possibly a
ne piece of electronic hardware at their
disposal, as they enjoy a level of disposable income and possibly different hardware
at the workplace to access the Internet for work. The fact that the desktop and laptop
umbers seems to bear out this fact,
given that they more or less offer a similar computing experience not strictly
fourths of the gadgets
hone, increasingly becoming a necessity for the ultimate degree of
portability it provides, is next in frequency of use with a 1:4 usage ratio with all the
< Occurrences

Question 14: Choice of Internet browsers
The principal choice of bro
Firefox (39% and 36% respectively). Google Chrome holds a 21% selection rate and
one user (4%) reports occasionally using Safari too. Nine of the contributors make
use of a combination of two or three
mixed browser usage but one possible explanation is compatibility issues, which are
of higher significance for the visually impaired, on different hardware devices.
Respondent 3, in fact, states "
compatibility often dictates Explorer or Firefox
Question 14:
With which
browser do you
connect to the
Internet
Internet
Explorer
Mozilla
Firefox
Respondent 11 10
R1 √ √
R2 √ √
R3 √ √
R4 √ √
R5 - -
R6 √
R7 √ √
R8 √
R9 √
R10 √
R11 √ √
R12 √
R13 - -
R14 √ √
R15
R16 - -
R17 √
R18 √
54
Choice of Internet browsers
The principal choice of browser is an even spread between Microsoft IE and Mozilla
Firefox (39% and 36% respectively). Google Chrome holds a 21% selection rate and
one user (4%) reports occasionally using Safari too. Nine of the contributors make
use of a combination of two or three browsers. No reasons have been recorded for
mixed browser usage but one possible explanation is compatibility issues, which are
of higher significance for the visually impaired, on different hardware devices.
Respondent 3, in fact, states "I use Internet Explorer and Firefox in equal proportion;
compatibility often dictates Explorer or Firefox".
Other
Mozilla
Firefox
ChromeDon't know Safari
10 6 0 1 < Occurrences
√ √
√ √
√
√ √
- - - -
√ √
√ √
√
√ √
- - - -
√
√
- - - -
√
wser is an even spread between Microsoft IE and Mozilla
Firefox (39% and 36% respectively). Google Chrome holds a 21% selection rate and
one user (4%) reports occasionally using Safari too. Nine of the contributors make
browsers. No reasons have been recorded for
mixed browser usage but one possible explanation is compatibility issues, which are
of higher significance for the visually impaired, on different hardware devices.
Explorer and Firefox in equal proportion;

Question 15: Activities pursued on the Internet
This table displays the contributors’ preferences of social networking, information
seeking, educational and other online activities. Fourteen respondents have
contributed to this question, with Respondent 15 not pursuing any of the listed
activities in spite of owning a desktop computer “
using the computer”. The Internet
only two activities to just one short of all
The social media and website preferences of the blind and visually impaired merit
dedicated enquiry alongside the issue of negative Internet effects on the imp
Question 10.3 (Does Internet use have negative effects?
the principal cause of excessive usage.
Question 15:
Do you use the
Internet for any of
the following
activities
Social
networking
Making new
or finding
past friends
Contributing
to a blog
Respondent 8 8
R1 √ √
R2 √ √
R3
R4 √
R5 - -
R6 √ √
R7 √ √
R8
R9 √
R10
R11 √ √
R12
R13 - -
R14
R15 - -
R16 - -
R17 √ √
R18 √ √
55
Activities pursued on the Internet
This table displays the contributors’ preferences of social networking, information
nal and other online activities. Fourteen respondents have
contributed to this question, with Respondent 15 not pursuing any of the listed
activities in spite of owning a desktop computer “because I have only just started
”. The Internet-connected contributors’ preferences range from
only two activities to just one short of all 10.
The social media and website preferences of the blind and visually impaired merit
dedicated enquiry alongside the issue of negative Internet effects on the imp
Does Internet use have negative effects?). Social media is very often
the principal cause of excessive usage.
Contributing
to a blog
Making job
seeking
contacts
Tele-
working
Reading the
news
Information
and
knowledge
Training
needsShopping
4 3 6 12 14 8 8
√ √ √ √ √ √
√ √ √ √ √
√ √ √ √ √
√ √ √ √
- - - - - - -
√ √ √ √ √ √ √
√ √
√ √ √ √
√
√ √ √
√ √ √ √ √ √
√ √ √
- - - - - - -
√ √ √ √
- - - - - - -
- - - - - - -
√ √
√ √ √
This table displays the contributors’ preferences of social networking, information
nal and other online activities. Fourteen respondents have
contributed to this question, with Respondent 15 not pursuing any of the listed
because I have only just started
connected contributors’ preferences range from
The social media and website preferences of the blind and visually impaired merit
dedicated enquiry alongside the issue of negative Internet effects on the impaired in
). Social media is very often
Shopping
Banking or
online
payments
Other
6 0 < Occurrences
√
√
√
- -
√
√
√
- -
- -
- -

56
Question 16: Why is no social networking, information seeking or other
activity pursued?
This question sought to discover barriers the Internet-connected blind and visually
impaired find to online participation or individually-pursued Internet activity. The table
below records the reply of Respondent 15, unemployed and suffering severe sight
impairment, who is the only Internet-connected contributor indicating no such activity
in Table 15 (Activities pursued on the Internet). He states “I have only just started
using the computer” and that he is still learning to operate the newly-acquired device.
Other
Question 16:
If you pursue none
of the above
activities, why not
Cost of
training
Privacy
worries
Not confident
I can learn
I do not have
assistance
I am new to
computer
use
Respondent 0 0 0 0 1 < Occurrences
R1 - - - - -
R2 - - - - -
R3 - - - - -
R4 - - - - -
R5 - - - - -
R6 - - - - -
R7 - - - - -
R8 - - - - -
R9 - - - - -
R10 - - - - -
R11 - - - - -
R12 - - - - -
R13 - - - - -
R14 - - - - -
R15 √
R16 - - - - -
R17 - - - - -
R18 - - - - -

57
Question 17: Which social media do you use?
This table seeks to discover the social media most used by respondents. There are
those participants who use a wide variety of applications, with others joining only one
or two. And there is Respondent 14 who has interestingly reported email as her social
medium of choice. Email is not popularly considered part of social media, but neither
can it be totally discounted as a means of collaboration or keeping in touch. Anthony
J. Bradley (Gartner, 2010) states that “it should not be shortchanged as a very
important communication channel and collaboration mechanism”, even if email is
thirty years of age and this is the era of mass collaboration media.
The concurrent use of social media reported by a number of respondents can be
explained by a variety of reasons. Different sets of friends with common interests
are found on different social media: Facebook enables connecting to and the
sharing of personal news and events with family and friends; Skype on the other
hand provides the platform to host video chats, voice calls, messaging and file
exchange with family and friends. YouTube hosts video sharing and a comments
board for every uploaded item; Twitter is about sharing news and information, and
entering into discussion, in short ‘tweets’ of a maximum 140 characters. Tumblr is
(like Twitter) a micro-blogging site as the user posts snippets of text but, in Tumblr’s
case, accompanied by bits of music, video or photos. Each of these social media
applications can perform a unique function.
There are also the social media applications that seek to emulate their
predecessors’ successes, even if with a defining twist. Google+ is one, and it
adopts Facebook’s offline interaction model structured around circles of interest.
However, the listed applications’ functions and user experience mostly differ,
thereby also providing a diverse social networking experience which the table on
the next page indicates is as equally sought by the blind and visually impaired.

Question 17:
Which of the
following social
media sevices do
you use
Facebook Twitter YouTube
Respondent 9 2
R1 √
R2 √
R3
R4
R5 - -
R6 √
R7 √ √
R8 √
R9 √
R10
R11 √ √
R12 √
R13 - -
R14
R15
R16 - -
R17 √
R18
58
YouTube Second Life Google+ Tumblr Skype Viber WhatsappMessenger
12 0 3 0 6 2 1
√ √
√ √ √ √
√
√ √
- - - - - - -
√ √ √
√ √ √
√ √
√ √
- - - - - - -
√
√
- - - - - - -
√
√ √
Other
MSN
MessengerEmail
1 1 < Occurrences
√
- -
- -
√
- -

59
4.3 Review
This chapter has displayed the study’s findings in tabulated form, described them,
and entered into a discussion tying them in with the theory of the topic as well as with
points emerging from the same findings.

60
5. Conclusion
The thesis question is motivated by the necessity of directing Technical
Communication at an audience not easily reached by the printed word. The
physical immobility of the ocularly disadvantaged is easily recognisable and
consequently receives the technological attention it warrants. On the other
hand, the immobility of aspiration to intellectual development or social
inclusion is not as immediately identifiable.
In the 1970s, text-to-speech technology started making inroads in the assistive
reading technology sphere. Braille’s standing as the principal means of
reading for the blind has since been in steady decline, burdened as it is with a
steep learning curve that increases with one's age. Apart from it also suffering
from diminished readability where other illnesses affecting the tactile sense
are present.
This study shows that speech technology has the potential not only of being a
learning curve-free purveyor of the published word, but also of spawning a
dual reading mode on the Internet. In the parallel reading mode being
recommended, the text pages are accompanied by a synthetic speech
rendering, or substitutable with one at the press of a key.
The enquiry also finds five of every six respondents connected to the Internet.
This is a share higher than Malta’s broadband ratio per household of 4:1
(Eurostat. 2014) and an indicator of how much store the majority of the visually
disabled set by independent access to information. The study did, however,
uncover one unexpected fact in this regard: there will still be the few who have
come to terms with their isolation and do not yearn for a return to the lost world
of print. They have adjusted to their ocular condition and live a contented life
regardless.

61
It has also been found that excessive time spent on the Internet may be a
matter of concern for the visually disadvantaged too. It may indeed be of
higher gravity given the more critical need the visually disadvantaged find for
the Internet, and the lack of ease of mobility that may most times drive them
towards activity restricted to the home.
The study looks at other questions of relevance in obtaining a picture of the
state of online accessibility and participation by the visually disadvantaged.
One such issue is that of the activities they pursue on the Net and the social
media sites they join. As far as the social media sites are concerned, YouTube
is the most popular with respondents, with two-thirds reporting using it. It is
followed by Facebook with half the survey contributors having an account, and
by Skype enjoying a usage by a third. There are conclusions to be extracted
from these respondent preferences if one looks at the brief description of
these three social media’s characteristics in Chapter 4 (Findings and
Discussion, Question 17: Which social media do you use?). It appears from
this data that the survey's respondents primarily seek social media for the
following needs: for the perusal of video content, to a lesser degree for
connecting to family and friends and, thirdly, for voice and video chatting.
The study also takes a look at the access barriers encountered on the Net,
and it is to social media’s credit that it is among the most accessibility-
conscious segments of the Internet industry. Facebook, in particular, hosts an
Accessibility for People with Disabilities page (https://www.facebook.com/help/
141636465971794/) providing the user with advice on how best to apply
extant assistive technology in reading and navigating it.
Another point for further enquiry is a reasonable level of penetration of the
labour market with a 2:1 ratio of respondents either in employment or having
been until retirement age. Less encouraging, however, is a high tendency for
employment not to reach beyond the clerical grade with six of the 11

62
contributors currently in employment falling within that category or below.
However, it has to be observed that three of the four impaired individuals who
set in motion the snowball sampling process are employed within that
category. The likeliness of their associating, both socially and professionally,
with others of similar background may have been a factor contributing to this
outcome.
The survey’s employment question also brings up the fact of just one
respondent being engaged in blue-collar work. Here, one has to keep in mind
the almost negligible job prospects suffered by those respondents unable of
obtaining white collar employment. Unskilled work can often be unsafe or
undoable for the blind and severely sight impaired. But it can at times be
achievable as seen with Respondent 10, employed as a cleaner. This
participant's occupation was a surprising find of the survey, but not all cleaning
jobs require full mobility or are unsafe for the blind to perform. Respondent
10’s case illustrates that niches of possibility can also be found where least
expected.
This conclusion has reviewed the most salient reflection and findings from the
preceding chapters. These raise derivative matter justifying further enquiry and
also the most central question of all: is there a solution? The next chapter,
Recommendations, proposes parallel assistive-ware driven website structures
and issues meriting further research.

63
6. Recommendations
This study, with the time resource available to it, cannot do full justice to the
wealth of hidden meaning that lies across the tabulated results in Chapter 4
(Findings and Discussion). Nor to the offshoot branches of enquiry that have
emerged from the findings and reflection. In this chapter, the author
summarises the derived areas of study worth further investigation and puts
forward his proposals on how the reading barriers can be pushed back further
for the blind and visually impaired.
The principal recommendation the author presents is that of a one-size-fits-all
web page structure for news portals, diffusion of government information, and
commercial websites. Chapter 2, Section 2.5 (A one-size-fits-all structure)
proposes that the default structure for the able-sighted resides alongside an
alternate assistive-ware driven reading mode framework for the assimilation of
the sight-impaired into the mainstream reading universe. The study also
strongly proposes that accessibility of information constitutes one of the
fundamental rights of the disadvantaged.
There is legislation providing for the right of accessibility, but as one in the
spectrum of disabilities requiring legislative support. The UK’s Equality Act
2010 (Government Equalities Office. July 2010) and its forerunner the
Disability Discrimination Act 1995 (legislation.gov.uk. 1995) which it replaced,
are one case. The Equality Act applies to “all service providers and those
providing goods and facilities... for example, those providing information”
(Government Equalities Office. July 2010). In Australia, the Disability
Discrimination Act 1992 (Australian Government, ComLaw. 1992) lays down
that websites and web content be made accessible. The provider is held as
discriminating if it “does not make, or proposes not to make, reasonable
adjustments for the person” upon request by a complainant.

64
What these recommendations propose, however, is an all-encompassing and
universal solution that will require the support of business interest too. This
study recommends a model of real-time accessibility incentivised beyond the
‘reasonable adjustment’ the Australian Act provides for upon a complainant’s
representations with the provider. Put more succinctly, incentivisation over
reparative redress.
While governments may be persuaded to provide this dual accessibility model
out of social consideration, the business world will need incentivisation that
can come about from stressing this model's benefits to commerce. The
commercial world can profit from the advertising revenue the Internet traffic of
an untruncated flow of potential readers brings with it if it can find the foresight
and courage to tap this potential. And equally gain from emerging niche
markets, as well as the ethical profile and social capital accruing from a
Corporate Social Responsibility (CSR) philosophy that the more marketing-
savvy modern enterprise values so highly.
Other points of recommendation are for the pursuit of further enquiry in a
number of spheres of potential interest touched upon by this study. Question 9
in this chapter (Reasons for no Internet connection) looks at the degree to
which the visually impaired may at times accept their handicap and pursue a
fulfilled life nonetheless, without feeling a need to turn to communication
media to cling on to a way of life since left behind.
A second matter for further enquiry is how excessive use of the Internet by the
blind and visually impaired may exacerbate their isolation. Those deprived of
sight are much more prone to excessive time online as a result of the lack of
sufficiently accessible structures, and of the Internet being of a bigger
necessity to them.

65
Another matter for study and in part related to the above issue, insofar as a
large share of excessive Internet usage is often credited to it, is the social
media preferences of the blind and visually impaired. Table 17 (Which social
media do you use? In Chapter 4, Findings and Discussion) illustrates the
contributors’ preferences, but the question did not go into the ‘why’ of the
respondent’s choice. Is it a result of joining the medium of choice of the
acquaintances the respondent wishes to make contact with? How much do
accessibility issues influence the choice and what are the barriers
encountered?
A final suggestion concerns the potential of extrapolating these findings to
Britain, and possibly other Commonwealth countries too. In Britain and its
former colonies with a shared level of educational standards and Internet
penetration, the cultural glue born from the colonial past is likely also to
produce a sharing of concomitant deficiencies such as inequality of online
access. The point being made is that a common language of reading and
shared news diffusion portals, home entertainment sources, and political and
cultural worldviews may produce common Internet sources and usage
patterns for the sight-impaired in these countries.
There is thus the potential for this study’s findings and reflection to be
extendable, both in method and results, to the visually disadvantaged in all
countries sharing these cultural characteristics.

66
Bibliography
1. American Foundation for the Blind 2014. Braille Technology. Last accessed 3rd
April 2014 at:
http://www.afb.org/info/living-with-vision-loss/using-technology/assistive-technology/braille-
technology/1235
2. Australian Government, ComLaw. 1992. Disability Discrimination Act 1992. Last accessed 25th
January 2015 at: http://www.comlaw.gov.au/Details/C2014C00013
3. Bradley, A. May 2010, The Gartner Blog Network. Anthony Bradley: Blog. Last accessed 10th
January 2015 at: http://blogs.gartner.com/anthony_bradley/2010/05/17/why-isnt-e-mail-and-
other-channels-considered-social-media/
4. Cohen, L., Manion, L., and Morrison, K. (2007). Educational Methods in Education (6th ed).
Routledge, Abingdon.
5. Denscombe, M. (2003). The Good Research Guide for Small-Scale Social Research Projects
(2nd
ed). Open University Press, Maidenhead.
6. Dills, C. R. and Romiszowski, A. J. (1997). The instructional development paradigm: An
introduction. Educational Technology Publications, Englewood, NJ.
7. Douglas, J. D. (1973). Understanding Everyday Life. Routledge & Kegan Paul, London. In:
Cohen, L., Manion, L., and Morrison, K. (2007).
8. Eurostat 2014, Households having access to the internet by type of connection, European
Commission, Brussels. Last accessed 4th January 2014 at:
http://ec.europa.eu/eurostat/tgm/refreshTableAction.do?tab=table&plugin=1&pcode=tin00073&l
anguage=en
9. Gerber, E. (2003). The Benefits of and Barriers to Computer Use for Individuals Who Are
Visually Impaired, Journal of Visual Impairment & Blindness 97(9): 536–50. In: Goudiras et al.
(2009).
10. Goudiras, D.B. et al. (May 2009). Factors affecting the reading media used by visually impaired
adults. British Journal of Visual Impairment, 27, 111-127. Last accessed 30th
March 2014 at:
http://jvi.sagepub.com/content/27/2/111.full.pdf+html
11. Government Equalities Office. July 2010. Equality Act 2010: What do I need to know? Disability
Quick Start Guide. Last accessed 25th
January 2015 at:
https://www.gov.uk/government/uploads/system/uploads/attachment_data/file/85011/disability.p
df
12. Hazan, R. and Hunt, A. (July 1990). For once the blind came first: the history of the Kurzweil
1970-1990. British Journal of Visual Impairment, 8, 45-47. Last accessed 30th
March 2014 at:
http://jvi.sagepub.com/content/8/2/45.full.pdf+html
13. Hersh, M.A. and Johnson, M.A. Eds (2008). Assistive Technology for Visually Impaired and
Blind People. Springer Verlag, London.
14. International Labour Organization (2014). International Standard Classification of Occupations,
ISCO-08 structure (Excel). Last accessed 7 January 2015 at:
http://www.ilo.org/public/english/bureau/stat/isco/isco08/
15. Jaeger, P.T., Bertot, J.C., Shilton, K. (2012). Access Perspectives and Design Values in
Government Social Media Usage. The Proceedings of the 13th Annual International Conference
on Digital Government Research. Pgs 216-222. Last accessed 22 March 2014 at:
http://delivery.acm.org.lcproxy.shu.ac.uk/10.1145/2310000/2307764/p216-
jaeger.pdf?ip=143.52.60.72&id=2307764&acc=ACTIVE%20SERVICE&key=BF07A2EE685417
C5%2E14F230B8D9330AE4%2E4D4702B0C3E38B35%2E4D4702B0C3E38B35&CFID=4257
60656&CFTOKEN=41524267&__acm__=1395524176_fe5d80d4b7a9effd24ae4e5d2053ecd9
16. Knobel and Bowker. (2011). In: Jaeger, P.T., Bertot, J.C., Shilton, K. (2012). Access
Perspectives and Design Values in Government Social Media Usage. The Proceedings of the
13th Annual International Conference on Digital Government Research. Pgs 216-222. Last
accessed 22 March 2014
17. legislation.gov.uk 1995, Disability Discrimination Act 1995. Last accessed 25th
January 2015 at:
http://www.legislation.gov.uk/ukpga/1995/50/contents

67
18. Leuthold, S., Bargas-Avila, J.A., Opwis, K. (April 2008). Beyond web content accessibility
guidelines: Enhanced text user interfaces for blind internet users. [online]. International Journal
of Human-Computer Studies Volume 66, Issue 4. Pgs 257–270. Last accessed 22 March 2014
at: http://ac.els-cdn.com/S1071581907001413/1-s2.0-S1071581907001413-
main.pdf?_tid=9fe72064-b20c-11e3-9b82-
00000aab0f26&acdnat=1395525484_e8d87982e7875841e90105f1ba1aa713
19. National Statistics Office (Malta) 2014, Census of Population and Housing 2011: Final Report,
Malta Government, Valletta. Last accessed 27th
December 2014 at:
http://census2011.gov.mt/downloads/Census%202011_Final%20Report.pdf slide 22
20. Patton, M. Q. (1990). Qualitative Evaluation and Research Methods (2nd ed.). Newbury Park,
CA: Sage.
21. Perrett, B. (1995). Marketing considerations. In P.Roe, (Ed.), Telecommunications for all.
Commission of the European Communities, Lausanne . Cited by Johnson, L., & Moxon, E.
(1993). In whose service? Technology, care and disabled people: the case for a disability
politics perspective. Disability & Society, 13(2). In: Williamson, K et al. (June 2006). The Internet
for the Blind and Visually Impaired. In: Journal of Computer-Mediated Communication, Volume
7, Issue 1, page 0,October 2001
22. Putz, V. (October 2006). Spacial Auditory User Interfaces. [online].Thesis. Graz University of
Technology. Last accessed 28th
October 2014 at:
http://iem.kug.ac.at/fileadmin/media/iem/altdaten/projekte/dsp/spatial/dp_putz.pdf
23. Snyder, C. (2009). Government agencies make friends with new media. Wired, 25 March.
Available: http://blog.wired. In: Jaeger, P.T., Bertot, J.C., Shilton, K. (2012). Access
Perspectives and Design Values in Government Social Media Usage. The Proceedings of the
13th Annual International Conference on Digital Government Research. Pgs 216-222. Last
accessed 22 March 2014
24. Sohn, G. (2004). Spracherkennung und Sprachautomatisierung boomen. Pressetext
Deutschland, June 26 StiftungWarentest, 2004, Ein eheähnliches Verhältnis. In: test, Vol. 39,
No. 1, pp. 38–41. In: Hersh and Johnson. 2008.
25. Stevens, J.C., Folke, E., and Patterson, M. (1996). Tactile acuity, ageing, and Braille reading in
long-term blindness. Experimental Psychology: Applied, Vol. 2, pp. 91–106. In: Hersh and
Johnson (2008).
26. Stein, V. et al. (2011). Designing With and For the Visually Impaired: Vocabulary, Spelling and
the Screen Reader. In: CSEDU 2, 462-467.
27. Sutton, J. (2002). A Guide to Making Documents Accessible to People Who Are Blind or
Visually Impaired. [online]. American Council of the Blind. Last accessed 22 March 2014 at:
http://www.sabeusa.org/user_storage/govoter/ResourceClearinghouse/PDF/A%20Guide%20to
%20Making%20Documents%20Accessible%20to%20People%20Who%20are%20Blind%20or
%20Visually%20Impaired.pdf
28. The Visual-Tech Connection 2014, Product Information. Last accessed 28th December 2014 at:
http://www.visual-techconnection.com/cctvs1.htm
29. Williamson, K et al. (June 2006). The Internet for the Blind and Visually Impaired. In: Journal of
Computer-Mediated Communication, Volume 7, Issue 1, page 0,October 2001
30. World Wide Web Consortium 1997, World Wide Web Consortium Launches International
Program Office for Web Accessibility Initiative. Last accessed 3rd
April 2014 at:
http://www.w3.org/Press/IPO-announce
31. Youtube 2014, Statistics. Last accessed 30th
March 2014 at:
https://www.youtube.com/yt/press/statistics.html

68
Appendix 1: Survey Information Sheet

69
Appendix 2: Survey Consent Form

70
Appendix 3: Ethics Form
71

72

73

74

75

76
Appendix 4: The Questionnaire

77

78

79

80

81

82

83
Appendix 5: The survey response coding
Please turn to the next page for the tabulated raw data emerging from the survey’s
questionnaire.

Respondent:- 1 2 3 4 5 6 7 8 9 10 11 12 13 14 15 16 17 18
Q.1 Particulars
Sex Female Male Male Male Male Female Male Female Female Male Male Female Male Female Male Female Female Male
Age 44 31 50 42 67 34 42 52 50 54 36 59 45 48 50 49 57 62
Town/City Malta Malta Malta Malta Malta Malta Malta Gozo Gozo Gozo Gozo Malta Malta Malta Malta Malta Malta Malta
Occupation Clerk Clerk ICT Officer Phone Oper/
Receptionist
Pensioner Clerk Trainer & Co-
ordinator for
Visually
Impaired
Disability
Coordinator
Unemployed Cleaner Solicitor Unemployed Unemployed Clerk Unemployed Unemployed Unemployed Pensioner
(Remark 1)
Accompanying disabilities None None None None Diabetes Diabetes None None None None None None None None None Arthritis Diabetes and only
3 fingers & a
conjoined 2
None
Q.2 Your disability: Sight
impaired (SI), Severely sight impaired
(SSI), Blind
SSI Blind Blind Blind (Remark
2)
SSI SSI Blind SSI SI Blind Blind SSI SI Blind SSI SI SSI Blind
Q.3 Impaired since Birth 12 23 20 62 20 7 12 9 40 13 50 30 32 30 22 50 17
Q.4 Level of educationSec (Remark
3)Ter Ter Ter Sec Ter Ter Sec Sec Sec Ter Ter Sec Sec Sec Sec Sec Sec
Q.5 Training in reading media No No No Yes No Yes No No No Yes YesYes
(Remark 4)No Yes No No No No
Q.6 How often do you use the following
on a scale of:
A Lot (1), A Little (2), Not At All (3)
Braille 2 2 2 2 3 2 1 1 2 3 2 3 3 2 3 3 3 1
Large print 1 3 3 3 3 2 3 1 1 3 3 1 3 3 3 3 3 3
Videos 1 1 2 1 3 2 2 1 3 3 2 2 2 2 2 3 2 2
CCTV 1 3 3 3 3 3 3 3 3 3 3 3 3 3 3 3 3 3
Computers 1 1 1 1 3 1 1 1 1 2 1 1 2 1 23
(Remark 5)1 1
Phone apps 3 1 3 3 3 1 1 2 3 3 1 2 3 3 3 3 3 3
Other None None None None None None None None None None None None None None None None None None
Q.7 How often do you use the following
on a scale of:
A Lot (1), A Little (2), Not At All (3)
Screen-reader 2 1 1 1 3 1 1 1 3 2 1 1 3 1 3 3 3 1
Speech-to-text 3 1 3 3 3 2 2 3 3 3 3 2 3 3 3 3 3 3
Scanner-to-speech 3 2 2 2 33
(Remark 6)1 3 3 3 1 3 3 2 3 3 3 3
Screen magnifier 1 3 3 3 3 3 3 2 1 3 3 2 3 3 3 3 2 3
Q.8 Do you have Internet access? Yes Yes Yes Yes No Yes Yes Yes Yes Yes Yes Yes No Yes Yes No Yes Yes
Q.9 If not, why? N/app N/app N/app N/app I don't
need it
(Remark 7)
N/app N/app N/app N/app N/app N/app N/app Difficulty
using
technology
N/app N/app Difficulty in
finding training
but I don't
need it
N/app N/app
Survey response: the coded replies
Remark 4: ''Yes' but "I started on Braille but dropped it as I lacked motivation too, as I held on to the little sight I had and assistive technology was sufficient "
Remark 5: Computer not used at all because of a fear the monitor will make her visual condition worse
Remark 1: Formerly spent some time as a Braille instructor
Remark 2: Vision lost as a result of injuries in a road accident
Remark 7: ''I don't need it', and definitely not because he would find difficulty using it as '"no fear of technology as I worked in a bank where I hooked up the PCs for presentations " in his sighted days
Remark 3: Received education up to a secondary level but kept pursuing further training and personal enrichmentVision lost as a result of injuries in a road accident
Remark 6: Scanner-to-speech software not used at all but looking forward to ontaining it

Respondent:- 1 2 3 4 5 6 7 8 9 10 11 12 13 14 15 16 17 18
Q.10 If you have Internet access... N/app N/app N/app
How many hours weekly? 40 15 70 60 50 60 40 20 15 50 20 10 5 7 40
Are you a proficient user? Yes Yes Yes Yes Yes Yes Yes No No Yes Yes No No No Yes
Any negative effects? No No Yes No No No No No No No Yes No No No No
If yes, what are they? "A tendency
to further
isolate me
from
humans"
"I spend too
much time on
it"
Q.11 How have you learned to use it? N/app N/app N/app
Trial and error √ √ √ √ √ √ √ √ √ √ √
Family help √ √ √ √
Training √ √ √ √ √ √ √ √ √ √
Other Through
friends
Through friends
Q.12 Where do you find support when
stuck on Internet?
N/app N/app N/app
On the Internet √ √ √
Family help √ √ √
Support gropup √ √ √ √
Other A friend A sighted
colleague
A sighted
colleague or
the wife
Visually
impaired
friends
By trial and
error
A friend A friend
I have no support √ √
Q.13 How do you connect to Internet? N/app N/app N/app
Desktop computer √ √ √ √ √ √ √ √ √ √ √
Laptop computer √ √ √ √ √ √ √ √ √ √
Tablet computer √
Smart TV √
Smartphone √ √ √ √ √
Games console
Other
Q.14 With which browser do you
connect to the Internet?
(Remark 8) (Remark 9) N/app N/app N/app
Internet Explorer √ √ √ √ √ √ √ √ √ √ √
Mozilla Firefox √ √ √ √ √ √ √ √ √ √
Google Chrome √ √ √ √ √ √
Don't know
Other Safari
Remark 9: Internet Explorer and Mozilla Firefox used (in more or less equal proportion) "as compatibility often dictates Explorer or Firefox".
Remark 8: Safari used on the iPhone

Respondent:- 1 2 3 4 5 6 7 8 9 10 11 12 13 14 15 16 17 18
Q.15 Do you use the Internet for any of
the following activities?
N/app N/app N/app
Social networking √ √ √ √ √ √ √ √
Making new or finding past
. friends√ √ √ √ √ √ √ √
Contributing to a blog √ √ √ √
Making job seeking contacts √ √ √
Tele-working√
(Remark 10)
√ √ √ √ √
Reading the news √ √ √ √ √ √ √ √ √ √ √ √
Information and knowledge √ √ √ √ √ √ √ √ √ √ √ √ √ √
Training needs √ √ √ √ √ √ √ √
Shopping √ √ √ √ √ √ √ √
Banking or online payments √ √ √ √ √ √
Other Research for a
religious
organisation
she forms part
of
Q.16 If you pursue none of the above
activities, why not?
N/app N/app N/app
Cost of training
Privacy worries
Not confident I can learn
I do not have assistance
Other "because I
have only just
started using
the computer"
Q.17 Which of the following social
media services do you use?
N/app N/app N/app
Facebook √ √ √ √ √ √ √ √ √
Twitter √ √
YouTube √ √ √ √ √ √ √ √ √ √ √ √
Second Life
Google+ √ √ √
Tumblr
Other Skype Skype,
Viber,
Whatsapp,
MSN
Messenger
Skype Skype,
Viber
Skype Social
contact
achieved by
Skype
Remark 10: Tele-working used for voluntary work only
Copyright © 2022 FDOKUMEN