A chorem-based approach for visually analyzing spatial data
30
A Chorem-based Approach for Visually Analyzing Spatial Data Davide De Chiara 2 , Vincenzo Del Fatto 2 , Robert Laurini 1 , Monica Sebillo 2 , Giuliana Vitiello 2 1 LIRIS, INSA de Lyon, F-69621 Villeurbanne [email protected] 2 DMI, Università di Salerno, Italy {ddechiara, vdelfatt, msebillo, gvitiello}@unisa.it Abstract The need to support the activities of decision makers through highly interactive visual environments has motivated the growing interest in the area of GeoVisual Analytics. New interactive visualization tools are being envisaged to deal with large datasets in order to synthesize information and perform complex analytical tasks. Along this line, our research efforts have been focusing on new cartographic approaches which could support daily analysts’ work by producing synthesis and presentation of discovered patterns in a concise and understandable way. As a result, we have proposed the adoption of chorems as an innovative method to visually summarize information from spatial databases and we have implemented an XML-based language, named ChorML, able to both specify chorems characterizing a map and store the information useful to their manipulation. The goal of the present paper is to enhance the role that chorems may play in geographic domains, by exploiting them also for querying and accessing data associated with a phenomenon under investigation. To develop this idea, we first extend the semantics associated with the chorem concept and define a set of operators useful for the rapid analysis of spatio-temporal phenomena. Then, starting from an initial prototype, we present a chorem-based visual environment which integrates traditional interactive visualization and analysis techniques. The environment is specifically conceived so that each visual interaction task has a context-sensitive behaviour, which allows users to acquire specific information from the underlying spatial database. Finally, we present an enhanced version of ChorML language, able to support the new analysis functionalities on chorems. 1. Introduction In the last decades, researchers from many disciplines have tried to facilitate people's use of computers and to provide ways for scientists to make sense of the huge amounts of data they can manage. However, the inconsistency and the disorder which typically exist in huge volumes of data may compromise the analysis of such data, which is a crucial task in many application domains and essential for decision makers and analysts [33]. One of the major challenges the Geographic Information community is facing is to provide decision makers with advanced tools capable to semantically and visually integrate quantitative, qualitative and cognitive aspects of a domain of interest. In fact, when a large amount of data is available, synthesizing information and deriving insight from it may result a time-consuming and expensive activity. Analogously, discovering hidden information and performing specific analytical tasks may require application domain expert users and high performance tools. Moreover, in case of geospatial data, analysis and visualization of huge volumes are further complicated by the
Transcript of A chorem-based approach for visually analyzing spatial data

A Chorem-based Approach for Visually Analyzing Spatial Data
Davide De Chiara2, Vincenzo Del Fatto
2, Robert Laurini
1,
Monica Sebillo2, Giuliana Vitiello
2
1LIRIS, INSA de Lyon, F-69621 Villeurbanne
[email protected] 2DMI, Università di Salerno, Italy
{ddechiara, vdelfatt, msebillo, gvitiello}@unisa.it
Abstract
The need to support the activities of decision makers through highly interactive visual environments has motivated
the growing interest in the area of GeoVisual Analytics. New interactive visualization tools are being envisaged to
deal with large datasets in order to synthesize information and perform complex analytical tasks. Along this line, our
research efforts have been focusing on new cartographic approaches which could support daily analysts’ work by
producing synthesis and presentation of discovered patterns in a concise and understandable way. As a result, we
have proposed the adoption of chorems as an innovative method to visually summarize information from spatial
databases and we have implemented an XML-based language, named ChorML, able to both specify chorems
characterizing a map and store the information useful to their manipulation.
The goal of the present paper is to enhance the role that chorems may play in geographic domains, by exploiting
them also for querying and accessing data associated with a phenomenon under investigation. To develop this idea,
we first extend the semantics associated with the chorem concept and define a set of operators useful for the rapid
analysis of spatio-temporal phenomena. Then, starting from an initial prototype, we present a chorem-based visual
environment which integrates traditional interactive visualization and analysis techniques. The environment is
specifically conceived so that each visual interaction task has a context-sensitive behaviour, which allows users to
acquire specific information from the underlying spatial database. Finally, we present an enhanced version of
ChorML language, able to support the new analysis functionalities on chorems.
1. Introduction
In the last decades, researchers from many disciplines have tried to facilitate people's use of computers and to
provide ways for scientists to make sense of the huge amounts of data they can manage. However, the inconsistency
and the disorder which typically exist in huge volumes of data may compromise the analysis of such data, which is a
crucial task in many application domains and essential for decision makers and analysts [33].
One of the major challenges the Geographic Information community is facing is to provide decision makers with
advanced tools capable to semantically and visually integrate quantitative, qualitative and cognitive aspects of a
domain of interest. In fact, when a large amount of data is available, synthesizing information and deriving insight
from it may result a time-consuming and expensive activity. Analogously, discovering hidden information and
performing specific analytical tasks may require application domain expert users and high performance tools.
Moreover, in case of geospatial data, analysis and visualization of huge volumes are further complicated by the

inner complexity of geospatial data [2 When geographical or physical spaces are involved, the analysis tasks employ
a wide range of techniques, including data mining, simulation and modeling, verification and communication of
results, along with visual representations and interfaces, which are recognized as a powerful support to analysis and
reasoning [58]. A significant contribution to this issue has been provided by the discipline of GeoVisual Analytics
(short for Geospatial Visual Analytics), whose aim is to maximize human capacity to perceive, understand and
reason about complex and dynamic geodata, by supporting the analytical reasoning process [2].
GeoVisual Analytics falls in the area of Geovisualization and benefits from the integration of different disciplines,
by inheriting from each result relevant for the achievement of proposed goals. In fact, the adoption of visual
interactive methods from the geovisualization research, and their integration with new possibilities offered by
computational techniques, lay the basis for effective support to data exploration and decision-making processes, due
to the capability of combining geospatial information with “human vision and domain expertise” [28, 55, 57].
The wider area of Geovisualization [28, 35, 36, 47] refers to a set of tools and techniques supporting geospatial
data analysis through the use of interactive visualization. As in the related fields of scientific visualization [43, 57]
and information visualization [55], geovisualization is focused on knowledge construction to allow for data
exploration and decision-making processes [31, 42, 43]. It integrates approaches from scientific visualization,
(exploratory) cartography, image analysis [12], information visualization [21] , exploratory data analysis (EDA)
[26] and Geographic Information System (GIS) [11, 24, 38, 40, 45] to provide theory, methods and tools for the
visual exploration, analysis, synthesis and presentation of geospatial data [44].
The major challenges in the field of geovisualization are investigated by the International Cartographic
Association (ICA) [28], which established a Commission on Visualization & Virtual Environments in 1995 [29].
Since then, this discipline has continued to grow as a subject of practice and research and in 2007 Andrienko et al.
set the research agenda about Geovisual Analytics, especially conceived for spatial decision support [2, 3].
The idea that, when dealing with scenarios describing complex issues, such as political, economic and
demographic problems, visual representations may provide useful support in locating facts and new patterns, has also
inspired our research on the definition of cartographic solutions able to better represent geographic information
extracted from (spatial) database contents, referring both to static objects and dynamic phenomena. Initial outcomes
of this research can be found in [19] where early results of an international project are described.
The cartographic solution we propose is based on the concept of chorem, first introduced by the French
geographer Brunet as a schematic territory representation which eliminates details not useful to the map
comprehension [8]. In Figure 1 three maps containing chorems referring to the island of Corse are depicted [9]. In
particular, Figure 1(a) shows the transhumance between summer and winter pastures, Figure 1(b) shows how the
wind influences ecosystems and Figure 1(c) shows agricultural specialities.
(a) (b) (c)
Fig. 1. Maps containing chorems about the island of Corse, France.
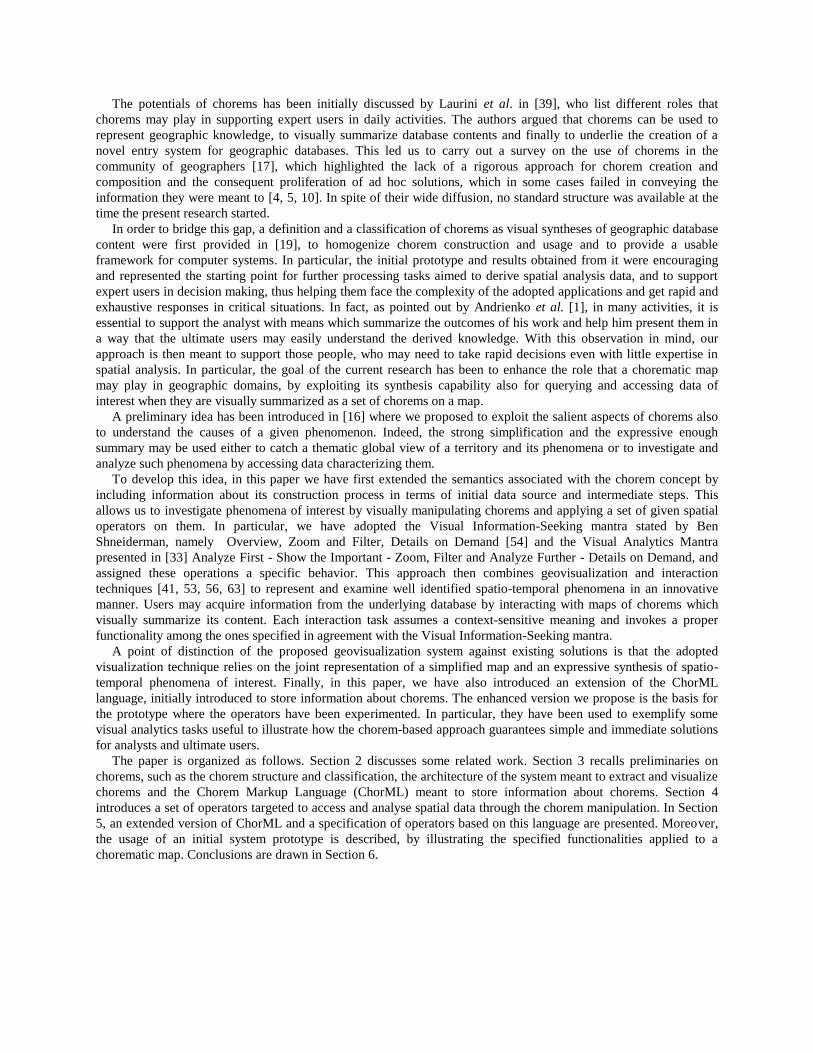
The potentials of chorems has been initially discussed by Laurini et al. in [39], who list different roles that
chorems may play in supporting expert users in daily activities. The authors argued that chorems can be used to
represent geographic knowledge, to visually summarize database contents and finally to underlie the creation of a
novel entry system for geographic databases. This led us to carry out a survey on the use of chorems in the
community of geographers [17], which highlighted the lack of a rigorous approach for chorem creation and
composition and the consequent proliferation of ad hoc solutions, which in some cases failed in conveying the
information they were meant to [4, 5, 10]. In spite of their wide diffusion, no standard structure was available at the
time the present research started.
In order to bridge this gap, a definition and a classification of chorems as visual syntheses of geographic database
content were first provided in [19], to homogenize chorem construction and usage and to provide a usable
framework for computer systems. In particular, the initial prototype and results obtained from it were encouraging
and represented the starting point for further processing tasks aimed to derive spatial analysis data, and to support
expert users in decision making, thus helping them face the complexity of the adopted applications and get rapid and
exhaustive responses in critical situations. In fact, as pointed out by Andrienko et al. [1], in many activities, it is
essential to support the analyst with means which summarize the outcomes of his work and help him present them in
a way that the ultimate users may easily understand the derived knowledge. With this observation in mind, our
approach is then meant to support those people, who may need to take rapid decisions even with little expertise in
spatial analysis. In particular, the goal of the current research has been to enhance the role that a chorematic map
may play in geographic domains, by exploiting its synthesis capability also for querying and accessing data of
interest when they are visually summarized as a set of chorems on a map.
A preliminary idea has been introduced in [16] where we proposed to exploit the salient aspects of chorems also
to understand the causes of a given phenomenon. Indeed, the strong simplification and the expressive enough
summary may be used either to catch a thematic global view of a territory and its phenomena or to investigate and
analyze such phenomena by accessing data characterizing them.
To develop this idea, in this paper we have first extended the semantics associated with the chorem concept by
including information about its construction process in terms of initial data source and intermediate steps. This
allows us to investigate phenomena of interest by visually manipulating chorems and applying a set of given spatial
operators on them. In particular, we have adopted the Visual Information-Seeking mantra stated by Ben
Shneiderman, namely Overview, Zoom and Filter, Details on Demand [54] and the Visual Analytics Mantra
presented in [33] Analyze First - Show the Important - Zoom, Filter and Analyze Further - Details on Demand, and
assigned these operations a specific behavior. This approach then combines geovisualization and interaction
techniques [41, 53, 56, 63] to represent and examine well identified spatio-temporal phenomena in an innovative
manner. Users may acquire information from the underlying database by interacting with maps of chorems which
visually summarize its content. Each interaction task assumes a context-sensitive meaning and invokes a proper
functionality among the ones specified in agreement with the Visual Information-Seeking mantra.
A point of distinction of the proposed geovisualization system against existing solutions is that the adopted
visualization technique relies on the joint representation of a simplified map and an expressive synthesis of spatio-
temporal phenomena of interest. Finally, in this paper, we have also introduced an extension of the ChorML
language, initially introduced to store information about chorems. The enhanced version we propose is the basis for
the prototype where the operators have been experimented. In particular, they have been used to exemplify some
visual analytics tasks useful to illustrate how the chorem-based approach guarantees simple and immediate solutions
for analysts and ultimate users.
The paper is organized as follows. Section 2 discusses some related work. Section 3 recalls preliminaries on
chorems, such as the chorem structure and classification, the architecture of the system meant to extract and visualize
chorems and the Chorem Markup Language (ChorML) meant to store information about chorems. Section 4
introduces a set of operators targeted to access and analyse spatial data through the chorem manipulation. In Section
5, an extended version of ChorML and a specification of operators based on this language are presented. Moreover,
the usage of an initial system prototype is described, by illustrating the specified functionalities applied to a
chorematic map. Conclusions are drawn in Section 6.

2. Related Work
Our approach, which is conceived to analyze and visualize huge volumes of geospatial data, summarizes ideas
and techniques from the domains of Geovisual Analytics, a particular branch of Geovisualization, and of Multiscale
Information Visualization.
Like other well-known GeoVisual analytics approaches [30, 48], the chorem-based solution combines visual
interactive geovisualization methods with advanced computational techniques to support data exploration and
decision-making processes. However, with respect to existing GeoVisual Analytics systems, our environment
exploits chorematic maps to represent together the observed phenomenon and the related geographic area, offering,
at each detail level, a unified, map-related view of data resulting from information seeking or analysis tasks.
In Geovisualization and Geovisual Analytics a variety of visualization methods are used to represent geospatial
data and/or spatio-temporal phenomena, such as Space-Time Cube [27], Circleview [37], interactive maps [30],
treemaps [51], parallel coordinates [52]. Such methods have been often used at the same time, in order to facilitate
the interpretation of relevant amount of information, even if in a synthesized form. Although multiple related views
may allow users to perform very complex data analysis tasks, the rationale behind our approach is to support rapid
decision making activities that require timely actions to face emergency situations. Our method is not indented to
visually mine geospatial data as in [32, 50], but it rather exploits Shneiderman’s visual information seeking mantra,
to represent well identified spatio-temporal phenomena in a strong synthesis and to allow for the rapid analysis of
such phenomena by using such geovisualization interaction techniques as filtering and zooming [41, 53, 56, 63].
As for Multiscale Information Visualization (MIV), it consists of techniques meant to help users to manipulate
information displayed on the screen through different levels of abstraction. Large amounts of data need to be
displayed at a high level of abstraction whereas more detailed representations are necessary when the data density
decreases. Two different typologies of abstraction are generally performed in MIV, namely, data abstraction, which
refers to the transformation applied to data before being visually mapped, such as aggregation, filtering, sampling
and summarization, and visual abstraction, which refers to abstraction gained by transforming the visual
representation of the mapped data. In the proposed chorematic framework, we profitably exploit MIV techniques to
dynamically change the visual representation of data and present them at different levels of abstraction as the user
filters or zoom in on it. Our approach follows MIV principles performing both data abstraction and visual
abstraction.
Unlike approaches in Pad series of interfaces, Pad++ [6] and Jazz [7] , which used only visual abstraction for
semantic zooming, since these Pad systems were developed not as data exploration tools but as alternate desktops,
we use the semantic zoom and other operations by applying both data and visual abstraction.
Our idea is analogous to systems like Datasplash [64], the first multiscale visualization system meant on data
exploration, based on the construction of multiscale visualization of graphs. However, in our approach data are not
organized into a structure of levels with graphs. Our method is in that respect, similar to the approach used in
Xmdvtools [48] where they exploit hierarchical clusters for structuring the underlying data in different levels of
abstraction.
3. Preliminaries
In the last few years, much work has been carried out about chorems. In particular, Del Fatto [17] provides an
extensive review about the history of chorem usage. Moreover, in [19] the authors detail how chorems are able to
visually summarize database content, providing a definition and a classification of chorems meant both to
homogenize chorem construction and usage and to provide a usable framework for computer systems.
This Section is meant to summarize such preliminaries and definitions in order to provide an exhaustive panorama
about chorems.
The term chorem derives from the Old Greek word χώρημα (read chorema), which means space or territory.
According to the definition of the French geographer Roger Brunet [8], a chorem is a schematized territory
representation, which eliminates any detail not necessary to the map comprehension, or, in other words, it is a kind of
synthetic global view of data of interest which emphasizes relevant aspects. According to Brunet [8], seven shapes
are sufficient to describe the models representing the chorems:

point, meant to represent places, spots, poles;
line, meant to represent contacts, breaking, ties, border, relations;
area, meant to represent extensions, shapes;
flow, meant to represent dynamics, movements, symmetry, intensity;
passage, meant to represent bridges, crossing, bifurcations, tunnels;
polarization, meant to represent focusing, dynamics;
gradient, meant to represent dissymmetry, attraction, repulsion.
The chorem capability to represent synthetic global views of data of interest provides decision makers with a means
to acquire basic information about the context (what, where and when), as well as deeper semantic aspects (why and
what if), useful to support human activity to model, interpret and analyze data of interest. In the literature several
uses of the concept of chorem can be found, especially by geographers, who have been using chorems as a
communication mean, e.g., to represent spatio-temporal phenomena, usually defining new ad hoc chorems starting
from personal knowledge, without a structural definition. In other words, since geographers are principally interested
in the semantic viewpoint of chorems, the definitions they propose are lacking of a structural description potentially
useful to define a chorem framework. Recently, a formalization need of the chorem concept has arisen in literature.
Some characteristic maps have been proposed both by geographers and by computer science researchers who work
in the area of visual languages, in order to allow a general and more diffuse applicability of such a concept to several
domains. However two relevant aspects could be noticed about the maps proposed at the time our research started,
namely:
all maps were manually-made and were based on the personal knowledge of the map maker,
no computer-based system that builds maps containing chorems existed.
The only formal approach adopting chorems appeared later in the literature is the wayfinding chorem theory by
Klippel et al. [34], introduced to characterize route knowledge based on mental conceptualizations of directions at
decision points.
3.1 Chorem definition and classification
In [17] a study was carried out meant to analyze the extent to which the set of 28 chorems proposed by Brunet (see
Fig. 2) is used. Starting from approximately one hundred manually-made maps containing chorems, we observed that
expert users typically prefer to adopt a minimal set of Brunet's chorems or to generate an ad hoc chorem vocabulary
instead. Moreover, we were able to group the most used chorems into two classes, namely chorems with inner
geographic properties, which may represent typical geographic elements such as cities, rivers and regions, and
chorems which describe phenomena among geographic elements, such as flow and regression.
Starting from this analysis, a specification of chorems in terms of components and structure, and a proper
classification which takes the chorem meaning into account have been proposed.
Our chorem definition is based on two background concepts, geographic patterns and proto-chorems, described as
follows:
A Geographic Pattern is an interesting bit of knowledge [49] discovered in a geographic database by using
functions for extracting relevant unknown information. Patterns can be used as a starting point to identify spatio-
temporal phenomena and relationships among them. An example of typical geographic pattern is “In regions of
Mexico where the agave is cultivated, tequila is produced”.
A Proto-chorems can be defined as a data item, properly cleaned and organized, on which SQL queries, (spatial)
data mining functions or other analysis methods can be applied, in order to discover geographic patterns. In
particular, a proto-chorem can be derived starting from a regular database whose structure is properly converted
and conformed to be input to knowledge discovery functionalities.
From a semantic point of view a first classification has been proposed in [19], arranging chorems into three main
categories, namely:

Geographic chorems,
Phenomenal chorems and
Annotation chorems.
Geographic chorems represent geographic data with associated simple geometries, such as points, lines, polygons,
and objects made up of their combinations, such as networks.
Phenomenal chorems describe spatio-temporal phenomena involving one or several geographic chorems. An
initial set of phenomenal chorems consists of three types, namely Flow, Tropism, and Spatial Diffusion. The Flow
represents population or object movement between geographic chorems. The Tropism represents an homogeneous
attractive or repulsive space, around a geographic chorem. Finally, the Spatial Diffusion represents a spatial
progression or regression, from a geographic chorem towards a specific direction. As an example, it can be used for
describing the development trend of a city in a particular region.
Fig. 2. The set of 28 chorems proposed by Brunet [8]

Finally, Annotation chorems represent map labels or remarks. They can be retrieved from the available data or
can be added by designers in order to complete a map. This provides users with additional information that may not
be in the database collecting information about the map.
Fig. 3 depicts the underlying structure of a chorem, which takes into account the complex nature of geographic data /
phenomena by visually integrating the iconic and the property components. As for the former, the iconic
representation assemblies a graphical component, corresponding to the visual representation, and a meaning,
referring to the semantic component. In such a way, users may quickly perceive the meaning associated with data and
use them properly. As for the property component of a chorem, it is divided into two parts, a type attribute specifying
the category the chorem belongs to, namely geographic, phenomenal or annotation, and a source indicating where
and how data could be retrieved (such as the proto-chorem along with functions used to extract the corresponding
chorem, a table or a view name, a SQL query or a function). It is worth noting that, in case of a phenomenal chorem,
the type attribute also contains information about the geographic chorems which it is related to.
Chorem
Properties Iconic Representation
Type
Source
GraphicalComponent
Meaning
Fig 3. The structure of a chorem
Based on this structure, a different classification can be provided which inherits the structural organization typical of
the well-established model used in GIS for managing spatial data, namely feature layer, layer and map. In particular,
we have introduced the concept of Chorem element, Chorem and Chorematic Map, as follows:
A Chorem element is a basic element that may represent either a single geographic object, such as a city and a
region (e.g. a single feature in a GIS data model), or a single phenomenon, such as demographic growth and
people displacement, as depicted in Fig. 4.
(a) (b)
Fig. 4. Chorem Elements representing a single dynamics (a) and a single City (b)
A Chorem is a set of chorem elements of the same typology (e.g. a feature layer in a GIS data model). For
instance, a set of the most important USA cities, or a set of the main flows between such cities, as depicted in
Fig. 5.
(a) (b)
Fig. 5. Chorems representing Dynamics (a) and Cities (b)

A Chorematic Map is a set of chorems which schematize data of interest related to a specific place or region
(e.g. a map in a GIS data model), as depicted in Fig. 6(a). A legend can be associated with a chorematic map,
which explains the meaning of each chorem, as depicted in Fig. 6(b).
Cities
Regions
Dynamics
(a) (b)
Over 10 million residentsOver 2 million residents
Big AgglomerationImpulse Center
Secondary Driving Region
Driving Region
Suburban Growth
Fig. 6. A manually made Chorematic Map (a) about USA and its legend (b) taken from [61]
The above classification emphasizes the relationships existing among a single instance of a chorem, the group
which it belongs to, and the whole scenario where different chorems, and consequently different chorem elements are
spatially arranged.
3.2 The Architecture of the Extraction and Visualization System (ChEViS)
This Section presents one of the results of an international research project launched among three research
institutions, namely Institut National des Sciences Appliqués (INSA) of Lyon (France), Dipartimento di Matematica
e Informatica (DMI), University of Salerno (Italy) and Tecnologico de Monterrey, Campus de Puebla (Mexico). The
project is meant to define cartographic solutions able to synthesize contents of geographic databases and represent
them within a map in a readable and intuitive way.
The result consists of the architecture design of ChEViS (Chorem Extraction and Visualization System), a system
for extracting geographic objects and spatio-temporal phenomena from geographic databases and representing them
as a map by using chorems.
In [19] a construction process of chorematic maps is also specified by describing the tasks needed to extract
relevant information from a large amount of data about a territory and its phenomena, and to represent them in a
form suitable for the ultimate users.
In Fig. 7 the architecture of the ChEViS system is given, which consists of two major components, namely the
Chorem Extraction System and the Chorem Visualization System. The former is meant to derive and manipulate the
information from available geographic datasets, the latter handles such information by assigning it a visual
representation in terms of chorem elements, chorems and chorematic maps. Moreover, as shown in Fig. 7, the system
architecture is composed of modules which express functionalities and algorithms coming from different disciplines,
from data mining to cartographic generalization. The management and the integration of these various modules raise
the complexity of both the system and the process which allow the user to obtain directly from a geographic database
a synthesized representation of spatio-temporal phenomena of interest.
It is worth noting that both subsystems handle the same data structure which stores information about chorems.
However, they manage, use and/or modify different subparts of the whole chorem structure depending on the running
step. In particular, the Chorem Extraction System handles the properties of several typology of chorems, such as
name, type, size and coordinates, by expressing them through alphanumeric attributes. As for the Chorem
Visualization System, it produces, elaborates and modifies the iconic representation of chorems, starting from the
properties generated by the previous phase, in order to assign them a proper visual representation.

The storage of chorem elements and the communication among system components are based on the multi-level
language ChorML, summarized in the following Subsection.
PatternsChorem/Pattern
mapping
ChorML 1
ChorML 0
Reduction
Relationshipcomputation
Choremdefinition
DBMSOracle
Pattern Extraction
SVG
ChoremEditing
ChorML 2
ChorML 2
ChorML 2Chorem Creation
Chorem Visualization System
Chorem Extraction System
Fig. 7. The Chorem extraction and visualization System
At present, the mentioned complexity of the system architecture has not yet allowed the implementation of all the
expected functionalities within a unique prototype. Indeed, specific prototypes has been implemented during the
research project, each of them focused on a particular aspect of the problem, namely the Chorem Editor prototype
[18] and the prototype to create and visualize a visual synthesis of spatio-temporal phenomena [19]. Starting from
the prototype proposed in [19], in this paper, we propose an enhanced new version, targeted at permitting analysis
tasks on a chorematic map.
3.3 ChorML structure
This Section recalls the initial definition of ChorML described in [19], in order to provide the reader with basis to
better understand changes we propose later on. The choice of this language derives from the need of a light and
interoperable data store / exchange structure which could be consistent with other well-known XML dialects used for
storing geographic data, namely Geography Markup Language (GML), and visualizing vector data, namely Scalable
Vector Graphics (SVG).
ChorML is therefore a language derived from the eXtensible Markup Language (XML) which has been specified to
store information about chorems. It consists of three levels which differ in terms of structure and typology of stored
information. In particular, level 0 of ChorML is made up of XML and GML tags. As shown in Fig. 8(a), it supports
the chorem extraction by storing information about proto-chorems, origin of data (lineage) and functions applied to
them in order to obtain a list of chorems.

Fig. 8. ChorML levels.
Level 1 of ChorML is still a combination of XML and GML tags. It connects the Chorem Extraction and the
Chorem Visualization subsystems by specifying the results of the application of (spatial) data mining algorithms. In
particular, as depicted in Fig. 8(b), the items of the language are:
general information containing id, project name, author name, creation date, layout, reference system, original
database name, last update;
the chorem list where geographic data are GML coded;
pre-legend containing a description of chorems;
spatial relationships between chorems.
Currently, this level is totally specified by an XML grammar presented in [14] , whereas in [13] a system for
generating ChorML starting from a DB extended by Oracle Spatial is described.
Level 2 of ChorML corresponds to XML and SVG tags, useful for visualization tasks. The elements of level 1
and level 2 differ on the coding of geographic components, GML and SVG respectively. Fig. 8(c) illustrates the level
2 structure. Finally, Fig. 9 shows the structure of ChorML, in terms of chorem list and chorem elements, whereas
Fig. 10 illustrates ChorML tags associated with each chorem element.
Fig. 9. The original structure of ChorML.

Fig. 10. ChorML tags of a Chorem Element.
4. Accessing Spatial Data through Chorematic Maps
The idea underlying our approach is based on the Visual Information-Seeking mantra stated by Ben Shneiderman
[54] and on Keim’s adaptation to the Visual Analytics domain, presented in [33]. Shneiderman’s formulation
“Overview first, zoom and filter, then details on demand”, is a well-known visualization paradigm which
encompasses several visual design guidelines and provides a general framework for designing information
visualization applications [62]. In such a macroscopic versus microscopic approach, the overview task is meant to
obtain a global view of a situation featuring a domain of interest. Shneiderman argues that by using it, a user can gain
a general idea of the entire collection of data and, at the same time, such an overview can help users control the
contents of the detail view [54]. According to Craft and Cairns [15] the “Overview provides a general context for
understanding the data set; it paints a picture of the whole data entity that the information visualization represents.
Significant features can be discerned and selected for further examination”.
Keim’s adaptation of the mantra, “Analyze First - Show the Important - Zoom, Filter and Analyze Further - Details
on Demand” points out that solely visual and interactive methods are not appropriate when dealing with the analysis
of huge amounts of data. In particular, starting from a huge data collection, it is reasonable to apply first some
analysis computations and then provide an overview of the resulting relevant contents, rather than directly providing
a complete overview of those data. In that way, the user may interact with a synthesis of the important components of
data, thus not running the risk to get lost inside the original data collection.
The synthetic global view offered by chorematic maps exactly results from the application of the analize first –
show the important step of the extended mantra. Chorematic maps were indeed conceived to provide a schematized
representation of a territory and related spatio-temporal phenomena, built upon larger sets of source data, supplied in
the form of proto-chorems, and on libraries of geographic patterns. A chorematic map is therefore able to emphasize
important aspects of a territory, which are useful for a better comprehension of the described phenomena. In
agreement to Shneiderman's theory, the overview represented by an initial chorematic map, not only provides users
with an immediate synthesis of the mini-world under investigation and capture salient information, but it is also used
to locate which part of it to analyze. As a matter of fact, it is always available during subsequent navigation and
analysis tasks to help users control the focus of the analysis and easily orient themselves in the map.
As for the zoom and filter step of the visual information-seeking mantra, the goal is to focus attention on a
reduced portion of the whole space. Zooming and Filtering represent the basic techniques often used in information
visualization and in GIS, meant to limit the amount of displayed information, also by applying filtering criteria.

According to Shneiderman [54], users usually point the attention on some portion of a collection, thus they need
tools which allow them to control the zoom focus and the zoom factor. About this step, Keim et al. [33] add the idea
that zooming and filtering data is a way to trigger further analysis, which requires visualization of the results in turn.
The zoom and filter step needs a more complex interaction with users. In our approach, by zooming and filtering a
chorematic map, users may gradually reduce the search space and select a subset of data in agreement with
Shneiderman’s and Keim’s interpretations.
The final step of the paradigm, namely details on demand, is meant to obtain detailed information about a
particular object or group of objects. Shneiderman states that once the entire collection has been trimmed to a
minimal subset, users could easily browse details about either a selected group or a single item, e.g., by clicking on
the selected area and getting details in a pop-up window [54]. Moreover, as explained in [25] “Details on Demand
stands for techniques that provide more detail on the data set only after the user requested them”. Keim et al. [33]
state that a particular attention is possible for small portions of data when they require a special attention from the
analyst, not necessarily at the end of the process. As for the details on demand step, our approach allows the user to
select and query a chorem element in order to obtain descriptive information related to it.
In the following subsections we describe the operations we propose, meant to realize visual analytics tasks on
chorematic maps.
4.1 Zooming and filtering a chorematic map
Given the underlying structure of a chorem (see Fig. 3), when specifying a zooming or a filtering operation on a
map, it is necessary to distinguish which chorem component is going to be affected, and how it may change. Indeed,
each part of a chorem structure can be manipulated and the corresponding result varies in agreement with the role of
the involved component. As an example, when more details about the graphical representation of a phenomenon are
required, a geographic zooming on the corresponding visual notation should be specified. Differently, when more
details about the meaning of a phenomenon are entailed, then a semantic zooming should be invoked, which allows
accessing data associated with the source component of the chorem under investigation. A similar distinction can be
detected for the filtering operations which can select occurrences of a phenomenon on the basis of either its
characteristics or the underlying territory.
These differences concerning operations and operands led us to define four operators, namely Geographic Zoom,
Semantic Zoom, Geographic Filter and Semantic Filter, through which users are able to navigate a chorematic map
from an initial overview to a particular detail. In particular, as for the zooming operators, the geographic modality
includes the usage of different geographic scales, whereas the semantic modality invokes a thematic
aggregation/disaggregation for navigating among different layers of information semantically related. As for the
filtering operators, the geographic modality determines which chorem elements have to be selected on the basis of a
territory chosen through a spatial condition. The semantic modality selects a subset of chorem elements which satisfy
an alphanumeric condition
In order to realize the above operations, the chorem structure depicted in Fig. 3 has been properly extended by
embedding information about levels of abstraction inside the Source component featuring the Chorem Properties.
4.1.1 Geographic Zoom
This operation corresponds to the traditional GIS zoom operator, also known as graphical or geometric zoom, which,
as defined in [56], “allows the user to specify the scale of magnification and increasing or decreasing the
magnification of an image by that scale. This allows the user focus on a specific area and information outside of this
area is generally discarded”. The geographic zoom operator acts exclusively on the visual aspect of the chorem, by
changing the size of the visible details of the involved chorem elements, leaving them unchanged, also in terms of
structure.
Fig. 11 shows the application of the geographic zoom operator on the chorematic map depicted in Fig. 11(a) meant
to visualize it at a different scale level (see Fig. 11(b)).

(a) (b)
Fig. 11. An example of a geographic zoom.
4.1.2 Semantic Zoom
Semantic Zoom is a well-known technique in Information Visualization research field. According to [41] as a
physical zoom changes the size and visible detail of an object, a semantic zoom changes the type and meaning of
information displayed by the object. As defined in [63], it is equivalent to “different representations for different
spatial scales. When zooming away, instead of seeing a scaled down version of an object, see a different
representation. The representation shown depends on the meaning to be imparted.” According to our definition, this
operation applied to a chorem presents it at a different level of abstraction. In fact, it allows to analyze chorems and
chorem elements visualizing them in detail, without affecting the initial map scale and their graphical representation.
In particular, by invoking the semantic zoom-in (resp., -out), an initial set of chorem elements may be disaggregated
(resp., aggregated) thus allowing the access to a different level of information. Moreover, when a Geographic
Chorem is involved, the operation is propagated to the Phenomenal Chorems in relationship with it. In a similar way,
when a Phenomenal Chorem is involved, the operation is propagated to the related Geographic Chorems.
Fig. 12 illustrates an example of application of semantic zoom-in to a Geographic Chorem, meant to disaggregate the
Region chorem and its chorem elements representing Italian regions. When the operation is applied to the chorem
elements of Fig.12(a), they are simply split up, by showing the level of geographic data abstraction referring to the
Province chorem elements (see Fig. 12(b)). This implies both a different source and meaning of data.
(a) (b)
Fig. 12. An example of a semantic zoom applied to a Geographic Chorem.
The chorem structure is modified accordingly, by properly substituting the Meaning of the corresponding Iconic
Representation component along with the Source of the Property component, as shown in Fig. 13.

Semantic Zoom ( ) =
Chorem
Properties Iconic Representation
Type=Geographic
Source
GraphicalComponent
Meaning
Chorem
Properties Iconic Representation
Type
Source
GraphicalComponent
Meaning
Fig. 13. The application of the semantic zoom operator which modifies the Source and the Meaning of a Geographic Chorem.
When a semantic zoom is applied on a Phenomenal Chorem, it is decomposed along with the Geographic
Chorems related to it. Fig. 14(a) depicts several occurrences of the Phenomenal Chorem representing the growth of
population in the last 30 years. By zooming on it, the Geographic Chorems related to it are disaggregated and each
single phenomenon is decomposed into phenomena in agreement with the derived Geographic Chorems, (see Fig.
14(b)).
(a) (b)
Fig. 14. An example of a semantic zoom applied to a Phenomenal Chorem.
In this case, the chorem structure is differently modified, as highlighted in Fig. 15. In fact, even if the output chorem
refers to a different abstraction of the territory, it still corresponds to the initial Phenomenal Chorem, i.e. the growth
of population in the last 30 years.

Semantic Zoom ( ) =
Chorem
Properties Iconic Representation
Type=Phenomenal
Source
GraphicalComponent
Meaning
Chorem
Properties Iconic Representation
Type
Source
GraphicalComponent
Meaning
Fig. 15. The application of a semantic zoom operator to a Phenomenal Chorem.
4.1.3 Geographic Filter
This operation allows the user to select Phenomenal Chorems elements by using as spatial filter the Graphical
Component of one or more Geographic Chorems elements. Generally, a filter is intended as a tool which satisfies
different criteria and conditions. In this case, the condition corresponds to the territory of interest where phenomenal
chorems elements have to be analyzed.
Fig. 16 illustrates how, by applying the filter on specific regions (highlighted in Fig. 16(a)), only the Phenomenal
Chorems elements associated with them are visualized, as shown in Fig. 16(b).
(a) (b)
Fig. 16. An example of a geographic filter
In Fig. 17 the application of a geographic filter is shown in terms of chorem structure. The input corresponds a
Geographic Chorem, namely the chorem on which the condition is applied, and a Geographic Condition, which
corresponds to a subset of Geographic Chorem elements used as a condition, belonging to the first parameter. The
output of the operation consists of one or more Phenomenal Chorems whose elements satisfy the given condition,
thus implying the modification of the Source of the Property component. It is worth to noting that the outputted
Phenomenal Chorems are filtered from the initial set of the ones related to the Geographic Chorem in input.

Geographic Filter ( ,
Chorem
Properties Iconic Representation
Type= geographic
Source
GraphicalComponent
Meaning
Geographic Condition) =
=
Chorem
Properties Iconic Representation
Type= phenomenal GraphicalComponent
Meaning
Chorem
Properties IconicRepresentation
Type= phenomenal GraphicalComponent
Meaning
…
SourceSource
Fig. 17. The application of a geographic filter
4.1.4 Semantic filter
This operation allows users to filter chorem elements which satisfy a particular condition, by directly operating on
the semantics associated to them. Users can select the chorem they need to analyze, and identify the descriptive
element on which a threshold or a condition should be applied in order to reduce the set of visualized data.
Fig. 18 illustrates the application of a semantic filter to a Phenomenal Chorem which represents the growth of
population in the last 30 years. In this case, only the Phenomenal Chorem elements which satisfy the given condition
(growth > 3%) are shown on the map.
>3
>3
>3>3
>3
>3
>3
>3
Fig. 18. The application of a semantic filter to a Phenomenal Chorem

As highlighted in Fig. 19, the semantic filter operator acts on both the Properties and the Iconic Representation of
the chorem structure. In fact, the Graphical Component changes since it embeds the applied condition, the Meaning
varies according to the semantics of the output chorem, and finally the Source is modified since it refers to a subset
of initial data.
Semantic Filter( condition, ) =
Chorem
Properties Iconic Representation
Type
Source
GraphicalComponent
Meaning
Chorem
Properties Iconic Representation
Type
Source
GraphicalComponent
Meaning
Fig. 19. The application of a semantic filter to a Phenomenal Chorem
5. Extending ChorML to Perform Visual Analytics Tasks
The set of previous operators can be applied to chorematic maps to perform visual analytics tasks. In particular, each
of them allows users to capture a specific aspect of a geographic object as well as a phenomenon, while their proper
combinations represent light solutions to derive complex information. These properties are implicitly guaranteed by
the nature of chorems and the result of any operator preserves them .
The goal of this Section is to exemplify the application of these operators when investigating phenomena
represented on a chorematic map. To this end, we have implemented the operations in a prototype developed in
agreement with the architecture of the ChEViS Visualization Subsystem. In particular, at present the proposed
operators are offered through a stand-alone ChorML-based environment where chorematic maps are input and
manipulated by expert users for visual analytics tasks. Due to the underlying architecture compliance, such an
environment could be embedded into ChEViS, thus providing a unique environment for producing, visualizing,
querying and analysing chorematic maps.
Two subsections follow. The former is devoted to present the extended version of ChorML used in the prototype
along with the specification of the proposed operators in the terms of the new ChorML version. The latter is meant to
illustrate how the analysis carried out in [19] on the migrating flows of population, can be now improved thanks to
the new operators.
5.1 The extended version of ChorML
The basic ChorML code stores information exclusively about the visual summary. No information about the
initial data source and intermediate steps is available. Then, a revised version of ChorML has been necessary, able
to collect both data referring to detected phenomena and functions used for aggregating those data. In particular, it
has been necessary to operate during the construction phase of a map by adding ChorML ad hoc information,
expressed as a multi-scale structure to store intermediate data processed during the map construction. Moreover, it
has been also necessary to store geographic components as geometric primitives whereas the associated
alphanumeric data can be derived by specifying dynamic queries used for their aggregation.
Fig. 20 illustrates the structure we have proposed. A hierarchy tag, containing a list of chorem elements, is used as
part of the ChorML tag to create nested chorem elements. Moreover, proper tags for specifying which chorem
element is active (for the application of operators) and visible in the hierarchy have been added. This organization
corresponds to a multi-scale representation, which allows to access the different levels of aggregation of the original
data, a very simple hierarchical organization which highly improves the expressive power of the structure. In fact,
once stored, such information may be managed to answer queries that end users pose by spatially manipulating a
chorematic map. Selecting a chorem, zooming a portion of it, filtering a region of interest, represent actions which

invoke the previously defined operations and which can be realized by parsing the ChorML code and choosing the
portion on which to operate.
Fig. 20. The extended structure of ChorML
Using the above extended version of ChorML it is possible to express geographical hierarchies in a seamless way.
As an example, the maps depicted in Fig. 21 represents two different feature layers referring to the same country, In
particular, Fig. 21(a) depicting the Italian regions and Fig. 21(b) illustrating the Italian provinces. When representing
them through a chorem-based approach, it is possible to derive either two chorematic maps, representing regions and
provinces respectively, or a unique chorematic map by using the proposed structure, where the aggregation of
provinces within regions is captured. Thus, a two-level geographic hierarchy could be managed which provides for
different views of the same geographic area. At the first level, each region is represented by a chorem element. Each
chorem element “Region” in turn contains a list of chorem elements which correspond to the provinces belonging to
it. Such a list of chorem elements “Province” represents the second level of the geographic hierarchy.
(a) (b)
Fig. 21. Maps representing the geographic hierarchy of Italian Region (a) and Provinces (b)
The following ChorML code represents a chorem element which stores the region “Basilicata”, highlighted in Fig.
21(a), and the corresponding provinces “Potenza” and “Matera”, highlighted in Fig. 21(b).

<Chorem element>
<Visible> False</Visible>
<Active> False</Active>
<Elementid> element 7</Elementid>
<ElementName>BASILICATA</ElementName>
<ElementSize>3</ElementSize>
<ElementShape>Shape of the element expressed in GML</ElementShape>
<Hierarchy>
<ChoremElementList>
<Chorem element>
<Visible> True</Visible>
<Active> True</Active>
<Elementid> element 21</Elementid>
<ElementName>POTENZA</ElementName>
<ElementSize>3</ElementSize>
<ElementShape>Shape of the element expressed in GML </ElementShape>
<Hierarchy>
<ChoremElementList>
</ChoremElementList>
</Hierarchy>
</Chorem element>
<Chorem element>
<Visible> True</Visible>
<Active> False</Active>
<Elementid> element 22</Elementid>
<ElementName>MATERA</ElementName>
<ElementSize>3</ElementSize>
<ElementShape>Shape of the element expressed in GML o</ElementShape>
<Hierarchy>
<ChoremElementList>
</ChoremElementList>
</Hierarchy>
</Chorem element>
</ChoremElementList>
</Hierarchy>
</Chorem element>
In the following, we describe a specification of the operators proposed in the previous section which can be
specified trough the extended version of the ChorML, namely GeographicZoom, SemanticZoom, GeographicFilter
and SemanticFilter. It is important to notice that given the substantial difference of definition between Geographic
and Phenomenal Chorems, we provide two different definitions of semantic zoom, namely: (1) SemanticZoomG,
which is a specification for semantic zoom applied to Geographic Chorems and (2) SemanticZoomPh, which is a
specification for semantic zoom applied to Phenomenal Chorems. In contrast, GeographicFilter applies only to
Geographic chorems, as GeographicZoom and SemanticFilter can be uniformly applied to both categories.
(1) SemanticZoomG ((ChoremG , [zoomIn/zoomOut] ) = (ChoremG’, (List(ChoremPh))), where
ChoremG: the input Geographic Chorem.
[zoomIn / zoomOut]: an optional boolean parameter which indicates the zoom modality (i.e., 0 specifies a zoom
in, 1 specifies zoom out);
ChoremG ': the ChoremG modified according to the zoom operation.
(List (ChoremPh)): a list of Phenomenal Chorems associated to the input Geographic Chorem. This list of
Chorems could be empty if no Phenomenal Chorem is associated with the input Geographic Chorem.
(2) SemanticZoomPh ((ChoremPh, x, [zoomIn / zoomOut]) = (ChoremPh’ ,ChoremG, (List (ChoremPh))),
where
ChoremPh: the input Phenomenal Chorem;
x: a numeric parameter related to the type of the input Phenomenal Chorem which indicates how the chorem
element should be explored. In case of a Flow Chorem, it can assume three values, allowing the exploration of
the single origin, single destination or both origin and destination of the flow;

[zoomIn / zoomOut], an optional boolean parameter which indicates the zoom modality ((i.e., 0 specifies a
zoom in, 1 specifies zoom out);
ChoremPh’: the ChoremPh modified according to the zoom operation;
ChoremG: the Geographical Chorem related to ChoremPh modified according to the zoom operation;
(List(ChoremPh)): a list of Phenomenal Chorems associated to ChoremG . This list of Chorems could be empty
if no Phenomenal Chorems are associated with ChoremG.
(3) GeographicZoomG ((Chorem , [zoomIn/zoomOut] ) = (Chorem’), where
Chorem indicates the Chorem (Geographic or Phenomenal) on which to apply the zoom.
[zoomIn / zoomOut]: an optional boolean parameter which indicates the zoom modality (i.e., 0 specifies a zoom
in, 1 specifies zoom out);
Chorem ': the ChoremG modified according to the zoom operation.
(4) GeographicFilter( (List(ChoremElementG)) = (ChoremG, (List(ChoremPh))), where
List (ChoremElementG): one or more chorem elements of a Geographic Chorem;
ChoremG: The Geographic Chorem which contains the list of chorem elements in input, modified according to
the operation;
List (ChoremPh)): a list of phenomenal Chorems associated with visible or selected chorem elements.
(5) SemanticFilter ((Chorem, FilteringElement, Condition, Value) =(Chorem’, (List(ChoremElement))), where
Chorem: indicates the Chorem (Geographic or Phenomenal) on which to apply the filter;
FilteringElement: specifies the descriptive element on which to apply the filter;
Condition: is the condition to apply to the item value, or a mathematical comparison operator: = (Equality), >
(greater than), <(less than),> = (greater than or equal), <= (less than or equal ), <> (different);
Value: is the descriptive value on which the Condition is applied.
Chorem’ : the input Chorem (Geographic or Phenomenal) modified according to the operation;
List (ChoremElement) : a list of chorem elements belonging to the input chorem filtered according to the input
condition.
5.2 The Analysis of migrating flows of population through a chorematic map
This subsection presents some examples of interaction tasks, meant to show how users may analyze particular
phenomena of interest, by performing appropriate operations on chorematic maps. The initial prototype of the
Chorem Visualization System has been modified to support users’ interaction on chorematic maps when they carry
out analyses on the represented spatio-temporal phenomena. In particular, the prototype modules, which generate the
visual representation of chorem elements have been slightly modified in order to fit the new version of ChorML. On
the contrary, the algorithms of the previous version still hold, namely:
a version of the Ramer-Douglas-Peucker [46, 20] algorithm modified for preserving particular topological
relationships. It is meant to simplify the shape of geometry associated to the chorems,
the Forced-Directed Map Labeling algorithm proposed by Ebner et al. [23], used for the resolution of
problems deriving from the label placement in a chorematic map,
a modified version of Tobler’s Flow Mapper algorithm proposed by the Center for Spatially Integrated Social
Science [60], based on the method suggested by Tobler [59]. It is used for the resolution of problems
deriving from the Flow Displaying in the chorematic map.
A new interface module has been also introduced in order to allow users to both navigate a chorematic map and
analyze data underlying the chorems through the implementation of the proposed operators.

The following figures show the screenshots of the proposed prototype and depict the usage of the previously
described operations in a specific domain, namely migrating flows of population in Italy. In particular, this
Subsection is focused on the changes occurred in the new version of ChorML code representing the chorematic map,
when the operations are executed.
Fig. 22 shows a chorematic map which corresponds to the overview of the mini-world under investigation. It
contains three chorems, Macro-Regions and Most Populated Cities (both Geographic Chorems) and Migrating Flows
(a Phenomenal Chorem), containing five macro-region elements, six most populated cities elements and three most
significant flows elements, respectively.
Fig. 22 The chorematic map of migrating flows in Italy in 2001
As illustrated in [19], the construction of the chorematic map of Fig. 22 results from a process which started from a
geographic database containing demographic data related to the Italian regions and cities in 2001. First, proto-
chorems are produced which contain data about cities and regions, as schematized in Table 1 and Table 2,
respectively. In particular, in Table 1 data related to cities in terms of city name (CityName), position (Lat,Lon),
population (Pop2001 ), city identifier (Codistat) and shape (Shape), are shown. In Table 2 a matrix is shown, where
the x value associated with the (a,b) pair corresponds to the x number of citizens who migrated from the a region
towards the b region. As an example, the (Calabria, Lombardia) = 5308 implies that 5308 citizens migrated from the
Calabria region towards the Lombardia region.
Then, by clustering and summarizing data in Table 1 according to proper functions, data reported in Table 3 have
been obtained. In particular, an Oracle Spatial function (the SDO SAM.SPATIAL CLUSTERS spatial function)
determined five groups of regions, clustered according to the closeness property. Such data synthesize the size of
migration between the five recognized macro-regions. Moreover, by applying a threshold of 25000, the three most
important flows have been highlighted (see Table 3). Finally, demographic data depicted in Table 2 are used to
determine a set of important cities in term of population. A proper threshold is used by the system to determine the 6
most populated cities through a SQL query, by filtering the cities exceeding 500000 residents.

Table 1. Demographic data related to the Italian cities.
CityName Lat Lon Pop2001 CodIstat Shape
Agrigento 13,5896 37,3219 54619 084001 Point
Alessandria 8,6200 44,9134 85438 006003 Point
Ancona 13,5110 45,5991 100507 042002 Point
Aosta 7,3177 45,7383 34062 007003 Point
Arezzo 11,8700 43,4733 91589 051002 Point
… … … … … …
Table 2. Citizen displacements between Italian regions
Region Piemonte V_d_A Lombardia Veneto …
Abruzzo 235 4 792 337 …
Basilicata 377 6 769 166 …
Calabria 2244 167 5308 1083 …
Campania 2648 69 8591 3183 …
Emilia-Romagna 852 55 4168 1953 …
… … … … … …
The current approach allows for managing data at different levels of aggregation, even if not planned during the
construction task. In the example, to achieve that, original data of Table 1 are stored into ChorML code together
with the summarized data reported in Table 3.
Table 3. Displacements between macro-regions
North Center Sud Sicilia Sardinia
North 0 18112 31130 13150 5248
Center 20903 0 10594 2084 1428
Sud 66668 22132 0 2521 847
Sicilia 26489 4172 2483 0 319
Sardinia 6323 1420 588 269 0
Users may browse the map from a global view to a detailed feature and pose dynamic queries on the interface, in
agreement with Shneiderman’s mantra. Let us consider the request “Determine the region which received the highest
number of migrating people from the South of Italy, disregarding the islands”.
By recalling the overview step, five macro-regions and three arrows, representing the most relevant migration
flows, can be detected as shown in Fig. 22 In particular, the arrow thickness is visually proportional to the number of
people who migrated between the macro-regions.

The zoom and filter step is then useful to determine the most significant flow from the South macro-region
towards a specific Northern region. In fact, by invoking a geographic filter, only the two flows depicted in Fig. 23
are visualized, whereas the third one is filtered out.
Fig. 23. The application of a geographic filter
By applying the definition of geographic filter, the following request is invoked by the system
GeographicFilter(North, Center, South, Sardinia). The input parameter of the request is the list of the chorem
elements which are fully visualized on the map, namely the macro-regions North, Center, South, Sardinia. The output
is described as (Macro-Regions Chorem, (SouthNorthFlow, NorthSouthFlow)). It consists of the output chorem,
namely the Macro-Regions chorem, and the list of phenomena related to the input list of chorem elements, namely
the two flows obtained, SouthNorthFlow and NorthSouthFlow.
In the following, the representation of ChorML code associated with the flows represented on the map of Fig. 23
is specified.
<Chorem>
<GeneralInformationChorem>
<Name>MigratingFlow</Name>
<Type>flow</Type>
<ChoremID>chorem3</ChoremID>
</GeneralInformationChorem>
<ChoremElementList>
<ChoremElement>
<Visible>true</Visible>
<Active>true</Active>
<ElementID>flow-1</ElementID>
<ElementName>North-South Flow</ElementName>
<ElementSize>2</ElementSize>
<ElementShape />
</ChoremElement>
<ChoremElement>
<Visible>true</Visible>
<Active>true</Active>
<ElementID>flow-2</ElementID>
<ElementName>south-north flow</ElementName>
<ElementSize>4</ElementSize>
<ElementShape />
</ChoremElement>
</ChoremElementList>
</Chorem>

As an alternative way to visualize data about the most relevant migration flow, the user may apply a semantic
filter on the phenomenal chorem depicted in Fig. 23, by selecting the operator to apply and the chorem on which to
apply the operator, and by typing the filter condition (>50000). The resulting chorematic map is depicted in Fig. 24.
Fig. 24. The application of a semantic filter on the Flow Phenomenal Chorem
Moreover, by applying a semantic zoom-in on the destination of the detected flow, the user may decompose it,
displaying regions belonging to the macro-region chorem, accordingly.
This operation allows the user to understand how the previous detected flow was created by aggregating
components of a lower level of representation, as depicted in Fig. 25.
Fig. 25. The application of a semantic zoom

Finally, let us suppose that the user aims to visualize the most significant migration flow. He can perform the
following tasks. First, a geographic zoom is used in order to gain the focus on a portion of the whole map, as shown
in Fig. 26.
Fig. 26. The application of a geographic zoom
Then, by applying again a semantic filter, the most significant flow may be selected. In particular, the user may
specify the MAX keyword, obtaining a map which contains only the requested flow, as depicted in Fig. 27. Within a
new version of the prototype, currently in progress, this kind of operation will be carried out in a more visual and
interactive way, by using a slider control, as suggested in Dynamaps [22].

Fig. 27. The application of a semantic filter
Finally, the third step of Shneiderman’s Mantra, details on demand, may be performed in order to obtain the exact
number of people associated with the flow. To do so, the user can zoom out the map in order to obtain an overview
of the result, then he can select the info mode and finally he can move over the flow to obtain the exact number of
people, namely 568 people, as shown in Fig. 28.
Fig. 28. The final result of user’s request

6. Conclusions
In their daily activities of monitoring and analysis, decision makers often face problems which require rapid
solutions in spite of the complexity of the scenarios under investigation.
The goal of the research we are carrying out is indeed devoted to provide expert users with tools which exploit
human-GIS interaction techniques. In particular, in this paper we have shown how the chorem-based visual approach
can be profitably adopted to develop light and immediate solutions in the context of visual analytics. To this end we
have adapted the well-known Visual Information-Seeking Mantra stated by Ben Shneiderman and the Visual
Analytics Mantra, presented in Keim et al., to the chorem structure proposed in previous work, in order to allow the
analysis of the spatio-temporal phenomena represented in chorematic maps. The result consists of operators which
manipulate chorem components to derive information underlying a chorematic map. In particular, they allow for
capturing each significant aspect of an object or a phenomenon, in terms of both the chorem type they manipulate
and the component they affect.
An enhanced version of ChorML language has been also presented, able to support the new analysis functionalities
on chorems. In particular, the extended version of ChoML implements the Multiscale Information Visualization
(MIV) guidelines, reorganizing the structure of data before they are displayed. Moreover, the implicit hierarchical
approach used allows users to navigate within more or less detailed information by simply choosing the level of
interest through the right manipulation of chorem components.
The paper has also presented a system prototype targeted at illustrating the potentiality of the introduced operations
and how users may exploit them in real scenarios. In particular, the initial prototype of the Chorem Visualization
System has been modified to support users’ interaction with chorematic maps meant to carry out analyses on the
represented spatio-temporal phenomena. Moreover, the prototype modules, responsible for the generation of the
visual representation of chorems have been slightly modified in order to fit the enhanced version of ChorML
The system prototype is currently evolving towards a more complete interactive system which encompasses a larger
variety of phenomenal chorems. It will be used in comparative experimental studies meant for the usability
assessment, which will evaluate ultimate users' capability to use chorematic maps for quick spatial analysis
activities. Also we plan to further investigate cognitive and semiotic aspects of chorems which could enhance users’
perception of the conveyed information.
At present, we are designing a mobile version of the prototype. In fact, two main features usually requested by
visualization methods of mobile interfaces are implicitly guaranteed by chorems, namely the strong simplification of
geographic data and the expressive enough summary of spatio-temporal phenomena. Thus, by exploiting these inner
characteristics it will be possible to develop a prototype to allow expert users to perform on-site visual analyses
through immediate and light solutions, without losing the communicative efficacy and the capability of investigation,
typical of chorematic maps. Moreover, based on such a mobile version, other experimental studies are planned,
addressed to verify that the proposed visualization technique is especially suitable for devices which have a limited
size and are often used for outdoor spatial analysis activities.
References [1] G. Andrienko, N. Andrienko, J. Dykes, S. I. Fabrikant, M. Wachowicz, Geovisualization of dynamics, movement and change:
key issues and developing approaches in visualization research. Information Visualization, 7(3-4):173-180 Palgrave
Macmillan, (2008).
[2] G. Andrienko, N. Andrienko, P. Jankowski, D. A. Keim, M.-J. Kraak, A. M. MacEachren, S. Wrobel, Geovisual analytics for
spatial decision support: Setting the research agenda. International Journal of Geographical Information Science 21(8): 839-
857 (2007).
[3] G. Andrienko, M. Jern, J. Dykes, S. I. Fabrikant, C. Weaver, Geovisualization and synergies from InfoVis and Visual
Analytics in Proceedings of the 11th International Conference Information Visualization IV 2007, IEEE Computer Society
Press, pp. 485-488, (2007).
[4] L. Arreghini, La modélisation graphique dans la réalisation des atlas pour le développement. Journées Géographiques de
l'ORSTOM, 11-12/09/1995, Maison de la Géographie, Montpellier, France. (1995)

[5] C. Batardy, Le Berry antique - De la carte au modèle-chorème, Revue Archéologique du Centre de la France, Tome 43, 2004
pp. 253-258.
[6] B. Bederson, J. Hollan, K. Perlin, J. Meyer, D. Bacon, and G. Furnas. Pad++: A Zoomable Graphical Sketchpad for
Exploring Alternate Interface Physics. In J. of Visual Languages and Computing, 7, 1996, pp. 3-31.
[7] B. Bederson, J. Meyer, L. Good, Jazz: An Extensible Zoomable User Interface Graphics Toolkit in Java. In Proc. UIST
2000, 2(2), pp. 171-180, (2000).
[8] R. Brunet, La carte-modèle et les chorèmes. Mappemonde. (1986). 4: 4–6,
[9] R. Brunet, La Corse, région d’Europe. Mappemonde. (2004). 4: 1-16.
[10] P. Caron, Modélisation graphique et chorèmes: la gestion des parcours collectifs à Massaroca (Brésil du Nordeste),
Mappemonde, Issue 62, 2001 pp. 17-21
11] K. Chang, Introduction to Geographic Information System, 4th Edition. McGraw Hill (2007).
[12] T. F. Chan, J. Shen, Image Processing and Analysis - Variational, PDE, Wavelet, and Stochastic Methods Society for
Industrial and Applied Mathematics (SIAM). Philadelphia, PA. 2005. xxii + 400 pages. ISBN 0-89871-589-X. (2005).
[13] I. Cherni, K. Lopez, R. Laurini, S. Faiz, Un langage et un générateur pour représenter les résumés visuels de bases de
données géographiques, 7ème Atelier Fouille de Données Complexes dans un processus d’extraction de connaissances.
Complexité liée aux données multiples, pp. 103-114. (2010).
[14] A. Coimbra, Chorml: Xml extension for modeling visual summaries of geographic databases based on chorems. Master's
thesis, INSA-Lyon, 2008.
[15] B. Craft, P. Cairns, Beyond Guidelines: What Can We Learn from the Visual Information Seeking Mantra? Proceedings of
the Ninth International Conference on Information Visualization (IV05), pp. 110-118 (2005).
[16] D. De Chiara, V. Del Fatto, R. Laurini, M. Sebillo, G. Vitiello “Visual Analysis of Spatial Data through Maps of Chorems”,
in Proceedings of the 15th International Conference on Distributed Multimedia Systems – Workshop on Visual Languages
and Computing VLC2009, San Francisco (USA), 10-12 September 2009. KSI Skokie Illinois, pp. 295-300.
[17] V. Del Fatto,Visual Summaries of Geographic Databases by Chorems. PhD thesis, (2009).
[18] V. Del Fatto, R. Laurini, K. Lopez, M. Sebillo, G. Tortora, M. Tucci, G. Vitiello, "Chorem Editing - Visual Summary of
Spatial Database Content", in Proceedings of International Workshop on Visual Languages and Computing, 6-8 September
2007, San Francisco USA. pp. 256-259.
[19] V. Del Fatto, R. Laurini, K. Lopez, M. Sebillo, G.Vitiello, A chorem-based approach for visually synthesizing complex
phenomena, in Journal of Information Visualization, vol. 7, n.3, pp. 253-264. (2008).
[20] D. H. Douglas and T. K. Peucker, Algorithms for the reduction of the number of points required to represent a digitized line
or its caricature. Canadian Cartographer, 10 (1973) :112-122
[21] J. Dykes, A. M. MacEachren, Exploring Geovisualization, Pergamon ISBN: 0080445314. (2005).
[22] G. Dang, C. North, B. Shneiderman, Dynamic queries and brushing on choropleth map, Technical report, Human-
Computer Interaction Lab & Department of Computer Science, (2003).
[23] D. Ebner, G. Klau, R. Weiskircher. Label number maximization in the slider model. In: Pach J. (ed). Proceedings of the
12th International Symposium on Graph Drawing (GD'04). Institut für Computergraphik und Algorithmen. Technische
University Wien: New York, 2004; pp. 144–154.
[24] M. Egenhofer, J. Richards, Exploratory access to geographic data based on the map-overlay metaphor, Journal of Visual
Languages and Computing 4, 2, (1993) 105-125..

[25] K. Hinum, Gravi++ An Interactive Information Visualization for High Dimensional, Temporal Data, PhD Dissertation,
Vienna University of Technology, (2006).
[26] D. C. Hoaglin, F. Mosteller, J. W. Tukey, Understanding Robust and Exploratory Data Analysis. ISBN 0-471-09777-2.
(1983).
[27] O. Huisman, I. F. Santiago, B. Retsios, M. J. Kraak, Development of a geovisual analytics environment for investigating
archaeological events based upon the space - time Cube, Extended abstract for GIScience Geovisual Analytics Workshop 23
September 2008 , Park City, Utah, USA. (2008).
[28] International Cartographic Association Web Site, < http://geoanalytics.net/ica >. Accessed January 2011.
[29] International Cartographic Association, Commission on Visualization and Virtual Environments, Web Site,
<http://kartoweb.itc.nl/icavis/index.html >. Accessed July 2010
[30] P. Jankowski, N. Andrienko, G. Andrienko, Map-centred exploratory approach to multiple criteria spatial decision making,
International Journal of Geographical Information Science 15(2): 101-127 (2001).
[31] B. Jiang, Z. Li, Editorial: Geovisualization: Design, Enhanced Visual Tools and Applications. The Cartographic Journal,
42(1), pp. 3-4, (2005).
[32] D.A. Keim, Information Visualization and Visual Data Mining. IEEE Transactions on Visualization and Computer Graphics
Vol. 7, n° 1. (2002).
[33] D.A. Keim, F. Mansmann, J. Schneidewind, H. Ziegler, Challenges in Visual Data Analysis, Proceedings of Information
Visualization (IV 2006), IEEE, p. 9-16, (2006).
[34] Klippel, A., Tappe, H., Kulik, L., and Lee, P. U. 2005. Wayfinding choremes-a language for modeling conceptual route
knowledge. J. Vis. Lang. Comput. 16, 4 (Aug. 2005), 311-329. Website, <http://dx.doi.org/10.1016/j.jvlc.2004.11.004>.
Accessed: January 2011.
[35] M.J. Kraak, "Geovisualization illustrated", ISPRS journal of photogrammetry and remote sensing. 57 390- 399 ISSN 0924-
2716. (2003).
[36] M.J. Kraak, "Visualization Viewpoints" Theresa-Marie Rhyne ed., July/August 2006, IEEE Computer Society. (2006).
[37] D. A. Keim, J. Schneidewind, M. Sips, Circleview – a new approach for visualizing time related multidimensional data sets.
In ACM Advanced Visual Interfaces (AVI). Association for Computing Machinery (ACM), ACM Press (2004).
[38] P.A. Longley, M.F. Goodchild, D.J. Maguire, D.W. Rhind, Geographic Information Systems and Science, Wiley. (2001)
[39] Laurini, F. Milleret-Raffort, K. Lopez, A Primer of Geographic Databases Based on Chorems. Workshop on Reliability in
Decentralized Distributed Systems (RDDS) LNCS 4278, pp. 1693 – 1702, 2006. © Springer-Verlag Berlin Heidelberg.
(2006).
[40] R. Laurini, D. Thompson, Fundamentals of Spatial Information Systems, Academic Press, New York, NY (1992).
[41] D. Modjeska. Navigation in Electronic Worlds: A Research Review, Technical Report. Computer Systems Research Group,
University of Toronto, (1997).
[42] A.M. MacEachren, Geovisualization for knowledge construction and decision support. IEEE computer graphics and
applications, 24(1), pp.13-17. (2004).
[43] A.M. MacEachren, M.J. Kraak, Exploratory cartographic visualization: advancing the agenda. Computers & Geosciences,
23(4), pp. 335-343. (1997).
[44] A.M. MacEachren, M.J. Kraak, Research challenges in geovisualization. Cartography and Geographic Information Systems
28 1, pp. 3-12. (2001).

[45] C. P. Lo, A.K.W. Yeung, Concepts and Techniques of Geographic Information Systems, Prentice Hall, Inc., Upper Saddle
River, NJ, USA. (2006).
[46] U. Ramer. An iterative procedure for the polygonal approximation of plane curves. Computer Graphics and Image
Processing, 1(3):244{256, November 1972.
[47] T. M. Rhyne, A. MacEachren, J. Dykes, Guest Editors' Introduction: Exploring Geovisualization. IEEE Computer Graphics
and Applications 26(4), 20-21. (2006).
[48] E. Rundensteiner, M. Ward, J. Yang, P. Doshi, XmdvTool: Visual Interactive Data Exploration and Trend Discovery of
High-dimensional Data Sets. In Proc. ACM SIGMOD 2002, (2002).
[49] A. Silberschatz and A. Tuzhilin, 1995. On Subjective Measures of Interestingness in Knowledge Discovery. In Proceedings
of KDD-95: First International Conference on Knowledge Discovery and Data Mining, pp. 275-281, Menlo Park, CA: AAAI
Press.
[50] S. J. Simoff, M. H. Böhlen, A. Mazeika, Visual Data Mining: Theory, Techniques and Tools for Visual Analytics. Springer-
Verlag, (2008).
[51] A. Slingsby, J. Dykes, J. Wood, Using treemaps for variable selection in spatio-temporal visualisation, Information
Visualization, vol. 7, no. 3-4, pp. 210-224, (2008).
[52] C. Steed, P. J. Fitzpatrick, T. Jankun-Kelly, J.E. Swan, Practical North Atlantic Hurricane Trend Analysis Using Parallel
Coordinates and Statistical Techniques. In Proceedings of the 2008 Workshop on Geospatial Visual Analytics. Park City,
UT, (2008).
[53] B. Shneiderman, Dynamic Queries for Visual Information Seeking, in IEEE Software, 11(6): 70-77, (1994).
[54] B. Shneiderman, The Eyes Have It: A Task by Data Type Taxonomy for Information Visualizations. In Proceedings of the
1996 IEEE Symposium on Visual Languages, pages 336-343. (1996).
[55] S. K. Card, J.D. Mackinlay, B. Shneidermann, Reading in Information Visualization: Using Vision to Think. San Francisco:
Morgan Kaumann Publishers. (1999).
[56] T. Stephens. A Passion for Metadata – An Interview with Todd Stephens of BellSouth, Wilshire Conferences, Inc., (2000)
Web Site, <http://www.wilshireconferences.com/interviews/Stephens.htm>. Accessed October 2010.
[57] D. Thalmann, Scientific Visualization and Graphics Simulation. Wiley. (1990).
[58] J.J. Thomas, K. A. Cook, Illuminating the Path – The Research and Development Agenda for Visual Analytics, National
Visualization and Analytics Center TM. IEEE 2005. (2005).
[59] T. Waldo, Experiments in migration mapping by computer. Cartography and Geographic Information Science, 14:155-
163(9), April 1987.
[60] Tobler’s Flow Mapper , Center for Spatially Integrated Social Science, Web site, <
http://www.csiss.org/clearinghouse/FlowMapper/> Accessed January 2011.
[61] USA maps, Web Site < http://lettres-histoire.info/lhg/geo/geo_usa/cartes_usa_geo.htm> Accessed January 2011.
[62] Visual Information-Seeking Mantra, Infovis Web Site, <http://www.infovis-wiki.net/index.php/Visual_Information-
Seeking_Mantra >. Accessed January 2011.
[63] G. Watson, Lecture 15 - Visualisation of Abstract Information. Edinburgh Virtual Environment Centre. Web Site
<http://www.infovis-wiki.net/index.php/Semantic_Zoom>. Accessed January 2011.
[64] A. Woodruff, C. Olston, A. Aiken, M. Chu, V. Ercegovac, M. Lin, M. Spalding, M. Stonebraker, DataSplash: A Direct
Manipulation Environment for Programming Semantic Zoom Visualizations of Tabular Data. J. of Visual Languages and
Computing, Special Issue on Visual Languages for End-user and Domain-specific Programming, 12(5), pp. 551-571. (2001)