
National Design and Multinational Integration of Balancing ...
164
1 National Design and Multinational Integration of Balancing Services Markets
-
Upload
khangminh22 -
Category
Documents
-
view
0 -
download
0
Transcript of National Design and Multinational Integration of Balancing ...

1
National Design and Multinational
Integration of Balancing Services Markets

2

3
National Design and Multinational
Integration of Balancing Services Markets
PROEFSCHRIFT
ter verkrijging van de graad van doctor
aan de Technische Universiteit Delft,
op gezag van de Rector Magnificus prof. ir. K.C.A.M. Luyben,
voorzitter van het College voor Promoties,
in het openbaar te verdedigen
op maandag 17 september 2012
Alireza ABBASY
Bestuurskundig ingenieur
geboren te Tehran, Iran.

4
Dit proefschrift is goedgekeurd door de promotor: Prof. dr. ir. M.P.C. Weijnen Copromotor: Dr. ir. R.A. Hakvoort Samenstelling promotiecommissie: Rector Magnificus voorzitter Prof. dr. ir. M.P.C. Weijnen Technische Universiteit Delft, promotor Dr. ir. R.A. Hakvoort Technische Universiteit Delft, copromotor Prof.dr.J.P.M.Groenewegen Technische Universiteit Delft Prof. dr. ir. G.L. Doorman Norges Teknisk-Naturvitenskapelige Universitet Prof. dr. R. Belmans Katholieke Universiteit Leuven
Prof. dr. c Technische Universiteit Delft/Carnegie Mellon University Prof. dr. G. Strbac Imperial College London ISBN 978-90-79787-37-1 Published and distributed by: Next Generation Infrastructures Foundation P.O. Box 5015, 2600 GA Delft, The Netherlands Phone: +31 15 278 2564 Fax: +31 15 278 2563 E-mail: [email protected]
Website: http://www.nextgenerationinfrastructures.eu This research was funded by the Next Generation Infrastructures Foundation and Delft University of Technology, was part of the international research project ‘Ba ance anagement n u t nat ona Power arkets’, and was supported by TenneT TSO B.V. Keywords: balance management, electricity markets, balancing market, market design, market integration Printing: Gildeprint drukkerijen, Enschede
Copyright © 2012 by Alireza Abbasy Some rights reserved. This work is licensed under the Creative Commons Attribution- Noncommercial-Share Alike 3.0 Netherlands License. To view a copy of this license, visit http://creativecommons.org/licenses/by-nc-sa/3.0/nl/ or send a letter to Creative Commons, 171 Second Street, Suite 300, San Francisco, California, 94105, USA. Author’s email: [email protected]

5

6
Acknowledgements
By finishing this book, an exceptional period in my life comes to an end. I started my
Ph when was 26, and today, ’m a d fferent person than was n 2008 When moved to
the Netherlands, everything was new, and my curiosity immense, so I took every opportunity
to experience, I devoured everything that life had to offer, I met so many different people
from all around the globe, went to many places for the first time, I had fun and I went
through hard times, occasionally I felt completely lost, both scientifically and non-
scientifically, however I see my years as a PhD researcher in TUDelft as an invaluable
experience that had a huge influence on me for the rest of my life.
In my research, I would like to firstly thank my promoter, professor Margot Weijnen,
and my co-promoter, dr. Rudi Hakvoort. I, just like other PhD researchers in our section,
adm re argot’s nte gence and her ab ty to see the big picture, but in addition to that, I think
of her as a real intellectual. I thank Rudi for his support especially in the beginning of the
journey, when everything was confusing and blurry, and also for all his helpful input that he
gave me over time about the course of the research and where to go next. I would also like to
thank him particularly for giving me his analogue SLR camera as a gift; that incident actually
changed the course of my life.
I would like to thank our partners in Norway, whose efforts and ideas really enriched
our research; professor Gerard Doorman and his research team Hossein Farahmand and
Stefan Jaehnert, in NTNU Trondheim, and Ove Grande from SINTEF Research who also
led the management of the project.
My very special thanks to Reinier van der Veen. We got to know each other only
because we were colleagues and working on the same project, but over time, a valuable
friendship started to grow between us, which surely will exist long after the end of our PhDs.
In the past few years, I enjoyed the company of so many young, intelligent and modest
individuals, most of them from the E & I section. I need to thank Laurens for his scientific
discussions as well as practical hints about how to live in Holland. Sharad, Catalin, Behzad,
Andreas, Amineh, Catherine, and Jooli, thank you all for your friendship.
And lastly, I want to thank my wonderful parents, my sweet sister Golnar and my little-
but-wise brother Behzad. Thank you so much for everything, including your amazing sense
of humor. Living far from your family, friends and city is not as easy as it may sound.
Alireza Abbasy,
Amsterdam, August 2012

7

8
Contents
1. Overview of balancing markets
1.1. The electricity sector and ancillary services
1.2. Definition of ‘balancing’ in electricity grids
1.3. Definition of balancing services
1.4. Components of balancing markets
1.4.1. Balancing service procurement
1.4.2. Balance responsibility
1.4.3. Balance settlement
1.5. Balancing services markets
1.6. Balancing market integration (EU context)
2. Research framework
2.1. The “Ba ance anagement n u t nat ona Power
arkets” project
2.2. Focus of the research
2.3. Research questions
2.4. Phase one – national design
2.5. Phase two – multinational design
3. Exploring the design space of balancing services markets
3.1. Introduction
3.2. Design variables
3.2.1. Definition of balancing services
3.2.2. Capacity and/or energy markets
19
20
21
21
24
24
25
25
26
28
30
31
32
33
34
35
37
38
38
39
39

9
3.2.3. Reserve requirements
3.2.4. Timing of markets
3.2.4.1. Timing of the bidding procedure
3.2.4.2. Timing of the markets clearance
3.2.5. Method of procurement
3.2.6. Pricing mechanism
3.3. Performance criteria
3.3.1. Operational security
3.3.2. Incentive compatibility
3.3.2.1. Transparency
3.3.2.2. Efficiency
3.3.2.3. Liquidity
3.3.2.4. Accuracy of balance planning
3.4. Current literature review on analysis of the design
variables
3.5. Conclusions
4. Reserve requirements and timing of markets
4.1. Introduction
4.2. Case studies
4.2.1. Germany
4.2.2. The Netherlands
4.3. Reserve requirements
4.4. Timing of reserve capacity markets
4.4.1. Bid prices
4.4.2. Excess supply ratios
40
41
41
42
43
43
44
45
45
45
45
46
47
47
50
51
52
52
52
54
55
59
59
62

10
4.4.3. Conclusions
4.4.4. Arguments against short-term markets
4.5. Timing of balancing energy markets
4.6. Conclusions
5. Coordination of timing of reserve capacity and day-ahead markets
5.1. Introduction
5.2. Agent-based modeling, motivation
5.3. Agent-based modeling, concepts and procedure
5.4. Agent-based modeling, various methods
5.5. The basic logic of the model
5.6. Inputs and parameter settings
5.7. Model results
5.8. Shortage of reserves
5.9. Discussion
5.10. Conclusions
6. Integration of reserve capacity markets
6.1. Introduction
6.2. s the ‘mu t nat ona arrangement’ the ma n concern?
6.3. Lost opportunity as a result of interconnection
capacity reservation
6.3.1. Year 2009
6.3.2. Year 2010
6.4. Is interconnection capacity reservation generally
wrong?
6.5. Are we arguing for more complexity?
66
68
70
75
76
77
78
78
79
82
83
85
89
92
93
95
96
96
98
99
102
105
108

11
6.6. Market integration, reform on a national level
6.7. Wind and future
6.8. Conclusions
7. Integration of balancing energy markets
7.1. Introduction
7.2. Basic ACE netting
7.3. Main aspects of balancing energy markets integration
7.4. BSP-TSO trading
7.4.1. Norway-Netherlands
7.4.2. Norway-Germany
7.4.3. Conclusions
7.4.4. Low reservoir levels in Norway
7.5. TSO-TSO trading
7.6. BSP-TSO or TSO-TSO
7.7. Restricted BSP-TSO
7.8. Practical complications
7.8.1. Bidding frequency
7.8.2. Coordination of imbalance settlement
7.9. Conclusions
8. Summary and policy recommendations
8.1. Critical characteristics of balancing markets
8.2. Short and long term view
8.3. Long-term view: national reforms
8.3.1. National reforms for northern Europe
108
110
110
112
113
113
114
116
117
123
127
127
130
131
132
133
133
134
135
136
137
137
137
138

12
8.3.2. How to stimulate reforms?
8.4. Short-term view: limited cross-border exchanges
8.4.1. Integration of reserve capacity markets
8.4.2. Integration of reserve capacity markets in northern
Europe
8.4.3. Integration of balancing energy markets
8.4.4. Integration of balancing energy markets for in
northern Europe
8.5. Notes on further research
Bibliography
Appendix
Curriculum Vitae
NGInfra PhD thesis series on infrastructures
139
140
140
140
141
142
142
145
152
158
160

13
List of figures
Figure 1. 1. three components of balancing markets
Figure 1. 2. Schematic view of balancing services markets: balancing energy and reserve capacity markets
Figure 3. 1. The design variables (divided into three main levels) and their interrelations
Figure 3. 2. Performance criteria in design of balancing services markets
Figure 4. 1. Yearly and monthly reserve requirements for secondary control in the Netherlands based on the system load in 2009
Figure 4. 2. Daily reserve requirements for secondary control in the Netherlands based on the system load in 2009
Figure 4. 3. Peak and off-peak reserve requirements for secondary control in the Netherlands based on the system load in 2009
Figure 4. 4. Average selected capacity bid prices for primary control, Germany 2009
Figure 4. 5. Average selected capacity bid prices of the fours monthly auctions for secondary control, Germany 2009
Figure 4. 6. Average selected capacity bid prices of the 12 daily auctions for tertiary control, Germany, 01-09-2009, Tuesday
Figure 4. 7. Average selected capacity bid prices of the 12 daily auctions for tertiary control, Germany, 06-09-2009, Sunday
Figure 4. 8. Excess supply ratios in the German auctions for Positive secondary control reserves (peak ad well as off-peak), beginning from January 2010
Figure 4. 9. Excess supply ratios in the German auctions for Negative secondary control reserves (peak ad well as off-peak), beginning from January 2010
Figure 4. 10. Average selected positive secondary control energy bid prices (peak
and off-peak hours) compared to the monthly average intraday prices for Germany
in 2009
Figure 4. 11. Average selected positive secondary control energy bid prices (peak and off-peak hours) divided by the monthly average intraday price for Germany in 2009
Figure 4. 12. The average hourly intra-day market prices in Germany and the Netherlands for 2009
26
27
38
44
57
57
58
60
60
61
62
63
64
70
71
71

14
Figure 4. 13. Comparison of the monthly average of the last energy bid price for positive secondary control in the Netherlands and Germany (peak and off-peak)- 2009
Figure 4. 14. The last energy bid price for positive secondary control in Germany (Peak hours) and the last bid price in the Netherlands- December 2009
Figure 5. 1. Cumulative distribution of the un ts’ operat ng costs
Figure 5. 2. Final market clearing price of the DA market for Case A, as a function of the critical cost level used for distinguishing between risk-averse and risk-prone units
Figure 5. 3. Real and simulated day-ahead market prices in Germany 2009
Figure 5. 4. Market clearing prices (MCPs) of (a) the DA market and (b) the RC market for the three cases- assum ng a cr t ca cost eve of 40 €/ Wh
Figure 5. 5. Individual bid prices of unit #43 in Case A- (a) DA bid price (b) RC bid price
Figure 5. 6. Individual bid volumes of unit #43 in Case A
Figure 5. 7. Market clearing prices (MCPs) of the DA market (left) and the RC
market (right) for the three cases- assum ng the cr t ca cost eve to be 44 €/ Wh
( nstead of 40 €/ Wh)
Figure 5. 8. Market clearing prices of (a) the DA market and (b) the RC market for the three cases (Cr t ca cost eve of 40 €/ Wh)- Distinction made between SC and TC reserves
Figure 5. 9. Offered volumes in the reserve capacity market for cases B and C, as the demand in the day-ahead market increases
Figure 6. 1. Prices in the RKOM market (reserve capacity market in Norway) for the
three Norwegian areas, 2009
Figure 6. 2. Monthly reserve capacity prices (upward) for peak and off-peak hours in Germany, 2009
Figure 6. 3. Difference in reserve capacity prices between Norway and Germany, peak and off-peak hours, 2009
Figure 6. 4. Day-ahead prices in Norway and Germany, January 2009
Figure 6. 5. Lost opportunity cost (in the day-ahead market) as a result of reservation of interconnection capacity (from Norway to Germany) on a monthly basis, for peak and off-peak hours
72
74
84
84
85
86
87
87
89
90
91
99
100
100
101
101

15
Figure 6. 6. Prices in the RKOM market (reserve capacity market in Norway) for the southern Norway (NO A), 2010
Figure 6. 7. Monthly reserve capacity prices in Germany, for peak and off-peak hours, 2010
Figure 6. 8. Lost opportunity cost (in the day-ahead market) as a result of reservation of interconnection capacity (from Norway to Germany) on a monthly basis, 2010
Figure 6. 9. Monthly price differences in the reserve capacity markets between Norway and Germany (peak and off-peak hours), 2010
Figure 6. 10. Monthly average day-ahead prices for Norway and the Netherlands, 2009
Figure 6. 11. The lost opportunity cost (in the day-ahead market) as a result of reservation of interconnection capacity (from Norway to the Netherlands) on a monthly basis, for peak and off-peak hours, 2009.
Figure 7. 1. Average day-ahead prices for Norway and the Netherlands, 2009.
Figure 7. 2. Upward regulation prices in the Netherlands for three available interconnection capacity values- Off-Peak hours
Figure 7. 3. Upward regulation prices in Norway for three available interconnection capacity values- Off-peak hours
Figure 7. 4. Downward regulation prices in the Netherlands for three available interconnection capacity values- Peak hours
Figure 7. 5. Downward regulation prices in Norway for three available interconnection capacity values- Peak hours
Figure 7. 6. Upward regulation prices in Germany for four available interconnection capacity values- Peak hours
Figure 7. 7. Upward regulation prices in Germany for full interconnection capacity available (1700 MW)- peak hours
Figure 7. 8. Price reductions as a result of importing upward regulation from Norway - Peak hours
Figure 7. 9. Upward regulation prices in Norway for different available interconnection capacity values- Peak hours
Figure 7. 10. Downward regulation prices in Germany for different available interconnection capacity values- Peak hours
Figure 7. 11. Downward regulation prices in Germany when 800MW interconnection is available- Peak hours
103
103
104
104
107
107
117
119
120
121
122
124
124
125
125
126
126

16
Figure 7. 12. Price reductions as a result of exporting downward regulation to Norway- Peak hours
Figure 7. 13. Upward regulation prices (in peak hours) in the Netherlands for two available interconnection capacity values, using the 2010 data (dry year in Norway)
Figure 7. 14. The amount of balancing exchanges (upward, for peak hours) between the Netherlands and Norway for the case of a dry year (2010)
Figure 7. 15. Upward regulation prices (in peak hours) in Germany for two available interconnection capacity values, using the 2010 data (dry year in Norway)
Figure 7. 16. Amount of balancing exchanges (upward, for peak hours) between Germany and Norway for the case of a dry year (2010)
127
128
129
129
130

17
List of tables
Table 1.1. Comparison of the definitions of balancing services in different countries
Table 3. 1. Time horizon of the bidding procedure of the reserve capacity markets
for different types of balancing services- different systems
Table 3. 2. Methods of reserve capacity procurement for different types of balancing
services used in different systems
Table 3. 3. Qualitative comparison of different procurement methods using the
identified performance criteria
Table 4. 1. Summary of the characteristics of balancing services markets in Germany
Table 4. 2. Summary of the characteristics of balancing services markets in the
Netherlands
Table 4. 3. Excess supply ratios (in percentage) of the four auctions for secondary
control- Germany 2009
Table 4. 4. Number of pivotal suppliers in the auction for positive secondary
control in off-peak hours- Germany 2009
Table 4. 5. Number of pivotal suppliers in the auction for positive secondary
control in peak hours- Germany 2009
Table 4. 6. Percentage of the time in which the market passes the pivotal supplier
tests- Positive secondary control for peak hours, Germany 2009
Table 4. 7. Excess supply ratios (in percentages) of the 12 auctions of tertiary
control in Germany- 01-09-2009
Table 5. 1. Total offered volumes (in MW) in the DA and RC markets for the three
cases- For a cr t ca cost eve of 40 €/ Wh
24
41
43
49
54
55
62
64
65
65
66
88

18

19
1. Overview of Balancing Markets

20
1.1. The electricity sector and ancillary services
Since power systems are aimed to deliver a very essential good to the society
(electricity), traditionally, states used to own and have control over everything from
generating the electricity, to transmitting, and distributing it. Traditionally, on the one side,
there were consumers of electricity, and on the other side, a huge state-owned entity who did
everything to make sure that the consumer will receive its electricity. After privatization of
almost all parts of the electricity sector, unbundling of the three basic components of power
systems (generation, transmission and distribution), and introduction of markets, everything
changed in the electricity industry. The process was justly called restructuring of the sector.
Now, electricity (electric energy) is being traded in various markets. Long-term bilateral
contracts are widely used and make for a very significant share of the entire power trades,
because these contracts bring stability to both the generator and the consumer; they can be
protected from price volatilities in other markets. Day-Ahead auctions are short-term auctions
for trading of electricity on a day-ahead basis, and can make up for a considerable share of all
power trades in a system. Additionally, Intra-Day auctions are hourly auctions that run during
the operating day. Through these auctions, energy can still be traded up to a short time
(usually one hour) before the real-time, and thus these markets are used for fairly small
adjustments.
These markets and their interrelations build the structure of the liberalized electricity
sector today. Next to these markets, which are all meant to create a platform for wholesale
trades of (electric) energy, in order for the system to work in a secure way, further actions need
to be taken. Security refers to the short-term resilience of the system to respond to standard
short run disturbances [1-3]. The need to satisfy system security has led many countries to
define certain services, generally known as Ancillary Services (simply because they are
complementary for the energy product) [4]. These services include voltage support (reactive
power control), black start capability, and all the services related to balancing generation and
consumption in the system. Since the balance between generation and consumption is
directly related to system frequency, this category of ancillary services is also known as
Frequency control. Frequency control maintains load and generation in balance in real time and
is most of the time divided into several other services of different qualities [1]. These services,
which are generally known as balancing services (representative of their purpose), are the main
focus of this dissertation.
In the following of the first chapter, the definition and objective of these services are
discussed and the structure of the markets used for procurement of these services is
presented. More importantly, we describe how these services (and their markets) fit in a more
comprehensive mechanism usually known as Balance Management Mechanism.

21
1.2. Definition of ‘balancing’ in electricity grids
According to the non-storable nature of electricity (a main difference between
electricity and other conventional commodities), the amount of electric power produced must
equal the amount of power consumed in a power system at every moment [5, 6]. The balance
between electricity supply and demand has a close relationship with the frequency of the
entire system. Imbalances can occur due to a wide variety of reasons: load forecast errors,
generation outages, intentional deviations from energy plans, etc. Any imbalance between
production and consumption will lead to frequency deviations from the synchronous
frequency of the system, which in turn can result in serious system stability problems and
equipment damage. Therefore, balancing production and consumption in a power system
plays a critical role in ensuring the security of the entire electric grid.
n the new bera zed power systems ntroduced n the ear y 90’s, the task of operat ng
the system in a secure and reliable way is the responsibility of the Transmission System
Operator (TSO). In order to fulfill its responsibility of balancing the system, the TSO needs
to have access to power resources able to change their generation/consumption in real time
on a short notice, to regulate the system up/down and to restore the system balance. The
TSO also needs slower-response resources in order to replace the faster ones and to free up
their capacity so that they can be used again. These services offered mainly by generators with
free capacity (and also large consumers in some cases), are called “ba anc ng serv ces”, wh ch
are the means of balancing the system used by the system operator [5, 7, 8].
In order to procure these services, the system operator has a wide range of options,
from purely mandatory approaches (in which the provision of the service by generators is
obligatory) to free market-based approaches in which service providers are free to decide on
the capacity they offer and the price they ask for their service. This entire mechanism, which
includes the system operator on the one hand and generators on the other hand is called
Balance Management Mechanism, which may include “markets” as well.
1.3. Definition of balancing services
As described above, the final objective of the balance management mechanism is to
mainta n system’s frequency at ts nom na value. Therefore, in many countries, the balance
management mechanism is also known as the Frequency Control Service. Categorization of
balancing services varies widely in different countries. Balancing services can be divided into
different types based on various criteria such as their activation time (response speed), the
method of activation (manual/automatic), the minimum deployment time, and the state of
the service compared to the system (synchronous/non-synchronous). Therefore, there is no
general consensus on categorization of balancing services. Definitions are different in
different countries because of the differences in the dominant generation portfolio,
techno og es used n the contro systems, regu ators’ po c es, h story, etc However,
regardless of the differences in terminologies used in different systems, based on the
objectives of activation of the services and the general response speeds, three main types of

22
services that are used to maintain the balance between load and generation can be identified
in all power systems according to [9, 10]. We use the general UCTE (Union for the
Coordination of Transmission of Electricity) terminologies here [11]:
• Primary Control Service
Primary control is a local automatic control that adjusts the active power generation of
generating units to quickly restore the balance between generation and consumption within
the synchronous area, using turbine speed or turbine governors. In particular this control is
designed to stabilize frequency after large generation or load outages, and therefore it is
indispensable for the stability of the system. The activation time of this service is in the time
frame of several seconds, less than 30 seconds. The primary control capacity that is used
must be replaced (freed up) by other resources in order to ensure that there is enough
primary control capacity available to respond to frequency deviations in the future. Primary
control is performed on generators based on the automatic frequency response defined by
the droop setting on each generating set.
• Secondary Control Service
Secondary contro restores the ba anc ng area’s frequency and nterchanges w th other
areas to their target values following an imbalance, without impairing the primary control that
is operated in the synchronous system in parallel but by a margin of seconds. While primary
control limits frequency deviations and stops them from growing, secondary control brings
the frequency back to its nominal value. Secondary control makes use of a centralized
generation control, modifying the active power set points/adjustments of the generation sets
in the time frame of seconds to typically around 15 minutes. In other words, secondary
control is required to change the output (set point) of the balancing resources so that the
total production (or consumption) can be achieved within 15 minutes [11, 12]. In North
America and continental Europe (the UCTE system), Automatic Generation Control (AGC)
is used as the central control for secondary control resources. The marketplace that the
system operator employs to procure this type of balancing service from the providers is
typically called “regulating power market” [13-16]. As the name of the market implies, the
serv ce that s traded n th s market s regu at ng power wh ch s used to regu ate system’s
generation up- or down-ward (up/down-ward regulation) in case of an imbalance.
• Tertiary Control Service
Tertiary control refers to manual changes in dispatch and commitment of generating
units. This service is procured by the system operators in order to free up activated
secondary and primary reserves, and also to relieve congestions in the transmission network.
Tertiary control resources may directly be used to restore the balance between generation and
consumption when secondary control is unable to maintain the balance (sufficient secondary
reserve is not available in case of large contingencies). The activation time of the tertiary
control service varies from several minutes to hours.

23
As mentioned above, there is no general consensus on the definition of balancing
services. Here, we present the definitions used in North European countries which are
actually the main case study of this research.
In the Nordic system, the following definitions are used [12, 17]:
• Frequency controlled normal operating reserves (FCNOR) are automatically activated
reserves used for handling small frequency deviations that occur during the operational hour.
• Frequency controlled disturbance reserves (FCDR) are reserves automatically activated by
sudden frequency fall caused by grid or production failure.
• Fast active disturbance reserves (FADR) are the manual reserve available within 15
minutes in the event of the loss of an individual principal component (production unit, line,
transformer, bus bar, etc.) and restores the FCDR.
In the Netherlands, the following definitions of balancing services are used [12, 18, 19]:
• Regulating power is continuously controllable and is used for controlling the
instantaneous system balance. It is procured by the TSO on contract with certain producers,
who through the contracts are obliged to offer this capacity. Other parties may also offer
regulating bids. “Regu at ng power” n the Nether ands perfect y f ts the UCTE def n t on of
secondary control.
• Reserve power can be used for restoring the control area balance. Reserve power is
primarily used to alleviate transmission constraints. It may sometimes be used to free some
regulation capacity for frequency regulation. Being manually activated with low response
speeds, “reserve power” f ts nto the UCTE def n t on of tert ary contro
• Emergency power is used to re-establish the system balance when there is insufficient
regulating or reserve power. It is procured through contracts with certain producers or
consumers as load shedding capability. Emergency power can be seen as the last resort, and
by UCTE standards it is slow tertiary control.
In Germany, the same definitions as in UCTE are used for balancing services, only the
Tertiary Control service is called Minutes Reserves [12, 20, 21]. Table 1. 1 summarizes the
differences in definition of balancing services in Northern Europe. The definitions in PJM
Interconnection are also added for the sake of comparison [15, 16]. The services in one
column have the same technical characteristics (response speed), but their method of
activation can be different (manual or automatic). For example, FADR in the Nordic system,
in terms of the response speed fits the UCTE definition of secondary control but the method
of activation is manual; there is no automatic generation control (AGC) in the Nordic system.

24
Table 1. 1. Comparison of the definitions of balancing services in different countries
UCTE Primary Control Secondary Control Tertiary Control
Netherlands Primary Reaction Regulating and
Reserve Power
Reserve Power
Emergency Power
Nordic System FCNOR FCDR FADR -
Germany Primary Control Secondary Control Minutes Reserves
PJM [22] Frequency Response Regulation Primary
Reserves
Secondary
Reserves
Reserve
Beyond 30
min
1.4. Components of balancing markets
The mechanism that system operators employ to procure balancing services may range
from a purely obligatory approach without any compensation for the services to a voluntary
approach based on free markets The term “ba anc ng market” has been widely used in
literature usually without a clear definition of its elements. In this dissertation, a “ba anc ng
market” s def ned as the “market-based balance management mechan sm” Therefore, a
balancing market is more than solely a single market, and it consists of different marketplaces
for the trade of different products (balancing services) used to balance the system, the system
operator being the single buyer in each of these markets. Based on this definition, a balancing
market also includes the procedure of allocating the costs of balancing the system (costs of
procuring the required balancing services) to the system users. In other words, a balancing
market includes purchasing of the required services by the system operator and also allocating
the resulting procurement costs to the parties who use the grid and benefit from system
security. In order to clarify the structure of a balancing market, its key components are
described in details in the following sections:
1.4.1. Balancing service procurement
The TSO procures the required amount of each balancing service from the
corresponding marketplace in order to resolve system imbalances. For each type of balancing
services, there can be two types of markets:
Reserve capacity markets are rather long-term opt on markets for “reserves” In
these markets, the TSO buys the reserves required for secure operation of the system. The
service providers (generators, and in some cases large consumers) offer their capacity in these
markets and if selected they have to leave that capacity free for the corresponding time period
and they will be compensated for “availability” of their service (“availability” or “capacity”
payment). In other words, they leave their capacity free so that if the system operator needs it
in real time it can be activated. Regardless of whether or not the capacity will be actually
activated, the reserve providers are compensated for making this capacity available (the basic
definition of “reserves”). The “demand” n th s market s the “reserve requ rement” of the
system, which is calculated based on technical characteristics of the system and shows the
minimum amount of reserves required for secure operation of the system.

25
Balancing energy markets are real-time markets through which the TSO procures
the required amount of (balancing) power that will compensate for the power imbalance
(production-consumption mismatch) in the system. Thus, in these markets, service providers
are compensated for the actual delivery of energy (“utilization” or “energy” payment). The
“demand” n th s market s the rea -time imbalance of the system.
As mentioned above, for each type of balancing services (primary, secondary, tertiary
control), a reserve capacity and/or a balancing energy market may exist in order to,
respectively, procure the required amount of reserve capacity to insure system security, and to
procure balancing energy to resolve imbalances in real-time. The need for establishment of
these markets for each type of balancing services highly depends on the characteristics of the
correspond ng serv ce and s a “des gn var ab e” of ba anc ng serv ces markets which will be
discussed in depth in the third chapter. The combination of all these different markets
const tutes the f rst component of a ba anc ng market, “ba anc ng serv ce procurement”
1.4.2. Balance responsibility
The system operator needs accurate generation, consumption, and trade “schedules” of
market parties beforehand in order to be able to ensure that operational constraints of the
system will be met and the system will work securely in real-time. The schedule of a party
shows the planned generation/consumption/trade of that party for the specified time period
(usually one hour). Needless to say, there can always be a mismatch or “ mba ance” (as a
result of forecast errors, an outage, etc.) between the scheduled (planned) portfolios and the
actual amount of generation, consumption or trade in real-time. These individual imbalances
const tute the “system mba ance” that w be resolved by activation of balancing energy in
the balancing energy markets. Balance Responsible Parties (BRPs) are market parties who
take over the responsibility of preparation and submission of schedules to the system
operator for all the parties under their control. A BRP can include generators, consumers,
and traders and submits one schedule for the entire portfolio under its control. A balance
responsible party is responsible for keeping the balance between its submitted schedule and
actual portfolio in real-time, and faces liability consequences ( n the form of an “ mba ance
charge”) if there is a mismatch. In other words, if a BRP has an imbalance (there is a
mismatch between its planned and actual portfolio), it will be charged with an imbalance
price. Construction of this imbalance price involves the third component of balancing
markets described in the next section.
1.4.3. Balance settlement
Balance settlement is the procedure of allocating the costs of balancing the system,
incurred by activation of balancing energy bids, to the balance responsible parties with an
imbalance (deviation from their submitted schedules). Therefore, the balance settlement
procedure determines the imbalance price with which the parties with an imbalance will be
charged. This imbalance for each BRP is the difference between its scheduled/planned
energy volume and its metered energy volume, and it can be either positive or negative. The

26
imbalance price is based on the balancing costs that are determined by the activated bids in
the balancing energy markets. In other words, the individual imbalances of BRPs form the
system imbalance, and the TSO buys balancing energy (in the balancing energy markets) by
activating bids of the service providers to resolve this system imbalance. Then based on the
price the TSO pays the service providers in the balancing energy market, the imbalance price
is calculated with which the BRPs who created the system imbalance are charged. Calculation
of the imbalance price involves many details and can be performed in a highly complex way.
Since it is not the focus of this research, we refer the interested reader to the current literature
on the different aspects of designing the “ba ance sett ement” procedure [23-29].
It should be noted that balance settlement concerns a ocat on of TSO’s expenses n the
“balancing energy markets”. Costs of procuring reserve capacity, wh ch are the TSO’s
expenses in the “reserve capacity markets” are usually socialized so that every system user
pays its share. This originates from the nature of the reserve capacity service: Reserves are
needed for insuring security of the system (that benefits all) regardless of the real-time
imbalances.
The three components of balancing markets are illustrated in Figure 1. 1.
BRP
BRP
BRP
BRP
TSO
Schedule
Schedule
Schedule
Schedule
Metered Data
Balancing
Energy
Market
Balance
Settlement
Purchase of
Balancing
Energy
TSO Expenses
Imbalance Price
Imbalance Price
Imbalance Price
Imbalance Price
Balance
Responsibility
Balancing
Service
Procurement
Balance
Settlement
Imbala
nce P
rice
Figure 1. 1. three components of balancing markets
1.5. Balancing services markets
The focus of this research is on the first element of balancing markets described above:
balancing service procurement. Therefore, “balancing services markets” are at the heart of
this research, and so, we describe these markets in more details in this section. As mentioned
earlier, there are three main balancing services namely primary, secondary and tertiary control.
For each of these services there can be a capacity (reserve capacity) and an energy (balancing
energy) market depending on the balancing market design which differs in different
countries/regions. We call all these different markets “ba anc ng serv ces markets”. Figure 1.

27
2 illustrates the reserve capacity and balancing energy markets for one type of balancing
services. The TSO is the single buyer and balancing service providers (BSPs) are the sellers in
both markets.
Balancing energy markets are real-time markets through which the TSO procures the
power that will compensate for the real-time power surplus/shortage in the system. BSPs
offer part of their capacity that is still available after the closure of all the other electricity
markets in balancing energy markets. Each bid consists of a volume in MW and a price in
€/ Wh BSPs can offer upward or downward bids. If there is a power shortage in the
system, the TSO will activate upward regulation bids so that more power is generated in the
system and the shortage is resolved. In case of a power surplus in the system, the TSO will
activate downward regulation bids so that less power is generated in the system and the
surplus is resolved. Therefore, for each time period, two bid ladders are formed; one for
upward and one for downward regulation. The TSO looks at the system imbalance and
activates the required amount of bids (in the direction needed) to remove that imbalance, the
cheapest bids activated first. Depending on the pricing mechanism used, the selected BSPs
will be compensated either by their own bid price or by the market price (price of the
marginal bid). Balancing energy markets are cleared once for each Program Time Unit (PTU),
the basic time unit used in the balancing market. PTU is the time unit for which the system
imbalance needs to be resolved, which can be as short as 10 minutes (e.g. in PJM
Interconnection) or as long as one hour (e.g. Nordic system) [12, 28, 30]. In other words,
PTU is the time unit for which the schedules are made by balance responsible parties,
balancing energy bids are submitted by balancing service providers, and imbalances are
resolved and settled.
Bid price (Euro/MWh)
Bid volume (MW)
upward regulation bid
downward regulation bid
BSP
BSP
BSP
Balancing energy bids
Balancing energy bids
Balancing energy bids
TSO
BSP
BSP
BSP
Reserve capacity bids
Reserve capacity bids
Reserve capacity bids
Real-time system
imbalance
System reserve
requirements
Bid price (Euro /MW)
Bid volume (MW)
Selection of balancing
energy bids
Selection of
reserve bids
Market Price
Market Price
Reserve Capacity Market
Balancing Energy Market
Figure 1. 2- Schematic view of balancing services markets: balancing energy and reserve capacity markets

28
As shown in Figure 1. 2, balancing services markets also include reserve capacity
markets. BSPs can offer their free capacity in the reserve capacity market, each bid consisting
of a vo ume n W and a pr ce n €/ W The demand n the reserve capac ty market s the
“reserve requ rement” of the system wh ch s ca cu ated based on techn ca character st cs of
the system and shows the minimum amount of reserves that needs to be available at all times
to insure system security. Thus, the TSO buys the required amount of reserves in the reserve
capacity market by selecting the cheapest bids offered by BSPs in the market. Depending on
the pricing mechanism used, the selected BSPs will be compensated either by their own bid
price or by the market price (price of the marginal bid). Reserve capacity markets by nature
are not real-time markets, and depending on the design they might be yearly, monthly,
weekly, daily or even hourly markets. Design of these markets will be discussed in details in
chapters 3 and 4.
1.6. Balancing market integration (EU context)
During recent years, there have been many discussions at the international level
regarding facilitation of cross-border balancing exchanges and creation of integrated
multinational balancing markets in order to use balancing resources in a more regionally
efficient way. European Regulators Group for Electricity and Gas (ERGEG) provides
guidelines of good practice for electricity balancing markets integration which consists of
general policy-related recommendations on design of integrated balancing markets with
special emphasis on improvement of operational security of the system, efficient allocation of
cross-border capacities, market efficiency and competition, transparency, and development of
standards for data and information exchange [31, 32]. Union of the Electricity Industry-
EURELECTRIC advocates a sequential approach in order to achieve integration of intra-day
and balancing markets across borders [33]. The report mentions the need for establishment
of national and cross-border “ ntra-day” markets, and n para e , ntroduct on of market-
based procurement mechanisms for reserve and balancing power with sufficient
harmonization of the key issues of these markets in order to allow, as a further step, the
cross-border optimization of balancing markets.
European Transmission System Operators (ETSO) focus on facilitation of cross-
border tertiary control service and analyzes the consequences of the steps in integration of
the corresponding markets considering four different models (related to different levels of
cooperation/integration) [34]. Although the report mentions that it is extremely difficult, if
not impossible, to quantify these effects ex ante or even assign them to regulatory differences
ex post, it recognizes main challenges in markets integration to be product incompatibility,
differences in price structure, and differences in procurement mechanisms of system
operators of different systems, and emphasizes the harmonization needed in market design
issues and calculation of imbalance prices.
In another report, ETSO envisages an evolving regional harmonization and integration
process enabled by a cooperation agreement between the TSOs in the region and supported
by changes in existing legal, regulatory and inter-TSO arrangements as far as necessary [35].

29
The report emphasizes that in order to achieve full benefits all issues defining the
characteristics and costs of the balancing services, including reserve definitions, technical
requirements and procurement principles, and also issues defining characteristics and price of
the balancing services, including gate closure time, balance responsibility, imbalance
definition, settlement period, determination of imbalances and imbalance pricing principles,
need to be harmonized. Based on previous reports, Union of the Electricity Industry
(EURELECTRIC) analyzes the balancing markets integration problem in more depth and
focuses on the design of markets for procurement of balancing services and proposes a
design model for the capacity and energy markets without any distinction between different
services with different characteristics [36, 37].
Beside the literature briefly reviewed above, which concerns high level policy-related
guidelines and recommendations on balancing markets integration as a single problem,
comprehensive studies addressing various technical, institutional and economic challenges of
integration of national balancing markets are missing. In addition, although as mentioned in
several reports, full harmonization of all components of balancing markets would lead to the
h ghest “benef ts”, cons der ng the fundamenta d fferences n the market design of different
countr es, a rea st c assessment of the current s tuat on and “feas b e” changes that can
enable cross-border balancing exchange is of critical importance. In other words, although a
fully integrated balancing market can be considered as the ideal case (in terms of yielding the
highest benefits), the fundamental market design differences, resistance against change by
market parties and system operators, and legal and regulatory complications make feasibility
of “fu harmon zat on/ ntegrat on” of ba anc ng markets debatab e. Therefore, in this
research, one main goa s to f nd a “feas b e” way of enab ng cross-border balancing
exchanges, with minimum structural changes imposed on the individual markets.
Since, in contrast to wholesale electricity markets, e.g. day-ahead markets, a balancing
market is not a single market with one single product to be traded in the market, the process
of integration is much more complex and every element of balancing markets needs to be
studied in more detail. This dissertation is focused on exchange of balancing services, and
thus, the two other components of balancing markets, namely balance responsibility and
balance settlement, are not directly addressed. We study the design of balancing services
markets first from a national perspective, studying the effect of different design variables on
the performance of the entire market. And then, using our findings in the first part, we study
the market design from a multinational perspective addressing challenges in realization of an
integrated balancing market for Northern Europe. We provide recommendations on the
basic changes essential for enabling cross-border exchange of balancing services, and then we
argue for some further changes that although not fundamentally essential for exchange of
balancing services but can improve the performance of the resulting integrated market rather
significantly.

30
2. RESEARCH FRAMEWORK

31
2.1. The “Balance Management in Multinational Power Markets”
project
According to the Union of the Electricity Industry-Eurelectric, although significant
progress has been made in the development of efficient national and multinational day-ahead
and forward markets, liquidity is still limited in intra-day markets – where these markets do
exist – and in real-time balancing markets [33]. Achieving open liquid intra-day and balancing
markets is crucial to allow further progress in developing efficient wholesale electricity
markets move towards the goal of a pan-European market [33]. In addition, due to the
continuously increasing share of Renewable Energy Sources (RES) with less predictable
outputs in power generation, the need for balancing services increases and the challenge of
balancing the system in an effective and efficient way becomes more prominent.
On th s bas s, the project t t ed “ba ance management n mu t nat ona power markets”
was defined and initiated in 2007 by the Norwegian Research Council [38, 39]. The main
object ve s: “To des gn the scientific foundation for a framework for efficient, market-based
ba anc ng of power systems that can be mp emented n mu t nat ona (‘reg ona ’ n the
word ng of the European Comm ss on) power markets ” The focus of the project s on
integrating separate balancing markets of the Nordic system, the Netherlands, Germany (and
probably Poland) [38]. The possibility to trade balancing services between Nordel on one
hand, and Germany and the Netherlands on the other hand is of particular interest because
of three main reasons [39]:
· Hydro generation has ideal characteristics for providing balancing services compared
to thermal plants.
· Increasing integration of the Nordic system with UCTE, specifically through the
recent Nor-Ned cable.
· Norway will be a net importer of electrical energy in the coming years, which leaves
more room for exporting balancing services.
According to the project proposal, cross-border trading of balancing services will lead
to more flexible and efficient use of balancing services, irrespective of the control area, which
in turn will result in reduced total balancing costs of the multinational balancing market. The
project consists of the following work packages [39]:
1. Identification and analysis of existing balancing mechanisms:
As a necessary prerequisite for further analysis, a thorough overview of the existing
balancing mechanisms and how they are applied is presented in this work package. As a
preparation for the subsequent activities, this work package will include analysis of the
institutional and regulatory differences between the countries as well as potential institutional
and technical barriers for integration.
2. Documentation and analysis of present costs:

32
The main objective of the project is to reduce the balancing costs in the North
European power markets. As a further preparation for the main activities in the project, it is
necessary to know the present costs of balancing. In this work package an attempt will be
made to estimate the real balancing costs of existing thermal plants in the relevant countries,
and compare these w th the TSOs’ actua ba anc ng costs.
3. Alternative market designs:
Based on outputs of the first two work packages the existing institutional and
regulatory environments in the respective countries will be analyzed, as well as any
supranational guidelines (European Commission, ETSO, Nordel, UCTE). This work package
analyzes the relation between technical characteristics, the market and the institutional design
of the existing balancing markets.
4. Balancing costs in integrated balancing markets:
The objective of this activity is to obtain accurate estimates of the balancing costs
under various assumptions with respect to the integration of balancing markets. To this end,
models are developed for simulating the operation of integrated multinational power systems,
with a specific focus on balancing markets.
5. Institutional design and harmonization:
In this part of the project the focus is on the institutional arrangements in the
participating countries, the necessary degree of harmonization, identification of barriers and a
systematic approach to overcoming these barriers. Output of this work package will be policy
advice with respect to how to integrate national balancing markets.
This dissertation addresses the aspects related to institutional and economic design of
integrated multinational balancing markets, which is part of work packages 3 and 5. It should
be emphasized that, although the above-mentioned distinction between different main
research activities (work packages) helps structure the research within a systematic
framework, the work packages are not independent. Work package 3 is related to finding the
most promising designs while work package 5 is focused on the implementation of the
selected design. Obviously, they are highly interrelated because the decision on the best
design cannot be made without deliberation on the implementation process.
2.2. Focus of the research
Although the task of balancing generation and consumption in a power grid is technical
by nature, any balance management mechanism is a complex institutional arrangement that,
among other things, includes various markets and thus, integration of separate national
balancing markets cannot be achieved without taking highly interwoven economic and
institutional aspects into consideration. As mentioned in the first chapter, this research
focuses on markets for procurement of balancing services. The market design will be the
main concern in this dissertation. We investigate how different designs for balancing services
market can possibly change the market performance.

33
As mentioned earlier, balancing services are markets with the system operator as the
single buyer on one side, and the balancing service providers (BSPs) as sellers on the other
side. The TSO is the entity responsible for security of the system; it buys the balancing
services needed for secure operation of the system and then allocates the costs to system
users. So the system operator is an entity that ideally does not have a financial stake in the
outcomes of the markets; as long as system security is ensured, the system operator has done
its responsibility. However, system operators are not necessarily totally objective or impartial
entities; in practice, system operators have their own sets of priorities and in particular cases,
may behave in ways that are in contradiction with their ideally intended neutrality in the
market.
On the other hand, the BSPs are profit-driven parties and their behavior can be
significantly influenced by the design chosen for the market. In our search for the possible
effects of different market designs on market performance, we study the behavior and
possible reactions of BSPs to market design (actor perspective), and then look at the
aggregate effect of behavioral changes of BSPs on the system performance (system
perspective).
In order to understand the dynamics of balancing services markets, we start our analysis
from a national perspective; we identify the variables that play an important role in design of
these markets and study the variables which have been partially overlooked in the current
terature on des gn of “anc ary serv ces markets” (a more gener c term that nc udes
balancing markets, as well as other markets needed for secure system operation, e.g. reactive
power control market). This first part of our analysis (design from a national perspective) will
lead to recommendations on how to improve the performance of the national balancing
services markets. These recommended changes will also facilitate integration of the separate
national markets; these reforms in the national markets would take us closer to the point
where integration of balancing services markets is feasible. In the second part of our research,
market design from a multinational perspective is studied. We investigate how alternative
arrangements for cross-border exchange of balancing services can influence the behavior of
balancing service providers and consequently the performance of the market as a whole.
2.3. Research questions
The main research question addressed in this dissertation is as follows:
Given the fundamental design differences in balancing services markets of different
countries (mainly in Europe), what changes need to be made, both at the national
and at the multinational level, in order to improve economic performance of the
national markets and to achieve a regionally integrated market for balancing
services?
As the main research question implies, this research is divided into two major parts.
The first part dealing with balancing services markets design from a national perspective
addresses the following sub-questions:

34
1. What are the decision variables in design of each type of balancing services
(identification of the design space)?
2. What are the relevant criteria in assessing the performance of balancing services
markets design (identification of the performance criteria)?
3. How can alternative decisions for each design variable influence the incentives and
behavior of market parties and consequently performance of the entire market?
4. What recommendations can be drawn regarding design of national markets in order
to improve market performance and also to facilitate market integration?
The second part of this research dealing with balancing services markets design from a
multinational perspective addresses the following sub-questions:
1. What is the design space for integration of separate national balancing services
markets?
2. How should the current infrastructure (interconnection lines) be managed in order
to use the transfer capacity in the most efficient way, concerning both day-ahead
and real-time balancing trades?
3. How should the basic design variables be harmonized in order to enable cross-
border exchange of balancing services with minimal structural changes on the
national markets?
4. As the next step, what other variables can be harmonized in order to improve the
performance of the multinational market and achieve a fully integrated market?
2.4. Phase one – national design
According to the wide differences in balancing services markets designs used in
different countries/regions, lack of scientific literature on the generic subject of balance
management, and high level of complexity in real-time electricity markets compared to
wholesale electricity markets, a comprehensive study of the existing balancing services
markets used in different power systems is the unavoidable first step. A combination of
various designs employed in different countries in Europe and designs used in the North
American systems can be a suitable set of case study. The markets in the Netherlands, the
Nordic system, Germany, PJM Interconnection and California ISO have been studied in this
research. Although our focus in this dissertation is Northern Europe, studying other designs
next to the European designs can broaden our perspective and help us understand the
various alternatives in market design.
After studying the different mechanisms used for procurement of balancing services in
each of the case studies, the different variables in design of the markets for balancing services

35
can be identified. In addition to identifying the design space, we identify the performance
criteria, which are the factors one should look at in order to assess the market performance.
So as the second research step, by identifying the design variables and performance criteria,
we create a too that can he p “measure” the performance of d fferent des gns that are to be
analyzed in this research.
The next step is dedicated to investigating the effect of the design variables on the
performance of balancing services markets using the identified performance criteria. We do
not study all the variables identified in the previous step, given the considerable literature on
the effect and role of some of the design variables (which will be reviewed in detail in chapter
3), we focus on the most critical and overlooked design variables. We will use market
simulation, agent based modeling and case studies as the methodologies of this step.
The last research step of the first phase, draws conclusions about reform on the
national markets that can improve market performance and also get the current national
markets closer to the point where market integration is achievable and realistic. This last step
will lead to two major outcomes:
General conclusions on appropriate designs for each balancing service market from
a national perspective.
Case-specific recommendations for required reform in design of balancing services
markets at the national level (case of Northern Europe).
2.5. Phase two - multinational design
Phase two of this research is focused on design of regional markets for balancing
services from a multinational perspective. In order to identify the main alternative designs,
the results of the first phase and the current literature on market integration in Europe is
taken into consideration. In order to investigate the effects of different designs, agent-based
models are developed and the markets are analyzed from a market party perspective and then
the aggregate effect of change of behavior of market parties on the system is studied. The
case of Northern Europe is particularly modeled in this step.
Fundamental differences in design of balancing services markets at the national level
lead to serious institutional and technical barriers in integration of markets, which in turn will
make the process of harmonization and integration extremely complex. Therefore,
considering the practical challenges in integration of national balancing services markets, the
integration problem is not solely about finding the best design for the resulting multinational
market: implementation of the desirable design is a crucial aspect of the integration problem
as well. The transition from separate individual national markets to a fully integrated market
for balancing services cannot be achieved in a single step. Therefore, the second step of
phase 2 focuses on facilitation of cross-border balancing services trades with minimal
changes imposed on the local (national) arrangements. In this step, which is an intermediary
step to achieve fully integrated balancing services markets, two main research activities are

36
performed. Firstly, the fundamental design variables that need to be harmonized in order to
enable cross-border balancing services trades are identified and the proper way of
harmonizing them (with minimal changes) is discussed. Secondly, the issue of
interconnection capacity allocation is addressed. Interconnection capacities (between
countries) can be used for wholesale electricity exchanges or for near real-time balancing
services. Therefore, in order to enable balancing services exchange, the most efficient
interconnection capacity allocation method needs to be found. This research step has two
main outcomes:
General and case-specific recommendations on integration of national balancing
services markets
Recommendations on efficient interconnection capacity management

37
3. EXPLORING THE DESIGN SPACE OF
BALANCING SERVICES MARKETS
38
3.1. Introduction
Identifying all the design variables is the prerequisite for finding possible market
designs for balancing services and eventually evaluating those different alternative designs.
For each design variable, there may be different possible states, therefore, based on the
identified design variables and different possible decisions for each variable, the entire design
space for each balancing service market can be identified. Additionally, in order to analyze the
effect of different decisions on the performance of the whole market, the relations between
design variables and the performance criteria should be understood. Identifying the relevant
performance criteria actually enables us to develop a tool to assess the performance of
alternative market designs.
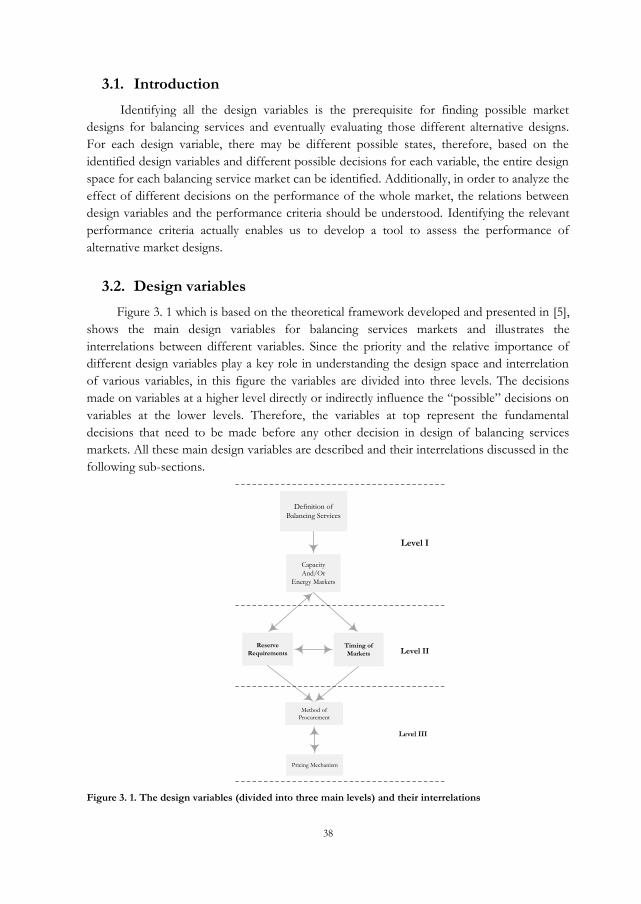
3.2. Design variables
Figure 3. 1 which is based on the theoretical framework developed and presented in [5],
shows the main design variables for balancing services markets and illustrates the
interrelations between different variables. Since the priority and the relative importance of
different design variables play a key role in understanding the design space and interrelation
of various variables, in this figure the variables are divided into three levels. The decisions
made on var ab es at a h gher eve d rect y or nd rect y nf uence the “poss b e” dec s ons on
variables at the lower levels. Therefore, the variables at top represent the fundamental
decisions that need to be made before any other decision in design of balancing services
markets. All these main design variables are described and their interrelations discussed in the
following sub-sections.
Definition of
Balancing Services
Capacity
And/Or
Energy Markets
Pricing Mechanism
Method of
Procurement
Timing of
Markets
Reserve
Requirements
Level I
Level II
Level III
Figure 3. 1. The design variables (divided into three main levels) and their interrelations

39
3.2.1. Definition of balancing services
The very fundamental variable in design of balancing services markets is the definition
and categorization of services. As mentioned in the previous chapters, in order to maintain
the balance between generation and consumption in a power system, the system operator
needs different types of services with different technical characteristics, e.g. the activation
times (response speed), the method of activation (manual/automatic), the minimum
deployment time, and their state (synchronous/non-synchronous). Definition of balancing
services is made based on technical characteristics of the system such as the share of different
technologies in the generation portfolio (thermal, nuclear, hydro, etc.), and the technologies
used in the control systems, for example use of Automatic Generation Control (AGC), and
the method of activation of services (automatic signals, manual over the phone, etc.). The
general criterion, based on which balanc ng serv ces are def ned, s ‘effect ve’ operation of the
entire balancing market. It should be noted that definition of balancing services is not really a
decision made when the markets are being designed. Even before the liberalization of the
electricity sector, in the vertically integrated systems that preceded the current systems,
balancing services were being used to balance the grid, the only difference was that these
services were not procured through a market-based mechanism. Therefore, the current
definitions for balancing services used in different countries are the result of a path taken
through the history of the electricity sector in that country.
However, this does not necessarily mean that the definitions cannot be changed.
Especially in Europe, with the omnipresent discussions on creating regional electricity
markets (and finally one single European market), some changes in how balancing services
are defined in different countries may seem likely, simply because if the balancing market are
to be integrated, the services traded in these markets should be more or less the same in
different countries across Europe so that they can be exchanged across borders more easily.
As an example, in the Nordic system where balancing services are manually activated (the
requests are sent using phone conversations), introduction of AGC is being seriously
discussed, so that the Nordic system can exchange balancing services with the UCTE system
(in continental Europe, where AGC is in use) [23].
3.2.2. Capacity and/or energy markets
As discussed in the first chapter, for each type of balancing services, a (reserve) capacity
and/or a (balancing) energy market may exist in order to, respectively, procure the required
amount of reserve capacity to ensure system security, and to procure balancing energy to
resolve imbalances in real-time. The need for establishment of these markets for each type of
balancing services highly depends on the characteristics of the corresponding service.
There may be no market at all: for example, provision of the primary control service in
the Netherlands and PJM interconnection is the prerequisite for generators to be connected
to the grid (because of the high interrelation of this service with system security), so service
provision is compulsory and there is no compensation for service providers [18, 19, 40].

40
There may be only a capacity market and no energy market, e.g. primary control service
in Germany is procured via a capacity market and there is no compensation for the actual
delivered energy (no utilization/energy payment). Since the primary control service has a high
response speed (15 seconds) and it is quickly replaced by other slower balancing services, the
amount of actual energy delivered in real-time by primary control resources is marginal and
therefore, no utilization compensation is considered for this service in Germany (no energy
market) [20].
Another possibility is the use of both a capacity and an energy market, e.g. regulating
power (corresponding to secondary control service in UCTE terms) in the Netherlands and
Norway. In this case, capacity bids selected in the capacity market receive the availability
payment and the energy bids selected in the energy market for real-time energy delivery
receive a utilization payment.
There may also be one single market that functions both as the capacity and the energy
market. For example, in PJM Interconnection, the regulation market (corresponding to
secondary control) is actually a capacity market with which the PJM system operator procures
the regulation reserve requirement of the system. But there is no other separate energy
market and the system operator uses the same bids for activation of regulating power in real-
time based on the actual imbalance of the system. So the regulation bids are in $/MWh, and
the service providers take their production costs (which is only applicable to energy bids and
not capacity bids) into account in their bids for the regulation market. Therefore once
selected, irrespective of whether or not their capacity is actually activated in real time,
regulation service providers will be compensated for both availability and utilization of their
service [15, 16]. In case they are actually activated in real-time, they may receive another
payment from the system operator which will compensate them for their lost opportunity
costs.
This design variable (the need for capacity and energy markets for each type of
balancing services), as Figure 3. 1 illustrates, is influenced by the definition of balancing
services, which is a higher level design variable itself.
3.2.3. Reserve Requirements
The reserve requirement is considered a design variable because, on the one hand, it is
the key to secure operation of the system, and on the other hand, plays a crucial role in
determ n ng the procurement costs of ‘reserves’ which is part of the costs of system security.
As noted in chapter 1, the reserve requirement for each type of balancing services is the
minimum amount of reserve (for that balancing service; primary, secondary, tertiary) that
must be available in order to ensure that the system will work in a secure and reliable way.
Thus, the reserve requirement for each type of balancing services determ nes the ‘demand’ in
the reserve capacity market for that balancing service; and therefore, it significantly influences
the total reserve procurement costs of the system. These requirements are determined based
on the system security criteria which are different for different types of balancing services
and for different countries, and determine the minimum amount of reserves for each type of

41
balancing services. However, the security criterion is not the only factor affecting reserve
requirements; Frequency of calculation of reserve requirements plays a crucial role as
well. Requirements can be calculated for different time horizons; annual, monthly, weekly,
daily, and even hourly. Once calculated, the minimum reserve requirements are fixed for that
time span. This design variable will be discussed in more detail in the next chapter.
3.2.4. Timing of markets
The var ab e that s ca ed ‘t m ng of markets’ in this dissertation is a complex variable
with critical importance regarding market performance. This variable has two main aspects:
timing of the bidding procedure and timing of the markets clearance, which are discussed in the
following subsections.
3.2.4.1. Timing of the bidding procedure
Different time horizons for the ‘b dd ng procedure’ can be used for different types of
balancing services, both reserve capacity and balancing energy markets. As an example, in
Germany, the bidding procedure of the capacity market for primary and secondary control
service is monthly, so capacity providers submit their monthly bids that are fixed for the
entire coming month. However, the capacity market for tertiary control (minute reserves in
Germany) is a daily market and capacity providers submit their bids on a day-ahead basis [20,
41]. The time horizon of the bidding procedure for different markets (which can also be seen
as ‘frequency of b dd ng’) highly depends on the characteristics of the service (primary,
secondary, tertiary) and the type of the market (capacity and energy). Table 3. 1 summarizes
the time horizon of the bidding procedure (frequency of bidding) of the reserve capacity
markets for different types of balancing services in different systems/countries. Since the
terminologies widely differ, the particular name, by which each balancing service is called in
the corresponding country (in case a different name is used), is also mentioned in
parentheses.
Table 3. 1. Time horizon of the bidding procedure of the reserve capacity markets for different types of
balancing services- different systems
Primary Control Secondary Control Tertiary Control
Netherlands - Yearly
(Regulating and Reserve Power)
Yearly
(Emergency Power)
Germany Monthly Monthly Daily
(Minutes Reserves)
Norway - Weekly
(FADR) -
PJM - Daily
(Regulation)
Daily
(Synchronized Reserves & Day-
ahead Scheduling Reserves)
After making the decision on frequency of bidding (possible from annual to PTU-
basis), the gate opening and closure times of the markets need to be decided upon. Since
generators have the possibility to offer their free capacity in wholesale electricity markets

42
(such as day-ahead and intra-day markets) or in capacity and energy markets for various types
of balancing services, the gate opening and closure times for the bidding procedure in
balancing services markets (both capacity and energy) need to be carefully coordinated with
those of other markets such as day-ahead market. This timing coordination aspect
significantly influences the interrelations between different markets and has a critical
influence on the efficiency and liquidity of balancing services markets (especially because of
the very small size of these markets compared to day-ahead markets).
3.2.4.2. Timing of the markets clearance
S m ar to ‘t m ng of the b dd ng procedure’, ‘timing of the markets c earance’ for
balancing services has two main elements: frequency of balancing services markets clearance
and coordination of markets clearance with other electricity markets. Generally speaking,
frequency of bidding (related to the time horizon of the bidding procedure discussed in the
paragraph above), can be different from the frequency of the clearance of the market.
As an example, the balancing energy market for secondary control in Germany is
monthly and generators submit one bid (a price and a volume) for the entire coming month
(frequency of bidding is once per month), while the ba anc ng energy market s ‘c eared’ once
for each Program Time Unit (PTU), which is 15 minutes in Germany and thus the frequency
of market clearance is once per quarter of an hour [5, 7].
The second aspect of ‘t m ng of the markets c earance’ is the coordination of balancing
services markets clearance with those of other electricity markets, specifically day-ahead (DA)
and intra-day (ID) markets. Since balancing energy markets are real-time markets and are
cleared when all other markets are closed and cleared, there is no coordination needed
between clearance of balancing energy markets and other markets. On the contrary, clearance
of the reserve capacity markets may need to be coordinated with clearance of day-ahead or
intra-day markets (depending on the frequency of market clearance of the capacity market).
In case of a day-ahead capacity market (e.g. tertiary control service in Germany, and day-
ahead scheduling reserves in PJM), there are two main possibilities in terms of coordination
of the capacity market clearance with the day-ahead market: sequential and simultaneous
clearance.
Another example is coordination of capacity markets clearance with each other (and
not with the day-ahead or intra-day markets). The Californian ISO (CAISO) uses four
capacity markets for four different balancing services (regulation service, spinning reserve,
non-spinning reserve, and replacement reserves) [13, 14, 42, 43]. CAISO used to clear these
markets sequentially (from higher quality services to lower quality ones) and has recently
changed it to simultaneous clearance of all the four capacity markets, because of efficiency
and liquidity considerations [42, 43]
n short, ‘t m ng of markets’ as a design variable can significantly influence the
interrelations of balancing services markets with each other and with other electricity markets,
and thus, the decisions that need to be made on this design variable demand meticulous

43
studies of the effect of this variable on the performance of balancing services markets as well
as day-ahead and intra-day markets.
3.2.5. Method of procurement
Different methods can be used in procurement of balancing services: compulsory
provision, bilateral contracts, long- and short-term auctions (tendering), and a combination of
bilateral contracts and auctions. For example, the primary control capacity is procured on a
compulsory basis in PJM and the Netherlands [5, 12]. Bilateral contracts are used for
secondary control capacity procurement in the Netherlands, Sweden and Finland [12]. Long-
term auctions are used for secondary control energy in Germany, and short-term auctions in
the Netherlands, and the Nordic system [4, 40]. In Australia and New Zealand, both bilateral
contracts and auctions are used to procure primary control capacity [9, 10].
Each of these procurement methods has its advantages and disadvantages that need to
be studied, taking into account different characteristics of different balancing services. Table
3. 2 summarizes the methods of reserve capacity procurement for different types of balancing
services used in different countries/systems. In case of balancing energy markets, auctions are
typically used.
Table 3. 2. Methods of reserve capacity procurement for different types of balancing services used in
different systems
Compulsory provision Bilateral contracts Long-term auctions Short-term auctions
Primary Control NL, PJM - DE -
Secondary Control - NL - DE, NO, PJM, CA
Tertiary Control PJM NL - DE, PJM, CA
Because of th s des gn var ab e’s nf uence on ba anc ng serv ce prov ders’ ncent ves, it
affects the offered capacities in different balancing service markets, available resources in
each market, bid prices of service providers, and transaction costs of market parties. This
variable also plays an important role in the transparency of balancing service markets, e.g. use
of confidential bilateral contracts for secondary control capacity procurement in the
Netherlands has led to a non-transparent situation in which no data from the market is
available to the public.
3.2.6. Pricing mechanism
The last design variable is the pricing mechanism of various balancing services markets.
Balancing services can either be non-remunerated, or paid for, using any of the following
types of pricing mechanisms: a regulated price, a pay-as-bid price, or a uniform clearing price
(marginal pricing). Although a non-remunerated mechanism may be very convenient for the
system operator, it will logically result in the costs of the balancing service providers being
reflected in the price of other products. A regulated price is set by the regulator or the system

44
operator and is usually the same for all service providers. In a pay as bid system, the supplier
receives the price of its accepted offer. This type of remuneration method is suitable when
the quality of the ancillary services offered is highly differentiated and those offers are thus
not easily comparable [44]. In a uniform-price system, all the successful providers are paid the
price of the most expensive accepted offer (and in some designs, the least expensive rejected
offer).
3.3. Performance criteria
In order to evaluate the effect of different design variables on the performance of a
balancing market, and eventually to evaluate different alternative market designs, a set of
performance criteria need to be identified. By studying and measuring the effect of different
decisions in market design on the performance criteria, impact of those decisions on the
performance of the entire balancing market can be studied. Figure 3. 2 demonstrates the
performance criteria related to design of balancing markets. The diagram starts with the most
generic abstract criteria and divides each criterion into several other lower-level more
concrete criteria that can be measured and studied.
As can be seen from the figure, the two main criteria in evaluating performance of
balancing markets are operational security and incentive compatibility. These two criteria
representing the technical and economic performance of the market respectively, can be
divided into other detailed performance criteria. The definition of each of the proposed
criteria is presented in the next section.
Operational
security
Balancing Services
Markets Performance
Criteria
Transparency
Operational
efficiency
Allocative
efficiency
Price
efficiency
Availability of
resources
Even
geographical
distribution of
resources
Effectiveness
Incentive
Compatibility
EfficiencyLiquidityAccuracy of
balance
planning
Figure 3. 2. Performance criteria in design of balancing services markets

45
3.3.1. Operational security
As mentioned before, the foremost objective of balancing markets is to balance supply
(generation) and demand (load) in the grid by means of a market-based mechanism. The
operational security criterion refers to the technical performance of balancing markets and
therefore to the ‘effect ve’ operation of the balancing mechanism in achieving its main goal.
Thus t s d rect y connected to ‘effect veness’ of the balancing mechanism, and consequently
effectiveness of the reserve capacity market and balancing energy markets. Availability of
resources (in these two types of markets) and even (geographical) distribution of resources
are the two criteria determining effectiveness of these markets. The latter plays an important
role in reserve capacity markets, especially for the primary control service. Purchasing
reserves from resources that are evenly distributed throughout the network reduces the
likelihood of not being able to activate the purchased reserves in real-time simply because of
transmission congestion.
3.3.2. Incentive compatibility
Incentive compatibility is the generic characteristic of the market design that addresses
incentivizing market parties to behave in such a way that best serves the general goal of
maximizing societal benefit. An incentive compatible rule is one that makes the people who
have to obey it do so voluntarily because it is in their own interest to do so [45]. According to
their self-interestedness, market parties will pursue the means available to them to maximize
their own profit in an open environment. This could lead to undesirable situations and sub-
optimal solutions that are more preferable to some parties and not acceptable to others.
Therefore, incentivizing market parties to behave in such a way that ensures the
fairness/optimality of the final solution plays a critical role in the design process. Incentive
compatibility is the key to defining proper rules [45].
Incentive compatibility in balancing markets design includes all the highly interrelated
institutional and economic aspects of balancing markets and it stands as the second main
criterion next to operational security. In order to be able to understand and study this high-
level abstract criterion, it needs to be divided into more concrete criteria.
3.3.2.1. Transparency
Information availability, information symmetry (equal access to information) and clarity
of the rules of balancing markets lead to market transparency which is a prerequisite of a
competitive market. High level of transparency regarding balancing market rules (balance
responsibility, balancing services markets and balance settlement), determination of
imbalance prices, and imbalance volumes will improve the functioning of the market by
enabling market parties to make informed decisions and eventually to encourage new entry
and increase competition in the market.
3.3.2.2. Efficiency
This performance criterion refers to the economic efficiency of both reserve capacity
and balancing energy markets. Because of the ambiguity of the concept, market efficiency, as

46
one of the primary objectives in design of electricity markets in general, needs to be carefully
defined and divided into more tangible performance criteria:
Operational efficiency is the aspect of market efficiency that addresses
transaction costs of market parties in the market. Therefore, operational
efficiency is related to carrying out the market operations with as low a cost as
possible. There are various variables in the design of balancing markets that
influence this aspect of market efficiency, e.g. method of procurement of
reserve capacities (compulsory, bilateral contracts and auctions), the time
horizon of reserve capacity and balancing energy markets (frequency of
bidding), etc.
Allocative efficiency (from a system perspective) is the aspect of market
efficiency relating to optimal use of limited available resources. In case of
balancing services markets, this performance criterion aims at meeting
system’s reserve requ rements (through reserve capac ty markets) and
reso v ng system’s rea -time imbalances (through balancing energy markets),
with use of the optimal set of available balancing resources. Since this criterion
addresses the “opt ma se ect on” of “ava ab e resources”, the two factors
influencing this criterion are: Firstly, the system operator’s use of the cheapest
balancing resources offered in the markets (optimal selection), and secondly,
incentives of balancing resource owners to offer their capacity as balancing
services (available resources). The second factor can play an important role
because in case of reserve capacity markets, service providers can offer their
capacity in other wholesale electricity markets instead of reserve capacity
markets, and in case of balancing energy markets, service providers may keep
their resources in order to regulate internally (self-regulation). So giving them
the incentive to offer their free capacity in balancing services markets is of
great importance.
Price efficiency relates to cost-reflectivity of prices in both reserve capacity
and balancing energy markets. The price efficiency criterion deals with
opportunity for service providers to behave strategically, and therefore it
addresses the issue of market power and competitiveness in balancing services
markets. It is also interrelated with markets liquidity (while it is not the same
as market liquidity).
3.3.2.3. Liquidity
arket qu d ty character zes the market’s ab ty to qu ck y match any b d to buy w th
an offer to sell without changing the market price. The liquidity incorporates four features:
the tightness (i.e., the capability to avoid a large spread between the highest demand price and
the lowest supply price); the depth (i.e., the capability to absorb large trade volumes without
significant price changes); the immediacy (i.e., the capability to quickly meet the demand to

47
sell or buy); and the resilience (i.e., the capability to recover after a price change) [46]. A
market is liquid if there are many buyers and sellers who can access each other easily and have
access to information about the market prices. A defining feature of a liquid market is that it
can generally absorb the addition or loss of a buyer or seller without a noticeable change in
the market price. Liquidity of balancing services markets criterion is related to both reserve
capacity and balancing energy markets for each type of balancing services. Since balancing
services markets are single buyer markets with system operator as the only buyer, liquidity of
these markets relates to the number of balancing services providers and their willingness to
offer services in these markets (instead of other electricity markets).
3.3.2.4. Accuracy of balance planning
The accuracy of planning deals with the accuracy of the energy schedules (energy
programs) that are submitted by the balance responsible parties to the TSO that show their
planned energy production/consumption/trade for specific hours. The accuracy of these
programs determines the size of the imbalances that occur in real-time (since these
imbalances are the deviations from the schedules). The balancing market should be designed
in a way that incentivizes balance responsible parties to minimize their own imbalance, or in
other words maximize the accuracy of their energy schedules.
3.4. Current literature on analysis of the design variables
The two design variables at the first level of Figure 3. 1 (‘definition of balancing
serv ces’ and ‘capac ty and energy markets’) represent the basic decisions regarding design of
balancing services markets. However, the definition of balancing services currently in use in
different countries/regions, as noted before, is the result of a complex path taken throughout
the history of the electricity sector in that country. In addition, definition of balancing
services highly depends on the technologies used in the power system (especially in
generation and in the control systems), which implies that different countries with different
technical characteristics would need somehow different definitions.
In case of the second des gn var ab e, ‘capac ty/energy markets’, the specific system
characteristics play a decisive role. As an example, in Norway, for FADR which is manual
secondary control, during summer there is no reserve capacity market. There is no need for
reserving capacity in summer because the load level is low, the excess of generation capacity
in Norway is high, and almost all the generating units are hydro that can provide FADR (they
meet the technical requirements). Therefore, the system operator does not need to reserve
capacity to ensure that enough resources will be available in real-time. However during
winter, weekly reserve capacity markets are employed by the system operator because the
higher load level in winter makes availability of sufficient resources in real-time less certain,
so the system operator buys sufficient reserves in the RKOM market.
Therefore, although the variables at the first level of Figure 3. 1 are fundamental to
market design, they are influenced by historical and technical issues to such an extent that the
decision on these variables is not essentially market design related.

48
The two var ab es at the second eve , ‘reserve requ rements’ and ‘t m ng of markets’ are
discussed in detail in this dissertation. The next chapter addresses reserve requirements and
timing of markets, and then, the fifth chapter discusses coordination of timing of balancing
services markets with other wholesale electricity markets.
The design variables at the third level of Figure 3. 1 (method of procurement and
pricing mechanism) have attracted significant attention in the research on ancillary services
markets design, and a considerable volume of literature exists addressing these two main
variables. Thus, in the following paragraphs, we give an overview of the studies performed on
these two variables and will not directly discuss them any further in the following chapters.
Authors in [4] give an overview of the advantages and disadvantages of various
procurement methods for balancing services; compulsory provision, bilateral contracts, long-
and short-term auctions. In compulsory provision, a certain category of service providers
(mainly large generators) are obliged to provide upon request from the TSO up to a certain
amount of a given balancing service. Although it is effective (will lead to insured system
security because of both availability of resources and even geographical distribution of
resources), and can be transparent and simple as well, compulsory provision would not be
efficient. If the service providers are not compensated for their service, the costs of service
provision will be reflected in other electricity products. And if they are compensated for their
service with a common regulated price, the mechanism would not be fair because the high-
cost resources are treated the same as low-cost ones [4].
When the TSO procures reserve capacity using bilateral contracts, it negotiates with
some providers on the quantity, quality, price and delivery conditions of the service to be
provided. Bilateral contracts will result in effective procurement of balancing services, they
can solve the two above-mentioned problems with compulsory provision (fairness and
unnecessary over-supply), and they enable service providers to hedge against risks [4].
However, they have disadvantages as well. Firstly, they lack transparency since they are
confidential contracts between the system operator and specific service providers. Secondly,
negotiations can be complex, time consuming and therefore costly; high transaction costs and
low operational efficiency. Thirdly, since bilateral contracts are long-term contracts, the prices
may be higher because of real or perceived opportunity costs for the service providers; lower
price efficiency. And lastly, bilateral contracts make competition for small resources and new
entries to the balancing services markets difficult (especially because contracts are long term,
the uncertainty is high and small resources do not have the flexibility of their large
counterparts); low allocative efficiency and liquidity.
Auctions enhance transparency and competition; higher price efficiency. In addition, in
short-term auctions, the demand in the market can be updated more frequently leading to
avoidance of unnecessary resource procurement; higher allocative efficiency. Short-term
auctions also make new entries and competition for small parties easier; higher allocative
efficiency and liquidity. However, installment of new auctions is costly and they can have a
high operating cost [40]. In addition, according to the authors in [40], in case of short-term

49
auctions, service providers get feedback from the market more frequently and can more easily
learn to behave strategically.
Authors in [4] present a table that summarizes for each procurement method some of
the perceived (by the authors) advantages and disadvantages. The authors mention that their
analysis of different procurement methods is subjective. Table 3. 1 compares the effect of
different procurement methods on the identified performance criteria in a qualitative way.
Table 3. 3. Qualitative comparison of different procurement methods using the identified performance
criteria
Compulsory
provision Bilateral contracts Long-term auctions Short-term auctions
Effectiveness ++ ++ ++ +
Transparency ++ - - ++ ++
Liquidity ++ - - +/- ++
Operational efficiency ++ - +/- +/-
Allocative efficiency - - - + ++
Price efficiency - - - - - +
Accuracy of balance
planning +/- +/- +/- +/-
As can be seen, no general statement can be made regarding superiority of a specific
method. Furthermore, the importance of each parameter varies across jurisdictions (e.g., a
market designer may give more importance to a procurement method that facilitates entrance
of new participants, whereas another designer may prioritize market transparency) [4]. As
various methods are complementary, market designers are likely to choose a mix of methods.
Regarding the other design variable, pricing mechanism, as noted earlier balancing
services can be either non-remunerated, or paid according to one of the three types of pricing
mechanisms. While a non-remunerated system is very convenient for the system operator
(and transparent), it is unlikely to be economically optimal because the costs that the
providers incur end up bundled in the price of other products such as electrical energy [40]. A
regulated price is set by the regulator or the system operator and can be either nodal or zonal.
Although using a regulated price might be justified to some extent when dominance of some
participants is an issue, a regulated price does not properly reflect the actual cost of providing
a balancing service, especially because the costs change with time and circumstances (it would
lead to very low price efficiency).
Discriminatory auction prices (pay-as-bid pricing) can be justified when the quality of
the balancing services offered is different, and so the offers are not easily comparable.
However, since basically there are separate markets for different types of balancing services,
non-comparability is not an issue. In addition, a discriminatory auction price does not give
providers an incentive to offer their marginal cost, except when market concentration is low
[47]. Authors in [48] argue that discriminatory auctions generally perform poorly in electric

50
power markets. Nevertheless, many systems have actually adopted discriminatory auction
prices, for example, all the balancing energy and reserve capacity markets (for primary,
secondary and tertiary control) in Germany use pay-as-bid pricing.
Uniform pricing, defended for example in [42, 49, 50] for balancing services, is deemed
to give suppliers a real incentive to offer their marginal cost. Uniform pricing can be used in
either a Zonal or a Nodal context. Some system operators, such as in Texas, argue that nodal
payment of reserve capacity gives an incentive for relieving congestion similar to energy [43].
In [42], the authors argue that it gives stronger signals to compute the marginal value of
security in a nodal fashion than in a zonal manner. Nevertheless, nodal pricing is expensive to
implement, increases the complexity of the system and may increase the market power of
some participants in the short run. Although t’s seen as a s mp e given fact that North
American systems use nodal and the European markets use zonal pricing, and there is no sign
of a willingness to change in this regard, discussions on the relative advantages of nodal and
zonal pricing are still ongoing in many countries [51].
Generally speaking, there is no consensus on the superiority of either
discriminatory/pay-as-bid (PAB) or uniform/marginal (MP) auctions for balancing services.
In [52, 53], authors conclude that although MP and PAB yield identical expected generator
profits and consumer payments, the risk of not meeting these values is greater under MP than
under PAB. In [44], the author using a qualitative argument concludes that since electricity
markets are non-homogeneous, the nature of the product and market incompleteness
necessitate a high degree of product fragmentation, in which case a pay-as-bid settlement
approach with optimized assignment based on requirements and multi-attribute of the tender,
may be promising. Analyzing the case of the UK, the authors in [54], conclude that a move
from uniform to discriminatory pricing under monopoly conditions has a negative impact on
profits and ambiguous implications for prices and welfare.
There are reasonable arguments on both sides. There seems to be simply no consensus.
3.5. Conclusions
In this chapter, we have identified the design variables dividing them into three levels.
At the top level are the variables that are influenced by historical and technical factors to such
an extent that the decision on these variab es actua y fa s out of the ‘market des gn’ domain.
The variables at the lowest level have attracted significant attention and a literature review
was presented showing the main findings regarding these variables. Nevertheless, the
variables at the intermediate level, namely reserve requirements (the market-related aspect of
it and not its technical dimension) and timing of markets, have been partially overlooked in
literature. Thus, these two variables will be discussed in detail in the next two chapters. In
addition, in this chapter the main performance criteria were identified which will be used in
order to assess balancing services markets performance. In short, this chapter serves as the
foundation for the analysis presented in the rest of this dissertation.

51
4. RESERVE REQUIREMENTS AND TIMING
OF MARKETS

52
4.1. Introduction
The objective of this chapter is to study two fundamental variables in design of
balancing services markets: reserve requ rements and t m ng of markets ‘Reserve
requ rements’ relates to reserve capac ty markets on y, wh e ‘t m ng of markets’ applies to
both reserve capacity and balancing energy markets. The two case studies used in this chapter
are the markets in Germany and the Netherlands. The structure of the chapter is as follows:
the market design characteristics of the two case studies are introduced, the var ab e ‘reserve
requ rements’ s stud ed, ‘t m ng of markets’ for reserve capacity as well as balancing energy
markets is analyzed in details, and finally conclusions (case-specific recommendations for
changes in the market design from a national perspective) are drawn based on the findings.
4.2. Case studies
In this chapter, we use the case of Germany as the main case study because of two
basic reasons:
• The transparency in the balancing services markets of Germany: A the ‘b ds’
(volumes and prices) are published after market clearance in all the markets (reserve
capacity and balancing energy) in Germany. Thus, in addition to the outputs of the
markets, all the inputs are accessible.
• Specific design characteristics of the German balancing services markets: The
designs of different balancing services markets are not only different from the
designs used in other countries/areas, but also differ from each other, i.e. different
designs are used for different types of balancing services in Germany.
In addition, the case of the Netherlands is also used for comparison. Since the design
of the wholesale markets (day-ahead and intraday) is similar in the Netherlands and Germany,
but the design of balancing services markets are fundamentally different, using the case of the
Netherlands can lead to meaningful insight into the effect of different market designs in the
two countr es fferent ‘ nd cators’ are used n order to measure the effect of different
design variables on the performance criteria. The indicators include the selected bid prices in
each market, excess supply ratios, and number of pivotal suppliers.
4.2.1. Germany
Since 2001, the German TSOs have been procuring their required primary, secondary
and tertiary control services on an open market. They cover their need for these reserves via a
common tendering procedure in accordance with the requirements stipulated in the Energy
Act ("EnWG" in German) and the associated Electricity Grid Access Regulation
(StromNZV) [41]. In case of primary control, monthly auctions are used for procuring the
required reserves (monthly reserve capacity markets). There is no balancing energy market for
primary control in Germany, so the service providers are compensated only for the
availability of their capacity and not for actual energy delivery. In addition, there is no
distinction between upward (positive) and downward (negative) capacities, therefore when a

53
service provider bids a certain capacity in the market, it implies that it can provide the
capacity in both directions. Thus, for primary control, there is one single auction for each
month.
In case of secondary control, monthly auctions are used as reserve capacity markets.
However, there is a real-time balancing energy market for secondary control as well. Service
prov ders subm t the r capac ty ( n €/ W) and energy ( n €/ Wh) b d pr ces s mu taneous y
during the preceding month. Bids are selected based on their capacity price until the reserve
requirement for secondary control is met. The selected bidders are obliged to keep their
capacity free for the entire coming month. During the month, for each PTU, depending on
the imbalance of the system in real-time, bids will be activated based on their energy prices
which were submitted (together with the capacity bid price) in the preceding month. These
energy bid prices are fixed for the whole month. Thus, in case of the reserve capacity market
for secondary control, the frequency of bidding and the frequency of market clearance are
once per month, while in case of the balancing energy market for secondary control, the
frequency of bidding is once per month and the frequency of market clearance is one per
PTU (15 minutes). There is a distinction between positive and negative capacities for
secondary control and two separate auctions are used. In addition, there are separate auctions
for peak and off peak hours. Thus, in each month, there are four separate auctions in which
service providers offer their capacities as secondary control reserves: negative capacity for
off-peak hours, negative capacity for peak hours, positive capacity for off-peak hours and
positive capacity for peak hours.
In case of tertiary control, daily auctions are used as reserve capacity markets. Similar to
secondary control, there is also a balancing energy market for tertiary control. Service
providers submit their capacity and energy bid prices at the same time on a day-ahead basis,
bids are selected based on their capacity price, and in real-time, in order to resolve system
imbalance, bids are actually activated for energy delivery based on their energy bid price.
Each day is divided into 6 periods, 4 hours each, and for each period two separate auctions
are used, one for positive and one for negative capacity. Thus, there are 12 separate auctions
in each day for procurement of tertiary control. In case of the reserve capacity markets for
tertiary control, the frequency of bidding and frequency of market clearance are once per day,
while in case of the balancing energy market, the frequency of bidding is once per day and the
frequency of market clearance once per PTU. Table 4. 1 summarizes the characteristics of
balancing services markets in Germany.

54
Table 4. 1. Summary of the characteristics of balancing services markets in Germany
Reserve Capacity Market Balancing Energy Market Number of
auctions per
bidding
period
Bidding
horizon
Market
clearance
Distinction Up-
Down-ward
capacity
Bidding
horizon
Market
clearance
Distinction Up-
Down-ward
capacity
Primary
Control Monthly Monthly No - - No 1
Secondary
Control Monthly Monthly Yes Monthly
Quarter
hourly Yes 4
Tertiary
Control Daily Daily Yes Daily
Quarter
hourly Yes 12
4.2.2. The Netherlands
In the Netherlands, no market-based mechanism is used for the procurement of
primary control. Providing the primary control service is mandatory and the generators
prov d ng the serv ce are not compensated “Regu at ng power” n the Nether ands s def ned
as “the capac ty wh ch can be contro ed by means of oad frequency contro (LFC) w th a
regu at ng speed of at east 7% per m nute” [18, 19]. Thus, regulating power is the exact
equivalent of secondary control in UCTE terms: resources that can be fully activated within
15 minutes (speed of 7% per minute) and are controlled by automatic generation control
( oad frequency contro n TenneT’s words). The reserve capacity market for regulating
power in the Netherlands is yearly; TenneT procures the required reserves for regulating
power (secondary control) through yearly bilateral contracts with generators.
The balancing energy market for secondary control is quarter hourly with quarter
hourly bidding. The bids can be different for different PTUs (15 minutes), and the bid for
each PTU can be changed up to one hour before the PTU of operation. Therefore, in case of
the balancing energy market for secondary control, the frequency of bidding and frequency of
market clearance are once per PTU, 15 minutes. This is the major difference between the
market designs in Germany and the Netherlands, see Table 4. 1.
“Reserve power” n the Nether ands s def ned as the reserves offered to the TSO that
do not fit the definition of regulating power. So they are not connected to the LFC system,
and can have response speeds of lower than 7% per minute. So it can be considered as the
equivalent of tertiary control in UCTE terms. There is no reserve capacity market for this
service in the Netherlands; only a balancing energy market is used which is a quarter hourly
market with quarter hourly bidding. Thus, in case of the balancing energy market for tertiary
control, the frequency of bidding and frequency of market clearance are once per PTU, 15
minutes.
In the Netherlands, in case of the reserve capacity markets, there is no distinction
between upward (positive) and downward (negative) capacity. However, separate auctions are
used for up and downward balancing energy in real-time.

55
Table 4. 2. Summary of the characteristics of balancing services markets in the Netherlands
Reserve Capacity Market Balancing Energy Market
Bidding horizon Market clearance
Distinction Up-
Down-ward
capacity
Bidding
horizon
Market
clearance
Distinction Up-
Down-ward
capacity
Primary
Control - - - - - -
Secondary
Control Yearly Yearly No
Quarter
hourly
Quarter
hourly Yes
Tertiary
Control - - -
Quarter
hourly
Quarter
hourly Yes
4.3. Reserve requirements
As ment oned n the prev ous chapter, ‘reserve requ rement’ determines the minimum
amount of reserves (for each type of balancing services) needed for secure operation of the
system. The reserve requirements are determined by the system security criterion, which differs
across countries and is different for different types of balancing services.
That s the techn ca aspect of ‘reserve requ rements’, wh ch has been extens ve y
discussed in the power systems engineering literature, [55-60] to mention a few. This
literature introduces the concepts of system reliability, adequacy and security. The basic role
of this very essential power systems literature is to translate our vague idea of reliability into
indices that can be measured. They tell us what exactly needs to be done in order to achieve a
certain level of system reliability. This technical literature on reserve requirements essentially
determines the minimum reserve requirements of the system by making a balance between
system reliability and costs, using various methods; cost-benefit analysis [56], reliability
cost/reliability worth method [59], and using risk indices [55, 58, 60], to mention a few.
In the context of the UCTE system, reserve requirements for primary, secondary and
tertiary control are discussed in the UCTE operation handbook [11]. The minimum amount
of primary control reserves is set at 3,000 MW which hedges against the simultaneous trip of
two generating units each 1500 MW (n-2 criterion) [11, 12]. This total amount will then be
allocated to all the control areas in UCTE proportional to their annual production volume.
In case of secondary control, UCTE uses the following square root formula as an
empiric sizing approach for the recommended minimal amount of secondary control reserves
of a control area [11]:
bbLaR 2
maxsec . (4.1)
maxL being the maximum anticipated consumer load for the control area over the period
considered and the parameters a and b being established empirically with the following values:
a=10 MW and b=150 MW [11]. It should be noted that although it is obligatory for UCTE
members to meet the reserve requirement for primary control calculated by UCTE, in case of

56
secondary control, the above-mentioned formu a on y shows the ‘recommended’ reserve
requirement by UCTE, and the members are free to use other values based on their local
needs.
The Netherlands complies with the UCTE reserve requirements both for primary and
secondary control. In 2009, the Netherlands represented a share of 3.6% of the total
production in UCTE and consequently its minimum primary reserve requirement was 3.6%
of 3000 MW or 110 MW. The secondary control reserve requirement for the Netherlands
according to equation (4.1) is approximately 300 MW, based on a maximum anticipated load
of 18 GW [19].
Germany represented a share of 22.4% of the total production in UCTE (in 2009) and
consequently the minimum primary control reserve requirement was 22.4% of 3000 MW or
673 MW [12]. According to [20], by means of a mathematical approach, the German TSOs
determine the required volume of secondary control and tertiary control for their control
areas in such a way that the defined residual risk probability of a power surplus or deficit that
cannot be balanced is not exceeded. We could not access the details of the method that is
used in Germany but according to [12] and [20], the amount of secondary control reserve
procured by the German TSOs is two to four times higher than the recommended UCTE
values, because of the use of a different method for calculation of the reserve requirements.
These d scuss ons are a re ated to the bas c techn ca aspect of ‘reserve requ rements’,
which is about how to determine the minimum amount of reserves that needs to be
purchased. However, there is a market-related aspect to this design variable that has been
partially overlooked in literature. Frequency of calculation of reserve requirements plays a crucial role
in determining how much reserves are purchased in different periods, and eventually
determining the reserve procurement costs. Requirements can be calculated for different time
horizons (using the exact same formula/approach): annual, monthly, weekly, daily, and even
hourly.
We use the case of UCTE as an example. In UCTE according to equation (4.1), the
reserve requirement of secondary control for a specific time span is related to the forecast
peak load in the corresponding time span. The UCTE handbook does not tell control areas
what time span this formula should be applied to; the formula gives the minimum reserve for
a certain period of time that can be one year (calculation of reserves once a year), or one day
(daily calculation of reserves).
If the reserve requirement is calculated on a monthly basis (since the load changes with
a seasonal pattern and the peak load is different for different months), then the reserve
requirement will be different from one month to the other, while if the requirement is
calculated on an annual basis, then it will be fixed throughout the year and will be related to
the peak load of the entire year meaning that the yearly reserve requirement will be equal to
the largest of all the monthly requirements. In the first case, the reserve requirement can
follow the monthly change of load while in the second case it will be fixed throughout the
year and in several months the amount of reserves procured will be more than necessary.

57
Thus, without changing the system security criterion (without compromising system security)
and only by changing the frequency of calculation of the reserve requirement, unnecessary
reserve procurement can be avoided, and the demand in the reserve capacity market and
consequently reserve procurement costs can be reduced.
In order to appreciate the size of this effect, the reserve capacity market for secondary
control in the Netherlands is studied here. In the Netherlands, TenneT, the Dutch TSO, buys
the required reserves, calculated based on equation (4.1), through annual bilateral contracts
from reserve providers. Figure 4. 1 shows the reserve requirements for the Netherlands
(using the load data of 2009) and compares the yearly reserve requirement with monthly
requirements (in case they had been calculated on a monthly basis instead of yearly) [61].
Figure 4. 1. Yearly and monthly reserve requirements for secondary control in the Netherlands based on
the system load in 2009
As can be seen from the figure, if calculated on a monthly basis, the reserve
requirement can follow the monthly load patterns and in several months during spring and
summer, the needed reserve requirement is considerably lower than the yearly requirement
simply because of the lower load levels in those seasons. Figure 4. 2 shows the reserve
requirements for secondary control in the Netherlands in case they were calculated on a daily
basis. In several days, the reserve requirement goes down to 200 MW which means more
than 30% reduction in secondary reserves that need to be purchased by the TSO in those
days.
Figure 4. 2. Daily reserve requirements for secondary control in the Netherlands based on the system load
in 2009
240
250
260
270
280
290
300
310
1 2 3 4 5 6 7 8 9 10 11 12
Rese
rve R
eq
uir
em
en
t (
MW
)
Month
Monthly
Yearly
180
200
220
240
260
280
300
320
1
21
41
61
81
101
121
141
161
181
201
221
241
261
281
301
321
341
361
Rese
rve R
eq
uir
em
en
t (M
W)
Day

58
Calculating the reserve requirement on a daily basis would lead to an average reduction
in the required reserves of 41 MW, or a 14% reduction in the reserves needed to be
purchased. Unfortunately, since in the Netherlands, the reserve capacity prices (with which
the TSO purchases reserves from service providers) are not public information (because of
the confidential nature of the yearly bilateral contracts between the TSO and service
providers), an estimation of the poss b e reduct on n the ‘costs’ of procuring reserves cannot
be made.
This issue can be taken even one step further: reserve requirements can be different for
peak and off-peak hours in each day (as is the case in PJM [16]), in which case an average
reduction of 20% in the amount of reserves required to be purchased can be achieved in the
Netherlands, using the data of year 2009. Figure 4. 3 shows the reserve requirements for the
Netherlands in case they are calculated separately for off-peak (from 00 to 07 hour) and peak
hours (from 07 to 24 hour) for each day. Because of the difference in load levels in these two
periods, the corresponding reserve requirements are noticeably different.
Figure 4. 3. Peak and off-peak reserve requirements for secondary control in the Netherlands based on the
system load in 2009
Therefore, using the exact same security criterion, and only by changing the frequency
of calculation, a considerable reduction in the amount of required reserves can be achieved,
which in turn will lead to lower reserve procurement costs. Needless to say, the frequency of
calculation of reserve requirements s c ose y re ated to the ‘t m ng’ of the reserve capacity
markets, which will be discussed in the next section.
It should be emphasized that the purpose in this section was to demonstrate that
regardless of the method we use for calculation of the reserve requirements (which is the
technical aspect of procuring reserves and discussed extensively in literature), the market
design decisions still play a decisive role in determining how much reserves needs to be
purchased, and eventually in determining reserve procurement costs. In other words, even if
we assume that the security criterion (the method to determine reserve requirements) is given,
considerable costs can be avoided by just calculating the reserve requirements on a more
frequent basis.
0
50
100
150
200
250
300
350
1 21 41 61 81 101 121 141 161 181 201 221 241 261 281 301 321 341 361
Rese
rve R
eq
uir
em
en
t (M
W)
Day
Off-Peak
Peak

59
4.4. Timing of reserve capacity markets
The two aspects of timing of markets are timing of the bidding procedure and timing of
the markets clearance. Timing of the bidding procedure addresses frequency of bidding
(which determines the time horizon of the market) and gate opening/closure times for
bidding, which need to be carefully coordinated with those of other electricity markets,
especially day-ahead (DA) market. ‘Timing of the market clearance’ addresses frequency of
markets clearance and their coordination with clearance of other markets. In this chapter, we
do not analyze the coordination aspect of balancing services and DA markets. We focus on
the frequency of bidding and frequency of market clearance of the balancing services
markets, without directly addressing the coordination that may be needed with other markets,
which is the subject of the following chapter of the dissertation.
In this section, we focus on timing of the reserve capacity markets and study the
German case. As noted before, various possibilities exist regarding the time horizon of the
reserve capacity markets; from yearly markets (such as regulating capacity market in NL) to
daily markets with hourly bidding (e.g. regulation market in PJM, and tertiary reserve capacity
market in Germany). At one extreme of the spectrum are long-term markets with bilateral
contracts (between the TSO and the reserve provider) as the procurement mechanism, and at
the other extreme are short-term auctions with daily or hourly bidding.
4.4.1. Bid prices
As shown in the previous section, in case of using a short-term auction, reserve
requirements can be calculated on a more frequent basis leading to avoidance of unnecessary
capacity reservation in many time periods. In addition to this factor, changing the time
horizon of the market has a direct impact on the possibilities for defining services in a more
specific way leading to prices that are more reflective of the real costs of providing the
service. In order to clarify the issue, the market prices of the reserve capacity markets for
primary, secondary and tertiary control in Germany are studied.
Figure 4. 4 shows the average selected bid prices in the reserve capacity market for
primary control in different months throughout 2009 [41]. As mentioned earlier, there is no
distinction between peak and off-peak hours or between up- and down-ward capacities.
Thus, as one can see from the figure, there is one market price per month for reservation of
primary control capacity. There is no significant variation in the average market prices; the
prices are not volatile. When bidding in the market, reserve providers calculate their lost
opportunity costs for offering their capacity in the primary control reserve market, other than
offering it in other markets including DA and ID markets. As the figure shows the prices are
high, and there is no price difference between up and down capacity or peak and off-peak
hours.

60
Figure 4. 4. Average selected capacity bid prices for primary control, Germany 2009
Figure 4. 5 shows the average selected bid prices in the reserve capacity market for
secondary control in different months throughout 2009. The improvement in the design of
the market for secondary control (compared to the primary control market) is a distinction
between peak and off-peak hours, and between up- and down-ward capacities. As can be
seen, these distinctions between services make the bid prices more reflective of the real value
of the corresponding service. During peak hours, many production units are running and can
decrease the r outputs on TSO’s not ce, therefore, n peak hours negat ve reserves cannot be
expensive because of the large number of units that can provide this service, so as can be
seen in Figure 4. 5, the average price for negative capacity in peak hours is the lowest; as low
as 1 €/ W/hour However, dur ng off-peak hours, when many gas and oil plants that can
provide secondary control reserve are not running, providing downward capacity will be
expensive because of the very limited number of the providers of this service, therefore as
the figure shows, the average price for negative capacity in peak hours is the highest, ranging
from 7 to 10 €/ W/hour Regard ng the pos t ve capac ty, the pr ce n peak hours s h gher
than in off-peak hours because of the limited availability of the resources able to regulate
upward (increase their output) during peak hours compared to off-peak hours.
Figure 4. 5. Average selected capacity bid prices of the fours monthly auctions for secondary control,
Germany 2009
10
15
20
25
30
35
Jan Feb Mar Apr May Jun Jul Aug Sep Oct Nov DecP
rice (
Eu
ro/
MW
/h
ou
r)
Month
0
2
4
6
8
10
12
Jan Feb Mar Apr May Jun Jul Aug Sep Oct Nov Dec
Pri
ce (
Eu
ro/
MW
/h
ou
r)
Month
NEG_Peak
Neg_Off Peak
Pos_Peak
Pos_Off Peak

61
Therefore, making these distinctions and defining services in a more specific way will
lead to prices that are more reflective of the value of the service and the price differences that
appear will result in a reduction of the costs of capacity reservation in general.
By reducing the time horizon of the market even more, the services can be defined in a
much more specific way, as is the case for the tertiary control reserve capacity market in
Germany, which is a daily market and the prices can be different in different days. Figure 4. 6
shows the average selected bid prices in the reserve capacity market for tertiary control in the
6 daily auctions, for the first day of September 2009, which is a Tuesday (a work day). The x-
axis shows different auctions, for instance, 00-04 shows the first auction of the day (from 00h
to 04 h), auctions are for 4 hours each. The first prominent point in the figure is the
variations of the prices. Prices dramatically vary for different hours during the day; the
phenomenon that was missing in the monthly markets for primary and secondary control, see
Figure 4. 4 and Figure 4. 5. The prices are more reflective of the real costs of providing the
service (higher price efficiency), with prices going down to almost zero in some hours:
negative reserves for peak hours (the last four auctions of the day). This cannot be the case in
markets with longer time horizons: prices in a monthly market cannot be different for
different hours or even different days.
In addition, using daily markets can lead to lower prices because it would lead to lower
opportunity costs (as a result of elimination of many uncertainties about the markets which
do exist when bidding one month or one year in advance), and also because of higher
competition since more players can participate in a daily market (small players with low
flexibility cannot participate in long-term markets).
Figure 4. 6. Average selected capacity bid prices of the 12 daily auctions for tertiary control, Germany, 01-
09-2009, Tuesday
Figure 4. 7 shows the average selected bid prices in the reserve capacity market for
tertiary control in the 6 daily auctions, for the 6th day of September 2009, which is a Sunday
(a holiday). The figure is presented for the sake of comparison. As can be seen the price for
positive reserves is consistently low, simply because of the fact that on a holiday with a low
demand, there is a lot of free capacity that can be offered as reserves. The price for negative
reserves is higher than in Figure 4. 6 because of the exact same reason.
0
5
10
15
00-04 04-08 08-12 12-16 16-20 20-24
Pri
ce (
Eu
ro/
MW
/h
ou
r)
Auction
Neg_Ave
Pos_Ave

62
Figure 4. 7. Average selected capacity bid prices of the 12 daily auctions for tertiary control, Germany, 06-
09-2009, Sunday
4.4.2. Excess supply ratios
A critical issue regarding increasing the time horizon of markets is its influence on
‘compet t on’ As the time horizon of the market increases, the number of service providers
participating in the market decreases because of the lack of flexibility of small units, and also
the uncertainties regarding forecasting the outcomes of other electricity markets: the capacity
that will be sold in other electricity markets and the corresponding prices. It simply originates
from interrelations of different electricity markets; generators have the opportunity to offer
their capacity in different electricity markets as different services, therefore these markets
compete with each other to attract capacity from suppliers. Thus, changing the design of one
market (e.g. changing the time horizon of one market) can lead to changes in the offered
capacities and bid prices in the corresponding market, simply because of its interrelations
with other electricity markets. Table 4. 3 shows the excess supply ratio, defined as the excess
of supply (not selected bid volumes) divided by demand (selected bid volumes), for the four
auctions of secondary control in Germany for different months of 2009. This indicator
compares the offered capacity in the market with the demand.
Table 4. 3. Excess supply ratios (in percentage) of the four auctions for secondary control- Germany 2009
Jan Feb Mar Apr May Jun Jul Aug Sep Oct Nov Dec Average
Negative Off-
Peak 16.7 17.4 19.5 0 0 0.4 0 0 0 1.8 9.1 2.7 5.6
Negative Peak 11 8.3 1.1 0 10.1 4.6 0 17.5 14 11.6 12.9 3.2 7.8
Positive Off-Peak 6.7 7.8 1.9 2.2 2.2 9 5.1 0 3.1 8.9 7.9 9.9 5.4
Positive Peak 15.2 9 0 0 0 8.1 16.3 16.7 24.2 17.2 15.6 19.6 11.8
One can see in the table that in 18 auctions (out of 48) the excess supply ratio is less
than 3% and in 11 auctions, the ratio is zero which indicates that absolutely all the bids are
needed to meet the demand (in order to meet the reserve requirement for secondary control).
This shows that because of the limited number of service providers and consequently the
limited amount of capacity offered in these markets, considerable market power exists in the
markets for secondary control in Germany.
0
10
20
30
40
1 2 3 4 5 6
Pri
ce(E
uro
/M
w/
ho
ur)
Auctions
Neg_Ave
Pos_Ave

63
Figure 4.8 shows the excess supply ratios in the German auctions for positive
secondary control reserves (peak as well as off-peak hours), for 16 months in a row, starting
January 2010. As can be seen, very low excess supply ratios is not a phenomenon limited to
2009 only. During 2010 and 2011 (the first six months), the excess of supply in the market
(for positive reserves) can hardly reach 10% of demand ever. In most months, the excess of
supply is negligible compared to demand, and in several months the indicator is negative,
indicating that the capacity offered in the market was not enough to meet the market
demand. In all those months, a secondary auction was held in which the TSOs procured the
remaining of their reserve requirement that they were not able to purchase in the first market,
due to extremely low supply.
Figure 4. 8. Excess supply ratios in the German auctions for Positive secondary control reserves (peak ad
well as off-peak), beginning from January 2010
Figure 4.9 is the counterpart of Figure 4.8 for negative reserves, thus it shows the
excess supply ratios for negative secondary control reserves (peak as well as off-peak hours),
starting from January 2010. The indicators show no improvement compared to positive
reserves. Actually in a few months in 2010, there was significantly low supply to the extent
that the TSOs had to repeat the auction two times more, to be able to meet their reserve
requirement for secondary control. Lack of participation in the reserve market, to such an
extent, creates serious opportunities for abuse of market power in the market.
Since we had access to detailed data for year 2009, we applied the pivotal supplier tests
to the 4 separate German auctions in 2009 (there were 4 separate control areas and thus 4
separate auctions).
-50
-40
-30
-20
-10
0
10
20
30
40
50
Jan Mar May Jul Sep Nov Jan Mar May
ex
cess
su
pp
ly r
ati
o (
%)
peak
off-peak

64
Figure 4. 9. Excess supply ratios in the German auctions for Negative secondary control reserves (peak ad
well as off-peak), beginning from January 2010
Table 4. 4 shows the number of pivotal suppliers (for each of the four German control
areas) n the auct on for pos t ve secondary contro n “off-peak” hours for a the months of
2009. The table confirms the existence of market power in the markets for secondary control
in Germany. As can be seen, in March, April, May and August 2009, absolutely all the bidders
are pivotal which illustrates serious market power, not even for the suppliers with large
market shares but also for all the small suppliers of secondary control reserve (for off-peak
hours) in these 4 months. In addition, in more than 60% of the time, more than one supplier
is pivotal in the auction for positive secondary control during off-peak hours.
Table 4. 4. Number of pivotal suppliers in the auction for positive secondary control in off-peak hours-
Germany 2009
Jan Feb Mar Apr May Jun Jul Aug Sep Oct Nov Dec
ENbW 0 3 10 (All) 6 (All) 8 (All) 0 3 18 (All) 5 0 1 1
Transpower 0 0 11 (All) 8 (All) 10 (All) 0 3 18 (All) 5 0 1 1
Amprion 3 4 11 (All) 9 (All) 10 (All) 3 9 (All) 8 (All) 4 4 4 4
50 Hertz 1 3 9 (All) 6 (All) 7 (All) 0 3 18 (All) 5 0 1 1
Table 4. 5 shows the number of pivotal suppliers (for each German area) in the auction
for pos t ve secondary contro n “peak” hours for a the months of 2009 Compared to
Table 4. 4, the number of pivotal suppliers is more promising for peak hours, which is
expectable because, in off-peak hours, the units that are synchronous to the grid and can
deliver power compatible with secondary control characteristics are very limited. However,
according to Table 4. 5, still during 3 months of 2009, all the units in all the four German
areas are pivotal meaning that all suppliers are needed to meet the demand. And this creates
serious market power concerns.
-50
-30
-10
10
30
50
Jan Mar May Jul Sep Nov Jan Mar May
ex
cess
su
pp
ly r
ati
o (
%)
peak
off-peak

65
Table 4. 5. Number of pivotal suppliers in the auction for positive secondary control in peak hours-
Germany 2009
Jan Feb Mar Apr May Jun Jul Aug Sep Oct Nov Dec
ENbW 0 0 10 (All) 6 (All) 8 (All) 0 0 0 0 0 0 0
Transpower 0 0 11 (All) 8 (All) 12 (All) 0 0 0 0 0 0 0
Amprion 0 3 11 (All) 10 (All) 12 (All) 3 10 (All) 1 0 6 0 2
50 Hertz 1 1 9 (All) 7 (All) 9 (All) 0 0 0 0 0 0 0
The pivotal supplier tests have been applied to the positive secondary control auctions
for peak hours and Table 4. 6 shows the percentage of the time in which the auction passes
each test in each German area separately. As one can see, in Amprion, in only 25% of the
time, the auction passes the one-pivotal supplier test and always fails the two- and three-
pivotal supplier tests. The other three areas can pass the two-supplier test in less than 50% of
the time and they pass the three-supplier test in only 25% of the time. These tables show that
serious attention is needed to solve the noticeably high market power concerns in the markets
for secondary control in Germany.
Table 4. 6. Percentage of the time in which the market passes the pivotal supplier tests- Positive secondary
control for peak hours, Germany 2009
One-Pivotal Supplier
Test
TWO-Pivotal Supplier
Test
THREE-Pivotal
Supplier Test
ENbW 75% 50% 25%
Transpower 75% 50% 25%
Amprion 25% 0 0
50 Hertz 58% 42% 25%
It should be noted that since the published bid data in Germany is anonymous, these
results are based on the implicit assumption that each bid is from a different supplier.
However, obviously a supplier might offer different parts of its capacity with different prices,
leading to different bids from the same supplier. Thus, the results of this analysis, showing
serious market power issues, could be much worse if the identity of every bidder was known.
In other words, the results presented above are optimistic.
As a comparison, Table 4. 7 shows the excess supply ratios in percentages for the 12
auctions of tertiary control in Germany for 1st of September, corresponding to Figure 4. 6. As
can be seen, the offered positive and negative capacities in all the auctions are at about 40%
more than the required capacity (the market demand). This phenomenon compared to the
excess supply ratios for the secondary control market, which according to Table 4. 3, for
different auctions differ from 5 to 11% on average, illustrates a noticeable difference between
these two markets (secondary and tertiary control). One reason is the difference in time
horizon of these two markets: monthly market for secondary and daily markets for tertiary
control. The frequency of bidding in the secondary control market is twice per month
(positive or negative), while the frequency of bidding in the tertiary control market is 12 times

66
per day. Serious uncertainties for bidding in a monthly market, considering the fact that when
the bid is selected the supplier has to make that capacity available (keep it free) for all the
PTUs of the coming month, significantly limits the service providers who can and have the
incentives to offer their capacity in the monthly secondary control market. While on a daily
basis, the suppliers have much more accurate forecasts about the state of different electricity
markets and therefore the risks and uncertainties are much more limited. In addition, they
offer their capacities for periods of 4 hours and not an entire month.
Table 4. 7. Excess supply ratios (in percentages) of the 12 auctions of tertiary control in Germany- 01-09-
2009
Neg.
00-04
Neg.
04-08
Neg.
08-12
Neg.
12-16
Neg.
16-20
Neg.
20-24
Pos.
00-04
Pos.
04-08
Pos.
08-12
Pos.
12-16
Pos.
16-20
Pos.
20-24
Excess Supply
Ratio (%) 40.7 40.3 39.7 39.3 39.6 39.8 46.3 43.6 41.3 41.7 41.5 43.3
4.4.3. Conclusions
Based on the results, we identify five main reasons to move towards auctions with
shorter-time horizons for reserve capacity markets:
1. Lower demand: As discussed in detail in the third section of this chapter,
reducing the time horizon of the reserve capacity market will provide the
possibility for the system operator to calculate the reserve requirements on a
more frequent basis, which in turn will reduce the demand for reserve capacity
in many time periods by avoiding unnecessary reservation of capacity. In fact,
using the same security criterion and only by calculating the reserve
requirement on a daily basis, rather than yearly, a 14% reduction in the
required reserves to be purchased (14% reduction in market demand) in the
Netherlands can be achieved. And by calculating separate requirements for
peak and off-peak hours (having two separate auctions) the reduction in the
amount of required reserves (demand in the reserve capacity market) would
increase up to 20%.
2. Easier new entries: Small players (small generating plants capable of offering
reserves) cannot enter long-term markets, especially because of their lack of
flexibility which will in turn increase their minimum profitable price at which
they are willing to sell their reserve. In addition, small players lack the
negotiating power in arranging bilateral contracts with the system operator,
and very high transaction cost is a deterrent as well. Therefore, moving
towards auctions with shorter time horizons (preferably daily markets) for
reserve capacity will enable small players to enter the market and compete
with larger players. The key point that makes the importance of enabling small
players to participate even more prominent in case of reserve capacity markets
is the small size of these markets. As an example, the average load in the
Netherlands is in the order of 14,000 MW, while the capacity that is reserved

67
for secondary control in the Netherlands is 300 MW. This is the total amount
of secondary control reserves that would be sufficient for the entire Dutch
system. Therefore, enabling the entrance of a small player with a very modest
size of 30 MW into the reserve capacity market would compensate for 10% of
the entire market demand. Thus, because of the mere small size of reserve
capacity markets, small players do matter and facilitating their entrance to the
market is of critical importance.
3. Higher competition and market liquidity: As a result of higher number of
market players being able to participate in the market, the excess of supply
would increase, less suppliers would have a dominant position (would be
pivotal) and consequently competition would improve and market liquidity
increase.
4. Lower lost opportunity costs: The prices can be lower because of various
reasons: more parties can participate in the market (especially smaller and less
flexible units), the level of competition will increase, and more importantly,
the opportunity costs will be much lower. Opportunity costs are based on the
predictions of a market party about how much of its capacity it can possibly
sell in other markets and with what price, so that it can calculate the profit it
could make by offering its capacity in other markets (other than reserve
capacity markets). Thus, the lower the time horizon of the market, the lower
the opportunity costs because of availability of more information (it is closer
to real-time), and the more accurate predictions on the prices of other
markets. These predictions obviously will be more accurate on a daily basis
rather than on a yearly basis where everything is extremely uncertain. In
addition, in case of an auction with short time horizon, bidding is less risky in
the sense that in case of a yearly market, once a party bids in the market the
bid will be fixed for the whole year and cannot be changed, so a mistake in
predicting possible future profits (underestimating the possible profits) can
lead to higher losses compared to the case where a daily market is used and if
the party makes a mistake (or underestimates possible profits) in its bidding, it
can change its bid for the next day. So on the one hand, having more accurate
information makes it possible to make a more accurate estimation of the real
opportunity costs, and on the other hand, since the level of uncertainty is
lower, the tendency to intentionally overestimate the opportunity costs (in
order to control the risks) becomes ower Thus, both ‘rea ’ and ‘perce ved’
opportunity costs can be much lower. It is this second reason that will
mprove ‘pr ce eff c ency’ of the market, meaning the bid prices will be more
reflective of the real costs of providing the service.
5. More proper TSO incentives: The incentives of the TSO, being the single
buyer in reserve capacity markets, play an important role in the efficiency of
these markets, specifically the allocative efficiency. On the one hand, the TSO

68
is the independent entity above the market that ensures system security
implying that it cannot have any financial incentive in the market outcomes,
and on the other hand, the TSO is the sole entity deciding on which resource
to purchase the reserves from. Therefore, by definition, the TSO lacks
incentives to truly try and minimize the costs of purchasing reserves. In this
situation, the only sensible action one can take is to limit the room the TSO
has to behave in a way that does not necessarily minimize costs but merely
ensures its convenience in fulfilling its responsibility of buying the required
reserves. Long-term bilateral contracts eave everyth ng to ‘conf dent a
negot at ons’ between the TSO and reserve providers. Information cannot be
disclosed because of confidentiality concerns and the TSO, after having
purchased the required amount of reserves from the most convenient
resources (and not necessarily from the cheapest available) claims the incurred
costs and gets reimbursed by the regulator. Lack of transparency as well as
proper incentives make low allocative efficiency unavoidable. Having a short-
term auction in which the reserve providers offer their reserves and the
cheapest bids are selected automatically can restrict the freedom the TSO has
to overlook efficiency concerns.
4.4.4. Arguments against short-term markets
Although the disadvantages of long-term reserve capacity markets were analyzed in the
previous section, one should be aware that there are arguments in literature against moving
towards short-term auctions. We discuss the main arguments mentioned in literature in this
section. The author in [40] mentions the following as a disadvantage of using markets with
shorter time horizons (higher frequency of market bidding/clearance) for ancillary services:
A high frequency market clearing helps players understand the behavior of the market, and therefore to
game it, as happened in California, where some capacities were withheld in order to raise prices [62].
Therefore, a low frequency market clearing has the advantage of reducing somewhat the influence of dominant
players.
Although at the first glance, it sounds true, looking deeper into the issue may prove
otherwise. The lower the frequency of market clearance, the higher the time horizon of the
market and the lower the number of players, simply because small players that are less flexible
(compared to large players with a flexible portfolio) cannot enter and compete in a yearly
market, as an example. Thus lowering the frequency of clearance in a sense actually makes the
dominant players even more dominant. In addition, small players are very important in
reserve capacity markets because the size of these markets is small and so small players do
matter. In this sense, small market parties can play a much more decisive role in balancing
services markets than in wholesale electricity markets, such as day-ahead market in which the
role of small players is not critical because of the large size of the market.
In addition, generally speaking, players being able to understand the behavior of the
market is only a good thing. They should be able to understand the market behavior, but the

69
regulator should be able to understand it better, so that it can design the rules and regulations
in a way that prevents players from gaming the market.
The author in [63] points out the vital issue of investment:
In the short term, a wholesale electricity system that is not a monopoly is feasible, as has been
demonstrated by the NordPool, which covers Norway, Sweden, Finland and Denmark, and by Britain.
However, in California and Brazil, serious under-investment in new capacity led to a near collapse of their
electricity systems, raising doubts about the sustainability of markets. It will do no service to consumers if
liberalization creates a market that is competitive in the short term, but is too risky to justify investment in
new generating capacity being undertaken.
Although the author does not mention this issue directly about ancillary services
markets (he addresses electricity markets in general), the investment argument can be used as
a valid argument against introduction of markets with short time horizons for balancing
services, especially reserve capacity: if they are real short-term markets with volatile and
unpredictable prices, then the investment would be risky which is the main concern regarding
sustainability of electricity markets. Although the argument is quite infallible considering
electricity markets in general, this investment issue is somehow different in case of reserve
capacity markets. The key is the very small size of the reserve capacity markets compared to
wholesale electricity markets, especially the day-ahead market (e.g. in the Netherlands the size
of the reserve capacity market for secondary control is only 2% of the system load).
Therefore, although one is right to say that moving towards markets with shorter time
horizons would increase the investment risks in general, the reserve capacity market, merely
because of its small size, does not seem to send a direct investment signal to market players.
In other words, in case of investment, the main worrying factor is the volatility and
unpredictability of the wholesale electricity market prices (especially the DA market) and not
the reserve capacity market prices.
Later on, the author in [63] rightly raises the issue of costs of arranging short-term
auctions:
The newly redesigned wholesale market (NETA) is rumored to have cost in excess of 600 million
Pounds. Running costs are also high, the Balancing Market element of NETA alone costs 80 million
Pounds per year to run [64].
The argument concerns the running costs of short-term auctions. However, the
number mentioned in the paper, 80 million Pounds per year just to run the balancing
mechanism in Great Britain, is slightly misleading because, according to the source, 80 million
is the annual cost of running balancing market operator Elexon, which is the company responsible for
operating the balancing mechanism [64]. Thus, this cost does not only reflect the running
costs of short-term auctions for balancing, but all the costs associated with the single
company responsible for performing the task of balancing the national grid.
Needless to say, introduction of new auctions incurs investment costs (development of
rules and regulations, development of software and data management tools, etc.), and incurs
running costs as well. And so, obviously a cost-benefit analysis needs to be performed on a

70
case-specific basis. However, it should be noted that the benefits from this change because of
increased competition, market efficiency and flexibility will be felt for a long time, while the
initial investment is an expenditure made once and for all.
4.5. Timing of balancing energy markets
In Germany, in the markets for procurement of secondary control, there is a clear
distinction between upward (positive) and downward (negative) regulation and they are
traded in two different sets of markets. In addition, separate auctions are used for off-peak
and peak hours. Thus, in each month, there are four separate auctions in which service
providers offer their capacities as secondary control reserve. The service providers bid once
per month for both reserve capacity and balancing energy markets. However, the reserve
capacity market is cleared once per month and the balancing energy market is cleared for
every quarter of an hour, using the same set of bids for all the PTUs (the energy bids are
fixed throughout the month). Therefore, in case of the balancing energy markets for
secondary control, while the frequency of bidding is once per month (time horizon of one
month), the frequency of market clearance is once per 15 minutes.
In the following paragraphs, using various indicators, we study the characteristics of the
German market and compare them with those of the Dutch market.
Figure 4. 10 shows the average se ected upward energy b d pr ces ( n €/ Wh) for
secondary control (SC) in Germany for 2009, for peak as well as off-peak hours. These are
the energy prices of the bids selected in the reserve capacity market and they constitute the
bid ladder that will be used for real-time balancing of the system. The figure compares these
prices with the monthly average intra-day (ID) prices in Germany for 2009, [41, 65]. As
mentioned earlier, the frequency of market clearance is a lot higher than the frequency of
bidding in case of balancing energy markets in Germany. According to the figure, while the
average ID pr ce n Germany (for 2009) s 39 €/ Wh, the average se ected pos t ve SC
energy bid price s 128 €/ Wh and 178 €/ Wh for off-peak and peak hours, respectively.
The intra-day market is the closest energy market to the real time.
Figure 4. 10. Average selected positive secondary control energy bid prices (peak and off-peak hours)
compared to the monthly average intraday prices for Germany in 2009
0
50
100
150
200
250
J an Feb Mar Apr May J un J ul Aug Sep Oct No v Dec
Pr
ce (
€/
Wh
)
Ave
Posit ive
Peak SC
Bids
Ave
Posit ive
Off-Peak
SC Bids
Ave ID
Prices

71
Figure 4. 11 illustrates the average selected positive SC energy bid prices divided by the
average intra-day price for the different months of 2009 in Germany. As can be seen, the
average SC energy bid prices (which are actually the real-time energy bids) are considerably
higher than the intra-day energy prices; from two to almost seven times higher.
Figure 4. 11- Average selected positive secondary control energy bid prices (peak and off-peak hours)
divided by the monthly average intraday price for Germany in 2009
In order to have a closer look at the situation, we compare these balancing energy bid
prices of Germany with those of the Netherlands. Before making the comparison on the
balancing markets of the two countries, we should make a short comparison of the wholesale
electricity prices of the two countries. Figure 4. 12 shows the average hourly day-ahead
market prices in Germany and the Netherlands for 2009. As one can notice, the average day-
ahead prices of the two countries almost match; no considerable difference in the average
day-ahead prices can be seen.
Figure 4. 12. The average hourly intra-day market prices in Germany and the Netherlands for 2009
While the wholesale electricity market designs in Germany and the Netherlands are
basically the same, and there is no considerable difference in the average market prices, the
designs of the balancing services markets (specifically the secondary control service studied in
this section) are very different. While the service providers bid once per month and the
balancing energy market for secondary control is cleared once per 15 minutes in Germany,
Ave Positive SC Bid Prices/Ave ID Price - Germany
0
1
2
3
4
5
6
7
Jan Feb Mar Apr May Jun Jul Aug Sep Oct Nov Dec
Peak
Off Peak
0
10
20
30
40
50
60
1 3 5 7 9 11 13 15 17 19 21 23
Pri
ce (
Eu
ro/
MW
h)
Hours
NL
DE

72
the service providers in the Netherlands can bid separately for each 15 minutes (they can
change their bids up to one hour before real-time) and so the frequency of market clearance
is the same as the frequency of bidding.
Figure 4. 13 compares the last selected positive secondary control (SC) energy bid
prices of Germany with those of the Netherlands. It shows the maximum selected positive
SC energy bid price (corresponding to the last selected bid in the reserve capacity market)
divided by the average intra-day price. In case of the Netherlands, the entire bid ladder is not
published publicly, but TenneT publishes four prices corresponding to four different points
on the bid ladder, including the bid price for 300 MW [61]. Since TenneT reserves 300MW
for regulating power (equivalent of secondary control) in the Netherlands (by annual
contracts), we used the price corresponding to this volume in Figure 4. 13. As the figure
illustrates, although the maximum bid in the Netherlands does not go higher than three times
the average DA price, the maximum SC bid of off-peak hours in Germany varies from four
to nine times the average DA price, and for peak hours it changes from five to even twenty
times the average DA price.
Figure 4. 13- Comparison of the monthly average of the last energy bid price for positive secondary control
in the Netherlands and Germany (peak and off-peak)- 2009
In the German market, pay-as-bid pricing is used which, according to the existing
extensive literature, does not provide the incentives for service providers to bid at their
marginal costs, compared to marginal pricing that is used in the Netherlands. Nevertheless,
the difference in bid prices is too high to be explained only by use of pay-as-bid pricing.
Other market design issues, specifically timing of markets, play an important role. First of all,
the difference in the time horizon of these two markets is critical: monthly market in
Germany and quarter-hourly market in the Netherlands. The uncertainties in bidding in the
German market are a lot higher than in the Dutch market (because of all the uncertainties in
forecasting the wholesale electricity market demand and prices one month in advance) which
will push the bid prices higher in Germany. Secondly, the difference between the frequency
of bidding (once per month) and frequency of market clearance (once per quarter an hour) in
the German market is of crucial importance. The consequence of this design is that since
each bidder has to submit one single bid price for the entire coming month (all the 15-
minutes of the next month), its secondary control (SC) bid price cannot follow the electricity
0
5
10
15
20
25
J an Feb Mar Apr May J un J ul Aug Sep Oct No v Dec
Mo nthly Average
o f the Las t P o s itive
SC Bid/Ave DA
P rice - Netherlands
Las t P o s itive SC
Bid P eak/Ave ID
P rice - Germany
Las t P o s itive SC
Bid Off-P eak/Ave
ID P rice - Germany

73
price changes in the day-ahead (DA) market, throughout the coming month. Therefore, if for
example, the bidder offers its SC energy at the expected monthly average DA price, it means
that it will lose some profit in half of the PTUs of the month (on average) because its SC bid
price will be lower than the DA price half the time, and it could have offered its energy in the
DA market other than the SC energy market. This phenomenon leads to an indirect and
unintentional introduction of a Lost Opportunity Cost (LOC) in the bids for SC energy
market, even though this service, in its nature, creates no LOC for the provider, simply
because this is a real-time market and it will be cleared after the closure of all the other
markets (in contrast to the capacity reservation service which creates LOCs for the provider
by nature, because the reserve capacity market is a longer term market). This large LOC will
push the bid prices even higher; the effect that could be seen in Figure 4. 13.
Figure 4. 14 illustrates the last energy bid price for positive secondary control in
Germany (for peak hours) and the Netherlands, in December 2009. As expected, the last
selected energy bid price in Germany is a fixed value for all the PTUs of the month. The
figure also illustrates the volatility of the energy bid price in the Netherlands which originates
from the fact that the frequency of bidding in the Netherlands for the energy market for
secondary control is once per PTU. Thus, the service providers, in the Netherlands, can
submit different bids for different PTUs so they have the opportunity to take into account
the changes of electricity prices in other electricity markets (day-ahead specifically) in their
energy bids for secondary control (which represent the real-time bid prices for electricity).
The secondary control service providers can follow the electricity price changes in different
hours of different days by their energy bids for secondary control. The figure also shows the
monthly maximum and average of the last bid in the Netherlands. It illustrates what was
described as introduction of lost opportunity costs by having different frequencies for
bidding and clearance. As one can see in the figure, the monthly average of the last bid in the
Nether ands s 99 €/ Wh, wh e the month y max mum of the ast b d (in the Netherlands)
s 246 €/ Wh n case of a month y b dd ng n the Nether ands (one s ng e b d for the ent re
coming month), it would be likely that the bidders would go for the expected monthly
maximum price in order to make sure that in all PTUs, their bid price is high enough so that
they would not lose any profit in other electricity markets. Therefore, in Figure 4. 14, for each
PTU, the difference between the last bid and the monthly maximum of the last bid can be
seen as the opportunity cost that would have been added in case monthly bidding had been
used in the Netherlands. As can be seen, the last bid (for peak hours) in Germany is even
higher than the monthly maximum of the last bid in the Netherlands which can be attributed
to the uncertainties in forecasting the electricity prices one month in advance, and the use of
pay-as-bid pricing in Germany.

74
Figure 4. 14. The last energy bid price for positive secondary control in Germany (Peak hours) and the last
bid price in the Netherlands- December 2009
In order to summarize, in addition to the reasons mentioned for moving towards daily
markets for reserve capacity, using long-term auctions for balancing energy has two more
disadvantages:
1. Introduction of a ‘lost opportunity cost’ element to bid prices: As
illustrated in the figures presented above, using a long time-horizon for
balancing energy markets means that the frequency of bidding will not be the
same as the frequency of market clearance. Balancing energy markets are by
definition cleared on a PTU basis because activation of balancing energy bids
aims to resolve system imbalance that is different in different PTUs. Thus,
using for example a monthly market for balancing energy means that the
bidding will happen once per month while the market will be cleared on a
PTU basis. Having to submit one bid for all the PTUs of the coming month
will push the bid prices high simply because of the added lost opportunity
cost (LOC): the one single bid submitted for the entire month needs to be
sufficiently high for the bidder to ensure that no profit is lost in other
markets, for each of the market clearing periods (each PTU). So the bid price
cannot follow the change in electricity price throughout the month, and this
will indirectly add the above mentioned LOC component into the bid prices, a
component that can be considerably large because of the volatility of the
electricity prices throughout the month. This unnecessary LOC component
can be eliminated if the bidders are allowed to submit different bid for
different PTUs: using a market with a time horizon equal to the PTU length.
2. Limited players: Since the market is monthly, as soon as the market is closed
no new bids can be accepted, so there cannot be any bidding throughout the
month. Close to real-time, many generating units may have free capacity that
can be offered as balancing energy in the real-time market, but because they
were not selected in the auction cleared in the preceding month, they cannot
participate in the market. This will significantly influence the allocative
0
100
200
300
400
500
600
700
1 1500 PTU
Pr
ce (
€/
Wh
)
Last Bid Peak-
Germany
Monthly
Maximum of the
Las t Bid -
Netherlands
Monthly Average
of the Las t Bid -
Netherlands
Las t Bid -
Netherlands

75
efficiency of the market: available resources are not used in an efficient way, a
large part of potential bids are left out because no new bidding is allowed
throughout the month. That is the implicit consequence of using different
frequencies for bidding and market clearance; in the Netherlands the players
who did not participate in the yearly reserve capacity market can still
participate in the real time energy market because in the energy market,
bidding and market clearance are both on a PTU basis, while in Germany the
players who did not participate in the monthly reserve market cannot
participate in the real time energy market because although the energy market
is cleared on a PTU basis, bidding in the market happens on a monthly basis.
4.6. Conclusions
In case of reserve capacity markets, short-term auctions (preferably daily) can avoid
several undesirable effects in performance of the market. Demand would be lower (because
of higher frequency of calculation of reserve requirements), new entries would be easier
(small plants can participate in the market that can have a significant effect on market price
because of the small size of the market), competition would be higher (because of more
players and higher excess supply ratios), opportunity costs would be lower (both the real and
perceived opportunity costs, because of lower uncertainties), and the TSO would have less
room to deviate from optimal procurement of resources. These factors would in turn lead to
higher liquidity, allocative and price efficiency, and transparency, in other words a more
incentive compatible design. Nevertheless, the costs of implementing this new design need to
be taken into consideration in an objective way. In case of a daily reserve capacity market, the
next quest on wou d be ‘should the daily reserve capacity market be closed and cleared before
the day-ahead market, or the other way around, or shou d they be s mu taneous?’ This
question is the topic of the next chapter.
In case of balancing energy markets, two more arguments exist for moving towards
markets with very short time horizons (bidding separately for every PTU). First, because the
balancing energy market is cleared on a PTU basis, having a bidding horizon longer than one
PTU will lead to introduction of an extra opportunity cost to the bid prices. And second, for
example in a monthly market, new bidders cannot participate in the market throughout the
month, because they were not selected in the market cleared in the preceding month. Thus,
for balancing energy markets, having a long time horizon (for bidding) will significantly
impact the liquidity, allocative and price efficiency of the market.

76
5. COORDINATION OF TIMING OF RESERVE
CAPACITY AND DAY-AHEAD MARKETS

77
5.1. Introduction
As discussed in the previous chapter, using markets with short time horizons for
procurement of reserve capacity would lead to various improvements in the market
performance. As a result of short term auctions, the number of reserve providers who can
participate in the market increases leading to higher liquidity and higher competition, the
reserve requirements can be calculated more frequently and more accurately resulting in a
reduct on of the “demand” n the reserve capac ty markets, the room for the TSO to deviate
from optimal procurement of reserves would be limited resulting in higher allocative
efficiency, the transparency of the market would improve, and the prices would be more
reflective of the real value of the service. As a conclusion in the last chapter, use of daily
auctions (preferably with hourly bidding) was recommended. However, in case of daily
reserve capacity markets, the critical question would be: how should the reserve capacity and
the wholesale day-ahead market be coordinated?
The complicating factor in design of reserve capacity markets is that generators have
the opportunity to offer their free capacity in day-ahead market or the reserve capacity
market. In other words, these markets compete with each other for attracting bids. Thus,
design of reserve capacity markets cannot be done in isolation from design of other electricity
markets especially the day-ahead market. This chapter focuses on coordination of timing of
the reserve capacity (RC) market and the day-ahead (DA) market. The effect of alternative
clearance sequences of the DA and RC markets are studied in this chapter. Using an intuitive
argument, the authors in [20] mention that in order to avoid low liquidity and higher prices,
the RC market must be closed before the DA market. Authors in [37] confirm this
recommendation arguing that in order to ensure that the system operator has the required
amount of reserves to maintain system security, the RC market should be the first one.
However, the issue of the sequence of these two markets is still an open question and there
are examples in various systems in which the RC market is cleared after the closure of the
DA market, e.g. the regulation market in PJM is closed one hour before the hour of
operation while the DA market is obviously cleared on a day-ahead basis [15, 16]. Since the
order of clearance of these two markets has a direct impact on possibilities for integration of
reserve capacity markets across borders, this entire chapter is devoted to study this issue and
the outcomes will be used in the next chapter that explicitly discusses challenges of
integration of reserve capacity markets.
In this chapter, the objective is to develop a model that can help us understand the
consequences of changing the sequences of these two markets. The objective of this study is
to see how these different possible designs can influence the behaviour of bidders in the two
markets, using market clearing prices and volumes of the offered capacity in each market as
the main indicators. A simulation model is developed in MATLAB, which focuses on
behav our of the generators as “se ers” n both the A and RC market Each generat ng un t

78
decides on its offered capacities in the two markets (bid capacities) and the corresponding bid
prices in each round of the simulation.
5.2. Agent-based modeling, motivation
The electricity sector, and economies in general are characterized by difficult real-world
aspects, such as asymmetric information, imperfect competition, strategic interaction,
collective learning, and the possibility of multiple equilibriums [66]. Analytical approaches
usually have to put strong and constraining assumptions on the agents that make up the
economic system under study, in order to set up elegant formal models [67]. Equilibrium
models either do not consider strategic bidding behavior or assume that players have all
relevant information about the other players' characteristics and behavior; they also disregard
the consequences of learning effects from daily repeated interactions [68]. Game theoretical
analysis is usually limited to stylized trading situations among few actors, and places rigid –
oftentimes unrealistic – assumpt ons on the p ayers’ behav or [67].
Introduction of the concept of complexity made some economists take a different
approach to market modeling. A system is typically defined to be complex if it exhibits the
following two properties [69]:
• The system s composed of nteract ng un ts
• The system exh b ts emergent properties, that is, properties arising from the
interactions of the units that are not properties of the individual units themselves.
As the concept of complexity and complex adaptive systems gained popularity, more
economics research was performed focusing on heterogeneity and adaptivity rather than
rational behavior and equilibrium. At the same time, the tremendous availability of
computational resources made it possible to set up large-scale and detailed computational
models that allow a high degree of design flexibility [67]. Agent-based models offered the
possibility of not only describing relationships in complex systems, but growing them in an
artificial environment [70]. Agent-based simulation is, thus, a third way between fully flexible
linguistic models and more transparent and precise but highly simplified analytical modeling
[71]; the resulting models are dynamic and executable, so that their evolving behavior can be
observed step by step [72].
5.3. Agent-based modeling, concepts and procedure
Agent based modeling essentially researches the two-way feedback between regularities
on the macro level and interaction of economic actors on the micro level. The actors are
modeled as computational agents. Each agent is an encapsulated piece of software that
includes data together with behavioral methods that act on these data [66]. Some of these
data and methods are designated as publicly accessible to all other agents, and some are
designated as private and so, not accessible by any other agents. Agents can communicate
with each other through their public and protected methods. The modeler specifies the initial

79
state of an econom c system by spec fy ng each agent’s n t a data and behav ora methods
and the degree of accessibility of these data and methods to other agents [66].
The concept of (computat ona or software) “agents” comes from the f e ds of
Distributed Artificial Intelligence (DAI) and Multi-Agent Systems (MAS). Common
definitions of the term characterize them as autonomous, reactive, goal-oriented, or socially
able, just to cite a few [67]. However, as the authors in [73] correctly annotate, these features
do not all translate into computational properties in agent-based simulations. Most AB
models do not require agents to exhibit all the characteristics of the software agents from the
DAI or MAS world; instead, the most important features of agents in AB models is that they
are goal-oriented and adaptive [67].
All agents are assigned a value, like e.g. payoff, fitness, or utility, the amount of which is
dependent on their actions in the environment they are placed in. Agents are goal-oriented
meaning that they seek to maximize this value, and they are adaptive, meaning they have the
ability to learn which actions to take in order to increase this value over time, and so to reach
the goal.
The modeling procedure can be described as follows [66]: After having (i) defined the
research questions to resolve, the modeler (ii) constructs an economy comprising an initial
population of agents and subsequently (iii) specifies the initial state of the economy by
def n ng the agents’ attr butes (e g type character st cs, earn ng behav or, know edge about
itself and other agents) and the structural and institutional framework of the electricity market
within which the agents operate; the modeler then (iv) lets the economy evolve over time
without further intervention—all events that subsequently occur must arise from the
historical time-line of agent-agent interactions, without extraneous coordination; this
procedure is followed by (v) a careful analysis of simulation results and an evaluation of the
regularities observed in the data.
Our aim is to develop a model that can help us understand what the possible
consequences are when the sequence of the day-ahead and the reserve capacity market is
changed. At the heart of such model is the behavior of market parties. Different designs
would lead to different outcomes partly because they are perceived and reacted to differently
by market parties, even though there might not be a fundamental difference between the
designs. Thus, what we would like to study is the mutual effect of the environment and the
actors: the environment changes, which would influence the behavior of the actors, and the
change in behavior will result in different outcomes at the system level. Therefore, the
behavior of market parties plays a decisive role, the behavior that is of course focused on
profit maximization and whose effect would be even more prominent considering the
oligopolistic structure of the electricity markets.
5.4. Agent-based modeling, various methods
Genetic algorithms have been applied to electricity markets in order to study the
bidding behavior of market parties [74-77]. Although genetic algorithms have been widely

80
and rather successfully applied to various optimization problems within power systems
engineering, use of these algorithms for determining the bidding behavior of individual
bidders in an electricity market seems to be contradictory to some fundamental issues in
electricity markets (and anonymous markets in general). In GAs, during each generation of
the evolutionary process, creatures are randomly selected for reproduction with some bias
towards higher fitness. After parents are selected for reproduction, they produce children via
the processes of crossover and mutation [77]. The parents are required to be in pairs for
reproduction, and the result is two children. Children are created by copying the contents of
parent 1 into child 1 and of parent 2 into child 2 until a randomly selected crossover location
is reached [76]. At this point, bits are copied from parent 1 into child 2, and from parent 2
into child 1.
So it is the sharing of information between agents that enables them to learn. In other
words, genetic algorithms are designed as systems in which agents cooperate and share
nformat on and t’s the ent re population that is learning something, and not individual agents
learning separately (using market outcomes). That’s n contrad ct on w th the bas cs of
markets in which bidders are independent and do not share information. Thus, although
genetic algorithms can be quite successful in solving optimization problems (in which case it
is the entire population trying to reach an optimal result, and not independent agents), seeing
the bidders in a real market as agents within a genetic algorithm seems to be in contradiction
with the basics of the market.
Based on psychological findings on human learning, Erev and Roth developed a three-
parameter reinforcement-learning algorithm [78]. This learning model has gained much
attention by agent-based modelers in many fields, including electricity market studies [79-82].
This algorithm assumes a certain limited number of actions for each agent, or in other words,
the algorithm assumes discreet decision variables. Each action of the agent has a certain
weight, which determines the likelihood of the agent taking the corresponding action in each
round. These weights are updated at the end of each round using the market outcomes (the
agent’s prof t)
The rules are simple, agents explore (the decision space) a lot and the final results are
very path-dependent, especially as the number of variables increases. Effective applicability of
this algorithm seems to be very dependent on the number of decision variables and the
complexity of the problem that is being analyzed. If there is only one variable (e.g. only bid
price) and very limited number of agents, these models manage to give us meaningful insight
about the dynamics of the market. However, as the problem gets more complex, and the
number of decision variables increases, this very simple algorithm does not seem to be able to
handle the complexity in an effective way. Adding a decision variable means adding another
dimension to the decision space, which means a large increase in the number of possible
actions for each agent.
Q-Learning is yet another popular algorithm that has been used to simulate electricity
markets [83-85]. Although the details of Q-learning and Roth-Erev are different (the way the
weights are updated in each round are different in the two algorithms), both algorithms use

81
the same basic assumptions and have the same structure. In this chapter, we are trying to
simulate two markets (and their interrelations), and we have bid capacities in addition to bid
prices in each market.
We applied Q-learning and Roth-Erev to this problem, which has 3 decision variables
(the capacity in the second market is a dependent variable), using the case of Germany, which
will be explained in detail later in this chapter, with 62 bidding agents. Different runs of the
simulation led to wildly different results, the standard deviation of the market prices
(compared to the mean) was too high to enable us make any meaningful conclusion. If one
looks closely at the results reported in the extensive and insightful working paper of Iowa
State University [86] which uses a modified Roth-Erev algorithm, the same issue can be
noticed.
For each day (one set of inputs), the algorithm is run for 20 times and the outcomes are
reported. As can be seen in the tables of the Appendix (particularly table 9), the price of the
same node, varies so much in those 20 runs that the standard deviation of the price is
sometimes more than 50% of the mean. These variations do not challenge the validity of the
conclusions of the report, because the report compares the no-learning case (bidding at
operating costs) with the learning case (where agents use the proposed algorithm) and aims to
show that using the learning algorithm would enable the agents to learn how to behave
strategically and take advantage of the opportunities in the market, and thus bidding at a price
higher than their operating costs.
However, those high variations (in different runs) would limit the applicability of this
algorithm if two or more particular designs are to be compared. In addition, it should be
emphasized that these high variations occur while the problem (studied in the report) is
highly simplified: there are only five generators and they each have two decision variables,
one with 5 possible states and the other only 3. So the number of players is limited, and the
decision variables are highly discretized, and yet the numerical results vary wildly in different
runs.
The method we use in this chapter falls under the last category of agent-based models
as categorized in [67]: model based adaptation algorithms, which are usually tailored for the
specific design of the simulated market(s). They do not explicitly rely on findings from
psychological research about learning or on developments from the DAI or MAS fields of
agent learning. The most prominent work in this field has been conducted at the London
Business School [87-89]. Other approaches, such as those by Visudhiphan and c , have also
attracted interest by researchers. Bower and Bunn in [87] present an agent based simulation
model of the England and Wales electricity market. The simulation is designed to compare
different market mechanisms, i.e. daily versus hourly bidding and uniform versus
discriminatory pricing. Generator agents use a simple reinforcement-learning algorithm,
which is driven by the goal to simultaneously maximize profits and reach a target utilization
rate of their own power plant portfolio. The agents adjust their bidding strategies according
to their last round's success: they either lower, raise, or repeat their last bid price, depending
on whether their utilization and profit targets have been met in the last round, or not. It is an

82
extremely simple mechanism used to simulate bidding, and yet manages to lead to new
insights regarding different market designs.
The following section will explain the basic logic of the model used in this chapter, and
the mathematical formulation can be found in Appendix A.
5.5. The basic logic of the model
The system we are trying to sturdy comprises of two basic elements: the environment
and the agents. The environment is determined by the rules of the market design, and the
actors are the generators who would bid in the market and if selected would be able to sell
their offered capacity.
Regarding the environment, there are two markets in which the actors can bid into: the
day-ahead (DA) market and the reserve capacity (RC) market. The question we try to answer
is what would happen if the sequence of these two markets is changed. Thus, three cases are
defined: two cases in which markets are cleared sequentially (first DA then RC, and the other
way around), and one case in which the markets are simultaneously cleared. Each of these
cases has its own characteristics. In case of sequential clearance, the bids in the first market
would have a lost opportunity cost component s mp y because from the se er’s perspect ve,
the product that is offered in the first market needs to have a price that is high enough for
the seller to make sure that by offering that product in the first market he is not losing a
possible profit in the second market. Another important characteristic of sequential clearance
is that when the outcomes of the first market are known, the seller can adjust its bid in the
second market. In other words, if the seller has some capacity that was not selected in the
first market, he still can offer that capacity in the second market, while in simultaneous
clearance, the bidder has to divide up its capacity between the two markets and cannot offer
the same capacity in both markets.
The second element of the model is the agents (generators/sellers in the market). In
each round, agents bid in the two markets, and based on the market outcomes they would
change their bids for the next round. Agents do not have information about the bids of the
other agents: they can only see the market outcomes. The decision variables that the agents
have are their bid price and the bid volume. There are two markets and therefore, in each
round, every agent decides on two bid prices and two bid volumes. The objective of an agent
is maximizing its total profit. They do not necessarily bid at their marginal cost. The marginal
cost only determines their minimum bid price. Depending on the market conditions, their
market power and other agents’ b ds, an agent can b d at a pr ce much h gher than its
marginal cost (there would be a price cap in the market though).
In order to be able to model the opportunistic behavior of the agents, we define a basic
characteristic for the agents which models their attitude towards risk. On one hand, we have
risk-averse agents who do not behave opportunistically: when they bid in the market and
their bid is selected they will not try to increase their bid price in order to increase the market
price and gain more profit. These agents do not try to take risks, they bid at their marginal

83
cost plus a margin and if they are selected in the market they would simply keep their bid
price for the next rounds. On the other hand, we have risk-prone agents who do not
necessarily keep their current bid price (for the next round) if they are selected, but they will
try to influence (increase) the market clearing price by increasing their bid price. So they take
the risk of not being selected (in the next round) in order to increase the market clearing
price. These agents try to abuse their market power and take advantage of all the
opportunities in the market to gain more profit.
In addition to the bid price, the agents need to decide on their bid volumes in every
round as well (based on the market outcomes). The agents use a simple logic to change their
offered volume in the two markets. They calculate their average profit per MW of their
capac ty ( n €/ W/hour) n the two markets and w thdraw some of the r capac ty from the
less profitable market and add it to their offered capacity in the other market. The size of this
volume change in each round depends on the difference between the two profit values (in the
two markets). The lower the difference, the smaller the size of the volume change in that
round. We use a simple linear relationship for shifting of volumes.
The mathematical formulation of all these rules and the model as a whole can be found
in Appendix A.
5.6. Inputs and parameters setting
The data list of the generating units in Germany is used in this model: 262 units
(different types) with different operating costs [90]. The list includes oil, gas, coal, nuclear and
hydro power plants. It is assumed that each generator bids separately. In the following results,
the demand of the DA market is 74,000 MW (rough estimation of the current peak load in
Germany) and the demand in the RC market is 6,000 MW which is the sum of the demand
for secondary and tertiary control in Germany (the average value in 2009) [41]. The total
generation capacity is 108,855 MW. It should be emphasized that the goal of this study is not
to “s mu ate the German market”, but to use the ava ab e rea data n order to be ab e to
have a realistic picture (to avoid making conclusions based on a non-real test system).
Distinguishing between risk-averse and risk-prone units is also a critical input to the
simulation. The desirability of taking a risk-prone approach highly depends on the level of the
operating costs of a unit; Low-cost units can add a decent profit margin to their operating
costs and expect to be selected in the market with a high probability, simply because of their
low level of operating costs. Thus, when marginal pricing is used, trying to increase the
market clearing price (taking a risk-prone approach) for low-cost units endangers their
otherwise-secure and continuous profit. Therefore, we define the risk attitude of units based
on their operating costs: units with costs lower than a certain level are considered risk-averse
and the ones with higher costs are considered risk-prone The sett ng of th s “cr t ca cost
eve ” has profound mpact on the s mu at on resu ts Figure 5. 1 shows the cumulative
distribution of the operating costs of the units used in this study (power plants list in
Germany). As can be seen, 50% of the total available capacity comes from units with an

84
operat ng cost of ess than 41 07 €/ Wh Us ng th s va ue as the cr t ca cost eve means that
half of the capacity will belong to risk-averse units and the other half to risk-prone units.
0 50 100 150 200 2500
0.1
0.2
0.3
0.4
0.5
0.6
0.7
0.8
0.9
1
Pro
bab
ilit
y
Operat ng Costs (€/ Wh)
41.07
Figure 5. 1. Cumulative distribution of the units’ operating costs
Figure 5. 2 illustrates how the DA market clearing price in case A depends on the
critical cost level used for distinguishing between risk-averse and risk-prone agents. As the
critical cost level increases, the number of risk-prone units decreases which results in
reduction of the market clearing price. Risk-prone units have to compete with others in order
to be selected in the market and by reduction of the number of risk-prone units, their impact
on the market clearing price would be more and more limited. However, it should be noted
that the objective in this study is to compare the three cases so the key factor is to apply the
same critical cost level to all the cases.
Figure 5. 2. Final market clearing price of the DA market for Case A, as a function of the critical cost level
used for distinguishing between risk-averse and risk-prone units
Various values for the critical cost level were used and the simulation results (for case
A, which is the current design in Germany) were compared with the real market price data in
Germany. Figure 5.3 shows the real day-ahead (DA) market prices in Germany for different
load levels in 2009, and the solid line shows the trendline estimating the trend of the data.
Us ng a cr t ca cost eve of 40 €/ Wh n the mode wou d resu t n the market pr ces shown
on the graph. As can be seen, the simulation results closely follow the trendline of the real
25 30 35 40 45 5040
45
50
55
60
65
70
75
80
85
90
95
Cost Leve (€/ Wh)
DA
Mar
ket
Cle
arin
g P
rice
- C
ase
A

85
market data, having a correlation coefficient of 0.98. Thus, we have used a critical cost level
of 40 €/ Wh for the s mu at on resu ts presented n the rest of th s chapter The exact same
parameter setting is applied to all the three cases.
Figure 5. 3. Real and simulated day-ahead market prices in Germany 2009
5.7. Model results
Figure 5. 4 shows the market clearing prices (for each round) of the DA market and the
RC market for the three cases, assuming the critical cost level of 40 €/ Wh As can be seen,
regard ng the A market, case A resu ts n the h ghest market pr ce, 70 €/ Wh, wh ch
originates from the lack of the possibility of capacity substitution between the two markets in
case A, meaning non-selected bids in one market cannot be bid into the other market so the
corresponding non-selected capacity is lost (not used). Case B and case C result in almost the
same A market pr ces, 67 €/ Wh and 66 €/ Wh, respect ve y Regard ng these two cases,
it seems that, although capacity substitution can be performed by units in these two cases
which leads to lower bid prices and consequently lower DA market clearing prices, because
of the significant difference in the size of the DA and RC markets (the DA market is 12 times
larger than the RC market) the sequence of market clearances has an insignificant effect on
the DA market prices. Thus, even though in case C, a lost opportunity cost component is
added to the bid prices in the DA market (the first market in case C), this case leads to the
lowest DA market clearing price. The difference in size of the markets originates from the
nature and objective of the two markets: the DA market aims to meet the electricity demand
of the system, but the RC market aims to procure the required reserve capacity to
compensate for deviations in real time.
0
20
40
60
80
100
120
140
160
180
200
40000 45000 50000 55000 60000 65000 70000 75000 80000
Pri
ce (
Eu
ro/
MW
h)
Demand (MW)
RealMarketPrices
ModelResults
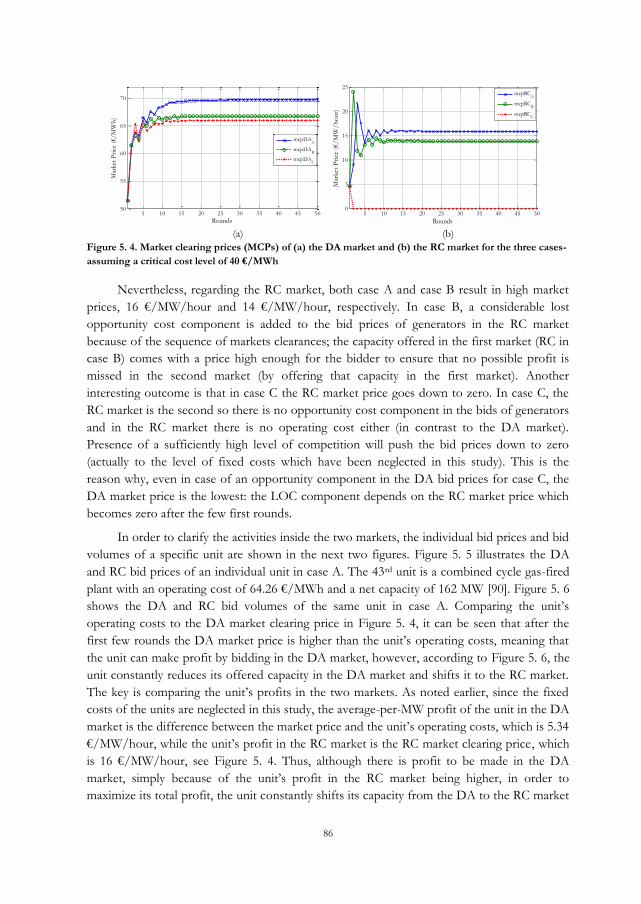
86
5 10 15 20 25 30 35 40 45 5050
55
60
65
70
Rounds
ar
ket
Pr
ce (
€/
Wh
)
mcpDAA
mcpDAB
mcpDAC
5 10 15 20 25 30 35 40 45 500
5
10
15
20
25
Rounds
ar
ket
Pr
ce (
€/
W
/h
ou
r)
mcpRC
A
mcpRCB
mcpRCC
(a) (b)
Figure 5. 4. Market clearing prices (MCPs) of (a) the DA market and (b) the RC market for the three cases-
assuming a critical cost level of 40 €/MWh
Nevertheless, regarding the RC market, both case A and case B result in high market
pr ces, 16 €/ W/hour and 14 €/ W/hour, respect ve y In case B, a considerable lost
opportunity cost component is added to the bid prices of generators in the RC market
because of the sequence of markets clearances; the capacity offered in the first market (RC in
case B) comes with a price high enough for the bidder to ensure that no possible profit is
missed in the second market (by offering that capacity in the first market). Another
interesting outcome is that in case C the RC market price goes down to zero. In case C, the
RC market is the second so there is no opportunity cost component in the bids of generators
and in the RC market there is no operating cost either (in contrast to the DA market).
Presence of a sufficiently high level of competition will push the bid prices down to zero
(actually to the level of fixed costs which have been neglected in this study). This is the
reason why, even in case of an opportunity component in the DA bid prices for case C, the
DA market price is the lowest: the LOC component depends on the RC market price which
becomes zero after the few first rounds.
In order to clarify the activities inside the two markets, the individual bid prices and bid
volumes of a specific unit are shown in the next two figures. Figure 5. 5 illustrates the DA
and RC bid prices of an individual unit in case A. The 43rd unit is a combined cycle gas-fired
p ant w th an operat ng cost of 64 26 €/ Wh and a net capac ty of 162 W [90]. Figure 5. 6
shows the A and RC b d vo umes of the same un t n case A Compar ng the un t’s
operating costs to the DA market clearing price in Figure 5. 4, it can be seen that after the
f rst few rounds the A market pr ce s h gher than the un t’s operat ng costs, mean ng that
the unit can make profit by bidding in the DA market, however, according to Figure 5. 6, the
unit constantly reduces its offered capacity in the DA market and shifts it to the RC market.
The key s compar ng the un t’s prof ts n the two markets As noted ear er, s nce the f xed
costs of the units are neglected in this study, the average-per-MW profit of the unit in the DA
market s the d fference between the market pr ce and the un t’s operat ng costs, wh ch s 5 34
€/ W/hour, wh e the un t’s prof t n the RC market s the RC market c ear ng pr ce, which
s 16 €/ W/hour, see Figure 5. 4. Thus, although there is profit to be made in the DA
market, s mp y because of the un t’s prof t n the RC market be ng h gher, n order to
maximize its total profit, the unit constantly shifts its capacity from the DA to the RC market

87
until all of its 162 MW of capacity is offered in the RC market and it has no capacity offered
in the DA market, see Figure 5. 6.
10 20 30 40 50 60 70 80
65
70
75
80
85
Rounds
B d
Pr
ce (
€/
Wh
)
10 20 30 40 50 60 70 800
5
10
15
20
Rounds
B d
Pr
ce (
€/
W/
ho
ur)
(a) (b)
Figure 5. 5. Individual bid prices of unit #43 in Case A- (a) DA bid price (b) RC bid price
20 40 60 80 100 120 140 160 180 2000
20
40
60
80
100
120
140
160
180
Rounds
Bid
Volu
me
(MW
)
DA market
RC market
Figure 5. 6. Individual bid volumes of unit #43 in Case A
Table 5. 1 shows the total volumes (in MW) offered in the RC and DA markets for the
three cases. It should be noted that the sum of the offered volumes in the two markets for
cases B and C is higher than the total available capacity in the system (108,855 MW) which is
because of the fact that in those two cases, capacity substitution between the two markets is
possible, so non-selected capacity of a unit in the first market can be offered in the second
market (offering of the same capacity in two markets, but not at the same time). However, in
case A, a unit has to divide up its total available capacity between the two markets because
bidding is simultaneous and the same capacity cannot be offered in both markets.

88
Table 5. 1. Total offered volumes (in MW) in the DA and RC markets for the three cases- For a critical cost
level of 40 €/MWh
Case A Case B Case C
Day Ahead Market (DA) 91,697 102,855 108,046
Reserve Capacity Market (RC) 17,158 16,373 34,855
Regarding the RC market, the lowest volume is offered in case B and the highest
volume is offered in case C in which the units learn to offer all of their capacity that is not
selected in the DA market (the first market in case C) in the RC market, resulting in a final
offered volume of 34,855 MW in the RC market (the difference between the total available
capacity and the demand in the DA market). In case B, because of the uncertainties in
whether or not offering the capacity in the RC market (first market) will lead to loss of profit
in the DA market (second market), the offered volume in the RC market is limited. One
might expect the same phenomenon to happen in case C for the DA market (the first market
in case C). However, the offered volume in the DA market for case C is the highest. The
main difference is that there is basically no minimum bid price in the RC market while in the
DA market, the bid price of a unit cannot go below the operating costs of the unit.
Therefore, while in case B the DA market price cannot go down to zero, in case C, the RC
market price reaches zero after a few rounds, which in turn leads to elimination of
uncertainties for bidding in the first market (DA in case C). Thus, although the uncertainties
in offering capacity in the first market lead to the lowest offered volume in the RC market for
case B, these uncertainties cannot limit the offered volume in the DA market for case C.
Comparing these market results with the perfect market situation may be useful in
clarifying the effect of strategic behavior. The fixed costs in providing reserves have been
neglected in this study, and therefore, at the perfect model situation, bidders would bid at
their marginal costs in the day-ahead market and at zero in the reserve market. If there were
no learning, the day-ahead market pr ce wou d have been 47 2 €/ Wh and the reserve price
would have been zero.
However, one cannot conclude that in any of the three cases, the difference between
the day-ahead market pr ce and 47 2 €/ Wh is the effect of opportunistic behavior of the
agents. The final cost of providing a service includes both the physical costs and the
opportunity costs, and these opportunity costs very much depend on the market design. In
terms of day-ahead market, cases A and C both incur opportunity costs for the day-ahead
market. Only in case B where the day-ahead market is second, there is no opportunity costs
in the day-ahead market. Same argument holds for the reserve capacity market.
In order to demonstrate the effect of the critical cost level (used for distinguishing
between the risk-averse and risk-prone units), Figure 5. 7 shows the DA and RC market
c ear ng pr ces for the three cases us ng a cr t ca cost eve of 44 €/ Wh, instead of 40
€/ Wh as used n the prev ous graphs As the f gure suggests, a the market pr ces decrease
compared to Figure 5. 4, for which a critical cost level of 40 €/ Wh was used Nonethe ess,

89
comparing the three different cases, case A still leads to the highest market prices, followed
by case B, and the differences in market prices in case A and case B are even more distinct.
Case C, again, results in the lowest market prices, with a zero RC market price, in particular.
5 10 15 20 25 30 35 40 45 500
5
10
15
20
Rounds
ar
ket
Pr
ce (
€/
W/
ho
ur)
mcpRC
A
mcpRCB
mcpRCC
5 10 15 20 25 30 35 40 45 5048
50
52
54
56
58
60
62
Rounds
ar
ket
Pr
ce (
€/
W
h)
mcpDAA
mcpDAB
mcpDAC
Figure 5. 7. Market clearing prices (MCPs) of the DA market (left) and the RC market (right) for the three
cases- assuming the critical cost level to be 44 €/MWh (instead of 40 €/MWh)
The results of this study so far, show that having the DA market closed first and then
closing and clearing the RC market (case C) will lead to the highest offered volumes in both
markets and lowest market clearing prices. The objective of the reserve capacity market is to
ensure that enough reserves will be available in real-time to compensate for deviations in
power generation and consumption. Thus, the entire RC market is aimed at guaranteeing
system security.
The results of this study suggest that making such a guarantee before closure of the
day-ahead market is much more expensive (case B) than making the guarantee after the
closure of the DA market (case C).
5.8. Shortage of reserves
The critical controversial issue, in case the reserve market is closed after the closure of
the day-ahead market, is the availability of capacity from proper resources in the reserve capacity
market. In other words, having the reserve market closed after the day-ahead market might
result in insufficient reserves in the reserve capacity market.
This would be crucial in case of secondary control reserves. To utilize the output of a
generator for secondary control, its response speed must meet specific requirements. The
offered capacity in the reserve market for secondary control must be capable of being fully
activated within 15 minutes; a minimum response speed (rate of change) of 7% of the
nominal output per minute. However the bids for tertiary control can take hours to be fully
activated.
Therefore, the question is: if the reserve market is closed and cleared after the closure of
the DA market (as in case C), will sufficient capacity from the proper resources, capable of
providing secondary control reserves, still be available in the reserve market? In order to
answer this question, we make a distinction between secondary and tertiary control reserves
in the RC market (in the simulation). The demand for secondary control is assumed to be

90
2800 MW (the average of the secondary control demand in Germany over 2009) and the
demand for tertiary control is 3200 MW (the average of the tertiary control demand in
Germany over 2009), summing up to 6000 MW demand in the RC market. According to [12,
20], the rate of change for oil- or gas- fired units is around 8% per minute. Reservoir power
stations, such as pumped storage plants, have rates between 1.5 and 2.5% per second (more
than 90% per minute) whereas for hard coal- and lignite-fired plants, rates from 2 to 4% per
minute and 1 to 2% per minute, respectively, are typical. The maximum rate of change for
nuclear plants is approximately 1 to 5% per minute. Therefore, we assume that only the gas,
oil and hydro units are capable of providing the secondary reserve. The simulation is run
again, assuming that in clearance of the RC market, the demand for secondary control
reserves has to be met only using bids from the gas, oil and hydro units, whose net capacity
sums up to 33,655 MW (30% of the total available capacity in the system). All units can
provide tertiary reserves.
Figure 5. 8 shows the market clearing prices of the day-ahead (DA) and reserve capacity
(RC) markets, for the three different cases (using the same critical cost level as in Figure 5. 4
to Figure 5. 6), making the aforementioned distinction between secondary and tertiary
reserves. An increase in the DA market prices for all the three cases (as compared to Figure
5. 4) can be observed. The RC market prices suffer a larger change for cases B and C (an
ncrease of a most 5 €/ W/hour), wh e the RC market pr ce n case C rema ns at zero
5 10 15 20 25 30 35 40 45 5050
55
60
65
70
75
Rounds
ar
ket
Pr
ce (
€/
Wh
)
mcpDAA
mcpDAB
mcpDAC
5 10 15 20 25 30 35 40 45 500
5
10
15
20
25
Rounds
ar
ket
Pr
ce (
€/
W
/h
ou
r)
mcpRCA
mcpRCB
mcpRCC
(a) (b)
Figure 5. 8. Market clearing prices of (a) the DA market and (b) the RC market for the three cases (Critical
cost level of 40 €/MWh)- Distinction made between SC and TC reserves
Therefore, even in case C, where the reserve market is the second market, still sufficient
capacity from eligible secondary control reserve resources is available. Clearing the reserve
market after the DA market does not lead to lack of enough secondary control capacity in the
reserve market.
This simulation so far shows that under normal operating conditions, availability of
reserves does not seem to be a serious concern if the reserve market is closed after the
closure of the day-ahead market. Nonetheless, since system security is concerned, extreme
cases need to be analyzed as well. The critical factors defining these extreme scenarios are the
demands in the two markets AND the availability of the generating units. The demand in the
reserve market is the reserve requirement of the system, and the demand in the day-ahead

91
market can very much depend on system load. Availability of the generating units depends on
the characteristics of the system (diversity of generation technology, the generation portfolio,
maintenance frequencies, extreme weather conditions, etc.).
In order to see the effect of demand (load level) on the results, we run the simulation
for cases B and C, with different demand values in the day-ahead market, assuming that all
generating units are available. For both cases (separately), demand in the day-ahead market is
increased until, in either markets, there is not sufficient capacity to meet the market demand.
The reserve capacity market in Case C (in which the reserve market is closed after the day-
ahead market) is suspected of not being able to attract sufficient bids as the load level and
consequently demand increases. Simply put, since the reserve market is second in case C, it
might end up with insufficient supply.
Based on our results, in both cases, it is indeed the reserve capacity market (and not the
day-ahead market) that collapses first. So, although it is the demand in the day-ahead market
that is increasing, because of the interrelations of the two markets, regardless of whether or
not the reserve market is first, it is indeed the reserve market that collapses (insufficient
supply to meet demand). Figure 5.9 illustrates the offered volume in the reserve capacity
market for cases B and C, as the day-ahead market demand increases. These two supply
curves ntersect w th demand (system’s reserve requ rement) at a most the same point, which
is the point where the market collapses. As the figure shows, the offered volume in the
reserve market for case B (reserve market first) is consistently lower than the offered volume
in case C (reserve market second).
Figure 5. 9. Offered volumes in the reserve capacity market for cases B and C, as the demand in the day-
ahead market increases
It might sound counter-intuitive at first sight but it essentially means that when there
are two markets, the players in the two markets are the same, and the products traded in the
two markets are to a great extent substitutable, if the markets are closed and cleared
sequent a y, p ayers’ expectations of the second market can highly influence the offered volume
in the first market. In case B (reserve market first), service providers do not bid some of their
available capacity in the reserve market simply because of what they expect to earn in the
second market, especially when the demand in the second market (day-ahead) is very high
(the cases studied here), and therefore high market prices in the day-ahead market are
0
5000
10000
15000
20000
25000
30000
35000
40000
45000
70 72 74 76 78 80 82 84 86 88 90 92 94 96 98 100 102 104
off
ere
d v
olu
me (
MW
)
peak load (GW)
case B
case C
demand

92
expected. While in case C (reserve market second), the agents learn to offer what is remained
after the closure of the day-ahead market in the reserve market which is still enough to meet
the market demand in the reserve market.
One should not forget that the size of the day-ahead market is much larger than the
reserve capacity market. In addition, the reserve capacity market is much less volatile in terms
of demand values and prices (and therefore profits), compared to the day-ahead market,
which has to take the burden of high peak load values and whose market price can be very
high at times. So, when the day-ahead market is second, it can have a large influence on the
small reserve market, which is cleared before. When the reserve market is first, it can be, to a
great extent, under the heavy shadow of a large, volatile and profitable market that is going to
be cleared afterwards, and this can significantly reduce the offered volume in the reserve
market.
5.9. Discussion
The author in [40] mentions the following, regarding coordination of timing of the day-
ahead and reserve capacity markets, or ancillary services (AS) in general:
Sequential auctions (also called cascading clearing) have been defended in the early designs of market for
frequency control AS [91] and [92]. With this method of coordination, AS are provided in a prioritized
manner. Once an AS is bought, the capacity of the successful provider of this service for the following AS
auction is reduced. However, this approach suffers from some flaws, in particular price reversals, illustrated by
the infamous failure of the Californian AS market at the end of the 1990s, [62, 93]. Since then, it has been
recognized that simultaneous auctions have to be in place for AS and energy-only markets (e.g., [94], [95,
96]).
The paragraph seems to be in clear contradiction with the findings of this chapter.
However, there are implicit assumptions that need to be pointed out and clarified. In this
chapter, the fundamenta des gn n Europe s used n wh ch “centra d spatch ng” does not
exist. In these markets, the system operator does not intervene in clearing the day-ahead
market. If the entities that clear the day-ahead market and the reserve market are not the
same, these two markets cannot be “co-opt m zed” n the European design, the day-ahead
market is cleared separately and the system operator who is the single buyer in the reserve
capacity market clears that market. Therefore, simultaneous clearance of these two markets in
this chapter does not imply co-optimization. The main difference is since under the
European design, there is no central dispatch, capacity cannot be substituted between the two
markets. Thus, if the bidding is simultaneous, a bidder has to split up its capacity between the
two markets, while if capacity substitution is possible (in presence of a central dispatch
system), one bidder can bid (part) of its capacity in both markets (with two different prices)
and the central dispatcher who co-optimizes the two markets, selects the bid in the way that
minimizes the total costs.
Therefore, if there is a central dispatch system, bidders do not have to divide up their
capacity between the two markets AND the two markets can be co-optimized in which case

93
simultaneous clearance is absolutely superior to sequential clearance, as mentioned by the
author in [40]. Nevertheless under the European design, there is no co-optimization of
reserve and energy, and the bidder cannot bid the same capacity in both markets and
therefore the answer to the quest on ‘wh ch one s super or’ s ess stra ghtforward Assume
that simultaneous clearance is used and a bidder has 100MW available capacity and offers
50MW in DA and 50 MW in the RC market. In this case if its bid gets selected in the DA
market but its bid price is too high to be selected in the RC market, the bidder does not have
the opportunity to offer the non-selected 50MW in the DA market again: that capacity is
simply lost. However if sequential clearance is used, there is always the possibility to offer the
non-selected capacity (in the first market) into the second market.
To summarize, under the European design, when there is no co-optimization of reserve
and energy AND capacity substitution is not possible, simultaneous clearance is not
‘necessar y’ the super or opt on as suggested n [40], and backed by references in literature.
The implicit assumption in those references is that the basics of the American design is in
place. This chapter investigated which design leads to better performance given that the
fundamental European design is used. And the findings show that case C in which sequential
clearance is used and the reserve capacity market is cleared after the closure of the day-ahead
market leads to lower market prices and higher offered volumes.
5.10. Conclusions
The dominant design in Europe, as mentioned and supported by [12, 20] involves
closing and clearance of the reserve capacity market before the day-ahead market. However,
the sequence of these two markets is still an open question and other designs are also
possible. This chapter tried to answer this question using a model that studies the change in
behavior of generators as a result of changing the market design. The results show that
clearing the reserve capacity market after the closure of the day-ahead market can lead to
higher efficiency and liquidity particularly in case of the reserve capacity market.
Nonetheless, the question of whether or not sufficient capacity from eligible secondary
control resources will be available in the reserve capacity market in case the market is cleared
after the clearance of the day-ahead market needs to be answered on a case-specific basis.
Our case study shows that if the reserve market is cleared first, the offered capacity in the
reserve market would be lower than in the case when the reserve market is second.
Therefore, our case study suggests that closing the reserve market after the closure of the
day-ahead market does not necessarily lead to lower offered reserves and therefore system
security issues. On the contrary, it can increase the offered volumes in the reserve market, as
this market would not be under the shadow of the much larger (and mostly more profitable)
day-ahead market anymore.
However, because of the very high stakes regarding security, this chapter does not
directly recommend clearing the reserve capacity market for secondary control after the day-
ahead market. More studies on a case-specific basis are required in order to evaluate the

94
security issues, studies that, particularly, take into account availability of the generation side
into consideration.
Nonetheless, since the requirements on tertiary control reserves are much looser and a
very high percentage of units can provide this type of reserve, based on the results of this
study, it is recommended that the market for tertiary control reserves be cleared after the
closure of the day-ahead market, which will lead to higher offered volumes in the market,
lower prices, and higher liquidity.
It should be emphasized that the objective in this chapter was not to make generic
conclusions about the sequence of clearance of the reserve capacity and day-ahead markets,
but primarily to raise the question and discuss the possibilities other than the ones that seem
obvious because of historical reasons.

95
6. INTEGRATION OF RESERVE CAPACITY
MARKETS

96
6.1. Introduction
This chapter is the first of two complementary chapters addressing integration of
balancing services markets. This chapter is dedicated to the essential discussions on
ntegrat on of ‘reserve capac ty’ markets ntegrat on of ‘ba anc ng energy’ markets will be
discussed in the forthcoming chapter.
In the documents and reports which study integration of balancing markets in Europe,
a significant amount of effort has been made in introducing generic integration models which
define how service providers and system operators interact in a multinational context [31-37,
97-99]. A though these mode s (known as “mu t nat ona arrangements”) are a va d concern
and can influence the performance of the resulting multinational market, there are
fundamental challenges that have to be faced, probab y even before the ‘ ntegrat on mode s’
are discussed. Challenges that stem from the design of the individual (national) markets in the
countries/regions involved. In addition, handling of interconnection capacity is an influential
factor in integration of reserve capacity markets.
In this chapter, first, using the case of Northern Europe as the main focus, we review
the already-proposed integration models, discuss the issue of interconnection capacity and
look into its interrelations with the designs of the national reserve capacity markets involved
in market integration. Then, we will discuss whether or not integration of reserve capacity
markets in Northern Europe in economically beneficial, and what factors its economic
justification depends on. In the last section, using the findings and discussions in the previous
sections, we discuss how reforms at the national level (proposed in chapter 4) can influence
the outcome of market integration at the international level. The basic question raised in the
last section is: what is the goal of integrating the reserve capacity markets in Europe?
6.2. Is the ‘multinational arrangement’ the main concern?
A large part of the current literature on integration of balancing services markets
focuses on formulating various models whose main goal is to define the arrangements (at the
international level) that can be used for exchange of balancing services across borders. These
multinational arrangements define how the service providers (sellers) and the system
operators (buyers) in different countries interact with each other in a multinational context.
In [97], written by ETSO, two alternative cross-border models are outlined: the BSP-
TSO trading model and the TSO-TSO trading model. In the first model, balancing service
providers (BSP) can directly offer their reserves to the neighboring system operators, whereas
in the second model, TSOs trade with each other. In [34], by ETSO, two basic models (in
add t on to the ‘no trad ng mode ’) are proposed that “represent different levels of technical
cooperat on/ ntegrat on” The f rst mode s ca ed ‘cross-border reserve poo ng’ wh ch
creates a common market in which the TSOs can voluntarily share 0-100% of their bids with
other TSOs The second mode of ‘cross-border reserve trad ng’ a ows for procurement of
part of the reserve capacity from another control area (separate markets, inter-TSO trading).

97
Later on, in [35], by ETSO, in addition to the models described in [97], a new model
ca ed ‘from area contro to reg ona contro ’ s proposed The mode s descr bed as the next
integration step, which w nc ude both ‘reserve poo ng’ and ‘reserve capac ty shar ng’, as
well as the leveling of surpluses and shortages in different areas.
Three generic models for the linking of balancing arrangements of neighboring control
areas are described and discussed in [100] (by Frontier Economics): ‘System Operator to
System Operator trad ng’, ‘ ntegrated ba anc ng arrangements’, and ‘part c pant offers to
mu t p e mechan sms’ A though different in wording, these models, in essence, are the
equivalents of, respectively, reserve pooling of [97], regional control of [35], and BSP-TSO
trading of [97].
Then, a report by EURELECTRIC, [37], has described principles and preferred design
choices for balancing market integration. In this report, the creation of a merit order is
advocated for exchange of reserves. This common merit order list is that last conceivable
phase of market integration in which one single merit order list (made of all the bids in all the
involved countries) is created and procurement of services is optimized at a regional level.
Furthermore, the European Commission has commissioned a report dedicated to
balancing market integration, which gives an overview of the proposals on cross-border
balancing models [98]. Three models are shortly descr bed: ‘TSO-BSP trad ng’, ‘TSO-TSO
trad ng’, and ‘one reg ona contro area’
Subsequently, a report on guidelines for balancing market integration by ERGEG,
[101], mentions three cross-border balancing models, namely a BSP-TSO model, a TSO-TSO
model without common merit order, and a TSO-TSO model with common merit order.
Finally, the author in [99] describes and evaluates five cross-border balancing proposals.
‘System mba ance nett ng’ (concern ng the nett ng of opposed contro area mba ances),
‘TSO-BSP trad ng’, ‘TSO-TSO trad ng’ and ‘Cross-border mba ance sett ement’ (concern ng
the cross-border trade of BRP mba ances) ‘One reg ona contro area’ s the ast model
which proposes the merging of control areas.
These models/arrangements mainly deal with how the system operators and service
providers should interact in a multinational context. These models can be applied to both
reserve capacity and balancing energy exchanges but because of the focus of this chapter we
only focus on exchange of reserve capacity. There is no doubt that the multinational
arrangement used for exchange of reserves (discussed extensively in literature, as shown
above) is a valid concern and that different arrangements (especially regarding the role of the
system operators) could have different consequences. However, before that, there is a need
to address some fundamental challenges regarding enabling cross-border exchange of
reserves: Challenges that originate mainly from the design of the reserve capacity markets in
the corresponding countries as well as the issue of interconnection capacity.
If we would like to come to conclusions that can be practically and effectively used, we
need to address ‘market ntegrat on’ on a case-specific basis. If studies are focused on market
integration in a specific region, with limited number of markets involved, then the market

98
design of the individual countries can be analyzed and the challenges that originate from
these national designs (and their differences) can be noticed and then addressed. Otherwise, if
the focus is, for example, on entire Europe (with all its diversity in market design), the
resulting analyses inevitably will stay at a conceptual level discussing the basics of how the
service providers and the system operators can work together in a multinational context.
Thus, we limit our focus to the case of Northern Europe (Norway, the Netherlands
and Germany) in this chapter. As discussed in details in the previous chapters, the reserve
capacity markets in Northern Europe are long-term markets. Reserves are purchased by
system operators in advance (on a long-term basis, yearly/monthly/weekly) in order to be
activated in real-time. This is where the ssue of ‘interconnect on capac ty reservat on’ comes
into the picture, in a multinational context. If a system operator purchases 50 MW of reserves
from a foreign service provider for a specific time period, the same amount of
interconnection capacity (50 MW) must be reserved in order to make sure that if needed in
real-time, the system operator can activate that 50 MW from the foreign resource. In other
words, exchange of reserves across borders implies reservation of interconnection capacity.
And this reservation period is long because of the long time horizon of the reserve capacity
markets in Northern Europe.
When a certain amount of interconnection capacity is reserved for a certain period, it
cannot be used for trades in other markets, mainly the day-ahead market. Thus, purchasing
50 MW of reserves from a foreign resource for a period of one year implies 50 MW less
room available for day-ahead trades throughout the entire year. In other words, exchange of
reserves across borders incurs opportunity costs. This lost opportunity cost depends on the
period of interconnection reservation and consequently on the time horizon of the reserve
capacity markets involved. In case of Northern Europe with monthly and yearly markets,
this opportunity cost can be a critical factor in determining the desirability of market
integration. The next section looks more into how reservation of interconnection capacity
relates to timing of the reserve capacity markets (an important design variable that was
discussed in the prev ous chapters mere y from a ‘nat ona ’ perspect ve)
6.3. Lost opportunity as a result of interconnection capacity
reservation
Generally speaking, when integration of two separate markets is being discussed, the
very first issue that comes to mind is: (from a system perspective) how much money can be
saved (costs avoided) by integrating the two markets? Reserve capacity markets are not an
exception in that respect. This cost-saving question, in turn, eads to the bas c ssue of ‘pr ce
d fference’ between the two markets. One could simply look at the two market prices and
consider the difference as the value of integrating the two markets, or in other words ‘the
money that could be saved’ Th s number can be tempting and yet deceiving. The price
d fference s usua y the gn ter for ‘market ntegrat on’ d scuss ons However, the des gns of
the two markets involved can impose significant limitations on what can be achieved
economically.

99
Exchange of reserve capacity implies reservation of interconnection capacity for quite
long periods of time, and that consequently means loss of trade in other electricity markets,
especially the day-ahead market. In several cases in Western Europe cross-border exchanges
in the day-ahead markets are at quite an advanced phase: as long as there is a difference in the
day-ahead prices on the two sides of the line, the line capacity is used to the fullest for cross-
border day-ahead exchanges, good examples are the Nor-Ned cable, or the trilateral market
coupling among the Netherlands, Belgium and France, with implicit interconnection capacity
auction. Thus, reservation of interconnection capacity for reserve capacity exchanges would
come at the cost of those trades. In other words, exchange of reserve capacity across borders
incurs opportunity cost and thus, to evaluate the economic viability of these exchanges, one
should look at the price difference in the reserve markets as well as the opportunity costs
incurred by trade losses in the day-ahead markets.
The day-ahead prices obviously play a critical role in determining this lost opportunity
cost, and since the day-ahead prices in Norway vary significantly depending on the reservoir
levels, we study the data of two consecutive years: 2009 during which there was no particular
shortage of hydro power, and 2010 which was a dry year and thus, the day-ahead prices in
Norway were significantly higher.
6.3.1. Year 2009
First let us study the case of the reserve capacity markets (for secondary control) for
Norway and Germany. The RKOM market, the Norwegian reserve capacity market, is a
weekly market that functions only in winter. The whole market is divided into three areas
(area A in the south, area B in the middle and area C in the north of Norway) and three
separate auctions are run for procurement of reserve capacity. Error! Reference source not
found. illustrates the prices in the RKOM market for the three areas during 2009 (weekly
prices). As mentioned above, the market did not operate in summer.
Figure 6. 1. Prices in the RKOM market (reserve capacity market in Norway) for the three Norwegian
areas, 2009
As one can see, the prices are quite similar. We use the prices in the Southern Norway
area (NO A) since if the reserves are in that area, then no interconnection capacity
reservation (within Norway) would be needed in order to exchange reserve with continental
0
0.5
1
1.5
2
2.5
2 7 12 17 22 27 32 37 42 47 52
Pri
ce (
eu
ro/
MW
/h
ou
r)
week
2009
NO A
NO B
NO C

100
Europe. If the weighted average of the weekly prices in NO A is calculated, it would lead to
an average reserve capacity price of 1 €/ W/hour, for 2009. The reserve capacity price in
Norway is, on average, considerably low.
In case of Germany, the monthly reserve capacity prices were shown earlier in Figure
4 5, but for reader’s conven ence, the f gure for upward reserves (peak and off-peak hours) is
shown in Figure 6. 2.
Figure 6. 2. Monthly reserve capacity prices (upward) for peak and off-peak hours in Germany, 2009
Figure 6.3 shows the difference in reserve capacity prices between Norway and
Germany (peak as well as off-peak hours), for different months in 2009. As can be seen, in
several months, there is a price difference as high as 5 €/ W/hour, mean ng that enabling
cross-border exchange of reserves between the two countries could lead to a cost reduction
of 5 €/ W/hour, on average, dur ng those months.
Figure 6. 3. Difference in reserve capacity prices between Norway and Germany, peak and off-peak hours,
2009
Nonetheless, exchange of reserves implies reservation of interconnection capacity and
consequent loss of trades. In order to determine the size of this loss in case of Norway and
Germany, the level of the day-ahead prices in the two countries has to be compared. The day-
ahead prices vary in different hours of different days. Figure 6. 4 shows the day-ahead prices
in Norway and Germany for January 2009 (as an example).
If interconnection capacity was reserved for exchange of reserves from Norway to
Germany meaning that the interconnection capacity would not be available to day-ahead
trades, in all the hours when the German price is higher than the Norwegian price, a potential
0
2
4
6
8
Jan Feb Mar Apr May Jun Jul Aug Sep Oct Nov Dec
Pri
ce (
Eu
ro/
MW
/h
ou
r)
Month
Pos_Peak
Pos_OffPeak
0
1
2
3
4
5
6
7
Jan Feb Mar Apr May Jun Jul Aug Sep Oct Nov DecPri
ce (
eu
ro/
MW
/h
ou
r)
week
peak
off-peak

101
profit is lost. The difference between the German and the Norwegian price determines this
opportunity cost. In the hours when the German price is lower than the Norwegian price,
reservation of interconnection capacity incurs no opportunity costs.
Figure 6. 4. Day-ahead prices in Norway and Germany, January 2009
Figure 6. 5 illustrates this lost opportunity cost as a result of reservation of
interconnection capacity from Norway to Germany, on a monthly basis. Two separate figures
for peak and off-peak hours are presented. As one can see from the figure, the opportunity
cost differs wildly in different months (as a result of the volatility of the day-ahead prices) and
is significantly high in many months. This opportunity cost needs to be subtracted from the
reserve capacity price differences between the two countries when calculating the ultimate
potential profit that can be achieved through reserve markets integration (enabling cross-
border exchange of reserves).
Figure 6. 5. Lost opportunity cost (in the day-ahead market) as a result of reservation of interconnection
capacity (from Norway to Germany) on a monthly basis, for peak and off-peak hours
Both for peak and off-peak hours, exchange of reserves between the two countries
would have been sound, economically, only in months where the opportunity cost shown in
Figure 6.5 is lower than the difference in reserve capacity prices shown in Figure 6.3, which
had a max mum of 6 4 €/ W/hour (for peak hours n January 2009). In case of peak hours,
during no month in 2009, the price difference in the reserve markets is higher than the lost
opportunity cost incurred by trade losses in the day-ahead markets.
-50
0
50
100
150
200
1 51 101 151 201 251 301 351 401 451 501 551 601 651 701
Pri
ce (
Eu
ro/
MW
h)
Hour
NO
DE
0
5
10
15
20
25
30
35
Jan Feb Mar Apr May Jun Jul Aug Sep Oct Nov Dec
Pri
ce (
Eu
ro/
MW
h)
Month
Peak
Off-Peak

102
In case of off-peak hours, in March, November and December, the lost opportunity
cost was lower than the reserve price differences, and so market integration in those months
passes the basic economic test. However, even in those months, the lost opportunity costs
leave only a tiny profit margin ( ess than 2 €/ Wh). In other words, even in those months,
after the opportunity cost is subtracted from the price difference, the remaining price
difference is not really significant enough to justify going through the complex costly process
of integrating the markets.
Therefore, according to the data of 2009, integrating the reserve capacity markets of
Norway and Germany does not introduce considerable economic benefit. Only comparing
the reserve capacity prices (after subtracting the opportunity costs) shows that the potential
for cost reduction is marginal. This fact, next to the inevitable costs of implementing an
integrated market (costs of making the institutional changes), challenges the idea of
integrating the reserve capacity markets between Norway and Germany as a means to reduce
costs at a regional level (or achieve higher allocative efficiency).
The case of Norway-Netherlands is less straightforward though. TenneT, the Dutch
system operator, purchases reserves on a yearly basis through bilateral contracts with reserve
providers. Because of the confidential nature of these contracts, no official figure of the
prices exists today. Therefore, comparing the reserve capacity prices of Norway and the
Netherlands is not possible. However, the opportunity cost as a result of the lost day-ahead
trades (in case the reserve markets were integrated) can be calculated.
If reserves can be exchanged across borders between these two countries, the
Netherlands can benefit from the cheap reserves of Norway. Since the Dutch market is
yearly, the Netherlands would be purchasing reserves from Norway on a yearly basis, and
thus some interconnection capacity needs to be reserved (from Norway to the Netherlands)
for the entire year, leading to lost trades in the day-ahead markets for an entire year.
If the day-ahead market price differences (between Norway and the Netherlands) are
averaged over one year, the data of 2009 wou d ead to a pr ce d fference of 6 8 €/ W/h
This indicates the potential profit in the day-ahead market that would have been lost if the
yearly interconnection capacity reservation had happened in 2009. Therefore, exchange of
reserves in 2009 would have been economically meaningful only if the price difference in the
reserve capac ty markets was h gher than 6 8 €/ Wh, mean ng a m n mum reserve capac ty
price of 9 €/ W/h n the Nether ands
Despite the conclusions made for 2009, a dry year (e.g. 2010) can potentially draw a
completely different picture.
6.3.2. Year 2010
Figure 6.6 shows the RKOM prices for Southern Norway (NO A) in 2010. As it was a
dry year, there was a jump in the reserve prices (compared to 2009): the average price in NO
A was 3.5 €/ W/h in 2010 (compared to 1 €/ W/h n 2009)

103
Figure 6. 6. Prices in the RKOM market (reserve capacity market in Norway) for the southern Norway (NO
A), 2010
Figure 6.7 shows the monthly reserve capacity prices (for upward regulation) in
Germany, for peak as well as off-peak hours in 2010.
Figure 6. 7. Monthly reserve capacity prices in Germany, for peak and off-peak hours, 2010
The pr ces are genera y above 3 5 €/ W/hour, but still the price difference is less
significant than in 2009 where the reserve prices in Norway were lower. However, what
changes the entire picture is the lost opportunity costs in the day-ahead market. Low
reservoir levels in a dry year such as 2010, not only increase the reserve prices but also the
day-ahead prices. The Norwegian day-ahead market price in 2010 was significantly higher
than in 2009. Actually, the vast majority of the time the prices in Norway were higher than the
pr ces n Germany n two months, the pr ces were more than 25 €/ Wh higher in Norway
than in Germany, on average.
Figure 6.8 shows the opportunity costs that would have been incurred in case
interconnection capacity (from Norway to Germany) was reserved for exchange of reserve
capacity (rather than used for day-ahead trades). As can be seen, since the Norwegian day-
ahead price is higher, the opportunity cost is negative. In other words, exchange of reserves
from Norway to Germany in 2010 would have not resulted in any opportunity costs, simply
because of the high Norwegian day-ahead prices in a dry year.
0
2
4
6
8
1 6 11 16 21 26 31 36 41 46 51Pri
ce (
eu
ro/
MW
/h
ou
r)
week
2010
0
1
2
3
4
5
6
7
Jan Feb Mar Apr May Jun Jul Aug Sep Oct Nov Dec
Pri
ce (
eu
ro/
MW
/h
ou
r)
2010 peak
off-peak

104
Figure 6. 8. Lost opportunity cost (in the day-ahead market) as a result of reservation of interconnection
capacity (from Norway to Germany) on a monthly basis, 2010
Therefore, in 2010, hydro power scarcity results in significantly high day-ahead prices in
Norway which would in turn mean that reservation of interconnection capacity for exchange
of reserves would incur almost no opportunity costs, and so the difference in the reserve
prices can be fully taken advantage of by cross-border exchange of reserves.
However, as mentioned earlier, the reserve prices are also higher in Norway in a dry
year. Figure 6.9 shows the monthly price difference in the reserve capacity markets of
Norway and Germany for peak as well as off-peak hours in 2010. As can be seen the price
d fference s typ ca y ower than 2 €/ W/h. So although in a dry year, there may be
absolutely no opportunity costs for reservation of interconnection capacity, since the reserve
prices in Norway are also higher in a dry year, the price difference between the two areas
would shrink. Nonetheless, exchange of reserves in 2010 (as a representation of a dry year)
passes the basic economic criterion: the reserve price difference is positive after subtracting
the opportunity costs.
Figure 6. 9. Monthly price differences in the reserve capacity markets between Norway and
Germany (peak and off-peak hours), 2010
To summarize, in case of Norway and Germany, in a normal year such as 2009 (with
no particular shortage of hydro power in Norway) the reserve price difference between the
two areas would probably be offset by the opportunity costs incurred by loss of day-ahead
trades as a result of interconnection capacity reservation. In case of a dry year, significantly
higher day-ahead prices in Norway would result in almost no opportunity costs as a result of
cross-border exchange of reserves, however in that case, the reserve price difference between
-30
-25
-20
-15
-10
-5
0
5
Jan Feb Mar Apr May Jun Jul Aug Sep Oct Nov Dec
Pri
ce (
eu
ro/
MW
h)
2010
-2
0
2
4
6
8
10
Jan Feb Mar Apr May Jun Jul Aug Sep Oct Nov Dec
Pri
ce (
eu
ro/
MW
/h
ou
r)
peak
off-peak

105
the two areas seems to be rather small to justify the costs and efforts of integrating the two
markets in order to enable cross-border exchange of reserves.
Nonetheless, in case of Norway and the Netherlands, the price difference is believed to
be considerably higher than the opportunity costs incurred by loss of day-ahead trades, even
in a normal year where there is significant price difference in the day-ahead markets.
6.4. Is interconnection capacity reservation generally wrong?
Regarding the justification of reservation of interconnection capacity for balancing
exchanges, there are arguments on both sides, [102] [103]. As discussed above, although the
difference in the reserve capacity prices might be significant, the opportunity cost originating
from the lost day-ahead trades can as well be significant, limiting the potential cost reduction
as a result of reserve capacity markets integration. So we are back to the question whether or
not interconnection capacity should be reserved for balancing services.
The key in answering this question is the opportunity costs incurred by reservation of
interconnection capacity. As was discussed above, in a dry year, reservation of
interconnection capacity from Norway to Germany implies almost no opportunity costs, and
so interconnection reservation makes perfect economic sense. However, in 2009, where there
was no particular shortage of hydropower, interconnection reservation would have incurred
rather significant opportunity costs, to the extent that integrating the two reserve markets
loses its economic justification.
The question is: are there ways to control this opportunity cost. Reservation of
interconnection capacity can be done in an indiscriminate way (reserving interconnection for all
the hours of the coming year) but it can also be done in a more flexible and intelligent way.
For example, in the Netherlands, if reserves are going to be purchased by TenneT from a
foreign resource, interconnection needs to be reserved for the entire year. And that means
the opportunity costs will be averaged out all over the year. Nonetheless, obviously there are
periods in which the opportunity cost is very high and there are periods in which
interconnection reservation incurs no costs at all. If TenneT could be more flexible, it could
reap the benefit from the difference in reserve prices during those periods where there is little
or no opportunity cost, and not purchase reserves from a foreign resource in the periods
when the opportunity cost is significant.
As noted above, if interconnection capacity (from Norway to the Netherlands) was
reserved indiscriminately for all the hours in one year, it would have led to an opportunity
cost of 6 8 €/ Wh, accord ng to the day-ahead prices of 2009. However, if the reservation of
interconnection capacity is done separately for peak and off-peak hours, the picture would be
completely different. In th s case, the opportun ty cost w be 11 €/ Wh for peak hours, and
2 4 €/ Wh for off peak hours (2009)
In other words, when reserving the interconnection capacity, the behavior of the day-
ahead prices are taken into consideration, unnecessary opportunity costs can be avoided.
Interconnection capacity can be reserved only for those periods that do not incur too high an

106
opportunity cost. In this case, reservation of interconnection capacity from Norway to the
Netherlands for off-peak hours ncurs an opportun ty cost of 2 4 €/ Wh, and so TenneT
can purchase reserves from Norway only for these hours and not for the peak hours which
incur a significant opportunity cost of 11 €/ Wh Th s way, opportun ty costs (as a result of
interconnection reservation) can be controlled.
Despite the above-mentioned discussion, the single yearly reserve market that is being
used in the Netherlands does not leave much room for flexibility. We have shown that
purchasing reserves from Norway for peak and off-peak hours (separately) limits the
unwanted opportunity costs. However, this cannot be achieved without some reform in the
Dutch market. Assume that TenneT buys 100 MW of reserves (one third of its demand)
from Norway, for off-peak hours only. That implies that in off-peak hours TenneT would
need to buy only 200 MW from internal resources, while for peak hours it buys 300 MW
from internal resources (no exchange with Norway in peak hours). This, in turn, would imply
that TenneT is using separate markets for peak and off-peak periods in the Netherlands. So
unless the market design currently in use in the Netherlands is changed, there is not much
room for handling the interconnection capacity reservation in a more flexible way.
One of the changes in the Dutch market proposed in chapter 4 was to use separate
auctions for peak and off-peak hours. This is where the reforms at the national level,
recommended in chapter 4, connect to the performance of the multinational market.
Although the reasons for recommending the reforms in chapter 4 came from concerns purely
at the national level (the only goal being improvement of the performance of the domestic
market), those reforms do improve the performance of the future multinational market as
well. Holding separate auctions for peak and off-peak hours in the Netherlands improves the
performance of the domestic market (by defining services in a more specific way leading to
more cost-reflective prices) as well as the future multinational market in the region (by
enabling more flexible and intelligent use of interconnection capacity).
In addition, shorter time horizons for reserve capacity markets (the other major
recommendation of chapter 4) play an important role in a multinational context as well.
Firstly, the closer to the real-time, the better the estimation of the behavior of the day-ahead
prices, which consequently means more informed decisions about reservation of
interconnection capacity for exchange of reserves (more accurate calculation of the
opportunity costs). Secondly, if exchange of reserves could be done on a monthly or (even
daily) basis rather than yearly, it would enable us to reserve interconnection capacity in a less
‘ nd scr m nate’ way Day-ahead prices follow seasonal patterns; there are months in which
the significant difference in day-ahead prices imposes too high an opportunity cost for
exchange of reserves. Figure 6. 10 shows the average day-ahead prices for different months
of 2009, in Norway and the Netherlands. As can be seen, the prices vary significantly in
different months meaning that the opportunity costs would be different as well, which
illustrates the need for handling reservation of interconnection capacity for reserve exchanges
on a shorter time horizon than yearly. If done on a monthly basis, the general monthly

107
patterns of the day-ahead prices can be taken into consideration while the decision on
reservation of interconnection capacity is being made.
Figure 6. 10. Monthly average day-ahead prices for Norway and the Netherlands, 2009
If separate auctions are held for peak and off-peak hours in each month, even higher
flexibility regarding reservation of interconnection capacity can be achieved. Figure 6. 11
shows the lost opportunity costs (for the case of Norway-Netherlands) on a monthly basis
for peak and off-peak hours using the day-ahead prices in 2009. The opportunity cost is
consistently low for off-peak hours. In case of peak-hours, during spring and summer, the
opportun ty costs are reasonab y ow, around 5 €/ Wh However n most w nter months,
the difference in day-ahead prices leads to very large opportunity costs. Thus, if separate
monthly peak and off-peak auctions are held, TenneT can purchase reserves from Norway
only for the periods in which the opportunity cost is sufficiently low.
Figure 6. 11. The lost opportunity cost (in the day-ahead market) as a result of reservation of
interconnection capacity (from Norway to the Netherlands) on a monthly basis, for peak and off-peak
hours, 2009.
The same argument can be used for moving towards daily markets instead of monthly.
Other than being able to reserve interconnection capacity only for those days and hours in
which the opportunity cost is sufficiently low, on a day-ahead basis, much more accurate
estimation of the day-ahead prices are available which results in much more informed
decisions regarding reservation of interconnection for exchange of reserves.
To summarize, if reservation of interconnection capacity is done in a flexible way, if the
services are defined in a specific way (there is a distinction between peak and off-peak hours),
and if the time horizon of the markets is relatively short, reservation of interconnection
25
30
35
40
45
50
55
60
Jan Feb Mar Apr May Jun Jul Aug Sep Oct Nov Dec
Pri
ce (
Eu
ro/
MW
h)
Month
NL
NO
0
5
10
15
20
25
30
35
Jan Feb Mar Apr May Jun Jul Aug Sep Oct Nov Dec
Pri
ce (
Eu
ro/
MW
h)
Month
Peak
Off-Peak

108
capacity can be quite beneficial even in a normal year like 2009 where there were significant
opportunity costs. The two above-mentioned factors (specific definition of services and the
time horizon of the market) are basic market design variables (discussed in the previous
chapters of this dissertation). Thus, in short, desirability of reservation of interconnection
capacity (and therefore, desirability of integrating reserve capacity markets) depends on the
design of the markets involved.
6.5. Are we arguing for more complexity?
Although using markets with shorter time horizons, especially daily markets, would lead
to more informed decisions and more intelligent handling of the interconnection capacity, it
does add complexity to the system. Exchanging reserves on a daily basis means handling daily
bids and daily calculation of the opportunity costs (as a result of reserving interconnection
capacity). Avoiding complexity is one of the reasons why some design aspects used in other
parts of the world (the nodal pricing as the most well-known example) are dismissed by
decision makers in Europe. Although their concern is very much understandable, we need to
admit that the complex nature of electricity markets (and especially their interrelations with
each other) in general, demands to-some-extent complex market design. As an example, using
one yearly market (with no distinction between peak and off-peak, or between upward and
downward capacity) for reserves underestimates the complexity of the system.
Needless to say, whether the reserves are purchased through yearly bilateral contracts
or daily auctions, as long as the required amount of reserves is procured, the objective is met.
In other words, from a technical perspective, as long as enough reserves are purchased, the
system will work properly (effective design). Although effective, a very simple design raises
efficiency concerns. Yearly confidential bilateral contracts raise the five issues discussed in
chapter 4 (from a national perspective), as well as the two issues discussed in this chapter
(from a multinational perspective). Thus, the difficult decision is to make a tradeoff between
efficiency and simplicity of design.
6.6. Market integration, reform on a national level
Integration of separate reserve capacity markets with different time horizons could lead
to yet another complication. The case of the Netherlands and Norway can be used as an
example. The Netherlands uses a yearly market while Norway has a weekly reserve capacity
market. If cross-border exchange of reserves is to be enabled without any change in the
Dutch market, TenneT would need to ask for yearly bids from the Norwegian reserve
providers. And that would imply different bid prices. The Norwegian service provider
offering a certain capacity for the entire coming year will probably ask for a different price
than the price it would ask for offering the same capacity not for the entire year but for a
specific week in summer. Uncertainties in estimating the potential profits that the reserve
provider could have made in other markets would be logically higher if the estimations are
done for a period of one year rather than one week. And higher uncertainties would probably

109
mean higher bid prices. So, if TenneT asks for yearly bids from Norway, the bids would be
likely to come with a price higher than the current weekly prices in Norway illustrated in
Figure 6. 1.
In other words, generally speaking, part of the initial price difference (for reserves) can
be artificial, in the sense that the price difference is not necessarily due to the difference in
technology, or the available capacity, or other physical/technical factors. Part of the price
difference is due to the difference in market design: the difference in the time horizon of the
markets and the method of procurement (bilateral contracts vs. auctions). Part of why the
reserve prices in the Netherlands are believed to be significantly high (compared to Germany
and Norway) is because of the (confidential) yearly contracts used in the Netherlands, and if
the Norwegian bidders are going to bid in that yearly market they probably would ask for a
higher price as well.
At the same time, reform in the Dutch market would have an effect on the potential
benefits of integrating the markets. If the Dutch market is changed from confidential bilateral
agreements (between TenneT and the large suppliers) into an auction running on a monthly
basis, with a distinction between peak and off-peak hours, the prices would probably change.
This reform, discussed in chapter 4, would enable participation of more suppliers and also
lead to more specific definition of the services (and in more cost-reflective prices). Thus, this
way the current price difference between the Netherlands and Norway (for example) would
probably shrink; the price difference that determines the benefit achievable by integrating the
markets. Thus, market integration would have less attraction, from an economic perspective.
The fundamenta quest on that needs to be answered s ‘what exact y do we seek’? o
we seek improvement in performance of the reserve capacity markets (and market integration
is a promising option) or do we see market integration as something of intrinsic value that
should be desired anyway?
If we assume the market design in the Netherlands is partly responsible for the high
Dutch market prices, what needs to be done in order to reduce costs and improve efficiency
is some reform in the Dutch market and not necessarily integrating the Dutch market (as it is
today) with the market in Norway. If the design in the Netherlands is kept as it is, according
to the analysis in this chapter, reservation of interconnection capacity will impose high
opportunity costs because of the lost day-ahead trades. Additionally, since the Netherlands
has to ask for yearly Norwegian bids (instead of the current weekly bids in Norway), the
reserve capacity from Norway will probably come with a higher price. And this will limit the
potential benefit of market integration even further.
Nonetheless, exchange of reserves (integrating the markets) can still be economically
beneficial for Norway and the Netherlands. It depends on the current Dutch prices (that are
not public) and the size of the increase in the Norwegian bid prices (when they are asked for
yearly bids instead of weekly). Although we believe it can still be beneficial, market
integration is not the primary solution for the high prices in the Netherlands. We first need to
address issues related to the Dutch market: lack of transparency, limited players, low

110
compet t on and qu d ty, h gh opportun ty costs and the system operator’s ack of proper
incentives (all discussed in chapter 4). If we define services in a more specific way and move
towards shorter term auctions, not only will these issues be addressed but interconnection
capacity reservation can also be handled in a more efficient way (as discussed in this chapter),
paving the way for integrating the reserve capacity markets in the future.
6.7. Wind and future
Despite all the discussions above, one factor that has significant impact on the picture
we have of reserve capacity markets is the issue of large-scale wind power integration.
Introduction of large-scale wind power generation raises lots of discussions regarding the
support schemes and market designs adjustments that are needed to promote investment in
wind generation and to achieve a high penetration of wind power in the system. Additionally,
wind power raises discussions regarding reserve capacity markets, and the minimum reserve
requirements of the system.
Authors in [104] using scenarios from [105] estimate that the minimum reserve
requirements in Northern Europe (the Nordic system, Germany and the Netherlands) will
increase by 19% in 2015 and by 50% in 2020 (compared to 2010). According to the authors,
the reserve capacity procurement costs will more than double in the course of 10 years. This
can potentially have a decisive influence on the future of the reserve markets, and particularly
it can change the picture that was presented in this chapter. The effects of large-scale wind
power integration would depend on many different variables, including the size and
distribution of the new wind generation capacity, and also the designs of the various
electricity markets in the region. As an example, effective and efficient integration of intra-day
markets (which at the moment suffer from lack of liquidity, especially in a multi-national
context) is mentioned repeatedly as an effective tool to prevent high imbalances in real-time
and therefore higher needs for reserves [106]. In short, large-scale introduction of wind
generation can potentially have a decisive role on the future of the reserve capacity markets,
particularly in Northern Europe.
6.8. Conclusions
Because reserve capacity markets are long-term markets, cross-border exchange of
reserves implies reservation of interconnection capacity for relatively large periods of time,
and that consequently implies loss of day-ahead trades for the entire period of reservation.
Thus, exchange of reserves implies lost opportunity cost in the day-ahead markets. Economic
benefits of integration of reserve capacity markets depend on the size of this opportunity
cost. If reservation is done indiscriminately for an entire year, the opportunity costs can be
significant. By defining reserves in a more specific way (a distinction between peak and off-
peak hours) and using shorter time horizons for reserve capacity markets, those opportunity
costs can be controlled. In other words, interconnection capacity will be handled in a more
efficient way, and the benefits of reserve capacity market integration will be higher. Thus,

111
desirability of integration of reserve capacity markets depends on our way of handling the
interconnection capacity, and that in turn depends on the design of the reserve capacity
markets involved.
According to our case studies, in case of Norway and Germany, when there is no
particular shortage of hydro power (e.g. 2009), the opportunity costs incurred by day-ahead
trade losses are so high that integrating the two markets loses its basic economic justification.
However, in a dry year such as 2010, high day-ahead prices in Norway would lead to almost
no opportunity costs and so exchange of reserves from Norway to Germany would be
economically desirable. Nonetheless, the price difference in the reserve capacity markets (in a
dry year) seems to be rather too small to justify the costs and efforts of market integration.
In case of Norway and the Netherlands, although in a normal year (e.g. 2009) the
opportunity costs are significant but the Dutch prices are believed to be sufficiently high to
make market integration a very logical decision. In a dry year, there are almost no opportunity
costs and therefor, exchange of reserves would be even more beneficial and would lead to
even higher cost savings.

112
7. INTEGRATION OF BALANCING ENERGY
MARKETS

113
7.1. Introduction
This chapter is the second of two complementary chapters addressing integration of
balancing services markets. This chapter is dedicated to the essential discussions on
ntegrat on of ‘ba anc ng energy’ markets. Firstly, we discuss ACE netting as the most basic
arrangement that can lead to significant reductions in the amount of activated balancing
energy (and thus in balancing costs). Then we compare two cross-border arrangements,
namely BSP-TSO trading and TSO-TSO trading, using a model that studies the change in
behavior of market parties as a result of implementing these arrangements. Discussing
advantages and disadvantages of each arrangement, we propose using an in-between
arrangement that can make a better trade-off between what is gained and what is lost by
implementing each arrangement. Having analyzed the arrangements from a market
perspective, in the last section we discuss some practical complications that can challenge the
efficiency of enabling cross-border exchanges to a great extent.
7.2. Basic ACE netting
The Area Control Error (ACE) signal determines the demand for secondary control in
each program time unit. According to [11], within each control area/block, the individual
Area Control Error (ACE) needs to be controlled to zero on a continuous basis. In
continental Europe (the UCTE system), automatic generation control is used which functions
according to the ACE signal. Each area has its ACE, which is calculated based on the
deviations in system frequency and in the planned interchanges with the neighboring areas:
ACE = DP+k´Df
where DP is the total power deviation of the area which is the difference between the
total activa power flow (actual measurements) and the control program (sum of all related
exchange schedules). Df is system frequency deviation and k is the contro area’s power
system frequency characteristic (for detailed descriptions see [11], appendix A).
The most basic cross-border arrangement that can lead to significant reductions in
balancing costs is what is known as ACE netting or imbalance netting, meaning that imbalances
(ACEs) in two areas, when in opposite directions, can cancel each other out. As an example,
when there is an imbalance of +50 MW in the Netherlands and -50 MW in Germany, they
can offset each other without a need for activation of balancing energy bids in either of the
areas. So when there is frequency deviation in the system and/or power interchanges with
other areas are different from the planned values, then balancing energy needs to be activated
to bring the ACE signal back to zero. Therefore, this arrangement is called ACE netting,
because, in UCTE, it is the ACE that defines the area’s mba ance Generally speaking
though, it is actually the demands for secondary control that offset each other in this

114
arrangement, so even for systems which do not use automatic generation control (e.g. Nordic
system), and therefore do not have an ACE signal, this arrangement can still be applied, in
which case, it would be the imbalances that offset each other. Thus, we call this arrangement
imbalance netting rather than ACE netting to show its general applicability to systems that do not
use ACE.
It should be emphasized that there is a fundamental difference between imbalance
netting within a synchronous system and between two systems that are connected with
HVDC lines and so, are not synchronous. Exchange between Scandinavia and continental
Europe is an example of the second case. In case of non-synchronous systems, when there
are imbalances in opposite directions, and imbalance netting is being used, then the power
needs to be physically transferred between the two areas. As an example, if there is a power
surplus of 50 MW in Norway and a power shortage of the same size in the Netherlands, the
excess of power in Norway needs to be physically delivered to the Netherlands, because
otherwise the frequency in the Netherlands (and the entire UCTE) will deviate. Therefore, in
case of non-synchronous systems, for activating imbalance netting, enough interconnection
capacity needs to be available in the right direction so that the power surplus can be
physically delivered to the area with a shortage.
Nonetheless, in case of imbalance netting within a synchronous system, the power does
not need to be physically transferred. Take the case of UCTE, assuming there is an imbalance
of +50 MW in the Netherlands and -50 MW in Germany, and there is no imbalances in the
other UCTE areas. In this case, whether or not imbalance netting is used, since the total
imbalance of the (UCTE) synchronous system is zero, the system frequency will not deviate.
Thus, in this case if imbalance netting is used, the power surplus (+50 MW) in the
Netherlands does not need to be physically transferred to Germany in order to avoid
frequency deviations. In other words, imbalance netting within a synchronous system, is all
about adjusting the signals and thus, availability of interconnection capacity plays no role in
imbalance netting. What needs to be done is developing an automatic control system, like the
one already implemented in Germany [107, 108], which automatically adjusts the imbalances
to avoid unnecessary activation of balancing energy (in case imbalances can offset each
other).
In short, while imbalance netting between two non-synchronous systems needs
physical transfer of power (and therefore, availability of interconnection capacity), in case of
imbalance netting within a synchronous system, it is all about adjusting the signals without a
need for any change in the power flows. Imbalance netting can yield considerable reductions
in the amount of activated balancing energy.
7.3. Main aspects of balancing energy markets integration
One fundamental difference between balancing energy and reserve capacity markets
(discussed in the last chapter) is that balancing energy markets are real-time markets while
reserve capacity markets are markets with long time horizons that are cleared way before the
real-time. Since balancing energy markets are real-time markets, they are cleared after the

115
closure of all the other electricity markets and that implies that for exchange of balancing
energy across borders, reservation of interconnection capacity is not a prerequisite, in
contrast to reserve capacity exchanges. For balancing energy, the interconnection capacity
that is remained after the closure of the day-ahead and intra-day markets can be used for
cross-border exchanges.
In the previous chapter (on integration of reserve capacity markets), we did not discuss
the deta s of d fferent ‘mu t nat ona arrangements’ for exchange of reserve capacity because
the more basic issue that needed to be addressed was the issue of interconnection capacity
reservation. However, in this chapter (in case of balancing energy markets), since the
interconnection capacity does not necessarily need to be reserved, we pay special attention to
the effect of different multinational arrangements for exchange of balancing energy across
borders.
An extensive literature review of various arrangements was given in the previous
chapter. If all the various arrangements, proposed in different reports/documents/theses are
summarized, three main arrangement can be distinguished:
BSP-TSO trading, in which the balancing service providers (sellers) in one
control area can directly bid in the market of the other area. The TSO of the
other area (importing TSO) selects the cheapest from its domestic and foreign
bids. Thus, this arrangement connects the sellers (BSPs) in one area to the
buyer in the other area (TSO).
TSO-TSO trading, in which it is the two TSOs who interact. The exporting
TSO collects the bids in its area and shares some of them with the other TSO.
Alternatively, the exporting TSO itself (before having collected its bids) can
bid in the other market a certain capacity with a certain price based on its
forecast of the bid prices in its area. In both cases, the exporting TSO
functions as an intermediary between the BSPs in its area and the (importing)
TSO of the other area.
Common merit order list, which is the most advanced arrangement in which the
two TSOs share everything in a common market and choose the cheapest
bids together on a regional basis. Obviously, this arrangement needs
significant changes and cooperation on a regional level between the TSOs.
The last arrangement is the one that has been discussed extensively in literature.
Authors in [6], [99] and [109] have studied the common merit order list arrangement using
different assumptions regarding modeling the markets. These studies are aimed at estimating
the potential balancing cost reduction as a result of integrating the markets. Therefore, they
compare the most advanced arrangement (common merit order list) with the case of no
balancing exchanges across borders, and consider the difference as the potential cost
reduction. Nonetheless, the underlying assumption is smooth transition from no-exchange to
full-exchange. Having a common merit order list means full harmonization of the markets
involved. From a market perspective, the timing of markets (frequency of bidding and market

116
clearance) needs to be fully harmonized, and the same pricing mechanism needs to be used.
In addition, since in this arrangement, the bids are activated in a way that minimizes the total
regional balancing costs, each TSO cannot decide on which bids to activate independently.
The TSOs need to be cooperating very closely and develop a common bid activation
mechanism that takes into account all the bids throughout the region, imbalances in all the
areas, and transmission restrictions. Therefore, although a common merit order list can lead
to an efficient market and low balancing costs (on a regional basis), it does need a great deal
of dedication and willingness to make fundamental changes in the market design.
Since transition from separate markets (with no exchanges) to a fully integrated market
with a common merit order list cannot be done in one single step, the intermediary stages are
of critical importance. In this chapter, we look into the details of the first two arrangements,
BSP-TSO and TSO-TSO trading, as the less ambitious arrangements that enable cross-border
exchange of balancing services while do not need fundamental changes in the national
markets. In other words, instead of focusing on what can be achieved if markets are fully
integrated (the last conceivable stage), this chapter focuses on how we can get to that final
stage where the markets are fully integrated.
7.4. BSP-TSO trading
In BSP-TSO trading, suppliers have the freedom to choose which market they like to
offer their bids in. As a clarifying example, consider the case of BSP-TSO trading between
two areas, area 1 with cheap resources and area 2 with more expensive ones. Since in this
arrangement, the TSOs are not directly involved in selection of the bids that will go to the
other market, the foremost concern is that too many bids go to area 2 in search of higher
profits, which may leave the cheaper area with not sufficient resources to resolve its own area
imbalances. This impact, from a system security perspective, is not acceptable at all. Even if
after the shifting of bids to area 2, area 1 still has sufficient resources for domestic use, the
market price in area 1 may increase dramatically because less bids are available, the excess of
supply in area 1 decreases, and therefore there is more opportunity for abuse of market
power by suppliers in area 1.
We investigate the validity of this concern for cases of Norway-Netherlands and
Norway-Germany using an agent-based model. The model uses the basics of the model
presented n chapter 5, w th the d fference that the ‘reserve capac ty’ and ‘day-ahead’ markets
are replaced by the two national balancing energy markets of the two countries involved in
market integration. The service provides in both countries can bid either in their own market
or the foreign market, and using the bidding logics of the model presented in chapter 5, they
change their bid prices and shift their offered capacities between the two markets based on
their per-MW profit in the two markets. Another difference is that the available
interconnection capacity is an extra variable that determines the maximum balancing energy
exchange possible between the two areas.

117
7.4.1. Norway-Netherlands
We have used the power plant list of the Netherlands in [90], in which the names of the
owners are presented as well. Each owner with its portfolio (the group of its generating
plants) is considered to be one BSP. The market for secondary control (or the regulation
market) is the focus of the simulation. A plant in order to be eligible to bid in this market has
to have a minimum response speed of 7% per minute; it needs to be able to fully activate its
offered capacity in 15 minutes. The power plants which can meet this requirement are oil, gas
and hydro units [40]. According to [90], there are 21 oil and gas units in the Netherlands
which we consider as the units which can bid in the regulation market. In case of Norway,
due to lack of public data, we do not have a complete list of the generating plants. Therefore,
we use the approach used in [110] which models each of the five areas in Norway by one
aggregate generating plant, each representing generation in the corresponding area.
One critical input to the model is the day-ahead (DA) market prices in the two
countries because these prices influence the minimum/maximum bid prices in the
upward/downward regulation markets. Take upward regulation as an example. In Norway it
is not allowed to bid at a price lower than the DA price in the corresponding hour. In the
Netherlands, there is not an explicit rule addressing this issue. However, the regulation
market is the last market the generators can sell their capacities in. Therefore, the capacity
sold in the regulation market is the capacity that is still available after the closure of all the
other electricity markets (including DA), so it is the capacity that was not selected in the other
markets. Thus, the upward regulation price has to be higher than the day-ahead market prices
under normal operating conditions. In this simulation, in case of upward regulation bids, the
minimum bid price for Norway is considered to be the Norwegian DA price, and for the
Netherlands it is assumed to be the maximum of the DA price (in the Netherlands) and the
marginal operating costs of each unit, because the bid price has to be higher than both the
DA price and the marginal cost of the unit.
In case of downward regulation bids, the maximum bid price for Norway is assumed to
be the DA price in Norway, and for the Netherlands it is assumed to be the minimum of the
DA price and the marginal operating costs of each unit, because the downward regulation bid
price has to be lower than both the DA price and the marginal cost of the unit. Figure 7. 1
shows the average DA prices for Norway and the Netherlands in 2009.
Figure 7. 1. Average day-ahead prices for Norway and the Netherlands, 2009.
0
10
20
30
40
50
60
1 3 5 7 9 11 13 15 17 19 21 23
Pri
ce (
Eu
ro/
MW
h)
Hours
NL
NO

118
Based on the graph, and considering the crucial effect of the DA prices on the
simulation outcomes, we define two periods: Off-peak hours (from hour 00 to 07), in which
the DA price in Norway is higher than the price in the Netherlands, and Peak hours (from
hour 08 to 24), in which the DA price in Norway is lower than the price in the Netherlands.
We simulate these two periods separately, using two different sets of DA prices as inputs.
Therefore, for upward regulation we will have two sets of outcomes, one for peak and
one for off-peak hours. The same applies to downward regulation. Another important input
is system imbalances in the two countries. These real-time imbalances have to be resolved by
activation of regulating power. Therefore, these imbalances determine the ‘market demand’ n
the regulation market. Studying the real data regarding activated regulating power in Norway
for 2009 [111], it can be seen that the imbalances fit a normal distribution function with a
mean of -30 MW and a standard deviation of 370 MW. Same trend can be seen for the
activated regulating power in the Netherlands in 2009; a normal distribution function with a
mean of -12 MW and a standard deviation of 102 MW. For each direction (upward and
downward), and for each period (peak and off-peak), we take 200 samples of these two
distribution functions (representing the demand in the two markets) and run the model once
for each pair of demand values.
Before presenting the results, one basic issue should be clarified about how the results
of the simulation should be seen. The results of every run of the model (for every set of
inputs) show the final outcomes after the model has run for enough iterations so that the
agents have ‘ earned’ how to b d, and the market outcomes do not change anymore with
more iterations. Therefore, the results of every run show the market outcomes after the
market has reached a steady state and there is no more learning happening.
Therefore, every time, the model is fed with a set of inputs (demands in the two
markets and available interconnection capacity), and agents learn how to bid for that set of
inputs in particular. In other words, agents do not learn how to bid for different demand
values in one run of the simulation. So every run simulates learning of bidders for a certain
demand value over time. The implicit concept is that the agent learns separately for separate
situations (demand values) over time. Therefore, the model simulates the real world situation
as follows:
Every time the market is cleared (every PTU), bidders decide on their bid price and volumes
for the particular demand values in that PTU, and so they learn (as much as one iteration) for
that demand. If the demand in the market changes in the next PTU, they will be learning (as
much as one iteration) for the new demand value. The next time the market has the same
demand, agents would, again, learn as much as one more step for that particular demand.
Thus, in order to have an overview of how the players will bid in the market, different
runs with different demand values and available interconnection capacities are required. In
the following graphs presenting the results, the model is run for various values of Norwegian
and Dutch demand, as well as various amounts of available interconnection capacity.

119
Figure 7. 2 shows the upward regulation market prices in the Netherlands during off-
peak hours. The market is cleared for three available interconnection capacities; 0 MW,
100MW, and 300MW. The first curve with zero interconnection capacity available between
the two countries represents no market integration, because there is no room for cross-
border exchange of balancing services, and therefore, the two markets are cleared separately
and no capacity is offered by BSPs in the foreign markets. The other two curves show the
market price in the Netherlands as a result of market integration (enabling foreign bidding
between the two markets). In all the following figures, we use this set of interconnection
capacities. The horizontal axis shows the demand in the Dutch market; 200 samples were
drawn from the distribution functions mentioned above.
Figure 7. 2. Upward regulation prices in the Netherlands for three available interconnection capacity
values- Off-Peak hours
As can be seen, with no market integration, the price in the Netherlands is the highest;
t starts from 50 €/ Wh, and ncreases up to 170 €/ Wh as the demand ncreases to 340
MW. When 100MW interconnection capacity is available from Norway to the Netherlands,
Norwegian BSPs start bidding in the Dutch market, which would consequently bring the
Dutch market price down. If the demand is lower than 100MW, the entire Dutch demand
can be met by the Norwegian bids so the market price would go down to the level of the
Norwegian market price. For demand values higher than 100MW, although the market price
would still decrease (because 100MW of the demand is met by the Norwegian bids), the
remaining demand has to be met by Dutch bids. Therefore, one can see a jump in the Dutch
price at a demand value of 100MW. In the third case, 300MW interconnection capacity is
available; therefore demands up to 300MW can be fully met by bids from Norway. So the
Dutch market price goes down to the Norwegian market price, for demand values lower than
300MW.
Figure 7. 3 shows the upward regulation prices in Norway during off-peak hours for
the three available interconnection capacities. Thus Figure 7. 3 is the counterpart of Figure 7.
2 for Norway. As one can see from the figure, there is no noticeable change in the
30
50
70
90
110
130
150
170
190
0 50 100 150 200 250 300 350
Pri
ce (
Eu
ro/
MW
h)
Demand (MW)
Dutch Market Prices
NL_00
NL_100
NL_300

120
Norwegian market price as a result of market integration. The three curves lie on top of one
another.
Therefore, the main potential disadvantage of BSP-TSO arrangement, which is shifting
of too much capacity from the cheap market (Norway) to the expensive market
(Netherlands) to the extent that the market price in the cheaper market increases, does not
seem to be a valid concern in case of Norway and the Netherlands. One important reason is
the huge excess of supply in the Norwegian market. During off-peak hours, the offered
capacity in the regulation market in Norway was 9,320MW on average in 2010, while the
activated upward regulation in Norway was less than 290MW on average. This means a
market with a supply 30 times higher than demand on average! Such an extremely high excess
of supply limits the extent to which BSPs can behave strategically and increase the market
price by abusing their market power. In addition, demand in the Netherlands is low, therefore
shifting of some capacity to the Netherlands that can meet the whole Dutch demand does
not have a noticeable effect on the competitiveness in the Norwegian market, and
consequently on the Norwegian market price.
Figure 7. 3. Upward regulation prices in Norway for three available interconnection capacity values- Off-
peak hours
The same trends were seen in case of upward regulation during peak hours as well, and
therefore we skip presenting the graphs illustrating market prices for peak hours.
In case of downward regulation, the situation can be different. In contrast to upward
regulation, bids are sorted in the decreasing order on the bid ladder for downward regulation;
a higher bid price is to be activated first. The reason is simply the sign convention for
downward regu at on; a pos t ve downward b d pr ce s the pr ce the BSP s w ng to ‘pay’
the system operator in order to decrease its power output. The BSP has already sold the
power in other markets, so if it reduces its output, it will be saving operating costs. Therefore
if it bids at zero for downward regulation, it is actually making an extra profit equal to its
operating costs in the regulation market. Thus if it pays the system operator any price lower
than its operating costs, it will still make a profit. The downward regulation price can become
30
35
40
45
50
55
60
65
70
75
80
0 200 400 600 800 1000 1200
Mark
et
Pri
ce (
Eu
ro/
MW
h)
Demand (MW)
Norwegian Market Prices
NO_00
NO_100
NO_300

121
negative too, in which case the BSP would be asking the system operator to pay him for
lowering its output As ment oned ear er, we use the m n mum of the un t’s marg na cost
and the day-ahead price, as the maximum downward regulation bid price of a generating unit.
Marginal cost of the units eligible for bidding in the regulation market in the
Netherlands are higher than those in Norway, simply because of the generation technology:
oil and gas plants in the Netherlands and hydro in Norway. Therefore, if in a certain hour,
the DA price in the Netherlands is higher than Norway, then the maximum bid price for
downward regulation would be higher as well in the Netherlands, which means the bid prices
can potentially be higher in the Netherlands, meaning for downward regulation the bids in
the Netherlands can be more attractive. According to Figure 7. 1, during peak hours, the
Dutch day-ahead price is higher on average which implies that the Dutch bids for downward
regulation can be more attractive than the Norwegian ones, and therefore the Netherlands
can be exporting downward regulation to Norway.
Figure 7. 4 shows the downward regulation prices in the Netherlands during peak hours
for the three values of available interconnection capacity.
Figure 7. 4. Downward regulation prices in the Netherlands for three available interconnection capacity
values- Peak hours
As can be seen, when 100 MW interconnection capacity is available and so the
Netherlands can export up to 100 MW of downward regulation to Norway, for high demand
values (higher than almost 150 MW), the market price decreases (corresponding to an
‘ ncrease’ of the market pr ce for upward regu at on; an increase of balancing costs) in the
Netherlands as a result of the export to Norway. This shows that the basic concern for BSP-
TSO trading (change of the market price of the exporting country because too much capacity
is shifted to the foreign market) is valid in case of downward regulation for the Netherlands.
That means what did not happen in case of upward regulation for Norway (see Figure 7. 3)
does happen in case of downward regulation for the Netherlands. The main reason is lower
excess of supply in the Netherlands; on average, the offered volume in the Dutch market for
downward regulation during peak hours is about 600 MW. Thus, if 100 MW is exported to
30
32
34
36
38
40
42
44
46
48
50
-300 -250 -200 -150 -100 -50 0
Pri
ce (
Eu
ro/
MW
h)
Demand (MW)
Dutch Market Prices
NL_00
NL_100
NL_300

122
another market (and the demand in the Netherlands is sufficiently high), it can easily have a
noticeable effect on the market price because it increases the opportunities of the BSPs to
behave strategically and change the market price to their advantage. As shown before, this did
not happen in case of Norway (for upward regulation) because of the huge excess of supply
in Norway. According to the figure, if 300 MW interconnection capacity is available, then the
Dutch market price decreases even for very small demand values in the Netherlands, as a
result of exporting downward regulation bids to Norway.
Figure 7. 5 shows the downward regulation prices in Norway for peak hours
(corresponding to Figure 7. 4 for the Netherlands). The price without cross-border exchanges
s 34 €/ Wh, and when the exchange is enabled (the other two cases), the market price for
ow demand va ues ncreases (correspond ng to a pr ce ‘decrease’ for upward regu at on; a
reduction of balancing costs). For higher demand values in Norway, since the whole demand
cannot be met with the bids from Dutch BSPs, the Norwegian bids need to be activated as
well, and therefore the price decreases again.
Figure 7. 5. Downward regulation prices in Norway for three available interconnection capacity values-
Peak hours
As mentioned before, the main concern in BSP-TSO trading is whether or not enabling
this arrangement would lead to shifting of too much capacity from the cheap market to the
expensive one to the extent that the market price in the cheap market considerably increases.
Having studied the case of Norway and the Netherlands, the first finding is that this question
has to be answered on a ‘case-spec f c’ basis, simply because there are numerous factors that
influence the answer to the question, such as the level of day-ahead prices, supply size,
demand size, generation portfolios, typical marginal costs, and the number of market players.
Thus, there s no ‘genera ’ answer to the question whether or not BSP-TSO trading has a
negative or positive effect on the market prices. In this specific case of Norway and the
Netherlands, according to our results, the market price in Norway (when it is the exporting
country) does not change noticeably (no undesirable effect on the market price in Norway),
because of the huge excess of supply and the flat bid ladder (almost fully hydro system) in
Norway. However, when the Netherlands is the exporting country (downward regulation
30
32
34
36
38
40
42
44
46
48
50
-1000 -800 -600 -400 -200 0
Mark
et
Pri
ce (
Eu
ro/
MW
h)
Demand (MW)
Norwegian Market Prices
MP_NO_00
MP_NO_100
MP_NO_300

123
during peak hours), this cross-border exchange has an undesirable effect on the Dutch
market price.
In other words, the market price in Norway is much more resistant to market
integration, while the price in the Netherlands is more sensitive and more likely to change as
a result of market integration. As can be seen in Figure 7. 2, the drop in the Dutch price is
immediate as soon as importing the Norwegian bids happens. The prices significantly drop as
the cheap Norwegian bids are selected in the Dutch market.
However, according to Figure 7. 4 (for downward regulation), firstly, the price
reduction does not happen immediately, simply because in this case, the Netherlands is an
exporter, and the effect of the exported bids on the market price might not be noticeable
unless the Dutch demand is high or when high bid volumes are sent to Norway. And
secondly, the price reduction is much more limited in size compared to the case for upward
regulation. In other words, the drop in the Dutch balancing costs (for upward regulation) is
significantly higher than the jump in the Dutch balancing costs (for downward regulation).
We conclude that enabling BSP-TSO trading in this case has a positive (desirable) effect on
lowering the balancing costs in total, and does not endanger system security.
7.4.2. Norway-Germany
The power plant list of Germany according to [90] is used. Two main scenarios for
peak and off-peak hours are generated, using two different day-ahead prices (same as the case
of the Netherlands). The German demand in the balancing energy market is the system
imbalance, which is (according to 2009 data) a normal distribution with a mean of -19 MW
and a standard deviation of 664 MW. Obviously, the size of the market demand is much
higher than the Dutch market.
Figure 7. 6 shows the upward regulation prices in Germany for 4 different available
interconnection capacity values (0, 400, 800 and 1700 MW). As can be seen, the German
prices dramatically reduce due to the Norwegian bids. However, one difference with the case
of the Netherlands can be seen in the graph for 1700 MW. This interconnection capacity
value is sufficient for the entire German demand to be met with Norwegian bids, however,
the market price does not go down to the Norwegian market price. In other words, the graph
is not flat. In this case, because of the high demand in the German market, the Norwegian
bidders have more opportunity to increase the market price. In contrast to the case of the
Netherlands, where competition among Norwegian bidders kept the price the same as the
Norwegian price, in case of Germany the demand can be so high (compared to supply) that
the Norwegian bidders can use their market power and bid at prices noticeably higher than
their operating costs. In other words, because of higher demand, the Norwegian bidders bid
more aggressively in the German market than in the Dutch market.

124
Figure 7. 6. Upward regulation prices in Germany for four available interconnection capacity values- Peak
hours
Figure 7. 7 shows the same graph for 1700 MW of interconnection capacity. The issue
raised above can be clearly noticed in the figure. The Norwegian suppliers bid at higher prices
when the demand in Germany is high; the curve is far from flat.
Figure 7. 7. Upward regulation prices in Germany for full interconnection capacity available (1700 MW)-
peak hours
Figure 7. 8 compares the reduction in upward regulation prices for the Netherlands and
Germany. The x-axis shows four sets of interconnection capacity. The bar for “0-200” shows
the difference between the market prices when zero interconnection capacity is available and
when 200 MW is available. As can be seen for small values of interconnection capacity, a
significant price reduction can be achieved in case of the Netherlands (much higher than in
Germany), which can be explained by the small size of the Dutch market.
30
80
130
180
230
0 500 1000 1500 2000
Mark
et
Pri
ce (
Eu
ro/
MW
h)
Demand (MW)
German Market Prices
0
400
800
1700
30
40
50
60
70
80
0 200 400 600 800 1000 1200 1400 1600 1800 2000Mark
et
Pri
ce (
Eu
ro/
MW
h)
Demand (MW)
German Market Price (Full interconnection availability)

125
Figure 7. 8. Price reductions as a result of importing upward regulation from Norway - Peak hours
Figure 7. 9 illustrates the upward regulation prices in Norway for different available
interconnection capacity values. As can be seen, the high demand in Germany (high export
from Norway) can increase the Norwegian market price up to 25%. However, generally
speaking, the Norwegian price is not influenced considerably by enabling cross-border
exchanges; the huge supply in Norway can still handle the German demand without
significant undesirable effects on the Norwegian price.
Figure 7. 9. Upward regulation prices in Norway for different available interconnection capacity values-
Peak hours
During peak hours, Germany can export downward regulation to Norway. Figure 7. 10
shows the German downward regulation prices for peak hours. As can be seen, the German
price is influenced by the export to Norway (price reduces, equivalent of a price increase for
upward regulation), up to 32% for high demands when 400 MW interconnection capacity is
available. However, this undesirable effect is limited for the typical demand values.
0
5
10
15
20
25
30
0-200 200-400 400-800 800-1600
Pri
ce r
ed
ucti
on
(E
uro
/M
Wh
)
Interconnection capacity
Price Reductions (per available interconnection)
DE
NL
35
37
39
41
43
45
47
49
51
53
0 200 400 600 800 1000
Pri
ce (
Eu
ro/
MW
h)
Demand (MW)
Norwegian Prices 0
400
1700

126
Figure 7. 10. Downward regulation prices in Germany for different available interconnection capacity
values- Peak hours
This price reduction is more prominent for higher values of available interconnection
capacity (more room for export from Germany). Figure 7. 11 illustrates the downward prices
in Germany when 800 MW interconnection capacity is available. The price reduction can be
huge (depending on demand); the price even changes sign, which is a significant undesirable
effect on the German market.
Figure 7. 11. Downward regulation prices in Germany when 800MW interconnection is available- Peak
hours
Figure 7. 12 shows the ‘average’ pr ce reduct ons for downward regu at on n peak
hours when the Netherlands or Germany are exporting to Norway. The price reduction is
averaged over all demand values (samples taken). As can be seen, for low interconnection
capac t es, the pr ce reduct on s not s gn f cant ‘on average’, but export ng arge amounts of
downward regulation to Norway can significantly influence the German market price in an
undesirable way.
25
27
29
31
33
35
37
39
41
-2000 -1500 -1000 -500 0
Pri
ce (
Eu
ro/
MW
h)
Demand (MW)
German Market Prices (Downward)
400
0
-55
-45
-35
-25
-15
-5
5
15
25
35
45
-2000 -1800 -1600 -1400 -1200 -1000 -800 -600 -400 -200 0
Pri
ce (
Eu
ro/
MW
h)
Demand (MW)
German market prices (downward)

127
Figure 7. 12. Price reductions as a result of exporting downward regulation to Norway- Peak hours
7.4.3. Conclusions
The main concern about BSP-TSO trading is, since the TSO of the exporting country
is not involved and has no control over which bids leave for the foreign market, too much
capacity may leave the cheaper (exporting) area leading to significantly high prices (low prices
in case of downward regulation) in the exporting area. The answer to this issue in general,
depends on many different factors, however, in the specific case of Northern Europe, based
on our results this concern can be considered as a factor without a decisive influence.
Norway, with its huge excess of supply, can handle the demand in Germany and the
Netherlands, without a significant change in the Norwegian market price. In case of
downward regulation in peak hours, when Norway can be an importer, the market price in
Germany (as the exporting area) can be significantly influenced for high demand values (and
high available interconnection capacity). Generally speaking, enabling bidding across borders,
in case of the Netherlands would result in large savings (cost reductions), even for small
values of exchange (because of the small size of the Dutch market). To reach the same size of
price reductions in Germany, significantly higher exchange volume is needed. In addition,
considering the presented graphs, the cost reductions for upward regulation are generally
much larger than for downward regulation.
7.4.4. Low reservoir levels in Norway
Since the Norwegian generation portfolio is hydro, the reservoir levels in Norway can
play an important role in determining the results of market integration, and the consequent
exchanges and price changes. Year 2010, in contrast to 2009, was a dry year with low
reservoir levels in Norway. The Norwegian day-ahead prices, as a result, increased by 50% in
2010 reach ng an average of 53 €/ Wh Both n peak and off-peak hours, the day-ahead
price in Norway was higher than in the Netherlands or Germany, and that can potentially
change all the insights discussed so far about balancing exchanges between Norway, the
Netherlands and Germany. The model was run given the new inputs for 2010. The results,
although different from the previous case (wet year), have some similarities with the results of
the other case. We first look at the Norway-Netherlands case and then Norway-Germany.
-20
-15
-10
-5
0
0-200 200-400 400-800 800-1600
Pri
ce (
Eu
ro/
MW
h)
interconnection capacity
DE
NL

128
Since the day-ahead price in the Netherlands is lower, balancing bids are generally lower
as well, and so one might think that the direction of the balancing exchanges would be the
opposite of the previous case. On the other hand, since the Dutch balancing market is
dominated by thermal plants (oil and gas), the Dutch bid ladder is quite steep: as the marginal
cost of these thermal plants increases, their bid prices in the balancing market would increase
as well. Therefore, although the day-ahead price in the Netherlands is lower, the Dutch
balancing bids can compete with the Norwegian bids only up to a certain extent. If the
demand in the Netherlands is low and the very cheap bids are available, the Netherlands can
export to Norway, but if those cheap bids are needed in the Netherlands, the next bids may
not be able to compete with the Norwegian bidders.
Another basic difference is that in this case, since the Dutch day-ahead price is lower,
the Nor-Ned cable is most of the time congested from the Netherlands to Norway, and that
means that there is plenty of room for balancing power to flow from Norway to the
Netherlands. Figure 7. 13 compares the upward Dutch market prices (for peak hours) in case
there is no exchange with the case for which there is 100MW interconnection capacity
available from the Netherlands to Norway. According to the figure, for low Dutch demand
values, because some Dutch providers bid in the Norwegian market and leave the small
market of the Netherlands, the Dutch market price would increase. However, because of the
steep bid ladder in the Netherlands, after a certain point, the Dutch bids cannot compete
with the Norwegian ones anymore. The Dutch balancing price becomes so high that not only
there’s no exchange poss b e from the Netherlands, but also the Norwegian bidders can be
selected in the Dutch market. Therefore, the direction of the exchange changes depending on
the demand value in the Netherlands. For low demand values, the Netherlands exports to
Norway and for higher demand values the other way around. That is the basic difference
between a dry and a normal year in Norway: Dutch bids can compete in the Norwegian
market for low demand values, and that would probably lead to market price increases in the
Netherlands. For higher demand values, the same phenomenon as for the previous case can
be seen: immense exchange from Norway to the Netherlands.
Figure 7. 13. Upward regulation prices (in peak hours) in the Netherlands for two available interconnection
capacity values, using the 2010 data (dry year in Norway)
50
55
60
65
70
75
80
85
90
95
0 50 100 150 200 250 300
Pri
ce (
Eu
ro/
MW
h)
Demand (MW)
noexchange
100 MW

129
Figure 7. 14 can clarify the issue further. The figure shows the exchange volumes
between the Netherlands and Norway, for different demand values in the Netherlands
(assuming 100MW interconnection capacity is available to Norway). As can be seen, for low
demand, there is exchanges up to 100 MW from the Netherlands to Norway because the
Dutch bids are attractive as a result of lower day-ahead price in the Netherlands. As the
demand increases, the exchange changes direction: for higher demand values in the
Netherlands, there is large amount of imports from Norway.
Figure 7. 14. The amount of balancing exchanges (upward, for peak hours) between the Netherlands and
Norway for the case of a dry year (2010)
Therefore, the difference between a wet and a dry year in Norway is that in a dry year,
the Dutch bids can compete in the Norwegian market, but only to a limited extent, and after
a certain point, again it will be the Norwegian bids which are cheaper and more likely to be
selected.
The same effect can be seen in case of Norway and Germany. For low demand values,
Germany exports upward balancing power to Norway but for higher demand values,
Germany is only an importer. Figure 7. 15 shows the upward regulation prices in peak hours
for Germany, corresponding to Figure 7. 13 for the Netherlands.
Figure 7. 15. Upward regulation prices (in peak hours) in Germany for two available interconnection
capacity values, using the 2010 data (dry year in Norway)
0
50
100
150
200
250
0 50 100 150 200 250 300
Ex
ch
an
ge (
MW
)
Dutch demand (MW)
NL->NO
NO -> NL
50
100
150
200
250
0 500 1000 1500 2000 2500
Pri
ce (
Eu
ro/
MW
h)
Demand (MW)
no exchange
100 MW

130
The only difference between this case and the case of Norway-Netherlands is the
volume of exchanges. Since the day-ahead price in Germany is lower, the interconnector is
most of the time congested from Germany to Norway which leaves large room for export of
upward regulation bids from Norway to Germany. Figure 7. 16 shows the amount of
balancing exchanges (upward, in peak hours) between Germany and Norway.
Figure 7. 16. Amount of balancing exchanges (upward, for peak hours) between Germany and Norway for
the case of a dry year (2010)
7.5. TSO-TSO trading
In this arrangement, both TSOs are directly involved. The TSO of the exporting area
decides on what will be shared with the other area. Thus, the exporting TSO functions as an
intermediary between the bidders of the exporting area and the importing TSO. Two
variations of this arrangement can be conceived.
In the first variation, the exporting TSO directly offers balancing energy in the other
area. In this case, the bid price is not based on the bids actually submitted to the exporting
TSO, but the TSO decides on the bid price based on its anticipation of the bid prices that it
will receive from its service providers later. An example of this arrangement is the agreement
between the UK (National Grid) and France (RTE) [112]. The arrangement allows for
submission of a buy and sell price by each TSO. When services are requested by the National
Grid, they are cleared at the prices submitted by RTE and vice versa for the services
requested by RTE. At present, each TSO submits a single pair of prices that covers the price
of utilization for the subsequent calendar day. So the TSOs, based on the forecast of the bids
they will receive from their service providers (throughout the next day), decide on the price
of their bid in the other market.
The main concern about this arrangement is the direct financial involvement of the
exporting TSO, which is in contrast with the functions of a TSO who should mainly focus on
security of supply and ideally not be financially involved in the workings of the market. Even
if the TSO does not intend to make profit (out of a cross-border exchange), since the TSO
has the financial responsibility, it will naturally try to hedge against the risks of bidding at a
price that is too low to be compensated by the bids it will later activate in its own area. Of
0
100
200
300
400
500
600
700
800
900
1000
0 200 400 600 800 1000
Ex
ch
an
ge (
MW
)
German demand (MW)
DE->NO
NO -> DE

131
course the TSO can accept losses in some hours, but a situation with consistent financial
losses for the TSO cannot be sustainable. Financial involvement of the TSO (or any third
party) would probably influence the prices (increase them). If the TSO is risk neutral, then it
will seek a ‘pos t ve expected prof t’, which obviously influences the economic efficiency of
the process And f t’s w ng to take r sks and somet mes oses n the process, the quest on s
who is going to make up for the difference? Even in the optimistic case of the TSO not
seeking any profit, this whole process would be more expensive and less efficient with
involvement of the TSOs. The TSO, in order to avoid financial loss, will (even without a
profit-seeking intention) overestimate the bid prices. And that limits the potential profits of
the cross-border exchange.
In the second variation, the TSOs offer the bids they have already received from the
service providers in their area. Obviously, in this arrangement the TSOs will have to be able
to bid in the foreign market after they have received all the bids in their own area and that
needs cooperation between the TSOs much closer to the real-time (compared to the first
variation). In this arrangement, the bids are shared and the TSOs do not have financial
involvement, even though they are directly involved in deciding which bids will be shared. In
this case, the TSOs might not be willing to share their cheap bids with the other area. In
other words, the TSO will probably share only the bids he already knows he is not going to
use; only the bids with higher prices will be shared while cheaper bids stay in the domestic
market and maybe not be used at all. This can significantly impact the potential cost
reductions as a result of enabling cross-border exchanges. Thus, even in this arrangement,
although the TSOs do not have a financial involvement in the exchanges, they still decide on
which bids will be shared, which obviously would influence the efficiency of this
arrangement.
7.6. BSP-TSO or TSO-TSO?
Our simulation results for BSP-TSO trading in case of Northern Europe suggest that
this arrangement can be enabled without a serious concern about significant undesirable
change in market prices, or too much capacity leaving the cheaper area (security of supply
issue). Nonetheless, it is very logical that the TSOs will be concerned about the issue of
security anyway. Since they are the sole entities responsible for system security, they will not
be willing to consider any option that may potentially endanger system security.
TSO-TSO trading, on the other hand, while solving that problem, as explained above,
is not efficient from a market perspective; financial involvement of the TSOs and their
natural tendency to hedge against financial risks would lead to higher prices and inefficiencies.
In any cross-border balancing exchange, the TSOs have the key role simply because they are
responsible for security. So they are already the ones who decide on all the technical issues
(and basically give permission to cross-border exchanges). Giving them control over the
workings of the market as well (getting them involved in determining which bids can be
shared with another area and with which price) does not represent a free competitive market.
The TSO of a control area s the “buyer” of ba anc ng serv ces n that area (by def n t on of

132
balancing services markets). In a TSO-TSO cross-border arrangement, the TSO is not only
the buyer n ts own area but a so the se er n the other area (us ng ts serv ce prov ders’ bids,
or their estimations).
Thus, on the one hand, we have a cross-border arrangement which is based on full
freedom of market players, there is no intermediary and the market players in one area can
freely decide whether they would bid in the internal or the foreign market, and they can freely
decide on their bid price (BSP-TSO trading). This arrangement naturally raises security
concerns, because in theory the TSO of the cheaper area may end up with not sufficient
resources (as a result of too much capacity leaving the market in search for a higher profit).
However, although the other market has a higher price in the beginning, as significant foreign
capacity is offered in the market, the price would go down eventually and a new equilibrium
would be reached. In case of Northern Europe, our results show that the large excess of
supply in Norway would help reach a new equilibrium with considerably lower prices in the
Netherlands and Germany and without a really noticeable price increase in Norway (let alone
ending up with insufficient bids). Nonetheless, the TSOs’ concern regarding security is valid.
The TSOs cannot afford any risks to security of supply of their own area.
On the other hand, we have the TSO-TSO arrangement in which both TSOs are
directly involved and they decide on which bids to be shared and with which price. This
arrangement although eliminates the security concern, raises market efficiency concerns,
especially since the TSOs are already involved in all the technical aspects of a balancing
exchange, as explained above.
7.7. Restricted BSP-TSO
In addition to the two basic arrangements proposed in various reports/papers and
discussed above, it seems there is need for an in-between arrangement, which can help ensure
market efficiency (to some extent) and relieve TSOs’ concerns regard ng system secur ty at
the same time.
n order to accommodate TSOs’ concerns regarding security (in a cross-border
exchange of balancing energy), the TSOs do not have to necessarily be the entity who decides
on the bid volume and bid prices for any cross-border exchange (as in TSO-TSO trading). In
both variations of TSO-TSO trading explained above, the exporting TSO (directly or
indirectly) determines the size and price of the cross-border exchange. Nonetheless, if the
TSO is after ensuring security of its system, it should only be concerned with volumes of the
shared resources, and not with the prices.
The first variation of TSO-TSO trading (explained above) allows TSOs to directly
determine the price of cross-border exchanges. That is unnecessary and can be avoided. In
the second variation, the TSO does not determine the prices, but it determines which bids
will be shared with the other area, which means the TSO still has all the saying about the
prices (depending on which bids it selects to share, the price of the exchange will change).

133
We need an arrangement that gives the TSO control over the amount of capacity that
goes to the other market (the volume), while the TSO does not have full control deciding
exactly which bids can leave. In the arrangement that is propose here, service providers can
be free to decide whether they want to offer their capacity in the domestic or the foreign
market (similar to BSP-TSO trading), but at the same time, the TSOs can have control over
how much capacity can leave the domestic market and be offered in the other market.
One simple and practical way to achieve that is to let the (exporting) TSO impose a
maximum allowed capacity that each service provider can offer in foreign markets. For example,
the service providers can be free to bid in foreign markets (and at their desired price) as long
as they offer at least 80% of their total available capacity in the domestic market. In other
words, a certa n part of each serv ce prov der’s capac ty wou d be ocked and cannot be
offered in any foreign market, however, it is still up to the service provider which part of its
available capacity that is. A service provider with a decent and flexible generating portfolio
would be free to choose that 20% of its capacity that it can offer in other markets from any
of its units; it can decide to offer its expensive or cheap resources in the foreign market, and
with the price it desires. The service provider enjoys a certain level of freedom and the TSO
ensures that it will have enough resources to meet its domestic demand.
This arrangement is essentially a restricted BSP-TSO arrangement. It should be noted that
the maximum capacity that the TSO allows to be offered in other markets, has to be calculated
carefully, on a case-specific basis, taking into consideration the excess of supply in the area
(for each type of balancing services). This maximum capacity, for example, can be much
higher for Norway than for Germany or the Netherlands (because of its large excess of
supply). Obviously, this maximum capacity would preferably be calculated separately for
different time periods (different seasons, peak/off-peak hours, etc.) so that this capacity cap
can follow the changes of supply and demand in the domestic reserve capacity market. This
cap on the shared capacity (final possible size of a cross-border exchange) also needs to be
negotiated by the involved TSOs on a case-specific basis.
7.8. Practical complications
In addition to the market-related issues discussed above, there are some complications
that can influence the practicality of enabling cross-border exchanges for balancing energy.
These issues arise as a result of differences in market designs of the areas involved in market
integration.
7.8.1. Bidding frequency
Difference in bidding frequency of the markets can significantly influence the efficiency
of the cross-border exchanges. The case of Germany is a perfect example for clarifying this
issue. As discussed earlier in this thesis, bidding for balancing energy happens on a monthly
basis in Germany. Service providers bid once per month and the bids will be fixed
throughout the month. If the status quo is maintained, then the Norwegian providers
wanting to bid in the German market have to submit monthly bids, while the domestic

134
market in Norway is run on hourly bids. Although feasible, submitting monthly bids in the
German market can cause distortions in the Norwegian market because as soon as some
Norwegian capacity is offered in Germany (and is selected in that market), it cannot be used
in Norway for the entire month anymore. In addition, as explained in previous chapters,
bidding in a monthly market for balancing energy (while the market is cleared on a quarter-
hourly basis) leads to higher prices (because of the lost opportunity costs). And that will limit
the potential gains as a result of enabling cross-border exchanges.
The same challenge applies to the case of Norway and the Netherlands; the bidding
period in the Netherlands is 15 minutes while in Norway it is one hour. Thus, when bidding
in the Dutch market, Norwegian bidders have to bid on a quarter-hourly basis. In that case,
when a Norwegian bid goes to the Dutch market (for a particular 15-minute period), then
that bid cannot be offered in the Norwegian market for the other three quarter hours of the
same hour. So although the bid is offered on a quarter-hourly basis in the Dutch market, the
Norwegian market loses that bid not for one quarter of an hour but for four. That can also
cause distortions in the Norwegian market.
Nonetheless, none of these differences in market design makes cross-border exchanges
infeasible. It imposes more complexity on the service providers who have to bid at different
time scales in different markets. It increases complexity and probably leads to higher prices
but cross-border exchange is possible.
7.8.2. Coordination of imbalance settlement
When the bid of a service provider is selected in the market, he will be paid for his
selected bid regardless of whether or not he delivers the energy. This issue is straightforward
to deal with in case of one single market. When a bid is selected, the bidder will be paid the
regulation price. If he does not deliver, then he will have an imbalance (after real-time) and
thus, he will have to pay the imbalance price (to the TSO). And the imbalance price is,
generally speaking, either equal to or higher than the regulation price (depending on the
details of the imbalance settlement system). Therefore, if he does not deliver, while he has
received the regulation price, he will have to pay the imbalance price which is generally
higher, leading to proper incentive for service providers to deliver the energy they are
supposed to deliver.
However, in a multinational context, this incentive issue is more complicated.
Assuming that two areas are involved, there will be two imbalance prices (one for each area).
Let’s cons der the case of Norway-Netherlands. If a Norwegian service provider bids in the
Dutch market and his bid gets selected, he will receive the Dutch regulation price. If he does
not deliver though, he will pay the Norwegian imbalance price. And given that the prices in
Norway are generally lower than in the Netherlands, the service provider will have a clear
incentive to not deliver; he receives a high price (Dutch price) and pays a low price
(Norwegian price) and so makes profit by doing nothing.
Therefore, enabling cross-border exchange of balancing energy is not only about
arranging a real-time multinational market in which balancing energy can be traded across

135
borders. It also needs close cooperation of TSOs in settling the imbalances. Solving the
above mentioned challenge is not complex but it does need dedication at the TSOs level, so
that an international mechanism for settling imbalances can be developed: a mechanism in
which the service providers are needed to pay the imbalance price of the area they bid in, in
case they do not deliver.
7.9. Conclusions
Regarding exchange of balancing energy across borders, ACE netting is the basic
arrangement that allows for imbalances in opposite directions to cancel each other out. This
will reduce the amount of balancing energy that needs to be activated in the corresponding
areas. According to the results of the model, BSP-TSO trading which enables foreign bidding
for service providers can dramatically reduce the market prices in Germany and the
Netherlands. The huge excess of supply in Norway can handle the Dutch and the German
demand without a sudden change in the Norwegian prices.
Nonetheless, BSP-TSO trading will logically raise TSOs concerns regarding system
security, because in this arrangement, bidders are free and the exporting TSO does not have
control over which bids leave the domestic market. TSO-TSO trading on the other hand, can
significantly influence the efficiency of the cross-border exchanges because of the direct
financial involvement of the TSOs. Therefore, an in-between arrangement was proposed in
this chapter: a restricted BSP-TSO arrangement, which gives service provider the freedom to
make effective decisions on their bid price and bid volume, while puts a cap on the capacity
that each service provider can offer in foreign markets and thus gives the TSOs the tool to
guarantee that the reserve capacity that is leaving its domestic market will not endanger its
system security.
And lastly, the difference in the bidding frequencies of the markets involved can
impose considerable complexity on the service providers because they have to bid in markets
with different time horizons. However, the difference in time horizons does not make cross-
border exchanges impossible. It would rather increase the bid prices and limit the potential
cost reductions. In addition, to ensure proper incentive for service providers regarding
actually delivering the balancing energy they are supposed to deliver, an imbalance settlement
mechanism has to be developed by the TSOs so that the service providers who do not deliver
will have to pay the imbalance price of the area they bid in.

136
8. SUMMARY AND POLICY
RECOMMENDATIONS

137
8.1. Critical characteristics of balancing markets
Although integration of balancing markets is generally seen as the next step after
integration of day-ahead and intra-day markets, complexity of balancing markets is an
important factor distinguishing these markets from wholesale electricity markets. What is
known as ‘ba anc ng market’ s a mechan sm cons st ng of var ous markets for trad ng of
various services. Different areas (countries) use their own definition of balancing services and
use market designs that in some cases have fundamental differences with each other. That is
the reason why integration of balancing markets is much more complex and challenging
compared to integration of day-ahead or intraday markets.
In addition, since balancing markets are aimed to balance generation and consumption
and prevent frequency deviations, these markets have a direct influence on security of supply.
Therefore, TSOs’ foremost concern (regard ng any change n the r ba anc ng market) is to
ensure that system security is not compromised in any sense. This factor complicates market
integration even further, and requires us to be more cautious in proposing arrangements for
cross-border exchanges of balancing services.
8.2. Short and long term view
Because of the basic differences in the market design (in different countries), the direct
nf uence of ba anc ng markets on system secur ty, and TSOs’ re uctance to make changes n
the basics of their market design, a cautious step-by-step approach should be taken regarding
integration of balancing markets. Designing the path of this gradual change needs accurate
short- and long-term planning.
Integration of balancing markets requires some kind of convergence of the market
designs across Europe. Based on this study, we believe the path to fully integrated balancing
markets goes through changes n the market des gn at the ‘nat ona ’ eve Nat ona reforms
improve the efficiency of the national market and if these reforms follow a general direction
pre-determined by an overarching European-wide view in mind, these reforms will lead to
more harmonized markets across Europe, or in other words, convergence of the market
designs, which will make fully integrated balancing markets across Europe practically
achievable.
These reforms are medium and long-term plans. However, in the short run, limited
exchange of services across borders can be enabled in some cases. The details of these two
long-term (national reforms) and short-term (limited cross-border exchanges) plans are
explained in the following sections.
8.3. Long-term view: National reforms
It seems that because of the main objective of balancing markets (system security), in
some cases, the ba anc ng markets were not des gned w th ‘market eff c ency’ as the main goal
in mind. Historical factors and path dependency of market designs can be seen as other

138
influential factors which make balancing markets across Europe, although effective, in some
cases not efficient, from a market perspective. In order to improve the performance of
balancing markets some reforms at the national level are recommended:
1. Defining services in a more specific way: Services should be distinguished
and ideally, separate markets should be held for different services. A
distinction between peak and off-peak hours is essential for higher efficiency
(in case hourly markets are not used). In addition, a distinction between
upward and downward capacities needs to be made. In case of balancing
energy, this distinction is already in place across Europe, but for reserve
capacity, in many cases, one single market is used without a distinction
between up- and down-ward capacity.
2. Moving towards shorter term markets: Especially in case of reserve
capacity markets, using long term contracts, although effective, raises market
efficiency concerns. Use of shorter term markets would lead to lower demand,
easier new entries, higher competition, lower opportunity costs, and more
proper incentives for system operators.
3. Using the same frequency for bidding and market clearance: Especially
in case of balancing energy markets, service providers should be able to
submit different bids for each period of market clearance. Otherwise, the
number of market players would be limited and an opportunity cost
component will be indirectly added to the bid prices of the service providers
resulting in lower price efficiency (lower cost-reflectivity of prices).
8.3.1. National reforms for Northern Europe
Based on the results of our study, the following can be seen as the case-specific
recommendations regarding national reforms (of balancing markets) in Northern Europe:
In case of the Netherlands, the balancing energy market is functioning
satisfactorily and no major institutional change seems necessary. Nevertheless,
the reserve capacity market (for secondary control) is far from efficient.
Because of the five reasons mentioned in the fourth chapter, a step-by-step
reform leading to short-term markets for reserve capacity is recommended to
be seriously considered. In the first step, the bilateral contract arrangement
can be abolished and monthly auctions can be used. In a further step, a
distinction between up and down capacity can be made, as well as a distinction
between peak and off-peak hours. And in the last step, weekly or preferably
daily markets can be considered. Implementation costs play a decisive role and
it is very understandable that abstract arguments such as higher
compet t on/ qu d ty/eff c ency can poss b y be eas y d sm ssed us ng ‘the
cost argument’ However, the considerable reduction in the demand for
reserve capacity (as a result of calculating reserve requirements on a more
frequent basis) is a concrete factor justifying consideration of short-term
auctions for reserve capacity.

139
In case of Germany, the reserve capacity markets are noticeably more
efficient than the one in the Netherlands. However, especially for secondary
control, considering the extremely low excess of supply ratios, there is room
for improvement, and daily markets, just like the market for tertiary control,
are recommended. Balancing energy markets in Germany however, need
serious attention. A monthly market with fixed bids for the entire coming
month, not allowing any new bidders close to real-time, significantly increases
the bid prices, adds a lost opportunity cost component to the bids, and limits
the number of bidders. Germany seems to need to move towards auctions
close to real time (as close as possible, ideally quarter-hourly markets similar to
the Netherlands) for balancing energy.
8.3.2. How to stimulate reforms
Reform at the national level comes from national initiatives, however, it does not mean
that nothing can be done at the international level. The first step can be developing guidelines
at the European eve By gu de nes, we do not mean a s ng e ‘des red’ design for balancing
markets, but the general characteristics that the market design should have. To achieve that,
European entities should perform thorough studies and publish guidelines which directly
address the design characteristics that a national balancing market should have, not in vague
terms such as transparency, liquidity and efficiency, but actually addressing issues such as the
pricing mechanism and timing of markets.
Although the national TSOs cannot be forced to make changes, publishing these
guidelines can raise awareness. The national TSOs will be able to see what can be improved
in their market, and actually, how far they are from a properly functioning balancing market.
Making TSOs aware of the inefficiencies, and showing them what can be gained by reforming
their market design, seems to be the first step.
Adoption of the Third Energy Package in 2009, which introduced a new institutional
framework for EU’s energy market s a prom s ng s gn By th s new eg s at on package,
ACER (Agency for the Cooperation of Energy Regulators) was born whose overall mission
according to its founding regulation is to assist national regulatory authorities (NRAs) to
perform their duties at EU level and to coordinate their actions whenever necessary. ACER
cooperates with EU institutions and stakeholders, notably NRAs and European Network of
Transmission System Operators (ENTSO), to deliver a series of instruments for the
completion of a single energy market. If the new network codes (to be developed by ENTSO
and then to be approved by ACER) will be concrete enough addressing the real market
design challenges, creation of ACER can then be seen as an effective stimulant for national
reform and eventually successful integration of balancing markets.

140
8.4. Short-term view: Limited cross-border exchanges
Although there are basic differences in the market design between different areas, even
if the status quo is maintained (no fundamental change in market designs), balancing services
can still be exchanged across borders in case there exists a minimum level of cooperation
between the TSOs. Next to our long term view which follows national reforms, a short-term
strategy can be used to enable cross-border exchanges with minimal structural changes in the
market design. We address reserve capacity and balancing energy markets separately:
8.4.1. Integration of reserve capacity markets
The key in enabling cross-border exchanges for reserve capacity is the issue of
interconnection capacity management. Since reserve capacity markets are rather long-term
markets, reservation of interconnection capacity will result in lost opportunity costs (loss of
trades in other markets) for quite long periods of time. The economic justification of reserve
capacity exchanges across-borders highly depends on these opportunity costs. Opportunity
costs need to be calculated on a case-specific basis using the historical data on market prices
(especially the day-ahead prices) and only if the opportunity costs are lower than the price
difference in the reserve capacity markets, cross-border exchanges will make economic sense.
In addition, opportunity costs can be controlled if reservation is done for short time
horizons and with a distinction for peak and off-peak hours; reservation on a yearly basis,
indiscriminately, can result in significant opportunity costs. Reservation for short time
horizons will result in a more intelligent and flexible way of managing interconnection
capacity, enabling the areas to benefit both from reserve exchanges as well as day-ahead
trades. However, reservation for short time horizons can be done only if the reserve capacity
markets have a short time horizon; if the market is yearly, reservation of interconnection
capacity has to be done on a yearly basis as well. Therefore, moving towards markets with
shorter time horizons (which was recommended from a national perspective) does have a
positive effect on performance of the future multinational markets as well. Reforming the
markets at the national level, cautiously and in a step-by-step approach, not only improves the
performance of the national markets, but also paves the way for integration of the national
balancing markets by eliminating the critical differences in market design.
8.4.2. Integration of reserve capacity markets in Northern Europe
Since the reservoir levels in Norway play a decisive role in the market situation in
Norway and consequently on the desirability of market integration in Northern Europe, the
data of two consecutive years were studied: 2009 as a normal year and 2010 a dry year with
low reservoir levels in Norway.
According to our case studies, in case of Norway and Germany, when there is no
particular shortage of hydro power (e.g. 2009), the opportunity costs incurred by day-ahead
trade losses are so high that integrating the two markets loses its basic economic justification.
However, in a dry year such as 2010, high day-ahead prices in Norway would lead to almost
no opportunity costs and so exchange of reserves from Norway to Germany would be

141
economically desirable. Nonetheless, the price difference in the reserve capacity markets (in a
dry year) seems to be rather too small to justify the costs and efforts of market integration.
In case of Norway and the Netherlands, although in a normal year (e.g. 2009) the
opportunity costs are significant but the Dutch prices are believed to be sufficiently high to
make market integration a very logical decision. In a dry year, there are almost no opportunity
costs and therefor, exchange of reserves would be even more beneficial and would lead to
even higher cost savings.
8.4.3. Integration of balancing energy markets
Although timing of balancing energy markets varies widely across Europe, cross-border
exchange of balancing energy is still possible. The first step seems to be enabling ACE
netting, which does not require foreign bidding. In this basic arrangement, balancing energy
bids are not activated; ACEs (in the opposite directions) offset each other without any bid
activation. When ACE netting is performed between two areas connected with HVDC lines,
the power surplus in one area has to be transferred to the other area, therefore, the TSOs
have to change the power flow on the DC line. However, within a synchronous system, ACE
netting does not require any physical power exchange; ACE netting is only a matter of
adjusting the ACE signals.
In addition to this basic arrangement, using the multinational arrangement proposed in
the previous chapter (restricted BSP-TSO trading), service providers can bid in other markets
while the TSO makes sure that not too much capacity leaves its own market. However, the
differences in timing of the markets (frequency of bidding specifically) can have quite some
undesirable consequences on the efficiency of the multinational arrangement. Bidding in
markets with different time horizons imposes significant complexity on service providers.
This factor will probably limit the number of players who participate in the multinational
arrangement. Because of the added complexity (and the subsequent confusion, especially on
the serv ce prov ders’ s de) and the structura d fferences n t m ng of markets, d stort ons n
the national markets are likely to happen.
The other critical factor in cross-border exchanges of balancing energy bids is the
procedure used for settling imbalances. In case no multinational mechanism for imbalance
settlement is developed, service providers might have a considerable incentive to not deliver
the energy they are asked to. Since the service provider, in case it does not deliver, pays the
imbalance price of its own area but receives the regulation price of the other area, depending
on the difference between these two prices, the service provider might have a strong
incentive to not deliver. The TSOs involved need to develop a simple mechanism in which
the service providers are needed to pay the imbalance price of the area they bid in, in case
they do not deliver.

142
8.4.4. Integration of balancing energy markets in Northern Europe
We studied the possible consequences of BSP-TSO trading using the model presented in
the previous chapter. Since in this arrangement, the TSO of the exporting country is not
involved and has no control over which bids leave for the foreign market, The main concern
about this arrangement is that too much capacity might leave the cheaper (exporting) area
leading to significantly high prices (low prices in case of downward regulation) in the
exporting area. The answer to this issue in general, depends on many different factors,
however, in the specific case of Northern Europe, based on our results this concern can be
considered as a factor without a decisive influence. Norway, with its huge excess of supply,
can handle the demand in Germany and the Netherlands, without a significant change in the
Norwegian market price. In case of downward regulation in peak hours, when Norway can
be an importer, the market price in Germany (as the exporting area) can be significantly
influenced for high demand values (and high available interconnection capacity). Generally
speaking, enabling bidding across borders, in case of the Netherlands would result in large
savings (cost reductions), even for small values of exchange (because of the small size of the
Dutch market). To reach the same size of price reductions in case of Germany, significantly
higher exchange volume is needed. In addition, the cost reductions for upward regulation are
generally much larger than for downward regulation.
Although based on our results, the BSP-TSO trading in Northern Europe, would not
result in higher prices in the cheaper area (Norway), this arrangement will logically raise TSOs
concerns regarding system security, because in this arrangement, bidders are free and the
exporting TSO does not have control over which bids leave the domestic market.
Although TSO-TSO trading can relieve that concern, it can significantly influence the
efficiency of the cross-border exchanges because of the direct financial involvement of the
TSOs. Therefore, we proposed an in-between arrangement, which tries to ensure market
efficiency and to relieve TSOs concerns regarding system security. The proposed restricted
BSP-TSO arrangement, which gives service provider the freedom to make effective decisions
on their bid price and bid volume, while puts a cap on the capacity that each service provider
can offer in foreign markets and thus gives the TSOs the tool to guarantee that the reserve
capacity that is leaving its domestic market will not endanger its system security.
8.5. Notes on further research
One of the basic issues that needs special attention seems to be physical limitations.
Exchange of electric power across borders throughout Europe needs available
interconnection capacity. The size of the installed interconnectors across Europe does not
seem to be proportional to the scale of the ambition of creating a pan-European market.
Thus, incentivizing investment in transmission (across-borders) is a critical issue, especially
given the complexity of the political and financial aspects of the problem.
Regarding integration of balancing markets, studies which address the specific technical
challenges are necessary. One basic challenge is effective real-time communication among the

143
TSOs. As a good example, in order to enable ACE netting, an automatic control system
needs to be developed and implemented, which receives the system frequency and system
imbalances as an input and automatically determines the ACE signals of each area.
Implementation of such a system in case there are multiple areas could be quite a challenge.
This issue is even more complicated when one (or more) area does not use an ACE signal
(does not have Automatic Generation Control, e.g. Norway). In addition, since in case of
HVDC lines the power needs to be physically transferred, managing the interconnector (the
flow on the line) requires real-time communication and cooperation among the TSOs.
Additionally, market design issues need special attention from economists, engineers
and policy analysts. Developing a roadmap for integration of balancing markets cannot be
done in isolation from other wholesale electricity markets; day-ahead and intra-day markets.
Since the players in these markets are essentially the same, these markets are highly
interrelated. We believe there is a need for studies which directly address these interrelations
and dependencies. In other words, studies which focus on integration of balancing markets
should be part of an overarching plan that addresses integration of electricity markets in
general.

144

145
Bibliography
1. Raineri, R., et al., From a bundled energy-capacity pricing model to an energy–
capacity– ancillary services pricing model. Energy Policy, 2008. 36: p. 2878– 2886.
2. Wood, A. and B. Wollenberg, Power Generation, Operation, and Control1996:
Wiley-Interscience.
3. Ilić, M., F. Galiana, and L. Fink, Power Systems Restructuring: Engineering and
Economics1998, MA, USA: Kluwer Academic Publishers.
4. Y. Rebours, D. Kirschen, and M. Trotignon, Fundamental Design Issues in
Markets for Ancillary Services. The Electricity Journal, 2007. 20(6): p. 26-34.
5. Abbasy, A. and R. Hakvoort, Exploring the Design Space of Balancing Services
Markets- A Theoretical Framework, in 2009 Second International Conference on Infrastructure
Systems and Services (INFRA)2009: Chennai, India. p. 1-6.
6. Abbasy, A., R.v.d. Veen, and R. Hakvoort, Effect of Integrating Regulating
Power Markets of Northern Europe on Total Balancing Costs, in PowerTech, 2009 IEEE
Bucharest2009: Bucharest, Romania. p. 1-7.
7. Abbasy, A., R.v.d. Veen, and R. Hakvoort, Timing of Markets- the Key
Variable in Design of Ancillary Service Markets for Power Reserves, in IAEE's Rio 2010
International Conference2010: Rio de Janeiro, Brazil.
8. Abbasy, A., R.v.d. Veen, and R. Hakvoort, Coordination of Timing of Reserve
Capacity and Day-Ahead Electricity Markets, in 11th IAEE European Conference2010:
Vilnius, Lithuania.
9. Y. G. Rebours, et al., A Survey of Frequency and Voltage Control Ancillary
Services—Part I: Technical Features. IEEE Transactions on Power Systems, 2007. 22(1):
p. 350-357.
10. Y. Rebours, et al., A Survey of Frequency and Voltage Control Ancillary Services—
Part II: Economic Features. IEEE Transactions on Power Systems, 2007. 22(1): p. 358-
366.
11. UCTE, UCTE Operation Handbook Policy 1: Load-frequency Control and
Performance, 2004.
12. O. Grande, G. Doorman, and B. Bakken, Exchange of Balancing Resources
between the Nordic Synchronous System and the Netherlands / Germany / Poland, 2008,
SINTEF Energiforskning AS.
13. California Independent System Operator CAISO, Market Issues and
Performance, 2008.
14. California Independent System Operator CAISO, Market Issues and
Performance, 2009.
15. PJM, PJM, Manual 35: Definitions and Acronyms, 2005.
16. PJM, Manual 12, Balancing operations, 2009.

146
17. Nordel, System Operation Agreement, 2006.
18. TenneT, Implementation Regulations for Grid Code and System Code, 2006,
TenneT.
19. TenneT, Handleiding Bieden Regel- en Reservevermogen, 2011, TenneT.
20. S. Riedel and H. Weigt, German Electricity Reserve Markets, 2007.
21. VDN, Procurement of Control Power and Energy in Germany, 2005.
22. PJM manual 11, Scheduling operations, 2010.
23. al, G.e., Alternative Schemes for Exchange of Balancing Resources between Separate
Synchronous Systems in Northern Europe, Preliminary Report, 2010, SINTEF.
24. R. A. C. Van der Veen, A. Abbasy, and R. A. Hakvoort, Analysis of the
Impact of Cross-Border Balancing Arrangements for Northern Europe, in 11th IAEE
European Conference2010: Vilnius, Lithuania.
25. R. A. C. van der Veen, A. Abbasy, and R. A. Hakvoort, An Agent-based
Analysis of Main Cross-border Balancing Arrangements for Northern Europe, in 8th
International Conference on the European Energy Market2011: Zagreb, Croatia.
26. R. van der Veen, A. Abbasy, and R. Hakvoort, A Qualitative Analysis of Main
Cross-border Balancing Arrangements, in 7th International Conference on the European Energy
Market (EEM)2010: Madrid, Spain.
27. R. van der Veen, A. Abbasy, and R.Hakvoort, Analysis of the Impact of
Imbalance Settlement Design on Market Behavior in Electricity Balancing Markets, in 11th
IAEE European Conference2010: Vilnius, Lithuania.
28. R. van der Veen and L. De Vries, Balancing Market Design for a Decentralized
Electricity System: Case of the Netherlands, in 2008 First International Conference on
Infrastructure Systems and Services(INFRA)2008: Rotterdam, the Netherlands.
29. R. van der Veen and R. Hakvoort, Balance Responsibility and Imbalance
Settlement in Northern Europe – An Evaluation, in 6th International Conference on the
European Energy Market2009: Leuven, Belgium.
30. R. van der Veen, et al., Harmonization and Integration of National Balancing
Markets in Europe – Regulatory Challenges, in Cigre 20102010.
31. European Regulators Group for Electricity and Gas- ERGEG, ERGEG
Guidelines of Good Practice for Electricity Balancing Markets Integration, 2006.
32. European Regulators Group for Electricity and Gas- ERGEG, The Creation
of the Regional Electricity Markets-an ERGEG Conclusions Paper, 2006.
33. Union of the Electricity Industry– EURELECTRIC, Towards European
Intra-day and Balancing Markets- Position Paper, 2006.
34. European Transmission System Operators- ETSO, Key Issues in Facilitating
Cross-border Trading of Tertiary Reserves and Energy Balancing, 2006.
35. European Transmission System Operators- ETSO, Balance Management
Harmonization and Integration- 4th Report. 2007.
36. Union of the Electricity Industry – EURELECTRIC, Towards market
integration of reserves & balancing markets, 2008.

147
37. Union of the Electricity Industry– EURELECTRIC, Towards Market
Integration of Reserves & Balancing Markets-Position Paper, 2008.
38. R. Hakvoort and L. de Vries, Socio-Technical Design of Multinational Power
Markets- Project proposal, 2007.
39. SINTEF Energy Research, Balance Management in Multinational Power
Markets- Project proposal, 2005.
40. Y. Rebours, A Comprehensive Assessment of Markets for Frequency and Voltage
Control Ancillary Services, 2008, University of Manchester.
41. The Internet Platform for Tendering Control Reserves (Germany).
Available from: https://http://www.regelleistung.net.
42. F. D. Galiana, et al. Scheduling and Pricing of Coupled Energy and Primary,
Secondary, and Tertiary Reserves. in Proceedings of the IEEE. 2005.
43. J. Mickey, Competitive Ancillary Services Market in ERCOT, in the Midwest ISO
Ancillary Services Roundtable2006: Carmel, IN, USA.
44. S. Oren, When is a Pay-as bid Preferable to Uniform Price in Electricity Markets, in
IEEE PES Power Systems Conference and Exposition2004. p. 1618-1620.
45. S. Hunt, Making Competition Work in Electricity2002, New York: John Wiley
& Sons Inc.
46. International Monetary Fund (IMF), Financial Soundness Indicators:
Compilation Guide, 2006: Washington DC.
47. S. Stoft, Power System Economics: Designing Markets for Electricity2002,
Piscataway, N.J.: IEEE Press: Wiley-Interscience.
48. C. Staropoli and C. Jullien, Using Laboratory Experiments to Design Efficient
Market Institutions. The case of wholesale markets, in the Journées de la section électrotechnique
du club EEA 20062006: Gif-sur-Yvette, France.
49. H. P. Chao and R. Wilson, Multi-Dimensional Procurement Auctions for Power
Reserves: Robust Incentive-Compatible Scoring and Settlement Rules. Journal of Regulatory
Economics, 2002. 22(2): p. 161-183.
50. Shuttleworth, G., Hot Topics in European Electricity: What Is Relevant and What
Isn’t? The Electricity Journal, 2002. 15(8): p. 25-39.
51. F. P. Sioshansi and W. Pfaffenberger, Electricity Market Reform: An
International Perspective. Energy Policy, 2007. 35(4): p. 2678-2679.
52. R. Yongjun and F. D. Galiana, Pay-as-bid versus Marginal Pricing- Part I:
Strategic Generator Offers. IEEE Transactions on Power Systems, 2004. 19(4): p. 1771.
53. R. Yongjun and F. D. Galiana, Pay-as-bid versus Marginal Pricing- Part II:
Market Behavior Under Strategic Generator Offers. IEEE Transactions on Power Systems,
2004. 19(4): p. 1777-1783.
54. G. Federico and D. Rahman, Bidding in an Electricity Pay-as-bid Auction.
Journal of Regulatory Economics, 2003. 24(2): p. 175-211.
55. Flynn, M., et al., Reliability and reserve in competitive electricity market scheduling.
IEEE Transactions on Power Systems, 2001. 16(1): p. 78-87.

148
56. Wang, J., X. Wang, and Y. Wu, Operating reserve model in the power market.
IEEE Transactions on Power Systems, 2005. 20(1): p. 223-229.
57. Moya, O., Spinning reserve, load shedding and economic solutionby Bender's
decomposition. IEEE Transactions on Power Systems, 2001. 20(1): p. 384-388.
58. Song, Z., L. Goel, and P. Wang, Optimal spinning reserve allocation deregulated
power systems. IEE Proceedings, 2005. 152(4): p. 483-488.
59. Billinton, R. and N. Allan, Reliability evaluation of power systems2006: second
edition- Plenum Press.
60. Gooi, H., et al., Optimal scheduling of spinning reserve. IEEE Transactions on
Power Systems, 1999. 14(4): p. 1485-1492.
61. TenneT website. Available from: http://www.tennet.org/.
62. Brien, L., Why the Ancillary Services Markets in California Don't Work and What
to Do About It. The Electricity Journal, 19999. 12(5): p. 38-49.
63. S. Thomas, The Seven Brothers. Energy Policy, 2003. 31(5): p. 393-403.
64. PowerUK, in PowerUK, News and Analysis of the UK Power Industry2002.
65. European Energy Exchange (EEX) website. Available from:
http://www.eex.com/en/.
66. Tesfatsion, L., Chapter Agent-Based Computational Economics: A Constructive
Approach to Economic Theory, in Handbook of computational economics2006, North-
Holland. p. 831–880.
67. Weidlich, A. and D. Veit, A Critical Survey of Agent-based Wholesale Electricity
Market Models. Energy Economics, 2008. 30: p. 1728–1759.
68. Rothkopf, M.H., Daily Repetition: a Neglected Factor in the Analysis of Electricity
Auctions. The Electricity Journal, 1999. 12(3): p. 60–70.
69. Flake, G., The Computational Beauty of Nature: Computer Explorations of Fractals,
Chaos, Complex Systems, and Adaptation. 1998, Cambridge, MA: The MIT Press.
70. Epstein, J. and R. Axtell, Growing Artificial Societies: Social Science from the
Bottom Up1996: The MIT Press.
71. Richiardi, M., The Promises and Perils of Agent- Based Computational Economics,
in EconWPA Working Paper2004.
72. Holland, J.H., Miller, J.H., , Artificial adaptive agents in economic theory.
American Economic Review, 1991. 81(2): p. 365–370.
73. Drogoul, A., D. Vanbergue, and T. Meurisse, Multi-agent based simulation:
where are the agents? . Proceedings of the Third International Workshop MABS 2002.
Lecture Notes in Computer Science, Springer, 2003. 2581: p. 1-15.
74. Cau, T.D.H., Anderson, E.J.,. A co-evolutionary approach to modelling the
behaviour of participants in competitive electricity markets. in IEEE Power Engineering Society
Summer Meeting 3. 2002. .
75. Nicolaisen, J., et al. Concentration and capacity effects on electricity market power. in
Proceedings of the 2000 Congress on Evolutionary Computation. 2000. . La Jolla, USA.

149
76. Petrov, and G Sheb e . Power auctions bid generation with adaptive agents using
genetic programming. in Proceedings of the 2000 North American Power Symposium, Institute of
Electrical and Electronic Engineers. 2000. Waterloo-Ontario, Canada.
77. R chter, C and G Sheb e , Genetic algorithm evolution of utility bidding strategies
for the competitive marketplace. IEEE Transactions on Power Systems 1998. 13(1): p.
256–261.
78. Erev, I. and A.E. Roth, Predicting how people play games: reinforcement learning in
experimental games with unique, mixed-strategy equilibria. American Economic Review,
1998. 8(4): p. 848–881.
79. Petrov, and G Sheb e . Building electric power auctions with improved roth-erev
reinforced learning. in Proceedings of the North American Power Symposium. 2001. Texas,
USA.
80. Koesrindartoto, D., Discrete double auctions with artificial adaptive agents: a case
study of an electricity market
using a double auction simulator. , in Department of Economics Working Papers Series. working
paper2002. .
81. Sun, J. and L. Tesfatsion, Dynamic testing of wholesale power market designs: an
open-source agent- based framework. . Computational Economics 2007. 30( 3): p. 291–
327.
82. co a, A R r , A B Estan ol, and D. Bunn, Incentives and Coordination in
Vertically Related Energy Markets in Discussion Paper SP II 2006 – 02,
Wissenschaftszentrum Berlin2006.
83. Krause, T. and G. Andersson, Evaluating congestion management schemes in
liberalized electricity markets using an agent-based simulator., in Proceedings of the Power
Engineering Society General Meeting2006: Montreal.
84. Naghibi-Sistani, M., et al. Application of Q-learning with temperature variation for
bidding strategies in market-based power systems. . in Energy Conversion and Management 47, .
2006.
85. Guo, M., Y. Liu, and J. Malec, A new Q-learning algorithm based on the metropolis
criterion. IEEE Transactions on Systems, Man, and Cybernetics, 2004. 34(5): p.
2140–2143.
86. Sun, J. and L. Tesfatsion, Dynamic Testing of Wholesale Power Market Designs:
An Open-Source Agent-Based Framework, in ISU Economics Working Paper No. 06025
2007, Iowa State University.
87. Bower, J. and D. Bunn, Model-based comparisons of pool and bilateral markets for
electricity. Energy Journal, 2000. 21( 3): p. 1–29.
88. Bower, J. and D. Bunn, Experimental analysis of the efficiency of uniform-price
versus discriminatory auctions in the England and Wales electricity market. . Journal of
Economic Dynamics & Control, 2001. 25: p. 561–592.
89. Bower, J., D.W. Bunn, and C. Wattendrup, A model-based analysis of strategic
consolidation in the german electricity industry. Energy Policy 2001. 29 (12): p. 987–1005.

150
90. ADAPT Consulting AS, KMB Balance Management in Multinational Power
Markets, WP2: Documentation and Analysis of Present Costs, 2008.
91. Hirst, E. and B. Kirby, Creating competitive markets for ancillary services, 1997,
Oak Ridge National Laboratory, Oak Ridge, TN, USA.
92. Singh, H., Auctions for ancillary services. Decision Support Systems, 1999. 24:
p. 183-191.
93. Oren, S., Design of ancillary service markets, in the 34th Annual Hawaii
International Conference on System Sciences2001: Maui, HI, USA.
94. Yan, J.H. and G.A. Stern, Simultaneous Optimal Auction and Unit Commitment
for Deregulated Electricity Markets. The Electricity Journal. 15(9): p. 72-80.
95. Baldick, R., et al., Design of efficient generation markets, in Proceedings of the
IEEE2005. p. 1998-2012.
96. Galiana, F.D., et al., Scheduling and pricing of coupled energy and primary, secondary,
and tertiary reserves, in Proceedings of the IEEE2005. p. 1970-1983.
97. European Transmission System Operators- ETSO, Current State of Trading
Tertiary Reserves Across Borders in Europe, 2005.
98. KU Leuven and Tractebel, Study of the Interactions and Dependencies of Balancing
Markets, Intraday Trade and Automatically Activated Reserves, 2009.
99. Vandezande, L., Design and Integraton of Balancing Markets in Europe, in
Faculteit Ingenieurswetenschappen2011, Katholieke Universiteit Leuven: Leuven.
100. Economics, F. and Consentec, Benefits and Practical Steps towards the Integration
of Intraday Electricity Markets and Balancing Mechanisms, 2005.
101. ERGEG, E.R.G.f.E.a.G.-. Revised ERGEG Guidelines of Good Practice for
Electricity Balancing Markets Integration (GGP-EBMI), 2009.
102. S. Jaehnert and G. Doorman, Reservation of Transmission Capacity for the
Exchange of Regulating Resources in Northern Europe: Is There a Benefit?, in 11th IAEE
European Conference2010: Vilnius, Lithuania.
103. Economics, F., The economic welfare impacts of reserving interconnector capacity for
trade in balancing products, 2009.
104. Jaehnert, S., et al., Impact of large scale wind integration on power system balancing,
in IEEE Trondheim PowerTech2011: Trondheim, Norway. p. 19-23.
105. orpa s, M., et al., “Further Developing Europe’s Power Market for Large Scale
Integration of Wind Power Grid modelling and power system data”, , in Tradewind Report,
http://www.trade-wind.eu/2008.
106. Borggrefe, F. and K. Neuhoff, Balancing and Intraday Market Design: Options
for Wind Integration, in Smart Power Market Project2011.
107. Dortmund, T. and E.-B.C. GmbH, Wissenschaftliches Gutachten: Optimierung
der Ausregelung von Leistungsungleichgewichten, 2009.
108. O. S. Grande and S. Jaehnert, Optimisation of the Exchange of Balancing Reserves
between Separate Synchronous Systems- Project memo, 2009, SINTEF Energy Research.

151
109. S. Jaehnert and G. L. Doorman, Modelling an Integrated Northern European
Regulating Power Market Based On A Common Day-Ahead Market, in IAEE's Rio 2010
International Conference2010: Rio de Janeiro, Brazil.
110. Wolfgang, O., et al., Hydro reservoir handling in Norway before and after
deregulation. Energy, 2009. 34(10): p. 1642-1651.
111. Nordpoolspot, http://www.nordpoolspot.com/Market-
data1/Elspot/Area-Prices/ALL1/Hourly/, 2009.
112. Grid, N. and RTE, FR-UK-IE Regional Initiative Balancing Work Stream-
Proposal for the introduction of cross border TSO balancing procurement, in FR-UK-IE Regional
Initiative.

152
APPENDIX A

153
The appendix presents the mathematical details of the simulation model used in
chapter 5. As explained earlier, an agent based model is used which models generators as
agents who can offer their available capacity in the day-ahead (DA) and/or the reserve
capacity (RC) market. Each agent has to decide on its bids in the RC and DA markets, and
the b ds cons st of a vo ume ( n W) and a pr ce ( n €/ Wh for the A market and n
€/ W/hour for the RC market) We have def ned two types of agents: “R sk-averse” agents
who do not try to nf uence the market c ear ng pr ce, and “R sk-prone” agents who do try to
increase the market price by increasing their bid prices. In each round of the simulation, each
agent decides on its bid prices for the next round by adapting its current bids, using the
market information of the last round. In addition to the bid price, each agent adapts its
offered capacities in the two markets (for the next round) by comparing its individual relative
profits in the two markets and shifting some capacity (depending on the size of the difference
in profit) from the less profitable to the more profitable market.
A.1. Bid Price Adaptation Strategy
Risk-averse agents: If their bid is selected in a market (in a specific round), they keep their
current bid price in the corresponding market for the next round. If their bid is not selected,
they reduce their bid price in order to be among the selected bids in the next round. The
price step size for a generating unit, by which the bid price of that unit is reduced for the next
round, s assumed to be a percentage of the un t’s tota operat ng costs and fixed throughout
the simulation.
Risk-prone agents: They use the same strategy as risk-averse agents for reducing their bid
prices in case of not being selected in a market. The difference is that risk-prone agents do
not necessarily keep their current bid price (for the next round) if they are selected, but they
will try to influence (increase) the market clearing price by increasing their bid price if their
bid is selected. So they take the risk of not being selected (in the next round) in order to
increase the market clearing price. The price step size, by which the bid price of an agent is
decreased or ncreased for the next round, s assumed to be a percentage of the un t’s tota
operating costs, and it might be decreased throughout the simulation. Assume that the bid of
agent i (a risk-prone agent) is not selected at round n-1 but is selected at round n. This means
that the bid price of the agent has been reduced by 1, niPss (the Price Step Size of unit i at
round n-1) for round n and the new bid price is low enough to get selected in the market.
Since the agent is risk-prone, it will try to increase its bid price for round n+1. Using the same
price step size will put the agent in the same situation as in round n-1. In other words, using
the same high step size will put the agent in a cycle of not being selected in one round and
being selected in the next, constantly increasing and decreasing its bid price in subsequent
rounds. Thus, the agent should use a lower step size for increasing its bid for round n+1
which means competition among bidders limits the opportunity of influencing the market
price by risk-prone agents. We introduce a variable, , (between 0 and 1), which is the
factor by which the price step size of a risk-prone agent is reduced in this situation; in case a

154
risk-prone un t’s b d s not se ected n one round (n-1) and gets selected in the next round (n).
Therefore, adaptation of the price step size is performed as follows:
nniinnini
nini
MPBMBPPSS
PSSPSS
P AND P if ;
Otherwise ; ,11,,
,1,
(A. 1)
Where nMP is the market price at round n.
A.2. Bid Volume Adaptation Strategy
In each round, all agents adapt their offered volumes in the DA and RC markets for the
next round, based on market outcomes of the current round. They calculate their average
profit per W of the r capac ty ( n €/ W/hour) n the two markets and w thdraw some of
their capacity from the less profitable market and add it to their offered capacity in the other
market. The volume step size of an agent, by which the offered volume is shifted between the
two markets for the next round, depends on the agent’s d fference n prof t n the two
markets. The higher the difference in profit, the more capacity is shifted between the
markets. A simple linear relationship is used in this simulation:
)1( 1,
max
, niini profratioVssVss (A. 2)
where niVss , is the volume step size of agent i at round n, max
iVss is the maximum volume
step size for agent i, and 1, niprofratio is the profit ratio (average profits per MW of capacity)
in the two markets for unit i at round n-1 Thus, n case an agent’s prof t n one of the two
markets is zero at one round, the maximum volume is shifted to the other market for the
next round And n case an agent’s prof ts n the two markets are equa , no vo ume s sh fted
between the two markets for the next round (the current level of offered volumes is used for
the next round).
The fixed costs of generating units are neglected in this study, so the cost of producing
power for each un t s equa to ts operat ng costs Thus, a un t’s prof ts n the RC and DA
markets are calculated as follows (if its bids are selected in the two markets):
)(,, i
DA
n
DA
ni
DA
ni OCMCPVprof (A. 3)
RC
n
RC
ni
RC
ni MCPVprof ,, (A. 4)
where DA
niV , and RC
niV , are the offered volumes in the DA and RC market respectively,DA
niprof ,
and RC
niprof , are agent i’s prof ts n the A and RC markets at round n, respectively, DA
nMCP
and RC
nMCP are the market clearing prices of the DA and RC markets at round n, and iOC is
the operating cost of unit i f an agent’s b d s not se ected n a market, ts prof t n the
corresponding market in zero.

155
A.3. The three cases
As mentioned earlier, three cases are defined, representing the three alternative designs
regarding coordination of timing of the DA and RC markets.
Case A
The first case represents simultaneous closure and clearance of the two markets. Each
agent decides on its bid prices and bid volumes in the two markets, based on the market
outcomes of each round. Since in simultaneous clearance, agents have to split their available
capacity between the two markets (no capacity can be offered in both), the only constraint for
agents in case A is on the total offered volumes:
.
,,
Avai
i
RC
ni
DA
ni VVV (A. 5)
where DA
niV , and RC
niV , are agent i’s offered volumes in the DA and RC markets for round n,
respectively, and .Avai
iV is the total available capacity of agent (generating unit) i. In addition,
the ower boundary of a un t’s b d pr ce n the A market, for a rounds, s the un t’s
operating costs:
i
DA
i OCP (A. 6)
where DA
iP is the bid price of unit i in the DA market. The inequality constraint in equation
i
DA
i OCP (A. 6) applies to all the three cases.
Case B
In the second case, first the RC market is closed and cleared and the DA market is
cleared afterwards. Because of sequential clearance of the markets, bid prices in the RC
market (the first market in the sequence) will include a lost opportunity cost component.
Using the following inequality constraint, agents make sure that, in the next round, no
potential profit in the DA market (second market) is lost by offering their capacity in the RC
market (first market):
i
DA
n
RC
ni OCMCPP 1, (A. 7)
where RC
niP 1, is the bid price of unit i in the RC market for round n+1. The right hand side of
the nequa ty constra nt represents the un t’s prof t (per W) n the A market for round n.
Therefore, by assur ng that the RC b d pr ce for the next round s h gher than the un t’s prof t
in the DA market at the current round, the unit ensures that no possible profit would be lost
in the DA market (for the next round) by offering its capacity in the RC market.
Case C
The third case represents the design in which the DA market is closed and cleared first
and the RC market is second. Since the lost-opportunity-cost component in bids of agents

156
originate from the sequential clearance of the markets (not from the nature of the products
traded in the two markets), the DA bid prices of agents in case C will include the lost-
opportunity-cost component because the DA market is first and agents should make sure
that no potential profit is lost in the RC market (second market) by offering part of their
capacity in the DA market (first market). Thus, the following inequality constraint is applied
to bid prices in the DA market for case C:
i
RC
n
DA
ni OCMCPP 1, (A. 8)
where DA
niP 1, is the bid price of unit i in the DA market for round n+1. The right hand side
of the constra nt represents the un t’s prof t (per W) n the RC market at round n plus the
operating costs of the unit (which is the minimum bid price in the DA market).
A.4. Parameter setting
The initial values of the step sizes and initial bid prices used in the simulation are
summarized in Table A. 2.
Table A. 2. The initial price and volume step sizes and the initial bid prices (at round 1)
Variable RC
iP 1, DA
iP 1, max
iVss RC
iPss 1, DA
iPss 1,
Initial Values iOC1.0 iOC1.1 .1.0 Avai
iV iOC1.0
iOC3.0
The initial bid prices (at round 1) in the RC and DA markets are 10% and 110% of
un t’s operat ng costs (a prof t marg n of 10% of the operat ng cost n both markets s
considered in the initial bids). The initial price step sizes for each unit are 10% and 30% of
un t’s operat ng costs, for the RC and A market b ds respect ve y The vo ume step s ze (the
max mum vo ume sh ft of a un t n each round) s 10% of the un t’s ava ab e capac ty At
round 1, each unit divides its capacity between the RC and DA markets proportional to the
total demand in the corresponding markets.

157

158
Curriculum Vitae
Alireza Abbasy was born in 1981, in Tehran, Iran. In 2003, he received his BSc in
Electrical Engineering from Sharif University of Technology, Tehran, Iran. He
received his MSc degree in Electrical Power Systems in 2006 from the same
university. In 2008, seeking something different than pure engineering, he moved to
Delft, the Netherlands, to work on his PhD in the faculty of Technology, Policy and
Management, which has a general multi-disciplinary scope.
He has been part of an international research group which has been working on
integration of balancing markets in Northern Europe, specifically on the project
‘Ba ance anagement n u t nat ona Power arkets’ The work of the project was
divided into two main parts: the technical aspect which the research group in
Norway (from the faculty of power engineering in NTNU) worked on, and the
institutional/economic challenges of integrating balancing markets which was
studied by the research group in Delft, which Alireza was part of. He published
various articles and was the co-author of the final project reports which were
finalized by SINTEF in Norway.

159

160
NGInfra PhD thesis series on infrastructures
1. Strategic behavior and regulatory styles in the Netherlands energy industry.
Martijn Kuit, 2002, Delft University of Technology, the Netherlands.
2. Securing the public interest in electricity generation markets – The myths of the
invisible hand and the copper plate. Laurens de Vries, 2004, Delft University of
Technology, the Netherlands.
3. Quality of service routing in the internet – Theory, complexity and algorithms.
Fernando Kuipers, 2004, Delft University of Technology, the Netherlands.
4. The role of power exchanges for the creation of a single European electricity
market – Market design and market regu at on Franc ois Boisseleau, 2004, Delft
University of Technology, the Netherlands, and University of Paris IX Dauphine,
France.
5. The ecology of metals. Ewoud Verhoef, 2004, Delft University of Technology,
the Netherlands.
6. MEDUSA – Survivable information security in critical infrastructures. Semir
Daskapan, 2005, Delft University of Technology, the Netherlands.
7. Transport infrastructure slot allocation. Kaspar Koolstra, 2005, Delft University
of Technology, the Netherlands.
8. Understanding open source communities – An organizational perspective. Ruben
van Wendel de Joode, 2005, Delft University of Technology, the Netherlands.
9. Regulating beyond price – Integrated price-quality regulation for electricity
distribution networks. Viren Ajodhia, 2006, Delft University of Technology, the
Nether- lands.
10. Networked reliability – Institutional fragmentation and the reliability of service
provision in critical infrastructures. Mark de Bruijne, 2006, Delft University of
Technology, the Netherlands.
11. Regional regulation as a new form of telecom sector governance– The
interactions with technological socio-economic systems and market performance.
Andrew Barendse, 2006, Delft University of Technology, the Netherlands.
12. The internet bubble – The impact on the development path of the
telecommunications sector. Wolter Lemstra, 2006, Delft University of Technology,
the Nether- lands.

161
13. Multi-agent model predictive control with applications to power networks. Rudy
Negenborn, 2007, Delft University of Technology, the Netherlands.
14. Dynamic bi-level optimal toll design approach for dynamic traffic networks.
Dusica Joksimovic, 2007, Delft University of Technology, the Netherlands.
15. Intertwining uncertainty analysis and decision-making about drinking water
infrastructure. Machtelt Meijer, 2007, Delft University of Technology, the
Netherlands.
16. The new EU approach to sector regulation in the network infrastructure
industries. Richard Cawley, 2007, Delft University of Technology, the Netherlands.
17. A functional legal design for reliable electricity supply– How technology affects
law. Hamilcar Knops, 2008, Delft University of Technology, the Netherlands and
Leiden University, the Netherlands.
18. Improving real-time train dispatching– Models, algorithms and applications.
Andrea ’Ar ano, 2008, e ft Un vers ty of Techno ogy, the Nether ands
19. Exploratory modeling and analysis–A promising method to deal with deep
uncertainty. Datu Buyung Agusdinata, 2008, Delft University of Technology, the
Netherlands.
20. Characterization of complex networks– Application to robustness analysis.
Almerima Jamakovic, 2008, Delft University of Technology, the Netherlands.
21. Shedding light on the black hole– The roll-out of broadband access networks by
private operators. Marieke Fijnvandraat, 2008, Delft University of Technology, the
Netherlands.
22. On Stackelberg and inverse Stackelberg games & their applications in the
optimal toll design problem, the energy markets liberalization problem, and in the
theory of incentives. Katerina Stankova, 2009, Delft University of Technology, the
Netherlands.
23. On the conceptual design of large-scale process & energy infrastructure
systems– Integrating flexibility, reliability, availability, maintainability and economics
(FRAME) performance metrics. Austine Ajah, 2009, Delft University of
Technology, the Netherlands.
24. Comprehensive models for security analysis of critical infrastructure as complex
systems. Fei Xue, 2009, Politecnico di Torino, Torino, Italy.

162
25. Towards a single European electricity market – A structured approach for
regulatory mode decision-making. Hanneke de Jong, 2009, Delft University of
Techno- logy, the Netherlands.
26. Co-evolutionary process for modeling large scale socio-technical systems
evo ut on gor N ko c, 2009, Delft University of Technology, the Netherlands.
27. Regulation in splendid isolation – A framework to promote effective and
efficient performance of the electricity industry in small isolated monopoly systems.
Steven Martina, 2009, Delft University of Technology, the Netherlands.
28. Reliability-based dynamic network design with stochastic networks. Hao Li,
2009, Delft University of Technology, the Netherlands.
29. Coping with competing public values. Bauke Steenhuisen, 2009, Delft University
of Technology, the Netherlands.
30. Innovative contracting practices in the road sector – Cross-national lessons in
dea ng w th opportun st c behav our o nica Altamirano, 2009, Delft University of
Technology, the Netherlands.
31. Reliability in urban public transport network assessment and design. Shahram
Tahmasseby, 2009, Delft University of Technology, the Netherlands.
32. Capturing socio-technical systems with agent-based modelling. Koen van Dam,
2009, Delft University of Technology, the Netherlands.
33. Road incidents and network dynamics – Effects on driving behaviour and
congestion. Victor L. Knoop, 2009, Delft University of Technology, The
Netherlands.
34. Governing mobile service innovation in co-evolving value networks. Mark de
Reuver, 2009, Delft University of Technology, The Netherlands.
35. Modelling risk control measures in railways. Jaap van den Top, 2009, Delft
University of Technology, The Netherlands.
36. Smart Heat and Power – Utilizing the Flexibility of Micro Cogeneration. Michiel
Houwing, 2010, Delft University of Technology, The Netherlands.
37. Architecture-Driven Integration of Modeling Languages for the Design of
Software- Intensive Systems. Michel dos Santos Soares, 2010, Delft University of
Technology, The Netherlands.

163
38. Modernization of electricity networks– Exploring the interrelations between
institutions and technology. Martijn Jonker, 2010, Delft University of Technology,
the Netherlands.
39. Experiencing Complexity – A gaming approach for understanding infrastructure
systems. Geertje Bekebrede, 2010, Delft University of Technology, The
Netherlands.
40. Epidemics in Networks – Modeling, Optimization and Security Games. Jasmina
Omic, 2010, Delft University of Technology, The Netherlands.
41. Designing Robust Road Networks – A general method applied to the
Netherlands. Maaike Snelder, 2010, Delft University of Technology, the
Netherlands.
42. Simulating Energy Transitions. Emile Chappin, 2011, Delft University of
Technology, the Netherlands.
43. De ingeslagen weg. Een dynamisch onderzoek naar de dynamiek van de
uitbesteding van onderhoud in de civiele infrastructuur. Rob Schoenmaker, 2011,
Delft University of Technology, the Netherlands.
44. Safety Management and Risk Modelling in Aviation: the challenge of quantifying
management influences. Pei-Hui Lin, 2011, Delft University of Technology, the
Netherlands.
45. Transportation modelling for large-scale evacuations. Adam J. Pel, 2011, Delft
University of Technology, the Netherlands.
46. Clearing the Road for ISA Implementation?– Applying Adaptive Policy making
for the Implementation of Intelligent Speed Adaptation. Jan-Willem van der Pas,
2011, Delft University of Technology, the Netherlands.
47. Designing Multinational Electricity Balancing Markets. Reinier van der Veen,
2012, Delft University of Technology, the Netherlands.
48. Understanding Social-technical Change – A System-Network-Agent Approach.
Catherine Chiong Meza, 2012, Delft University of Technology, the Netherlands.
49. National design and multi-national integration of balancing markets. Alireza
Abbasy, 2012, Delft University of Technology, the Netherlands.
50. Regulation of gas infrastructure expansion. Jeroen de Joode, 2012, Delft
University of Technology, the Netherlands.