Prediction of perceived astringency induced by phenolic compounds
9
Prediction of perceived astringency induced by phenolic compounds Erminio Monteleone a, * , Nicola Condelli a , Caterina Dinnella a , Mario Bertuccioli b a Dipartimento di Biologia DBAF, Universit a degli Studi di Basilicata, Campus di Macchia Romana, 85100 Potenza, Italy b Dipartimento di Biotecnologie Agrarie, Universit a degli Studi di Firenze, Via Donizetti 42, Firenze, Italy Received 21 July 2003; received in revised form 8 June 2004; accepted 8 June 2004 Available online 6 July 2004 Abstract A method which can be used to estimate perceived astringency due to polyphenolic compounds is presented here. Thirty subjects were selected on the basis of them having similar salivary flows and they were trained to rate the perceived astringency of tannic acid and grape seed extract solutions. A scale of phenolic compound concentrations ranging from 0 to 3.2 g/L was selected in order to obtain an experimental curve describing the perceived intensity of the sensation. The same astringent solutions were added to a mucin solution in conditions resembling those present in the oral cavity. The formation of polyphenol–protein complexes was measured on the basis of the increasing turbidity of the reaction mixture and was expressed in terms of nephelometric turbidity units (NTU). Experimental curves describing NTU vs polyphenol concentration were obtained. Predictive models of astringency intensity vs NTU were produced. The predictive capacity of the models was checked by comparing the measured and predicted intensities of a set of samples prepared at phenolic compound concentration level varying from 0.94 to 2.13 g/L. Ó 2004 Elsevier Ltd. All rights reserved. Keywords: Polyphenols; Proteins; Mucin; Sensory evaluation; Astringency; Nephelometry 1. Introduction The sensation of astringency on the human palate has been defined as a complex group of sensations involving dryness of the oral surface and tightening and puckering sensations of the mucosa and muscles around the mouth (Gawell, Oberholster, & Francis, 2000; Lee & Lawless, 1991). It is generally accepted that astringent com- pounds form complexes with salivary proteins, resulting in their aggregation and/or precipitation and the loss of their lubricating properties (Kallithraka, Bakker, & Clifford, 1998). These interactions have led to the theory that astringency is, at least initially, due to de-lubrica- tion via the removal of slippery coating on the oral surface. Mechanoreceptors stimulation might contribute to this sensation (Thorngate & Noble, 1995). It has also been suggested that other factors such as the presence of precipitate on the tongue and on the soft palate might contribute to the sensation. Moreover, traces of astrin- gent substance remaining in solution might interact with taste receptors and might stimulate the classical taste pathways and contribute to the overall sensation (Critchley & Rolls, 1996). The formation of soluble complexes of polyphenol–protein able to modulate sal- ivary viscosity has also been proposed as a factor affecting astringency perception (Clifford, 1997). The reintroduction of various sort of lubricants such as gums, polysaccharides and proteins alleviates astrin- gency after it has been elicited (Brannan, Setser, & Kemp, 2001; Colonna, Adams, & Noble, 2004). A recent study pointed out the importance of indi- vidual saliva flow and composition variations in influ- encing the intensity of the perceived sensation (Horne, Hayes, & Lawless, 2002). The intensity of perceived astringency plays a key role in determining the acceptability of various food prod- ucts and is produced by a variety of oral-chemical stimuli such as aluminium salts, acids and polyphenols. Several studies have been performed to mimic the pol- yphenol–protein reaction which takes place in the oral cavity in order to produce chemical–physical responses that can be correlated to the astringency inducing capability of compounds under consideration. The in * Corresponding author. Tel.: +39-971-205694; fax: +39-971- 205693. E-mail address: [email protected] (E. Monteleone). 0950-3293/$ - see front matter Ó 2004 Elsevier Ltd. All rights reserved. doi:10.1016/j.foodqual.2004.06.002 Food Quality and Preference 15 (2004) 761–769 www.elsevier.com/locate/foodqual
Transcript of Prediction of perceived astringency induced by phenolic compounds

Food Quality and Preference 15 (2004) 761–769
www.elsevier.com/locate/foodqual
Prediction of perceived astringency induced by phenolic compounds
Erminio Monteleone a,*, Nicola Condelli a, Caterina Dinnella a, Mario Bertuccioli b
a Dipartimento di Biologia DBAF, Universit�a degli Studi di Basilicata, Campus di Macchia Romana, 85100 Potenza, Italyb Dipartimento di Biotecnologie Agrarie, Universit�a degli Studi di Firenze, Via Donizetti 42, Firenze, Italy
Received 21 July 2003; received in revised form 8 June 2004; accepted 8 June 2004
Available online 6 July 2004
Abstract
A method which can be used to estimate perceived astringency due to polyphenolic compounds is presented here. Thirty subjects
were selected on the basis of them having similar salivary flows and they were trained to rate the perceived astringency of tannic acid
and grape seed extract solutions. A scale of phenolic compound concentrations ranging from 0 to 3.2 g/L was selected in order to
obtain an experimental curve describing the perceived intensity of the sensation. The same astringent solutions were added to a
mucin solution in conditions resembling those present in the oral cavity. The formation of polyphenol–protein complexes was
measured on the basis of the increasing turbidity of the reaction mixture and was expressed in terms of nephelometric turbidity units
(NTU). Experimental curves describing NTU vs polyphenol concentration were obtained. Predictive models of astringency intensity
vs NTU were produced. The predictive capacity of the models was checked by comparing the measured and predicted intensities of a
set of samples prepared at phenolic compound concentration level varying from 0.94 to 2.13 g/L.
� 2004 Elsevier Ltd. All rights reserved.
Keywords: Polyphenols; Proteins; Mucin; Sensory evaluation; Astringency; Nephelometry
1. Introduction
The sensation of astringency on the human palate has
been defined as a complex group of sensations involving
dryness of the oral surface and tightening and puckering
sensations of the mucosa and muscles around the mouth
(Gawell, Oberholster, & Francis, 2000; Lee & Lawless,1991). It is generally accepted that astringent com-
pounds form complexes with salivary proteins, resulting
in their aggregation and/or precipitation and the loss of
their lubricating properties (Kallithraka, Bakker, &
Clifford, 1998). These interactions have led to the theory
that astringency is, at least initially, due to de-lubrica-
tion via the removal of slippery coating on the oral
surface. Mechanoreceptors stimulation might contributeto this sensation (Thorngate & Noble, 1995). It has also
been suggested that other factors such as the presence of
precipitate on the tongue and on the soft palate might
contribute to the sensation. Moreover, traces of astrin-
*Corresponding author. Tel.: +39-971-205694; fax: +39-971-
205693.
E-mail address: [email protected] (E. Monteleone).
0950-3293/$ - see front matter � 2004 Elsevier Ltd. All rights reserved.
doi:10.1016/j.foodqual.2004.06.002
gent substance remaining in solution might interact with
taste receptors and might stimulate the classical taste
pathways and contribute to the overall sensation
(Critchley & Rolls, 1996). The formation of soluble
complexes of polyphenol–protein able to modulate sal-
ivary viscosity has also been proposed as a factor
affecting astringency perception (Clifford, 1997). Thereintroduction of various sort of lubricants such as
gums, polysaccharides and proteins alleviates astrin-
gency after it has been elicited (Brannan, Setser, &
Kemp, 2001; Colonna, Adams, & Noble, 2004).
A recent study pointed out the importance of indi-
vidual saliva flow and composition variations in influ-
encing the intensity of the perceived sensation (Horne,
Hayes, & Lawless, 2002).The intensity of perceived astringency plays a key role
in determining the acceptability of various food prod-
ucts and is produced by a variety of oral-chemical
stimuli such as aluminium salts, acids and polyphenols.
Several studies have been performed to mimic the pol-
yphenol–protein reaction which takes place in the oral
cavity in order to produce chemical–physical responses
that can be correlated to the astringency inducingcapability of compounds under consideration. The in

762 E. Monteleone et al. / Food Quality and Preference 15 (2004) 761–769
vitro reactivity of polyphenols with various proteins has
often been used for this purpose (Bacon & Rhodes,
1998; de Freitas & Mateus, 2001a; Edelmann & Lendl,
2002; Glories, 1978; Sarni-Manchado, Cheynier, &Moutounet, 1999). The formation of complexes between
polyphenols and purified salivary proteins (Horne et al.,
2002; Kallithraka, Bakker, & Clifford, 2000) as well as
gelatin (Siebert, Troukhanova, & Lynn, 1996), bovine
serum albumine (de Freitas & Mateus, 2001b; de Fre-
itas, Carvalho, & Mateus, 2003; Naczk, Amarowicz,
Zadernowski, & Shahidi, 2001) and other plant proteins
(Asquit et al., 1987; Luck et al., 1994), can lead to hazeand sediment development in the reaction mixture. The
curvilinear relationship found between both protein and
polyphenol concentrations and haze formation pro-
duced a polyphenol–protein model of reactivity analo-
gous to the antigen–antibody model in which each
polyphenol molecule is viewed as having a fixed number
of binding ends and each reactive protein is seen as
having a fixed number of polyphenol binding sites(Siebert et al., 1996). The stages occurring in the binding
and precipitation of polyphenol–protein complexes are
schematised in Fig. 1: proteins and polyphenols combine
to form soluble complexes and these can grow to col-
loidal size at which point they scatter light and become
larger still which can lead to sediment formation
(Charlton et al., 2002).
Experimental relationships were found between tur-bidity development in human saliva and tannic acid
mixtures prepared over a range of concentrations
known to elicit astringent sensations (Horne et al., 2002;
Kallithraka et al., 1998; Kallithraka, Bakker, Clifford, &
Vallis, 2001; Lawless, Hartono, Horne, & Siebert, 1999).
Based on the literature cited above, it is possible to
assert that turbidity measurement has proved to be a
very sensitive and simple technique in measuring thereactivity of polyphenol–protein in order to determine
to what extent single phenolic compounds are able to
bind both a selected model protein or human salivary
proteins.
The aim of this study is to provide an in vitro assay
which can correlate turbidity measurements with
soluble aggregates colloidal size insoluble aggregates
protein binding site polyphenol
Fig. 1. Schematic representation of stages occurring in binding an
precipitation of polyphenols by proteins. Polyphenols are represented
as bi-dentate linkers and reactive proteins as having a fixed number of
binding sites.
astringency sensory response in order to obtain a pre-
diction of perceived astringency induced by specific
phenolic compounds. This assay should find its appli-
cation in the possibility of estimating the potentialcontribution to astringency of different phenolic classes
in food products, with particular reference to red wine.
For this purpose the relationship between astringency
induced by polyphenol solutions and their reactivity with
a model protein has been systematically investigated.
The experimental plan consisted of four stages:
1. A first stage to study the perceived astringency inten-sity in relation to selected polyphenol solution con-
centrations (training set sample selection).
2. A second stage to study the reactivity of selected pol-
yphenol solutions with a model protein by nephelo-
metric measurement of the resulting turbidity
(setting up an in vitro assay).
3. A third stage to build up an astringency predictive
model based on the relationship between the per-ceived intensity of the selected stimuli and the turbid-
ity development in the in vitro assay (building up a
predictive model).
4. A fourth stage to validate the predictive capacity of
the model by comparing predicted and measured
astringency intensities in test set samples (predictive
model validation).
2. Materials and methods
2.1. Samples
Tannic acid (TA, Sigma-Aldrich) and Grape Seeds
extract (GSE, Inntec, Verona, Italy) were selected as
phenolic compounds for astringency stimulation. The
amount of phenolics in samples was determined
according to the Folin–Ciocalteau method (Off. J. Eur.
Communitie, 1992) and expressed as catechin (g/L). TA
and GSE contain 0.85 and 0.75 g of phenolics per gram
of material, respectively. In the present work, sampleconcentration (g/L) of phenolic compounds was always
expressed in terms of phenolic content.
Sample solutions were prepared by dissolving TA and
GSE in 1% ethanol. All samples were prepared
approximately 2 h prior to testing.
Training set solutions were prepared at the following
concentrations: TA––0, 0.43, 0.60, 0.83, 1.16, 1.63, 2.28,
3.20 g/L; GSE––0, 0.36, 0.50, 0.70, 0.97, 1.36, 1.90, 2.67g/L.
These concentrations were chosen, following earlier
tests, by experienced laboratory personnel to provide the
same wide range of astringency for both polyphenol
compounds. Test set solutions were prepared at the
following concentrations: TA––0.5, 0.94, 1.53, 2.13 g/L;
GSE––0.4, 0.78, 1.35, 1.88 g/L.

E. Monteleone et al. / Food Quality and Preference 15 (2004) 761–769 763
2.2. Subjects
Thirty volunteers 16 females and 14 males from the
University of Basilicata were selected on the basis oftheir salivary flow so that individual saliva flow would
not act as a source of variation in the intensity of per-
ceived astringency. Subject selection was performed
according to the procedure described by Peleg, Gacon,
Schlich, and Noble (1999). Judges ingested 15 mL of an
aqueous solution of citric acid (4 g/L) which was
expectorated at 10 s. The subjects then spat stimulated
saliva into a weighed container for 1 min. The salivacollected in duplicate was weighted on an analytical
balance. The salivary flow of selected subjects ranged
from 1.5 to 2.8 g/min with a mean value of 2.09 g/min.
Prior to their participation in the experiments, the
subjects were trained to recognize and rate the perceived
intensity of the following different sensations: sourness,
bitterness and astringency using the following standard
solutions: citric acid––0.25, 0.38, 0.50 g/L; quininemonohydrochloride dihydrate––0.025, 0.037, 0.050 g/L;
aluminium potassium sulphate––0.3, 0.6, 0.9 g/L.
Then subjects were trained to rate the perceived
astringency of TA solutions with concentration values
of 0.55, 1.2 and 2.32 g/L, and GSE solutions with con-
centration values of 0.50, 0.98 and 1.92 g/L. During
training sessions the subjects were asked to rate the
perceived astringency on a 7 point category scale (notastringent; very weak; weak; moderate; strong; very
strong; extremely strong). The different concentrations
were not anchored to specific intensity categories. Sub-
jects participated in a total of four training sessions.
2.2.1. Training sets sample evaluation
Subjects took part in the experiment which consisted
of two repetitions for both TA and GSE solutions and
participated in a total of four sessions. During the first
two sessions the set TA solution was evaluated. In each
session eight samples were presented. There was a 30-
min interval between the evaluation of two subsets each
consisting of four samples. For each sample, subjectsreceived a glass containing 15 mL of solution. Samples
were presented at room temperature. In order to eval-
uate the target stimuli, subjects were asked to take each
sample in their mouth for 8 s, spit it out and rate the
intensity of astringency on a 7 point category scale
named: not astringent, very weak, weak, moderate,
strong, very strong, extremely strong. Between the
evaluation of two samples, subjects were asked to rinsetheir mouths with distilled water for 45 s, to have some
plain crackers for 30 s and finally to rinse their mouths
with water for a further 45 s. The evaluations were
performed in individual booths under red lights in order
to eliminate any visual clues. The data were collected
using the FIZZ computer system ver. 1.31 (Biosystemes,
Couternon, France).
Within each session the presentation order of samples
was balanced for first order and carry over effects.
2.2.2. Test set sample evaluation
Three weeks after the last session of the training sets
sample evaluation, subjects participated in a further test
session. They were presented eight samples and asked to
rate the perceived astringency intensity using a 7 point
category scale (from not astringent to extremely astrin-
gent). Two subsets of four samples were evaluated at 30-
min intervals. Half of the subjects were presented thefour AT test set samples first; whereas the other half
were presented GSE samples first. Within each subset
the presentation order of samples was balanced for first
order and carry over effect. Samples were evaluated
under the same conditions with regards to: amount of
sample; sample temperature and presentation; break
between samples; rinsing procedure; data acquisition as
described above. Test set sample evaluations were notreplicated.
2.3. Polyphenol–mucin reactivity assay
Mucin from bovine sub-maxillary glands (Sigma-Al-
drich, Lot no. 06 4H7170) was used as a model protein.Polyphenol solutions (8 mL) in 1% ethanol were
mixed with 2 mL of mucin solution 0.2% in citrate
phosphate buffer pH 3.5. The protein concentration was
chosen taking into consideration the amount used in the
artificial saliva formulations (van Ruth & Roozen,
2000). Two milliliters of mucin solution mixed with 1%
(8 mL) ethanol and (8 mL) astringent solutions mixed
with 2 mL citrate phosphate buffer were used as refer-ence samples. All the reagents were thermo-stated at 37
�C corresponding to the average temperature in the oral
cavity.
The turbidity values of all the three mixes were
measured by HACH 2001N Laboratory Turbidimeter
(Hach Co., Loveland, CO) in nephelometric turbidity
unit (NTU). The optical system was fitted with a tung-
sten-filament lamp with three detectors: a 90� scatteredlight detector, a forward-scatter light detector and a
transmitted light detector. The instrument was cali-
brated prior to the experiment with Formazin primary
standards prepared from a 4000 NTU stock solution
(Hach Co.) and HPLC grade deionised water. The
instrument calibration was periodically verified during
the experiments using Gelex secondary turbidimetry
standards (Hach Co.). Each phenol solution was pre-pared and tested in six replicates. For each tube tur-
bidity was measured after 1, 60 and 180 min. For both
reference samples NTU values did not vary over time.
The polyphenol–mucin reactivity was expressed in
terms of nephelometric turbidity units by subtracting the
NTU values measured for the mucin reference sample
(NTUM) plus the polyphenol reference sample (NTUA)
6
7
764 E. Monteleone et al. / Food Quality and Preference 15 (2004) 761–769
from the NTU value of the polyphenol–mucin sample
after 1 min of reaction (NTUS):
NTU ¼ NTUS � ðNTUM þNTUAÞ
1
2
3
4
5
0 1 2 3 4[g/L]
Inte
nsity
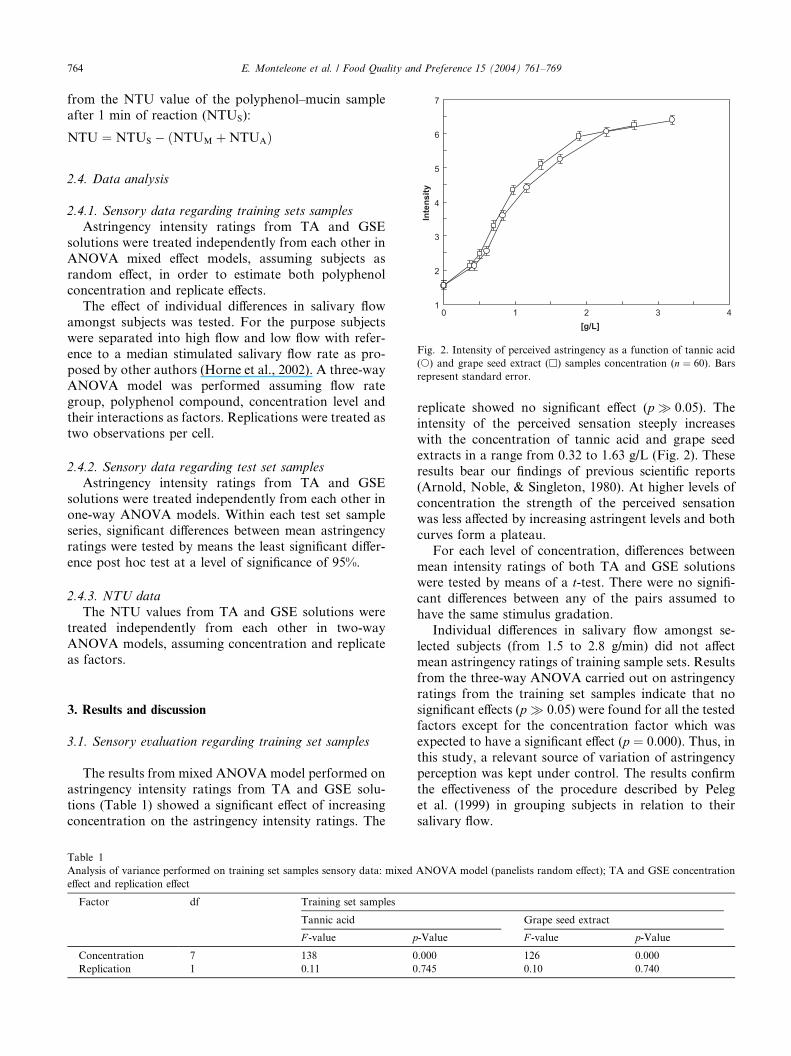
Fig. 2. Intensity of perceived astringency as a function of tannic acid
(s) and grape seed extract (h) samples concentration (n ¼ 60). Bars
represent standard error.
2.4. Data analysis
2.4.1. Sensory data regarding training sets samples
Astringency intensity ratings from TA and GSE
solutions were treated independently from each other in
ANOVA mixed effect models, assuming subjects as
random effect, in order to estimate both polyphenolconcentration and replicate effects.
The effect of individual differences in salivary flow
amongst subjects was tested. For the purpose subjects
were separated into high flow and low flow with refer-
ence to a median stimulated salivary flow rate as pro-
posed by other authors (Horne et al., 2002). A three-way
ANOVA model was performed assuming flow rate
group, polyphenol compound, concentration level andtheir interactions as factors. Replications were treated as
two observations per cell.
2.4.2. Sensory data regarding test set samples
Astringency intensity ratings from TA and GSE
solutions were treated independently from each other in
one-way ANOVA models. Within each test set sampleseries, significant differences between mean astringency
ratings were tested by means the least significant differ-
ence post hoc test at a level of significance of 95%.
2.4.3. NTU data
The NTU values from TA and GSE solutions were
treated independently from each other in two-way
ANOVA models, assuming concentration and replicateas factors.
3. Results and discussion
3.1. Sensory evaluation regarding training set samples
The results from mixed ANOVA model performed on
astringency intensity ratings from TA and GSE solu-
tions (Table 1) showed a significant effect of increasing
concentration on the astringency intensity ratings. The
Table 1
Analysis of variance performed on training set samples sensory data: mixed
effect and replication effect
Factor df Training set samples
Tannic acid
F -value p
Concentration 7 138 0
Replication 1 0.11 0
replicate showed no significant effect (p � 0:05). The
intensity of the perceived sensation steeply increases
with the concentration of tannic acid and grape seedextracts in a range from 0.32 to 1.63 g/L (Fig. 2). These
results bear our findings of previous scientific reports
(Arnold, Noble, & Singleton, 1980). At higher levels of
concentration the strength of the perceived sensation
was less affected by increasing astringent levels and both
curves form a plateau.
For each level of concentration, differences between
mean intensity ratings of both TA and GSE solutionswere tested by means of a t-test. There were no signifi-
cant differences between any of the pairs assumed to
have the same stimulus gradation.
Individual differences in salivary flow amongst se-
lected subjects (from 1.5 to 2.8 g/min) did not affect
mean astringency ratings of training sample sets. Results
from the three-way ANOVA carried out on astringency
ratings from the training set samples indicate that nosignificant effects (p � 0:05) were found for all the tested
factors except for the concentration factor which was
expected to have a significant effect (p ¼ 0:000). Thus, inthis study, a relevant source of variation of astringency
perception was kept under control. The results confirm
the effectiveness of the procedure described by Peleg
et al. (1999) in grouping subjects in relation to their
salivary flow.
ANOVA model (panelists random effect); TA and GSE concentration
Grape seed extract
-Value F -value p-Value
.000 126 0.000
.745 0.10 0.740

150
250
350
0 50 100 150 200min
NTU
0.43 g/L0.6 g/L0.83 g/L1.16 g/L1.63 g/L2.28 g/L3.2 g/L
250
350
NTU
0.36 g/L0.5 g/L 0.7 g/L0.97 g/L1.36 g/L
(a)
E. Monteleone et al. / Food Quality and Preference 15 (2004) 761–769 765
3.2. Test set sample sensory evaluation
Results from the one-way analysis of variance carried
out on the astringency ratings from the TA and GSEtest set sample solutions showed a significant and posi-
tive effect of the factor ‘‘concentration’’ (Table 2). Mean
intensity ratings and their standard errors are reported
in Table 3. The results of the LSD post hoc test showed
that, in both AT and GSE sample sets, the mean of the
intensity ratings of the two samples prepared at lower
concentration levels, were not significantly different
(p > 0:05).As expected the intensity of perceived sensation in-
creases with the concentration of phenolic compounds.
Mean intensity ratings of AT samples ranged from 2.30
to 5.76, indicating that the perceived strength of sensa-
tion varied, on average, from very weak to very strong
on the used 7 point category scale. Similarly, the mean
intensities of GSE samples ranged from 3.32 to 5.52
indicating that the perceived strength of the sensationvaried, on average, from weak to very strong on the used
scale. Although both test set sample series were com-
posed of four solutions only, the mean intensity ratings,
within each sample series, covered a wide range of the
strength of the sensation rated on a 7 point category
scale. Thus the number of test set samples was assumed
to be sufficient in order to validate the proposed pre-
dictive model.
1500 50 100 150 200
min
1.9 g/L2.67 g/L
(b)
Fig. 3. Change in turbidity, measured as NTU values, as a function of
incubation time of mucin solutions with increasing concentration of
tannic acid (a) or grape seed extracts (b) samples (n ¼ 6).
3.3. In vitro assay setting up
Mucin from bovine sub-maxillary glands was chosenas model protein taking into consideration that it rep-
resents the major glycoprotein synthesized and secreted
by mucous cells and serves to lubricate the oral cavity
Table 2
Analysis of variance performed on test set samples sensory data: one way A
Factor df Test set samples
Tannic acid
F -value p
Concentration 3 26.00 0
Table 3
Test set samples sensory evaluation: astringency mean intensity ratings and
Test set samples
Tannic acid ðn ¼ 30Þ G
Concentration* Mean Standard error C
0.50 2.30 0.29 0
0.94 2.91 0.27 0
1.53 4.89 0.37 1
2.13 5.76 0.38 1
* Phenolic content (g/L).
and to protect it from the external environment.
Moreover, mucin serves as a major protein component
in artificial saliva formulations (Friel & Taylor, 2001;
Hutteau & Mathlouthi, 1998; van Ruth & Roozen,2000) and it has already been reported to form com-
plexes with tannins (Asquit et al., 1987).
The turbidity of mucin/polyphenol mixes developed
almost instantaneously and then increased slightly over
incubation time reaching equilibrium in 1 h (Fig. 3). The
NOVA model; TA and GSE concentration effect
Grape seed extract
-Value F -value p-Value
.000 13.66 0.000
their standard deviation
rape seed extract ðn ¼ 30Þoncentration* Mean Standard error
.40 3.46 0.32
.78 3.32 0.27
.35 4.58 0.30
.88 5.59 0.27

100
110
120
130
140
0 1 2 3 4 [g/L]
NTU
Fig. 4. NTU values measured after 1 min of reaction with mucin as a
function of tannic acid (s) and grape seed extract (h) concentration
(n ¼ 6 for both compounds). Bars represent standard errors.
766 E. Monteleone et al. / Food Quality and Preference 15 (2004) 761–769
results confirm previous data on the high reaction rate
between both bovine serum albumin and salivary pro-
teins with polyphenol solutions (de Freitas & Mateus,
2001b; Horne et al., 2002). The formation of insolublecomplexes has been described as a spontaneous phase
separation which starts when two polyphenol-coated
protein complexes are bridged together and the doubling
in size renders the complex insoluble (Charlton et al.,
2002). The precipitate forms in a time-dependent way
depending on medium characteristics (pH, composition,
protein–polyphenols relative concentrations). Dynamic
laser light scattering measurements showed the forma-tion of particles of various sizes depending on the pol-
yphenol concentration of the medium (Charlton et al.,
2002). On the other hand, nephelometry requires ideal
conditions in which all the particles are small and
identical. On this basis a short reaction time was
adopted (1 min) after which the colloidal aggregates
might just have formed and are likely to have small
differences in size.Turbidity of reference samples with mucin only ran-
ged from 85 to 105 NTU and the one with polyphenols
only ranged from 1 to 8. The turbidity values of both
reference samples did not change over the reaction time
thus confirming that the turbidity development in the
reaction mixes was related to specific polyphenols–mu-
cin interactions.
The results of the two-way ANOVA models carriedout on the NTU values from TA and GSE solutions
showed a significant effect (p ¼ 0:000) of increasing
concentration on the NTU values (F6;30 ¼ 547 for TA;
F6;30 ¼ 765 for GSE). In both ANOVA models, the effect
of replicates was not significant at a 95% level of sig-
nificance (F5;30 ¼ 1:53, p ¼ 0:21 for TA; F5;30 ¼ 1:39,p ¼ 0:26 for GSE).
The turbidity of mucin/polyphenol mixes as a func-tion of the concentration of tannic acid and grape
seed extract samples is reported in Fig. 4. In the ini-
tial part of the curves the turbidity increased with
the phenol concentration, then NTU values were less
affected by increasing astringent levels and both
curves tend to a plateau. The shape of these curves
reproduce those relevant to the intensity of perceived
astringency vs tannic acid and grape seed extract con-centrations.
In a range of concentration varying from 0.36 to 0.83
g/L the turbidity responses of TA and GSE samples
describe two superimposed curves. At a phenolic com-
pound concentration above 0.83 g/L the two curves are
clearly separated. This difference in NTU readings is
probably due to the different effect of the concentration
ratio phenols/mucin on the light scattering capability ofmucin–AT and mucin–GSE complexes. At low con-
centration levels of phenolic compounds it can be sup-
posed that both TA and GSE samples form relatively
small mucin–phenol complexes, similar in size, and thus
with the same light scattering capacity. At higher con-
centration levels of phenols (over than 0.83 g/L), mucin
concentration became a limiting factor in mucin–phenol
complex formation. In these conditions any phenols in
excess can bridge together two or more small mucin–phenol complexes and relatively large aggregates are
likely to be formed. It can be supposed that, due to their
chemical composition, AT and GSE determine the for-
mation of large aggregates differing in size and thus in
light scattering capability.
The turbidity responses from AT and GSE training
set samples suggest that the relationship between NTU
values and perceived astringency is phenolic-sample-specific.
3.4. Building up predictive models
The relationship between the intensity of perceived
astringency and NTU was studied. Linear correlations
were obtained by relating mean intensity ratings of
astringency and mean NTU values induced either bytraining set solutions of tannic acid or of grape seed
extract. Two predictive models were obtained. Fig. 5
shows the results of the linear regressions in a concen-
tration range from 0.43 to 3.20 g/L for TA and from
0.36 to 2.67 g/L for GSE. Standard errors associated
with predictive models for tannic acid and grape seed
extract were 0.27 and 0.10 respectively.
The goodness of fit was estimated too. Residual val-ues were never higher than 0.20 (absolute value) for
either TA or GSE predictive model. The residuals for
TA and GSE, respectively ranged from )0.01 to 0.16
and from )0.20 to 0.18.
TA residual distribution around the zero value indi-
cates that the predictions have the same level of accu-
racy over the whole range of variation of predicted
GSE = 0.1311x - 11.351R2 = 0.996; p=0.000
TA = 0.1578x - 14.468R2 = 0.993 p=0.000
1
2
3
4
5
6
7
100 110 120 130 140NTU
Inte
nsity
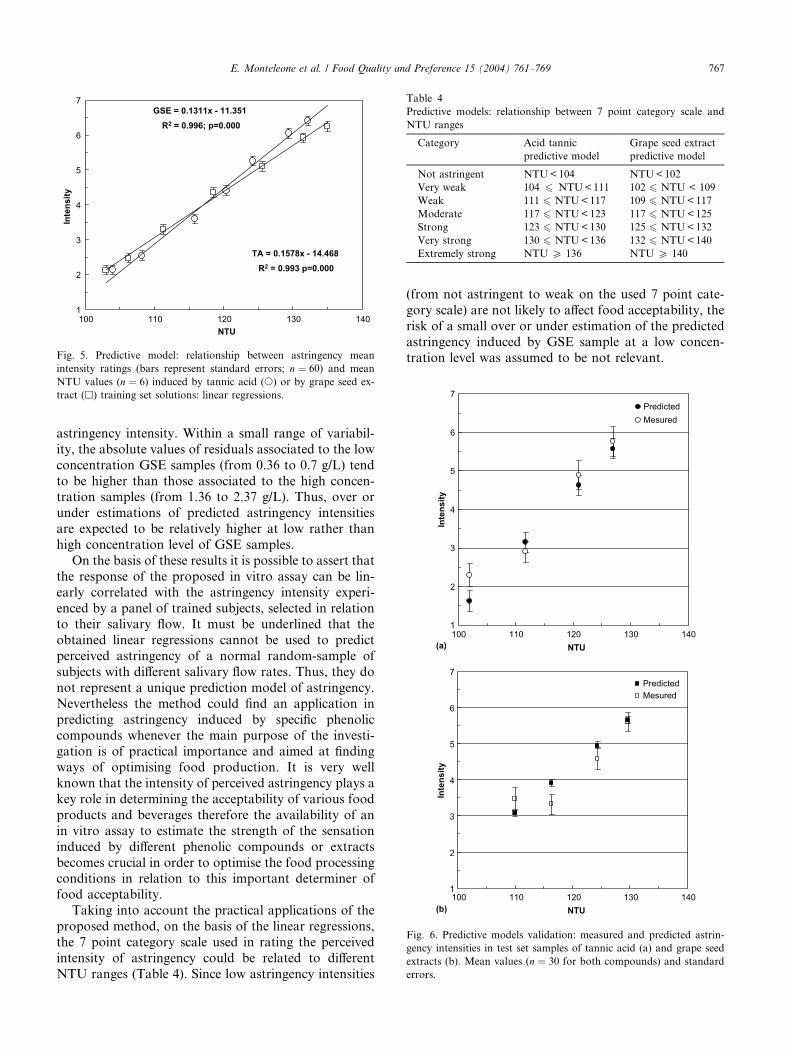
Fig. 5. Predictive model: relationship between astringency mean
intensity ratings (bars represent standard errors; n ¼ 60) and mean
NTU values (n ¼ 6) induced by tannic acid (s) or by grape seed ex-
tract (h) training set solutions: linear regressions.
Table 4
Predictive models: relationship between 7 point category scale and
NTU ranges
Category Acid tannic
predictive model
Grape seed extract
predictive model
Not astringent NTU<104 NTU<102
Very weak 104 6 NTU<111 102 6 NTU < 109
Weak 111 6 NTU<117 109 6 NTU<117
Moderate 117 6 NTU<123 117 6 NTU<125
Strong 123 6 NTU<130 125 6 NTU<132
Very strong 130 6 NTU<136 132 6 NTU<140
Extremely strong NTU P 136 NTU P 140
1
2
3
4
5
6
7
100 110 120 130 140NTU
Inte
nsity
PredictedMesured
1
2
3
4
5
6
7
100 110 120 130 140NTU
Inte
nsity
PredictedMesured
(b)
(a)
Fig. 6. Predictive models validation: measured and predicted astrin-
gency intensities in test set samples of tannic acid (a) and grape seed
extracts (b). Mean values (n ¼ 30 for both compounds) and standard
errors.
E. Monteleone et al. / Food Quality and Preference 15 (2004) 761–769 767
astringency intensity. Within a small range of variabil-
ity, the absolute values of residuals associated to the low
concentration GSE samples (from 0.36 to 0.7 g/L) tend
to be higher than those associated to the high concen-tration samples (from 1.36 to 2.37 g/L). Thus, over or
under estimations of predicted astringency intensities
are expected to be relatively higher at low rather than
high concentration level of GSE samples.
On the basis of these results it is possible to assert that
the response of the proposed in vitro assay can be lin-
early correlated with the astringency intensity experi-
enced by a panel of trained subjects, selected in relationto their salivary flow. It must be underlined that the
obtained linear regressions cannot be used to predict
perceived astringency of a normal random-sample of
subjects with different salivary flow rates. Thus, they do
not represent a unique prediction model of astringency.
Nevertheless the method could find an application in
predicting astringency induced by specific phenolic
compounds whenever the main purpose of the investi-gation is of practical importance and aimed at finding
ways of optimising food production. It is very well
known that the intensity of perceived astringency plays a
key role in determining the acceptability of various food
products and beverages therefore the availability of an
in vitro assay to estimate the strength of the sensation
induced by different phenolic compounds or extracts
becomes crucial in order to optimise the food processingconditions in relation to this important determiner of
food acceptability.
Taking into account the practical applications of the
proposed method, on the basis of the linear regressions,
the 7 point category scale used in rating the perceived
intensity of astringency could be related to different
NTU ranges (Table 4). Since low astringency intensities
(from not astringent to weak on the used 7 point cate-
gory scale) are not likely to affect food acceptability, the
risk of a small over or under estimation of the predicted
astringency induced by GSE sample at a low concen-tration level was assumed to be not relevant.

768 E. Monteleone et al. / Food Quality and Preference 15 (2004) 761–769
3.5. Predictive model validation
The predictive capacity of the models was tested by
comparing measured and predicted astringency intensityin the test set sample. Results are reported in Fig. 6(a)
and (b).
The predicted intensity scores were not significantly
different from the measured mean scores, except for two
observations. However, in one of these two cases, the
predicted values of the astringency intensity fell within
the same category range as the measured values.
4. Conclusions
Despite extensive research the available experimental
data are not yet sufficient to explain the entire mecha-
nism of astringency. However, when polyphenolic
compounds are involved, it seems likely that the for-mation of salivary protein–polyphenol complexes is the
first step in the development of astringency. Moreover, it
is evident that individual factors are of great importance
in the modulation of the perceived intensity of this
sensation. The simplification of complex physiological
phenomena in suitable in vitro assays has already
proved to be an useful approach (Garret, Failla, &
Sarama, 1999) whenever the main purpose of research isof practical importance and aimed at finding ways of
optimising food production.
In the present study, the reactivity of polyphenol
compounds with a model salivary protein was assumed
to be an index of their capability of inducing astrin-
gency. The reaction conditions were standardized in
order to mimic the complex oral cavity environment and
turbidity measurements, in terms of NTU, were used toestimate the extent of protein–polyphenol interaction.
The response of the proposed in vitro assay proved to be
linearly correlated with the astringency intensity expe-
rienced by a panel of trained subjects. On the basis of
these results a predictive model of astringency has been
proposed in which the capability of polyphenolic ex-
tracts to induce astringency can be estimated on the
basis of their ability to develop turbidity in the in vitroassay. Seven ranges of NTU values have been defined
which predict the strength of astringency measured on a
7 point category scale.
Further studies will be performed to verify the pos-
sibility of extending the present model to different clas-
ses of polyphenolic compounds.
The proposed method may have a practical applica-
tion in predicting the astringency of different fractionsof both grape, wine and other plant polyphenolic ex-
tracts in order to optimise the food processing condi-
tions in relation to this important driver of food
acceptability.
References
Arnold, R. A., Noble, A. C., & Singleton, V. L. (1980). Bitterness and
astringency of phenolic fractions in wine. Journal of Agricultural
and Food Chemistry, 28, 675–678.
Asquit, T. N., Uhlig, J., Mehansho, H., Putman, L., Carlson, D. M., &
Butler, L. (1987). Binding of condensed tannins to salivary protein
rich glycoproteins: The role of carbohydrate. Journal of Agricul-
tural and Food Chemistry, 35, 331–334.
Bacon, J. R., & Rhodes, M. J. C. (1998). Development of a
competition assay for the evaluation of the binding of human
parotid salivary proteins to dietary complex phenols and tannins
using a peroxidase–labeled tannin. Journal of Agricultural and Food
Chemistry, 46, 5083–5088.
Brannan, G. D., Setser, C. S., & Kemp, K. E. (2001). Effectiveness
of rinses in alleviating bitterness and astringency residuals in model
solutions. Journal of Sensory Studies, 16(3), 261–
275.
Charlton, A. J., Baxter, N. J., Lokman Khan, M., Moir, A. J. G.,
Haslam, E., Davies, A. P., & Williamson, M. P. (2002). Polyphe-
nol/peptide binding and precipitation. Journal of Agricultural and
Food Chemistry, 50, 1593–1601.
Clifford, M. N. (1997). Astringency. In F. A. Thomas-Barberan & R. J.
Robins (Eds.), Phytochemistry of fruit and vegetables (pp. 87–107).
Oxford: Clarendon Press.
Colonna, A. E., Adams, D. O., & Noble, A. (2004). Comparison of
procedures for reducing astringency carry-over effects in evaluation
of red wines. Australian Journal of Grape and Wine Research, 10(1),
26–31.
Critchley, H. D., & Rolls, E. T. (1996). Responses of primate taste
cortex neurons to the astringent tastant tannic acid. Chemical
Senses, 21, 135–145.
de Freitas, Carvalho, E., & Mateus, N. (2003). Study of carbohydrate
influence on protein–tannin aggregation by nephelometry. Food
Chemistry, 81, 503–509.
de Freitas, & Mateus, N. (2001a). Structural features of procyanidin
with salivary proteins. Journal of Agricultural and Food Chemistry,
49, 940–945.
de Freitas, & Mateus, N. (2001b). Nephelometric study of salivary
protein–tannin aggregates. Journal of the Science of Food and
Agriculture, 82, 113–119.
Edelmann, A., & Lendl, B. (2002). Towards the optical tongue: Flow-
through sensing of tannin–protein interactions based on FTIR
spectroscopy. Journal of American Chemical Society, 124, 14741–
14747.
Folin–Ciocalteau Index (1992). Off. J. Eur. Communitie (pp. 178–179).
Friel, E. N., & Taylor, A. J. (2001). Effect of salivary components on
volatile partitioning from solutions. Journal of Agricultural and
Food Chemistry, 49, 3898–3905.
Garret, D. A., Failla, M. L., & Sarama, R. J. (1999). Development of
an in vitro digestion method to assess carotenoid bioavailability
from meals. Journal of Agricultural and Food Chemistry, 47, 4301–
4309.
Gawell, R., Oberholster, A., & Francis, I. L. (2000). A ‘‘Mouth–feel
Wheel’’: Therminology for communicating the mouthfeel charac-
teristics of red wine. Australian Journal of Grape and Wine
Research, 6, 203–207.
Glories, Y. (1978). Recherches sur la mati�ere colorant des vin rouges.
PhD Thesis, University of Bordeaux II.
Horne, J., Hayes, J., & Lawless, H. T. (2002). Turbidity as a measure
of salivary proteins reactions with astringent substances. Chemical
Senses, 27, 653–659.
Hutteau, F., & Mathlouthi (1998). Physicochemical properties
of sweeteners in artificial saliva and determination of a hydropho-
bicity scale for sweeteners. Food Chemistry, 63(2), 199–
206.

E. Monteleone et al. / Food Quality and Preference 15 (2004) 761–769 769
Kallithraka, S., Bakker, J., & Clifford, M. N. (1998). Evidence that
salivary proteins are involved in astringency. Journal of Sensory
Studies, 13, 29–44.
Kallithraka, S., Bakker, J., & Clifford, M. N. (2000). Interaction of
(+)-catechin, (-)-epicatechin, procyanidin B2 and procyanidin C1
with pooled human saliva in vitro. Journal of the Science of Food
and Agriculture, 81, 261–268.
Kallithraka, S., Bakker, J., Clifford, M. N., & Vallis, L. (2001).
Correlations between saliva composition and some T-I parameters
of astringency. Food Quality and Preference, 12, 145–152.
Lawless, H. T., Hartono, C., Horne, J., & Siebert, K. J. (1999).
Interactions of tannins and human salivary proteins assessed by
turbidimetry. Chemical Senses, 24, 543–544.
Lee, C. B., & Lawless, H. T. (1991). Time-course of astringent
materials. Chemical Senses, 16, 225–238.
Luck, G., Liao, H., Murray, N. J., Grimmer, H. R., Warminski, E. E.,
Williamson, M. P., Lilley, T. H., & Haslam, E. (1994). Polyphe-
nols, astringency and proline-rich proteins. Phytochemistry, 37(2),
357–371.
Naczk, M., Amarowicz, R., Zadernowski, R., & Shahidi, F. (2001).
Protein precipitating capacity of condensed tannins of beach pea,
canola hulls, evening primrose and faba bean. Food Chemistry, 73,
467–471.
Peleg, H., Gacon, K., Schlich, P., & Noble, A. C. (1999). Bitterness
and astringency of flavan-3-ol monomers, dimers and trimers.
Journal of the Science of Food and Agriculture, 79, 123–1128.
Sarni-Manchado, P., Cheynier, V., & Moutounet, M. (1999). Interac-
tion of grape seed tannins with salivary proteins. Journal of
Agricultural and Food Chemistry, 47, 42–47.
Siebert, K. J., Troukhanova, N. V., & Lynn, P. Y. (1996). Nature of
polyphenol–protein interactions. Journal of Agricultural and Food
Chemistry, 44, 80–85.
Thorngate, J. H., & Noble, A. (1995). Sensory evaluation of bitterness
and astringency of 3R(-)-epicatechin and 3S(+)-catechin. Journal of
the Science of Food and Agriculture, 67, 531–535.
van Ruth, S. M., & Roozen (2000). Influence of mastication and saliva
on aroma release in a model mouth system. Food Chemistry, 71,
339–345.