Electrochemical Impedance Spectroscopy (EIS) - MDPI
21
sensors Review Electrochemical Impedance Spectroscopy (EIS): Principles, Construction, and Biosensing Applications Hend S. Magar 1 , Rabeay Y. A. Hassan 1,2 and Ashok Mulchandani 3,4, * Citation: Magar, H.S.; Hassan, R.Y.A.; Mulchandani, A. Electrochemical Impedance Spectroscopy (EIS): Principles, Construction, and Biosensing Applications. Sensors 2021, 21, 6578. https://doi.org/10.3390/s21196578 Academic Editor: Huangxian Ju Received: 30 July 2021 Accepted: 26 September 2021 Published: 1 October 2021 Publisher’s Note: MDPI stays neutral with regard to jurisdictional claims in published maps and institutional affil- iations. Copyright: © 2021 by the authors. Licensee MDPI, Basel, Switzerland. This article is an open access article distributed under the terms and conditions of the Creative Commons Attribution (CC BY) license (https:// creativecommons.org/licenses/by/ 4.0/). 1 Applied Organic Chemistry Department, National Research Centre (NRC), Dokki, Giza 12622, Egypt; [email protected] (H.S.M.); [email protected] (R.Y.A.H.) 2 Nanoscience Program, University of Science and Technology (UST), Zewail City of Science and Technology, 6th October City, Giza 12578, Egypt 3 Department of Chemical and Environmental Engineering, University of California Riverside, Riverside, CA 92521, USA 4 Center of Environmental Research and Technology, University of California Riverside, Riverside, CA 92507, USA * Correspondence: [email protected] Abstract: Electrochemical impedance spectroscopy (EIS) is a powerful technique used for the analysis of interfacial properties related to bio-recognition events occurring at the electrode surface, such as antibody–antigen recognition, substrate–enzyme interaction, or whole cell capturing. Thus, EIS could be exploited in several important biomedical diagnosis and environmental applications. However, the EIS is one of the most complex electrochemical methods, therefore, this review introduced the basic concepts and the theoretical background of the impedimetric technique along with the state of the art of the impedimetric biosensors and the impact of nanomaterials on the EIS performance. The use of nanomaterials such as nanoparticles, nanotubes, nanowires, and nanocomposites provided catalytic activity, enhanced sensing elements immobilization, promoted faster electron transfer, and increased reliability and accuracy of the reported EIS sensors. Thus, the EIS was used for the effective quantitative and qualitative detections of pathogens, DNA, cancer-associated biomarkers, etc. Through this review article, intensive literature review is provided to highlight the impact of nanomaterials on enhancing the analytical features of impedimetric biosensors. Keywords: electrochemical impedance spectroscopy (EIS); impedimetric biosensors; nanomaterials 1. Overview of Electroanalytical Methods Electroanalytical methods are considered as the most important branch of analytical chemistry, which determines characteristics along with quantity of specific analyte(s) present in an electrochemical cell. The measurement of electrochemical features taking place at the electrode interface reflects the association between the magnitude of the property measured and the concentration of particular chemical species. Compared to other analytical methods, e.g., chromatography or spectroscopy, electroanalytical techniques are much simpler and easier to miniaturize as well as being cheaper, which makes them more appropriate for rapid and accurate detection. Based on the measurable signals, electroanalytical methods are categorized as follows: Potentiometric analysis: a reference electrode and an indicator electrode are allocated in a simple electrochemical cell whereas the difference of potential between the two elec- trodes is recorded to provide significant information about the sample concentration [1]. In the potentiometric technique, at zero current, the potential changes (vs. a reference electrode) are correlated to the changes of a concentration of a target analyte. The EMF of a cell depends on that concentration. Therefore, a direct calculation is easily obtained from the Nernst correlation (Equation (1)): E cell =E 0 cell - (RT/nF) ln Q (1) Sensors 2021, 21, 6578. https://doi.org/10.3390/s21196578 https://www.mdpi.com/journal/sensors
-
Upload
khangminh22 -
Category
Documents
-
view
3 -
download
0
Transcript of Electrochemical Impedance Spectroscopy (EIS) - MDPI
sensors
Review
Electrochemical Impedance Spectroscopy (EIS): Principles,Construction, and Biosensing Applications
Hend S. Magar 1 , Rabeay Y. A. Hassan 1,2 and Ashok Mulchandani 3,4,*
�����������������
Citation: Magar, H.S.; Hassan,
R.Y.A.; Mulchandani, A.
Electrochemical Impedance
Spectroscopy (EIS): Principles,
Construction, and Biosensing
Applications. Sensors 2021, 21, 6578.
https://doi.org/10.3390/s21196578
Academic Editor: Huangxian Ju
Received: 30 July 2021
Accepted: 26 September 2021
Published: 1 October 2021
Publisher’s Note: MDPI stays neutral
with regard to jurisdictional claims in
published maps and institutional affil-
iations.
Copyright: © 2021 by the authors.
Licensee MDPI, Basel, Switzerland.
This article is an open access article
distributed under the terms and
conditions of the Creative Commons
Attribution (CC BY) license (https://
creativecommons.org/licenses/by/
4.0/).
1 Applied Organic Chemistry Department, National Research Centre (NRC), Dokki, Giza 12622, Egypt;[email protected] (H.S.M.); [email protected] (R.Y.A.H.)
2 Nanoscience Program, University of Science and Technology (UST), Zewail City of Science and Technology,6th October City, Giza 12578, Egypt
3 Department of Chemical and Environmental Engineering, University of California Riverside,Riverside, CA 92521, USA
4 Center of Environmental Research and Technology, University of California Riverside,Riverside, CA 92507, USA
* Correspondence: [email protected]
Abstract: Electrochemical impedance spectroscopy (EIS) is a powerful technique used for the analysisof interfacial properties related to bio-recognition events occurring at the electrode surface, such asantibody–antigen recognition, substrate–enzyme interaction, or whole cell capturing. Thus, EIS couldbe exploited in several important biomedical diagnosis and environmental applications. However,the EIS is one of the most complex electrochemical methods, therefore, this review introduced thebasic concepts and the theoretical background of the impedimetric technique along with the state ofthe art of the impedimetric biosensors and the impact of nanomaterials on the EIS performance. Theuse of nanomaterials such as nanoparticles, nanotubes, nanowires, and nanocomposites providedcatalytic activity, enhanced sensing elements immobilization, promoted faster electron transfer,and increased reliability and accuracy of the reported EIS sensors. Thus, the EIS was used for theeffective quantitative and qualitative detections of pathogens, DNA, cancer-associated biomarkers,etc. Through this review article, intensive literature review is provided to highlight the impact ofnanomaterials on enhancing the analytical features of impedimetric biosensors.
Keywords: electrochemical impedance spectroscopy (EIS); impedimetric biosensors; nanomaterials
1. Overview of Electroanalytical Methods
Electroanalytical methods are considered as the most important branch of analyticalchemistry, which determines characteristics along with quantity of specific analyte(s)present in an electrochemical cell. The measurement of electrochemical features takingplace at the electrode interface reflects the association between the magnitude of theproperty measured and the concentration of particular chemical species. Compared to otheranalytical methods, e.g., chromatography or spectroscopy, electroanalytical techniquesare much simpler and easier to miniaturize as well as being cheaper, which makes themmore appropriate for rapid and accurate detection. Based on the measurable signals,electroanalytical methods are categorized as follows:
Potentiometric analysis: a reference electrode and an indicator electrode are allocatedin a simple electrochemical cell whereas the difference of potential between the two elec-trodes is recorded to provide significant information about the sample concentration [1].In the potentiometric technique, at zero current, the potential changes (vs. a referenceelectrode) are correlated to the changes of a concentration of a target analyte. The EMF of acell depends on that concentration. Therefore, a direct calculation is easily obtained fromthe Nernst correlation (Equation (1)):
Ecell = E0cell − (RT/nF) ln Q (1)
Sensors 2021, 21, 6578. https://doi.org/10.3390/s21196578 https://www.mdpi.com/journal/sensors
Sensors 2021, 21, 6578 2 of 21
where Ecell is the measured cell potential, E0 is the standard cell potential, R is the universalgas constant, T is the temperature, n is the number of electron transfer, F is the Faradayconstant, and Q is the reaction quotient that represents the instantaneous ratio of redox-concentrations between the anode and the cathode.
Coulometric analysis: Coulometry is a method to carry out exhaustive electrolysis ofan analyte by applying constant potential onto a working electrode surface with respect to areference electrode [2]. Coulometric titrations are common practices to measure the sample.However, the constant-potential coulometry is not subjected to the effects of interferences,since the potential of the working electrode is controlled at a value at which only a singleelectrochemical reaction is conducted.
Voltammetric analysis: The sample is subjected to a constant/varying potential at theelectrode’s surface to record the Faradaic current produced. This technique is very impor-tant to understand the mechanisms and the kinetics of oxidation–reduction reactions andthe electrochemical reactivity of an analyte [3]. The voltammetry falls into two sub-classestermed as polarography and amperometry. Polarography is a voltammetric technique inwhich chemical species (ions or molecules) undergo oxidation or reduction at the surface ofa polarized dropping mercury electrode (DME) at an applied fixed potential vs. a referenceelectrode. From the resulting current–voltage (I–V) curve, both the concentration and thenature of the oxidized and/or the reduced substance(s) adsorbed at the dropping mercuryelectrode surface could be determined [4]. In amperometric methods, redox reactions(oxidation or reduction) of electroactive molecule(s) are measured at a constant potential.Application of voltammetry is widely exploited in biomedical diagnosis and environmentalanalysis [5].
Electrochemical impedance spectroscopy (EIS): EIS is one of the most important elec-trochemical techniques where the impedance in a circuit is measured by ohms (as resistanceunit). Over the other electrochemical technique, EIS offers several advantages reliant onthe fact that it is a steady-state technique, that it utilizes small signal analysis, and that itis able to probe signal relaxations over a very wide range of applied frequency, from lessthan 1 mHz to greater than 1 MHz, using commercially available electrochemical workingstations (potentiostat). EIS theory and its data interpretation are very complicated for re-searchers who are not familiar with it, such as biologists, biochemists, or material scientists.Therefore, we directed our attention to explain its fundamentals in the next sections.
2. Basic Concept of EIS
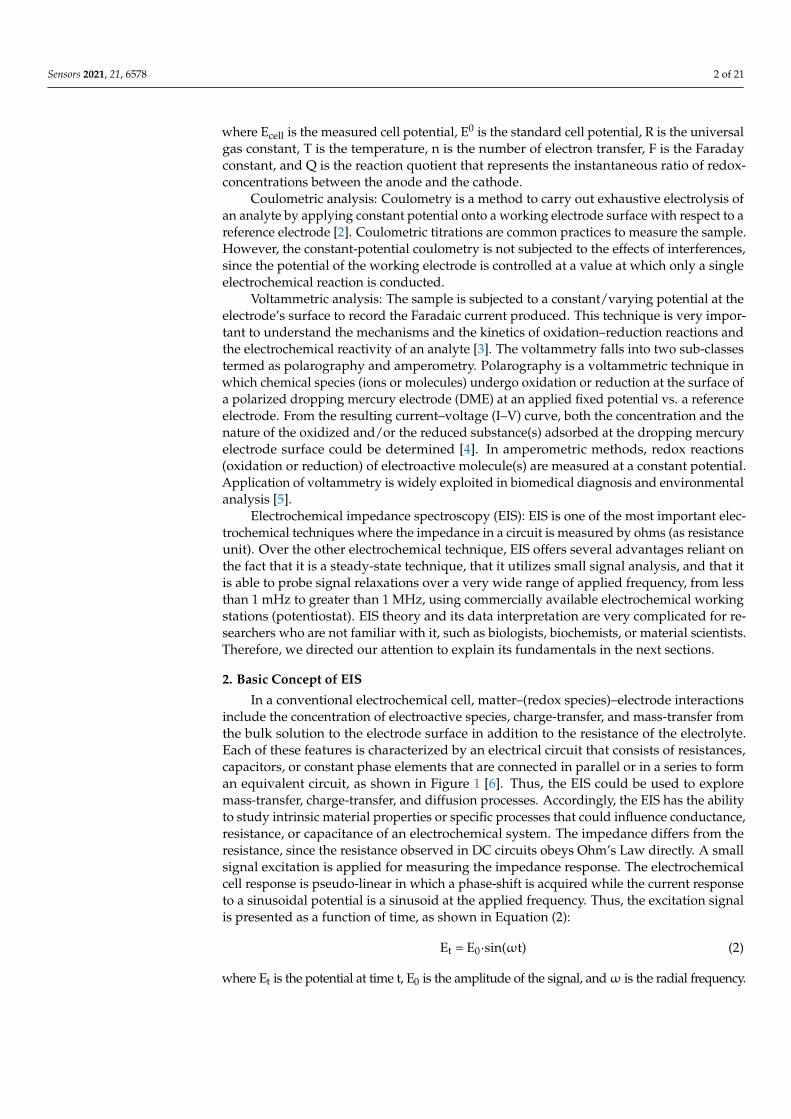
In a conventional electrochemical cell, matter–(redox species)–electrode interactionsinclude the concentration of electroactive species, charge-transfer, and mass-transfer fromthe bulk solution to the electrode surface in addition to the resistance of the electrolyte.Each of these features is characterized by an electrical circuit that consists of resistances,capacitors, or constant phase elements that are connected in parallel or in a series to forman equivalent circuit, as shown in Figure 1 [6]. Thus, the EIS could be used to exploremass-transfer, charge-transfer, and diffusion processes. Accordingly, the EIS has the abilityto study intrinsic material properties or specific processes that could influence conductance,resistance, or capacitance of an electrochemical system. The impedance differs from theresistance, since the resistance observed in DC circuits obeys Ohm’s Law directly. A smallsignal excitation is applied for measuring the impedance response. The electrochemicalcell response is pseudo-linear in which a phase-shift is acquired while the current responseto a sinusoidal potential is a sinusoid at the applied frequency. Thus, the excitation signalis presented as a function of time, as shown in Equation (2):
Et = E0·sin(ωt) (2)
where Et is the potential at time t, E0 is the amplitude of the signal, andω is the radial frequency.
Sensors 2021, 21, 6578 3 of 21
Sensors 2021, 21, x FOR PEER REVIEW 3 of 21
where Et is the potential at time t, E0 is the amplitude of the signal, and ω is the radial frequency.
The correlation between the radial frequency (ω) and the applied frequency (f) is calculated by Equation (3):
ω = 2·π·f (3)
In a linear system, the signal is shifted in phase (Φ) and has a different amplitude than I0 (Equation (4)).
It = I0 sin(ωt + Φ) (4)
Thus, the impedance of the whole system can be obtained from Equation (5):
Z = E/I = Z0 exp(iΦ) = Z0 (cosΦ + isinΦ) (5)
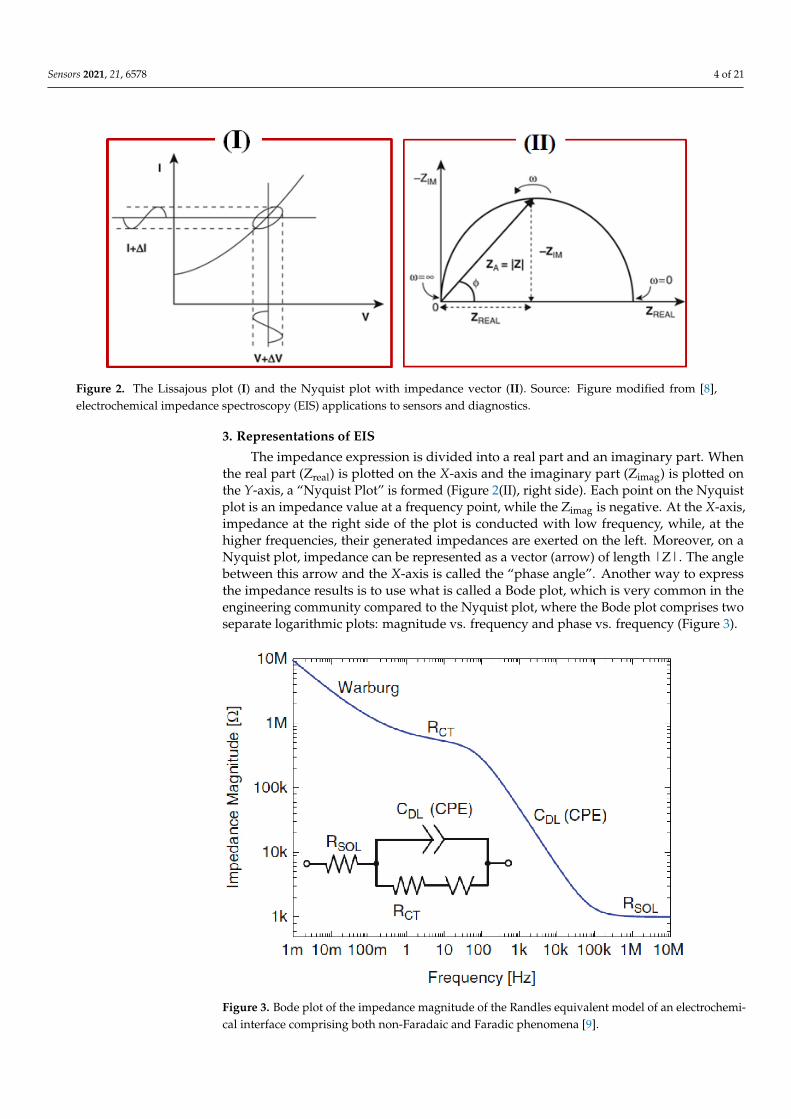
where Z, E, I, ω, and Φ are impedance, potential, current, frequency, and phase shift between E and I, respectively. The impedance is expressed in terms of a magnitude, Z0, and a phase shift, Φ. If the applied sinusoidal signal is plotted on the X-axis and the si-nusoidal response signal (I) on the Y-axis, the result is a “Lissajous Plot”, Figure 2(I). Before the existence of modern EIS instrumentation, Lissajous analysis was the only way for the impedance measurement [6,7].
3. Representations of EIS The impedance expression is divided into a real part and an imaginary part. When
the real part (Zreal) is plotted on the X-axis and the imaginary part (Zimag) is plotted on the Y-axis, a “Nyquist Plot” is formed (Figure 2(II), right side). Each point on the Nyquist plot is an impedance value at a frequency point, while the Zimag is negative. At the X-axis, impedance at the right side of the plot is conducted with low frequency, while, at the higher frequencies, their generated impedances are exerted on the left. Moreover, on a Nyquist plot, impedance can be represented as a vector (arrow) of length |Z|. The angle between this arrow and the X-axis is called the “phase angle”. Another way to express the impedance results is to use what is called a Bode plot, which is very common in the engineering community compared to the Nyquist plot, where the Bode plot comprises two separate logarithmic plots: magnitude vs. frequency and phase vs. frequency (Figure 3).
Figure 1. A simple scheme to descript the EIS circuit and the redox reaction takes place at the surfaceof working electrodes in a conventional-electrochemical cell (i.e., three-electrode system). Rct is thecharge transfer resistance, Rs is electrolyte resistance, and Cdl is the capacitance double layer.
The correlation between the radial frequency (ω) and the applied frequency (f) iscalculated by Equation (3):
ω = 2·π·f (3)
In a linear system, the signal is shifted in phase (Φ) and has a different amplitude thanI0 (Equation (4)).
It = I0 sin(ωt + Φ) (4)
Thus, the impedance of the whole system can be obtained from Equation (5):
Z = E/I = Z0 exp(iΦ) = Z0 (cosΦ + isinΦ) (5)
where Z, E, I, ω, and Φ are impedance, potential, current, frequency, and phase shiftbetween E and I, respectively. The impedance is expressed in terms of a magnitude, Z0,and a phase shift, Φ. If the applied sinusoidal signal is plotted on the X-axis and thesinusoidal response signal (I) on the Y-axis, the result is a “Lissajous Plot”, Figure 2(I).Before the existence of modern EIS instrumentation, Lissajous analysis was the only wayfor the impedance measurement [6,7].
Sensors 2021, 21, 6578 4 of 21
Sensors 2021, 21, x FOR PEER REVIEW 4 of 21
Figure 1. A simple scheme to descript the EIS circuit and the redox reaction takes place at the sur-face of working electrodes in a conventional-electrochemical cell (i.e., three-electrode system). Rct is the charge transfer resistance, Rs is electrolyte resistance, and Cdl is the capacitance double layer.
Figure 2. The Lissajous plot (I) and the Nyquist plot with impedance vector (II). Source: Figure modified from [8], electrochemical impedance spectroscopy (EIS) applications to sensors and di-agnostics.
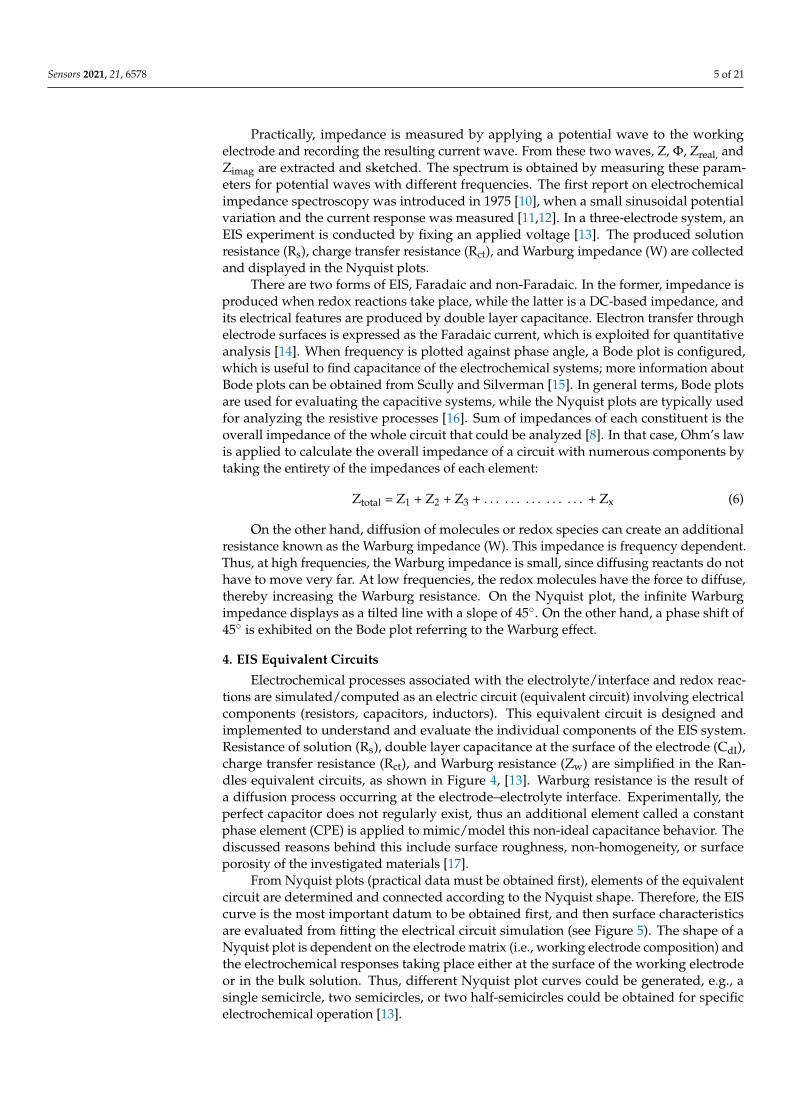
Figure 3. Bode plot of the impedance magnitude of the Randles equivalent model of an electro-chemical interface comprising both non-Faradaic and Faradic phenomena [9].
Practically, impedance is measured by applying a potential wave to the working electrode and recording the resulting current wave. From these two waves, Z, Φ, Zreal, and Zimag are extracted and sketched. The spectrum is obtained by measuring these parame-ters for potential waves with different frequencies. The first report on electrochemical impedance spectroscopy was introduced in 1975 [10], when a small sinusoidal potential variation and the current response was measured [11,12]. In a three-electrode system, an EIS experiment is conducted by fixing an applied voltage [13,14]. The produced solution resistance (Rs), charge transfer resistance (Rct), and Warburg impedance (W) are collected and displayed in the Nyquist plots.
Figure 2. The Lissajous plot (I) and the Nyquist plot with impedance vector (II). Source: Figure modified from [8],electrochemical impedance spectroscopy (EIS) applications to sensors and diagnostics.
3. Representations of EIS
The impedance expression is divided into a real part and an imaginary part. Whenthe real part (Zreal) is plotted on the X-axis and the imaginary part (Zimag) is plotted onthe Y-axis, a “Nyquist Plot” is formed (Figure 2(II), right side). Each point on the Nyquistplot is an impedance value at a frequency point, while the Zimag is negative. At the X-axis,impedance at the right side of the plot is conducted with low frequency, while, at thehigher frequencies, their generated impedances are exerted on the left. Moreover, on aNyquist plot, impedance can be represented as a vector (arrow) of length |Z|. The anglebetween this arrow and the X-axis is called the “phase angle”. Another way to expressthe impedance results is to use what is called a Bode plot, which is very common in theengineering community compared to the Nyquist plot, where the Bode plot comprises twoseparate logarithmic plots: magnitude vs. frequency and phase vs. frequency (Figure 3).
Sensors 2021, 21, x FOR PEER REVIEW 4 of 21
Figure 1. A simple scheme to descript the EIS circuit and the redox reaction takes place at the sur-face of working electrodes in a conventional-electrochemical cell (i.e., three-electrode system). Rct is the charge transfer resistance, Rs is electrolyte resistance, and Cdl is the capacitance double layer.
Figure 2. The Lissajous plot (I) and the Nyquist plot with impedance vector (II). Source: Figure modified from [8], electrochemical impedance spectroscopy (EIS) applications to sensors and di-agnostics.
Figure 3. Bode plot of the impedance magnitude of the Randles equivalent model of an electro-chemical interface comprising both non-Faradaic and Faradic phenomena [9].
Practically, impedance is measured by applying a potential wave to the working electrode and recording the resulting current wave. From these two waves, Z, Φ, Zreal, and Zimag are extracted and sketched. The spectrum is obtained by measuring these parame-ters for potential waves with different frequencies. The first report on electrochemical impedance spectroscopy was introduced in 1975 [10], when a small sinusoidal potential variation and the current response was measured [11,12]. In a three-electrode system, an EIS experiment is conducted by fixing an applied voltage [13,14]. The produced solution resistance (Rs), charge transfer resistance (Rct), and Warburg impedance (W) are collected and displayed in the Nyquist plots.
Figure 3. Bode plot of the impedance magnitude of the Randles equivalent model of an electrochemi-cal interface comprising both non-Faradaic and Faradic phenomena [9].
Sensors 2021, 21, 6578 5 of 21
Practically, impedance is measured by applying a potential wave to the workingelectrode and recording the resulting current wave. From these two waves, Z, Φ, Zreal, andZimag are extracted and sketched. The spectrum is obtained by measuring these param-eters for potential waves with different frequencies. The first report on electrochemicalimpedance spectroscopy was introduced in 1975 [10], when a small sinusoidal potentialvariation and the current response was measured [11,12]. In a three-electrode system, anEIS experiment is conducted by fixing an applied voltage [13]. The produced solutionresistance (Rs), charge transfer resistance (Rct), and Warburg impedance (W) are collectedand displayed in the Nyquist plots.
There are two forms of EIS, Faradaic and non-Faradaic. In the former, impedance isproduced when redox reactions take place, while the latter is a DC-based impedance, andits electrical features are produced by double layer capacitance. Electron transfer throughelectrode surfaces is expressed as the Faradaic current, which is exploited for quantitativeanalysis [14]. When frequency is plotted against phase angle, a Bode plot is configured,which is useful to find capacitance of the electrochemical systems; more information aboutBode plots can be obtained from Scully and Silverman [15]. In general terms, Bode plotsare used for evaluating the capacitive systems, while the Nyquist plots are typically usedfor analyzing the resistive processes [16]. Sum of impedances of each constituent is theoverall impedance of the whole circuit that could be analyzed [8]. In that case, Ohm’s lawis applied to calculate the overall impedance of a circuit with numerous components bytaking the entirety of the impedances of each element:
Ztotal = Z1 + Z2 + Z3 + . . . . . . . . . . . . . . . + Zx (6)
On the other hand, diffusion of molecules or redox species can create an additionalresistance known as the Warburg impedance (W). This impedance is frequency dependent.Thus, at high frequencies, the Warburg impedance is small, since diffusing reactants do nothave to move very far. At low frequencies, the redox molecules have the force to diffuse,thereby increasing the Warburg resistance. On the Nyquist plot, the infinite Warburgimpedance displays as a tilted line with a slope of 45◦. On the other hand, a phase shift of45◦ is exhibited on the Bode plot referring to the Warburg effect.
4. EIS Equivalent Circuits
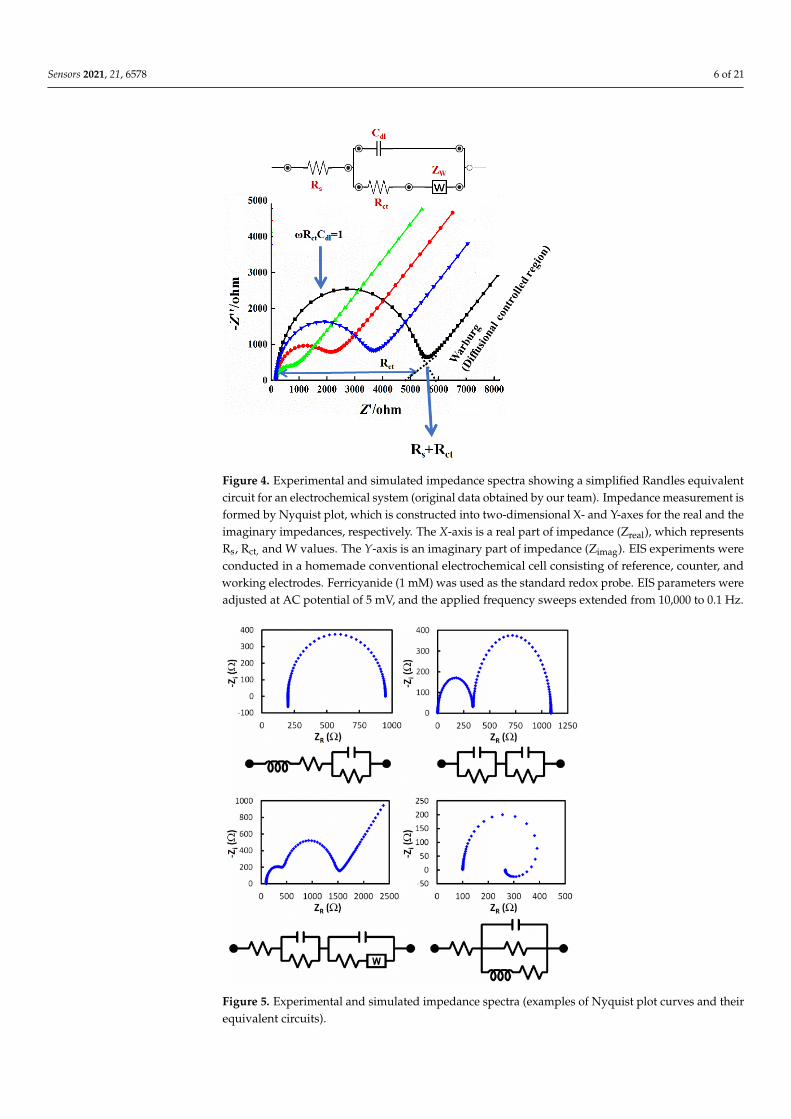
Electrochemical processes associated with the electrolyte/interface and redox reac-tions are simulated/computed as an electric circuit (equivalent circuit) involving electricalcomponents (resistors, capacitors, inductors). This equivalent circuit is designed andimplemented to understand and evaluate the individual components of the EIS system.Resistance of solution (Rs), double layer capacitance at the surface of the electrode (CdI),charge transfer resistance (Rct), and Warburg resistance (Zw) are simplified in the Ran-dles equivalent circuits, as shown in Figure 4, [13]. Warburg resistance is the result ofa diffusion process occurring at the electrode–electrolyte interface. Experimentally, theperfect capacitor does not regularly exist, thus an additional element called a constantphase element (CPE) is applied to mimic/model this non-ideal capacitance behavior. Thediscussed reasons behind this include surface roughness, non-homogeneity, or surfaceporosity of the investigated materials [17].
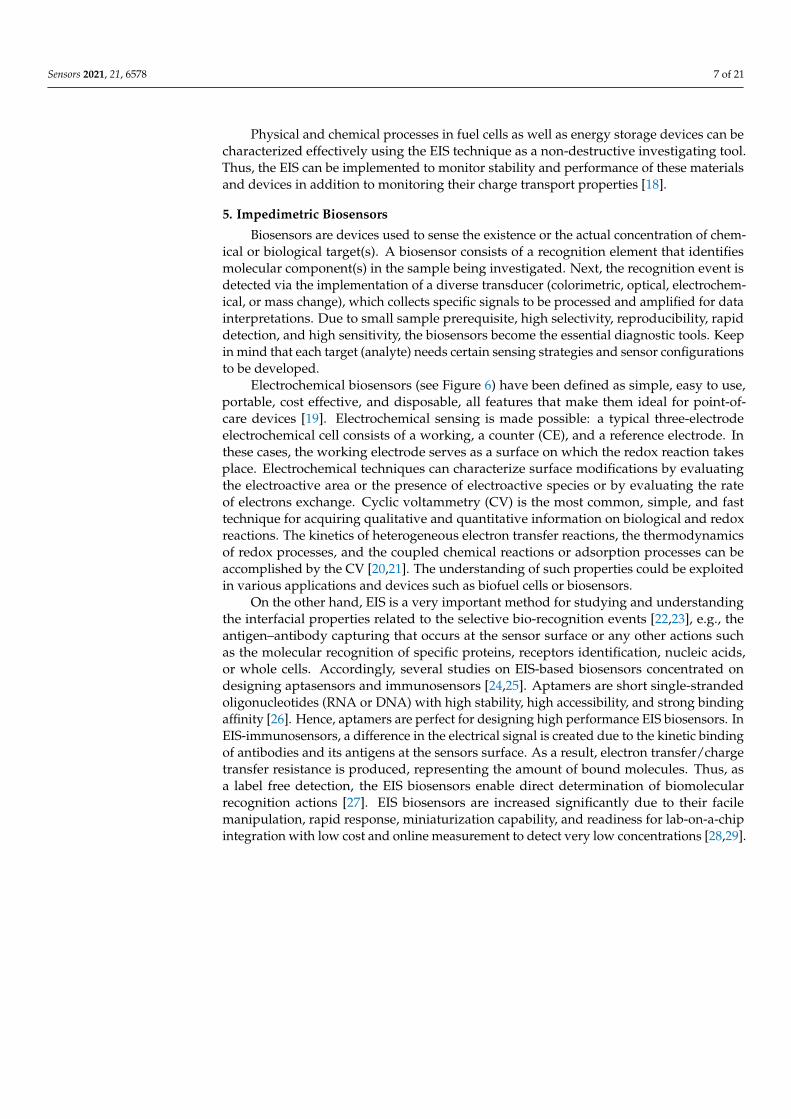
From Nyquist plots (practical data must be obtained first), elements of the equivalentcircuit are determined and connected according to the Nyquist shape. Therefore, the EIScurve is the most important datum to be obtained first, and then surface characteristicsare evaluated from fitting the electrical circuit simulation (see Figure 5). The shape of aNyquist plot is dependent on the electrode matrix (i.e., working electrode composition) andthe electrochemical responses taking place either at the surface of the working electrodeor in the bulk solution. Thus, different Nyquist plot curves could be generated, e.g., asingle semicircle, two semicircles, or two half-semicircles could be obtained for specificelectrochemical operation [13].
Sensors 2021, 21, 6578 6 of 21Sensors 2021, 21, x FOR PEER REVIEW 6 of 21
Figure 4. Experimental and simulated impedance spectra showing a simplified Randles equivalent circuit for an electrochemical system (original data obtained by our team). Impedance measure-ment is formed by Nyquist plot, which is constructed into two-dimensional X- and Y-axes for the real and the imaginary impedances, respectively. The X-axis is a real part of impedance (Zreal), which represents Rs, Rct, and W values. The Y-axis is an imaginary part of impedance (Zimag). EIS experiments were conducted in a homemade conventional electrochemical cell consisting of ref-erence, counter, and working electrodes. Ferricyanide (1 mM) was used as the standard redox probe. EIS parameters were adjusted at AC potential of 5 mV, and the applied frequency sweeps extended from 10,000 to 0.1 Hz.
Figure 5. Experimental and simulated impedance spectra (examples of Nyquist plot curves and their equivalent circuits).
Figure 4. Experimental and simulated impedance spectra showing a simplified Randles equivalentcircuit for an electrochemical system (original data obtained by our team). Impedance measurement isformed by Nyquist plot, which is constructed into two-dimensional X- and Y-axes for the real and theimaginary impedances, respectively. The X-axis is a real part of impedance (Zreal), which representsRs, Rct, and W values. The Y-axis is an imaginary part of impedance (Zimag). EIS experiments wereconducted in a homemade conventional electrochemical cell consisting of reference, counter, andworking electrodes. Ferricyanide (1 mM) was used as the standard redox probe. EIS parameters wereadjusted at AC potential of 5 mV, and the applied frequency sweeps extended from 10,000 to 0.1 Hz.
Sensors 2021, 21, x FOR PEER REVIEW 6 of 21
Figure 4. Experimental and simulated impedance spectra showing a simplified Randles equivalent circuit for an electrochemical system (original data obtained by our team). Impedance measure-ment is formed by Nyquist plot, which is constructed into two-dimensional X- and Y-axes for the real and the imaginary impedances, respectively. The X-axis is a real part of impedance (Zreal), which represents Rs, Rct, and W values. The Y-axis is an imaginary part of impedance (Zimag). EIS experiments were conducted in a homemade conventional electrochemical cell consisting of ref-erence, counter, and working electrodes. Ferricyanide (1 mM) was used as the standard redox probe. EIS parameters were adjusted at AC potential of 5 mV, and the applied frequency sweeps extended from 10,000 to 0.1 Hz.
Figure 5. Experimental and simulated impedance spectra (examples of Nyquist plot curves and their equivalent circuits).
Figure 5. Experimental and simulated impedance spectra (examples of Nyquist plot curves and theirequivalent circuits).
Sensors 2021, 21, 6578 7 of 21
Physical and chemical processes in fuel cells as well as energy storage devices can becharacterized effectively using the EIS technique as a non-destructive investigating tool.Thus, the EIS can be implemented to monitor stability and performance of these materialsand devices in addition to monitoring their charge transport properties [18].
5. Impedimetric Biosensors
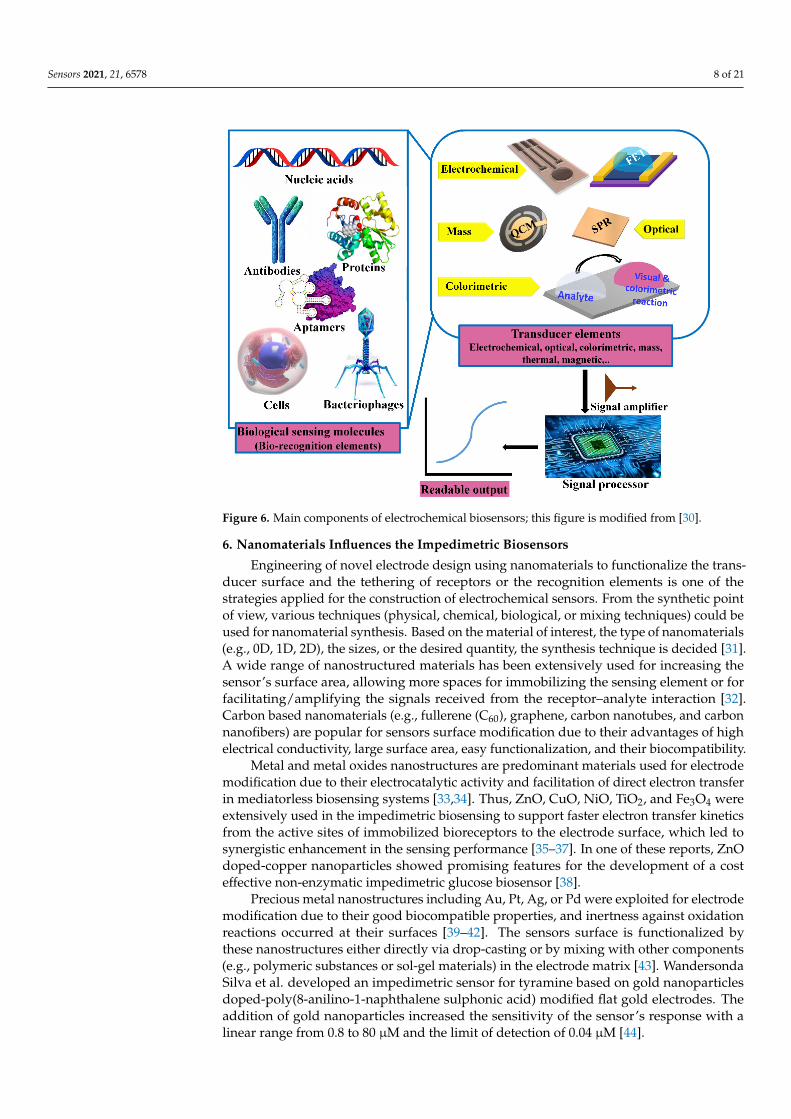
Biosensors are devices used to sense the existence or the actual concentration of chem-ical or biological target(s). A biosensor consists of a recognition element that identifiesmolecular component(s) in the sample being investigated. Next, the recognition event isdetected via the implementation of a diverse transducer (colorimetric, optical, electrochem-ical, or mass change), which collects specific signals to be processed and amplified for datainterpretations. Due to small sample prerequisite, high selectivity, reproducibility, rapiddetection, and high sensitivity, the biosensors become the essential diagnostic tools. Keepin mind that each target (analyte) needs certain sensing strategies and sensor configurationsto be developed.
Electrochemical biosensors (see Figure 6) have been defined as simple, easy to use,portable, cost effective, and disposable, all features that make them ideal for point-of-care devices [19]. Electrochemical sensing is made possible: a typical three-electrodeelectrochemical cell consists of a working, a counter (CE), and a reference electrode. Inthese cases, the working electrode serves as a surface on which the redox reaction takesplace. Electrochemical techniques can characterize surface modifications by evaluatingthe electroactive area or the presence of electroactive species or by evaluating the rateof electrons exchange. Cyclic voltammetry (CV) is the most common, simple, and fasttechnique for acquiring qualitative and quantitative information on biological and redoxreactions. The kinetics of heterogeneous electron transfer reactions, the thermodynamicsof redox processes, and the coupled chemical reactions or adsorption processes can beaccomplished by the CV [20,21]. The understanding of such properties could be exploitedin various applications and devices such as biofuel cells or biosensors.
On the other hand, EIS is a very important method for studying and understandingthe interfacial properties related to the selective bio-recognition events [22,23], e.g., theantigen–antibody capturing that occurs at the sensor surface or any other actions suchas the molecular recognition of specific proteins, receptors identification, nucleic acids,or whole cells. Accordingly, several studies on EIS-based biosensors concentrated ondesigning aptasensors and immunosensors [24,25]. Aptamers are short single-strandedoligonucleotides (RNA or DNA) with high stability, high accessibility, and strong bindingaffinity [26]. Hence, aptamers are perfect for designing high performance EIS biosensors. InEIS-immunosensors, a difference in the electrical signal is created due to the kinetic bindingof antibodies and its antigens at the sensors surface. As a result, electron transfer/chargetransfer resistance is produced, representing the amount of bound molecules. Thus, asa label free detection, the EIS biosensors enable direct determination of biomolecularrecognition actions [27]. EIS biosensors are increased significantly due to their facilemanipulation, rapid response, miniaturization capability, and readiness for lab-on-a-chipintegration with low cost and online measurement to detect very low concentrations [28,29].
Sensors 2021, 21, 6578 8 of 21Sensors 2021, 21, x FOR PEER REVIEW 8 of 21
Figure 6. Main components of electrochemical biosensors; this figure is modified from [31].
6. Nanomaterials Influences the Impedimetric Biosensors Engineering of novel electrode design using nanomaterials to functionalize the
transducer surface and the tethering of receptors or the recognition elements is one of the strategies applied for the construction of electrochemical sensors. From the synthetic point of view, various techniques (physical, chemical, biological, or mixing techniques) could be used for nanomaterial synthesis. Based on the material of interest, the type of nanomaterials (e.g., 0D, 1D, 2D), the sizes, or the desired quantity, the synthesis tech-nique is decided [32]. A wide range of nanostructured materials has been extensively used for increasing the sensor’s surface area, allowing more spaces for immobilizing the sensing element or for facilitating/amplifying the signals received from the recep-tor–analyte interaction [33]. Carbon based nanomaterials (e.g., fullerene (C60), graphene, carbon nanotubes, and carbon nanofibers) are popular for sensors surface modification due to their advantages of high electrical conductivity, large surface area, easy function-alization, and their biocompatibility.
Metal and metal oxides nanostructures are predominant materials used for electrode modification due to their electrocatalytic activity and facilitation of direct electron trans-fer in mediatorless biosensing systems [34,35]. Thus, ZnO, CuO, NiO, TiO2, and Fe3O4 were extensively used in the impedimetric biosensing to support faster electron transfer kinetics from the active sites of immobilized bioreceptors to the electrode surface, which led to synergistic enhancement in the sensing performance [36–38]. In one of these re-ports, ZnO doped-copper nanoparticles showed promising features for the development of a cost effective non-enzymatic impedimetric glucose biosensor [39].
Precious metal nanostructures including Au, Pt, Ag, or Pd were exploited for elec-trode modification due to their good biocompatible properties, and inertness against oxidation reactions occurred at their surfaces [40–43]. The sensors surface is functional-ized by these nanostructures either directly via drop-casting or by mixing with other components (e.g., polymeric substances or sol-gel materials) in the electrode matrix [44]. Wandersonda Silva et al. developed an impedimetric sensor for tyramine based on gold
Figure 6. Main components of electrochemical biosensors; this figure is modified from [30].
6. Nanomaterials Influences the Impedimetric Biosensors
Engineering of novel electrode design using nanomaterials to functionalize the trans-ducer surface and the tethering of receptors or the recognition elements is one of thestrategies applied for the construction of electrochemical sensors. From the synthetic pointof view, various techniques (physical, chemical, biological, or mixing techniques) could beused for nanomaterial synthesis. Based on the material of interest, the type of nanomaterials(e.g., 0D, 1D, 2D), the sizes, or the desired quantity, the synthesis technique is decided [31].A wide range of nanostructured materials has been extensively used for increasing thesensor’s surface area, allowing more spaces for immobilizing the sensing element or forfacilitating/amplifying the signals received from the receptor–analyte interaction [32].Carbon based nanomaterials (e.g., fullerene (C60), graphene, carbon nanotubes, and carbonnanofibers) are popular for sensors surface modification due to their advantages of highelectrical conductivity, large surface area, easy functionalization, and their biocompatibility.
Metal and metal oxides nanostructures are predominant materials used for electrodemodification due to their electrocatalytic activity and facilitation of direct electron transferin mediatorless biosensing systems [33,34]. Thus, ZnO, CuO, NiO, TiO2, and Fe3O4 wereextensively used in the impedimetric biosensing to support faster electron transfer kineticsfrom the active sites of immobilized bioreceptors to the electrode surface, which led tosynergistic enhancement in the sensing performance [35–37]. In one of these reports, ZnOdoped-copper nanoparticles showed promising features for the development of a costeffective non-enzymatic impedimetric glucose biosensor [38].
Precious metal nanostructures including Au, Pt, Ag, or Pd were exploited for electrodemodification due to their good biocompatible properties, and inertness against oxidationreactions occurred at their surfaces [39–42]. The sensors surface is functionalized bythese nanostructures either directly via drop-casting or by mixing with other components(e.g., polymeric substances or sol-gel materials) in the electrode matrix [43]. WandersondaSilva et al. developed an impedimetric sensor for tyramine based on gold nanoparticlesdoped-poly(8-anilino-1-naphthalene sulphonic acid) modified flat gold electrodes. Theaddition of gold nanoparticles increased the sensitivity of the sensor’s response with alinear range from 0.8 to 80 µM and the limit of detection of 0.04 µM [44].
Sensors 2021, 21, 6578 9 of 21
In a recent study, an impedimetric sensor for total calcium detection was developedusing a gold nanoparticle self-assembled monolayer to provide high sensitivity and awide linear range from 5 × 10⁻¹² to 1 × 10⁻⁶ mol L−1 with the low limit of detection of3.6 × 10−12 mol L−1 [45].
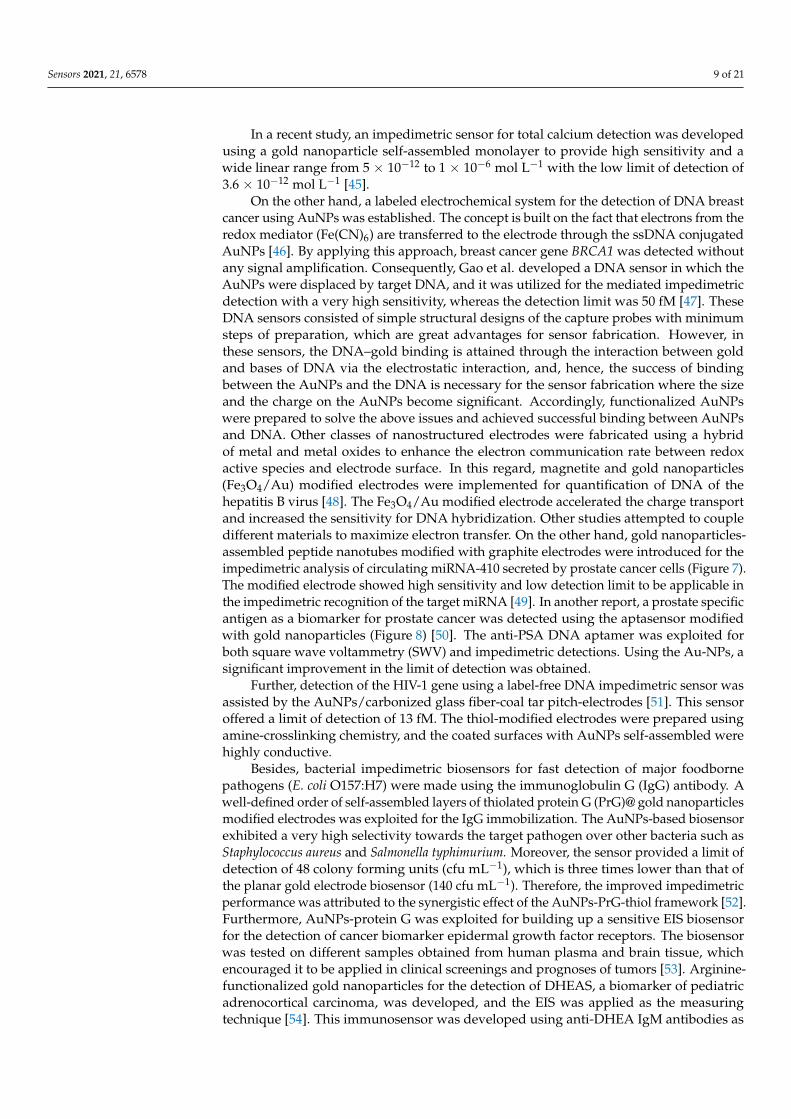
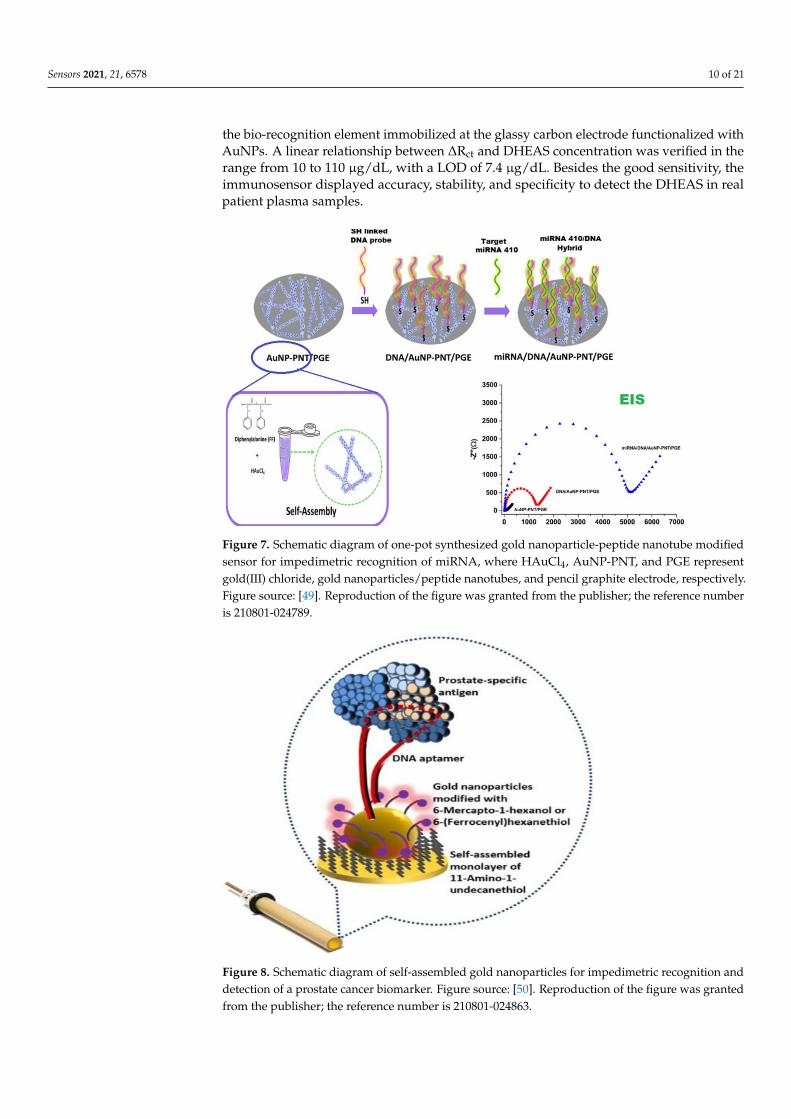
On the other hand, a labeled electrochemical system for the detection of DNA breastcancer using AuNPs was established. The concept is built on the fact that electrons from theredox mediator (Fe(CN)6) are transferred to the electrode through the ssDNA conjugatedAuNPs [46]. By applying this approach, breast cancer gene BRCA1 was detected withoutany signal amplification. Consequently, Gao et al. developed a DNA sensor in which theAuNPs were displaced by target DNA, and it was utilized for the mediated impedimetricdetection with a very high sensitivity, whereas the detection limit was 50 fM [47]. TheseDNA sensors consisted of simple structural designs of the capture probes with minimumsteps of preparation, which are great advantages for sensor fabrication. However, inthese sensors, the DNA–gold binding is attained through the interaction between goldand bases of DNA via the electrostatic interaction, and, hence, the success of bindingbetween the AuNPs and the DNA is necessary for the sensor fabrication where the sizeand the charge on the AuNPs become significant. Accordingly, functionalized AuNPswere prepared to solve the above issues and achieved successful binding between AuNPsand DNA. Other classes of nanostructured electrodes were fabricated using a hybridof metal and metal oxides to enhance the electron communication rate between redoxactive species and electrode surface. In this regard, magnetite and gold nanoparticles(Fe3O4/Au) modified electrodes were implemented for quantification of DNA of thehepatitis B virus [48]. The Fe3O4/Au modified electrode accelerated the charge transportand increased the sensitivity for DNA hybridization. Other studies attempted to coupledifferent materials to maximize electron transfer. On the other hand, gold nanoparticles-assembled peptide nanotubes modified with graphite electrodes were introduced for theimpedimetric analysis of circulating miRNA-410 secreted by prostate cancer cells (Figure 7).The modified electrode showed high sensitivity and low detection limit to be applicable inthe impedimetric recognition of the target miRNA [49]. In another report, a prostate specificantigen as a biomarker for prostate cancer was detected using the aptasensor modifiedwith gold nanoparticles (Figure 8) [50]. The anti-PSA DNA aptamer was exploited forboth square wave voltammetry (SWV) and impedimetric detections. Using the Au-NPs, asignificant improvement in the limit of detection was obtained.
Further, detection of the HIV-1 gene using a label-free DNA impedimetric sensor wasassisted by the AuNPs/carbonized glass fiber-coal tar pitch-electrodes [51]. This sensoroffered a limit of detection of 13 fM. The thiol-modified electrodes were prepared usingamine-crosslinking chemistry, and the coated surfaces with AuNPs self-assembled werehighly conductive.
Besides, bacterial impedimetric biosensors for fast detection of major foodbornepathogens (E. coli O157:H7) were made using the immunoglobulin G (IgG) antibody. Awell-defined order of self-assembled layers of thiolated protein G (PrG)@ gold nanoparticlesmodified electrodes was exploited for the IgG immobilization. The AuNPs-based biosensorexhibited a very high selectivity towards the target pathogen over other bacteria such asStaphylococcus aureus and Salmonella typhimurium. Moreover, the sensor provided a limit ofdetection of 48 colony forming units (cfu mL−1), which is three times lower than that ofthe planar gold electrode biosensor (140 cfu mL−1). Therefore, the improved impedimetricperformance was attributed to the synergistic effect of the AuNPs-PrG-thiol framework [52].Furthermore, AuNPs-protein G was exploited for building up a sensitive EIS biosensorfor the detection of cancer biomarker epidermal growth factor receptors. The biosensorwas tested on different samples obtained from human plasma and brain tissue, whichencouraged it to be applied in clinical screenings and prognoses of tumors [53]. Arginine-functionalized gold nanoparticles for the detection of DHEAS, a biomarker of pediatricadrenocortical carcinoma, was developed, and the EIS was applied as the measuringtechnique [54]. This immunosensor was developed using anti-DHEA IgM antibodies as
Sensors 2021, 21, 6578 10 of 21
the bio-recognition element immobilized at the glassy carbon electrode functionalized withAuNPs. A linear relationship between ∆Rct and DHEAS concentration was verified in therange from 10 to 110 µg/dL, with a LOD of 7.4 µg/dL. Besides the good sensitivity, theimmunosensor displayed accuracy, stability, and specificity to detect the DHEAS in realpatient plasma samples.
Sensors 2021, 21, x FOR PEER REVIEW 10 of 21
human plasma and brain tissue, which encouraged it to be applied in clinical screenings and prognoses of tumors [54]. Arginine-functionalized gold nanoparticles for the detec-tion of DHEAS, a biomarker of pediatric adrenocortical carcinoma, was developed, and the EIS was applied as the measuring technique [55]. This immunosensor was developed using anti-DHEA IgM antibodies as the bio-recognition element immobilized at the glassy carbon electrode functionalized with AuNPs. A linear relationship between ΔRct and DHEAS concentration was verified in the range from 10 to 110 µg/dL, with a LOD of 7.4 µg/dL. Besides the good sensitivity, the immunosensor displayed accuracy, stability, and specificity to detect the DHEAS in real patient plasma samples.
As a sensing strategy, from the above mentioned finding, the use of nanomaterials for developing EIS biosensors did not only increase the electrode surface but also allowed rapid and sensitive detection of desired analytes.
Figure 7. Schematic diagram of one-pot synthesized gold nanoparticle-peptide nanotube modified sensor for impedimetric recognition of miRNA, where HAuCl4, AuNP-PNT, and PGE represent gold(III) chloride, gold nanoparticles/peptide nanotubes, and pencil graphite electrode, respec-tively. Figure source: [50]. Reproduction of the figure was granted from the publisher; the reference number is 210801-024789.
Figure 7. Schematic diagram of one-pot synthesized gold nanoparticle-peptide nanotube modifiedsensor for impedimetric recognition of miRNA, where HAuCl4, AuNP-PNT, and PGE representgold(III) chloride, gold nanoparticles/peptide nanotubes, and pencil graphite electrode, respectively.Figure source: [49]. Reproduction of the figure was granted from the publisher; the reference numberis 210801-024789.
Sensors 2021, 21, x FOR PEER REVIEW 11 of 21
Figure 8. Schematic diagram of self-assembled gold nanoparticles for impedimetric recognition and detection of a prostate cancer biomarker. Figure source: [51]. Reproduction of the figure was granted from the publisher; the reference number is 210801-024863.
7. Carbon-Based Impedimetric Biosensors As a result of the advances made in developing electrochemical biosensors, carbon
nanomaterials have continuously expanded in various aspects, from raw electrode materials to surface modifications at the nanoscale. Graphene and carbon nanotubes are the most common carbon materials used for constructing EIS biosensors due to their high electrochemical activity, high electrical conductivity, large surface area, ease for functionalization, and biocompatibility [56,57]. Thus, derivatives of carbon materials including graphene oxide (GO) and reduced graphene oxide (rGO) have been utilized in electrochemical sensing. By exfoliation of graphite in water using sonication, a single layer to a few layers (nano-sheets) of graphene oxides could be produced [58]. The GO is strongly affected by the density of oxygen-containing groups because of the higher negative charge of the graphitic surface that causes a higher charge transfer resistance [59]. Therefore, the formed GO has less electrical conductivity than the reduced GO. On the other hand, the hydrophilicity of graphene oxides is increased due to the presence of oxygen-containing functional groups on its surface, which provides high dispersion and more surface area for molecular binding [60].
Those oxygen-containing groups could be reduced electrochemically by applying a suitable electrical potential to create a reduced graphene oxide (rGO) with excellent conductivity [61]. Alternatively, thermal, chemical, or combined chemical and thermal methods could be used to achieve the complete reduction and exfoliation of graphene oxide [62,63,64]. Composition and functionalization of graphene-related nanomaterials have a strong effect on the immobilization of biorecognition elements. Generally, EIS measurements are performed in Faradaic mode using electrochemical redox probes (electron mediators) to focus on the Rct variations between the solution and the electrode interface [65]. Using graphene quantum dots and gold-embedded polyaniline nanowires, impedimetric sensors for the hepatitis E virus (HEV) were designed. HEV virus particles were captured by the immobilized antibody to provide high sensitivity. The sensor linearity response in serum samples ranged from 10 fg mL−1 to 100 pg mL−1. Ultimately, the proposed sensor was suggested as a robust probe for rapid HEV detection [66].
Three-to-four-layers of reduced graphene oxide were fabricated and used as a sensing platform for hairpin DNA [67]. The detection of complementary ssDNA was more robust and sensitive with LOD of 6.6 pM, while the single rGO-layer platform gave LOD of 50 nM. Moreover, a DNA-based rGO sensor was developed by Hu’s group. In this approach, positively charged moieties were introduced for the chemical coupling of
Figure 8. Schematic diagram of self-assembled gold nanoparticles for impedimetric recognition anddetection of a prostate cancer biomarker. Figure source: [50]. Reproduction of the figure was grantedfrom the publisher; the reference number is 210801-024863.
Sensors 2021, 21, 6578 11 of 21
As a sensing strategy, from the above mentioned finding, the use of nanomaterialsfor developing EIS biosensors did not only increase the electrode surface but also allowedrapid and sensitive detection of desired analytes.
7. Carbon-Based Impedimetric Biosensors
As a result of the advances made in developing electrochemical biosensors, carbonnanomaterials have continuously expanded in various aspects, from raw electrode mate-rials to surface modifications at the nanoscale. Graphene and carbon nanotubes are themost common carbon materials used for constructing EIS biosensors due to their highelectrochemical activity, high electrical conductivity, large surface area, ease for function-alization, and biocompatibility [55,56]. Thus, derivatives of carbon materials includinggraphene oxide (GO) and reduced graphene oxide (rGO) have been utilized in electro-chemical sensing. By exfoliation of graphite in water using sonication, a single layer to afew layers (nano-sheets) of graphene oxides could be produced [57]. The GO is stronglyaffected by the density of oxygen-containing groups because of the higher negative chargeof the graphitic surface that causes a higher charge transfer resistance [58]. Therefore, theformed GO has less electrical conductivity than the reduced GO. On the other hand, thehydrophilicity of graphene oxides is increased due to the presence of oxygen-containingfunctional groups on its surface, which provides high dispersion and more surface area formolecular binding [59].
Those oxygen-containing groups could be reduced electrochemically by applying asuitable electrical potential to create a reduced graphene oxide (rGO) with excellent conduc-tivity [60]. Alternatively, thermal, chemical, or combined chemical and thermal methodscould be used to achieve the complete reduction and exfoliation of graphene oxide [61–63].Composition and functionalization of graphene-related nanomaterials have a strong ef-fect on the immobilization of biorecognition elements. Generally, EIS measurements areperformed in Faradaic mode using electrochemical redox probes (electron mediators) tofocus on the Rct variations between the solution and the electrode interface [64]. Usinggraphene quantum dots and gold-embedded polyaniline nanowires, impedimetric sensorsfor the hepatitis E virus (HEV) were designed. HEV virus particles were captured by theimmobilized antibody to provide high sensitivity. The sensor linearity response in serumsamples ranged from 10 fg mL−1 to 100 pg mL−1. Ultimately, the proposed sensor wassuggested as a robust probe for rapid HEV detection [65].
Three-to-four-layers of reduced graphene oxide were fabricated and used as a sensingplatform for hairpin DNA [66]. The detection of complementary ssDNA was more robustand sensitive with LOD of 6.6 pM, while the single rGO-layer platform gave LOD of 50 nM.Moreover, a DNA-based rGO sensor was developed by Hu’s group. In this approach,positively charged moieties were introduced for the chemical coupling of DNA probes [67].Additionally, rGO-nanoparticles were formed on indium tin oxide (ITO) flat electrodesusing cyclic voltammetry. This sensor platform was applied for the direct impedimetricdetection of C-reactive protein (CRP) in human serum samples with a detection limit of0.08 ng mL−1 [68].
Another label-free impedimetric biosensor was constructed for the detection of low-density lipoprotein (lipid or LDL) cholesterol. Anti-lipoprotein B-100 was covalentlyimmobilized on amine-functionalized reduced graphene oxide using EDC/NHS cou-pling chemistry to show a high sensitivity with the limit of detection of 5 mg/dL of LDLmolecules within 250 s [69].
Referring to the other carbon-based materials, single-walled carbon nanotubes (SWC-NTs) and multi-walled carbon nanotube (MWCNTs) are two basic forms of the carbonnanotubes (CNTs) which possess almost all of the aforementioned advantages of graphenematerials, making them the second most popular nanomaterials for electrochemical biosen-sors. Different electrochemical properties could be induced upon changing the orientationand the arrangement of CNTs on the electrode surface [69]. CNTs can be utilized eitheras a nanocarrier due to the large surface area and the easy amendment or as an electro-

Sensors 2021, 21, 6578 12 of 21
chemical nanoprobe-based sensor. Growth of Au nanoparticles onto the vertically alignedMWCNTs was reported to detect a specific TP53 gene sequence [70]. Hence, the EIS wasused to evaluate the DNA hybridization events related to the TP53 gene, and it exhibitedoutstanding response towards the target TP53 mutation. The detection limit was 10 nM,and the sensitivity enhancement was due to the synergistic interactions of the alignedMWCNTs arrays with the well-distributed AuNPs. On the other hand, gold-coated SWC-NTs as a microelectrode were exploited to detect complementary 10-base DNA whereasthe charge transfer resistance of the sensor was varied with respect to the target DNAconcentrations. The synergistic interactions of horizontal SWCNT arrays with the AuNPswere the reason behind the major enhancement occurring in the sensitivity of this sensor.By using this methodology, the sensor gave a detection limit of 100 nM for single basemismatch DNA. As the authors claimed in their report, each gold-coated SWCNT acted asa separate micro-electrode, which could be used to detect fewer than six DNA moleculesin a 1 mL sample [71]. On the other side, heavy metal (Pb2+) was detected indirectlybased on its inhibition effects on choline oxidase using the MWCNTs conjugated withAuNPs [72]. A unique nanocomposite made of Au NPs/MWCNTs-graphene quantumdots was produced by Ghanavati et al. [73] for the label-free detection of a prostate specificantigen (PSA) in clinical samples with a limit of detection of 0.48 pg/mL. Based on thementioned EIS applications of the carbon-based materials (graphene and carbon nanotubesor their nanocomposites), they share interesting features in common, including thermalproperties and them being electronic and excellent mechanics. However, graphene affordsmore opportunities in biosensing applications, as it can be greatly produced at a low costin large-scale construction.
8. Nanowires-Based Impedimetric Biosensors
Among the nanomaterials used, nanowires (NWs) have emerged as a new class ofpromising functional nanomaterials [74,75]. Certain aspects render considerable interestin the use of NWs as electrochemical transducers. Those unique NWs characteristicsare unidirectional conduction channels, diameters and dimensions appropriate to thesize and the shape of target molecules, in addition to the outstanding electrical transportproperty. Both conducting and semiconducting nanowires were reported, including goldnanowires for Alzheimer’s disease detection [76], gallium nitride nanowires for nucleicacid detection [77], titanium oxide nanowires for bacterial sensing, and silicon nanowiresfor the detection of hepatitis B and liver cancer biomarkers (α-fetoprotein (AFP)) [78].NWs EIS-based sensors have different constructions and configurations that affect theirapplications. One-dimensional (1D) nanostructure wires are used for semiconducting fieldeffect devices, while 3D collections of nanowires are implemented as sensing ensembles(nanowires array) [75]. A nanowire array performance is highly dependent on the fabrica-tion techniques that control the structural parameters, such as diameter, length, orderedorientation, and crystallinity structure. For example, a DNA biosensor based on verticallyaligned gold nanowires array by electrodeposition was developed by Ramulu et al. [77].From Au-NWs morphological studies, the nanowires were strongly attached to the flatgold surface and well-aligned, which provided more electron transfer ability to detectthe specific hybridized DNA in a low concentration. In another study, different metalnanowire types with different lengths were grown on paper substrates using electrodeposi-tion template-assisted and simple adhesive tape-based patterning at room temperature.The approach exhibited excellent electrode tissue impedance suitable for recording electro-cardiogram signals without any wet-gel adhesives [79]. Moreover, tellurium doped zincoxide (Te-ZnO NWs) nanowires were used for highly sensitive impedimetric DNA sensorsin a label-free approach for hepatitis B virus (HBV) detection [80]. The HBV-DNA sensorresponded to the complementary target in a concentration range from 1 pM to 1 µM, withthe detection limit of 0.1 pM.
Additionally, functionalized ZnO nanorods and carboxylated graphene nano-flakeswere used as a composite deposited on an indium tin oxide (ITO) substrate for the covalent
Sensors 2021, 21, 6578 13 of 21
immobilization of E. coli O157:H7-specific DNA probe. The obtained impedimetric resultsdisplayed linear response in a wide range of DNA concentrations (10−16 M to 10−6 M)with a detection limit of 0.1 fM.
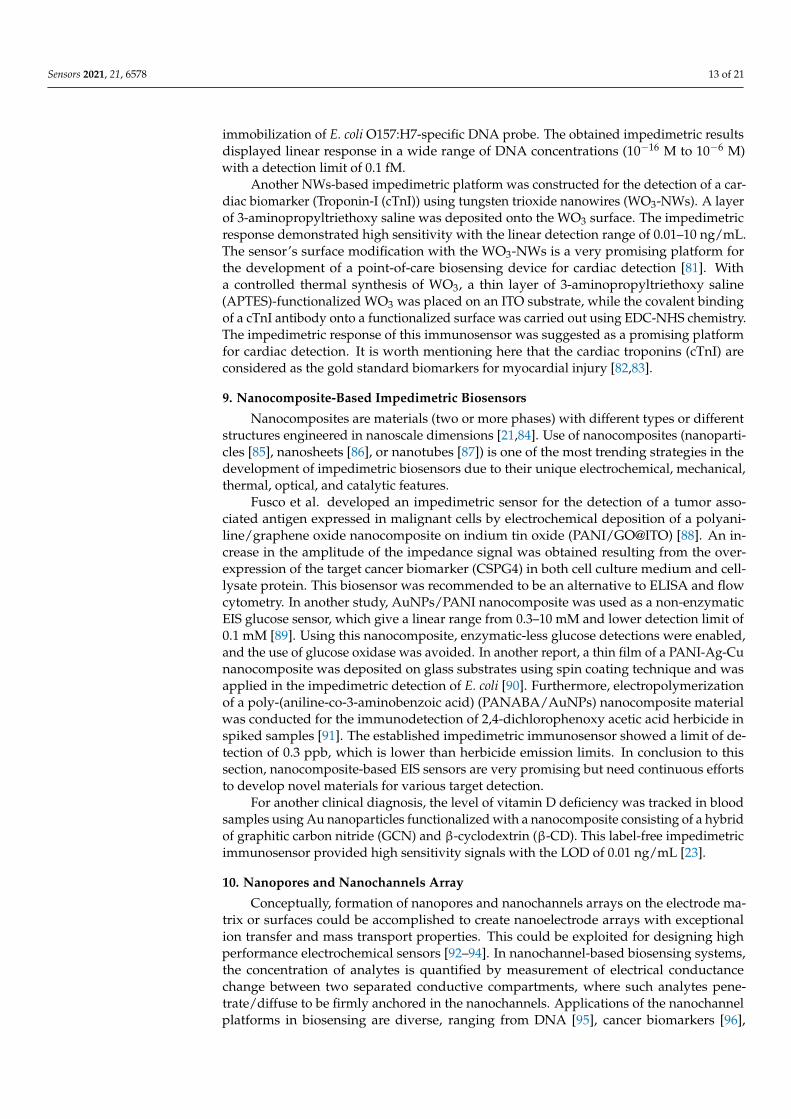
Another NWs-based impedimetric platform was constructed for the detection of a car-diac biomarker (Troponin-I (cTnI)) using tungsten trioxide nanowires (WO3-NWs). A layerof 3-aminopropyltriethoxy saline was deposited onto the WO3 surface. The impedimetricresponse demonstrated high sensitivity with the linear detection range of 0.01–10 ng/mL.The sensor’s surface modification with the WO3-NWs is a very promising platform forthe development of a point-of-care biosensing device for cardiac detection [81]. Witha controlled thermal synthesis of WO3, a thin layer of 3-aminopropyltriethoxy saline(APTES)-functionalized WO3 was placed on an ITO substrate, while the covalent bindingof a cTnI antibody onto a functionalized surface was carried out using EDC-NHS chemistry.The impedimetric response of this immunosensor was suggested as a promising platformfor cardiac detection. It is worth mentioning here that the cardiac troponins (cTnI) areconsidered as the gold standard biomarkers for myocardial injury [82,83].
9. Nanocomposite-Based Impedimetric Biosensors
Nanocomposites are materials (two or more phases) with different types or differentstructures engineered in nanoscale dimensions [21,84]. Use of nanocomposites (nanoparti-cles [85], nanosheets [86], or nanotubes [87]) is one of the most trending strategies in thedevelopment of impedimetric biosensors due to their unique electrochemical, mechanical,thermal, optical, and catalytic features.
Fusco et al. developed an impedimetric sensor for the detection of a tumor asso-ciated antigen expressed in malignant cells by electrochemical deposition of a polyani-line/graphene oxide nanocomposite on indium tin oxide (PANI/GO@ITO) [88]. An in-crease in the amplitude of the impedance signal was obtained resulting from the over-expression of the target cancer biomarker (CSPG4) in both cell culture medium and cell-lysate protein. This biosensor was recommended to be an alternative to ELISA and flowcytometry. In another study, AuNPs/PANI nanocomposite was used as a non-enzymaticEIS glucose sensor, which give a linear range from 0.3–10 mM and lower detection limit of0.1 mM [89]. Using this nanocomposite, enzymatic-less glucose detections were enabled,and the use of glucose oxidase was avoided. In another report, a thin film of a PANI-Ag-Cunanocomposite was deposited on glass substrates using spin coating technique and wasapplied in the impedimetric detection of E. coli [90]. Furthermore, electropolymerizationof a poly-(aniline-co-3-aminobenzoic acid) (PANABA/AuNPs) nanocomposite materialwas conducted for the immunodetection of 2,4-dichlorophenoxy acetic acid herbicide inspiked samples [91]. The established impedimetric immunosensor showed a limit of de-tection of 0.3 ppb, which is lower than herbicide emission limits. In conclusion to thissection, nanocomposite-based EIS sensors are very promising but need continuous effortsto develop novel materials for various target detection.
For another clinical diagnosis, the level of vitamin D deficiency was tracked in bloodsamples using Au nanoparticles functionalized with a nanocomposite consisting of a hybridof graphitic carbon nitride (GCN) and β-cyclodextrin (β-CD). This label-free impedimetricimmunosensor provided high sensitivity signals with the LOD of 0.01 ng/mL [23].
10. Nanopores and Nanochannels Array
Conceptually, formation of nanopores and nanochannels arrays on the electrode ma-trix or surfaces could be accomplished to create nanoelectrode arrays with exceptionalion transfer and mass transport properties. This could be exploited for designing highperformance electrochemical sensors [92–94]. In nanochannel-based biosensing systems,the concentration of analytes is quantified by measurement of electrical conductancechange between two separated conductive compartments, where such analytes pene-trate/diffuse to be firmly anchored in the nanochannels. Applications of the nanochannelplatforms in biosensing are diverse, ranging from DNA [95], cancer biomarkers [96],

Sensors 2021, 21, 6578 14 of 21
enzyme [97], and pathogens [98] to gases and vapors of small molecules such as polychlori-nated biphenyls [99]. In nanochannel-based biosensing systems, the impedance sensing canbe performed by Faradaic or non-Faradaic models [100]. To avoid the use of redox species,the non-Faradaic models are more common. Thus, they are well-suited for the detection ofbinding events inside the nanopores. Anodic aluminum oxide nano-porous membranesare the most popular nanochannel-based platforms used with EIS technique [101]. Thepreparation of anodic aluminum oxide nano-porous membranes was performed by usingelectrochemical anodization, and they present an attractive method to develop nanoporebiosensing devices due to their uniform pore size, high surface area, high aspect ratio, andinexpensive preparation [102].
Nagaraj and his group successfully improved a nanochannel sensor for pharmaceuticalcontaminants detection in water. Ibuprofen concentration was measured in water sampleswith the LOD of 0.25 pg mL−1 [100]. Furthermore, different pathogens (such as S. aureusand E. coli O157:H7) were detected, where selectivity and sensitivity reached a detectioncapability of 102 CFU/mL [103].
For adjusting the nanostructures to be suitable for non-Faradaic sensing models, Kantet al. studied the impact of pore dimension on the performance of biosensing by attachingstreptavidin and biotin covalently with a selected monoclonal antibody of the targetedorganisms [103]. The anodic aluminum oxide nano-porous membrane was prepared withdifferent pore sizes and lengths followed by the functionalization of streptavidin on theinner surface of the pores, creating a covalent binding site for biotin molecules. As arecommendation, lowering nanochannel diameters (less than 10 µm) is not favorablefor non-Faradaic EIS detection due to the high resistance and the long time required foranalyte diffusion inside the channels. Hence, optimization of nanochannel dimensionsis a critical factor that has significant influence on the performance of nanopore-basedelectrochemical biosensing devices. Nanochannel-based biosensing approaches are a verypromising research area with tremendous potential applications. In conclusion to thissection, the construction of nanodevices enabling real-time detection systems for sensing ofselected target(s) occurring at confined spaces or interfaces is a significant challenge. Thus,the nanochannel-based electrochemical sensors could be constructed and optimized.
11. Nanogap Electrodes
As a suggested solution to eliminate the negative effect of the double layer, the debyelength was increased as the ionic strength of the solution was increased. However, this re-quired additional separation and purification steps for medium replacement. Alternatively,decreasing the electrode separation distance permitted the electric field uniformity withinthe target medium. This concept inspired researchers to construct nanogap electrodes [104].A nanogap-based biosensing platform represents the organization of two conductive elec-trodes separated by a distance of no more than 300 nm. Nanogab sensors were appliedin the detection of chemical or biological interactions taking place at the interface. Thedistance limit of 300 nm was defined, since it characterizes the upper limit of the electricaldouble layer, which formed at all charged conductive sides in aqueous media [105,106].
By exploiting this advance approach, DNA [107], protein [108], and other biologicalmolecules [109] were detected. The 1D nanogap with point-type gap junctions is classi-cally intended for single molecule detection by applying AC potential to produce resistivequantities. The 2D nanogap with band-type gap junctions and the 3D nanogap withsurface-type gap junctions are intended for monitoring of biological parameters (e.g., bind-ing efficiency of biomolecules) from complex impedance response via AC measurementtechniques [110]. To overlap the double layer effect as well as to reduce the ohmic dropbetween electrodes, the gap size was defined to be less than 100 nm. Graphene nanogapelectrodes (GNEs) were used for the detection of streptavidin–biotin biomolecular interac-tions. The electrodes showed high-affinity interactions of streptavidin–gold nanoparticlesto the biotin-functionalized nanogaps. This platform is recommended as a biosensor for thedetection of other affinity-based biomolecular interactions, such as nucleic acid, antigen–
Sensors 2021, 21, 6578 15 of 21
antibody, or chemo-selective interactions [111]. In another study, nanogap interdigitatedelectrode (IDE) arrays with assisted gold nanoparticles were used to enhance the sensitivityof detection [85].
Nanogap biosensors were able to detect specific proteins in serum or blood directly,and they were used also in early disease detection. Despite nanogap biosensors devel-opment, there is still no commercial device available in the research phase to fulfill theselectivity and the reproducibility issues due to the technical limitations in mass fabri-cation. However, the perspective of a small volume, highly sensitive, label-free, lowpower consumption and all-electrical biosensing device is still appealing. Ultimately, thenanogap electrodes are very important tools for the investigation of material propertiesat the nanometer scale or at the molecular level. Therefore, they might be considered asbuilding blocks for the construction of nano-circuits and nanodevices.
12. Conclusions, Remarks and Future Perspective
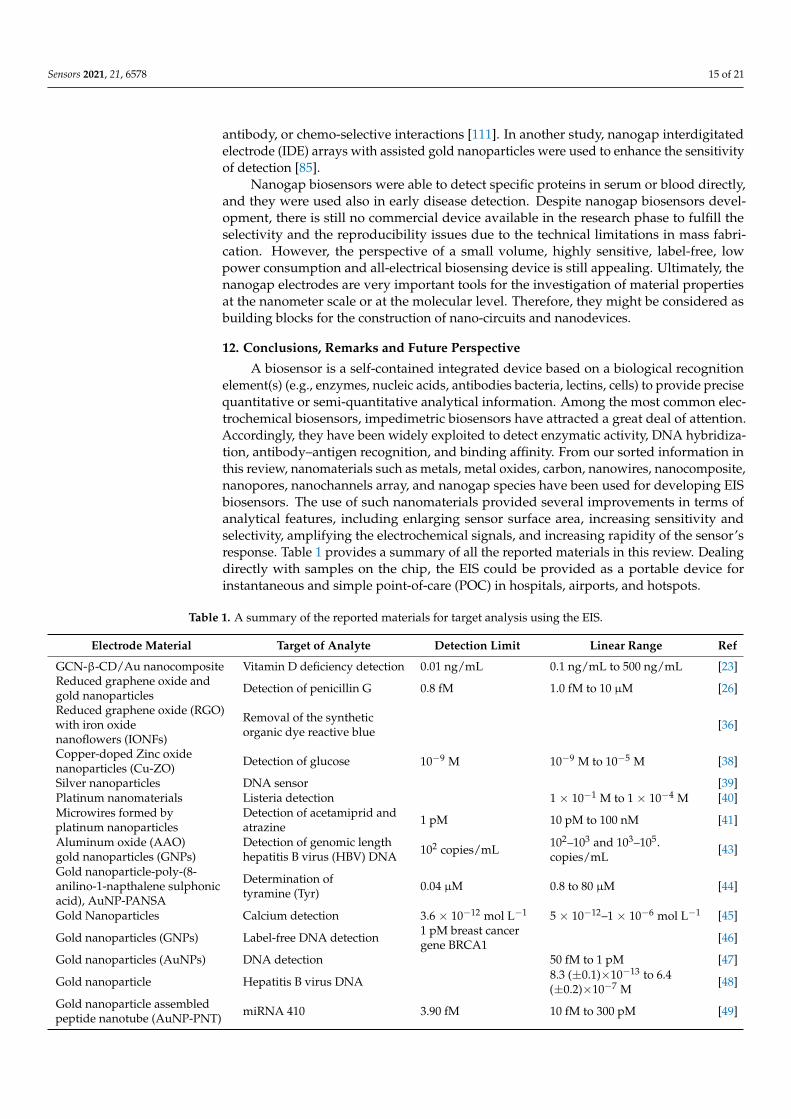
A biosensor is a self-contained integrated device based on a biological recognitionelement(s) (e.g., enzymes, nucleic acids, antibodies bacteria, lectins, cells) to provide precisequantitative or semi-quantitative analytical information. Among the most common elec-trochemical biosensors, impedimetric biosensors have attracted a great deal of attention.Accordingly, they have been widely exploited to detect enzymatic activity, DNA hybridiza-tion, antibody–antigen recognition, and binding affinity. From our sorted information inthis review, nanomaterials such as metals, metal oxides, carbon, nanowires, nanocomposite,nanopores, nanochannels array, and nanogap species have been used for developing EISbiosensors. The use of such nanomaterials provided several improvements in terms ofanalytical features, including enlarging sensor surface area, increasing sensitivity andselectivity, amplifying the electrochemical signals, and increasing rapidity of the sensor’sresponse. Table 1 provides a summary of all the reported materials in this review. Dealingdirectly with samples on the chip, the EIS could be provided as a portable device forinstantaneous and simple point-of-care (POC) in hospitals, airports, and hotspots.
Table 1. A summary of the reported materials for target analysis using the EIS.
Electrode Material Target of Analyte Detection Limit Linear Range Ref
GCN-β-CD/Au nanocomposite Vitamin D deficiency detection 0.01 ng/mL 0.1 ng/mL to 500 ng/mL [23]Reduced graphene oxide andgold nanoparticles Detection of penicillin G 0.8 fM 1.0 fM to 10 µM [26]
Reduced graphene oxide (RGO)with iron oxidenanoflowers (IONFs)
Removal of the syntheticorganic dye reactive blue [36]
Copper-doped Zinc oxidenanoparticles (Cu-ZO) Detection of glucose 10−9 M 10−9 M to 10−5 M [38]
Silver nanoparticles DNA sensor [39]Platinum nanomaterials Listeria detection 1 × 10⁻¹ M to 1 × 10⁻⁴ M [40]Microwires formed byplatinum nanoparticles
Detection of acetamiprid andatrazine 1 pM 10 pM to 100 nM [41]
Aluminum oxide (AAO)gold nanoparticles (GNPs)
Detection of genomic lengthhepatitis B virus (HBV) DNA 102 copies/mL 102–103 and 103–105.
copies/mL[43]
Gold nanoparticle-poly-(8-anilino-1-napthalene sulphonicacid), AuNP-PANSA
Determination oftyramine (Tyr) 0.04 µM 0.8 to 80 µM [44]
Gold Nanoparticles Calcium detection 3.6 × 10⁻¹² mol L−1 5 × 10⁻¹²–1 × 10⁻⁶ mol L−1 [45]
Gold nanoparticles (GNPs) Label-free DNA detection 1 pM breast cancergene BRCA1 [46]
Gold nanoparticles (AuNPs) DNA detection 50 fM to 1 pM [47]
Gold nanoparticle Hepatitis B virus DNA 8.3 (±0.1)×10−13 to 6.4(±0.2)×10−7 M
[48]
Gold nanoparticle assembledpeptide nanotube (AuNP-PNT) miRNA 410 3.90 fM 10 fM to 300 pM [49]
Sensors 2021, 21, 6578 16 of 21
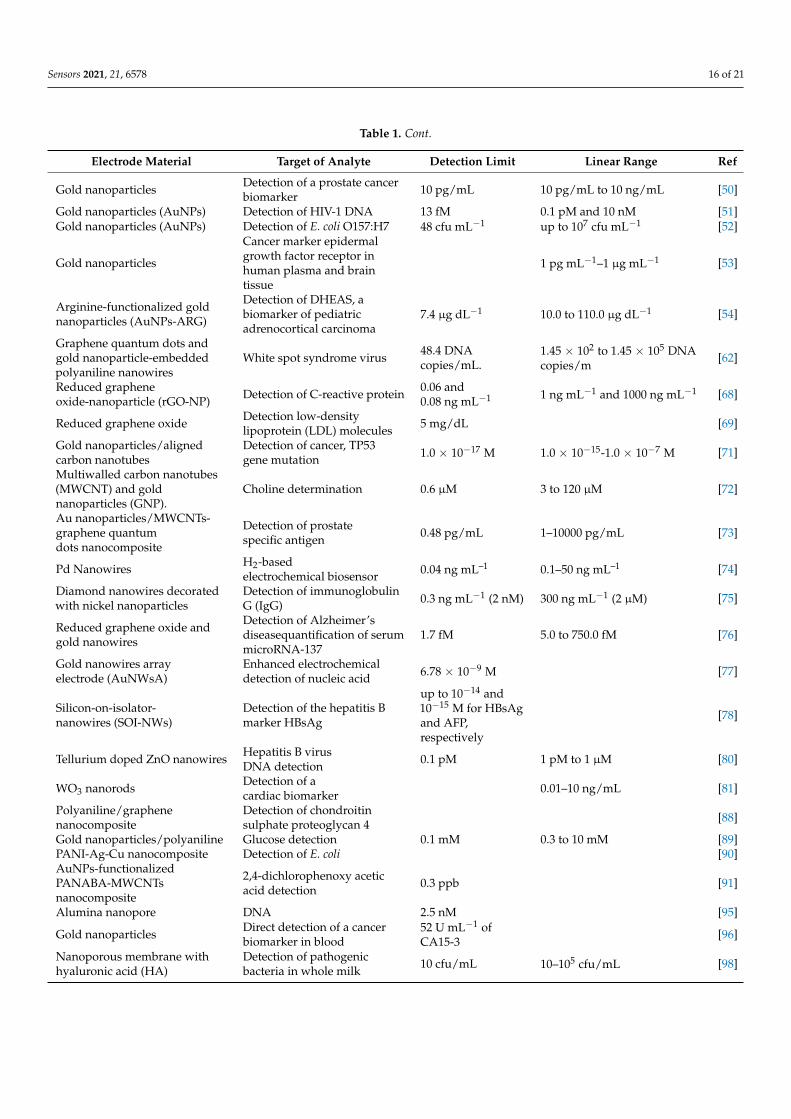
Table 1. Cont.
Electrode Material Target of Analyte Detection Limit Linear Range Ref
Gold nanoparticles Detection of a prostate cancerbiomarker 10 pg/mL 10 pg/mL to 10 ng/mL [50]
Gold nanoparticles (AuNPs) Detection of HIV-1 DNA 13 fM 0.1 pM and 10 nM [51]Gold nanoparticles (AuNPs) Detection of E. coli O157:H7 48 cfu mL−1 up to 107 cfu mL−1 [52]
Gold nanoparticles
Cancer marker epidermalgrowth factor receptor inhuman plasma and braintissue
1 pg mL−1–1 µg mL−1 [53]
Arginine-functionalized goldnanoparticles (AuNPs-ARG)
Detection of DHEAS, abiomarker of pediatricadrenocortical carcinoma
7.4 µg dL−1 10.0 to 110.0 µg dL−1 [54]
Graphene quantum dots andgold nanoparticle-embeddedpolyaniline nanowires
White spot syndrome virus 48.4 DNAcopies/mL.
1.45 × 10² to 1.45 × 10⁵ DNAcopies/m
[62]
Reduced grapheneoxide-nanoparticle (rGO-NP) Detection of C-reactive protein 0.06 and
0.08 ng mL−1 1 ng mL−1 and 1000 ng mL−1 [68]
Reduced graphene oxide Detection low-densitylipoprotein (LDL) molecules 5 mg/dL [69]
Gold nanoparticles/alignedcarbon nanotubes
Detection of cancer, TP53gene mutation 1.0 × 10⁻¹⁷ M 1.0 × 10⁻¹⁵-1.0 × 10⁻⁷ M [71]
Multiwalled carbon nanotubes(MWCNT) and goldnanoparticles (GNP).
Choline determination 0.6 µM 3 to 120 µM [72]
Au nanoparticles/MWCNTs-graphene quantumdots nanocomposite
Detection of prostatespecific antigen 0.48 pg/mL 1–10000 pg/mL [73]
Pd Nanowires H2-basedelectrochemical biosensor 0.04 ng mL–1 0.1–50 ng mL–1 [74]
Diamond nanowires decoratedwith nickel nanoparticles
Detection of immunoglobulinG (IgG) 0.3 ng mL−1 (2 nM) 300 ng mL−1 (2 µM) [75]
Reduced graphene oxide andgold nanowires
Detection of Alzheimer’sdiseasequantification of serummicroRNA-137
1.7 fM 5.0 to 750.0 fM [76]
Gold nanowires arrayelectrode (AuNWsA)
Enhanced electrochemicaldetection of nucleic acid 6.78 × 10⁻⁹ M [77]
Silicon-on-isolator-nanowires (SOI-NWs)
Detection of the hepatitis Bmarker HBsAg
up to 10−14 and10−15 M for HBsAgand AFP,respectively
[78]
Tellurium doped ZnO nanowires Hepatitis B virusDNA detection 0.1 pM 1 pM to 1 µM [80]
WO3 nanorods Detection of acardiac biomarker 0.01–10 ng/mL [81]
Polyaniline/graphenenanocomposite
Detection of chondroitinsulphate proteoglycan 4 [88]
Gold nanoparticles/polyaniline Glucose detection 0.1 mM 0.3 to 10 mM [89]PANI-Ag-Cu nanocomposite Detection of E. coli [90]AuNPs-functionalizedPANABA-MWCNTsnanocomposite
2,4-dichlorophenoxy aceticacid detection 0.3 ppb [91]
Alumina nanopore DNA 2.5 nM [95]
Gold nanoparticles Direct detection of a cancerbiomarker in blood
52 U mL−1 ofCA15-3
[96]
Nanoporous membrane withhyaluronic acid (HA)
Detection of pathogenicbacteria in whole milk 10 cfu/mL 10–105 cfu/mL [98]
Sensors 2021, 21, 6578 17 of 21
Author Contributions: All authors shared the conceptualization, writing the review and did effortsin the editing, and visualization. R.Y.A.H. and A.M. supervised the review structure and its scientificcontents. All authors have read and agreed to the published version of the manuscript.
Funding: This research received no external funding.
Institutional Review Board Statement: Not applicable.
Informed Consent Statement: Not applicable.
Data Availability Statement: Not applicable.
Acknowledgments: A.M. acknowledges the support of National Institute of Justice (2019-NE-BX-006)and W. Ruel Johnson Chair.
Conflicts of Interest: The authors declare no conflict of interest.
References1. Ozdemir, M.S.; Marczak, M.; Bohets, H.; Bonroy, K.; Roymans, D.; Stuyver, L.; Vanhoutte, K.; Pawlak, M.; Bakker, E. A Label-Free
Potentiometric Sensor Principle for the Detection of Antibody–Antigen Interactions. Anal. Chem. 2013, 85, 4770–4776. [CrossRef]2. Hsueh, C.-J.; Janyasupab, M.; Lee, Y.-H.; Liu, C.-C. Coulometric Analysis. In Encyclopedia of Applied Electrochemistry; Kreysa, G.,
Ota, K.-i., Savinell, R.F., Eds.; Springer: New York, NY, USA, 2014; pp. 275–283.3. Scholz, F. Voltammetric techniques of analysis: The essentials. ChemTexts 2015, 1, 17. [CrossRef]4. Page, J.E. Recent Developments in Polarographic Analysis. Nature 1944, 154, 199–202. [CrossRef]5. Chauhan, C. Contemporary voltammetric techniques and its application to pesticide analysis: A review. Mater. Today Proc. 2021,
37, 3231–3240. [CrossRef]6. Bahadır, E.B.; Sezgintürk, M.K. A review on impedimetric biosensors. Artif. Cells Nanomed. Biotechnol. 2016, 44, 248–262.
[CrossRef]7. Benavente, J. Electrochemical Impedance Spectroscopy as a Tool for Electrical and Structural Characterizations of Membranes in
Contact with Electrolyte Solutions. In Recent Advances in Multidisciplinary Applied Physics; Méndez-Vilas, A., Ed.; Elsevier ScienceLtd.: Oxford, UK, 2005; pp. 463–471.
8. Lvovich, V.F. Electrochemical Impedance Spectroscopy (EIS) Applications to Sensors and Diagnostics. In Encyclopedia of AppliedElectrochemistry; Kreysa, G., Ota, K.-i., Savinell, R.F., Eds.; Springer: New York, NY, USA, 2014; pp. 485–507.
9. Carminati, M.; Ferrari, G.; Bianchi, D.; Sampietro, M. Impedance Spectroscopy for Biosensing: Circuits and Applications. InHandbook of Biochips: Integrated Circuits and Systems for Biology and Medicine; Sawan, M., Ed.; Springer: New York, NY, USA, 2015;pp. 1–24.
10. Ha, L.D.; Park, K.; Chang, B.-Y.; Hwang, S. Implementation of Second-Generation Fourier Transform Electrochemical ImpedanceSpectroscopy with Commercial Potentiostat and Application to Time-Resolved Electrochemical Impedance Spectroscopy.Anal. Chem. 2019, 91, 14208–14213. [CrossRef] [PubMed]
11. Katz, E.; Willner, I. Probing Biomolecular Interactions at Conductive and Semiconductive Surfaces by Impedance Spectroscopy:Routes to Impedimetric Immunosensors, DNA-Sensors, and Enzyme Biosensors. Electroanalysis 2003, 15, 913–947. [CrossRef]
12. Fasmin, F.; Srinivasan, R. Review—Nonlinear Electrochemical Impedance Spectroscopy. J. Electrochem. Soc. 2017, 164, H443–H455.[CrossRef]
13. Wang, S.; Zhang, J.; Gharbi, O.; Vivier, V.; Gao, M.; Orazem, M.E. Electrochemical impedance spectroscopy. Nat. Rev. Methods Primers2021, 1, 41. [CrossRef]
14. Prodromidis, M.I. Impedimetric immunosensors—A review. Electrochim. Acta 2010, 55, 4227–4233. [CrossRef]15. Lasia, A. Impedance of the Faradaic Reactions in the Presence of Mass Transfer. In Electrochemical Impedance Spectroscopy and Its
Applications; Lasia, A., Ed.; Springer: New York, NY, USA, 2014; pp. 85–125.16. Lasia, A. Definition of Impedance and Impedance of Electrical Circuits. In Electrochemical Impedance Spectroscopy and Its Applications;
Lasia, A., Ed.; Springer: New York, NY, USA, 2014; pp. 7–66.17. Sun, J.; Liu, Y. Unique Constant Phase Element Behavior of the Electrolyte-Graphene Interface. Nanomaterials 2019, 9, 923.
[CrossRef]18. Cherian, C.T.; Zheng, M.; Reddy, M.V.; Chowdari, B.V.R.; Sow, C.H. Zn2SnO4 Nanowires versus Nanoplates: Electrochemical
Performance and Morphological Evolution during Li-Cycling. ACS Appl. Mater. Interfaces 2013, 5, 6054–6060. [CrossRef][PubMed]
19. Karunakaran, C.; Bhargava, K.; Benjamin, R. Biosensors and Bioelectronics; Elsevier: Amsterdam, The Netherlands, 2015.20. Sedki, M.; Hassan, R.Y.A.; Andreescu, S.; El-Sherbiny, I.M. Online-monitoring of biofilm formation using nanostructured electrode
surfaces. Mater. Sci. Eng. C 2019, 100, 178–185. [CrossRef]21. Hassan, R.Y.A.; Mekawy, M.M.; Ramnani, P.; Mulchandani, A. Monitoring of microbial cell viability using nanostructured
electrodes modified with Graphene/Alumina nanocomposite. Biosens. Bioelectron. 2017, 91, 857–862. [CrossRef]
Sensors 2021, 21, 6578 18 of 21
22. Slouka, C.; Wurm, D.J.; Brunauer, G.; Welzl-Wachter, A.; Spadiut, O.; Fleig, J.; Herwig, C. A Novel Application for Low FrequencyElectrochemical Impedance Spectroscopy as an Online Process Monitoring Tool for Viable Cell Concentrations. Sensors 2016,16, 1900. [CrossRef]
23. Anusha, T.; Sai Bhavani, K.; Shankumkha Kumar, J.V.; Kumar Brahman, P.; Hassan, R.Y.A. Fabrication of electrochemicalimmunosensor based on GCN-β-CD/Au nanocomposite for the monitoring of vitamin D deficiency. Bioelectrochemistry 2021,107935, In Press. [CrossRef]
24. Leva-Bueno, J.; Peyman, S.A.; Millner, P.A. A review on impedimetric immunosensors for pathogen and biomarker detection.Med. Microbiol. Immunol. 2020, 209, 343–362. [CrossRef] [PubMed]
25. Bertok, T.; Lorencova, L.; Chocholova, E.; Jane, E.; Vikartovska, A.; Kasak, P.; Tkac, J. Electrochemical Impedance SpectroscopyBased Biosensors: Mechanistic Principles, Analytical Examples and Challenges towards Commercialization for Assays of ProteinCancer Biomarkers. ChemElectroChem 2019, 6, 989–1003. [CrossRef]
26. Mohammad-Razdari, A.; Ghasemi-Varnamkhasti, M.; Izadi, Z.; Ensafi, A.A.; Rostami, S.; Siadat, M. An impedimetric aptasensorfor ultrasensitive detection of Penicillin G based on the use of reduced graphene oxide and gold nanoparticles. Microchim. Acta2019, 186, 372. [CrossRef]
27. Kim, D.C.; Kang, D.J. Molecular Recognition and Specific Interactions for Biosensing Applications. Sensors 2008, 8, 6605–6641.[CrossRef]
28. Millner, P.A.; Caygill, R.L.; Conroy, D.J.R.; Shahidan, M.A. 4—Impedance interrogated affinity biosensors for medical applications:Novel targets and mechanistic studies. In Biosensors for Medical Applications; Higson, S., Ed.; Woodhead Publishing: Sawston, UK,2012; pp. 103–134.
29. Manickam, A.; Chevalier, A.; McDermott, M.; Ellington, A.D.; Hassibi, A. A CMOS Electrochemical Impedance Spectroscopy(EIS) Biosensor Array. IEEE Trans. Biomed. Circuits Syst. 2010, 4, 379–390. [CrossRef] [PubMed]
30. Hussein, H.A.; Hassan, R.Y.A.; Chino, M.; Febbraio, F. Point-of-Care Diagnostics of COVID-19: From Current Work to FuturePerspectives. Sensors 2020, 20, 4289. [CrossRef]
31. Wang, Y.; Xia, Y. Bottom-Up and Top-Down Approaches to the Synthesis of Monodispersed Spherical Colloids of Low Melting-Point Metals. Nano Lett. 2004, 4, 2047–2050. [CrossRef]
32. Mustafa, F.; Hassan, R.Y.A.; Andreescu, S. Multifunctional Nanotechnology-Enabled Sensors for Rapid Capture and Detection ofPathogens. Sensors 2017, 17, 2121. [CrossRef]
33. Gooding, J.J. Nanostructuring electrodes with carbon nanotubes: A review on electrochemistry and applications for sensing.Electrochim. Acta 2005, 50, 3049–3060. [CrossRef]
34. Georgakilas, V.; Perman, J.A.; Tucek, J.; Zboril, R. Broad Family of Carbon Nanoallotropes: Classification, Chemistry, andApplications of Fullerenes, Carbon Dots, Nanotubes, Graphene, Nanodiamonds, and Combined Superstructures. Chem. Rev.2015, 115, 4744–4822. [CrossRef]
35. Sulciute, A.; Nishimura, K.; Gilshtein, E.; Cesano, F.; Viscardi, G.; Nasibulin, A.G.; Ohno, Y.; Rackauskas, S. ZnO NanostructuresApplication in Electrochemistry: Influence of Morphology. J. Phys. Chem. C 2021, 125, 1472–1482. [CrossRef]
36. Stankovic, D.M.; Ognjanovic, M.; Espinosa, A.; del Puerto Morales, M.; Bessais, L.; Zehani, K.; Antic, B.; Dojcinovic, B. IronOxide Nanoflower–Based Screen Print Electrode for Enhancement Removal of Organic Dye Using Electrochemical Approach.Electrocatalysis 2019, 10, 663–671. [CrossRef]
37. Bredar, A.R.C.; Chown, A.L.; Burton, A.R.; Farnum, B.H. Electrochemical Impedance Spectroscopy of Metal Oxide Electrodes forEnergy Applications. ACS Appl. Energy Mater. 2020, 3, 66–98. [CrossRef]
38. Mahmoud, A.; Echabaane, M.; Omri, K.; El Mir, L.; Ben Chaabane, R. Development of an impedimetric non enzymatic sensorbased on ZnO and Cu doped ZnO nanoparticles for the detection of glucose. J. Alloy. Compd. 2019, 786, 960–968. [CrossRef]
39. Kuzin, Y.; Porfireva, A.; Stepanova, V.; Evtugyn, V.; Stoikov, I.; Evtugyn, G.; Hianik, T. Impedimetric Detection of DNA Damagewith the Sensor Based on Silver Nanoparticles and Neutral Red. Electroanalysis 2015, 27, 2800–2808. [CrossRef]
40. Kashish; Gupta, S.; Dubey, S.K.; Prakash, R. Genosensor based on a nanostructured, platinum-modified glassy carbon electrodefor Listeria detection. Anal. Methods 2015, 7, 2616–2622. [CrossRef]
41. Madianos, L.; Tsekenis, G.; Skotadis, E.; Patsiouras, L.; Tsoukalas, D. A highly sensitive impedimetric aptasensor for the selectivedetection of acetamiprid and atrazine based on microwires formed by platinum nanoparticles. Biosens. Bioelectron. 2018, 101,268–274. [CrossRef] [PubMed]
42. Rick, J.; Tsai, M.-C.; Hwang, B.J. Biosensors Incorporating Bimetallic Nanoparticles. Nanomaterials 2015, 6, 5. [CrossRef]43. Chen, C.-C.; Lai, Z.-L.; Wang, G.-J.; Wu, C.-Y. Polymerase chain reaction-free detection of hepatitis B virus DNA using a
nanostructured impedance biosensor. Biosens. Bioelectron. 2016, 77, 603–608. [CrossRef]44. da Silva, W.; Ghica, M.E.; Ajayi, R.F.; Iwuoha, E.I.; Brett, C.M.A. Impedimetric sensor for tyramine based on gold nanoparticle
doped-poly(8-anilino-1-naphthalene sulphonic acid) modified gold electrodes. Talanta 2019, 195, 604–612. [CrossRef]45. Magar, H.S.; Abbas, M.N.; Ali, M.B.; Ahmed, M.A. Picomolar-sensitive impedimetric sensor for salivary calcium analysis at POC
based on SAM of Schiff base–modified gold electrode. J. Solid State Electrochem. 2020, 24, 723–737. [CrossRef]46. Yang, Y.; Li, C.; Yin, L.; Liu, M.; Wang, Z.; Shu, Y.; Li, G. Enhanced Charge Transfer by Gold Nanoparticle at DNA Modified
Electrode and Its Application to Label-Free DNA Detection. ACS Appl. Mater. Interfaces 2014, 6, 7579–7584. [CrossRef]47. Gao, Q.; Zhang, W.; Guo, Y.; Qi, H.; Zhang, C. Highly sensitive impedimetric sensing of DNA hybridization based on the target
DNA-induced displacement of gold nanoparticles attached to ssDNA probe. Electrochem. Commun. 2011, 13, 335–337. [CrossRef]

Sensors 2021, 21, 6578 19 of 21
48. Mashhadizadeh, M.H.; Talemi, R.P. Synergistic effect of magnetite and gold nanoparticles onto the response of a label-freeimpedimetric hepatitis B virus DNA biosensor. Mater. Sci. Eng.. C Mater. Biol. Appl. 2016, 59, 773–781. [CrossRef] [PubMed]
49. Yaman, Y.T.; Vural, O.A.; Bolat, G.; Abaci, S. One-pot synthesized gold nanoparticle-peptide nanotube modified disposable sensorfor impedimetric recognition of miRNA 410. Sens. Actuators B Chem. 2020, 320, 128343. [CrossRef]
50. Jolly, P.; Zhurauski, P.; Hammond, J.L.; Miodek, A.; Liébana, S.; Bertok, T.; Tkác, J.; Estrela, P. Self-assembled gold nanoparticles forimpedimetric and amperometric detection of a prostate cancer biomarker. Sens. Actuators B Chem. 2017, 251, 637–643. [CrossRef]
51. Yeter, E.Ç.; Sahin, S.; Caglayan, M.O.; Üstündag, Z. An electrochemical label-free DNA impedimetric sensor with AuNP-modifiedglass fiber/carbonaceous electrode for the detection of HIV-1 DNA. Chem. Pap. 2021, 75, 77–87. [CrossRef] [PubMed]
52. Lin, D.; Pillai, R.G.; Lee, W.E.; Jemere, A.B. An impedimetric biosensor for E. coli O157:H7 based on the use of self-assembledgold nanoparticles and protein G. Microchim. Acta 2019, 186, 169. [CrossRef]
53. Elshafey, R.; Tavares, A.C.; Siaj, M.; Zourob, M. Electrochemical impedance immunosensor based on gold nanoparticles–proteinG for the detection of cancer marker epidermal growth factor receptor in human plasma and brain tissue. Biosens. Bioelectron.2013, 50, 143–149. [CrossRef] [PubMed]
54. Lima, D.; Inaba, J.; Clarindo Lopes, L.; Calaça, G.N.; Los Weinert, P.; Lenzi Fogaça, R.; Ferreira de Moura, J.; Magalhães Alvarenga, L.;Cavalcante de Figueiredo, B.; Wohnrath, K.; et al. Label-free impedimetric immunosensor based on arginine-functionalized goldnanoparticles for detection of DHEAS, a biomarker of pediatric adrenocortical carcinoma. Biosens Bioelectron 2019, 133, 86–93.[CrossRef]
55. Cho, I.H.; Kim, D.H.; Park, S. Electrochemical biosensors: Perspective on functional nanomaterials for on-site analysis.Biomater Res. 2020, 24, 6. [CrossRef]
56. Li, M.; Chen, T.; Gooding, J.J.; Liu, J. Review of Carbon and Graphene Quantum Dots for Sensing. ACS Sens. 2019, 4, 1732–1748.[CrossRef] [PubMed]
57. Zaaba, N.I.; Foo, K.L.; Hashim, U.; Tan, S.J.; Liu, W.-W.; Voon, C.H. Synthesis of Graphene Oxide using Modified HummersMethod: Solvent Influence. Procedia Eng. 2017, 184, 469–477. [CrossRef]
58. Filip, J.; Kasák, P.; Tkac, J. Graphene as a signal amplifier for preparation of ultrasensitive electrochemical biosensors. Chem Zvesti2015, 69, 112–133. [CrossRef] [PubMed]
59. Gupta, B.; Kumar, N.; Panda, K.; Kanan, V.; Joshi, S.; Visoly-Fisher, I. Role of oxygen functional groups in reduced graphene oxidefor lubrication. Sci. Rep. 2017, 7, 45030. [CrossRef] [PubMed]
60. García-Argumánez, A.; Llorente, I.; Caballero-Calero, O.; González, Z.; Menéndez, R.; Escudero, M.L.; García-Alonso, M.C.Electrochemical reduction of graphene oxide on biomedical grade CoCr alloy. Appl. Surf. Sci. 2019, 465, 1028–1036. [CrossRef]
61. Sun, X.; Huang, C.; Wang, L.; Liang, L.; Cheng, Y.; Fei, W.; Li, Y. Recent Progress in Graphene/Polymer Nanocomposites.Adv. Mater. 2021, 33, 2001105. [CrossRef] [PubMed]
62. Kim, H.; Abdala, A.A.; Macosko, C.W. Graphene/Polymer Nanocomposites. Macromolecules 2010, 43, 6515–6530. [CrossRef]63. Pei, S.; Cheng, H.-M. The reduction of graphene oxide. Carbon 2012, 50, 3210–3228. [CrossRef]64. Takemura, K.; Satoh, J.; Boonyakida, J.; Park, S.; Chowdhury, A.D.; Park, E.Y. Electrochemical detection of white spot syndrome
virus with a silicone rubber disposable electrode composed of graphene quantum dots and gold nanoparticle-embeddedpolyaniline nanowires. J. Nanobiotechnology 2020, 18, 152. [CrossRef]
65. Chowdhury, A.D.; Takemura, K.; Li, T.-C.; Suzuki, T.; Park, E.Y. Electrical pulse-induced electrochemical biosensor for hepatitis Evirus detection. Nat. Commun. 2019, 10, 3737. [CrossRef]
66. Bonanni, A.; Pumera, M. Graphene Platform for Hairpin-DNA-Based Impedimetric Genosensing. ACS Nano 2011, 5, 2356–2361.[CrossRef]
67. Hu, Y.; Wang, K.; Zhang, Q.; Li, F.; Wu, T.; Niu, L. Decorated graphene sheets for label-free DNA impedance biosensing.Biomaterials 2012, 33, 1097–1106. [CrossRef]
68. Yagati, A.K.; Pyun, J.-C.; Min, J.; Cho, S. Label-free and direct detection of C-reactive protein using reduced graphene oxide-nanoparticle hybrid impedimetric sensor. Bioelectrochemistry 2016, 107, 37–44. [CrossRef] [PubMed]
69. Zhu, Z. An Overview of Carbon Nanotubes and Graphene for Biosensing Applications. Nano-Micro Lett. 2017, 9, 25. [CrossRef][PubMed]
70. Fayazfar, H.; Afshar, A.; Dolati, M.; Dolati, A. DNA impedance biosensor for detection of cancer, TP53 gene mutation, based ongold nanoparticles/aligned carbon nanotubes modified electrode. Anal. Chim Acta 2014, 836, 34–44. [CrossRef]
71. Li, L.; Wang, S.; Yang, T.; Huang, S.; Wang, J. Electrochemical growth of gold nanoparticles on horizontally aligned carbonnanotubes: A new platform for ultrasensitive DNA sensing. Biosens Bioelectron 2012, 33, 279–283. [CrossRef]
72. Magar, H.S.; Ghica, M.E.; Abbas, M.N.; Brett, C.M.A. A novel sensitive amperometric choline biosensor based on multiwalledcarbon nanotubes and gold nanoparticles. Talanta 2017, 167, 462–469. [CrossRef] [PubMed]
73. Ghanavati, M.; Tadayon, F.; Bagheri, H. A novel label-free impedimetric immunosensor for sensitive detection of prostate specificantigen using Au nanoparticles/MWCNTs- graphene quantum dots nanocomposite. Microchem. J. 2020, 159, 105301. [CrossRef]
74. Lv, S.; Zhang, K.; Zhu, L.; Tang, D.; Niessner, R.; Knopp, D. H2-Based Electrochemical Biosensor with Pd Nanowires@ZIF-67Molecular Sieve Bilayered Sensing Interface for Immunoassay. Anal. Chem. 2019, 91, 12055–12062. [CrossRef]
75. Subramanian, P.; Motorina, A.; Yeap, W.S.; Haenen, K.; Coffinier, Y.; Zaitsev, V.; Niedziolka-Jonsson, J.; Boukherroub, R.;Szunerits, S. An impedimetric immunosensor based on diamond nanowires decorated with nickel nanoparticles. Analyst 2014,139, 1726–1731. [CrossRef]
Sensors 2021, 21, 6578 20 of 21
76. Azimzadeh, M.; Nasirizadeh, N.; Rahaie, M.; Naderi-Manesh, H. Early detection of Alzheimer’s disease using a biosensor basedon electrochemically-reduced graphene oxide and gold nanowires for the quantification of serum microRNA-137. RSC Adv. 2017,7, 55709–55719. [CrossRef]
77. Ramulu, T.S.; Venu, R.; Sinha, B.; Lim, B.; Jeon, S.J.; Yoon, S.S.; Kim, C.G. Nanowires array modified electrode for enhancedelectrochemical detection of nucleic acid. Biosens. Bioelectron. 2013, 40, 258–264. [CrossRef]
78. Ivanov, Y.D.; Pleshakova, T.O.; Kozlov, A.F.; Malsagova, K.A.; Krohin, N.V.; Shumyantseva, V.V.; Shumov, I.D.; Popov, V.P.;Naumova, O.V.; Fomin, B.I.; et al. SOI nanowire for the high-sensitive detection of HBsAg and α-fetoprotein. Lab. A Chip 2012, 12,5104–5111. [CrossRef]
79. Li, X.; Qin, Z.; Fu, H.; Li, T.; Peng, R.; Li, Z.; Rini, J.M.; Liu, X. Enhancing the performance of paper-based electrochemicalimpedance spectroscopy nanobiosensors: An experimental approach. Biosens. Bioelectron. 2021, 177, 112672. [CrossRef]
80. Khosravi-Nejad, F.; Teimouri, M.; Jafari Marandi, S.; Shariati, M. The highly sensitive impedimetric biosensor in label freeapproach for hepatitis B virus DNA detection based on tellurium doped ZnO nanowires. Appl. Phys. A 2019, 125, 616. [CrossRef]
81. Sandil, D.; Sharma, S.C.; Puri, N.K. Protein-functionalized WO3 nanorods–based impedimetric platform for sensitive andlabel-free detection of a cardiac biomarker. J. Mater. Res. 2019, 34, 1331–1340. [CrossRef]
82. La Vecchia, L.; Mezzena, G.; Zanolla, L.; Paccanaro, M.; Varotto, L.; Bonanno, C.; Ometto, R. Cardiac troponin I as diagnosticand prognostic marker in severe heart failure. J. Heart Lung Transplant. Off. Publ. Int. Soc. Heart Transplant. 2000, 19, 644–652.[CrossRef]
83. Babuin, L.; Jaffe, A.S. Troponin: The biomarker of choice for the detection of cardiac injury. CMAJ Can. Med Assoc. J. J. DeL’association Med Can. 2005, 173, 1191–1202. [CrossRef]
84. Alfadaly, R.A.; Elsayed, A.; Hassan, R.Y.A.; Noureldeen, A.; Darwish, H.; Gebreil, A.S. Microbial Sensing and Removal of HeavyMetals: Bioelectrochemical Detection and Removal of Chromium(VI) and Cadmium(II). Molecules 2021, 26, 2549. [CrossRef]
85. Singh, K.V.; Bhura, D.K.; Nandamuri, G.; Whited, A.M.; Evans, D.; King, J.; Solanki, R. Nanoparticle-Enhanced Sensitivity of aNanogap-Interdigitated Electrode Array Impedimetric Biosensor. Langmuir 2011, 27, 13931–13939. [CrossRef]
86. Luo, X.; Weaver, C.L.; Tan, S.; Cui, X.T. Pure graphene oxide doped conducting polymer nanocomposite for bio-interfacing.J. Mater. Chem. B 2013, 1, 1340–1348. [CrossRef]
87. Sireesha, M.; Jagadeesh Babu, V.; Kranthi Kiran, A.S.; Ramakrishna, S. A review on carbon nanotubes in biosensor devices andtheir applications in medicine. Nanocomposites 2018, 4, 36–57. [CrossRef]
88. Fu, J.; Shi, Z.; Li, M.; Wang, Y.; Yu, L. Label-Free Detection of Chondroitin Sulphate Proteoglycan 4 by a Polyaniline/GrapheneNanocomposite Functionalized Impedimetric Immunosensor. J. Nanomater. 2016, 2016, 7834657. [CrossRef]
89. Ahammad, A.J.S.; Al Mamun, A.; Akter, T.; Mamun, M.A.; Faraezi, S.; Monira, F.Z. Enzyme-free impedimetric glucose sensorbased on gold nanoparticles/polyaniline composite film. J. Solid State Electrochem. 2016, 20, 1933–1939. [CrossRef]
90. Abdullah, H.; Mohammad Naim, N.; Noor Azmy, N.A.; Abdul Hamid, A. PANI-Ag-Cu Nanocomposite Thin Films BasedImpedimetric Microbial Sensor for Detection of E. coli Bacteria. J. Nanomater. 2014, 2014, 951640. [CrossRef]
91. Fusco, G.; Gallo, F.; Tortolini, C.; Bollella, P.; Ietto, F.; De Mico, A.; D’Annibale, A.; Antiochia, R.; Favero, G.; Mazzei, F. AuNPs-functionalized PANABA-MWCNTs nanocomposite-based impedimetric immunosensor for 2,4-dichlorophenoxy acetic aciddetection. Biosens. Bioelectron. 2017, 93, 52–56. [CrossRef] [PubMed]
92. Zaino, L.P.; Ma, C.; Bohn, P.W. Nanopore-enabled electrode arrays and ensembles. Microchim. Acta 2016, 183, 1019–1032.[CrossRef]
93. de la Escosura-Muñiz, A.; Merkoçi, A. Nanochannels Preparation and Application in Biosensing. ACS Nano 2012, 6, 7556–7583.[CrossRef]
94. Hou, X.; Guo, W.; Jiang, L. Biomimetic smart nanopores and nanochannels. Chem. Soc. Rev. 2011, 40, 2385–2401. [CrossRef]95. Wu, S.; Ye, W.; Yang, M.; Taghipoor, M.; Meissner, R.; Brugger, J.; Renaud, P. Impedance sensing of DNA immobilization and
hybridization by microfabricated alumina nanopore membranes. Sens. Actuators B: Chem. 2015, 216, 105–112. [CrossRef]96. de la Escosura-Muñiz, A.; Merkoçi, A. A nanochannel/nanoparticle-based filtering and sensing platform for direct detection of a
cancer biomarker in blood. Small Weinh. Der Bergstr. 2011, 7, 675–682. [CrossRef] [PubMed]97. Yang, Z.; Si, S.; Zhang, C. Study on the activity and stability of urease immobilized onto nanoporous alumina membranes.
Microporous Mesoporous Mater. 2008, 111, 359–366. [CrossRef]98. Joung, C.-K.; Kim, H.-N.; Lim, M.-C.; Jeon, T.-J.; Kim, H.-Y.; Kim, Y.-R. A nanoporous membrane-based impedimetric im-
munosensor for label-free detection of pathogenic bacteria in whole milk. Biosens. Bioelectron. 2013, 44, 210–215. [CrossRef][PubMed]
99. Jin, Z.; Meng, F.; Liu, J.; Li, M.; Kong, L.; Liu, J. A novel porous anodic alumina based capacitive sensor towards trace detection ofPCBs. Sens. Actuators B: Chem. 2011, 157, 641–646. [CrossRef]
100. Nagaraj, V.J.; Jacobs, M.; Vattipalli, K.M.; Annam, V.P.; Prasad, S. Nanochannel-based electrochemical sensor for the detection ofpharmaceutical contaminants in water. Environ. Sci. Process. Impacts 2014, 16, 135–140. [CrossRef] [PubMed]
101. Lillo, M.; Losic, D. Ion-beam pore opening of porous anodic alumina: The formation of single nanopore and nanopore arrays.Mater. Lett. 2009, 63, 457–460. [CrossRef]
102. Sriram, G.; Patil, P.; Bhat, M.P.; Hegde, R.M.; Ajeya, K.V.; Udachyan, I.; Bhavya, M.B.; Gatti, M.G.; Uthappa, U.T.;Neelgund, G.M.; et al. Current Trends in Nanoporous Anodized Alumina Platforms for Biosensing Applications. J. Nanomater.2016, 2016, 1753574. [CrossRef]
Sensors 2021, 21, 6578 21 of 21
103. Tan, F.; Leung, P.H.M.; Liu, Z.-b.; Zhang, Y.; Xiao, L.; Ye, W.; Zhang, X.; Yi, L.; Yang, M. A PDMS microfluidic impedanceimmunosensor for E. coli O157:H7 and Staphylococcus aureus detection via antibody-immobilized nanoporous membrane.Sens. Actuators B Chem. 2011, 159, 328–335. [CrossRef]
104. Li, T.; Hu, W.; Zhu, D. Nanogap Electrodes. Adv. Mater. 2010, 22, 286–300. [CrossRef]105. Nevill, J.T.; Malleo, D. Nanogap Biosensors. In Encyclopedia of Nanotechnology; Bhushan, B., Ed.; Springer: Dordrecht, The
Netherlands, 2012; pp. 1544–1552.106. Chen, X.; Guo, Z.; Yang, G.-M.; Li, J.; Li, M.-Q.; Liu, J.-H.; Huang, X.-J. Electrical nanogap devices for biosensing. Mater. Today
2010, 13, 28–41. [CrossRef]107. Ali, M.E.; Dhahi, T.S.; Das, R.; Hashim, U. DNA hybridization detection using less than 10-nm gap silicon nanogap structure.
Sens. Actuators A Phys. 2013, 199, 304–309. [CrossRef]108. Mannoor, M.S.; James, T.; Ivanov, D.V.; Beadling, L.; Braunlin, W. Nanogap Dielectric Spectroscopy for Aptamer-Based Protein
Detection. Biophys. J. 2010, 98, 724–732. [CrossRef]109. Okyay, A.K.; Hanoglu, O.; Yuksel, M.; Acar, H.; Sülek, S.; Tekcan, B.; Agan, S.; Biyikli, N.; Guler, M.O. Using nanogap in label-free
impedance based electrical biosensors to overcome electrical double layer effect. Microsyst. Technol. 2017, 23, 889–897. [CrossRef]110. Balakrishnan, S.R.; Hashim, U.; Letchumanan, G.R.; Kashif, M.; Ruslinda, A.R.; Liu, W.W.; Veeradasan, P.; Haarindra Prasad, R.;
Foo, K.L.; Poopalan, P. Development of highly sensitive polysilicon nanogap with APTES/GOx based lab-on-chip biosensor todetermine low levels of salivary glucose. Sens. Actuators A Phys. 2014, 220, 101–111. [CrossRef]
111. Terse-Thakoor, T.; Ramnani, P.; Villarreal, C.; Yan, D.; Tran, T.-T.; Pham, T.; Mulchandani, A. Graphene nanogap electrodes inelectrical biosensing. Biosens. Bioelectron. 2019, 126, 838–844. [CrossRef] [PubMed]