Voltammetry and electrochemical impedance spectroscopy of gold electrodes modified with CdTe quantum...
9
Voltammetry and electrochemical impedance spectroscopy of gold electrodes modified with CdTe quantum dots and their conjugates with nickel tetraamino phthalocyanine Samson Khene, Sharon Moeno, Tebello Nyokong ⇑ Department of Chemistry, Rhodes University, Grahamstown 6140, South Africa article info Article history: Received 15 April 2011 Accepted 6 June 2011 Available online 15 June 2011 Keywords: Nickel tetraamino phthalocyanine CdTe quantum dots Cyclic voltammetry Electrochemical impedance spectroscopy Atomic force microscopy abstract This work reports on the synthesis of conjugates of cadmium telluride quantum dots (CdTe-QDs) caped with thioglycolic acid and peripherally substituted nickel tetraamino phthalocyanine (NiTAPc) complex. The conjugates are characterized using cyclic (CV) and differential pulse (DPV) voltammetries, electro- chemical impedance spectroscopy, X-ray powder diffraction, infrared spectroscopy, Raman spectroscopy, atomic force microscopy and time correlated single photon counting. CV and DPV show that NiTAPc sta- bilizes the CdTe QDs against oxidation to metallic products. Ó 2011 Elsevier Ltd. All rights reserved. 1. Introduction Over the past two decades there has been a rapid growth in re- search of nanometer sized conducting and semiconducting struc- tures such as quantum dots (QDs) and singled walled carbon nanotubes (SWCNT) [1–5]. QDs’ unique electronic properties, which depend on their size, have sparked intense interest. Quan- tized electronic behavior of these nanoparticles have been ex- plored by electrochemical means [2]. The reduction and oxidation peak positions in the cyclic voltammograms of CdTe- QDs and CdSe-QDs have been correlated with the optical band gap of these semiconductors [1,2]. However, voltammetry and electrochemical impedance spectroscopy of CdTe-QDs and other semiconductor QDs in general are still under explored. CdTe-QDs spontaneously adsorb on Au surfaces [1]. Quantum dots show excellent electrochemical properties when properly functionalized, hence have been used in electrochemical detection of some ana- lytes [6–8]. On the other hand, metallophthalocyanine (MPc) com- plexes, containing electroactive metal centers, have attracted tremendous attention mainly in the construction of electrochemi- cal sensors [5,9,10]. Therefore, deliberate combination of these two electrochemical sensors (QDs and MPc complexes) may have a syn- ergetic effect on each other. In most applications such as in electro- chemical sensing, in light emitting diodes and photovoltaic panels, QDs (and MPcs) are ultimately required to be stably immobilized on a substrate as films. However, the electrochemistry of CdTe QDs is highly influenced by any changes on their surface. QDs cap- ping consisting of carboxylic acid functionalities (such as glycolic acid, TGA, used in this work) could be used to covalently attach amino functionalized molecules. Thus in this work we aim to investigate the effect of linking nickel tetraamino phthalocyanine (NiTAPc, Fig. 1) complex to QDs (forming: CdTe-QDs-NiTAPc conjugates) on the redox proper- ties of QDs. NiTAPc is linked via an amide bond to CdTe-QDs. The electrochemistry of QDs, NiTAPc and CdTe-QDs-NiTAPc are carried out when adsorbed on the electrode and also when in solution. Our focus is to investigate the electrochemical stability of QD on elec- trode surfaces alone or when coordinated to NiTAPc. These studies are useful for application of the conjugates as electrocatalysts. Ni- TAPc was chosen due to the presence of amino groups on the periphery which can form an amide bond with the carboxylic acid group of the TGA capped CdTe-QDs. NiPc complexes are also well known electrocatalysts [9–11]. 2. Experimental 2.1. Materials N,N-Dimethylformamide (DMF) and tetrahydrofuran (THF) were from SAARCHEM. Dicyclohexylcarbodiimide (DCC), N-hydro- xy succinimide (NHS), tellurium powder (200 mesh), thioglycolic acid (TGA), were from Sigma Aldrich. 0277-5387/$ - see front matter Ó 2011 Elsevier Ltd. All rights reserved. doi:10.1016/j.poly.2011.06.002 ⇑ Corresponding author. Tel.: +27 46 6038260; fax: +27 46 6225109. E-mail address: [email protected] (T. Nyokong). Polyhedron 30 (2011) 2162–2170 Contents lists available at ScienceDirect Polyhedron journal homepage: www.elsevier.com/locate/poly
-
Upload
independent -
Category
Documents
-
view
3 -
download
0
Transcript of Voltammetry and electrochemical impedance spectroscopy of gold electrodes modified with CdTe quantum...
Polyhedron 30 (2011) 2162–2170
Contents lists available at ScienceDirect
Polyhedron
journal homepage: www.elsevier .com/locate /poly
Voltammetry and electrochemical impedance spectroscopy of gold electrodesmodified with CdTe quantum dots and their conjugates with nickeltetraamino phthalocyanine
Samson Khene, Sharon Moeno, Tebello Nyokong ⇑Department of Chemistry, Rhodes University, Grahamstown 6140, South Africa
a r t i c l e i n f o
Article history:Received 15 April 2011Accepted 6 June 2011Available online 15 June 2011
Keywords:Nickel tetraamino phthalocyanineCdTe quantum dotsCyclic voltammetryElectrochemical impedance spectroscopyAtomic force microscopy
0277-5387/$ - see front matter � 2011 Elsevier Ltd. Adoi:10.1016/j.poly.2011.06.002
⇑ Corresponding author. Tel.: +27 46 6038260; fax:E-mail address: [email protected] (T. Nyokong).
a b s t r a c t
This work reports on the synthesis of conjugates of cadmium telluride quantum dots (CdTe-QDs) capedwith thioglycolic acid and peripherally substituted nickel tetraamino phthalocyanine (NiTAPc) complex.The conjugates are characterized using cyclic (CV) and differential pulse (DPV) voltammetries, electro-chemical impedance spectroscopy, X-ray powder diffraction, infrared spectroscopy, Raman spectroscopy,atomic force microscopy and time correlated single photon counting. CV and DPV show that NiTAPc sta-bilizes the CdTe QDs against oxidation to metallic products.
� 2011 Elsevier Ltd. All rights reserved.
1. Introduction
Over the past two decades there has been a rapid growth in re-search of nanometer sized conducting and semiconducting struc-tures such as quantum dots (QDs) and singled walled carbonnanotubes (SWCNT) [1–5]. QDs’ unique electronic properties,which depend on their size, have sparked intense interest. Quan-tized electronic behavior of these nanoparticles have been ex-plored by electrochemical means [2]. The reduction andoxidation peak positions in the cyclic voltammograms of CdTe-QDs and CdSe-QDs have been correlated with the optical bandgap of these semiconductors [1,2]. However, voltammetry andelectrochemical impedance spectroscopy of CdTe-QDs and othersemiconductor QDs in general are still under explored. CdTe-QDsspontaneously adsorb on Au surfaces [1]. Quantum dots showexcellent electrochemical properties when properly functionalized,hence have been used in electrochemical detection of some ana-lytes [6–8]. On the other hand, metallophthalocyanine (MPc) com-plexes, containing electroactive metal centers, have attractedtremendous attention mainly in the construction of electrochemi-cal sensors [5,9,10]. Therefore, deliberate combination of these twoelectrochemical sensors (QDs and MPc complexes) may have a syn-ergetic effect on each other. In most applications such as in electro-chemical sensing, in light emitting diodes and photovoltaic panels,QDs (and MPcs) are ultimately required to be stably immobilized
ll rights reserved.
+27 46 6225109.
on a substrate as films. However, the electrochemistry of CdTeQDs is highly influenced by any changes on their surface. QDs cap-ping consisting of carboxylic acid functionalities (such as glycolicacid, TGA, used in this work) could be used to covalently attachamino functionalized molecules.
Thus in this work we aim to investigate the effect of linkingnickel tetraamino phthalocyanine (NiTAPc, Fig. 1) complex toQDs (forming: CdTe-QDs-NiTAPc conjugates) on the redox proper-ties of QDs. NiTAPc is linked via an amide bond to CdTe-QDs. Theelectrochemistry of QDs, NiTAPc and CdTe-QDs-NiTAPc are carriedout when adsorbed on the electrode and also when in solution. Ourfocus is to investigate the electrochemical stability of QD on elec-trode surfaces alone or when coordinated to NiTAPc. These studiesare useful for application of the conjugates as electrocatalysts. Ni-TAPc was chosen due to the presence of amino groups on theperiphery which can form an amide bond with the carboxylic acidgroup of the TGA capped CdTe-QDs. NiPc complexes are also wellknown electrocatalysts [9–11].
2. Experimental
2.1. Materials
N,N-Dimethylformamide (DMF) and tetrahydrofuran (THF)were from SAARCHEM. Dicyclohexylcarbodiimide (DCC), N-hydro-xy succinimide (NHS), tellurium powder (200 mesh), thioglycolicacid (TGA), were from Sigma Aldrich.
N
N
N
N
N
N
N
N
Ni
NH2
NH2
NH2
NH2
NH2
NH2
NH2
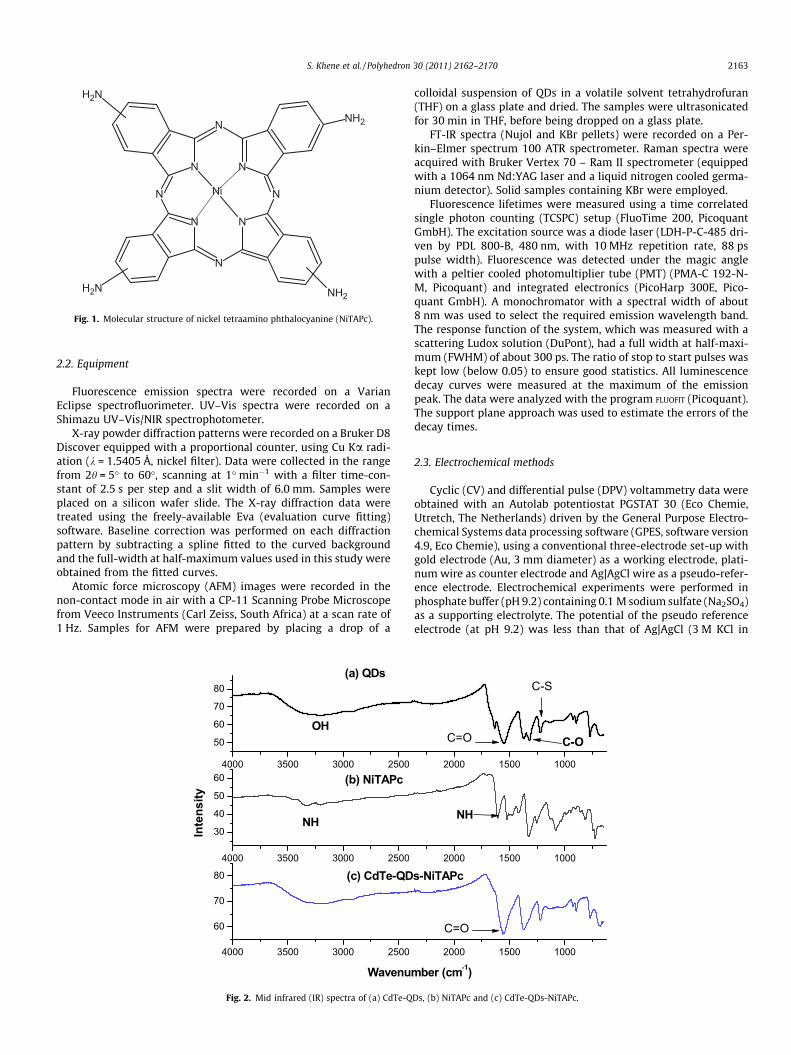
Fig. 1. Molecular structure of nickel tetraamino phthalocyanine (NiTAPc).
S. Khene et al. / Polyhedron 30 (2011) 2162–2170 2163
2.2. Equipment
Fluorescence emission spectra were recorded on a VarianEclipse spectrofluorimeter. UV–Vis spectra were recorded on aShimazu UV–Vis/NIR spectrophotometer.
X-ray powder diffraction patterns were recorded on a Bruker D8Discover equipped with a proportional counter, using Cu Ka radi-ation (k = 1.5405 Å, nickel filter). Data were collected in the rangefrom 2h = 5� to 60�, scanning at 1� min�1 with a filter time-con-stant of 2.5 s per step and a slit width of 6.0 mm. Samples wereplaced on a silicon wafer slide. The X-ray diffraction data weretreated using the freely-available Eva (evaluation curve fitting)software. Baseline correction was performed on each diffractionpattern by subtracting a spline fitted to the curved backgroundand the full-width at half-maximum values used in this study wereobtained from the fitted curves.
Atomic force microscopy (AFM) images were recorded in thenon-contact mode in air with a CP-11 Scanning Probe Microscopefrom Veeco Instruments (Carl Zeiss, South Africa) at a scan rate of1 Hz. Samples for AFM were prepared by placing a drop of a
4000 3500 3000 2500
60
70
80
4000 3500 3000 2500
30
40
50
604000 3500 3000 2500
50
60
70
80
Wavenum
Inte
nsity
NH
OH
(a) QDs
(c) CdTe-QD
(b) NiTAPc
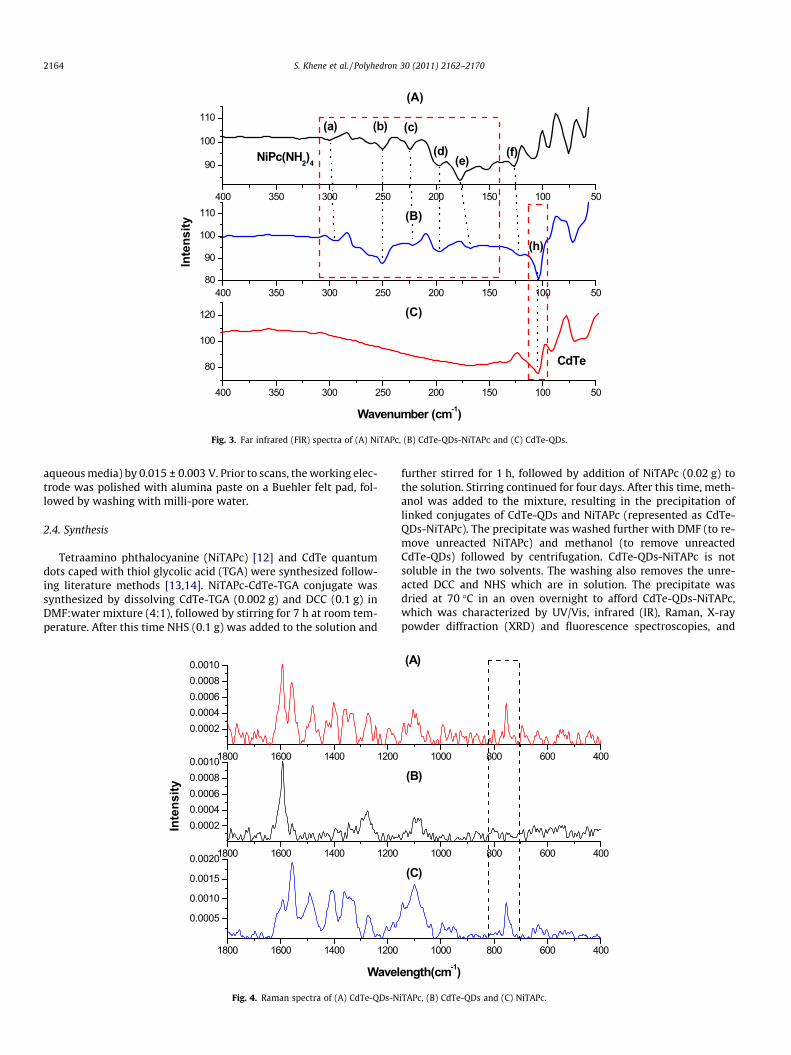
Fig. 2. Mid infrared (IR) spectra of (a) CdTe-Q
colloidal suspension of QDs in a volatile solvent tetrahydrofuran(THF) on a glass plate and dried. The samples were ultrasonicatedfor 30 min in THF, before being dropped on a glass plate.
FT-IR spectra (Nujol and KBr pellets) were recorded on a Per-kin–Elmer spectrum 100 ATR spectrometer. Raman spectra wereacquired with Bruker Vertex 70 – Ram II spectrometer (equippedwith a 1064 nm Nd:YAG laser and a liquid nitrogen cooled germa-nium detector). Solid samples containing KBr were employed.
Fluorescence lifetimes were measured using a time correlatedsingle photon counting (TCSPC) setup (FluoTime 200, PicoquantGmbH). The excitation source was a diode laser (LDH-P-C-485 dri-ven by PDL 800-B, 480 nm, with 10 MHz repetition rate, 88 pspulse width). Fluorescence was detected under the magic anglewith a peltier cooled photomultiplier tube (PMT) (PMA-C 192-N-M, Picoquant) and integrated electronics (PicoHarp 300E, Pico-quant GmbH). A monochromator with a spectral width of about8 nm was used to select the required emission wavelength band.The response function of the system, which was measured with ascattering Ludox solution (DuPont), had a full width at half-maxi-mum (FWHM) of about 300 ps. The ratio of stop to start pulses waskept low (below 0.05) to ensure good statistics. All luminescencedecay curves were measured at the maximum of the emissionpeak. The data were analyzed with the program FLUOFIT (Picoquant).The support plane approach was used to estimate the errors of thedecay times.
2.3. Electrochemical methods
Cyclic (CV) and differential pulse (DPV) voltammetry data wereobtained with an Autolab potentiostat PGSTAT 30 (Eco Chemie,Utretch, The Netherlands) driven by the General Purpose Electro-chemical Systems data processing software (GPES, software version4.9, Eco Chemie), using a conventional three-electrode set-up withgold electrode (Au, 3 mm diameter) as a working electrode, plati-num wire as counter electrode and Ag|AgCl wire as a pseudo-refer-ence electrode. Electrochemical experiments were performed inphosphate buffer (pH 9.2) containing 0.1 M sodium sulfate (Na2SO4)as a supporting electrolyte. The potential of the pseudo referenceelectrode (at pH 9.2) was less than that of Ag|AgCl (3 M KCl in
2000 1500 1000
2000 1500 1000
2000 1500 1000
C=O
ber (cm-1)
NH
C-O
s-NiTAPc
C=O
C-S
Ds, (b) NiTAPc and (c) CdTe-QDs-NiTAPc.
400 350 300 250 200 150 100 5080
90
100
110400 350 300 250 200 150 100 50
90
100
110
400 350 300 250 200 150 100 50
80
100
120
Inte
nsity
(C)
(A)
CdTe
(B)
NiPc(NH2)4
(a) (b) (c)
(d)(e)
Wavenumber (cm-1)
(f)
(h)
Fig. 3. Far infrared (FIR) spectra of (A) NiTAPc, (B) CdTe-QDs-NiTAPc and (C) CdTe-QDs.
2164 S. Khene et al. / Polyhedron 30 (2011) 2162–2170
aqueous media) by 0.015 ± 0.003 V. Prior to scans, the working elec-trode was polished with alumina paste on a Buehler felt pad, fol-lowed by washing with milli-pore water.
2.4. Synthesis
Tetraamino phthalocyanine (NiTAPc) [12] and CdTe quantumdots caped with thiol glycolic acid (TGA) were synthesized follow-ing literature methods [13,14]. NiTAPc-CdTe-TGA conjugate wassynthesized by dissolving CdTe-TGA (0.002 g) and DCC (0.1 g) inDMF:water mixture (4:1), followed by stirring for 7 h at room tem-perature. After this time NHS (0.1 g) was added to the solution and
1800 1600 1400 1200
0.0005
0.0010
0.0015
0.00201800 1600 1400 1200
0.00020.00040.00060.00080.00101800 1600 1400 1200
0.00020.00040.00060.00080.0010
Wavel
Inte
nsity
Fig. 4. Raman spectra of (A) CdTe-QDs-N
further stirred for 1 h, followed by addition of NiTAPc (0.02 g) tothe solution. Stirring continued for four days. After this time, meth-anol was added to the mixture, resulting in the precipitation oflinked conjugates of CdTe-QDs and NiTAPc (represented as CdTe-QDs-NiTAPc). The precipitate was washed further with DMF (to re-move unreacted NiTAPc) and methanol (to remove unreactedCdTe-QDs) followed by centrifugation. CdTe-QDs-NiTAPc is notsoluble in the two solvents. The washing also removes the unre-acted DCC and NHS which are in solution. The precipitate wasdried at 70 �C in an oven overnight to afford CdTe-QDs-NiTAPc,which was characterized by UV/Vis, infrared (IR), Raman, X-raypowder diffraction (XRD) and fluorescence spectroscopies, and
1000 800 600 400
1000 800 600 400
1000 800 600 400
ength(cm-1)
(A)
(C)
(B)
iTAPc, (B) CdTe-QDs and (C) NiTAPc.
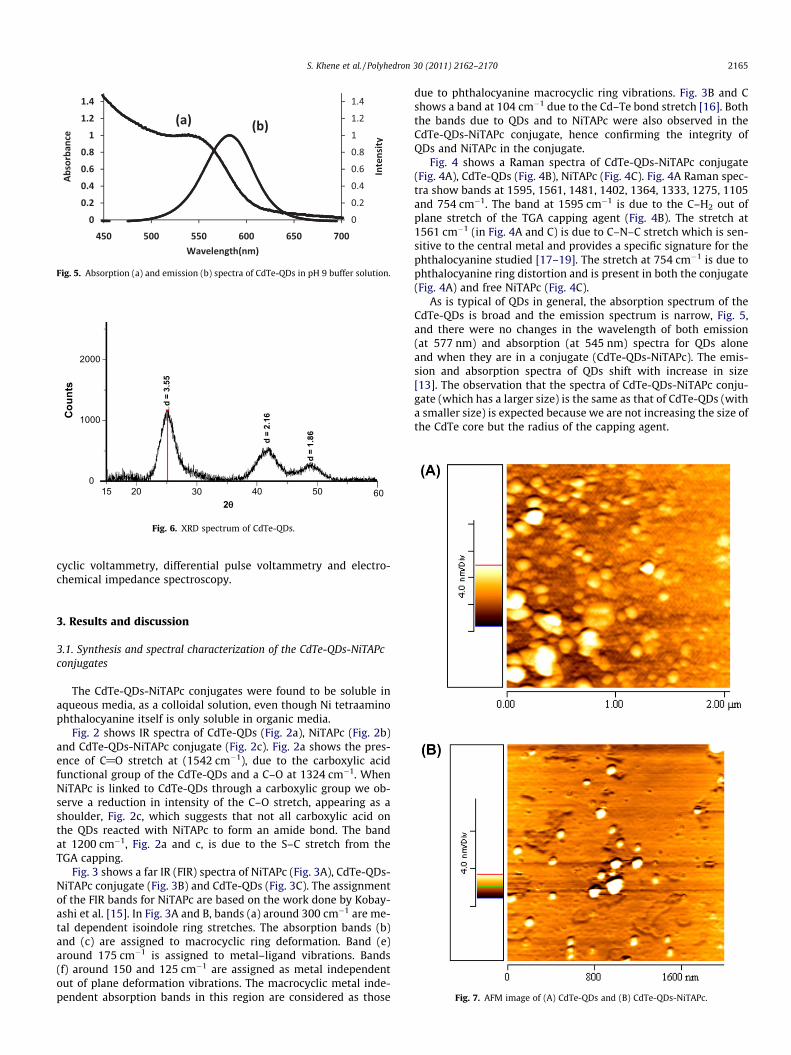
Fig. 5. Absorption (a) and emission (b) spectra of CdTe-QDs in pH 9 buffer solution.
15 20 30 40 50 60
d =
3.55
d =
2.16
d =
1.86
2000
1000
0
Coun
ts
2θθ
Fig. 6. XRD spectrum of CdTe-QDs.
S. Khene et al. / Polyhedron 30 (2011) 2162–2170 2165
cyclic voltammetry, differential pulse voltammetry and electro-chemical impedance spectroscopy.
Fig. 7. AFM image of (A) CdTe-QDs and (B) CdTe-QDs-NiTAPc.
3. Results and discussion
3.1. Synthesis and spectral characterization of the CdTe-QDs-NiTAPcconjugates
The CdTe-QDs-NiTAPc conjugates were found to be soluble inaqueous media, as a colloidal solution, even though Ni tetraaminophthalocyanine itself is only soluble in organic media.
Fig. 2 shows IR spectra of CdTe-QDs (Fig. 2a), NiTAPc (Fig. 2b)and CdTe-QDs-NiTAPc conjugate (Fig. 2c). Fig. 2a shows the pres-ence of C@O stretch at (1542 cm�1), due to the carboxylic acidfunctional group of the CdTe-QDs and a C–O at 1324 cm�1. WhenNiTAPc is linked to CdTe-QDs through a carboxylic group we ob-serve a reduction in intensity of the C–O stretch, appearing as ashoulder, Fig. 2c, which suggests that not all carboxylic acid onthe QDs reacted with NiTAPc to form an amide bond. The bandat 1200 cm�1, Fig. 2a and c, is due to the S–C stretch from theTGA capping.
Fig. 3 shows a far IR (FIR) spectra of NiTAPc (Fig. 3A), CdTe-QDs-NiTAPc conjugate (Fig. 3B) and CdTe-QDs (Fig. 3C). The assignmentof the FIR bands for NiTAPc are based on the work done by Kobay-ashi et al. [15]. In Fig. 3A and B, bands (a) around 300 cm�1 are me-tal dependent isoindole ring stretches. The absorption bands (b)and (c) are assigned to macrocyclic ring deformation. Band (e)around 175 cm�1 is assigned to metal–ligand vibrations. Bands(f) around 150 and 125 cm�1 are assigned as metal independentout of plane deformation vibrations. The macrocyclic metal inde-pendent absorption bands in this region are considered as those
due to phthalocyanine macrocyclic ring vibrations. Fig. 3B and Cshows a band at 104 cm�1 due to the Cd–Te bond stretch [16]. Boththe bands due to QDs and to NiTAPc were also observed in theCdTe-QDs-NiTAPc conjugate, hence confirming the integrity ofQDs and NiTAPc in the conjugate.
Fig. 4 shows a Raman spectra of CdTe-QDs-NiTAPc conjugate(Fig. 4A), CdTe-QDs (Fig. 4B), NiTAPc (Fig. 4C). Fig. 4A Raman spec-tra show bands at 1595, 1561, 1481, 1402, 1364, 1333, 1275, 1105and 754 cm�1. The band at 1595 cm�1 is due to the C–H2 out ofplane stretch of the TGA capping agent (Fig. 4B). The stretch at1561 cm�1 (in Fig. 4A and C) is due to C–N–C stretch which is sen-sitive to the central metal and provides a specific signature for thephthalocyanine studied [17–19]. The stretch at 754 cm�1 is due tophthalocyanine ring distortion and is present in both the conjugate(Fig. 4A) and free NiTAPc (Fig. 4C).
As is typical of QDs in general, the absorption spectrum of theCdTe-QDs is broad and the emission spectrum is narrow, Fig. 5,and there were no changes in the wavelength of both emission(at 577 nm) and absorption (at 545 nm) spectra for QDs aloneand when they are in a conjugate (CdTe-QDs-NiTAPc). The emis-sion and absorption spectra of QDs shift with increase in size[13]. The observation that the spectra of CdTe-QDs-NiTAPc conju-gate (which has a larger size) is the same as that of CdTe-QDs (witha smaller size) is expected because we are not increasing the size ofthe CdTe core but the radius of the capping agent.
2166 S. Khene et al. / Polyhedron 30 (2011) 2162–2170
Fig. 6 shows an XRD spectrum of CdTe-QDs, which is similar tothat of CdTe-QDs-NiTAPc. The diffraction pattern in Fig. 6, corre-sponds well with the three characteristic peaks for bulk CdTestructure having a cubic crystalline structure.
By fitting the whole XRD spectra we were able to calculate therelative size of 2.3 nm for CdTe-QDs and 2.4 nm for CdTe-QDs-Ni-TAPc conjugate using the Scherrer Eq. (1),
dðÅÞ ¼ kkbCosh
ð1Þ
where k is an empirical constant equal to 0.9, k is the wavelength ofthe X-ray source (1.5405 Å), b is the full width at half maximum ofthe diffraction peak and h is the angular position of the peak.
Fig. 7 shows an AFM images of CdTe-QDs (Fig. 7A) and CdTe-QDs-NiTAPc conjugate (Fig. 7B). The AFM pictures show thatCdTe-QDs (Fig. 7A) is highly aggregated compared to QDs-NiTAPcconjugate (Fig. 7B). Aggregation problem of CdTe-QDs did not al-low us to estimate the size of an individual quantum dot. The aver-age size measured of CdTe-QDs aggregates (Fig. 7A) is 5.5 nm andthat of the disaggregated QDs (Fig. 7B) is 2.2 nm. The size is very
2000
4000
6000
8000
10000
0 5 10
-4-3-2-101234
Intensity
Res
idua
ls
tim
2000
4000
6000
8000
10000
1050
-4
-2
0
2
4
Inensity
Res
idua
ls
ti
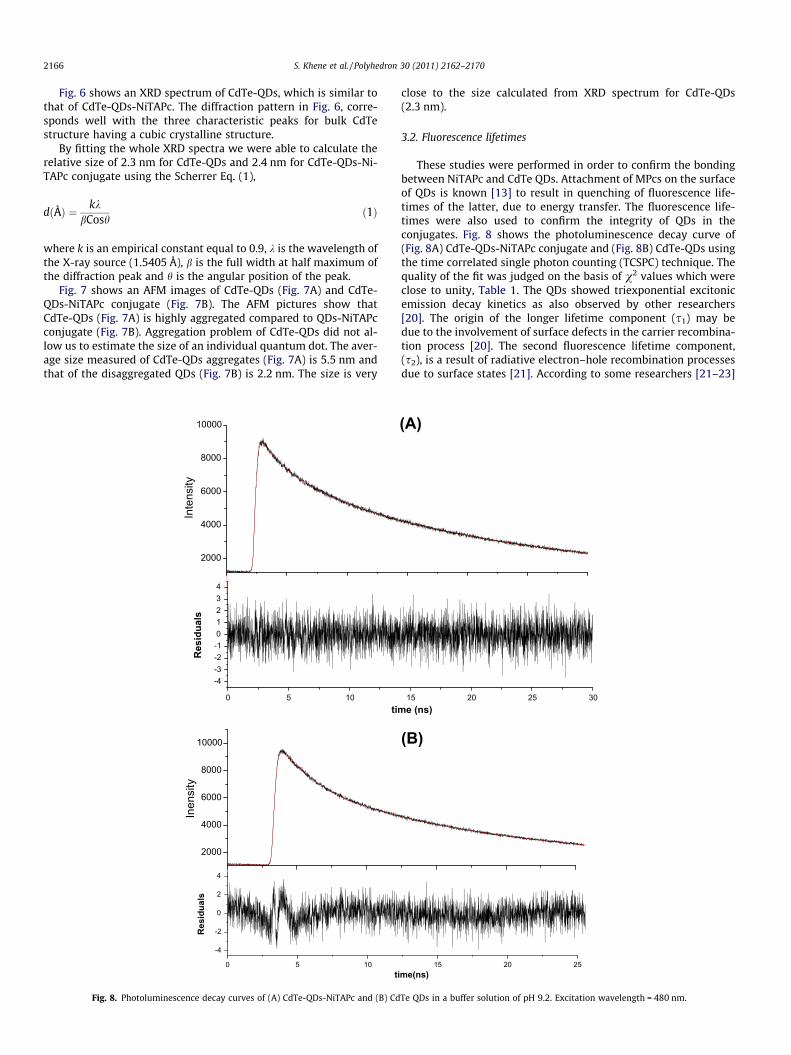
Fig. 8. Photoluminescence decay curves of (A) CdTe-QDs-NiTAPc and (B) Cd
close to the size calculated from XRD spectrum for CdTe-QDs(2.3 nm).
3.2. Fluorescence lifetimes
These studies were performed in order to confirm the bondingbetween NiTAPc and CdTe QDs. Attachment of MPcs on the surfaceof QDs is known [13] to result in quenching of fluorescence life-times of the latter, due to energy transfer. The fluorescence life-times were also used to confirm the integrity of QDs in theconjugates. Fig. 8 shows the photoluminescence decay curve of(Fig. 8A) CdTe-QDs-NiTAPc conjugate and (Fig. 8B) CdTe-QDs usingthe time correlated single photon counting (TCSPC) technique. Thequality of the fit was judged on the basis of v2 values which wereclose to unity, Table 1. The QDs showed triexponential excitonicemission decay kinetics as also observed by other researchers[20]. The origin of the longer lifetime component (s1) may bedue to the involvement of surface defects in the carrier recombina-tion process [20]. The second fluorescence lifetime component,(s2), is a result of radiative electron–hole recombination processesdue to surface states [21]. According to some researchers [21–23]
15 20 25 30
(A)
e (ns)
252015
(B)
me(ns)
Te QDs in a buffer solution of pH 9.2. Excitation wavelength = 480 nm.
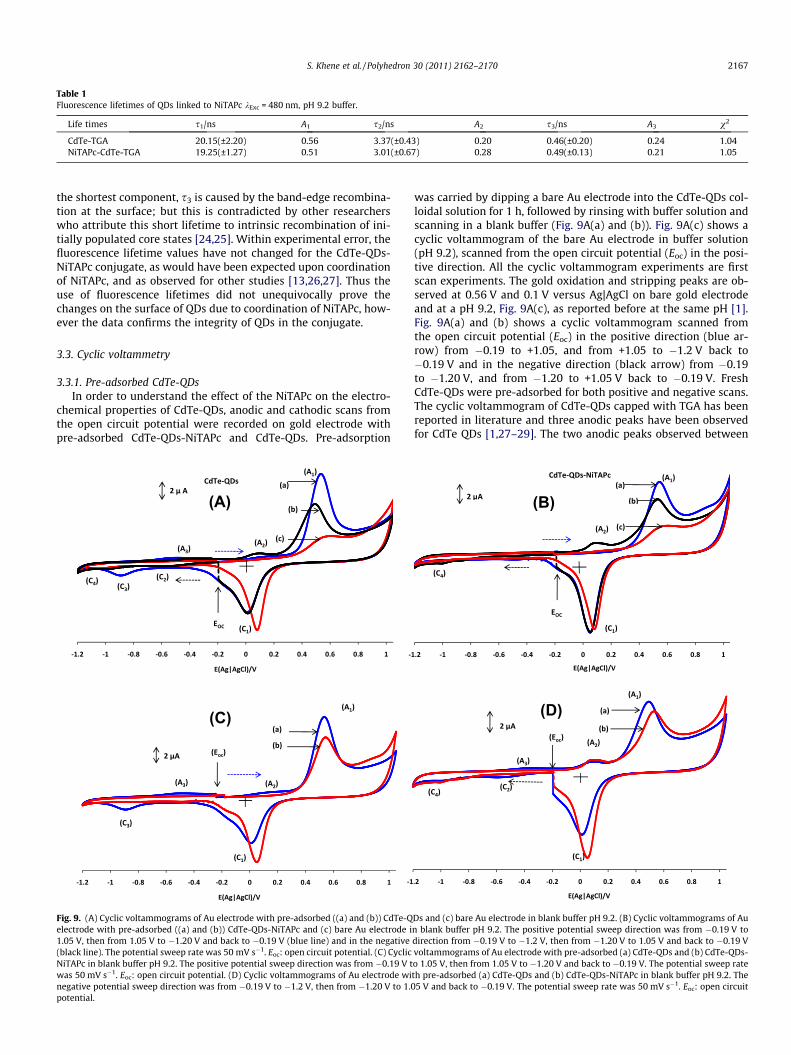
Table 1Fluorescence lifetimes of QDs linked to NiTAPc kExc = 480 nm, pH 9.2 buffer.
Life times s1/ns A1 s2/ns A2 s3/ns A3 v2
CdTe-TGA 20.15(±2.20) 0.56 3.37(±0.43) 0.20 0.46(±0.20) 0.24 1.04NiTAPc-CdTe-TGA 19.25(±1.27) 0.51 3.01(±0.67) 0.28 0.49(±0.13) 0.21 1.05
S. Khene et al. / Polyhedron 30 (2011) 2162–2170 2167
the shortest component, s3 is caused by the band-edge recombina-tion at the surface; but this is contradicted by other researcherswho attribute this short lifetime to intrinsic recombination of ini-tially populated core states [24,25]. Within experimental error, thefluorescence lifetime values have not changed for the CdTe-QDs-NiTAPc conjugate, as would have been expected upon coordinationof NiTAPc, and as observed for other studies [13,26,27]. Thus theuse of fluorescence lifetimes did not unequivocally prove thechanges on the surface of QDs due to coordination of NiTAPc, how-ever the data confirms the integrity of QDs in the conjugate.
3.3. Cyclic voltammetry
3.3.1. Pre-adsorbed CdTe-QDsIn order to understand the effect of the NiTAPc on the electro-
chemical properties of CdTe-QDs, anodic and cathodic scans fromthe open circuit potential were recorded on gold electrode withpre-adsorbed CdTe-QDs-NiTAPc and CdTe-QDs. Pre-adsorption
(A)
(C)
Fig. 9. (A) Cyclic voltammograms of Au electrode with pre-adsorbed ((a) and (b)) CdTe-Qelectrode with pre-adsorbed ((a) and (b)) CdTe-QDs-NiTAPc and (c) bare Au electrode i1.05 V, then from 1.05 V to �1.20 V and back to �0.19 V (blue line) and in the negative(black line). The potential sweep rate was 50 mV s�1. Eoc: open circuit potential. (C) CyclicNiTAPc in blank buffer pH 9.2. The positive potential sweep direction was from �0.19 V twas 50 mV s�1. Eoc: open circuit potential. (D) Cyclic voltammograms of Au electrode winegative potential sweep direction was from �0.19 V to �1.2 V, then from �1.20 V to 1.0potential.
was carried by dipping a bare Au electrode into the CdTe-QDs col-loidal solution for 1 h, followed by rinsing with buffer solution andscanning in a blank buffer (Fig. 9A(a) and (b)). Fig. 9A(c) shows acyclic voltammogram of the bare Au electrode in buffer solution(pH 9.2), scanned from the open circuit potential (Eoc) in the posi-tive direction. All the cyclic voltammogram experiments are firstscan experiments. The gold oxidation and stripping peaks are ob-served at 0.56 V and 0.1 V versus Ag|AgCl on bare gold electrodeand at a pH 9.2, Fig. 9A(c), as reported before at the same pH [1].Fig. 9A(a) and (b) shows a cyclic voltammogram scanned fromthe open circuit potential (Eoc) in the positive direction (blue ar-row) from �0.19 to +1.05, and from +1.05 to �1.2 V back to�0.19 V and in the negative direction (black arrow) from �0.19to �1.20 V, and from �1.20 to +1.05 V back to �0.19 V. FreshCdTe-QDs were pre-adsorbed for both positive and negative scans.The cyclic voltammogram of CdTe-QDs capped with TGA has beenreported in literature and three anodic peaks have been observedfor CdTe QDs [1,27–29]. The two anodic peaks observed between
(D)
(B)
Ds and (c) bare Au electrode in blank buffer pH 9.2. (B) Cyclic voltammograms of Aun blank buffer pH 9.2. The positive potential sweep direction was from �0.19 V todirection from �0.19 V to �1.2 V, then from �1.20 V to 1.05 V and back to �0.19 Vvoltammograms of Au electrode with pre-adsorbed (a) CdTe-QDs and (b) CdTe-QDs-o 1.05 V, then from 1.05 V to �1.20 V and back to �0.19 V. The potential sweep rateth pre-adsorbed (a) CdTe-QDs and (b) CdTe-QDs-NiTAPc in blank buffer pH 9.2. The5 V and back to �0.19 V. The potential sweep rate was 50 mV s�1. Eoc: open circuit
2168 S. Khene et al. / Polyhedron 30 (2011) 2162–2170
0 and 1.0 V are known to be due to oxidation of QDs (in pH 9.2 buf-fer solution). When the potential is swept in positive direction(Fig. 9A(a)), the anodic scan shows one distinct peak at 0.51 V(A1) and one weak peak �0.50 V (A3). The peak at 0.51 V (A1) willhave a contribution of the Au and CdTe-QDs, oxidation peaks hencethe enhancement in currents compared to bare Au electrode. TheQDs oxidation is overlapped with gold oxidation. The reverse scanshows two peaks at 0.04 V (C1) and �0.86 V (C3). Peak (C1) isshifted to more negative potentials compared the peak observedfor gold electrode in blank buffer solution. Peak C3 is associatedwith the electrochemical reduction of CdTe-QDs oxidation prod-ucts which are metallic in nature. The metallic oxidation productswhich are obtained on oxidation are shown by Eq. (2) [1]
CdTeþ 6OH� ! Cd2þ þ TeO2�3 þ 3H2Oþ 6e� ð2Þ
As Eq. (2) shows the oxidation of QDs generates Te4+ and Cd2+.Two DPV peaks have been reported for the reduction of Te4+ in pH9.4 buffer [30]. The first is attributed to the reduction Te4+ to Te0,the second to Te0 to Te2�. The two peaks have been reported tobe located at ��0.6 and �0.9 V in basic media [30] versus Ag|AgCl.There is only a weak peak near �0.6 V in Fig. 9A (C2), but a strongerone at ��0.86 V (C3). Thus both C2 and C3 are associated withreduction of metallic oxidation products of QDs.
The electrochemistry of CdTe QDs is highly influenced by thenature of the stabilisers, pH of solution and QD size [1,8]. The rel-ative intensities of the peaks are highly influenced by pH, with onlytwo peaks A1 and A2 normally dominating the voltammograms inbasic media [8], in this work the dominating peak is A1 which is
(A)
(B)
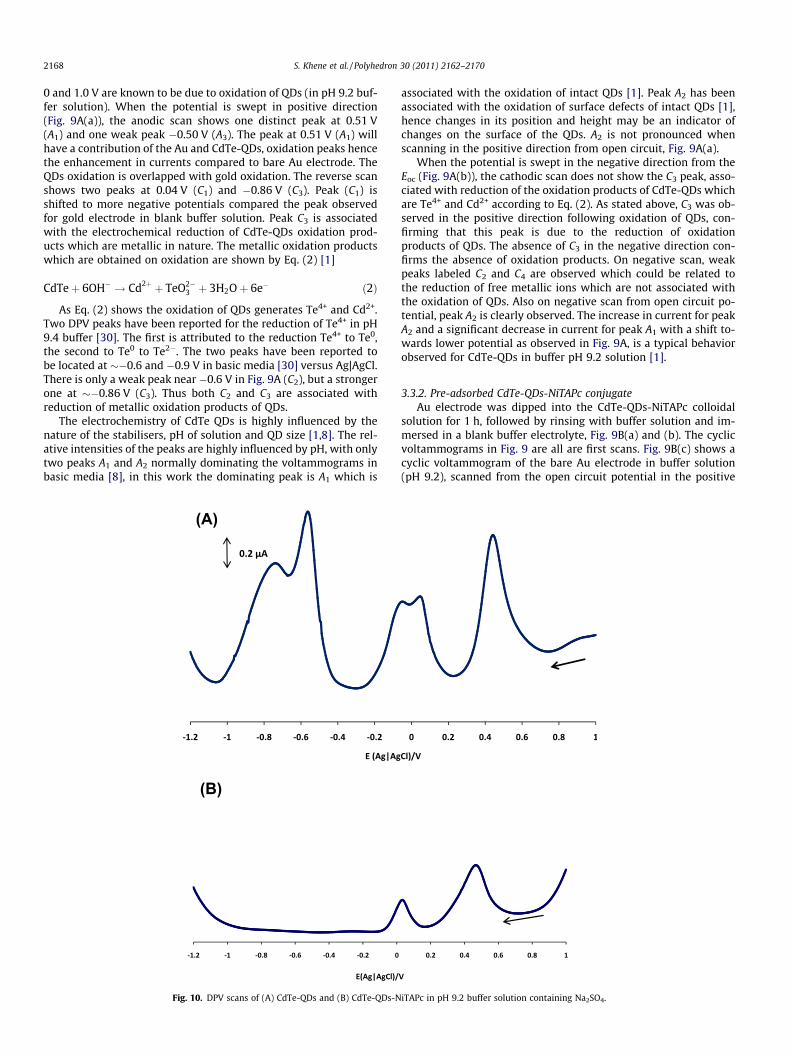
Fig. 10. DPV scans of (A) CdTe-QDs and (B) CdTe-QDs-N
associated with the oxidation of intact QDs [1]. Peak A2 has beenassociated with the oxidation of surface defects of intact QDs [1],hence changes in its position and height may be an indicator ofchanges on the surface of the QDs. A2 is not pronounced whenscanning in the positive direction from open circuit, Fig. 9A(a).
When the potential is swept in the negative direction from theEoc (Fig. 9A(b)), the cathodic scan does not show the C3 peak, asso-ciated with reduction of the oxidation products of CdTe-QDs whichare Te4+ and Cd2+ according to Eq. (2). As stated above, C3 was ob-served in the positive direction following oxidation of QDs, con-firming that this peak is due to the reduction of oxidationproducts of QDs. The absence of C3 in the negative direction con-firms the absence of oxidation products. On negative scan, weakpeaks labeled C2 and C4 are observed which could be related tothe reduction of free metallic ions which are not associated withthe oxidation of QDs. Also on negative scan from open circuit po-tential, peak A2 is clearly observed. The increase in current for peakA2 and a significant decrease in current for peak A1 with a shift to-wards lower potential as observed in Fig. 9A, is a typical behaviorobserved for CdTe-QDs in buffer pH 9.2 solution [1].
3.3.2. Pre-adsorbed CdTe-QDs-NiTAPc conjugateAu electrode was dipped into the CdTe-QDs-NiTAPc colloidal
solution for 1 h, followed by rinsing with buffer solution and im-mersed in a blank buffer electrolyte, Fig. 9B(a) and (b). The cyclicvoltammograms in Fig. 9 are all are first scans. Fig. 9B(c) shows acyclic voltammogram of the bare Au electrode in buffer solution(pH 9.2), scanned from the open circuit potential in the positive
iTAPc in pH 9.2 buffer solution containing Na2SO4.
(b)
(c)
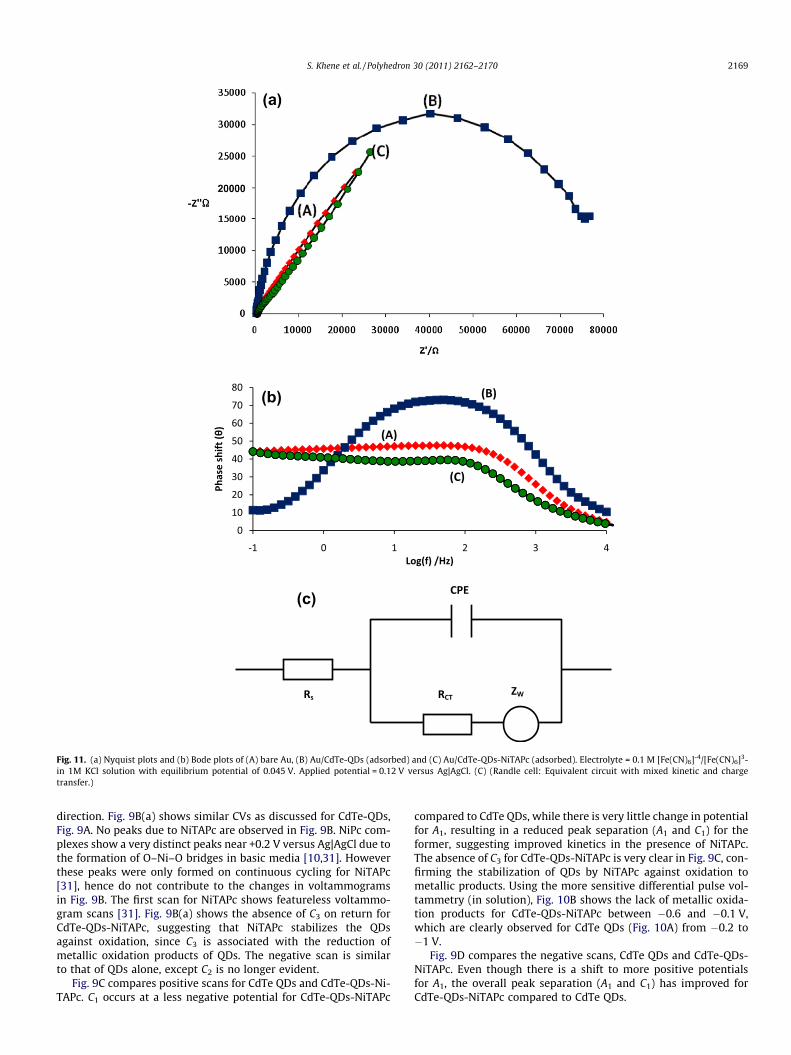
Fig. 11. (a) Nyquist plots and (b) Bode plots of (A) bare Au, (B) Au/CdTe-QDs (adsorbed) and (C) Au/CdTe-QDs-NiTAPc (adsorbed). Electrolyte = 0.1 M [Fe(CN)6]-4/[Fe(CN)6]3-in 1M KCl solution with equilibrium potential of 0.045 V. Applied potential = 0.12 V versus Ag|AgCl. (C) (Randle cell: Equivalent circuit with mixed kinetic and chargetransfer.)
S. Khene et al. / Polyhedron 30 (2011) 2162–2170 2169
direction. Fig. 9B(a) shows similar CVs as discussed for CdTe-QDs,Fig. 9A. No peaks due to NiTAPc are observed in Fig. 9B. NiPc com-plexes show a very distinct peaks near +0.2 V versus Ag|AgCl due tothe formation of O–Ni–O bridges in basic media [10,31]. Howeverthese peaks were only formed on continuous cycling for NiTAPc[31], hence do not contribute to the changes in voltammogramsin Fig. 9B. The first scan for NiTAPc shows featureless voltammo-gram scans [31]. Fig. 9B(a) shows the absence of C3 on return forCdTe-QDs-NiTAPc, suggesting that NiTAPc stabilizes the QDsagainst oxidation, since C3 is associated with the reduction ofmetallic oxidation products of QDs. The negative scan is similarto that of QDs alone, except C2 is no longer evident.
Fig. 9C compares positive scans for CdTe QDs and CdTe-QDs-Ni-TAPc. C1 occurs at a less negative potential for CdTe-QDs-NiTAPc
compared to CdTe QDs, while there is very little change in potentialfor A1, resulting in a reduced peak separation (A1 and C1) for theformer, suggesting improved kinetics in the presence of NiTAPc.The absence of C3 for CdTe-QDs-NiTAPc is very clear in Fig. 9C, con-firming the stabilization of QDs by NiTAPc against oxidation tometallic products. Using the more sensitive differential pulse vol-tammetry (in solution), Fig. 10B shows the lack of metallic oxida-tion products for CdTe-QDs-NiTAPc between �0.6 and �0.1 V,which are clearly observed for CdTe QDs (Fig. 10A) from �0.2 to�1 V.
Fig. 9D compares the negative scans, CdTe QDs and CdTe-QDs-NiTAPc. Even though there is a shift to more positive potentialsfor A1, the overall peak separation (A1 and C1) has improved forCdTe-QDs-NiTAPc compared to CdTe QDs.
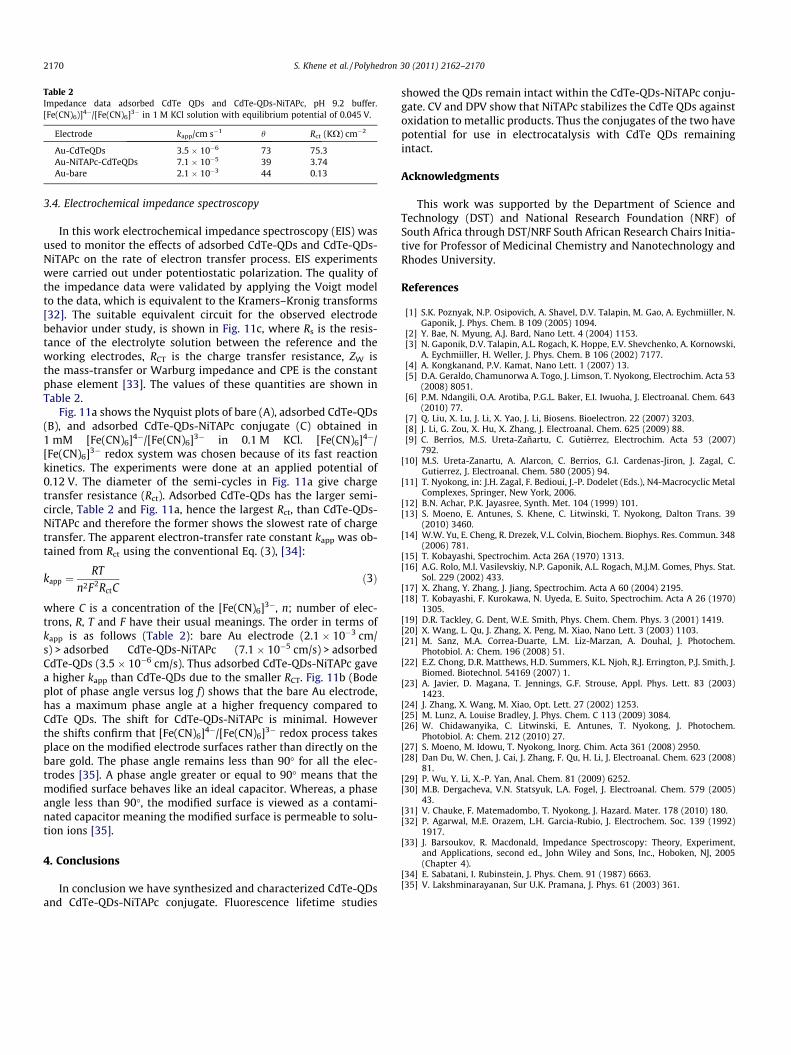
Table 2Impedance data adsorbed CdTe QDs and CdTe-QDs-NiTAPc, pH 9.2 buffer.[Fe(CN)6)]4�/[Fe(CN)6]3� in 1 M KCl solution with equilibrium potential of 0.045 V.
Electrode kapp/cm s�1 h Rct (KX) cm�2
Au-CdTeQDs 3.5 � 10�6 73 75.3Au-NiTAPc-CdTeQDs 7.1 � 10�5 39 3.74Au-bare 2.1 � 10�3 44 0.13
2170 S. Khene et al. / Polyhedron 30 (2011) 2162–2170
3.4. Electrochemical impedance spectroscopy
In this work electrochemical impedance spectroscopy (EIS) wasused to monitor the effects of adsorbed CdTe-QDs and CdTe-QDs-NiTAPc on the rate of electron transfer process. EIS experimentswere carried out under potentiostatic polarization. The quality ofthe impedance data were validated by applying the Voigt modelto the data, which is equivalent to the Kramers–Kronig transforms[32]. The suitable equivalent circuit for the observed electrodebehavior under study, is shown in Fig. 11c, where Rs is the resis-tance of the electrolyte solution between the reference and theworking electrodes, RCT is the charge transfer resistance, ZW isthe mass-transfer or Warburg impedance and CPE is the constantphase element [33]. The values of these quantities are shown inTable 2.
Fig. 11a shows the Nyquist plots of bare (A), adsorbed CdTe-QDs(B), and adsorbed CdTe-QDs-NiTAPc conjugate (C) obtained in1 mM [Fe(CN)6]4�/[Fe(CN)6]3� in 0.1 M KCl. [Fe(CN)6]4�/[Fe(CN)6]3� redox system was chosen because of its fast reactionkinetics. The experiments were done at an applied potential of0.12 V. The diameter of the semi-cycles in Fig. 11a give chargetransfer resistance (Rct). Adsorbed CdTe-QDs has the larger semi-circle, Table 2 and Fig. 11a, hence the largest Rct, than CdTe-QDs-NiTAPc and therefore the former shows the slowest rate of chargetransfer. The apparent electron-transfer rate constant kapp was ob-tained from Rct using the conventional Eq. (3), [34]:
kapp ¼RT
n2F2RctCð3Þ
where C is a concentration of the [Fe(CN)6]3�, n; number of elec-trons, R, T and F have their usual meanings. The order in terms ofkapp is as follows (Table 2): bare Au electrode (2.1 � 10�3 cm/s) > adsorbed CdTe-QDs-NiTAPc (7.1 � 10�5 cm/s) > adsorbedCdTe-QDs (3.5 � 10�6 cm/s). Thus adsorbed CdTe-QDs-NiTAPc gavea higher kapp than CdTe-QDs due to the smaller RCT. Fig. 11b (Bodeplot of phase angle versus log f) shows that the bare Au electrode,has a maximum phase angle at a higher frequency compared toCdTe QDs. The shift for CdTe-QDs-NiTAPc is minimal. Howeverthe shifts confirm that [Fe(CN)6]4�/[Fe(CN)6]3� redox process takesplace on the modified electrode surfaces rather than directly on thebare gold. The phase angle remains less than 90� for all the elec-trodes [35]. A phase angle greater or equal to 90� means that themodified surface behaves like an ideal capacitor. Whereas, a phaseangle less than 90�, the modified surface is viewed as a contami-nated capacitor meaning the modified surface is permeable to solu-tion ions [35].
4. Conclusions
In conclusion we have synthesized and characterized CdTe-QDsand CdTe-QDs-NiTAPc conjugate. Fluorescence lifetime studies
showed the QDs remain intact within the CdTe-QDs-NiTAPc conju-gate. CV and DPV show that NiTAPc stabilizes the CdTe QDs againstoxidation to metallic products. Thus the conjugates of the two havepotential for use in electrocatalysis with CdTe QDs remainingintact.
Acknowledgments
This work was supported by the Department of Science andTechnology (DST) and National Research Foundation (NRF) ofSouth Africa through DST/NRF South African Research Chairs Initia-tive for Professor of Medicinal Chemistry and Nanotechnology andRhodes University.
References
[1] S.K. Poznyak, N.P. Osipovich, A. Shavel, D.V. Talapin, M. Gao, A. Eychmiiller, N.Gaponik, J. Phys. Chem. B 109 (2005) 1094.
[2] Y. Bae, N. Myung, A.J. Bard, Nano Lett. 4 (2004) 1153.[3] N. Gaponik, D.V. Talapin, A.L. Rogach, K. Hoppe, E.V. Shevchenko, A. Kornowski,
A. Eychmiiller, H. Weller, J. Phys. Chem. B 106 (2002) 7177.[4] A. Kongkanand, P.V. Kamat, Nano Lett. 1 (2007) 13.[5] D.A. Geraldo, Chamunorwa A. Togo, J. Limson, T. Nyokong, Electrochim. Acta 53
(2008) 8051.[6] P.M. Ndangili, O.A. Arotiba, P.G.L. Baker, E.I. Iwuoha, J. Electroanal. Chem. 643
(2010) 77.[7] Q. Liu, X. Lu, J. Li, X. Yao, J. Li, Biosens. Bioelectron. 22 (2007) 3203.[8] J. Li, G. Zou, X. Hu, X. Zhang, J. Electroanal. Chem. 625 (2009) 88.[9] C. Berrìos, M.S. Ureta-Zañartu, C. Gutièrrez, Electrochim. Acta 53 (2007)
792.[10] M.S. Ureta-Zanartu, A. Alarcon, C. Berrios, G.I. Cardenas-Jiron, J. Zagal, C.
Gutierrez, J. Electroanal. Chem. 580 (2005) 94.[11] T. Nyokong, in: J.H. Zagal, F. Bedioui, J.-P. Dodelet (Eds.), N4-Macrocyclic Metal
Complexes, Springer, New York, 2006.[12] B.N. Achar, P.K. Jayasree, Synth. Met. 104 (1999) 101.[13] S. Moeno, E. Antunes, S. Khene, C. Litwinski, T. Nyokong, Dalton Trans. 39
(2010) 3460.[14] W.W. Yu, E. Cheng, R. Drezek, V.L. Colvin, Biochem. Biophys. Res. Commun. 348
(2006) 781.[15] T. Kobayashi, Spectrochim. Acta 26A (1970) 1313.[16] A.G. Rolo, M.I. Vasilevskiy, N.P. Gaponik, A.L. Rogach, M.J.M. Gomes, Phys. Stat.
Sol. 229 (2002) 433.[17] X. Zhang, Y. Zhang, J. Jiang, Spectrochim. Acta A 60 (2004) 2195.[18] T. Kobayashi, F. Kurokawa, N. Uyeda, E. Suito, Spectrochim. Acta A 26 (1970)
1305.[19] D.R. Tackley, G. Dent, W.E. Smith, Phys. Chem. Chem. Phys. 3 (2001) 1419.[20] X. Wang, L. Qu, J. Zhang, X. Peng, M. Xiao, Nano Lett. 3 (2003) 1103.[21] M. Sanz, M.A. Correa-Duarte, L.M. Liz-Marzan, A. Douhal, J. Photochem.
Photobiol. A: Chem. 196 (2008) 51.[22] E.Z. Chong, D.R. Matthews, H.D. Summers, K.L. Njoh, R.J. Errington, P.J. Smith, J.
Biomed. Biotechnol. 54169 (2007) 1.[23] A. Javier, D. Magana, T. Jennings, G.F. Strouse, Appl. Phys. Lett. 83 (2003)
1423.[24] J. Zhang, X. Wang, M. Xiao, Opt. Lett. 27 (2002) 1253.[25] M. Lunz, A. Louise Bradley, J. Phys. Chem. C 113 (2009) 3084.[26] W. Chidawanyika, C. Litwinski, E. Antunes, T. Nyokong, J. Photochem.
Photobiol. A: Chem. 212 (2010) 27.[27] S. Moeno, M. Idowu, T. Nyokong, Inorg. Chim. Acta 361 (2008) 2950.[28] Dan Du, W. Chen, J. Cai, J. Zhang, F. Qu, H. Li, J. Electroanal. Chem. 623 (2008)
81.[29] P. Wu, Y. Li, X.-P. Yan, Anal. Chem. 81 (2009) 6252.[30] M.B. Dergacheva, V.N. Statsyuk, L.A. Fogel, J. Electroanal. Chem. 579 (2005)
43.[31] V. Chauke, F. Matemadombo, T. Nyokong, J. Hazard. Mater. 178 (2010) 180.[32] P. Agarwal, M.E. Orazem, L.H. Garcia-Rubio, J. Electrochem. Soc. 139 (1992)
1917.[33] J. Barsoukov, R. Macdonald, Impedance Spectroscopy: Theory, Experiment,
and Applications, second ed., John Wiley and Sons, Inc., Hoboken, NJ, 2005(Chapter 4).
[34] E. Sabatani, I. Rubinstein, J. Phys. Chem. 91 (1987) 6663.[35] V. Lakshminarayanan, Sur U.K. Pramana, J. Phys. 61 (2003) 361.