
Tryptophan Determination at Carbon Fiber Ultramicroelectrodes by Fast-Scan Cyclic Voltammetry
Upload
independentCategory
view
7download
0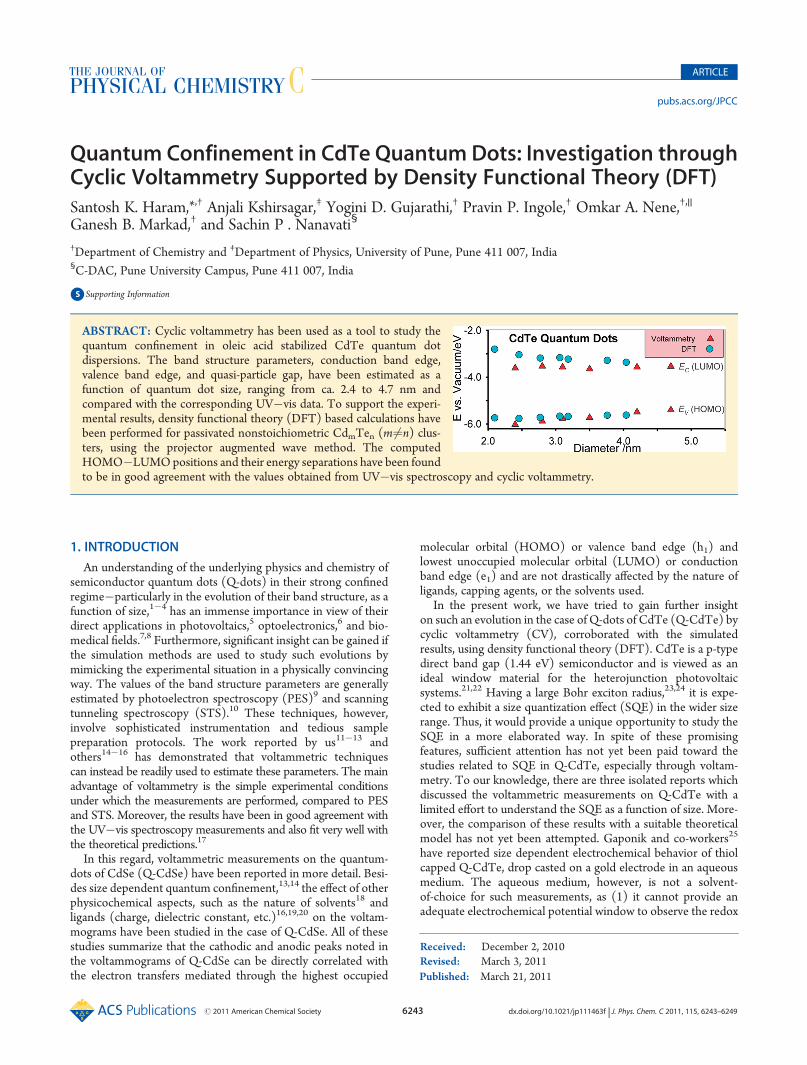
Published: March 21, 2011
r 2011 American Chemical Society 6243 dx.doi.org/10.1021/jp111463f | J. Phys. Chem. C 2011, 115, 6243–6249
ARTICLE
pubs.acs.org/JPCC
Quantum Confinement in CdTe Quantum Dots: Investigation throughCyclic Voltammetry Supported by Density Functional Theory (DFT)Santosh K. Haram,*,† Anjali Kshirsagar,‡ Yogini D. Gujarathi,† Pravin P. Ingole,† Omkar A. Nene,†,||
Ganesh B. Markad,† and Sachin P . Nanavati§
†Department of Chemistry and ‡Department of Physics, University of Pune, Pune 411 007, India§C-DAC, Pune University Campus, Pune 411 007, India
bS Supporting Information
1. INTRODUCTION
An understanding of the underlying physics and chemistry ofsemiconductor quantum dots (Q-dots) in their strong confinedregime�particularly in the evolution of their band structure, as afunction of size,1�4 has an immense importance in view of theirdirect applications in photovoltaics,5 optoelectronics,6 and bio-medical fields.7,8 Furthermore, significant insight can be gained ifthe simulation methods are used to study such evolutions bymimicking the experimental situation in a physically convincingway. The values of the band structure parameters are generallyestimated by photoelectron spectroscopy (PES)9 and scanningtunneling spectroscopy (STS).10 These techniques, however,involve sophisticated instrumentation and tedious samplepreparation protocols. The work reported by us11�13 andothers14�16 has demonstrated that voltammetric techniquescan instead be readily used to estimate these parameters. The mainadvantage of voltammetry is the simple experimental conditionsunder which the measurements are performed, compared to PESand STS. Moreover, the results have been in good agreement withthe UV�vis spectroscopy measurements and also fit very well withthe theoretical predictions.17
In this regard, voltammetric measurements on the quantum-dots of CdSe (Q-CdSe) have been reported in more detail. Besi-des size dependent quantum confinement,13,14 the effect of otherphysicochemical aspects, such as the nature of solvents18 andligands (charge, dielectric constant, etc.)16,19,20 on the voltam-mograms have been studied in the case of Q-CdSe. All of thesestudies summarize that the cathodic and anodic peaks noted inthe voltammograms of Q-CdSe can be directly correlated withthe electron transfers mediated through the highest occupied
molecular orbital (HOMO) or valence band edge (h1) andlowest unoccupied molecular orbital (LUMO) or conductionband edge (e1) and are not drastically affected by the nature ofligands, capping agents, or the solvents used.
In the present work, we have tried to gain further insighton such an evolution in the case of Q-dots of CdTe (Q-CdTe) bycyclic voltammetry (CV), corroborated with the simulatedresults, using density functional theory (DFT). CdTe is a p-typedirect band gap (1.44 eV) semiconductor and is viewed as anideal window material for the heterojunction photovoltaicsystems.21,22 Having a large Bohr exciton radius,23,24 it is expe-cted to exhibit a size quantization effect (SQE) in the wider sizerange. Thus, it would provide a unique opportunity to study theSQE in a more elaborated way. In spite of these promisingfeatures, sufficient attention has not yet been paid toward thestudies related to SQE in Q-CdTe, especially through voltam-metry. To our knowledge, there are three isolated reports whichdiscussed the voltammetric measurements on Q-CdTe with alimited effort to understand the SQE as a function of size. More-over, the comparison of these results with a suitable theoreticalmodel has not yet been attempted. Gaponik and co-workers25
have reported size dependent electrochemical behavior of thiolcapped Q-CdTe, drop casted on a gold electrode in an aqueousmedium. The aqueous medium, however, is not a solvent-of-choice for such measurements, as (1) it cannot provide anadequate electrochemical potential window to observe the redox
Received: December 2, 2010Revised: March 3, 2011
ABSTRACT: Cyclic voltammetry has been used as a tool to study thequantum confinement in oleic acid stabilized CdTe quantum dotdispersions. The band structure parameters, conduction band edge,valence band edge, and quasi-particle gap, have been estimated as afunction of quantum dot size, ranging from ca. 2.4 to 4.7 nm andcompared with the corresponding UV�vis data. To support the experi-mental results, density functional theory (DFT) based calculations havebeen performed for passivated nonstoichiometric CdmTen (m 6¼n) clus-ters, using the projector augmented wave method. The computedHOMO�LUMOpositions and their energy separations have been foundto be in good agreement with the values obtained from UV�vis spectroscopy and cyclic voltammetry.
6244 dx.doi.org/10.1021/jp111463f |J. Phys. Chem. C 2011, 115, 6243–6249
The Journal of Physical Chemistry C ARTICLE
peaks which are ca. 2�2.5 V apart, and (2) after charge transfer,the Q-dots are likely to undergo rapid hydrolysis, which maydestabilize the Q-dots and may not provide the desired outcome.Besides, the measurements on drop-casted Q-dots seldom fulfillthe fundamental requirement of charge transfer on a physicallyisolated system, and thus, the results obtained may not inprinciple be correlated to the quasiparticle gap (εgap
qp ).13,17 Allof these limitations can be overcome by carrying out measure-ments on the Q-dot dispersion in polar organic solvents. Bardand co-workers26 have reported differential pulse voltammetry(DPV) and electro-generated chemiluminescence (ECL) re-sponse from 3.9 nm trioctylphosphine oxide (TOPO) cappedQ-CdTe, dispersed in an acetonitrile�benzene mixture. Poordispensability of the TOPO capped Q-CdTe27 in the solventmixture perhaps did not allow them to accomplish the measure-ments on varied size. Li et al.28 carried out electrochemicalcharacterization of anisotropic shaped Q-CdTe (6.9 nm), drop-casted on the glassy carbon (GC) electrode. Again, the SQE withrespect to the particle size has not been studied.
Thus, to the best of our knowledge, a complete investigationand related data regarding the band structure parameters ofQ-CdTe for varying sizes and their direct comparison with theknown theoretical model are lacking in the literature. This gap inthe literature has motivated us to undertake a detailed studyregarding the size dependent voltammetric behavior of Q-CdTedispersion in dichloromethane (DCM) medium. Q-CdTe stabi-lized with oleic acid has been employed in the present studiesbecause of their better dispersibility in the solvent of interest inthe wider size range (ca. 2.4 to 4.7 nm). These samples werecharacterized with UV�vis, PL, and CV measurements toprovide the information about the band structure parameters,quasi-particle gap (εgap
qp ), and optical band gap (εgapop ) as a function
of size. To support the experimental results, density functionaltheory (DFT) based calculations have been performed fornonstoichiometric CdmTen (m 6¼n) clusters using the projectoraugmented wave (PAW) method. To render the surface ofQ-CdTe inert, the active sites have been passivated with fictitioushydrogen atoms (H*) as terminating ligands. The computedHOMO and LUMO positions and the energy gaps (εgap
DFT)as a function of size have been found to be in good agreementwith the one obtained from CV measurements.
2. EXPERIMENTAL SECTION
2.1. Materials. Cadmium oxide (CdO), Te powder, and oleicacid were purchased from SD fine chemicals. Octadecene(Across Organics), toluene (Merck), and tri-n-octylphosphine(TOP), (Technical grade, Aldrich) were used as received, with-out further purification. Methanol, ethanol, and 1-butanol pur-chased fromMerck chemicals were dried over CaH2 and distilledtwice before use. Dichloromethane (DCM) (Merck, dried reagentgrade) was treated with CaH2, double distilled, and stored overpreactivated Linde 4A-type molecular sieves. Electrochemical gradetetrabutylammonium perchlorate (TBAP) was purchased fromFluka and used as received.2.2. Preparation of Oleic Acid Capped Q-CdTe. Varied sizes
of oleic acid capped Q-CdTe were prepared using the methodsuggested by Peng et al.29,30 The stock solution of TOP-Te wasprepared by the reported protocol.29 In brief, 0.159 g of Te and5.0 mL of TOP was heated gently at ca. 210 �C, until theappearance of pale green-yellow color to the solution. It was thendiluted to 25mLwith 1-octadecene to form 0.1MTOP-Te stock
solution. CdO (0.064 g) was predried in situ over N2 flow at200 �C, in the specially designed borosilicate cylindrical cell(Figure-S1, Supporting Information). The temperature of thecell was brought down, and a solution of oleic acid (1.0 mL) inoctadecene (2.5 mL) was injected with constant stirring. Thetemperature was subsequently elevated to 300 �C under con-tinuous flow of N2 until the complete dissolution of CdOwas noted. Into this, freshly prepared TOP-Te stock solution(2.5 mL) was swiftly injected with vigorous stirring. After thedesired time interval, the reaction was quenched by lowering thetemperature, followed by the addition of toluene (ca. 10 mL) tothe reaction mixture. To separate the product from the motherliquor, a mixture of dry ethanol and dry n-butanol was used asantisolvents. The resultant ruby-red color precipitate was cen-trifuged and washed repeatedly with methanol. Eventually, thesample was vacuum-dried and stored in a vacuum desiccator forfurther analysis. Varied particle sizes were accomplished by with-drawing the aliquots at predecided time intervals. The productsthus prepared were used for further analysis within 48 h to avoidpossible agglomeration.2.3. Material Characterization. For routine characterization,
UV�vis spectra were recorded using an Agilent 8453 diode arraysingle beam spectrophotometer. Steady state photoluminescence(PL) spectra were recorded at room temperature, with the help of aShimadzu RF-5301PC spectrofluorometer. For the molecular levelunderstanding of the surface passivation of Q-CdTe, FTIR spectrawere recorded using a Shimadzu FTIR-8400 spectrophotometer,having the attenuated total reflection (ATR) attachment. PowderX-ray diffractograms (XRD) were recorded on the dried productusing a Bruker, D8-Advance, X-ray diffractometer (CukR, 40 kVand 40 mA). Low resolution transmission electron microscopic(TEM) images were recorded on the samples using a PhilipsCM200 transmission electron microscope (200 kV).2.4. Electrochemical Characterization.The Electrochemical
measurements were performed with the help of MetrohmPotentiostat/Galvanostat (model Autolab PGSTAT 100). Acommercial Pt disk electrode (CHI Instruments, USA, 2-mmdiameter), Ag wire, and Pt-wire loop were used as working, quasi-reference, and counter electrodes, respectively. Prior to use, theworking electrode was polished over 0.5 μm alumina powder,rinsed with copious amounts of Milli-Q water, and was pre-treated electrochemically with 0.5 M H2SO4 by cycling thepotential between 1.2 V and �0.55 V (scan rate of 1 V s�1),until characteristic H2/O2 adsorption/desorption peaks re-ported for the clean Pt surface were observed.31 In order tominimize the interference of moisture and CO2, the voltam-metric measurements were carried out in an indigenously devel-oped vacuum electrochemical cell, having a special provision totransfer the analytes with minimum exposure to the laboratoryatmosphere. After fixing the electrodes to the cell, 0.239 g ofTBAP (typically 100 mM for a 5 mL solution) was transferredand vacuum-dried in situ, at 80 �C for an hour. The cell wascooled down to room temperature and brought to atmosphericpressure by relieving the vacuum through high purity Ar gas.Predried 5 mLDCMwas injected into the cell through a Siliconeseptum under Ar atmosphere. The blank or controlled voltam-mograms were acquired in TBAP-DCM mixture, prior tothe measurements. Dispersion of Q-dots in predried DCM(net concentration 1.0 mg mL�1) was then injected through asilicone�rubber septum, and similar experiments were per-formed under a slight positive pressure of Ar gas. At the end ofeach set of experiments, the potentials were calibrated with
6245 dx.doi.org/10.1021/jp111463f |J. Phys. Chem. C 2011, 115, 6243–6249
The Journal of Physical Chemistry C ARTICLE
respect to the normal hydrogen electrode (NHE), using ferro-cene as an internal standard.
3. THEORETICAL METHODS
Bulk CdTe occurs in zinc blende (ZB) and wurtzite structures.The wurtzite structure is higher in energy by 9 meV per Cd�Tepair than the ZB structure.32 Bulk CdTe is reported to have adirect band gap of 1.44 eV at Γ point. It has been reported thatII�VI semiconductor Q-dots possess the same geometric struc-ture as that of respective bulk material with slight variations inlattice parameters. Thus, nonstoichiometric clusters can beconsidered as fragments of bulk, possessing the same structuralsymmetry as that of the bulk.33 We have therefore considered theQ-dots as atom-centered ZB fragments.
For the computational modeling of electronic structure ofQ-dots, surface passivation has to be implemented to mimic theexperimental situation. Bare clusters have dangling bonds at thesurface. These unsaturated bonds alter the chemical and electro-nic properties of the Q-dots, and therefore, these unsaturatedbonds have to be satisfied. To arrest the growth and to preventcoalescing of the Q-dots, passivating organic ligands are normallyemployed in experiments. In the present work, we have used theprocedure given by Chelikowsky et al.34 satisfying danglingbonds. We have passivated the Q-dots with a suitable numberof two types of neutral fictitious hydrogen (H*) atoms. Onespecies having nuclear charge 1.5 is bonded to Cd atoms and theother species having a nuclear charge 0.5 is to be bonded to Teatoms, and the overall charge neutrality of the system is main-tained. (For details, the reader may refer to refs 35 and 36.) In ourearlier work, we have shown that passivation locks the symmetryfor three-dimensional structures;35 hence, no structure minimi-zations are carried out for the passivated ZB fragments con-structed with a lattice constant of 0.645 nm. Computations basedon the Kohn�Sham density functional framework37 have beenperformed. The electronic structure is calculated self-consis-tently using the PAW method38 as implemented in the VASPpackage39 within the framework of generalized gradient approx-imation (GGA). We have used the Perdew�Barke�Ernzerhof(PBE) exchange correlation energy functional40 for our calcula-tion as it is known to provide decent estimates of the total energyand molecule atomization energy, and therefore, the electronicproperties. The valence electronic configurations used for Cdand Te are 5s24d10 and 5s25p4, respectively. The 4d levels in theTe atom are well separated from the 5s levels and hence areincluded in the core. The size of the basis set was decided by theplane wave cut off energy, which was varied from 205.76 to274.34 eV, depending on the size of the Q-dot. Calculations weredone in a supercell geometry by varying the size from 2.5 to5.0 nm to be large enough to mimic free Q-dots geometries withenough vacuum region on all sides. The total energy convergenceused for the electronic self-consistency is ∼10�4 eV.
Single particle energy values are obtained by solving theKohn�Sham equations for passivated CdTe clusters of varyingsizes as mentioned above. It is well known that DFT under-estimates the band gap of semiconductors due to the underneathapproximations used for the exchange correlation energy func-tional. Normally, a scissor operator is applied to make the theore-tical band gap match the experimental value for the bulk material.We too have followed a similar procedure. The HOMO�LUMOgap (εgap
DFT) obtained from the VASP results for Q-CdTe iscorrected by an appropriate factor. To compare the actual HOMO
and LUMO energy values, we have rigidly shifted the HOMOlevels by the same factor.
4. RESULTS AND DISCUSSION
4.1. Characterization of Oleic Acid Capped Q-CdTe. Asdescribed in Experimental Section, the varying sizes of Q-CdTewere obtained by quenching the growth at stipulated timeintervals. These dispersions were extracted from the motherliquor in the form of a dry powder. Figure 1 shows the typicalUV�vis and photoluminescence (PL) spectra obtained forQ-CdTe, redispersed in toluene. The characteristic absorptionand emission peaks were observed in the range 500�730 nmwhich are attributed to the size quantization or quantum con-finement effect for Q-CdTe.41 The average particle sizes for allthe samples were obtained by fitting the absorption peak maxima(refer Figure 1A to F) in the sizing curves reported indepen-dently by Yu et al.42 and Dagtepe et al.,43 for identical systems.On the basis of these curves, the average particle sizes wereestimated to be in the range of 2.4�4.7 nm. The size of the Q-dotsand their corresponding labels are listed in Table 1. These valuesmatch reasonably with the average diameters measured from thelow resolution TEM images recorded for these samples (for therepresentative TEMs refer to Figure-S2 in Supporting Informa-tion). The narrow full width at half maxima and symmetry inthe PL peaks further suggest that the Q-dots have narrow sizedistribution which commemorated the TEM images.41 Freshlyprepared Q-CdTe is known to give very bright luminescence;however, they lose most of their quantum yield over time dueto exposure to ambient conditions. This suggests the formationof surface trap states. Thus, relatively large Stoke shifts in thePL peaks are attributed to the presence of trap states associatedwith the Q-CdTe surface. Nevertheless, a systematic correlationbetween the Stoke shift and the particle size has not beenobserved.44
A powder X-ray diffractogram (XRD) recorded on thesesamples (for typical XRD refer, Figure-S3 in Supporting In-formation) displayed reflections at ca. 24.2�, 40.1�, 46.7�, 61.5�,and 71.3�, which fitted faithfully into the d-spacings for (111),(220), (311), (331), and (422) planes of CdTe- cubic phase(JCPDS-15-0770). A comparison between FTIR spectra re-corded on pristine oleic acid and oleic acid capped Q-CdTe
Figure 1. UV�visible absorption and the corresponding emissionspectra recorded for the varied sizes (samples A�F) of the oleic acidcapped Q-CdTe, redispersed in toluene.
6246 dx.doi.org/10.1021/jp111463f |J. Phys. Chem. C 2011, 115, 6243–6249
The Journal of Physical Chemistry C ARTICLE
(refer, Figure-S4 in Supporting Information) suggested theadsorption of oleic acid molecules on the Q-dot surface. Thus,from all these experimental evidences, we concluded the forma-tion of monodispersed oleic acid capped Q-CdTe in the sizesranging from ca. 2.4 to 4.7 nm, which are labeled, respectively, assample-A to sample-F.
4.2. Voltammetric Investigation onQ-CdTe Dispersions.Asuccessful use of CV measurements for the determination ofband structure parameters viz. the conduction band edge (e1LUMO), valence band edge (h1 HOMO), and εgap
qp have beendescribed in detail in our earlier report.13 The electron transferwith Q-dots is mediated through e1 and h1, which are mani-fested as respective cathodic and anodic peaks in the CVs. Asthe Q-dot size decreases, the cathodic and anodic peaks areexpected to shift toward more negative and positive potentials,respectively. Thus, the SQE can readily be confirmed by simplevoltammetric experiments. In the present investigation, the CVmeasurements were carried out on Q-dots dispersions. Thus,the charge transfer can be viewed as a formation of thenoninteracting electron�hole pair. The potential differencebetween cathodic and anodic peaks is correlated to the singleparticle or quasi-particle gap (εgap
qp ) estimated by scanningtunneling spectroscopy.13�17
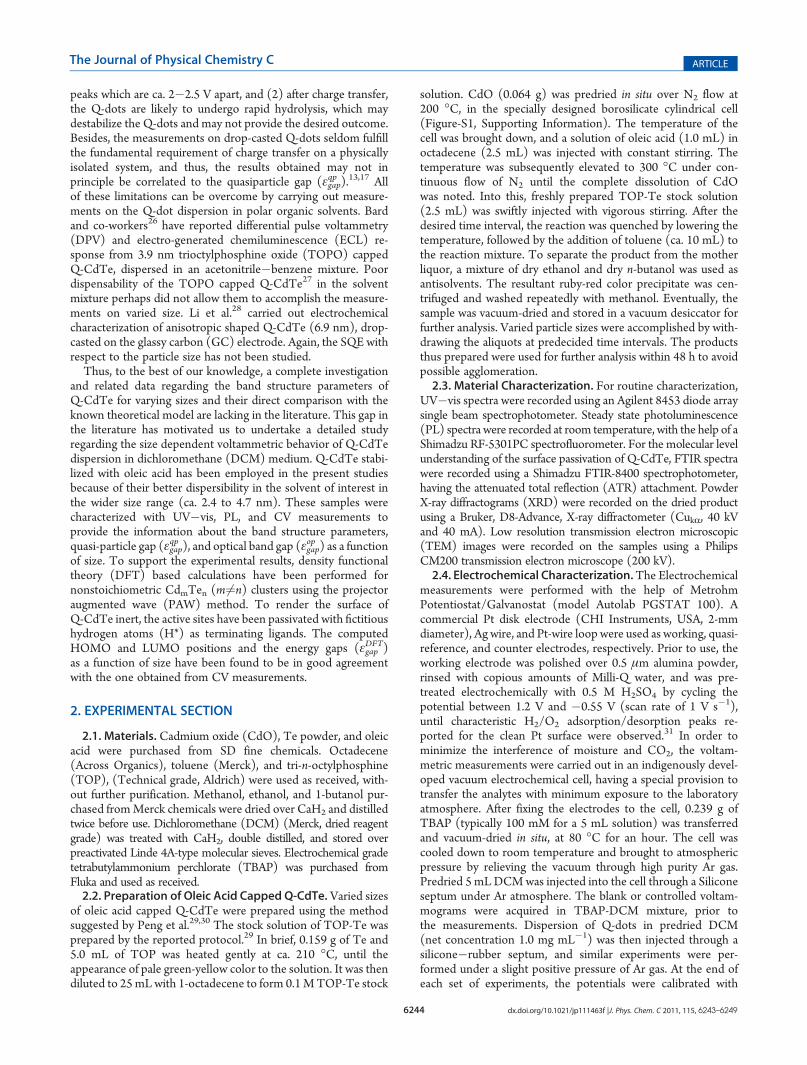
Figure 2a shows a typical CV recorded for the dispersion ofQ-CdTe (sample-F, 2.4 nm) in a TBAP-DCM mixture. Thecorresponding CV curves obtained for the controlled sample(without Q-CdTe) are superimposed as Figure 2b. The promi-nent, cathodic and anodic peaks at ca. �0.89 V (marked asC1),�0.60 V (marked as A1), and 1.52 V (marked as A2), respec-tively, are observed. The potential difference of 2.41 V between
Table 1. Band Structure Parameters of Oleic Acid Capped Q-CdTe, Obtained from UV�Vis Spectroscopy and CyclicVoltammetry
from UV�vis spectroscopy from cyclic voltammetry
sample
ID
average Q-dot size
(nm)
optical band gap (εgapop )
(eV)
conduction band edge (e1) vs vacuum
(eV)
valence band edge (h1) vs vacuum
(eV)
Quasi-particle gap (εgapqp )
(eV)
A 4.7 1.88 �3.54 �5.40 1.86
B 4.2 1.94 �3.56 �5.49 1.93
C 3.5 2.09 �3.65 �5.73 2.08
D 3.1 2.19 �3.57 �5.76 2.19
E 2.8 2.33 �3.53 �5.88 2.34
F 2.4 2.40 �3.61 �6.02 2.41
Figure 2. Cyclic voltammograms recorded for (b) 100 mM TBAP inDCM, i.e., background, without any sample and (a) after the addition ofQ-CdTe (sample-F, 1.0-mg/mL). The scan rate was 100 mV s�1.
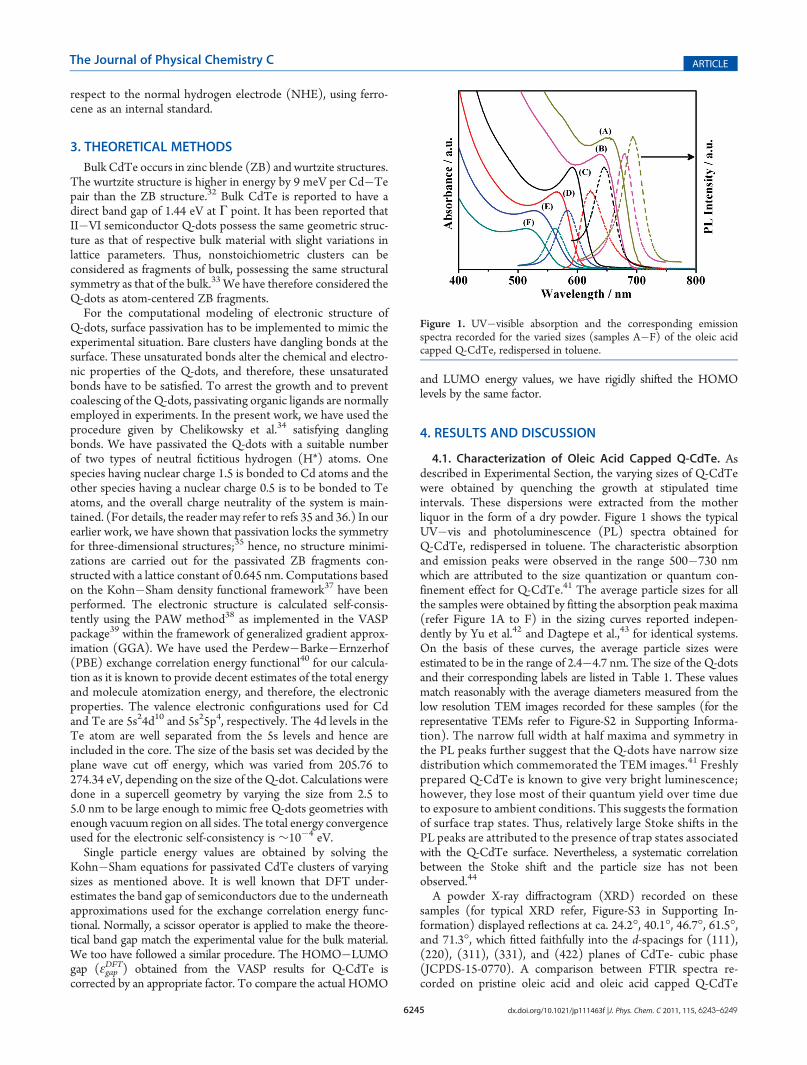
Figure 3. Plots of (B) cathodic (Ip,c) and (A) anodic (Ip,a)peak currentvalues (0 and O, respectively) vs ν1/2 obtained from scan ratedependent CV response recorded on Q-CdTe dispersions (not shown).The solid lines indicate corresponding linear regression fits for theRandles-Savcik equation, suggesting that the electron transfer is thediffusion controlled one.
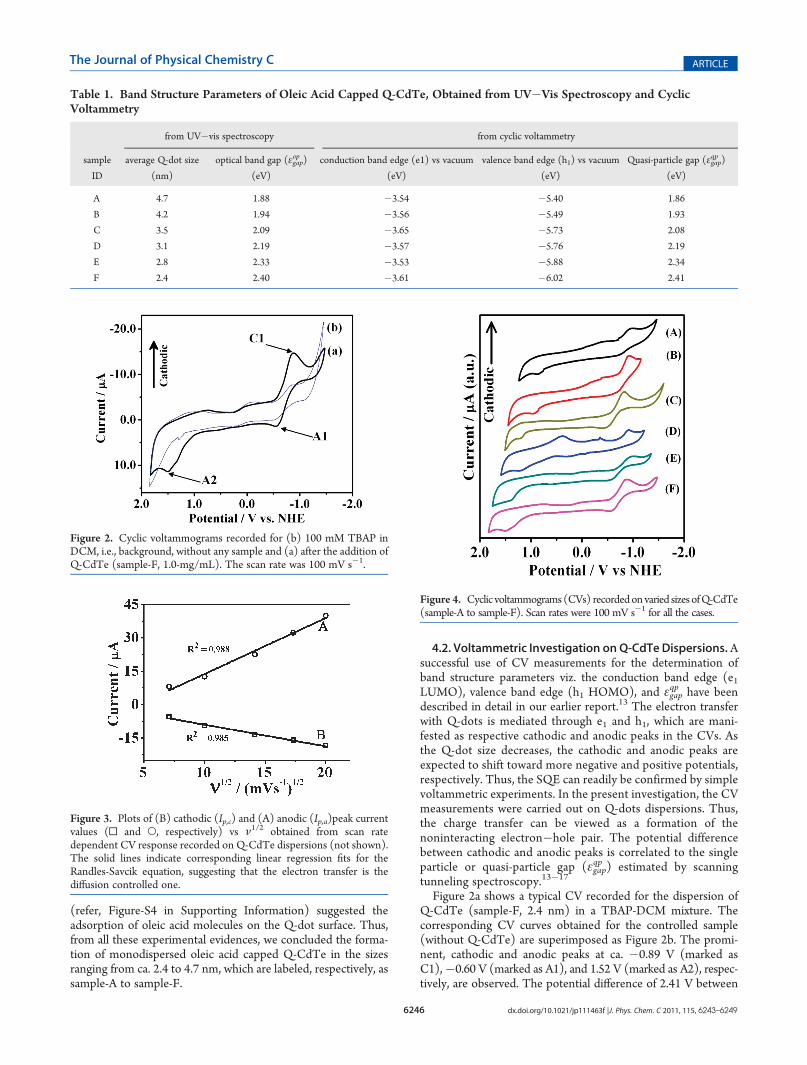
Figure 4. Cyclic voltammograms(CVs) recordedonvaried sizesofQ-CdTe(sample-A to sample-F). Scan rates were 100 mV s�1 for all the cases.
6247 dx.doi.org/10.1021/jp111463f |J. Phys. Chem. C 2011, 115, 6243–6249
The Journal of Physical Chemistry C ARTICLE
C1 and A2 is in accordance with the optical band gap of 2.40 eV,observed in the UV�vis spectrum (Table 1). Unlike Q-CdS andQ-CdSe,11�13 Q-CdTe shows an anodic peak A1, which is foundto be complementary to C1. The peak separation between C1and A1 is observed to be 306 ( 56 mV, which is far higher toqualify as a Nernstian type quasi-reversible case. The comple-mentary peak-pair indicates that the reduction of Q-CdTe formsa relatively stable anion radical (Q-CdTe�•) in a given timeframe and the solvent system. A similar observation has beenmade earlier by Bard et al. in which the addition of an oxidant inthe electrochemically reduced Q-CdTe led to the observation ofthe electro-generated chemiluminesence (ECL) and confirmedthe formation of stable CdTe radical anions.26 An additionaldifference of 247 mV over and above the typical reversible case(59 mV) is comparable with the average Stoke shift of ca. 258(39 meV (48 ( 6 nm) observed in the PL spectra. The coinc-idence in these values further supports the model of surface statemediated electron transfer, during the complementary oxidation.On other side, the anodic peak (A2) does not show such acomplementary nature even for fast scan rates (not shown). Thisfeature is attributed to the well known electron transfer followedby the chemical reaction (E-C) mechanism, i.e., an oxidation oftelluride to tellurium.26
Tounderstand the rate determining steps in the electron transferreaction, the scan rate dependent CV measurements (not shown)have been carried out. Figure 3 shows a plot of peak current valuesat C1 and A2 positions vs square root of the scan rates. The linearregression of the data fitted in the Randles-Sevick equation (R2 =0.98) suggesting that the charge transfer is diffusion controlled, i.e,the electron transfer is taking place on diffusing and isolatedQ-CdTe rather than the adsorbed film. Hence, the formation ofthe noninteracting pair is inferred, and the potential differencebetween (C1) and (A2) is correlated to εgap
qp .17
Figure 4 shows CVs recorded on varied sizes of Q-CdTe, i.e.,from sample-A (4.7 nm) to sample-F (2.4 nm). These voltam-mograms show similar features, i.e., the presence of cathodicand complementary anodic peak pair and irreversible anodicpeak. Moreover, the separation between these two set of peaksincreases with decreases in particle size (from samples A to F).This observation is attributed to the quantum confinement ofcharge, whose energy and thus εgap
qp increases upon decreasing theparticle size. In few cases, less prominent cathodic and anodicpeaks in the potential range of ca. 0.5 to �0.5 V are apparent.These peaks are attributed to the redox activity of degradationproducts, which are formed during the electron transfer followedby chemical reaction, for example, the reduction of telluriumformed at A2 to telluride. Similar observations were reportedpreviously in the case of Q-CdTe26 and also in the cases ofQ-CdS and Q-CdSe.11�13
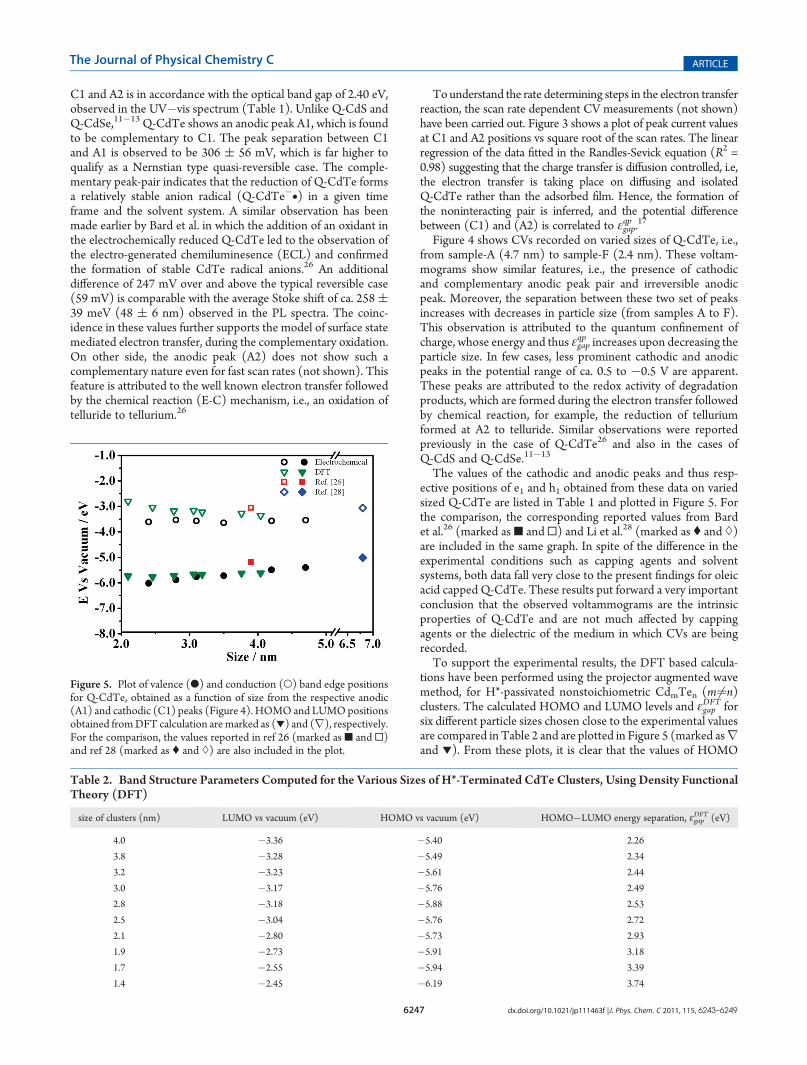
The values of the cathodic and anodic peaks and thus resp-ective positions of e1 and h1 obtained from these data on variedsized Q-CdTe are listed in Table 1 and plotted in Figure 5. Forthe comparison, the corresponding reported values from Bardet al.26 (marked as 9 and 0) and Li et al.28 (marked as ( and ))are included in the same graph. In spite of the difference in theexperimental conditions such as capping agents and solventsystems, both data fall very close to the present findings for oleicacid capped Q-CdTe. These results put forward a very importantconclusion that the observed voltammograms are the intrinsicproperties of Q-CdTe and are not much affected by cappingagents or the dielectric of the medium in which CVs are beingrecorded.To support the experimental results, the DFT based calcula-
tions have been performed using the projector augmented wavemethod, for H*-passivated nonstoichiometric CdmTen (m 6¼n)clusters. The calculated HOMO and LUMO levels and εgap
DFT forsix different particle sizes chosen close to the experimental valuesare compared in Table 2 and are plotted in Figure 5 (marked asrand 1). From these plots, it is clear that the values of HOMO
Figure 5. Plot of valence (b) and conduction (O) band edge positionsfor Q-CdTe, obtained as a function of size from the respective anodic(A1) and cathodic (C1) peaks (Figure 4). HOMO and LUMOpositionsobtained fromDFT calculation aremarked as (1) and (r), respectively.For the comparison, the values reported in ref 26 (marked as 9 and 0)and ref 28 (marked as ( and )) are also included in the plot.
Table 2. Band Structure Parameters Computed for the Various Sizes of H*-Terminated CdTe Clusters, Using Density FunctionalTheory (DFT)
size of clusters (nm) LUMO vs vacuum (eV) HOMO vs vacuum (eV) HOMO�LUMO energy separation, εgapDFT (eV)
4.0 �3.36 �5.40 2.26
3.8 �3.28 �5.49 2.34
3.2 �3.23 �5.61 2.44
3.0 �3.17 �5.76 2.49
2.8 �3.18 �5.88 2.53
2.5 �3.04 �5.76 2.72
2.1 �2.80 �5.73 2.93
1.9 �2.73 �5.91 3.18
1.7 �2.55 �5.94 3.39
1.4 �2.45 �6.19 3.74
6248 dx.doi.org/10.1021/jp111463f |J. Phys. Chem. C 2011, 115, 6243–6249
The Journal of Physical Chemistry C ARTICLE
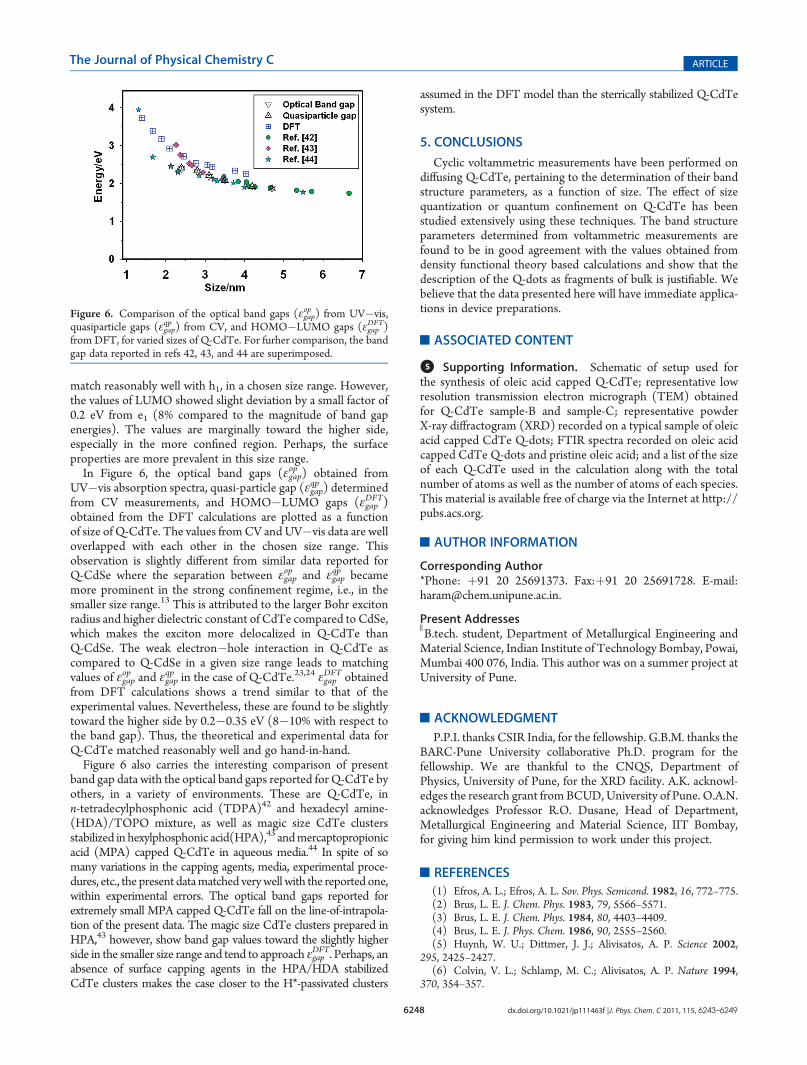
match reasonably well with h1, in a chosen size range. However,the values of LUMO showed slight deviation by a small factor of0.2 eV from e1 (8% compared to the magnitude of band gapenergies). The values are marginally toward the higher side,especially in the more confined region. Perhaps, the surfaceproperties are more prevalent in this size range.In Figure 6, the optical band gaps (εgap
op ) obtained fromUV�vis absorption spectra, quasi-particle gap (εgap
qp ) determinedfrom CV measurements, and HOMO�LUMO gaps (εgap
DFT)obtained from the DFT calculations are plotted as a functionof size of Q-CdTe. The values fromCV andUV�vis data are welloverlapped with each other in the chosen size range. Thisobservation is slightly different from similar data reported forQ-CdSe where the separation between εgap
op and εgapqp became
more prominent in the strong confinement regime, i.e., in thesmaller size range.13 This is attributed to the larger Bohr excitonradius and higher dielectric constant of CdTe compared to CdSe,which makes the exciton more delocalized in Q-CdTe thanQ-CdSe. The weak electron�hole interaction in Q-CdTe ascompared to Q-CdSe in a given size range leads to matchingvalues of εgap
op and εgapqp in the case of Q-CdTe.23,24 εgap
DFT obtainedfrom DFT calculations shows a trend similar to that of theexperimental values. Nevertheless, these are found to be slightlytoward the higher side by 0.2�0.35 eV (8�10% with respect tothe band gap). Thus, the theoretical and experimental data forQ-CdTe matched reasonably well and go hand-in-hand.Figure 6 also carries the interesting comparison of present
band gap data with the optical band gaps reported for Q-CdTe byothers, in a variety of environments. These are Q-CdTe, inn-tetradecylphosphonic acid (TDPA)42 and hexadecyl amine-(HDA)/TOPO mixture, as well as magic size CdTe clustersstabilized in hexylphosphonic acid(HPA),43 andmercaptopropionicacid (MPA) capped Q-CdTe in aqueous media.44 In spite of somany variations in the capping agents, media, experimental proce-dures, etc., the present datamatched verywell with the reported one,within experimental errors. The optical band gaps reported forextremely small MPA capped Q-CdTe fall on the line-of-intrapola-tion of the present data. The magic size CdTe clusters prepared inHPA,43 however, show band gap values toward the slightly higherside in the smaller size range and tend to approach εgap
DFT. Perhaps, anabsence of surface capping agents in the HPA/HDA stabilizedCdTe clusters makes the case closer to the H*-passivated clusters
assumed in the DFT model than the sterrically stabilized Q-CdTesystem.
5. CONCLUSIONS
Cyclic voltammetric measurements have been performed ondiffusing Q-CdTe, pertaining to the determination of their bandstructure parameters, as a function of size. The effect of sizequantization or quantum confinement on Q-CdTe has beenstudied extensively using these techniques. The band structureparameters determined from voltammetric measurements arefound to be in good agreement with the values obtained fromdensity functional theory based calculations and show that thedescription of the Q-dots as fragments of bulk is justifiable. Webelieve that the data presented here will have immediate applica-tions in device preparations.
’ASSOCIATED CONTENT
bS Supporting Information. Schematic of setup used forthe synthesis of oleic acid capped Q-CdTe; representative lowresolution transmission electron micrograph (TEM) obtainedfor Q-CdTe sample-B and sample-C; representative powderX-ray diffractogram (XRD) recorded on a typical sample of oleicacid capped CdTe Q-dots; FTIR spectra recorded on oleic acidcapped CdTe Q-dots and pristine oleic acid; and a list of the sizeof each Q-CdTe used in the calculation along with the totalnumber of atoms as well as the number of atoms of each species.This material is available free of charge via the Internet at http://pubs.acs.org.
’AUTHOR INFORMATION
Corresponding Author*Phone: þ91 20 25691373. Fax:þ91 20 25691728. E-mail:[email protected].
Present Addresses
)B.tech. student, Department of Metallurgical Engineering andMaterial Science, Indian Institute of Technology Bombay, Powai,Mumbai 400 076, India. This author was on a summer project atUniversity of Pune.
’ACKNOWLEDGMENT
P.P.I. thanks CSIR India, for the fellowship. G.B.M. thanks theBARC-Pune University collaborative Ph.D. program for thefellowship. We are thankful to the CNQS, Department ofPhysics, University of Pune, for the XRD facility. A.K. acknowl-edges the research grant from BCUD,University of Pune. O.A.N.acknowledges Professor R.O. Dusane, Head of Department,Metallurgical Engineering and Material Science, IIT Bombay,for giving him kind permission to work under this project.
’REFERENCES
(1) Efros, A. L.; Efros, A. L. Sov. Phys. Semicond. 1982, 16, 772–775.(2) Brus, L. E. J. Chem. Phys. 1983, 79, 5566–5571.(3) Brus, L. E. J. Chem. Phys. 1984, 80, 4403–4409.(4) Brus, L. E. J. Phys. Chem. 1986, 90, 2555–2560.(5) Huynh, W. U.; Dittmer, J. J.; Alivisatos, A. P. Science 2002,
295, 2425–2427.(6) Colvin, V. L.; Schlamp, M. C.; Alivisatos, A. P. Nature 1994,
370, 354–357.
Figure 6. Comparison of the optical band gaps (εgapop ) from UV�vis,
quasiparticle gaps (εgapqp ) from CV, and HOMO�LUMO gaps (εgap
DFT)from DFT, for varied sizes of Q-CdTe. For furher comparison, the bandgap data reported in refs 42, 43, and 44 are superimposed.
6249 dx.doi.org/10.1021/jp111463f |J. Phys. Chem. C 2011, 115, 6243–6249
The Journal of Physical Chemistry C ARTICLE
(7) Medintz, I. L.; Uyeda, H. T.; Goldman, E. R.; Mattoussi, H. Nat.Mater. 2005, 4, 435–446.(8) Michalet, X.; Pinaud, F. F.; Bentolila, L. A.; Tsay, J. M.; Doose, S.;
Li, J. J.; Sundarsan, G.; Wu, A. M.; Gambhir, S. S.; Weiss, S. S. Science2005, 307, 538–544.(9) Katari, J. E.B.; Colvin, V. L.; Alivisatos, A. P. J. Phys. Chem. 1994,
98, 4109–4117.(10) Liljeroth, P.; Jdira, L.; Overgaag, K.; Grandidier, B.; Speller, S.;
Vanmaekelbergh, D. Phys. Chem. Chem. Phys. 2006, 8, 3845–3850.(11) Haram, S. K.; Quinn, B. M.; Bard, A. J. J. Am. Chem. Soc. 2001,
123, 8860–8861.(12) Ding, Z; Quinn, B. M.; Haram, S. K.; Pell, L. E.; Korgel, B. A.;
Bard, A. J. Science 2002, 296, 1293–1297.(13) Inamdar, S. N.; Ingole, P. P.; Haram, S. K. ChemPhysChem
2008, 9, 2574–2579.(14) Kucur, E.; Riegler, J.; Urban, G. A.; Nann, T. J. Chem. Phys.
2003, 119, 2333–2337.(15) Kucur, E.; Bucking, W.; Giernoth, R.; Nann, T. J. Phys. Chem. B
2005, 109, 20355–20360.(16) Querner, C.; Reiss, P.; Sadki, S.; Zagorska, M.; Pron, A. Phys.
Chem. Chem. Phys. 2005, 7, 3204–3209.(17) Franceschetti, A.; Zunger, A. Phys. Rev. B 2000, 62, 2614–2623.(18) Kucur, E.; Bucking, W.; Arenz, S.; Giernoth, R.; Nann, T.
ChemPhysChem 2006, 7, 77–81.(19) Shalom,M.; Ruhle, S.; Hod, I.; Yadav, S.; Zaban, A. J. Am. Chem.
Soc. 2009, 131, 9876–9877.(20) Markus, T. Z.; Wu, M.; Wang, L.; Waldeck, D. H.; Oron, D.;
Naaman, R. J. Phys. Chem. C 2009, 113, 14200–14206.(21) Gaponik, N.; Talapin, D. V.; Rogach, A. L.; Hoppe, K.;
Shevchenko, E. V.; Kornowski, A; Eychmuller, A.; Weller, H. J. Phys.Chem. B 2002, 106, 7177–7185.(22) Schulz-Drost, C.; Sgobba, V.; Guldi, D. M. J. Phys. Chem. C
2007, 111, 9694–9703.(23) Wu, F. X.; Lewis, J. W.; Kliger, D. S.; Zhang, J. Z. J. Chem. Phys.
2003, 118, 12–16.(24) Danieli, T.; Gaponik, N.; Eychmuller, A.; Mandler, D. J. Phys.
Chem. C 2008, 112, 8881–8889.(25) Poznyak, S. K.; Osipovich, N. P.; Shavel, A.; Talapin, D. V.; Gao,
M.; Eychmuller, A.; Gaponik, N. J. Phys. Chem. B 2005, 109, 1094–1100.(26) Bae, Y.; Myung, N.; Bard, A. J. Nano Lett. 2004, 4 (6), 1153–
1161.(27) Qu, L.; Peng, Z. A.; Peng, X. Nano Lett. 2001, 1 (6), 333–
337.(28) Li, Y.; Zhong, H.; Li, R.; Zhou, Y.; Yang, C.; Li, Y. Adv. Funct.
Mater. 2006, 16, 1705–1716.(29) Peng, Z. A.; Peng, X. J. Am. Chem. Soc. 2001, 123, 183–184.(30) Yu, W. W.; Peng, X. Angew. Chem., Int. Ed. 2002, 41 (13),
2368–2371.(31) Bard, A. J.; Faulkner, L. R. Electrochemical Methods: Funda-
mentals and Applications, 2nd ed.; John Wiley & Sons: New York, 2001.(32) Wei, Su-H.; Zhang, S. B. Phys. Rev. B 2000, 62, 6944–6947.(33) Wang, X. Q.; Clark, S. J.; Abram, R. A. Phys. Rev. B 2004,
70, 235328.(34) Huang, X.; Lindgren, E.; Chelikowsky, J. R. Phys. Rev. B 2005,
71, 165328.(35) Bhattacharya, S. Kr.; Kshirsagar, A. Eur. Phys. J. D 2008,
48, 355–364.(36) Bhattacharya, S. Kr.; Kshirsagar, A. Phys. Rev. B 2007,
75, 035402.(37) Hohenberg, P.; Kohn, W. Phys. Rev. 1964, 136, B864–B871.
Kohn, W.; Sham, L. J. Phys. Rev. 1965, 140, A1133–A1138.(38) Bl€ochl, P. E. Phys. Rev. B 1994, 50, 17953–17979. Kresse, G.;
Joubert J. Phys. Rev. B 1999, 59, 1758–1775.(39) Kresse, G.; Furthmuller J. Phys. Rev. B 1996, 54, 11169–11186.(40) Perdew, J. P.; Burke, K.; Ernzerhof, M. Phys. Rev. Lett. 1996,
77, 3865–3868.(41) Murray, C. B.; Norris, D. J.; Bawendi, M. G. J. Am. Chem. Soc.
1993, 115, 8706–8715.
(42) Yu, W. W.; Qu, L.; Guo, W.; Peng, X. Chem. Mater. 2003,15, 2854–2860.
(43) Dagtepe, P.; Chikan, V.; Jasinski, J.; Leppert, V. J. J. Phys. Chem.C 2007, 111, 14977–14983.
(44) Rogach, A. L.; Franzl, T.; Klar, T. A.; Feldmann, J.; Gaponik, N.;Lesnyak, V.; Shavel, A.; Eychmuller, A.; Rakovich, Y. P.; Donegan, J. F.J. Phys. Chem. C 2007, 111, 14628–14637.
Copyright © 2022 FDOKUMEN