Detection of Fusarium culmorum in wheat by a surface plasmon resonance-based DNA sensor

Sensors 2013, 13, 14650-14661; doi:10.3390/s131114650
sensors ISSN 1424-8220
www.mdpi.com/journal/sensors
Article
Combining Electrochemical Impedance Spectroscopy and
Surface Plasmon Resonance into one Simultaneous Read-Out
System for the Detection of Surface Interactions
Thijs Vandenryt 1,2,†,
*, Andrea Pohl 3,†
, Bart van Grinsven 1, Ronald Thoelen
1,2,
Ward De Ceuninck 1,4
, Patrick Wagner 1,4
and Jörg Opitz 3
1 Institute for Materials Research IMO, Hasselt University, Wetenschapspark 1, 3590 Diepenbeek,
Belgium; E-Mails: [email protected] (B.G); [email protected] (R.T.);
[email protected] (W.C); [email protected] (P.W.) 2 XIOS University College, Agoralaan building H, 3590 Diepenbeek, Belgium
3 Fraunhofer Institute for Non Destructive Testing (IZFP), Maria-Reiche-Strasse 2, 01109 Dresden,
Germany; E-Mails: [email protected] (A.P.);
[email protected] (J.O.) 4 IMEC vzw, IMOMEC, Hasselt University, Wetenschapspark 1, B-3590 Diepenbeek, Belgium
† These authors contributed equally to this work.
* Author to whom correspondence should be addressed; E-Mail: [email protected];
Tel.: +32-11-268-871; Fax: +32-11-268-899.
Received: 28 August 2013; in revised form: 24 September 2013 / Accepted: 3 October 2013 /
Published: 29 October 2013
Abstract: In this article we describe the integration of impedance spectroscopy (EIS) and
surface plasmon resonance (SPR) into one surface analytic device. A polydimethylsiloxane
(PDMS) flow cell is created, matching the dimensions of a commercially available sensor
chip used for SPR measurements. This flow cell allowed simultaneous measurements
between an EIS and a SPR setup. After a successful integration, a proof of principle study
was conducted to investigate any signs of interference between the two systems during a
measurement. The flow cell was rinsed with 10 mM Tris-HCl and 1× PBS buffer in an
alternating manner, while impedance and shifts of the resonance angle were monitored. After
achieving a successful proof of principle, a usability test was conducted. It was assessed
whether simultaneous detection occurred when: (i) Protein A is adsorbed to the gold surface
of the chip; (ii) The non-occupied zone is blocked with BSA molecules and (iii) IgG1 is
bound to the Protein A. The results indicate a successful merge between SPR and EIS.
OPEN ACCESS

Sensors 2013, 13 14651
Keywords: SPR; EIS; flow-cell; lab on chip; Protein A; immunoglobulin
1. Introduction
Since the early development of biosensors [1], biosensor technology has successfully been used in
many applications and has become more important in recent years for the detection of various analytes.
Within biosensor technology surface plasmon resonance (SPR) is considered to be a real-time and
label-free tool [2]. Over the past two decades SPR has found its way into medical diagnostics [3–5],
environmental analysis [6–9] and food control [9–12]. The working principle is based on changes in
the refractive index at interfaces. In the case of biosensors these changes are associated with the
binding of the molecules of interest onto a functionalized sensor surface. Though SPR is considered to
be a valuable tool, its functionality in some applications might be improved through combined
technologies [13–15]. SPR can only measure a limited height above the sensor surface, usually 200 nm
or less, for the device used in this paper [16,17], and does not provide any spatial information
regarding the binding of a target molecule to its receptor. As an example, we have shown recently that
a combination of impedance spectroscopy (EIS) with confocal laser scanning microscopy (CLSM) will
lead to a better understanding of the binding kinetics of DNA [18]. Impedance spectroscopy has already
been used successfully for monitoring DNA hybridization and the detection of single nucleotide
polymorphisms [19], recognition of small molecules by means of molecular imprinted polymers [20]
and the detection of C-reactive protein (CRP) [21]. The impedance-based detection offers the
possibility of device miniaturization and an electronic read-out. Besides these advantages, EIS does not
have the 200 nm limitation and even allows tuning of the penetration depth [15,22]. To investigate the
power of a combined SPR and EIS measurement, a PDMS flow-through cell was developed to
integrate with the dimensions of the disposable sensor chips, normally used for SPR measurements.
First it was studied whether or not the systems would interfere with each other, when simply
alternating buffer-media. After proving that the systems were not influencing each other, sensor chips
were functionalized with Protein A as receptor for immunoglobulin-G (IgG1) [23]. The binding of
IgG1 was then monitored simultaneously by SPR and EIS.
2. Experimental
2.1. Surface Plasmon Resonance
The optical phenomenon of SPR occurs on the interface between a metal surface and a dielectric.
When light strikes the surface of a certain metal, there is a minimum of the reflected light intensity.
The angle of this minimum (resonance angle, θ) is a property of the plasmon resonance and depends
on the refractive index of the medium and the wavelength used. The adsorption of molecules to this
interface results in a change of the refractive index, which can be detected as a shift of the resonance
angle. The change in angle is reported as resonance units (RU): one unit corresponds with the binding
of 1 pg of analyte per mm2; an angle change of roughly 0.1° corresponds to 1,000 RU. The
SPR measurements in this study were performed using the SPR measurement system, developed by
Sensors 2013, 13 14652
Fraunhofer and sold by capitalis technology GmbH (Berlin, Germany). The system consisted of an
SPR-read-out unit, combined with an automated on-chip microfluidic system. For the SPR
measurements, commercially available, disposable, 76 × 26 × 4 mm3 (equal in area to a standard
microscopy slide) sensor chips were used, that were molded from a cyclic olefin copolymer referred to as
Topas
(KDS Radeberger Präzisions-Formen-und Werkzeugbau, Radeberg, Germany). An area of
12 × 3 mm2 on the chip surface
was covered with a 50 nm thick gold layer, serving as the metal
interface onto which antibodies are grafted. The angle of incidence of collimated light from light
emitting diodes (LEDs with a wavelength of 810 nm) was scanned over the underside of the gold area
of the chip, through a scanning mirror. The reflected light was detected by a high resolution CCD
camera. This is schematically represented in Figure 1. A CPU controlled syringe pump (MLE,
Dresden, Germany) was used to administer fluids with programmable flow rates, ranging from 1.25 to
689 µL/s.
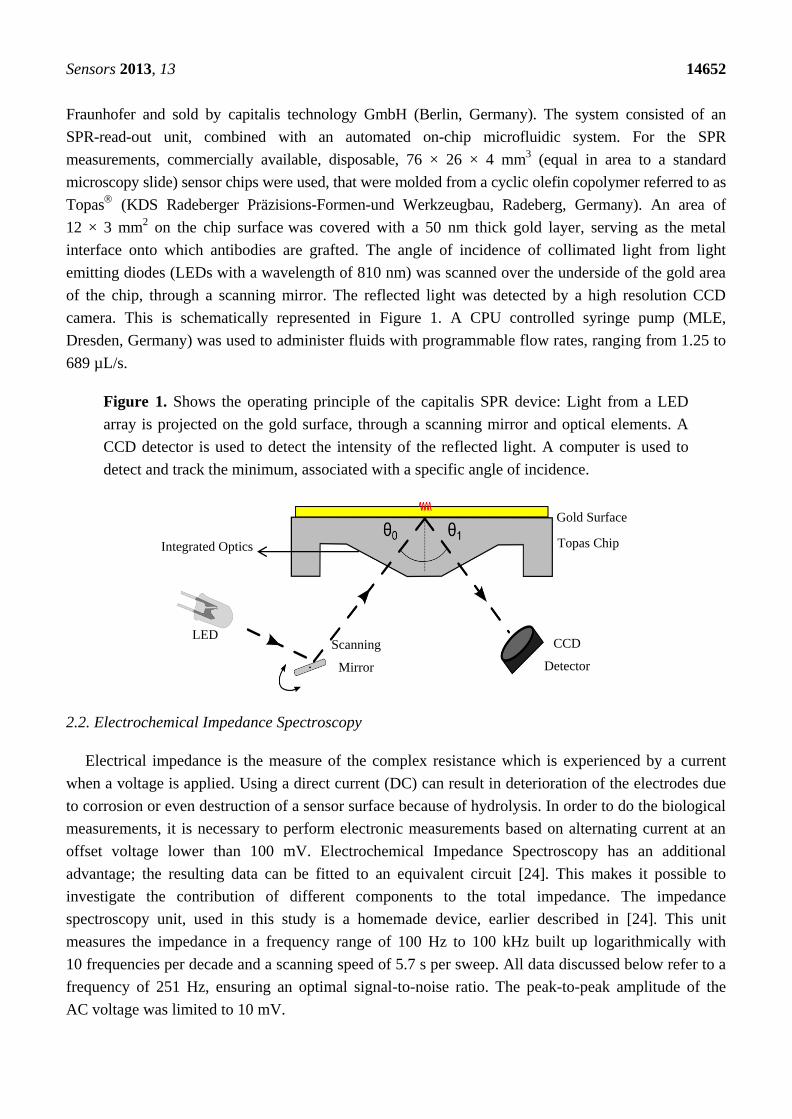
Figure 1. Shows the operating principle of the capitalis SPR device: Light from a LED
array is projected on the gold surface, through a scanning mirror and optical elements. A
CCD detector is used to detect the intensity of the reflected light. A computer is used to
detect and track the minimum, associated with a specific angle of incidence.
2.2. Electrochemical Impedance Spectroscopy
Electrical impedance is the measure of the complex resistance which is experienced by a current
when a voltage is applied. Using a direct current (DC) can result in deterioration of the electrodes due
to corrosion or even destruction of a sensor surface because of hydrolysis. In order to do the biological
measurements, it is necessary to perform electronic measurements based on alternating current at an
offset voltage lower than 100 mV. Electrochemical Impedance Spectroscopy has an additional
advantage; the resulting data can be fitted to an equivalent circuit [24]. This makes it possible to
investigate the contribution of different components to the total impedance. The impedance
spectroscopy unit, used in this study is a homemade device, earlier described in [24]. This unit
measures the impedance in a frequency range of 100 Hz to 100 kHz built up logarithmically with
10 frequencies per decade and a scanning speed of 5.7 s per sweep. All data discussed below refer to a
frequency of 251 Hz, ensuring an optimal signal-to-noise ratio. The peak-to-peak amplitude of the
AC voltage was limited to 10 mV.
LED Scanning
Mirror
CCD
Detector
Topas Chip
Gold Surface
Integrated Optics

Sensors 2013, 13 14653
2.3. Combining SPR and EIS
To combine the surface plasmon resonance setup with the impedance spectroscopy unit, a flow-cell
was developed. This cell was designed to match the dimensions of the existing Topas
chip. The
dimensions are 76 × 26 × 4 mm3, a patch of gold (12 × 3 mm
2, with a thickness of 50 nm) is deposited
on top of the slide. The chip is shown in Figure 2A. A PDMS (polydimethylsiloxane) flow-cell is key
to achieve a successful combination between the two technologies. PDMS is a transparent flexible
silicone elastomer, it is biocompatible and has a high degree of chemical inertness. Its reusability and
self-sealing properties make it an ideal material for this application. Figure 2B shows the PDMS
flow-cell. To fabricate this cell, a mold is fabricated in PTFE (polytetrafluoroethylene/Teflon; PCH
Technischer Handel, Dresden, Germany) to serve as the master template, through computer numerical
control (CNC) milling [25]. This master mold is then encapsulated in the PDMS base polymer
(Sylgard 184, Dow Corning, Midland, MI, USA), which is mixed thoroughly in a 10:1 ratio with its
curing agent. The mixture is degassed for 30 min at an absolute pressure of 50 kPa to remove trapped
gas bubbles. Complete curing of the PDMS in an oven at 65 °C takes approximately 3 h. The cured
daughter-mold can be gently peeled from the master template and cut to the required dimensions with
a lancet. Cavities for the inlet, outlet and spring contact are present in the master mold, so no
post-treatment to the PDMS mold is necessary. The resulting reaction-chamber of the flow-cell is
positioned directly over the gold patch. A small part of the gold sensor surface is sacrificed to allow a
gold plated spring contact to make a connection without any contact with the fluid compartment. The
spring contact is pressed gently onto the gold surface of the Topas
chip, ensuring a good electrical
connection. As the second connection, a gold wire with a diameter of 500 µm is placed in the outlet
compartment of the flow-cell, closing the electrical circuit from the spring contact, to the gold plated
patch, through the reagents, to the counter-electrode and finally back to the impedance analyzer. The
PDMS flow-cell is permanently bound to a transparent polymethylmethacrylate (PMMA) carrier
board. This board acts as a strain relief for the electrical connections and has integrated HPLC (high
performance liquid chromatography) fittings to simplify the fluidic handling, as shown in Figure 2C.
Figure 2. (A) The Topas chip with gold sensor surface is covered with a PDMS flow-cell
(B). The reaction-chamber of the flow-cell is positioned directly over the gold patch of the
Topas chip. The flow-cell is permanently bound to a transparent PMMA (Poly methyl
methacrylate) carrier board (C), carrying the necessary electrical and fluidic connections.

Sensors 2013, 13 14654
The volume of the entire flow-cell is 17.6 µL, with a height of 150 µm. The PMMA and PDMS
assembly has a combined height of about 6 mm (2 mm PDMS slab). This mimics the height of the
original capitalis flow-cell and ensures sufficient pressure to seal the flow-cell in the snap-fitted
SPR unit.
2.4. Proof of Principle
To assess the working principle of the combined unit, the reaction chamber of the PDMS flow-cell
was filled sequentially with 10 mM Tris-HCl (Carl Roth, Karlsruhe, Germany) and 1× PBS buffer (pH
7.4; GIBCO Life Technologies GmbH, Darmstadt, Germany). These analytes were chosen because
they can be distinguished clearly both by impedance spectroscopy and surface plasmon resonance.
First 500 µL of 10 mM Tris-HCl is pumped into the reaction chamber. Impedance is measured in a
frequency range of 100 Hz–100 kHz. At the same time a surface plasmon resonance measurement is
performed. After obtaining a stable signal for both techniques, the medium is exchanged with 500 µL
of 1× PBS buffer. This process is repeated three times to verify that the initial stable values for both
techniques are reproducible and stay constant in time.
2.5. Usability Test
After achieving a successful proof of principle a usability test was conducted. It was studied
whether the binding of IgG1 (Sigma-Aldrich Biochemie GmbH, Taufkirchen, Germany) to Protein A
(biopur, Reinach, Switzerland) could be observed, both by EIS and SPR in real time. First, the gold
patch of the Topas®
chip is cleansed by means of a 65% HNO3 solution then it is neutralized in a
solution containing 25% NH3, 30% H2O2 (all three purchased at Carl Roth) and ultrapure water
(Direct-Q3 UV system—Millipore, Schwalbag, Germany) in a ratio of 1:1:5 for 2 min. Subsequent
rinsing with ultrapure water and drying under N2 atmosphere finalized the cleaning procedure. After
this cleaning procedure, the Topas®
chip, PDMS flow-cell and PMMA carrier board are assembled.
First, the reaction chamber was filled with 500 µL of 10 mM Tris-HCl solution (Figure 3A), to obtain
a stable signal for both EIS and SPR. Next, 500 µL of 0.25 mg/mL Protein A solution was added and
left for 90 min to be adsorbed to the gold surface (Figure 3B). In the next step, the gold surface was
rinsed with 500 µL of 10 mM Tris-HCl solution, to remove the unbound Protein A. When a stable
signal was obtained, 500 µL of 1 mg/mL BSA solution was added for 20 min, to block the unoccupied
areas of the gold surface (Figure 3C). Then, the system was rinsed again with 500 µL of 10 mM
Tris-HCl solution. Upon observing a stable signal, 500 µL of 0.565 mg/mL IgG1 solution was added to
the reaction chamber, to bind with the Protein A, for 90 min. Finally, the system was rinsed with
500 µL of 10 mM Tris-HCl solution.

Sensors 2013, 13 14655
Figure 3. Different stages throughout the usability test. (A) Flow-cell is rinsed with 10 mM
Tris-HCl solution, nothing is bound to the sensor surface. (B) Protein A is attached through
physical adsorption to the gold surface, acting as a receptor for IgG1. (C) Non-occupied
zones of the sensor surface are blocked with BSA molecules. (D) IgG1 is bound to the
Protein A.
3. Results
3.1. Proof of Principle
Figure 4 shows the results when exchanging the media 10 mM Tris-HCl and 1× PBS buffer for
three consecutive runs. The response to an exchange of buffer media can be seen in Figure 4A. Filling
the reaction chamber with 10 mM Tris-HCl provides a local minimum of 610 ± 2 RU. Replacing this
solution with 1× PBS buffer provides a local minimum in the intensity of reflected light of 635 ± 2
resonance units (RU). When repeating this medium exchange it can be seen that this result is highly
reproducible with minor signs of drift. Figure 4B shows the changes in impedance and its phase at a
frequency of 251 Hz, while exchanging the media. The 10 mM Tris-HCl solution provides a complex
resistance of 40 kΩ ± 58 Ω and an accompanying phase of −3.7 ± 0.4°. When exchanging the 10 mM
Tris-HCl solution with 1× PBS, the impedance decreases to 15.5 kΩ ± 35 Ω with a phase shift towards
−4.4° ± 0.1°. Repeating the medium exchange for three consecutive runs shows again a high
reproducibility of the values mentioned above with little drift or increasing error on the signal. To
assess whether the EIS and SPR unit detected the media exchange at the same time, the minimum shift
from Figure 4A and changes in impedance, depicted in Figure 4B are plotted in one graph as can be
seen in Figure 4C. Comparing the signals, when plotted together in the same graph, reveals that the
units detected the media exchange at the same time, without any signs of crosstalk or influencing each
other. The results of the proof-of-principle test, described in Section 3.1 reveal that, when changing the
medium from 10 mM Tris-HCl to 1× PBS and then back to 10 mM Tris-HCl, little shift in response or
impedance occurs when comparing the 10 mM Tris-HCl plateaus. When comparing the effect sizes,

Sensors 2013, 13 14656
very low noise levels can be observed in the SPR and EIS magnitude data. However the EIS phase data
appears to be noisy. Exchanging media provides a predominantly resistive effect, which explains the
minor change in phase (±1°). Having an error of ± 0.5° will therefore lead to a high noise level when
compared to the small effect size.
Figure 4. Alternating the media 10 mM Tris-HCl and 1× PBS buffer for three consecutive
runs. (A) Shows the minimum shift when exchanging the media. (B) Illustrates the changes
in amplitude and its phase at a frequency of 251 Hz, when exchanging the media.
Comparing the signals, when plotted in the same graph, reveals that the read-out systems
detected the media exchange simultaneously, without influencing each other (C).
3.2. Usability Test
After proving the system to be free of crosstalk and systematic errors, Topas®
chips were
functionalized with adsorbed Protein A as receptor for IgG1, then BSA blocker molecules were added
and finally the binding of IgG1 was monitored simultaneously with SPR and EIS. Between each
addition the system was rinsed with 500 µL of 10 mM Tris-HCl solution. Comparing the 10 mM
Tris-HCl plateaus between additions provides the net effect of each addition and excludes any medium
effects. Figure 5 shows the minimum shift and impedance throughout the entire experiment, arrows
indicate the exchange of medium. Filling the reaction chamber with 10 mM Tris-HCl provides a local

Sensors 2013, 13 14657
minimum of 340 ± 2 RU and an impedimetric value of 43 kΩ ± 58 Ω. Then Protein A is added as a
receptor for the IgG1 antibodies. The system is then rinsed for the first time with 10 mM Tris-HCl,
providing a minimum of 370 ± 2 RU and an impedance of 46 kΩ ± 41 Ω.
Figure 5. (A) Shows the minimum shift and (B) illustrates the changes in impedance and
its phase at a frequency of 251 Hz, when attaching Protein A to the surface, blocking the
non-occupied zone with BSA molecules and binding the IgG1 to the Protein A. Comparing
the signals, when plotted in the same graph, reveals that the read-out systems detected each
addition simultaneously (C).
After the BSA solution is added, the system is rinsed for a second time with 10 mM Tris-HCl,
leading to a local minimum of 375 ± 2 RU and an impedance of 48 kΩ ± 53 Ω. Finally the IgG1
solution is pumped into the reaction chamber, followed by a last washing step of 10 mM Tris-HCl
solution, which gives a local minimum of 460 ± 2 RU and an impedimetric value of 51 kΩ ± 49 Ω.
Comparing the signals, by plotting them in the same graph (Figure 5C), reveals simultaneous
detections without crosstalk.

Sensors 2013, 13 14658
4. Discussion and Conclusions
In this study we explored the possibility of combining two different read-out techniques (EIS and
SPR). After establishing a combined setup (Figure 2), a proof of principle experiment was conducted.
10 mM Tris-HCl and 1× PBS buffer was introduced in an alternating manner to the reaction chamber of
the PDMS flow-cell. The results have shown that these media changes could be detected both by EIS and
SPR and when changing the medium from 10 mM Tris-HCl to 1× PBS and then back to 10 mM
Tris-HCl, no shift in minimum or impedance occurs. Plotting the results in one graph (Figure 4C)
revealed that EIS and SPR detected the changes simultaneously, without any evidence of crosstalk.
After the successful proof of principle experiment a usability test was conducted with Protein A as
receptors and IgG1 as target molecules. The possibility to detect the binding of IgG1 to Protein A
simultaneously by EIS and SPR was investigated. Comparing the 10 mM Tris-HCl plateaus between
additions provided the net effect of each addition and excluded any media effects. Figure 6 illustrates
the percentual effect sizes for EIS and SPR for each addition.
Figure 6. Relative effect sizes for EIS and SPR for each addition during the usability
test. The effect sizes are normalized to their initial value and appear to be in the same order
of magnitude.
The effect sizes have been normalized to their initial value (reaction chamber filled with 10 mM
Tris-HCl). Adding Protein A to the reaction chamber resulted in a minimum shift of 8.5% and an
increase in impedance by 7.0%. Blocking the non-occupied zone with the BSA molecules resulted in a
minimum shift of 10.3% and an increase in impedance of 11.6%. The final attachment of IgG1 to
Protein A led to a minimum shift of 35.3% and an increase in impedance of 18.6%. Overall error on
the results shown in Section 4, lie in the order of ±0.1%. Despite the fact these results originate from
two independent physical phenomena, the percentual minimum shifts and changes in impedance are on
the same order of magnitude. However, for the attachment of IgG1, a distinct difference in effect size
obtained by the two technologies can be observed. This could be explained through the fact that SPR is
sensitive to changes in dielectric constant, whereas impedance is more sensitive to changes in
resistance and charge distribution. Attaching IgG1 appears to create a greater change in dielectric

Sensors 2013, 13 14659
constant as compared to the change in resistance or charge distribution. Additionally, the structure of
the set-up may also contribute to this phenomenon: the dielectric constant is measured in parallel to the
surface. As IgG1 covers almost the entire surface, it will have a great and distinct effect on the
dielectric constant. Impedance is measured top-down. This means that covering an entire surface does
not imply an excessive effect size, because the resistive layer which is added is relatively thin. In this
case the effect size measured vertically is smaller than the effect size measured horizontally. The
results indicate that a merge between SPR and EIS is technically possible. Combining these
technologies into one read-out system provides a real time reference for two different physical
phenomena and facilitates the interpretation of data.
Acknowledgments
This work was financed by the Life Science Initiative of the Province of Limburg, by the Special
Research Funds BOF of Hasselt University, XIOS University College and the Staatsministerium für
Wissenschaft und Kunst—SMWK und EFRE and the European Funds for Regional Development
EFRD. The authors wish to thank M. Mertig (TU Dresden) for stimulating scientific discussions.
Conflict of Interest
The authors declare no conflict of interest.
References
1. Clark, L.C.; Lyons, C. Electrode systems for continuous monitoring in cardiovascular surgery.
Ann. N.Y. Acad. Sci. 1962, 102, 29–45.
2. Yao, X.; Li, X.; Toledo, F.; Zurita-Lopez, C.; Gutova, M.; Momand, J.; Zhou, F. Sub-attomole
oligonucleotide and p53 cDNA determinations via a high-resolution surface plasmon resonance
combined with oligonucleotide-capped gold nanoparticle signal amplification. Anal. Biochem.
2006, 354, 220–228.
3. Tao, L.; Barlen, B.; Mazumdar, S.D.; Zhao, F.; Keusgen, M. A new detection method of mistletoe
lectin I by surface plasmon resonance. Sens. Actuator B: Chem. 2009, 141, 192–199.
4. Kausaite-Minkstimiene, A.; Ramanaviciene, A.; Ramanavicius, A. Surface plasmon resonance
biosensor for direct detection of antibodies against human growth hormone. Analyst 2009, 134,
2051–2057.
5. Jung, S.-H.; Jung, J.-W.; Suh, I.-B.; Yuk, J.S.; Kim, W.-J.; Choi, E.Y.; Kim, Y.-M.; Ha, K.-S.
Analysis of C-reactive protein on amide-linked N-hydroxysuccinimide-dextran arrays with a
spectral surface plasmon resonance biosensor for serodiagnosis. Anal. Chem. 2007, 79,
5703–5710.
6. Mauriz, E.; Calle, A.; Montoya, A.; Lechuga, L.M. Determination of environmental organic
pollutants with a portable optical immunosensor. Talanta 2006, 69, 359–364.
7. Mauriz, E.; Calle, A.; Manclús, J.J.; Montoya, A.; Lechuga, L.M. Multi-analyte SPR
immunoassays for environmental biosensing of pesticides. Anal. Bioanal. Chem. 2007, 387,
1449–1458.

Sensors 2013, 13 14660
8. Dillon, P.P.; Daly, S.J.; Browne, J.G.; Manning, B.M.; Loomans, E.; van Amerongen, A.;
O’Kennedy, R. Application of an immunosensor for the detection of the beta-lactam antibiotic,
cephalexin. Food Agric Immunol. 2003, 15, 225–234.
9. Forzani, E.S.; Zhang, H.; Chen, W.; Tao, N. Detection of heavy metal ions in drinking water
using a high-resolution differential surface plasmon resonance sensor. Environ. Sci. Technol.
2005, 39, 1257–1262.
10. Dupont, D.; Muller-Renaud, S. Quantification of proteins in dairy products using an optical
biosensor. J. Aoac. Int. 2006, 89, 843–848.
11. Homola, J.; Dostálek, J.; Chen, S.; Rasooly, A.; Jiang, S.; Yee, S.S. Spectral surface plasmon
resonance biosensor for detection of staphylococcal enterotoxin B in milk. Int. J. Food. Microbiol.
2002, 75, 61–69.
12. Muller-Renaud, S.; Dupont, D.; Dulieu, P. Quantification of beta casein in milk and cheese using
an optical immunosensor. J. Agric. Food Chem. 2004, 52, 659–664.
13. Lu, J.; Wang, W.; Wang, S.; Shan, X.; Li, J.; Tao, N. Plasmonic-based electrochemical impedance
spectroscopy: Application to molecular binding. Anal. Chem. 2012, 84, 327–333.
14. Manesse, M.; Stambouli, V.; Boukherroub, R.; Szunerits, S. Electrochemical impedance
spectroscopy and surface plasmon resonance studies of DNA hybridization on gold/SiO(x)
interfaces. Analyst 2008, 133, 1097–1103.
15. Bart, M.; van Os, P.J.H.J.; Kamp, B.; Bult, A.; van Bennekom, W.P. Development of a confined
wall-jet flow-through cell for simultaneous electrochemical and surface plasmon resonance
applications. Sens. Actuator B: Chem. 2002, 84, 129–135.
16. Mertig, M.; Kick, A.; Bonsch, M.; Katzschner, B.; Voigt, J.; Sonntag, F.; Schilling, N.;
Klotzbach, U.; Danz, N.; Begemann, S.; et al. A Novel Platform Technology for the Detection of
Genetic Variations by Surface Plasmon Resonance. In Proceedings of the 2009 IEEE Sensors,
Christchurch, New Zealand, 25–28 October 2009; pp. 392–395.
17. Sigal, G.B.; Mrksich, M.; Whitesides, G.M. Using surface plasmon resonance spectroscopy to
measure the association of detergents with self-assembled monolayers of hexadecanethiolate on
gold. Langmuir 1997, 13, 2749–2755.
18. Van Grinsven, B.; Vanden Bon, N.; Grieten, L.; Murib, M.; Janssens, S.D.; Haenen, K.;
Schneider, E.; Ingebrandt, S.; Schöning, M.J.; Vermeeren, V.; et al. Rapid assessment of the
stability of DNA duplexes by impedimetric real-time monitoring of chemically induced
denaturation. Lab Chip 2011, 11, 1656–1663.
19. Vermeeren, V.; Bijnens, N.; Wenmackers, S.; Daenen, M.; Haenen, K.; Williams, O.A.;
Ameloot, M.; vandeVen, M.; Wagner, P.; Michiels, L. Towards a real-time, label-free,
diamond-based DNA sensor. Langmuir 2007, 23, 13193–13202.
20. Thoelen, R.; Vansweevelt, R.; Duchateau, J.; Horemans, F.; D’Haen, J.; Lutsen, L.; Vanderzande, D.;
Ameloot, M.; VandeVen, M.; Cleij, T.J.; Wagner, P. A MIP-based impedimetric sensor for the
detection of low-MW molecules. Biosens. Bioelectron. 2008, 23, 913–918.
21. Bijnens, N.; Vermeeren, V.; Daenen, M.; Grieten, L.; Haenen, K.; Wenmackers, S.;
Williams, O.A.; Ameloot, M.; VandeVen, M.; Michiels, L.; Wagner, P. Synthetic diamond films
as a platform material for label-free protein sensors. Phys. Status Solidi A 2009, 206, 520–526.

Sensors 2013, 13 14661
22. Wink, T.; van Zuilen, S.J.; Bult, A.; van Bennekom, W.P. Liposome-mediated enhancement of
the sensitivity in immunoassays of proteins and peptides in surface plasmon resonance
spectrometry. Anal. Chem. 1998, 70, 827–832.
23. Vermeeren, V.; Grieten, L.; Bon, N. Vanden; Bijnens, N.; Wenmackers, S.; Janssens, S.D.;
Haenen, K.; Wagner, P.; Michiels, L. Impedimetric, diamond-based immmunosensor for the
detection of C-reactive protein. Sens. Actuator B: Chem 2011, 157, 130–138.
24. Van Grinsven, B.; Vandenryt, T.; Duchateau, S.; Gaulke, A.; Grieten, L.; Thoelen, R.;
Ingebrandt, S.; de Ceuninck, W.; Wagner, P. Customized impedance spectroscopy device as
possible sensor platform for biosensor applications. Phys. Status Solidi A 2010, 207, 919–923.
25. Bers, K.; van Grinsven, B.; Vandenryt, T.; Murib, M.; Janssen, W.; Geerets, B.; Ameloot, M.;
Haenen, K.; Michiels, L.; Ceuninck, W. de Wagner, P. Implementing heat transfer resistivity as a
key element in a nanocrystalline diamond based single nucleotide polymorphism detection array.
Diam. Relat. Mater. 2013, 38, 45–51.
© 2013 by the authors; licensee MDPI, Basel, Switzerland. This article is an open access article
distributed under the terms and conditions of the Creative Commons Attribution license
(http://creativecommons.org/licenses/by/3.0/).
Copyright © 2022 FDOKUMEN


![Resonant Raman effect enhanced by surface plasmon excitation of CdSe nanocrystals embedded in thin SiO[sub 2] films](https://static.fdokumen.com/doc/165x107/634518516cfb3d40640985a1/resonant-raman-effect-enhanced-by-surface-plasmon-excitation-of-cdse-nanocrystals.jpg)