
In Situ Biosensing with a Surface Plasmon Resonance Fiber Grating Aptasensor
8
Published: August 04, 2011 r2011 American Chemical Society 7027 dx.doi.org/10.1021/ac201641n | Anal. Chem. 2011, 83, 7027–7034 ARTICLE pubs.acs.org/ac In Situ Biosensing with a Surface Plasmon Resonance Fiber Grating Aptasensor Yanina Shevchenko, † Tariq J. Francis, ‡ David A. D. Blair, ‡ Ryan Walsh, ‡ Maria C. DeRosa,* ,‡ and Jacques Albert* ,† † Department of Electronics, Carleton University, 1125 Colonel By Drive, Ottawa, K1S 5B6, Canada ‡ Department of Chemistry, Carleton University, 1125 Colonel By Drive, Ottawa, K1S 5B6, Canada b S Supporting Information ABSTRACT: Surface plasmon resonance (SPR) biosensors prepared using optical fibers can be used as a cost-effective and relatively simple-to- implement alternative to well established biosensor platforms for monitoring biomolecular interactions in situ or possibly in vivo. The fiber biosensor presented in this study utilizes an in-fiber tilted Bragg grating to excite the SPR on the surface of the sensor over a large range of external medium refractive indices, with minimal cross-sensitivity to temperature and without compromising the structural integrity of the fiber. The label-free biorecognition scheme used demonstrates that the sensor relies on the functionalization of the gold-coated fiber with aptamers, synthetic DNA sequences that bind with high specificity to a given target. In addition to monitoring the functionalization of the fiber by the aptamers in real-time, the results also show how the fiber biosensor can detect the presence of the aptamer’s target, in various concentrations of thrombin in buffer and serum solutions. The findings also show how the SPR biosensor can be used to evaluate the dissociation constant (K d ), as the binding constant agrees with values already reported in the literature. T he rapid and sensitive detection of analytes at low concen- trations is paramount in many fields, such as medicine, environmental monitoring, and food safety. Fiber sensors are an appealing solution to this problem because the sensing platform is compact and cost-effective (low cost equipment), and it is possible to collect measurements in situ and remotely. However, the performance of fiber sensors can be compromised by several issues associated with the design of the transducing mechanism and with difficulties arising from the need to modify the fiber geometry. In most fiber biosensors, light guided in the core must be exposed to the external medium in order to perform measurements. This is typically done by removing all or part of the cladding (via etching or side polishing) or tapering down the fiber to allow core guided light to escape into the cladding. 13 Another approach consists of the use of a long period grating (LPG) to couple core guided light to cladding guided light. 4 While several fiber-based biosensing platforms have been pro- posed along these lines, they have not yet been able to replace or compete for real-life applications with other biosensing plat- forms, such as those relying on planar optical, piezo-electric, or electronic transducing elements. The main reason for this is that all these approaches present practical difficulties that can be overcome in laboratory settings but not in actual use. For instance, the need to etch, taper, or side-polish optical fibers makes them very fragile and requires protective packaging for their use. Also, the cladding removal process must be controlled accurately for each sensor device (with a precision of the order of μm of glass thickness removal). These two factors would increase the cost per sensor to prohibitively high levels in biosensing applications. LPG-based sensors do not suffer from these issues, but their large sensitivity comes with a price: a large cross- sensitivity to everything (especially temperature 5,6 ). As a result, while LPG sensors have been around in the literature for as long as Fiber Bragg Grating (FBG) sensors (1994 vs 1989), they have never found widespread use (for any application) while FBGs are now widely deployed in structural engineering 7 and for oil and gas applications. 8 Finally, in the specific case of fiber-based surface plasmon resonance (SPR) sensing, apart from the approaches Received: April 22, 2011 Accepted: August 4, 2011
Transcript of In Situ Biosensing with a Surface Plasmon Resonance Fiber Grating Aptasensor

Published: August 04, 2011
r 2011 American Chemical Society 7027 dx.doi.org/10.1021/ac201641n |Anal. Chem. 2011, 83, 7027–7034
ARTICLE
pubs.acs.org/ac
In Situ Biosensing with a Surface Plasmon Resonance FiberGrating AptasensorYanina Shevchenko,† Tariq J. Francis,‡ David A. D. Blair,‡ Ryan Walsh,‡ Maria C. DeRosa,*,‡ andJacques Albert*,†
†Department of Electronics, Carleton University, 1125 Colonel By Drive, Ottawa, K1S 5B6, Canada‡Department of Chemistry, Carleton University, 1125 Colonel By Drive, Ottawa, K1S 5B6, Canada
bS Supporting Information
ABSTRACT:
Surface plasmon resonance (SPR) biosensors prepared using optical fibers can be used as a cost-effective and relatively simple-to-implement alternative to well established biosensor platforms for monitoring biomolecular interactions in situ or possibly in vivo.The fiber biosensor presented in this study utilizes an in-fiber tilted Bragg grating to excite the SPR on the surface of the sensor over alarge range of external medium refractive indices, with minimal cross-sensitivity to temperature and without compromising thestructural integrity of the fiber. The label-free biorecognition scheme used demonstrates that the sensor relies on thefunctionalization of the gold-coated fiber with aptamers, synthetic DNA sequences that bind with high specificity to a given target.In addition tomonitoring the functionalization of the fiber by the aptamers in real-time, the results also show how the fiber biosensorcan detect the presence of the aptamer’s target, in various concentrations of thrombin in buffer and serum solutions. The findingsalso show how the SPR biosensor can be used to evaluate the dissociation constant (Kd), as the binding constant agrees with valuesalready reported in the literature.
The rapid and sensitive detection of analytes at low concen-trations is paramount in many fields, such as medicine,
environmental monitoring, and food safety. Fiber sensors arean appealing solution to this problem because the sensingplatform is compact and cost-effective (low cost equipment),and it is possible to collect measurements in situ and remotely.However, the performance of fiber sensors can be compromisedby several issues associated with the design of the transducingmechanism and with difficulties arising from the need to modifythe fiber geometry. In most fiber biosensors, light guided in thecore must be exposed to the external medium in order to performmeasurements. This is typically done by removing all or part ofthe cladding (via etching or side polishing) or tapering down thefiber to allow core guided light to escape into the cladding.1�3
Another approach consists of the use of a long period grating(LPG) to couple core guided light to cladding guided light.4
While several fiber-based biosensing platforms have been pro-posed along these lines, they have not yet been able to replace orcompete for real-life applications with other biosensing plat-forms, such as those relying on planar optical, piezo-electric, orelectronic transducing elements. The main reason for this is that
all these approaches present practical difficulties that can beovercome in laboratory settings but not in actual use. Forinstance, the need to etch, taper, or side-polish optical fibersmakes them very fragile and requires protective packaging fortheir use. Also, the cladding removal process must be controlledaccurately for each sensor device (with a precision of the order ofμmof glass thickness removal). These two factors would increasethe cost per sensor to prohibitively high levels in biosensingapplications. LPG-based sensors do not suffer from these issues,but their large sensitivity comes with a price: a large cross-sensitivity to everything (especially temperature5,6). As a result,while LPG sensors have been around in the literature for as longas Fiber Bragg Grating (FBG) sensors (1994 vs 1989), they havenever found widespread use (for any application) while FBGs arenow widely deployed in structural engineering7 and for oil andgas applications.8 Finally, in the specific case of fiber-based surfaceplasmon resonance (SPR) sensing, apart from the approaches
Received: April 22, 2011Accepted: August 4, 2011

7028 dx.doi.org/10.1021/ac201641n |Anal. Chem. 2011, 83, 7027–7034
Analytical Chemistry ARTICLE
mentioned above and their limitations for general fiber biosen-sors, cladding-removed multimode fibers have been the mostsuccessful devices so far.3 In fact, recent results showing highsensitivity fiber SPR biosensing3,9 are still based on the conceptoriginally demonstrated by Yee et al. in 1993.10 The issue withthese multimode sensors is that the polarization state and thedistribution of the light among all possible cladding modes mustbe controlled and maintained with a high degree of precision.This requires strictly controlled launch conditions at the input ofthe fiber, short fiber lengths without sharp bends, and the absenceof fiber motion during experiments (or between experiments ifcomparative measurements are required).
The sensor presented here avoids all of the above issues usinga single-mode tilted Fiber Bragg Grating (TFBG). It combines anumber of technologies to create a simple and robust platformthat has been successfully applied to a full range of target�analyte interactions.11 The sensing mechanism used in this studyrelies on SPR, which is a unique electro-magnetic phenomenonoccurring at the interface between materials with oppositedielectric constants.12 It allows for the detection of materialchanges occurring at the nanometer level in layers adjacent to thisinterface. As a result, SPR has been successfully applied for thecharacterization of various biomolecular reactions and theirdynamics.13 SPR platforms traditionally employed in biosensinguse the total internal reflection of light on the base of a highrefractive index prism to excite Plasmon waves, as in the so-called“Kretschmann” configuration.14 Although the prism-based SPRplatform has a high sensitivity, it is rather costly, bulky, andlimited because it can only be applied in a laboratory environ-ment. Thus, SPR sensing platforms utilizing an optical fiber as atransducing element have gained considerable attention since itallows for the sensor design to be very compact and cost-effective. Another advantage is gained if a single-mode fiber isused, making it possible to operate remotely over large distancesbecause there is no issue with the modal distribution of theguided light that reaches the sensor element. However, com-pared to the commonly used prism-based SPR configuration, theimplementation of SPR on the surface of an optical fiber is morechallenging because light propagating in a fiber has to be first“phase-matched” and polarized perpendicular to the metal sur-face to allow coupling to the surface Plasmon waves. The latter isespecially challenging because of the cylindrical symmetry of thefiber. Another issue is the spectral width of the SPR resonance: inall fiber-SPR approaches developed so far (and in fact also inmost bulk optic SPR instruments), the SPR resonances have hadwidths of the order of tens of nm. Since the spectral resolution(minimum detectable wavelength shift) required to achievelow concentration biochemical sensing is of the order of pm,1,9
such wide resonances hinder reproducibility and accuracy(a commonly used figure of merit for optical resonant sensorsis the spectral sensitivity divided by the spectral width of theresonance).1
The sensor we propose here uses ordinary single mode fiber,does not require physical modification of the fiber, provides amechanism to eliminate cross-sensitivities (including temperature),and automatically generates a dense comb-like spectrum ofnarrowband (0.1 nm wide) SPR active resonances of the optimumpolarization.15 Those resonances that are phase matched to theSPR have sensitivities between 500 and 1000 nm/RIU (RIU =refractive index units). Unlike FBG or LPG approaches, asingle sensor design can be used for media with refractiveindices ranging from 1.25 to 1.4, also contributing to the low
cost per sensor as the same design can be used in multipleapplications.
These features of the TFBG-SPR sensor are obtained becausethe grating is imprinted in the fiber core at a certain angle relativeto the longitudinal axis of the fiber. This results in the excitationof tens of claddings modes (Figure 1A), each at a unique well-defined wavelength, over a relatively modest spectral window(approximately 100 nm). Some of the excited cladding modescan couple to a SPR wave on the surface of the fiber if the SPRphase matching condition is satisfied, as determined by therefractive index of the medium immediately adjacent to the fibersurface.15 Furthermore, the tilt plane of the TFBG breaks theinternal cylindrical symmetry and allows the user to select thedominant polarization of the excited cladding modes for opti-mum SPR coupling.16 We use an unmodified and inexpensivestandard telecommunication single mode fiber (CORNINGSMF-28) in these experiments, making the sensor very robustand simple to manufacture. TFBGs are fabricated with the sametools and techniques as FBGs, and these are now mass producedat very low cost per sensor in highly automated factories for useby the structural sensing community.17 Besides being robust,the single mode fiber has no issues with the modal distribution ofthe guided light that reaches the sensor element: in multimodesensors, changes in modal distribution impact the shape of theSPR resonance and our ability to track it accurately over smallwavelength shifts. Furthermore, the single mode fiber’s transmis-sion loss is 0.17 dB/km18 (or equivalently, less than 4% of powerloss per km) while the dynamic range for measuring the trans-mission of in-fiber devices with widely available telecommunication
Figure 1. (A) 3D illustration of the presented SPR-TFBG biosensor: astandard optical fiber with a TFBG imprinted in its core coupling light tothe SPR. A monolayer of thrombin aptamer probes (shown in red)immobilized on the gold coating interacts with their cognate thrombinprotein targets (shown in blue). (B) Sensor’s response measured in theaptamer solution, SPR-coupled part is shown with red brackets. The redarrow indicates the most sensitive SPR-coupled cladding resonance.

7029 dx.doi.org/10.1021/ac201641n |Anal. Chem. 2011, 83, 7027–7034
Analytical Chemistry ARTICLE
instrumentation (since we are using ordinary telecommunicationfiber in its normalwavelength range) is well over 40 dB (or 99.99%).Such low transmission losses could allow for remote operation overlarge distances (up to multikm distances).
A final, unique advantage associated with the use of TFBGs isthe elimination of the effect of temperature cross-sensitivity fromthe sensor readings. In other kinds of SPR sensors, the well-known cross-sensitivity of the SPR coupling condition ontemperature requires stringent temperature control during ex-periments and the presence of a temperature sensor or secondsensing element. This problem essentially negates the possibilityof remote, in situ sensing that fiber devices should be able toachieve. Although our metal-coated TFBGs are also sensitive totemperature variations, it is possible to eliminate this effectduring the processing of the experimental data (even in realtime). This is due to the invariance of the overall transmissionspectrum of the TFBG to the temperature and the presence of acore-mode spectral resonance whose wavelength only dependson the temperature. Also, if needed, the core mode resonance canbe used as a high accuracy local thermometer (with 0.1 �Cprecision).19
Having a wide operating range, a relatively high wavelengthshift sensitivity of 400�1000 nm/RIU, depending on theresonance used,20 and a very simple fabrication method hasallowed this sensor platform to be successfully applied for chemicalsensing and real-time in situ monitoring of polyelectrolytemultilayer formation.14 The material presented here deals withthe first comprehensive study of this novel sensor technologytoward biosensing.
As molecular recognition is the cornerstone of biosensing, anessential component to any biosensor is the specific molecularrecognition probe that can target the analyte of interest. Whileantibodies have been the gold standard for molecular recognitionprobes for several decades, the relatively new technology ofaptamers is emerging as a more robust and cost-effective alter-native. Aptamers are short oligonucleotide sequences that can besynthesized to bind with a strong affinity and specificity to a givenmolecular target.21,22 Aptamers have already been successfullyapplied as molecular recognition probes for a variety of sensortechniques such as electrochemical,23,24 piezoelectric,25,26 andoptical sensors.22,27,28 Prism-based SPR sensors have also beenpreviously reported to use aptamers.26,29,30 In the field ofbiosensing, one of the most promising advantages associatedwith the use of aptamers is the possibility of synthesizing aptamersthat bind to a wide range of targets including drugs,31 proteins,32
or even supramolecular complexes such as viruses or bacteria.33,34
Recently, an aptamer-modified biosensor9 using a pre-existingand partially automated SPR sensor platform was implementedin an etched multimode fiber.10 Taking into account growinginterest toward aptamers as highly modifiable and versatilebiorecognition elements and the advantages of fiber-basedSPR sensors, we were interested in studying the effectivenessof an aptamer-based SPR sensor implemented with our TFBG,standard single-mode fiber platform (See Figure 1). In this way,we sought to avoid the drawbacks of the use of a modified,multimode fiber, while preserving the ease of use, sensitivity,and selectivity of an aptamer�fiber system. Our experimentalresults indicate that our sensor can be used for the real-timemonitoring of both the self-assembly of aptamers on the surfaceof a gold-coated fiber as well as for detection of protein mol-ecules at various concentrations in solutions including serum.The dissociation constant (Kd) of the target bound to the
aptamer�sensor surface was determined and was found to becomparable to that found in solution studies.
’EXPERIMENTAL SECTION
Fabrication of the TFBG-SPR Sensor.As reported earlier,15,16,35
the SPR-TFBG sensor was manufactured using a standard single-mode fiber (Corning SMF-28) with a TFBG inscribed in the fiber’score and gold coating deposited on the surface of the fiber’scladding. TFBGwasmanufactured using the phase-mask technique:it required shining of UV light at 248 nm onto the surface of a barefiber that was previously saturated with hydrogen. The grating’splanes were written with a certain tilt relatively to the longitudinalaxis of the fiber (Figure 1A). Tilt of the grating is an importantparameter that can be used to choose which set of claddingmodes isgoing to be excited. As a result, it makes it possible to adjust theoperating range of the sensor in order to optimize the response forcertain refractive indices. Here, the gratings had a tilt of 10�, whichallowed them to operate in aqueous solutions with refractive indicesaround 1.31�1.34.A thin gold coating was deposited on the surface of the fiber
after the gratings were inscribed. Deposition was conducted in avacuum sputtering chamber and required two consecutive runswith the fiber being rotated by 180� between depositions toensure a more or less uniform coating around the circumferenceof the fiber. Thickness of the gold layer was optimized to havethe strongest SPR effect and was selected to be 50 nm for theseexperiments.Experimental Setup, Optical Configuration. The experi-
mental setup required the sensor to operate in the transmissionregime. During the experiments, the sensors had to be fixed in a7.5 cm by 2 cm plastic cell designed specifically for the biosensingtests. While each individual sensor was fixed in the platform withhelp of UV-sensitive adhesive, the sensing element (0.5 cm inlength) was immersed in a carved out indentation (45 mm by5 mm), which was then covered by a glass slide to avoidevaporation of fluids during the experiments. Immersion of thesensor was conducted at the beginning of each test using a pipet;on average, 600 μL of fluid was added.Sensors were interrogated using an Optical Sensing Analyzer
(model Si720 fromMicronOptics). Light over the 1520�1570 nmrange was linearly polarized using Polarization Controller fromJDS Uniphase. Before each experiment, the orientation of thepolarization was adjusted to maximize coupling of the claddingmodes to the SPR to ensure the strongest contrast between SPR-coupled and non-SPR modes. The measurement resolution wasset at 0.0025 nm, and measurements were recorded each 0.8 s. Aschematic of the used optical setup can be found in the SupportingInformation (Figure S1).Analysis of the Experimental Data. Figure 1B provides an
example of the typical transmission spectrum obtained with theSPR-TFBG sensor while being immersed in the aptamer solu-tion, making it possible to excite the SPR. The red bracket inFigure 1B denotes the portion of the SPR-modified spectrum.The analysis presented in this paper is based on tracking thechanges in the SPR-modified portion of the spectrum, moreparticularly, tracking of the most sensitive SPR coupled claddingresonance. This resonance occurs on the left from the narrowestpart of the SPR-coupled region, as indicated by the red arrow inFigure 1B. The power level of the maximum of that resonancewas taken into account during evaluation of the SPR signalchange.

7030 dx.doi.org/10.1021/ac201641n |Anal. Chem. 2011, 83, 7027–7034
Analytical Chemistry ARTICLE
Evaluation of the SPR signal change based on this method,where the absolute value of the position of only one resonanceis considered, was applied for analysis of the data where therefractive index change was anticipated to be relatively small.Such experiments included simple one-step tests with a certainchemical reaction taking place on the surface of the sensor, suchas self-assembly of aptamers or binding of target molecules to theaptamers. However, experiments, where a larger refractive indexchange occurred, required a different approach that would ensureconsistency between the data sets obtained during different partsof the experiment. Such experiments, where the sensor wasimmersed in several solutions with different refractive indices,would be impossible to analyze taking into account the sameSPR-coupled resonance because different solutions would resultin different resonances being identified as the most sensitive.Thus, the analysis of such tests was based on tracking of thenormalized amplitude value of that resonance. Such normal-ization ensured that the SPR changes happening in differentsolutions and affecting different resonances with different am-plitudes could be compatible and comparable. Data analysisbased on normalized value of the resonance’s amplitude wasapplied for the Kd evaluation (see below). All experimental datawas smoothed using a 400-term LOESS filter.36
Aptamer Sequences, Buffers, Serum, Thrombin Protein,and Water. All buffer solutions were prepared using doublydeionized water from a Milli-Q water system (ThermoFisher).All DNA phosphoramidites and modifiers were purchased fromGlen Research. Bovine serum and bovine serum albumin werepurchased from Sigma Aldrich. Bovine serum solution for testingwas prepared as a solution of 50% serum/50% Tris buffer(50 mM Tris, 1 mM MgCl2, 140 mM NaCl, 5 mM KCl). Thethiolated thrombin aptamer, DNA sequence HS-(CH2)6-50-GGTTGGTGTGGTTGG-30 (herein called thrombin aptamer),was synthesized on aMerMADE6DNA synthesizer (BioautomationCorporation). The sequence purification was conducted usingClarity QSP Cartridges (Phenomenex). The DNA was dissolvedin “DNA buffer” (5 mM phosphate, 100 mM MgCl2, 50 mMNaCl). DNA sequences were confirmed by ESI-MS, and theEllman’s test37 was conducted to test for presence of the 50 Thiolgroup prior to binding.Human R-thrombin protein was purchased from Haematolo-
gic Technologies Inc. The protein was aliquoted as needed anddissolved in “protein buffer” (50 mM Tris, 1 mM MgCl2,140 mM NaCl, 5 mM KCl).The sequences used for the confocal microscopy experiments
were purchased from Alpha DNA (Montreal). The thrombinaptamer sequences possessed the 50-thiol0C6 modifier, as well asa Cyanine 3 (Cy3) dye modifier at the 30 end, making the overallsequence 50-HS-(CH2)6-GGT TGG TGT GGT TGG-Cy3-30(herein called Cy3 DNA).Immobilization of the Thrombin Aptamer. Prior to the
immobilization of the thrombin aptamer on the surface of thesensor, the sensors were washed with ethanol and then withMilli-Qwater. After the cleaning step,DNA functionalizationwas conductedby filling out the carved indentation with the aptamer solution of thedesired concentration. Transmission spectra were collected auto-matically every 0.8 s during the entire experiment. Aptamer depo-sition times and concentrations varied between tests. After theaptamer adsorption step was complete, the sensor was rinsed withDNA buffer several times before the protein solution was added.Binding of the Thrombin Protein to the Thrombin Aptamer.
Thrombin solutions were prepared to a desired concentration using
human R-thrombin and protein buffer. The solutions were used tofill the cut out indentation of the platform. The duration of soakingin the thrombin solution varied between 20 min and 2 h dependingon the experiment. After immersion in the protein solution, thesensorwaswashedwith protein buffer for severalminutes to preparefor the next step.Confocal Microscope Imaging. Confocal microscope ima-
ging combined with fluorescent labeling was used to evaluate andconfirm the self-assembly of the aptamer on the surface of thegold coating of the sensors. All confocal microscopy images werecollected on a Zeiss LSM510 with a Plan-Acochromat 63�/1.4Oil Dic objective with LP950 filter, with an excitation wavelengthof 550 nm and an emission wavelength of 570 nm.Before running the experiment, the sensors were prepared by
rinsing them with anhydrous ethanol and then with DNA buffer.Cy3 DNA was dissolved in DNA buffer to make a 45 μMsolution. Sensors were then immersed in the aptamer solution for20 h, rinsed thoroughly, and later imaged while mounted onmicroscope slides in a solution of 50% glycerol in water andcovered with 1.7 μm thick cover slides.Atomic Force Microscope (AFM) Imaging. AFM imaging
was conducted in order to evaluate the surface of the sensor afterbinding to thrombin protein. All AFM images were collected onan Ntegra system using a SFC050LNTF AFM Head on aninverted microscope (Olympus IX71). (See Supporting Infor-mation for details regarding AFM tools.) Before imaging, gold-coated fibers were immersed in a 25 μM solution of thiolatedthrombin aptamer for a period of 4 h. The fiber was then rinsedwithDNA buffer and immersed in a 30 μM solution of R-thrombin inprotein buffer for approximately 12 h. After immersion, the fiberswere rinsed with Milli-Q water and dried in air before imaging. Allsamples were collected in air on the dry samples.
’RESULTS AND DISCUSSION
Monitoring of Thrombin�Aptamer Self-Assembly.Resultsof the experiments that involved soaking of the sensor in theaptamer solutions of varying concentrations are shown in Figure 2.Raw SPR data is shown in the sensorgram in Figure 2A along withthe filtered signal in order to illustrate a difference between bothtypes of signals. As it can be seen, the signals obtained in thesolutions with aptamers showed a considerable increase over thefirst 6 to 8 min of soaking (Figure 2A) and then showed a muchslower change, suggesting that initial binding of the aptamer tothe surface occurs quickly. Moreover, the signal obtained fromsoaking in the DNA buffer was significantly lower than the signalobtained in the aptamer solutions. Doubling the aptamer con-centration from 10 to 20 μM did not lead to a doubling of thesignal, suggesting that 20 μM aptamer is concentrated enough tosaturate the surface for our experiments.Attachment of the aptamers was verified using confocal fluo-
rescent imaging (Figure 3A). DNAmodified with the fluorescentCy3 dye was immobilized on the surface of the sensor and wasimaged after unbound aptamers were rinsed away during thewashing step. A fluorescent signal coming from the fiber surfacecan clearly be seen in the case of the Cy3 DNAmodified surfaces.As a control, a bare sensor immersed in a solution of free Cy3 dyeshowed no fluorescence (see Supporting Information, Figure S3A-B). These results confirm the immobilization of the modifiedthrombin aptamer sequence on the surface of the fiber.Detection of the Thrombin Target. Thrombin is a multi-
functional protein that helps regulate many physiological processes

7031 dx.doi.org/10.1021/ac201641n |Anal. Chem. 2011, 83, 7027–7034
Analytical Chemistry ARTICLE
including the coagulation of blood. During a coagulation reac-tion, dynamically changing thrombin concentrations from 1 nMto greater than 500 nM have been observed.38 A sensor able todetect thrombin at these concentrations, in situ and in real-time,could provide valuable insight into conditions associated withabnormal thrombin generation. Moreover, the thrombin apta-mer is one of the best characterized and widely studied protein-binding aptamers. Therefore, using thrombin detection as a testcase for our SPR-TFBG aptasensor should serve as an indicationthat this system could be used to detect and monitor otherproteins found in human plasma or blood that could be ofinterest to the science community.Results of the immersion of the aptamer-functionalized sensor
into the thrombin solutions are shown in the Figures 3B and 4.Figure 4A indicates that, similarly to soaking in DNA solution,the SPR signal changes rapidly within the first 10 min ofimmersion and then stabilizes. In addition to the signal compar-ison with protein buffer, several control solutions were alsoexamined. BSA is typically used as a control for thrombin aptamerstudies;39 however, it is much larger than thrombin which canlead to some nonspecific binding (67 kDa compared to throm-bin’s 37 kDa). Pepsin, which is comparable in size to thrombin(35 kDa) and should have no affinity for the thrombin aptamer,
was also examined in order to gain a better perspective regardingnonspecific binding. Comparison of the thrombin data againstthat generated by soaking in the BSA, pepsin, and buffer solutionsindicates that selective detection of target molecules at concen-trations that are as low as 0.1 μM is possible. A difference insignals can be detected in as little as 10 min (Figure 4A).However, after 100 min, the signals have stabilized and showthe greatest discrimination between specific and nonspecificsignals (Figure 4B). As real samples will undoubtedly containinterferences at concentrations higher than those tested in ourcontrol experiments, evaluation of the sensor’s response in amore complex solution such as serum was also attempted asshown in the bar diagram, Figure 4B. The 50% bovine serumsolution used for these experiments has a nonspecific proteinconcentration of 30mg/mL. The results for soaking in serum andserum mixed with thrombin (5 μM or 0.18 mg/mL) show that,despite a strong nonspecific signal increase in the presence ofserum, the attachment of thrombin at a concentration more than2 orders of magnitude lower than the interfering agents can stillbe detected. The absolute SPR signal difference between the 50%serum solution and the 5 μM thrombin�serum solution(approximately 0.07 dB) is very similar to the difference betweenbuffer and 5 μM thrombin�buffer solution (0.074 dB) Thus, the
Figure 2. (A) Real-time SPR signal changes over the first 15min of aptamer self-assembly versus soaking in the DNA buffer andMilli-Q water; raw SPRsignal is shown along with filtered data. (B) Bar diagram illustrating difference in SPR signals after the first 15 min of soaking in solutions.
Figure 3. (A) Confocal microscope image of an optical fiber immersed in a 45 μMCy3- and thiol-modified DNA solution for 20 h; 11% laser strength,detector pinhole width of 55 μm, and 63� magnification were applied. (B) AFM image of sensor’s surface after attachment of the thrombin (tappingmode, measured in air on the dry sample).

7032 dx.doi.org/10.1021/ac201641n |Anal. Chem. 2011, 83, 7027–7034
Analytical Chemistry ARTICLE
specific thrombin�aptamer interactions can be effectively de-tected, even in complex media. Errors found as a standarddeviation describe the uncertainty between the filtered signaland a linear fit where the signal became saturated and leveled off.The attachment of protein was confirmed by imaging the
sensor’s surface using AFM (Figure 3B). AFM reveals that thescanned sensor’s surface has many new structural features withsizes at the μm and subμm scale that are not present on theaptamer modified surface alone (see Supporting Information for3D AFM images, Figure 4S A�C). It is anticipated that amolecule of thrombin protein has a dimension of 4.5 � 4.5 �5 nm,40 which is much smaller than the observed features. Apossible explanation of observed features could be that theprotein molecules formed clusters in the solution before orduring the interaction with aptamer molecules. In the lattercase, formation of protein clusters on the surface of the sensorcould be a result of the uneven distribution of aptamer mol-ecules on the surface of the sensor, a finding that has beenpreviously reported.34
Even though the thrombin molecules did not form a uniformlayer on the surface of the sensor, measured SPR signal changesshould be proportional to the overall protein amount adsorbed tothe surface of the grating. The SPR is excited over the full lengthof the grating, which is 1 cm; therefore, the observed SPRresponse was averaged over the length of the TFBG that wasused to excite the SPR.Sensor Characterization and Kd Analysis. Signal to noise
ratio (SNR) and limit of detection (LOD) are importantparameters for the characterization of sensor performance. TheSNR for our system varied from 2.11 to 194.51 for the experi-ments with thrombin (Figure 4B) and from 8.58 to 36.97 forexperiments with aptamers (Figure 3B). The limit of detection ofthrombin (LOD) was calculated as 3 times the noise level41 andwas found to be 22.6 nM. This compares well to the 2 nM LODreported by Pollet et al.9 for another fiber SPR sensor.The dissociation constant (Kd) is a widely used parameter
applied to characterize binding strength between two interactingmolecules. The motivation behind using a fiber biosensor fordeterminingKd constants stems from the interest in developing aportable sensor platform that can be applied to the in situmeasurement of biomolecular kinetic interactions without per-turbing the surrounding environment.
The dissociation constant (Kd) for the thrombin aptamer hasbeen reported earlier, based on studies,42,43 to be between 20 and200 nM. However, it is well-known that the functionalization ofaptamers to surfaces may alter the binding characteristics of thesystem.44 Therefore, the characteristics of the immobilizedaptamers and their effect on the binding dynamics had to beassessed.Evaluation of the Kd constant was performed using an analyte
“Ladder” test. Initially, the sensor was functionalized with theaptamer followed by its immersion in successive solutions ofincreasing concentrations of the target. Figure 5 shows the resultsof one ladder experiment where the sensor was immersed in a setof solutions with thrombin concentration increasing from 0.1 to5 μM. The SPR signal (raw and smoothed data) was obtained bynormalizing the amplitude of the most sensitive SPR-coupledresonance. Figure 5 illustrates the correlation between increase in
Figure 4. (A) Real-time SPR response measured during the first 15 min of soaking in 0.1 and 5 μM thrombin solutions versus soaking in 5 μM BSA,5 μM pepsin, and protein buffer. (B) Bar diagram comparing SPR response obtained in serum and protein solutions after soaking for 100 min.
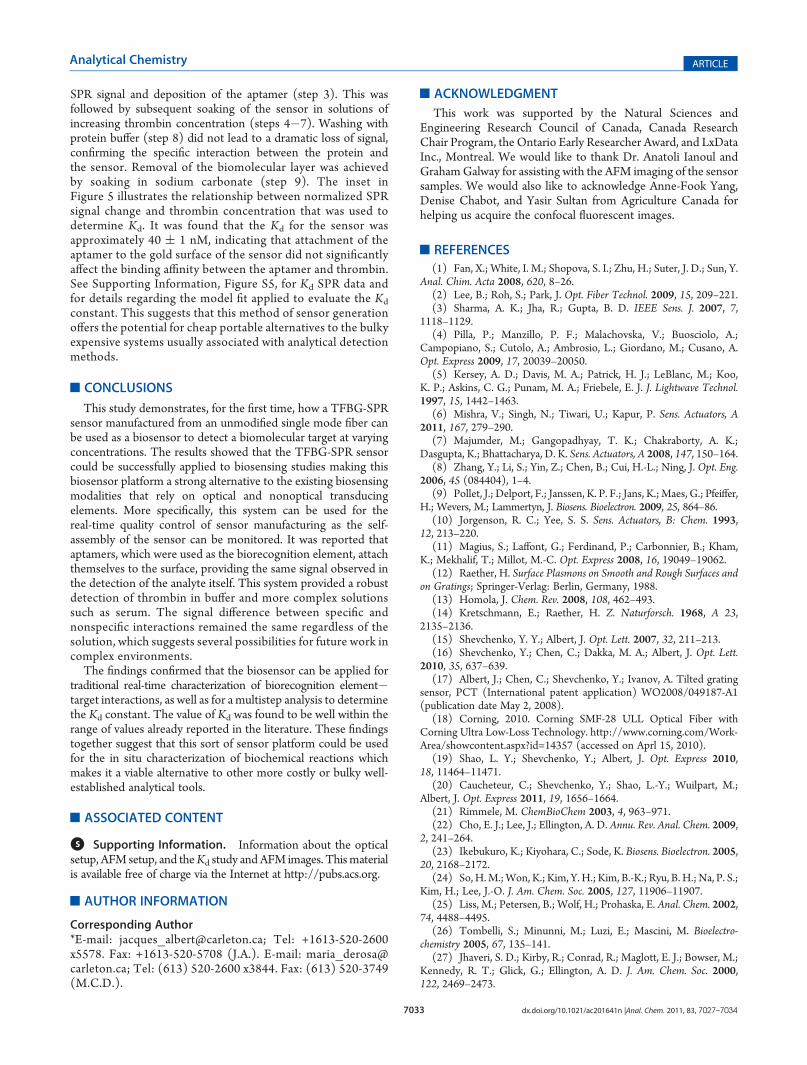
Figure 5. SPR signal change during the Kd- type test (“Ladder” test).Description of each step: (1) Milli-Q water; (2) DNA buffer; (3)aptamers concentration, 20 μM; (4) thrombin concentration, 0.1 μM;(5) thrombin concentration, 0.5 μM; (6) thrombin concentration,1 μM; (7) thrombin concentration, 5 μM; (8) protein buffer; (9)regeneration in 0.2 M of Na2CO3. Inset: Evaluation of the Kd constantusing relation between ligand’s concentration and SPR signal. The dataset was normalized to the maximum of the SPR signal and was fittedusing Hill’s equation.45 (See Supporting Information for informationregarding the fitted model and Kd experiment’s data.)
7033 dx.doi.org/10.1021/ac201641n |Anal. Chem. 2011, 83, 7027–7034
Analytical Chemistry ARTICLE
SPR signal and deposition of the aptamer (step 3). This wasfollowed by subsequent soaking of the sensor in solutions ofincreasing thrombin concentration (steps 4�7). Washing withprotein buffer (step 8) did not lead to a dramatic loss of signal,confirming the specific interaction between the protein andthe sensor. Removal of the biomolecular layer was achievedby soaking in sodium carbonate (step 9). The inset inFigure 5 illustrates the relationship between normalized SPRsignal change and thrombin concentration that was used todetermine Kd. It was found that the Kd for the sensor wasapproximately 40 ( 1 nM, indicating that attachment of theaptamer to the gold surface of the sensor did not significantlyaffect the binding affinity between the aptamer and thrombin.See Supporting Information, Figure S5, for Kd SPR data andfor details regarding the model fit applied to evaluate the Kd
constant. This suggests that this method of sensor generationoffers the potential for cheap portable alternatives to the bulkyexpensive systems usually associated with analytical detectionmethods.
’CONCLUSIONS
This study demonstrates, for the first time, how a TFBG-SPRsensor manufactured from an unmodified single mode fiber canbe used as a biosensor to detect a biomolecular target at varyingconcentrations. The results showed that the TFBG-SPR sensorcould be successfully applied to biosensing studies making thisbiosensor platform a strong alternative to the existing biosensingmodalities that rely on optical and nonoptical transducingelements. More specifically, this system can be used for thereal-time quality control of sensor manufacturing as the self-assembly of the sensor can be monitored. It was reported thataptamers, which were used as the biorecognition element, attachthemselves to the surface, providing the same signal observed inthe detection of the analyte itself. This system provided a robustdetection of thrombin in buffer and more complex solutionssuch as serum. The signal difference between specific andnonspecific interactions remained the same regardless of thesolution, which suggests several possibilities for future work incomplex environments.
The findings confirmed that the biosensor can be applied fortraditional real-time characterization of biorecognition element�target interactions, as well as for a multistep analysis to determinethe Kd constant. The value of Kd was found to be well within therange of values already reported in the literature. These findingstogether suggest that this sort of sensor platform could be usedfor the in situ characterization of biochemical reactions whichmakes it a viable alternative to other more costly or bulky well-established analytical tools.
’ASSOCIATED CONTENT
bS Supporting Information. Information about the opticalsetup, AFM setup, and theKd study andAFM images. Thismaterialis available free of charge via the Internet at http://pubs.acs.org.
’AUTHOR INFORMATION
Corresponding Author*E-mail: [email protected]; Tel: +1613-520-2600x5578. Fax: +1613-520-5708 (J.A.). E-mail: [email protected]; Tel: (613) 520-2600 x3844. Fax: (613) 520-3749(M.C.D.).
’ACKNOWLEDGMENT
This work was supported by the Natural Sciences andEngineering Research Council of Canada, Canada ResearchChair Program, the Ontario Early Researcher Award, and LxDataInc., Montreal. We would like to thank Dr. Anatoli Ianoul andGrahamGalway for assisting with the AFM imaging of the sensorsamples. We would also like to acknowledge Anne-Fook Yang,Denise Chabot, and Yasir Sultan from Agriculture Canada forhelping us acquire the confocal fluorescent images.
’REFERENCES
(1) Fan, X.; White, I. M.; Shopova, S. I.; Zhu, H.; Suter, J. D.; Sun, Y.Anal. Chim. Acta 2008, 620, 8–26.
(2) Lee, B.; Roh, S.; Park, J. Opt. Fiber Technol. 2009, 15, 209–221.(3) Sharma, A. K.; Jha, R.; Gupta, B. D. IEEE Sens. J. 2007, 7,
1118–1129.(4) Pilla, P.; Manzillo, P. F.; Malachovska, V.; Buosciolo, A.;
Campopiano, S.; Cutolo, A.; Ambrosio, L.; Giordano, M.; Cusano, A.Opt. Express 2009, 17, 20039–20050.
(5) Kersey, A. D.; Davis, M. A.; Patrick, H. J.; LeBlanc, M.; Koo,K. P.; Askins, C. G.; Punam, M. A.; Friebele, E. J. J. Lightwave Technol.1997, 15, 1442–1463.
(6) Mishra, V.; Singh, N.; Tiwari, U.; Kapur, P. Sens. Actuators, A2011, 167, 279–290.
(7) Majumder, M.; Gangopadhyay, T. K.; Chakraborty, A. K.;Dasgupta, K.; Bhattacharya, D. K. Sens. Actuators, A 2008, 147, 150–164.
(8) Zhang, Y.; Li, S.; Yin, Z.; Chen, B.; Cui, H.-L.; Ning, J. Opt. Eng.2006, 45 (084404), 1–4.
(9) Pollet, J.; Delport, F.; Janssen, K. P. F.; Jans, K.; Maes, G.; Pfeiffer,H.; Wevers, M.; Lammertyn, J. Biosens. Bioelectron. 2009, 25, 864–86.
(10) Jorgenson, R. C.; Yee, S. S. Sens. Actuators, B: Chem. 1993,12, 213–220.
(11) Magius, S.; Laffont, G.; Ferdinand, P.; Carbonnier, B.; Kham,K.; Mekhalif, T.; Millot, M.-C. Opt. Express 2008, 16, 19049–19062.
(12) Raether, H. Surface Plasmons on Smooth and Rough Surfaces andon Gratings; Springer-Verlag: Berlin, Germany, 1988.
(13) Homola, J. Chem. Rev. 2008, 108, 462–493.(14) Kretschmann, E.; Raether, H. Z. Naturforsch. 1968, A 23,
2135–2136.(15) Shevchenko, Y. Y.; Albert, J. Opt. Lett. 2007, 32, 211–213.(16) Shevchenko, Y.; Chen, C.; Dakka, M. A.; Albert, J. Opt. Lett.
2010, 35, 637–639.(17) Albert, J.; Chen, C.; Shevchenko, Y.; Ivanov, A. Tilted grating
sensor, PCT (International patent application) WO2008/049187-A1(publication date May 2, 2008).
(18) Corning, 2010. Corning SMF-28 ULL Optical Fiber withCorning Ultra Low-Loss Technology. http://www.corning.com/Work-Area/showcontent.aspx?id=14357 (accessed on Aprl 15, 2010).
(19) Shao, L. Y.; Shevchenko, Y.; Albert, J. Opt. Express 2010,18, 11464–11471.
(20) Caucheteur, C.; Shevchenko, Y.; Shao, L.-Y.; Wuilpart, M.;Albert, J. Opt. Express 2011, 19, 1656–1664.
(21) Rimmele, M. ChemBioChem 2003, 4, 963–971.(22) Cho, E. J.; Lee, J.; Ellington, A. D. Annu. Rev. Anal. Chem. 2009,
2, 241–264.(23) Ikebukuro, K.; Kiyohara, C.; Sode, K. Biosens. Bioelectron. 2005,
20, 2168–2172.(24) So, H.M.;Won, K.; Kim, Y. H.; Kim, B.-K.; Ryu, B. H.; Na, P. S.;
Kim, H.; Lee, J.-O. J. Am. Chem. Soc. 2005, 127, 11906–11907.(25) Liss, M.; Petersen, B.; Wolf, H.; Prohaska, E. Anal. Chem. 2002,
74, 4488–4495.(26) Tombelli, S.; Minunni, M.; Luzi, E.; Mascini, M. Bioelectro-
chemistry 2005, 67, 135–141.(27) Jhaveri, S. D.; Kirby, R.; Conrad, R.; Maglott, E. J.; Bowser, M.;
Kennedy, R. T.; Glick, G.; Ellington, A. D. J. Am. Chem. Soc. 2000,122, 2469–2473.

7034 dx.doi.org/10.1021/ac201641n |Anal. Chem. 2011, 83, 7027–7034
Analytical Chemistry ARTICLE
(28) Stojanovic, M. N.; De Prada, P.; Landry, D.W. J. Am. Chem. Soc.2001, 123, 4928–4931.(29) Ostatn�a, V.; Vaisocherov�a, H.; Homola, J.; Hianik, T. Anal.
Bioanal. Chem. 2008, 391, 1861–1869.(30) Wang, J.; Zhou, H. S. Anal. Chem. 2008, 80, 7174–7178.(31) Xiao, H.; Edwards, T. E.; Ferre-D�eAmare, A. R. Chem. Biol.
2008, 15, 1125–1137.(32) Keefe, A. D.; Pai, S.; Ellingto, A. Nat. Rev. Drug Discovery 2010,
9, 537–550.(33) Bruno, J. G.; Carrillo, M. P.; Phillips, T.; Andrews, C. J.
J. Fluoresc. 2010, 20, 1211–1223.(34) Jeon, S. H.; Kayhan, B.; Ben-Yedidia, T.; Arnon, R. J. Biol. Chem.
2004, 279, 48410–48419.(35) Shevchenko, Y.; Ahamad, N. U.; Ianoul, A.; Albert, J. Opt.
Express 2010, 18, 20409–20421.(36) Cleveland, W.S. J. Am. Stat. Assoc. 1979, 74, 829–835.(37) Ellman, G. L. Arch. Biochem. Biophys. 1959, 82, 70–77.(38) Wolberg, A. S. Blood Rev. 2007, 21, 131–142.(39) Rahman, M. A.; Son, J. I.; Won, M.; Shim, Y. Anal. Chem. 2009,
81, 6604–6611.(40) Bode, W.; Mayr, I.; Baumann, U.; Huber, R.; Stone, S. R.;
Hofsteenge, J. EMBO J. 1989, 8, 3467–3475.(41) Vial, J.; Jardy, A. Anal. Chem. 1999, 71, 2672–2677.(42) Bock, L. C.; Griffin, L. C.; Latham, J. A.; Vermaas, E. H.; Toole,
J. J. Nature 1992, 355, 564–566.(43) Hamaguchi, N.; Ellington, A.; Stanton, M. Anal. Biochem. 2001,
294, 126–131.(44) Jing, M.; Bowser, M. T. Anal. Chim. Acta 2011, 686, 9–18.(45) Goutelle, S.; Maurin, M.; Rougier, F.; Barbaut, X.; Bourguignon,
L.; Ducher, M.; Maire, P. Fundam. Clin. Pharmacol. 2008, 22, 633–648.