Fragile States: Defining Difficult Environments for Poverty ...
Upload
independentCategory
view
0download
0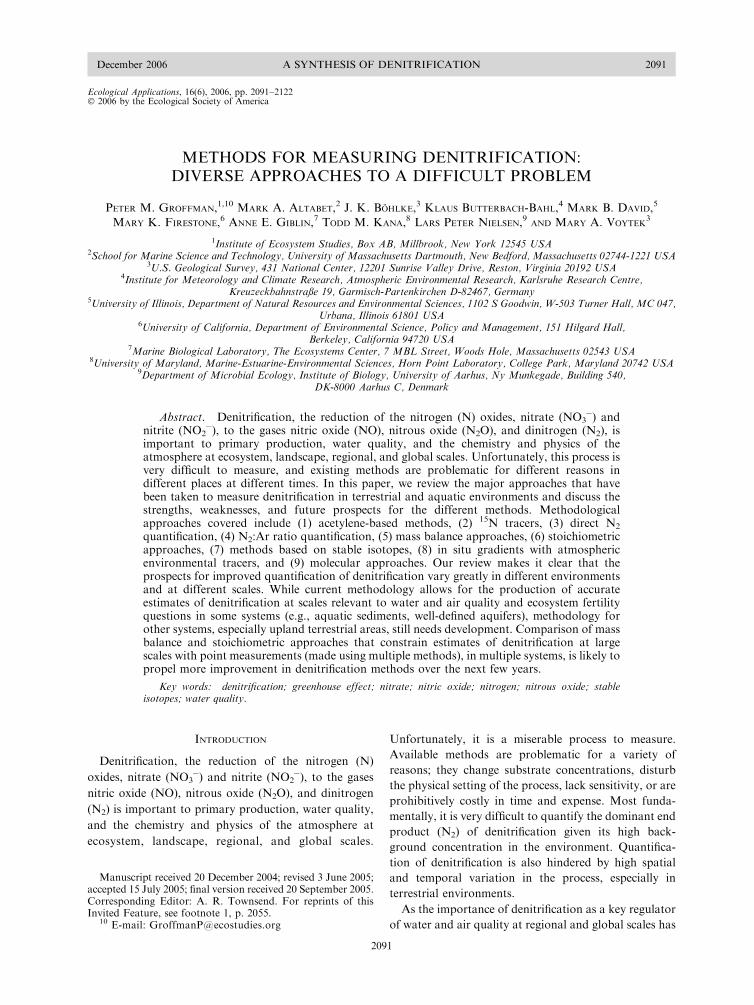
Ecological Applications, 16(6), 2006, pp. 2091–2122� 2006 by the Ecological Society of America
METHODS FOR MEASURING DENITRIFICATION:DIVERSE APPROACHES TO A DIFFICULT PROBLEM
PETER M. GROFFMAN,1,10 MARK A. ALTABET,2 J. K. BOHLKE,3 KLAUS BUTTERBACH-BAHL,4 MARK B. DAVID,5
MARY K. FIRESTONE,6 ANNE E. GIBLIN,7 TODD M. KANA,8 LARS PETER NIELSEN,9 AND MARY A. VOYTEK3
1Institute of Ecosystem Studies, Box AB, Millbrook, New York 12545 USA2School for Marine Science and Technology, University of Massachusetts Dartmouth, New Bedford, Massachusetts 02744-1221 USA
3U.S. Geological Survey, 431 National Center, 12201 Sunrise Valley Drive, Reston, Virginia 20192 USA4Institute for Meteorology and Climate Research, Atmospheric Environmental Research, Karlsruhe Research Centre,
Kreuzeckbahnstraße 19, Garmisch-Partenkirchen D-82467, Germany5University of Illinois, Department of Natural Resources and Environmental Sciences, 1102 S Goodwin, W-503 Turner Hall, MC 047,
Urbana, Illinois 61801 USA6University of California, Department of Environmental Science, Policy and Management, 151 Hilgard Hall,
Berkeley, California 94720 USA7Marine Biological Laboratory, The Ecosystems Center, 7 MBL Street, Woods Hole, Massachusetts 02543 USA
8University of Maryland, Marine-Estuarine-Environmental Sciences, Horn Point Laboratory, College Park, Maryland 20742 USA9Department of Microbial Ecology, Institute of Biology, University of Aarhus, Ny Munkegade, Building 540,
DK-8000 Aarhus C, Denmark
Abstract. Denitrification, the reduction of the nitrogen (N) oxides, nitrate (NO3�) and
nitrite (NO2�), to the gases nitric oxide (NO), nitrous oxide (N2O), and dinitrogen (N2), is
important to primary production, water quality, and the chemistry and physics of theatmosphere at ecosystem, landscape, regional, and global scales. Unfortunately, this process isvery difficult to measure, and existing methods are problematic for different reasons indifferent places at different times. In this paper, we review the major approaches that havebeen taken to measure denitrification in terrestrial and aquatic environments and discuss thestrengths, weaknesses, and future prospects for the different methods. Methodologicalapproaches covered include (1) acetylene-based methods, (2) 15N tracers, (3) direct N2
quantification, (4) N2:Ar ratio quantification, (5) mass balance approaches, (6) stoichiometricapproaches, (7) methods based on stable isotopes, (8) in situ gradients with atmosphericenvironmental tracers, and (9) molecular approaches. Our review makes it clear that theprospects for improved quantification of denitrification vary greatly in different environmentsand at different scales. While current methodology allows for the production of accurateestimates of denitrification at scales relevant to water and air quality and ecosystem fertilityquestions in some systems (e.g., aquatic sediments, well-defined aquifers), methodology forother systems, especially upland terrestrial areas, still needs development. Comparison of massbalance and stoichiometric approaches that constrain estimates of denitrification at largescales with point measurements (made using multiple methods), in multiple systems, is likely topropel more improvement in denitrification methods over the next few years.
Key words: denitrification; greenhouse effect; nitrate; nitric oxide; nitrogen; nitrous oxide; stableisotopes; water quality.
INTRODUCTION
Denitrification, the reduction of the nitrogen (N)
oxides, nitrate (NO3�) and nitrite (NO2
�), to the gases
nitric oxide (NO), nitrous oxide (N2O), and dinitrogen
(N2) is important to primary production, water quality,
and the chemistry and physics of the atmosphere at
ecosystem, landscape, regional, and global scales.
Unfortunately, it is a miserable process to measure.
Available methods are problematic for a variety of
reasons; they change substrate concentrations, disturb
the physical setting of the process, lack sensitivity, or are
prohibitively costly in time and expense. Most funda-
mentally, it is very difficult to quantify the dominant end
product (N2) of denitrification given its high back-
ground concentration in the environment. Quantifica-
tion of denitrification is also hindered by high spatial
and temporal variation in the process, especially in
terrestrial environments.
As the importance of denitrification as a key regulator
of water and air quality at regional and global scales has
Manuscript received 20 December 2004; revised 3 June 2005;accepted 15 July 2005; final version received 20 September 2005.Corresponding Editor: A. R. Townsend. For reprints of thisInvited Feature, see footnote 1, p. 2055.
10 E-mail: [email protected]
2091
December 2006 2091A SYNTHESIS OF DENITRIFICATION

become more obvious (Galloway et al. 2003), concerns
about methodological misery have grown. This paper is
a result of a U.S. National Science Foundation funded
workshop on denitrification methodology that took
place in May 2004 that was designed to advance the
state of the science so that important questions related
to denitrification can be addressed. Here, we review the
major approaches that have been taken to measure
denitrification in terrestrial and aquatic environments.
For each method, we (1) provide a description of the
method, (2) review the historical development and use of
the method, (3) discuss the strengths and what have we
learned using this method, (4) describe the weaknesses of
the method and where it has led us astray in our
attempts to understand and quantify denitrification, and
(5) discuss prospects for future development and use of
the method.
An exceptionally wide range of methods and ap-
proaches are described in this paper. This range makes it
clear that the prospects for improved quantification of
denitrification vary greatly in different environments
and at different scales. One of our major objectives was
to present the diversity of approaches to measuring
denitrification so that readers from different disciplines
could benefit from, and possibly adapt, methods from
different environments, furthering progress on this
important topic.
THE ACETYLENE INHIBITION METHOD
The most commonly applied method to measure
denitrification is based on the ability of acetylene (C2H2)
to inhibit the reduction of N2O to N2 (Fig. 1; Balderston
et al. 1976, Yoshinari and Knowles 1976). In the
presence of C2H2, N2O becomes the terminal product
of denitrification, which can then be quantified by
measuring production of N2O, which is relatively easy
due to its low atmospheric concentration and the
availability of sensitive detectors for this gas (Fig. 1).
Numerous reviews of the C2H2 method, and its
application, have been published (Tiedje et al. 1982,
1989, Keeney 1986, Nieder et al. 1989, Revsbech and
Sørensen 1990, von Rheinbaben 1990, Payne 1991,
Aulakh et al. 1992, Barton et al. 1999, Groffman et al.
1999).
The development of the C2H2 method in both
terrestrial (Yoshinari and Knowles 1976) and aquatic
(Balderston et al. 1976) contexts stimulated a large body
of denitrification research in the late 1970s and early1980s. Methods involving in situ chambers, recirculation
cores, and static cores were developed and applied inboth environments. A series of problems with the
method were discovered beginning in the late 1970s thathave made its use problematic and controversial in
several contexts.In terrestrial environments, an early powerful appli-
cation of the C2H2 method was the system for perfusingsoil profiles beneath in situ chambers with C2H2
developed by John Ryden and colleagues (Ryden et al.1979a, b, Ryden and Dawson 1982). This method was
used to produce estimates of field fluxes of denitrifica-tion from a series of row crop and grassland ecosystems.
Use of the method never became widespread however,because it was laborious and because of the discovery of
problems with C2H2 effects on soil microbial commun-ities (detailed below).
The next major advance in application of the C2H2
method in terrestrial environments was the development
of gas recirculation methods where the atmosphere of asoil core could be amended with C2H2, oxygen levelscould be controlled, and N2O accumulation rates could
be measured with high sensitivity (Parkin et al. 1984,Sexstone et al. 1985, Robertson and Tiedje 1987).
Recirculation methods continue to be widely used (withand without C2H2) to examine relationships between
various environmental factors and denitrification(Swerts et al. 1995, Butterbach-Bahl et al. 2002).
Perhaps the most widely applied C2H2-based ap-proach in both terrestrial and aquatic environments has
been ‘‘static core’’ methods where C2H2 is injected oradded to the headspace of a sealed soil/sediment core
and N2O accumulation is measured over incubationtimes ranging from one to 24 hours (Sørensen 1978,
Ryden and Skinner 1987, Tiedje et al. 1989, Groffman etal. 1999). These methods have been applied in a wide
variety of ecosystems because they are simple to carryout, allowing large numbers of samples to be run, a
major advantage given the high spatial and temporalvariability of denitrification rates.
Problems with C2H2 methods began to emerge in thelate 1970s, the most critical of which is that C2H2
inhibits the production of NO3� via nitrification (Fig. 1;
Hynes and Knowles 1978, Walter et al. 1979, Mosier1980). This inhibition can lead to underestimation of
denitrification rates in systems with small and/ordynamic NO3
� pools, especially sediments (Seitzinger
et al. 1993). Other concerns that arose in the 1970s and1980s included (1) slow diffusion of C2H2 into fine-
textured and/or saturated soils and sediments (Jury et al.1982), (2) enhancement of soil respiration, (3) rapid
decomposition of C2H2 by C2H2-degrading microbes(Yeomans and Beauchamp 1982, Terry and Duxbury
1985, Topp and Germon 1986, Flather and Beauchamp1992), and (4) contamination of C2H2 with other gases
that can affect denitrification (Hyman and Arp 1987,
FIG. 1. Acetylene effects on nitrification and denitrificationpathways.
INVITED FEATURE2092Ecological Applications
Vol. 16, No. 6

Gross and Bremner 1992). In aquatic systems, there was
concern about sulfide interference and low NO3�
concentrations relieving C2H2 inhibition of N2O reduc-
tase (Oremland et al. 1984, Slater and Capone 1989,Christensen et al. 1989, Rudolph et al. 1991). More
recently, there has been concern about C2H2 scavengingof NO leading to underestimation of denitrification
(Bollmann and Conrad 1997).The problems with the C2H2 method caused many
investigators to consider abandoning this approach tomeasuring denitrification, but the lack of a viable
alternative method, especially one that allows for largenumbers of samples to be run, has fostered its
persistence (Groffman et al. 1999). We then need toask: ‘‘Just where is the method valid?’’, ‘‘What have we
learned about denitrification from C2H2 methods?’’, and‘‘Where have these methods led us ‘astray’?’’
In a positive sense, C2H2 methods have given us alarge number of denitrification rate estimates. Indeed,
the body of denitrification rate estimates, especially forterrestrial systems, is dominated by C2H2-based meth-
ods. And these estimates are reasonably robust,especially for systems with moderate or high NO3
�
levels. We have also used C2H2-based methods to learn
much about environmental regulation of denitrification,e.g., control by oxygen, NO3
�, carbon (C), soil moisture,
pH, and other factors. These methods have alsoproduced understanding of the ‘‘hotspot’’ nature of
denitrification, where small areas of soil cores, ecosys-tems and landscapes account for a very high percentage
of areal denitrification (Parkin 1987, McClain et al.2003). A by-product of the hotspot nature of denitrifi-
cation is high spatial and temporal variability, which hasbeen well studied by taking advantage of the ability to
run large numbers of C2H2-based assays (Foloronusoand Rolston 1984, Burton and Beauchamp 1985,
Robertson and Tiedje 1985, Parkin et al. 1987,Robertson et al. 1988).
In a negative sense, C2H2 methods have caused us tounderestimate denitrification in large numbers of pri-
marily native ecosystems, where inhibition of nitrifica-tion by C2H2 creates an entirely inaccurate picture ofdenitrification. The reliance on extracted cores and
disturbed samples (rather than, say, the in situ chambermethods pioneered by Ryden et al.) has led to
inaccuracies in cases where the physical structure ofthe environment strongly regulates the substrates or
end-products of denitrification. These physical prob-lems, as well as the general alteration of substrate and
product flow by C2H2, have particularly led us astray inanalysis of the relative importance of the denitrification
end-products (NO, N2O, N2; Robertson and Tiedje1987); a topic of increasing interest due to the
importance of NO and N2O to the greenhouse effectand atmospheric ozone levels.
There have been surprisingly few attempts to sort outwhere and when results of the C2H2 inhibition method
are valid in aquatic systems. The two major potential
problems, inhibition of nitrification and incomplete
inhibition of N2O reduction are both very time depend-ent and therefore likely to become obvious over the time
course of an incubation, i.e., the initial N2O accumu-lation rate should reflect the true denitrification rate and
then gradually decline as NO3� levels decline and/or as
N2O diffuses into the NO3� free zone and becomes
reduced (Christensen et al. 1989). Consistent, linearaccumulation of N2O is therefore strong evidence for the
validity of the results. Measurements with NO3� micro-
sensors in a freshwater sediment suggested that nitrifi-
cation was too transitent, and NO3� pools were too
small for the C2H2 method to be valid (Jensen et al.
1993), while a method comparison study in North Seasediment indicated that, at least in this case, coupled
nitrification–denitrification could be picked up reason-ably well by a short term incubation with C2H2 (Lohseet al. 1996). The maximum possible contribution of
coupled nitrification–denitrification to total denitrifica-tion in sediments may also be estimated from the
availability of ammonium (NH4þ) and NO3
� in thewater and the stoichiometry of O2 consumption and
NH4þ production (Christensen et al. 1990).
Is there still a role for C2H2-based methods in
denitrification studies? In systems with high NO3�
concentrations, certainly yes. And certainly for measure-
ments of denitrification potential, e.g., the widely useddenitrification enzyme activity (DEA) assay (Groffman
et al. 1999). This assay is still widely (and validly) usedfor comparisons of sites and experimental treatments in
both terrestrial and aquatic environments, for evalua-tion of controlling factors, and even as an indirect
measure of microbial functional diversity (Cavigelli andRobertson 2000).
On the other hand, would we recommend that a newgraduate student, interested in understanding the
importance of denitrification to the global ‘‘nitrogencascade’’ (Galloway et al. 2003) or atmospheric chem-
istry use C2H2 methods for their study? Perhaps not,especially if they are working with natural ecosystems.In our view, C2H2 methods will continue to be used in
certain circumstances, and the knowledge that we havegained from these methods will help to guide future
studies, but the future is likely to be dominated by thenew methods described elsewhere in this paper.
15N TRACER METHODS
Several methods based on 15N have been applied instudies of denitrification in soil, sediment and water,
including isotope fractionation, isotope dilution, 15Nmass balances, and direct measurement of 15N labeled
gases upon addition of 15NO3� and 15NH4
þ. The lattermethod, applied to intact samples of soil and sediment
as well as to ground water and surface water, has beenthe most popular, and will be the focus of this section.
Adding 15N-labeled NO3� to soil and measuring the
production of 15N-labeled N2 was the first method
applied for direct quantification of denitrification in
December 2006 2093A SYNTHESIS OF DENITRIFICATION
environmental samples (Hauck and Melsted 1956). With
some improvements, the 15N tracer method has been
considered one of the best for soil studies, but its
application has been limited by the laborious procedures
and expensive instrumentation required for this method
compared to approaches based on C2H2 inhibition or N
mass balances. A review and evaluation of the different15N approaches for estimating soil denitrification was
given by Myrold (1990). Nishio et al. (1982, 1983)
developed a technique for measuring denitrification
rates in intact estuarine sediments incubated in a
complete flow-through system.
An early problem identified with 15N tracer methods
was the need to know the ratio of 15N to 14N in the
NO3� being denitrified in order to translate tracer data
into estimates of total denitrification rates. This problem
was rapidly solved for soil studies by Hauck et al. (1958)
who demonstrated how the ratio of the two enriched N2
species, 14N15N and 15N15N, reflects the ratio of 14N to15N in the source, provided that N2 is formed by random
pairing of N atoms. More direct measures of the isotope
mixing ratio were later obtained by accurate isotope
analysis of N2O, the obligate precursor for N2 (Stevens
et al. 1993, Stevens and Laughlin 2001).
In incubations of aquatic sediment, it is straightfor-
ward to add 15NO3� in a controlled mixing ratio with
14NO3� in the overlying water column. Using that ratio
in the calculation, however, will only provide estimates
of the denitrification rate of NO3� from the water
column, while coupled nitrification–denitrification in the
sediment may not be detected. The immediate solution
to this problem was parallel incubations with 15NH4þ for
specific measurement of coupled nitrification–denitrifi-
cation (Nishio et al. 1983). For that approach it was
necessary to assume that nitrification was not NH4þ
limited and that the isotope mixing of NH4þ in the
nitrification zone was homogenous and measurable
(Seitzinger et al. 1993): two assumptions that are
difficult to fulfill and test.Much later, the original solution of Hauck et al.
(1958), based on the ratio of 14N15N and 15N15Nproduction, was implemented in aquatic studies (Nielsen
1992). As the ratio of 15N14N and 15N15N reflected theisotope ratio of NO3
� within the denitrification zone and
not in the overlying water, the isotope pairing methodcould measure and differentiate denitrification of NO3
�
from the water column and coupled nitrification–denitrification in one simple incubation (see the review
by Steingruber et al. [2001]). Several methods compar-ison and evaluation studies have been published
(vanLuijn et al. 1996, Risgaard-Petersen et al. 1998,Eyre et al. 2002) and a protocol handbook for
application in various systems is available (Dalsgaardet al. 2000).
It is interesting that the ideas of Hauck et al. (1958)were applied in aquatic systems only after a 34-yeardelay, highlighting the limited interaction of terrestrial
and aquatic researchers. An additional reason for thedelay is probably that the pioneers in aquatic studies by
chance only had access to mass spectrometers with dualcollectors for 14N14N and 14N15N (Nishio et al. 1983).
Production of 15N15N was therefore considered anuisance that should be minimized by applying NO3
�
with a low 15N%. These methods are now much morewidely applied in aquatic than terrestrial systems.
Addition of 15NO3� or 15NH4
þ to achieve high levelsof 15N enrichment increases the availability of N and
may result in an overestimation of denitrification insystems with N limitation. These techniques are mostly
used in agricultural soils and N rich waters, and here thefertilization problem is less likely to appear. In pristine
systems with low in situ concentrations of inorganic N,it is more important to evaluate the levels of NO3
�
present during the experiment.
Myrold (1990) summarized studies comparing C2H2
inhibition and 15N tracer methods in soil, and they
deviated by less than 30%. Typically the C2H2 methodestimated about 20% higher rates than the 15N tracers
which could be explained by the bacteria compensatingfor the lower number of electrons accepted by NO3
�
reduction to N2O only. Groffman et al. (1993) foundindications of larger discrepancies in a poorly drained
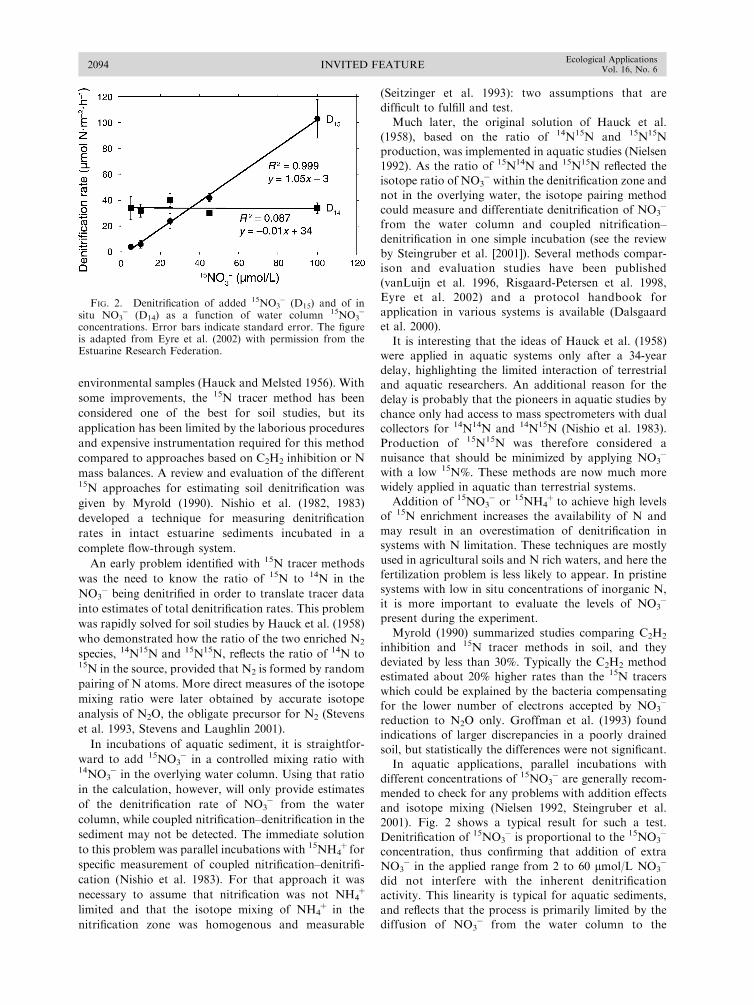
soil, but statistically the differences were not significant.In aquatic applications, parallel incubations with
different concentrations of 15NO3� are generally recom-
mended to check for any problems with addition effects
and isotope mixing (Nielsen 1992, Steingruber et al.2001). Fig. 2 shows a typical result for such a test.
Denitrification of 15NO3� is proportional to the 15NO3
�
concentration, thus confirming that addition of extra
NO3� in the applied range from 2 to 60 lmol/L NO3
�
did not interfere with the inherent denitrificationactivity. This linearity is typical for aquatic sediments,
and reflects that the process is primarily limited by thediffusion of NO3
� from the water column to the
FIG. 2. Denitrification of added 15NO3� (D15) and of in
situ NO3� (D14) as a function of water column 15NO3
�
concentrations. Error bars indicate standard error. The figureis adapted from Eyre et al. (2002) with permission from theEstuarine Research Federation.
INVITED FEATURE2094Ecological Applications
Vol. 16, No. 6

denitrification zone (Andersen 1977, Christensen et al.
1990). If NO3� assimilation in the sediment had been
restricting denitrification in situ, the line would intercept
the x-axis at a concentration indicating a saturationthreshold for assimilation. At the other end, the curve
must level off at higher NO3� concentrations as
diffusion limitation is displaced by limits in process
kinetics and extension of the denitrification zone. Theuniform estimate of inherent denitrification (D14) proves
that there was homogenous isotope mixing and confirmsthe absence of NO3
� addition effects at all concen-
trations applied. If there was nonhomogeneous isotopemixing, the D14 estimate would have increased with15NO3
� concentration as more and more of the 14Nwould be captured in the directly measured 14N15N
fraction and not in the underestimated 14N14N fraction.Theoretically, the ideal instantaneous and homoge-
nous isotope mixing will never be achieved in theapplication of the 15N tracer technique in static cores.Diffusion barriers, structural heterogeneity, bioturba-
tion, isotope fractionation, microoxic zones with over-lapping nitrification and denitrification, anammox,
temporal variations, and many more phenomena willall generate a more or less nonhomogeneous isotope
mixing. Nevertheless, concentration tests have repeat-edly offered a comfortable range of 15NO3
� concen-
trations where the effect of nonhomogeneous isotopemixing is insignificant and low enough to avoid addition
effects (see summary by Steingruber et al. [2001]). Asimulation model of the method showed that neither
isotope fractionation, overlapping nitrification–denitri-fication, or NO3
� addition effects should result in errors
above 10% (Middelburg et al. 1996a). This model paperalso triggered a peculiar dispute on the nature of
diffusion and the physical reality of the distinctionbetween denitrification of NO3
� from the water columnand coupled nitrification–denitrification (Nielsen et al.
1996, Middelburg et al. 1996b).
Coupled nitrification–denitrification in the rhizo-sphere of O2 excreting aquatic plants is not measuredby the standard isotope pairing, as added 15NO3
� will
not be in contact with the rhizosphere. Therefore, analternative approach based on injection of 15NH4
þ has
been developed for the investigation of vegetated sedi-ments (Caffrey and Kemp 1992, Ottosen et al. 1999,
Welsh et al. 2000). 15NH4þ has also been used to
measure denitrification in exposed intertidal sediments
where a water column source of NO3� for denitrification
is absent (Ottosen et al. 2001).
Recent discoveries of anammox in aquatic systemsand the existence of bacterial populations with large and
dynamic intracellular pools of NO3� deep in the
sediment has raised unexpected new questions in our
understanding and measures of N2 production (Tham-drup and Dalsgaard 1992, Fossing et al. 1995). A
protocol for simultaneous measurement of anammoxand denitrification in sediments with 15N tracer methods
has been presented, but field validation is still lacking
(Risgaard-Petersen et al. 2003). Reduction to NH4þ
seems to be the major pathway of NO3� reduction in the
NO3� accumulating bacteria, but the question is still
open whether they may denitrify as well or liberateNO3
� to denitrifiers in the sediment (see review by
Schulz and Jørgensen 2001).Aquatic systems with a complex matrix of macro-
phytes, microphytes, and solid substrates might be anoverwhelming challenge for 15N tracer methods. In
addition to the sediment, multiple, more or lessephemeral hotspots of nitrification and denitrification
could be present in biofilms, periphyton, and decom-posing pieces of leaves and stems in these systems. Here
the standard concentration test may well indicate thatthe isotope pairing method is not applicable, as the
assumptions of homogenous isotope mixing and line-arity between denitrification rates and bulk water NO3
�
concentration will be far from valid. In these systemstypical of many streams, wetlands, and littoral zones,the C2H2 inhibition technique or other methods may be
superior.
Enclosure effects are a major problem shared by allmethods relying on incubations. It is essential to keephydrodynamics and concentrations of O2, NH4
þ, and
NO3� near in situ conditions to produce accurate
estimates of in situ denitrification rates. An extreme
demonstration of this was seen when significantdiscrepancies between lake N mass balances and
denitrification measured in static cores lead to the setup of large, flexible in situ enclosures for 15N tracer
experiments (Risgaard-Petersen et al. 1999). Denitrifica-tion rates in the enclosures were an order of magnitude
higher than rates measured in cores because wave forcesin situ forced the sediment into a semifluid state with
greatly enhanced solute transport. These conditionscould not be reproduced in the cores, even with vigorous
stirring. In estuaries with more consolidated sediment,comparisons of denitrification rates obtained fromsystem mass balance and static core incubations have
been much more satisfactory (Nielsen et al. 1995, 2001).
Enclosure effects are not a concern in aquifer andsmall stream studies, and 15N tracer methods have beenapplied in these systems with relatively little disturbance
of in situ conditions. Smith et al. (2004) describe amethod that includes measurement and modeling of the
isotopic evolution of nitrate, nitrite, nitrous oxide, andnitrogen gas along natural flow paths between injection
and recovery sites. Bohlke et al. (2004) and Mulhollandet al. (2004) describe similar experiments at the reach
scale in small streams, which are complicated bynitrogen gas inputs from air and discharging ground
water. Istok et al. (1997) developed a ‘‘push–pull’’method to determine in situ groundwater denitrification
where a single mini-piezometer is used for both dosingand sampling.
Provided that standard tests and measures of isotopemixing ratios are integrated in the application of the 15N
tracer method in soil and sediment, there is little doubt
December 2006 2095A SYNTHESIS OF DENITRIFICATION

that it can be used to generate reliable estimates of
denitrification rates within the sampled unit. The results
obtained so far have also provided a much better
understanding of the regulation of denitrification and
interactions with other processes and environmental
conditions. The major question left for the method is
how to do representative sampling in space and time and
how to successfully simulate in situ conditions in
experimental enclosures. Integration with landscape
scale measures and models may eventually provide an
answer to these challenges.
DIRECT N2 QUANTIFICATION IN TERRESTRIAL SYSTEMS
Direct measurements of N2 emissions from soils are a
major challenge. It is not currently possible to quantify
small changes in N2 concentrations due to denitrification
against the atmospheric background of 79% N2. Because
of these analytical difficulties (which have been noted for
five decades [Nommik 1956]), one needs to apply
enclosure techniques in which either mixed or intact
core samples are incubated under conditions of reduced
atmospheric N2 to allow for quantification of N2 (and
N2O) production by denitrification (Scholefield et al.
1997a, Butterbach-Bahl et al. 2002) without addition of
labeled substrates (e.g., 15N compounds) or inhibitors
such as C2H2. Maintaining a partial pressure of N2 of a
few microliters per liter requires a very gas-tight system,
built from material which does not outgas N2, as well as
complete removal of N2 stored in aggregates and pores
of the soil or sediment sample before measurements
begin. Such incubation systems were first developed in
the early 1970s and have recently been improved (greater
sensitivity; Scholefield et al. 1997a, Butterbach-Bahl et
al. 2002, Cardenas et al. 2003). In these methods, intact
or mixed samples are enclosed in a gas tight vessel whichis then flushed with an artificial gas mixture (He or Ar
based) to remove N2. The purging time needed to ensurethat all N2 is removed depends on the soil/sediment
texture, moisture content and the volume of the sample(Fig. 3). The entire process can be accelerated substan-
tially by varying pressure.In most cases, the incubation vessels are constructed
so that temperature can be controlled and so thatsubstrate or moisture additions (e.g., to imitate rainfall
events) can be made. Because of the need to maintain agas-tight system, design, construction and operation of
these gas flow incubation systems can be complex anddifficult. However, gas flow core methods are well suited
for parameterization experiments where the effects oftemperature or moisture on N2O and N2 emission from
soils are quantified and then used as a basis forestimating N2 losses due to denitrification (Scholefieldet al. 1997b, Butterbach-Bahl et al. 2002).
The need to develop ‘‘undisturbed’’ soil, sediment, or
soil–plant incubation systems for direct measurement ofN gas production was first noted by Nommik (1956).Since then, several attempts have been made to develop
gas-tight systems with reduced partial pressure of N2 forboth terrestrial (e.g., Ross et al. 1964, Stefanson 1970,
1972, Van Cleemput 1971, Scholefield et al. 1997a,Butterbach-Bahl et al. 2002) and aquatic (Barbaree and
Payne 1967, Seitzinger 1988) systems. In most of thesestudies, N2 was replaced with inert gases such as He or
Ar (e.g., Stefanson and Greenland 1970, Stefanson 1972,Galsworthy and Burford 1978, Wickramasinghe et al.
1978) or the N2 partial pressure was reduced to ,30 000kPa and an 15N tracer was used (e.g., Ross et al. 1964,
Kralova et al. 1992). Until recent years, the majorshortcoming of these methods was a rather low
sensitivity, since mostly robust katharometers or ther-mal conductivity detectors were used for N2 analysis,
yielding detection limits for denitrification of at best 50 gN�ha�1�d�1 (e.g., Galsworthy and Burford 1978, Schole-field et al. 1997a). For this reason, the methods were
mainly used in studies with highly fertilized agriculturalor grassland soils (Stefanson and Greenland 1970,
Wickramasinghe et al. 1978, Scholefield et al. 1997b)or in sediments with high denitrification rates (e.g.,
Seitzinger 1988). Recently, development of the non-radioactive pulsed-discharged helium ionization detector
has significantly improved sensitivity for N2, allowingfor measurement of N2 fluxes from soils due to
denitrification as low as 2.4 g N�ha�1�d�1 (Butterbach-Bahl et al. 2002, Cardenas et al. 2003).
Gas flow core techniques that allow for directestimation of N2 emission from soil due to denitrifica-
tion have several advantages: (1) they are nondestruc-tive; (2) no label (e.g., 15N) needs to be introduced to the
soil or sediment system, which is of significant impor-tance for studies of semi-natural and natural environ-
ments; (3) no inhibitor needs to be used; and (4) it can be
FIG. 3. Time needed to reduce the background emission ofN2 from a sterilized soil column to the system inherent leakagerate (0.2 lL N2�L�1�h�1) in soils of different texture. Purgingrate with an N2-free He–O2 gas mixture (80% to 20%) is 200mL/min; soil volume is approximately 3 L; and soil moisture ishigh.
INVITED FEATURE2096Ecological Applications
Vol. 16, No. 6

a very sensitive method for measurements of N2
emissions, with a detection limit ,1 kg N2-N�ha�1�yr�1.Furthermore, provided that an adequate gas-tight
incubation system is available, it is a rather simplemethod, which can easily be used for quantification and
parameterization experiments of denitrification in soils,sediments and open water. Based on a series of
experiments and a comparison of N2O fluxes measuredunder ambient and N2-free atmospheres, Scholefield et
al. (1997a) and Butterbach-Bahl et al. (2002) concludedthat alteration of the soil atmosphere to remove N2 does
not affect the magnitude of microbial processes involvedin N trace gas production. Shortcomings of gas flow
core techniques are mainly associated with the timeneeded to establish an N2 free atmosphere and with the
complex technology needed to ensure the gas-tightnessof the incubation vessel and the precise and uncontami-nated sampling of gas samples from the headspace of the
vessel.The gas flow core technique is increasingly being used
for the quantification of N2 (and N2O) production bydenitrification in a wide range of terrestrial and marine
ecosystems. There are also strong prospects for combin-ing gas flow core methods with inhibitors and 15N
tracers to address specific research questions related toenvironmental regulation of denitrification or in vali-
dation studies of other methods. A major advance willbe the development of methods to measure NO flux in
gas flow core techniques so that all three gaseousdenitrification products can be measured simultane-
ously.
DIRECT N2 AND N2:Ar MEASUREMENTS
IN AQUATIC AND MARINE SYSTEMS
It is generally easier to measure the end-product ofdenitrification in aquatic and marine systems than it is interrestrial systems. This is partly a result of the fact that
soils exchange gas freely with the atmosphere, whereasdeep saturated systems tend to be more closed to gas
exchange. Also, because of lower background concen-trations in water, denitrification typically produces a N2
concentration gradient on the order of 1000 timesgreater than that produced in air, making it possible to
measure realistic denitrification rates with an analyticalprecision in the range of 0.03–0.3%. This is attainable
using mass spectrometry (Kana et al. 1994) or, at thelower precisions, gas chromatography (An and Joye
1997). Such measurements were made in the early 1960s,but subsequent development and application of direct
N2 methods was slowed by the limited availability ofinstrumentation with the requisite precision.
Seitzinger et al. (1980) made the first extensive directN2 flux measurements using enclosed core incubations
with a pre-incubation period to remove N2 from the coreby flushing with N2-free gases. These methods wereinstrumental in defining the problems with acetylene
inhibition of coupled nitrification-denitrification, butthere were concerns about the long pre-incubation
period required to remove N2 creating ‘‘bottle effects’’
and decoupling of the sediment sample from watercolumn NO3
� and C flow (Seitzinger et al. 1993,
Nowicki 1994).In recent years, low-cost mass spectrometers have
become available and this has spurred interest amonglimnologists and oceanographers in measuring denitri-
fication by N2 production without altering backgroundN2 concentrations. Because mass spectrometric mea-
surements are more precise for gas ratio data, mostdirect N2 studies are actually based on N2:Ar ratio
measurements, and the technique is also referred to asthe N2:Ar method.
A number of approaches have been taken to detect N2
production from denitrification in aquatic and marine
systems. These approaches fall into two general catego-ries: enclosure experiments designed to measure N2
fluxes and open system measurements of ambient N2:Ar.It is worth noting that both approaches measure net
denitrification which is the difference between grossdenitrification and gross N fixation. Methods have been
described that separate these fluxes by the use ofisotopes (An et al. 2001) or inhibitors (Joye and Paerl1993). A brief description of each direct N2 approach as
used in contemporary studies follows.Enclosure experiments are typically used for studies
involving sediment, which is the site of most denitrifi-cation activity. The method usually involves either a
benthic chamber (Devol 1991) or closed-chamber sedi-ment core sample (Cornwell et al. 1999) that is
subsampled over time for dissolved gases in the waterabove the sediment. The N2 flux is determined from the
rate of change in N2 concentration. If N2:Ar data areused, the change in N2 (DN2) is determined from
DN2:Ar) 3 [Ar], where [Ar] is the Ar concentration atair saturation determined from solubility equations
(Weiss 1970, Colt 1984). In practice, changes in [N2]can usually be resolved in incubations lasting ,12 h. For
oxic water, it is desirable to measure changes in oxygenconcentration within the chambers and confine the
analysis of D[N2] to the period when [O2] is greaterthan ;50% of saturation. This minimizes the effect ofreduced oxygen availability on coupled nitrification
denitrification activity (Jenkins and Kemp 1985). Thisapproach is readily scaled to multiple cores for site
replication and/or for sampling multiple environments.A second type of enclosure experiment involves
sediment cores with flow-through headwater (Kana etal. 1998). Denitrification rates are determined from
measurements of the difference in N2:Ar between inletand outlet water, flow rate, and core surface area. This
type of setup allows the experiment to be run understeady-state conditions and allows perturbation experi-
ments that are not possible with batch experiments. Forroutine determinations of denitrification rates there are
disadvantages of flow-through experiments including amore elaborate setup and greater incubation time
(minimum of several days).
December 2006 2097A SYNTHESIS OF DENITRIFICATION

With proper care, enclosure experiments can provide
accurate rates of denitrification in environmental sam-ples. For studies of ecosystem denitrification, the rates
determined in centimeter- and hour-scale experimentsmust be extrapolated to kilometer- and months-scale
estimates. There is inherent uncertainty in this process,because it is usually not possible to accurately assess the
environmental heterogeneity of the system. An alter-native approach, one that integrates large scale systems,
is through the measurement of N2 in water samplestaken from the environment in question. We refer to this
approach as in situ or environmental measurementstudies.
In situ measurement studies depend on the ability todetect, in the ambient water, N2 that is contributed by
the denitrification process. This is made difficult by thehigh concentration of N2 in the aqueous environment
(400�800 lmol/L) and physical processes related tomixing, air exchange, and water volume in contact withthe area of denitrification. Nevertheless, some environ-
ments have proved amenable to this approach and thereis active interest in exploiting this inherently large-scale
integrated measurement approach. Several differentsystems have been studied using in situ measurements.
Within the oceans, suboxic zones exist within the watercolumn in specific regions and N2:Ar ratios within those
zones have been found to be up to 3% in excess of thatexpected from physical processes owing to in situ water
column denitrification (Codispoti et al. 2001). In riverreaches, two related approaches have been taken to
study denitrification. One study measured the change inN2:Ar with distance (and related time) and corrected for
air exchange measured using a volatile tracer (Laursenand Seitzinger 2002). Another study used time-series
measurements of diel N2:Ar and corrected for airexchange and groundwater discharge (McCutchan etal. 2003).
In contrast to surface waters that may be turbulently
mixed and in exchange with air, water trapped insediments and aquifers may be somewhat more closedwith respect to external fluxes. Some of the earliest
studies of excess N2 production in sediments were doneby analyzing dissolved gases in pore water (Reeburgh
1969, Barnes et al., 1975, Nishio et al. 1981). Deni-trification in aquifers has been studied from dissolved
gas analyses of groundwater samples from a variety ofhydrogeologic environments in which the gases were
under sufficient hydrostatic pressure to prevent majorloss or exchange with air (Vogel et al. 1981, Wilson et al.
1990, Bohlke and Denver 1995, Bohlke et al. 2002,McMahon et al. 2004a, b). Blicher-Mathiesen et al.
(1998) describe a study of shallow groundwater in ariparian-wetland system in which denitrification was
accompanied by substantial degassing. In this case,changes in groundwater N2 and Ar along a flow pathwere used to adjust the apparent N2 losses for ebullition
(determined from Ar losses) and determine the amountof N2 excess from denitrification.
Measurement technologies play an important role in
these studies. Dissolved N2 has been measured using gaschromatography (GC) and mass spectrometry (MS).
The GC technique has precision on the order of 0.1–0.3% (An and Joye 1997), and has been used to measure
N2 flux in sediment core experiments kept at ambient[N2] (Devol 1991) and reduced [N2] (Seitzinger et
al.1980, Nowicki 1994), as well as in groundwater,where denitrification contributions to N2 commonly
accumulate in a closed system. GC is used less frequentlynow for surface-water studies because of the availability
of comparably priced mass spectrometers that offerbetter precision and water handling. There are two
approaches to measuring dissolved gases by massspectrometry. One method involves an off-line degassing
step and subsequent analysis of a head-space gas sample(Emerson et al. 1991, 1999). A second method involvesan inline degassing process using a membrane separator
between a flowing sample stream and the MS vacuuminlet (Kana et al. 1994). The later membrane inlet (or
introduction) mass spectrometry (MIMS) technique hasbecome popular for denitrification measurements be-
cause it provides rapid (,2 min) measurements on small(,7 mL) samples with no preprocessing and provides
high precision (;0.03% for N2:Ar ratios) (Kana et al.1994).
Although determinations of denitrification usingN2:Ar data go back to the 1950s (Richards and Benson
1961), the mass spectrometry technique was notavailable to most laboratories. GC measurements were
applied in the 1960s and 1970s on sediment pore watersamples, which exhibited large gradients with depth
(Reeburgh 1969, Barnes et al. 1975). The first direct fluxmeasurements on sediment cores were done by Seit-
zinger et al. (1980) using a technique involving thereduction in N2 in the chamber (cf. part 4). This alloweddetection of N2 fluxes by GC. The introduction of the
relatively simple MIMS technique (Kana et al. 1994)coupled to low-cost MS detectors has led to growing
interest in the development of both core incubationtechniques (e.g., Kana et al. 1998, Cornwell et al. 1999)
and open system measurements (Laursen and Seitzinger2002, McCutchan et al. 2003). A MIMS ‘‘probe’’ was
also developed to measure depth profiles of sedimentgases (Thomas and Lloyd 1995).
Detection of the end product (N2) is a direct measureof net denitrification. Interferences are limited in closed
systems to biological N fixation when experiments areproperly controlled for solubility-driven fluxes. Current
incubation methods allow replication and relativelyefficient use of resources and time. The method is also
amenable to large-scale integrated measurements ofaquatic and marine systems.
Eyre et al. (2002, but see also Kana and Weiss 2004)pointed out a number of concerns with the core
incubation technique where care is needed to minimizeerrors due to uncontrolled physical fluxes. For core
incubations, there is no completely adequate control
INVITED FEATURE2098Ecological Applications
Vol. 16, No. 6

that can account for all solubility flux errors and this
generally sets the lower limit of detection. For someenvironments (e.g., oceanic oxygen minimum zones),
open system measurements of N2 excess can only beconverted to rates when water mass age tracers are also
measured to estimate the time variable associated withthe accumulated N2. In some cases (e.g., river systems),
the time variable is built into the method, but theenvironmental signal may be dominated by physical
transport.The prospects for methods based on N2 detection of
denitrification in aquatic and marine systems areexcellent. The combination of direct N2 measurements
with isotope (15N2) methods is just now being exploredfor separating denitrification from N fixation in systems
where they coexist (An et al. 2001, Eyre et al. 2002).Currently, there are only a handful of in situ measure-
ments in open systems (streams and rivers), but theprospect for expanding these measurements, and im-proving techniques to account for physical transport
and time units, are good. The great challenge remains toapply these methods to unsaturated terrestrial systems
(e.g., soils), where the N2 background is high andexchanges rapidly with air.
MASS BALANCE APPROACHES
Mass balance has long been used to estimate variousterrestrial N fluxes at the field scale (Allison 1955), and
more recently at stream reach, watershed, or regionalscales (e.g., Goolsby et al. 1999, David and Gentry 2000,
Pribyl et al. 2005). In some studies, denitrification isestimated using literature values and is one component
of the mass balance (Goolsby et al. 1999). Othersestimate denitrification by difference in the mass balance
(e.g., David and Gentry 2000, Pribyl et al. 2005).In the marine environment, Johnstone (1908) first
speculated that the imbalance between the amount of Nentering and leaving the North Sea could be due at least
in part to denitrification but did not calculate a rate.Nearly 50 years later, Emery et al. (1955) used thedifference in a mass balance of the world’s oceans to
estimate that nearly 70 3 1012 g of N per year were lostby denitrification. More recently, estimates of denitrifi-
cation by the difference in a mass balance have beencarried out in semi-enclosed seas and bays (Billen et al.
1985, Wulff et al. 1990, Kamp Neilsen 1992), however,due to the difficulty of accurately measuring water fluxes
it is more common to compare laboratory measurementsof denitrification to mass balance calculations of major
fluxes to assess the magnitude of denitrification (e.g.,reviewed for estuarine systems by Nixon et al. 1996). In
rare cases, both laboratory measurements and massbalance calculations have been compared in the same
system (Nielsen et al. 1995, Kelly 1997).To correctly estimate denitrification by mass balance,
direct measurements or estimates of all other N fluxesand changes in storage for the system are needed.
Frequently, it is assumed that the system is at steady
state with regard to large internal pools and only inputs
and outputs are quantified. Major inputs to terrestrialsystems typically include fertilizer, biological N2 fixa-
tion, and atmospheric deposition, with outputs includ-ing crop or biomass harvest and export from the area
and leaching/runoff/riverine export (Fig. 4). Typicallymeasured inputs to marine systems include: atmospheric
deposition, inputs from ‘‘nonpoint’’ sources such as roadrunoff, and direct sewage discharge; with outputs
assumed to be due to fisheries harvest, oceanic flushing,and sediment burial. More recently the potential
importance of biological N2 fixation and N inputs fromthe oceanic endmember are being recognized and
included in budgets.For most terrestrial fertilized systems considered
using mass balance, inputs are typically much greaterthan outputs, and the difference can be attributed to
denitrification (often both terrestrial and in-stream orreservoir/lake, depending on the scale). Generally thechange in storage is assumed to be very small and is
ignored, because it is difficult to accurately estimateacross the short time scales of most mass balance
studies. However, storage pools of N in many ecosys-tems, particularly midwestern agricultural watersheds,
are often extremely large (e.g., 10 000 to 20 000 kg N/hain the upper 1 m of soil [David et al. 2001]), so that even
relatively minor changes in storage could affect fluxestimates of denitrification. In addition, groundwater
residence times may be long enough (decades or more)that recharge and discharge fluxes of N may be
imbalanced simply because of changes in land use andagricultural practices on decadal time scales (Bohlke
2002, Lindsey et al. 2003). For pristine terrestrialsystems, where external N inputs and outputs are small,
mass balance approaches lack the sensitivity to pick upsmall, but important denitrification fluxes.
Regional denitrification has recently been estimatedby mass balance in the midwestern United States, where
large fluxes of N are present, and can be used toillustrate the method. In this example, the net anthro-pogenic N input (NNI) approach used by Howarth et al.
(1996) was extended further by using estimates ofriverine export and obtaining denitrification by differ-
ence as the only remaining, important, N flux unac-counted for. The NNI approach estimates residual N
that could be lost from an ecosystem by riverine exportor other fates, and focuses on relating inputs to riverine
losses. In this midwestern example, David and Gentry(2000) and David et al. (2001) developed recent and
historical N mass balances treating the state of Illinois asa large watershed. In their approach, major inputs and
outputs were estimated, including denitrification (Fig.4). Inputs included fertilizer N, soybean N2 fixation,
other N2 fixation, and atmospheric deposition, whereasoutputs included net grain export, animal productexport, riverine export, and field þ in-stream denitrifi-
cation. Denitrification was assumed to be equal toinputs not lost to grain/animal exportsþ riverine losses,
December 2006 2099A SYNTHESIS OF DENITRIFICATION

balancing the inputs and estimated outputs in the mass
balance. In this approach, net soil mineralization for the
ten-year period was assumed to be zero, indicating that
soils were not gaining nor losing N. An earlier version of
this mass balance (David and Gentry 2000) estimated
denitrification using literature values, and developed
values of 87 000 and 132 000 Mg N/yr for field and in-
stream denitrification, respectively. However, recent
measurements of denitrification in Illinois streams
reported by Royer et al. (2004) suggested that in-stream
denitrification may have been overestimated by the mass
balance approach. Therefore, the lumped value of David
et al. (2001) is probably a better indication of our
current knowledge of the magnitude of denitrification in
agricultural landscapes, and our uncertainty of whether
it is occurring primarily in fields or in streams/reservoirs.
Mass balance at this scale doesn’t tell us much about
where denitrification is occurring or about the temporal
dynamics of denitrification (McIsaac and Hu 2004).
All of the issues of using mass balance to measure
denitrification in terrestrial systems apply to aquatic
systems and can be illustrated with the estimates of the
global oceanic N budget (Table 1). Since Emery et al.’s
(1955) initial budget we have not only discovered the
importance of N fixation but also revised our estimates
of all of the original sources and sinks by at least a factor
of 2. Estimates of N fixation have varied by more than a
factor of 10 over the last 15 years (see review by Karl et
al. 2002) so measuring denitrification using mass balance
becomes problematic. However, perhaps a more serious
obstacle is that it isn’t known whether or not the oceans
are at steady state. McElroy (1983) has proposed that
the oceans oscillate between storing N during glacial
periods and losing N during interglacial periods. Gruber
and Sarmiento’s budget (1997; Table 1), suggests that
the ocean is more or less in balance while Codispoti et al.
(2001), (Table 1), argue that denitrification greatly
exceeds N inputs due to human disturbances of the
global N cycle. Ocean pools are so large there is little
chance that changes in oceanic N stores due to human
activities over the last 100 years could be measured
(Galloway et al. 1995). Hence, estimates of denitrifica-
tion by difference in mass balances are not likely to
resolve the critical question of whether or not the oceans
are at steady state.
In conclusion, the mass balance approach is quite
limited in providing quantitative rate measurements of
denitrification. We have chosen examples that may
represent ‘‘worst cases.’’ In systems where inputs,
outputs, and storages can be very well constrained, such
as reservoirs, there have been successes in measuring
denitrification by mass balance (e.g., Jossette et al.
1999). For all systems, mass balance can provide some
insight into the potential importance of denitrification.
FIG. 4. Nitrogen mass balance for treating the state of Illinois, USA, as a watershed, showing average fluxes for a ten-yearperiod. Line thickness is proportional to flux rate. Units are Gg N/yr (1 Gg¼ 109 g). The figure is adapted from David et al. (2001)with permission from the The Scientific World.
INVITED FEATURE2100Ecological Applications
Vol. 16, No. 6

These approximations can be improved if multiple years
of data are used and averaged, rather than trying to
estimate balances for each year or on even shorter time
scales. The method is also attractive in that it is one of
the few that can be applied at a range of scales, from
small plots to large watersheds, lakes, estuaries, and
open marine systems. Indeed, it is the large amounts of
‘‘missing N’’ in regional-scale mass balances (Howarth et
al. 1996) that has motivated much of the increased
recent interest in denitrification. However, until we are
able to improve upon our ability to quantify all fluxes
accurately, and to accurately determine changes in N
storage pools, the estimates by mass balance will have to
be verified by direct measurements. Therefore, the future
application of mass balance for providing a benchmark
measurement of denitrification rates in terrestrial and
aquatic ecosystems is still quite poor. Likely they are
most useful for constraining estimates produced by
other methods, e.g., if a new laboratory method suggests
that denitrification is much larger than estimates of
system inputs or changes in storage determined from
mass balance, this would be a sure sign that there is a
problem with the new method.
STOICHIOMETRIC APPROACHES
Stoichiometric methods have been extensively used to
estimate denitrification in aquatic environments. The
basis of the stoichiometric method arose from the
observations of Redfield (1934) that marine phytoplank-
ton had the same elemental ratio as that found dissolved
in deep ocean seawater. This ratio (106 C:16 N:1 P, in
molar units), is now referred to as the Redfield ratio.
Estimates of denitrification using stoichiometery still
rely on a mass balance approach but because of this
consistency in elemental composition, the behavior of N
is referenced to another element whose fluxes and/or
storages can be more accurately determined. The
method has been largely restricted to use in aquatic
systems where the elemental concentration of aquatic
primary producers is believed to be far more constrained
than in the terrestrial environment. In the terrestrial
environment, the presence of woody plants leads to wide
variations in C:N:P ratios, and even non-woody species
show considerable plasticity in elemental ratios (Sterner
and Elser 2002). Recent analyses have confirmed that
the elemental ratio of marine phytoplankton varies
within relatively narrow ranges, however, freshwater
phytoplankton are far less constrained in their elemental
ratios than previously assumed (Sterner and Elser 2002,
Hecky et al. 1993), hence there is more potential for
error when applying stoichiometric techniques in fresh-
waters.
In practice, the stoichiometric method assumes that
when organic matter with a known elemental ratio is
decomposed using oxygen, or some other electron
acceptor, there will be a set of products with a defined
elemental composition (Table 2). Based upon the
calculated consumption of electron acceptors, or the
appearance of phosphate or CO2, the expected dissolved
inorganic N can be calculated. The difference between
the expected and the observed DIN is then used to
calculate denitrification. When applied to large oceanic
water masses it is normally assumed that the water was
originally in equilibrium with the atmosphere at the
temperature and salinity observed in situ and the
difference between the observed and measured oxygen
concentration is the apparent oxygen utilization (AOU)
for decomposition. A correction must also be made for
the quantities of nutrients present in the water mass
(preformed nutrients) at the time it sank from the
TABLE 1. A comparison of global nitrogen budgets since 1955 showing how the calculatedmagnitude of denitrification would have changed over time if estimated by mass balance.
Source
Global N (Tg), by study
Emery etal. (1955)
Gruber andSarmiento (1997)
Codispotiet al. (2001)Preindustrial Modern
Inputs
Land drainage 19 41 76 76Precipitation 59 15 30 86N fixation 125 125 125Total inputs 78 181 231 287
Sinks (excluding denitrification)
Sediment burial 8.6 15 25 25Fisheries, guano 1N2O loss 4 46
Total non-denitrification sinks 8.6 19 29 32
Difference 69.4 162 202 255Denitrification estimate 165 175 450
Notes: Emery et al. (1955) estimated denitrification by difference; the other authors usedindependent estimates of denitrification. All values are in Tg (¼1 3 1012 g). Empty cells indicatevariables that were not measured in the analysis in that column.
December 2006 2101A SYNTHESIS OF DENITRIFICATION

surface. The preformed nutrient content is usually
estimated from hydrographic data, and phos-
phate :AOU relationships.
The stoichiometric approach to calculating denitrifi-
cation was first illustrated using previously published
data from the Black Sea and the Cariaco Trench by
Redfield et al. (1963) and expanded upon by Richards
(1965). Samples were taken from the anoxic bottom
water in these relatively stagnant basins, where relatively
high concentrations of metabolites build up facilitating
the measurements. It is impressive to see that the
authors were able to compare these stoichiometric
estimates to direct N2 measurements with reasonable
success. However, because water turnover times were
not well known they did not calculate an areal rate.
Later, Cline and Richards (1972) calculated a denitrifi-
cation rate in an oxygen minimum zone of the Eastern
Tropical North Pacific Ocean from apparent oxygen
utilization (AOU), NOx, and phosphate relationships
and demonstrated that denitrification in the oxygen
deficient regions of the world was likely of sufficient
magnitude to close the oceanic N budget of Emery et al.
(1955). For these calculations atmospheric exchange and
interactions with the sediments are assumed to be
unimportant, and denitrification and fixation are
assumed to take place in different water masses. Since
then, stoichiometric relationships have been widely
applied to calculate denitrification in stratified water
bodies and in oceanic oxygen minimum zones. Modern
estimates have been improved by better analytical
methods and by the development of tracers such as3H:3He to determine the turnover time of the water
masses. However, in spite of these improvements there is
still considerable uncertainty in the estimates of global
oceanic water column denitrification due to uncertain-
ties in the stoichiometry of the reactions, the stoichiom-
etry of the organic matter being decomposed, and
possible interactions with sediments and the atmosphere
(e.g., see Table 2; Codispoti et al. 2001).
Stoichiometric relationships have also been used to
calculate denitrification occurring within sediments.
Typically cores or benthic chambers are used to enclose
a small quantity of sediment and overlying water and the
exchange of gases and nutrients across the sediment–
water interface is measured. Nixon et al. (1976) was
among the first to note that in these incubations the
ratio of oxygen consumption to N release, was often
much greater than expected based upon the Redfield
ratio and suggested that the missing N may have been
denitrified. Many studies have now confirmed that
benthic fluxes are usually deficient in N and that the
amount of missing N can be considerable. Independent
methods of measuring denitrification have shown that
coupled nitrification/denitrification is a major process in
many sediments (Seitzinger 1988, Devol 1991).
TABLE 2. Stoichiometric reactions used for the calculation of denitrification rates by various authors.
Eq. no. Equation
1 (CH2O)106(NH3)16(H3PO4)1 þ 138O2 ! 106CO2 þ 16NO3� þ H2PO4
� þ 122H2O þ 17Hþ
2 (CH2O)106(NH3)16(H3PO4)1 þ 84.8NO3� þ 99.8Hþ ! 106CO2 þ 42.2N2 þ 16NH4
þ þ H2PO4� þ 148.4H2O
3 (CH2O)106(NH3)16(H3PO4)1 þ 94.4NO3� þ 93.4Hþ ! 106CO2 þ 55.2N2 þ H2PO4
� þ 177.2H2O
4 (CH2O)106(NH3)16(H3PO4)1 þ 53SO4�2 þ 121Hþ ! 106CO2 þ 53H2S þ 16NH4
þ þ H2PO4� þ 106 H2O
5 C61H97O42N16 þ 60.2NO3� þ 60.2Hþ ! 61CO2 þ 38.1N2 þ 78.6H2O
6 (CH2O)106(NH3)16(H3PO4)1 þ 106O2 þ 15Hþ ! 106CO2 þ 16NH4þ þ H2PO4
� þ 106H2O
Notes: Eqs. 1–4 are essentially those of Richards (1965), and Eq. 5 is presented in Codispoti et al. (2001). Eq. 6 is used by Nixonet al. (1976). All equations except Eq. 5 assume organic matter of a Redfield stoichiometry. The equations have been slightlyrewritten to more clearly represent the changes in alkalinity and the form of the products at seawater pH. The ratios of some of theproducts and reactants are reported below. DIC represents all forms of inorganic carbon (CO2, H2CO3, CO3) and is represented bythe product CO2 in the equations. Following convention, the ratio of DIC:O2 (often referred to as the RQ) is calculated on amole :mole basis, while the ratio of oxygen consumed to DIN or P produced is calculated on an atom : atom basis. DIN refers toeither NH4 or NO3 released by the reaction. The notations (NO3) and (SO4) are used to denote nitrate and sulfate when they areconsumed as electron acceptors. Ratios involving N2 produced by the reaction are also expressed on an atom : atom basis. NCindicates that the ratio cannot be calculated because the denominator is 0. Notes on the individual equations are as follows:
Eq. 1.—The reaction for aerobic respiration where the mineralized N is nitrified. Note that it is assumed in this reaction thatthere is no CO2 uptake by nitrifying bacteria. Fenchel and Blackburn (1979) suggest that (CO2 fixed)/(NH4 oxidized)¼ 0.2. Ratios:DIC:O2 ¼ 0.768, DIC:DIN¼ 6.625, O:DIN ¼ 17.25, DIC:P¼ 106, O:P ¼ 276, DIN:P¼ 16.
Eq. 2.—The reaction for decomposition using nitrate reduction where the N in the organic matter is mineralized to NH4. Ratios:DIC:(NO3)¼ 1.25, DIC:DIN¼ 6.625, DIC:(N2-N)¼ 1.25, DIC:P ¼ 106, (N2-N):P¼ 84.8, DIN:P¼ 16.
Eq. 3.—The reaction for decomposition using nitrate reduction where the N mineralized from the organic matter is converted toN2 though the reaction 5NH3þ 3HNO3! 4N2þ 9H2O. Ratios: DIC:(NO3)¼ 1.12, DIC:DIN¼NC, DIC:(N2-N)¼ 1.12, DIC:P¼106, (N2-N):P¼ 110.4, DIN:P¼ 0.
Eq. 4.—The reaction for decomposition using sulfate reduction. Ratios: DIC:(SO4)¼ 2, DIC:DIN¼ 6.625, (SO4):DIN¼ 3.31,DIC:P ¼ 106, (SO4):P ¼ 53, DIN:P ¼ 16.
Eq. 5.—The reaction for the decomposition of ideal proteins using nitrate reduction and assuming all of the mineralized N isconverted to N2 though the reaction shown in the footnote for Eq. 3. Ratios: DIC:(NO3)¼ 1.01, DIC:DIN¼NC , DIC:(N2-N)¼1.01, DIC:P ¼NC, (N2-N):P¼NC, DIN:P¼NC.
Eq. 6.—The reaction for decomposition using oxygen where the mineralized DIN is not nitrified. Ratios: DIC:O2¼ 1, DIC:DIN¼ 6.625, O:DIN ¼ 13.25, DIC:P¼ 106, O:P ¼ 212, DIN:P ¼ 16.
INVITED FEATURE2102Ecological Applications
Vol. 16, No. 6
When used to measure denitrification in sediment
cores or chambers, rather than open water columns, thestoichiometric method has the advantage that atmos-
pheric exchange is eliminated and water turn over iseither zero or easily measured. However, the technique
still relies on the same assumptions as those describedfor oceanic water masses, which may be less likely to be
met in sediment systems. First, seasonal or permanentstorage of some compounds is more likely to occur in
sediments than in the open water, altering the expectedratios. Because of difficulties measuring small changes in
DIC, oxygen historically was used as a measure ofdenitrification. Oxygen uptake includes anaerobic me-
tabolism if the reduced end products are reoxidized. Ifreduced species from anaerobic respiration are perma-
nently stored or lost in a reduced form, oxygen uptakewill underestimate the decomposition rate. In marinesystems dominated by sulfate reduction, the permanent
storage of reduced sulfur is usually rather small, lessthan 10% (Jorgensen 1982), but there can be substantial
discrepancies in sediments with high sedimentation rates(Chanton et al. 1987, Zimmerman and Benner 1994).
Seasonal storage and reoxidation can be extremelyimportant even in sediments where there is little
permanent burial (Cornwell and Sampou 1995, Giblinet al. 1997), so calculated denitrification rates will be in
error unless integrated over an annual time frame.Difficulties with using oxygen as a measure of decom-
position have lead investigators to rely on DIC fluxes astechniques have improved but DIC fluxes are subject to
potential artifacts from carbonate precipitation ordissolution. In some cases, this can be checked by using
high precision measurements of sediment calcium fluxes.Nixon et al. (1976) also noted aberrant N:P flux ratios
from sediments and this has been widely confirmed.However, phosphorus fluxes are rarely used to calculatedenitrification in core incubations. Although P fluxes do
appear to follow Redfield stoichiometery in somesystems (Nixon et al. 1976, S. V. Smith et al. 1991); in
other systems DIC:P and O:P ratios indicate permanentP burial (Hopkinson et al. 1999). Large seasonal changes
in P storage and release due to redox processes have beenwell documented in lakes (Mortimer 1941) and can also
occur in fully marine systems that do not experiencewater column anoxia (Giblin et al. 1997, Hopkinson et al.
2001). Finally, while DIN usually does not exhibit muchchange in storage over the season in marine or freshwater
systems, in sediments undergoing seasonal changes insalinity there may be a fairly large temporary storage and
release of adsorbed NH4þ from particles leading to
aberrant O:N or DIC:N ratios (Hopkinson et al. 1999).
A second problem in using stoichiometric methods insediments is uncertainty about the C:N ratio of the
substrate being metabolized. In lakes and estuaries, theremay be substantial inputs of allochthonous terrestrialmaterial of a high C:N ratio and, in deep systems, the
sinking particles may have undergone substantialdecomposition in the water column. In the deep ocean,
sinking particles have a higher C:N ratio than do live
phytoplankton (Martin et al. 1987). If the material being
decomposed has a C:N ratio substantially above the
Redfield ratio, stoichiometric techniques will overesti-
mate the denitrification rate. One approach to this
problem is to use the C:N value found in the sediments
themselves to determine the ratio of the decomposing
organic matter (Hopkinson et al. 1999). Using the C:N
ratio of the sediment may yield a minimum denitrifica-
tion rate as the few studies which have measured the
mineralization rate directly have usually found that the
C:N ratio of material mineralized from surface sediments
is substantially lower than that from bulk sediment
(Burdige 1991, Zimmerman and Benner 1994).
Both water column suboxic zones and sediments are
somewhat physically constrained systems. There has
also been an effort to use a combination of mass balance
and stoichiometric calculations to assess denitrification
in open bays and estuaries. S. V. Smith et al. (1991) used
water and salt budgets to estimate water exchange and
mixing between Tomales Bay, California, and the open
ocean and then calculated the net exchange of C, N, and
P. High atmospheric exchange precluded direct meas-
urement of water fluxes of O2 and CO2 and therefore
total net metabolism could not be measured directly.
Instead, they used the net P export as a measure of net
ecosystem production (primary production minus respi-
ration) and concluded that the bay was heterotrophic.
The mismatch from Redfield stoichiometry in N:P fluxes
was then used to calculate net denitrification (N fixation
minus denitrification). This approach has been expanded
to form the Land Ocean Interactions in the Coastal
Zone (LOICZ) guidelines for constructing such budgets
(Gordon et al. 1996) and more than 100 budgets have
been published (LOICZ budgets; available online).11 The
simple box modeling approach used in this project has
potentially large errors associated with it (Webster et al.
2000). But in systems where the hydrodynamics are well
constrained and there is good spatial and temporal
coverage of nutrient data, whole-system stoichiometry
may be a useful way to constrain estimates of the
importance of the net difference between denitrification
and N fixation over large areas.
In conclusion, although stoichiometry is essentially a
mass balance technique, referencing N to other elements
provides additional constraints for estimating denitrifi-
cation that make it useful in some aquatic situations. It
is important to recognize that in many cases, however,
the measurement may be yielding the net difference
between fixation and denitrification, not simply deni-
trification. Large errors can be introduced if the
stoichiometry of the decomposing organic matter differs
from what is assumed or if the sediment is acting as an
unmeasured sink or source of key elements. Whenever
possible these should be measured. For small scales,
11 hhttp://data.ecology.su.se/MNODE/i
December 2006 2103A SYNTHESIS OF DENITRIFICATION

such as sediment cores, some of the newer isotopic tracer
and direct gas techniques should provide superior results
to stoichiometry. For larger scale oceanic observations,
stoichiometry may provide the best way to scale up
estimates of denitrification, especially if the assumptions
can be locally verified with direct measurements of
dissolved gases, or by using stable isotopic measure-
ments to further constrain the systems.
METHODS BASED ON STABLE ISOTOPE ABUNDANCES
Stable isotopes that are used in various ways in
denitrification studies include those of H and O in water;
N andO in ammonium, nitrate, nitrite, nitrous oxide, and
dissolved nitrogen gas; S andO in sulfate and sulfide; C in
oxidized and reduced dissolved carbon; O in dissolved
oxygen gas; and C, N, and S in organic and inorganic
solids. These data provide evidence for the occurrence of
denitrification along with information about sources of
water and the various reactants (e.g., electron donors) and
products of denitrification. The same isotopes also can be
used as tracers of movement and reaction of nitrate when
injected deliberately into laboratory or field systems, but
this section is focused on collection and analysis of
environmental samples to assess in situ conditions.
The stable isotope ratios typically are expressed in
‘‘delta’’ (d) notation, for example,
d15N ¼ 15N=14N
� �sam= 15N=14
N� �
air� 1
h i3 1000ø
ð1Þ
FIG. 5. Hypothetical stable isotope effects of denitrification in closed aquatic systems (modified from Bohlke 2002). Isotopiccompositions and fractionation factors in these diagrams are realistic but not necessarily representative. (a, b) Isotope fractionationof N and O in nitrate and N2den with reaction progress (see Eqs. 3–6). Qualitatively similar effects could be caused by assimilationof nitrate during primary production. (c, d, e, f ) Changes in the concentration and isotopic composition of nitrate and N2, wherethe N2 is a mixture of the denitrification component and typical atmospheric component (108C, no excess air, at sea level). (g, h)Changes in the concentration and isotopic composition of DIC and sulfate in mixtures of pre-denitrification components anddenitrification components, according to the following stoichiometric mass transfers:
4NO3� þ 5C8þ 2H2O ! 2N2þ CO2þ 4HCO3
� [d13C(C8) ¼�25ø]6NO3
� þ 2FeS2 þ 2H2O ! 3N2þ 4SO4�2 þ 2FeOOHþ 2Hþ [d34S(FeS2) ¼�20ø].
Panels (c)–(h) include hypothetical reaction paths for two waters, one with initial nitrate concentration equal to the maximumcontaminant level of 10 mg/L as N (714 lmol/L) and one with twice that amount (1428 lmol/L). d15N[NO3
�]8 and e[N]den areassumed to be þ10ø and �20ø, respectively.
INVITED FEATURE2104Ecological Applications
Vol. 16, No. 6

d18O ¼ 18O=16O
� �sam= 18O=16
O� �
VSMOW� 1
h i3 1000%
ð2Þ
where the isotope ratios reflect molar abundances and
‘‘air’’ (atmospheric N2) and ‘‘VSMOW’’ (Vienna stand-
ard mean ocean water) are reference materials for which
d equals 0ø by consensus (the subscript ‘‘sam’’ stands
for sample). The effects of isotopic fractionation on
reactants (r) and products (p) during processes such as
denitrification commonly are described by a version of
the Rayleigh distillation equation (Rayleigh 1896, Clark
and Fritz 1997):
15N=14N
� �r¼ 15N=14
N� �
r;ini3 14Nr=
14Nr;ini
� �ða�1Þð3Þ
(the subscript ‘‘ini’’ stands for initial). In Eq. 3, the
fractionation factor (a) is given by the instantaneous
relation between reactant and product isotope ratios,
a ¼ 15N=14N
� �p= 15N=14
N� �
rð4Þ
which can also be used to describe simple kinetic
fractionation effects:
a ¼ kr15N� �
=kr14N� �
ð5Þ
and
e ¼ a� 1ð Þ3 1000% ð6Þ
where kr refers to the relative first-order reaction rate
constant for reactant molecules containing either 15N or14N. In some publications, a negative sign has been
added to the right side of Eq. 6 to make e values
positive.
Denitrification causes changes in the concentrations
and isotopic compositions of many different aqueous
species and solids in aquatic systems, for example (Fig.
5): (1) the d15N and d18O values of NO3� typically
increase together because of kinetic isotope fractiona-
tions during NO3� reduction (Amberger and Schmidt
1987, Bottcher et al. 1990), (2) the d15N value of N2 may
decrease or increase as a result of adding denitrification
product N2 (N2den) to other components of N2 in the
system (Vogel et al. 1981), (3) the d34S value of sulfate or
the d13C value of DIC may change as oxidation products
of reduced S or C compounds are added to the existing
reservoirs during denitrification (Strebel et al. 1990,
R. L. Smith et al. 1991), and (4) the d13C, d15N, and d34S
FIG. 5. Continued.
December 2006 2105A SYNTHESIS OF DENITRIFICATION

values of organisms (and derivative sediments and soils)
may change as a result of changes in the isotopiccompositions of their C, N, and S sources during
denitrification (e.g., Altabet et al. [1999] for N isotopechanges).
Kinetic isotopic fractionation of NO3� during bacte-
rial denitrification has been documented in laboratory
cultures and field settings since the 1960s (Richards andBenson 1961, Wellman et al. 1968, Delwiche and Steyn
1970, Miyake and Wada 1971, Cline and Kaplan 1975,Mariotti et al. 1981, 1988, Brandes et al. 1998, Altabet et
al. 1999, Barford et al. 1999, Voss et al. 2001). ApparentN isotope fractionation factors (e) ranging from 0ø to
about �30ø (possibly �40ø) have been reported,indicating that kr[
15N] � kr[14N] and that the d15N
value of the residual unreacted NO3� increases by
varying amounts as denitrification products with low
d15N values are formed. The relatively large negativevalues of e have been obtained from water-columnstudies and from suspended cultures in the laboratory,
whereas the smaller values commonly are derived fromstudies of ground waters and of surface waters that
interact with ground waters as well as in marinesediments.
One explanation for the variability of apparentisotope effects is that the maximum kinetic fractionation
caused by enzyme-catalyzed reaction at the microscale isexpressed fully when the reaction itself limits the rate of
NO3� reduction in the measurable reservoir, whereas the
effect is suppressed when the rate of NO3� reduction is
limited by transport to the reaction site and when thereaction goes largely to completion locally without
exchanging freely with the external reservoir. Forexample, Mariotti et al. (1988) concluded that relatively
small apparent e values of around �5ø in partiallydenitrified ground water could be a result of relatively
complete reaction in dead-end pores that had limiteddiffusional exchange with more mobile NO3
� bearing
water. Similarly, apparent e values as small as �3ø to0ø have been reported in marine surface water over-lying the sediment–water interface where denitrification
was limited by diffusion into the sediment (Brandes andDevol 2002, Sigman et al. 2003). Therefore, although
isotopic fractionation can be a useful indicator ofdenitrification, the magnitude of the isotope effect may
not reflect the progress of the reaction or the amount ofNO3
� reduced in physically heterogeneous systems.
Regardless of the magnitude of the apparent fraction-ation factors, the effects of denitrification also can be
deduced from correlations between d15N and d18O andthe relative e values for N and O in NO3
�. Several of the
early studies indicated that the ratio eN:eO duringdenitrification in ground water is around 2.1 (Bottcher et
al. 1990, Aravena and Robertson 1998). Subsequentstudies in a variety of aquatic settings with a wide range
of reaction rates have indicated a range of eN:eO ratiosduring denitrification that could extend from about 1.3
to 2.1 (Cey et al. 1999, Mengis et al. 1999, Fukada et al.
2003, Lehman et al. 2003; McMahon et al. 2004a), and it
has been suggested that values close to 1.0 may berealized during NO3
� reduction by phytoplankton in
some marine systems (Granger et al. 2004). It is not clearat present how much of the reported variability in this
ratio is due to analytical errors, misinterpretation of fielddata, or real variations in the fractionation effects. It is
important to recognize that some variation in theisotopic composition of NO3
� in a given field situation
may be related to variations in the NO3� source, rather
than to subsequent fractionation effects (Bohlke et al.
2002). Nevertheless, positively correlated variations in Nand O isotopes of NO3
� can provide valuable evidence
for denitrification in many situations.Quantitative field studies of denitrification in ground
water, and to a lesser extent in surface water, includeanalyses of the N2 product. If the concentration and
d15N value of the reaction product N2 can be resolvedfrom the atmospheric components of N2, then thereaction progress and initial NO3
� concentration and
isotopic composition can be reconstructed from partiallyor completely reacted samples (Vogel et al. 1981, Wilson
et al. 1990, Bohlke and Denver 1995, Bohlke et al. 2002,Griggs et al. 2003, McMahon et al. 2004a; Fig. 5c, d, f).
This information is especially important where the NO3�
inputs have changed over time, in which case both the
concentration and isotopic composition of NO3� could
change along a flow path independently of denitrifica-
tion (Bohlke et al. 2002). A major limitation of thisapproach in ground water is that the initial concen-
trations of atmospheric gases including N2 may vary bymore than the analytical uncertainties as a result of
varying equilibration temperatures and incorporation ofexcess air during recharge (Sugisaki 1959, Heaton and
Vogel 1981, Aeschbach-Hertig et al. 2000, Stute andSchlosser 2000). This means that improvements inanalytical precision will not necessarily yield improve-
ments in the estimation of N2den. Complete resolution ofthe atmospheric N2 component generally will require
analyses of one or more nonreactive atmospheric gaseslike Ar, Ne, Kr, and Xe. Argon data have been used
extensively for this purpose in denitrification studies, butuncertainties of the order of 20–40 lmol/L or more for
N2den commonly result from necessary assumptionsabout recharge conditions. Addition of Ne data can
reduce uncertainties substantially (e.g., 10–20 lmol/LN2den; Verstraeten et al. 2001a, McMahon et al. 2004a),
and it is likely that further work with other noble gaseswill be helpful.
Isotopic analyses of S and C can provide indirectevidence for denitrification as well as information about
the major electron donors for the coupled redox reaction(Strebel et al. 1990, R. L. Smith et al. 1991, Bohlke and
Denver 1995, Aravena and Robertson 1998, Bohlke etal. 2002; Fig. 5g, h). Indirect evidence for variation inthe importance of denitrification in terrestrial and
freshwater systems also can be derived from variationsin the d15N values of plants, peat, soils, and aquatic
INVITED FEATURE2106Ecological Applications
Vol. 16, No. 6

sediments. For example, if denitrification causes an
increase in the d15N value of NO3� that is subsequently
assimilated by organisms, then the organic matter
produced with that N also may exhibit an increase in
d15N. Thus, variations in the intensity of denitrification
may result in N isotopic variations in organic matter
preserved in aquatic sediments.
In the open ocean, the isotopic discrimination
associated with denitrification produces large isotopic
signals. Here, the 15N enrichment in residual NO3�
clearly propagates throughout the marine N cycle via
NO3� uptake by phytoplankton. In particular, high d15N
values are transferred to sinking organic matter derived
from phytoplankton production that is ultimately
incorporated in the underlying sediments. As shown
below, the sedimentary record thus provides a history of
past variation in overlying water column denitrification.
In addition, because denitrification is the primary sink
for combined N from the oceans, another important
consequence is that denitrification raises oceanic average
d15N above the average of the combined N sources.
The clearest examples of denitrification-produced
isotope enrichment in the deep, open ocean are found
in the main regions of water column denitrification; the
Arabian Sea and the Eastern Tropical Pacific (ETP) to
the north off Mexico (ETNP) and to the south off Peru
(ETSP), respectively. Each of these regions is charac-
terized as having a suboxic oxygen minimum zone
(OMZ) between 100 m and almost to 800 m depth, a
vertical region also known as the O2 minimum zone
(OMZ). While the oceanic average for d15NO3� is near
5ø relative to atmospheric N2, depths with greatest
intensity of denitrification reach .20ø. In each of the
water column denitrification regions, 15N enrichment in
NO3� is clearly associated with the core of the OMZ,
and the greatest removal of NO3�. It is only with the
recent advent of methodology suitable for seawater
samples (Casciotti et al. 2002) that the coupled enrich-
ment in 18O and 15N in the residual NO3� can be
studied and such data are appearing rapidly in the
literature.
To study the quantitative relationship between
denitrification and isotopic enrichment, the removal of
NO3� may be estimated by examining the anomaly in
observed NO3� (and NO2
�) concentration relative to the
value expected from Redfield stoichiometry with PO4�3:
N 0 ¼ NO �3 þ NO �
2 � 16 3 PO �34 : ð7Þ
N0 can be used to estimate the residual fraction NO3�
remaining after denitrification:
f ¼ ðNO �3 þ NO �
2 Þ=ðNO �3 þ NO �
2 � N 0Þ ð8Þ
permitting fits to an approximation of the Rayleigh
equation (Eq. 3),
d15NO �3 ’ d15NO �
3 ini þ e 3 lnð f Þ ð9Þ
in a closed system, or
d15NO �3 ’ d15NO �
3 ini � e 3ð1� f Þ ð10Þ
in a steady-state open system. Note the above equations
adopt the convention of negative e values for kinetic
effects in which products are enriched in the light isotope
(Eq. 6).
Using the Arabian Sea as an example, d15NO3�
maxima within the OMZ vary between stations suggest-
ing variable isotopic fractionation (Fig. 6). Nevertheless,
when all station data are plotted together, strong linear
correlations are found between d15NO3� and its frac-
tional removal as estimated by Eq. 8 (Fig. 6). Neither the
goodness of fit nor the value for eden estimated from the
slope appears sensitive to whether the system is assumed
to be open or closed. eden is between �30 and �20ø,
consistent with both laboratory and field observations.
Similar results have been reported for the ETNP off
Mexico (Voss et al. 2001).
The most successful marine applications to date for
natural N isotope abundance in denitrification studies
have been in historical reconstruction, particularly in
relation to climate change. Sediment core bulk d15N has
been used to both identify and understand past changes
in water-column denitrification on time scales from
hundreds to millions of years. Water-column denitrifi-
cation is regionally isolatable, produces large isotopic
signals, and is strongly coupled to past climate change.
Suboxic intermediate waters overlying continental mar-
gin sediments with high organic matter content input
ensure both fidelity of the preserved d15N signal and the
availability of sediment cores with high accumulation
rates for good to excellent temporal resolution. In these
sediments, N content is high enough that only tens of
milligrams of material are necessary for isotopic
analysis.
Detailed denitrification records based on sediment
d15N have been published for the Arabian Sea (Altabet
et al. 1995, 1999, 2002) and the ETNP (Ganeshram et al.
1995, 2000, Kienast et al. 2002). In the latter case, sites
along the western American margin are included since
upwelled waters are derived from the California Under-
current, which in turn carries denitrification-influenced
water northward from the ETNP. Current studies now
also include the ETSP off Peru (Higginson and Altabet
2004), the third of the ocean’s major water column
denitrification zones.
Variation in Arabian Sea denitrification occurs on a
variety of climatologically relevant time scales. The
longest record from the Owen Ridge off Oman reaches
back nearly 1 Myr from the present (Altabet et al. 1999).
Variation is primarily at the Milankovitch periods of
Earth’s orbital variation (23, 41, and 100 kyr), which are
also found in the glacial cycles of Pleistocene climate. In
general, lower d15N and denitrification is found during
cold periods of glacial maxima. A detailed study of the
last 60 kyr at centennial resolution (Fig. 7) reveals strong
millennial variability during MIS 3 (30 to 60 kyr before
present, BP), with transitions from low d15N to d15N
December 2006 2107A SYNTHESIS OF DENITRIFICATION

maximum occurring relatively abruptly, on the order of
a few hundred years or less (Altabet et al. 2002).We can make use of nature’s ‘‘past experiments’’ to
probe the causes of changing denitrification intensity by
analysis of synoptic proxies of relevant processes. Aleading hypothesis linking N. Hemisphere climate to
Arabian Sea denitrification is that climate changemodulates the strength of the summer South Asian
monsoon and upwelling favorable winds off Oman.Corresponding oscillation in productivity influencessubsurface suboxia and thus denitrification intensity in
the Arabian Sea. Studies in the ETNP off Mexico haveshown similar linkages between past-climate change and
denitrification with glacial periods marked by loweredlevels (Fig. 7). Recent work, though, indicates significant
phase lags between the productivity and denitrification(Kienast et al. 2002). It has been argued that changes inthe proportion and ventilation of intermediate waters in
the ETNP exert the major proximal control on ETNPOMZ oxygenation (Hendy and Kennett 2003). The
ETSP off Peru is the third and last of the major water
column denitrification regions to be subjected to
paleoceanographic reconstruction. A priori, we mayexpect differences in climate response as compared tothe Arabian Sea and ETNP because this region is only
one of the three located in the Southern Hemisphere. Aselsewhere, margin sediments overlaid by low O2 present
the best targets due to excellent OM preservation andhigh accumulation. Not surprisingly, large variations in
d15N, and hence denitrification, are observed over thelast 50 kyr. As in the Arabian Sea and ETNP, upondeglaciation there is a dramatic ramp up in denitrifica-
tion. However, the history of Peru denitrificationdeparts from its northern hemisphere counterparts in
several striking respects. First, the deglacial peak indenitrification occurs very early at between 15 and 16 ka,when most of the planet is still very much experiencing
glacial conditions. We suspect this is the result of S.Hemisphere forcing of intermediate water ventilation.
Second, MIS 3 (30–60 ka) shows overall low denitrifi-cation similar to last glacial maximum (LGM) levels
except for modest maxima that may be related to
FIG. 6. (a) Depth profiles for d15NO3� from several stations in the Arabian Sea denitrification zone. The maxima between 200
and 400 m are in the core of this OMZ and co-occur with the most negative N0 values. The vertical dashed line represents averageoceanic d15NO3 for reference. (b, c) Cross plots of the d15NO3
� data with either the estimated fraction of NO3� remaining after
denitrification ( f ) or ln( f ) as prescribed by the open- and closed-system Rayleigh equations (Eqs. 9 and 10), respectively. Theregression slopes estimate the fractionation factor (e).
INVITED FEATURE2108Ecological Applications
Vol. 16, No. 6

Antarctic Climate Events (ACEs) as observed in
Antarctic ice cores. Third, there is substantial late
Holocene (0–5 ka) variability in denitrification with
excursions in d15N almost as large as upon deglaciation
occurring over centuries or less. Of the three oceanic
denitrification regions, Peru is most impacted by ENSO
(El Nino/La Nina southern oscillation) variability, and
while individual ENSO events cannot be observed at our
temporal resolution, changes in the overall frequency
and amplitude would be.
In sum, d15N variations in the open ocean are very
sensitive to water column denitrification intensity. These
d15N variations are preserved in underlying sediments,
permitting past reconstruction at timescales limited only
by the fidelity and resolution of sedimentary records.
Results to date show large variations in each of the
major oceanic denitrification regions that appear sensi-
tive to regional and global climate change. Though there
are significant differences in denitrification history
between the ETP off Mexico and Peru, and the Arabian
Sea (Oman Margin; Fig. 7), they all show deglacial
increases in d15N and denitrification between 20 and 10
kyr before present. The combined global increase in
denitrification would have resulted in a significant
decrease in combined N inventory for the ocean that
in turn may have contributed to the increase in
atmospheric CO2 through reduction in marine produc-
tivity.
DENITRIFICATION RATES FROM IN SITU GRADIENTS
USING ENVIRONMENTAL TRACERS
Although in situ chemical and isotopic data com-
monly indicate that denitrification has occurred, and in
some cases they may indicate how much denitrification
has occurred, they do not indicate directly the rate of
denitrification, which requires additional information
about time. Because apparent denitrification rates range
over at least eight to 10 orders of magnitude, approaches
for measuring them require some flexibility. This section
summarizes some of the approaches for determining
denitrification rates using analyses of atmospheric
environmental tracers as indicators of elapsed time.
Environmental tracers used for dating purposes in
denitrification studies include anthropogenic atmospher-
FIG. 7. Comparison of d15N records from the three major water column denitrification zones covering the last 60 kyr. Notethe relatively low d15N values for the ETSP (Eastern Tropical South Pacific off Peru; Peru Margin) record during MIS 3 (MarineIsotope Stage; 30–60 kyr BP) and the early and sharp rise during the early part of the last deglacial period (14—18 ka BP). The icecore record for atmospheric CO2 is shown for reference (Indermuhle et al. 2000). The ETP (Eastern Tropical Pacific off Mexico;Mexican Margin) data are from Ganeshram et al. (2000).
December 2006 2109A SYNTHESIS OF DENITRIFICATION
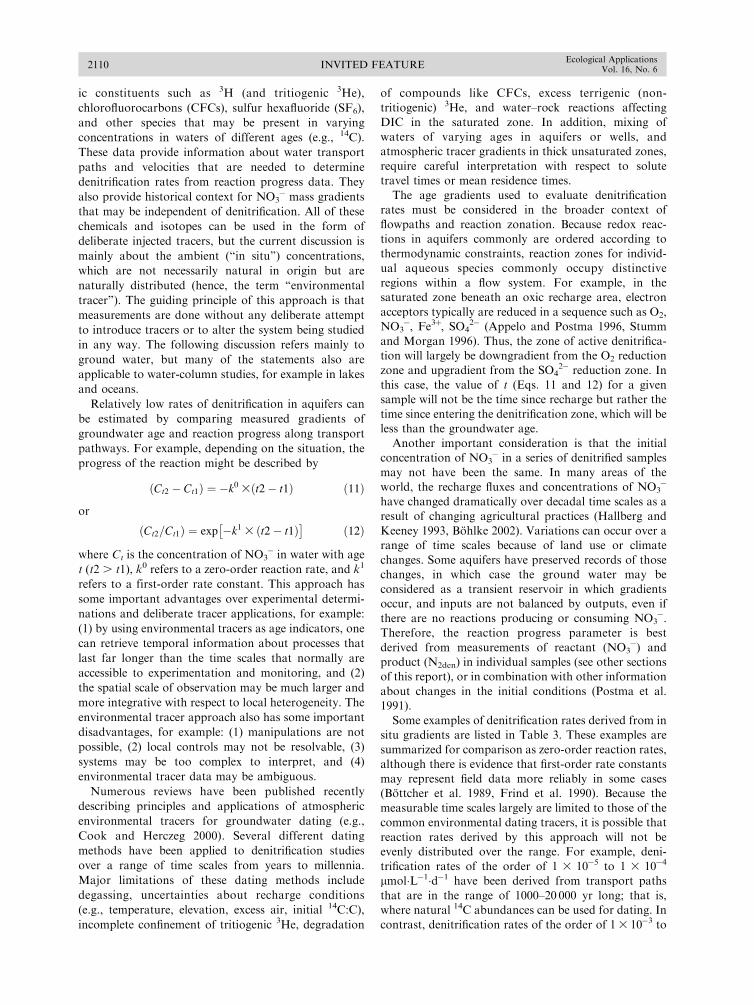
ic constituents such as 3H (and tritiogenic 3He),
chlorofluorocarbons (CFCs), sulfur hexafluoride (SF6),
and other species that may be present in varying
concentrations in waters of different ages (e.g., 14C).
These data provide information about water transport
paths and velocities that are needed to determine
denitrification rates from reaction progress data. They
also provide historical context for NO3� mass gradients
that may be independent of denitrification. All of these
chemicals and isotopes can be used in the form of
deliberate injected tracers, but the current discussion is
mainly about the ambient (‘‘in situ’’) concentrations,
which are not necessarily natural in origin but are
naturally distributed (hence, the term ‘‘environmental
tracer’’). The guiding principle of this approach is that
measurements are done without any deliberate attempt
to introduce tracers or to alter the system being studied
in any way. The following discussion refers mainly to
ground water, but many of the statements also are
applicable to water-column studies, for example in lakes
and oceans.
Relatively low rates of denitrification in aquifers can
be estimated by comparing measured gradients of
groundwater age and reaction progress along transport
pathways. For example, depending on the situation, the
progress of the reaction might be described by
ðCt2 � Ct1Þ ¼ �k0 3ðt2� t1Þ ð11Þ
or
ðCt2=Ct1Þ ¼ exp �k1 3 t2� t1ð Þ� �
ð12Þ
where Ct is the concentration of NO3� in water with age
t (t2 . t1), k0 refers to a zero-order reaction rate, and k1
refers to a first-order rate constant. This approach has
some important advantages over experimental determi-
nations and deliberate tracer applications, for example:
(1) by using environmental tracers as age indicators, one
can retrieve temporal information about processes that
last far longer than the time scales that normally are
accessible to experimentation and monitoring, and (2)
the spatial scale of observation may be much larger and
more integrative with respect to local heterogeneity. The
environmental tracer approach also has some important
disadvantages, for example: (1) manipulations are not
possible, (2) local controls may not be resolvable, (3)
systems may be too complex to interpret, and (4)
environmental tracer data may be ambiguous.
Numerous reviews have been published recently
describing principles and applications of atmospheric
environmental tracers for groundwater dating (e.g.,
Cook and Herczeg 2000). Several different dating
methods have been applied to denitrification studies
over a range of time scales from years to millennia.
Major limitations of these dating methods include
degassing, uncertainties about recharge conditions
(e.g., temperature, elevation, excess air, initial 14C:C),
incomplete confinement of tritiogenic 3He, degradation
of compounds like CFCs, excess terrigenic (non-
tritiogenic) 3He, and water–rock reactions affectingDIC in the saturated zone. In addition, mixing of
waters of varying ages in aquifers or wells, andatmospheric tracer gradients in thick unsaturated zones,
require careful interpretation with respect to solutetravel times or mean residence times.
The age gradients used to evaluate denitrificationrates must be considered in the broader context of
flowpaths and reaction zonation. Because redox reac-tions in aquifers commonly are ordered according to
thermodynamic constraints, reaction zones for individ-ual aqueous species commonly occupy distinctive
regions within a flow system. For example, in thesaturated zone beneath an oxic recharge area, electron
acceptors typically are reduced in a sequence such as O2,NO3
�, Fe3þ, SO42� (Appelo and Postma 1996, Stumm
and Morgan 1996). Thus, the zone of active denitrifica-tion will largely be downgradient from the O2 reductionzone and upgradient from the SO4
2� reduction zone. In
this case, the value of t (Eqs. 11 and 12) for a givensample will not be the time since recharge but rather the
time since entering the denitrification zone, which will beless than the groundwater age.
Another important consideration is that the initialconcentration of NO3
� in a series of denitrified samples
may not have been the same. In many areas of theworld, the recharge fluxes and concentrations of NO3
�
have changed dramatically over decadal time scales as aresult of changing agricultural practices (Hallberg and
Keeney 1993, Bohlke 2002). Variations can occur over arange of time scales because of land use or climate
changes. Some aquifers have preserved records of thosechanges, in which case the ground water may be
considered as a transient reservoir in which gradientsoccur, and inputs are not balanced by outputs, even if
there are no reactions producing or consuming NO3�.
Therefore, the reaction progress parameter is best
derived from measurements of reactant (NO3�) and
product (N2den) in individual samples (see other sectionsof this report), or in combination with other information
about changes in the initial conditions (Postma et al.1991).
Some examples of denitrification rates derived from insitu gradients are listed in Table 3. These examples are
summarized for comparison as zero-order reaction rates,although there is evidence that first-order rate constants
may represent field data more reliably in some cases(Bottcher et al. 1989, Frind et al. 1990). Because the
measurable time scales largely are limited to those of thecommon environmental dating tracers, it is possible that
reaction rates derived by this approach will not beevenly distributed over the range. For example, deni-
trification rates of the order of 1 3 10�5 to 1 3 10�4
lmol�L�1�d�1 have been derived from transport paths
that are in the range of 1000–20 000 yr long; that is,where natural 14C abundances can be used for dating. In
contrast, denitrification rates of the order of 1 3 10�3 to
INVITED FEATURE2110Ecological Applications
Vol. 16, No. 6

13 10�1 lmol�L�1�d�1 have been derived from transport
paths that are in the range of 0–60 yr long; that is, where
the modern anthropogenic atmospheric environmental
tracers can be applied. Given typical uncertainties in the
concentration of N2den, clustering of rates and scarcity
of some ranges of values are likely to result from a lack
of dating methods for certain time scales (e.g., 60–1000
yr) and not to any real feature of natural systems.
Similarly, the distribution of in situ environmental
denitrification rates at the high end may not merge
smoothly with the distribution of rates derived from
laboratory experiments and deliberate tracers. Entries in
Table 3 include some groundwater studies that fill these
gaps by combining numerical simulations with hydraulic
or environmental tracer data. Cline and Kaplan (1975)
report denitrification rates in ocean water that were
estimated by combining reaction progress data with
transport velocities based on advection–dispersion
modeling with 226Ra (t1/2 ¼ 1600 yr) as the internal
chronometer. Expansion of efforts to analyze a wide
variety of environmental tracers and to calibrate
numerical models with environmental tracer data should
increase the range of applicability of the in situ gradient
approach for estimating low reaction rates.
In aquatic systems with low rates of reaction, NO3�
can be transported for years to millennia or longer
before denitrification becomes a substantial NO3� sink,
and then lose NO3� gradually over comparable time
scales. In contrast, there are many situations in which
water and solutes move from an oxidized environment
to a reduced environment abruptly, and where O2
reduction, denitrification, and perhaps other redox
reactions occur over short travel times and may not be
amenable to the approaches described above (Postma et
al. 1991, Robertson et al. 1996). In these situations, it is
likely that the rate of denitrification is largely controlled
by the rate of transport of NO3� to the reactive sites at
the redox boundary. In aquifers, concentrations of solid
electron donor phases may be large compared to the
concentrations of electron acceptors in the water, in
which case the rate of migration of the denitrification
boundary itself may be several orders of magnitude
slower than the rate of movement of water delivering
NO3� to the boundary. Where a sharp boundary is
present, the rate of denitrification may be expressed as
the flux of NO3� in ground water crossing the boundary
(Fden), in the same way that the recharge rate of NO3� is
given by the flux across the water table:
Fden ¼ Cin 3 Vin 3 n ð13Þ
where Fden is measured in lmol�m�2�d�1, Cin is the NO3�
concentration at the upgradient edge of the redox
boundary, V is the component of groundwater velocity
normal to the redox boundary, and n is aquifer porosity.
It is important to recognize that the velocity of ground
water across a redox boundary may be substantially
different from the recharge velocity at the water table,
even in simple aquifers with horizontal redox boundaries
(Cook and Bohlke 2000). Furthermore, because ofchanges in the recharge rate of NO3
� over time, the
concentration of NO3� entering the redox boundary
commonly is not the same as the concentration at the
water table.The distinction between gradual and abrupt redox
boundaries and reaction rates is related both to the scaleof accessible observation (Table 3) and to the scale of the
information needed. For example, the reaction boun-dary approach (Eq. 13) may be more widely applicable
for assessing the importance of groundwater denitrifi-cation at the watershed scale, whereas the reaction rate
approach (Eq. 11 or 12) may be relatively important forpredicting contaminant trends at specific locations
within the system (Frind et al. 1990). In either case,the empirical information derived from the environ-
mental tracer data can be used to guide various types ofmodel simulations, which may be largely unconstrainedotherwise.
MOLECULAR APPROACHES
Denitrification rates are a result of complex inter-actions between physical, hydrological, and chemical
parameters in the environment. Many studies have triedto identify the important factors in various systems and
model these controls based on what we know fromlaboratory and field studies. However, abiotic factors
alone often do not provide sufficient information foraccurate assessment and prediction of rates of N
transformations in natural environments. The metabolicresponse in a given environment to these controllers is
largely dependent on characteristics of the microbialcommunity. The extant microbial community reflects
the recent history of environmental conditions which hasin part framed the community composition. Theprimary goal of current application of molecular
methods to denitrification is to understand how thecomposition and physiology of the microbial commun-
ity affects N transformations in the environment andvice versa.
Because denitrification is catalyzed by a diverse groupof bacteria, archaea, and fungi (Zumft 1997), research
on the abundance and diversity of denitrifiers in theenvironment has focused on the functional genes
involved in the denitrification pathway. Although somestudies have utilized the periplasmic and membrane-
bound NO3� reductase genes (napA and narG) (Flana-
gan et al. 1999, Gregory et al. 2000, Mergel et al. 2001)
and a gene encoding nitrous oxide reductase (nosZ;Michotey et al. 2000, Scala and Kerkhof 2000, Mergel et
al. 2001, Rich et al. 2003), most molecular investigationsof bacterial denitrification in natural environments (see
review by Bothe et al. 2000) have utilized nitritereductase (nirS and nirK; Linne von Berg and Bothe1992, Hallin and Lindgren 1999, Braker et al. 2000,
2001, Michotey et al. 2000, Mergel et al. 2001), becauseit catalyses the first committed step that leads to a
December 2006 2111A SYNTHESIS OF DENITRIFICATION
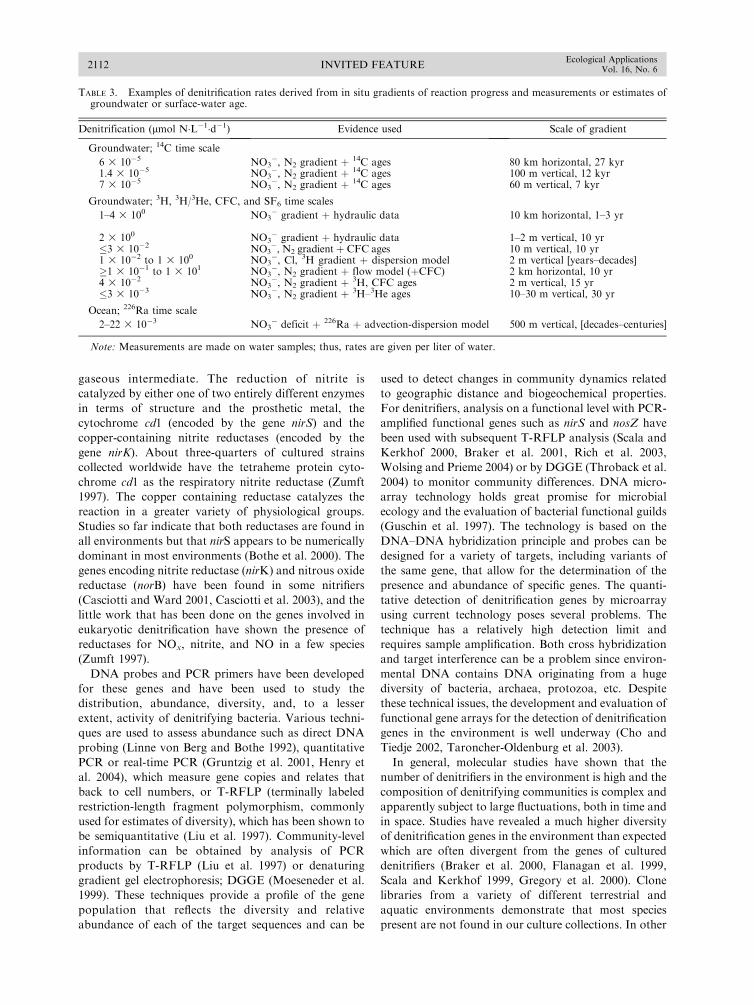
gaseous intermediate. The reduction of nitrite is
catalyzed by either one of two entirely different enzymes
in terms of structure and the prosthetic metal, the
cytochrome cd1 (encoded by the gene nirS) and the
copper-containing nitrite reductases (encoded by the
gene nirK). About three-quarters of cultured strains
collected worldwide have the tetraheme protein cyto-
chrome cd1 as the respiratory nitrite reductase (Zumft
1997). The copper containing reductase catalyzes the
reaction in a greater variety of physiological groups.
Studies so far indicate that both reductases are found in
all environments but that nirS appears to be numerically
dominant in most environments (Bothe et al. 2000). The
genes encoding nitrite reductase (nirK) and nitrous oxide
reductase (norB) have been found in some nitrifiers
(Casciotti and Ward 2001, Casciotti et al. 2003), and the
little work that has been done on the genes involved in
eukaryotic denitrification have shown the presence of
reductases for NOx, nitrite, and NO in a few species
(Zumft 1997).
DNA probes and PCR primers have been developed
for these genes and have been used to study the
distribution, abundance, diversity, and, to a lesser
extent, activity of denitrifying bacteria. Various techni-
ques are used to assess abundance such as direct DNA
probing (Linne von Berg and Bothe 1992), quantitative
PCR or real-time PCR (Gruntzig et al. 2001, Henry et
al. 2004), which measure gene copies and relates that
back to cell numbers, or T-RFLP (terminally labeled
restriction-length fragment polymorphism, commonly
used for estimates of diversity), which has been shown to
be semiquantitative (Liu et al. 1997). Community-level
information can be obtained by analysis of PCR
products by T-RFLP (Liu et al. 1997) or denaturing
gradient gel electrophoresis; DGGE (Moeseneder et al.
1999). These techniques provide a profile of the gene
population that reflects the diversity and relative
abundance of each of the target sequences and can be
used to detect changes in community dynamics related
to geographic distance and biogeochemical properties.
For denitrifiers, analysis on a functional level with PCR-
amplified functional genes such as nirS and nosZ have
been used with subsequent T-RFLP analysis (Scala and
Kerkhof 2000, Braker et al. 2001, Rich et al. 2003,
Wolsing and Prieme 2004) or by DGGE (Throback et al.
2004) to monitor community differences. DNA micro-
array technology holds great promise for microbial
ecology and the evaluation of bacterial functional guilds
(Guschin et al. 1997). The technology is based on the
DNA–DNA hybridization principle and probes can be
designed for a variety of targets, including variants of
the same gene, that allow for the determination of the
presence and abundance of specific genes. The quanti-
tative detection of denitrification genes by microarray
using current technology poses several problems. The
technique has a relatively high detection limit and
requires sample amplification. Both cross hybridization
and target interference can be a problem since environ-
mental DNA contains DNA originating from a huge
diversity of bacteria, archaea, protozoa, etc. Despite
these technical issues, the development and evaluation of
functional gene arrays for the detection of denitrification
genes in the environment is well underway (Cho and
Tiedje 2002, Taroncher-Oldenburg et al. 2003).
In general, molecular studies have shown that the
number of denitrifiers in the environment is high and the
composition of denitrifying communities is complex and
apparently subject to large fluctuations, both in time and
in space. Studies have revealed a much higher diversity
of denitrification genes in the environment than expected
which are often divergent from the genes of cultured
denitrifiers (Braker et al. 2000, Flanagan et al. 1999,
Scala and Kerkhof 1999, Gregory et al. 2000). Clone
libraries from a variety of different terrestrial and
aquatic environments demonstrate that most species
present are not found in our culture collections. In other
TABLE 3. Examples of denitrification rates derived from in situ gradients of reaction progress and measurements or estimates ofgroundwater or surface-water age.
Denitrification (lmol N�L�1�d�1) Evidence used Scale of gradient
Groundwater; 14C time scale
6 3 10�5 NO3�, N2 gradient þ 14C ages 80 km horizontal, 27 kyr
1.4 3 10�5 NO3�, N2 gradient þ 14C ages 100 m vertical, 12 kyr
7 3 10�5 NO3�, N2 gradient þ 14C ages 60 m vertical, 7 kyr
Groundwater; 3H, 3H/3He, CFC, and SF6 time scales
1–4 3 100 NO3� gradient þ hydraulic data 10 km horizontal, 1–3 yr
2 3 100 NO3� gradient þ hydraulic data 1–2 m vertical, 10 yr
�3 3 10�2 NO3�, N2 gradientþ CFC ages 10 m vertical, 10 yr
1 3 10�2 to 1 3 100 NO3�, Cl, 3H gradient þ dispersion model 2 m vertical [years–decades]
�1 3 10�1 to 1 3 101 NO3�, N2 gradient þ flow model (þCFC) 2 km horizontal, 10 yr
4 3 10�2 NO3�, N2 gradient þ 3H, CFC ages 2 m vertical, 15 yr
�3 3 10�3 NO3�, N2 gradient þ 3H–3He ages 10–30 m vertical, 30 yr
Ocean; 226Ra time scale
2–22 3 10�3 NO3� deficit þ 226Ra þ advection-dispersion model 500 m vertical, [decades–centuries]
Note: Measurements are made on water samples; thus, rates are given per liter of water.
INVITED FEATURE2112Ecological Applications
Vol. 16, No. 6
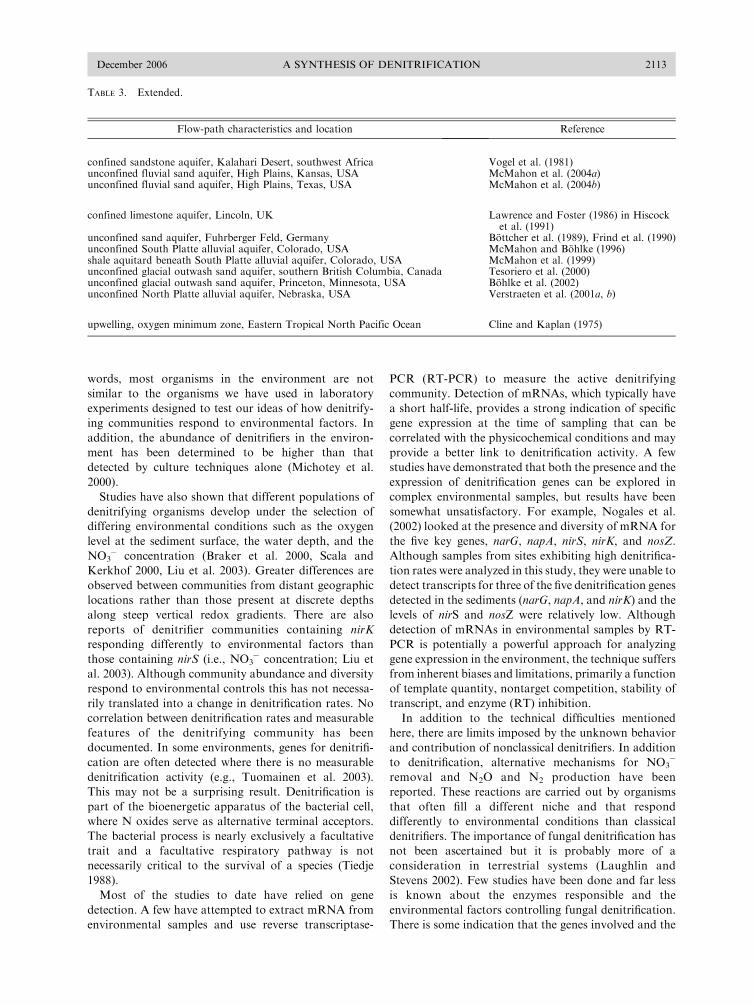
words, most organisms in the environment are not
similar to the organisms we have used in laboratory
experiments designed to test our ideas of how denitrify-
ing communities respond to environmental factors. In
addition, the abundance of denitrifiers in the environ-
ment has been determined to be higher than that
detected by culture techniques alone (Michotey et al.
2000).
Studies have also shown that different populations of
denitrifying organisms develop under the selection of
differing environmental conditions such as the oxygen
level at the sediment surface, the water depth, and the
NO3� concentration (Braker et al. 2000, Scala and
Kerkhof 2000, Liu et al. 2003). Greater differences are
observed between communities from distant geographic
locations rather than those present at discrete depths
along steep vertical redox gradients. There are also
reports of denitrifier communities containing nirK
responding differently to environmental factors than
those containing nirS (i.e., NO3� concentration; Liu et
al. 2003). Although community abundance and diversity
respond to environmental controls this has not necessa-
rily translated into a change in denitrification rates. No
correlation between denitrification rates and measurable
features of the denitrifying community has been
documented. In some environments, genes for denitrifi-
cation are often detected where there is no measurable
denitrification activity (e.g., Tuomainen et al. 2003).
This may not be a surprising result. Denitrification is
part of the bioenergetic apparatus of the bacterial cell,
where N oxides serve as alternative terminal acceptors.
The bacterial process is nearly exclusively a facultative
trait and a facultative respiratory pathway is not
necessarily critical to the survival of a species (Tiedje
1988).
Most of the studies to date have relied on gene
detection. A few have attempted to extract mRNA from
environmental samples and use reverse transcriptase-
PCR (RT-PCR) to measure the active denitrifying
community. Detection of mRNAs, which typically have
a short half-life, provides a strong indication of specific
gene expression at the time of sampling that can be
correlated with the physicochemical conditions and may
provide a better link to denitrification activity. A few
studies have demonstrated that both the presence and the
expression of denitrification genes can be explored in
complex environmental samples, but results have been
somewhat unsatisfactory. For example, Nogales et al.
(2002) looked at the presence and diversity of mRNA for
the five key genes, narG, napA, nirS, nirK, and nosZ.
Although samples from sites exhibiting high denitrifica-
tion rates were analyzed in this study, they were unable to
detect transcripts for three of the five denitrification genes
detected in the sediments (narG, napA, and nirK) and the
levels of nirS and nosZ were relatively low. Although
detection of mRNAs in environmental samples by RT-
PCR is potentially a powerful approach for analyzing
gene expression in the environment, the technique suffers
from inherent biases and limitations, primarily a function
of template quantity, nontarget competition, stability of
transcript, and enzyme (RT) inhibition.
In addition to the technical difficulties mentioned
here, there are limits imposed by the unknown behavior
and contribution of nonclassical denitrifiers. In addition
to denitrification, alternative mechanisms for NO3�
removal and N2O and N2 production have been
reported. These reactions are carried out by organisms
that often fill a different niche and that respond
differently to environmental conditions than classical
denitrifiers. The importance of fungal denitrification has
not been ascertained but it is probably more of a
consideration in terrestrial systems (Laughlin and
Stevens 2002). Few studies have been done and far less
is known about the enzymes responsible and the
environmental factors controlling fungal denitrification.
There is some indication that the genes involved and the
TABLE 3. Extended.
Flow-path characteristics and location Reference
confined sandstone aquifer, Kalahari Desert, southwest Africa Vogel et al. (1981)unconfined fluvial sand aquifer, High Plains, Kansas, USA McMahon et al. (2004a)unconfined fluvial sand aquifer, High Plains, Texas, USA McMahon et al. (2004b)
confined limestone aquifer, Lincoln, UK Lawrence and Foster (1986) in Hiscocket al. (1991)
unconfined sand aquifer, Fuhrberger Feld, Germany Bottcher et al. (1989), Frind et al. (1990)unconfined South Platte alluvial aquifer, Colorado, USA McMahon and Bohlke (1996)shale aquitard beneath South Platte alluvial aquifer, Colorado, USA McMahon et al. (1999)unconfined glacial outwash sand aquifer, southern British Columbia, Canada Tesoriero et al. (2000)unconfined glacial outwash sand aquifer, Princeton, Minnesota, USA Bohlke et al. (2002)unconfined North Platte alluvial aquifer, Nebraska, USA Verstraeten et al. (2001a, b)
upwelling, oxygen minimum zone, Eastern Tropical North Pacific Ocean Cline and Kaplan (1975)
December 2006 2113A SYNTHESIS OF DENITRIFICATION

response to environmental conditions in fungi is differ-
ent than for prokaryotic cells (Zumft 1997, Zhang et al.2001), and will hence require new primers and probes to
target them. For example, early reports were equivocalwith respect to an inhibitory or stimulatory effect of
oxygen, association of the reaction with NO3� assim-
ilation, and the use of NO3� or nitrite as the active
substrate. The importance of denitrifying metabolism bynitrifying bacteria in the environment and its signifi-
cance to the physiological ecology of these organisms isunknown. In nitrifiers, and even in some methylotrophs,
the enzymes responsible for catalyzing the reactions areencoded by nitrite reductase and NO reductase genes
that are homologous to the nirK and norB genes ofconventional denitrifying bacteria (Casciotti and Ward
2001, Ye and Thomas 2001). This complicates theinterpretation of molecular data but may also providean opportunity to refine or modify existing molecular
techniques in order to evaluate the contribution of theseother reactions. Further work is needed to determine if
molecular tools can be used to apportion the relativecontributions of these nonconventional denitrifiers.
Last, the roles of anammox and dissimilatory NO3�
reduction are unclear in most environments. Dissim-
ilatory reduction of NO3� to NH4
þ (DNRA) is oftenignored in aquatic and upland soil systems but has been
shown to be important in sediments and wet tropicalsoils in which fermentative bacteria (with whose
metabolism it is often associated) are likely to be found(Tiedje 1988, Silver et al. 2001). In low-redox soils,
DNRA competes with denitrification as a fate for NO3�
resulting in N conservation not gaseous N loss. At this
time, there are no specific primers for bacteria carryingout DNRA and hence the relationships between
denitrifying and DNRA communities has yet to beexamined. Anammox is a newly discovered process, inwhich ammonia and nitrite are converted anaerobically
to dinitrogen gas, and has recently been reported fromanaerobic wastewater systems and oxygen minimum
zones (Strous et al. 1999, Dalsgaard et al. 2003). Anorganism responsible for this novel metabolism has been
identified; it is a relative of Planctomyces and molecularprobes have been developed (Kuypers et al. 2003).
In general, there are few differences in the applicationof molecular techniques to aquatic or terrestrial environ-
ments. Molecular analysis is limited by the quantity andquality of nucleic acids recovered from an environ-
mental sample. One difference between these systems isdue to the scales of the process and impacts the sampling
strategies. In systems where denitrification is occurringin the surface water column or groundwater, the
dimensions of denitrification activity is on the order ofmeters to kilometers. In aquatic sediments or terrestrial
soils, localized zones of denitrification occur on the 100sof microns to cm scale. Sediment and soil samples tendto have a higher density of organisms and the typical
sample size is a few grams so care must be taken tosample the appropriate sediment layers. Whereas, water
samples are commonly in liters collected onto a filter.
DNA extractions of filtered samples are straightforward,
and yield high quality DNA ready for further analyses.
The extraction of nucleic acids, particularly RNA, from
soils and sediments can be difficult in part because the
soil/sediment matrix can interfere with efficient extrac-
tion and often substances inhibitory to PCR are co-
extracted. Subsequent cleanup, if successful, can result
in significant loss of total nucleic acids or preferential
loss from certain organisms.
In summary, molecular characterization combined
with quantification of environmental controllers and
denitrification rates will allow us to evaluate abiotic and
biotic controls responsible for the N transformations
that we observe. Understanding the diversity of deni-
trifying bacterial populations in aquatic and terrestrial
environments, the responses of microbial communities
to environmental factors and the impact of changes in
microbial community structure and composition on the
rate of denitrification may be critical to understanding
how environmental change will impact rates of the
process. The development of molecular techniques has
contributed enormously to the rapid recent progress in
the field. While PCR and probing with nucleotides have
been used to study the structure of denitrifying
communities, studies of their function in natural
habitats, which require quantification at the transcrip-
tional level, are currently not routine. Future improve-
ments in molecular techniques are needed to provide
meaningful data for natural, noncultured assemblages.
These data should eventually provide a complete picture
of the potential for denitrification.
CONCLUSIONS
Scientists have struggled with denitrification method-
ology for many decades, and it appears that their efforts
have produced mixed results. Our review indicates that
in some systems, (e.g., aquatic sediments, unconsoli-
dated aquifers), current methodology allows for the
production of useful estimates of denitrification at scales
relevant to water quality and ecosystem fertility ques-
tions. Advances in denitrification measurement method-
ology have been driven partly by improvements in
instrumentation, e.g., membrane inlet and other types of
mass spectrometry, but also by clever reasoning about
isotopic and hydrologic dynamics. Unsaturated terres-
trial systems (soils) remain the greatest challenge, largely
because of the high atmospheric background levels of N2
that exchange rapidly with air. But even there, progress
is being made, and new gas flow soil core and tracer level15N methods are producing estimates of denitrification
relevant to large scale questions about atmospheric
deposition and coastal eutrophication. Given that the
ultimate test of methods is their ability to provide data
useful to answering such questions, mass balance and
stoichiometric approaches that constrain estimates of
denitrification at large scales, will continue to be
INVITED FEATURE2114Ecological Applications
Vol. 16, No. 6

important components of denitrification methodology.
Continued comparison of mass balances with point
measurements (made using multiple methods), in multi-
ple systems, is likely to propel more improvement in
denitrification methods over the next few years.
ACKNOWLEDGMENTS
The workshop on ‘‘Advanced Approaches to QuantifyDenitrification’’ was sponsored by the U.S. National ScienceFoundation, Divisions of Environmental Biology and EarthSciences, the Environmental Protection Agency, Clean AirMarkets Division, the International Global AtmosphericChemistry (IGAC) Program, and the National Aeronauticsand Space Administration, Terrestrial Ecology Program. Thesections of this paper are directly derived from presentationsmade at the meeting as follows: acetylene and 15N tracermethods (Groffman and Nielsen), direct N2 quantification(Butterbach-Bahl and Kana), stoichiometry and mass balance(Giblin and David), 15N natural abundance and environmentaltracers (Bohlke and Altabet), and molecular approaches(Voytek and Firestone). We thank the workshop participantsand organizers (Eric Davidson and Sybil Seitzinger) as well asother colleagues (especially Scott Nixon, Alan Devol, PeterMcMahon, and JoAnn Holloway) for helpful suggestions.Salary support for A. E. Giblin came from NSF-DEB-0423565.
LITERATURE CITED
Aeschbach-Hertig, W., F. Peeters, U. Beyerle, and R. Kipfer.2000. Paleotemperature reconstruction from noble gases inground water taking into account equilibration with trappedair. Nature 405:1040–1044.
Allison, F. E. 1955. The enigma of soil nitrogen balance sheets.Advances in Agronomy 7:213–250.
Altabet, M. A., R. Francois, D. W. Murray, and W. L. Prell.1995. Climate-related variations in denitrification in theArabian Sea from sediment 15N/14N ratios. Nature 373:506–509.
Altabet, M., M. Higginson, and D. W. Murray. 2002. The effectof millennial-scale changes in Arabian Sea denitrification onatmospheric CO2. Nature 415:159–162.
Altabet, M. A., C. Pilskaln, R. Thunell, C. Pride, D. Sigman, F.Chavez, and R. Francois. 1999. The nitrogen isotopebiogeochemistry of sinking particles from the margin of theEastern North Pacific. Deep-Sea Research 46:655–679.
Amberger, A., and H. L. Schmidt. 1987. Naturliche isotopen-genhalte von nitrat als indikatoren fur dessen herkunft.Geochimica et Cosmochimica Acta 51:2699–2705.
An, S., W. S. Gardner, and T. M. Kana. 2001. Simultaneousmeasurement of denitrification and nitrogen fixation usingisotope pairing with membrane inlet mass spectrometer(MIMS) analysis. Applied and Environmental Microbiology67:1171–1178.
An, S. M., and S. B. Joye. 1997. An improved chromatographicmethod to measure nitrogen, oxygen, argon and methane ingas or liquid samples. Marine Chemistry 59:63–70.
Andersen, J. M. 1977. Rates of denitrification of undisturbedsediment from six lakes as a function of nitrate concen-tration, oxygen, and temperature. Archives of Hydrobiology80:147–159.
Appelo, C. A. J., and D. Postma. 1996. Geochemistry,groundwater and pollution. A. A. Balkema, Rotterdam,The Netherlands.
Aravena, R., and W. D. Robertson. 1998. Use of multipleisotope tracers to evaluate denitrification in ground water:study of nitrate from a large-flux septic system plume.Ground Water 36:975–982.
Aulakh, M. S., J. W. Doran, and A. R. Mosier. 1992. Soildenitrification: significance, measurement, and effects ofmanagement. Advances in Soil Science 18:1–52.
Balderston, W. L., B. Sherr, and W. J. Payne. 1976. Blockageby acetylene of nitrous oxide reduction in Pseudomonasperfectomarinus. Applied and Environmental Microbiology31:504–508.
Barbaree, J. M., and W. J. Payne. 1967. Products of a marinebacterium as revealed by gas chromatography. MarineBiology 1:136–139.
Barford, C. C., J. P. Montoya, M. A. Altabet, and R. Mitchell.1999. Steady-state nitrogen isotope effects of N2 and N2Oproduction in Paracoccus denitrificans. Applied and Environ-mental Microbiology 65:989–994.
Barnes, R. O., K. K. Bertine, and E. D. Goldberg. 1975. N2:Ar,nitrification and denitrification in southern California bor-derland basin sediments. Limnology and Oceanography 20:962–970.
Barton, L., C. D. A. McLay, and L. A. Schipper. 1999. Annualdenitrification rates in agricultural and forest soils: a review.Australian Journal of Soil Research 37:1073–1093.
Billen, G., M. Somville, E. deBecker, and P. Servais. 1985. Anitrogen budget of the Scheldt hydrographical basin. Pages191–285 in F. Colijn and W. Helder, editors. Nutrients inestuaries: eutrophication and other effects. EBSA/Hydro-biological Society Symposium: Nederlands Instituut voorOnderzoek, Texel, The Netherlands.
Blicher-Mathiesen, G., G. W. McCarty, and L. P. Neilsen.1998. Denitrification and degassing in groundwater estimatedfrom dissolved dinitrogen and argon. Journal of Hydrology208:16–24.
Bohlke, J. K. 2002. Groundwater recharge and agriculturalcontamination. Hydrogeology Journal 10:153–179 [Erratum,2002, Hydrogeology Journal 2010:438–439].
Bohlke, J. K., and J. M. Denver. 1995. Combined use ofgroundwater dating, chemical, and isotopic analyses toresolve the history and fate of nitrate contamination in twoagricultural watersheds, Atlantic coastal plain, Maryland.Water Resources Research 31:2319–2339.
Bohlke, J. K., J. W. Harvey, and M. A. Voytek. 2004, Reach-scale isotope tracer experiment to quantify denitrification andrelated processes in a nitrate-rich stream, midcontinentUnited States. Limnology and Oceanography 49:821–838.
Bohlke, J. K., R. Wanty, M. Tuttle, G. Delin, and M. Landon.2002. Denitrification in the recharge area and discharge areaof a transient agricultural nitrate plume in a glacial outwashsand aquifer. Minnesota. Water Resources Research 38:1105.[doi: 10.1029/2001WR000663]
Bollmann, A., and R. Conrad. 1997. Acetylene blockagetechnique leads to underestimation of denitrification ratesin oxic soils due to scavenging of intermediate nitric oxide.Soil Biology and Biochemistry 29:1067–1077.
Bothe, H., G. Jost, M. Schloter, B. B. Ward, and K. P. Witzel.2000. Molecular analysis of ammonia oxidation and deni-trification in natural environments. FEMS MicrobiologyReview 24:673–690.
Bottcher, J., O. Strebel, and W. H. M. Duynisveld. 1989.Kinetik und modellierung gekoppelter stoffumsetzungen imgrundwasser eines lockergesteins-aquifers. Geologishes Jahr-buch 51:3–40.
Bottcher, J., O. Strebel, S. Voerkelius, and H.-L. Schmidt. 1990.Using isotope fractionation of nitrate-nitrogen and nitrate-oxygen for evaluation of microbial denitrification in a sandyaquifer. Journal of Hydrology 114:413–424.
Braker, G., H. L. Ayala-del-Rio, A. H. Devol, A. Fesefeldt, andJ. M. Tiedje. 2001. Community structure of denitrifiers,bacteria, and Archaea along redox gradients in Pacificnorthwest marine sediments by terminal restriction fragmentlength polymorphism analysis of amplified nitrite reductase
December 2006 2115A SYNTHESIS OF DENITRIFICATION

(nirS) and 16S rRNA genes. Applied and EnvironmentalMicrobiology 67:1893–1901.
Braker, G., J. Z. Zhou, L. Y. Wu, A. H. Devol, and J. M.Tiedje. 2000. Nitrite reductase genes (nirK and nirS) asfunctional markers to investigate diversity of denitrifyingbacteria in Pacific northwest marine sediment communities.Applied and Environmental Microbiology 66:2096–2104.
Brandes, J. A., and A. H. Devol. 2002. A global marine-fixednitrogen isotopic budget: implications for Holocene nitrogencycling. Global Biogeochemical Cycles 16:1120. [doi: 10.1029/2001GB001856]
Brandes, J. A., A. H. Devol, T. Yoshinari, D. A. Jayakumar,and S. W. A. Naqvi. 1998. Isotopic composition of nitrate inthe central Arabian Sea and eastern tropical North Pacific: atracer for mixing and nitrogen cycles. Limnology andOceanography 43:1680–1689.
Burdige, D. 1991. The kinetics of organic matter mineralizationin anoxic marine sediments. Journal of Marine Research 49:727–761.
Burton, D. L., and E. G. Beauchamp. 1985. Denitrification raterelationships with soil parameters in the field. Communica-tions in Soil Science and Plant Analysis 16:539–549.
Butterbach-Bahl, K., G. Willibald, and H. Papen. 2002. Soilcore method for direct simultaneous determination of N2 andN2O emissions from forest soils. Plant and Soil 240:105–116.
Caffrey, J. M., and W. M. Kemp. 1992. Influence of thesubmersed plant, Potamogeton perfoliatus, on nitrogencycling in estuarine sediments. Limnology and Oceanography37:1483–1495.
Cardenas, L. M., J. M. B. Hawkins, D. Chadwick, and D.Scholefield. 2003. Biogenic gas emissions from soils measuredusing an automated incubation system. Soil Biology andBiochemistry 35:867–870.
Casciotti, K. L., D. M. Sigman, M. Galanter Hastings, J. K.Bohlke, and A. Hilkert. 2002. Measurement of the oxygenisotopic composition of nitrate in marine and fresh watersusing the denitrifier method. Analytical Chemistry 74:4905–4912.
Casciotti, K. L., D. M. Sigman, and B. B. Ward. 2003. Linkingdiversity and stable isotope fractionation in ammonia-oxidizing bacteria. Geomicrobiology Journal 20:335–353.
Casciotti, K. L., and B. B. Ward. 2001. Nitrite reductase genesin ammonia oxidizing bacteria. Applied and EnvironmentalMicrobiology 67:2213–2221.
Cavigelli, M. A., and G. P. Robertson. 2000. The functionalsignificance of denitrifier community composition in aterrestrial ecosystem. Ecology 81:1402–1414.
Cey, E. E., D. L. Rudolph, R. Aravena, and G. Parkin. 1999.Role of the riparian zone in controlling the distribution andfate of agricultural nitrogen near a small stream in southernOntario. Journal of Hydrology. 37:45–67.
Chanton, J. P., C. S. Martens, and M. B. Goldhaber. 1987.Biogeochemical cycling in an organic-rich coastal marinebasin. 7. Sulfur mass balance, oxygen uptake and sulfideretention. Geochimica et Cosmochima Acta 51:1187–1199.
Cho, J.-C., and J. M. Tiedje. 2002. Quantitative detection ofmicrobial genes by using DNA microarrays. Applied andEnvironmental Microbiology. 68:1425–1430.
Christensen, P. B., L. P. Nielsen, N. P. Revsbech, and J.Sørensen. 1989. Microzonation of denitrification activity instream sediments as studied with a combined oxygen andnitrous oxide microsensor. Applied and EnvironmentalMicrobiology 55:1234–1241.
Christensen, P. B., L. P. Nielsen, J. Sorensen, and N. P.Revsbech. 1990. Denitrification in nitrate-rich streams:diurnal and seasonal-variation related to benthic oxygenmetabolism. Limnology and Oceanography 35:640–651.
Clark, I. D., and P. Fritz. 1997. Environmental isotopes inhydrogeology. Lewis Publishers, New York, New York,USA.
Cline, J. D., and I. R. Kaplan. 1975. Isotopic fractionation ofdissolved nitrate during denitrification in the eastern tropicalNorth Pacific Ocean. Marine Chemistry 3:271–299.
Cline, J. D., and F. A. Richards. 1972. Oxygen deficientconditions and nitrate reduction in the Eastern TropicalNorth Pacific Ocean. Limnology and Oceanography 17:885–900.
Codispoti, L. A., J. A. Brandes, J. P. Christensen, A. H. Devol,S. W. A. Naqvi, H. W. Pearl, and T. Yoshinari. 2001. Theoceanic fixed nitrogen and nitrous oxide budgets: movingtargets as we enter the anthropocene. Scientia Marina 65:85–105.
Colt, J. 1984. Computation of dissolved gas concentrations inwater as functions of temperature, salinity, and pressure.American Fisheries Society Symposium Special Publication14.
Cook, P. G., and J. K. Bohlke. 2000. Determining timescalesfor groundwater flow and solute transport. Pages 1–30 inP. G. Cook and A. Herczeg, editors. Environmental tracersin subsurface hydrology. Kluwer Academic Publishers,Boston, Massachusetts, USA.
Cook, P. G., and A. L. Herczeg, editors. 2000. Environmentaltracers in subsurface hydrology. Kluwer Academic Publish-ers, Boston, Massachusetts, USA.
Cornwell, J. C., W. M. Kemp, and T. M. Kana. 1999.Denitrification in coastal ecosystems: environmental controlsand aspects of spatial and temporal scale. Aquatic Ecology33:41–54.
Cornwell, J. C., and P. A. Sampou. 1995. Environmentalcontrols on iron sulfide mineral formation in a coastal plainestuary. Pages 2224–2242 in M. A. Vairavamuthy and M. A.Schoonen, editors. Geochemical transformations of sedimen-tary sulfur. American Chemical Society, Washington, D.C.,USA.
Dalsgaard, T., D. E. Canfield, J. Pederesen, B. Thamdrup, andJ. Acuna-Gonzalez. 2003. N2 production by the anammoxreaction in the anoxic water column of the Golfo Dulce,Costa Rica. Nature 422:606–608.
Dalsgaard, T., et al., 2000. Protocol handbook for NICE—nitrogen cycling in estuaries: a project under the EU researchprogramme: Marine Science and Technology (MAST III).National Environmental Research Institute, Silkeborg, Den-mark.
David, M. B., and L. E. Gentry. 2000. Anthropogenic inputs ofnitrogen and phosphorus and riverine export for Illinois,USA. Journal of Environmental Quality 29:494–508.
David, M. B., G. F. McIsaac, T. V. Royer, R. G. Darmody,and L. E. Gentry. 2001. Estimated historical and currentnitrogen balances for Illinois. Scientific World 1:597–604.
Delwiche, C. C., and P. L. Steyn. 1970. Nitrogen isotopefractionation in soils and microbial reactions. EnvironmentalScience and Technology 4:929–935.
Devol, A. H. 1991. Direct measurements of nitrogen gas fluxesfrom continental shelf sediments. Nature 349:319–321.
Emerson, S., P. Quay, C. Stump, D. Wilbur, and M. Knox.1991. O2, Ar, N2, and
222Rn in surface waters of the subarcticocean: net biological O2 production. Global BiogeochemicalCycles 5:49–69.
Emerson, S., C. Stump, D. Wilbur, and P. Quay. 1999.Accurate measurement of O2, N2, and Ar gases in waterand the solubility of N2. Marine Chemistry 64:337–347.
Emery, K. O., W. L. Orr, and S. C. Rittenberg. 1955. Nutrientbudgets in the ocean. Pages 299–310 in Essays in the naturalsciences in honor of Captain Alan Hancock. University ofSouthern California Press, Los Angeles, California, USA.
Eyre, B. D., S. Rysgaard, T. Dalsgaard, and P. B. Christensen.2002. Comparison of isotope pairing and N2/Ar methods formeasuring sediment denitrification: assumptions, modifica-tions, and implications. Estuaries 25:1077–1087.
INVITED FEATURE2116Ecological Applications
Vol. 16, No. 6

Fenchel, T., and T. H. Blackburn. 1979. Bacteria and mineralcycling. Academic Press, New York, New York, USA.
Flanagan, D. A., L. G. Gregory, J. P. Carter, A. Karakas-Sen,D. J. Richardson, and S. Spiro. 1999. Detection of genes forperiplasmic nitrate reductase in nitrate respiring bacteria andin community DNA. FEMS Microbiology Letters 177:263–270.
Flather, D. H., and E. G. Beauchamp. 1992. Inhibition of thefermentation process in soil by acetylene. Soil Biology andBiochemistry 24:905–911.
Foloronuso, O. A., and D. E. Rolston. 1984. Spatial variabilityof field-measured denitrification gas fluxes and soil proper-ties. Soil Science Society of America Journal 49:1087–1093.
Fossing, H., et al. 1995. Concentration and transport of nitrateby the mat-forming sulfur bacterium Thioploca. Nature 374:713–715.
Frind, E. O., W. H. M. Duynisveld, O. Strebel, and J.Boettcher. 1990. Modeling of multicomponent transportwith microbial transformation in groundwater: the Fuhrbergcase. Water Resources Research 26:1707–1719.
Fukada, T., K. M. Hiscock, P. F. Dennis, and T. Grischek.2003. A dual isotope approach to identify denitrification ingroundwater at a river-bank infiltration site. Water Research37:3070–3078.
Galloway, J. N., J. D. Aber, J. W. Erisman, S. P. Seitzinger,R. W. Howarth, E. B. Cowling, and B. J. Cosby. 2003. Thenitrogen cascade. BioScience 53:341–356.
Galloway, J. N., W. H. Schlesinger, H. Levy, A. Michaels, andJ. L. Schnoor. 1995. Nitrogen fixation: anthropogenicenhancement-environmental response. Global Biogeochem-ical Cycles 9:235–252.
Galsworthy, A. M., and J. R. Burford. 1978. A system formeasuring the rates of evolution of nitrous oxide andnitrogen from incubated soils during denitrification. Journalof Soil Science 29:537–550.
Ganeshram, R. S., T. F. Pedersen, S. E. Calvert, G. W.McNeill, and M. R. Fontugne. 2000. Glacial-interglacialvariability in denitrification in the world’s oceans: causes andconsequences. Paleoceanography 15:361–376.
Ganeshram, R. S., T. F. Pedersen, S. E. Calvert, and J. W.Murray. 1995. Large changes in oceanic nutrient inventoriesfrom glacial to interglacial periods. Nature 376:755–757.
Giblin, A. E., C. S. Hopkinson, and J. Tucker. 1997. Benthicmetabolism and nutrient cycling in Boston Harbor, Massa-chusetts, U.S.A. Estuaries 20:346–364.
Goolsby, D. A., W. A. Battaglin, G. B. Lawrence, R. S. Artz,B. T. Aulenbach, R. P. Hooper, D. R. Keeney, and G. J.Stensland. 1999. Flux and sources of nutrients in theMississippi–Atchafalaya River basin. Topic 3. Report ofthe integrated assessment on hypoxia in the Gulf of Mexico.NOAA Coastal Ocean Program Decision Analysis Series No.17. NOAA Coastal Ocean Program, Silver Spring, Maryland,USA.
Gordon, D. C., Jr., P. R. Boudreau, K. H. Mann, J.-E. Ong,W. L. Silvert, S. V. Smith, G. Wattayakorn, F. Wulff, and T.Yanagi. 1996. LOICZ biogeochemical modelling guidelines.LOICZ Reports and Studies 5:1–96.
Granger, J., D. M. Sigman, J. A. Needoba, and P. J. Harrison.2004. Coupled nitrogen and oxygen isotope fractionation ofnitrate during assimilation by cultures of marine phytoplank-ton. Limnology and Oceanography 49:1763–1773.
Gregory, L. G., A. Karakas-Sen, D. J. Richardson, and S.Spiro. 2000. Detection of genes for membrane-bound nitratereductase in nitrate-respiring bacteria and in communityDNA. FEMS Microbiology Letters 183:275–279.
Griggs, E. M., L. R. Kump, and J. K. Bohlke. 2003. The fate ofwastewater-derived nitrate in the subsurface of the FloridaKeys: Key Colony Beach, Florida. Estuarine, Coastal andShelf Science 58:517–539.
Groffman, P. M., E. Holland, D. D. Myrold, G. P. Robertson,and X. Zou. 1999. Denitrification. Pages 272–288 in G. P.Robertson, C. S. Bledsoe, D. C. Coleman, and P. Sollins,editors. Standard soil methods for long term ecologicalresearch. Oxford University Press, New York, New York,USA.
Groffman, P. M., D. R. Zak, S. Christensen, A. R. Mosier, andJ. M. Tiedje. 1993. Early spring nitrogen dynamics in atemperate forest landscape. Ecology 74:1579–1585.
Gross, P. J., and J. M. Bremner. 1992. Acetone problem in useof the acetylene blockage method for assessment ofdenitrifying activity in soil. Communications in Soil Scienceand Plant Analysis 23:1345–1358.
Gruber, N., and J. L. Sarmiento. 1997. Global patterns ofmarine nitrogen fixation and denitrification. Global Bio-geochemical Cycles 11:235–266.
Gruntzig, V., S. C. Nold, J. Z. Zhou, and J. M. Tiedje. 2001.Pseudomonas stutzeri nitrite reductase gene abundance inenvironmental samples measured by real-time PCR. Appliedand Environmental Microbiology. 67:760–768.
Guschin, D. Y., B. K. Mobarry, D. Proudnikov, D. A. Stahl,B. E. Rittmann, and A. D. Mirzabekov. 1997. Oligonucleo-tide microchips as genosensors for determinative andenvironmental studies in microbiology. Applied and Environ-mental Microbiology 63:2397–2402.
Hallberg, G. R., and D. R. Keeney. 1993. Nitrate. Pages 297–322 in W. M. Alley, editor. Regional ground-water quality.Van Nostrand Reinhold, New York, New York, USA.
Hallin, S., and P. E. Lindgren. 1999. PCR detection of genesencoding nitrite reductase in denitrifying bacteria. Appliedand Environmental Microbiology. 65:1652–1657.
Hauck, R. D., and S. W. Melsted. 1956. Some aspects of theproblem of evaluating denitrification in soils. Soil ScienceSociety of America Proceedings 20:361–364.
Hauck, R. D., S. W. Melsted, and P. E. Yankwich. 1958. Use ofN-isotope distribution in nitrogen gas in the study ofdenitrification. Soil Science 86:287–291.
Heaton, T. H. E., and J. C. Vogel. 1981. ‘‘Excess air’’ in groundwater. Journal of Hydrology 50:201–216.
Hecky, R. E., P. Campbell, and L. L. Hendzel. 1993. Thestoichiometry of carbon, nitrogen, and phosphorus inparticulate matter of lakes and oceans. Limnology andOceanography 38:709–742.
Hendy, I. L., and J. P. Kennett. 2003. Tropical forcing of NorthPacific Intermediate water distribution during late Quater-nary rapid climate change. Quaternary Science Review 22:673–689.
Henry, S., E. Baudoin, J. C. Lopez-Gutierrez, F. Martin-Laurent, A. Brauman, and L. Philippot. 2004. Quantificationof denitrifying bacteria in soils by nirK gene targeted real-time PCR. Journal of Microbiological Methods 59:327–335.
Higginson, M. J., and M. A. Altabet. 2004. Initial test of thesilicic acid leakage hypothesis using sedimentary biomarkers.Geophysical Research Letters 31:L18303. [doi: 10.1029/2004GL020511]
Hiscock, K. M., J. W. Lloyd, and D. N. Lerner. 1991. Reviewof natural and artificial denitrification of groundwater. WaterResources 25:1099–1111.
Hopkinson, C. S., A. E. Giblin, and J. Tucker. 2001. Benthicmetabolism and nutrient regeneration on the continentalshelf of Eastern Massachusetts, USA. Marine EcologyProgress Series 224:1–19.
Hopkinson, C. S., A. E. Giblin, J. Tucker, and R. H. Garritt.1999. Benthic metabolism and nutrient cycling along anestuarine salinity gradient. Estuaries 22:863–881.
Howarth, R. W., et al. 1996. Regional nitrogen budgets andriverine N and P fluxes for the drainages to the NorthAtlantic Ocean: natural and human influences. Biogeochem-istry 35:75–139.
December 2006 2117A SYNTHESIS OF DENITRIFICATION

Hyman, M. R., and D. J. Arp. 1987. Quantification andremoval of some contaminating gases from acetylene used tostudy gas-utilizing enzymes and microorganisms. Appliedand Environmental Microbiology 53:298–303.
Hynes, R. K., and R. Knowles. 1978. Inhibition by acetylene ofammonia oxidation in Nitrosomonas europaea. FEMSMicro-biology Letters 4:319–321.
Indermuhle, A., E. Monnin, B. Stauffer, T. F. Stocker, and M.Wahlen. 2000. Atmospheric CO2 concentration from 60 to 20Kyr BP from the Taylor Dome ice core, Antarctica.Geophysical Research Letters 27:735–738.
Istok, J. D., M. D. Humphrey, M. H. Schroth, M. R. Hyman,and K. T. O’Reilly. 1997. Single-well, ‘‘push-pull’’ test for insitu determination of microbial activities. Ground Water 35:619–631.
Jenkins, M. C., and W. M. Kemp. 1985. The coupling ofnitrification and denitrification in two estuarine sediments.Limnology and Oceanography 29:609–619.
Jensen, K., N. P. Revsbech, and L. P. Nielsen. 1993. Microscaledistribution of nitrification activity in sediment determinedwith a shielded microsensor for nitrate. Applied andEnvironmental Microbiology 59:3287–3296.
Johnstone, J. 1908. Conditions of life in the sea. CambridgeUniversity Press, Cambridge, UK.
Jorgensen, B. B. 1982. Mineralization of organic matter in thesea bed: the role of sulfate reduction. Nature 296:643–645.
Jossette, G., B. Leporcq, N. Sanchez, and X. Philippon. 1999.Biogeochemical mass-balances (C, N, P, Si) in three largereservoirs of the Seine Basin (France). Biogeochemistry 47:119–146.
Joye, S. B., and H. W. Paerl. 1993. Contemporaneous nitrogenfixation and denitrification in intertidal microbial mats: rapidresponse to runoff events. Marine Ecology Progress Series 94:267–274.
Jury, W. A., J. Letey, and T. Collins. 1982. Analysis of chambermethods used for measuring nitrous oxide production in thefield. Soil Science Society of America Journal 46:250–255.
Kamp-Nielsen, L. 1992. Benthic-pelagic coupling of nutrientmetabolism along an estuarine eutrophication gradient.Hydrobiologia 235/236:457–470.
Kana, T. M., C. Darkangelo, M. D. Hunt, J. B. Oldham, G. E.Bennett, and J. C. Cornwell. 1994. A membrane inlet massspectrometer for rapid high precision determination of N2,O2, and Ar in environmental water samples. AnalyticalChemistry 66:4166–4170.
Kana, T. M., M. B. Sullivan, J. C. Cornwell, and K.Groszkowski. 1998. Denitrification in estuarine sedimentsdetermined by membrane inlet mass spectrometry. Limnol-ogy and Oceanography 43:334–339.
Kana, T. M., and D. L. Weiss. 2004. Comment on ‘‘comparisonof isotope pairing and N2/Ar methods for measured sedi-ments’’ by B. D. Eyre, S. Rysaard, T. Dalsgaard, and P.Bondo Christensen. (2002. Estuaries 25:1077–1087.) Estua-ries 27:157–160.
Karl, D., A. Michaels, B. Bergman, D. Capone, E. Carpenter,R. Letelier, F. Lipshultz, H. Pearl, D. Sigman, and L. Stal.2002. Dinitrogen fixation in the world’s oceans. Biogeochem-istry 57/58:47–98.
Keeney, D. R. 1986. Critique of the acetylene blockagetechnique for field measurement of denitrification. Pages103–115 in R. D. Hauck and R. W. Weaver, editors. Fieldmeasurement of dinitrogen fixation and denitrification. SoilScience Society of America, Madison, Wisconsin.
Kelly, J. R. 1997. Nitrogen flow and the interaction of BostonHarbor with Massachusetts Bay. Estuaries 20:365–380.
Kienast, S. S., S. E. Calvert, R. W. Collier, and T. F. Pedersen.2002. Nitrogen isotope and productivity variations along thenortheast Pacific margin over the last 120 kyr: surface andsubsurface paleoceanography. Paleoceanography 17:1055.[doi: 10.1029/2001PA000650]
Kralova, M., P. H. Masscheleyn, C. W. Lindau, and W. H.Patrick. 1992. Production of dinitrogen and nitrous oxide insoil suspensions as affected by redox potential. Water, Airand Soil Pollution 61:37–45.
Kuypers, M. M. M., A. O. Sliekers, G. Lavik, M. Schmid, B. B.Jorgensen, J. G. Kuenen, J. S. Sinninghe Damste, M. Strous,and M. S. M. Jetten. 2003. Anaerobic ammonium oxidationby anammox bacteria in the Black Sea. Nature 422:608–611.
Laughlin, R. J., and R. J. Stevens. 2002. Evidence for fungaldominance of denitrification and codenitrification in agrassland soil. Soil Science Society America Journal 66:1540–1548.
Laursen, A. E., and S. P. Seitzinger. 2002. Measurement ofdenitrification in rivers: an integrated, whole reach approach.Hydrobiology 485:67–81.
Lehman, M. F., P. Reichert, S. M. Bernasconi, A. Barbieri, andJ. A. McKenzie. 2003. Modelling nitrogen and oxygenisotope fractionation during denitrification in a lacustrineredox-transition zone. Geochimica et Cosmochimica Acta 67:2529–2542.
Lindsey, B. D., S. W. Phillips, C. A. Donnelly, G. K. Speiran,L. N. Plummer, J. K. Bohlke, M. J. Focazio, W. C. Burton,and E. Busenberg. 2003. Residence times and nitrate trans-port in ground water discharging to streams in theChesapeake Bay Watershed. U.S. Geological Survey WaterResources Investigations Report 03-4035. U.S. GeologicalSurvey, New Cumberland, Pennsylvania, USA.
Linne von Berg, K.-H., and H. Bothe. 1992. The distribution ofdenitrifying bacteria in soils monitored by DNA-probing.FEMS Microbiology Ecology 86:331–340.
Liu, W.-T., T. L. Marsh, H. Cheng, and L. J. Forney. 1997.Characterization of microbial diversity by determiningterminal restriction fragment length polymorphisms of genesencoding 16S rRNA. Applied and Environmental Micro-biology 63:4516–4522.
Liu, X., S. M. Tiquia, G. Holguin, L. Wu, S. C. Nold, A. H.Devol, K. Luo, A. V. Palumbo, J. M. Tiedje, and J. Zhou.2003. Molecular diversity of denitrifying genes in continentalmargin sediments within the oxygen-deficient zone off thePacific coast of Mexico. Applied and Environmental Micro-biology 69:3549–3560.
Lohse, L., H. T. Kloosterhuis, W. van Raaphorst, and W.Heldere. 1996. Denitrification rates as measured by theisotope pairing method and by the acetylene inhibitiontechnique in continental shelf sediments of the North Sea.Marine Ecology Progress Series 29:169–179.
Mariotti, A., J. C. Germon, P. Hubert, P. Kaiser, R. Letolle, A.Tardieux, and P. Tardieux. 1981. Experimental determina-tion of nitrogen kinetic isotope fractionation: some princi-ples; illustration for the denitrification and nitrificationprocesses. Plant and Soil 62:413–430.
Mariotti, A., A. Landreau, and B. Simon. 1988. N isotopebiogeochemistry and natural denitrification process ingroundwater: application to the chalk aquifer of northernFrance. Geochimica et Cosmochimica Acta 52:1869–1878.
Martin, J. H., G. A. Knauer, D. M. Karl, and W. W.Broenkow. 1987. VERTEX: carbon cycling in the northeastPacific. Deep Sea Research Part A 34:267–285.
McClain, M. E., E. W. Boyer, C. L. Dent, S. E. Gergel, N. B.Grimm, P. M. Groffman, S. C. Hart, J. W. Harvey, C. A.Johnston, E. Mayorga, W. H. McDowell, and G. Pinay.2003. Biogeochemical hot spots and hot moments at theinterface of terrestrial and aquatic ecosystems. Ecosystems 6:301–312.
McCutchan, J. H., J. F. Saunders, A. L. Pribyl, and W. M.Lewis. 2003. Open-channel estimation of denitrification.Limnology and Oceanography Methods 1:74–81.
McElroy, M. B. 1983. Marine biological controls on atmos-pheric CO2 and climate. Nature 302:328–329.
INVITED FEATURE2118Ecological Applications
Vol. 16, No. 6

McIsaac, G. F., and X. Hu. 2004. Net N input and riverine Nexport from Illinois agricultural watersheds with and withoutextensive tile drainage. Biogeochemistry 70:251–271.
McMahon, P. B., and J. K. Bohlke. 1996. Denitrification andmixing in a stream-aquifer system: effects on nitrate loadingto surface water. Journal of Hydrology 186:105–128.
McMahon, P. B., J. K. Bohlke, and B. W. Bruce. 1999.Denitrification in marine shales in northeastern Colorado,USA. Water Resources Research 35:1629–1642.
McMahon, P. B., J. K. Bohlke, and S. C. Christenson. 2004a.Geochemistry, radiocarbon ages, and paleorecharge condi-tions along a transect in the central High Plains aquifer,southwestern Kansas, USA. Applied Geochemistry 19:1655–1686.
McMahon, P. B., J. K. Bohlke, and T. M. Lehman. 2004b.Vertical gradients in water chemistry and age in the southernHigh Plains Aquifer, Texas, 2002. U.S. Geological SurveyScientific Investigations Report 2004-5053. U.S. GeologicalSurvey, Reston, Virginia, USA.
Mengis, M., S. L. Schiff, M. Harris, M. C. English, R. Aravena,R. J. Elgood, and A. MacLean. 1999. Multiple geochemicaland isotopic approaches for assessing ground water NO3
–
elimination in a riparian zone. Ground Water 37:448–457.Mergel, A., O. Schmitz, T. Mallmann, and H. Bothe. 2001.Relative abundance of denitrifying and dinitrogen-fixingbacteria in layers of a forest soil. FEMS MicrobiologyEcology 36:33–42.
Michotey, V., V. Mejean, and P. Bonin. 2000. Comparison ofmethods for quantification of cytochrome cd1-denitrifyingbacteria in environmental marine samples. Applied andEnvironmental Microbiology 66:1564–1571.
Middelburg, J. J., K. Soetaert, and P. M. J. Herman. 1996a.Evaluation of the nitrogen isotope-pairing method formeasuring benthic denitrification: a simulation analysis.Limnology and Oceanography 41:1839–1844.
Middelburg, J. J., K. Soetaert, and P. M. J. Herman. 1996b.Reply to the comment by Nielsen et al. Limnology andOceanography 41:1846–1847.
Miyake, Y., and E. Wada. 1971. The isotope effect on thenitrogen in biochemical, oxidation-reduction reactions. Re-cords of Oceanographic Works in Japan 11:1–6.
Moeseneder, M., J. M. Arrieta, G. Muyzer, C. Winter, and G.Herndl. 1999. Optimization of terminal-restriction fragmentlength polymorphism analysis for complex marine bacter-ioplankton communities and comparison with denaturinggradient gel electrophoresis. Applied and EnvironmentalMicrobiology 65:3518–3525.
Mortimer, C. H. 1941. The exchange of dissolved substancesbetween mud and water. I and II. Journal of Ecology 29:280–329.
Mosier, A. R. 1980. Acetylene inhibition of ammoniumoxidation in soil. Soil Biology and Biochemistry 12:443–444.
Mulholland, P. J., H. M. Vallett, J. R. Webster, S. A. Thomas,L. N. Cooper, S. K. Hamilton, and B. J. Peterson. 2004.Stream denitrification and total nitrate uptake rates meas-ured using a field 15N tracer addition approach. Limnologyand Oceanography 49:809–820.
Myrold, D. D. 1990. Measuring denitrification in soils using15N techniques. Pages 181–198 in N. P. Revsbech and J.Sørensen, editors. Denitrification in soil and sediment.Plenum Press, New York, New York, USA.
Nieder, R., G. Schollmayer, and J. Richter. 1989. Denitrifica-tion in the rooting zone of cropped soils with regard tomethodology and climate: a review. Biology and Fertility ofSoils 8:219–226.
Nielsen, K., L. P. Nielsen, and P. Rasmussen. 1995. Estuarinenitrogen retention independently estimated by the denitrifi-cation rate and mass balance methods: a study of NorsmindeFjord, Denmark. Marine Ecology Progress Series 119:275–283.
Nielsen, K., N. Risgaard-Petersen, B. Sømod, S. Rysgaard, andT. Bergo. 2001. Nitrogen and phosphorus retention estimatedindependently by flux measurements and dynamic modellingin the estuary, Randers Fjord, Denmark. Marine EcologyProgress Series 219:25–40.
Nielsen, L. P. 1992. Denitrification in sediment determinedfrom nitrogen isotope pairing. FEMS Microbiology Ecology86:357–362.
Nielsen, L. P., N. Risgaard-Petersen, S. Rysgaard, and T. H.Blackburn. 1996. Reply to the note by Middelburg et al.Limnology and Oceanography 41:1845–1846.
Nishio, T., I. Koike, and A. Hattori. 1981. N2/Ar anddenitrification in Tama Estuary sediments. GeomicrobiologyJournal 2:193–209.
Nishio, T., I. Koike, and A. Hattori. 1982. Denitrification,nitrate reduction and oxygen-consumption in coastal andestuarine sediments. Applied and Environmental Micro-biology 43:648–653.
Nishio, T., I. Koike, and A. Hattori. 1983. Estimates ofdenitrification and nitrification in coastal and estuarinesediments. Applied and Environmental Microbiology 45:444–450.
Nixon, S. W., et al. 1996. The fate of nitrogen and phosphorusat the land-sea margin of the North Atlantic Ocean.Biogeochemistry 35:141–180.
Nixon, S. W., C. A. Oviatt, and S. S. Hale. 1976. Nitrogenregeneration and the metabolism of coastal marine bottomcommunities. Pages 269–283 in J. M. Anderson and A.MacFadyen, editors. The role of terrestrial and aquaticorganisms in decomposition processes. Blackwell, Oxford,UK.
Nogales, B., K. N. Timmis, D. B. Nedwell, and A. M. Osborn.2002. Detection and diversity of expressed denitrificationgenes in estuarine sediments after reverse transcription-PCRamplification from mRNA. Applied and EnvironmentalMicrobiology 68:5017–5025.
Nommik, H. 1956. Investigations on denitrification in soils.Acta Agriculturae Scandinavica 6:195–228.
Nowicki, B. L. 1994. The effect of temperature, oxygen,salinity, and nutrient enrichment on estuarine denitrificationrates measured with a modified nitrogen gas flux technique.Estuarine and Coastal Shelf Science 38:137–156.
Oremland, R. S., C. Umberger, C. W. Culbertson, and R. L.Smith. 1984. Denitrification in San Francisco Bay intertidalsediments. Applied and Environmental Microbiology 47:1106–1112.
Ottosen, L. D. M., N. Risgaard-Petersen, and L. P. Nielsen.1999. Direct and indirect measurements of nitrification anddenitrification in the rhizosphere of aquatic macrophytes.Aquatic Microbial Ecology 19:81–91.
Ottosen, L. D. M., N. Risgaard-Petersen, L. P. Nielsen, and T.Dalsgaard. 2001. Denitrification in exposed intertidal mud-flats, measured with a new N-15-ammonium spray technique.Marine Ecology Progress Series 209:35–42.
Parkin, T. B. 1987. Soil microsites as a source of denitrificationvariability. Soil Science Society of America Journal 51:1194–1199.
Parkin, T. B., H. F. Kaspar, A. J. Sexstone, and J. M. Tiedje.1984. A gas-flow soil core method to measure fielddenitrification rates. Soil Biology and Biochemistry 16:323–330.
Parkin, T. B., J. L. Starr, and J. J. Meisinger. 1987. Influence ofsample size on measurements of soil denitrification rates. SoilScience Society of America Journal 51:1492–1501.
Payne, W. J. 1991. A review of methods for field measurementsof denitrification. Forest Ecology and Management 44:5–14.
Postma, D., C. Boesen, H. Kristiansen, and F. Larsen. 1991.Nitrate reduction in an unconfined sandy aquifer: waterchemistry, reduction processes, and geochemical modeling.Water Resources Research 27:2027–2045.
December 2006 2119A SYNTHESIS OF DENITRIFICATION

Pribyl, A. L., J. H. McCutchan, Jr., W. M. Lewis, Jr., and J. F.Saunders. 2005. Whole-system estimation of denitrification ina plains river: a comparison of two methods. Biogeochem-istry 73:439–455.
Rayleigh, L. 1896. Theoretical considerations respecting theseparation of gases by diffusion and similar processes.Philosophical Magazine 42:493–498.
Redfield, A. C. 1934. On the proportions of organic derivativesin sea water and their relation to the composition ofplankton. Pages 177–192 in R. J. Daniel, editor. JamesJohnstone Memorial Volume. Liverpool University Press,Liverpool, UK.
Redfield, A. C., B. H. Ketchum, and F. A. Richards. 1963. Theinfluence of organisms on the composition of sea-water.Pages 26–77 in M. N. Hill, editor. The sea. Volume 2. JohnWiley and Sons, New York, New York, USA.
Reeburgh, W. S. 1969. Observation of gases in Chesapeake Baysediments. Limnology and Oceanography 14:368–375.
Revsbech, N. P., and J. Sørensen. 1990. Measurement ofsediment denitrification using 15-N tracer method. Pages259–275 in N. P. Revsbech and J. Sørensen, editors.Denitrification in soil and sediment. Plenum Press, NewYork, New York, USA.
Rich, J. J., R. S. Heichen, P. J. Bottomley, K. Cromack, Jr., andD. D. Myrold. 2003. Community composition and function-ing of denitrifying bacteria from adjacent meadow and forestsoils. Applied and Environmental Microbiology 69:5974–5982.
Richards, F. A. 1965. Anoxic basins and fjords. Pages 611–645in J. P. Riley and G. Skirrow, editors. Chemical ocean-ography. Volume 1. Academic Press, New York, New York,USA.
Richards, F. A., and B. B. Benson. 1961. Nitrogen/argon andnitrogen isotope ratios in two anaerobic environments, theCariaco Trench in the Caribbean Sea and Dramsfjord,Norway. Deep-Sea Research 7:254–264.
Risgaard-Petersen, N., L. P. Nielsen, and T. H. Blackburn.1998. Simultaneous measurement of benthic denitrification,with the isotope pairing technique and the N2 flux method ina continuous flow-through system. Water Research 32:3371–3377.
Risgaard-Petersen, N., L. P. Nielsen, S. Rysgaard, T. Dals-gaard, and R. L. Meyer. 2003. Application of the isotopepairing technique in sediments where anammox and deni-trification coexist. Limnology and Oceanography Methods 1:63–73.
Risgaard-Petersen, N., S. Skarup, and L. P. Nielsen. 1999.Denitrification in a soft bottom lake: evaluation of labo-ratory incubation. Aquatic Microbial Ecology 17:279–287.
Robertson, G. P., M. A. Huston, F. C. Evans, and J. M. Tiedje.1988. Spatial variability in a successional plant community:patterns of nitrogen availability. Ecology 69:1517–1524.
Robertson, G. P., and J. M. Tiedje. 1985. Denitrification andnitrous oxide production in old growth and successionalMichigan forests. Soil Science Society of America Journal 48:383–389.
Robertson, G. P., and J. M. Tiedje. 1987. Nitrous oxide sourcesin aerobic soils: nitrification, denitrification and otherbiological processes. Soil Biology and Biochemistry 19:187–193.
Robertson, W. D., B. M. Russell, and J. A. Cherry. 1996.Attenuation of nitrate in aquitard sediments of southernOntario. Journal of Hydrology 180:267–281.
Ross, P. J., A. E. Martin, and E. F. Henzell. 1964. A gas-tightgrowth chamber for investigating gaseous nitrogen changesin the soil : plant : atmosphere system. Nature 204:444–447.
Royer, T. V., J. L. Tank, and M. B. David. 2004. The transportand fate of nitrate in headwater, agricultural streams inIllinois. Journal of Environmental Quality 33:1296–1304.
Rudolph, J., P. Frenzel, and N. Pfennig. 1991. Acetyleneinhibition technique underestimates in situ denitrificationrates in intact cores of freshwater sediment. FEMS Micro-biology Ecology 85:101–106.
Ryden, J. C., and K. P. Dawson. 1982. Evaluation of theacetylene-inhibition technique for the measurement ofdenitrification in grassland soils. Journal of the Science ofFood and Agriculture 33:1197–1206.
Ryden, J. C., L. J. Lund, and D. D. Focht. 1979a. Directmeasurement of denitrification loss from soils: I. Laboratoryevaluation of acetylene inhibition of nitrous oxide reduction.Soil Science Society of America Journal 43:104–109.
Ryden, J. C., L. J. Lund, J. Letey, and D. D. Focht. 1979b.Direct measurement of denitrification loss from soils: II.Development and application of field methods. Soil ScienceSociety of America Journal 43:110–118.
Ryden, J. C., and J. H. Skinner. 1987. Soil core incubationsystem for the field measurement of denitrification usingacetylene inhibition. Soil Biology and Biochemistry 19:753–757.
Scala, D. J., and L. J. Kerkhof. 1999. Diversity of nitrous oxidereductase (nosZ) genes in continental shelf sediments.Applied and Environmental Microbiology. 65:1681–1687.
Scala, D. J., and L. J. Kerkhof. 2000. Horizontal heterogeneityof denitrifying bacterial communities in marine sediments byterminal restriction fragment length polymorphism analysis.Applied and Environmental Microbiology. 66:1980–1986.
Scholefield, D., J. M. B. Hawkins, and S. M. Jackson. 1997a.Development of a helium atmosphere soil incubationtechnique for direct measurement of nitrous oxide anddinitrogen fluxes during denitrification. Soil Biology andBiochemistry 29:1345–1352.
Scholefield, D., J. M. B. Hawkins, and S. M. Jackson. 1997b.Use of a flowing helium atmosphere incubation technique tomeasure the effects of denitrification controls applied tointact cores of a clay soil. Soil Biology and Biochemistry 29:1337–1344.
Schulz, H. N., and B. B. Jørgensen. 2001. Big bacteria. AnnualReview of Microbiology 55:105–137.
Seitzinger, S. 1988. Denitrification in freshwater and coastalmarine ecosystems: ecological and geochemical significance.Limnology and Oceanography 33:702–724.
Seitzinger, S. P., L. P. Nielsen, J. Caffrey, and P. B.Christensen. 1993. Denitrification measurements in aquaticsediments: a comparison of three methods. Biogeochemistry23:147–167.
Seitzinger, S. P., S. W. Nixon, M. E. Q. Pilson, and S. Burke.1980. Denitrification and N2O production in nearshoremarine sediments. Geochimica Cosmochima Acta 44:1853–1860.
Sexstone, A. J., T. B. Parkin, and J. M. Tiedje. 1985. Temporalresponse of soil denitrification rates to rainfall and irrigation.Soil Science Society of America Journal 49:99–103.
Sigman, D. M., R. Robinson, A. N. Knapp, A. van Geen, D. C.McCorkle, J. A. Brandes, and R. C. Thunell. 2003.Distinguishing between water column and sedimentarydenitrification in the Santa Barbara Basin using the stableisotopes of nitrate. Geochemistry Geophysics Geosystems 4:1–20.
Silver, W. L., D. L. Herman, and M. K. Firestone. 2001.Dissimilatory nitrate reduction to ammonium in uplandtropical forest soils. Ecology 82:2410–2416.
Slater, J. M., and D. G. Capone. 1989. Nitrate requirement foracetylene inhibition of nitrous oxide reduction in marinesediments. Microbial Ecology 17:143–157.
Smith, R. L., J. K. Bohlke, S. P. Garabedian, K. M. Revesz,and T. Yoshinari. 2004. Assessing denitrification in ground-water using natural gradient tracer tests with 15N: in situmeasurement of a sequential multistep reaction. Water
INVITED FEATURE2120Ecological Applications
Vol. 16, No. 6
Resources Research 40 :W07101. [doi : 10.1029/2003WR002919]
Smith, R. L., B. L. Howes, and J. H. Duff. 1991. Denitrificationin nitrate-contaminated ground water: occurrence in steepvertical geochemical gradients. Geochimica et CosmochimicaActa 55:1815–1825.
Smith, S. V., J. T. Hollibaugh, S. J. Dollar, and S. Vink. 1991.Tomales Bay metabolism: C–N–P stoichiometry and ecosys-tem heterotrophy at the land-sea interface. Estuarine Coastaland Shelf Science 33:223–257.
Sørenson, J. 1978. Denitrification rates in a marine sediment asmeasured by acetylene inhibition technique. Applied andEnvironmental Microbiology 36:143–189.
Stefanson, R. C. 1970. Sealed growth chambers for studies ofthe effect of plants on the soil atmosphere. Journal ofAgriculture and Engineering Research 15:295–301.
Stefanson, R. C. 1972. Soil denitrification in sealed soil–plantsystems. I. Effect of plants, soil water content and soilorganic matter content. Plant and Soil 33:113–127.
Stefanson, R. C., and D. J. Greenland. 1970. Measurement ofnitrogen and nitrous oxide evolution from soil–plant systemsusing sealed growth chambers. Soil Science 109:203–206.
Steingruber, S. M., J. Friedrich, R. Gachter, and B. Wehrli.2001. Measurement of denitrification in sediments with theN-15 isoptope pairing technique. Applied and EnvironmentalMicrobiology 67:3771–3778.
Sterner, R. W., and J. J. Elser. 2002. Ecological stoichiometry:the biology of elements from molecules to the biosphere.Princeton University Press, Princeton, New Jersey, USA.
Stevens, R. J., and R. J. Laughlin. 2001. Lowering the detectionlimit for dinitrogen using the enrichment of nitrous oxide.Soil Biology and Biochemistry 33:1287–1289.
Stevens, R. J., R. J. Laughlin, G. J. Atkins, and S. J. Prosser.1993. Automated determination of nitrogen-15-labeled dini-trogen and nitrous oxide by mass spectrometry. Soil ScienceSociety of America Journal 57:981–988.
Strebel, O., J. Boettcher, and P. Fritz. 1990. Use of isotopefractionation of sulfate-sulfur and sulfate-oxygen to assessbacterial desulfurication in a sandy aquifer. Journal ofHydrology 121:155–172.
Strous, M., J. A. Fuerst, E. H. M. Kramer, S. Logemann, G.Muyzer, K. T. van de Pas-Schoonen, R. Webb, J. G. Kuenen,and M. S. M. Jetten. 1999. Missing lithotroph identified asnew planctomycete. Nature 400:446–449.
Stumm, W., and J. J. Morgan. 1996. Aquatic chemistry. Thirdedition. Wiley, New York, New York, USA.
Stute, M., and P. Schlosser. 2000. Atmospheric noble gases.Pages 349–377 in P. G. Cook and A. L. Herczeg, editors.Environmental tracers in subsurface hydrology. KluwerAcademic Publishers, Boston, Massachusetts, USA.
Sugisaki, R. 1959. Measurement of effective flow velocity ofground water by means of dissolved gases. American Journalof Science 259:144–153.
Swerts, M., G. Uytterhoeven, R. Merckx, and K. Vlassak.1995. Semicontinuous measurement of soil atmosphere gaseswith gas-flow soil core method. Soil Science Society ofAmerica Journal 59:1336–1342.
Taroncher-Oldenburg, G., E. M. Griner, C. A. Francis, andB. B. Ward. 2003. Oligonucleotide microarray for the studyof functional gene diversity in the nitrogen cycle in theenvironment. Applied and Environmental Microbiology 69:1159–1171.
Terry, R. E., and J. M. Duxbury. 1985. Acetylene decom-position in soils. Soil Science Society of America Journal 49:90–94.
Tesoriero, A. J., H. Liebscher, and S. E. Cox. 2000. Mechanismand rate of denitrification in an agricultural watershed:Electron and mass balance along groundwater flow paths.Water Resources Research 36:1545–1559.
Thamdrup, B., and T. Dalsgaard. 2002. Production of N2
through anaerobic ammonium oxidation coupled to nitratereduction in marine sediments. Applied and EnvironmentalMicrobiology 68:1312–1318.
Thomas, K. L., and D. Lloyd. 1995. Measurement ofdenitrification in estuarine sediment using membrane inletmass spectrometry. FEMS Microbiology Ecology 16:103–113.
Throback, I. N., K. Enwall, A. Jarvis, and S. Hallin. 2004.Reassessing PCR primers targeting nirS, nirK and nosZ genesfor community surveys of denitrifying bacteria with DGGE.FEMS Microbiology Ecology 49:401–417.
Tiedje, J. M. 1988. Ecology of denitrification and dissimilatorynitrate reduction to ammonium. Pages 170–244 in A. J. B.Zehnder, editor. Biology of anaerobic microorganisms. JohnWiley and Sons, New York, New York, USA.
Tiedje, J. M., A. J. Sexstone, D. D. Myrold, and J. A.Robinson. 1982. Denitrification: ecological niches, competi-tion and survival. Antonie van Leeuwenhoek 48:569–583.
Tiedje, J. M., S. Simkins, and P. M. Groffman. 1989.Perspectives on measurement of denitrification in the fieldincluding recommended protocols for acetylene basedmethods. Plant and Soil 115:261–284.
Topp, E., and J. C. Germon. 1986. Acetylene metabolism andstimulation of denitrification in an agricultural soil. Appliedand Environmental Microbiology 52:802–806.
Tuomainen, J. M., S. Hietanen, J. Kuparinen, P. J. Martikai-nen, and K. Servomaa. 2003. Baltic Sea cyanobacterialbloom contains denitrification and nitrification genes, but hasnegligible denitrification activity. FEMS Microbiology Ecol-ogy 45:83–96.
Van Cleemput, O. 1971. Etude de la denitrification dans le sol.Pedologie 21:367–376.
Van Luijn, F., P. C. M. Boers, and L. Lijklema. 1996.Comparison of denitrification rates in lake sedimentsobtained by the N2 flux method, the 15N isotope pairingtechnique and the mass-balance approach. Water Research30:893–900.
Verstraeten, I. M., G. V. Steele, J. K. Bohlke, T. F. Kraemer,K. E. Wilson, and A. E. Carnes. 2001a. Selected field andanalytical methods and analytical results in the Dutch Flatsarea, western Nebraska, 1995–99. U.S. Geological SurveyOpen-File Report 00-413. U.S. Geological Survey Informa-tion Services, Denver, Colorado, USA.
Verstraeten, I. M., G. V. Steele, J. C. Cannia, D. E. Hitch,K. G. Scripter, J. K. Bohlke, T. F. Kraemer, and J. S.Stanton. 2001b. Interaction of surface water and groundwater in the Dutch Flats area, western Nebraska, 1995–99.U.S. Geological Survey Water-Resources InvestigationsReport 01-4070. U.S. Geological Survey Information Serv-ices, Denver, Colorado, USA.
Vogel, J. C., A. S. Talma, and T. H. E. Heaton. 1981. Gaseousnitrogen as evidence for denitrification in groundwater.Journal of Hydrology 50:191–200.
von Rheinbaben, W. 1990. Nitrogen losses from agriculturalsoils through denitrification: a critical evaluation. Zeitschriftfur Pflanzenernahrung und Bodenkunde 153:157–166.
Voss, M., J. W. Dippner, and J. P. Montoya. 2001. Nitrogenisotope patterns in the oxygen-deficient waters of the EasternTropical North Pacific Ocean. Deep Sea Research II 48:1905–1921.
Walter, H. M., D. R. Keeney, and I. R. Fillery. 1979. Inhibitionof nitrification by acetylene. Soil Science Society of AmericaJournal 43:195–196.
Webster, I. T., J. S. Parslow, and S. V. Smith. 2000.Implications of spatial and temporal variation for biogeo-chemical budgets of estuaries. Estuaries 23:341–350.
Weiss, R. F. 1970. The solubility of nitrogen, oxygen and argonin water and seawater. Deep-Sea Research 17:721–735.
December 2006 2121A SYNTHESIS OF DENITRIFICATION

Wellman, R. P., F. D. Cook, and H. R. Krouse. 1968.Nitrogen-15: microbiological alteration of abundance. Sci-ence 161:269–270.
Welsh, D. T., M. Bartoli, D. Nizzoli, G. Castaldelli, S. A. Riou,and P. Viaroli. 2000. Denitrification, nitrogen fixation,community primary productivity and inorganic-N and oxy-gen fluxes in an intertidal Zostera noltii meadow. MarineEcology Progress Series 208:65–77.
Wickramasinghe, K. N., O. Talibudeen, and J. F. Witty. 1978.A gas flow-through system for studying denitrification insoils. Journal of Soil Science 29:527–536.
Wilson, G. B., J. N. Andrews, and A. H. Bath. 1990. Dissolvedgas evidence for denitrification in the Lincolnshire limestonegroundwaters, eastern England. Journal of Hydrology 113:51–60.
Wolsing, M., and A. Prieme. 2004. Observation of highseasonal variation in community structure of denitrifyingbacteria in arable soil receiving artificial fertilizer and cattlemanure by determining T-RFLP of nir gene fragments.FEMS Microbiology Ecology 48:261–271.
Wulff, F., A. Stigebrandt, and L. Rahm. 1990. Nutrientdynamics of the Baltic Sea. Ambio 19:126–133.
Ye, R. W., and S. M. Thomas. 2001. Microbial nitrogen cycles:physiology, genomics and applications. Current Opinion inMicrobiology 4:307–312.
Yeomans, J. C., and E. G. Beauchamp. 1982. Acetylene as apossible substrate in the denitrification process. CanadianJournal of Soil Science 62:137–144.
Yoshinari, T., and R. Knowles. 1976. Acetylene inhibition ofnitrous oxide reduction by denitrifying bacteria. Biochemicaland Biophysical Research Communications 69:705–710.
Zhang, L., N. Takaya, T. Kitazume, T. Kondo, and H. Shoun.2001. Purification and cDNA cloning of nitric oxidereductase cytochrome P450nor (CYP55A4) from Trichospor-on cutaneum. European Journal Biochemistry 268:3198–3204.
Zimmerman, A. R., and R. Benner. 1994. Denitrification,nutrient regeneration and carbon mineralization in sedimentsof Galveston Bay, Texas, USA. Marine Ecology ProgressSeries 114:275–288.
Zumft, W. G. 1997. Cell biology and molecular basis ofdenitrification. Microbiology and Molecular Biology Review61:533–616.
Zumft, W. G. 1999. The denitrifying prokaryotes. In M.Dworkin, S. Falkow, E. Rosenberg, K.-H. Schleifer, and E.Stackebrandt, editors. The prokaryotes: an evolving elec-tronic resource for the microbiological community. Third
edition, release 3.0. Springer-Verlag, New York, New York,USA. hhttp://141.150.157.117:8080/prokPUB/index.htmi
INVITED FEATURE2122Ecological Applications
Vol. 16, No. 6
Copyright © 2022 FDOKUMEN