Silver chances arise in the difficult times - VIETDATA
146
Silver chances arise in the difficult times
-
Upload
khangminh22 -
Category
Documents
-
view
2 -
download
0
Transcript of Silver chances arise in the difficult times - VIETDATA
Silver chances arise in the difficult times

Highlights and Recommendations for 2020
• Global stock market is forecasted to face upwinds such as US election, Brexit, 11-year growth market and possibly rising commodity prices. Because monetary policies seems to have reached the limit in terms of providing growth drivers, we think this is the time to consider a coordination betwwen monetary and fiscal policies
• Regarding to Vietnam, the Government may combine fiscal and monetary policies to stabilize the domestic macro environment and maintain growth. The Vietnamese economy is going to continue to grow steadily and is forecasted to reach the Government's target, 6.8% YoY.
• Expectations, difficulties and potential risks for Vietnam's stock market are not much different from the 2019’s, including expectations about the progress of divestment and equitization of SOEs and the market reclassification. However, there will be no significant progress at these events in 2020.
• The largest risk to the stock market still comes from geopolitical developments and the global trade, rather than the country itself. However, investors may have been familiar with both the disappointment of unfullfiled expectations and the fluctuations of global factors. The impact on market sentiment, therefore, will not be too strong. In terms of capital flow, it is difficult to expect large foreign capital flows, especially when the impressive growth in developed economies makes the frontier markets become less attractive.
• On the positive side, the Government's perseverance in implementing policies to stabilize the macroeconomy and support the development of domestic participants will benefit the economy, in general, and listed companies, in particular, in the long term. Forecasted earnings and EPS growth of listed companies will recover to double digits after a flat in 2019. Contrarily, domestic capital flow into the stock market will still be relatively limited, due to the influence from regulations to limit capital flows into high-risk assets such as securities and real estates.
• In the context that the capital flows will not be as abundant in 2020 as in the late 2016 to early 2018, the investment also needs to be carefully scrutinized, aiming at businesses with organic growth from core business. The increase of VN-Index in 2020 will be moderate and closely related to the fundamentals rather than due to price inflation.
• We forecast that VNIndex will fluctuate in the range of 950 – 1,120.
• 2020 will continue to favor bottom-up investment strategy. Investors can consider companies benefiting from domestic consumption and infrastructure investments. Besides, some high dividend yield stocks will be suitable for the risk-averse.
• Our preferred stocks in 2020 include MWG, SMB, VPB, NLG, QNS, PVD, HPG, PVS, IMP, DRC, BID, and BMP.

CONTENTS
GLOBAL EQUITY MARKETS .............................................................................................................................................................. 6
VIETNAM MACROECONOMY – INNER STRENGTH ........................................................................................................................ 11
MARKET OUTLOOK 2020 – ............................................................................................................................................................. 18
INVESTMENT STRATEGY AND IDEAS ............................................................................................................................................ 23
CONSUMER INDUSTRY – A WONDERLAND BUT NOT FOR EVERYONE ........................................................................................ 32
MOBILE WORLD INVESTMENT JSC ..................................................................................................................................................................................... 36
PHU NHUAN JEWELRY JSC .................................................................................................................................................................................................. 37
FPT DIGITAL RETAIL JSC ......................................................................................................................................................................................... 38
QUANG NGAI SUGAR JSC ................................................................................................................................................................................................... 39
SAIGON MIEN TRUNG BEER JSC ........................................................................................................................................................................................ 40
VIETNAM DAIRY PRODUCTS JSC ........................................................................................................................................................................................ 41
BANK – STRICTER REGULATIONS, YET GROWTH TO REMAIN POSITIVE ..................................................................................... 42
VIETNAM PROSPERITY JSB. .................................................................................................................................................................................................. 47
BANK FOR INVESTMENT AND DEVELOPMENT OF VIETNAM J.S.C ............................................................................................................................. 48
JSC BANK FOR FOREIGN TRADE OF VIETNAM ................................................................................................................................................................. 49
ASIA COMMERCIAL JOINT STOCK BANK ........................................................................................................................................................................ 50
MILITARY COMMERCIAL JOINT STOCK BANK ................................................................................................................................................................ 51
TECHNOLOGICAL AND COMMERCIAL JOINT STOCK BANK ........................................................................................................................................ 52
HOCHIMINH DEVELOPMENT JOINT STOCK BANK .......................................................................................................................................................... 53
INDUSTRIAL PARK – HIGH LEASE DEMAND ................................................................................................................................. 54
KINH BAC JSC .................................................................................................................................................................................................................. 57
NAM TAN UYEN JSC ...................................................................................................................................................................................................... 58
OIL & GAS – PUSH THE NEW PROJECTS TO GO ONLINE ............................................................................................................... 59
PETRO VIETNAM DRILLING & WELL SERVICES CORP ................................................................................................................................................. 61
PETROVIETNAM TRANSPORTATION CORP ........................................................................................................................................................... 62
PETROVIETNAM TECHNICAL SERVICES CORP ................................................................................................................................................................ 63
AUTOMOBILE AND PARTS – CONTINUING TO GROW .................................................................................................................. 64
DA NANG RUBBER JSC ........................................................................................................................................................................................................ 67
DRY CELL AND STORAGE BATTERY JSC ............................................................................................................................................................................ 68
HANG XANH MOTORS SERVICE JSC ................................................................................................................................................................................... 69
POWER - LITTLE CHANCE FOR EARNING GROWTH DESPITE STRONG DEMAND ......................................................................... 70
PHA LAI THERMAL POWER JSC ........................................................................................................................................................................................... 72
PETROVIETNAM POWER JSC. .............................................................................................................................................................................................. 73
AVIATION - A MIX OF TAILWINDS AND HEADWINDS ................................................................................................................... 74
AIRPORTS CORPORATION OF VIETNAM JSC .................................................................................................................................................................... 78
VIETJET AVIATION JSC .......................................................................................................................................................................................................... 79
Bloomberg: VJC VN ............................................................................................................................................................................................................... 79

SAIGON CARGO SERVICE CORPORATION ........................................................................................................................................................................ 80
TASECO AIRS JSC ................................................................................................................................................................................................................... 81
INSURANCE INDUSTRY: PRUDENT GROWTH ................................................................................................................................ 82
PETROLIMEX INSURANCE CORPORATION ...................................................................................................................................................................... 85
PHARMACEUTICALS – POLICY CHANGES FAVOR THE HOSPITAL CHANNEL .............................................................................. 86
IMEXPHARM PHARMACEUTICAL JSC ................................................................................................................................................................................ 89
SEAPORT INDUSTRY – GETTING TOUGHER .................................................................................................................................. 91
GEMADEPT CORPORATION ............................................................................................................................................................................................... 94
VINCONSHIP JSC ................................................................................................................................................................................................................... 95
Bloomberg: VSC VN .............................................................................................................................................................................................................. 95
TEXTILE & GARMENT – MIXED EMOTIONS .................................................................................................................................... 96
SONG HONG GARMENT JSC .............................................................................................................................................................................................. 99
CENTURY SYNTHETIC FIBER JSC ...................................................................................................................................................................................... 100
THANH CONG TEXTILE GARMENT INVESTMENT TRADING JSC ................................................................................................................................. 101
PANGASIUS INDUSTRY – MARKET DIVERSIFICATION FOR GROWTH ........................................................................................ 102
VINH HOAN CORPORATION ........................................................................................................................................................................................... 106
NAM VIET CORPORATION ............................................................................................................................................................................................... 107
SHRIMP INDUSTRY – EXPORT PRICES MAY NOT RECOVER ........................................................................................................ 108
REAL ESTATE - MORE CHALLENGES ............................................................................................................................................ 111
NAM LONG JSC ....................................................................................................................................................................................................... 114
HA DO GROUP JSC ........................................................................................................................................................................................................ 115
KHANG DIEN JSC ........................................................................................................................................................................................................... 116
DAT XANH GROUP JSC ............................................................................................................................................................................................... 117
DIC GROUP JSC .......................................................................................................................................................................................................... 118
VINCOM RETAIL JSC ...................................................................................................................................................................................................... 119
AGRICULTURE, FERTILIZER – NOT REALLY POSITIVE IN 2020 .................................................................................................... 120
LOC TROI GROUP JSC ...................................................................................................................................................................................................... 123
PETROVIETNAM FERTILIZER AND CHEMICALS .......................................................................................................................................................... 124
BINH DIEN FERTILIZER JSC ........................................................................................................................................................................................... 125
STEEL - CAPACITY EXPANSION FACES UP WITH WEAK DEMAND .............................................................................................. 126
HOA PHAT GROUP JOINT STOCK COMPANY .............................................................................................................................................................. 129
HOA SEN GROUP JSC ......................................................................................................................................................................................................... 130
NAM KIM GROUP JSC ........................................................................................................................................................................................................ 131
CONSTRUCTION - OBSTACLES IN THE MEDIUM TERM............................................................................................................... 132
POWER ENGINEERING CONSULTING COMPANY 2 ...................................................................................................................................................... 134
POWER CONSTRUCTION NO.1 JSC ................................................................................................................................................................................. 135

OTHER STOCK PICKS .................................................................................................................................................................... 136
FPT CORPORATION ........................................................................................................................................................................................................ 137
PHU TAI JSC ............................................................................................................................................................................................................... 138
CMC JSC ........................................................................................................................................................................................................................ 139
PHUOC HOA RUBBER JSC .............................................................................................................................................................................................. 140
BINH MINH PLASTIC JSC ................................................................................................................................................................................................... 141
REFREGERATION ELECTRICAL ENGINEERING CORPORATION .......................................................................................................... 142
MACRO OUTLOOK
www.vdsc.com.vn | Bloomberg: VDSC <GO> 6
GLOBAL EQUITY MARKETS Bernard Lapointe ([email protected])
Market Recap and Views
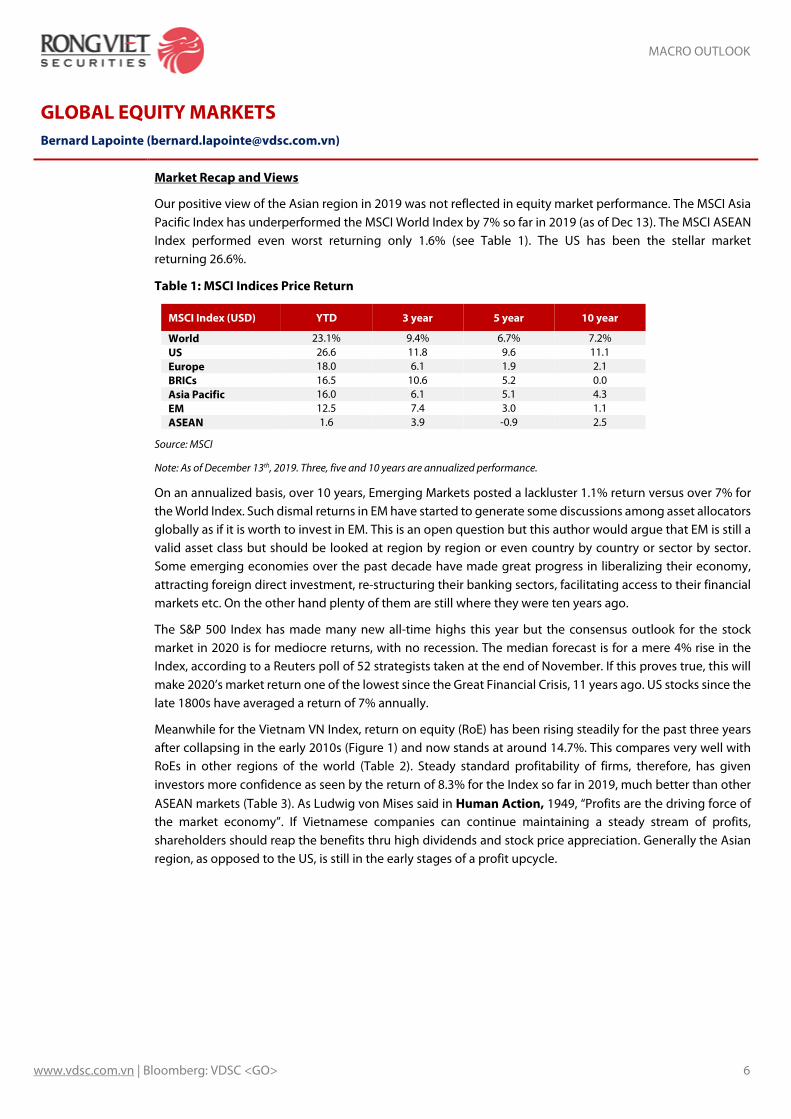
Our positive view of the Asian region in 2019 was not reflected in equity market performance. The MSCI Asia Pacific Index has underperformed the MSCI World Index by 7% so far in 2019 (as of Dec 13). The MSCI ASEAN Index performed even worst returning only 1.6% (see Table 1). The US has been the stellar market returning 26.6%.
Table 1: MSCI Indices Price Return
MSCI Index (USD) YTD 3 year 5 year 10 year
World 23.1% 9.4% 6.7% 7.2% US 26.6 11.8 9.6 11.1 Europe 18.0 6.1 1.9 2.1 BRICs 16.5 10.6 5.2 0.0 Asia Pacific 16.0 6.1 5.1 4.3 EM 12.5 7.4 3.0 1.1 ASEAN 1.6 3.9 -0.9 2.5
Source: MSCI
Note: As of December 13th, 2019. Three, five and 10 years are annualized performance.
On an annualized basis, over 10 years, Emerging Markets posted a lackluster 1.1% return versus over 7% for the World Index. Such dismal returns in EM have started to generate some discussions among asset allocators globally as if it is worth to invest in EM. This is an open question but this author would argue that EM is still a valid asset class but should be looked at region by region or even country by country or sector by sector. Some emerging economies over the past decade have made great progress in liberalizing their economy, attracting foreign direct investment, re-structuring their banking sectors, facilitating access to their financial markets etc. On the other hand plenty of them are still where they were ten years ago.
The S&P 500 Index has made many new all-time highs this year but the consensus outlook for the stock market in 2020 is for mediocre returns, with no recession. The median forecast is for a mere 4% rise in the Index, according to a Reuters poll of 52 strategists taken at the end of November. If this proves true, this will make 2020’s market return one of the lowest since the Great Financial Crisis, 11 years ago. US stocks since the late 1800s have averaged a return of 7% annually.
Meanwhile for the Vietnam VN Index, return on equity (RoE) has been rising steadily for the past three years after collapsing in the early 2010s (Figure 1) and now stands at around 14.7%. This compares very well with RoEs in other regions of the world (Table 2). Steady standard profitability of firms, therefore, has given investors more confidence as seen by the return of 8.3% for the Index so far in 2019, much better than other ASEAN markets (Table 3). As Ludwig von Mises said in Human Action, 1949, “Profits are the driving force of the market economy”. If Vietnamese companies can continue maintaining a steady stream of profits, shareholders should reap the benefits thru high dividends and stock price appreciation. Generally the Asian region, as opposed to the US, is still in the early stages of a profit upcycle.

MACRO OUTLOOK
www.vdsc.com.vn | Bloomberg: VDSC <GO> 7
Figure 1: VN Index
Source : Bloomberg, Rong Viet Securities
Table 2: Return on Equity, 2019E
Global 12.7% Vietnam 14.7 Emerging Markets 13.0
Developed Markets 12.6 Eurozone 10.6
Asia Pacific 10.4
Source : Bloomberg, Rong Viet Securities
Table 3: ASEAN Indices Price Return
Index, 2019, local currency % Vietnam- VN Index 8.3 Philippines- PCOMP 5.5
Singapore- STI 5.3 Thailand- SET 0.6
Indonesia- JCI 0.1
Malaysia- FBMKLCI -7.2
Source: Bloomberg
Note: as of December 13, 2019
On the US$ we remain convinced that its best days are behind. The DXY Index, a proxy for the US$, has been unable to break sustainably above the 98 level in 2019 (see Figure 2).
0
5
10
15
20
25
10
12
14
16
18
20
22
24
26RoE (%, LHS), EV/EBITDA (ratio, RHS)
RoE EV/EBITDA

MACRO OUTLOOK
www.vdsc.com.vn | Bloomberg: VDSC <GO> 8
Figure 2: Dollar Index, 2015-2019
This poor behavior in a strong US economy coupled with a record stock market and favorable interest rate differentials versus its main trading partners signal potential forward weakness. At best for 2020 it should be in a trading range. Currencies we like against the US$ include Asian EM, particularly the Thai Baht and Vietnam \Dong.
Finally on Palladium, the 46th element in the periodic table, which broke to a record high this year (see Figure 3), due in part to severe shortages of electricity at South African mines which has affected production. Why does it matter? Because Palladium is widely used by the auto industry – catalytic converters, electronic industry – cell phones, computers – jewelers and dentists. Even though car sales globally are not growing much, new and stricter anti-pollution norms in China and Europe are boosting the demand for more efficient vehicles, and the demand for Palladium. South Africa is the world’s largest producer and reserves holder followed by Russia.
Figure 3 : Palladium Price, 2015-2019

MACRO OUTLOOK
www.vdsc.com.vn | Bloomberg: VDSC <GO> 9
Is Monetary Policy Still Relevant?
Turning to the subject of monetary policies globally, a recurrent question that has arisen in 2019: have we arrived at the inflexion point where the effectiveness of monetary policies has a decreasing marginal impact on global growth? Since the 2008-09 Great Financial Crisis, the ascendency of various forms of monetarism has made fiscal policy almost redundant in most parts of the world. Could the pendulum swing back to the Keynesian idea that fiscal policy – government spending, taxation and borrowing- could matter again? Certain central bankers around the world have started to recognize that monetary policy has reached its limit, forty years after the election of Margaret Thatcher as Prime Minister of Great Britain.
More importantly is the abnormal ex ante assumption that fiscal policy cannot stimulate economic growth because higher government spending crowds out private investment and higher public borrowing is equivalent to higher taxes. The various theories supporting the notion that fiscal policies have been ineffective throughout the past 15-20 years because government borrowing would increase interest rates, inflationary expectations or future taxation, have all turned out to be wrong.
In the past two decades or so, public borrowing and debt have increased enormously in all advanced economies. But interestingly, investors have lent governments money at record low interest rates, without necessarily demanding a higher risk premium. The main tool for macroeconomic management remains monetary policy. It is seen as responsible and effective. But is it anymore? Could we argue that the limit of the effectiveness of that ‘tool’ is close? Can Keynesianism come back? Maybe.
The main message of the keynote address by Kristalina Georgieva, the IMF’s managing director, at this year’s IMF annual meeting was an appeal for “fiscal policy to play a more central role.” Almost all of the background discussions revolved around this theme as well. There is rising awareness around the world that more ‘government’ help is needed to keep economies growing, which is exposing the limits of relying on central banks to do the heavy lifting of economic management.
Japan’s heavy reliance on decades of unconventional monetary policy, starting in the late 80s, has failed to produce substantial growth. The Abe government may have to turn on the spigot in case growth starts declining. Japan’s 10-year bonds have rebounded from negative 0.3% in the summer to almost zero percent now, there highest level since early 2019 (Figure 4). Maybe the market is sensing the possibility of some fiscal stimulus on the horizon!
Figure 4: Japan’s 10-year Bond Yield

MACRO OUTLOOK
www.vdsc.com.vn | Bloomberg: VDSC <GO> 10
As Mr. Draghi just left the European Central Bank, we can ask ourselves what guided the monetary policies of the institution since 2011. The expansionist policy (quantitative easing), which was necessary between 2012 and 2014 and was legitimate and indispensable, found its role after 2014 difficult to justify. One theory is that the ECB kept a very expansionary monetary policy because it wanted to avoid the return of rising public debt. The new European Commission’s members who are responsible for enforcing the European Union’s outdated fiscal rules, written in the heyday of late-20th century monetarism, have begun to admit publicly the need for less restrictive budget policies. The permanent head of the EU department responsible for assessing national budgets has called for a “more balanced policy mix,” involving more expansionary fiscal policy “right here and right now.”
In short, central bankers and senior economic officials now almost unanimously believe that monetary policy has reached its limits and that fiscal policy should be reinstated as the main tool for managing business cycles and supporting economic growth. After all, governments expenditure as a percent of GDP in most regions has stabilized in the last ten years (see Figure 5). In advanced economies this ratio has fallen from 43% of GDP just after the end of the GFC to 39% now. Hence there is some room to spend if necessary.
Figure 5: Government Expenditure as a % of GDP
Source: IMF
Note: 2019 to 2023 are IMF Forecasts
36
37
38
39
40
41
42
43
44
45
10
15
20
25
30
35
1993
1994
1995
1996
1997
1998
1999
2000
2001
2002
2003
2004
2005
2006
2007
2008
2009
2010
2011
2012
2013
2014
2015
2016
2017
2018
2019
2020
2021
2022
2023
2024
EM/ Middle-Income Economies (LHS) Low-Income Countries (LHS)
Advanced Economies (RHS)

MACRO OUTLOOK
www.vdsc.com.vn | Bloomberg: VDSC <GO> 11
VIETNAM MACROECONOMY – INNER STRENGTH Tu Vu ([email protected])
Stretching economic growth
Vietnam’s business cycle extended to the 7th year. Looking ahead 2020, stabilizing domestic consumption and supporting private sector are the main policy choice of the government in the context of decreasing cross-border trade and investment
In 2019 Vietnamese economy remained its high growth in compared with other regional countries’. The global rate cuts in the middle of a cycle offseted negative impact of uncertainty stemming from Sino-US trade tension and other geopolitical changes.
Vietnam’s GDP growth in 2019 is estimated at 7% YoY, which is slightly below 2018’s 7.1% YoY but higher than the average pace in 2012-2017 and fulfills the Parliament’s target of 6.8% YoY. In 2019, the headline inflation dropped to 2.8% YoY from 2018’s 3.5% YoY. Additionally, Vietnam trade surplus hit a record high of USD 9.9 bn.
In addition, the macro-economic stability has been reinforced as the public debt/GDP gradually decreased to 57.4% from the peak of 63.7% recorded in 2016. Notably, 18 commercial banks qualified Basel II requirement with above 8% CAR. In 2020-2021, State Bank of Vietnam commits to stabilize the financial system and restrict money flow into risky sectors.
Looking back Vietnam’s two economic cycle in 2000-2020, it is clear that the current economic growth is healthier and more independent from the money supply. In 2019, money supply just grew at an annual pace of 12.5% YoY, lower than the 5-year average of 16% YoY. The upward momentum has diversified into various industries such as steel, oil refinery, electrononic devices, textiles, etc instead of the denomination of real estate.
Figure 1: Vietnam’s GDP growht in 2000-2020 (%, YoY)
Source: GSO, Rong Viet Securities
However, there will be more challenges to the Government’s target of macro-economic stability and healthy economic growth in 2020. Those come from both inside and outside of the country, urging for a coordiation between monetary and fiscal policies.
Manufacturing, cross-border trade and investment globally shrunk because of geopolitical tensions. In our opinion, the expectation variable plays a decisive role in those decreases.
According to Netherlands Bureau for Economic Policy Analysis (CPB), global trade volume dropped by 1.1% YoY in 09/2019 while trade price slummed 4.1% YoY on average. In the
0%
10%
20%
30%
40%
50%
60%
4%
5%
6%
7%
8%
9%
2000
2001
2002
2003
2004
2005
2006
2007
2008
2009
2010
2011
2012
2013
2014
2015
2016
2017
2018
2019
E
2020
F
GDP growth LHS Money supply growth RHS

MACRO OUTLOOK
www.vdsc.com.vn | Bloomberg: VDSC <GO> 12
first nine months of 2019, volume and price earsed 0.4% and 2.7% YoY, in turn. Reasonably, the concerns about economic recessions in China, which economic growth hit a decade low of 5.8% YoY in the third quarter, and geopolitical ambiguity clouded the outlook of basic commodity prices which generally decreased, excepted gold prices.
Manufacturing sector saw the same result as the pessimitic views on business environment dampened the PMI survey despite no clear plunge in the number of orders and employment. In the US, the business optimism recorded the lowest level since 10/2018 although the real output remained high, ISM’s survey.
Figure 2: Global trade volumes and prices (2010 = 100) Figure 3: US Manufacturing PMI (Points)
Source: CBP, Rong Viet Securities Source: Bloomberg, Rong Viet Securities
In recent months, there are some warning points in Vietnam’s economy to which should be paid attention in 2020. In details, total revenue of goods and service at current price rose by 11.6% YoY in 11 months of 2019, lower than 2018’s 12% YoY. In the GDP structure, wholesale and retail sale grew at 7.9% YoY in 2019, the lowest level in the past three years.
Regarding to manufacturing activities, both industrial production index (IPI) and PMI weakened in the last two months. Although the PMI remained at the expansion area, above 50 points, it’s no hard to see significant decreases in compared with the past. The participant’s business optimism and the number of new orders were lower than past months.
According to GSO’s statistics, Vietnam’s industrial production increased by 5.4% YoY, dropping the 3-month moving average to 8.2% YoY. That is the lowest level since 07/2017. The contribution of oil refineries contracted while FDI companies’ electronic production slowed down. That were proofed by the IPI in Bac Ninh province (-15.8% YoY) and Thanh Hoa province (-29.7% YoY) in November.
In our point of view, The biggest risk of spreading global trade and manfacturing’s weaknesses may impact the household consumption and corporate investment in 2020. While the household consumption acccounts for over 60% of Vietnam’s economy, the private investment has replaced the leading role of FDI companies and rose by 17.2% YoY in 09 months of 2019. Therefore, how to stabilize domestic consumption and private investment is core to the macro-economic stability plan of the government.
Starting from 2020, we expect a tigher coordination between monetary and fiscal policies to support the economic growth through domestic consumtion and private investment channels. Based on the assumption for government policies will make impact in 2020 and a softer trade tension, we forecast Vietnamese economy grow at 6.6-6.9% YoY.
50 60 70 80 90
100 110 120 130 140
01/2
000
03/2
001
05/2
002
07/2
003
09/2
004
11/2
005
01/2
007
03/2
008
05/2
009
07/2
010
09/2
011
11/2
012
01/2
014
03/2
015
05/2
016
07/2
017
09/2
018
Volume Price
98
100
102
104
106
108
110
112
51
53
55
57
59
61
63
01/2
012
07/2
012
01/2
013
07/2
013
01/2
014
07/2
014
01/2
015
07/2
015
01/2
016
07/2
016
01/2
017
07/2
017
01/2
018
07/2
018
01/2
019
07/2
019
ISM Manufacturing PMI LHS
Total industrial production RHS
(Points) (Points)

MACRO OUTLOOK
www.vdsc.com.vn | Bloomberg: VDSC <GO> 13
Figure 4: Retail sales and car sales growth (%, YoY) Figure 5: Vietnam IPI and PMI
Source: GSO, VAMA, Rong Viet Securities Source: IHS, GSO, Rong Viet Securities
Coordination between monetary and fiscal policies
Monetary and fiscal policies shared the similar direction on fostering economic growth via supporting domestic consumption and private investment
The coordination, mentioned above, concentrated on two key points. Firstly, SBV aims to do an ample liquidity in the banking sector and drag down the lending/deposit rates. Secondly, the government directs its fiscal policy toward a high investment disbursement into major infrastructure projects.
Although Vietnam still have room for policy rate cuts, requirements for keeping money supply growth and nominal GDP growht balance and controlling the headline inflation are the main barriers with monetary policy.
In 2019, estimated nominal GDP growth was at 9% YoY, lower than the 3-year average of 10-11% YoY. Besides, 2020’s inflation is likely to up due to a hyper-increase of pork prices.
Upto the mid of December, pork prices doubled compared to the beginning of 2019. The African Swine Fever (ASF) significantly has hurted farmers and forced the government to import more. Scientists are racing to invent a vaccine. Under the circumstance, the current hyper-increase in pork prices did not come from the conventional demand-supply changes. Therefore, it should be treated as a big and real threat to inflation instead of short-term fluctuation.
Given our assumption of a good reproduction, pork prices can soften in the next second and third quarter. We expect 2020’s CPI to be at 3.5% YoY.
In September and November 2019, SBV continuously reduced its policy rates, including rediscounting, refinancing, OMO, note rates as well as the celling of short-term deposit. Monetary policy usually takes time to make an impact and we think it will start in 1H2020. If necessary, we assess that the State Bank of Vietnam could cut further 25bps of policy rates in the third quarter of 2020 to ensure the Government’s yealy growth target.
Figure 6: Credit growth and money supply growth (%, YoY) Figure 7: Inflation (%, YoY)
10.0%
10.5%
11.0%
11.5%
12.0%
12.5%
230
240
250
260
270
280
290
300
310
320
330
2015 2016 2017 2018 2019
Car sales Goods&services revenue growth(Thousands)
105
107
109
111
113
115
117
50
51
52
53
54
55
56
57
Jan-
17
Apr
-17
Jul-1
7
Oct
-17
Jan-
18
Apr
-18
Jul-1
8
Oct
-18
Jan-
19
Apr
-19
Jul-1
9
Oct
-19
PMI IPI(Points) (%, YoY)

MACRO OUTLOOK
www.vdsc.com.vn | Bloomberg: VDSC <GO> 14
Source: SBV, Rong Viet Securities Source: GSO, Rong Viet Securities
Public investment’s disbursement can reach to VND 500 thousands bn, an increase of 16% YoY compared to planned 2019’s
In the context of restrictions in monetary policy, fiscal policy will play a more important role in 2020 than before, as mentioned in the world macro section. Over the years, the process of disbursing public investment has been slow because of the policies and the laws. From 2020, we believe that the process of disbursement of public investment will begin to increase sharply in 04 key areas including: 1) Expressways, 2) Airports, 03) Thermal power and 04) Infrastructure for Sea Games 31. The size of disbursed public investment in 2020 is up to VND 500 trillion, up 16% yoy compared to the 2019’s plan.
2020 is the last year of the 2016-2020 medium-term public investment plan set by the National Assembly. Right in the January 2020, the rivised Public Investment Law will officially come into effect and is expected.
The starting-construction event of the first components of the North-South Expressway project in September was seen as the starting point for the period of large-scale infrastructure upgrading in Vietnam. In addition to the resumption of key road traffic projects that are delayed, the North-South expressway project and Long Thanh airport will be started construction in the next 2 years.
The North-South Expressway Project, the backbone of Vietnam's road transport system, will connect and bring development opportunities to the provinces / cities in the Vietnam Central region. The total project scale is about USD 5 bn, of which 3 out of 11 sections using the State Budget capital have been and will be implemented in the fourth quarter of 2019. The rest of the project is expected to gradually deploy from the second quarter of 2020 in a form of PPP. Each section is expected to be completed in 18 months its starting construction.
The highlight of the North-South Expressway project is associated with the announcement of the cancellation of international bidding to domestic bidding from the Ministry of Transport. With the total investment of PPP projects in the North-South expressway reaching up to 4 billion USD, this is a great opportunity for domestic corporation.
Raising capital is a big challenge for the project. Currently, finding the source of fund for highway investment projects is still a difficult problem because banks are more cautious with problems of public-private investment (PPP) mechanism. However, recent efforts from the policy markers have helped to mobilize nearly VND 9,000 bn from banks for the Trung Luong - My Thuan and Huu Nghi - Chi Lang expressway projects, signaling to ensure adequate supply of capital for national key projects.
In order to ease the pressure for local baking system, IFC has recently received support from the Ministry of Finance on the plan to issue Bong Sen bonds, IFC local currency bonds,
0%
10%
20%
30%
40%
50%
60%
2007
2008
2009
2010
2011
2012
2013
2014
2015
2016
2017
2018
2019
Credit growth Money supply growth
1.1%
1.3%
1.5%
1.7%
1.9%
2.1%
2.3%
-1%
0%
1%
2%
3%
4%
5%
6%
07/2
015
11/2
015
03/2
016
07/2
016
11/2
016
03/2
017
07/2
017
11/2
017
03/2
018
07/2
018
11/2
018
03/2
019
07/2
019
11/2
019
Headline inflation (LHS) Core inflation

MACRO OUTLOOK
www.vdsc.com.vn | Bloomberg: VDSC <GO> 15
to the international market to raise capital for domestic businesses without having to worry about exchange rates.
Figure 8: Public investment’s disbursement (Trillion VND) Table 1: Infrustructure projects (billion US dollars)
Orders Names Size
1 Cam Lo - La Son high way 7.669
2 High way 45 - Nghi Son 6.333
3 My Thuan - Can Tho high way 4.758
4 Phan Thiet - Dau Giay high way 14.360
5 High way 45 - Mai Son 12.918
6 Trung Luong – My Thuan high way 12.668
7 Huu Nghi - Chi Lang high way 5.947
8 Sa Pa airport 5.903
9 Phan Thiet airport 10.273
10 BOT 1 Quang Tri thermal power 55.000
11 BOT Van Phong 1 thermal power 59.985
12 Hoa Binh hydropower expansion 9.220
Source: Ministry in Finance, Rong Viet Securities Source: Rong Viet Securities
Unknown exchange rate and “Phantom trade”
Vietnam is currently the seventh trade deficit partners of US and “Phantom trade” increases the risk of US imposing tarriffs on Vietnam export goods. Those cause the Vietnam exchange rate unknown in 2020
Exchange rate stability is one of the most notable highlights in Vietnam's macroeconomic management in 2019. As of December 15, the exchange rate on the banking and free market has not changed, while the central reference exchange rate increased by 1.8% ytd and rebalanced with the market exchange rate.
Looking back to the path of the central exchange rate in 2019, the SBV adjusted exchange rate higher and unchange in turn when the exchange rate on the market fluctuated. This is probably the SBV's operating art in terms of stabilizing market sentiment.
In 2019, the total amount of foreign exchange supply remained stable as the main highlight helping to regulate the exchange rate as well as increase foreign exchange reserves to over 73 billion USD. While remittance is estimated at USD 16 billion, FDI disbursement is nearly USD 20 billion, growing 8% per year.
We note concerns regarding the prospect of FDI when total new and additional investment capital in 2019 decreased by 11% YoY. However, from our perspective, the supply of foreign currency from FDI inflows will still be positive in 2020. Instead of focusing on the growth of total registered capital and additional capital, we focus on a number of investment projects that can be disbursed right in the year as well as characteristics of projects.
Looking back at 2017-2018, registered FDI inflows recorded billion-dollar projects in energy and real estate sectors. In 2017, the disbursement progress of thermoelectric billion-dollar projects slowed down due to capital mobilization process and environmental impact assessment. For example, Van Phong 1 Thermal Power Project was proposed by Sumitomo in 2006, granted investment certificate at the end of 2017, and approved by the Ministry of Natural Resources and Environment for environmental impact assessment. The project started in the second half of 2019.
However, in 2019, despite the absence of billion-dollar projects, the number of 100-500 million USD mid-sized projects focusing on manufacturing and processing activities have increased significantly. In the Red River Delta, the number of newly-registered projects in Hanoi, Bac Ninh, Thai Nguyen, Bac Giang, Hai Duong and Ha Nam have grown significantly over 20% YoY and focused on electronic equipment production and electronics industry . In the Southeast region, Ho Chi Minh, Binh Duong and Long An are
296451
365526
411277429300
500000
250000
300000
350000
400000
450000
500000
550000
2016 2017 2018 2019e 2020f

MACRO OUTLOOK
www.vdsc.com.vn | Bloomberg: VDSC <GO> 16
still the provinces attracting the most newly-registered FDI capital. In addition, the distribution of FDI projects in 2019 is quite broad since there are mid-range projects in Nghe An, Binh Phuoc, Tay Ninh, Tien Giang, ...
In upcoming period, we remain optimistic about the prospect of attracting FDI into Vietnam. In addition to diversifying trade partners and signing new free trade agreements, the private sector in Vietnam is actively investing in order to participate more in global value chains.
Based on Vietnam's current strength and production value chain classification, we believe that investment projects will come from three main groups, including labor-intensive goods (textiles and furniture), processing goods & regional trading (food, paper, plastic and rubber, metal products, and construction materials) and global innovation (computers manufacturing, phones and electronic components). Specifically, the last group mainly relies on the value chain created by large FDI enterprises such as Samsung, LG, Microsoft, ...
Figure 9: Exchange rate, USDVND
Source: Bloomberg, Rong Viet Securities
However, we believe that the exchange rate in 2020 is still unknown when the risk of U.S. putting tariffs on Vietnamese goods is increasing. Vietnam currently ranks fifth on U.S. trade deficit list, only behind Japan, Germany, Mexico and China and its exports to U.S. market has increased by nearly 30% YoY in 2019. While the wave of mass production shift to Vietnam has not been recognized, Vietnam's current production conditions are difficult to compare with those countries’ and the trade deficit of over 43 billion USD is unbelievable.
"Phantom trade", which implies that businesses move goods to a third country before exporting to the final destination to avoid trade tax barriers, is taking place in Vietnam. While the trade surplus with the U.S. increased by 33% YoY, the trade deficit with China increased over 40% YoY.
In "Anti-dumping Duty Circumvention through Trade Re-routing: Evidence from Chinese Exporters" (Liu and Shi's, 2016), the author provided abundant evidence on the cause and effect relationship between the U.S. tax increase on Chinese goods and the flows of goods to third countries. There are two noteworthy conclusions:
1) The U.S. raises tariffs on Chinese goods, resulting in re-routing goods from China to a third country before export to U.S.
20,500
21,000
21,500
22,000
22,500
23,000
23,500
24,000
01/2
013
04/2
013
07/2
013
10/2
013
01/2
014
04/2
014
07/2
014
10/2
014
01/2
015
04/2
015
07/2
015
10/2
015
01/2
016
04/2
016
07/2
016
10/2
016
01/2
017
04/2
017
07/2
017
10/2
017
01/2
018
04/2
018
07/2
018
10/2
018
01/2
019
04/2
019
07/2
019
10/2
019
Free selling FX rate Central FX rate Trading FX rate

MACRO OUTLOOK
www.vdsc.com.vn | Bloomberg: VDSC <GO> 17
2) Countries with geographic location closed to U.S. and China or large Chinese population community often become a transit point for Chinese goods to avoid taxes.
Therefore, the role of the Government is extremely more important now than ever.
Figure 10: FDI (%, YoY) Figure 11: US deficit list (billion US dollars)
Source: GSO, Rong Viet Securities Source: ITC, Rong Viet Securities
Table 2: Macro-indicators forecast for 2020 2015 2016 2017 2018 2019E 2020F
GDP GROWTH (%) 6.68 6.25 6.81 7.1 7.0 6.8
TRADE BALANCE (BILLION US DOLLARS) -4.1 +1.5 +2.9 +7.2 +9.9 +8.7
EXPORT GRWOTH (%) 8.1 9.0 21.2 13.8 8.1 8.3
IMPORT GROWTH (%) 12.0 5.3 20.8 11.5 7.0 9.5
INFLATION (%) 0.6 4.7 3.5 3.5 2.8 3.5
REFINANCING RATE (%) 6.5 6.5 6.25 6.25 6.0 5.75
OMO INTEREST RATE (%) 5.0 5.0 5.0 4.75 4.0 3.75
MONEY SUPPLY GROWTH (%) 16.2 18.3 14.9 12.4 12.0 12.0
CREDIT GROWTH (%) 17.3 18.2 18.2 13.9 13.5 14.0
BUGDET DEFICIT TO GDP (%) 4.6 3.9 3.5 3.5 3.4 3.4
EXCHANGE RATE (VND) 22,485 22,761 22,735 23,245 23,240 23,705
Source: Rong Viet Securities
-30%
-20%
-10%
0%
10%
20%
30%
40%
50%
60%
11T2014 11T2015 11T2016 11T2017 11T2018 11T2019
Disbursed FDI
Newly registered and additional FDI
Numbers of projects in newly registered and additionally FDI
0 100 200 300 400
Switzerland
Malaysia
Italy
Canada
Ireland
Viet Nam
Japan
Germany
Mexico
China
3Q 2019 3Q 2018

STOCK MARKET
www.vdsc.com.vn | Bloomberg: VDSC <GO> 18
MARKET OUTLOOK 2020 – MODERATE GROWTH Hoang Nguyen ([email protected])
In 2019, although the VNIndex increased by 8.3% as of Dec 13, 2019, we notice not many investors did as well. The high earning growth rates in 2017 and 2018 ended in 2019 in many large stocks and sectors, reducing local investors’ excitement. Moreover, the uncertainties from trade war, along with the recoveries in developed economies, including the USA, affected the foreign capital flow into emerging markets like Vietnam.
Expectations, challenges and potential risks with the Vietnam stock market in 2020 are not different from those in 2019, namely state divestment and IPO and market reclassification. We assume there will not a big change in those events. We also think the biggest risk to the market comes mainly from global political and trade issues rather than from the Vietnam itself. However, we think the market are familiar with unfulfilled expectations and external risks. Hence, the market sentiment will not be affected much.
The biggest support comes from the consistent of the Vietnam Governement in emplementing its policies in order to stablize macroeconomic factors and encourage domestic firms to develop. This will benefit the Vietnam economy in general and domestic companies in particular in the long term. In 2020, net income and EPS growth of listed companies is forecasted to recover at two digit numbers when it was flat in 2019. In a context that capital flow will not be as much now as in the late 2016 to early 2018, investment decision needs more filtering. We assume that VNIndex’s growth will moderate and closely related to fundamentals rather than price bubble. We predict the VNIndex to move in range of 950 to 1120.
CAPITAL FLOW: POSITIVE FROM THE FOREIGN INVESTORS
Foreign investors can turn to net buyers
As we have mentioned in global market part, we do not think foreign investors will rush into pour money in Emerging and Frontier markets. However, they will selectively invest in some markets.
In Vietnam stock market, we notice that although foreigners were net buyers for the past two years, they mainly bought via put-through (negotiation) transaction. Meanwhile, they were strong net sellers on exchange via matching-order transaction, negatively impacting the VNindex. Nevertheless, foreign capital outflow through matching-order transaction has declined sharply as the value dropped from nearly USD 700 mn in 2018 to USD 50 mn in 2019. In fact, foreign investors were net buyers via matching-order transaction with a value of USD 121 mn in the first four months of 2019 and has turned to net sellers mainly because of rising US and China tension in May.
Figure 1: Foreigners yearly acitivity on VNIndex (million US dollars)
Figure 2: Foreigners monthly acitivity on VNIndex in 2019 (million US dollars)
Source: Bloomberg, Fiinpro, Rong Viet Securities Source: Bloomberg, Fiinpro, Rong Viet Securities
-1,000
-500
0
500
1,000
1,500
2,000
2,500
3,000
2012 2013 2014 2015 2016 2017 2018 2019
Net purchases through put-through transaction
Net purchases through order-matching transaction
Total net purchases
31.4
57.6
7.125.2
-65.2
2.2
100.9
-74.5
-50.4-56.0
-4.5-22.8
-100-80-60-40-20
020406080
100120

STOCK MARKET
www.vdsc.com.vn | Bloomberg: VDSC <GO> 19
We expect foreigners to turns to net buyers through matching-order transaction in 2020 because of 1) the Vietnam ETF can continue to draw money from Thailand and Korea, 2) Vietnam’s weights in MSCI Frontier Market 100 Index can increase to 30% when Kuwait shiftes to MSCI Emerging Market Index, 3) progress in US and China negotiation, and 4) new ETFs, that partly solves foreign ownership limit, are allowed to launch. Furthermore, if the divestment and state IPO actitivities pick up in 2020, it will help to draw foreign capital but not as much as in late 2017.
The main ETF fund flow comes from E1VFVN30 and VNM US Equity ETF. We think the E1VFVN30 ETF is likely to draw more money from its main investors, Korean and Thailand, as Korean and Thailand central decreased interest rates in 2019 and VNIndex (+8.3% YoY) outperformed KOSPI Index (+6.3% YoY) and SET Index (+0.6% YoY).
Meanwhile, we do not expect much inflow from VNM US Equity ETF as S&P 500 (+26% YoY) increased significantly in 2019, lowering attractiveness of other stock markets. Instead of investing in ETF, we think investors from EU and US will likely to invest based on bottom-up approach in Vietnam stock market.
Kuwait is surely moved up to MSCI Emerging Market Index in May 2020. Hence, Vietnam stock market’s weight in MSCI Frontier Market 100 Index will increase to 30% from is 12.3% now, according to MSCI Kuwait Consultation. As a result, Ishare MSCI Frontier 100 ETF can put USD 90 mn more into Vietnam stock market. Additionally, Vietnam’s weight in MSCI Frontier Market Index will increase to 25% from 17% now. Even though there is not any ETFs track this Index, some active frontier funds that benchmark to the Index may selectively put more money in large and liquidity Vietnamese stocks.
In addition, although the US and China’s structure conflict has not been addressed, the Phase I deal has reduced some risks.
Indices including VNDiamond, VNFin Select and VNFin Lead that can help to partly solve foreign ownership limit, have been introduced in November. hence we expect the ETFs track those indices to be allowed to launch in the 1H2020. SSIAM management company has recently received approval from State Securities Commission of Vietnam (SSC) to release its ETF, which is expected to go IPO from Dec 24th 2019 to Jan 15th 2020 with a estimated size of USD 25 to 30 mn.
Figure 3: Vietnam ETF fund flow
Source: Bloomberg, Rong Viet Securities
Limited local capital
Even though we expect the foreign capital flow to turnaround in 2020, market may face difficulties in drawing money from local investors as the high performance of corporate bonds, gold (+14% YTD), and real estate in 2019. Additionally, SBV’s lowering maximum of short-term mobilizing interest rates should help the market to draw money from bank depositors, but above-1-year term interest rates remain high. Positively, the main supports for the market to draw local capital is high earning growths and state divestment and IPO expectation.
199
27
-47
728
-18 -5
9 5
-32-10
18 17
9479
16 4
87
6
-48
-14 -10
0 1
-100
-50
0
50
100
150
200
250
Jan-18 Mar-18 May-18 Jul-18 Sep-18 Nov-18 Jan-19 Mar-19 May-19 Jul-19 Sep-19 Nov-19

STOCK MARKET
www.vdsc.com.vn | Bloomberg: VDSC <GO> 20
ATTRACTIVE VALUATION COMPARED TO THE PAST
Based on forecasted earnings from Bloomberg, earning growth of the Top 50 in term of market cap will increase in 2020. In detail, forecasted net income and EPS growth reach 21.7% and 11.6% YoY respectively compared to estimated figures for 2019 of 15.8% and 1.3% YoY respectively. Contributing the most to the Top 50’s net income in 2020, VHM and VCB’s net income will increase 31.6% and 39.2% YoY respectively. Even when we exclude VCB and VHM’s net income, the Top 48’s net income is forecasted to increase 18.2% YoY.
Even though forecasted net income growths of main sectors such as banking (26.4% YoY) and retail (28.7% YoY) declines slightly, they remain high. Contrarily, net income growth of another importance sector, real estate, is expected to rise.
Figure 4: Net income growth rises in 2020 Figure 5: Net income growth of main sectors remains high
Source: Bloomberg, Rong Viet Securities Source: Bloomberg, Fiinpro, Rong Viet Securities
We notice that in term of valuation and earnings, VNIndex price is not cheaper than MSCI EM and MSCI FM’s. However, VNIndex is quite attractive compared to its past as the forward PE based on the EPS growth of Top 50 is 14.2x, just slighlty above 10 average PE.
Based on forecasted EPS growth of the Top 50, we predict the range for VNIndex in 2020 is 950 to 1120.
Table 1: VNindex is not cheaper than MSCI EM and MSCI FM, but is quite attractive compared to its past
VNIndex MSCI Emerging Market MSCI Frontier Market
PE (13/12/2019, x) 15.9 15.1 10.3
5 year average PE (x) 15.7 14.3 12.2
10 year average PE (x) 14.0 13.2 12.3
Estimated EPS growth in 2020 (%)
11.6 (*) 14.0 9.8
Source: Bloomberg, Rong Viet Securities
(*): Calculated based on the Top 50’s data on bloomberg
Table 2: VNIndex range in 2020
10 year average PE (x) 5 year average PE (x) PE as of13/12/2019 (x) Average PE of 2019 (x)
14.0 15.7 15.9 16.5
VNIndex 951 1,066 1,080 1,120
Source: Bloomberg, Fiinpro, Rong Viet Securities
17.7%21.7%
11.6%
-10%
-5%
0%
5%
10%
15%
20%
25%
30%
35%
2017 2018 2019E 2020F
Revenue YoY Net income YoY EPS YoY
0%
20%
40%
60%
80%
100%
120%
140%
160%
0%5%
10%15%20%25%30%35%40%45%50%
2017 2018 2019E 2020F
Retail Banking Real estate

STOCK MARKET
www.vdsc.com.vn | Bloomberg: VDSC <GO> 21
DIVESTMENT ACTIVITIES PICK UP
Sluggies divestment and state IPO in 2019
The divestment and state IPO was sluggish in 2019 as only two corporates in Documentary 991/TTg-ĐMDN and one corporate in Decision 26/2019/QĐ-TTg went IPO, according to the Minitry of Finance. Moreover, only 28% plan has been completed since 2017 and State needs to IPO 92 more corporates in 2020.
Meanwhile, state divested in only 13 companies, receiving USD 79 mn, in 2019. It means they have completed only 8% the number of planned divestees since 2017.
Divestment and state IPO will pick up in 2020
The Ministry of Finance has submited a draft, fixing current issues in Decree 126/2017/NĐ-CP and 32/2018/NĐ-CP after collecting ideas from related participants, to the Government. In the bull case, the draft will be passed and comes into effect in the 1H2020. In that case, we expect it will boost divestment and state IPO activities in 2H2020. The leftover work load for the state is quite large, hence we do not expect them to finish their plans in 2020. However, we assume some big divestments and IPOs to occur in 2020.
Table 3: Important changes in the draft
Topic Current law Draft
State enterprise value determination Add brand value, which is based on historical factor and traditional (if any), to determine state corporate
value when it goes to IPO Dismiss that context
Land utilization plan of state corporate after IPO Decree 126/2017/NĐ-CP does not specify subjects, course, and authorities to sign land utilization plan
of state corporate after IPO
Dismiss Clause 1 Article 13 of the Decree 126/2017/NĐ-CP and give
more instructrions.
Determine intellectual property of state corporate when divest
Accroding to the Decree 32/2018/NĐ-CP, authorities must determine intellectuall property value which includes cultural, other historical, trademark, brand
value (if any)
Dismiss the context “ which includes cultural, other historical, trademark, brand value (if any)”
Determine starting price of state corporate when divests
According to the current law, in case the stock price at auction date is higher than winning price,
investors must pay for state at the stock price.
Dismiss that context and add instruction of starting price
determination
Added value of land borrowing that pays rent annually The state requires to add value of land borrwing that pays rent annually to the starting price but the law is
not clear
The draft give instruction on how to determine added value of land
borrowing
Raising capital in state-owned commercial banks to maintain Governement’s ownership ratio
State-owned commerical banks are not in the lists that allows the Government to raise capital to
maintain its ownership ratio
The draft adds state-owned commerical banks to the list
Prime Minister’s authority in term of divestment and state IPO
There is no specific right for the Prime Minister to solve special and/or surprise issues related to
divestment and state IPO
The draft allows the Prime Minister to consider and manage special or surpise issues in divestment and
state IPO process.
Source: Vietnam Government, Rong Viet Securities
In the divestment and IPO, we notice some big names. In which, Commission for the Managenment of State Capital at Enterprises suggests the Government to divest 15% HVN in 2019 -2020 and raise capital in HVN in 2019 – 2025 to dilute state ownership ratio to 51%. In addition, some big names that went IPO can continue to divest such as BSR, OIL and POW once they finish after-IPO settlement. Regarding to IPO, Power Generation Corporation 1 is waiting for the suitable time to determine its enterprise value. Meanwhile, Power Generation Corporation 2 just chose IPO consultant.

STOCK MARKET
www.vdsc.com.vn | Bloomberg: VDSC <GO> 22
Table 4: big names in divestment and IPO plan Name or ticker Exchange Equity (6/2019) or market cap (13/12) (billion US dollars)
VEA UPCOM 2,818 PLX HOSE 2,796
Vietnam Bank for Agriculture and Rural Development 2,760 HVN HOSE 2,115
Vietnam National Coal – Mineral Industry Holding Corporation Limited
1,797
Vietnam National Cement Corporation 901 Power Generation Corporation 2 882
Mobifone corporation 872 Power Generation Corporation 2 (Earning report in
6/2018) 823
PVI HNX 313 Vietnam Posts and Telecommunications Group 143
Source: Fiinpro, Rong Viet Securities NEW SECURITIES LAW AND MARKET RECLASSIFICATION
New Securities Law
The National Assembly passed the new securities law in November. We notice some essential developments from the law 1) Aiming to list stocks on HOSE while bonds and derivatives on HNX, creating a way to merger HOSE and HNX to Vietnam stock exchange (VSE) in the future; 2) Giving definition of depositary receipts and allowing VSE to create subsidiaries, building foundation to create non-voting depositary receipts (NVDR) (HOSE is studying to propose regulation for NVDR); 3) establishing Vietnam Clearing and Settlement Company in order to equitize in the future; and 4) improving quality and transparency of stock market by giving the SSC more power and increasing purnishment.
We think the new securities law will not impact the market in 2020. However, it will affect the market in a longer term as it helps to tackle some current issues, including 1) increase market supply as all stocks will be listed on HOSE; 2) Solving partly foreign ownership limit problem via NVDR; and 3) Opening further the stock market as even VSE and Vietnam Clearing and Settlement Company will be equitized.
Market reclassification
Vietnam stock market still restricts to many major requirements from MSCI. Besides foreign ownership limit issue, clearing and settlement, language barrier, and applying global accounting standard requirements are also important. Although the new securities can help to solve some of those issues, the law will take time to come into effect and operate; the MSCI also needs time to re-assess. Hence, it is hard for Vietnam to be reclassified as Emerging Market before 2022.
Regarding to FTSE, Vietnam market only restricts with clearing and settlement requirement as the current law requires pre funding. The current restriction prevents FTSE from evaluating failed trades requirements, which is also needed to be reclassified. However, the Vice President of Vietnam SSC has, recently, said that the Vietnam stock market will not try to reclassify at all price, including changing some of the market principles such as pre-funding requirement. Hence, the possibility of Vietnam reclassification from FTSE in 2020 is quite low.
RISKS
External risks
Since the late 2018, Vietnam stock market has been affected largely by the external uncertainties. Not just about psychology, if the the trade war escalates, it will really have a major impact on the global economy. This is the main reason that foreign capital flows are somewhat cautious for the frontier markets (penny) compared to developed markets (bluechips). Although the US - China have reached the Phase I agreements, the core disagreements have not been resolved and there are doubts about the possibility that the two sides will make their commitments seriously. In addition, the timeline for the the Phase 2 negotiation is still a question mark.
In addition, major political events such as Trump's Impeachment and the Re-election in 2020 could also bring shocks to the US market when the S&P 500 (+ 26.4%) has reached new highs in 2019. This may indirectly affect the Vietnam stock market sentiment.

SECTOR OUTLOOK AND INVESTMENT STRATEGY
www.vdsc.com.vn | Bloomberg: VDSC <GO> 23
Silver chances arise in difficult times
Considering a gloomy outlook we predicted for 2019, mostly due to external factors, we are looking forward to 2020. In the last year of the 2016 – 2020 Socio-Economic Development Plan, Vietnam’s economy should do well. Officials, however, will keep watching the residential real estate and equity markets for any signs of a ‘bubble’. As such, although we expect that credit growth will be kept at a decent rate and interest rates will decrease. We do not think that it will benefit the stock market. In addition, given the uncertainty of the global economy, it is unlikely that large offshore investments will flow into Vietnam’s stock market. Therefore, we anticipate that market liquidity will be muted in 2020.
Fundamentally, Vietnam has done better than its regional peers in terms of GDP growth as well as inflation and FX rate control. The Government consistently implemented institutional reforms and supportive actions to strengthen the private sector. Our own forecasts, as well as consensus, show an improvement in business performance of listed companies. Bloomberg’s consensus projected net earnings growth (of top 50 firms) for 2020 show a higher rate than it was in 2019 (c. 22% YoY vs c. 16% YoY). Regarding our 57 coverage stocks (representing 46% of total market cap on the three exchanges), 2020 net earnings growth will be 23% YoY, compared with 16% YoY in 2019.
To sum up, it is clear that global geographic tensions and the US-China trade-war and the recovery of developed economies will make frontier markets becoming less attractive. We do not expect huge cash flow from foreign as well as domestic investors to push the VNIndex. The uptrend is less likely to spread out to entire sectors or stocks. 2020, instead, will be another year which is for stock pickers. Bottom-up strategy. We believe that companies having business activities associated with growth from domestic consumption and infrastructure investment are the ones that investors can consider. We also find some attractive high dividend yield stocks which would be suitable for risk-averse investors.
Domestic demand to boost economic growth
Though we still see a huge amount of FDI, the contribution to Vietnam’s GDP growth has been decreasing. During the transition phase of Vietnam economic growth model, foreign capital still plays an important role. In the meantime, to be well-prepared for the long-term, the Government has tried to support domestic economic sectors, especially private groups. Economic growth no longer depends solely on real estate development but also on retail, steel, oil refinery, vehicle assembly, electronic devices, textile, etc. We believe the trend will continue in 2020. Those companies who do business within or related to these sectors will do well.
Table 1: Rong Viet Securities’ top pick for 2020
Ticker
Market cap
(USD mn)
Target price
(VND)
Expected
return (%)
2018 2019F 2020F ROAE 2020F
(%)
ROAA 2020F
(%)
PER 2020F
(x)
Current PBR (x) +/-
Rev. (%)
+/- NPAT
(%)
+/- Rev. (%)
+/- NPAT
(%)
+/- Rev. (%)
+/- NPAT
(%) MWG 2,159 171,000 52.7 30.0 30.5 17.9 34.6 22.9 32.9 31.4 13.5 10.3 4.4 SMB 51 55,000 48.5 37.0 10.0 4.4 48.6 4.9 10.6 36.6 21.2 5.7 2.2 VPB 2,041 28,000 42.5 24.2 14.2 18.7 20.0 14.2 32.2 23.3 2.9 4.1 1.2 NLG 295 38,900 42.2 24.8 55.0 -25.9 25.2 -22.4 19.0 14.0 8.8 5.5 1.5 QNS 455 40,500 42.1 5.2 20.8 -2.7 -6.3 17.4 10.9 17.3 14.6 7.0 1.8 PVD 270 21,060 41.8 -27.2 -79.8 -22.3 -14.5 41.9 199.1 2.2 1.5 20.0 0.5 HPG 2,836 33,400 40.3 22.0 0.0 12.2 -13.1 33.8 50.7 19.8 10.5 6.0 1.4 PVS 359 23,510 39.1 -12.9 30.8 17.9 -7.6 8.4 13.8 8.2 4.0 7.6 0.7 IMP 111 64,500 27.4 1.7 18.2 11.1 11.5 15.7 18.7 11.4 9.4 16.0 1.7 DRC 118 27,900 25.9 -3.0 -17.0 11.7 84.4 4.5 8.4 15.9 10.8 9.5 1.5 BID 7,272 50,000 21.0 14.0 8.4 22.8 18.8 16.7 36.4 13.6 0.7 19.2 2.2 BMP 169 51,100 17.1 15.6 -24.9 7.8 10.0 3.0 -3.7 20.0 17.0 9.2 1.5
Source: Rong Viet Securities
INVESTMENT STRATEGY AND IDEAS
Lam Nguyen ([email protected])

SECTOR OUTLOOK AND INVESTMENT STRATEGY
www.vdsc.com.vn | Bloomberg: VDSC <GO> 24
In the 4Q 2019, the SBV has ratified a number of new regulations effective by late 2019 or beginning of 2020, not only to enhance the quality of the banking sector but also to lower interest rates. Following its effort, we believe that interest rates, in general, will slightly decrease (at least 50 bps) in 2020. We believe that this will support the expansion of manufacturing and certain prioritized sectors. Along with that, the expansion of fiscal stimulus measures will play a key role. Corporate income tax rate will be decreasing from 20% to 17%. Infrastructure investment is one of the method that the Government is considering to boost growth.
There are many Vietnam private giants have had success following the Government’s actions to support the private sector. In this report, to best service our investors in the secondary market, we would like to mention HPG and DRC.
HPG, due to the Dung Quat Steel Complex, has become an important player in the steel industry’s supply chain. The complex will, firstly, help the company expand in the the southern part of the country. Secondly, HRC’s capacity will enable HPG to move upstream in the flat steel value chain as it probably will become a supplier for domestic coated steel producers. Lastly, high-quality wire rods and PC steel, as import-competing products, are going to expand HPG’s product mix to more niche markets.
Regarding DRC, the radial tire segment will be its key growth driver in the upcoming year as demand increases gradually. For 2020, we expect that it can operate at its full capacity (or even higher as DRC can upgrade the capacity up to 110%). In addition, due to lower natural rubber prices, the gross profit margin can increase 110bps to 9.4%. The company is also waiting Vinachem’s approval for doubling its current capacity (from 600K to 1.200K tires) at a significant lower capex (VND 933 Bn, total capex in first-600K tires factory was VND 2.2 Tn)
It should be noticed that the ratio of Vietnam public debt to GDP slumped following recent GDP adjustments. In our calculation, the estimated ratio in 2019 is 42.5%, leaving ample room for the Government to find money for large infrastructure projects. Sectors which are believed to be subjected to public investments are aviation, ports, thermal power plants, O&G exploration, and functional sports area (for SeaGame 31).
Figure 1: Vietnam’s public debt to GDP to significant decrease following GPD adjustments
Source: GSO, Rong Viet Securities
O&G: More work for upstream companies given the acceleration of delayed exploration projects
The investment into O&G exploration sharply decreased in recent years, resulting in its production volume hitting a 20-year low to 11 mn tons. Due to O&G production’s high contribution to GDP’s growth as well as being an important contributor to the state, it should be time to re-start delayed exploration projects. Given that PVN’s senior leadership has already been determined, we expect the investment progress will become more visible. Up-stream companies will be the first ones to benefit. Our top pick is PVD. Other interesting names are PVS due to the exploration and production activities as well as the construction in Nam Con Son 2, Sao Vang Dai Nguyet, and LNG Thi Vai. Last but not least, the acceleration in Nam Con Son 2, Long Son Refinery Plant, Sao Vang Dai Nguyet and other small projects will also be turnaround stories for PVB and PXS.
53.4
42.5
30
35
40
45
50
55
60
65
70
2010 2011 2012 2013 2014 2015 2016 2017 2018 2019E 2020F
Public debt/GDP Public debt/ Adjusted GDP

SECTOR OUTLOOK AND INVESTMENT STRATEGY
www.vdsc.com.vn | Bloomberg: VDSC <GO> 25
Figure 2: CAPEX for PVN’s E&P activities (USD mn)
Source: Rong Viet Securities
Domestic advantages for a decent long-term growth in consumer-related sectors
Vietnam’s consumer market has always been in the eyes of global investors due to its young population structure, rising disposal income and urbanization rate. The USD 160 billion market (2019 estimated), however, is still dominated by the traditional retail channel. Accordingly, major retailers with superior chain management and financial capabilities are setting their footprints into new fields to claim market share: MWG with food & FMCG, FRT with pharmaceutical and PNJ with fashion jewelry. Besides these major markets, cross selling sub products like wrist watches, sunglasses, supplements and beauty care goods, etc. give plenty of room for margin improvement for retailers who can generate synergies. Among retailers who are following cross-selling strategies, MWG is currently the most successful one due to its well-known brand name, targeting the mass segment and having an effective pricing policy.
After a period of deceleration in 2018, the FMCG market regained its momentum driven by an increase in sales volume, of which rural areas continued to record higher growth faster than four urban key cities. In addition, rising living standards and awareness among consumers is bolstering demand. Consumers want more products with healthy and stringent quality standards. As a result, the demand for nutritional beverages like organic milk has been increasing. Domestic pioneering firms such as VNM, TH True Milk have gained the acceptance of consumers, benefiting over other competitors thanks to production systems adapted to international standards and the launch of new products. Besides, there is an increasing demand for alternative milk products, which is forecasted to lead the growth of the dairy segment in the next five years (according to Euromonitor). This will benefit QNS, a leading player in the soymilk sector. The contribution of packaged soymilk in the total soy milk market is still low (~37%).
Figure 3: Consumer Confidence Index – Asia Pacific Q3 2019 Figure 4: Retail revenue and growth in Vietnam (2013-2020)
Sources: The Conference Board® Global Consumer Confidence Survey in collaboration with Nielsen, Rong Viet Securities
Sources: General Statistics Office, Rong Viet Securities
0
500
1,000
1,500
2,000
2,500
3,000
3,500
2018 2019E 2020F 2021F 2022F 2023F
0
20
40
60
80
100
120
140
Q2 2018 Q3 2018 Q4 2018 Q1 2019 Q2 2019 Q3 2019
85 94 103 115 126 142160
180
13.0%
11.0%10.0%
11.0%10.0%
13.0% 12.7% 12.5%
0%
2%
4%
6%
8%
10%
12%
14%
020406080
100120140160180200
2013 2014 2015 2016 2017 2018 2019E 2020F
Revenue, USD bn Growth rate

SECTOR OUTLOOK AND INVESTMENT STRATEGY
www.vdsc.com.vn | Bloomberg: VDSC <GO> 26
After years of restructuring, Vietnam banks almost cleared their legacy issues (sold to VAMC) occurring during the asset bubble period, prior to 2012. Banks’ bottom line have grown well in 2017 – 2019, due to not only lower provision expenses but also higher sales from diversified services product lines. Though SBV’s recent regulars may limit banks’ NIM expansion, cross-selling of products will boost their service income. We believe that most banks can manage their net earnings to growth at least 15% YoY with an improvement in ROE. Private banks look cheaper than State-owned banks (SOBs) on a PBR basis. We prefer SOBs, however, given (1) large lending market size and huge retail customer base that will allow them to cross-sell better, which in turn, will result in higher service income growth, (2) possible chance of equity capital incrementation (according to draft amendment of Decree 126/2017/ND-CP and 32/2018/ND-CP), and (3) room left for foreign investors to buy shares. We like BID over VCB at this time. Meanwhile, for investors who care more about long-term growth potential as well as the appearance of an active private bank, we recommend VPB.
2020 may not an easy year for real estate developers due to (1) drying of land bank in Tier 1 cities like Ho Chi Minh and Ha Noi making it costly to acquire new land, even in neighboring provinces, (2) restrain of legal frameworks limiting apartment supply, and (3) rising of funding cost given SBV’s policies to tighten credit flow into this sector. However, the long-term outlook is decidedly bullish for Vietnam’s residential market. Developers who are very active in accumulating land bank to catch up with this trend, especially in suburban provinces, will be the winners. VHM, NLG and KDH are the largest developers considering their total current land bank in the largest cities likes Hanoi, Ho Chi Minh and neighboring provinces. Yet we prefer NLG.
Vietnam possesses a low-cost labor force, stable government and one of the fastest global growth rates – all appealing features leading to a fertile investment environment. The US-China trade war, and new free trade agreements have driven companies to diversify and relocate into Vietnam industrial parks.
Looking to 2020, we believe that the demand for leasing will continue to be high and, as such, it should be a prosperous year for industrial park enterprises who possess a large clean land bank. We like the fact that KBC (953 ha) and VGC (1,182 ha) have huge leasable land banks. These land banks represent a major part of the northern industrial land and are mostly in Bac Ninh, Hai Phong. This should help KBC and VGC better capture rental demand from electronics and parts & accessories FDI enterprises. BCM and PHR, in the south, also own substantial industrial land, more than 1,000 ha located in Binh Duong. Various tenants with diverse backgrounds include logistics, electricity, mechanism, timber and consumer goods.
Figure 5: Estimated leasable supply (ha)
Source: Rong Viet Securities
333
1,182 934
284
689
91 45
755
213
350 - 140
490 204
77
456
350
556
BCM VGC IDC KBC PHR SZC LHG KSB
Available leasable area 2-year new supply >3-year new supply

SECTOR OUTLOOK AND INVESTMENT STRATEGY
www.vdsc.com.vn | Bloomberg: VDSC <GO> 27
Interest rate decreasing versus high dividend yield stocks
As mentioned above, we believe that interest rates, including deposit rates, will decrease by at least 50bps in 2020. Rental yields have decreased to around five to six percent in 2019 (and likely in 2020) making high dividend yield stocks very attractive, especially after a poor performance year (in term of capital gain) in 2019.
The rising of dividend yield, however, will come not only from increasing payout ratio but also from decreasing stocks market prices. Therefore, we believe that a high dividend yield stock will be unattractive unless it comes with sustainable earnings growth.
Among high dividend yield stocks we have filtered, we prefer pharmaceutical groups due to we believe 2020 will be a better year for some of them. The new circular on bidding in ETC channels will come in effect in 2020. Companies who target ETC as their key market like PME, DBD, and IMP will be the winners. Though we prefer PME, the illiquidity of some stocks make them less attractive. Therefore, IMP will be our first choice in the sector.
SMB and BMP are also worth to look at, both offering a cash dividend yield of around nine to 10%. Both companies do business in the consumer-related sector. The common story of these two companies are that they have new Thailand strategic investors, helping them eventually standardize production processes and raise long-term efficiency.
Figure 6: Rong Viet Securities’ favorite stocks
Source: Rong Viet Securities; Price as of Dec 13th 2019; Square size: Market cap

SECTOR OUTLOOK AND INVESTMENT STRATEGY
www.vdsc.com.vn | Bloomberg: VDSC <GO> 28
Vietnam entered the seventh consecutive year of a relative high GDP growth to its peers in the region. The growth in 2019 looks healthy: less dependent on monetary supply, and divesified from residential real estate to other sectors like retail, manufacturing, O&G refinery, electric equipment, textile, etc. We think that the Government’s support-oriented-policies have brought certain positive results. In 2020, we think that the Government will pay high attention on infrastructure development and corporations operation and financial cost reductions. Legal framework improvement will also be an important issue. As such, along with monetary policies, fiscal policies will play an important role to boost the economy growth in the upcoming years.
We believe that 2020 will be another successful year of Vietnam in terms of GDP growth, well-controlled inflation and FX rate. Though there are external risks, espectially the US-China trade war, we maintain a certain conservative view: be cautious in an optimistic outlook.
Our six-factor rating system (see below) shows our outlook in 2020 for various industries. Overall, our analysts believe that 2020 will be a better year for doing businesses. Sector wise we prefer consumer discretionary stocks, F&B and banks.
Although we think that sectors that are correlated to export or to FDI will also benefit from the trade war or FTAs, the simple disavantage production business, or the severe fragmetation within sectors will restrain companies (within those sectors) to fully take the chances. We are neutral on industrial parks, logistics, textiles and fisheries.
Subsectors 2020
Supply - Demand
Input price Legal Environment
Long-term Growth
Potential
Technological Development
Competition View Conviction list
Following List
Technology ++ - ++ + Positive FPT YEG
Retails - ++ + Good MWG, PNJ FRT, DGW, HAX
F&B (Beer, milk) + - + + - Good QNS, SMB VNM
Bank ++ - - ++ ++ - Good BID, VPB VCB ACB, MBB, TCB,
HDB RE - Industrial park ++ - ++ Good KBC NTC
Oil & Gas + + - - Good PVD, PVT PVS, PVB, PXS
Automotive - Spare parts ++ + + + - Good DRC PAC
Power + -- - + - + Neutral PPC, POW, NT2
Aviation - + ++ + - Neutral ACV, VJC, SCS, AST
Insurance - + + - Neutral PGI BVH, BMI
Phamarceutical - - + -- Neutral IMP PME, DBD, MKP
Logistic - - + + - Neutral GMD, VSC
Textile - - + + - Neutral MSH, STK TCM
Fishery - - + + Neutral VHC, ANV,
FMC MPC
RE - Residential + -- -- ++ Neutral NLG, HDG KDH, DXG, DIG
Chemicals - Agochemicals - - - + - Neutral LTG
Steel - + - + -- Neutral HPG
Securities + - + -- Neutral
Chemicals - Natural rubber - + - Neutral PHR
Construction -- -- + + Neutral
Others PBT, FPT, CVT, PHR, BMP, REE
Source: Rong Viet Securities
SECTOR OUTLOOK
Lam Nguyen ([email protected])

SECTOR OUTLOOK AND INVESTMENT STRATEGY
www.vdsc.com.vn | Bloomberg: VDSC <GO> 29
NOTES
SECTOR QUALITATIVE RATINGS
Our table of qualitative ratings is based upon six industry-wide criteria’s, specifically: 2019 supply-demand outlook, legal environment, long-term growth potential, technological development and competition with ratings from 1 to 5 and different criteria weights across sectors.
Positive sectors are sectors we believe will have growth opportunities and/or optimistic earnings outlook this year. Neutral sectors are driven by favorable factors but also have many external and/or internal risks; we believe these sectors would be more appropriate for investors with moderate-to-high risk tolerance and the ability to follow market fluctuations. For negative sectors, opportunities only open when critical problem(s) are resolved.
RATING/RECOMMENDATION EXPLANATIONS
At the end of each sector, we have included a table of key financial metrics and ratings for individual stocks within the sector. Our rating system is specified as below:
Ratings BUY ACCUMULATE NEUTRAL REDUCE SELL
Total return including dividends, 12-month horizon >20% >5% to 20% -5 to 5% -20% to -<5% <-20%

www.vdsc.com.vn | Bloomberg: VDSC <GO> 30
HIGHLIGHT STOCKS
Ticker
Exchange
Market cap
(USD mn)
Target price
(VND)
Current price
(VND)
Total Return
(%) Rating
2018 2019E 2020F PER
Trailing (x)
PER 2020F (x)
PBR Cur. (x)
Div Yield (%)
+/- Price 1y (%)
3-month avg. daily turnover
(USD thousand)
Foreign remaining
room (%)
+/- Rev. (%)
+/- NPAT (%)
+/- Rev. (%)
+/- NPAT (%)
+/- Rev. (%)
+/- NPAT (%)
LHG HOSE 34 25,000 15,600 60.3 Buy -11.8 6.6 7.0 -8.7 17.6 30.5 5.6 3.7 0.7 0.0 -19.1 103 38.3 MWG HOSE 2,159 171,000 113,000 52.7 Buy 30.0 30.5 17.9 34.6 22.9 32.9 13.6 10.3 4.4 1.3 29.1 4,080 0.0 PC1 HOSE 122 26,800 17,700 51.4 Buy 60.5 90.0 22.2 -9.6 -4.0 21.5 8.0 6.2 0.8 0.0 -9.2 215 9.9 SMB HOSE 51 55,000 39,400 48.5 Buy 37.0 10.0 4.4 48.6 4.9 10.6 6.5 5.7 2.2 8.9 37.9 110 40.4 ANV HOSE 126 31,800 23,000 47.0 Buy 39.6 321.4 5.1 -3.8 12.4 23.2 3.6 4.1 1.3 8.7 -20.0 531 47.4 LTG UPCOM 74 29,400 21,368 45.1 Buy 4.0 0.0 -5.7 20.2 -3.2 -12.6 3.7 4.7 0.7 7.5 -10.4 38 4.7 DXG HOSE 321 20,500 14,300 43.4 Buy 14.9 39.8 7.8 16.7 32.3 15.0 4.8 4.7 1.1 0.0 -29.6 1,398 3.4 PME HOSE 177 76,500 54,800 43.2 Buy 3.2 8.0 10.0 1.3 12.6 16.9 13.5 11.3 2.2 3.6 -12.8 18 37.9 VPB HOSE 2,041 28,000 19,650 42.5 Buy 24.2 14.2 18.7 20.0 14.2 32.2 5.8 4.1 1.2 0.0 -12.5 4,483 0.0 DIG HOSE 186 19,500 13,700 42.3 Buy 68.4 31.7 -17.8 23.1 102.6 44.8 13.4 7.6 1.2 0.0 -4.8 794 13.1 NLG HOSE 295 38,900 27,350 42.2 Buy 24.8 55.0 -25.9 25.2 -22.4 19.0 12.9 5.5 1.5 0.0 6.0 897 0.0 QNS UPCOM 455 40,500 29,549 42.1 Buy 5.2 20.8 -2.7 -6.3 17.4 10.9 8.3 7.0 1.8 5.1 -17.3 450 31.8 PVD HOSE 270 21,060 14,850 41.8 Buy -27.2 -79.8 -22.3 -14.5 41.9 199.1 14.4 20.0 0.5 0.0 -5.6 1,309 28.6 HPG HOSE 2,836 33,400 23,800 40.3 Buy 22.0 0.0 12.2 -13.1 33.8 50.7 8.9 6.0 1.4 0.0 -9.0 5,848 10.9 PVS HNX 359 23,510 17,400 39.1 Buy -12.9 30.8 17.9 -7.6 8.4 13.8 8.5 7.6 0.7 4.0 -12.1 1,386 27.2 MSH HOSE 99 60,000 46,050 39.0 Buy 20.4 84.5 10.4 23.2 12.5 10.3 4.9 5.1 1.8 8.7 19.6 119 40.7 STK HOSE 52 23,000 17,150 37.0 Buy 21.0 79.0 -7.9 20.2 6.3 12.1 5.5 5.9 1.2 2.9 13.4 27 40.1 FRT HOSE 92 35,000 27,050 33.1 Buy 16.0 20.0 14.4 -4.6 15.1 22.6 6.0 5.5 1.6 3.7 -57.7 108 1.2 NT2 HOSE 278 27,100 22,400 32.1 Buy 13.4 -3.5 2.4 -3.7 0.3 4.7 8.0 8.3 1.5 11.2 -11.2 410 30.3 PNJ HOSE 802 108,500 83,500 32.1 Buy 33.0 32.5 15.7 22.3 18.4 27.9 17.3 13.7 4.5 2.2 14.9 2,081 0.0 PVT HOSE 203 21,300 16,750 30.1 Buy 22.4 44.9 5.6 2.6 1.8 11.8 6.6 6.7 1.1 3.0 10.7 448 17.3 CVT HOSE 33 24,500 20,750 30.1 Buy 5.6 14.6 27.6 -14.1 2.0 11.3 4.7 4.6 1.3 12.0 0.2 285 35.6 VHC HOSE 308 97,100 78,400 28.3 Buy 13.7 138.5 -16.6 -18.1 19.2 1.9 5.1 6.0 1.5 4.5 -22.2 435 65.8 IMP HOSE 111 64,500 52,200 27.4 Buy 1.7 18.2 11.1 11.5 15.7 18.7 17.2 16.0 1.7 3.8 -4.6 109 0.0 MBB HOSE 2,188 27,000 21,800 26.6 Buy 40.9 68.3 27.7 27.2 20.2 24.9 6.8 5.4 1.4 2.8 8.9 4,699 0.0 POW HOSE 1,248 15,300 12,350 26.3 Buy 5.3 107.8 7.1 56.1 16.3 17.1 11.5 9.5 1.1 2.4 0.0 1,092 35.1 FPT HOSE 1,671 70,000 57,100 26.1 Buy 17.0 35.0 21.2 23.8 17.2 20.8 12.2 9.9 2.9 3.5 46.5 4,924 0.0 DRC HOSE 118 27,900 22,950 25.9 Buy 0.0 -0.2 11.7 83.5 4.5 8.6 13.5 10.6 1.7 4.4 5.2 393 25.6 HDG HOSE 168 40,100 31,864 25.8 Buy 14.1 -16.0 40.9 30.9 26.3 23.6 3.5 3.8 1.7 0.0 11.3 733 31.4 PTB HOSE 148 86,600 72,700 22.4 Buy 18.8 11.6 17.7 23.7 11.3 24.7 8.1 5.8 2.1 3.3 16.5 348 25.7 PGI HOSE 64 19,100 16,700 21.6 Buy 3.4 15.6 6.6 4.9 6.3 5.4 9.8 10.3 1.0 7.2 -0.3 4 28.4 BID HOSE 7,272 50,000 41,900 21.0 Buy 14.0 8.4 22.8 18.8 16.7 36.4 20.3 19.2 2.2 1.7 26.4 1,655 12.1 ACB HNX 1,658 27,000 23,200 20.7 Buy 22.7 142.5 10.4 15.4 13.0 14.6 6.5 5.8 1.5 4.3 -1.8 3,094 0.0

www.vdsc.com.vn | Bloomberg: VDSC <GO> 31
VSC HOSE 61 28,200 25,600 19.9 Accumulate 30.1 26.6 -5.8 -16.3 -3.1 -14.9 6.2 6.0 0.9 9.8 -32.6 121 11.5 HDB HOSE 1,183 33,000 27,950 18.1 Accumulate 38.5 136.6 23.3 26.7 13.9 20.1 8.4 6.3 1.5 0.0 -8.7 2,312 6.2 VRE HOSE 3,371 39,500 33,550 17.7 Accumulate -13.6 -17.2 2.5 21.7 13.3 22.2 29.4 21.8 2.8 0.0 5.6 6,621 16.3 HAX HOSE 28 19,600 18,000 17.2 Accumulate 33.1 8.1 12.0 9.6 10.3 11.1 8.1 5.5 1.5 8.3 21.1 175 38.3 BMP HOSE 169 51,100 47,900 17.1 Accumulate 15.6 -24.9 7.8 10.0 3.0 -3.7 9.4 9.2 1.5 10.4 -9.2 353 19.6 GMD HOSE 302 26,000 23,600 16.5 Accumulate -32.0 263.8 1.7 -65.6 7.2 -17.0 11.6 13.5 1.1 6.4 -13.5 677 0.0 PAC HOSE 51 27,200 25,650 15.8 Accumulate 12.7 -42.6 -2.6 -6.6 15.9 12.3 7.3 8.1 1.8 9.7 -31.7 73 23.9 VGC HOSE 353 20,100 18,250 15.3 Accumulate -2.3 -6.4 -2.8 10.3 2.3 7.6 13.1 12.3 1.3 5.2 0.0 758 35.6 ACV UPCOM 7,034 85,000 74,883 14.7 Accumulate 16.0 50.0 14.5 26.9 11.4 14.6 22.8 20.3 4.7 1.2 -9.2 330 45.3 REE HOSE 488 39,900 36,500 14.2 Accumulate 36.5 26.0 -2.2 -14.5 -0.4 6.8 6.5 6.9 1.1 4.9 17.0 1,458 0.0 BFC HOSE 30 12,100 11,510 13.8 Accumulate 1.6 -30.1 -4.4 -56.7 0.1 34.5 8.4 6.3 0.7 8.7 -52.5 52 35.1 KBC HOSE 298 16,200 14,700 13.6 Accumulate 98.8 27.9 21.5 12.1 -10.7 12.2 9.1 7.4 0.7 3.4 8.3 1,100 21.9 VNM HOSE 8,867 126,000 116,997 11.5 Accumulate 3.0 -0.7 6.2 5.5 9.4 3.5 19.2 20.3 7.5 3.8 -9.3 7,628 41.5 KDH HOSE 637 29,500 27,100 10.7 Accumulate -16.5 36.4 -14.6 79.0 33.1 38.1 16.0 11.8 2.0 1.8 16.5 934 4.5 SCS HOSE 312 130,000 125,500 10.0 Accumulate 14.8 20.7 11.6 20.7 10.0 12.4 15.1 11.2 7.0 6.4 -12.4 184 24.6
DPM HOSE 225 13,600 13,300 9.8 Accumulate 16.0 0.7 -15.8 -49.6 16.4 53.3 17.8 11.3 0.7 7.5 -32.7 239 30.0 VCB HOSE 14,147 95,000 88,400 8.4 Accumulate 33.6 61.1 20.1 28.3 18.7 21.4 16.8 16.1 4.0 0.9 53.5 3,161 6.2 TCM HOSE 50 20,500 19,950 5.3 Accumulate 14.1 35.1 -1.0 -31.3 4.0 20.2 5.8 6.3 0.9 2.5 -14.5 418 0.0 CTG HOSE 3,310 21,300 20,600 3.4 Neutral -11.9 -27.1 36.6 47.6 6.3 10.2 12.5 12.0 1.0 0.0 -11.0 3,811 0.7 VJC HOSE 3,266 140,000 144,500 -1.0 Neutral 26.7 5.2 -3.3 -8.0 27.9 -6.7 14.9 16.5 5.1 2.1 12.6 4,200 10.4 PPC HOSE 405 25,200 27,759 -1.3 Neutral 14.1 35.3 13.4 -16.5 0.3 -20.3 8.9 12.4 1.6 7.9 65.7 360 32.8 AST HOSE 160 75,000 82,500 -6.7 Reduce 31.2 9.2 29.1 23.6 20.0 14.1 18.9 16.3 5.8 2.4 55.2 191 3.1 VIC HOSE 16,861 106,661 116,000 -8.1 Reduce 68.4 74.1 7.6 50.0 41.2 106.5 85.2 34.3 5.1 0.0 12.8 2,593 34.4
Source: Rong Viet Securities

SECTOR OUTLOOK AND INVESTMENT STRATEGY
www.vdsc.com.vn | Bloomberg: VDSC <GO> 32
Vietnam’s consumer market has always been in the eyes of global investors due to its young population structure, rising disposal income and urbanization rate.
Retail sector: while foreign players such as AEON, Lotte, Central Group and BJC are gaining advantage in the Mega/Supermarket segment, domestic retailers still reign kings in mid and small-sized stores, which are more popular due to the high population density and undeveloped traffic condition. In this segment, besides the electronics market that is almost saturated, the rest is still extremely fragmented and dominated by the traditional channel. That implies a huge potential growth for modern chains to conquer the “no-man’s land”. In which we favor MWG and PNJ due to their leading retail expertise, strong financial health and large networks that enable omni-channel capabilities.
Food & Beverage sector: After a period of slow growth in domestic demand, especially in the dairy sector, we believe next year will see positive changes. Increasing living standards and consumer awareness have driven requirements for product quality. This will be an opportunity for the giants in the food and beverage industry. We like QNS due to its leading soymilk position and promotion of its development of new products to meet increasing consumers demand. Beside, we have a positive outlook for SMB thanks to better business performance through the positive transformation of the whole group and high cash dividend yield.
Consumer Confidence Index: Consumers in Vietnam remains the third most confident globally, just behind India and the Philippines due to an increase in job prospects, personal finances and spending. Vietnam witnessed one of the most improvement in consumer confidence in Q3/2019, benefiting from trade and investment flows.
In 11M/2019, total retail sales of consumer goods and services reached VND 4,482 tn (USD 195 bn), increasing 11.8% YoY. Of which, retail sales reached VND 3,400 tn (USD 148 bn, +12.7% YoY) thanks to increasing demand in staple consumer goods.
Vietnam’s retail revenue is projected to growth at 10% for the coming years, supported by the rising middle class, young population and changes in consumer behavior.
Figure 1: Consumer Confidence Index – Asia Pacific Q3 2019 Figure 2: Retail revenue and growth in Vietnam (2013-2020)
Sources: The Conference Board® Global Consumer Confidence Survey in collaboration with Nielsen, Rong Viet Securities
Sources: General Statistics Office, Rong Viet Securities
0
20
40
60
80
100
120
140
Q2 2018 Q3 2018 Q4 2018 Q1 2019 Q2 2019 Q3 2019
85 94 103 115 126142
160180
13.0%
11.0%10.0%
11.0%10.0%
13.0% 12.7% 12.5%
0%
2%
4%
6%
8%
10%
12%
14%
0
20
40
60
80
100
120
140
160
180
200
2013 2014 2015 2016 2017 2018 2019E 2020F
Revenue, USD bn Growth rate
CONSUMER INDUSTRY – A WONDERLAND BUT NOT FOR EVERYONE
Son Tran ([email protected])
Thao Dang ([email protected]) Negative Positive Neutral

SECTOR OUTLOOK AND INVESTMENT STRATEGY
www.vdsc.com.vn | Bloomberg: VDSC <GO> 33
FMCG market trend: After a period of deceleration in 2018, the FMCG market regained its momentum driven by an increase in sales volume, of which rural areas continued to record higher growth faster than four urban key cities (including Hanoi, Ho Chi Minh, Da Nang and Can Tho). Specifically, in 11M2019 rural areas achieved a 9.3% value growth, while urban areas grew by 6.1% over the same period last year (2018’s rural: +5.4% YoY & urban: +2.5% YoY). Favorable demographic factors and a growing middle-class income are part of the reason.
Figure 3: FMCG growth in the urban four key cities (LHS) and rural areas (RHS), Unit: %
Source: Kantar Worldpanel, Rong Viet Securities
Personal care led the growth in the urban four key cities. Dairy and related products recorded a higher growth than the same period last year. In rural areas, dairy and related products achieved the highest growth, followed by personal care. Beverage, while recording double-digit growth in rural areas, just showed signs of recovery in the urban four key cities. The recent trend of FMCG industry shows that consumers are more concerned about their health and are willing to pay more for personal care products and nutritional beverages like dairy.
Figure 4: FMCG growth by categories in the urban four key cities (LHS) and rural areas (RHS)
Source: Kantar Worldpanel, Rong Viet Securities
Consumers are shifting away from GT (traditional channel) to MT (modern channel). This is a big and inevitable trend as the retail market grows. We believe minimarts & convenience stores will have higher growth than hyper/super markets due to the high population density and undeveloped traffic
-2
0
2
4
6
8
10
12
Q12017
Q22017
Q32017
Q42017
Q12018
Q22018
Q32018
Q42018
Q12019
Q22019
Q32019
Q42019
Average price Value Volume
-2
0
2
4
6
8
10
12
Q12017
Q22017
Q32017
Q42017
Q12018
Q22018
Q32018
Q42018
Q12019
Q22019
Q32019
Q42019
Average price Value Volume
-5%
0%
5%
10%
15%
Dairy Beverages PackagedFood
PersonalCare
Home Care
Q1 2018 Q2 2018 Q3 2018 Q4 2018Q1 2019 Q2 2019 Q3 2019 Q4 2019
-5%
0%
5%
10%
15%
Dairy Beverages PackagedFood
PersonalCare
Home Care
Q1 2018 Q2 2018 Q3 2018 Q4 2018Q1 2019 Q2 2019 Q3 2019 Q4 2019

SECTOR OUTLOOK AND INVESTMENT STRATEGY
www.vdsc.com.vn | Bloomberg: VDSC <GO> 34
infrastructure. In urban areas, ecommerce (+53% YoY) and minimarts & convenience stores (+22% YoY) are posting the highest sales growth while traditional groceries and wet markets are on the downhill.
Figure 5: FMCG sales by channels (inner circle: 12 w/e P11’18, outer circle: 12 w/e P11’19*), Unit: %
Source: Kantar Worldpanel, Rong Viet Securities *12 weeks period ending 3 November 2019
Investment Outlook
Fast-growing middle and affluent class (MAC), young population and increasing urbanization rate makes Vietnam one of the most attractive consumer markets in the world (placed 6th in A.T. Kearney’s 2017 ranking in the retail sector). Driving consumer preference for luxury food and beverage items are not only for staying healthy but also for the need of self-expression.
This creates opportunities for the retail sector, especially modern retailers offering high-quality products with better customer services than mom-and-pop stores and wet markets. Consequently, there is a clear shift of customers to the modern channels. In addition, since the retail market is still offline-based, retailers who can effectively operate a wide-coverage store network will benefit the most. Moreover, high internet and smartphone penetration among the youth enables more opportunities for retailers to approach customers, making way for future omni-channel development that could take advantage of their physical stores.
Changing consumer habits. Rising living standards and awareness among consumers will bolster demand, switch to consume more products with healthy and stringent quality standards. As a result, the demand for nutritional beverages like organic milk has been increasing. Domestic pioneering firms such as VNM, TH True Milk have gained the acceptance, benefiting over other competitors thanks to a production system adapted to international standards and new the launch of new products. Besides, there is an increasing demand for alternative milk products, which is forecasted to lead the growth of the dairy segment in the next five years (according to Euromonitor). This will benefit QNS, a leading player in the soymilk sector. The contribution of packaged soymilk in the total soy milk market is still low (~37%).
A big and very fragmented retail market. The USD 160 billion market (2019 estimated) is still dominated by the traditional retail channel. Accordingly, major retailers with superior chain management and financial capabilities are setting their footprints into new fields to claim market share: MWG with food & FMCG, FRT with pharmaceutical and PNJ with fashion jewelry.
Besides these major markets, cross selling sub products like wrist watches, sunglasses, supplements and beauty care goods, etc. gives plenty of room for margin improvement for retailers who can generate synergies. Among retailers who are following the cross-selling strategy, MWG is currently the most successful one due to a well-known brand name, targeting the mass segment and having effective pricing.
Unlike Hyper/super markets which have been overwhelmed by foreign retail giants (Central Group, Lotte, AEON), the small-street-shops model still restricts foreign investors by ENT*. Thus Vietnamese retailers
55
10
9
14
5 2 5
54
9
9
14
6 3 5
Traditional groceries
Wet markets
Specialist stores
Hyper/Super markets
Minimarts &Convenience storesOnline
Others
4 Key Cities
75
16
2 2 5
76
13
3 3 5
Rural

SECTOR OUTLOOK AND INVESTMENT STRATEGY
www.vdsc.com.vn | Bloomberg: VDSC <GO> 35
such as MWG, PNJ, FRT and Vinmart will not be competing against foreign retailers until 2024 when ENT is removed (five years from CPTPP).
*ENT has been limiting foreigners’ abilities to establish second and subsequent retail outlets. It does not apply for retail outlets less than 500 sqm, located at commercial centers and not categorized as mini-supermarket or convenience stores.
Risks
• Declining purchasing power due to a slowdown in credit growth or economic downturn.
• Rising interest rate environment. This would increase financial expenses for retailers, which heavily rely on short-term loans to finance working capital.
• Fierce competition from foreign players due to concerns of consumers about the domestic product quality and preferences for international brand names.
Figure 6: ROE, PE and PB of some listed consumer firms
Sources: Fiingroup, Rong Viet Securities
Table 1: Consumer stocks – Market cap, price, rating, per share, dividends and ROE summary
Market cap
(VND bn)
Cur. price
Target price
ETR % Rating P/E
2019F P/BVPS 2019F
ROE 2019F
DY 2019F
P/E 2020F
P/BVPS 2020F
ROE 2020F
DY 2020F
Foreign room
MWG 50,024 113,000 171,000 53.0% Buy 13.2x 4.3x 32.8% 1.3% 10.3x 3.2x 31.4% 1.3% 0.0%
PNJ 18,584 83,500 108,500 32.0% Buy 17.1x 4.5x 27.6% 2.2% 13.7x 3.7x 28.3% 2.2% 0.0%
FRT 2,137 27,000 35,000 33.0% Buy 6.7x 1.4x 22.0% 3.7% 5.5x 1.2x 22.1% 3.7% 1.2%
SMB 1,176 39,400 55,000 48.0% Buy 6.2x 2.2x 39.7% 8.9% 5.6x 1.9x 36.8% 8.9% 40.4%
QNS 10,547 29,550 40,500 42.0% Buy 8.0x 1.4x 18.2% 5.1% 7.2x 1.2x 17.3% 5.1% 31.8%
VNM 205,482 118,000 126,000 11.0% Accumulate 21.2x 7.4x 39.0% 3.8% 20.4x 6.9x 37.4% 3.8% 41.5%
Source: Rong Viet Securities forecast, share prices as of December 13th, 2019
MWG PNJ
FRTQNS
VNM
SMB
0.2
1.2
2.2
3.2
4.2
5.2
6.2
7.2
8.2
9.2
5.0 7.0 9.0 11.0 13.0 15.0 17.0 19.0 21.0
P/B
P/E

www.vdsc.com.vn | Bloomberg: VDSC <GO> 36
MOBILE WORLD INVESTMENT JSC Bloomberg: MWG VN
Groceries accelerates while electronics’ growth remains solid
BUY 53% After four years of development, Bach Hoa Xanh’s success model has been found – the new minimart is expected to be a major growth engine in the long run for MWG. Besides, the consumer electronics segment is still finding potential from market consolidation , while the smartphone stores are being reconstructed to maintain the growth. In 2020, MWG’s growth will come from continuing to expand Dien May Xanh (consumer electronics chain) and the initial significant contribution from Bach Hoa Xanh.
Investment Rationale
- Dien May Xanh is still a short-term growth driver. The consumer electronics market is still growing quite well (10% value yoy, 2019). Dien May Xanh’s market share in 2019 is estimated at ~37% (from 35% in 2018), indicating that there is still potential from market consolidation.
- Cross-selling potential for The Gioi Di Dong/Dien May Xanh stores.
Layout-optimization creates plenty of free space in current stores, allowing to add more products that have high margin and good synergy with current product mix, such as wrist watches, sunglasses, household good. These products have very high gross margin (around 40-50%) and can take advantage of traffic at current stores.
- Bach Hoa Xanh’s success model is formed and being expanded quickly. Not only succeeding in HCMC, BHX is also having favorable expansion to other regions in the south, showed by high sales/store and customer acceptance. It reached EBITDA break even for its existing 700 stores in 08/2019. Average monthly sales/store (to 11/2019) reached VND 1.3 bn, up 18% YoY while gross margin reached 20% (from 18% in Dec 2018).
- Attractive valuation. MWG is trading at a 2019 forward P/E of 13x, equivalent to a PEG ratio of 0.4x. We expect the market to pay a higher P/E for MWG from 2020 on, when Bach Hoa Xanh becomes profitable.
2020 Outlook
- Open 100 small Dien May Xanh stores (some will be converted from The Gioi Di Dong stores). Thereby, Dien May Xanh and The Gioi Di Dong’s sales will change +18% and -4% respectively.
- Open 800 Bach Hoa Xanh, revenue growth will be around 130%. Year-total gross margin could reach 21.5%.
- Bach Hoa Xanh is forecasted to contribute VND 25,000 bn revenue, but still make a net loss of around VND 400 bn for the whole year. It will break even in the second half of the year.
- Accordingly, MWG’s consolidated revenue and PAT will rise by 23% and 33% yoy respectively.
Risks to Our Call
- Bach Hoa Xanh’s expansion speed does not meet expectations due to obstacle in logistic in the central region.
- MWG’s cross selling of fashion accessories does not meet expectations due to not-big-enough market demand.
CMP (VND) 113,000 Target Price (VND) 171,000 Cash Dividend (VND)* 1,500 (*) expected in next 12 months STOCK INFO Sector Retails Market Cap (USD mn) 2,158.5 Current Shares O/S (mn) 442.7 3M Avg. Volume (K) 774.8 3M Avg. Trading Value (VND bn) 4.1 Remaining Foreign Room (%) 0.0 52-week range (‘000 VND) 79.2 - 129.5 PERFORMANCE
FORECAST VND bn 2017 2018 2019E 2020F Revenue 66,340 86,516 101,974 125,332 % yoy 48.7 30.4 17.9 22.9 NPAT 2,206 2,879 3,874 5,150 % yoy 38.9 30.5 34.6 32.9 ROA (%) 9.7 10.2 12.5 13.5 ROE (%) 37.6 34.2 32.8 31.4 EPS (VND) 4,860 6,343 8,535 10,960 BV (VND) 18,516 19,011 25,983 34,930 Div (VND) 1,500 1,500 1,500 1,500 P/E (x) 20.2 13.0 13.2 10.3 P/BV (x) 7.0 4.3 4.3 3.2 *Price as of Dec 13th, 2019 COMPANY SNAPSHOT
Mobile World Investment JSC is the largest retailer in Vietnam with nearly 3,000 retail outlets covering 63 provinces.
By the end of 2019, the company had 50% of the mobile phone market share, 37% of the consumer electronics market and is expanding fast in the food & FMCG market thru its new grocery chain.
525456585105125145
0
5
10
15
20
PE Price ('000 VND, RHS)

www.vdsc.com.vn | Bloomberg: VDSC <GO> 37
PHU NHUAN JEWELRY JSC Bloomberg: PNJ VN
Sustainable growth from a fragmented jewelry market
BUY 32% Among the major jewelry firms in Vietnam, PNJ is the pioneer (from 2012) in converting its business model from gold bar focused to jewelry focused. Due to that, the company has been able to increase jewelry consumption and minimize the impact of the government's gold bar restrictions. PNJ has become the leading fashion jewelry retailer in the country in terms of market share and number of outlets, far outperforming its competitors.
In 2019, PNJ implemented a new ERP system that temporarily affected short-term results. In the next few years, due to the favorable business environment and enhanced ERP system, PNJ's business results will continue to be positive.
Investment Rationale
- Gold jewelry demand in Vietnam is growing at 10% per year. Meanwhile, gold jewelry consumption per capita is one of the lowest among Asian countries. Growth potential is high as demand for gold bars is gradually declining.
- The middle class is growing rapidly in Vietnam (estimated to account for one third of the population by 2020). These are modern-minded consumers who are target customers for fashion jewelry retailers.
- Dominating the branded jewelry market. In branded jewelry, PNJ’s market share is estimated at 30%. It has great advantages in production /design capability. PNJ will increasingly widen the gap with other competitors.
- Wide coverage in the retail market. PNJ’s store count reached 353 (at the end of November 2019), an increase of 33 stores compared with the beginning of 2019, and far exceeding the number of its competitors: SJC (50), Doji (47) and Precita (15). Moreover, the new ERP system also strengthens PNJ’s superior chain management compared to other competitors.
2020 Outlook
- Total store count will reach 384, from 354 stores (estimated) by the end of 2019. PNJ will open more stores in other regions, especially in the north. Most of the new stores will be independent shops, with higher sales and better experience than counters in shopping mall.
- Revenue and PAT growth of 18%, 28% respectively. Retail jewelery will increase its contribution to total sales (to over 60%) and grow by 22% YoY while gold bar and wholesale will grow at around 10%.
- Gross margin will be up 50 bps to 21.3% due to an increase in gross margin of gold jewelry retail and its sales contribution in total revenue. SG&A/sales will not change much since PNJ will still keep the same expansion pace in 2020. Net margin will improve to 7.5% (+50 bps YoY).
Risks to Our Call
- New stores opened in the north do not meet performance expectations.
- Wrist watches sales can make PNJ’s profit growth better than expectations.
CMP (VND) 83,500 Target Price (VND) 108,500 Cash Dividend (VND)* 1,800 (*) expected in next 12 months STOCK INFO Sector Retails Market Cap (USD mn) 801.9 Current Shares O/S (mn) 222.6 3M Avg. Volume (K) 576.6 3M Avg. Trading Value (VND bn) 2.1 Remaining Foreign Room (%) 0.0 52-week range (‘000 VND) 64 - 89.3 PERFORMANCE
FORECAST VND bn 2017 2018 2019E 2020F Revenue 10,977 14,573 16,860 19,959 % yoy 28.2 32.8 15.7 18.4 NPAT 725 960 1,174 1,502 % yoy 61 32.5 22.2 28.0 ROA (%) 16.1 15.2 16.2 17.7 ROE (%) 35.0 34.0 27.6 28.3 EPS (VND) 3,160 4,186 4,907 6,110 BV (VND) 19,174 16,885 18,506 22,465 Div (VND) 1,800 1,800 1,800 1,800 P/E (x) 23.8 16.2 17.1 13.7 P/BV (x) 5.0 4.2 4.5 3.7 *Price as of Dec 13th, 2019 COMPANY SNAPSHOT
Phu Nhuan Jewelry JSC is the largest jewelry manufacturer and retailer of in Vietnam, accounting for 30% of the branded jewelry market share.
The company has the largest jewelry factory in Vietnam with about 1,000 goldsmiths and a capacity of four million products per year.
525456585105
05
1015202530
Jan-
18
Apr
-18
Jul-1
8
Oct
-18
Jan-
19
Apr
-19
Jul-1
9
Oct
-19
PE Price ('000 VND, RHS)

www.vdsc.com.vn | Bloomberg: VDSC <GO> 38
FPT DIGITAL RETAIL JSC Bloomberg: FRT VN
Expected to recover after a difficult year
BUY 33% FRT, like its competitor MWG, is also influenced by the saturation of the mobile phone industry. The company has chosen to expand into pharmaceutical retail by acquiring Long Chau drugstores. In the long run, FRT expects to be able to capture a good share of the pharmaceutical retail market worth USD 1.6 bn from 30,000 mom-and-pop pharmacies.
In order to maintain its growth in the short and medium term, FRT deployed two installment plans, namely F.friends and Subsidy, to capitalize on consumer credit growth. However, this has not worked as planned in 2019 as FRT had a negative year with bad debt from the two said programs as well as a slowdown in the iPhone market. The stock has been oversold and can be considered for investing with expectation that the ICT segment will recover in 2020 and Long Chau will post a positive growth in revenue & number of stores.
Investment Rationale
- 2019’s result was heavily impacted by bad debt provision and the iPhone unsuccessful launch. We expect FRT to recover in 2020. The company booked VND 30 bn in bad debt provision in 2019 from F.friends and Subsidy. It was related to technical issues that have now been solved. Moreover, iPhone’s 2018 unsuccessful launch made new sales stumble in 2019. We believe iPhone sales in 2020 will recover and will have positive impact on FRT’s result, whose revenue is a third dependent from iPhone sales.
- Long Chau pharmacy chain is moving in the right direction with an appropriate model: (1) strategic locations such as intersection corners, near markets, hospitals and residential areas, (2) maintaining high SKU and (3) competitive pricing strategy. FRT plans to expand the chain to make it one of the main drivers of the company in the next five years. Long Chau is forecasted to break even in 2021.
- Attractive valuation: 2019’s negative results dragged down the stock price to 6.7x 2019’s forward P/E and 0.12x P/S which is attractive considering the company is expected to recover in 2020 with an EPS growth of over 20%. We believe FRT can be considered for investing with expectation that the ICT segment will recover in 2020 and Long Chau will post a positive growth in revenue & number of stores.
2019 Outlook
- Stop opening more FPT Shop. The ICT division is estimated to grow 7% in sales, coming from new stores opened in 2019. Those will operate fully next year.
- Long Chau speeds up with the store count reaching 150 and total sales of VND 2,100 bn (USD 90 mn).
- Net margin will improve due to better margin from iPhone and no more bad debt provision. Accordingly, revenue and PAT will rise by 15% and 22% YoY respectively.
Risks to Our Call
- More bad debt increasing from the two installment programs.
- iPhone sales in 2020 is not positive as expected due to more competition.
- The expansion progress of Long Chau drugstores is not as expected due to difficulties in finding locations and managing inventories.
CMP (VND) 27,000 Target Price (VND) 35,000 Cash Dividend (VND)* 1,000 (*) expected in next 12 months STOCK INFO Sector Retails Market Cap (USD mn) 92.2 Current Shares O/S (mn) 79.0 3M Avg. Volume (K) 69.1 3M Avg. Trading Value (VND bn) 0.1 Remaining Foreign Room (%) 1.2 52-week range (‘000 VND) 26.6 - 64.4 PERFORMANCE
FORECAST VND bn 2017 2018 2019E 2020F Revenue 13,147 15,298 17,504 20,151 % yoy 21.1 16.4 14.4 15.1 NPAT 290 348 332 407 % yoy 40 20.0 -4.5 22.4 ROA (%) 7.5 6.7 4.9 5.3 ROE (%) 36.4 30.7 22.0 22.1 EPS (VND) 3,634 4,360 4,055 4,896 BV (VND) 19,911 16,673 18,896 22,615 Div (VND) 2,000 2,000 1,000 1,000 P/E (x) N/A 14.5 6.7 5.5 P/BV (x) N/A 4.2 1.4 1.2 *Price as of Dec 13th, 2019 COMPANY SNAPSHOT
FPT Retail (FRT) is the second largest electronic retailer in Vietnam, after MWG, with 585 stores. FRT is currently operating three retail chains: FPT Shop that sells electronics products, F.Studio sells Apple devices and Long Chau - the pharmaceutical retail chain.
By following MWG’s expansion strategy, FRT had experienced an impressive growth. CAGR revenue and PAT during 2014-2017 were 36% and 92%, respectively. However, FRT is struggling in maintaining growth in the saturated smartphone market.
5
25
45
65
85
105
5
10
15
20
25
May
-18
Jul-1
8
Sep-
18
Nov
-18
Jan-
19
Mar
-19
May
-19
Jul-1
9
Sep-
19
Nov
-19
PE Price ('000 VND, RHS)

www.vdsc.com.vn | Bloomberg: VDSC <GO> 39
QUANG NGAI SUGAR JSC Bloomberg: QNS VN
Accelerating new soymilk product development
BUY +42% QNS is trading at a trailing P/E of 7x, quite attractive compared to the overwhelming market share of its soy milk segment. However, the sale of shares from management and negative movement in its sugar sector caused investors to apply a high discount to the fair value of this stock. We expect that when ATIGA (ASEAN Trade in Goods Agreement) comes into effect and the An Khe factory is put into operation of refined extra (RE) sugar, QNS should enhance its domestic market share and improve its gross margin. At the same time, the strategy of expanding its soy milk sector in both domestic and export markets to reach US 1 bn in revenue will be a catalyst for the stock price.
Investment Rationale
- Expanding the soymilk segment in the domestic market. Its soymilk segment currently accounts for only 37% of total soymilk and related soybean products in Vietnam, so there is still plenty of room to grow. The firm is building up its six strategic pillars, including distribution channels development, new products packaging, materials area development, etc. Besides, QNS expects to launch 15 new product lines in 2020 to boost sales, gradually reaching USD 1 bn in revenue by 2027.
- Looking for opportunities to export its soymilk products to China. QNS plans to change its designs, packaging and develop a proper marketing plan to penetrate into this market. Management expects that the firm will launch its pure Fami product lines and flavorful soymilk products in March 2020 to penetrate into the traditional and modern distribution channels in China.
- Expecting a recovery of sugar price from a low base. World sugar production in the 2019/20 crop year is estimated to decline to 174 mn tons (-3.4% YoY) mainly due to India's reduction in sugarcane area and unfavorable weather resulting in declining sugarcane productivity (according to USDA). Narrowing the supply while demand is estimated equivalent to the same as last year will help the sugar price recover. In the domestic market, it is expected that the wholesale sugar price will remain at the price of VND 12,500-13,000/kg so far thanks to (1) the decrease in sugarcane material area reducing supply, (2) the increase of demand for imported raw sugars to produce refined extra sugars from enterprises such as QNS and SBT. This will partially help to solve the problem of illegal smuggling of raw sugars to Vietnam from neighboring countries.
2020 Outlook
- Net revenue and NPAT-MI are expected to grow by 17.4% YoY and 10.9% YoY.
- Gross margin is estimated at 28.4%.
Risks to Our Call
- Demand for soymilk drops sharply.
- Soybean material prices soar.
- Sugar price plummet due to increase in import of raw and refined sugars from Thailand and neighboring countries when ATIGA comes into effect.
CMP (VND) 29,550 Target Price (VND) 40,500 Cash Dividend (VND)* 1,500 (*) expected in next 12 months STOCK INFO Sector Consumer Market cap ( VND bn) 10,547.0 Current shares (millions) 356.9 3M avg. volume (K) 350.2 3M avg. Trading value (VND bn) 10.4 Remaining foreign room (%) 31.8 52-week range (‘000 VND) 23.9 – 36.4 PERFORMANCE
FORECAST VND bn 2017 2018 2019E 2020F Revenue 7,633 8,031 7,818 9,176 % yoy 9.5 5.2 -2.6 17.4 NPAT 1,027 1,240 1,162 1,289 % yoy -27.2 20.8 -6.3 10.9 ROA (%) 14.7 15.5 15.3 14.6 ROE (%) 22.9 23.2 18.2 17.3 EPS (VND) 3,407 4,155 3,779 4,192 BV (VND) 21,829 21,733 21,154 24,704 Div (VND) 1,500 1,500 1,500 1,500 P/E (x) 9.1 8.3 8.0 7.2 P/BV (x) 2.4 2.3 1.4 1.2 *Price as of Dec 13th, 2019 COMPANY SNAPSHOT
Quang Ngai Sugar JSC (UPCOM: QNS) is a leading player in the Vietnamese soymilk industry, with its overwhelming market share of around 84%. It is also one of the largest refined standard (RS) sugar producers in Vietnam. Currently, the firm has a plan to produce its RE sugar with higher margin once ATIGA (ASEAN Trade in Goods Agreement) comes into effect. Besides, its other businesses include confectionery, beer, mineral water and biomass.
5
15
25
35
45
0
5
10
15
Jan-
18
Apr
-18
Jul-1
8
Oct
-18
Jan-
19
Apr
-19
Jul-1
9
Oct
-19
PE Price ('000 VND, RHS)

www.vdsc.com.vn | Bloomberg: VDSC <GO> 40
SAIGON MIEN TRUNG BEER JSC Bloomberg: SMB VN
An attractive valuation
BUY +40% We has a positive outlook for this stock thanks to (1) better business performance through the positive transformation of the whole group, (2) an attractive valuation with trailing P/E of 6.5x (quite low compared to peers of 9x) and (3) high cash dividend ratio compared to the current market price. With its healthy cash flow, we believe that the firm can maintain a high cash dividend payout ratio for years.
Investment Rationales
- There is still room to cut cost thanks to the restructuring strategy of Sabeco. SAB is still under the restructure of its subsidiaries and affiliates through (1) re-building its employee compensation policies and (2) cooperation with ThaiBev to buy raw materials at higher volume in order to get competitive price. In addition, efficient marketing strategies from ThaiBev are expected to support its related parties including SMB, which continues to bolster sales growth.
- Profit margin is expected to improve thanks to the decrease of raw material prices. Malt price is estimated to decrease by 21% from the peak level in Q2 2019 and down 4% from the beginning of the year. As malt materials take over high proportion in the cost structure of about 30%, we expect the decrease in raw material prices will help its gross margin improve.
- An attractive dividend yield. The firm already paid its cash dividend of VND 3,500/share based on its 2019 guidance. According to management, SMB may proceed with an additional VND 1,500/share cash dividend thanks to its positive performance. With the expected 2020’s cash dividend of VND 3,500/share, dividend yield is about 9%, quite attractive compared to current market price.
- An attractive valuation compared to the peers. SMB is trading at a trailing P/E of 6.5x, quite attractive compared to the peers of around 9x.
2021 Outlook
- Net revenue and NPAT-MI are expected to grow by 5% YoY and 11% YoY.
- Gross profit margin is estimated at 23.6%, higher than the forecast of 22.4% in 2019.
Risks to Our Call
- SAB sharply reduced orders of the firm to focus on allocating sales volumes of its subsidiaries in Quang Ngai.
- Fierce competition from foreign rivals (Heineken, Carlsberg) to decline the demand of SMB’s beer consumption.
- The price of malt and aluminum material grow significantly.
CMP (VND) 39,400 Target Price (VND) 50,000 Cash Dividend (VND)* 3,500 (*) expected in next 12 months STOCK INFO Sector Consumer Market cap ( VND bn) 1,176.0 Current shares (millions) 29.8 3M avg. volume (K) 64.5 3M avg. Trading value (VND bn) 2.6 Remaining foreign room (%) 40.4 52-week range (‘000 VND) 27.3 – 40.9 PERFORMANCE
FORECAST VND bn 2017 2018 2019E 2020F Revenue 1,122 1,538 1,605 1,683 % yoy 37.0 37.0 4.4 4.9 NPAT 127 140 208 230 % yoy 23.0 10.0 48.6 10.6 ROA (%) 16.8 16.7 20.8 21.2 ROE (%) 26.7 31.6 39.5 36.6 EPS (VND) 4,264 4,691 6,273 6,939 BV (VND) 15,989 14,853 17,669 21,198 Div (VND) 2,500 4,000 3,500 3,500 P/E (x) 7.3 6.9 6.2 5.6 P/BV (x) 1.9 2.2 2.2 1.9 *Price as of Dec 13th, 2019 COMPANY SNAPSHOT
Saigon Mien Trung Beer JSC (HSX: SMB) was established through the merger of Saigon Quy Nhon Beer JSC, Saigon Phu Yen Beer JSC and Saigon Dak Lak Beer JSC in 2008. Its specialty is the production of beer and beverage products. It is also and affiliate company of Sabeco (HSX: SAB), of which SAB owns 32%.
5
15
25
35
45
0
2
4
6
8
10
Jan-
18
Apr
-18
Jul-1
8
Oct
-18
Jan-
19
Apr
-19
Jul-1
9
Oct
-19
PE Price ('000 VND, RHS)

www.vdsc.com.vn | Bloomberg: VDSC <GO> 41
VIETNAM DAIRY PRODUCTS JSC Bloomberg: VNM VN
Gaining more market share through the acquisition of GTN
ACCUMULATE +11% Thanks to the recovery of dairy demand in both the domestic and export markets (mainly in the Middle East), VNM's business performance recorded a positive growth compared to the low base of 2018. Looking to 2020, we expect that the acquisition of GTN and the acceleration of new products launch will support sales growth. However low margins are considered to negatively affect its profit growth.
Investment Rationale
- Recovery of domestic demand drives growth. After a period of deceleration, dairy demand has recovered. Specifically, dairy and its related products achieved positive sales growth in 11M 2019, up 15% YoY and 7% YoY in rural and urban key cities respectively (according to Kantar Worldpanel). With a leading position and strong financial structure, we believe that the firm will continue to accelerate the development its new product lines and marketing campaigns to bolster its organic growth (9M2019: net sales was up 6.4% YoY vs. market shares gained 0.3% to 61.3%).
- Acquisition of GTN will help the firm diversify its product portfolio and gain more market share in the north. Through owning a 75% stake of GTN Foods, VNM indirectly owns Moc Chau Milk (MCM), a well-known brand in the northern market (achieving 23% and 9% of liquid milk market share in the north and nationwide respectively) and current product portfolio of MCM (such as pasteurized fresh milk, yogurt, butter, cheese, etc). In addition, the firm may enhance its cow herd by 23,500 cows owning from MCM, up to 153,500 cows. This could help VNM more self-sufficiency of fresh milk materials.
- Gross margin is likely to decline compared to 2019 due to (1) a significant increase of skim milk powder materials and (2) the consolidation of GTN with lower gross margin (9M2019: 15.3%). The price of skim milk powder fixed in October 2019 is estimated to grow by 11% compared to the previous fixed time of raw milks, while the whole milk powder is due to decline by 4%, which is not enough to offset the skim milk powder increase.
2022 Outlook
- Net sales and NPAT will grow by 9,4% YoY and 3,5% YoY respectively.
- Gross margin is forecasted to decline to 45,6% from 47,2% in 2019.
Risks to Our Call
- The price of skim milk powder and whole milk powder soar.
- Sharp decline in cow milk demand.
- Political instability in the Middle East. A main export market, causing a reduction in demand for imported dairy products.
CMP (VND) 118,000 Target Price (VND) 126,000 Cash Dividend (VND)* 4,500 (*) expected in next 12 months STOCK INFO Sector Consumer Market cap ( VND bn) 205,482.6 Current shares (millions) 1,741.4 3M avg. volume (K) 1,408.6 3M avg. Trading value (VND bn) 176.8 Remaining foreign room (%) 41.5 52-week range (‘000 VND) 115.4 – 148.3 PERFORMANCE
FORECAST VND bn 2017 2018 2019E 2020F Revenue 51,041 52,562 55,840 61,078 % yoy 9.1 3.0 6.2 9.4 NPAT 10,296 10,227 10,794 11,173 % yoy 10.1 -0.7 5.5 3.5 ROA (%) 32.2 28.4 27.5 26.2 ROE (%) 44.5 40.8 39.0 37.4 EPS (VND) 6,355 5,295 5,578 5,773 BV (VND) 16,105 14,802 15,880 17,154 Div (VND) 5,000 4,500 4,500 4,500 P/E (x) 32.8 22.7 21.2 20.4 P/BV (x) 12.7 8.0 7.4 6.9 *Price as of Dec 13th, 2019 COMPANY SNAPSHOT
Vietnam Dairy JSC (HSX: VNM) is a leading dairy producer in Vietnam with more than 40 years of experience, leading the market in many segments such as liquid milk, condensed milk, yogurt, etc. VNM’s brand name is deeply embedded into the minds of consumers. This is the company’s great competitive advantage. High brand awareness help it easily promote new products launch. Currently the firm has expanded high-quality dairy products and alternative milk from plants to meet market demand.
5
55
105
155
205
0
10
20
30
40
Jan-
18
Apr
-18
Jul-1
8
Oct
-18
Jan-
19
Apr
-19
Jul-1
9
Oct
-19
PE Price ('000 VND, RHS)

SECTOR OUTLOOK AND INVESTMENT STRATEGY
www.vdsc.com.vn | Bloomberg: VDSC <GO> 42
Lam Nguyen ([email protected])
Anh Nguyen ([email protected])
Banks’ earnings growth in 9M2019 has slowed down to a significant lower yet more stable rate than 2018’s. While credit volume is growing at a slightly lower rate YoY following SBV’s credit growth quota, NIM has still improved for many banks. At the same time, service income continued to expand further thanks to banks’ efforts to boost cross-selling activities. As a result, the portion of net interest income and service income on TOI for banks under our watch list have moved up to 77.7% and 10.5% in 9M2019 (from respectively 75.5% and 9.6% in 2018), reflecting a more sustainable income structure. Meanwhile, asset quality is still under controlled with more VAMC clearance and mostly stable NPL, though provision expenses is still high in those with legacy debts burden or high NPL formation from rapid retail lending expansion.
With an aim to lower interest rate and enhance the quality of the banking sector, in 2019, the SBV has ratified a number of new regulations effective by late 2019 or beginning of 2020. These policies, in our view, show SBV’s proactive approach in macroeconomics management, though banks’ activities is likely to be controlled more closely. Particularly, the impacts on banks’ performance could diverge: NIM expansion in state-owned banks would become more difficult while the effect on private banks would be to a smaller extent.
For 2020, we believe volume growth to remain similar to 2019’s, NIM to expand selectively and certain banks to save more on provision expenses. Accordingly, most banks should be able to secure at least 15% core earnings growth in 2020. We see low relative valuation (2020f PBR of 0.9x – 1.2x), and high profitability (ROE 2020f of 20 – 24%) as advantages for banking stocks.
2020 volume growth to remain stable
Retail lending still served as the main loan growth drivers for most banks, with the strongest retail loan expansion found at VIB, TPB, ACB and MBB. Another lending growth driver is corporate bonds, with TCB, MBB and TPB maintaining a higher portion of corporate bonds than peers.
After a stagnation period in 2018 and 1Q 2019, consumer finance lending recovered in FE Credit in 1H 2019 and HD Saison in 3Q 2019. With current favorable economics condition and the recent recovery signs we believe that consumer finance will be able to maintain positive growth in 2020.
Nine out of 10 banks under our watch list, except for CTG, have already been approved to apply Basel II CAR (Circular 41). We believe these compliant banks should be able to maintain at least their 2019 lending growth rate, or even higher in the case of BID who has just got the approval recently. Meanwhile, CTG is likely to have more difficulties raising capital by next year, so its credit growth should be lower than in 2019.
Net interest income to slow down yet become more stable
In 2019, NIM continued to improve for many banks owing to the expansion of consumer finance (MBB, HDB), auto and mortgage lending (TPB, VIB), restructuring of investment book (VCB) or LDR utilization (VCB, HDB). Other banks saw stable or slightly decreasing NIM.
From end 2019/beginning 2020, many of the new regulations regarding capital/funding/consumer finance are going to become effective and should have a mix impact on banks’ business.
• The adjustment of deposit rates for some tenures and lending rates to encouraging sectors could have diverse immediate impacts depending on banks’ responses to the regulations. In the long-term, we expect that SBV’s efforts to reduce lending rates would limit asset yields expansion.
• The new capital adequacy requirements (according to either Circular 41/2016-TT-NHNN or Circular 22/2019-TT-NHNN) and the lower threshold for the ratio of short-term deposit funding for medium/long-term loans (Circular 22/2019-TT-NHNN) is likely to limit banks’ ability to expand NIM.
BANK – STRICTER REGULATIONS, YET GROWTH TO REMAIN POSITIVE
Negative Positive Neutral

SECTOR OUTLOOK AND INVESTMENT STRATEGY
www.vdsc.com.vn | Bloomberg: VDSC <GO> 43
The impact is stronger for banks with thin capital buffers (such as CTG) and high short-term deposit funding for medium/long-term loans ratio (such as VIB and TCB).
• An equalized LDR threshold of 85% for all banks (Circular 22/2019-TT-NHNN) would allow private banks more room to leverage this ratio but have an opposite effect on state-owned banks.
• The regulation to transfer day-end outstanding demand deposit of the State Treasury from commercial banks to SBV (Circular 58/2019/TT-BTC) should affect funding cost of state-owned banks, those with higher percentage of this deposit category.
• The regulation imposing a threshold for direct disbursement to customers (Circular 18/2019/TT-NHNN) would limit credit and NIM growth of cash loan-focused players such as FECredit and MCredit, though more likely in the long-term rather than the short-term.
Overall, we expect that these new regulations will limit margin expansion for state-owned banks (CTG likely the most affected bank) while the impact on private banks will be less significant (ACB and HDB likely the least affected ones). Particularly, we expect that banks with relatively comfortable consumer finance expansion (MBB, HDB) would still have opportunities to improve NIM further in 2020. Nevertheless, we see opportunities for banks given credit growth is most likely to remain decent, because (1) Lending is still the key income source and (2) Credit expansion will allow banks to cross-sell products, which in turns boost their service income.
Despite the difficulties of state-owned banks, we see that they could benefit from possible chances to raise capital from (1) state budget (according to draft amendment of Decree 126/2017/ND-CP and 32/2018/ND-CP) or (2) reducing state ownership limit from 65% to 51% (according to the Banking sector Development strategy until 2025), though the specific timeline is not defined yet.
Service income to expand further, primarily driven by bancassurance. Amongst service activities that banks are trying to boost, such as bancassurance, transaction, guarantees, bond services, brokerages, etc., bancassurance became a crucial growth driver, especialy bancassurance life-premium. This category has expanded with a CAGR of 84% during 2016-2018, contributing 15.8% (and increasing) to total life market premium in 9M2019. We believe the deeper penetration of life-insurance would continue to support the high growth of banks’ insurance income.
With the boost of life bancassurance, in 9M2019, service income expanded most strongly at VIB and VPB, followed by TPB, CTG and MBB. Meanwhile, the growth is lower in BID and HDB due to the lack of growth drivers in not only in bancassurance activities, but also in settlement. We expect that VCB and ACB should be the next to see significant annual growth in insurance income, upon their newly signed bancassurance agreements (VCB with FWD in Nov 2019; ACB with Manulife in Sep and FWD in Dec 2019).
Despite strong bancassurance growth, the growth of service fee is quite low at TCB, due to the deep penetration of its zero fee and unlimited cash back policies. The fee exemption trend has become more popular amongst banks with the participation of VIB, TPB and ACB, in order to support their target of CASA improvement in response to more funding pressure. As such, we expect that many banks would see lower growth of settlement income in the medium term, despite the spread of non-cash payment. On the other hand, banks can find a source to boost service income from the fee of bonds underwriting and distribution. TCB is still the dominant player in the bond market, but MBB and TPB also have potential to boost this activity.
VCB has finalized the exclusive bancassurance agreement with FWD, which is expected to supplement a large amount of extraordinary earnings possibly in a couple of years. Other banks such as BID and ACB are also seeking exclusive life-insurance partners, and therefore, are eligible for potential high up-front fees though these deals are unlikely to be finalized shortly.
Asset quality improved with VAMC clearance and controlled NPL ratios
For the entire sector, as of August 2019, the on-balance sheet NPL ratio reached 1.98% (slightly higher than 1.90% in 2018 and 2Q2019). However, considering the sum of NPL, VAMC and restructuring debts to total

SECTOR OUTLOOK AND INVESTMENT STRATEGY
www.vdsc.com.vn | Bloomberg: VDSC <GO> 44
credit, this ratio was reduced gradually to 4.84% from 5.85% in 2018 - a positive signal of the effort to handle bad debts in the system.
The clearance of VAMC debts remains progressive. In the two years from August 2017 to August 2019, with Decision 42 coming into effective, a total of VND 236.8 Tn (USD 10,296 mn) VAMC debts has been handled, equivalent to an average amount of VND 9.6 Tn per month (USD 417 mn), more than twice the average amount handled during the 2012-2017 period. In particular, VPB and TPB were able to clear all remaining VAMC debts within 2019, so their ratio of provision on TOI should ease in 2020. Meanwhile, with a relatively small part of VAMC debt remaining, BID and HDB would still need to book some VAMC provision, though the cost should be much less than in 2019. Amongst them, HDB would subsequently bear PGBank’s VAMC debts (of VND 908 bn or USD 39.5 mn by September 2019) if the merger between the two banks is completed next year. The provision burden in CTG, despite the progress to handle 25% of the 2018 net VAMC debts during 9M2019, is likely to persist in 2020.
On the balance sheet, asset quality is moving in different directions. Due to the fast growth of retail and consumer lending recently, the NPL of some banks has gradually increased. We saw this trend in MBB and TPB in 2018, which continued during 2019. We believe these banks would see a substantial growth in provision expenses for on-balance sheet assets in 2020.
CIR is declining but less likely to improve significantly
We see that normalized CIR 9M2019 has improved slightly for all banks under our watch list. We expect this trend to continue in 2020, but the improvement is unlikely to be significant as banks still need to keep investing in digital banking to capture the expansion of CASA and non-cash payment. An opposite trend should be found in BID who is in need to upgrade its core banking system, which is expected to affect the bank’s CIR for at least the next two years.
Despite the challenges to reduce CIR in the near term, we believe that further down the road operating costs can ease, starting with heavy investors in digital transformation, including VPB, TCB, TPB and ACB.
Low valuation and high profitability are banking stocks’ advantages
Overall, for eight banks under our coverage, we expect revenue to increase by 16.0% and earnings to increase by 23.7% in 2020, with mostly unchanged provision expenses and operating costs increasing by 20%. We forecast that all banks, excluding CTG, should be able to achieve at least 15% earnings growth. We see low relative valuation (2020f PBR of 0.9x – 1.2x), and high profitability (ROE 2020f of 20 – 24%) as advantages for banking stocks. Note that most private banks have reached their threshold of foreign ownership.
VPB and BID are our top picks. We prefer VPB considering that its subsidiary, FE Credit, has recovered since early 2019. We expect that the company will contribute approximately 60% and 51% of consolidated net interest income and PBT respectively. By entering an exclusive bancassurance partnership with AIA and expanding credit card loan, fees from life insurance and settlement will be service income’s growth driver. We regard the current PB ratio as attractive (0.9x 2020f and 0.7x 2021f), despite the absence of remaining FOL. We also like BID, a state-owned bank, who has been progressing on its restructuring plan. The deal with new strategic investor – Keb Hana Bank - would pave the way for better prospects for the bank. Therefore, though its current PB 2020f ratio is higher than peer’s average (2.0x vs 1.2x), we believe BID can become a strong contender in the sector.
Risks
• Positive progress in the recovery of NPLs and VAMC debts could lower the provision charges burden by more than our expectations.
• The SBV’s direction to lower lending rate in the context of tightening funding regulations could affect NIM movement to a greater extent than our expectations.
• The potential of a downturn in construction and real estate (especially in the hospitality sector).

SECTOR OUTLOOK AND INVESTMENT STRATEGY
www.vdsc.com.vn | Bloomberg: VDSC <GO> 45
Figure 1: Customer loan and deposit growth of the banking sector 2013-2019E (%)
Source: Banks’ FS, Rong Viet Securities
Figure 2: YoY growth rate of bancassurance life-premium and the contribution to total life market premium in VN
Source: Insurance Association of Vietnam, Rong Viet Securities
Figure 3: Earnings growth of some banks in 9M2018 and 9M2019 (%)
Source: Banks’ FS, Rong Viet Securities
Figure 4: Total operating income structure of some banks 9M2019 (%)
Source: Banks’ FS, Rong Viet Securities
10%
12%
14%
16%
18%
20%
2014 2015 2016 2017 2018 2019E
Customer loan growth Customer deposit growth
5.9 7.6
12.0 15.8
10.0 11.6
21.0
29.0
88
69
104
85
0
50
100
150
0
10
20
30
40
2016 2017 2018 9M2019
% of life-premium% of 1st-year life-premiumYoY growth rates (RHS)
76
68
89
80
86
76
68
75 75
86
50
55
60
65
70
75
80
85
90
95
-20
0
20
40
60
80
100
120
140
160
180
200
ACB BID CTG MBB VCB VPB HDB TCB TPB VIB
% of 2019 guidance (RHS) 9M2018 PBT growth (YoY, LHS) 9M2019 PBT growth (YoY, LHS)
77.8 77.1 81.873.0 74.0
82.3 80.9
61.4
77.284.3
12.5 8.810.2
12.9 9.84.5 5.0
15.9
10.9
12.4
0%
10%
20%
30%
40%
50%
60%
70%
80%
90%
100%
ACB BID CTG MBB VCB VPB HDB TCB TPB VIB
Net interest income Service income Other income

SECTOR OUTLOOK AND INVESTMENT STRATEGY
www.vdsc.com.vn | Bloomberg: VDSC <GO> 46
Figure 5: Bad debts ratio (NPL plus VAMC) and loan loss reserve ratio of some listed banks in 3Q2019 (%)
Source: Banks’ FS, Rong Viet Securities
Figure 6: ROE, PB, PE of some listed banks
Source: FiinGroup, Rong Viet Securities. Bubble size equals respective ROE.
Table 1: Banking stocks – Market cap, price, rating, per share, dividends and ROE summary
Sticker
Market cap
(VND bn)
Current Price
(VND)
Target price
(VND) ETR (%) Rating
P/E 2019F
(x)
P/BVPS 2019F
(x)
ROE 2019F
(%)
DY 2019F (%)
P/E 2020F (x)
P/BVPS
2020F (x)
ROE 2020F (%)
DY 2020F
(%)
Foreign room
(%)
VPB 47,293 19,650 28,000 42.5 Buy 7.8 1.2 23.0 0.0 4.1 0.9 24.5 0.0 0.5 MBB 50,700 21,800 27,000 26.6 Buy 8.4 1.3 21.3 2.8 5.4 1.1 22.5 2.8 0.0 BID 168,523 41,900 50,000 21.0 Buy 30.4 2.2 12.3 1.7 19.2 2.0 13.6 1.7 12.1 TCB 81,028 23,150 28,000 21.0 Buy 10.6 1.3 16.7 0.0 7.5 1.1 16.5 0.0 0.0 ACB 38,431 23,200 27,000 20.7 Buy 7.7 1.4 24.3 0.0 5.8 1.2 22.3 4.3 0.0 HDB 27,419 27,950 33,000 18.1 Accumulate 9.0 1.4 19.4 0.0 6.3 1.2 19.8 0.0 6.2 VCB 327,865 88,400 95,000 8.4 Accumulate 20.9 3.9 25.7 0.9 16.1 3.2 24.2 0.9 6.2
Source: Rong Viet Securities forecast, share prices as of 13th Dec 2019
0.7
2.32.5
1.71.5
1.1
3.5
1.81.5
2.0
0
20
40
60
80
100
120
140
160
180
200
ACB BID CTG HDB MBB VCB VPB TCB TPB VIB0.0
0.5
1.0
1.5
2.0
2.5
3.0
3.5
4.0NPL+VAMC ratio (LHS) LLR (RHS)
TPB
VIBCTG
VCB
BID
HDB
VPBMBB TCB
0.0
0.5
1.0
1.5
2.0
2.5
3.0
3.5
4.0
4.5
5.0
4.0 6.0 8.0 10.0 12.0 14.0 16.0 18.0 20.0 22.0
P/B
P/E

www.vdsc.com.vn | Bloomberg: VDSC <GO> 47
VIETNAM PROSPERITY JSB. Bloomberg: VPB VN
A high-risk appetite retail bank
BUY 43% We like VPB considering that its subsidiary, FE Credit, has recovered since early 2019. We expect that FE Credit will contribute approximately 59% and 53% of 2020 consolidated NII and PBT respectively. By entering in an exclusive bancassurance partnership with AIA, expanding credit card loan, fee from life insurance and settlement will be service income’s growth driver. We regard the current PB ratio as attractive (0.9x 2020f and 0.7x 2021f), despite the absence of remaining FOL.
Investment Rationale
- Consumer lending plays an important role. Consumer lending has accounted for 22 – 23% of VPB’s total lending book yet it contributes c. 51% on average in consolidated PBT in the past three years. The issuance of Circular 18/2019/TT-NHNN, aiming to reduce the cash loan proportion of consumer financing firms is unlikely to hurt FE (FE Credit). We expect FE to maintain its loan book growth at 14 –15% per annum and generate more than 50% of consolidated net earnings in the next four years.
- Healthy shift in the TOI structure. While we believe that NII growth would be slower in the upcoming years due to the lower NIM and credit growth, we see ample room to increase services income via insurance commission and card fee. Net services income is expected to grow at a CAGR of 28% and its contribution into TOI would increase to more than 11% by 2023.
- Technology to save operating costs and control risk. VPB launched its digital projects quite soon compared to peers. Though we believe this is a long journey with heavy workload and capital needs, there are preliminary encouraging results in terms of cost saving and customer acquisition.
- Strong capital buffer and attractive valuation. VPB is among banks who applied CAR Basel II earlier than SBV’s requirement. Low leverage and high CAR will allow it to grow at a higher rate than peers. In addition, given our ROAE forecast of more than 20% in the next four years, the forward 2020 PBR of 0.9x looks attractive.
2020 Outlook
- We expect VPB’s consolidated total credit and deposit to grow 15.4% YoY and 15.7% YoY given strong capital buffer (low leverage and high CAR Basel 2).
- Consolidated NIM would go down by 4.7 bps to 9.28%. NII, hence, will grow more than 14.6% YoY and contribute c. 82% in total operating income (TOI).
- Growth momentum from insurance commission and card fee would slow down from 2019’s but still be services income drivers. The proportion of services income in TOI would increase by 100 bps to 8.5%.
- TOI and Opex would increase 14% YoY and 13.3% YoY respectively. PBT and NPAT, therefore, would increase by more than 31% YoY.
Risks to Our Call
- Lower-than-expected earnings growth due to unpredicted high NPLs and credit costs.
- Reduction of cash loan proportion (due to Circular 18/2019/TT-NHNN) would negatively affect FE’s NIM in particular and consolidated NIM overall.
CMP (VND) 19,650 Target Price (VND) 28,000 Cash Dividend (VND)* 0 (*) expected in next 12 months STOCK INFO Sector Banks Market cap ( VND bn) 47,292.6
Current shares (millions) 2,406.7
3M avg. volume (K) 4,862.2
3M avg. Trading value (VND bn) 103.9
Remaining foreign room (%) 0.5
52-week range (‘000 VND) 17.5–22.8 PERFORMANCE
FORECAST VND bn 2017 2018 2019E 2020F Revenue 25,026 31,086 36,884 42,119 % yoy 48.4 24.2 18.7 14.2 NPAT 6,441 7,356 8,823 11,665 % yoy 63.7 14.2 19.9 32.2 ROA (%) 2.5 2.4 2.8 2.9 ROE (%) 27.5 22.8 24.7 23.3 EPS (VND) 4,101 2,907 3,610 4,847 BV (VND) 18,907 13,735 17,074 21,894 Div (VND) 0 0 0 0 P/E (x) 4.8 6.8 5.8 4.1 P/BV (x) 1.0 1.4 1.2 0.9 *Price as of Dec 13th, 2019 COMPANY SNAPSHOT
VPB is among the most active and successfully private banks in Vietnam. Though the parent bank’s deposit and lending market share are tiny, it benefits from the consumer financing segment of its subsidiary, FE Credit, which made up most of the bank’s high profitability since 2015.
VPB is also a pioneer in Vietnam digital banking trend. Timo, its joined venture digital bank, VPB has built its own digital bank named YOLO. The investment, however, has not delivered a significant contribution into consolidated earnings yet. The advantage at this time is that paper-work digitalized process can help save operating expenses.
5
15
25
35
45
0
5
10
15
Jan-
18M
ar-1
8M
ay-1
8Ju
l-18
Sep-
18N
ov-1
8Ja
n-19
Mar
-19
May
-19
Jul-1
9
Sep-
19N
ov-1
9
PE Price ('000 VND, RHS)

www.vdsc.com.vn | Bloomberg: VDSC <GO> 48
BANK FOR INVESTMENT AND DEVELOPMENT OF VIETNAM J.S.C Bloomberg: BID VN
Fundamentals to improve upon strategic placement deal
BUY 21% BID, a state-owned bank, has been progressing on its restructuring plan while keeping a modest earnings growth. The stock is trading at a 2019 PBR of 2.2x, significantly higher than industry average (excluding VCB). We would anticipate, however, that the bank deserves such a high PBR given its much better growth potential upon the strategic placement to Keb Hana Bank and the clearance of legacy bad debts. We forecast NPAT CAGR of 30% in 2019 – 2022 and ROE approaching 18% in the next three years.
Investment Rationale
- Continue to enhance capital strength. BID has completed a strategic placement deal by issuing 603 million shares to KEB Hana Bank (KHB), at VND 33,640 per share, equivalent to post-money PBR of 1.7x. With over VND 20.2 Tn (or c. USD 875 Tn) collected, BID became the biggest bank in Vietnam in terms of charter capital (at VND 40.22 Tn or c. USD 1.73 Bn). Accordingly, CAR (Basel 1) rose to 10.5%, and CAR (Basel 2) to 9%. BID is still planning to make placements of up to 10% of new charter capital to dilute the government’s ownership to 65% starting next year.
- The strategic placement will help improve BID’s fundamentals and growth prospect. First, NIM is likely to end its declining trend and turn around with a slight improvement in 2020 due to (1) a possible higher credit growth - expected to reach 13%/year after 2019 and (2) a funding pressure relief, as BID could become less dependent on long-term deposit and bonds. Second, BID’s competitive competency in retail/SME/FDI banking, digital banking and asset quality management is likely to improve with the involvement of KHB. KEB Hana is a leading Korean bank in terms of assets, reputation and innovative banking services. The bank is highly committed to its digitalization and globalization strategy in which Vietnam is one of the target destinations.
- Giving priority to the improvement of asset quality. BID prioritizes the cleaning of its asset book, resulting in low growth of earnings. For 9M2019, while the NPL ratio increased by 19bps, the bank spent 70% of pre-provision profit (PPOP) as credit cost, raising provision coverage from 66.0% to 78.2%. Meanwhile, the collection of VAMC debts is progressing positively. We expect BID to book some provision to clear all VAMC by 1H next year, yet the provision burden should ease and earnings growth is likely to accelerate since 2020.
2020 Outlook
- We expect customer loans and deposits to grow at 13% and 12.5% respectively. NIM would move up slightly to 3.0% (from 2.9% in 2019) and net interest income to grow by 17.2% YoY, contributing to 79.8% of TOI.
- Services income and TOI are forecast to grow by 15% and 16.7% YoY, respectively.
- CIR is likely to go up to 39.2% due to the core banking upgrades. Provision expenses are expected to reach VND 20.7 Tn (USD 900 mn), equivalent to 66.6% of PPOP.
- We expect NPAT to reach VND 11 Tn (USD 478.3 mn, +36.4% YoY), offering an EPS of VND 2,177.
Risks to Our Call
- Challenge in maintaining margins due to increasing competition in retail lending. - Unexpectedly high provision expenses .
CMP (VND) 41,900 Target Price (VND) 50,000 Cash Dividend (VND)* 700 (*) expected in next 12 months STOCK INFO Sector Banks Market cap ( VND bn) 168,522.6 Current shares (millions) 4,022.0 3M avg. volume (K) 940.0 3M avg. Trading value (VND bn) 38.3 Remaining foreign room (%) 12.1 52-week range (‘000 VND) 29.5 - 43 PERFORMANCE
FORECAST VND bn 2017 2018 2019E 2020F Revenue 39,017 44,483 47,929 55,926 % yoy 28.2 14.0 7.7 16.7 NPAT 6,787 7,358 8,062 10,998 % yoy 10.6 8.4 9.6 36.4 ROA (%) 0.6 0.6 0.6 0.7 ROE (%) 14.9 14.2 12.3 13.6 EPS (VND) 1,698 1,714 1,596 2,177 BV (VND) 14,284 15,957 19,128 21,174 Div (VND) 850 700 700 700 P/E (x) 8.1 14.9 24.9 18.2 P/BV (x) 1.0 1.6 2.1 1.9 *Price as of Dec 13th, 2019 COMPANY SNAPSHOT
As the longest-established bank in Vietnam, BIDV is one of the largest local commercial banks with total assets of more than VND1,425 Tn.
BIDV’s network is also among the top three in the sector with 189 branches, 871 transaction offices in Vietnam, and one branch in Yangon, Myanmar.
Upon the strategic placement deal to KEB Hana Bank in Oct 2019, BID became the biggest banks in Vietnam in terms of charter capital (VND 40.22 Tn or USD 1.73 Bn).
51525354555
05
10152025
Jan-
18M
ar-1
8M
ay-1
8Ju
l-18
Sep-
18N
ov-1
8Ja
n-19
Mar
-19
May
-19
Jul-1
9
Sep-
19N
ov-1
9
PE Price ('000 VND, RHS)

www.vdsc.com.vn | Bloomberg: VDSC <GO> 49
JSC BANK FOR FOREIGN TRADE OF VIETNAM Bloomberg: VCB VN
Staying Firmly On Top Position
ACCUMULATE 8.4% VCB continued to outperform peers in terms of both business performance and stock performance in YTD2019. Based on the advantages of low-cost funding, the bank has successfully improved its NIM by shifting to higher margin segments such as retail lending and financial institutions bonds while maintaining very strong asset quality. In addition to the positive expansion in interest income, service fee is also expected to achieve substantial growth in the medium term thanks to a surge in insurance income. We believe this would enable VCB to maintain a strong growth of around 20% per year in the period of 2020-2022.
Investment Rationale
- Potential for high service income growth. With VCB’s exclusive bancassurance agreement with FWD, it is expected that the bank will be able to boost insurance income by cross selling to the current vast customer base. Coupled with the positive expansion in settlement income (with a plan to maintain current fee tariff), we expect VCB’s service income to grow by 50% per annum and account for 20% of TOI in 2022 (from 9.8% in 9M2019). The bancassurance deal should also supplement a large amount of extraordinary earnings possibly in a couple of years.
- Room to expand NIM further, though likely to be more limited. We believe that with a high CASA ratio of c. 30%, VCB will be able to resist to rising funding pressure and deposit rate better than its peers. In fact, NIM was on a stable upward trend to improve from 2.9% in 3Q2018 to 3.3% in 3Q2019, thanks to the strong constant expansion into retail lending coupled with the shifting of the investment book structure (shift from g-bonds to FI bonds). We expect that the bank will still be able to improve current NIM, though the room would become more limited due to the application of new LDR threshold (85% from 90% previously for state-owned commercial banks).
- Healthy asset quality and liquidity. We consider that VCB has successfully balanced its asset book restructuring and asset quality control efforts. NPL ratio is low at 1.1% and provision coverage very high at 185.2% by 3Q2019. Current capital buffers remain sufficient with Circular 41 CAR at 9.9%. The bank is still looking to raise capital by a private placement of roughly 7% charter capital to maintain its high credit growth in the coming years.
2020 Outlook
- Customer loans and deposits growth is forecast to reach 15.0% and 12.5% respectively. NIM should slightly increase to 3.4%. Accordingly, net interest income will grow by 18.3% YoY and account for approximately 75% of TOI.
- Net service income is forecasted to grow by 60% with higher contribution from bancassurance. We expect that service fee’s contribution to TOI will reach 14.4%, from 9.8% in 9M2019.
- Consequently, VCB’s TOI is forecasted to grow at around 18.7% YoY while operating and provision expenses are likely to expand moderately at 16% and 14% respectively.
- NPAT is expected to grow by 21.4% YoY, delivering an EPS of VND 5,505.
Risks to Our Call
- Upside: 1) A huge one-off fee from the exclusive bancassurance contract with FWD, 2) stock rise not driven by fundamentals due to VCB’s high weight in VN30.
CMP (VND) 88,400 Target Price (VND) 95,000 Cash Dividend (VND)* 800 (*) expected in next 12 months STOCK INFO Sector Banks Market cap ( VND bn) 327,864.8 Current shares (millions) 3,708.9 3M avg. volume (K) 860.2 3M avg. Trading value (VND bn) 73.2 Remaining foreign room (%) 6.2 52-week range (‘000 VND) 51 - 92.5 PERFORMANCE
FORECAST VND bn 2017 2018 2019E 2020F Revenue 29,406 39,278 47,192 55,999 % yoy 18.2 33.6 20.1 18.7 NPAT 9,091 14,606 18,783 22,795 % yoy 32.2 60.7 28.6 21.4 ROA (%) 1.0 1.4 1.6 1.8 ROE (%) 18.1 25.5 25.7 24.2 EPS (VND) 2,133 3,636 4,536 5,505 BV (VND) 14,608 17,283 22,681 28,027 Div (VND) 1,000 800 800 800 P/E (x) - 14.9 18.6 15.4 P/BV (x) - 3.1 3.7 3.0 *Price as of Dec 13th, 2019 COMPANY SNAPSHOT
VCB is an interesting stock in Vietnam’s banking industry because of its high transparency as well as strong asset quality. Despite being the 4st largest state bank in term of total assets, credit and mobilization, VCB generates the highest earning In the sector. The bank is also considered the leading transactional bank in Vietnam.
The State owns 74.8% while strategic investor (Mizuho) owns 15%.
525456585105
0
10
20
30
40
PE Price ('000 VND, RHS)

www.vdsc.com.vn | Bloomberg: VDSC <GO> 50
ASIA COMMERCIAL JOINT STOCK BANK Bloomberg: ACB VN
Core earnings growth to remain stable in the medium term
BUY 21% We have a positive view on ACB considering the bank’s high liquidity and a laser focus on its traditional strengths instead of expanding into high-risk areas. In addition, the potential for insurance income growth should be boosted by the recent non-exclusive bancassurance agreements with Manulife and FWD, given ACB’s loyal retail customer base. This will act as a main driver for normalized operating income since few growth factors for interest income and other income are expected. More importantly, healthy asset quality and strong competency in controlling credit costs are advantages that can help ACB maintain a stable profit growth in the medium term.
Investment Rationale
- Focus on retail banking with low risk appetite. ACB’s customer lending structure continues to shift towards retail and SME, which is a traditional strength of the bank. The proportion of individual and SME lending consistently accounted for over 90% of total lending, with a relatively moderate portion of mortgage loans (about 20%), insignificant lending to real estate developers (at less than 3%) and no corporate bonds. The bank is likely to maintain a fairly moderate lending expansion policy to control CAR, liquidity ratios and average funding costs.
- Healthy assets quality and liquidity reserves. ACB has successfully maintained abundant liquidity with a 3Q2019 regulatory LDR ratio at 78.6% and the ratio of short-term funding for medium/long-term loans at 29%. Furthermore, ACB’s prudent makes it among the top asset quality among listed banks with the lowest NPL ratio and top highest provision coverage (at respectively 0.7% and 158.9% in 3Q2019). As a result, the burden of provision stayed low as provision charges are only equivalent to the smallest portion of pre-provision profit amongst most banks.
- Service income is set to grow strongly upon new bancassurance agreements. While the bank tries to boost service income, insurance income achieved the strongest expansion and is expected to be the growth driver in the context of limited growth coming from other sources. We believe that ACB's life insurance segment has great potential and will be further promoted after the non-exclusive agreement with Manulife and FWD – on top of the current existing partner AIA – and is well positioned to achieve CAGR of 50% in the next three years. As ACB is still planning to look for an exclusive bancassurance partner, we expect that the bank could collect a decent amount of up-front fee possibly after 2020.
2020 Outlook
- We forecast credit growth to reach 16% mainly by continuous expansion into retail and SME lending. In addition, NIM is expected to stay the same and NII to increase by 15.6% to VND 14.2 Tn (USD 317 mn).
- Service income should reach VND 2.5 Tn (USD 107 mn, +29.7%) and consolidated operating income will be 17.5 Tn (USD 761 mn, +13.0%).
- Operating expenses are expected to increase by 11.5% to VND 8.6 Tn (USD 375 mn), translating to a CIR of 49.5%. Provision expenses are likely to increase at the same rate of credit growth (16%) to VND 385 bn (USD 16.7 mn).
- NPAT is estimated at VND 6.8 Tn (USD 296 mn, +14.6% YoY), delivering an EPS of VND 4,008.
Risks to Our Call
- Challenge in expanding margins given increasing competition in retail lending.
CMP (VND) 23,200 Target Price (VND) 27,000 Cash Dividend (VND)* 1,000 (*) expected in next 12 months STOCK INFO Sector Banks Market cap ( VND bn) 38,431.2 Current shares (millions) 1,656.5 3M avg. volume (K) 3,014.8 3M avg. Trading value (VND bn) 71.7 Remaining foreign room (%) 0.0 52-week range (‘000 VND) 20 - 26.3 PERFORMANCE
FORECAST VND bn 2017 2018 2019E 2020F Revenue 11,439 14,033 15,487 17,496 % yoy 51.3 22.7 10.4 13.0 NPAT 2,118 5,137 5,927 6,790 % yoy 59.8 142.5 15.4 14.6 ROA (%) 0.8 1.7 1.7 1.7 ROE (%) 14.1 27.7 24.3 22.3 EPS (VND) 1,220 3,076 3,487 4,008 BV (VND) 9,321 12,963 16,794 19,894 Div (VND) 0 0 0 1,000 P/E (x) 27.5 9.6 6.5 5.6 P/BV (x) 2.4 1.7 1.3 1.1 *Price as of Dec 13th, 2019 COMPANY SNAPSHOT
Asia Commercial Joint Stock Bank was established in April 1993 as a small private bank focusing on retail.. It is a pioneer in implementing modern banking service activities such as issuing various kind of credit cards since the 90’s.
ACB is the 3rd largest commercial bank in terms of total assets and is also considered one of the leading retail bank. ACB carried out an IPO in 2006, and was the first bank to be listed on the HNX.
Mr. Tran Huy Hung (chairman and relatives) owns 6% while foreign ownership is 30%.
5
15
25
35
45
05
1015202530
Jan-
18M
ar-1
8M
ay-1
8Ju
l-18
Sep-
18N
ov-1
8Ja
n-19
Mar
-19
May
-19
Jul-1
9
Sep-
19N
ov-1
9
PE Price ('000 VND, RHS)

www.vdsc.com.vn | Bloomberg: VDSC <GO> 51
MILITARY COMMERCIAL JOINT STOCK BANK Bloomberg: MBB VN
Solid earnings growth, yet likely to slowdown
BUY +27% MBB has been able to maintain a solid income growth owing to a strong expansion in both interest income and service income. This high growth allowed the bank to write off debts early and maintain a healthy book, though the trend of impaired loan formation is increasing.
Investment Rationale
- Growing margin due to higher contribution of retail lending (including consumer finance). The 9M2019 total lending growth of 11.9% YTD was driven by stronger expansion of the parent bank’s retail lending (+17.7% YTD) and MCredit’s lending (+ 38.2% YTD). As such, the percentage of retail lending (including consumer lending) in total has expanded to more than 40%. As a result, MBB’s net interest margin has been improving constantly to 5.0% in 3Q2019 (trailing 4Q). Though the parent bank’s NIM was affected by rising funding cost due to a drop of 5.9 ppt in CASA this year, we hold the view that consumer lending has expanded to a decent portion to sustain an expansion in consolidated margin. However, lending and NIM expansion of MCredit should become more limited in the longer term due to the impact of Circular 18 imposing a stricter control on cash loan.
- Strong insurance income expansion driving service fee. MBB’s service income continued to grow strongly at 37% YoY in 9M2019, contributing to 12.9% of TOI (versus 12.2% in 9M2018), which was attributable to a 45.6% YoY growth in insurance income. MB Ageas Life has risen as one of top three players in terms of life bancassurance premium in 9M 2019, notwithstanding competition from others banks collaborating with top life insurers. We believe that insurance income growth will remain strong, though other activities also need to be pushed to secure a high service income growth overall.
- Asset quality remains relatively healthy, yet NPL formation trend is increasing. MBB keeps its NPL ratio stable at 1.2-1.3% and provision coverage at more than 100%. The NPL ratio increased 21 bps from the end 2018 to 3Q2019, but we believe it will be normalized towards the end of the year due to MBB’s write-off and recovery efforts. However, we anticipate that the current NPL formation trend could raise provision charges for MBB, the parent bank and MCredit.
- The plan to issue 7.5% capital to foreign investors. MBB is looking to issue 123mn new shares and selling 38.9mn treasury stocks to raise capital. If the placement succeeds, the bank is likely to acquire at least VND 4 Tn (USD 174 mn) and get enough capital to see comfortable growth in the next several years.
2020 Outlook
- We expect customer loans of the parent bank to grow at 17%, and loans of MCredit to grow at 30% YoY. Customer deposits is expected to grow by 13%. Consolidated NIM is likely to expand to 5.1%.
- We forecast that net interest income will grow by 17.3% YoY and contribute to 72.6% of TOI. We also expect that services income growth will reach 25%, pushed by net income from insurance activities.
- CIR is likely to improve to 40.7% and provision expenses are expected to reach VND 5.4 Tn (USD 103.3 mn, + 16.8% YoY). NPAT is forecasted to reach VND 9,761bn (USD 424.4 mn), translating to an EPS of VND 4,000.
Risks to Our Call
- Challenge to improve NIM due to more intensive competition in retail lending - Credit cost increase due to higher risk appetite from expansion in retail lending,
consumer finance, corporate bonds and security brokerage.
CMP (VND) 21,800 Target Price (VND) 27,000 Cash Dividend (VND)* 600 (*) expected in next 12 months STOCK INFO Sector Banks Market cap ( VND bn) 50,699.8 Current shares (millions) 2,325.7 3M avg. volume (K) 4,767.7 3M avg. Trading value (VND bn) 108.9 Remaining foreign room (%) 0.0 52-week range (‘000 VND) 16.3 - 23.9 PERFORMANCE
FORECAST VND bn 2017 2018 2019E 2020F Revenue 13,867 19,539 24,960 29,992 % yoy 40.7 40.9 27.7 20.2 NPAT 3,520 6,148 7,817 9,761 % yoy 20.9 74.7 27.2 24.9 ROA (%) 1.2 1.8 2.0 2.2 ROE (%) 12.8 19.3 21.3 22.5 EPS (VND) 1,434 2,520 3,204 4,001 BV (VND) 12,707 14,669 16,812 20,402 Div (VND) 600 600 600 600 P/E (x) 14.6 7.7 6.9 5.5 P/BV (x) 1.6 1.3 1.3 1.1 *Price as of Dec 13th, 2019 COMPANY SNAPSHOT
Established in 1994, Military Bank provides personal and corporate banking services for organizations and individuals in Vietnam. As of 3Q 2019, the bank has 101 branches (including two overseas), 198 transaction offices (including one overseas), and one representative office in Russia.
MBB currently hold 100% of MB AMC, 90.8% of MB Capital, 79.5% of MB Securities, 68% of MB Insurance Corporation, 61% of MB Ageas Life and 50% of MCredit.
51015202530
0
5
10
15
20
Jan-
18M
ar-1
8M
ay-1
8Ju
l-18
Sep-
18N
ov-1
8Ja
n-19
Mar
-19
May
-19
Jul-1
9
Sep-
19N
ov-1
9
PE Price ('000 VND, RHS)

www.vdsc.com.vn | Bloomberg: VDSC <GO> 52
TECHNOLOGICAL AND COMMERCIAL JOINT STOCK BANK Bloomberg: TCB VN
Taking a different path from others
BUY +21% We hold the view that TCB has advantages in the long term with a clear strategic orientation, a strong affluent customer base, advanced human resource management and efficient operations. The bank also successfully strengthened its advantages in terms of funding costs and service income from insurance and bonds services. Currently, asset quality is still well controlled and provision expenses has eased significantly. We forecast that the bank can achieve earnings of CAGR 17% in 2019 – 2022.
Investment Rationale
- A clear strategy with an ecosystem approach. TCB implements an inclusive ecosystem approach targeting the entire value chain in certain sectors. The bank focuses on selective partners/customer segments to drive profitability while controlling risk. As a result, TCB built a strong affluent customer base, and its efficiency is amongst the highest in the industry.
- Healthy assets quality and liquidity reserves, though NIM expansion could be limited. TCB is maintaining a close control on asset quality with stable NPL at 1.8%, LLR at 77.1%, while provision expenses has eased significantly (-66% YoY) in 9M2019. In addition, TCB is maintaining a very strong capital buffers (CAR Basel II at 16.5%) and abundant liquidity (regulatory LDR at 70.9%). Having said that, the ratio of short-term funding for medium/long-term loans reached 36.1%, quite close to the threshold by SBV. As such, TCB could be impacted by the newly issued Circular 22/2019-TT-NHNN and would have to restructure its mobilization (deposit plus bonds issuance) to cover for high growth in mortgage lending (which primarily includes long-term loans).
- Focus on enhancing digital experience. Thanks to the zero fee and 1% unlimited cash back policy, CASA improved from 22.7% by end 2016 to more than 30%, higher than VCB’s and approaching MBB’s. This supported funding cost improvement is expected to offer long-term benefits including (1) the shift of customers to digital banking, (2) saving on operating costs and (3) customer loyalty reinforcement.
- Advanced management practices. TCB’s strategy is to focus on branding, customer relation, employee management. These are in line with the overall organizational strategy and set the bank apart from peers.
2020 Outlook - We forecast that credit growth will reach 18.1% (with a 39% growth in lending
and 43% decline in corporate bonds). Total mobilization is forecasted to increase by 13.5%. We also expect that NIM will be kept stable at 4.2%. Accordingly, NII would increase by 15.6% YoY, with proportion on TOI up to nearly 70%.
- We expect that services income will grow by 20% YoY, accounting for 15.8% of TOI.
- CIR is likely to drop to 34.0%. Total provision expenses could move up moderately by 12% to VND 851 bn (USD 37 mn).
- Consolidated NPAT is expected to increase by 16.3% to VND 11 Tn (USD 478 mn), for an EPS of VND 3,102.
Risks to Our Call - The difficulties of some large clients in the ecosystem and the downturn of some
main economics sectors (especially real estate), which contribute significantly to TCB’s performance.
CMP (VND) 23,150 Target Price (VND) 28,000 Cash Dividend (VND)* 0 (*) expected in next 12 months STOCK INFO Sector Banks Market cap ( VND bn) 81,028.2 Current shares (millions) 3,500.1 3M avg. volume (K) 3,806.3 3M avg. Trading value (VND bn) 88.5 Remaining foreign room (%) 0.0 52-week range (‘000 VND) 19.9 - 28.5 PERFORMANCE
FORECAST VND bn 2017 2018 2019E 2020F Revenue 16,344 18,350 19,373 22,212 % yoy 37.1 12.3 5.6 14.7 NPAT 6,446 8,463 9,421 10,997 % yoy 104.7 31.3 11.3 16.7 ROA (%) 2.6 2.9 2.7 2.8 ROE (%) 27.7 21.5 16.7 16.5 EPS (VND) 7,695 2,377 2,651 3,102 BV (VND) 32,251 14,809 17,484 20,629 Div (VND) 0 0 0 0 P/E (x) 0.0 10.9 8.7 7.5 P/BV (x) 0.7 1.6 1.3 1.1 *Price as of Dec 13th, 2019 COMPANY SNAPSHOT
From modest beginnings in 1993 with charter capital of a mere VND 20 bn, TCB has grown to become the third largest bank in terms of chartered capital in Vietnam. Currently, the bank provides a broad range of products and services to more than 6 million retail and corporate customers through an extensive network of one head office, two representative offices and 314 transaction offices across 45 cities and provinces nationwide, satisfying not only traditional banking needs but also security and wealth management.
5
15
25
35
45
0
5
10
15
20
Jan-
18M
ar-1
8M
ay-1
8Ju
l-18
Sep-
18N
ov-1
8Ja
n-19
Mar
-19
May
-19
Jul-1
9
Sep-
19N
ov-1
9
PE Price ('000 VND, RHS)

www.vdsc.com.vn | Bloomberg: VDSC <GO> 53
HOCHIMINH DEVELOPMENT JOINT STOCK BANK Bloomberg: HDB VN
The consumer lending recovery to support earnings growth
ACCUMULATE 18% HDB’s growth was primarily driven by NII in the context of a lack of other growth factors such as service fees and other income. As NII accounts for more than 80% of TOI, and increasing, while service fee only accounts for 5%, we believe the bank needs to build a more sustainable operating income structure. Despite of that, HDB is among banks who successfully expanded NIM considerably during 9M2019 owing to the leverage of LDR, shift into higher margin segments, and recovery of consumer lending.
Investment Rationale
The parent bank is expanding loans effectively while maintaining healthy asset quality. Due to close partnerships with major retail-oriented companies such as Vietjet Air (HSX: VJC), Petrolimex (HSX: PLX), Vinamilk (HSX: VNM) and Saigon Coop, HDB was able to exploit this customer ecosystem to expand lending. Asset quality at the parent bank remains healthy with stable NPL ratio in the last three years despite near-zero write-offs. Outstanding net VAMC was gradually reduced to 0.2% of gross loans by 3Q2019. HD Saison’s NPL ratio, in contrast, is increasing. However, we expect that the pressure on provision expenses should not cause too much concern, considering that overall consolidated asset quality remains healthy and debt recovery is progressing.
Consumer finance is recovering. After a period of stagnation until 1H 2019, HD Saison’s lending seemed to pick up in 3Q with a 3.1% YTD growth (+4.3% QoQ). Meanwhile, NIM dropped from 28.5% to 28.3%, better than our expectations against intensive competition in the consumer finance sector. Given the current favorable economic conditions and the recent recovery in loan expansion, we believe that HD Saison will be able to maintain a moderate lending growth of at least 10% in 2020, thereby contributing to the expansion of consolidated margin. Furthermore, with a focus on non-cash loan, HDB is virtually unaffected by Circular 18/2019-TT-NHNN. However, there is a possibility that the regulation might drive other competitors to expand into motorbike and consumer durable lending, posing a threat to HD Saison’ market share and NIM.
The merger with PG Bank is expected to strengthen the bank’s customer base and transaction network, which in turn supports HDB’s retail banking strategy. The bank got approval for the merger by SBV in 3Q2018. Upon the merger, HDB is also likely to benefit from higher CASA, higher credit quota and service income from Petrolimex and associates. However, we hold the view that the near-term performance of the post-merger bank will partly be affected by PG Bank’s high NPL and VAMC special bond.
2020 Outlook
- We forecast that lending growth will reach 16.9% (17.5% for parent bank and 10.2% for HD Saison), while customer deposit would increase by 11.5%. We also expect that consolidated NIM would rise slightly to 4.8%.
- We expect that services income will grow by 23.6% YoY, accounting for 5.5% of TOI.
- We forecast that consolidated CIR will drop slightly to 45.2%. Provision expenses are forecasted to stay at a similar level as in 2019, at VND 1,224 bn (USD 53.2 mn).
- Consolidated NPAT is expected to increase by 20.1% YoY, for an EPS of VND 4,404.
Risks to Our Call
- Upside: 1) Faster recovery of consumer finance than our expectations.
- Downside: 1) Challenge in expanding margins due to increasing competition in retail lending/consumer finance and 2) Asset quality deterioration of consumer finance loans.
CMP (VND) 29,750 Target Price (VND) 33,000 Cash Dividend (VND)* 0 (*) expected in next 12 months STOCK INFO Sector Banks Market cap ( VND bn) 27,418.9 Current shares (millions) 981.0 3M avg. volume (K) 1,910.0 3M avg. Trading value (VND bn) 53.6 Remaining foreign room (%) 6.2 52-week range (‘000 VND) 24.5 - 32.4 PERFORMANCE
FORECAST VND bn 2017 2018 2019E 2020F Revenue 7,506 9,440 11,637 13,259 % yoy 38.5 25.8 23.3 13.9 NPAT 1,746 2,842 3,600 4,323 % yoy 136.6 62.7 26.7 20.1 ROA (%) 1.0 1.4 1.6 1.8 ROE (%) 14.5 18.0 19.5 19.8 EPS (VND) 1,777 2,894 3,666 4,404 BV (VND) 15,045 17,154 20,543 23,963 Div (VND) 1,300 - - - P/E (x) - 10.5 8.0 6.6 P/BV (x) - 1.8 1.4 1.2 *Price as of Dec 13th, 2019 COMPANY SNAPSHOT
HDBank established in 1990 with the original name of Ho Chi Minh City Housing Development Joint Stock Commercial Bank. In 2013, HDBank took over Dai A Bank, and acquired Societe Generale Viet Finance (currently known as HD Saison). HD Saison is the third biggest company in consumer finance, after FE Credit and Home Credit.
In April 2018, HDB signed a strategic partnership agreement with Petrolimex, the market leader in petroleum retailing in the country, including a plan to take over PG Bank. If the merger succeed, HDBank’s charter capital is going to increase to VND 12,810bn. The post-merger bank is going to keep the same management structure.
51525354555
05
1015202530
Jan-
18M
ar-1
8M
ay-1
8Ju
l-18
Sep-
18N
ov-1
8Ja
n-19
Mar
-19
May
-19
Jul-1
9
Sep-
19N
ov-1
9
PE Price ('000 VND, RHS)

SECTOR OUTLOOK AND INVESTMENT STRATEGY
www.vdsc.com.vn | Bloomberg: VDSC <GO> 54
The US-China trade war, additional investments and new free trade agreements have driven companies to diversify and relocate into Vietnam industrial parks. The country possesses a low-cost labor force, stable government and one of the fastest global growth rates – all appealing features leading to a fertile investment environment. In 2019, this trend was still very strong, creating impressive business results for operators. Rental prices accordingly also increased by 15-20% compared to the end of 2018, helping to cover projects’ development costs. Looking to 2020, we believe that the demand for leasing will continue to be high and, as such, it should be a prosperous year for industrial park enterprises.
Investment Outlook
Leasing demand to soar
During 11M 2019, FDI inflows stayed flat (+3.1% YoY), led by the manufacturing sector. Notably, the number of companies exploring investment opportunities in Vietnam has increased sharply (+30% YoY). The main purpose was to seek opportunities to shift factories from China to Vietnam. Potential partners are mainly from Japan, Korea, China, Hong Kong and Singapore.
• Hanoi and HCMC were the best performers, obtaining 21.5% and 17.2% of FDI respectively, followed by Binh Duong, Dong Nai and Bac Ninh.
• Investments from East Asian countries, including Hong Kong, Korea and China, dominated the inflows.
Mounting environmental pressures have led many Chinese and foreign multinationals to relocate their factories to Southeast Asia. More importantly, many are looking to offset the business risks from the intensification of the trade war between the United States and China. One can assume that the business environment in Vietnam is excellent for foreign investors and more attractive than that of some other countries in the region, with low labor costs and a stable political situation.
• Estimated Vietnam’s labor cost are equal to 48% and 77% of that of China and ASEAN’s average.
• The business environment is improving, ranking Vietnam 69th in 2018, behind Malaysia, Thailand and China. We think Indonesia, who ranked 73rd, should be Vietnam’s main competitor in attracting FDI.
Positive outlook for developers that have a large land bank
We like the fact that KBC and VGC have huge leasable land banks; 950 ha for KBC and 1,100 ha for VGC. These land bank represents a major part of the northern industrial land and possesses favorable standings, mostly in Bac Ninh, Hai Phong. This should help KBC and VGC better capture rental demand from electronics and parts & accessories FDI enterprises.
BCM and PHR, in the South, also own enormous areas of industrial land, more than 1,000 ha for each, located in Binh Duong. Major tenants are timber enterprises, including domestic and FDI ones. Various tenants with diverse backgrounds include logistics, electricity, mechanism, timber and consumer goods.
Risks
• Slowdown of foreign inflows due to global instability
• Soaring relocation costs
• Regulatory changes that cause delay in deployment and rising land clearance costs
INDUSTRIAL PARK – HIGH LEASE DEMAND
Duong Lai ([email protected]) Negative Positive Neutral

SECTOR OUTLOOK AND INVESTMENT STRATEGY
www.vdsc.com.vn | Bloomberg: VDSC <GO> 55
Figure 1: Estimated leasable supply (ha)
Source: Rong Viet Securities’s estimates. PHR counts for Tan Binh Expansion only
Figure 2: Rent across provinces
Source: knoema.com Source: Vietnam tourism
Figure 3: Monthly minimum wages
Source: Trading Economics, Rong Viet Securities’s estimates.
333
1,182 934
284
689
91 45
755
213
350 - 140
490 204
77
456
350 556
BCM VGC IDC KBC PHR SZC LHG KSB
Available leasable area 2-year new supply >3-year new supply
6.1%
8.3%
11.4%
12.2%
12.0%
12.6%
12.0%
16.4%
20.9%
Singapore
Korea
Malaysia
Thailand
China
Indonesia
India
Philippines
Vietnam
-20%
-10%
0%
10%
20%
30%
40%
50%
60%
2012 2013 2014 2015 2016 2017 9M2018
International tourists Chinese Korean
50
100
150
200
250
300
350
400
2013 2014 2015 2016 2017 2018 2019
USD
per
mon
th
China Vietnam Thailand Indonesia Malaysia Philippines Bangladesh

SECTOR OUTLOOK AND INVESTMENT STRATEGY
www.vdsc.com.vn | Bloomberg: VDSC <GO> 56
Table 1: ROE, PB, PE of some listed companies
Source: Rong Viet Securities
Table 2: Industrial park stocks – Market cap, price, rating, per share, dividends and ROE summary
Market cap (USD mn)
Cur. price
Target price
ETR Rating P/E
2019F P/BVPS 2019F
ROE 2019F
DY 2019F
P/E 2020F
P/BVPS 2020F
ROE 2020F
DY 2020F
Foreign room
KBC 298.0 14,700 16,200 14% Accumulate 8,3x 0,9x 9.1% 6.8% 7.4x 0.8x 9.5% 6.8% 21.9%
VGC 353.1 18,250 N/A N/A N/A 13,1x 1,3x 9.2% 5.2% 12.3x 1.2x 9.9% 5.2% 35.6%
NTC 118.3 171,418 127,000 -26% Sell 16,2x 5,0x 30.7% 2.9% 15.8x 3.9x 24.7% 0.0% 45.3%
LHG 33.7 15,600 N/A N/A N/A 5,6x 0,7x 12.3% 10.2% 3.7x 0.5x 13.9% 0.0% 38.3%
Source: Rong Viet Securities forecast, share prices as of Dec 13th, 2019
(*) Bloomberg’s consensus, data as of f Dec 13th, 2019
KBC
VGC
NTC
LHG
SZC
D2DBCM
IDC
0.2
1.2
2.2
3.2
4.2
5.2
6.2
7.2
2.0 7.0 12.0 17.0 22.0
P/B
P/E

www.vdsc.com.vn | Bloomberg: VDSC <GO> 57
KINH BAC JSC Bloomberg: KBC VN Leases stay strong
ACCUMULATE 14% Our view on KBC’s core business remains positive given the company’s ample land bank and stable rental demand in the north of the country. Leasing revenue currently come mostly from Quang Chau and Tan Phu Trung. We, however, see that in the mid-term, 669 ha from Nam Son Hap Linh and Trang Due 3 look promising revenue drivers. Demand should stay high as well. The US-China trade dispute, in our view, is a bit of an accelerator which may help attract companies. Phuc Ninh and Trang Due are another growth driver in the next three to five years, given 40 ha of commercial land unsold.
Investment Rationale
- Ample leasable supply in both the short and long term. Remaining leasable area is estimated at nearly 450 ha at end-Sep 2019; including Quang Chau, Tan Phu Trung and Nam Son Hap Linh. This should be an adequate supply for at least the next four years, given a positive leasing scenario of 100 ha per year. Long term supply also comes from Trang Due 3 (456 ha - Hai Phong) and Binh Giang (860 ha - Hai Duong), where manufacturing hubs are being created. In 2019, KBC will complete its planned yearly leasing plan, 110ha. For next year, the company expects 150ha to be leased, with new contribution from Nam Son Hap Linh of about 60ha. There is a global mobile manufacturing company signing MOU land lease contract with KBC and waiting for the proceed to be deposited. Regarding legal procedures of Nam Son Hap Linh, KBC expects to have the paper done in early-2020 and could welcome its very first tenants from about 2Q 2020. Besides, Tan Phu Trung and Quang Chau expect to maintain their leasing area in 2020, with a total of 90-100ha.
- Prime location allows significant increase in price level. Management observed a 25% increase of the average rental price in Quang Chau and Tan Phu Trung in 2019. US-China trade tensions has been escalating the relocation of factories out of China. Vietnam is an option for the relocation thanks to its competitive advantages related to lower-cost labor workforce, increasing investment in infrastructure and preferential policies. This trend could be maintained for the next 6-9 months.
- Upside potential on better sales of Phuc Ninh and the approval of Trang Due 3 IP. Phuc Ninh’s handover is possibly postponed. That is compared to the company’s estimation of approximate 4 ha being handed over in 4Q 2019. Currently, the legal procedures have not been completed yet.
2020 Outlook
- For 2020, our forecast is for revenue of VND 2,719 billion (-11% YoY) and NPAT of VND 940 billion (+12% YoY).
- P/E and P/B forward 2020 will be at 7.4x and 0.8x.
Risks to Our Call
- Prolonged delay on land area adjustment in Nam Son Hap Linh & handover of Phuc Ninh.
- Increasing site clearance costs and slowing FDI flows.
CMP (VND) 14,700 Target Price (VND) 16,200 Cash Dividend (VND)* 500 (*) expected in next 12 months STOCK INFO Sector Financials Market cap ( VND bn) 6.905,5 Current shares (millions) 469,8 3M avg. volume (K) 1.691,0 3M avg. Trading value (VND bn) 25,5 Remaining foreign room (%) 21,9 52-week range (‘000 VND) 12,1 - 15,9 PERFORMANCE
FORECAST VND bn 2017 2018 2019E 2020F Revenue 1,260 2,491 3,044 2,719 % yoy -36.1 97.7 22.2 -10.7 NPAT 585 746 838 940 % yoy 4.9 27.7 12.3 12.2 ROA (%) 3.8 4.6 5.0 5.7 ROE (%) 6.6 7.9 9.1 9.5 EPS (VND) 1,229 1,569 1,761 1,975 BV (VND) 17,423 18,992 16,366 18,001 Div (VND) 0 1,000 1,000 1,000 P/E (x) 12.0 9.4 8.3 7.4 P/BV (x) 0.8 0.8 0.9 0.8 *Price as of Dec 13th, 2019 COMPANY SNAPSHOT
Kinh Bac is one of the leading industrial park developer. The company possesses a huge land bank including 5,174 ha for industrial land and more than 1,100 ha for urban area development. It owns seven major IPs in Bac Ninh, Hai Phong and HCMC as well as seven IPs in association with other parties.
5
10
15
20
0
5
10
15
Jan-
18
Apr
-18
Jul-1
8
Oct
-18
Jan-
19
Apr
-19
Jul-1
9
Oct
-19
PE Price ('000 VND, RHS)

www.vdsc.com.vn | Bloomberg: VDSC <GO> 58
NAM TAN UYEN JSC Bloomberg: NTC VN
The NTU3 project is about to be launched
SELL -26% Future growth depends greatly on the launch of the NTU3 industrial park. The huge land bank (346ha) and its prime location near Ho Chi Minh City, will ensure a high absorption rate and rental performance, estimated at 90-100 USD/m2. Our concern is corporate governance: two main shareholders of Phuoc Hoa Rubber JSC (HSX: PHR) and its parent company, Vietnam Rubber Group (UPCOM: GVR). As well, valuations are still high and there is low liquidity in the stock. We suggest that investors should wait before investing in the stock.
Investment Rationale
- Nam Tan Uyen 3 is showing signs of soon been deployed. The zone has a total area of 346 ha; of which 255 ha is leasable. The 2019 AGM approved its capital raising plan, in order to meet the minimum amount of charter capital for NTU3. Its major (32%) shareholder, PHR, announced its plan of transferring the development plan for NTU3 in 2H 2019. However, there is no update on this deal. We suppose that it could be delayed until 2020.
- Attractive cash dividend. Plenty of cash, VND 1,278 bn, accounting for 37% of total assets at end-September 2019. This has been bringing a major amount of financial income for NTC during 2016-19. Coupled with increasing dividends from associates, NTC has maintained its attractive cash dividend, which is 60%/200%/50% in 2017/2018/2019E. However, land-used-rights and compensation for NTU3 may cause the current cash position to dwindle, leading to a lower level of cash deposit and financial income when NTU3 is launched.
- Forthcoming change in shareholding structure, in our view, is positive. The divestment of either GVR or PHR in NTC might be sooner or latter taking place, due to the disallowance in cross-holding structure of GVR and PHR. When this is solved, NTU3 will be released.
2020 Outlook
- For 2020, our forecast is for revenue of VND 251 billion (+9% YoY) and NPAT of VND 227 billion (+3% YoY).
- P/E and P/B forward 2020 will be at 15.8x and 3.9x, not very attractive.
Risks to Our Call
- Lingering delay in solving shareholding issue and thus NTU3’s timeline.
- Increasing development cost of NTU3.
CMP (VND) 171,418 Target Price (VND) 127,000 Cash Dividend (VND)* - (*) expected in next 12 months STOCK INFO Sector Industrial Market cap ( VND bn) 2,742.7 Current shares (millions) 16.0 3M avg. volume (K) 53.9 3M avg. Trading value (VND bn) 8.9 Remaining foreign room (%) 45.3 52-week range (‘000 VND) 66.6 - 192.2 PERFORMANCE
FORECAST VND bn 2017 2018 2019E 2020F Revenue 146 532 231 251 % yoy -0.8 264.4 -56.6 8.7 NPAT 142 470 221 227 % yoy 8.6 229.7 -53.0 2.7 ROA (%) 5.8 15.1 6.2 5.4 ROE (%) 41.8 97.0 30.7 24.7 EPS (VND) 8,639 28,737 10,502 10,821 BV (VND) 23,720 36,810 34,190 43,875 Div (VND) 6,000 20,000 5,000 0 P/E (x) 19.8 6.0 16.2 15.8 P/BV (x) 7.2 4.7 5.0 3.9 *Price as of Dec 13th, 2019 COMPANY SNAPSHOT
The company possesses three industrial parks in Binh Duong province, of which two are 100% occupied. The remaining is awaiting for development, with land site of 346 ha, of which 255ha is commercial land.
5
55
105
155
205
02468
10
Jan-
18
Apr
-18
Jul-1
8
Oct
-18
Jan-
19
Apr
-19
Jul-1
9
Oct
-19
PE Price ('000 VND, RHS)
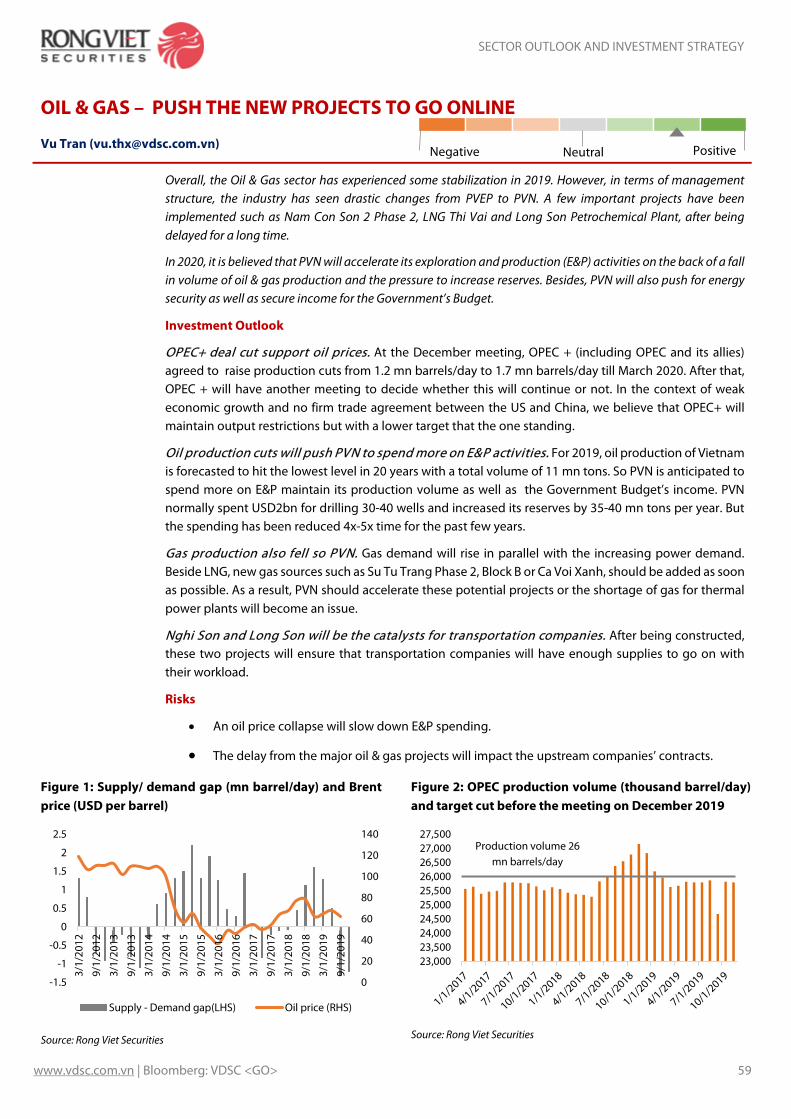
SECTOR OUTLOOK AND INVESTMENT STRATEGY
www.vdsc.com.vn | Bloomberg: VDSC <GO> 59
Overall, the Oil & Gas sector has experienced some stabilization in 2019. However, in terms of management structure, the industry has seen drastic changes from PVEP to PVN. A few important projects have been implemented such as Nam Con Son 2 Phase 2, LNG Thi Vai and Long Son Petrochemical Plant, after being delayed for a long time.
In 2020, it is believed that PVN will accelerate its exploration and production (E&P) activities on the back of a fall in volume of oil & gas production and the pressure to increase reserves. Besides, PVN will also push for energy security as well as secure income for the Government’s Budget.
Investment Outlook
OPEC+ deal cut support oil prices. At the December meeting, OPEC + (including OPEC and its allies) agreed to raise production cuts from 1.2 mn barrels/day to 1.7 mn barrels/day till March 2020. After that, OPEC + will have another meeting to decide whether this will continue or not. In the context of weak economic growth and no firm trade agreement between the US and China, we believe that OPEC+ will maintain output restrictions but with a lower target that the one standing.
Oil production cuts will push PVN to spend more on E&P activities. For 2019, oil production of Vietnam is forecasted to hit the lowest level in 20 years with a total volume of 11 mn tons. So PVN is anticipated to spend more on E&P maintain its production volume as well as the Government Budget’s income. PVN normally spent USD2bn for drilling 30-40 wells and increased its reserves by 35-40 mn tons per year. But the spending has been reduced 4x-5x time for the past few years.
Gas production also fell so PVN. Gas demand will rise in parallel with the increasing power demand. Beside LNG, new gas sources such as Su Tu Trang Phase 2, Block B or Ca Voi Xanh, should be added as soon as possible. As a result, PVN should accelerate these potential projects or the shortage of gas for thermal power plants will become an issue.
Nghi Son and Long Son will be the catalysts for transportation companies. After being constructed, these two projects will ensure that transportation companies will have enough supplies to go on with their workload.
Risks
• An oil price collapse will slow down E&P spending.
• The delay from the major oil & gas projects will impact the upstream companies’ contracts.
Figure 1: Supply/ demand gap (mn barrel/day) and Brent price (USD per barrel)
Source: Rong Viet Securities
Figure 2: OPEC production volume (thousand barrel/day) and target cut before the meeting on December 2019
Source: Rong Viet Securities
0
20
40
60
80
100
120
140
-1.5
-1
-0.5
0
0.5
1
1.5
2
2.5
3/1/
2012
9/1/
2012
3/1/
2013
9/1/
2013
3/1/
2014
9/1/
2014
3/1/
2015
9/1/
2015
3/1/
2016
9/1/
2016
3/1/
2017
9/1/
2017
3/1/
2018
9/1/
2018
3/1/
2019
9/1/
2019
Supply - Demand gap(LHS) Oil price (RHS)
23,00023,50024,00024,50025,00025,50026,00026,50027,00027,500
Production volume 26 mn barrels/day
OIL & GAS – PUSH THE NEW PROJECTS TO GO ONLINE
Vu Tran ([email protected]) Negative Positive Neutral

SECTOR OUTLOOK AND INVESTMENT STRATEGY
www.vdsc.com.vn | Bloomberg: VDSC <GO> 60
Figure 3: CAPEX for PVN’s E&P activities (USD mn)
Source: Rong Viet Securities complied
Figure 4: Gas production volume (bcm) and % of domestic demand
Source: BMI
Figure 5: ROE, PB, PE of some listed Oil & Gas companies
Source: FiinGroup, Rong Viet Securities
Note: Bubble size is ROE
Table 1: Oil & Gas stocks – Market cap, price, rating, dividends and ROE summary
Market cap
(USD mn)
Cur. price
Target price
ETR % Rating P/E
2019F P/BVPS 2019F
ROE 2019F
DY 2019
F
P/E 2020
F
P/BVPS 2020F
ROE 2020
F
DY 2020F
Foreign room
PVD 6,253 14,850 21,060 41.8% Buy 58.9x 0.4x 0.8% 0.0% 20.0x 0.4x 2.2% 0.0% 28.6%
PVS 8,316 17,400 23,500 39.0% Buy 8.7x 0.7x 7.7% 4.0% 7.6x 0.6x 8.3% 5.7% 27.2%
PVT 4,714 16,750 21,300 30.1% Buy 7.5x 1.0x 14.8% 2.9% 6.9x 0.9x 14.6% 2.9% 17.3%
GAS (*) 187,565 98,000 N/A N/A N/A 15.2x 3.7x 25.8% 3.1% 15.1x 3.5x 25.5% 3.1% 45.3%
BSR (*) 27,284 8,800 N/A N/A N/A 12.3x 0.7x 6.1% N/A 9.2x 0.7x 8.1% N/A N/A
OIL (*) 9,904 9,100 N/A N/A N/A 35.5x N/A N/A N/A 32.5x N/A N/A N/A N/A
Source: Rong Viet Securities forecast, share prices as of Dec 13th, 2019
(*) Bloomberg’s consensus, data as of Dec 13th, 2019
0
500
1,000
1,500
2,000
2,500
3,000
3,500
2018 2019E 2020F 2021F 2022F 2023F
100 100 100 10098.1
85
70
75
80
85
90
95
100
0
2
4
6
8
10
12
14
2018 2019 2020 2021 2022 2023
Gas production volume (LHS)Fullfilling for the domestic demand (RHS)
PVD
PVT
PVS
GAS
BSROIL
PGS
0.2
0.7
1.2
1.7
2.2
2.7
3.2
3.7
4.2
4.7
5.2
1.0 11.0 21.0 31.0 41.0 51.0 61.0 71.0 81.0 91.0 101.0
P/B
P/E

www.vdsc.com.vn | Bloomberg: VDSC <GO> 61
PETRO VIETNAM DRILLING & WELL SERVICES CORP Bloomberg: PVD VN
Core earnings to improve significantly
BUY 41% Thanks to the long term contracts and higher rig day rate, compared to 2019, we anticipate a significant movement in 2020 the company business. Besides, the Jack Up market in South East Asia is showing an improvement as the CAPEX for E&P activities are expected to increase, resulting in a rise in demand for Jack Up rigs as well as the day rate in the coming times.
Investment Rationales
- All the Jack Up rigs are secured jobs in 2020. At present, all PVD’s Jack Up rigs are offered contracts for the whole 2020. Moreover, all of them will operate continuously, which means that there will be less rig move in 2020. As a result, 2020 utilization rate is forecasted to be higher.
- The average rig day rate is estimated to up 10% YoY. Thanks to a rising demand for Jack Up rig in the region, the Jack Up day rate has been improving since 2019. As a result, the Jack Up rig day rate of PVD also reach 10% higher in 2020.
- PVD V comes back in 2021. After a long time being idle, PVD V will come back to work for Shell in Brunei with a 6 years contract plus an 2 options to extend 2 years more each. Through this campaign, PVD V can generate the cash flow to pay its debt as well as the maintenance expense.
- CAPEX for E&P activities will be surged. According to GlobalData, the total oil production in the South East Asia is expected to increase from under 50,000 barrels/day to 223,000 barrels/day in 2025. So we think that CAPEX for E&P activities will surge in the future, keeping the Jack Up rig demand stable in the region.
- Revert the provision from PVEP. PVD has been starting to collect money from PVEP and reverted VND263 bn since 2018. Given the assumption that the company keeps getting money from PVEP, an amount of VND233 bn could be contributed to the profit in the upcoming years.
2020 Outlook
- 2020 average day rate is USD65,000 per day. The 2020 utilization rate is 98%, higher than the level of 89% in 2019.
- Reverting VND96 bn from PVEP.
- In 2020, we forecast that PVS could post VND6,068 bn in revenue (+41.9% YoY) and VND 317 bn in NPATMI (+198% YoY).
Risks to Our Call
- A fall in the oil price will hurt the upstream activity.
- The key Oil & Gas Projects may be delayed that impacts on the E&P activities.
- PVD can not revert the provison as PVEP is not able to pay the money.
CMP (VND) 14,850 Target Price (VND) 21,060 Cash Dividend (VND)* (*) expected in next 12 months STOCK INFO Sector Oil & Gas Market cap ( VND bn) 6,253 Current shares (millions) 421.1 3M avg. volume (K) 1,820 3M avg. Trading value (VND bn) 30.3 Remaining foreign room (%) 28.6 52-week range (‘000 VND) 12.6 – 19.6 PERFORMANCE
FORECAST VND bn 2017 2018 2019E 2020F Revenue 3,902 5,503 4,276 6,068 % yoy -27.2 41.0 -22.3 41.9 NPAT 26 124 106 317 % yoy -93.7 374.9 -43.4 198.0 ROA (%) 0.1 0.6 0.5 1.5 ROE (%) 0.2 0.9 0.8 2.2 EPS (VND) 74 396 252 744 BV (VND) 34,413 35,440 33,289 34,033 Div (VND) 0 0 0 0 P/E (x) 315.5 36.9 58.9 20.0 P/BV (x) 0.7 0.4 0.4 0.4 *Price as of Dec 13th, 2019 COMPANY SNAPSHOT
PV Drilling is a professional provider of drilling rigs and drilling-related services as well as manpower supply for onshore and offshore drilling operation. In which, providing drilling rigs is the main business with 4 Jack Up Rigs (PVD I, PVD II, PVD III, PVD VI), 1 TAD (PVD V) and 1 onshore rig (PVD 11).
After the difficult time in 2016-2018, the business is improving as the Jack Up rigs demand revives and the day rate reaches high.
10
15
20
25
30
5
105
205
305
405PE Price ('000 VND, RHS)

www.vdsc.com.vn | Bloomberg: VDSC <GO> 62
PETROVIETNAM TRANSPORTATION CORP Bloomberg: PVT VN
Expanding the fleets and rising charter rate
BUY 30% PVT has been going through 2019 with a positive in earnings growth thanks to the increasing in its fleets as well as the charter rate. In 2020, the company keeps enlarging its owned vessels to fulfill the esclating demand both from the international market and domestic one. Besides, the surging charter rate due to IMO 2020 also supports its business results in the content of falling in crude oil transportation volume for Binh Son next year.
Investment Rationales
- More USD140mn for new vessels in 2020. For 2019, PVT has bought seven vessels including one Aframax crude oil tanker, two oil product tankers, three LPG tankers and one bulk carrier, resulting in 19.2% growth in the 9M2019 revenue and 14.1% for the whole year as our forecast. For 2020, we expect that PVT will buy one Aframax crude oil tanker, four oil product tankers, two LPG tankers and two bulk carriers with a total capex of USD140 mn.
- Rising charter rate is expected to offset the slump in crude oil transportation volume. In 2020, PVT will see a 35% drop in the crude oil transportation volume for Binh Son due to the turnaround (major maintenance) and higher input proportion of imported crude oil. However, the higher charter rate, compared to the same period last year, is expected to compensate this falling. As a result, PVT is likely to bring all its crude oil tankers to international routes and leave only one ship to serve Binh Son plant.
- Hope a steady operation from Nghi Son in 2020. Since operating in late 2018, Nghi Son is forecasted to become the growth engige for PVT. However, this plant is now running only 80% its capacity so the contribution to 2019 result of PVT is not so significant. For 2020, we hope to see a steady operation from Nghi Son so that PVT can process to invest a VLCC to carry the crude oil input for the plant as well as compensate the decline in the oil product output of Binh Son during its turn around. If Nghi Son runs smoothly, the transport output from these two plants may reach 2.4 mn m3, up 33% YoY.
- Divestment from 51% to 36%. As planned, PVN will decrease its ownership in PVT from 51% to 36%. This could be a support for the stock price.
2020 Outlook
- Carrying 4.3 mn tons crude oil input for Binh Son plus 2.4 mn tons m3 oil product for Binh Son and Nghi Son. LPG volume keeps growing 15%.
- For 2020, PVT could post VND8,093bn in revenue, up 1.8% YoY. The core business is projected to grow 9.2%. The NPATMI is forecasted to go up 11.6% to VND747bn. In case of selling Athena vessel, the NPATMI will be higher than our forecast.
Risks to Our Call
- Nghi Son keeps running below the designed capacity, decreasing the oil product transportation volume.
- Charter rate to go down in 2020.
CMP (VND) 16,750 Target Price (VND) 21,300 Cash Dividend (VND)* 500 (*) expected in next 12 months STOCK INFO Sector Industrials Market cap ( VND bn) 4,714 Current shares (millions) 281.4 3M avg. volume (K) 602.6 3M avg. Trading value (VND bn) 10.4 Remaining foreign room (%) 17.3 52-week range (‘000 VND) 14,1 – 18,6 PERFORMANCE
FORECAST VND bn 2017 2018 2019E 2020F Revenue 6,148 7,523 7,948 8,093 % yoy -8.7 22.4 5.7 1.8 NPAT 450 652 669 747 % yoy 10.4 44.9 2.6 11.6 ROA (%) 4.9 6.4 6.0 6.0 ROE (%) 12.2 16.2 14.8 14.6 EPS (VND) 1,436 2,183 2,236 2,424 BV (VND) 13,102 14,293 16,029 17,953 Div (VND) 1,000 1,000 500 500 P/E (x) 13.1 7.2 7.5 6.9 P/BV (x) 1.1 0.9 1.0 0.9 *Price as of Dec 13th, 2019 COMPANY SNAPSHOT
PetroVietnam Transportation Corporation (PVTrans) is a member of the Vietnam Oil and Gas Group. PVTrans’ main operations are to supply services to crude oil and oil product tankers as well as LPG tankers. Currently, PVTrans is a ledear in Crude Oil Tanker as well as LPG Tanker with 100% domestic market share. Besides, PVTrans is also delivering FSO services and O&M for oil&gas projects.
10
12
14
16
18
20
5
7
9
11
13
Jan-
18M
ar-1
8M
ay-1
8Ju
l-18
Sep-
18N
ov-1
8Ja
n-19
Mar
-19
May
-19
Jul-1
9
Sep-
19N
ov-1
9
PE Price ('000 VND, RHS)

www.vdsc.com.vn | Bloomberg: VDSC <GO> 63
PETROVIETNAM TECHNICAL SERVICES CORP Bloomberg: PVS VN
2020 - Time to book for M&C segment
BUY 39% Amid the stable oil price and the rising demand for energy projects (including oil&gas) to fulfill the internal power need, we believe that PVS is still the most beneficery thanks to its leading positon in the sector. Besides, the company is trying to solve current issues related to the FPSO Lam Son and the JV between PVS and CGG Veritas (PTSC-CGGV) so that business results can improve soon.
Investment Rationales
- Expect to win more M&C projects in the future . In the past few years, the Exploration & Production (E&P) expense in Vietnam was only ¼ compared to the its peak (USD2bn). As a result, the internal oil reserve as well as the oil production have been decreasing. So we believe the Government will push the E&P acitivty thanks to (1) stable oil price (2) PVN restructure completition (3) rising demand for energy that supports the M&C segment.
- Expand the FSO/FPSO. More new oil&gas projects go online, the more demand for FSO/FPSO. And PVS can take advantage of its competitiveness to expand this stable cash flow service. In 2021, FSO Sao Vang will start operation and FSO Lac Da Vang could be the next one in 2022 in case of bidding successfully.
- Solving the current issues. In 4Q2019, PVS will complete the dissolution of PTSC-CGGV and could make for some more losses. Moreover, PVS has been starting to book provision, related to FPSO Lam Son since 3Q2019.
- Cash and cash equivalent at the end of 3Q2019 excess the market cap. The cash holding amount is staying at VND10,685 bn, excessing the company market cap of VND8,316 bn at the market price of VND17,400 per share.
2020 Outlook
- PVS will book a lot of M&C projects in 2020 such as LNG Thi Vai, Nam Con Son 2 Phase 2, Long Son and the rest of Sao Vang Dai Nguyet, Gallaf. So we believe that the M&C segment can record VND 11,044 bn in revenue, up 12.9% YoY.
- In 2020, we forecast that PVS could post VND18,714 bn in revenue (+8.4% YoY) and VND 1,100 bn in NPATMI (+13.7% YoY).
Risks to Our Call
- A fall in the oil price will hurt the E&P activity.
- The key Oil & Gas Projects may be delayed that impacts on the M&C segment.
- Expense related to PTSC-CGGV dissolution or FPSO Lam Son could be higher than the expectation.
CMP (VND) 17,400 Target Price (VND) 23,516 Cash Dividend (VND)* 700 (*) expected in next 12 months STOCK INFO Sector Oil & Gas Market cap ( VND bn) 8,316 Current shares (millions) 478.0 3M avg. volume (K) 1,705 3M avg. Trading value (VND bn) 32.1 Remaining foreign room (%) 27.2 52-week range (‘000 VND) 15.8 – 24.6 PERFORMANCE
FORECAST VND bn 2017 2018 2019E 2020F Revenue 16,812 14,638 17,265 18,714 % yoy -10.0 -12.9 17.9 8.4 NPAT 800 1,047 967 1,100 % yoy -22.9 30.8 -7.6 13.7 ROA (%) 3.4 4.5 4.1 4.0 ROE (%) 7.4 8.8 7.7 8.3 EPS (VND) 1,608 2,028 2,010 2,284 BV (VND) 24,054 24,839 18,730 19,502 Div (VND) 500 500 700 1,000 P/E (x) 14.7 8.7 8.7 7.6 P/BV (x) 0.9 0.7 0.7 0.6 *Price as of Dec 13th, 2019 COMPANY SNAPSHOT
PetroVietnam Technical Services Corporation (PTSC) is a member of Vietnam Oil and Gas Group. PTSC’s main operation field is to supply technical services to the oil & gas, industries such as: EPCI for Offshore projects, EPC for Industrial facilities, FSO/FPSO services, Offshore support vessels, Seismic survey services, Geochemical Metocean and Oceanographic survey services, ROV Services and Subsea works, Installation, Operation and Maintenance Offshore facilities, Supply Base and Port services and Other services.
12
17
22
27
32
5
7
9
11
13
15
Jan-
18M
ar-1
8M
ay-1
8Ju
l-18
Sep-
18N
ov-1
8Ja
n-19
Mar
-19
May
-19
Jul-1
9
Sep-
19N
ov-1
9
PE Price ('000 VND, RHS)

SECTOR OUTLOOK AND INVESTMENT STRATEGY
www.vdsc.com.vn | Bloomberg: VDSC <GO> 64
In 2018, the import tax rate on imported vehicles (CBU) from ASEAN countries dropped to zero. As a result, vehicles coming from Thailand, Indonesia and Malaysia grew significantly. In order to protect the domestic automobile industry, the Government issued Decree 116/2017/ND-CP. This decree has stricter requirements for imported automobiles. In fact, the supply of CBU cars decreased by 6% in 2018, while the sales of domestically assembled cars (CKD) increased by 11%. In general, sales in 2018 climbed slightly by 6%. In 2019, exporters have qualified the legal procedures to meet the requirements of Decree 116, so the supply of CBU cars increased sharply by 118% in the first 10 months of the year. Specifically, the number of CBU imports from Thailand and Indonesia jumped by 88% (reaching 68,957 units) and 287% (39,911 units). In contrast, CKD car sales dropped by 12%. Thus, the industry’s growth rate reached 15% while total sales was 246,624 units. In 2020, we believe that the automotive demand will continue to grow. However, the price of cars will decrease due to the pressure of selling the inventory of 2019 and the intensive competition.
Investment opportunities in the Vietnamese automotive industry are limited because the majority of listed companies are relatively small. In 2020, there will be an increase in the revenue of automotive companies. However, due to higher competition, the profit of those companies will not improve.
Investment Outlook
Positive outlook for the automobile industry. There are three factors supporting the growth of the automotive market. Firstly, rich people who are most willing to buy a car is growing rapidly. According to the Boston Consulting Group, CAGR growth rate of the high-income families will be around 29% for the period of 2012-2020. In 2012, Vietnam had 2.6 million “affluent” people and the expected population of “affluent” people will be 10.2 million in 2020. The high income population will maintain its rise because Vietnam's GDP is predicted to increase steadily by 7% per year in the period of 2021-2030. Meanwhile the development of infrastructure is the second factor. In early 2019, there were 950 km of expressways put into use and the Government expected there will be more expressways to be completed by the end of this year. Finally, in comparison to other Southeast Asia countries, the rate of people owning cars in Vietnam is very low. Specifically, on average 1,000 Vietnamese only own 23 cars, while the number of cars owned by 1,000 people in Thailand, Indonesia and the Philippines are 226, 87 and 38, respectively. Therefore, we believe that the automobile industry can still grow.
Supply is expected to increase sharply in 2020. The number of imported cars is increasing. Due to the ASEAN Trade in Goods Agreement (ATIGA), the import tax on CBU cars from Southeast Asian countries to Vietnam has decreased to zero since 2018. The lower import tax has led to lower selling prices, so that the demand for CBU cars rose dramatically. In 2020, the number of cars from these three countries is expected to keep growing. Besides, the Vietnam-EU Free Trade Agreement (EVFTA) is likely to officially take effect from 2020. That will reduce the import tax on CBU cars from EU countries. Currently EU cars imported to Vietnam are taxed at 70%. This tax rate will be reduced to zero percent within 7-10 years. Therefore, the supply of cars originating from Europe will go up.
Besides, the supply of assembled cars from domestic companies will also rise in the coming years. Specifically, while Truong Hai Automobile Company has increased the capacity of its KIA factory from 20,000 cars to 50,000 cars/year, TC Motor also plans to build a new assembly plant in 2020, with a capacity of 100,000 car/year. In addition, both Ford Vietnam and Vinfast will raise the capacity of their existing plants to increase production and expand their market share.
Price will fall. The pressure from new supply and high inventories in 2019 have made the industry more prone to competitiveness. Certain companies will have to lower their prices in order to attract new customers. In addition, in 2020, there will be new policies announced by the Government to support
AUTOMOBILE AND PARTS – CONTINUING TO GROW
Vu Tran ([email protected])
Hoang Bui ([email protected]) Negative Positive Neutral

SECTOR OUTLOOK AND INVESTMENT STRATEGY
www.vdsc.com.vn | Bloomberg: VDSC <GO> 65
the automotive industry. In fact, there was a proposal that there should be no special consumption tax on domestic components if they are used for cars assembled domestically. Also, the zero percent tax on imported car components will lead to lower production costs.
Risks
• Higher competition has led companies to not only reduce their prices but also increase the selling and administrative expenses to attract more potential customers. That led to a decline in GPM and incomes of automobile companies.
• Vietnam's economy grows at a slower rate than expectations or falls into crisis. That will affect the demand for cars.
Figure 1: Sale by origins (number of cars)
Source: VAMA, Rong Viet Securities
Figure 2: Sale by types (number of cars)
Source: VAMA, Rong Viet Securities
116,541
173,040
228,964
194,960 215,704
153,144
41,269
71,874
75,463
77,790 72,979
106,138 32%
48% 32%
-15%
11%
-12%
83%74%
5% 3%-6%
118%
-40%
-20%
0%
20%
40%
60%
80%
100%
120%
140%
0
50,000
100,000
150,000
200,000
250,000
2014 2015 2016 2017 2018 10T2019
CKD vehicles CBU vehicles Growth of CKD vehicles (%) Growth of CBU vehicles (%)
100,439
143,392
182,347
154,209
196,949 190,049
43% 43%
27%
-15%
28% 26%
-40%
-20%
0%
20%
40%
60%
80%
0
50,000
100,000
150,000
200,000
250,000
2014 2015 2016 2017 2018 10T2019
Passenger cars Commercial vehicles Special-Purpose vehicles
Growth of Passenger cars (%) Growth of Commercial vehicles (%)

SECTOR OUTLOOK AND INVESTMENT STRATEGY
www.vdsc.com.vn | Bloomberg: VDSC <GO> 66
Figure 3: ROE, PB, PE of some listed automobile companies
Source: Fiin Pro, Rong Viet Securities (bubble size: ROE)
Table 1: Automotive stocks – Market cap, price, rating, per share, dividends and ROE summary
Market cap
(USD mn)
Cur. price
Target price
ETR % Rating P/E
2019F P/BVPS 2019F
ROE 2019F
DY 2019F
P/E 2020
F
P/BVPS 2020F
ROE 2020
F
DY 2020F
Foreign room
DRC 2,726.3 22,950 27,900 26% Buy 10.3x 1.5x 15.6% 4.4% 9.5x 1.4x 15.9% 5.2% 25.6%
HAX 659 18,000 19,600 17% Accumulate 5.5x 1.2x 21.9% 8.3% 4.9x 1.0x 21.4% 8.3% 38.3%
PAC 1,192 25,650 27,300 12% Accumulate 13.7x 3.0x 22.1% 5.9% 12.1x 2.7x 23.0% 7.8% 23.9%
VEA (*) 65,373 49,200 N/A N/A N/A 7.5x 2.1x 28.3% 7.9% 6.9x 2.0x 29.9% 7.9% 43.5%
Source: Rong Viet Securities forecast, share prices as of Dec 13th, 2019
(*) Bloomberg’s consensus, data as of Dec 13th, 2019
DRC
HAX
PAC
CSM
SVC
VEA
SRC
0.7
0.9
1.1
1.3
1.5
1.7
1.9
2.1
2.3
2.5
2.0 12.0 22.0 32.0 42.0 52.0 62.0 72.0
P/B
P/E

www.vdsc.com.vn | Bloomberg: VDSC <GO> 67
DA NANG RUBBER JSC Bloomberg: DRC VN
Expect the radial segment to keep growing
BUY +26% We believe that DRC can improve its revenue and profit in 2020. The main contribution will come from the radial tire segment as it is getting better due to lower COGS per unit. Meanwhile, although the bias tire segment has decreased, it is still able to maintain a high proportion in DRC’s profit. Therefore, this is our top choice in this sector for 2020.
Investment Rationale
- The GPM of radial tires is expected to improve in 2020. In 2019, DRC only used 85% of the radial factory’s capacity. The plant will operate at full capacity (or even higher as DRC can upgrade the capacity up to 110%) to meet increasing export orders. Moreover, rubber is the main material of DRC’s production and its price is forecasted to go down slightly in 2020. As a result, the COGS is expected to decline and the GPM will improve from 8.3% (2019) to 9.4% (2020).
- DRC is planning to increase the radial plant's capacity from 600,000 units/year to 1,200,000 units/year due to a boost in export demand. The expansion will cost approximately VND 933 billion which is significantly lower than the total cost of the existing factory (VND 2,222 billion). At the moment, the company is waiting for the approval from Vinachem - the biggest shareholder with 50.5%. According to their plan, the expansion will take place in 2020 and operate from 2021. Based on the result of 9M2019, the total revenue and gross profit of the new radial factory when it operates at its highest capacity (1,200,000 units/year) will be VND 4,483 and VND 321 billion respectively, up 127% and 95% compared to the 2019 radial’s forecast.
- The decrease of bias segment is slower than forecast. The market size of bias tires was predicted to get smaller quickly due to the substitution to radial tires. However, DRC still has a strong position in the market so its revenue and gross profit of this segment fell slower than prediction. In fact, the revenue and gross profit of this segment only dropped slightly by 12% and 4% respectively (first 9M of the year). Most tire companies have mainly concentrated on radial tires instead of bias tires for the last few years, hence, the competition in this market has been lower. As a result, DRC is still able to gain lots of profit from this segment in the next few years.
2020 Outlook
- We expect revenue to grow by 4.5%, reaching VND 4,145 billion, driven by a growth of 11% in the radial tire segment (to VND 2,197 billion). The total GPM will remain nearly the same as the 2019 GPM, around 14.3%. The PBT will be VND 346 billion which is higher than the 2019 PBT as loans will be reduced so the interest expense will be lower.
- DRC gets the approval from Vinachem for expanding the radial plant.
Risks to Our Call
- The price of raw materials may climb up whilst the selling price cannot be increased due to intensive competition. This will lead to lower GPM.
- DRC cannot get the approval to expand the radial plant.
CMP (VND) 22,950 Target Price (VND) 27,900 Cash Dividend (VND)* 1,000 (*) expected in next 12 months STOCK INFO
Sector Automobile & Parts
Market cap (VND bn) 2,726.3 Current shares (millions) 118.8 3M avg. volume (K) 389 3M avg. Trading value (VND bn) 9.1 Remaining foreign room (%) 25.6 State ownership (%) 17.6 – 24.2 PERFORMANCE
FORECAST VND bn 2017 2018 2019E 2020F Revenue 3,669 3,551 3,965 4,145 % yoy 9 -3 11.7 4.5 NPAT 166 139 255 277 % yoy -58.0 -16.5 84.4 8.4 ROA (%) 5.9 4.9 10.6 10.8 ROE (%) 10.9 9.1 15.6 15.9 EPS (VND) 1,285 1,085 2,000 2,169 BV (VND) 12,853 12,819 13,818 14,671 Div (VND) 1,300 1,200 1,000 1,200 P/E (x) 17.3 18.4 10.3 9.5 P/BV (x) 1.9 1.7 1.5 1.4 *Price as of Dec 13th, 2019 COMPANY SNAPSHOT
DRC is the biggest company operating in the tire industry. Its main products are radial tires and bias tires which are used for heavy trucks and light trucks.
The radial tire segment will be the main reason for the growth of DRC in the future as demand has increased gradually. DRC is competing mostly with Chinese products in its two largest export markets – Brazil and the US.
The market size of bias tires has shrunk. However, this market is less challenging than radial tires.
051015202530
05
101520253035
Jan-
18
Mar
-18
May
-18
Jul-1
8
Sep-
18
Nov
-18
Jan-
19
Mar
-19
May
-19
Jul-1
9
Sep-
19
Nov
-19
PE Price ('000 VND, RHS)

www.vdsc.com.vn | Bloomberg: VDSC <GO> 68
DRY CELL AND STORAGE BATTERY JSC Bloomberg: PAC VN
Attempt to get better in 2020
ACCUMULATE 12% The PBT and PAT of PAC climbed by 9% and 7% respectively in the first nine months of 2019 while the revenue remained at the same level. However, after fluctuating around VND 34,000, PAC’s stock price has dropped down to around VND 25,000. The two main reasons may come from the fire in the battery factory Dong Nai 2 and the poor results from 3Q2019. In 2020, we believe that the divestment of Vinachem, the increase in car demand and the higher capacity of battery factory Dong Nai 2 will be the catalysts supporting PAC.
Investment Rationale
- Battery demand is expected to grow due to the growth of automotive industry. According to Seasia, there are 721 cars per 1,000 people in Brunei while the ratio in Malaysia and Thailand are 443 and 225 respectively. On the other hand, every 1,000 Vietnamese only own 23 cars so that there is still a lot of room for the car industry to develop. As the demand for cars rise, so will the demand for batteries. PAC is expected to gain significantly from the increasing demand as its current market share is around 40%.
- The used capacity of battery factory Dong Nai 2 is expected to be higher. In 2019, PAC only used around 87.5% of the factory’s capacity (1.2 million kWh). After the fire in July, the company upgraded the factory by 10%, costing VND 10 billion. The company is planning to produce at its highest level (1.32 million kWh) in 2020. As a result, the total GPM will improve from 13.8% (2019E) to 15.6%, in case of no significant changes in material prices and selling prices.
- The divestment of Vinachem could be a catalyst for an increase in PAC price. According to the 2019 Annual General Meeting of Vinachem, the company plans to withdraw its investment in PAC. Currently, Vinachem calculates the value of its share in PAC. The divestment of Vinachem may help strategic investors raise their ownership and their chances to manage the company. Moreover, PAC is more active in planning their future business.
2021 Outlook
- We expect revenue to grow by 15.9%, reaching VND 3,348 billion. While the total GPM and the PBT will be around 13.9% and VND 212 billion, respectively.
- Vinachem officially finalize the process of divestment.
Risks to Our Call
- The price of raw materials such as lead and zinc may climb up whilst the selling price cannot increase due to intensive competition.
- PAC cannot get the approval from Vinachem so the movement of battery factory to An Phuoc may be delayed. That may affect their future plans.
CMP (VND) 25,650 Target Price (VND) 27,300 Cash Dividend (VND)* 1,500 (*) expected in next 12 months STOCK INFO
Sector Automobile & Parts
Market cap ( VND bn) 1,192 Current shares (millions) 46.5 3M avg. volume (K) 60.8 3M avg. Trading value (VND bn) 1.7 Remaining foreign room (%) 23.9 State ownership (%) 24.3 – 38.3 PERFORMANCE
FORECAST VND bn 2017 2018 2019E 2020F Revenue 2,613 2,965 2,888 3,348 % yoy 14 13 -2.6 15.9 NPAT 136 158 147 165 % yoy -28 16.3 -7.2 12.6 ROA (%) 7.6 6.9 6.7 7.0 ROE (%) 20.3 26.3 22.1 23.0 EPS (VND) 2,513 3,058 2,839 3,195 BV (VND) 14,386 14,423 12,906 14,239 Div (VND) 4,500 2,000 1,500 2,000 P/E (x) 7.0 17.7 13.7 12.1 P/BV (x) 2.0 3.1 3.0 2.7 *Price as of Dec 13th, 2019 COMPANY SNAPSHOT
PAC is the largest batteries and cells producer with a market share of 40%. Currently, the company has two battery factories and one cell factory whose capacities are 2,320,000 kWh and 300 million units respectively.
The battery segment contributes 88% to total revenue. Most of those come from the replacement channel as the company has 159 distribution agents. GS is the biggest competitor in this market. Meanwhile, 12% of total revenue comes from the cell segment. PAC is competing with companies in Japan, the US and China.
15202530354045
468
10121416
Jan-
18M
ar-1
8
May
-18
Jul-1
8
Sep-
18
Nov
-18
Jan-
19M
ar-1
9
May
-19
Jul-1
9
Sep-
19
Nov
-19
PE Price ('000 VND, RHS)

www.vdsc.com.vn | Bloomberg: VDSC <GO> 69
HANG XANH MOTORS SERVICE JSC Bloomberg: HAX VN
Competition is getting tougher
ACCUMULATE 17% After a difficult year in 2018, the automotive market has seen a better year in 2019 as sales grew up by 18% (9M2019). Mercedes-Benz Vietnam (MBV) is likely to keep growing when looking at the revenue of HAX - one of the biggest distributors of MBV. In the first 9 months of 2019, HAX’s revenue increased by 11%. The selling prices actually decline slightly due to the intensive competition, so that the growth of sales is likely to come from a higher sales volume. However, the tougher competition leaded to higher costs. Thus, PBT of HAX dropped down by 31% to VND 56 billion.
In 2020, we believe that the competition among automobile distributors will be higher. However, due to (1) the rise of “affluent” population (2) the Vietnam-EU FTA, the imported car prices will decline. This will help HAX maintain the growth rate of sales volume.
Investment Rationales
- HAX will benefit from the favorable luxury car market. We believe that the demand for high-end car is still strong in 2020 for 3 reasons: (1) according to Boston Consulting Group, the affluent population has been growing at CAGR of 29% for the period of 2012-2020. (2) Every 1,000 people in Vietnam only have 23 cars. This is significantly low compared to Thailand (226 cars), Indonesia (87) and Philippines (38) and (3) Vietnam-EU FTA may lead to lower selling prices of Mercedes.
- Expand their business by distributing the other brands. In detail, two subsidiary companies of HAX are Can Tho Automobile Engineering JSC and PTM JSC already planned to sell Nissan and Vinfast vehicles in 2019, respectively. In fact, HAX has already earned profit from selling Nissan cars meanwhile distributing Vinfast has not bring much profit since everything is still in the preparing steps. Even this channel will contribute a small amount in HAX revenue and profit in 2020 but we believe that it will support the long-term earnings growth.
- HAX expected to extend their market share by cooperating with The Class Hyosung. Currently, The Class Hyosung (the second biggest distributor of Mercedes-Benz in Korea) wants to buy 51% shares of HAX. This quickly brought lots of positive effects on HAX share price. The company expects to improve their business and expand their market share with the supports and experiences from Korean partner.
2022 Outlook
- We expect revenue to grow by 10%, reaching VND 5,877 billion. Meanwhile the GPM will be around 4,6%.
- The 2020 PBT will be VND 150 billion which mainly comes from Other incomes/selling commission (VND 107 billion).
Risks to Our Call
- The highly intensive competition from other MBV distributors may reduce HAX’s sales result.
CMP (VND) 18,000 Target Price (VND) 19,600 Cash Dividend (VND)* 1,500 (*) expected in next 12 months STOCK INFO
Sector Automotive & Parts
Market cap ( VND bn) 659 Current shares (millions) 36.6 3M avg. volume (K) 211.9 3M avg. Trading value (VND bn) 4.1 Remaining foreign room (%) 38.3 State ownership (%) 13.4 – 24.9 PERFORMANCE
FORECAST VND bn 2017 2018 2019E 2020F Revenue 3,833 4,756 5,328 5,877 % yoy 33.1 24.1 12.0 10.3 NPAT 78 84 99 108 % yoy 8 8.1 17.0 9.6 ROA (%) 9.1 5.7 5.4 6.1 ROE (%) 25.9 21.8 21.9 21.4 EPS (VND) 3,611 2,815 2,952 3,289 BV (VND) 16,525 11,016 13,790 15,644 Div (VND) 1,500 1,500 1,500 1,500 P/E (x) 9.7 6.0 5.5 4.9 P/BV (x) 1.4 1.3 1.2 1.0 *Price as of Dec 13th, 2019 COMPANY SNAPSHOT
Hang Xanh Motors Service JSC is the first and only authorized distributor of Mercedes-Benz Vietnam (MBV) which is listed on Vietnam stock market. Their main businesses are about distributing, assuring and repairing Mercedes-Benz cars.
HAX and Vietnam Star are the two biggest distributors of MBV with around 40% market share for each.
Because HAX is a distributor so their gross profit margin (GPM) is pretty thin. However, their income also comes from the selling commission.
10
15
20
25
30
468
101214
Jan-
18M
ar-1
8
May
-18
Jul-1
8
Sep-
18
Nov
-18
Jan-
19M
ar-1
9
May
-19
Jul-1
9
Sep-
19
Nov
-19
PE Price ('000 VND, RHS)

SECTOR OUTLOOK AND INVESTMENT STRATEGY
www.vdsc.com.vn | Bloomberg: VDSC <GO> 70
The power industry in 2019 has moved in the same direction as we had expected in terms of output and demand. Electricity consumption in Vietnam still outpaced its supply, which resulted in the overall utilization rate remained high for coal-fired and gas-fired power plants, whereas large hydropower plants could not take advantage of the market because of the water level caps. Even though several solar farms have come online, their contribution stayed minimal due to the over-capacity problem in the crowded areas.
El Nino will get peak in 2020, implying a poor performance to hydropower second year in a row. Therefore, it is likely that coal-burning and gas-turbine plants will be mobilized at their full capacity. The key issue, which need focusing to solve, however, is well-preparing input to generate electricity meeting demand. The plants who have power to balance between generated volume and materials/fuel cost will be winners. If not, there will be a temporary drop in gross margin of thermal power plants.
Investment Outlook
Electricity demand is likely to continue growing substantially. Fitch Solutions forecasts that Vietnam’s electricity consumption will achieve 6.8% CAGR during the next five-year period, fueled by the urbanization and industrialization. Accordingly, demand for new capacity is indispensable and rather urgent, meaning pressures on EVN’s disbursement process to expand capacity and improve infrastructure. As EVN aims to disburse USD 22 billion in the next 10 years, we consider this a promising growth potential for power companies that successfully propose their own capacity expansion. At the same time, we believe renewable energy companies can benefit from this trend, including solar power plants and wind farm.
Hydropower plants face constraints because of the water level boundery. The prolonged dry weather has prevented HPPs from increasing output in 2019. As a result, 9M2019 volume among HPPs was 18.3% lower yoy while EVN had to ultilize oil-fired at a remarkably higher cost. As the NOAA forecasts that the probability for El Nino is higher than that of La Nina in the medium-term, Vietnamese HPPs are predicted to struggle with growth in 2020, especially those that reached the water reserve requirement. Meanwhile, small-scaled HPPs are favored because of its independence on the CGM. Among listed companies with small HPPs, we believe PC1 has sizable upsize owing to new capacity coming online in late-2019.
Coal-fired and gas turbine power plants might not achieve earning growth even though their utilization rates are going to remain high in 2020. We notice both types of thermal power plants are facing up with cost-push problems in the medium-term. Regarding coal-fired plants, despite the fact that the materials for their contracted volume (Qc) have been covered for by EVN, the majority of them would find their CGM volume vulnerable to input price increase. We observe that coal price increased by around 10% due to the national coal shortage while an average of 20% of coal-fired generators are exposed to the input price risk. Moreover, for old machinery, the change in the coal mixtured would result in deteriorated efficiency, thus further inflating the cost. In terms of the gas turbine power plants, new gas fields coming online in the next few years, including Thien Ung- Dai Hung and Sao Vang Dai Nguyet are likely to bear higher production cost, impacting these plants’ gross margin on the CGM.
Renewable energy can take over a more important role in the industry, but we think it is too soon to select potential names. Regarding solar farms, there are concerns over the stability of the supply and the actual utilization rate. We noticed a large number of solar farms are eligible for subsidized price from the government, but many of them are in the heavily-crowded regions in Binh Thuan and Ninh Thuan. Therefore, it is not until the transmission system facilitates all of the capacity can we select names with sizable growth potential. Regarding wind farms, the government is going to grant subsidiary for those who come online before 4Q/2021. Nevertheless, renewable energy, due to its high dependence
POWER - LITTLE CHANCE FOR EARNING GROWTH DESPITE STRONG DEMAND
Trinh Nguyen ([email protected]) Negative Positive Neutral

SECTOR OUTLOOK AND INVESTMENT STRATEGY
www.vdsc.com.vn | Bloomberg: VDSC <GO> 71
on the weather and overwhelming impact on the national transmission, the sector’s contribution to the industry remains questionable, and so does their profitability.
Risks
• As a solution for input issues faced by thermal power plants, importing coal (to make mixed coal) and LPG is likely to increase costs to those who sell a large proportion of output on the CGM.
• Operational and environmental risks remain crucial as the possible severity of the impact on companies’ bottomline can be unexpected.
Figure 1: Industry growth (%)
Source: Fitch Solutions, Rong Viet Securities compiled
Figure 2: Market price (VND per kWh)
Source: Rong Viet Securities compiled
Figure 3: Probabilistic ENSO forecasts
Source: NOAA, Rong Viet Securities compiled
Table 1: Power stocks’ information
Market
cap (VND bn)
Current Price
(VND)
Target price
(VND)
ETR (%)
Rating P/E
2019F (x) P/BVPS
2019F (x)
ROE 2019F
(%)
DY 2019F
(%)
P/E 2020F
(x)
P/BVPS 2020F
(x)
ROE 2020F
(%)
DY 2020F
(%)
Foreign room
(%)
POW 28,922.1 12,350 15,300 26% Buy 11.1 1.1 9.9 2.4 9.5 1.0 10.7 2.4 35.1
NT2 6,448.4 22,400 27,100 32% Buy 8.7 2.5 20.3 11.2 8.2 2.4 20.2 11.2 30.3
PPC 9,394.0 29,300 25,000 -2,0% Neutral 8.9 1.6 17.6 10.2 9.2 1.5 18.3 10.2 32.8
SHP 2,141.3 22,850 N/A N/A N/A 11.0 1.8 13.2 7.0 11.4 1.8 15.8 7.0 44.0
CHP 2,799.7 20,200 N/A N/A N/A 14.8 1.8 11.1 7.9 14.8 1.4 13.3 7.9 45.5
PGV 10,429.0 9,747 N/A N/A N/A N/A N/A N/A N/A N/A N/A N/A N/A N/A
Source: Rong Viet Securities forecast, share prices as of Dec 13th, 2019
(*) Bloomberg’s consensus, data as of Dec 13th, 2019
6
6.5
7
7.5
8
8.5
2017E 2018E 2019F 2020F 2021F 2022F
GDP growth Electricity consumption growth
-20%
0%
20%
40%
60%
80%
100%
600
800
1,000
1,200
1,400
Jan Feb Mar Apr May Jun Jul Aug Sep Oct Nov Dec
2018 FMP (LHS) 2019 FMP (LHS) Growth (RHS)
0%
20%
40%
60%
80%
100%
NDJ DJF JFM FMA MAM AMJ MJJ JJA JAS
El Nino Forecast Probability Neutral Forecast Probability La Nina Forecast Probability

www.vdsc.com.vn | Bloomberg: VDSC <GO> 72
PHA LAI THERMAL POWER JSC Bloomberg: PPC VN
High Volume is not Enough
NEUTRAL -2,0% While PPC went through its peak in 2018, higher contract volume in 2019 means less incremental profit from selling at the CGM. In compensation, maintenance Capex less than expected has retained a substantial amount of earnings and cash flows for PPC. However, there is concern that the one-time item might not sustain in 2020 while coal shortage could affect Pha Lai 1, the older generator, regarding efficiency. Therefore, in addition to a likely lowered dividend, investors should also pay attention to Pha Lai 1’s ability to function stably as 2019 maintenance schedule was compromised.
Investment Rationales
- The weather condition is likely to result in higher Qc in 2020. The NCHMF forecasts that river flows will be 20-50% lower in early-2020, resulting in water levels at HPP possibly 20-40% lower than average as well. As a result, the assigned volume to PPC is likely to remain high for another year. For a smart player on the CGM like PPC, this means less chance to make extra profit for 2020.
- PPC’s financial situation can become more comprehensible towards the long-run, as 2020 can possibly be the last year PPC receives revenue for FX fluctuations. Accordingly, PPC’s profit margins can also be stabilized in the long-term without depending on such revenue. Besides, PPC can enjoy cash flows from its interest income and a minimum short-term debt while getting rid of FX rate risk.
- PPA for Pha Lai 1 is feasible with a maximum of VND 25 per kWh reduction in revenue. It means that the fully-depreciated power plant can generate cash flows to PPC for another 4 years starting 2020. However, operating an old power plant exposes the company to multiple types of risks including operational, financial and legal issues.
2020 Outlook
- We estimate PPC’s 2020 volume to hover around 5.5 billion kWh, close to their peak volume (6 billion kWh). Accordingly, 2020 revenue is forecasted to go up slightly because of the FX rate change revenue and CGM revenue.
- Profitability is going to lower in 2020. We believe 2020 maintenance activities will follow the schedule closely, resulting in a “normalized” profit in 2020 compared to 2019. PPC’s 2020 gross margin could also be impacted by the national coal shortage. In particular, coal usage per kWh at Pha Lai 1 might become higher due to the different coal mix.
Risks to Our Call
- Compromised maintenance schedule in 2019 has exposed PPC to operational risk in 2020, especially Pha Lai 1. Having ran since 1982, Pha Lai 1 Power Plant is vulnerable to technical problems, particularly while it has not been maintained as scheduled.
- Environmental risk is worth paying attention to.
CMP (VND) 27,760 Target Price (VND) 25,000 Cash Dividend (VND)* 2,200 (*) expected in next 12 months STOCK INFO Sector Market cap ( VND bn) Current shares (millions) 3M avg. volume (K) 3M avg. Trading value (VND bn) Remaining foreign room (%) 52-week range (‘000 VND) PERFORMANCE
FORECAST VND bn 2017 2018 2019E 2020F Revenue 6,236.0 7,116.8 8,073.4 8,095.8 % yoy 4.3 14.1 13.4 0.3 NPAT 854.0 1,122.5 964.3 768.6 % yoy 55.7 31.4 -14.1 -20.3 ROA (%) 11.3 16.1 13.7 10.9 ROE (%) 15.8 15.7 12.9 10.1 EPS (VND) 2,680 3,282 2,820 2,247 BV (VND) 17,083 17,488 17,635 17,705 Div (VND) 3,200 2,800 2,700 2,200 P/E (x) 8.5 8.3 9.6 12.1 P/BV (x) 1.3 1.6 1.5 1.5 *Price as of Dec 13th, 2019 COMPANY SNAPSHOT
Pha Lai Thermal Power is currently operating two coal-burning power plants, Pha Lai 1 and Pha Lai 2, collectively having a capacity of over 1,000 MW. PPC also holds 26% ownership in Hai Phong Thermal (UpCOM- HND). Located at an important region in the Northern electricity system, PPC’s demand has been abundant and stable over the years while Pha Lai 1’s conditions might not be favorable for future operation.
Profits from the CGM, income from investing activities and maintenance activities have resulted attractive dividends payouts for PPC’s shareholders.
0
10
20
30
40
02468
1012
Jan-
18M
ar-1
8
May
-18
Jul-1
8
Sep-
18
Nov
-18
Jan-
19M
ar-1
9
May
-19
Jul-1
9
Sep-
19
Nov
-19
PE Price ('000 VND, RHS)

www.vdsc.com.vn | Bloomberg: VDSC <GO> 73
PETROVIETNAM POWER JSC. Bloomberg: POW VN
Long-term outlook remains attractive
BUY +26% Despite risks of changes in policy, input material prices and supply shortage, the cut in depreciation and oustanding debts should help POW improve earnings and cash flow. Furthermore, the Nhon Trach 3&4 project is expected to become the long-term growth driver, given that the shortage of electricity in the south is inevitable since many big projects are behind schedule.
Investment Rationales
- POW has a huge portfolio of plants concentrated in the key economic region in the south. Electricity shortage is expected to occur in the south, where 64% of POW’s total capacity is located. Hence, these power plants are most likely to be operating at maximum capacity and face low competition pressure even during rainy season.
- Young plant fleet with advanced technology ensures stable operation. With modern combined-cycle gas turbine in all four gas-fired thermal plants, POW is able to produce more efficiently and at a low heat rate compared to other gas power plants. We believe effective operations is a critical competitive advantage to ensure the ability to capture consumption growth under supply shortage and low competition. As such, POW would have the opportunity to capitalize on its advanced technology.
- Low investment capex and strong cash flows coupled with healthy cash dividend. POW’s average capex per MW capacity is VND 16.4 bn (0.8 mn USD) for all plants, and is VND 10.5 bn (0.5 mn USD) for four gas-fired power plants. This is substantial lower than industry average of around USD 2 mn for hydropower, USD 1.5 mn for coal-fired power and USD 0.9 mn for gas-fired power plants. In addition, earnings and cash flow are expected to improve strongly thanks to the reduction in depreciation and outstanding debts.
2020 Outlook
- Total electricity output is projected to decrease by 0.8% YoY, reaching 22,387 mn kWh.
- We expect revenue to grow by 16.3% YoY to VND 40,7 Tn and NPAT-MI to grow by 17.1% YoY to VND 3,064 bn, corresponding to an EPS of 1,303 VND.
Risks to Our Call
- Faster fall of gas and coal supply than our expectations, which can divert actual performance from our forecast.
- Exchange rate fluctuation greater than our forecast (2% VND depreciation).
CMP (VND) 12,350 Target Price (VND) 15,300 Cash Dividend (VND)* 300 (*) expected in next 12 months STOCK INFO Sector Utilities Market cap ( VND bn) 28,922.1 Current shares (millions) 2,341.9 3M avg. volume (K) 1,926.6 3M avg. Trading value (VND bn) 25.3 Remaining foreign room (%) 35.1 52-week range (‘000 VND) 12.1 - 17.6 PERFORMANCE
FORECAST VND bn 2017 2018 2019E 2020F Revenue 29,710 32,663 34,990 40,701 % yoy 5.3 9.9 7.1 16.3 NPAT 2,233 1,676 2,616 3,064 % yoy 107.8 -25.0 56.1 17.1 ROA (%) 3.7 2.9 4.7 5.6 ROE (%) 9.0 6.8 9.9 10.7 EPS (VND) 1,014 749 1,112 1,303 BV (VND) 11,437 10,474 11,241 12,191 Div (VND) 0 0 300 300 P/E (x) N/A 21.4 11.1 9.5 P/BV (x) N/A 1.4 1.1 1.0 *Price as of Dec 13th, 2019 COMPANY SNAPSHOT
PV Power established in 2007, at that time wholly owned by Vietnam Oil and Gas Group (PVN). The company was successfully equitized through initial public offering (IPO) on January 31, 2018. Currently POW is the second largest power producer in Vietnam with a portfolio of 4.2 GW, constituting 9% total capacity of national power system. In terms of capacity structure, gas-fired thermal power makes up the largest proportion with 64% of total capacity, the remaining are coal-fired thermal power (30%) and hydropower (6%).
0
5
10
15
20
05
10152025
Jan-
18M
ar-1
8M
ay-1
8Ju
l-18
Sep-
18N
ov-1
8Ja
n-19
Mar
-19
May
-19
Jul-1
9
Sep-
19N
ov-1
9
PE Price ('000 VND, RHS)

SECTOR OUTLOOK AND INVESTMENT STRATEGY
www.vdsc.com.vn | Bloomberg: VDSC <GO> 74
In 2019, the growth rate of air traffic volume is estimated to be 10%. In particular, we estimate international passenger volume growth of 12%, slower than the 21% of 2018, as a result of the decline in tourists arrivals in Vietnam in the 1H 2019. Meanwhile, the growth rate of domestic air passenger volume has improved, accelerating from 5% last year to 10% in 2019. This is likely to be driven by the new supply from Bamboo Airways (BA), a brand-new carrier that joined the industry in early 2019. For 2020, we expect the positive growth of the aviation market to be maintained, but at a slower pace due to the overload issue at some major airports.
Investment Outlook
Vietnam is still one of the most attractive aviation markets in the world. ACI forecasts that Vietnam's aviation market will have the fastest passenger growth in the world in the period of 2017-2040 with an average annual growth rate of 7.8% (figure 5). In fact, Vietnam's aviation market is supported by many favorable factors such as (1) the rising wealth of the middle class, (2) the development of low-cost carriers, stimulating demand for air travel, and (3) the government's efforts to promote tourism.
However, bottlenecks in infrastructure are a short-term obstacle. The expansion of the capacity of aviation infrastructure hasn’t been commensurate with the high-speed growth rate of air traffic volume. This has led to the fact that some aviation terminals are operating beyond their designed capacity. In addition, the availability of landing/take-off (LTO) slot is also a limitation. Specifically, at SGN, the largest airport accounting for about 40% of the country's air passenger traffic, airlines have used up LTO slots during the winter flight schedule of 2019/2020. This will be a short-term barrier for airlines to increase the frequency of flights there. In addition, the runways at SGN and HAN airports have been seriously degraded. It is likely that these runways will be closed for maintenance in 2020, negatively affecting the growth of the industry.
Competition among carriers to intensify. 2019 marked a significant change in the competitive landscape of Vietnam's aviation industry with the arrival of Bamboo Airways (BA). Attractive fares in combination with services of legacy carriers (serving meals, free checked baggage) are competitive advantages of BA. This advantage, along with the aggresive fleet expansion and strong focus on exploiting key domestic routes, such as SGN-HAN or SGN-DAD, has helped BA gain nearly 6% of the domestic market share after less than one year of operation. We believe that BA will continue to expand its fleet in 2020. The fleet size may increase to 30-35 aircraft by the end of 2020 (up 40-50% compared to end- 2019). After receiving new aircrafts, we expect BA to strengthen its domestic market share along with opening new international routes. In general, the competitive pressure of the air transport market should intensify in 2020.
Risks
• Runways closure at SGN and HAN airport for maintenance.
• A sudden slowdown in growth of tourist arrivals from China or South Korea. Vietnam's tourism is fairly dependent on the Chinese and Korean markets. These two markets account for 56% of total tourist arrivals in 11M 2019. An unexpected reversal trend from either of these two markets may negatively impact international passenger arrivals..
• Appreciation of fuel prices. In the context of increasing competition, low-cost carriers seem to have little room to pass the incremental fuel cost to customers, which may lead to a contraction in profit margins.
AVIATION - A MIX OF TAILWINDS AND HEADWINDS
Tung Do ([email protected]) Negative Positive Neutral

SECTOR OUTLOOK AND INVESTMENT STRATEGY
www.vdsc.com.vn | Bloomberg: VDSC <GO> 75
Figure 1: Vietnam air traffic volume (mn pax) Figure 2: Air traffic volume at major airports in 10M 2019 (mn pax)
Source: ACV, Rong Viet Securities Source: ACV, Rong Viet Securities
Figure 3: Over 50% of the Vietnam population is forecasted to join the global middle class by 2035, compared to 15% today
Figure 4: Forecast on outbound trips of Vietnamese
Source: GSO, World Bank Source: ASEAN Travel, Outbox Consulting, Rong Viet Securities
Figure 5: Vietnam is forecasted to be the country with the fastest air traffic volume growth in the world in 2017-2040
Figure 6: Vietnam’s international arrivals growth to be the highest in Asia in 2019-2023
Source: ACI Source: PATA, Rong Viet Securities
63.1
81.1
94.1103.6
87.296.8
0
20
40
60
80
100
120
2015 2016 2017 2018 10M 2018 10M 2019
CAGR 2015-2018: 18% YoY
0%
2%
4%
6%
8%
10%
12%
14%
16%
18%
20%
0
5
10
15
20
25
30
35
40
SGN HAN DAD CXR PQC
10T 2018 10T 2019 YoY %
0%
20%
40%
60%
80%
100%
201520162017201820192020202120222023202420252026202720282029203020312032203320342035
Global poor (< USD3.1/day)Near poor (USD 3.1-5.5/day)Emerging consumer (USD 5.5-15.0/day)
0%
2%
4%
6%
8%
10%
12%
14%
16%
18%
0
2
4
6
8
10
12
2016 2017 2018 2019F 2020F 2021F
Outbound trips (million, LHS) YoY %
7.8%
0% 2% 4% 6% 8% 10%
Vietnam
India
Saudi Arabia
UAE
China
Philippines
Indonesia
Colombia
Mexico
Malaysia
14.0%
0% 5% 10% 15%
Vietnam
Papua New Guinea
Laos
Asia Pacific

SECTOR OUTLOOK AND INVESTMENT STRATEGY
www.vdsc.com.vn | Bloomberg: VDSC <GO> 76
Figure 7: Vietnam’s international arrivals Figure 8: Arrivals growth from Northeast Asia countries which accounts for two third of total Vietnam int’l arrivals
Source: GSO, Rong Viet Securities Source: GSO, Rong Viet Securities
Figure 9: Estimated utilization rate of major airports in 2019
Figure 10: Correlation between growth of air travelers to Vietnam and growth of int’l air passenger
Source: Rong Viet Securities Source: GSO, ACV, Rong Viet Securities
Figure 11: ROE, PE and PB of listed firms in the aviation industry
Source: Fiin Pro, Rong Viet Securities (bubble size: ROE)
22% 27% 31% 32% 32%
14%15%
19%22% 24%
8%7%
6%5% 5%
6%5%
5%5% 5%
6%6%
5%4% 4%
43% 40% 35% 31% 29%
0%
10%
20%
30%
40%
50%
60%
70%
80%
90%
100%
2015 2016 2017 2018 11M 2019
China South Korea Japan Taiwan US Others
0%
10%
20%
30%
40%
50%
60%
2015 2016 2017 2018 11M 2019
China South KoreaJapan Taiwan
0%
20%
40%
60%
80%
100%
120%
140%
160%
180%
SGN HAN DAD CXR PQC
0%5%
10%15%20%25%30%35%40%
Air travelers to Vietnam YoY%
Air int'l passenger volume YoY%
CIA
NCT
ACV
SGN
VJC
AST
SAS HVN
0.0
1.0
2.0
3.0
4.0
5.0
6.0
7.0
0.0 5.0 10.0 15.0 20.0 25.0 30.0
P/B
P/E

SECTOR OUTLOOK AND INVESTMENT STRATEGY
www.vdsc.com.vn | Bloomberg: VDSC <GO> 77
Table 1: Aviation stocks – Market cap, price, rating, per share, dividends and ROE summary
Market cap
(USD mn)
Cur. Price
Target price
ETR %
Rating P/E
2019F P/BVPS 2019F
ROE 2019F
DY 2019F
P/E 2020F
P/BVPS 2020F
ROE 2020F
DY 2020F
Foreign room
ACV 163,020 74,883 85,000 14.7% Accumulate 22.8x 4.7x 21.3% 1.2% 20.3x 3.8x 20.9% 1.2% 45.3
SCS 7,223.2 125,500 130,000 10.0% Accumulate 15.1x 7.0x 54.4% 6.4% 11.2x 5.8x 52.0% 6.4% 24.6%
VJC 75,694.7 144,500 140,000 -1.0% Reduce 14.9x 5.1x 30.5% 2.0% 16.5x 3.8x 22.7% 2.0% 10.4%
AST 3,712.5 82,500 75,000 -6.7% Reduce 18.9x 4.1x 25.9% 2.4% 16.3x 4.1x 25.2% 2.4% 3.1%
Source: Rong Viet Securities forecast, share price as of Dec 13th 2019

www.vdsc.com.vn | Bloomberg: VDSC <GO> 78
AIRPORTS CORPORATION OF VIETNAM JSC Bloomberg: ACV VN
Earnings Growth To Decelerate
ACCUMULATE 15% Aeronautical service charges hike in 2H 2018 was positive for ACV’s 2019 earnings. Estimated NPAT should be up 15% for the year. Looking forward to 2020, there will be no fees hike. Hence ACV's profit growth will largely depend on air traffic volume growth, which we forecast to be lower than previous years’ level. However, other than traffic growth, we believe profit margin expansion, due to a to higher forecasted proportion of international flights, could be another propeller for ACV's profit growth. On the downside, investors should watch closely the information related to runways shut downs (for rehabilitation purpose) in Saigon and Hanoi. This is the potential biggest headwind for ACV in 2020. We still forecast NPAT to grow 11% in 2020.
Investment Rationale
- As the sole manager of nearly all airports across the country, ACV is the main beneficiary of the growing Vietnam's aviation market, which is forecasted to post the fastest growth in the world by ACI in the period of 2018-2040.
- Gross profit margin (GPM) is poised to improve owing to the higher proportion of international flights. Service charges for passengers traveling on international flights is four to six times higher (depending on the airport) than domestic ones. Besides, the proportion of international passengers has increased steadily in recent years from 30% in 2016 to 39% in 2018, lifting the GPM from 40% to 48% over the same period. We expect the trend of increasing international passengers in the ACV’s air traffic mix to continue in 2020 as (1) domestic carriers prioritizing the international market and (2) positive outlook on the Vietnam inbound/outbound tourism demand. As such, we forecast the GPM in 2019-20F will expand to 51%/52%.
- Huge potential for non-aeronautical yield improvements. Non-aviation revenue per passenger at Vietnam airports is very low at one USD per person. In Thailand and Malaysia, this figure is much higher, about four USD to five USD, thanks to high retail concession rate of approximately 20-30%. Meanwhile, we estimate that the concession rate in Vietnam is much lower, around 5%.
2020 Outlook
- Air traffic volume in 2019-20F to reach 115/125 million pax, up 11% / 9% YoY, respectively. Net sales are expected to grow by 11%.
- NPAT-MI is estimated to increase by 15% YoY, reaching VND 8,928 billion.
Risks to Our Call
- Runways closure for maintenance at Tan Son Nhat and Noi Bai.
- Lower than expected financial income. In 2020, it’s more likely that ACV may withdraw a part of its term deposit to fund the T3 Terminal at SGN Airport.
CMP (VND) 74,883 Target Price (VND) 85,000 Cash Dividend (VND)* 900 (*) expected in next 12 months STOCK INFO Sector Industrials Market cap ( VND bn) 163,020.2 Current shares (millions) 2,177.0 3M avg. volume (K) 100.1 3M avg. Trading value (VND bn) 7.7 Remaining foreign room (%) 45.3 52-week range (‘000 VND) 62.9 – 95.9 PERFORMANCE
FORECAST VND bn 2017 2018 2019E 2020F Revenue 13,830 16,090 18,416 20,520 % yoy -5.6 16.3 14.5 11.4 NPAT 4,101 6,135 7,788 8,928 % yoy -19.7 49.6 26.9 14.6 ROA (%) 8.5 11.9 12.8 12.9 ROE (%) 15.9 21.1 21.3 20.9 EPS (VND) 1,697 2,504 3,219 3,691 BV (VND) 12,556 14,099 16,776 19,618 Div (VND) 900 900 900 900 P/E (x) 57.0 31.9 23.3 20.3 P/BV (x) 8.5 6.4 4.5 3.8 *Price as of Dec 13th, 2019 COMPANY SNAPSHOT
ACV is a state-owned enterprise responsible for managing 22 airports in Vietnam, including 9 international airports and 13 domestic ones with a total capacity of about 100 million passenger per year.
ACV’s main revenue stream are: (1) aeronautical services, (2) non-aeronautical services and (3) retail sales at airports. Aeronautical services contribute 80% of revenue.
10
30
50
70
90
110
130
414243444546474
PE Price ('000 VND, RHS)

www.vdsc.com.vn | Bloomberg: VDSC <GO> 79
VIETJET AVIATION JSC Bloomberg: VJC VN
International Segment Growth To Offset Sluggish Domestic Operation REDUCE -1% After years of expanding international flight network, transportation revenue from
international routes has been continuously growing and has accounted for the majority of VJC's transportation revenue in 2019. The resilient growth of international flights revenue may continue in near term as VJC had its international routes increase more than 30% for the last 12 months. Therefore, we expect the international segment to be the key driver for core earnings in the future. However, we concern about the limited room for growth of domestic transport segment whereas major airports are overloaded and the competitive pressure in the market is getting fiercer.
Investment Rationales
- International transportation segment to be the main growth engine. VJC has been actively expanding its international flight network in recent years. The number of international routes has reached 86 at the end of Q3 2019, doubling after 2 years. Most of these routes are focused on the Northeast Asia market, which accounts for two-thirds of international visitors to Vietnam. We expect the number of visitors to Vietnam from this market and vice versa to maintain a double-digit growth rate. This, along with the competitive advantage of the cheapest airfares on these routes, should help VJC maintain the growth momentum of international transportation segment in the coming years.
- Ancillary revenue per passenger to sustain high speed growth. In line with the trend of increasing the proportion of international flights, ancillary revenue is likely to continue to climb as these flights often generate more ancillary revenue than domestic flights.
- Improved fleet efficiency. From 2019, VJC started to receive ACF variant of the A321neo family with 240 seats combined with a gradual reduction of the old A320s (180 seats). Not only being able to carry more passengers, the new type of aircraft will also be more fuel efficient.
2020 Outlook
- Total volume transported in 2019-20F to reach 26/29 million pax, growing by 13%/12% YoY. We forecast core revenue to be VND47Tn (+18% YoY), aircraft sales to be VND19Tn with 15 sale-leaseback transactions. Thus, total revenue to rise to VND66Tn (+28% YoY).
- NPAT-MI down 7% YoY. 2020 EPS is estimated at VND 8,738 (P/E forward: 16.5x).
Risks to Our Call
- The runways closure at SGN and HAN airports affect VJC's passenger volume.
- Delay in aircraft deliveries. A technical problem of the Boeing 737Max has caused Boeing to postpone the delivery of these aircrafts to customers, including VJC. To ensure business plan, it is likely that the company would have to wet-lease aircrafts to compensate for the aforementioned delayed deliveries, which should drive operating costs higher.
CMP (VND) 144,500 Target Price (VND) 140,000 Cash Dividend (VND)* 3,000 (*) expected in next 12 months STOCK INFO Sector Industrials Market cap ( VND bn) 75,694.7 Current shares (millions) 523.8 3M avg. volume (K) 686.7 3M avg. Trading value (VND bn) 97.3 Remaining foreign room (%) 10.4 52-week range (‘000 VND) 106.4 - 147.1 PERFORMANCE
FORECAST VND bn 2017 2018 2019E 2020F Revenue 42,303 53,577 51,823 66,275 % yoy 53,8 26,7 -3,3 27,9 NPAT 5,073 5,335 4,906 4,577 % yoy 103,3 5,2 -8,0 -6,7 ROA (%) 19,6 15,1 10,7 8,5 ROE (%) 66,2 43,3 30,5 22,7 EPS (VND) 11,241 9,850 9,365 8,738 BV (VND) 23,469 25,917 30,692 38,438 Div (VND) 4,000 3,000 3,000 3,000 P/E (x) 12,9 14,7 15,4 16,5 P/BV (x) 6,2 5,6 4,7 3,8 *Price as of Dec 13th, 2019 COMPANY SNAPSHOT
VietJet Aviation Joint Stock Company is the largest low-cost airline in Vietnam. As of September 2019, VJC operates a fleet of 67 aircrafts on 41 domestic routes and 86 international routes, with an average load factor of 88%.
10
60
110
160
210
4
9
14
19
24
PE Price ('000 VND, RHS)

www.vdsc.com.vn | Bloomberg: VDSC <GO> 80
SAIGON CARGO SERVICE CORPORATION Bloomberg: SCS VN
International Cargoes Growth May Decelerate ACCUMULATE 10% In 2019, the slowdown of the air freight market has affected SCS's throughput.
Accordingly, the growth rate of international cargo volume for 11M 2019 was only 7% YoY, much lower than the 3Y CAGR over the period 2015-2018 of 23%. However, expanded profit margins, through efficient cost control together with higher average selling prices, helped the company cope with the deceleration in volume growth. As a result, we estimate 2019 NPAT to rise 14%. In 2020, we expect the air cargo market at SGN airport to continue growing, albeit at a modestly slower pace.
Investment Rationales
- SCS's competitive advantage lies in its ability to increase operating capacity, while the only competitor, TCS, has reached full capacity and there is not much room for expansion. In fact, SCS can easily increase capacity by investing more machines and equipment. Therefore, in the long term, we expect SCS will be the main beneficiary of the natural growth of air cargo volume at SGN airport.
- High barriers to entry, the threat from new entrants is almost none. Currently, the limited space in SGN creates a lot of difficulties for new players to join this industry. In fact, since SCS entered this market from at end-2010, the duopoly nature of the air cargo service market has not changed.
- Profit margins still have room for improvement. Favorable market condition along with pricing power helped SCS gradually increase ASP by 3-5% per year. In addition, high operating leverage (fixed costs account for 30% total costs) offers the potential to expand profit margins as long as volume throughput continue to grow. We forecast the GPM to be 79%/80% in 2019-20F, compared to 78% in 2018.
- Sound financial manangement. SCS's business activities require minor CAPEX whilst generate robust cash flow. As a result, the company has paid off its debt since 2018. In addition, most of the profit generated are paid in cash dividends, the payout ratio has been as high as 86-87% in 2017-2018. Expected dividend yield in 2020 to be 6%.
2020 Outlook
- International cargoes up 7% to reach 179 thousand tons, leading to a 10% increase in revenue.
- NPAT-MI is estimated to increase by 12% YoY, equivalent to 2020 EPS of VND11,200 (P/E forward 10.7x).
Risks to Our Call
- Slower than expected international cargoes growth due to the influence from the SGN runway closure for maintenance.
- Unpredictable consequences of trade war tension on global and regional air freight demand.
CMP (VND) 125,500 Target Price (VND) 130,000 Cash Dividend (VND)* 8,000 (*) expected in next 12 months STOCK INFO Sector Industrials Market cap ( VND bn) 7,223.2 Current shares (millions) 57.6 3M avg. volume (K) 27.9 3M avg. Trading value (VND bn) 4.3 Remaining foreign room (%) 24.6 52-week range (‘000 VND) 124.6 – 166.7 PERFORMANCE
FORECAST VND bn 2017 2018 2019E 2020F Revenue 588 675 753 828 % yoy 18.6 14.8 11.5 10.0 NPAT 344 416 502 564 % yoy 40.5 20.7 14.8 12.5 ROA (%) 35.2 43.6 50.1 48.4 ROE (%) 40.9 48.0 54.4 52.0 EPS (VND) 6,025 6,907 9,961 11,202 BV (VND) 15,993 14,293 18,324 21,525 Div (VND) 6,000 7,200 8,000 8,000 P/E (x) 20.8 18.2 12.6 11.2 P/BV (x) 7.8 8.8 6.8 5.8 *Price as of Dec 13th, 2019 COMPANY SNAPSHOT
SCS is one of the two air cargo terminal operators at SGN airport, accounting for 35% market share by cargo volume in 2018. Currently, the company operates a cargo terminal with a capacity of 200 thousand tons per year. Estimated operating efficiency for 2019 is 85%. In the future, the company will gradually increase the capacity to 350 thousand tons per year by investing in additional machines and equipments.
10
60
110
160
210
49
1419242934
PE Price ('000 VND, RHS)

www.vdsc.com.vn | Bloomberg: VDSC <GO> 81
TASECO AIRS JSC Bloomberg: AST VN
Earnings Growth May Decelerate
REDUCE -7% In 2019, AST expanded its presence in the southern market by opening seven sales outlets at SGN and PQC Airports. In addition, the company consolidated its duty-free business, previously recorded as an affiliate. These aforementioned factors should help estimated 2019 NPAT to increase by 21% YoY. Going forward to 2020, income from the newly opened stores (both duty-free and non-duty-free) are expected to be a main driver for earnings growth. However, we are slightly concerned about the growth plan: to open much fewer sale points (three in 2020 vs nine in 2019) and the declining operation efficiency of the hotel segment (due to stiffening competition) that may led to a slowdown in the profit growth momentum over the next few years.
Investment Rationale
- Retail segment, key driver of profit growth, benefits from the positive outlook of air traffic volume at key airports. Most of AST’s sale points are located in DAD, HAN and PQC airports. In 10M 2019, traffic growth at these airports remained robust at 17%YoY, 12% YoY and 10% YoY respectively. In particular, DAD and PQC airports witnessed a surge of 23% YoY and 80% YoY in international passengers. In general, we believe that the growth of passenger volume at these airports should remain positive. This will help boost the retail segment’s profit. In addition, income from newly-consolidated duty-free business is another potential driver for this segment. We forecast that the gross profit from the retail segment (both duty-free and non duty-free) will rise by 15% in 2020.
- Gain from affiliate, VINACS, to become ‘healthier’. After nearly two years of losses, VINACS's activities started to prosper in 2019 owing to acquiring many new customers, notably Bamboo Airways (BA). This carrier, after joining the industry in early 2019, has aggressively expanded its domestic flight operations and became one of the largest customers of VINACS at HAN and CXR airports. We expect BA to accelerate its fleet expansion in 2020, and further enhance its flight operations. Thus, this should positively affect the business results of VINACS. We forecast gain from this affiliate to rise 20% in 2020.
2020 Outlook
- Revenue is expected to grow by 16% to VND1.3Tn, mainly driven by the 21% growth rate of retail segment.
- NPAT-MI is estimated to increase by 14% YoY. 2020 EPS to be VND5,050 (P/E forward 16x).
Risks to Our Call
- Rental expenses at airports to increase faster than expected.
- Lower than expected profit from the hotel segment. AST is currently managing a four-star hotel in Da Nang. The hospitality market there is very competitive due to oversupply.
CMP (VND) 82,500 Target Price (VND) 75,000 Cash Dividend (VND)* 2,000 (*) expected in next 12 months STOCK INFO Sector Industrials Market cap ( VND bn) 3,712.5 Current shares (millions) 45.0 3M avg. volume (K) 62.0 3M avg. Trading value (VND bn) 4.4 Remaining foreign room (%) 3.1 52-week range (‘000 VND) 47.4 – 89.9 PERFORMANCE
FORECAST VND bn 2017 2018 2019E 2020F Revenue 659 865 1,117 1,341 % yoy 108.0 31.2 29.2 20.0 NPAT 147 161 199 227 % yoy 236.1 9.2 23.4 14.4 ROA (%) 29.6 24.9 21.4 20.3 ROE (%) 43.9 31.4 25.9 25.2 EPS (VND) 3,970 4,336 4,414 5,051 BV (VND) 12,924 15,253 17,016 20,067 Div (VND) 2,500 1,500 2,000 2,000 P/E (x) - 19.0 18.7 16.3 P/BV (x) - 5.4 4.8 4.1 *Price as of Dec 13th, 2019 COMPANY SNAPSHOT AST is one of the leading companies operating in the non-aeronautical field in Vietnam. Its main business is to operate a chain of more than 80 retail stores that sell souvenir, consumer goods, F&B and duty-free products at seven airports. In addition, the company manages a four-star hotel in Da Nang and participates in the air meal catering market through its affiliate, VINACS.
10
30
50
70
90
110
4
9
14
19
24
PE Price ('000 VND, RHS)

SECTOR OUTLOOK AND INVESTMENT STRATEGY
www.vdsc.com.vn | Bloomberg: VDSC <GO> 82
The OECD forecasts that Vietnam's GDP can maintain an average growth rate of 6.0 - 6.2% per year until 2025. This combined with low insurance penetration (total insurance premium to GDP, Figure 1) and young population with rapidly growing income, creates great potential for the industry. After the 2015-2018 strong growth of 25%/ year (Figure 2), insurance premium revenue growth has slowed down this year and will decline in the coming years. The slowdown is pronounced in the life sector, as G-bond yields have declined in 2019 and are expected to remain low in the following years.
Investment Outlook
Rising middle class increases demand for personal insurance. More than 50% of Vietnam's population will enter the global middle class by 2035 compared to 11% in 2015 (Figure 3). The demand for saving, investing and owning cars will boost demand for personal insurance including life insurance, health care insurance and motor vehicle insurance.
Low G-bond yields are likely to be maintained in 2020 as seen in 2H2019 (Figure 4). Because interest rates on deposits are much higher than those on government bonds, investment in government bonds may be partly replaced by bank deposits in order to maintain investment yields and ensure the obligations of payment to policy holders.
Life insurance sector to adjust to the low-interest rate environment. Companies may have to be more prudent in their growth of new business life insurance premiums (Figure 5) to curb mathematical provision expense. Universal life (investment-linked) has been promoted while endowment is limited (Figure 6) as endowment has the term of interest payment, leading to a mathematical provision. Non-life insurance continues to grow strongly. Health, accident and motor vehicle insurances are the driving factors while traditional insurances (maritime, technical assets and fire and explosion) still face difficulties.
Revenue via bancassurance. In many countries, bancassurance contributes significantly to the total premium revenue of insurance companies: 72% in Spain, 70% in Italy, 60% in France. In Vietnam, bancassurance revenue in total premium revenue has increased from 5% in 2012 to more than 30% in 8M2019. Many contracts with banks were signed in 2019 at a high value, especially in life insurance sector, prompting that competition in this sector will be increasingly fierce. The prepayment commission fee (upfront fee) is often high, which will affect margins of companies and may cause some of them to increase charter capital to ensure growth in the next years.
4.0 technology has affected the industry value chain from market research, product design, risk assessment, sales, after-sales to claim payment. In addition, it benefitted insurance companies by increasing operational efficiency and reducing costs. 4.0 technology also helps insurers support agents and partners better, as well as improve customer experience.
Insurance business conditions improvement and the divestment plan of the Government should attract more foreign investors. Detailed regulating for the Law on Insurance Business 2019, Decree 80/2019 / ND-CP (effective on November 1, 2019) amending Decree 73/2016 / ND-BTC and Decree 98/2013 / ND-CP sets out a complete legal framework for insurance supporting activities, preparing for the opening of the insurance market as committed in the signed FTAs such as CPTPP and EVFTA. In addition, the government’s divestment plan from the insurance sector is expected to accelerate. This should be a catalyst for the ongoing wave of cooperation between domestic insurers and foreign partners in enhancing underwriting and management expertise.
INSURANCE INDUSTRY: PRUDENT GROWTH
Tam Pham ([email protected]) Negative Positive Neutral

SECTOR OUTLOOK AND INVESTMENT STRATEGY
www.vdsc.com.vn | Bloomberg: VDSC <GO> 83
Risks
• Natural disasters more serious than forecasts. Natural disasters are the most important risks to insurers because of the large scale of losses it can cause. More severe and unpredictable damages can make compensation higher than forecasts.
• Fall in Government bond yields. The lower G-bond yields, the greater pressure on provisions of life insurance companies. Profits, therefore, may fall.
Figure 1: Insurance penetration rate in 2018 (%) Figure 2: Insurance revenues growth vs GDP growth
Source: Swiss Re Institute Source: ISA, GSO, Rong Viet Securities
Figure 3: Middle class proportion in the Vietnam’s population
Figure 4: Deposit interest rates and G-bond yields (%/year)
Source: GSO, World Bank Source: Fiinpro
Figure 5: Growth of new business life insurance premium has declined
Figure 6: New business life insurance product structure is changing
Source: ISA, Rong Viet Securities Source: IAV, Rong Viet Securities
7.8
5.3
4.8
4.2
2.0
2.4
6.1
0.0 2.0 4.0 6.0 8.0 10.0
Singapore
Thailand
Malaysia
China
Indonesia
Vietnam
World
1216
12
3027
23 23 25
17
5 5 6 7 6 7 7 7 7
05
101520253035
2012
2013
2014
2015
2016
2017
2018
9M20
18
9M20
19
Premium growth (%) GDP growth (%)
0%
10%
20%
30%
40%
50%
60%
70%
80%
90%
100%
2015
2017
2019
2021
2023
2025
2027
2029
2031
2033
2035
Global poor (< USD3.1 PPP/day)
Near poor(USD 3.1-5.5 PPP/day)
Emerging consumer (USD 5.5-15.0 PPP/day)
Global middle class (>USD15.0 PPP/day)
1
2
3
4
5
6
7
8
1/05/2015 01/05/2016 01/05/2017 01/05/2018 01/05/20192-year G bond 3-year G bond
5-year G bond 10-year G bond
1-6 months mobilization 6-12 months mobilization
More than 12 months mobilization
0%
10%
20%
30%
40%
50%
60%
05000
100001500020000250003000035000
2013
2014
2015
2016
2017
2018
9T20
18
9T20
19
New business premium (VND bn) (LHS) Growth (RHS)
60%25%
3%10% 2%
72%
13%
3%
11%2%
Investment-link
Endowment
Term life
Riders
Pension, Annuity,Healthcare, Group
Inner ring: 9T2018Outer ring: 8T2019

SECTOR OUTLOOK AND INVESTMENT STRATEGY
www.vdsc.com.vn | Bloomberg: VDSC <GO> 84
Figure 7: ROE, PB, PE of some listed insurance companies
Source: FiinGroup, Rong Viet Securities. Bubble size equals respective ROE
Table 1: Insurance stocks – Market cap, price, rating, per share, dividends and ROE summary
Market
cap (USD mn)
Cur. price
Target price
ETR % Rating P/E
2019F P/BVPS 2019F
ROE 2019F
DY 2019F
P/E 2020
F
P/BVPS 2020F
ROE 2020
F
DY 2020F
Foreign room
PGI 1,482 16,050 19,100 26% BUY 11.0x 1.0x 9.9% 7.5% 10.4x 1.0x 10.2% 7.5% 28.3%
BVH* 50,478 68,000 N/A N/A N/A 39.5x 2.8x 8.3% 1.5% 29.7x 2.6x 9.6% 2.2% 20.6%
PVI* 7,095 30,700 N/A N/A N/A 12.0x N/A 8.7% N/A N/A N/A N/A N/A 45.7%
VNR* 2,622 20,000 N/A N/A N/A N/A N/A N/A N/A N/A N/A N/A N/A 20.6%
BMI* 2,247 24,600 N/A N/A N/A 13.2x N/A 7.9% N/A N/A N/A N/A N/A 11.5%
MIG* 1,443 11,100 N/A N/A N/A N/A N/A N/A N/A N/A N/A N/A N/A 48.9%
PTI* 1,439 17,900 N/A N/A N/A N/A N/A N/A N/A N/A N/A N/A N/A 11.0%
Source: Rong Viet Securities forecast, share prices as of Dec 13th, 2019
(*) Bloomberg’s consensus, data as of Dec 13th, 2019
BVH
PGI
BIC
PTI
BMI
PVI
VNR
0.2
0.7
1.2
1.7
2.2
2.7
3.2
3.7
1.0 11.0 21.0 31.0 41.0 51.0 61.0 71.0
P/B
P/E

www.vdsc.com.vn | Bloomberg: VDSC <GO> 85
PETROLIMEX INSURANCE CORPORATION Bloomberg: PGI VN
Bright prospects due to a good credit rating
BUY 22% Continuing to stick to a prudent business strategy focusing on profit instead of competing for market share, PGI maintains a growth rate target of 7% for gross premium in 2020. Operation and profit will be stable in a fiercely competitive environment. Along with a well-managed portfolio, PGI is a notable investment in the insurance sector.
Investment Rationales
- The insurance industry benefits from a thriving economy. The OECD forecasts that Vietnam’s GDP will grow by 6-6.2% per year for the next five years. The proportion of the middle class is forecasted to reach 23% of the country’s population from 11% in 2012. Therefore, the demand for many types of insurance products (health, property and vehicle) will increase significantly and support the revenue growth of insurers. In fact, the growth of the non-life insurance sector has been twice that of GDP growth in the past four years.
- Product restructuring. Health and accident insurance is expected to become the more important driver for the company while motor vehicle insurance will be gradually reduced and maintained at 35% of direct written premiums. Customers who send claims too frequently will be taken off the list of clients.
- Samsung Fire and Marine Insurance (SFMI), a strategic partner, supports staff training, marketing, digitalization and introducing PGI to Samsung subsidiaries and the Korean community working in Vietnam. SFMI is ranked 1st in South Korea and 23rd in the world. Samsung has invested USD 17.3 bn in Vietnam. There are about 60,000 Koreans living in Vietnam. This will help PGI to increase revenues and reduce costs and compensation.
- Deposit interest rates went sideways compared to the end of 2019 while the stock market seems to lack of supportive factors. Investment income thus increased slowly in the coming years. More than 96% of PGI's portfolio is in bank deposits.
- Maintaining good credit rating. Rated B+ (Good) for financial strength and bbb- (Good) as a long-term issuer, by A.M. Best1. Because of this, the company can maintain its competitive advantage in a fiercely competitive market. With a good credit rating, PGI can provide insurance to foreign customers, who have better awareness of risk prevention than domestic customers.
2020 Outlook
- Direct written premiums will grow by 6.5%.
- Due to the strong competition, loss ratio stays at 52.75%, the same level as in 2019 while the expense ratio will rise slightly to 43.04% from an estimated 42.97% for 2019. The combined ratio comes at 95.79% and the insurance business makes a profit.
- PAT reaches VND 157 bn, giving an EPS of VND 1,629/share.
Risks to Our Call
- Natural disasters more severe than expected could make compensation higher than expected.
CMP (VND) 16,700 Target Price (VND) 19,100 Cash Dividend (VND)* 1,200 (*) expected in next 12 months STOCK INFO Sector Financials Market cap ( VND bn) 1,481.6 Current shares (millions) 88.7 3M avg. volume (K) 5.6 3M avg. Trading value (VND bn) 0.1 Remaining foreign room (%) 28.4 52-week range (‘000 VND) 14.1 - 18.7 PERFORMANCE
FORECAST VND bn 2017 2018 2019E 2020F Revenue 2,335 2,413 2,573 2,735 % yoy 13.0 3.4 6.6 6.3 NPAT 127 142 149 157 % yoy 24.9 11.2 4.9 5.8 ROA (%) 2.7 2.7 2.7 2.8 ROE (%) 10.7 9.6 9.9 10.2 EPS (VND) 1,436 1,468 1,540 1,629 BV (VND) 16,546 16,827 16,998 17,563 Div (VND) 1,200 1,200 1,200 1,200 P/E (x) 15.6 11.6 11.0 10.4 P/BV (x) 1.3 1.0 1.0 1.0 *Price as of Dec 13th, 2019 COMPANY SNAPSHOT
Founded in 1995 and listed on HSX in 2011, Petrolimex Insurance Corp. is among the top five largest non-life insurance companies in Vietnam with a market share of 6%.
Providing a wide range of products like all other non-life insurers, the four major segments include health and accident insurance, motor vehicle insurance, cargo transportation insurance and property and damage insurance.
1 A.M. Best is the only global credit rating agency focusing on the insurance industry.
5
10
15
20
25
89
10111213
Jan-
18M
ar-1
8M
ay-1
8Ju
l-18
Sep-
18N
ov-1
8Ja
n-19
Mar
-19
May
-19
Jul-1
9
Sep-
19N
ov-1
9
PE Price ('000 VND, RHS)

SECTOR OUTLOOK AND INVESTMENT STRATEGY
www.vdsc.com.vn | Bloomberg: VDSC <GO> 86
Rising healthcare spending and the replacement of foreign drugs with domestic ones are an inevitable trend in Vietnam. The transition has been slow but started to speed up in 2019. It was also helped by Circular 15 which was implemented in October 2019. It provides specific guidance for bidding in hospitals as well as tightens technical requirement in a way that favors EU-GMP medicines. Therefore, big pharmaceutical companies with EU-GMP plants and focus on the ETC channel will benefit the most, namely PME and IMP. For the rest of the players, slow growth of the OTC market and fierce competition in the WHO-GMP segment medicine are challenging. Therefore, we have a NEUTRAL view on the overall pharmaceutical industry for 2020.
Investment Opportunities
Aging population requires higher spending on healthcare
Although Vietnam is still a young country, the population entered the "aging phase” in 2017, according to UNFPA2. A report from the World Bank warned that aging will likely hit Vietnam with full force within a very short span time. This transition would come in a mere 15 years and be completed well before the 2040s. An aging population means more spending on pension and healthcare.
Healthcare spending leaning towards the ‘hospital channel’ while the “pharmacies channel” faces stricter control.
According to Fitch Solutions, Vietnam pharmaceutical sales is estimated at USD 6.5 bn in 2019 of which sales to hospitals (ETC) account for 75% and is in an increasing trend. The government plays the most important role by its series of policy to promote social insurance. Social insurance coverage over population, from 76% in 2015, has reached 89% in 2019 and is on its way to the 90.7% target by 2020 (as stated in Resolution 1167/QĐ-TTg in 2016).
Besides that, recent Circular 02/2018 controlling the abuse of prescription drugs and unauthorized drugs in the OTC channel also put pressure on pharmacies’ sales. Therefore, even though, still growing along with the overall market, OTC’s sales growth is projected to be lower than that of ETC’s.
This trend should favor manufacturers focusing on the hospital channels while put OTC-oriented companies in a tougher competition.
Replacement of foreign medicines with domestic medicines – quicker progress
According to bidding results in 2019, as reported by medical facilities up until 11/22/2019, 75% of winning bid value for western medicines were imported drugs. Counting only generic drugs, that number is 60%. These statistics show the heavy dependence of Vietnam on imported drugs which are mostly high standard and expensive ones (patent drugs and tier 1 & 2 bidding groups).
In order to promote social insurance as well as control inflation, one of the “must-do” for the government is to reduce healthcare expenditures. Specifically, replacing foreign generic drugs with domestic ones, especially in the high standard segment (Tier 1 and 2) where only drugs made on EU-GMP or PIC/S-GMP can bid in.
Circular 15 (effective from October 2019) is a big catalyst that will speed up the transition as it imposes changes in favor of EU-GMP facilities while many foreign drugs made on non-ICH PIC/S-GMP facilities will be disqualified in Tier 2 (see Table 1). Therefore, we believe that domestic firms with EU-GMP lines will benefit from the changes. For the same standard, EU-GMP in particular, Vietnamese drugs are cheaper by 20-30% due to lower labor, construction and factory operating costs than in developed countries.
Among the listed pharmaceutical companies, only PME and IMP have EU-GMP plants while DBD’s new plant is still waiting for EU-GMP approval. For ICH PIC/S-GMP, there are DHG and MKP but both are not
2 United Nations Population Fund
PHARMACEUTICALS – POLICY CHANGES FAVOR THE HOSPITAL CHANNEL
Son Tran ([email protected]) Negative Positive Neutral

SECTOR OUTLOOK AND INVESTMENT STRATEGY
www.vdsc.com.vn | Bloomberg: VDSC <GO> 87
focusing on the ETC channel. DHG’s product portfolio is OTC-based while MKP is keen on outsourcing to its Japanese partner (Nipro).
Pharmaceutical retail’s modernization and consolidation – slowly progressing
Currently there are around 30,000 mom-and-pop pharmacies in Vietnam, indicating an extremely fragmented retail market. With the rising average income and health awareness, people tend to shift away from small and unqualified pharmacies to more professional drug chains or drugstores with qualified standard (GPP - Good Pharmacy Practices). The transition might take a long time but the government’s policies to control OTC market (namely Circular 02/2018) and the currently quick expansion of modern chains such as Pharmacity and Long Chau (FRT) is expected to speed up the progress.
Risks
• Policy risk is the major issue as the industry is heavily policy dependent.
• Ongoing environment protection act from China can increase input prices.
Figure 1: Forecast of pharmaceutical sales (USD bn) and the percentage of patent & generic drugs in total drug sales
Figure 2: Forecast of sales by channel (USD bn) and the percentage of ETC & OTC channels in total drug sales
Sources: FitchSolutions, Rong Viet Securities Sources: FitchSolutions, Rong Viet Securities
Figure 3: Bid winning value by drug tiers (VND bn) Figure 4: Bidding result of some top listed pharmaceutical companies (VND bn)
Sources: Drug Administration of Vietnam, Rong Viet Securities * Collected from bidding result in 2019 reported by medical facilities up until 11/22/2019
Sources: Drug Administration of Vietnam, Rong Viet Securities
Table 1: Some major changes in Tier classification of Circular 15/2019
2.22.5
2.83.2
3.64.1
4.6
5.1 5.7
18%
58%
10%
20%
30%
40%
50%
60%
0
1
2
3
4
5
6
2015 2016 2017 2018 2019F 2020F 2021F 2022F 2023F
Patent drugs (LHS) Generic drugs (LHS)
Patent drugs/total sales (RHS) Generic drugs/total sales (RHS)
3.13.5
3.94.4
4.95.5
6.16.7
7.4
20%
30%
40%
50%
60%
70%
80%
0
1
2
3
4
5
6
7
8
2015 2016 2017 2018 2019F 2020F 2021F 2022F 2023F
OTC (LHS) ETC (LHS)OTC/total sales (RHS) ETC/total sales (RHS)
235
1,503
7,762
3,000
300
32
0 3,000 6,000 9,000 12,000 15,000 18,000
Tier 5
Tier 4
Tier 3
Tier 2
Tier 1
Patent drugs
Made in Vietnam Made in other countries
0
100
200
300
400
500
600
700
800
Tier 1 Tier 2 Tier 3 Tier 4 Tier 5
PME IMP DBD DHG DMC MKP

SECTOR OUTLOOK AND INVESTMENT STRATEGY
www.vdsc.com.vn | Bloomberg: VDSC <GO> 88
Drug tier Circular 11 - 2016 Circular 15 - 2019
Tier 1 Drugs produced on EU-GMP or PIC/S-GMP lines granted by ICH member countries or Australia
Drugs produced completely on EU-GMP or EU-GMP equivalent lines granted by SRA countries
Tier 2 Drugs produced on EU-GMP or PIC/S-GMP lines granted by non-ICH member countries nor Australia
Drugs produced completely on EU-GMP or PIC/S-GMP granted by PIC/S and ICH member countries
Tier 3 Drugs produced on WHO-GMP lines Drugs produced on WHO-GMP lines and are Bioequivalence tested
Tier 4 Drugs are bioequivalence tested by Ministry of Health Drugs produced on WHO-GMP lines in Vietnam
Tier 5 Drugs that do not meet requirements of Tier 1,2,3 and 4 Drugs produced on WHO-GMP lines and do not qualify in Tier 1,2,3 and 4
Sources: Ministry of Health, Rong Viet Securities
Figure 5: ROE, PE and PB of some listed pharmaceuticals firms
Sources: Fiingroup, Rong Viet Securities
Table 2: Pharmaceuticals stocks – Market cap, price, rating, per share, dividends and ROE summary
Market cap (USD mn)
Cur. price Target price
ETR % Rating P/E
2019F P/BVPS 2019F
ROE 2019F
DY 2019F
P/E 2020F
P/BVPS 2020F
ROE 2020F
DY 2020F Foreign
room
PME 177.4 54,800 76,500 43.0% Buy 13.2x 2.1x 16.1% 3.6% 11.3x 1.9x 16.9% 3.6% 37.9%
IMP 111.2 52,200 64,500 27.0% Buy 18.9x 1.7x 10.1% 3.8% 16.0x 1.6x 11.4% 3.8% 0.0%
DHG * 519.0 92,000 N/A N/A N/A 20.2x 3.6x 20.1% 3.6% 18.9x 3.4x 20.0% 3.8% 45.6%
Source: Rong Viet Securities forecast, share prices as of December 13rd, 2019
(*) Bloomberg’s consensus, data as of December 13rd, 2019
DHG
IMP
PME
DBD
MKP
DMC
DHT
TRA
0.2
0.7
1.2
1.7
2.2
2.7
3.2
3.7
4.2
4.7
7.0 9.0 11.0 13.0 15.0 17.0 19.0 21.0 23.0 25.0
P/B
P/E

www.vdsc.com.vn | Bloomberg: VDSC <GO> 89
IMEXPHARM PHARMACEUTICAL JSC Bloomberg: IMP VN
New bidding policy strengthens its competitive advantage
BUY 27% After many years of focusing on the OTC channel, IMP is coming back to the ETC channel. IMP’s ETC sales has started to pick up since 2019 due to quicker transition from foreign drugs to domestic ones. With new modern factories and beneficial changes in the government’s policies to favor domestic drugs, IMP’s ETC sales growth potential in the coming years is very promising. We believe that pharmaceutical stocks with sustainable growth prospects such as IMP would be suitable as defensive stocks in a current risky market.
Investment Rationale
- Circular 15/2019 helps promote the transition from foreign medicines to domestic drugs and reduce the competition in drug Tier 2, where IMP’s strength lies in, as non-ICH PIC/S drugs are disqualified under the new circular.
- Nationwide centralized bidding creates a transparent and favorable environment for businesses with large-scale production and high standard products like IMP.
- Plentiful room to increase production from EU-GMP factories. Besides the coming up IMP4 factory, the other EU-GMP plants are either just starting to run commercially (IMP2) or operating at low capacity in 2019 due to EU-GMP retesting (IMP3).
2020 Outlook
- We expect ETC sales to increase 50%, reaching VND 470 Bn (USD 20 mn), and OTC sales to grow by 5%, equivalent to VND 807 Bn (USD 35 mn).
- The IMP4 factory in Binh Duong starts operating. It manufactures specialty medicines for bidding to hospitals.
- Better utilization rate at the current EU-GMP factories due to IMP winning more bid into the ETC channel.
Risks to Our Call
- Policy changes take too much time to implement.
- The OTC market does not recover as expected.
- IMP looks for a strategic partner.
CMP (VND) 52,200 Target Price (VND) 64,500 Cash Dividend (VND)* 2,000 (*) expected in next 12 months STOCK INFO Sector Pharmaceutical Market Cap (VND bn) 2,578.0 Current Shares O/S (mn) 49.4 3M Avg. Volume (K) 51.7 3M Avg. Trading Value (VND bn) 2.5 Remaining Foreign Room (%) 0.0 52-week range (‘000 VND) 46.1 - 58.5 PERFORMANCE
FORECAST VND bn 2017 2018 2019E 2020F Revenue 1,165 1,185 1,317 1,524 % yoy 15.4 1.7 11.2 15.7 NPAT 117 139 155 184 % yoy 16.0 18.2 11.7 18.6 ROA (%) 6.6 7.8 8.4 9.4 ROE (%) 8.4 9.2 10.1 11.4 EPS (VND) 2,090 2,469 2,758 3,271 BV (VND) 32,466 30,445 31,176 32,518 Div (VND) 500 2,000 2,000 2,000 P/E (x) 27.5 24.7 18.9 16.0 P/BV (x) 2.0 2.0 1.7 1.6 *Price as of Dec 13th, 2019 COMPANY SNAPSHOT
One of the five largest domestic pharmaceutical companies. Along with PME, IMP is one of the only two pharmaceutical companies in Vietnam that have three EU-GMP plants.
Key products are antibiotic and digestive drugs such as Pms-Claminat, Pms-Probio, and parenteral antibiotics, which are all produced with Spain’s Enzymatic technology.
40
45
50
55
60
15
20
25
30
Jan-
18
Apr
-18
Jul-1
8
Oct
-18
Jan-
19
Apr
-19
Jul-1
9
Oct
-19
PE Price ('000 VND, RHS)

www.vdsc.com.vn | Bloomberg: VDSC <GO> 90
PYMEPHARCO JSC Bloomberg: PME VN
Heightened standards, strengthened position
BUY 43% Pymepharco (PME) is the second largest western medicine manufacturer in terms of revenue and profit. When the non-beta factory is approved for EU-GMP in early 2Q next year, PME will be one of the first two (with IMP) in Vietnam to have 3 EU-GMP plants. Along with its strength in the ETC channel and beneficial changes in government’s policies to favor domestic drugs, PME’s potential in the coming years is very promising. We also expect Stada to transfer more products to PME after increasing its ownership in the company and divesting from Stada Vietnam JV, thereby increasing PME's capacity in the high-quality drug segment which is now dominated by foreign drugs.
Investment Rationale
- Supporting policies promote domestic and high standard drugs in the hospital channel. Circular 15 reclassified drug tiers in a way that favors EU-GMP products and provides guidance for the transition from foreign drugs to domestic ones.
- Leading the ETC market with competitive advantage from EU-GMP facilities and support from Stada. PME is the most winning bidder in the ETC channel for the period 2019 - 2020 (mostly in Tier 1 and 2). Especially, with Stada’s support, PME has the advantage to acquire export visa to Europe in order to bid into Tier 1 which has the highest value and margin among generic drug tiers.
- STADA is likely to increase sales through PME to retain its influence in Vietnam after Stada’s divestment from Stada Vietnam in 2020 which means PME is the only subsidiary left.
2020 Outlook
- We expect revenue to grow by 13%, mostly from the ETC channel. Net margin will improve to 17,6% due to a decrease in SG&A/sales while gross margin will remain at 49,3%.
- The new non-beta capsule factory, expected to receive EU-GMP in early 2Q/2020, will strengthen PME’s abilities to bid into the ETC channel for high-quality non-beta drugs as well as distribute via the OTC channel.
Risks to Our Call
- Policy changes take too much time to implement.
- Additional revenue from STADA products is not as high as expected.
CMP (VND) 54,800 Target Price (VND) 76,500 Cash Dividend (VND)* 2,000 (*) expected in next 12 months STOCK INFO Sector Pharmaceutical Market Cap (VND bn) 4,110.6 Current Shares O/S (mn) 75.0 3M Avg. Volume (K) 8.0 3M Avg. Trading Value (VND bn) 0.4 Remaining Foreign Room (%) 37.9 52-week range (‘000 VND) 44.7 - 61.7 PERFORMANCE
FORECAST VND bn 2017 2018 2019E 2020F Revenue 1,622 1,675 1,843 2,075 % yoy 7.6 3.2 10.1 12.6 NPAT 286 309 313 366 % yoy 19.7 8.0 1.2 16.9 ROA (%) 14.6 14.5 13.4 14.6 ROE (%) 17.8 17.3 16.1 16.9 EPS (VND) 3,818 4,124 4,146 4,837 BV (VND) 24,677 23,803 25,950 28,787 Div (VND) 2,000 2,000 2,000 2,500 P/E (x) 19.1 15.4 13.2 11.3 P/BV (x) 3.4 2.7 2.1 1.9 *Price as of Dec 13th, 2019 COMPANY SNAPSHOT
With the support from STADA (Germany), PME is the first pharmaceutical company in Vietnam having the antibiotic workshop that meet EU-GMP standard since 2013.
The company currently owns three plants: a capsule plant and an injection plant (both have EU-GMP antibiotic lines) as well as a new non-betalactam plant which will receive EU-GMP in early 2020.
25354555657585
10
12
14
16
18
Jan-
18
Apr
-18
Jul-1
8
Oct
-18
Jan-
19
Apr
-19
Jul-1
9
Oct
-19
PE Price ('000 VND, RHS)

SECTOR OUTLOOK AND INVESTMENT STRATEGY
www.vdsc.com.vn | Bloomberg: VDSC <GO> 91
According to the Vietnam Maritime Administration, the total container throughput of Vietnam's seaport system in 2019 is estimated at 19.4 million TEUs, an increase of 6% YoY. If compared to the growth rate in 2018 of 24%, the growth momentum has decelerated dramatically. The trend of slowdown was also seen in Hai Phong area. In 11T 2019, the throughput growth was nearly flat. However, if viewed in more detail, this growth rate was mainly affected by the decline of domestic container volume, due to China tightened the policy of unofficial import from Vietnam. Meanwhile, import/export container volume in Hai Phong maintained a steady increase. In fact, in 9M 2019, domestic container volume dropped by 16% YoY, while import/export container volume was up 9% YoY. In 2020, we expect the stable growth of import/export container in Hai Phong to continue, helping port operators here to cope with the fierce competition due to severe excess container handling capacity.
Investment Outlook
Hai Phong port market is getting tougher
The oversupply situation to be more and more serious. The total container loading/unloading capacity in Hai Phong has increased considerably in the past 2 years. A series of new ports has come in operation (HICT deep-water port, Nam Dinh Vu port and MIPEC port) has increased the total container handling capacity by the end of 2019 to nearly 8 million TEU per year, up 38% within 2 years. This growth rate outpaced the demand growth of 10% for the same period. What’s worse, by 2021, it is expected that the second phase of Nam Dinh Vu port will be operational, bringing the total supply in the market to 8.4 million TEUs. At that time, we estimate the market will be oversupplied by 40%, even if the demand is forecasred to grow at a CAGR of 8% over the 2019-2021 period.
Ever-increasing competitive pressure from deep-water port HICT. This terminal, with the advantage of being able to receive large tonnage vessels and a highly competitive pricing policy, has consistently attracted more than 10 international shipping lines since it began operation in May 2018. In 2019, the throughput of this port is estimated at 380,000 TEU, 5 times higher than in 2018, accounting for about 7% of Hai Phong market share. Most of HICT's customers, including Maersk, MSC, Wan Hai Line, and Evergreen Line, are also existing clients of other river ports. In the long run, it would be inefficient for shipping companies to exploit two different ship sizes (mother vessel for deep-sea terminal and feeder for river ports) for one maritime route. Instead, shipping lines tend to upsize their fleet to utilize costs per container unit and prefer to dock at deep-water ports. This means that, in the long term, river ports’ market share are at risk.
Upstream ports continue to face hardship. Beside the trend of losing import/export container market share, these players are likely to face weakening domestic container volume. The change of unofficial trade policy between Vietnam and China has led to a decrease in volume of agricultural and seafood products through Hai Phong In 2019. This is because of most of these cargo are mainly domestically transported from Southern Vietnam to Hai Phong before exporting to China via unofficial channels near border. Therefore, the above change may reduce domestic container throughput in Hai Phong, making it more and more difficult for upstream seaports who depend mostly on domestic cargo.
Risks
• Unpredictable consequences from US-China trade tensions affect investment flow, global trade and the volume of cargo through Vietnam's ports.
SEAPORT INDUSTRY – GETTING TOUGHER
Tung Do ([email protected]) Negative Positive Neutral

SECTOR OUTLOOK AND INVESTMENT STRATEGY
www.vdsc.com.vn | Bloomberg: VDSC <GO> 92
Figure 1: Supply and utilization rate of Hai Phong seaport market
Figure 2: Container volume throughput (Mn TEU, LHS) at main container terminals in Cai Mep, Vung Tau
Source: Hai Phong maritime administration, Rong Viet Securities Source: VPA, Vinamarine, Rong Viet Securities
* Account for container terminals only
Figure 3: Average calls per week at some ports in Hai Phong in the period of 2015-2019E
Source: Hai Phong maritime administration, Rong Viet Securities; in the parenthesis is ticker of the related seaport firm
Figure 4: ROE, PE and PB of listed seaports firms
Source: Fiin Pro, Rong Viet Securities (bubble size: ROE)
3.43.9 4.0
4.55
4.5
0%
20%
40%
60%
80%
100%
0
1
2
3
4
5
6
2014 2015 2016 2017 2018 11T 2019
Container volume (Mn TEU, LHS)
Market utilization rate ( %, RHS)
0.9 1.0 1.1 1.3 1.6 2.00.20.7 0.7
0.70.8
0.9
0.1
0.1 0.20.4
0.5
0.6
0%
20
40
60
80
0
1
2
3
4
2014 2015 2016 2017 2018 2019E
SSITTCTTCMITTCIT + TCCTMarket utilization rate* ( %, phải)
-
2
4
6
8
10
12
14
16
18
Nam HaiPort
(GMD)
Doan XaPort
(DXP)
GreenPort
(VSC)
Chua VePort
(PHP)
Tan Cang128
Hai AnPort
(HAH)
Tan Cang189
PTSCDinh Vu
(PSP)
Dinh VuPort
(DVP)
Tan VuPort
(PHP)
Nam HaiDinh Vu
Port(GMD)
VIP GreenPort
(VSC)
NamDinh Vu
Port(GMD)
HICT
2015 2016 2017 2018 2019E
DVP
HAH
VSCGMD
PDN
PHP
CLL
DXP
0.0
0.5
1.0
1.5
2.0
2.5
3.0
0.0 2.0 4.0 6.0 8.0 10.0 12.0 14.0
P/B
P/E

SECTOR OUTLOOK AND INVESTMENT STRATEGY
www.vdsc.com.vn | Bloomberg: VDSC <GO> 93
Table 1: Seaport stocks – Market cap, price, rating, per share, dividends and ROE summary
Market cap
(USD mn)
Cur. Price
Target price
ETR % Rating P/E
2019F P/BVPS 2019F
ROE 2019F
DY 2019F
P/E 2020F
P/BVPS 2020F
ROE 2020F
DY 2020F
Foreign room
VSC 1,411.1 25,600 28,200 20.0% Buy 7.2x 0.8x 11.5% 9.8% 5.4x 0.8x 13.9% 9.8% 11.5% GMD 7,007.4 23,600 26,000 16.5% Accumulate 11.2x 1.1x 10.1% 6.3% 13.5x 1.1x 8.1% 6.3% 0% DVP 1,532.0 36,800 38,000 14.1% Accumulate 5.9x 1.3x 19.5% 8.1% 5.9x 1.3x 17.2 8.1% 35.5%
Source: Rong Viet Securities forecast, share price as of Dec 13th 2019

www.vdsc.com.vn | Bloomberg: VDSC <GO> 94
GEMADEPT CORPORATION Bloomberg: GMD VN
Gain From Joint Ventures To Watch Closely ACCUMULATE 14% The weakening demand in Hai Phong market has significantly affected the growth of
container volume through GMD's port system in 2019, thereby, making the revenue growth stay flat. However, we estimate core PBT still witnessed a healthy growth rate of 25% thanks to improved profit margins, owing to good control of operating costs, along with robust profit growth from affiliates. Going forward, in 2020, though we expect core EBIT to sustain a moderate growth of 9%, gain from joint ventures is likely to lower as new deep water terminal project Gemalink (to be operational in Q3 2020) may record lossses and SCSC, another affiliate that operates air cargo terminal in Tan Son Nhat Airport, to witness a slowdown in net profit.
Investment Rationales
- Owning a system of seaports located in key economic regions. Currently, GMD operates 3 container ports in Hai Phong, 1 Dung Quat general port and 1 ICD port in Ho Chi Minh City with a total capacity of nearly 1.7 million TEU / year. This helps GMD to make the most from the potential growth of the import and export cargoes, which was bolstered by the resilient growth of FDI inflow to Vietnam. The implementation of FDI in Vietnam averaged ~ USD17 bn per year, with a 3Y CAGR of 10% in the period of 2015-2018. We expect that the trend of FDI influx will remain resilient, especially when several recent FTAs become effective in near-term. This trend suggests that Vietnam trade should remain healthy and propel Vietnam's export and import cargoes through seaports, which is likely to benefit GMD in the long-run.
- Major projects, deep-water port Gemalink and Nam Dinh Vu port phase 2, to boost the long-term prospect. When these two key projects come into operation, in Q3 2020 and Q1 2021 respectively, the container stevedoring capacity of GMD will reach 3.8 million TEUs per annum, more than double compared the capacity at end-2019. In terms of capacity, GMD will be the second largest port operator in Vung Tau (with 1.5 million TEU p.a) and Hai Phong (with 1.8 million TEU p.a). In addition, when most of the competitors in these two location are running full capacity, the ample room of capacity in these new terminals should be the advantage that help GMD gain more market share and, thus, more container volume throughput in the future.
2020 Outlook
- The total container volume is projected to increase by 5% (excluding Gemalink), reaching 1.9 million TEUs, and, beside port segment, we expect the logistics segment to grow steadily. Thereby, the consolidated revenue is estimated at VND 2.9 tn (+ 5% YoY).
- EBT is estimated to decrease by 9% YoY with the assumption that (1) no divestments will be made and (2) Profit from associated companies will decrease by 17% YoY.
Risks to Our Call
- The fierce competition in Hai Phong results in lower service prices than expected.
- Losses from Gemalink project and rubber segment are worse than expected.
- MSC, a container shipping company and also a current customer of GMD, has established a new maritime route for mother vessels at deep-water terminal HICT in Lach Huyen, Hai Phong. The risk of MSC shifting its operation to HICT will lower GMD's throughput.
CMP (VND) 23,600 Target Price (VND) 26,000 Cash Dividend (VND)* 1,000 (*) expected in next 12 months STOCK INFO Sector Industrials Market cap ( VND bn) 7,007.4 Current shares (millions) 296.9 3M avg. volume (K) 590.6 3M avg. Trading value (VND bn) 15.7 Remaining foreign room (%) 0.0 52-week range (‘000 VND) 22.7 – 27.5 PERFORMANCE
FORECAST VND bn 2017 2018 2019E 2020F Revenue 3,984 2,708 2,753 2,951 % yoy 6.5 -32.0 1.7 7.2 NPAT 508 1,848 636 528 % yoy 30.3 263.8 -65.6 -17.0 ROA (%) 4.7 17.4 6.2 4.8 ROE (%) 7.8 27.1 10.1 8.1 EPS (VND) 1,661 5,929 2,108 1,750 BV (VND) 22,005 19,804 21,140 21,953 Div (VND) 1,500 8,000 1,500 1,000 P/E (x) 14.2 4.0 11.2 13.5 P/BV (x) 1.1 1.2 1.1 1.1 *Price as of Dec 13th, 2019 COMPANY SNAPSHOT
Gemadept JSC is the leading private logistics enterprise in Vietnam. The company focuses on seaport busisness, with many container terminals located in key economic areas such as the HCMC, Hai Phong and Dung Quat Industrial Zone. GMD accounted for approximately 10% of container throughput in Vietnam seaports in 2018.
Through its affiliates, GMD also offers many other logistics services such as air cargo terminal operation, warehouses, and cargo shipping.
10
15
20
25
30
35
0
5
10
15
20
Jan-
18M
ar-1
8M
ay-1
8Ju
l-18
Sep-
18N
ov-1
8Ja
n-19
Mar
-19
May
-19
Jul-1
9
Sep-
19N
ov-1
9
PE Price ('000 VND, RHS)

www.vdsc.com.vn | Bloomberg: VDSC <GO> 95
VINCONSHIP JSC Bloomberg: VSC VN
Attractive Valuation Together With Robust 2020 Earnings Growth
BUY 20% VSC has experienced a turbulent 2019 with many negative factors such as other losses related to changes its promotion policies for customers, and additional CIT expenses recognition due to previous years. In addition, the slowdown of Hai Phong market has also affected VSC's throughput growth. These have significantly affected the profit, estimated 2019 NPAT to decline 34%. In 2020, those aforementioned negative factors are unlikely to recur. Furthermore, we expect the the stability of port operation and a sharp drop in interest expenses, together with a low base of profit in 2019, would help net profit to surge 32% YoY in the next year.
Investment Rationales
- Low base in 2019 should create a opportunity for high profit growth in short-term. In 2019, VSC had to record a CIT provision of VND26Bn (due to tax underpayment from previous years) and an extraordinary losses VND14 bn. These items, approximately 12% of VSC's estimated 2019 EBIT, are not likely to recur in the next year. In addition, we expect the port operation to remain stable, whereas weekly vessel arrivals at VIP Green port to be 9-10 calls and at Green port to be 4-5 calls. These factors should bolster the earnings outlook for 2020.
- Interest expenses to drop sharply by 67% YoY. Thanks to the robust operating cash flow and low investment demand, VIP Green Port, a subsidiary of VSC, has continuously repayed VND50Bn of debt each quarter in the last 3 years. By the end of Q3 2019, this port had VND109Bn of long-term loan balance. Based on the VIP Green port’s debt repayment ability, we forecast that this port is likely to pay off all outstanding loans next year. As the consolidated debt balance is mostly contributed by VIP Green port, this should help VSC's interest expenses plummet.
- Attractive valuation. VSC is being traded at a 2020 P/E of 5.4x and P/B of 0.8x. Given the expected dividend yield of 7.8% and prosperous 2020 earnings growth, we think that the current valuation is relatively attractive.
2020 Outlook
- Organic growth of Hai Phong market to drive VSC’s throughput moderately. As a result, revenue is expected to grow by 6% to VND1.9Tn.
- NPATMI is estimated to jump by 32% YoY, reaching VND260Bn equivalent to a 2020 EPS of VND 4,700 (P/E forward 5.4x).
Risks to Our Call
- Profit margin to be lower than expected due to (1) container loading/unloading tariffs to drop sharply due to competition pressure, and (2) VSC to witness overlap berthing schedule issue.
CMP (VND) 25,600 Target Price (VND) 28,200 Cash Dividend (VND)* 2,500 (*) expected in next 12 months STOCK INFO Sector Industrials Market cap ( VND bn) 1,411.1 Current shares (millions) 55.1 3M avg. volume (K) 108.0 3M avg. Trading value (VND bn) 2.8 Remaining foreign room (%) 11.5 52-week range (‘000 VND) 23.5 – 38.8 PERFORMANCE
FORECAST VND bn 2017 2018 2019E 2020F Revenue 1,303 1,694 1,815 1,929 % yoy 20.4 30.1 7.1 6.3 NPAT 237 300 197 260 % yoy -5.6 26.6 -34.3 31.7 ROA (%) 9.7 12.1 8.1 10.3 ROE (%) 14.7 16.4 11.5 13.9 EPS (VND) 4,290 5,496 3,578 4,714 BV (VND) 29,307 32,808 31,131 34,027 Div (VND) 2,000 2,500 2,500 2,500 P/E (x) 6.0 4.7 7.2 5.4 P/BV (x) 0.9 0.8 0.8 0.8 *Price as of Dec 13th, 2019 COMPANY SNAPSHOT
VSC is one of the experienced private port operators in Vietnam. The company manages two terminals: Green Port and VIP Green Port in Hai Phong, with a total capacity of 900k TEUs per year. With these ports, VSC accounted for 20% market share in Hai Phong seaport industry in 2018. 3Y CAGR in the period of 2015-2018 was impressive, staying at 42%.
1015202530354045
4
5
6
7
8
9
Jan-
18M
ar-1
8
May
-18
Jul-1
8
Sep-
18
Nov
-18
Jan-
19M
ar-1
9
May
-19
Jul-1
9
Sep-
19
Nov
-19
PE Price ('000 VND, RHS)

SECTOR OUTLOOK AND INVESTMENT STRATEGY
www.vdsc.com.vn | Bloomberg: VDSC <GO> 96
TEXTILE & GARMENT – MIXED EMOTIONS Thao Dang ([email protected])
As a result of the US-China trade war, barrier of origin requirements and declining competitiveness and other factors, the textile & garment industry in Vietnam in 2019 has been under pressure. The barrier of origin requirement is still a "bottleneck" that makes domestic firms unable to take advantage of free trade agreements. Besides, the negative impact of the US-China trade war caused fashion retailers to split orders and diversify their suppliers to minimize risks. As a result, some Vietnamese enterprises have been under pressure due to rapid order declines which are unlikely to be replaced quickly, reducing business performance. Looking to 2020, we believe that the whole industry will be ‘mixed’: opportunities will be largely reserved for firms that are capable to meet product quality and price requirements in order to maintain and expand their activities.
Investment Outlook
The US, Vietnam’s main export market, is forecasted to see a reduction in economic growth in 2020. According to the latest IMF forecast, GDP growth in the US will decline from 2.4% YoY in 2019 to 2.1% in 2020. In this context it is possible that consumers will reduce their spending on clothing products.
Vietnam’s textile and garment industry growth decelerated, but was still higher than rivals. Global textile and apparel import turnover in the first nine months dropped by 1% YoY (9M2018: +7% YoY). Particularly, major export countries such as China and Turkey all recorded negative growth, down 3% YoY and 1% YoY respectively (see Figure 5). Other countries such as Bangladesh and Indonesia had lower growth rates over the same period last year, at 5% YoY and 4% YoY respectively (9M2018: 11% YoY and 7% YoY). Meanwhile, Vietnam still registered growth of 9% YoY (9M2018: 16% YoY). This is a positive signal showing that even though global demand for clothing has slowed down, Vietnam is still one of the top choice for fashion brands.
The movement of orders from China to neighboring countries continues to increase. China's policy to shift to high value-added products, a political and economic choice, limits the development of downstream garment using intensive cheap labor. As a result, fashion brands will continue to diversify their supply, shifting apparel orders from China to neighboring countries, including Vietnam.
Risks
• Competitive advantage of cheap labor declining. The risks will be mostly for small and medium-sized garment firms, which do not have many competitive advantages and produce mass orders under the CMT method. These orders may move to other markets with lower costs such as Bangladesh, Cambodia or Myanmar.
• Risks from traceability of raw materials and additional taxes. One cannot exclude the possibility that the US will conduct traceability of textile & garment products manufactured in Vietnam to restrict originating materials from China. Therefore, it is imperative that domestic firms actively diversify their garment & textile supplies instead of relying on China (50% of fabric materials are imported from China).
• Vietnam has not invested much in the upstream part. Since Vietnam has not invested much in the upstream part of the textile value chain such as dyeing and weaving, many domestic firms participate in the downstream segment, like processing garment orders. Hence, competitiveness is not very high, profits may decline under fierce competition.
Negative Positive Neutral

SECTOR OUTLOOK AND INVESTMENT STRATEGY
www.vdsc.com.vn | Bloomberg: VDSC <GO> 97
Figure 1: Minimum wage for garment workers (USD/month)
Figure 2: Top 10 clothing exporters in 2018 (USD bn)
Source: PRI, Rong Viet Securities Source: WTO, Rong Viet Securities Figure 3: Export turnover of Vietnam’s textile & apparels (USD bn)
Figure 4: Vietnam’s export turnover growth (%)
Source: VITAS, Rong Viet Securities Source: VITAS, Rong Viet Securities
Figure 5: Growth of large exporters, value (%) Figure 6: Vietnam textile & garment export by market (%)
Source: Trademap, TCDM, Rong Viet Securities Source: VITAS, Rong Viet Securities
1,864
933
632
270 248 207 194
0
400
800
1,200
1,600
2,000158
143
32 3217 16 14 9 8 6
0
40
80
120
160
200
0%
4%
8%
12%
16%
20%
0
10
20
30
40
2015 2016 2017 2018 9M 2019
Value Growth (%)
-5%
0%
5%
10%
15%
20%
25%
30%
35%
2015 2016 2017 2018 9M 2019
Apparel Yarn Fabric Total
4%
11%
5%7%
16%
-3%
1%
5%
-1%
4%
9%
-5%
0%
5%
10%
15%
20%
9M 2018 9M 2019
46.6%
12.9%
11.8%
9.2%
US
EU
Japan
Korea
China
Canada
Cambodia
Others

SECTOR OUTLOOK AND INVESTMENT STRATEGY
www.vdsc.com.vn | Bloomberg: VDSC <GO> 98
Figure 7: ROE, PE and PB of listed textile and garment firms
Source: FiinGroup, Rong Viet Securities
Note: Bubble size is ROE
Table 1: Textile & Garment stocks – Market cap, price, rating, per share, dividends and ROE summary
Market cap
(VND bn)
Cur. price
Target price ETR % Rating P/E
2019F P/BVPS 2019F
ROE 2019F
DY 2019F
P/E 2020F
P/BVPS 2020F
ROE 2020F
DY 2020F
Foreign room
MSH 2,302.9 46,050 60,000 38.9% Buy 5.6x 2.0x 39.9% 8.5% 5.1x 1.7x 36.1% 8.7% 40.7% STK 1,213.0 17,150 23,000 37.0% Buy 6.4x 1.1x 19.0% 2.9% 5.4x 1.0x 20.0% 2.9% 40.1%
TCM 1,155.4 19,000 20,500 11.0% Neutral 6.9x 0.8x 12.6% 2.6% 6.0x 0.7x 12.9% 2.6% 0.0%
Source: Rong Viet Securities forecast, share prices as of Dec 13th, 2019
MSH
VGTGMC
STK
TCMTNG
M10
EVE
0.0
0.5
1.0
1.5
2.0
2.5
0.0 2.0 4.0 6.0 8.0 10.0 12.0 14.0
P/B
P/E

www.vdsc.com.vn | Bloomberg: VDSC <GO> 99
SONG HONG GARMENT JSC Bloomberg: MSH VN
Keep moving forward
BUY +39% Although business performance of the garment industry has been uneven in 2019, MSH has still improved its profitability thanks to the increase in the proportion of FOB orders. For 2020, we still maintain a positive outlook on this stock thanks to the positive growth of FOB production through new orders of Walmart and the expansion plan of the bedding segment.
Investment Rationale
- Outperform in profitability compared to other rivals. MSH continued to improve its profitability in the first nine months with impressive gross margin and net margin of 20.9% and 10.6%, respectively (peers: 15% and 5%). We believe that MSH has a competitive advantage over competitors thanks to the establishment of a synchronous quality control process from input materials to finished products in order to reduce production costs. Besides, the firm has applied advanced technology in production to improve its productivity and labor quality.
- There is still room to shift its production chain from CMT to FOB. FOB orders accounted for 60% of total capacity and contributed 82%-85% of total sales in 9M (2018: ~70%). The company still has room to shift the entire production chain towards FOB method in order to enhance its competitiveness. Moreover, MSH has received new orders from Walmart (USA). The firm plans to export 6 million pieces to this customer in Q2 and Q3 2019. Total value of FOB orders is estimated to be USD 165 mn (+ 18% YoY) in 2020.
- Expanding the scale of bedding products, which bring the highest gross margin (37%-40%). The firm is undertaking internationalization of packaging, improving its product quality and penetrating into new Asian markets. In March 2020, it plans to launch a new bedding collection, expecting its sales to increase by 1.5 times compared to the same period last year.
- SH10 factory helps to solve capacity issue. SH10 is expected to come into operation at the end of 2020, operating at 50% of capacity in 2021. As a result, it will help the firm increase the capacity to develop FOB orders. On the other hand, we estimate that the new factory should take around three years to break even as revenue generated is not enough to cover operating costs.
2023 Outlook
- Gross margin is forecasted to be 20.7%.
- Net sales and NPAT grow by 13% and 10%, at VND 4,909 bn and VND 503 bn respectively.
- Selling and G&A expenses to revenue to be 4% and 5%, respectively.
Risks to Our Call
- Global economic downturn causing decline in demand for apparels, especially in two major markets: the US and the EU.
- Fabric material price grow sharply.
CMP (VND) 46,050 Target Price (VND) 60,000 Cash Dividend (VND)* 4,000 (*) expected in next 12 months STOCK INFO Sector Textile Market cap (VND bn) 2,302.9 Current shares (millions) 50.0 3M avg. volume (K) 50.6 3M avg. Trading value (VND bn) 2.8 Remaining foreign room (%) 40.7 52-week range (‘000 VND) 35.8 – 60.3 PERFORMANCE
FORECAST VND bn 2017 2018 2019E 2020F Revenue 3,282 3,951 4,362 4,909 % yoy 9.7 20.4 10.4 12.5 NPAT 200 370 456 503 % yoy 8.4 84.5 23.3 10.3 ROA (%) 8.4 14.7 16.9 16.5 ROE (%) 26.5 39.6 39.9 36.1 EPS (VND) 4,007 9,745 8,205 9,054 BV (VND) 31,711 19,601 22,849 27,904 Div (VND) 4,500 4,000 4,500 4,000 P/E (x) N/A 4.0 5.6 5.1 P/BV (x) N/A 2.1 2.0 1.7 *Price as of Dec 13th, 2019 COMPANY SNAPSHOT
MSH is one of the leading company in the garment sector with stable business activities and high cash dividend over the years. Its main business activities include manufacturing and exporting garment products under CMT and FOB methods, along with producing bedding products under its own brand name “Song Hong”. Currently, the firm has shifted its production method to FOB and expanded its export markets for bedding products in order to improve profit margins and enhance competitiveness.
5
25
45
65
0
2
4
6
8
Jan-
18
Apr
-18
Jul-1
8
Oct
-18
Jan-
19
Apr
-19
Jul-1
9
Oct
-19
PE Price ('000 VND, RHS)

www.vdsc.com.vn | Bloomberg: VDSC <GO> 100
CENTURY SYNTHETIC FIBER JSC Bloomberg: STK VN
Recycled yarn continues to drive growth
BUY +37% 2019 is considered to be quite challenging for the yarn industry. Regarding STK, its virgin yarn products are still facing difficulties due to the negative impacts of (1) the dumping of yarns from China, India and (2) the delay or split of sales volume from customers to minimize risks. However, we think that STK will continue to increase in its recycled yarn orders to improve business efficiency. Sustainable and green fashion is driving the demand for recycled yarns. Besides, thanks to the use of spinning chip technology instead of direct spinning, the firm could completely convert its virgin yarns to recycled yarns production. This will be an advantage to support the firm in the context of a difficult market.
Investment Rationale
- Large growth potential for recycled yarn orders. According to the Textile Exchange, the number of companies/brands committed to use at least 25% of recycled polyester materials by 2020 has increased from 48 (October 2017) to 62 (October 2018). Specifically, Nike commits to fully use recycled materials by 2020 (2018: 19%). Adidas and H&M, although they did not announce the usage rate, pledged to fully use recycled materials by 2024 and 2030 respectively. Olympic Games Tokyo 2020 is expected to use clothes and sports shoes made from recycled materials. As a result, we believe that the growth prospect for that products will remain positive. The firm should actively join into the global supply chain to enhance its orders.
- Developing high value-added yarns to maximize profits. STK is conducting a pilot production of dope dyed yarns with black colors, and plans to develop gray and navy color yarns. The selling price is expected to be 20-30% higher than its virgin yarns with a gross margin of around 18% and an estimated capacity of 4,000 tons per year.
2024 Outlook
- Recycled yarn is estimated to achieve 43% of net sales, with gross margin of 21.6%.
- Virgin yarn is forecasted to be affected by dumping activities, down 3.5% over the same period. Gross margin is about 12%.
- Net sales and NPAT grow by 7% and 20% respectively.
Risks to Our Call
- The selling price of virgin yarns plummeted lately as Chinese and Indian manufacturers continued dumping to reduce inventories.
- The sharp decline in crude oil price caused the decrease of output yarn’s prices, which is not enough to offset high input raw materials prices.
CMP (VND) 17,150 Target Price (VND) 23,000 Cash Dividend (VND)* 500 (*) expected in next 12 months STOCK INFO Sector Textile Market cap (VND bn) 1,213.0 Current shares (millions) 70.7 3M avg. volume (K) 33.0 3M avg. Trading value (VND bn) 0.6 Remaining foreign room (%) 40.1 52-week range (‘000 VND) 12.1 – 25.5 PERFORMANCE
FORECAST VND bn 2017 2018 2019E 2020F Revenue 1,989 2,408 2,217 2,382 % yoy 46.0 21.0 -7.9 7.4 NPAT 100 178 209 250 % yoy 248.0 79.1 17.1 19.7 ROA (%) 5.0 8.4 9.9 11.8 ROE (%) 12.8 19.6 19.0 20.0 EPS (VND) 1,408 2,522 2,658 3,182 BV (VND) 12,991 15,167 15,537 17,719 Div (VND) 800 1,500 1,000 1,000 P/E (x) 12.1 6.8 6.4 5.4 P/BV (x) 1.3 1.2 1.1 1.0 *Price as of Dec 13th, 2019 COMPANY SNAPSHOT
STK is one of the largest polyester filament yarn manufacturers in Vietnam, positioned in the middle and high-end segments. Currently, its total capacity is about 63,000 tons/year, behind Formosa (72,000 tons/year) and Hualon (84,000 tons/year). The firm will continue to increase the proportion of recycled yarns over revenue and develop high value-added yarns in order to meet the sustainable fashion trend.
5
10
15
20
25
30
02468
1012
Jan-
18
Apr
-18
Jul-1
8
Oct
-18
Jan-
19
Apr
-19
Jul-1
9
Oct
-19
PE Price ('000 VND, RHS)

SECTOR OUTLOOK AND INVESTMENT STRATEGY
www.vdsc.com.vn | Bloomberg: VDSC <GO> 101
THANH CONG TEXTILE GARMENT INVESTMENT TRADING JSC Bloomberg: TCM VN
Facing difficulties in the short run
NEUTRAL Thanks to a closed production chain from yarns to garments, TCM has many opportunities to take advantage of FTAs to improve its competitiveness. However, the negative impact of cotton yarn and the shortage of Sears’ orders, which have not been replaced by new orders, are risks to consider in the short run.
Investment Rationale
- Slow down demand in yarn segment due to escalation of US – China trade war. 9M net sales of the yarn segment plummeted by 25% YoY, of which sales volume declined by 22% YoY. Gross margin dropped significantly to only one to two percent from the high level of 10% over the same period last year. We believe that the yarn segment will face short-term difficulties as China continues dumping to clear its inventories.
- Woven fabric, meanwhile, is a bright spot. Since April 2019, TCM has increased its capacity by 17% to 14.4 mn meters of woven fabric/year. This segment still recorded the highest growth rate (9M2019: +7% of sales). Through FTAs, we believe that TCM has a favorable opportunity to develop its domestic market, supporting garment processing enterprises to solve the origin requirement (such as EVFTA).
- Garment segment has not had many breakthroughs despite great advantages of its closed production chains. The firm has developed new orders in the US and EU markets, but not enough to offset Sears’s orders (7% of garment sales). Besides, due to low labor productivity at Trang Bang – its new factory - the firm has to receive mass orders that do not require highly skilled labor. Hence, its garment segment should reduce profit margin.
- Expansion plan of Vinh Long factory in the medium term. In the next two to three years, it plans to build up new knitting, dyeing and sewing factories in Vinh Long province, with estimated capital investment of USD 40 mn. This project is considered to be financed by additional share issuance to existing shareholders, or private placement to strategic partners.
2025 Outlook
- Net sales and NPAT grow by 4% and 14% respectively.
- Gross margin is estimated to be 16.1%.
Risks to Our Call
- An economic downturn leading to a decline for apparel demand.
- Cotton yarn prices drop sharply due to dumping activities by China.
- Logistic costs grow significantly.
CMP (VND) 19,000 Target Price (VND) 20,500 Cash Dividend (VND)* 500 (*) expected in next 12 months STOCK INFO Sector Textile Market cap (VND bn) 1,155.4 Current shares (millions) 57.9 3M avg. volume (K) 441.7 3M avg. Trading value (VND bn) 9.7 Remaining foreign room (%) 0.0 52-week range (‘000 VND) 18.9 – 32.6 PERFORMANCE
FORECAST VND bn 2017 2018 2019E 2020F Revenue 3,209 3,662 3,625 3,770 % yoy 4.5 14.1 -1.0 4.0 NPAT 192 259 178 214 % yoy 67.8 35.1 -31.5 14.1 ROA (%) 6.3 8.0 5.4 6.2 ROE (%) 18.0 20.4 12.6 12.9 EPS (VND) 2,681 3,803 2,755 3,144 BV (VND) 20,595 23,380 24,370 27,014 Div (VND) 800 1,500 500 500 P/E (x) 9.5 7.0 6.9 6.0 P/BV (x) 1.4 1.2 0.8 0.7 *Price as of Dec 13th, 2019 COMPANY SNAPSHOT
TCM is one of the few garment enterprises in Vietnam owning a closed production chain from yarns to garments. Its main products include yarn, woven fabric, knit fabric and garments. Recently, the firm has gradually been reducing the proportion of yarn sold, switching to internal consumption to minimize risks of that volatile business. However, in the short run, its business performance has faced many difficulties under the negative impacts of yarn dumping by China.
5
15
25
35
0
5
10
15
Jan-
18
Apr
-18
Jul-1
8
Oct
-18
Jan-
19
Apr
-19
Jul-1
9
Oct
-19
PE Price ('000 VND, RHS)

SECTOR OUTLOOK AND INVESTMENT STRATEGY
www.vdsc.com.vn | Bloomberg: VDSC <GO> 102
Vietnam is the largest pangasius producer and exporter in the world due to favorable natural conditions and long-standing farming experience for high quality products with low production costs. Pangasius is ranked 6th among the most consumed seafood in the world thanks to its mild taste and low price. As wild caught seafood is controlled to preserve natural resources reproduction, aquaculture seafood has a tremendous growth opportunity to meet the food demand of the world’s rising population.
Investment Outlook
Aquaculture seafood demand is increasing. The world’s population will exceed 9.5 billion in 2030. Nevertheless, the growth of captured fish will likely be flat to secure biodiversity. The proportion of aquaculture fish in the total fish supply will increase from 47% in 2016 to 54% in 2030 (according to FAO, Figure 1).
US market would recover in terms of quantity. High inventory due to high priced pangasius imported in 2H2018, the waiting for the final result of the 14th review of anti-dumping (AD) duty and the unpredictable movement of the US-China tensions have reduced pangasius export to the US in 2019. Pangasius has so far regained its competitive advantage compared to tilapia (the closest alternative to pangasius) when its price has been adjusted down to the similar level to the price of tilapia in September 2019 and has been stable until now (Figure 2). China accounts for most of the annual US tilapia imports (Figure 4, Figure 5) but Chinese tilapia has been subjected to a 25% tariff from May 2019. The process of producing pangasius in Vietnam has been approved by the United States Food and Inspection Service (FSIS). It means that Vietnam’s pangasius is considered to have the same standards in food hygiene and safety with the system of the US. In addition, the preliminary result of AD duty on pangasius in the 15th review (POR 15) was significantly lower than POR 14 (Table 1). These factors is likely to stimulate demand for pangasius. However, export prices are unlikely to recover compared to 2019 as importers may place orders moderately to wait for the final result of POR 15 and the agreement to reduce or revoke tariffs on Chinese tilapia if the US-China negotiations progress.
Vietnam-EU Free Trade Agreement (EVFTA) is likely to be ratified in the middle of 2020. EVFTA is expected to take effect in early 2021. Import taxes will be reduced from the current rate of 5.5% to 0% in three years for material pangasius and from 7% to 0% in seven years for processed pangasius. Tax reductions will stimulate demand for pangasius in the EU.
Efforts to diversify exports to reduce risks. The US and the EU are traditional large markets, but exports to these markets in recent years have been precarious due to increasingly stringent import barriers, along with political instability. Meanwhile, China and ASEAN have been emerging as alternative markets (Figure 2). Location, large population, increasing demand for seafood, the pork shortage as well as the Chinese seafood production reduction policy (Figure 3), provide a great opportunity for Vietnamese pangasius.
Prices of raw pangasius in the market may increase. Prices of raw pangasius has remained below cost for most of 2019 (Figure 7), which has made farmers hesitate in seeding new crops. Shortages of raw fish may put pressure on prices of raw fish in the market. For companies, self-raised fish costs may drop due to a sharp drop in fingerling prices in 2019.
Risks
• Political uncertainty in the EU may cause the EVFTA ratification to be delayed.
PANGASIUS INDUSTRY – MARKET DIVERSIFICATION FOR GROWTH
Tam Pham ([email protected]) Negative Positive Neutral

SECTOR OUTLOOK AND INVESTMENT STRATEGY
www.vdsc.com.vn | Bloomberg: VDSC <GO> 103
Figure 1: Global wild catch and aquaculture seafood Figure 2: In the US, pangasius prices have fallen to the same level of tilapia prices (USD/kg)
Source: FAO Source: US National Oceanic and Atmospheric Administration (NOAA), Rong Viet Securities
Figure 3: Whitefish imported by the US (by volume) 10M2018
Figure 4: US’s tilapia suppliers (by volume)
Source: VASEP, Rong Viet Securities Source: International Trade Center, Rong Viet Securities
Figure 5: Shares of China and ASEAN in total export are increasing
Figure 6: Chinese seafood production is declining (million tons)
Source: VASEP, Rong Viet Securities Source: Rabobank (2018), Rong Viet Securities
53%47% 46%
54%
Wild catch
Aquaculture
Inner ring: 2016Outer ring: 2030 2
3
4
5
6
01/1
4
06/1
4
11/1
4
04/1
5
09/1
5
02/1
6
07/1
6
12/1
6
05/1
7
10/1
7
03/1
8
08/1
8
01/1
9
06/1
9
Tilapia frozen fillet Pangasius frozen fillet
28%
8%
2%25%
36%
1%
PangasiusHaddockPollackCodTilapiaHake
91%
86%
China
Indonesia
Taiwan
Mexico
Others
Inner ring: 2018Outer ring: 10M2019
18%23%
23% 32%
8% 8%9% 10%
0%
20%
40%
60%
80%
100%
2016 2017 2018 10T2019
EU US China ASEAN Others
0
20
40
60
80
2000
2002
2004
2006
2008
2010
2012
2014
2016
2018
F
2020
F
Wild cautgh Marine farmed Freshwater farmed

SECTOR OUTLOOK AND INVESTMENT STRATEGY
www.vdsc.com.vn | Bloomberg: VDSC <GO> 104
Figure 7: Raw pangasius price, fingerling price and farming cost
Source: VASEP, Agromonitor, Rong Viet Securities
Figure 8: ROE, PB, PE of some listed companies
Source: FiinGroup, Rong Viet Securities. Bubble size equals respective ROE
Table 1: US anti-dumping duty on Vietnamese pangasius
Mandatory respondent
Self-request respondent
Country-wide
Period of review
POR 10 USD/kg 0 0,97 2,39 08/01/2012 - 07/31/2013
POR 11 USD/kg 0 0,69 2,39 08/01/2013 - 07/31/2014
POR 12 USD/kg 0,69 2,39 2,39 08/01/2014 - 07/31/2015
POR 13 USD/kg 3,87 7,74 2,39 08/01/2015 - 07/31/2016
POR 14 USD/kg 1,37-3,87 1,37 2,39 08/01/2016 - 07/31/2017
POR 15* USD/kg 0 0 2,39 08/01/2017 – 07/31/2018
*Preliminary result
Source: US Department of Commerce, International Trade Administration
0
500
1,000
1,500
2,000
2,500
15,000
20,000
25,000
30,000
35,000
40,000
12/2
014
5/20
15
10/2
015
3/20
16
8/20
16
1/20
17
6/20
17
11/2
017
4/20
18
9/20
18
2/20
19
7/20
19
Raw fish (VND/kg) (LHS)Farming cost (VND/kg) (LHS)Fingerling (VND/piece) (RHS)
VHC
ANV
IDI
ACL
AAM
0.0
0.2
0.4
0.6
0.8
1.0
1.2
1.4
1.6
1.8
0.0 2.0 4.0 6.0 8.0 10.0 12.0 14.0 16.0 18.0 20.0
P/B
P/E

SECTOR OUTLOOK AND INVESTMENT STRATEGY
www.vdsc.com.vn | Bloomberg: VDSC <GO> 105
Table 2: Pangasius stocks – Market cap, price, rating, per share, dividends and ROE summary
Market cap
(USD mn)
Cur. price
Target price
ETR % Rating P/E
2019F P/BVPS 2019F
ROE 2019F
DY 2019F
P/E 2020F
P/BVPS 2020F
ROE 2020F
DY 2020F
Foreign room
ANV 2,924 23,000 31,800 47% BUY 5.8x 1.5x 25.8% 8.7% 4.7x 1.2x 26.4% 8.7% 47.4%
VHC 7,132 78,400 97,100 24% BUY 6.1x 1.4x 23.9% 0% 6.0x 1.2x 20.4% 4.5% 65.8%
IDI* 1,184 5,270 N/A N/A N/A N/A N/A N/A N/A N/A N/A N/A N/A 47.7%
ACL* 529 23,600 N/A N/A N/A N/A N/A N/A N/A N/A N/A N/A N/A 36.7%
ABT* 390 34,000 N/A N/A N/A N/A N/A N/A N/A N/A N/A N/A N/A 46.3%
Source: Rong Viet Securities forecast, share prices as of Dec 13th, 2019
(*) Bloomberg’s consensus, data as of Dec 13th, 2019

www.vdsc.com.vn | Bloomberg: VDSC <GO> 106
VINH HOAN CORPORATION Bloomberg: VHC VN
Stand firm in headwinds with non-stop innovation
BUY 24% The high-profit Collagen-Gelatin product group begins to make an impress of quality in the market, showing the potential for increasing sales and profits. In the long term, continuous investment in capacity of farming, processing, product development as well as diversifying distribution channels will help the Company minimize the cyclical effects of the industry on profitability.
Investment Rationales
- US market would recover in terms of quantity. Pangasius price has been adjusted down to the similar level of the price of tilapa, Chinese tilapia has been subjected to 25% tariff from May 2019 and the Vietnames system of producing pangasius has been recognized to be similar in food hygiene and safety control with the system of the US. Export prices are unlikely to recover compared to 2019 as importers may place orders moderately to wait for the final result anti-dumping duty of POR 15 and the agreement to reduce or revoke tariffs on Chinese tilapia when the US-China negotiation has made some progress.
- Vietnam-EU Free Trade Agreement (EVFTA) is likely to be ratified in middle 2020. EVFTA is expected to take effect in early 2021. Import taxes will be reduced from the current rate of 5.5% to 0% in three years for material pangasius and from 7% to 0% in seven years for processed pangasius. Tax reduction will stimulate demand for pangasius in EU.
- Remarkable Collagen-Gelatin (C-G). A collagen-based product that has achieved ASC certification for sustainable farming, enhancing the posibility of increasing selling price, curbing negative effects of the cyclicality of the pangasius export and stabilize the overall profit margin. C-G processing capacity will increase from the current 2,000 tons / year to 3,500 tons / year from 7/2020. C-G has a gross profit margin of more than 40%, compared to 22-25% of value-added pangasius and 12-16% of frozen fillets.
- Fingerling project improves product quality and reduce farming costs. High technology and experience from Norway reduce raising time and mortality, reduce or eliminate the use of antibiotics, reduce feed consumption and protect the environment.
- Expanding farming and production capacity. The new 220-hectare farm will start operating in Jan 2020 and produce the first harvest in Jul/Aug 2020. Self-produced material will increase by 30-40% YoY when the new farm fully operates. Processing capacity is forecasted to increase from the current level of 1,000 tons/day to 1,100 tons/day by the end of 2020.
2020 Outlook
- We expect revenue to grow by 19.2%, equivalent to VND 9,214 bn. Export value of pangasius comes at USD 380 mn, of which the proportion of main markets are the US 52%, the EU 10% and China 25%.
- VHC will boost sales in other markets, especially in the large market China, to reduce its dependence on the US. Export volume could increase by 15.4% YoY while average selling price stable. Prices of raw fish bought from the market may increase due to shortage in supply when many farmers have hesitated seeding new crops because of large losses in 2019. Gross margin falls to 19.06% from 20.43% in 2019.
- NPAT is VND 1,204 bn, equivalent to an EPS of VND 13,131/share.
Risks to Our Call
- Political uncertainty in the EU may cause the EVFTA ratification to be delayed.
CMP (VND) 78,400
Target Price (VND) 97,100
Cash Dividend (VND)* 0
(*) expected in next 12 months STOCK INFO
Sector Consumer Goods
Market cap ( VND bn) 7,132.3 Current shares (millions) 91.0 3M avg. volume (K) 126.9 3M avg. Trading value (VND bn) 10.1 Remaining foreign room (%) 65.8 52-week range (‘000 VND) 75 - 98.3 PERFORMANCE
FORECAST VND bn 2017 2018 2019E 2020F Revenue 8,151 9,271 7,732 9,214 % yoy 11.6 13.7 -16.6 19.2 NPAT 605 1,442 1,181 1,204 % yoy 6.7 138.5 -18.1 1.9 ROA (%) 12.7 25.4 17.0 14.6 ROE (%) 22.7 41.5 23.9 20.4 EPS (VND) 6,544 15,607 12,878 13,131 BV (VND) 31,844 43,452 54,333 64,972 Div (VND) 2,000 4,000 0 3,500 P/E (x) 8.3 6.1 6.1 6.0 P/BV (x) 1.7 2.2 1.4 1.2 *Price as of Dec 13th, 2019 COMPANY SNAPSHOT
Vinh Hoan’s business is processing and exporting pangasius fillets, fish oil, fish powder and collagen and gelatin.
With a 15% market share of Vietnam pangasius exports, VHC is the leading company in the industry in Vietnam since 2010.
The company has 600 hectares of fish farms and a production capacity of 1,000 tons/day.
5
55
105
155
4
6
8
10
12
Jan-
18
Apr
-18
Jul-1
8
Oct
-18
Jan-
19
Apr
-19
Jul-1
9
Oct
-19
PE Price ('000 VND, RHS)

www.vdsc.com.vn | Bloomberg: VDSC <GO> 107
NAM VIET CORPORATION Bloomberg: ANV VN
Strong self-supply and diversified markets facilitate growth
BUY 47% In 2020, we forecast that global export prices, fluctuating following prices in the US market, will not likely recover compared to 2019. However, the ability of the company to control production costs thanks to its self-supply raw materials and the new and low-cost farm giving large output harvests from 2020 will be the factors that helps ANV maintain sales growth and increase profitability.
Investment Rationales
- The ability to fully be self-dependent in terms of materials inputs help reduce production costs. ANV can self-supply all of its need of feed and fingerling (70% currently, 100% from 2020 thanks to the Binh Phu farm). Quality fingerlings have a high survival rate, which reduces feed consumption and antibiotic use and thus reduces cost.
- Binh Phu farm will double capacity to provide self-farmed fish from 2021. Raw material fish output will reach 100,000 tons in 2020 and 250,000 tons / year from 2021, increasing by 108% compared to 2019. High technology enhances the quality of farming, protects the environment and reduces costs. The ability to supply large volumes is the foundation for direct distribution into supermarkets in the future when the ANV brand becomes familiar to consumers, especially in China.
- Diversed markets limit the impact of export barriers and political risks in terms of the ability to increase sales. The largest market accounts for less than 30% of total sales. China has been a strategic market since 2018. Geographic location, Chinese policies on the fishery industry reforms, tariff reduction and cross-border import control are favorable factors for Vietnam's pangasius export to China.
- Vietnam-EU Free Trade Agreement (EVFTA) is likely to be ratified by the middle of 2020. EVFTA is expected to take effect in early 2021. Import taxes will be reduced from the current rate of 5.5% to 0% in three years for material pangasius and from 7% to 0% in seven years for processed pangasius. Tax reduction will stimulate demand for pangasius in the EU.
2020 Outlook
- We expect revenue to grow by 14.2%, equivalent to VND 4,866 bn. Export value will be USD 165 mn.
- Export volume could increase by 12% YoY while average selling price remains stable. The low-cost Binh Phu farm will boost harvest by a large amount from 2020, reducing raw material costs. Gross margin rises to 21.7% from 20.1% in 2019.
- NPAT is VND 711 bn, equivalent to an EPS of VND 5,595/share.
Risks to Our Call
- Political uncertainty in the EU may cause the EVFTA ratification to be delayed.
CMP (VND) 23,000 Target Price (VND) 31,800 Cash Dividend (VND)* 2,000 (*) expected in next 12 months STOCK INFO
Sector Consumer Goods
Market cap ( VND bn) 2,923.9 Current shares (millions) 127.1 3M avg. volume (K) 482.4 3M avg. Trading value (VND bn) 12.3 Remaining foreign room (%) 47.4 52-week range (‘000 VND) 21.3 - 32.5 PERFORMANCE
FORECAST VND bn 2017 2018 2019E 2020F Revenue 2,949 4,118 4,329 4,866 % yoy 4.4 39.6 5.1 12.4 NPAT 142 600 577 711 % yoy 632.2 321.4 -3.8 23.2 ROA (%) 5.0 19.6 15.1 15.9 ROE (%) 10.5 37.0 25.8 26.4 EPS (VND) 1,136 4,795 4,542 5,595 BV (VND) 11,179 14,779 17,577 21,171 Div (VND) 1,200 1,500 1,500 2,000 P/E (x) 9.7 6.0 5.8 4.7 P/BV (x) 1.0 1.9 1.5 1.2 *Price as of Dec 13th, 2019 COMPANY SNAPSHOT
Starting out as a civil and industrial construction company, ANV has shifted its business into pangasius farming, processing and export since 2000. The company used to be the leading pangasius exporter in the 2006-2009 period. Expanding into banking, fertilizer and minerals from 2009 was a loss-making idea. ANV has divested from non-core businesses in 2016 and 2017 to focus on the pangasius business.
The family of the Chairman owns nearly 72% of the company.
Fish feed capacity 800,000 tons/year, operating at nearly 400,000 tons/year.
Pangasius processing capacity of 1,200 tons raw fish/day, operating at 500 tons/day.
5
15
25
35
2
7
12
17
Jan-
18M
ar-1
8M
ay-1
8Ju
l-18
Sep-
18N
ov-1
8Ja
n-19
Mar
-19
May
-19
Jul-1
9
Sep-
19N
ov-1
9
PE Price ('000 VND, RHS)

SECTOR OUTLOOK AND INVESTMENT STRATEGY
www.vdsc.com.vn | Bloomberg: VDSC <GO> 108
SHRIMP INDUSTRY – EXPORT PRICES MAY NOT RECOVER Tam Pham ([email protected])
Vietnam is among the three largest shrimp exporting countries, following India and Ecuador (Figure 1) thanks to the favorable tropical climate for farming and skillful processing techniques. Accounting for only 6% of volume but 16% of global seafood trading value, shrimp is a high value seafood, which is mainly consumed in developed countries due to its high nutritional value. The world’s population is growing while wild caught fish volume will be limited to ensure biodiversity. These will be major factors that drive the demand of farmed shrimp..
Investment Outlook
Skilful processing technique. Compared to competitors, value added (VA) products account for a significant share of Vietnam's shrimp exports (Figure 2), highlighting the strength of the country’s processing skill. VA shrimps have selling prices that are 15-20% higher than material shrimps.
World shrimp prices may not recover in 2020. Export prices in 2019 remain at the lowest level since 2014 (Figure 3) as major producing countries, India, Ecuador, Indonesia, Vietnam (Figure 4) have changed their shrimp industry and increased export volume to gain market share. Some farming areas in India have been affected by bad weather and disease outbreaks in 2H2019, leading to production reduction in 2020. However, high production in Ecuador could offset the shortage in India.
Opportunities and challenges in the US market. Chinese shrimps are subject to a 25% import tax, creating an opportunity for Vietnamese shrimp in the US, especially breaded shrimp as Vietnamese breaded shrimp price is the second lowest following Chinese one and it is not subject to AD duty. Vietnamese shrimps are currently entitled to a zero percent AD duty according to the final results of the 13th AD review (Table 1). This duty is much lower than the result of the 12th review. However, the traceability monitoring program (SIMP), effective since January 1st, 2019, for 13 aquatic species, including shrimp, is something that Vietnam’s shrimp industry needs time to adapt. Therefore, the opportunity to take advantage of the low AD duty is not for all companies.
The Vietnam-EU Free Trade Agreement (EVFTA) is likely to be ratified in mid-2020. EVFTA is expected to take effect in early 2021. Import tax on material shrimp will be reduced from the current 4,2% to 0% immediately or within three to five years and import tax on processed shrimps will be reduced from 7% to 0% in seven years. Europe is the biggest customer of Vietnamese shrimps. Material shrimp accounts for over 70% of Vietnam's shrimp export value to the EU every year. Therefore, the tax reduction will be an important catalyst for the growth of Vietnam’s shrimp industry in the next few years.
China is a potential alternative market. The Chinese government's fisheries reform policy has shifted China’s focus from quantity to quality and is expected to reduce China's wild-caught and aquaculture fishery production in the long run (Figure 5). Geographic location, policies of tariff and cross-border import control are also favorable factors for Vietnam's shrimp exports to this market.
Risks
• Abnormal weather and disease outbreak. Temperature changes that exceed shrimp’s adaptive threshold. Storms and floods reduce salinity in farming ponds. These are difficult-to-control factors that can reduce shrimp production.
• Political instability in Europe may cause the EVFTA to be ratified later than expected.
Negative Positive Neutral

SECTOR OUTLOOK AND INVESTMENT STRATEGY
www.vdsc.com.vn | Bloomberg: VDSC <GO> 109
Figure 1: Vietnam’s market share in world shrimp export Figure 2: Shares of material shrimp and processed shrimp (by volume, 2017)
Source: International Trade Center (ITC), Rong Viet Securities Source: ITC, Rong Viet Securities
Figure 3: Average export price (USD/lb) in the US market Figure 4: Shrimp farming volume of major shrimp production countries (thousand tons)
Source: Wells Fargo, Rong Viet Securities Source: 2018 World conference of seafood production, Rong Viet Securities
Figure 5: Chinese seafood production is declining (million tons)
Source: Rabobank (2018), Rong Viet Securities
17% 17% 18% 21% 20%9% 10% 11% 11% 13%
17% 15% 15% 15% 15%9% 8% 8% 7% 7%
0%
20%
40%
60%
80%
100%
2014 2015 2016 2017 2018
India Ecuador Viet Nam Indonesia China Others
95% 100%
67%82%
5% 0%
33%18%
0%
20%
40%
60%
80%
100%
India Ecuador Vietnam Indonesia
Material shrimp Processed shrimp
4
5
6
7
1/14
5/14
9/14
1/15
5/15
9/15
1/16
5/16
9/16
1/17
5/17
9/17
1/18
5/18
9/18
1/19
5/19
0
500
1000
1500
2000
2500
3000
3500
2012 2013 2014 2015 2016 2017 2018
China India Ecuador Vietnam Indonesia Thailand Others
0
20
40
60
80
2000
2002
2004
2006
2008
2010
2012
2014
2016
2018
F
2020
F
Wild cautgh Marine farmed Freshwater farmed

SECTOR OUTLOOK AND INVESTMENT STRATEGY
www.vdsc.com.vn | Bloomberg: VDSC <GO> 110
Figure 6: ROE, PB, PE of some listed companies
Source: FiinGroup, Rong Viet Securities. Bubble size equals respective ROE.
Table 1: US anti-dumping duty on Vietnamese warmwater shrimp
Table 2: Shrimp stocks – Market cap, price, rating, per share, dividends and ROE summary
Market cap
(USD mn)
Cur. price
Target price
ETR % Rating P/E
2019F P/BVPS 2019F
ROE 2019F
DY 2019F
P/E 2020F
P/BVPS 2020F
ROE 2020F
DY 2020F
Foreign room
MPC* 4,366 22,000 N/A N/A N/A N/A N/A N/A N/A N/A N/A N/A N/A 13.1%
FMC* 1,359 26,750 N/A N/A N/A N/A N/A N/A N/A N/A N/A N/A N/A 41.7%
SJ1* 380 19,900 N/A N/A N/A N/A N/A N/A N/A N/A N/A N/A N/A 47.8%
CMX* 196 15,200 N/A N/A N/A N/A N/A N/A N/A N/A N/A N/A N/A 47.1%
Source: Rong Viet Securities forecast, share prices as of Dec 13th, 2019
(*) Bloomberg’s consensus, data as of Dec 13th, 2019
Mandatory respondent
Sefl-requested respondent
Country-wide
Period of review
POR 8 % 4.98-9.75 6.37 25.76 2/1/2012 – 1/31/2013
POR 9 % 0-1.16-1.39 0.91 25.76 2/1/2013 – 1/31/2014
POR 10 % 4.78 4.78 25.76 2/1/2014 – 1/31/2015
POR 11 % 4.78 4.78 25.76 2/1/2015 – 1/31/2016
POR 12 % 4.58 4.58 25.76 2/1/2016 – 1/31/2017
POR 13 % 0 0 25.76 2/1/2017 – 1/31/2018
Source: US Department of Commerce, International Trade Administration
MPC
FMC
CMX
SJ1
0.0
0.2
0.4
0.6
0.8
1.0
1.2
1.4
1.6
1.8
0.0 2.0 4.0 6.0 8.0 10.0 12.0 14.0 16.0 18.0 20.0
P/B
P/E

SECTOR OUTLOOK AND INVESTMENT STRATEGY
www.vdsc.com.vn | Bloomberg: VDSC <GO> 111
The real estate market in 2019 was marked by tightening supply due to the review of legal conditions. There were more projects launched towards the end of the year, giving a positive signal about accelerating supply in 2020. Land bank has gradually dried out in two key markets, namely Hanoi and Ho Chi Minh Cities, thereby shifting "the heat" to the neighboring provinces. The risk is a lack of adequate infrastructure, resulting in the demand being mainly driven by investments. In addition, the land price has skyrocketed across all segments, a factor to pay attention to.
In 2020, we believe that legal conditions will be relaxed, but growth will be limited. Reputed developers owning clean land bank will benefit from this trend. The downside would be credit tightening policies and the relatively high land price level, reducing the absorption rate. Real estate is highly cyclical and the industry will enter a correction zone in the short term. However, long-term conditions are very favorable for growth.
Investment Outlook
Transaction increases thanks to large-scale projects
The market this year was driven by the launches of large-scale projects from Vinhomes. In terms of condominium transaction volume, during 9M 2019, Hanoi saw an increase of 22% yoy while Ho Chi Minh improve slightly by 5% yoy. On the other side, excluding three large projects from Vinhomes, the residential sector in these cities remained relatively bleak due to legal processes. Demand was still good with a high absorption rate. Selling prices in the condominium segment increased by an average of 15-20% compared to the end of 2018, led by a decrease in supply.
Looking forward to 2020, we forecast that the overall supply will improve slightly thanks to easing legal conditions, but the selling price’s growth will be lower than in 2019. Besides, many developers are also shifting their focus to other neighboring markets to capture the upgrade of infrastructure projects as well as compensate for the shortages in Hanoi and Ho Chi Minh. Rapid price increases in neighboring provinces have fueled fears about the sustainability of the trend and the health of the property market. Some local governments have therefore tightened the new launches in the past few months to cool down the market and step up efforts to clamp down on speculative buying.
Credit tightening could limit the growth
Data showed that the growth of total outstanding credit in the first eight months increased by 8.5%, while real estate credit increased by 14.6%, accounting for 19.1% of total credit outstanding loans. The demand for real estate loans was great, coupled with low interest rates. It is worth noting that the reason for the high credit growth was the sharp increase in lending to homebuyers. The mortgage debt fundamentals are very different, which reduces the overall risk to the economy. Regarding real estate developers’ loans, credit tightening has caused capital flows to shift to other forms, especially the bond market. As of September 2019, 41% of real estate companies in the market have participated in offering corporate bonds, with issuing value of about VND 37,000 billion (USD 1.6 billion).
Looking to 2020, there will be a decrease in credit growth due to the roadmap of increasing the risk weighting of real estate loans and reducing the ratio of short-term capital for medium and long-term loans from 40% to 30% from 2020 until 2022. The central bank is limiting loans to the real estate sector, aiming to ensure the sustainable development and the safety of the banking sector. We suppose that the tightening could affect the property market.
Developers landbank sufficient for long-term prospect
The outlook is decidedly bullish for Vietnam’s residential market in the long term. Developers are very active in accumulating land bank to catch up with this trend, especially in suburban provinces. However, we believe that only projects located in the CBD such as Hanoi or Ho Chi Minh City cities will achieve high absorption
REAL ESTATE - MORE CHALLENGES
Duong Lai ([email protected]) Negative Positive Neutral

SECTOR OUTLOOK AND INVESTMENT STRATEGY
www.vdsc.com.vn | Bloomberg: VDSC <GO> 112
rates, and the tier-2 and 3 provinces will face headwinds. Accordingly, the developers like Khang Dien and Vinhomes, possessing available land bank in key cites (Hanoi and HCMC) will benefit from this trend.
In terms of the total current land bank in the largest cities likes Hanoi, Ho Chi Minh and neighboring provinces, VHM, NLG and KDH are the largest developers:
• VHM to dominate the market, with 50% land bank located in Hanoi and HCMC and the remaining is in hot-spot places like Quang Ninh provinces.
• Nam Long is one of the most active developers among real estate companies, with new addition land bank of 230ha, located in hot spots like Dong Nai and Hai Phong.
• KDH: Land bank accumulated through acquisition of BCCI in end-2017, located in HCM City.
Risks
• Land fever can cause a bubble: prices skyrocketed across the country by 50% - 300%.
• Speculative transactions: the percentage of investors and speculators in certain high-rise projects in Hanoi and HCMC is around 50% (Savills). For projects in neighboring provinces, we believe the level is higher.
Figure 1: Sold condominium (units) in Hanoi and Ho Chi Minh
Source: CBRE, Rong Viet Securities
Figure 2: Condominium prices in Hanoi and Ho Chi Minh
Source: CBRE, Rong Viet Securities
- 2,000 4,000 6,000 8,000
10,000 12,000 14,000 16,000
Q1
2015
Q2
2015
Q3
2015
Q4
2015
Q1
2016
Q2
2016
Q3
2016
Q4
2016
Q1
2017
Q2
2017
Q3
2017
Q4
2017
Q1
2018
Q2
2018
Q3
2018
Q4
2018
Q1
2019
Q2
2019
Q3
2019
HCMC
Luxury High-end Mid-end Affordable
-
2,000
4,000
6,000
8,000
10,000
12,000
Q12015
Q32015
Q12016
Q32016
Q12017
Q32017
Q12018
Q32018
Q12019
Q32019
Hanoi
Luxury High-end Mid-end Affordable
-
2,000
4,000
6,000
8,000
USD
/sqm
HCMC
Luxury High-end Mid-end Affordable
-
500
1,000
1,500
2,000
2,500
USD
/sqm
Hanoi
High-end Mid-end Affordable

SECTOR OUTLOOK AND INVESTMENT STRATEGY
www.vdsc.com.vn | Bloomberg: VDSC <GO> 113
Figure 3: Land bank across developers
Source: RongViet Securities
Figure 4: ROE, PB, PE of some listed companies
Source: RongViet Securities
Table 1: Real estate stocks – Market cap, price, rating, per share, dividends and ROE summary
Market
cap (USD mn)
Cur. price
Target price
ETR % Rating P/E
2019F P/BVPS 2019F
ROE 2019F
DY 2019F
P/E 2020F
P/BVPS 2020F
ROE 2020F
DY 2020F
Foreign room
NLG 294.7 27,350 38,900 42% Buy 7.4x 1.4x 13.1% 0.0% 6.3x 1.1x 14.0% 0.0% 0.0%
DXG 320.7 14,300 20,500 43% Buy 5.4x 0.9x 21.6% 0.0% 4.7x 0.7x 21.8% 0.0% 3.4%
KDH 544.4 27,100 29,500 11% Accumulate 16.3x 1.5x 11.5% 1.8% 11.8x 1.5x 13.2% 1.8% 4.5%
DIG 186.2 13,700 19,500 42% Buy 10.9x 1.1x 11.2% 5.1% 7.6x 1.0x 14.0% 0.0% 13.1%
HDG 168.4 23,900 40,100 22% Buy 4.9x 1.0x 25.2% 0.0% 4.0x 0.8x 23.1% 0.0% 31.4%
VHM*
12,647.1 89,100 N/A N/A N/A 14.6x 4.7x 33.5% 0.0% 10.5x 3.2x 35.8% 0.0% 34.0%
Source: Rong Viet Securities forecast, share prices as of Dec 13th, 2019
(*) Bloomberg’s consensus, data as of Dec 13th, 2019
14,900
750650 640
350
15070 30
VHM NVL KDH NLG DIG VPI DXG HDG
ha
NLGDXG
KDHHDG
VHM
DIG
VPI
HDCNTL
0.2
1.2
2.2
3.2
4.2
5.2
6.2
7.2
2.0 7.0 12.0 17.0 22.0
P/B
P/E

www.vdsc.com.vn | Bloomberg: VDSC <GO> 114
NAM LONG JSC Bloomberg: NLG VN Land bank monetization
BUY 42% Nam Long is one of the most active developers. New launches coupled with a shortage of new supply in the overall residential market, and hence higher selling prices, will provide better returns for the company. In the coming months, the company will complete deals to co-develop two residential projects in Dong Nai with strategic partners, namely Paragon Dai Phuoc and Waterfont. In addition, the company is continuously expanding into new provinces, including Dong Nai and Hai Phong. Recent land bank acquired is quite large and mostly located in strategic areas of neighboring provinces of Hanoi and Ho Chi Minh City. Those are benefiting from the ongoing trend of people moving to suburbs. It is also a long-term vision that will guarantee the growth of Nam Long for the next five to ten years.
Investment Rationale
- Awaiting to unlock the land bank. 2019 is considered a successful year for Nam Long, compared to 2018, with the successful opening of two projects, Waterpoint and Akari City. Moreover, the selling price is also higher than the company's estimate in 2018, bringing more profits. Looking to 2020-2021, the picture will become more positive, with two more projects to be implemented, Nam Long Hai Phong and two newly acquired projects, including Waterfont City and Paragon Dai Phuoc.
- New land bank acquisition in favorable locations. Total new acquiring land bank is over 230ha, located in favorable locations like Dong Nai and Hai Phong, owning huge potential growth in the medium term due to the improvement in infrastructure conditions. Legal procedures are nearly completed, guaranteeing a medium term cash inflow.
- Attractive valuation: P/E and P/B forward 2020 is estimated at 6.3x and 1.1x, which is attractive for a residential company owning a huge and strategically located land bank.
2020 Outlook
- For 2020, our forecast is for revenue of VND 2,042 billion (-23% YoY) and NPAT of VND 1,134 billion (+19% YoY). The growth drivers are the hand-over of existing projects like the Mizuki Park, Waterpoint and transferring stake in the Paragon City, Akari City.
Risks to Our Call
- Prolonged delay of legal procedures.
- Slowdown overall in the residential market, causing negative sentiment for the launch of new projects.
CMP (VND) 27,350 Target Price (VND) 38,900 Cash Dividend (VND)* - (*) expected in next 12 months STOCK INFO Sector Financials Market cap ( VND bn) 6,829.4 Current shares (millions) 249.7 3M avg. volume (K) 718.4 3M avg. Trading value (VND bn) 20.8 Remaining foreign room (%) 0.0 52-week range (‘000 VND) 21.9 - 29.4 PERFORMANCE
FORECAST VND bn 2017 2018 2019E 2020F Revenue 3,161 3,480 2,633 2,042 % yoy 24.8 10.1 -24.3 -22.4 NPAT 535 763 953 1,134 % yoy 55.0 42.7 24.9 19.0 ROA (%) 7.6 8.7 9.1 8.8 ROE (%) 15.6 17.0 13.1 14.0 EPS (VND) 3,165 3,023 3,671 4,975 BV (VND) 18,573 19,237 20,244 24,722 Div (VND) 414 489 0 0 P/E (x) 7.3 7.8 7.4 6.3 P/BV (x) 1.0 1.1 1.4 1.1 *Price as of Dec 13th, 2019 COMPANY SNAPSHOT
After establishing a solid position in the affordable housing segment, NLG's strategy has shifted to mid-end housing with mini-villas as well as residential urban areas, under the brand names of Valora and Flora.
Currenly, the company owns a sizeable land bank located in Ho Chi Minh, Dong Nai, Long An, Can Tho and Hai Phong provinces.
1
6
11
16
21
10
20
30
40
1/2/
2018
3/2/
2018
5/2/
2018
7/2/
2018
9/2/
2018
11/2
/201
8
1/2/
2019
3/2/
2019
5/2/
2019
7/2/
2019
9/2/
2019
11/2
/201
9
Price ('000, LHS) P/E (RHS)

www.vdsc.com.vn | Bloomberg: VDSC <GO> 115
HA DO GROUP JSC Bloomberg: HDG VN
Awaiting the launch of Charm Villas
BUY 22% The launching of the Charm Villas project in 2020 will be a good catalyst for HDG, creating a cash inflow for Ha Do for next two years. This is considered to be the best potential real estate project in the company's current pipeline. In addition, the project will also generate high margins due to the low cost of land, helping HDG record better results, especially after the Centrosa Garden has been completed. Regarding the energy segment, HDG is still active in acquring as well as developing new plants, especially in the renewable sector. However, the current downside risk depends on the Government’s policies.
Generally, HDG is still our favorite stock, with potential growth in their strategy segments, including real estate and energy businesses as well as positive business results prospect positive in coming years.
Investment Rationale
- Real estate: Charm Villas project to launch. In 2019, the company has focused on developing the infrastructure and landscape for this project. It is considered a key project for the next three years, following the Centrosa Garden project. There are 376 low-rise unsold units, equivalent to a total commercial land of about 6ha. The company is expected to launch the first sale in early-2020. Management is optimistic about the project's sales prospects. Accordingly, the company has also revised up the selling price vs previous estimation, generating an additional VND 500 billion in total revenue.
- Energy: Growth momentum. Renewable energy is one of HDG’s key pillars for the coming years. HDG has increased its stake in energy projects, as well it is on track to manage the construction. Two construction hydropower projects, namely Song Tranh 4 and Dak Mi 2, have been on track with the development plan. It is expected that those projects will go into operation in late-2020 and early-2021, respectively. In addition, HDG also plans to start construction of a new solar power project in Ninh Thuan province in early-2020, namely Bac Ai 14. The project’s capacity is 120MW. We have not factored the project in our valuation model, due to the risk of overload capacity in Ninh Thuan province and new guideline in solar sector.
2020 Outlook
- For 2020, our forecast is for revenue of VND 5,699 billion (+26% YoY) and NPAT of VND 983 billion (+24% YoY). The real estate segment continues to be driven by the hand-over of the Centrosa Garden project, while the energy segment will see a gross profit growth of 32%, thanks to the contribution of new plants, namely Hong Phong and Song Tranh 4.
- HDG is still our favorite stock with a P/E and P/B forward 2020 at 4.0x and 0.9x.
Risks to Our Call
- Policy risks in the renewable industry.
CMP (VND) 32,900 Target Price (VND) 40,100 Cash Dividend (VND)* - (*) expected in next 12 months STOCK INFO Sector Financials Market cap ( VND bn) 3,903.5 Current shares (millions) 118.6 3M avg. volume (K) 488.2 3M avg. Trading value (VND bn) 17.0 Remaining foreign room (%) 31.4 52-week range (‘000 VND) 25.8 - 37.7 PERFORMANCE
FORECAST VND bn 2017 2018 2019E 2020F Revenue 2,297 3,221 4,512 5,699 % yoy 15.5 40.2 40.1 26.3 NPAT 178 633 795 983 % yoy -24.3 255.1 25.6 23.6 ROA (%) 2.4 6.5 7.5 9.1 ROE (%) 9.1 26.5 25.2 23.1 EPS (VND) 2,277 6,560 6,700 8,284 BV (VND) 16,760 19,314 29,365 37,470 Div (VND) 500 1,000 0 0 P/E (x) 11.9 8.3 4.9 4.0 P/BV (x) 1.0 1.3 1.0 0.8 *Price as of Dec 13th, 2019 COMPANY SNAPSHOT
Established as a construction firm, Ha Do Group expanded its business into real estate property development, which became its core business. The increased involvement in the energy segment, including hydro power and renewable businesses, also help maintain a stable cash flow.
5
15
25
35
45
05
10152025
Jan-
18
Apr
-18
Jul-1
8
Oct
-18
Jan-
19
Apr
-19
Jul-1
9
Oct
-19
PE Price ('000 VND, RHS)

www.vdsc.com.vn | Bloomberg: VDSC <GO> 116
KHANG DIEN JSC Bloomberg: KDH VN
Solid growth
ACCUMULATE 11% Khang Dien is a real estate developer with steady growth and development. Being experienced in developing low-rise residential projects, mainly located in District 9, HCMC, Khang Dien utilizes its cash flow to shorten the time for development of projects. It meets the preferences of Vietnamese of owning land lots. The next two year development plan is very solid, including two main projects, namely Verosa Park and Clarita, hopefully helping the company achieve a net profit CAGR of 30-40%.
Investment Rationale
- Profit growth is nearly certain for the next two years. The two on-going construction and development projects are the Verosa Park and the Clarita, with a scale of 296 and 159 low-rise units, respectively, located in District 9, HCMC. These location are quite premium, at the center of Ho Chi Minh, with a well-developed infrastructure. Currently, the phase 1 of the Verosa Park project has been launched to the market, with 150 units, and the absorption rate reached 70%. The Clarita project is expected to launch the first sale in 2020, and start to be handed over from 2021. Accordingly, we estimate the pre-sales value by the end of 2019 of nearly VND 5,000 billion (USD 215 million). Regarding construction progress, the development of existing projects like Verosa Park, Safira or Lovera Vista are on track, adding credibility for homebuyers and shareholders. We project that NPAT-MI in 2020 will be VND 1,400 billion (+ 40% YoY), mainly driven from two projects, Verosa Park (VND 1,000 billion) and Safira (VND 400 billion).
- Low development risks. The two upcoming development projects of KDH are both low-rise projects, therefore, the timeline to deploy will be short. In addition, the company is also known as one of the reliable developers in terms of the legal process, ensuring the trust of customers. The Clarita project has completed the legal procedures and is ready to launch.
2020 Outlook
- We expect revenue and NPAT-MI to grow by 33% and 38%, respectively. 2021 will also be a good year for the company, depending on the success of the Clarita project’s launch in 2020. It is also considered a catalyst for KDH in the medium term.
- P/E and P/B forward 2020 will be at 11.8x and 1.5x, looking fair.
Risks to Our Call
- Pending the development progress of the Clarita project.
CMP (VND) 27,100 Target Price (VND) 29,500 Cash Dividend (VND)* 500 (*) expected in next 12 months STOCK INFO Sector Financials Market cap ( VND bn) 14,754.0 Current shares (millions) 544.4 3M avg. volume (K) 836.0 3M avg. Trading value (VND bn) 21.7 Remaining foreign room (%) 4.5 52-week range (‘000 VND) 21.6 - 27.4 PERFORMANCE
FORECAST VND bn 2017 2018 2019E 2020F Revenue 3,055 2,917 2,804 3,731 % yoy -22.3 -4.5 -3.9 33.1 NPAT 502 808 908 1,254 % yoy 35.1 60.9 12.4 38.1 ROA (%) 5.7 8.1 8.3 11.5 ROE (%) 9.5 12.3 11.5 13.2 EPS (VND) 1,420 1,854 1,668 2,304 BV (VND) 15,517 16,579 16,450 18,507 Div (VND) 500 500 500 500 P/E (x) 19.1 14.6 16.3 11.8 P/BV (x) 1.7 1.6 1.5 1.4 *Price as of Dec 13th, 2019 COMPANY SNAPSHOT
KDH is a well-known landed property (townhouses and villas) developer in HCMC. Currently, KDH owns a residential land bank of ~700 ha located in Ho Chi Minh, guaranteeing development for 10 years.
5
15
25
35
0
10
20
30
Jan-
18
Apr
-18
Jul-1
8
Oct
-18
Jan-
19
Apr
-19
Jul-1
9
Oct
-19
PE Price ('000 VND, RHS)

www.vdsc.com.vn | Bloomberg: VDSC <GO> 117
DAT XANH GROUP JSC Bloomberg: DXG VN
Attractive valuation
BUY 43% The company has been significantly affected by legal reviewing during the past two year. Its land bank is mainly concentrated in Ho Chi Minh City. There were almost no notable projects launched during the period, negatively affecting the company’s value. We suppose that the current negative news have been partly priced in. The risk is that legal reviews may take more time than expectations. In this context, the brokerage and secondary investments in suburban provinces may offset the earnings shortfall. Looking to 2020, prospects could be brighter, with legal conditions easing, and in particular, deploying a newly acquired project, namely Long Thanh Township.
Investment Rationale
- Launching and acquisition plans. DXG continued to miss its 2019’s launch targets, due to the prolonged slow progress of the legal status. They were supposed to launch projects in Ho Chi Minh (Gem Riverside). Looking forward to 2020, management expects 12,000 units offering to the market. We maintain a cautious view on that. Notable projects will be Long Thanh Township (4,000 land lots) and Gem Riverside project (3,200 units).
- Spin-off of the brokerage segment. DXG is a leading broker of mid-end and affordable housing with an estimated market share of 20-25% in FY2018-19. During 2019, the segment was the main driver of profit. Looking ahead to 2020, the brokerage services will be the key driver, while property revenue will depend on new launches. The company has restructured its brokerage services business and prepared for a spin-off. The company not only wants to seek financial support but also take advantage of their partner’s management and development experience. The deal is expected to be finalized in 2020.
2020 Outlook
- For 2020, our forecast is for revenue of VND 6,623 billion (+32.3% YoY) and NPAT of VND 1,581 billion (+15% YoY).
- Property revenue will be driven by the recognition of newly acquired project, namely the Long Thanh Township. The brokerage and secondary segment will see a lower growth (+10% YoY), due to the slowdown of the residential market in tier-2 and 3 provinces.
- P/E and P/B forward 2020 will be at 4.7x and 0.7x, looking attractive.
Risks to Our Call
- Legal reviews to affect the development progress. Construction has been delayed. Besides, the rumors about the legal status of certain projects started in 2018, causing a slump in the stock price. We suppose that the current negative news have been partly priced in. The risk is that legal reviews may take more time than expectations.
CMP (VND) 14,300 Target Price (VND) 20,500 Cash Dividend (VND)* - (*) expected in next 12 months STOCK INFO Sector Financials Market cap ( VND bn) 7,432.9 Current shares (millions) 519.8 3M avg. volume (K) 2,029.7 3M avg. Trading value (VND bn) 32.4 Remaining foreign room (%) 3.4 52-week range (‘000 VND) 11.3 - 20.6 PERFORMANCE
FORECAST VND bn 2017 2018 2019E 2020F Revenue 2,879 4,645 5,007 6,623 % yoy 14.9 61.3 7.8 32.3 NPAT 751 1,178 1,375 1,581 % yoy 39.8 56.9 16.7 15.0 ROA (%) 9.5 9.8 10.4 9.3 ROE (%) 18.3 21.7 21.6 21.8 EPS (VND) 2,402 3,265 2,649 3,046 BV (VND) 12,578 14,282 15,368 20,442 Div (VND) 0 0 0 0 P/E (x) 7.7 6.9 5.4 4.7 P/BV (x) 1.2 1.3 0.9 0.7 *Price as of Dec 13th, 2019 COMPANY SNAPSHOT
Established as a brokerage firm, Dat Xanh Group leveraged its business into real estate development, based on its knowledge and customer database in the residential industry. The company is very active on land bank acquisitions and targets the mid-end segment.
51015202530
0
5
10
15
20
Jan-
18
Apr
-18
Jul-1
8
Oct
-18
Jan-
19
Apr
-19
Jul-1
9
Oct
-19
PE Price ('000 VND, RHS)

www.vdsc.com.vn | Bloomberg: VDSC <GO> 118
DIC GROUP JSC Bloomberg: DIG VN
Huge land bank at a low cost
BUY 42% In 2019, DIG improved its performance in terms of profit growth (+21% YoY) and new project development (Nam Vinh Yen phase 2). However, the growth is still slow, compared to the company's potential. The company owns a very huge land bank, located in strategic locations like Dong Nai (350ha) and Vung Tau (120ha). Looking to 2020, profit growth will be improved, thanks to contributions from the Gateway, Cap Saint Jacques and Nam Vinh Yen projects. The company should be more active in project development in order to merit higher valuations.
Investment Rationale
- Profit growth is remained. Net profit for 2020 is estimated at VND 567 billion (+45% YoY), resulting in a P/E ratio of 7.6 times. We think that the company should be more aggressive in project development. However, profit growth in 2020 may be higher, depending on the development progress of Nam Vinh Yen phase 2. The project has completed almost all legal procedures and is ready to be exploited. Total land area is 74ha, of which 30ha is commercial land. Management is positive on the absorption rate.
- Huge land bank and good asset quality. Recently DIG accelerated the sale launches of two high-rise projects, namely Phoenix and Gateway. DIG plans to complete the deliveries by 2020. The remaining land bank, namely Nam Vinh Yen and Dai Phuoc will be the next catalysts. Looking further, Long Tan will be key driver, due to the huge land site of over 300ha and being able to benefit from upcoming infrastructure improvements in the medium term. Currently, the company is very active in land compensation. Currently, 70ha has been compensated and it is expected to increase by 80ha by the end of 2020. The stock is trading at a P/B forward 2020 of 1.0x, which is attractive for long-term holders.
2020 Outlook
- For 2020, our forecast arrives at revenue of VND 3,912 billion (+102% YoY) and NPAT of VND 567 billion (+45% YoY), mainly driven by the hand-over of the Gateway, Cap Saint Jacques and part of Nam Vinh Yen.
- P/E and P/B forward 2020 will be at 7.6x and 1.0x, which is very attractive for a company owning high liquidity and a large land bank.
Risks to Our Call
- Slowdown in the residential market, specifically neighboring provinces.
CMP (VND) 13,700 Target Price (VND) 19,500 Cash Dividend (VND)* - (*) expected in next 12 months STOCK INFO Sector Financials Market cap ( VND bn) 4,314.7 Current shares (millions) 314.9 3M avg. volume (K) 1,321.2 3M avg. Trading value (VND bn) 18.4 Remaining foreign room (%) 13.1 52-week range (‘000 VND) 11.9 – 16.1 PERFORMANCE
FORECAST VND bn 2017 2018 2019E 2020F Revenue 1,594 2,345 1,931 3,912 % yoy 38.4 47.1 -17.7 102.6 NPAT 196 324 392 567 % yoy 235.8 65.1 21.0 44.6 ROA (%) 3.3 5.0 5.1 6.6 ROE (%) 6.9 10.6 11.2 14.0 EPS (VND) 792 1,283 1,244 1,801 BV (VND) 11,829 12,406 11,371 13,804 Div (VND) 0 700 700 0 P/E (x) 23.6 15.1 10.9 7.6 P/BV (x) 1.6 1.5 1.1 1.0 *Price as of Dec 13th, 2019 COMPANY SNAPSHOT
DIG’s projects typically cover a very large land area, mainly focusing on second grade cities close to major industrial parks, tourism destinations and ports such as Vung Tau, Dong Nai and Vinh Phuc.
In term of shareholder ownership, Dragon Capital, VCSC and the BoDs are the main holders.
5
10
15
20
25
0
10
20
30
40
Jan-
18
Apr
-18
Jul-1
8
Oct
-18
Jan-
19
Apr
-19
Jul-1
9
Oct
-19
PE Price ('000 VND, RHS)

www.vdsc.com.vn | Bloomberg: VDSC <GO> 119
VINCOM RETAIL JSC Bloomberg: VRE VN
Launching of Vincom Megamall
ACCUMULATE 18% We remain positive on VRE’s core business given its (1) ample room for growth in the coming years as part of the Vinhomes’ residential complexe and (2) performance can be improved. Vincom Retail dominates Vietnam’s retail leasing market, with an estimated market share of 45%. One catalyst for 2020 will come from the opening of the new Vincom Megamalls.
Investment Rationale
- Further expansion. There are 79 operational shopping malls as of the end of 2019, equivalent to a total GFA of 1.7 million sqm, accounting for 45% of the total market. Vincom Retail is the undisputable leader in Vietnam’s retail leasing market. Looking forward to 2020, the company is looking at launching 12 shopping malls. Notably, three Vincom Megamalls located in Vinhomes mega-city projects will be put into operation by the end of the year. That will bring more than 180,000 sqm GFA to the market.
- Performance to be improved. The average occupancy rate has generally improved across all segments, reaching 91.9% by Sep 2019 (+250 bps YoY). Additionally, there is a slight increase in the rental rate (+10% YoY), thanks to new contracts with anchor tenants. The company periodically upgrades its tenant mix towards increasing the contribution from the anchor F&B, entertainment and services sectors, enhancing mall positioning and optimizing rental yield.
2020 Outlook
- For 2020, our forecast is for revenue of VND 10,513 billion (+13% YoY) and NPAT of VND 3,578 billion (+22% YoY). Higher profit growth is due to more contribution from its core business with higher margin, retail leasing.
- Average rental rate in 2020 is estimated at around USD 22/sqm/month (+ 10% YoY).
- There will be more than 250,000 sqm GFA added, bringing the total GFA of 2.0 million sqm (+15% YoY).
- P/E and P/B forward 2020 will be at 21.8x and 2.2x.
Risks to Our Call
- Rising influence of e-commerce.
CMP (VND) 33,550 Target Price (VND) 39,500 Cash Dividend (VND)* - (*) expected in next 12 months STOCK INFO Sector Financials Market cap (USD bn) 3371.4 Current shares (millions) 2,328.8 3M avg. volume (K) 4,527.7 3M avg. Trading value (VND bn) 6.6 Remaining foreign room (%) 16.3 52-week range (‘000 VND) 25.9 - 38.8 PERFORMANCE
FORECAST VND bn 2017 2018 2019E 2020F Revenue 5,518 9,124 9,276 10,513 % yoy -13.6 65.3 1.7 13.3 NPAT 2,027 2,404 2,927 3,578 % yoy -16.8 18.6 21.8 22.2 ROA (%) 5.6 6.3 7.5 8.6 ROE (%) 8.0 8.8 9.8 10.8 EPS (VND) 1,066 1,032 1,257 1,536 BV (VND) 13,710 12,224 13,472 15,013 Div (VND) 0 1,050 0 0 P/E (x) 31.5 32.5 29.4 21.8 P/BV (x) 2.4 2.7 2.8 2.2 *Price as of Dec 13th, 2019 COMPANY SNAPSHOT
Vincom Retail, Vietnam’s largest retail property company, is ramping up its portfolio to an unprecedented scale. As of September 2019, it owns 70 shopping malls covering 39 provinces and cities across Vietnam. Total GFA is about 1.5 million sqm.
51525354555
0
20
40
60
80
Jan-
18
Apr
-18
Jul-1
8
Oct
-18
Jan-
19
Apr
-19
Jul-1
9
Oct
-19
PE Price ('000 VND, RHS)

SECTOR OUTLOOK AND INVESTMENT STRATEGY
www.vdsc.com.vn | Bloomberg: VDSC <GO> 120
In 2019, the agricultural sector faced many difficulties due to three major reasons. Firstly, slower economic growth globally affected the demand for agricultural products of which Vietnam is one of the big exporters. Secondly, the trade war between the United States and China led to lower demand in these two countries which are important markets for Vietnam's agricultural exports. Thirdly, hot weather caused serious damage to many crops. In 2020, the Ministry of Agriculture and Rural Development has plans to improve agriculture productivity through restructuring by shifting to high-quality products, applying high technology to production and looking for new export markets. However, we believe that the difficulties in 2019 will last to 2020, along with the unpredictable changes in export markets. We believe that 2020 will be a challenging year for the agricultural sector.
The difficulties of the agricultural sector directly affected the fertilizer demand in 2019, leading to a sharp drop in the industry’s results. In addition, the VAT policy has not been changed to support fertilizer companies. In 2020 the demand for fertilizer is unlikely to rise much.
Investment Outlook
Expecting a slight growth in 2020. According to the Ministry of Agriculture and Rural development, the agriculture segment grew by two percent in the first nine months of 2019. The ministry also forecasted that 1.5% will be the growth for 2020.
The Government encourages the development of high-quality agriculture products and the application of high technology into agriculture. Many countries are increasingly tightening regulations on imports of commodities. Hence, the agriculture sector needs to invest in ‘hi-tech agriculture’ in order to compete better. By focusing on hi-tech agriculture, the fragmented and outdated small agriculture producers will be replaced gradually by modernized and large operators. The introduction of high technology will lead to higher yields, good-quality, clean and fresh agricultural products. Moreover, it can satisfy the increasing quality barriers of potential export markets.
In order to catch up with the trend of high-quality agriculture, the fertilizer sector must transform itself as the whole industry is saturated. In fact, the amount of chemical fertilizers used per hectare in Vietnam is pretty high compared to the world average (373 tons/ha compared to 120 tons/ha). Besides, the total demand for fertilizer in Vietnam has been fluctuating around 11 million tons - 11.5 million tons for the past few years. Due to the increasing trend of hi-tech agriculture, the demand for chemical fertilizers will decrease whilst organic fertilizers will see demand expanding.
Shift from low-value agricultural products to high-value agricultural products. The World Bank forecasts that the urbanizing rate in Vietnam will be 50% in 2025 and the middle class will increase very quick. Hence, food consumption will change from low/middle-quality rice demand to high-quality rice, meat, fruits, vegetables and processed foods. Therefore, about a third of the current rice land will be converted to other agricultural purposes or ecological services which may bring higher profit to farmers. Meanwhile, the area of saline sodic soil used for cultivating rice will be changed to grow fishery. As a result, the rice cultivated area will shrink in the next years while land used for other purposes such as aquatic products or fruits will expand. However, the total cultivated land will stay at current levels, around 27 thousand hectares.
Potential export markets. Vietnam has signed a few free trade agreements lately. This will create opportunities in markets such Japan and the EU.
AGRICULTURE, FERTILIZER – NOT REALLY POSITIVE IN 2020
Vu Tran ([email protected])
Hoang Bui ([email protected]) Negative Positive Neutral

SECTOR OUTLOOK AND INVESTMENT STRATEGY
www.vdsc.com.vn | Bloomberg: VDSC <GO> 121
Risks
• If the negotiation between the US and China is not as good as expected, that will negatively affect the global economy in 2020.
• Abnormal/unpredictable hot weather and saltwater intrusion in the Mekong Delta can affect agricultural productivity and demand for fertilizer.
• The development of high-quality (hi-tech) agriculture will take some time to materialize. Plus a lot of money. Thus, it will not be booming quickly.
• Vietnam’s agricultural products may not pass the high standards required by countries that signed FTAs. Consequently, exports may not grow as fast as expected.
Figure 1: Vietnam’s rice production
Source: Vietnam Customs, General Statistics Office of Vietnam, Rong Viet Securities
Figure 3: Imported volume of fertilizer (tons)
Source: Rong Viet Securities complied
7,903 7,816 7,828 7,737 7,705 7,562 6,350
44,039 44,975 45,091 43,165 42,739 43,979
37,800
6,592 6,378 6,587 4,836 5,789 6,115 5,506
444
463
426
449 452
501
438
380
400
420
440
460
480
500
520
0
5,000
10,000
15,000
20,000
25,000
30,000
35,000
40,000
45,000
50,000
2013 2014 2015 2016 2017 2018 10M2019
Cultivating land (thousand hectares) - left Total quantity (thousand tons) - left
Export quantity (thousand tons) - left Average price (USD/ton) -right
620,796 608,045 476,815 498,976 354,313
1,043,741 1,037,169 1,098,759 1,054,403891,760
377,920 318,206 495,238 498,099337,165
978,836805,746 880,087 693,625
460,165
971,2841,007,463
1,267,4591,014,940
767,236
0
500,000
1,000,000
1,500,000
2,000,000
2,500,000
3,000,000
3,500,000
4,000,000
4,500,000
2015 2016 2017 2018 11M2019
Ure SA NPK DAP Kali

SECTOR OUTLOOK AND INVESTMENT STRATEGY
www.vdsc.com.vn | Bloomberg: VDSC <GO> 122
Figure 4: Gross profit margin of fertilizer companies (%) Figure 5: Net profit margin of fertilizer companies (%)
Source: Rong Viet Securities complied Source: Rong Viet Securities complied
Figure 6: ROE, PB, PE of some listed Agriculture companies
Source: Fiinpro, RongViet Securities * Size of bubble: ROE
Table 1: Agriculture stocks – Market cap, price, rating, per share, dividends and ROE summary
Market cap
(USD mn)
Cur. price
Target price
ETR % Rating P/E
2019F P/BVPS 2019F
ROE 2019F
DY 2019F
P/E 2020
F
P/BVPS 2020F
ROE 2020
F
DY 2020F
Foreign room
LTG 1,722.1 21,370 29,400 45% Buy 4.1x 0.6x 17.7% 7.5% 4.7x 0.6x 14.5% 9.4% 4.7%
BFC 686 11,510 12,100 15% Accumulate 8.5x 0.7x 9.1% 10.4% 6.3x 0.7x 11.7% 9.0% 35.1%
DPM 5,204 13,300 13,600 9.7% Accumulate 17.4x 0.7x 4.4% 7.5% 11.3x 0.6x 6.7% 7.5% 30.0%
DCM(*) 3,494 6,600 N/A N/A N/A 8.8x 0.6x 6.4% 13.6% 10.7x 0.6x 5.3% 13.6% 46.6%
Source: Rong Viet Securities forecast, share prices as of Dec 13th, 2019
(*) Bloomberg’s consensus, data as of Dec 13th, 2019
-30.0%
-20.0%
-10.0%
0.0%
10.0%
20.0%
30.0%
40.0%
BFC DCM DDV DPM LAS NFC QBS SFG VAF
2015 2016 2017 2018 9M2019
-40.0%
-30.0%
-20.0%
-10.0%
0.0%
10.0%
20.0%
BFC DCM DDV DPM LAS NFC QBS SFG VAF
2015 2016 2017 2018 9M2019
LTG
HAI
VFG
CPC VPS
DPMBFC
DCMLAS
0.2
0.4
0.6
0.8
1.0
1.2
1.4
1.6
1.8
2.0 4.0 6.0 8.0 10.0 12.0 14.0 16.0 18.0 20.0
P/B
P/E

www.vdsc.com.vn | Bloomberg: VDSC <GO> 123
LOC TROI GROUP JSC Bloomberg: LTG VN
Attempting to restructure in 2020
BUY +45% Loc Troi has a large and stable market share in the pesticide market. In a nearly saturated market such as pesticide, LTG is still the biggest player and its gross profit margin (GPM) has slightly improved. Moreover, the seed segment’s GPM has risen. In contrast, the rice segment is still struggling so that LTG will have to restructure this segment in 2020. High interest expenses and the difficulties of collecting debts from distribution agents are key risks.
Investment Rationale
- Crop protection chemicals (CPC) will still contribute gradually to the profit of LTG. Although the market was predicted to be saturated soon, there is still room for LTG to grow. The reasons are (1) the agricultural land has remained at 27 thousand hectares for the last few years instead of shrinking and (2) farmers still rely significantly on using pesticide and it is not easy for them to change. Moreover, LTG is able to keep CPC’s revenue on growing and gross profit high as they jumped by 8% and 13% respectively in the first 9M of 2019. LTG is working with the Plant Protection Department about their bio-fertilizer in order to develop their bio-CPC products.
- The efficiency of the rice segment may improve in 2020. Revenue and GPM of rice have not been stable and predictable. However, LTG plans to reorganize this segment. The company stopped producing the non-branded rice (low GPM) and concentrates more on the domestic market (higher GPM than exports). Therefore, the GPM of 2020 is expected to be better than the 2019 GPM.
- LTG will benefit gradually from seeds segment and there are opportunities to grow. The revenue of this segment grew averagely by 6.4% in the period of 2012-2018, while the GPM has been remained around 22% for the last few years. Obviously, the seed segment has been providing steady profits to LTG. In addition, LTG has a small market share in the seed market. Therefore, we believe that LTG has plenty of opportunities to increase their profits from this segment due to their advantages in the agricultural sector.
- LTG’s valuation is quite low with a P/E below the one of other companies. The company is facing many internal problems such as relying heavily on loans and having difficulties in debt collection. Therefore, the market determined P/E of LTG to be at 3.6x, while P/E of competitors are priced at around 7.0x to 10.0x. If the company can solve those issues, it could be an interesting investment.
2023 Outlook
- We expect revenue to drop by 3.2% to VND 8,224 billion, driven by a decrease of 16% in the rice segment to VND 1,792 billion. Meanwhile, the GPM will improve, to 23.6%.
- The PBT will be VND 575 billion which is lower than the 2019 PBT by 14% as in 2019 LTG received VND 162 billion from transferring their real estate in HCM City.
Risks to Our Call
- The selling price of CPC may go down due to intensive competition.
- Rice exports fluctuations. For example, China and the Philippines may reduce their imports.
- LTG cannot manage its working capital successfully. This may lead to higher interest expenses and lower profit.
CMP (VND) 21,370 Target Price (VND) 29,400 Cash Dividend (VND)* 1,600 (*) expected in next 12 months STOCK INFO
Sector Agricultural chemicals
Market cap ( VND bn) 1,722.1 Current shares (millions) 80.6 3M avg. volume (K) 37.9 3M avg. Trading value (VND bn) 0.9 Remaining foreign room (%) 4.7 State ownership (%) 19.6 – 26.5 PERFORMANCE
FORECAST VND bn 2017 2018 2019E 2020F Revenue 8,687 9,031 8,498 8,224 % yoy 12 4.0 -5.9 -3.2 NPAT 415 412 493 431 % yoy 19 -0.8 19.7 -12.5 ROA (%) 6.3 5.3 7.4 6.4 ROE (%) 17.9 16.5 17.7 14.5 EPS (VND) 5,243 4,341 5,195 4,548 BV (VND) 29,075 31,207 34,469 37,017 Div (VND) 3,000 2,000 1,600 2,000 P/E (x) 10.3 6.3 4.1 4.7 P/BV (x) 1.6 0.9 0.6 0.6 *Price as of Dec 13th, 2019 COMPANY SNAPSHOT
LTG is the largest operator of agricultural chemicals. Its main businesses are pesticide, rice and seeds.
LTG has the biggest share in the pesticide segment with 20% of the market. The distribution for Syngenta products is the main source of this sector’s revenue, around 60%. Even though LTG has been operating in the rice segment since 2011, it could not benefit much from it due to several challenges. Also, LTG is the second biggest player in the seed market. This business usually contributes nearly 10% to LTG’s revenue.
10
15
20
25
30
35
4
5
6
7
8
Jan-
18
Mar
-18
May
-18
Jul-1
8
Sep-
18
Nov
-18
Jan-
19
Mar
-19
May
-19
Jul-1
9
Sep-
19
Nov
-19
PE Price ('000 VND, RHS)

www.vdsc.com.vn | Bloomberg: VDSC <GO> 124
PETROVIETNAM FERTILIZER AND CHEMICALS Bloomberg: DPM VN
Expecting sales recovery and abnormal profit
ACCUMULATE 9,7% Despite the major maintenance, Urea sales volume is expected to rise in 2020 because the Urea plant will run for a longer time compared to 2019. Besides, the abnormal profit from the insurance claim, relating to the Urea 2019 shut down, supports the 2020 bottom line. We believe that the tariff is likely to keep increasing compared to the current temporary one: 1.4 USD / MMBTU.
Investment Rationale
- Urea sales volume to recover. Due to the unfavorable agricultural sector and the 71 days Urea plant shut down, Urea sales volume has dropped significantly in 2019. However, operating for a longer time period coupled with stable agricultural conditions could push sales in 2020.
- Extraordinary income from insurance claim. We expect that DPM will get two insurance indemnities from the Urea plant shutdown (1) machinery insurance (2) losses caused by the longer-than-expected shutdown. If these two compensation packages are fully received, DPM's results will increase sharply compared to 2019.
- Abnormal profit from tariff. DPM may record VND119 bn from the retrospecting tariff (the difference between 1.4 USD/MMBTU and 1 USD/MMBTU) in 2020.
- Lower loss from NPK. In 2019, DPM changed the depreciation time from 10 years to 15 years. We think that the NPK plant will incur a lower loss next year.
2020 Outlook
- Urea sales of 780 thousand tons. Average selling price of VND6,635 per kg.
- NPK sales of 158 thousand tons. Average selling price of VND8,845 per kg.
- For 2020, DPM could post VND9,106bn in revenue, up 16.4% YoY. The NPATMI is forecasted to go up 53.4% to VND541bn. In case of receiving the full insurance claim and retrospecting tariff, the NPATMI will be higher than our forecast.
Risks to Our Call
- Unfavorable weather and worse agricultural sector than our expectations weaken Urea demand.
- More competition than our expectations.
- Not receive the full insurance claim. DPM and the insurance company are negotiating whether DPM will be paid for the losses caused by the longer-than-expected shutdown or not.
CMP (VND) 13,300 Target Price (VND) 13,600 Cash Dividend (VND)* 1,000 (*) expected in next 12 months STOCK INFO Sector Basic Materials Market cap ( VND bn) 5,204.7 Current shares (millions) 391.3 3M avg. volume (K) 403.8 3M avg. Trading value (VND bn) 5.6 Remaining foreign room (%) 30.0 52-week range (‘000 VND) 12.6 - 22.5 PERFORMANCE
FORECAST VND bn 2017 2018 2019E 2020F Revenue 7,996 9,297 7,826 9,106 % yoy 0.9 16.3 -15.8 16.4 NPAT 694 700 353 541 % yoy -38.5 0.7 -49.6 53.4 ROA (%) 6.8 6.3 3.2 4.9 ROE (%) 8.8 8.7 4.4 6.7 EPS (VND) 1,532 1,551 766 1,176 BV (VND) 20,113 20,662 20,423 20,593 Div (VND) 2,000 1,000 1,000 1,000 P/E (x) 14.0 14.4 17.4 11.3 P/BV (x) 1.0 1.1 0.7 0.6 *Price as of Dec 13th, 2019 COMPANY SNAPSHOT
Phu My Fertilizer (DPM) is known as a leading player in the Urea market with a total production capacity of 800,000 tons/year. The plant normally runs at 100% of its designed capacity as the domestic Urea demand is higher than domestic supply. Since 2018, DPM has run the NPK plant to expand its business.
Petro Vietnam is currently the largest shareholder with a 59.5% stake but plans to reduce its ownership in the future.
10
30
50
70
90
110
4
5
6
7
8
9
10
Jan-
18M
ar-1
8M
ay-1
8Ju
l-18
Sep-
18N
ov-1
8Ja
n-19
Mar
-19
May
-19
Jul-1
9
Sep-
19N
ov-1
9
PE Price ('000 VND, RHS)

www.vdsc.com.vn | Bloomberg: VDSC <GO> 125
BINH DIEN FERTILIZER JSC Bloomberg: BFC VN
Recover from a low base
ACCUMULATE 15% Fierce competition and low fertilizer demand (due to unfavorable conditions in the agricultural sector) have been depressing 2019 results. Profit is forecasted to hit its lowest level in seven years. However, due to the stabilization in the agricultural sector, demand for NPK is expected to recover, lifting the 2020 bottom line from the 2019 low base. However, the market is still difficult.
Investment Rationale
- Expecting a stabilization in the agricultural sector next year. The agricultural sector has been experiencing difficulties in 2019 due to (1) unfavorable weather (2) trade war, leading to weak demand from the biggest customer – China (3) huge drop in the selling price of key industrial crops. For 2020, despite some issues in the Mekong Delta Area, the weather is forecasted to be cooler. Besides, US and China are trying to reach a deal to solve problems between them which supports the overall demand from China. Lastly, prices of some key products like coffee and natural rubber are recovering.
- NPK demand to rise from a low base. Basing on the expectation about the agricultural sector, NPK demand is anticipated not to get worse in 2020. The recovery trend has started in 3Q2019 and should keep its momentum in 1H2020, helping the company's total consumption volume grow, compared to the low level in 2019.
- Gross margin to rise. In 1H2019, the input price was high but the selling price remained low due to competition. Consequently, the gross margin slumped in 1H2019. Nevertheless, the materials price have been coming down, improving the gross margin from 11.4% to 12%.
- Dividend yield looks attractive. Recently, BFC’s stock price collapsed due to the strong selling pressure by foreigner investors. Thanks to that, the low stock price makes the dividend yield look attractive with a cash dividend of VND1,200 to VND1,500 per share, based on our projections, equivalent to a yield of 9.7% 12.2%.
2020 Outlook
- Sales volume of 643 thousand tons. Average selling price of VND9,847 per kg
- The gross margin reaches to 12%.
- We predict that revenue will be flat at VND 6,128 bn and the NPATMI will increase by 35.1% to VND 113 bn.
Risks to Our Call
- Unfavorable weather and worse agricultural conditions than our expectations weaken demand for NPK.
- More competition than our expectations.
- Higher input material prices hurt the gross margin.
CMP (VND) 11,510 Target Price (VND) 12,100 Cash Dividend (VND)* 1,200 (*) expected in next 12 months STOCK INFO Sector Basic Materials Market cap ( VND bn) 686.0 Current shares (millions) 57.2 3M avg. volume (K) 85.2 3M avg. Trading value (VND bn) 1.2 Remaining foreign room (%) 35.1 52-week range (‘000 VND) 11.8 - 26.1 PERFORMANCE
FORECAST VND bn 2017 2018 2019E 2020F Revenue 6,306 6,405 6,122 6,128 % yoy 6.1 1.6 -4.4 0.1 NPAT 277 194 84 113 % yoy -0.3 -30.1 -56.7 35.1 ROA (%) 7.2 5.2 2.4 3.2 ROE (%) 28.4 20.7 9.1 11.7 EPS (VND) 4,457 3,048 1,349 1,823 BV (VND) 17,049 16,329 16,478 17,301 Div (VND) 3,500 3,500 1,200 1,000 P/E (x) 7.5 8.4 8.5 6.3 P/BV (x) 1.6 1.2 0.7 0.7 *Price as of Dec 13th, 2019 COMPANY SNAPSHOT
Binh Dien is a high-quality NPK producer under the brand name “Dau Trau”, a top leading company in NPK markets. The company operates on a designed capacity of 975,000 tons/year and 70% capacity on average. The company has diversified operations through other sectors such as organic fertilizer and agrochemical products.
Vietnam National Chemical Group (Vinachem) is currently the largest shareholder with a 65% stake BFC but plans to reduce its ownership in the future.
10
30
50
70
90
110
4
5
6
7
8
9
10
Jan-
18M
ar-1
8M
ay-1
8Ju
l-18
Sep-
18N
ov-1
8Ja
n-19
Mar
-19
May
-19
Jul-1
9
Sep-
19N
ov-1
9
PE Price ('000 VND, RHS)

SECTOR OUTLOOK AND INVESTMENT STRATEGY
www.vdsc.com.vn | Bloomberg: VDSC <GO> 126
After a strong growth phase, the steel industry eventually has slown down. The major problem is the domestic construction activities were insufficient to push material demand’s growth. Meanwhile, the export market has not been favorable for Vietnamese exporters due to the trade protection. Simultaneously, companies in the flat steel segment has been facing up with cheap HRC imports from India. HRC’s downtrend since May has caused even the largest names in the coated steel industry to suffer operating loss. To tackle the problem, very few of them chose to expand its value chain upsteams, while the rest became conservative in terms of setting growth target and switch to the less risky trading platform, the domestic market.
Investment Outlook
Most steel makers might find their recovery slow and might remain vulnerable to interest expenses. Fixed asset accumulation during the past years have inflated steel companies’ long-term debts. Additionally, some of them even engaged in speculative activities, making short-term debts go up strongly as well. As a result, interest expenses have been overwhelming, particularly during sale price’s downtrend, causing pressures on the companies’ bottom-line. Therefore, the recovery process often takes time while interest rate risk prolongs.
Only leading companies with healthy financials can scale up to achieve growth. We observed that excessively levered steel makers have postponed their expansion plans to focus on pay off their current long-term debts. Moreover, firms with speculative track records have restrained from taking risks due to the unmatched risk-benefit relationship between bearing higher interest expense and betting on input price changes. As a result, the only firms who can grow their bottom-line are the one who have established sound financials. HPG is among this group as the company has already operated an efficient steel mill, generating thousands of billion Vietnam dong annually in operating cash flows to fund its capacity expansion.
Investors should be prudent when investing in stocks with volatile gross margin. Observing the input price’s impacts on listed steel stocks’ performance, we suggest investors consider carefully the chance of these companies making loss again in the future. Steel-related commodities often are highly volatile in prices, thus companies’s earnings might fluctuate quarter-by-quarter. Therefore, steel stocks should only be held for medium and long-term investment horizon if they have a sustainable profitability that can be immune to input price volatility, given the fact that very few Vietnamese producers use proper hedging instruments.
Risks
• As 38% of coated steel output is sold overseas(11M2019), trade protection can harm Vietnamese exporters’ sales. Another risk to the coated steel export activities is the chance of the MoIT imposing trade protection on HRC imports, causing higher input cost to domestic producers.
• Anti-dumping measures on rebar and billet exprire in March 2020, which if not continuing might depress domestic long-steel makers’s gross margin even more. If it occurs, we might experience multiple belly-ups in the near future.
STEEL - CAPACITY EXPANSION FACES UP WITH WEAK DEMAND
Trinh Nguyen ([email protected]) Negative Positive Neutral

SECTOR OUTLOOK AND INVESTMENT STRATEGY
www.vdsc.com.vn | Bloomberg: VDSC <GO> 127
Figure 1: Steel production Figure 2: Construction steel market share
Source: Vietnam Steel Association, Rong Viet Securities compiled Source: Vietnam Steel Association, Rong Viet Securities compiled
Figure 3: Steel pipe market share Figure 4: Coated steel market share
Source: Vietnam Steel Association, Rong Viet Securities compiled
Source: Vietnam Steel Association, Rong Viet Securities compiled
0
1
2
3
4
5
6
7
8
9
10
11
Constructionsteel
Steel pipes Coated steel HRC, CRC
Mill
ions
tons
2015 2016 2017 2018 11M2019
24%
10%
9%8%8%
41%
26%
8%
8%
9%7%
42%
HPG
POM
Posco SS
Vinakyoei
TISCO
Others
Inner: 2018Outer: 11M2019
28%
17%
8%8%7%
33%31%
15%
9%7%
8%
30%
HPG
HSG
Minh Ngoc
SeAh VN
VGS
Others
Inner: 2018Outer: 11M2019
33%
15%17%
7%
5%
23% 30%
16%
17%
7%
5%
26%
HSG
NKG
Ton Dong A
CSVC
Sunsteel
Others
Inner: 2018Outer: 11M2019

SECTOR OUTLOOK AND INVESTMENT STRATEGY
www.vdsc.com.vn | Bloomberg: VDSC <GO> 128
Figure 5: Listed steel stocks’ operating margin
Source: Companies’ financial statements, Rong Viet Securities compiled
Table 1: Steel stocks’ information
Market cap
(USD mn)
Cur. price
Target price
ETR % Rating P/E
2019F P/BVPS 2019F
ROE 2019F
DY 2019F
P/E 2020F
P/BVPS 2020F
ROE 2020F
DY 2020F
Foreign room
HPG 65,713.6 23,800 33,400 40.3% Buy 8.9 1.4 16.1 0.0 6.0 1.1 19.8 0.0 10.9
HSG 3,546.6 8,380 N/A N/A N/A 9.0 0.6 6.2 12.4 6.9 0.5 8.0 N/A 31.3
NKG 1,294.0 7,110 N/A N/A N/A 15.1 0.4 2.1 N/A 14.7 0.5 2.9 N/A 60.7
SMC 624.9 10,250 N/A N/A N/A N/A 0.5 N/A N/A N/A 0.7 N/A N/A 15.5
VGS 294.8 7,000 N/A N/A N/A N/A 0.4 N/A N/A N/A 0.5 N/A N/A 47.4
TVN 4,418.5 6,517 N/A N/A N/A N/A 0.5 N/A N/A N/A 0.7 N/A N/A 48.9
Source: Rong Viet Securities forecast, share prices as of Dec 13th, 2019
(*) Bloomberg’s consensus, data as of Dec 13th, 2019

www.vdsc.com.vn | Bloomberg: VDSC <GO> 129
HOA PHAT GROUP JOINT STOCK COMPANY Bloomberg: HPG VN
Becoming the “Steel King”
BUY 40% We believe HPG is becoming the “Steel King” in the domestic market because of its role in the industry’s supply chain owing to the Dung Quat Steel Complex. Moreover, we like HPG’s highly competitive steel production costs and high operating margins, which should be supported by favorable material prices. Therefore, this is our top choice in this sector for 2020.
Investment Rationale
- New steel complex as the key growth driver by enhancing HPG’s role in the steel industry in terms of geographical market, value chain and product range. Firstly, it will help the company get a stronghold in Southern Vietnam. Secondly, HRC’s capacity will enable HPG to move upstream in the flat steel value chain as it probably will become a supplier for domestic coated steel producers. Lastly, high-quality wire rods and PC steel, as import-competing products, are going to expand HPG’s product mix to penetrate more niche markets.
- HPG’s sustainable advantage: lower production cost. Its basic oxygen furnaces can maintain HPG’s strength against most domestic steel-makers due to the significant lower production cost per ton of steel billet.
- Possible gross margin improvement in 2020 due to favorable input prices. Weak steel industry growth in China caused coking coal demand to fall, resulting in lower prices. Meanwhile, the iron ore price is on a downtrend. Despite falling steel prices (-4%, yoy), we believe HPG's steel gross margin will expand in 2020.
2020 Outlook
- We expect revenue to grow by 33.8%, reaching VND 85,215 billion, driven by a growth of 43.6% in total steel volume (around 5.2 million tons).
- We predict that 2020 output can reach 4.17 million tons of construction steel and 0.84 million tons of HRC.
- The average rebar price is predicted to decrease 4.0% in Vietnam compared with 2019 (estimate).
- The steel segment’s gross margin could increase to 20.8% due to the lower price of iron ore (-8.0%) and coking coal (-10.0%).
Risks to Our Call
- Material prices could change unfavorably. Iron ore, coking coal prices could move unpredictably, impacting HPG’s profitability if not fully hedged.
- Interest rate risks can be noticeable. We estimate that each one percentage increase of the interest rate will cause HPG’s interest rate expenses to go up by over VND 200 billion.
- It might take more time than expected for HPG to operate Dung Quat Steel Complex efficiently.
CMP (VND) 23,800 Target Price (VND) 33,400 Cash Dividend (VND)* 0 (*) expected in next 12 months STOCK INFO Sector Basic materials Market cap ( VND bn) 65,713.6 Current shares (millions) 2,761.1 3M avg. volume (K) 6,036.7 3M avg. Trading value (VND bn) 135.5 Remaining foreign room (%) 10.9 52-week range (‘000 VND) 20.3-27.4 PERFORMANCE
FORECAST VND bn 2017 2018 2019E 2020F Revenue 46,162 55,836 63,669 85,215 % yoy 38.7 21.0 14.0 33.8 NPAT 8,007 8,573 7,678 11,569 % yoy 21.3 7.1 -10.4 50.7 ROA (%) 15.3 11.0 7.6 10.5 ROE (%) 24.8 21.2 16.1 19.8 EPS (VND) 4,961 3,794 2,614 3,939 BV (VND) 11,694 14,661 17,272 21,210 Div (VND) 0 0 0 0 P/E (x) 8.9 7.7 9,1 6.0 P/BV (x) 1.6 1.6 1.4 1.1 *Price as of Dec 13th, 2019 COMPANY SNAPSHOT
Hoa Phat Group is the leading steel company in the construction and steel pipe market with a 25.0% and 31.0% market share (10M2019) respectively.
Currently, HPG is completing its Dung Quat steel complex, which is going to double HPG’s construction steel capacity and to allow HPG’s flat steel segment to become self-sufficient.
HPG’s agriculture segment is playing more important role in the overall business. The company supplies pork, beef and eggs to the market and operates its own feed factories.
10152025303540
4
6
8
10
12
Jan-
18M
ar-1
8M
ay-1
8Ju
l-18
Sep-
18N
ov-1
8Ja
n-19
Mar
-19
May
-19
Jul-1
9
Sep-
19N
ov-1
9
PE Price ('000 VND, RHS)

www.vdsc.com.vn | Bloomberg: VDSC <GO> 130
HOA SEN GROUP JSC Bloomberg: HSG VN
Efforts to revamp operations
N/A N/A Among building material companies, only HSG has its own distribution network that sells directly to end-users. This advantage allows HSG to stabilize its gross margin amid HRC prices volatile movements, which we consider essential to its recovery compared to other firms in the industry. In addition, HSG has been restraining its speculative activities to reduce short-term debts and interest expenses. Despite the short-term improvement, we remain conservative regarding HSG’s long-term stability and suggest investors monitor HSG’s working capital and related parties’ transactions closely to make sound investment decisions.
Investment Rationale
- HSG has the ultimate advantage in the retail space as it is the leader in the coated steel industry. HSG’s market share remained higher than 30%, followed by Ton Dong A (17%). 500 retailers nationwide ensure HSG’s volume, which is the key advantage over rivals. Its well-perceived brand name for coated steel, steel pipe and plastic pipe allows HSG to enjoy higher margin because of its pricing power.
- A turnaround story is feasible given HSG’s efforts to revamp its financials and corporate governance. Should HSG minimize speculative transactions for a period of time, its net margin will be able to stabilize. More importantly, limiting speculation might also reduce interest expenses and improve the bottom-line. Besides, in case it successfully eliminate trades with related parties, corporate governance risks will be reduced and HSG’s turnaround story would be a reliable long-term investment.
2020 Outlook
- HSG might see its steel volume decrease in 2020 due to its strategy, which focuses on keeping a profitable margin instead of engaging in price war to capture market share.
- HSG needs to keep its short-term debt at the current level to reduce interest expenses. In contrast, SG&A expenses have been cut substantially in the last financial year, thus are likely to remain stable.
- HSG’s plastic pipe segment can grow steadily in 2020 because of its continued discount policy. However, revenue contribution will remain low as well since profit contribution is minimal because of selling expenses.
Risks to Our Call
- Speculative activities are short-term and very difficult to track. Thus, investors need to be prudent particularly during HRC’s downtrend and strong fluctuations.
- Similarly, transactions with related parties might become unbeknownst to investors. Hence, investors need to acknowledge the corporate governance risk before taking action.
CMP (VND) 8,380 Target Price (VND) N/A Cash Dividend (VND)* N/A (*) expected in next 12 months STOCK INFO Sector Basic Materials Market cap ( VND bn) 3,546.6 Current shares (millions) 423.2 3M avg. volume (K) 3,630.2 3M avg. Trading value (VND bn) 27.4 Remaining foreign room (%) 31.3 52-week range (‘000 VND) 5.4 - 9.5 PERFORMANCE
FORECAST VND bn ’15-16 ’16-17 ’17-18 ’18-19 Revenue 17,886 26,148 34,441 28,035 % yoy 2.5 46.2 31.7 -18.6 NPAT 1,501 1,331 410 361 % yoy 129.9 -11.3 -69.2 -11.9 ROA (%) 12.2 6.2 1.9 2.1 ROE (%) 36.4 26.1 8.0 6.6 EPS (VND) 3,544 3,144 969 854 BV (VND) 9,748 12,041 12,085 12,912 Div (VND) 541 422 376 0 P/E (x) 12.4 8.0 6.7 9.8 P/BV (x) 2.1 1.7 0.5 0.6 *Price as of Dec 13th, 2019 COMPANY SNAPSHOT
Hoa Sen Group JSC has the highest market share in the domestic coated steel market and also operates its own retailers. HSG’s product mix also include steel pipe and plastic pipe.
Similar to other flat steel businesses, HSG struggled during input prices volatility. However, HSG has the advantage of its retailing activities, thus lessening its dependence on HRC prices. Its income recovery has been rapid.
Investors have been concerned over HSG’s speculative activities and corporate governance.
0510152025
0
10
20
30
40
Jan-
18M
ar-1
8M
ay-1
8Ju
l-18
Sep-
18N
ov-1
8Ja
n-19
Mar
-19
May
-19
Jul-1
9
Sep-
19N
ov-1
9
PE Price ('000 VND, RHS)

www.vdsc.com.vn | Bloomberg: VDSC <GO> 131
NAM KIM GROUP JSC Bloomberg: NKG VN
Highly dependent on input price movements
N/A N/A Scaling up using excessive leverage has been a double-edged sword for NKG. On the one hand, it enabled NKG to seize the opportunity to boost exports and to reach record-high earnings during 2016-2017. However, during the difficult period that endured the flat steel market in 2018-2019, NKG’s downstream capacity did not manage to sustain its profitability. We think the uncertainties in HRC price will continue to be the major obstacle for NKG’s recovery.
Investment Rationale
- NKG is among the leading coated steel firms with large capacity and is one of the few that are self-sufficient in CRC. NKG’s total capacity exceeds one million tpy of coated steel and more than 200,000 tpy of steel pipe, equivalent to around 16% and 6% of the respective market. Being self-sufficient in CRC means that NKG can retain profits during high-demand seasons and be less dependent on the domestic market.
- Regardless of the cold rolling capacity, NKG’s profit is still highly dependent on the HRC price. In terms of the domestic market, NKG mostly trades with wholesalers and has to accept lower prices to boost sales. As a result, HRC price fluctuations are often fully reflected in NKG’s margin without passthrough. Therefore, unfavorable HRC price conditions can impact NKG’s profit.
- NKG’s excessive debt, both short and long-term, impacts the bottom line even further due to high interest expenses.
2020 Outlook
- NKG’s sale volume might decrease in 2020 due to fierce competition in the domestic market as well as trade protection at potential export destinations. NKG’s gross margin is going to remain low and might be difficult to go back to pre-2019 levels.
- Even though HRC price is in a recovery trend, its volatility in 2020 might cause fluctuations in NKG’s quarterly net income. Accordingly, we are concerned that operating losses might occur again if HRC price goes down strongly.
- No new capacity in the intermediate term due to both external and internal conditions, which we believe is safe for NKG now as it needs time to recover before further expansion.
Risks to Our Call
- Since NKG’s bottom-line is highly dependent on the HRC price, there is a chance that HRC share price recovery exceeds our expectations, which would make NKG’s output, sales and NPAT surge, ending up in contrast to our prediction.
CMP (VND) 6,990 Target Price (VND) N/A Cash Dividend (VND)* N/A (*) expected in next 12 months STOCK INFO Sector Basic Materials Market cap ( VND bn) 1,294.0 Current shares (millions) 182.0 3M avg. volume (K) 414.0 3M avg. Trading value (VND bn) 2.6 Remaining foreign room (%) 60.7 52-week range (‘000 VND) 5.6 - 8.2 PERFORMANCE
FORECAST VND bn 2015 2016 2017 2018 Revenue 5,750.8 8,936.3 12,619.3 14,811.8 % yoy -1.5 55.4 41.2 17.4 NPAT 126.1 517.8 707.5 57.3 % yoy 64.5 310.7 36.6 -91.9 ROA (%) 3.5 8.1 7.0 0.7 ROE (%) 19.7 32.8 24.1 1.9 EPS (VND) 2,872 7,841 5,442 315 BV (VND) 2,728 1,192 1,759 214 Div (VND) 3,515 8,667 16,156 16,325 P/E (x) 0 0 0 0 P/BV (x) 2.6 3.0 2.1 52.9 *Price as of Dec 13th, 2019 COMPANY SNAPSHOT
Nam Kim Group JSC is known for being one of the largest coated steel producers in Vietnam. NKG expanded capacity strongly during 2015-2017 to take advantage of the global market conditions, exporting around half of its output.
However, lack of upstream capacity has caused difficulties as NKG’s gross margin is vulnerable to input price fluctuations. During HRC’s downtrend, NKG made operating loss while exporting activities faced protective measures.
0
10
20
30
40
05
1015202530
Jan-
18M
ar-1
8M
ay-1
8Ju
l-18
Sep-
18N
ov-1
8Ja
n-19
Mar
-19
May
-19
Jul-1
9
Sep-
19N
ov-1
9
PE Price ('000 VND, RHS)

SECTOR OUTLOOK AND INVESTMENT STRATEGY
www.vdsc.com.vn | Bloomberg: VDSC <GO> 132
Similar to our expectations at the beginning of the year, the construction industry continued to struggle to find growth drivers after the peak in 2017. Large general contractors fell one by one out of our conviction list due to both external and internal shortfalls. Lengthy legal processes caused many developers to experience delayed progress at their construction sites, while the banking system’s credit policy resulted in a lower value of new housing projects. Even though industrial and infrastructure construction managed to grow substantially, the whole construction industry has still been impacted by a slowdown in the housing market. For 2020-2021, we think there are few good choices among large contractors, but leading companies in several sub-segments, including power construction an industrial construction, might still benefit from the capex flow into the respective industry.
Investment Outlook
Civil construction is likely to have no nominees for 2020 as far as stock picks. The prolonged delay at grand projects in major city centers has put leading construction companies’ short-term growth at risk. In the intermediate-term, issues regarding legal procedures are likely to affect new projects. Even though the demand for housing and office leasing remains substantial in a developing country like Vietnam, the market still lacks cleared land banks with legitimate construction approval. As a result, large contractors in the housing segments including CTD, HBC and HTN face difficulties in finding new projects. Some companies expanded to other sub-segments, yet none found growth drivers sufficient to offset the slowdown in the housing market.
The power construction industry benefits from the demand for new generation capacity. Electricity demand’s ample growth potential has attracted investments from all public, private and foreign sectors. In particular, the pressure on EVN’s disbursement has been critical as Vietnam still lacks power plants, grids and even transmission lines to import electricity. EVN’s capex is estimated to be around USD 10 billion, which provides abundant jobs for contractors in the industry. Among listed power construction companies, we have paid attention to TV2 and PC1 and believe the two have a certain market power and growth potential.
Disbursement from the public and foreign sectors are predicted to be stable, supporting the overall construction demand. 9M2019’s disbursement from the foreign sector grew by 7.3% yoy, depicting a stable growth driver for the industry. Several industrial contractors had anticipated the foreign manufacturers’ relocation trend toward the South East Asian region and have taken advantage of this to stabilize growth rates. Additionally, public investment disbursed was only VND 192,130 billion in 9M2019, completing only 45% of the annual target. As a result, we believe the pressure to disburse will be high in 2020-2021, meaning substantial jobs for market participants.
Risks
• If public spending continues to be stagnant, intermediate-term growth drivers will be insufficient to boost the construction market.
• If legal procedures remain a problem, large projects will continue to be delayed, impacting construction contractors’ revenue recognition as well as deteriorating their profitability.
CONSTRUCTION - OBSTACLES IN THE MEDIUM TERM
Trinh Nguyen ([email protected]) Negative Positive Neutral

SECTOR OUTLOOK AND INVESTMENT STRATEGY
www.vdsc.com.vn | Bloomberg: VDSC <GO> 133
Figure 1: Industry growth
Source: Rong Viet Securities
Figure 2: Companies’ growth
Source: Companies’ FS, Rong Viet Securities compiled. (*) PC1’s revenue growth is computed using Construction segment only.
Table 1: Construction stocks’ information
Market
cap (USD mn)
Cur. price
Target price
ETR % Rating P/E
2019F P/BVPS 2019F
ROE 2019F
DY 2019F
P/E 2020F
P/BVPS 2020F
ROE 2020F
DY 2020F
Foreign room
CTD 4,730.1 62,000 N/A N/A N/A 6.2 0.5 8.4 5.5 6.6 1.5 7.8 6.2 0.5
HBC 2,562.7 11,100 N/A N/A N/A 5.5 0.8 13.9 2.3 7.3 1.3 10.7 5.5 0.8
PC1 2,820.0 17,700 26,800 51.4% Buy 8.0 0.8 15.0 2.8 6.4 0.8 11.6 2.8 9.9
TV2 1,971.2 82,100 N/A N/A N/A N/A 2.2 N/A N/A N/A 2.3 N/A N/A 2.2
HTN 581.9 17,600 N/A N/A N/A N/A 1.0 N/A N/A N/A 1.1 N/A N/A 1.0
DPG 1,998.0 44,400 N/A N/A N/A N/A 2.6 N/A N/A N/A 2.1 N/A N/A 2.6
FCN 1,225.3 10,250 N/A N/A N/A N/A 0.6 N/A N/A N/A 0.8 N/A N/A 0.6
TA9 101.8 8,200 N/A N/A N/A N/A 0.7 N/A N/A N/A 0.8 N/A N/A 0.7
Source: Rong Viet Securities forecast, share prices as of Dec 13th, 2019
(*) Bloomberg’s consensus, data as of Dec 13th, 2019
-15%
-10%
-5%
0%
5%
10%
15%
20%
25%
2016 2017 2018 9M2019
GDP growth
Construction industry growth
FDI disbursement growth
Public disbursement growth
-50%
0%
50%
100%
150%
200%
250%
300%
PC1's revenue growth* CTD's revenue growth HBC's revenue growth TV2's revenue growth HTN's revenue growth
2016
2017
2018
9M2019

www.vdsc.com.vn | Bloomberg: VDSC <GO> 134
POWER ENGINEERING CONSULTING COMPANY 2 Bloomberg: TV2 VN
Benefiting from the Prosperous Electricity Industry
N/A N/A TV2 achieved substantial growth in recent years owing to its participation in EPC bids. EPC contracts have sizable workload compared to TV2’s traditional contracts. In the intermediate term, we think that TV2 needs to focus on winning EPC bids to boost its backlog. Progress at the Quang Tri 1 Thermal power plant, the backbone of TV2’s 5-year plan, is going to determine the company’s business results in the intermediate and long-term. Nevertheless, TV2 can maintain its healthy financials with minimal borrowings and abundant liquid assets.
Investment Rationale
- TV2 benefits from growing investments in the electricity industry. In order to add nearly 10,000 MW electricity generation until 2030, EVN needs to disburse a total capex of up to USD 22 billion. We estimate that TV2’s feasible backlog might exceed VND 4,300 billion, equivalent to 1.5% of its investment Capex.
- EPC service is the key advantage. Having sufficient experience in thermal power, TV2 might win bids in the future. Additionally, having international experience, TV2 will also be able to bid on of FDI-related projects including the upcoming Quang Tri 1 TPP (Thailand’s EGATi) and Dung Quat TPP (Singapore’s Semcorp).
- Strong financials distinguish TV2 from the rest. TV2 has a lot of cash. The company has been capable of retaining cash flows to its creditors or reducing its inventory to finance its outflows to debtors. TV2’s cash flows from operating activities were higher than its net profits for seven out of eight recent years, which demonstrates the company’s efficient cash flow management
2020 Outlook
- In 2020, the Quang Tri 1 Thermal Power Plant can add around VND 4,500 billion to the 2020-2024 backlog.
- Construction of the Tan Thuan Wind Power Plant and Thac Ba Hydropower Plant will also contribute to 2020’s performance.
- Assuming stable SG&A expenses, we estimate 2020 NPAT to reach VND 220 billion.
Risks to Our Call
- Major risks to TV2’s earning growth include the ability to add more EPC contracts to the current backlog.
- Construction progress risk is another typical concern among contractors working at EVN’s projects. However, TV2’s traditional business is mostly brief pre-construction work; thus, we expect that a solid part of the company’s operating business can continue to be immune to EVN project’s progress.
CMP (VND) 82,100 Target Price (VND) N/A Cash Dividend (VND)* 2,500 (*) expected in next 12 months STOCK INFO Sector Industrials Market cap ( VND bn) 1.971,2 Current shares (millions) 24,0 3M avg. volume (K) 28,3 3M avg. Trading value (VND bn) 2,5 Remaining foreign room (%) 0,7 52-week range (‘000 VND) 73,8 – 96,0 PERFORMANCE
FORECAST VND bn 2015 2016 2017 2018 Revenue 708.4 1,646.6 1,838.0 1,840.5 % yoy 50.4 132.4 11.6 0.1 NPAT 57.1 99.4 214.5 224.1 % yoy 57.7 74.3 115.7 4.5 ROA (%) 9.4 14.2 11.9 11.9 ROE (%) 32.9 42.7 32.1 32.1 EPS (VND) 8,076 17,417 9,335 18,203 BV (VND) 7,063 12,606 20,894 29,073 Div (VND) 2,200 1,000 1,000 1,000 P/E (x) 3.9 10.6 3.9 4.3 P/BV (x) 1.3 3.4 1.6 2.7 *Price as of Dec 13th, 2019 COMPANY SNAPSHOT
TV2 is one of the subsidiaries under EVN that is capable of planning, surveying, designing, inspecting, supervising and operating electricity, industrial and civil construction projects. TV2 has experience constructing and operating many of EVN’s hydropower, thermal power and grid projects.
TV2 listed on HSX in June 2019 and since then has drawn attention because of its earnings and cash dividends.
1030507090110
0
5
10
PE Price ('000 VND, RHS)

www.vdsc.com.vn | Bloomberg: VDSC <GO> 135
POWER CONSTRUCTION NO.1 JSC Bloomberg: PC1 VN
Peaking in 2020 BUY 51% PC1 is one of our top picks for 2020 because of its long-term potential even though share
price performance has been fairly weak. We believe 2020 is going to be the peak for PC1’s performance. Firstly, its construction segment is benefiting from the capital flows into the electricity industry, including both generation and transmission. Secondly, two new hydropower plants going into production in late-2019 are likely to create substantial yoy growth in 2020. Last but not least, PCC1 Thanh Xuan apartment is scheduled to handover in early-2020, thus creating strong yoy growth in NPAT because of the low based 2019.
Investment Rationales
- The market leader in the power construction industry is capable of strong growth in the intermediate term because of the flows into the industry. After 500kV Grid No.3, other transmission projects take up a considerable amount in PC1’s backlog as it is critical for the Vietnamese government to provide infrastructure for the increasing number of private electricity plants. PC1 can also benefit from the flows into renewable energy, wind power in particular as many investors rush to finish construction by 4Q/2021 to enjoy governmental subsidiary policies.
- Increasing contribution from hydropower helps improve its stability and profitability considering PC1’s adherence to timeline. PC1 is operating four HPPs efficiently and having numerous in the pipeline. Two new HPPs started in late-2019, increasing PC1’s capacity to 268 MW. As all of them are small-scale HPPs, their little dependence on the weather and highly stable cash flows are going to contribute a larger part to PC1’s performance.
2020 Outlook
- We expect revenue to remain flat because of the offsetting impact in the construction and real estate segments. As 2019 revenue is estimated to grow by 96% yoy, 2020 would be considered successful if PC1 manages to keep it flat. The loss in construction revenue may be compensated by a higher electricity generating revenue as well as real estate sales.
- NPAT is forecasted to grow by 17% owing to the HPP portfolio’s sustainable gross margin as well as the attractive income from PCC1 Thanh Xuan apartment’s handover in 2020.
- PC1’s wind farm Lien Lap is going to start construction during the year, expected to benefit from the government’s policy on renewable energy.
Risks to Our Call
- PC1 might find obstacles in adding backlogs because the industry is highly dependent on supportive policies from the government.
- EVN’s disbursement can affect PC1’s business results and cash flows.
CMP (VND) 17,800 Target Price (VND) 26,800 Cash Dividend (VND)* - (*) expected in next 12 months STOCK INFO Sector Industrials Market cap ( VND bn) 2,820.0 Current shares (millions) 159.3 3M avg. volume (K) 256.3 3M avg. Trading value (VND bn) 5.0 Remaining foreign room (%) 9.9 52-week range (‘000 VND) 15.5 - 21.7 PERFORMANCE
FORECAST VND bn 2017 2018 2019E 2020F Revenue 3,161 5,084 6,197 5,948 % yoy 5.1 60.9 21.9 -4.0 NPAT 236.7 466.5 416.0 505.5 % yoy -22.3 97.1 -10.8 21.5 ROA (%) 7.8 4.8 7.3 5.4 ROE (%) 14.8 9.1 15.0 11.9 EPS (VND) 1,782 3,514 2,350 2,856 BV (VND) 16,847 19,578 22,006 24,957 Div (VND) 0 0 0 0 P/E (x) 14.7 7.1 7.6 6.3 P/BV (x) 1.1 1.0 0.8 0.7 *Price as of Dec 13th, 2019 COMPANY SNAPSHOT
Power Construction No 1 JSC is one of the leading contractors in the electricity construction market. Being a privatized SOE, PC1 has both the ability to play leading roles in major public projects and the capacity to bid for private and foreign owned electricity deals.
PC1 has a portfolio of small-scale hydropower plants with stable operation and is currently initialising renewable energy projects including a wind farm.
PC1 is also a residential developer, specialising in apartment blocks in Hanoi’s suburban area.
10
15
20
25
30
4
9
14
19
Jan-
18M
ar-1
8M
ay-1
8Ju
l-18
Sep-
18N
ov-1
8Ja
n-19
Mar
-19
May
-19
Jul-1
9
Sep-
19N
ov-1
9
PE Price ('000 VND, RHS)

www.vdsc.com.vn | Bloomberg: VDSC <GO> 137
FPT CORPORATION Bloomberg: FPT VN
Sustainable growth from core businesses BUY 26% From a multi-sector conglomerate, FPT divested from FPT Retail and FPT Trading, earning
VND 1,072 bn (USD 50 mn) in financial profit and officially became a pure technology and telecommunication corporation in 2017. It is the biggest technology company and among the top three internet provider in Vietnam. FPT benefits most from the development of the global IT industry, especially through software exports and digital transformation. Not only benefiting from Vietnam’s low labor cost, the company also has a sustainable business model consisting of education, software development and recently digital transformation consulting.
Investment Rationale
- Global software spending is forecasted to reach USD 466 bn in 2020, an increase of 8.2% yoy. FPT, with lower labor cost than Chinese and Indian companies, has a significant competitive advantage.
- Increase efficiency in software exports, coming from: (1) increasing the contribution from digital transformation, which has a higher profit margin than software outsourcing, (2) increase labor productivity and (3) providing more value-added services by acquiring local consultant companies. The recent acquisition of Intellinet boosted FPT’s growth in the US by providing implementation services for Intellinet’s existing customers.
- Attractive valuation. FPT is trading at a 2019 forward P/ E of 12x. We believe this is a low valuation considering the ability to maintain a CAGR of approximately 20% over the next five years. The main growth driver will come from software outsourcing. The contribution from the education sector will also drive earnings.
- More sustainable growth quality. FPT's profit growth always fluctuated widely due to the impact of the retail & trading and information systems segments. The company has divested from retail & trading, while the proportion of information system has become insignificant.
2020 Outlook
- Revenue and PAT will grow by 17% and 21% yoy compared to 2019, respectively.
- The two sectors that contribute the most to revenue: (1) Software outsourcing will still be the major driver (revenue +27%, PBT +29%) and (2): Telecom services will still post a healthy growth (revenue +14%, PBT +16%), led by enterprise clients while broadband internet will slow down due to increasing competition.
Risks to Our Call
- Geopolitical uncertainties in major markets such as Japan, the US and Europe could affect software export growth.
- Increasing competition in fixed Internet services can make the broadband segment slow down faster than expected.
CMP (VND) 57,100 Target Price (VND) 70,000 Cash Dividend (VND)* 2,000 (*) expected in next 12 months STOCK INFO Sector Technology Market Cap (VND bn) 38,729.6 Current Shares O/S (mn) 678.3 3M Avg. Volume (K) 1,966.2 3M Avg. Trading Value (VND bn) 114.1 Remaining Foreign Room (%) 0.0 52-week range (‘000 VND) 35.4 - 61.3 PERFORMANCE
FORECAST VND bn 2017 2018 2019E 2020F Revenue 42,659 23,214 28,143 32,981 % yoy 7.9 -45.6 21.2 17.2 NPAT 2,932 2,615 3,238 3,911 % yoy 37 -10.8 23.9 20.8 ROA (%) 11.7 8.8 10.5 11.3 ROE (%) 25.7 21.0 21.5 22.2 EPS (VND) 4,340 3,871 4,775 5,768 BV (VND) 21,520 20,306 22,305 26,058 Div (VND) 2,500 2,000 2,000 2,000 P/E (x) 10.3 9.9 12.0 9.9 P/BV (x) 2.3 1.8 2.6 2.2 *Price as of Dec 13th, 2019 COMPANY SNAPSHOT
FPT provides services in system integration, outsourcing, internet and telecommunications. FPT is the parent company of FPT Telecom (UpCom-FOX), one of the largest internet providers in Vietnam. FPT is a leading technology companies with a substantial proportion of revenue derived from overseas by providing software outsourcing services for developed countries. Having been restructured by divesting from the trading and retail subsidiaries, FPT is now able to improve its financials by focusing on its technology and telecommunication businesses.
5152535455565
0
5
10
15
PE Price ('000 VND, RHS)

www.vdsc.com.vn | Bloomberg: VDSC <GO> 138
PHU TAI JSC Bloomberg: PTB VN Wooden Exports to Drive Mid-Term Growth
BUY 22% We like PTB’s ability to accumulate quarries given its more than 10 years of experience and healthy financials. Efforts in restructuring personnel and production processes in both the wood and stone segments should lead to sustainable growth. Stone consumption is levelling off but the long-term outlook remains positive given the ramp-up in infrastructure works and real estate supply, including residential, tourism & office projects. In 2020, the growth driver will come from the furniture business. The US-China trade dispute will continue to push export orders to the US in the mid-term. Further growth should come from the EU market, especially the UK driven by the VPA/FLEGT and EVFTA agreements.
Investment Rationale
- Wood exports to boost mid-term growth. Opportunities in both the short and long term for timber exports. In the short term, the US - China trade dispute is shifting US orders to Vietnam. Further down the line exports to the EU market will be driven by the VPA/FLEGT, EVFTA or Vietnam’s Forest Law. We believe PTB is one of the beneficiaries, seeing (1) its US market dominance; (2) sustainable export orientation; (3) stable supply of raw materials and (4) increasing production capacity.
- Restructuring in stone expected to foster long-term growth. Consecutive M&A for accumulating quarries has been one of PTB’s prominent traits. It has been acquiring two new quarries per year and now has abundant reserve of 53 million m3 under 13 quarries. Slowing residential supply in certain markets and intense competition from imported Chinese stones have weakened Phu Tai's stone sales. However, restructuring efforts on product mix and plants are expected to boost stone sales and maintain an average growth of 10.6% in 2019-23.
- The very first residential project is on the way. The company started construction works since July and plans to launch in coming period. It possesses a favorable standing, amid three main roads in Quy Nhon city, Binh Dinh. This is a non-core business project. We however think this project is an add-on catalyst and will not have any great contribution to the company.
- Healthy finance and stable business performance. The financial structure improved though debt financing was enhanced for expansion works, especially in accumulating quarries and investment in plants and equipment. The debt/equity ratio decreased from 1.86x in 2012 to 0.96x in 1H2019.
2020 Outlook
- For 2020, our forecast arrives at a revenue of VND 6,179 billion (+11% YoY) and NPAT of VND 593 billion (+25% YoY).
- P/E and P/B forward 2020 will be at 5.8x and 1.6x, looking attractive.
Risks to Our Call
- Shortage of labor force and fluctuations in raw material prices.
- Intense competition from China-originated timber exports to the US.
CMP (VND) 72,700 Target Price (VND) 86,600 Cash Dividend (VND)* 2,400 (*) expected in next 12 months STOCK INFO Sector Industrials Market cap ( VND bn) 3.438,7 Current shares (millions) 47,3 3M avg. volume (K) 110,9 3M avg. Trading value (VND bn) 8,1 Remaining foreign room (%) 25,7 52-week range (‘000 VND) 54,1 - 76,5 PERFORMANCE
FORECAST VND bn 2017 2018 2019E 2020F Revenue 3,971 4,719 5,552 6,179 % yoy 8.5 18.8 17.7 11.3 NPAT 345 385 476 593 % yoy 30.1 11.6 23.6 24.6 ROA (%) 15.7 12.9 12.2 12.0 ROE (%) 36.4 27.9 26.7 27.4 EPS (VND) 12,669 7,534 10,061 12,542 BV (VND) 40,411 33,071 36,661 44,473 Div (VND) 1,000 3,200 3,200 2,400 P/E (x) 5.7 9.6 7.2 5.8 P/BV (x) 1.8 2.2 1.9 1.6 *Price as of Dec 13th, 2019 COMPANY SNAPSHOT
Phu Tai JSC is one of the few listed firms that specializes in stone and wood exploitation. It has ample stone reserves (53 mil m3, 13 quarries) and seen tremendous
growth of the furniture business recently.
5
25
45
65
85
0
5
10
15
Jan-
18
Apr
-18
Jul-1
8
Oct
-18
Jan-
19
Apr
-19
Jul-1
9
Oct
-19
PE Price ('000 VND, RHS)
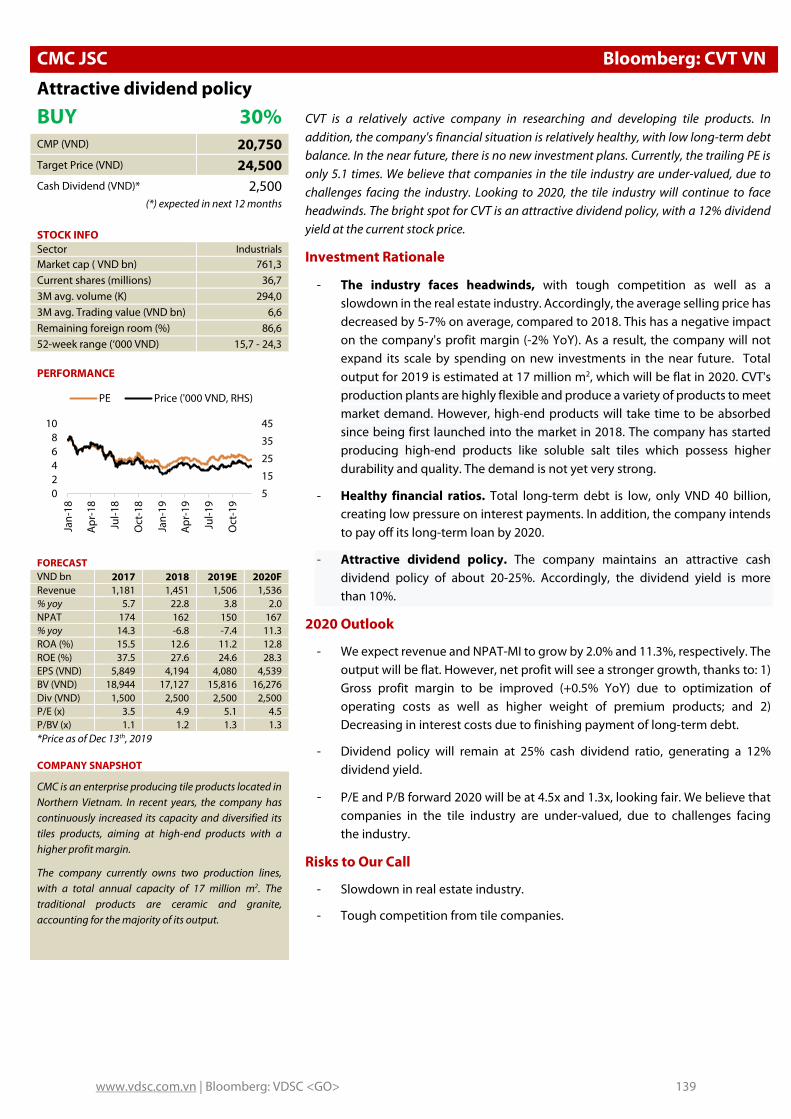
www.vdsc.com.vn | Bloomberg: VDSC <GO> 139
CMC JSC Bloomberg: CVT VN
Attractive dividend policy BUY 30% CVT is a relatively active company in researching and developing tile products. In
addition, the company's financial situation is relatively healthy, with low long-term debt balance. In the near future, there is no new investment plans. Currently, the trailing PE is only 5.1 times. We believe that companies in the tile industry are under-valued, due to challenges facing the industry. Looking to 2020, the tile industry will continue to face headwinds. The bright spot for CVT is an attractive dividend policy, with a 12% dividend yield at the current stock price.
Investment Rationale
- The industry faces headwinds, with tough competition as well as a slowdown in the real estate industry. Accordingly, the average selling price has decreased by 5-7% on average, compared to 2018. This has a negative impact on the company's profit margin (-2% YoY). As a result, the company will not expand its scale by spending on new investments in the near future. Total output for 2019 is estimated at 17 million m2, which will be flat in 2020. CVT's production plants are highly flexible and produce a variety of products to meet market demand. However, high-end products will take time to be absorbed since being first launched into the market in 2018. The company has started producing high-end products like soluble salt tiles which possess higher durability and quality. The demand is not yet very strong.
- Healthy financial ratios. Total long-term debt is low, only VND 40 billion, creating low pressure on interest payments. In addition, the company intends to pay off its long-term loan by 2020.
- Attractive dividend policy. The company maintains an attractive cash dividend policy of about 20-25%. Accordingly, the dividend yield is more than 10%.
2020 Outlook
- We expect revenue and NPAT-MI to grow by 2.0% and 11.3%, respectively. The output will be flat. However, net profit will see a stronger growth, thanks to: 1) Gross profit margin to be improved (+0.5% YoY) due to optimization of operating costs as well as higher weight of premium products; and 2) Decreasing in interest costs due to finishing payment of long-term debt.
- Dividend policy will remain at 25% cash dividend ratio, generating a 12% dividend yield.
- P/E and P/B forward 2020 will be at 4.5x and 1.3x, looking fair. We believe that companies in the tile industry are under-valued, due to challenges facing the industry.
Risks to Our Call
- Slowdown in real estate industry.
- Tough competition from tile companies.
CMP (VND) 20,750 Target Price (VND) 24,500 Cash Dividend (VND)* 2,500 (*) expected in next 12 months STOCK INFO Sector Industrials Market cap ( VND bn) 761,3 Current shares (millions) 36,7 3M avg. volume (K) 294,0 3M avg. Trading value (VND bn) 6,6 Remaining foreign room (%) 86,6 52-week range (‘000 VND) 15,7 - 24,3 PERFORMANCE
FORECAST VND bn 2017 2018 2019E 2020F Revenue 1,181 1,451 1,506 1,536 % yoy 5.7 22.8 3.8 2.0 NPAT 174 162 150 167 % yoy 14.3 -6.8 -7.4 11.3 ROA (%) 15.5 12.6 11.2 12.8 ROE (%) 37.5 27.6 24.6 28.3 EPS (VND) 5,849 4,194 4,080 4,539 BV (VND) 18,944 17,127 15,816 16,276 Div (VND) 1,500 2,500 2,500 2,500 P/E (x) 3.5 4.9 5.1 4.5 P/BV (x) 1.1 1.2 1.3 1.3 *Price as of Dec 13th, 2019 COMPANY SNAPSHOT
CMC is an enterprise producing tile products located in Northern Vietnam. In recent years, the company has continuously increased its capacity and diversified its tiles products, aiming at high-end products with a higher profit margin.
The company currently owns two production lines, with a total annual capacity of 17 million m2. The traditional products are ceramic and granite, accounting for the majority of its output.
5
15
25
35
45
02468
10
Jan-
18
Apr
-18
Jul-1
8
Oct
-18
Jan-
19
Apr
-19
Jul-1
9
Oct
-19
PE Price ('000 VND, RHS)

www.vdsc.com.vn | Bloomberg: VDSC <GO> 140
PHUOC HOA RUBBER JSC Bloomberg: PHR VN
Significantly concentrate on industrial park ACCUMULATE +5% For the last two and a half years, the rubber price has fluctuated at its low level which
leads to low profit of those companies working in rubber industry and PHR is not an exception. In order to solve this problem, the company decided to move the rubber segment to Cambodia while they have changed the rubber tree land in Vietnam to industrial park used for leasing. We believe that most of PHR’s income in 2020 will come from wood liquidation and industrial park leasing.
Investment Rationales - The compensation for land from VSIP and Nam Tan Uyen (NTC) ensures
PHR's profits and helps the company pay 40%-50% dividends in 2020. In 3Q2019, PHR already received VND 300 billion from VSIP and NTC (VND 150 billion from each). According to their plan, PHR will transfer 1.037 ha to those two companies in order to receive the payment of VND 1,763 billion as well as book it in 2019 and 2020. However, PHR is not able to book part of this amount in 2019 due to some legal problems. Hence, in 2020 they are expected to record full of VND1.763 billions. After receiving that huge money, PHR will be confident to achieve the 2020 plan and pay dividend higher than 40%.
- Tan Lap IP whose goal is supporting the wood industry will be put into operation in 2020. This 400-hectare industrial park will be used with the purpose of attracting wood enterprises to Binh Duong province. According to the plan, PHR will hold 51%, the remaining 49% will be distributed to other partners, including Kaiser who specializes in wood manufacturing. The first 200 hectares will be leased in 2020 and the remaining 200 hectares are in the approval process for being part of industrial zones in the 2021-2025 period.
- Expanding Tan Binh IP will take advantages of FDI "pouring" into Binh Duong province. Currently, the occupancy rate of the existing Tan Binh Industrial Park is approximately 85% while the demand for industrial park land is increasing. The reason is that many multinational companies moving their factories from China to Vietnam. Therefore, Phuoc Hoa is urgently seeking the Government approval to expand Tan Binh IP by 1,500 hectares which is expected to operate in 2020. If the remaining area of Tan Binh IP (15%) and 10% of the expanded area is rented in 2020, the expected revenue will be around VND 1,068 billion.
2020 Outlook - The income from liquidating old rubber tree of 2020 will be VND 143 billion
(+208% YoY). - PHR will transfer 861 ha to VSIP and NTC. In return, they will receive the
compensation of VND 1,463 billion. - We expect revenue to grow by 31.4%, reaching VND 2,088 billion. The total GPM
will be around 44% due to a high GPM of industrial park sector. The PBT will be VND 2,334 billion (+106% YoY).
Risks to Our Call - The rubber price may even go lower than current as China demand is weak due
to the intensive trade war between China and the US. This may cause a decline in revenue and profit of rubber segment.
- The process of transferring land to NTC and VSIP may get stuck due to some legal problems. This may affect the compensation receive. However, PHR stock could go higher than our target price in case of fully booking VND1,763bn in 2020.
- The demand for industrial land may be lower than forecast and the competition among industrial parks can be aggressive. Hence, the fulfillment rate and renting price may be influenced negatively.
CMP (VND) 48,300 Target Price (VND) 47,500 Cash Dividend (VND)* 3,000 (*) expected in next 12 months STOCK INFO Sector Chemicals Market cap ( VND bn) 7,018.9 Current shares (millions) 135.5 3M avg. volume (K) 495.7 3M avg. Trading value (VND bn) 28.5 Remaining foreign room (%) 42.4 State ownership (%) 29.3 – 76.1 PERFORMANCE
FORECAST VND bn 2017 2018 2019E 2020F Revenue 1,654 1,558 1,589 2,088 % yoy 40.4 -5.8 2.0 31.4 NPAT 327 628 459 2,326 % yoy 48.7 92.2 -26.9 406.6 ROA (%) 7.6 12.4 7.9 35.6 ROE (%) 13.9 24.0 16.1 59.9 EPS (VND) 3,331 3,788 2,768 14,025 BV (VND) 29,892 19,710 21,441 29,243 Div (VND) 2,300 2,000 1,000 6,000 P/E (x) 14.2 12.5 17.1 3.4 P/BV (x) 0.8 1.6 2.2 1.6 *Price as of Dec 13th, 2019 COMPANY SNAPSHOT
PHR is one of the biggest companies in rubber industry. They have 15,300 ha of rubber trees and 3 rubber factories whose capacities are around 27,000 tons/year. Also, the company owns 7,764 ha of rubber trees in Kampongthom – Cambodia.
Besides, PHR expanded their business to industrial park (IP) leasing in order to diversify their income. Tan Binh IP was already leased while Tan Lap IP and the expansion of Tan Binh IP are waiting to get the approval from the Government. Moreover, PHR also invested on 2 IP companies which are Nam Tan Uyen and VSIP.
01020304050607080
0
5
10
15
20
Jan-
18M
ar-1
8
May
-18
Jul-1
8
Sep-
18
Nov
-18
Jan-
19M
ar-1
9
May
-19
Jul-1
9
Sep-
19
Nov
-19
PE Price ('000 VND, RHS)

www.vdsc.com.vn | Bloomberg: VDSC <GO> 141
BINH MINH PLASTIC JSC Bloomberg: BMP VN
Maintaining Remarkable Financial Health NEUTRAL 17.1% In contrast to most Vietnamese building material firms who remain in growth phase, BMP
stands out as an industry leader who possesses the characteristics of a mature company. BMP’s well-perceived brand name allows it to enjoy sustainable profitability and strong operating cash flow. Since the Nawaplastics takeover in 2018, BMP has focused on standardized process and long-term efficiency. Accordingly, we expect BMP to maintain its debt-free status and to raise a substantial amount of cash, most of which would be paid out as cash dividend.
Investment Rationale
- We believe that difficult times for BMP are behind and the company can stabilize its performance because of less competition in the market. Even though volume growth potential is limited, BMP’s gross profit can benefit from a lower PVC resin price as well as more stability in the plastic pipe market. We expect that after a few years of raising discount to take over market shares, firms need to target operating profits. Hence, the current gross and net margin, at around 23% and 12% respectively can be sustainable for BMP it is a leading player.
- Healthy financials are the key rationale. BMP has been taking advantage of its popular brand name to generate cash inflows. It is capable of matching its operating cash flow with its accounting profit, thus hoarding a great amount of cash. Taking into account Nawaplastics’ active participation in the board of management, we predict that BMP’s dividend payouts will remain high for the upcoming years.
2020 Outlook
- Our 2020 forecasts for BMP include VND 4,248 billion (USD 190 million) in revenue (+3.0% yoy) and VND 499 billion (USD 22 million) in NPAT (-3.7% yoy).
- We forecast that BMP will continue to run its retail-size mills at full capacity to monetize its strong brand name. In contrast, no Capex for capacity expansion is going to limit BMP’s revenue growth. However, being conservative is going to help BMP retain cash and minimize financial expenses.
- BMP is spending on improving its fixed assets to match the parent company’s standards. Accordingly, there will be Capex spending and 2020 net margin might be affected before going into stable operation.
Risks to Our Call
- Corporate governance must be closely monitored as half of BMP’s input is purchased from a related party.
- BMP’s outstanding gross and net margin might still attract new entrants, causing price competition and impacting the bottom-line.
CMP (VND) 47,900 Target Price (VND) 51,100 Cash Dividend (VND)* 4,000 (*) expected in next 12 months STOCK INFO Sector Industrials Market cap ( VND bn) 3,921.1 Current shares (millions) 81.9 3M avg. volume (K) 155.7 3M avg. Trading value (VND bn) 8.2 Remaining foreign room (%) 19.6 52-week range (‘000 VND) 39.4 – 53.3 PERFORMANCE
FORECAST VND bn 2017 2018 2019E 2020F Revenue 3,825 3,920 4,123 4,249 % yoy 15.6 2.5 5.2 3.0 NPAT 464.7 427.6 518.3 499.1 % yoy -25.9 -8.0 21.2 -3.7 ROA (%) 16.2 15.2 17.9 17.0 ROE (%) 19.0 17.4 20.9 20.0 EPS (VND) 4,825 4,440 5,381 5,183 BV (VND) 29,918 53,952 30,355 30,538 Div (VND) 4,000 4,000 5,000 5,000 P/E (x) 13.2 9.5 8.6 9.0 P/BV (x) 2.5 1.7 1.5 1.5 *Price as of Dec 13th, 2019 COMPANY SNAPSHOT
Binh Minh Plastic JSC, founded in 1977 as an SOE, is a leading company in the plastic pipe market. It is a subsidiary of Nawaplastics (a Thai company in the same industry), BMP holds the largest market share in the South.
Binh Minh’s PVC pipe is a well-perceived brand name among Vietnamese consumers. This key strength allows BMP to enjoy higher bargaining power over its distributors and a stable profitability compared to its industry peers.
10
30
50
70
90
468
10121416
Jan-
18M
ar-1
8M
ay-1
8Ju
l-18
Sep-
18N
ov-1
8Ja
n-19
Mar
-19
May
-19
Jul-1
9
Sep-
19N
ov-1
9
PE Price ('000 VND, RHS)

www.vdsc.com.vn | Bloomberg: VDSC <GO> 142
REFREGERATION ELECTRICAL ENGINEERING CORPORATION Bloomberg: REE VN
Moderate bottom line growth ACCUMULATE 14.2% Without the contribution of transferring earnings from real estate projects and due to off-
peak power income, REE’s 2019 net earnings decreased from a strong growth in 2018. In 2020, given a mixed outlook for the hydro and thermal power segments, income from power segment will be flat. Meanwhile, office leasing will become REE’s growth driver in 2020 – 2022. Overall, REE will see a slightly better year in 2020.
Investment Rationale
- Office leasing to be key growth driver in 2020. The total office leasing area will increase approximately 7.3% YoY in 2020. At a current 100% occupancy rate in all of its buildings, office leasing has become REE’s key pillar in terms of earnings and cash flow. The company plans to develop 100,000 m2 more for leasing. If the progress is in line with its plan, total leasing area will up by more than 60% after 2022.
- Boost M&A activities: to ensure sustainable long-term growth. 2019 was another successful year in terms M&A progress. The company disbursed more than VN 1 Tn into the energy sector (hydro power plant and wind farm) and water supply (increasing its ownership in KHW). Since the majority of disbursements are likely to happen in the second half of this year, we expect the impact on REE’s business result to be from 2020 on. These investments should be mid- and long-term catalysts.
- Solid earnings growth and stable cash dividend make the current relative valuation attractive. The CAGR of adjusted-EPS was 11% in the last five years and is expected to remain at 10% in the next five years. In addition, besides large retained earnings for reinvestment, REE has a consistent stable cash dividend policy at 1,800 VND/share, corresponding to a dividend yield of 5%.
2020 Outlook
- While the water supply segment can maintain stable earnings growth of 14%, net earnings from the power segment will be flat, due to: (1) Mixed business performance of hydro and thermal plants, impacted by El Nino; (2) Thuong Kon Tum plant will come online from 2Q 2020. Due to its high depreciation yet low revenue, we expect that it will occur a loss.
- Office leasing area will increase by 7.3% and net earnings will grow 16% YoY, accounting for 25% in total NPAT (2019E: 22%).
- There are some residential real estate projects of which its subsidiary (VIID) and associate (SGR:HSX) have developed. We, however, do not expect a significant contribution from this in 2020.
- We forecast total NPAT to grow 7% YoY, delivering an EPS of VND 5,252.
Risks to Our Call
- Upside risk may come from the sooner-than-expected reporting residential projects.
- Downside risk is that REE can become more exposed to VSH, due to poor hydrological condition, or even in case the company increases its ownership in VSH and consolidates it as a subsidiary.
CMP (VND) 36,500 Target Price (VND) 39,900 Cash Dividend (VND)* 1,800 (*) expected in next 12 months STOCK INFO Sector Industrials Market cap ( VND bn) 11,316.9 Current shares (millions) 310.1 3M avg. volume (K) 898.2 3M avg. Trading value (VND bn) 33.8 Remaining foreign room (%) 0.0 52-week range (‘000 VND) 28 - 40.2 PERFORMANCE
FORECAST VND bn 2017 2018 2019E 2020F Revenue 4,995 5,101 4,991 4,971 % yoy 36.5 2.1 -2.1 -0.4 NPAT 1,377 1,784 1,526 1,629 % yoy 26.0 29.5 -14.5 6.8 ROA (%) 27.6 35.0 30.6 32.8 ROE (%) 8.9 9.7 8.1 8.1 EPS (VND) 14.8 17.3 13.4 13.0 BV (VND) 4,441 5,754 4,918 5,252 Div (VND) 4,441 5,754 4,918 5,252 P/E (x) 25,913 30,056 33,174 36,626 P/BV (x) 1,600 1,800 1,800 1,800 *Price as of Dec 13th, 2019 COMPANY SNAPSHOT
Refrigeration Electrical Engineering JSC was established in 1977 and equitized in 1993. REE is a holding organization whose main operations are in M&E, Reetech and the electricity/water sector investments. REE’s companies includes: REE M&E, Electric REE and REE real estate. Its real estate company operates REE’s office and buildings for rent. REE Land is in charge of developing its real estate projects. REE’s foreign ownership limitation is still 49%, and it is currently fully held by foreign investors.
25
30
35
40
45
456789
10
Jan-
18M
ar-1
8M
ay-1
8Ju
l-18
Sep-
18N
ov-1
8Ja
n-19
Mar
-19
May
-19
Jul-1
9
Sep-
19N
ov-1
9
PE Price ('000 VND, RHS)

ANALYSIS & INVESTMENT ADVISORY DEPARTMENT
Lam Nguyen
+ 84 28 6299 2006 | 1313
Duong Lai
+ 84 28 6299 2006 | 1522
Vu Tran
+ 84 28 6299 2006 | 1518
Trinh Nguyen
+ 84 28 6299 2006 | 1551
Tu Vu
+ 84 28 6299 2006 | 1511
Son Tran
+ 84 28 6299 2006 | 1527
Tung Do
+ 84 28 6299 2006 | 1521
Thao Dang
+ 84 28 6299 2006 | 1529
Tam Pham
+ 84 28 6299 2006 | 1530
Anh Nguyen
+ 84 28 6299 2006 | 1531
Hoang Nguyen
+ 84 28 6299 2006 | 1538
Hoang Bui
+ 84 28 6299 2006 | 1514
Tu Pham
+ 84 28 6299 2006 | 1536
Bernard Lapointe
+ 84 28 6299 2006
Ha Tran
+ 84 28 6299 2006 | 1526
Vi Truong
+ 84 28 6299 2006 | 1517
BROKERAGE FOR FOREIGN & INSTITUTIONAL CLIENTS DEPARTMENT
Thomas Defauw – Director
+ 84 28 6299 2006 | Ext: 1525
Van Pham– Manager
+ 84 28 6299 2006 | Ext: 1249
Hang Nguyen –Deputy Manager
+ 84 28 6299 2006 | Ext: 1250
BROKERAGE FOR INDIVIDUAL CLIENTS DEPARTMENT
Hung Le – Director
+ 84 28 6299 2006 | Ext: 1214
Thanh Pham– Director
+ 84 28 6299 2006 | Ext: 1225
OTHER BRANCHES
Long Tran
Director of Ha Noi branch
+ 84 24 6288 2006 | Ext: 2366
Nam Nguyen
Deputy Director of Nha Trang branch
+ 84 58 3820 006 | Ext: 3106
Huy Huynh
Director of Can Tho branch
+ 84 710 381 7578 | Ext: 4101


DISCLAIMERS
This report is prepared in order to provide information and analysis to clients of Rong Viet Securities only. It is and should not be construed as an offer to sell or a solicitation of an offer to purchase any securities. No consideration has been given to the investment objectives, financial situation or particular needs of any specific. The readers should be aware that Rong Viet Securities may have a conflict of interest that can compromise the objectivity this research. This research is to be viewed by investors only as a source of reference when making investments. Investors are to take full responsibility of their own decisions. VDSC shall not be liable for any loss, damages, cost or expense incurring or arising from the use or reliance, either full or partial, of the information in this publication. The opinions expressed in this research report reflect only the analyst's personal views of the subject securities or matters; and no part of the research analyst's compensation was, is, or will be, directly or indirectly, related to the specific recommendations or opinions expressed in the report. The information herein is compiled by or arrived at Rong Viet Securities from sources believed to be reliable. We, however, do not guarantee its accuracy or completeness. Opinions, estimations and projections expressed in this report are deemed valid up to the date of publication of this report and can be subject to change without notice. This research report is copyrighted by Rong Viet Securities. All rights reserved. Therefore, copy, reproduction, republish or redistribution by any person or party for any purpose is strictly prohibited without the written permission of VDSC. Copyright 2019 Viet Dragon Securities Corporation. IMPORTANT DISCLOSURES FOR U.S. PERSONS
This research report was prepared by Viet Dragon Securities Corp. (“VDSC”), a company authorized to engage in securities activities in Vietnam. VDSC is not a registered broker-dealer in the United States and, therefore, is not subject to U.S. rules regarding the preparation of research reports and the independence of research analysts. This research report is provided for distribution to “major U.S. institutional investors” in reliance on the exemption from registration provided by Rule 15a-6 of the U.S. Securities Exchange Act of 1934, as amended (the “Exchange Act”).
Additional Disclosures
This research report is for distribution only under such circumstances as may be permitted by applicable law. This research report has no regard to the specific investment objectives, financial situation or particular needs of any specific recipient, even if sent only to a single recipient. This research report is not guaranteed to be a complete statement or summary of any securities, markets, reports or developments referred to in this research report. Neither VDSC nor any of its directors, officers, employees or agents shall have any liability, however arising, for any error, inaccuracy or incompleteness of fact or opinion in this research report or lack of care in this research report’s preparation or publication, or any losses or damages which may arise from the use of this research report.
VDSC may rely on information barriers, such as “Chinese Walls” to control the flow of information within the areas, units, divisions, groups, or affiliates of VDSC.
Investing in any non-U.S. securities or related financial instruments (including ADRs) discussed in this research report may present certain risks. The securities of non-U.S. issuers may not be registered with, or be subject to the regulations of, the U.S. Securities and Exchange Commission. Information on such non-U.S. securities or related financial instruments may be limited. Foreign companies may not be subject to audit and reporting standards and regulatory requirements comparable to those in effect within the United States.
The value of any investment or income from any securities or related financial instruments discussed in this research report denominated in a currency other than U.S. dollars is subject to exchange rate fluctuations that may have a positive or adverse effect on the value of or income from such securities or related financial instruments.
Past performance is not necessarily a guide to future performance and no representation or warranty, express or implied, is made by VDSC with respect to future performance. Income from investments may fluctuate. The price or value of the investments to which this research report relates, either directly or indirectly, may fall or rise against the interest of investors. Any recommendation or opinion contained in this research report may become outdated as a consequence of changes in the environment in which the issuer of the securities under analysis operates, in addition to changes in the estimates and forecasts, assumptions and valuation methodology used herein.
No part of the content of this research report may be copied, forwarded or duplicated in any form or by any means without the prior. RESEARCH DISCLOSURES
Third Party Research
This is third party research. It was prepared by Rong Viet Securities Corporation (Rong Viet), with headquarters in Ho Chi Minh City, Vietnam. Rong Viet is authorized to engage in securities activities according to its domestic legislation. This research is not a product of Tellimer Markets, Inc., a U.S. registered broker-dealer. Rong Viet has sole control over the contents of this research report. Tellimer Markets, Inc. does not exercise any control over the contents of, or the views expressed in, research reports prepared by Rong Viet.
Rong Viet is not registered as a broker-dealer in the United States and, therefore, is not subject to U.S. rules regarding the preparation of research reports and the independence of research analysts. This research report is provided for distribution to “major U.S. institutional investors” and other “U.S. institutional investors” in reliance on the exemption from registration provided by Rule 15a-6 of the U.S. Securities Exchange Act of 1934, as amended (the “Exchange Act”).
Any U.S. recipient of this research report wishing to effect any transaction to buy or sell securities or related financial instruments based on the information provided in this research report should do so only through Tellimer Markets, Inc., located at 575 Fifth Avenue, 27th Floor, New York, NY 10017. A representative of Tellimer Markets, Inc. is contactable on +1 (212) 551 3480. Under no circumstances should any U.S. recipient of this research report effect

any transaction to buy or sell securities or related financial instruments through Rong Viet. Tellimer Markets, Inc. accepts responsibility for the contents of this research report, subject to the terms set out below, to the extent that it is delivered to a U.S. person other than a major U.S. institutional investor.
None of the materials provided in this report may be used, reproduced, or transmitted, in any form or by any means, electronic or mechanical, including recording or the use of any information storage and retrieval system, without written permission from.
Rong Viet is the employer of the research analyst(s) responsible for the content of this report and research analysts preparing this report are resident outside the U.S. and are not associated persons of any U.S. regulated broker-dealer. The analyst whose name appears in this research report is not registered or qualified as a research analyst with the Financial Industry Regulatory Authority (“FINRA”) and may not be an associated person of Tellimer Markets, Inc. and, therefore, may not be subject to applicable restrictions under FINRA Rules on communications with a subject company, public appearances and trading securities held by a research analyst account.
Tellimer Markets, Inc. or its affiliates has not managed or co-managed a public offering of securities for the subject company in the past 12 months, has not received compensation for investment banking services from the subject company in the past 12 months, and does not expect to receive or intend to seek compensation for investment banking services from the subject company in the next three months. Tellimer Markets, Inc. has never owned any class of equity securities of the subject company. There are no other actual, or potential, material conflicts of interest of Tellimer Markets, Inc. at the time of the publication of this report. As of the publication of this report, Tellimer Markets, Inc. does not make a market in the subject securities.
About Tellimer
Tellimer is a registered trade mark of Exotix Partners LLP. Exotix Partners LLP and its subsidiaries ("Tellimer") provide specialist investment banking services to trading professionals in the wholesale markets. Tellimer draws together liquidity and matches buyers and sellers so that deals can be executed by its customers. Tellimer may at any time, hold a trading position in the securities and financial instruments discussed in this report. Tellimer has procedures in place to identify and manage any potential conflicts of interests that arise in connection with its research. A copy of Tellimer’s conflict of interest policy is available at www.tellimer.com/regulatory-information.
Distribution
This report is not intended for distribution to the public and may not be reproduced, redistributed or published, in whole or in part, for any purpose without the written permission of Tellimer. Tellimer shall accept no liability whatsoever for the actions of third parties in this respect. This report is for distribution only under such circumstances as may be permitted by applicable law.
This report may not be used to create any financial instruments or products or any indices. Neither Tellimer, nor its members, directors, representatives, or employees accept any liability for any direct or consequential loss or damage arising out of the use of all or any part of the information herein.
United Kingdom: Distributed by Exotix Partners LLP only to Eligible Counterparties or Professional Clients (as defined in the FCA Handbook). The information herein does not apply to, and should not be relied upon by, Retail Clients (as defined in the FCA Handbook); neither the FCA’s protection rules nor compensation scheme may be applied.
UAE: Distributed in the Dubai International Financial Centre by Exotix Partners LLP (Dubai) which is regulated by the Dubai Financial Services Authority (“DFSA”). Material is intended only for persons who meet the criteria for Professional Clients under the Rules of the DFSA and no other person should act upon it.
Other distribution: The distribution of this report in other jurisdictions may be restricted by law and persons into whose possession this document comes should inform themselves about, and observe, any such restriction.
Disclaimers
Tellimer and/or its members, directors or employees may have interests, or long or short positions, and may at any time make purchases or sales as a principal or agent of the securities referred to herein. Tellimer may rely on information barriers, such as “Chinese Walls” to control the flow of information within the areas, units, divisions, groups of Tellimer.
Investing in any non-U.S. securities or related financial instruments (including ADRs) discussed in this report may present certain risks. The securities of non-U.S. issuers may not be registered with, or be subject to the regulations of, the U.S. Securities and Exchange Commission. Information on such non-U.S. securities or related financial instruments may be limited. Foreign companies may not be subject to audit and reporting standards and regulatory requirements comparable to those in effect within the United States. The value of any investment or income from any securities or related financial instruments discussed in this report denominated in a currency other than U.S. dollars is subject to exchange rate fluctuations that may have a positive or adverse effect on the value of or income from such securities or related financial instruments.
Frontier and Emerging Market laws and regulations governing investments in securities markets may not be sufficiently developed or may be subject to inconsistent or arbitrary interpretation or application. Frontier and Emerging Market securities are often not issued in physical form and registration of ownership may not be subject to a centralised system. Registration of ownership of certain types of securities may not be subject to standardised procedures and may even be effected on an ad hoc basis. The value of investments in Frontier and Emerging Market securities may also be affected by fluctuations in available currency rates and exchange control regulations. Not all of these or other risks associated with the relevant company, market or instrument which are the subject matter of the report are necessarily considered.