Vietnam Food & Drink Report Q1 2015 - VIETDATA
140
Q1 2015 www.businessmonitor.com VIETNAM FOOD & DRINK REPORT INCLUDES 5-YEAR FORECASTS TO 2018 ISSN 1749-3072 Published by:Business Monitor International
-
Upload
khangminh22 -
Category
Documents
-
view
5 -
download
0
Transcript of Vietnam Food & Drink Report Q1 2015 - VIETDATA

Q1 2015www.businessmonitor.com
VIETNAMFOOD & DRINK REPORTINCLUDES 5-YEAR FORECASTS TO 2018
ISSN 1749-3072Published by:Business Monitor International
Vietnam Food & Drink Report Q12015INCLUDES 5-YEAR FORECASTS TO 2018
Part of BMI’s Industry Report & Forecasts Series
Published by: Business Monitor International
Copy deadline: December 2014
Business Monitor InternationalSenator House85 Queen Victoria StreetLondonEC4V 4ABUnited KingdomTel: +44 (0) 20 7248 0468Fax: +44 (0) 20 7248 0467Email: [email protected]: http://www.businessmonitor.com
© 2014 Business Monitor InternationalAll rights reserved.
All information contained in this publication iscopyrighted in the name of Business MonitorInternational, and as such no part of thispublication may be reproduced, repackaged,redistributed, resold in whole or in any part, or usedin any form or by any means graphic, electronic ormechanical, including photocopying, recording,taping, or by information storage or retrieval, or byany other means, without the express written consentof the publisher.
DISCLAIMERAll information contained in this publication has been researched and compiled from sources believed to be accurate and reliable at the time ofpublishing. However, in view of the natural scope for human and/or mechanical error, either at source or during production, Business MonitorInternational accepts no liability whatsoever for any loss or damage resulting from errors, inaccuracies or omissions affecting any part of thepublication. All information is provided without warranty, and Business Monitor International makes no representation of warranty of any kind asto the accuracy or completeness of any information hereto contained.

CONTENTS
BMI Industry View ............................................................................................................... 7
SWOT .................................................................................................................................... 9Food ....................................................................................................................................................... 9
Drink .................................................................................................................................................... 11
Mass Grocery Retail ................................................................................................................................ 13
Industry Forecast .............................................................................................................. 15Consumer Outlook ................................................................................................................................... 15
Food ..................................................................................................................................................... 16
Food Consumption ................................................................................................................................ 16Table: Food Consumption Indicators - Historical Data & Forecasts (Vietnam 2011-2018) . . . . . . . . . . . . . . . . . . . . . . . . . . . . . . . . . . . . . . . . . . . . . . . . . . . . . . . . . . 18
Canned Food ........................................................................................................................................ 18
Confectionery ........................................................................................................................................ 19Table: Confectionery Value/Volume Sales, Production & Trade - Historical Data & Forecasts (Vietnam 2011-2018) . . . . . . . . . . . . . . . . . . . . . . . . . . . . . . 21
Pasta ................................................................................................................................................... 23Table: Pasta Volume Sales, Production & Trade - Historical Data & Forecasts (Vietnam 2013-2018) . . . . . . . . . . . . . . . . . . . . . . . . . . . . . . . . . . . . . . . . . . . . . . 23
Dairy ................................................................................................................................................... 23Table: Dairy Volume Sales, Production & Trade - Historical Data & Forecasts (Vietnam 2013-2018) . . . . . . . . . . . . . . . . . . . . . . . . . . . . . . . . . . . . . . . . . . . . . . 24
Drink .................................................................................................................................................... 25
Alcoholic Drinks .................................................................................................................................... 25Table: Alcoholic Drinks Value/Volume Sales, Production & Trade - Historical Data & Forecasts (Vietnam 2013-2018) . . . . . . . . . . . . . . . . . . . . . . . . . . . 27
Hot Drinks ............................................................................................................................................ 29Table: Hot Drink Value/Volume Sales, Production & Trade - Historical Data & Forecasts (Vietnam 2013-2018) . . . . . . . . . . . . . . . . . . . . . . . . . . . . . . . . . . 30
Soft Drinks ............................................................................................................................................ 31Table: Soft Drinks Sales, Production & Trade (Vietnam 2013-2018) . . . . . . . . . . . . . . . . . . . . . . . . . . . . . . . . . . . . . . . . . . . . . . . . . . . . . . . . . . . . . . . . . . . . . . . . . . . . . . . . . . 32
Mass Grocery Retail ................................................................................................................................ 34Table: Mass Grocery Retail Sales By Format - Historical Data & Forecasts (Vietnam 2013-2018) . . . . . . . . . . . . . . . . . . . . . . . . . . . . . . . . . . . . . . . . . . . . . . . . . . 37
Table: Grocery Retail Sales By Format (%) . . . . . . . . . . . . . . . . . . . . . . . . . . . . . . . . . . . . . . . . . . . . . . . . . . . . . . . . . . . . . . . . . . . . . . . . . . . . . . . . . . . . . . . . . . . . . . . . . . . . . . . . . . . 37
Trade .................................................................................................................................................... 38Table: Trade Balance - Historical Data & Forecasts (Vietnam 2013-2018) . . . . . . . . . . . . . . . . . . . . . . . . . . . . . . . . . . . . . . . . . . . . . . . . . . . . . . . . . . . . . . . . . . . . . . . . . . 39
Macroeconomic Forecast ................................................................................................ 40Expecting Sustained Growth Momentum In 2015 ........................................................................................... 40
Table: Economic Activity (Vietnam 2009-2018) . . . . . . . . . . . . . . . . . . . . . . . . . . . . . . . . . . . . . . . . . . . . . . . . . . . . . . . . . . . . . . . . . . . . . . . . . . . . . . . . . . . . . . . . . . . . . . . . . . . . . . . . 44
Industry Risk Reward Index ............................................................................................. 45Asia Pacific - Risk/Reward Index ................................................................................................................ 45
Table: Asia Pacific Food & Drink Risk/Reward Index Q115 . . . . . . . . . . . . . . . . . . . . . . . . . . . . . . . . . . . . . . . . . . . . . . . . . . . . . . . . . . . . . . . . . . . . . . . . . . . . . . . . . . . . . . . . . . 46
Table: Asia Pacific Food & Drink Risk/Reward Sub-Factor Index Q115 - Selected Countries (scores out of 10) . . . . . . . . . . . . . . . . . . . . . . . . . . . . . . . . . . . 50
Vietnam Risk/Reward Index ....................................................................................................................... 51
Market Overview ............................................................................................................... 53
Vietnam Food & Drink Report Q1 2015
© Business Monitor International Page 4

Food ..................................................................................................................................................... 53
Agriculture ........................................................................................................................................... 53
Food Processing .................................................................................................................................... 54
Food Consumption ................................................................................................................................. 54
Drink .................................................................................................................................................... 56
Hot Drinks .......................................................................................................................................... 56
Soft Drinks ............................................................................................................................................ 56
Alcoholic Drinks .................................................................................................................................... 57
Mass Grocery Retail ................................................................................................................................ 60Table: Structure Of Mass Grocery Retail Market By Estimated Number of Outlets (Vietnam 2005-2014) . . . . . . . . . . . . . . . . . . . . . . . . . . . . . . . . . . . . . . . . . . . 61
Table: Mass Grocery Retail Sales By Format (Vietnam 2005-2014) . . . . . . . . . . . . . . . . . . . . . . . . . . . . . . . . . . . . . . . . . . . . . . . . . . . . . . . . . . . . . . . . . . . . . . . . . . . . . . . . . . 62
Industry Trends And Developments ................................................................................ 63Food ..................................................................................................................................................... 63
Key Industry Trends And Developments ...................................................................................................... 63
Drink .................................................................................................................................................... 68
Key Industry Trends And Developments ...................................................................................................... 68
Mass Grocery Retail ................................................................................................................................ 77
Key Industry Trends And Developments ...................................................................................................... 77
Competitive Landscape .................................................................................................... 81Table: Key Players In Vietnam's Food Sector . . . . . . . . . . . . . . . . . . . . . . . . . . . . . . . . . . . . . . . . . . . . . . . . . . . . . . . . . . . . . . . . . . . . . . . . . . . . . . . . . . . . . . . . . . . . . . . . . . . . . . . . . . 81
Table: Key Players In Vietnam's Drink Sector . . . . . . . . . . . . . . . . . . . . . . . . . . . . . . . . . . . . . . . . . . . . . . . . . . . . . . . . . . . . . . . . . . . . . . . . . . . . . . . . . . . . . . . . . . . . . . . . . . . . . . . . . 81
Table: Key Players In Vietnam's Mass Grocery Retail Sector . . . . . . . . . . . . . . . . . . . . . . . . . . . . . . . . . . . . . . . . . . . . . . . . . . . . . . . . . . . . . . . . . . . . . . . . . . . . . . . . . . . . . . . . . 82
Company Profile ................................................................................................................ 84Vinamilk ................................................................................................................................................ 84
Table: Vinamilk - Financial Highlights, 2008-2013 . . . . . . . . . . . . . . . . . . . . . . . . . . . . . . . . . . . . . . . . . . . . . . . . . . . . . . . . . . . . . . . . . . . . . . . . . . . . . . . . . . . . . . . . . . . . . . . . . . . . 94
Unilever Vietnam ..................................................................................................................................... 96
Nestlé Vietnam ........................................................................................................................................ 99
Masan Consumer ................................................................................................................................... 101
San Miguel Pure Foods Vietnam Co Ltd .................................................................................................... 104
Hanoi Beer Alcohol Beverage Corp (Habeco) ............................................................................................. 106
Saigon Beer Alcohol And Beverage Corporation (Sabeco) ............................................................................. 109
Carlsberg ............................................................................................................................................. 111
Saigon Co-op ........................................................................................................................................ 113
Global Industry Overview ................................................................................................ 116Table: Dollar General And Family Dollar Historic Quarterly Same-Store Sales Growth (% Change Y-O-Y) . . . . . . . . . . . . . . . . . . . . . . . . . . . . . . . . . . . . . . . 120
Table: Selected US And Global Spirits Companies - Historical Financial Indicators . . . . . . . . . . . . . . . . . . . . . . . . . . . . . . . . . . . . . . . . . . . . . . . . . . . . . . . . . . . . . . . . 123
Table: Select US Beverage Companies - Historic Eva Spread . . . . . . . . . . . . . . . . . . . . . . . . . . . . . . . . . . . . . . . . . . . . . . . . . . . . . . . . . . . . . . . . . . . . . . . . . . . . . . . . . . . . . . . . 125
Table: Food and Drink Team's Core Views . . . . . . . . . . . . . . . . . . . . . . . . . . . . . . . . . . . . . . . . . . . . . . . . . . . . . . . . . . . . . . . . . . . . . . . . . . . . . . . . . . . . . . . . . . . . . . . . . . . . . . . . . . . 126
Demographic Forecast ................................................................................................... 128Table: Population Headline Indicators (Vietnam 1990-2025) . . . . . . . . . . . . . . . . . . . . . . . . . . . . . . . . . . . . . . . . . . . . . . . . . . . . . . . . . . . . . . . . . . . . . . . . . . . . . . . . . . . . . . . . 129
Table: Key Population Ratios (Vietnam 1990-2025) . . . . . . . . . . . . . . . . . . . . . . . . . . . . . . . . . . . . . . . . . . . . . . . . . . . . . . . . . . . . . . . . . . . . . . . . . . . . . . . . . . . . . . . . . . . . . . . . . . 129
Table: Urban/Rural Population & Life Expectancy (Vietnam 1990-2025) . . . . . . . . . . . . . . . . . . . . . . . . . . . . . . . . . . . . . . . . . . . . . . . . . . . . . . . . . . . . . . . . . . . . . . . . . . . 130
Vietnam Food & Drink Report Q1 2015
© Business Monitor International Page 5
Table: Population By Age Group (Vietnam 1990-2025) . . . . . . . . . . . . . . . . . . . . . . . . . . . . . . . . . . . . . . . . . . . . . . . . . . . . . . . . . . . . . . . . . . . . . . . . . . . . . . . . . . . . . . . . . . . . . . 130
Table: Population By Age Group % (Vietnam 1990-2025) . . . . . . . . . . . . . . . . . . . . . . . . . . . . . . . . . . . . . . . . . . . . . . . . . . . . . . . . . . . . . . . . . . . . . . . . . . . . . . . . . . . . . . . . . . . 131
Glossary ........................................................................................................................... 133Food & Drink ...................................................................................................................................... 133
Mass Grocery Retail ............................................................................................................................. 133
Methodology .................................................................................................................... 135Industry Forecast Methodology .............................................................................................................. 135
Sector-Specific Methodology .................................................................................................................. 136
Sources .............................................................................................................................................. 136
Risk/Reward Index Methodology ............................................................................................................. 137Table: Food & Drink Risk/Reward Index Indicators . . . . . . . . . . . . . . . . . . . . . . . . . . . . . . . . . . . . . . . . . . . . . . . . . . . . . . . . . . . . . . . . . . . . . . . . . . . . . . . . . . . . . . . . . . . . . . . . . . 138
Table: Weighting . . . . . . . . . . . . . . . . . . . . . . . . . . . . . . . . . . . . . . . . . . . . . . . . . . . . . . . . . . . . . . . . . . . . . . . . . . . . . . . . . . . . . . . . . . . . . . . . . . . . . . . . . . . . . . . . . . . . . . . . . . . . . . . . . . . . . . . 139
Vietnam Food & Drink Report Q1 2015
© Business Monitor International Page 6
BMI Industry View
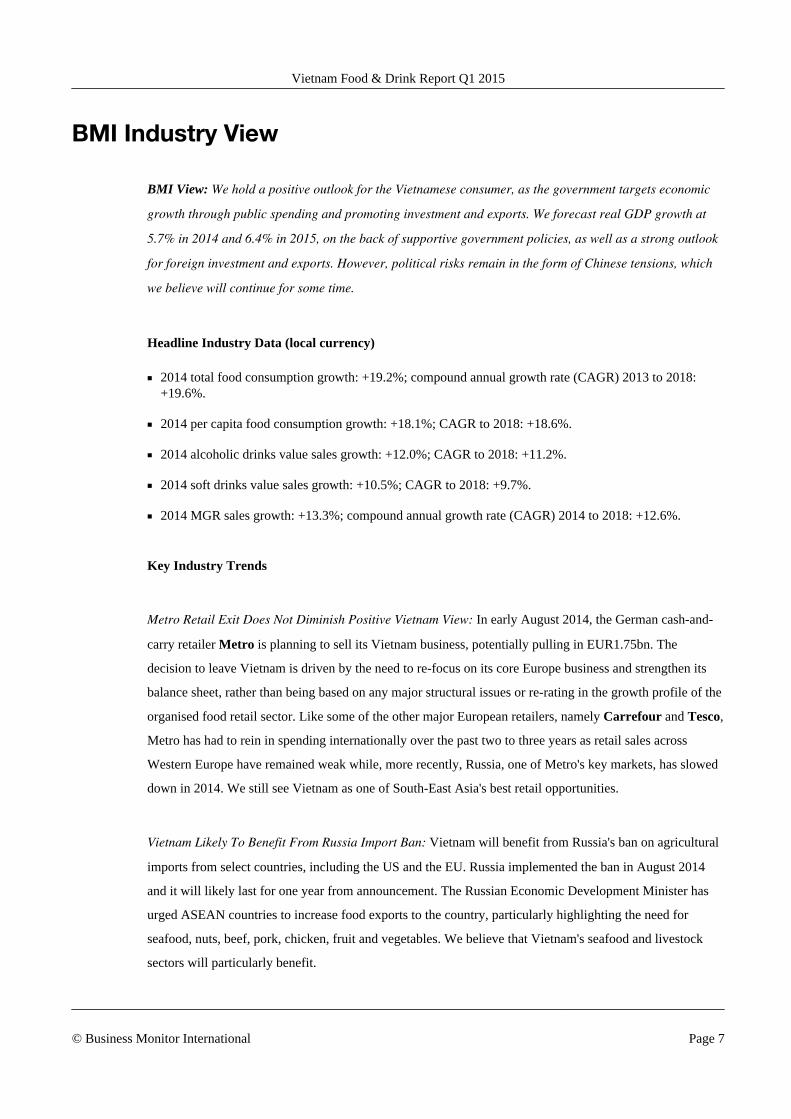
BMI View: We hold a positive outlook for the Vietnamese consumer, as the government targets economic
growth through public spending and promoting investment and exports. We forecast real GDP growth at
5.7% in 2014 and 6.4% in 2015, on the back of supportive government policies, as well as a strong outlook
for foreign investment and exports. However, political risks remain in the form of Chinese tensions, which
we believe will continue for some time.
Headline Industry Data (local currency)
■ 2014 total food consumption growth: +19.2%; compound annual growth rate (CAGR) 2013 to 2018:+19.6%.
■ 2014 per capita food consumption growth: +18.1%; CAGR to 2018: +18.6%.
■ 2014 alcoholic drinks value sales growth: +12.0%; CAGR to 2018: +11.2%.
■ 2014 soft drinks value sales growth: +10.5%; CAGR to 2018: +9.7%.
■ 2014 MGR sales growth: +13.3%; compound annual growth rate (CAGR) 2014 to 2018: +12.6%.
Key Industry Trends
Metro Retail Exit Does Not Diminish Positive Vietnam View: In early August 2014, the German cash-and-
carry retailer Metro is planning to sell its Vietnam business, potentially pulling in EUR1.75bn. The
decision to leave Vietnam is driven by the need to re-focus on its core Europe business and strengthen its
balance sheet, rather than being based on any major structural issues or re-rating in the growth profile of the
organised food retail sector. Like some of the other major European retailers, namely Carrefour and Tesco,
Metro has had to rein in spending internationally over the past two to three years as retail sales across
Western Europe have remained weak while, more recently, Russia, one of Metro's key markets, has slowed
down in 2014. We still see Vietnam as one of South-East Asia's best retail opportunities.
Vietnam Likely To Benefit From Russia Import Ban: Vietnam will benefit from Russia's ban on agricultural
imports from select countries, including the US and the EU. Russia implemented the ban in August 2014
and it will likely last for one year from announcement. The Russian Economic Development Minister has
urged ASEAN countries to increase food exports to the country, particularly highlighting the need for
seafood, nuts, beef, pork, chicken, fruit and vegetables. We believe that Vietnam's seafood and livestock
sectors will particularly benefit.
Vietnam Food & Drink Report Q1 2015
© Business Monitor International Page 7
ThaiBev Looks To High Growth Vietnam: Thai Beverage Public Company (ThaiBev), Thailand's largest
beverage producer and distributor, is seeking expansion opportunities in South East Asian countries, due to
limited opportunities in its domestic market. ThaiBev has recently shown interest in purchasing a stake in
Vietnam's leading beer company, Sabeco, which controls 45-50% of Vietnam's beer market. The
Vietnamese government currently owns 89% of Sabeco, but is expected to sell more than 50% of the
company to investors. We believe this will be an opportunity for ThaiBev to boost its exposure to a high-
growth market as Thailand slows down.
Vietnam Food & Drink Report Q1 2015
© Business Monitor International Page 8
SWOT
Food
SWOT Analysis
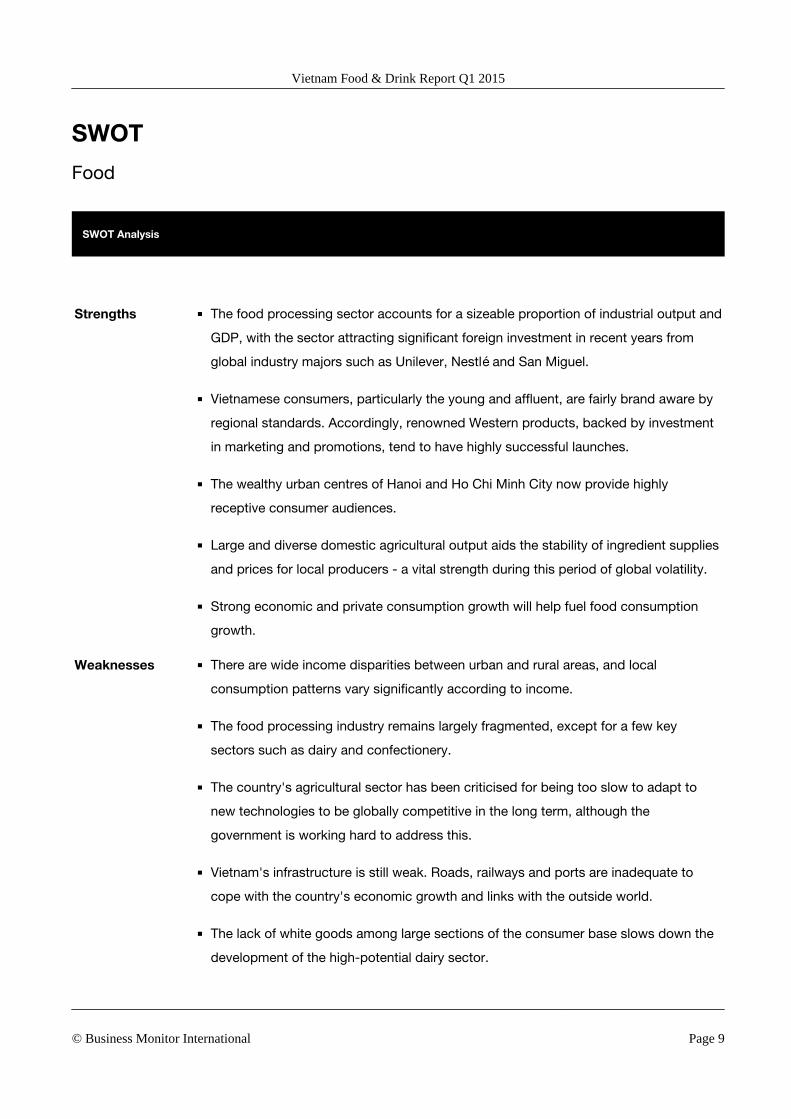
Strengths ■ The food processing sector accounts for a sizeable proportion of industrial output and
GDP, with the sector attracting significant foreign investment in recent years from
global industry majors such as Unilever, Nestlé and San Miguel.
■ Vietnamese consumers, particularly the young and affluent, are fairly brand aware by
regional standards. Accordingly, renowned Western products, backed by investment
in marketing and promotions, tend to have highly successful launches.
■ The wealthy urban centres of Hanoi and Ho Chi Minh City now provide highly
receptive consumer audiences.
■ Large and diverse domestic agricultural output aids the stability of ingredient supplies
and prices for local producers - a vital strength during this period of global volatility.
■ Strong economic and private consumption growth will help fuel food consumption
growth.
Weaknesses ■ There are wide income disparities between urban and rural areas, and local
consumption patterns vary significantly according to income.
■ The food processing industry remains largely fragmented, except for a few key
sectors such as dairy and confectionery.
■ The country's agricultural sector has been criticised for being too slow to adapt to
new technologies to be globally competitive in the long term, although the
government is working hard to address this.
■ Vietnam's infrastructure is still weak. Roads, railways and ports are inadequate to
cope with the country's economic growth and links with the outside world.
■ The lack of white goods among large sections of the consumer base slows down the
development of the high-potential dairy sector.
Vietnam Food & Drink Report Q1 2015
© Business Monitor International Page 9
SWOT Analysis - Continued
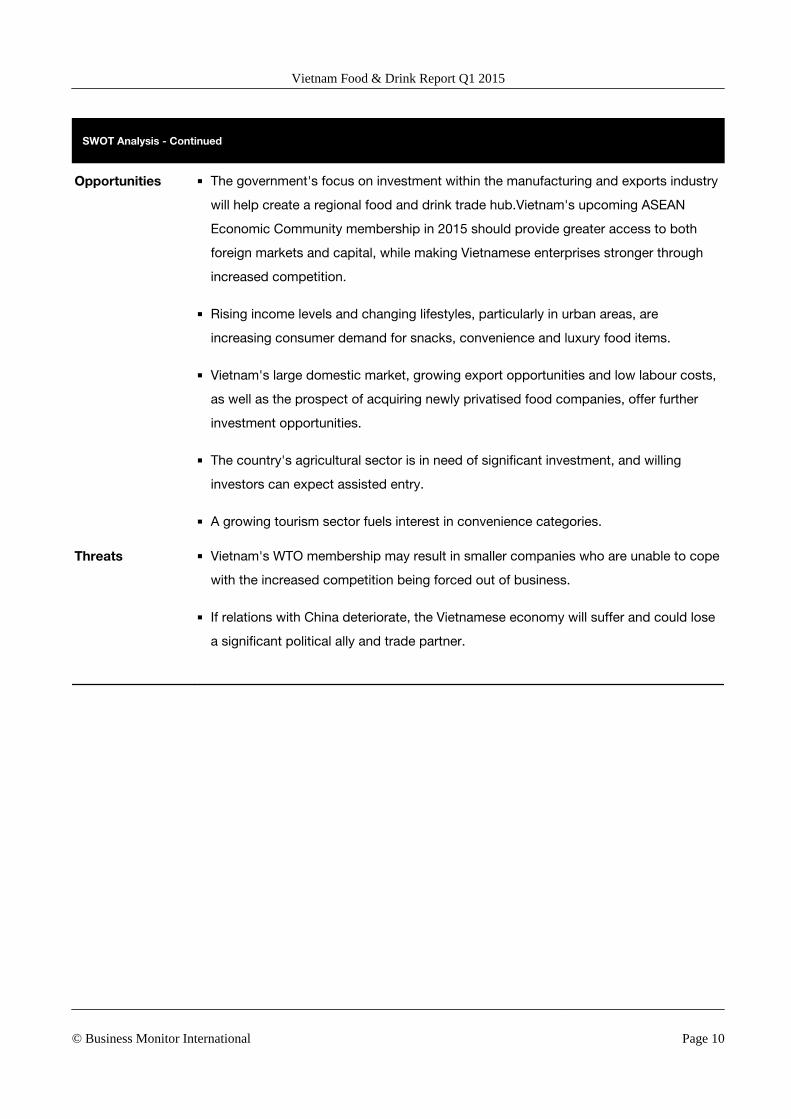
Opportunities ■ The government's focus on investment within the manufacturing and exports industry
will help create a regional food and drink trade hub.Vietnam's upcoming ASEAN
Economic Community membership in 2015 should provide greater access to both
foreign markets and capital, while making Vietnamese enterprises stronger through
increased competition.
■ Rising income levels and changing lifestyles, particularly in urban areas, are
increasing consumer demand for snacks, convenience and luxury food items.
■ Vietnam's large domestic market, growing export opportunities and low labour costs,
as well as the prospect of acquiring newly privatised food companies, offer further
investment opportunities.
■ The country's agricultural sector is in need of significant investment, and willing
investors can expect assisted entry.
■ A growing tourism sector fuels interest in convenience categories.
Threats ■ Vietnam's WTO membership may result in smaller companies who are unable to cope
with the increased competition being forced out of business.
■ If relations with China deteriorate, the Vietnamese economy will suffer and could lose
a significant political ally and trade partner.
Vietnam Food & Drink Report Q1 2015
© Business Monitor International Page 10
Drink
SWOT Analysis
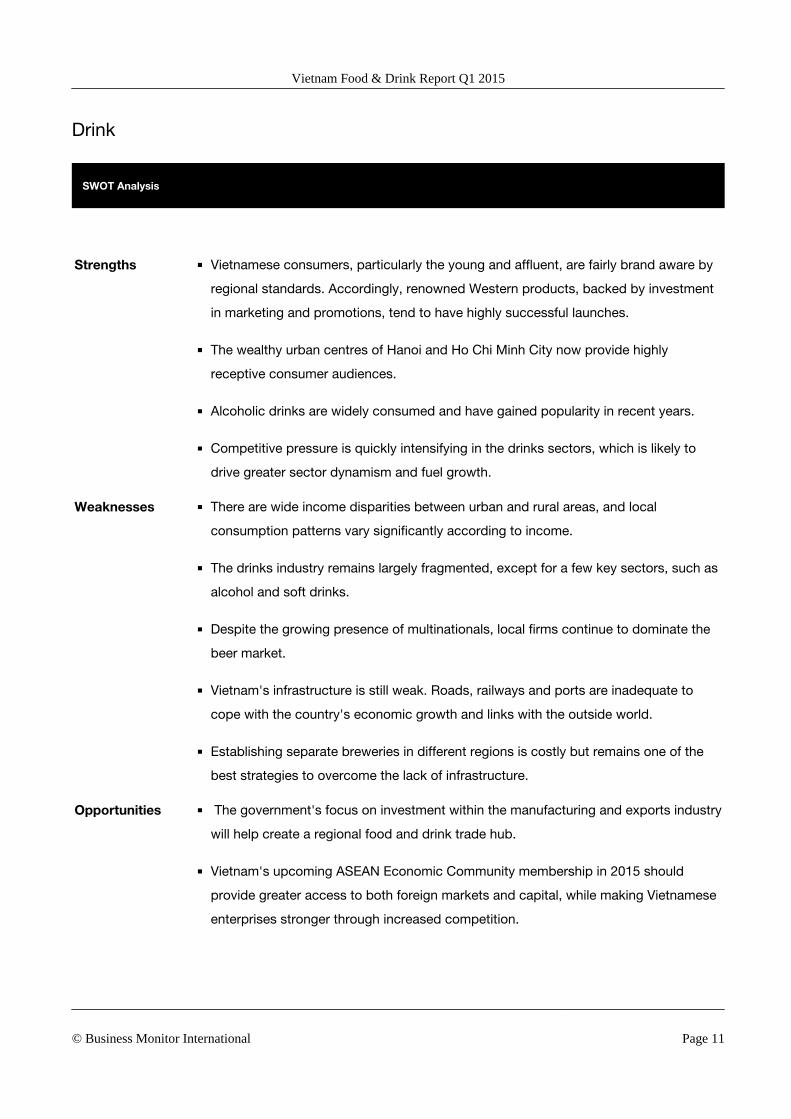
Strengths ■ Vietnamese consumers, particularly the young and affluent, are fairly brand aware by
regional standards. Accordingly, renowned Western products, backed by investment
in marketing and promotions, tend to have highly successful launches.
■ The wealthy urban centres of Hanoi and Ho Chi Minh City now provide highly
receptive consumer audiences.
■ Alcoholic drinks are widely consumed and have gained popularity in recent years.
■ Competitive pressure is quickly intensifying in the drinks sectors, which is likely to
drive greater sector dynamism and fuel growth.
Weaknesses ■ There are wide income disparities between urban and rural areas, and local
consumption patterns vary significantly according to income.
■ The drinks industry remains largely fragmented, except for a few key sectors, such as
alcohol and soft drinks.
■ Despite the growing presence of multinationals, local firms continue to dominate the
beer market.
■ Vietnam's infrastructure is still weak. Roads, railways and ports are inadequate to
cope with the country's economic growth and links with the outside world.
■ Establishing separate breweries in different regions is costly but remains one of the
best strategies to overcome the lack of infrastructure.
Opportunities ■ The government's focus on investment within the manufacturing and exports industry
will help create a regional food and drink trade hub.
■ Vietnam's upcoming ASEAN Economic Community membership in 2015 should
provide greater access to both foreign markets and capital, while making Vietnamese
enterprises stronger through increased competition.
Vietnam Food & Drink Report Q1 2015
© Business Monitor International Page 11
SWOT Analysis - Continued
■ Vietnam's large domestic market, growing export opportunities and low labour costs,
as well as the prospect of acquiring newly privatised drink companies, offer further
investment opportunities.
■ A growing tourism sector is fuelling interest in convenience categories, in addition to
sub-sectors such as soft and alcoholic drinks.
■ In line with consumers' rising disposable incomes, there are opportunities for
premium-branded products in the soft and alcoholic drinks sub-sectors.
■ The global trend towards health consciousness provides an opportunity for drinks
manufacturers to diversify into perceived healthier options.
Threats ■ Vietnam's WTO membership may result in smaller companies who are unable to cope
with the increased competition being forced out of business.
■ If relations with China deteriorate, the Vietnamese economy will suffer and could lose
a significant political ally and trade partner.
Vietnam Food & Drink Report Q1 2015
© Business Monitor International Page 12
Mass Grocery Retail
SWOT Analysis
Strengths ■ The potential size of the mass grocery retail market makes it an attractive target for
foreign retailers once improved market terms are granted. Further growth is expected,
especially in the supermarket format.
■ Hypermarkets, supermarkets and convenience stores have all proved popular in
Vietnam, catering for different types of consumers and different shopping occasions.
■ A growing multinational presence in the retail sector has aided the acceptance of
modern retail best practices in Vietnam, particularly things such as added-value in-
store services.
■ Vietnamese economic growth averaged 7.1% annually between 2000 and 2012,
fuelling a steady middle-class emergence and growing consumerism. The economic
boom has lifted many Vietnamese out of poverty, generating a greater demand for the
higher-value modern retail concepts.
■ The formation of buying groups has proved an effective means of facilitating quicker
expansion among smaller industry players.
Weaknesses ■ Vietnam's retail distribution networks remain underdeveloped, and expansion-
oriented firms must invest in infrastructural development as well as new store
openings.
■ Regulations governing international participation in modern retail in Vietnam have
resulted in slow rates of expansion, and aspects of government policy continue to
make life challenging for foreign firms in spite of WTO accession.
■ Poverty levels among the country's vast rural population hugely inhibit the potential
audience size for modern retail in Vietnam.
■ Vietnam's infrastructure is still weak. Roads, railways and ports are inadequate to
cope with the country's economic growth and links with the outside world.
Vietnam Food & Drink Report Q1 2015
© Business Monitor International Page 13
SWOT Analysis - Continued
Opportunities ■ The hypermarket concept is still in its infancy and, as familiarity with modern retailing
grows, this format will represent an immense growth opportunity.
■ Modern retail is currently focused on the major urban centres of the north and south,
which still boast space for new entrants. Central Vietnam and the provinces provide
further opportunities still.
■ Modern retail concepts, such as discounting and private labelling, are likely to prove
popular with price-conscious Vietnamese consumers as familiarity with modern
retailing builds.
■ Rapid urbanisation and the development of new housing complexes provide ideal
locations for modern retail outlets.
■ The government's focus on investment within the manufacturing and exports industry
will result in lower production costs for such items, which have the potential to boost
the profits of MGR firms.
Threats ■ Rising operating costs will threaten retailer profit margins; price increases have to
date been passed on to shoppers, but this cannot continue indefinitely in the price-
conscious market.
■ The potential exit of Metro from Vietnam highlights the more inward looking global
MGR sector, which could limit investment in emerging markets for the foreseeable
future.
■ If relations with China deteriorate, the Vietnamese economy will suffer and could lose
a significant political ally and trade partner.
Vietnam Food & Drink Report Q1 2015
© Business Monitor International Page 14

Industry Forecast
Consumer Outlook
We hold a positive outlook for the Vietnamese consumer, as the government targets economic growth
through public spending and promoting investment and exports. However, political risks remain in the form
of Chinese tensions, which we believe will continue for some time.
In line with our positive outlook for the Vietnamese economy, we forecast real GDP growth at 5.7% in
2014 and 6.4% in 2015, on the back of supportive government policies, as well as a strong outlook for
foreign investment and exports. Following weaker-than-expected H114 growth numbers, Vietnam's real
GDP growth accelerated to 6.2% in Q314, marking the fastest pace of expansion since Q411. Over the first
eleven months of 2014, the manufacturing sector expanded by 7.5% year-on-year (y-o-y). The Purchasing
Managers' Index (PMI) came at 52.1 in November, representing the 15th consecutive month of expansion.
The services sector was also a strong driver of growth. Over January-November, total retail sales of goods
and services expanded by 11.1% y-o-y.
Sustained Expansion On The Cards
Vietnam - Purchasing Managers' Index (PMI)
Source: Bloomberg, BMI
Vietnam Food & Drink Report Q1 2015
© Business Monitor International Page 15
We believe that the food and drink industry in Vietnam will benefit from the government's drive to increase
the manufacturing sector for regional and international trade. Vietnam is quickly becoming a regional trade
powerhouse, especially in the food and drink sector. Vietnam's export sector continues to be a driver of
growth for the country, and we forecast this trend to remain in play over the coming months. Exports in the
first eleven months of the year expanded by a robust 13.7% y-o-y. We expect exports to continue driving
growth going forward given that the Vietnamese government has been making a concerted push to build
diplomatic and trade ties with many countries and is negotiating several free trade agreements. One of the
most important ones is the Trans-Pacific Partnership (TPP), which could be signed by as early as 2015.
On the consumer side, we note that a proposed increase in the tax base on food and drink products could be
implemented in July 2015. This will decrease sales of certain food and drink items, predominantly products
such as carbonated drinks and confectionery. If and when this tax increase is confirmed, we will be
adjusting our forecasts accordingly.
In the long term, rapid economic growth in Vietnam over the coming years is likely to translate into higher
income, in turn benefiting consumerism. We forecast strong private consumption growth over the next few
years, at 6.5% in 2014 and 2015. Most exciting is the country's favourable demographic profile: 49.6% of
the population is estimated to be younger than 30. This implies potentially dynamic opportunities for
consumer goods players targeting the mass-market segment in particular. Rapid urbanisation provides
additional opportunities for modern retail outlets.
What Vietnam offers investors is arguably one of the most attractive consumer bases in South East Asia
after India. With a youthful population of 90mn, and GDP growth forecast at 5.7% in 2014, the country
provides attractive demographic potential for retailers keen to capture the vast consumer base. A flurry of
international investment interest in the country over recent years has given continued focus on the merits of
the unravelling consumer story in Vietnam, particularly in its mass grocery retail sector. Overall, we believe
that Vietnam remains one the most exciting mass grocery retail Asian growth stories. With the potential to
outperform regionally in the coming years, the country continues to gradually prove its growing reputation
as Asia's 'little India'.
Food
Food Consumption
■ 2014 total food consumption (local currency) growth: +19.2%; compound annual growth rate (CAGR)2013 to 2018: +19.6%.
■ 2014 per capita food consumption (local currency) growth: +18.1%; CAGR to 2018: +18.6%.
Vietnam Food & Drink Report Q1 2015
© Business Monitor International Page 16

Vietnam will remain one of the most attractive
investment opportunities in the region over our
forecast period to 2018 and beyond. Domestic
consumer expenditure will continue to grow, and the
country is a major regional hub for exports. The food
sector represents a large and growing portion of the
country's manufacturing output.
We expect per capita food consumption to grow at a
fast pace, by 18.1% in 2014 and by a compound
annual rate of 18.6% from 2013 through to 2018. An
attractive demographic profile, rapid urbanisation
and rapid expansion of country's mass grocery retail
sector will fuel this growth over the longer term.
Currently, income levels in Vietnam are a long way
behind those enjoyed in developed economies, and
consumer purchases remain largely centred on food staples and daily necessities. However, as incomes
continue to accelerate off a low base on the back of sturdy economic growth, consumer tastes and
preferences are expected to calibrate towards the higher-value food and beverage segments, which will be
very likely to guarantee a receptive and growing audience for branded food and beverage products in the
medium term.
The massive potential provided by the burgeoning middle class in Vietnam is already attracting the sights of
major consumer-facing players in the country. The ongoing expansion of the mass grocery retail industry
will drive up per capita food consumption levels, provided goods sold through such outlets remain
competitively priced. Ultimately, food consumption growth will be driven by the government's ability to
harness rural spending power and by modern retailers' ability to find a model that stirs consumer interest,
without forgetting that price will remain the major purchasing determinant.
As a regional manufacturing and trade hub, we also highlight Vietnam's strong food processing sector as an
ongoing investment driver. Food products account for 21% of all of Vietnam's manufacturing output, which
in itself makes up about 17-18% of GDP. The manufacturing sector will expand robustly in the country on
the back of an improved macroeconomic and investment climate, a growing domestic market, and an
abundant working age population with competitive wages relative to regional peers.
Food Consumption
(2009-2018)
Food consumption VNDbn (LHS)Food consumption, VND, % y-o-y (RHS)
2009
2010
2011
2012
2013
e
2014
f
2015
f
2016
f
2017
f
2018
f
0
500,000
1,000,000
1,500,000
5
10
15
20
25
e/f = BMI estimate/forecast. Source: National sources, BMI
Vietnam Food & Drink Report Q1 2015
© Business Monitor International Page 17
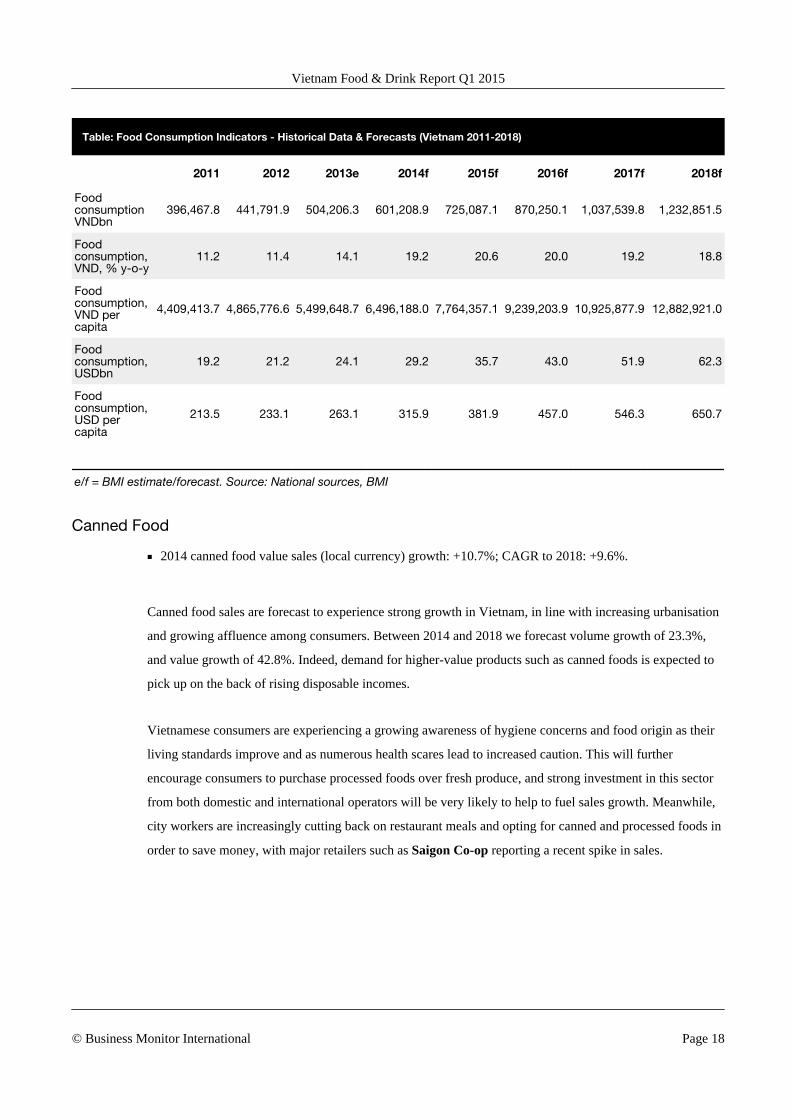
Table: Food Consumption Indicators - Historical Data & Forecasts (Vietnam 2011-2018)
2011 2012 2013e 2014f 2015f 2016f 2017f 2018f
FoodconsumptionVNDbn
396,467.8 441,791.9 504,206.3 601,208.9 725,087.1 870,250.1 1,037,539.8 1,232,851.5
Foodconsumption,VND, % y-o-y
11.2 11.4 14.1 19.2 20.6 20.0 19.2 18.8
Foodconsumption,VND percapita
4,409,413.7 4,865,776.6 5,499,648.7 6,496,188.0 7,764,357.1 9,239,203.9 10,925,877.9 12,882,921.0
Foodconsumption,USDbn
19.2 21.2 24.1 29.2 35.7 43.0 51.9 62.3
Foodconsumption,USD percapita
213.5 233.1 263.1 315.9 381.9 457.0 546.3 650.7
e/f = BMI estimate/forecast. Source: National sources, BMI
Canned Food
■ 2014 canned food value sales (local currency) growth: +10.7%; CAGR to 2018: +9.6%.
Canned food sales are forecast to experience strong growth in Vietnam, in line with increasing urbanisation
and growing affluence among consumers. Between 2014 and 2018 we forecast volume growth of 23.3%,
and value growth of 42.8%. Indeed, demand for higher-value products such as canned foods is expected to
pick up on the back of rising disposable incomes.
Vietnamese consumers are experiencing a growing awareness of hygiene concerns and food origin as their
living standards improve and as numerous health scares lead to increased caution. This will further
encourage consumers to purchase processed foods over fresh produce, and strong investment in this sector
from both domestic and international operators will be very likely to help to fuel sales growth. Meanwhile,
city workers are increasingly cutting back on restaurant meals and opting for canned and processed foods in
order to save money, with major retailers such as Saigon Co-op reporting a recent spike in sales.
Vietnam Food & Drink Report Q1 2015
© Business Monitor International Page 18
Confectionery
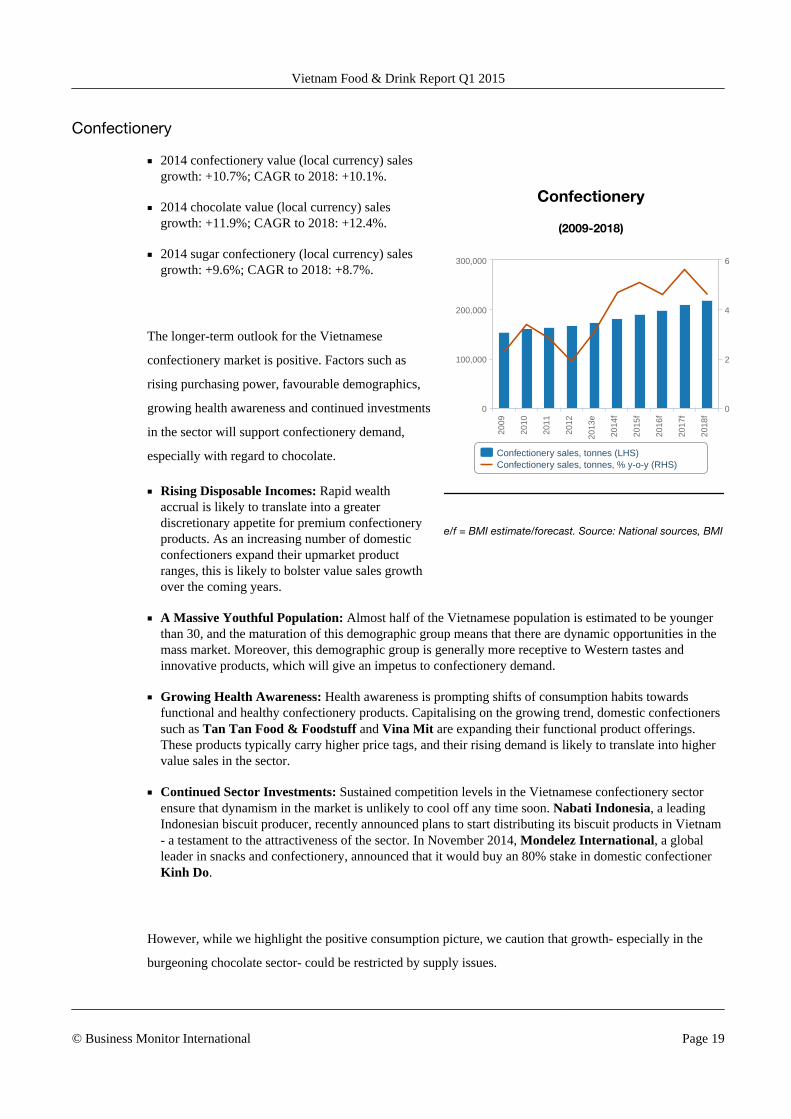
■ 2014 confectionery value (local currency) salesgrowth: +10.7%; CAGR to 2018: +10.1%.
■ 2014 chocolate value (local currency) salesgrowth: +11.9%; CAGR to 2018: +12.4%.
■ 2014 sugar confectionery (local currency) salesgrowth: +9.6%; CAGR to 2018: +8.7%.
The longer-term outlook for the Vietnamese
confectionery market is positive. Factors such as
rising purchasing power, favourable demographics,
growing health awareness and continued investments
in the sector will support confectionery demand,
especially with regard to chocolate.
■ Rising Disposable Incomes: Rapid wealthaccrual is likely to translate into a greaterdiscretionary appetite for premium confectioneryproducts. As an increasing number of domesticconfectioners expand their upmarket productranges, this is likely to bolster value sales growthover the coming years.
■ A Massive Youthful Population: Almost half of the Vietnamese population is estimated to be youngerthan 30, and the maturation of this demographic group means that there are dynamic opportunities in themass market. Moreover, this demographic group is generally more receptive to Western tastes andinnovative products, which will give an impetus to confectionery demand.
■ Growing Health Awareness: Health awareness is prompting shifts of consumption habits towardsfunctional and healthy confectionery products. Capitalising on the growing trend, domestic confectionerssuch as Tan Tan Food & Foodstuff and Vina Mit are expanding their functional product offerings.These products typically carry higher price tags, and their rising demand is likely to translate into highervalue sales in the sector.
■ Continued Sector Investments: Sustained competition levels in the Vietnamese confectionery sectorensure that dynamism in the market is unlikely to cool off any time soon. Nabati Indonesia, a leadingIndonesian biscuit producer, recently announced plans to start distributing its biscuit products in Vietnam- a testament to the attractiveness of the sector. In November 2014, Mondelez International, a globalleader in snacks and confectionery, announced that it would buy an 80% stake in domestic confectionerKinh Do.
However, while we highlight the positive consumption picture, we caution that growth- especially in the
burgeoning chocolate sector- could be restricted by supply issues.
Confectionery
(2009-2018)
Confectionery sales, tonnes (LHS)Confectionery sales, tonnes, % y-o-y (RHS)
2009
2010
2011
2012
2013
e
2014
f
2015
f
2016
f
2017
f
2018
f
0
100,000
200,000
300,000
2
4
6
0
e/f = BMI estimate/forecast. Source: National sources, BMI
Vietnam Food & Drink Report Q1 2015
© Business Monitor International Page 19
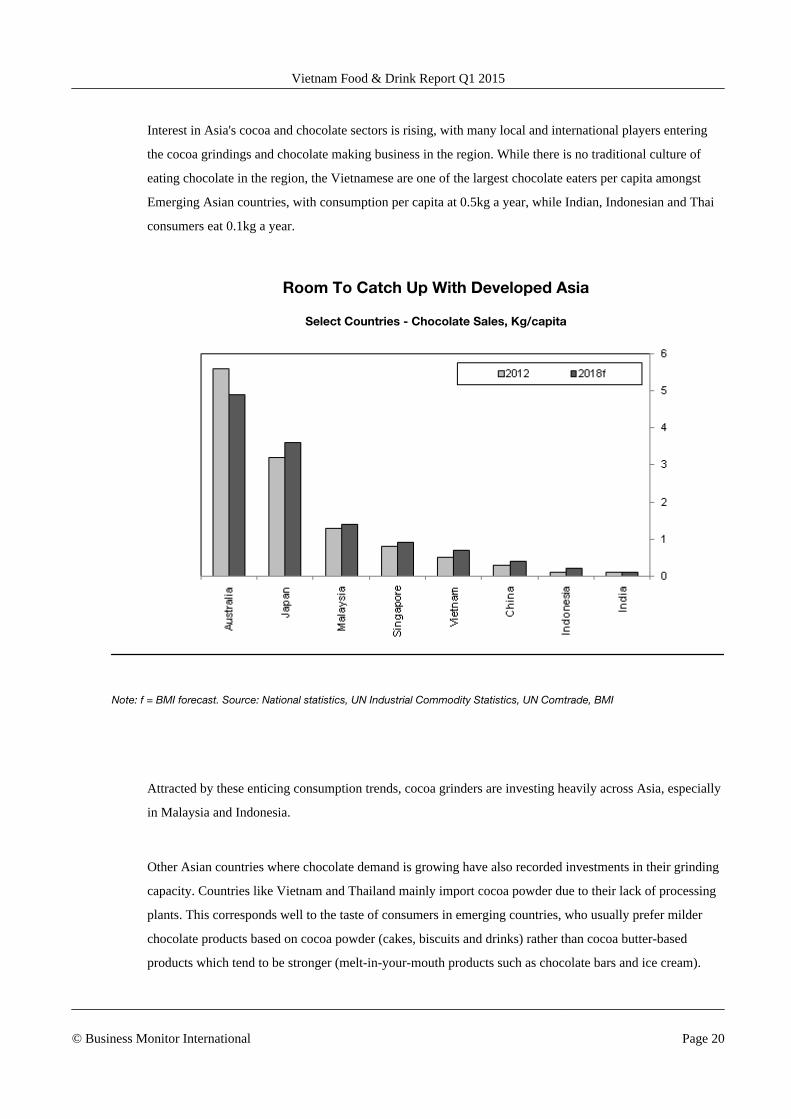
Interest in Asia's cocoa and chocolate sectors is rising, with many local and international players entering
the cocoa grindings and chocolate making business in the region. While there is no traditional culture of
eating chocolate in the region, the Vietnamese are one of the largest chocolate eaters per capita amongst
Emerging Asian countries, with consumption per capita at 0.5kg a year, while Indian, Indonesian and Thai
consumers eat 0.1kg a year.
Room To Catch Up With Developed Asia
Select Countries - Chocolate Sales, Kg/capita
Note: f = BMI forecast. Source: National statistics, UN Industrial Commodity Statistics, UN Comtrade, BMI
Attracted by these enticing consumption trends, cocoa grinders are investing heavily across Asia, especially
in Malaysia and Indonesia.
Other Asian countries where chocolate demand is growing have also recorded investments in their grinding
capacity. Countries like Vietnam and Thailand mainly import cocoa powder due to their lack of processing
plants. This corresponds well to the taste of consumers in emerging countries, who usually prefer milder
chocolate products based on cocoa powder (cakes, biscuits and drinks) rather than cocoa butter-based
products which tend to be stronger (melt-in-your-mouth products such as chocolate bars and ice cream).
Vietnam Food & Drink Report Q1 2015
© Business Monitor International Page 20

In spite of strong demand fundamentals for the cocoa and chocolate sectors in Asia, headwinds are growing
in the processing industry. First, the ongoing wave of investment in cocoa processing plants has led to
overcapacity in Malaysia and Indonesia. We believe the fast development of capacity will have a lingering
impact on cocoa grinders' profitability in the coming years, with margins in the industry remaining in the
doldrums. The second challenge facing the sector is the dwindling supply of cocoa beans coming Indonesia,
which has traditionally been Asia's main supplier. Cocoa production in Indonesia has been declining since
2012/13, as the government's ambitious plan to double output has been a failure so far. Seeds supplied by
the Indonesian Coffee and Cocoa Research Institute are producing defective cocoa trees that yield poor-
quality pods and small, discoloured beans. The scarcity of locally grown bean is being exacerbated by the
fast development of the grinding sector. Indonesia's cocoa production surplus is steadily narrowing and is
expected to come in at a low 119,600 tonnes in 2013/14, compared with the five-year average of 274,000
tonnes.
Not only have beans exports fallen recently, hampering the processing sector in Asia, but Indonesia is now
forced to import higher-quality beans from Africa. In addition, grinders in Indonesia are lobbying to lower
the import tax on cocoa beans in order to increase domestic supply. This would put further pressure on
Indonesian cocoa bean farmers, as they would have to face stiffer competition from African beans, which
are cheaper and of better quality. Many Indonesian cocoa farmers could be pushed out of business, limiting
production further in the future.
We believe the growing scarcity of Indonesian beans, on which many Asian grinders were counting to
supply their plants, will put the development of the chocolate making sector in Asia in jeopardy. The
stagnation in beans output will leave the world dependent on a single source of cocoa, West Africa, known
for its unstable production. This is likely to lead to volatile and slim margins in times of elevated cocoa
prices. Decreasing supply from Indonesia should limit the global production surpluses in the coming years,
leaving cocoa prices at high levels compared with historical averages.
Table: Confectionery Value/Volume Sales, Production & Trade - Historical Data & Forecasts (Vietnam 2011-2018)
2011 2012 2013e 2014f 2015f 2016f 2017f 2018f
Confectionerysales, VNDmn 20,109,915 22,411,421 24,641,933 27,266,416 30,150,945 33,014,227 36,491,850 39,884,680
Confectionerysales, VND percapita
223,657.3 246,833.3 268,782.8 294,619.3 322,861.5 350,502.9 384,279.7 416,782.7
Confectionerysales, USDmn 973.5 1,073.7 1,179.0 1,325.9 1,483.1 1,633.2 1,824.6 2,014.4
Vietnam Food & Drink Report Q1 2015
© Business Monitor International Page 21

Confectionery Value/Volume Sales, Production & Trade - Historical Data & Forecasts (Vietnam 2011-2018) - Continued
2011 2012 2013e 2014f 2015f 2016f 2017f 2018f
Confectionerysales, tonnes 164,815.7 167,979.8 173,192.3 181,310.5 190,617.3 199,339.8 210,529.0 220,143.8
Chocolatesales, VNDmn 3,340,752.6 3,703,892.4 4,054,380.0 4,536,173.9 5,083,520.6 5,700,780.5 6,461,089.7 7,272,341.3
Chocolatesales, USDmn 161.73 177.45 193.99 220.58 250.05 282.01 323.05 367.29
Chocolatesales, tonnes 46,763.9 47,448.7 48,722.9 51,541.4 54,879.3 58,612.4 63,326.5 67,948.2
Chocolatesales, kg percapita
0.5 0.5 0.5 0.6 0.6 0.6 0.7 0.7
Sugarconfectionerysales, tonnes
111,922.8 114,300.6 118,200.2 122,518.2 127,125.4 131,231.4 135,966.7 139,727.9
Sugarconfectionerysales, kg percapita
1.2 1.3 1.3 1.3 1.4 1.4 1.4 1.5
Sugarconfectioneryexports,tonnes
26,956.6 29,615.0 30,789.8 31,952.1 33,223.4 35,614.6 36,566.9 39,188.7
Sugarconfectioneryimports,tonnes
13,963.2 15,089.2 16,156.1 17,249.1 18,424.0 19,997.0 21,065.9 22,709.8
Sugarconfectionerybalance,tonnes
12,993.4 14,525.8 14,633.7 14,703.0 14,799.3 15,617.6 15,501.0 16,479.0
Gum sales,tonnes 6,129.1 6,230.6 6,269.2 7,250.9 8,612.6 9,496.0 11,235.8 12,467.6
Gum sales, kgper capita 0.1 0.1 0.1 0.1 0.1 0.1 0.1 0.1
Gum sales,VNDmn 1,060,011.8 1,177,461.1 1,262,944.8 1,544,923.6 1,931,391.6 2,235,979.3 2,775,288.0 3,230,437.6
Gum sales,VND percapita
11,789.2 12,968.2 13,775.6 16,693.2 20,681.7 23,738.8 29,225.3 33,757.1
Gum sales,USDmn 51.32 56.41 60.43 75.12 95.00 110.61 138.76 163.15
e/f = BMI estimate/forecast. Source: National sources, BMI
Vietnam Food & Drink Report Q1 2015
© Business Monitor International Page 22
Pasta
The Vietnamese pasta market is underdeveloped, although the product has become more recognisable in
view of Westernisation of lifestyles, particularly in urban areas. Around half of the retail market is
dominated by Barilla, with other prominent importers including Italpasta and Pasta Zara.
However, the market for instant noodles is well established, with the market supplied by a mixture of
locally made (by companies such as Masan Consumer and Acecook Vietnam JSC) and imported products.
Goods are receiving strong marketing and advertising support, especially as the more challenging economic
times have prioritised non-discretionary spending. Instant noodles are expected to remain very popular, on
account of their affordability, versatility as a cooking ingredient, wide-ranging availability and convenience.
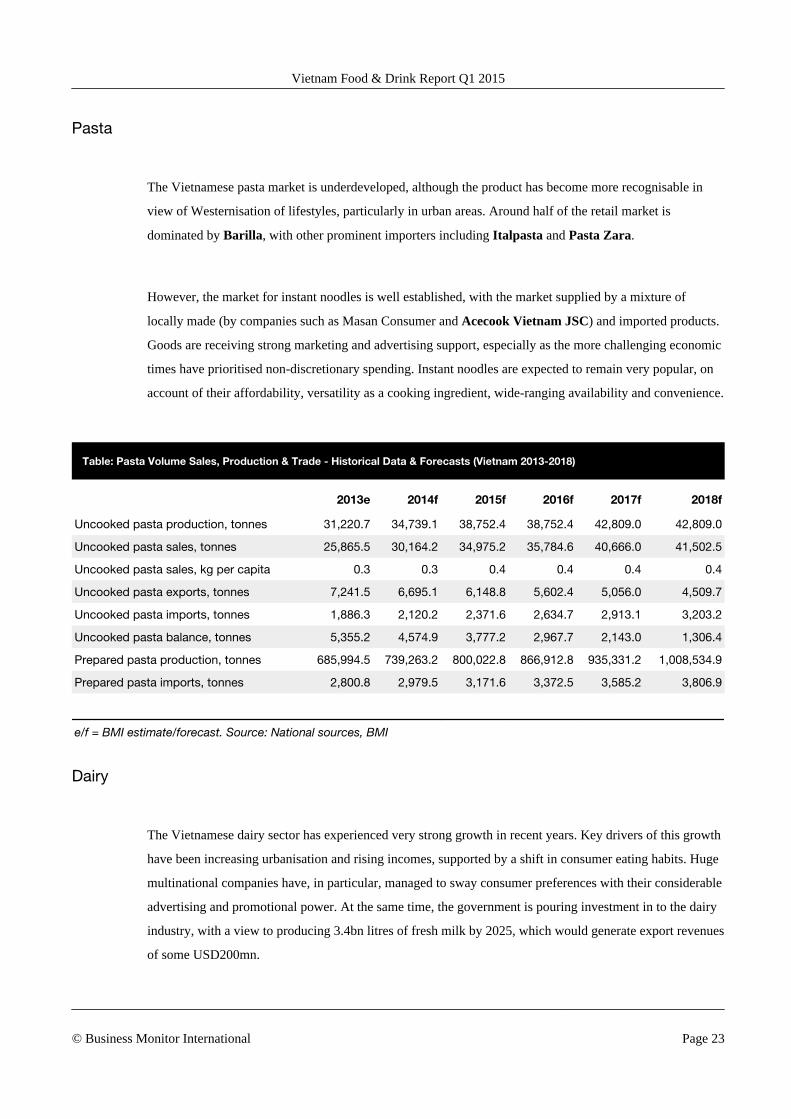
Table: Pasta Volume Sales, Production & Trade - Historical Data & Forecasts (Vietnam 2013-2018)
2013e 2014f 2015f 2016f 2017f 2018f
Uncooked pasta production, tonnes 31,220.7 34,739.1 38,752.4 38,752.4 42,809.0 42,809.0
Uncooked pasta sales, tonnes 25,865.5 30,164.2 34,975.2 35,784.6 40,666.0 41,502.5
Uncooked pasta sales, kg per capita 0.3 0.3 0.4 0.4 0.4 0.4
Uncooked pasta exports, tonnes 7,241.5 6,695.1 6,148.8 5,602.4 5,056.0 4,509.7
Uncooked pasta imports, tonnes 1,886.3 2,120.2 2,371.6 2,634.7 2,913.1 3,203.2
Uncooked pasta balance, tonnes 5,355.2 4,574.9 3,777.2 2,967.7 2,143.0 1,306.4
Prepared pasta production, tonnes 685,994.5 739,263.2 800,022.8 866,912.8 935,331.2 1,008,534.9
Prepared pasta imports, tonnes 2,800.8 2,979.5 3,171.6 3,372.5 3,585.2 3,806.9
e/f = BMI estimate/forecast. Source: National sources, BMI
Dairy
The Vietnamese dairy sector has experienced very strong growth in recent years. Key drivers of this growth
have been increasing urbanisation and rising incomes, supported by a shift in consumer eating habits. Huge
multinational companies have, in particular, managed to sway consumer preferences with their considerable
advertising and promotional power. At the same time, the government is pouring investment in to the dairy
industry, with a view to producing 3.4bn litres of fresh milk by 2025, which would generate export revenues
of some USD200mn.
Vietnam Food & Drink Report Q1 2015
© Business Monitor International Page 23

Table: Dairy Volume Sales, Production & Trade - Historical Data & Forecasts (Vietnam 2013-2018)
2013e 2014f 2015f 2016f 2017f 2018f
Processed liquid milk production, tonnes 425,910.8 468,472.0 517,018.3 570,462.8 625,128.4 683,617.4
Processed liquid milk sales, tonnes 210,765.4 226,680.8 243,630.6 261,404.5 280,020.4 299,495.0
Butter sales, tonnes 13,900.6 15,084.5 16,345.3 17,667.3 19,052.1 20,500.7
Cheese sales, tonnes 5,203.0 5,661.8 6,150.4 6,662.8 7,199.5 7,760.9
Ice cream production, tonnes 30,075.6 33,028.8 36,397.3 40,105.7 43,898.8 47,957.2
e/f = BMI estimate/forecast. Source: National sources, BMI
The local demand for dairy products is met by a combination of locally produced goods, which accounts for
20% of consumption, according to the US Department of Agriculture, and imports from countries including
New Zealand, the US and Australia. Vietnam Dairy Products Co (Vinamilk) is one of the key players in
the sector. Indeed, reflecting the promise of the Vietnamese dairy sector, Vinamilk aims to become one of
the largest 50 dairy firms in the world. The company is also expanding internationally, as Vietnam is in a
geographically strong place to take advantage of the growing Asian dairy story. Other prominent dairy
producers include Dutch Lady, Hanoimilk and Anco.
Vietnam Food & Drink Report Q1 2015
© Business Monitor International Page 24
Drink
Alcoholic Drinks
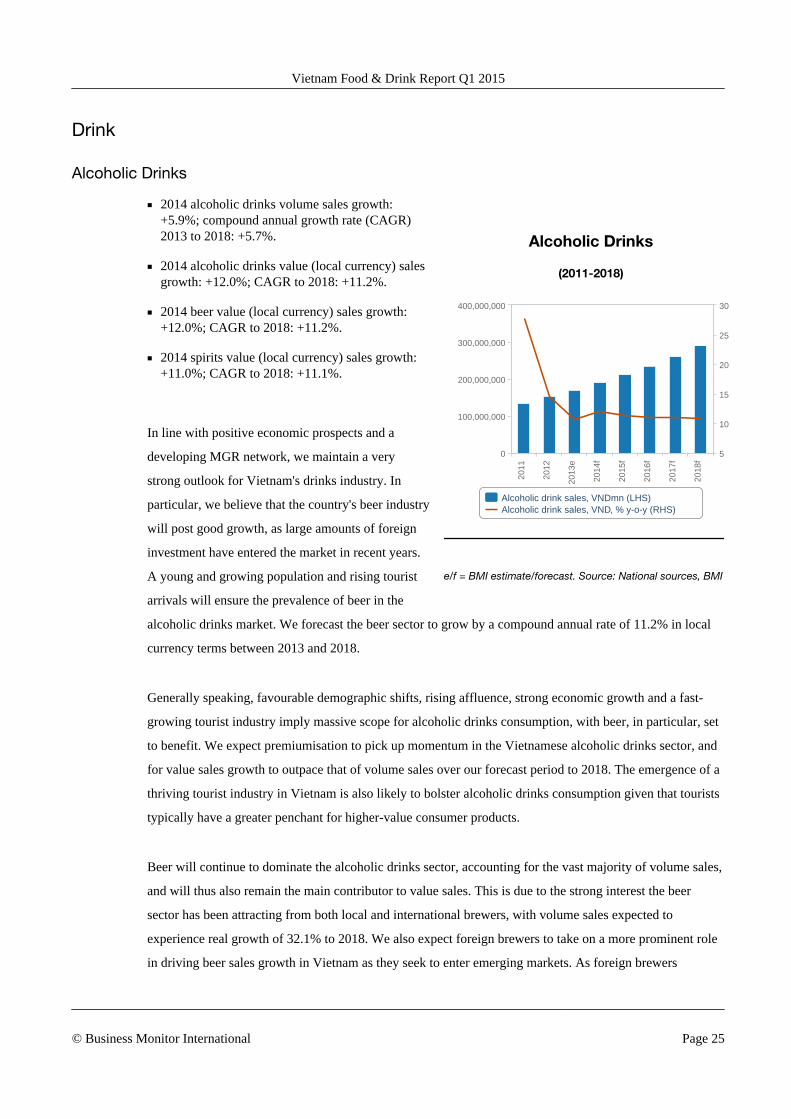
■ 2014 alcoholic drinks volume sales growth:+5.9%; compound annual growth rate (CAGR)2013 to 2018: +5.7%.
■ 2014 alcoholic drinks value (local currency) salesgrowth: +12.0%; CAGR to 2018: +11.2%.
■ 2014 beer value (local currency) sales growth:+12.0%; CAGR to 2018: +11.2%.
■ 2014 spirits value (local currency) sales growth:+11.0%; CAGR to 2018: +11.1%.
In line with positive economic prospects and a
developing MGR network, we maintain a very
strong outlook for Vietnam's drinks industry. In
particular, we believe that the country's beer industry
will post good growth, as large amounts of foreign
investment have entered the market in recent years.
A young and growing population and rising tourist
arrivals will ensure the prevalence of beer in the
alcoholic drinks market. We forecast the beer sector to grow by a compound annual rate of 11.2% in local
currency terms between 2013 and 2018.
Generally speaking, favourable demographic shifts, rising affluence, strong economic growth and a fast-
growing tourist industry imply massive scope for alcoholic drinks consumption, with beer, in particular, set
to benefit. We expect premiumisation to pick up momentum in the Vietnamese alcoholic drinks sector, and
for value sales growth to outpace that of volume sales over our forecast period to 2018. The emergence of a
thriving tourist industry in Vietnam is also likely to bolster alcoholic drinks consumption given that tourists
typically have a greater penchant for higher-value consumer products.
Beer will continue to dominate the alcoholic drinks sector, accounting for the vast majority of volume sales,
and will thus also remain the main contributor to value sales. This is due to the strong interest the beer
sector has been attracting from both local and international brewers, with volume sales expected to
experience real growth of 32.1% to 2018. We also expect foreign brewers to take on a more prominent role
in driving beer sales growth in Vietnam as they seek to enter emerging markets. As foreign brewers
Alcoholic Drinks
(2011-2018)
Alcoholic drink sales, VNDmn (LHS)Alcoholic drink sales, VND, % y-o-y (RHS)
2011
2012
2013
e
2014
f
2015
f
2016
f
2017
f
2018
f
0
100,000,000
200,000,000
300,000,000
400,000,000
5
10
15
20
25
30
e/f = BMI estimate/forecast. Source: National sources, BMI
Vietnam Food & Drink Report Q1 2015
© Business Monitor International Page 25

strengthen their competitive position, and as the local giants Habeco and Sabeco extend their presence
beyond their regional strongholds, sector dynamism will intensify rapidly.
Volume sales growth in the wine and spirits industries are also expected to be robust over our forecast
period to 2018, albeit developing from much lower bases. Both are fairly immature industries, having been
held back by an absence of multinational investment and by their relatively higher price tags. However,
prolific wealth accrual among Vietnamese consumers is fuelling shifts in consumption habits towards
higher-value alcoholic drink products, and this trend is particularly evident in the urban centres such as Ho
Chi Minh City, Hanoi and Danang.
Exposure to Western cultures is also driving the local demand for spirits and wines. The biggest consumers
of wine and spirits in Vietnam used to be Western expatriates and tourists, but local consumers are
developing a strong appetite for these products in line with their rapidly growing affluence. The spread of
organised retail in the country acts as another impetus behind spirits and wine sales, facilitating consumer
reach to a greater variety of brands in supermarkets, hypermarkets and local wine stores.
Looking ahead, investments in the Vietnamese spirits and wine sub-sectors are expected to intensify as an
increasing number of investors recognise the higher margin growth opportunities on offer in these sub-
sectors, and this is likely to instil further dynamism to drive volume sales.
Vietnam Food & Drink Report Q1 2015
© Business Monitor International Page 26
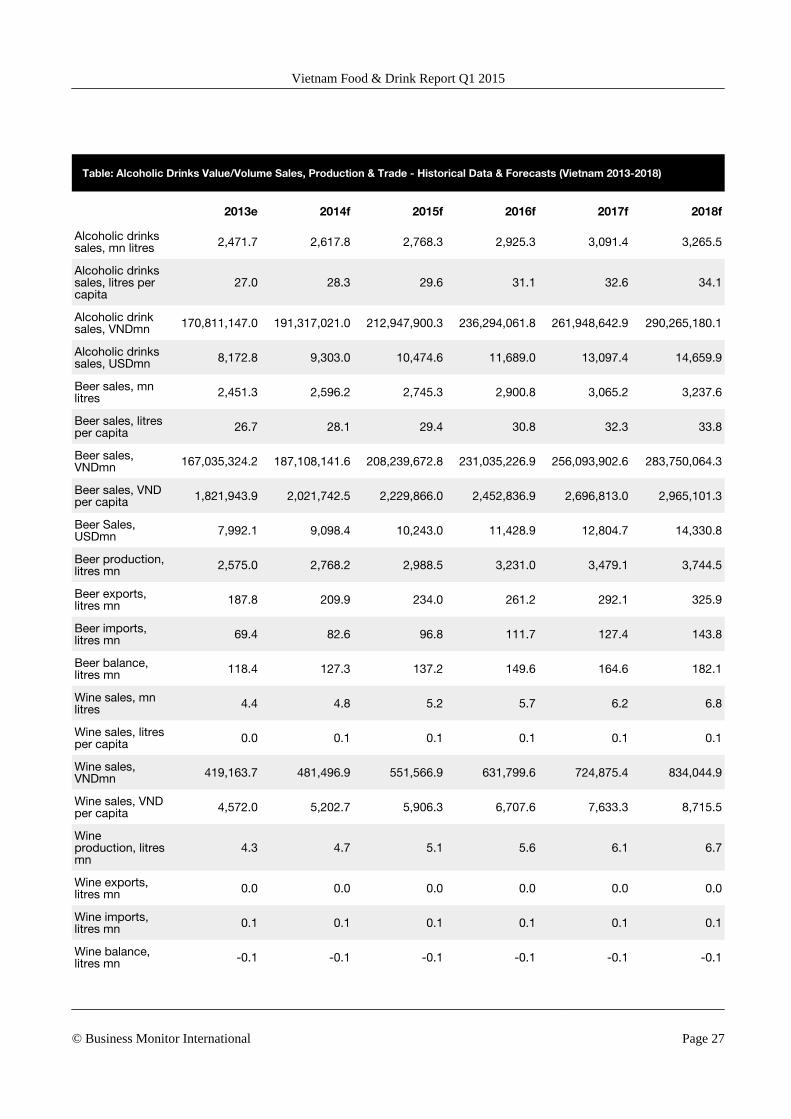
Table: Alcoholic Drinks Value/Volume Sales, Production & Trade - Historical Data & Forecasts (Vietnam 2013-2018)
2013e 2014f 2015f 2016f 2017f 2018f
Alcoholic drinkssales, mn litres 2,471.7 2,617.8 2,768.3 2,925.3 3,091.4 3,265.5
Alcoholic drinkssales, litres percapita
27.0 28.3 29.6 31.1 32.6 34.1
Alcoholic drinksales, VNDmn 170,811,147.0 191,317,021.0 212,947,900.3 236,294,061.8 261,948,642.9 290,265,180.1
Alcoholic drinkssales, USDmn 8,172.8 9,303.0 10,474.6 11,689.0 13,097.4 14,659.9
Beer sales, mnlitres 2,451.3 2,596.2 2,745.3 2,900.8 3,065.2 3,237.6
Beer sales, litresper capita 26.7 28.1 29.4 30.8 32.3 33.8
Beer sales,VNDmn 167,035,324.2 187,108,141.6 208,239,672.8 231,035,226.9 256,093,902.6 283,750,064.3
Beer sales, VNDper capita 1,821,943.9 2,021,742.5 2,229,866.0 2,452,836.9 2,696,813.0 2,965,101.3
Beer Sales,USDmn 7,992.1 9,098.4 10,243.0 11,428.9 12,804.7 14,330.8
Beer production,litres mn 2,575.0 2,768.2 2,988.5 3,231.0 3,479.1 3,744.5
Beer exports,litres mn 187.8 209.9 234.0 261.2 292.1 325.9
Beer imports,litres mn 69.4 82.6 96.8 111.7 127.4 143.8
Beer balance,litres mn 118.4 127.3 137.2 149.6 164.6 182.1
Wine sales, mnlitres 4.4 4.8 5.2 5.7 6.2 6.8
Wine sales, litresper capita 0.0 0.1 0.1 0.1 0.1 0.1
Wine sales,VNDmn 419,163.7 481,496.9 551,566.9 631,799.6 724,875.4 834,044.9
Wine sales, VNDper capita 4,572.0 5,202.7 5,906.3 6,707.6 7,633.3 8,715.5
Wineproduction, litresmn
4.3 4.7 5.1 5.6 6.1 6.7
Wine exports,litres mn 0.0 0.0 0.0 0.0 0.0 0.0
Wine imports,litres mn 0.1 0.1 0.1 0.1 0.1 0.1
Wine balance,litres mn -0.1 -0.1 -0.1 -0.1 -0.1 -0.1
Vietnam Food & Drink Report Q1 2015
© Business Monitor International Page 27
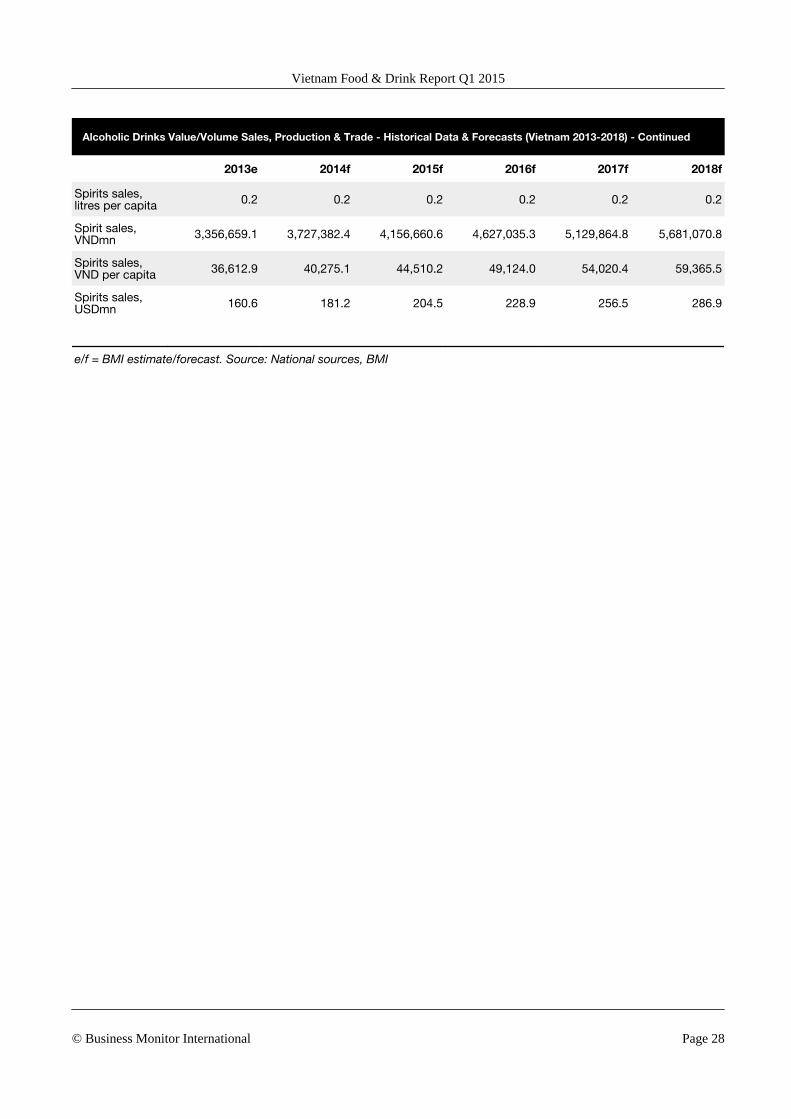
Alcoholic Drinks Value/Volume Sales, Production & Trade - Historical Data & Forecasts (Vietnam 2013-2018) - Continued
2013e 2014f 2015f 2016f 2017f 2018f
Spirits sales,litres per capita 0.2 0.2 0.2 0.2 0.2 0.2
Spirit sales,VNDmn 3,356,659.1 3,727,382.4 4,156,660.6 4,627,035.3 5,129,864.8 5,681,070.8
Spirits sales,VND per capita 36,612.9 40,275.1 44,510.2 49,124.0 54,020.4 59,365.5
Spirits sales,USDmn 160.6 181.2 204.5 228.9 256.5 286.9
e/f = BMI estimate/forecast. Source: National sources, BMI
Vietnam Food & Drink Report Q1 2015
© Business Monitor International Page 28
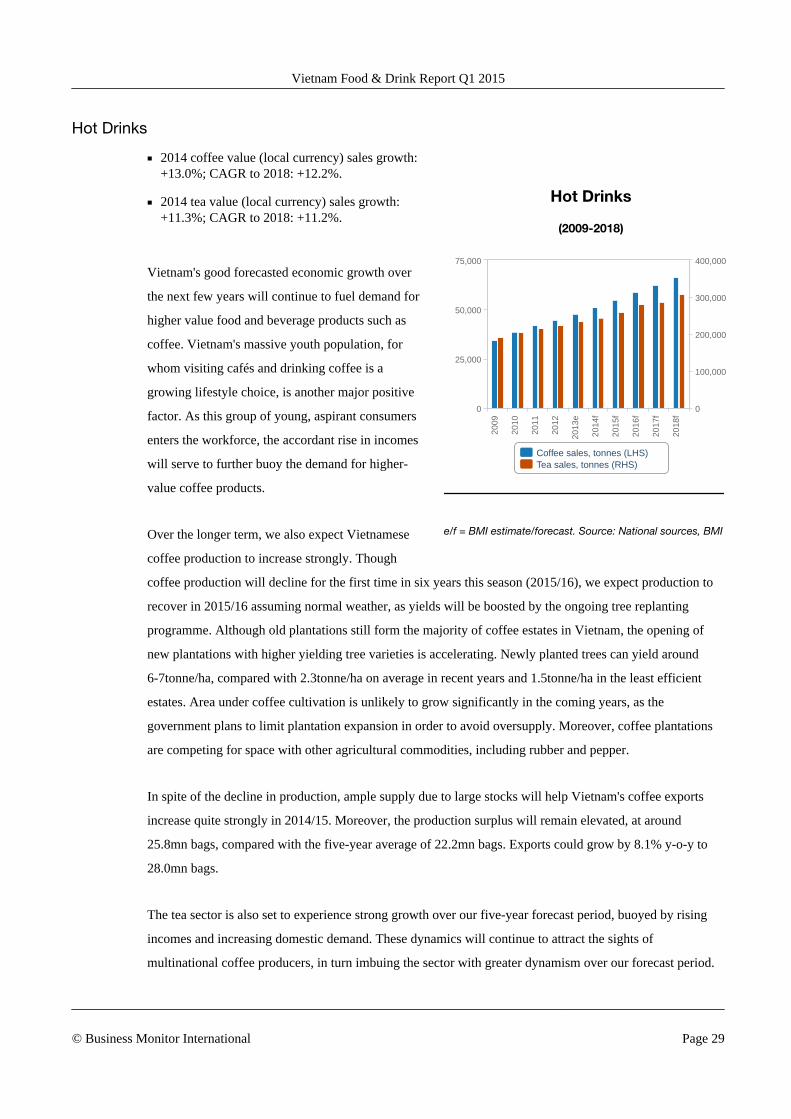
Hot Drinks
■ 2014 coffee value (local currency) sales growth:+13.0%; CAGR to 2018: +12.2%.
■ 2014 tea value (local currency) sales growth:+11.3%; CAGR to 2018: +11.2%.
Vietnam's good forecasted economic growth over
the next few years will continue to fuel demand for
higher value food and beverage products such as
coffee. Vietnam's massive youth population, for
whom visiting cafés and drinking coffee is a
growing lifestyle choice, is another major positive
factor. As this group of young, aspirant consumers
enters the workforce, the accordant rise in incomes
will serve to further buoy the demand for higher-
value coffee products.
Over the longer term, we also expect Vietnamese
coffee production to increase strongly. Though
coffee production will decline for the first time in six years this season (2015/16), we expect production to
recover in 2015/16 assuming normal weather, as yields will be boosted by the ongoing tree replanting
programme. Although old plantations still form the majority of coffee estates in Vietnam, the opening of
new plantations with higher yielding tree varieties is accelerating. Newly planted trees can yield around
6-7tonne/ha, compared with 2.3tonne/ha on average in recent years and 1.5tonne/ha in the least efficient
estates. Area under coffee cultivation is unlikely to grow significantly in the coming years, as the
government plans to limit plantation expansion in order to avoid oversupply. Moreover, coffee plantations
are competing for space with other agricultural commodities, including rubber and pepper.
In spite of the decline in production, ample supply due to large stocks will help Vietnam's coffee exports
increase quite strongly in 2014/15. Moreover, the production surplus will remain elevated, at around
25.8mn bags, compared with the five-year average of 22.2mn bags. Exports could grow by 8.1% y-o-y to
28.0mn bags.
The tea sector is also set to experience strong growth over our five-year forecast period, buoyed by rising
incomes and increasing domestic demand. These dynamics will continue to attract the sights of
multinational coffee producers, in turn imbuing the sector with greater dynamism over our forecast period.
Hot Drinks
(2009-2018)
Coffee sales, tonnes (LHS)Tea sales, tonnes (RHS)
2009
2010
2011
2012
2013
e
2014
f
2015
f
2016
f
2017
f
2018
f
0
25,000
50,000
75,000
0
100,000
200,000
300,000
400,000
e/f = BMI estimate/forecast. Source: National sources, BMI
Vietnam Food & Drink Report Q1 2015
© Business Monitor International Page 29
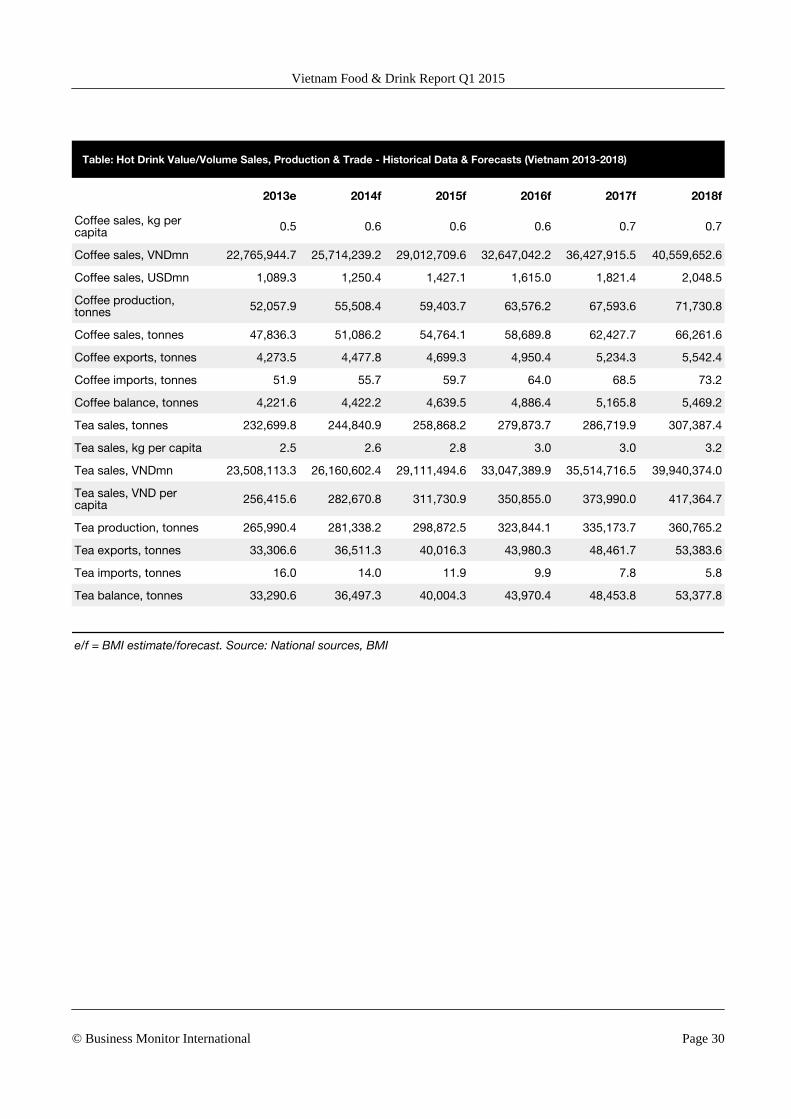
Table: Hot Drink Value/Volume Sales, Production & Trade - Historical Data & Forecasts (Vietnam 2013-2018)
2013e 2014f 2015f 2016f 2017f 2018f
Coffee sales, kg percapita 0.5 0.6 0.6 0.6 0.7 0.7
Coffee sales, VNDmn 22,765,944.7 25,714,239.2 29,012,709.6 32,647,042.2 36,427,915.5 40,559,652.6
Coffee sales, USDmn 1,089.3 1,250.4 1,427.1 1,615.0 1,821.4 2,048.5
Coffee production,tonnes 52,057.9 55,508.4 59,403.7 63,576.2 67,593.6 71,730.8
Coffee sales, tonnes 47,836.3 51,086.2 54,764.1 58,689.8 62,427.7 66,261.6
Coffee exports, tonnes 4,273.5 4,477.8 4,699.3 4,950.4 5,234.3 5,542.4
Coffee imports, tonnes 51.9 55.7 59.7 64.0 68.5 73.2
Coffee balance, tonnes 4,221.6 4,422.2 4,639.5 4,886.4 5,165.8 5,469.2
Tea sales, tonnes 232,699.8 244,840.9 258,868.2 279,873.7 286,719.9 307,387.4
Tea sales, kg per capita 2.5 2.6 2.8 3.0 3.0 3.2
Tea sales, VNDmn 23,508,113.3 26,160,602.4 29,111,494.6 33,047,389.9 35,514,716.5 39,940,374.0
Tea sales, VND percapita 256,415.6 282,670.8 311,730.9 350,855.0 373,990.0 417,364.7
Tea production, tonnes 265,990.4 281,338.2 298,872.5 323,844.1 335,173.7 360,765.2
Tea exports, tonnes 33,306.6 36,511.3 40,016.3 43,980.3 48,461.7 53,383.6
Tea imports, tonnes 16.0 14.0 11.9 9.9 7.8 5.8
Tea balance, tonnes 33,290.6 36,497.3 40,004.3 43,970.4 48,453.8 53,377.8
e/f = BMI estimate/forecast. Source: National sources, BMI
Vietnam Food & Drink Report Q1 2015
© Business Monitor International Page 30
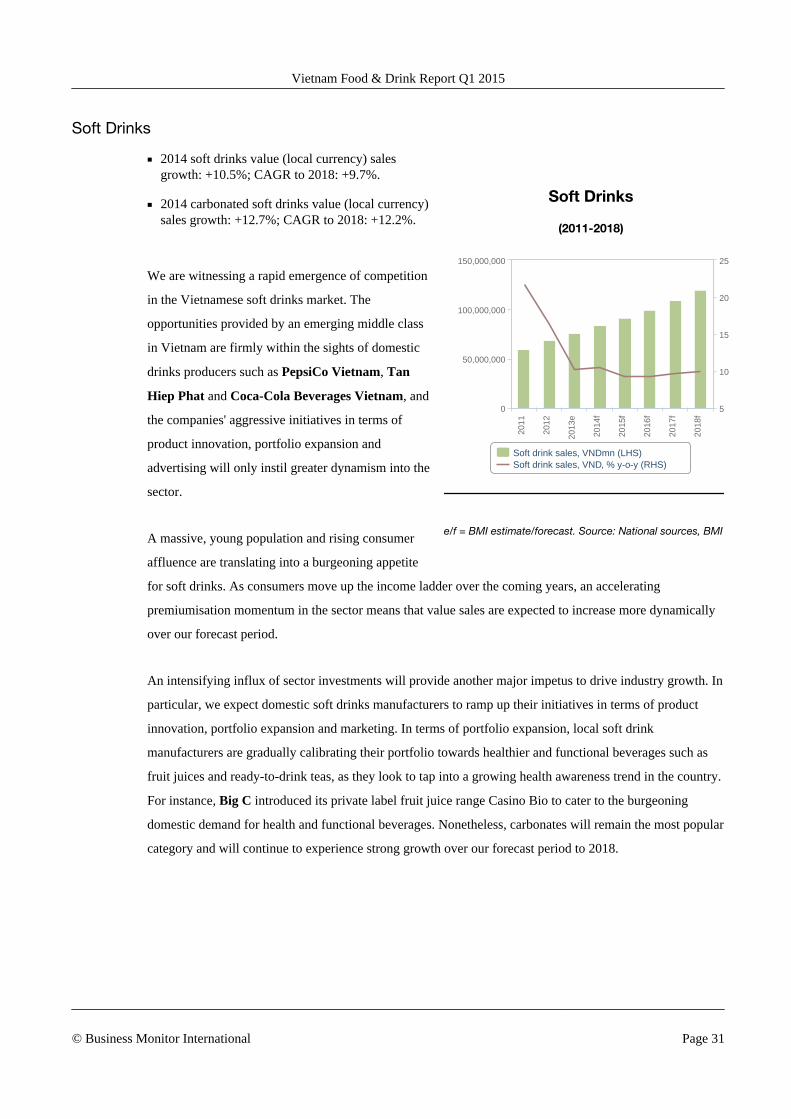
Soft Drinks
■ 2014 soft drinks value (local currency) salesgrowth: +10.5%; CAGR to 2018: +9.7%.
■ 2014 carbonated soft drinks value (local currency)sales growth: +12.7%; CAGR to 2018: +12.2%.
We are witnessing a rapid emergence of competition
in the Vietnamese soft drinks market. The
opportunities provided by an emerging middle class
in Vietnam are firmly within the sights of domestic
drinks producers such as PepsiCo Vietnam, Tan
Hiep Phat and Coca-Cola Beverages Vietnam, and
the companies' aggressive initiatives in terms of
product innovation, portfolio expansion and
advertising will only instil greater dynamism into the
sector.
A massive, young population and rising consumer
affluence are translating into a burgeoning appetite
for soft drinks. As consumers move up the income ladder over the coming years, an accelerating
premiumisation momentum in the sector means that value sales are expected to increase more dynamically
over our forecast period.
An intensifying influx of sector investments will provide another major impetus to drive industry growth. In
particular, we expect domestic soft drinks manufacturers to ramp up their initiatives in terms of product
innovation, portfolio expansion and marketing. In terms of portfolio expansion, local soft drink
manufacturers are gradually calibrating their portfolio towards healthier and functional beverages such as
fruit juices and ready-to-drink teas, as they look to tap into a growing health awareness trend in the country.
For instance, Big C introduced its private label fruit juice range Casino Bio to cater to the burgeoning
domestic demand for health and functional beverages. Nonetheless, carbonates will remain the most popular
category and will continue to experience strong growth over our forecast period to 2018.
Soft Drinks
(2011-2018)
Soft drink sales, VNDmn (LHS)Soft drink sales, VND, % y-o-y (RHS)
2011
2012
2013
e
2014
f
2015
f
2016
f
2017
f
2018
f
0
50,000,000
100,000,000
150,000,000
10
15
20
5
25
e/f = BMI estimate/forecast. Source: National sources, BMI
Vietnam Food & Drink Report Q1 2015
© Business Monitor International Page 31
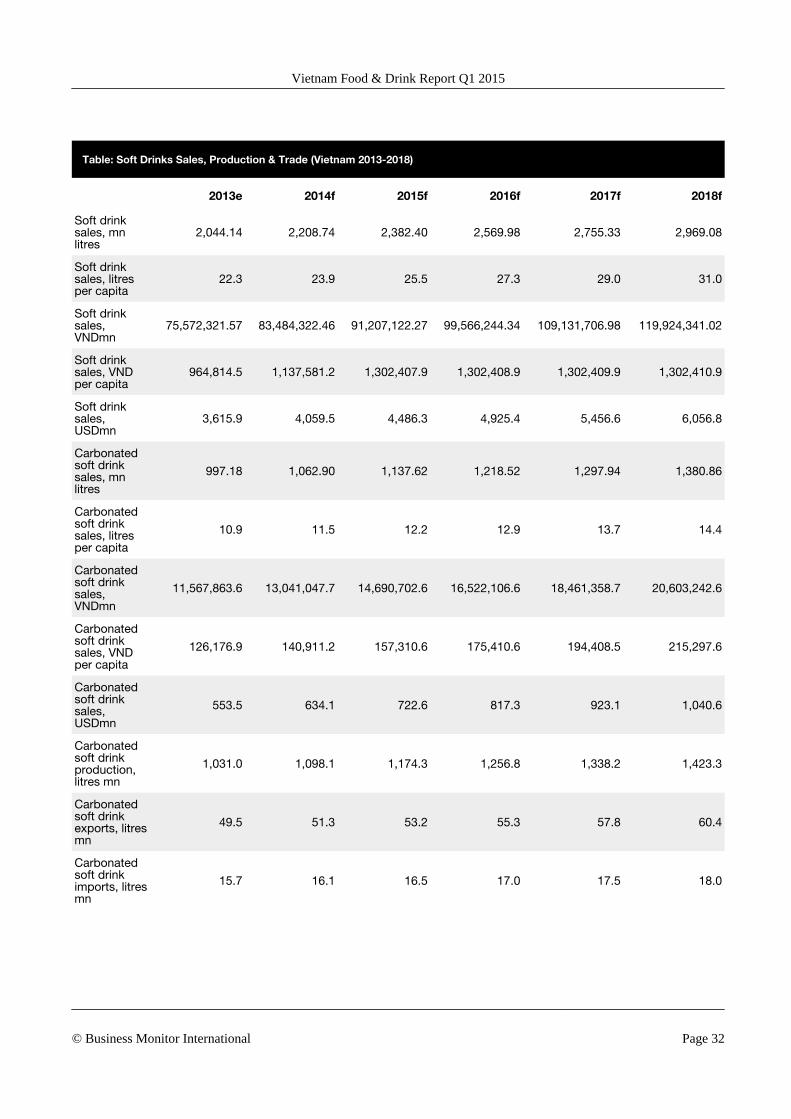
Table: Soft Drinks Sales, Production & Trade (Vietnam 2013-2018)
2013e 2014f 2015f 2016f 2017f 2018f
Soft drinksales, mnlitres
2,044.14 2,208.74 2,382.40 2,569.98 2,755.33 2,969.08
Soft drinksales, litresper capita
22.3 23.9 25.5 27.3 29.0 31.0
Soft drinksales,VNDmn
75,572,321.57 83,484,322.46 91,207,122.27 99,566,244.34 109,131,706.98 119,924,341.02
Soft drinksales, VNDper capita
964,814.5 1,137,581.2 1,302,407.9 1,302,408.9 1,302,409.9 1,302,410.9
Soft drinksales,USDmn
3,615.9 4,059.5 4,486.3 4,925.4 5,456.6 6,056.8
Carbonatedsoft drinksales, mnlitres
997.18 1,062.90 1,137.62 1,218.52 1,297.94 1,380.86
Carbonatedsoft drinksales, litresper capita
10.9 11.5 12.2 12.9 13.7 14.4
Carbonatedsoft drinksales,VNDmn
11,567,863.6 13,041,047.7 14,690,702.6 16,522,106.6 18,461,358.7 20,603,242.6
Carbonatedsoft drinksales, VNDper capita
126,176.9 140,911.2 157,310.6 175,410.6 194,408.5 215,297.6
Carbonatedsoft drinksales,USDmn
553.5 634.1 722.6 817.3 923.1 1,040.6
Carbonatedsoft drinkproduction,litres mn
1,031.0 1,098.1 1,174.3 1,256.8 1,338.2 1,423.3
Carbonatedsoft drinkexports, litresmn
49.5 51.3 53.2 55.3 57.8 60.4
Carbonatedsoft drinkimports, litresmn
15.7 16.1 16.5 17.0 17.5 18.0
Vietnam Food & Drink Report Q1 2015
© Business Monitor International Page 32

Soft Drinks Sales, Production & Trade (Vietnam 2013-2018) - Continued
2013e 2014f 2015f 2016f 2017f 2018f
Carbonatedsoft drinkbalance, litresmn
33.8 35.2 36.6 38.3 40.3 42.4
e/f = BMI estimate/forecast. Source: National sources, BMI
Moreover, domestic soft drinks manufacturers will continue to engage in product innovation by offering
different bottle formats and sizes in an attempt to cater to the varying consumer tastes and preferences. For
instance, Coca-Cola Beverages Vietnam and PepsiCo Vietnam produce their soft drinks in varying sizes,
and this has facilitated their reach to the end-consumer market. As more companies hop on the product
innovation bandwagon, this will bring about greater dynamism in the sector and further fuel sales growth.
Vietnam Food & Drink Report Q1 2015
© Business Monitor International Page 33
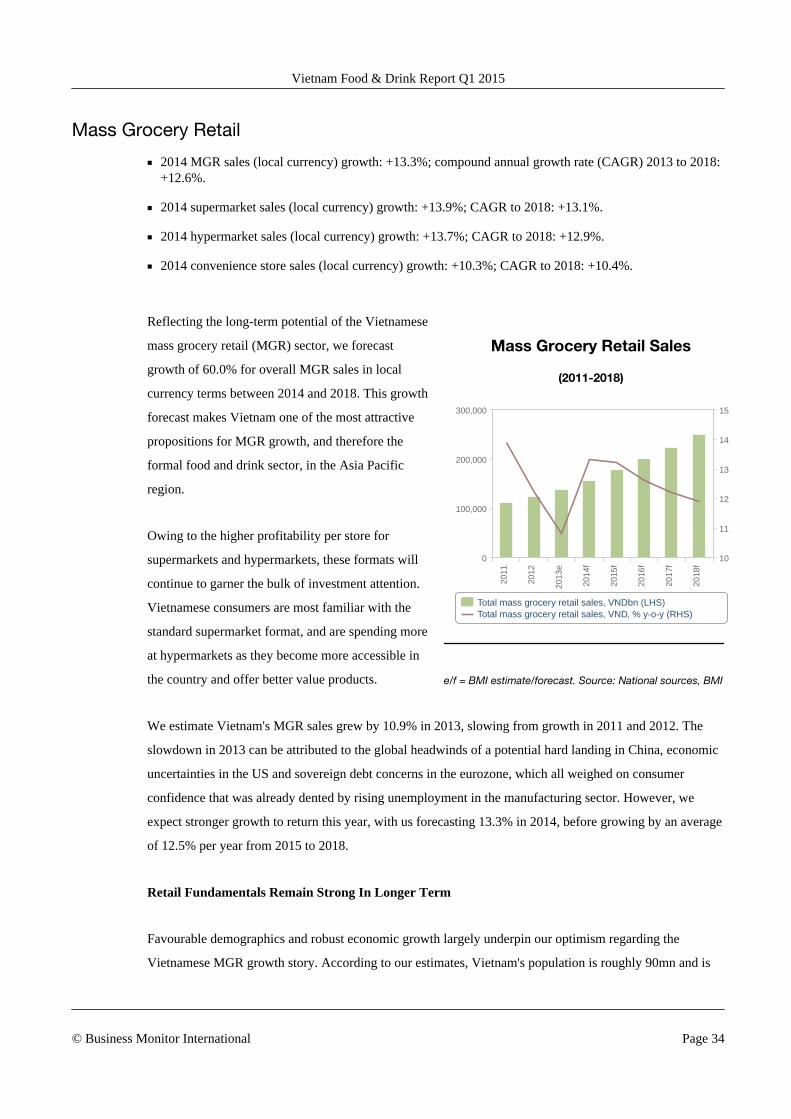
Mass Grocery Retail
■ 2014 MGR sales (local currency) growth: +13.3%; compound annual growth rate (CAGR) 2013 to 2018:+12.6%.
■ 2014 supermarket sales (local currency) growth: +13.9%; CAGR to 2018: +13.1%.
■ 2014 hypermarket sales (local currency) growth: +13.7%; CAGR to 2018: +12.9%.
■ 2014 convenience store sales (local currency) growth: +10.3%; CAGR to 2018: +10.4%.
Reflecting the long-term potential of the Vietnamese
mass grocery retail (MGR) sector, we forecast
growth of 60.0% for overall MGR sales in local
currency terms between 2014 and 2018. This growth
forecast makes Vietnam one of the most attractive
propositions for MGR growth, and therefore the
formal food and drink sector, in the Asia Pacific
region.
Owing to the higher profitability per store for
supermarkets and hypermarkets, these formats will
continue to garner the bulk of investment attention.
Vietnamese consumers are most familiar with the
standard supermarket format, and are spending more
at hypermarkets as they become more accessible in
the country and offer better value products.
We estimate Vietnam's MGR sales grew by 10.9% in 2013, slowing from growth in 2011 and 2012. The
slowdown in 2013 can be attributed to the global headwinds of a potential hard landing in China, economic
uncertainties in the US and sovereign debt concerns in the eurozone, which all weighed on consumer
confidence that was already dented by rising unemployment in the manufacturing sector. However, we
expect stronger growth to return this year, with us forecasting 13.3% in 2014, before growing by an average
of 12.5% per year from 2015 to 2018.
Retail Fundamentals Remain Strong In Longer Term
Favourable demographics and robust economic growth largely underpin our optimism regarding the
Vietnamese MGR growth story. According to our estimates, Vietnam's population is roughly 90mn and is
Mass Grocery Retail Sales
(2011-2018)
Total mass grocery retail sales, VNDbn (LHS)Total mass grocery retail sales, VND, % y-o-y (RHS)
2011
2012
2013
e
2014
f
2015
f
2016
f
2017
f
2018
f
0
100,000
200,000
300,000
10
11
12
13
14
15
e/f = BMI estimate/forecast. Source: National sources, BMI
Vietnam Food & Drink Report Q1 2015
© Business Monitor International Page 34
forecast to grow over the forecast period to 2022. More importantly, Vietnam has a youthful demographic
profile, implying attractive opportunities in the mass market.
Vietnam's rapid economic development also is likely to assist the emergence of a new consumer class - in
major urban centres at least - that has an interest, and can afford to participate, in modern consumption
methods such as mass grocery retailing. GDP per capita in Vietnam is forecast to more than double over our
10-year forecast period. This rise in purchasing power will only trigger a swathe of consumer spending
across the country's retail scene.
Vietnam Unlikely To Reach Full Retail Potential In Near Term
Although Vietnam is equipped with the aforementioned elements that are necessary to support strong
growth in mass grocery retailing, the country is unlikely to reach the full potential of its retail growth story
in the near future. Organised retail accounts for only 15% of overall grocery sales in Vietnam, highlighting
the prevalence of mom-and-pop shops. The relative immaturity of the Vietnamese MGR sector can be
partly attributed to the country's restrictive business climate. Vietnam remains a risky place to do business,
with the lack of transparency of laws and regulations, as well as restrictions on foreign investment, deterring
less-hardy retailers from setting up shop in the country. The lack of an established transport infrastructure
further complicates distribution efforts for MGR operators.
Foreign Interest Abound…
Despite the challenges, foreign interest in the Vietnamese MGR sector will continue to grow steadily over
the coming years given the sector's hugely untapped potential. We believe that the bulk of multinational
investment in the near future is likely to come from bigger retail names such as Aeon and Groupe Casino,
which are eager to expand their emerging market footprint and have the financial capacity to deploy the
necessary distribution infrastructure in the sector. After receiving the regulatory permit from the
Vietnamese government, Japanese retailer Aeon plans to develop around 20 retail and trade centres
nationwide by 2020, which will house both local and foreign MGR operators.
Interest from less-hardy foreign investors will also pick up, in our view, although such investment will
largely take the form of joint ventures as foreign retailers leverage on the local market expertise and
financial strength of their local counterparts. As a case in point, South Korean MGR player E-Mart recently
reached an agreement with U&I Investment Corporation, to establish a joint venture (JV) in Vietnam with
the aim of setting up retail stores in the country. Similarly, Singapore MGR operator NTUC FairPrice and
Vietnam Food & Drink Report Q1 2015
© Business Monitor International Page 35
Vietnam's Saigon Union of Trading Co-operatives are looking to establish a chain of hypermarkets in
Vietnam through their local JV.
The latest multinational reported to be entering the market, as of summer 2013, is French retailer Auchan
which, according to local sources, is set to inject USD500mn into the sector over the next decade.
…Though Challenges At The Company Level
Despite our outlook for dynamic growth from multinational retailers in Vietnam, the exit of German cash-
and-carry retailer Metro highlights the possibility of foreign retailers exiting or mothballing their
enterprises in developing countries in order to concentrate on issues in home markets. Metro's decision to
leave Vietnam is driven by the need to re-focus on its core Europe business and strengthen its balance sheet,
rather than being based on any major structural issues or re-rating in the growth profile of the organised
food retail sector.
Like some of the other major European retailers, namely Carrefour and Tesco, Metro has had to rein in
spending internationally over the past two to three years as retail sales across Western Europe have
remained weak while, more recently, Russia, one of Metro's key markets, has slowed down in 2014.
One company that continues to do well in Vietnam is France-based Casino's wholly owned subsidiary Big
C, which entered in 1998. Dominating the hypermarket format (which remains in its infancy in Vietnam),
the retailer is an impressive example of the benefits to be gained by entering this still largely fragmented
sector.
Supermarket And Hypermarket Sectors The Outperformers
While the supermarket and hypermarket sub-sectors will feature most prominently on investors' radars, the
convenience retail sector will increasingly attract interest from retailers. Accordingly, the demand for
convenience with the pay-off of higher prices is not yet on the agenda for most consumers. However, with
purchasing power on the rise, this will bring the concept of convenience retailing more within reach of the
average consumer.
Vietnam Food & Drink Report Q1 2015
© Business Monitor International Page 36
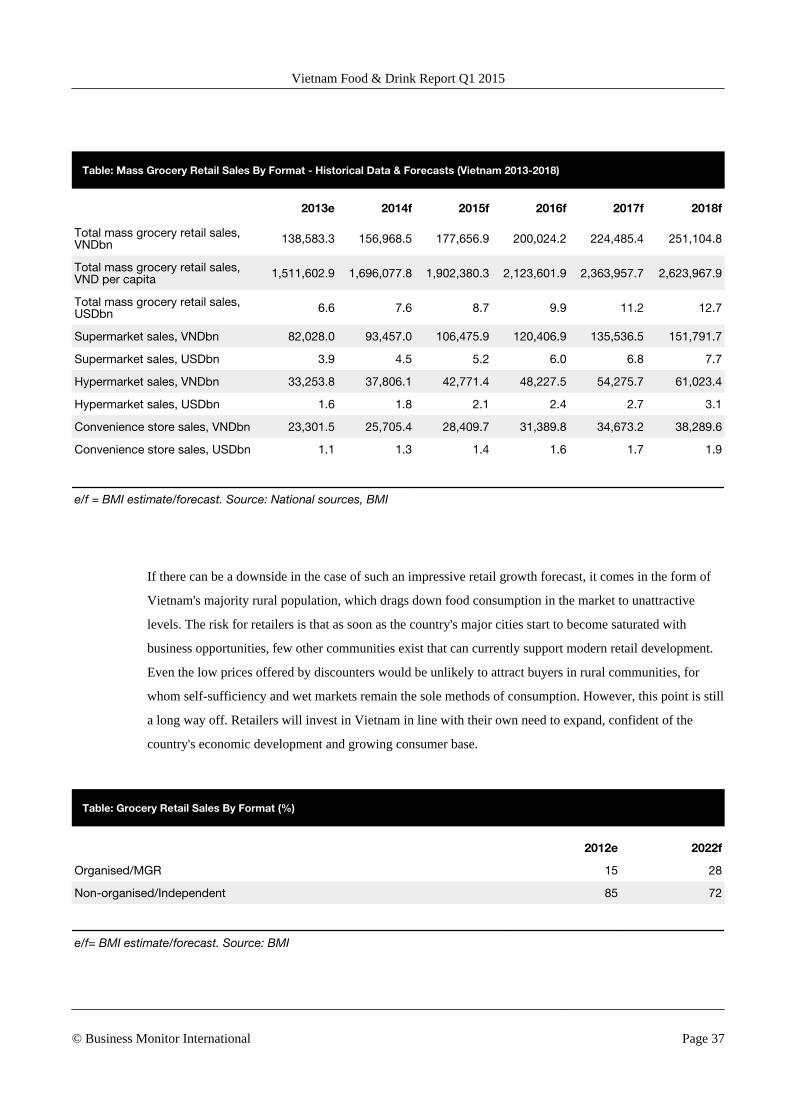
Table: Mass Grocery Retail Sales By Format - Historical Data & Forecasts (Vietnam 2013-2018)
2013e 2014f 2015f 2016f 2017f 2018f
Total mass grocery retail sales,VNDbn 138,583.3 156,968.5 177,656.9 200,024.2 224,485.4 251,104.8
Total mass grocery retail sales,VND per capita 1,511,602.9 1,696,077.8 1,902,380.3 2,123,601.9 2,363,957.7 2,623,967.9
Total mass grocery retail sales,USDbn 6.6 7.6 8.7 9.9 11.2 12.7
Supermarket sales, VNDbn 82,028.0 93,457.0 106,475.9 120,406.9 135,536.5 151,791.7
Supermarket sales, USDbn 3.9 4.5 5.2 6.0 6.8 7.7
Hypermarket sales, VNDbn 33,253.8 37,806.1 42,771.4 48,227.5 54,275.7 61,023.4
Hypermarket sales, USDbn 1.6 1.8 2.1 2.4 2.7 3.1
Convenience store sales, VNDbn 23,301.5 25,705.4 28,409.7 31,389.8 34,673.2 38,289.6
Convenience store sales, USDbn 1.1 1.3 1.4 1.6 1.7 1.9
e/f = BMI estimate/forecast. Source: National sources, BMI
If there can be a downside in the case of such an impressive retail growth forecast, it comes in the form of
Vietnam's majority rural population, which drags down food consumption in the market to unattractive
levels. The risk for retailers is that as soon as the country's major cities start to become saturated with
business opportunities, few other communities exist that can currently support modern retail development.
Even the low prices offered by discounters would be unlikely to attract buyers in rural communities, for
whom self-sufficiency and wet markets remain the sole methods of consumption. However, this point is still
a long way off. Retailers will invest in Vietnam in line with their own need to expand, confident of the
country's economic development and growing consumer base.
Table: Grocery Retail Sales By Format (%)
2012e 2022f
Organised/MGR 15 28
Non-organised/Independent 85 72
e/f= BMI estimate/forecast. Source: BMI
Vietnam Food & Drink Report Q1 2015
© Business Monitor International Page 37

Trade
■ 2014 exports growth (USD terms): +10.6%;compound annual growth rate (CAGR) 2013 to2018: +10.8%.
■ 2014 imports growth (USD terms): +12.4%;CAGR to 2018: +11.8%.
We are positive on Vietnam's food and drink trade
balance out to the end of our forecast period. Though
we forecast import growth to outpace that of exports
through to 2018, imports are coming off a much
lower base. Vietnam has a thriving manufacturing
sector, with food and drink products making up
about a quarter of total output. As per capita incomes
in the region grow over the next decade, we believe
that Vietnamese food and drink exports will post
strong growth.
A major driver behind the growth in exports is
sustained government effort to improve local food
production and agricultural industries. This will boost output and make more produce available for export,
and will also improve the quality competitiveness of local exports.
Vietnam's food and drink exports are also likely to marginally benefit from Russia's ban on agricultural
imports from certain countries such as the US and EU. Russia announced the ban in August 2014, and it is
likely to last for one year, which will provide opportunities for Vietnamese exporters to establish trade links
that they will try to keep for more than one year. We believe that the country's seafood sector will
particularly benefit from the sanctions, and also see opportunities in the livestock sector.
Trade
(2009-2018)
Exports of food and drink, USDmn (LHS)Imports of food and drink, USDmn (LHS)Food and drink trade balance USDmn (RHS)
2009
2010
2011
2012
2013
e
2014
f
2015
f
2016
f
2017
f
2018
f
0
10,000
20,000
30,000
40,000
5,000
10,000
15,000
20,000
25,000
e/f = BMI estimate/forecast. Source: National sources, BMI
Vietnam Food & Drink Report Q1 2015
© Business Monitor International Page 38

Table: Trade Balance - Historical Data & Forecasts (Vietnam 2013-2018)
2013e 2014f 2015f 2016f 2017f 2018f
Exports of food and drink, USDmn 18,676 20,663 22,819 25,252 28,039 31,211
Imports of food and drink, USDmn 4,912 5,520 6,184 6,908 7,710 8,596
Food and drink trade balance USDmn 13,764.4 15,142.6 16,634.4 18,343.9 20,329.3 22,615.0
e/f = BMI estimate/forecast. Source: National sources, BMI
Over the long term, increasing urbanisation and continued exposure to Western influences are expected to
generate growing import demand, and increasingly busy lifestyles and rising interest in branded produce
will lead to growth in the processed-food industry. In order to meet this demand, local manufacturers will be
forced to import the necessary raw ingredients. Beyond 2018, the government is likely to be hopeful that its
investments and efforts to attract foreign investors will pay off, and that much of this new and specific type
of demand will be able to be accommodated domestically.
Vietnam Food & Drink Report Q1 2015
© Business Monitor International Page 39
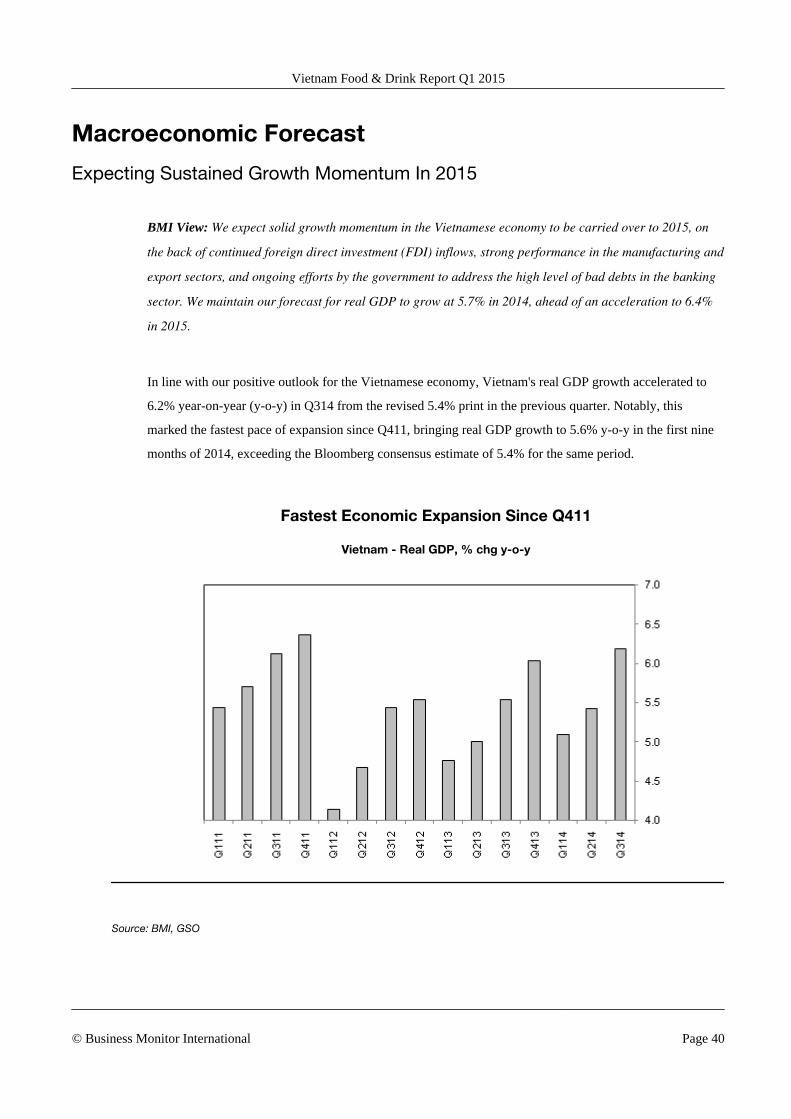
Macroeconomic Forecast
Expecting Sustained Growth Momentum In 2015
BMI View: We expect solid growth momentum in the Vietnamese economy to be carried over to 2015, on
the back of continued foreign direct investment (FDI) inflows, strong performance in the manufacturing and
export sectors, and ongoing efforts by the government to address the high level of bad debts in the banking
sector. We maintain our forecast for real GDP to grow at 5.7% in 2014, ahead of an acceleration to 6.4%
in 2015.
In line with our positive outlook for the Vietnamese economy, Vietnam's real GDP growth accelerated to
6.2% year-on-year (y-o-y) in Q314 from the revised 5.4% print in the previous quarter. Notably, this
marked the fastest pace of expansion since Q411, bringing real GDP growth to 5.6% y-o-y in the first nine
months of 2014, exceeding the Bloomberg consensus estimate of 5.4% for the same period.
Fastest Economic Expansion Since Q411
Vietnam - Real GDP, % chg y-o-y
Source: BMI, GSO
Vietnam Food & Drink Report Q1 2015
© Business Monitor International Page 40
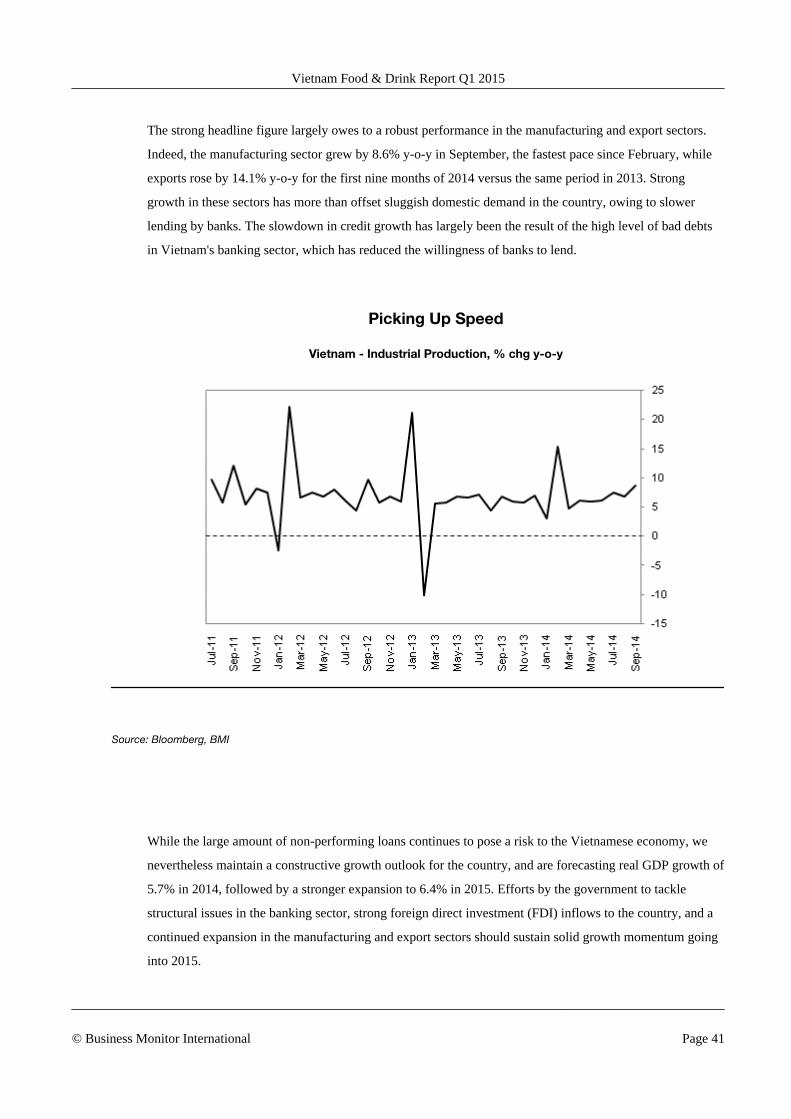
The strong headline figure largely owes to a robust performance in the manufacturing and export sectors.
Indeed, the manufacturing sector grew by 8.6% y-o-y in September, the fastest pace since February, while
exports rose by 14.1% y-o-y for the first nine months of 2014 versus the same period in 2013. Strong
growth in these sectors has more than offset sluggish domestic demand in the country, owing to slower
lending by banks. The slowdown in credit growth has largely been the result of the high level of bad debts
in Vietnam's banking sector, which has reduced the willingness of banks to lend.
Picking Up Speed
Vietnam - Industrial Production, % chg y-o-y
Source: Bloomberg, BMI
While the large amount of non-performing loans continues to pose a risk to the Vietnamese economy, we
nevertheless maintain a constructive growth outlook for the country, and are forecasting real GDP growth of
5.7% in 2014, followed by a stronger expansion to 6.4% in 2015. Efforts by the government to tackle
structural issues in the banking sector, strong foreign direct investment (FDI) inflows to the country, and a
continued expansion in the manufacturing and export sectors should sustain solid growth momentum going
into 2015.
Vietnam Food & Drink Report Q1 2015
© Business Monitor International Page 41

Taking Positive Steps To Reduce Banks' Non-Performing Loans
The Vietnamese government has already taken steps to address the high level of sour loans in the banking
sector, which constituted 4.2% of total loans as of end-June according to the State Bank of Vietnam. While
we expect progress on this front to be gradual, strengthening of the banking sector is a step in the right
direction by the government to secure the country's long-term growth prospects. In July 2013, the
government established the Vietnam Asset Management Company (VAMC) to take bad debts off banks'
books, allowing time for banks to undergo restructuring and strengthening of their credit assessment
mechanisms. Meanwhile, the government has continued to reform its state-owned enterprises (SOEs),
which accounted for more than half of the bad debts in the banking sector. While SOE reform has
progressed at a very slow pace over recent years, it should gain some momentum over the coming quarters,
as the government plans to privatise 432 state companies by end-2015.
Manufacturing Sector To Sustain Strong Growth
The Vietnamese economy will also ride on a stronger manufacturing performance over the coming quarters.
The Purchasing Managers' Index (PMI), a leading health indicator of the manufacturing sector, points to
higher production activity. The index came in at 50.3 in August, marking the 12th straight month of
expansion in the manufacturing sector. Additionally, given that Vietnam remains a low-cost manufacturing
base for foreign firms, the country has continued to attract fervent foreign investment interest. The
manufacturing sector received 68.4% of total registered capital, amounting to USD7.0bn in the first eight
months of 2014.
Exports To Ride On A Recovering US Economy
Continued strong export growth will also be another driver of strong economic growth. Given the country's
export orientation to the US, which received 17.3% of total Vietnamese outbound shipments in 2013, a
recovering US economy will lend strength to Vietnam's exports.
Vietnam Food & Drink Report Q1 2015
© Business Monitor International Page 42
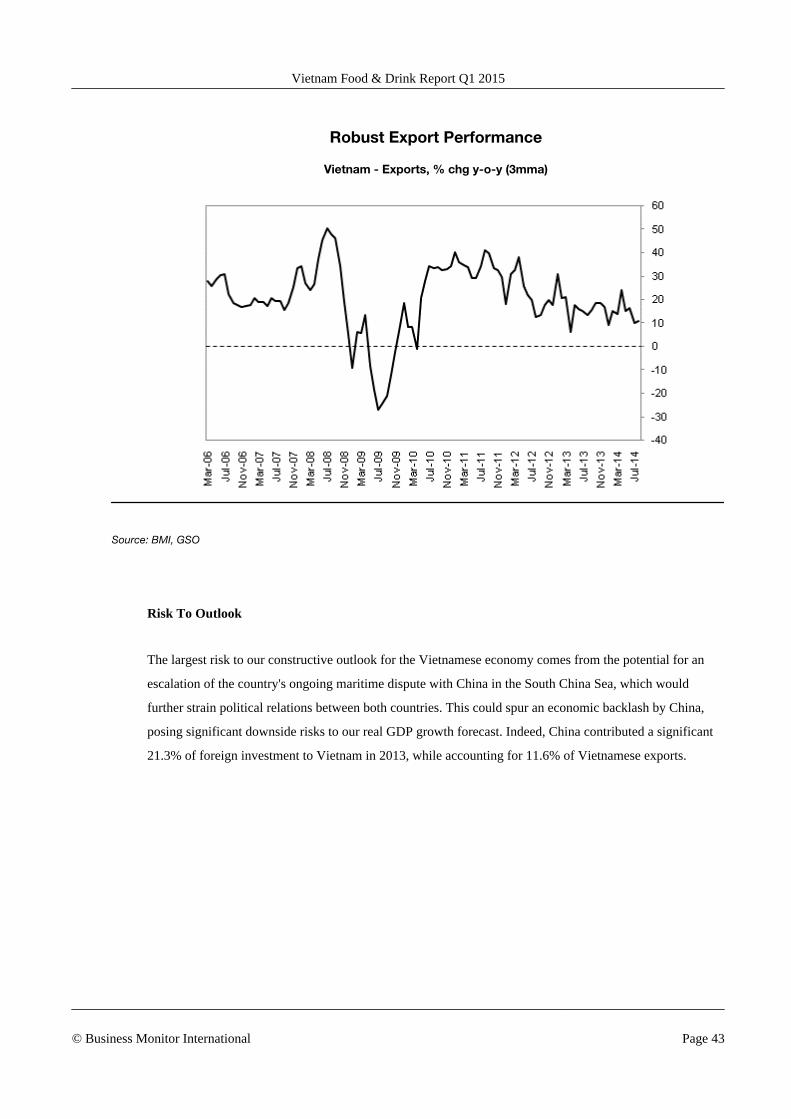
Robust Export Performance
Vietnam - Exports, % chg y-o-y (3mma)
Source: BMI, GSO
Risk To Outlook
The largest risk to our constructive outlook for the Vietnamese economy comes from the potential for an
escalation of the country's ongoing maritime dispute with China in the South China Sea, which would
further strain political relations between both countries. This could spur an economic backlash by China,
posing significant downside risks to our real GDP growth forecast. Indeed, China contributed a significant
21.3% of foreign investment to Vietnam in 2013, while accounting for 11.6% of Vietnamese exports.
Vietnam Food & Drink Report Q1 2015
© Business Monitor International Page 43

Table: Economic Activity (Vietnam 2009-2018)
2009 2010 2011 2012 2013e 2014f 2015f 2016f 2017f 2018f
Nominal GDP, USDbn 101.6 112.9 134.6 155.5 170.4 185.5 210.2 240.6 275.9 311.0
Real GDP growth, % y-o-y 5.4 6.4 6.2 5.2 5.4 5.7 6.4 6.6 6.4 6.4
GDP per capita, USD 1,152 1,267 1,496 1,712 1,859 2,004 2,251 2,554 2,905 3,250
Population, mn 88.2 89.0 89.9 90.8 91.7 92.5 93.4 94.2 95.0 95.7
Industrial production, % y-o-y, ave 6.7 14.1 10.9 7.0 5.9 7.7 8.4 8.6 8.6 8.5
Unemployment, % of labour force, eop 4.6 4.3 3.6 3.2 3.6 3.5 3.4 3.5 3.5 3.5
f = BMI forecast. Source: National Sources/BMI
Vietnam Food & Drink Report Q1 2015
© Business Monitor International Page 44
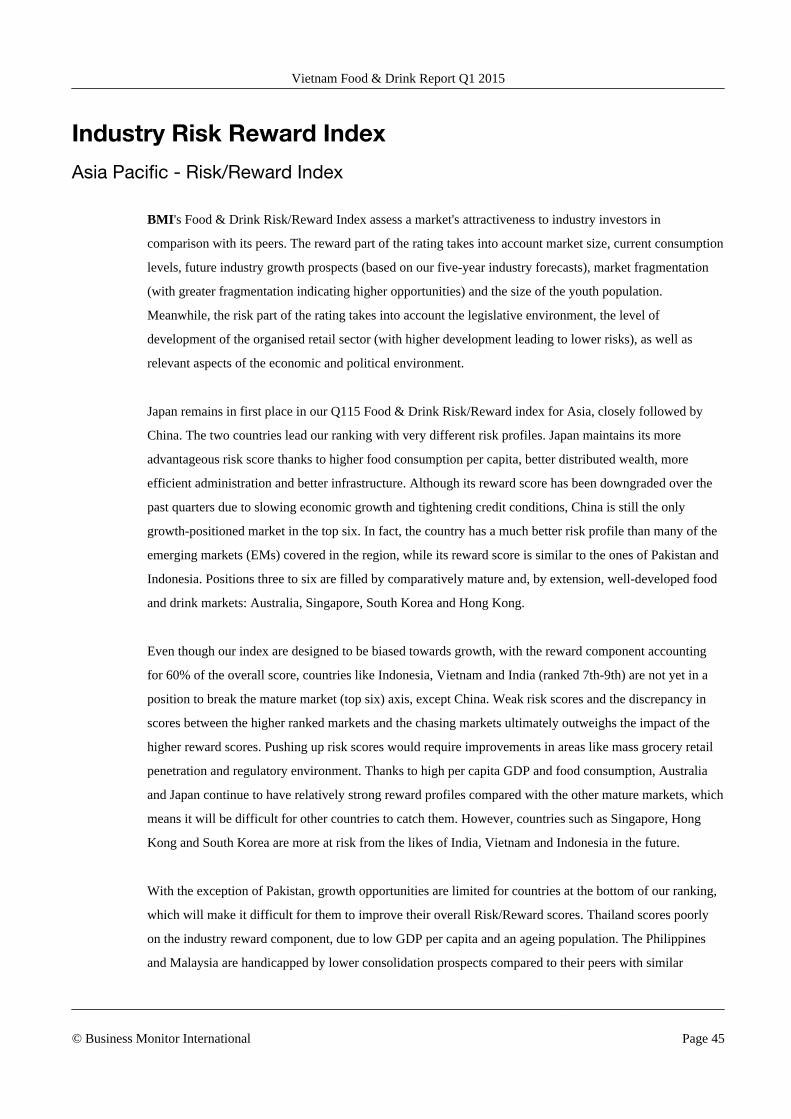
Industry Risk Reward Index
Asia Pacific - Risk/Reward Index
BMI's Food & Drink Risk/Reward Index assess a market's attractiveness to industry investors in
comparison with its peers. The reward part of the rating takes into account market size, current consumption
levels, future industry growth prospects (based on our five-year industry forecasts), market fragmentation
(with greater fragmentation indicating higher opportunities) and the size of the youth population.
Meanwhile, the risk part of the rating takes into account the legislative environment, the level of
development of the organised retail sector (with higher development leading to lower risks), as well as
relevant aspects of the economic and political environment.
Japan remains in first place in our Q115 Food & Drink Risk/Reward index for Asia, closely followed by
China. The two countries lead our ranking with very different risk profiles. Japan maintains its more
advantageous risk score thanks to higher food consumption per capita, better distributed wealth, more
efficient administration and better infrastructure. Although its reward score has been downgraded over the
past quarters due to slowing economic growth and tightening credit conditions, China is still the only
growth-positioned market in the top six. In fact, the country has a much better risk profile than many of the
emerging markets (EMs) covered in the region, while its reward score is similar to the ones of Pakistan and
Indonesia. Positions three to six are filled by comparatively mature and, by extension, well-developed food
and drink markets: Australia, Singapore, South Korea and Hong Kong.
Even though our index are designed to be biased towards growth, with the reward component accounting
for 60% of the overall score, countries like Indonesia, Vietnam and India (ranked 7th-9th) are not yet in a
position to break the mature market (top six) axis, except China. Weak risk scores and the discrepancy in
scores between the higher ranked markets and the chasing markets ultimately outweighs the impact of the
higher reward scores. Pushing up risk scores would require improvements in areas like mass grocery retail
penetration and regulatory environment. Thanks to high per capita GDP and food consumption, Australia
and Japan continue to have relatively strong reward profiles compared with the other mature markets, which
means it will be difficult for other countries to catch them. However, countries such as Singapore, Hong
Kong and South Korea are more at risk from the likes of India, Vietnam and Indonesia in the future.
With the exception of Pakistan, growth opportunities are limited for countries at the bottom of our ranking,
which will make it difficult for them to improve their overall Risk/Reward scores. Thailand scores poorly
on the industry reward component, due to low GDP per capita and an ageing population. The Philippines
and Malaysia are handicapped by lower consolidation prospects compared to their peers with similar
Vietnam Food & Drink Report Q1 2015
© Business Monitor International Page 45
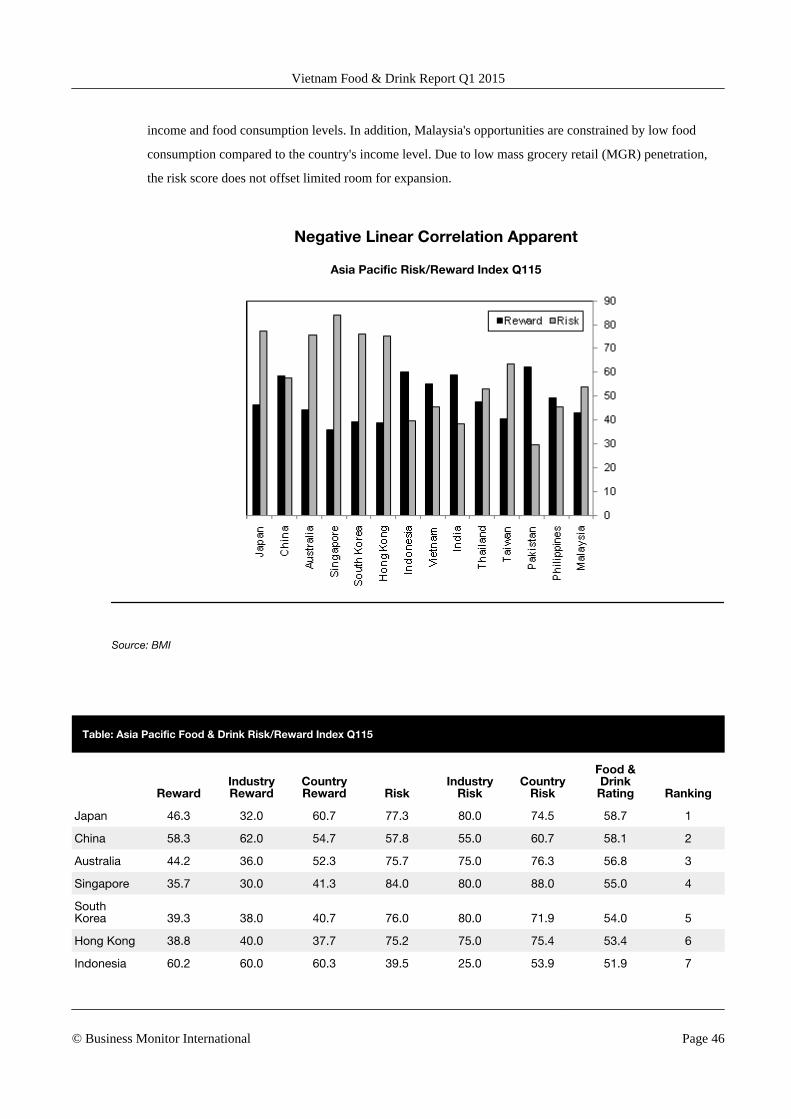
income and food consumption levels. In addition, Malaysia's opportunities are constrained by low food
consumption compared to the country's income level. Due to low mass grocery retail (MGR) penetration,
the risk score does not offset limited room for expansion.
Negative Linear Correlation Apparent
Asia Pacific Risk/Reward Index Q115
Source: BMI
Table: Asia Pacific Food & Drink Risk/Reward Index Q115
RewardIndustryReward
CountryReward Risk
IndustryRisk
CountryRisk
Food &DrinkRating Ranking
Japan 46.3 32.0 60.7 77.3 80.0 74.5 58.7 1
China 58.3 62.0 54.7 57.8 55.0 60.7 58.1 2
Australia 44.2 36.0 52.3 75.7 75.0 76.3 56.8 3
Singapore 35.7 30.0 41.3 84.0 80.0 88.0 55.0 4
SouthKorea 39.3 38.0 40.7 76.0 80.0 71.9 54.0 5
Hong Kong 38.8 40.0 37.7 75.2 75.0 75.4 53.4 6
Indonesia 60.2 60.0 60.3 39.5 25.0 53.9 51.9 7
Vietnam Food & Drink Report Q1 2015
© Business Monitor International Page 46

Asia Pacific Food & Drink Risk/Reward Index Q115 - Continued
RewardIndustryReward
CountryReward Risk
IndustryRisk
CountryRisk
Food &DrinkRating Ranking
Vietnam 55.0 68.0 42.0 45.6 30.0 61.2 51.2 8
India 59.0 54.0 64.0 38.3 20.0 56.7 50.7 9
Thailand 47.7 58.0 37.3 53.1 40.0 66.2 49.8 10
Taiwan 40.3 40.0 40.7 63.5 50.0 76.9 49.6 11
Pakistan 62.2 64.0 60.3 29.8 10.0 49.6 49.2 12
Philippines 49.2 38.0 60.3 45.3 30.0 60.6 47.6 13
Malaysia 43.2 40.0 46.3 53.9 40.0 67.8 47.5 14
Scores out of 100, with 100 highest. The Food & Drink Risk/Reward Rating is the principal rating. It comprises two sub-index, 'reward' and 'risk', which have a 60% and 40% weighting respectively. In turn, the 'reward' rating comprises'industry reward' and 'country reward', which have equal weighting and are based upon growth/size of food/alcohol andsoft drinks industry (market) and the broader economic/socio-demographic environment (country). The 'risk' ratingcomprises 'industry risk' and 'country risk', which both have 20% weightings and are based on a subjective evaluation ofindustry regulatory and competitive issues (market) and the industry's broader country risk exposure (country), which isbased on BMI's proprietary Country Risk Index. Source: BMI
The six factors that make up the reward score in our index are: food consumption per capita, market
fragmentation, per capita food consumption (five-year compound annual growth), population size, GDP per
capita, and youth population.
The first indicator, food consumption per capita, reflects the existing spending power of the Japanese
consumer (the country scores 10 out of 10 on this metric), with South Korea, Australia, Singapore, Hong
Kong and Taiwan also achieving high scores. Although these countries show high levels of spending, the
performance of other countries is markedly different, pointing to a clear division between regional peers.
China, for example, scores only 5, indicating scope for income growth. India has the lowest score of 1 while
Pakistan and Vietnam have a score of 2, highlighting even more potential for acceleration despite the
current low reward marking.
Our second indicator, market fragmentation, assesses how relatively developed (less fragmented) or
underdeveloped (more fragmented) a market is. Whereas the first indicator confers strong scores for high
existing spending, the second indicator rewards countries where the long-term scope for growth is the
greatest. These are typically markets where there is significant room for growth, innovation and
development. Unsurprisingly, Japan, with a highly developed, saturated mass grocery retail (MGR) sector,
is comfortably outscored by India, China and almost all the EMs rated.
Vietnam Food & Drink Report Q1 2015
© Business Monitor International Page 47
The third indicator within the reward breakdown of our index system is per capita food consumption
growth (five-year compound annual growth). Paired with market fragmentation, this is the joint highest
weighted indicator within our reward score framework. Since our index are designed to be forward-looking,
this indicator is one of the main ways we gauge growth and, in combination with some of the other high-
weight indicators we look at, informs our preferences for certain markets. Despite lower scores than in
previous quarters, countries such as China, India and Vietnam outscore Japan and Australia, demonstrating
the future promise of these Asian markets in challenging Japan's lead. One notable high scorer is South
Korea, which is forecast to increase per capita food consumption at a similar rate to many emerging
markets. Such growth could see the country move higher up the rankings in the near future.
Population size is the fourth indicator, and China and India unsurprisingly score well, as does Japan, with
its population of nearly 130mn. Paired with our fifth indicator, GDP per capita, large populations and
strong spending power have reinforced Japan's continued dominance in our index this quarter. Though
Singapore possesses one of the highest per capita income expenditures and a very good risk score, the
limited size of the market means that the country loses ground on this metric.
The final reward indicator, youth population, was introduced as a way to factor in a more comprehensive
demographic angle to our index. Here, Pakistan, Vietnam and the Philippines stand out, with high scores
rewarding the growth potential associated with young populations and poor scores for Japan and Australia
pointing to the restraints that can be presented by ageing populations. Thailand is also handicapped by its
ageing population.
The seven factors that make up the risk score are: mass grocery retail (MGR) penetration, regulatory
environment, short-term economic risk rating, income distribution, lack of bureaucracy, market orientation,
and physical infrastructure.
Our first risk indicator is MGR penetration, which assesses how relatively developed the overall consumer
sector is. Very low MGR scores reflect the ongoing predominance of informal retail, comprised of kiosks
and markets with weak centralised distribution mechanisms. Many of the more mature and developed
markets score well here, including Australia, Singapore and Japan. India, which has very recently initiated
efforts to open up its food retailing sector to multinationals, scores very poorly (1/10). Conversely, China is
much further along in the development of organised retailing channels when compared with other low
scorers such as Vietnam and Malaysia.
Vietnam Food & Drink Report Q1 2015
© Business Monitor International Page 48
The second factor, regulatory environment, evaluates the complexity of regulations such as labelling and
nutrition requirements. It can also be used to gauge the state of the overall business environment. The more
developed and mature markets usually score better here, and that is once again the case in Q115, with
Pakistan, India and Vietnam scoring poorly, highlighting persisting food regulatory hurdles, particularly for
non-domestic producers. Notably, however, China and the Philippines score fairly impressively in this
metric, hinting that future growth will be encouraged by both of these countries' strong regulatory
environments.
The third factor, short-term economic risk rating, assesses the degree to which the country approximates
the ideal of non-inflationary growth with falling unemployment, contained fiscal and external deficits and
manageable debt ratios. It is principally the candidates towards the top of our index that do well on this
criterion, underlining the link between economic stability and the overall attractiveness of the consumer
market. Pakistan's position as the lowest scorer across the region points to continued investor concern, with
its score failing to increase over recent quarters. Again, South Korea posts a very favourable rating here.
The fourth factor, income distribution, is measured by the proportion of private consumption accounted for
by the middle 60% of earners. Unsurprisingly, countries such as Japan, Singapore and South Korea lead the
pack, though developing markets also score relatively well in this regard.
Lack of bureaucracy, our fifth indicator, is a measure of the hurdles that any producer is likely to face in
areas such as starting and closing businesses, paying taxes, dealing with licences and registering property.
Here India continues to score poorly, with its draconian bureaucracy highlighted in the press regarding
multinational grocery retailers. This is paired with our sixth factor, market orientation, which measures
how business-orientated an economy is and measures the level of foreign direct investment protectionism,
tax rates and the level of government intervention. Another low score for India points to the continued
difficulties facing investors looking to enter this market in particular.
Our final risk factor, physical infrastructure, measures the ease and cost of operating in a market from an
infrastructure perspective. Some of our favourite regional economies have a lot of work to do here, with the
reward profiles of high-growth markets such as China and Indonesia facing poor scores. Paired with factors
such as market orientation, regulatory environment and MGR penetration, countries will have to perform
well here if they are to challenge the continuing index dominance of Japan.
Vietnam Food & Drink Report Q1 2015
© Business Monitor International Page 49

Table: Asia Pacific Food & Drink Risk/Reward Sub-Factor Index Q115 - Selected Countries (scores out of 10)
Reward China Japan India Philippines
Food consumption per capita 5.0 10.0 1.0 3.0
Market fragmentation 8.0 1.0 9.0 5.0
Per capita food consumption,five-year compound annualgrowth
5.0 2.0 4.0 3.0
Population size 10.0 8.0 10.0 7.0
GDP per capita, US$ 4.0 9.0 2.0 2.0
Youth population, % 2.0 2.0 6.0 8.0
Risk
MGR penetration 5.0 9.0 1.0 1.0
Regulatory environment 6.0 7.0 3.0 5.0
Short-term economic riskrating 9.0 7.0 6.2 7.4
Income distribution 7.0 9.0 7.0 7.0
Lack of bureaucracy 5.0 8.0 4.2 3.9
Market orientation 4.0 5.6 4.3 6.0
Physical infrastructure 5.5 8.0 6.6 6.1
Source: BMI
Vietnam Food & Drink Report Q1 2015
© Business Monitor International Page 50
Vietnam Risk/Reward Index
Vietnam retains its eighth place in BMI's Q115 Food & Drink Risk/Reward Index for the Asia Pacific
region. Recently, Vietnam's consumer sector has been the recipient of a flurry of investment activity, as the
country offers huge potential for growth, both domestically and through its role as a regional manufacturing
hub.
We believe that Vietnam offers one of the greatest opportunities in the Asian food and drink sphere, given
the country's fairly young and large population, and a relatively high per capita expenditure on food and
drink for the region. Furthermore, the food, drink and MGR segments are all very fragmented, meaning that
great opportunities exist for consolidation from both domestic and international companies.
Vietnam ranks well in terms of its rewards score, as the country's food and drink markets are forecast to
deliver strong growth over the coming years. Vietnam scores nine out of ten on our indicator of five year
compound annual growth per capita food consumption.
The relatively fragmented nature of the Vietnamese food and drink market is also indicative of the strong
scope for growth in the market. Given the lack of strong incumbents in sectors such as coffee and mass
grocery retail, multinational consumer goods players would face lesser competitive headwinds in trying to
build up scale across Vietnam.
Currently, income levels in Vietnam are a long way behind developed economies, and consumer purchases
remain largely centred on food staples and daily necessities. However, as incomes start to accelerate off a
low base on the back of sturdy economic growth, consumer tastes and preferences are expected to calibrate
towards the higher-value food and beverage segments, which will be very likely to guarantee a receptive
and growing audience for branded food and beverage products in the medium term.
A massive youthful population enhances the investment appeal of Vietnam. Young consumers are typically
very receptive to new ideas and product innovation, and multinational consumer goods producers targeting
the mass market in particular are likely to find a growing market among this demographic group. The trend
of consumer-facing players focusing their expansion on the mass-market segment is under way and will
continue to pick up momentum as consumers get richer over the coming years. The lack of a homogenous
and sprawling MGR network acts as a headwind to the distribution of packaged, formalised food and drink
items, though again offers a further opportunity in the long term.
Vietnam Food & Drink Report Q1 2015
© Business Monitor International Page 51

A relatively subdued Industry Risks performance will continue to weigh on Vietnam's overall investment
appeal. The country has a low score on the indicator of mass grocery retail penetration, which highlights the
significant challenges multinationals would face in facilitating the distribution of their products and
improving the visibility of their brands. In contrast, in emerging markets such as China and Thailand, which
have relatively more developed food retailing markets, consumer goods players would find it relatively easy
to entrench their presence.
Vietnam continues to underperform on the Country Risks indicator. The country's poor infrastructure
continues to be an impediment for many foreign investors; however, we see this as a diminishing problem
as the government is investing heavily in new roads, railways and ports. Corruption is another major
hindrance to running a business in Vietnam, as well as ongoing weakness in the country's political
environment. Our Country Risk team, however, expects this to recover in the coming months.
Vietnam Food & Drink Report Q1 2015
© Business Monitor International Page 52
Market Overview
Food
Agriculture
Owing to the country's vast population, food security - or the state's desire to be free from reliance on food
imports - has always been something of an issue in Vietnam. As a result, the country's agricultural sector
has become one of its most important industries and serves as a major employment provider, particularly in
rural areas.
Thanks to significant government investment in the sector, agriculture in Vietnam has developed
enormously in recent years, and output is now achieving annual growth to the point where the country can
meet domestic demand in most areas. In fact, some agricultural sub-sectors have developed to such an
extent that surplus produce is becoming available for the export market. This has predominantly occurred in
the fields of livestock and fisheries which are, owing to their potential profitability, the areas that have
attracted most private investment in recent years.
However, despite improvements over the review period, Vietnam's agricultural industry still has some way
to go if it is to become globally competitive and prove a real stimulant to the country's economy.
Considerable investment in new processing facilities that meet international standards will be needed, while
production capacity will also need to be increased to meet the longer-term storage needs of processed foods.
Agricultural losses also remain a problem, and we believe a review of harvesting techniques will be needed
if the industry is to fulfil its vast potential.
Vietnam is a major global producer of coffee, and the world's largest coffee distributor Nestlé has
developed its business in the region significantly over recent years. The Swiss company has trained almost
20,000 farmers, and has distributed over 2 million coffee plants in the country.
The country's rice sector has also grown tremendously over the past 20 years, as the country is now one of
the region's key rice exporters. Output grew by more than 25% between 2000 and 2012, though we expect
rice production in the country to decline for the first time in 15 years in the 2014/15 season starting in
January 2015, mainly due to a government push to produce more corn and soybean at the expense of rice.
That said, we hold a positive long term view for the sector, as Vietnamese rice is very competitive relative
to many of its regional peers and is well positioned to benefit from both regional and global demand growth.
Another advantage of Vietnamese rice is its relatively higher yields. The government is looking to increase
Vietnam Food & Drink Report Q1 2015
© Business Monitor International Page 53
by 50% the area planted with hybrid rice varieties, and this bolsters our outlook for the country's rice
production capabilities over the long term.
Food Processing
Despite a significant proportion of processed food being imported, consumption of imported produce
remains fairly low in the country - although it has increased in the main population centres of Ho Chi Minh
City and Hanoi.
Overall, the Vietnamese food-processing industry remains largely fragmented and is dominated by
relatively small domestic operators. However, an increasing number of consumer goods investors are setting
up shop in Vietnam and we expect competitive pressures to heat up quickly. In November 2014, Mondelez
International, the spin-off of Kraft Foods, acquired an 80% stake in the domestic snack company Kinh
Do. In 2012, Philippine food major Jollibee Foods Corporation acquired a 50% interest in SuperFoods
Group, which will give it a 49% stake in SF Vung Tau Joint Stock Company in Vietnam and a 60%
share in Blue Sky Holdings in Hong Kong. In 2011, Thai consumer food and agribusiness firm Charoen
Pokphand Foods acquired a 74.18% stake in Vietnam-based feed business and agribusiness services firm
CK Pokphand.
Food Consumption
In terms of consumption trends, the expansion of modern lifestyles and the rise in disposable incomes -
which have accompanied Vietnam's economic growth, particularly in major urban centres - have increased
consumer demand for snacks, convenience foods, and premium and luxury food items. Domestic food
manufacturers are beginning to respond to this trend, albeit slowly, and are increasing the range of ready-to-
eat and semi-prepared foods on offer. In addition, domestic food producers are having to confront the
penchant for Western consumption habits and brands that is common in Vietnam, particularly among
younger and more affluent consumers. The dairy sector, in particular, has experienced very strong growth in
recent years, alongside increasing urbanisation and rising incomes. Huge multinational companies have
managed to sway consumer preferences with their considerable advertising and promotional power, and
domestic firms have had to work hard to secure brand loyalty.
Fast food giant McDonald's has launched its first restaurant in Vietnam in 2014, in the commercial capital
Ho Chi Minh City. Vietnam is the 38th Asian market that McDonald's has entered and, judging by its track
record in emerging markets across the world, we believe that its prospects look strong.
Vietnam Food & Drink Report Q1 2015
© Business Monitor International Page 54
Foreign Brands Dominating Consumer Goods Industry
Foreign brands are making stronger headway than domestic brands in the Vietnamese consumer goods
industry. Domestic brands have only a modest presence in Vietnam, which can be attributed to the
distribution hurdles faced by local consumer goods players, the stronger brand appeal of foreign companies
and the perceived better quality of foreign goods. In our view, local consumer goods investors would
probably do best to improve their product quality and tailor their portfolio to meet the localised needs of the
Vietnamese consumer.
■ Distribution Challenges: While the majority of domestically produced consumer goods can be found inlocal supermarket stores such as Saigon Co-op and Big C, domestic consumer firms have a far lessextensive reach than their foreign counterparts across the traditional retail channels such as wet marketsand independent stores. Given that organised grocery retail remains a fledgling concept in Vietnam,traditional retail networks arguably provide the most effective and widespread reach to the end-consumermarket, which explains the weaker presence of domestic brands in the country.
■ Perceived Better Quality Of Foreign Goods: Foreign consumer goods are typically viewed to be ofbetter quality than domestically produced goods among local consumers. As foreign consumer goodsinvestors typically have stronger financial clout, they are equipped with a greater capacity to invest inproduction infrastructure, as well as in research and development to improve product quality.
■ Stronger Brand Appeal Of Foreign Brands: Foreign consumer firms typically enjoy stronger brandappeal than their domestic counterparts, which can be largely attributed to the aggressive brandinginitiatives employed by foreign firms. Foreign brands, such as US coffee firm Starbucks, are generallyassociated with social prestige, and as consumer affluence grows over the coming years, more consumersare likely to associate themselves with foreign brands rather than local brands.
With more multinationals setting foot in Vietnam as they look to ride on the country's dynamic consumer
growth story, domestic companies are likely to find it more difficult to compete for market share gains.
Indeed, Thai brewer Singha, Philippines-based fast-food chain Jollibee and Japanese retailer Aeon are
looking to ramp up their expansion push into Vietnam, fuelling competitive pressure for domestic firms.
As competition heats up quickly in the Vietnamese consumer goods market, domestic firms would probably
do best to tailor their product offerings to cater to the unique tastes of the Vietnamese consumer and
improve their product quality to better compete against their foreign counterparts. Domestic companies
typically have a stronger competitive advantage than foreign companies with regard to understanding local
market needs and preferences, and they could leverage on this competitive edge to grow their market share.
Although domestic firms have a weaker competitive advantage in terms of distribution reach, the ongoing
proliferation of organised grocery retail is likely to ease distribution challenges for these companies.
Vietnam Food & Drink Report Q1 2015
© Business Monitor International Page 55
Drink
Hot Drinks
As incomes rise in Vietnam, coffee consumption is expected to grow impressively over the coming decade.
As people get richer, opportunities at the premium end of the coffee market are likely to strengthen.
Indeed, US coffee giant Starbucks launched in Vietnam in 2013, opening its first coffee shop in Ho Chi
Minh City. In July 2014, the company expanded its store network and now operates a number of stores in
second city Hanoi. In September 2014, the company announced that it would purchase the whole of its
Japanese operations, suggesting that the company is looking to build a stronger footprint in the Asia Pacific
region, which has been one of our core views for some time.
We also expect more regional players to get involved in the Vietnamese coffee market over the coming
years. This is demonstrated by Masan Consumer's acquisition of a 50.1% stake in Vinacafe. Masan clearly
wants to put itself in a strong position to leverage on the exciting demand dynamics in the Vietnamese
coffee sector.
Also looking to capitalise on Vietnam's coffee potential, Nestlé plans to increase its coffee sourcing from
local farmers in Vietnam and has committed to a new coffee factory in the country. The USD270mn factory
will be constructed in the south east province of Dong Nai, and will produce Nescafé-branded products for
the domestic and international markets from 2013. The plant was opened in summer 2013. In November
2014, Italy-based Massimo Zanetti Beverage Group inaugurated its first coffee-roasting plant in Vietnam.
Soft Drinks
Per capita consumption of soft drinks in Vietnam is low but growing. The soft drinks sector is dominated by
multinationals The Coca-Cola Company and PepsiCo, which jointly command an estimated 88% share of
the market. PepsiCo opened its new USD45mn manufacturing plant in southern Dong Nai Province in
March 2012. The plant has a capacity of 180mn litres a year and will produce carbonated and non-
carbonated drinks including Pepsi, 7up, Mirinda, Twister, Sting and Aquafina.
The major focus of the multinationals is on carbonated soft beverages, with small local drinks firms
producing other types of drinks and fighting it out for the remaining market share. The largest of the other
players is Saigon Beverages Joint Stock Company (Tribeco), with an approximate 6% market share.
Vietnam Food & Drink Report Q1 2015
© Business Monitor International Page 56

The expiration of a bottling agreement between US soft drinks giant The Coca-Cola Company and
Singapore-based soft drinks producer Fraser and Neave (F&N) marks a fresh start for both companies.
Upon the termination of this agreement, F&N can now expand freely into the other high-growth regional
markets such as Thailand and Indonesia.
The announcement, in late 2012, of a tie-up between Suntory and PepsiCo in Vietnam looks as if it could
prompt further consolidation in the industry. Indeed, it has been reported that local drinks group Tanh Hiep
Phat is looking for an international partner to help it maintain its competitive position. The firm's chairman,
Tran Qui Thanh, suggested that The Coca-Cola Company was among the firms which had expressed an
interest in a joint venture.
Smaller drinks companies have had a chance, in recent years, to win some market share back from the
major multinationals owing to the rising interest in healthy drinks, such as teas and juices, in which these
local firms specialise. In fact, the competition that these high-growth categories have stimulated has seen
investment interest in the soft drinks sector increase.
Alcoholic Drinks
The government levies substantial duties on all imported alcoholic beverages, and there are consumption
taxes. As a result, a substantial black market for smuggled products has developed, with the government
estimating that a third of spirit sales come from smuggled goods.
Owing to the inherent price sensitivity of Vietnamese consumers, the majority of alcoholic drink products in
the country fall at the economy end of the market. However, this is changing gradually - particularly within
wealthy urban centres - and the brewing industry is a major driver of this slow move towards
premiumisation.
Western expatriates and tourists remain the biggest consumers of wines and spirits in Vietnam, although
domestic drinking habits have also been changing in line with higher consumer incomes and greater
exposure to Western cultures. Alcohol consumption habits of the Vietnamese consumer have traditionally
centred on largely cheap beer and whiskies. However, we are witnessing a shift of consumption habits
towards quality wines at reasonable prices. Wines are often perceived as a symbol of social prestige, and as
living standards improve, demand for wines is likely to increase.
In the beer sector, several multinational operators have established joint ventures (JVs) to avoid being
subject to the high import duties on beer. Domestically produced international brands include Heineken,
Vietnam Food & Drink Report Q1 2015
© Business Monitor International Page 57
Fosters, Tiger, Carlsberg and San Miguel, with the first three all produced by Asia Pacific Breweries
(APB). Heineken recently secured full control of APB after F&N shareholders voted in favour of the firm's
SGD5.6bn (USD4.5bn) bid. Heineken previously held a 42.5% stake in APB, which it operated in
partnership with F&N. However, a bid for F&N by ThaiBev put this position under jeopardy and forced
Heineken to launch a takeover bid.
APB has brewing facilities in 13 different high growth markets - Singapore, Malaysia, China, India,
Vietnam, Cambodia, Thailand, Sri Lanka, New Zealand, Papua New Guinea, New Caledonia, Mongolia and
Laos. Its flagship product is its Tiger beer brand.
A number of foreign players have invested in the Vietnamese market, including the Danish major
Carlsberg (operating both alone and via a 17% stake in Habeco); UK spirits leader Diageo (operating both
alone and through a partnership with Halico); the Philippines' San Miguel; Anglo-South African brewing
leader SABMiller (which bought out local partner Vinamilk); UK-based Scottish & Newcastle (S&N) and
its partner Vinataba (S&N's Vietnamese operations fell into the hands of Carlsberg after the Danish firm's
takeover of the UK brewery and asset split in partnership with Heineken - Carlsberg has subsequently
decided to withdraw from its joint venture with Vinataba); and, most recently, Japan's Sapporo through its
acquisition of a 65% stake in Kronenbourg Vietnam, the Carlsberg and Vinataba 50:50 JV. In November
2014, Thai Beverage Public Company showed interest in purchasing a share in Sabeco, as the Vietnamese
government is expected to sell more than 50% of the company to investors (it currently owns a 89% stake).
Heineken's Vietnamese operation is controlled through Vietnam Brewery. The group's Vietnamese partner
is Saigon Trading Co. Japanese drinks company Kirin owns a 48% stake in the beverages arm of San
Miguel Corporation, as Japanese FMCG companies look overseas for growth away from their saturated
domestic market.
Despite the growing presence of multinationals in the market, local firms continue to dominate. The sector
remains highly regionalised, with Habeco (Hanoi Alcohol Beer and Beverage Company), which is partly
owned by Danish beer giant Carlsberg, dominating the north of the country and Sabeco (Saigon Beer
Alcohol Beverage Corporation) being the key player in the south. Sabeco and Habeco - both state-backed
brewers - control an impressive 34% and 19% of the local beer market respectively. It is not surprising,
therefore, that domestic brands are continuing to lead overall sales in the Vietnamese beer market.
While these two state- backed companies dominate the beer industry in the country, the dominance of
domestic brewers in their respective regions underlines the less-competitive nature of the regional beer
markets and partly explains the sector's higher-margin operating environment. With growing consumer
Vietnam Food & Drink Report Q1 2015
© Business Monitor International Page 58

awareness and receptiveness of foreign brands, there is certainly potential for foreign brewers to make big
waves across the sector.
We are already witnessing increasingly fierce competition from foreign brewers as they seek to strengthen
their market foothold in the sector, particularly in the premium beer segment. Japanese brewer Sapporo
announced that it intends to make a fivefold increase its beer production in Vietnam in the period up to
2019, while compatriot Asahi plans to pursue acquisitional growth across a number of South East Asian
markets, including Vietnam. As it looks to stretch its regional presence further, APB plans to invest
SGD90mn in expanding production by 50% at its Ho Chi Minh brewing JV with Saigon Trading.
Similarly, Thai brewer Singha clearly has its eyes set on the tremendous potential on offer in the Indochina
region. While Singha has previously been exporting its beer products to the Indochina region through local
importers and distributors, the brewer now plans to establish sales offices across the region in a bid to
consolidate a stronger presence in these markets.
Vietnam Food & Drink Report Q1 2015
© Business Monitor International Page 59
Mass Grocery Retail
Over the past five years, the growing presence of supermarkets and shopping centres has gradually been
eroding the traditionally dominant position of open-air markets in urban areas. Modern mass grocery retail
(MGR) outlets are now concentrated around Vietnam's major urban centres. The vast majority of these
outlets are found in and around the main urban centres of Hanoi and Ho Chi Minh City, although modern
retail outlets are increasingly appearing in smaller central towns and cities.
Vietnamese supermarkets are facing strong competition from foreign competitors, as the increasing number
of foreign retail outlets compounds the economic hardships faced by domestic retailers. Domestic
retailers FiviMart and Intimex have particularly struggled in recent years, having reduced their number of
outlets. The presence of international MGR firms such as French-owned Casino's Big C enterprise,
Malaysian department store Parkson and Japan's FamilyMart has damaged the prevalence of smaller,
domestic store networks.
Convenience stores in Vietnam are generally larger than those in Western Europe or the US and stock a
wider range of goods in order to fully cater for areas that do not have the scale to warrant a large
supermarket outlet. In rural areas of the country, open-air markets continue to dominate, although this can
be expected to change as modern retail formats become more commonplace and acceptance of this spreads
to the provinces.
Unlike many markets in the region, the Vietnamese authorities initially encouraged the entry of modern
retailers rather than viewing them as a threat to traditional operators. In Hanoi, city authorities have actively
encouraged supermarket expansion as a means of modernising lifestyles and progressing towards a fully
functioning market economy. However, as cities have started to get more crowded, and the market share of
traditional retailers began suffering accordingly, there have been signs that the government is backtracking
slightly on this open policy. In line with the country's WTO accession, the Vietnamese government now
looks like it will have to allow foreign investment in order to stimulate modernisation and job creation while
at the same time employing restrictions to protect its traditional retail sector.
Owing to the growing demands of customers in Vietnam, supermarkets are increasingly providing a wider
variety of products. Demand for a wide range of produce and a certain standard of product has risen in line
with disposable incomes, which have in turn increased in line with improvements in the economy. Food
products such as fresh meat and vegetables, ready-to-cook meals and snack foods are sold alongside non-
food product lines, including toys, gifts and electrical appliances, in supermarkets and hypermarkets. In fact,
MGR outlets in Vietnam focus more on non-food items than similar stores in the Western world. Daily food
Vietnam Food & Drink Report Q1 2015
© Business Monitor International Page 60
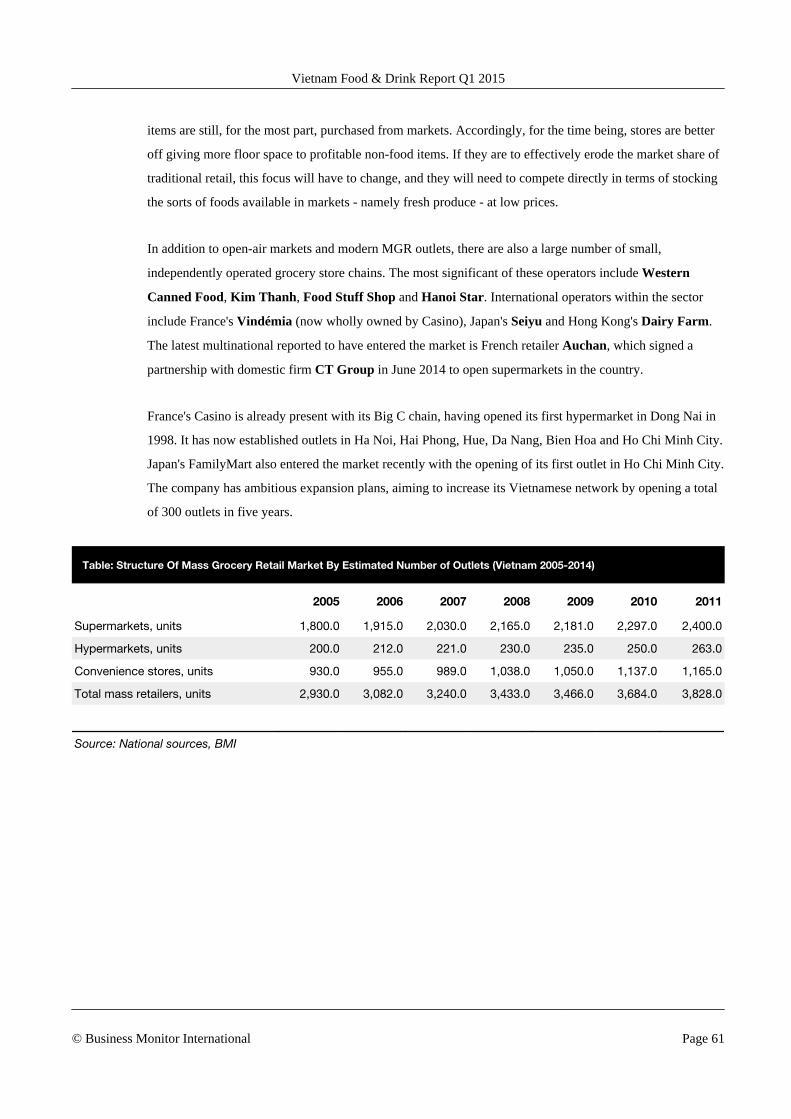
items are still, for the most part, purchased from markets. Accordingly, for the time being, stores are better
off giving more floor space to profitable non-food items. If they are to effectively erode the market share of
traditional retail, this focus will have to change, and they will need to compete directly in terms of stocking
the sorts of foods available in markets - namely fresh produce - at low prices.
In addition to open-air markets and modern MGR outlets, there are also a large number of small,
independently operated grocery store chains. The most significant of these operators include Western
Canned Food, Kim Thanh, Food Stuff Shop and Hanoi Star. International operators within the sector
include France's Vindémia (now wholly owned by Casino), Japan's Seiyu and Hong Kong's Dairy Farm.
The latest multinational reported to have entered the market is French retailer Auchan, which signed a
partnership with domestic firm CT Group in June 2014 to open supermarkets in the country.
France's Casino is already present with its Big C chain, having opened its first hypermarket in Dong Nai in
1998. It has now established outlets in Ha Noi, Hai Phong, Hue, Da Nang, Bien Hoa and Ho Chi Minh City.
Japan's FamilyMart also entered the market recently with the opening of its first outlet in Ho Chi Minh City.
The company has ambitious expansion plans, aiming to increase its Vietnamese network by opening a total
of 300 outlets in five years.
Table: Structure Of Mass Grocery Retail Market By Estimated Number of Outlets (Vietnam 2005-2014)
2005 2006 2007 2008 2009 2010 2011
Supermarkets, units 1,800.0 1,915.0 2,030.0 2,165.0 2,181.0 2,297.0 2,400.0
Hypermarkets, units 200.0 212.0 221.0 230.0 235.0 250.0 263.0
Convenience stores, units 930.0 955.0 989.0 1,038.0 1,050.0 1,137.0 1,165.0
Total mass retailers, units 2,930.0 3,082.0 3,240.0 3,433.0 3,466.0 3,684.0 3,828.0
Source: National sources, BMI
Vietnam Food & Drink Report Q1 2015
© Business Monitor International Page 61
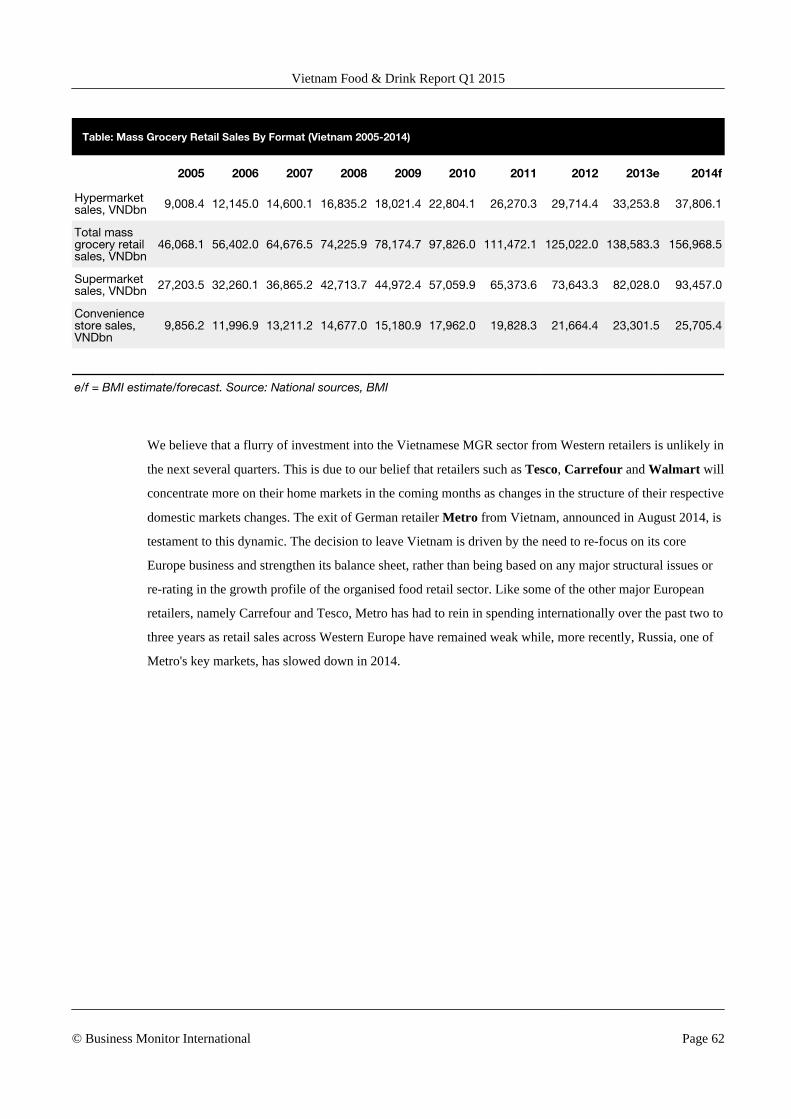
Table: Mass Grocery Retail Sales By Format (Vietnam 2005-2014)
2005 2006 2007 2008 2009 2010 2011 2012 2013e 2014f
Hypermarketsales, VNDbn 9,008.4 12,145.0 14,600.1 16,835.2 18,021.4 22,804.1 26,270.3 29,714.4 33,253.8 37,806.1
Total massgrocery retailsales, VNDbn
46,068.1 56,402.0 64,676.5 74,225.9 78,174.7 97,826.0 111,472.1 125,022.0 138,583.3 156,968.5
Supermarketsales, VNDbn 27,203.5 32,260.1 36,865.2 42,713.7 44,972.4 57,059.9 65,373.6 73,643.3 82,028.0 93,457.0
Conveniencestore sales,VNDbn
9,856.2 11,996.9 13,211.2 14,677.0 15,180.9 17,962.0 19,828.3 21,664.4 23,301.5 25,705.4
e/f = BMI estimate/forecast. Source: National sources, BMI
We believe that a flurry of investment into the Vietnamese MGR sector from Western retailers is unlikely in
the next several quarters. This is due to our belief that retailers such as Tesco, Carrefour and Walmart will
concentrate more on their home markets in the coming months as changes in the structure of their respective
domestic markets changes. The exit of German retailer Metro from Vietnam, announced in August 2014, is
testament to this dynamic. The decision to leave Vietnam is driven by the need to re-focus on its core
Europe business and strengthen its balance sheet, rather than being based on any major structural issues or
re-rating in the growth profile of the organised food retail sector. Like some of the other major European
retailers, namely Carrefour and Tesco, Metro has had to rein in spending internationally over the past two to
three years as retail sales across Western Europe have remained weak while, more recently, Russia, one of
Metro's key markets, has slowed down in 2014.
Vietnam Food & Drink Report Q1 2015
© Business Monitor International Page 62

Industry Trends And Developments
Food
Key Industry Trends And Developments
Vietnam Attractive Opportunity For Sweet Snack Producers
The Vietnamese food industry, and more specifically sweet biscuits and confectionery products, will offer
tremendous growth opportunities over our forecast period to 2018. We forecast per capita food consumption
(in local currency terms) to grow at a compound annual rate of 18.6% over 2013-2018. Over the same
period, sweet biscuits volume sales are expected to grow by an average of 10.3% per year. While data on
sweet biscuits value sales are not available, we expect them to grow faster than volume sales due to
premiumisation. On November 11 2014, Mondelez, a global leader in snacks and confectionery, announced
it would buy an 80% stake in the Vietnamese snack company Kinh Do for USD370mn.
Despite the huge potential of the confectionery industry in Vietnam and more generally in emerging Asia,
international confectionery and biscuits producers have a relatively weak presence in the region. For
instance, the Asia Pacific region accounts for only 14% of Mondelez's annual sales. Asia Pacific also
receives less investment compared to other emerging regions, such as Latin America and Eastern Europe,
the Middle East and Africa (EEMEA). Mondelez's capital expenditure/revenue ratio is about 5.4% for Asia
Pacific, against 6.5% for EEMEA and 7.7% for Latin America. Nonetheless, we believe that investing in the
region will offer strong opportunities for international snack producers. Increasing its capital expenditure in
Asia would enable Mondelez to further benefit from the growth story in the confectionery segment over the
next few years. Partnering with local companies, as Mondelez is doing with Kinh Do, will also enable it to
adapt to local preferences, especially in a region where confectionery is traditionally less popular compared
to Latin America or the Middle East, and to benefit from their distribution networks.
Previously, in October 2012, Belgian ingredients firm Puratos, which manufactures products for the baking
and confectionery sector, established a joint venture with fellow Belgian firm Grand-Place Holding, which
produces chocolate ingredients, in order to enter the Vietnamese confectionery market.
Nestlé Reveals Factory Expansion Plans
Switzerland-based food company Nestlé has revealed plans to invest USD42mn in its Milo chocolate malt
beverage factory at the Binh An facility in south east Vietnam. The expansion is part of the company's
Vietnam Food & Drink Report Q1 2015
© Business Monitor International Page 63

strategy to strengthen its presence in the country's growing nutritional beverage sector. The investment will
double the production capacity of the Binh An facility, enabling it to meet growing consumer demand for
Milo and other ready-to-drink products. Nestlé chairman and CEO Wayne England said the investment
reflects Nestlé's confidence about opportunities in Vietnam, fuelled by its young and dynamic population,
expanding consumer market and favourable business environment, reports Food Magazine.
Vietnam Likely To Benefit From Russia Import Ban
Vietnam will benefit from Russia's ban on agricultural imports from select countries, including the US and
the EU. Russia implemented the ban in August 2014 and it will likely last for one year from announcement.
The Russian Economic Development Minister has urged ASEAN countries to increase food exports to the
country, particularly highlighting the need for seafood, nuts, beef, pork, chicken, fruit and vegetables. We
believe that Vietnam's seafood and livestock sectors will particularly benefit.
Asia Cocoa Sector Boom At Risk Of Bean Scarcity
Interest in Asia's cocoa and chocolate sectors is rising, with many local and international players entering
the cocoa grindings and chocolate making business in the region. These sectors hold a promising future, as
they will benefit from strong demand for chocolate confectionery in Asia in the coming years. Although
there is no traditional culture of eating chocolate in the region, consumption has been growing in recent
years in some countries, driven by increasing purchasing power and the westernisation of diets. The
Vietnamese are one of the largest chocolate eaters per capita amongst Emerging Asian countries, with
consumption per capita at 0.5kg a year, while Indian, Indonesian and Thai consumers eat 0.1kg a year.
Attracted by these enticing consumption trends, cocoa grinders are investing heavily across Asia, especially
in Malaysia and Indonesia. Although modest, the growth seen in Indonesian cocoa production in the 2000s,
along with the implementation in 2009 of an ambitious public programme to boost output, made grinders
believe they could count on a stable supply of beans from Indonesia. As a result, although Europe remains
by far the largest grinding region (holding a 39% market share in 2013), the global cocoa grinding capacity
is currently shifting to Asia. Asia's grindings have grown at the fastest pace globally over the past five
years, slowly eating into Europe's market share. Asia now accounts for 21% of global grindings, compared
with 18% a decade ago.
In spite of strong demand fundamentals for the cocoa and chocolate sectors in Asia, headwinds are growing
in the processing industry. First, the ongoing wave of investment in cocoa processing plants has led to
overcapacity in Malaysia and Indonesia. We believe the fast development of capacity will have a lingering
Vietnam Food & Drink Report Q1 2015
© Business Monitor International Page 64
impact on cocoa grinders' profitability in the coming years, with margins in the industry remaining in the
doldrums. Operating and profit margins of Guan Chong Berhat's, one of the largest cocoa processing
firms in Malaysia, have been declining since Q312. In fact, the reason behind Petra Foods' decision to sell
in 2013 its Indonesian cocoa business to Barry Callebaut, may have been the lingering overcapacity in the
processing sector.
McDonald's Opens First Ho Chi Minh Restaurant In February 2014
US fast-food restaurant McDonald's, with its partner Vietnam-based company Good Day Hospitality, has
forayed into the Vietnamese food market in a bid to compete with its rivals, such as KFC and Burger King
Worldwide. The company launched its first outlet in the Vietnamese city of Ho Chi Minh on February 8.
'Expanding the chain to at least 100 branches within a decade was an achievable, if tough, goal. Vietnam's
appetite lured Berkshire Hathaway's International Dairy Queen to open in Ho Chi Minh City last month,
joining a field of US brands that since 2010 has added CKE's Carl's Jr, Domino's Pizza, Dunkin' Brands
Group's Dunkin' Donuts and Baskin-Robbins, Popeyes Louisiana Kitchen, Subway Restaurants and
Starbucks, according to the son-in-law of Prime Minister Nguyen Tan Dung.
The fact that it has taken McDonald's a particularly long time to enter Vietnam can probably be ascribed to
supply chain concerns. This in itself is not uncommon. McDonald's main rival, Yum! Brands, which owns
KFC and Pizza Hut among other restaurant trademarks, often enters markets ahead of its rival, particularly
in frontier markets. Yum! Brands' recent entries into the likes of Kenya and Tanzania highlight this.
Vietnam is not nearly as frontier as these two African countries, but this does highlight that McDonald's is
often happy to bide its time to make sure that the infrastructure on the ground is right before committing
itself.
Regional Players Expanding Footprint
Philippine food major Jollibee Worldwide, the wholly owned subsidiary of Jollibee Foods, acquired a
50% stake in SuperFoods Group in early 2012. The stake includes a 49% share in SF Vung Tau Joint
Stock Company in Vietnam and a 60% share in Hong Kong-based Blue Sky Holdings. Jollibee
Worldwide has paid USD5mn in an advance payment to the SuperFoods Group, and has also invested
USD25mn for 50% of the SuperFoods business and has given a USD35mn loan to its partner Viet Thai
International Joint Stock Company.
Vietnam Food & Drink Report Q1 2015
© Business Monitor International Page 65

Jollibee's ambition to establish a strong foothold in the international market can be traced to its domestic
market dominance and the relatively weaker prospects in the Philippine market. Despite the positives of
favourable demographics and rising consumer affluence, the Philippines still fails to compare with regional
peers such as Indonesia and China in terms of our consumer investment favourites. Sector crowding and the
presence of dominant industry players, which make market entry difficult for newcomers, are some factors
deterring investors.
The acquisition of a majority interest in the SuperFoods Group could expedite Jollibee's international push,
given the former's reach across the coffee markets of Macau, Hong Kong and Vietnam. The Vietnamese
coffee market is one of the most dynamic prospects in the Asia Pacific region, as drinking coffee is quickly
emerging as a growing lifestyle choice, particularly among younger consumers. While Hong Kong and
Macau do not share similarly exciting growth prospects as that of Vietnam, they nonetheless provide strong
scope for premiumisation growth and could create a better-rounded portfolio for Jollibee.
More noteworthy is the potential synergies Jollibee could enjoy between its coffee portfolio and its fast-
food offerings. Jollibee could serve its Highlands Coffee in its fast-food outlets, thereby offering consumers
a wider array of product choices. Additionally, SuperFoods has a Pho 24 Vietnamese restaurant chain, with
outlets across Vietnam, Indonesia, the Philippines, Hong Kong, Cambodia and Japan, which could further
enhance Jollibee's regional reach.
Similarly, Japanese confectioner Ezaki Glico announced, in early 2012, that it would acquire a 10% stake
in Vietnam-based sweets maker Kinh Do Corp, reports Reuters. The company will purchase 14mn newly
issued shares in the sweets maker. The company aims to expand its business presence in South East Asia
through the expansion.
Thai consumer food and agribusiness firm Charoen Pokphand Foods (CPF) acquired a 74.18% stake in
Vietnam-based feed business and agribusiness services firm CK Pokphand in late 2011. The stake
purchase will help CPF to enhance its business in both China and Vietnam, according to president and CEO
of CPF Adirek Sripratak.
Rural Market Potential Attracting Manufacturers
Rural consumers, who generally have lower incomes, have a smaller discretionary appetite for higher-value
consumer goods, which has made it tougher for companies such as Unilever and Proctor & Gamble
(P&G) to sell some of their products. Also, weak distribution infrastructure in rural areas frustrates the
Vietnam Food & Drink Report Q1 2015
© Business Monitor International Page 66
expansion efforts of consumer goods producers, while the dominance of traditional retail makes it even
harder to reach would-be consumers efficiently.
However, these challenges have not deterred several consumer goods manufacturers from setting up shop in
the Vietnamese rural consumer market, clearly underlining its immense potential. Fast-growing rural sales
at Masan Consumer, the largest producer of condiments including fish, soy and chilli sauce and the second
biggest producer of instant noodles in Vietnam, have attracted the sights of global private equity firm
Kohlberg Kravis Roberts & Co (KKR). KKR agreed to acquire a 10% stake in Masan Consumer for
USD159mn in April 2011. As another example, Vietnamese spirits major Halico's expansion in the rural
market caught the attention of UK spirits producer Diageo, which in March 2011 agreed to acquire a stake
of around 24% in Halico for GBP33.0mn (USD53.9mn).
These investments underline the fantastic fundamental long-term growth prospects in the Vietnamese rural
market, which ties in nicely with our wider outlook on the country's domestic demand story. Rising
incomes, sector immaturity, the spread of organised retail and a plethora of macroeconomic driving factors
make the Vietnamese consumer goods sector a high-growth prospect, and the rural consumer market will
benefit strongly from these dynamics.
Vietnam Food & Drink Report Q1 2015
© Business Monitor International Page 67
Drink
Key Industry Trends And Developments
ThaiBev Looks To High Growth Vietnam
We believe that investing in Vietnam's beer market will create an opportunity for Thai Beverage Public
Company (ThaiBev) to boost its sales and take advantage of our upbeat outlook for the market to 2018.
ThaiBev, Thailand's largest beverage producer and distributor, is seeking expansion opportunities in South
East Asian countries, due to limited opportunities in its domestic market. This reinforces our previous view
that, within South East Asia, Thailand offers only limited growth prospects in the alcoholic drinks sector.
ThaiBev has recently shown interest in purchasing a stake in Vietnam's leading beer company, Sabeco,
which controls 45-50% of Vietnam's beer market. The Vietnamese government currently owns 89% of
Sabeco, but is expected to sell more than 50% of the company to investors. We believe this will be an
opportunity for ThaiBev to boost its exposure to a high-growth market as Thailand slows down.
Vietnam's alcohol sector will offer strong opportunities over the next five years. Despite having relatively
low private consumption by regional standards, Vietnam has a widespread beer culture and we expect
alcohol consumption to rise quickly over the next few years. We forecast alcoholic drinks sales to grow at a
compound annual rate of 5.7% in volume terms and 11.2% in value (local currency) terms. As beer is by far
the most popular alcohol category in Vietnam, acquiring a stake in Sabeco would allow ThaiBev to benefit
from the fast-growing beer sector, and in the longer term, to use Sabeco's distribution capacities to expand
in the under-developed spirits category.
Sabeco Begins Construction On New Brewery
Vietnam-based brewer Saigon Beer Alcohol And Beverage Corporation (Sabeco) started construction on a
new brewery in Vietnam's Ninh Thuan region in September 2013. The USD21mn facility will have an
estimated annual capacity of 50mn litres of beer. The brewery will cover an area of 20 hectares and is
expected to address the rising demand for Sabeco products in the south-central region. The brewery is
scheduled to become operational before the end of 2014.
Brand diversification remains a key element of Sabeco's strategy as it looks to complement its popular local
economy brands with some premium, potentially international, products. Finding a multinational partner
could contribute enormously towards this and should not be a difficult objective for such an attractive firm.
Vietnam Food & Drink Report Q1 2015
© Business Monitor International Page 68

Non Carbonates Likely To Outperform In Vietnam
Vietnam's soft drinks industry is one of South East Asia's great opportunities. Sales on a per capita basis
remain low, at an estimated 22 litres in 2012, suggesting that Vietnam will be one of the countries that
attract the most interest from major multinationals - including PepsiCo and The Coca-Cola Company - as
well as from some of the largest regional companies, mainly from Japan.
Vietnam's soft drinks industry has been consolidating over the past few years, and this is likely to remain a
dominant theme. In November 2012, it was announced that Japan-based Suntory and PepsiCo had entered
into a tie-up, and that domestic company Tanh Hiep Phat was looking for an international partner to help it
maintain its competitive position. While it was thought that Tanh Hiep Phat's strong array of non-
carbonated drinks products could be of interest to Coca-Cola, nothing concrete has materialised thus far.
While we do not have segmented soft drinks data for Vietnam, it is widely believed that most of the growth
over the next few years will take place away from traditional carbonates. Bottled water, juices, functional/
energy drinks and ready-to-drink teas are likely to attract more interest from consumers and, by extension,
the main drinks players.
Vietnam Food & Drink Report Q1 2015
© Business Monitor International Page 69
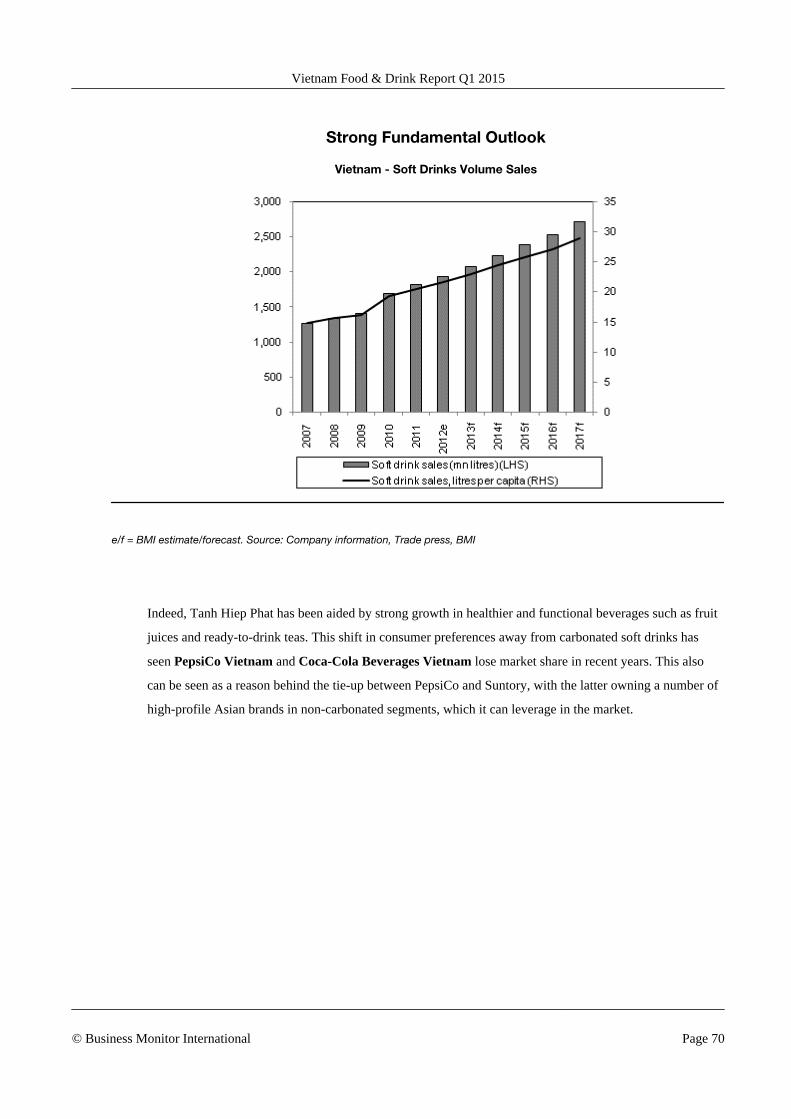
Strong Fundamental Outlook
Vietnam - Soft Drinks Volume Sales
e/f = BMI estimate/forecast. Source: Company information, Trade press, BMI
Indeed, Tanh Hiep Phat has been aided by strong growth in healthier and functional beverages such as fruit
juices and ready-to-drink teas. This shift in consumer preferences away from carbonated soft drinks has
seen PepsiCo Vietnam and Coca-Cola Beverages Vietnam lose market share in recent years. This also
can be seen as a reason behind the tie-up between PepsiCo and Suntory, with the latter owning a number of
high-profile Asian brands in non-carbonated segments, which it can leverage in the market.
Vietnam Food & Drink Report Q1 2015
© Business Monitor International Page 70
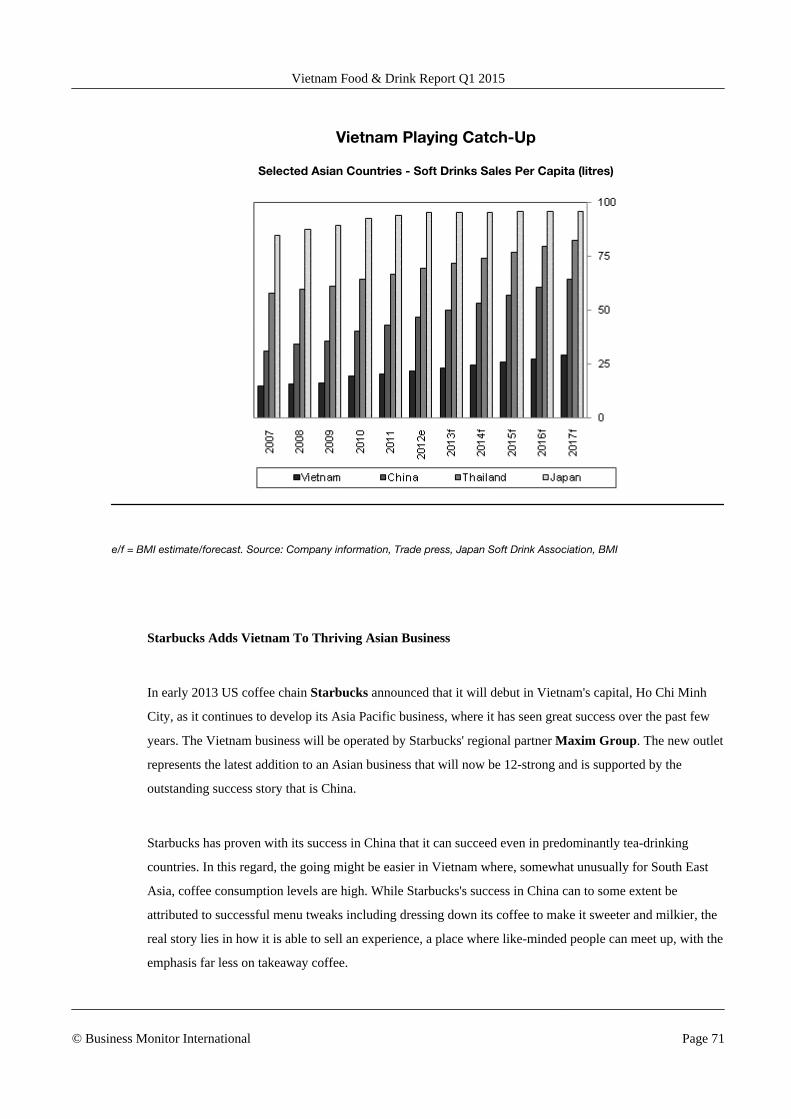
Vietnam Playing Catch-Up
Selected Asian Countries - Soft Drinks Sales Per Capita (litres)
e/f = BMI estimate/forecast. Source: Company information, Trade press, Japan Soft Drink Association, BMI
Starbucks Adds Vietnam To Thriving Asian Business
In early 2013 US coffee chain Starbucks announced that it will debut in Vietnam's capital, Ho Chi Minh
City, as it continues to develop its Asia Pacific business, where it has seen great success over the past few
years. The Vietnam business will be operated by Starbucks' regional partner Maxim Group. The new outlet
represents the latest addition to an Asian business that will now be 12-strong and is supported by the
outstanding success story that is China.
Starbucks has proven with its success in China that it can succeed even in predominantly tea-drinking
countries. In this regard, the going might be easier in Vietnam where, somewhat unusually for South East
Asia, coffee consumption levels are high. While Starbucks's success in China can to some extent be
attributed to successful menu tweaks including dressing down its coffee to make it sweeter and milkier, the
real story lies in how it is able to sell an experience, a place where like-minded people can meet up, with the
emphasis far less on takeaway coffee.
Vietnam Food & Drink Report Q1 2015
© Business Monitor International Page 71

Indeed, in Asia there is much more emphasis placed on making Starbucks a place where people meet up
socially and for business. We believe that the same model is likely to do well in Vietnam. Moreover, the
country bears all the hallmarks of an ideal market for Starbucks given the rising spending of the middle
class and, crucially, its large population of around 90mn.
Increase In Habeco Stake To Boost Carlsberg's Asia Exposure
It has been clear for some time that Carlsberg, the world's fourth largest beer company by sales, could
benefit from greater exposure to Asia given its underlining reliance on Europe. The Danish brewer's
announcement, at the end of 2012, that it will increase its stake in Vietnamese beer company Habeco from
16% to 30% demonstrates its expansionary ambitions in Asia.
The Vietnamese Ministry of Industry and Trade gave Carlsberg the green light to increase its stake in
Habeco for about USD72mn - valuing the company at more than USD500mn. While Carlsberg's critical
Russian business (the country is thought to account for more than 40% of the group's operating income) has
shown some encouraging signs after a difficult few years, we believe that the brewer is probably in a
stronger position to take on expansionary projects in Asia.
In 2011, Asia accounted for close to 11% of Carlsberg's annual sales revenue - up from nearly 6% in 2006.
However, most of its growth focus has traditionally been on emerging Europe, which distinguishes
Carlsberg from drinks firms AB InBev, Heineken and SABMiller - all of which are less exposed to
Europe. We believe that a stronger position in Vietnam, a country with a population of about 90mn and
where per capita consumption of commercial beer is in excess of 30 litres, is a positive move for Carlsberg.
Habeco is, along with Sabeco, one of two government-owned beer companies that dominate the Vietnamese
beer industry. To 2017, we see beer volume sales in Vietnam growing at a compound annual rate of 8%.
This would bring per capita beer consumption close to 40 litres, taking into account our Asia team's
demographic outlook
Move Towards Consolidation In Vietnamese Soft Drinks Sector
The announcement, in late 2012, of a tie-up between Suntory and PepsiCo in Vietnam looks like it could
prompt further consolidation in the industry. Indeed, it has been reported that local drinks group Tanh Hiep
Phat is looking for an international partner to help it to maintain its competitive position. The firm's
chairman, Tran Qui Thanh, suggested that The Coca-Cola Company was among the firms that had
expressed an interest in a joint venture. Coca-Cola has so far not commented on the idea, but Tanh Hiep
Vietnam Food & Drink Report Q1 2015
© Business Monitor International Page 72
Phat's portfolio of non-carbonated beverages could certainly be an attractive proposition for the soft drink
behemoth. Tanh Hiep Phat generates revenues of USD400mn and has recently invested in its production
facilities to increase capacity. However, with the company facing tough competition from PepsiCo/Suntory
and The Coca-Cola Company, it may well find that its competitive advantages are gradually eroded.
The Coca-Cola Company has already revealed that it is seeking to tap growth opportunities in Vietnam by
investing USD300mn in the country during the next three years. Subsequent to the new financial
commitment, the total investment by the US beverage major and its bottling partners will reach USD500mn
in Vietnam between 2010 and 2015. Coke aims to double its system revenues by 2020, and Vietnam will
play a significant role in achieving this goal, according to CEO Muhtar Kent.
Tan Hiep Phat was established in 1994, and is a strong player in energy drinks and the market leader in
ready-to-drink tea. The group's brands include Barley Lemon Green Tea, Zero Degree (green tea), Laser, Dr
Thanh and Number One, and the firm registered an average growth rate of 40% between 2007 and 2010.
This growth has pushed the firm to invest in capacity, and in September 2012 Tan Hiep Phat Group began
construction of a new plant in northern Ha Nam province. The factory, which will have annual capacity of
600mn litres, is expected to focus on the production of the Number One energy drink brand.
The firm has been aided by strong growth in healthier and functional beverages such as fruit juices and
ready-to-drink teas. This reflects a shift in consumer preferences away from carbonated soft drinks, which
has seen PepsiCo Vietnam and Coca-Cola Beverages Vietnam losing market shares in recent years. This
can be seen as a reason behind the tie-up between PepsiCo and Suntory, with the latter owning a number of
high profile Asian brands in non-carbonated sectors which it can leverage in the market.
However, this partnership will generate some concern at Tanh Hiep Phat, as the prospect of a competitor
that combines Suntory's strong brands and PepsiCo's financial firepower and marketing expertise is a
significant threat. Tanh Hiep Phat's wish to enter into more joint ventures with international partners can be
seen as a direct response to these developments, and we think that a tie up with The Coca-Cola Company
could potentially be a big win for both parties, with the latter being able to match Pepsi in terms of financial
firepower and Tanh Hiep Phat offering a portfolio of brands that have already established their
attractiveness in the local market.
An intensifying influx of sector investments will provide another major impetus to drive industry growth. In
particular, we are seeing soft drinks manufacturers ramp up their initiatives in terms of product innovation,
portfolio expansion and marketing. With regard to portfolio expansion, local soft drink manufacturers are
gradually calibrating their portfolio towards healthier and functional beverages such as fruit juices and
Vietnam Food & Drink Report Q1 2015
© Business Monitor International Page 73

ready-to-drink teas as they look to tap into a growing health awareness trend in the country. With the health
awareness trend remaining well entrenched over the coming years, we expect more domestic soft drinks
manufacturers to expand their non-carbonates offerings. PepsiCo's push in this direction is likely to be
supported by its newly signed venture with Suntory, which has a number of high profile Asian brands which
it can leverage in the market. Suntory also has additional skills in the areas of distribution within the Asian
region, which PepsiCo will be able to lean on while focusing its own efforts on its strengths in marketing
and innovation. Suntory Pepsico Vietnam Beverage Company Ltd began operations on April 4 2013.
Spirits Major Diageo Acquires Additional Stake In Halico
In June 2012, UK drinks group Diageo acquired an additional 10.62% stake in Vietnamese spirits firm
Hanoi Liquor Joint Stock Company (Halico) for some GBP14mn (USD22mn). The deal, which will raise
Diageo's total equity stake in Halico to 45.52%, is in line with the firm's strategy to increase the proportion
of its sales in emerging markets from 40% to 50% of its total sales. Diageo is seeking to capitalise on the
robust growth of the branded spirits sector in Vietnam. Diageo has earmarked Vietnam due to its rising
population, rapidly growing middle class and Halico's strong market standing in local premium spirits.
Diageo previously increased its stake to Halico in August 2011, with the purchase of 5.07% of its stock for
GBP6.4mn (USD10.5mn).
Diageo's strategy is focused on marketing and brand building, with enormous sums invested in effective
brand communication. The firm has a highly focused and innovative marketing strategy, which has worked
very well in the past. It acknowledges the strength of its eight 'global priority brands' in comparison to the
rest of its portfolio, and allocates disproportionate levels of marketing investment towards these brands.
Similarly, it has a disproportionate, although slightly less so, marketing bias towards its 30 'local priority
brands'.
SMB Eyeing Regional Growth
Philippine brewer San Miguel Brewery (SMB) has its sights set firmly on the demand potential in the
markets of Cambodia, Laos and Vietnam. The brewer plans to set up three new breweries in these countries,
with a planned investment of around USD100mn per plant. According to the chairman of SMB, Ramon
Ang, each plant has the potential to add between USD200mn and USD300mn in annual revenues.
While the Philippine beer sector will remain a strong revenue contributor for SMB, at least in the near
future, the relative maturity of the market and SMB's market dominance mean that there is realistically
limited scope for growth domestically over the longer term. Acknowledging the need to look afield for more
Vietnam Food & Drink Report Q1 2015
© Business Monitor International Page 74
exciting opportunities, SMB's new brewing facilities in Cambodia, Laos and Vietnam will have a brewing
capacity of 500,000 hectolitres each.
The attractiveness of the Vietnamese beer market is underpinned by strong consumer beer demand, rising
tourist arrivals and continued sector dynamism. However, we acknowledge that the Vietnamese beer market
is relatively crowded and mature compared with Cambodia and Laos. Therefore, SMB is likely to face
considerable headwinds in expanding its presence across Vietnam, particularly amid the rapid emergence of
sector competition as regional brewers, such as Thai Singha Corporation Co Ltd, ramp up their
expansions across the market. The Vietnamese beer market is dominated by more established market
players such as Habeco and Sabeco, and it will not be easy for SMB to entrench a strong foothold against
the companies' market dominance.
Regional Brewers Expanding Across Vietnam
Despite the near-term economic uncertainties in Vietnam, the country's long-term potential remains bright,
and this explains the continued flurry of expansionary activity in its consumer sectors. Japanese brewer
Sapporo has announced that it intends to significantly increase its beer production in Vietnam in the period
up to 2019. The company expects to produce 200,000 kilolitres of beer in the country by 2019, a fivefold
increase from its expected 40,000 kilolitres in 2014. The overseas expansion is intended to offset the effect
of a declining Japanese population, which has hampered growth in the domestic beer market. Sapporo also
has plans to open a second factory in Hanoi during 2014.
Japanese brewer Asahi Group Holdings has announced that it intends to extend its operations across Asia
through a series of acquisitions. Asahi President, Naoki Izumiya, said that the company had already
identified viable targets in Indonesia, Malaysia, the Philippines, Thailand and Vietnam. The Japanese beer
market has stalled in recent years as its ageing population has stymied demand, but Asahi still only makes
6.6% of its sales from overseas markets, compared with rival brewer Kirin Holdings, which makes 23.4%
of its sales overseas. Asahi has targeted an increase in annual sales by JPY100bn to JPY2.0-2.5trn by 2015,
with 20-30% attained from overseas revenue.
Thai brewer Singha also has its eyes set on the potential of the Indochina region. While Singha has
previously been exporting its beer products to the Indochina region through local importers and distributors,
the brewer now plans to establish sales offices across the region in a bid to consolidate a stronger presence
in these markets. Given the relative maturity of the Thai beer market and the government's anti-alcohol
initiatives, we have repeatedly stressed the importance for Thai brewers to pursue product and geographical
diversification to create a better-rounded portfolio and to lock in higher growth opportunities.
Vietnam Food & Drink Report Q1 2015
© Business Monitor International Page 75
Singha's beer sales in the Indochina region currently stand at around 35-40mn litres per annum, and the firm
was expected to have increased its sales in the region by 50-80% in 2012 through its aggressive expansion
plans. While the fairly immature beer markets of Cambodia, Laos and Vietnam are likely to provide a
stronger scope for growth, some markets are likely to serve up greater challenges for Singha. Although
Vietnam represents a more exciting growth prospect than Thailand, thanks to strong consumer demand,
rising tourist arrivals and continued sector investment, competition levels are quickly heating up, and
Singha is likely to face stronger competitive headwinds in expanding in the market. Being a relative
latecomer to the Vietnamese beer market, Singha will have to compete against more established market
players.
Coffee Potential Perking Up Sector Investments
Masan Consumer, which is the largest producer of condiments such as fish, soy and chilli sauce and the
second biggest producer of instant noodles in Vietnam, acquired a 50.1% stake, valued at around
VND1.07trn (USD51mn), in the Vietnamese coffee producer Vinacafe Bien Hoa Joint-Stock Company in
2011. In September 2012, there were media reports that Vinacafe was planning to invest VND50mn per
hectare (ha) in 10,000ha of coffee plantations in Myanmar. Vinacafe currently farms 25,000ha of coffee
plantations, of which 8,000ha of aging trees need to be replanted by 2015.
US coffee giant Starbucks has launched its instant coffee brand in Singapore as it looks to build a stronger
footprint in the Asia Pacific region. A high growth coffee market that is likely to emerge on Starbucks's
radar is Vietnam. As in China and India, drinking coffee is a growing lifestyle choice in Vietnam, and the
rise in incomes of the local youth population will serve to further buoy the demand for premium coffee
products.
Also looking to capitalise on Vietnam's coffee potential, Nestlé plans to increase its coffee sourcing from
local farmers in Vietnam and has committed to a new coffee factory in the country. The USD270mn factory
will be constructed in the south-east province of Dong Nai and will produce Nescafé-branded products for
the domestic and international markets from 2013. The plant was opened in summer 2013.
Masan Consumer's strategy has been to pursue growth acquisitions, and in February 2013 Masan announced
its plans to purchase 24.9% of bottled beverage company Vinh Hao Mineral Joint Stock Company.
Established in 1930, Vinh Hao was the first domestic mineral water producer in the country, with a portfolio
of mineral water, purified water and mineral water based soft drinks.
Vietnam Food & Drink Report Q1 2015
© Business Monitor International Page 76
Mass Grocery Retail
Key Industry Trends And Developments
Metro Retail Exit Does Not Diminish Positive Vietnam View
In early August 2014, the German cash-and-carry retailer Metro is planning to sell its Vietnam business,
potentially pulling in EUR1.75bn. The decision to leave Vietnam is driven by the need to re-focus on its
core Europe business and strengthen its balance sheet, rather than being based on any major structural issues
or re-rating in the growth profile of the organised food retail sector. Like some of the other major European
retailers, namely Carrefour and Tesco, Metro has had to rein in spending internationally over the past two
to three years as retail sales across Western Europe have remained weak while, more recently, Russia, one
of Metro's key markets, has slowed down in 2014. We still see Vietnam as one of South-East Asia's best
retail opportunities.
South East Asia's Potential Outperformer
Vietnam's mass grocery retail (MGR) sector continues to look increasingly promising. Given the
country's large, youthful population and our expectations for a robust economic recovery, Vietnam's
emerging dynamic consumer base presents impressive opportunities for retailer investment.
What Vietnam offers investors is arguably one of the most attractive consumer bases in South East Asia
after India. Its youthful population of 90mn and GDP growth forecast of 5.3% in 2013, mean that the
country provides attractive demographic potential for retailers keen to capture the vast consumer base.
A flurry of international investment interest in the country over recent years has sparked this
continued focus on the merits of the unravelling consumer story in Vietnam, particularly in its mass grocery
retail sector. The latest multinational reported to be entering the market is French retailer Auchan which,
according to local sources, is set to inject US$500mn in the next decade. This highlights the attractive long-
term potential of a country that has been largely devoid of international investment in the grocery sector.
One company that continues to do well in Vietnam is France-based Casino's wholly owned subsidiary Big
C, which entered in 1998. Dominating the hypermarket format (which remains in its infancy in Vietnam),
the retailer is an impressive example of the benefits to be gained by entering this still largely fragmented
sector. Despite rumours surrounding the potential entry of France's Carrefour and UK-based Tesco, we
expect this to remain unlikely in the short term given these retailers' recent struggles abroad. Consequently,
Vietnam Food & Drink Report Q1 2015
© Business Monitor International Page 77
as the sector remains largely untouched by foreign industry heavyweights, the potential for growth in
Vietnam remains impressive for Auchan, or any other multi-format retailer looking to secure Asian
exposure.
Despite the positive opportunities, there remain risks to retailers looking to boost their presence in the
region. Government policy and regulation still pose potential challenges to investors; this obstacle
prevented Auchan from entering in the 1990s, for example. Also, although the economy is making
impressive gains, much of the population continues to live in poverty, reducing retailers' access to large
swathes of the population. Overall, however, we believe that Vietnam remains one the most exciting MGR
Asian growth stories. The potential to outperform regionally in the coming years, means that the country
continues to gradually prove its growing reputation as Asia's 'little India'.
Vietnam A Stepping Stone To Achieve Regional Ambitions
Ramping up its presence in Vietnam, Japanese retailer Aeon is planning to build seven shopping centres in
the country, with construction on its first shopping mall due to be completed by early 2014. Aeon's
announcement came closely after the Vietnamese government gave its regulatory approval for the retailer to
establish a local subsidiary in the country. Under the regulatory permit, Aeon will be able to establish its
own-branded supermarkets, shopping malls, department stores and specialised stores. The retailer also
inaugurated a new national headquarters in Ho Chi Minh City in Vietnam in March 2012. The new unit will
be responsible for the retailer's convenience stores, shopping centres and supermarkets in the country. The
tremendous opportunities on offer in the Vietnamese food retailing sector, mean that we believe the spread
of modern retail into the food sector will only accelerate in the years to come, and Aeon's plan to expand its
Vietnamese presence reinforces this view. In late 2012 it was reported that Aeon is in fact planning to build
20 malls in Vietnam by 2020 due to strong consumption growth in the country.
South Korean retailer Lotte also has its sights set on overseas markets; it now has 107 outlets outside South
Korea as a result of an aggressive expansion drive, with 82 based in China, 23 in Indonesia and two in
Vietnam. Looking to further expand its footprint in these high-growth MGR markets, Lotte plans to open
more than 200 stores in the region by 2018.
Lotte is not alone in pursuing opportunities abroad. Fellow Korean retailer E-Mart, which is owned by
Shinsegae, agreed a deal with U&I Investment Corporation to establish a joint venture in Vietnam with
an aim of setting up retail stores in the country. in early 2013 there were unconfirmed reports that E-Mart
was looking to open its first supermarket in Hanoi later in the year. The relative immaturity of MGR sectors
in these emerging markets translates into much stronger scope for growth than in South Korea over the long
Vietnam Food & Drink Report Q1 2015
© Business Monitor International Page 78

run, and these high-growth markets will continue to figure prominently on the radars of South Korean
retailers.
Singapore MGR operator NTUC FairPrice also has concrete plans to expand in Vietnam, and in 2010
formed a joint venture agreement with Vietnam's Saigon Union of Trading Co-operative to establish a
chain of hypermarkets in Vietnam. Given Saigon's local expertise and NTUC's experience in operating
hypermarket stores, this is clearly a formidable-looking partnership, and their expansionary activities are
likely to place considerable upward pressure on our hypermarket growth forecast for Vietnam.
In May 2013 the two partners announced plans to set up two hypermarket chains in Vietnam under the
banner names Co.opXtra and Co.opXtraplus. The former banner will target retail consumers whilst the
second banner will focus more on the business and catering sectors. The joint venture intends to launch one
or two hypermarkets each year in major cities across the country.
This followed Japanese convenience retailer FamilyMart announcing plans to focus on its Asian operations
outside of Japan, with a concentration on Vietnam and China, in order to reduce its reliance on its stagnant
domestic market. The company, which operates one outlet in Vietnam, is aiming to launch five more stores
in Ho Chi Minh City in the near term and expand its Vietnamese network to 300 outlets in five years. By
the end of 2012, FamilyMart was operating 27 outlets in Vietnam.
Retailers Scouting For New Retail Locations
Despite the rapid influx of foreign investment in the expansion of modern retail stores across Vietnam in
recent years, the country's MGR sector remains relatively underdeveloped. Nevertheless, supermarket
chains in Ho Chi Minh City are thriving. Indeed, many have seen good sales growth and a turnover increase
of 15-25% each year at the expense of traditional markets in the city, which are experiencing a continued
decline, reported Saigon GP in February 2012. Ho Chi Minh City now has more than 200 supermarkets,
double the number in 2005, while the number of traditional markets has fallen from 300 in 2005 to 200
currently. The number of smaller supermarkets in the city has increased by four times compared to 2005.
The success of supermarkets has been attributed to successful promotional campaigns and enticing prize
offers.
Indeed, pockets of wealth in less-urbanised areas are beginning to attract the attention of foreign retailers.
Stretching its retailing footprint beyond the big cities, where it is already enjoying rapid growth, French
retailer Groupe Casino has opened its 14th Vietnamese outlet in the city of Nam Dinh and hopes to replicate
its urban success in the smaller provinces and cities. German retailer Metro Cash & Carry Vietnam is also
Vietnam Food & Drink Report Q1 2015
© Business Monitor International Page 79

looking further afield for strong growth opportunities by opening distribution centres in the provinces of
Binh Dinh, An Giang and Binh Duong, as well as in the southern city of Vung Tau.
Domestic retailers do not intend to let these massive growth opportunities pass them by. Interestingly,
domestic retailers have sought partnerships with foreign retailers in expanding their retail reach rather than
going it alone. One example is Trung Nguyen Group's partnership with Japanese retailer Aeon's
convenience subsidiary Ministop to develop a convenience store chain in Vietnam. By the end of 2012
Ministop had opened its first 12 outlets in Ho Chi Minh City.
This strategy can be linked to the capital springboard and expertise provided by foreign retailers. By linking
up with a financially powerful, expansion-oriented foreign retailer, domestic retailers are likely to find
themselves in a stronger position to contend with growing competition from big multinational retailers.
For now, traditional retail stores will continue to dominate Vietnam's retail landscape. Eventually, however,
retailers could find it increasingly difficult to expand their networks in increasingly crowded big cities. Such
a scenario would, in turn, prompt retailers to turn to under-retailed areas in search of future growth,
encouraging the spread of modern retail across the country.
Vietnam Food & Drink Report Q1 2015
© Business Monitor International Page 80
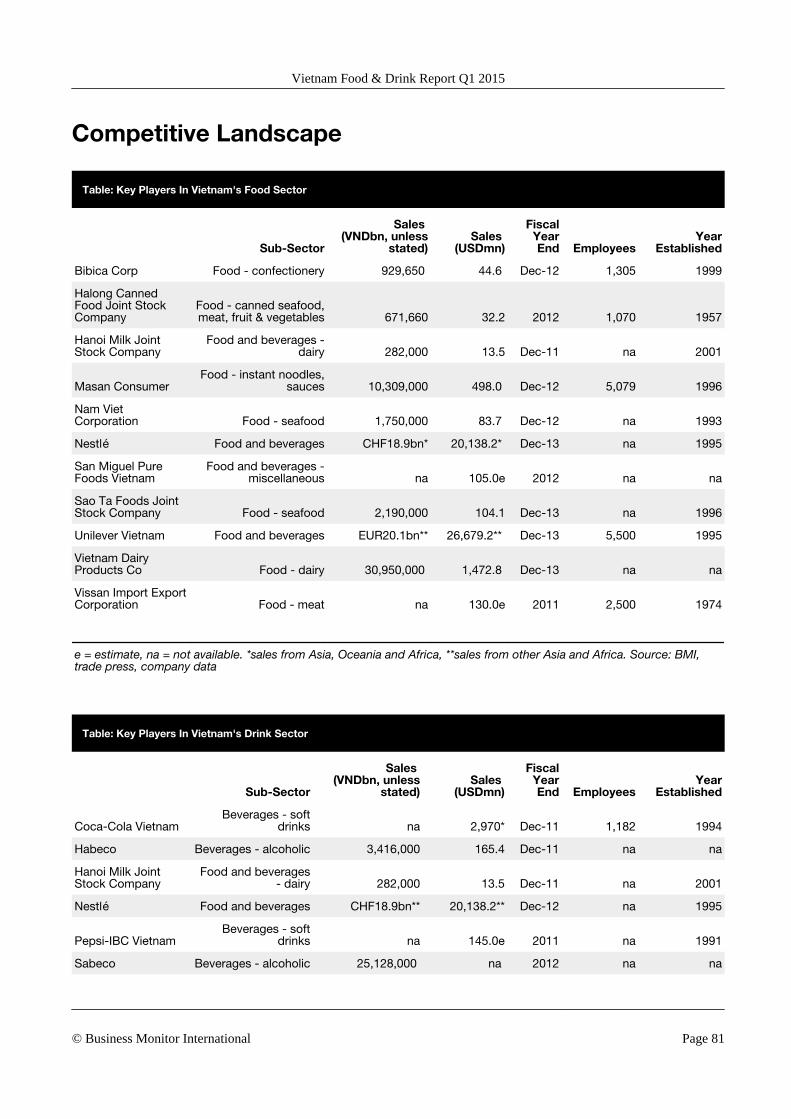
Competitive Landscape
Table: Key Players In Vietnam's Food Sector
Sub-Sector
Sales (VNDbn, unless
stated)Sales
(USDmn)
FiscalYearEnd Employees
YearEstablished
Bibica Corp Food - confectionery 929,650 44.6 Dec-12 1,305 1999
Halong CannedFood Joint StockCompany
Food - canned seafood,meat, fruit & vegetables 671,660 32.2 2012 1,070 1957
Hanoi Milk JointStock Company
Food and beverages -dairy 282,000 13.5 Dec-11 na 2001
Masan ConsumerFood - instant noodles,
sauces 10,309,000 498.0 Dec-12 5,079 1996
Nam VietCorporation Food - seafood 1,750,000 83.7 Dec-12 na 1993
Nestlé Food and beverages CHF18.9bn* 20,138.2* Dec-13 na 1995
San Miguel PureFoods Vietnam
Food and beverages -miscellaneous na 105.0e 2012 na na
Sao Ta Foods JointStock Company Food - seafood 2,190,000 104.1 Dec-13 na 1996
Unilever Vietnam Food and beverages EUR20.1bn** 26,679.2** Dec-13 5,500 1995
Vietnam DairyProducts Co Food - dairy 30,950,000 1,472.8 Dec-13 na na
Vissan Import ExportCorporation Food - meat na 130.0e 2011 2,500 1974
e = estimate, na = not available. *sales from Asia, Oceania and Africa, **sales from other Asia and Africa. Source: BMI,trade press, company data
Table: Key Players In Vietnam's Drink Sector
Sub-Sector
Sales (VNDbn, unless
stated)Sales
(USDmn)
FiscalYearEnd Employees
YearEstablished
Coca-Cola VietnamBeverages - soft
drinks na 2,970* Dec-11 1,182 1994
Habeco Beverages - alcoholic 3,416,000 165.4 Dec-11 na na
Hanoi Milk JointStock Company
Food and beverages- dairy 282,000 13.5 Dec-11 na 2001
Nestlé Food and beverages CHF18.9bn** 20,138.2** Dec-12 na 1995
Pepsi-IBC VietnamBeverages - soft
drinks na 145.0e 2011 na 1991
Sabeco Beverages - alcoholic 25,128,000 na 2012 na na
Vietnam Food & Drink Report Q1 2015
© Business Monitor International Page 81

Key Players In Vietnam's Drink Sector - Continued
Sub-Sector
Sales (VNDbn, unless
stated)Sales
(USDmn)
FiscalYearEnd Employees
YearEstablished
Saigon BeveragesJoint StockCompany (Tribeco)
Beverages - softdrinks 742,000 35.9 Dec-11 1,250 1992
San Miguel PureFoods Vietnam
Food and beverages- miscellaneous na 105.0e 2012 na na
Tan Hiep Phat GroupBeverages - alcoholic
& soft na 25.8e 2011 2,000+ 1994
Trung Nguyen Corp Beverages - coffee na 129.0e 2011 na 1996
Unilever Vietnam Food and beverages EUR20.1bn*** 26,679.2*** Dec-13 5,500 1995
Vietnam Brewery Ltd Beverages - alcoholic na 155.0e 2011 500 1991
Vinacafe BienhoaJoint StockCompany
Beverages - hotdrinks 2,298.7 109.4 Dec-13 na 1969
Vinamilk Beverages - dairy 30,948.6 1,472.8 Dec-13 3,000 1976
e = estimate, na = not available. *sales from Eurasia and Africa, **sales from Asia, Oceania and Africa, ***sales from Asiaand Africa. Source: BMI, trade press, company data, Bloomberg
Table: Key Players In Vietnam's Mass Grocery Retail Sector
Parent CompanyCountry of
Origin
Sales (VNDbn, unless
stated)Sales
(USDmn)
FiscalYearEnd Fascias Format
Outlets InVietnam
Saigon Co-op Vietnam 11,800e 560.97e Dec-11 Co-op Mart Supermarkets 50
- - - - - Co-opConvenience
stores 90
- - - - - Co-op FoodConvenience
stores 17
Metro Cash &Carry Vietnam
Germany/Vietnam EUR3.50bn* 4,556 Dec-12 Metro Cash & Carry 17
CP GroupThailand/Vietnam THB749bn e 24,192e 2011 FreshMart
Conveniencestores 120
Groupe CasinoFrance/Vietnam EUR23.5bn*** 30,550 Dec-12 Big C Hypermarkets 9
Hanoi TradeCorporation Vietnam 6,780e 326.3e Dec-11 Hapro Supermarkets 50
- - - - - HaproConvenience
stores 700
Vietnam NationalTextile AndGarment Group Vietnam na 22e 2011 Vinatexmart Supermarkets 58
Vietnam Food & Drink Report Q1 2015
© Business Monitor International Page 82
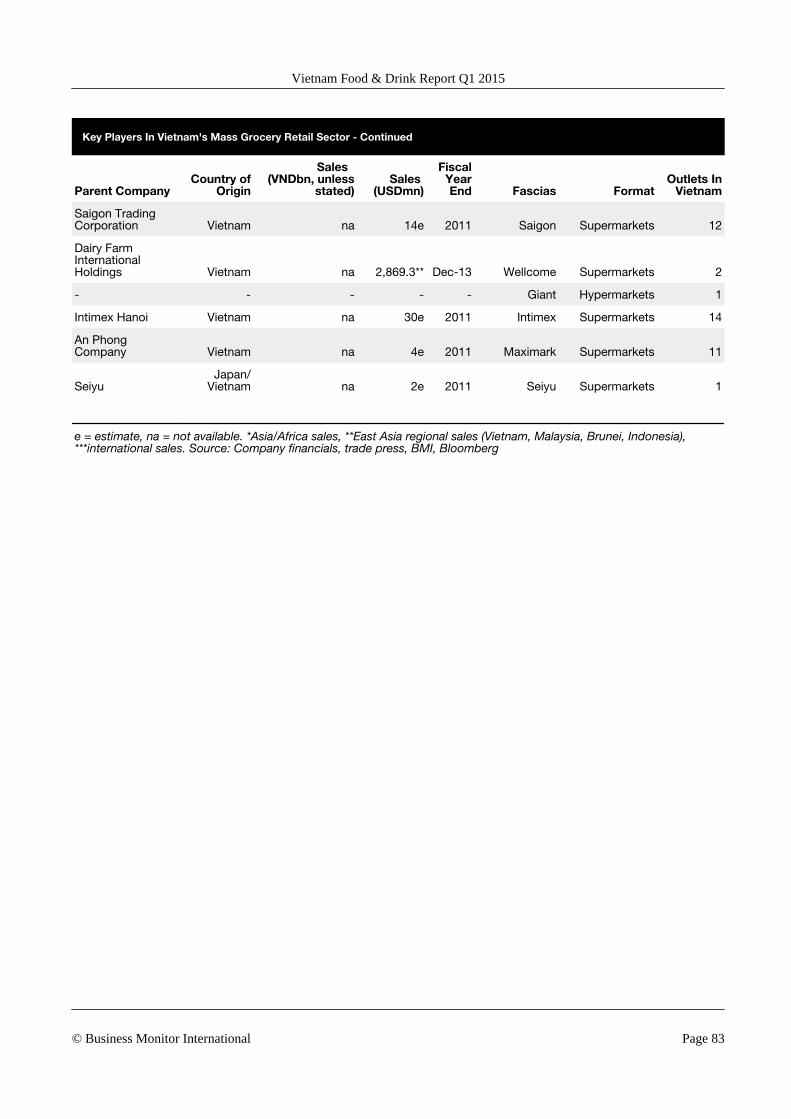
Key Players In Vietnam's Mass Grocery Retail Sector - Continued
Parent CompanyCountry of
Origin
Sales (VNDbn, unless
stated)Sales
(USDmn)
FiscalYearEnd Fascias Format
Outlets InVietnam
Saigon TradingCorporation Vietnam na 14e 2011 Saigon Supermarkets 12
Dairy FarmInternationalHoldings Vietnam na 2,869.3** Dec-13 Wellcome Supermarkets 2
- - - - - Giant Hypermarkets 1
Intimex Hanoi Vietnam na 30e 2011 Intimex Supermarkets 14
An PhongCompany Vietnam na 4e 2011 Maximark Supermarkets 11
SeiyuJapan/
Vietnam na 2e 2011 Seiyu Supermarkets 1
e = estimate, na = not available. *Asia/Africa sales, **East Asia regional sales (Vietnam, Malaysia, Brunei, Indonesia),***international sales. Source: Company financials, trade press, BMI, Bloomberg
Vietnam Food & Drink Report Q1 2015
© Business Monitor International Page 83

Company Profile
Vinamilk
Company Overview
Vietnam Dairy Products Joint Stock Company (Vinamilk) is the market leader in Vietnam's dairy industry.
It produces more than 200 dairy products for domestic sale and for export. The company was founded in
1993 as a state-owned enterprise. The state's share was recently reduced to 50% to qualify for listing on the
stock market. Vinamilk controls an estimated 39% of the Vietnamese dairy market. It exports to 26
countries, including Iraq, Cambodia and the Philippines.
SWOT Analysis
Strengths
■ Leading dairy producer in Vietnam, with a dominant market share in various dairy segments (liquid milk,yoghurt, condensed milk).
■ Extensive distribution network.
■ Diverse product range and constant product innovation.
■ Soaring demand outlook in the medium term (following temporary weaker demand in 2014) for bothprimary and processed dairy products in the fast-growing local economy.
■ Strong financial fundamentals (no debt, good margins).
Weaknesses
■ Reliant on international supply from New Zealand for raw materials, making the company vulnerable tointernational milk supply and prices as well as to foreign exchange fluctuations.
Opportunities
■ Gradual integration in the Association of Southeast Asian Nations (ASEAN) region could allow thecompany to grow exports and benefit from lower production costs via processing plants in countrieswithin the region.
■ Experience in the emerging Vietnamese market is likely to increase Vinamilk's chances of success whenexporting to other emerging South East Asian markets.
■ Vinamilk's recent investments in domestic capacity expansions and in New Zealand's Miraka will allowit to ease current supply shortages.
Vietnam Food & Drink Report Q1 2015
© Business Monitor International Page 84
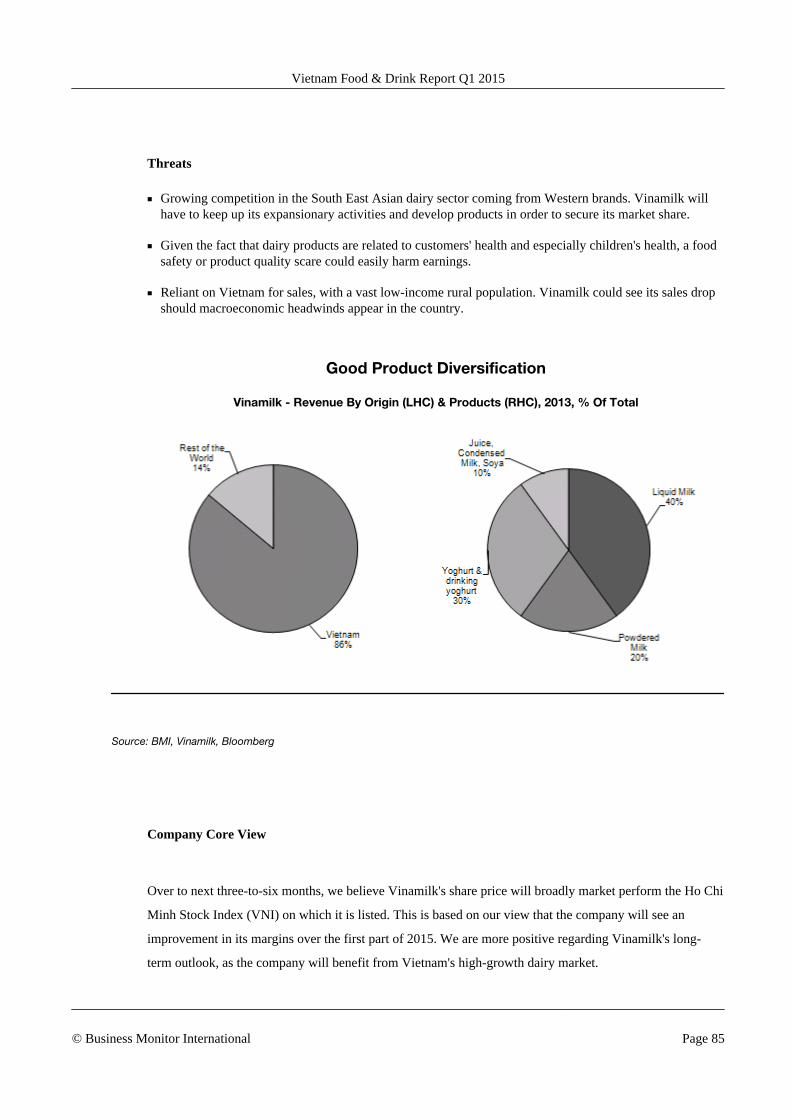
Threats
■ Growing competition in the South East Asian dairy sector coming from Western brands. Vinamilk willhave to keep up its expansionary activities and develop products in order to secure its market share.
■ Given the fact that dairy products are related to customers' health and especially children's health, a foodsafety or product quality scare could easily harm earnings.
■ Reliant on Vietnam for sales, with a vast low-income rural population. Vinamilk could see its sales dropshould macroeconomic headwinds appear in the country.
Good Product Diversification
Vinamilk - Revenue By Origin (LHC) & Products (RHC), 2013, % Of Total
Source: BMI, Vinamilk, Bloomberg
Company Core View
Over to next three-to-six months, we believe Vinamilk's share price will broadly market perform the Ho Chi
Minh Stock Index (VNI) on which it is listed. This is based on our view that the company will see an
improvement in its margins over the first part of 2015. We are more positive regarding Vinamilk's long-
term outlook, as the company will benefit from Vietnam's high-growth dairy market.
Vietnam Food & Drink Report Q1 2015
© Business Monitor International Page 85

Latest Results
Vinamilk's performance remained lacklustre in Q314 (July-September), mainly due to increasing input
costs. Year-on-year (y-o-y) revenue growth continued to slow and came in below 10% for the first time
since Q407. Revenue grew by a weak 8.8% y-o-y in Q314 to VND8,731bn in Q314, compared with an
average quarterly growth of 24.2% y-o-y over the Q111-Q214 period.
Operating and net income decreased y-o-y for the fourth consecutive quarter in Q314, by 19.0% and 18.6%
y-o-y respectively. Gross margins improved slightly compared with the start of the year, as global powder
milk prices tumbled after March 2014, which lead to a decrease in raw material prices. However, operating
and profit margins remained on a downtrend, as Vinamilk's selling expenses continued to increase. Amidst
growing competition and lacklustre domestic demand for dairy in 2014 so far, the company's strategy is to
safeguard sales volume by boosting advertisement and promotions. Operating margins came in at 17.7% in
Q314, down 6.1 percentage points y-o-y.
Lower Growth
Vinamilk - Revenue Growth, % y-o-y (LHS) & Select Income, VNDbn (RHS)
Source: BMI, Vinamilk
Vietnam Food & Drink Report Q1 2015
© Business Monitor International Page 86
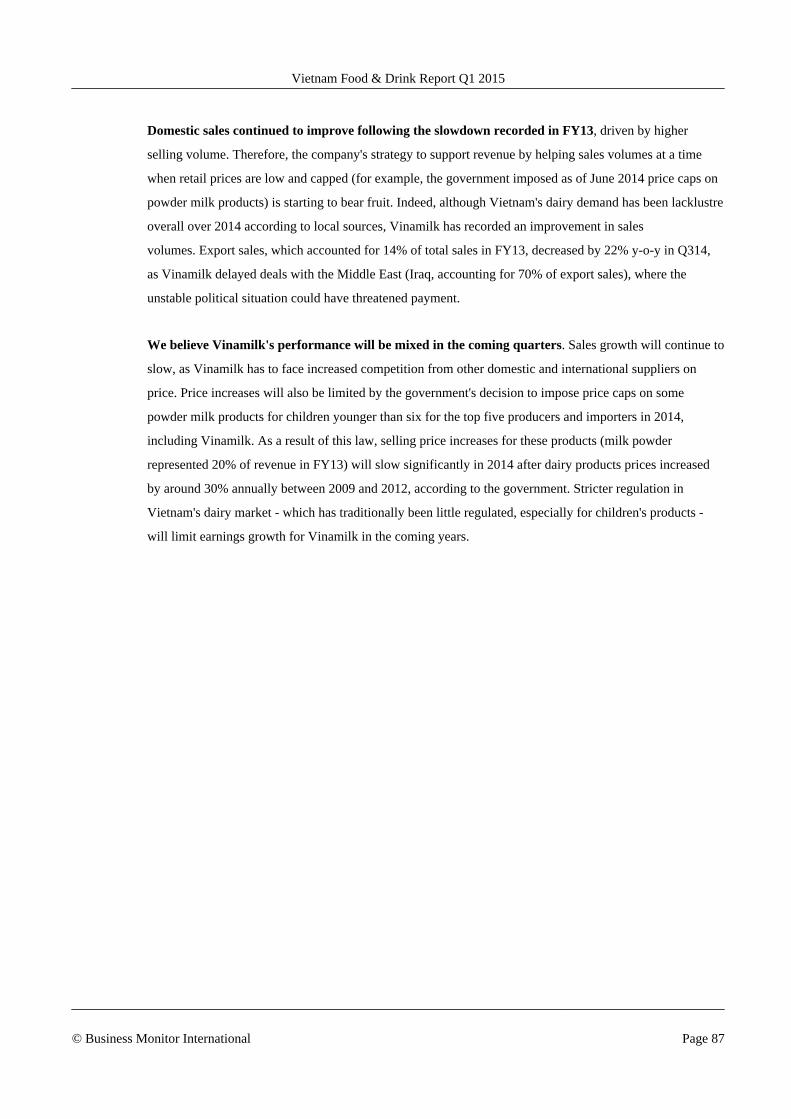
Domestic sales continued to improve following the slowdown recorded in FY13, driven by higher
selling volume. Therefore, the company's strategy to support revenue by helping sales volumes at a time
when retail prices are low and capped (for example, the government imposed as of June 2014 price caps on
powder milk products) is starting to bear fruit. Indeed, although Vietnam's dairy demand has been lacklustre
overall over 2014 according to local sources, Vinamilk has recorded an improvement in sales
volumes. Export sales, which accounted for 14% of total sales in FY13, decreased by 22% y-o-y in Q314,
as Vinamilk delayed deals with the Middle East (Iraq, accounting for 70% of export sales), where the
unstable political situation could have threatened payment.
We believe Vinamilk's performance will be mixed in the coming quarters. Sales growth will continue to
slow, as Vinamilk has to face increased competition from other domestic and international suppliers on
price. Price increases will also be limited by the government's decision to impose price caps on some
powder milk products for children younger than six for the top five producers and importers in 2014,
including Vinamilk. As a result of this law, selling price increases for these products (milk powder
represented 20% of revenue in FY13) will slow significantly in 2014 after dairy products prices increased
by around 30% annually between 2009 and 2012, according to the government. Stricter regulation in
Vietnam's dairy market - which has traditionally been little regulated, especially for children's products -
will limit earnings growth for Vinamilk in the coming years.
Vietnam Food & Drink Report Q1 2015
© Business Monitor International Page 87
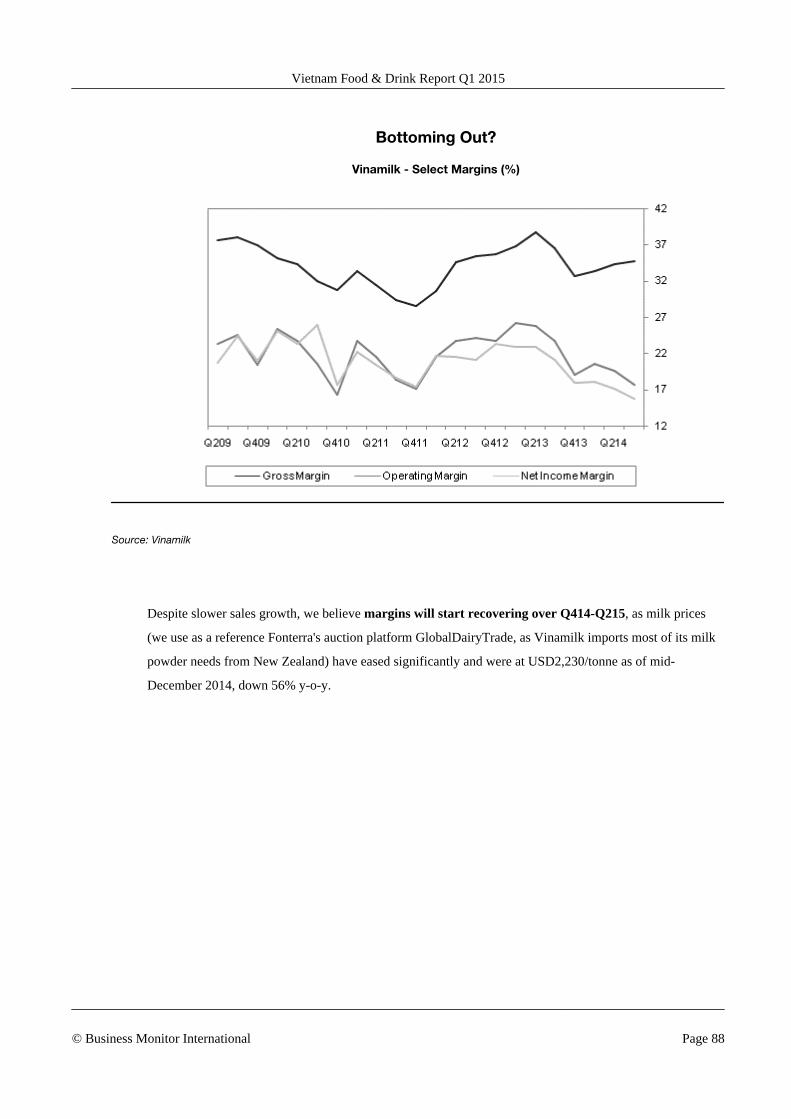
Bottoming Out?
Vinamilk - Select Margins (%)
Source: Vinamilk
Despite slower sales growth, we believe margins will start recovering over Q414-Q215, as milk prices
(we use as a reference Fonterra's auction platform GlobalDairyTrade, as Vinamilk imports most of its milk
powder needs from New Zealand) have eased significantly and were at USD2,230/tonne as of mid-
December 2014, down 56% y-o-y.
Vietnam Food & Drink Report Q1 2015
© Business Monitor International Page 88
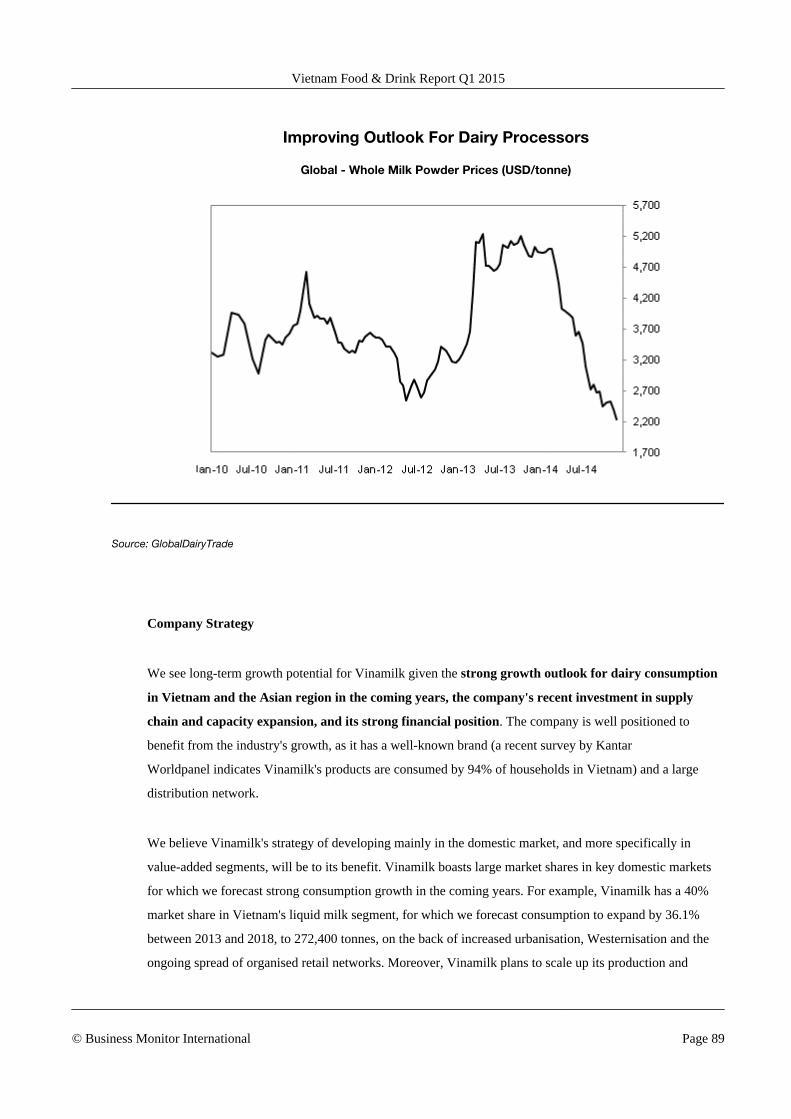
Improving Outlook For Dairy Processors
Global - Whole Milk Powder Prices (USD/tonne)
Source: GlobalDairyTrade
Company Strategy
We see long-term growth potential for Vinamilk given the strong growth outlook for dairy consumption
in Vietnam and the Asian region in the coming years, the company's recent investment in supply
chain and capacity expansion, and its strong financial position. The company is well positioned to
benefit from the industry's growth, as it has a well-known brand (a recent survey by Kantar
Worldpanel indicates Vinamilk's products are consumed by 94% of households in Vietnam) and a large
distribution network.
We believe Vinamilk's strategy of developing mainly in the domestic market, and more specifically in
value-added segments, will be to its benefit. Vinamilk boasts large market shares in key domestic markets
for which we forecast strong consumption growth in the coming years. For example, Vinamilk has a 40%
market share in Vietnam's liquid milk segment, for which we forecast consumption to expand by 36.1%
between 2013 and 2018, to 272,400 tonnes, on the back of increased urbanisation, Westernisation and the
ongoing spread of organised retail networks. Moreover, Vinamilk plans to scale up its production and
Vietnam Food & Drink Report Q1 2015
© Business Monitor International Page 89
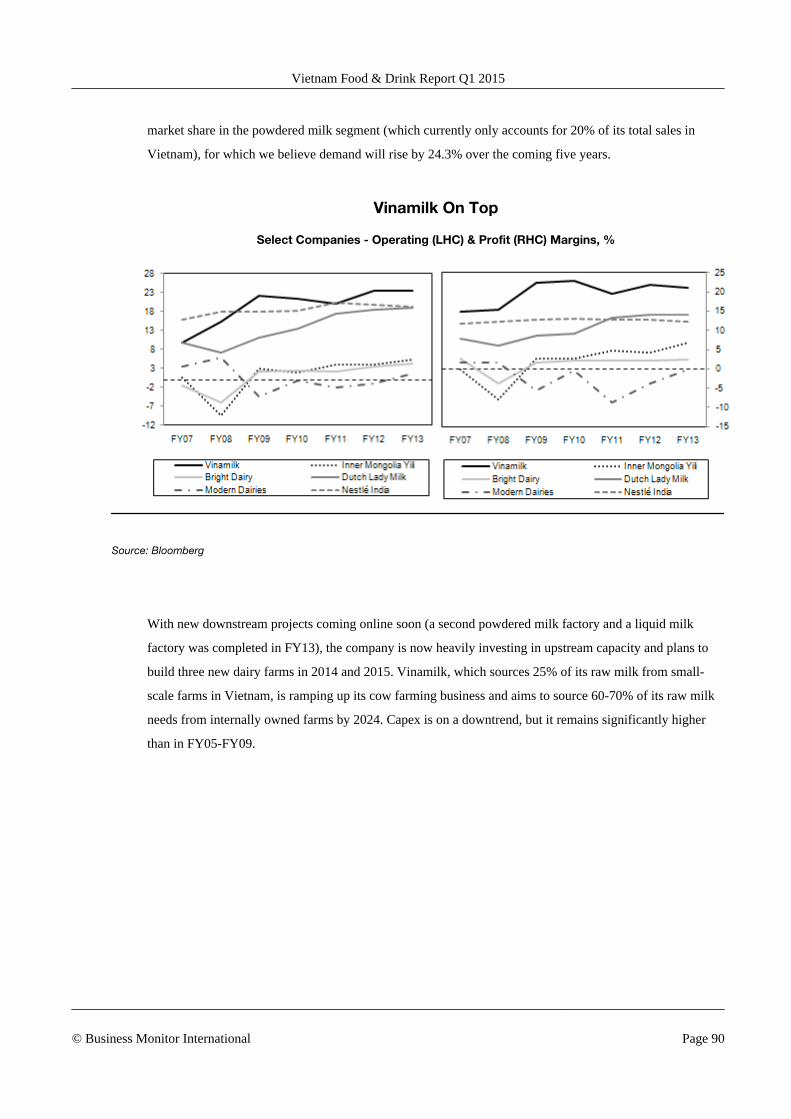
market share in the powdered milk segment (which currently only accounts for 20% of its total sales in
Vietnam), for which we believe demand will rise by 24.3% over the coming five years.
Vinamilk On Top
Select Companies - Operating (LHC) & Profit (RHC) Margins, %
Source: Bloomberg
With new downstream projects coming online soon (a second powdered milk factory and a liquid milk
factory was completed in FY13), the company is now heavily investing in upstream capacity and plans to
build three new dairy farms in 2014 and 2015. Vinamilk, which sources 25% of its raw milk from small-
scale farms in Vietnam, is ramping up its cow farming business and aims to source 60-70% of its raw milk
needs from internally owned farms by 2024. Capex is on a downtrend, but it remains significantly higher
than in FY05-FY09.
Vietnam Food & Drink Report Q1 2015
© Business Monitor International Page 90
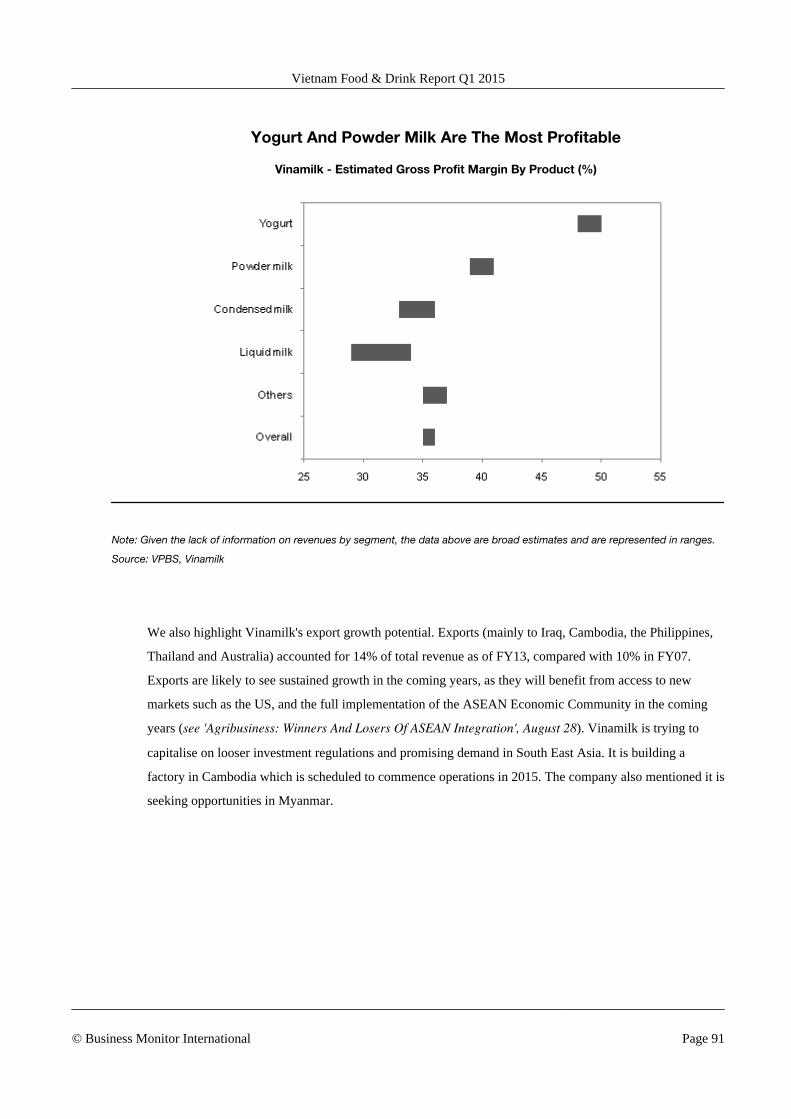
Yogurt And Powder Milk Are The Most Profitable
Vinamilk - Estimated Gross Profit Margin By Product (%)
Note: Given the lack of information on revenues by segment, the data above are broad estimates and are represented in ranges.
Source: VPBS, Vinamilk
We also highlight Vinamilk's export growth potential. Exports (mainly to Iraq, Cambodia, the Philippines,
Thailand and Australia) accounted for 14% of total revenue as of FY13, compared with 10% in FY07.
Exports are likely to see sustained growth in the coming years, as they will benefit from access to new
markets such as the US, and the full implementation of the ASEAN Economic Community in the coming
years (see 'Agribusiness: Winners And Losers Of ASEAN Integration', August 28). Vinamilk is trying to
capitalise on looser investment regulations and promising demand in South East Asia. It is building a
factory in Cambodia which is scheduled to commence operations in 2015. The company also mentioned it is
seeking opportunities in Myanmar.
Vietnam Food & Drink Report Q1 2015
© Business Monitor International Page 91
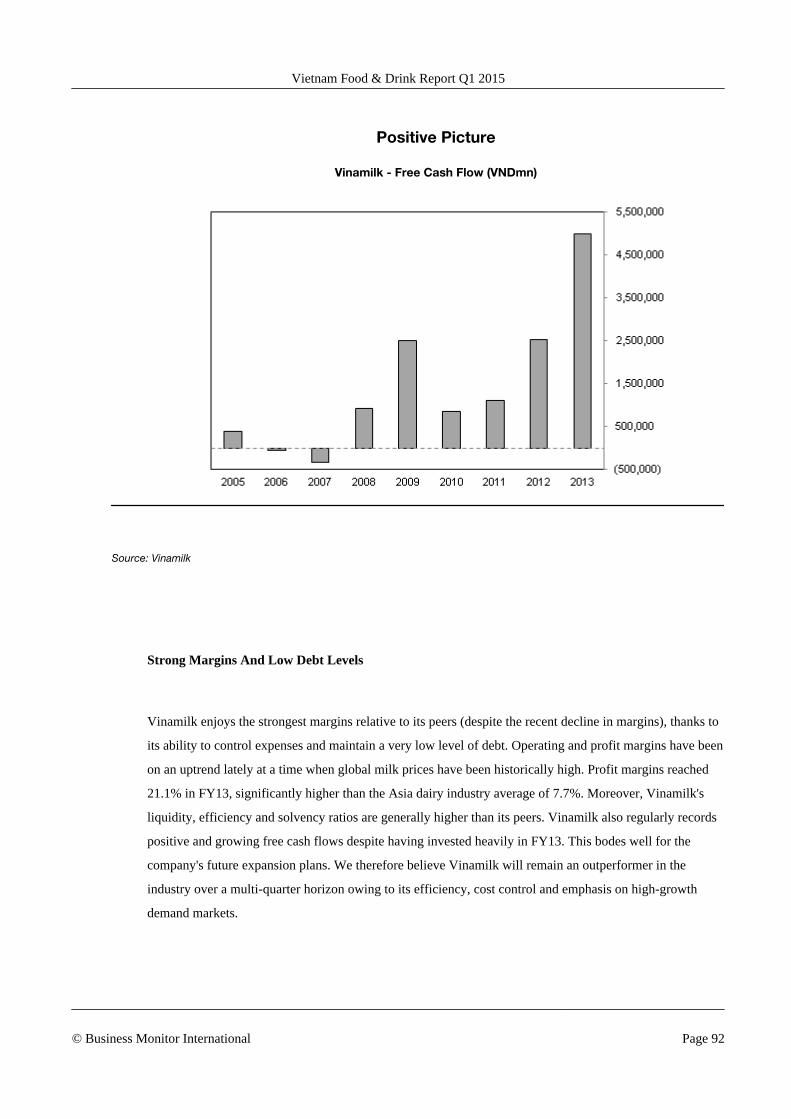
Positive Picture
Vinamilk - Free Cash Flow (VNDmn)
Source: Vinamilk
Strong Margins And Low Debt Levels
Vinamilk enjoys the strongest margins relative to its peers (despite the recent decline in margins), thanks to
its ability to control expenses and maintain a very low level of debt. Operating and profit margins have been
on an uptrend lately at a time when global milk prices have been historically high. Profit margins reached
21.1% in FY13, significantly higher than the Asia dairy industry average of 7.7%. Moreover, Vinamilk's
liquidity, efficiency and solvency ratios are generally higher than its peers. Vinamilk also regularly records
positive and growing free cash flows despite having invested heavily in FY13. This bodes well for the
company's future expansion plans. We therefore believe Vinamilk will remain an outperformer in the
industry over a multi-quarter horizon owing to its efficiency, cost control and emphasis on high-growth
demand markets.
Vietnam Food & Drink Report Q1 2015
© Business Monitor International Page 92

Improved Performance Over Longer Term
Select Companies & Ho Chi Minh Index (VNI), Rebased
Note: January 2 2014 = 100. Source: BMI, Bloomberg
Valuation
We believe Vinamilk has now relatively low valuations relative to historical levels and to peers. Vinamilk's
12-month trailing price/earnings ratio (PE) has decreased significantly since November 2013 and is now
standing at 15.2x. This is close to its three-year average of 15.7x and to the current PE of the VNI of 13.8x.
It is significantly below its competitors' average of 36.3x (the average is pushed higher by Bright
Dairy and Nestlé India).
Vietnam Food & Drink Report Q1 2015
© Business Monitor International Page 93

Eventually Heading Up
Vinamilk - Share Price, VND (daily chart)
Source: BMI, Bloomberg
Share Price Analysis
We remain cautious on Vinamilk's share price over the coming quarters and believe it will trade within the
VND95,000-110,000 range over the period. The share price could head higher in the first part of 2015 as
margins improve. However, it is unlikely to exceed its previous highs coming at VND120,000. We are more
positive on the share price performance over the longer term, in light of Vinamilk's strong revenue outlook
and sound financial results.
Table: Vinamilk - Financial Highlights, 2008-2013
2008 2009 2010 2011 2013
Revenues* 8,209 10,614 15,753 21,627 30,949
Revenues Growth 25.6 29.3 48.4 37.3 16.5
Operating Income* 1,248 2,340 3,347 4,317 7,295
Operating Margin (%) 15.2 22 21.2 20 23.6
Net Income* 1,250 2,376 3,616 4,218 6,534
Vietnam Food & Drink Report Q1 2015
© Business Monitor International Page 94
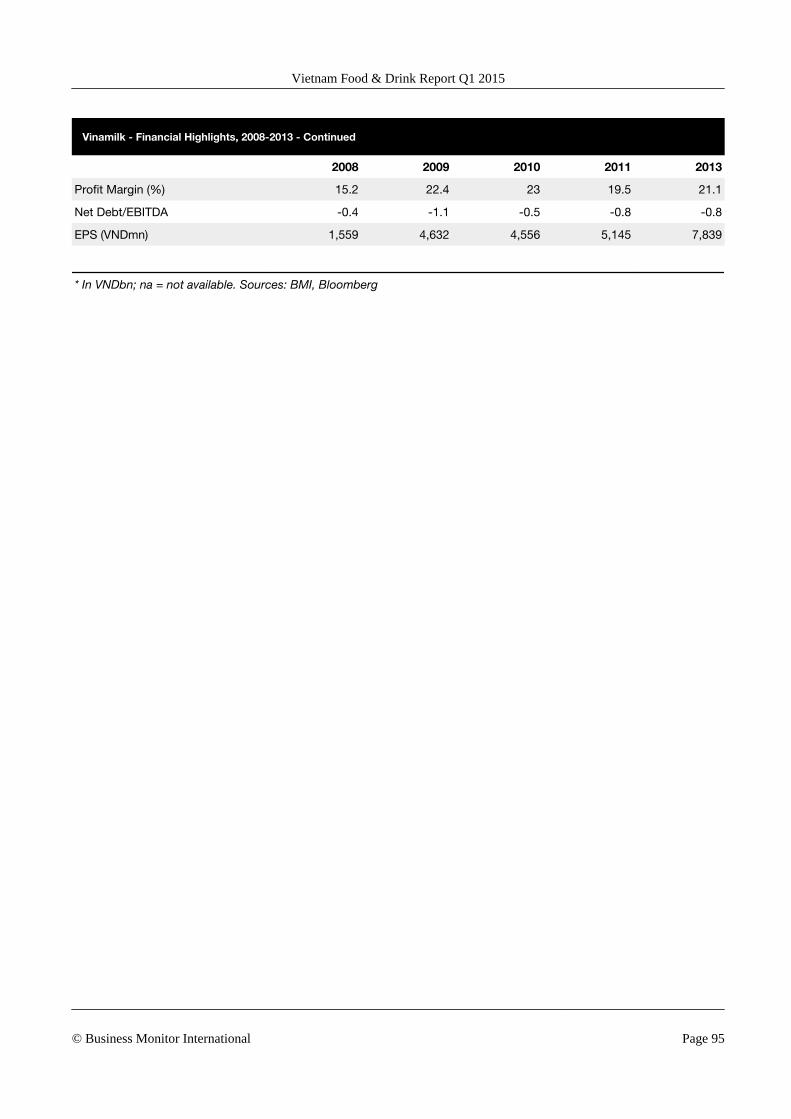
Vinamilk - Financial Highlights, 2008-2013 - Continued
2008 2009 2010 2011 2013
Profit Margin (%) 15.2 22.4 23 19.5 21.1
Net Debt/EBITDA -0.4 -1.1 -0.5 -0.8 -0.8
EPS (VNDmn) 1,559 4,632 4,556 5,145 7,839
* In VNDbn; na = not available. Sources: BMI, Bloomberg
Vietnam Food & Drink Report Q1 2015
© Business Monitor International Page 95
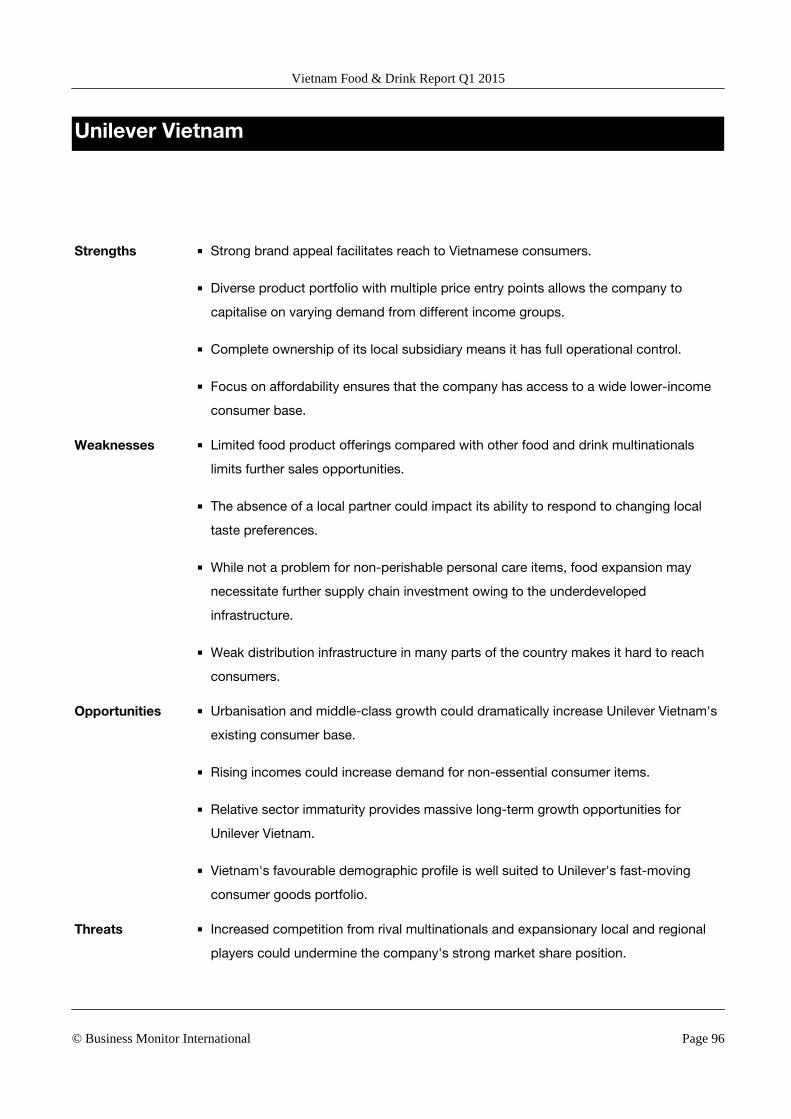
Unilever Vietnam
SWOT Analysis
Strengths ■ Strong brand appeal facilitates reach to Vietnamese consumers.
■ Diverse product portfolio with multiple price entry points allows the company to
capitalise on varying demand from different income groups.
■ Complete ownership of its local subsidiary means it has full operational control.
■ Focus on affordability ensures that the company has access to a wide lower-income
consumer base.
Weaknesses ■ Limited food product offerings compared with other food and drink multinationals
limits further sales opportunities.
■ The absence of a local partner could impact its ability to respond to changing local
taste preferences.
■ While not a problem for non-perishable personal care items, food expansion may
necessitate further supply chain investment owing to the underdeveloped
infrastructure.
■ Weak distribution infrastructure in many parts of the country makes it hard to reach
consumers.
Opportunities ■ Urbanisation and middle-class growth could dramatically increase Unilever Vietnam's
existing consumer base.
■ Rising incomes could increase demand for non-essential consumer items.
■ Relative sector immaturity provides massive long-term growth opportunities for
Unilever Vietnam.
■ Vietnam's favourable demographic profile is well suited to Unilever's fast-moving
consumer goods portfolio.
Threats ■ Increased competition from rival multinationals and expansionary local and regional
players could undermine the company's strong market share position.
Vietnam Food & Drink Report Q1 2015
© Business Monitor International Page 96

SWOT Analysis - Continued
■ Input cost volatility cannot easily be passed on in such a price-sensitive environment.
Company Overview Unilever Vietnam is a wholly owned subsidiary of Anglo-Dutch fast-moving consumer
goods leader Unilever. The parent took full control of the subsidiary in mid-2009, buying
the 33.3% stake it did not already own from its local partner. By far the largest section
of Unilever's portfolio in Vietnam is accounted for by personal care products; the
company also has a large number of homecare brands. Its presence in the food sector
is relatively smaller than that of its other consumer products, but it does have some
notable brands in Knorr, Lipton and Wall's.
Strategy Reaching out to the Vietnamese rural consumer base has not been particularly easy for
consumer goods manufacturers, whether local and multinational. Lower-income, rural
consumers have a smaller discretionary appetite for higher-value consumer goods,
which has made it tougher for Unilever to sell some of its products. In rural areas, weak
distribution infrastructure frustrates the expansion efforts of consumer goods
producers, while the dominance of traditional retail makes it even harder to reach
would-be consumers efficiently.
However, these challenges have not deterred Unilever from setting up shop in the
Vietnamese rural consumer market, clearly underlining the immense potential in this
market. According to Kantar Worldpanel's Brand Footprint ranking, Unilever is the
brand which is bought by the most people in Vietnam's rural areas, reflecting the
company's successful expansion in these areas. Rising incomes, sector immaturity, the
spread of organised retail and a plethora of macroeconomic driving factors make the
Vietnamese consumer goods sector a high-growth prospect, and the rural consumer
market will benefit strongly from these dynamics. According to Tran Vu Hoai, the head
of corporate relations for Unilever Vietnam, the firm's sales have been growing at an
annual average of 18.5% over the past decade to reach USD700mn in 2010, of which
rural sales make up about 50%, bearing out strong growth prospects in the rural
consumer market.
These dynamics mean that multinationals and local consumer goods players have
unsurprisingly been keen to position themselves early and will continue expanding in
the rural markets in order to reap the exciting rewards on offer. Unilever is offering some
of its products such as shampoos and fabric softeners in cheaper small sachets, which
cost around VND500 (USD0.02), as it looks to familiarise consumers with its products.
Vietnam Food & Drink Report Q1 2015
© Business Monitor International Page 97
Financial Data Unilever does not publish country-specific performance data. Vietnam is included within
the Asia, Africa and Central & Eastern Europe operating region.
Asia, Africa and Central & Eastern Europe revenue:
■ 2013: EUR20.1bn■ 2012: EUR18.9bn■ 2011: EUR18.9bn■ 2010: EUR17.7bn■ 2009: EUR14.9bn■ 2008: EUR14.5bn
Vietnam Food & Drink Report Q1 2015
© Business Monitor International Page 98
Nestlé Vietnam
SWOT Analysis
Strengths ■ Strong brand appeal facilitates reach to young, aspirational Vietnamese consumers.
■ Strong price propositions will appeal to emerging consumers.
■ Health and wellness commitment will be very likely to appeal to an increasingly
affluent middle class.
Weaknesses ■ Nestlé has struggled to turn a profit in Vietnam since its entry into the country.
■ Domestic and multinational competition is high, even in this fragmented marketplace,
and Nestlé Vietnam will have to continue pouring in capital investment to secure its
market share.
■ Non-organised retailers account for the majority of grocery sales.
■ Disposable incomes are still very low, and necessity remains a far more important
purchasing determinant than health.
Opportunities ■ High birth rates create strong sales opportunities for Nestlé's infant nutrition products.
■ Urbanisation and middle-class growth could dramatically increase Nestlé Vietnam's
existing consumer base.
■ Rising incomes could increase demand for non-essential consumer items.
■ Relative sector immaturity provides massive long-term growth opportunities for
Nestlé Vietnam.
Threats ■ Further expansion in Nestlé's core dairy sector will necessitate significant supply
chain investments to improve distribution infrastructure.
■ Input cost volatility cannot easily be passed on in such a price-sensitive environment.
Vietnam Food & Drink Report Q1 2015
© Business Monitor International Page 99
Company Overview Nestlé Vietnam is a wholly owned subsidiary of Swiss food and beverage major Nestlé.
The subsidiary manufactures beverages, dairy products, prepared meals and cooking
ingredients in three Vietnamese production plants. The company also distributes
pharmaceuticals in Vietnam, although it imports rather than domestically manufactures
these. In terms of food and beverage brands, the company markets Nescafé, La Vie,
Gau, Milo, Nestea and Maggi in Vietnam.
Strategy Given Nestlé's enormous global product portfolio, its Vietnamese product offerings are
fairly limited. The company has also failed to turn a consistent profit within the country,
despite being one of Vietnam's leading consumer goods players. In August 2013,
Nestlé announced that it had lost a cumulative USD30.8mn since entry into the country
in 1995. The company had, however, turned a profit in 2007, 2008, 2011 and 2012. We
believe that Nestlé will turn a more sustained profit over the coming years, as profit
margins increase from lower input costs and greater efficiency gains.
In 2012 Nestlé announced plans to boost direct purchases of coffee from farmers in
Vietnam by as much as five times over the next five years as demand increases. At that
point Nestlé Vietnam may buy about 60,000 metric tonnes from growers annually,
compared with 12,000-14,000 tonnes in 2012. According to Managing Director Rashid
Qureshi, 'Shortening the supply chain to reach more directly to farmers will improve the
growers' income, as well as the traceability of the coffee. We can train them, help them
increase yield and quality of coffee.'
In summer 2013 Nestlé opened a new Nescafé coffee factory in the Vietnamese city of
Bien Hoa. Nestlé says that the move will help it meet the increasing demand for
Nescafé products in the region. The new CHF230mn (USD237.11mn) factory, called
Nestle Tri An, has created over 200 new jobs and will produce goods for domestic
consumption and export.
In October 2014, Nestlé inaugurated a new production plant in Binh An, following a
USD36.6mn investment. The new plant will allow Nestlé Vietnam to double production
capacity of its Milo chocolate malt and other ready-to-drink (RTD) beverages.
Vietnam Food & Drink Report Q1 2015
© Business Monitor International Page 100
Masan Consumer
SWOT Analysis
Strengths ■ A nationwide distribution network gives Masan rare access to both the country's
high-spending urban centres and the rural, low-spending population.
■ Established, strong brands are a significant advantage in the current environment of
regional food hygiene and safety scares.
■ Investment from a leading private equity fund is likely to provide capital for expansion.
■ Its increasingly diversified product portfolio caters specifically to local tastes.
■ Private equity backing will enable large scale growth, both organically and via
acquisitions.
Weaknesses ■ Local consumers generally do not exhibit strong brand loyalty or a preference for
Vietnamese products.
■ Domestic and multinational competition is high, even in a fragmented marketplace,
and Masan will have to continue pouring in capital investment to secure its market
share.
Opportunities ■ A young and fast-growing population represents a receptive audience for branded
foods.
■ Further product development in perceived healthy and innovative product channels is
a long-term opportunity, even if the audience for such goods is currently small.
■ Masan has received investment from a number of multinationals, providing funds for
future expansion, product launches and marketing campaigns.
■ The company has confirmed that it may consider mergers and acquisitions as a
means of accelerating growth.
■ Product diversification will help to secure new avenues of growth.
Threats ■ Despite having an established nationwide distribution network, the movement of
goods remains a problem given the country's underdeveloped infrastructure.
Vietnam Food & Drink Report Q1 2015
© Business Monitor International Page 101
SWOT Analysis - Continued
■ The arrival of multinationals, with an emphasis on branded food sales, will jeopardise
Masan's market share.
■ Volatile input costs could threaten margins, with these difficult to pass on to
consumers in what remains a price-sensitive environment.
■ Recent monetary tightening measures could reduce discretionary spending, with
demand for branded food and beverages suffering as a result.
Company Overview Masan Consumer is part of Masan Group, a company that is engaged in financial
services via its Techcombank arm. Masan Consumer is one of Vietnam's largest local
fast-moving consumer goods (FMCG) companies, and is a leading producer of instant
noodles and sauces, including soy sauce, fish sauce and chilli sauce. Some of its core
brands include Nam Ngu, Chin-Su, Tam Thai Tu and Omachi. The company controls
74% of the domestic fish sauce market, 80% of the Vietnamese soy sauce market and
40% of the local premium instant noodles market. In January 2013, US private equity
firm KKR invested an extra USD200mn into Masan, and now controls a stake of about
25% in the company.
Strategy Masan has been a key local player in terms of Vietnam's transition from non-branded to
branded foodstuffs. If it is to maintain healthy growth rates in the long term, it may also
have to look to further portfolio diversification. Increased investment from international
food and drink companies, with powerhouse brands and immense marketing resources,
will create additional competitive pressure for Masan. Yet the company does have the
advantage of an existing distribution reach and an established domestic name.
Masan's significant capital investments will help facilitate its move into non-food
consumer products, including beverages, home and personal care. To aid its transition
to a more diversified company, Masan will seek to establish umbrella brands, thus
leveraging its existing strong brand name. This is an advisable strategy if under
pressure from Western powerhouse brands. The company is also likely to pursue
increased manufacturing efficiency, a priority that must be balanced against
expansionary investments during such a period of volatile input costs. Demonstrating its
diversification ambitions, Masan has acquired a 50.1% stake, valued at around
VND1.07trn (USD51mn), in Vietnamese coffee producer Vinacafe Bien Hoa Joint-Stock
Company.
A very dynamic consumer story continues to take shape in Vietnam, and Masan's
investment underlines its confidence in the country's consumer outlook. By acquiring a
Vietnam Food & Drink Report Q1 2015
© Business Monitor International Page 102
controlling stake in Vinacafe, Masan clearly wants to put itself in a strong position to
leverage on the exciting demand dynamics in the Vietnamese coffee sector. According
to the Vietnam Coffee and Cocoa Association, Vinacafe is the country's second largest
coffee exporter, and Masan could tap into Vinacafe's expertise and brand name to grow
its presence in the domestic coffee sector.
Looking ahead, the backing of expansion-oriented private equity player Kohlberg Kravis
Roberts & Co (KKR) will most likely continue to prove very supportive of Masan's
expansion plans beyond the processed food sectors into other consumer goods
products. At the beginning of 2013, KKR doubled its investment in Masan Consumer,
investing an additional USD200mn in the Vietnamese company. According to KKR
regional head of Southeast Asia, Ming Lu, 'Doubling our investment in less than two
years demonstrates our strong conviction in Vietnam's growth story, Masan Group as
our partner of choice in Vietnam and Masan Consumer as a leading Vietnam
consumption platform.'
Given KKR's growing appetite for emerging market-based assets, we believe that it will
continue to commit significant sums of investment in expanding Masan's domestic
scale. Closely following KKR's injection of equity capital into Masan, the latter
announced that it could commit as much as USD500mn to pursue acquisitional growth,
which is likely to leave Masan increasingly well placed to reap the attractive rewards on
offer in Vietnam.
In February 2013 Masan announced its plans to acquire 24.9% of bottled beverage
company Vinh Hao Mineral Joint Stock Company. Established in 1930, Vinh Hao was
the first domestic mineral water producer in the country, with a portfolio of mineral
water, purified water and mineral water-based soft drinks.
Vietnam Food & Drink Report Q1 2015
© Business Monitor International Page 103
San Miguel Pure Foods Vietnam Co Ltd
SWOT Analysis
Strengths ■ San Miguel Corporation is Southeast Asia's largest publicly listed food, beverage and
packaging company. The company has significant financial power behind it.
■ The company has a strong tradition in health food production, which stands it in good
stead as the global health trend catches up with emerging Asia.
■ The company has a diverse portfolio of goods.
Weaknesses ■ Questions have been raised about Pure Foods' ability to balance meat farming, feed
manufacture and branded food operations, with product focus tending to be the
industry buzzword during periods of high operating costs.
■ The company has faced significant negative publicity in recent years, with
accusations that its plant has caused serious environmental and health concerns.
Opportunities ■ High feed prices are likely to help to supplement Pure Foods' profits as long as grain
demand from the alternative energy sector remains strong.
■ Branded consumer food products represent an important long-term growth channel
for the company.
■ Processed meat products, which meet the emerging demand for convenience, will
very probably prove to be the next logical step for Pure Foods.
■ 48% ownership in its beverages arm from Kirin puts it in good stead for expansion.
Threats ■ Regional food hygiene scares have served to undermine consumer confidence in
local meat producers.
■ Growing competition from international food manufacturers could undermine any
competitive advantage Pure Foods possesses from being a regional player.
■ Just as higher animal feed costs will benefit Pure Foods in its feed division, they could
make life more challenging in the company's meat-farming sector.
Vietnam Food & Drink Report Q1 2015
© Business Monitor International Page 104
Company Overview Pure Foods is a leading Vietnamese food and beverage company and is part of the
Philippines-based San Miguel Corporation, which owns 97% of the company. In 2003,
Pure Foods acquired a pig farming and feeding mill facility from Taiwan Tea
Corporation. It was the food division's first acquisition, and feed now contributes
around 15% to group revenue. In Vietnam, 80% of the unit's output is used directly by
the business, while the remainder is sold to customers within Vietnam.
Strategy Pure Foods is focused on increasing revenues and improving profit margins by boosting
operating efficiencies across all divisions. Accordingly, it embraces and attempts to use
the most up-to-date technologies in its business activities. In terms of specific
strategies, the company intends to increase the size of its hog farm by 19%, as the
division has contributed significantly to profits. The company has recently opened five
Monterey Meatshops in southern Vietnam. Three are in major supermarkets in Ho Chi
Minh City, with the remaining two in Binh Duong.
San Miguel has interests in a range of businesses in Vietnam, including a glass
production plant, non- alcoholic beverage production plant, feedmill and processed
meat plant, and six hog farms. In Vietnam, the company is well diversified, like its parent
in the Philippines.
San Miguel is now looking to sell up to 49% of Pure Foods in order to finance its
diversification into other sectors. Such a capital injection could benefit the Vietnamese
subsidiary. The parent's diversification strategy has meant that Pure Foods has not
received significant expansionary investments in recent years; a renewed focus,
triggered by a new partner, could be beneficial.
Vietnam Food & Drink Report Q1 2015
© Business Monitor International Page 105

Hanoi Beer Alcohol Beverage Corp (Habeco)
SWOT Analysis
Strengths ■ Habeco is already looking towards regional expansion, profitable partnerships and
premium brands.
■ A good position in what is perceived as one of the world's highest-potential beer
markets provides strong growth potential.
■ Its economy-heavy portfolio means that Habeco brands tend to perform well even
during periods of low consumer confidence.
■ Backing from global beer giant Carlsberg will provide access to capital, as well as the
ability to enhance its product offering.
Weaknesses ■ Relatively weaker presence in the more affluent southern part of Vietnam limits the
potential for stronger revenue growth.
■ Focus on economy segment could eventually prove an impediment to growth as
incomes increase.
Opportunities ■ Vietnam's proximity to the dynamic frontier beer markets of Laos, Cambodia and
Myanmar offer up huge opportunities for regional expansion.
■ Vietnam's beer market has grown at a rapid pace, supported by economic growth,
rising tourism and favourable age demographics.
■ Relationship with Carlsberg is likely to facilitate wider distribution and synergies.
Vietnam Food & Drink Report Q1 2015
© Business Monitor International Page 106
SWOT Analysis - Continued
Threats ■ Competition in the sector continues to intensify as multinationals seek out the few
truly explosive growth opportunities that remain in the regional beer market.
■ The expansion pace of the market leaders has raised concerns that the beer industry
is now oversupplied, particularly when one considers much of the population remain
on very low incomes.
■ Problems faced by Carlsberg owing to its own business could limit investment into
Habeco.
Company Overview Habeco is the third largest Vietnamese brewer and dominates sales in the north of the
country, particularly in the increasingly affluent city of Hanoi. Danish beer company
Carlsberg is Habeco's largest single investor, with a stake of around 30%. Carlsberg
has access to a number of popular Western beer brands, and Habeco could look to
bring in these brands to bolster its premium portfolio and to ramp up its presence
beyond its northern stronghold.
For the time being, however, the firm has focused on economy brands, which has
helped it to ward off international competition and delivered sustained growth. The firm
is also positioning itself for growth in the spirits markets. In 2008, through its subsidiary
Hanoi Liquor Joint Stock Company (Halico), the firm entered into a joint venture with
Diageo, the world's largest spirits company. The two companies have joined forces to
expand within what remains a fledgling branded spirits industry and to exploit the
strong growth potential that exists in the market.
Strategy While Habeco has a sizeable presence in the northern region of Vietnam, the
company will have to work on improving its reach in the higher-spending southern
region and the higher-end beer segments to establish a strong competitive foothold. On
this front, Habeco could leverage on the financial backing of its expansion-oriented
shareholder Carlsberg and facilitate its expansion across the market.
While Habeco already has a sturdy foothold in the southern region of Vietnam, we
stress the strategic importance of the northern region. The Vietnamese beer market has
previously been regionalised, with Habeco dominating the north and Sabeco the south.
However, the rapid influx of investments from regional brewers such as Asia Pacific
Breweries and Carlsberg has seen competition intensify.. However, the brewer's
relatively weaker presence in the more affluent southern part of Vietnam limits its
potential for stronger revenue growth. Given the rapidly growing ranks of middle-class
Vietnam Food & Drink Report Q1 2015
© Business Monitor International Page 107
consumers across Vietnam, Habeco will need to put itself in the best possible position
to ride on the emerging wave of consumer spending across the country, and
expansions into the higher-spending southern region will very likely provide greater
opportunities in this direction.
Habeco's focus on the economy segment could also prove an impediment to growth as
incomes increase and fuel the premiumisation trend. The brewer's expansionary efforts
are primarily focused on the low-margin but high-volume Bia Hoi draft beer segment.
The unique distribution challenges of Bia Hoi - it is sold in the Hanoi area's street cafés
- means that Habeco is largely catering to the lower-income crowd. As Habeco builds a
nationwide presence across Vietnam, it is also important for it to calibrate its product
portfolio towards the higher-end and position itself to better capture the increasingly
sophisticated tastes of the Vietnamese consumer.
In 2010, Habeco's market share of the Vietnamese beer industry stood at 13.9%,
behind Sabeco and Vietnam Brewery Limited. In 2011, the company sold 413.5mn litres
of beer, an increase of 2.3% on 2010.
Vietnam Food & Drink Report Q1 2015
© Business Monitor International Page 108
Saigon Beer Alcohol And Beverage Corporation (Sabeco)
SWOT Analysis
Strengths ■ Dominance in what is perceived as one of the world's highest potential beer markets
provides strong growth potential.
■ Strong economy beer brands Saigon Beer and Beer 333 are very popular in the south.
■ Its economy-heavy portfolio means that Sabeco brands tend to perform well even
during periods of low consumer confidence.
Weaknesses ■ A disappointing initial public offering, although not attributable to the perceived
attractiveness of Sabeco itself, is reflective of tough market conditions.
■ A predominantly economy portfolio reduces Sabeco's competitiveness in wealthy
urban centres and its ability to exploit the tourist dollar.
Opportunities ■ A potential multinational corporation partnership would improve its brand portfolio
and boost the availability of capital, with behemoths SABMiller, Anheuser-Busch
InBev, Asahi Breweries and Heineken all thought to be interested.
■ Tourism represents an excellent opportunity for Sabeco to enter the premium
branded segment.
■ Regional diversity allows for easy expansion in what remains an immature market
despite investment levels.
Threats ■ Fluctuating raw material costs threaten profitability in a competitive market in which
higher prices cannot easily be passed on to consumers.
■ The expansion pace of the market leaders has raised concerns that the beer industry
is now oversupplied, particularly when one considers that much of the country still
lives in poverty.
■ Significant expansion plans from Carlsberg, APB and Habeco could threaten
Sabeco's market share.
Vietnam Food & Drink Report Q1 2015
© Business Monitor International Page 109

Company Overview Sabeco is Vietnam's leading brewer, controlling around 50% of total beer sales
in Vietnam. The state-backed brewer had commenced initial privatisation and had
planned to offload around 20% of its shares in order to raise USD560mn. Tough market
conditions meant than only 61% of this target was reached, although this was not seen
as a poor reflection on Sabeco, whose flagship Saigon Beer and Beer 333 continue to
enjoy strong success. The state currently holds an 89.5% stake in Sabeco.
Strategy Sabeco's initial public offering (IPO) was to raise funds to support continued expansion
- a vital requirement if it is to continue to dominate amid intense local and international
competition. Although short of initial targets, IPO funds are likely to drive further
expansion, with regional diversity thought to be a particular priority.
As well as expansion, brand diversification remains a key element of the company's
strategy as it looks to complement its popular local economy brands with some
premium, potentially international, products. Finding a multinational partner could
contribute enormously towards this and it should not be a difficult objective for such an
attractive firm.
At the end of 2012 major multinational brewers Heineken and SABMiller declined to
comment on reports that they are separately considering taking a stake in Sabeco.
Sabeco is targeting volume sales of 1.33bn litres in 2014, an increase of 1% compared
to 2013, with an estimated turnover of VND8.97trn. In 2013, the brewer also invested
VND1trn on marketing and expanding its distribution network, doubling the expenditure
from 2012.
In July 2014, the Vietnamese government, which still holds an 89.5% stake in Sabeco,
announced its two-stage share sell-off plan. During the first stage, the government will
reduce its stake in the company from 89.5% to 65%, with around 20% of the company
sold to a strategic partner. At a later stage, the Vietnamese government plans to
decrease its stake to 40%. In November 2014, Thai Beverage Public Company,
Thailand's largest beverage producer and distributor, demonstrated interest in
purchasing a stake in Sabeco, as it seeks expansion opportunities in South East Asia.
Sabeco's main competitors are Habeco (also owned by the Ministry of Industry and
Trade) with a market share of 13.9% and Vietnam Brewery Limited (VBL, 29.7%), a
joint-venture of Singapore's Asia Pacific Breweries and Saigon Trading Group (Satra),
which brews and sells Heineken, Tiger Beer and Larue Beer in Vietnam.
Vietnam Food & Drink Report Q1 2015
© Business Monitor International Page 110

Carlsberg
SWOT Analysis
Strengths ■ Carlsberg's strong financial capacity enables it to pour in significant capital
investment without the need for immediate returns.
■ The famous Carlsberg brand will very likely prove popular with young, brand-oriented
consumers.
■ Early pursuit of a diverse regional presence has given Carlsberg a head-start.
■ Carlsberg acquired Scottish & Newcastle (S&N)'s Vietnamese business. S&N had
itself been expansionary in Vietnam, thus significantly lifting Carlsberg's output.
Weaknesses ■ Distribution infrastructure remains problematic; having separate brewing facilities in
separate regions is the best way to overcome this, despite the obvious expense.
■ Carlsberg lacks a presence in the economy end of the market, and in such a price-
sensitive market, economy brands remain the most popular.
■ Non-organised retailers account for the bulk of the grocery market.
■ Carlsberg will have to invest heavily in acquisitions and expansions if it is to achieve
its goal of establishing a strong presence across the country, which could weigh on
its profitability.
Opportunities ■ Economic growth will be very likely to lift sales of Carlsberg's premium, international
brands.
■ Small-scale brewers, struggling with increased competition, could represent handy
market-share-building acquisition targets.
Threats ■ In line with market liberalisation, the beer market is expected to receive a flood of
investment in the coming years, dramatically ramping up competition levels.
■ Fluctuating commodity costs threaten brewers in a market where higher costs cannot
be passed on to consumers.
Vietnam Food & Drink Report Q1 2015
© Business Monitor International Page 111
Company Overview Carlsberg entered Vietnam in 1993 via the acquisition of a 60% stake in South East Asia
Brewery in northern Vietnam. It has since expanded, acquiring 30% of Halong Brewery
in the north east of the country in early 2007 and 50% of Central Vietnam's Hue
Brewery in 1994, followed by an announcement in late 2009 that it would acquire the
remaining 50%. In early 2007, Carlsberg acquired a 10% stake in Habeco and has since
increased its holding to 16%, making it Habeco's largest single strategic investor. The
Danish company now has a market share of around 10% in Vietnam, which increased
following the completion of the Hue Brewery acquisition, and it is the country's second
largest international player behind Heineken-backed Asia Pacific Breweries. Carlsberg
estimates that together it and Habeco control 33% of Vietnam's beer market, putting
them level with market leader Sabeco.
Strategy One of Carlsberg's key objectives in Vietnam is to improve its regional presence. To this
end, it has formed a joint venture (JV) - Hanoi Vung Tau Joint Stock Company - with
Habeco for a brewery construction in southern Vietnam, thus complementing its
northern, north-eastern and central facilities.
In 1994, Carlsberg formed a JV with the Thua Thien-Hue Province Peoples Committee
for the construction of the Hue Brewery. The brewery is now 100% owned by
Carlsberg, which acquired a 50% stake from its partner in 2011.
Carlsberg's focus remains on economy local brands, such as Hue. However, it is
increasingly targeting tourists and wealthy urban residents with its premium,
eponymous Carlsberg brand. The Vietnamese beer market continues to attract major
investment, and Carlsberg will want to ensure that its early entry sees it retains a
favourable position. Inorganic growth will be integral to this, and Carlsberg is expected
to play an active role in the future auction of small-scale brewers. With its increased
stake in Habeco, the company is optimistic about achieving market leadership, after
which regional growth is likely to become a priority. The company has also been
investing heavily in marketing and brand building, and is now the sponsor of the
Carlsberg Gulf Classic in the region.
At the end of 2012 Carlsberg announced that it will increase its stake in Habeco from
16% to 30%, demonstrating the company's expansionary ambition in Asia. The
Vietnamese Ministry of Industry and Trade gave Carlsberg the green light to increase its
stake in Habeco for about US$72mn - valuing the company at more than US$500mn.
Financial Data For Asia region:
■ 2012 revenue: DKK9.1mn, growth of 33.0%■ 2011 revenue: DKK6.8mn, growth of 21.8% ■ 2010 revenue: DKK5.6mn, growth of 33.0%
Vietnam Food & Drink Report Q1 2015
© Business Monitor International Page 112
Saigon Co-op
SWOT Analysis
Strengths ■ Saigon Co-op has a very strong brand in the southern part of the country, where its
name is synonymous with low prices.
■ Operating in both the supermarket and convenience sectors diversifies Saigon Co-
op's potential audience size.
■ With a focus on low-cost and, increasingly, private label goods, the company is well
positioned for strong performance during periods of low consumer confidence.
Weaknesses ■ Scale-building investments of the type needed if Saigon Co-op is to remain
competitive will be enormously costly.
■ Unlike its potential rivals, Saigon Co-op cannot make high-risk investments, needing
immediate returns in order to remain afloat.
■ Unlike in many other markets in the region, being a domestic operator does not give
Saigon Co-op a major advantage against its foreign counterparts.
Opportunities ■ Saigon Co-op's low-profit mark-up will give it a strong edge over its multinational
rivals should they enter Vietnam.
■ Price-cutting promotions are an excellent means of generating customer loyalty,
although they are becoming increasingly hard to offer.
■ Seeking partnerships is a wise means of building scale in a low-risk manner.
■ Planned fresh food and convenience offerings are strong long-term growth prospects.
■ The retailer has announced plans to launch an outlet in neighbouring Cambodia,
which has a far less developed mass grocery retail sector, giving it a first-mover
advantage.
Threats ■ The imminent arrival of international retailers poses a real threat to Saigon Co-op's
market leadership, as it is far less experienced than the newcomers.
■ Focus on Vietnamese brands could backfire as exposure to Western brands
increases.
Vietnam Food & Drink Report Q1 2015
© Business Monitor International Page 113

SWOT Analysis - Continued
■ Price hikes - a result of rising food prices - could threaten customer loyalty.
Company Overview Saigon Co-op is Vietnam's leading retailer. The firm has around 200 convenience stores
and almost 75 supermarkets, the majority of which are located in Ho Chi Minh City,
where Co-op controls 50% of the city's supermarket sector. It has also launched a new
chain of convenience stores called Co-op Food. Its network is oriented towards low-
income consumers, although it increasingly resembles that of the modern retail concept
proliferating in the country.
Strategy Saigon targets Vietnam's low-income population - providing choice at affordable prices.
Its strategy involves maintenance of this image and, having been forced to raise prices
in 2008 due to high wholesale costs, it has since been promoting a five-pronged
approach to keeping prices low. This involves requesting suppliers to justify price
increases; building stockpiles of basic items; improving distribution to ensure supply
and reduce panic buying; accepting lower profit margins; and looking for further cost
cuts through efficiency.
As well as targeting 100 supermarkets by 2015, it is also targeting logistical
improvements and, potentially, further joint ventures and partnerships to help meet its
store-opening aims, particularly in those cities in which it lacks expertise or
infrastructure. Saigon Co-op's slim margin mark-up is likely to help it in the face of
multinational competition. The firm has joined the trend towards private label goods,
recently developing its Co-op Mart brand for frozen and dried goods and its SGC brand
for clothing. It has also launched a chain of small-scale convenience stores, Co-op
Food. Bringing convenience to residential areas of Ho Chi Minh City, along with further
supermarket openings, is part of the company's strategy for preparing for the arrival of
multinational competition. The firm also has announced plans to build its first-ever
overseas supermarket in Cambodia.
Saigon's recent partnership, in autumn 2012, with Singapore mass grocery retail
operator NTUC FairPrice will also give it a strong boost in the Vietnamese mass grocery
retail market. NTUC and Saigon signed a joint venture agreement to establish a chain of
hypermarkets in Vietnam as they look to ride on the exciting emerging market demand
story that is expected to play out in Vietnam over the next decade. For Saigon, the
partnership deal makes clear strategic sense as Saigon would be able to leverage
NTUC's expertise in the hypermarket sector to build and grow its domestic presence.
An enlarged scale of operations would also lift its bargaining power and strengthen its
competitive position in this price-competitive retail environment.
Vietnam Food & Drink Report Q1 2015
© Business Monitor International Page 114

In May 2013 the two partners announced plans to set up two hypermarket chains in
Vietnam under the banner names Co.opXtra and Co.opXtraplus. The former banner will
target retail consumers, while the second banner will focus more on the business and
catering sectors. The joint venture intends to launch one or two hypermarkets each year
in major cities across the country.
In January 2014, Saigon opened the doors to its first shopping mall, in the city of Can
Tho. The company said it invested USD9.47mn into the mall, and plans to open two
more next year in the Ca Mau and Ben Tre provinces. The shopping malls operate
under the Sense City fascia.
Vietnam Food & Drink Report Q1 2015
© Business Monitor International Page 115

Global Industry Overview
The July-September third quarter period represented a firm step back from the cautious optimism
surrounding the state of the global economy that gathered momentum from the second half of 2013 into the
first quarter of 2014 particularly. Declining food prices, deflation or the threat of it in a number of European
countries especially and a broad-based sell-off in emerging market assets have dominated headlines over
recent weeks. While the eurozone looks particularly weak with France, Italy and Spain standing out, the
outlook for food and drink companies across a number of sub-sectors still looks sound in key markets like
the US and UK.
Touching on food prices, our agribusiness and wider commodities team expect grains prices to continue
declining over Q414 before finding a base towards the end of the year, following heavy selling action in the
third quarter.
Food Prices To Continue Decline
S&P GSCI Grains Index
Source: Bloomberg, BMI
Vietnam Food & Drink Report Q1 2015
© Business Monitor International Page 116
Deflation A Monumental Challenge For Retailers Especially
Deflation weighed heavily on a number of European food retailers in Q314. We noted that Spain's discount
food retail sector, led by Dia, would not recover until the consumer price index broke out of the deflationary
territory it entered over recent months. Dia is one of the best managed food retailers in Western Europe in
the attractive discount format; however deflation is especially troublesome for retailers as it leads to lower
sales. Therefore the near-12% sell-off in its shares since the start of September 2014 does not present a
sector-strategy opportunity yet.
The consumer price index (CPI) in Spain has been in a downward spiral for more than two years (see 'Pre-
Crisis Growth Levels Unlikely' August 5 2014). For food retailers, the pressure on sales in a deflationary
environment is typically fiercer than it is on the overall cost structure with the end-result typically being
downward pressure on margins.
Dia performed very well in the 2011-2013 period particularly in Spain despite a really tough environment
for consumer spending. Its shares were one of the best performing on the IBEX 35 index. Dia's low prices
and well structured (and positioned) stores were a winner. Its market share grew consistently as discount
retailing became more established.
However, this took place largely at a time when there was just enough inflation to allow Dia to really make
the most of its business model; consumer price inflation averaged 1.8% year-on-year between 2011 and
2013 according to our data, which is shown in the table below. To compound matters, as well as the
macroeconomic headwinds affecting most eurozone economies, the ongoing success of discounters,
particularly Aldi and Lidl, in key markets like the UK has put pressure on food companies to lower their
prices. Dia is better positioned to ride the wave of deflation given its historic ability to cut costs; however,
until the headline CPI begins to pick up it is going to be tough trading.
Vietnam Food & Drink Report Q1 2015
© Business Monitor International Page 117
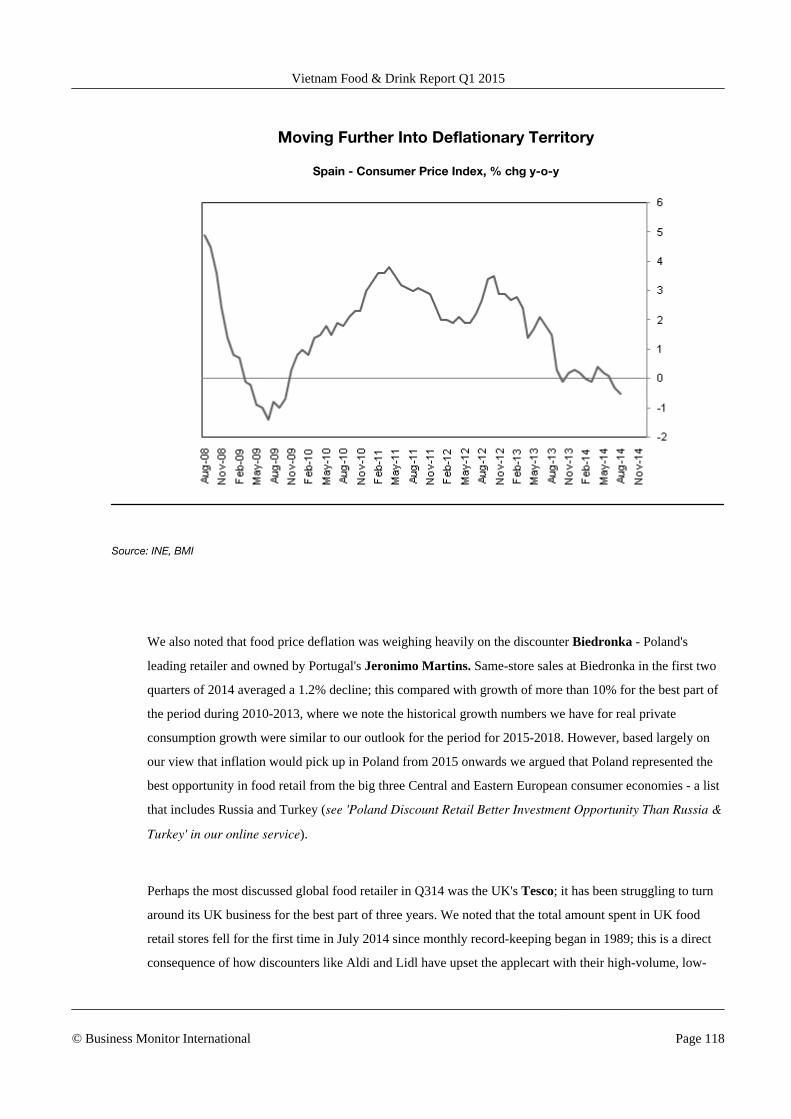
Moving Further Into Deflationary Territory
Spain - Consumer Price Index, % chg y-o-y
Source: INE, BMI
We also noted that food price deflation was weighing heavily on the discounter Biedronka - Poland's
leading retailer and owned by Portugal's Jeronimo Martins. Same-store sales at Biedronka in the first two
quarters of 2014 averaged a 1.2% decline; this compared with growth of more than 10% for the best part of
the period during 2010-2013, where we note the historical growth numbers we have for real private
consumption growth were similar to our outlook for the period for 2015-2018. However, based largely on
our view that inflation would pick up in Poland from 2015 onwards we argued that Poland represented the
best opportunity in food retail from the big three Central and Eastern European consumer economies - a list
that includes Russia and Turkey (see 'Poland Discount Retail Better Investment Opportunity Than Russia &
Turkey' in our online service).
Perhaps the most discussed global food retailer in Q314 was the UK's Tesco; it has been struggling to turn
around its UK business for the best part of three years. We noted that the total amount spent in UK food
retail stores fell for the first time in July 2014 since monthly record-keeping began in 1989; this is a direct
consequence of how discounters like Aldi and Lidl have upset the applecart with their high-volume, low-
Vietnam Food & Drink Report Q1 2015
© Business Monitor International Page 118
price models, taking market share away from legacy retailers like Tesco and forcing them into price war
terrain that they are loathe to go into.
Food retailers have little choice in this environment, as abstaining from up giving up margin will lead to
more market share losses. We expect price wars to remain the dominant theme in UK retailing through our
forecast period to 2018; ultimately, the level of success that Tesco and its UK legacy rivals WM Morrison
and Sainsbury will have in arresting declining market share will to a large extent depend on how much
more food shopping they are able to move online and how well they are able to balance market share and
margin from the ongoing price war. The level of industry competition is underlined by the presence of price
deflation in food retailing at a time when headline inflation is forecast to increase by 2% in 2014. So
although the deflation in UK food retailing is difference in structure to that in Poland and Spain the end
result is the same; UK retailers are facing unprecedented challenges.
Strengthening Pound and Dollar Impact
The strengthening pound and dollar in 2014 against emerging market currencies, particularly in Q314, has
been bad news for multinational food and drink companies with extensive international exposure as it is
making their foreign currency sales less valuable when converted into their presentational currencies.
Diageo and SABMiller have been particularly affected in the beverages space, as has Unilever with its
extensive fast-moving consumer goods portfolio. Back in mid-2013 the main foreign exchange concern
came from weakening emerging market currencies as the threat of the US tapering its quantitative easing
programme saw emerging market assets sell off, so it has been more than a year of currency related
headwinds.
Consolidation In Global Food and Drink
We expect mergers and acquisitions (M&A) activity to gather pace over the coming quarters in global food
and drink as more companies look to consolidate having focused primarily on growing organically and
cutting costs since 2008. One industry that has the potential to throw up one of the biggest deals in global
M&A is beer.
It is looking increasingly likely that AB InBev (ABI) will look to acquire SABMiller (SAB) over the next
one to two years with a bid that would value it at more than USD100bn. Our view over the past two to three
years, as the potential for this tie-up has generated increasingly more interest from the analyst community
and markets, has been that a deal was unlikely on account of the level of financing that would be required
and the regulatory hurdles that would have to be overcome, with SABMiller's strong positions in China and
Vietnam Food & Drink Report Q1 2015
© Business Monitor International Page 119
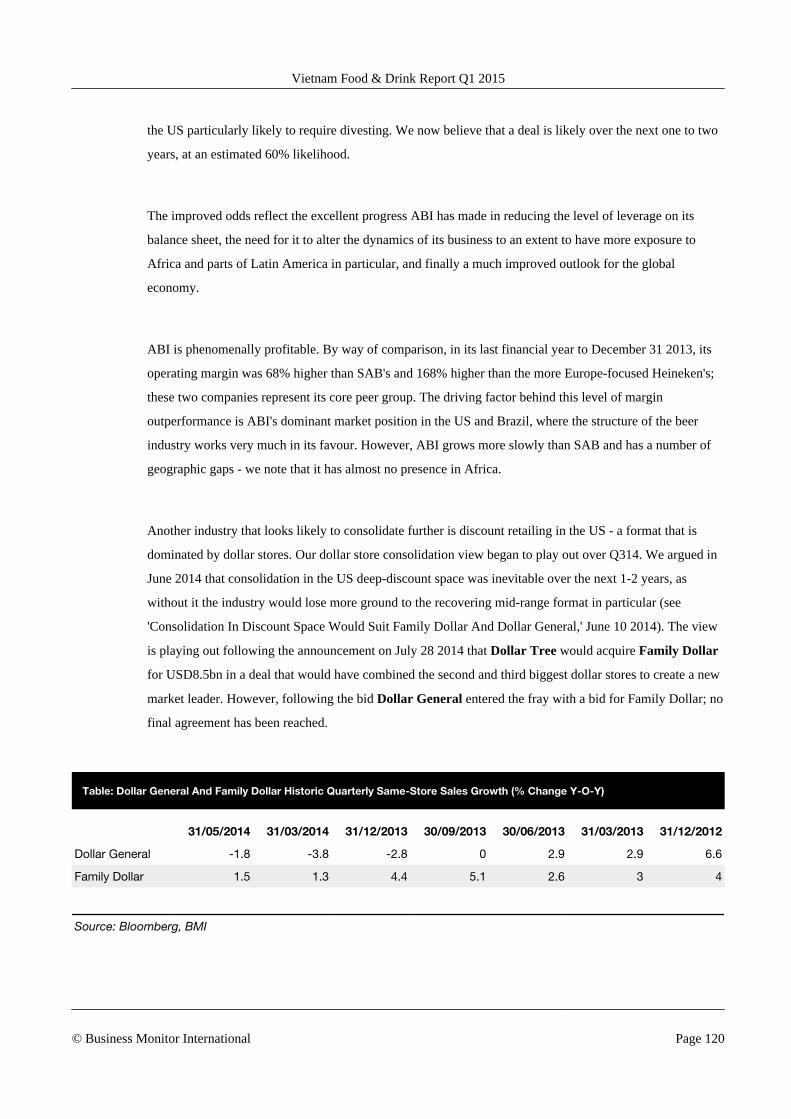
the US particularly likely to require divesting. We now believe that a deal is likely over the next one to two
years, at an estimated 60% likelihood.
The improved odds reflect the excellent progress ABI has made in reducing the level of leverage on its
balance sheet, the need for it to alter the dynamics of its business to an extent to have more exposure to
Africa and parts of Latin America in particular, and finally a much improved outlook for the global
economy.
ABI is phenomenally profitable. By way of comparison, in its last financial year to December 31 2013, its
operating margin was 68% higher than SAB's and 168% higher than the more Europe-focused Heineken's;
these two companies represent its core peer group. The driving factor behind this level of margin
outperformance is ABI's dominant market position in the US and Brazil, where the structure of the beer
industry works very much in its favour. However, ABI grows more slowly than SAB and has a number of
geographic gaps - we note that it has almost no presence in Africa.
Another industry that looks likely to consolidate further is discount retailing in the US - a format that is
dominated by dollar stores. Our dollar store consolidation view began to play out over Q314. We argued in
June 2014 that consolidation in the US deep-discount space was inevitable over the next 1-2 years, as
without it the industry would lose more ground to the recovering mid-range format in particular (see
'Consolidation In Discount Space Would Suit Family Dollar And Dollar General,' June 10 2014). The view
is playing out following the announcement on July 28 2014 that Dollar Tree would acquire Family Dollar
for USD8.5bn in a deal that would have combined the second and third biggest dollar stores to create a new
market leader. However, following the bid Dollar General entered the fray with a bid for Family Dollar; no
final agreement has been reached.
Table: Dollar General And Family Dollar Historic Quarterly Same-Store Sales Growth (% Change Y-O-Y)
31/05/2014 31/03/2014 31/12/2013 30/09/2013 30/06/2013 31/03/2013 31/12/2012
Dollar General -1.8 -3.8 -2.8 0 2.9 2.9 6.6
Family Dollar 1.5 1.3 4.4 5.1 2.6 3 4
Source: Bloomberg, BMI
Vietnam Food & Drink Report Q1 2015
© Business Monitor International Page 120
Scotch Exports Slowing As Bourbon View Plays Out
Export sales of American bourbon whiskey have outperformed Scotch so far in 2014, in line with our view.
We expect this to continue over the rest of the year and into 2015, as Scotch battles weakness in China
particularly following the government clampdown on luxury spirits.
Scotch as an industry should benefit from the stability brought upon by the No vote since the referendum
was a major source of uncertainty, particularly with regard to the impact Scottish independence would have
had on the pound.
According to the Scotch Whisky Association (SWA), export sales were down 11% year-on-year (y-o-y) to
GBP1.77bn in the six month period to June 2014. The US is the biggest export market for Scotch globally
and it did not fare well either, possibly due in part to the ongoing boom in bourbon. Bourbon has been at the
forefront of the latest wave of consolidation in global alcohol in 2014, highlighted by Japan's Suntory
buying the US bourbon producer Beam earlier in 2014 for USD16bn in the biggest ever spirits deal by
value.
Vietnam Food & Drink Report Q1 2015
© Business Monitor International Page 121
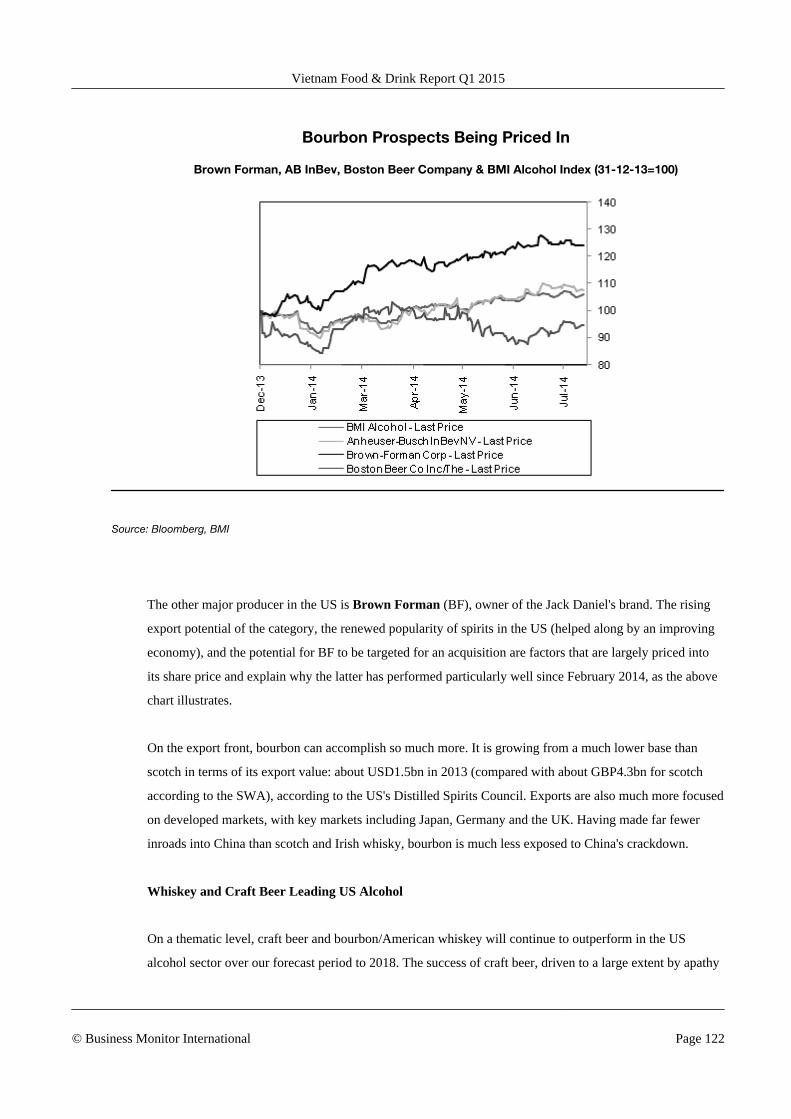
Bourbon Prospects Being Priced In
Brown Forman, AB InBev, Boston Beer Company & BMI Alcohol Index (31-12-13=100)
Source: Bloomberg, BMI
The other major producer in the US is Brown Forman (BF), owner of the Jack Daniel's brand. The rising
export potential of the category, the renewed popularity of spirits in the US (helped along by an improving
economy), and the potential for BF to be targeted for an acquisition are factors that are largely priced into
its share price and explain why the latter has performed particularly well since February 2014, as the above
chart illustrates.
On the export front, bourbon can accomplish so much more. It is growing from a much lower base than
scotch in terms of its export value: about USD1.5bn in 2013 (compared with about GBP4.3bn for scotch
according to the SWA), according to the US's Distilled Spirits Council. Exports are also much more focused
on developed markets, with key markets including Japan, Germany and the UK. Having made far fewer
inroads into China than scotch and Irish whisky, bourbon is much less exposed to China's crackdown.
Whiskey and Craft Beer Leading US Alcohol
On a thematic level, craft beer and bourbon/American whiskey will continue to outperform in the US
alcohol sector over our forecast period to 2018. The success of craft beer, driven to a large extent by apathy
Vietnam Food & Drink Report Q1 2015
© Business Monitor International Page 122
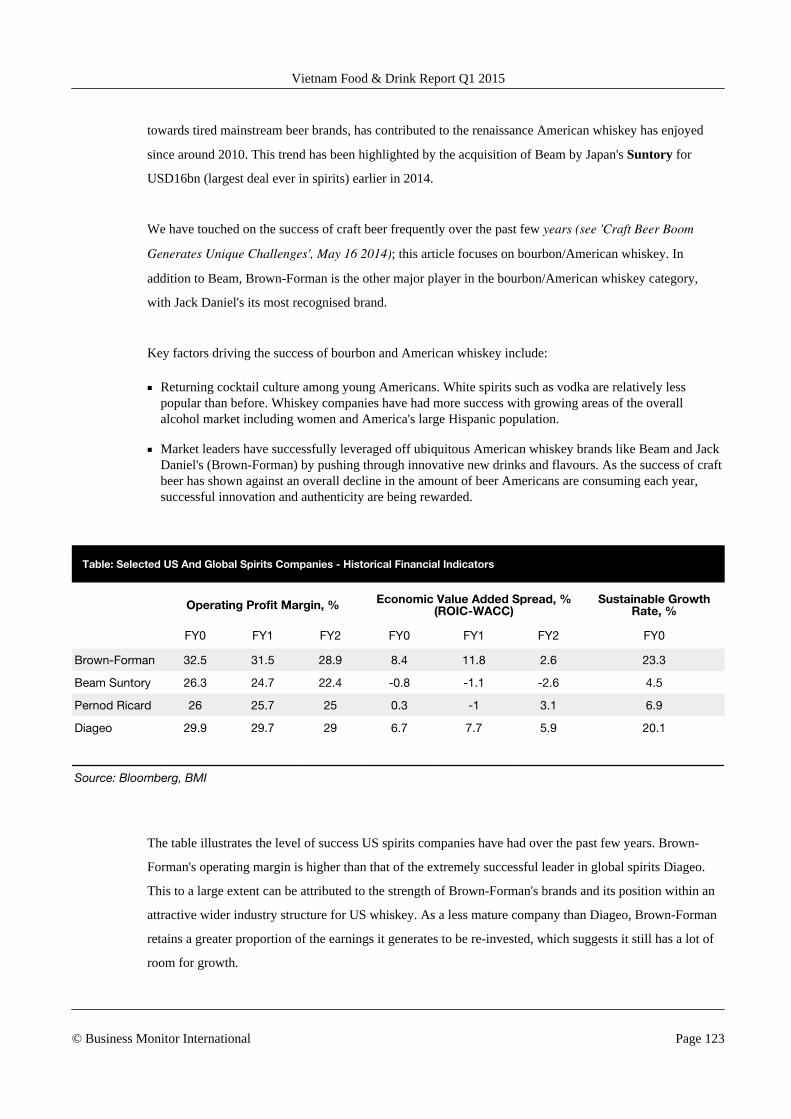
towards tired mainstream beer brands, has contributed to the renaissance American whiskey has enjoyed
since around 2010. This trend has been highlighted by the acquisition of Beam by Japan's Suntory for
USD16bn (largest deal ever in spirits) earlier in 2014.
We have touched on the success of craft beer frequently over the past few years (see 'Craft Beer Boom
Generates Unique Challenges', May 16 2014); this article focuses on bourbon/American whiskey. In
addition to Beam, Brown-Forman is the other major player in the bourbon/American whiskey category,
with Jack Daniel's its most recognised brand.
Key factors driving the success of bourbon and American whiskey include:
■ Returning cocktail culture among young Americans. White spirits such as vodka are relatively lesspopular than before. Whiskey companies have had more success with growing areas of the overallalcohol market including women and America's large Hispanic population.
■ Market leaders have successfully leveraged off ubiquitous American whiskey brands like Beam and JackDaniel's (Brown-Forman) by pushing through innovative new drinks and flavours. As the success of craftbeer has shown against an overall decline in the amount of beer Americans are consuming each year,successful innovation and authenticity are being rewarded.
Table: Selected US And Global Spirits Companies - Historical Financial Indicators
Operating Profit Margin, % Economic Value Added Spread, %(ROIC-WACC)
Sustainable GrowthRate, %
FY0 FY1 FY2 FY0 FY1 FY2 FY0
Brown-Forman 32.5 31.5 28.9 8.4 11.8 2.6 23.3
Beam Suntory 26.3 24.7 22.4 -0.8 -1.1 -2.6 4.5
Pernod Ricard 26 25.7 25 0.3 -1 3.1 6.9
Diageo 29.9 29.7 29 6.7 7.7 5.9 20.1
Source: Bloomberg, BMI
The table illustrates the level of success US spirits companies have had over the past few years. Brown-
Forman's operating margin is higher than that of the extremely successful leader in global spirits Diageo.
This to a large extent can be attributed to the strength of Brown-Forman's brands and its position within an
attractive wider industry structure for US whiskey. As a less mature company than Diageo, Brown-Forman
retains a greater proportion of the earnings it generates to be re-invested, which suggests it still has a lot of
room for growth.
Vietnam Food & Drink Report Q1 2015
© Business Monitor International Page 123
The economic value added spread is used to gauge the level of residual income a company is able to
generate above the minimum level required to cover the cost of capital. For our purposes we use this
measure to pick out outperforming companies within wider themes that we like, such as US whiskey in this
case. Brown-Forman is among the most profitable major spirits companies in the world by this measure.
Bottled water, juices and energy drinks will be outperformers in global soft drinks.
Battling declining volumes in its core carbonated drinks business, The Coca-Cola Company (Coke) has
been behind PepsiCo (Pepsi) in addressing the weakening industry structure; Pepsi has a leg-up on Coke
with its successful snacks business. We expect per capita carbonated drinks sales in the US to decline to 147
litres over our five-year forecast period to 2018; this compares with about 160 litres in 2013 and, going back
further, nearly 200 litres in 2004.
Coke took a major step towards addressing its lack of growth in the US in Q314 moving to acquire a 16.7%
stake worth USD2.15bn in US-based energy drinks company Monster Beverages. This represented an
excellent strategic move given the ongoing decline of the carbonated soft drinks market in the US.
Monster has been the absolute standout compared with some of the other major US drinks firms in terms of
the excess value it has been creating for its shareholders. This reflects its dominant position and the strength
of the industry in which it operates (energy drinks). Energy drinks have been a clear outperformer in the US
over the past five or so years, and Monster has only been getting stronger. We see a lot more room for
growth in US energy drinks, and Monster continues to be the best-positioned company. Historical precedent
suggests that Coke will ultimately move to bid for full control of Monster, having previously taken stakes in
well-placed companies such as Zico coconut water before taking full control.
For all its international strength, the US still accounts for more than 45% of Coke's business, and this is not
growing. Putting more growth into its US business with more direct exposure to energy drinks via Monster
is a major development.
Vietnam Food & Drink Report Q1 2015
© Business Monitor International Page 124
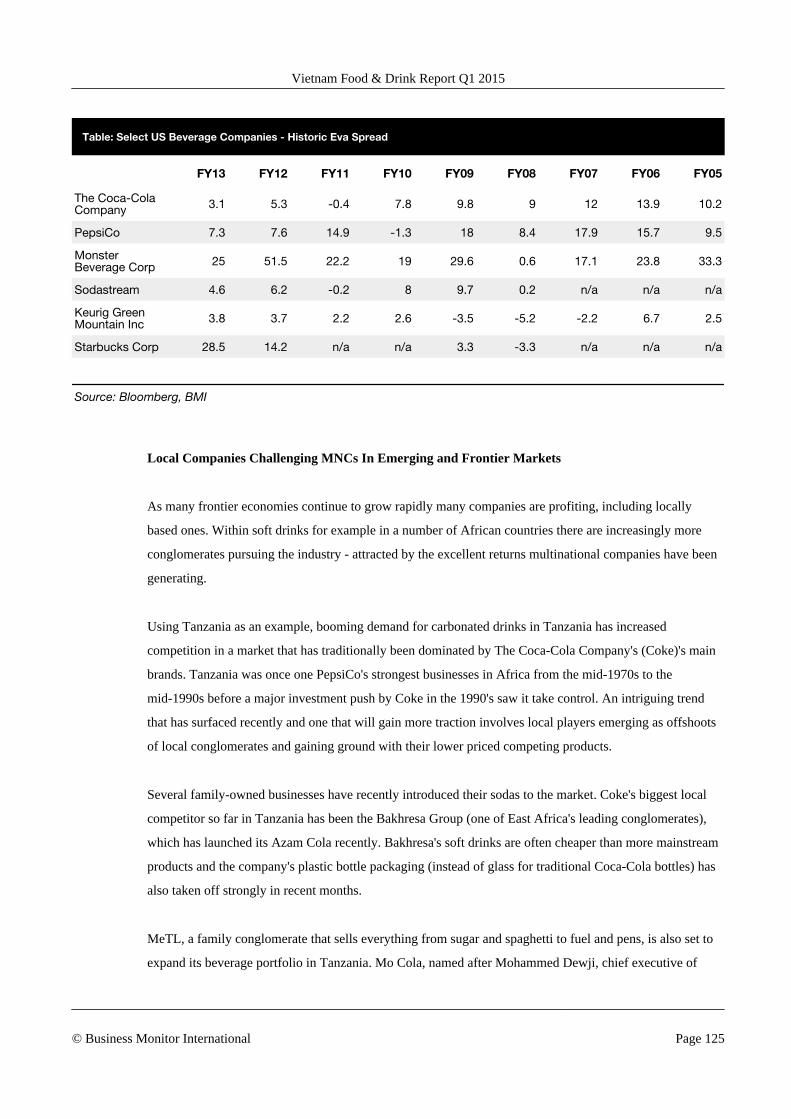
Table: Select US Beverage Companies - Historic Eva Spread
FY13 FY12 FY11 FY10 FY09 FY08 FY07 FY06 FY05
The Coca-ColaCompany 3.1 5.3 -0.4 7.8 9.8 9 12 13.9 10.2
PepsiCo 7.3 7.6 14.9 -1.3 18 8.4 17.9 15.7 9.5
MonsterBeverage Corp 25 51.5 22.2 19 29.6 0.6 17.1 23.8 33.3
Sodastream 4.6 6.2 -0.2 8 9.7 0.2 n/a n/a n/a
Keurig GreenMountain Inc 3.8 3.7 2.2 2.6 -3.5 -5.2 -2.2 6.7 2.5
Starbucks Corp 28.5 14.2 n/a n/a 3.3 -3.3 n/a n/a n/a
Source: Bloomberg, BMI
Local Companies Challenging MNCs In Emerging and Frontier Markets
As many frontier economies continue to grow rapidly many companies are profiting, including locally
based ones. Within soft drinks for example in a number of African countries there are increasingly more
conglomerates pursuing the industry - attracted by the excellent returns multinational companies have been
generating.
Using Tanzania as an example, booming demand for carbonated drinks in Tanzania has increased
competition in a market that has traditionally been dominated by The Coca-Cola Company's (Coke)'s main
brands. Tanzania was once one PepsiCo's strongest businesses in Africa from the mid-1970s to the
mid-1990s before a major investment push by Coke in the 1990's saw it take control. An intriguing trend
that has surfaced recently and one that will gain more traction involves local players emerging as offshoots
of local conglomerates and gaining ground with their lower priced competing products.
Several family-owned businesses have recently introduced their sodas to the market. Coke's biggest local
competitor so far in Tanzania has been the Bakhresa Group (one of East Africa's leading conglomerates),
which has launched its Azam Cola recently. Bakhresa's soft drinks are often cheaper than more mainstream
products and the company's plastic bottle packaging (instead of glass for traditional Coca-Cola bottles) has
also taken off strongly in recent months.
MeTL, a family conglomerate that sells everything from sugar and spaghetti to fuel and pens, is also set to
expand its beverage portfolio in Tanzania. Mo Cola, named after Mohammed Dewji, chief executive of
Vietnam Food & Drink Report Q1 2015
© Business Monitor International Page 125
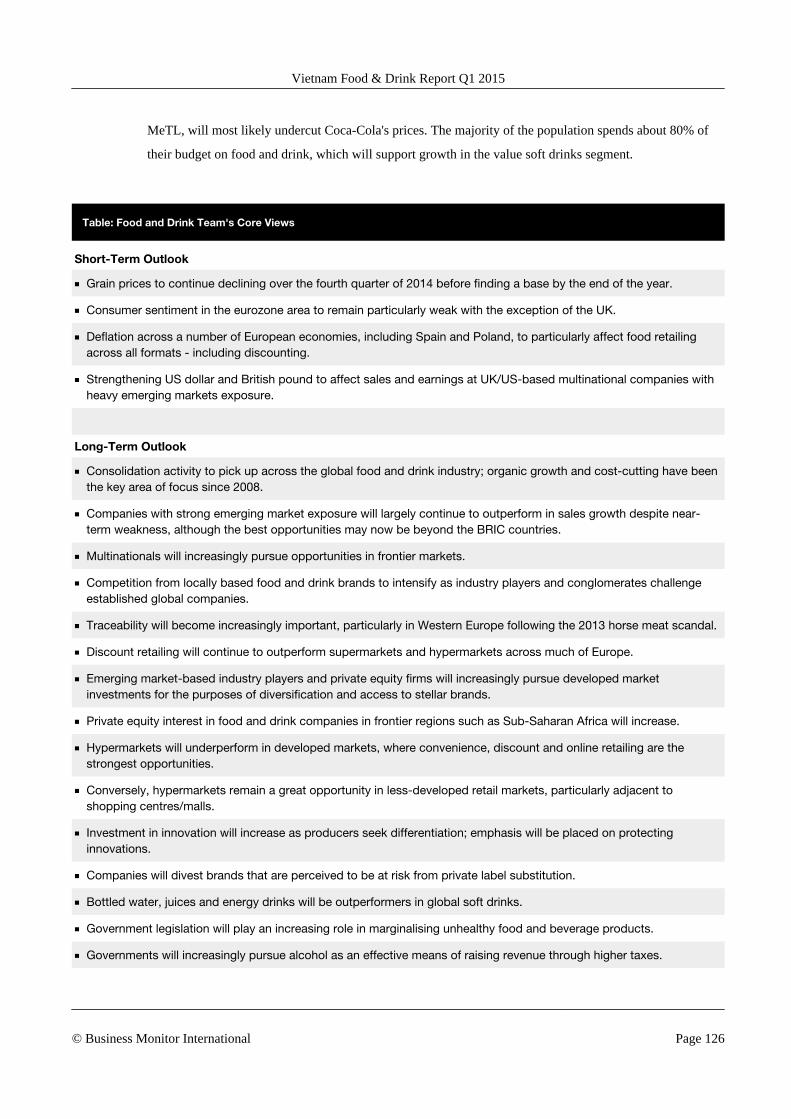
MeTL, will most likely undercut Coca-Cola's prices. The majority of the population spends about 80% of
their budget on food and drink, which will support growth in the value soft drinks segment.
Table: Food and Drink Team's Core Views
Short-Term Outlook
■ Grain prices to continue declining over the fourth quarter of 2014 before finding a base by the end of the year.
■ Consumer sentiment in the eurozone area to remain particularly weak with the exception of the UK.
■ Deflation across a number of European economies, including Spain and Poland, to particularly affect food retailingacross all formats - including discounting.
■ Strengthening US dollar and British pound to affect sales and earnings at UK/US-based multinational companies withheavy emerging markets exposure.
Long-Term Outlook
■ Consolidation activity to pick up across the global food and drink industry; organic growth and cost-cutting have beenthe key area of focus since 2008.
■ Companies with strong emerging market exposure will largely continue to outperform in sales growth despite near-term weakness, although the best opportunities may now be beyond the BRIC countries.
■ Multinationals will increasingly pursue opportunities in frontier markets.
■ Competition from locally based food and drink brands to intensify as industry players and conglomerates challengeestablished global companies.
■ Traceability will become increasingly important, particularly in Western Europe following the 2013 horse meat scandal.
■ Discount retailing will continue to outperform supermarkets and hypermarkets across much of Europe.
■ Emerging market-based industry players and private equity firms will increasingly pursue developed marketinvestments for the purposes of diversification and access to stellar brands.
■ Private equity interest in food and drink companies in frontier regions such as Sub-Saharan Africa will increase.
■ Hypermarkets will underperform in developed markets, where convenience, discount and online retailing are thestrongest opportunities.
■ Conversely, hypermarkets remain a great opportunity in less-developed retail markets, particularly adjacent toshopping centres/malls.
■ Investment in innovation will increase as producers seek differentiation; emphasis will be placed on protectinginnovations.
■ Companies will divest brands that are perceived to be at risk from private label substitution.
■ Bottled water, juices and energy drinks will be outperformers in global soft drinks.
■ Government legislation will play an increasing role in marginalising unhealthy food and beverage products.
■ Governments will increasingly pursue alcohol as an effective means of raising revenue through higher taxes.
Vietnam Food & Drink Report Q1 2015
© Business Monitor International Page 126
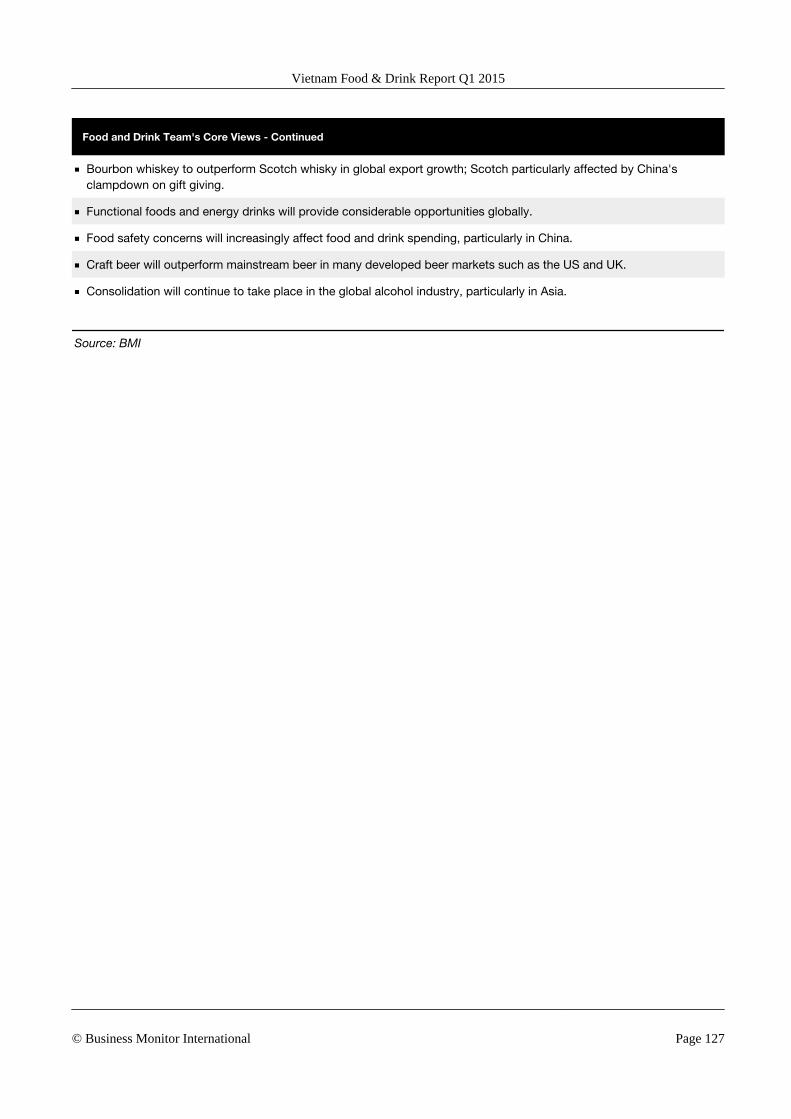
Food and Drink Team's Core Views - Continued
■ Bourbon whiskey to outperform Scotch whisky in global export growth; Scotch particularly affected by China'sclampdown on gift giving.
■ Functional foods and energy drinks will provide considerable opportunities globally.
■ Food safety concerns will increasingly affect food and drink spending, particularly in China.
■ Craft beer will outperform mainstream beer in many developed beer markets such as the US and UK.
■ Consolidation will continue to take place in the global alcohol industry, particularly in Asia.
Source: BMI
Vietnam Food & Drink Report Q1 2015
© Business Monitor International Page 127

Demographic Forecast
Demographic analysis is a key pillar of BMI's macroeconomic and industry forecasting model. Not only
is the total population of a country a key variable in consumer demand, but an understanding of
the demographic profile is essential to understanding issues ranging from future population trends to
productivity growth and government spending requirements.
The accompanying charts detail the population pyramid for 2015, the change in the structure of
the population between 2015 and 2050 and the total population between 1990 and 2050. The tables show
indicators from all of these charts, in addition to key metrics such as population ratios, the urban/rural split
and life expectancy.
Population
(1990-2050)
Vietnam - Population, mn
1990
2000
2005
2010
2015
f
2020
f
2025
f
2030
f
2035
f
2040
f
2045
f
2050
f
0
50
100
150
f = BMI forecast. Source: World Bank, UN, BMI
Vietnam Food & Drink Report Q1 2015
© Business Monitor International Page 128

Vietnam Population Pyramid
2015 (LHS) & 2015 Versus 2050 (RHS)
Source: World Bank, UN, BMI
Table: Population Headline Indicators (Vietnam 1990-2025)
1990 2000 2005 2010 2015f 2020f 2025f
Population, total, '000 68,909 80,887 84,947 89,047 93,386 97,057 99,811
Population, % y-o-y na 1.1 0.9 1.0 0.9 0.7 0.5
Population, total, male, '000 33,892 39,827 41,830 43,970 46,158 47,980 49,302
Population, total, female, '000 35,017 41,060 43,117 45,077 47,228 49,076 50,508
Population ratio, male/female 0.97 0.97 0.97 0.98 0.98 0.98 0.98
na = not available; f = BMI forecast. Source: World Bank, UN, BMI
Table: Key Population Ratios (Vietnam 1990-2025)
1990 2000 2005 2010 2015f 2020f 2025f
Active population, total, '000 39,197 50,153 56,330 62,305 66,093 68,401 70,001
Active population, % of total population 56.9 62.0 66.3 70.0 70.8 70.5 70.1
Dependent population, total, '000 29,712 30,733 28,617 26,741 27,292 28,655 29,810
Dependent ratio, % of total working age 75.8 61.3 50.8 42.9 41.3 41.9 42.6
Vietnam Food & Drink Report Q1 2015
© Business Monitor International Page 129

Key Population Ratios (Vietnam 1990-2025) - Continued
1990 2000 2005 2010 2015f 2020f 2025f
Youth population, total, '000 25,778 25,543 23,038 20,918 20,950 20,690 19,395
Youth population, % of total working age 65.8 50.9 40.9 33.6 31.7 30.2 27.7
Pensionable population, '000 3,934 5,190 5,578 5,823 6,342 7,964 10,414
Pensionable population, % of total working age 10.0 10.3 9.9 9.3 9.6 11.6 14.9
f = BMI forecast. Source: World Bank, UN, BMI
Table: Urban/Rural Population & Life Expectancy (Vietnam 1990-2025)
1990 2000 2005 2010 2015f 2020f 2025f
Urban population, '000 13,957.7 19,715.6 23,174.6 27,064.2 31,383.5 35,771.3 40,027.3
Urban population, % of total 20.3 24.4 27.3 30.4 33.6 36.9 40.1
Rural population, '000 54,952.2 61,172.3 61,773.2 61,983.2 62,003.1 61,285.7 59,783.9
Rural population, % of total 79.7 75.6 72.7 69.6 66.4 63.1 59.9
Life expectancy at birth, male, years 66.1 69.0 69.9 70.7 71.7 72.7 73.7
Life expectancy at birth, female, years 75.1 78.5 79.6 80.2 80.7 81.2 81.7
Life expectancy at birth, average, years 70.6 73.8 74.8 75.5 76.2 77.0 77.8
f = BMI forecast. Source: World Bank, UN, BMI
Table: Population By Age Group (Vietnam 1990-2025)
1990 2000 2005 2010 2015f 2020f 2025f
Population, 0-4 yrs, total, '000 9,314 7,127 6,897 7,228 7,012 6,574 5,922
Population, 5-9 yrs, total, '000 8,606 9,253 7,023 6,790 7,180 6,968 6,535
Population, 10-14 yrs, total, '000 7,856 9,162 9,117 6,898 6,757 7,147 6,936
Population, 15-19 yrs, total, '000 7,359 8,492 9,050 9,011 6,865 6,725 7,116
Population, 20-24 yrs, total, '000 6,644 7,672 8,332 8,873 8,936 6,802 6,664
Population, 25-29 yrs, total, '000 6,005 7,065 7,470 8,111 8,772 8,837 6,717
Population, 30-34 yrs, total, '000 5,138 6,351 6,909 7,285 8,021 8,680 8,747
Population, 35-39 yrs, total, '000 3,888 5,803 6,241 6,763 7,207 7,939 8,596
Population, 40-44 yrs, total, '000 2,462 4,994 5,719 6,147 6,684 7,127 7,856
Population, 45-49 yrs, total, '000 2,016 3,753 4,935 5,647 6,054 6,588 7,031
Vietnam Food & Drink Report Q1 2015
© Business Monitor International Page 130
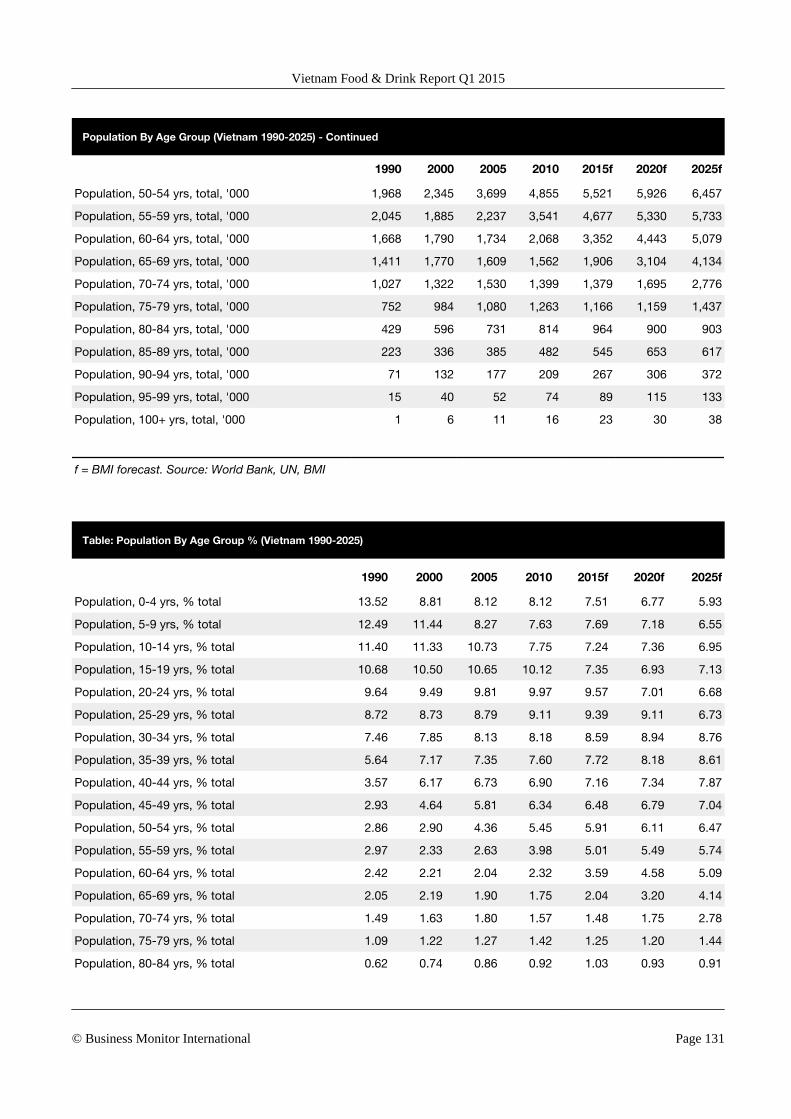
Population By Age Group (Vietnam 1990-2025) - Continued
1990 2000 2005 2010 2015f 2020f 2025f
Population, 50-54 yrs, total, '000 1,968 2,345 3,699 4,855 5,521 5,926 6,457
Population, 55-59 yrs, total, '000 2,045 1,885 2,237 3,541 4,677 5,330 5,733
Population, 60-64 yrs, total, '000 1,668 1,790 1,734 2,068 3,352 4,443 5,079
Population, 65-69 yrs, total, '000 1,411 1,770 1,609 1,562 1,906 3,104 4,134
Population, 70-74 yrs, total, '000 1,027 1,322 1,530 1,399 1,379 1,695 2,776
Population, 75-79 yrs, total, '000 752 984 1,080 1,263 1,166 1,159 1,437
Population, 80-84 yrs, total, '000 429 596 731 814 964 900 903
Population, 85-89 yrs, total, '000 223 336 385 482 545 653 617
Population, 90-94 yrs, total, '000 71 132 177 209 267 306 372
Population, 95-99 yrs, total, '000 15 40 52 74 89 115 133
Population, 100+ yrs, total, '000 1 6 11 16 23 30 38
f = BMI forecast. Source: World Bank, UN, BMI
Table: Population By Age Group % (Vietnam 1990-2025)
1990 2000 2005 2010 2015f 2020f 2025f
Population, 0-4 yrs, % total 13.52 8.81 8.12 8.12 7.51 6.77 5.93
Population, 5-9 yrs, % total 12.49 11.44 8.27 7.63 7.69 7.18 6.55
Population, 10-14 yrs, % total 11.40 11.33 10.73 7.75 7.24 7.36 6.95
Population, 15-19 yrs, % total 10.68 10.50 10.65 10.12 7.35 6.93 7.13
Population, 20-24 yrs, % total 9.64 9.49 9.81 9.97 9.57 7.01 6.68
Population, 25-29 yrs, % total 8.72 8.73 8.79 9.11 9.39 9.11 6.73
Population, 30-34 yrs, % total 7.46 7.85 8.13 8.18 8.59 8.94 8.76
Population, 35-39 yrs, % total 5.64 7.17 7.35 7.60 7.72 8.18 8.61
Population, 40-44 yrs, % total 3.57 6.17 6.73 6.90 7.16 7.34 7.87
Population, 45-49 yrs, % total 2.93 4.64 5.81 6.34 6.48 6.79 7.04
Population, 50-54 yrs, % total 2.86 2.90 4.36 5.45 5.91 6.11 6.47
Population, 55-59 yrs, % total 2.97 2.33 2.63 3.98 5.01 5.49 5.74
Population, 60-64 yrs, % total 2.42 2.21 2.04 2.32 3.59 4.58 5.09
Population, 65-69 yrs, % total 2.05 2.19 1.90 1.75 2.04 3.20 4.14
Population, 70-74 yrs, % total 1.49 1.63 1.80 1.57 1.48 1.75 2.78
Population, 75-79 yrs, % total 1.09 1.22 1.27 1.42 1.25 1.20 1.44
Population, 80-84 yrs, % total 0.62 0.74 0.86 0.92 1.03 0.93 0.91
Vietnam Food & Drink Report Q1 2015
© Business Monitor International Page 131

Population By Age Group % (Vietnam 1990-2025) - Continued
1990 2000 2005 2010 2015f 2020f 2025f
Population, 85-89 yrs, % total 0.32 0.42 0.45 0.54 0.58 0.67 0.62
Population, 90-94 yrs, % total 0.10 0.16 0.21 0.24 0.29 0.32 0.37
Population, 95-99 yrs, % total 0.02 0.05 0.06 0.08 0.10 0.12 0.13
Population, 100+ yrs, % total 0.00 0.01 0.01 0.02 0.03 0.03 0.04
f = BMI forecast. Source: World Bank, UN, BMI
Vietnam Food & Drink Report Q1 2015
© Business Monitor International Page 132

Glossary
Food & Drink
Food Consumption: All four food consumption indicators (food consumption in local currency, food
consumption in US dollar terms, per capita food consumption and food consumption as a percentage of
GDP) relate to off-trade food and non-alcoholic drinks consumption, unless stated in the relevant table/
section.
Off-trade: Relates to an item consumed away from the premises on which it was purchased. For example, a
bottle of water bought in a supermarket would count as off-trade, while a bottle of water purchased as part
of a meal in a restaurant would count as on-trade.
Canned Food: Relates to the sale of food products preserved by canning. This is inclusive of canned meat
and fish, canned ready meals, canned desserts and canned fruits and vegetables. Volume sales are measured
in thousand tonnes as opposed to on a unit basis to allow for cross-market comparisons.
Confectionery: Refers to retail sales of chocolate, sugar confectionery and gum products. Chocolate sales
include chocolate bars and boxed chocolates; gum sales incorporate both bubble gum and chewing gum;
and sugar confectionery sales include hard-boiled sweets, mints, jellies and medicated sweets.
Trade: In the majority of BMI's Food & Drink reports, we use the UN Standard International Trade
Classification, using categories Food and Live Animals, Beverages and Tobacco, Animal and Vegetable
Oils, Fats and Waxes and Oil-seeds and Oleaginous Fruits. Where an alternative classification is used due to
data availability, this is clearly stated.
Drinks Sales: Soft drink sales (including carbonates, fruit juices, energy drinks, bottled water, functional
beverages and ready-to-drink tea and coffee), alcoholic drink sales (including beer, wine and spirits) and tea
and coffee sales (excluding ready-to-drink tea and coffee products that are incorporated under BMI's soft
drinks banner) are all off-trade only, unless stated.
Mass Grocery Retail
Mass Grocery Retail: BMI classifies mass grocery retail (MGR) as organised retail, performed by
companies with a network of modern grocery retail stores and modern distribution networks. MGR differs
from independent or traditional retail, which relates to informal, independent-owned grocery stores or
traditional market retailing. MGR incorporates hypermarket, supermarket, convenience and discount
retailing, and in unique cases cooperative retailing. Where supermarkets are independently owned and not
classified as MGR, BMI will state so clearly within the relevant report.
Vietnam Food & Drink Report Q1 2015
© Business Monitor International Page 133
Hypermarket: BMI classifies hypermarkets as retail outlets selling both groceries and a large range of
general merchandise goods (non-food items) and typically more than 2,500m² in size. Traditionally only
found on the outskirts of town centres, hypermarkets are increasingly appearing in urban locations.
Supermarket: Supermarkets are the original and still most globally prevalent form of self-service grocery
retail outlet. BMI classifies supermarkets as more than 300m², up to the size of a hypermarket. The typical
supermarket carries both fresh and processed food and will stock a range of non-food items, most
commonly household and beauty goods. The average supermarket will increasingly offer some added-value
services, such as dry cleaning or in-store ATMs.
Discount Stores: Although most commonly between 500m² and 1,500m² in size, and thus of the same
classification as supermarkets, discount stores will typically have a smaller floor space than their
supermarket counterparts. Other distinguishing features include the prevalence of low-priced and private
label goods, an absence of added-value services, often called a no-frills environment, and a high product
turnover rate.
Convenience Stores: BMI's classification of convenience stores includes small outlets typically less than
300m² in size, with long opening hours and located in high footfall areas. These stores mainly sell fast-
moving food and drink products (such as confectionery, beverages and snack foods) and non-food items,
typically stocking only two or three brand choices per item and often carrying higher prices than other
forms of grocery store.
Cooperatives: BMI classifies cooperatives as retail stores that are independently owned but club together
to form buying groups under a cooperative arrangement, trading under the same banner, although each is
privately owned. The arrangement is similar to a franchise system, although all profits are returned to
members. The term is becoming more archaic, with fewer cooperatives remaining that conform to this
model. Most cooperative groups now have a more centralised management structure, operate more like
normal supermarkets, and are thus classified as such in BMI's reports.
Vietnam Food & Drink Report Q1 2015
© Business Monitor International Page 134
Methodology
Industry Forecast Methodology
BMI's industry forecasts are generated using the best-practice techniques of time-series modelling and
causal/econometric modelling. The precise form of model we use varies from industry to industry, in each
case being determined, as per standard practice, by the prevailing features of the industry data being
examined.
Common to our analysis of every industry is the use of vector autoregressions. Vector autoregressions allow
us to forecast a variable using more than the variable's own history as explanatory information. For
example, when forecasting oil prices, we can include information about oil consumption, supply and
capacity.
When forecasting for some of our industry sub-component variables, however, using a variable's own
history is often the most desirable method of analysis. Such single-variable analysis is called univariate
modelling. We use the most common and versatile form of univariate models: the autoregressive moving
average model (ARMA). In some cases, ARMA techniques are inappropriate because there is insufficient
historic data or data quality is poor. In such cases, we use either traditional decomposition methods or
smoothing methods as a basis for analysis and forecasting.
BMI mainly uses ordinary least squares estimators. In order to avoid relying on subjective views and
encourage the use of objective views, BMI uses a 'general-to-specific' method. BMI mainly uses a linear
model, but simple non-linear models, such as the log-linear model, are used when necessary. During periods
of 'industry shock', for example when poor weather conditions impede agricultural output, dummy variables
are used to determine the level of impact.
Effective forecasting depends on appropriately selected regression models. BMI selects the best model
according to various different criteria and tests, including but not exclusive to:
■ R2 tests explanatory power; adjusted R2 takes degree of freedom into account
■ Testing the directional movement and magnitude of coefficients
■ Hypothesis testing to ensure coefficients are significant (normally t-test and/or P-value)
■ All results are assessed to alleviate issues related to auto-correlation and multi-collinearity
Vietnam Food & Drink Report Q1 2015
© Business Monitor International Page 135
BMI uses the selected best model to perform forecasting.
Human intervention plays a necessary and desirable role in all of BMI's industry forecasting. Experience,
expertise and knowledge of industry data and trends ensure that analysts spot structural breaks, anomalous
data, turning points and seasonal features where a purely mechanical forecasting process would not.
Sector-Specific Methodology
Within the Food & Drink industry, issues that might result in human intervention might include but are not
exclusive to:
■ Significant company expansion plans;
■ New product development that might influence pricing levels;
■ Dramatic changes in local production levels;
■ Product taxation;
■ The regulatory environment and specific areas of legislation;
■ Changes in lifestyles and general societal trends;
■ The formation of bilateral and multilateral trading agreements and negotiations;
■ Political factors influencing trade;
■ The development of the industry in neighbouring markets that are potential competitors for foreign directinvestment.
Example Of Food Consumption Model
(Food Consumption)t = β0 + β1*(GDP)t + β2*(inflation)t + β3*(lending rate)t + β4* (foreign exchange
rate)t + β5*(government expenditure)t + β6*(food consumption)t-1 + εt
Sources
BMI uses the following sources in the compilation of data, developments and analysis for its range of Food
& Drink reports: national statistics offices; local industry governing-bodies and associations; local trade
associations; central banks; government departments, particularly trade, agricultural and commerce
ministries; officially released information and financial results from local and multinational companies;
cross-referenced information from local and international news agencies and trade press outlets; figures
from global organisations, such as the WTO, the World Health Organization (WHO), the UN Food and
Vietnam Food & Drink Report Q1 2015
© Business Monitor International Page 136
Agricultural Organization (FAO) and the Organisation for Economic Co-operation and Development
(OECD).
Risk/Reward Index Methodology
BMI's Risk/Reward Index (RRI) provides a comparative regional ranking system evaluating the ease of
doing business and the industry-specific opportunities and limitations for potential investors in a given
market. The RRI system divides into two distinct areas:
Rewards: Evaluation of sector's size and growth potential in each state, and also broader industry/state
characteristics that may inhibit its development. This is further broken down into two sub categories:
■ Industry Rewards: This is an industry-specific category taking into account current industry size andgrowth forecasts, the openness of market to new entrants and foreign investors, to provide an overallscore for potential returns for investors.
• Country Rewards: this is a country-specific category, and the score factors in favourable political andeconomic conditions for the industry.
Risks: Evaluation of industry-specific dangers and those emanating from the state's political/economic
profile that call into question the likelihood of expected returns being realised over the assessed time period.
This is further broken down into two sub categories:
■ Industry Risks: This is an industry-specific category whose score covers potential operational risks toinvestors, regulatory issues inhibiting the industry, and the relative maturity of a market.
• Country Risks: This is a country-specific category in which political and economic instability,unfavourable legislation and a poor overall business environment are evaluated to provide an overallscore.
We take a weighted average, combining industry and country risks, or industry and country rewards. These
two results in turn provide an overall Risk/Reward Index, which is used to create our regional ranking
system for the risks and rewards of involvement in a specific industry in a particular country.
For each category and sub-category, each state is scored out of 100 (100 being the best), with the overall
index a weighted average of the total score. Importantly, as most of the countries and territories evaluated
are considered by BMI to be 'emerging markets', our index is revised on a quarterly basis. This ensures that
the index draws on the latest information and data across our broad range of sources, and the expertise of
our analysts.
In constructing these indices, the following indicators have been used. Almost all indicators are objectively
based.
Vietnam Food & Drink Report Q1 2015
© Business Monitor International Page 137
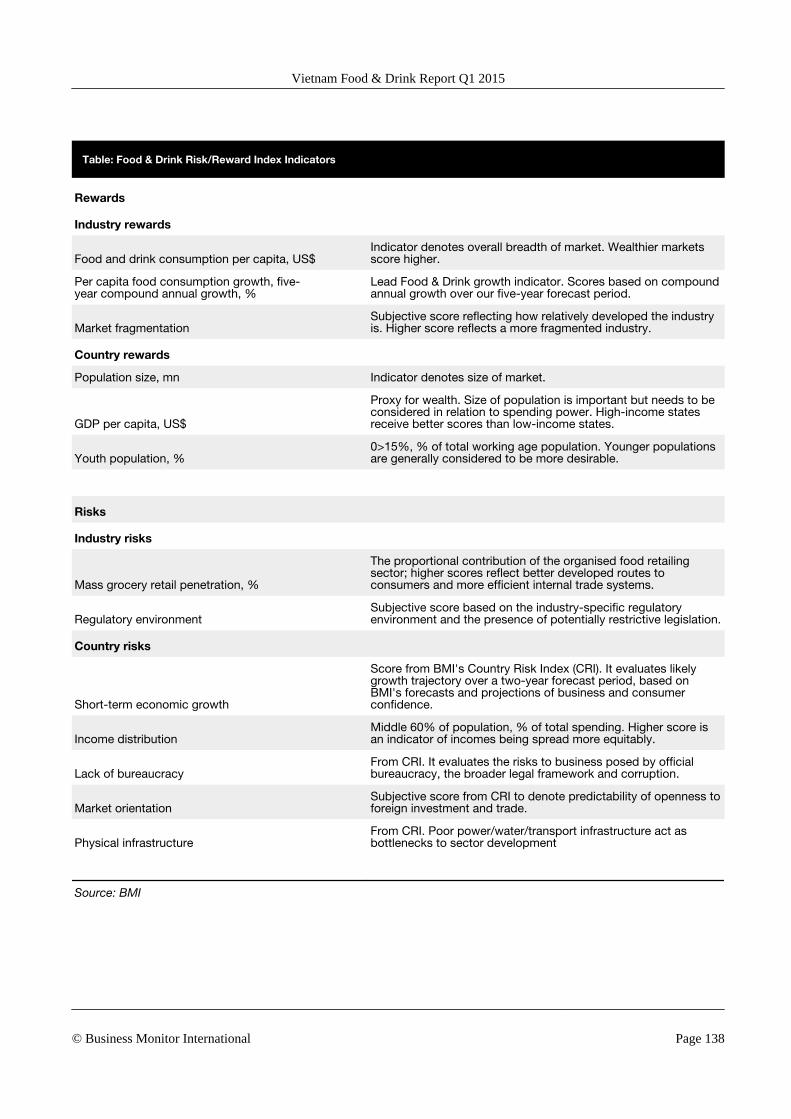
Table: Food & Drink Risk/Reward Index Indicators
Rewards
Industry rewards
Food and drink consumption per capita, US$Indicator denotes overall breadth of market. Wealthier marketsscore higher.
Per capita food consumption growth, five-year compound annual growth, %
Lead Food & Drink growth indicator. Scores based on compoundannual growth over our five-year forecast period.
Market fragmentationSubjective score reflecting how relatively developed the industryis. Higher score reflects a more fragmented industry.
Country rewards
Population size, mn Indicator denotes size of market.
GDP per capita, US$
Proxy for wealth. Size of population is important but needs to beconsidered in relation to spending power. High-income statesreceive better scores than low-income states.
Youth population, %0>15%, % of total working age population. Younger populationsare generally considered to be more desirable.
Risks
Industry risks
Mass grocery retail penetration, %
The proportional contribution of the organised food retailingsector; higher scores reflect better developed routes toconsumers and more efficient internal trade systems.
Regulatory environmentSubjective score based on the industry-specific regulatoryenvironment and the presence of potentially restrictive legislation.
Country risks
Short-term economic growth
Score from BMI's Country Risk Index (CRI). It evaluates likelygrowth trajectory over a two-year forecast period, based onBMI's forecasts and projections of business and consumerconfidence.
Income distributionMiddle 60% of population, % of total spending. Higher score isan indicator of incomes being spread more equitably.
Lack of bureaucracyFrom CRI. It evaluates the risks to business posed by officialbureaucracy, the broader legal framework and corruption.
Market orientationSubjective score from CRI to denote predictability of openness toforeign investment and trade.
Physical infrastructureFrom CRI. Poor power/water/transport infrastructure act asbottlenecks to sector development
Source: BMI
Vietnam Food & Drink Report Q1 2015
© Business Monitor International Page 138

Weighting: Given the number of indicators/datasets used, it would be inappropriate to give all sub-
components equal weight. Consequently, the following weights have been adopted:
Table: Weighting
Component Weighting
Rewards 60%
- Industry rewards 30%
- Country rewards 30%
Risks 40%
- Industry risks 20%
- Country risks 20%
Source: BMI
Vietnam Food & Drink Report Q1 2015
© Business Monitor International Page 139
Reproduced with permission of the copyright owner. Further reproduction prohibited withoutpermission.