Social inclusion in diverse work settings
167
Social inclusion in diverse work settings Wiebren S. Jansen
Transcript of Social inclusion in diverse work settings

Social inclusion in diverse work settings
Wiebren S. Jansen

This research was financially supported by Instituut Gak Cover design by: Bregje Jaspers – www.studio0404.nl Printing: Ridderprint BV ISBN (printed version): 978-90-367-7655-4 ISBN (electronic version): 978-90-367-7654-7 Copyright © 2015 Wiebren Jansen

Social inclusion in diverse work settings
Proefschrift
ter verkrijging van de graad van doctor aan de Rijksuniversiteit Groningen
op gezag van de rector magnificus prof. dr. E. Sterken
en volgens besluit van het College voor Promoties.
De openbare verdediging zal plaatsvinden op
maandag 20 april 2015 om 14.30 uur
door
Wiebren Siebren Jansen
geboren op 10 april 1981 te Oldehove

Promotores Prof. dr. S. Otten Prof. dr. K.I. Van Oudenhoven-Van der Zee Beoordelingscommissie
Prof. dr. C.K.W. De Dreu Prof. dr. R. Spears Prof. dr. M.J.A.M. Verkuyten

TABLE OF CONTENTS
Chapter 1 General introduction
7
Chapter 2 Inclusion: Conceptualization and measurement
21
Chapter 3 Colorblind or colorful? The relationship between organizational diversity approaches, inclusion, and work outcomes among majority and minority employees
55
Chapter 4 Being part of diversity. The effects of an all-inclusive multicultural diversity approach on majority members’ perceived inclusion and support for organizational diversity efforts
75
Chapter 5 I’m sick of being different. The relationship between gender dissimilarity, work group inclusion, and absenteeism
97
Chapter 6
General discussion
115
References 129 Dutch Summary (Samenvatting) 149 Acknowledgements (Dankwoord) 155 Curriculum Vitae 159 KLI Dissertation Series 163


Chapter 1
General introduction
This chapter is partly based on Otten, S., & Jansen, W.S. (2014). Predictors and consequences
of exclusion and inclusion at the culturally diverse workplace. In Otten, S., Van der Zee, K.I.,
& Brewer, M.B. (Eds.), Towards inclusive organizations: Determinants of successful diversity management
at work (pp. 67-86). New York: Psychology Press.


GENERAL INTRODUCTION
9
“Man is by nature a social animal; an individual who is unsocial naturally and not accidentally is either beneath our notice or more than human. Society is something that precedes the individual. Anyone who either cannot lead the common life or is so self-sufficient as not to need to, and therefore does not partake of society, is either a beast or a god.” Aristotle, Politics This famous quotation from Aristotle is at the heart of this dissertation. It reflects that groups are essential to humans. We depend on others for our food, housing, and safety. Hence, most of us are unable to survive without the help of others (Caporael & Baron, 1997). Yet, inclusion into groups does not only serve our material interests, but also has important psychological benefits (Correll & Park, 2005). Being part of a group enhances our self-esteem (Leary & Baumeister, 2000; Tajfel & Turner, 1986), reduces our uncertainties (Hogg & Abrams, 1993), and makes us feel distinct from others (Brewer, 1991).
Considering that inclusion into groups is so vital to our well-being, researchers have devoted substantial effort to investigate how inclusion is established, and, more specifically, in which type of groups we tend to seek inclusion in. In this regard, a well-established insight is that we generally prefer to be part of groups whose members are similar to ourselves (Kristof-Brown, Zimmerman, & Johnson, 2005). For example, consider our group(s) of friends. Our friends usually share our opinions and values. In addition, it is highly likely that they are similar to us in terms of demographic attributes, such as gender, age, and ethnicity. This is no coincidence. There are many good reasons for why we prefer to seek inclusion into homogeneous groups. Similarity eases interactions and facilitates communication. It provides a common ground from which we can build relationships with others (D. Byrne, 1971). In addition, similarity is attractive for intrapersonal reasons. Interacting with similar others helps us to establish a sense of who we are and reinforces our own attitudes, opinions, and worldviews (Hogg & Abrams, 1993).
However, we cannot always freely choose our fellow group members. One context in which this is particularly true is the work domain. We usually have little control over who we work with. Accordingly, despite our general preference for homogeneity, we often need to collaborate with people that have different opinions and values or are different from us in terms of demographic group memberships. In fact, this has become a particular pressing issue as organizations have increasingly diversified over the past decades (Bureau of Labor Statistics, 2012). Moreover,
CHAPTER 1
10
research indicates that feeling included in a diverse work setting1 is by no means straightforward. For instance, a highly consistent finding is that people who are different from their coworkers in terms of demographic attributes tend to experience less work satisfaction and feel less attached to their organization than those who are demographically similar to their peers (Guillaume, Brodbeck, & Riketta, 2012).
While securing inclusion into diverse work settings is certainly a challenge for individuals, it is just as much a concern for organizations. In fact, social-psychological theories suggest that diversity may have detrimental consequences for effective group functioning. According to self-categorization theory (Turner, Hogg, Oakes, Reicher, & Wetherell, 1987), people use observable differences, such as demographic attributes, to place themselves and similar others into in-groups and dissimilar others into out-groups. Social identity theory (Tajfel & Turner, 1986) further posits that in order to enhance and maintain a positive social identity, people like and trust in-group members more than out-group members. As a result, workforce diversity may create us-them distinctions which undermines the unity of the organization (Van Knippenberg, De Dreu, & Homan, 2004).
Yet, diversity is not just bad news. It potentially has important benefits to both individuals and organizations. Being included in diverse work groups and organizations may enlarge one’s social network, which in turn increases one’s access to material resources and information (Granovetter, 1973). In addition, diversity in our immediate work environment may lead to the development of a more complex social identity, which expands our worldview (Roccas & Brewer, 2002) and enhances our well-being (Van Dick & Haslam, 2012). Likewise, for organizations, diversity may be a source of strength, rather than a necessary evil. Having a diverse workforce can improve internal work processes, may enlarge the organization’s external network, and can improve the moral image of the organization (Ely & Thomas, 2001; Jackson & Joshi, 2011; Joshi & Roh, 2009).
Developing an understanding of how inclusion in diverse work settings can be fostered is therefore essential. This is the central aim of this dissertation. In the remainder of this introduction we2 will first define the concepts of inclusion and diversity. Next, we turn to which strategies organizations may use to create work environments in which employees from diverse backgrounds feel included. Finally, we present an overview of the empirical chapters of this dissertation.
1 The term work setting is deliberately used to indicate that this dissertation is not only directed at work groups that are embedded within a larger organization, but also focuses on the organization as a whole. 2 Throughout this dissertation “we” is used instead of “I” to reflect that the research described is a product of my collaboration with my advisors – Sabine Otten and Karen Van der Zee – and others.

GENERAL INTRODUCTION
11
Defining Inclusion
The concept of inclusion has received considerable attention in the organizational diversity literature (e.g., Lirio, Lee, Williams, Haugen, & Kossek, 2008; Miller, 1998; Pelled, Ledford, & Mohrman, 1999; Pless & Maak, 2004; Roberson, 2006; Shore et al., 2011), but also in related disciplines such as social work (Mor-Barak, 2000), social psychology (Brewer, 1991; Ellemers & Jetten, 2013), educational research (Koster, Nakken, Pijl, & Van Houten, 2009), and sports psychology (Allen, 2006). Research across these disciplines has yielded a vast amount of definitions and conceptualizations of inclusion. In this dissertation (chapter 2), we attempt to integrate these existing notions about inclusion by formulating our own definition. We define inclusion as the degree to which an individual perceives that the group provides him or her with a sense of belonging and authenticity (Jansen et al., 2014).
As becomes apparent from our definition, we consider inclusion to be a two-dimensional concept, consisting of perceptions of belonging and authenticity. That is, an individual experiences inclusion to the extent that he or she perceives to be an accepted group member that is allowed to be him- or herself within the group. Herewith, inclusion is thought to satisfy two fundamental human needs: the need for belonging and the need for authenticity. The need for belonging, on the one hand, is the motivation to form and maintain strong and stable relationships with other people. Satisfying this need requires having frequent and affectively pleasant interactions in a temporally stable group (Baumeister & Leary, 1995). Research suggest that when the need for belonging is thwarted, individuals may experience cognitive, emotional, behavioral, and health problems (Baumeister, DeWall, Ciarocco, & Twenge, 2005; DeWall, Deckman, Pond, & Bonser, 2011). The need for authenticity, on the other hand, is the desire to feel and act in accordance with one’s true self. Satisfying this need requires that group members perceive to be allowed and encouraged to be themselves in a group. That is, they should perceive that their idiosyncratic personality, opinions, and skills are recognized and appreciated by the group. Similar to the need for belonging (Baumeister & Leary, 1995), satisfying one’s need for authenticity has been shown to be positively associated with individual well-being (Deci & Ryan, 2000; Ito & Kodama, 2005; Sheldon, Ryan, Rawsthorne, & Ilardi, 1997; Wood, Linley, Maltby, Baliousis, & Joseph, 2008) and organizational performance (Sheldon et al., 1997).
Another important feature of our inclusion definition is that it explicates that individual perceptions of inclusion are based on signals sent out from the group. Inclusion is thereby qualitatively different from another important psychological

CHAPTER 1
12
concept: social identification (Edwards & Peccei, 2007; Leach et al., 2008; Mael & Ashforth, 1992). Social identification reflects the extent to which an individual connects to and values the group, and is assumed to be largely under one’s own control (Edwards & Peccei, 2007; Ellemers, Kortekaas, & Ouwerkerk, 1999; Leach et al., 2008; Mael & Ashforth, 1992; Postmes, Haslam, & Jans, 2013). In contrast, in the process of inclusion it is the group that primarily determines whether an individual is included or not. This conceptualization of inclusion is in line with sociometer theory (Leary & Baumeister, 2000), which poses that people constantly monitor their social environment for cues or signals that pertain to one’s inclusionary status, and fits with experimental manipulations of inclusion (and exclusion) in which it is the group that includes (or excludes) the individual (e.g., Baumeister et al., 2005; DeWall et al., 2011). Figure 1.1 portrays these different foci of identification and inclusion schematically.
Figure 1.1 The Individual-Group Relationship in Social Identification and Inclusion
Defining inclusion as a two-dimensional construct, consisting of perceptions
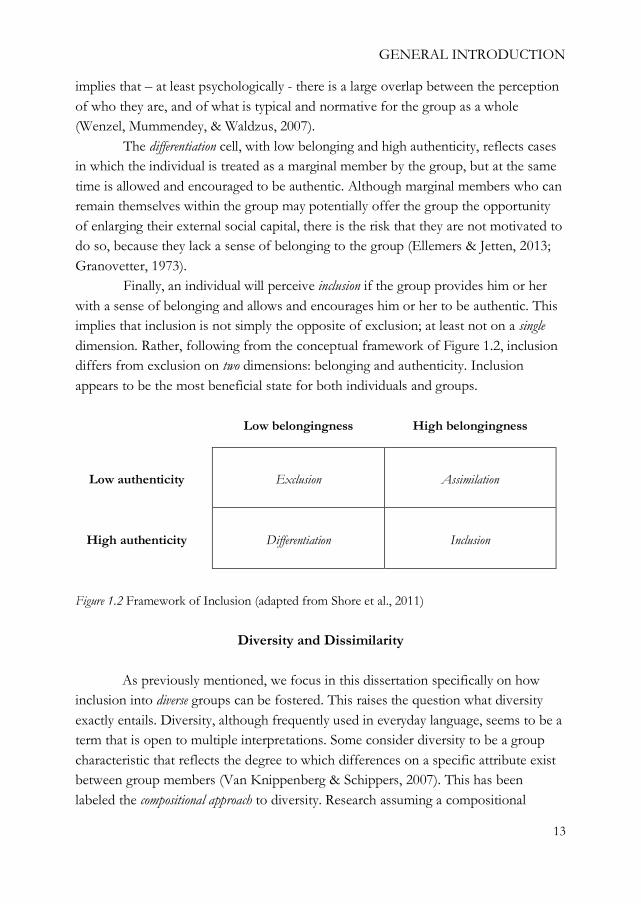
of belonging and authenticity, implies that individual group members potentially can find themselves in one of four different situations. Figure 1.2 graphically depicts this framework.
An individual perceives exclusion to the extent that he or she is treated as an outsider and also receives signals from the group that he or she is not allowed to be him- or herself. An individual facing exclusion is neither able to satisfy the need for belongingness nor the need for authenticity. This is likely to reduce work satisfaction and well-being, but most probably also the productivity of group members.
The assimilation cell reflects situations in which an individual perceives to be an accepted group member, but at the same time experiences difficulty with fully disclosing his or her true self. In diverse groups, this usually implies that minority members should conform to the norms of the majority group. Majority members, conversely, are less likely to experience assimilation pressure. Their majority status
Group I
I Group
Social identification
Inclusion
GENERAL INTRODUCTION
13
implies that – at least psychologically - there is a large overlap between the perception of who they are, and of what is typical and normative for the group as a whole (Wenzel, Mummendey, & Waldzus, 2007).
The differentiation cell, with low belonging and high authenticity, reflects cases in which the individual is treated as a marginal member by the group, but at the same time is allowed and encouraged to be authentic. Although marginal members who can remain themselves within the group may potentially offer the group the opportunity of enlarging their external social capital, there is the risk that they are not motivated to do so, because they lack a sense of belonging to the group (Ellemers & Jetten, 2013; Granovetter, 1973).
Finally, an individual will perceive inclusion if the group provides him or her with a sense of belonging and allows and encourages him or her to be authentic. This implies that inclusion is not simply the opposite of exclusion; at least not on a single dimension. Rather, following from the conceptual framework of Figure 1.2, inclusion differs from exclusion on two dimensions: belonging and authenticity. Inclusion appears to be the most beneficial state for both individuals and groups.
Low belongingness High belongingness
Low authenticity
Exclusion
Assimilation
High authenticity
Differentiation
Inclusion
Figure 1.2 Framework of Inclusion (adapted from Shore et al., 2011)
Diversity and Dissimilarity
As previously mentioned, we focus in this dissertation specifically on how inclusion into diverse groups can be fostered. This raises the question what diversity exactly entails. Diversity, although frequently used in everyday language, seems to be a term that is open to multiple interpretations. Some consider diversity to be a group characteristic that reflects the degree to which differences on a specific attribute exist between group members (Van Knippenberg & Schippers, 2007). This has been labeled the compositional approach to diversity. Research assuming a compositional

CHAPTER 1
14
approach focuses on how the distribution of differences among group members affects groups (Harrison & Klein, 2007). It attempts to answer questions such as: are mixed gender work groups more creative than same gender work groups? Hence, the implicit assumption in this approach is that diversity affects all individual group members in the same way.
In contrast, others consider diversity to be an individual characteristic indicating the extent to which an individual group member is different from other group members in terms of a specific attribute (Tsui, Egan, & O'Reilly, 1992). This has been labeled the relational approach to diversity. Research conducted in this tradition focuses on how being dissimilar from others affects individual group members. It attempts to answer questions such as: does a male employee feel more included in his work group when a larger share of his colleagues is also male? Thus, this approach assumes that diversity affects individuals differently depending on the extent to which they are dissimilar.
The difference between the compositional and the relational approach is perhaps most clearly illustrated with an example. Figure 1.3 depicts two four-person work groups.
Figure 1.3 Illustration of the Difference between the Compositional and the Relational
Approach towards Diversity
In group 1, one of the group members is female, while the other three are
male. In group 2, one member is male, while the other three are female. In the compositional approach, where diversity is seen as a group-level characteristic, the two groups are considered to be equally diverse. In contrast, in the relational approach, where diversity is considered to be an individual measure of dissimilarity, the two groups are clearly different from each other. Take the woman in the dashed oval. She is both a member of group 1 and group 2. While both groups may be equally diverse
GROUP 1 GROUP 2

GENERAL INTRODUCTION
15
at the group level, she belongs to the minority in group 1 and to the majority in group 2. Thus, from her perspective both groups are clearly different from each other. Correspondingly, this example illustrates that while the compositional approach is most suited to study how diversity affects the group as a whole, the relational approach is best equipped to study how diversity influences individual group members.
Besides these two different approaches to diversity, another important feature of diversity is that it in principle may concern any possible dimension of differentiation. Various typologies have been proposed to structure these diversity dimensions. An often made distinction is that between surface- and deep-level diversity (Harrison, Price, & Bell, 1998; Jackson & Joshi, 2011). Surface-level diversity refers to differences among group members on attributes that are easily discerned and quickly detected, such as gender, age, and ethnicity. In contrast, deep-level diversity refers to differences among group members on attributes that are less visible and that only become apparent through interaction, such as personality, attitudes, and skills.3
In this dissertation, we take a relational approach to diversity, because we are particularly interested in how diversity affects individual group members. In addition, we specifically focus on surface-level diversity. We choose to do so because differences that are easily observable, such as one’s gender and ethnicity, are in many situations the attributes that are most likely to be used by people as criteria for inclusion (E. R. Smith & Mackie, 2007). Together, this implies that we investigate how individual perceptions of inclusion into demographically diverse work settings can be fostered, and consider whether the same processes apply to majority and minority members. We hereby specifically focus on the role of organizational diversity approaches.
Diversity Approaches
Organizational diversity approaches entail the organization’s normative beliefs and expectations about the reason to diversify, the value of diversity, and the connection to work processes (Stevens et al., 2008). Thus, diversity approaches reflect the organizational stance towards how differences within the organization should be dealt with.
The two most commonly described diversity approaches in the literature are colorblindness and multiculturalism (Stevens et al., 2008). The colorblind approach is
3 Note that this distinction does not imply that surface- and deep-level diversity are unrelated. For example, men and women could very well also differ from each other in their underlying attributes (e.g., their personality and educational background).

CHAPTER 1
16
characterized by the notion that subgroup differences are superficial and mostly irrelevant. Colorblindness involves the belief that subgroup identities (e.g., one’s cultural identity) do not matter and should be ignored. According to this approach, the focus should instead be on individual merits and qualifications. For these reasons, colorblindness is held to be strongly resonated in American and Western European ideals of individualism, meritocracy and equality (Markus & Steele, 2000; Plaut, 2002; K. M. Thomas, Mack, & Montagliani, 2004). In an organizational setting, a colorblind approach to diversity implies that the organization stresses that people should be treated equally as individuals and that subgroup differences should be ignored when making decisions, such as hiring new employees and promoting sitting organizational members (Stevens et al., 2008).
In contrast, the multicultural approach asserts that differences between subgroups are substantial and should be celebrated because they are valuable to the larger group. This approach holds that people have socialized in the context of their subgroup. As a result, they have legitimately different perspectives, which can be used for the benefit of the larger group or organization (Cox, 1991; Stevens et al., 2008). In an organizational setting, a multicultural approach to diversity implies that the organization emphasizes that subgroup differences should be acknowledged and appreciated because these differences are thought to enhance work outcomes, such as creativity and innovation.
Interestingly, the extent to which colorblindness and multiculturalism is supported differs between majority and minority employees. In general, majority group members show higher levels of endorsement of colorblindness, whereas minority members tend to support multiculturalism to a greater extent (Plaut, Garnett, Buffardi, & Sanchez-Burks, 2011; Ryan, Hunt, Weible, Peterson, & Casas, 2007; Verkuyten, 2005; Wolsko, Park, & Judd, 2006).
A prominent explanation for why colorblindness is more positively received by majority members than by minority members, departs from the notion that majority members are –by definition- more prototypical of the organization than minority members (Chattopadhyay, George, & Lawrence, 2004; Rosette, Leonardelli, & Phillips, 2008). As a result, although subgroup differences officially should not matter, in the colorblind approach the norms and values of the majority group may become dominant throughout the entire organization and may be used as criteria for inclusion. While this is certainly comfortable for majority members, this may result in perceptions of exclusion by those who are in the minority (Chrobot-Mason & Thomas, 2002; Markus & Steele, 2000; Stevens et al., 2008). Thus, while ignoring subgroup differences and stressing individualism, the colorblind approach is likely to

GENERAL INTRODUCTION
17
fail to acknowledge the unequal effects this may have for majority and minority group members.
Conversely, a multicultural approach to diversity is generally more supported by minority members than by majority members. One possible reason for this difference is that majority members perceive multiculturalism to be “only for minorities” (Plaut et al., 2011, p. 338).Valuing diversity, as is typical for the multicultural approach, implies that being different, rather than prototypical, is the requirement for group inclusion. As majority members generally do not consider themselves to be “diverse,” they may refrain from endorsing multicultural views or even feel excluded within organizations that emphasize the value of diversity (Linnehan & Konrad, 1999; K. M. Thomas & Plaut, 2008; Verkuyten, 2005; Wolsko et al., 2000). Thus, while stressing an all-encompassing diversity approach in which differences are valued and seen as a source of learning, the multicultural approach may –unintendedly- be perceived as exclusionary by majority members.
This poses organizations with an important challenge. How to ensure that both majority and minority members feel included in the organization? In response to this, scholars have argued that organizations should move beyond the colorblindness/multiculturalism dichotomy, and develop a new diversity approach that is inclusive of both majority and minority members. Perhaps the most prominent example of such an inclusive approach is the all-inclusive multicultural (AIM) approach as developed by Stevens and colleagues (2008). The main premise of the AIM approach is that majority members’ resistance to a multicultural approach is reduced when their cultural group is included in an organizational conception of diversity (e.g., in mission statements or diversity task forces). Similar to the multicultural approach, the AIM approach acknowledges the importance of an individuals’ demographic group membership, which is essential for gaining minority support. Unlike the multicultural approach, however, the AIM approach explicitly emphasizes that this holds for members of all groups, including majority members. Accordingly, the AIM approach is thought to address the deficiencies in the standard multicultural approach without reverting to colorblindness (Stevens et al., 2008).
In this dissertation we investigate how each of these diversity approaches affects individual group members. Consistent with the relational approach to diversity, we hereby distinguish between employees belonging to the demographic majority and those belonging to the demographic minority.

CHAPTER 1
18
Dissertation Overview
The empirical part of this dissertation consists of four chapters (chapters 2-5).4 In chapter 2, we introduce a conceptual framework of inclusion and subsequently use this as a starting point to develop and validate a scale to measure perceptions of inclusion. Departing from existing work on inclusion and complementing this with theoretical insights from optimal distinctiveness theory (Brewer, 1991) and self-determination theory (Deci & Ryan, 2000), we derive two components of perceived inclusion: belonging and authenticity. In addition, we pose that in the process of inclusion, it is the group rather than the individual that has primary agency. From this conceptualization, we develop and validate a scale to measure perceptions of inclusion. We use data from two samples to determine whether our proposed configuration of inclusion is empirically supported and to assess the psychometric properties of our newly developed scale.
In chapter 3 we examine how and under which conditions perceived diversity approaches relate to employees’ work satisfaction and perceived innovation. Corresponding with our reasoning in the previous section, we anticipate that perceptions of a colorblind diversity approach will be most strongly related to these (positive) outcomes for cultural majority employees, whereas perceptions of a multicultural diversity approach will be most beneficial to cultural minority employees. In addition, we predict that perceptions of inclusion within the organization will mediate these effects.
While chapter 3 clarifies how organizational diversity approaches are associated with employees’ perceptions of inclusions and work outcomes, the cross-sectional nature of our data prohibits us from drawing any reliable conclusions about the causality of these relationships. In addition, chapter 3 does not yet assess whether majority members indeed consider the AIM approach to be an improvement to the “standard” multicultural approach in which the majority group is not explicitly made part of organizational diversity. In chapter 4 we address these issues. We present two field experiments in which we test whether the explicit mentioning of the cultural majority group in an organization’s diversity philosophy indeed results in higher levels of perceived inclusion among majority group members. Participants of Experiment 1 are prospective employees (i.e., job-seekers) belonging to the cultural majority. Here, we specifically test whether the AIM approach, compared with the standard
4 It should be noted that the empirical chapters of this dissertation were deliberately written such that they could be read independently from each other. As a result, they may partially overlap with this introduction and with each other.

GENERAL INTRODUCTION
19
multicultural approach, results in higher levels of anticipated inclusion. Participants of Experiment 2 are sitting organizational members. This enables us to assess whether the beneficial effects of the AIM approach extend to those who are already part of an organization. In addition, Experiment 2 allows us to test whether an AIM approach to diversity enhances majority members’ support for organizational diversity efforts.
While chapters 3 and 4 consider how perceptions of inclusion into culturally diverse work settings can be fostered, in chapter 5 we attempt to answer the same question for gender diverse work groups. In addition, whereas in chapter 3 and 4 we make a dichotomous, and arguably rather unsophisticated, distinction between majority and minority members, in chapter 5 we operationalize dissimilarity in a more refined manner. By combining responses to a survey administered among employees from a university of applied sciences with data from the organization’s personnel administration, we calculate for each respondent how much he or she is different from his or her direct colleagues in terms of gender. To illustrate, consider a female worker that either has three or four male colleagues. While in both cases she is in the minority, she is more dissimilar when she has four rather than three male coworkers. Thus, by operationalizing dissimilarity as a continuous rather than a dichotomous variable, we are able to test our hypotheses in a more refined manner in chapter 5. Specifically, we investigate how and under which conditions gender dissimilarity relates to perceptions of inclusion. In addition, we assess how perceived inclusion, in turn, is associated with the number of days that people are absent from work.
Finally, in chapter 6 we provide a short summary of our research findings and reflect on the theoretical and practical implications of this dissertation. Furthermore, we identify the main strengths and weaknesses of our investigations and provide suggestions for how future research may build upon our findings.


Chapter 2
Inclusion: Conceptualization and measurement
This chapter is based on Jansen, W. S., Otten, S., Van der Zee, K. I. and Jans, L. (2014),
Inclusion: Conceptualization and measurement. European Journal of Social Psychology, 44(4), 370-
385. doi:10.1002/ejsp.2011

CHAPTER 2
22
Abstract
In the present research we introduced a conceptual framework of inclusion and subsequently used this as a starting point to develop and validate a scale to measure perceptions of inclusion. Departing from existing work on inclusion and complementing this with theoretical insights from optimal distinctiveness theory and self-determination theory, we proposed that inclusion is a hierarchical two-dimensional concept consisting of perceptions of belonging and authenticity. In addition, we posed that in the process of inclusion it is the group rather than the individual that has primary agency. Based on this conceptualization, we developed and validated the 16-item perceived group inclusion scale (PGIS). Data from two samples supported our proposed two-dimensional conceptualization of inclusion. In addition, the PGIS appeared to be a reliable measure of inclusion and was demonstrated to possess both nomological and predictive validity. Taken together, this research contributes to the conceptual refinement of the inclusion construct and offers researchers a reliable and valid tool to conduct future inclusion research.

INCLUSION: CONCEPTUALIZATION AND MEASUREMENT
23
Being included in groups is essential to humans (Correll & Park, 2005). Groups serve our material interests (Caporael & Baron, 1997), enhance our self-esteem (Leary & Baumeister, 2000; Tajfel & Turner, 1986), validate our beliefs (Hogg & Abrams, 1993), provide us with the notion of symbolic immortality (Greenberg et al., 1990), and offer us distinctiveness and acceptance (Brewer, 1991). Experiencing inclusion, however, is not a given, but partly depends on the match between ourselves and other group members. In general, inclusion is more easily secured when other group members are more similar to us (Kristof-Brown et al., 2005). However, in contemporary societies, homogeneous groups have become the exception rather than the rule (Hooghe, Trappers, Meuleman, & Reeskens, 2008).
Understanding how and under which conditions people in diverse groups feel included has therefore received increased interest from diversity scholars (e.g., Lirio et al., 2008; Roberson, 2006). Yet, despite this attention, there is still considerable ambiguity and lack of consensus regarding (a) the appropriate theoretical conceptualization of inclusion (Shore et al., 2011), and, as a related matter, (b) the proper measurement of the concept. The present research addresses both these issues by introducing a conceptual framework of inclusion and subsequently using this to develop and validate a scale measuring perceived group inclusion.5
What is Inclusion?
The concept of inclusion has recently received substantial attention in the diversity literature (e.g., Lirio et al., 2008; Miller, 1998; Pless & Maak, 2004; Roberson, 2006), but also in related fields such as social work (Mor-Barak, 2000), social psychology (Ellemers & Jetten, 2013), and educational research (Koster et al., 2009). Research across these disciplines has yielded a vast amount of definitions and conceptualizations of inclusion. In an attempt to identify the common elements of these definitions, Shore and collaborators recently defined inclusion as “the degree to which individuals experience treatment from the group that satisfies their need for belongingness and uniqueness” (Shore et al., 2011, p. 1265).
Three important things become apparent from this definition. First, inclusion is seen as the satisfaction of individual needs within a group. Second, inclusion consists of two components: belongingness and uniqueness. Third, it is the group that includes the individual, rather than the individual who connects to the group. We
5 Note that when we use the term inclusion in the present research, we refer to the individual psychological experience of inclusion, rather than to an objective assessment of whether the individual is included.

CHAPTER 2
24
elaborate on these three points in the subsequent sections. Based on this analysis, we refine the definition of Shore and collaborators and use this as the conceptual basis for the development of our scale.
Components of Inclusion
Following from the definition by Shore and collaborators (2011), inclusion is established when individuals have a sense of belonging to the group and, at the same time, perceive themselves to be a distinct and unique individual. In exploring the theoretical underpinnings of the inclusion concept we will therefore turn to two theories that specifically address the interplay between group belongingness and individuality: optimal distinctiveness theory (ODT) and self-determination theory (SDT).
According to ODT (Brewer, 1991; Brewer & Roccas, 2001), people have the opposing fundamental needs for belongingness and uniqueness. The need to belong is the motivation to form and maintain strong and stable relationships with other people. To satisfy this need, people need to have frequent and affectively pleasant interactions in a temporally stable group (Baumeister & Leary, 1995). Belonging is thought to consist of two components: group membership and group affection. Whereas group membership reflects the perceived strength of the bond between an individual and the group, group affection indicates the perceived positive valence of that bond (cf. Allport, 1954).
In contrast, the need for uniqueness is the motivation to have a distinctive self-concept. Satisfying this need requires that people perceptually distance themselves from meaningful others by downplaying one’s commonalities with others or by defining oneself in terms of one’s idiosyncratic traits and opinions (Snyder & Fromkin, 1977; Turner et al., 1987).
Importantly, ODT posits that these two needs are opposing if they are strived for at the same level (e.g., the intragroup level; Brewer & Roccas, 2001). That is, ODT predicts that, as people feel more related to others, they also tend to feel less distinct and separate (cf. Sheldon & Bettencourt, 2002). Contrary to this prediction, and arguably more in line with the definition put forward by Shore and colleagues (2011) who conceptualized inclusion as the simultaneous satisfaction of belongingness and uniqueness needs, scholars have reasoned and empirically shown that an increased sense of belonging to a group is not necessarily accompanied by a diminished sense of individual uniqueness (Bettencourt et al., 2006; Hornsey & Jetten, 2004). For example, it has been proposed that individuals can simultaneously satisfy belongingness and

INCLUSION: CONCEPTUALIZATION AND MEASUREMENT
25
uniqueness needs by assuming a specific role within the group (Bettencourt et al., 2006), or by joining a group that encourages group members to express their individuality (Hornsey & Jetten, 2004). Yet another way to reconcile individuality with belongingness is reflected in the concept of inductive social identity formation, as introduced by Postmes, Spears, Lee and Novak (2005). They argued that groups can form both top-down, such that individual group members adapt to an already existing group prototype, or bottom-up, such that the group prototype is defined over time, and is shaped by the contributions of all individual members. In this latter, inductive, process, retaining individuality is thus not merely reconcilable with belonging to the group, but seen as the defining aspect of the group’s identity (Jans, Postmes, & Van der Zee, 2012). Taken together, these lines of research suggest that it is feasible for individuals to belong to a group, while, at the same time, perceive to be able to retain their individual features.
Corresponding with these insights, and in line with the notion that in the process of inclusion it is the group that includes the individual rather than the individual who connects to the group (a point on which we will elaborate below), Shore et al. (2011) stated that people are included in a group if they receive a sense of belonging from the group and, at the same time, are valued for their particular unique characteristics. We agree with these authors that both securing a sense of belonging and valuing uniqueness are important elements of inclusion. Yet, at the same time, we propose that the “valuing uniqueness” component of inclusion requires to be conceptually refined.
In particular, we believe that valuing group members only for their non-overlapping (unique) part of their identity is not sufficient to result in perceptions of inclusion. Also, valuing people for their unique traits, insights, or perspectives most probably has different effects on group members depending on their majority or minority status within the group. That is, the more prototypical group members are, the less they benefit from others’ appreciation of uniqueness. Indeed, research has shown that (cultural) majority group members are likely to experience exclusion in groups that emphasize the benefits of uniqueness (Plaut et al., 2011). As a consequence, a conceptualization that makes perceived appreciation of uniqueness a defining characteristic of inclusion may endanger the safe inclusion of prototypical group members. This is neither in line with the face validity of the concept, nor is it desirable for developing a scale to measure inclusion that will be applied in groups that consist of members who differ in their prototypicality. Thus, in our conceptualization, we need to consider an alternative component for valuing

CHAPTER 2
26
uniqueness that does address the need to be unique, but applies to all group members, irrespective of their prototypicality.
In doing so, we complement the conceptualization of Shore et al. (2011), which is inspired by ODT, with insights from self-determination theory (SDT; Deci & Ryan, 1991, 2000). Similar to ODT, SDT posits that humans have fundamental needs that can be satisfied within a group context. Also, the needs distinguished in SDT closely resemble the needs identified in ODT. Specifically, SDT identified these needs to be “relatedness” and “autonomy.”6 The need for relatedness involves the desire to feel connected to others (Deci & Ryan, 2000), which can be seen as equivalent to the need for belongingness as it is defined in ODT. The need for autonomy involves the desire to experience choice, and the wish to behave in accordance with one’s integrated sense of self (Deci & Ryan, 2000). Autonomy can thus both be task-related (“what am I allowed to do?”) and identity-related (“who am I allowed to be?”). This latter form of autonomy, which has also been labeled authenticity (Bettencourt et al., 2006), resembles to some extent the need for uniqueness as it is defined in ODT. Similar to valuing uniqueness, valuing authenticity implies that group members are allowed to be different from each other. Unlike valuing uniqueness, however, valuing authenticity also implies that group members are just as well allowed to be similar to each other. In this sense, valuing authenticity is a broader concept than valuing uniqueness, and may appeal to both atypical (e.g., minority) and prototypical (e.g., majority) group members. In addition to this, SDT posits that the need for relatedness and the need for autonomy can simultaneously be satisfied at the intragroup level. Thus, in contrast with ODT, but in line with the research we described above (e.g., Bettencourt et al., 2006; Postmes et al., 2005), SDT asserts that individuals are able to both retain their individuality and experience a sense of belonging within the group.
Based on this analysis, we propose that perceived authenticity, rather than perceived uniqueness, should be seen as a key component of inclusion. We define perceived authenticity as the extent to which a group member perceives that he or she is allowed and encouraged by the group to remain true to oneself (cf. Kernis & Goldman, 2006). Thus, in our view, authenticity consists of two subcomponents: room for authenticity and value in authenticity. Whereas room for authenticity captures the extent to which the group allows that individual group members feel and act in accordance with their true self, the value in authenticity component captures the degree to which the group actively encourages group members to be themselves within the group. This
6 The third basic need postulated by SDT (experience of competence) is not addressed here, as it is not directly related to the issue of retaining individuality within a group. It therefore falls outside the scope of our inclusion conceptualization (for a similar line of reasoning, see Bettencourt et al., 2006).

INCLUSION: CONCEPTUALIZATION AND MEASUREMENT
27
particular distinction can also be recognized in work on the defining features of inclusive organizations. For example, Cox (1991) makes a distinction between organizations that merely tolerate the presence of diversity and those that lend active support for diversity. Importantly, similar to perceptions of belongingness (Leary & Baumeister, 2000; Twenge, Baumeister, DeWall, Ciarocco, & Bartels, 2007), feelings of authenticity have also been shown to be positively associated with individual well-being (Deci & Ryan, 2000) and group performance (Sheldon et al., 1997).
In sum, we conceptualize inclusion as a two-dimensional concept, which is defined by perceptions of belonging and authenticity. In addition, we propose that these two dimensions each consist of two subcomponents. On the one hand, belonging can be further divided into group membership and group affection. On the other hand, authenticity is partitioned into room for authenticity and value in authenticity. Importantly, we consider belonging and authenticity to be interrelated, yet distinct concepts. At least theoretically, situations exist in which group members do receive a strong sense of belonging from the group, but at the same time do not experience they are allowed to be themselves (i.e., assimilation). In contrast, group members may also perceive that the group considers them to be peripheral group members, but simultaneously do perceive that they are allowed and encouraged to be themselves (i.e., differentiation, a similar point has been made by Shore et al., 2011). The same logic applies to our four subcomponents. That is, whereas in some groups it may be useful to distinguish between the different subcomponents of belonging and authenticity, in other group contexts they may be more closely aligned with each other. In short, we propose that, although theoretically inclusion may be further divided into multiple subcomponents, the question whether this is empirically substantiated is likely to be context dependent.
Inclusion versus Identification
Importantly, the above conceptualization not only identifies the key components of inclusion, but also underlines that inclusion is different from the related concept of social identification (Leach et al., 2008). This distinction is important because it helps to further clarify who the target and who the source is in the process of inclusion.
Consistent with social identity theory (Tajfel & Turner, 1986) and self-categorization theory (Turner et al., 1987), social identification has recently been defined as “the positive emotional valuation of the relationship between self and in-group” (Postmes et al., 2013, p.3) and as “the abstract psychological connection that

CHAPTER 2
28
an individual has to their in-group as a whole” (Leach et al., 2008, p.146). Correspondingly, social identification is usually measured with items measuring how the individual appreciates and connects to the group. Importantly, these items reveal that in the concept of social identification, the link between self and group is such that the group is the target while the self is the actor who defines how close the link to the group is (e.g., “I identify with this group”; “I feel a bond with this group” (Ellemers & Jetten, 2013; Leach et al., 2008; Postmes et al., 2013).
Inclusion, on the other hand, can be seen as a function of the group’s willingness to include the individual (Ellemers & Jetten, 2013). That is, perceived inclusion is determined by the signals that the individual receives from the group concerning his or her position within the group. Accordingly, inclusion should be measured with items in which the group is defined as the source and the individual as the target of inclusion (e.g., “This group gives me the feeling that I belong”: “This group allows me to be authentic”). This particular conceptualization of inclusion is in line with sociometer theory (Leary & Baumeister, 2000), which poses that people constantly monitor their social environment for cues or signals that pertain to one’s inclusionary status. Moreover, it fits with experimental manipulations of inclusion (and exclusion) in which it is the group that includes (or excludes) the individual (e.g., DeWall et al., 2011).7 Figure 2.1 portrays these different foci of identification and inclusion schematically.
Figure 2.1 The Individual-Group Relationship in Social Identification and Inclusion
7 In the present research, “the group” refers to other group members. Yet, we maintain that other aspects of the group, such as specific group policies or promotion/reward systems, may also generate perceptions of inclusion. For example, affirmative action programs aimed at increasing female representation may be perceived as exclusionary by male employees (cf. Harrison, Kravitz, Mayer, Leslie, & Lev-Arey, 2006). We consider these elements to be part of what we have labeled “the group.”
Group I
I Group
Social identification
Inclusion

INCLUSION: CONCEPTUALIZATION AND MEASUREMENT
29
Although inclusion and social identification can be assumed to often covary, at times they may also be distinct and should therefore be considered different constructs. To illustrate, even marginal group members can perceive the group as central to the self. Similarly, it is possible that people perceive to be included in a group, but do not identify with this group (Ellemers & Jetten, 2013). Another notable difference between inclusion and social identification refers to the types of groups that are involved. While in theory one can identify with groups that consist of people who one has never met, perceiving to be included in a group requires the experience of actual interactions with other group members (Ellemers & Jetten, 2013). We will assess the empirical interplay between these two concepts in the development of our scale (see below).
Synopsis
To summarize, based on existing inclusion conceptualizations, and on theoretical insights from ODT and SDT, we identified two components of inclusion: belonging and authenticity. By contrasting inclusion with the related concept of identification, we further posited that an individual’s perception of the extent to which he or she is included is primarily based on cues and signals that are sent out by the group. Combining these insights, we thus define inclusion as the degree to which an individual perceives that the group provides him or her with a sense of belonging and authenticity. We use this definition as the conceptual basis for the development of our scale.
Overview Development and Validation
To develop and validate the perceived group inclusion scale (PGIS) we
followed a stepwise procedure as recommended by Hinkin (1998). Accordingly, we first generated an initial item pool. Second, we administered the items to a sample of students and conducted an exploratory factor analysis. Third, we performed confirmatory factor analyses to compare our proposed hierarchical two-dimensional model with alternative factor configurations. In addition, we cross-validated the factorial structure of the PGIS in a sample of employees and established its convergent and discriminant validity. Fourth, we assessed the scale’s nomological validity. Here, we correlated our inclusion components with constructs to which they theoretically should be related, and then examined whether these relationships confirmed our theoretically derived predictions. Fifth, we assessed whether the PGIS

CHAPTER 2
30
possessed predictive validity, by regressing a number of group- and individual-level outcome measures on our inclusion components.
Step 1: Item Generation
We generated our initial item set using both an inductive and deductive approach (Hinkin, 1998; MacKenzie, Podsakoff, & Podsakoff, 2011).8 Initially, we formulated items based on our conceptualization of inclusion as a two-dimensional construct involving perceptions of belonging (group membership and group affection) and perceptions of authenticity (room for authenticity and value in authenticity). To be consistent with our conceptualization of inclusion, the formulation of these items was subject to three criteria. First, items should pertain to the relationship between the group and the individual, rather than refer to the individual or the group in isolation. Second, the primary actor in the phrasing of the items should be the group rather than the individual. That is, items should capture an individual’s perception of how the group sees and treats him or her, rather than how the individual relates him- or herself to the group. Third, the items should refer to the group as a whole, rather than to individuals with specific roles (such as coworkers and supervisors) to ensure that the instrument can be used throughout various contexts, which may or may not consist of these specific group members.
In a second step, using a deductive approach, we complemented our item pool with items derived and modified from existing scales that measure conceptually similar concepts. Most items had to be reformulated to meet the three criteria outlined above. Specifically, the items to measure belonging were complemented with items derived from scales measuring the following concepts: need to belong (Leary, Kelly, Cottrell, & Schreindorfer, 2013), group attachment (E. R. Smith, Murphy, & Coats, 1999), work-related basic need satisfaction (Van den Broeck, Vansteenkiste, De Witte, Soenens, & Lens, 2010), and membership collective self-esteem (Luhtanen & Crocker, 1992). The items to measure authenticity were complemented with items derived from scales measuring authentic personality (Wood et al., 2008), perceived authenticity
8 We deliberately chose not to include any reverse-scored items in our scale for two reasons. First, research indicates that negated items may in fact constitute different constructs (Magazine, Williams, & Williams, 1996). In our case, negatively formulated items may measure exclusion rather than inclusion. Second, negative items have been found to be much harder to interpret and to require greater cognitive capacity than positive items (Pilotte & Gable, 1990). As a result, reverse-scored items often do not meet scale analyses criteria and may even constitute reverse coding method factors (Cordery & Sevastos, 1993). Indeed, positively worded items were shown to be much more reliable and accurate than negatively phrased items (Schriesheim, Eisenbach, & Hill, 1991).

INCLUSION: CONCEPTUALIZATION AND MEASUREMENT
31
(Sheldon et al., 1997), and personal autonomy (Sheldon & Bettencourt, 2002). Following these procedures we arrived at an initial item pool of 44 items, which were proportionally divided between our four subcomponents (i.e., 11 items per subcomponent).
Step 2: Exploratory Factor Analysis
In the second step of our scale development and validation procedure we administered our newly generated item pool to a sample of students and subsequently performed an exploratory factor analysis. The goals of this analysis were to (1) obtain a preliminary indication of the factorial structure of the PGIS, and (2) to reduce our initial item pool into a more parsimonious set of items. Method
Participants and procedure.
Using an online questionnaire, we collected data from 277 first-year Psychology students from the University of Groningen (in the remainder of the text we call this the student sample). Sixty-six percent were female. Mean age was 20.32 years (SD = 2.06). As part of their curriculum, all students were allocated to a “student work group” together with other first-year students (the average group size was about 10 students). Throughout the entire first study year, these groups met on average about once a week for two hours. During these meetings, students completed and discussed individual and/or group assignments on topics such as scientific writing, presenting, and research methods. We collected our data around the mid-term of the second semester (i.e., about six months after the students started with their study). Thus, we assumed that by then, students were able to reliably indicate the extent to which they perceived to be included.
Materials.
Inclusion. We asked the respondents to rate the extent to which they perceived to be included in their group. Participants responded to all of the 44 items from our initial pool. Items were presented in a completely randomized order. We used a 5-point Likert-type scale ranging from 1 (strongly disagree) to 5 (strongly agree). Results and Discussion
To determine the number of factors to be extracted in the EFA, we first performed a parallel analysis (Horn, 1965). A parallel analysis (PA) tests which of the eigenvalues of the resulting common factors reaches significance. Therefore, a PA allows for a more statistically informed decision of the number of factors to be extracted in an EFA than the more commonly used “eigenvalue greater than one”

CHAPTER 2
32
criterion (Kaiser criterion; Timmermans & Lorenza-Seva, 2011). This analysis yielded two significant eigenvalues, indicating that, in this sample, two factors should be extracted.
Table 2.1 Factor Loadings from EFA
Item
(This group…)
Factor 1 Factor 2
…gives me the feeling that I belong .92 -.08
…gives me the feeling that I am part of this group .94 -.12
…gives me the feeling that I fit in .79 .04
…treats me as an insider .82 -.01
…likes me .64 .18
…appreciates me .80 .05
…is pleased with me .58 .18
…cares about me .59 .18
…allows me to be authentic .04 .78
…allows me to be who I am .13 .70
…allows me to express my authentic self -.05 .88
…allows me to present myself the way I am .07 .76
…encourages me to be authentic -.04 .83
…encourages me to be who I am .03 .83
…encourages me to express my authentic self -.02 .85
…encourages me to present myself the way I am .01 .85
Note. For each item, the strongest loading is in boldface.
Next, an EFA was run using principal axis factoring with a Direct Oblimin rotation. We chose to perform an oblique rotation rather than the usual orthogonal Varimax rotation, because we expected our factors to be interrelated. Based on the results of the PA, we specified the number of factors to be extracted in the EFA to be two. Following Hinkin’s (1998) recommendations, we only retained those items whose factor loadings exceeded .50 and who had no cross-loadings larger than .20. Also, we excluded items with communalities lower than .50. This left us with 16 items (see Appendix). Each subcomponent was equally represented (i.e., four items for group membership, four for group affection, four for room for authenticity, and four for value in authenticity). Table 2.1 displays the factor loadings of these remaining items. The items for belonging and authenticity appeared to reliably load on separate factors (eigenvalues after rotation were respectively 8.60 and 8.83).

INCLUSION: CONCEPTUALIZATION AND MEASUREMENT
33
Step 3: Confirmatory Factor Analyses
In the third step of our scale development and validation procedure we performed a series of confirmatory factor analyses (CFA’s). These analyses served four specific goals. First, we wanted to obtain a more quantified and explicit indication of the goodness of fit of the factorial structure we found in the EFA. Second, we aimed to statistically compare the model fit of alternative factor configurations, including the hierarchical configuration that we proposed in our conceptualization. Third, we sought to provide evidence for the robustness of our scale. That is, we were interested in whether the factorial structure of the PGIS was equivalent across a number of groups. Fourth, we intended to establish the convergent and discriminant validity of our measurement model. To these ends, we collected additional data from a diverse sample of employees. Method
Participants and procedure.
For this third step, we used the same student sample as we did in step 2, and, in addition, collected data from an employee sample. In particular, a panel study was conducted among 468 people who were employed in various Dutch organizations (Mage = 41.58 years; SD = 11.56 years). Fifty-eight percent of these participants were female and about three-quarters (n = 344) were Dutch nationals. Respondents worked in a broad range of different organizations. These organizations operated in 15 different sectors, with most participants employed in the health sector (20%), and in public governance (10%). The sample was selected such that all participants worked at least 20 hours per week in their organization. For the purpose of the present study, we asked them to indicate the extent to which they felt included in their group of direct colleagues. The size of this group was on average 12 people and ranged from 4 to 30.
Materials.
Inclusion. Participants responded to the 16 remaining items of our inclusion scale. Again, all items were presented in a completely randomized order and the response categories ranged from 1 (strongly disagree) to 5 (strongly agree). Results and Discussion
Competing models of inclusion.
We first performed CFA’s to statistically compare the model fit of several alternative factor configurations. In particular, we compared four alternative models (see Figure 2.2) and estimated the fit of these configurations for both of our samples. To determine which of the models fitted the data best, we subsequently compared their AIC (Akaike Information Criterion) values (Kline, 2011). In all models, the items
CHAPTER 2
34
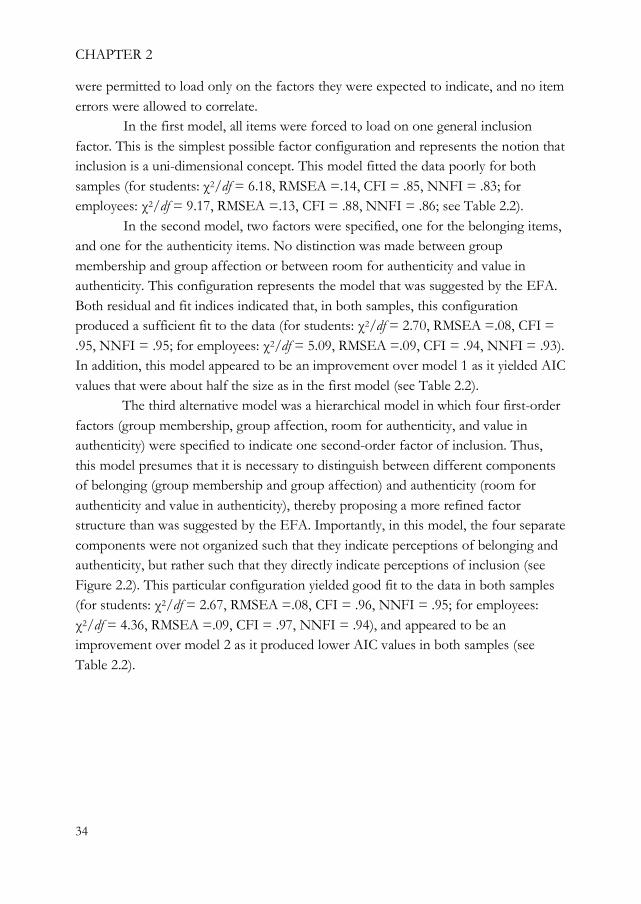
were permitted to load only on the factors they were expected to indicate, and no item errors were allowed to correlate.
In the first model, all items were forced to load on one general inclusion factor. This is the simplest possible factor configuration and represents the notion that inclusion is a uni-dimensional concept. This model fitted the data poorly for both samples (for students: χ2/df = 6.18, RMSEA =.14, CFI = .85, NNFI = .83; for employees: χ2/df = 9.17, RMSEA =.13, CFI = .88, NNFI = .86; see Table 2.2).
In the second model, two factors were specified, one for the belonging items, and one for the authenticity items. No distinction was made between group membership and group affection or between room for authenticity and value in authenticity. This configuration represents the model that was suggested by the EFA. Both residual and fit indices indicated that, in both samples, this configuration produced a sufficient fit to the data (for students: χ2/df = 2.70, RMSEA =.08, CFI = .95, NNFI = .95; for employees: χ2/df = 5.09, RMSEA =.09, CFI = .94, NNFI = .93). In addition, this model appeared to be an improvement over model 1 as it yielded AIC values that were about half the size as in the first model (see Table 2.2).
The third alternative model was a hierarchical model in which four first-order factors (group membership, group affection, room for authenticity, and value in authenticity) were specified to indicate one second-order factor of inclusion. Thus, this model presumes that it is necessary to distinguish between different components of belonging (group membership and group affection) and authenticity (room for authenticity and value in authenticity), thereby proposing a more refined factor structure than was suggested by the EFA. Importantly, in this model, the four separate components were not organized such that they indicate perceptions of belonging and authenticity, but rather such that they directly indicate perceptions of inclusion (see Figure 2.2). This particular configuration yielded good fit to the data in both samples (for students: χ2/df = 2.67, RMSEA =.08, CFI = .96, NNFI = .95; for employees: χ2/df = 4.36, RMSEA =.09, CFI = .97, NNFI = .94), and appeared to be an improvement over model 2 as it produced lower AIC values in both samples (see Table 2.2).

INCLUSION: CONCEPTUALIZATION AND MEASUREMENT
35
Figure 2.2 Competing Models of Perceived Group Inclusion
Model 1 Model 2
Model 3 Model 4

CHAPTER 2
36
In the fourth and final model, the same four first-order factors (group membership, group affection, room for authenticity, and value in authenticity) were construed, but now were specified to indicate two second-order factors (belonging and authenticity; see Figure 2.2).9 This configuration most closely resembles our proposed conceptualization of inclusion. Thus, similar to the third model, this model presumes that it is useful to distinguish between the two different subcomponents of belonging and authenticity. Different from model 3, however, this model posits that belonging and authenticity are necessary second-order factors. This means that group membership and group affection are assumed to fall within the more abstract dimension of belonging, whereas room for authenticity and value in authenticity are assumed to fall within the more abstract dimension of authenticity. Hence, similar to model 2, this model reflects our theoretical conceptualization of inclusion as consisting of two distinct components: perceptions of belonging and perceptions of authenticity. Unlike model 2, however, this model further partitions each of these two components into two subcomponents. This fourth model produced excellent fit to the data (for students: χ2/df = 1.81, RMSEA =.05, CFI = .97, NNFI = .96; for employees: χ2/df = 3.56, RMSEA =.07, CFI = .97, NNFI = .96), with all item and first-order factor loadings exceeding .70 and differing reliably from zero (p < .01). In addition, an inspection of the AIC values indicated that, in comparison to the other configurations, this fourth model was superior in fit in both of our samples (see Table 2.2). Table 2.2 Model Fit of Competing Models of Perceived Group Inclusion
Students Employees
Model 1 Model 2 Model 3 Model 4 Model 1 Model 2 Model 3 Model 4
χ2 642.42 278.05 267.24 185.66 953.20 524.73 435.97 352.80
df 104 103 100 99 104 103 100 99
χ2/df 6.18 2.70 2.67 1.88 9.17 5.09 4.36 3.56
RMSEA .14 .08 .08 .06 .13 .09 .09 .07
CFI .85 .95 .96 .98 .88 .94 .95 .97
NNFI .83 .95 .95 .97 .86 .93 .94 .96
AIC 706.42 344.05 339.24 259.66 1017.20 590.73 507.97 426.80 Note. RMSEA= Root-Mean-Square Error of Approximation, CFI = Comparative Fit Index, NNFI = Non-Normed Fit Index, AIC = Akaike Information Criterion.
9 Note that this fourth model is statistically equivalent to a model in which a third-order factor is added (i.e., a general inclusion factor that indicates the two second-order factors of belonging and authenticity).

INCLUSION: CONCEPTUALIZATION AND MEASUREMENT
37
Multigroup comparison.
Although our proposed model of perceived inclusion appeared to fit equally well across both samples, we examined this directly by performing a multigroup comparison. This means that we estimated a multigroup model in which both the factor configuration and the factor loadings were constrained to be equal for students and employees, and subsequently used the fit of this model as an indicator of robustness (Kline, 2011). The model produced good fit to the data (χ2/df = 3.00, RMSEA =.04, CFI = .98, NNFI = .98), indicating that the factorial structure and factor loadings of the PGIS were equivalent for students and employees. To further demonstrate the robustness of the factorial structure of our scale, we performed two additional multigroup analyses. Specifically, we tested (1) whether the structure was the same for men and women, and (2) whether the structure was equivalent among cultural majority and cultural minority group members. Both models reached good fit (men/women: χ2/df = 2.36, RMSEA =.04, CFI = .97, NNFI = .97; cultural majority/minority: χ2/df = 2.33, RMSEA =.04, CFI = .97, NNFI = .97), indicating the scale’s configural and loading invariance across these groups.
Convergent and discriminant validity.
Taken together, the CFA’s confirm the empirical accurateness of our proposed hierarchical two-dimensional conceptualization across important groups. Yet, this evidence does not provide a straightforward answer to the question whether we should proceed with our validation by computing composite scale scores at the level of the first-order factors (group membership, group affection, room for authenticity and value in authenticity) or at the level of the second-order factors (belonging and authenticity; Russell, 2002). To decide upon this, we also assessed the degree of convergent and discriminant validity of this particular measurement model (Reise, Bonifay, & Haviland, 2013). Convergent validity refers to the degree to which items indicating the same factor are related to each other. Discriminant validity reflects the extent to which items indicating one factor are discernible from items indicating another factor. By assessing these types of validity, one can decide which factors can be meaningfully used in further analyses, such as testing the nomological and predictive validity as we will do in the next steps of our validation procedure (Hair et al., 2010). Convergent validity is established when, for each factor, the composite reliability (CR) is larger than the average variance extracted (AVE) and the AVE is larger than .50. Discriminant validity is established when, for each factor, the amount of variance extracted from its items (AVE) is greater than both the average (average shared variance; ASV) and maximum variance shared with items from other factors (maximum shared squared variance; MSV; Hair et al., 2010).
CHAPTER 2
38
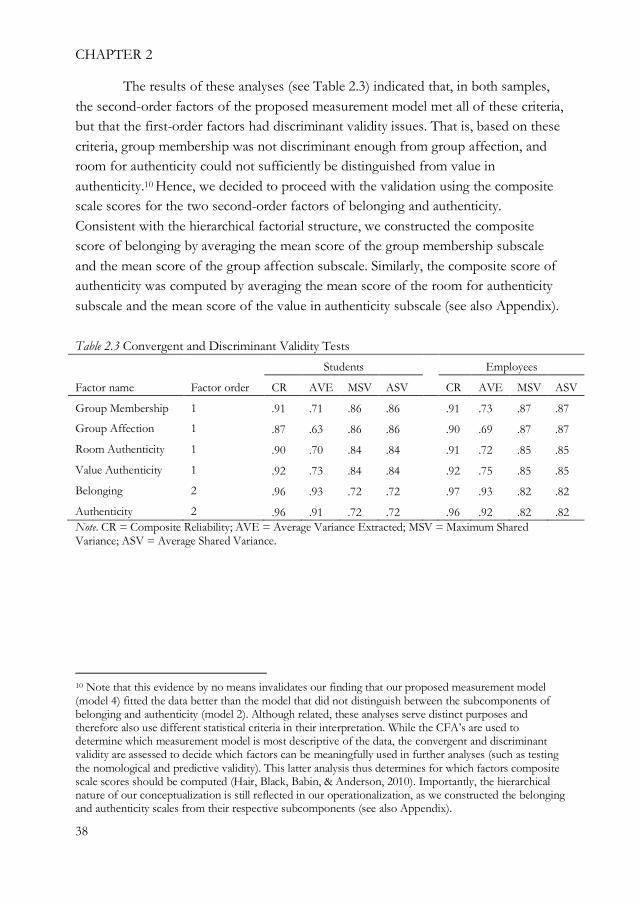
The results of these analyses (see Table 2.3) indicated that, in both samples, the second-order factors of the proposed measurement model met all of these criteria, but that the first-order factors had discriminant validity issues. That is, based on these criteria, group membership was not discriminant enough from group affection, and room for authenticity could not sufficiently be distinguished from value in authenticity.10 Hence, we decided to proceed with the validation using the composite scale scores for the two second-order factors of belonging and authenticity. Consistent with the hierarchical factorial structure, we constructed the composite score of belonging by averaging the mean score of the group membership subscale and the mean score of the group affection subscale. Similarly, the composite score of authenticity was computed by averaging the mean score of the room for authenticity subscale and the mean score of the value in authenticity subscale (see also Appendix). Table 2.3 Convergent and Discriminant Validity Tests
Students Employees
Factor name Factor order CR AVE MSV ASV CR AVE MSV ASV
Group Membership 1 .91 .71 .86 .86 .91 .73 .87 .87
Group Affection 1 .87 .63 .86 .86 .90 .69 .87 .87
Room Authenticity 1 .90 .70 .84 .84 .91 .72 .85 .85
Value Authenticity 1 .92 .73 .84 .84 .92 .75 .85 .85
Belonging 2 .96 .93 .72 .72 .97 .93 .82 .82
Authenticity 2 .96 .91 .72 .72 .96 .92 .82 .82 Note. CR = Composite Reliability; AVE = Average Variance Extracted; MSV = Maximum Shared Variance; ASV = Average Shared Variance.
10 Note that this evidence by no means invalidates our finding that our proposed measurement model (model 4) fitted the data better than the model that did not distinguish between the subcomponents of belonging and authenticity (model 2). Although related, these analyses serve distinct purposes and therefore also use different statistical criteria in their interpretation. While the CFA’s are used to determine which measurement model is most descriptive of the data, the convergent and discriminant validity are assessed to decide which factors can be meaningfully used in further analyses (such as testing the nomological and predictive validity). This latter analysis thus determines for which factors composite scale scores should be computed (Hair, Black, Babin, & Anderson, 2010). Importantly, the hierarchical nature of our conceptualization is still reflected in our operationalization, as we constructed the belonging and authenticity scales from their respective subcomponents (see also Appendix).

INCLUSION: CONCEPTUALIZATION AND MEASUREMENT
39
Reliabilities and descriptive statistics.
Table 2.4 shows the reliabilities and descriptive statistics of the PGIS as a whole and its two components. For both samples, the reliability of the total scale (α’s > .96) and its components (α’s > .93) were excellent. As would be expected from our CFA’s, belonging and authenticity were strongly interrelated in both samples (r’s > .77).
Table 2.4 Reliabilities and Descriptive Statistics
Sample Component α M SD 1 2
Students Belonging .93 3.61 .68 - .77**
Authenticity .95 3.61 .66 -
Total .96 3.61 .63
Employees Belonging .94 3.82 .64 - .84**
Authenticity .95 3.67 .63 -
Total .97 3.75 .61 **p < .01.
Step 4: Nomological Validity
In step 4 we aimed to further validate the PGIS by assessing the scale’s nomological validity. Nomological validity is the degree to which a scale is related to other variables to which it theoretically should be related. Establishing this type of validity thus ensures that a scale is actually measuring what it is supposed to measure (MacKenzie et al., 2011). Therefore, in this validation step, we correlated our scale with a number of constructs which we expected to be related to perceptions of inclusion.
As inclusion captures the extent to which an individual perceives to be included in a group, it is most likely to be related to both individual- and group-level concepts. Thus, for our analysis, we selected both concepts that are situated at the individual level (e.g., self-esteem) and concepts that pertain to the group as a whole (e.g., psychological safety). In addition, some concepts were selected because we expected them to be particularly related to one of our inclusion components, and less with the other. This way, we were able to provide further evidence of the multidimensional nature of inclusion that we proposed in our conceptualization (MacKenzie et al., 2011). We tested our expectations with data from both our student and employee sample. In order to include as wide a variety of concepts as possible, we decided to measure different concepts across our two samples. For each sample, we

CHAPTER 2
40
introduce the measured concepts below and then explain how we think they are related to the inclusion components. Unless mentioned otherwise, we used a 5-point Likert-type scale ranging from 1 (strongly disagree) to 5 (strongly agree). Method
Materials: student sample.
Self-esteem. According to socio-meter theory (Leary & Baumeister, 2000), an individual’s self-esteem serves as an internal, subjective monitor of social belongingness. That is, self-esteem is thought to indicate the extent to which an individual perceives him- or herself to be a socially valued member of the groups to which he or she belongs. This prediction has received empirical support (Krehbiel & Cropanzano, 2000), although there is also evidence of the reversed relation, with self-esteem affecting perceptions of appreciation (Abrams & Hogg, 2001). Whatever cause and effect may be, the important conclusion we draw from this is that self-esteem is likely to be most strongly related to the belonging component of the PGIS.
As indicators of self-esteem, we considered both state self-esteem and trait self-esteem. Whereas state self-esteem refers to one’s self-esteem within a particular setting, trait self-esteem refers to one’s general level of self-esteem (i.e., beyond the specific group context), and is therefore assumed to be more stable over time (Heatherton & Polivy, 1991). Given that inclusion is inherently also a context-specific construct, we expect that state self-esteem will be stronger correlated with our belonging component than trait self-esteem. We measured state self-esteem with seven items from the original 20-item scale of Heatherton and Polivy (1991). An example item is: “I am worried about what other students think of me” (scores reversed; α = .83). Trait self-esteem was measured with 10 items (Rosenberg, Schooler, Schoenbach, & Rosenberg, 1995), including: “On the whole, I am satisfied with myself” (α = .87).
Identification. As previously argued, we think that inclusion and identification are conceptually related. To better disentangle these concepts, it is important to first acknowledge that identification is not a uni-dimensional construct. Rather, it is thought to consist of two main components, self-investment and self-definition, which, in turn, are each comprised of multiple subcomponents (Leach et al., 2008). On the one hand, self-investment refers to the strength of the bond between self and the group (solidarity), the positive evaluation of the group (satisfaction), and the importance of the group to self (centrality). On the other hand, self-definition refers to the perceived similarity of self (self-stereotyping) and others (in-group homogeneity) in terms of an overarching group prototype. This latter form of identification thus presupposes that an overarching group prototype exists.

INCLUSION: CONCEPTUALIZATION AND MEASUREMENT
41
However, such a group prototype may not always be present (as is for example the case in inductively formed groups that were introduced earlier). Based on this, it has been convincingly argued that the self-investment dimension best captures the concept of identification (Postmes et al., 2013). Thus, in our analysis, we choose to relate inclusion only to the self-investment components of identification.
Note that the solidarity and satisfaction components of identification are similar to our belonging component in the sense that they refer to the strength and valence of the relationship that exists between the individual and the group. In contrast, the centrality component is conceptually more different from our inclusion components, as it refers to the importance of the group to self. Taken together, we expect solidarity and satisfaction to be stronger related to belonging than to authenticity. In addition, we expect that, out of all identification components, centrality will be least strongly related to our inclusion components. Solidarity was measured with three items (e.g., “I feel a bond with this group”; α = .89), satisfaction with four (e.g., “I am glad to be a member of this group; α = .90), and centrality with three (e.g., “This group is an important part of how I see myself”; α = .86).
Materials: employee sample.
Psychological safety. Psychological safety reflects the belief that the team will not embarrass, reject, or punish someone for speaking up (Edmondson, 1999). Although seeing the group as psychologically safe is also likely to be positively related to perceptions of belonging, we feel that psychological safety is conceptually closest to perceptions of authenticity. We therefore expect that the correlation with our authenticity component will be strongest. To measure psychological safety, we selected three items from the original seven-item scale of Edmondson (1999). An example item is: “In my team it is safe to take a risk” (α = .78). Diversity climate. Diversity climate is the degree to which one perceives the group to be open towards and appreciative of differences between group members (Harquail & Cox, 1993). This concept is conceptually similar to psychological safety in that it captures the extent to which one believes that group members are allowed to deviate from each other. Unlike psychological safety however, diversity climate also entails the perception that differences between group members are seen as positive within the group, and therefore resembles our operationalization of authenticity even more closely. Hence, we expect a particular strong correlation between diversity climate and our authenticity component. An example item of the diversity climate scale we used (four items) is: “In my team, differences between colleagues are seen as positive” (α = .86).

CHAPTER 2
42
Personal self-verification. Personal self-verification is the degree to which individuals feel that they are known and understood by others (Swann, 1983). Self-verification thus implies congruence between how an individual sees him- or herself and how he or she thinks to be seen by others. This correspondence is most likely to be achieved when individuals feel to be an integral part of the group and when they can act and feel authentically. Hence, we expect that personal self-verification will be related to both the belonging and the authenticity component of inclusion. We measured self-verification with the same three items used by Wiesenfeld, Swann, Brockner, and Bartel (2007), including: “My colleagues see me as I see myself” (α = .83). Results
Intraclass correlation analysis.
Because the data of our student sample were nested (i.e., students were grouped into work groups), we first assessed whether we needed to adopt a multilevel analytic strategy. In principle, some groups could be more inclusive than others, which may result in a substantial proportion of between group variance. Note that we do not consider this to be an issue in the employee sample, as it is highly unlikely that some employees worked in the same organization. To assess whether it was necessary to analyze the data of the student sample with multi-level analysis, we calculated the intraclass correlation coefficient for all of our measured constructs (ICC; defined as the proportion of between-group variance relative to the total amount of variance; Field, 2005). We found that the ICC, when considering scores on the belonging component, was equal to .0043. For the authenticity component, the ICC was .00014. This suggests that .43% of the variation in scores on belonging and .014% of the variation in authenticity is situated at the level of the work group, with the remaining variation located at the individual level. For the other constructs, the average ICC was .0028 and ranged from .00028 to .011. Given these relatively low ICC’s, it was not surprising that our analyses also revealed that none of these between-group variance components were significant (p’s > .05). Based on these results, we decided that it was not necessary to perform multi-level analysis on our student data.
Main analysis.
Table 2.5 shows the zero-order and partial correlations of our inclusion components with the related constructs for both the student and employee sample. We calculated the partial correlation between a PGIS component and a related construct, by controlling for the correlation between the other component and that specific construct. Hence, a significant partial correlation between a PGIS component and another construct is indicative of explaining a unique part of variance of that

INCLUSION: CONCEPTUALIZATION AND MEASUREMENT
43
construct. In addition, to more explicitly test our expectations, we analyzed whether the zero-order correlations differed significantly from each other by calculating the t-statistic for difference between dependent correlations (J. Cohen, Cohen, West, & Aiken, 2003). Table 2.5 Inclusion Components: Correlations with Conceptually Related Measures
Sample Measure Statistic Belonging Authenticity t-difference
Students State self-esteem r .46** .38** 1.99*
pr .27** .06ns
Trait self-esteem r .38** .32** 1.55†
pr .22** .05ns
Solidarity r .69** .51** 6.31**
pr .55** -.06ns
Satisfaction r .64** .57** 2.13*
pr .38** .16**
Centrality r .42** .35** 2.01*
pr .26** .04ns
Employees Diversity climate r .49** .55** -2.35**
pr .08† .28**
Psychological safety r .35** .38** -1.06ns
pr .07ns .16**
Personal self-verification r .68** .62** 3.23**
pr .38** .13** Note. For each inclusion component the table shows both the zero-order correlations and the partial correlations (controlled for the other inclusion component) with the related constructs. The significance of the difference between the zero-order correlations is tested with the t-statistic (one-sided). †p < .10, *p < .05, **p < .01.
The results were largely as expected. That is, in our student sample, state self-esteem was significantly stronger correlated with our belonging subscale (r = .46) than with our authenticity subscale (r = .38), t(274) = 1.99, p = .02. The same pattern was shown for trait self-esteem (rbelonging = .38; rauthenticity = .32), although this difference was only marginally significant, t(274) = 1.55, p = .06. Also in line with our expectations, the self-investment components of identification (solidarity, satisfaction and centrality) were all significantly (p’s < .05) stronger related to belonging (respectively: r = .69; r = .64; r = .42) than to authenticity (respectively: r = .51; r = .57; r = .35). Note that, as expected, centrality displayed the lowest correlation with belonging.

CHAPTER 2
44
In the employee sample, consistent with our predictions, we found that diversity climate was less strongly related to belonging (r = .49) than to authenticity (r = .55), t(483) = -2.35, p < .01. The same pattern was shown for psychological safety (rbelonging = .35; rauthenticity = .38), although this difference was not significant, t(483) = -1.06, p = .14. Finally, personal self-verification was stronger related to belonging (r = .68) than to authenticity (r = .62), t(483) = 3.23, p < .01. Corresponding with what we expected, both belonging (pr = .38) and authenticity (pr = .13) explained a unique part of variance of personal-self-verification.
Taken together, most of our predictions received empirical support. We therefore conclude that these findings provide evidence for the nomological validity of the PGIS and further support the notion that inclusion is a multi-dimensional concept.
Step 5: Predictive validity
The final step in the validation of the PGIS was to establish its predictive validity. Predictive validity refers to the extent to which a scale is able to predict outcomes that it should theoretically predict (Hinkin, 1998). Here, we specifically expect that inclusion has positive effects on individual, interpersonal and group level outcomes. First, given that inclusion can be seen as the satisfaction of the individual needs for belonging and authenticity, it is likely that inclusion will predict individual well-being and performance. Second, as inclusion refers to the strength and valence of the relationship between the group and the individual, we also expect that inclusion will result in more positive interactions with other group members. Third, we assume that inclusion may not only benefit the individual, but can also be advantageous for groups as a whole. In this context, it has been argued that as group members perceive to be more included in their group, they become more likely to act in accordance with group goals (Ellemers & Jetten, 2013).
In line with our conceptualization and with previous research (e.g., Deci & Ryan, 2000; Leary & Baumeister, 2000; Sheldon et al., 1997), we expect that both perceptions of belonging and perceptions of authenticity will predict these outcomes. However, also following from our conceptualization, we expect that their relevant impact may vary depending on the specific type of outcome assessed. In this respect, we distinguish between affective (mood within the group, work satisfaction, interpersonal trust, and group conflict) and productive outcomes (creativity, group performance, group learning behavior, and group creativity; see Van der Zee, Paulus, Vos, & Parthasarathy, 2009 for a similar distinction). We anticipate that belonging will

INCLUSION: CONCEPTUALIZATION AND MEASUREMENT
45
be particularly predictive of affective outcomes, as this inclusion component captures the extent to which there is a perceived affective bond between the group and the individual (in fact, we labeled one of the belonging subcomponents “group affection”). In turn, we expect that authenticity will be particularly predictive of productive outcomes. In this context, it has been proposed that group members’ identities constitute a potential resource that may be utilized to enhance group performance. This potential can be realized if group members feel comfortable to fully disclose their identities (Haslam, Eggins, & Reynolds, 2003). We therefore expect that perceived authenticity will be a crucial factor to enhance productive outcomes.
Besides these main effects (an additive model of inclusion), we also explored whether belonging and authenticity had a combined effect on our outcomes (a multiplicative model). That is, we tested whether the effect of belonging was to a certain extent dependent on the score of authenticity (or the other way around: whether the effect of authenticity was partly dependent on the score of belonging). One possible explanation for an interaction effect could be that while perceptions of belonging are likely to motivate individuals to actively participate in and contribute to the group (by creating a bond between the group and the individual), perceptions of value of authenticity may enable them to actually do so (by creating a scope for individual contributions). Thus, from this perspective, the combined presence of perceptions of belonging and authenticity seems to be a particular fruitful ground for improved outcomes, which would be reflected in a significant interaction effect. Finally, we assessed whether taking into account this interaction would change the predictive strength of the two main effects.
Due to practical restrictions, we were not able to include all of the outcome measures in both our samples. We specify below which measures were only included in one of our samples. Unless mentioned otherwise, we used a 5-point Likert-type scale ranging from 1 (strongly disagree) to 5 (strongly agree). Method
Materials.
Positive and negative mood. We assessed group-specific well-being by measuring participants’ typical positive and negative mood within the group. These two concepts have been shown to be essential and conceptually distinct components of well-being (Diener, 1994). Respondents were asked to indicate on a 5-point scale ranging from 1 (not at all) to 5 (very much) the extent to which they typically experienced eight different moods in their group. Responses to “joyful,” “happy,” “pleasure,” and “satisfaction” were used to measure positive mood (αstudents = .93; αemployees = .92),
CHAPTER 2
46
while responses to “depressive,” “worried,” “frustrated,” “unhappy,” and “angry” were taken to indicate negative mood (αstudents = .84; αemployees = .87).
Work satisfaction. We measured work satisfaction with three items from the Job Satisfaction Survey of Spector (1985). An example item is: “I enjoy my work.” Because this measure is typical for a work setting, we included work satisfaction only in our employee sample (α = .91).
Interpersonal trust. Interpersonal trust is the extent to which one is willing to ascribe good intentions to and have confidence in the words and actions of other people. We adapted and adjusted a scale from Cook and Wall (1980), resulting in a scale of five items, including: “I can trust my fellow students [colleagues] to lend me a hand if I needed it” (αstudents = 76; αemployees = .86).
Group conflict. Group conflict was measured with six questions (Jehn & Mannix, 2001), including: “How often do people get angry in this group?” (αstudents = .76; αemployees = .85). All questions were answered on a scale ranging from 1 (never) to 5 (very often).
Individual creativity. Individual creativity was measured using an abbreviated scale (three items) from Zhou and George (2001). An example item is: “I often come up with creative solutions to problems.” Creativity was only measured in our student sample (α = .85).
Group creativity. Group creativity was measured by adapting three items from the original scale from Zhou and George (2001), including: “In my group, one is very creative.” We solely measured group creativity in our employee sample (α = .92).
Group performance. Group performance was assessed using two items adapted from a scale from Hackman (1987). These were: “This group performs excellent,” and “This group does superb work” (rstudents = .80; remployees = .82).
Group learning behavior. Group learning behavior is the extent to which a group engages in an ongoing process of reflection and action, characterized by asking questions, seeking feedback, experimenting, reflecting on results, and discussing errors or unexpected outcomes of actions (Edmondson, 1999). Three items were used, including: “We regularly take time to figure out ways to improve our team’s work processes.” Group learning behavior was only assessed in our employee sample (α = .86). Results
Intraclass correlation analysis.
Again, we first determined whether the nested data from the student sample needed to be analyzed with multi-level analysis by calculating the ICC for each of the above listed constructs. We found that the average ICC was .011 and ranged from

INCLUSION: CONCEPTUALIZATION AND MEASUREMENT
47
.00067 to .041. None of the between-group variance components were found to be significant (p’s > .05). We therefore decided to not use multi-level analysis.
Common method variance analysis.
As all of the above measures were self-reported and collected in a cross-sectional manner, we also assessed to what extent our results were influenced by common method variance. In doing so, we conducted two post-hoc analyses. First, we performed Harman’s single factor test, which is a widely used technique to address the issue of common method bias (Podsakoff, MacKenzie, Lee, & Podsakoff, 2003). According to this procedure, items of all constructs should be entered into an unrotated exploratory factor analysis with the number of extracted factors constrained to be one. Common method variance is thought to be present when the resulting factor explains more than 50% of the variance in the items (Podsakoff et al., 2003). We found that the resulting factor accounted for 32% of variance of the items in the student sample and for 36% of the variance in the employee sample.
As a second approach to assess the extent of common method bias, we added an unmeasured latent factor to our measurement model (i.e., to the model including all constructs used in the predictive validity evaluation), and assessed how much variance per item was due to common method variance (Podsakoff et al., 2003). We found that the incremental explained variance was on average 1.34% per item in the student sample and on average 6.50% per item in the employee sample. Although there is no clear consensus about cutoff values concerning the incremental explained variance of a common method bias factor, the findings of the meta-analysis of Williams, Cote and Buckley (1989) may serve as a benchmark. They found that, in all of the studies they examined, approximately 25% of the variance per item was due to common method bias. For the present study, this suggests that common method bias, even though present, is likely to be minimal and probably did not impact our results substantially.
Regression analyses.
We performed a series of stepwise regression analyses. The first block of predictors included the standardized scores for belonging and authenticity. In the second block we added the interaction term (J. Cohen et al., 2003). Table 2.6 displays the results. As expected, we found that belonging and authenticity each predicted a unique portion of variance of almost all outcome measures. Specifically, we found significant effects for both belonging and authenticity in 11 of the 15 regression analyses we conducted. In the remaining four regressions, only authenticity was a significant predictor.

CHAPTER 2
48
Table 2.6 Results of Regression of Outcome Measures on the Inclusion Components
Students Employees
Step 1 Step 2 Step 1 Step 2
Dep. var. Predictor β R2 β R2 β R2 β R2
Positive Belonging .51** .52** .32** .46**
mood Authenticity .22** .23** .24** .23**
Bel x Auth .04ns .28**
.48 .48 .29 .34
Negative Belonging -.34** -.31** -.30** -.36**
mood Authenticity -.29** -.27** -.12† -.11†
Bel x Auth .15** -.12*
.34 .36 .16 .17
Work Belonging .29** .41**
satisfaction Authenticity .13* .12†
Bel x Auth .23**
.16 .20
Trust Belonging .36** .36** .36** .50**
Authenticity .23** .23** .19** .18**
Bel x Auth .02ns .27**
.31 .31 .28 .33
Group Belonging .04ns .03ns -.17* -.24**
conflict Authenticity -.27** -.28** -.16* -.15†
Bel x Auth -.05ns -.13**
.06 .06 .10 .11
Individual Belonging .28** .27** -.01ns .13†
creativity Authenticity .25** .25** .24** .23**
Bel x Auth -.03ns .26**
.25 .25 .05 .10
Group Belonging -.02ns .12ns
creativity Authenticity .36** .35**
Bel x Auth .26**
.12 .17
Group Belonging .25** .27** .33** .47**
performance Authenticity .26** .27** .11† .10†
Bel x Auth .12* .28**
.23 .24 .18 .23
Group learning Belonging .09ns .21**
behavior Authenticity .38** .37**
Bel x Auth .24**
.20 .25 †p < .10, *p < .05, **p < .01.

INCLUSION: CONCEPTUALIZATION AND MEASUREMENT
49
We further hypothesized that belonging would be most predictive of affective outcomes (i.e., mood within the group, work satisfaction, interpersonal trust, and group conflict) and that authenticity would be the relatively strongest predictor when considering productive outcomes (i.e., creativity, group performance, group learning behavior). We found support for this hypothesis in 12 of the 15 regression analyses we performed (by comparing the standardized regression coefficients for belonging and authenticity). The only three exceptions to this pattern appeared when we regressed individual creativity and group conflict in the student sample and group performance in the employee sample.
In addition, we explored the existence of an interaction effect. We found evidence of a combined effect of belonging and authenticity in 10 of the 15 regression analyses we conducted, with most of the interaction effects situated in the employee sample (see Table 2.6). However, as a result of the high correlations between belonging and authenticity, the addition of the interaction term led to relatively high levels of multicollinearity in both samples (Variance Inflation Factors > 10). This prohibits us from drawing any reliable conclusions concerning the combined effect of belonging and authenticity (Kutner, Nachtsheim, & Neter, 2004). Furthermore, we found that adding the interaction term did not decrease the strength of the main effects of belonging and authenticity, which indicates the suitability of an additive model of inclusion.
In sum, these findings provide support for the predictive validity of the PGIS. In addition, it delivers a further indication of the multidimensionality of the inclusion concept.
Conclusions and Discussion
Creating inclusive environments, in which people from diverse backgrounds perceive to be included, is a key challenge for groups. Yet, to date, the literature on perceived group inclusion displayed little agreement in the appropriate conceptualization and measurement of the concept (cf. Shore et al., 2011). In the present research we addressed these issues by introducing a conceptual framework of inclusion and subsequently using this as a starting point to develop and validate a scale to measure perceptions of inclusion.
Departing from existing work on inclusion and complementing this with theoretical insights from ODT and SDT, we proposed that inclusion is a hierarchical two-dimensional concept consisting of perceptions of belonging and authenticity. In addition, we posed that in the process of inclusion it is the group rather than the

CHAPTER 2
50
individual that has primary agency. Based on this conceptualization, we developed and validated the 16-item perceived group inclusion scale (PGIS). Data from two samples supported our proposed configuration of inclusion. Furthermore, we found evidence for the robustness of this factorial structure. In particular, the structure was found to be equivalent for students and employees, for men and women, and for cultural majority and cultural minority group members. The invariance across these groups is especially important as it ensures that the PGIS can be adequately administered in a wide range of groups. Finally, we demonstrated that the PGIS is a reliable measure of inclusion and possesses both nomological and predictive validity.
We find it important to stress that although we started our research from the notion that inclusion is a relevant concept to consider in heterogeneous groups, we believe this to be equally true for homogeneous groups. Furthermore, we see no theoretical obstacles in translating our conceptualization to other group contexts than the specific ones we focused on in the empirical part of the present research. That is, we believe that belongingness and authenticity in conjunction define inclusion in all types of interactive groups. Yet importantly, the extent to which these components are aligned with each other may very well differ between groups. To illustrate, and as already hinted at earlier, some groups may force their members to forsake their authentic self in order to fit in (i.e., to assimilate). A typical example of such a group could be a military squadron in which soldiers perceive to belong to the group, but at the same time do not feel they are encouraged to behave in an authentic manner. In contrast, other groups may provide its members with a low sense of belonging yet allow and encourage them to be themselves (i.e., to differentiate). A typical example of this particular configuration is an organization that hires external consultants. Whereas these consultants are probably seen as peripheral organizational members, they are likely to be valued for their authentic insights. An interesting line for future research is to systematically sample different types of groups and explore how belonging and authenticity are related to one another across these groups. In addition, for those groups in which the degree of correlation between the two inclusion dimensions is relatively low, the interactive effect of belonging and authenticity can be analyzed more reliably than we were able to do in the present research. Importantly, we think that our newly developed scale may be a particularly suitable instrument to explore these ideas as we deliberately formulated its items in a general manner to ensure the scale’s applicability across a wide range of groups (e.g., organizations, schools, group of close friends, and sports teams).
Furthermore, although situations invariably exist in which our inclusion components are highly correlated with each other, we firmly hold that this neither

INCLUSION: CONCEPTUALIZATION AND MEASUREMENT
51
diminishes the theoretical accuracy nor the practical usefulness of our conceptualization. As we will further outline below, being able to distinguish between multiple components of inclusion may be very informative in certain research contexts. In this light, it is worth noting that although belonging and authenticity were highly correlated with each other in both of our samples, we still found support for the multidimensional nature of the construct when we assessed the factorial structure, the nomological validity, and the predictive validity of the PGIS. Relatedly, we think that our distinction between the subcomponents of belonging (group membership and group affection) and authenticity (room for authenticity and value in authenticity) not only resulted in a more refined conceptualization, but also enriched the development of our scale as it allowed us to tap into a wider spectrum of inclusion aspects.
Importantly, our conceptualization offers a clear theoretical framework on which future research may build. An interesting path for future studies is for example suggested by the results of our predictive validity assessment. Here we found that belonging was particularly predictive of affective outcomes, whereas authenticity appeared to be the strongest predictor when we considered productive outcomes. Future research may elaborate on these findings by explicitly testing why and under which conditions these differential effects occur. Furthermore, future research may also test the idea that the relative importance of establishing either group members’ belongingness or authenticity in predicting group performance could be dependent on the nature of the group task. In this regard, it can be hypothesized that performance on tasks that predominantly demand efficiency may benefit most from establishing perceptions of belonging, whereas performance on tasks that require creative processes may benefit most from securing authenticity.
The present research may also contribute to the refinement of experimental inclusion research. While in our conceptualization inclusion consists of perceptions of both belonging and authenticity, in existing experimental studies inclusion is often manipulated by just altering perceived levels of belongingness. For example, an often used manipulation in inclusion (and exclusion) research is cyberball—a cyber-analogue of a ball-tossing game (K. D. Williams, Cheung, & Choi, 2000). In this game, participants receive the ball from the fictional other players either a proportionate amount of times (inclusion condition) or a disproportionate low amount of times (exclusion condition). While we see this as a clear manipulation of the extent to which someone is considered to belong to the group, we hold that this does not directly manipulate the extent to which someone is allowed and encouraged to be him- or herself within a group. Our research suggests that inclusion manipulations also need

CHAPTER 2
52
to address authenticity. Based on our present results, we may hypothesize that people who are provided with a low sense of belonging and at the same time are forced to adjust themselves to the group will report lower individual well-being and other relevant outcomes than those who are considered to be peripheral group members, but at the same time are allowed to remain themselves within the group.
Furthermore, our conceptualization and scale might prove to be useful in research focusing on identifying the determinants of inclusion. In this regard, a crucial feature of our conceptualization is that we identified the group to be the primary actor in the process of inclusion. This directional flow underlines the responsibility and the power that groups and organizations have in establishing perceptions of inclusion among its members. Indeed, to date, various organizational interventions aimed at enhancing inclusion have been proposed, such as adopting “all-inclusive” managerial perspectives towards diversity (e.g., Stevens et al., 2008), developing inclusive leadership styles (Shore et al., 2011), and promoting “inclusion competencies” among employees (Pless & Maak, 2004). Combining the PGIS with these existing frameworks offers a promising road for future inclusion research.
In sum, by proposing that inclusion consists of perceptions of belonging and authenticity, and by identifying the group as the primary source of these perceptions, this research provides a conceptual refinement of the inclusion construct. At the same time, it also equips researchers with a valid and reliable measurement instrument that can be used in future inclusion research.

INCLUSION: CONCEPTUALIZATION AND MEASUREMENT
53
Appendix The Perceived Group Inclusion Scale
This group… 1. …gives me the feeling that I belong 2. …gives me the feeling that I am part of this group 3. …gives me the feeling that I fit in 4. …treats me as an insider 5. …likes me 6. …appreciates me 7. …is pleased with me 8. …cares about me 9. …allows me to be authentic 10. …allows me to be who I am 11. …allows me to express my authentic self 12. …allows me to present myself the way I am 13. …encourages me to be authentic 14. …encourages me to be who I am 15. …encourages me to express my authentic self 16. …encourages me to present myself the way I am
1-4: group membership subscale; 5-8: group affection subscale; 9-12: room for authenticity subscale; 13-16: value in authenticity subscale.
The composite scale scores for the higher order components of belonging and authenticity are computed by averaging the mean scores of the corresponding subscales. That is, belonging is computed by averaging the mean score of the group membership subscale and the mean score of the group affection subscale. Authenticity is computed by averaging the mean score of the room for authenticity subscale and the mean score of the value in authenticity subscale.


Chapter 3
Colorblind or colorful? The relationship between
organizational diversity approaches, inclusion, and work
outcomes among majority and minority employees
This chapter is based on Vos, M.W.*, Jansen, W.S.*, Otten, S., Podsiadlowski, A., & Van der
Zee, K.I. Colorblind or colorful? The relationship between organizational diversity approaches,
inclusion and work outcomes among majority and minority employees. International Journal of
Intercultural Relations, Manuscript under review.
*These authors contributed equally to this manuscript and should therefore both be considered as first
author.

CHAPTER 3
56
Abstract
In the present study we examined how perceived organizational diversity approaches relate to affective and productive work outcomes among cultural majority and minority employees. We compared a colorblind approach to diversity, in which cultural differences between employees are ignored, with a multicultural diversity approach, in which cultural differences are explicitly acknowledged and valued. Using structural equation modeling on data collected in a panel study among 152 native Dutch majority and 77 non-Western minority employees, we found that perceptions of a colorblind approach were most strongly related to work satisfaction and perceived innovation for majority members, while perceptions of a multicultural approach “worked best” for minority members. Moreover, these effects were fully mediated by the extent to which employees felt included in the organization. Thus, while inclusion is an important factor for both groups to enhance work outcomes, it is facilitated by different diversity approaches for majority and minority members.

COLORBLIND OR COLORFUL?
57
Over the past decades, the European workforce has become increasingly culturally diverse (Bureau of Labor Statistics, 2012; Hooghe et al., 2008). This cultural diversity has been shown to have a profound impact on employee well-being and organizational performance, with both positive (e.g., enhanced creativity) and negative effects (e.g., increased levels of interpersonal conflict) being reported (e.g., Bowers, Pharmer, & Salas, 2000; Joshi & Roh, 2009; Shore et al., 2009; Webber & Donahue, 2001; K. Y. Williams & O'Reilly, 1998). As a result, organizations have developed a range of different approaches to effectively cope with the cultural differences of their employees (D. A. Thomas & Ely, 1996). Diversity approaches reflect the organizations’ normative beliefs and expectations about the reason to diversify, the value of cultural diversity, and its connection to work processes (Stevens et al., 2008). These approaches to diversity are aimed to serve as a catalyst for increasing productive work outcomes, but also to safeguard the psychological well-being of employees.
However, it has proven difficult for organizations to manage diversity in such a way that all employees are satisfied. Whereas diversity policies that emphasize the value of diversity may be received positively by employees from a cultural minority background, such policies may yield low acceptance by employees from the cultural majority (Plaut et al., 2011). Accordingly, developing an understanding of how and why diversity approaches affect majority and minority employees is essential. This is the aim of the current research. We will argue that how employees perceive their organization approaches diversity has different consequences for majority and minority members’ perceptions of inclusion within the organization. In addition, we posit that these perceptions of inclusion, in turn, result in different levels of productive and affective work outcomes.
Diversity Approaches
An organization’s strategic approach towards diversity can be episodic,
freestanding or systemic (Dass & Parker, 1999) and can be classified on a continuum ranging from “not doing anything” to “having a full blown diversity strategy” that integrates various interventions into an organization-wide general framework (Bhawuk, Podsiadlowski, Graf, & Triandis, 2002). Two commonly described diversity approaches in the literature are colorblindness and multiculturalism (Stevens et al., 2008). Organizations adopting a colorblind approach stress that people should be treated equally as individuals and that group differences should be ignored when making decisions, such as hiring and promotion. Individual accomplishments and qualifications are stressed over any other factor (Stevens et al., 2008). In contrast,

CHAPTER 3
58
organizations adopting a multicultural approach emphasize that differences between cultural groups should be acknowledged and are beneficial for work processes (Cox, 1991; Stevens et al., 2008).
Interestingly, the extent to which colorblindness or multiculturalism is supported differs between majority and minority group members. In general, majority group members show higher levels of endorsement of colorblindness, whereas minority members tend to support multiculturalism to a greater extent (Plaut et al., 2011; Ryan et al., 2007; Verkuyten, 2005; Wolsko et al., 2006). To date, the vast majority of research investigating this group-based difference in preference for colorblindness and multiculturalism has been concerned with national integration policies (i.e., the extent to which colorblind or multicultural integration policies are supported) rather than with how organizational diversity approaches affect employees (e.g., Karafantis, Pierre-Louis, & Lewandowski, 2010; Levin et al., 2012; Plaut et al., 2011; Ryan et al., 2007; Wolsko et al., 2000). As a result, little is known about the impact of diversity approaches on majority and minority group members in an organizational context. Moreover, while the evidence for the difference between majority and minority members in their support for colorblindness and multiculturalism is substantive, few studies have sought to explain why this difference exists (Rattan & Ambady, 2013; Rosenthal & Levy, 2010). Given that diversity approaches are ideological statements about the value of difference, and that cultural majority and minority members are likely to differ in the extent to which they perceive themselves to be different, we believe that the degree to which majority and minority members feel included in the organization is a key factor to consider in this context (cf. Plaut et al., 2011; Stevens et al., 2008).
Accordingly, in the current study we aim to contribute to the existing research on organizational diversity approaches by creating a deeper understanding of how and why diversity approaches impact majority and minority employees. Importantly, we choose to focus on subjectively perceived rather than objectively assessed diversity approaches, because previous research demonstrated that individuals’ perceptions of their social environment have a far greater and more direct impact on behavior than the social environment itself (Eisenberger, Huntington, Hutchison, & Sowa, 1986; Krackhardt, 1990). In our theoretical analysis, we first consider how perceptions of diversity approaches among majority and minority employees affect the extent to which they perceive to be included in the organization. Second, we argue that perceived inclusion is a strong predictor of productive and affective work outcomes for both majority and minority group members. Figure 3.1 displays the conceptual model of this study.

COLORBLIND OR COLORFUL?
59
Figure 3.1 Conceptual Model
Diversity Approaches and Inclusion: Differences between Majority and
Minority Group Members
As stated before, previous research demonstrated that majority and minority members differ in the extent to which they support colorblindness and multiculturalism. In the present study we aim to extend this finding by looking at how perceptions of these diversity approaches influence the extent to which employees feel included in an actual interactive group setting (i.e., an organization). Inclusion is the degree to which an individual perceives that the group provides him or her with a sense of belongingness and authenticity. In other words, people perceive to be included in a group when they experience to belong to the group, while at the same time perceive they are allowed and encouraged to be themselves (cf. Jansen et al., 2014; Lirio et al., 2008; Pelled et al., 1999; Pless & Maak, 2004; Shore et al., 2011).
To understand why and how perceived organizational diversity approaches are related to feelings of inclusion for employees, it is important to recognize that diversity approaches communicate an organizational prototype which employees use as a frame of reference to determine whether they are included. That is, diversity approaches are thought to convey contextual cues that are used by employees to check whether they “fit in” (Purdie-Vaughns, Steele, Davies, Ditlmann, & Crosby, 2008). From this perspective, it is likely that perceptions of colorblindness and multiculturalism affect the extent to which majority and minority members feel included differently.
According to the colorblind approach, people should be treated equally as individuals and group differences should be ignored when making decisions such as hiring new employees or promoting sitting organizational members. Although group differences should not matter in this approach, in reality, majority members are more prototypical of the organization than minority members (Chattopadhyay et al., 2004;
Cult. background
(Majority/Minority)
Diversity approach Work outcomes Inclusion

CHAPTER 3
60
Rosette et al., 2008). As a result, in a colorblind approach the norms and values of the majority group may become dominant throughout the entire organization and may be used as criteria for inclusion and exclusion of employees (a process called “in-group projection”; Mummendey & Wenzel, 1999). While this is certainly comfortable for majority members, colorblindness may be perceived as exclusionary by those who are in the cultural minority (Chrobot-Mason & Thomas, 2002; Markus & Steele, 2000; Stevens et al., 2008). Particularly, minority members may perceive organizational policies based on the colorblind approach as being insincere - that is as an attempt by the organization to claim a concern for fairness and equality, while in reality little or nothing is done to support these goals (Purdie-Vaughns et al., 2008). Thus, while ignoring group differences and stressing individualism, the colorblind approach is likely to fail to acknowledge the unequal effects this may have for majority and minority group members. This reasoning is supported by research showing that the colorblind approach is associated with stronger racial bias and interpersonal discrimination among majority members (Richeson & Nussbaum, 2004) and with lower psychological engagement among minorities (Plaut, Thomas, & Goren, 2009). Accordingly, our first hypothesis is:
Hypothesis 1: The extent to which an organization is perceived to adopt a colorblind approach is positively related to perceived inclusion for cultural majority employees, but not for cultural minority employees. In contrast to the colorblind approach, the multicultural approach portrays an
organizational prototype in which the benefits of diversity are emphasized and where differences between cultural groups are seen as a source of strength to the organization (Cox, 1991; Stevens et al., 2008). Although multiculturalism stresses an all-encompassing diversity approach in which differences are valued and a source for learning (see also Ely & Thomas, 1996), positive effects of this approach do not seem similarly evident for all employees in the organization. Particularly, majority members may perceive multiculturalism to be “only for minorities” (Plaut et al., 2011, p. 338). Valuing diversity implies that being different, rather than prototypical, is the requirement for group inclusion. As majority members generally do not consider themselves to be “diverse,” they may refrain from endorsing such multicultural views or even feel excluded within the organization.
For minority members, however, working in an organization that is perceived to adopt a multicultural approach might result in stronger feelings of inclusion. In this approach, different backgrounds and cultural group identities are recognized and

COLORBLIND OR COLORFUL?
61
valued (Purdie-Vaughns et al., 2008; Verkuyten, 2005). In comparison to colorblindness, the organizational prototype encompassing multiculturalism is therefore much more diffuse (cf. Chattopadhyay et al., 2004). As a result, the aforementioned process of in-group projection, which is particularly detrimental for minority group members, is tackled in the multicultural approach. Our second hypothesis is therefore:
Hypothesis 2: The extent to which an organization is perceived to adopt a multicultural approach is positively related to perceived inclusion for cultural minority employees, but not for cultural majority employees.
Inclusion and Work Outcomes
We have previously argued that how diversity approaches are perceived relates to feelings of inclusion in the organization differently for minority and majority members. This relationship is important as inclusion is regarded a key factor in predicting relevant work outcomes (cf. Acquavita, Pittman, Gibbons, & Castellanos-Brown, 2009; Jansen et al., 2014). In particular, because perceiving to be socially included satisfies individuals’ needs for belonging and authenticity, it may improve individual well-being. Indeed, research has indicated that inclusion enhances people’s self-esteem and work satisfaction (Jansen et al., 2014; Nembhard & Edmondson, 2006) and reduces employee absenteeism (Jansen, Otten, & Van der Zee, under review). However, perceptions of inclusion may not only enhance affective individual work outcomes, but can also improve the functioning of groups and organizations. In this regard, it has been posited that as people perceive to be more included, they are more motivated to contribute to the group (Ellemers & Jetten, 2013). Corroborating this prediction, inclusion has found to be positively related to productive work outcomes such as performance (Pearce & Randel, 2004) and organizational creativity and innovation (Jansen et al., 2014).
Correspondingly, we posit that inclusion is a key factor in understanding how perceived diversity approaches relate to both affective (i.e., work satisfaction) and productive work outcomes (i.e., perceived innovation). Specifically, we hypothesize that an organization’s perceived diversity approach affects the extent to which organizational members feel included in the organization, which in turn predicts how satisfied they are with their job and to what extent they perceive their organization to be innovative. Linking this line of reasoning with hypotheses 1 and 2, we expect this process to differ for majority and minority members. For majority members, the

CHAPTER 3
62
extent to which the organization is perceived to adopt a colorblind approach is expected to enhance feelings of inclusion and subsequently result in more positive work outcomes. In contrast, for minority members we expected that the extent to which the organization is perceived to adopt a multicultural approach will determine perceived inclusion and subsequently predict positive work outcomes. Capturing our full conceptual model (see Figure 3.1), our third hypothesis is therefore:
Hypothesis 3: The relationship between perceived organizational diversity approaches and work outcomes (work satisfaction and perceived innovation) is mediated by perceived inclusion.
a. For majority members, the relationship between perceptions of a colorblind approach and work outcomes is mediated by inclusion.
b. For minority members, the relationship between perceptions of a multicultural approach and work outcomes is mediated by inclusion.
Method
Sample
Data were collected in a panel study among 229 participants (Mage = 39.40 years; SD = 11.77 years). All participants were individually approached by a professional online panel research company and were told they would participate in a study about cultural diversity management in organizations. Participants were included in the sample when they met two criteria: they were at least 18 years old and they were employed in an organization. The sample consisted of 77 employees from a Non-Western descent, based on the criterion they were born in a Non-Western European country. The remaining 152 employees were born in the Netherlands. In the remainder of the text, we will refer to these groups of participants as minority and majority members. Of these 229 respondents, 128 were female (55.2%). Two participants did not report their gender (0.9%). The gender distribution was equal between minority and majority members. All respondents were employed in different organizations that operated in 15 different sectors according to the International Standard Industrial Classification (ISIC). Most participants were employed in the health sector (15.4%) and community services (15.1%). Measures
Diversity approaches. The extent to which organizations were perceived to employ a colorblind or multicultural diversity approach was measured with the Diversity Perspective Questionnaire (Podsiadlowski, Gröschke, Kogler, Springer, & Van der Zee, 2013). Participants were presented with a number of statements about

COLORBLIND OR COLORFUL?
63
diversity approaches and were asked to indicate on a 7-point Likert-type scale to what extent these statements applied to their organization (1 = does not apply at all, 7 = applies very much). Colorblindness was measured with four items (e.g., “People fit into our organization when they match the required job qualifications”; α = .84). Multiculturalism was measured with four items (e.g., “Cultural diversity brings new ideas and different knowledge to the workplace for various business units”; α = .86).11
Inclusion. The extent to which respondents felt included within their organization was measured with the Perceived Group Inclusion Scale (Jansen et al., 2014). This scale distinguishes between two components: belonging and authenticity. While the subscale for belonging measures the extent to which employees have a sense of belonging to the organization (five items, e.g., “I feel I belong to this organization”; α = .86), the authenticity subscale assesses the degree to which individuals perceive they are allowed and encouraged to be themselves within the organization (two items, e.g., “Within this organization I dare to be myself”; r = .59). All items were assessed using a 5-point Likert-type scale ranging from 1 (strongly disagree) to 5 (strongly agree). Exploratory factor analysis (with the extraction criterion eigenvalue > 1) resulted in a single factor solution (eigenvalue = 4.28; 61% of variance explained), indicating that the two components of inclusion could be collapsed into a single scale measuring perceived inclusion (α = .87).
Work satisfaction. Work satisfaction was measured with three items of the short Job Descriptive Index (P. C. Smith, Kendall, & Hulin, 1969). A sample question was: “How satisfied are you with your development?” A 5-point Likert-type scale was used, ranging from 1 (very dissatisfied) to 5 (very satisfied). Cronbach’s alpha of the work satisfaction scale was .83.
Perceived innovation. Perceived innovation was measured with three items that were similar to those used by De Dreu & West (2001). A sample question was “Employees of this organization often implement new ideas to improve the quality of our products and services.” Responses were given on a 5-point Likert-type scale ranging from 1 (strongly disagree) to 5 (strongly agree). Cronbach’s alpha of this scale was .88.
Control variables. We included gender, age, and organizational tenure as control variables. In addition, we controlled for the extent of cultural diversity in the organization as this may be correlated to some of the variables in our model. In
11 We measured multiculturalism with the “integration and learning” component of the Diversity Perspective Questionnaire. Whereas the term “multiculturalism” has predominantly been used to describe a value-in-diversity approach at the societal level (i.e., a nation’s integration policy), the term “integration and learning” is used as the equivalent approach at the organizational level (cf. Ely & Thomas, 2001).

CHAPTER 3
64
particular, we expected this to be related to the diversity approaches, as it is likely that organizations that explicitly value diversity also employ a larger share of cultural minority members (Kristof-Brown et al., 2005). We measured this with one item: “To what extent do you regard your organization as diverse in terms of ethnicity and/or nationality?” Answers were given on a 7-point Likert-type scale, ranging from 1 = not diverse at all to 7 = very much diverse. Preparatory Analyses
Before testing our hypotheses we conducted several preparatory analyses. This included assessing the validity of our measurement model, evaluating the presence of common method variance, and specifying our structural model.
Confirmatory factor analyses. We first assessed the measures’ factor structure with confirmatory factor analyses (CFAs). A model was tested with the proposed five core concepts of the study: Colorblindness, Multiculturalism, Inclusion, Satisfaction, and Innovation (Model 4 in Table 3.1). This model reached acceptable fit, χ2 = 422.83, p <. 001, df = 179, RMSEA = .08, CFI = .91. All items loaded significantly on their respective factors (with all standardized factor loadings exceeding .50). Moreover, this model fitted significantly better than a range of models with fewer factors (see Table 3.1), providing support for the factor structure.
Common method variance analysis. We investigated the possible presence of common method variance in two ways. First, we used Harman’s single factor test, which is a widely used technique to address the issue of common method bias (Podsakoff et al., 2003). According to this procedure, all of the items should be entered into an unrotated exploratory factor analysis with the number of extracted factors constrained to be one. Common method variance is thought to be present when the resulting factor explains more than 50% of the variance in the items (Podsakoff et al., 2003). We found that the resulting factor accounted for about 37% of variance of the items.
As a second approach to assess the extent of common method bias, we added an unmeasured latent factor (Podsakoff et al., 2003). The model including this latent factor (Model 5 in Table 3.1) significantly improved model fit (∆χ2 = 62.58, ∆df = 2, p < .01). This implies that some common method variance influenced the validity of the factor structure. The incremental explained variance was on average 17.6% per item. Although there is no clear consensus about cutoff values concerning the incremental explained variance of a common method bias factor, the findings of the meta-analysis of Williams, Cote and Buckley (1989) may serve as a benchmark. They found that, in all of the studies they examined, approximately 25% of the variance per item was due to common method bias. For the present study, this suggests that common method
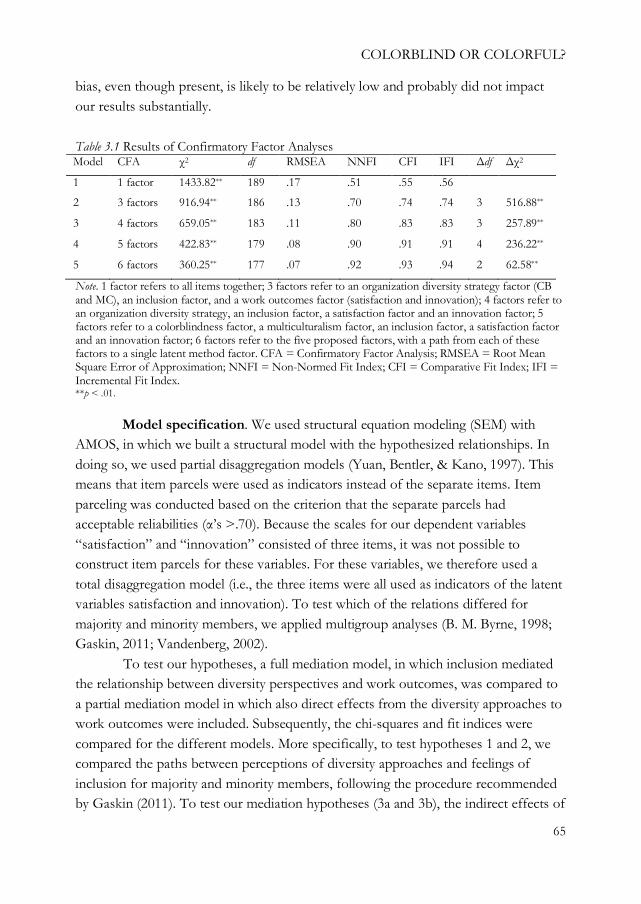
COLORBLIND OR COLORFUL?
65
bias, even though present, is likely to be relatively low and probably did not impact our results substantially.
Table 3.1 Results of Confirmatory Factor Analyses Model CFA χ2 df RMSEA NNFI CFI IFI ∆df ∆χ2
1 1 factor 1433.82** 189 .17 .51 .55 .56
2 3 factors 916.94** 186 .13 .70 .74 .74 3 516.88**
3 4 factors 659.05** 183 .11 .80 .83 .83 3 257.89**
4 5 factors 422.83** 179 .08 .90 .91 .91 4 236.22**
5 6 factors 360.25** 177 .07 .92 .93 .94 2 62.58**
Note. 1 factor refers to all items together; 3 factors refer to an organization diversity strategy factor (CB and MC), an inclusion factor, and a work outcomes factor (satisfaction and innovation); 4 factors refer to an organization diversity strategy, an inclusion factor, a satisfaction factor and an innovation factor; 5 factors refer to a colorblindness factor, a multiculturalism factor, an inclusion factor, a satisfaction factor and an innovation factor; 6 factors refer to the five proposed factors, with a path from each of these factors to a single latent method factor. CFA = Confirmatory Factor Analysis; RMSEA = Root Mean Square Error of Approximation; NNFI = Non-Normed Fit Index; CFI = Comparative Fit Index; IFI = Incremental Fit Index. **p < .01.
Model specification. We used structural equation modeling (SEM) with AMOS, in which we built a structural model with the hypothesized relationships. In doing so, we used partial disaggregation models (Yuan, Bentler, & Kano, 1997). This means that item parcels were used as indicators instead of the separate items. Item parceling was conducted based on the criterion that the separate parcels had acceptable reliabilities (α’s >.70). Because the scales for our dependent variables “satisfaction” and “innovation” consisted of three items, it was not possible to construct item parcels for these variables. For these variables, we therefore used a total disaggregation model (i.e., the three items were all used as indicators of the latent variables satisfaction and innovation). To test which of the relations differed for majority and minority members, we applied multigroup analyses (B. M. Byrne, 1998; Gaskin, 2011; Vandenberg, 2002).
To test our hypotheses, a full mediation model, in which inclusion mediated the relationship between diversity perspectives and work outcomes, was compared to a partial mediation model in which also direct effects from the diversity approaches to work outcomes were included. Subsequently, the chi-squares and fit indices were compared for the different models. More specifically, to test hypotheses 1 and 2, we compared the paths between perceptions of diversity approaches and feelings of inclusion for majority and minority members, following the procedure recommended by Gaskin (2011). To test our mediation hypotheses (3a and 3b), the indirect effects of

CHAPTER 3
66
the independent variables on the dependent variables were estimated, and a bootstrap procedure (5000 samples) was conducted to test whether these indirect effects were significant. Importantly, these analyses allowed us to estimate the entire model as depicted in Figure 3.1 and thereby to test all of our hypotheses simultaneously.
Results
Descriptive statistics
Table 3.2 shows the means, standard deviations, and correlations among all study variables for the full sample. In addition, as we specifically focus on possible differences between minority and majority employees, Table 3.3 provides descriptive statistics for these two groups separately.
Table 3.2 Means, Standard Deviations, and Correlations of the Study Variables
M SD 1 2 3 4 5 6 7 8 9 10
1. Gender .56 .50 -
2. Age 39.40 11.77 -.01 -
3. Tenure 8.19 8.48 -.01 .55** -
4. Perc. cult. div. 4.80 1.80 .02 .05 .02 -
5. Cult. backgr. .34 .47 -.10 .02 -.10 .15* -
6. Colorblindness 3.82 0.67 -.01 .04 -.04 .22** -.01 -
7. Multiculturalism 3.37 0.63 -.10 .04 -.07 .25** .18** .38** -
8. Inclusion 3.75 0.61 .06 .06 .02 .04 -.07 .57** .34** -
9. Satisfaction 3.35 0.81 .09 .07 .05 .04 .03 .32** .30** .57** -
10. Innovation 3.42 0.82 .11 .04 -.01 .14* .00 .30** .26** .41** .46** -
Note. Gender: 0 = male; 1 = female; Cultural background: 0 = majority; 1 = minority. p < .05, **p < .01.
Independent t-tests were performed to assess whether the means of the
variables significantly differed between the majority and minority group. It appeared that the extent to which the respondents perceived their organization to adopt a multicultural approach differed between the two groups, with the minority group members reporting higher levels of multiculturalism in their organization (M = 3.53) than majority group members (M = 3.29; t = 9.38, p < .01). The other studied main variables were not significantly different for majority and minority members. Among the control variables it appeared that gender, age, and tenure did not correlate with any of our main variables. However, the extent to which respondents perceive their

COLORBLIND OR COLORFUL?
67
organization as culturally diverse also differed between the two groups, with the minority group regarding their organization as more culturally diverse (M = 5.17) compared with the majority group (M = 4.61; t = 2.23, p < .05). Given these results, we excluded the control variables from subsequent analyses, with the exception of perceived diversity in the organization.
Table 3.3 Descriptive Statistics for Majority and Minority Members Separately
M
(maj/min)
SD
(maj/min)
1 2 3 4 5 6 7 8 9
1. Gender .60/.49 .49/.50 - -.03 -.17 -.03 -.01 .06 .11 .18 .14
2. Age 39.20/39.79 11.99/11.39 .00 - .44** .11 .11 -.03 .03 .10 .12
3. Tenure 8.76/7.01 9.03/7.15 .03 .54** - .19 .07 .06 -.06 .15 .17
4. Perc. cult. div. 4.61/5.17 1.87/1.60 .00 .04 -.01 - .24* .13 -.08 .03 .03
5. Colorblindness 3.83/3.82 0.67/0.67 -.02 .01 -.08 .21** - .53** .50** .41** .24*
6. Multiculturalism 3.29/3.53 0.64/0.58 -.15 .06 -.09 .26** .33** - .58** .47** .28*
7. Inclusion 3.78/3.70 0.62/0.61 .03 .07 .04 .11 .61** .26** - .61** .51**
8. Satisfaction 3.34/3.38 0.80/0.83 .04 .06 .02 .05 .28** .22** .54*** - .41**
9. Innovation 3.42/3.43 0.83/0.79 .11 .00 -.07 .19* .33** .25** .36** .49** -
Note. Correlations for the majority group are reported below the diagonal; Correlations for the minority group are reported above the diagonal; Gender: 0 = male; 1 = female. *p < .05, **p < .01.
Model fit
Our hypothesized multigroup full mediation model fitted the data well, χ2 = 203.66, df = 112, p < .01, RMSEA = .060, CFI = .95, NNFI = .93. In addition, the more complex partial mediation model (χ2 = 195.78, df = 104, p <. 01, RMSEA = .061, CFI = .95, NNFI = .92) did not significantly improve model fit, ∆χ2 = 9.88, ∆df = 8, n.s. In particular, it appeared that none of the direct paths from diversity perspectives to work outcomes were significant. Therefore, we concluded that the full mediation model obtained the best fit.12 Hypothesis testing
We expected that the relationships between perceived diversity approaches and feelings of inclusion differed for majority and minority group members (hypotheses 1 and 2). To test these hypotheses, we compared the paths for majority
12 In addition, to ascertain the assumed directional flow of our model, we estimated all possible alternative models (e.g., a model in which diversity approaches were specified to predict feelings of inclusion through work outcomes). In line with what we expected, we found that all of these alternative configurations yielded a significantly worse fit than our hypothesized model.

CHAPTER 3
68
and minority members following the procedure recommended by Gaskin (2011). In line with hypothesis 1, there was a positive relationship between colorblindness and inclusion for majority members (γ = .65, p < .01), but not for minority members (γ = .17, n.s.; Zdifference = 2.18, p < .01). Consistent with hypothesis 2, multiculturalism was positively related to inclusion for minority members (γ = .69, p < .01), but not for majority members (γ = .06, n.s.; Zdifference = 3.22, p < .01).
We further predicted that for majority members, inclusion mediates the relationship between colorblindness and work outcomes (hypothesis 3a), whereas we expected that for minority members, inclusion mediates the relationship between multiculturalism and work outcomes (hypothesis 3b). Initial support for these hypotheses was obtained by comparing the model fit of the fully mediated model with the partially mediated model (see above). In addition, we assessed the indirect effects of the diversity approaches on work outcomes for both majority and minority members (see Table 3.4).
Table 3.4 Indirect Effects of Diversity Perspectives on Work Outcomes for Majority and
Minority Members
Work Satisfaction Perceived innovation
Colorblindness Majority .37** .25**
Minority .06 .08
Multiculturalism Majority .04 .01
Minority .49** .39**
Note. Significance testing was based on bootstrapping (5000 iterations). **p < .01.
Confirming hypothesis 3a, we found a significant indirect effect of
colorblindness on satisfaction (γ = .37, p < .01) and perceived innovation (γ = .25, p < .01) for majority members. Consistent with hypothesis 3b, we found a significant indirect effect of multiculturalism on satisfaction (γ = .49, p < .01) and perceived innovation (γ = .39, p < .01) for minority members.
Thus, for majority members, stronger perceptions of a colorblind approach elicited feelings of inclusion, which in turn predicted job satisfaction and innovation. In contrast, for minority members, stronger perceptions of a multicultural approach were associated with increased feelings of inclusion, which in turn predicted these

COLORBLIND OR COLORFUL?
69
outcomes. Figure 3.2 and 3.3 presents the results with standardized regression coefficients for the final models of the analyses.13
Figure 3.2 Results for the Hypothesized Model for Majority Members (n = 152)
Figure 3.3 Results for the Hypothesized Model for Minority Members (n = 77)
13 For the clarity of presentation, Figures 3.2 and 3.3 do not show the paths from the control variable “perceived cultural diversity” to each latent variable. The reported standardized regression coefficients are however derived from a model that does control for perceived cultural diversity.
CHAPTER 3
70
Discussion
Due to demographic changes in their workforce, organizations are increasingly faced with the challenge to develop and implement successful diversity approaches. The goal of the current study was to provide a better understanding of how and why perceived organizational diversity approaches relate to work outcomes for majority and minority employees.
For majority members, we found that the extent to which they perceived their organization to value equality regardless of group membership (i.e., a colorblind approach) was positively related to work outcomes in terms of work satisfaction and perceived innovation. In contrast, for minority members, the extent to which they perceived their organization to adopt an approach in which differences between cultural groups are acknowledged and appreciated (i.e., a multicultural approach) was positively related to these work outcomes. Although the importance of diversity approaches has been pointed out by several scholars, empirical evidence that link these approaches to outcomes in an organizational setting is scarce (cf. Rattan & Ambady, 2013). That is, most of the empirical work concerns support for specific diversity approaches in a societal context (e.g., Karafantis et al., 2010; Levin et al., 2012; Plaut et al., 2011; Ryan et al., 2007; Wolsko et al., 2000). Yet, in this study, going beyond a mere preference for colorblindness or multiculturalism, we provided insights into how actual perceived diversity approaches in organizations impact people in their daily working life.
Perhaps even more important, we identified a key process in understanding these differential routes to work outcomes. For both majority and minority members, the relationship between the organizational approach towards diversity and work outcomes was fully mediated by the extent to which they perceived to be included in the organization. Majority members, however, feel especially included when they perceive their organization to ignore cultural group differences and to stress individualism. In contrast, the degree to which an organization is perceived to adopt a multicultural approach was particularly related to feelings of inclusion for minority members. In sum, inclusion seems an important factor for both majority and minority members to secure affective and productive work outcomes. Yet, how inclusion is established appears to be different for majority and minority members.
Taken together, the present research offers an interesting starting point to further examine the struggle for equality in the workforce. Equality in terms of colorblindness seems to include an implicit expectation of similarity, which leave little possibilities for expressing one’s cultural background. Indeed, previous studies show

COLORBLIND OR COLORFUL?
71
that employees report high pressure to assimilate to existing organizational norms when colorblind messages are conveyed by managers (Chattopadhyay et al., 2004; Ely & Thomas, 2001; Plaut et al., 2011). In addition, research suggests that the colorblind ideology is especially sensitive to strategic reframing by majority employees to defend their dominant position within the organization (Knowles, Lowery, Hogan, & Chow, 2009). In contrast, equality in a multicultural approach refers to attaching equal value to all contributing cultural groups within the organization. Ironically, while in theory majority members are included in such a multicultural approach, the present study suggests that majority member do not perceive this approach as being inclusive of their group. This is in line with previous research that indicates that the “value in diversity” approach is less embraced by majority members as it may threaten their current dominant position in the organization (Bell, Harrison, & McLaughlin, 2000; Brief et al., 2005; Gilbert & Ivancevich, 2001; Plaut et al., 2011; K. M. Thomas & Plaut, 2008). Possible Limitations and Future Research
The present study had a number of possible limitations. The first and most important limitation of this study is that we relied on cross-sectional data to test our hypotheses. Therefore, we are not able to draw any straightforward conclusions regarding the causality and sequence of the relations examined. However, we believe that the direction of the relationships in our conceptual model is both theoretically plausible and in line with previous research (e.g., Levin et al., 2012; Plaut et al., 2009; Plaut et al., 2011). In addition, we found that all possible alternative configurations fitted the data significantly worse than our hypothesized model.
A second potential limitation is that all data were self-reported, which may inflate common method bias (Podsakoff et al., 2003). As mentioned in the introduction, we relied on subjective assessments of organizational approaches to diversity, as research shows that perceptions of one’s social environment have a far greater and more direct impact on one’s behavior than the social environment itself (Eisenberger et al., 1986). Therefore, we hold that subjective perceptions of diversity approaches have more proximal explanatory power than objective measures of diversity approaches (cf. Krackhardt, 1990). In addition, the results of our CFA’s supported the construct validity and the lack of overlap between the different scales we used, decreasing the possibility of substantial noise due to common method bias. Indeed, our post-hoc analyses revealed that the amount of common method variance present was relatively low and therefore probably did not impact our results substantially. Notwithstanding these observations, future studies could attempt to gather information from different sources. Going beyond the mere perceptions of

CHAPTER 3
72
diversity approaches among employees, HR or general managers could be asked to assess the diversity approach in their organization. Similarly, performance indicators could be provided by line- or general managers. Such triangulation of multiple data sources would further increase the reliability and validity of the present results.
Our findings suggest that belonging to either the cultural majority or cultural minority group within an organization is a crucial factor to consider when studying the impact of diversity approaches on employees. This does not necessarily imply, however, that all majority members will benefit from a colorblind approach or that all minority members will prosper under a multicultural diversity approach. Future research may elaborate on this notion by exploring whether there are individual employee characteristics (e.g., personality traits) that can explain which diversity approach works best for whom. This research may be informed by previous work on individual differences in the endorsement of colorblind and multicultural national integration policies. In this context, it has been found that majority members who score high on social dominance orientation (SDO; Pratto, Sidanius, Stallworth, & Malle, 1994) endorse a colorblind approach significantly more than those low in SDO (Knowles et al., 2009). In addition, minority members who are highly identified with their cultural group have been found to be especially susceptible to the exclusionary effect of colorblindness and to benefit most from an environment in which cultural differences are valued (Gonzales & Cauce, 1995; Rosenthal & Levy, 2010). Testing these predictions in an organizational setting may further improve our understanding of why and how perceived organizational diversity approaches affect employees. Implications
In our view, the present study has some important implications for organizations. Our results show that different strategies towards diversity management relate to work outcomes for majority and minority employees differently. The patterns between diversity approaches and inclusion suggest that when organizations focus on a single approach to deal with diversity, some groups in the organization may feel excluded. Ensuring that both majority and minority members feel included is therefore a key challenge for organizations that have a culturally diverse workforce. In order to do so, scholars have argued that organizations should move beyond the colorblindness/multiculturalism dichotomy, and develop a new diversity approach that is inclusive of both majority and minority members ("all-inclusive multiculturalism"; Stevens et al., 2008).
One way to develop such an approach is to focus on elements out of both approaches that potentially appeal to both majority and minority members (Purdie-Vaughns & Ditlmann, 2010). While colorblindness and multiculturalism seem to be

COLORBLIND OR COLORFUL?
73
clearly distinct and constitute cohesive sets of ideas and practices, they may not be entirely mutually exclusive (Plaut, 2002). Particularly, to acknowledge and value the positive influence that cultural differences may have on work processes is not necessarily incompatible with a focus on individual qualifications in recruitment, selection, and employee development. Corresponding with this line of reasoning and with findings from previous research (e.g., Levin et al., 2012; Plaut et al., 2009; Ryan et al., 2007; Wolsko et al., 2006), we found a positive association between perceptions of colorblindness and multiculturalism in the present study. Future research could elaborate on this finding by more explicitly modeling how colorblindness and multiculturalism are manifested in organizations.
From a practical point of view, organizations may implement diversity approaches that are more inclusive by explicitly valuing the contributions of all cultural subgroups in their diversity communication (e.g., in mission statements). In addition, diversity policies and initiatives can be framed as benefiting everyone, as opposed to just one particular subgroup. Furthermore, when a practice does not directly benefit everyone, employees can be reminded that such diversity practices promote professionalism and collegiality and are part of a greater effort to create a stronger workplace environment for everyone (K. M. Thomas, 2005). Yet, a more inclusive diversity approach should not only be manifested in diversity communication. Organizations should “put their money where their mouth is” and also implement structural changes to include all employees (Stevens et al., 2008). For example, organizations could ensure that members of all cultural subgroups are represented in leadership roles and in diversity structures (e.g., diversity task forces; Stevens et al., 2008). The results of the present research underline the importance of developing and implementing such an all-inclusive diversity approach.


Chapter 4
Being part of diversity. The effects of an all-inclusive
multicultural diversity approach on majority members’
perceived inclusion and support for organizational diversity
efforts
This chapter is based on Jansen, W.S., Otten, S., & Van der Zee, K.I. (in press). Being part of
diversity. The effects of an all-inclusive multicultural diversity approach on majority members’
perceived inclusion and support for organizational diversity efforts. Group Processes and Intergroup
Relations. doi: 10.1177/1368430214566892

CHAPTER 4
76
Abstract
In two experiments we tested how explicitly including the cultural majority group in an organization’s diversity approach (all-inclusive multiculturalism) affects the extent to which majority members feel included in the organization and support organizational diversity efforts. In Study 1 we focused on prospective employees. We found that an all-inclusive diversity approach, compared with the “standard” multicultural approach in which the majority group is not explicitly made part of organizational diversity, led to higher levels of anticipated inclusion for those with a high need to belong. In Study 2 we turned to sitting organizational members. Here, we again found that an all-inclusive multicultural approach increased perceptions of inclusion, but now the effect was present regardless of individual levels of need to belong. Perceived inclusion, in turn, was positively related to majority members’ support for organizational diversity efforts. Together, these findings underline the effectiveness of an all-inclusive multicultural approach towards diversity.

BEING PART OF DIVERSITY
77
Due to demographic changes in the European and U.S. workforce, Western organizations have become progressively culturally diverse (Bureau of Labor Statistics, 2012). As cultural diversity can have a profound impact on employee well-being and organizational performance, successful diversity management is essential (Jackson & Joshi, 2011; Van Knippenberg & Schippers, 2007). Indeed, many organizations recognize this challenge and attempt to actively manage diversity by implementing diversity initiatives, such as offering diversity awareness training programs, setting up diversity task forces, and including diversity in organizational mission statements (Kalev, Dobbin, & Kelly, 2006).
Yet, while the effectiveness of diversity initiatives is largely dependent on the receptiveness of majority members, diversity efforts and communication often deal exclusively with minority groups (James, Brief, Dietz, & Cohen, 2001). That is, diversity initiatives are more often than not launched to solve problems that minorities are primarily faced with, such as workplace discrimination and underrepresentation of minorities in leadership positions. As an unintended consequence, this one-sided focus may lead majorities to perceive diversity to be “only for minorities.” Indeed, majority members were found to be less interested in working for organizations that indicate to value diversity (i.e., pursue a “multicultural” diversity approach; Plaut, Garnet, Buffardi, & Sanchez-Burks, 2011), and have been shown to endorse diversity efforts consistently less than minorities (Wolsko et al., 2006).
In the present research we examine whether majority members’ perceived lack of inclusion and their resistance to organizational diversity efforts can be attenuated by explicitly including the majority group in the organization’s diversity approach (“all-inclusive multiculturalism”; Stevens, Plaut, & Sanchez-Burks, 2008). Diversity approaches reflect the organizations’ normative beliefs and expectations about the reason to diversify, the value of cultural diversity, and its connection to work processes (Stevens et al., 2008).14 In our view, diversity approaches constitute contextual cues that employees use to evaluate their inclusionary status (cf. Purdie-Vaughns et al., 2008). Formulating diversity approaches in a more inclusive manner, such that both majority and minority groups are considered part of organizational diversity, therefore has the potential to enhance majority members’ perceived inclusion. Inclusion, in this regard, refers to the extent to which an individual
14 Different terms have been used throughout the existing literature to describe the concept of diversity approaches. Examples include diversity perspectives (Ely & Thomas, 2001), ideologies (Wolsko, Park, Judd, & Wittenbrink, 2000), models (Plaut, 2002), and paradigms (Thomas & Ely, 1996). In order to avoid confusion, we opted to use a single term in this article. In line with Stevens et al. (2008), we favor the term diversity approaches.
CHAPTER 4
78
perceives to be an accepted organizational member that is allowed to be him- or herself within the organization (cf. Jansen et al., 2014). In addition, we expect that when majority members perceive to be more included, they will also be more supportive of organizational diversity efforts. We test these predictions in two experiments. First, we assess whether an all-inclusive diversity approach (compared with a “standard” multicultural approach) affects the extent to which prospective majority employees anticipate to be included in an organization. Second, we test how sitting organizational members belonging to the cultural majority group react to all-inclusive diversity approaches.
Diversity Approaches as Contextual Cues
In response to increasing levels of cultural diversity, many organizations have launched diversity initiatives. In fact, according to a survey of companies listed in the Fortune 1000, 95% of large U.S. organizations implemented some form of diversity management, with mentoring programs and diversity awareness trainings most frequently mentioned (Grensing-Pophal, 2002). As reflected in these examples, traditionally, the main goals of diversity management were to avoid discriminatory employment practices and to foster a work climate in which differences between employees are tolerated and accepted. More recently, many employers moved away from such a problem-focused approach and began to perceive diversity as a strategic resource that can be utilized to enhance organizational performance (Jackson & Joshi, 2011). The rationale behind such a multicultural approach is that people from different backgrounds possess different skills, perspectives, and social networks, which can be used for the benefit of the larger organization (Cox, 1991; Haslam et al., 2003; Stevens et al., 2008).15
Paradoxically, while a multicultural approach in principle should foster a work environment in which all employees feel included, multicultural activities are often met with resentment, skepticism and resistance by non-minorities, who represent overlooked, yet critical stakeholders in diversity issues (Brief et al., 2005; Stevens et al., 2008; K. M. Thomas & Plaut, 2008). Indeed, researchers have argued and demonstrated that managing diversity through a multicultural approach can generate
15 What we and others have labeled a multicultural approach closely resembles the integration and learning perspective of Ely and Thomas (2001). Whereas multiculturalism is a more common term in the acculturation and intergroup literature, integration and learning is more widely used in the organizational psychology literature. Both refer to the belief that diversity is a valuable resource to improve organizational learning and innovation.

BEING PART OF DIVERSITY
79
significant backlash among majority members, as manifested in lower levels of organizational identification, reduced motivation, and increased discrimination of minorities (Linnehan & Konrad, 1999; K. M. Thomas & Plaut, 2008; Verkuyten, 2005).
Several explanations for majority members’ negative attitudes towards a multicultural approach have been put forward in the literature. Among these are perceived losses in status and social dominance, in-group bias, and prejudice (e.g., James et al., 2001; Knowles et al., 2009; Sidanius & Pratto, 1999). While these are all important and plausible reasons, in the present research, we focus on an explanation that is often overlooked: majority members may perceive to be excluded by organizational policies and initiatives that emphasize the value of diversity (cf. Plaut et al., 2011).
To provide a fundamental understanding of why non-minorities may perceive to be excluded by a multicultural diversity approach, we build on previous research that suggests that people monitor their social environment for contextual cues that indicate the social fit or safety of their (social) identity (Leary & Baumeister, 2000; Purdie-Vaughns et al., 2008). Social identity safety refers to the perception that one’s social identity is not threatened in a particular group context (Markus & Steele, 2000). Contextual cues indicating the safety of a social identity can either be physical (e.g., observing that members of one’s own group are present in the organization) or affective (e.g., noticing that one’s group is valued by the organization). Research suggests that when a specific setting (e.g., an organization) is perceived to be socially safe, people display higher levels of trust and motivation, and also perform better (Adams, Garcia, Purdie-Vaughns, & Steele, 2006; G. L. Cohen, Steele, & Ross, 1999; Irving & Hudley, 2005).
While there is ample evidence that minority members use contextual cues, such as diversity approaches, to determine the safety of their social identity within the organization (e.g., Purdie-Vaughns et al., 2008), research on how susceptible majority members are to organizational diversity approaches is still more scarce (for exceptions, see Avery, 2003; Rau & Hyland, 2003). In the present study we attempt to extend this body of research by investigating how and why majority members react to (multicultural) organizational diversity approaches. Our premise is that majorities, just like minorities, may use organizational diversity approaches to assess whether their social identity is safe and thereby whether they are included. To the extent that an organization only stresses the contribution of minority groups in their diversity initiatives, a multicultural strategy is thus likely to result in lower levels of perceived inclusion among majority group members.

CHAPTER 4
80
In response to the perceived exclusionary effect of multiculturalism, researchers have sought to develop more inclusive approaches, with perhaps the most prominent being the all-inclusive multicultural (AIM) approach (Stevens et al., 2008). The main premise of the AIM approach is that majority members’ resistance to a multicultural approach is reduced when their cultural group is included in the organization’s conception of diversity (e.g., in mission statements). Similar to the multicultural approach, the AIM approach acknowledges the importance of an individual’s demographic group membership. Unlike the multicultural approach, the AIM approach explicitly emphasizes that this holds for members of all groups, including majority members.
In a series of studies, Plaut and collaborators (2011) tested the effectiveness of the AIM approach. In their first study, majority members (White Americans) appeared to be faster in an implicit association task at pairing multiculturalism with exclusion than with inclusion. In their second study, this association disappeared through a subtle framing of diversity efforts as targeted at all groups, including White Americans. This indicates that the AIM approach, at least at an implicit level, can attenuate the exclusionary effect of the “standard” multicultural approach. It also suggests, however, that majority members may benefit at a more explicit level. That is, they may explicitly anticipate (if they are prospective employees) or perceive (if they are sitting organizational members) higher levels of inclusion when their cultural group is mentioned in the organization’s diversity approach. Hence, our first hypothesis is:
Hypothesis 1: Explicitly including the cultural majority group in an organization’s diversity approach will increase the extent to which majority members anticipate/perceive to be included in the organization. While it is assumed that all people monitor their social context to assess the
safety of their social identities, research suggests that some people may be especially attentive to contextual cues. Specifically, people who have a high need to belong (i.e., a strong desire to be included into groups; Baumeister & Leary, 1995) have been found to be particularly sensitive to cues pertaining to their inclusionary status (Pickett, Gardner, & Knowles, 2004). In line with these findings, other research revealed that prospective majority employees high in need to belong (NTB) were less attracted to an organization espousing a multicultural approach than those low in need to belong (Plaut et al., 2011; Study 5). Following from this, we expect that majority members high in NTB may benefit most from an AIM approach towards diversity. This leads us to our second hypothesis:

BEING PART OF DIVERSITY
81
Hypothesis 2: The effect of explicitly including the cultural majority group in an organization’s diversity approach on majority members’ anticipated/perceived inclusion is moderated by an individual’s NTB, such that the effect is stronger for those high in NTB than for those low in NTB.
The Present Research
We test the above hypotheses in two studies. In Study 1 we focus on prospective organizational members, as previous research suggests that organizational diversity approaches may be used by potential employees to get an initial impression of how they would fit in (Rau & Hyland, 2003). In Study 2, using a similar paradigm, we test these hypotheses for sitting organizational members. This second study not only allows us to explore whether the pattern of results of Study 1 are similar for a different group of majority members, but also permits us to test whether an all-inclusive diversity approach may in fact enhance majority members’ support for organizational diversity efforts.
Study 1
Method
Participants and procedure. All 153 participants of Study 1 were visitors to a job fair in the Netherlands. Thirty-nine participants were left out because they indicated that they themselves (n = 8) or at least one of their parents (n =31) was born in a country other than the Netherlands.16 The mean age of the remaining 114 participants was 38.06 years (SD = 12.14 years; range 18-70 years), of which roughly half (56%) were female. Fifty-six percent had at least a college education. The respondents were asked to participate in a study in which they would evaluate a trifold brochure of the management consulting firm “CCG Consultancy.” As an incentive to participate, each participant had the chance to win a coffee machine. After providing informed consent, the participants were instructed to study the brochure of CCG Consultancy. They were unaware that this was a fictitious organization. The brochure
16 In accordance with both the Dutch Central Bureau of Statistics (CBS, 2014) and with most other social-scientific research conducted in the Netherlands, we chose to operationalize an individual’s ethnicity by considering his or her country of birth. People who were themselves and/or had at least one parent that was born outside of the Netherlands are typically considered to belong to an ethnic minority group.

CHAPTER 4
82
contained the experimental manipulation, consisting of two conditions to which participants were randomly assigned: multiculturalism (n = 60) versus all-inclusive multiculturalism (n = 54). After participants indicated they had studied the brochure in detail, they completed a brief paper-and-pencil questionnaire concerning their impression of the company and were subsequently debriefed.
Stimulus materials. A trifold brochure was used to introduce the fictitious management consulting firm CCG consultancy. The bulk of the brochure outlined the company in detail: the services, expertises, portfolio, and possible career opportunities. These sections remained constant across both conditions. The section containing the experimental manipulation was labeled “Our HR vision.” It consisted of a quote from the HR director describing the company’s diversity approach and was largely similar to the manipulation used by Plaut and colleagues (2011).17 Participants in the multicultural condition read the following:
“Many companies miss the point when thinking about putting together the best team of people. At CCG we know that diversity, for example in cultural background, is very important. Therefore, we are very happy to have employees with a Moroccan, Turkish or Antillean background. It is exactly this diversity that strengthens our organization.”
Participants in the all-inclusive multicultural condition read the following:
“Many companies miss the point when thinking about putting together the best team of people. At CCG we know that diversity, for example in cultural background, is very important. Therefore, we are very happy to have employees with a Moroccan, Turkish or Antillean background. But, of course, we also value our Dutch employees. It is exactly this diversity that strengthens our organization.” In addition to these text-based cues, we included two pictures of employees
in each brochure to further strengthen our manipulation. In both conditions, one picture depicted a female cultural minority employee. In fact, the same picture was
17 Among the largest ethnic minority groups in the Netherlands are people from Moroccan, Turkish or Antillean descent. These groups are considered to be “non-western” immigrant groups. They not only differ from “western” immigrants in their country of heritage, but also typically have a lower socio-economic status and report higher levels of unemployment. Because of this, diversity initiatives within Dutch organizations are often focused on these groups in particular. Accordingly, we decided to focus on these groups in our manipulation.

BEING PART OF DIVERSITY
83
used in both conditions. In the MC condition, this was complemented with a picture of a male minority employee. In contrast, in the AIM condition, the second picture depicted a male majority employee. In a previously conducted pilot study (n = 73) we established that the people displayed were equally attractive and could be correctly identified as belonging to either the cultural majority or one of the cultural minority groups.
Measures. As mentioned before, after reading the brochure, participants completed a brief questionnaire. They responded to the questions in the order as listed below.
Manipulation check. At the beginning of the questionnaire we stressed that the quality of the present research was only warranted if participants had read the brochure with sufficient attention. For each section, we subsequently asked them to recall what was written in the brochure. As a check of our manipulation, participants were asked to list the cultural groups mentioned in the section “Our HR vision.”
Inclusion. We adapted three items from the Perceived Group Inclusion Scale (Jansen et al., 2014) to assess the extent to which participants anticipated to be included within the organization. An example item is: “Imagine you work at CCG. How likely is it that you would fit in?” (α = .79). Answer categories ranged from 1 (very unlikely) to 6 (very likely), M = 4.60, SD = .88.
Need to belong. NTB was measured with seven items of the original 10-item scale of Leary, Kelly, Cottrell, and Schreindorfer (2013). An example item is: “I have a strong need to belong” (α = .67). Respondents indicated the degree to which they agreed with each statement on a Likert-type scale ranging from 1 (strongly disagree) to 5 (strongly agree), M = 3.27, SD = .46.
Control variables. To ensure that possible differences in anticipated inclusion between our conditions could be solely ascribed to our manipulation, we measured several potential confounding variables. First, we asked respondents to what extent they were attracted to the consultancy sector in the first place: “Regardless of your impression of CCG, to what extent would you like to work in the consultancy sector?” Respondents answered on a 5-point Likert-type scale ranging from 1 (absolutely not) to 5 (very much), M = 3.32, SD = .94. In addition, we included the conventional control variables age, gender, and level of education. Level of education was measured on a 5-point Likert-type scale ranging from 1 (elementary school) to 5 (university degree), M = 4.08, SD = 1.08. Finally, we asked respondents to rate the attractiveness of the design of the brochure on a 10-point scale, M = 6.47, SD = 1.43.

CHAPTER 4
84
Results
Manipulation check. To test the success of our manipulation, we coded whether participants listed the Dutch as being one of the cultural groups that were mentioned in the HR vision. In line with what we expected, in the multicultural condition only five participants (8%) listed that the Dutch were mentioned in the HR vision, whereas in the AIM condition 45 participants (83%) indicated the Dutch were mentioned. Because we did not want to undermine the random assignment to conditions, we decided to include the data of these participants in our analyses.18
Preliminary analyses. We first performed two independent t-tests to get an initial notion about the difference in condition means of our main study variables. We found that the mean level of anticipated inclusion did not significantly differ between the MC condition (M = 4.57) and the AIM condition (M = 4.63), t(110) = -.37, p = .71. Similarly, the conditions appeared to be comparable in terms of mean NTB scores (MMC = 3.35; MAIM = 3.18; t(111) = 1.95, p = .06). In addition to comparing our conditions in terms of the main study variables, we checked whether they were equivalent in terms of the control variables listed above. A chi-square analysis revealed that men and women were equally distributed across our two conditions, χ2(1, N = 114) = .01, p = .91. In addition, independent t-tests indicated that there were no significant differences between our conditions in age (MMC = 37.93 years; MAIM = 38.21 years; t(110) = -.12, p = .91), level of education (MMC = 4.15; MAIM = 4.00; t(112) = .74, p = .46), or attractiveness of the brochure (MMC = 6.40; MAIM = 6.54; t(106) = -.49, p = .63). We did however find a difference between our conditions in the extent to which respondents were attracted to the consultancy sector in the first place, with people in the multicultural condition indicating to be more attracted to work in consultancy (MMC = 3.49, SD = .88) than those in the all-inclusive multicultural condition (MAIM = 3.13; SD = .97), t(111) = 2.08, p = .04). Hence, we will control for this last factor in the main analysis.
Main analysis. A regression analysis was conducted to examine whether diversity approaches and an individual’s NTB influence the extent to which people anticipate to be included in an organization (see Table 4.1). Dummy codes were used for the diversity approach condition (0 = multiculturalism, 1 = all-inclusive
18 A plausible explanation for why the number of failures on the manipulation check in the AIM condition was relatively high might be that participants were Dutch themselves. Hence, the Dutch are probably more a “ground” from which they differentiate and specify other cultural groups. Yet, whether these participants did not read and process the information on the approach properly, or whether they simply forgot to list their own ethnic group, cannot be determined. The results of our analyses (see following) when we did exclude the 14 participants who failed the manipulation check were essentially the same.

BEING PART OF DIVERSITY
85
multiculturalism). The NTB scores were standardized, and the interaction term was construed based on these standardized scores (e.g., J. Cohen et al., 2003). In addition, we standardized the control variable “consultancy preference.” Results indicated there was no significant main effect of diversity approach condition (b = .18, t(109) = 1.11, p = .27) or of NTB (b = -.09, t(109) = -.72, p = .47) on anticipated inclusion. Yet, in line with our second hypothesis, there was a significant effect of the interaction between diversity approach condition and NTB on anticipated inclusion, b = .37, t(109) = 2.19, p = .03.
Table 4.1 Regression of Anticipated Inclusion on Diversity Approach Condition and NTB Step Predictor B SE (B) ∆R2 R2
Step 1 .07** .07
Consultancy preference .25** .09
Step 2 .02ns .09
Consultancy preference .26** .09
Diversity approach (MC = 0, AIM = 1) .18ns .17
NTB .11ns .09
Step 3 .04* .13
Consultancy preference .24** .09
Diversity approach (MC = 0, AIM = 1) .18ns .16
NTB -.09ns .12
Diversity approach x NTB .37* .17
Note. Total F(4, 105) for Step 3 = 3.87**, Adjusted R2 = .10. *p < .05, **p < .01.
An inspection of the simple slopes (see Figure 4.1) revealed that participants
high in NTB expected to be more included in the organization when the Dutch group was explicitly mentioned (all-inclusive multiculturalism) than when it was not (multiculturalism), b = .53, t(109) = 2.38, p = .02. For those low in NTB, there was no difference in anticipated inclusion between the two conditions, b = -.18, t(109) = -.79, p = .43.19
19 We also performed the analysis without the 14 people who failed the manipulation check. The results were largely similar. That is, there appeared to be no significant main effect of diversity ideology condition (b = .20, t(95) = 1.05, p = .30) or of NTB (b = -.08, t(95) = -.59, p = .56) on anticipated inclusion. In addition, the interaction effect between the diversity ideology condition and NTB on anticipated inclusion was (marginally) significant, b = .35, t(95) = 1.91, p = .06. Again, the simple slope analysis revealed that explicitly including the Dutch in the diversity ideology enhanced anticipated inclusion for people high in NTB (b = .53, t(95) = 2.07, p = .04) but not for people low in NTB (b = -.17, t(95) = -.63, p = .53).

CHAPTER 4
86
Figure 4.1 Anticipated Inclusion as a Function of Diversity Approach Condition and NTB
(adjusted means are displayed)
Conclusions and Discussion
Results from Study 1 revealed no main effect of our diversity approach manipulation on the extent to which majority members anticipated to be included in the organization. Although this is different from what we initially expected (hypothesis 1), this finding seems consistent with previous research on organizational attractiveness among prospective majority employees. In particular, Avery (2003) found that the display of racial diversity in recruitment advertisements did not affect the extent to which majority members were attracted to the organization. Consistent with hypothesis 2, however, we did find an effect for majority members with a high NTB. For these people, the explicit inclusion of their cultural group in organizational diversity appeared to be especially important.
A possible explanation for why there was no main effect of our manipulation is that our respondents were prospective employees rather than sitting organizational members. One could argue that people who are not yet part of an organization may be less attuned to cues send out by an organization than those who are already part of the organization. For prospective employees, diversity messages communicate the degree to which one will be included in a future scenario. The hypothetical nature of this information may explain why an all-inclusive diversity approach only affected those who were especially attentive to inclusionary signals (i.e., have a high NTB). For sitting organizational members, however, diversity messages are likely to have a much more direct impact on their perceived position within the organization (cf. Vos, Jansen, Otten, Podsiadlowski, & Van der Zee, under review). As a result, for these majority members, the AIM approach may be more effective. Thus, we performed a second
1
2
3
4
5
6
MC AIM
An
ticip
ate
d in
clu
sio
n
High NTB
Low NTB

BEING PART OF DIVERSITY
87
study in which we explored whether for sitting organizational members the AIM approach has positive consequences regardless of individual levels of NTB.
Study 2
In addition to focusing on sitting organizational members rather than prospective employees, Study 2 elaborated on Study 1 by considering inclusion not only as a dependent variable, but also by exploring whether inclusion, in turn, predicts the extent to which majority members support organizational diversity efforts. Previous research suggests that when majority members perceive to be more included in their company’s conception of diversity (as is the central goal of the AIM approach), they also tend to endorse organizational diversity efforts more (Plaut et al., 2011; Study 4). Besides hypotheses 1 and 2, we therefore tested two additional hypotheses in Study 2:
Hypothesis 3: The extent to which majority members perceive to be included is positively related to their support for organizational diversity efforts. Hypothesis 4: Perceived inclusion mediates the link between an organization’s diversity approach and majority members’ support for organizational diversity efforts.
Method
Participants and procedure. The participants of Study 2 were asked to take part in a study in which they would evaluate the internationalization vision of their university. All 142 participants were students of the University of Groningen and were recruited in a university cafeteria. Forty-three participants were left out because they indicated that they themselves (n = 35) or at least one of their parents (n = 8) was born in a country other than the Netherlands. The mean age of the remaining 99 respondents was 21.39 years (SD = 2.32 years; range 16-28 years), and exactly two-thirds of these participants (n = 66) were female. The vast majority of students were enrolled at the faculty of Arts (n = 76) or Law (n = 20). Students enrolled in the second year of their study (n = 27) were in the majority, followed by first-year students (n = 22), and third-year students (n = 17). The remaining participants (n = 33) were enrolled at the university for four years or longer. Similar to Study 1, each participant was given the chance to win a coffee machine as an incentive to participate. After providing informed consent, the participants were instructed to study a brochure with the internationalization vision of the university. The brochure contained the

CHAPTER 4
88
experimental manipulation, consisting of two conditions to which participants were randomly assigned: multiculturalism (n = 42) and all-inclusive multiculturalism (n = 57). After participants indicated they had studied the brochure in detail, they completed a brief paper-and-pencil questionnaire concerning their impression of the internationalization vision and were subsequently debriefed.
Stimulus materials. Similar to Study 1, we constructed (two versions of) a brochure that conveyed the diversity/internationalization approach of the University of Groningen. The design was in accordance with the official house style of the university and the content was inspired by the actual internationalization brochure. The brochure was divided into two parts: “Facts” and “Future.” The “Facts” part listed a few key internationalization figures. In the multicultural condition, only the number of international students were mentioned, whereas in the all-inclusive multicultural condition, both the number of international and the number of Dutch students were listed. Specifically, the numbers presented in a bulleted list were: “1,100 visiting students; 2,974 of 27,345 are international students (AIM condition: 24,371 Dutch and 2,974 international students); 800 of 1,500 are international PhD candidates (AIM condition: 700 Dutch and 800 international PhD candidates); 18.2% of the academic staff is international; 115 nationalities currently study or work at the University; 93 English-taught Master's degree programmes; 20 English-taught Bachelor’s degree programmes; 8 Erasmus Mundus programmes.” In the “Future” section, the university’s diversity approach was presented. Similar to our first study, participants in the multicultural condition read the following:
“The university realizes that diversity, for example in the cultural background of staff and students, is very important. In fact, the presence of international students has helped us to be what we are today: a leading university. We are therefore particularly happy with our international students. It is exactly this diversity that strengthens our organization.”
Participants in the all-inclusive multicultural condition read the following:
“The university realizes that diversity, for example in the cultural background of staff and students, is very important. In fact, the combined presence of Dutch and international students has helped us to be what we are today: a leading university. We are therefore particularly happy with both our Dutch and international students. It is exactly this diversity that strengthens our organization.”

BEING PART OF DIVERSITY
89
Again, we supplemented these text-based cues with a visual manipulation. That is, in each brochure, we included two pictures of students. In the multicultural condition, both pictures depicted an international student. In the all-inclusive multicultural condition, one picture depicted an international student while the other depicted a native Dutch student. Similar to Study 1, we previously conducted a pilot study (n = 57) to match the pictures on attractiveness, and to ensure that the students displayed could be correctly identified as being either Dutch or non-Dutch. Again, we used a picture of one male and one female student in each brochure to further safeguard the comparability of the pictures across our conditions. Finally, the last section of the brochure mentioned the concrete internationalization plans of the university. In both versions of the brochure it stated that the university strived to increase the number of international students to 5000 by the year 2015.
Measures. As mentioned before, after reading the brochure, participants completed a brief questionnaire. They responded to the questions in the order as listed below.
Manipulation check. Similar to Study 1, we emphasized in the beginning of the questionnaire that it was very important that participants had read the brochure carefully. We subsequently asked them a number of questions about the brochure, including our manipulation check: “Which group(s) of students was/were mentioned in the internationalization brochure?” Participants could choose between three answers: (1) international students, (2) Dutch students, and (3) both international and Dutch students.
Inclusion. We adapted six items from the Perceived Group Inclusion Scale (Jansen et al., 2014) to assess the extent to which participants perceived to be included by the internationalization vision. An example item is: “With this vision the university signals that I belong” (α = .87). Answer categories ranged from 1 (strongly disagree) to 6 (strongly agree), M = 4.42, SD = .66.
Need to belong. NTB was measured with six items of the original 10-item scale of Leary, Kelly, Cottrell, and Schreindorfer (2013). An example item is: “I have a strong need to belong” (α = .71). Answer categories ranged from 1 (strongly disagree) to 5 (strongly agree), M = 3.31, SD = .60.
Diversity support. The extent to which participants supported the university’s internationalization plans (to increase the number of international students to 5000 by the year 2015), was measured with three items, including: “I support these internationalization plans” (α = .65). Participants responded on a 6-point Likert-type scale, with answer categories ranging from 1 (strongly disagree) to 6 (strongly agree), M = 4.17, SD = .76.
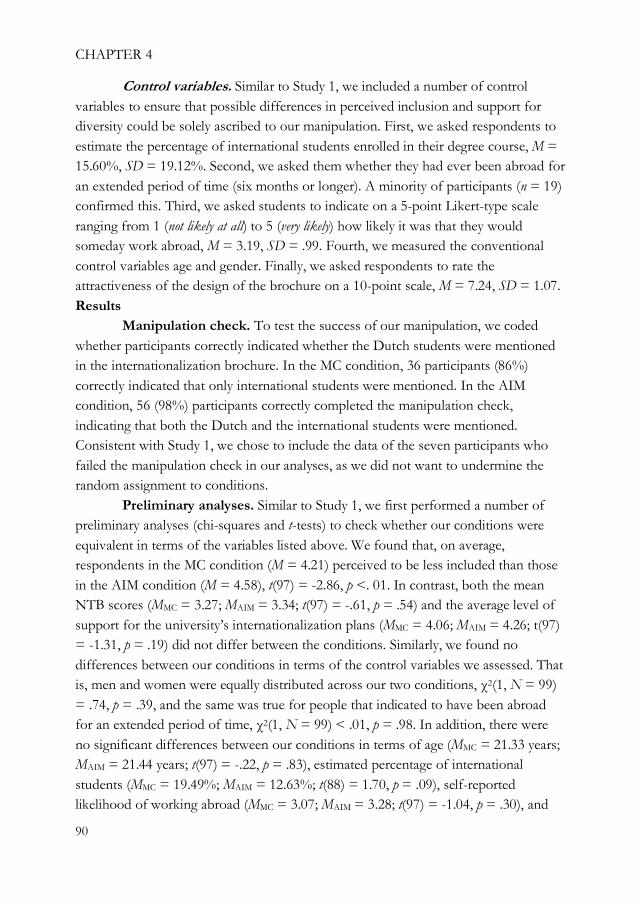
CHAPTER 4
90
Control variables. Similar to Study 1, we included a number of control variables to ensure that possible differences in perceived inclusion and support for diversity could be solely ascribed to our manipulation. First, we asked respondents to estimate the percentage of international students enrolled in their degree course, M = 15.60%, SD = 19.12%. Second, we asked them whether they had ever been abroad for an extended period of time (six months or longer). A minority of participants (n = 19) confirmed this. Third, we asked students to indicate on a 5-point Likert-type scale ranging from 1 (not likely at all) to 5 (very likely) how likely it was that they would someday work abroad, M = 3.19, SD = .99. Fourth, we measured the conventional control variables age and gender. Finally, we asked respondents to rate the attractiveness of the design of the brochure on a 10-point scale, M = 7.24, SD = 1.07. Results
Manipulation check. To test the success of our manipulation, we coded whether participants correctly indicated whether the Dutch students were mentioned in the internationalization brochure. In the MC condition, 36 participants (86%) correctly indicated that only international students were mentioned. In the AIM condition, 56 (98%) participants correctly completed the manipulation check, indicating that both the Dutch and the international students were mentioned. Consistent with Study 1, we chose to include the data of the seven participants who failed the manipulation check in our analyses, as we did not want to undermine the random assignment to conditions.
Preliminary analyses. Similar to Study 1, we first performed a number of preliminary analyses (chi-squares and t-tests) to check whether our conditions were equivalent in terms of the variables listed above. We found that, on average, respondents in the MC condition (M = 4.21) perceived to be less included than those in the AIM condition (M = 4.58), t(97) = -2.86, p <. 01. In contrast, both the mean NTB scores (MMC = 3.27; MAIM = 3.34; t(97) = -.61, p = .54) and the average level of support for the university’s internationalization plans (MMC = 4.06; MAIM = 4.26; t(97) = -1.31, p = .19) did not differ between the conditions. Similarly, we found no differences between our conditions in terms of the control variables we assessed. That is, men and women were equally distributed across our two conditions, χ2(1, N = 99) = .74, p = .39, and the same was true for people that indicated to have been abroad for an extended period of time, χ2(1, N = 99) < .01, p = .98. In addition, there were no significant differences between our conditions in terms of age (MMC = 21.33 years; MAIM = 21.44 years; t(97) = -.22, p = .83), estimated percentage of international students (MMC = 19.49%; MAIM = 12.63%; t(88) = 1.70, p = .09), self-reported likelihood of working abroad (MMC = 3.07; MAIM = 3.28; t(97) = -1.04, p = .30), and

BEING PART OF DIVERSITY
91
attractiveness of the brochure (MMC = 7.15; MAIM = 7.30; t(97) = -.66, p = .51). Based on these results, we decided not to include any control variables in our main analysis.20
Main analysis. We tested all of our hypotheses using the PROCESS macro of Hayes (2013). This included using a bootstrapping procedure to test the significance of the indirect effect of diversity approach condition on diversity support through inclusion. Table 4.2 shows the results.
Table 4.2 Results of Moderation and Mediation Analyses DV: Inclusion DV: Diversity support
Predictor B SE t R2 B SE t R2
Constant 4.42 .06 68.34* 2.73 .52 5.26**
Div. approach (0 = MC, 1 = AIM) .37 .13 2.86** .08 .15 .52ns
NTB -.05 .11 -.49ns
Diversity approach x NTB -.08 .22 -.38ns
Inclusion .33 .12 2.80**
.08 .09
Note. *p < .05, **p < .01.
Confirming hypothesis 1, there was a main effect of our diversity approach manipulation on perceived inclusion. That is, participants in the AIM condition reported significantly higher levels of perceived inclusion (MAIM = 4.58) than those in the MC condition (MMC = 4.21; b = .37, t(95) = 2.86, p < .01). There was no main effect of NTB on perceived inclusion, b = -.05, t(95) = -.49, p = .62. Also, the interaction term of the diversity approach manipulation and NTB did not reach significance, b = -.08, t(95) = -.38, p = .71. Hypothesis 2 could therefore not be confirmed. As displayed in the right pane of Table 4.2, and consistent with hypothesis 3, perceived inclusion positively predicted majority members’ support for diversity, b = .33, t(96) = 2.80, p < .01. Finally, supporting hypothesis 4, the bootstrapping results indicated the presence of an indirect effect. That is, explicitly including the Dutch in the internationalization vision increased majority members’ support for internationalization through higher levels of perceived inclusion, ρ = .12, 95% CI [.02, .27].21,22
20 The results of our main analysis (see following) did not substantially change when we did include the control variables. 21 Similar to Study 1, we also performed the analysis without the people who failed the manipulation check (n = 7). The results were essentially the same. That is, participants in the AIM condition reported significantly higher levels of perceived inclusion (MAIM = 4.59) than those in the MC condition (MMC = 4.20), b = .40, t(88) = 2.86, p < .01. Again, there was no main effect of NTB on perceived inclusion, b = -

CHAPTER 4
92
Conclusions and Discussion
In line with hypothesis 1, we found that explicitly including the majority group in an organization’s diversity approach resulted in higher levels of perceived inclusion among sitting organizational members. In contrast to Study 1, the positive effect of an all-inclusive approach was now present irrespective of the level of NTB. This fits our reasoning that diversity messages are more powerful and immediate contextual cues for sitting organizational members than they are for prospective members. The beneficial effect of the AIM approach even appeared to be just as strong for people with a high NTB as for those with a low NTB. Consistent with hypothesis 3, perceived inclusion was positively related to majority members’ support for organizational diversity efforts. Finally, confirming hypothesis 4, we found that explicitly including the majority group increased their support for internationalization through higher levels of perceived inclusion.
General Discussion
As a result of increasing levels of cultural diversity, contemporary organizations face an important challenge: How to become an organization in which employees from all cultural backgrounds feel included? To meet this challenge, many organizations have implemented a multicultural diversity approach in which the value of cultural diversity is emphasized. Yet, while in theory a multicultural approach should turn diversity into an organizational resource and thereby enhance organizational performance, multicultural activities are frequently met with resistance and skepticism by majority members (Brief et al., 2005). One plausible reason for why this may occur is that diversity initiatives are usually exclusively targeted at minorities. Yet, provided that majorities are crucial stakeholders in diversity initiatives, securing their support for diversity seems essential (James et al., 2001).
The present research aimed to further explore how majority support for diversity can be fostered. We posited that diversity approaches, such as multiculturalism, constitute powerful contextual cues that are used by employees to
.06, t(88) = -.54, p = .59. Also similar, the interaction term of the diversity approach manipulation and NTB did not reach significance, b = -.04, t(88) = -.18, p = .85. In addition, perceived inclusion again positively predicted majority members’ support for diversity, b = .31, t(89) = 2.58, p = .01, and explicitly including the Dutch in the internationalization vision increased majority members’ support for internationalization through higher levels of perceived inclusion, ρ = .13, 95% CI [.03, .29]. 22 We also estimated the reverse path. That is, we tested whether our diversity approach manipulation affected the extent to which majority members perceived to be included through their support for diversity efforts. The bootstrapping results indicate that this indirect effect was not significant, ρ = .05, 95% CI [-.02, .15].

BEING PART OF DIVERSITY
93
assess whether their social identity is considered to be valuable by the organization. Accordingly, to the extent that an organization only emphasizes the contribution of minority members in organizational diversity, majority members may perceive to be excluded by a multicultural approach to diversity, and, as a result, may resist organizational diversity efforts. In two studies we tested whether this perceived exclusionary effect can be attenuated by explicitly making majority members part of organizational diversity approaches (an all-inclusive multicultural approach towards diversity; Stevens et al., 2008).
In Study 1 we focused on prospective majority employees. Here, we found that explicitly acknowledging that the cultural majority is an integral part of an organization’s diversity approach led to higher levels of anticipated inclusion, but only for those with a high NTB. In Study 2 we turned to sitting organizational members belonging to the cultural majority. Here, we again found that an AIM approach increased perceptions of inclusion, but now the effect was present irrespective of the level of NTB. Perceptions of inclusion, in turn, predicted majority members’ support for organizational diversity efforts. Together, these results confirm that AIM is an effective strategy to enhance majority members’ perceptions of inclusion and thereby to foster majority support for organizational diversity efforts. Implications and Directions for Future Research
The present research extends previous research in a number of ways and gives rise to several interesting questions for future research. In the first place, we assessed the merits of the AIM approach in a more explicit manner than has previously been done (cf. Plaut et al., 2011). Thereby, our studies offer additional support for the beneficial effects of the AIM approach. In this respect, our results are particularly compelling as we demonstrated that AIM affects the extent to which participants anticipated/perceived to be included in the organization in general, rather than how they specifically feel included in organizational diversity.
In addition, our research further qualifies the effectiveness of an all-inclusive approach towards diversity. In particular, we found differential effects for prospective employees and sitting organizational members. Although we did not test this directly, our findings suggest that the AIM approach in specific, but also diversity approaches in general, may be more consequential for sitting organizational members than for prospective employees. Yet, even among prospective employees, we found that those high in NTB anticipated to be more included when their cultural group was explicitly mentioned. The AIM approach thereby addresses the needs of a potentially very important group of prospective employees. Precisely because they have a strong motivation to be part of a group, prospective employees with a high NTB may prove

CHAPTER 4
94
to be the most faithful organizational members and are most likely to remain committed to the organization for an extended period of time. Thus, ensuring that majority members are included in organizational diversity is not only important to address the needs of sitting organizational members, but also to enhance the organization’s attractiveness for future employees.
Relatedly, our work may inform future research attempting to understand for which majority members the AIM approach is most effective. We conceptualized diversity approaches as contextual cues that indicate the safety of one’s social identity. Accordingly, we proposed that the success of the AIM approach is dependent on the extent to which majority members are attuned to these cues. In the present research we focused on majority members’ NTB as an indicator of this sensitivity. Yet, majority members’ responsiveness to all-inclusive signals may also depend on the extent to which their cultural group membership is psychologically relevant to them. Corresponding with this notion, research conducted among cultural minority members indicates that diversity approaches have stronger effects on those who are highly identified with their cultural group (Gonzales & Cauce, 1995; Rosenthal & Levy, 2010). Likewise, future research may test the idea that the explicit inclusion of the cultural majority group in an organization’s diversity approach is especially important for highly identified majority members. Such investigation is likely to further improve our understanding of the workings of the AIM approach.
Yet another contribution of the present work is that it provides support for the beneficial effects of the AIM approach in a different socio-cultural context than that of most previous work. In particular, most existing research on cultural diversity in general, and the AIM approach in specific, has focused narrowly on immigrant cultures, and in particular on the U.S. context (e.g., Jackson & Joshi, 2011; Plaut et al., 2011; Purdie-Vaughns & Ditlmann, 2010; Stevens et al., 2008). Yet, different from the U.S., the cultural majority group within the Netherlands is not an immigrant group itself. Nevertheless, our findings suggest that AIM may also be a successful strategy when the majority group does not have an immigration background. We may even speculate that in this particular situation the AIM approach may be especially effective. Members of a majority group without an immigration background may have a less positive stance towards, or feel less included in, organizational diversity than majority members who do have an immigration background. In other words, explicitly including the majority group in organizational diversity may be especially important in contexts in which the majority group is not an immigrant group itself. While we did not directly investigate this in our studies, future research may elaborate on this notion

BEING PART OF DIVERSITY
95
by including the presence of an immigration history of the majority group as a factor in its (experimental) research design.
Importantly, although our results highlight the importance of how diversity approaches are communicated, we hold that an AIM approach towards diversity should not only be superficially manifested. Organizations should be careful not to induce the impression among majority members that the all-inclusive character of the organization’s diversity approach is nothing more than window-dressing. Phrased differently: organizations should “put their money where their mouth is” and also implement structural changes to include majority members in organizational diversity (Stevens et al., 2008). An example of such a structural all-inclusive intervention is ensuring that majority members are also part of diversity structures, such as diversity task forces. In this context, research conducted among minorities showed that a mismatch between an organization’s diversity approach and the perceived representation of minorities within the organization led to higher levels of mistrust (Purdie-Vaughns et al., 2008). An interesting question to address in future research is whether the effectiveness of an all-inclusive multicultural approach is contingent upon the extent to which majority members are in fact represented in diversity structures. Potential Limitations
A possible methodological shortcoming of our studies might have been that we measured respondents’ need to belong (in Study 1 and Study 2) and consultancy interest (in Study 1) after our experimental manipulation. Ideally, these measures would have been assessed before the manipulation. Yet, we felt that the setting of our two experiments (Study 1: job market; Study 2: university cafeteria) demanded that participants would be able to complete the experiment in one go, rather than having to complete a first questionnaire, subsequently study the brochure, and then complete a second questionnaire. Besides this practical reason, there is reason to believe that our manipulation did not affect responses to these measures. The NTB items do not measure the extent to which an individual desires to be part of a specific group (such as the fictitious consultancy firm we used in Study 1). Rather, they are intended to capture the degree to which people in general have the need to be included into groups (Baumeister & Leary, 1995). Similarly, the item used to measure “consultancy interest” was deliberately phrased such that the individual’s preference to work in consultancy independent of our manipulation was captured. Together, while we do not expect that our manipulation affected responses to the NTB items and the initial preference to work in consultancy, we recommend that future studies, and especially lab studies, assess these measures before the manipulation.

CHAPTER 4
96
In addition, one could argue that a possible limitation of the present research is our use of a student sample in Study 2. Yet, although student samples arguably have less external validity than employee samples, we think that using students as participants may in fact have resulted in a conservative test of our hypotheses. Universities are typically very large organizations. Hence, the way they approach diversity may be less consequential for students than organizational diversity approaches are for regular employees. Thus, the fact that even students were affected by our manipulation underlines the relevance of adopting an all-inclusive, rather than a “standard,” multicultural approach towards diversity. Nonetheless, future research could validate the current findings by replicating our second study with an employee sample.
A potential second point of criticism regarding our second study may concern the nature of our manipulation. Although the explicit mentioning (or lack thereof) of the majority group in the diversity statement parallels Study 1, in Study 2 we extended this manipulation by listing either only the number of international students (MC condition) or both the number of international and Dutch students (AIM condition) in the brochure. In our view, both aspects signal to the majority group that they are considered to be a valuable part of the university’s internationalization vision. Yet, one may also argue that displaying the number of Dutch students enrolled in the university may simply remind Dutch students of the fact they constitute the majority group, rather than that they necessarily perceive that the university attributes an important role to them in its internationalization vision. We therefore hold that future manipulations can be more precise by disentangling these two aspects. Concluding Remarks
Altogether, the present research underlines the importance of an all-inclusive multicultural approach towards diversity. We argued and demonstrated that making majority members explicitly part of organizational diversity enhances the extent to which they perceive to be socially included, and, as a result, increases their support for organizational diversity efforts. These findings are particularly important considering that majority members are key stakeholders whose support is essential for successful diversity management.

Chapter 5
I’m sick of being different. The relationship between
gender dissimilarity, work group inclusion, and absenteeism
This chapter is based on Jansen, W.S., Otten, S., & Van der Zee, K.I. I’m sick of being
different. The relationship between gender dissimilarity, work group inclusion, and
absenteeism. Human Relations, Manuscript under review.

CHAPTER 5
98
Abstract
In the present research we investigated how and when gender dissimilarity relates to two highly important individual work outcomes: social inclusion and absenteeism. We administered a questionnaire among 397 employees from a university of applied sciences and combined these survey data with data from the organization’s personnel administration. We found that gender dissimilarity was negatively related to the extent to which employees perceived to be included in their work group. In addition, we found that this negative effect was more pronounced when the group was perceived to not be open towards and appreciative of gender differences (i.e., to have a negative diversity climate). Finally, we found evidence for a conditional indirect effect of gender dissimilarity on absenteeism through inclusion. That is, being different from other group members in terms of gender was associated with higher absenteeism through lower levels of perceived inclusion, but only when the group was perceived to have a negative diversity climate. Together, the present research demonstrates that sometimes being different is associated with more absences and underlines the importance of establishing a positive climate for gender diversity.

I’M SICK OF BEING DIFFERENT
99
Having a gender diverse workforce is important to organizations in many respects. Gender diversity can improve internal work processes, may enlarge the organization’s external network, and can improve the moral image of the organization (Jackson & Joshi, 2011; Phillips, Kim-Jun, & Shim, 2011). Yet, while gender diversity may offer organizations a competitive advantage, research suggests that individual employees sometimes struggle with being different from their colleagues in terms of gender, as manifested in lower levels of affective and productive work outcomes (Guillaume et al., 2012; Tsui & Gutek, 1999). Accordingly, there is a strong need for research that clarifies under which conditions the problems associated with gender differences can be avoided. The present research addressed this need by considering how gender diversity relates to two highly important work outcomes: social inclusion and absenteeism.
Research attempting to understand how diversity affects work-related outcomes can be divided into two distinct categories that differ in their conceptualization of diversity (Guillaume et al., 2012). In the compositional approach, diversity is seen as the distribution of differences among the members of a unit (e.g., a work group). Hence, this approach takes a group perspective by considering diversity to be a group characteristic that may explain group level outcomes (Harrison & Klein, 2007). It attempts to answer questions such as: are mixed gender work groups more creative than same gender work groups? While this approach has generated important insights as to how diverse work groups can be effectively managed and structured, it is less suited to study how individual group members are affected by diversity. The implicit assumption in the compositional approach is that diversity affects all group members in the same way.
In contrast, the relational approach conceptualizes diversity as dissimilarity: the extent to which an individual is different from other group members in terms of a specific attribute (e.g., gender; Tsui et al., 1992). Thus, this approach assumes an individual-within-the-group perspective by considering diversity to be an individual characteristic that may explain individual level outcomes. It attempts to answer questions such as: does a male employee feel more included in his work group when a larger share of the other group members is also male? Thus, the main premise of the relational approach is that diversity affects group members differently depending on how dissimilar they are within the group.
In the present research we are particularly interested in how diversity affects individual work-related outcomes. Accordingly, we choose to adopt a relational approach to diversity. In doing so, our work offers a valuable contribution to existing diversity research, considering that the vast majority of diversity studies has taken a

CHAPTER 5
100
compositional approach (for a review, see Guillaume et al., 2012). Furthermore, unlike previous research that has mostly focused on how dissimilarity affects the extent to which individuals psychologically connect to their work group, we consider how being different affects the extent to which the group is perceived to include the individual (cf. Jansen, Otten, Van der Zee, & Jans, 2014). In addition, by investigating how perceived inclusion, in turn, relates to the number of days that people are absent from work, we are able to determine how dissimilarity is related to an objectively assessed work outcome. Finally, we provide a deeper understanding of when being dissimilar is most consequential. In particular, we posit that the extent to which the group is perceived to be open towards and appreciative of gender differences (i.e., has a positive diversity climate; Harquail & Cox, 1993) is a key contingency factor of the dissimilarity-outcomes relationship. Our conceptual model is depicted in Figure 5.1.
Figure 5.1 Conceptual Model
Gender Dissimilarity and Inclusion
Gender dissimilarity in work groups has been defined as the difference between a focal group member and his or her peers with respect to gender (Guillaume et al., 2012). Accordingly, gender dissimilarity reflects how prototypical a group member is within a group in terms of his or her gender (Oakes, Haslam, & Turner, 1998). This relative position is deemed to have important consequences for the individual, with the few existing studies focusing on how being dissimilar affects the extent to which an individual psychologically connects to the group (Guillaume et al., 2012).
Based on self-categorization theory (SCT; Turner et al., 1987) and social identity theory (SIT; Tajfel & Turner, 1986), researchers have hypothesized that dissimilarity is negatively related to individuals’ attachment to the group. According to SCT, people use observable similarities and differences (such as gender) to categorize themselves and others into in-groups and out-groups. SCT further suggests that people who are dissimilar are more prone to become aware of their demographic group membership (i.e., their gender). As a result, they are more likely to define
Perceived diversity climate
Gender dissimilarity Perceived inclusion Absenteeism

I’M SICK OF BEING DIFFERENT
101
themselves in terms of their demographic group membership, rather than in terms of their work group membership. SIT extends this reasoning by positing that in order to enhance and maintain a positive social identity, people like and trust in-group members more than out-group members. Together, this implies that dissimilar individuals may feel less attached to other group members. This prediction has found empirical support in a number of studies (e.g., Chattopadhyay et al., 2004; Guillaume et al., 2012; Tsui et al., 1992).
Importantly, while we concur with the above reasoning, we hold that these arguments do not only imply that dissimilar individuals may refrain from attaching themselves to the group, but also that the group may be perceived as less willing to include the individual. In this regard, inclusion refers to the extent to which an individual perceives to be an accepted group member that is allowed to be him- or herself within the group (Jansen et al., 2014). Because being dissimilar (i.e., being in the minority) increases one’s visibility within the group, group members belonging to the demographic majority may see and treat dissimilar individuals as peripheral group members (Mullen, Chapman, & Peaugh, 1989). Also, similar to minorities, majority group members are motivated to maintain and enhance a positive social identity. As a result, they may develop a relatively less positive stance towards minority members. Together, these arguments lead us to expect an inverse relationship between gender dissimilarity and the extent to which an individual perceives to be included in his or her work group. Accordingly, our first hypothesis is:
Hypothesis 1: Gender dissimilarity is negatively related to perceived inclusion.
The Moderating Effect of Diversity Climate
So far, the arguments we have put forward suggest that being dissimilar in terms of gender is associated with lower levels of perceived inclusion. However, there is reason to believe that this relationship may be contingent on contextual factors. For example, previous research suggests that the extent to which work group members depend on each other to perform their tasks plays an important role (Guillaume et al., 2012). Specifically, Guillaume and colleagues found that the negative effects of gender dissimilarity on social integration and individual performance were more pronounced in groups characterized by low interdependence than in groups with high interdependence. The rationale behind this is that team interdependence fosters personalized interactions among group members. That is, when people are dependent on each other, they come to see one another as individuals rather than as

CHAPTER 5
102
representatives of demographic categories, rendering more harmonious subgroup relations (Brewer & Miller, 1984; Brickson, 2000).
However, another viewpoint is that subgroup salience does not necessarily undermine positive relationships among group members. That is, as long as subgroup differences are seen as positive, perceiving one another as group representatives is not harmful for subgroup relations (Hewstone & Brown, 1986). Following this perspective, in the present research we focus on the group’s climate for gender diversity as a potential contingency factor of the dissimilarity-outcomes relationship (cf. Gonzalez & Denisi, 2009). We define diversity climate as the degree to which individuals perceive the group to be open towards and appreciative of differences between men and women (Harquail & Cox, 1993).
We posit that the negative association between gender dissimilarity and perceived inclusion may be especially pronounced if the group is perceived not to be open towards and appreciative of gender differences (i.e., to have a negative diversity climate). In these groups, dissimilarity is seen as a liability, leading majority members to be particularly inclined to display in-group favoritism. Accordingly, in this context, dissimilarity may result in lower levels of perceived inclusion.
In contrast, the negative effect of being dissimilar may be weaker or even disappear if the group is perceived to have a positive diversity climate. In these groups, being dissimilar is not considered to be a hindrance, but is seen as valuable. Accordingly, majority members may be less inclined to have a relative preference for interacting with in-group members. Hence, when a group is perceived to have a positive diversity climate, the negative relationship between gender dissimilarity and perceived inclusion may be weaker.
These predictions have already received some empirical support. For example, it has been found that diversity climate perceptions attenuated the positive effect of gender dissimilarity on turnover intentions (Gonzalez & Denisi, 2009). Further evidence for the moderating effect of diversity climate comes from research conducted in the domain of racial and cultural diversity. Specifically, diversity climate perceptions have been found to moderate the effect of cultural/racial dissimilarity on a range of work-related outcomes, such as organizational commitment and identification (Hofhuis, Van der Zee, & Otten, 2012; McKay et al., 2007; Wolfson, Kraiger, & Finkelstein, 2011), perceived inclusion (Vos et al., under review), and perceived job recognition (Hofhuis et al., 2012). Together, this leads us to our second hypothesis:

I’M SICK OF BEING DIFFERENT
103
Hypothesis 2: The negative relationship between gender dissimilarity and perceived inclusion is moderated by perceived diversity climate, such that it will be stronger for employees who perceive their work group to have a negative diversity climate than for employees who perceive their work group to have a positive diversity climate.
Inclusion and Absenteeism
An important follow-up question is why inclusion in the workplace matters. The significance of social inclusion for both individual employees and their immediate work environment has been well documented in previous research. In particular, perceptions of inclusion have been found to be positively associated with a range of individual (e.g., mood, work satisfaction, and creativity), interpersonal (e.g., trust) and group-level outcomes (conflict, performance, and team learning behavior; Jansen et al., 2014). Also, experimental studies have shown that inclusion (compared with exclusion) improved self-regulation (Baumeister et al., 2005), resulted in lower levels of distress (K. D. Williams & Nida, 2011), and increased pro-social behavior (Twenge et al., 2007).
These findings suggest that inclusion may also be related to another highly relevant work-related outcome, which is the focus of the present research: absenteeism. Absenteeism, defined as the number of days that people are absent from work, has important consequences for both individual employees and organizations. For individuals, absenteeism may have short term effects such as reduced performance, stress, and an increased workload when returning to work. In the long run, absenteeism may reduce individuals’ chances for promotion and can even be a precursor for turnover. For organizations, absenteeism usually causes capacity problems and reduces group performance (Harrison & Martocchio, 1998). But above all, employee absences are very costly. In fact, estimates of the average cost per employee per missed day vary from 200 USD to 700 USD (Anderson, 2005; Armes, 2005).
Although researchers have not specifically focused on inclusion as a predictor of absenteeism, there is some indirect evidence for such a link. First, as already mentioned, inclusion has been found to be positively associated with psychological well-being (e.g., Baumeister et al., 2005; K. D. Williams & Nida, 2011). We predict that such an improved mental state may cause employees to be less often sick and thereby reduce their absences from work. Second, scholars have argued that people who feel more included in their group are also more motivated to contribute to their

CHAPTER 5
104
group (e.g., Ellemers & Jetten, 2013). We may expect that, because of this increased motivation, employees who strongly feel included are more likely to show up for work. In line with these predictions, there is evidence that factors similar to perceived inclusion, such as the perceived affective tone and support of the group, result in fewer employee absences (George, 1990; Rhoades & Eisenberger, 2002). Together, this leads us to our third hypothesis:
Hypothesis 3: The extent to which employees perceive to be included in their group is negatively related to the number of days they are absent. Capturing our full research model (see Figure 5.1), the final relationship we
focus on is that between gender dissimilarity and absenteeism. Following from our first three hypotheses, and building on research that considers inclusion to be a process variable that links organizational features to work-related outcomes (Vos et al., under review), we hypothesize a conditional indirect effect of gender dissimilarity on absenteeism. That is, we predict that the indirect relationship between gender dissimilarity and absenteeism through perceived inclusion will depend on how positive employees perceive their work group’s diversity climate. More precisely, our reasoning implies the following hypothesis:
Hypothesis 4: The indirect effect of gender dissimilarity on absenteeism through perceived inclusion is stronger for people who perceive their work group to have a negative diversity climate than for employees who perceive their work group to have a positive diversity climate.
Gender Differences
The last question we address is whether our hypothesized relationships are different for men and women. Previous research on this matter appears to be quite inconsistent. Some research showed that dissimilarity effects may be stronger for women than for men (e.g., Gonzalez & Denisi, 2009), but there is also evidence that being dissimilar is more consequential for men than for women (e.g., Tsui et al., 1992). Thus, instead of formulating an explicit hypothesis about the moderating effect of gender, in the present research we will explore whether our hypothesized relationships differ between men and women.

I’M SICK OF BEING DIFFERENT
105
Method
Participants
Respondents were 397 employees from a university of applied sciences located in the Netherlands. Their mean age was 45.05 years (SD = 10.77 years) and 61% of all participants were female. The sample was selected such that all respondents had no leadership roles and were part of a larger work group. Participants were part of either the supporting staff (n = 225) or educational staff (n = 172). All respondents completed an online questionnaire about organizational diversity, in which we asked them both personal questions and questions about their group of direct colleagues. In the remainder, we refer to this group as “work group.” We identified 132 work groups. Using data from the personnel administration, we found that the average size of these work groups was about 10 people and ranged from 3 to 20 people. This implies that, on average, for each work group we analyzed, we obtained the data of 30% of all group members. Respondents indicated to be part of their work group for 5.61 years om average (SD = 5.48 years). Measures
Gender dissimilarity. As recommended by Harrison and Klein (2007) we operationalized gender dissimilarity by calculating the Euclidean distance between each respondent and his or her other group members. Specifically, for each individual group member the Euclidean distance was calculated by dividing the number of other group members with a different gender by group size and then taking the square root of this fraction (Tsui et al., 1992). To illustrate, consider a work group of three male and two female members. For the men in this group, the Euclidean distance equals √(2/5) = .63. For the women, the Euclidean distance equals √(3/5) = .77. We obtained the necessary information about group size and the gender of all group members from the personnel administration.
Perceived inclusion. The extent to which employees perceived to be included within their work group was measured with eight items from the original 16-item Perceived Group Inclusion Scale (Jansen et al., 2014).23 Example items include “My work group gives me the feeling that I belong” and “My work group allows me
23 We decided not to use the complete original scale for two reasons. First, the items of the original scale are to a high degree homogenously formulated. In our view, this justifies the use of an abbreviated version of the scale. Second, due to practical restrictions (i.e., we were instructed by the organization to keep the average completion time of the questionnaire below the 10 minute mark), we were limited in the number of items that we could present to the respondents. Provided that, in the validation article of the original scale (Jansen et al., 2014), all items were shown to highly load on their intended factors (all factor loadings exceeded .70), we chose to randomly pick out 4 items of each subscale of the perceived group inclusion scale (belonging and authenticity).

CHAPTER 5
106
to be who I am” (α = .90). All items were assessed using a 5-point Likert-type scale ranging from 1(strongly disagree) to 5 (strongly agree).
Diversity climate. Perceived diversity climate was assessed with four items based on Harquail and Cox (1993). We slightly adapted the wording of the original items. That is, rather than measuring the perceived work group stance towards differences in general, as the original items do, we rephrased the items to measure the perceived openness towards and appreciation of gender differences in particular. An example item of the scale we used is: “In my work group differences between men and women are seen as positive” (α = .83). Again, answer categories ranged from 1(strongly disagree) to 5 (strongly agree).
Absenteeism. The number of days that people were absent was obtained from the organization’s personnel administration.24 Because absence data tend to be highly positively skewed, we performed a square-root transformation. This type of transformation helps to reduce the impact of skew and outliers. Consistent with previous research on absenteeism (Avery, McKay, Wilson, & Tonidandel, 2007) and as recommended by statisticians (J. Cohen et al., 2003; Howell, 1992; Johns, 1994), we used the following formula to perform the transformation: Absenteeismtransformed = √(Days absent) + √(Days absent + 1).
Control variables. We included the control variables age, gender, and staff type (support or educational). Gender was not only included to control for its potential relationship with our study variables, but also to be able to assess whether our hypothesized relationships differed for men and women.
Results
Descriptive Statistics
Descriptive statistics of the study variables and their intercorrelations are displayed in Table 5.1. Note that, in line with our first hypothesis, gender dissimilarity was negatively related to perceived inclusion, r = -.11, p = .03. Consistent with hypothesis 3, perceived inclusion was negatively correlated with absenteeism, r = -.12, p = .02. Also notable, gender was significantly related to gender dissimilarity (r = .21, p < .01), indicating that male employees were on average more dissimilar than female
24 At the time of our data collection, the organization’s administration system was organized such that absenteeism data was available per calendar year (i.e., the number of days that employees were absent from January 1st to December 31st). We administered the questionnaire in early June of 2012 and used the absence data for the calendar year 2012. In doing so, we made sure that we only used the data of people who were in the same work group as they were in the beginning of the year (and therefore also at the time of our questionnaire). This way, we ruled out the possibility that people had switched groups.

I’M SICK OF BEING DIFFERENT
107
employees. This finding is a reflection of the organization’s demographics, in which the majority of employees (54%) was female. In addition, gender was significantly correlated with absenteeism (r = -.19, p < .01), indicating that on average men were less absent than women. This is consistent with findings from previous research (e.g., Harrison & Martocchio, 1998). Similarly, respondents that were part of the supporting staff appeared to be more often absent than those in the educational staff (r = -.14, p < .01). Finally, age was not significantly related to any of our other main variables and was therefore excluded from further analysis.
Table 5.1 Descriptive Statistics of Study Variables Variable M SD 1 2 3 4 5 6 7
1. Gender dissimilarity .51 .27 -
2. Perceived inclusion 4.01 .62 -.11* -
3. Perc. diversity climate 3.53 .67 -.09† .30** -
4. Absenteeism 4.56 5.44 .00ns -.12* -.09† -
5. Age 45.05 10.77 -.03ns .01ns .00ns .04ns -
6. Gendera .40 .49 .21** -.02ns .04ns -.19** .20** -
7. Staff typeb .43 .50 .09† .01ns .02ns -.14** .02ns .19** -
Note. a 0= female; 1 = male. b 0 = support; 1 = educational. †p < .10, *p < .05, **p < .01. Preliminary Analyses
Before testing our hypotheses, we conducted two preliminary analyses. First, we assessed whether our measures could be empirically distinguished. Second, because our data were nested (i.e., employees were part of work groups), we tested whether it was appropriate to adopt a multilevel analytic strategy.
Confirmatory factor analyses. We evaluated the measures’ factor structure with confirmatory factor analyses (CFA’s). Here, we specifically focused on the study variables that were assessed with Likert-type questionnaire items (i.e., perceived inclusion and perceived diversity climate). First, we estimated a model in which all items loaded on one factor, and found that this model fitted the data poorly, χ2/df = 19.68, RMSEA = .22, NNFI = .57, CFI = .65. Second, we estimated a two-factor model, distinguishing between perceived inclusion and perceived diversity climate. This model reached acceptable fit, χ2/df = 2.71, RMSEA = .07, NNFI = .96, CFI = .97. All items loaded significantly on their respective factors (standardized factor loadings > .40). Moreover, this model appeared to be a significant improvement over the one-factor model, ∆χ2 = 930.39, p < .01.

CHAPTER 5
108
Intraclass correlation analysis. We assessed the appropriateness of a multi-level analysis by calculating the intraclass correlation coefficients (ICC) for our mediator, moderator, and dependent variable (absenteeism, perceived diversity climate, and perceived inclusion). The ICC is defined as the proportion of between-group variance relative to the total amount of variance (Field, 2005). The ICC’s for absenteeism, perceived diversity climate, and perceived inclusion were respectively .044, .12, and .015. This indicates that about 4.4% of the variation in scores on absenteeism, 12% of the variation in perceived diversity climate, and 1.5% of the variance in inclusion responses were situated at the level of the work group, with the remaining variation located at the individual level. In addition, we tested whether these between-group variance components were significant. This was not the case for absenteeism and perceived inclusion (p’s > .05). Yet, we did find that the between-group variance component of perceived diversity climate was significant (p < .01), suggesting that a multi-level analysis was necessary. Main Analyses
We tested all of our hypotheses by estimating a multi-level random intercept model in Mplus (Muthén & Muthén, 2007). This allowed us to control for the nested structure of our data. Consistent with our operationalization, all variables were specified as individual level (level 1) variables. We used a bootstrapping procedure (1000 samples) to test the significance of the conditional indirect effect of gender dissimilarity on absenteeism through inclusion. Dummy codes were used for gender (0 = female, 1 = male) and staff type (0 = support, 1 = educational). In addition, the Euclidean distances and perceived diversity climate scores were standardized, and their interaction term was construed based on these standardized scores (cf. J. Cohen et al., 2003). Table 5.2 shows the results.
Our hypothesized model fitted the data well, χ2/df = .58, RMSEA = .00, CFI = 1.00. Consistent with hypothesis 1, gender dissimilarity was negatively related to perceived inclusion, although this main effect was only marginally significant, b = -.06, t(260) = -1.81, p = .07. Confirming hypothesis 2, this relationship was moderated by perceived diversity climate, b = .07, t(260) = 2.28, p = .02. An inspection of the simple slopes (see Figure 5.2) revealed that for group members who perceived their work group to have a negative diversity climate, gender dissimilarity was negatively related to perceived inclusion, b = -.12, t(260) = -2.77, p < .01. For group members who perceived their work group to have a positive diversity climate, gender dissimilarity was unrelated to the extent to which they perceived to be included, b = .01, t(260) = .29, p = .77. There also appeared to be a positive main effect of perceived diversity climate on perceived inclusion, b = .17, t(260) = 5.63, p < .01.

I’M SICK OF BEING DIFFERENT
109
Table 5.2 Results of Multilevel Regression Analyses Perc. inclusion (mediator) Absenteeism
Parameter B SE (B) t B SE (B) t
Intercept 4.03 .05 88.89** 9.80 1.75 5.58**
Gender (0 = female; 1 = male) -.05 .06 -0.78 -1.96 .56 -3.49**
Staff type (0 = support; 1= education) .03 .06 0.47 -1.22 .55 -2.22*
Gender dissimilarity -.06 .03 -1.81† .20 .27 0.47
Perceived diversity climate .17 .03 5.63**
Gender diss. x Perc. diversity climate .07 .03 2.28*
Perceived inclusion -.98* .43 -2.30*
Overall model statistics
Level 1 variance 0.34 27.41
Level 2 variance 0.01 0.26
-2log-likelihood 702.19 2442.94
Note. Full maximum likelihood estimation was used (n = 397 individuals from 132 work groups). The table displays unstandardized regression weights. †p < .10, *p < .05, **p < .01.
Figure 5.2 Perceived Inclusion as a Function of Gender Dissimilarity and Perceived Diversity
Climate (adjusted means are displayed)
Turning to the right pane of Table 5.2, we found that perceived inclusion was
negatively related to absenteeism, b = -.98, t(260) = -2.30, p = .02. This confirms hypothesis 3. Because absenteeism was a transformed variable in our model we performed an additional analysis to demonstrate how perceptions of inclusion were related to the actual number of days that people were absent (i.e., the untransformed
3
3,5
4
4,5
5
Low gender dissimilarity High gender dissimilarity
Perc
eiv
ed
in
clu
sio
n
High diversityclimate
Low diversityclimate

CHAPTER 5
110
variable). For each point in the range of the inclusion scale (1-5), we calculated the corresponding number of (untransformed) absence days (assuming all other variables were kept constant) and plotted this in Figure 5.3.
Figure 5.3 Days Absent (untransformed) as a Function of Perceived Inclusion
In addition, the bootstrapping results indicated the presence of a conditional
indirect effect, supporting hypothesis 4. That is, for people experiencing a negative diversity climate, gender dissimilarity was positively related to absenteeism through lower levels of perceived inclusion, ρ = .12, 95% CI [.02, .31]. For people experiencing a positive diversity climate, the indirect effect of gender dissimilarity on absenteeism through inclusion was not significant, ρ = -.01, 95% CI [-.11, .07].25
Finally, to test whether our estimated effects differed for men and women, we performed a multi-group analysis on our proposed model (Vandenberg, 2002). This is a two-step procedure. First, effect sizes are estimated separately for men and women. Second, the differences between these estimates are tested for statistical significance. The results (see Table 5.3) indicated that all of the estimated effects were equivalent for men and women.
25 We also estimated an alternative model to check for the presence of feedback effects. Specifically, we assessed whether a model in which inclusion and absenteeism were switched in their position provided a better fit to the data than our hypothesized model. The results indicated that this alternative model yielded a significantly worse fit to our data than our hypothesized model, ∆χ2 = 37.82, p < .01. In addition, the bootstrapping results indicated that, this time, there was no conditional indirect effect. That is, regardless of the level of perceived diversity climate, gender dissimilarity was not related to inclusion through absenteeism. These results suggest that feedback effects did not play a substantial role in our model.
02468
10121416182022
1 2 3 4 5
Days
ab
sen
t
Perceived inclusion
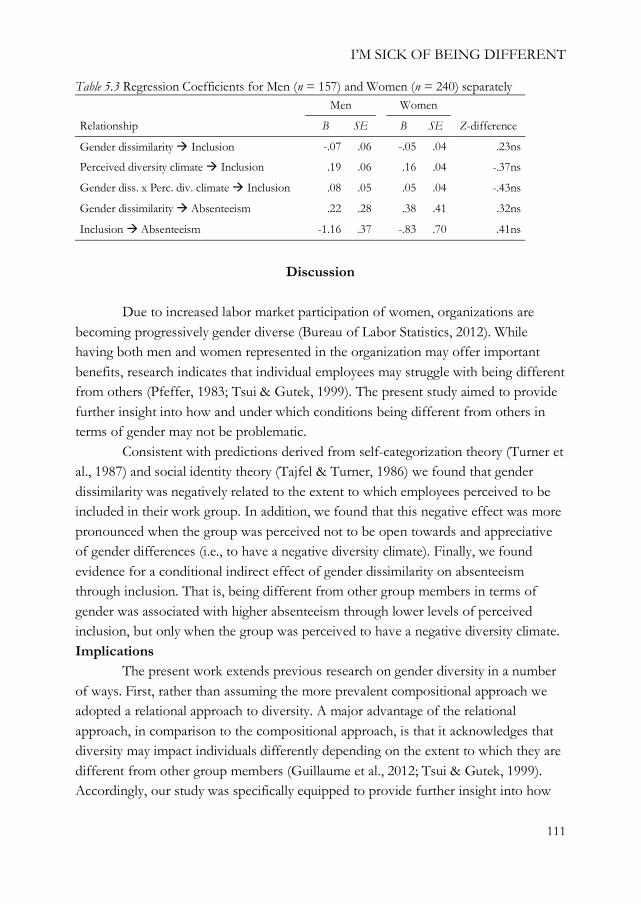
I’M SICK OF BEING DIFFERENT
111
Table 5.3 Regression Coefficients for Men (n = 157) and Women (n = 240) separately Men Women
Relationship B SE B SE Z-difference
Gender dissimilarity Inclusion -.07 .06 -.05 .04 .23ns
Perceived diversity climate Inclusion .19 .06 .16 .04 -.37ns
Gender diss. x Perc. div. climate Inclusion .08 .05 .05 .04 -.43ns
Gender dissimilarity Absenteeism .22 .28 .38 .41 .32ns
Inclusion Absenteeism -1.16 .37 -.83 .70 .41ns
Discussion
Due to increased labor market participation of women, organizations are
becoming progressively gender diverse (Bureau of Labor Statistics, 2012). While having both men and women represented in the organization may offer important benefits, research indicates that individual employees may struggle with being different from others (Pfeffer, 1983; Tsui & Gutek, 1999). The present study aimed to provide further insight into how and under which conditions being different from others in terms of gender may not be problematic.
Consistent with predictions derived from self-categorization theory (Turner et al., 1987) and social identity theory (Tajfel & Turner, 1986) we found that gender dissimilarity was negatively related to the extent to which employees perceived to be included in their work group. In addition, we found that this negative effect was more pronounced when the group was perceived not to be open towards and appreciative of gender differences (i.e., to have a negative diversity climate). Finally, we found evidence for a conditional indirect effect of gender dissimilarity on absenteeism through inclusion. That is, being different from other group members in terms of gender was associated with higher absenteeism through lower levels of perceived inclusion, but only when the group was perceived to have a negative diversity climate. Implications
The present work extends previous research on gender diversity in a number of ways. First, rather than assuming the more prevalent compositional approach we adopted a relational approach to diversity. A major advantage of the relational approach, in comparison to the compositional approach, is that it acknowledges that diversity may impact individuals differently depending on the extent to which they are different from other group members (Guillaume et al., 2012; Tsui & Gutek, 1999). Accordingly, our study was specifically equipped to provide further insight into how

CHAPTER 5
112
gender diversity is related to individual work outcomes, such as inclusion and absenteeism.
In addition, whereas existing dissimilarity studies have almost exclusively focused on how dissimilarity affects the extent to which the individual psychologically connects to the group (Guillaume et al., 2012) the current research suggests that dissimilarity may also affect the extent to which the group is perceived to be willing to include the individual. This is an important extension of previous dissimilarity research, as it explicitly focuses on the role that groups play in shaping individual group members’ work experience. Such a focus is likely to improve our understanding of how being dissimilar affects individuals, and seems a promising road for future dissimilarity research.
Another contribution of the present research is that it provides further evidence for the importance of social inclusion at work. Specifically, we demonstrated that perceptions of inclusion are negatively related to the number of days that people are absent from work. As such, we established that perceptions of inclusion not only relate to self-reported outcome measures (as has been demonstrated in previous research; see Jansen et al., 2014), but are also associated with an objectively assessed work outcome.
Finally, the present study offers further insights into under which conditions the negative effects of dissimilarity within work groups may be attenuated. Specifically, our results suggest that the perception of a positive diversity climate might help to overcome the potential negative effects of being dissimilar. This finding not only advances dissimilarity research, but also may inform organizations as to how to reduce employee absences. Strengths, Limitations, and Future Research
A notable strength of the present research concerns our research design. We were able to combine responses to our questionnaire with data from the personnel administration. Such a multiple source dataset greatly reduces the likelihood of common method variance, allowing for drawing more valid conclusions about the relationships between our measures (Podsakoff et al., 2003).
In addition, having access to the organization’s personnel administration allowed us to operationalize dissimilarity in an objective and precise manner. Whereas in other studies (e.g., Hofhuis et al., 2012; Vos et al., under review) a dichotomous, and arguably rather unsophisticated, distinction is made between majority and minority members (or between racial groups; e.g., McKay et al., 2007; Wolfson et al., 2011), in the present research we operationalized dissimilarity in a more precise manner by calculating for each respondent how much he or she is different from his

I’M SICK OF BEING DIFFERENT
113
or her direct colleagues in terms of gender. We consider this an important adaptation, as this allowed for a more refined test of our hypothesized relationships. While the multi-source nature of our data is a considerable strength, at the same time one may posit that our data were cross-sectional, inhibiting our ability to draw conclusions regarding the causality of the relations examined. For example, whether our respondents were more absent and as a result felt less included in their work group, or whether lower levels of perceived inclusion resulted in more absences cannot be determined with our data. As such, we believe that future research may elaborate on our findings by adopting a longitudinal or experimental research design.
Furthermore, while the results of our multigroup analysis indicated that all of the estimated effects were equivalent for men and women, they also revealed that most regression weights for men and women separately were not significant. This could be due to a loss in statistical power. Accordingly, we think that future research may more adequately test the separate effects for men and women by sampling a larger number of respondents.
In addition, future studies may further clarify under which conditions dissimilarity effects may be stronger for men or women. As already hinted at earlier, previous research is inconsistent as to whether dissimilarity effects are stronger for men than for women. Interestingly, both the prediction that men are more affected by dissimilarity than women and the opposite prediction that women are more affected by being dissimilar than men depart from the same assumption: men are a higher status group than women. Researchers predicting that dissimilarity is more consequential for men than for women continue to posit that members of high status groups may feel more threatened to lose their dominant position when they are more dissimilar (Chatman & O'Reilly, 2004; Tsui et al., 1992). In contrast, researchers predicting that dissimilarity has a stronger impact on women than men continue the argument by positing that members of low status groups, when placed in a numerical minority, are subject to higher visibility, scrutiny, and performance standards than members of high status groups (Roth, 2004). As already mentioned, in the present research we did not find any gender differences in our hypothesized relationships. Considering the arguments above, this could be because, in our specific sample, there were no perceived status differences between men and women. Yet another explanation is that the two processes described above may have operated at the same time. That is, while for men dissimilarity may have been positively associated with perceived levels of threat, for women being more dissimilar could have been accompanied with increased concern for how one is evaluated. Thus, future dissimilarity research may further clarify under which conditions being dissimilar will

CHAPTER 5
114
be more consequential for either men or women by measuring the extent to which men and women are perceived to differ in status, and by simultaneously considering how dissimilarity is related to threat and concern for evaluations by others.
Related to this, dissimilarity research may be further refined by taking into account the moderating role of occupational demography. In this respect, research assuming a compositional approach to diversity has found that occupational gender composition moderated the negative effect of team gender diversity on performance, such that the effect was weaker in gender-balanced occupations (Joshi & Roh, 2009). A similar effect may be expected with regard to gender dissimilarity. That is, dissimilarity may have a stronger impact on employees in professions that are less gender-balanced. Applying this prediction to the present research, we can expect that the dissimilarity effects we found would have been even stronger if we had focused on an organization that operates in a less gender-balanced sector than the specific one we considered (i.e., higher education). In addition, whereas in male-dominated occupations one might expect that being different from others in terms of gender is especially consequential for women, in female-dominated occupations gender dissimilarity is likely to have the strongest effects for men. Future research may provide an adequate test of these predictions by systematically sampling respondents from different occupational settings. Concluding Remarks
Together, the present research substantially enhances our understanding of how individual employees are affected by gender diversity. It demonstrates that being different sometimes implies being more absent and highlights that establishing a positive diversity climate is essential to make gender diversity beneficial to organizations and their employees.

Chapter 6
General discussion


GENERAL DISCUSSION
117
The central question that this dissertation set out to answer was how inclusion in diverse work settings can be fostered. In addition, we investigated whether the determinants of inclusion differ between majority and minority members. In this final chapter we assess the merits of our investigations in conjunction. We start by summarizing the main findings from each empirical chapter. Next, we reflect on the theoretical and practical implications of this dissertation. Finally, we identify the main strengths and weaknesses of our inquiries and provide suggestions for how future research may build upon our findings.
Overview of Findings
In chapter 2 we introduced a conceptual framework of inclusion. Based on
existing inclusion conceptualizations, and on theoretical insights from optimal distinctiveness theory (Brewer, 1991) and self-determination theory (Deci & Ryan, 2000), we posited that inclusion is a two-dimensional concept consisting of perceptions of belonging and authenticity. In addition, we proposed that individual perceptions of inclusion are based on signals sent out from the group. Combining these assertions, we defined inclusion as the degree to which an individual perceives that the group provides him or her with a sense of belonging and authenticity. Based on this definition, we developed and validated the 16-item perceived group inclusion scale (PGIS). Data from two samples supported our proposed two-dimensional conceptualization of inclusion. In addition, the PGIS appeared to be a reliable measure of inclusion and was demonstrated to possess both nomological and predictive validity.
In chapter 3 we used our newly developed scale in a panel study to examine how perceived organizational diversity approaches relate to affective and productive work outcomes among cultural majority and minority employees. We compared a colorblind approach to diversity, in which cultural differences between employees are ignored, with a multicultural diversity approach, in which cultural differences are explicitly acknowledged and valued. Using structural equation modeling on data collected in a panel study among 152 native Dutch majority and 77 non-Western minority employees, we found that perceptions of a colorblind approach were most strongly related to work satisfaction and perceived innovation for majority members, while perceptions of a multicultural approach “worked best” for minority members. Moreover, the effects of perceived diversity approaches on work outcomes were fully mediated by the extent to which employees felt included in the organization. Together, these results indicate that diversity approaches have different effects on

CHAPTER 6
118
perceived inclusion for majority and minority members, but also that such perceptions of inclusion are important to both groups.
Chapter 3 demonstrated that a multicultural approach to diversity is likely to have beneficial consequences, but only for minority members. Therefore, in chapter 4 we assessed whether the multicultural approach can be adjusted such that it also renders more positive work outcomes for majority members. Specifically, we presented two experiments that tested whether a reformulation of the multicultural approach such that it includes majority members (all-inclusive multiculturalism) increases the extent to which they feel included and support organizational diversity efforts. In Study 1 we focused on prospective employees (n = 114). We found that an all-inclusive diversity approach, compared with the “standard” multicultural approach in which the majority group is not explicitly made part of organizational diversity, led to higher levels of anticipated inclusion for those with a high need to belong. In Study 2 we turned to sitting organizational members (n = 99). Here, we again found that an all-inclusive multicultural approach increased perceptions of inclusion, but now the effect was present regardless of individual levels of need to belong. Perceived inclusion, in turn, was positively related to majority members’ support for organizational diversity efforts.
While chapters 3 and 4 considered how perceived inclusion into culturally diverse work settings can be fostered, in chapter 5 we attempted to answer the same question for gender diverse work groups. Specifically, we investigated how and when being different from others in terms of gender related to employees’ perceived inclusion and absenteeism. We administered a questionnaire among 397 employees from a university of applied sciences and combined these survey data with data from the personnel administration. We found that gender dissimilarity was negatively related to the extent to which employees perceived to be included in their work group. In addition, our results indicated that this negative effect was more pronounced when the group was perceived to not be open towards and appreciative of gender differences (i.e., to have a negative diversity climate). Finally, we found that perceived diversity climate also moderated the indirect effect of gender dissimilarity on absenteeism through inclusion. That is, being different from other group members in terms of gender was associated with higher absenteeism through lower levels of perceived inclusion, but only when the group was perceived to have a negative diversity climate.

GENERAL DISCUSSION
119
Theoretical Implications
This dissertation has a number of important theoretical implications. First and foremost, our research extends the existing body of knowledge on social inclusion in diverse work settings. Second, there are several interesting theoretical links between our work and research conducted in other domains. Contributions to Inclusion Research
A major contribution of this dissertation is that we provide a theoretically grounded conceptualization of inclusion, which may refine future inclusion research. For example, while the majority of existing research has operationalized inclusion as the extent to which group members perceive to belong to the group (K. D. Williams & Nida, 2011), our conceptualization implies that inclusion also entails the extent to which group members perceive to be allowed and encouraged to be themselves. We deem this to be an important extension, considering that we found that perceptions of belonging and authenticity each explained a unique portion of variance in a range of work-related outcomes (e.g., work satisfaction, trust, and group conflict). Accordingly, we believe that future research may be refined by considering perceived authenticity as a distinct element of inclusion, and by measuring or manipulating inclusion correspondingly.
Moreover, we advance inclusion research by offering a theoretically grounded and empirically validated measurement instrument: the Perceived Group Inclusion Scale (PGIS). This scale might prove to be useful in research focusing on identifying the determinants of inclusion. To date, various organizational interventions aimed at enhancing inclusion have been proposed, such as developing inclusive leadership styles (Shore et al., 2011) and promoting “inclusion competencies” among employees (Pless & Maak, 2004). Combining the PGIS with these existing frameworks offers a promising road for future inclusion research. Furthermore, while we focused on the work domain, we believe our scale is also applicable in other types of interactive groups, such as sports teams, schools, and groups of close friends. In this regard, an important characteristic of the PGIS is that its items are formulated in a general manner, to ensure the scale’s applicability across a wide range of groups.
In addition, this dissertation contributes to developing an understanding of how perceptions of inclusion come about. In this respect, an important feature of our conceptualization is that it explicates that inclusion is a function of the group’s willingness to include the individual (cf. Ellemers & Jetten, 2013). Accordingly, we focused on what groups and organizations can do to include their members. In particular, we investigated how (perceived) diversity approaches relate to feelings of

CHAPTER 6
120
inclusion. Our studies converge on the finding that the effectiveness of diversity approaches is dependent on the majority or minority status of individual group members. We found that the extent to which the group is (perceived to be) open towards and appreciative of subgroup differences (i.e., pursues a multicultural approach or has a positive diversity climate) was especially beneficial to minority members. Conversely, we found that a colorblind approach to diversity, in which differences between subgroups are ignored, was most effective for majority members. In addition, our results indicate that majority members feel more included and show more support for organizational diversity efforts when they are explicitly made part of organizational diversity. Together, these findings constitute an important extension of previous research, considering that most existing studies have considered how majority and minority members differ in their support for diversity approaches in a societal context (cf. Rattan & Ambady, 2013). Going beyond a mere preference for specific diversity approaches, our studies demonstrate how (perceived) diversity approaches in organizations actually affect people in their daily working life.
Finally, our findings further qualify the effects of diversity approaches. Not only do our results indicate that belonging to either the majority or minority is a crucial factor to consider when studying the impact of diversity approaches on group members, we also found evidence for the importance of other individual characteristics. Specifically, we found that job-seekers that had a high need to belong were especially sensitive to the way an organization formulates its strategic diversity vision. In addition, our results suggest that prospective employees are less attuned to inclusionary signals than sitting organizational members. As such, these findings may contribute to a more sophisticated understanding of how and when (perceived) diversity approaches affect group members. Connections to other Research Fields
Interestingly, this dissertation connects in a number of ways to research conducted in other domains. In particular, our work relates to the categorization-elaboration model, acculturation research, and self-verification theory.
Categorization-elaboration model. To begin with, there are significant links between our work and the categorization-elaboration model (CEM) introduced by Van Knippenberg, De Dreu, and Homan (2004). Importantly, whereas we have focused on how diversity at the relational level affects individual group members (i.e., a relational approach to diversity), the CEM details how diversity at the group level affects groups as a whole (i.e., a compositional approach). In particular, the CEM asserts that work group diversity affects group performance through two distinct processes. First, diversity may instigate social categorization processes (i.e., placement of

GENERAL DISCUSSION
121
group members into in- and out-groups), which can result in problematic relations between subgroups. Second, work group diversity may prompt elaboration processes (i.e., discussion, exchange, and integration of ideas) which can improve the group’s creativity, innovation, and decision quality. Thus, although different in its focus, similar to our conceptualization, the CEM poses that harmonious relations within the group are needed to achieve positive diversity outcomes. In addition, similar to our assertion that securing authenticity is important to establish productive outcomes, the CEM contends that positive outcomes of diversity are obtained if group members are able to freely share their idiosyncratic ideas.
Importantly, a central premise of the CEM is that social categorization and elaboration do not operate in isolation. Rather, the model poses that the extent to which diverse work groups can successfully process group members’ distinct perspectives depends on the degree to which biases between subgroups are avoided. This notion echoes our speculation that the combined presence of belonging and authenticity perceptions yields the most positive results for individual well-being and performance. While we found initial evidence for such an interactive effect in our scale validation procedure, the high correlation between belonging and authenticity in our specific samples prohibited us from drawing any reliable conclusions about the presence of an interactive effect of belonging and authenticity. It would be highly interesting to further explore this idea in future research. Acculturation research. In addition, our work has several interesting relations with research on the acculturation of migrants. Acculturation has been defined as the process of cultural and psychological change that results when individuals from different cultures meet (Redfield, Linton, & Herskovits, 1936; Sam & Berry, 2010). How this process affects individuals is thought to be largely dependent on people’s responses to two issues. First, to what extent do people wish to have contact with (or avoid) others outside their group? Second, to what extent do people wish to maintain (or give up) their heritage culture and identities? Preferences with respect to these issues lead to the adoption of four different acculturation strategies which have been labeled assimilation, integration, separation, and marginalization. Assimilation is the preferred strategy when individuals do not wish to maintain their cultural identity and seek daily interaction with other cultures. A separation strategy is pursued when individuals place a value on holding on to their original culture, and at the same time wish to avoid interaction with others. When there is both an interest in maintaining one’s heritage culture and in having daily interactions with other groups, integration is the preferred strategy. Finally, the marginalization strategy is defined by little
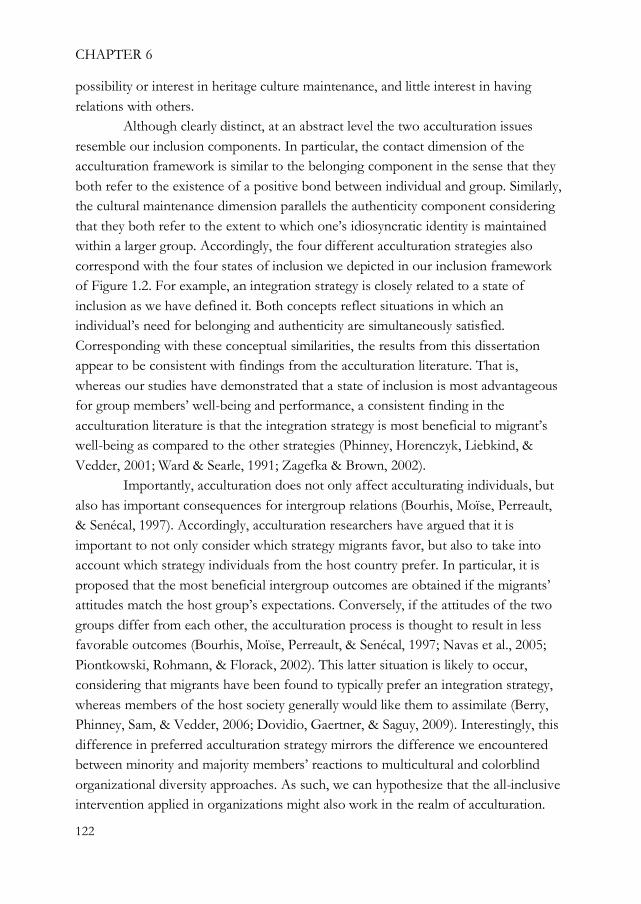
CHAPTER 6
122
possibility or interest in heritage culture maintenance, and little interest in having relations with others.
Although clearly distinct, at an abstract level the two acculturation issues resemble our inclusion components. In particular, the contact dimension of the acculturation framework is similar to the belonging component in the sense that they both refer to the existence of a positive bond between individual and group. Similarly, the cultural maintenance dimension parallels the authenticity component considering that they both refer to the extent to which one’s idiosyncratic identity is maintained within a larger group. Accordingly, the four different acculturation strategies also correspond with the four states of inclusion we depicted in our inclusion framework of Figure 1.2. For example, an integration strategy is closely related to a state of inclusion as we have defined it. Both concepts reflect situations in which an individual’s need for belonging and authenticity are simultaneously satisfied. Corresponding with these conceptual similarities, the results from this dissertation appear to be consistent with findings from the acculturation literature. That is, whereas our studies have demonstrated that a state of inclusion is most advantageous for group members’ well-being and performance, a consistent finding in the acculturation literature is that the integration strategy is most beneficial to migrant’s well-being as compared to the other strategies (Phinney, Horenczyk, Liebkind, & Vedder, 2001; Ward & Searle, 1991; Zagefka & Brown, 2002).
Importantly, acculturation does not only affect acculturating individuals, but also has important consequences for intergroup relations (Bourhis, Moïse, Perreault, & Senécal, 1997). Accordingly, acculturation researchers have argued that it is important to not only consider which strategy migrants favor, but also to take into account which strategy individuals from the host country prefer. In particular, it is proposed that the most beneficial intergroup outcomes are obtained if the migrants’ attitudes match the host group’s expectations. Conversely, if the attitudes of the two groups differ from each other, the acculturation process is thought to result in less favorable outcomes (Bourhis, Moïse, Perreault, & Senécal, 1997; Navas et al., 2005; Piontkowski, Rohmann, & Florack, 2002). This latter situation is likely to occur, considering that migrants have been found to typically prefer an integration strategy, whereas members of the host society generally would like them to assimilate (Berry, Phinney, Sam, & Vedder, 2006; Dovidio, Gaertner, & Saguy, 2009). Interestingly, this difference in preferred acculturation strategy mirrors the difference we encountered between minority and majority members’ reactions to multicultural and colorblind organizational diversity approaches. As such, we can hypothesize that the all-inclusive intervention applied in organizations might also work in the realm of acculturation.

GENERAL DISCUSSION
123
That is, members of the dominant group in the host society may develop a more positive stance toward the integration strategy if they feel that public policies not only emphasize the importance of maintaining migrants’ heritage culture, but also invest in preserving the dominant group’s culture. Self-verification theory. Finally, our research relates to work on self-verification theory (SVT; Swann, 1983). SVT proposes that people want others to see them as they see themselves. Self-verification is thought to bring stability to people’s lives, rendering their experiences more coherent, orderly, and comprehensible than they would be otherwise. SVT asserts that people can adopt three strategies to elicit support for their self-views. First, they may select interaction partners and settings that are likely to provide self-confirming evaluations (e.g., picking like-minded friends). Second, people may systematically communicate to others who they are (e.g., wearing clothes that signal one’s religious conviction). Third, people may see the world as more supportive of their self-views than it really is by processing information in a biased manner (e.g., only attending to feedback one expects). Hence, similar to our work, SVT seeks to understand how perceptions of authenticity are established. Yet, whereas we focused on how social environments shape individuals’ sense of authenticity, SVT centers on what individuals can do to make others see them as they see themselves. Importantly, besides improving individual well-being, self-verification processes are thought to enhance group performance as they make people more predictable to one another (Swann, 2012). Moreover, particularly noteworthy in the context of this dissertation, self-verification processes are thought to be especially important for the functioning of diverse groups. That is, SVT argues that particularly people in diverse groups may refrain from expressing controversial ideas out of fear they are misunderstood. Self-verification is thought to reduce such fear by convincing group members that they are understood. The result is that people may open up to other group members and bring their unique ideas to the table, which, in turn, improves group performance. Confirming these assertions, there is evidence that when group members offer one another self-verification, diverse groups outperform homogeneous groups (Polzer, Milton, & Swann, 2002; Swann, Polzer, Seyle, & Ko, 2004). These findings highlight that groups and organizations should particularly invest in fostering perceptions of authenticity when group members are different from each other.

CHAPTER 6
124
Practical Implications
This dissertation not only contributes to theory, but also has a number of important practical implications. First, our results underline that groups and organizations should take care that their members feel socially included. Perhaps the most consistent finding across our studies is that perceived inclusion is highly important. Specifically, we found that inclusion was positively associated with measures of individual well-being (e.g., self-esteem) and effectiveness (e.g., creativity). In addition, inclusion was a strong predictor of indicators of group cohesion (e.g., interpersonal trust) and performance (e.g., group learning behavior). Hence, our findings unequivocally demonstrate that creating inclusive work environments is beneficial to both individual employees and organizations as a whole.
Second, our results indicate that how organizations strategically approach workforce diversity has different effects on perceived inclusion for majority and minority group members. Whereas a colorblind approach to diversity was positively associated with inclusion for majority members, a multicultural approach was most effective for minority members. Hence, neither strategy appeared to be an effective means to create a work environment in which all subgroups perceive to be included. Nevertheless, our studies also indicate that reformulating the multicultural approach such that majority members are explicitly made part of organizational diversity does have the potential to render an inclusive work setting. We found that such an all-inclusive multicultural (AIM) approach (Stevens et al., 2008), compared with a “standard” multicultural approach in which the majority group is not explicitly made part of organizational diversity, increased the extent to which majority members perceived to be included. In addition, inclusion perceptions positively predicted the degree to which majority members supported organizational diversity efforts. This latter result is especially important considering that the successful implementation of diversity initiatives is to a large degree dependent on the receptiveness of majority members (James et al., 2001).
Third, our studies illustrate how an AIM approach may be implemented. For example, organizations can reformulate their diversity communication (e.g., in mission statements) such that all organizational subgroups are considered to be part of diversity. Similarly, diversity policies and initiatives can be framed as benefiting everyone, as opposed to just one particular subgroup. Notwithstanding the viability of these suggestions, we do hold that an AIM approach should not only be superficially manifested in diversity communication as this may induce the impression of window-dressing. That is, if an organization claims to pursue an all-inclusive approach, but

GENERAL DISCUSSION
125
does not back this up with structural interventions, the AIM approach is likely to fail. This implies, for example, that organizations should not only declare to value all cultural identities, but also ensure that members of all cultural subgroups are in fact represented in leadership roles.
Strengths, Limitations, and Future Research
A notable feature of this dissertation is that we combined survey studies
(chapters 2, 3, and 5) with field experiments (chapter 4). As such, we attempted to counterbalance the weaknesses of each of these methodologies by the strengths of the other. The primary advantage of the use of questionnaires is their external validity. However, as is typical for most surveys, the cross-sectional nature of our survey data prohibited us from making any causal claims about our hypothesized relationships. We therefore also conducted two field experiments. While experiments may lack external validity due to their artificial nature (Colquitt, 2008), they have the primary advantage of internal validity and are therefore especially suited to infer causality (Spencer, Zanna, & Fong, 2005).
Whereas the combination of different methodologies can be seen as a strength, a potential limitation of this dissertation is that none of the studies directly manipulated inclusion. Rather, in each of our studies, we examined how inclusion was correlated with a variety of outcome measures. Future research may provide more causal evidence for the importance of perceived belonging and authenticity by considering these as experimental factors. As such, the effects of each possible combination of belonging and authenticity (we have previously labeled these exclusion, assimilation, differentiation, and inclusion; see figure 1.2) on individual well-being and performance could be tested.
Importantly, our findings also give rise to a number of interesting questions to be addressed in future research. First, one may explore how belonging and authenticity are related to one another across different groups. The results from our scale validation demonstrated that belonging and authenticity were distinct components of inclusion. Yet, when we administered the PGIS in our subsequent studies we found that the belonging and authenticity subscale could be collapsed into a single scale measuring perceived inclusion. Future research may elaborate on this by systematically sampling different types of groups and exploring to what extent belonging and authenticity are aligned with each other across these groups. Whereas in some groups, members may feel forced to forsake their authentic self in order to fit in, in other groups they may feel that their sense of belonging is not contingent on the

CHAPTER 6
126
extent to which they can disclose their identity. Moreover, one may explore whether there is intra-individual stability in the extent to which belonging and authenticity are related to one another. That is, do people more or less have the same position within different groups? Answers to these questions are likely to further improve our understanding of the inclusion concept.
Furthermore, future research may examine the idea that the relative importance of establishing either group members’ belongingness or authenticity in predicting group performance could be dependent on the nature of the group task. While we did not directly test this in our studies, we may infer from our conceptualization that performance on tasks that predominantly demand efficiency may benefit most from establishing perceptions of belonging, whereas performance on tasks that require creative processes may benefit most from securing authenticity.
In addition, an interesting path for future research is to explore whether there are individual employee characteristics (e.g., personality traits) that can explain which diversity approach works best for whom. Although our results indicate that colorblindness and multiculturalism have different effects on majority and minority members, this does not necessarily imply that all majority members will benefit from a colorblind approach or that all minority members will prosper under a multicultural diversity approach. Future research may further develop this idea by drawing on previous work on individual differences in the endorsement of colorblind and multicultural national integration policies. In this context, it has been found that majority members who score high on social dominance orientation (SDO; Pratto, Sidanius, Stallworth, & Malle, 1994) endorse a colorblind approach significantly more than those low in SDO (Knowles et al., 2009). In addition, minority members who are highly identified with their cultural group have been found to be especially susceptible to the exclusionary effect of colorblindness and to benefit most from an environment in which cultural differences are valued (Gonzales & Cauce, 1995; Rosenthal & Levy, 2010). It would be important to assess whether the same contingency factors operate in the work domain.
Finally, future research may explore whether the effects of being demographically different from other group members are stronger in occupations that are dominated by specific groups. For example, being the sole female firefighter may be more consequential than being the only female high school teacher. In our studies we did not take into account this potential moderating role of occupational demography. Accordingly, future research may elaborate on our findings by systematically sampling respondents from different occupational settings.

GENERAL DISCUSSION
127
Concluding Remarks
Aristotle was undoubtedly right when he stated that “man is by nature a social
animal.” Yet, ensuring that people feel socially included in diverse groups seems to be a particular challenge. This was the focus of this dissertation. We conceptually refined the inclusion construct and introduced a scale to measure individual perceptions of inclusion. Furthermore, we demonstrated that the way organizations strategically approach workforce diversity has different effects on perceived inclusion for majority and minority group members. Together, we are confident that this dissertation substantially improves our understanding of how inclusion in diverse work settings can be established and hope that it opens many new avenues for investigating and managing inclusion in a diversifying world.


References


REFERENCES
131
Abrams, D., & Hogg, M. A. (2001). Comments
on the motivational status of self-esteem in
social identity and intergroup
discrimination. In M. A. Hogg, D. Abrams,
M. A. Hogg & D. Abrams (Eds.), Intergroup
relations: Essential readings (pp. 232-244).
New York, NY US: Psychology Press.
Adams, G., Garcia, D. M., Purdie-Vaughns, V.,
& Steele, C. M. (2006). The detrimental
effects of a suggestion of sexism in an
instruction situation. Journal of Experimental
Social Psychology, 42(5), 602-615.
doi:10.1016/j.jesp.2005.10.004
Allen, J. B. (2006). The perceived belonging in
sport scale: Examining validity. Psychology of
Sport and Exercise, 7(4), 387-405.
doi:10.1016/j.psychsport.2005.09.004
Allport, G. W. (1954). The nature of prejudice.
Oxford England: Addison-Wesley.
Anderson, T. (2005). Employers miss standard
measures for absences. Employee Benefit
News, 19(13), 12-82.
Acquavita, S. P., Pittman, J., Gibbons, M., &
Castellanos-Brown, K. (2009). Personal and
organizational diversity factors’ impact on
social workers’ job satisfaction: Results
from a national internet-based survey.
Administration in Social Work, 33(2), 151-
160. doi:10.1080/03643100902768824
Armes, A. (2005). Study examines costs of
unscheduled absenteeism. Safety & Health,
172(6), 15-16.
Avery, D. R. (2003). Reactions to diversity in
recruitment advertising--are differences
black and white? Journal of Applied Psychology,
88(4), 672-679. doi:10.1037/0021-
9010.88.4.672
Avery, D. R., McKay, P. F., Wilson, D. C., &
Tonidandel, S. (2007). Unequal attendance:
The relationships between race,
organizational diversity cues, and
absenteeism. Personnel Psychology, 60(4), 875-
902. doi:10.1111/j.1744-6570.2007.00094.x
Baumeister, R. F., DeWall, C. N., Ciarocco, N.
J., & Twenge, J. M. (2005). Social exclusion
impairs self-regulation. Journal of Personality
and Social Psychology, 88(4), 589-604.
doi:10.1037/0022-3514.88.4.589
Baumeister, R. F., & Leary, M. R. (1995). The
need to belong: Desire for interpersonal
attachments as a fundamental human
motivation. Psychological Bulletin, 117(3), 497-
529. doi:10.1037/0033-2909.117.3.497
Bell, M. P., Harrison, D. A., & McLaughlin, M.
E. (2000). Forming, changing, and acting
on attitude toward affirmative action
programs in employment: A theory-driven
approach. Journal of Applied Psychology, 85(5),
784-798. doi:10.1037/0021-9010.85.5.784
Berry, J. W., Phinney, J. S., Sam, D. L., &
Vedder, P. (2006). Immigrant youth in cultural
transitions: Acculturation, identity, and adaptation
across national contexts. Mahwah, NJ:
Erlbaum.
Bettencourt, B. A., Molix, L., Talley, A. E., &
Sheldon, K. M. (2006). Psychological need
satisfaction through social roles. In T.
Postmes, & J. Jetten (Eds.), Individuality and
the group: Advances in social identity (pp. 196-
214). Thousand Oaks, CA US: Sage
Publications, Inc.

REFERENCES
132
Bhawuk, D. P., Podsiadlowski, A., Graf, J., &
Triandis, H. C. (2002). Corporate strategies
for managing diversity in the global
workplace. In G. Ferris, M. R. Buckley &
D. Fedor (Eds.), Human resource management:
Perspectives, context, functions, and outcomes (pp.
112-145). Englewood Cliffs, NJ: Prentice
Hall.
Bourhis, R. Y., Moïse, L. C., Perreault, S., &
Senécal, S. (1997). Towards an interactive
acculturation model: A social psychological
approach. International Journal of Psychology,
32(6), 369-386.
doi:10.1080/002075997400629
Bowers, C. A., Pharmer, J. A., & Salas, E.
(2000). When member homogeneity is
needed in work teams: A meta-analysis.
Small Group Research, 31(3), 305-327.
doi:10.1177/104649640003100303
Brewer, M. B. (1991). The social self: On being
the same and different at the same time.
Personality and Social Psychology Bulletin, 17(5),
475-482. doi:10.1177/0146167291175001
Brewer, M. B., & Miller, N. (1984). Beyond the
contact hypothesis: Theoretical
perspectives on desegregation. In N. Miller,
& M. B. Brewer (Eds.), Groups in contact:
The psychology of desegregation (pp. 281-
302). Orlando, FL: Academic Press.
Brewer, M. B., & Roccas, S. (2001). Individual
values, social identity, and optimal
distinctiveness. In C. Sedikides, M. B.
Brewer, C. Sedikides & M. B. Brewer
(Eds.), Individual self, relational self, collective
self. (pp. 219-237). New York, NY US:
Psychology Press.
Brickson, S. (2000). The impact of identity
orientation on individual and organizational
outcomes in demographically diverse
settings. The Academy of Management Review,
25(1), 82-101. doi:10.2307/259264
Brief, A. P., Umphress, E. E., Dietz, J.,
Burrows, J. W., Butz, R. M., & Scholten, L.
(2005). Community matters: Realistic group
conflict theory and the impact of diversity.
Academy of Management Journal, 48(5), 830-
844. doi:10.5465/AMJ.2005.18803925
Bureau of Labor Statistics. (2012).
Demographic characteristics of the labor
force (current population survey).
Retrieved from
http://www.bls.gov/cps/cpsrace2012.pdf
Byrne, B. M. (1998). Structural equation modeling
with LISREL, PRELIS, and SIMPLIS: Basic
concepts, applications, and programming.
Mahwah, NJ US: Lawrence Erlbaum
Associates Publishers.
Byrne, D. (1971). The attraction paradigm. New
York: Academic Press.
Caporael, L. R., & Baron, R. M. (1997). Groups
as the mind's natural environment. In J. A.
Simpson, & D. T. Kenrick (Eds.),
Evolutionary social psychology (pp. 317-344).
Hillsdale, NJ England: Lawrence Erlbaum
Associates, Inc.
CBS (2014). Definitions. Retrieved from
http://www.cbs.nl/en-
GB/menu/methoden/begrippen/default.h
tm?Languageswitch=on&ConceptID=37

REFERENCES
133
Chatman, J. A., & O'Reilly, C. A. (2004).
Asymmetric reactions to work group sex
diversity among men and women. Academy
of Management Journal, 47(2), 193-208.
doi:10.2307/20159572
Chattopadhyay, P., George, E., & Lawrence, S.
A. (2004). Why does dissimilarity matter?
Exploring self-categorization, self-
enhancement, and uncertainty reduction.
Journal of Applied Psychology, 89(5), 892-900.
doi:10.1037/0021-9010.89.5.892
Chrobot-Mason, D., & Thomas, K. M. (2002).
Minority employees in majority
organizations: The intersection of
individual and organizational racial identity
in the workplace. Human Resource
Development Review, 1(3), 323-344.
doi:10.1177/1534484302013004
Cohen, G. L., Steele, C. M., & Ross, L. D.
(1999). The mentor's dilemma: Providing
critical feedback across the racial divide.
Personality and Social Psychology Bulletin,
25(10), 1302-1318.
doi:10.1177/0146167299258011
Cohen, J., Cohen, P., West, S. G., & Aiken, L.
S. (2003). Applied multiple regression/correlation
analysis for the behavioral sciences (3rd ed.).
Mahwah, NJ US: Lawrence Erlbaum
Associates Publishers.
Colquitt, J. A. (2008). From the editors:
Publishing laboratory research in AMJ--A
question of when, not if. Academy of
Management Journal, 51(4), 616-620.
doi:10.5465/AMR.2008.33664717
Cook, J., & Wall, T. (1980). New work attitude
measures of trust, organizational
commitment and personal need non-
fulfilment. Journal of Occupational Psychology,
53(1), 39-52. doi:10.1111/j.2044-
8325.1980.tb00005.x
Cordery, J. L., & Sevastos, P. P. (1993).
Responses to the original and revised job
diagnostic survey: Is education a factor in
responses to negatively worded items?
Journal of Applied Psychology, 78(1), 141-143.
doi:10.1037/0021-9010.78.1.141
Correll, J., & Park, B. (2005). A model of the
ingroup as a social resource. Personality and
Social Psychology Review, 9(4), 341-359.
doi:10.1207/s15327957pspr0904_4
Cox, T. (1991). The multicultural organization.
Executive, 5(2), 34-47.
doi:10.5465/AME.1991.4274675
Dass, P., & Parker, B. (1999). Strategies for
managing human resource diversity: From
resistance to learning. Academy of
Management Executive, 13(2), 68-80.
doi:10.5465/AME.1999.1899550
De Dreu, C. K. W., & West, M. A. (2001).
Minority dissent and team innovation: The
importance of participation in decision
making. Journal of Applied Psychology, 86(6),
1191-1201. doi:10.1037/0021-
9010.86.6.1191
Deci, E. L., & Ryan, R. M. (1991). A
motivational approach to self: Integration
in personality. In R. A. Dienstbier, & R. A.
Dienstbier (Eds.), Nebraska symposium on
motivation, 1990: Perspectives on motivation. (pp.
237-288). Lincoln, NE US: University of
Nebraska Press.

REFERENCES
134
Deci, E. L., & Ryan, R. M. (2000). The 'what'
and 'why' of goal pursuits: Human needs
and the self-determination of behavior.
Psychological Inquiry, 11(4), 227-268.
doi:10.1207/S15327965PLI1104_01
DeWall, C. N., Deckman, T., Pond, R. S. J., &
Bonser, I. (2011). Belongingness as a core
personality trait: How social exclusion
influences social functioning and
personality expression. Journal of Personality,
79(6), 979-1012. doi:10.1111/j.1467-
6494.2010.00695.x
Diener, E. (1994). Assessing subjective well-
being: Progress and opportunities. Social
Indicators Research, 31(2), 103-157.
doi:10.1007/BF01207052
Dovidio, J. F., Gaertner, S. L., & Saguy, T.
(2009). Commonality and the complexity of
'we': Social attitudes and social change.
Personality and Social Psychology Review, 13(1),
3-20. doi:10.1177/1088868308326751
Edmondson, A. (1999). Psychological safety
and learning behavior in work teams.
Administrative Science Quarterly, 44(2), 350-
383. doi:10.2307/2666999
Edwards, M. R., & Peccei, R. (2007).
Organizational identification: Development
and testing of a conceptually grounded
measure. European Journal of Work &
Organizational Psychology, 16(1), 25-57.
doi:10.1080/13594320601088195
Eisenberger, R., Huntington, R., Hutchison, S.,
& Sowa, D. (1986). Perceived
organizational support. Journal of Applied
Psychology, 71(3), 500-507.
doi:10.1037/0021-9010.71.3.500
Ellemers, N., & Jetten, J. (2013). The many
ways to be marginal in a group. Personality
and Social Psychology Review, 17(1), 3-21.
doi:10.1177/1088868312453086
Ellemers, N., Kortekaas, P., & Ouwerkerk, J.
W. (1999). Self-categorisation, commitment
to the group and group self-esteem as
related but distinct aspects of social
identity. European Journal of Social Psychology,
29(2-3), 371-389. doi:10.1002/(SICI)1099-
0992(199903/05)29:2/3<371::AID-
EJSP932>3.0.CO;2-U
Ely, R. J., & Thomas, D. A. (2001). Cultural
diversity at work: The effects of diversity
perspectives on work group processes and
outcomes. Administrative Science Quarterly,
46(2), pp. 229-273. doi:10.2307/2667087
Field, A. P. (2005). Intraclass correlation. In B.
Everitt, & D. C. Howell (Eds.), Encyclopedia
of statistics in behavioral science (pp. 948-954).
New York: Wiley.
Gaskin, J. (2011). Multigroup moderation in
amos - made easy. Retrieved from
http://statwiki.kolobkreations.com
George, J. M. (1990). Personality, affect, and
behavior in groups. Journal of Applied
Psychology, 75(2), 107-116.
doi:10.1037/0021-9010.75.2.107
Gilbert, J. A., & Ivancevich, J. M. (2001).
Effects of diversity management on
attachment. Journal of Applied Social
Psychology, 31(7), 1331-1349.
doi:10.1111/j.1559-1816.2001.tb02676.x

REFERENCES
135
Gonzales, N. A., & Cauce, A. M. (1995).
Ethnic identity and multicultural
competence: Dilemmas and challenges for
minority youth. In W. D. Hawley, & A. W.
Jackson (Eds.), Toward a common destiny:
Improving race and ethnic relations in America
(pp. 131-162). San Francisco, CA US:
Jossey-Bass.
Gonzalez, J. A., & Denisi, A. S. (2009). Cross-
level effects of demography and diversity
climate on organizational attachment and
firm effectiveness. Journal of Organizational
Behavior, 30(1), 21-40. doi:10.1002/job.498
Granovetter, M. S. (1973). The strength of
weak ties. American Journal of Sociology, 78(6),
1360-1380.
Greenberg, J., Pyszczynski, T., Solomon, S.,
Rosenblatt, A., Veeder, M., Kirkland, S., &
Lyon, D. (1990). Evidence for terror
management theory II: The effects of
mortality salience on reactions to those
who threaten or bolster the cultural
worldview. Journal of Personality and Social
Psychology, 58(2), 308-318.
doi:10.1037/0022-3514.58.2.308
Grensing-Pophal, L. (2002). Reaching for
diversity. HR Magazine, 47(5), 53-56.
Guillaume, Y. R. F., Brodbeck, F. C., & Riketta,
M. (2012). Surface- and deep-level
dissimilarity effects on social integration
and individual effectiveness related
outcomes in work groups: A meta-analytic
integration. Journal of Occupational and
Organizational Psychology, 85(1), 80-115.
doi:10.1111/j.2044-8325.2010.02005.x
Hackman, J. R. (1987). The design of work
teams. In J. W. Lorsch (Ed.), Handbook of
organizational behavior (pp. 315-342).
Englewood-Cliffs, N.J.: Prentice-Hall.
Hair, J., Black, W., Babin, B., & Anderson, R.
(2010). Multivariate data analysis (7th ed.).
Upper Saddle River, NJ, USA: Prentice-
Hall, Inc.
Harquail, C. V., & Cox, T. C. (1993).
Organizational culture and acculturation. In
T. J. Cox (Ed.), Cultural diversity in
organizations. Theory, research & practice (pp.
161-176). San Francisco: Berret-Koehler
Publishers.
Harrison, D. A., & Klein, K. J. (2007). What's
the difference? Diversity constructs as
separation, variety, or disparity in
organizations. The Academy of Management
Review, 32(4), 1199-1228.
doi:10.2307/20159363
Harrison, D. A., Kravitz, D. A., Mayer, D. M.,
Leslie, L. M., & Lev-Arey, D. (2006).
Understanding attitudes toward affirmative
action programs in employment: Summary
and meta-analysis of 35 years of research.
Journal of Applied Psychology, 91(5), 1013-
1036. doi:10.1037/0021-9010.91.5.1013
Harrison, D. A., & Martocchio, J. J. (1998).
Time for absenteeism: A 20-year review of
origins, offshoots, and outcomes. Journal of
Management, 24(3), 305-350.
doi:10.1016/S0149-2063(99)80064-6

REFERENCES
136
Harrison, D. A., Price, K. H., & Bell, M. P.
(1998). Beyond relational demography:
Time and the effects of surface- and deep-
level diversity on work group cohesion.
Academy of Management Journal, 41(1), 96-
107. doi:10.2307/256901
Haslam, S. A., Eggins, R. A., & Reynolds, K. J.
(2003). The ASPIRe model: Actualizing
social and personal identity resources to
enhance organizational outcomes. Journal of
Occupational and Organizational Psychology,
76(1), 83-113.
doi:10.1348/096317903321208907
Hayes, A. F. (2013). Introduction to mediation,
moderation, and conditional process analysis: A
regression-based approach. New York, NY US:
Guilford Press.
Heatherton, T. F., & Polivy, J. (1991).
Development and validation of a scale for
measuring state self-esteem. Journal of
Personality and Social Psychology, 60(6), 895-
910. doi:10.1037/0022-3514.60.6.895
Hewstone, M., & Brown, R. (1986). Contact is
not enough: An intergroup perspective on
the 'contact hypothesis.'. In M. Hewstone,
& R. Brown (Eds.), (pp. 1-44). Cambridge,
MA US: Basil Blackwell.
Hinkin, T. R. (1998). A brief tutorial on the
development of measures for use in survey
questionnaires. Organizational Research
Methods, 1(1), 104-121.
doi:10.1177/109442819800100106
Hofhuis, J., Van der Zee, K. I., & Otten, S.
(2012). Social identity patterns in culturally
diverse organizations: The role of diversity
climate. Journal of Applied Social Psychology,
42(4), 964-989. doi:10.1111/j.1559-
1816.2011.00848.x
Hogg, M. A., & Abrams, D. (1993). Towards a
single-process uncertainty-reduction model
of social motivation in groups. In M. A.
Hogg, & D. Abrams (Eds.), Group
motivation: Social psychological perspectives (pp.
173-190). Hertfordshire, HP2 7EZ
England: Harvester Wheatsheaf.
Hooghe, M., Trappers, A., Meuleman, B., &
Reeskens, T. (2008). Migration to
European countries: A structural
explanation of patterns, 1980–2004.
International Migration Review, 42(2), 476-504.
doi:10.1111/j.1747-7379.2008.00132.x
Horn, J. L. (1965). A rationale and test for the
number of factors in factor analysis.
Psychometrika, 30(2), 179-185.
doi:10.1007/BF02289447
Hornsey, M. J., & Jetten, J. (2004). The
individual within the group: Balancing the
need to belong with the need to be
different. Personality and Social Psychology
Review, 8(3), 248-264.
doi:10.1207/s15327957pspr0803_2
Howell, D. C. (1992). Statistical methods for
psychology (3rd ed.). Boston, MA US: PWS-
Kent Publishing Co.

REFERENCES
137
Irving, M. A., & Hudley, C. (2005). Cultural
mistrust, academic outcome expectations,
and outcome values among African
American adolescent men. Urban Education,
40(5), 476-496.
doi:10.1177/0042085905278019
Ito, M., & Kodama, M. (2005). Sense of
authenticity, self-esteem, and subjective and
psychological well-being. Japanese Journal of
Educational Psychology, 53(1), 74-85.
doi:10.5926/jjep1953.53.1_74
Jackson, S. E., & Joshi, A. (2011). Work team
diversity. In S. Zedeck (Ed.),
APA handbook of industrial and organizational
psychology (1st ed., pp. 651-686).
Washington, DC US: American
Psychological Association.
doi:10.1037/12169-020
James, E. H., Brief, A. P., Dietz, J., & Cohen,
R. R. (2001). Prejudice matters:
Understanding the reactions of Whites to
affirmative action programs targeted to
benefit Blacks. Journal of Applied Psychology,
86(6), 1120-1128. doi:10.1037/0021-
9010.86.6.1120
Jans, L., Postmes, T., & Van der Zee, K. I.
(2012). Sharing differences: The inductive
route to social identity formation. Journal of
Experimental Social Psychology, 48(5), 1145-
1149. doi:10.1016/j.jesp.2012.04.013
Jansen, W. S., Otten, S., & Van der Zee, K. I.
I'm sick of being different. The relationship
between gender dissimilarity, work group
inclusion, and absenteeism. Human
Relations, Manuscript under review.
Jansen, W. S., Otten, S., Van der Zee, K. I., &
Jans, L. (2014). Inclusion:
Conceptualization and measurement.
European Journal of Social Psychology, 44(4),
370-385. doi:10.1002/ejsp.2011
Jehn, K. A., & Mannix, E. A. (2001). The
dynamic nature of conflict: A longitudinal
study of intragroup conflict and group
performance. Academy of Management Journal,
44(2), 238-251. doi:10.2307/3069453
Johns, G. (1994). How often were you absent?
A review of the use of self-reported
absence data. Journal of Applied Psychology,
79(4), 574-591. doi:10.1037/0021-
9010.79.4.574
Joshi, A., & Roh, H. (2009). The role of
context in work team diversity research: A
meta-analytic review. Academy of Management
Journal, 52(3), 599-627.
doi:10.5465/AMJ.2009.41331491
Kalev, A., Dobbin, F., & Kelly, E. (2006). Best
practices or best guesses? Assessing the
efficacy of corporate affirmative action and
diversity policies. American Sociological
Review, 71(4), 589-617.
doi:10.1177/000312240607100404
Karafantis, D. M., Pierre-Louis, J., &
Lewandowski, G. W. J. (2010). A
comparison of the multicultural and
colorblind perspectives on the intergroup
attitudes of college students. Journal of
Human Behavior in the Social Environment,
20(5), 688-710.
doi:10.1080/10911351003751876

REFERENCES
138
Kernis, M. H., & Goldman, B. M. (2006). A
multicomponent conceptualization of
authenticity: Theory and research. In M. P.
Zanna (Ed.), Advances in experimental social
psychology (pp. 283-357). San Diego, CA US:
Elsevier Academic Press.
doi:10.1016/S0065-2601(06)38006-9
Kline, R. B. (2011). Principles and practice of
structural equation modeling (3rd ed.). New
York, NY US: Guilford Press.
Knowles, E. D., Lowery, B. S., Hogan, C. M.,
& Chow, R. M. (2009). On the malleability
of ideology: Motivated construals of color
blindness. Journal of Personality and Social
Psychology, 96(4), 857-869.
doi:10.1037/a0013595
Koster, M., Nakken, H., Pijl, S. J., & Van
Houten, E. (2009). Being part of the peer
group: A literature study focusing on the
social dimension of inclusion in education.
International Journal of Inclusive Education,
13(2), 117-140.
doi:10.1080/13603110701284680
Krackhardt, D. (1990). Assessing the political
landscape: Structure, cognition, and power
in organizations. Administrative Science
Quarterly, 35(2), 342-369.
doi:10.2307/2393394
Krehbiel, P. J., & Cropanzano, R. (2000).
Procedural justic, outcome favorability, and
emotion. Social Justice Research, 13(4), 339-
360. doi:10.1023/A:1007670909889
Kristof-Brown, A., Zimmerman, R. D., &
Johnson, E. C. (2005). Consequences of
individual's fit at work: A meta-analysis of
person-job, person-organization, person-
group, and person-supervisor fit. Personnel
Psychology, 58(2), 281-342.
doi:10.1111/j.1744-6570.2005.00672.x
Kutner, M. H., Nachtsheim, C. J., & Neter, J.
(2004). Applied linear regression models (4th
ed.). New York: McGraw-Hill/Irwin.
Leach, C. W., Van Zomeren, M., Zebel, S.,
Vliek, M. L. W., Pennekamp, S. F., Doosje,
B., . . . Spears, R. (2008). Group-level self-
definition and self-investment: A
hierarchical (multicomponent) model of in-
group identification. Journal of Personality and
Social Psychology, 95(1), 144-165.
doi:10.1037/0022-3514.95.1.144
Leary, M. R., & Baumeister, R. F. (2000). The
nature and function of self-esteem:
Sociometer theory. In M. P. Zanna (Ed.),
Advances in experimental social psychology, vol.
32. (pp. 1-62). San Diego, CA US:
Academic Press.
Leary, M. R., Kelly, K. M., Cottrell, C. A., &
Schreindorfer, L. S. (2013). Construct
validity of the need to belong scale:
Mapping the nomological network. Journal
of Personality Assessment, 95(6), 610-624.
doi:10.1080/00223891.2013.819511

REFERENCES
139
Levin, S., Matthews, M., Guimond, S., Sidanius,
J., Pratto, F., Kteily, N., . . . Dover, T.
(2012). Assimilation, multiculturalism, and
colorblindness: Mediated and moderated
relationships between social dominance
orientation and prejudice. Journal of
Experimental Social Psychology, 48(1), 207-212.
doi:10.1016/j.jesp.2011.06.019
Linnehan, F., & Konrad, A. M. (1999). Diluting
diversity implications for intergroup
inequality in organizations. Journal of
Management Inquiry, 8(4), 399.
doi:10.1177/105649269984009
Lirio, P., Lee, M. D., Williams, M. L., Haugen,
L. K., & Kossek, E. E. (2008). The
inclusion challenge with reduced-load
professionals: The role of the manager.
Human Resource Management, 47(3), 443-461.
doi:10.1002/hrm.20226
Luhtanen, R., & Crocker, J. (1992). A collective
self-esteem scale: Self-evaluation of one's
social identity. Personality and Social Psychology
Bulletin, 18(3), 302-318.
doi:10.1177/0146167292183006
MacKenzie, S. B., Podsakoff, P. M., &
Podsakoff, N. P. (2011). Construct
measurement and validation procedures in
MIS and behavioral research: Integrating
new and existing techniques. MIS Quarterly,
35(2), 293-334.
Mael, F., & Ashforth, B. E. (1992). Alumni and
their alma mater: A partial test of the
reformulated model of organizational
identification. Journal of Organizational
Behavior, 13(2), 103-123.
doi:10.1002/job.4030130202
Magazine, S. L., Williams, L. J., & Williams, M.
L. (1996). A confirmatory factor analysis
examination of reverse coding effects in
Meyer and Allen's affective and
continuance commitment scales.
Educational and Psychological Measurement,
56(2), 241-250.
doi:10.1177/0013164496056002005
Markus, H. R., & Steele, C. M. (2000).
Colorblindness as a barrier to inclusion:
Assimilation and nonimmigrant minorities.
Daedalus, 129(4), 233-259.
McKay, P. F., Avery, D. R., Tonidandel, S.,
Morris, M. A., Hernandez, M., & Hebl, M.
R. (2007). Racial differences in employee
retention: Are diversity climate perceptions
the key? Personnel Psychology, 60(1), 35-62.
doi:10.1111/j.1744-6570.2007.00064.x
Miller, F. A. (1998). Strategic culture change:
The door to achieving high performance
and inclusion. Public Personnel Management,
27(2), 151-160.
Mor-Barak, M. E. (2000). Beyond affirmative
action: Toward a model of diversity and
organizational inclusion. Administration in
Social Work, 23, 47-68.
Mullen, B., Chapman, J. G., & Peaugh, S.
(1989). Focus of attention in groups: A
self-attention perspective. Journal of Social
Psychology, 129(6), 807.
doi:10.1080/00224545.1989.9712089
Mummendey, A., & Wenzel, M. (1999). Social
discrimination and tolerance in intergroup
relations: Reactions to intergroup
difference. Personality and Social Psychology
Review, 3(2), 158-174.
doi:10.1207/s15327957pspr0302_4

REFERENCES
140
Muthén, L. K., & Muthén, B. O. (2007). Mplus
user's guide (Sixth ed.). Los Angeles, CA:
Muthén & Muthén.
Navas, M., García, M. C., Sánchez, J., Rojas, A.
J., Pumares, P., & Fernández, J. S. (2005).
Relative acculturation extended model
(RAEM): New contributions with regard to
the study of acculturation. International
Journal of Intercultural Relations, 29(1), 21-37.
doi:10.1016/j.ijintrel.2005.04.001
Nembhard, I. M., & Edmondson, A. C. (2006).
Making it safe: The effects of leader
inclusiveness and professional status on
psychological safety and improvement
efforts in health care teams. Journal of
Organizational Behavior, 27(7), 941-966.
doi:10.1002/job.413
Oakes, P., Haslam, S. A., & Turner, J. C.
(1998). The role of prototypicality in group
influence and cohesion: Contextual
variation in the graded structure of social
categories. In S. Worchel, J. F. Morales, D.
Páez & J. Deschamps (Eds.), Social identity:
International perspectives (pp. 75-92).
Thousand Oaks, CA US: Sage Publications,
Inc.
Pearce, J. L., & Randel, A. E. (2004).
Expectations of organizational mobility,
workplace social inclusion, and employee
job performance. Journal of Organizational
Behavior, 25(1), 81-98.
doi:10.1002/job.232
Pelled, L. H., Ledford, G. E., & Mohrman, S.
A. (1999). Demographic dissimilarity and
workplace inclusion. Journal of Management
Studies, 36(7), 1013-1031.
doi:10.1111/1467-6486.00168
Pfeffer, J. (1983). Organizational demography.
Research in Organizational Behavior, 5, 299-
357.
Phillips, K. W., Kim-Jun, S., & Shim, S. (2011).
The value of diversity in organizations: A
social psychological perspective. In D. De
Cremer, R. Van Dick & J. K. Murnighan
(Eds.), Social psychology and organizations (pp.
253-271). New York, NY US:
Routledge/Taylor & Francis Group.
Phinney, J. S., Horenczyk, G., Liebkind, K., &
Vedder, P. (2001). Ethnic identity,
immigration, and well-being: An
interactional perspective. Journal of Social
Issues, 57(3), 493-510. doi:10.1111/0022-
4537.00225
Pickett, C. L., Gardner, W. L., & Knowles, M.
(2004). Getting a cue: The need to belong
and enhanced sensitivity to social cues.
Personality and Social Psychology Bulletin, 30(9),
1095-1107.
doi:10.1177/0146167203262085
Pilotte, W. J., & Gable, R. K. (1990). The
impact of positive and negative item stems
on the validity of a computer anxiety scale.
Educational and Psychological Measurement,
50(3), 603-610.
doi:10.1177/0013164490503016
Piontkowski, U., Rohmann, A., & Florack, A.
(2002). Concordance of acculturation
attitudes and perceived threat. Group
Processes & Intergroup Relations, 5(3), 221-232.
doi:10.1177/1368430202005003003

REFERENCES
141
Plaut, V. C. (2002). Cultural models of diversity
in America: The psychology of difference
and inclusion. In R. A. Shweder, M.
Minow, H. R. Markus, R. A. Shweder, M.
Minow & H. R. Markus (Eds.), Engaging
cultural differences: The multicultural challenge in
liberal democracies. (pp. 365-395). New York,
NY US: Russell Sage Foundation.
Plaut, V. C., Garnett, F. G., Buffardi, L. E., &
Sanchez-Burks, J. (2011). “What about
me?” Perceptions of exclusion and Whites'
reactions to multiculturalism. Journal of
Personality and Social Psychology, 101(2), 337-
353. doi:10.1037/a0022832
Plaut, V. C., Thomas, K. M., & Goren, M. J.
(2009). Is multiculturalism or
colorblindness better for minorities?
Psychological Science, 20(4), 444-446.
doi:10.1111/j.1467-9280.2009.02318.x
Pless, N. M., & Maak, T. (2004). Building an
inclusive diversity culture: Principles,
processes and practice. Journal of Business
Ethics, 54(2), 129-148. doi:10.1007/s10551-
004-9465-8
Podsakoff, P. M., MacKenzie, S. B., Lee, J., &
Podsakoff, N. P. (2003). Common method
biases in behavioral research: A critical
review of the literature and recommended
remedies. Journal of Applied Psychology, 88(5),
879-903. doi:10.1037/0021-9010.88.5.879
Podsiadlowski, A., Gröschke, D., Kogler, M.,
Springer, C., & Van der Zee, K. I. (2013).
Managing a culturally diverse workforce:
Diversity perspectives in organizations.
International Journal of Intercultural Relations,
37(2), 159-175.
doi:10.1016/j.ijintrel.2012.09.001
Polzer, J. T., Milton, L. P., & Swann, W. B.
(2002). Capitalizing on diversity:
Interpersonal congruence in small work
groups. Administrative Science Quarterly, 47(2),
296-324. doi:10.2307/3094807
Postmes, T., Haslam, S. A., & Jans, L. (2013). A
single-item measure of social identification:
Reliability, validity, and utility. British Journal
of Social Psychology, 52(4), 597-617.
doi:10.1111/bjso.12006
Postmes, T., Spears, R., Lee, A. T., & Novak,
R. J. (2005). Individuality and social
influence in groups: Inductive and
deductive routes to group identity. Journal of
Personality and Social Psychology, 89(5), 747-
763. doi:10.1037/0022-3514.89.5.747
Pratto, F., Sidanius, J., Stallworth, L. M., &
Malle, B. F. (1994). Social dominance
orientation: A personality variable
predicting social and political attitudes.
Journal of Personality and Social Psychology,
67(4), 741-763. doi:10.1037/0022-
3514.67.4.741
Purdie-Vaughns, V., & Ditlmann, R. (2010).
Reflection on diversity science in social
psychology. Psychological Inquiry, 21(2), 153-
159. doi:10.1080/1047840X.2010.486758
Purdie-Vaughns, V., Steele, C. M., Davies, P.
G., Ditlmann, R., & Crosby, J. R. (2008).
Social identity contingencies: How diversity
cues signal threat or safety for African
Americans in mainstream institutions.
Journal of Personality and Social Psychology,
94(4), 615-630. doi:10.1037/0022-
3514.94.4.615

REFERENCES
142
Rattan, A., & Ambady, N. (2013). Diversity
ideologies and intergroup relations: An
examination of colorblindness and
multiculturalism. European Journal of Social
Psychology, 43(1), 12-21.
doi:10.1002/ejsp.1892
Rau, B. L., & Hyland, M. M. (2003). Corporate
teamwork and diversity statements in
college recruitment brochures: Effects on
attraction. Journal of Applied Social Psychology,
33(12), 2465-2492. doi:10.1111/j.1559-
1816.2003.tb02776.x
Redfield, R., Linton, R., & Herskovits, M.
(1936). Memorandum on the study of
acculturation. American Anthropologist,
38(1), 149–152.
doi:10.1525/aa.1936.38.1.02a00330
Reise, S. P., Bonifay, W. E., & Haviland, M. G.
(2013). Scoring and modeling psychological
measures in the presence of
multidimensionality. Journal of Personality
Assessment, 95(2), 129-140.
doi:10.1080/00223891.2012.725437
Rhoades, L., & Eisenberger, R. (2002).
Perceived organizational support: A review
of the literature. Journal of Applied Psychology,
87(4), 698-714. doi:10.1037/0021-
9010.87.4.698
Richeson, J. A., & Nussbaum, R. J. (2004). The
impact of multiculturalism versus color-
blindness on racial bias. Journal of
Experimental Social Psychology, 40(3), 417-423.
doi:10.1016/j.jesp.2003.09.002
Roberson, Q. M. (2006). Disentangling the
meanings of diversity and inclusion in
organizations. Group & Organization
Management, 31(2), 212-236.
doi:10.1177/1059601104273064
Roccas, S., & Brewer, M. (2002). Social identity
complexity. Personality and Social Psychology
Review, 6(2), 88-106.
doi:10.1207/S15327957PSPR0602_01
Rosenberg, M., Schooler, C., Schoenbach, C.,
& Rosenberg, F. (1995). Global self-esteem
and specific self-esteem: Different
concepts, different outcomes. American
Sociological Review, 60(1), 141-156.
doi:10.2307/2096350
Rosenthal, L., & Levy, S. R. (2010). The
colorblind, multicultural, and polycultural
ideological approaches to improving
intergroup attitudes and relations. Social
Issues & Policy Review, 4(1), 215-246.
doi:10.1111/j.1751-2409.2010.01022.x
Rosette, A. S., Leonardelli, G. J., & Phillips, K.
W. (2008). The White standard: Racial bias
in leader categorization. Journal of Applied
Psychology, 93(4), 758-777.
doi:10.1037/0021-9010.93.4.758
Roth, L. M. (2004). Engendering inequality:
Processes of sex-segregation on Wall
Street. Sociological Forum, 19(2), 203-228.
doi:10.1023/B:SOFO.0000031980.82004.d
7
Russell, D. W. (2002). In search of underlying
dimensions: The use (and abuse) of factor
analysis in personality and social
psychology bulletin. Personality and Social
Psychology Bulletin, 28(12), 1629-1646.
doi:10.1177/014616702237645

REFERENCES
143
Ryan, C. S., Hunt, J. S., Weible, J. A., Peterson,
C. R., & Casas, J. F. (2007). Multicultural
and colorblind ideology, stereotypes, and
ethnocentrism among Black and White
Americans. Group Processes & Intergroup
Relations, 10(4), 617-637.
doi:10.1177/1368430207084105
Sam, D. L., & Berry, J. W. (2010).
Acculturation: When individuals and
groups of different cultural backgrounds
meet. Perspectives on Psychological Science, 5(4),
472-481. doi:10.1177/1745691610373075
Schriesheim, C. A., Eisenbach, R. J., & Hill, K.
D. (1991). The effect of negation and polar
opposite item reversals on questionnaire
reliability and validity: An experimental
investigation. Educational and Psychological
Measurement, 51(1), 67-78.
doi:10.1177/0013164491511005
Sheldon, K. M., & Bettencourt, B. A. (2002).
Psychological need-satisfaction and
subjective well-being within social groups.
British Journal of Social Psychology, 41(1), 25-
38. doi:10.1348/014466602165036
Sheldon, K. M., Ryan, R. M., Rawsthorne, L. J.,
& Ilardi, B. (1997). Trait self and true self:
Cross-role variation in the big-five
personality traits and its relations with
psychological authenticity and subjective
well-being. Journal of Personality and Social
Psychology, 73(6), 1380-1393.
doi:10.1037/0022-3514.73.6.1380
Shore, L. M., Chung-Herrera, B., Dean, M. A.,
Ehrhart, K. H., Jung, D. I., Randel, A. E.,
& Singh, G. (2009). Diversity in
organizations: Where are we now and
where are we going? Human Resource
Management Review, 19(2), 117-133.
doi:10.1016/j.hrmr.2008.10.004
Shore, L. M., Randel, A. E., Chung, B. G.,
Dean, M. A., Holcombe Ehrhart, K., &
Singh, G. (2011). Inclusion and diversity in
work groups: A review and model for
future research. Journal of Management, 37(4),
1262-1289.
doi:10.1177/0149206310385943
Sidanius, J., & Pratto, F. (1999). Social dominance:
An intergroup theory of social hierarchy and
oppression. New York, NY US: Cambridge
University Press.
Smith, E. R., & Mackie, D. M. (2007). Social
psychology (3rd ed.). Hove England:
Psychology Press/Taylor & Francis (UK).
Smith, E. R., Murphy, J., & Coats, S. (1999).
Attachment to groups: Theory and
management. Journal of Personality and Social
Psychology, 77(1), 94-110. doi:10.1037/0022-
3514.77.1.94
Smith, P. C., Kendall, L. M., & Hulin, C. L.
(1969). The measurement of satisfaction in work
and retirement: A strategy for the study of
attitudes. Oxford England: Rand Mcnally.
Snyder, C. R., & Fromkin, H. L. (1977).
Uniqueness: The human pursuit of difference.
New York: Plenum.

REFERENCES
144
Spector, P. E. (1985). Measurement of human
service staff satisfaction: Development of
the job satisfaction survey. American Journal
of Community Psychology, 13(6), 693-713.
doi:10.1007/BF00929796
Spencer, S. J., Zanna, M. P., & Fong, G. T.
(2005). Establishing a causal chain: Why
experiments are often more effective than
mediational analyses in examining
psychological processes. Journal of Personality
and Social Psychology, 89(6), 845-851.
Stevens, F. G., Plaut, V. C., & Sanchez-Burks,
J. (2008). Unlocking the benefits of
diversity: All-inclusive multiculturalism and
positive organizational change. Journal of
Applied Behavioral Science, 44(1), 116-133.
doi:10.1177/0021886308314460
Swann, W. B. (2012). Self-verification theory.
In P. A. M. Van Lange, A. W. Kruglanski
& E. T. Higgins (Eds.), Handbook of theories
of social psychology (vol. 2, pp. 23-42).
Thousand Oaks, CA: Sage Publications
Ltd.
Swann, W. B. (1983). Self-verification: Bringing
social reality into harmony with the self. In
J. Suls, & A. G. Greenwald (Eds.), Social
psychological perspectives on the self (2nd ed., pp.
33-66). Hillsdale, NJ: Erlbaum.
Swann, W. B., Polzer, J. T., Seyle, D. C., & Ko,
S. J. (2004). Finding value in diversity:
Verification of personal and social self-
views in diverse groups. Academy of
Management Review, 29(1), 9-27.
doi:10.5465/AMR.2004.11851702
Tajfel, H., & Turner, J. C. (1986). The social
identity theory of inter-group behavior. In
S. Worchel, & L. W. Austin (Eds.),
Psychology of intergroup relations (pp. 38-48).
Chicago: Nelson-Hall.
Thomas, D. A., & Ely, R. J. (1996). Making
differences matter: A new paradigm for
managing diversity. Harvard Business Review,
74(5), 79-90.
Thomas, K. M. (2005). Diversity dynamics in the
workplace. Ontario: Thomson Wadsworth.
Thomas, K. M., Mack, D. A., & Montagliani,
A. (2004). The arguments against diversity:
Are they valid? In M. S. Stockdale, & F. J.
Crosby (Eds.), The psychology and management
of workplace diversity (pp. 31-51). Malden:
Blackwell Publishing.
Thomas, K. M., & Plaut, V. C. (2008). The
many faces of diversity resistance in the
workplace. In K. M. Thomas, & K. M.
Thomas (Eds.), Diversity resistance in
organizations (pp. 1-22). New York, NY:
Taylor & Francis Group/Lawrence
Erlbaum Associates.
Timmerman, M. E., & Lorenzo-Seva, U.
(2011). Dimensionality assessment of
ordered polytomous items with parallel
analysis. Psychological Methods, 16(2), 209-
220. doi:10.1037/a0023353
Tsui, A. S., Egan, T. D., & O'Reilly, C. A.
(1992). Being different: Relational
demography and organizational
attachment. Administrative Science Quarterly,
37(4), 549-579. doi:10.2307/2393472

REFERENCES
145
Tsui, A. S., & Gutek, B. A. (1999). Demographic
differences in organizations: Current research and
future directions. New York, NY US:
Lexington Books/Macmillan.
Turner, J. C., Hogg, M. A., Oakes, P. J.,
Reicher, S. D., & Wetherell, M. S. (1987).
Rediscovering the social group: A self-
categorization theory. Cambridge, MA US:
Basil Blackwell.
Twenge, J. M., Baumeister, R. F., DeWall, C.
N., Ciarocco, N. J., & Bartels, J. M. (2007).
Social exclusion decreases prosocial
behavior. Journal of Personality and Social
Psychology, 92(1), 56-66. doi:10.1037/0022-
3514.92.1.56
Van den Broeck, A., Vansteenkiste, M., De
Witte, H., Soenens, B., & Lens, W. (2010).
Capturing autonomy, competence, and
relatedness at work: Construction and
initial validation of the work-related basic
need satisfaction scale. Journal of Occupational
and Organizational Psychology, 83(4), 981-
1002. doi:10.1348/096317909X481382
Van der Zee, K. I., Paulus, P., Vos, M., &
Parthasarathy, N. (2009). The impact of
group composition and attitudes towards
diversity on anticipated outcomes of
diversity in groups. Group Processes &
Intergroup Relations, 12(2), 257-280.
doi:10.1177/1368430208101347
Van Dick, R., & Haslam, S. A. (2012). Stress
and well-being in the workplace: Support
for key propositions from the social
identity approach. In J. Jetten, C. Haslam &
S. A. Haslam (Eds.), The social cure: Identity,
health and well-being (pp. 175-194). New
York, NY, US: Psychology Press.
Van Knippenberg, D., De Dreu, C. K. W., &
Homan, A. C. (2004). Work group diversity
and group performance: An integrative
model and research agenda. Journal of
Applied Psychology, 89(6), 1008-1022.
doi:10.1037/0021-9010.89.6.1008
Van Knippenberg, D., & Schippers, M. C.
(2007). Work group diversity. Annual Review
of Psychology, 58, 515-541.
doi:10.1146/annurev.psych.58.110405.0855
46
Vandenberg, R. J. (2002). Toward a further
understanding of an improvement in
measurement invariance methods and
procedures. Organizational Research Methods,
5(2), 139-158.
doi:10.1177/1094428102005002001
Verkuyten, M. (2005). Ethnic group
identification and group evaluation among
minority and majority groups: Testing the
multiculturalism hypothesis. Journal of
Personality and Social Psychology, 88(1), 121-
138. doi:10.1037/0022-3514.88.1.121
Vos, M. W., Jansen, W. S., Otten, S.,
Podsiadlowski, A., & Van der Zee, K. I.
Colorblind or colorful? The relationship
between diversity approaches on inclusion
and work outcomes among majority and
minority employees. International Journal of
Intercultural Relations, Manuscript under
review.
Ward, C., & Searle, W. (1991). The impact of
value discrepancies and cultural identity on
psychological and sociocultural adjustment
of sojourners. International Journal of
Intercultural Relations, 15(2), 209-225.
doi:10.1016/0147-1767(91)90030-K
REFERENCES
146
Webber, S. S., & Donahue, L. M. (2001).
Impact of highly and less job-related
diversity on work group cohesion and
performance: A meta-analysis. Journal of
Management, 27(2), 141-162.
doi:10.1016/S0149-2063(00)00093-3
Wenzel, M., Mummendey, A., & Waldzus, S.
(2007). Superordinate identities and
intergroup conflict: The ingroup projection
model. European Review of Social Psychology,
18, 331-372.
doi:10.1080/10463280701728302
Wiesenfeld, B. M., Swann, W. B., Brockner, J.,
& Bartel, C. A. (2007). Is more fairness
always preferred? Self-esteem moderates
reactions to procedural justice. Academy of
Management Journal, 50(5), 1235-1253.
doi:10.2307/20159922
Williams, K. Y., & O'Reilly, C. A. (1998).
Demography and diversity in organizations:
A review of 40 years of research. Research in
Organizational Behavior, Vol 20, 1998, 20, 77-
140.
Williams, K. D., Cheung, C. K. T., & Choi, W.
(2000). Cyberostracism: Effects of being
ignored over the internet. Journal of
Personality and Social Psychology, 79(5), 748-
762. doi:10.1037/0022-3514.79.5.748
Williams, K. D., & Nida, S. A. (2011).
Ostracism: Consequences and coping.
Current Directions in Psychological Science, 20(2),
71-75. doi:10.1177/0963721411402480
Williams, L. J., Cote, J. A., & Buckley, M. R.
(1989). Lack of method variance in self-
reported affect and perceptions at work:
Reality or artifact? Journal of Applied
Psychology, 74(3), 462-468.
doi:10.1037/0021-9010.74.3.462
Wolfson, N., Kraiger, K., & Finkelstein, L.
(2011). The relationship between diversity
climate perceptions and workplace
attitudes. The Psychologist-Manager Journal,
14(3), 161-176.
doi:10.1080/10887156.2011.546170
Wolsko, C., Park, B., & Judd, C. M. (2006).
Considering the tower of Babel: Correlates
of assimilation and multiculturalism among
ethnic minority and majority groups in the
United States. Social Justice Research, 19(3),
277-306. doi:10.1007/s11211-006-0014-8
Wolsko, C., Park, B., Judd, C. M., &
Wittenbrink, B. (2000). Framing interethnic
ideology: Effects of multicultural and
color-blind perspectives on judgments of
groups and individuals. Journal of Personality
and Social Psychology, 78(4), 635-654.
doi:10.1037/0022-3514.78.4.635
Wood, A. M., Linley, P. A., Maltby, J.,
Baliousis, M., & Joseph, S. (2008). The
authentic personality: A theoretical and
empirical conceptualization and the
development of the authenticity scale.
Journal of Counseling Psychology, 55(3), 385-
399. doi:10.1037/0022-0167.55.3.385
Yuan, K., Bentler, P. M., & Kano, Y. (1997).
On averaging variables in a confirmatory
factor analysis model. Behaviormetrika, 24(1),
71-83. doi:10.2333/bhmk.24.71

REFERENCES
147
Zagefka, H., & Brown, R. (2002). The
relationship between acculturation
strategies, relative fit and intergroup
relations: Immigrant-majority relations in
Germany. European Journal of Social
Psychology, 32(2), 171-188.
doi:10.1002/ejsp.73
Zhou, J., & George, J. M. (2001). When job
dissatisfaction leads to creativity:
Encouraging the expression of voice.
Academy of Management Journal, 44(4), 682-
696. doi:10.2307/3069410


Dutch Summary
Samenvatting


DUTCH SUMMARY
151
De mens is een sociaal dier. We zijn afhankelijk van anderen voor ons voedsel, onderdak en veiligheid (Caporael & Baron, 1997). Naast het dienen van onze materiële behoeftes, biedt inclusie in groepen ons ook belangrijke psychologische voordelen (Correll & Park, 2005). Het onderdeel zijn van een groep verhoogt onze zelfwaardering (Leary & Baumeister, 2000; Tajfel & Turner, 1986), vermindert onze onzekerheden (Hogg & Abrams, 1993), en geeft ons het gevoel anders te zijn dan anderen (Brewer, 1991). Een belangrijk inzicht uit sociaalpsychologisch onderzoek is dat we bij voorkeur behoren tot groepen wiens leden op onszelf lijken (Kristof-Brown, Zimmerman, & Johnson, 2005). Zo vinden we het prettig om met gelijkgestemden om te gaan en is de kans bijvoorbeeld groot dat onze vrienden dezelfde leeftijd, sekse en etniciteit hebben als wijzelf.
Echter, in bepaalde contexten kunnen we niet zelf bepalen wie onze groepsgenoten zijn. We kunnen onze collega’s op het werk bijvoorbeeld niet uitkiezen. Het gevolg is dat, ondanks onze voorkeur voor homogeniteit, we ook moeten samenwerken met mensen die andere normen en waarden hebben en/of demografisch gezien van ons verschillen. Het kunnen omgaan met verschillen op het werk is in de afgelopen jaren zelfs steeds belangrijker geworden, omdat organisaties de laatste decennia enorm gediversifieerd zijn (Bureau of Labor Statistics, 2012). Het realiseren van inclusie in diverse werkomgevingen is echter niet alleen een uitdaging voor individuen; het is net zo goed een zorg voor organisaties. Diversiteit op het werk kan zorgen voor verminderde cohesie (groepjesvorming) en kan daarmee de productiviteit van organisaties verlagen. Tegelijkertijd is het echter zo dat diversiteit creativiteit kan stimuleren en daarmee juist bij kan dragen aan een verbeterd functioneren van de organisatie (Van Knippenberg, De Dreu, & Homan, 2004).
Het begrijpen van hoe sociale inclusie in diverse werkomgevingen bevorderd kan worden is daarom essentieel. Dit was het centrale doel van dit proefschrift. In hoofdstuk 2 hebben we een conceptueel raamwerk van inclusie geïntroduceerd en dit vervolgens gebruikt om een schaal te ontwikkelen en valideren die individuele percepties van inclusie in een groep meet. In een eerste stap, gebruikmakend van bestaande definities van het concept, aangevuld met theoretische inzichten uit “optimal distinctiveness theory” (Brewer, 1991; Roccas & Brewer, 2001) en “self-determination theory” (Deci & Ryan, 1991), onderscheidden we twee dimensies van inclusie: toebehoren en authenticiteit. Toebehoren geeft aan in hoeverre een individu het gevoel heeft erbij te horen; authenticiteit geeft de mate aan waarin een individu de ruimte ervaart om zichzelf te kunnen zijn binnen een groep. In een tweede stap identificeerden we hoe inclusiepercepties tot stand komen. In dit kader vergeleken we inclusie met het gerelateerde concept “identificatie.” Identificatie wordt gezien als de

DUTCH SUMMARY
152
mate waarin een individu zich verbindt met een groep. In het proces van inclusie daarentegen, is het de groep die aangeeft in hoeverre het individu een belangrijk onderdeel is van de groep (Ellemers & Jetten, 2013). Op basis van deze twee stappen hebben we inclusie gedefinieerd als: de mate waarin een individu ervaart dat de groep hem of haar een gevoel van toebehoren en authenticiteit geeft. Deze definitie is vervolgens gebruikt als de conceptuele basis voor het ontwikkelen en valideren van een schaal om inclusie te meten: de Perceived Group Inclusion Scale (PGIS). Data van twee steekproeven leverden steun op voor onze tweedimensionale conceptualisatie. Bovendien bleek de PGIS een betrouwbare schaal te zijn en te beschikken over nomologische en voorspellende validiteit.
In hoofdstuk 3 hebben we onze nieuw ontwikkelde schaal toegepast in een panelstudie om te onderzoeken hoe de waargenomen ideologische visie van een organisatie ten aanzien van diversiteit gerelateerd is aan affectieve en productieve werkuitkomsten. We vergeleken een kleurenblinde diversiteitsbenadering, waarin culturele verschillen tussen werknemers genegeerd worden, met een multiculturele benadering, waarin culturele verschillen erkend en gewaardeerd worden. Voor meerderheidsleden vonden we dat percepties van een kleurenblinde benadering positief gerelateerd waren aan werktevredenheid en waargenomen innovatie. Voor minderheidsleden bleken juist percepties van een multiculturele diversiteitsbenadering positief gerelateerd te zijn aan deze uitkomsten. Deze effecten werden volledig verklaard door de mate waarin werknemers inclusie ervoeren binnen hun organisatie.
In hoofdstuk 4 hebben we verder onderzocht hoe diversiteitsbenaderingen van invloed zijn op individuele groepsleden. Twee experimenten werden gepresenteerd waarin getoetst werd hoe het expliciet benoemen van de culturele meerderheidsgroep in de diversiteitsbenadering van een organisatie (all-inclusive multiculturalisme) de mate van ervaren inclusie onder meerderheidsleden beïnvloedt. In Experiment 1 richtten we ons op banenzoekers. We vonden dat een all-inclusive benadering, in vergelijking tot de “standaard” multiculturele benadering waarin de meerderheidsgroep niet expliciet onderdeel wordt gemaakt van diversiteit binnen de organisatie, leidde tot verhoogde geanticipeerde inclusiegevoelens voor individuen met een sterke behoefte aan toebehoren. In Experiment 2 onderzochten we zittende organisatieleden. Opnieuw vonden we dat een all-inclusive multiculturele benadering resulteerde in verhoogde inclusiepercepties onder meerderheidsleden, maar nu bleek dit effect niet afhankelijk te zien van iemands behoefte aan toebehoren. Daarnaast vonden we dat inclusie op zijn beurt positief gerelateerd was aan de mate waarin meerderheidsleden een positieve houding hadden ten aanzien van diversiteitsinitiatieven van de organisatie.

DUTCH SUMMARY
153
Terwijl we ons in hoofdstuk en 3 en 4 richtten op de vraag hoe inclusie in cultureel diverse werkomgevingen bewerkstelligd kan worden, probeerden we in hoofdstuk 5 dezelfde vraag te beantwoorden voor seksediverse werkgroepen. Specifiek waren we geïnteresseerd in hoe het verschillend zijn van anderen in termen van geslacht gerelateerd was aan inclusiepercepties en verzuim van werknemers. We namen een vragenlijst af onder 397 werknemers van een hogeschool en koppelden deze data aan gegevens uit het personeelsbestand van de betreffende organisatie. Onze resultaten lieten zien dat het anders zijn van collega’s in termen van geslacht negatief gerelateerd was aan de mate waarin werknemers inclusie ervoeren binnen hun werkgroep. Daarnaast vonden we dat dit negatieve effect sterker was wanneer men vond dat de groep niet openstond voor sekseverschillen (oftewel een negatief diversiteitsklimaat had). Tenslotte was er bewijs voor een conditioneel indirect effect van het anders zijn in termen van geslacht op verzuim via inclusie. Dit betekent dat het verschillend zijn van anderen in termen van geslacht positief gerelateerd was aan verzuim via een verminderd gevoel van inclusie, maar alleen wanneer men vond dat de groep een negatief diversiteitsklimaat had.
Het doel van dit proefschrift was om een begrip te creëren van hoe sociale inclusie in diverse werkomgevingen bevorderd kan worden. Hiertoe hebben we een theoretisch gefundeerde conceptualisatie van inclusie voorgesteld en een bijpassend meetinstrument geïntroduceerd. Vervolgens hebben we laten zien hoe diversiteitsbenaderingen gerelateerd zijn aan inclusiegevoelens en of deze relaties verschillend zijn voor meerder- en minderheidsleden. We hopen dat dit proefschrift hiermee een substantiële bijdrage levert aan toekomstig inclusieonderzoek.


Acknowledgements
Dankwoord


ACKNOWLEDGEMENTS
157
Dit proefschrift is tot stand gekomen door de steun van en samenwerking met een groot aantal mensen. De eerste personen die ik hier wil noemen zijn mijn begeleiders (“Doktormutters”) Sabine en Karen. Dank voor de kans die jullie mij geboden hebben om een promotieonderzoek uit te voeren. Ik heb onze samenwerking als zeer inspirerend en prettig ervaren. Niet alleen tijdens mijn promotietraject hebben jullie mij betrokken en deskundig begeleid, maar ook in mijn zoektocht naar een nieuwe baan heb ik kunnen rekenen op jullie steun. Ik had geen betere begeleiders kunnen wensen.
Instituut Gak verdient ook een prominente plaats in dit dankwoord. In de eerste plaats uiteraard vanwege de ruimhartige financiering van ons onderzoek. Echter, ook de uitstekende begeleiding en steun tijdens de uitvoering van het onderzoek is lovenswaardig. In het bijzonder wil ik Boudien Krol en Henriëtte Maassen van den Brink bedanken voor hun inspanning en betrokkenheid. Hoewel ons onderzoeksproject vanuit een duidelijk andere discipline werd uitgevoerd dan de meeste projecten die door Instituut Gak worden gefinancierd, heb ik altijd het gevoel gehad dat ons project er echt bij hoorde en gewaardeerd werd om onze eigen, authentieke, inzichten. Naar mijn idee een uitstekend voorbeeld van een succesvolle multidisciplinaire onderzoeksbenadering.
Dank gaat ook uit naar mijn onderzoeksschool, het Kurt Lewin Instituut. Niet alleen heb ik heb veel geleerd tijdens de aangeboden workshops en cursussen, maar ik heb het ook altijd plezierig gevonden om in contact te komen met promovendi van andere universiteiten. Specifiek ben ik Hillie en Seval erkentelijk voor hun enthousiasme en betrokkenheid.
Uiteraard mogen mijn directe collega’s niet ontbreken in dit dankwoord. In het bijzonder wil ik Thijs, Menno, Ruth, Anne Fetsje, Joep, Hedy, Lise, Thomas, Jacomijn, Joachim, Nicole, Aafje, Mieke, Coby, Bart, Namkje en Julia bedanken voor een zeer productieve en prettige samenwerking. Ook het secretariaat van zowel het ISW als van Sociale en Organisatiepsychologie verdient alle lof. Jullie ondersteuning is geweldig geweest.
Dank gaat ook uit naar mijn vrienden. Geheel in lijn met het citaat van Aristoteles aan het begin van dit proefschrift besef ik hoe waardevol en fijn het is om onderdeel te zijn van een hechte groep. Het is daarom ook zeker niet toevallig dat ik mijn paranimfen, Pim en Richard, kan rekenen tot mijn beste vrienden. Hartelijk dank!
Ik wil mijn ouders en broer in het bijzonder bedanken voor hun onvoorwaardelijke liefde en steun. Ik prijs me zeer gelukkig met zo’n fijne familie. Ook mijn schoonouders, Hans en Joke, verdienen het om hier genoemd te worden. Vanaf dag één heb ik een gevoel van inclusie bij jullie ervaren.

ACKNOWLEDGEMENTS
158
Lieve Leanne, dank voor al je liefde en steun. Toen we elkaar leerden kennen hadden we beiden de vurige wens om een promotieonderzoek uit te voeren. Door het hart te volgen, gedurfde keuzes te maken en niet op te geven is het ons beiden gelukt. Daar ben ik ontzettend trots op. Ik heb geweldig veel zin in onze gezamenlijke toekomst. Tenslotte, lieve Norah, je bent nog maar net op deze wereld. Toch ben je nu al onmisbaar voor mij en je moeder. Ik hou van jullie beiden.

Curriculum Vitae


CURRICULUM VITAE
161
Wiebren Jansen (Oldehove, 1981) obtained master’s degrees in both Industrial Engineering and Management Science and in Sociology. He wrote his Sociology thesis at the Centre for Refugee Research at the University of New South Wales in Sydney, Australia. After working as a Lecturer in Sociology for three years, Wiebren started his PhD-project in 2010 under supervision of prof. dr. Sabine Otten and prof. dr. Karen Van Oudenhoven-Van der Zee. The goal of his dissertation was to study how social inclusion in diverse work settings can be fostered. Wiebren has presented his work at various (inter)national conferences, including the General Meeting of the European Association of Social Psychology and the bi-annual conference of the European Association of Work and Organizational Psychology.


KLI Dissertation series


KLI DISSERTATION SERIES
165
The “Kurt Lewin Institute Dissertation Series” started in 1997. Since 2013 the following dissertations have been published in this series: 2013-1: Annemarie Hiemstra: Fairness in Paper and Video Resume Screening
2013-2: Gert-Jan Lelieveld: Emotions in Negotiations: The Role of Communicated Anger and
Disappointment
2013-3 Saar Mollen: Fitting in or Breaking Free? On Health Behavior, Social Norms and Conformity
2013-4: Karin Menninga: Exploring Learning Abstinence Theory: A new theoretical perspective on
continued abstinence in smoking cessation
2013-5: Jessie Koen: Prepare and Pursue: Routes to suitable (re-)employment
2013-6: Marieke Roskes: Motivated creativity: A conservation of energy approach
2013-7: Claire Marie Zedelius: Investigating Consciousness in Reward Pursuit
2013-8: Anouk van der Weiden: When You Think You Know What You're Doing: Experiencing
Self-Agency Over Intended and Unintended Outcomes
2013-9: Gert Stulp: Sex, Stature and Status: Natural Selection on Height in Contemporary Human
Populations
2013-10: Evert-Jan van Doorn: Emotion Affords Social Influence: Responding to Others' Emotions In
Context
2013-11: Frank de Wit: The paradox of intragroup conflict
2013-12: Iris Schneider: The dynamics of ambivalence: Cognitive, affective and physical consequences of
evaluative conflict
2013-13: Jana Niemann: Feedback Is the Breakfast of Champions, but It Can Be Hard to Digest: A
Psychological Perspective on Feedback Seeking and Receiving
2013-14: Serena Does: At the heart of egalitarianism: How morality framing shapes Whites' responses to
social inequality
2013-15: Romy van der Lee: Moral Motivation Within Groups
2013-16: Melvyn Hamstra: Self-Regulation in a Social Environment
2013-17: Chantal den Daas: In the heat of the moment: The effect of impulsive and reflective states on
sexual risk decisions
2013-18: Kelly Cobey: Female Physiology Meets Psychology: Menstrual Cycle and Contraceptive Pill
Effects
2013-19: Ellen van der Werff: Growing environmental self-identity
2013-20: Lise Jans: Reconciling individuality with social solidarity: Forming social identity from the bottom
up
2013-21: Ruth van Veelen: Integrating I and We: Cognitive Routes to Social Identification
2013-22: Lottie Bullens: Having second thoughts: consequences of decision reversibility
2013-23: Daniel Sligte: The functionality of creativity

KLI DISSERTATION SERIES
166
2014-01: Marijn Stok: Eating by the Norm: The Influence of Social Norms on Young People's Eating
Behavior
2014-02: Michèlle Bal: Making Sense of Injustice: Benign and Derogatory Reactions to Innocent Victims
2014-03: Nicoletta Dimitrova: Rethinking errors: How error-handling strategy affects our thoughts and
others' thoughts about us
2014-04: Namkje Koudenburg: Conversational Flow: The Emergence and Regulation of Solidarity
through social interaction
2014-05: Thomas Sitser: Predicting sales performance: Strengthening the personality – job performance
linkage
2014-06: Goda Perlaviciute: Goal-driven evaluations of sustainable products
2014-07: Said Shafa: In the eyes of others: The role of honor concerns in explaining and preventing
insult-elicited aggression
2014-08: Felice van Nunspeet: Neural correlates of the motivation to be moral
2014-09: Anne Fetsje Sluis: Towards a virtuous society: Virtues as potential instruments to enhance
2014-10: Gerdien de Vries: Pitfalls in the Communication about CO2 Capture and Storage
2014-11: Thecla Brakel: The effects of social comparison information on cancer survivors’ quality of life: A
field-experimental intervention approach
2014-12: Hans Marien: Understanding and Motivating Human Control: Outcome and Reward
Information in Action
2014-13: Daniel Alink: Public Trust: Expectancies, Beliefs, and Behavior
2014-14: Linda Daphne Muusses: How Internet use may affect our relationships: Characteristics of
Internet use and personal and relational wellbeing
2014-15: Hillie Aaldering: Parochial and universal cooperation in intergroup conflicts
2014-16: Martijn Keizer: Do norms matter? The role of normative considerations as predictors of pro-
environmental behavior
2015-01: Maartje Elshout: Vengeance
2015-02: Seval Gündemir: The Minority Glass Ceiling Hypothesis: Exploring Reasons and Remedies
for the Underrepresentation of Racial-ethnic Minorities in Leadership Positions
2015-03: Dagmar Beudeker: On regulatory focus and performance in organizational environments
2015-04: Charlotte Koot: Making up your mind about a complex technology: An investigation into
factors that help or hinder the achievement of cognitive closure about CCS
2015-05: Marco van Bommel: The Reputable Bystander: The Role of Reputation in Activating or
Deactivating Bystanders
2015-06: Kira O. McCabe: The Role of Personality in the Pursuit of Context-Specific Goals
2015-07: Wiebren Jansen: Social inclusion in diverse work settings