Financial Inclusion and Financial Sector Stability With Reference To Kenya: A Review of Literature
Upload
khangminh22Category
view
4download
0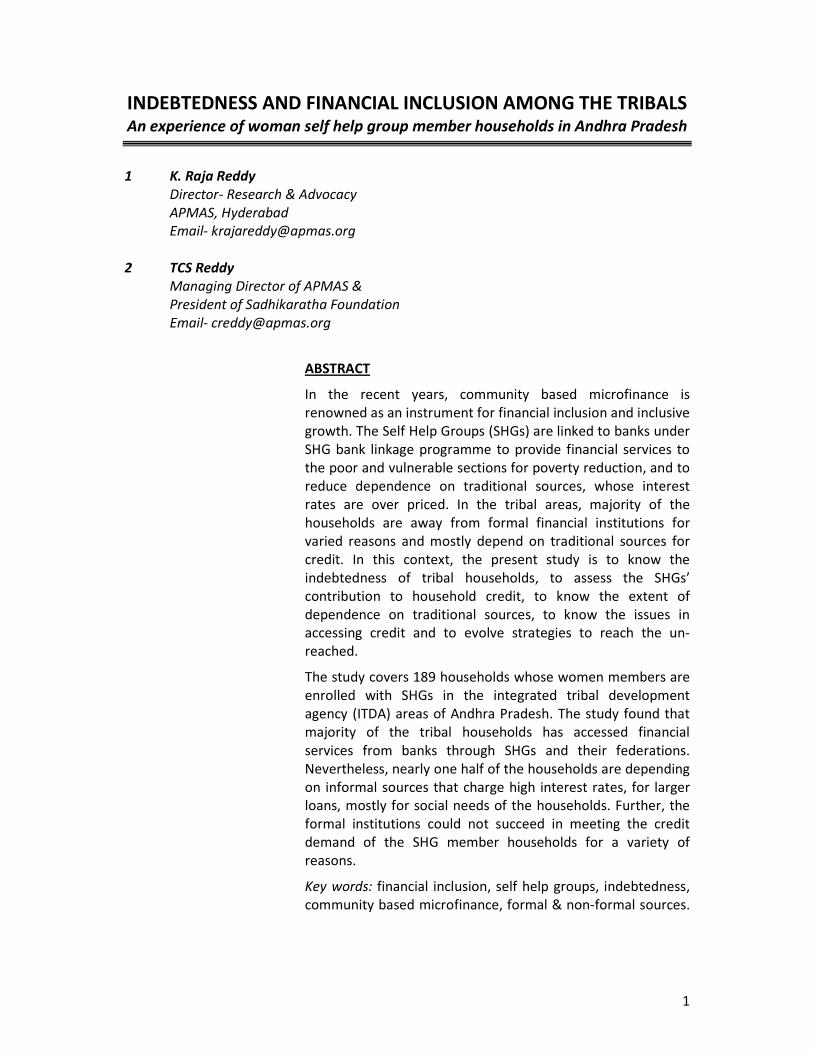
1
INDEBTEDNESS AND FINANCIAL INCLUSION AMONG THE TRIBALS An experience of woman self help group member households in Andhra Pradesh
1 K. Raja Reddy
Director- Research & Advocacy
APMAS, Hyderabad
Email- [email protected]
2 TCS Reddy
Managing Director of APMAS &
President of Sadhikaratha Foundation
Email- [email protected]
ABSTRACT
In the recent years, community based microfinance is
renowned as an instrument for financial inclusion and inclusive
growth. The Self Help Groups (SHGs) are linked to banks under
SHG bank linkage programme to provide financial services to
the poor and vulnerable sections for poverty reduction, and to
reduce dependence on traditional sources, whose interest
rates are over priced. In the tribal areas, majority of the
households are away from formal financial institutions for
varied reasons and mostly depend on traditional sources for
credit. In this context, the present study is to know the
indebtedness of tribal households, to assess the SHGs’
contribution to household credit, to know the extent of
dependence on traditional sources, to know the issues in
accessing credit and to evolve strategies to reach the un-
reached.
The study covers 189 households whose women members are
enrolled with SHGs in the integrated tribal development
agency (ITDA) areas of Andhra Pradesh. The study found that
majority of the tribal households has accessed financial
services from banks through SHGs and their federations.
Nevertheless, nearly one half of the households are depending
on informal sources that charge high interest rates, for larger
loans, mostly for social needs of the households. Further, the
formal institutions could not succeed in meeting the credit
demand of the SHG member households for a variety of
reasons.
Key words: financial inclusion, self help groups, indebtedness,
community based microfinance, formal & non-formal sources.

2
FINANCIAL INCLUSION AND INDEBTEDNESS AMONG THE TRIBALS An experience of woman self help group member households in Andhra Pradesh
K. Raja Reddy
TCS Reddy
1 INTRODUCTION
1.1 Context of the study
Access to finance by the poor and vulnerable groups is a prerequisite for poverty reduction
and social cohesion. This has to become an integral part of our efforts to promote inclusive
growth. In fact, providing access to finance is a form of empowerment of the vulnerable
groups. Financial inclusion denotes delivery of financial services at an affordable cost to the
vast sections of the disadvantaged and low-income groups. The various financial services
include savings, credit insurance and remittance facilities. The objective of financial
inclusion is to extend the scope of activities of the organized financial system to include
within its ambit people with low incomes. Through graduated credit, the attempt must be to
lift the poor from one level to another so that they can come out of poverty.
The poverty ratio in rural areas among the social categories, Scheduled Tribes exhibit the
highest level of poverty (47%) followed by Scheduled Castes (SCs) (42%) and Other
Backward Classes (OBC) (32%) against 34% for all classes (Planning Commission,
Government of India, 2012). According to NSSO survey, 51% of farmer households are
financially excluded from both formal /non-formal sources. Of the total farmer households,
only 27% access formal sources of credit and one third of this group even borrow from other
non-formal sources. About 36% of Scheduled Tribe (ST) farmer households are indebted
mostly to non-formal sources (Rangarajan, C. 2008).
According to the Society for Elimination of Rural Poverty1 (SERP) there are around 1.16
crores SHG2 members in about 11 lakh SHGs organized into 38,821 Village Organizations
3
(VOs) and 1,099 Mandal Samakhyas4 (MSs) in Andhra Pradesh. Of the total SHGs, about 5.4
percent of SHGs covering 5.8 percent of members are in Tribal Project Management Unit
(TPMU) areas. In addition to the above MSs, there are 262 Mandal Vikalangula Sangams
(MVSs), 17 Chenchu Mandal Samakhyas (CMSs), 7 Fishermen Mandal Samakhyas (FMSs) and
20 Yanadi Mandal Samakyas (YMSs) in the AP. The total savings and corpus of SHG members
as on March 2012 are around Rs.3,724 crores and Rs. 5,538 crores respectively.
To encourage the poor including disadvantaged groups and communities to access the
credit services seamlessly Community Investment Fund (CIF) from project side, and linkages
from bank side are provided to the poor women SHG members to improve their livelihoods.
CIF supports the poor in prioritizing livelihood needs by investments in sub-projects
1 SERP is a non-government organization promoted by Govt. of Andhra Pradesh working with the World
Bank funding support for poverty reduction and empowerment. 2 SHG is a small group (15 to 20 members), voluntarily formed and related by affinity for specific purpose, it
is a group whose members use savings, credit and social involvement as instruments of empowerment. 3 Village organization is the primary level federation of SHGs at village level. A federation is an association
of primary organizations. 4 Mandal Samakhya is the federation at mandal level formed with primary level federations.

3
proposed and implemented by the Community Based Organizations5 (CBOs). The
cumulative CIF expenditure up to March, 2012 is Rs.1088 Crores and the total numbers of
beneficiaries are 29,94,227. During the financial year 2011-12, SERP has facilitated Rs.
7941.57 crores of bank loans to 3,48,449 SHGs (Annual Report 2011-12, SERP).
To address the issues of inadequate finance and to ensure timely availability of
supplementary financial services for meeting emergency and emergent needs of the SHG
members, Mandal Samakhyas in the State, in association with Government of AP have
promoted “Sthree Nidhi” Credit Cooperative Federation Ltd. Sthree Nidhi is operationalized
from October 2011 and Rs. 122 crores was lent to 94,000 SHG members from 30,041 SHGs
of 10,116 VOs from more than 800 Mandal Samakhyas as on 5th
June 2012
(www.sthreenidhi.org).
According to a study conducted by APMAS in 2011-12, there is a wide disparity between
regions, districts and mandals in the coverage of clients and the amount disbursed through
Sthree Nidhi. The data on Sthree Nidhi disbursement shows that the TPMUs are also not
exceptional to the above observation. The difference between the size of the loan accessed
by SHGs with ST/SC members and that accessed by more advantaged groups had widened
over the years (APMAS, 2007).
1.2 Objectives and methodology of the study
Objectives of the study: In the above context, the present study was initiated with a broad
objective to assess the debt status and credit requirement of the tribal households in
Andhra Pradesh. The specific objectives of the present investigation were: i) to know the
socio-economic status of tribal households, ii) to assess the magnitude of household debts,
iii) to know the SHGs’ contribution to household credit, and iv) to know the issues in
accessing credit from the formal financial sources including SHGs.
Research methodology: The universe of the present study is the tribal households who
enrolled membership with SHGs in all the nine Integrated Tribal Development Agencies
(ITDAs). The present study has covered 189 SHG members of 126 SHGs in 21 mandals of 7
ITDAs in Andhra Pradesh (see map below). Of the 9 ITDAs in AP, 7 were selected based on
the number of SHGs and SHGs credit linked to banks. Based on the socio-economic diversity
and location, three mandals were selected in each ITDA. Based on location, three villages –
mandal / block head quarters, roadside and interior, were purposively selected. Within the
village, two SHGs were randomly selected, and from each SHG, three members were
randomly selected based on the availability of SHG members.
Data collection tools & fieldwork: Both qualitative and quantitative data was collected from
primary as well as secondary sources through quantitative as well as qualitative data
collection methods. Primary data were mainly collected from SHG member households by
executing an interview schedule and focus group discussions with SHG members. Fieldwork
for data collection was carried out from October 3-20, 2012.
Data analysis and structure of the report: The filled in formats were edited and coded before
entering the data into a computer. Simple statistical tools like percentages, ranges and
averages were computed by using a statistical package for social sciences (SPSS). To make
comparisons and draw meaningful inferences, frequency and comparative tables were
5 Community based organization is a non-profit organization which works to serve the disadvantaged in the
community with public and private funds in which it is located.
4
prepared. The findings of the study are presented as i) an overview of tribal Andhra Pradesh
ii) the socio-economic status of tribals, iii) access to credit, iv) extent of household debt, v)
promotion of savings, vi) issues and problems in accessing credit and vii) conclusions and
way forward.
2 AN OVERVIEW OF TRIBAL ANDHRA PRADESH
According to 2001 Census, the total tribal population of AP is 50,24,104. In AP there are 35
communities6 officially designated as Scheduled Tribes, in which, 8 are recognized as
primitive tribal groups7 (PTGs) are also known as ‘Vulnerable Tribal Groups’. The STs of AP
constitute 6.75 per cent of India’s tribal population. Although the state’s STs comprise only
6.59 per cent of the state’s population, they account for the largest tribal concentration in
southern India.
The scheduled areas of Andhra Pradesh, covered by the Tribal Sub-Plan (TSP) approach, are
spread over 31,485 sq km in the districts of Srikakulam, Vizianagaram, Visakhapatnam, East
Godavari, West Godavari, Warangal, Khammam, Adilabad and Kurnool. This zone forms the
traditional habitat of 32 tribal communities. The other three tribal groups namely Lambada,
Yerukala and Yanadi mostly live outside the scheduled areas.
In some districts tribal population is spread thinly and they live along with non-tribal
communities. The indigenous tribes are mostly concentrated in contiguous tracts of the
above districts that have been designated as scheduled areas administered by the ITDAs.
There are some one million ST households in the state and about half of them live in 5,936
villages in the nine ITDA areas. The scheduled areas are inhabited by an estimated 28 lakh
tribals who are entitled to the benefits of TSP projects and protective legislations. In
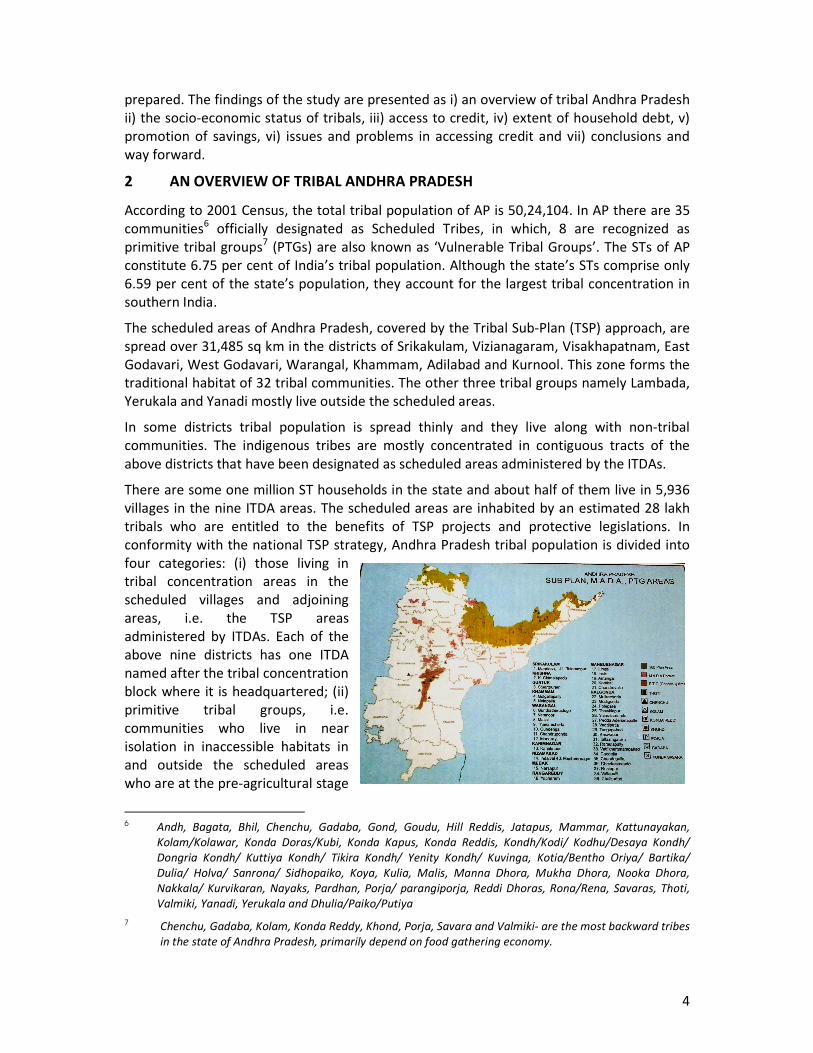
conformity with the national TSP strategy, Andhra Pradesh tribal population is divided into
four categories: (i) those living in
tribal concentration areas in the
scheduled villages and adjoining
areas, i.e. the TSP areas
administered by ITDAs. Each of the
above nine districts has one ITDA
named after the tribal concentration
block where it is headquartered; (ii)
primitive tribal groups, i.e.
communities who live in near
isolation in inaccessible habitats in
and outside the scheduled areas
who are at the pre-agricultural stage
6 Andh, Bagata, Bhil, Chenchu, Gadaba, Gond, Goudu, Hill Reddis, Jatapus, Mammar, Kattunayakan,
Kolam/Kolawar, Konda Doras/Kubi, Konda Kapus, Konda Reddis, Kondh/Kodi/ Kodhu/Desaya Kondh/
Dongria Kondh/ Kuttiya Kondh/ Tikira Kondh/ Yenity Kondh/ Kuvinga, Kotia/Bentho Oriya/ Bartika/
Dulia/ Holva/ Sanrona/ Sidhopaiko, Koya, Kulia, Malis, Manna Dhora, Mukha Dhora, Nooka Dhora,
Nakkala/ Kurvikaran, Nayaks, Pardhan, Porja/ parangiporja, Reddi Dhoras, Rona/Rena, Savaras, Thoti,
Valmiki, Yanadi, Yerukala and Dhulia/Paiko/Putiya
7 Chenchu, Gadaba, Kolam, Konda Reddy, Khond, Porja, Savara and Valmiki- are the most backward tribes
in the state of Andhra Pradesh, primarily depend on food gathering economy.
5
of the economy; (iii) those living in small pockets outside the scheduled areas, i.e. Modified
Area Development Agency (MADA) areas and tribal clusters; and (iv) Dispersed Tribal
Groups, i.e. those dispersed throughout the state (see map).
Table-1: ITDA-wise Number of SHGs Credit Linked to Banks as on December 2012
Name of
ITDA
Total No. of
SHGs
SHGs credit
linked to
bank
% of SHGs
credit linked
to bank
Amount of loan
outstanding
(in lakhs)
1. Badhrachalam 15,109 12,236 80.9 14,968.89
2. Eturnagaram 4,155 3,856 92.8 4,420.15
3. Utnoor 12,674 10,224 80.6 12,304.23
4. Paderu 8,714 3,391 38.9 2,589.41
5. Parvathipuram 6,140 3,905 63.6 3,379.40
6. Rampachodavaram 4,436 3,546 79.9 2,251.66
7. Seethampet 6,640 5,199 78.3 6,079.37
Total 57,868 42,357 73.2 45,993.11
Andhra Pradesh 10,75,605 8,68,082 80.7 11,52,667
The data in table-1 shows that as on December 2012, there are about 10.76 lakh SHGs in
Andhra Pradesh. Of these, 57,868 SHGs are in ITDA areas. About 73% of SHGs are credit
linked to banks in ITDA areas, is less than the state numbers (90%), and having a loan
outstanding of Rs. 45,993 crores as on Dec 2012. The percentage of SHGs credit linked to
bank is high in Eturunagaram with 93%, and low in Paderu with 39% when compared to
other ITDAs. The percentage of SHGs credit linked to banks is high in Telangana region as
compared to Coastal. It shows that there are regional disparities between ITDAs in credit
linkage of SHGs to banks because of various regions. The average amount of loan
outstanding with banks by the SHG is low with Rs. 1.08 lakh compared to the state average
amount of Rs. 1.33 lakh. It shows that the SHGs in the tribal areas marginalized are
marginalized in credit linking of SHGs to banks.
3 SOCIO-ECONOMIC STATUS OF TRIBALS
3.1 Social conditions
Ethnic composition: The sample households of the present study were covered about 20 out
of 35 Scheduled Tribes (STs) in AP. The ITDA-wise coverage STs is as follows:
Name of the ITDA Name of the Tribe
i) Paderu : Bagata, Kodu, Kotia, Kondadora and Valmiki
ii) Rampachodavaram : Kondareddy, Koya, Savara and Valmiki
iii) Seetampet : Savara, Kotia, Konda Reddy, Koya, Naikpodu, and Valmiki
iv) Khammam : Koya Naik Podu and Gond
v) Eturunagaram : Koya, Lambada Naik Podu and Gond
vi) Utnoor : Gond, Auanth, Kolam, Lambada and Manyawar
vii) Srisailam : Chenchu, Lambada and Yerukala
Medium size households are numerically dominant: The household size varies between one
and nine members with an average of four. A majority of the sample households are
medium in size (65.1% with 4-5 members) followed by small (20.6% with < 4 members) and
6
large families (14.3% with 6 and above members). Most of households are of simple families
consisting of parents and children, and in some cases one or two dependent members.
Female population is more than the male population: Of the total population of the
households (1430), the female population is more (52.2%) than the male (47.8%). Further, it
is also high when compared to the state (49.79%) and national facts (48.46%). The age of
the household members shows that 71% are adults and the remaining (29%) are children.
The total number of female children (53.05%) is more as compared to the male (46.95%). It
indicates that the female infanticide or discrimination towards girl child is not found among
the tribals.
Majority of the household members are working: Of the total household members, 54.6%
are working and the remaining (45.4%) are non-working, those include children, aged and
chronic diseased. It shows that there are many non-working / dependent members in the
family. Of the non working, if we presume that all the children (29%) are non-working,
16.4% of the adults are non-working in the families.
More female illiteracy: Majority of the household members is illiterate, and majority of
them are female (59.9%) followed by male (40.25%). Of the literates, there is no difference
between male and female among those who studied between 1st
and 5th
class; however,
there is a noticeable difference in the educational levels of male and female among those
who studied between 6th
and 10th
class (110/89) and college (73/53). The present study also
confirms that the girl child drop-outs are more as compared to male because of various
socio-economic reasons.
Vulnerability-persons with disability (PWDs): Out of 189, 9 families have accounted about 9
PWDs, in which five are male and four are female; and of the 12 families reported about 13
members chronically diseased, five are male and eight are female.
3.2 Economic conditions
Majority of the households are residing in thatched and tiled houses: Of the 189 households,
many are living in colony houses (29.1%), thatched houses (28.6%) and tiled houses (28.6%)
followed by pucca houses (13.8%). It shows that a majority of the households (57.2%) are
residing in thatched and tiled houses. It indicates the poor implementation of housing
programme in the tribal areas, even though the Govt. of AP is very keen about it.
The incidence of migration is very minimal: Out of 189 households, 21 have accounted about
migration, and many are from Seetampet (7 out of 27 households) and Srisailam (5 out of 27
households) ITDAs. However, except in Badrachalam, in all the ITDAs, one to two
households reported about migration. Out of 21, 13 households have said that the male
members go for work to nearby towns and the female take care of children and aged in the
family. During individual interactions, the respondents have reported the reasons for
migration as push factors like less availability of work at the village, and pull factors like
more wages and availability of work outside the village.
Majority of the households are marginal and small farmers: Majority of the tribal
households (79%) possesses one to five acres of land with an average of 5 acres per
household. A majority of the households have dry/ rain-fed lands and a few households
possessed wet lands with some irrigation facilities. The data shows that many households
possess less than 2.5 acres of land (44.4%) followed by 2.5 to 5 acres (24.9%) and more than
7
5 acres (9.5%). But more than one-fifth of them are landless. It reveals that majority of the
tribal households are marginal and small farmers mostly depend on rain-fed agriculture.
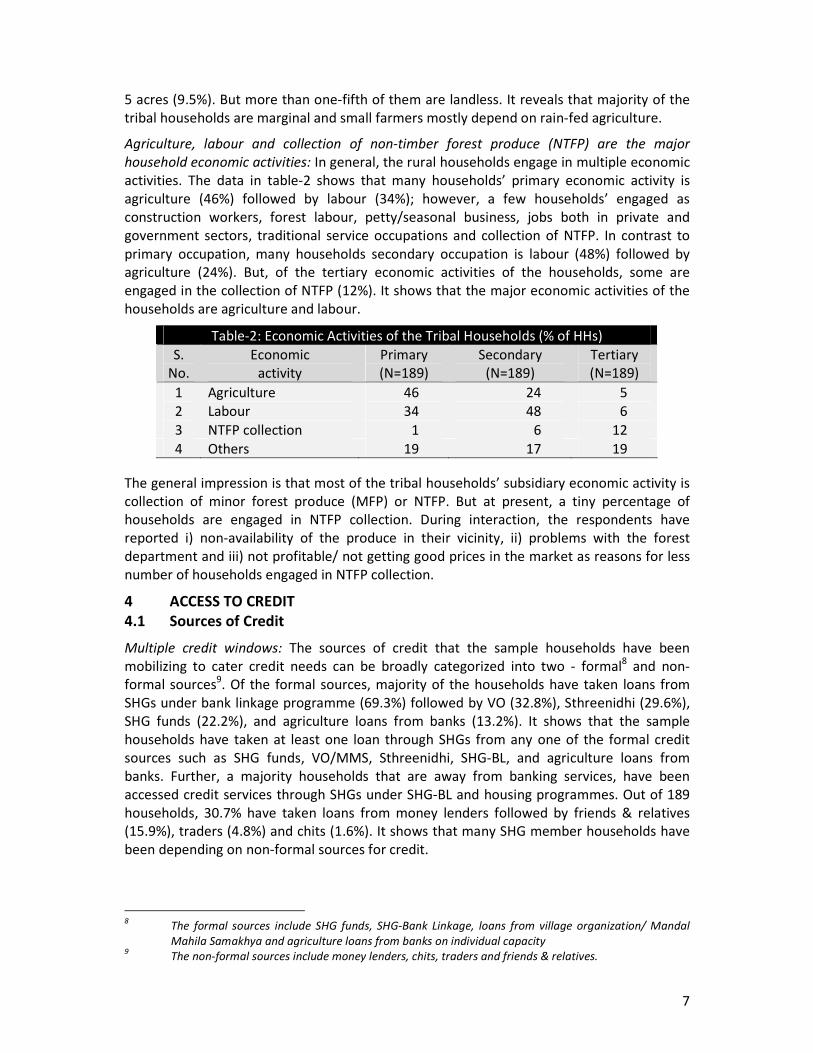
Agriculture, labour and collection of non-timber forest produce (NTFP) are the major
household economic activities: In general, the rural households engage in multiple economic
activities. The data in table-2 shows that many households’ primary economic activity is
agriculture (46%) followed by labour (34%); however, a few households’ engaged as
construction workers, forest labour, petty/seasonal business, jobs both in private and
government sectors, traditional service occupations and collection of NTFP. In contrast to
primary occupation, many households secondary occupation is labour (48%) followed by
agriculture (24%). But, of the tertiary economic activities of the households, some are
engaged in the collection of NTFP (12%). It shows that the major economic activities of the
households are agriculture and labour.
Table-2: Economic Activities of the Tribal Households (% of HHs)
S.
No.
Economic
activity
Primary
(N=189)
Secondary
(N=189)
Tertiary
(N=189)
1 Agriculture 46 24 5
2 Labour 34 48 6
3 NTFP collection 1 6 12
4 Others 19 17 19
The general impression is that most of the tribal households’ subsidiary economic activity is
collection of minor forest produce (MFP) or NTFP. But at present, a tiny percentage of
households are engaged in NTFP collection. During interaction, the respondents have
reported i) non-availability of the produce in their vicinity, ii) problems with the forest
department and iii) not profitable/ not getting good prices in the market as reasons for less
number of households engaged in NTFP collection.
4 ACCESS TO CREDIT
4.1 Sources of Credit
Multiple credit windows: The sources of credit that the sample households have been
mobilizing to cater credit needs can be broadly categorized into two - formal8 and non-
formal sources9. Of the formal sources, majority of the households have taken loans from
SHGs under bank linkage programme (69.3%) followed by VO (32.8%), Sthreenidhi (29.6%),
SHG funds (22.2%), and agriculture loans from banks (13.2%). It shows that the sample
households have taken at least one loan through SHGs from any one of the formal credit
sources such as SHG funds, VO/MMS, Sthreenidhi, SHG-BL, and agriculture loans from
banks. Further, a majority households that are away from banking services, have been
accessed credit services through SHGs under SHG-BL and housing programmes. Out of 189
households, 30.7% have taken loans from money lenders followed by friends & relatives
(15.9%), traders (4.8%) and chits (1.6%). It shows that many SHG member households have
been depending on non-formal sources for credit.
8 The formal sources include SHG funds, SHG-Bank Linkage, loans from village organization/ Mandal
Mahila Samakhya and agriculture loans from banks on individual capacity 9 The non-formal sources include money lenders, chits, traders and friends & relatives.
8
Multiple loans from formal and non-formal sources: The data shows that of the 189
households, except 4, all the households have taken 1-5 loans with an average of 2.2 from
formal and non-formal sources. The households have taken a total of 416 loans of Rs. 85.92
lakhs with an average loan of Rs. 20,457 per household. A majority of the households have
taken 1-2 loans (60.3%) followed by three & above loans (37.6%); however, 70% of the
households have more than one loan. It reveals that the households accessed credit from
multiple sources. Further, of the total 185 households reported debts, 53% of them have
taken loans exclusively from formal sources, 3.2% exclusively from non-formal sources, and
42.9% from both formal and non-formal sources. It is evident that most of the households
have taken at least one loan from formal sources (96.75%). Nevertheless, nearly half of the
households depended on non-formal sources for credit.
4.2 Extent of household credit
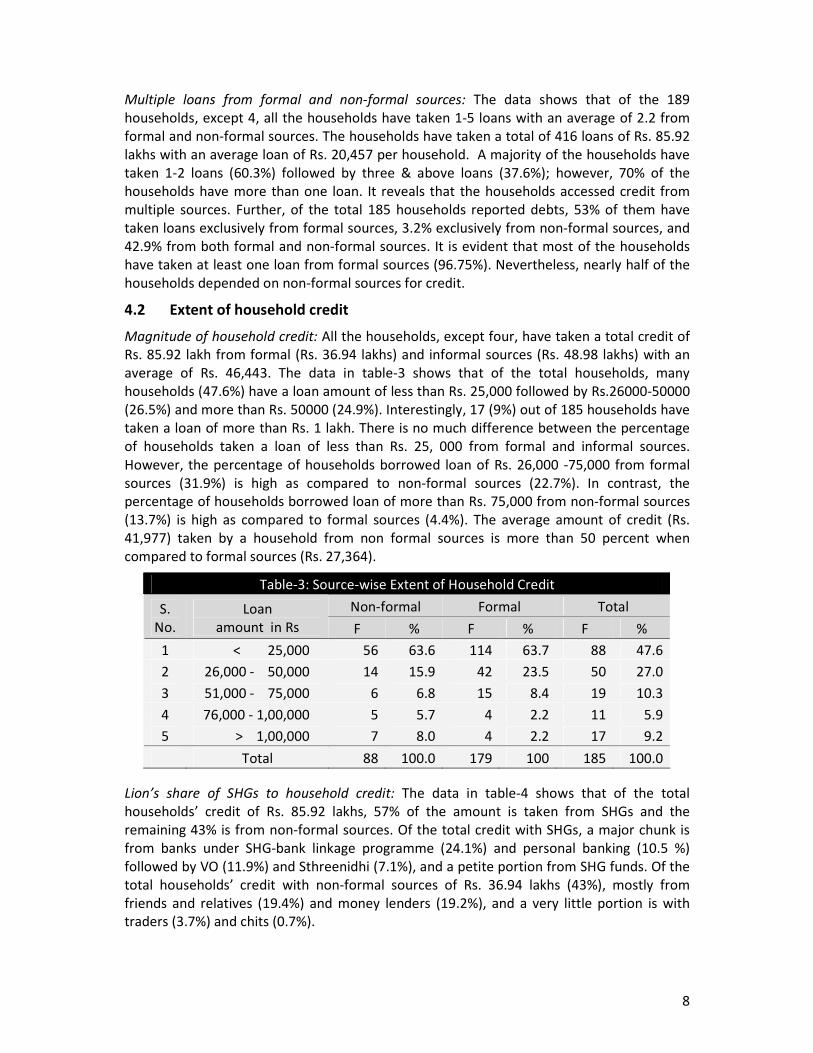
Magnitude of household credit: All the households, except four, have taken a total credit of
Rs. 85.92 lakh from formal (Rs. 36.94 lakhs) and informal sources (Rs. 48.98 lakhs) with an
average of Rs. 46,443. The data in table-3 shows that of the total households, many
households (47.6%) have a loan amount of less than Rs. 25,000 followed by Rs.26000-50000
(26.5%) and more than Rs. 50000 (24.9%). Interestingly, 17 (9%) out of 185 households have
taken a loan of more than Rs. 1 lakh. There is no much difference between the percentage
of households taken a loan of less than Rs. 25, 000 from formal and informal sources.
However, the percentage of households borrowed loan of Rs. 26,000 -75,000 from formal
sources (31.9%) is high as compared to non-formal sources (22.7%). In contrast, the
percentage of households borrowed loan of more than Rs. 75,000 from non-formal sources
(13.7%) is high as compared to formal sources (4.4%). The average amount of credit (Rs.
41,977) taken by a household from non formal sources is more than 50 percent when
compared to formal sources (Rs. 27,364).
Table-3: Source-wise Extent of Household Credit
Non-formal Formal Total S.
No.
Loan
amount in Rs F % F % F %
1 < 25,000 56 63.6 114 63.7 88 47.6
2 26,000 - 50,000 14 15.9 42 23.5 50 27.0
3 51,000 - 75,000 6 6.8 15 8.4 19 10.3
4 76,000 - 1,00,000 5 5.7 4 2.2 11 5.9
5 > 1,00,000 7 8.0 4 2.2 17 9.2
Total 88 100.0 179 100 185 100.0
Lion’s share of SHGs to household credit: The data in table-4 shows that of the total
households’ credit of Rs. 85.92 lakhs, 57% of the amount is taken from SHGs and the
remaining 43% is from non-formal sources. Of the total credit with SHGs, a major chunk is
from banks under SHG-bank linkage programme (24.1%) and personal banking (10.5 %)
followed by VO (11.9%) and Sthreenidhi (7.1%), and a petite portion from SHG funds. Of the
total households’ credit with non-formal sources of Rs. 36.94 lakhs (43%), mostly from
friends and relatives (19.4%) and money lenders (19.2%), and a very little portion is with
traders (3.7%) and chits (0.7%).
9
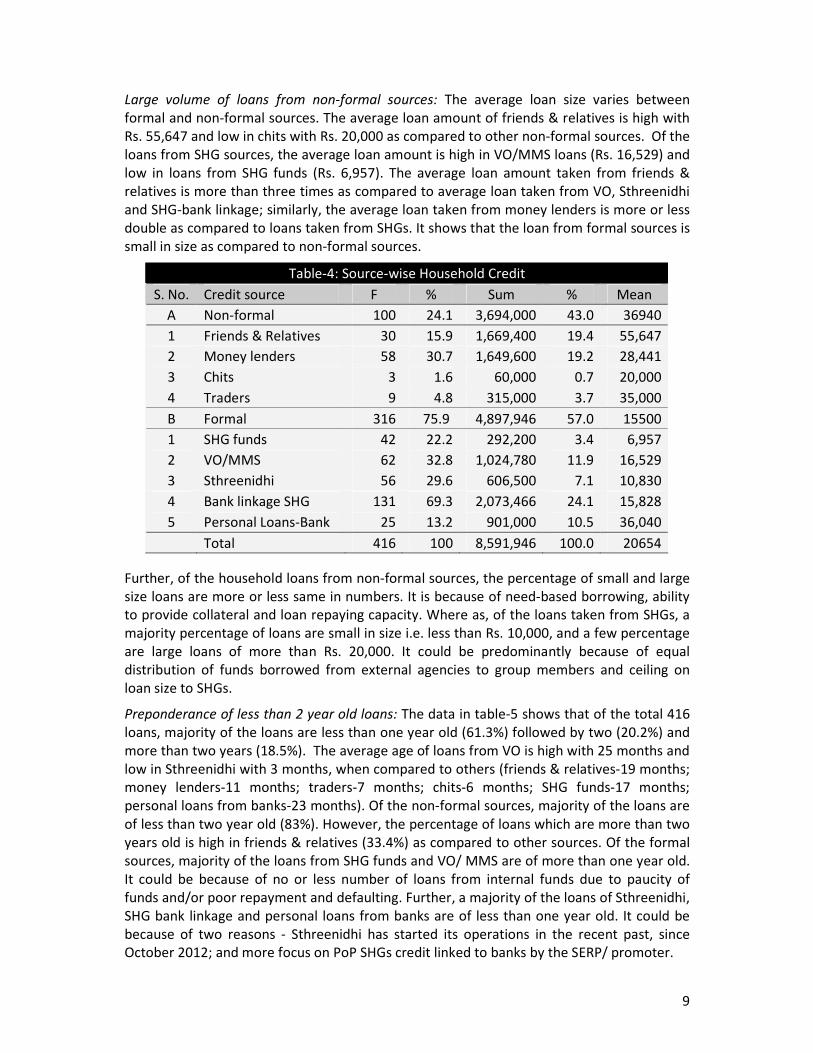
Large volume of loans from non-formal sources: The average loan size varies between
formal and non-formal sources. The average loan amount of friends & relatives is high with
Rs. 55,647 and low in chits with Rs. 20,000 as compared to other non-formal sources. Of the
loans from SHG sources, the average loan amount is high in VO/MMS loans (Rs. 16,529) and
low in loans from SHG funds (Rs. 6,957). The average loan amount taken from friends &
relatives is more than three times as compared to average loan taken from VO, Sthreenidhi
and SHG-bank linkage; similarly, the average loan taken from money lenders is more or less
double as compared to loans taken from SHGs. It shows that the loan from formal sources is
small in size as compared to non-formal sources.
Table-4: Source-wise Household Credit
S. No. Credit source F % Sum % Mean
A Non-formal 100 24.1 3,694,000 43.0 36940
1 Friends & Relatives 30 15.9 1,669,400 19.4 55,647
2 Money lenders 58 30.7 1,649,600 19.2 28,441
3 Chits 3 1.6 60,000 0.7 20,000
4 Traders 9 4.8 315,000 3.7 35,000
B Formal 316 75.9 4,897,946 57.0 15500
1 SHG funds 42 22.2 292,200 3.4 6,957
2 VO/MMS 62 32.8 1,024,780 11.9 16,529
3 Sthreenidhi 56 29.6 606,500 7.1 10,830
4 Bank linkage SHG 131 69.3 2,073,466 24.1 15,828
5 Personal Loans-Bank 25 13.2 901,000 10.5 36,040
Total 416 100 8,591,946 100.0 20654
Further, of the household loans from non-formal sources, the percentage of small and large
size loans are more or less same in numbers. It is because of need-based borrowing, ability
to provide collateral and loan repaying capacity. Where as, of the loans taken from SHGs, a
majority percentage of loans are small in size i.e. less than Rs. 10,000, and a few percentage
are large loans of more than Rs. 20,000. It could be predominantly because of equal
distribution of funds borrowed from external agencies to group members and ceiling on
loan size to SHGs.
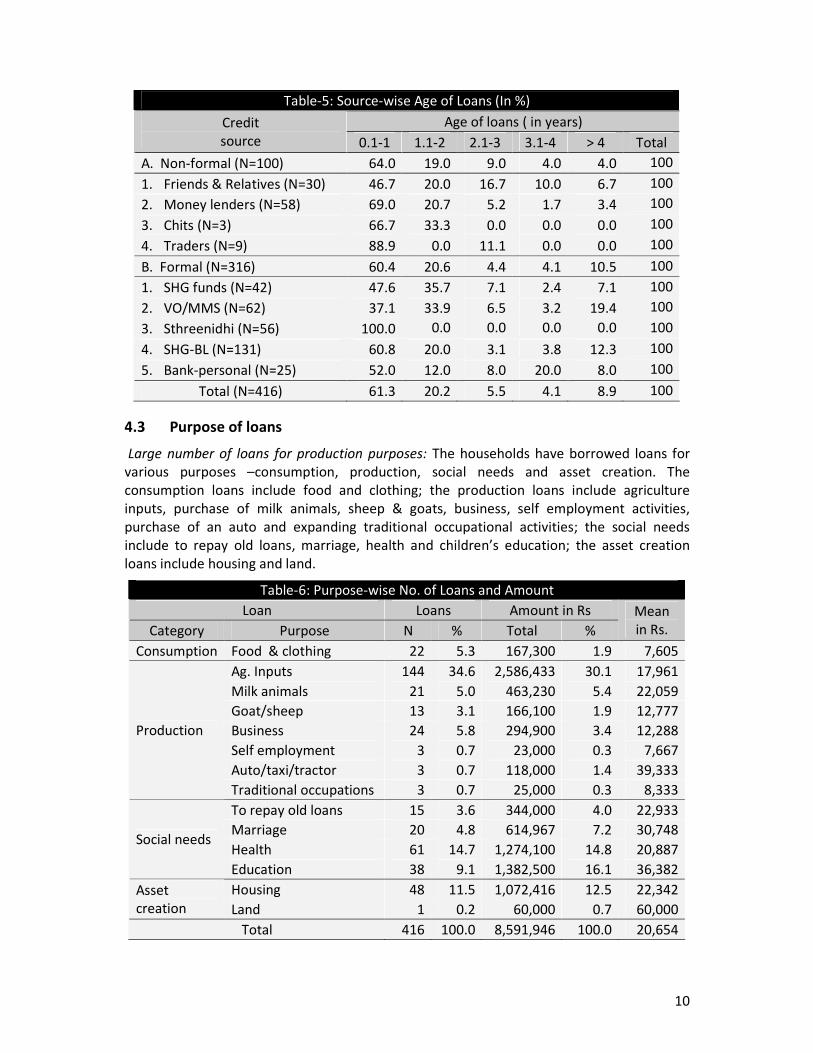
Preponderance of less than 2 year old loans: The data in table-5 shows that of the total 416
loans, majority of the loans are less than one year old (61.3%) followed by two (20.2%) and
more than two years (18.5%). The average age of loans from VO is high with 25 months and
low in Sthreenidhi with 3 months, when compared to others (friends & relatives-19 months;
money lenders-11 months; traders-7 months; chits-6 months; SHG funds-17 months;
personal loans from banks-23 months). Of the non-formal sources, majority of the loans are
of less than two year old (83%). However, the percentage of loans which are more than two
years old is high in friends & relatives (33.4%) as compared to other sources. Of the formal
sources, majority of the loans from SHG funds and VO/ MMS are of more than one year old.
It could be because of no or less number of loans from internal funds due to paucity of
funds and/or poor repayment and defaulting. Further, a majority of the loans of Sthreenidhi,
SHG bank linkage and personal loans from banks are of less than one year old. It could be
because of two reasons - Sthreenidhi has started its operations in the recent past, since
October 2012; and more focus on PoP SHGs credit linked to banks by the SERP/ promoter.
10
Table-5: Source-wise Age of Loans (In %)
Age of loans ( in years) Credit
source 0.1-1 1.1-2 2.1-3 3.1-4 > 4 Total
A. Non-formal (N=100) 64.0 19.0 9.0 4.0 4.0 100
1. Friends & Relatives (N=30) 46.7 20.0 16.7 10.0 6.7 100
2. Money lenders (N=58) 69.0 20.7 5.2 1.7 3.4 100
3. Chits (N=3) 66.7 33.3 0.0 0.0 0.0 100
4. Traders (N=9) 88.9 0.0 11.1 0.0 0.0 100
B. Formal (N=316) 60.4 20.6 4.4 4.1 10.5 100
1. SHG funds (N=42) 47.6 35.7 7.1 2.4 7.1 100
2. VO/MMS (N=62) 37.1 33.9 6.5 3.2 19.4 100
3. Sthreenidhi (N=56) 100.0 0.0 0.0 0.0 0.0 100
4. SHG-BL (N=131) 60.8 20.0 3.1 3.8 12.3 100
5. Bank-personal (N=25) 52.0 12.0 8.0 20.0 8.0 100
Total (N=416) 61.3 20.2 5.5 4.1 8.9 100
4.3 Purpose of loans
Large number of loans for production purposes: The households have borrowed loans for
various purposes –consumption, production, social needs and asset creation. The
consumption loans include food and clothing; the production loans include agriculture
inputs, purchase of milk animals, sheep & goats, business, self employment activities,
purchase of an auto and expanding traditional occupational activities; the social needs
include to repay old loans, marriage, health and children’s education; the asset creation
loans include housing and land.
Table-6: Purpose-wise No. of Loans and Amount
Loan Loans Amount in Rs
Category Purpose N % Total %
Mean
in Rs.
Consumption Food & clothing 22 5.3 167,300 1.9 7,605
Ag. Inputs 144 34.6 2,586,433 30.1 17,961
Milk animals 21 5.0 463,230 5.4 22,059
Goat/sheep 13 3.1 166,100 1.9 12,777
Business 24 5.8 294,900 3.4 12,288
Self employment 3 0.7 23,000 0.3 7,667
Auto/taxi/tractor 3 0.7 118,000 1.4 39,333
Production
Traditional occupations 3 0.7 25,000 0.3 8,333
To repay old loans 15 3.6 344,000 4.0 22,933
Marriage 20 4.8 614,967 7.2 30,748
Health 61 14.7 1,274,100 14.8 20,887 Social needs
Education 38 9.1 1,382,500 16.1 36,382
Housing 48 11.5 1,072,416 12.5 22,342 Asset
creation Land 1 0.2 60,000 0.7 60,000
Total 416 100.0 8,591,946 100.0 20,654
11
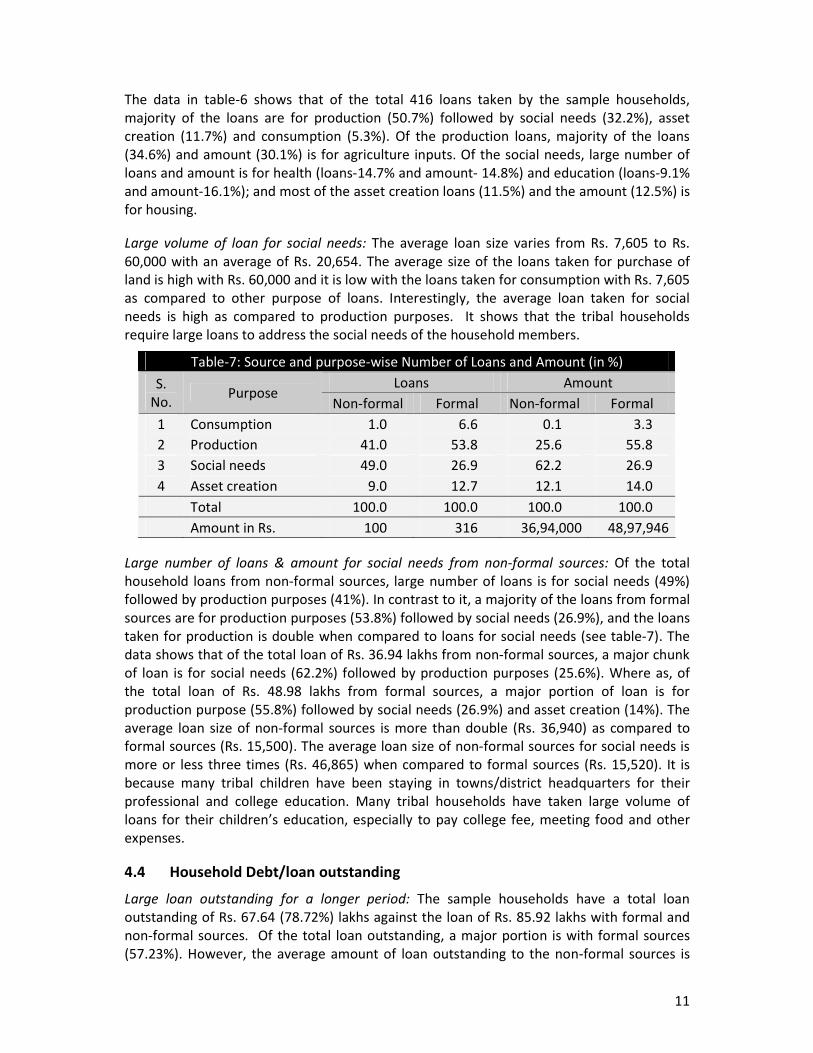
The data in table-6 shows that of the total 416 loans taken by the sample households,
majority of the loans are for production (50.7%) followed by social needs (32.2%), asset
creation (11.7%) and consumption (5.3%). Of the production loans, majority of the loans
(34.6%) and amount (30.1%) is for agriculture inputs. Of the social needs, large number of
loans and amount is for health (loans-14.7% and amount- 14.8%) and education (loans-9.1%
and amount-16.1%); and most of the asset creation loans (11.5%) and the amount (12.5%) is
for housing.
Large volume of loan for social needs: The average loan size varies from Rs. 7,605 to Rs.
60,000 with an average of Rs. 20,654. The average size of the loans taken for purchase of
land is high with Rs. 60,000 and it is low with the loans taken for consumption with Rs. 7,605
as compared to other purpose of loans. Interestingly, the average loan taken for social
needs is high as compared to production purposes. It shows that the tribal households
require large loans to address the social needs of the household members.
Table-7: Source and purpose-wise Number of Loans and Amount (in %)
Loans Amount S.
No. Purpose
Non-formal Formal Non-formal Formal
1 Consumption 1.0 6.6 0.1 3.3
2 Production 41.0 53.8 25.6 55.8
3 Social needs 49.0 26.9 62.2 26.9
4 Asset creation 9.0 12.7 12.1 14.0
Total 100.0 100.0 100.0 100.0
Amount in Rs. 100 316 36,94,000 48,97,946
Large number of loans & amount for social needs from non-formal sources: Of the total
household loans from non-formal sources, large number of loans is for social needs (49%)
followed by production purposes (41%). In contrast to it, a majority of the loans from formal
sources are for production purposes (53.8%) followed by social needs (26.9%), and the loans
taken for production is double when compared to loans for social needs (see table-7). The
data shows that of the total loan of Rs. 36.94 lakhs from non-formal sources, a major chunk
of loan is for social needs (62.2%) followed by production purposes (25.6%). Where as, of
the total loan of Rs. 48.98 lakhs from formal sources, a major portion of loan is for
production purpose (55.8%) followed by social needs (26.9%) and asset creation (14%). The
average loan size of non-formal sources is more than double (Rs. 36,940) as compared to
formal sources (Rs. 15,500). The average loan size of non-formal sources for social needs is
more or less three times (Rs. 46,865) when compared to formal sources (Rs. 15,520). It is
because many tribal children have been staying in towns/district headquarters for their
professional and college education. Many tribal households have taken large volume of
loans for their children’s education, especially to pay college fee, meeting food and other
expenses.
4.4 Household Debt/loan outstanding
Large loan outstanding for a longer period: The sample households have a total loan
outstanding of Rs. 67.64 (78.72%) lakhs against the loan of Rs. 85.92 lakhs with formal and
non-formal sources. Of the total loan outstanding, a major portion is with formal sources
(57.23%). However, the average amount of loan outstanding to the non-formal sources is
12
more than double (Rs. 28,934) when compared to the formal sources (Rs. 12,248) as it is
because of large volume of loans from non-formal credit sources.
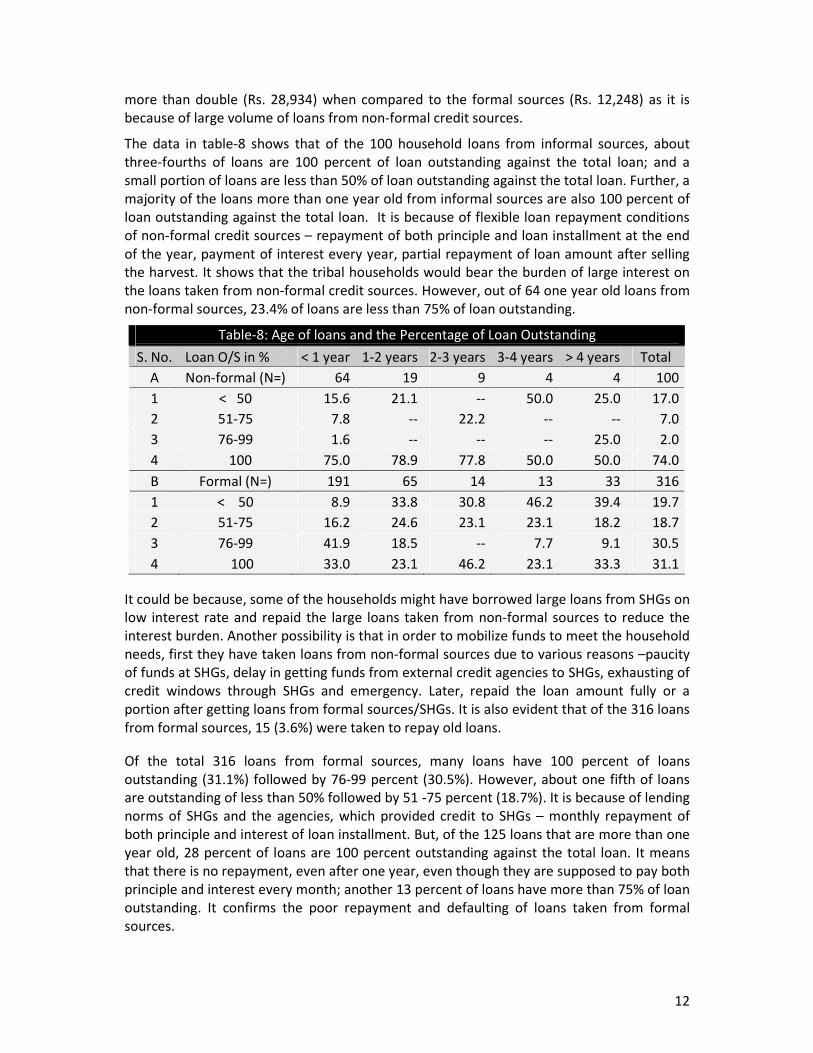
The data in table-8 shows that of the 100 household loans from informal sources, about
three-fourths of loans are 100 percent of loan outstanding against the total loan; and a
small portion of loans are less than 50% of loan outstanding against the total loan. Further, a
majority of the loans more than one year old from informal sources are also 100 percent of
loan outstanding against the total loan. It is because of flexible loan repayment conditions
of non-formal credit sources – repayment of both principle and loan installment at the end
of the year, payment of interest every year, partial repayment of loan amount after selling
the harvest. It shows that the tribal households would bear the burden of large interest on
the loans taken from non-formal credit sources. However, out of 64 one year old loans from
non-formal sources, 23.4% of loans are less than 75% of loan outstanding.
Table-8: Age of loans and the Percentage of Loan Outstanding
Total S. No. Loan O/S in % < 1 year 1-2 years 2-3 years 3-4 years > 4 years Total
A Non-formal (N=) 64 19 9 4 4 100
1 < 50 15.6 21.1 -- 50.0 25.0 17.0
2 51-75 7.8 -- 22.2 -- -- 7.0
3 76-99 1.6 -- -- -- 25.0 2.0
4 100 75.0 78.9 77.8 50.0 50.0 74.0
B Formal (N=) 191 65 14 13 33 316
1 < 50 8.9 33.8 30.8 46.2 39.4 19.7
2 51-75 16.2 24.6 23.1 23.1 18.2 18.7
3 76-99 41.9 18.5 -- 7.7 9.1 30.5
4 100 33.0 23.1 46.2 23.1 33.3 31.1
It could be because, some of the households might have borrowed large loans from SHGs on
low interest rate and repaid the large loans taken from non-formal sources to reduce the
interest burden. Another possibility is that in order to mobilize funds to meet the household
needs, first they have taken loans from non-formal sources due to various reasons –paucity
of funds at SHGs, delay in getting funds from external credit agencies to SHGs, exhausting of
credit windows through SHGs and emergency. Later, repaid the loan amount fully or a
portion after getting loans from formal sources/SHGs. It is also evident that of the 316 loans
from formal sources, 15 (3.6%) were taken to repay old loans.
Of the total 316 loans from formal sources, many loans have 100 percent of loans
outstanding (31.1%) followed by 76-99 percent (30.5%). However, about one fifth of loans
are outstanding of less than 50% followed by 51 -75 percent (18.7%). It is because of lending
norms of SHGs and the agencies, which provided credit to SHGs – monthly repayment of
both principle and interest of loan installment. But, of the 125 loans that are more than one
year old, 28 percent of loans are 100 percent outstanding against the total loan. It means
that there is no repayment, even after one year, even though they are supposed to pay both
principle and interest every month; another 13 percent of loans have more than 75% of loan
outstanding. It confirms the poor repayment and defaulting of loans taken from formal
sources.
13
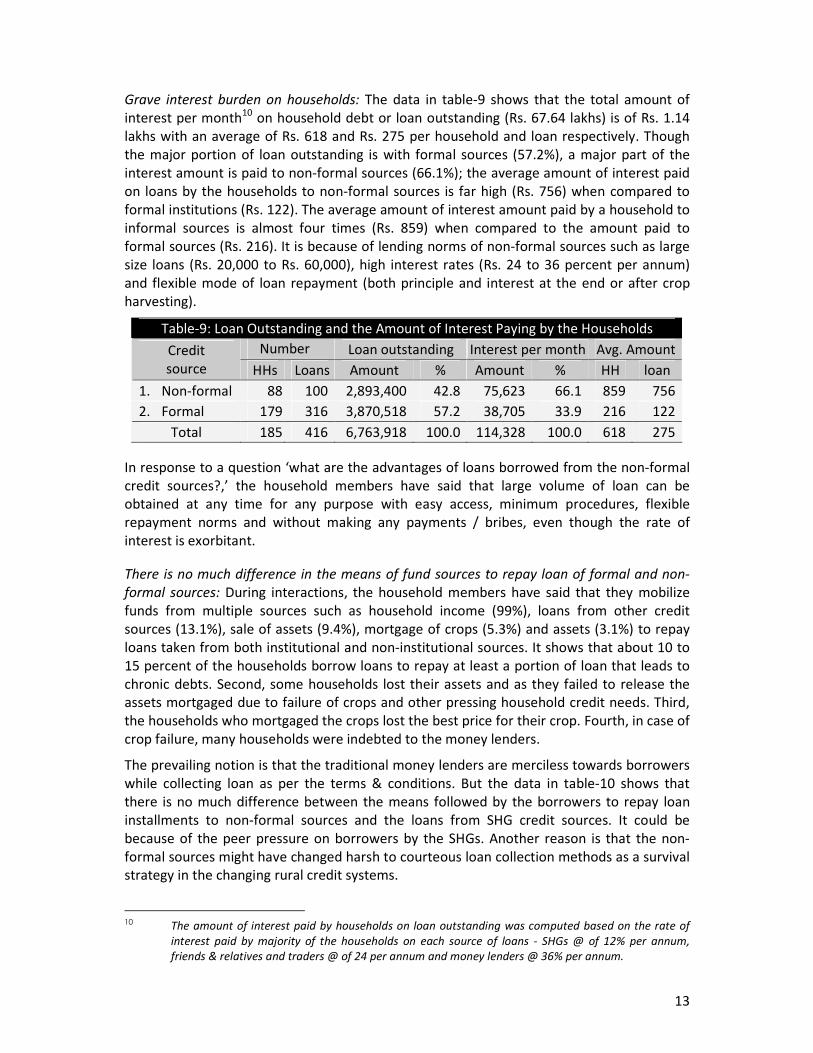
Grave interest burden on households: The data in table-9 shows that the total amount of
interest per month10
on household debt or loan outstanding (Rs. 67.64 lakhs) is of Rs. 1.14
lakhs with an average of Rs. 618 and Rs. 275 per household and loan respectively. Though
the major portion of loan outstanding is with formal sources (57.2%), a major part of the
interest amount is paid to non-formal sources (66.1%); the average amount of interest paid
on loans by the households to non-formal sources is far high (Rs. 756) when compared to
formal institutions (Rs. 122). The average amount of interest amount paid by a household to
informal sources is almost four times (Rs. 859) when compared to the amount paid to
formal sources (Rs. 216). It is because of lending norms of non-formal sources such as large
size loans (Rs. 20,000 to Rs. 60,000), high interest rates (Rs. 24 to 36 percent per annum)
and flexible mode of loan repayment (both principle and interest at the end or after crop
harvesting).
Table-9: Loan Outstanding and the Amount of Interest Paying by the Households
Number
of
Loan outstanding Interest per month Avg. Amount Credit
source HHs Loans Amount % Amount % HH loan
1. Non-formal 88 100 2,893,400 42.8 75,623 66.1 859 756
2. Formal 179 316 3,870,518 57.2 38,705 33.9 216 122
Total 185 416 6,763,918 100.0 114,328 100.0 618 275
In response to a question ‘what are the advantages of loans borrowed from the non-formal
credit sources?,’ the household members have said that large volume of loan can be
obtained at any time for any purpose with easy access, minimum procedures, flexible
repayment norms and without making any payments / bribes, even though the rate of
interest is exorbitant.
There is no much difference in the means of fund sources to repay loan of formal and non-
formal sources: During interactions, the household members have said that they mobilize
funds from multiple sources such as household income (99%), loans from other credit
sources (13.1%), sale of assets (9.4%), mortgage of crops (5.3%) and assets (3.1%) to repay
loans taken from both institutional and non-institutional sources. It shows that about 10 to
15 percent of the households borrow loans to repay at least a portion of loan that leads to
chronic debts. Second, some households lost their assets and as they failed to release the
assets mortgaged due to failure of crops and other pressing household credit needs. Third,
the households who mortgaged the crops lost the best price for their crop. Fourth, in case of
crop failure, many households were indebted to the money lenders.
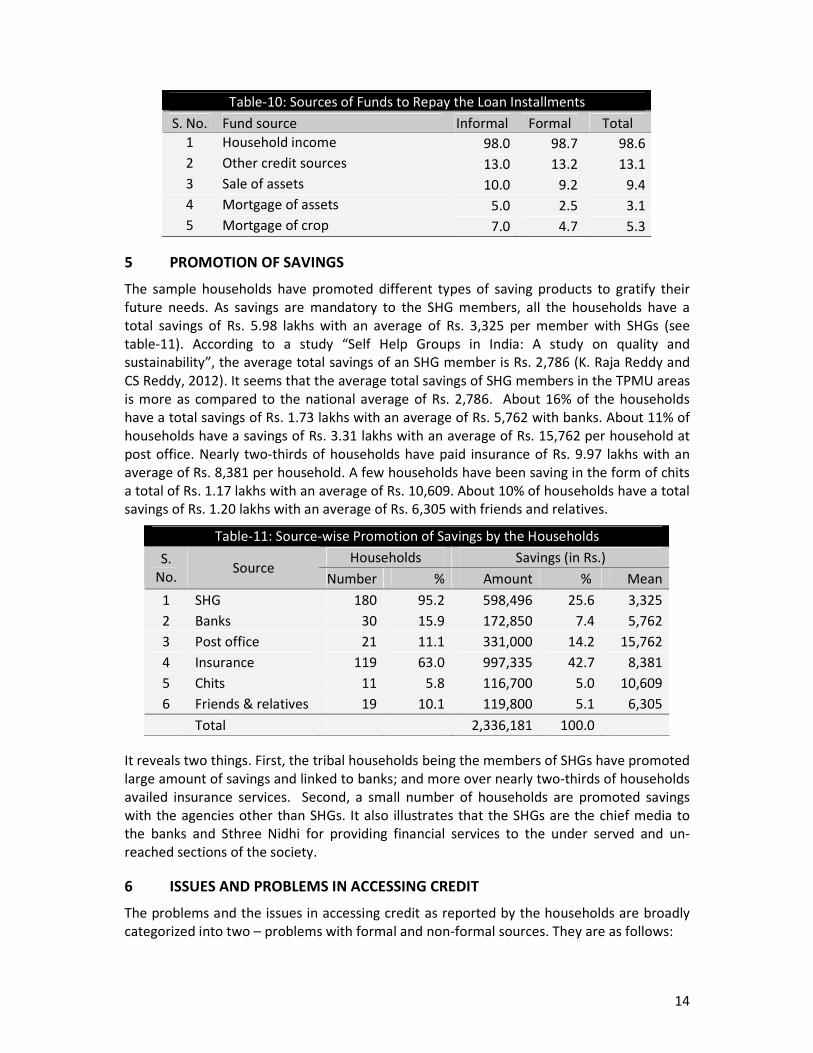
The prevailing notion is that the traditional money lenders are merciless towards borrowers
while collecting loan as per the terms & conditions. But the data in table-10 shows that
there is no much difference between the means followed by the borrowers to repay loan
installments to non-formal sources and the loans from SHG credit sources. It could be
because of the peer pressure on borrowers by the SHGs. Another reason is that the non-
formal sources might have changed harsh to courteous loan collection methods as a survival
strategy in the changing rural credit systems.
10 The amount of interest paid by households on loan outstanding was computed based on the rate of
interest paid by majority of the households on each source of loans - SHGs @ of 12% per annum,
friends & relatives and traders @ of 24 per annum and money lenders @ 36% per annum.
14
Table-10: Sources of Funds to Repay the Loan Installments
S. No. Fund source Informal Formal Total
1 Household income 98.0 98.7 98.6
2 Other credit sources 13.0 13.2 13.1
3 Sale of assets 10.0 9.2 9.4
4 Mortgage of assets 5.0 2.5 3.1
5 Mortgage of crop 7.0 4.7 5.3
5 PROMOTION OF SAVINGS
The sample households have promoted different types of saving products to gratify their
future needs. As savings are mandatory to the SHG members, all the households have a
total savings of Rs. 5.98 lakhs with an average of Rs. 3,325 per member with SHGs (see
table-11). According to a study “Self Help Groups in India: A study on quality and
sustainability”, the average total savings of an SHG member is Rs. 2,786 (K. Raja Reddy and
CS Reddy, 2012). It seems that the average total savings of SHG members in the TPMU areas
is more as compared to the national average of Rs. 2,786. About 16% of the households
have a total savings of Rs. 1.73 lakhs with an average of Rs. 5,762 with banks. About 11% of
households have a savings of Rs. 3.31 lakhs with an average of Rs. 15,762 per household at
post office. Nearly two-thirds of households have paid insurance of Rs. 9.97 lakhs with an
average of Rs. 8,381 per household. A few households have been saving in the form of chits
a total of Rs. 1.17 lakhs with an average of Rs. 10,609. About 10% of households have a total
savings of Rs. 1.20 lakhs with an average of Rs. 6,305 with friends and relatives.
Table-11: Source-wise Promotion of Savings by the Households
Households Savings (in Rs.) S.
No. Source
Number % Amount % Mean
1 SHG 180 95.2 598,496 25.6 3,325
2 Banks 30 15.9 172,850 7.4 5,762
3 Post office 21 11.1 331,000 14.2 15,762
4 Insurance 119 63.0 997,335 42.7 8,381
5 Chits 11 5.8 116,700 5.0 10,609
6 Friends & relatives 19 10.1 119,800 5.1 6,305
Total 2,336,181 100.0
It reveals two things. First, the tribal households being the members of SHGs have promoted
large amount of savings and linked to banks; and more over nearly two-thirds of households
availed insurance services. Second, a small number of households are promoted savings
with the agencies other than SHGs. It also illustrates that the SHGs are the chief media to
the banks and Sthree Nidhi for providing financial services to the under served and un-
reached sections of the society.
6 ISSUES AND PROBLEMS IN ACCESSING CREDIT
The problems and the issues in accessing credit as reported by the households are broadly
categorized into two – problems with formal and non-formal sources. They are as follows:
15
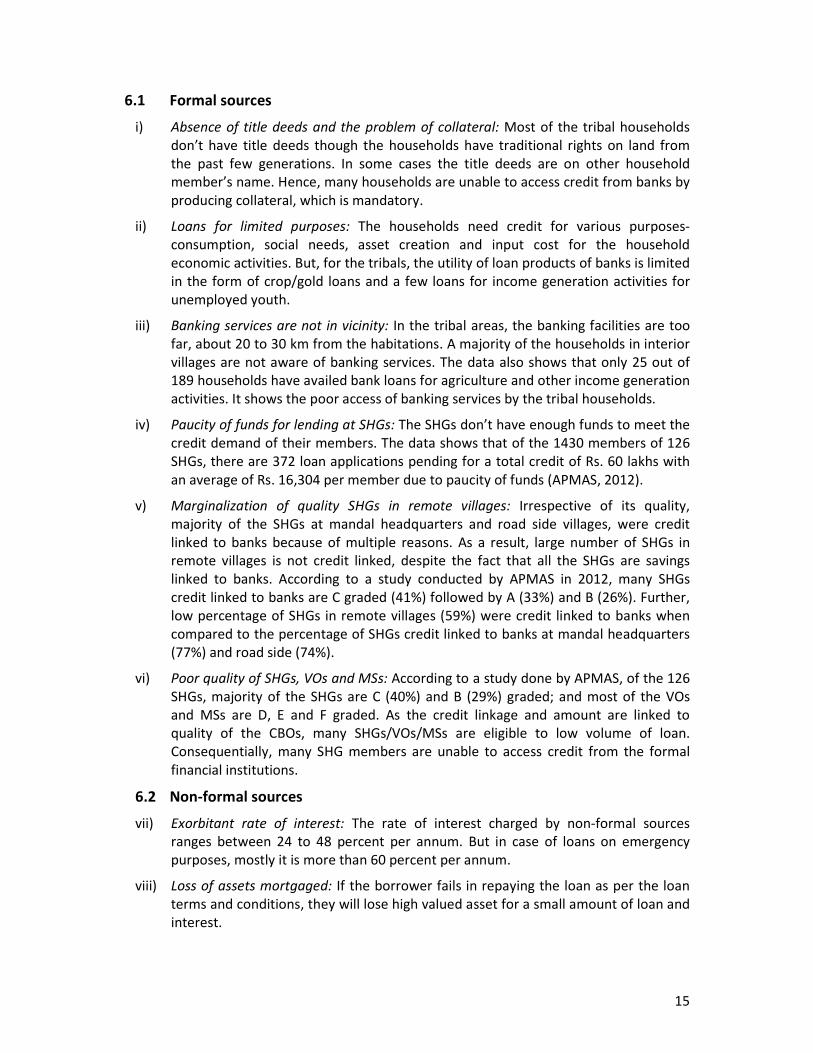
6.1 Formal sources
i) Absence of title deeds and the problem of collateral: Most of the tribal households
don’t have title deeds though the households have traditional rights on land from
the past few generations. In some cases the title deeds are on other household
member’s name. Hence, many households are unable to access credit from banks by
producing collateral, which is mandatory.
ii) Loans for limited purposes: The households need credit for various purposes-
consumption, social needs, asset creation and input cost for the household
economic activities. But, for the tribals, the utility of loan products of banks is limited
in the form of crop/gold loans and a few loans for income generation activities for
unemployed youth.
iii) Banking services are not in vicinity: In the tribal areas, the banking facilities are too
far, about 20 to 30 km from the habitations. A majority of the households in interior
villages are not aware of banking services. The data also shows that only 25 out of
189 households have availed bank loans for agriculture and other income generation
activities. It shows the poor access of banking services by the tribal households.
iv) Paucity of funds for lending at SHGs: The SHGs don’t have enough funds to meet the
credit demand of their members. The data shows that of the 1430 members of 126
SHGs, there are 372 loan applications pending for a total credit of Rs. 60 lakhs with
an average of Rs. 16,304 per member due to paucity of funds (APMAS, 2012).
v) Marginalization of quality SHGs in remote villages: Irrespective of its quality,
majority of the SHGs at mandal headquarters and road side villages, were credit
linked to banks because of multiple reasons. As a result, large number of SHGs in
remote villages is not credit linked, despite the fact that all the SHGs are savings
linked to banks. According to a study conducted by APMAS in 2012, many SHGs
credit linked to banks are C graded (41%) followed by A (33%) and B (26%). Further,
low percentage of SHGs in remote villages (59%) were credit linked to banks when
compared to the percentage of SHGs credit linked to banks at mandal headquarters
(77%) and road side (74%).
vi) Poor quality of SHGs, VOs and MSs: According to a study done by APMAS, of the 126
SHGs, majority of the SHGs are C (40%) and B (29%) graded; and most of the VOs
and MSs are D, E and F graded. As the credit linkage and amount are linked to
quality of the CBOs, many SHGs/VOs/MSs are eligible to low volume of loan.
Consequentially, many SHG members are unable to access credit from the formal
financial institutions.
6.2 Non-formal sources
vii) Exorbitant rate of interest: The rate of interest charged by non-formal sources
ranges between 24 to 48 percent per annum. But in case of loans on emergency
purposes, mostly it is more than 60 percent per annum.
viii) Loss of assets mortgaged: If the borrower fails in repaying the loan as per the loan
terms and conditions, they will lose high valued asset for a small amount of loan and
interest.
16
ix) Low prices to the agriculture produce and minor forest produce (MFP): Many
households take loans/advances from the traders and money lenders to meet the
cost of agriculture inputs and other needs on a condition that the agriculture
produce/MFP would be sold to them only. The traders taking it as advantage and
have been exploiting the tribals with wrong weights and measures and by paying
comparatively low prices than the market prices besides exorbitant interest rate on
the advances/loans.
7 CONCLUSIONS AND WAY FORWARD
There are 32 Scheduled Tribes inhabiting over 31,485 sq km in the districts of Srikakulam,
Vizianagaram, Visakhapatnam, East Godavari, West Godavari, Warangal, Khammam,
Adilabad and Kurnool. The other three tribal groups namely the Lambada, Yerukala and
Yanadi mostly live outside the Scheduled Areas. There are one million ST households in the
State and about a half of them live in 5,936 villages in the nine ITDA areas. The Scheduled
areas are inhabited by an estimated 2.8 million tribals who are entitled to the benefits of
tribal sub-plan (TSP) projects and protective legislations. A good number of households
formed into SHGs and credit linked to banks.
The tribals are socially and economically vulnerable. A majority of the households are simple
families, with more illiterates and many non-working members. A few households have
accounted seasonal migration due to economic factors. Mostly, they are small and marginal
farmers primarily depending on rain-fed agriculture; labour and MFP/NTFP collection are
the household subsidiary economic activities. At present, the households’ engagement in
MFP collection is minimal, though it is most of the households’ subsidiary activity in the
past.
The tribal households accessed credit from multiple formal and informal sources. Of the
formal sources, banks have provided a lion’s share to household credit under SHG bank
linkage programme; where as, of the non-formal sources, money lenders and friends &
relatives have contributed much to the household credit. The household credit varies from
less than one thousand to more than a lakh. The size of the loans taken from non-formal
sources is high, when compared to the size of loans from formal sources. Irrespective of
credit sources, a majority loans are less than one year old. However, many loans from VO
and friends & relatives are more than two years old.
The tribal households borrowed majority of the loans & amount for production - especially
for meeting the costs of agriculture inputs, followed by social needs -mainly for health and
education. Of the loans and amount from formal sources, a major chunk is for production
followed by social needs. In contrast, majority of the loans and amount from non-formal
sources is to social needs followed by production. It shows that the tribal households largely
depend on formal sources for production purposes, and on non-formal sources for social
needs.
The households have large loans outstanding with formal and non-formal sources. A
majority of loans from non-formal sources have 100 percent of loan outstanding against the
total loan. Further, majority of the loans that are more than one year old also have 100
percent of loan outstanding because of flexible loan repayment norms of non-formal
sources. However, in case of formal sources, the percentage of loans having 100 percent of
loan outstanding against total loan is low because of monthly repayment norm; further,
17
many loans which are more than one year old have 75-100 percent of loan outstanding,
which indicates low repayment rate from members to SHGs or defaulting to formal sources.
Tribals are not able to take advantage of the “pavala vaddi” and the more recently
introduced “interest-free” loans available from the banking sector with interest subsidy paid
by the Government of Andhra Pradesh. There is a substantial interest burden on many tribal
households because of exorbitant rate of interest on loans charged by the non-formal
sources; even then, many households prefer loans because of large volume of loan at door
steps, at any time and for any purpose with flexible repayment norms and without any
bribe/ payments.
The tribal households have been encountering some core issues in accessing credit from
formal and non-formal sources. Exorbitant rate of interest, loss of assets mortgaged and low
prices to their agriculture produce are the important issues while accessing credit from non-
formal sources. The major problems that have been faced by the households in accessing
credit from banks are absence of title deeds and the problems of collateral security, loans
for limited purposes and credit services are not in vicinity, that are contradictory to the
advantages of non-formal sources. The problems in accessing credit from SHGs are paucity
of funds at SHGs for on lending to members, marginalization of quality SHGs in remote
villages and poor quality of SHGs, VOs and MSs, that are distinct in accessing credit from
banks and traditional sources.
In conclusion, majority of the tribal households have accessed financial services from banks
through SHGs. Nevertheless, nearly one half of the households depending on non-formal
sources, whose interest rates are high, for large credit, mostly to cater the social needs of
the household members. Further, the formal institutions could not succeed in meeting the
credit demand of the SHG member households because of diverse reasons.
In the above context, to reduce the dependence of tribal households on money lenders and
to extend and provide quality financial services to the underserved to enable them to take
advantage of the interest-free loans, banks and Sthree Nidhi should adopt a two pronged
approach: i) adoption of business correspondents model by using modern technologies
where there is no problem of connectivity; and ii) In the absence of technology, engagement
of village organizations as ‘business correspondents’ with adequate capacity building inputs
on ‘strengthening CBOs’ and ‘financial literacy’.
ACKNOWLEDGEMENTS
The authors are highly thankful to APMAS staff Dr. S. Prahalladaiah, Ms. Geethanjali, Mr. Gopal Raju,
Mr. G. Srinivas, Mr. Bhaskar, Mr. Brahmaiah, Mr. B. Venkateswarulu and Ms. B. Pravalika, who have
taken many pains and whose support is immense in collecting the data from tribal households. We
are also grateful to ‘Sthree Nidhi Cooperative Federation Pvt. Ltd’ for their financial support to
conduct the study in the TPMU areas of Andhra Pradesh.
18
REFERENCES
APMAS (2007) SHG-Bank Linkage Programme- A Recurrent Study in Andhra Pradesh,
Research and Advocacy Unit, APMAS, Hyderabad.
APMAS (2011-12) A Study on Utilization of Sthree Nidhi Loans by the Self Help Group
Members in Andhra Pradesh, study conducted by APMAS to Sthree Nidhi
Cooperative Federation Private Ltd., Hyderabad
APMAS (2012-13) Credit Requirements of Tribal Households in Tribal Project Management
Units and Delivery Mechanisms in Andhra Pradesh’ study sponsored by
Sthree Nidhi Cooperative Federation Pvt. Ltd., Hyderabad.
Census of AP (2011), Census of Andhra Pradesh, Govt. of Andhra Pradesh.
NIRD (1999) Indebtedness among the Scheduled – V Areas of Bihar, Madhya Pradesh and
Orissa.
Planning Commission, Govt. of India, (2012) Press Note on Poverty Estimates, 2009-10.
Raja Reddy, K. and CS Reddy (2012) Self Help Groups in India: A Study on Quality and
Sustainability, ENABLE Network Publication, APMAS, Hyderabad.
Rangarajan, C. (2008) Report of the Committee on Financial Inclusion
Sarangi, T.P. (2011) Rural Indebtedness and Practices of Microfinance Institutions in Andhra
Pradesh, study conducted by Centre for Microfinance Research, Bankers
Institute of Rural Development, Lucknow.
www.serp.org
www.sthreenidhi.org
Copyright © 2022 FDOKUMEN