Demand-Side Surveys for Financial Inclusion: - Squarespace
59
Bringing smart policies to life. 1 Guidance Note Demand-Side Surveys for Financial Inclusion: A practical, how-to guide based on the experience of AFI member countries
-
Upload
khangminh22 -
Category
Documents
-
view
2 -
download
0
Transcript of Demand-Side Surveys for Financial Inclusion: - Squarespace
Bringing smart policies to life.
1
Guidance Note
Demand-Side Surveys for Financial Inclusion:
A practical, how-to guide based on the experience of AFI member countries

Bringing smart policies to life.
2
This report is dedicated to our dear colleague and friend
Raúl Hernández Cos, a tireless advocate for financial inclusion, comprehensive data collection, and improving the lives of the
poor in Mexico and around the world.

Bringing smart policies to life.
3
Contents Tables, figures, and boxes ............................................................................................................................. 4
Main Findings from AFI experience with demand-side surveys ................................................................... 6
Practitioners Notes: advice from the field .................................................................................................... 8
I. Introduction .......................................................................................................................................... 9
About this report....................................................................................................................................... 9
II. Part I: A solid working foundation ...................................................................................................... 11
a. Engaging stakeholders and working with partners ............................................................................. 12
Selecting the organization to implement the survey .......................................................................... 12
b. Budgeting and scope ........................................................................................................................... 14
c. Designing a policy-relevant survey ..................................................................................................... 17
III. Part II: Survey Design and Implementation .................................................................................... 19
a. Establishing a timeframe .................................................................................................................... 20
b. Gap analysis ........................................................................................................................................ 21
c. Approaches to survey design .............................................................................................................. 21
d. Sampling .............................................................................................................................................. 23
Probability Samples: simple random samples and clustered stratified samples ................................ 24
Sample size .......................................................................................................................................... 24
The sampling frame ............................................................................................................................ 25
Individual versus household sample and identifying the respondent ................................................ 26
Weighting ............................................................................................................................................ 27
e. Designing the questionnaire ............................................................................................................... 28
Modules and topics to include in the survey instrument ................................................................... 30
Length and organization of the questionnaire ................................................................................... 31
f. Piloting ................................................................................................................................................ 34
g. Training ............................................................................................................................................... 36
Ethics ................................................................................................................................................... 37
Nonsampling errors ............................................................................................................................ 38
Quality control and monitoring of field researchers .......................................................................... 39
IV. Part III: Analysis, dissemination, and making the best use of results ............................................. 42
a. Shaping data analysis ...................................................................................................................... 42

Bringing smart policies to life.
4
b. Dissemination ................................................................................................................................. 43
c. Examples of how data can be used to inform policy ...................................................................... 44
V. Conclusion ........................................................................................................................................... 46
Annex A: List of people interviewed ........................................................................................................... 47
Annex B: AFI Core Set.................................................................................................................................. 48
Annex C: Criteria for selecting a research house to implement a demand-side financial inclusion survey
.................................................................................................................................................................... 50
Annex D: Example of Gantt Chart for planning the timeframe of a survey ................................................ 52
Annex E: More technical information of sample size ................................................................................ 53
Annex F: Example of Kish Grid to randomly identify a respondent in the household ................................ 55
Annex G: Example of table for detailed data analysis plan ........................................................................ 57
References .................................................................................................................................................. 58
Tables, figures, and boxes Table 1: Example costs of country-led demand side surveys ..................................................................... 15
Table 2: Possible Survey Designs ................................................................................................................ 21
Table 3: The AFI Core Set ............................................................................................................................ 48
Figure 1: Defining the scope of a demand-side survey ............................................................................... 15
Figure 2: Process of survey design and implementation ............................................................................ 19
Figure 3: Steps used in Mexico's demand-side survey .............................................................................. 20
Figure 4: Levels of random selection in a sample of individuals ................................................................ 26
Figure 5: Five steps in questionnaire design ............................................................................................... 28
Figure 6: Possible structure for demand-side research instrument design ................................................ 33
Figure 7: Example table for prioritizing and cutting questions ................................................................... 34
Figure 8: Checklist before piloting .............................................................................................................. 35
Figure 9: Use of financial services by Belarusian adults ............................................................................. 45
Box 1: FinMark Trust FinScope.................................................................................................................... 10
Box 2: Examples of management structures used to oversee the survey process .................................... 11
Box 3: Kenya’s Financial Access Partnership ............................................................................................... 12
Box 4: Selecting a research house or survey company ............................................................................... 14
Box 5: Policy questions guiding demand-side research in Malaysia ........................................................... 18
Box 6: Making Kenya’s FinAccess sustainable through fees to access data ............................................... 16
Box 7: Definition of key sampling terms ..................................................................................................... 23

Bringing smart policies to life.
5
Box 8: Alternative sampling approach when a household listing is not possible ....................................... 25
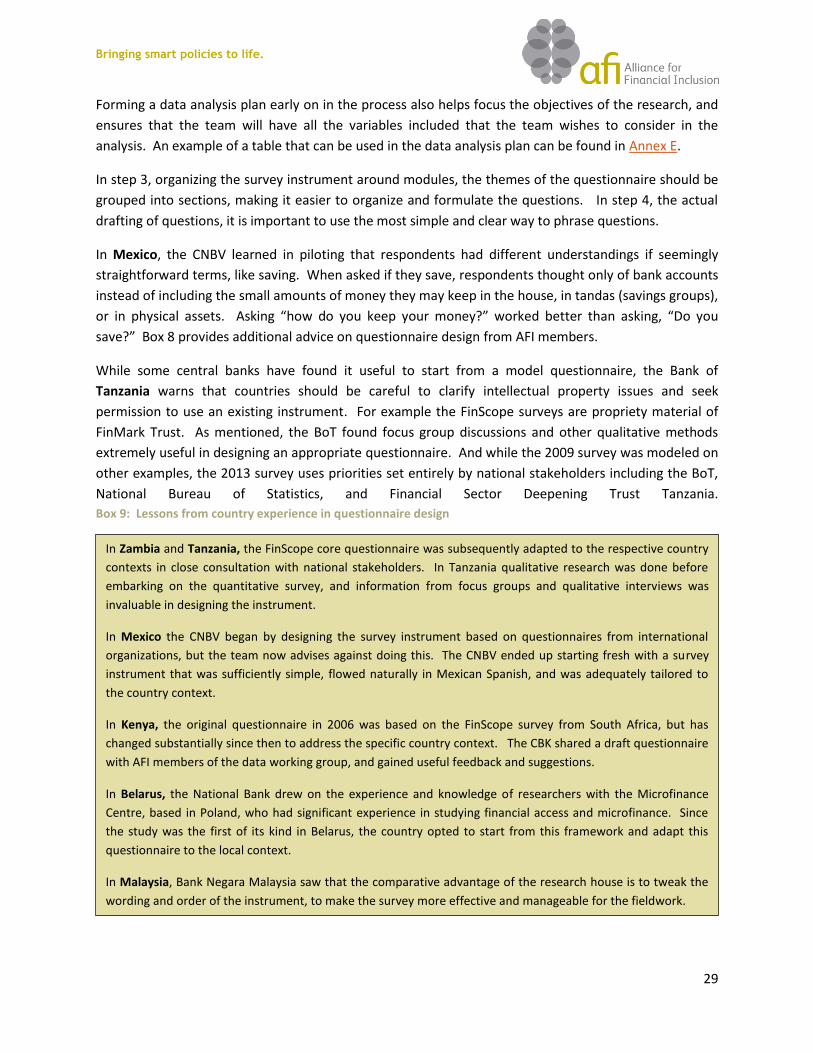
Box 9: Lessons from country experience in questionnaire design............................................................. 29
Box 10: Topics covered in the Mexico and Zambia questionnaires ............................................................ 30
Box 11: Informed consent ........................................................................................................................... 38
Box 12: Insuring anonymity in financial inclusion ....................................................................................... 38
Box 13: Reporting bias ................................................................................................................................ 39
Box 14: Verification and ensuring data quality ........................................................................................... 40
Box 15: Possible topics the survey firm could include in a field report ...................................................... 40
Box 16: Statistical programs for use in computing sampling errors ........................................................... 43
Box 17: Resources available from the Belarus survey of financial inclusion .............................................. 43

Bringing smart policies to life.
6
Main Findings from AFI experience with demand-side surveys Value of demand-side surveys
A demand-side survey is necessary to gain information on access, usage, and quality
of financial services in addition to information that banks and service providers can
provide.
A nationally-led survey is useful to supplement international data sets by delving into
specific policy questions pertinent to the country context.
Institutional arrangements
Clearly defining roles and having a working group with an appointed coordinator to
manage the survey helps ensure that the process goes smoothly.
Working with the national statistics institute, whether to execute the survey or to
design the sample, is useful, but not necessary for a successful survey.
Good data on market saturation, access among underserved populations, and
geographic patterns of financial inclusion is of interest to many diverse actors, and the
promise of this data can galvanize support for the survey.
Survey design and content
The first time a demand-side survey of financial inclusion is carried out in a country,
the focus should be on establishing a baseline of access to and use of financial
services, while subsequent waves can be focused on measuring progress.
Tailor the survey design— sample size, survey method, length of questionnaire — to
be reasonably implemented within the allocated budget.
Kenya, Tanzania, and Zambia have elected to survey repeated cross-sections of the
population at 2-3 year intervals, with interviews conducted with randomly selected
individuals within the selected households. The majority of the other countries
surveyed are planning a similar approach, although this may not be the best
methodology for all contexts.
Preparation
Plan the stratification, or divisions you want to include in the analysis, such as gender,
administrative units, urban and rural, etc. early on, from the time the sample is
designed.
Prioritize the main questions and themes to be explored in the survey at the onset,
and try to keep the scope narrow. Then group questions into modules or sections on
each topic.
Use qualitative work, such as focus group discussions and semi-structured interviews
to inform the questionnaire design.
Bringing smart policies to life.
7
Main Findings from AFI experience with demand-side surveys,
continued Implementation
Invest in translating the questionnaire into major local languages. Data quality
decreases when researchers have to translate on the spot.
Piloting the questionnaire is an essential step, and this step, along with the related
revisions and re-testing, often takes longer than expected.
It is wise for the central bank or other staff involved in the project to attend the field
researcher training and participate in piloting to ensure that all financial terms are
understood and questions are yielding the desired information.
The survey instrument itself should have a logic and flow, structured around a series of
sections or modules. This helps both the interviewer and the respondent understand
what is being discussed, and progress at a good pace.
Ethical considerations, such as preserving confidentiality and anonymity, are
important. In particular, respondents should provide informed consent, the risks and
benefits of the research should be carefully weighed, and that selection of subjects
should be fair, considering a just allocation of the costs and benefits of research.
Sampling and non-sampling error should be minimized.
Monitor data collection and verification closely, checking for irregularities.
Dissemination and use for policy
Dissemination costs can be significant, but there is a tendency to neglect these costs
that seem far down the line when planning the survey.
Consider innovative approaches to dissemination, such as workshops, TV and radio
distribution and publishing results internationally.
Use the survey to measure willingness to pay, demand for services, financial capability,
and other areas where regulation, policy, and changing incentives can make a
difference for financial inclusion.
Bringing smart policies to life.
8
Practitioners Notes: advice from the field
CNBV Mexico: “It is important to have an individual or office that will champion the
[survey] effort. It pays off to be inclusive, as a national survey on financial inclusion is a
big project. Now everyone is talking about the survey, so there is no need to promote it.”
Bank of Thailand: “The survey should be specific about whether it wants to understand
financial inclusion at a macro or micro and behavioral level. Although demographic and
economic variables need to be included, keep the survey focused on financial inclusion.”
Central Bank of Kenya: “It is important to focus on the common interests participating
actors may share. Banks, savings and credit cooperatives, MFIs and other market
participants have the desire to better understand potential markets and expand coverage
and market share. The government and development partners have an interest in
improving access, especially among the poor, and information is important to be able to
do this in terms of initiating reforms and/or policies that are evidence based. Academia
and research institutes have interests in the rich datasets to undertake more in-depth
analysis and gain further insights into the evolving financial access landscapes.”
Bank of Tanzania: “The lower the level of representation (e.g. national, regional, district,
etcetera), the bigger the sample and the more expensive the survey.”
“The survey should engage a wide range of stakeholders aiming at insuring stakeholders'
understanding of key issues such as sampling, questionnaire design and project
management. This secures "buy in" and maximizes the chances of stakeholders actively
using the data and analysis. This involvement also creates knowledge sharing and
learning at local level to feed back into subsequent surveys. (In Tanzania the stakeholders
in this survey are Bank of Tanzania, commercial banks, microfinance institutions,
government agencies, telephone companies).”

Bringing smart policies to life.
9
I. Introduction A well-functioning financial system is an important building block for economic growth and prosperity.
Fostering an inclusive financial system helps ensure that low-income people will share in the benefits of
growth, by being better able to access credit markets, smooth consumption, and plan for the future.
There has been remarkable international consensus about the importance of financial inclusion for
development in recent years. Regulators and other policymakers are learning about how they can
change laws and incentives in order to reduce barriers to financial inclusion in their countries. But in
order to know where we stand, to set the targets for where we are going, and to track progress along
the way, reliable data is needed.
In an important effort to galvanize support for harmonized financial inclusion data collection, the
Alliance for Financial Inclusion (AFI) has developed a Core Set of indicators, presented in Annex B of this
report. The AFI core set focuses on the access dimension of financial inclusion: the availability of
financial services, and the usage dimension: how many people are using these services and how often.
Indicators are currently being developed to measure the quality of financial products available and of
the overall environment to foster financial inclusion. When collecting data for the AFI Core Set and for
national objectives, especially related to access, policymakers can often collect fairly good data on the
supply of financial services from central bank supervision activities. But to quantify the fraction of
people using various savings and credit instruments1, to understand why some people do not have bank
accounts, and to delve into not just possession of products, but how often they are used and if they
meet clients’ needs, a demand-side survey— a survey of the population— is needed.
While the availability and comprehensive coverage of demand-side data from international datasets is
improving, governments stand to benefit significantly from designing a nationally tailored demand-side
survey of financial inclusion. Central banks and other regulatory authorities that support demand-side
surveys gain indispensable information that they can use as an evidence base on which to make policy
decisions.
This guidance note aims to provide practical advice on all steps required to successfully implement a
demand-side survey of financial inclusion, based on the experience of various Alliance for Financial
Inclusion (AFI) member countries that have recently implemented such a survey.
About this report
Members of the AFI Financial Inclusion Data Working Group (FIDWG) expressed interest in a document
synthesizing the experience and best practices for demand-side surveys at the working group meeting in
Livingstone, Zambia, in March 2012.2 Central bankers and other policymakers, primarily in developing
1 While central banks usually have information about the number of deposit and credit accounts, in many countries
it is not possible to determine which are multiple accounts held by the same individual, making a survey of consumers necessary to determine national access levels. 2 A subgroup to produce this report was formed at this meeting, chaired by Mr. Norbert Mumba at the Bank of
Zambia.

Bringing smart policies to life.
10
countries, are envisioned to be the primary audience for the report. This Guidance Note is based on the
experiences of Belarus, Kenya, Malaysia, Mexico, Tanzania, Thailand and Zambia, all of which have
carried out nationally representative surveys on financial inclusion. To inform the study, interviews
were carried out with staff working in the central banks, or with other officials who have been closely
involved in the survey implementation process in these seven countries. A list of people interviewed for
this report can be found in Annex A.
Background information about each of these surveys is helpful in framing the report. In Belarus the
National Bank worked closely with the Microfinance Center, a regional network in Central and Eastern
Europe and Asia based in Poland, to implement a baseline financial inclusion survey in early 2012. A
survey with a larger sample that will collect information about the barriers to financial access in all
regions of Belarus, allowing for supply and demand of financial services to be mapped in detail, will be
finalized in later in 2012. The Central Bank of Kenya (CBK) together with the Financial Sector Deepening
Trust (FSD Kenya) the Kenya National Bureau of Statistics (KNBS) have implemented demand-side
surveys, called FinAccess, in 2006 and 2009, and have another survey in the pipeline for late 2012.
Bank Negara Malaysia, the Central Bank of Malaysia, commissioned the first demand-side survey of
financial inclusion in 2011. Similarly, the Comición Nacional Bancaria y de Valores (CNBV) in Mexico
completed a national survey of financial inclusion in 2012. The Bank of Tanzania (BoT) has become
more involved with the FinScope survey there through the Financial Sector Deepening Trust Tanzania.
The third demand-side survey is planned for 2012. In Thailand, the Bank of Thailand initiated two
demand side surveys in 2006 and 2010, and has a third survey planned for 2013. The Bank of Zambia
supported the adaptation and implementation of a FinScope survey (see Box 1)3 there in 2005 and again
in 2009, under the Financial Sector Development Plan.
The report proceeds as follows: Part I provides guidance on how to establish strong working
partnerships between organizations implementing the survey, how to select the organization that will
implement the survey, how to tailor the survey to match the available budget, and how to craft a policy-
relevant survey. Part II provides guidance on survey design and implementation— including sampling,
questionnaire design, training fieldworkers, piloting, and supervision. Part III focuses on analysis,
dissemination, and using results for policymaking. A series of annexes offer examples of practical tables
and tools for use throughout the survey process.
3 More information available at : http://www.finscope.co.za/
Box 1: FinMark Trust FinScope
FinMark Trust FinScope Surveys
FinScope is a survey initiative of the South Africa- based FinMark Trust, supported by UK Aid. FinScope surveys
study perceptions and use of financial services among the adult population of a country. Nationally
representative surveys at the individual level, FinScope surveys cover attitudes, behaviors, and use of both
formal and informal financial instruments, with the aim of understanding the financial lives of the population.
To date, the surveys have been primarily implemented in Sub-Saharan Africa.

Bringing smart policies to life.
11
II. Part I: A solid working foundation In many countries, there is sufficient drive and interest in producing a nationally-led demand-side survey
of financial inclusion to garner the support of the government, industry, academics, and other relevant
stakeholders. In other countries, the central bank may need to do significant groundwork to convince
other institutional actors of the value of surveying consumers about their access to and use of financial
services. Regardless of the degree of commitment to the research effort, establishing solid working
relationships and clear roles early on in the process paves the way for a productive and seamless survey
management process.
Although the size of central banks staffs varies, designating a unit or office to support the demand-side
survey, where possible, can deliver considerable gains. The structures various central banks have
established to oversee the survey process are described in Box 2.
Box 2: Examples of management structures used to oversee the survey process
In Malaysia, the Development Finance and Enterprise Department (DFE) was responsible for supervising
the 2011 survey process, designing the questionnaire, and conducting the detailed analysis and report
writing.
In Kenya, the Financial Stability and Access Division of the Research Division of the Central Bank of Kenya
together with Financial Sector Deepening (FSD) Kenya and the Kenya National Bureau of Statistics (KNBS)
organize and manage demand side surveys on behalf of Financial Access Partnership (FAP).
In Mexico, the CNBV created a Financial Inclusion Data unit, which had the time and resources to manage
the demand-side survey conducted in 2011 and 2012.
In Zambia, the Bank of Zambia (BoZ) hosts the Financial Sector Development Plan (FSDP), which is also
under the purview of the Ministry of Finance. A Financial Sector Assessment Program in 2002 resulted in
the recommendation that Zambia collect demand-side data on financial inclusion, and a FSDP working group
was formed to manage this process.
In Belarus, a Deputy Chairman of the National Bank, the head of a special department, and two of their staff
were entrusted with the project. They also hired an external project manager who had significant expertise
in project management for financial inclusion, and was involved with various financial inclusion projects, the
Microfinance Center in Poland and AFI.
In Tanzania the Financial Sector Deepening Trust coordinates stakeholders for the demand-side survey.
Within the Bank of Tanzania, the Microfinance Unit within the Real Sector and Microfinance Department
manages the survey.
In Thailand, surveys have been used to understand more about the financial access situation, including a
focus on financial inclusion as a component of the Financial Sector Master Plan, a 5-year plan to enhance
efficiency, strength, and access of the Thai financial system.

Bringing smart policies to life.
12
a. Engaging stakeholders and working with partners
A strong organizational structure in the central bank, including designating one or two staff-members to
be fully dedicated to the process, is fundamental for the execution of a successful demand-side survey.
However, it is unlikely and perhaps unadvisable for the regulatory body to supervise implementation
entirely on their own. The central bank should engage other stakeholders, such as commercial banks,
academic researchers, experts, and other government agencies, in order to gain an audience for the
results and ensure the largest possible impact of the survey.
As the team from Mexico describes, a balance should be struck between being widely inclusive of
stakeholders in the design and implementation process, and maintaining a single point person or unit to
manage the survey efficiently. The Bank of Tanzania advises that the more local actors involved in the
process, the longer it will take.
In Malaysia, the survey team from Development Finance and Enterprise (DFE) Department compiled
inputs provided by various members of the Financial Inclusion Working Group (FIWG) in the Central
Bank of Malaysia to prepare the first drafts of the questionnaire. In Belarus, the National Bank looked
to the regional Microfinance Center in Poland to gain support and guidance through the survey process.
In Thailand, the five-year Financial Sector Master Plan provided a framework for designing the survey.
The Financial Access Partnership (FAP) in Kenya represents an institutionalized, enduring venture to
support a variety of financial inclusion initiatives. Box 3 describes the FAP in Kenya.
As more countries develop national strategies on financial inclusion, national-level alliances are likely to
form, such as the National Council on Financial Inclusion in Mexico or the National Financial Inclusion
Partnership in Brazil, and these structures can be a natural starting point for raising interest and
support, preparing a captive audience, and articulating the most pressing questions to be answered in a
demand-side survey.
Selecting the organization to implement the survey
Perhaps the most important partnership that will be formed is with the entity that will conduct the
survey itself. It is important to select a research institution that is competent, experienced, trustworthy,
and has the flexibility to work with the central bank and broader working group to ensure good data
collection and meet stakeholder expectations.
The Financial Access Partnership (FAP) is a public-private partnership in Kenya comprised of representatives
from government, industry, research institutes and the Financial Sector Deepening Trust Kenya (FSD Kenya),
which is a development partner. The FAP successfully implemented the 2006 and 2009 FinAccess Surveys, and
is planning the next iteration of the survey for late 2012. Kenyan regulators report that the success of the FAP
emerges from participants coming together around a shared goal of collecting more useful information on
financial access in the country.
Box 3: Kenya’s Financial Access Partnership

Bringing smart policies to life.
13
Selecting the organization that will execute the survey is likely to come down to a decision between the
national statistics institute and a private survey company or research house, or a combination of the two
working together. There are a number of advantages of involving the national statistics office, including:
Experience and technical know-how: National statistics offices often employ top statisticians,
sample design experts, and interviewers that have experience with nationally representative
surveys, such as the census. These offices have intimate knowledge of nationally representative
surveys in the country.
Access to national sample frame: In countries where there is a listing of household addresses
that is produced with each national census, the national statistics institute will have first-hand
access to this information. The address listing is usually needed to design the sample frame for
the financial inclusion survey.
Institutionalization: Working with the national statistics office offers the possibility that the
government will see the value of financial inclusion data, and add a demand-side survey to the
inventory of surveys that the national statistics office periodically performs.
Credibility and recognition: Respondents are accustomed to receiving visits from census
workers, and many more people have heard of the national statistics institute than any given
research house, increasing trust and possibly response rates.
In Mexico, the CNBV was able to engage the national statistics institute, Instituto Nacional de Estadística
y Geografía (INEGI), to implement their 2012 demand-side survey, and were pleased with the
implementation. Similarly, in Thailand the Bank of Thailand and the National Statistics Office (NSO)
carried out the survey once every three years in conjunction with other household surveys the NSO
conducts. Piggy-backing on existing surveys saved the Bank of Thailand considerable funds, and they
only ended up investing US$28,000 in the last survey. In Zambia, the national statistics office, the
Central Statistical Office (CSO), did not execute the survey, but did design a nationally representative
sample of 4,000 respondents, covering all nine provinces and targeting all residents aged 16 years and
above, the age at which Zambians are legally eligible to open a bank account.
Despite the benefits of working with the national statistics institute, the reality is that in many countries
these institutes are still building capacity. National statistics institutes may also already be juggling a full
schedule of surveys. In these cases, qualified survey firms with the capacity to undertake can be
contracted.
In Belarus, there are two main institutions that implement national polls: the Institute of Sociology at
the National Academy of Sciences, and the Belarusian State University. From these options, the
National Bank selected the Institute of Sociology at the National Academy of Sciences because they had
more experience in surveys on financial topics, and, unlike the university, they work all year round.
In Kenya the Kenya National Bureau of Statistics has been heavily involved in the research, participating
as a key member of the FAP. It provided the sample frames for the past two surveys and is currently
finalizing the new address listing for the next survey, which is being updated to consider changes in
administrative units in the country following the promulgation of the country’s new constitution in

Bringing smart policies to life.
14
2010, and using the new 2009 census data. The two previous FinAccess surveys were drawn using the
National Survey Sampling Evaluation Program (NASSEP) IV, which used 1999 census data and was also
based on the old administrative boundaries. FAP, however, contracts an independent research house
through competitive bidding to undertake field work but supervised by both the KNBS and the FinAccess
Secretariat.
The Bank of Tanzania also relied on the national statistics office to design the sample, but hired an
independent research house to carry out the survey. Based on Tanzanian experience, an either/or
decision between the statistics office and the survey company is not necessary, rather a collaborative
arrangement between National Bureau of Statistics (NBS), BoT, and the research house was an optimal
solution for survey implementation in Tanzania. The BoT felt that their established procurement
processes worked well to select a well-qualified research house. However, some central banks may wish
to consider additional factors alongside the standard government procurement rules. A template table
that can be used to evaluate firms is presented in Annex C. Box 4 details the Malaysia and Kenya
experience, and more information on the selection process.
Box 4: Selecting a research house or survey company
b. Budgeting and scope From modest to massive budgets, resources available for demand-side research on financial inclusion
vary. The cost of implementing a national survey also varies widely by country. But gaining valuable
In countries where the national statistics institute is occupied with either the national census or other research,
as was the case in Malaysia, Kenya, and Tanzania or does not have the capacity to implement the survey
themselves, a private survey company or research house can be selected through a competitive bidding
process. In addition to the national bidding procedures and rules, countries may wish to use or adapt the list of
criteria for selecting a research house in Annex C.
Bank Negara in Malaysia found that in selecting a research house, experience with nationally representative
surveys and familiarity with financial topics are important qualifications to consider.
In Kenya, FAP embraces the spirit of competitive bidding to improve on the quality of the survey. Towards this
end and in line with the laid out procurement procedures, a new research house was recruited and this is
expected to bring freshness and new approaches to the implementation process. The new research house
contracted for the third wave of the survey brought the idea of using tablet computers for data collection,
which will result in time and efficiency gains.
The Bank of Tanzania found that having the bank play a coordinating role between the National Bureau of
Statistics, the research house, the Technical Committee and other external advisors was essential to a
successful survey. For a geographically large country like Tanzania, with many stakeholders involved in the
survey, strong partnerships and monitoring is of paramount importance.
The Bank of Thailand found that having the NSO carry out the survey enhances the reliability of the data by
using a nationally representative sample, and provides the benefit of the accuracy of data collection through
the expertise of the NSO’s staff.

Bringing smart policies to life.
15
demand-side insights is still possible with a smaller budget. The essential points are that the research
design must take into account the resources available, and expectations must be adjusted accordingly.
In contrast, a survey for which the ambitions greatly exceed the budget is almost sure to fail. In
addition to the level of funding, the data already available and the research capacity in-country should
also be taken into account in defining the scope of the demand-side exercise, so as not to duplicate
efforts or waste resources on a data collection effort that is beyond the capabilities of researchers in the
country. Figure 1 shows this relationship.
Figure 1: Defining the scope of a demand-side survey4
Funds for the survey can be raised from government sources, contributions from banks and other
industry players, as well as from development partners. Table 1 gives the costs of various survey
efforts.
Table 1: Example costs of country-led demand side surveys
Country Year Sample size Cost5
Kenya 2006 4500 US$ 413,400
Kenya 2009 6500 US$ 551,000
Kenya 2013 TBD US$ 758,000
Malaysia 2011 2000 US$ 120,000
Belarus 2012 2500 Cost of two surveys together and National
Strategy was Belarus 2012 8000
4 Source: Adapted from Grosh, M. and P. Glewwe. 2000.
5 Value calculated in the year in which the survey was done. 2006 surveys in 2006 US dollars, etc.

Bringing smart policies to life.
16
US$291,500
Thailand 2010 11000 $28,000 because done
as an add-on to NSO
annual household
survey6
In Thailand, the Bank of Thailand was able to leverage the fact that the National Statistics Office was
already fielding a large-sample annual national survey to greatly reduce costs. Because the financial
access survey was added on to the NSO’s existing work, the cost for 11,000 interviews was only about
US$ 28,000. In Kenya, the FAP has opted to charge to access the FinAccess data in order generate
revenue for repeated surveys, as described in Box 6.
Box 5: Making Kenya’s FinAccess sustainable through fees to access data
The Bank of Tanzania found that the costs of ensuring national buy-in through consultation, and
dissemination are important to consider. While international surveys may not invest as much in local
consultation and dissemination in the country, the national demand-side survey should direct resources
towards these important steps in order to leverage the survey for the greatest possible impact.
If regulators wish to gain information about the consumer perspective, but do not have the budget to
launch a full-fledged, nationally representative survey, they may choose to reduce the sample size and
survey a particular segment of the population, such as poor and underserved populations, residents in a
major metropolitan area, or social transfer recipients, for example. Qualitative research can also be a
lower-cost alternative, and results of focus group discussions, for example, could be used to inform a
large, quantitative survey further down the road. Alternatively, financial inclusion questions can be
included in household consumption and budget surveys, or other research efforts that the government
6 Using an annual exchange rate of 31.7 Baht/ US$ in 2010
In order to generate revenue and contribute to sustainability of survey efforts, the FAP in Kenya decided to
charge token fees for accessing the FinAccess datasets. Masters students pay US$ 100, PhD students pay US$
300, and industry pays US$ 6000 to access the data set, although exceptions will be granted for needy
students. So far the CBK has raised 6 million Kenyan Shillings (about US$ 70,000) to help fund ongoing waves
of the survey.
Quick tip: Do not ignore national-level consultation and dissemination costs in budgeting. Dissemination is essential to affecting policy change and getting buy-in from private sector, academic, and other stakeholders.

Bringing smart policies to life.
17
already supports at regular intervals, allowing policymakers to track progress on key indicators without
having to fund an independent survey.7
The next section discusses strategies for ensuring that they demand-side survey answers policy
questions.
c. Designing a policy-relevant survey
Each regulatory body faces pressing financial inclusion policy questions—be they related to mobile
banking, use of cash versus electronic payments, agent banking, distance and perceived cost to access
financial services, use of informal financial tools, or many other issues. The demand-side survey offers
the valuable chance to obtain this targeted information and to employ it in evidence-based policy
making. All seven central banks interviewed for this report prioritized establishing a baseline level of
financial inclusion in the first demand-side survey implemented in the country. As stated in AFI (2010),
there are two high-level objectives for which data can be used to support policymaking:
1. Diagnosing the state of financial inclusion to help develop policy solutions, and
2. Monitoring the growth of financial inclusion to modify or create new policy reforms accordingly.
Belarus conducted a snapshot survey of 2500 people to gauge the overall condition of financial access in
the country in early 2012, and the results whet the appetite of policymakers for more data. The
National Bank and partners expanded the sample in a follow up survey later in 2012 to 8000 individuals,
in order to produce a detailed map of availability of financial services compared with use. National
Bank staff were so committed to the expansion of the survey that they opted not to go on a planned
study tour in order to use the money saved to fund the additional surveys.
Similarly, the Bank of Thailand emphasized that they wanted their survey to answer questions about the
macro picture of financial inclusion, and to be able to disaggregate this data at lower administrative
levels. The team focused on this objective rather than understanding micro-level behavior in their
national survey. Kenya and Zambia based their first surveys on the FinScope format, and have
continued to find the Financial Access Strand to be a useful metric in the country.
7 For example, the Central Bank of Brazil has delayed launching a demand-side survey until the national research
institute, Instituto Brasileiro de Geografia e Estatistica (IBGE), can conduct the survey, in the hopes that IBGE will be able to include financial inclusion research questions in its regular national information gathering efforts.
Quick tip: Do not let a small budget deter you from collecting demand-side information. Rather, scale back the scope. Thailand worked with the statistics office to spend less than US$ 30,000 on their survey, and Malaysia managed to implement a nationally representative survey for only US$ 120,000.

Bringing smart policies to life.
18
Box 5 gives more details on the policy questions Bank Negara Malaysia was able to answer by
conducting a demand-side survey.
Box 6: Policy questions guiding demand-side research in Malaysia
Once the institutional arrangements, budget, and scope, have been established, work can begin
planning the phases and timeframe of the research, and preparing the questionnaire itself.
Quick tip: The Financial Access Strand (FAS), developed by FinMark Trust for the FinScope surveys is a useful and internationally comparable measurement of financial inclusion. The Access Strand measures access across the formal-informal provider continuum, ranging from people who are served by formal institutions, to those who use only informal providers, and finally to those who
do not use any provider.
In Malaysia, Bank Negara Malaysia identified high-level objectives of the 2011 demand-side survey, including:
1. To develop an in-depth understanding of Malaysians’ access and use of financial services
2. To gauge whether low-income individuals have equal access to financial products
3. To assess the level of financial literacy among Malaysians, and their attitudes and behaviors with
respect to financial matters
4. To identify the gaps and needs of Malaysians to execute effective financial program in the long term
5. Establish a national baseline for level of financial inclusion
Some specific policy objectives of the survey were:
1. Benchmark willingness to pay for transactions at agents in order to inform Agent Banking Guidelines
2. Understand the penetration and interest by market segments in order to formulate strategies to
enhance usage of internet and mobile banking
3. Probe reception of microinsurance, asking, in which sectors, purposes, and for what type of products
is their demand for insurance, especially among low-income individuals
4. Better understand borrowing options and degree of indebtedness both among the general population,
particularly the low income individuals and microenterprises

Bringing smart policies to life.
19
III. Part II: Survey Design and Implementation Figure 2: Process of survey design and implementation
8
8 Source: Adapted from Yansaneh, I.S. 2005. “Chapter II: Overview of sample design issues for household surveys
in developing and transition countries. United Nations Statistical Division.
Sample design
1. Define target population and sampling frame
2. Define stratification variables for sample design
3. Design the sample- size, domains, stratification
4. Select respondent households from household listing
1. Clarify policy questions and assemble a questionnaire design team
Questionnaire
design
2. Identify modules or blocks around which to organize the questionnaire
5. Pre-test and pilot
3. Iterative revisions of questions and order
4. Expert review
Data collection
and
processing
1. Respondents selected at selected households
2. Data capture
3. Data verification, supervision and quality control
Data analysis
and
dissemination
1. Development of sample weights, code preparation, select statistical program
2. Data analysis
3. Variance estimation
4. Data entry
4. Field report and survey report
5. Produce and release report and public or paid-use file
DEFINE SURVEY OBJECTIVES

Bringing smart policies to life.
20
Once a strong foundation and clear objectives have been established, the team is ready to work towards
writing the instrument, designing the sample, and fielding the survey. Figure 2 shows the steps that are
often required throughout the research process, from defining clear objectives to creating a
dissemination strategy and publishing the report. Note that sample design and questionnaire design can
be done concurrently.
The Bank of Tanzania advises that once the questions for each sub-objective or theme have been
drafted, qualitative research to understand the market prior to the pilot can be used to inform the
possible replies and options.
a. Establishing a timeframe It is helpful to distill and consolidate the many steps in Figure 2. In Mexico, the CNBV identified seven
steps required to plan and implement the large-scale financial inclusion study there, and these steps are
shown in Figure 3.9 AFI member countries that have implemented demand-side surveys report that
taking adequate time, especially in the design stage, is imperative.
Figure 3: Steps used in Mexico's demand-side survey
Having a larger vision of the trajectory of the project, parceled into sequential steps, offers a useful
guiding framework and allows the team to keep the project on schedule. Planning the survey process
from beginning to end using a Gantt chart can help organize and map this process. Annex D provides an
example of a Gantt chart for hypothetical demand-side survey.
9 The differences between Figure 2 and 3 highlight that each country can define the phases to match their process.
Quick tip: Use qualitative research, such as focus groups and individual semi-structured interviews
to inform the questions and options in the quantitative survey. A large quantitative survey should
not have open ended questions, which make coding and analysis extremely difficult. In Tanzania,
qualitative research was useful in understanding how people speak about their financial behavior
to inform the wording and structure of the survey.
Quick tip: Consider any holidays, seasonal practices such as harvests, school holidays, elections, and
weather events such as monsoons or rainy seasons when planning the timing of the survey. Fielding
a survey when interviewers cannot travel or respondents are not at home can at best yield atypical
data and at worst jeopardize the collection of enough interviews.

Bringing smart policies to life.
21
The Bank of Thailand reported that the timeline to execute the project from start to finish improves
with each wave of the survey due to experience gained. In 2010 the process took about nine months,
not including data analysis and report writing.
b. Gap analysis When deciding to do a demand-side survey, the first step is to assess the information available from
existing sources. This process allows the central bank to determine the specific gaps and data needs.
IFC (2011) and IFC and CGAP (2011) are good starting points for identifying all the international data and
sources. In Mexico, the CNBV was able to delegate this task to a consultant, who completed the gap
analysis over the course of a few months. One person’s time dedicated to mapping existing data should
be sufficient. In Tanzania, the BoT found that if the demand-side survey is also intended to be useful
for the private sector, stakeholders must understand what data banks, telecoms, and other players
already have. Once the data needs have been clearly identified, agreeing on the best survey design to
obtain the desired information is a good next step.
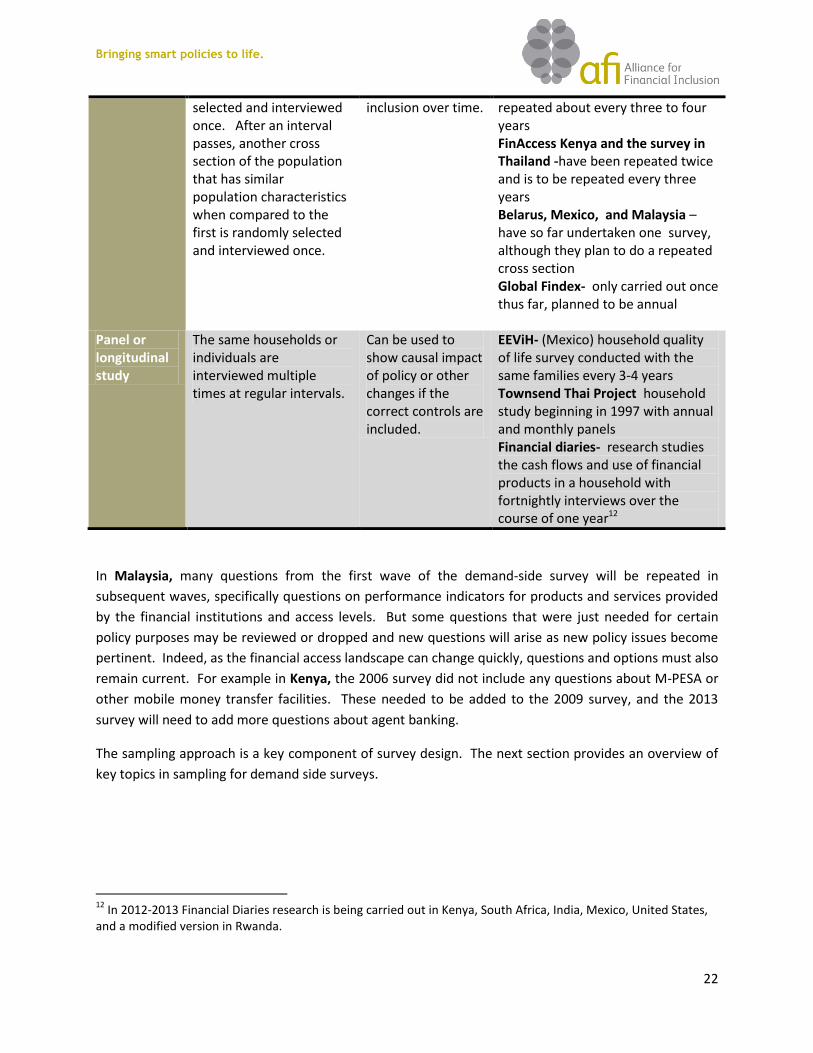
c. Approaches to survey design
There are a variety of survey designs that can be employed in demand-side analysis, as portrayed in
Table 2, adapted from AFI (2010). Most AFI-member countries plan to undertake repeated cross-section
surveys, in order to be able to track progress in achieving financial inclusion without incurring additional
costs and challenges to response rate that are characteristic of panel surveys.10 In a repeated cross
section, it is useful to have a core of questions that do not change and are asked in exactly the same
way, so as to accurately measure change.
Table 2: Possible Survey Designs11
Type of survey
Definition Survey objective Examples
One-time cross section
Cross –section of the population is randomly selected and interviewed once
Snapshot of the current level of financial access
FinScope – In many countries there is not a specific intention to repeat the survey at a regular interval World Bank Living Standards Measurement Surveys- have only been implemented once in select countries
Repeated cross section
Cross-section of the population is randomly
Monitor progress of financial
FinScope South Africa- is repeated annually. FinScope Zambia has been
10
Finding the same respondents after years have passed can be challenging and costly. Panel data is very useful to more precisely measure causal impact, but the nonresponse rate in such surveys can be high. 11
Source: Adapted from AFI 2010.
Bringing smart policies to life.
22
selected and interviewed once. After an interval passes, another cross section of the population that has similar population characteristics when compared to the first is randomly selected and interviewed once.
inclusion over time. repeated about every three to four years FinAccess Kenya and the survey in Thailand -have been repeated twice and is to be repeated every three years Belarus, Mexico, and Malaysia – have so far undertaken one survey, although they plan to do a repeated cross section Global Findex- only carried out once thus far, planned to be annual
Panel or longitudinal study
The same households or individuals are interviewed multiple times at regular intervals.
Can be used to show causal impact of policy or other changes if the correct controls are included.
EEViH- (Mexico) household quality of life survey conducted with the same families every 3-4 years Townsend Thai Project household study beginning in 1997 with annual and monthly panels Financial diaries- research studies the cash flows and use of financial products in a household with fortnightly interviews over the course of one year12
In Malaysia, many questions from the first wave of the demand-side survey will be repeated in
subsequent waves, specifically questions on performance indicators for products and services provided
by the financial institutions and access levels. But some questions that were just needed for certain
policy purposes may be reviewed or dropped and new questions will arise as new policy issues become
pertinent. Indeed, as the financial access landscape can change quickly, questions and options must also
remain current. For example in Kenya, the 2006 survey did not include any questions about M-PESA or
other mobile money transfer facilities. These needed to be added to the 2009 survey, and the 2013
survey will need to add more questions about agent banking.
The sampling approach is a key component of survey design. The next section provides an overview of
key topics in sampling for demand side surveys.
12
In 2012-2013 Financial Diaries research is being carried out in Kenya, South Africa, India, Mexico, United States, and a modified version in Rwanda.

Bringing smart policies to life.
23
d. Sampling13 Policymakers will certainly engage experts to design the sample, but it is nonetheless valuable for
officials to obtain background knowledge on various sampling techniques and procedures. To
understand important elements of sample design, definitions of key terms will be useful. Box 7 provides
a list of key terms. 14
13
Some elements of this section are slightly technical, and can be skipped by readers who will outsource the sample design and do not need to supervise the process closely. 14
Source: Adapted from Lohr,1999. Sampling: Design and Analysis.
Box 7: Definition of key sampling terms
Observation unit- An object on which measurement is taken. In financial inclusion surveys, the observation
units are often individuals or households.
Target population- The complete collection of observations we want to study. In national demand-side
surveys this is often the adult population over 15 or 16 years old, small differences in the age of adults can
seriously affect the statistics that result.
Sample- A subset of a population.
Sampled population- The collection of all possible observation units that might have been chosen in a sample,
for example all adults in the country.
Sampling frame- The list of possible sampling units from which the sample can be selected. For a household
survey this is the list of all street addresses, for a small business survey this is the list of all businesses under a
certain size.
Enumeration area (EA)- The geographic area canvased by one census worker. The smallest division used in a
census.
Strata- Subgroups of interest to the research that are used in selecting the sample. In demand-side surveys
this might be the urban and rural populations, regions of a country, or income groups.
Sampling error- The margin of error, or the error that results from taking one sample instead of examining the
whole population.
Non-sampling error- Errors in the survey process, such as inaccuracy of responses, selection bias, or other
errors that cannot be attributed to sample-to-sample variability.
Representative- each sampled unit will represent the characteristics of a known number of people in the
country.

Bringing smart policies to life.
24
Probability Samples: simple random samples and clustered stratified samples
Probability samples are the most accurate type of samples for representative surveys. In a probability
sample, each population unit has a known, non-zero probability of selection into the sample.
The simple random sample (SRS) is the most simple sample design. In this methodology for a SRS of
sample size N, each subset of the population of size n has an equal chance of being selected. In a SRS no
members of the population are excluded a priori (including remote populations or regions in conflict),
and all have an equal chance of selection.
However, for practical reasons, most demand-side surveys use a clustered and stratified sample.
Clustered sampling is when clusters, such as census enumeration areas or villages, are selected in a first
tier selection before individuals are selected. Using clusters reduces the variation in the information
collected, but is much more practical in allowing interviewers to visit a smaller number of places and
stay there for a bit longer.
For stratification, the population is divided into groups, or strata, and then a random sample is taken
from each group proportional to the proportion of the population this group represents. Since elements
in the same strata are likely to be more similar than randomly chosen elements, the precision of
estimates increases in stratified samples.15 In demand-side surveys common strata include regions,
urban/rural, poor/ non-poor, and ethnic groups. This sampling approach allows for analyzing differences
among groups.
Sample size
In order to be able to accurately report on variables such as the number of adults with regulated
deposits and credit accounts, the sample of the financial inclusion survey should be nationally
representative, such that each interview can be backed out to represent a given proportion of the
population. A big question, then, is how large a sample is needed to create a nationally representative
survey? Annex E contains a more technical appendix on calculating sample size and an example of this
calculation for Belarus.
Even without getting into the math, it is useful to know that a good statistician can design a nationally
representative sample that is still manageable with a reasonable budget. On average, a sample size of
between 2000 and 3000 is usually sufficient for a nationally representative sample with some
stratification. The Central Bank of Malaysia had originally budgeted about US$ 150,000 for its demand-
15
Lohr, 1999 p. 24
Quick tip: If the central bank knows it wants to analyze the difference in financial access among
given populations, it is strongly recommended to include these characteristics as stratifications of
the sample, for example urban/ rural divisions or regions in the country. It is wise to define these
categories of interest early on in the survey design process, as they will have implications on
sample size, questionnaire design and resource allocation.

Bringing smart policies to life.
25
side survey, and ended up spending closer to US$ 120,000 because the research house was able to craft
a nationally representative sample with a smaller sample size than the project had originally budgeted
for (a sample of 2000 with the Malaysian population at 28.7 million in 2011). Larger samples are
needed as you add more layers of stratification and add representation at smaller administrative units.
For example, in Thailand, a sample size of 11,000 is statistically sufficient for a nationally representative
sample that can be disaggregated at lower administrative levels, with the Thai population at
approximately 65 million in 2010.
The sampling frame
The quality of the data obtained in a household survey often depends on the quality of the sample
frame. The seven countries interviewed for this note used a recent listing of household addresses in the
country, often from the most recent census, as the sample frame. In Kenya, the national sampling
frame is changing in 2012, as mentioned, due to the promulgation of the new constitution that changed
the administrative boundaries in the country and use of the new census data. Although FAP had
planned to field the next wave of the demand-side survey in 2011, it was postponed due to delays in
finalization of the development of the new NASSEP V which reflects the new administrative boundaries
and the new 2009 census data, as mentioned. Commendable progress has been made on this front and
the survey may be undertaken in the months of October and November 2012 once the frame is
finalized.
In some countries, a household address listing does not exist or is of such poor quality that it is unusable
for a large-scale survey. In such cases, small administrative units can be selected randomly, and a listing
can be done within these enumeration areas to select the households. However, the process of listing all
addresses, even in a subset of enumeration areas, is often very costly.
Box 8: Alternative sampling approach when a household listing is not possible
When a listing cannot be done, sampling may be carried out using a systematic or random walk approach. In
this methodology, enumeration areas (EA) are selected based on the chosen stratification. Then, using the
sample size of the survey, one can determine how many interviews should take place in each EA. For example,
if the survey has a sample size of 2000 individuals and 200 EA are selected to be visited, there should be 10
interviews in each to reach 2000 interviews. If the approximate number of households in an enumeration area
is known from the census, this number of households in the EA should be divided by 10, coming up with a
number x.1 Field researchers should then start in a designated place in the EA, and should visit every x houses
to conduct the interview.
This approach achieves similar results to selecting addresses randomly from a listing, as long as there are no
patterns in household blocks or formations of households in villages, although it is seen as less statistically
rigorous than using an address listing. When using this method researchers should be monitored carefully so
they do not stay from this pattern, which could result in bias. In a percentage of the EAs repeat visits should be
made to make sure the methodology is being followed.

Bringing smart policies to life.
26
Individual versus household sample and identifying the respondent
When defining the observation unit, an important consideration is whether to collect information about
the household or the individual. FinScope and most demand-side surveys done by AFI members thus far
have chosen the individual as the observation unit. This permits measurement of the number of adults
with regulated credit and deposit accounts in a country.
Note that if the head of household is interviewed, as is the best practice when collecting information
about the whole household, the individual data gained is not representative of the financial access of all
adults in the country, but is representative of the heads of households in the country. Furthermore, a
household-level survey will not be comparable with individual level surveys in other countries. Cull and
Scott (2009) performed an experiment using different interview designs in Ghana, and found that asking
the head of household about the household level information is nearly equally as reliable as asking all
household members about their individual use of financial services. Therefore, if doing a household
survey it is sufficient to interview the head of household.
If the interview will be at the individual level, the respondent must be selected randomly within the
household. Therefore, there will be three layers of randomization in the sample process, as depicted in
Figure 4. One drawback of surveys of individuals’ financial inclusion is that an individual who reports
only accounts in their name may understate their access, as he or she may have access to products that
are officially in the name of another household member.
Figure 4: Levels of random selection in a sample of individuals

Bringing smart policies to life.
27
The decision to interview randomly selected individuals or heads of households should also be driven by
the country context and policy. For example, if in the country, culturally, women or another group are
thought to have lower access levels, and this is a policy priority, individual-level surveys will do a better
job of capturing these differences. If the assumption is that households are run with equal benefit to all,
a household-level survey might give a more appropriate picture.
In Thailand, the 2006 survey interviewed heads of households about the entire household’s financial
instrument use. However, in the 2010 survey, the heads of the households were interviewed to assess
the level of his or her inclusiveness in financial services at the individual level. In this regard, the
information gained from the heads of the households was used to draw conclusions about the level of
inclusion among heads of households in the Thai population. Household level information was not
considered in 2010 because those heads of the households might not accurately know the financial
transactions of the other household members.
If the survey will be done at the individual level, one way to select a random adult is to list all the adults
in the household and choose the one who has the next birthday. However, AFI members have found
that in rural communities it is not uncommon for people not to know their date of birth. This also leaves
more temptation for fieldworkers to alter the “next birthday” to be someone who is more easily
accessible or already in the household at the time of the interview, so that they do not have to go back.
A more widely used method is the Kish table for random selection of a respondent. This grid uses the
number of people in the household and the number of the current interview in the enumeration area to
randomly select a household member. This method, which has been used by field teams in Kenya and
elsewhere, is explained with a sample table in Annex F.
Weighting
When the data is cleaned and ready for analysis it is incorrect to start calculating means and
percentages straight away: weights must be applied and used in the analysis. Therefore the
engagement of statisticians should continue through the analysis stage, and if the central bank or
regulatory authority is to be engaged in the analysis, it is important to bring someone on board who can
do calculations with weights.
Although this guidance note will not go into the details of weighting during analysis, it is important to
understand that observations will need to be weighted in order to gain representative estimates. The
weights in a nationally representative sample can be thought of as how many other people in the
country the individual represents. As Yaseneh (2005) describes in a guidance document on household
surveys in developing countries produced by the UN statistical division,
“Sampling weights are needed to compensate for unequal selection probabilities, for
nonresponse, and for known differences between the sample and the…population. The weights
should be used in the estimation of population characteristics of interest and also in the
estimation of the standard errors of the survey estimates generated.”

Bringing smart policies to life.
28
It is best to consider how the weighting will be done during the sampling design stage, although the final
weights can only be calculated after data collection to take into account nonresponse rates. Note that
questions about the household and questions about the individual will be weighted differently,
considering the number of households or individuals the respondent represents at the national level.
While the sample is being defined, central bank staff will likely be more substantially involved in the
questionnaire design, discussed in the next section.
e. Designing the questionnaire A well-designed questionnaire, also known as a survey instrument, can yield a wealth of information
about financial access, usage, and quality. But there will likely be a myriad of possible questions,
requiring the working group or steering committee to prioritize and improve useful, policy- and industry-
relevant questions, while eliminating less useful ones. The process of trimming down the survey
instrument will be easier if objectives are clearly identified early on in the process.
After the objectives are clearly identified, collecting the questions and forming the design team are
steps 1 and 2 to designing a strong questionnaire, as depicted in Figure 5.
Figure 5: Five steps in questionnaire design
Quick tip: Make sure the primary research objectives are defined and understood by all
contributors early on. Based on BoT experience in Tanzania, it is difficult to cut questions without a
clear prioritization ex-ante. Prioritization of subject areas to investigate should be done before the
questionnaire is designed.
Questionnaire
ready for pilot
testing, final
revision, and
translation
Bringing smart policies to life.
29
Forming a data analysis plan early on in the process also helps focus the objectives of the research, and
ensures that the team will have all the variables included that the team wishes to consider in the
analysis. An example of a table that can be used in the data analysis plan can be found in Annex E.
In step 3, organizing the survey instrument around modules, the themes of the questionnaire should be
grouped into sections, making it easier to organize and formulate the questions. In step 4, the actual
drafting of questions, it is important to use the most simple and clear way to phrase questions.
In Mexico, the CNBV learned in piloting that respondents had different understandings if seemingly
straightforward terms, like saving. When asked if they save, respondents thought only of bank accounts
instead of including the small amounts of money they may keep in the house, in tandas (savings groups),
or in physical assets. Asking “how do you keep your money?” worked better than asking, “Do you
save?” Box 8 provides additional advice on questionnaire design from AFI members.
While some central banks have found it useful to start from a model questionnaire, the Bank of
Tanzania warns that countries should be careful to clarify intellectual property issues and seek
permission to use an existing instrument. For example the FinScope surveys are propriety material of
FinMark Trust. As mentioned, the BoT found focus group discussions and other qualitative methods
extremely useful in designing an appropriate questionnaire. And while the 2009 survey was modeled on
other examples, the 2013 survey uses priorities set entirely by national stakeholders including the BoT,
National Bureau of Statistics, and Financial Sector Deepening Trust Tanzania.
Box 9: Lessons from country experience in questionnaire design
In Zambia and Tanzania, the FinScope core questionnaire was subsequently adapted to the respective country
contexts in close consultation with national stakeholders. In Tanzania qualitative research was done before
embarking on the quantitative survey, and information from focus groups and qualitative interviews was
invaluable in designing the instrument.
In Mexico the CNBV began by designing the survey instrument based on questionnaires from international
organizations, but the team now advises against doing this. The CNBV ended up starting fresh with a survey
instrument that was sufficiently simple, flowed naturally in Mexican Spanish, and was adequately tailored to
the country context.
In Kenya, the original questionnaire in 2006 was based on the FinScope survey from South Africa, but has
changed substantially since then to address the specific country context. The CBK shared a draft questionnaire
with AFI members of the data working group, and gained useful feedback and suggestions.
In Belarus, the National Bank drew on the experience and knowledge of researchers with the Microfinance
Centre, based in Poland, who had significant experience in studying financial access and microfinance. Since
the study was the first of its kind in Belarus, the country opted to start from this framework and adapt this
questionnaire to the local context.
In Malaysia, Bank Negara Malaysia saw that the comparative advantage of the research house is to tweak the
wording and order of the instrument, to make the survey more effective and manageable for the fieldwork.

Bringing smart policies to life.
30
Modules and topics to include in the survey instrument
The survey instrument itself should have a logic and flow, structured around a series of sections or
modules. This helps both the interviewer and the respondent understand what is being discussed, and
progress through it at a good pace. The questionnaire should include questions about demographic
characteristics that can be used as covariates in regressions, or simply to find averages for populations
of interest (women with an account, rural residents receiving remittances, etc.)
Mexican questionnaire structure
1. Section 1: Residents and Households in Dwelling
2. Section 2: Socio-demographic features of household members
3. Section 3: Socio-demographic features of the selected member
4. Section 4: Financial Capabilities and Income
5. Section 5: Informal and Formal Savings
6. Section 6: Informal and Formal Credit
7. Section 7: Insurance
8. Section 8: Retirement Savings Accounts
9. Section 9: Remittances
10. Section 10: Use of Financial Means
Topics in the Zambian Questionnaire
1. Access to, and usage of, formal and informal financial products and services
2. Household economic, financial and risk management
3. Financial discipline and knowledge
4. Attitudes to, and preference for, financial service providers
5. Features associated with products and providers
6. Asset accumulation patterns
7. Remittances
8. Access to, and usage of, technology
9. Psychographics and lifestyles
10. Business finance issues.
Categories of financial instruments in the Thai questionnaire
1. Savings
2. Loans
3. Credit cards
4. Payments transfer
5. Savings insurance
6. Other insurance
7. Government bonds
8. Private bonds, securities, and managed funds
9. Shares
Box 10: Topics covered in the Mexico and Zambia questionnaires
Bringing smart policies to life.
31
The Bank of Tanzania advises that the same demographic questions used by the national statistics
institution in the census or other national survey should be used in the demand-side survey to ensure
data is comparable with other research. Modules on bank accounts, savings, credit, and physical assets
are common. Box 10 shows the modules used in the Mexican, Zambian, and Thai questionnaires.
Looking at more sample questions and organizational structures can be helpful even if the national
questionnaire will be built from scratch. The AFI FIDWG catalog of questions is an excellent source for
example questions.16
The Mexican CNBV feels that there should be a minimum amount of information we can learn from
demand-side surveys. For example, an essential data point is percentage of adults with an account at a
regulated institution. Defining the minimum data that a demand-side survey should include is a possible
next step for the AFI Financial Inclusion Data Working Group. Other information that is collected can
vary based on the country context and budget.
Length and organization of the questionnaire
Once modules have been agreed upon, the design team should work on populating the modules with
questions, and organizing modules into an order that flows naturally.
Some demand-side surveys include questions about values in bank accounts or in other savings
instruments, or about the value of physical assets. These questions are sensitive, and especially if the
interview takes place in the household, respondents may be reluctant to answer about the value they
are keeping for fear of theft. Sensitive questions that might result in the respondent refusing to
continue the interview should also be placed at the end of the survey, so as to minimize loss of data if
refusal does occur.
In another approach used in the Mexican questionnaire, which did not include any particularly invasive
questions, the team opted to place easy questions about the household at the end of the questionnaire,
16
Contact AFI for more information
Quick tip: The AFI FIDWG catalog is a collection of indicators and questions that are road tested by
AFI members. The questions in the catalogue, which are organized according to the dimensions of
access, usage, and quality, provide a useful question database from which countries can pick and
choose the most relevant indicators for their country.
Quick tip: It is recommended to start with questions that are easy to answer and not too intrusive.
But if there are questions that require some thought, basic calculations, or remembering financial
activities from the past, it is also advisable to include these mentally taxing questions towards the
beginning of the questionnaire, so that the respondent are still fresh when answering these
questions.

Bringing smart policies to life.
32
as it is recognized that data quality decreases as respondents get tired at the end of the questionnaire.
The CBK in Kenya feels that it is important to start with easy questions that make the respondent feel
comfortable. Both approaches are valid.
Getting the length of the questionnaire right is a challenge for financial inclusion surveys, as the time it
takes to ask a survey instrument often has a bimodal distribution: the survey is shorter for lower
income people who do not have many financial products mentioned in the survey, but can be very long
for wealthy people with many bank accounts, insurance, and credit products. In Thailand, the surveys
have included information about the household, socioeconomic data, standard of living, financial access,
financial service channels, consumer protection perspective and financial literacy.
This results in a paradox that while policymakers are often more interested in lower-income segments
that are financially excluded, the quantity of information gained is skewed away from such individuals
towards wealthier segments.17 In Mexico, the CNBV found it useful to progress from asking about
informal to formal services, so more people can answer the first questions in every section, as more
Mexicans are likely to have borrowed money from a friend or family member than they are to have
invested in stocks or bonds.
Instruments modeled on the FinScope surveys such as those used in Zambia and Kenya, take about one
hour. The surveys used in Mexico, Malaysia, and Belarus, took on average about 30 minutes. Figure 6
gives a possible breakdown of the content and structure of a demand-side survey instrument.
17
An interesting counterpoint is articulated by Deaton, 1997, who describes how household surveys often result in a selection bias towards over-representation of lower-income profiles. This is because it is more difficult for field researchers to gain access to high-income housing that often are gated and come with security systems. Wealthier people also often seem to be more reluctant to respond to longer questionnaires.
Quick tip: Although it is tempting to try to learn about behavior change by asking how people
used to manage their finances, do not extend the recall period beyond what people can
reasonably remember. Asking about behavior a long time in the past will yield poor quality data.
Quick tip: As a general rule, the median time to ask a demand-side survey on financial inclusion
should not be much longer than one hour. Although other household surveys, such as the Living
Standards Measurement Surveys done by the World Bank, can be longer, it is generally understood
that response rates and data quality decrease when longer questionnaires are used. In very long or
detailed questionnaires, more than one meeting with the respondent might be required.

Bringing smart policies to life.
33
Figure 6: Possible structure for demand-side research instrument design
After collecting all questions and ordering them, initial shortening of the instrument is often necessary to make piloting manageable. Eliminating questions can be challenging, especially because those who suggested a question often had a compelling reason to do so and do not want to see it go. The CNBV suggests carefully considering, as was done in Mexico, which questions are best answered in a general survey with a large sample size, and which questions could be answered in a more targeted research effort, such as a smaller survey or quantitative methods.
In Belarus, when the organization implementing the survey, the Institute of Sociology, reported that the
questionnaire was taking too long for it to be viable, the National Bank requested that the Microfinance
Center assist them in cutting the length of the questionnaire, since the Microfinance Center was
attempting to produce a questionnaire that could be used in different countries and eventually for
regional comparison.
Focusing on the essentials in the data analysis plan, as well as organizing the question into information
policymakers and other users must have from the survey, information that the stakeholders would really
like to have, and information that would be nice to have can facilitate cutting questions. The “nice to
have” questions become the first target for elimination, as doing so will not jeopardize the quality of
information needed for policymaking purposes. Figure 7 gives an example of such a chart that can be
helpful in prioritizing questions.
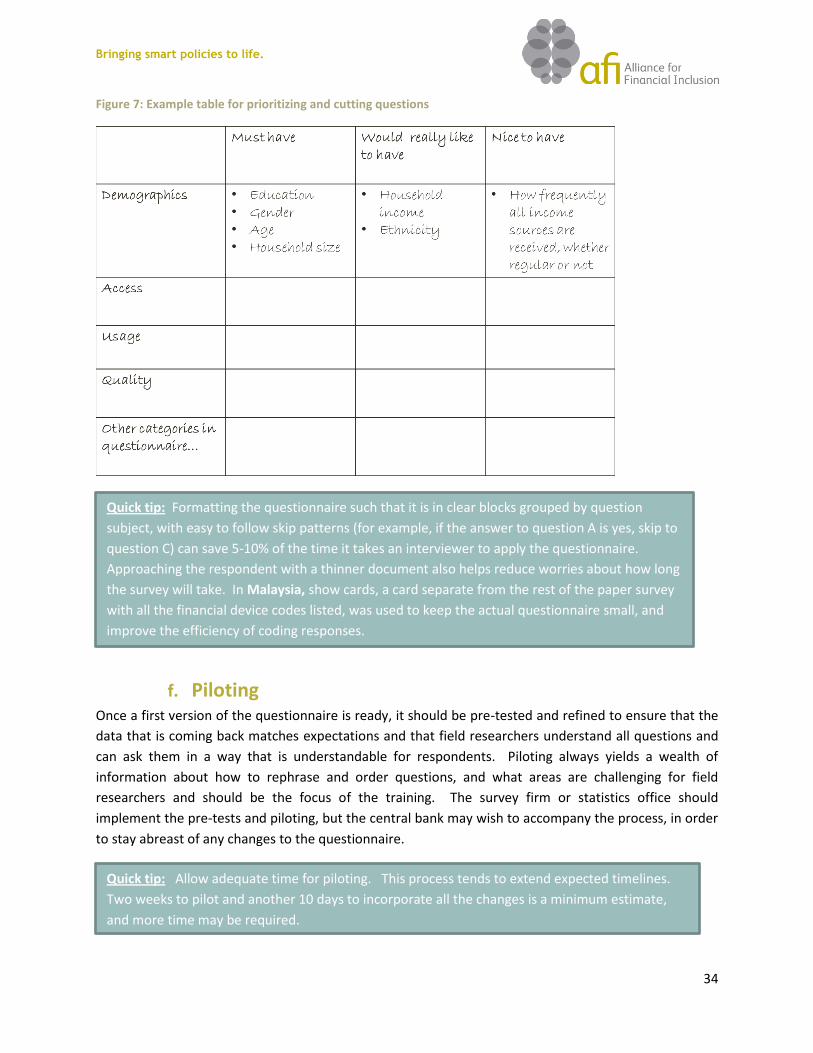
Bringing smart policies to life.
34
Figure 7: Example table for prioritizing and cutting questions
f. Piloting Once a first version of the questionnaire is ready, it should be pre-tested and refined to ensure that the
data that is coming back matches expectations and that field researchers understand all questions and
can ask them in a way that is understandable for respondents. Piloting always yields a wealth of
information about how to rephrase and order questions, and what areas are challenging for field
researchers and should be the focus of the training. The survey firm or statistics office should
implement the pre-tests and piloting, but the central bank may wish to accompany the process, in order
to stay abreast of any changes to the questionnaire.
Quick tip: Formatting the questionnaire such that it is in clear blocks grouped by question
subject, with easy to follow skip patterns (for example, if the answer to question A is yes, skip to
question C) can save 5-10% of the time it takes an interviewer to apply the questionnaire.
Approaching the respondent with a thinner document also helps reduce worries about how long
the survey will take. In Malaysia, show cards, a card separate from the rest of the paper survey
with all the financial device codes listed, was used to keep the actual questionnaire small, and
improve the efficiency of coding responses.
Quick tip: Allow adequate time for piloting. This process tends to extend expected timelines.
Two weeks to pilot and another 10 days to incorporate all the changes is a minimum estimate,
and more time may be required.
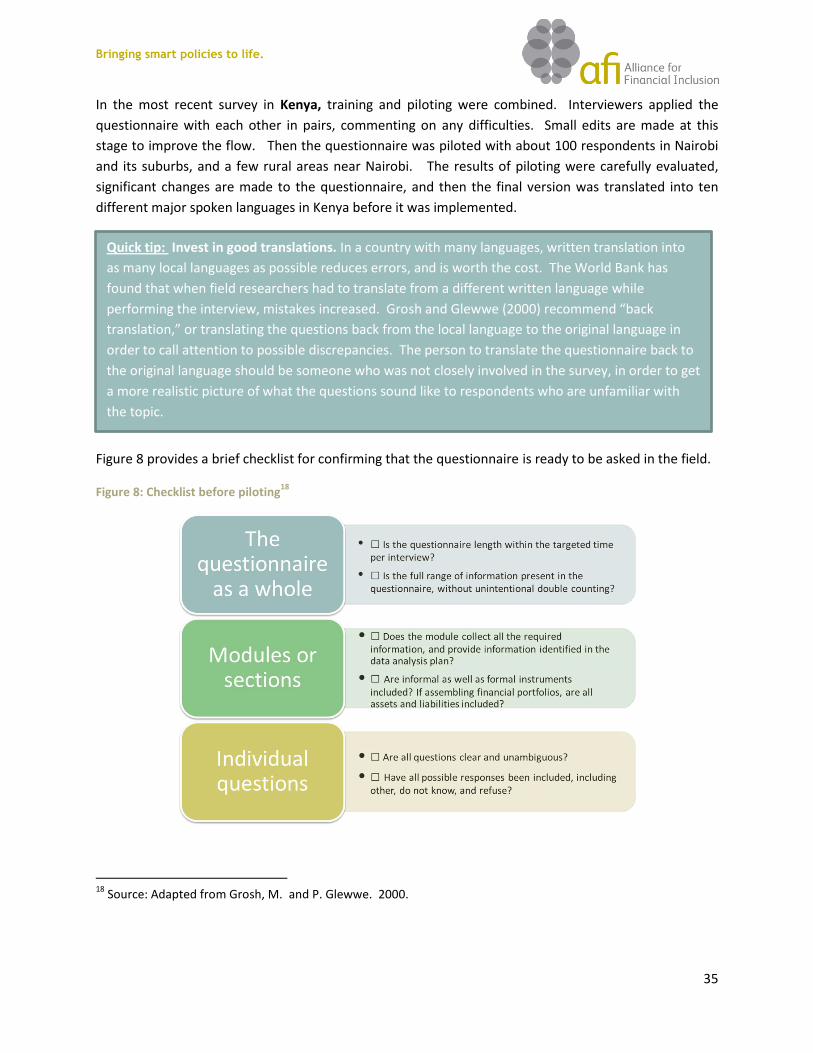
Bringing smart policies to life.
35
In the most recent survey in Kenya, training and piloting were combined. Interviewers applied the
questionnaire with each other in pairs, commenting on any difficulties. Small edits are made at this
stage to improve the flow. Then the questionnaire was piloted with about 100 respondents in Nairobi
and its suburbs, and a few rural areas near Nairobi. The results of piloting were carefully evaluated,
significant changes are made to the questionnaire, and then the final version was translated into ten
different major spoken languages in Kenya before it was implemented.
Figure 8 provides a brief checklist for confirming that the questionnaire is ready to be asked in the field.
Figure 8: Checklist before piloting18
18
Source: Adapted from Grosh, M. and P. Glewwe. 2000.
Quick tip: Invest in good translations. In a country with many languages, written translation into
as many local languages as possible reduces errors, and is worth the cost. The World Bank has
found that when field researchers had to translate from a different written language while
performing the interview, mistakes increased. Grosh and Glewwe (2000) recommend “back
translation,” or translating the questions back from the local language to the original language in
order to call attention to possible discrepancies. The person to translate the questionnaire back to
the original language should be someone who was not closely involved in the survey, in order to get
a more realistic picture of what the questions sound like to respondents who are unfamiliar with
the topic.

Bringing smart policies to life.
36
In Mexico, piloting was done in the state of Puebla, which is a microcosm for the types of populations
that can be found throughout the country. INEGI practiced the same methodology of visiting
households that was used in the real survey, and collected a sample of 200 interviews. After this
piloting the questionnaire was revised.
g. Training Training of the field researchers is the last essential step before fielding the survey. Although survey
companies are experienced in training, it is wise to have a technical expert with knowledge of financial
inclusion terms and the objectives of the survey participate in the training to clarify any technical
questions.
For a large national survey, there are likely to be many field researchers (about 150 in Belarus and
Mexico), so training them all together is not practical. But in smaller surveys, bringing the whole group
of field researchers together is wise in order to limit miscommunications from survey supervisors to field
researchers. In most cases, however, supervisors will be trained together, and they will then train the
field researchers in their teams in various parts of the country. The training team should make sure the
supervisors thoroughly understand all parts of the questionnaire and are capable of explaining it.
In Tanzania, the BoT found that field workers need theoretical as well as practical training. That is,
researchers should be trained not only on how to ask the questions, but on the meaning of financial
sector terms, common names to call informal instruments, and how to distinguish between different
types of bank accounts and other products.
Training can take time, and for a complex questionnaire, up to five days of training, including plenty of
practice with not only other interviewers, but also with respondents recruited from the general
population , is advisable.
The CNBV in Mexico emphasized that a well-written and easy to use field manual — a document that
explains what each question is asking, addresses possible ambiguities, and advises on the units of
entry— is invaluable, as this is the only source of information the field researchers can consult when
they are performing interviews possibly in remote areas out of communication range.
Once the field workers have been trained and have a good manual in hand, it is time to field the survey!
But first, an overview of ethical principles of survey research is useful to ensure that fielding the survey
does not violate the rights of respondents.
Quick tip: Someone from the central bank or another individual with in-depth knowledge of the
project should check the field manual to verify that all financial terms are defined correctly and that
the instructions for how to respond to each module match the intention of the instrument design
team.

Bringing smart policies to life.
37
h. Implementation of the survey in the field
Ethics
The need for human subjects review in biomedical research, in which there could be serious health risks
to participants, is obvious. However, it is also important that behavioral and social science research
abide by ethical principles to avoid more subtle harm to respondents. 19 Familiarizing oneself with these
ethical concepts before fielding a survey can be helpful.
Social science research respondents bear costs during interviews, such as he time and thought required
to answer questions accurately. But they do not gain any direct benefits from participating. It is
important to be honest about the lack of direct benefits from the survey, while at the same time
investing serious effort in ensuring the results will be used to improve overall welfare. This evokes the
important ethical distinction between practice and research. Studying financial inclusion is about
understanding the status quo so that appropriate decisions can be taken to improve well-being.
Research is therefore separate from promoting financial inclusion or providing assistance such as
financial literacy or capability training. Field researchers should be honest about the limits and indirect
nature of their work, and should not alter behavior by giving advice about financial decisions or anything
else.
Other important ethical concepts in survey research, as defined by the Belmont Report, a doctrine on
ethical principles for research,20 are:
1. Respect for persons- all people should be treated as autonomous agents. They are free to
participate in the survey or to refuse. They should be respected by disclosing the objective of
the survey, and by keeping all information they provide anonymous.
2. Beneficence- The research should have an intended benefit. The Belmont report summarizes
Beneficence as a.) Do not harm (subjects or interviewers), and b.) Maximize potential benefits
and minimize potential harms of the research.
3. Justice- Which groups will bear the burden of research and which group will enjoy the benefits?
It is unjust for the costs of the survey to be borne by one group when the results will benefit
another group. Although this applies more clearly to medical research, we can imagine a
financial survey that tests loan products in poor areas or with a certain group that is easy to
access for research, and then only make the product available to a higher income groups.
19
One of the earliest institutionalized standards for ethics in research is the Nuremberg code, which was drafted to judge scientists and doctors who had performed experiments on concentration camp victims during World War II. The World Medical Association Declaration of Helsinki and the Belmont Report from the United States Department of Health and Human Services are other institutional guidelines. 20
Available http://www.hhs.gov/ohrp/humansubjects/guidance/belmont.html

Bringing smart policies to life.
38
In practice, these principles imply that respondents should provide informed consent (described in Box
11) that the risks and benefits of the research should be carefully weighed and that selection of
subjects should be fair, considering a just allocation of the costs and benefits of research.
Box 11: Informed consent
Studies of financial behavior may ask very sensitive information about wealth, income, emergencies,
and vulnerability. It is of paramount importance that the anonymity of respondents be protected.
Anonymizing a dataset consists in removing or changing any identifying information contained in the
dataset. Box 12 describes steps required to make data anonymous.
Box 12: Insuring anonymity in financial inclusion
Just as ethical considerations and respect for respondents must be considered throughout the survey
implementation, it is important to be vigilant for inconsistencies that can decrease data quality. The
next section discusses how to avoid these nonsampling errors.
Nonsampling errors
Part II section d describes sampling error, or the margin of error that will always be present in a
representative survey. Sampling error is the error that results from taking a sample rather than
surveying the entire population. Nonsampling errors however, errors in the survey process, such as
Informed consent means that the field researchers should inform the respondents of the research procedure,
the purpose of the research, any risks and anticipated benefits, and a statement offering the subject the
opportunity to ask questions or to withdraw from the research at any time. This information should be
presented in a way that the respondent can understand, and participation should be voluntary.
According to the International Household Survey Network, identifying variables include:
“Direct identifiers, which are variables such as names, addresses, or identity card numbers. They
permit direct identification of a respondent but are not needed for statistical or research purposes,
and should thus be removed from the published dataset.
Indirect identifiers, which are characteristics that may be shared by several respondents, and whose
combination could lead to the re-identification of one of them. For example, the combination of
variables such as district of residence, age, sex, and profession would be identifying if only one
individual of that particular sex, age and profession lived in that particular district. Such variables are
needed for statistical purposes, and should thus not be removed from the published data files, unless
they can be combined to form direct identifiers.”
(http://www.surveynetwork.org/home/index.php?q=tools/anonymization/principles)
The survey team should determine which variables are direct identifiers (often address, national ID number,
phone number), and remove these from any dataset that is to be shared beyond a very small core research
team. As the survey will discuss where respondents keep money, interviewers should be trained to pause or
temporarily skip over sensitive questions if a neighbor or other intruder enters when the interview is
underway.

Bringing smart policies to life.
39
inaccuracy of responses, selection bias, or other errors that cannot be attributed to sample-to-sample
variability, often pose a bigger threat to the accuracy and integrity of data.21 For example, a survey with
a 2% margin of error, but 40% response rate should not be taken seriously. The main kinds of
nonsampling error are:22
Specification error: The concept intended by the question is not fully understood by or disclosed
to the respondent. For example, beneficiaries may have a bank account to receive social
transfer payments, but if they say they receive money on a benefits card, and the interviewer
does not probe whether there is an account associated with the benefit, the fraction of the
population with a bank account can be underreported.
Nonresponse error: Some people will inevitably refuse to respond to the survey or will not be
found at home during the required number of visits. This causes problems only if there are
patterns in the type of people who do not respond. Field researchers should keep track of
nonresponse due to not being home versus refusal, and statisticians can then determine the
impact of nonresponse error on the total error.
Selection bias: Selection bias occurs when a certain type of person from the selected
household is over-represented in a survey. In certain cultures, a survey that allowed field
researchers to interview the first person who is found at home would result in a selection bias
towards older people and women, making the survey non-representative. Similarly, surveying
every 10th person who entered a bank would not give you a good picture of the population as a
whole, as those who go to the bank have implicitly been selected into the survey.
Processing errors- include errors in coding, editing, and data entry.
Reporting bias, as described in Box 13, is another issue to consider.
Box 13: Reporting bias
The team should keep an eye out for such sources of bias in the design and implementation stages.
Indeed, good supervision can help minimize all these kinds of nonsampling error.
Quality control and monitoring of field researchers
The research house or national statistics office should have clear process in place to check data
collection and support field researchers when they have questions or doubts. The role of the central
bank or working group is to ensure that the survey firm or statistics institute has in place a solid
21
Lohr, 1999. 22
Adapted from Banda, 2003.
Interestingly, different population segments have a tendency to systematically over or under-report for
certain questions, resulting in nonsampling error. One classic example is the difference between male and
female responses when asked about number of sexual partners in public health surveys. In financial surveys,
we suspect that in some cultures lower-income individuals may over-report income and bank balances and
wealthier individuals may underreport, as both groups prefer to present themselves as more middle class.

Bringing smart policies to life.
40
supervision plan, and that they are following through to monitor researchers and verify responses.
Showing interest in the supervision activities signals that the funders of the survey take data quality
seriously. Box 14 describes good rules of thumb for verification of entered data.
Box 14: Verification and ensuring data quality
As the field work is concluded, the survey company or national statistics institute should produce a field
report containing information about issues or problems that arose in the data collection process, as well
as information that will be needed for producing the final sample weights. Box 15 suggests possible
topics to include in a field report.
In addition to rigorous monitoring of fieldworkers and verification, a new and increasingly popular
method to improve data quality and efficiency of interviews is to use PDAs, mobile devices, or tablets to
do interviews. This is discussed in more detail in the next section.
Although each institution will have their own standards, verifying 20 or 25% of all questionnaires by taking a
phone number and calling the household to confirm answers, or visiting the household in person to confirm
that the researcher was there, is a good rule of thumb. Such extensive verification is needed to catch
potential fraud or mistakes, and to convey to the field researchers that they are being monitored and
therefore must carefully follow the established process for locating households and respondents.
A percentage of the written or digital questionnaires should also be checked for consistency and clarity,
making sure there is one response where only one response is permitted, and multiple responses are
entered for questions that should capture more than one answer, such as questions about all sources of
income or all places the respondent has ever made a withdrawal. Finally, during the data entry stage, a
fraction of the entered data should be compared to the written forms to check for accuracy.
Box 15: Possible topics the survey firm could include in a field report
A detailed field report might include:
How often and when households and household members were visited
Which fieldworkers interviewed which households
Which enumeration areas or households were replaced in the sample
Number of nonresponses due to not being home and due to refusals
What dates were the field teams in each area and how many field workers were in each area
Any problems encountered and any general comments arising during the course of data collection,
inputting, cleaning and coding.

Bringing smart policies to life.
41
i. Use of technology in surveys
Computer Assisted Personal Interviews, known as CAPI, is a survey approach that uses electronic devices
to integrate interviews with data entry. The main advantages of using CAPI are23:
A faster questionnaire process and automatic skip patterns: When skips are automatic, the
interviewer saves time in flipping through the questionnaire
More accurate data entry: eliminating the time between collection and entry, and having the
interviewer rather than a data entry person input the data improves accuracy.24
Confidentiality: some devices could be used to allow the respondent to input their bank
balance, level of debt, or worth of physical assets into the computer directly, reducing the
discomfort they feel in sharing detailed financial information with the interviewer.
Instant results- data can be retuned for validation and cleaning much more quickly.
In Mexico, INEGI used mini-laptops to field their financial inclusion survey, and the team had very few
problems. INEGI had experience using these tools, and knows how to manage security concerns and
ensure that data is backed up to a cloud through the cellular network, or by connecting to the internet.
However, using computers is not without risks and disadvantageous. The program may crash, or the
device may run out of batteries or otherwise fail. Many data collection programs use the cellular phone
network to access and send data in real time, and all devices will need to be charged using electricity.
Such programs are unlikely to work well in areas where there is spotty access to electricity or cellular
networks.
When using electronic data capture, field researchers should carry plenty of paper questionnaires as
backups if something goes wrong with the device. In some places carrying such a device increases the
risk of theft or potential attacks on field workers. Using electronic devices also may increase the cost of
the surveys, although this is not necessarily the case as the cost of data entry is eliminated and only
verification is required.25
23
More information on this topic can be found in Goldstein, M. 2012. “Paper v. Plastic I: The Survey Revolution is in Progress.” http://blogs.worldbank.org/impactevaluations/paper-v-plastic-part-i-the-survey-revolution-is-in-progress 24
See also Caeyers et al 2012 for evidence of improved data collection from a randomized experiment using CAPI. 25
A low –cost option is the free software Open Data Kit, which can be used on any mobile phone with the Android operating system. Open Data Kit has been used in a cash-lite study in Kenya and in a survey of banking agents in Brazil. Learn more at http://opendatakit.org/

Bringing smart policies to life.
42
IV. Part III: Analysis, dissemination, and making the best use of
results
a. Shaping data analysis
The main objective of the demand-side survey on financial inclusion is to produce a collection of
statistics that can be used by policymakers, researchers, and market participants to generate ideas and
actions that can improve financial inclusion. In order to glean as much information as possible from the
dataset, it can be useful for the central bank to be involved in the analysis.
In Thailand, the team found that the survey produced a large amount of detailed data. The Bank of
Thailand staff did the analysis themselves, and the team did more advanced econometric analysis of the
2006 survey, to explore relationships between different variables, including the link between use of
financial services and the ability to absorb shocks. Findings using this data were published for an
academic symposium.
In Malaysia, the staff within Bank Negara Malaysia that managed the survey process carried out the
analysis themselves. In Belarus, the research institute at the Ministry of Economy undertook the first
phase of analysis with input from the National Bank. This approach included another important
government stakeholder in the process, and allowed the economics ministry to capitalize on their
comparative advantage in econometric analysis.
In Tanzania, the Central Bank suggests three sequential phases of data analysis:
1. Descriptive analysis
2. Explorative analysis
3. Hypothesis testing depending on research objectives
It is good practice to document the steps taken in manipulating the data so that other researchers could
replicate the process. The International Household Survey Network defines information for replication
as, “sufficient information with which to understand, evaluate, and build upon household survey
analysis. A third party could replicate the results without any additional information from the
producer.”26
Recall that sampling weights and standard errors that take into account clusters and stratifications
should be used in the analysis. Box 16 provides a list of statistical programs that are useful in survey
analysis. 27
26
http://www.surveynetwork.org/home/index.php?q=tools/anonymization/principles 27
Source: International Household Survey Network: http://www.surveynetwork.org/home/index.php?q=tools/sampletools

Bringing smart policies to life.
43
Box 16: Statistical programs for use in computing sampling errors
b. Dissemination
Once the results are ready, there are a few options for sharing them with stakeholders. The National
Bank of Belarus opted to post their research report and the questionnaire in both English and Russian
on their website.28 Box 17 explains how the National Bank is making public all information related to the
Belarus survey, in hopes that their questionnaire can serve as a building block for other countries—
especially in Central and Eastern Europe— to use in implementing demand-side surveys.
In Kenya, the results from the FinAccess surveys are consolidated in a report, which is widely distributed
to libraries, universities, and among industry players. The central bank research department and
academic researchers have used the survey data to publish in national and international journals. For
28
Report available: www.nbrb.by/engl/Publications/InternationalCooperation/UN/Individuals.pdf
The following software can be used to compute sampling errors:
CENVAR is a free variance calculation package which produces reliability measures for estimates
from stratified multistage sample surveys or simpler survey designs
SPSS, in particular its Complex Samples module
Stata, which provides special survey analysis commands
SUDAAN developed by RTI International
WesVar developed and distributed by Westat
SAS, Splus, Minitab, MATLAB and R are other possible statistical analysis programs, although not
specifically tailored for sample analysis.
Quick tip: Don’t be daunted by data analysis. Those involved with the Belarus survey explained
that in a fairly short baseline survey not much complex econometric analysis can be done. Simple
averages, calculated in Microsoft Excel for example can be among the most valuable information
gained from the survey.
The financial inclusion survey in Belarus was made possible with support from AFI, UNDP and the
Microfinance Center. The Microfinance Center provided the National Bank a draft questionnaire and all the
materials necessary to implement the survey. In order to continue sharing this useful information, the
National Bank is making available all field reports and questionnaires so that other countries can use the
information in building their own demand-side surveys. Information is available at www.nbrb.by, in both
English and Russian.
The survey team in Belarus has advised that the information will be most useful for Central and Eastern
Europe and Asian countries, where the financial environment is similar to that of Belarus.
Box 17: Resources available from the Belarus survey of financial inclusion

Bringing smart policies to life.
44
the third FinAccess survey that will be fielded in 2012, radio and television outreach is planned to raise
awareness about financial inclusion. The idea here is that radio and TV talk shows and or interviews on
issues pertaining to financial inclusion could be aired to reach a much wider audience. The new survey
findings will provide current information on the issues, but also help people relate their situations
others— technology-wise, gender-wise, education-wise and learn from the experiences of others in so
far as acquisition of financial services is concerned. Workshops have also already been used to bring
stakeholders together and discuss the survey results.
The FAP shares widely the top line findings from its survey, but, as mentioned, charges token fees that
are differentiated for masters and PhD students, researchers with public or private interests, and
financial sector industry players for accessing the full data set to help partly raise funding for future
FinAccess surveys and accord the process some degree of sustainability and also to avoid abuse of the
datasets.
The detailed findings of the Malaysian survey will be made available to government agencies, and a final
report will be prepared for the sharing the information with the public. In Tanzania, a simple website,
which will include resources, information, and data from the demand-side surveys, is being designed.
This will make the information widely available to those with internet access in Tanzania and
internationally.
c. Examples of how data can be used to inform policy
It can be helpful to see the kind of data demand-side surveys generate, and how it can be used. In
Belarus, the expanded 8000-interview sample survey will be compared with supply side information to
prepare a detailed map of financial access in the country. The map will make clear the areas of low
access, allowing regulators to consider adjustments to promote extension of services to these areas,
while banks and mobile operators can use the data to discover potential untapped markets.
Figure 9 shows an example of detailed access rates for all products in Belarus. Before the survey, only
rough approximations of access and usage could be made using supply side data. The data collected
also allows for analysis of financial inclusion by geographic area, gender, level of education, employment
type, and other covariates.

Bringing smart policies to life.
45
Figure 9: Use of financial services by Belarusian adults
In Zambia, the Bank of Zambia used the survey to analyze both product usage and institutional reach. The Bank of Zambia uses the Financial Access Strand to track progress towards creating a more inclusive financial system in the country. The primary outcomes of the survey were: first, understanding Zambia’s Financial Access Landscape by measuring usage of financial products across transactions, savings, credit and insurance, and second, measuring access using an institutional dimension, as opposed to the functional (product) dimension. Based on the results of their demand-side survey, Bank Negara Malaysia is making tangible policy
changes. First, the survey asked about willingness to pay for services at agents. The research found that
costs must be low in order for people to use agents. The Bank is using this information to help promote
use of banking agents. Based on these survey results, the agent guidelines limited the fees for agent
banking to similar levels as fees for ATMs and internet banking.
Second, the demand-side survey revealed that internet and mobile banking usage was very low in
Malaysia. Bank Negara decided to make use of this information to promote the use of these channels,
by launching a new mobile banking platform. Third, the survey revealed that the population, especially
of low-income Malaysians is willing to pay for medical insurance, but not for very many other kinds of
insurance protection, especially not for property insurance. This information is helping Bank Negara
refine its strategy for how to promote micro-insurance.
As was the case in Belarus, the Malaysian survey included a survey of small and medium enterprises.
From the small enterprise study, Bank Negara learned that while small business owners are able to track
their cash flows carefully and are aware of the value of keeping surpluses, many small businesses are
heavily indebted and are still unaware of the process and methods in sourcing external financing. This

Bringing smart policies to life.
46
information raised new concerns about awareness of the borrowing options available to such
businesses.
V. Conclusion Executing a successful demand-side survey is not possible without significant organization, planning, and
monitoring. But the results of a successful demand-side survey will be supremely useful— for
completing collection on the AFI Core Set of indicators, for taking important policy and regulatory
decisions, and for regional and international benchmarking if the team finds this appropriate. Although
the steps involved in properly developing and implementing a demand-side survey may seem daunting,
the central bank can delegate many of the complex tasks. And management of the process will be
easier with the foundation of knowledge about the theory and practice of financial inclusion surveys
provided in this report.
As central banks from Sub-Saharan Africa to the Middle East to Central Asia plan to implement their first
demand-side survey of financial inclusion, AFI members that have been through the process can offer
valuable advice and respond to any remaining questions. Peer learning through sharing questionnaires
and guidance material, on the AFI member zone or through direct communications, is a source of fresh
ideas and support for the difficult but rewarding process of conducting a demand-side survey of financial
inclusion.

Bringing smart policies to life.
47
Annex A: List of people interviewed Name Organization
Luis Treviño Garza and Raúl Hernández Cos Comisión Nacional Bancaria y de Valores
Zarina Abd Rahman Bank Negara Malaysia
Norbert Mumba Central Bank of Zambia
Dr. Shem A. O. Central Bank of Kenya
Yuri Malafey Project Manager, Belarus
Nangi Massawe, Amani Itatiro Bank of Tanzania
Mr. Chitkasem and Ms.Pornyupa Bank of Thailand

Bringing smart policies to life.
48
Annex B: AFI Core Set “The Core Set of Financial Inclusion Indicators (“the Core Set”) is the first step in establishing a common understanding of financial inclusion with
respect to data and measurement… The Core Set is a limited set of quantitative indicators that captures the status of financial inclusion in a
country. The indicators are meant to measure the most basic and fundamental aspects of financial inclusion in a way that is as standardized as
possible while remaining relevant to individual countries.” - AFI (2011) “Measuring Financial Inclusion: Core Set of Financial Inclusion Indicators.”
Table 3: The AFI Core Set
Dimension Definition of Dimension Core indicator Proxy indicator Definitional comments
Access Ability to use financial services, minimal barriers to opening an account.
Physical Proximity
Affordability
1. Number of access points per 10,000 adults at national level and segmented by type and relevant administrative units
2.1 Percent of administrative units with at least one transactions point
2.2 Percent of total population living in administrative units with at least one access point
Regulated access points where cash-in (including deposits) and cash-out transactions can be performed. Demand-side indicators of distance may help here if nationally consistent.
Usage Actual usage of financial services/ products
Regularity
Frequency
Length of time used
3.1 Percentage of adults with at least one type of regulated deposit account 3.2 Percentage of adults with at least one type of regulated credit account
3.a Number of deposit accounts per 10,000 adults 3.b Number of loan accounts per 10,000 adults
Adults 15 and older, or age defined by the country. Attempt to measure active accounts.
It is clear from the AFI Core Set and second tier that demand-side data is needed to report on usage data without relying on proxies. For many
countries, international data collection efforts, such as the World Bank’s Global Findex, FinScope surveys, or other research can be used to

Bringing smart policies to life.
49
collect the Core Set usage indicators. Even so, a national validation of these data points is extremely useful. While supply-side data and data
from international data sets such as Findex are excellent sources for access data, robustly measuring usage and quality across many products
usually requires a demand-side survey. Table 3 provides a refresher of the AFI Core Set of Indicators.

Bringing smart policies to life.
50
Annex C: Criteria for selecting a research house to implement a demand-side financial inclusion
survey a.
Quoted costs for survey
b. Timeline to complete field work and data entry
c. Quality of proposal for verification and supervision (Scale 0-5)
d. Quality and size of field team (Scale 0-5, smaller = better)
e. Quality of proposal for training, including time spent training and methods to ensure consistency (Scale 0-5)
f. Experience implementing nationally representative surveys (Scale 0-5)
g. Knowledge or familiarity with financial inclusion and similar content (Scale 0-5)
h. Comments and innovations the team brings to the survey
Company 1
Company 2
Company 3
Company 4
…
This table can be modified and completed in addition to government procurement documents to assist countries in selecting a survey company
that is best suited to implement the costly survey on financial inclusion from among shortlisted options. The costs, timeline, and comments
(columns a, b, and h) can be evaluated together, and then columns c-g can be scored by a variety of team-members, and then summed up to

Bringing smart policies to life.
51
result in numerical scores for each shortlisted research house. In addition to quantitative metrics, the degree of comfort, confidence, and
communication between the coordinators and the research house staff are also important, as challenges are bound to arise in survey
implementation.
Column c, the quality of verification and supervision, should consider the percent of questionnaires verified using in-person and telephone verification, and the procedure proposed to check questionnaires for completion and accuracy and to verify data entry, including double entry and verification. Double entry is a method in which for some questionnaires data is entered twice and the resulting entries are compared to check for consistency, helping to identify mistakes or problematic data entry staff. In column d, the quality and size of the field team, a smaller team can be better for consistency and because each interviewer will perform more
interviews. However the size of the team must be weighed against the time in the field, as smaller teams take longer. Interviewers from the
regions where they will perform interviews often do better because of regional dialects and phrasing, and because they can more easily relate to
the local population.
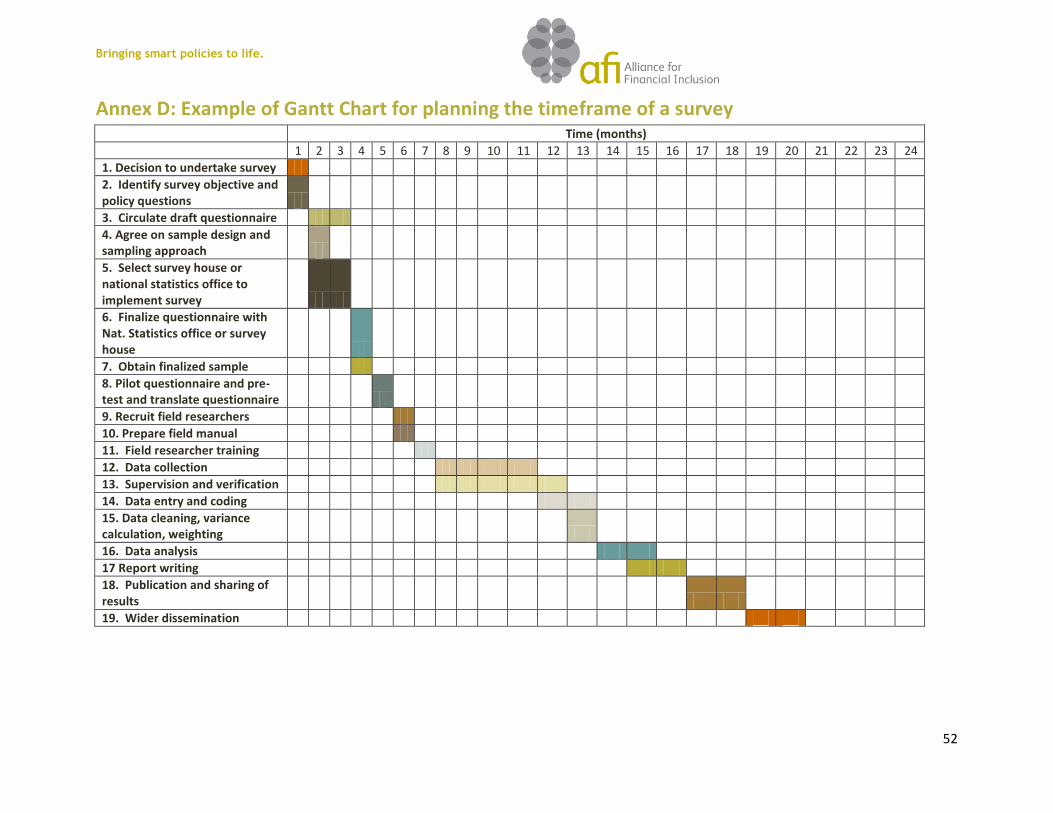
Bringing smart policies to life.
52
Annex D: Example of Gantt Chart for planning the timeframe of a survey Time (months)
1 2 3 4 5 6 7 8 9 10 11 12 13 14 15 16 17 18 19 20 21 22 23 24
1. Decision to undertake survey
2. Identify survey objective and policy questions
3. Circulate draft questionnaire
4. Agree on sample design and sampling approach
5. Select survey house or national statistics office to implement survey
6. Finalize questionnaire with Nat. Statistics office or survey house
7. Obtain finalized sample
8. Pilot questionnaire and pre-test and translate questionnaire
9. Recruit field researchers
10. Prepare field manual
11. Field researcher training
12. Data collection
13. Supervision and verification
14. Data entry and coding
15. Data cleaning, variance calculation, weighting
16. Data analysis
17 Report writing
18. Publication and sharing of results
19. Wider dissemination

Bringing smart policies to life.
53
Annex E: More technical information of sample size
Most demand-side surveys on financial inclusion aim to obtain data that is representative of the adult
population. But representative with what degree of precision? This is a fundamental question that
should be asked in determining the sample size, and there are likely to be trade-offs between the
margin of error and the cost of the survey.
The following steps, adapted from Lohr, 1999 can be used to specify the sample size:
1. Define what is expected of the sample and how much error can be tolerated. Generally financial
inclusion surveys that may be implemented every two to four years do not need as much
precision as other types of economic data, such as high frequency unemployment data that
tracks rapid change.
Precision increases proportional to the square root of the absolute size of the sample, and not
the proportion of the population that is represented. Therefore, asking what percentage of the
population needs to be included in a sample is not usually the right way to think about sample
size.
2. Find an equation relating the sample size n and the expected margin of error that would be
tolerable in the sample. The precision can be expressed as:
(| ̅ ̅ | )
Where ̅ is the population mean, ̅ is the sample mean, e is the margin of error and 1- α is the level of
confidence. A common target is e = 0.03 and (95% confidence level). Using the idea of
confidence intervals, the following equation can be solved for n, the sample size, to obtain the desired
margin of error e.
√(
) (
√ )
Where
is the
th percentile of the standard normal distribution, N is the overall population, and
S is the standard deviation √ .
In large populations , which attains a maximum value at ½, which can be used in the
calculation in step 3.
3. Solve for n to get:

Bringing smart policies to life.
54
Where
and is the sample size for a simple random sample.
4. Include the desired confidence level, error, and the population size to solve for
For example, in Belarus the following assumptions were used in the calculation of sample size:
Confidence level = 95% (α = 0.05)
Standard deviation maximum = 0.5
Margin of error = 0.03
Population size = 9,465,400
= 1.96 for α = 0.05 (obtained from statistical tables)
Using this information, calculate as follows:
(
)
= 1067.11
So, for the population of Belarus, about 9.5 million, a sample of 1067 interviews was required for a
representative sample.

Bringing smart policies to life.
55
Annex F: Example of Kish Grid to randomly identify a respondent in the household29 The term “Kish Grid” refers to a method developed by statistician Leslie Kish in 1949 to objectively select a respondent within a household.
USE THE KISH TABLES AS FOLLOWS:
1. Find out how many people in the household are eligible to be interviewed (adults over 15 or 16, or the age determined as eligible to participate in the
survey). Include people who take most of their meals in the household and are likely to share financial resources with the household (not extended
family).
2. List the household members from oldest to youngest, giving them a number 1 for the oldest, 2 for the next oldest.
3. The columns list the number of interviews in this enumeration area.
4. Look at the row for the number of eligible people in the household, and the column for the number of interview that you are doing. Where the row
and column meet you will find the household roster number of the person who is to be interviewed. For example, if the 5th
interview is with a
household with 3 eligible members, the 2nd
person listed on the roster (the second-oldest) is the person to be interviewed.
Eligible household members
Household visit number
1 2 3 4 5 6 7 8 9 10 11 12 13
1 1 1 1 1 1 1 1 1 1 1 1 1 1
2 1 2 1 2 1 2 1 2 1 2 1 2 1
3 1 2 3 1 2 3 1 2 3 3 2 1 3
4 1 2 3 4 1 2 3 4 3 2 1 4 2
5 1 2 3 4 5 3 4 5 2 1 5 4 3
6 1 2 3 4 5 6 3 2 4 5 1 6 2
7 1 2 3 4 5 6 7 3 4 2 5 6 4
8 1 2 3 4 5 6 7 8 6 7 8 5 6
9 1 2 3 4 5 6 7 8 9 7 6 8 5
10 1 2 3 4 5 6 7 8 9 10 5 9 3
More than 10 1 2 3 4 5 6 7 8 9 10 7 6 9
ROSTER NUMBER SELECTED: |__|__| INTERVIEWER: CARRY OUT THE REST OF THE INTERVIEW WITH THIS PERSON
29
Components adapted from Audience Dialogue. 2006 “Know your Audience: Sample: Choosing Respondents. Available: http://www.audiencedialogue.net/kya2c.html
Bringing smart policies to life.
56
Other online resources for developing a Kish Grid include:
Audience Dialogue. 2006 “Know your Audience: Sample: Choosing Respondents. Available:
http://www.audiencedialogue.net/kya2c.html
Survey ToGo Manual. “How to Create a Kish Grid.” http://manual.dooblo.net/2012/04/23/how-to-create-a-kish-grid-model/
Media Rating Council, Inc. “Within Household Respondent Selection.”
http://www.mediaratingcouncil.org/MRC%20Point%20of%20View%20-%20Within%20HH%20Respondent%20Selection%20Methods.pdf
Gaziano, Cecilie. “Kish Selection Method.” Sage Research Methods. http://srmo.sagepub.com/view/encyclopedia-of-survey-research-
methods/n262.xml
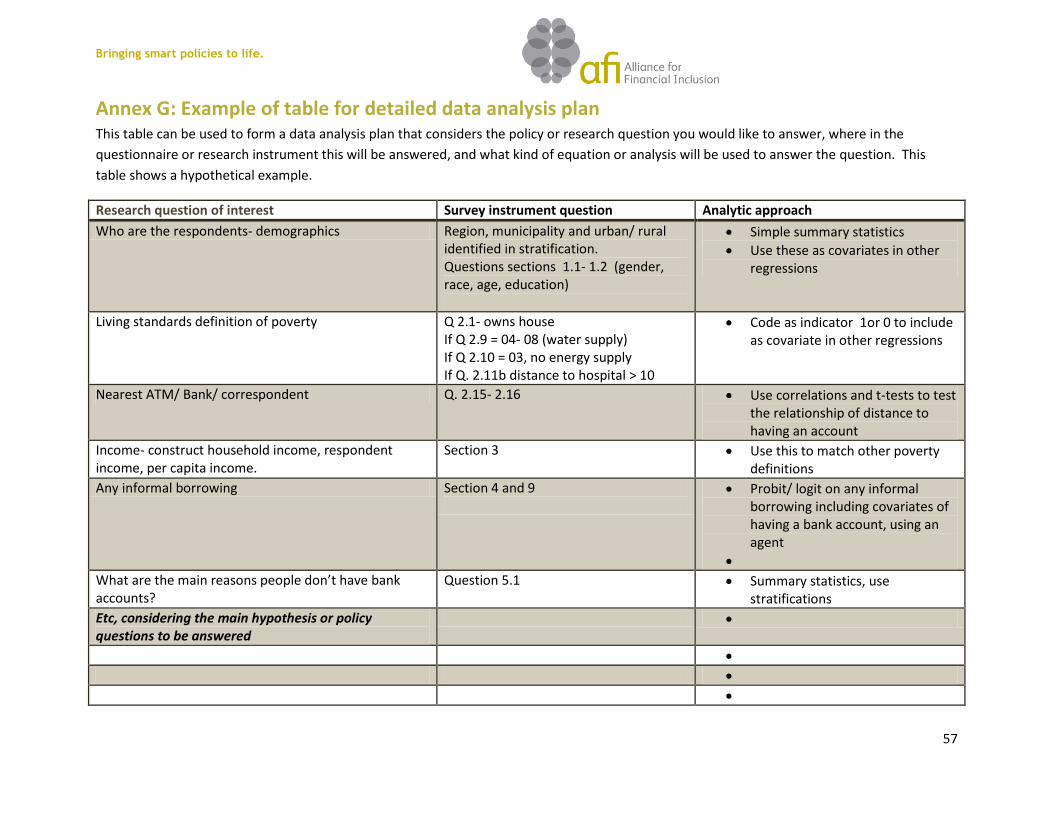
Bringing smart policies to life.
57
Annex G: Example of table for detailed data analysis plan This table can be used to form a data analysis plan that considers the policy or research question you would like to answer, where in the
questionnaire or research instrument this will be answered, and what kind of equation or analysis will be used to answer the question. This
table shows a hypothetical example.
Research question of interest Survey instrument question Analytic approach
Who are the respondents- demographics Region, municipality and urban/ rural identified in stratification. Questions sections 1.1- 1.2 (gender, race, age, education)
Simple summary statistics
Use these as covariates in other regressions
Living standards definition of poverty Q 2.1- owns house If Q 2.9 = 04- 08 (water supply) If Q 2.10 = 03, no energy supply If Q. 2.11b distance to hospital > 10
Code as indicator 1or 0 to include as covariate in other regressions
Nearest ATM/ Bank/ correspondent Q. 2.15- 2.16 Use correlations and t-tests to test the relationship of distance to having an account
Income- construct household income, respondent income, per capita income.
Section 3
Use this to match other poverty definitions
Any informal borrowing Section 4 and 9
Probit/ logit on any informal borrowing including covariates of having a bank account, using an agent
What are the main reasons people don’t have bank accounts?
Question 5.1 Summary statistics, use stratifications
Etc, considering the main hypothesis or policy questions to be answered
Bringing smart policies to life.
58
References Alliance for Financial Inclusion (AFI). 2010. “Policy Paper: Financial Inclusion Measurement for
Regulators: Survey Design and Implementation.” Available: http://www.afi-global.org/news-
and-events/news/afi-policy-paper-financial-inclusion-measurement-regulators-survey-design-
and-i
Alliance for Financial Inclusion (AFI). 2011. “Charter of the AFI Financial Inclusion Data Working Group.”
Available: http://www.afi-global.org/resources/publications/en/charter-afi-financial-inclusion-
data-working-group
Audience Dialogue. 2006 “Know your Audience: Sample: Choosing Respondents. Available:
http://www.audiencedialogue.net/kya2c.html
Banda, Jeremiah P. 2003. “Nonsampling errors in Surveys.” United Nations Statistics Division, Draft
Handbook on Designing Household Sample Surveys. Available July 24th 2012:
http://unstats.un.org/unsd/demographic/meetings/egm/Sampling_1203/docs/no_7.pdf
Bill & Melinda Gates Foundation. 2010. “The Measurement Challenge.” Note prepared for the Global
Savings Challenge.
Charkravarty, S.R. and Pal, R. 2010. “Measuring Financial Inclusion: An Axiomatic Approach.” Indira Gandhi Institute of Development Research Working Paper.
Cull, R. and K. Scott. 2009 "Measuring household usage of financial services : does it matter how or whom You Ask ?" Policy Research Working Paper Series 5048, The World Bank. Deaton, A. 1997. The Analysis of Household Surveys. A Microeconometric Approach to Development
Policy. Baltimore MD, Johns Hopkins University Press for The World Bank Demirguc-Kunt, A. and L. Klapper. 2012. "Measuring Financial Inclusion: The Global Findex", World Bank Policy Research WP 6025. Federman, D., K. Hanna, and L. Rodriguez. 2003. Responsible Research. Washington,
D.C.: The National Academic Press, 2003. Goldstein, M. 2012. " Paper v Plastic Part I: The survey revolution is in progress” Available July 25th 2012: http://blogs.worldbank.org/impactevaluations/paper-v-plastic-part-i-the-survey- revolution-is-in-progress Grosh M. and P. Glewwe. 2000. Designing Household Survey Questionnaires for Developing Countries: Lessons from 15 Years of the Living Standards Measurement Study. Volumes 1, 2, and 3. Washington DC: The World Bank. Hernandez-Cos, R. and R, Goofben. 2012. “Better Data Can Mean Better Decisions For Financial
Inclusion Policy Making.”Available: http://microfinance.cgap.org/2012/04/19/better-data-can-mean-better-decisions-for-financial-inclusion-policy-making/
Honohan, P. 2007. “Cross country variation in household access to financial services.” Washington, D.C.: World Bank. IFC. 2011. “Financial Inclusion Data: Assessing the Landscape and Country-level Target Approaches.”
Discussion Paper prepared by the IFC in behalf of the Global Partnership for Financial Inclusion. Available: http://www.gpfi.org/sites/default/files/documents/workingdata.pdf.
IFC and CGAP. 2011. “Financial Inclusion Data Stocktaking and Gap Analysis.” Unpublished manuscript. International Household Survey Network. “Tools and Guidelines.” Available: http://www.surveynetwork.org/home/index.php?q=tools/budgeting Lohr, Sharon. 2010. Sampling Design and Analysis. 2nd edition. Boston, MA: Brooks/ Cole

Bringing smart policies to life.
59
Cengage Learning. National Bank of the Republic of Belarus. 2012a. “Estimation and analysis of financial inclusion among households and individuals in the Republic of Belarus.” Minsk: National Bank of Belarus.
Available July 24th: http://www.nbrb.by/engl/Publications/InternationalCooperation/UN/Individuals_full.pdf
-----. 2012b . “Estimation and analysis of SME access to finance in the Republic of Belarus.” Minsk: National Bank of Belarus.
National Institute of Health. “Research ethics: How to Treat People who Participate in Research.” National Research Council. 2003. Protecting Participants and Facilitating Social and Behavioral Sciences
Research. Washington D.C.: The National Academies Press. Turner, A.G. 2003. “Sampling Strategies.” United Nations Statistical Division. Available 18 July 2012:
http://unstats.un.org/unsd/demographic/meetings/egm/Sampling_1203/docs/no_2.pdf United Nations Statistics Division. 2005. Household Sample Surveys in Developing and Transition Countries. United Nations Statistical Division. Available: http://unstats.un.org/unsd/hhsurveys/ Yaseneh, I.S. 2005. “Chapter II: Overview of sample design issues for household surveys in developing
and transition countries.” In Household Sample Surveys in Developing and Transition Countries. United Nations Statistical Division.