67 CHAPTER 3 HOUSEHOLD INDEBTEDNESS AND ITS IMPLICATIONS FOR FINANCIAL STABILITY IN MALAYSIA
22
67 CHAPTER 3 HOUSEHOLD INDEBTEDNESS AND ITS IMPLICATIONS FOR FINANCIAL STABILITY IN MALAYSIA By Nazreen Abdul Ghani 1 1. Introduction The aggregate Malaysian household sector exhibited sustained financial capacity and adaptability in adjusting to greater employment pressures under the challenging economic environment in 2008-09. This was also supported by a healthy balance sheet as well as stable indebtedness and income levels. Following the Asian Financial Crisis in 1997-98, banking institutions in Malaysia had diversified their intermediation focus. This resulted in portfolio shifts from being highly-concentrated in corporate sector financing towards greater retail financing to households and, small and medium enterprises (SMEs). This was accompanied by a strengthened financial infrastructure with the establishment of the Central Credit Reference Information System (CCRIS), an online system of borrower credit information in 2001. The greater emphasis on retail financing was also supported by a strengthened risk management infrastructure and capability at the institutional front. As at end-2008, total financing to the household sector accounted for 54% of outstanding financing extended by the banking system 2 , a marked increase from 28.4% as at end 1996. With the increased significance of banks’ exposures to the household sector, concerted efforts were undertaken over the years to progressively enhance the assessment of household sector in Malaysia, particularly in identifying potential stress in different segments of the population. This was necessary given the significant direct and indirect spillover effects of problems _______________ 1. The author is a Senior Executive in the Financial Surveillance Department in BNM. The author wishes to express her gratitude to Dr. Don Nakornthab, Madelena Mohamed, Dr Zarina Zainal Abidin, Dr Hamim Syahrum Ahmad Mokhtar, Lau Chin Ching, Siti Hanifah Borhan Nordin, Raymond Yeo, Shaza Marina Azmi and Lim Le Sze for their comments. The views expressed here are solely those of the author and do not necessarily reflect the views of the Central Bank of Malaysia (Bank Negara Malaysia, BNM). 2. Banking system consists of commercial, investment and Islamic banks.
-
Upload
independent -
Category
Documents
-
view
0 -
download
0
Transcript of 67 CHAPTER 3 HOUSEHOLD INDEBTEDNESS AND ITS IMPLICATIONS FOR FINANCIAL STABILITY IN MALAYSIA

67
CHAPTER 3
HOUSEHOLD INDEBTEDNESS AND ITS IMPLICA TIONSFOR FINANCIAL STABILITY IN MALA YSIA
By
Nazreen Abdul Ghani1
1. Introduction
The aggregate Malaysian household sector exhibited sustained financialcapacity and adaptability in adjusting to greater employment pressures under thechallenging economic environment in 2008-09. This was also supported by ahealthy balance sheet as well as stable indebtedness and income levels.
Following the Asian Financial Crisis in 1997-98, banking institutions inMalaysia had diversified their intermediation focus. This resulted in portfolioshifts from being highly-concentrated in corporate sector financing towardsgreater retail financing to households and, small and medium enterprises (SMEs).This was accompanied by a strengthened financial infrastructure with theestablishment of the Central Credit Reference Information System (CCRIS), anonline system of borrower credit information in 2001. The greater emphasis onretail financing was also supported by a strengthened risk managementinfrastructure and capability at the institutional front.
As at end-2008, total financing to the household sector accounted for 54%of outstanding financing extended by the banking system2, a marked increasefrom 28.4% as at end 1996. With the increased significance of banks’ exposuresto the household sector, concerted efforts were undertaken over the years toprogressively enhance the assessment of household sector in Malaysia, particularlyin identifying potential stress in different segments of the population. This wasnecessary given the significant direct and indirect spillover effects of problems_______________
1. The author is a Senior Executive in the Financial Surveillance Department in BNM. Theauthor wishes to express her gratitude to Dr. Don Nakornthab, Madelena Mohamed, DrZarina Zainal Abidin, Dr Hamim Syahrum Ahmad Mokhtar, Lau Chin Ching, Siti HanifahBorhan Nordin, Raymond Yeo, Shaza Marina Azmi and Lim Le Sze for their comments.The views expressed here are solely those of the author and do not necessarily reflect theviews of the Central Bank of Malaysia (Bank Negara Malaysia, BNM).
2. Banking system consists of commercial, investment and Islamic banks.

68
associated with excessive indebtedness to economic and financial system stabilityas well as social implications. The approach to surveillance has been forwardlooking in nature with emphasis on stress testing and scenario-based, to enablepre-emptive policy responses if and where necessary. Efforts to enhancehousehold data collection at a granular level remain a priority to facilitate in-depth understanding of the issues and any potential concerns on a particularincome group.
Several key Financial Soundness Indicators (FSIs)3 for the household sectoras recommended by the International Monetary Fund (IMF) are publishedannually in the Financial Stability and Payment Systems Report (FSPSR) ofBNM as shown in Table 1. The level of household non-performing loans (NPLs)continued to trend downwards until September 2008.
Table 1Financial Soundness Indicators for Households 2003-08
Source: Annual Report and Financial Stability and Payment Systems Report, Bank NegaraMalaysia, various issues
_______________
3. Based on the IMF Financial Soundness Indicators: Compilation Guide. See list of referencesin the appendix.
4. Household debt consists of borrowings made by individuals from the banking system,development financial institutions, government (public sector employees only) and insurancecompanies.
5. Household Liquid Financial Assets consist of deposits in the banking system anddevelopment financial institutions, and the market value of unit trust funds and equityholdings.
6. Debt repayment ratio consists of outstanding loan payments of principal and interest topersonal disposable income

69
2. Literatur e Review of Household Debt Studies in Malaysia7
A few studies relating to household debts in Malaysia were conducted in2006 in accordance to the increasing exposures of the banking system to thesector during the period. The studies generally focused on the residential marketin Malaysia, given that bulk of household debts are for house financing(approximately 50% of total household debts), and the strong inter-linkagesbetween the housing property market and real economic growth. One of thestudies also discussed the prevailing developments in household financing inMalaysia and the implications for monetary policy and financial stability.
3. Facts About Household Debt in Malaysia
3.1 Aggregate Tr ends (Time Series)
Figure 1HH Indebtedness and Debt Repayment Ratio
Figure 2HH Financial Assets to HH Debt Ratio
_______________
7. Please refer to the Appendix for list of references used.
Source: Bank Negara Malaysia, Treasury HousingLoans Division, Employees Provident Fund andSecurities Commission Malaysia

70
The aggregate household debt-to-gross domestic product (GDP) ratio inMalaysia has been relatively stable at around 64% - 69% throughout 2004 to2008 (See Figure 1). During this period, household debts grew rather stronglyat an annual growth rate of 17.1%. This was supported by growth in incomelevels, largely in tandem with the favourable economic conditions. The growingaffluence of the Malaysian population in an environment of greater focus bybanks on retail business was also another driving factor contributing to the growthin indebtedness. The continued improvement in income level has partly contributedto the improvement in the ratio of loan repayments-to-disposable income. Thedebt servicing capacity is further boosted by a strong level in financial buffers.The financial assets-to-debts ratio has remained high at 2.3 times as at end-2008 (See Figure 2). The strong initial position more than offset the small declineof 4.1% in household financial assets during the year as the value of investmentsin equity and unit trust funds declined following greater market volatility.
Household financial assets in Malaysia comprise deposits with bankinginstitutions, development financial institutions, unit trusts, equity holdings, lifeinsurance funds and employee provident fund. Taking into account only thedeposits and equity/unit trust portfolios, the level of liquid assets remained ampleat 138.5% of household debts. The increase in disposable income in recent yearshas enabled households to accumulate savings as reflected in the average annualincrease of 9% in households’ deposits with banking and development financialinstitutions over the last five years.
Figure 3Composition of HH Financial Assets and HH Debt by Purpose
Source: Employee Provident Fund, SecuritiesCommission Malaysia and internal estimates
Source: Treasury Housing Loans Division,Bank Negara Malaysia

71
Meanwhile, the bulk of household debts are mainly for asset acquisition,with housing loan and motor vehicle financing accounting for over 75% ofhousehold loans as at end-2008 (See Figure 3).
3.2 Sources of Household Debt
The primary source of borrowings for households is the commercial banks,Islamic banks and development financial institutions. Other institutions providinglending facility to households include several non-banking institutions, such ascredit companies, building society, credit cooperatives, and insurance companies.
Information on the household sector in Malaysia is available at the aggregatelevel and compiled through statistical submissions and publications by bankinginstitutions, selected development financial institutions, insurance companies,takaful operators and the Government Housing Loan Division. In addition,information sources like the credit bureau (Central Credit Reference andInformation System) – detailed aggregate financing data, the Ministry of HumanResources – labour market indicators, and the Department of Statistics ofMalaysia – Population and Housing Census (once in every decade), HouseholdIncome Survey (biennial) and the Survey on Household Expenditure (once infive years) are also used.
3.3 Financial Institution (Supply-Side) Perspectives
Figure 4Banking System Outstanding Household Loans by Key Purposes
Source: Bank Negara Malaysia

72
Figure 5Banking System’s Outstanding Loans by Customer
Outstanding loans to household have been trending upwards since 2000 asshown in Figure 4. The upward trend is contributed by banking institutionsdiversifying their financing portfolios from being highly-concentrated in financingto the corporate sector towards greater retail financing to households (See Figure5). In addition, banks have been actively introducing various financing packagesto expand market share. The favourable conditions in the economy has alsospurred numerous residential developments, thus increasing the availability andchoices of residential properties and hence demand for housing loans.
Figure 6Annual Growth of Household Loans
Source: Bank Negara Malaysia

73
The steep decline in growth of household loans as seen in Figure 6 was dueto high base effect. In 2001, demand for household loans flourished due to thelow interest rate environment with financial institutions offering competitivehousing loan packages with lower margin requirements and longer tenure. Otherincentives included withdrawals of EPF funds for the purchase of a secondhouse provided the first house has been sold; exemption from stamp duties;lifting limitations for financial institutions to finance the construction of residentialproperties priced above RM250,000 each and shop houses within residentialareas; and allowing proceeds from private debt securities to be used to financethe development of such properties.
4. Forces Behind the Rise of Household Indebtedness in Malaysia
To create a better understanding of household indebtedness and its possibleimplications on banks’ loan losses, we first review several possible explanatoryvariables. These variables are then run on an econometric model to identifysignificant variables contributing to household NPL levels and whether the modelestimate conforms to our expectations based on the review of these variables.The variables used were based on previous literature including Ng (2006), Endut& Toh (2009) and Debelle (2004).8
Household indebtedness in Malaysia, measured by the ratio of householddebt-to-GDP averaged 66% between January 2000 and July 2009. Meanwhile,total household loans increased gradually as depicted in Figure 7, and accountedfor 54.6% of total banking system loans as at July 2009. Household indebtednessis believed to have a positive relationship with household delinquencies level ashigher indebtedness increases the chance of default. Thus, we set the householdindebtedness to affect household NPLs with 1 quarter lag.
_______________
8. Please refer to the Appendix for list of references used.

74
Figure 7Banking System Loans to Individuals
After the Asian Financial Crisis, the average lending rate remained steadyat around 6% (See Figure 8). Lending rates, or costs of borrowing, are expectedto be the main force of household indebtedness as households are expected toborrow more when the cost of borrowing is lower. As lending rates start to rise,this trend may induce greater caution on households to incur additional or newdebts and vice-versa. Higher rates may also cause existing borrowers to facedifficulties to repay their debt, subsequently causing delinquencies. Furthermore,about 60% of banking system household loans is based on floating rates.Therefore, interest rates are expected to positively affect household NPLs. Forthis research, we use the average lending rate of Malaysian’s banking systemto represent the interest rate affecting household debt.
Figure 8Average Lending Rates (ALR) of Malaysia’s Banking System
Source: Monthly Statistical Bulletin (MSB) July 2009, Bank Negara Malaysia
Source: Bank Negara Malaysia
75
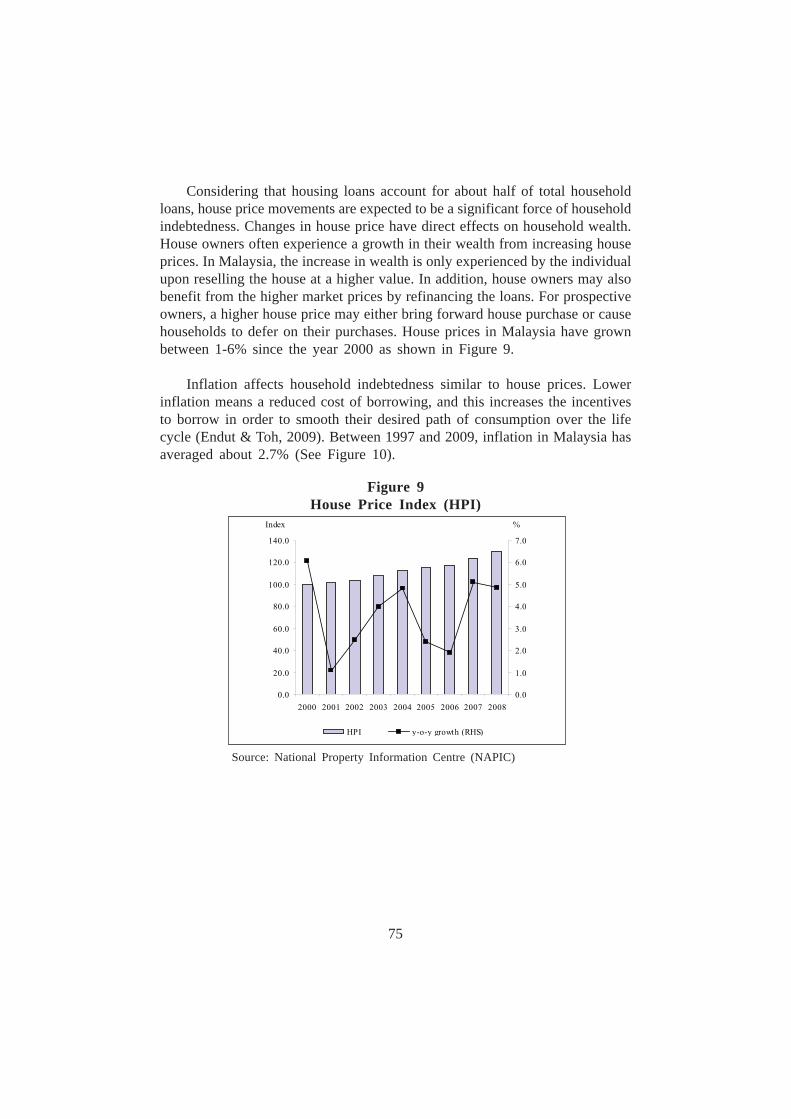
Considering that housing loans account for about half of total householdloans, house price movements are expected to be a significant force of householdindebtedness. Changes in house price have direct effects on household wealth.House owners often experience a growth in their wealth from increasing houseprices. In Malaysia, the increase in wealth is only experienced by the individualupon reselling the house at a higher value. In addition, house owners may alsobenefit from the higher market prices by refinancing the loans. For prospectiveowners, a higher house price may either bring forward house purchase or causehouseholds to defer on their purchases. House prices in Malaysia have grownbetween 1-6% since the year 2000 as shown in Figure 9.
Inflation affects household indebtedness similar to house prices. Lowerinflation means a reduced cost of borrowing, and this increases the incentivesto borrow in order to smooth their desired path of consumption over the lifecycle (Endut & Toh, 2009). Between 1997 and 2009, inflation in Malaysia hasaveraged about 2.7% (See Figure 10).
Figure 9House Price Index (HPI)
Source: National Property Information Centre (NAPIC)

76
Employment affects households’ ability to repay loans. A householdexperiencing loss of part or entire income, with insufficient buffers, wouldexperience great difficulty in repayment leading them to default on their loans.Another scenario is that people entering employment may start taking up debt,assuming that they are able to service their loan in the long term by having astable job and continuous income. This is especially true for new entrants to theworkforce. Higher household income and boosted consumer confidence induceoptimistic expectations of future income (Endut & Toh, 2009). Malaysia’semployment rate has remained stable between 3 – 4% post-Asian FinancialCrisis as shown in Figure 11.
A household’s willingness and need to borrow rely heavily on income. Higherincome also increases the capacity to service existing debts. For this paper, weuse the GDP of Malaysia as a proxy to household income due to unavailabilityof data. When GDP rises, NPL levels are expected to reduce, signifying a negativerelationship. Malaysia’s GDP has been trending upwards whilst the unemploymentrate shows some seasonality albeit stable between 1998 and 2008 (See Figure11).
Figure 10Inflation (y-o-y)
Source: CEIC

77
Figure 11Gross Domestic Product and Employment Rates
Source: Department of Statistics, Malaysia, Bank Negara Malaysia, Economic Planning Unit
5. Assessment of Household Debt Vulnerability
5.1 Aggregate Debt Repayment Ratio
Figure 12Household Indebtedness and Debt Repayment Ratio
Source: Bank Negara Malaysia
78
The debt service ratio is commonly used by banks to assess applicants’ability to repay by setting a threshold based on income level for the level of debtto be granted. For example, a 60% threshold will disallow individuals to be morethan 60% indebted out of their personal disposable income. However, data onthe total current obligations is unavailable; therefore debt repayment ratio isused to assess the repayment behaviours of households.
The debt repayment ratio equals to the total amount of loan repayments(principal and interest) by individuals to personal disposable income. The debtrepayment ratio may not accurately capture the exact servicing capacity ofhouseholds, as some individuals could either overpay or underpay their monthlyobligation. However, it still serves as a useful indicator in the place of the debtservice ratio at the aggregate level.
Between 2004 and 2008, the debt repayment ratio has continued to stabilisearound 40% as shown in Figure 12. This may indicate that the householdindebtedness to personal disposable income is relatively low, thus providing morecapacity to borrow.
Meanwhile, a higher debt service ratio may translate into having a biggerdebt obligation as a proportion of one’s income. Households’ personal disposableincome is used for living needs, and unless they have accumulated savings orsufficient liquid financial assets, any increase in a household’s debt service ratiomay increase the likelihood of a default in loans. Therefore, the debt serviceratio is expected to have a positive relationship with household NPLs.
However, given that we use the debt repayment ratio in the place of thedebt service ratio, the debt repayment ratio is expected to have an oppositeeffect on household NPLs. This is mainly because debt repayment is based onhistorical data, where households have serviced their debt in a proportion suchthat the remainder of their disposable income is sufficient to cater for their livingexpenses. Therefore, a higher debt repayment ratio may signify households beingable to service their debt at a higher proportion of their income, subsequentlylowering the chances of household delinquency occurring. Thus, the debtrepayment ratio is expected to have a negative effect on household NPLs.

79
5.2 Aggregate Asset-to-debt Ratio
Household financial assets to debt have been stable since 2004, amountingup to 2.3 times as at end 2008. Figure 13 shows the household liquid financialassets at around 1.4 times, providing ample liquidity to service sudden shortterm obligations.
5.3 NPL Rates of Different Types of Consumer Loans of CommercialBanks
Household NPL ratios for households had shown a downward trend withhousehold NPL ratio at 3.75% as at end-July 2009 (See Figure 14). This is inline with improvements in risk management practices by the banks despite therapid growth in household loans.
Figure 13Household Financial Assets to Household Debt Ratio
Source: Bank Negara Malaysia, Treasury Housing Loans Division, Employees Provident Fund,Securities Commission Malaysia and internal estimates

80
The soundness and stability of households are commonly assessed byhousehold non-performing loans to total household loans financial position (HHNPL Ratio). Increasing HH NPL levels may result in lenders holding back oncredit to household, subsequently resulting in implications to financial stability.We then attempt to understand the possible variables that influence householdNPL levels by using household NPL levels as the dependant variable in aneconometric model.
5.4 Model of Banking System’s Household Loan NPL Levels UsingAggregate Data
The data that is available is presented in three different time intervals: monthly,quarterly and yearly. The monthly and yearly data was converted into quarterlydata through averaging. The model was estimated using quarterly data from2000 Q1 to 2009 Q2. Since the model is limited to a size of 35 observations,the appropriate methodology to be used would be the Ordinary Least Squares(OLS) method.
Initially a model incorporating all the variables mentioned in Section 4 ofthis paper and debt repayment ratio was constructed using the econometric
Figure 14NPL Ratio of Household Sector in the Banking System by Purpose
Source: Bank Negara Malaysia

81
analysis software of Eviews 6. However, due to lack of goodness of fit wherethe residuals did not conform to the normality assumptions, several combinationsof variables were tested and dropped and the resultant model is as follows:
log(Household NPL)t
= β0 + β
1 (household indebtedness)
t-1 + β
2 log
(interest rate)
t
+ β3
(debt repayment ratio)t + β
4 log(inflation)
t + β
5
log(income)t
log(Household NPL)t
= 12.7717 + 2.2698 (household indebtedness) t-1
+ 0.3772log(average lending rate)
t
- 1.6706 (debt repayment ratio)t - 0.0608 log(inflation)
t – 0.3825
log(gross domestic product)t
The model estimate shows a good fit and has a significant p-value andadjusted R2 of 0.82. Using Breusch-Godfrey Serial Correlation LM Test, theindependent variables were tested and found to have no correlation with theresiduals at the 95% confidence level.
Table 2Ordinary Least Squares of Household NPL with 95%
Confidence Level
*denotes significant independent variables

82
Figure 15Graph of Actual, Fitted and Residuals
The empirical model confirms several assumptions made in the review. Themodel shows a positive relationship between the level of household NPLs withhousehold indebtedness and interest rates. As households become more indebted,there is a higher possibility for household loans to turn non-performing.
Higher interest rates may also increase the likelihood of delinquencies ashigher interest rates result in higher obligations in servicing debt for households.Whilst the model estimates that interest rate is not a significant independentvariable for household NPLs, the variable was kept in the model as it has sufficientexplanatory powers given that about 60% of household loans are based on floatinginterest rates. Thus, the loan service obligations are directly affected by interestrate movements which may subsequently affect household NPLs.
On the other hand, the debt repayment ratio, inflation and gross domesticproduct negatively affect household NPL level. The opposite effect of GDP andhousehold NPL signifies that the nation’s growth helps to keep household NPLat moderate levels. This also conforms to our hypothesis where increase inincome or GDP lowers NPL levels.

83
The opposite effect of inflation suggests that inflation increases householdwealth, therefore positively affecting their capability to service their debt. Lastly,the negative relationship between the debt repayment ratio and household NPLsdepicts that an increase in the debt repayment ratio results in a decrease in HHNPLs as expected. The significance of the debt repayment ratio shows that theratio is a very useful indicator to assess the debt servicing capability ofhouseholds.
6. Implications to Financial Stability
Household lending has significantly grown over the decade, and constitutesat least half of bank loans as at July 2009. The growing trend raises the concernon whether the quality of the household debt is sustainable. With householdassets generally growing as well, the household sector is becoming more sensitiveto macroeconomic indicators such as interest rates, income and inflation. Thisexposure creates vulnerability to the household sector as a whole, possibly causingimplications on other sectors within the financial system.
In the event of an unfavourable occurrence, the following depicts an exampleof the linkages of the household sector to financial stability concerns - a significantincrease in household NPL levels could lead to financial instability. High levelsof household NPLs would drain up provisions and buffers set by financialinstitutions, depleting their capital. In return, banks become unwilling to providefinancing, leading to credit constraint on the household sector and even othereconomic sectors as capital is eroded. The financial institutions’ role in financialintermediation will be compromised as a result. The effects may then spilloverinto the property sector as home owners and/or lender begin to flood the marketwith properties for sale. As financial institutions become more reluctant to lendto households, the demand for properties and automotives may also be reduced.
With decreased access to financing, households may draw out savings anddeposits for consumption of goods and services, creating a need for banks tohave the agility to rebalance their funding and liquidity strategies.
With the household sector’s high significance in the financial system, vigilantmonitoring, assessment of the sector and thorough understanding of linkages isextremely important to preserve financial stability. The interlinkages of thehousehold sector can be described in Figure 16.

84
This paper examines the variables that could significantly affect householdNPLs, as household NPL levels are one of the key indicators in determining thesustainability of household indebtedness. By identifying potential variables andassessing their implication on household NPLs, these variables may serve asindications or early warnings on changes in NPL levels. We then ascertainedthat household indebtedness, interest rates, debt repayment ratio, inflation andGDP are the important variables to consider. The trends of these variables remainrelatively stable whilst the HH NPL ratio trended downward. Thus, householdindebtedness does not pose a concern to financial stability at this point in time.
7. Policy Implications
Bank Negara Malaysia has implemented measures to manage the potentialrisks arising from household indebtedness. These measures are aimed atfacilitating the assessment of individual’s credit standing and to promote financialliteracy.
The Central Credit Reference Information System (CCRIS) becameoperational in October 2001. The CCRIS is a database that stores all creditinformation and history of a borrower. Financial institutions are able to look upa potential borrower’s current credit status and history, and assess their capabilityto repay their loans. With CCRIS, lenders are able to practice better riskassessment of borrowers.
Figure 16Interlinkages in the Financial Sector
Source: Bank Negara Malaysia
85
Informative channels such as BankingInfo and InsuranceInfo wereestablished to enhance financial education and literacy. These information portalsalso facilitate decision making by households. Households are able to seekfinancial advice through BNMLINK and TELELINK. Ongoing schoolprogrammes like DuitSaku aim to nurture financial understanding from a youngage.
In 2006, BNM established the Credit Counselling and Debt ManagementAgency (CCDMA) to provide counseling and advice to individuals on issuesrelated to financial management, debt management and financial education. Theexistence of CCDMA continues to equip the public with financial know-howand its results are seen with the better management of personal finance thatcontinues to keep NPL rates low. Since its inception, there has been growingawareness among the banking public of the importance of maintaining financialdiscipline to avoid being overly indebted as well as the banks’ readiness torestructure loans. Given the experiences and the relationships built with financialinstitutions since its establishment, the CCDMA is well-positioned to handleincreased demand for debt counselling and restructuring should the economicenvironment face greater challenges.
There is a dedicated division in BNM that is accountable for financial stabilitymandate, with functions distributed across several departments. In 2006, atransformation exercise was undertaken to facilitate a more integrated, holisticand harmonised approach to regulation and supervision and thereby furtherstrengthen the conduct of financial stability within BNM. This transformationexercise has now yielded positive results. The macroprudential orientation andconduct of surveillance was further enhanced with the setting up of the FinancialSurveillance Department in late 2006. The Department is entrusted to undertakecomprehensive and integrated identification of vulnerabilities and the calibrationof assessment methodologies via collaborative mechanisms within BNM andwith domestic regulators to facilitate robust assessment of the risks emanatingfrom domestic and international developments on the overall stability andfunctioning of the financial system. As part of its overall surveillance framework,the Department also works closely with the supervisors to ensure that riskassessment incorporates and integrates both macroprudential and microprudentialperspectives.
Efforts to enhance data collection at a more granular level on the householdfinancial position are currently underway, in collaboration with other relevantauthorities to obtain information by income levels and social segments. Financial

86
institutions’ risk management practices and tools are reviewed and developedfor improvement in assessing credit risk and adapting to changing environments.
8. Conclusions
The rising trend of household indebtedness has prompted more studies andmore rigorous assessments of the household sector. The increasing lending tohousehold depicts a growing economy with ample circulation of funds. A robusteconomy, coupled with high savings of households, have enabled households toaccumulate more debts. In addition, household lending is generally seen as lowrisk as borrowers are fragmented, and their loan amount is considerably smalleras compared to business loans. Therefore, it would require a very adverseslowdown in the economy to result in major losses on the households’ portfolioof the financial institutions.
Statistically, the rise may be explained by the trends in household debt-to-GDP, interest rates, debt repayment ratio, inflation and income. This study hashelped to identify and assess several variables that influence household NPLs.The identification of these variables also enhanced understanding of theinterlinkages between economic data with financial indicators.
Efforts to enhance household data collection at a granular level remain apriority to facilitate an in-depth understanding of the issues and any potentialconcerns on a particular income group. Micro data enables analysis on thestructure and assessment of the mismatch between assets and liabilities ofhouseholds. Besides that, identification of the proportion of individuals with over-accumulation of wealth, its risks and possible consequences to the economy canbe assessed. Valuable insights about how institutions and policies affect thetransmission of shocks and the distribution of risks can be better understood.Reliable data on households’ wealth, income and consumption can provideimportant input into central banks’ policies, ranging from monetary policy tofinancial stability and payment systems policy. Meanwhile, BNM is continuouslyenhancing its assessments of the debt servicing capacity of the household sectorin order to identify any emerging risks to financial stability.
As the household sector continues to be increasingly important to the financialsector, vigilant monitoring and proper assessments are vital. By ensuring adequaterisk management systems such as credit scoring, the banks are able to managerisks in a changing economic landscape, thus ensuring a resilient financial system.

87
REFERENCES
Bank Negara Malaysia, Financial Stability and Payment Systems Report, (2006,2007, 2008).
Bank Negara Malaysia, Annual Report, 2001.
Bank Negara Malaysia, Monthly Statistical Bulletin, July 2009.
Debelle, Guy, (2004), “Household Debt and the Macroeconomy”, BIS QuarterlyReview, March.
Endut, Norhana and Toh Geok Hua, (2009), “Household Debt in Malaysia’, BISPapers No.46, May 2009.
International Monetary Fund, (2006), Financial Soundness Indicators: CompilationGuide. http://www.imf.org/external/pubs/ft/fsi/guide/2006/index.htm
International Monetary Fund, (2006), “Household Credit Growth in EmergingMarket Countries”, Chapter II, Global Financial Stability Report.
Jacobsen, Dag Henning and Bjorn E. Naug, (2004), “What Influences the Growthof Household Debt?”, Economic Bulletin, October.
Ng, Allen, (2006), Housing and Mortgage Markets in Malaysia, January.
OECD, (2006), “Has The Rise in Debt Made Households More Vulnerable?”,Chapter III, OECD Economic Outlook No. 80.
Raj, Sharon and Lionel Price, (2004), “Rising Household Debt in the AdvancedEconomies: Does it Matter?”, Fitch Ratings Sovereigns Special Report,July.

88
Appendix
Explanation and Definitions of Data and Ratios