the determinants of financial inclusion in selected african ...
335
THE DETERMINANTS OF FINANCIAL INCLUSION IN SELECTED AFRICAN COUNTRIES by KOSMAS NJANIKE submitted in accordance with the requirements for the degree of DOCTOR OF PHILOSOPHY in the subject of MANAGEMENT STUDIES at the UNIVERSITY OF SOUTH AFRICA Supervisor: Prof R.T. Mpofu June 2021
-
Upload
khangminh22 -
Category
Documents
-
view
0 -
download
0
Transcript of the determinants of financial inclusion in selected african ...
THE DETERMINANTS OF FINANCIAL INCLUSION IN
SELECTED AFRICAN COUNTRIES
by
KOSMAS NJANIKE
submitted in accordance with the requirements
for the degree of
DOCTOR OF PHILOSOPHY
in the subject of
MANAGEMENT STUDIES
at the
UNIVERSITY OF SOUTH AFRICA
Supervisor: Prof R.T. Mpofu
June 2021

i
DECLARATION
Name: Kosmas Njanike
Student number: 50401521
Degree: Doctor of Philosophy (PhD) in Management Studies
I, the undersigned, declare that this thesis entitled,
“Determinants of financial inclusion in selected African countries”
is my own work, and that all the sources I have used or cited have been indicated and
acknowledged by means of complete references.
I further declare that I submitted the thesis to originality checking software and that it
falls within the accepted requirements for originality.
I further declare that I have not previously submitted this work, or part of it, for
examination at UNISA for another qualification or at any other higher education
institution.
13 September 2021
_______________________________ ____________________________
Signature Date
ii
ACKNOWLEDGEMENTS
My sincere appreciation goes to the following persons:
(1) My supervisor, Professor Raphael Mpofu, who provided guidance throughout this
energy-draining journey. Without his assistance, completing this thesis would have
been an impossible task.
(2) Dr Terrence Kairiza, a lecturer at Bindura University of Science Education,
Zimbabwe. He offered useful econometric advice at different stages of this thesis.
(3) Professor Tsaurai from the department of Finance, Risk Management and Banking
of the University of South Africa for his assistance during the early stages of the thesis.
(4) My wife, Melisa and my children, for all their moral support and understanding.

iii
DEDICATION
I dedicate this thesis to my parents, Mr Simon and Mrs Spinola Njanike, both of whom
not only taught me but also inspired me to work hard and achieve results.
iv
ABSTRACT
This thesis investigated the determinants of financial inclusion with the emphasis on
social networks in selected African countries, namely, the Democratic Republic of the
Congo, Kenya, Eswatini and South Africa. Many individuals in Africa are still excluded
from using formal financial services. Low financial inclusion can result in income
disparity, poverty and sluggish economic growth. The purpose of this study was to
comprehend and explain financial inclusion, while examining the effects of social
networks on financial inclusion. An empirical exploration was conducted to establish
theoretically hypothesised relationships. The study contributed to the existing body of
literature in that it determined the contribution of social networks to individual financial
inclusion, a topic which had not been explored adequately.
Probit models were run, using Finscope Surveys data to estimate the determinants of
financial inclusion in the selected African countries. The following variables were
considered: age, gender, marital status, proof of residence, bank access, location,
education status, social networks, getting financial advice, monthly salary, annual
income, access to internet and the use of mobile phones. Linear probability models
were used to check for robustness. Robust consistent errors were used to reduce the
effect of heterogeneity.
The use of merged data showed that social networks significantly influence financial
inclusion in most of the selected African countries, with the exception of the
Democratic Republic of the Congo, although a relationship was found to exist. The
results also showed that the variable ‘access to internet’ is significant in all country
datasets, except for the DRC. The variable ‘getting financial advice’ is significant in all
five datasets.
The study recommends that the governments of the countries studied invest in
improving the information and communications technology infrastructure in their
countries in order to improve access to financial services and the use thereof. Finally,
as part of financial inclusion, concerted efforts should be made to disseminate financial
advice through the internet and social media platforms to influence how financial
decisions or choices are made.
Keywords: financial inclusion; determinants; Africa; Democratic Republic of Congo,
Eswatini; Kenya
v
KAKARETSO
Phuputso ena e batlisitse mabaka a kenyeletso ya ditjhelete ka toboketso ya
dikgokahano tsa setjhaba dinaheng tse kgethilweng tsa Afrika, e leng, Rephabliki ya
Demokrasi ya Congo, Kenya, Eswatini le Afrika Borwa. Batho ba bangata Afrika ba
ntse ba qhelelwa ka thoko tshebedisong ya ditshebeletso tsa ditjhelete e
hlophisitsweng. Kenyeletso e tlase ya ditjhelete e ka baka ho se lekane ditabeng tsa
ditjhelete, bofuma le kgolo e monyebe ya moruo. Sepheo sa phuputso ena e ne e le
ho utlwisisa le ho hlalosa kenyeletso ya ditjheleteng, ha ho ntse ho hlahlojwa diphello
tsa dikgokahano tsa setjhaba kenyeletsong ya ditjhelete. Patlisiso ya dinnete e ile ya
etswa ho theha dikamano tse inahanelwang tsa mehopolo. Phuputso e kentse letsoho
dingodilweng tse teng ka hore e lekantse tlatsetso ya dikgokahano tsa setjhaba ho
kenyeletso ya ditjhelete ka bomong, sehlooho se neng se sa hlahlojwa ka ho lekana.
Mokgwa wa tshusumetso o ile wa etswa, ho sebediswa dintlha tsa Diphuputso tsa
Finscope ho hakanya ditekanyo tsa kenyeletso ya ditjhelete dinaheng tse kgethilweng
tsa Afrika. Ho ile ha nahanwa ka dikarolo tse latelang: dilemo, bong, boemo ba lenyalo,
bopaki ba bodulo, phihlello ya banka, sebaka, boemo ba thuto,dikgokahano tsa
setjhaba, ho fumana dikeletso tsa ditjhelete, moputso wa kgwedi, lekeno la selemo,
phihlello ya inthanete le tshebediso ya mehala ya thekeng. Mekgwa e fapaneng ya
menyetla e ile ya sebediswa ho lekola matla. Diphoso tse matla tse tsitsitseng di
sebedisitswe ho fokotsa phello ya ho fapana.
Tshebediso ya dintlha tse kopaneng e bontshitse hore dikgokahano tsa setjhaba di
susumetsa kenyeletso ya ditjhelete dinaheng tse ngata tse kgethilweng tsa Afrika, ntle
le Rephabliki ya Demokrasi ya Congo, leha ele hore kamano e fumanwe e le teng.
Diphetho di boetse di bontshitse hore 'phihlello ya inthanete' e fapaneng e bohlokwa
ho disete tsa dintlha tsohle tsa dinaha, ntle le DRC. Mofuta o fapaneng wa 'ho fumana
keletso ya ditjhelete' o bohlokwa ho disete tsohle tsa dintlha tse hlano.
Phuputso e kgothaletsa hore mebuso ya dinaha tse ithutilweng e tsetele ho ntlafatseng
meralo ya theknoloji ya tlhahisoleseding le dikgokahano dinaheng tsa yona e le ho
ntlafatsa phihlello ya ditshebeletso tsa ditjhelete le tshebediso ya tsona. Qetellong, e
le karolo ya kenyeletso ya ditjhelete, ho lokela hore ho etswe boiteko bo
kopanetsweng ho phatlalatsa keletso ka tsa ditjhelete ka inthanete le dithala tsa

vi
metjha ya phatlalatso ya ditaba tsa setjhaba ho susumetsa hore na diqeto tsa
ditjhelete kapa dikgetho di etswa jwang.
Mantswe a sehlooho: kenyeletso ya ditjhelete; ditekanyo; Afrika; Rephabliki ya
Demokrasi ya Congo, Eswatini; Kenya
vii
ISIFINQO
Lo mqondo uphenye izinkomba zokufakwa kwezezimali kugcizelelwa ukuxhumana
nabantu emazweni akhethiwe ase-Afrika, okungukuthi, iDemocratic Republic of the
Congo, Kenya, ESwatini kanye neNingizimu Afrika. Abantu abaningi e-Afrika
basabekelwe nxanye ekusebenziseni izinsizakalo ezisemthethweni zezezimali.
Ukufakwa kwezezimali okuphansi kungaholela ekungalingani kwemali engenayo,
ubumpofu kanye nokukhula komnotho okuntengantengayo. Inhloso yalolu cwaningo
bekuwukuqonda nokuchaza ukufakwa kwezezimali, ngenkathi kubhekwa imiphumela
yokuxhumana nabantu ekufakweni kwezezimali. Ukuhlola okwenziwe ngamandla
kwenziwa ukuze kusungulwe ubudlelwano obucatshangelwayo. Ucwaningo lube
nomthelela ohlakeni lwezincwadi olukhona ngoba lunqume umnikelo wokuxhumana
nabantu ekufakweni kwezezimali ngakunye, isihloko ebesingakahlolwa ngokwanele.
Amamodeli kaProbit aqhutshwa, kusetshenziswa idatha yeZinhlolovo zikaFinscope
ukulinganisa izinkomba zokufakwa kwezezimali emazweni akhethiwe ase-Afrika.
Lokhu okuguqukayo okulandelayo kubhekiwe: ubudala, ubulili, isimo somshado,
ubufakazi bendawo yokuhlala, ukufinyelela kwebhange, indawo, isimo semfundo,
ukuxhumana nomphakathi, ukuthola izeluleko ngezezimali, umholo wanyanga zonke,
imali engenayo yonyaka, ukufinyelela kuyi-inthanethi nokusetshenziswa
komakhalekhukhwini. Amamodeli wamathuba wokulinganisa asetshenziselwe
ukubheka ukuqina. Kusetshenziswe amaphutha angaguquki aqinile ukunciphisa
umphumela wokungafani.
Ukusetshenziswa kwemininingwane ehlanganisiwe kukhombisile ukuthi ukuxhumana
nomphakathi kunomthelela omkhulu ekufakweni kwezezimali emazweni amaningi
ase-Afrika akhethiwe, ngaphandle kweDemocratic Republic of the Congo, yize
kwatholakala ukuthi kukhona ubudlelwano. Imiphumela futhi ikhombise ukuthi
okuguquguqukayo 'ukufinyelela kuyi-inthanethi' kubalulekile kuwo wonke amasethi
wedatha wezwe, ngaphandle kweDRC. Ukuhlukahluka 'kokuthola izeluleko
zezezimali' kubalulekile kuwo wonke amasethi wedatha amahlanu.
Ucwaningo luncoma ukuthi ohulumeni bamazwe abafundile batshale imali ekwenzeni
ngcono ingqalasizinda yezobuchwepheshe bezokwazisa nokuxhumana emazweni
abo ukuze kuthuthukiswe ukutholakala kwezinsizakalo zezezimali nokusetshenziswa
kwazo. Ekugcineni, njengengxenye yokufakwa kwezezimali, kufanele kwenziwe

viii
imizamo ebumbene yokusabalalisa izeluleko zezezimali nge-inthanethi kanye
nezinkundla zokuxhumana ukuze kube nomthelela ekutheni izinqumo zezimali noma
ukukhetha kwenziwa kanjani.
Amagama abalulekile: ukufakwa kwezezimali; izinkomba; Afrika; Democratic
Republic of Congo, Eswatini; Kenya
ix
TABLE OF CONTENTS
DECLARATION ....................................................................................................................... I
ACKNOWLEDGEMENTS ...................................................................................................... II
DEDICATION ......................................................................................................................... III
ABSTRACT ........................................................................................................................... IV
KAKARETSO ......................................................................................................................... V
ISIFINQO .............................................................................................................................. VII
TABLE OF CONTENTS ........................................................................................................ IX
LIST OF FIGURES .............................................................................................................. XIII
LIST OF TABLES ................................................................................................................ XIV
DEFINITION OF TERMS ...................................................................................................... XV
LIST OF ABBREVIATIONS AND ACRONYMS ................................................................. XVII
INTRODUCTION AND BACKGROUND TO THE STUDY .............................. 1
1.1 INTRODUCTION ........................................................................................................... 1
1.2 RESEARCH THEMES AND QUESTIONS.................................................................... 5
1.2.1 Theme I: Testing for differences in the study variables across countries ............ 6
1.2.2 Theme II: Determinants of financial inclusion in selected African countries ........ 6
1.2.3 Theme III: Determinants of FI in each of the selected countries .......................... 6
1.3 RESEARCH OBJECTIVES ........................................................................................... 7
1.4 JUSTIFICATION FOR THE STUDY ............................................................................. 7
1.5 STRUCTURE OF THESIS .......................................................................................... 10
1.6 CONCLUSION ............................................................................................................ 12
FINANCIAL INCLUSION AND ECONOMIC DEVELOPMENT: THEORETICAL AND EMPIRICAL REVIEW ................................................................................... 13
2.1 INTRODUCTION ......................................................................................................... 13
2.2 OVERVIEW OF FINANCIAL INCLUSION .................................................................. 13
2.2.1 Dimensions of financial inclusion ....................................................................... 15
2.2.2 Levels of financial inclusion ............................................................................... 16
2.3 FINANCE AND GROWTH THEORIES ....................................................................... 19
2.3.1 Purpose of financial inclusion ............................................................................ 19
2.3.2 Financial development and economic growth .................................................... 25
2.4 POVERTY REDUCTION THEORIES .......................................................................... 33
2.4.1 The Minority Group Theory ................................................................................ 34
2.4.2 Classical Theory ................................................................................................ 35
2.4.3 Orthodox Economic Theory ............................................................................... 35
2.4.4 The Functionalist Approach ............................................................................... 36
x
2.5 RISK MANAGEMENT ROLE OF FINANCIAL INSTITUTIONS .................................. 37
2.5.1 Risk management in the financial sector ........................................................... 38
2.5.2 Role of inclusive financial systems in developing economies ............................ 39
2.6 FINANCIAL SYSTEMS AND ECONOMIC GROWTH ................................................ 42
2.7 DISTRIBUTION OF RESOURCES FOR DEVELOPMENT ........................................ 46
2.7.1 The indirect channel ........................................................................................... 46
2.7.2 The direct channel ............................................................................................. 48
2.8 BANKING THEORIES ................................................................................................ 55
2.8.1 The banking system ........................................................................................... 55
2.8.2 Theories of saving and consumption behaviour ................................................ 59
2.9 ROLE OF SOCIAL NETWORKS IN FINANCIAL INCLUSION .................................. 62
2.10 COMPLICATIONS IN SELECTING THE MOST APPROPRIATE THEORY .............. 66
2.10.1 Theories relevant to the current study ............................................................... 66
2.11 CONCLUSION ............................................................................................................ 68
FINANCIAL INCLUSION AND FINANCIAL SECTOR GROWTH: THEORETICAL AND EMPIRICAL REVIEW ......................................................... 70
3.1 INTRODUCTION ......................................................................................................... 70
3.2 THE FUNDAMENTAL ROLE OF FINANCIAL ACCESS ............................................ 70
3.3 THEORIES OF SOCIAL NETWORKS ........................................................................ 75
3.3.1 Social network theories and models .................................................................. 75
3.3.2 Social networks and behaviour change ............................................................. 79
3.3.3 Social networks and online community .............................................................. 82
3.4 THE HARROD-DOMAR THEORETICAL FRAMEWORK .......................................... 84
3.4.1 Financial Intermediation Theory ......................................................................... 87
3.5 DETERMINANTS OF FINANCIAL INCLUSION ......................................................... 90
3.5.1 Empirical work that included social networks ................................................... 108
3.6 MODELS AND FORMS OF SAVING ........................................................................ 112
3.6.1 The Life-Cycle Hypothesis (LCH) .................................................................... 112
3.6.2 Precautionary savings models ......................................................................... 113
3.7 CONCLUSION .......................................................................................................... 116
RESEARCH METHODOLOGY .................................................................... 118
4.1 INTRODUCTION ....................................................................................................... 118
4.2 SUMMARY OF VARIABLES .................................................................................... 119
4.3 MAIN VARIABLES APPLIED IN THE RESEARCH ................................................. 121
4.3.1 Factors incorporated in the research model .................................................... 122
4.4 DATA SOURCES ...................................................................................................... 131
4.4.1 Reliability and validity ....................................................................................... 133
4.4.2 Heteroskedasticity ............................................................................................ 133
4.5 MULTICOLLINEARITY BETWEEN THE EXPLANATORY VARIABLES ................ 136
xi
4.6 THE ENDOGENEITY PROBLEM ............................................................................. 137
4.7 MISSING VALUE ANALYSIS ................................................................................... 138
4.8 THE PROBIT/LOGIT MODEL ................................................................................... 141
4.8.1 The Logit Model ............................................................................................... 142
4.8.2 The Probit Model .............................................................................................. 143
4.8.3 Models used in previous studies ...................................................................... 143
4.9 RESEARCH DESIGN AND APPROACH ................................................................. 145
4.9.1 Unit of analysis ................................................................................................. 146
4.10 GENERAL MODEL ARRANGEMENT OF FI FUNCTION ........................................ 146
4.10.1 Factors influencing financial inclusion .............................................................. 147
4.10.2 Hypotheses ...................................................................................................... 148
4.10.3 Data explanation and analysis ......................................................................... 150
4.10.4 Multicollinearity between the independent variables ........................................ 152
4.10.5 Testing for differences ..................................................................................... 152
4.10.6 Robustness checks .......................................................................................... 153
4.11 CONCLUSION .......................................................................................................... 153
ESTIMATION AND EMPIRICAL RESULTS ................................................ 155
5.1 INTRODUCTION ....................................................................................................... 155
5.2 PRELIMINARY ESTIMATION DIAGNOSTICS ......................................................... 155
5.2.1 Descriptive data ............................................................................................... 155
5.3 THEME I: DIFFERENCES IN THE STUDY VARIABLES ......................................... 163
5.3.1 Correlation among the key variables ............................................................... 164
5.3.2 Testing for differences in the study variables across countries........................ 174
5.4 THEME II: DETERMINANTS OF FI IN SELECTED AFRICAN ECONOMIES ......... 179
5.4.1 Estimated empirical results .............................................................................. 180
5.4.2 Empirical results for selected African countries ............................................... 181
5.5 THEME III: DETERMINANTS FOR FINANCIAL INCLUSION IN EACH OF THE SELECTED COUNTRIES ......................................................................................... 185
5.5.1 Data estimation and analysis for Kenya ........................................................... 186
5.5.2 Data estimation and analysis for the DRC ....................................................... 189
5.5.3 Data estimation and analysis for South Africa ................................................. 192
5.5.4 Data estimation and analysis for Eswatini ....................................................... 195
5.6 CONCLUSION .......................................................................................................... 198
DISCUSSION OF RESULTS ....................................................................... 200
6.1 INTRODUCTION ....................................................................................................... 200
6.2 THEME 1: DIFFERENCES IN THE STUDY VARIABLES ACROSS COUNTRIES . 200
6.3 THEME II: DETERMINANTS OF FINANCIAL INCLUSION IN SELECTED AFRICAN COUNTRIES ............................................................................................................. 204
6.3.1 Social network and financial inclusion ............................................................. 216
xii
6.4 THEME III: DETERMINANTS OF FINANCIAL INCLUSION IN EACH OF THE SELECTED AFRICAN COUNTRIES ........................................................................ 217
6.4.1 Social networks and financial inclusion ............................................................ 224
6.5 CONCLUSION .......................................................................................................... 225
CONCLUSION, IMPLICATIONS AND DIRECTION FOR FURTHER STUDY ............................................................................................................................. 227
7.1 CONCLUSION .......................................................................................................... 227
7.1.1 Theme I ............................................................................................................ 228
7.1.2 Theme II ........................................................................................................... 229
7.1.3 Theme III .......................................................................................................... 232
7.2 STUDY CONTRIBUTIONS AND IMPLICATIONS .................................................... 233
7.2.1 Theoretical implications ................................................................................... 233
7.3 METHODOLOGICAL IMPLICATIONS ..................................................................... 236
7.4 POLICY AND MANAGERIAL IMPLICATIONS ........................................................ 237
7.4.1 Policy implications ............................................................................................ 237
7.4.2 Managerial implications ................................................................................... 243
7.5 STUDY LIMITATIONS .............................................................................................. 246
7.6 DIRECTION FOR PROSPECTIVE STUDIES ........................................................... 247
REFERENCES ................................................................................................................... 250
APPENDIX A: ETHICAL CLEARANCE CERTIFICATE .............................................. 298
APPENDIX B: SOURCE, INDICATION FOR AND AGAINST KEY FI THEORIES ..... 300
APPENDIX C: TESTS FOR HETEROGENEITY .......................................................... 302
APPENDIX D: MISSING VALUE ANALYSIS & IMPUTED VALUES .......................... 303
APPENDIX E: CHECKING FOR MULTICOLLINEARITY ............................................ 306
APPENDIX F: FINSCOPE QUESTIONNAIRE, DIMENSIONS AND VARIABLES ...... 310
APPENDIX G: EXPLANATORY VARIABLES ............................................................. 313
APPENDIX H: FINSCOPE DATA SETS SECTION ..................................................... 315
APPENDIX I: DECLARATION OF PROFESSIONAL EDIT ........................................ 316
xiii
LIST OF FIGURES
Figure 1.1: Organisation of thesis ...................................................................................... 11
Figure 2.1: Categories of causes of low financial inclusion .............................................. 17
Figure 2.2: Key theories discussed in literature review ..................................................... 18
Figure 2.3: Financial inclusion virtuous cycle .................................................................... 22
Figure 2.4: The Financial Intermediation Theory of Banking ............................................. 56
Figure 3.1: Association among foreign capital flows, financial markets and development 86
xiv
LIST OF TABLES
Table 4.1: Summary of probit/logit models used in previous studies .............................. 120
Table 4.2: Summary of independent variables ............................................................... 121
Table 4.3: Summary of operationalisation and measurement of study variables ........... 129
Table 4.4: Summary of financial inclusion proxies ......................................................... 131
Table 5.1: Descriptive statistics ...................................................................................... 156
Table 5.2: Combined pairwise correlations .................................................................... 165
Table 5.3: Pairwise correlations: DRC ........................................................................... 167
Table 5.4: Pairwise correlations: Kenya ......................................................................... 169
Table 5.5: Pairwise correlations: South Africa ................................................................ 171
Table 5.6: Pairwise correlations: Eswatini ...................................................................... 173
Table 5.7: Analysis of variance (ANOVA) of study variables ......................................... 176
Table 5.8: Linear Probability Model (LPM) on determinants of financial inclusion: combined ...................................................................................................................... 182
Table 5.9: Linear Probability Model (LPM) and Probit Regression on determinants of FI: Kenya ............................................................................................................ 186
Table 5.10: Linear Probability Model (LPM) and Probit Regression on determinants of FI: DRC ............................................................................................................... 189
Table 5.11: Linear Probability Model (LPM) and Probit Regression on determinants of FI: South Africa .................................................................................................... 193
Table 5.12: Linear Probability Model (LPM) and Probit Regression and determinants of FI: Eswatini .......................................................................................................... 196
xv
DEFINITION OF TERMS
Financial inclusion
According to Gwalani and Parkhi (2014:372), financial inclusion is the process of
ensuring that timely and adequate credit financial services as needed by vulnerable
groups (weaker sections and low income) are available at an affordable cost. The
International Monetary Fund (IMF) (2015:4) defined financial inclusion as the access
to and use of formal financial services by households and firms. Financial inclusion
has also been described as individuals and businesses having access to useful and
affordable financial products and services, including transactions, savings, payments,
credit and insurance, that meet their needs and that are delivered in a responsible and
sustainable way (World Bank, 2014; 2017a; ADB, 2013, Cámara & Tuesta, 2014).
Having reasonable access to all the important financial services is terms as being
financially included because once-off access to some financial services does not
construe financial inclusion in the true sense (Demirguc-Kunt, Klapper & Singer,
2013).
For the purposes of the current study, financial inclusion is defined as the delivery of
appropriate formal financial services to all segments of the society, thereby meeting
their savings, investment and credit requirements, financial literacy levels and
convenience needs in a responsible and sustainable way.
Financial exclusion
This describes the inability of individuals, households or groups to access appropriate
formal financial services (Sarma, 2012; Chakraborty, 2010).
Hedonicity
The word describes the level of satisfaction or pleasure in the use of formal financial
services. The sense of wellbeing is based on the idea that increased pleasure and
decreased pain lead to satisfaction. The concept of hedonicity is based on the notion
of subjective wellbeing. An individual experiences happiness when positive effects and
satisfaction with financial services are both high (Carruthers & Hood, 2004:229).
xvi
Pragmaticity
Pragmaticity refers to the degree of consideration of words and thoughts as tools and
instruments for prediction, problem-solving, and action. The word describes the level
of rejection of the idea that the function of thought is to pronounce, represent, or mirror
reality in financial matters. Pragmaticity can be obtained when arriving at the
conclusion that a high level of satisfaction has been achieved from the use of formal
financial services. If one analyses the theory of pragmatism, it is clear that it is common
to defend the rights of reason and morality (Hampden-Turner & Trompenaars, 2000;
McFall, 1987).
Social network
This is a platform that uses internet-based social media sites to connect friends, family,
colleagues, customers, or clients for a social or business purpose, or both (Musiał &
Kazienko, 2013). The networking occurs through social media sites, such as
Facebook, Twitter, LinkedIn, and Instagram.
xvii
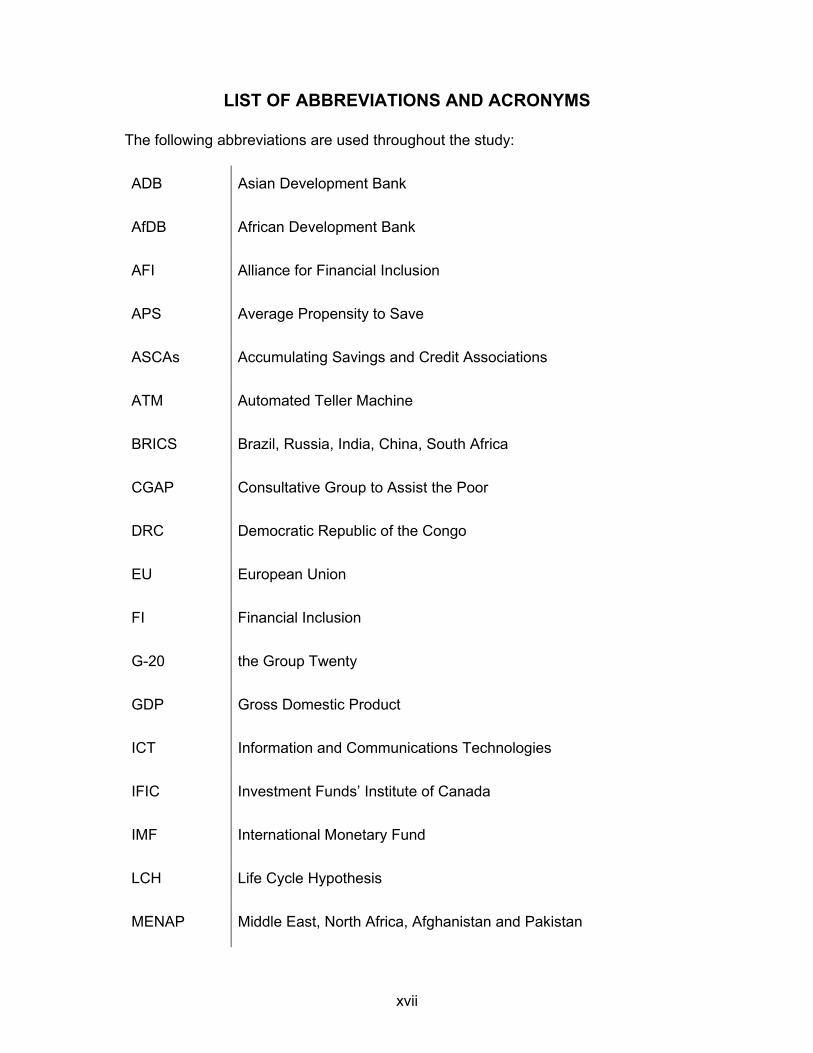
LIST OF ABBREVIATIONS AND ACRONYMS
The following abbreviations are used throughout the study:
ADB Asian Development Bank
AfDB African Development Bank
AFI Alliance for Financial Inclusion
APS Average Propensity to Save
ASCAs Accumulating Savings and Credit Associations
ATM Automated Teller Machine
BRICS Brazil, Russia, India, China, South Africa
CGAP Consultative Group to Assist the Poor
DRC Democratic Republic of the Congo
EU European Union
FI Financial Inclusion
G-20 the Group Twenty
GDP Gross Domestic Product
ICT Information and Communications Technologies
IFIC Investment Funds’ Institute of Canada
IMF International Monetary Fund
LCH Life Cycle Hypothesis
MENAP Middle East, North Africa, Afghanistan and Pakistan
xviii
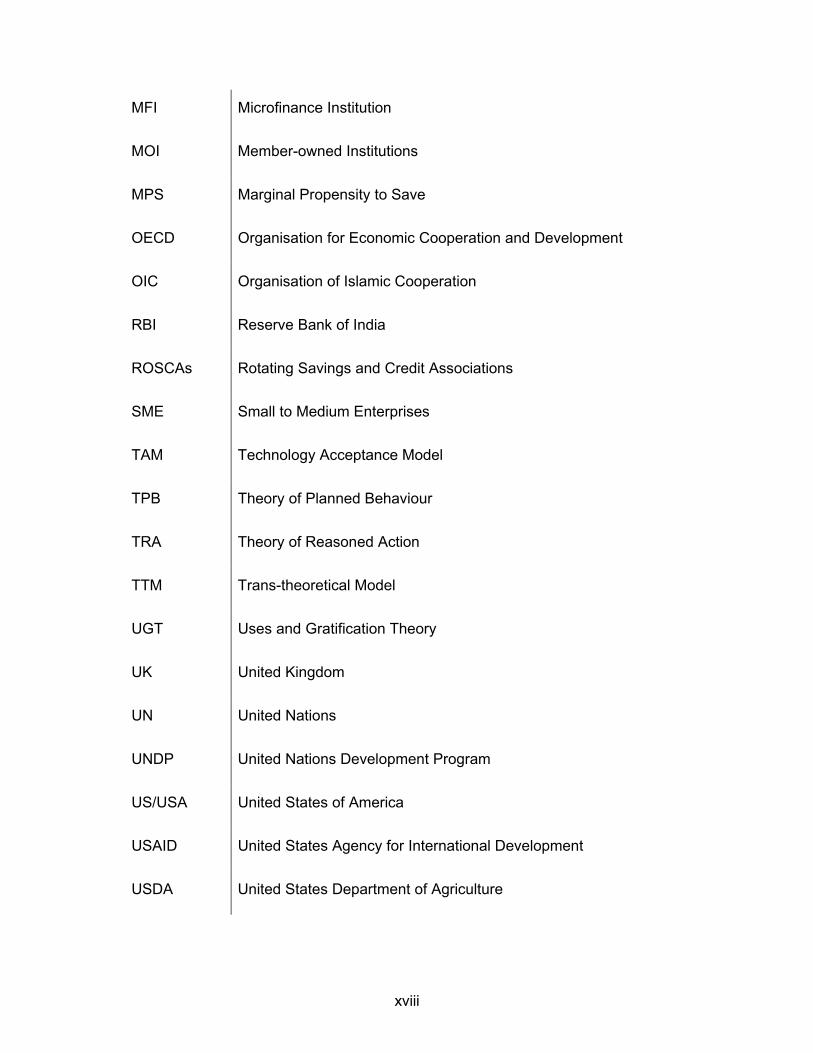
MFI Microfinance Institution
MOI Member-owned Institutions
MPS Marginal Propensity to Save
OECD Organisation for Economic Cooperation and Development
OIC Organisation of Islamic Cooperation
RBI Reserve Bank of India
ROSCAs Rotating Savings and Credit Associations
SME Small to Medium Enterprises
TAM Technology Acceptance Model
TPB Theory of Planned Behaviour
TRA Theory of Reasoned Action
TTM Trans-theoretical Model
UGT Uses and Gratification Theory
UK United Kingdom
UN United Nations
UNDP United Nations Development Program
US/USA United States of America
USAID United States Agency for International Development
USDA United States Department of Agriculture
1
INTRODUCTION AND BACKGROUND TO THE STUDY
1.1 INTRODUCTION
Globally there has been an increased focus on issues concerning financial inclusion.
According to the World Bank, the majority of people in Africa are financially excluded
(World Bank, 2017b). However, opportunities to expand the formal financial
ecosystem are increasing through the implementation of robust financial inclusion
strategies. Financial inclusion is a crucial socioeconomic issue that requires the
consideration of international institutions, governments, central banks, financial
institutions, researchers and policy-makers (World Bank, 2015; 2017a; 2018). The
absence of accessible and affordable bank accounts in a financial system can result
in obstinate income disparity, poverty and sluggish economic growth (Honohan & King,
2009; Sarma & Pais, 2010; Mihasonirina & Kangni, 2011; Hussain & Chakraborty,
2012; Rama & Pal, 2012). In addition, low levels of financial inclusion in an economy
lead to increased disparity between the poor and rich, as the population is
characterised by inequitable growth. An absence of formal accounts at individual level
may hinder formal savings, hence, a lack of access to affordable credit facilities.
Individuals can also find that some informal financial services are risky and expensive.
Existing studies have mainly focused on financial inclusion (FI) at country, regional or
continental level using supply data (Sarma & Pais, 2010; Camara & Tuesta, 2014).
However, once the level of FI has been ascertained, it is critical for decision-makers
to understand the factors that influence the decision to become financially included
(Levine, Loayza & Beck, 2000; Martinez, Hidalgo & Tuesta, 2013; Thapur, 2013). A
study by Zins and Weill (2016) examined the determinants of FI in Africa. Zins and
Weill did not include variables such as use of social networks, access to internet and
getting financial advice in their study.
Studies on the contribution of social networks to financial inclusion seem to be sparse
and lacking in literature. The current study adds to literature by investigating the
influence of social networks on FI, among other determinants, in selected African
countries. The study used sixteen proxies for the dependent variable of FI at individual
level, using four dimensions in four selected African countries. The purpose of the
2
current study was to investigate the determinants of financial inclusion, with the
emphasis on social networks in selected African countries, namely, the Democratic
Republic of the Congo (DRC), Kenya, Eswatini and South Africa.
According to Gwalani and Parkhi (2014:372), financial inclusion is the process of
allocating suitable and sufficient financial products that are required by every segment
of the population at a reasonable cost. The IMF defined financial inclusion as “the
access to and use of formal financial services by households and firms” (IMF 2015:4).
Financial inclusion has also been described as a way in which “individuals and
businesses have access to useful and affordable financial products and services that
meet their needs – transactions, payments, savings, credit and insurance – delivered
in a responsible and sustainable way” (World Bank 2018:1). Reasonable access to all
the important financial services implies being financially included, as opposed to the
once-off use of formal financial products (Demirguc-Kunt et al., 2013).
Therefore, this study defines financial inclusion as the distribution of suitable formal
financial products and facilities to every segment of a society, meeting their savings
and convenience needs, and investment and credit requirements at their various
financial literacy levels in a responsible and sustainable way.
Another critical aspect of understanding FI is the need to address the robust
formulation, implementation and evaluation of policies. This is done by equipping
policy-makers with sufficient information, scientific evidence on FI, and learning from
previous experiences. Whilst many existing studies used only supply data to determine
the factors affecting FI, this study analysed from both the supply and demand sides.
The study used data from Finscope Surveys done in the four selected countries.
The expansion of inclusive financial systems has become a high policy priority in many
countries. The public policy process in Africa can be viewed at the following three
levels: policy-making, policy implementation and policy evaluation (Nutley, 2003;
Makinde, 2005; Hai, 2010). The three levels require appropriate information for
effective decision-making. Therefore, the present study used sixteen proxies for FI to
clarify the aspects that promote the use of formal financial products at any stage. This
is to ensure the availability of appropriate products for all segments of the population
(Banerjee & Newman, 1993; Gupte, Venkataramani & Gupta, 2012; World Bank,
2013). Although there have been several studies on inclusive financial systems, the
3
proof that the problem still exists has prompted that more ideas need to be brought to
the fore (World Bank, 2013).
The issues of inclusive financial systems are a cause for concern, as more than half
of the world’s adult population is financially excluded (World Bank, 2014, 2017a). The
World Bank (2019) reported that only 34% of adults in Sub-Saharan Africa are
financially included. A significant proportion of adults across Africa fall outside the
formal financial system because of poverty, costs, travel distance, low confidence in
the banking sectors and lack of financial education. Worldwide, only 44% of
youngsters are part of the formal financial systems, and about 1.3 billion women are
financially excluded (Global Findex, 2019). Global Findex (2019) also reports that
about 23% of the adult population earning less than USD2 daily are financially
included. Reports also show that Africa has 66% of the adult population that fall outside
the formal financial system (World Bank, 2019).
Given the low levels of FI in Africa, there is need to come up with policies that enhance
the use of formal financial services. Due to the financial sector facilitating economic
growth, the fiscal and monetary authorities of the country have to formulate policies
that produce sustainability in development and economic growth. However, many
people who would have benefited from formal financial services are not accessing
these financial services because of ineffective public policies and the inefficient
distribution of financial services.
As such, banking services are public goods; private entities, such as banks, provide
these services and charge those who consume their services, but unfortunately, they
are also able to exclude others. Investigating the availability of at least the basic formal
financial products to the whole population, without excluding some persons was the
key goal of the current study. The Bretton Woods institutions (the IMF and the World
Bank) have propelled the financial inclusivity programme, revealing the revolutionary
capability of FI and its role in eliminating poverty and promoting collective success.
The causes of low levels of FI in Africa can be categorised into demand and supply
factors (AfDB, 2013). Demand factors refer to the characteristics of individuals or
entities that influence them in terms of accessing financial products and facilities.
These characteristics involve levels of income, education and religion, to mention just
a few. Supply-side factors refer to the characteristics of financial service suppliers that
4
hinder individuals from accessing their products and services. These barriers include
high bank charges, travel distance and too much paperwork and onerous
requirements for accessibility or provision.
There are several versions of the financial inclusion definition that are propounded by
individual researchers and institutions. Financial inclusion is defined as “when
individuals and businesses have access to useful and affordable financial products
and services that meet their needs – transactions, payments, savings, credit and
insurance – delivered in a responsible and sustainable way” (World Bank, 2020:1). In
terms of availability of financial services, FI has also been described as “a state in
which all people who can use them have access to a full suite of quality financial
services, provided at affordable prices, in a convenient manner, and with dignity for
the clients” (Centre for Financial Inclusion, 2020:1). As informed by the literature, FI is
the delivery of appropriate official financial facilities to all segments of the society
meeting their savings, investment, credit, financial literacy levels and convenience
needs delivered in a responsible and sustainable way.
Low levels of financial inclusion remain a challenge on the African continent (World
Bank, 2020). For the continent to achieve high levels of FI there is need for the
reinforcement and assurance of the use of research-informed suggestions or
recommendations in policy advice. This strategy will not weaken the authority of the
political process but actually strengthen it. The Finscope Surveys, among others, that
are done in different countries provide a basis for insight into informed FI policy
formulation. However, the statistics themselves are not adequate for robust FI
strategies, hence the need for research and other appropriate studies. The need to
address these weaknesses in addressing FI issues is one of the purposes for this
research. Thus, the following problem was investigated: What are the factors affecting
FI in selected African countries? Section 1.2 below provides an outline of the research
themes and related questions that the study sought to answer.
The remainder of the chapter is structured into four sections. Section 1.3 considers
the research objectives, whilst Section 1.4 explains the significance of the study.
Section 1.5 depicts the organisation of the entire thesis, and Section 1.6 concludes
the chapter.
5
1.2 RESEARCH THEMES AND QUESTIONS
While significant proportion of the population in Africa is financially excluded (World
Bank, 2017d), there are opportunities to expand formal financial access through robust
FI strategies. The absence of accessible and affordable bank accounts in a financial
system can result in obstinate income disparity, poverty and sluggish economic growth
(Claessens, Evenett & Hoekman, 2010; Rama & Pal, 2012). Low levels of FI in an
economy increase the difference between the wealthy and the impoverished because
the population is characterised by inequitable growth (Schumpeter, 1911). Low levels
of FI also lead to inefficient allocation of funds in the economy (World Bank, 2013). A
low FI level exacerbates poverty, and many researchers have found a negative
relationship between the two. This is because FI bridges the gap between the source
of finance and the needy through the issue of loans, and therefore FI becomes a boost
for low-income households.
The absence of formal accounts at individual level may hinder formal savings and
accessibility to formal credit facilities. In addition, it can be risky and expensive for
individuals to obtain financing from some informal financial services, such as Rotating
Savings and Credit Associations (ROSCAs), Accumulating Savings and Credit
Associations (ASCAs) and pawnbrokers. With low FI levels, people have to carry huge
sums of money, as a large proportion of their transactions are in cash. In such cases,
cash finds its way ‘under mattresses’, and not much can circulate in the formal financial
system where the government can benefit from tax. Many African countries experience
problems with policy implementation that hinder progress in many facets of economic
development (Makinde, 2005). Several initiatives to improve the FI levels in various
countries have met with limited success.
A purposive sampling technique was used to select the four African countries for the
current study. Initially, 21 Finscope country data sets were considered but some
questionnaires left out important variables resulting in them being excluded from the
study. The variables required included social networks, financial advice and internet,
among others, in each questionnaire. Considering this, four countries, DRC, Kenya,
Eswatini and South Africa were selected.
The study’s thematised research questions investigated the determinants of financial
inclusion, with the emphasis on social networks in four selected African countries. As
6
a result, the study attempted to answer the following questions, which are categorised
into three themes.
1.2.1 Theme I: Testing for differences in the study variables across countries
To determine whether there were significant differences among the four countries, the
one-way analysis of variance (ANOVA) test was used to address the research
questions as formulated below:
How does the use of social networks compare across the selected four African
countries?
How do other variables considered in the study compare across countries? The
variables include the following: financial inclusion, age, financial advice, internet
access, gender, marital status, proof of residence, branch access, location,
education, use of mobile phone, monthly salary and income.
1.2.2 Theme II: Determinants of financial inclusion in selected African
countries
This theme covered the investigation of determinants of financial inclusion (FI), with
the emphasis on social networks using a merged data set. The related research
questions were:
What are the effects of social networks on FI in selected African countries?
What are the other determinants of FI in the selected African countries?
1.2.3 Theme III: Determinants of FI in each of the selected countries
This theme covered FI issues at country level because of the inherent differences in
ICT infrastructure development, and social networks’ penetration or use among
countries. The related research questions were:
What are the effects of social networks on FI in each of the selected African
countries?
What other factors influence financial inclusion in each selected African country?
7
1.3 RESEARCH OBJECTIVES
The following research objectives were formulated for the study to answer the
aforementioned research questions:
To investigate the differences in the study variables across the selected African
countries.
To find the determinants of financial inclusion, with the focus on the influence of
social networks in selected African countries using a merged dataset.
To explore the determinants of financial inclusion with the emphasis on the
influence of social networks in each of the selected African countries.
1.4 JUSTIFICATION FOR THE STUDY
This segment outlines the core arguments for pursuing the current study. Subsequent
to the study of Martinez et al. (2013), this study aims at understanding the dynamics
of FI in selected African countries. The need to understand the relationship between
FI and social networks, among other factors, also motivated the current study.
The current study on financial inclusion is justified because finance is the lifeblood of
the modern economic unit (Sharma et al., 2013). FI facilitates the inclusive
participation of all sections of society in the financial sector. The ability to channel
funds from excess to needy components of the economy influences the effectiveness
of the financial sector. The banking sector has established primary control over a
county’s wealth, and it is able to place the rudimentary means of production in the
hands of pioneers in the high-yielding components of the economy (Schumpeter,
1956:105; Festre & Nasica, 2009). The core of contemporary lending is in the
formation of such funds.
According to Franklin, Demirguç-Kunt, Klapper and Peria (2012) and Sharma et al.
(2014), there are many objectives for the need of FI among all segments of the
population. There are economic objectives that are mainly useful for equitable growth
in all segments of the society for the reduction of disparities. The reduction of
differences amongst the population may serve as catalyst for the growth of
underdeveloped and developing communities. The provision of banking facilities to
marginalised sections can enhance the mobilisation of savings in the economy. Money
8
usually kept at home could be effectively mobilised for capital formation, expenditure
and economic development. The growth in FI levels improves the development of the
financial sector. The larger the financial sector, the more the financial players and
participants.
The study on FI is justified, as the majority of individuals on the African continent do
not have accounts with formal financial institutions (World Bank, 2020). Advances in
ICT and the lowering of the costs related to financial services offer more people the
chance to use them, particularly the poor and those that are financially excluded
(AfDB, 2017:3). Currently, many low-income people on the continent depend on
informal financial services. The absence of official financial regulation can put people
in a vulnerable position, for example, they may lose their money or be exposed to
moneylenders applying huge interests. The AfDB (2013) notes that the utilisation of
unofficial services is widespread all over the continent, and they argue that formal
financial services may fail to meet people’s requirements or people are not aware of
their existence.
One important objective of FI is to reduce poverty in a society. There are high levels
of poverty across the African continent. The following statistics related to poverty were
reported for the selected African countries (World Bank, 2019) that the current study
focused on: in the DRC 73%, Kenya 39.9%, Eswatini 39.7% and South Africa 55.5%
of their population was living under the subsistence level. FI bridges the gap between
the source of finance and the needy (weaker section) through the issue of loans
(Sarma & Pais, 2010). Those in need can get loans to start their own businesses or
finance their education to sustain their livelihoods. In such cases, FI becomes a boost
for low-income households. FI has also been widely accepted as a promoter of seven
out of the 17 Sustainable Development Goals that were set up in 2015 by the United
Nations General Assembly (World Bank, 2017c). FI makes political intentions or goals
achievable. As the lower strata benefit, certain political objectives are achieved, and
an effective direction is given to government policies and programmes.
With the global environment changing, access to formal financial services has been
found to be vital (Demirguc-Kunt & Levine, 2008; World Bank, 2018, 2020). The
environmental changes motivated the current study to investigate the effects of social
networks on access to formal financial services.

9
The benefits associated with obtaining financial advice to enhance FI provide
justification for the current study. Banks often advertise their financial products and
inform clients about the benefits of financial advice. Industry practitioners frequently
claim that advice influences, among other things, investments, savings, financial
product selection and risk tolerance (Montmarquette & Vietnnot-Briot, 2012). Financial
advice also enhances peace of mind and financial confidence. A financial mentor not
only teaches someone financial knowledge but also inspires someone to make a
positive financial decision that improves his/her welfare (Hilgert, Hogarth & Beverly,
2003; Xiao et al., 2004).
Furthermore, financial advice or educational programmes can achieve positive
financial behaviour, and positive financial behaviour result in financial gratification
(Xiao, Sorhaindo & Garman, 2006). Consumer finance researchers emphasise that
there is need to understand how and why consumers change their financial behaviours
to take significant positive actions. Therefore, the current study sought to determine
the contribution of financial advice to FI levels.
The effect of the internet on FI, using rich cross-sectional data has been inadequately
covered in the literature. It is obvious that low ICT development levels in Africa are
restricting development on the continent. Although there are many studies on the use
of mobile phones to access financial services, these are yet to gain popularity in rural
areas characterised by low FI levels. However, having access to a mobile or smart
phone does not necessarily mean one has internet access because data is needed to
access the internet. The future development and transformation in the financial sector
rests on the strategies adopted to foster internet access or technologies. The current
study examined the effects of internet access on FI. The nexus between internet
access and FI assists in confronting the problems that have negatively affected the
African continent for a long time.
The World Bank (2017c) and AfDB’s (2017) call for advances in FI, especially in
developing countries, justifies the current study. The choice of African countries was
motivated by:
The availability of secondary data for all the variables, including social media,
financial advice and internet access at individual level, for these countries.
African countries rank among the lowest FI levels.
10
High poverty levels in Africa.
The question that needs to be asked is: Why does Africa still lag behind in inclusive
financial systems? An investigation into the determinants of FI sheds light that can be
applied in policy design, implementation and evaluation. The current study is a building
block for digital FI.
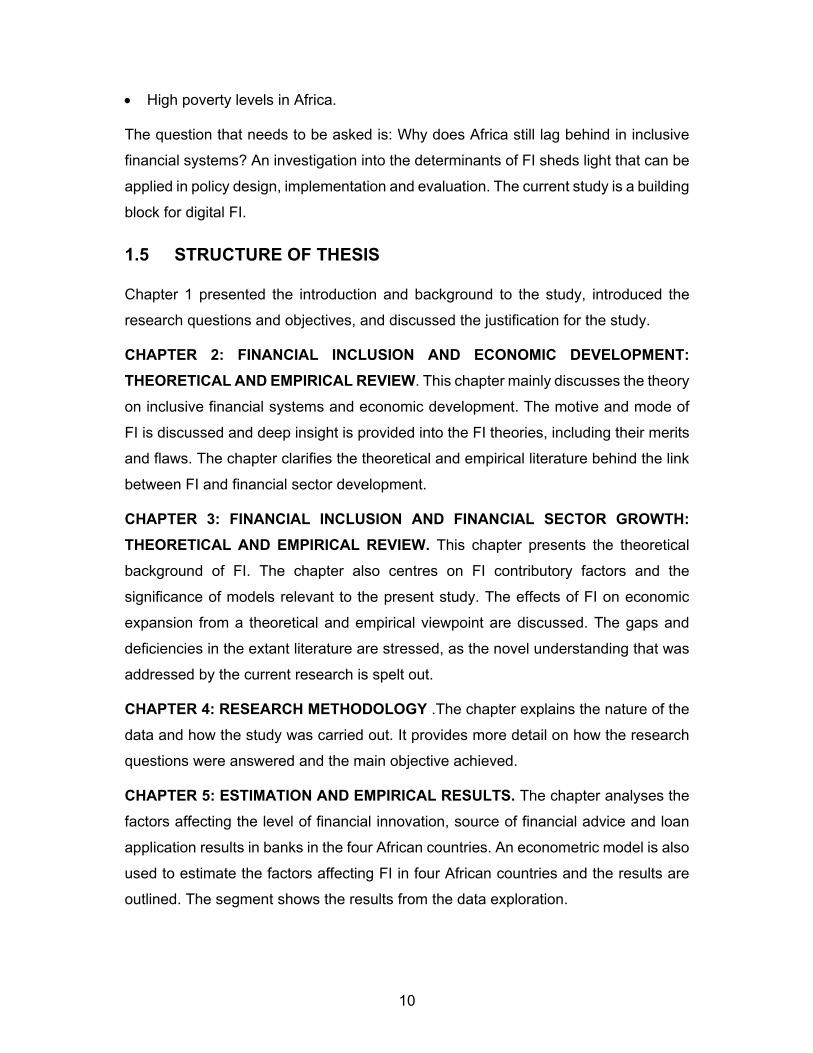
1.5 STRUCTURE OF THESIS
Chapter 1 presented the introduction and background to the study, introduced the
research questions and objectives, and discussed the justification for the study.
CHAPTER 2: FINANCIAL INCLUSION AND ECONOMIC DEVELOPMENT:
THEORETICAL AND EMPIRICAL REVIEW. This chapter mainly discusses the theory
on inclusive financial systems and economic development. The motive and mode of
FI is discussed and deep insight is provided into the FI theories, including their merits
and flaws. The chapter clarifies the theoretical and empirical literature behind the link
between FI and financial sector development.
CHAPTER 3: FINANCIAL INCLUSION AND FINANCIAL SECTOR GROWTH:
THEORETICAL AND EMPIRICAL REVIEW. This chapter presents the theoretical
background of FI. The chapter also centres on FI contributory factors and the
significance of models relevant to the present study. The effects of FI on economic
expansion from a theoretical and empirical viewpoint are discussed. The gaps and
deficiencies in the extant literature are stressed, as the novel understanding that was
addressed by the current research is spelt out.
CHAPTER 4: RESEARCH METHODOLOGY .The chapter explains the nature of the
data and how the study was carried out. It provides more detail on how the research
questions were answered and the main objective achieved.
CHAPTER 5: ESTIMATION AND EMPIRICAL RESULTS. The chapter analyses the
factors affecting the level of financial innovation, source of financial advice and loan
application results in banks in the four African countries. An econometric model is also
used to estimate the factors affecting FI in four African countries and the results are
outlined. The segment shows the results from the data exploration.
11
CHAPTER 6: DISCUSSION OF RESULTS. This chapter entails a detailed discussion
of the results presented in Chapter 5. The discussion is based on the research
questions and tested hypotheses that support the drawing of definite conclusions in
selected African countries.
CHAPTER 7: CONCLUSIONS, IMPLICATION AND DIRECTIONS FOR FURTHER
RESEARCH. The chapter discusses what the findings mean in relation to the
theoretical body of knowledge on FI. The study also discusses the practical
implications of the findings.
Figure 1.1 below presents the structure of the thesis.
Figure 1.1: Organisation of thesis
12
1.6 CONCLUSION
The chapter introduced and provided context to the study. The discussions that
followed covered the thematised research questions and objectives of the research.
This first chapter also explained the importance of the research, and provided a
comprehensive outline of the entire thesis. The subsequent chapter elaborates on the
research by comprehensively concentrating on both the theoretical and empirical
literature on financial inclusion.
13
FINANCIAL INCLUSION AND ECONOMIC DEVELOPMENT:
THEORETICAL AND EMPIRICAL REVIEW
2.1 INTRODUCTION
This chapter focuses on the following three areas as relevant to the current study: (1)
To lay out a comprehensive clarification of the theories related to the diverse facets of
financial inclusion (FI); (2) To clarify the relevant concepts related to financial access
and to explain the relationships existing in financial systems; and (3) To review the
consequences of FI to economic development.
The theories of inclusive financial systems discussed in this chapter provide a point of
focus for tackling the problem of low FI in developing countries. Theories help to
identify the point of departure with regard to the research problem and establish a
roadmap for directing the problem (Driver & Erickson, 2008). Though the current
chapter deliberates on and explains the core theories of FI, its principal drive is to
evaluate the theories and to ascertain the factors of significance to the existing study.
The chapter is structured as follows: Section 2.2 provides and overview of FI. Section
2.3 provides and in-depth discussion of the major finance and growth theories, while
Section 2.4 discusses the theories related to poverty reduction. Section 2.5 explains
the risk management role of financial institutions. Section 2.6 discusses the
contribution of financial systems to economic growth that justifies FI. Section 2.7
discusses the distribution of financial resources for development. Section 2.8 presents
the various theories of banking. Section 2.9 discusses the role of social network in FI.
Section 2.10 highlights the complications that can arise while selecting the most
appropriate theories, and Section 2.11 presents the conclusion to the chapter.
2.2 OVERVIEW OF FINANCIAL INCLUSION
There are various theories or sets of guiding principles that are fundamental to FI
practice, and that can assist in achieving an understanding of FI as a pro-development
initiative in the economics and finance discipline.
14
There is need for a framework or a set of principles to help us understand what FI is,
how it is achieved and who benefits from FI. The extant literature has many idealistic
interpretations of how to achieve FI. The literature mostly focus on the link between
FI, poverty levels and income inequality, as well as the effect of FI on the economy
(Sarma & Pais, 2010; Cull, Demirquc-Kunt & Lyman, 2012; Demirguc-Kunt et al.,
2013; Morgan & Pontines, 2014). Theories explain why different ideas exist regarding
what the FI objectives should be, and how to raise the levels of FI. Theories also
explain the current observations in FI practice and abnormal deviations that exist. This
enables a clear and comprehensive system of principles for the development of FI.
The set of theories discussed in this section provides a structure of ideas that clarify
FI goals, practices and results.
Financial inclusion is a process of accessing and using the financial services that are
suitable for the population’s needs and that can affect their wellbeing (IFC, 2011). The
current notion is that FI is an active and multi-levelled development that gradually
improves. The explanation emphasises the notion that the process of FI influences the
individual’s welfare and demonstrates the benefits of continual improvement, hence FI
promotion policies have to embrace elements of consumer protection, financial
education and regulation. The theories must be wide-ranging enough to incorporate
all the relevant stakeholders and matters, as financial services delivery is not limited
to the actions and objectives of financial organisations only.
Bruhn and Bilal (2011) state that there are other issues and actors involved in FI
initiatives. For example, factoring firms are not in the same category as banks. These
firms assist small organisations unable to access official sources of funds. In such
cases, transactions are done predominantly by way of cheques and credit official
papers. Other actors in FI initiatives may include non-profit development institutions
that may collaborate with the public sector in implementing particular projects, and
they may have an array of disparate goals; therefore, flexibility is paramount in
granting funding. Therefore, theories of FI should include a wider range of options
involving diverse entities.
In summary, an appropriate set of FI theories have to embrace the aspects of
obtainability, usage, appropriateness, and accessibility of the financial facilities. A
theory also has to capture how sections of the society can benefit from being financially
included. In a set of FI theories, common indicators should be traced that include, for
15
example, access to deposits, savings, direct or indirect investments, loans, money
transfers, financial literacy, transaction services, use of social networks and financial
advice, among other services. There are different perspectives on FI but the bottom
line is having a product that stems from a regulated financial organisation.
An explanation of the different dimensions of FI assists in creating an appreciation for
the problems related to policy-making and policy evaluation. Section 2.2.1 below
explains the various dimensions of FI.
2.2.1 Dimensions of financial inclusion
The various dimensions of FI include measurements of the different aspects of FI. The
various scholars studying the phenomenon have also determined different numbers
of dimensions, depending on the area under consideration. Information by dimension
helps to understand the problem of FI for policy formulation and evaluation (Sarma,
2012).
Kodan-Kablana and Chhikara (2013) postulate that the dimensions of FI can be
categorised into three wide classes, which are Communication Facilities, Defensive
Facilities, and Publicity Facilities:
The Communication services dimension permits the receipt and transfer of money
and other basic banking services. These transmission services provide protection
for individual participation in society, including their wellbeing and health.
Defensive services offer financial security in the medium and long term, as well as
smoothening consumption. The following services are included under this
category: home contents’ insurance, life guarantee, private pension requirements,
reserves and credit.
The third dimension includes the promotional services that facilitate autonomy and
help individuals promote themselves, with facilities such as loans for starting up
enterprises. Publicity services may not be applicable to individuals who are
financially excluded because of the exposure and expenditures linked to a start-up
(Fisher et al., 1999; Lederle, 2009).
Being excluded from these three areas may have a number of repercussions for an
individual and society at large.
16
Some researchers have used different approaches to study FI. For example, using a
sample of 49 countries, Sarma (2012) used the following three scopes of FI: Bank
permeation, Obtainability of banking facilities and Utilisation. Similarly, Camara and
Tuesta (2014) used the dimensions of Utilisation, Obstacles, and Access to official
financial facilities in their study. Some studies used different dimensions of FI but they
are similar in one way or the other (see Laba & Kuri, 2011; Bhuvana & Vasantha,
2016). Some may differ in the names they used but the indicators and/or variables
used are the same.
However, the literature has not adequately addressed the following: 1) The dimension
aspect of technological diffusion in formal financial services delivery, and 2) Utilising
social networks on the uptake of financial products.
The absence of regulated financial services may have a negative effect on individuals,
for example, being excluded from long-term protective services, such as a pension
fund, may have wider repercussions for society because of one’s need to be
cushioned when there is lack of income. Therefore, FI does not only positively
influence economic conditions but improves both individuals’ and the organisations’
welfare. The dimensions of FI include Obstacles, Bank permeation, Obtainability of
banking products, and Access to financial facilities. The level of FI is a determinant of
the social status, economic status, and growth of individuals, organisations and
countries. Therefore, it is paramount to examine the issues relating to the levels of FI
in a society or country to obtain more insight.
2.2.2 Levels of financial inclusion
Individuals have different motives for partaking in the official financial system.
Financial inclusion is classified into involuntary FI and voluntary FI (World Bank, 2014).
Customs and religious conviction are vital incentive elements influencing indirect
accessibility to funds, though non-obtainability, financial ignorance, ineligibility and
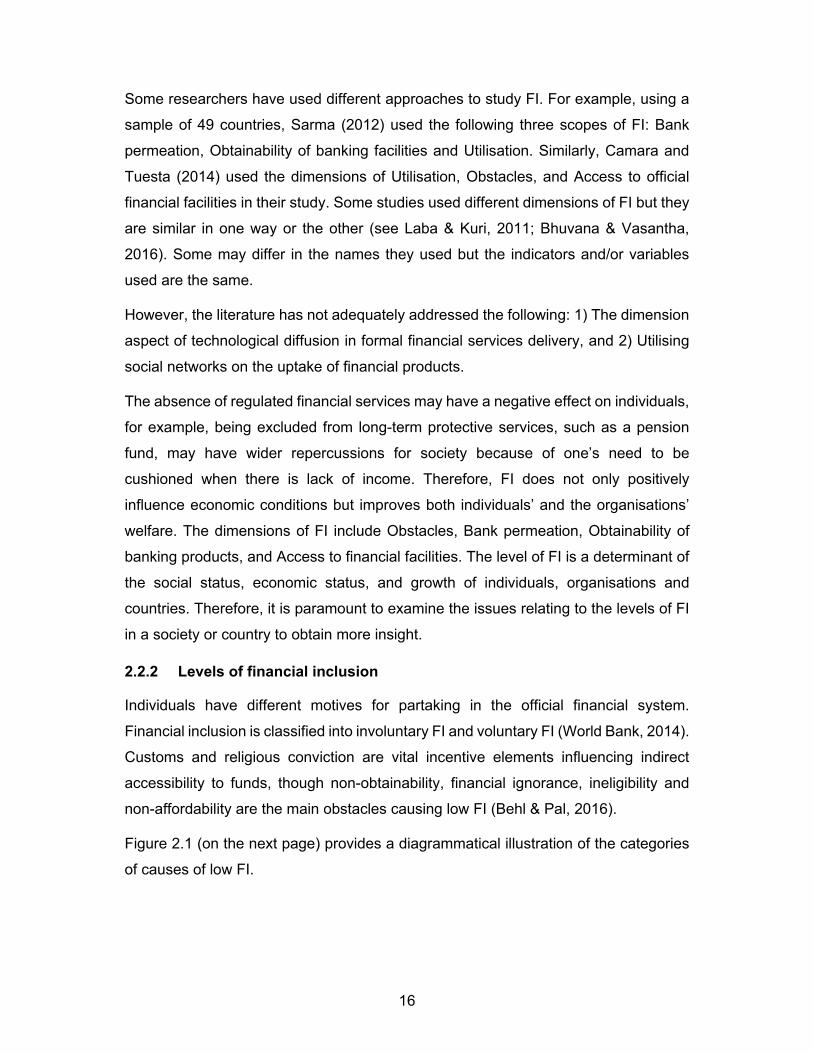
non-affordability are the main obstacles causing low FI (Behl & Pal, 2016).
Figure 2.1 (on the next page) provides a diagrammatical illustration of the categories
of causes of low FI.
17
Figure 2.1: Categories of causes of low financial inclusion
Source: Adapted from World Bank (2014)
As depicted in Figure 2.1, FI has levels and is multidimensional. Consequently, the
level of FI is influenced by the use of numerous financial facilities by the individuals.
In some countries, a significant number of family units are marginally included, that is,
they may have one or two financial products only (called under-banked), while other
households do not have mainstream financial products at all (called unbanked) (Saint-
Paul, 1992; Sharma & Kukreja, 2013).
These seemingly different situations demand a holistic and robust approach to deal
with them. The degree of FI in the country is vital in the transformation matters related
to financial markets. Across Africa, the degree of FI is extremely low, and when it
occurs, it is confined to a minority of the populace.
For the purposes of the current study, FI theories are divided into the following five
categories: Finance and Growth, Risk Management, Financial System Efficiency,
Poverty Reduction Theories, and Banking Theories, that are discussed in the sections
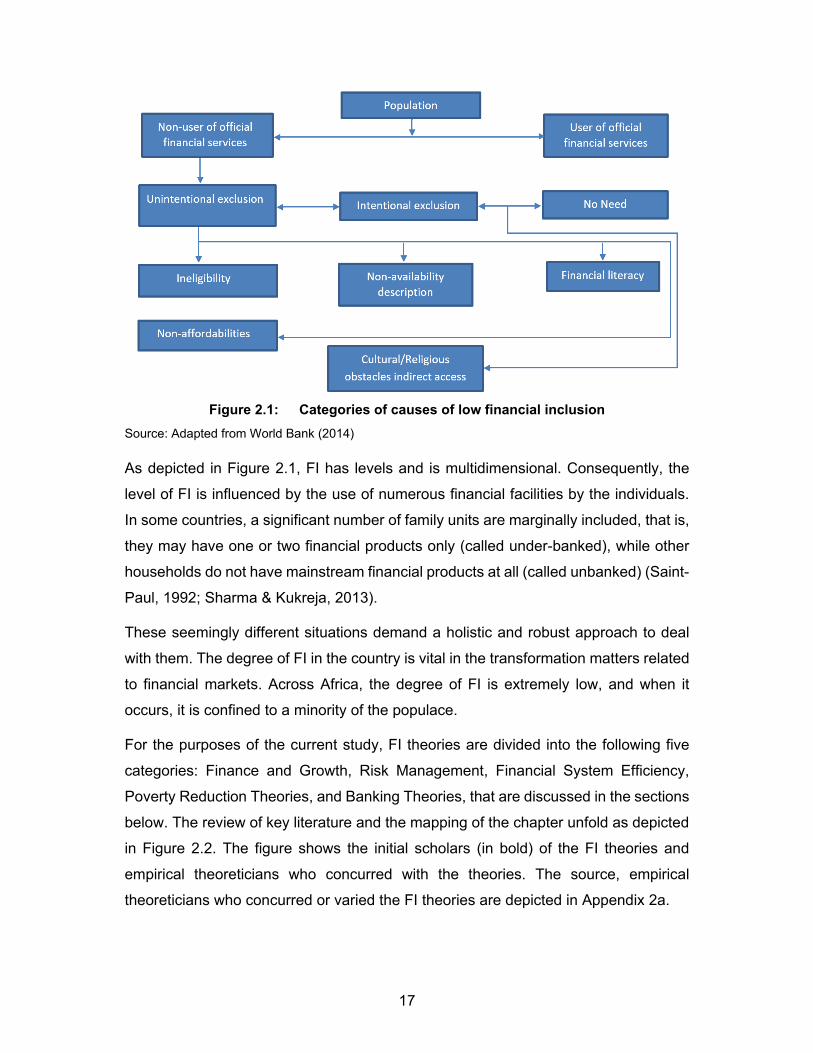
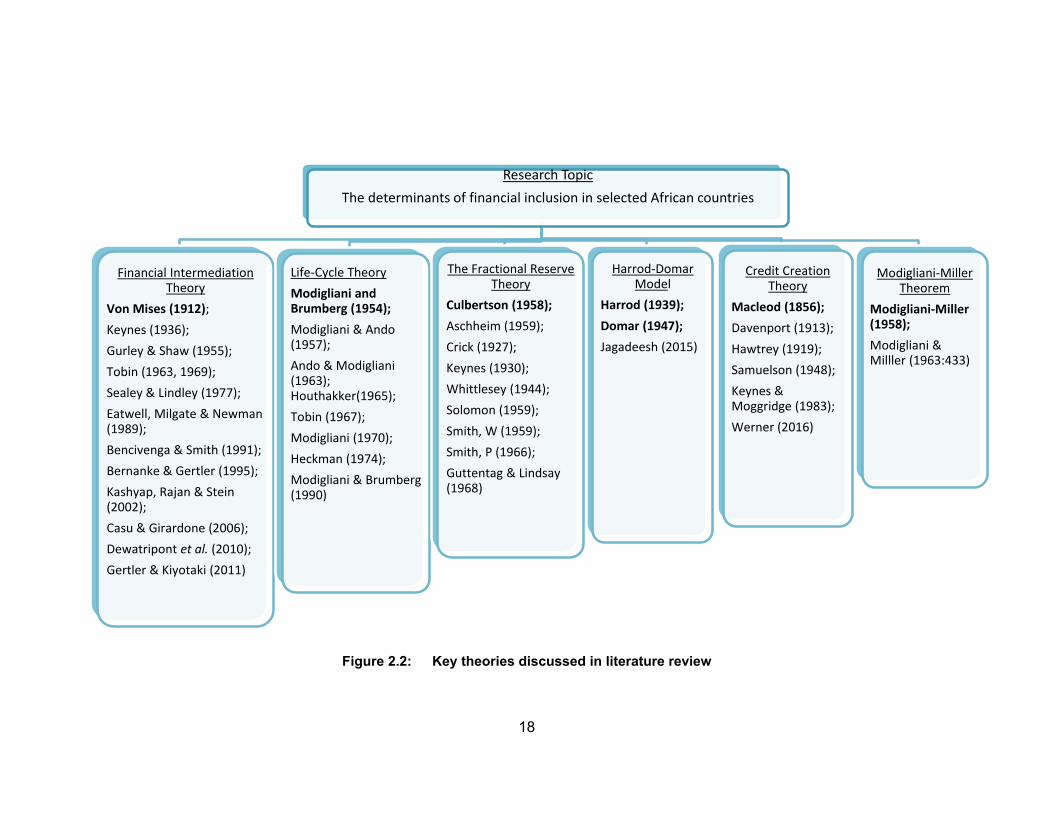
below. The review of key literature and the mapping of the chapter unfold as depicted
in Figure 2.2. The figure shows the initial scholars (in bold) of the FI theories and
empirical theoreticians who concurred with the theories. The source, empirical
theoreticians who concurred or varied the FI theories are depicted in Appendix 2a.
18
Figure 2.2: Key theories discussed in literature review
Research Topic
The determinants of financial inclusion in selected African countries
Financial Intermediation Theory
Von Mises (1912); Keynes (1936);
Gurley & Shaw (1955);
Tobin (1963, 1969);
Sealey & Lindley (1977);
Eatwell, Milgate & Newman (1989);
Bencivenga & Smith (1991);
Bernanke & Gertler (1995);
Kashyap, Rajan & Stein (2002);
Casu & Girardone (2006);
Dewatripont et al. (2010);Gertler & Kiyotaki (2011)
Life‐Cycle Theory
Modigliani and Brumberg (1954); Modigliani & Ando (1957);
Ando & Modigliani (1963); Houthakker(1965);
Tobin (1967);
Modigliani (1970);
Heckman (1974);
Modigliani & Brumberg (1990)
The Fractional Reserve Theory
Culbertson (1958); Aschheim (1959);
Crick (1927);
Keynes (1930);
Whittlesey (1944);
Solomon (1959);
Smith, W (1959);
Smith, P (1966);
Guttentag & Lindsay (1968)
Harrod‐Domar Model
Harrod (1939); Domar (1947);Jagadeesh (2015)
Credit Creation Theory
Macleod (1856); Davenport (1913);
Hawtrey (1919);
Samuelson (1948);
Keynes & Moggridge (1983);
Werner (2016)
Modigliani‐Miller Theorem
Modigliani‐Miller (1958); Modigliani & Milller (1963:433)
19
2.3 FINANCE AND GROWTH THEORIES
This section discusses the key theories of development. The discussion includes the
purpose of FI and its contribution to the financial sector and economic growth.
2.3.1 Purpose of financial inclusion
The Harrod-Domar Model serves to explain the economic development determinants,
and the crucial role played by savings and investments. The Harrod–Domar Model is
a classical Keynesian Model of economic development. According to the Harrod-
Domar Model, the main strategy for economic development is savings mobilisation
and the generation of investment (Harrod, 1939; Domar, 1947). The model affirms that
savings result in investments that, in turn, result in economic growth. Harrod and
Domar argue that the economic development proportion is determined by the levels
of savings in the economy and the capital-output ratio.
For its part, the main purpose of FI is to harness savings through financial
intermediaries and to direct the funds to the productive sector to enhance economic
growth (World Bank, 2017c). In a study investigating the influence of savings on
economic expansion in Botswana, Jagadeesh (2015) applied the Harrod–Domar
growth model, based on Auto Regressive Distributed Lagged (ARDL). The study
investigated the presence of a long-run association between the Gross Domestic
Product (GDP) and Gross Domestic Savings, and found a substantial association
between savings and economic expansion in Botswana. The study found the Harrod-
Domar Model was applicable to the nation’s economy. The emphasis of savings in the
model makes it important for the justification of FI studies.
However, the Harrod-Domar Model has a number of shortcomings, which include that
increasing the savings ratio in developing countries is not easy (Nurkse, 1953).
Several developing countries have shallow financial sectors with limited financial
assets/opportunities (Morgan, 1969) and it is difficult to achieve financial system
efficiency in developing countries (Boianovsky, 2015). The situation is exacerbated by
the fact that in many developing countries, research and development is underfunded
to allow savings to be effectively converted to investments for economic growth
purposes. Borrowing money from abroad causes external debt repayment problems
or creates a debt trap, in the end. A rise in capital spending does not always lead to
20
economic growth (Siraj & Bengali, 2007). In light of the aforementioned, a question
that remains unanswered is what determines the level of savings?
2.3.1.1 Contribution of FI to financial sector and economic growth
It is vital to clarify the significance of FI in the growth of the financial sector, the
economy, as well as the welfare of individuals. All over the world, there is
heterogeneity with regard to FI. The requirements related to financial facilities differ
from person to person and one country to another (Kempson & Whyley, 1999; Speak
& Graham, 2000; Regan & Paxton, 2003). Currently, however, in terms of developing
countries, one option is to foster inclusive growth, and FI is the key to achieving this.
There are two major reasons why the current socioeconomic development agenda
targets wide access to formal financial facilities as a possible solution. One of the
reasons is that both the theoretical and empirical literature have revealed that an
inclusive financial system is imperative for poverty alleviation and economic growth
(Beck, Levine & Loayza, 2000; Honohan, 2004a; Beck & Torre, 2006; RBI, 2008). The
second reason is that financial facilities are a public good that enables individuals to
enjoy the benefits of a modern, market-based economy (Peachey & Roe, 2004).
Hence, the current study is crucial in the development of a conceptual framework and
the identification of factors influencing FI.
Researchers have noted that integrity, stability and financial inclusion are
complementary factors. The central banks need to strive to improve the regulatory
framework and coordinate the various stakeholders involved in the provision of
financial services (Agenor & Pereira da Silva, 2013). This study is guided by the
principle that finding and coordinating the devices for FI is necessary in the reduction
of social inequalities and in enhancing economic development (ADB, 2013; World
Bank, 2014, 2017b). The systems may yield a ‘domino effect’, as the additional
accessibility to official financial services may encourage higher savings and funding.
This sequentially enlarges the secondary sector, as well as contributing to economic
development (Sharma & Kukreja, 2013).
In terms of economic development, inclusive financial systems elevate a country to a
higher growth trajectory. Furthermore, inclusive financial systems reduce inequality
and promote economic growth and poverty alleviation, as has been stated before in
this study. The provision of financial services to all segments of the population helps
21
to overcome a range of constraints that hinder growth at individual and country level
(Kodan-Kablana & Chhikara, 2013). Some of the constraints may need intervention,
as they may be specific to individual or institutional shortcomings.
An all-encompassing financial structure assists in reducing the development of
unofficial sources of finance, such as exploitive moneylenders (Bell, 1990). In
contradiction with this view, in his theory on moneylenders, Madestam (2014)
postulates that the formal and informal credit segments of an economy can be
complementary or substitutes (Madestam, 2014). In the study, Madestam poses a
pertinent question of why banks do not merge with moneylenders, with the latter being
the local branch manager. He argues that formal banks have unlimited access to funds
but they are not able to control the use of loans. Justifying the existence of informal
lenders in the sub-economy, Madestam argues that moneylenders are able to prevent
non-diligent behaviour, although they often have capital constraints.
Traditional development economics emphasises that wealth redistribution is the route
to growth and development (Bardhan, Bowles & Gintis, 2000). However, many studies
in various developing countries have revealed that moneylenders are largely
exploitative, and thereby hinder growth. The literature also reveals that an inclusive
formal system of financing is the panacea for economic development.
The initial theories of economic evolution acknowledged institutions, labour and
finance as the determinants of economic development, ignoring the role of the financial
sector. The ignorance was due to the Modigliani-Miller Theorem and the Efficient
Market Hypothesis. Both theories made assumptions that the financial system is
flawless and has no defects. Therefore, the financial securities market is perfect, which
means that traders acquire and dispose of financial securities with no transaction costs
(Modigliani & Miller, 1958). The weakness with this theory is that it cannot be applied
in the real world (Stern & Chew, 2003). Additional criticism is levelled at the
assumption made by Modigliani and Miller that individuals and firms borrow at the
same rate of interest, which in practice is not the case (Ahmeti & Prenaj, 2015). This
is so because firms and individuals who have fixed assets have a higher credit rating
(UK Essays, 2013).
An optional growth strategy would be to regard financial market deficiencies as a
complement to the redistributive policies for growth promotion, poverty reduction and
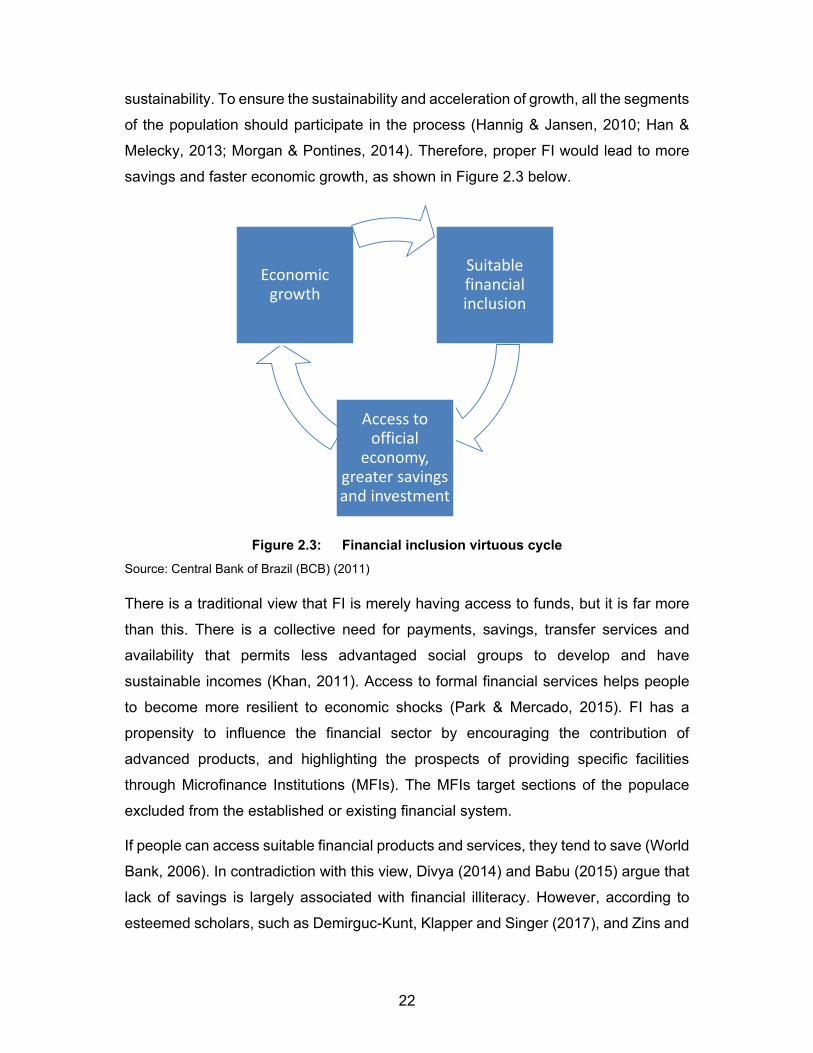
22
sustainability. To ensure the sustainability and acceleration of growth, all the segments
of the population should participate in the process (Hannig & Jansen, 2010; Han &
Melecky, 2013; Morgan & Pontines, 2014). Therefore, proper FI would lead to more
savings and faster economic growth, as shown in Figure 2.3 below.
Figure 2.3: Financial inclusion virtuous cycle
Source: Central Bank of Brazil (BCB) (2011)
There is a traditional view that FI is merely having access to funds, but it is far more
than this. There is a collective need for payments, savings, transfer services and
availability that permits less advantaged social groups to develop and have
sustainable incomes (Khan, 2011). Access to formal financial services helps people
to become more resilient to economic shocks (Park & Mercado, 2015). FI has a
propensity to influence the financial sector by encouraging the contribution of
advanced products, and highlighting the prospects of providing specific facilities
through Microfinance Institutions (MFIs). The MFIs target sections of the populace
excluded from the established or existing financial system.
If people can access suitable financial products and services, they tend to save (World
Bank, 2006). In contradiction with this view, Divya (2014) and Babu (2015) argue that
lack of savings is largely associated with financial illiteracy. However, according to
esteemed scholars, such as Demirguc-Kunt, Klapper and Singer (2017), and Zins and
Suitable financial inclusion
Access to official
economy, greater savings and investment
Economic growth
23
Weill (2016), lack of savings is due to low-income levels. In addition, access to financial
services also improves individual financial security (Potrich, Vieira & Kirch, 2015).
For broader financial access to be effective, financial products need to be tailored and
services must be available when needed under affordable conditions, for example,
credit facilities should not only be available to those borrowers with collateral,
connections and a good track record. Therefore, there is need to discuss the literature
on the contribution of innovative activities to financial and economic development.
2.3.1.2 Financial inclusion and innovation
Agenor, Canuto and Jelenic (2014) stress the role of FI in supporting innovative
activities that can assist countries to rise to high-income status. Although this assertion
mainly applies to firms, individuals with brilliant ideas or talent have no source of funds
if unbanked (Beck, Senbet & Simbanegavi, 2014). Lack of access to finance has
hampered many individuals from innovation opportunities and growing their wealth.
A body of empirical research buttresses the association between FI and innovation.
The literature suggests that financial exclusion retards innovative activities in both
developing and developed nations (Ang, 2010, 2011; Ayyagari et al., 2011). Contrary
to this finding, Agenor et al. (2014) argue that in developed countries, it is more about
sufficient enticements motivating individuals to engage in entrepreneurial activities,
than financial access. However, studies have shown that access to formal finance can
have positive effects on innovation investment at individual, corporate and country
level (Urzúa, 2013), as experienced in Latin America.
In addition to formal financial access, other factors come into play to boost the
economy’s ability or capacity to grow. Among them are macroeconomic stability, high
financial literacy, and openness (Gill & Kharas, 2007). Though the aforementioned
foundations are not the focus of this study, it is worth noting them as drivers of
economic growth.
Aggarwal (2014) asserts that small savings by poor people can provide a lump
investment to business for capital purposes. The pooled funds used for productive
activities can thereby open up employment opportunities for many (Khan, 2011). FI for
all makes electronic transfer of social benefits, savings and investments possible.
Aggarwal postulates that the distribution of financial services in convenient places or
through the use of convenient delivery channels reduces the cost of accessing
24
financial services. An inclusive financial system enables the banking sector to serve
across several segments of the society not limited to gender, income levels, and
regions, thereby encouraging the public to embrace proper banking habits (Demirguc-
Kunt et al., 2017; Wright, Chopra, Mehta & Shukla, 2013). With high FI levels, growth
and development improves quickly among the needy sectors.
The poor would be able to achieve their goals if they have access to financing facilities.
Several studies have established the effect of accessibility and the availability of formal
finance on poverty mitigation. According to Banerjee and Newman (1993) and
Vashisht and Wadhwa (2015), access to funding is a vital element enabling people to
improve their welfare. Khandker (1995) also observed a significant improvement in the
welfare of a rural Indian community through a financial services provision expansion
programme. The programme also significantly increased non-agricultural
employment.
Eastwood and Kohli (1999) reported that expansions to the physical networks of banks
and selective advancing of banks enhanced small-scale industrial output. In a study
of India, Bell and Rousseau (2001) established that the banking sector players
influence economic performance. The accessibility and ease of use of official financial
facilities remains an ingredient of economic growth. The capacity to direct funds from
surplus units to the high yielding section of the economy determines the efficiency of
the financial system.
The significance of FI to the economy is demonstrated by the attention the issues are
getting from governments and other international bodies, such as Breton Woods’
institutions (Demirguc-Kunt et al., 2017; Frost & Sullivan, 2009). Banking facilities are
a common good, regardless of the degree of ‘publicness’ that is different from typical
public goods. Mehrotra, Puhazhendhi, Nair and Sahoo (2009) argue that banking
facilities are as vital as access to water and basic education.
In many countries, banking services are classified as a ‘quasi-public good’. This
perspective has prompted governments, scholars, researchers and developmental
organisations to design FI strategies. The focus on inclusive growth as an economic
growth strategy ensures that the gains of economic development are equitably shared
(Chakraborty, 2010). The view that FI is a powerful mechanism for poverty mitigation
and enhanced production has caused it to be prioritised by governments.
25
The literature has satisfactorily covered the purpose of an inclusive financial system,
though with varying empirical results as discussed expansively in the subsequent
sections of this thesis. However, the literature has not adequately covered the
following: (1) How high levels of FI can be achieved in different countries, regions,
cultures, and so on; (2) The determinants of disparate levels of FI at individual level,
countries and regions; and (3) Proper models of FI that suit different country
development and individual income levels. Therefore, it was important for the current
study to discuss theoretical and empirical studies that investigated the link between
financial development and economic growth.
2.3.2 Financial development and economic growth
Research studies that investigated the link between the financial system and economic
growth do exist. There are a multitude of academic studies on the conceptualisation
of how economic improvement and the state of a country’s financial sector influence
domestic savings, capital accumulation, changes in technology and increase in
income, or vice versa. The papers also investigated the relationship that includes
identifying the nature of the causality and its relevance with the use of different data
(see Honohan 2004b; Andrianova & Demetriades, 2008; Levine, 2012).
However, there are differing views among scholars and researchers with respect to
the function of an inclusive financial system in economic development. Historically,
Bagehot (1873) and Hicks (1969) contend that the financial sector significantly
contributed to England’s industrial revolution by enabling the raising of funds for the
productive sector. Schumpeter (1912) argues that a robust banking sector spurs
technological development by locating project owners with the highest prospects of
effectively executing novel production methods.
On the contrary, Robinson (1952:86) holds a different view, and maintains that where
venture leads the way, finance follows, not the other way round. In this perspective,
economic evolution generates the needed forms of financial structures, then the
financial sector reacts to the demands. Furthermore, some analysts do not support the
notion that the finance-growth relationship is significant. In concurrence with Robinson
(1952), Lucas (1988:6) states that some financial experts overrate the contribution of
financial systems to economic development. In addition, some developmental analysts
are often doubtful with regard to the function of the financial sectors and do not

26
consider it relevant (Chandavarkar, 1992). The role of the financial sector in growth
has been ignored in many studies. These include the studies of Meier and Seers
(1984) and Stern (1989), where there was no mention of the financial sector.
The need to transact and acquire information creates inducements for the growth of
financial players and securities. Arrow (1964) and Debreu (1959) propounded a
conditional claim structure without evidence and operational expenses. The Arrow-
Debren model, advocates a financial system that does not waste resources on
research projects and risk management exercises, and does not scrutinise managers
to enable transactions. Any theory that considers the crucial role played by the
financial system in economic development contradicts the Arrow-Debreu model,
whether implicitly or explicitly. Financial markets and players may grow in response to
the challenges brought about by information and transactional frictions. Furthermore,
different types of problems prompt well-functioning and distinct financial institutions,
products and players.
To reduce business and evidence expenses, an inclusive financial structure serves
one primary purpose, which is the facilitation of resource allocation, over space and
time, in risky environments (Merton & Bodie, 1995:12). The prime role of a financial
system is classified into different basic tasks (Levine, 1997), which include the
following:
mobilising savings,
facilitating trade, hedging, diversifying, and pooling risk,
allocating resources,
facilitating the trade of products, and
keeping track of supervisors and exercising business control.
The section below provides a further analysis of the two channels, namely,
technological innovation and capital accumulation. Through these two channels, the
function of the financial system in economic development is enhanced.
2.3.2.1 Technological innovation and capital accumulation
The first category is a category of development models that uses either capital
expansion or capital commodities derived through the utilisation of constant incomes
to scale, but that do not use irreproducible factors to create a stable per capita increase
27
(Romer 1986; Lucas, 1988; Rebelo, 1991). In this class of models, the roles played by
the inclusive financial systems influence economic growth by prompting the rate of net
capital accumulation. Capital formation is influenced by a shift in the degree of savings
or by the reallocation of reserves in capital-generating technologies.
The next class of growth models centres on technological innovation. These look at
the development of innovative production methods and commodities (Romer, 1990;
Aghion & Howitt, 1992). The models influence stable economic growth by shifting the
speed of technological advancement. However, there were scholars with counterviews
on the emphasis of innovations in economic development, especially Schumpeter
(1911). Firstly, they maintained that innovation is mostly useful in the development of
capitalism. In addition, innovations are among a mirage of factors affecting cyclical
instabilities in a capitalistic economy (Robinson, 1952). Moreover, differentiating
innovating activities from the normal business activities is a challenge.
These days, innovation activities are part of everyday business and there may not be
need for a special agent, such as an innovator to carry out activities. Lucas (1988) is
of a different view, as he argues that Schumpeter overemphasised the role of the
innovator in his model. Schumpeter also regards innovation as the lead factor in
economy development. This position has been criticised based on economic
development and other economic and social factors.
Where some information and transaction costs are present, the inclusive financial
system plays a crucial role in the hedging, trading and pooling of risk. The types of risk
managed at that level include liquidity and idiosyncratic risk. Schumpeter assumes
that technological innovations are supported by bank credit, and the assumption is not
convincing (Hagemann, 2003). Usually, banks provide short-term credit facilities, as it
actually transpired in Germany, but it is not applicable to many other countries. This
theory leaves out some important sources of real savings, such as public borrowings,
deficit financing, budgetary savings and other fiscal methods (Schutz & Rainer, 2016).
Hence, the need to discuss the nexus between liquidity, FI and development.
2.3.2.2 Role of liquidity on financial inclusion and sector development
Liquidity is the speed at which the holders of assets can transform them into buying
power at arranged prices (Fethi & Katircioglu, 2015). For example, land and buildings
are less liquid than stocks. Uncertainties in the conversion of properties into
28
purchasing power gives rise to liquidity risk. Information asymmetry and transaction
costs play a critical part in influencing the degree of liquidity risk. These market frictions
prompt the creation of new financial products and players that enhance liquidity.
Therefore, liquid financial markets will make financial assets’ transactions relatively
inexpensive and there will be little uncertainty on trade settlement. The relationship
between liquidity and economic growth emerges from the existence of high-yielding
projects requiring long-term capital, but savers may not be in a position to commit their
funds for longer times. If the financial structure does not provide the liquidity for longer
tenor investments, the establishment of high-return projects are unlikely.
Hicks (1969) argued that financial market developments that reduced liquidity risk
prompted the industrial development in England. As stated by Hicks, the financial
facilities offered in the initial stages of industrial revolution had previously existed.
Therefore, it follows that technological advancement did not prompt sustained
economic development. The existing inventions required large long-term capital
injections, coupled with savings from all possible sources. The major ingredient that
influenced the industrial development in the eighteenth century in England was a high
level of liquidity.
In liquid capital markets, assets held that include bonds and equity are easily
converted. Concurrently, these capital markets convert the short liquid financial
instruments into long-term investments that are important for industrial production
requirements. As the industrial revolution in England required long large capital
commitments of capital liquidity, transformation was a prerequisite. The industrial
revolution could not have taken place without financial market development
(Bencivenga, Smith & Starr, 1995:243). In recent times, economists have modelled
growth inclusive financial systems in reaction to liquidity uncertainties, and have
investigated the influence of the capital markets on economic development.
The Influential Model of Liquidity propounds that some investors experience crises
having made a choice between two investments that are either: 1) Liquid, low return,
or 2) Illiquid, high return projects (Diamond & Dybvig, 1983). The investors
experiencing shocks require their savings before the project, that is, illiquid before
starting production. The uncertainty creates an incentive for investing in projects that
are relatively liquid but with a low return. This model assumes the methods to see if
29
an individual saver has received a shock(s) that is too costly. The prohibitive costs of
information have ignited the growth of financial markets for the facilitation of trade,
whilst ruling out state-contingent insurance contracts.
Those savers experiencing shocks are able to trade shares on the gains of the illiquid
production equipment ventures (Levine, 1991). In such scenarios, market participants
may not be worried about the shocks of other parties but trade through independent
stock exchanges. Therefore, with inclusive liquid equity markets, participants can
readily buy or sell their shares, and then the productive sector has permanent access
to the capital. In the facilitation of trade equity, markets reduce liquidity risk. In addition,
the reduction in transactional costs causes greater investment in the illiquid and risky
high-yielding investments. Quicker steady growth is experienced, as illiquid projects
will have adequately large externalities.
Conversely, the theory indicates that greater liquidity has an unclear effect on savings
and the development of the economy. The majority of the models suggest that more
liquidity improves investment returns and reduces risk. Greater returns have no direct
relationship with saving rates because of some income and substitution effects, and
lower risk somehow influences the saving levels (Levhari & Srinivasan, 1969). This
entails that fluctuations in savings may still result in the rise of liquidity levels.
In models that have an expanse of physical assets, the deposit rates may tumble as
development slows down with higher liquidity (Jappelli & Pagano, 1994). Inclusive
financial systems can also reduce the uncertainties related to particular regions,
projects, countries, firms, industries, and so on. It is important to note that mutual
funds, equities’ markets, and banks provide instruments for pooling, trading and
spreading. Resource allocation and savings are the prerogative of an inclusive
financial system, as the system provides risk management services that have an
influence on long-term economic development.
The risk reduction abilities of the financial sector tend to encourage the movement of
funds toward higher yield investments (Devereux & Smith, 1994; Obstfeld, 1994). Risk
diversity may influence the technological revolution, as financial players continuously
leverage technological advances to gain profitable market niches. Furthermore,
novelty in production methods involves uncertainty but having a spread portfolio of
ground-breaking projects lessens exposure, and the investment in growth-enhancing
30
projects is improved. A highly developed and efficient financial sector that reduces risk
accelerates technological changes, hence leading to steady economic growth (King &
Levine, 1993a).
According to Bagehot (1873:53), in the 1800s England’s financial system identified
and funded profitable projects better than other countries and that resulted in it
enjoying superior economic growth. Financial intermediaries also have a crucial role
to play in screening or identifying entrepreneurs with high prospects of succeeding in
their novel ventures (King & Levine, 1993a). As postulated by Schumpeter (1912:74),
financial intermediaries are not necessarily ‘middlemen’ but encourage and support
innovators in the society. As equities’ markets develop, the acquisition and
dissemination of information become almost automatic, thereby incentivising
participants (Grossman & Stiglitz, 1980). The developments can also be catalysed by
a wide pool of savings (total financial inclusion), contributing to the financial markets’
liquidity.
As markets become liquid, it becomes easier for market participants who acquire
information not to disclose their identity and make money (Kyle, 1984; Holmstrom &
Tirole, 1993). The easily cash convertible equity trades stimulate financial resource
mobilisation and allocation resulting in economic development (Merton, 1987). With a
greater number of market participants (high FI levels), the equities’ market becomes
more efficient. Therefore, more individuals need to participate in the financial system
for efficiency objectives, which must be the drive in many African countries.
The existing theories have not established links from equity trade to data procurement,
and ultimately, long-term economic development. However, participants that are not
concerned about evaluating still benefit from that aggregated and disseminated
information through published stock prices. As long as the financial system is inclusive
and efficient, equities’ markets speedily make public information available through
posted prices (Stiglitz, 1985). For individual investors, it becomes irrational to expend
finances to attain information that is available to the public immediately.
Financial intermediaries support the efficient separation of management from
ownership. According to the comparative advantage principle, efficient specialisation
in production is possible through the separation of ownership from management
(Merton & Bodie, 1995:14). In contrast to this arrangement, the debate is still ongoing
31
about who will keep track of the monitor (Krasa & Villamil, 1992). It is not possible for
the savers to monitor an intermediary with a well-diversified portfolio, as long as they
get their interest on deposit. In addition, when financial intermediaries and firms pursue
long-run relationships, the costs of obtaining information can further be reduced,
thereby enhancing better resource allocation (Sharpe, 1990). The financial measures
that seek to improve corporate control encourage fast capital mobilisation and its
allocation (Bencivenga & Smith, 1993).
However, equity markets promote corporate control (Jensen & Meckling, 1976). Firms
listed on the stock exchange may efficiently reflect the firms’ information on their stock
prices. If share performance is linked to managerial compensation, this will help align
the interests of executives to that of stockholders (Diamond & Verrecchia, 1982;
Jensen & Murphy, 1990). It can also be argued that if managers of underperforming
companies are sacked as a consequence of a takeover, developed equity markets
would prompt corporate control to avoid takeovers. The possibility of company
takeovers is also an incentive for managers to work hard (Scharfstein, 1988; Stein,
1988). However, there is a scarcity of structures directly linking the function of the
equities’ market in improving corporate governance to economic development.
The pooling of funds from different savers results in capital availability for investment
purposes. In the absence of a multitude of savers, several production processes
become economically inefficient (Sirri & Tufano, 1995). Moreover, the amassing of
deposits comprises the formation of financial assets that give smaller investors a
chance to diversify their investments. Households and individuals are then able to
invest in efficient scale companies, thereby increasing asset liquidity, and hence,
contributing to economic growth. Mobilising the savings from different depositors
enhances risk diversification, the size and efficiency of the financial system, and the
sizes of projects (Sirri & Tufano, 1995).
The savings mobilisation role played by financial intermediaries is costly, as there are
transaction and informational asymmetries to overcome. However, it is expensive to
amass savings from a multitude of different savers. Banks play a pivotal role in the
reliable raising of capital and production processes, and an example is the account of
Investment Banking in America (Carroll et al., 2000), through which, some merchant
banks in the United States (US) collaborated with European strategic partners to
mobilise funds from out of the country for production purposes in the US in the 1980s.
32
Major banking players focused on mobilising capital with other banks and industrialists
by offering securities to households. It is evident that financial intermediaries must
ensure high levels of reputation and sound government backing for depositors to
entrust them with their savings (De Long, 1991; Lamoreaux, 1994).
In any financial system, measures that reduce transaction costs enable promotion,
focus, industrial revolution and development. In 1776, Smith expounded this
relationship in the book entitled Wealth of Nations. In his book, Smith (1776:7) claimed
that the specialisation of the workforce is the primary variable fundamental to
productive developments. More specialisation entails that the labourers are highly
likely to invent more efficient machinery and come up with better production
processes. Smith maintained that lesser transaction costs gives rise to specialisation,
as it needs a greater number of transactions than a self-sufficient environment. Smith
articulated his argument in light of the advantages of the use of financial intermediaries
over barter. The costs involved in the evaluation of goods in barter exchange motivate
the emergence of money. Thus, a medium of exchange facilitates trade (Williamson &
Wright, 1994; King & Plosser 1986). The use of innovative payment channels lower
transaction and information costs, which means that such developments enable
ingenious persons to focus and be more efficacious at discovery (Lamoreaux &
Sokoloff, 1996:17). The reduction of the transaction and information costs causes
monetary and institutional development that boosts special focus and creativity
through similar mechanisms, as explained more than 200 years ago by Adam Smith.
In the context of underdevelopment, the Schumpeter theory proves to be inadequate.
In underdeveloped countries, the class of innovators is very small, due to the small
extent of the market and the low expectation of profits. Schumpeter mentioned private
innovators as the prime mover of economic expansion, but in the majority of the poor
nations, the government is the biggest innovator (Solo, 1951). Schumpeter believes
that economic and social development is dependent on domestic (internal) forces. The
majority of developing economies depend on imported technology, foreign direct
investment, joint ventures, and so on. In developing economies, exogenous forces
play a huge role in determining the pace of development in the initial stages (Elliott,
1985). In addition, the developing countries have a population growth strain to grapple
with, which Schumpeter did not consider in his analysis (Thanawala, 1994). Population

33
growth issues continue to cause social, economic and political complications that
retard the development process.
Contemporary theorists have endeavoured to explain with better accuracy the links in
exchange, specialisation and improvement (Greenwood & Smith, 1997). Lower
transaction costs facilitate specialisation, thereby promoting productivity gains. A
feedback from these gains to the financial markets may occur. When fixed expenses
linked with the market establishment remain, the greater earnings per person entail
that the fixed expenses become less taxing.
Economic development spurs novelty and expansion in the financial markets. The
method of relating financial sectors with speciality has not officially wrapped Adam
Smith’s account of improvement. According to Greenwood and Smith (1997), a market
that has reduced business expenses fails to motivate the discovery or innovation of
novel and improved business operation processes. In contrast, lower business
expenses increase the number of considerable creative technologies that are
economically viable. A more developed market is the key to producing and sustaining
specialised production methods. However, the model does not clarify how the
development of financial markets lowers transaction costs, thereby enhancing the
stimulation of specialised production technologies.
The literature has not adequately covered the following: (1) The role of technological
development in advancing inclusive financial systems; (2) How the financially excluded
can be lured into the official financial system, as well as contributing to poverty
reduction; and (3) The factors determining high levels of financial development.
In light of the contradicting opinions, this study utilises current theory to organise a
logical context for the inclusive finance-development relationship and then establish
the factors influencing it. Therefore, it is imperative to examine the different theories
linking monetary expansion and poverty elimination.
2.4 POVERTY REDUCTION THEORIES
The theories of FI and poverty are linked to different policies to improve
comprehension. It is imperative to note the differences in the literature regarding the
remedies, explanations, conceptions and measurements of the problem.

34
Any poverty reduction policy should include a clear description of the causes of
poverty. However, explanations of poverty and impoverishment possess an implied
recommendation and formulation that contain an implicit account of the occurrence.
The following poverty theories are discussed in the below section: The Minority Group
Theory, Orthodox Economic Theory, Classical Theory, and Functionalist Approach.
2.4.1 The Minority Group Theory
The Minority Group Theory that emanated from the early studies represents an
attempt to find the features of particular categories of impoverished individuals in those
studies. In his study, Rowntree did not attempt to find the eventual determinants of
lack, but instead outlined the instantaneous reasons for destitution. Rowntree also did
not discuss how poverty could be reduced. The causes of poverty mentioned are as
follows: size of family; death of head of family; unemployed wage earner; incapacity
of head of family; sickness or old age; irregularity of work and low wages (Gordon,
2006:34; Rowntree, 1901:119).
Rowntree acknowledged the vicious cycle of poverty that applied to children, old
people and young partners with children. These, he identified as having the highest
risk of plunging into poverty. The classification used by Rowntree epitomised an
important advance, and influenced policies related to the provisional wellbeing for
those with the least income, and for the vulnerable such as the sick, unemployed and
aged. It was important to indicate the causes of poverty and identify the different
categories. The advocates of the minority theory maintained that the notion of groups
has an essential place in the development of theory, and the definition of the smaller
segments was the chief purpose of the study (Grogger, 2009; Bane, 2009; Pantazis,
Gordon & Levitas, 2006).
One weakness of the Minority Group Theory is that it did not go further in identifying
the possible remedies for high poverty levels. A gap exists in terms of the role of an
all-encompassing financial structure to reduce or eliminate impoverishment. In
addition, there is a gap regarding the use of latest communication technologies or
social platforms to enhance inclusive growth in a country.
35
2.4.2 Classical Theory
In the last few decades, the occurrence of lack was introduced in theoretical
economics. In the Classical Theory, the focus was on the total distribution of incomes,
wages and rent (Grogger, 2009; Narayan et al., 2009). For example, Ricardo identified
the following as the major challenges of economic science: the distribution of the
global harvest classified as the proprietor of the land, the stockholder, funds important
for farming, and the workers in the sector.
A more thorough challenge to classical theory emerged in the 1930s and 1940s
through the work of John Maynard Keynes. Keynes thought that free-market
economies tended toward under-consumption and under-spending. He called this the
crucial economic problem and used it to criticise high-interest rates and individual
preferences for saving.
2.4.3 Orthodox Economic Theory
Orthodox economists believed that a balanced budget was the key to economic
growth. The Orthodox Economic Theory has been criticised for not paying attention to
and explaining the sharing of private earnings and the association of individual
earnings and total portions of wages, rentals and profits (Gordon, 2006; Grogger,
2009). Lately, the focus has been on the disparity of earnings’ distribution. Economists
and scholars preferred to focus on the factors influencing individual earnings in family
incomes in the explanation of disparity. Earlier studies concentrated on identifying the
form of distribution or shape of the curve, and the three conceptions developed include
the normal, the lognormal and Pareto (Rose, 1972:13; Webb, 1926:177). Pareto
argued that the disparity in the income distribution in different countries and historical
phases was remarkably similar.
There are noteworthy differences in theorists’ perspectives regarding the application
of the Orthodox Economic Theory to poverty and income distribution. The theorists
assumed perfect competition and market equilibrium to be those that emanate from
the market practices of progressive capitalist economies to demonstrate a robust
association between marginal productivity and wages. As postulated by Thurow (1969,
1981), a person’s earnings are insufficient when the yield is not enough. In other
words, if productivity goes up, so does income. The weakness of this school of thought
is that the ingredients of productivity were limited to education, skill and experience.
36
There was no mention of entrepreneurship, nor the sources of finance or an inclusive
financial system, which are vital ingredients to income levels. Posner (1973) criticised
this theory as having no basis in economics for the argument of economic justice that
was put forward. However, the Orthodox Economic Theory was built on the typical
hypothesis of supply and demand by allowing an explanation of the productivity
features of the labour provided.
The determination of major economic philosophers can gain from a broader view
approach. Working on the supposition that problems related to the explanation of
inequalities in income and asset distribution, which is in monetary terms, is the
preserve of economic theory, sociologists concentrated on disparities in wages or
occupational status and focused less on power. Income and occupational status also
contribute to financial or social inclusion or exclusion (Trivelli, 2013; Pantazis et al.,
2006; Schorr, 1964).
However, there are still gaps in the literature, as theoretical and empirical work has
diverted from complementing the first work on the concept of economic class by Marx
and continued with excessively common and vague studies. There are many studies
on economic classes but little is discussed on the emancipation of poverty or
promoting the poor, and the use of communication technologies for the amelioration
of information asymmetry in advancing financial and social inclusion. For example, the
background philosophies of Marx and Weber are of ongoing significance, albeit limited
to explaining the degrees of inequality in a society.
2.4.4 The Functionalist Approach
In explaining issues to do with poverty and inequality, some sociologists have used
the ‘Functionalist’ Approach which agrees in philosophy and universal expectations
with the Conventional Economic theoreticians. The approach also reveals the
assumptions put forward in political deliberations by elites about worth and deserts.
The approach is grounded on variances conjectured in the practical significance of
diverse professions. The scholars, Talcott Parsons, Kingsley Davis and W.E. Moore
advanced the philosophy from 1940 to 1945, where after Levy and Barber further
developed the philosophy.
The theory begins by indicating the existence of different social positions or statuses
in all societies. The positions and status differ in difficulty and pleasantness, as well
37
as their functional importance for society. For all positions to be filled, certain rewards
need to be linked with them, and inequality ensures that all positions are filled (Davis
& Moore, 1945). The central idea of this theory is motivation. More substantial rewards
and greater status are important to encourage people to try to occupy certain positions.
The use of the Functionalist perspective to penury permits one to learn some common
lessons. Gans (1972) listed some purposes of poverty following Merton’s
recommendation that things in society can be dysfunctional for some (see Gans,
1972:3). Gans notes that society does not appreciate the resultant opportunities
brought by impoverishment.
In contrast to the Functionalist Approach, contemporary economists argue that poverty
should be eliminated to ensure equitable and sustainable distribution of resources in
society (UNDP, 2014; IMF, 2015; World Bank, 2017c). FI and sector enhancement
have a huge effect on an individual’s welfare and the economic activity of a country
(World Bank, 2014, 2015).
However, the theories do not go further to investigate the determinants of their status,
for example, that can help in explanations of their social status and financial inclusion
or exclusion. Inequality is reduced by ensuring the inclusion of all segments of the
society, particularly the poor or low-income earners. Marx is criticised for his non-
observance of the rise of diverse social classes or the decrease of the dominant
fundamentals of the waged people, and the stressing of discordant production instead
of consumption (Lydall, 1968). In addition, Marx does not discuss the following: (1)
How poor individuals can raise their income and their status in the society; (2) How
inclusive growth or financial systems can enhance individuals’ welfare; and (3) How to
reduce the difference between the different classes (inequality).
2.5 RISK MANAGEMENT ROLE OF FINANCIAL INSTITUTIONS
Although a deep and wide financial sector enables economic development, the
financial system growth attracts risks. The risk management process allows evaluation
of the potential losses for the financial institutions in the future and allows them to take
measures to deal with the problems. The literature suggests that stable economic
development needs a steady and conducive macroeconomic environment. This is
explored briefly below by discussing the role of risk management in the financial
sector’s development.
38
2.5.1 Risk management in the financial sector
Researchers maintain that the ability of the financial sector to ameliorate risks enables
the economy to withstand economic downturns. This then leads to a more sustainable
environment that supports growth. However, there are contrasting views, for example,
that as the financial sector develops, the opportunities for conjecture and volatility
increase instability and the likelihood of financial disasters (Easterly, Islam & Stiglitz,
2000). Arner (2007) maintains that risks are inherent in the liberalisation of the sector
across the world in emerging economies, such that adequate domestic restructuring
is a prerequisite. Without a supervisory and regulatory framework that keeps pace with
financial development, sophisticated financial systems will not be able to avoid
financial crisis.
Consequently, the concern is how to structure an inclusive financial sector that
empowers and facilitates economic development in view of financial sector stability.
The studies on banking system challenges reveal that several of the financial crises
experienced in recent decades resulted from structural weaknesses in the financial
systems (Krugman, 2009; Shiller, 2008:29). These include fragile regulation and
supervision, poor governance and extreme deposit protection, since they are
associated with the rewards for bank managers on taking risks in lending operations.
Krugman (2009) argues that there is the possibility of a catastrophic failure in any
market economy. In a study done in the US, Shiller (2008:29) found that a financial
crisis could be the result of borrowing defaults. He argued that the 2007-2009 financial
crisis resulted from asymmetric information and lax lending standards. In addition,
there are specific banks’ characteristics that include currency and maturity conversion,
as well as unbalanced data, that cause banks to be susceptible to withdrawals, and to
collapse when hostile shocks occur. The collapse of a banking institution can lead to
a systemic banking crisis. Studies highlight the significance of well-structured financial
regulation and supervision in a country’s financial sector.
However, there are differences in the sequencing of financial sector innovation in
developing economies. The debate is related to the significance of a country’s financial
arrangement, that is, the extent to which economic growth of a country is bank-
centred. Lin (2009) argues that developing countries have to create inclusive
appropriate local banking institutions that will spearhead domestic economic growth.
39
He argues that the important issue is setting up an inclusive financial system that
serves the economy’s productive sectors. Lin further argues that the magnitude and
intricacy of financial sectors and institutions in the developed world may be
inappropriate for developing countries. Lin recommends that the financial sector of
developing countries should focus on activities such as small-scale manufacturing and
agricultural activities.
There are contrary views to the notion of inclusive small, private domestic institutions
taking the lead in economic activities. Banerjee and Duflo (2009) agree that large
foreign banks may not be the answer to low-income countries’ problems, as there is
little evidence to support that. However, they argue that most low-income countries
face the challenge of inadequate supply of risk capital. This is because the funding of
new ideas and projects may be a challenge for minor banks, but in principle, stock
markets can supply this type of funding. Stock markets directly fund large projects,
and venture capitalists can close such gaps. In their argument for stock markets and
venture capital to fund new firms, Banerjee and Duflo (2009) acknowledge that
establishing a stock market may not be easy.
Moss (2009) argues that equity markets do not provide capital for small firms or
projects. He also does not deny that inclusive domestic banks are more likely to serve
the poor and small clients. Moss maintains that developing countries’ problem is not
on the choice between equity markets and minor community banks. He views stock
markets as better positioned than banks in developing an economy. Moss maintains
that equity markets are useful in different ways to stimulate wide involvement in the
official economy. He mentions the issue of public securities as a way to allow small
resident investors (individuals and firms) to take part in the formal financial sector, as
large institutions list on the bourse. He recommends long-term plans for the nascent
equities markets in developing countries. Inclusive financial systems also play a crucial
role in firm development as discussed below.
2.5.2 Role of inclusive financial systems in developing economies
Regarding the role of inclusive financial systems, Moss (2009) argued that equity
markets usually provide capital for large firms and projects. Schoar (2009) concurs
with many other economists’ views that an inclusive and developed banking system is
significant in enabling firm development and competition. She is also agreeable to the
40
view that stock markets play an insignificant part in the total financing in developing
economies.
However, Schoar argues that minor banks and micro financial institutions are not able
to supply adequate risk capital to fund small firms to enable them to grow. The reason
for this being that the small financial institutions may be fragile and susceptible to local
shocks. The fragility then reduces the capacity to fund small, risky firms or new
projects. Schoar further argues that this becomes disadvantageous to countries that
largely depend on banks for financing new projects. Whilst concurring on the important
role of banks to improve the economy, she states that finance is simply a tool to create
opportunities, not a goal in itself.
In answer to this, Schoar (2009) then proposes a two-tier way of financing which: 1)
Consists of small banks serving largely subsistence entrepreneurs, 2) Consists of
bigger banks serving transformational entrepreneurs, namely those who create job
opportunities for a multitude and develop to large scales. The argument is that this
calibre of entrepreneurs possesses the ambition and proclivity to take risks different
from subsistence entrepreneurs. They need huge capital amounts that the small
institutions are not able to supply.
Levine (2009) agrees that economic development is dependent on the level of
development of the financial structure. Levine postulates that the structure of the
financial sector of developed countries is inappropriate for developing countries, a fact
that many policy advisors ignore. The suitable structure and role of the financial sector
depends on the nation’s political, regulatory and economic systems. However, Levine
maintains that the consent for inclusive indigenous resident banking institutions being
the backbone of low-income economies’ financial structures overemphasises the
method rather than substance. His perspective is that the objective must be to design
laws, policies and players that create a conducive situation for the provision of
appropriate risk, credit and liquidity facilities to the economy. Levine highlights studies
identifying the destructive consequences of establishing minor banking institutions as
the anchor of the financial sector in the larger part of the 20th century in the USA
(Zhuang et al., 2009). The strategy of maintaining minor banks and limiting the
proliferation of large banks was successful but resulted in some challenges. The
several small, localised banks created monopolies, blocking new entrants that would
bring some form of competition. This ended up negatively affecting the impoverished
41
by channelling funds to borrowers from the neighbourhood, thereby retarding
economic development. There was unproductive allocation of credit and increased the
fragility of the banking sector because it was undiversified.
Small, local banking institutions may have more information about the small firms in
the local area, whilst big banks diversify with more effective credit scoring procedures.
On the issue of banks, Levine postulates that large banking institutions may be too
large to supervise and the small banks may be too small to monitor. He also maintains
that equity markets may not supply much risk capital to companies, but supply
corresponding risk services that assist in the productive allocation of funds.
Zingales (2009) shares the same sentiments with other economists that the model that
works in developed countries may not work in low-income countries. Zingales
maintains that the future change and growth of equity markets is crucial. However,
Zingales differs regarding the over-reliance on microfinance in economic development
to spearhead growth. He supports the notion of small banking institutions in
championing development, as the organisations have more information for
development purposes. The large government-owned banks might be less active than
inclusive small banks due to political interference in credit allocation becoming a huge
barrier. Generally, he is in favour of a competitive financial system that is inclusive and
relies on markets.
Thoma (2009) similarly maintains that low-income countries require an inclusive
banking system with minor banks and MFIs to provide the basic financial services.
Advanced financial services may be required for efficiency, and these include products
such as derivatives. He maintains that not all financial requirements must be
straightforward or simple even in low-income countries. Thoma goes on to argue that
one hindrance in the effective delivery of financial services in underdeveloped
countries is inadequate information of borrowers, a problem he thinks small banks can
solve. Overall, he is for the small banks taking the lead in economic activities in low-
income countries.
Khwaja (2009) claims that in theory, small banks respond to localised information
because of lack of bureaucracy. Khwaja argues that it is not clear why large banking
institutions do not establish better-devolved decision-making systems. There is
empirical evidence that small resident banking institutions serve largely small
42
customers, but it may mean that the situation may force them to focus on that type of
clientele, as the larger banking institutions would have grabbed the good borrowers.
He contends that countries that experience high growth rates have created a
conducive platform for minor banks, and growth ignites the rise in the small bank share
and not the other way round.
The literature did not adequately address some financial aspects that include that
which contributes to the strength of the financial sector in terms of effective and
efficient delivery. For example, the literature has inadequately addressed the
appropriate model(s) that advance the function of the official financial system in
economic expansion. There are still gaps on how financial institutions can work to
improve information asymmetry for low-income earners, and how the financially
excluded can obtain accounts with formal financial institutions. Research is yet to
consider how the financially excluded will get relevant information on financial
institutions’ processes, products and services. In other words, what is the best
information dissemination channel for the bank to the prospective and current
customers?
The current study examined the contribution of social networks to FI. This is because
the use of social networks may result in the easy flow or dissemination of information
that will enable an individual to make an informed financial decision. The section below
discusses the theories and empirical studies linking FI and economic growth.
2.6 FINANCIAL SYSTEMS AND ECONOMIC GROWTH
The early theories of economic growth acknowledged factors, such as capital, labour
and institutions, as having an influence on economic development. However, earlier
scholars, because of the existence of the Modigliani–Miller Theorem and EMH
(Modigliani & Miller, 1958; Malkiel, 2003:19), often ignored the significance of funding
for economic development. These theories made an assumption of the perfection of
the capital markets with no frictions. This supposition entails that investors trade
securities with no transaction costs in a perfect capital market situation.
In contrast to this view, the assumption that entrepreneurs can borrow and advance
at the same price is practically not valid in financial markets (Fama, 1990). The first
theories of economic development also assumed that there is a need for an
43
established and broad financial sector that mobilises funds and directs them to
productive units of the economy. This leads to the question: Which development
precedes the other?
Recent work and theories of economic growth intensely maintain that financial
development is a prerequisite, as it enables the necessary environment for economic
expansion (Petkovski & Kjosevski, 2014; Fink, Haiss & Vuksic, 2005; Levine, 1997,
2005; Wachtel, 2001). The main services offered by banks include savings
mobilisation, risk diversification, savings allocation and monitoring the allocations of
managers. These functions are aimed at influencing savings and investment
decisions, thereby enhancing economic growth.
Economic development can be fund guided, such as when financial development
ignites expansion. On the other hand, it is demand following, that is, when industry
expansion generates the necessity for financial facilities (Mohan, 2006). An enormous
body of empirical literature advises that financial system development, and more
accessibility to formal financial products accelerate economic growth. This is achieved
when income disparity and poverty are reduced (Kakwani & Pernia, 2000). Several
research studies have explored the macroeconomic relationship between financial
growth (inclusion) and sustainable economic expansion. Those studies involved
averaging out factors in the long term and used regression with the objective of
identifying differences in the various economies’ growth rates (Arestis & Demetriades,
1997).
The findings of numerous observational researches reveal a positive association
between economic and monetary development (Levine, Loayza & Beck, 2000; Beck
et al., 2000; Caporale, Rault, Sova & Sova, 2009). Contrary to this view, other studies
have reached varied conclusions on the role played by financial system improvement
in economic growth. A study by Demetriades and Hussein (1996), proposes that the
link between monetary and economic expansion rates differ from nation to nation. In
a study of 12 economies, they found a feedback relationship in four of them, while in
the rest, the relationship stretches from industry expansion to finance, pointing to the
fact that there is no way monetary structures contribute to economic expansion across
countries. Contrarily, a study by Drakos on the association of industry and monetary
system growth in 21 economies, found that defective rivalry in the banking system
slows down economic development, in addition to influencing business cycles
44
(Drakos, 2002). However, the banking sector dominates the financial intermediation in
production or developing economies.
Recent development theories show that when there is no access to finance, there will
be a persistent income inequality. The income disparity also makes the economic
growth rate slower (Bonin & Watchel, 2003). Low FI levels prevail more in imbalanced
societies, if compared to those with less disparity. Burgess and Pande (2005)
established that when countryside outlets in India increased meaningfully it resulted in
poverty emancipation in those areas. Apparently, a strong accord exists in different
studies that large and aggressive financial players make a significant contribution to
economic development.
A developed and sound financial system permits greater access to funds, as under-
developed financial systems restrict and constrain the availability of funds. In the
absence of formal finance, borrowers resort to high-cost informal sources that include
moneylenders (Germidis, Kessler & Meghir, 1991). Underdeveloped financial systems
finance less economic activities. The reason being the constrained availability of funds
and the exorbitant costs. Conversely, developed financial systems may also struggle
to serve low-income groups because of a lack of the required securities and
documents (World Bank, 2006). In many cases, low-income groups end up accessing
high-cost informal sources, resulting in the growth benefits accruing to those who are
already financially included (RBI, 2008).
Where FI levels are low, some small firms and low-income individuals utilise their
inadequate resources for investment in schooling and entrepreneurial activities (World
Bank, 2011). It is essential that susceptible groups have access to reliable, convenient
and sound formal financial products, especially those in disadvantaged areas, to
speed up economic growth (Kakwani, 2000; RBI, 2008). It ought to be emphasised
that the Gini index (a measure of the distribution of income across a population) is
adversely and significantly related with FI (Alesina & Rodrick, 1994; Persson &
Tabellini, 1994).
An established and efficient banking system is vital for development, since only formal
financial players have the capacity to satisfy the required credit, savings and
investment products (Chhikara & Kodan, 2011). Moreover, a developed monetary
system allows the financially and communally excluded people to participate in
45
production, aggressively contributing to economic growth and cushioning from
financial disasters (World Bank, 2013; RBI, 2008). Social, as well as FI, contributes to
the equal distribution of economic growth benefits.
A robust link between the rural and the entire global financial marketplace reduces the
cyclical, industrial and regional variations in the supply of credit and demand thereof.
This will go a long way towards making the rural population partake in investments
outside the rural areas (Moll, 1989). In least developed countries, accessibility to rural
credit goes a long way in stimulating new investments and encouraging new
technology developments. Therefore, improving financial accessibility to the poor
people must be a priority everywhere to ensure quicker economic growth (UNDP,
2014).
Developed financial systems should be able to organise appraisal techniques and
other mechanisms, empowering them to fund even the marginal production activities
for the promotion of economic growth. The obtainability of credit to prospective
businesspersons permits new entrants on the markets, resulting in more competition,
which, in turn, enhances enterprising and production. The high industrial growth rates
reported across the world can be attributed to the expansion in bank credit in recent
years (Bell & Rousseau, 2001).
Highly developed financial systems ensure safe savings, appropriate loans for all,
appropriate credit facilities, and transaction services that enhance incomes,
management of risk, and emancipation from poverty (UNDP, 2014). Studies have
revealed that access to financial services helps in reducing transaction costs. Formal
financial services contribute to greater productivity and social security, as the financial
structure plays a catastrophic amelioration role.
Empirical studies also sustain the notion that the efficiency of a financial structure has
a great influence on the expansion of the economy (Chhikara & Kodan, 2011; Rajan
& Zingales, 2003). There is an observation that different processes of financial
expansion, which embrace the agents’ financial assets, broad money, domestic
funding to free enterprises, equity and debt market funding, are associated with
economic development (King & Levine, 1993a; Levine & Zervos, 1998). Moreover,
Rajan (1998) found a positive association between monetary sector growth and
industrial level development. In addition, the modern endogenous growth studies,

46
grounded on ‘learning through action’ procedures, merit finance with an extraordinary
role in development (Aghion & Howitt, 1998). Furthermore, FI ensures several benefits
flow to consumers, regulators and the entire economy.
In summary, FI is the route to inclusive and impartial growth in an economy. An
inclusive financial system permits the parsimoniously and communally excepted
individuals to participate, taken together production, aggressively contributing to
economic growth, as well as cushioning of financial crisis. Once an account
relationship is established, more benefits will accrue to the customer, such as access
to a broad range of financial products. There will be access to safe, standardised
products and services provided by credible regulated and supervised institutions. A
banking account is by far the most effective way to robust FI, and represents a valuable
position for all the economic divisions in a country. Therefore, there is need to examine
the channels for financial resources distribution. Discussed below are the indirect and
direct channels of inclusive financial system benefits.
2.7 DISTRIBUTION OF RESOURCES FOR DEVELOPMENT
This section discusses the literature on how the resources for development are
distributed. There are different channels that relate how the financial system benefits
improve society. One channel operates indirectly via economic expansion and another
one directly when the deprived benefit from using appropriate monetary products.
Discussed below are the channels.
2.7.1 The indirect channel
One major way that financial system development reduces poverty is through
economic growth. Opportunities may arise when investment is done in the productive
sector. There can be job creation as small to medium enterprises, as well as other
sectors, increase production. The investment could also be in human capital
development, thus improving the capacity building of the enterprises. A number of
scholars agree that economic development eases utter poverty. The following four
possible channels explain the product of economic expansion on lessening poverty.
The growth of the economy could create employment opportunities for the poor.
47
Greater economic growth rates can decrease the wage disparities between the
trained and untrained, while the advanced phases of development benefit the poor
(Galor & Tsiddon, 1996).
High economic growth may result in more tax income, facilitating the national
authorities to create bigger economic space in terms of communal amenities, for
instance, schooling, wellbeing, recreation, and other social welfare needs. These
could then benefit the marginalised and the poor, as the government spends on
human capital development (Perroti, 1993).
As the financial systems become inclusive, capital mobilisation improves with
higher economic development. Therefore, more money is availed for the needs of
the prospective entrepreneurs for productive reasons (Aghion & Bolton, 1997), thus
raising their earnings.
In earlier literature, there exists contrasting opinions on the development–poverty
elimination link. The Kuznets’ Inverted-U proposition suggests that economic
development could raise income disparity at the initial stages of growth, then decrease
it at the later stages of industrialisation (Kuznets, 1955, 1963). The argument is that
the asset-rich class that have easy access to credit or are able to self-finance
themselves and enjoy the early harvest of industrialisation. The early beneficiaries also
manage to get a larger portion of the economic gains, as the poor remain
disadvantaged. Contrary to this view, the ‘Trickle Down’ Theory suggested that
economic development could benefit the poor through vast economic opportunities
and job creation, thereby creating the requisite conditions for more delivery of the
gains of economic expansion (Todaro, 1997).
There has been unanimity in recent years that economic growth, FI and financial
system growth reduce poverty. In the early 1990s, quality data from several countries
related to the distribution of income permitted empirical testing of standing arguments.
Several studies focused on explaining the changes in poverty levels, considering the
growth effect and the delivery effect triggered by changes in the Lorenz Graph
maintaining regular earnings the same (Datt & Ravallion, 1992; Kakwani, 2000).
The studies found that expansion outcome clarifies the greatest portion of the
variations observed in poverty. Other studies, such as that of Fields (2001) that span
a period of 20 years in a cross-sectional survey, found that people with better per
48
capita incomes or consumption had better welfare levels. Scholars concur that the role
of economic development in dealing with poverty does not imply that “it is all about
growth”. Fields (2001) postulates that the influence of development on poverty
mitigation is determined by the rate and the extent of the disparity.
It is worth noting that as much as growth may be important for poverty alleviation, it is
not sufficient in itself. Besides growth, a number of elements are also necessary for
poverty alleviation. It is important for the poor households to partake in the economic
development process by building up their asset base. Growth has to be widely
inclusive and involve all segments of society. High disparity levels are also a cause for
concern in fighting poverty, and FI must be a policy priority (Kanbur & Lustig, 1999).
Economic development and wealth delivery are interrelated in a number of ways, and
the success of economic improvement translation to a lessening of poverty is
determined by the early stage of inequality (Lustig et al., 2002). It becomes imperative
for governments to introduce some measures in the short term to assist the public, as
it may take long periods for the marginalised to enjoy the pay-offs of policies or
strategies. The direct channel is an option and a discussion of thereof informs policy
reviews. The direct channel involves accessing financial products for development
purposes. Section 2.7.2 gives insight on the direct channel of resources.
2.7.2 The direct channel
Institutions for acquiring, tracking and serving customers through multiple channels
can utilise direct financing channels. Direct distribution allows quicker observable
results. The channel involves more issues than the indirect channels. These include
profitability, competition, product performance, customer feedback, and building
relationships with customers. Several scholars are of the opinion that growth of the
financial system unswervingly contributes to a decrease of poverty by supplying or
raising the accessibility of monetary products to individuals who were previously
excluded (Park & Mercado, 2015; Amidžić et al., 2014).
Many economists believe that monetary system growth has a huge influence on the
poor. The main reason being information asymmetry because there are credit
constraints in funding the projects of the poor, as they cannot fund themselves and
have no collateral (Banerjee & Newman 1993; Galor & Zeira, 1993; Aghion & Bolton,
1997). Such controls limit the impoverished from taking advantage of venture
49
prospects that arise. The situation can also be worsened by the fact that the poor will
be financially excluded (no accounts with formal financial intermediaries) and those
institutions with a capacity to extend credit will have no history of the borrower. An
inefficient financial system produces greater income differences by inexplicably
preventing capital from flowing to ‘unbankable’ entrepreneurs.
In the past decade, confidence has been pinned on the life-changing power of having
access to formal financial services and products. One financial access advocate is
Muhammad Yunus, 2006 Nobel Peace Prize winner, together with the Grameen Bank,
the institution he established to supply the financially deprived citizens of Bangladesh
with formal finance. Muhammad is an advocate for the transformative power of small
business loans to the poor, arguing that as incomes improve, children get long-denied
opportunities (Karlan & Morduch, 2009). Yunus’ contribution has its foundation in
economic concepts.
The view is consistent with investigations of credit control showing that a lack of
requisite information on customers can cause the enforcement of contracts and the
outcomes are not Pareto efficient (Karlan & Morduch, 2009; Besley, 1994; Stiglitz &
Weiss, 1981). Therefore, developments in lending markets then channel gains to both
equity and banking sectors. The argument that the marginal yield to investment is
significant when funds are limited buttresses the assertion that the financially excluded
have huge benefits to realise from accessing formal finance.
However, on the ground, banks have experienced challenges in providing such
services and products cost-effectively. The financially excluded remain poor, and in
most cases, lack the collateral to offer for loans. Furthermore, the financially excluded
want to make largely small amount transactions that are unattractive to profit-making
organisations (Cull, Demirgüç-Kunt & Morduch, 2014; Johnston & Morduch, 2008).
Consequently, MFIs close the gaps left by those incentive-seeking institutions and the
problems triggered by transaction expenses. In contrast with Yunus’ views, it is argued
that there is a long list of other factors associated with poverty that include weak labour
markets, low education levels, discrimination and poor health (Karlan & Morduch,
2009). These challenges are likely to undermine the efforts of financial access in
raising incomes.
50
There is evidence that while funds may bring resounding results for some, for others
the results may not be significant. Yunus’ way of emancipating the poor centred on the
investment’s potential returns but the results vary. More significantly, the model
concentrated on the provision of small amounts of credit for investment purposes.
Yunus’ ideology of unleashing the potential of small to medium enterprises has
resulted in a powerful account. This may prompt experts, as well as policy-makers, to
respond appropriately and make recommendations to address the needs of the
marginalised. However, the larger financial requirements of the poor are comparable
in different ways to the needs of wealthier households. The needs include tools for
managing financial resources, ideas to save for investment purposes in the short to
long term, and strategies for managing exposure. Therefore, the access to formal
funds for expansion of business yields income that can facilitate these tasks.
Collins et al. (2009), in a study to display yearlong financial plans, tracked the financial
activities of marginalised households in India, South Africa and Bangladesh, they
found that the immediate needs of individuals guide financial plans. The basic needs
include illness, school fees, food, other large expenditures and productive prospects
arising. In contrast to small loans for business drive, the study found that no needs are
necessarily close to running a small business. This is so because requirements are
the same for those working in towns and that of females operating small ventures in
the countryside.
Views against the FI agenda include that the case for FI that was advanced by the
World Bank (World Bank, 2006) depends on the naive perspective of the link between
access to formal finance and economic growth sustaining them. The increasing
evidence involving the real effect of small credit programmes in developing countries
claiming that positive developments follow FI. According to Gans (1972), poverty is
reduced, not eliminated, implying that some efforts to deal with it may be futile.
According to Mader (2017), the high expectations of FI of reducing poverty and the
financial system growth effects on economic growth lack justification. It is also argued
that the estimations of statistical relationships of FI approaches and bigger economic
activities using information from several countries are only valid if conditions are the
same (Kvangraven & Dos Santos, 2016; Baylis, Smith & Owens, 2011). That is, the
association between financial growth and macroeconomic effects must be uniform
across all nations, and at the same stage, for the findings to be credible. The World
51
Bank has also been criticised for depending too much on cross-country
approximations, while downplaying the impact of history and the institutional specifics
of the economies (Banerjee, Deaton, Lustig, Rogoff & Hsu, 2006). The differences in
underlying relationships across countries make the empirical work unreliable.
At the micro level, studies linked with the World Bank, such as that of Cull et al. (2014)
on the influence of numerous FI initiatives, were criticised for saying little about what
may transpire in different settings. The studies also lacked external validity (Baylis et
al., 2011). Financial-intermediation services in different economies, regions or
socioeconomic strata will have varying results (Sarma & Pais, 2010). An example is
that of a credit facility capable of instantaneously changing the financial status of the
beneficiaries and the community, as the tenor and delivery depend on the purposes
to which credit is utilised, especially in terms of speculative, consumption or productive
activities (Dos Santos, 2011, 2009; Beck et al., 2012).
Countries such as Thailand, Iran and Turkey, have shown high levels of FI and low
measures of human development (Kvangraven & Dos Santos, 2016; Narasimhan,
2014). In contrast, countries such as Armenia, Peru, Albania and Mexico have
reported significant improvement in the welfare of their people against low measures
of FI. This implies that a country’s financial services conditions should be considered,
and that includes evaluations of the modalities of service delivery.
Kvangraven and Dos Santos posit that claims established on the panel-data
approximations from different countries are not a systematically binding conclusion
regarding the effects of FI. Therefore, it is wrong to assume that FI characterised by
well-regulated micro-credit and broad microfinance initiatives will result in positive
developments everywhere. However, these limitations should not refrain the
advocates of FI from supporting the idea that FI is comprehensively proficient in
delivering positive change in individuals’ lives (Kvangraven & Dos Santos, 2016).
Banking institutions take deposits and offer loans, among other services. In the mid-
19th century, the Schulze-Delitzsch and Raiffeisen strategies resulted in the
establishment of cooperative banks as philanthropic institutions. These aimed to
encourage workers to pool funds and accumulate savings (Hesse & Cihak, 2007).
These banks were intended to ameliorate famine, disasters in labour markets and
glitches with public allowances, as studied by Ravallion and Chen (1997). Such
52
developments quickly spread to other countries in Europe, such as Austria and Italy,
and the Americas (Mettenheim & Butzbach, 2012). The Financial Institutions Model
contributed positively to the economic development of other countries.
According to Hesse and Cibak (2007), lower revenue diversification offsets lower
profitability and capitalisation. Consistent incomes vital for banking institutions’
efficiency come as a result of high FI levels (Gurtner et al., 2002). High levels of FI in
a country aid the ordinary deposit-taking and credit-delivering formats in improving
exposure reduction strategies at banks. However, in contradiction to the Modern
Market-driven Banking Philosophy, banking corporations that have to maintain
traditional supplies of deposits has strengthened the soundness and viability of the
banking sector. According to De Jonghe (2010), the Banking Theory anticipated
markets to lessen risk on the asset side, but this perspective has lost credibility since
2008.
The reliance of banks on commission-centred earnings seems to increase revenue
unpredictability (Mercieca, Sckaeck & Wolfe, 2007; Stiroh, 2004). The banking
institutions’ reluctance to diversify earnings assists in explaining the long-term stability
and performance enjoyed by these institutions linked to their business and governance
models. The main advantage of supporting the banking sector over equity and bond
markets is the capability of banks to balance inter-temporal risk (Loayza & Ranciere,
2005; Allen & Gale, 2004a). As deposits tend to increase, the stability or risk
absorption by banks remain even during crises.
The competitive advantages of banks may produce a future modernisation of the
banking sector concerning efforts in maximising FI levels. Large banking institutions
can accumulate capital in the form of deposits or profits to be used in times of need.
Ayadi, Llewellyn, Schmidt, Arbak and De Groen (2010:108) postulate that the creation
and unlocking of funds is a risk management strategy. The accessibility, trust and
more public confidence in the banking sector offers competitive advantages. This
increases the importance of ensuring a higher percentage of the population is
financially included.
The need for stability in the banking sector implies the use of original approaches in
banking theory, FI issues and laws guiding institutions’ operations (Gorton, 2010; De
Grauwe, 2009). Gorton and De Grauwe concur that from 1980, changes and
53
regulations were designed to support market-oriented finance to avert financial
suppression and free enterprise system forces. In light of the competition, strategy
options and systemic significance with banking institutions, a return to the original
strategy of ensuring high levels of FI will be imperative. Basing on the rudimentary
meaning of a banking institution as client centred, deposit dependent and loan creating
organisations, there is need to explore factors influencing FI levels in a country (World
Bank, 2017d). Greater client/customer confidence, trust, communication, effective
customer relationship management, broad deposit bases, long-term profit
sustainability, disinclination to unprincipled marketing and sales sum to serious
competitive advantages. Through innovations, banking institutions in Europe have
modernised in line with revolutions in ICT to offer better secure savings, insurance and
credit among other services for upsurge in competition, transforming risk, allocating
resources and flattening credit and growth curves (Aliyu & Tamin, 2012).
The inclusiveness and development of the financial sector reduces transaction and
information costs by allowing less well-off entrepreneurs to access capital, improving
capital allocation and having a huge influence on the poor. Fields (2001) maintains
that there are huge benefits in developing the financial and credit markets, as
underdevelopment causes perpetual income disparity, slower economic growth, and
continued poverty. As the poor get more access to credit, more opportunities to
participate in productive endeavours arise thereby improving their incomes. The
outstanding strategy to alleviate penury in developing countries is supporting small to
medium enterprises (SMEs) through the provision of appropriate financial services
(credit) (Morgan & Pontines, 2017). SMEs and other informal household enterprises
are employment intensive and this could be the pathway to poverty elimination.
Providing credit to productive (high yielding) businesses of poor households has a
huge influence on poverty reduction.
FI allows the poor to manage financial or medical expenses, reducing the challenges
of impoverishment, in case hitches are experienced. Nevertheless, there are sceptics
who hold the view of the financial system development leading to broader financial
access in the early stages. It is claimed that it is mainly the wealthy and high political
figures who enjoy such developments in the financial system (Haber, 2004). In these
scenarios, more financial development succeeds in directing more capital to a few. It
has remained debatable whether financial system development narrows or broadens
54
income inequality even though it causes aggregate development. There are views
backing a curved connection between funding and earnings delivery. In a research on
the association between monetary and trade and industry expansion, Greenwood and
Smit (1997) reveal that the link may result in an upturned U-shaped curvature of
earnings disparity and monetary system growth. In the initial phases of expansion, just
a few comparatively rich people have access to financial markets and higher yielding
investments. Inclusive economic development allows more individuals to be able to be
part of the official monetary system, with positive consequences on trade and industry
expansion. When there is huge success in economic growth, everyone takes part in
the financial system enjoying the full array of gains.
Financial system development does not automatically result in better accessibility to
formal financial facilities by poor folks. For the financial system development benefits
to quickly cascade down to the poor, a public sector interference such as microfinance
schemes and SME credit programmes is necessary. In theory, justifications exist for
the accessibility of credit being more adverse to SMEs. The costs involved with loan
appraisal, supervision, and collection are very significant. Lenders prefer providing
higher sums of loans to bigger enterprises than smaller sums to numerous small
corporations. The small to medium enterprises are unlikely to provide security for
loans, and this discourages lenders, as the default risk may be high. Because of the
challenges, governments may establish various programmes to ensure that all
segments of the population have access to financial services (ADB, 2009). An
example of one success story of microfinance is that of the Grameen Bank (Yunus,
2007).
The support of microfinance organisations and SMEs credit programmes has a special
for development purposes. There have been opposing views on poverty reduction and
greater access to financial products and services by SMEs. One argument is that
access to finance is not the only limitation for SMEs such that one can say it is a
panacea for reducing poverty. Other challenges influential to the growth of SMEs
include lack of market access, expertise, technology and market failures (Levine,
2012).
There are several studies that have cited limitations to the application of loan facilities
for impoverishment reduction that include challenges in categorising the poverty-
stricken and ensuring loans are accessed by the deprived; lack of business skills; the
55
desire by the poor to engage in economic activity and fragile administration (Sajeda et
al., 2003; UNDP, 2014). The other challenge is that in many instances, the microcredit
programmes are in isolation instead of combining with other backing services such as
training, information, land and technology (Biswas, 2010). The ADB (2009) argues that
the major constraints to enterprise growth are financial access, lack of access to new
technology and vibrant markets. SMEs must be innovative and adopt new technology
if they are to grow. ADB also recommends that governments have to assist SMEs by
providing financial literacy education, information technology services, vocational
training and capacity building as well as facilitating access to finance.
In light of the previously mentioned, the literature has not adequately explored the
effect of some factors influencing banking sector development and efficiency. These
factors are important as they shed light on policy reforms in the sector influencing
operations of banking institutions. The marketing and sales aspect has a great
influence on the operations of today’s institutions (World Bank, 2017c), and there is a
lack of literature on the effects of social networks on bank operations. The need for
inclusive financial systems requires insight into the existing banking theories.
2.8 BANKING THEORIES
The discussion of the three banking theories in this section may help to provide insight
into the nature and benefits of FI.
2.8.1 The banking system
The literature commonly refers to three separate and independent banking theories.
The Credit Creation Theory, which postulates that banking institutions are capable of
creating money ‘from naught’ when extending credit from accounting procedures. The
Fractional Reserve Theory, which affirms that it is the sole function of the entire
banking system to create money, whereas every bank becomes a sheer financial
intermediary, receiving deposits and issuing loans. The Financial Intermediation
Theory states that banking institutions are financial intermediaries, individually and
severally, making them inseparable in terms of their role from other non-bank financial
institutions, particularly regarding deposit and loan businesses (Werner, 2016). These
theories vary in their loan accounting procedures and policy implications. The theories
also have their critiques and advocates.
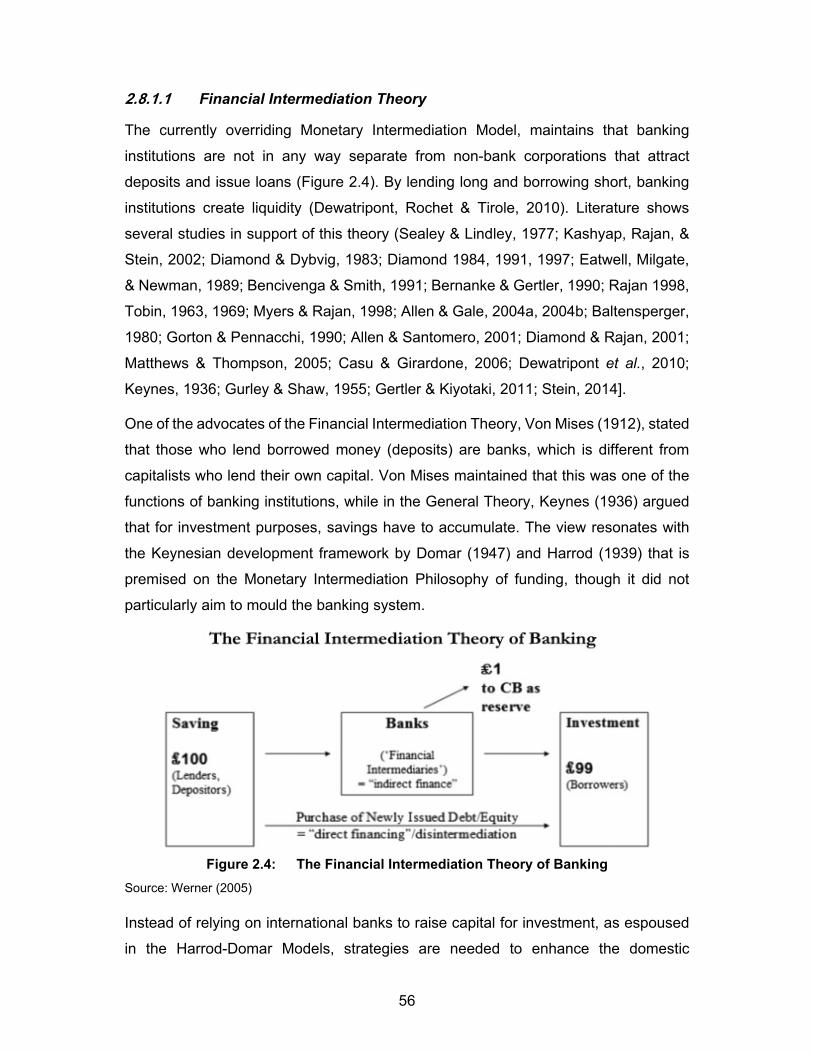
56
2.8.1.1 Financial Intermediation Theory
The currently overriding Monetary Intermediation Model, maintains that banking
institutions are not in any way separate from non-bank corporations that attract
deposits and issue loans (Figure 2.4). By lending long and borrowing short, banking
institutions create liquidity (Dewatripont, Rochet & Tirole, 2010). Literature shows
several studies in support of this theory (Sealey & Lindley, 1977; Kashyap, Rajan, &
Stein, 2002; Diamond & Dybvig, 1983; Diamond 1984, 1991, 1997; Eatwell, Milgate,
& Newman, 1989; Bencivenga & Smith, 1991; Bernanke & Gertler, 1990; Rajan 1998,
Tobin, 1963, 1969; Myers & Rajan, 1998; Allen & Gale, 2004a, 2004b; Baltensperger,
1980; Gorton & Pennacchi, 1990; Allen & Santomero, 2001; Diamond & Rajan, 2001;
Matthews & Thompson, 2005; Casu & Girardone, 2006; Dewatripont et al., 2010;
Keynes, 1936; Gurley & Shaw, 1955; Gertler & Kiyotaki, 2011; Stein, 2014].
One of the advocates of the Financial Intermediation Theory, Von Mises (1912), stated
that those who lend borrowed money (deposits) are banks, which is different from
capitalists who lend their own capital. Von Mises maintained that this was one of the
functions of banking institutions, while in the General Theory, Keynes (1936) argued
that for investment purposes, savings have to accumulate. The view resonates with
the Keynesian development framework by Domar (1947) and Harrod (1939) that is
premised on the Monetary Intermediation Philosophy of funding, though it did not
particularly aim to mould the banking system.
Figure 2.4: The Financial Intermediation Theory of Banking
Source: Werner (2005)
Instead of relying on international banks to raise capital for investment, as espoused
in the Harrod-Domar Models, strategies are needed to enhance the domestic
57
mobilisation of savings by the banking sector. One weakness of the model is the non-
consideration of the determinants of savings levels or rates in different countries, as
there appears to be an assumption that savings are automatic. In addition, it does not
consider the policies and strategies of ensuring an inclusive financial system. Also left
out in the discussions is the influence of ICT in enhancing domestic savings or FI for
the purposes of trade and industry expansion.
2.8.1.2 The Fractional Reserve Theory
The Fractional Reserve Theory postulates that each bank plays a financial
intermediary role. Conversely, this theory differs with the Financial Intermediation
Theory in that it affirms that collectively, the banking system creates money by multiple
deposit extension. When Gurley and Shaw (1955) claimed that banking and non-
banking entities play related intermediary roles in creating financial claims, they were
criticised by many scholars during the 1950s and 1960s (Culbertson, 1958; Smith,
1959; Solomon, 1959). Several of these challengers are advocates of the Fractional
Reserve Philosophy. The consideration of money multiplier differentiated the
Fractional Reserve Philosophy from the Intermediation Philosophy, and influenced
other researchers to promote the method of fractional reserve banking. Phillips
(1920:40) stated that what applies to the entire banking system is different from that
of one of many units in that aggregate. In support of this theory, Crick (1927) affirms
that the whole system creates money even though individual institutions play an
intermediary role.
Consistent with this theory, Von Hayek (1929:90) states that with a tenth of a deposit,
each banking institution can loan out 90% of the total amount that, in turn, increases
deposits at other institutions, and that results in the formation of numerous deposits in
the entire monetary system. Although Keynes (1936:25) subscribed to the Proportional
Reserve Philosophy, he referred to money ‘creation’ implying scepticism regarding the
creation of deposits. Moore (1988:65) argues in contradiction of the Proportional
Reserve Philosophy, that the selection of the phrase ‘bank intermediation’ is not
proper. He affirms that divergent from conventional wisdom, the shifts in proportional
allocations as directed by the central banker have no direct effect on the volume of
bank intermediation.
58
In summary, the Fractional Reserve Theory has the following weakness: too much
weight on debt, which leaves nations exposed, governments with inadequate
resources, and people beset with mortgages and overdrafts. The recent global
financial crisis is attributed to monetary scarcity and insolvency (Hulsmann, 2003).
There is a lack of a balanced view that includes savings mobilisation that is also vital
for investments in the productive sector to be possible. There is no mention of
adequacy of loanable funds and efficiency of the system. There is no mention of the
determinants of loan availability from the demand or supply side.
2.8.1.3 The Credit Creation Theory
The Credit Creation Theory differs from the Financial Intermediary and Fractional
Reserve Theories by arguing that banks are not financial intermediaries individually or
aggregately. The theory postulates that each bank produces loans and money out of
naught every time it effects a credit facility contract or purchases an asset. Banks need
not to accumulate deposits first or reserves to extent credit. According to other
theories, bank lending creates new loan and deposit funds, such that the upsurge in
aggregate balances transpires without a matching drop somewhere else. However,
the Credit Creation Theory affirms that the bank’s statement of financial position and
system of money supply are likely to reveal an upward trend when the remaining bank
loan facilities expand. This contradicts the Monetary Intermediation Model, where the
prevailing buying influence is reallocated, with the money supply not changing.
In summary, the Credit Creation Theory has been criticised by economists, such as
Edwin Cannon and Walter Leaf, who concluded that banks cannot loan out more than
the deposits received (Somashekar, 2009:15; Muraleedharan, 2009). One critique is
that the initiative in the credit creation does not lie with banks, as postulated in this
model, but with the depositors (savings) as bankers are merely intermediaries
between lenders and borrowers. As loans are issued, the customer’s account is
credited with the same figure but the customer can withdraw the loan amount at any
time. If cash is withdrawn from the bank, the cash reserve is reduced, meaning that
the banker cannot grant loans beyond the cash deposited by customers. The bank is
able to give loans because customers do not withdraw all their funds at once, and the
funds that remain are lent out.
59
The Credit Creation Theory also fell short in the following aspects: a) No discussion of
the determinants of deposits, which is the guarantee for loanable funds; and b) Some
countries have high levels of financial exclusion, which makes the theory inapplicable.
The three theories have been criticised based on independency, that is, in reality, the
three are undistinguishable and their definitions are misleading. The definitions are
vague and appear to represent the same thing (Cochran & Steven, 1998; De Soto,
1998; Hoppe et al., 1998). Von Mises (1971:264) argued that the matter referred to in
the Credit Creation Theory is different from a real credit transaction where the lender
for the time being surrenders something, namely, the transfer that makes it the basis
of contentment and rejection and that is a basis of displeasure.
Further insight into the theories of saving and consumption behaviour will provide more
information for policy formulation.
2.8.2 Theories of saving and consumption behaviour
The financial intermediary’s role is to mobilise savings and create capital (loans) for
the productive sector. In the formation of policies to enhance FI levels, it is important
to consider the savings aspects that also include different investment vehicles. There
are three main theories of saving and consumption behaviour that have been
developed: (1) The Relative Income Hypothesis (Dusenberry, 1949); (2) The
Permanent Income Hypothesis (Friedman, 1957); and (3) The Life-Cycle Theory (LCT)
(Ando & Modigliani, 1963; Modigliani & Ando, 1957; Modigliani & Brumberg, 1954).
The three theories stem from the Microeconomic Theory of Consumer Choice, and
these theories give insight into the drive for higher FI levels in developing countries.
2.8.2.1 Life-Cycle Theory
This theory was employed to analyse the savings and retirement activities of the
ageing population. The LCT acknowledges the differences in consumption
requirements and income at various stages in an individual’s life. Younger people have
a tendency to consume more than their income, with their needs mainly being
accommodation and schooling, which emanate from little savings. In middle age,
income commonly increases and people pay off debts incurred earlier, and as such,
savings accumulate. In retirement, income declines as the individuals utilise their
accumulated savings.
60
Many studies have established proof of an arch-designed shape of savings which
resonates with the Life-Cycle Assumption (Setterfield, 2010; Cynamon & Fazzari,
2008; Asteriou & Hall, 2007). Jappelli and Modigliani (1998) established proof for the
bulge-designed savings shape following the account for individual contributions and
drawing of retirement funds. The LCT sheds light on saving behaviours, and to some
extent, the levels of FI of individuals.
This approach has attracted some criticism from different scholars. Gardner points out,
among other scenarios, that the assumption in the Life-Cycle Hypothesis of all
households having a certain, sensible vision of the size of family and composition that
includes life expectancy of each member have an influence on consumption (Gardner,
1961). The assumption of each household holding to such visions, and the certainty
of the use of the rational plan weaken the theory. Gardner argues these assumptions
are unrealistic. Gardner did not agree with the origin of the LCT, that is, the statement
by Modigliani that saving and consumption decisions of households give a deliberate
endeavour to accomplish the preferred spread of expenditure over the life cycle.
In addition, contrary to the Life-Cycle Theory, James Duesenberry, in the Relative
Income Hypothesis, affirms that people care more about their earnings and
consumptions in comparison to other people around them, even more than their
absolute wellbeing (Duesenberry, 1949). Lower income earners may consume more
of what they earn than those earning more, as they desire to reduce the gap in their
standards of living/consumption levels. The Relative Income Hypothesis contradicts
the Permanent Income Hypothesis, a consumer spending theory that postulates that
individuals spend money at a level which is in line with their anticipated long-term
regular income. The early models of household saving hypothesised that poor
households behaved differently from rich households with regard to consumption, and
concluded that saving rates move in tandem with the income distribution rather than
age.
Another criticism of the Life-Cycle Theory is that it fails to acknowledge liquidity
constraints in different countries that hinder many from saving, or influence the
financial sector’s activities (Horlacher, 2002). Even though a household may have a
clear vision of future income, there are remote chances in the real-world capital
markets for borrowing long against expected future income. In such cases,
consumption is influenced by current income, whether temporary or otherwise, not
61
necessarily because of the Life-Cycle Hypothesis. However, the response of
consumption is to present income as not simple as portrayed by the “Absolute Income”
Hypothesis. However, the consumption of younger households experiencing liquidity
challenges may be affected by variations in their present income.
Many empirical studies have generated an enormous amount of LCT literature. The
weaknesses of the articles that considered the savings conduct of senior citizens was
indecisive on the links between the evident savings’ conduct and saving patterns.
Contrary to the findings of the Life-Cycle Theory, King (1985) established that aged
citizens continued to save into their retirement. King also postulates that savings in
retirement may be inconsistent with the LCT, if there is uncertainty in the future, for
example, inflation and life span. The assumption made in this theory is that individuals
will save or invest and disinvest at some later stage in life (retirement).
2.8.2.2 The Permanent Income and Relative Income Hypothesis
The Permanent Income and Life-Cycle Theory (LCT) are closely linked in that they
use the same assumption that an individual attempts to maximise utility or welfare by
matching a lifetime pattern of consumption with the period of constant earnings.
However, it differs from Duesenberry’s Relative Income Hypothesis that conjectured
that an individual is less concerned with their absolute level of consumption than their
relative level. Age plays a crucial role in influencing FI levels, as savings and
consumption patterns differ in a lifetime in line with the LCT.
To understand the forces driving FI, there is need to know the determinants and
implications of national savings rates. As policy-makers strive for target rates both in
developed and developing economies, there is a huge variance between these two
worlds (Gersovitz, 1988; Yannick, 2020). Collins et al. (2009) and Foster and
Rosenzweig (2001) argue that the focus on saving rates by policy-makers puts too
much emphasis on asset levels, which results in missing the value of savings for poor
households. Several poor households can save even with low levels of assets but the
lump sums accumulated are spent within a year.
However, personal savings rates are largely determined by a person’s monetary plan,
as well as at household level and access to different savings services (Karlan &
Morduch, 2009; Adams & West, 2015). Contrary to the views that by making many
financial products (CDs, savings accounts, savings bonds, automatic transfers)
62
available will increase FI, Karlan and Morduch (2009) argue that those able to save
may end up buying risky assets, such as animals and jewellery, or use informal
savings arrangements. These findings came out in a study on savings behaviours in
developed economies and the study found that households do not always save more
when having access to an array of lucrative saving products. Nevertheless, the main
drive for FI is to mobilise savings for onward lending to the productive units of the
economy.
The drive for credit in microfinance covertly assumes that the poor are unable to save
for investments but instead borrow at relatively high interest rates for investments. This
view has been heavily criticised from the 1970s, following the studies of McKinnon
(1973) and Shaw (1973). To achieve high FI results, there must be an emphasis on
the encouragement or campaign related to the appropriate formal financial products
in rural areas (Guth, 2008; Adams, 1978).
Contrary to the views that the ‘poor cannot save’, there is evidence from various
economies showing a high propensity to save in the rural areas. In his paper, Adams
refers to the notable savings degrees reported after World War II East Asia. These
included the typical inclination to save from 1973-74 that rose to 31% in Taiwan, an
improvement from 19% in 1960. Japan reported 22%, an increase from 10% in 1950;
and 33% in Korea, an improvement from 4% in 1965.
Adams contends that the remarkable achievements were the result of the pro-saving
public policy. He further argues that regardless of the poor households’ considerable
voluntary saving, their capacity is affected by unreliable and unsustainable credit in
the rural financial markets. Therefore, there is a vital need for an inclusive financial
system for economic development.
To improve levels of savings, the current study examined the contribution of financial
advice, internet access and social media, among other factors, to FI in selected African
countries. A well-functioning financial system is a prerequisite for exponential
economic growth. Discussed below is the role of social networks on FI.
2.9 ROLE OF SOCIAL NETWORKS IN FINANCIAL INCLUSION
Individuals with common consumer and social interests usually make up social
networks. Communications through the social networks can facilitate consumer
63
wellbeing, relationship building and trade (Berger & Messerschmidt, 2009). The cause
of user-generated media popularity is that it is easy to use and controlled by the
consumers (Bai, Philippon & Savov, 2016). The use of social networks is also a quick
way of interacting with others and to consume information. Bai et al. (2016) maintain
that users’ largely access huge amount of information with no participation or little
involvement.
Smith, Sabat, Martinez, Weaver and Xu (2015) maintain that diverse forms of social
networks are in existence and that they can be categorised according to how much
social presence, media richness, and self-disclosure they contain. For instance,
Wikipedia is a social media platform with a low social presence and media richness. It
is a free and editable page with content written interactively by a number of unnamed
internet volunteers. There are posts written in more than 270 languages with anyone
having access to internet contributing (King, 2010). A blog shares both text and photos
with individuals having the capability to put forward their own comments to the content.
Most popular online platforms include blogs used by individuals to publish some
personal information. Permalinks and trackbacks that allow links and comments
between blogs are exclusive features of the platform (Swani, Milne & Brown, 2013).
Those with the highest media richness and social presence include WhatsApp,
YouTube and Facebook (Dimitriu & Guesalaga, 2017). These social media platforms
endeavour to reproduce three-dimensional interaction, such as live chats and picture,
video and text sharing (Smith et al., 2015). Researchers have categorised the levels
of engagement that people show in social networks. Some users “lurk” in social
networks, meaning that they see others, without generating any content themselves.
“Newbies” are those who have just started commenting on a social platform without
displaying signs of commitment. Consumers with popular discussion topics become
“celebrities”, commanding a huge following of members. In social media use,
“minglers” refer to those who do not participate regularly, and “devotees” are
enthusiastic members, while the “insider” possesses expert knowledge. Both
“devotees” and “insiders” exhibit strong social and emotional ties to the network
(Quinton & Harridge-March, 2010). Tobia and Stephen (2013) state that more
individuals are willing to join a community than to contribute to it. About 10% will write
on the wall, and tiny fractions of this will post photos or videos, or reply to discussion
64
topics. Kozinet calls such communities “semiquasi-not quite-communities” (Tobia &
Stephen, 2013).
Word-of-mouth being an important tool of communication, social networks can access
and benefit from it. Electronically, word-of-mouth occurs when people discuss
products, brands and services among each other on the internet. Some users might
have tried a product before, and can recommend it, or not recommend it to other users.
Encouraging word-of-mouth can be regarded as a customer’s willingness to refer a
product to others (Ashley & Tutan, 2015). Such a word of mouth is inspired by the
need to spread information, assist others, or even advise them of poor service or
product (Kozinets, De Valck, Wojnicki & Wilner, 2010). Such spreading of information
is a social force with a huge effect on consumers’ purchasing decisions. Some
scholars have argued that word of mouth has more of an impact than traditional
marketing tools (Kozinets et al., 2010).
Research also shows that marketers need not be alarmed by negative word of mouth
if complemented by positive ads. Other scholars argue that it is not the positivity or
negativity of the news that matters but the volume of the word of mouth (Ashman et
al., 2015). Agresta and Bonin Bough (2011) recommend that if unsuitable remarks
from a customer occur in a business-sponsored community, the tip is to not respond,
or to respond offline. The cause for not reacting online is to avoid crowding the
business’ social media space with information of no value. If the negative comment is
on inaccurate information, the business should answer immediately to correct it.
However, if someone is attempting to stir up trouble, a business should not respond.
A response may drive the person to a negative discussion that will ‘pollute’ the social
media room. Practitioners suggest that is ideal to encourage the customers to contact
the company through a private line, where the query can be addressed away from the
public sphere (Agresta & Bonin Bough, 2011).
Though online discussions can generate unfavourable comments for all to see, such
forums present an opportunity for marketers to follow discussions on their brand. The
marketers can see comments and the response generated. This is not possible for
word-of-mouth that happen offline (Quinton & Harridge-March, 2010). Researchers
have been focusing on organisation-sponsored communities and their potential
(Berger & Messerschmidt, 2009). The fact that consumers use these platforms to
research new products/services and establish relationships is the motive for firms to
65
sponsor online communities to facilitate word of mouth on their products (Berger &
Messerschmidt, 2009). Since the relationships formed in these networks are grounded
in social bonds, they are difficult to replicate by rivals.
Social networks can be powerful and create a competitive advantage (Quinton &
Harridge-March, 2010). However, a social network is not built around information
sharing alone, but also around trust, friendship and alliances. One must be careful not
to insert too much marketing in a social community, as it may undermine its integrity
(Kozinets et al., 2010). Agresta & Bonin Bough (2011), maintain that a firm must not
post too much content on a Facebook wall. This might be seen as spam and be
annoying to the followers. They suggest posting real valuable content that gives
customers something to talk about (Agresta & Bonin Bough, 2011). As mentioned by
Berger and Messerschmidt (2009), more consumers have less trust toward
information coming from commercial sources. Instead, consumers go online searching
for product reviews by other consumers, asking them questions directly. Online
societies often attract like-minded users, and are therefore an ideal platform for
searching this kind of product information (Berger & Messerschmidt, 2009).
In an investigation of online communities, Quinton and Harridge-March (2010) found
that the most useful product and service information came from regular posters in the
community. It also happens that other community users and customers know the
answer to something better than a sales assistance that employed to answer customer
enquiries (Berger & Messerschmidt, 2009). Many consumers view financial services
as complex, thus a service that needs pre-purchase information and evaluation.
Because financial products are viewed as being complex, they are also high-
involvement products (King, 2010). For the financial services marketer it may be
difficult to identify true versus not so true, loyal customers. This might be because even
if a customer experiences dissatisfying service, many financial service customers stick
with their financial service provider because switching may bring too much stress
(Ashman et al., 2015).
Social media steps over traditional outlets to offer faster information delivery with
opinions, commentary and perspectives on business activity. It has become the need
of the era for financial services organisations to set a policy concerning social media.
Getting it wrong could mean noteworthy reputational damage. The financial services
institutions that embrace social media are better able to attend to customer complaints
66
circulating in the online world. This enables them to respond before a reputational
damage occurs. Social media is collective rather than monologue as many people are
able to talk when they want, where they want, and how they want. Connecting through
WhatsApp, Blogs, Twitter, Instagram and so on does not require physically going to a
particular place. It is important to investigate the contribution of social networks to FI
levels. Previous studies have concentrated on the influence of social networks on
other products in other sectors. Existing studies have focused on social networks as
a determinant of performance of products in other sectors (Chai et al., 2018; Hu &
Chen, 2012). The current study explores the determinants of FI in selected African
countries with emphasis on social networks.
2.10 COMPLICATIONS IN SELECTING THE MOST APPROPRIATE
THEORY
There is no agreement in literature regarding the best FI theory that is appropriate for
the heterogeneous nature of economies. This is in line with the findings of Kodan-
Kablana and Chhikara (2013) who noted that the need for financial products differs
from nation to nation and from person to person. A proper FI theory includes the
following aspects: (1) The financial products’ availability aspects; (2) Affordability; (3)
Convenience; (4) Adequacy; (5) Appropriateness; (6) Accessibility; and (7) Impact.
Furthermore, Mader (2017) noted that it is difficult for a single theory to explain all
aspects of FI, as new ideologies, theories and expectations are constantly emerging.
Tuesta, Sorensen, Haring and Cámara (2015), and Olaniyi and Adeoye (2016)
summed it up by claiming that there is no agreement yet in literature regarding the
theoretical framework on factors influencing FI. In other words, there is no established
set of variables mentioned or referred to as the true determinants of FI levels. The
demand and supply factors of FI require different approaches to the insightful
investigation of FI (Osei-Assibey, 2009). The changes, dynamics and wide aspects of
FI make it difficult to refer to a single theory.
2.10.1 Theories relevant to the current study
This section discusses the applicable theories related to FI. These supply a basis for
the hypotheses and choice of research methods.
67
The Modern Development Theory postulates that modern states are wealthier and
more powerful and that their citizens are freer to enjoy a higher standard of living.
These theories are relevant as they encompass or analyse relative income
inequalities, the evolution of growth and their determination in combined models.
These theories emphasise the occurrence of financial market imperfections that play
a crucial role in physical and human capital accumulation and their occupational
choices. For example, financial market imperfections have a huge bearing on the
extent of borrowing for investment by the poor. The Galor and Zeira (1993) model
affirms that market frictions lead to deprived people not choosing investments. The
Banerjee and Newman (1993) model postulates that the choice of occupation is
influenced by their original endowments. Furthermore, the design of their occupational
selection determines their savings, as well as risk appetite and profile.
The Harrod-Domar Model serves to explain the economic growth determinants and
the crucial role played by savings and investments. According to the Harrod-Domar
Model, the main strategy for economic development is savings mobilisation and
generation of investment (Harrod, 1939; Domar, 1947). The model affirms that savings
result in investments that culminate in economic growth. Harrod and Domar argued
that the pace of trade and industry expansion is shaped by the levels of the economy,
enabling savings and the investment-yield proportion. As such, the main purpose of
FI is to harness savings through financial intermediaries, and channelling the funds to
the productive sector and enhance economic growth.
The theories emphasising entrepreneurship maintain that the financial sector
determines the extent to which the poor are able to raise money for projects. Financial
development ensures that there is efficiency of resource allocation and comparative
economic opportunities for the poor or relatively rich households. These theories show
that the lack of finance can generate persistent income inequality. In addition, the
contemporary development theories imply that the reallocation of wealth can facilitate
exponential economic growth.
The Kuznets Hypothesis is relevant in the case of an indirect channel of development
(see Section 2.7.1), as it stresses that inequality decreases with more economic
development, that is, it may be higher when development emerges but increases when
growth spreads to the entire economy.
68
2.11 CONCLUSION
This literature overview presented in this chapter illustrated the positive changes to a
person’s welfare as a result of financial inclusion. Financial exclusion was classified
into optional and non-optional financial exclusion. Several theories were discussed
that explain the economic growth determinants and the crucial role played by savings
and investments. The main purpose for economic development is savings’
mobilisation and the generation of investment. The literature revealed that an inclusive
monetary structure is vital for penury alleviation and economic expansion.
Although a deep and wide monetary structure enables economic expansion, there are
threats that accompany financial sector improvement. There is consensus among
scholars that continuous economic growth needs an established and conducive
macroeconomic background. The importance of an inclusive financial system in a
modern economy characterised by economic growth is vital. While deductions shown
cautiously and with sufficient qualifications, the majority of theoretic thoughts, as well
as empirical indications, propose that there is a significant positive link between
economic growth and monetary development. There are two main channels through
which monetary system expansion influences poverty reduction in a country. One
channel contributes indirectly through economic expansion, and the other directly
when the impoverished benefit from reaching appropriate financial facilities.
The following three independent banking theories are commonly referred to in
literature: (1) Credit Creation, (2) Fractional Reserve, and (3) Financial Intermediation.
Werner’s three theories have been criticised because in reality, the three are
undistinguishable and their definitions are misleading. Financial trade and
organisations ease market frictions that may inhibit the direct combining of savings in
the society and channelling them to high yielding entities. Advanced monetary systems
simplify the transacting of goods and services by the provision of payment facilities,
assisting in mobilising and pooling savings from a multitude of depositors, obtaining
and processing information concerning ventures and prospective investment activities.
Numerous deductions emanated from this chapter. Several FI models were discussed
in detail and the inherent major problem is found in their inability to provide a collective
outline of demand and supply factors determining FI. In other words, the existing FI
theories are unreliable at giving a complete explanation of FI.

69
The next chapter centres on FI determinants, the significance of FI theories to the
present study, and the influence of FI on economic expansion from both a theoretical
and empirical viewpoint. The gaps and deficiencies in the extant literature are
emphasised and the novel knowledge added by the present study clarified.
70
FINANCIAL INCLUSION AND FINANCIAL SECTOR
GROWTH: THEORETICAL AND EMPIRICAL REVIEW
3.1 INTRODUCTION
The previous chapter discussed theories of inclusive financial systems to provide a
point of focus for approaching the problem of low FI in developing countries. The
design of a strong economic development policy requires an understanding in terms
of the theoretical and practical point of view of how individuals access formal financial
services from financial institutions. The main purpose of this chapter is to explain the
literature underpinning the relationship between FI and financial sector development.
FI can help to promote financial development.
The chapter also discusses the underlying theory or a set of guiding principles that
can help to improve our understanding of FI as a pro-development initiative in the
economics and finance discipline. As the aim of the study was to explore the
determinants of FI in selected African countries, more emphasis was directed towards
social networks. The insufficiencies and gaps in the existing studies are outlined and
the new understanding to be added by the present research is explained.
The chapter continues as follows. Section 3.2 discusses the influence of FI on financial
system improvement. Section 3.3 discusses the theories of social media networks.
Section 3.4 explains the theoretical framework of the study. Section 3.5 examines the
determinants of FI and their influence on the financial sector and economic growth,
revealing precisely where the present study could contribute to the current body of
knowledge. The section confines the discussion to the determinants of FI that are
inadequately discussed in literature and the contribution to, and associated benefits of
focusing on them for policy formulation, implementation and evaluation processes.
Section 3.6 discusses the models and forms of saving. Section 3.7 concludes the
chapter.
3.2 THE FUNDAMENTAL ROLE OF FINANCIAL ACCESS
The existing literature has considered the role of financial development on economic
growth (King & Levine, 1993a; Demetriades & Hussein, 1996). Financial markets play

71
a vital role in providing basic services in the modern economy, particularly in the
processing of funds from surplus units to deficit units. Developed financial systems
can help to promote economic growth (Levine, 1997). Although FI has recently
become a key issue, there is still much progress to be made. In this regard, Kumar
(2013) revealed that increases in banking networks have a positive impact on FI.
Furthermore, Beck et al. (2014) found that an increase in the number of bank branches
increases efficiency among the banks as well as showing a positive increase in the
growth rate. Financial inclusion is a way to utilise financial services at a low and
affordable cost, and to reduce informal accounts (Gwalani & Parkhi, 2014).
Financial access allows individuals to take advantage of business opportunities, invest
in education, save for retirement, and insure against risks (Demirguc-Kunt & Levin
2007). The old development philosophies’ method of production underscored the role
of disparity and prosperity in the first phase of a nation’s economic expansion. Kaldor
(1957) affirmed that wealthy individuals had a greater marginal propensity to save than
the marginalised, In addition, Kaldor (1957) maintained that incentives were necessary
to reward productive efficiency, which was essential for wealth centralisation, resulting
in a major trade-off between social justice and efficiency.
There was empirical substantiation from the US and numerous OECD (Organisation
for Economic Co-operation and Development) nations that supported the Kuznets
postulation that income disparity rose in the initial phases of expansion up to the
1970s, particularly, in the developed nations. The subsequent years, saw a downward
trend in the experience of equality. The perspective of inequality in growth was
criticised by numerous researchers using cross-nation regressions that found an
adverse relationship between the inequality measures and the regular proportion of
development (Alesina & Rodrick, 1994; Persson & Tabellini, 1994).
For example, South Korea and the Philippines seemed quite alike in terms of
development in the early 1960s, excluding the income disparity levels. In the following
30-year period, GDP in the Philippines, that had greater disparity levels, barely
doubled, while there was faster growth in South Korea with a fivefold upsurge of
production.
In contradiction to this view, Piketty (2014) argues that the Kaldor-Kuznets specifics
no longer apply to developed nations, explaining that the share of capital as normally
72
evaluated and interpersonal inequality of income and wealth have been on the rise.
There may be differences in the nature of data and interpretation, thus causing
variations in the pattern (Stiglitz, 2014).
New development theories focusing on credit market imperfections were developed
explaining the negative effects of inequality on growth. In imperfect capital markets,
the poor with high marginal productivity of capital are unable to participate in
educational activities and are limited in their job-related choices (see Chakraborty,
2010; Demirguc-Kunt & Levine, 2008; Aghion & Bolton, 1997; Galor & Zeira, 1993;
Banerjee & Newman, 1993). These models reveal that financial exclusion contributes
to a vicious cycle of persistent income inequality and poverty. The literature also shows
that inclusive, effective and sustainable financial systems remove capital market
imperfections. The argument resonates with the suggestions of new theories putting
financial sector reforms at the core, and promoting FI as a development agenda.
There is widespread empirical evidence suggesting a substantial and strong
association between financial depth and economic growth (see Karimo & Ogbonna,
2017; Demirguc-Kunt et al., 2006; Rajan & Zingales, 2004; Beck et al., 2000;
Demirguc-Kunt & Maksimovic, 1998). Economic theory submits that the monetary
structure is an engine of development, and as the financial sector offers appropriate
credit facilities to individuals and the productive sector of the economy, inclusive
economic growth is experienced.
Recent studies show financial depth has value for the impoverished, and does lead to
decreased income disparity (Cheema & Sial, 2012; Beck et al., 2004; Honohan,
2004b). In a rural and urban study in Pakistan, Cheema and Sial (2012) showed that
growth had a significantly robust adverse association with poverty and disparity; and
disparity had a noteworthy positive connection with impoverishment. On the contrary,
Dollar and Kraay (2002), Ravallion and Chen (1997), and Deininger and Squire (1998)
maintain that expansion has no influence on inequality. However, the theory focusing
on the purpose of broader financial access provides little guidance in terms of the
factors contributing to FI in different African nations. In addition, it is evident that
financial access promotion is complemented by the comprehensive and credible
measures of FI to achieve greater access.
73
The topics of financial sector development, financial liberalisation and universal
financial integration have been receiving attention from economists, academics and
policy-makers in the last five decades because of their effects on general economic
performance. In the initial neoclassical evolution literature, the financial system was
considered to be a channel for household funds to the productive sector. In this view,
McKinnon (1973) and Goldsmith (1969) proposed the robust features of financial
services. Following these seminal papers, the empirical and theoretical literature has
concentrated on the function of a well-organised monetary structure as a prerequisite
for an open and robust economic system (Adeoye, 2015; Adeoye & Sangosanya,
2015; Adeoye & Saibu, 2014; Mirdala, 2011; Demetriades & Andrianova, 2004;
Godhart, 2004).
The development of a robust economic system is a result of an efficient inclusive
financial system. The transformation of the financial sector involves the promotion of
competition, market-based procedures and the easing of regulations. The aim of such
a transformation is the building of a stable and robust system, which is a prerequisite
for the amassing of funds leading to the alleviation of poverty (Adeoye, 2015; Johnston
& Morduck, 1999). Therefore, it is evident that African countries have to formulate
policies for the development and deepening of their financial systems to enable them
to achieve their poverty-reduction objectives and FI goals. By mobilising savings,
facilitating payments and promoting the efficient allocation of resources, the financial
sector stops the chain of poverty by playing an important role in broadening financial
access and increasing FI (Zhuang et al., 2009).
Several studies have shown the importance of FI for individuals, reinforcing the
political and economic basis for policies promoting FI. Various scholars, such as
Demirguc-Kunt and Levine (2007), Aghion and Bolton (1997), Banerjee and Newman
(1993), and Galor and Zeira (1993) developed models demonstrating how financial
exclusion can be detrimental and can lead to inequality and poverty. The literature has
also established that inclusive financial systems enhance expenditure, profitable
investment (Dupas & Robinson, 2013), savings (Aportela, 1999) and individual welfare
(Ashraf, Karlan & Yin, 2007).
Nonetheless, literature has not adequately addressed the determinants of FI,
particularly the effect of the latest technologies such as social networks. This gap in
the literature, requires that various theories need to be analysed, as theories can
74
explain why different ideas exist. According to Ozili’s (2020) findings, a study based in
problem-driven social science research can use one or multiple theories to analyse a
problem and solve it. This suggests that the theories for describing a FI problem may
differ from the theories for its solution. In the current study, theories help to explain
what FI objectives should be and how to improve on them. Theories helped to explain
the current problems of financial exclusion and the abnormal deviations that exist in
practice, so that a coherent and comprehensive system of principles for FI could be
developed.
According to Ozili (2020:3), financial services delivery uses the necessary technology
in combination with other inputs to meet the needs of clients. These services are
delivered in an effective, predictable, reliable and customer-friendly manner (Tang, Gu
& Whinston, 2012; Hirschland, Chao-Béroff, Harper & Lee, 2008). According to Hilgert
(2003), the latest trends in technology and personal financial management influence
FI. Technology is a major enabler in the process of providing banking services to the
needs of a larger section of society (Hogarth & O’Donnell, 1999).
The analysis of the data related to FI practice should support or refute the discussed
theories. For example, according to Caldieraro, Zhang, Cunha and Shulman (2018),
internet banking helps to build an inclusive financial system in a country by providing
an easy way to access banking products and services. Furthermore, Montmarquette
and Vietnnot-Briot (2012) postulate that by building a social media presence, advisors
can build credibility, engage with prospective clients and network with others.
In view of the previously mentioned, the current study considered the contribution of
social networks to FI. To achieve the objectives of the current study, the following
variables were used to investigate the influence of social networks on FI: financial
advice, internet access and social media. Financial advice was incorporated, as
financial firms around the world are taking a novel, centralised virtual approach offering
high-quality personal financial advice to clients without a relationship manager
(Dimitriu & Guesalaga, 2017).
The section below discusses the relevant financial advice, internet access and social
media theories.
75
3.3 THEORIES OF SOCIAL NETWORKS
The social networks of internet users differ somewhat from the networks existing in
the real world where people have in-person contact with each other (Musiał &
Kazienko, 2013). Although social networks on the Internet have been studied in many
contexts and various definitions have been created, there is no one coherent and
recognised model of social networks on the Internet. Furthermore, different
researchers name these networks differently, for example, they are called: computer-
supported social networks, online social networks, web-based social networks, web
communities, or virtual communities (Min-Sook, Jong-Kuk & Yong, 2015; Musiał &
Kazienko, 2013).
Theories are required to achieve a high level of synthesis between the objectives and
the determinants of FI. The set of theories would provide a system of ideas that can
explain how policies are formulated to achieve the FI objectives. The theories are
discussed below and in each group, several theories are explained. These theories
can consolidate the recent technological developments and idealistic debates on the
determinants of FI.
3.3.1 Social network theories and models
Developments in the latest technology have ushered in social networking that has
significantly transformed the manner in which people, organisations and communities
interact and connect. The term ‘social network’ is defined as “a group of Internet-based
applications that build on the ideological and technological foundations of Web 2.0,
and that allow the creation and exchange of user-generated content” (Kaplan &
Haenlein 2010:61). Based on the applications, individuals then arrange exchanges
and share material in a computer-generated community. The social networks’
advancement has contributed to shaping individuals’ links and contacts through
diverse social network podiums (Colliander & Dahlén, 2011).
The advent of social networks has brought a new set of communication modes for the
different trades that are challenging traditional operations and procedures (Hanna,
Rohm & Crittenden, 2011). The significant difference is that one-to-one mob
customisation has increasingly grown to be the norm and has replaced the one-to-
several business advancement framework. In addition, in this technological age, the
76
virtual customer review has grown to be a crucial benchmark by which a marketer
formulates a marketing strategy.
Social networks can serve as a tool for firms to facilitate internally or externally with
their customers, peers, organisations and business associates, and is also concerned
with product improvement (McBride, 2001; Porter & Donthu, 2008). Social networks
can be useful in collective education and creativeness (Peppler & Solomou, 2011) and
the formation of information distribution platforms (Fernando, 2006; Kasavana et al.,
2010; Yates & Paquette, 2011). The media can be applied in marketing approaches
for product promotion (Jin, 2012; Laroche et al., 2013) and in the application of
corporate discussions in financial organisations (Bonsón & Flores, 2011). Firms and
individuals should be ready to adopt the prospects and challenges brought by social
media. The next section discusses the key social network theories and models. These
provide insight into how social networks can contribute to FI.
Several theories and models have been applied in existing technological community
studies to investigate the socio-psychological behaviour of consumers and other
participants of social networks. Discussed below are three groups of theories, social
behaviour, personal behaviour and mob communication. Discussed in each group of
theories are several theories that enlighten the determinants of FI.
3.3.1.1 Personal behaviour theories
This set of accepted models and theories in the literature related to social networks
clarifies human behaviour at a personal level. The key theories and models that help
to explain financial behaviour are listed and discussed as follows:
Personality Traits: this theory explains the characteristics that influence user
behaviour. According to Digman (1990), the Five Factor Model of Personality Traits
can be summarised as ingenuousness, friendliness, thoroughness, agitation and
socialness that collectively or separately increase the behavioural objectives of the
users of social networks. Examples of studies done include that of Labrecque,
Markos and Milne (2010) and Zhong, Hardin and Sun (2011).
Technology Acceptance Model (TAM): this model was advanced by Davis
(1989) and helps to clarify the necessity and application of innovative technology,
given people’s approach to its implementation. The model was applied in social
77
media researches in investigating the same in relation to a number of social
network technologies (see Casaló, Carlos & Guinalíu, 2011; Kwon & Wen, 2010).
Theory of Reasoned Action (TRA): This theory was propounded by Ajzen and
Fishbein (1980) and Ajzen (1985) and predicted people’s behaviour centred on the
combined efforts of their subjective usual ways and perspectives. The model is
mentioned in various social network studies and gives more detail on the scenario
where individuals willingly use and work in social media events.
Theory of Planned Behaviour (TPB): this theory is an addition to TRA and was
established by Ajzen (1985). It suggests that behaviour control is applied to lessen
the influence of assertiveness and subjective customs on conduct. In a study on
social media, Casaló, Flavián and Guinalíu (2010) and Chang and Zhu (2011)
employed the TPB philosophy to forecast consumers’ actions.
3.3.1.2 Social behaviour theories
This set of philosophies applies to communal behaviour, and the key theories are
discussed below:
The Social Aspects Theory: the theory points to all communal aspects,
specifically social effects (Kelman, 1958), social capital and social recognition
(Chang & Chuang, 2011; Portes, 1998), communal ties, and interaction. Since
internet community is determined by volitional behaviour and socio-psychology,
social factors are used to research users’ intentions, attitudes and decisions in
relation to the usage or adoption of internet community platforms (Cheung & Lee,
2010).
Social Loafing Theory: is utilised in conjunction with social networks in internet
community researches. A study by Latané, Williams and Harkin (1979) revealed
that a person applies less exertion in group set-ups than individually, and therefore,
they invented the phrase ‘social loafing’. Social media is an intermediation for
combined exertions, where the extent of individual input is negligible. Shiue, Chiu
and Chang (2010) implemented the model in a study on group cohesion in online
platforms.
Social Power is the five bases of power that French and Raven (1959) developed.
The five centres of authority include: authentic, coercive, denotation, reward and
adept power. According to Wei (2009:540), social power is the blogger’s ability to
78
affect other audiences, as many as possible. This confined definition was used to
enlighten the number of individuals that are influenced by social power.
3.3.1.3 Mass communication theories
A mass statement uses conspicuous domination of an individual’s behaviour or
actions. According to McCombs and Guo (2014), there are two key mass
communication theories, as discussed below:
Para-social Interaction (PSI): This model was applied in film media and television in
the 1950s in the study of celebrities’ influence on consumer behaviour. Eighmey and
McCord (1998) initially detected the theory on the internet while doing research on the
proportion of website visits where PSI was connected. Colliander and Dahlén (2011)
applied PSI to research customer reaction in purchase intentions and product
attitudes.
Uses and Gratifications Theory (UGT): is a model of mob statement used to
understand the behaviour of customers to traditional media (Eighmey & McCord,
1998). As a theory, UGT has attracted the attention of social media researchers mainly
in the investigation of customer satisfaction needs (Chen, 2010; Porter & Donthu,
2008).
The following are the five main assumptions of UGT:
(1) Media is used for gratifications or satisfaction;
(2) The audience is dynamic and result-oriented in their media consumption;
(3) Media competes with other means of need gratification;
(4) People understand their personal media motives, use and interests; and
(5) The audience can make conclusions regarding the value of the media content.
The fourth assumption that people appreciate the use and motives of media is one
limitation of the theory. People are not always aware of all the uses of media (Moreno
& Koff, 2016) and such an opinion is centred on the scholarship notion that audience
members are inactive, that is, they do not participate in any way. In the application of
social networks, lack of understanding of media usage and the inability of audiences
to communicate their thoughts may require some guidance or advice.
79
3.3.2 Social networks and behaviour change
Banks often advertise and encourage the benefits of virtual financial advice. Industry
practitioners frequently claim that this type of advice can influence, among other
things, investments, savings, financial product selection and risk tolerance
(Montmarquette & Vietnnot-Briot, 2012). Financial advice done through social
networks can enhance peace of mind and financial confidence.
A financial mentor not only teaches someone financial knowledge, but also inspires
the individual to make appropriate financial decisions that will improve his or her
standard of living (Xiao et al., 2004; Hilgert et al., 2003). Furthermore, the desired
financial behaviours will result in financial fulfilment (Xiao et al., 2006). Therefore,
appropriate financial advice or educational programmes can achieve positive
monetary behaviour.
Consumer finance researchers emphasise that there is need to understand how and
why consumers change their financial behaviours to make significant progressive
financial actions. Although there are several behaviour models in social attitude
literature (Armitage & Conner, 2000), there are two that are linked to the financial
services described below. The first one is the Theory of Planned Behaviour (TPB) that
aims to comprehend and envisage human action (Ajzen, 1991). The second one is the
Trans-theoretical Model that has the objective of helping individuals to attain
progressive behaviours and to change adverse behaviours (Prochaska, DiClemente
& Norcross, 1992). Financial behaviour refers to any form of human behaviour related
to money management (Xiao et al., 2006; Hogarth, Beverly & Hilgert, 2003). These
financial behaviours include saving, credit and cash.
The Theory of Planned Behaviour (Ajzen, 1991, 1985) emanated from the concept of
rational deeds (Fishbein & Ajzen, 1975). The TPB is more appropriate when the actual
control and probability of success of behaviour performance are suboptimal. The
TPB's main input is the notion of perceived behavioural control that is described as
somebody's opinion of the challenge or simplicity of acting in a particular way (Ajzen,
1987). The contribution is an addition to the subjective norms and attitudes that
comprise the Theory of Reasoned Action. Moreover, both models are founded on the
idea that individuals make reasoned and logical decisions to behave in a certain way
by evaluating the available information. One’s behaviour or action is determined by a

80
person’s plan to be involved and the view that the behaviour is within his/her control.
This theory is applied in financial decision matters to enhance FI levels, as financial
advice can lead to changes in terms of financial decisions or perspectives.
The Trans-theoretical Model, advanced by Prochaska and Di Clemente in the 1970s,
emanated from research that examined the experience of smokers that quit by
themselves, while others needed more action. The study aimed to appreciate why
some individuals were able to quit by themselves. It was found that individuals quit
smoking if they were prepared to give up the habit. The Trans-theoretical Model (TTM)
is an intentional change model that looks at an individual’s decision-making. The
model assumes that individuals do not change their behaviours decisively and quickly.
The TTM posits that a behaviour change, particularly habitual behaviour, occurs
uninterruptedly through a cyclical process. In this model, behavioural constructs and
theories can be linked to different stages of the model. The model postulates that
individuals go through the following six steps of transformation: pre-contemplation,
meditation, preparation, action, preservation and termination. At each stage, there is
a different intervention strategy that is effective at taking an individual to the next stage
of transformation, and so on, successively through the model to reach maintenance,
the perfect phase of behaviour, as discussed below.
Pre-contemplation: At this stage, the individual has no intention to take action in
the near future, which could be up to six months. The individual is often unaware
that his/her behaviour has problems or contributes to negative consequences. At
this stage, people underestimate the advantages of changing behaviour and they
stress the disadvantages of changing behaviour.
Contemplation: At this phase, the individual intends to change behaviour in the
near future. The individual now realises his/her behaviour has problems and takes
cognisance of the pros and cons of behaviour change, stressing both. However,
the person is still uncertain about changing their behaviour.
Preparation: At this point, the individual is prepared to change his/her behaviour in
the following 30 days. Individuals begin taking small steps toward behaviour
change, believing that transforming behaviour can result in a better life.
Action: This time, people have just changed their behaviour, that is, in the last six
months. In addition, the individual intends to keep on moving toward behaviour
81
change. This is exhibited by the person modifying the problem behaviour or
acquiring positive behaviours.
Maintenance: At this point, the individual has sustained his/her behaviour
transformation for some time (at least six months) and plans to continue the
behaviour change onwards. The individual is wary of relapsing to the former
phases.
Termination: Eventually, the individual has no intention to relapse to his/her old
negative behaviours and is certain of not relapsing. As this stage is seldom
achieved, people tend to stop in the maintenance phase.
Although TTM may be useful in financial advice research, it has several limitations.
The model leaves out the social perspective where transformation may occur, for
example, social media influence and income. There is no clue as to how FI levels can
be improved. The lines between the stages are subjective, since there are no criteria
of determining a person’s stage of change.
The TTM helps with the approaches towards financial development by addressing
individuals at different phases of making a financial choice. Strategies for each stage
can be tailor made to involve programmes or messages targeting people/population
at some level of motivation and knowledge. The TTM inspires the valuation of the
present phase of transformation and reveals the backsliding in an individual’s course
of making a choice.
The two theories discussed have been used to investigate some financial behaviours
and populations, but they can still be used in more behaviours and diverse
populations. For example, to encourage the online deposits of government allowances
distributed by the Federal Government, the US Department of Treasury implemented
the Go Direct Operation.
Researchers, academics and consumer analysts can work with financial institutions
and government ministries to use the models in designing proper outreach and
education strategies so that these social activities can have more influence. The TTM
is applied in assisting consumers to shift from adverse behaviours and to develop
positive financial behaviours phase by phase.

82
A strategy centred on social networks can be formulated to address all people,
emphasising some approaches that are relevant to the particular behaviour
transformation phases to allow for a more effective social impact and approach. The
all people method also requires personalisation and may take the form of online self-
assessment instruments that reach multitudes of people but that provide every
consumer with a personalised answer (O’Neill & Xiao, 2006).
The social network and financial advice can be complemented by an individual’s
internet access (Mas-Tur, 2016). According to Mas-Tur (2016), there are prospects of
using internet channels and applications to increase FI. The Internet can complement
social media and financial advice in increasing FI in Africa. The discussion of internet
theories can help to explain, predict, and understand the phenomena, and extend
existing knowledge on FI.
3.3.3 Social networks and online community
Online community and social networks may complement each other in achieving FI
goals. Many studies on FI improvement suggest that there are bottlenecks that impede
the healthy welfare progress of individuals and small firms. This includes being unable
to access formal or outside funds to fulfil their financial requirements and sustain
development (Nowak, Ross & Yencha, 2008; Hall & Mishkin, 1982; Caldieraro et al.,
2018). The question that arises is: Why is this the case? According to Chen, Gong,
Chu and Cao (2018), this can be ascribed to information asymmetry. Information
asymmetry or the agency problem between lenders and borrowers results in financing
challenges hindering the financial development of most individuals and small firms.
In the process of financing, information asymmetry limits financial development
growth. For individuals without the required documentation, income, assets, and so
on, the problem attracts more attention and becomes more conspicuous. The
increasing body of research has suggested an array of theoretical framework, and has
used a variety of empirical theories to gain an understanding of individuals’ financial
challenges and to approximate the vital effects of information asymmetry on business
development (Holmstrom & Tirole, 1997; Holmstrom, 1979; Jensen & Meckling, 1976).
Feltham and Hofmann (2007) propounded a Principal–Agent Model in a numerous
task-numerous agent structure. As revealed in the Principal–Agent Theory,
information asymmetry is unresolved in their model but a substitute is developed using
83
appropriate inducement setup schemes as advised in their study. Holmstrom and
Tirole (1997) propounded an inducement scheme of monetary intermediation, where
businesses, people and financial players have limited capital. All forms of inadequate
funds affect mostly poor individuals and firms.
The existing literature has studied financing problems related to firms, and information
asymmetry or internet finance in the process. However, to the knowledge of the
researcher in the current study, there is a lack of studies that have directly investigated
how the Internet itself influences the information asymmetry problem between lenders
and borrowers. There is little literature also on the effects of the Internet on FI in
developing countries.
In summary, the social network is not a substitute for conventional mainstream media
but it can enhance the efforts of the mainstream media. The social network can offer
substantial benefits in terms of customer engagement and feedback, and can be
utilised to strengthen relations with external and internal stakeholders. The existing
social network theories have explained the characteristics influencing user behaviour,
ease of use of new technology, social influence and the intermediary functions of these
communication platforms. However, none of these theories can explain the influence
or effect of social network on FI or development. This implies a space in the extant
literature that requires filling.
On social networks, financial advice can be supplied from anywhere, as long as there
is a connection. Financial advice can complement social media use in influencing a
person’s financial decisions. The positive action is achieved by the provision of
relevant information (Xiao et al., 2006). Hence, the need to discuss financial advice
theories to understand and explain the financial behaviour process. This will also guide
the development of appropriate financial services, thereby improving FI levels. The
relevant financial advice theories and models are discussed in the next section.
To fill the gap in the literature that has been identified by the current study, a model is
required which explains why the research problem exists. In the current study, the
problem is the low FI levels in selected African countries. The theoretical framework
below describes how the Harrod-Domar Models and other theories explain why the
research problem under study exists.
84
3.4 THE HARROD-DOMAR THEORETICAL FRAMEWORK
The Harrod-Domar Model provides an appropriate structure for enlightening the
association between FI and monetary system expansion. The Harrod-Domar
framework demonstrates how monetary system improvement makes it likely for
nations to build resources for investment purposes. The Harrod-Domar framework
also demonstrates the significance of saving and investment in a developing economy.
Harrod (1939) propounded the model independently. The model was driven by the
quest for a growth theory. The growth model states that trade and production
expansion is correlated to savings. Then trade and production are adversely linked
with capital-output. This suggests that there is no justification for an economy to
experience balanced development.
However, the Harrod-Domar Models are grounded on a number of assumptions. It is
assumed that there is no gap in the adjustment of economic variables, implying that
savings, income, expenditure and investment adjust themselves completely in the
same period. There is a ‘closed economy’ that rules out trade restrictions and other
complications caused by international trade. The Marginal Propensity to Save (MPS)
and Average Propensity to Save (APS) are equal, that is, MPS = APS or ∆S/∆Y= S/Y.
The capital-output ratio is constant, in other words, the law of constant returns works
in the economy because the capita-output ratio is fixed. The economy functions with
no government interference. Investment, income and savings are over and above the
depreciation. Depreciation rates are excluded in these variables. In addition, a full-
employment level of income exists. Investments and savings are equal in ex-post and
ex-ante sense, that is, there is a functional equality, as well as accounting between
investments and saving.
The aim is to get the value for growth rate (g). Assuming output is proportional to
capital, K/Y is constant
Where,
K is capital
Y is output.
Let ν = K/Y……………………………………………………………………….………… (1)
85
Where, ν is capital-output ratio.
Rearranging the above Y= . K ……………………………………………………….… (2)
Equation 1 is the production function.
Since ν is a constant:
∆Y=∆K/ν
Therefore, by substitution g = ∆Y/Y= ∆K/K.
This implies that output growth equals capital growth. This relationship also means
that there is a 1 to 1 association between output and capital.
Net change of investment input (∆K) equals investment (I) less capital depreciation
d.K.
∆K= 1-d.K…………………………………………………………..…………………….... (3)
Where, d is depreciation rate.
Since all savings (S) eventually find their way to investments, we have S=I and assume
savings is a fixed proportion of income, we have S = s.Y …………………………… (4)
By plugging the two equations (1) and (2) into equation (3), we get
∆K= 1-d.K= s.Y-d.K= s.Y-d. ν.Y= (S-dν).Y
To get growth rate g, we combine equation (2) and (4).
g= ∆Y/Y= (s-dν).ν= – d …………………………………………………………………. (5)
Where,
s is savings rate.
ν is capital output ratio.
d is depreciation rate.
Since, g= ∆Y/Y = ∆K/K. it implies that GDP growth will be proportional to investment
in GDP.
It is imperative to mention that funds come from savings. Without savings, there are
no funds for investments. In the absence of savings (high financial exclusion levels),
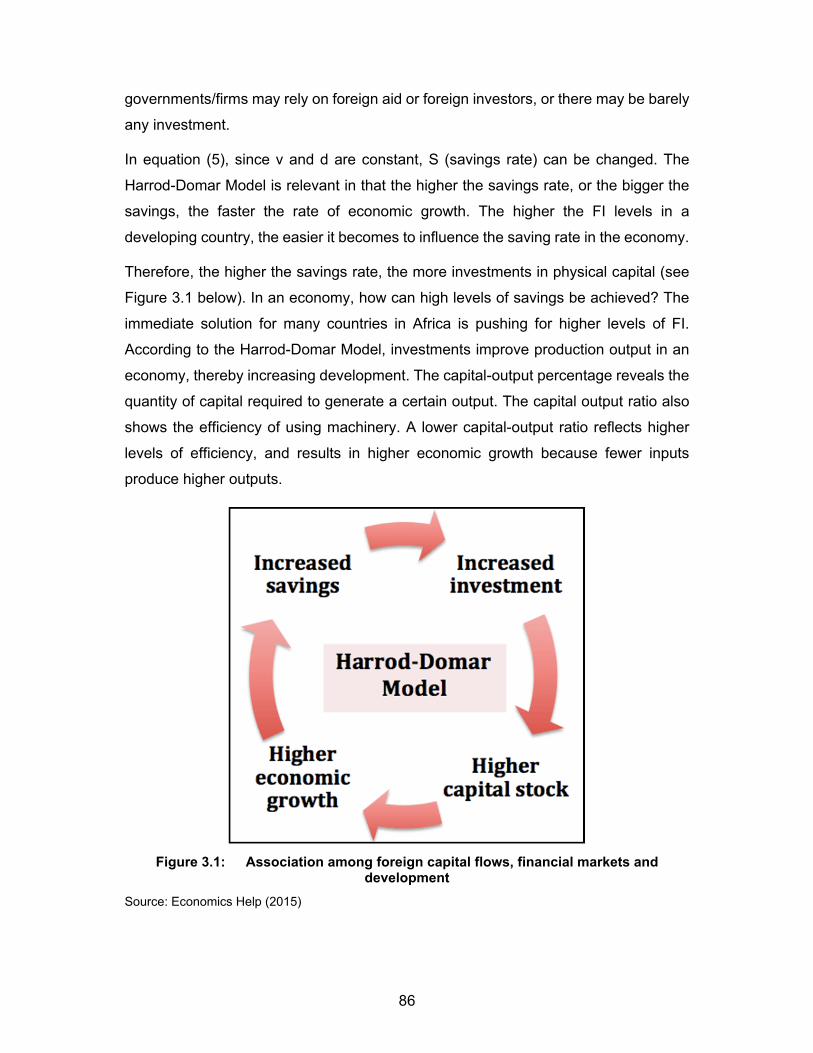
86
governments/firms may rely on foreign aid or foreign investors, or there may be barely
any investment.
In equation (5), since v and d are constant, S (savings rate) can be changed. The
Harrod-Domar Model is relevant in that the higher the savings rate, or the bigger the
savings, the faster the rate of economic growth. The higher the FI levels in a
developing country, the easier it becomes to influence the saving rate in the economy.
Therefore, the higher the savings rate, the more investments in physical capital (see
Figure 3.1 below). In an economy, how can high levels of savings be achieved? The
immediate solution for many countries in Africa is pushing for higher levels of FI.
According to the Harrod-Domar Model, investments improve production output in an
economy, thereby increasing development. The capital-output percentage reveals the
quantity of capital required to generate a certain output. The capital output ratio also
shows the efficiency of using machinery. A lower capital-output ratio reflects higher
levels of efficiency, and results in higher economic growth because fewer inputs
produce higher outputs.
Figure 3.1: Association among foreign capital flows, financial markets and development
Source: Economics Help (2015)
87
The financial systems perform a critical role in providing savings, loans, transactions,
and risk amelioration services for a variety of needs. Broad financial structures permit
wide connections to suitable financial products that are set to help the underprivileged
and impoverished segments of the society (Demirguc-Kunt & Klapper, 2013). For
example, having access to formal savings and credit facilities can enable funding of
productive activities such as enterprise development and schooling. When individuals
lack access, they tend to depend on informal or own savings for investment. With
limited resources for productive activities, persistent income inequality prevails,
resulting in slower economic growth. Higher FI levels result in increased savings for
more investments to build up higher capital stock, and ultimately, higher economic
growth (see Figure 4.1 above). The fact that the relationship among savings,
investment and economic development is explainable, makes the Harrod-Domar
Model relevant to this study.
Though the Harrod and Domar Models are different in detail, they have the same
substance. The Harrod’s model is the English version of Domar’s model. However, the
Domar growth model has a particular resemblance to the model of Harrod. Harrod
considered Domar’s design as a rekindling of his own version seven years later. The
models emphasise the important conditions of attaining and sustaining steady growth.
Harrod and Domar ascribe an essential role to capital accumulation in the growth
process. The models stress the dual role of capital accumulation. FI results in higher
levels of savings as more capital for investment builds up. Although the Harrod-Domar
models explain the importance of capital accumulation, there is no focus on how the
savings come about. The Financial Intermediation Theory discussed below closes the
gap by supporting that the savings process is centred on effective and inclusive
financial systems.
3.4.1 Financial Intermediation Theory
The Financial Intermediation Theory, propounded by Gurley and Shaw (1960), is a
common theoretical structure that describes the task of FI in unequivocal terms. This
model complements the Harrod-Domar, as it highlights the need for individuals to use
formal financial services. The goal of the model is to elucidate the purpose or function
of financial intermediaries. Gurley and Shaw (1960) postulate that the
savings/investment process is hinged on an effective and efficient financial sector in
88
capitalist economies. Financial systems and players play a critical role in economic
growth, since they offer the optimal distribution of resources. Financial players accept
deposits from savers/consumers for the on-lending to firms (productive sector) in need
of resources for investment purposes.
The Financial Intermediation theory is grounded on the Agency model and framework
of informational asymmetry. The following classes of aspects explain financial players’
existence: lack of comprehensive information in time, high transaction costs and the
method of regulation. Informational asymmetry is the dominant factor in studies on the
subject of financial intermediation. Informational disproportionateness maybe ex ante,
causing the complication of adverse choice, or ex post leading to costly verification
and auditing procedures.
Information asymmetry produces market imperfections, contrary to the Theory of
Efficient Markets from the Arrow-Debreu perspective. An inclusive financial system is
expected to be highly efficient where all investors have access to the same
information. The Perfect Financial Markets Models helps to shed light on the ideal
market required for FI.
The Perfect Financial Markets Model in neo-classical economics has a number of
assumptions. There are not any competitive advantages at participants’ level; there
are no discriminatory fees. There are homogeneous financial securities, transactional
and dividable. The placement/borrowing circumstances are the same for all. There are
no transaction costs for finding information. No single participant influences prices;
and all participants have access to all information concerning the issues and features
that influence the future or current quality of financial assets. In real-life information,
asymmetry is an important element in FI matters. This is because some parties
possess more information than others do.
Informational asymmetry results in the advent of certain arrangements of business
expenses. The major role of monetary players is to eradicate these costs. Diamond
and Dybvig (1983) argued that financial players (banks) are an ‘alliance’ that ensures
that people who save up against the exposures could influence their liquidity status.
According to Leland and Pyle (1977), financial intermediaries are an alliance working
on the dissemination of facts. Diamond (1984) maintained that the monetary alliance
function sanctions managers or people who save up and can attain significant
89
economies. The savers entrust their available funds to the intermediaries for
investment. The depositors are able to access their monies at any time under the
agreed terms.
The Financial Intermediation theory model explains the association between the bank
and the borrower (the major issue of concern in tracking approved credit), as well as
the complication of moral hazard and adverse choice that may also have an influence
on FI levels. Furthermore, in the bank and depositor relationship, special focus is on
aspects that influence depositors to save more or withdraw. The theory is also of
importance as it analyses the function of financial intermediation and its impact on
trade and production expansion. The theory also complements growth philosophies,
for instance, the Harrod-Domar Models, as it explains how the financial sector
influences the economy.
Many studies have also highlighted the intermediary role in attaining higher stages of
trade and industry expansion, and the influence of policies on their effectiveness. The
relationship between the banking institution and its customer that is highlighted in this
theoretical approach makes the Financial Intermediary Theory relevant to this study.
However, the approach does not explain how financial advice can improve the opening
and usage of bank accounts, and this area still needs to be explored.
Another approach to financial intermediation is based on transaction charges. Fama
(1980) and Benston and Smith (1976) used this approach. The approach is rooted in
the varieties of technologies used by participants in accessing or delivering services.
The transaction costs referred to also include the costs related to investigation,
evaluation and monitoring. The financial sector then changes the characteristics of
financial instruments, providing liquidity and other investment prospects to allow for a
divergence in placements. However, the strategy does not explain how technologies
or use of social networks can be of relevance to FI levels. There is still a gap on how
social media, internet access and financial advice determine FI in African countries.
The third approach to financial intermediaries was developed by Merton (1995) and
Guttentag and Lindsay (1968), and is grounded on the regulation of the saving,
monetary creation and financing of the economy. Methods of regulation influence the
solvability and liquidity of intermediaries. The regulations and policies determine the
efficiency of the financial sector or its effectiveness in its intermediation role (Diamond
90
& Rajan, 2000). The approach of regulation mainly affects the supply-side aspects of
FI. The notion that the financial sector or intermediaries play a key part in economic
development makes the Financial Intermediary Theory relevant to the current study.
The efficiency in the financial system is brought about by high levels of FI. The
Financial Intermediation Theory reveals the importance of formal financial systems to
allow for economic development. The Harrod-Domar Models emphasise savings,
highlighting the need for formal financial systems. Savings come through financial
intermediaries and intermediation is enhanced by FI. The efficiency of formal financial
systems is linked to the levels of FI. A number of factors determine FI, which is the
focus of the current study. Discussed below are studies on the determinants of FI.
3.5 DETERMINANTS OF FINANCIAL INCLUSION
All the information or observations from FI practice is understood in terms of a prior,
often implicit theory. This idea is consistent with Popper (1976) who argued that theory
should precede observation. Data related to FI can be obtained by using direct
observations, interviews and surveys. The data obtained from FI practice and the
analysis of such data should support or refute the above-discussed theories. Better
theories of FI should replace those that are poorer, if they explain existing observations
more effectively. In addition, the empirical modelling of FI determinants should take
into account the nature of the data and the magnitude of the explained and
unexplained variations in an FI model.
Due to FI gaining in importance in several countries across the world, studies have
been evaluating its determinants, measurements and effects. There is a need to
investigate the factors influencing FI in an area, be it at district, regional or country
level. The reason for this step is that the formulation and implementation of a policy
requires the availability of adequate information to allow for an informed decision.
FI or the access to an official financial system is influenced by different factors.
Demand-side factors are those that play a role in influencing consumers to use
financial services, or that affect their ability to make effective, informed financial
decisions (Paramasivan & Ganeshkumar, 2013). Supply-side factors are related to the
method and function of the monetary system and its design, which results in
consumers being financially excluded or included (Kumar, 2013). The supply factors
91
can further be broken into structural and policy-related factors (Evans & Adeoye,
2016). Structural factors influence the financial services’ costs and strategy which is
linked to features permitting conditions for FI. There is no consensus on the
determinants of FI in literature.
The literature has affirmed that unintentional monetary marginalisation and intentional
monetary marginalisation can be found (De Koker & Jentzsch, 2013; World Bank,
2011). The intentionally left out do not utilise official financial products due to a lack of
need for them, religious and cultural aspects (Beck et al., 2005). Those intentionally
financially left out lack confidence in the financial system or face hindrances such as
unsuitable product structure, affordability, and being unable to meet the requirements
(Dittus & Klein, 2011; European Commission 2008). In addition to these classes of the
financially excluded, literature points out the existence of those who voluntarily
withdraw. Those who self-withdraw are bank clients who once accessed financial
services but later withdrew from the formal financial system. According to the
FinScope (2014) survey in South Africa, more than three million individuals had
withdrawn from the formal financial sector. Ellison, Whyley and Forster (2010) argue
that the withdrawals are a result of costs, problems in managing spending, a lack of
confidence in banks, unfavourable credit records and unsuitable product features.
There is a difference between financial usage and access. Although many people can
be encouraged to open accounts, numerous accounts become inactive. Therefore,
financial access does not essentially lead to the daily use of the services (Platt et al.,
2011).
A study by Ghatak (2013) that aimed to ascertain the demand-side factors of FI in
India, using factor analysis, found that several factors influenced FI. The factors
include Culture, Properties, Accessibility and Income. Using correlation analysis in the
study, Accessibility had the highest correlation to demand for FI, followed by Literacy,
Income, Culture, and lastly, Properties. However, after running a multiple regression
analysis, the Properties factor was the least important of the five in driving FI. Ghatak
further asserted that there is empirical substantiation indicating that robust growth rate
is positively correlated with FI. He stated that the economic buoyancy experienced by
India was financed predominately by domestic savings. In this study, Ghatak (2013)
suggested that as the development of India relies on FI, the more people are aware
and availed of financial services, the greater the potential for capital formation.
92
However, the weaknesses of this study includes that the sample of 500 used in the
study is insufficient to draw an inference in a populous nation such as India. The study
also was done in a small part of the country leaving out other areas that could have
produced different results. Factors, such as social media, were left out that may have
a huge effect on levels of FI. Moreover, in Africa, studies have shown that the
possession of assets seems to be insignificant in influencing FI.
The provision of credit plays a crucial role in influencing FI levels, since a person can
be enticed to open an account to gain access to additional financial facilities. In a study
to ascertain the factors influencing access to bank loans in Bolivia, the scholars,
Altunbas, Thornton and Kara (2010) found that the following factors influenced credit
provision: gender, citizenship status, income, formal employment, age of family head,
size of family, and level of education. Using the same data, focusing on borrowing
households, Altunbas et al. (2010) estimated the probability of getting credit from a
formal financial organisation. The study used the Probit Model to examine borrower
characteristics that led to credit exclusion from formal financial firms. The findings
showed that females and indigenous borrowers are likely to be excluded from the
formal loan supplying institutions and pushed to informal credit mechanisms. The
results also showed that the higher the level of education, the more the probability of
accessing bank credit. In addition, the study showed that those employed in the public
sector have high a probability of gaining access to the formal credit market. However,
location (urban or rural) did not appear to affect the likelihood of accessing the formal
credit market. The finding that location had no effect seems to be inconsistent with the
factors affecting FI in Africa, as the institutions consider collateral and costs of
monitoring, among others. The demerit of this study is the narrow focus on one
product, which is credit.
Several studies have shown education has an effect on levels of FI (Allen, Demirquc-
Kunt, Klapper & Peria, 2012; Ghatak, 2013; Clamara, Pena & Tuesta, 2014; Zins &
Weiss, 2016). In a study to find factors influencing FI, Park and Mercado (2015:14),
found an educational level at primary school level and lower reading/writing level had
no influence on FI levels in developing Asia. In the same study, per capita income was
found to have an influence on FI. The study advocates the idea of raising income to
reduce impoverishment rates. Better financial accessibility is related with lower income
disparity, though the approximations are substantial only for some stipulations. On the
93
contrary, in a cross-country study for 160 countries, Honohan (2008) found a
correlation between poverty and financial access but not clearly causal.
Adewale (2011) studied the determining factors of financial exclusion in small
enterprises in Ilorin, Nigeria. The study found the factors influencing FI as follows:
eligibility, affordability, cultural capital, financial complacency and religious
inclinations. Adewale (2011:13) argues that the phobia regarding debt was identified
as an explanation for financial exclusion. A questionnaire survey of 450 was used from
a small part of Nigeria. The study noted that the limitation of macro-level researches
and use of aggregate data may be misleading. To correct the weaknesses that are
found in many studies, Adewale investigated the financial exclusion hindrances
experienced by micro enterprises in Ilorin, Nigeria. The two major weaknesses of the
study are: (1) The study focused on a small area that may not bring a
comprehensive/detailed perspective of the real-world situation on the ground, and (2)
The area studied was inhabited by predominantly Muslim people who shun the
conventional banking products in favour of Shariah-compliant products.
According to King (2011), the unbanked population showed the following
characteristics in Nigeria: lack of documentation, lower incomes, lower financial
literacy levels, lower education, not possessing a mobile phone, and are more likely
to be female. The aim of King’s research was to investigate the extent and
determinants of demand and supply barriers influencing FI in Nigeria. On the supply
side, the number of ATMs (automated teller machines), GDP per capita, access to
branches, societal trust and levels of informality had an influence on FI. For example,
in the rural areas, individuals found that the distance from a branch was a hindrance
to financial access. However, the literature shows that the effect of costs associated
with distance can be reduced by applying technology, mobile banking and mobile
money agents (Ouma, Odongo & Were, 2017; Lal & Sachidev, 2015; Donovan, 2012).
Although the study by King examined both sides of FI (demand and supply), it left out
some important factors that include financial advice and social media. The issue that
remains outstanding is ascertaining the extent to which social media can influence FI
levels.
Using the Global Findex database, Zins and Weiss (2016) investigated the causes of
FI in 37 African countries. Using probit estimations, they found that education, gender,
income, education and age influenced FI. The strength of the study is that it cuts
94
across 37 countries making it easier for cross-country comparison, however, the
limitation of the methodology is the absence of country-level analysis. The analysis of
the factors was not exhaustive, as it did not include variables such as social networks
and financial advice. Only three dimensions were used in the study, limiting the scope
of FI. The analysis was on a global scale, and not country-specific, considering that
countries have different development levels and cultures (Adewale & Afolabi, 2013:7;
Demirguc-Kunt & Detragiache, 2005:26).
Allen et al. (2012) examined the individual traits and country features related to the
utilisation of formal accounts. The study investigated factors influencing FI across
individuals and countries. The study found that the richer, the more educated and the
older had a greater possibility of operating an account with an official financial firm. In
addition, married, employed and separated individuals were more likely to be
financially excluded. The potency of the exploration was that it covered 124 000
individuals from 123 countries. One of the weaknesses of the study is the lack of
country analysis, as there are differences in culture and economic policies between
countries.
Bapat and Bhattacharyay (2016) analysed the determinants of FI in the large city of
Pune, India, using a household survey done in a slum area. The study found that the
respondents’ demographic profile, income, age, occupation, gender, account ratio per
household, savings and loan sources influenced levels FI. The study implies that the
variable of location (see Martinez et al., 2013; Clamara et al., 2014) may be irrelevant
in some cases, as the disadvantaged groups in some urban areas are financially
excluded. In another study using a survey sample of 300 households, Sahoo, Pradan
and Sahu (2017) investigated the determinants of the FI levels of two districts in India.
The study found that the education level of household head, land size, level of income
and nature of employment were determinants of FI among tribal people. The
weakness of these studies is that the analysis was based on too small samples (202
and 300 households) to generalise the results.
Although the study focused on enterprises, Karpowicz (2014:6) found that collateral,
cost of services and lack of savings were the major obstacles to FI in Columbia. The
findings are comparable across other regions and countries (Demirguc-Kunt &
Klapper, 2012; Dupas & Robinson, 2013). The lack of savings and collateral for
individuals causes people to rely on informal sources of credit (Bending, Glesbert &
95
Steiner, 2009; Zeller & Manohar, 2002). Bending et al. (2009:26) found that income
levels in rural Ghana influence credit demand, insurance purchase and savings
behaviour. The research also established that higher education level, more assets and
formal job status boost formal financial product use. The findings confirm the notion
that the poorer the household, the more likely it is to be financially excluded. The study
also stated that a female-headed family was more likely to be excluded than a male-
headed family.
In a quantitative approach study to investigate the determinants of FI in Peru, Clamara
et al. (2014) found that some groups, such as females, youth and individuals staying
in rural areas, had a difficulty in reaching the formal financial players’ services. With
regard to financial products, mortgages and loans seemed to be more dominant
drivers of FI than saving products. The study also reported that formality, age, gender,
education, income level and education are significant factors for FI. The findings were
consistent with those of Allen et al. (2012). However, one demerit of the study is that
some factors, such as internet access, social media and financial advice, were not
considered.
In a study done in the United Kingdom (UK) to determine the impact of financial
education on levels of FI, Lewis and Lindley (2015) found that vulnerable groups with
the lowest capability were more likely to be financially excluded. Those with low
financial literacy levels were unable to access appropriate financial facilities to satisfy
their requirements. The research also discovered the nature of employment also
determined whether the person had a formal account or not. The self-employed
experienced certain problems such as high levels of unsecured debt, lack of pension
savings and financial advice. In the same study, the authors pointed out that there was
need for the authorities to ensure that financial education was taught in schools. It was
also stated that the following were required: synchronisation of FI policies, more
savings invectives, financial advice for the self-employed, and appropriate financial
requirements of the susceptible groups. The research focused on financial education
for the financially excluded and did not address factors influencing FI.
The outcomes were also consistent with that of Lusardi (2008:17) who also
recommended more financial education to certain vulnerable groups in the US, as
individuals become increasingly in charge of their financial security and face complex
financial instruments. The demographic groups included the African-Americans and
96
Hispanics who had inferior levels of financial schooling. Financial knowledge
influences consumers’ financial services choice-making process (Artkinson, 2008:33).
One question that remains unanswered is related to how financial advice influences
the levels of FI in developing countries in Africa.
In a research to explore the demand aspects influencing FI in Mexico, Martinez et al.
(2013:15) found lack of and inconsistent income flows and self-exclusion to be the
most influential barriers. They found three different types of factors influencing FI,
which are: 1) Variables that denote individual vulnerability, education, gender,
occupation and income level; (2) Factors that appeared to be associated with
inclination towards the informal financial market, including the capability to respond to
exogenous shocks and a proclivity to save, and (3) Geographical factors which
included community size and location. However, the study had the weakness of
focusing on a single country, thereby lacking cross-country analysis.
The scholars, Soumare, Tchana and Kengne (2016) studied the factors of FI in West
and Central African nations using data from Global Findex. Their study established
that FI in the region was driven by gender, marital status, income, employment status,
education, residence area, family size, age, and level of confidence in financial
organisations. The West and Central African region differ from other parts of Africa in
that being male and/or married were positively correlated to FI. Earnings were weighty
in West African nations and the entire continent. It was also reported that household
size is negatively correlated to account use in West Africa but not significant in Central
African nations. FI indicators such as saving, usage and borrowing were significant for
Africa, although in Central Africa or West Africa they differed on the levels of
significance. The findings were in line with other studies on the factors influencing FI
that used the Global Findex database (see Klapper & Singer, 2013; Allen et al., 2013;
Demirguc-Kunt et al., 2013; Anson et al., 2013; Allen et al., 2012; Demirguc-Kunt &
Klapper, 2012). One demerit of the study is that of using a single proxy for FI, limiting
the scope of FI, instead of using different proxies.
In a study to analyse the socioeconomic, terrestrial, and population features of
individuals in Kenya, Johnson and Arnold (2012) found the following factors strongly
linked to bank access: age, employment, gender, education and location (urban/rural).
The results concur with the results of other studies done around the globe (see
Martinez et al., 2013; Clamara et al., 2014; Tuesta et al., 2015). Johnson and Arnold
97
(2012:2) argue that technology ushers in lower transaction costs, as it is one of the
major barriers to financial access. The study also reported the impact of M-PESA, a
mobile phone-linked transaction service. Although the study covered a number of
dimensional aspects of FI in Kenya, Johnson and Arnold (2012) did not include the
investigation of factors such as financial advice, internet access and social media.
Financial literacy levels undoubtedly have a great influence on FI levels, and the
factors affecting the former have an influence on the latter. Financial education is a
vital skill for people entrenched in intricate financial environments. The majority of
people in the African region suffer from financial illiteracy, and improvements to that
aspect on the continent will go a long way towards rectifying the problem (Atkinson &
Messy, 2012, 2013; World Bank, 2014).
In a study done in Brazil to craft a model to elucidate the individuals’ financial
knowledge levels through socioeconomic and demographic factors, Potrich et al.
(2015) found that gender, educational level, family income, individual income and
dependent family members had an impact on financial literacy levels. The findings are
similar to other studies that found the same determinants on FI levels (see Zins &
Weill, 2016; Fungácová & Weill, 2015; Ghatak, 2013; Adewale, 2011). The findings
reveal the need to devise effective actions to reduce incidences of financial illiteracy
in an economy, as the same factors that ultimately affect global FI levels. However,
the flaw of the research is that it concentrated on the determinants of financial literacy,
and not FI per se, and the study was based one country, Brazil, leaving no room for
cross-country analysis.
In a study to investigate the influence of belonging to the Islamic religion on the use of
formal saving, loan and accounts, Demirguc-Kunt et al. (2013) found that Muslims
were less probable to utilise formal financial services than those from other religions.
The study used a sample of 65 000 people from 64 nations. Religion may influence FI
(Zins & Weill, 2016; Demirguc-Kunt et al., 2013). For example, in a study done in
Norway, Brekke (2018) reported that there are real possibilities that religious norms
against conventional banking influence FI. However, the research did not focus on the
actual use of conventional banks. The study by Brekke has several weaknesses that
include too small a sample of 707 respondents in a country of more than 5 million, and
the study was qualitative and the results do not allow for a meaningful analysis.
98
Furthermore, research done in Europe is likely to produce different results than would
be obtained from an African country.
A study by Naceur Barajas and Massara (2015:25) that aimed to find out if Islamic
banking can increase FI, found that in Muslim countries, there are significantly more
religious reasons for financial exclusion than found in other countries. However, the
usage of services did not increase as quickly, although geographic financial
accessibility had increased swiftly within the Organisation of Islamic Cooperation (OIC)
nations. Furthermore, regression analysis affirmed a positive correlation to credit for
borrowers in financing investment, but the empirical association was tentative and
quite weak. Therefore, there is still need to investigate the influence of religion in
African selected countries.
In a study to find whether the distances between bank customers and bank institutions
have increased in a decade, Brevoort and Wolken (2008) found that distance plays a
role in the accessibility, provision and delivery of banking services. Costs of
transaction are directly related to the number of transactions and the distance between
the customer and service providers. ATMs and online banking reduce the costs of
service provision and transaction costs for suppliers and customers, respectively.
Brevoort and Wolken argue that although ATMs serve as alternatives for bank tellers,
the same is not essentially true for bank branches. For example, for loan transactions,
in person interactions are unavoidable and costs for loan monitoring in case of
commercial loans are imminent. The use of credit bureaus for hard information on
individuals’ credit history and automated credit scoring systems for pre-screening, loan
originations and loan monitoring decrease the information costs incurred by lenders.
The study also found a common tendency towards less personal contact between the
bank and the customer. Brevoort and Wolken conclude that distance is still of
importance to a subgroup of customers and suppliers. This study has two major
weaknesses, which are: (1) The data set used in the study focuses on small
businesses and service providers, and (2) The study focused on one developed
country with an advanced financial structure. Therefore, the findings cannot be
generalised for all countries, particularly those in Africa.
There are existing studies that found that technology has significantly reduced costs
of transactions (Elliehausen & Wolken, 1990). Other studies pointed out that
transportation costs between the financial institution and the borrower and alternative
99
financial institutions affect the costs of services and products (Degryse & Ongena,
2005; Degryse, Laeven & Ongena, 2006). Martinez et al. (2013:14) argue that
although the factor of distance is vital at a global level, in Mexico, that barrier is being
overcome due to technological developments. What then is the role of distance in the
consumer’s choice of an institution, services or products?
The weakness of the existing literature on distance is that the majority of the studies
used data on small businesses and not individuals. The variables that affect
businesses do not necessarily influence individuals in the same way. The significance
of the contribution of distance to FI may differ among individuals, financial institutions
and countries.
Charges and earnings are highlighted as the most influential economic elements
influencing the use of payment and saving services (European Union, 2008; Beck &
De la Torre, 2006; Schreigner & Nagarajan, 1998). There is consensus that economic
growth and per capita income raises the necessity for innovative services.
Inducements to demand are not limited to economic features but also arise from
subcultural factors, leading to voluntary exclusion (Claessens, 2006).
Using the data from Global Findex for 2011, Fungácová and Weill (2015) focused on
FI in China, and made further evaluations using the BRICS (Brazil, Russia, India,
China and South Africa) nations. The study established that the high levels of FI in
China are based on official account usage and savings. The research showed that in
the BRICS countries, China led with regard to FI levels, and it was reported that
financial exclusion was mainly voluntary (Fungácová & Weill, 2015:19). The study
found that income, schooling, gender and age have a correlation with the use of formal
loan and other bank accounts in China. Education and income are also associated
with the use of alternative sources of credit.
There are studies that found similar results in terms of the gender effects on FI
(Demirguc-Kunt et al., 2013; Aterido, Beck & Iacovone, 2013). Demirguc-Kunt et al.
(2013) maintain that the difficulties for women to financial access also include the non-
existence of collateral and inferior financial schooling. The strength of this study is that
it used three indicators of FI which are formal saving, credit and account, showing a
wider range of FI, unlike other studies that limited the scope to having a formal account
(see Martinez et al., 2013; Clamara et al., 2014). Another strength is that of cross-

100
country comparison, taking the BRICS countries as a sample. However, the study
focused on a single country, China, an Asian nation, and the findings may differ from
that of other countries or continents.
Using Global Findex Data (2012), Tuesta et al. (2015) estimated Probit Models to
analyse the associations that existed between FI and certain variables in Argentina.
This study considered three dimensions influencing FI levels in Argentina from the
consumer perspective. The study found that official financial facilities are used through
traditional ways such as outlets and ATMs. The following variables were significant to
influencing FI: level of education, income and age. The study is superior to other
studies as it used a number of variables as dependent variables, unlike those studies
that used only one such as formal accounts. Another strength is that the usage of
formal financial products was considered, which is vital in an analysis of FI. However,
the study focused on a single country, Argentina, with its unique characteristics, and
the results cannot be generalised for every country.
In an investigation of the factors affecting FI in Peru, Camara and Tuesta (2014)
established that gender, age, schooling and income were determinants of FI levels.
The study comprised of a quantitative perspective of FI in Peru using household
survey data. Significant associations were used to find the socioeconomic
characteristics affecting the FI of households and enterprises. The study also analysed
the sensitivity to some barriers of individuals not using banking services. The results
showed that women, young people and individuals living in rural areas faced the most
difficulty in accessing formal financial products. Credits and mortgages were more
influential in influencing FI than savings products. The strength of the study is that it
considered FI at individual and enterprise level. However, the study did not consider
other explanatory variables, such as financial advice, internet access and social media
that may have significant effects on FI.
In a study to examine the factors influencing geographic exclusion from banking
services (and basic bank accounts) in rural communities in Ghana, Osei-Assibey
(2009) found that the need for bank accounts were driven by market and non-market
factors. These include price, wealth status, literacy level, proximity to a bank, ethno-
religion, employment and dependency. On the supply side, the study found that
financial institutions are controlled by factors that include market size, stages of
infrastructure (communication facilities and energy), market activeness and security
101
(natural disasters, crime, conflict). In contrast to many studies of FI determination (Zins
& Weill, 2016; Park & Mercado, 2015, Tuesta et al., 2015 Clamara et al., 2014), Osei-
Assibey (2009:231) found that gender has no influence on FI levels in Ghana. One
demerit of the study is limiting the proxies for FI, as the dependent variable limited the
scope of FI.
Nature of employment may influence FI in various ways, depending on how wages
and salaries are paid. In the study referring to the variable of employment, Schneider
and Enste (2000) argue that lawful making of goods and services that are not
registered or taxed are likely to include informal finances. The purpose of the research
was to establish the connection of sizes, causes and consequences of shadow
economies.
Ghosh and Vinod (2016) studied the link between gender and FI in India. On
investigating the factors influencing the relationship, the study found that there was a
significant variance in financial access and usage of finance by gender in India. Using
household data, results showed that woman headed homes were 8% less probable to
be financially included and 6% more probable to acquire unofficial finance contrasted
to male lead families. On further analysis of the possible causes of such disparity, the
study found that nature of employment and education levels were influential in
determining FI levels. However, Ghosh and Vinod (2016) and Schneider and Enste
(2000) focused on single determinants of FI.
In a study done in Cambodia, Seng and Lay (2018) investigated the influence of mobile
phones on FI. The study estimated Probit Models using a FinScope survey (2015)
dataset and found a positive significant relationship between owning a mobile phone
and being financially included. The study used three proxies for FI, namely, formal
account, credit account and saving account. Furthermore, the study revealed a greater
marginal effect of smart phones than non-smart phones on FI. The results also
revealed that mobile phones are likely to cause households to use official microcredit,
particularly for non-agricultural investment purposes. The study was insightful as it
provided policy-makers with knowledge on the role played by cell phones in that
country. However, the study had the following shortcomings: Only five factors were
considered, whereas the study could have included social media, internet access,
financial advice and distance from the next bank branch, among others.
102
In a study by Yoshino and Morgan (2016) to assess factors influencing the financial
access of low-income households in Sri Lanka, Germany, the UK, India, Indonesia,
the Philippines, Bangladesh and Thailand, policies were suggested to improve
financial access. The study also reported the following: market-driven factors:
exorbitant costs of financial products in rural areas, absence of convenient access
points, and lack of usable collateral. Regulatory factors that included supervisory and
capital sufficiency rules, limited the attractiveness of small savings, credit or other
financial services. Infrastructure associated obstacles included the absence of safe
and dependable settlement structures, fixed or mobile telephone availability and
transportation, bank branch network, and ATMs. The study found the following
demand-side factors: lack of funds, low financial literacy and lack of trust. Yoshino and
Morgan (2016:29) postulate that financial literacy levels in Asia were low, and there
could be enormous potential benefits from directing more resources to this region.
Financial literacy is also a cause for concern in the UK and OECD countries, and
studies suggest that financial education should be taught in schools and specialised
financial advice should be provided (Lewis & Lindley 2015:20; Atkinson & Messy,
2013:40). This brings to the fore the aspect of financial advice’s effect on FI levels and
the need for it to be considered in research.
Beck and Cull (2015) stated that it is problematic to separate the causes of exclusion
as they are interrelated in intricate ways. Bankable Frontier Associates (2007) identify
the causes of exclusion as discriminatory policies, informational and contractual
frameworks, gender, education, income, age and rurality. In contrast, a study on
Kenya, found that rurality was insignificantly associated with reduced access (Johnson
& Nino-Zarazua, 2011).
Some studies and surveys have shown people or households with access to formal
savings products with other reasons for being financially excluded. Some surveys
have focused on formal savings products, while other studies have shown relatively
high proportions of financially excluded people actually do save through informal
methods (Stanley & Bhattacharya, 2008; Kempson, 1998). An analysis of informal
finance is vital in finding the determinants of FI. A significant portion of the financially
excluded save through informal finance mechanisms that include accumulating
savings and credit associations (ASCAs), rotating savings and credit associations
(ROSCAs), credit dealers, unofficial lending and interment communities. The informal
103
mechanisms meet some diverse needs that include consumption smoothing, in
addition to promoting savings discipline and playing an intermediary role. One of the
reasons for informal financial mechanisms is the inter-personal relationships that
develop, instead of relying on anonymous interactions between clients and formal
institutions.
In a study to examine the theory that informal finance is influential in supporting
informal operators to exploit opportunities existing in the informal economy, Aliber
(2015:16) found the nature of employment influential. Another study by Stanley and
Bhattacharya (2008) in the US, found that better education, more income and greater
English proficiency reduced the likelihood of being financially excluded. Srinivas
(2016a:6) outlines the following reasons for the sustenance of the informal financial
market: it enables very small savings behaviour; no need for collateral; localises
services; personalises services; specific borrowers are identified; close information
networks; enables reciprocation of credit disbursal; transactions unregulated by the
central bank; and encourages community participation.
Factors influencing FI include gender, distance, location, income, level of education,
financial advice, and proof of residence. The lack of advice aimed at the larger
population of adults hinders the development of targeted and coordinated services.
There are a variety of problems related to individuals’ financial exclusion. Around the
globe today, people who are not able to access loans from the mainstream sources of
credit are losing more from unscrupulous lenders. Financial exclusion makes people
unable to manage financial risks and seasonal shocks. Financial exclusion may result
in depression and mental health problems, while the individuals may be socially
excluded as well. Meanwhile, those who do not store their money in bank accounts
are vulnerable to loss or theft, as reported in the media now and again.
The barriers of high FI levels should be dealt with to achieve inclusive financial
systems. At individual level, these may include low levels of income, psychological
barriers, low literacy levels, home location, cultural barriers, and insufficient
information. Governments implement different methods to address these challenges,
and transformation has varied results and is generally long drawn-out. On the supply
side, the constraints emanating from institutional inadequacies may end in the inability
to offer convenient accessibility to a broader range of financial products.
104
Empirical studies on FI play the fundamental role of unveiling the theories that
underpin the argument of this thesis. The purpose of a discussion on empirical work
that includes social media, internet access and financial advice is to gain an
understanding of the existing research and debates relevant to factors influencing FI.
The current study sought to investigate the determinants of FI in selected African
countries. The study contributes to the body of literature by including the following
explanatory variables: social media, internet access and financial advice. The section
below discusses empirical work that included these explanatory variables.
The implementation of the Trans-theoretical Model (TTM) to financial behaviour began
in the last twenty years. Kerkman (1998) focused on using TTM in financial counselling
and brought to the fore a case demonstrating her strategy. Bristow (1997) postulated
that the strategy might be employed in shifting individuals’ financial behaviour in
Money 20001, which is an example of an effective monetary schooling initiative that
was accepted by 29 states and resulted in an impact of about USD20 million (O’Neill,
2001). The results revealed that amongst the 1998 programme beneficiaries in New
York and New Jersey, certain stages of change were used more regularly (O’Neill
2001).
Some scholars used TTM in loan counselling situations to create a method of
measuring to assist consumers in transforming behaviours that eradicate unnecessary
credit card outstanding amounts (Xiao, Newman et al., 2004; Xiao et al., 2004). TTM
was used in low-income consumers’ monetary schooling initiatives and there are some
educational strategies that fall under the TTM framework that were established
(Shockey & Seiling, 2004). In addition, TTM was applied in the provision of advice to
females to enable them to become informed savers (Loibl & Hira, 2007).
According to Montmarquette and Vietnnot-Briot (2012:12), investors who received
financial advice amassed more financial assets than those who did not receive advice,
regardless of their income and age. The study focused on an econometric framework
on the significance of a monetary counsellor. The authors also pointed out that the
advised investors began to consider advice when they had relatively little financial
assets (IFIC, 2011). Those advised viewed their investment knowledge as more
1 a USDA Cooperative Extension project.
105
improved (Pollara, 2011). The advised displayed behaviours that left them in a better
retirement position, and the advised people exhibited more confidence and peace of
mind on financial matters (IFIC, 2010; Ray, 2010).
A study by Sherraden (2010) maintained that financial capability comprises the
capacity to take action (awareness, motivation, resilience and skills) and the prospect
of acting (through obtaining of financial products). The study found that those who
required financial information that kept them out of the formal financial system at any
level needed both monetary schooling and FI. One of the objectives of the research
was to illustrate how financial knowledge, skills and FI are associated. Therefore, the
study concluded by calling for more research on monetary understanding and
guidance.
Contrarily, some studies reveal a restricted or adverse outcome as a result of financial
education or advice among some communities. For instance, Mandell (2008), in a
study of high school scholars that spanned over 10 years, found no significant link
between financial knowledge scores and financial training in schools. Using a separate
sample, Mandell and Klein (2009) also found no proof of a desirable behaviour change
in the first five years after high school. A study by Braucher (2001) found that
individuals who attended debtor-training sessions were less likely to pay back their
loans than those who did not, even though the link is not essentially causal.
According to Hathaway and Khatiwada (2008) and Hogarth (2006), the impact of
financial training is problematic to quantity because of the scope of audiences,
purposes, timing and deeds. To this end, several questions are unclear pertaining to
the stage in which to initiate financial training, the material to be taught, appropriate
training approaches and how the factors could influence different target populations
(Burhouse et al., 2004). The ability to apply new information in monetary matters might
come in stages but the timing remains unclear (Xiao et al., 2004). The influence of
monetary counsel on the poor and the financially excluded, in particular, are seriously
unexplored (Schuchardt et al., 2009; Hathaway & Khatiwada, 2008; Lyons et al.,
2006).
The existing work on financial advice has three demerits. There is no focus on the
influence of financial advice on FI. Secondly, the majority of the research studies apply
the case study and pre-post test approaches using little and indicative samples
106
(Holden et al., 2009; Lyons et al., 2006). Thirdly, some studies include comparison
clusters, while a limited number uses control batches (Collins & O’Rourke, 2009;
Martin, 2007). The contribution or impact of financial advice to FI levels is not yet clear,
and this requires more research. In addition, more thorough and well-designed studies
that comprise effect valuation are necessary (McCormick, 2008; Lyons et al., 2006;
Fox et al., 2005).
A theoretical and empirical study by Chen et al. (2018) examined the association
between internet use and accessibility of outside sources of funds for firms. A
theoretical model was developed to explore the influence of internet access to loan
facilities for firms. The study finds that the Internet can successfully reduce the
financing challenges of firms by decreasing information asymmetry and agency costs.
The study also finds that the Internet can boost sustainable development and social
welfare aspects. Chen et al. (2018) used Chinese family economics data from the
China Household Finance Survey. The results revealed or confirmed a positive link
between internet access and access to financial facilities. In addition, it was found that
the Internet can lessen the borrowers’ dependence on physical bank outlets when
making important financial decisions.
In a study done in Mexico, Bruhn and Love (2014) acknowledged that internet access
eases information asymmetry between banks and prospective borrowers. Bruhn and
Love also found that access to finance has an influence on earning levels and
employment market. Based on data from Mexico, Bruhn and Love showed that the
effect was significant in poor people and those regions with low bank penetration. The
study also revealed that FI was among the major macroeconomic causes of
entrepreneurialism in 18 European Union nations. The aim of the research was to find
the effect of FI on the real economic activity. One of the questions was whether internet
access can have an influence on the real economy. The study explored the association
between internet access and finance access together with its economic structures and
economic effects hypothetically. Nevertheless, the study has the following
weaknesses: 1) Experiment was done in a more advanced economy than any African
country, Mexico and the other conclusions being based on China and 18 EU countries;
and 2) The dependent variable was limited, as the scope could be broader.
Lenka and Barik (2018) investigated the contribution of online network applications to
FI in the South Asian Association for Regional Cooperation (SAARC) nations, between
107
2004 and 2014. Principal component exploration was applied to create an FI index
that was used as a proxy for the availability of monetary facilities in SAARC nations.
Having used the fixed effect, panel correction standard errors and random effect
models, the results showed a positive and significant link amongst mobile phone use,
FI and internet services. Lenka and Barik also found a progressive link amongst
spread of internet services, increase in cell phone use, and improvement of FI in the
region.
In a study by Nowak et al. (2008), to reduce funding challenges, small firm credit facility
explanations could be employed as an instrument to hint at the prospective
beneficiary’s merit. The tool may forecast that the credit would be financed and the
investor could make venture resolutions centred on appropriate and important
indications given by the small firms.
Based on data from the UK, Cosh et al. (2009) studied the determinants of disavowal
rates for financing from diverse investors, including individuals. The study showed that
small firms were likely to acquire funds from private individuals. Following the increase
in virtual finance, individual borrowers or small organisations can acquire external
funds from virtual funding marketplaces. The capability of virtual marketplaces to
proficiently and successfully connect borrowers and lenders (sellers and buyers) has
shifted the models of business processes. It has also changed the role of a traditional
intermediary.
In light of these developments, it is worth noting that peer-to-peer and crowd-funding
lending are on the rise around the globe. Therefore, the role of the Internet in improving
FI is yet to be exhausted, and there exists a gap in the literature. Prior studies focused
on business entities and only a few studies have considered the effect of internet
access on FI at personal level. There is a need to find the effect of internet access to
FI in most African countries, as this may provide insight into the status quo and
probable trade and industry instruments of digital or virtual money and the prospective
relationships between the Internet and the use of formal financial services.
The existing studies on internet access have a number of weaknesses. Their focus
was limited to one country making no provisions for cross-country analysis. The
dependent variables were limited yet the scope was broader. Limited factors were
108
used and the studies could have included the effects of social media and financial
advice.
To obtain significant insight into the determinants of FI, there is need to understand
models and forms of saving that enhance inclusive formal financial systems. This is in
line with the Harrod-Domar Model that can also be used to show not only the rate at
which the economy must grow if it is to make full use of the capacity created by new
investment, but inversely, the required savings and capital-output ratios if income is to
attain a certain target growth rate.
The models and forms of saving discussed below will assist in viewing the systems
from multiple perspectives. This will also assist in discovering the causes and effects
of FI, using model traceability. In the formulation of policies, errors may be discovered
earlier and system defects may be reduced. Discussed below are the models and
forms of saving.
3.5.1 Empirical work that included social networks
Many studies have concentrated on the user experience, opinion and temperament
when applying them to indicate the behavioural, psychological and essential
characteristics of social media users. Some studies have employed the Technology
Acceptance Model (TAM) to investigate the supposed essence of internet community
networks. For instance, Hsu and Lin (2008) researched on the role of the TAM in
consumer’s intention and attitude to blogging. Hossain and De Silva (2009) applied
the TAM with a special focus on the use of internet communities within the control of
societal links. Steyn et al. (2010) researched the TAM with respect to social network
announcements entrenched in the image management circles to appreciate blog
users’ objectives in terms of utilising the essentials of the statements. Casaló et al.
(2011) applied the TAM to study the consumer’s intent to track counsel.
Porter and Donthu (2008) studied the influence of consumers’ views of the exertions
anticipated by the sponsoring firms of an online community to cultivate assurance and
harvest value. Freberg et al. (2011) examined the significance of perceived social
media users’ personality to public relations in affecting the customer’s attitude to a
brand. A study by Fischer and Reuber (2011) investigated the manner in which
connections on Twitter influenced the effectuation procedures of an industrialist. The
study also noted the perceived time that an entrepreneur spent on social media via
109
Twitter. Using a theoretical model, Parra-López et al. (2011) considered the effects of
perceived gains on the intent to use a virtual network to plan and embark on vacation
expeditions from a shopper’s viewpoint. Kang et al. (2007) examined the supposed
value to the community of understanding social interactions in a virtual community.
To appreciate users’ intention to pay, Lu and Hsiao (2010) applied supposed cost in
relation to price/value for money, social value, emotional value, as well as
enactment/standard. Using the Existence, Relatedness and Growth Philosophy, Hau
and Kim (2011) examined the extrinsic as well as the intrinsic benefits of knowledge
sharing on social media. Using the Social Network Theory, Hsiao et al. (2010)
assessed how the perceived goodwill/reliability, capability and critical mass of a web
page were associated with the objective of acquiring goods through that platform.
Chang and Zhu (2011) used the Theory of Planned Behaviour (TPB) to examine the
influence of supposed behavioural management on plans to pre-accept and post-
accept a virtual network.
In a study to examine the behaviour of Twitter patrons by using the usages and
gratification methodology, Chen (2010) established that the greater the amount of time
that one spent on Twitter, the greater the gratification and desire to connect with
others. Nambisan and Watt (2010) assessed the experience of social media
consumers in terms of sociability, pragmaticity, usability and hedonicity to understand
their approach toward company, product and service quality. In a study on users’
attitude towards social media promotion, Akar and Topcu (2011) suggested that the
social media experience was positively correlated to social media advertising.
In research on the intersection of social media use and a user’s personality, Correa et
al. (2010) found that openness and extraversion to experience had a positive effect on
virtual network use. Zhong et al. (2011) examined the relationship between usage of
virtual network and the personality traits of cognition need and ICT innovativeness.
The study found that less thoughtful actions resulted in more application of the virtual
network. Huang, Chou and Lin (2010) investigated blogger’s individual factors in terms
of their involvement related to brand attitude and advertisement effect.
Karakaya and Barnes (2010) examined the influence of patron care practice on
company or brand choice in relation to virtual evaluations. The study found a robust
association between virtual customer view and selection through social sites. De Valck
110
et al. (2009) studied consumer traits in online networks to appreciate their pre- and
post-buying assessment and information exploration.
According to Kohli and Jaworski (1990), market orientation is the application of selling
ideas such as product price, service feature and information value through social
media platforms to consumer behaviour appreciation. Using switching effort,
contractual costs and continuity costs, Mathwick (2002) examined virtual customers’
loyalty intention, entertainment value, intrinsic enjoyment and escapism. Using a
longitudinal methodology, Chen, Fay and Wang (2011) examined the impact of
product charge and feature with respect to consumer virtual evaluation posting
behaviour. The study found that marketing variables had either a negative or positive
impact on virtual posting behaviour at different periods of internet usage that affected
customers’ brand and product choice. Hsiao et al. (2010) examined the influence of
system efficiency and details value based on perceived performance, expectation and
disconfirmation with respect to the satisfaction of blog-users.
In a study to explore the status of banking institutions on virtual networks in Bosnia
and Herzegovina, Mabic, Gaspar and Lucovic (2017) used a sample of 24 banks. The
study found that 50% of banks had description/pages on various virtual networks such
as YouTube and Facebook. The banks used the profiles/pages mostly for content
marketing involving business operations presentations. There was no ‘message’ or
encouragement by banks for bank-client interaction. However, this study focused on
an analysis of the social media use, and not the contribution of social media to FI.
Although the study pointed out that there was ample room for improvement in banks-
client interactions, there is need to explore the contribution of social media to FI levels.
A study by Mucan and Ozelturkay (2014) focused on investigating how Turkish
banking institutions used virtual networks, such as YouTube, Facebook, Blogs, Twitter
and others, in trying to develop a competitive advantage in Turkey. They used coding
schema to analyse their usage types. The study reported statistical results for the use
of different social media by Turkish banks. The study pointed out that although a social
media tool was vital in the current e-environment, there was no effort by banks to
improve the uptake of financial services through social networks. The research did not
explore how social media influenced FI levels in Turkey. Moreover, the study was
narrow focused as it was based on Turkey only. There is still a research gap to find
111
out the contribution of social media links (Facebook Twitter, Zoom, LinkedIn and so
on) to the FI levels in developing countries.
The extant literature shows the attributes used in earlier researches on social media
to be varied and various. The causal-sequence structure reveals that the bulk of
existing studies focused on the causal association that converts the users’ personal
values and beliefs into individual desires toward social networks. The focus on
personal perspectives shows a research gap in the research related to the adoption
of social media relevant to an organisational setting. Although various features of
social factors have been used in the existing research models, little or no investigation
of the effects of social networks on FI levels has been done. In addition, assuming that
the virtual networks that are utilised transcend borders, few studies determining the
outcome of virtual network implementation and the application to the financial sector
development of FI exist.
However, the discussed literature on social networks did not focus on the application
of financial services. The studies were also narrowly focused, analysing social media
aspects in a single country or sector. None of the studies focused on social networks
as a determinant of FI levels. Though there was no investigation of social network’s
contribution to FI, the studies revealed that the tools boost trade and industry growth.
From the existing literature, it is evident that researchers concentrated on individual
traits and paid less consideration to financial organisational features. Only marketing
and customer centricity were included in discussions related to adopting social media
in business circumstances. Social networks are viewed as useful in connecting and
assisting firms to improve their customer retention, brand equity and other business
matters (He, Zha & Li, 2013; Laroche et al., 2013; Hanna et al., 2011; Kaplan &
Haenlein, 2010).
Despite its attributes, social media is neither extensively used by financial firms in their
everyday tasks nor used as strategic tools for customer relationship management
(Mabic et al., 2017:68; American Bankers Association, 2017:21). Concerning social
networks, some pertinent questions have to be answered. Why do many financial
institutions, particularly in Africa, not embrace virtual network in their daily commercial
operations? What is the contribution of social networks to FI in selected African
countries? These questions are inadequately addressed in existing studies.
112
3.6 MODELS AND FORMS OF SAVING
To allow for appropriate FI policy design and implementation, there is need to analyse
models that can be used to explain saving motivations. Motivations, forms and theories
of saving will guide the study on how social media, internet access and financial
advice, among other determinants, are used to achieve FI goals. The motivations for
saving include precautionary, down payment, life cycle (to make up for foreseen
essentials), improvement (to delight in increasing expenditure), intertemporal
substitution (to enjoy interest), bequest, avarice, independence, enterprise (Browning
& Lusardi, 1996).
There are major economic theories of savings, as well as the empirical evidence
related to these theories. Data and other studies provide descriptions or analysis of
the savers and the degree of saving rates’ movements over a period, but there is no
exclusive model that clarifies why individuals save (Rosenzweig, 2001; Armendáriz &
Morduch, 2010). It remains imperative to concentrate on the main driving and classic
strategies then analyse (critique) them in relation to evidence from developing
countries. The Life-Cycle Hypothesis (LCH) and Model of Precautionary Savings are
discussed below.
3.6.1 The Life-Cycle Hypothesis (LCH)
The Life-Cycle Hypothesis (LCH) remains a prominent theory of savings. The LCH
structure expresses the association of wealth, expenditure, savings and income in the
life of an individual (Modigliani, 1970; Ando & Modigliani, 1963). The central view is
that families possess a limited life and a long-term vision of consumption and revenue
requirements. The other insight is that the household unit increases its earnings during
the member’s productive phase to smoothen expenditure during retirement. Sources
of earnings include the accumulation of savings (permanent minus transitory income)
or from legacies.
The LCH is among the early theories coined to enlighten savings patterns, and is
backed by several empirical studies done in developed countries. However, the LCH
has the following weakness: the model does not apply to poor communities,
particularly in the developing world, for example, those families that live on farms in
many developing countries and live from hand to mouth because of the low wages.
The cycle can go on from generation to generation. The model is silent about the
113
determinants of savings but assumes that every family will save with access to an
array of tools. It is wrong to assume that a family has access to formal and safe
investments, as some may settle for informal and unsustainable investment tools.
Deaton (1997), who maintains that the model requires alteration to apply to the multi-
generational households usually found in developing countries, put one critique of the
LCH forward. Deaton argues that in a situation where a family component has
extended family members, the rate of saving over the individual’s lifespan is reduced
as intergenerational transferences substitute the requirement for borrowing and saving
over the individual’s generation. An example is that of the AIDS epidemic that led to
the premature deaths of income-earning generations, bringing the vision for
intergenerational household transfer of wealth to nought. What saving models then
apply to the selected African countries?
3.6.2 Precautionary savings models
According to Deaton (1997), precautionary savings models for poor households are a
better fit. These models encompass the element that the volatility of income and
inability to borrow for many households can be as harmful as the determinedly low
level of expenditure. Rutherford (2000) lays a modest forecast that emanates from the
majority of savings theories generating an inclination for smooth expenditure: the low
income require mechanisms for small saving amounts and huge drawings to be
possible. The notion is that people with a low income can save to achieve their life
cycle requirements, deal with the unexpected, develop businesses, and obtain wealth.
In contrast to these views on poor people, Barr et al. (2008) argue that the poor are
just like everyone else, as they sometimes make good decisions and at times make
rushed or uninformed decisions. The questions that need to be answered are: How
can people save when they have no accounts with formal institutions? What
determines FI in selected African countries?
As Rutherford (2000) argues, what people need is a secure, suitable custody for
money, coupled with a mechanism to accumulate small amounts, transforming them
into significant sums. Rutherford states that some home-grown mechanisms include
Rotating Savings and Credit Associations (ROSCAs) and saving’s gatherers that
charge a fee for taking their savings. In contradiction to Rutherford’s view, ROSCAs
are not a safe mechanism for savers (Wright & Mutesasira, 2001) and the savings are
114
not in the formal system. In a study using Microsave data, Wright and Mutesasira
(2001) found that individuals who had access to formal financial services had superior
savings to those deprived of it. The study also found that those from official processes
(15%) reported lower losses than those in the semi-official (26%) and unofficial (99%,
although lightly defined) regions. An appropriate model to enhance the take up and
proper usage of formal financial services must ascertain the optimal arrangements of
all the facets by establishing the factors influencing clients.
An effective model takes cognisance of choice matters and provides guidance on how
services and procedures can be structured to help the low income and financially
excluded individuals to achieve their objectives. Properly designed obligatory savings
accounts can prevent unnecessary expenditure and provide savings for the future, for
example, investments, assets or retirement (Ashraf et al., 2006). For example,
modifying the ‘default’ settings is one way a product can be designed to nudge
individuals towards preferred decisions, and a good example is that of a stop order.
For a better understanding of product design to enhance FI, firstly, the psychology of
the decision-making at individual, household and societal level must be understood.
Factors, constraints and characteristics of individuals must be clearly investigated for
effective decisions and policies to be achieved.
Therefore, savings remain imperative to both the poor and rich households, as
individuals are prepared to make payment for the services rendered. The promise to
make periodical savings has resulted in some experts arguing that those contributions
are more important than loans in the promotion of FI programmes, especially for the
very poor (Karian & Morduch, 2009). While this view may be true for some households,
it does not apply to others. Collins et al. (2009) argue that in some circumstances the
deprived are unable to save, regardless of the clear advantages for them to do so.
A related finding is of entrepreneurs in India who borrow persistently and routinely for
working capital, which is extremely expensive. An example is that of vegetable
vendors in that country who borrow small amounts each day to repay after their daily
sales. The findings suggest that savings or FI promotion need a sophisticated strategy
(models) that involves better research to understand the factors influencing decision-
making. Both saving and credit approaches are important in the promotion of FI
programmes. If the poor are the major users of the informal financial system, what
115
attracts them in that sector? To be able to design policies to bring them into the formal
system, there is need to understand the dynamics in the informal credit sector.
For proper FI policies to be crafted, implemented and evaluated, it is crucial to analyse
the models that are used to explain saving motivations. Motivations for saving include
precautionary, down payment, life cycle, improvement, intertemporal substitution,
bequest, avarice, independence and enterprise. The Life-Cycle Theory (LCT) remains
a prominent model of savings. However, it is argued that the model requires alteration
to apply to the multi-generational households usually found in developing countries.
What people need is a secure, appropriate custodian to preserve their funds. Proper
savings products are necessary to enable the disciplined build-up of small amounts
and transforming them into great investments. An effective model takes cognisance of
choice matters and guides on how products and methods of delivery can be structured
to support the marginalised and financially excluded to allow them to achieve their
objectives. Therefore, savings remain imperative to the poor and rich households as
persons are keen to pay for the service. Credit remains equally important, as it plays
a pivotal part in capital allocation.
The models that could be relevant for this discussion include associations, village
banking models, bank sureties, communal finance, small business, credit unions, the
Grameen, cluster, peer pressure, person, mediators, NGOs and ROSCAs (Srinivas,
2016b). The models are interwoven and the different organisations have
characteristics of two or more models in their operations. The informal financial system
exists today due to the occurrence of low-income households/individuals with no
access to formal banks.
However, the informal financial sector models have several weaknesses. Repayment
rates are high and there is a wide spread between the savings and loan interest rates,
whereas commercial banks apply reasonable lending rates. There is generally poor
record keeping in the informal financial sector, as there may be no trace of the saving
and borrowing transactions of its clientele. The availability and size of loanable funds
could be influenced by seasonal fluctuations. Seasonal lending is common in the
sector as the supply of loanable funds is limited. In addition, informal group members
are unaware of the latest financial products on the market and the adoption of new
technology is slow. The new methods would permit them to elevate their earnings,
116
diversify risk and raise their quality of life. Many of these informal transactions have a
high-risk premium and do not contribute anything to the fiscus.
The literature has not adequately covered several areas. This includes how FI is
boosted by harnessing the public in the informal monetary system to the formal
system. In addition, the use of modern communication technology to efficiently reach
and serve those in the informal sector. The effect of social media on taking advantage
of informal savings and credit groups that exist. The effect of internet access on FI
status. How financial advice can enhance FI to the financially excluded and the
marginally included.
To be able to design policies, there is need to discuss the dynamics in the informal
financial sector. This can be done by analysing different savings and/or credit models
being used in informal financial systems across the globe. Informal credit models
include associations, village banking models, bank sureties, communal banking, small
business, cooperatives, credit unions, the Grameen, cluster, peer pressure, solo,
mediators, NGOs and ROSCAs. The security of loans in these models is moral
collateral, that is, the commitment that the cluster stands behind each individual loan.
The major issue with the unofficial monetary system is that it is not monitored by the
central bank and high risk is inherent in every contract or transaction done in the
sector. How can the informal savings and credit groups be accommodated to the
formal financial system using modern communication technologies? Is there a way to
utilise social networks to harness the financially excluded or those associated with the
informal financial system? Does internet access have an effect on FI at individual
level? To what degree can financial advice through social networks increase the level
of financial inclusivity in selected African nations? There is a gap in literature that
needs to be filled for FI levels to be improved.
3.7 CONCLUSION
There is broad empirical evidence suggesting a substantial and robust association
between financial deepness and economic expansion. There is large material of
empirical work assessing the link amongst financial sector development, economic
expansion and the extent of the impact. Also assessed is the role of certain players of
the financial sector that include banking institutions and stock marketplaces in
stimulating growth in various stages of economic expansion. There has also been
117
empirical work on the degree of the direct impact of the financial industry evolution to
the impoverished. In addition, a body of literature explores the degree to which trade
and industry expansion results in penury mitigation.
As FI is increasingly becoming important for several countries across the world,
studies have been evaluating its determinants, measurements and effects. There is
need to understand the factors influencing FI in an area, be it at district, regional or
country level. The reason being that in formulating and implementing a policy, there
has to be adequate information for an informed decision to be made. FI or the access
to a formal financial organisation is determined by several factors.
The Harrod-Domar Models, among others, provide a significant structure for
elucidating the connection between FI and financial system expansion.
Fundamentally, the Harrod-Domar Model is not limited to showing how FI (savings)
leads to greater trade and industry expansion but also how financial industry evolution
makes it likely for nations to create resources for investment purposes. The Harrod-
Domar framework shows the importance of savings and investment in a developing
economy. However, it does not explain how the FI levels (savings levels/rates) can be
enhanced in developing countries.
Several philosophies and models have been applied in the existing social platform
studies to research on the socio-psychological behaviour of consumers and other
interested parties of social media. Literature reveals that financial advice influences
among other things investments, savings, financial product selection and risk
tolerance. Financial advice also enhances peace of mind, decision making and
financial confidence. The extant literature implies a link between corruption and
various facets of development. There is a gap in the existing studies on the contribution
of financial advice, social media and internet related to FI. There is more to explore on
these three variables, as the literature has suggested their potential contribution to FI
levels.
The next chapter will discuss the nature of data and discuss how the study was
conducted. It will give more detail on how the research questions were addressed and
the main objective achieved.
118
RESEARCH METHODOLOGY
4.1 INTRODUCTION
The previous two chapters explored the philosophy and pragmatic indication related
to key FI philosophies, the overall influence of FI, and the link between FI and the
financial industry evolution. The current study investigated the determinants of FI in
selected African countries with more emphasis directed towards social networks. This
chapter provides the research techniques, foundation, design and overall research
strategy applied in this study. The chapter further highlights the following: the research
design, unit of analysis, operationalisation of the study variables, validity, reliability,
data analysis techniques, diagnostic statistics and tests for control of common
methods bias.
The aim of the current study was to gain an understanding of and to explain FI with
the emphasis on the influence of social networks. To accomplish this, an empirical
exploration was necessary to establish the theoretical hypothesised relationships.
Specifically, the hypothesised links amongst Demographic (age, gender, marital
status, proof of residence, branch access, location), Literacy (level of education, social
media participation, financial advice, internet access) and Income factors (salaried/not
salaried, level of income), and FI.
The current research is entrenched in the positivist methodological analysis, which
emphasises clarifications and forecasts in the communal sphere by divulging
underlying links between its variables or elements (Babbie, 2014; Scotland, 2012;
Crotty, 1998). The positivism methodology is employed when a study seeks to
measure, document and project the truth, using an assortment of constructs and
variables. Positivists pre-suppose that realism in the societal world is tangible and can
be known, premeditated and assessed by exact sciences methods (Babbie, 2014;
Saunders, Lewis & Thornhill, 2012).
Furthermore, a researcher might select a quantitative research methodology when
large data samples are available for analysis. Hence, the current study is structured in
the objectivism ontological viewpoint that posits that a solitary certainty exist in the
communal spheres, where human behaviour is examined ‘from without’, devoid of
119
obtaining the connotations that a person offers their quantifiable behaviour (Tuli, 2010;
Sarantakos, 2005). In that regard, a large sample size and the use of a quantitative
research methodology was applicable, in light of the objectivist ontological and
positivist epistemology perspective. The approach enabled the investigation of factors
influencing FI.
Section 4.2 presents summaries of the dependent and independent variables. Section
4.3 explains the main variables employed in the research. Section 4.4 explains the
data sources, reliability, validity, and how the heteroskedasticity exists in cross-
sectional data. This section also discusses how the endogeneity problem exists in the
association between the regressand (FI) and the independent variables. Section 4.5
discusses multicollinearity between the independent variables. Unit 4.6 considers the
endogeneity problem, while Section 4.7 presents the analysis of the missing values.
Unit 4.8 discusses the Probit/Logit Models, and Section 4.9 discusses the Probit/Logit
Models used in previous studies. Section 4.10 discusses the research design and
approach employed in the study. Section 4.11 presents the general model
specification of the FI function, and explains how data was analysed. Section 4.12
concludes the chapter.
4.2 SUMMARY OF VARIABLES
Table 4.1 below summarises the studies discussed in this chapter that used
Probit/Logit Models in their FI studies. The table outlines the proxies used for the
dependent variables.
The analysis will help to compare the methodologies that were used, and show the
gaps that exist in the literature.
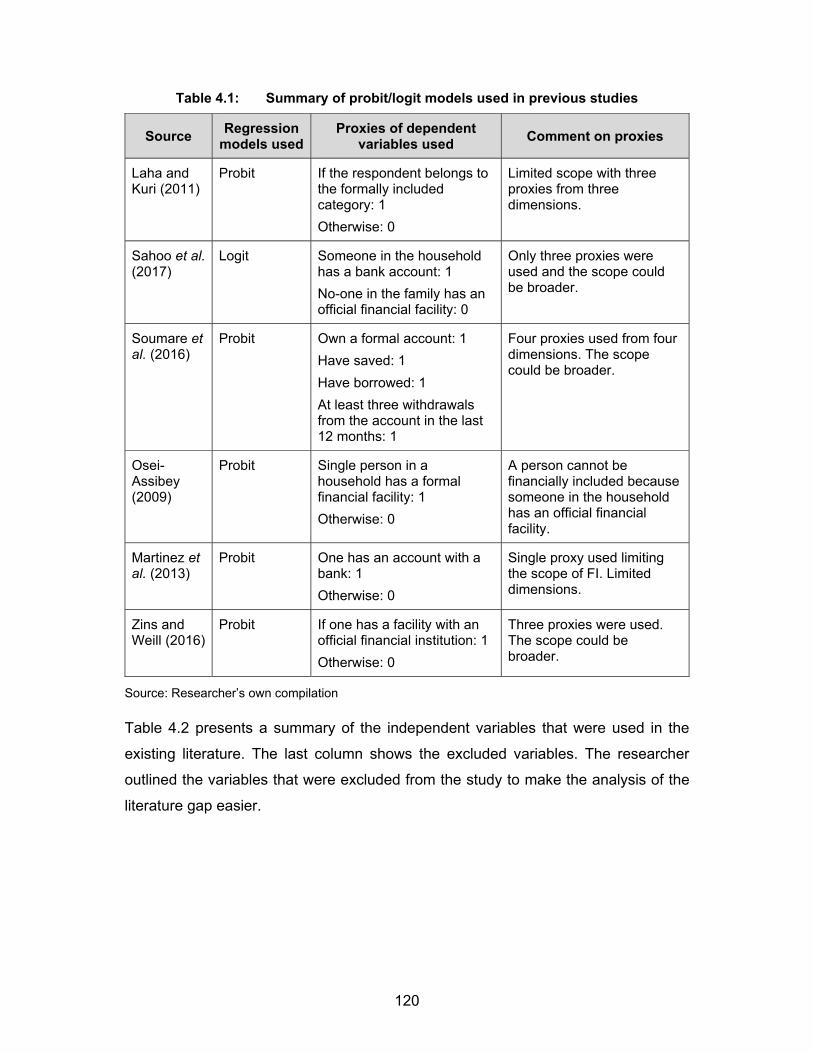
120
Table 4.1: Summary of probit/logit models used in previous studies
Source Regression
models used Proxies of dependent
variables used Comment on proxies
Laha and Kuri (2011)
Probit If the respondent belongs to the formally included category: 1
Otherwise: 0
Limited scope with three proxies from three dimensions.
Sahoo et al. (2017)
Logit Someone in the household has a bank account: 1
No-one in the family has an official financial facility: 0
Only three proxies were used and the scope could be broader.
Soumare et al. (2016)
Probit Own a formal account: 1
Have saved: 1
Have borrowed: 1
At least three withdrawals from the account in the last 12 months: 1
Four proxies used from four dimensions. The scope could be broader.
Osei-Assibey (2009)
Probit Single person in a household has a formal financial facility: 1
Otherwise: 0
A person cannot be financially included because someone in the household has an official financial facility.
Martinez et al. (2013)
Probit One has an account with a bank: 1
Otherwise: 0
Single proxy used limiting the scope of FI. Limited dimensions.
Zins and Weill (2016)
Probit If one has a facility with an official financial institution: 1
Otherwise: 0
Three proxies were used. The scope could be broader.
Source: Researcher’s own compilation
Table 4.2 presents a summary of the independent variables that were used in the
existing literature. The last column shows the excluded variables. The researcher
outlined the variables that were excluded from the study to make the analysis of the
literature gap easier.
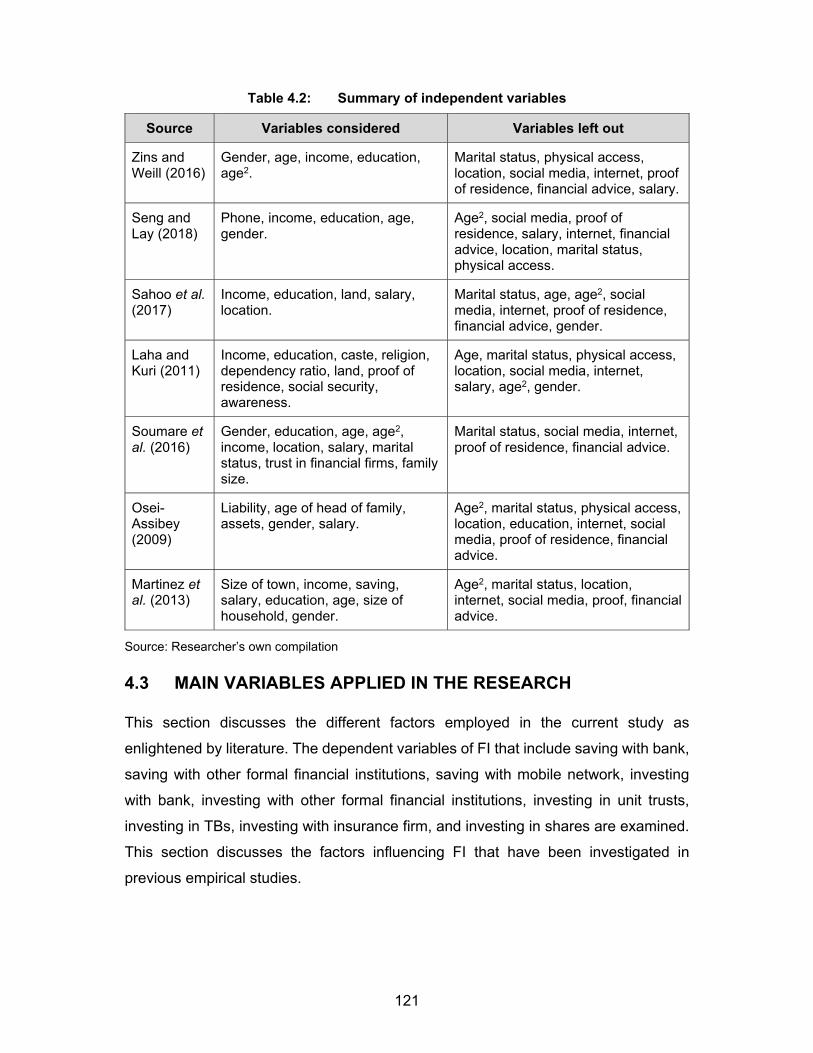
121
Table 4.2: Summary of independent variables
Source Variables considered Variables left out
Zins and Weill (2016)
Gender, age, income, education, age2.
Marital status, physical access, location, social media, internet, proof of residence, financial advice, salary.
Seng and Lay (2018)
Phone, income, education, age, gender.
Age2, social media, proof of residence, salary, internet, financial advice, location, marital status, physical access.
Sahoo et al. (2017)
Income, education, land, salary, location.
Marital status, age, age2, social media, internet, proof of residence, financial advice, gender.
Laha and Kuri (2011)
Income, education, caste, religion, dependency ratio, land, proof of residence, social security, awareness.
Age, marital status, physical access, location, social media, internet, salary, age2, gender.
Soumare et al. (2016)
Gender, education, age, age2, income, location, salary, marital status, trust in financial firms, family size.
Marital status, social media, internet, proof of residence, financial advice.
Osei-Assibey (2009)
Liability, age of head of family, assets, gender, salary.
Age2, marital status, physical access, location, education, internet, social media, proof of residence, financial advice.
Martinez et al. (2013)
Size of town, income, saving, salary, education, age, size of household, gender.
Age2, marital status, location, internet, social media, proof, financial advice.
Source: Researcher’s own compilation
4.3 MAIN VARIABLES APPLIED IN THE RESEARCH
This section discusses the different factors employed in the current study as
enlightened by literature. The dependent variables of FI that include saving with bank,
saving with other formal financial institutions, saving with mobile network, investing
with bank, investing with other formal financial institutions, investing in unit trusts,
investing in TBs, investing with insurance firm, and investing in shares are examined.
This section discusses the factors influencing FI that have been investigated in
previous empirical studies.
122
4.3.1 Factors incorporated in the research model
This section deliberates on the main variables employed in the present study as
enlightened by literature. The justification for using each of the independent variables
is explained. The 16 proxies that were applied for the dependent variable of FI are
outlined under the four dimensions of FI that were adopted for this study. Existing
studies have been limited on the use of FI proxies due to the lack of data, therefore,
to close the gap the current study used 16 proxies.
4.3.1.1 Independent variables
The variables that were examined in this study are those that conform to extant
scholarly work. The availability of Finscope data helped to estimate the determinants
of FI. Below follows a brief account of all the factors incorporated in the models, as
well as the motives for using them (see Appendix G).
Proof of residence
Any person wishing to access official financial organisations’ facilities is required to
submit a number of documents, which include identity documents and address
validation (World Bank, 2018). The proof of residence requirements have played
varying roles in influencing FI, particularly in developing countries with no formal
documentation for rented accommodation. People from the rural areas may also face
similar harrowing experiences, as formal proof of residence is hard to come by. In the
UK, lack of proof of address is a huge obstacle in opening a current account that
enables employers to pay salaries (European Commission, 2008).
The vital documents have to be original and authentic. The commonly used documents
are as follows: water bills, electricity bills, lease contracts, council rent cards and
mortgage reports. These documents are regarded as credible documents in many
countries (World Bank, 2018). For the current study, proof of residence was
incorporated as an indicator variable for people possessing the necessary official
papers.
Salary
The type of job also determines the likelihood of an individual accessing official
financial facilities or not. There is a greater chance of someone who is formally
employed to be using official financial facilities (Clamara et al., 2014). There are low
123
chances for a household with nobody with a formal employment to be financially
included. In some developed countries, it is more probable for those without a job or
in informal jobs to be out of the official financial system than those formally employed
(CGAP, 2013; Carbo-Valverde & Rodriguez-Fernandez, 2014). However, Olit’s
2011:91) study revealed that in Spain’s rural areas FI did not appear to be influenced
by the nature of employment. The current study considered salary as a dummy
variable for people formally employed.
Educational level
The higher the level of schooling, the more likely the person is to financially included
(Lewis et al., 2016). Studies have shown that monetary exclusivity is predominant in
commonly marginalised populations whose education standards are low. Such
situations are characterised by numerous social exclusion problems. Studies have
found that people who attained only primary education were less likely to have formal
financial products in comparison with those who had tertiary education (Messy &
Monticone, 2012).
The education level does not only influence whether the person has a formal account
or not but also the mechanisms through which the services are accessed. An
Australian research study found that in view of facility usage, schooling standard
influenced FI. The current study considered the education variable as different
categories of dummy variables according to the education level. The current study
categorised the education level into four groups varying from Early Childhood
Development to a Postgraduate degree.
Marital status
An individual’s civil status is fundamental in determining the individual’s FI status
(Martinez et al., 2013). A married person has a bigger chance of being financially
included than someone who is single (Soumare et al., 2016:247). In most cases, joint
accounts will be in use enabling the partners to be financially included. Some
researchers have revealed that a single person is not motivated to open an account
as s/he literally lives from hand to mouth. In a study done in Columbia, Cano et al.
(2013) maintained that marriage increased the possibility of an individual using official
financial facilities. Cano et al. also revealed that married males had greater chances
124
of using official financial facilities. The current study considered marriage as an
indicator variable for married persons.
Location
Location is a fundamental determinant of service provision that has an influence on
financial availability. There are variances in the financial accessibility of individuals
staying in urban areas and those in rural areas. Other studies have revealed differing
impacts of geographic location of individuals related to formal financial services (Beck
& Cull, 2015; Kedir, 2003). Some research done in the UK showed that FI is
geographically concentrated because of an uneven supply of financial services and
facilities (European Commission, 2008). The current study considered location as an
indicator variable in the projected model centred on if an individual lives in the
countryside or an urban area.
Gender
The accessibility of financial services varies according to gender. A study carried out
in Mexico found that 42% of males used official savings, whilst about 30% females
accessed the same. Other studies also showed that females had lower access to
formal financial services (Allen et al., 2012; Johnson & Nino-Zarazua, 2011). The need
to build inclusive financial systems has prompted governments and other development
partners to take initiatives to improve women’s welfare. Therefore, policy interventions
were initiated to promote FI among women (Samaniego & Tejerina, 2010; Trivelli,
2013). The current study considered gender as an indicator variable.
Age
Age is an important factor influencing FI status. Financial services’ uptake and use
can be affected by age, prompting suppliers to change approach or strategies to
ensure that the various age categories are served. People are inclined to spend or use
less depending on age, as illustrated in Modigliani's Life Process Model. According to
Modigliani’s model, individuals amass reserves in their economically active phase,
with de-savings following in the later stages of life (Deaton, 2005). The implication is
that FI level is greater in the economically active phase and exclusion rises or becomes
greater in old age and among adolescents (Barnet & Solow, 2000:246).
125
A study done in Spain ascertained that the aged and adolescents displayed common
characteristics in terms of FI trends. According to the Life Process framework, as age
increases, there is a probability of a lack of concern regarding financial facilities,
although only up to a particular phase. In a study done in West Africa, Soumare et al.
(2016) ascertained that age was positively correlated with having an account with a
bank. Consequently, it is vital to establish the pattern of the variable in selected African
nations. In the current study, age was considered as a sequence of dummy variables
subject to the individual’s age, stretching from 18 to 85 years.
Age2
Age-squared is also an important variable to consider in light of the non-linear effect
of age. In the current study, a supposition was made that financial services’ use rises
with age and falls at some age threshold. Age2 embraces the non-linear influence. A
study by Soumare et al. (2016) indicated that the age-squared coefficient was
negative, showing a threshold influence for the age factor.
Social networks
Social networks can offer a substantial upside in terms of customer engagement and
feedback, and is utilised to strengthen relations with external and internal
stakeholders. The existing social network theories explain the characteristics
influencing user behaviour, ease of use of new technology, social influence and the
intermediary functions of these communication platforms.
Many studies have focused on the consumer experience, insight and temperament,
applying them to exhibit the behaviour, frame of mind and essential physiognomies of
virtual network consumers. Other studies have used the TAM to investigate the
supposed helpfulness of social networks. For instance, Hsu and Lin (2008) researched
the role of TAM in consumers’ intention and attitude to blog. Hossain and De Silva
(2009) applied TAM, with a special focus on the use of online society platforms in the
control of social links. Steyn et al. (2010) researched the TAM with respect to virtual
social network announcements in image management circles to appreciate blog users’
objectives for utilising the essentials of the statements. Casaló et al. (2011) applied
the TAM to study consumers’ intent to heed guidance. Nevertheless, no study has
investigated the impact or result of social network on FI or FI development. For this
current study, social network was included as a dummy variable.
126
Financial advice
A financial mentor not only teaches someone financial knowledge but also stimulates
the person to make progressive monetary decisions to advance their personal
gratification (Xiao et al., 2004; Hilgert et al., 2003). Therefore, positive monetary
behaviours result in monetary gratification (Xiao et al., 2006). Financial advice or
educational programmes can achieve positive financial behaviour. Consumer finance
researchers emphasise that there is need to understand how and why consumers
change their financial behaviours to make significant positive financial behaviours.
Sherraden (2010) asserted that financial capability comprises of the capacity to decide
(information, motivation, composure and skills) and the expectation to act (having
accessibility to banking services and other facilities). Sherraden’s research
established that a lack of monetary knowledge keeps people out of the official
monetary structure, and that at any level people need both financial knowledge and
skills to be financially included. Some studies reveal that some people experience
restricted or adverse outcomes from financial training or advice.
In a study involving high school pupils that ran over a decade, Mandell (2008)
established no weighty link between the financial literacy scores and monetary training
programmes in schools. Using a separate sample, Mandell found no resulting positive
action in the initial five years after secondary school (Mandell & Klein, 2009). In a
research to ascertain the influence of debtor schooling on loan repayments, Braucher
(2001) established that the participants in the debtor programme were less likely to
pay back loans than non-participants were. Although this was the result, the
association was not essentially causal. Financial advice was a dummy variable for the
current study.
Income level
An individual’s income can influence FI in any economy. It is vital to examine the
relationship between FI and total income from all sources personally received by an
individual in the last 12 months. In a study done in Mexico, Martinez et al. (2013) state
that 62% of the financially excluded in that country are poor. Numerous studies show
a direct link between FI and higher income (Cano et al., 2013; Allen et al., 2012; Kedir,
2003). The current study considered income from all sources personally received in
the last 12 months.
127
Branch access
Having access to financial services or a bank branch may influence an individual’s FI
status. High levels of FI may be realised in many developing countries if consumers
can gain access to formal financial organisations (Brevoort & Wolken, 2008:21).
Financial facilities that have infrastructure that is not accessible to persons with
physical accessibilities can be a barrier to an inclusive monetary system. Studies have
also shown evidence that the bank branch network is lowest in low-income
communities. Distance or physical accessibility is one factor that has a great influence
on the decision to open an account (Brevoort & Wolken, 2008). The more time it takes,
or the longer the journey to the banking outlet, the lower the probability of FI.
This remains an important aspect, as digital banking is still in its infancy in numerous
developing countries. This is a necessary factor affecting FI, and for the current study,
physical access was measured in terms of the time taken to get to the next branch or
formal financial institution.
Internet access
Is internet use an important influence of FI? The increase in the use of internet banking
and credit cards has reduced the need for branches in the country, prompting a rise in
FI levels. The distance from financial services suppliers is rapidly losing its significance
with the advent of online services channels (Brevoort & Wolken, 2008:1), but it is still
a significant factor of service delivery in Africa.
A study done in the metropolitan areas in the US revealed that technology was the
most important determinant of FI. This study by Karp and Nash-Stacey (2015) also
discovered internet and computer access positively correlated to FI. A study done in
South Asia by Lenka and Barik (2018) discovered a progressive correlation among the
evolution of FI and the spreading out of internet services and mobile money. In this
current study, the internet is an indicator variable, that is, whether an individual can
access internet facilities or not.
Mobile phone
Mobile phones have brought changes to business processes. Financial service
delivery has been revolutionised by these technological advancements, as shown in
a number of studies (Seng & Lay, 2018; Ouma et al., 2017; Ghosh & Vinod, 2016).
128
The influence comes from mobile phone users having access to banking facilities,
financial information and other monetary products.
In a study done in Africa, Ouma et al. (2017) found that wireless finances positively
influenced saving habits among poor households. In another study on Africa,
Andrianaivo and Kpodar (2012) discovered that cell phones significantly impact the
trade and industry development through FI. In India, the results in Ghosh’s (2016)
study show that mobile phones had a progressive and substantial influence on FI in
that country. Kenya, among other African countries, has made progress in employing
wireless telephones to access financial facilities (Johnson & Arnold, 2012; Jack et al.,
2010; Jack & Suri, 2009). The question that remains unanswered is the contribution
made by the use of mobile phones to FI in selected African countries.
Religion
Religion plays an influential role in Muslim countries, and conventional banking
products are not attractive (popular) in that part of the global community (Dai-Won,
Jung-Suk & Hassan, 2018; Njanike, 2010). Contrary to this view, Shinadeh’s (2018)
study that investigated the impact of individual traits on FI in the MENAP (Middle East,
North Africa, Afghanistan and Pakistan) region, found that religion was not an obstacle
to having an account with a bank. Dai-Won et al. (2018) found that religion was an
influential factor in determining the FI status of individuals in Muslim countries. This
would have been an important factor to consider in the current study, but the
questionnaires that were used in the study did not provide this information.
All the independent variables discussed above are summarised in Table 4.3 below.
The definitions and expected links with the dependent variable are outlined in the
table.
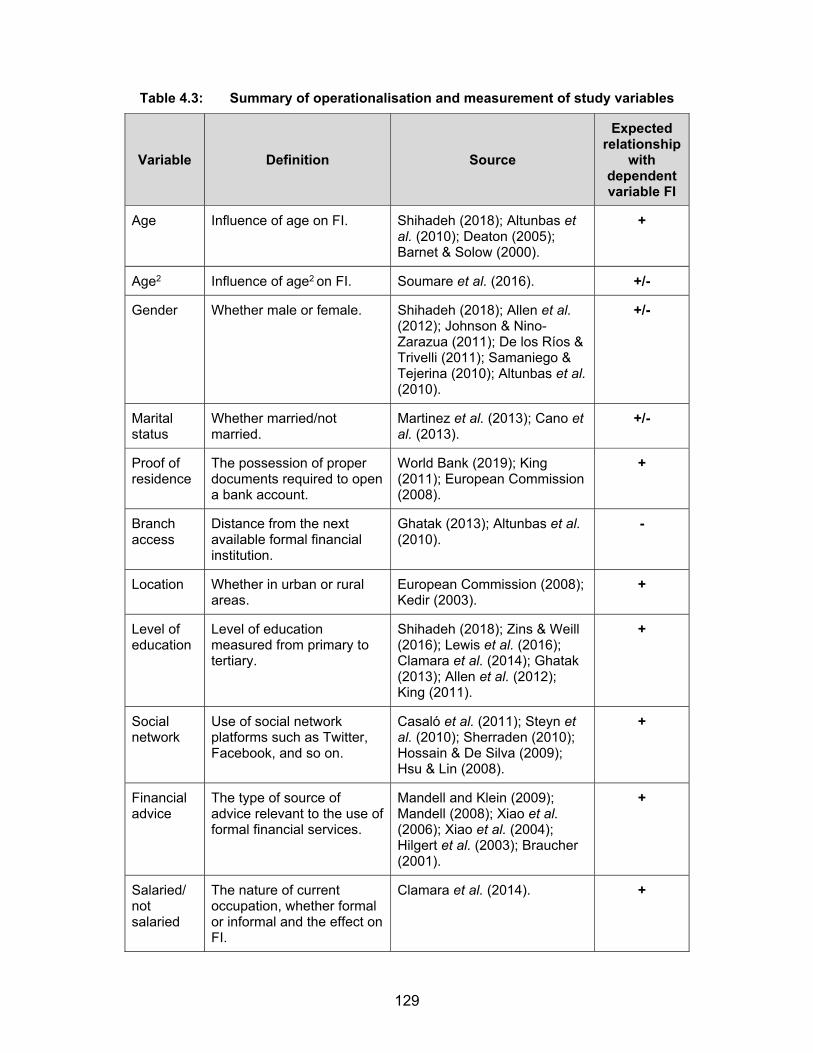
129
Table 4.3: Summary of operationalisation and measurement of study variables
Variable Definition Source
Expected relationship
with dependent variable FI
Age Influence of age on FI. Shihadeh (2018); Altunbas et al. (2010); Deaton (2005); Barnet & Solow (2000).
+
Age2 Influence of age2 on FI. Soumare et al. (2016). +/-
Gender Whether male or female. Shihadeh (2018); Allen et al. (2012); Johnson & Nino-Zarazua (2011); De los Ríos & Trivelli (2011); Samaniego & Tejerina (2010); Altunbas et al. (2010).
+/-
Marital status
Whether married/not married.
Martinez et al. (2013); Cano et al. (2013).
+/-
Proof of residence
The possession of proper documents required to open a bank account.
World Bank (2019); King (2011); European Commission (2008).
+
Branch access
Distance from the next available formal financial institution.
Ghatak (2013); Altunbas et al. (2010).
-
Location Whether in urban or rural areas.
European Commission (2008); Kedir (2003).
+
Level of education
Level of education measured from primary to tertiary.
Shihadeh (2018); Zins & Weill (2016); Lewis et al. (2016); Clamara et al. (2014); Ghatak (2013); Allen et al. (2012); King (2011).
+
Social network
Use of social network platforms such as Twitter, Facebook, and so on.
Casaló et al. (2011); Steyn et al. (2010); Sherraden (2010); Hossain & De Silva (2009); Hsu & Lin (2008).
+
Financial advice
The type of source of advice relevant to the use of formal financial services.
Mandell and Klein (2009); Mandell (2008); Xiao et al. (2006); Xiao et al. (2004); Hilgert et al. (2003); Braucher (2001).
+
Salaried/ not salaried
The nature of current occupation, whether formal or informal and the effect on FI.
Clamara et al. (2014). +
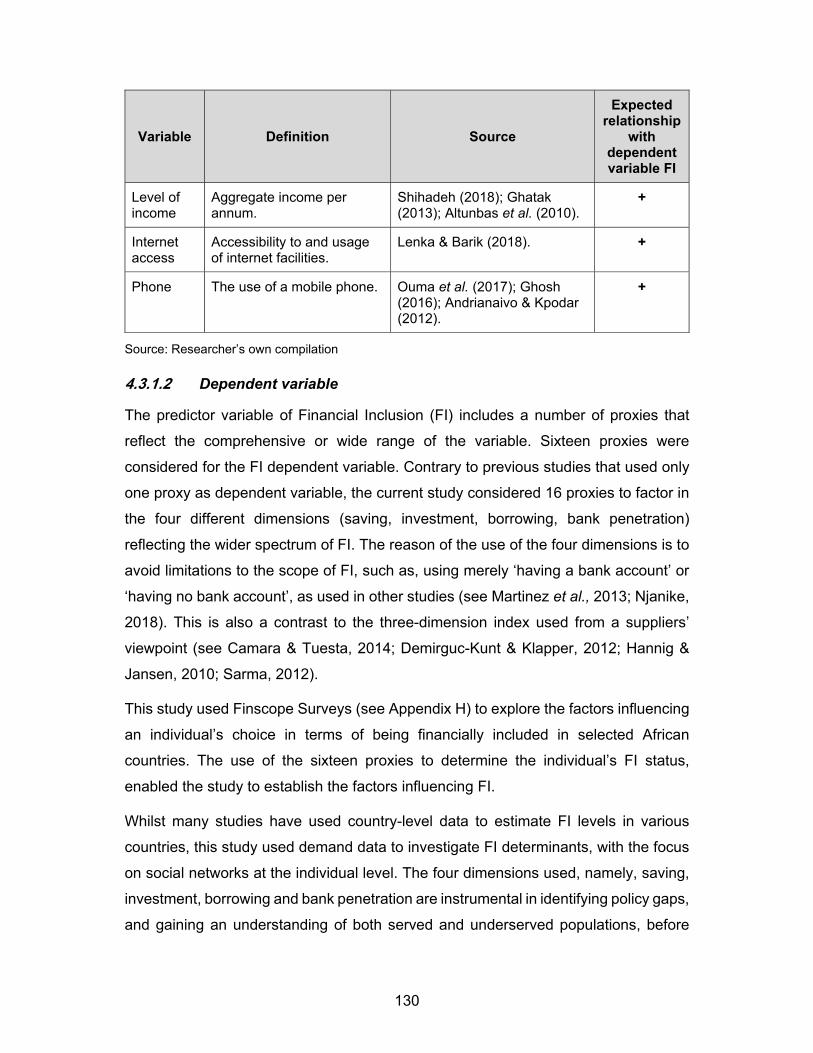
130
Variable Definition Source
Expected relationship
with dependent variable FI
Level of income
Aggregate income per annum.
Shihadeh (2018); Ghatak (2013); Altunbas et al. (2010).
+
Internet access
Accessibility to and usage of internet facilities.
Lenka & Barik (2018). +
Phone The use of a mobile phone. Ouma et al. (2017); Ghosh (2016); Andrianaivo & Kpodar (2012).
+
Source: Researcher’s own compilation
4.3.1.2 Dependent variable
The predictor variable of Financial Inclusion (FI) includes a number of proxies that
reflect the comprehensive or wide range of the variable. Sixteen proxies were
considered for the FI dependent variable. Contrary to previous studies that used only
one proxy as dependent variable, the current study considered 16 proxies to factor in
the four different dimensions (saving, investment, borrowing, bank penetration)
reflecting the wider spectrum of FI. The reason of the use of the four dimensions is to
avoid limitations to the scope of FI, such as, using merely ‘having a bank account’ or
‘having no bank account’, as used in other studies (see Martinez et al., 2013; Njanike,
2018). This is also a contrast to the three-dimension index used from a suppliers’
viewpoint (see Camara & Tuesta, 2014; Demirguc-Kunt & Klapper, 2012; Hannig &
Jansen, 2010; Sarma, 2012).
This study used Finscope Surveys (see Appendix H) to explore the factors influencing
an individual’s choice in terms of being financially included in selected African
countries. The use of the sixteen proxies to determine the individual’s FI status,
enabled the study to establish the factors influencing FI.
Whilst many studies have used country-level data to estimate FI levels in various
countries, this study used demand data to investigate FI determinants, with the focus
on social networks at the individual level. The four dimensions used, namely, saving,
investment, borrowing and bank penetration are instrumental in identifying policy gaps,
and gaining an understanding of both served and underserved populations, before
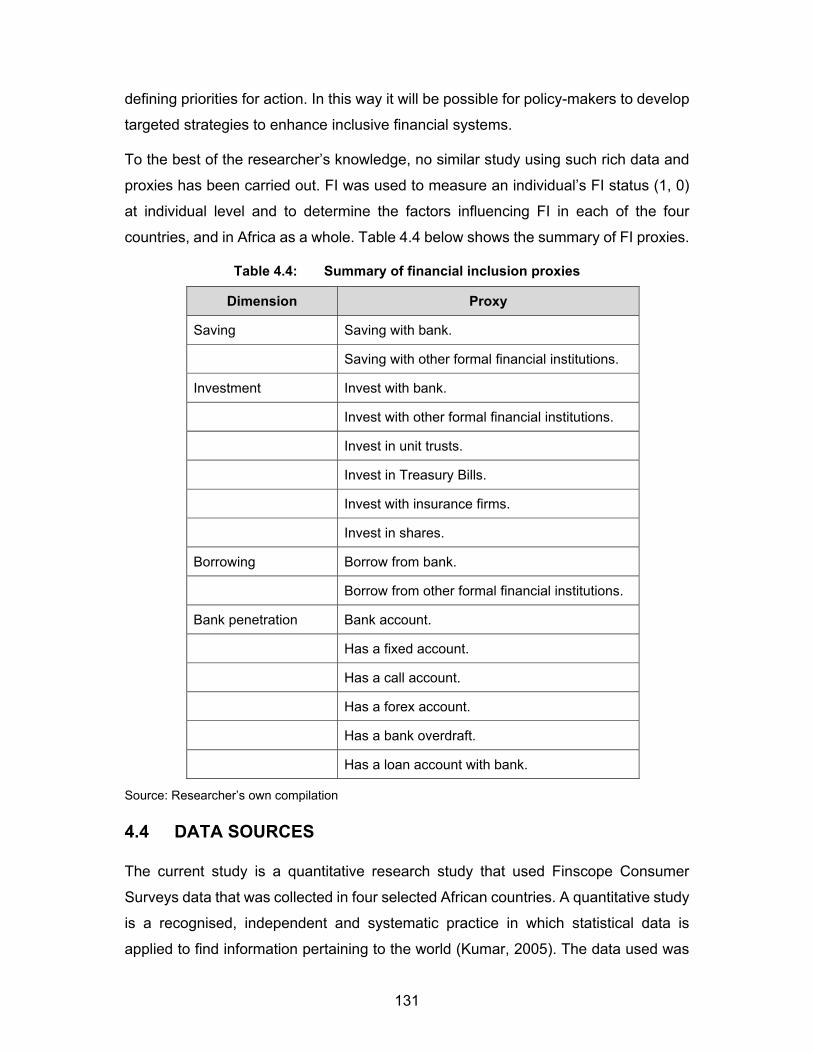
131
defining priorities for action. In this way it will be possible for policy-makers to develop
targeted strategies to enhance inclusive financial systems.
To the best of the researcher’s knowledge, no similar study using such rich data and
proxies has been carried out. FI was used to measure an individual’s FI status (1, 0)
at individual level and to determine the factors influencing FI in each of the four
countries, and in Africa as a whole. Table 4.4 below shows the summary of FI proxies.
Table 4.4: Summary of financial inclusion proxies
Dimension Proxy
Saving Saving with bank.
Saving with other formal financial institutions.
Investment Invest with bank.
Invest with other formal financial institutions.
Invest in unit trusts.
Invest in Treasury Bills.
Invest with insurance firms.
Invest in shares.
Borrowing Borrow from bank.
Borrow from other formal financial institutions.
Bank penetration Bank account.
Has a fixed account.
Has a call account.
Has a forex account.
Has a bank overdraft.
Has a loan account with bank.
Source: Researcher’s own compilation
4.4 DATA SOURCES
The current study is a quantitative research study that used Finscope Consumer
Surveys data that was collected in four selected African countries. A quantitative study
is a recognised, independent and systematic practice in which statistical data is
applied to find information pertaining to the world (Kumar, 2005). The data used was
132
generated from questionnaires. Secondary data analysis was done using surveys
conducted at different periods and the latest available data from these countries was
used. The questionnaires consisted of a series of questions on FI, covering topics
such as Management of Money, Financial literacy, Saving, Investment, Borrowing, and
Bank penetration, among other issues (see Appendix F). Questionnaires used in these
countries have the same standard.
Governments need evidence-based information to aid them in the development of
strategies that create sustainable and inclusive growth and development. The
formulation of these strategies requires facts on the financial systems and the degree
of FI in a country. To attain this objective, FinMark Trust, in collaboration with different
stakeholders, conducted surveys in several countries. Thousands of face-to-face
interviews were conducted, and the samples were a countrywide representation of
individuals. The respondents were aged 18 years and older. Finscope Surveys used
an unsystematic choice of suitable participants from the respective families through
the use of a Kish selection grid.
The data collected in seven African countries was used to measure FI, and to
determine the factors influencing the different levels of FI in the relevant countries in
the manner explained below. The findings then led to the development of policy
frameworks for the selected African countries.
A purposive sampling technique was used to select the four African countries under
study. Initially, there were 21 Finscope country data sets (see Appendix H) but some
questionnaires left out important variables which resulted in them being dropped. The
study was informed by the literature that the variables required included social
networks, financial advice and internet, among others, in each questionnaire. Taking
this into consideration, the following four countries’ data sets were selected: Eswatini
(2014), the DRC (2014), South Africa (2015) and Kenya (2016). The surveys provide
the necessary statistics that permitted the researcher to assess the fundamentals of
FI that have yet to be researched owing to the absence of suitable records at country
and personal level. The investigations produced figures concerning the
physiognomies and numbers of both formal and informal consumers of monetary
facilities.
133
The use of secondary data to investigate the determinants of FI had the following
advantages: it was inexpensive; allowed the researcher to cover a greater geographic
range; it was not time consuming and involved the re-collection of readily available
data; and the available Finscope Survey data was dedicated to improving FI quality
across Africa. However, the study also encountered drawbacks, such as that surveys
were done at different periods (years), and some surveys left out important variables
(questions), for example, aspects of social networks. Another disadvantage is that
data-collection methods may change over time. An assumption was made that all the
surveys were similar regardless of the time taken and the latest survey available for
every country sampled was used. Those surveys that left out pertinent variables in the
study were dropped.
4.4.1 Reliability and validity
When using secondary data to make important economic decisions, it is necessary to
substantiate the reliability and validity of the data (Biasutti & Frate, 2016; Saunders et
al., 2012). An evaluation process needs to be followed to ensure the accuracy and
validity of any external secondary data. Factors such as the data collector, purpose,
time, collection process, type and relation to other data should be considered when
secondary data is in use (Dahl, 2008). Reliability is the extent an assessment tool can
consistently measure what it is anticipated to quantify (Babbie, 2014).
Validity is the level where a quantifying instrument measures and performs that which
it is designed to accomplish (Wilson, 2010). Therefore, reliability is closely related to
validity but validity is more important than the former (Babbie, 2014). In other words,
what is valid is also reliable.
Therefore, this study used Kenya’s Finscope Survey 2015 data for validation. The
questionnaire was the same as the questionnaire used in previous surveys.
4.4.2 Heteroskedasticity
One supposition of the classical rectilinear regression framework is that the difference
of every statistical error ei, depending on the selected value of the regressors, is a
constant number identical to variance (σ2 ) (Verbeek, 2004; Fox, 1997). This is true for
an equal spread or homoskedasticity. Figuratively, E (ei2) =σ2 (i=1, 2…n).
134
When this assumption is violated, to say variances of the error term are not the same,
that is, V(ei)≠σ2, the problem of heteroskedasticity arises (Greene, 2012; Cortina,
1993). Cross-sectional data is prone to the problem of heteroskedasticity.
Heteroskedasticity arises as individuals’ income improves, and people have more
disposable income and more scope for choice on the use of their money. Therefore,
i2 is probable to increase with inflows. Thus, in the model of FI on income, there is
the probability of finding i2 rising with income, as more choices result in changing
behaviour.
Heteroskedasticity emerges in the case of FI, as people become more educated, and
they become more inclined to be more inclusive. In such cases, i2 is expected to
decrease. The better the data collection techniques, the more likely i2 will decrease.
The presence of outliers also gives rise to heteroskedasticity. An outlier is an
observation that is either very large or small relative to the observations in the sample.
The exclusion or inclusion of such an observation can significantly alter the results of
regression analyses. Omitted variables can also be a source of heteroskedasticity.
Variables omitted may be more important at some stage.
As the problem of heteroskedasticity is prevalent in cross-sectional data, the
researcher should typically deal with a sample population at a given time. The person
may be a consumer, family, or geographical subdivisions, such as country, state, city
and so on. The individuals may also be of different ages, income, location and different
access to some services.
When building a linear regression model it is imperative to check for heteroskedasticity
of residuals. The OLS (ordinary least squares) approximation enforces
heteroskedasticity in the event of a dichotomous response variable. The purpose of
checking is to see if the model has the capability of explaining some design in the
regressand that appears in the residuals. This gives rise to an unbalanced and
inefficient regression model that can result in a wrong/biased prediction.
The following are the most commonly used methods for detecting heteroskedasticity:
Graphical Method, White’s General Heteroskedasticity Test, Goldfled Quandt Test,
Spearsman’s Rank Correlation Method, and Park Test. The Breusch-Pagan Test and
White Test were used to detect heteroskedasticity in the current study.
135
4.4.2.1 Breusch-Pagan Test
The Breusch-Pagan assessment checks the null hypothesis that the residuals’
variances are not linked to a set of explanatory variables against the alternative
hypothesis that the residuals’ variances are a parametric function of the predictor
variables (Breusch & Pagan, 1979). The idea is to regress the squared residuals from
the original model on all of the independent variables and check for the general impact
of the other regression. The test can be represented in an auxiliary regression form in
which the squared residuals of the suggested models are regressed on the predictors
that cause heteroskedasticity. If it is found that there is joint significance, the
conclusion is that the explanatory variables have an effect on the variance of the error
term. Therefore, there is heteroskedasticity.
The test was done on the five different regression models and data sets, which are 1)
Combined, Eswatini, 2) Kenya, 3) the DRC, 4) South Africa, and 5) Eswatini (see
Appendix C). In all five cases, the hypothesis tested was as follows:
Ho : Constant variance
Considering the F statistic, if there is joint significance, the conclusion is that there is
heteroskedasticity.
The tests done on all the data sets (models) showed joint significance of the second
regression, showing the existence of heteroskedasticity (see Appendix C). The H0 was
rejected in all the cases, concluding that heteroskedasticity existed.
4.4.2.2 White Test
The White Test was used because it was referred to most frequently in applied papers,
and the results were consistent with the Breusch-Pagan (1979) tests. The White
(1980) Test computation is worked by regressing squared residual, ei2 , on the initial
x’s, their own product, and the multi-products. The White statistic is W = NR2, where,
R2 is the coefficient of determination. If the inaccuracies are homoskedastic, W is
spread as χ2 with degrees of freedom equivalent to the amount of independent
variables in the supplementary retrogression, not including the constant (White, 1980).
The significant price of W results in the refusal of the null premise of homoskedasticity.
136
If a test has a p-value less than a significance level of 0.05, the H0 is declined. The H0
can be declined that the variance of the residuals is constant and deduce that
heteroskedasticity is indeed there.
The tests were done on the five different models and data sets (see Appendix C).
Considering the F-Statistic, H0 was rejected, confirming the existence of
heteroskedasticity.
4.4.2.3 Procedure used in the study
Since heteroskedasticity is a predominant challenge in cross-sectional data analysis,
methods to rectify the problem of heteroskedasticity are required for prudent data
examination. Although it is possible to come up with a correct standard error of OLS
estimator, the formula is not dependent on the model for heteroskedasticity. The
current study used heteroskedasticity consistent standard estimates, according to the
recommendations made by Hayes and Cai (2007:711).
4.5 MULTICOLLINEARITY BETWEEN THE EXPLANATORY
VARIABLES
Multicollinearity is a scenario where at least two predictor variables in a multivariate
analysis are greatly interconnected (Sekaran & Bougie, 2010). Tests were done on
the data to confirm the absence of multicollinearity within the hypothesised model. As
the levels of multicollinearity increase, the more difficult it becomes to discover the
definite result of the predictor variables on the regressand as the normal variation rises
(Hair, Black, Babin & Anderson, 2010; Field, 2009).
The current study assessed multicollinearity using the variance inflation factor (VIF)
and tolerance (1/VIF) value. The acceptable close-off value is a VIF of 10 and
tolerance value of 0.10 (Hair et al., 2010; Field, 2009). For all five models, that is, for
Africa, Kenya, the DRC, South Africa (RSA) and Eswatini, the VIF and tolerance
(1/VIF) values were within acceptable ranges, except for age and age-squared (see
Appendix E). The results related to age and age-squared were expected, as the two
variables are closely linked as shown by their correlation values that range from 0.96
to 0.77 (see Tables 5.2 to 5.6). This type of collinearity is known as structural
multicollinearity that arises when a model term is created using other terms. Put
differently, it is a by-product of the model specified and not within the data itself.
137
Another test was done with age-squared omitted; VIF and (1/VIF) fell in the acceptable
ranges, including those of other variables in all five models.
Although multicollinearity may cause problems, it is not always necessary to correct it,
particularly when it is structural in nature (El-Dereny & Rashwan, 2011). Moreover,
according to Mason and Perreault (2016), multicollinearity should not be viewed in
isolation but in conjunction with factors affecting the estimation accuracy. Therefore,
the requirement to reduce multicollinearity also depends on the severity and primary
goal for the regression model. Hence, in the current study, there was no remedy
sought as the problem was not severe.
4.6 THE ENDOGENEITY PROBLEM
A situation where an explanatory variable is connected to the error term is referred to
as an endogeneity problem. In a model, the endogeneity challenge arises when there
is a link between the regressand and the error term (Cameron & Tinedi, 2005;
Antonakis & Dietz, 2011:218). This means that the error term is due to all of the factors
in the regressand that are not due to the variables in the model.
The bias is mainly triggered by the omission of relevant variables that explain the
endogenous variable, measurement error and simultaneity of variables (Antonakis,
Bendahan, Jacquart & Lalive, 2014; Hayduk, 1996). Additionally, endogeneity bias is
likely to arise where the error terms causing the endogenous variable within a
hypothesised regression model are correlated with each other. Endogeneity is said to
occur in a multiple regression model if
E(Xj u) ≠ 0, for some j = 1, ..., k.
In a case where a regression model excludes a key variable due to data unavailability,
estimates become biased (inconsistent).
To investigate the existence of absent factors, a single test, named Ramsey’s (1969)
is available to assess if polynomial expressions are missing from a model Regression-
Error-Specification Test (RESET). Nevertheless, the test does not control if other
forms of absent factors exist, which implies that it is imperative to be guided by theory
(Antonakis & Dietz, 2011: 218). Direct tests to identify omitted variable(s) do not exist,
which might be a leading outcome or an interaction consequence too in a certain
model.
138
Financial knowledge is a critical variable contributing to FI in developing countries
(OECD, 2013). Financial literacy may influence education as there may be a need to
understand the financial (investment) world better. FI is also correlated to the
education variable. Some data sets used in this research provided this variable and
the other sets omitted it.
The following is a FI equation recognising that financial literacy affects FI:
FI = β0+ β1age + β2gen + β3mar + β4Proof + β5 Baccess + β6Loc + β7age2 + α1edu+ α2
media+ α3finliteracy + α4 internet + α5phone + Ω1 sala +Ω2 Inc + ℮
In the case of a missing important variable, one remedy is to obtain a proxy variable
that is correlated to the omitted variable (Wooldridge, 2002; Hayduk, 1996).
Considering the results of omitting a variable and whether the particular variable must
be incorporated or not in a model, it is always best to include an additional variable
(Antonakis et al., 2014; Cameron & Trivedi, 2005).
In the current study, instead of financial literacy (finliteracy), financial advice was used.
In the absence of financial literacy, financial advice (Advice) ensures that one makes
an informed decision. In the FI equation, financial advice was used as a proxy.
FI = β0+ β1age + β2gen + β3mar + β4Proof + β5 Baccess + β6Loc + β7age2 + α1edu+ α2
media+ α3Advice + α4 internet + α5phone +Ω1 sala +Ω2 Inc + ℮
The interdependence that exists in a model, as illustrated by the equations,
complicates accuracy in deciding the extent to which the predictor variables influence
the criterion variable of interest when another exogenous factor is simultaneously
used. The potential existence of such an effect and overlap was addressed by refining
the model. This was achieved through the inclusion of variables for the improvement
of the consistency and accuracy of the estimated results (Bollen, Guilkey & Mroz,
1995; Villa-Boas & Winer, 1999; Timpone, 2003).
4.7 MISSING VALUE ANALYSIS
In surveys, misplaced figures and varying data are problematic to circumvent (Hair et
al., 2010). The errors can be attributed to the data-capturing phase or the respondents’
unintended or intentional omission, or discordant material in the process of answering
139
a questionnaire (Sekaran & Bougie, 2010). Missing values are problematic because
of their potential to negatively affect the sample size, and ultimately, statistical results.
The use of multivariate statistical tests can also be negatively affected by missing
values (Hair et al., 2010). The test results may be affected by the reduction in sample
size in case of missing values from the analysis techniques. To solve the missing data
problem, the following methods can be used: weighting methods, likelihood-based
methods and multiple imputation (Korczyński, 2018).
The researcher needs an understanding of the nature of the process leading to
missing values when examining the incomplete data set. According to Jakobsen,
Gluud, Wetterslev and Winke (2017:1), “there are three typical mechanisms causing
missing data: Missing Completely At Random (MCAR); Missing At Random (MAR);
and Missing Not At Random (MNAR)”. The current study used the Multiple Imputation
Technique to solve the challenge of missing values in the data.
Using the Multiple Imputation method (MI), the missing values are substituted with
several values (Zmyślona, 2011). Each data set is then analysed by the Standard
Complete-Data Method, producing m estimates. The estimates are then combined to
make one inference. The uncertainty that arises has two different sources: variability
that arises due to lack of sufficient knowledge about the actual reasons for non-
response and the sampling variability.
Sampling variability is combined through the use of numerous imputations under one
imputation result. Non-response variability is stated by using numerous imputation
models. However, this method has a drawback due its complexity and sensitivity to
the choice of imputation models. Furthermore, it is not clear if methods apply to
discrete data (Carpenter, Kenward & Vansteelandt, 2006:12–13).
The Multiple Imputation method comprises of the following two major steps:
Step 1. Describe the imputation model. The two commonly referred to groups of
imputation models in literature are the Regression Models and the Hot Deck
Procedure Based models. In the Hot Deck method, observation units are separated
into groups with diverse probabilities of “missingness”, and the missing values are
replaced by draws from the observed values made within homogenous groups (see
Song & Shepperd, 2007).
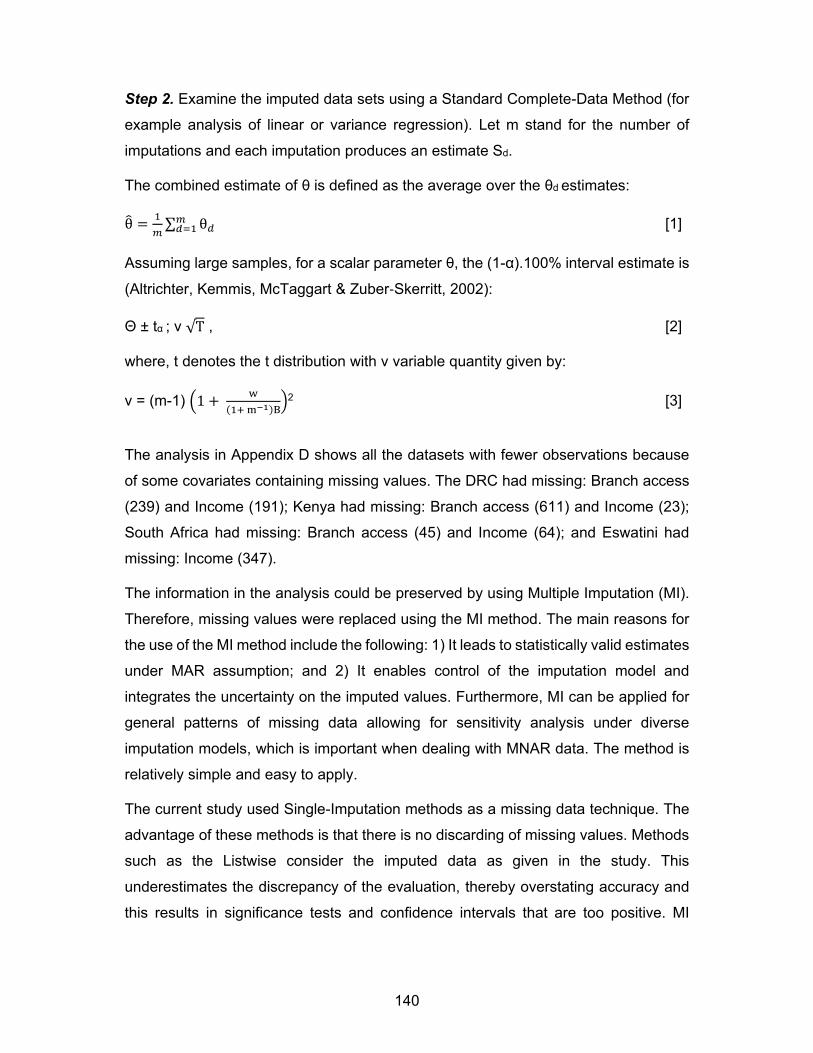
140
Step 2. Examine the imputed data sets using a Standard Complete-Data Method (for
example analysis of linear or variance regression). Let m stand for the number of
imputations and each imputation produces an estimate Sd.
The combined estimate of θ is defined as the average over the θd estimates:
θ ∑ θ [1]
Assuming large samples, for a scalar parameter θ, the (1-α).100% interval estimate is
(Altrichter, Kemmis, McTaggart & Zuber-Skerritt, 2002):
Θ ± tα ; ν √T , [2]
where, t denotes the t distribution with ν variable quantity given by:
ν = (m-1) 1
2 [3]
The analysis in Appendix D shows all the datasets with fewer observations because
of some covariates containing missing values. The DRC had missing: Branch access
(239) and Income (191); Kenya had missing: Branch access (611) and Income (23);
South Africa had missing: Branch access (45) and Income (64); and Eswatini had
missing: Income (347).
The information in the analysis could be preserved by using Multiple Imputation (MI).
Therefore, missing values were replaced using the MI method. The main reasons for
the use of the MI method include the following: 1) It leads to statistically valid estimates
under MAR assumption; and 2) It enables control of the imputation model and
integrates the uncertainty on the imputed values. Furthermore, MI can be applied for
general patterns of missing data allowing for sensitivity analysis under diverse
imputation models, which is important when dealing with MNAR data. The method is
relatively simple and easy to apply.
The current study used Single-Imputation methods as a missing data technique. The
advantage of these methods is that there is no discarding of missing values. Methods
such as the Listwise consider the imputed data as given in the study. This
underestimates the discrepancy of the evaluation, thereby overstating accuracy and
this results in significance tests and confidence intervals that are too positive. MI
141
resolves such a challenge by producing numerous imputations, and it regards the
selection variability due to the omitted data (Little & Rubin, 2002; Altrichter et al., 2002).
The current study used Stata that gives complete backing for MI scanning from
imputation to the pooling stage. At the imputation stage, several analyses were made
for each variable missing data of all the data sets (see Appendix 4C). The following
are the steps that were followed using Stata:
The datasets were MI set in the Marginal Long Style and the Memory Efficient
Style. Frequency distribution and descriptive statistics showing minimum,
maximum and means were shown on checking for missing data. It was found that
the data was missing at random.
The imputation variables were registered, that is, Branch access and Income for
Kenya, RSA and the DRC datasets. Eswatini had Branch access only considered,
as indicated above.
All other variables used in the study were registered as regular.
To reduce the simulation (Monte Carlo) error, 20 imputations were arbitrarily
created. The option was also specified for reproducibility. Verification was done
and all missing values for the four datasets were successfully imputed. There was
also a quick check by examining the imputations to confirm if any irregular activity
transpired in the course of the imputation process. Everything was normal.
From the output, all incomplete values of Branch access and Income were
successfully imputed for all datasets. To manage the data, missing values were
replaced using the Linear Regression Method supported by Stata.
4.8 THE PROBIT/LOGIT MODEL
In Binary Regression Variable Models, the assumption is that the regressand is
computable, whereas the independent variables are qualitative or quantitative
(Wooldridge, 2013). Certain types of regression models have the response variable
dichotomous in nature with a 1 or 0 value. The problem associated with such models
is on inference or estimation. The common models that are used for estimations are
the Linear Probability Model (LPM), Probit Regression and Logistic Regression.
However, there are problems linked to the use of LPM that include:
142
i) Non- fulfilment of 0 ≤ E(Y|X) ≤ 1.
ii) Heteroskedastic variances of the disturbances.
iii) The disturbances are not normally distributed.
iv) Value of R2 is an unreliable measure of goodness of fit.
v) The assumption that Pi = E(Y=1|X), that is, the incremental effect of X is
constant throughout.
The Logit and Probit models largely solve some of these problems.
4.8.1 The Logit Model
Logit Regression investigation is a multivariate method that permits the probability
approximations that an event occurs or not. The Logit predicts the binary dependent
outcome from given independent variables. For example, in the current study of
financial inclusion, whether one is financially included or not, the LPM depicted it as:
Pi =E(FI| x1 , x2 ,…, xk )= β1 + β2 x2 + …+ βk xk , [4]
where, xk is the independent variable and FI= 1 means an individual is financially
included.
The following representations of FI are then considered:
Pi = E(FI=1|xi ) = 1/[1+exp-(β1 + β2 x2 +.. + βk xk)] = 1/[1+exp(-Zi )] [5]
Where, Zi = β1 + β2 x2 + …+ βk xk
The probability of an individual being FI is given by (3). This equation is termed the
(cumulative) Logistic Distribution Function. Zi ranges from -∞ to +∞ ; Pi stretches from
0 to 1; Pi is non-linearly related to Zi, thereby satisfying both conditions required for a
probability model.
The Logit analysis gives statistically sound results by transforming a dichotomous
regressand to a continuous variable stretching from -∞ to +∞, circumventing the out-
of-range estimation problem. The analysis also produces results that are easily
interpreted. The Logit Model produces estimates that are asymptotically consistent,
standard and efficient, for the analogue of the regression t-test to be applicable.
143
4.8.2 The Probit Model
For the analysis of dichotomous dependent variable behaviour, it is necessary to utilise
a suitable Cumulative Distribution Function (CDF). The Probit model uses a normal
CDF, whereas the Logit employs the Cumulative Distribution Function of the logistic
distribution (Wooldridge, 2013).
For the current study, for example, the result of a person using official financial facilities
or not is hinged on unobservable utility Index, Ii , dictated by the predictor variables, in
the way that the greater the value of index Ii , the more the chances of using official
financial facilities.
The index, Ii can be expressed as:
Ii = β1 + β2 x2 +…+ βk xk , [6]
Where, x is the explanatory variable.
It is assumed that Ii is ordinarily dispersed with the same variance and mean. If this
holds, estimations of parameters can be estimated to get information about the
unobservable index itself.
In order to estimate β1 to βk, it can be expressed as:
Ii = β1 + β2 x2 +…+ βk xk + ui [7]
As in the case of Logit Model, Pi is estimated as follows: Pi = ni /Ni
To get efficient estimates, it will be necessary to transform the model then estimate:
Ii = β1 + β2 + …+ βk xk +ui by OLS. [8]
The key distinction between the Probit and Logit models is that the latter has
somewhat flatter tails. The Probit and Logit models generate similar outcomes but the
approximations of parameters of these models are incomparable.
4.8.3 Models used in previous studies
This section articulates the Logit/Probit regression models used in the limited number
of empirical studies that are available (Laha & Kuri, 2011; Martinez et al., 2013; Zins
& Weill, 2016; Soumare et al., 2016; Sahoo et al., 2017).
144
Laha and Kuri (2011) investigated the underlying factors responsible for FI barriers in
rural West Bengal, India. The sample used in the study covered three districts of India.
The study used the Probit Regression Model for analysis to determine the factors
influencing FI in India. However, this study used a small sample to represent the
populous country of India, and the sampling is not convincingly representative of the
whole country. Laha and Kuri used a narrow independent variable with four proxies of
FI. More independent variables could have been included for better results.
Zins and Weill (2016) did research on the factors influencing FI in Africa, and used a
sample of 37 countries. The study utilised the Global Findex data to perform probit
estimations. The following three proxies for the dependent variable were used: (1) Has
a formal account; (2) Has a saving account, and (3) Has formal credit. Although a
sample of 37 countries is a better representation for the generalisation of the entire
continent, the methodology lacked country-by-country analysis, which would have
provided better insight for policy-makers. The scope of FI was limited to three factors,
which are Savings, Borrowing and Services’ availability, when it could have been
broader.
Using a sample from six villages in two districts of India, Sahoo et al. (2017)
investigated the determinants of FI of tribal households. A sample of 300 households
was used and a Logit Regression Model was utilised for analysis. The study focused
on two districts which were arguably not representative of the different cultures and
the whole country. Three proxies were used for the dependent variable of FI when the
scope could be broader.
Soumare et al. (2016) applied data from Global Findex to ascertain and analyse the
determinants of FI in West and Central Africa. Dependent variables used were four
proxies using a sample of 10 countries. The Probit Model was used to analyse the
determinants of FI in the region. However, the study did not provide a country-specific
analysis which is more important for crafting policies.
In a study done in Mexico, Martinez et al. (2013) used the Probit Models to estimate
the factors influencing FI in that country. Whether the individual has an account or not,
was used as a proxy for FI in that country, ignoring some dimensions of FI. However,
the analysis was based on one country and the socioeconomic status of that country
145
is unique, such that the results cannot be generalised for countries in Africa, for
example.
Osei-Assibey (2009) examined the factors driving geographic exclusion of banking
services to households in rural Ghana. Whether one person in a household was using
official financial facilities or not, was utilised as a proxy for FI. The application of such
a proxy does not give a true reflection of an individual’s status, for example, a person
being financially included because of a brother/sister who has an account with a bank.
The study used 10 explanatory variables.
The five studies on FI were narrow-focused on one or two dimensions, when in fact it
is broader. Some studies used a sample as small as 300, and a portion of a country
to represent the whole nation (see Sahoo et al., 2017; Laha & Kuri, 2011). All the
studies, except Soumare et al. (2016), focused on one country or a part of it.
4.9 RESEARCH DESIGN AND APPROACH
The study was divided into three themes with different research questions under each
(see Section 1.2). The themes determined where and what kind of research the study
would be looking for. The themes also led to the identification of the specific objectives
of the study. The focus of Theme I was to test for differences in the study variables
across countries. Theme II focused on the determinants of FI, with more emphasis
directed towards social networks in selected African countries. Theme III focused on
the determinants of FI, with the emphasis on social networks in each of the selected
countries.
From the 21 data sets available from Finmark Trust, the latest data sets from 2014 to
2016 were selected. The datasets derived from the four different Finscope Surveys
(namely, South Africa, the DRC, Kenya, Eswatini) covered 22 105 households. The
surveys were done at different times, and included respondents from rural and urban
areas. This enabled the study to analyse FI at the level of the country’s economy, in
contrast to some researches that focused on population sub-groups (Saunders et al.,
2012).
The study specifically examined statistical associations amongst individuals’ financial
capability, saving, borrowing, bank penetration and investments, and various factors
(demographic, education, income) influencing them were examined.
146
The use of cross-sectional data is comparatively economical, quicker and suitable for
producing an explicatory hypothesis, laying the groundwork for follow-up studies
(Sekaran & Bougie, 2010). Cross-sectional data makes statistical explanations and
inferences for key variables easier (Brink, 1996).
This research study applied a deductive approach of examination and exploration
because the other inductive approach makes use of exploratory methods to establish
links among constructs (Saunders et al., 2012). The deductive approach emphasises
developing a hypothesis or hypotheses grounded on current theories and then to
structure an exploration design that tests the hypothesis. On the other hand, an
inductive approach is concerned with building theory using quantitative or exploratory
techniques for the establishment of patterns or relationships between variables. The
major drawback of inductive judgements is that it depends on observations, and in the
case of incomplete observations, unreliable outcomes may be articulated (Saunders
et al., 2012). According to Johnson and Turner (2003), the conjectural-deductive
approach is often applied to design or elucidate earlier theories in line with the new
understanding.
4.9.1 Unit of analysis
The majority of FI literature concentrated on the supply side, while the current study
focused on both demand and supply. The study aimed to suggest solutions to financial
exclusion in Africa, and used a sample of four countries, which are the DRC, Kenya,
Eswatini and South Africa. Factors influencing FI, with the emphasis on the social
networks in the specific countries in the sample were also explored. Therefore, in the
current work, the component of analysis also included adults from the four selected
African countries.
4.10 GENERAL MODEL ARRANGEMENT OF FI FUNCTION
There are several elements that influence FI levels in developing nations. The leading
elements as acknowledged by literature consist of age, education, religion, education,
marital status, branch access, location, internet access, social network, formal
employment (salary), income, proof of residence, financial advice and gender. In light
of these aspects, the FI utility is epitomised by the ensuing universal model
description:
147
FI = f (age, age2 , education, religion, education, marital status, branch access,
location, internet, salary, income, proof of residence, financial advice, social network,
gender, phone) + ℮ [9]
4.10.1 Factors influencing financial inclusion
To find the determinants of FI, a regression can be run with FI being the dependent
variable. An understanding of the factors influencing financial inclusion/exclusion in a
country is essential to prevent the occurrence and reoccurrence of problems. This will
assist in developing measures or policies for intervening, correcting or preventing the
issues that may influence an individual.
As the objective is to ascertain the factors influencing the resolution to be financially
included, a model was formulated as below. The decision to use official financial
services is determined by numerous explanatory variables.
As discoursed in the World Bank (2015), the potential variables were classified into
four groups, namely, Demographic (D) [Age, Age2, Gender, Marital status, Proof of
residence, Branch access, Location], Human Capital (H) [Level of education, Financial
advice], (C) [Social networks, Internet, Phone] and Income (I) [Salaried/not salaried,
Level of income]. The regression expression becomes:
FI= 𝛽 +∑ 𝛽 𝐷 +∑ ∝ 𝐻 + ∑ µ Ci + ∑ 𝛺 𝐼 + ℮, [10]
Where, FI is the dependent variable of financial inclusion; 𝛽 is y intercept, βi is
coefficient of the Di (demographic group); 𝛺 is coefficient of Ii (Income group); µi is
coefficient of the Ci (communication group); and αi is coefficient of the Hi (Human
capital group).
To achieve Objective number 1, that is, to find the factors influencing FI using a
combined data set from selected African countries, the study estimated the following
model of equation:
FIA = β0+ β1age + β2gen + β3mar + β4Proof + β5 Baccess + β6Loc + β7age2 + α1edu+
µ2 media+ α3Advice + µ4 internet + µ5phone +Ω1 sala +Ω2 Inc + ℮, [11]
Where, FIA is the financial inclusion indicator for combined data set.
To achieve Objective number 2, to find the factors affecting FI in Kenya, it was
necessary to estimate the following model of equation:

148
FIK = β0+ β1age + β2gen + β3mar + β4Proof + β5 Baccess + β6Loc + β7age2 + α1edu+
µ2 media+ α3Advice + µ4 internet+ µ5phone +Ω1 sala +Ω2 Inc +℮, [12]
Where FIK is the financial inclusion indicator for Kenya.
To explore the factors influencing FI in the DRC, the following model of equation was
estimated:
FID = β0+ β1age + β2gen + β3mar + β4Proof + β5 Baccess + β6Loc + β7age2 + α1edu+
µ2 media+ α3Advice + µ4 internet + µ5phone +Ω1 sala +Ω2 Inc +℮, [13]
Where FID is the financial inclusion indicator for the DRC.
To determine the factors influencing FI in South Africa, the following model of equation
was estimated:
FISA = β0+ β1age + β2gen + β3mar + β4Proof + β5 Baccess + β6Loc + β7age2 + α1edu+
µ2 media+ α3Advice + µ4 internet + µ5phone +Ω1 sala +Ω2 Inc +℮, [14]
Where FISA is the financial inclusion indicator for South Africa.
To find the factors influencing FI in Eswatini, the following model of equation was
estimated:
FISW = β0+ β1age + β2gen + β3mar + β4Proof + β5 Baccess + β6Loc + β7age2 + α1edu+
µ2 media+ α3Advice + µ4 internet + µ5phone +Ω1 sala +Ω2 Inc +℮, [15]
Where FISW is the financial inclusion indicator for Eswatini.
To estimate the factors influencing financial inclusion, the hypotheses that were tested
are presented below. These were used to address both Theme II and III of the thesis.
Section 4.10.3 discusses how the data were presented and analysed.
4.10.2 Hypotheses
To allow for the comparison of the variables across the four countries selected for the
study, the differences needed to be investigated. Calculations of the F-statistic showed
the differences between groups and it was applied to infer conclusions. A significance
value of ≤0.05 concluded that there are significant differences across the four
countries. Therefore, the following hypotheses were tested accordingly:
H1: There are FI differences among individuals in the designated nations,

149
H2: There are differences in the age structures of individuals in the designated
countries,
H3: There are gender differences among the respondents in the designated nations,
H4: There are differences in the marital status of individuals in the four designated
nations,
H5: There are differences in the proof of residence of individuals in the designated
nations,
H6: There are differences in physical access among individuals in the designated
nations,
H7: There are differences in location in the designated nations,
H8: There are differences in education among individuals in the designated four
nations,
H9: There are differences in the use of social networks among individuals in the
designated nations,
H10: There are differences on the issue of financial advice among individuals in the
designated nations,
H11: There are differences on the use of internet among individuals in the designated
four nations,
H12: There are differences on phone use among individuals in the designated four
nations,
H13: There are differences in the nature of jobs among individuals in the designated
four nations,
H14: There are differences in income earned among individuals in the designated four
nations.
The first and second objectives of the study were to determine the determinants of
financial inclusion, with the emphasis on social networks in selected African countries,
and in individual countries, respectively. From the research questions the hypotheses
were developed. Informed by literature the following hypotheses guided this study.
H031: Age has no influence on financial inclusion,
150
H032: Age2 has no influence on financial inclusion,
H033: Gender has no influence on financial inclusion,
H034: Marital status has no influence on financial inclusion,
H035: Proof of residence has no influence on financial inclusion,
H036: Branch access has no influence on financial inclusion,
H037: Location has no influence on financial inclusion,
H038: Level of education has no influence on financial inclusion,
H039: Social networks have no influence on financial inclusion,
H040: Financial advice has no influence on financial inclusion,
H041: Phone has no influence on financial inclusion,
H042: Employment history has no influence on financial inclusion,
H043: Salaried/not salaried has no influence on financial inclusion,
H044: Level of income has no influence on financial inclusion, and
H045: Internet access has no influence on financial inclusion.
The hypotheses were used to estimate the determinants of FI in selected African
countries using combined data, and in each of the four countries. Section 4.10.3 below
explains how the data was analysed.
4.10.3 Data explanation and analysis
Probit Models were estimated to investigate the determinants of FI in 1) a combined
data set from selected African nations, 2) South Africa, 3) the DRC, 4) Eswatini, and
5) Kenya.
In this study, the Probit models consider as the regressand, FI, whether a person uses
formal financial facilities or not. That is, 1 if an individual uses formal financial facilities
and 0 if excluded. In a dichotomous regressand, concern is mainly in the dependent
likelihood:
P(FI=1|x)= P(FI=1|x1 , x2 , …, xk), [16]
Where,
151
FI is a financial inclusion measure.
x is the complete set of predictor variables.
The Linear Probability Model (LPM) was employed mainly to permit the study to find
a coefficient approximation at once. An estimation was obtained, instead of the
valuation of scaled coefficients that are attained with the probit regression that requires
transformation. As the emphasis of this research was to explore the determinants of
the resolution to be financially included, this would not be problematic, since LPM and
the Probit Models generate similar coefficient approximations at the mean
(Wooldridge, 2013). To solve a possible weakness associated with LPM, that is,
heteroskedasticity (that nullifies numerical implication), the predictable errors brought
by models are robust to heteroskedasticity. For the circumvention of LPM restrictions,
the study, furthermore, considered a category of dichotomous regressand of the
formula:
P(FI=1|x) = G(β0 + β1x1 +…+ βkxk) [17]
Where,
G is a function captivating values ranging from zero to one: 0< G(z)< 1 for all statistics
z. The Logit and Probity regressions are applied in popular research studies, implying
that either can be used (Wooldridge, 2002:575). For the current study, probit
regression was approximated, together with LPM for a probe of robustness. In that
Probit regression, G is the typical normal cumulative distribution function (cdf) that is
stated as an integral:
G(z)= ɸ(z)= ɸ 𝑣 dv, [18]
Where,
ɸ(z) is the standard normal density.
ɸ(z)= 2𝜋 -1/2exp(-z2 /2) [19]
The next task was to perform a maximum likelihood approximation as a sequence of
probit regression. The dichotomous choice regression was formed from an individual
having any of the following 16 FI proxies:
Saving with bank, Saving with other formal financial institutions, Invest with bank,
Invest with other formal financial institutions, Invest in unit trusts, Invest in Treasury

152
Bills, Invest with insurance firms, Invest in shares, Borrow from bank, Borrow from
other formal financial institutions, Bank account, Has a fixed account, Has a call
account, Has a forex account, Has a bank overdraft, and Has a loan account with
bank.
4.10.4 Multicollinearity between the independent variables
Collinearity infers that two variables are near perfect linear amalgamations of each
other, and in a case of more than two variables, is called multicollinearity (Sekaran &
Bougie, 2010).
As the degree of multicollinearity rises, the regression model estimates become
unstable and the coefficients standard errors become wildly inflated. The five datasets
were further tested to check the absence of multicollinearity within the hypothesised
models (Hair et al., 2010; Field, 2009).
The current study measured multicollinearity by using The Variance Inflation Factor
(VIF) and Tolerance, which two are closely-related statistics for diagnosing collinearity
in multiple regression (Miles, 2014:1). The common cut-off value is a VIF of 10 and a
tolerance value of 0.10 (Hair et al., 2010).
In all five models, that is, for Africa, Kenya, the DRC, RSA and Eswatini, the VIF and
Tolerance (1/VIF) values for Age and Age-squared were worrisome (Appendix D). This
was expected, since the two variables are closely linked. Omitting Age-squared, the
VIF and (1/VIF) values fell within the acceptable levels in all five cases.
All the other variables were within acceptable levels, an indication that there is no
multicollinearity present. As there was no multicollinearity within the hypothesised
models, there was a need to test for differences in the variables used across the
selected four countries. The section below discusses the tests that were conducted.
4.10.5 Testing for differences
In the current study, hypotheses were tested to find the extent to which variables used
in the study differ across the selected four countries. Hypotheses tests were done
using ANOVA, involving the means and the F-statistic. Tests of differences were
sought on the following: FI, Age, Gender, Marital status, Proof of residence, Branch
access, Location, Education, Social networks, Financial advice, Internet access,
Phone, Salary, and Income.
153
4.10.6 Robustness checks
Having run probit models, the results were compared with those from the LPM. The
current study used LPM for a robustness check, while the probit results were reported
as depicted in Tables 5.12 to 5.16. According to Young and Kroeger (2015:53), the
lack of comparability in regression coefficients across different functional forms can be
a frequent and cumbersome problem in multi-model analysis. Young and Kroeger
recommend focusing on the key aspects of results that are consistently comparable:
the signs and significance tests.
4.11 CONCLUSION
The chapter focused on the four main methodological issues in the current study.
Initially, a number of potential independent variables influencing FI were discussed,
and their expected relation with the dependent variable FI was given. A summary was
also given of the variables used in extant studies, and those that have not been
applied. The chapter also acknowledged that the use of proxies for FI is a difficult task
in empirical research. A summary of the FI proxies was given under the four different
dimensions, which are Saving, Investment, Borrowing and Bank penetration that were
identified in this study.
Secondly, the heteroskedasticity problem that characterises cross-sectional survey
data affecting the outcomes of the study was explained. Two different tests to address
the heteroskedasticity problem were discussed. The diverse methods implemented by
empirical scholars to tackle the endogeneity challenges were deliberated. Thirdly, the
progression of Binary Regression replicas of Logit and Probit were discussed.
Fourthly, the Logit/Probit Models used in previous FI-related studies were critically
assessed and appraised.
An appropriate econometric methodology and exploration strategy for testing the
hypotheses, framed in view of the highlighted methodological concerns were
subsequently established. This chapter explained the reasons for the assortment of
Probit Models in addressing the purposes and demands of the research work. The
probit models estimated in the present research work were capable of aiding the
analysis of the study to produce the crucial outcomes and deductions relevant to
determinants of FI in selected African countries. The extant empirical work and the
154
fulcrum of the present research work were instrumental in the selection of the binary
model employed in the study. The criteria leading to the choice of country data sets
used in the study were explained.
The next chapter tests the hypotheses advanced or answers questions in the
introductory segment by employing the Probit Models. For a robustness check, the
LPM was estimated. In the next chapter, the Probit Model results are reported and
interpreted.
155
ESTIMATION AND EMPIRICAL RESULTS
5.1 INTRODUCTION
The previous chapter advanced the econometric approximation modus operandi
crucial to tackling the research problem, as well as the purpose of the present
research. The major aim of the current study was to explore the determinants of FI in
selected African countries, with more emphasis directed towards social networks. This
chapter reports and interprets the outcomes obtained from the selected econometric
estimation techniques consistent with the purpose of the study. The chapter begins by
presenting and interpreting the results addressing Theme I, which ascertains the
differences to the study variables across countries. The theme is structured in the
following manner: Section 5.2.1 considers the preliminary estimates of the
investigation’s outcomes and Section 5.3.1 discusses the correlation among key
variables. Theme II presents the results related to the determinants of FI in Africa. The
determinants of FI in each of the selected countries are presented under Theme III.
Section 5.5 delivers a brief summary of the entire chapter.
5.2 PRELIMINARY ESTIMATION DIAGNOSTICS
Three forms of preliminary estimation diagnostics, specifically, descriptive data,
correlation investigation and analysis of variance were done for the current study using
Stata software packages. According to Rykov, Balakrishnan and Nikulin (2010:369),
the software package is preferred for preliminary approximation diagnostics, since it is
not problematic to employ and can be used devoid of any programme design. The
following section discusses the pre-estimation diagnostics.
5.2.1 Descriptive data
Descriptive statistics helped to describe and understand the characteristics of the five
data sets used in the current study. The percentages, mean and standard deviation
were analysed for the current study using Stata software. Table 5.1 (on the next page)
presents the statistics for the combined data set, RSA, the DRC, Eswatini and Kenya.
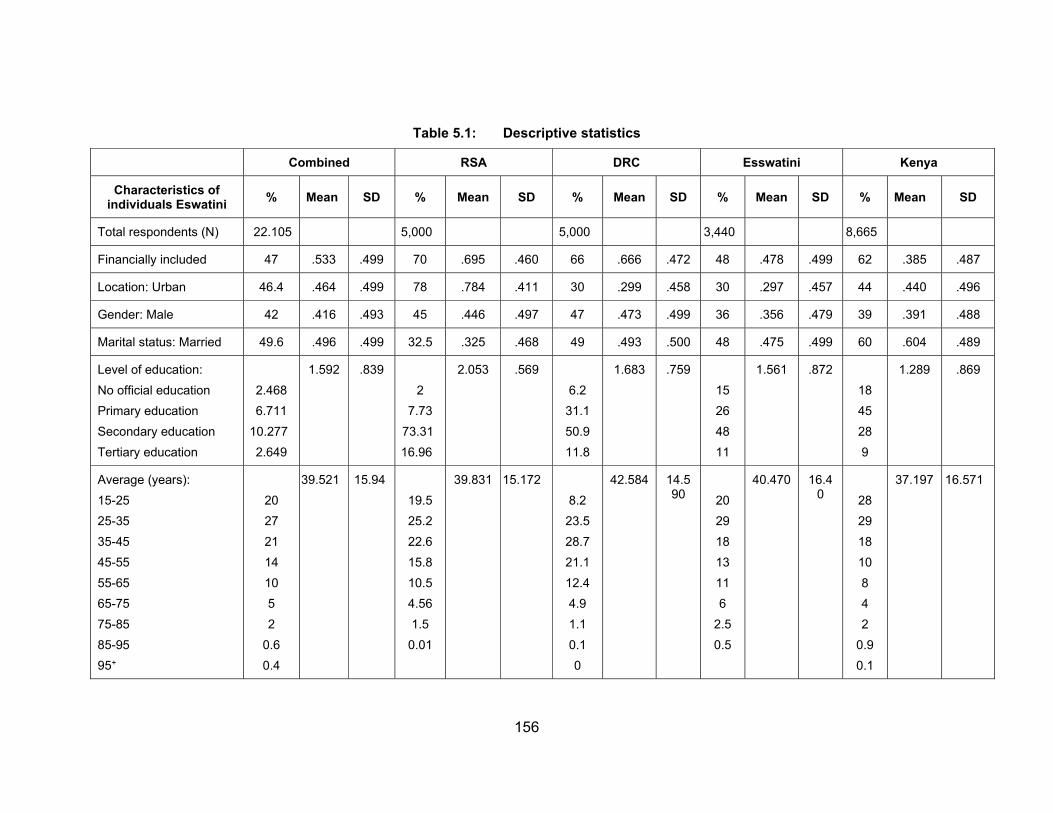
156
Table 5.1: Descriptive statistics
Combined RSA DRC Esswatini Kenya
Characteristics of individuals Eswatini
% Mean SD % Mean SD % Mean SD % Mean SD % Mean SD
Total respondents (N) 22.105 5,000 5,000 3,440 8,665
Financially included 47 .533 .499 70 .695 .460 66 .666 .472 48 .478 .499 62 .385 .487
Location: Urban 46.4 .464 .499 78 .784 .411 30 .299 .458 30 .297 .457 44 .440 .496
Gender: Male 42 .416 .493 45 .446 .497 47 .473 .499 36 .356 .479 39 .391 .488
Marital status: Married 49.6 .496 .499 32.5 .325 .468 49 .493 .500 48 .475 .499 60 .604 .489
Level of education:
No official education
Primary education
Secondary education
Tertiary education
2.468
6.711
10.277
2.649
1.592 .839
2
7.73
73.31
16.96
2.053 .569
6.2
31.1
50.9
11.8
1.683 .759
15
26
48
11
1.561 .872
18
45
28
9
1.289 .869
Average (years):
15-25
25-35
35-45
45-55
55-65
65-75
75-85
85-95
95+
20
27
21
14
10
5
2
0.6
0.4
39.521 15.94
19.5
25.2
22.6
15.8
10.5
4.56
1.5
0.01
39.831 15.172
8.2
23.5
28.7
21.1
12.4
4.9
1.1
0.1
0
42.584 14.590
20
29
18
13
11
6
2.5
0.5
40.470 16.40
28
29
18
10
8
4
2
0.9
0.1
37.197 16.571
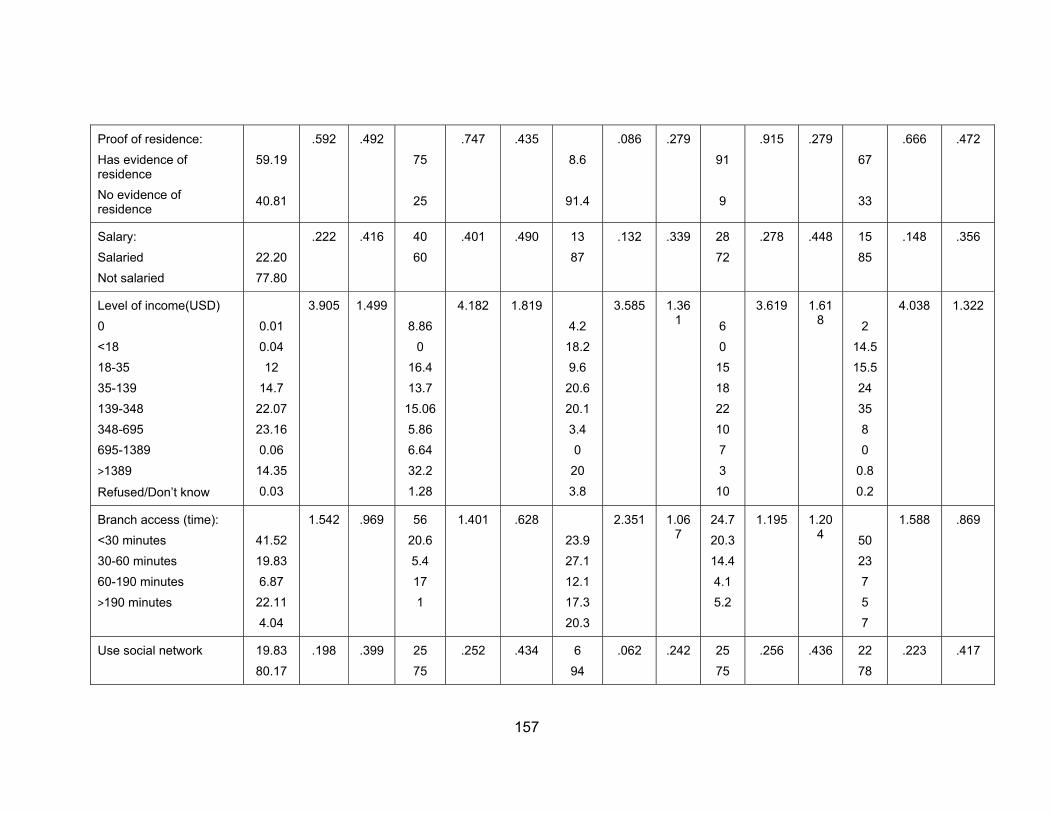
157
Proof of residence:
Has evidence of residence
No evidence of residence
59.19
40.81
.592 .492
75
25
.747 .435
8.6
91.4
.086 .279
91
9
.915 .279
67
33
.666 .472
Salary:
Salaried
Not salaried
22.20
77.80
.222 .416 40
60
.401 .490 13
87
.132 .339 28
72
.278 .448 15
85
.148 .356
Level of income(USD)
0
<18
18-35
35-139
139-348
348-695
695-1389
>1389
Refused/Don’t know
0.01
0.04
12
14.7
22.07
23.16
0.06
14.35
0.03
3.905 1.499
8.86
0
16.4
13.7
15.06
5.86
6.64
32.2
1.28
4.182 1.819
4.2
18.2
9.6
20.6
20.1
3.4
0
20
3.8
3.585 1.361
6
0
15
18
22
10
7
3
10
3.619 1.618
2
14.5
15.5
24
35
8
0
0.8
0.2
4.038 1.322
Branch access (time):
<30 minutes
30-60 minutes
60-190 minutes
>190 minutes
41.52
19.83
6.87
22.11
4.04
1.542 .969 56
20.6
5.4
17
1
1.401 .628
23.9
27.1
12.1
17.3
20.3
2.351 1.067
24.7
20.3
14.4
4.1
5.2
1.195 1.204
50
23
7
5
7
1.588 .869
Use social network 19.83
80.17
.198 .399 25
75
.252 .434 6
94
.062 .242 25
75
.256 .436 22
78
.223 .417
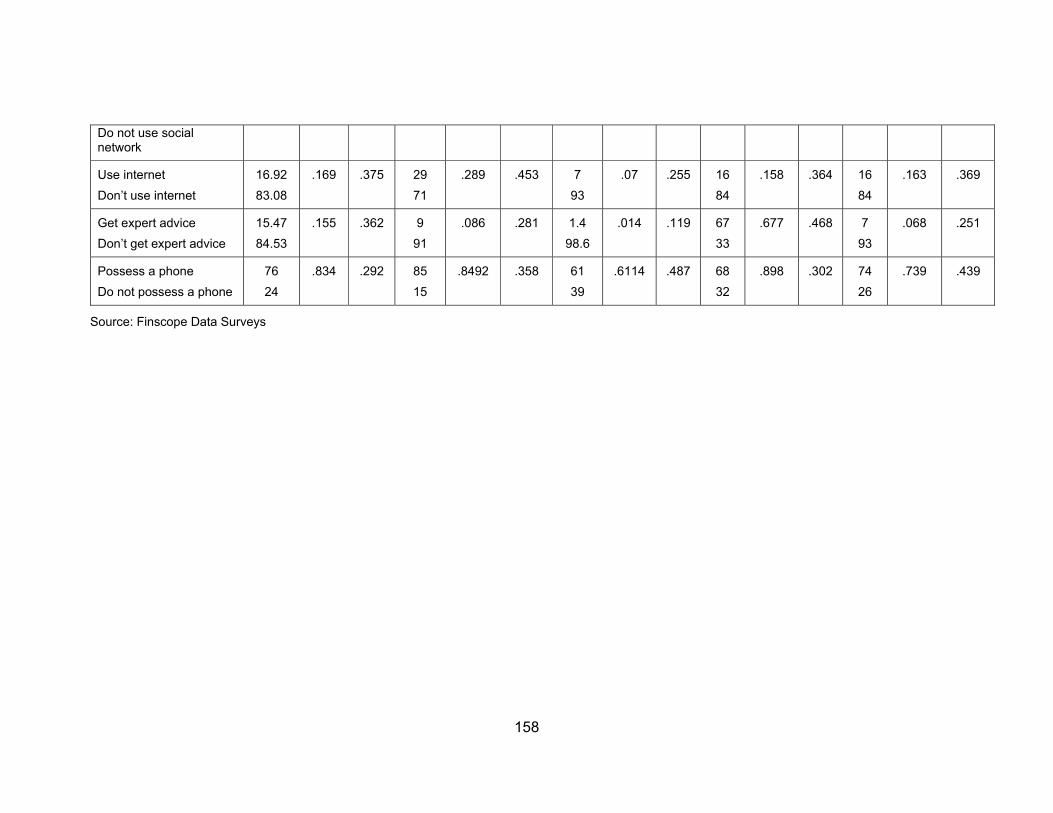
158
Source: Finscope Data Surveys
Do not use social network
Use internet
Don’t use internet
16.92
83.08
.169 .375 29
71
.289 .453 7
93
.07 .255 16
84
.158 .364 16
84
.163 .369
Get expert advice
Don’t get expert advice
15.47
84.53
.155 .362 9
91
.086 .281 1.4
98.6
.014 .119 67
33
.677 .468 7
93
.068 .251
Possess a phone
Do not possess a phone
76
24
.834 .292 85
15
.8492 .358 61
39
.6114 .487 68
32
.898 .302 74
26
.739 .439

159
5.2.1.1 Combined data set
The combined data set showed that Kenya had the highest number of respondents
(39%), followed by South Africa and the DRC with 23% (n=5000), and lastly, Eswatini
(15%). More of the respondents that were interviewed lived in the rural areas (53.6%)
than the urban areas (46.4%). Table 5.1 shows that more respondents were women
(58%), and more were not married (50.4%). About 11% of the population did not attend
formal education, while more than 50% attained secondary and tertiary education.
With a large percentage of a population not having attained at least secondary
education, financial education programmes may be difficult to implement.
The majority of the respondents were below 55 years (83%) showing that the bulk of
them are still in their active and productive stage. One worrisome fact shown in the
table above is that only 59% of the respondents had proof of residence, making it
problematic for the rest to open accounts with formal financial organisations.
Approximately 78% of the respondents did not receive a regular income or were not
formally employed. Such a high level of informal employment negatively influences FI
levels across the African continent.
Income level is also a worrying factor, as 31% in the selected African countries were
earning below USD140 monthly, with only 14% earning above USD1389. However,
625 respondents could not provide their monthly income. About 41.5% (n= 9,179) of
the respondents take less than 30 minutes to get to the nearest bank branch, whilst
22% (n=4,888) take more than 190 minutes, showing that a huge fraction of the
populace has no or limited access to infrastructure on the continent. The physical
infrastructure (presence) of banks is still an influential factor in financial services
delivery in many countries in Africa. The majority of the respondents (80%) are not
part of a social network, although 76% of them possess mobile phones.
Only 17% of the respondents have access to the Internet, which is a worrying state of
affairs in this day and age. Internet use has many benefits that include information
accessibility and it also serves as a financial services platform. About 15% of the
respondents are privileged to have access to financial advice that may have an
influential role on FI levels across the African continent. About 53% of the respondents
were financially included, which is worrisome as 47% were still excluded.
160
Standard deviation (SD) reflects a large amount of variation in the group being studied.
For FI variable, the SD of 0.498912 shows how varied the respondents are in terms of
the number of financial products they possess (see Table 4.4). Location, gender and
marital status had approximately the same SD of 0.49, meaning that the values in the
data set are close to the mean. A high standard deviation of .9695382 of branch
access time reflects how respondents are dispersed from their nearest formal financial
institution. The small SD for social media, internet access, financial advice and mobile
phone means that the values in the statistical data set were close to the mean.
5.2.1.2 South Africa (RSA)
As shown in Table 5.1, out of the 5 000 respondents from South Africa, 78% were
from rural areas, 55% were female, while 67.5% were not married. With regard to
education, 90% attained secondary and tertiary education, which makes it easier for
financial education to raise FI levels. About 75% of the respondents had proof of
residence, which is a major requirement for an individual opening an account with a
formal financial organisation. Those formally employed or receiving regular income
constituted 40%, and 39% earned at least USD695 per month. These two variables
play a key role in determining FI levels. About 56% of the respondents take 30 minutes
or less to get to the nearest bank branch or agent, showing a positive sign regarding
infrastructure accessibility.
Of the respondents, 75% were a part of a social network, a figure that was lower than
the 85% who possessed mobile phones. About 91% of the respondents had access
to financial advice or had consulted experts at some stage, which has a huge bearing
on FI levels. Only 29% of the respondents use the Internet that may have a bearing
on the FI levels of the country. About 85% of the population use cell phones, which
could be the right foundation for digital FI. About 70% of the respondents were
financially included, which is a cause for concern as 30% are still excluded.
The standard deviation (SD) reflects a large amount of variation in the group being
studied. For the FI variable, an SD of 0.46028 reflects the varied number of formal
financial products the respondents have. The number of products range from one to
16 as depicted in Table 4.4. The SD for location, gender and marital status had
approximately the same SDs of 0.41127, 0.49710 and 0.4684217, respectively, which
means that the values in the data set are close to the mean. The high SD for age and
161
level of income shows how varied the values in the data set are farther away from the
mean. The ages of the individuals ranged from 15 to 95 years, and income varied from
0 to ˃USD1 389. The SD for branch access reflects the variation in the times it took to
reach the nearest formal financial facility. The small SD for social media, internet
access, financial advice and mobile phone means that the values in the statistical data
set were close to the mean.
5.2.1.3 Democratic Republic of Congo (DRC)
Of the 5 000 respondents in the DRC, 70% were from rural areas; 50% females; and
51% not married. About 63% attained secondary and tertiary education, 87% were
informally employed, while 20% earned USD695 and above. A worrying fact is that
91% of the respondents were without proof of residence, which is an important
document that is required to open an account. Only 9% spend 30 minutes or less to
get to the nearest branch or agent, which may imply lack of infrastructure in the DRC.
About 94% were not part of any social network, although 61% possessed phones. The
high proportion (93%) of those without access to internet and 98.6% not getting
financial advice are worrying facts.
Only 7% of the population had access to the Internet, which may be a hindrance to
accessing other financial services. One worry is the marginal 13% who were formally
employed, which may also influence the level of FI in the country. About 66% of the
respondents were financially included, which is worrisome as 33% are still excluded.
In terms of the FI variables, the SD of 0.47187 shows how varied the respondents are
in terms of the number of financial products they possess (see Table 4.4). Location
and gender had approximately the same SDs of 0.45786 and 0.49930, respectively,
meaning that the values in the data set are close to the mean. Level of education and
age had high SD, reflecting how the values in the data set are farther away from the
mean. The high SD for mobile phone for the DRC reflects how skewed the distribution
of data is. The small SD for social media, internet access, social media, and financial
advice means that the values in the statistical data set were close to the mean.
5.2.1.4 Eswatini
Table 5.1 shows that 3 440 respondents from Eswatini were interviewed, of which 30%
were from urban areas and 48% were married. About 59% attained secondary and
tertiary education, showing that the majority of the respondents were still economically
162
active. Only 28% of the respondents were formally employed, and this status has a
huge influence on FI levels. On the income variable, 10% of the population earned
USD695 per month.
To get to the nearest financial services provider, 30% of the respondents took 30
minutes or less. About 68% possessed cell phones but only 25% were part of a social
network, and close to 16% used the Internet. Close to 48% of the respondents were
financially included, which is worrisome, as 52% are still excluded.
The standard deviation (SD) reflects a large amount of variation in the group under
study. The high SD of 0.499597 for FI shows how varied the respondents are in terms
of the number of financial products they possess. Location, gender and marital status
have approximately the same SD of 0.4571, 0.4788 and 0.4995, respectively, meaning
that the values in the data set are close to the mean. A high standard deviation of
0.87237 for branch access time reflects how varied the respondents are from their
nearest formal financial institution. The small SD for internet access and mobile phone
means that the values in the statistical data set are close to the mean. The larger SD
for financial advice reflects how skewed the data distribution is.
5.2.1.5 Kenya
The study included 8 665 respondents from Kenya, with 44% being from urban areas.
About 39% were male, 60% were married, while 37% had attained secondary or
tertiary education. The economically active (≤55 years) constituted 85% of the
population of the study in Kenya. About 67% had proof of residence, 15% earned
salaries or were formally employed. About half of the respondents took 30 minutes or
less to get to the nearest financial services provider.
About 74% had cell phones but only 22% were part of a social network. Only 16%
used the Internet, which may make it difficult to introduce digital financial services.
Also worrisome is the fact that only 7% received financial advice, and 38% of the
respondents were financially excluded.
The SD of 0.48659 for FI showed how varied the respondents are in terms of the
number of financial products they possess. Location, gender and marital status have
SDs of 0.49642, 0.48789 and 0.48908, respectively, reflecting how skewed the values
are distributed. A high SD of 16.5707 for age reflects how the values in the data set
are farther away from the mean. The issue of outliers in the age of respondents also
163
explain the large of SD. The skewed value distribution for proof of residence and
mobile phone is reflected in the large SDs of 0.47154 and 0.43891, respectively.
Salary, internet access and financial advice had small SDs, meaning that the values
in a statistical data set are close to the mean.
5.3 THEME I: DIFFERENCES IN THE STUDY VARIABLES
The aim of this section is to explore the links and differences in FI variables across
countries. The independent variables considered are as follows: age, gender, marital
status, proof of residence, physical access, location, education, social networks,
financial advice, internet access, mobile phone, salary and income.
As highlighted in Section 4.6, it is problematic to circumvent misplaced or missing
figures and varying data in surveys (Hair et al., 2010). The current study used the
Multiple Imputation Technique to solve the challenge of missing values in the data
(see Appendix D). The Stata software was used to impute the data.
As discussed in Chapter 4, the current study assessed multicollinearity using the
variance inflation factor (VIF) and tolerance (1/VIF) values. The acceptable close-off
value is a VIF of 10, and a tolerance value of 0.10 (Hair et al., 2010; Field, 2009). For
all five models, that is, for Africa, Kenya, the DRC, South Africa and Eswatini, the VIF
and tolerance (1/VIF) values were within acceptable ranges, except for age and age-
squared (see Appendix E). For age and age-squared, it was expected, as the two
variables are closely linked as shown by their correlation values that range from 0.96
to 0.77 (see Tables 5.2 to 5.6).
This type is known as structural multicollinearity that arises when a model term is
created using other terms. A further test was done that omitted age-squared, and the
resulting VIF and (1/VIF) fell in the acceptable ranges, including those of other
variables in all five models. Although multicollinearity may cause problems, it is not
always necessary to attempt to correct it, particularly when it is structural in nature (El-
Dereny & Rashwan, 2011).
The following section discusses the strength and direction of a linear relationship
among all the variables.
164
5.3.1 Correlation among the key variables
After finding the frequency, mean and standard deviation, the research established
the focus, as well as landscape of the links among all the variables employing
Pearson's connection. The outcomes of the correlation analysis matrix for all five data
sets/models considered in this study are shown in Tables 5.6 to 5.10.
Correlation analysis is a statistical method that shows whether variables are
associated, which is vital in measuring the negative or positive relationship between
the variables under study. The Zero Order Pearson correlation analysis examined the
relationships.
The primary reason for using the Pearson’s correlation coefficient for binary,
continuous, and ordinal data is that it measures the soundness of the rectilinear link
between two variables. The Pearson’s correlativity statistic is linked to linear
regression; it attempts to draw a line of best fit through data of two variables.
Therefore, the magnitude of the relationship is measured on a scale of -1 to +1. Zero
shows no relationship, implying that as the value of one variable increases, the other
one is random. In addition, as the value (r) approaches -1, it signifies a negative
relationship, implying that one variable increases when the other one decreases. As
the value approaches +1, it indicates a positive link, meaning that as the value of a
variable increases, the other increases.
Table 5.2 (on the next page) presents the results of the combined pairwise
correlations.
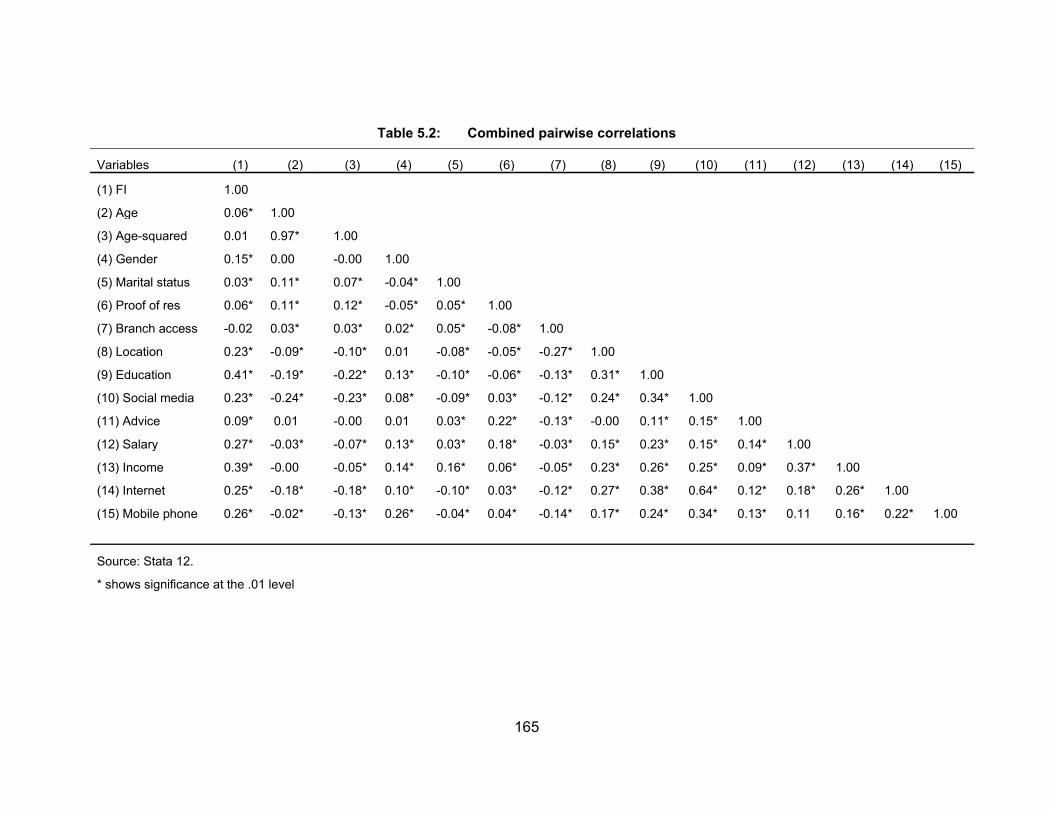
165
Table 5.2: Combined pairwise correlations
Variables (1) (2) (3) (4) (5) (6) (7) (8) (9) (10) (11) (12) (13) (14) (15)
(1) FI 1.00
(2) Age 0.06* 1.00
(3) Age-squared 0.01 0.97* 1.00
(4) Gender 0.15* 0.00 -0.00 1.00
(5) Marital status 0.03* 0.11* 0.07* -0.04* 1.00
(6) Proof of res 0.06* 0.11* 0.12* -0.05* 0.05* 1.00
(7) Branch access -0.02 0.03* 0.03* 0.02* 0.05* -0.08* 1.00
(8) Location 0.23* -0.09* -0.10* 0.01 -0.08* -0.05* -0.27* 1.00
(9) Education 0.41* -0.19* -0.22* 0.13* -0.10* -0.06* -0.13* 0.31* 1.00
(10) Social media 0.23* -0.24* -0.23* 0.08* -0.09* 0.03* -0.12* 0.24* 0.34* 1.00
(11) Advice 0.09* 0.01 -0.00 0.01 0.03* 0.22* -0.13* -0.00 0.11* 0.15* 1.00
(12) Salary 0.27* -0.03* -0.07* 0.13* 0.03* 0.18* -0.03* 0.15* 0.23* 0.15* 0.14* 1.00
(13) Income 0.39* -0.00 -0.05* 0.14* 0.16* 0.06* -0.05* 0.23* 0.26* 0.25* 0.09* 0.37* 1.00
(14) Internet 0.25* -0.18* -0.18* 0.10* -0.10* 0.03* -0.12* 0.27* 0.38* 0.64* 0.12* 0.18* 0.26* 1.00
(15) Mobile phone 0.26* -0.02* -0.13* 0.26* -0.04* 0.04* -0.14* 0.17* 0.24* 0.34* 0.13* 0.11 0.16* 0.22* 1.00
Source: Stata 12.
* shows significance at the .01 level

166
The outcomes shown in Table 5.2 reveal a positive linear link between age and the
following variables: age-squared, marital status, proof of residence, branch access
and financial advice. A negative association was observed between location,
education, media, salary, income, internet and phone. The correlation coefficient
between age and gender was 0, demonstrating that there is no relationship between
the two variables.
Age-squared was positively correlated with marital status, proof of residence and
physical access but had a negative relationship with the rest of the variables. Gender
showed a negative association with marital status and proof of residence but was
positively correlated with the rest of the variables under study.
Marital status was negatively correlated with phone, internet, media, education and
location, with a positive association with the rest of the independent variables. Proof
of residence showed a negative association with the following: physical access,
location and education with positive relationship with the rest of the variables.
Location had a positive correlation with all the variables save for advice that
maintained a negative correlation. Education showed a positive correlation with all the
variables under study.
The following variables reported a positive correlation to each other: media, advice,
salary, income, internet and phone.
The correlation analysis results are in line with theoretical predictions. The low
magnitudes of the relationships show that the problem of multi-collinearity might not
exist between and among most variables used for the current study. This is consistent
with El-Dereny and Rashwan’s (2011) observations.
Table 5.3 (on the next page) shows the pairwise correlations for the DRC.
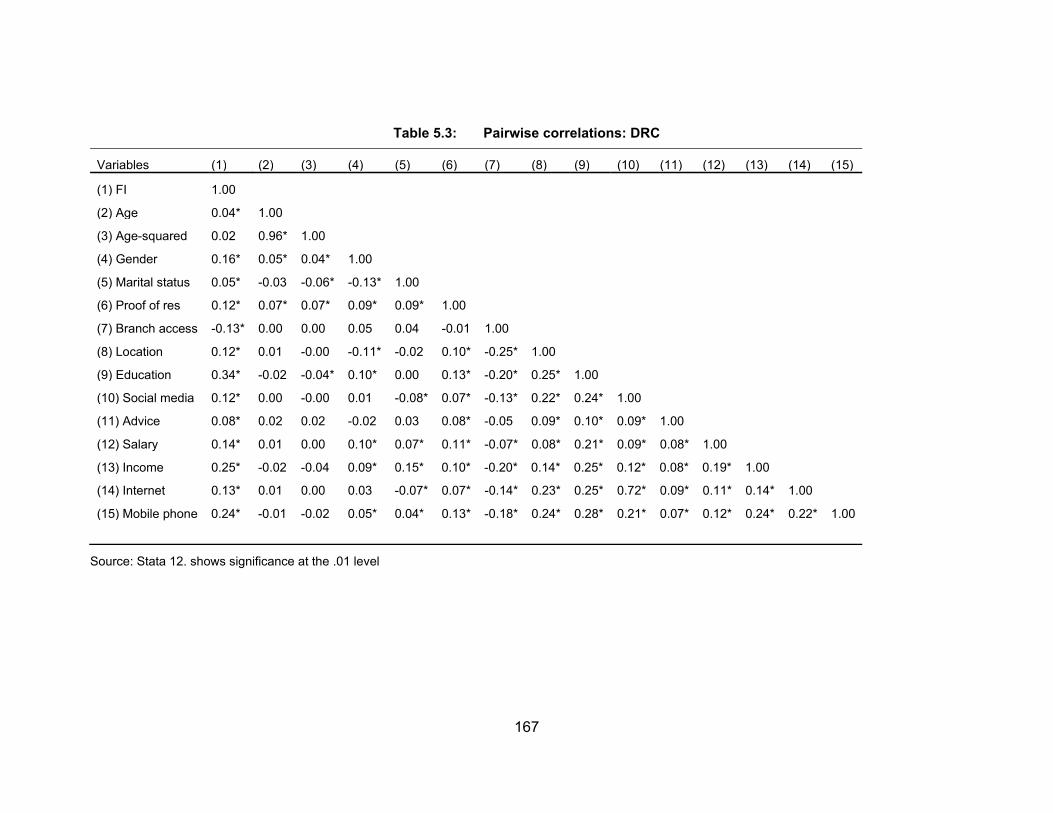
167
Table 5.3: Pairwise correlations: DRC
Variables (1) (2) (3) (4) (5) (6) (7) (8) (9) (10) (11) (12) (13) (14) (15)
(1) FI 1.00
(2) Age 0.04* 1.00
(3) Age-squared 0.02 0.96* 1.00
(4) Gender 0.16* 0.05* 0.04* 1.00
(5) Marital status 0.05* -0.03 -0.06* -0.13* 1.00
(6) Proof of res 0.12* 0.07* 0.07* 0.09* 0.09* 1.00
(7) Branch access -0.13* 0.00 0.00 0.05 0.04 -0.01 1.00
(8) Location 0.12* 0.01 -0.00 -0.11* -0.02 0.10* -0.25* 1.00
(9) Education 0.34* -0.02 -0.04* 0.10* 0.00 0.13* -0.20* 0.25* 1.00
(10) Social media 0.12* 0.00 -0.00 0.01 -0.08* 0.07* -0.13* 0.22* 0.24* 1.00
(11) Advice 0.08* 0.02 0.02 -0.02 0.03 0.08* -0.05 0.09* 0.10* 0.09* 1.00
(12) Salary 0.14* 0.01 0.00 0.10* 0.07* 0.11* -0.07* 0.08* 0.21* 0.09* 0.08* 1.00
(13) Income 0.25* -0.02 -0.04 0.09* 0.15* 0.10* -0.20* 0.14* 0.25* 0.12* 0.08* 0.19* 1.00
(14) Internet 0.13* 0.01 0.00 0.03 -0.07* 0.07* -0.14* 0.23* 0.25* 0.72* 0.09* 0.11* 0.14* 1.00
(15) Mobile phone 0.24* -0.01 -0.02 0.05* 0.04* 0.13* -0.18* 0.24* 0.28* 0.21* 0.07* 0.12* 0.24* 0.22* 1.00
Source: Stata 12. shows significance at the .01 level

168
Table 5.3 shows that age negatively correlated with marital status, education, income
and phone, with a positive association with the rest of the variables. Age-squared was
negatively correlated with marital status, education, income and phone. Age-squared
had no relationship with salary, internet and physical access, as the correlation values
were 0.
Gender was negatively associated with the following marital status, location and
advice, with a positive relationship with the rest of the remaining independent
variables. Marital status was negatively associated with media, location and internet
with the rest of the variables maintaining a positive relationship.
Proof of residence had a positive relationship with all other independent variables,
save for physical access. Physical access reported a negative relationship with all the
variables.
Education, location, media, advice, salary, income, internet and phone showed
positive relationships among themselves. The low magnitudes of the relationship show
that the problem of multicollinearity might not exist between and among most variables
used for the current study.
Table 5.4 (on the next page) shows the pairwise correlations for Kenya.
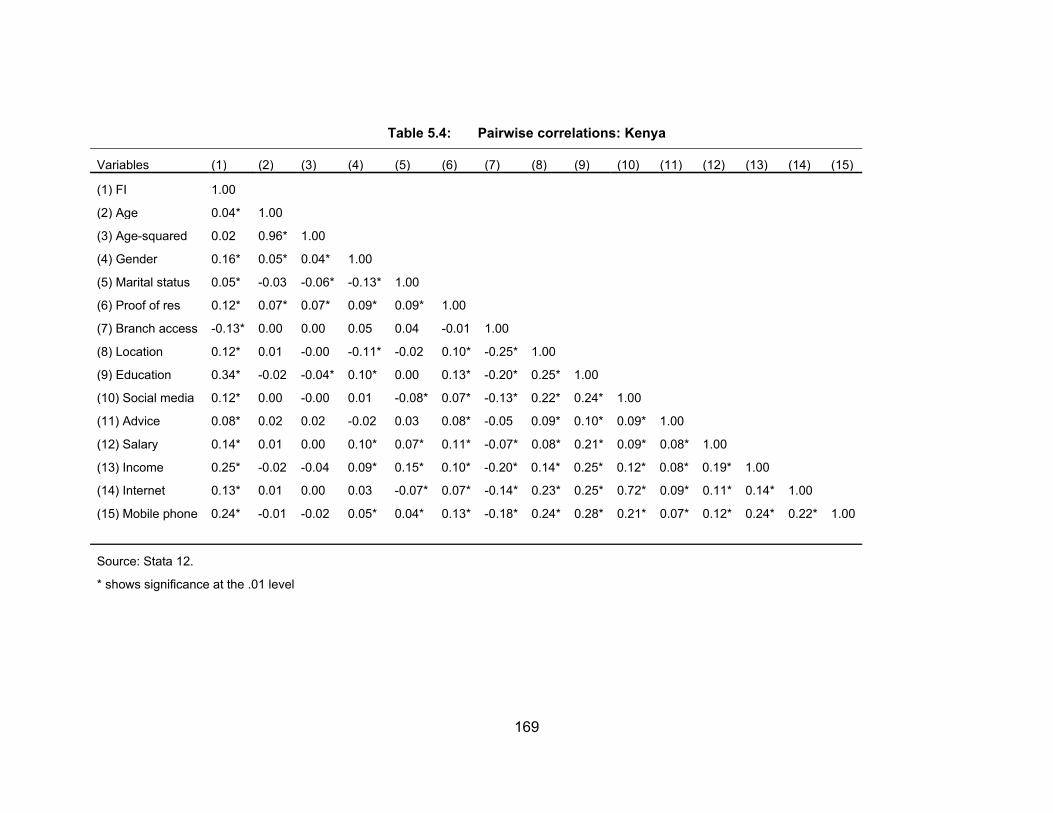
169
Table 5.4: Pairwise correlations: Kenya
Variables (1) (2) (3) (4) (5) (6) (7) (8) (9) (10) (11) (12) (13) (14) (15)
(1) FI 1.00
(2) Age 0.04* 1.00
(3) Age-squared 0.02 0.96* 1.00
(4) Gender 0.16* 0.05* 0.04* 1.00
(5) Marital status 0.05* -0.03 -0.06* -0.13* 1.00
(6) Proof of res 0.12* 0.07* 0.07* 0.09* 0.09* 1.00
(7) Branch access -0.13* 0.00 0.00 0.05 0.04 -0.01 1.00
(8) Location 0.12* 0.01 -0.00 -0.11* -0.02 0.10* -0.25* 1.00
(9) Education 0.34* -0.02 -0.04* 0.10* 0.00 0.13* -0.20* 0.25* 1.00
(10) Social media 0.12* 0.00 -0.00 0.01 -0.08* 0.07* -0.13* 0.22* 0.24* 1.00
(11) Advice 0.08* 0.02 0.02 -0.02 0.03 0.08* -0.05 0.09* 0.10* 0.09* 1.00
(12) Salary 0.14* 0.01 0.00 0.10* 0.07* 0.11* -0.07* 0.08* 0.21* 0.09* 0.08* 1.00
(13) Income 0.25* -0.02 -0.04 0.09* 0.15* 0.10* -0.20* 0.14* 0.25* 0.12* 0.08* 0.19* 1.00
(14) Internet 0.13* 0.01 0.00 0.03 -0.07* 0.07* -0.14* 0.23* 0.25* 0.72* 0.09* 0.11* 0.14* 1.00
(15) Mobile phone 0.24* -0.01 -0.02 0.05* 0.04* 0.13* -0.18* 0.24* 0.28* 0.21* 0.07* 0.12* 0.24* 0.22* 1.00
Source: Stata 12.
* shows significance at the .01 level

170
In Table 5.4, age is negatively associated with marital status, education, income and
phone, with positive correlations with the rest of the variables. Age-squared was
negatively associated with education, income and phone; and had positive relationship
with the rest of the variables.
Gender also shows a negative relationship with marital status, location and advice.
Marital status showed a negative relationship with location, media and internet.
Proof of residence had a positive association with all other variables, except for
physical access that had a negative relationship.
Location, education, media, advice, salary, income, internet and phone were positively
correlated among themselves. The low magnitudes of the relationship show that the
problem of multi-collinearity might not exist between and among most variables used
for the current study.
Table 5.5 (on the next page) shows the pairwise correlations for South Africa.
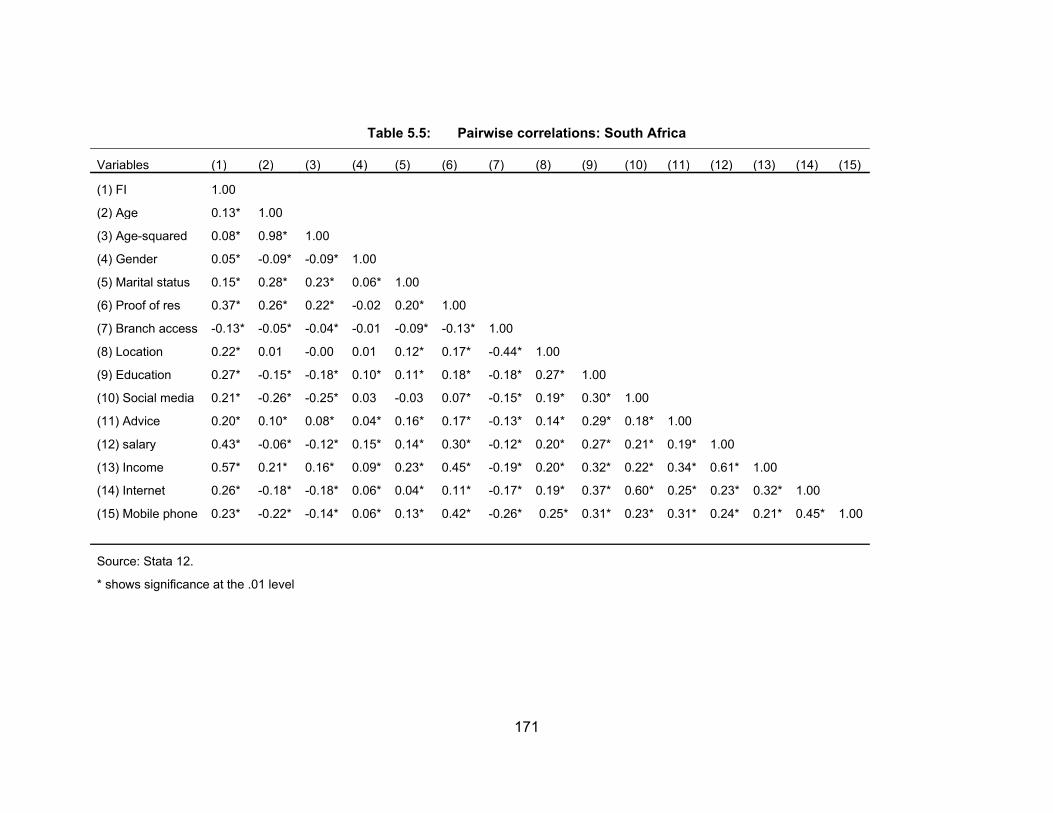
171
Table 5.5: Pairwise correlations: South Africa
Variables (1) (2) (3) (4) (5) (6) (7) (8) (9) (10) (11) (12) (13) (14) (15)
(1) FI 1.00
(2) Age 0.13* 1.00
(3) Age-squared 0.08* 0.98* 1.00
(4) Gender 0.05* -0.09* -0.09* 1.00
(5) Marital status 0.15* 0.28* 0.23* 0.06* 1.00
(6) Proof of res 0.37* 0.26* 0.22* -0.02 0.20* 1.00
(7) Branch access -0.13* -0.05* -0.04* -0.01 -0.09* -0.13* 1.00
(8) Location 0.22* 0.01 -0.00 0.01 0.12* 0.17* -0.44* 1.00
(9) Education 0.27* -0.15* -0.18* 0.10* 0.11* 0.18* -0.18* 0.27* 1.00
(10) Social media 0.21* -0.26* -0.25* 0.03 -0.03 0.07* -0.15* 0.19* 0.30* 1.00
(11) Advice 0.20* 0.10* 0.08* 0.04* 0.16* 0.17* -0.13* 0.14* 0.29* 0.18* 1.00
(12) salary 0.43* -0.06* -0.12* 0.15* 0.14* 0.30* -0.12* 0.20* 0.27* 0.21* 0.19* 1.00
(13) Income 0.57* 0.21* 0.16* 0.09* 0.23* 0.45* -0.19* 0.20* 0.32* 0.22* 0.34* 0.61* 1.00
(14) Internet 0.26* -0.18* -0.18* 0.06* 0.04* 0.11* -0.17* 0.19* 0.37* 0.60* 0.25* 0.23* 0.32* 1.00
(15) Mobile phone 0.23* -0.22* -0.14* 0.06* 0.13* 0.42* -0.26* 0.25* 0.31* 0.23* 0.31* 0.24* 0.21* 0.45* 1.00
Source: Stata 12.
* shows significance at the .01 level

172
Table 5.5 shows age having a negative relationship with gender, physical access,
education, media, salary, internet and phone. Age-squared had positive relationships
with marital status, proof, advice and income.
Gender had a negative relationship with proof and physical access. Marital status had
a negative relationship with physical access and media.
Proof had a negative relationship with physical access. Physical access had negative
relationships with all the variables under study.
Location, education, media, advice, salary, income, internet and phone had positive
relationships among themselves. The low magnitudes of the relationship show that the
problem of multicollinearity might not exist between and among most variables used
for the current study.
Table 5.6 (on the next page) shows the pairwise correlations for Eswatini.
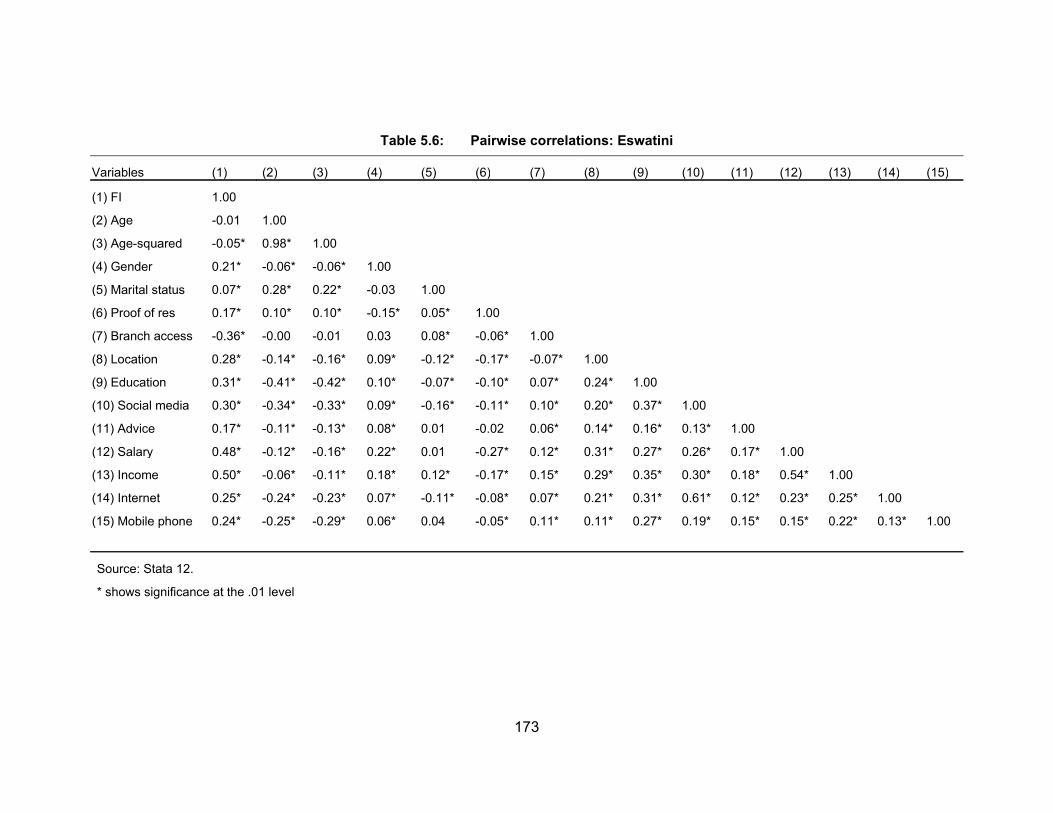
173
Table 5.6: Pairwise correlations: Eswatini
Variables (1) (2) (3) (4) (5) (6) (7) (8) (9) (10) (11) (12) (13) (14) (15)
(1) FI 1.00
(2) Age -0.01 1.00
(3) Age-squared -0.05* 0.98* 1.00
(4) Gender 0.21* -0.06* -0.06* 1.00
(5) Marital status 0.07* 0.28* 0.22* -0.03 1.00
(6) Proof of res 0.17* 0.10* 0.10* -0.15* 0.05* 1.00
(7) Branch access -0.36* -0.00 -0.01 0.03 0.08* -0.06* 1.00
(8) Location 0.28* -0.14* -0.16* 0.09* -0.12* -0.17* -0.07* 1.00
(9) Education 0.31* -0.41* -0.42* 0.10* -0.07* -0.10* 0.07* 0.24* 1.00
(10) Social media 0.30* -0.34* -0.33* 0.09* -0.16* -0.11* 0.10* 0.20* 0.37* 1.00
(11) Advice 0.17* -0.11* -0.13* 0.08* 0.01 -0.02 0.06* 0.14* 0.16* 0.13* 1.00
(12) Salary 0.48* -0.12* -0.16* 0.22* 0.01 -0.27* 0.12* 0.31* 0.27* 0.26* 0.17* 1.00
(13) Income 0.50* -0.06* -0.11* 0.18* 0.12* -0.17* 0.15* 0.29* 0.35* 0.30* 0.18* 0.54* 1.00
(14) Internet 0.25* -0.24* -0.23* 0.07* -0.11* -0.08* 0.07* 0.21* 0.31* 0.61* 0.12* 0.23* 0.25* 1.00
(15) Mobile phone 0.24* -0.25* -0.29* 0.06* 0.04 -0.05* 0.11* 0.11* 0.27* 0.19* 0.15* 0.15* 0.22* 0.13* 1.00
Source: Stata 12.
* shows significance at the .01 level
174
In Table 5.6, age is positively related with marital status and proof of residence. Age-
squared is positively associated with marital status and proof of residence. Marital
status is negatively correlated with location, education, media and internet.
Proof of residence had negative correlations with all the other independent variables.
Physical access was negatively associated with location.
Location, education, media, advice, salary, income, internet and phone display
positive associations among themselves.
All the correlations between or among variables shown in Tables 5.2 to 5.6 are below
65%, save for the correlation between age and age-squared. The problem of multi-
collinearity may not occur among the bulk of the variables applied in the present
research work. These results concur with Mason and Perreault’s (2016) observations.
The results shown in Tables 5.2 to 5.6 show positive correlations between FI and all
the independent variables under study, except for branch access (period of time for
journey to the next bank branch or agent). The greater the period of time for the trip to
the next bank branch or agent, the less people are financially included. The negative
correlation between FI and branch access was expected and in line with predicted
relations with dependent variable shown in Table 3.1.
It is also worth highlighting that the correlation between age and age-squared across
all five models ranged from 0.96 and 0.98 as expected because of the structural
multicollinearity nature (see Section 4.4). All the other correlations in Tables 5.2 to 5.6
are below 65%, showing that the problem of multicollinearity might not occur among
and between variables.
The link between FI and all the other independent variables prompted further analysis,
such as a Probit Model, for the determination of factors influencing FI in selected
countries in Africa.
5.3.2 Testing for differences in the study variables across countries
The current study used the Analysis of Variance (ANOVA) assessment to ascertain
whether there were significant dissimilarities among the four selected countries’ data
sets used. The test that was done addresses Theme I, specifically the research
question on whether there are differences in terms of variables across the four
countries. The variables that were considered included the following: FI, age, gender,
175
marital status, proof of residence, physical access, location, education, social media,
advice, internet, mobile phone, salary and income.
Post-hoc comparisons, since they have the ability to determine where the differences
in the groups lie, were used to investigate the differences (Pallant, 2010). The
calculation of the F-statistic that shows the differences in groups was determined and
used to infer conclusions, as displayed in Table 5.7.
If the significance value is ≤0.05, it is concluded that there are significant differences
in terms of FI among other variables across the four countries. In this regard, the
following hypotheses were tested accordingly:
H1: There are FI differences among individuals in the designated nations,
H2: There are differences in the age structures of individuals in the designated
countries,
H3: There are gender differences among the respondents in the designated nations,
H4: There are differences in the marital status of individuals in the four designated
nations,
H5: There are differences in the proof of residence of individuals in the designated
nations,
H6: There are differences in physical access among individuals in the designated
nations,
H7: There are differences in location in the designated nations,
H8: There are differences in education among individuals in the designated four
nations,
H9: There are differences in the use of social networks among individuals in the
designated nations,
H10: There are differences on the issue of financial advice among individuals in the
designated nations,
H11: There are differences on the use of internet among individuals in the designated
four nations,
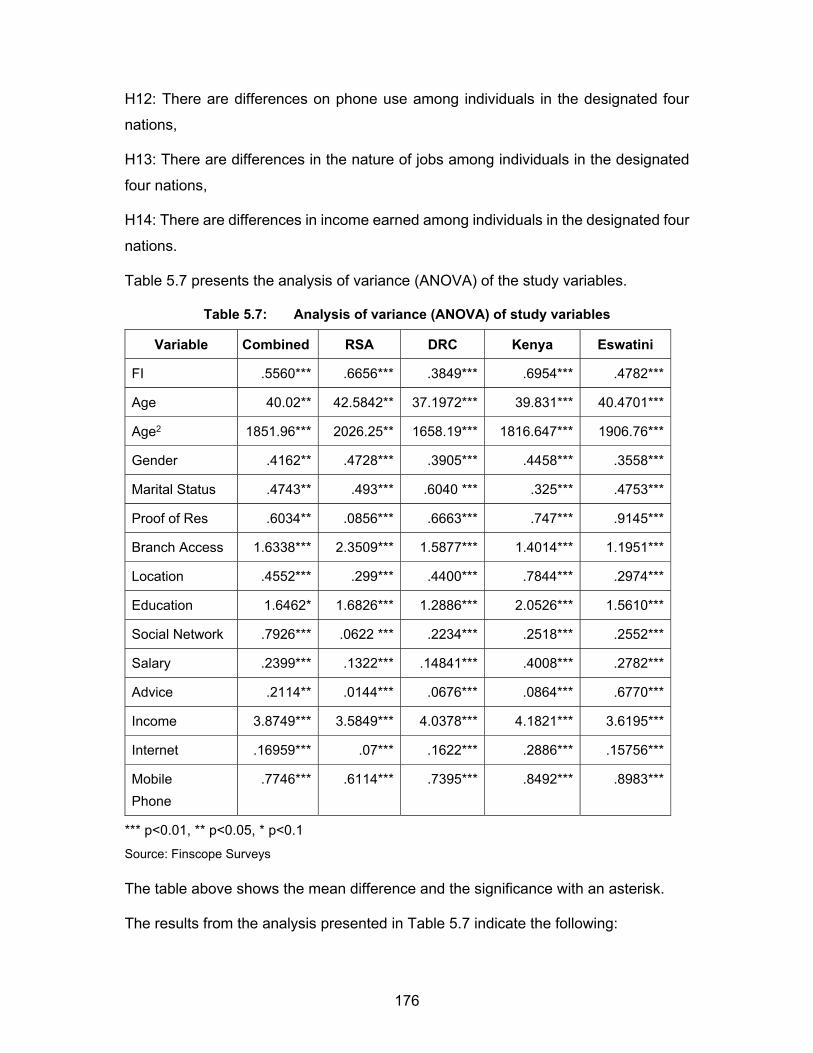
176
H12: There are differences on phone use among individuals in the designated four
nations,
H13: There are differences in the nature of jobs among individuals in the designated
four nations,
H14: There are differences in income earned among individuals in the designated four
nations.
Table 5.7 presents the analysis of variance (ANOVA) of the study variables.
Table 5.7: Analysis of variance (ANOVA) of study variables
Variable Combined RSA DRC Kenya Eswatini
FI .5560*** .6656*** .3849*** .6954*** .4782***
Age 40.02** 42.5842** 37.1972*** 39.831*** 40.4701***
Age2 1851.96*** 2026.25** 1658.19*** 1816.647*** 1906.76***
Gender .4162** .4728*** .3905*** .4458*** .3558***
Marital Status .4743** .493*** .6040 *** .325*** .4753***
Proof of Res .6034** .0856*** .6663*** .747*** .9145***
Branch Access 1.6338*** 2.3509*** 1.5877*** 1.4014*** 1.1951***
Location .4552*** .299*** .4400*** .7844*** .2974***
Education 1.6462* 1.6826*** 1.2886*** 2.0526*** 1.5610***
Social Network .7926*** .0622 *** .2234*** .2518*** .2552***
Salary .2399*** .1322*** .14841*** .4008*** .2782***
Advice .2114** .0144*** .0676*** .0864*** .6770***
Income 3.8749*** 3.5849*** 4.0378*** 4.1821*** 3.6195***
Internet .16959*** .07*** .1622*** .2886*** .15756***
Mobile
Phone
.7746*** .6114*** .7395*** .8492*** .8983***
*** p<0.01, ** p<0.05, * p<0.1
Source: Finscope Surveys
The table above shows the mean difference and the significance with an asterisk.
The results from the analysis presented in Table 5.7 indicate the following:
177
There are significant differences in the FI indicators across the selected African
countries, and South Africa has the highest level of FI in Africa (Mean=0.6954). The
study hypothesised that H1: There are FI differences among individuals in the
designated African nations. The results show that there are differences in FI among
individuals among the four countries, supporting the hypothesis.
There are significant differences in the age structure across the four countries under
study, and the DRC has the highest score (Mean= 42.5842). The study hypothesised
that H2: There are differences in the age structures of individuals in the selected
countries. The results support the hypothesis that there are differences in the age
structures among individuals in the four selected countries.
There are significant differences in the gender variable among the selected African
countries, and the DRC had the highest score (Mean=0.4728). The study
hypothesised that H3: There are gender differences among the respondents in the
four designated nations. The results show that there are differences in the gender
variable among individuals in the four countries, supporting the hypothesis.
There are significant differences in marital status across the selected African
countries, and Kenya had the highest level of married individuals among the selected
African countries (Mean=0.60403). The study hypothesised that H4: There are
differences in the marital status of individuals in the four designated nations. The
results show that there are differences in the marital status among individuals in the
four countries, supporting the hypothesis.
There are significant differences in proof of residence across the selected African
countries, and Kenya had the highest level of FI in Africa (Mean=0.3848817). The
study hypothesised that H5: There are differences in the proof of residence of
individuals in the designated four nations. The outcomes show that there are
differences in proof of residence among individuals from the four countries, supporting
the hypothesis.
There are significant differences in branch access to a bank branch across the
selected African countries, and the DRC had the highest level of physical access in
Africa (Mean=2.350937). The study hypothesised that H6: There are differences in
physical access among individuals in the designated nations. The outcomes show that
178
there are differences in physical access among individuals in the four countries,
supporting the hypothesis.
There are significant differences in location (urban/rural) in the selected African
countries, and RSA had the highest score (Mean=0.7844). The study hypothesised
that H7: There are differences in location in the designated nations. The results show
that there are differences in location (urban/rural) among individuals in the four
countries, supporting the hypothesis.
There are significant differences in education across the selected African countries,
and RSA had the highest level of education in Africa (Mean=2.0526). The study
hypothesised that H8: There are differences in education among individuals in the
designated four nations. The outcomes show that there are differences in education
among individuals in the four countries, supporting the hypothesis.
There are significant differences in social networks in the selected African countries
and Eswatini had the highest score of social networks in selected African countries
(Mean=0.2552). The study hypothesised that H9: There are differences in the use of
social networks among individuals in the designated nations. The outcomes show that
there are differences in social media access among individuals from the four countries,
supporting the hypothesis.
There are significant differences in financial advice indicators in the selected African
countries and Eswatini had the highest level of financial advice in selected African
countries (Mean=0.0.67703). The study hypothesised that H10: There are differences
on the issue of financial advice among individuals in the designated nations. The
results show that there are differences in financial advice among individuals from the
four countries, supporting the hypothesis.
There are significant differences in internet access use across the selected African
countries, and South Africa had the highest level of internet access (Mean=0.2886).
The study hypothesised that H11: There are differences on the use of internet among
individuals in the designated four nations. The results show that there are differences
in internet access among individuals from the four countries, supporting the
hypothesis.
There are significant differences in mobile phone use across the selected African
countries, and the DRC had the highest level of phone use (Mean=0.6656). The study
179
hypothesised that H12: There are differences on phone use among individuals in the
designated four nations. The outcomes show that there are differences in mobile
phone use among individuals from the four countries, supporting the hypothesis.
There are significant differences in the nature of jobs across the selected African
countries, and South Africa had the highest score of in that regard (Mean=4.1822).
The study hypothesised that H13: There are differences in the nature of jobs among
individuals in the designated four nations. The outcomes reveal that there are
dissimilarities in the nature of jobs amongst individuals from the four countries,
supporting the hypothesis.
There are significant differences in salary (income) indicators across the selected
African countries and RSA has the highest level of salary (Mean=0.4008). The study
hypothesised that H14: There are differences in income earned among individuals in
the designated four nations. The results show that there are differences in salary
among individuals in the four countries, supporting the hypothesis.
5.4 THEME II: DETERMINANTS OF FI IN SELECTED AFRICAN
ECONOMIES
This theme is concerned with the investigation into the determinants of financial
inclusion (FI), using a merged data set. Theme II of this study details the first objective
and the two research questions that seek to ascertain the determinants of FI in
selected African countries. From the methodological perspective, the study ran some
probit models. As cited in literature, according to King and Roberts (2015:1), "Robust
standard errors" were used to correct standard errors for model misspecification. For
robustness checks, Linear Probability Models were run and probit model results were
reported.
The literature reviewed in this study cited Fischer and Reuber (2011) who asserted
that social networks can be applied in many ways to influence the effectuation
procedures of an industrialist. Fischer and Reuber also recommended studies on how
social networks can contribute to the service delivery of financial institutions. In
addition, Parra-López et al. (2011) posited that the theory has indicated that social
networks can bring about gains in terms of planning and winning “shoppers”. Kang et
al. (2007) recommended more research on social networks’ supposed value to the
180
online community. Accordingly, the study took on the challenges identified by the
different authors to find the effect on social networks on FI.
The literature overview that was conducted as part of the current study, cited how the
implementation of the Trans-theoretical Model (TTM) related to financial behaviour
began in the last 20 years. Kerkman (1998) focused on using TTM in financial
counselling and brought to the fore a case demonstrating her strategy. Bristow (1997)
postulated that the strategy might be employed to shift individuals’ financial behaviour
in Money 20002. Accordingly, the study takes on the recommendations by some
authors to ascertain how financial advice influences the uptake of formal financial
products by individuals (O’Neill, 2001; Xiao, Newman et al., 2004).
The literature also cited Chen et al. (2018) who found a link between internet use and
accessibility of loan facilities. Bruhn and Love (2014) posited that internet access may
ease information asymmetry between banks and prospective borrowers. Lenka and
Barik (2018) investigated the contribution of online network application to FI in South
Asia. Lenka and Barik recommended more studies on the contribution of internet
access to the use of formal financial services. The online networks can complement
the application of social networks in influencing FI. Accordingly, the current study has
confirmed the contribution of internet access to FI in selected African countries.
The findings in this aspect provide the answers to the research questions related to
Theme II and the associated objective of finding the determinants of FI in selected
African countries. The results from the probit estimation models that were run in this
study will be presented and interpreted next.
5.4.1 Estimated empirical results
As alluded to in Chapter 3, this study sought to propose a FI model that factored in
social networks. This section presents and interprets the finding in this regard. The
proposed FI model is motivated by theory. Despite the existence of studies done on
the investigation of determinants of FI (Sahoo et al., 2017; Martinez et al., 2013; Laha
& Kuri, 2011; Osei-Assibey, 2009), this study did not come across a model that
incorporates social networks, internet access and financial advice.
2 a USDA Cooperative Extension project.
181
During the investigation to come up with an FI model the researcher ran some
regression with merged cross-sectional data. Financial inclusion (FI) was the
dependent variable and the regressors were age, age2, gender, marital status, proof
of residence, branch access, location, level of education, social networks, financial
advice, mobile phone, internet access, salaried/not salaried, and level of income.
As alluded to in Chapter 4, the problem of heteroskedasticity is prevalent in cross-
sectional data, therefore, the Breusch-Pagan Test and White Test were done. For the
Breusch-Pagan Test for heterogeneity the study rejected H0 (see Appendix C). The
study also rejected H0 based on the results of the White Test that also rejected the H0.
Therefore, there is heteroskedasticity in all five data sets used in the current study.
Heteroskedasticity consistent standard error estimates were used to control for
heteroskedasticity. The probit models that used heteroskedasticity consistent
standard errors shown in the fourth columns of Tables 5.8 to 5.12 were reported, whilst
the other columns are included for robustness checks.
As depicted in Tables 5.8 to 5.12, asterisks are used to denote a p-value below some
predetermined level. In the current study, there are three asterisks (***) for p<0.01,
two asterisks (**) for p<0.05, and one (*) for p<0.1. The number not in parentheses is
called a regression coefficient. The regression coefficient provides the expected
change in the dependent variable. A negative coefficient indicates a negative
relationship. The number in brackets is a standard error. The standard error is our
estimate of the standard deviation of the coefficient.
5.4.2 Empirical results for selected African countries
Equation 11 expresses the empirical estimation of the relationship between financial
inclusion (FI) and age, age2, gender, marital status, proof of residence, branch access,
location, level of education, social networks, internet access, financial advice, mobile
phone, employment history, salaried/not salaried, and level of income.
Equation 11 is restated below:
FIA = β0+ β1age + β2gen + β3mar + β4Proof + β5 Baccess + β6Loc + β7age2 + α1edu+
µ2 media+ α3Advice + µ4 internet + µ5phone +Ω1 sala +Ω2 Inc + ℮,

182
The suggested model is applied to estimate the relationship between FI and the
aforesaid explanatory variables in selected African countries. The estimated probit
models for selected African countries using merged data are presented below.
Table 5.8: Linear Probability Model (LPM) on determinants of financial inclusion: combined
(1) LPM (2) Probit (3) LPM (robust) (4) Probit (robust)
Variables FI FI FI FI
Age 0.0201*** 0.0684*** 0.0201*** 0.0684***
(0.00106) (0.00383) (0.00115) (0.00438)
Age-squared -0.000162*** -0.000535*** -0.000162*** -0.000535***
(1.15e-05) (4.14e-05) (1.26e-05) (4.78e-05)
Gender 0.0454*** 0.131*** 0.0454*** 0.131***
(0.00683) (0.0247) (0.00685) (0.0246)
Marital status -0.0213*** -0.0461* -0.0213*** -0.0461*
(0.00699) (0.0254) (0.00703) (0.0257)
Proof of res 0.0943*** 0.302*** 0.0943*** 0.302***
(0.00753) (0.0271) (0.00764) (0.0273)
Branch access -0.0506*** -0.179*** -0.0506*** -0.179***
(0.00356) (0.0130) (0.00352) (0.0129)
Location 0.0907*** 0.303*** 0.0907*** 0.303***
(0.00748) (0.0266) (0.00762) (0.0262)
Education 0.164*** 0.580*** 0.164*** 0.580***
(0.00457) (0.0173) (0.00447) (0.0175)
Social networks 0.0910*** 0.330*** 0.0910*** 0.330***
(0.0103) (0.0383) (0.00996) (0.0376)
Financial advice 0.0620*** 0.293*** 0.0620*** 0.293***
(0.00863) (0.0326) (0.00830) (0.0321)
Salary 0.0896*** 0.360*** 0.0896*** 0.360***
(0.00861) (0.0321) (0.00831) (0.0309)
Income 0.0752*** 0.283*** 0.0752*** 0.283***
(0.00260) (0.00987) (0.00259) (0.0101)
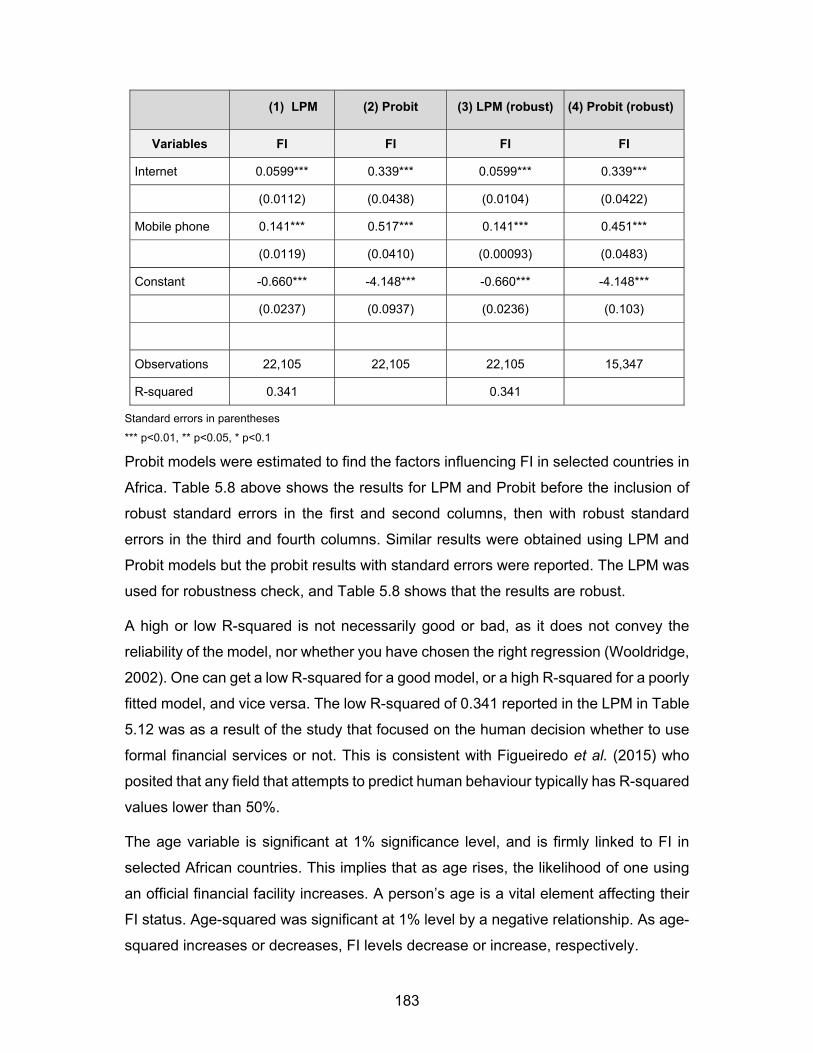
183
(1) LPM (2) Probit (3) LPM (robust) (4) Probit (robust)
Variables FI FI FI FI
Internet 0.0599*** 0.339*** 0.0599*** 0.339***
(0.0112) (0.0438) (0.0104) (0.0422)
Mobile phone 0.141*** 0.517*** 0.141*** 0.451***
(0.0119) (0.0410) (0.00093) (0.0483)
Constant -0.660*** -4.148*** -0.660*** -4.148***
(0.0237) (0.0937) (0.0236) (0.103)
Observations 22,105 22,105 22,105 15,347
R-squared 0.341 0.341
Standard errors in parentheses
*** p<0.01, ** p<0.05, * p<0.1
Probit models were estimated to find the factors influencing FI in selected countries in
Africa. Table 5.8 above shows the results for LPM and Probit before the inclusion of
robust standard errors in the first and second columns, then with robust standard
errors in the third and fourth columns. Similar results were obtained using LPM and
Probit models but the probit results with standard errors were reported. The LPM was
used for robustness check, and Table 5.8 shows that the results are robust.
A high or low R-squared is not necessarily good or bad, as it does not convey the
reliability of the model, nor whether you have chosen the right regression (Wooldridge,
2002). One can get a low R-squared for a good model, or a high R-squared for a poorly
fitted model, and vice versa. The low R-squared of 0.341 reported in the LPM in Table
5.12 was as a result of the study that focused on the human decision whether to use
formal financial services or not. This is consistent with Figueiredo et al. (2015) who
posited that any field that attempts to predict human behaviour typically has R-squared
values lower than 50%.
The age variable is significant at 1% significance level, and is firmly linked to FI in
selected African countries. This implies that as age rises, the likelihood of one using
an official financial facility increases. A person’s age is a vital element affecting their
FI status. Age-squared was significant at 1% level by a negative relationship. As age-
squared increases or decreases, FI levels decrease or increase, respectively.
184
The results show that gender is relevant at 1% significance level with a positive
relationship. A male individual is more likely to be financially included than a female.
The outcomes show that gender is a determinant of FI in selected African countries.
Marital status is significant at 10% significance level, and is negatively correlated to
FI. This indicates that if an individual is married, it is improbable that he/she will be
using official financial facilities compared to an unmarried individual. The outcomes
show that marital status is a significant factor in influencing FI.
Proof of residence is significant at 1% level, and is positively correlated to FI. An
individual that has a proof of residence is more likely to be financially included. The
results show that proof of residence is an important factor in the determination of the
FI status of an individual.
Branch access is significant at 1% level, and is negatively linked to FI. The more time
an individual takes on a journey to the next bank branch, the less probable s/he to be
financially included. The empirical results show that the period of the journey to the
next bank branch is an influential factor of FI.
Location influenced FI at 1% level, with a positive association. An individual living in
town was more likely to be using a facility with an official financial firm than an
individual living in a rural area. The results show that people from the countryside are
less likely to have facilities with official financial firms as there may not be infrastructure
or suppliers in those areas.
Education influences FI at 1% level, with a positive link. A more educated individual is
more likely to be financially included than someone who is less educated. The results
show that when a person is educated, s/he is likely to better appreciate the significance
of having a formal account than a person who is less educated.
The variable, ‘social networks’ is significant at 1% level, and is positively linked to FI.
An individual who uses social networks has a higher probability of being financially
included than someone who does not use it. The results show that a social networks
user is more likely to be using a facility with an official financial firm, as this person
may be more knowledgeable about the importance and use of financial services.
Financial advice is significant at 1% level, and is positively linked to FI. Someone who
has access to financial advice is more likely to be financially included than a person
185
who does not have access to financial advice. The empirical results demonstrate that
financial advice is a vital factor in the distribution of financial services, as the individual
will be equipped with the requisite information to make a positive decision.
Salary is significant at 1% level, and is positively linked to FI. There is a higher
probability that a person who is formally employed will be financially included than
someone who is not. The person in formal employment has access to regular income
and it may be a requirement to have a formal account to receive a salary on a
monthly/weekly basis.
Income affects FI at 1% level, with a positive link. The higher the individual’s income,
the greater the probability of being financially included. With a greater income level,
the individual is likely to have more disposable income for savings, investment, and so
on, increasing the chances of being financially included.
Internet access is significant at 1% level, and is positively correlated to FI. A person
who uses internet is more likely to be financially included than someone with no
internet. Accessibility to the Internet may imply that the individual may be accessing
financial services online and may have access to important information leading to
obtaining an account with a formal financial organisation.
Mobile phone use is significant at 1% level, and is positively correlated to FI. There is
a higher probability of an individual with a mobile phone being financially included than
someone without a mobile phone. A phone can enable the person to use mobile
banking services, regardless of distance or any form of inconvenience as he/she can
easily access formal financial services.
5.5 THEME III: DETERMINANTS FOR FINANCIAL INCLUSION IN
EACH OF THE SELECTED COUNTRIES
Theme III of this study is concerned with the second objective and the two research
questions that seek to ascertain the factors influencing FI in each selected African
country. As in Theme II, the study sought to determine the effects of financial advice,
social media and internet access on FI. As cited in the literature, Bakari, Idi and Ibrahim
(2018) posited that country level analysis is necessary because of the inherent
differences in the development, demographics, income, and so on.
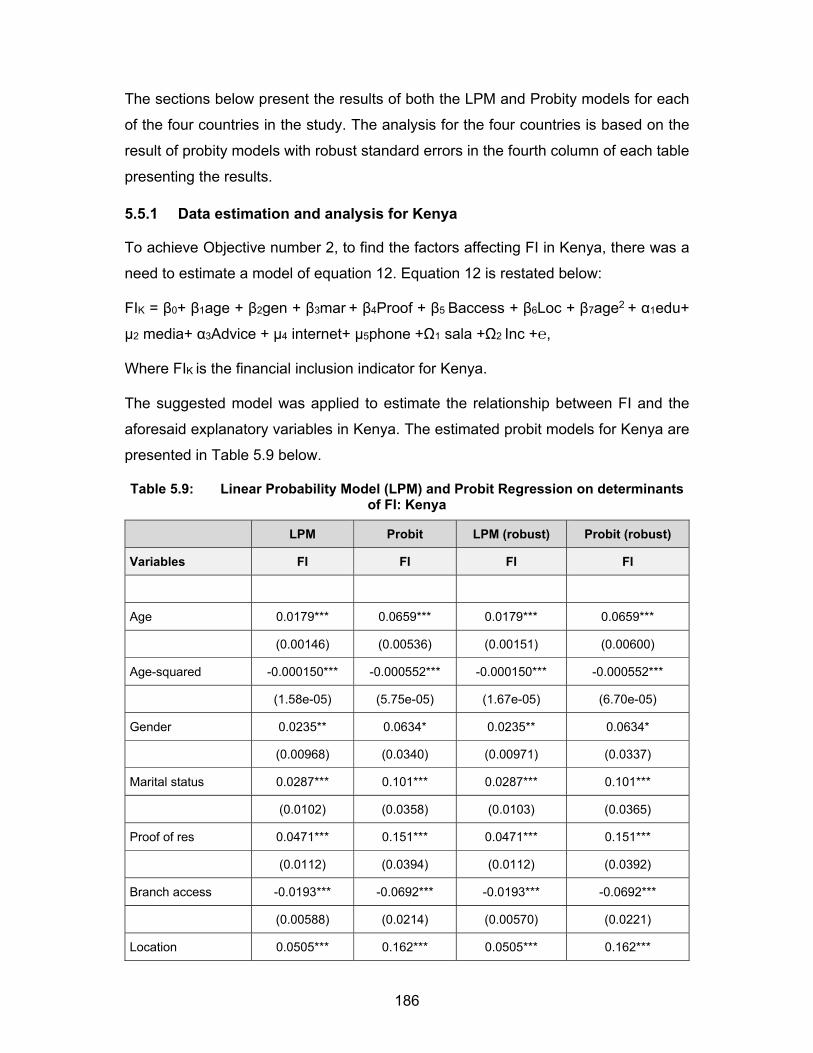
186
The sections below present the results of both the LPM and Probity models for each
of the four countries in the study. The analysis for the four countries is based on the
result of probity models with robust standard errors in the fourth column of each table
presenting the results.
5.5.1 Data estimation and analysis for Kenya
To achieve Objective number 2, to find the factors affecting FI in Kenya, there was a
need to estimate a model of equation 12. Equation 12 is restated below:
FIK = β0+ β1age + β2gen + β3mar + β4Proof + β5 Baccess + β6Loc + β7age2 + α1edu+
µ2 media+ α3Advice + µ4 internet+ µ5phone +Ω1 sala +Ω2 Inc +℮,
Where FIK is the financial inclusion indicator for Kenya.
The suggested model was applied to estimate the relationship between FI and the
aforesaid explanatory variables in Kenya. The estimated probit models for Kenya are
presented in Table 5.9 below.
Table 5.9: Linear Probability Model (LPM) and Probit Regression on determinants of FI: Kenya
LPM Probit LPM (robust) Probit (robust)
Variables FI FI FI FI
Age 0.0179*** 0.0659*** 0.0179*** 0.0659***
(0.00146) (0.00536) (0.00151) (0.00600)
Age-squared -0.000150*** -0.000552*** -0.000150*** -0.000552***
(1.58e-05) (5.75e-05) (1.67e-05) (6.70e-05)
Gender 0.0235** 0.0634* 0.0235** 0.0634*
(0.00968) (0.0340) (0.00971) (0.0337)
Marital status 0.0287*** 0.101*** 0.0287*** 0.101***
(0.0102) (0.0358) (0.0103) (0.0365)
Proof of res 0.0471*** 0.151*** 0.0471*** 0.151***
(0.0112) (0.0394) (0.0112) (0.0392)
Branch access -0.0193*** -0.0692*** -0.0193*** -0.0692***
(0.00588) (0.0214) (0.00570) (0.0221)
Location 0.0505*** 0.162*** 0.0505*** 0.162***
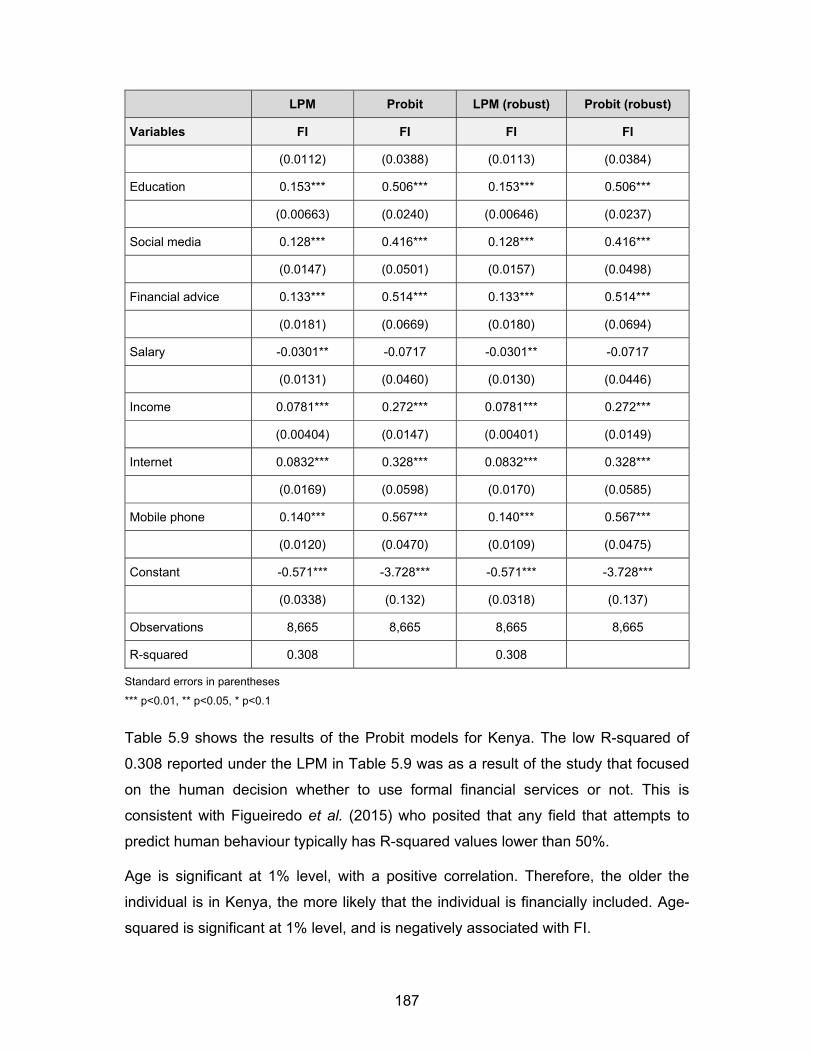
187
LPM Probit LPM (robust) Probit (robust)
Variables FI FI FI FI
(0.0112) (0.0388) (0.0113) (0.0384)
Education 0.153*** 0.506*** 0.153*** 0.506***
(0.00663) (0.0240) (0.00646) (0.0237)
Social media 0.128*** 0.416*** 0.128*** 0.416***
(0.0147) (0.0501) (0.0157) (0.0498)
Financial advice 0.133*** 0.514*** 0.133*** 0.514***
(0.0181) (0.0669) (0.0180) (0.0694)
Salary -0.0301** -0.0717 -0.0301** -0.0717
(0.0131) (0.0460) (0.0130) (0.0446)
Income 0.0781*** 0.272*** 0.0781*** 0.272***
(0.00404) (0.0147) (0.00401) (0.0149)
Internet 0.0832*** 0.328*** 0.0832*** 0.328***
(0.0169) (0.0598) (0.0170) (0.0585)
Mobile phone 0.140*** 0.567*** 0.140*** 0.567***
(0.0120) (0.0470) (0.0109) (0.0475)
Constant -0.571*** -3.728*** -0.571*** -3.728***
(0.0338) (0.132) (0.0318) (0.137)
Observations 8,665 8,665 8,665 8,665
R-squared 0.308 0.308
Standard errors in parentheses
*** p<0.01, ** p<0.05, * p<0.1
Table 5.9 shows the results of the Probit models for Kenya. The low R-squared of
0.308 reported under the LPM in Table 5.9 was as a result of the study that focused
on the human decision whether to use formal financial services or not. This is
consistent with Figueiredo et al. (2015) who posited that any field that attempts to
predict human behaviour typically has R-squared values lower than 50%.
Age is significant at 1% level, with a positive correlation. Therefore, the older the
individual is in Kenya, the more likely that the individual is financially included. Age-
squared is significant at 1% level, and is negatively associated with FI.
188
The gender variable is influential at 10% level, with a positive link. This suggests that
a male is more likely to be financially included than a woman in Kenya.
Marital status is significant at 5% level, and is positively linked to FI. This suggests
that a married individual is more likely to be financially included than a single person.
The result is different from the result obtained for selected countries (merged data) in
Africa (see Table 5.12), where marital status is significant and has a negative
correlation with FI.
Proof of residence is significant at 1% level, and is correlated to FI. This suggests that
someone with a proof of residence is more likely to be financially included than those
without. This shows how important proof of residence is, so much so that the
authorities and suppliers have to consider amending or aligning it to improve the levels
of FI.
Branch access is significant at 1% level, and is negatively correlated to FI. This
suggests that the greater the time taken to reach the nearest bank branch or formal
financial services provider, the less likely the person is to be financially included.
Location is significant at 1%, and is positively correlated to FI. A person from a rural
area is less likely to be using the facilities of official financial firms than someone from
an urban area. This also suggests that there have to be more financial suppliers or
financial services provisions if high FI levels are to be achieved in Kenya.
Education is significant at 1%, and is positively correlated to FI. The more educated,
the higher the chance of being financially included.
The variable, ‘social networks’ is significant at 1%, and is positively correlated with FI.
A person who uses social media is more likely to be financially included than an
individual who does not.
Financial advice is significantly positive at 1% level. An individual with access to
financial advice is more likely to be financially included than someone without.
Salary is insignificant, and is negatively correlated with FI. This suggests that whether
someone is formally employed and receiving a regular income or not, it has no
significant impact on FI levels in Kenya. A relationship does exist but it is insignificant.
The majority of those earning a regular income may be relying more on mobile money
transfer services that include the M-PESA which is dominant in Kenya (Mugo &
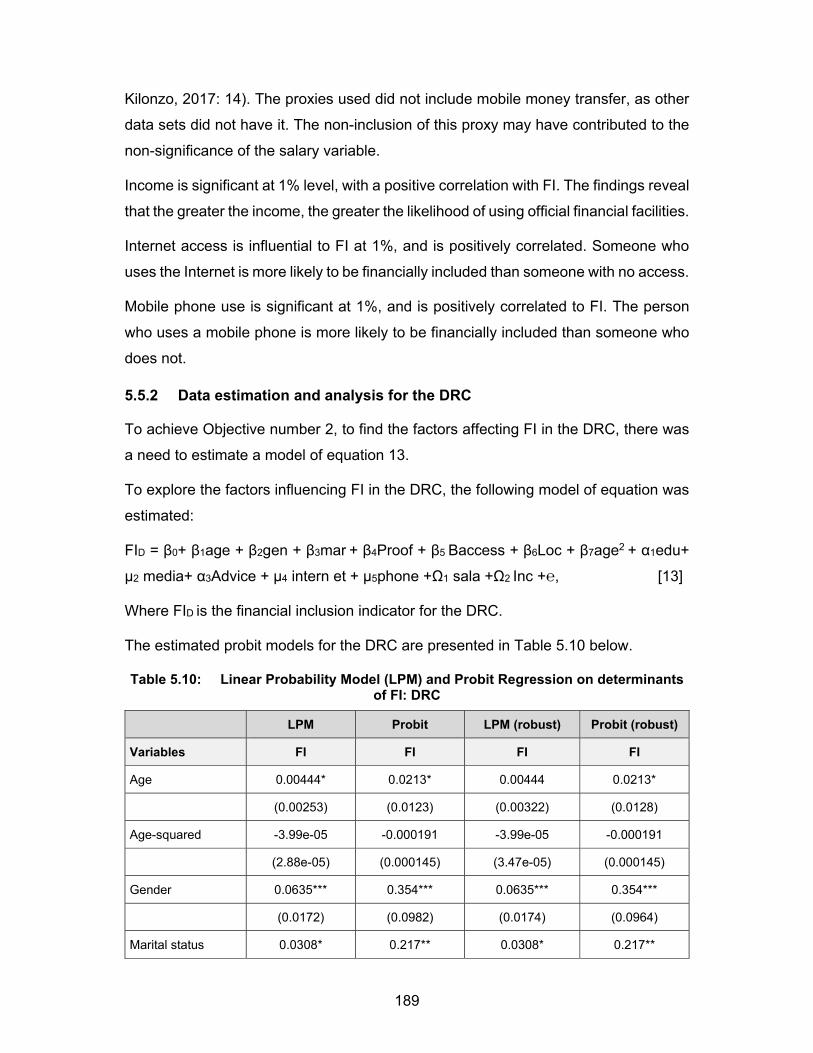
189
Kilonzo, 2017: 14). The proxies used did not include mobile money transfer, as other
data sets did not have it. The non-inclusion of this proxy may have contributed to the
non-significance of the salary variable.
Income is significant at 1% level, with a positive correlation with FI. The findings reveal
that the greater the income, the greater the likelihood of using official financial facilities.
Internet access is influential to FI at 1%, and is positively correlated. Someone who
uses the Internet is more likely to be financially included than someone with no access.
Mobile phone use is significant at 1%, and is positively correlated to FI. The person
who uses a mobile phone is more likely to be financially included than someone who
does not.
5.5.2 Data estimation and analysis for the DRC
To achieve Objective number 2, to find the factors affecting FI in the DRC, there was
a need to estimate a model of equation 13.
To explore the factors influencing FI in the DRC, the following model of equation was
estimated:
FID = β0+ β1age + β2gen + β3mar + β4Proof + β5 Baccess + β6Loc + β7age2 + α1edu+
µ2 media+ α3Advice + µ4 intern et + µ5phone +Ω1 sala +Ω2 Inc +℮, [13]
Where FID is the financial inclusion indicator for the DRC.
The estimated probit models for the DRC are presented in Table 5.10 below.
Table 5.10: Linear Probability Model (LPM) and Probit Regression on determinants of FI: DRC
LPM Probit LPM (robust) Probit (robust)
Variables FI FI FI FI
Age 0.00444* 0.0213* 0.00444 0.0213*
(0.00253) (0.0123) (0.00322) (0.0128)
Age-squared -3.99e-05 -0.000191 -3.99e-05 -0.000191
(2.88e-05) (0.000145) (3.47e-05) (0.000145)
Gender 0.0635*** 0.354*** 0.0635*** 0.354***
(0.0172) (0.0982) (0.0174) (0.0964)
Marital status 0.0308* 0.217** 0.0308* 0.217**
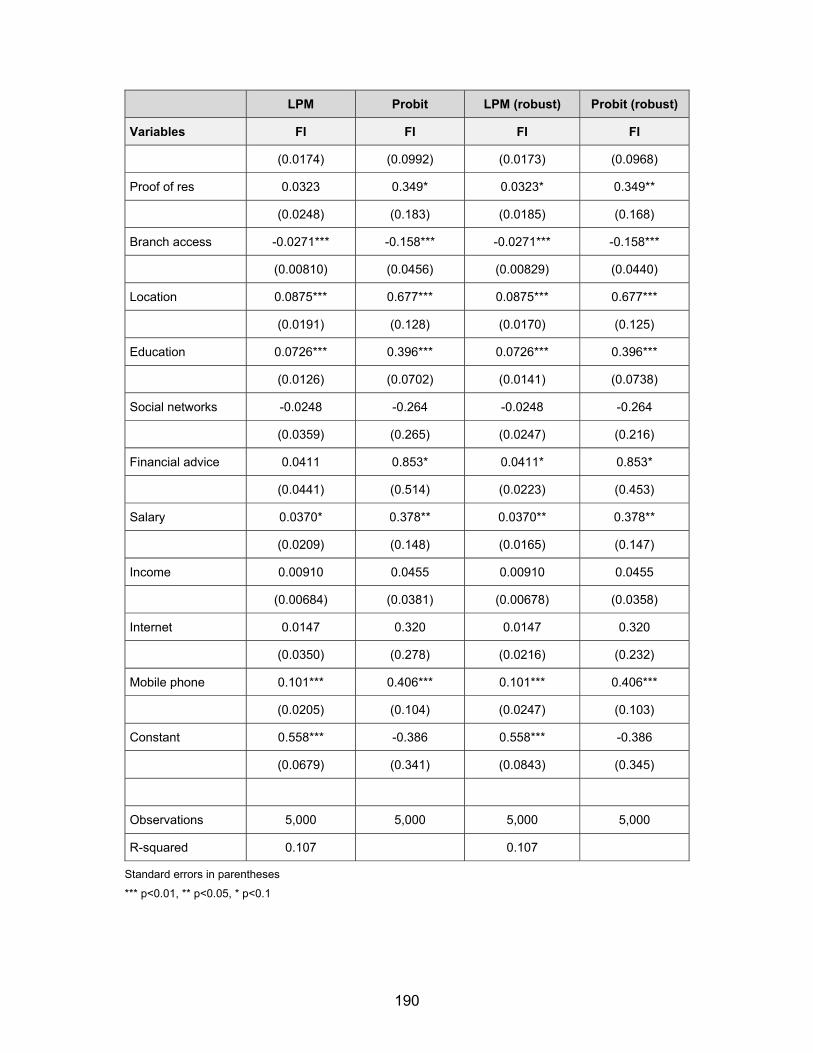
190
LPM Probit LPM (robust) Probit (robust)
Variables FI FI FI FI
(0.0174) (0.0992) (0.0173) (0.0968)
Proof of res 0.0323 0.349* 0.0323* 0.349**
(0.0248) (0.183) (0.0185) (0.168)
Branch access -0.0271*** -0.158*** -0.0271*** -0.158***
(0.00810) (0.0456) (0.00829) (0.0440)
Location 0.0875*** 0.677*** 0.0875*** 0.677***
(0.0191) (0.128) (0.0170) (0.125)
Education 0.0726*** 0.396*** 0.0726*** 0.396***
(0.0126) (0.0702) (0.0141) (0.0738)
Social networks -0.0248 -0.264 -0.0248 -0.264
(0.0359) (0.265) (0.0247) (0.216)
Financial advice 0.0411 0.853* 0.0411* 0.853*
(0.0441) (0.514) (0.0223) (0.453)
Salary 0.0370* 0.378** 0.0370** 0.378**
(0.0209) (0.148) (0.0165) (0.147)
Income 0.00910 0.0455 0.00910 0.0455
(0.00684) (0.0381) (0.00678) (0.0358)
Internet 0.0147 0.320 0.0147 0.320
(0.0350) (0.278) (0.0216) (0.232)
Mobile phone 0.101*** 0.406*** 0.101*** 0.406***
(0.0205) (0.104) (0.0247) (0.103)
Constant 0.558*** -0.386 0.558*** -0.386
(0.0679) (0.341) (0.0843) (0.345)
Observations 5,000 5,000 5,000 5,000
R-squared 0.107 0.107
Standard errors in parentheses
*** p<0.01, ** p<0.05, * p<0.1
191
Table 5.10 shows the results of the Probit models for the DRC. The low R-squared of
0.107 reported under the LPM in Table 5.10 was as a result of the study that focused
on the human decision whether to use formal financial services or not. This is
consistent with Figueiredo et al. (2015) who posited that any field that attempts to
predict human behaviour typically has R-squared values lower than 50%.
Age is significant at 10% level, with a positive correlation to FI. The older the individual
is, the more likely s/he is to be financially included. Age-squared is insignificant and
negatively linked to FI.
The gender variable is positively significant at 1% level to FI, implying that a male has
greater chances of using official financial services than a woman in the DRC.
Marital status is significant at 5% level, and is positively linked to FI. This shows that
a married individual is more likely to be financially included than a single person is.
The result is also different from that obtained for selected countries (combined data)
in Combined (see Table 5. 8) where marital status had an influential negative link with
FI.
Proof of residence is significant at 10% level, and is positively linked to FI. This
indicates that someone with a proof of residence is more likely to be financially
included than an individual without. This shows how important proof of residence is,
to such a degree that the authorities and suppliers have to consider amending or
aligning the requirements to improve the levels of FI.
Branch access is significant at 1% level, and is negatively linked to FI. This indicates
that the greater the period of a journey to the closest formal financial services provider,
the less likely someone is to be financially included.
Location is significant at 1%, and is positively correlated to FI. Those in the urban
areas are more likely to be financially included than those in the rural areas. This also
suggests that there has to be more finance suppliers or financial services provisions if
higher FI levels are to be achieved in the DRC.
Education is significant at 1%, and is positively linked to FI. The more educated the
individual is, the bigger the chance of being financially included.
The variable, ‘social networks’ is not significant, but is negatively correlated with FI.
Though the variable is not significant, there is some form of relationship. This implies
192
that in the DRC, whether the individual uses social media or not, it has no significant
influence on the level of FI in the country.
Financial advice is positively significant at 10% level. The individual with access to
financial advice is more likely to be financially included than someone without access
to financial advice.
Salary is positively significant at 5% level. This suggests that when the individual is
formally employed receiving a regular income, s/he is likely to be financially included
in the DRC.
Income is not significant, but is positively linked to FI. This indicates that the
individual’s level of income has no significant impact on his/her FI status. The high
levels of informality in the DRC economy may be the leading reason for such a result.
Internet access is not significant, but is positively correlated to FI. Whether the
individual uses or does not use internet access has no impact on FI. However, there
is a positive relationship though not significant. The result was different from the
merged data for selected African countries, which was significant and positive.
Phone use is significant at 1%, and is positively linked to FI. The individual who uses
a mobile phone is more likely to be financially included than the individual without.
5.5.3 Data estimation and analysis for South Africa
To achieve Objective number 2, to find factors affecting FI in South Africa, there was
a need to estimate the model of equation 14.
To determine factors influencing FI in South Africa, the following model of equation
was estimated:
FISA = β0+ β1age + β2gen + β3mar + β4Proof + β5 Baccess + β6Loc + β7age2 + α1edu+
µ2 media+ α3Advice + µ4 internet + µ5phone +Ω1 sala +Ω2 Inc +℮, [14]
Where FISA is the financial inclusion indicator for South Africa.
The estimated probit models for South Africa are presented in Table 5.11 below.
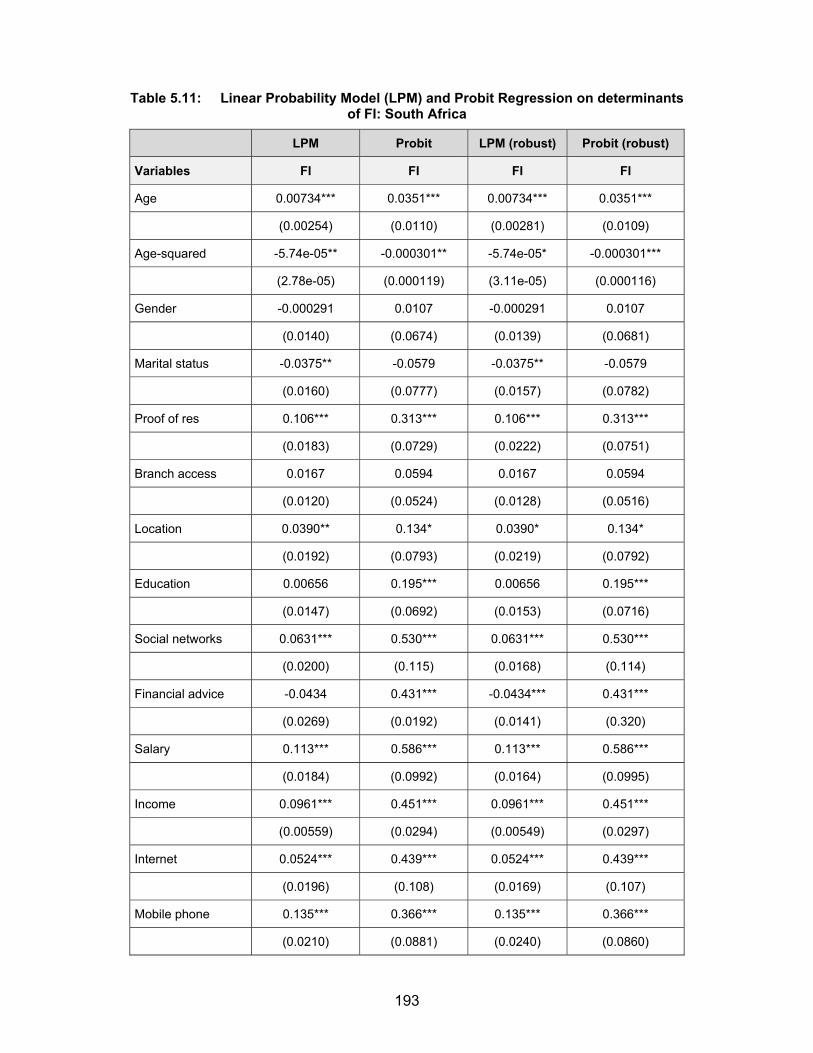
193
Table 5.11: Linear Probability Model (LPM) and Probit Regression on determinants of FI: South Africa
LPM Probit LPM (robust) Probit (robust)
Variables FI FI FI FI
Age 0.00734*** 0.0351*** 0.00734*** 0.0351***
(0.00254) (0.0110) (0.00281) (0.0109)
Age-squared -5.74e-05** -0.000301** -5.74e-05* -0.000301***
(2.78e-05) (0.000119) (3.11e-05) (0.000116)
Gender -0.000291 0.0107 -0.000291 0.0107
(0.0140) (0.0674) (0.0139) (0.0681)
Marital status -0.0375** -0.0579 -0.0375** -0.0579
(0.0160) (0.0777) (0.0157) (0.0782)
Proof of res 0.106*** 0.313*** 0.106*** 0.313***
(0.0183) (0.0729) (0.0222) (0.0751)
Branch access 0.0167 0.0594 0.0167 0.0594
(0.0120) (0.0524) (0.0128) (0.0516)
Location 0.0390** 0.134* 0.0390* 0.134*
(0.0192) (0.0793) (0.0219) (0.0792)
Education 0.00656 0.195*** 0.00656 0.195***
(0.0147) (0.0692) (0.0153) (0.0716)
Social networks 0.0631*** 0.530*** 0.0631*** 0.530***
(0.0200) (0.115) (0.0168) (0.114)
Financial advice -0.0434 0.431*** -0.0434*** 0.431***
(0.0269) (0.0192) (0.0141) (0.320)
Salary 0.113*** 0.586*** 0.113*** 0.586***
(0.0184) (0.0992) (0.0164) (0.0995)
Income 0.0961*** 0.451*** 0.0961*** 0.451***
(0.00559) (0.0294) (0.00549) (0.0297)
Internet 0.0524*** 0.439*** 0.0524*** 0.439***
(0.0196) (0.108) (0.0169) (0.107)
Mobile phone 0.135*** 0.366*** 0.135*** 0.366***
(0.0210) (0.0881) (0.0240) (0.0860)
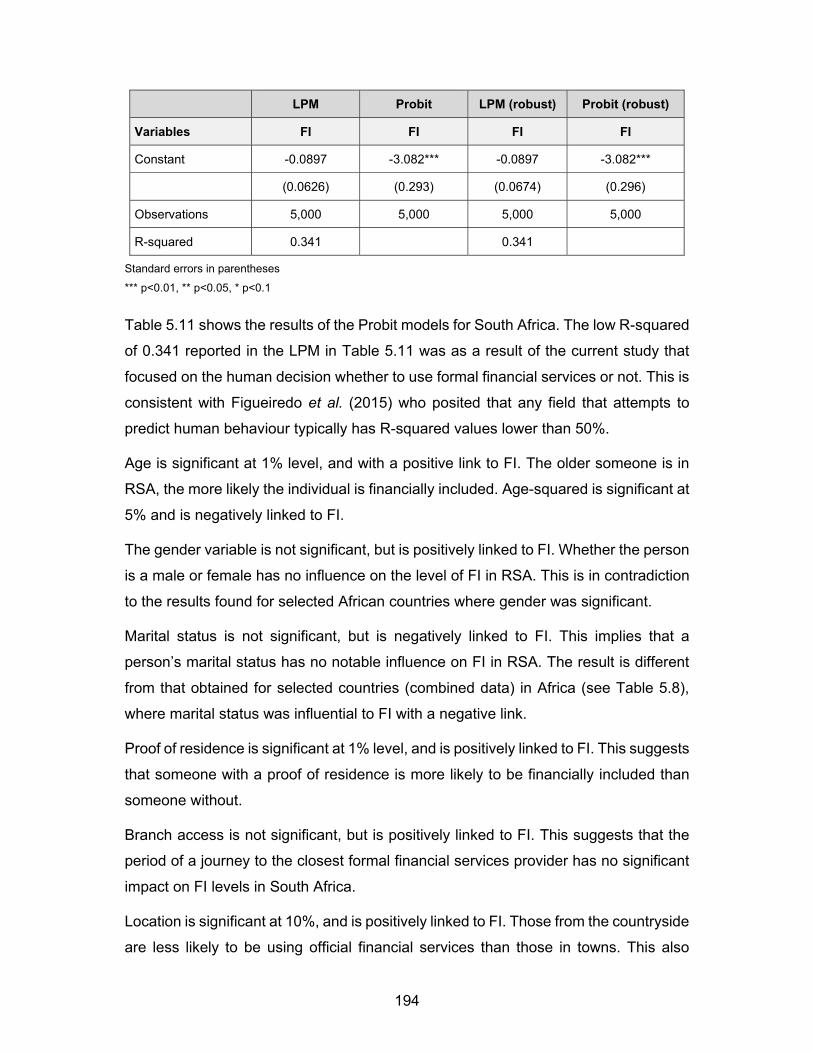
194
LPM Probit LPM (robust) Probit (robust)
Variables FI FI FI FI
Constant -0.0897 -3.082*** -0.0897 -3.082***
(0.0626) (0.293) (0.0674) (0.296)
Observations 5,000 5,000 5,000 5,000
R-squared 0.341 0.341
Standard errors in parentheses
*** p<0.01, ** p<0.05, * p<0.1
Table 5.11 shows the results of the Probit models for South Africa. The low R-squared
of 0.341 reported in the LPM in Table 5.11 was as a result of the current study that
focused on the human decision whether to use formal financial services or not. This is
consistent with Figueiredo et al. (2015) who posited that any field that attempts to
predict human behaviour typically has R-squared values lower than 50%.
Age is significant at 1% level, and with a positive link to FI. The older someone is in
RSA, the more likely the individual is financially included. Age-squared is significant at
5% and is negatively linked to FI.
The gender variable is not significant, but is positively linked to FI. Whether the person
is a male or female has no influence on the level of FI in RSA. This is in contradiction
to the results found for selected African countries where gender was significant.
Marital status is not significant, but is negatively linked to FI. This implies that a
person’s marital status has no notable influence on FI in RSA. The result is different
from that obtained for selected countries (combined data) in Africa (see Table 5.8),
where marital status was influential to FI with a negative link.
Proof of residence is significant at 1% level, and is positively linked to FI. This suggests
that someone with a proof of residence is more likely to be financially included than
someone without.
Branch access is not significant, but is positively linked to FI. This suggests that the
period of a journey to the closest formal financial services provider has no significant
impact on FI levels in South Africa.
Location is significant at 10%, and is positively linked to FI. Those from the countryside
are less likely to be using official financial services than those in towns. This also
195
suggests that there have to be more financial suppliers or financial services provisions
if high FI levels are to be achieved in South Africa.
Education is significant at 1%, and is positively linked to FI. The higher someone is
educated, the bigger the chance of being financially included in RSA.
The variable, ‘social networks’ is significant at 1%, and is positively linked to FI. A
person who uses social media is more likely to be financially included than an
individual who does not.
Financial advice is significant at 1% level, and is positively linked to FI. Someone with
access to financial advice is more likely to be financially included than someone
without.
Salary is significant at 1% level, and is positively linked to FI. This implies that an
individual who is formally employed and receiving a regular income is more likely to
be financially included than someone without a regular income.
Income is significant at 1% level, with a positive link to FI. This shows that the greater
the individual’s income, the greater the chance of being financially included.
Internet access is influential at 1% level, with a positive link to FI. Someone who uses
the Internet is more likely to be financially included than someone who does not.
Phone use is significant at 1%, and is positively linked to FI. The person who uses a
mobile phone is more likely to be financially included than someone who does not.
5.5.4 Data estimation and analysis for Eswatini
To achieve Objective number 2, to find the factors affecting FI in Eswatini, there was
a need to estimate the model of equation 15.
To find the factors influencing FI in Eswatini, the following model of equation was
estimated:
FISW = β0+ β1age + β2gen + β3mar + β4Proof + β5 Baccess + β6Loc + β7age2 + α1edu+
µ2 media+ α3Advice + µ4 internet + µ5phone +Ω1 sala +Ω2 Inc +℮, [15]
Where FISW is the financial inclusion indicator for Eswatini.
The estimated probit models for Eswatini are presented in Table 5.12 below.
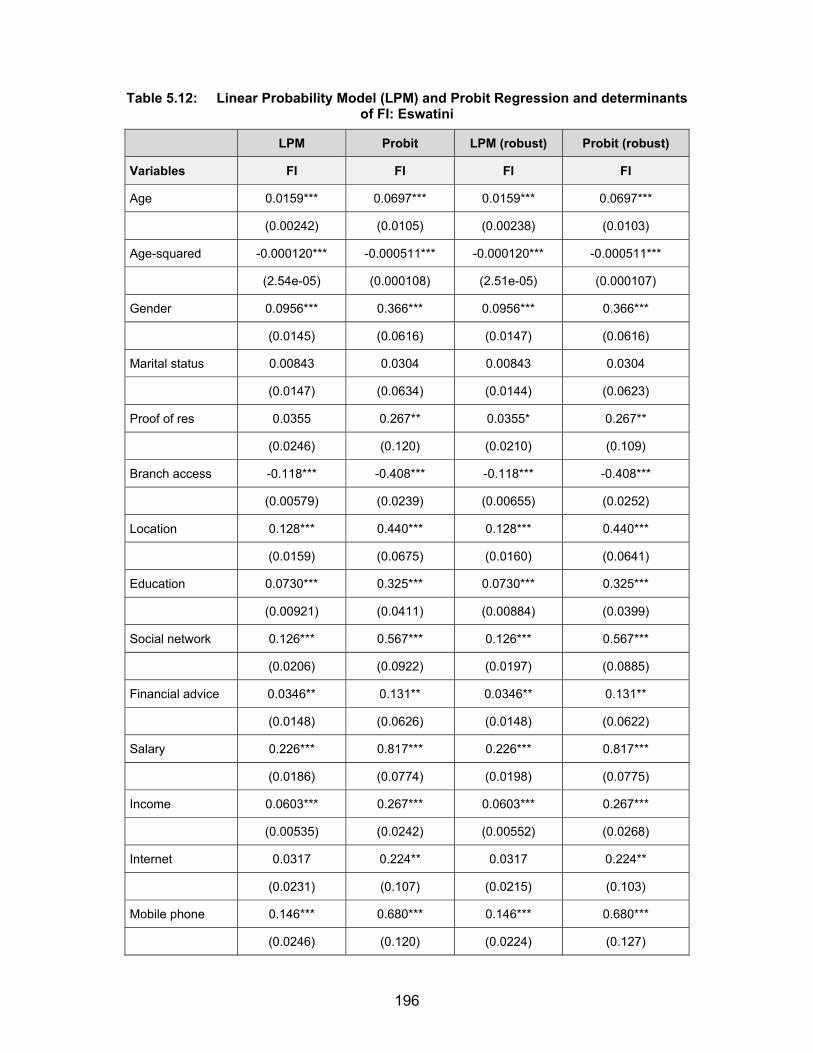
196
Table 5.12: Linear Probability Model (LPM) and Probit Regression and determinants of FI: Eswatini
LPM Probit LPM (robust) Probit (robust)
Variables FI FI FI FI
Age 0.0159*** 0.0697*** 0.0159*** 0.0697***
(0.00242) (0.0105) (0.00238) (0.0103)
Age-squared -0.000120*** -0.000511*** -0.000120*** -0.000511***
(2.54e-05) (0.000108) (2.51e-05) (0.000107)
Gender 0.0956*** 0.366*** 0.0956*** 0.366***
(0.0145) (0.0616) (0.0147) (0.0616)
Marital status 0.00843 0.0304 0.00843 0.0304
(0.0147) (0.0634) (0.0144) (0.0623)
Proof of res 0.0355 0.267** 0.0355* 0.267**
(0.0246) (0.120) (0.0210) (0.109)
Branch access -0.118*** -0.408*** -0.118*** -0.408***
(0.00579) (0.0239) (0.00655) (0.0252)
Location 0.128*** 0.440*** 0.128*** 0.440***
(0.0159) (0.0675) (0.0160) (0.0641)
Education 0.0730*** 0.325*** 0.0730*** 0.325***
(0.00921) (0.0411) (0.00884) (0.0399)
Social network 0.126*** 0.567*** 0.126*** 0.567***
(0.0206) (0.0922) (0.0197) (0.0885)
Financial advice 0.0346** 0.131** 0.0346** 0.131**
(0.0148) (0.0626) (0.0148) (0.0622)
Salary 0.226*** 0.817*** 0.226*** 0.817***
(0.0186) (0.0774) (0.0198) (0.0775)
Income 0.0603*** 0.267*** 0.0603*** 0.267***
(0.00535) (0.0242) (0.00552) (0.0268)
Internet 0.0317 0.224** 0.0317 0.224**
(0.0231) (0.107) (0.0215) (0.103)
Mobile phone 0.146*** 0.680*** 0.146*** 0.680***
(0.0246) (0.120) (0.0224) (0.127)
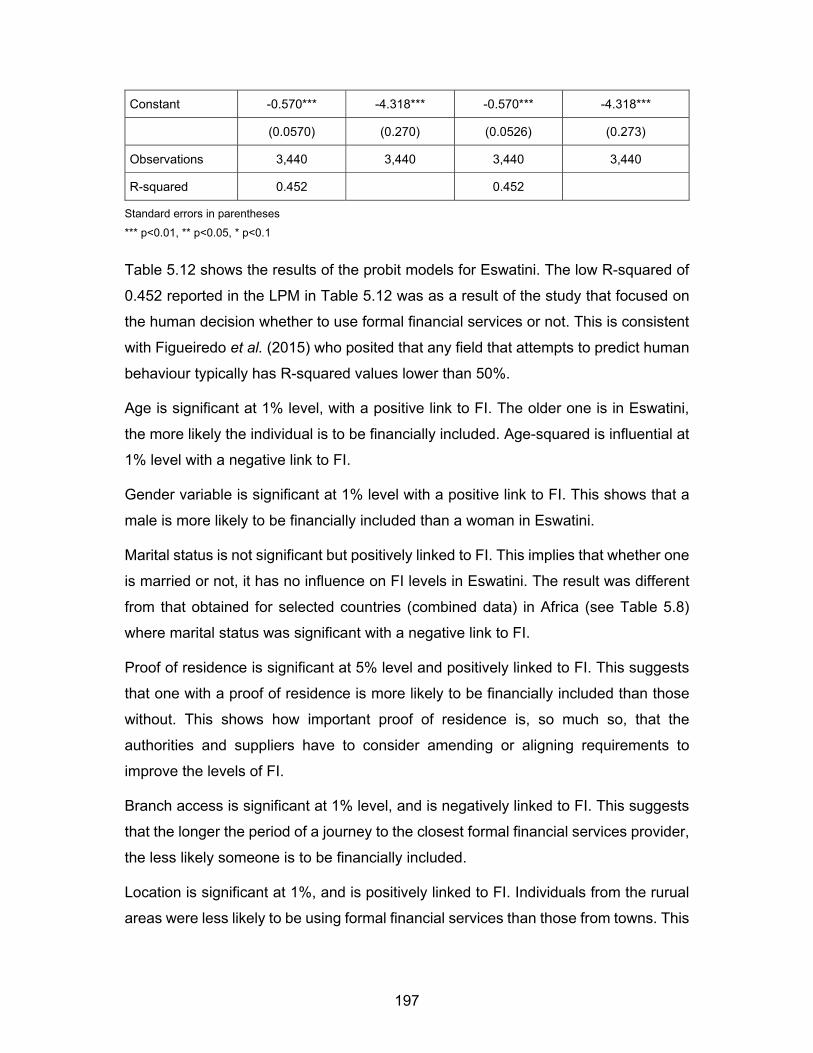
197
Constant -0.570*** -4.318*** -0.570*** -4.318***
(0.0570) (0.270) (0.0526) (0.273)
Observations 3,440 3,440 3,440 3,440
R-squared 0.452 0.452
Standard errors in parentheses
*** p<0.01, ** p<0.05, * p<0.1
Table 5.12 shows the results of the probit models for Eswatini. The low R-squared of
0.452 reported in the LPM in Table 5.12 was as a result of the study that focused on
the human decision whether to use formal financial services or not. This is consistent
with Figueiredo et al. (2015) who posited that any field that attempts to predict human
behaviour typically has R-squared values lower than 50%.
Age is significant at 1% level, with a positive link to FI. The older one is in Eswatini,
the more likely the individual is to be financially included. Age-squared is influential at
1% level with a negative link to FI.
Gender variable is significant at 1% level with a positive link to FI. This shows that a
male is more likely to be financially included than a woman in Eswatini.
Marital status is not significant but positively linked to FI. This implies that whether one
is married or not, it has no influence on FI levels in Eswatini. The result was different
from that obtained for selected countries (combined data) in Africa (see Table 5.8)
where marital status was significant with a negative link to FI.
Proof of residence is significant at 5% level and positively linked to FI. This suggests
that one with a proof of residence is more likely to be financially included than those
without. This shows how important proof of residence is, so much so, that the
authorities and suppliers have to consider amending or aligning requirements to
improve the levels of FI.
Branch access is significant at 1% level, and is negatively linked to FI. This suggests
that the longer the period of a journey to the closest formal financial services provider,
the less likely someone is to be financially included.
Location is significant at 1%, and is positively linked to FI. Individuals from the rurual
areas were less likely to be using formal financial services than those from towns. This
198
also suggests that there have to be more financial suppliers or financial services
provisions if higher FI levels are to be achieved in Kenya.
Education is significant at 1%, and is positively linked to FI. The higher someone is
educated, the higher the chance of being financially included.
The variable, ‘social networks’ is significant at 1%, and is positively linked to FI.
Someone who uses social media is more likely to be financially included than an
individual who does not.
Financial advice is significant at 5% level, and is positively linked to FI. A person with
access to financial advice is more likely to be financially included than someone
without.
Salary is significant at 1% level, and is positively linked to FI. This means that a person
receiving a regular income or who is formally employed, is more likely to be financially
included.
Income is significant at 1% level, with a positive link to FI. This shows that the higher
the earnings, the greater the chances of using official financial services.
Internet access is influential at 5%, and is positively linked to FI. Someone who uses
the Internet is more likely to be financially included than someone who does not.
Mobile phone use is significant at 1%, and is positively linked to FI. The person who
uses a mobile phone is more likely to be financially included than someone who does
not use a mobile phone.
5.6 CONCLUSION
The current study concludes that in the selected African countries, FI is determined by
age, gender, marital status, proof of residence, branch access, location, education,
social networks, financial advice, internet access, mobile phone, salary and income.
These findings were in line with the theoretical predictions. However, there were slight
differences in the results of the individual countries. The following differences were
found: 1) In Kenya, salary was non-significant; 2) In the DRC, age-squared, media,
income and the Internet were not significant; 3) In South Africa, gender, bank access
and marital status were not significant; and 4) In Eswatini, marital status was non-
significant. The results of the contribution of internet access, social media and financial

199
advice to FI were similar under both the LPM and Probit Models in all five models.
Universal access to formal financial services is feasible in Africa. If effectively utilised,
the new technologies, social media, financial advice, internet, transformative business
models and ambitious reforms, among other strategies, will improve FI levels.
Three categories of pre-valuation diagnostics, specifically, the descriptive indicators,
relationship examination and analysis of variance were done using the Stata Software
Package. Descriptive data entailed compiling the information into four categories,
namely, frequency, percentages, mean and standard deviation. Having revealed the
frequency, mean and standard deviation, the research discovered the trend as well as
the type of the link among all the variables using Pearson's Correlation.
Testing for differences in the study variables across countries was done using the
analysis of variance (ANOVA) examination to establish if there were notable variances
among the four selected countries’ data sets or not. The test was mainly done to
address Theme I that focuses on testing for differences in the study variables across
countries. The next chapter discusses the results presented in this chapter.
200
DISCUSSION OF RESULTS
6.1 INTRODUCTION
The prior chapter reported and interpreted the outcomes obtained from the selected
econometric estimation techniques consistent with the purpose of the study. The major
aim of the current research was to explore the determinants of FI in selected African
countries with more emphasis directed towards social networks. The chapter begins
by discussing the results addressing Theme I, which ascertain the differences to the
study variables across countries. Under Theme II, the results for the determinants of
FI in Africa are discussed. Determinants of FI in each of the selected countries are
discussed under Theme III.
This section includes a comprehensive discussion of the outcomes shown in chapter
five. Consistent with Sekaran and Bougie (2010), this section of the thesis presents
the research questions and tested hypotheses drawing conclusions in selected African
countries. The discussion explains how the answers fit relative to the existing body of
knowledge about FI (Brink, 1996).
6.2 THEME 1: DIFFERENCES IN THE STUDY VARIABLES ACROSS
COUNTRIES
Comparisons were necessary in the current research, since the surveys that were
used came from different countries. The surveys were done in rural and urban parts
of the selected African countries. The selected African countries are South Africa, the
DRC, Eswatini and Kenya. The four countries differ in many aspects that include
infrastructural availability, social conduct in terms of views and tradition. The
dissimilarities perhaps influence the individuals’ abilities and FI in these countries.
The Finscope surveys used in the current study showed the variances in banking
services supply and socioeconomic features across the selected countries.
Noteworthy, differences are present in the four countries given their economic
development, governmental, social and financial differences consistent with the study
results.
201
Significant differences in FI were present across the four countries. South Africa had
the highest level of FI (70%) among individuals. The results show support for the
hypothesis grounded on variances in individuals’ FI in the four countries. The study
results are consistent with Demirguc-Kunt and Detragiache (2005), Demirguc-Kunt
and Levine (2001) on disparities in FI across countries. Similarly, Demetriades and
Andrianova (2004) found that the level of FI differed by a country’s level of economic
growth. This also demonstrates that residents of countries with higher income have
more prospects of accessing formal financial products in comparison to lower income
countries. This is in view of the assertion that South Africa is an anomaly among
developing countries (World Bank, 2018). South Africa is regarded as a developed
country with good infrastructure but with huge social and economic problems.
The samples used included all age groups from 18 years to about 95 years in some
cases. Therefore, significant differences were present in age in the four countries. The
results show dissimilar distributions in age for respondents from the countries
investigated. The results provide support for the hypothesis based on differences in
age of people accessing financial services among the four countries. The study results
are consistent with Jukan and Softić (2016) who asserted that the young generation
might take time to secure formal employment. However, this also depends with the
nature of employment opportunities in a country.
The samples used had unequal and different weights on the gender variable. There
were significant differences in gender in the four countries. The results reveal
variances in access to financial services based on gender in the selected economies.
The results give support to the hypothesis grounded on variances in gender. The
findings are in line with that of Aterido et al. (2013) who found varying levels of
women’s access to formal financial services across Sub-Saharan Africa.
There were significant differences in marital status in the four countries. The results
show the differences in financial services access based on marital status in the
selected African countries. The results also provide support for the hypothesis centred
on marital status. The study outcomes are in line with Ashraf et al. (2006) who
observed differences in access to financial services based on marital status in
developing countries.
202
The documents required and stringent requirements on the part of the banks differed
from one country to another. There were significant differences in proof of residence
in the four countries. The results show the differences in the nature of documentation
required or available for opening or accessing financial services. The results are in
support of the hypothesis based on proof of residence. The study results are
consistent with Johnson and Nino-Zarazua (2011) who found variations in proof of
residence required by banks in Kenya and Uganda.
Distance from formal financial services points or premises vary from country to country
and place to place. There were significant differences in branch access in the four
countries. The results reveal variations in the time taken to the nearest formal financial
services supplier across the countries. The results give support for the hypothesis
based on branch access. The study outcomes are in line with Anson et al. (2013) who
observed differences in distances to the nearest formal services providers.
In Africa, a significant population dwells in the rural areas and proportions may differ
from country to country. There were significant differences in location in the four
countries. The results reveal differences in accessing financial services by those in
urban and rural areas. In some countries, infrastructure is more developed causing
variations in distribution of financial services. The findings give support for the
hypothesis grounded on differences in location. The results of the study are consistent
with that of Babu (2015) who found differences in the provision of financial services in
different districts in India.
There were significant differences in education in the four countries. The results reveal
differences in financial services access based on individual educational levels. The
results provide support for the hypothesis based on education in the selected African
countries. The study results are consistent with Divya (2014) who found variations in
education levels of individuals from different countries.
Access to or use of social networks differs from place to place, and in some cases,
was determined by age. There were significant differences in social network use
across the four countries. The results show that social network participation varies
from individual to individual across countries. The results are in support of the
hypothesis based on differences in social media use in the selected African countries.
The result was in line with Chen (2010) who found differences in the use of Twitter to
203
connect with others. In that regard, Chang and Zhu (2011) found differences in terms
of social networking adoption in China.
Advice on financial matters is determined by among other things the desire to make
informed decisions. Significant differences were present in financial advice in the four
countries. The results reveal the differences in access to financial products for
individual financial decisions in the four nations. The results show support for the
hypothesis centred on variances in financial advice. The study outcomes are in line
with Casaló et al. (2011) who observed differences in following advice on online travel
communities. Though the advice was not on financial matters, it demonstrates that
advice influences one’s decision-making.
The nature of jobs available for the economically productive citizens varied from one
economy to the other. There were significant differences in salary in the four countries.
The results reveal the differences in the nature of jobs for adults across the selected
African countries. A job can be formal or informal and that may influence the
distribution of financial products. The results also back the hypothesis based on
differences in salary. The study results are consistent with Honohan and King (2009)
who found variations in the nature of jobs across countries.
A number of factors influence individuals’ income ranging from individual
circumstances to level of economic development. There were significant differences
in income for the four countries. This shows that income varies from individuals across
countries. The results support the hypothesis based on differences in individual
income. The study results are consistent with Chithra and Selvam (2013) who found
variations in income of samples from different states in India. Karian and Morduch
(2009) assert that there are differences in income across the world.
ICT infrastructure is crucial in delivery of financial products and services. There were
significant differences in internet access in four countries. The result reveals
differences in access and use of internet facilities, which also depends on
infrastructure availability. The outcome gives support for the hypothesis on variances
in internet access. The study results are consistent with Aliyu and Tasmin (2012) who
found variations in internet use. In this regard, Bakari et al. (2018) found disparities in
internet access across ten African countries.
204
Communication structures are vital for convenience and costs in financial services
delivery. There were significant differences in mobile phone use in the four countries.
The results reveal differences in possession and use of mobile phones across the
selected African countries. The outcome gives support for the hypothesis on variances
in mobile phone use. The study results are consistent with Andrianivo and Kpodar
(2012) who found differences in the use of mobile phones in the samples used.
Though no empirical evidence exists on differences in FI and other independent
variables of the study, the outcomes show the necessity for wider and accurate
consideration of the complex structure of societies. Moreover, the significant and
consistent variances indicate that future studies ought to acknowledge that individuals
across countries may possess the same characteristics but their capabilities to access
and use financial services differ. The capabilities differ particularly when evaluated
separately. The noteworthy outcomes support the participation in the financial system
regardless of the variances in individual characteristics.
The study results show variances in variables influencing FI. The results show an
uneven distribution of formal banking services in the selected countries. This also
shows the importance of utilisation of individual capabilities. For development,
particularly, in the underprivileged African nations such as Eswatini, banking needs
ought to be met. This is in view of improving supply-side strategies and reinforcing
demand-side factors inhibiting FI. Therefore, the initiatives by policy-makers and
financial institutions should focus on the delivery of appropriate products and services.
The products and services must be easily comprehensible and culturally suitable to
those who live in those countries or communities. The implementation ought to take
place regardless of the challenges financial suppliers may experience in providing
those segments.
6.3 THEME II: DETERMINANTS OF FINANCIAL INCLUSION IN
SELECTED AFRICAN COUNTRIES
This section discusses results presented in chapter five that address Theme II. In the
current study, the hypothesised model that shows the contribution of age, age2,
education, education, marital status, bank branch accessibility, location, internet
access, salary, income, proof of residence, financial advice, gender and mobile phone
to FI shows disparities in the results obtained in Chapter 5. Based on the FI model and
205
research outcomes, this segment gives meaning to the hypotheses tested for the
selected African countries. Presented in this segment is a comparison of the findings
to extant literature and theoretical viewpoints.
This study sought to examine how age influenced FI in designated African countries.
The results indicated a significant positive link between age and FI as projected (see
Table 4.3). The hypothesis H031 that age has no influence on FI was rejected. The
results show that age positively affects FI in selected African countries. The results
indicated a strong negative correlation between age-squared and FI, which shows that
age, has a non-linear relationship with FI. This was in line with Fitzpatrick and Kingston
(2008) who found a non-linearity in the relationship between Age and FI. The barriers
that old people encounter include knowledge gap created on current systems of
money management, dislike of online banking methods, less older people using credit
card/s, increased preference of using cash, mental health and physical problems as
well as scepticism of assistance on financial matters. Policy-makers and financial
institutions can take the initiative to design services designed to assist older people in
dealing with complex financial issues, financial aptitude and cybercrime. Services such
as financial advice, guidance and information supply through different electronic
platforms.
Between the age of 18 and 23, there may be lower uptake of financial services as the
group is mainly composed of college going citizens, higher unemployment and lower
financial independence levels. From 24 onwards, that population segment begins to
work or become economically active and beginning to be financially independent thus
the probability of financial services use increases. The findings are consistent with
Zins and Weill (2016), Clamara et al. (2014) and Altunbas et al. (2010) who established
that age was influential to FI in different countries. The findings of the study support
the Life-Cycle Theory (LCT) that acknowledges the differences in consumption
requirements and income at various stages in one’s life.
This study sought to investigate how gender influenced FI. The results indicated a
strong positive association between gender and FI as projected. The alternative
hypothesis that gender contributed to FI among adults in selected African countries
was supported. Males were more probable to be financially included than females.
The difference could be emanating from an imbalance in job opportunities in the

206
different countries. As more males occupy the formal job space where bank accounts
are required, the uptake is more likely to be that of the female counterpart.
The results resonates with Demirguc-Kunt et al. (2013), who found that
underprivileged women were 28% less probable to be financially included than poor
men. The solution lies on the existence of opportunities to deliver a wide-range of
official financial products for women and the poor. Many studies have found that more
formal financial facilities still have to reach the women (Demirguc-Kunt et al., 2017;
Koch et al., 2014). As reported by Global Findex (2019), 57% of women on the globe
were financially included compared to 64% of man. Gender gap has continued in spite
of more people having accessibility to official financial facilities particularly the
impoverished. The imbalance in some countries may be traced to the member owned
institutions (MOI) that primarily serve men with inadequate collateral, no proof of
identity, mobility limitations and low financial literacy levels. Focus should be put as
well on agricultural activities dominated by men where women do not have the
collateral requirements.
The prevailing formal financial system structures continue to discriminate women for
the same reasons. More attention to economic women empowerment and financial
needs is required to improve gender equality and FI in selected African countries
(Shihadeh, 2018; Allen et al., 2012; Johnson & Nino-Zarazua, 2011). Other measures
may include collecting gender-disaggregated data by all stakeholders for development
of tailored financial services and products. Training of financial institutions’ personnel
for provision of expertise and financial education to women will also go a long way into
improving women’s FI levels. Policy-makers and banks can advocate for the relaxation
of KYC as well as AML (anti money laundering) by developing guidelines promoting
different collateral registries. Such an arrangement can become a building block for
fintech firms that can create new instruments to cater for women’s financial needs.
This study sought to investigate how marital status influenced FI. The results indicated
a negative link between marital status and FI. The alternative hypothesis that marital
status influenced FI among adults in selected African countries was supported. A
financial decision making process made by a single person may differ from that of a
married person. Results of the current study show that the married were more likely to
be using formal financial products than the single.

207
The result is in line with findings by Yao and Hanna (2004) who stated that never
married males (70%) were likely to take the greatest risk, after that married males
(66%), next were divorced men (61%), married females (55%), never married women
(50%), divorced females (45%), surviving husband (38%) and surviving wife (27%).
The process of decision-making may differ in the case of a married individual and an
unmarried one. In the selected African countries model, married (49.6%) had a lower
rate than the unmarried (50.4%) did. The relatively less usage of official financial
facilities by the married may escalate their exposure to income shocks and decrease
the ability to save and invest as couples. The policies designed, services and products
offered by financial organisations must consider the differences that exist in marital
status to improve FI levels.
This study sought to investigate how proof of residence influenced FI. The outcomes
showed a significant positive association between proof of residence and FI as
projected. Documents such as water bills, local council bills, leases, and title deeds
among others are widely accepted by banks. Those formally employed can use letters
from the employer indicating their residential address. Without the required
documentation, a person is incapable of opening a formal account. The alternative
hypothesis proof of residence contributed to FI among individuals in selected African
countries was supported.
One must have some form of proof of residence where s/he is staying to open an
official financial account. The findings resemble that of other studies done around the
globe (Tuesta et al., 2015; Martinez et al., 2013). According to the Bank of International
Settlement, the reasons for this requirement include know your customer (KYC) and
dealing with money laundering issues (Lessambo, 2015). As many people fail to open
accounts because of lack of the required documents, financial institutions can consider
other forms of verification such as witnesses to testify of the background of the
prospective customer.
This study investigated how time taken to the nearest formal financial services point
influenced FI. The outcomes showed a strong negative relationship between branch
access and FI as projected. Physical financial facilities, such as bank branch or agent,
still influence an individual’s financial decision-making. The cost of travel and lack of
trust are other significant contributors to the non-use of formal financial services.
“Seeing is believing” makes individuals more confident when they deal with the bank
208
which is in a physical structure. The alternative hypothesis that branch access
influenced FI among adults in selected African countries was supported.
The results resonate with Osei-Assibey (2009:214) who argues that branch opening
is mainly driven by market size, physical infrastructure, level of technological
advancement and security concerns. Technology could also reduce the costs or
problems associated with distance but the challenge in many African countries is the
low level of literacy. The other problem could be poor infrastructure in many areas in
African countries. To enhance FI levels, digitilisation may go a long way into solving
problems of inconvenience and related transaction costs (Omarini, 2017, 2011).
Technology can be embraced by banks in providing enhanced customer services for
convenience to customers and time saving. Osei-Assibey also argues that the will or
ability of one to open an account is not sufficient. There must be financial institutions
available because the longer the distance to a bank, the more the transaction costs
are incurred. The distance from and the costs of accessing services have the potential
to discourage owning a bank account.
Living in the rural or in the urban areas has a huge bearing on an individual’s access
to formal financial services in the selected African countries. This study investigated
how location influenced FI in selected African countries. The outcomes indicated a
strong positive link between location and FI. The alternative hypothesis that location
influenced FI among individuals in selected African countries was consequently
supported. The results reveal that those from rural places are less probable to be
financially included. The non-availability of facilities in the rural areas reduces the
chances of individuals to be financially included. The lack of infrastructure results in
many using local informal facilities for saving and borrowing purposes.
The problem of lower FI levels in remote areas can be solved by bank agencies’ use
in rural business centres. The outcomes of the current study are consistent with
Hirschland et al. (2008) who argue that the rural are generally poor, and, the poor are
mostly rural. The rural population has inferior accessibility to formal financial facilities
than those in towns and cities. Financial institutions can collaborate (engage) with
member owned institutions (MOI) that is credit unions, cooperatives and savings clubs
to use banks’ platforms to access official financial facilities. The usage of banks’
platforms is safer and governments are set to benefit from transactions and savings
done through formal financial institutions. The created platforms may also lead to more
209
innovative financial products coming on board. This arrangement will enable banks to
reach the most sparsely populated rural areas and the clients to enjoy the tailor made
financial products and facilities. For the policy-maker, this is one way to alleviate the
high poverty levels associated with rural areas as appropriate financial services are
delivered. The microfinance bank model may also work as a solution for these
communities (Chao-Béroff, 2007). Therefore, it is vital for the policy-makers and
suppliers of financial services to ensure that distance does not affect financial services
delivery to the entire population. Promoting technology-based transactions may go a
long way in ensuring universal accessibility of official financial facilities because those
in the remote areas will not be deterred by distance.
Education is important for reading and writing purposes as well as appreciating
financial services’ needs. This study examined how individual education influenced FI.
The results indicated a strong positive link between education and FI. The alternative
hypothesis that education influenced FI among adults in selected African countries
was supported. Higher levels of education increase the likelihood of an individual using
formal financial services.
The role of education in promoting FI is critical in the selected African countries. The
outcomes of the present research h are consistent with a number of empirical studies
done (Atkinson & Messy, 2013; Atkinson, 2008). The more superior one’s level of
education is, the better the appreciation of financial matters and financial education is
easier to impact on such a person. Education is a vital element for promoting FI,
consumer protection and eventually financial stability. The academic education has to
be complemented by financial education however, the former fosters the latter.
Financial literacy programmes at national level are important to achieve FI in Africa.
As well, this study sought to investigate how the nature of jobs influenced FI. Earning
a monthly salary, weekly wage or periodical income from a job increases the likelihood
of an individual’s use of formal financial services. The results indicated a strong
positive link between salary and FI. The alternative hypothesis that salary influenced
FI among adults in selected African countries was supported. In countries such as the
DRC that have a larger population that is informally employed, lower FI levels prevail.
The youth are the worst affected, as they may still be at school or looking for stable
job opportunities which has an influence on their FI status.
210
The outcomes concur with the findings of Kumar (2013) and Kumbhakar and Mavrotas
(2008) who found that a person who is formally employed is more likely to be using
official financial facilities. In many evolving or developed economies, a formal job
means earning income periodically. Such a scenario is associated with high levels of
formal financial services use. There is also an argument of reverse causation, where
high FI levels improve job creation in an economy. Several empirical studies and
traditional economic literature have focused on these relationships, and there is a
general view that the linkages are real. In many developing countries, the formal
employment level is low, and for FI levels to be improved, formalisation is key.
Millions of families generate jobs for themselves by becoming self-employed micro-
entrepreneurs because they have no alternative. If high levels of informal employment
prevail, the use of official financial facilities becomes low. In reference to youths, Justin
et al. (2016:4) argue that accessing formal financial services may be difficult as it is
not easy for a young person in the labour market today. The need to create jobs or
formalise the economy must assist in policy formulation and programme interventions
that are designed specifically for youth financial products that will stimulate the
productive activities associated with job creation.
Individuals in the lower income brackets are less likely to be financially included
because of a low disposable income. The study investigated how income influenced
FI in selected African economies. The results indicated a strong positive link between
income and FI. The alternative hypothesis that income contributed to FI among
individuals in selected African countries was upheld. The unemployed or those who
earn little or nothing at all in a month are less likely to be financially included.
The outcomes are in line with some studies that found income as the greatest
influential economic determinant of demand for formal transactions (Beck & De la
Torre, 2006; Schreigner & Nagarajan, 1998). There is consensus that trade and
industry expansion and the related surge in per capita income raise the necessity for
more sophisticated facilities. The results support the Harrod–Domar Model that
indicates that trade and industry expansion is centred on upsurge of savings and
investment. One saves when having surplus income so the more one earns the more
likely s/he is financially included.

211
If income leads to greater FI or financial expansion and ultimately economic
progression, what will become of those with less or no income? Some scholars are of
the opinion that financial sector depth directly contributes to the lessening of poverty
by supplying or improving the poor’s ability access to official financial facilities (Park &
Mercado, 2015; Amidžić, Massara & Mialou, 2014). Many economists believe that
financial industry expansion and depth has a significant influence on the poor. The
main reason being information asymmetry as there are credit constraints in funding
the projects of the poor because they cannot fund their projects and have no collateral
(Banerjee & Newman 1993; Galor & Zeira, 1993; Aghion & Bolton, 1997). The
restrictions limit the poor from taking advantage of investment prospects that arise.
The situation can also be worsened by the fact that the poor will be financially excluded
(no accounts with formal financial intermediaries) and those institutions with a capacity
to extend credit will be having no history of the borrower.
High disparity levels are also a cause for concern in fighting poverty, and FI should be
a policy priority (Kanbur & Lustig, 1999). Economic evolution and wealth sharing are
interrelated in a number of channels, and the success of economic growth translating
to the amelioration of poverty is determined by the early stage of inequality (Lustig et
al., 2002). It is also vital for the government to introduce some strategies in the short
term to assist the public, as it may take long for the marginalised to enjoy the benefits
of a strategy or measure.
The use of mobile telephones increases the accessibility to financial services and
products. With mobile phones, those that see and believe are capable of saving and
borrowing and track their balances. This study investigated how mobile phone use
influenced FI. The outcomes showed a strong positive link between mobile phone use
and FI. The alternative hypothesis that mobile phone use influenced FI among adults
in selected African nations was upheld. Social networks and internet access to achieve
phenomenal FI levels can complement the use of mobile phones. The correlation
results in Table 4.2 show positive links among the variables.
The current study results reveal that mobile phone use is an important factor in
influencing FI levels in African countries. The results are in line with that of Ragui
(2017) who researched on how mobile banking services can enhance FI levels of
women in Kenya. Since mobile banking involves the use of mobile devices, greater
use of the gadgets improves FI levels in African countries. The findings of significance

212
of mobile phones use in determining FI levels becomes a building block for digital
financial services accessed through these gadgets.
The use of phones may result in strategic designs of financial products that attract
women entrepreneurs. Studies have also shown that women consider mobile banking
as a convenient and safer way of banking (Seng & Lay, 2018; Ragui, 2017) in
comparison with traditional physical banking. The demand for such products shows
the need for financial services but inappropriate ones may be available. On the
introduction of digital credit in Kenya, women entrepreneurs were not keen to use the
credit facility and banks were cautious on offering such products because of the risk
perceived. Therefore, banks have to collaborate with phone services providers to
come up with tailor made products. However, the financial institutions could still be
sceptical in offering such products, for example, credit facilities with no collateral.
There is need for bank-mobile phone partnerships for designing tailor made products
for the financially excluded population and the under included. There is need for
initiatives to enable new partnerships that make it easy for banks to integrate with
strategic players. Embracing of new FinTech partnerships by banks will significantly
enhance FI levels. Banks may be strong in the provision of core products, established
financial processes and payment rails but weak in ICT applications. For fast-paced
technologies, data analysis, artificial intelligence and customer sentiment analysis, the
more IT-focused FinTech players outpace banks. More appropriate financial services
and products may be developed if such partnerships are fostered to enhance FI levels.
This study investigated how internet access influenced FI in the selected African
countries. The outcomes showed that internet had a significant positive correlation
with FI (p<.001). The alternative hypothesis that internet access influenced FI among
adults in the four countries was upheld.
Internet plays an essential function in the world today. Online official financial facilities
break the physical distance as one can access services from anywhere as long as
there is internet connection. It brings convenience for there is no need to visit a bank
branch for some online transactions and payments. Information of different financial
products is available online and one must be in a position to open an account online.
The use of ICT brings the latest marketing strategies that are employable to marketing
213
of financial services. Content marketing is an approach that can be used for
distribution of content.
The evidence calls for policy-makers to foster the development of internet
infrastructure to enhance the FI levels of individuals in different countries. Though
Chen et al. (2018) examined the association between internet use and access to
outside finance companies, the study unit was not individuals, focus was on one highly
developed country of China. Also Chen et al. used a dependent variable that was
limited to formal/informal borrowing yet the scope is broader. Bruhn and Love (2014)
acknowledged that internet access alleviates information asymmetry between banks
and potential borrowers. The existing studies were done in more advanced economies
such as Mexico. Other conclusions were based on China and some European
countries. Lenka and Barik (2018) examined the contribution of net usage to FI in
South Asian Association for Regional Cooperation (SAARC) nations, however, limited
proxies on the dependent variable were used in the study.
The study results supported a model postulated by Chen et al. (2018). The model
considered the effect of productive setups of people via the internet on individuals’
access to finance and social welfare. They developed their model premised on the
Principal-Agent Model. The model developed in the study predicts that internet access
has an outstanding progressive impact on finance access. The study also suggested
that internet access shrinks the difference between the real and ideal social gross
investment level. However, the model does not consider the influence of internet use
on FI levels of individuals. Based on the results of the current study, it can convincingly
be concluded that internet access can positively influence FI.
It is therefore imperative for governments to ensure internet infrastructure is in place
across their countries. One in the remote areas has to access the bank online so as
not to be disadvantaged because of the absence of branches in the area. The use of
internet reduces costs both for the supply and demand sides because there is no
human interaction and travelling. The banks have to be innovative to enhance their
system infrastructures and embrace cheaper internet alternatives. The benefit of
internet platforms is the minimal costs involved, providing easier and broader
accessibility to target audience. The other advantage is that with the advent of internet
technology, people are able to access such platforms from anywhere, making it
necessary to employ some effective marketing strategies.
214
This study sought to examine how financial advice influenced FI. The outcomes
showed a strong positive association between financial advice and FI (p<.001). The
alternative hypothesis that financial advice influenced FI was consequently supported.
The results reveal that one who receives financial advice is more probable to be using
official financial facilities. A financial advisor in this case was an expert or consultant
whose advice is likely to cause one to make an informed decision. Ceteris paribus,
financial advice may encourage one to use formal financial services and reach his/her
financial goals. Professional financial planners can assist in organising finances,
savings, investments and projects of an individual. The establishment of such
professional bodies will advance FI in many countries in Africa.
Financial advice enhances investment management but the current study shows that
it can be used to enhance uptake of formal financial services. This was in support of
Trans-theoretical Model (TTM), which focuses on the decision-making and intentional
change of an individual. Other researchers applied TTM in credit counselling situation
to advance a measuring method to assist users’ transformation behaviours that
eradicate detrimental credit card arrears (Xiao, Newman et al., 2004). TTM was used
in low-income consumers’ financial education programmes and there are some
educational strategies that fall under the TTM framework that were developed
(Shockey & Seiling, 2004). In addition, TTM was applied in provision of advice for
women to be astute investors (Loibl & Hira, 2007).
The promotion of financial advisors or planners is crucial, as many people are sceptical
about their relevance and cost. Financial planners and investment advisors can work
wonders for one’s financial life. Furthermore, financial advisors look beyond just
banking and investments. In this dynamic and complex environment, it has become
more important to consult experienced and qualified guidance in securing a successful
financial future. Many developed economies have these professional bodies in place
but they are not common in majority of African countries. It becomes imperative for the
governments to make it easier for all citizens to access and benefit from the right
advisor for their individual objectives and needs. The professional financial advisor
also plays the following roles: tailor a plan to assist in achieving one’s short and long-
term goals; protect one’s assets; tax advice; investment strategy formulation and
retirement plan. Studies have also shown that financial advice also improves physical
health, increased personal happiness and ultimately standard of living.
215
Many researchers, financial institutions and governments have overlooked the use of
financial advice to improve FI. The current study has found that those who have access
to financial advice are more probable to be financially included. The extant literature
has not addressed the influence of financial advice on FI due to shortage of
appropriate information.
Though there may not be support in extant literature on the contribution of financial
advice to FI, financial advice enhances peace of mind and financial confidence
(Montmarquette & Vietnnot-Briot, 2012). Financial advice inspires one to make a
desirable financial decision to improve one’s standard of living (Xiao et al., 2004;
Hilgert et al., 2003). The current study results support the Theory of Planned
Behaviour (TPB) that emanated from the concept of rational deed (Fishbein & Ajzen,
1975). The TPB is more appropriate when actual control and probability of success of
behaviour performance are suboptimal. The TPB's main input is the notion of
perceived behavioural control that can be described as somebody's opinion of the
challenge or simplicity of acting in a particular way (Ajzen, 1987). Based on the findings
of the current study, it can justifiably be concluded that financial advice has a positive
influence on the uptake of formal financial services.
In sum, FI in selected African countries (combined data) is determined by age, gender,
marital status, proof of residence, branch access, location, education, social networks,
advice, internet access, mobile phone, salary and income. All variables considered in
the selected African countries (combined) model were significant. In view of the
results, to enhance FI, there is need to: 1) Expand access points; 2) Create a
conducive regulatory environment; and 3) Improve financial capability. There is also
need to drive scale and viability through government programmes by reaching women
and rural dwellers. Attention can be on encouraging the use of formal financial services
through awareness programmes or social media platforms. These initiatives
encourage account use and digitalise payments, thereby creating accessibility to
credit, savings and insurance services.
The second research question of Theme II, that seeks to find the effects of social
networks to FI, is provided for in Section 6.3.1 below.
216
6.3.1 Social network and financial inclusion
The current study investigated how social networks use influenced FI in the selected
African nations. The results indicated a strong positive link between social media and
FI (p<.001). The alternative hypothesis that social media influenced FI among
individuals in the four countries was upheld.
The significant results show that social networks use can be an essential tool to
promote FI in many countries in Africa. Social networks help make the world a global
village and financial players can use the platforms to market services and products to
target audience. As financial exclusion remains high across Africa, with high demands
for technology to improve financial access to all, social networks have been widely
used to market other businesses but the financial industry is yet to utilise it. The
outcomes of the current study demonstrate the need to use social media for marketing
financial products and facilities as well as to disseminate information. As audiences
become active, engagement and converting information to existing and prospective
customers is easier. Social networks have several benefits that include low costs
involved, increased visibility, promotion of content offers, increased trust and
credibility. Nowadays, the sense and scope of content may include images, info
graphics, podcasts, videos, and so on, making social platforms appropriate. The
introduction of smartphones enables individuals to utilise different social network
platforms from anywhere. This becomes imperative to design appropriate marketing
strategies to enhance FI levels. Social platforms are for not only raising brand
awareness but also increasing expert-based recommendations while creating more
traffic and ultimately greater leads.
To the best of the author’s understanding, no research has investigated the influence
of social media on FI. The extant literature has considered the effects of social
networks on other types of business, while the current study focuses on the
contribution of social network to FI. The current study used cross-sectional data to
determine the influence of social networks on FI at a personal (individual) level. Many
studies have concentrated on the user experience, views and personality, applying
these factors to prompt the behavioural, attitudinal and essential features of social
network consumers. Some studies used the TAM (Technology Acceptance Model) to
investigate the supposed expediency of virtual networks. For instance, Hsu and Lin
(2008) researched the role of TAM in consumers’ intention and attitude to blog.
217
Hossain and De Silva (2009) applied TAM with a special emphasis on the use of online
societies under the control of societal connections. Steyn et al. (2010) researched the
TAM with respect to social network announcements in public affairs circles to
appreciate blog users’ intent to apply the essentials of the publications. Casaló et al.
(2011) applied TAM to study the consumers’ intent to take counsel. The study results
support the Personality Traits Theory that explains the characteristics that influence
user behaviour. According to Digman (1990), the Five Factor Model of Personality
Traits can be summarised as ingenuousness, friendliness, thoroughness, agitation
and socialness that collectively or separately increase behavioural objectives of users
of social media. The current study reveals that financial services players to advance
FI levels can use social networks.
6.4 THEME III: DETERMINANTS OF FINANCIAL INCLUSION IN
EACH OF THE SELECTED AFRICAN COUNTRIES
The current study sought to examine the contribution of age to FI in each of the four
selected African countries.
For Kenya, South Africa and Eswatini results indicated a strong positive link between
age and FI (p<.001). For the DRC, the outcomes show a significant positive correlation
between age and FI at 10% significance. The alternative hypothesis that age
influenced FI in each of the four countries was upheld. The significant and positive
correlation suggests that as one becomes older with more opportunities that include
steady income, s/he is more likely to be financially included. The results are in line with
some studies that found age influencing FI in different countries (Deaton, 2005; Barnet
and Solow, 2000).
This study sought to investigate the influence of age-squared on FI in each of the four
selected African countries.
For Kenya, South Africa and Eswatini, results indicated a strong positive association
between age-squared and FI (p<.001). The alternative hypothesis that age-squared
influenced FI in the three countries was upheld. The significant and positive link
suggests that financial services’ use rises with age and falls at some age threshold.
The results reveal that in retirement, income declines as one utilises the accumulated
savings. Many studies established proof of an arch designed shape of savings which
218
resonates with the Life-Cycle Hypothesis (Setterfield, 2010; Cynamon & Fazzari,
2008; Asteriou & Hall, 2007).
The results for the DRC showed an insignificant relationship between age-squared
and FI. This reveals that the null hypothesis that age-squared had no influence on FI
was accepted. Though the relationship was not significant, the coefficient was
negative. The results contradict the findings of Soumaré et al. (2016) who observed a
significant link between age-squared and use of financial services. The differences in
the association between age-squared and FI for selected countries (merged data) and
that of the DRC confirm the need for independent assessment.
The study investigated the influence of gender on FI in each of the four selected
African countries.
The results indicated that for the DRC and Eswatini, there was a strong positive
correlation between gender and FI (p<.001). For Kenya, the result was also significant
at 10% significance level. The alternative hypothesis that gender influences FI in the
DRC, Kenya and Eswatini was upheld. The significant and positive association
suggests that males are more likely to be financially included than females. Demirguc-
Kunt et al. (2013) maintain that the difficulties women experience to gain financial
access is exacerbated by the non-existence of collateral and inferior financial
schooling.
The results for South Africa indicated that gender had no significant relationship with
FI. The null hypothesis that gender had no influence on FI in South Africa was
accepted. The other study results show males more likely to be financially included
but for South Africa, it was different. This may be attributed to the fact that South Africa
has an outstanding economic empowerment for women in the region that includes
monthly government grants. The results were in line with Osei-Assibey (2009) who
found that gender had no influence on FI levels in Ghana.
The study investigated the influence of marital status on FI in each of the four selected
African countries.
The results for Kenya indicated a strong positive association between marital status
and FI (p<.001). For the DRC, the results show a significant relationship, at 5%
significance level. The alternative hypothesis that marital status influenced FI among
adults in Kenya and the DRC was upheld. The significant and positive relationship

219
suggests that a married individual is more likely to be financially included than a person
not married. The findings were consistent with that of Soumare et al. (2016) who found
marital status influential in West and Central African nations. Martinez et al. (2013)
found that the gender variable influenced FI in Mexico.
The results for South Africa and Eswatini showed an insignificant relationship between
marital status and FI. The null hypothesis that marital status influenced FI in South
Africa and Eswatini was accepted. The results were different from those obtained in
the selected African countries model. The reason could be the differences in culture
where anyone is capable of accessing financial services without considerations of
whether one is married or single.
The study explored the influence of proof of residence on FI in each of the four selected
African countries.
For Kenya and South Africa, the outcomes showed a strong positive association
between proof of residence and FI (p<.001). For the DRC and Eswatini, the
relationship was significant at 5% significance level. The alternative hypothesis that
proof of residence has influence on FI among individuals in Kenya, the DRC, Eswatini
and South Africa was upheld. The significant and positive association shows that those
with documents required for accessing financial services are more likely to be
financially included. This was also supported by some studies that revealed the lack
of proper documents and collateral by individuals caused one to rely on informal
sources of credit (Bending, Glesbert & Steiner, 2009; Zeller & Manohar, 2002).
The study explored the influence of branch access on FI in each of the four selected
African countries.
In terms of Kenya, Eswatini and the DRC, the results indicated a strong positive
association between branch access and FI (p<.001). The hypothesis that branch
access has an influence on FI among individuals in Kenya, Eswatini and the DRC was
upheld. The significant and positive association indicates that the further the distance
from a formal financial services supplier one is, the less likely s/he is financially
included. The results are in line with King (2011) who found distance to be a hindrance
to financial access to individuals in the rural areas.
The results were different for South Africa where the relationship between branch
access and FI in insignificant. The null hypothesis that branch access has no influence
220
on FI was accepted. South Africa has superior financial infrastructure compared to the
other three countries, which may explain the non-significant relationship found. Branch
access may not have a major effect in a country with formal financial services across
the country even in the remotest parts of South Africa.
The study also explored the influence of location on FI in each of the four selected
African countries.
For Kenya, the DRC and Eswatini, the results indicated a strong positive association
between location and FI (p<.001). For South Africa, the relationship was significant at
10% significance level. The alternative hypothesis that location has an influence on FI
among individuals in South Africa, Kenya, the DRC and Eswatini was upheld. The
significant and positive link shows that one from the urban areas is more likely to be
financially included than the one from rural areas. The results were consistent with
Clamara et al. (2014) who found that some groups such as females, youths and
individuals staying in rural areas had a difficulty in reaching the formal financial players’
services in Peru. However, literature reviewed revealed that the effects of location
could be reduced by applying technology and mobile money agents (Ouma et al.,
2017; Donovan, 2012).
The study explored the influence of education level on FI in each of the four selected
African countries.
For the four countries, the results indicated a strong positive association between
education and FI (p<.001). The hypothesis that education has influence on FI among
adults in South Africa, Kenya, the DRC and Eswatini was upheld. The significant and
positive relationship suggests that as one’s education level gets higher, the more likely
s/he is financially included. The results were consistent with Allen et al. (2012) who
found education influential to the use of formal financial services. King (2011) who
found that education influenced FI in Nigeria also supported the results. The findings
differ from Park and Mercado (2015) who found that primary school level had no
influence on FI levels in developing Asia.
The study went on to explore the influence of salary on FI in each of the four selected
African countries.
For South Africa and Eswatini, the results showed a strong positive association
between salary and FI (p<.001). For the DRC, the relationship was significant at 5%
221
significance level. The hypothesis that salary has an influence on FI among individuals
in South Africa, the DRC and Eswatini was upheld. The significant and positive
association shows that those formally employed are more probable to be financially
included. The results are in line with the finding of Sahoo, Pradan and Sahu (2017)
who found that the nature of employment determined the FI levels of two districts in
India. In Mexico, Martinez et al. (2013:15) found lack and inconsistent income flows
as the most influential barriers to formal financial services. Employment nature was
influential to FI in another study by Stanley and Bhattacharya (2008) in US.
The results indicated that the relationship between salary and FI was not significant
for Kenya. The null hypothesis that salary has no influence on FI among adults in
Kenya was accepted. The insignificant correlation contradicted Clamara et al. (2014)
who found the nature of employment influencing financial access in developing
countries.
This study explored the influence of income on FI in each of the four selected African
countries.
For Kenya, South Africa and Eswatini, the results indicated a strong positive link
between income and FI (p<.001). The null hypothesis that income influenced FI in the
three countries was upheld. The significant and positive association shows that as one
gets more income s/he is more likely to be financially included. The results were in line
with Adewale (2011) who found income influential to FI in Nigeria.
For the DRC, the outcomes show that the relationship between income and FI was not
significant. The null hypothesis that income had no influence on FI among individuals
in the DRC was accepted. There is a difference with the results from the merged data
model where income had a significant relationship with FI. Our result might surprise,
in that in literature reviewed, income is influential to financial access. The insignificant
relationship for the DRC contradicts studies that found income had an effect on the
individual’s FI status (Shihadeh 2018; Ghatak, 2013). In the view of the current study,
this is a crucial issue for future research on the relationship between income and
financial access in the DRC.
The study investigated the influence of mobile phone on FI in each of the four selected
African countries.
222
For Kenya, Eswatini, the DRC and South Africa, the results indicated a strong positive
correlation between mobile phone and FI (p<.001). The hypothesis that mobile phone
influenced FI among individuals in Kenya, Eswatini, the DRC and South Africa was
upheld. The significant and positive association indicates that one who uses a mobile
phone is more probable to be financially included than the one who does not use it.
The results were consistent with Seng and Lay (2018) who found mobile phone use
by individuals influential to FI in Cambodia. In Kenya, mobile phone services promote
FI, not only by giving users access to financial services through their mobile phones,
but also by supposedly functioning as a stepping stone toward the adoption of a
traditional bank account (World Bank, 2018).
The study explored the influence of internet access on FI in each of the four selected
African countries.
For Kenya and South Africa, the results indicated that there was a strong positive
association between internet and FI (p<.001). For Eswatini, outcomes indicated a
strong relationship at 5% significance level. The hypothesis that internet access has
an effect on FI among individuals in Eswatini, Kenya and South Africa was upheld.
The significant and positive association shows that one who has internet access is
more probable to be financially included. The outcomes are in line with Johnson and
Arnold (2012:2) who argue that technology ushers in lower transaction costs as the
cost of services is one of the major barriers to financial access.
Though there are, no studies in extant literature that support results of the current
study, Bruhn and Love (2014) acknowledged that internet access may ease
information asymmetry between banks and prospective borrowers. Bruhn and Love
showed that the effect was significant in poor people and those regions with low bank
penetration. Additionally, Lenka and Barik (2018) found a progressive link amongst
spread of internet services, increase in cell phone use and improvement of FI in the
region. Based on the outcomes of the current study, it can be concluded that internet
access can have a positive effect on FI in the countries, with a significant relationship.
For the DRC, the association between internet access and FI was not significant. The
null hypothesis that internet access has no effect on FI among individuals in the DRC
was accepted. No study explains the insignificance of the association between internet
access and FI. The results may be attributed to the low internet penetration rate of
223
8.62% in the DRC (World Bank, 2018). The ICT infrastructure in the DRC needs a lot
of improvement before the country can experience high levels of FI.
The study investigated the influence of financial advice on FI in each of the four
selected African countries.
For Kenya and South Africa, the outcomes indicated a strong positive link between
financial advice and FI (p<.001). In the DRC, the relationship was significant at 10%
significance level and for Eswatini at 5% significance level. The hypothesis that
financial advice had an influence on FI in the DRC, Eswatini, Kenya and South Africa
was upheld. The significant and positive relationship suggests that one who gets
advice on financial matters from experts or the knowledgeable is more probable to be
financially included. The findings are supported by studies that recommend the
teaching of financial education in schools and provision of specialised financial advice
(Lewis & Lindley 2015:20; Atkinson & Messy, 2013:40).
The results support the Theory of Reasoned Action that was founded on the idea that
individuals make reasoned and logical decisions to behave in a certain way by
evaluating the available information. Additionally, the findings also support the Trans-
Theoretical Model (TTM), which is an intentional change model that looks at an
individual’s decision-making. The model assumes that individuals do not change their
behaviours decisively and quickly.
The impact to influence an individual’s decision through financial advice supports the
Theory of Planned Behaviour (TPB), whose objective is to understand and predict
human action (Ajzen, 1991). These financial behaviours include decision on saving
and borrowing (Xiao et al., 2006; Hogarth et al., 2003). It can justifiably be concluded
that financial advice positively influences FI in each of the four countries. Financial
advice, internet access and social networks can complement each other as Table 5.3
shows positive correlation among the three variables. The policy-makers can
formulate policies to stimulate them all for FI goals to be realised in all the selected
countries.
The second research question of Theme III, that seeks to find the effects of social
networks to FI, is provided in Sections 6.4.1.
224
6.4.1 Social networks and financial inclusion
The study explored the influence of social networks on FI in each of the four selected
African countries.
For South Africa, Kenya and Eswatini, the results indicated a strong positive link
between social media and FI (p<.001). The hypothesis that social networks influenced
FI among individuals in the three countries was upheld. The significant and positive
association shows that those who use social networks are more probable to be
financially included.
For the DRC, the results showed that the relationship was not significant. The null
hypothesis that social media had no influence on FI was accepted. Our result might
surprise, in that the study had predicted a positive relationship. The result may be
attributed to the small number of the population that used social media. About 6% of
the DRC’s population used social networks compared to South Africa-25%, Kenya-
22% and Eswatini-25% (see Table 5.1). The low percentage of social networks users
may also explain the insignificant negative relationship suggesting that social media
made no contribution to FI in the DRC.
Regarding the significant results of the link between social networks and FI, the
Technology Acceptance Model (TAM) is supported. Davis (1989), to clarify the
necessity and application of innovative technology given people’s approach to its
implementation, advanced the TAM. This model has been adopted in social networks
researches to investigate the same in relation to a number of social network
technologies (see Casaló et al., 2011; Kwon & Wen, 2010). It can justifiably be
concluded that social networks can be a tool to improve FI in selected African
countries.
The significance of demographic factors shows how important they are in formulation
of policies by financial institutions, governments and other developmental bodies.
Demographics are important because they provide broad understanding of the
different characteristics of a population. The demographics are important for
developing a better understanding of the public and, accordingly, make strategic
business and marketing plans.
In FI, human capital factors are important because they increase capability and
improve uptake of regulated financial services. If policy-makers invest in its citizens
225
through their education and training, the better the FI levels. The significance of
income group factors prompts policy-makers to ensure that the population has more
disposable incomes. Policies can be formulated to ensure that the formal sector grows
at the expense of the informal. The policy-maker can focus on the communication
factors as they improve innovation in the financial services sector. Cost effective,
convenient and latest service delivery systems are a panacea for higher FI levels. The
use of social networks and internet services will go a long way to encourage use of
regulated financial services and products.
6.5 CONCLUSION
Formal financial institutions and individuals are anticipated to play a major function in
realising high levels of FI. Marginal consideration was given to the determinants of FI
specifically social networks, internet access and financial advice. The study results
show the Demographic, Human Capital and Income factors that contribute the use of
financial products and continually leading to FI/exclusion. Therefore, by distinguishing
the different factors, this study offers a new model and dimension of thought towards
FI.
Studies on social networks and FI are almost non-existent in light of the fact that in
other fields, social network is an affordable platform for communication. Literature
reviewed show that internet connections are vital for uptake of financial services
delivery and no study has focused on the influence of internet access on uptake of
formal financial services. Studies on financial advice focused on its effects on the
choice of financial services/products to a financially included individual. The study
results demonstrate that social networks, internet and financial advice can be used as
tools to improve formal financial services use.
The outcomes on the variances across the selected African countries give evidence
of the significant variances in FI as well as in the magnitude of abilities they possess
due to different political and socioeconomic aspects prevailing in the various
environments. It is worth noting that these Demographic, Human capital and Income
factors are significant in clarifying FI regardless of the differences. That is what the
current study also intended to reveal.
226
For the selected African countries model, significant relationships were established
between age, age2, education, religion, education, marital status, branch access,
location, internet access, salary, income, proof of residence, financial advice, gender,
mobile phone, and FI. However, the relationship with FI results differed on an
individual assessment of the four countries. Salary was statistically insignificant in
Kenya. Age-squared, social networks, income, and internet access were statistically
insignificant in the DRC. Gender, marital status, and branch access were insignificant
in South Africa. Marital status was insignificant in Eswatini.
These outcomes provide new evidence in the FI literature with its rich independence
and interaction of social networks. These help increase and improve the explanations
power of FI both at personal and institutional levels. This is in addition to other
Demographic, Human capital and Income factors considered in the study.
The results support and enhance the Financial Intermediation Theory that builds on
the idea that financial institutions serve to accumulate savings for investment
purposes. The savings accumulation for investment purposes reflects the Harrod-
Domar Model that postulates that the higher the savings rate or the bigger the savings,
the faster the rate of economic growth. The higher the FI levels in the selected African
countries, the easier it becomes to influence the saving rate in the economy. The
savings and investments take place through the formal financial system as postulated
in the Financial Intermediation Theory. The Financial Intermediation Theory and
Harrod-Domar Models frame the articulation of this study.
The subsequent chapter outlines the impact to new information, deductions of the
research, advice and propositions for future studies based on the outcomes of this
study.
227
CONCLUSION, IMPLICATIONS AND DIRECTION FOR
FURTHER STUDY
The key purpose of this study was to explore the determinants of Financial Inclusion
(FI) in selected African countries, with the emphasis on social networks. Financial
inclusion assists individuals in making reliable daily payments, decisions related to
investments, as well as supplying access to savings and enabling them to access
credit and other financial services. Research has shown that FI is a strategic enabler
in boosting economic growth, lessening poverty and enhancing wealth. Chapter 6
discussed the results addressing Theme I, Theme II and Theme III of the study. The
chapter presented the outcomes for the determinants of FI in Africa and in each of the
selected countries. The theories and their interpretations clearly showed that all the
variables considered influenced FI levels in the selected African countries. However,
the results of the individual countries showed that some factors were not significant
(see Tables 5.5 to 5.8).
This chapter aims firstly to abridge the empirical results obtained in the previous
chapter to make it easier to advise the African governments and other stakeholders
on the formulation of financial inclusion development policies. Secondly, to explain the
impact of the present research to the extant literature and to stress the limitations and
policy advice of the research. Finally, the chapter aims to wind up the study and to
give suggestions for further research.
7.1 CONCLUSION
African nations have inferior FI levels in comparison to other regions on the globe,
contributing to the low levels of development on the continent. Due to the pivotal role
played by the financial systems in alleviating impoverishment and stimulating trade
and industry expansion, it is imperative to appreciate the factors influencing FI in
Africa. The results of the study show the empirical evidence regarding the factors
contributing to FI in selected nations in Africa. The designated African countries being
South Africa, Eswatini, Kenya and the DRC. The confirmation provides further support
to the existing theory and literature enlightening FI matters. Therefore, the results add
to a wider FI discourse, particularly on the four dimensions of FI used for this study,
228
namely, Saving, Investment, Borrowing and Bank penetration. The findings support
previous studies, policies, programmes, initiatives by various development institutions,
and financial institutions’ decisions to promote inclusive banking systems.
The research focus was to fill the knowledge gap that existed on other factors
influencing FI. The gaps also emanated from the existing literature’s focus on the
supply-side perspective. This resulted in ineffective FI policies and programmes which
caused the problem to persist in many developing countries. Individuals or users are
important in all FI activities and programmes. The key research question was whether
participation in social networks, among other factors, influenced FI. The section below
presents the conclusions for each Theme of the study.
7.1.1 Theme I
The study presents evidence of significant dissimilarities among the four selected
countries’ data sets used. There are differences in terms of variables across the four
countries. The variables considered include the following: FI, age, gender, marital
status, proof of residence, branch access, location, education, social networks,
financial advice, internet access, mobile phone, salary and income.
The results show an uneven distribution of formal banking services in the four
countries, reflecting the differences in financial product use and abilities that adults
possess. For developmental purposes, particularly in African countries such as
Eswatini and the DRC, banking needs should be addressed. This is in line with
improving supplies through aggressive strategies and attending to the demand-side
aspects inhibiting FI. The initiatives by decision makers and financial organisations
have to focus on the distribution of appropriate financial services. The products and
services must simply be comprehensible and culturally fit to the banking public.
The results show the requirement for a wider and greater insight into the complicated
nature of societies. Moreover, the significant and consistent variances suggest that
future research ought to appreciate that individuals from different nations may have
common characteristics albeit with varying capabilities in terms of accessing and using
financial services. The distinct abilities vary, especially if examined separately. The
significant outcomes buttress the participation in the financial system, regardless of
the differences in people’s characteristics.
229
7.1.2 Theme II
In economics literature, FI is a vital means of improving the welfare of individuals and
the mobilisation of savings for capital across the globe. FI has become important for
the development of economies across the world, with some studies evaluating its
determinants and measurements. The establishment of FI determinants are important
for the formulation and implementation of policies.
With low levels of FI prevailing across Africa, the identification of the determinants
sheds more light on how the policy-makers and financial players could improve FI
levels. Bank branch access is one aspect of the supply side that has been investigated,
whilst the rest of the determinants have emanated from the demand side. The current
study brings a relatively novel and significant viewpoint to addressing FI across the
globe. All independent variables were significant in merged data for selected African
countries but the results were different when tested at country level. The consideration
of social networks into the five models brought in a new perspective of improving the
FI levels in the different countries. The current study makes it a building block for digital
FI.
The first objective was to explore the determinants of FI in selected nations from the
African continent. The study presents evidence that the following factors influence
financial inclusion: age, education, marital status, bank branch accessibility, location,
internet access, formal employment (salary), income, proof of residence, financial
advice, gender, social networks, and mobile phone. The findings provided insight
contributing to the debate on how FI or usage of official financial facilities could be
improved and deepened across Africa.
Age has a huge bearing on financial services uptake and usage. Different categories
have unique needs and characteristics. The significant results obtained on age shows
that the greater the chance of being financially included increased with age. Age
square had non-linear relationship with financial inclusion. Policies should consider
the uniqueness of each age group in the provision of appropriate financial products to
improve FI levels. For example, no-frills personal accounts for those that possess
tertiary qualification will help ensure that they are financially included. This will make
them deposit as and when they have something to save or be in a position to borrow.
230
Women were less likely to be financially included than men, implying that policies to
improve the financial status of women are required. A married individual was less likely
to be financially included than an unmarried individual, reflecting the likely effects of
consumer buyer behaviour on decision-making. Married couples should be
encouraged to open separate accounts where each partner can make their own
decision. Mistrusts between couples can contribute to lower FI levels, as reflected by
the results. Products targeting an individual making an independent decision will push
further FI results. More studies should investigate how financial services products are
to be designed so that more married people can use formal financial services.
Having a proof of residence increases the probability of an individual using formal
financial services. The regulations and compliance challenges that prevail in opening
bank accounts require consideration by authorities. This can be done in light of some
people having some form of national identification but without supporting documents
for their residences. Accommodating those with compromised residences will improve
their welfare rather than letting them go without formal financial products at all.
Literature has shown how the poor can improve their lives by borrowing for their
education or productive purposes. Therefore, it is important for know your customer
(KYC) procedures to be tailor made for different classes of citizens to ensure that all
are included.
Nature of employment is a determinant of an individual’s FI status as a person in formal
employment is more likely to be using formal financial services. The person who is
formally employed and has access to a regular income may be required to have a
formal account in which to receive the salary on a monthly/weekly basis. The higher
the income a person receives, the higher the chance of being financially included.
Higher income demonstrates better disposable income for savings, investment, and
so on, increasing the probabilities of having a desirable FI standing.
Internet use has an encouraging influence on FI standing, as the individual may be
accessing financial services online. Through the Internet, an individual has access to
important information leading to a decision to use an official financial organisation’s
facilities. In Africa, the use of mobile phones has also made a positive contribution to
FI, as the individual is likely to access mobile financial services at his or her
convenience and access other important information.
231
The more time it takes the individual to reach the nearest bank branch, the less likely
s/he to be financially included. This then implies the need to design policies that
encourage the use of technology in accessing financial services. In addition, the rural
poor are less likely to be included, implying that the governments, financial players
and other developmental institutions must ensure that infrastructure is set up to
improve the FI levels in rural areas. Adoption of latest ICT applications that are
accessible to customers is crucial, as literature has shown that it is cheaper and more
convenient. Mobile banks are an alternative for areas where there is poor
infrastructure, however, ensuring security of the same is important.
The more educated the individual is, the more likely s/he is financially included,
meaning that someone highly educated is capable of better appreciating the
significance of having a formal account than the someone who is less educated.
Literature has shown that improvements to the literacy levels help shape a better
society to live in by improving understanding and taking advice. As individual becomes
more educated, the use of latest ICT applications or social networks may not be a
challenge. Governments have to continue improving literacy levels as this makes a
positive contribution to financial inclusion.
An individual who participates in social networks is more likely to be financially
included than an individual who does not use it. It is important for financial players to
use social networks to influence the unbanked to use formal financial services, in this
way ensuring that financial inclusion levels improve. The literature has shown that
many people have become part of social networks and the platforms are effective in
influencing an individual’s decision. Information may be disseminated through social
networks to market financial services and products that are appropriate for particular
segments of the population. Utilising social networks in a proper and effective way
makes crucial financial information accessible to the users, thereby making individuals
use more formal financial services.
There is a higher probability that an individual with access to financial advice is
financially included than someone who does not have access to financial advice. The
empirical outcomes demonstrate that financial advice is an essential element in the
delivery of financial services, as the person will be equipped with the requisite
information to make a positive financial decision. The results of the current study have
shown that online platforms can complement social networks in giving financial advice.
232
This is in line with the extant literature that shows the importance of information to
enable positive decision-making. However, the literature has not considered the
combination of social networks and internet access in terms of improving financial
inclusion levels through crucial financial information (advice).
7.1.3 Theme III
At individual country level, the results differed from those observed in the selected
countries (combined data) model. Another objective was to explore the determinants
of FI in each of the four designated nations.
In the DRC, the following factors were insignificant: age-squared, social networks,
income and internet access. Participation in social networks was low in the DRC and
that contributed to its non-significance. Internet access was also low in the DRC due
to poor infrastructure. The low number of respondents using internet contributed to its
non-significance. The DRC government has to work on improving the ICT
infrastructure across the country to facilitate online connections. The literature has
shown that less developed infrastructure hinders online connections that are pivotal
for services delivery. With better connections, the DRC will be able to record more
people using phones that can be utilised for internet purposes, social networks and
financial services use. Such developments will result in the transformation of the
financial services sector with innovations being the main driving force.
In Kenya, all the factors considered were significant, except for salary, although the
combined model showed a different result. With more people on formal jobs, Kenya
has the potential to record more people using formal financial services. The literature
has also shown that the youth are the most affected as low job opportunities prevail in
many African countries.
In South Africa, all the factors were significant, except for gender, marital status and
bank accessibility. From a financial services perspective, women have similar
opportunities to open bank accounts. The payment of social grants in South Africa
contributes to the proportion of people using financial services, though the rate of
usage is compromised. South Africa has the most developed infrastructures among
the four countries under study and bank accessibility levels in the country are
advanced. The facilities are easily reachable, such that the distance/time taken is
233
seldom a hindrance. Bank facilities should be available and easily reachable to the
convenience of all.
In Eswatini, marital status was insignificant, while the rest of the factors were
significant. The non-significance of marital status goes to show the accommodative
policies and few challenges faced by a married or single individual.
The single-country research analysis permits comparison of results. The study
presents evidence that the intensive study of a single country can yield general
theoretical insights with comparative implications.
7.2 STUDY CONTRIBUTIONS AND IMPLICATIONS
7.2.1 Theoretical implications
The theoretical implications are based on the premise that the outcomes of the study
supported the theory and filled the identified gaps, as well as whether they answered
the theoretical questions or not. The findings of the determinants of FI and variances
in Chapter 5 confirm the existence of financial exclusion problems in selected African
countries. According to the Harrod-Domar Model, the lack of physical capital slows
down economic progress. This implies that low FI hinders economic development in
selected African countries.
The Harrod-Domar (HD) approach provided the theoretical foundation for this study.
The HD model postulates that savings, investments and financial sector expansion
lead to higher economic evolution. In this regard, saving and investments for growth
are pointless without consideration of the challenges related to high financial
disintermediation or low FI levels. There are limitations in the HD assumption that
growth target is achieved by savings that eventually become investments. This leads
to the question: Where does capital come from without savings? In many developing
economies, the function is largely inapplicable without recognising the means of
accumulating savings in view of low FI levels. Therefore, this study established that
high FI levels in Africa should complement savings and financial investments. Savings
are enhanced by the use of social networks in improving the use of regulated financial
products.
The growth rate (g) will remain slow in selected African countries if FI matters are not
addressed. The exclusion of FI in the growth function helps explain the reliance by
234
many countries on foreign aid or sovereign debt. The current study established the
equation below that could extend to factor in FI level.
g = s/ν – d (s: savings rates; d: depreciation rate; and ν: capital output ratio)....... [19]
Thus, savings rate (s) is a function of FI. Where, the FI levels are determined by all
the variables considered in this study. The variables include, among other
determinants, social networks. The higher the FI level, the greater the savings rate,
and the faster the growth rate. The study acknowledges the role of the financial system
(savings) on economic evolution by exploring the determining factors of FI in
designated African nations.
The Uses and Gratifications Theory (UGT) that provides the theoretical grounding for
the use of media points out how people actively seek out particular media content for
specific intentions and goals (Moreno & Koff, 2016; Katz, Blumler & Gurevitch, 1974).
The UGT assumes an active audience member with the capacity to deliberately
examine and evaluate media in order to achieve certain goals (Wang, Fink & Cai,
2008). The UGT theory contributed immensely to the functional shift in
communications, moving from what media did to audiences, to what people could do
with media. However, the key gap in this theory emanates from assumption four (see
Section 3.2.1.3) that people or users are self-aware of their media use, which has been
perceived as one limitation of the theory (Moreno & Koff, 2016). The study found that
a combination of financial advice or guidance in combination with other platforms is
important in influencing FI in designated nations in Africa.
From the Theory of Planned Behaviour (TPB) perspective, which posits that an
individual's behaviour or intentions are shaped by the following: approach toward
behaviour, supposed behavioural control and personalised norms (Ajzen, 1991,
1985), the factors that shape one’s behaviour are limited and a gap exists (Ajzen &
Fishbein, 1980). Though Ajzen and Fishbein improved this theory in the Theory of
Reasoned Action, there remains a gap filled by considering changes in technology.
The current study notes the effects of social media and internet in shaping one’s
behaviour or attitude. The theory can be extended by including a factor(s) that shape
the individual’s behaviour. This study therefore established that the Internet, social
media and financial advice, among other factors, could determine an individual’s plan
in managing his/her finances. Financial information, if accessed through different

235
social networks and internet platforms, may possibly influence an individual to make
a positive financial act.
The Theory of Planned Behaviour (TPB) is more appropriate when the actual control
and probability of success and behaviour performance are suboptimal. The TPB's
main input is the notion of perceived behavioural control described as somebody's
opinion of the struggle or simplicity of acting in a particular way (Ajzen, 1987). Based
on the outcomes of the current study, the idea of perceived behavioural control can be
shaped by financial information (advice) disseminated through the Internet or social
media using mobile phones, among other gadgets.
The contribution is in addition to subjective norms and attitudes that comprise the
Theory of Reasoned Action. Moreover, both models emphasise the idea that
individuals make reasoned and logical decisions to behave in a certain way by
evaluating the available information. Information disseminated through social media
platforms can influence the individual’s financial behaviour or FI decision. The control
of the individual’s financial behaviour will result in higher levels of FI, as financial
advice leads to changes in financial decisions or perspectives.
This study thus extends each theory from the use of social networks and internet
platforms to ability to access financial advice, thereby enhancing positive behaviour.
Therefore, the contribution of the study is the proposed financial inclusion model. The
financial inclusion model states that the probability of an individual being financially
included is a function of age, age-squared, gender, marital status, proof of residence,
branch access, location, level of education, social networks, financial advice, mobile
phone use, salaried/not salaried, and level of income. The financial inclusion model is
proposed in Equation 11 as:
FI = β0+ β1age + β2gen + β3mar + β4Proof + β5 Baccess + β6Loc + β7age2 + α1edu+ α2
media+ α3Advice + α4 internet + α5phone +Ω1 sala +Ω2 Inc + ℮,
The study proposes that a financial inclusion model should reflect the role of social
networks’ use, internet access and financial advice, among other determinants. In this
way it will provide better insight and stimulate scholarly debate, and lead to more
research on financial inclusion in Africa.
236
7.3 METHODOLOGICAL IMPLICATIONS
The similarity of the empirical work that investigated the determinants of FI done by
Bakari et al. (2018); Evans and Adeoye (2016); Tuesta et al. (2015); Laha and Kuri
(2011) is that FI was analysed from three scopes, specifically Penetration, Availability
and Usage. The current study contributed new knowledge by introducing saving and
investment as separate dimensions for policy-making reasons. This is in line with
theory, as the Harrod-Domar (HD) models postulate that savings, investments and
financial sector expansion lead to higher economic evolution. The current study
considered the following dimensions in light of the emphasis in theory: Saving;
Investment; Borrowing and Bank Penetration.
Prior empirical studies used a limited number of proxies for FI as the dependent
variable (see Soumare et al., 2016; Bapat & Bhuttacharyay, 2016; Martinez et al.,
2013; Laha & Kuri, 2011). Bakari et al. (2018) and Tuesta et al. (2015) used a
composite index as the dependent variable using supply-side data, which did not give
the correct reflection of FI status at personal level. To the best of the researcher’s
knowledge, the present work is the first to use 16 proxies for the dependent variable.
The proxies used are outlined in Table 4.2. The proxies that are used in the current
study provide a more comprehensive reflection of an individual’s FI status.
No study, according to the researcher’s knowledge, has done a double-stage analysis,
in other words, a regional and country-specific analysis in the same study. The prior
empirical studies have either done studies for blocs and regions, or focused on an
individual country (Bakari et al., 2018; Tuesta et al., 2015; Sarma & Pais, 2010).
Instead of using a large number of nations, the current research used a smaller sample
of selected countries in Africa, and to allow for better analysis, Probit Model results
were reported at regional level and individual countries.
The results showed that the use of many countries in a sample with the objective of
attaining a common or general result has limitations. The limitations are that countries
have different levels of economic development, policy procedures, cultures, and so
on, making a general conclusion inaccurate. The results obtained at combined level
and individual country level were different. At combined level, all variables were found
significant but at individual country level, some were not significant.
237
In addition to the double stage analysis, the current study did an ANOVA, and found
that all variables across the four countries were different. There were notable
variances in all the elements under consideration. According to the researcher’s best
knowledge, no research has focused on analysing merged and country-specific data.
The double-stage analysis was in addition to ANOVA. The current study has therefore
closed that gap.
The current study’s methodology provides robust findings on FI that are applicable to
the developing countries’ context. This was possible because large cross-sectional
data from four different countries’ surveys was used. Therefore, the current study
displayed a comprehensive reflection of the composition of citizens from rural or urban,
and income segments that are vital in evaluating inclusive financial systems.
7.4 POLICY AND MANAGERIAL IMPLICATIONS
Based on the study’s outcomes, theoretical and methodological inferences, this
section discusses the strategy and managerial implications/recommendations relevant
to boosting FI among individuals in Africa.
7.4.1 Policy implications
The promotion of FI across the world is a shared obligation of governments,
development partners and other stakeholders. While finance is the lifeblood of the
modern economic unit, FI is the harbinger that facilitates the participation of all
sections of the population in the financial industry. The effectiveness of the financial
sector is influenced by its capability to direct funds from surplus to productive units.
The banking sector has established principal control of the economy, and its dictates
place the basic mode of production at the disposal of pioneers in high yielding
structures. There are economic objectives to reduce disparities that are mainly useful
for equitable growth in all segments of society. The reduction of differences amongst
the population may serve as a catalyst for the growth of underdeveloped and
developing communities or economies. The provision of banking facilities to
marginalised sections can enhance the mobilisation of savings in the economy. Money
that is effectively channelled to savings, investment and capital through formal
financial systems improves economic growth in African countries. The growth in FI
levels increases the innovation of the monetary system.
238
The necessities, as well as requirements, of a larger section of society are met through
the provision of a wide variety of instruments amongst other services. The larger the
financial sector, the more the financial players and participants, leading to banking
sector growth. The analysis at regional and country level done in the current study
opens discussions to more suggestions. Discussions stimulate empirical work and
policy initiatives, thereby promoting inclusive financial systems.
The United Nations’ (UN) capital investment business, UNCDF, has also taken FI on
its development agenda. The current study will contribute to the research needs of
such organisations because it is a building block for digital FI. The current study will
close the gaps in the UN’s sustainable development goals (SDGs) research needs,
particularly in terms of the following: 1) SDG 1- no lack of basics of life; 2) SDG 8-
satisfactory work and economic development; and 3) SDG- 17- unravelling public and
private finance for the marginalised at local level. The current study contributes to the
identification of: 1) Determinants of FI for policy formulation, and 2) Market segments
where advanced financing models can be transformational in addressing financial
exclusion.
When there is an impending economic constraint, it is imperative to get a practical
solution to improving FI of all segments of the society. Collecting information and
arriving at the correct judgment regarding the FI status in Africa is a crucial stage in
the development of public strategies that may generate greater coherent instruments
for financial system efficiency. The gathering of information will also help in promoting
the FI of the African population. The analysis of facts on obtainability and usability of
formal financial facilities in Africa will aid the central banks to accomplish their
organisational duty, and achieve their mandates of promoting the efficacy of the
nation’s financial system and maximising levels of FI on the continent. The provision
of FI data enables the determination of factors influencing FI at different levels, and
policy designing, implementation and evaluation become possible. The availability of
proper financial inclusion information also assists countries to define a future model
and draw up plans for achieving higher economic growth levels.
To improve FI in rural areas, the governments have to provide appropriate
infrastructure that will attract financial services suppliers to those areas. The provision
of mobile phone networks will make it possible to access mobile banking services,
encouraging those in the areas to become financially included. The governments can
239
foster the provision of Point of Sale (POS) machines to reduce the need to keep cash
and instead promote the use of bank cards.
In all rural areas, the governments can introduce Post Savings Bank services that are
wholly owned by the government to keep the people financially included. Although the
majority of countries across Africa have such institutions, they operate as private
players resulting in some remote areas going without official financial services
providers. There is need to introduce mobile financial products that operate from one
point to the other periodically to ensure and encourage the uptake of official financial
services.
Furthermore, the outcomes of the current study show that mobile phone use
contributes to the increase in FI at an individual level. The government can encourage
the use of mobile phones through the provision of a range of infrastructure and
awareness programmes that may be presented in partnership with mobile phone
suppliers. The use of cellular phones will enable a multitude of people to reach digital
financial facilities and foster improvements toward modernisation that include digital
technologies. These developments can encourage the use of formal financial services
in countries or areas with low levels of phone use, such as the DRC.
Women still lag behind in terms of formal financial products across the African
continent. There is a need to design policies focusing on women’s financial
empowerment resulting in improvements related to FI in women. The governments in
conjunction with some pressure groups can create platforms where women can
advance their concerns, such as no collateral on borrowing, as the husband may be a
hindrance in the process. The governments can assist in the establishment of women-
focused institutions, such as Women’s Banks, with appropriate savings, investments
and borrowing products. In addition, there is a need for products that cater for the
different types of marital status, in other words, for the married, single or divorced.
Governments may take a cue from the Bangladesh model initiated by Mahomed Yunis.
Across all selected African countries, the levels of education should improve to
increase FI. The more educated people are, the better the level of appreciation of
financial matters. It is therefore important to improve education standards for the entire
population in all countries, particularly those with low literacy levels. Financial literacy
programme initiatives work better and more effectively in an educated society.
240
Proper policies have to be designed to avoid the exclusion of those with inadequate
documents that prevent them from opening an account. The Bank of International
Settlement can consider encouraging all banking institutions to relax the KYC
conditions/requirements to ensure all adult citizens are financially included. The
Bankers Associations can design a coherent policy that will apply across the banking
sector to enable all eligible citizens to operate basic or special bank accounts.
Legislation may be created that ease the banks’ requirements in terms of the
documentation needed to open an account. The majority of the population who are
tenants experience challenges in this regard because they have no utility bills in their
names. The cumbersome process to meet the documentation requirements of banks
puts off consumers. With government’s assistance, just the national ID should suffice
for opening an account with a formal financial institution. The government can design
a policy that prohibits banks from denying any citizen carrying a national ID to open
an account. Some governments, for example, have successfully implemented such
policies and it has been effective in improving high FI levels. The governments only
have to be strict on issuing national IDs to reduce the possibilities of frauds.
The formalisation of the economy is the key to ensuring all formally employed persons
pay their tax dues. If every citizen has a tax number, it will ultimately improve the
formality of the African economies.
To improve branch accessibility in areas where it may not be profitable to establish a
branch, banks may share infrastructure to reduce overheads. The governments can
also provide the infrastructure, while the service providers pay a nominal fee for
maintenance. The model popular with mobile phone services providers and internet
services suppliers can be followed to reduce overhead expenditure. The use of bank
agents at central points or shops all over the countries can help to improve FI levels.
This will improve branch accessibility in areas where it is considered unprofitable to
establish a branch.
The provision of internet facilities and/or infrastructure by the government will go a
long way in encouraging or improving FI at the individual level. The provision of some
financial information online to capture internet users is a brilliant idea. Governments
can actually provide financial information online as part of its financial literacy
programme.
241
Providing financial advice through different social media and internet platforms allows
instant feedback. The same concept used in the medical field where advice is
accessed through a virtual platform could be adopted. When financial advice is easily
accessible at a minimal cost or free of charge, a consumer is able to make an informed
financial decision. Financial advice should be encouraged to all citizens, as it
increases their ability to make informed decisions, thereby actively contributing to the
national FI policy goals. Bankers Associations and bodies representing all banks can
provide platforms for information dissemination, thereby increasing the use of financial
services and products that may include high interest savings accounts. To be effective,
advisors must be from the same area, where possible; clarifying, translating, and
promoting products appropriate for the people.
Setting up financial advice desks in banking halls is another way that information on
banking services and products can be disseminated. The researcher also
recommends the creation of a ‘Citizen’s Advice Bureau’ which will provide financial
guidance and assistance to those in rural areas. In addition, volunteers from the rural
community must be capable of offering advice on a regular basis. This strategy is likely
to be relevant but it needs to ensure the availability and accessibility of relevant
material.
Sources of financial advice in Africa may include financial institutions, professional
financial advisors and friends/family. Trust is a major issue in financial advice. Many
people are more likely to believe a financial advisor from the neighbourhood, speaking
their own language than someone unknown to them. This policy must also include
those speaking their own language, interpreting for them or explaining issues to them
in banks. Many African governments require functional Financial Advisory Boards that
set rules, regulations and ethics for practice.
The governments should consider introducing a relevant and practical financial
inclusion policy to tackle financial exclusion. The overall aim will be to enable every
citizen to oversee their finances meritoriously and unwaveringly by having access to
official financial accounts, confidence and being able to get the most benefit from it.
The government programmes can increase formal financial access to all segments
through financial education, savings groups and digital literacy. The policies can be
split into: 1) Access to a financial institution, and 2) Having the knowledge to use it
properly. In terms of access to bank accounts, the major issue is to ensure as many
242
as possible people are able to operate bank accounts. This enables citizens to use
direct debits (bill payments). The relevant Government departments or ministries,
Central Banks, Bankers Associations and Consumer Bodies must team up if these
policies are to produce results.
Financial education schemes can start at the primary school level, and the youth
should have access to scheduled and linked programmes that include training in
personal finance management. Training teachers in money management, will enable
financial inclusion to become part of the curriculum. Financial literacy can start right
from the birth of the child. Midwives having information about financial planning can
issue booklets guiding parents. This can go a long way in boosting confidence and
increasing knowledge amongst low-income groups in different countries. The parents’
guide if translated into the different local languages will be effective.
Services can be tailor-made to fit the various people from all income brackets and
locations. Government programmes should be in place, and earmarked to improve
financial capability, especially to those exposed to the effects of poor financial
judgements. These programmes may also embrace money advice campaign
programmes. In addition, there has to be a plethora of actions involving some
government ministries for educating certain marginalised sections of the populations.
Through various information and community centres, professional sessions on
personal finance, financial management or basic training can be done at rural business
centres. These sessions can be done concurrently with women organisation or
pressure groups. In these centres, different financial information can be availed as
locals have confidence in advisors from their communities or acquainted with their
cultural backgrounds and language.
Data plays a crucial part in the policy formulation, implementation, monitoring, and
evaluation. Financial inclusion surveys or consumer surveys with exhaustive,
unbiased, and consistent key pointers enable policy-makers to establish high financial
inclusion levels. With the use of relevant data, the policy-makers can also set targets,
detect prevailing hurdles, formulate efficacious policies, monitor and then measure
policy results. It is also possible to foster private sector objectives and targets
grounded on household or any other relevant information that financial access
assessments can avail. Data on FI remains scarce, but recently, there has been an
increase. As data is a prerequisite for an effective financial inclusion policy, countries
243
without sufficiently developed statistical departments can make use of data collected
by other organisations while developing sustainable infrastructure for proper collection
of own data. External sources of data have one disadvantage that the analysis lacks
depth and less tailored than country surveys. Financial inclusion indicators if outlined
will help countries come up with measures.
The researcher strongly recommends a guide to good professional practice involving
individuals from different areas. In addition, financial competence workshops should
be held periodically to help reach the different segments of the society. For the efforts
to be effective, they must work closely with other organisations in achieving the
financial inclusion goals. These bureaus must be accountable to a government body
or another type of authority. The reporting systems must be in place. Advisors from
the local communities can act as staff and/or volunteers. Data must also be
continuously or periodically available for impact assessment.
Consumer bodies can assist in achieving higher levels of FI by designing policies,
embarking on FI studies and financial information promotions on financial proficiency,
financial markets and financial inclusion. In addition to these initiatives, establishing
Ombudsman offices will cater for financial customer queries. Therefore, policies and
regulations must also focus on articulation of flexible approaches accommodating
innovation and competition.
7.4.2 Managerial implications
There are a multitude of initiatives that financial institutions can take in the financial
inclusion programme. Banks can offer tailored services that are easier to use and more
convenient to the excluded and vulnerable groups. Target groups should include the
low-income earners. There can be specific accounts for rural people that they can
access through agents located in their areas. Low charge accounts should cater for
low-income citizens to enable them to access basic bank accounts.
Financial institutions have to invest in research and development to be able to
significantly improve or achieve FI goals. For proper policies to be crafted,
implemented and evaluated, it is crucial for the players operating in African countries
to analyse models that can be used to explain saving motivations. Motivations for
saving include precautionary, down payment, life cycle, improvement, intertemporal
substitution, bequest, avarice, independence and enterprise. The Life-Cycle
244
Hypothesis remains a prominent model of savings. However, the model requires
alteration to apply to the multi-generational households usually found in African
societies.
People need a secure and suitable place to preserve their funds which is coupled with
a mechanism to save periodic small amounts transforming them into huge sums. An
effective model takes cognisance of choice matters and guide on how services and
mechanisms support the poor and financially excluded individuals to fulfil their
objectives. Therefore, savings remain imperative to the poor and rich households, as
folks are keen to pay for the service. Credit is equally important as it plays a significant
part in capital allocation.
For the formal financial industry to be in a position to capture the informal financial
system there is need to formalise or convert the informal structures. The informal
system models existing in many African countries are important to understand
formalisation as possible. The models that could be relevant for consideration include
associations, village banking models, bank sureties, communal banking, cooperatives,
credit unions, clusters, peer pressure, individuals, intermediaries and ROSCAs (see
Section 3.5). The models are interwoven, and different organisations have included
the structures of two or more models in their operations. The informal financial system
exists today due to low-income individuals with no access to formal financial
institutions.
Structures existing in the informal financial system, if harnessed by banks using social
networks (WhatsApp, Facebook, Instagram, and so on) and other internet platforms,
will bring convenience in the personal financial advice and marketing of formal
financial services and products. In addition, if an identified influential and trusted
member of the group is advised and encouraged, other members are likely to be for
the idea. If such groups are in place and are on social media platforms, banks can
attract them into the formal system.
There is a necessity for financial entities to introduce innovative methods by using
technology to reduce barriers and costs in accessing or provision of formal financial
products. The use of cell phones can transform the cost and access equation, enabling
financial services suppliers to serve the isolated and poor individuals or communities.
245
In addition, the increase in the use of phones will make it easier for the introduction of
mobile financial services, such as M-PESA in Kenya, wherever there is a network. The
use of mobile phones is transformational, as services spread to those unreachable
through traditional branches.
Financial institutions can collaborate mobile phone suppliers and consider marketing
a whole package i.e. phones and financial products.
The opportunity in the risk analysis space is where banks utilise innovative social and
analytics technologies originating from the FinTech realm. This assists in doing
customer analysis or evaluations from different dimensions to ascertain their
creditworthiness. Banks and FinTechs are then able to discover entirely new lending
models that may attract those using informal financial products into the official financial
stream. Financial institutions are also capable of evolving from simple transactional
relationships to a platform business model that opens more opportunities to engage
with existing and potential customers. With social media, internet, financial advice and
other technology architecture in place, financial institutions have many partnership
opportunities with FinTechs and other unconventional players.
Governments should be encouraged to come up with Financial Inclusion Taskforces.
Financial Inclusion Taskforces track governmental FI policies, as well as making
recommendations about linked programmes. The team of experts can be composed
of financial inclusion scholars and banking industry players. FI matters should be
researched to revealing insight related to the information foundation of financial
inclusion in Africa or developing countries. The taskforce can be part of the central
banks playing a catalyst role in the uptake of basic bank accounts.
The promotion of salary-based financial products, such as loans, will encourage
employers to formalise the salaries by paying through the banks. The regularisation
and formalisation of salaries and wages will see many workers receiving loans through
formal financial institutions.
Banks are encouraged to develop special bank accounts that serve the desires of the
marginalised population that requires accounts for payment of goods and services.
Innovative products is one option as instruments such as e-money facilities, debit card
and little-charge regular bank facilities can improve financial obtainability to the
financially excluded.

246
Financial institutions must take advantage of consumers’ desire to use or access
social media to interact with potential or existing customers. This will also improve
uptake of formal financial services as consumers are advised through social media.
Communication has taken a dynamic shift from print or television to two way
(feedback) chats through different social media platforms.
Banks are encouraged to work together with women support organisations and
community clusters. This study advocates a coherent working relationship with
government agencies and women clusters to enable funding and capacity building. In
addition, there can be notes and advice exchanges, developing a multi-agency
platform for the service of referrals that are used across women pressure groups and
other community groups.
Financial sector policies and regulations are important in fostering technology use to
promote FI. This allows the financially excluded to have access to a broader scope of
financial facilities. Innovation by using internet, social media, financial advice and
mobile phones assists in designing and distributing financial services.
7.5 STUDY LIMITATIONS
The impetus of the research was to examine the determinants of FI in designated
nations in Africa. In carrying out the study, some limitations were evident.
A sample of four countries was used, as the other data sets considered did not have
proxies for internet, social media and financial advice. A larger sample would have
been more appropriate if data and variables were available for all African countries.
This calls for replication of the study in other countries because the current study has
come up with a significant basis for other empirical enquiries.
The current work used cross-sectional data providing a snapshot at a certain period.
Person behaviour and perception shift with time as well as environs compelling
investigation over a period to attain a better understanding of financial behaviour
capabilities. In such cases, a longitudinal study would produce a better result.
There are also drawbacks of the current study that include surveys done at different
periods (years), and some surveys leaving out important variables (questions) such
as use of social media. Data collection methods may change over time. An assumption
was made that all surveys are similar, regardless of the time taken and the latest
247
survey for every country sampled was used. Those surveys that left out pertinent
variables in the study were dropped.
Religion is a very influential factor of FI and the data sets used did not have a proxy.
Many religious linked financial products can extend official financial services to the
excluded owing to religious reasons. The introduction of Islamic finance in different
countries’ financial sectors can solve the financial exclusion challenges.
The other constraint was the scarcity of literature on the determination of FI in
developing or African countries at personal level. This also included the contribution
of variables such as personal financial advice to FI. The absence of specialised
theories of financial advice and other aspects of FI in terms of developing countries
made it difficult to evaluate the existing FI policies and programmes. The closest
literature available on financial development was used for interpreting and
understanding the financial development-economic growth relationship.
7.6 DIRECTION FOR PROSPECTIVE STUDIES
There is need to look at the impact of having bank accounts, using bank accounts, the
informal economy, employment and poverty on the economy. An analytical study on
the influence of financial and economic crisis on FI levels in Africa will provide a good
reference.
Financial inclusivity is a reinforcing pillar for both poverty reduction and the prospects
for trade and industry expansion, with the obtainability of digital financial facilities
necessary to fuse the innovative digital thrift. There is more to research on the
determinants of digitalisation and digital FI.
Financial inclusivity enables daily living, and aids people and organisations organise
for all from long-term objectives to unforeseen crises. As users of official financial
facilities, societies are more probable to utilise other financial facilities that include
savings, loans, insurance, open industries, schooling or healthiness and risk
management to ameliorate financial crises. All these are capable of improving the
entire standard of their lives. It is important for researchers to consider focusing on the
effectiveness of digitalisation on distribution of formal financial facilities particularly to
those outside the official financial system in Africa.
248
Some future studies may also investigate the contribution of religion to FI, as the data
used for the current study did not include it.
The need for data collection is important as different institutions collect information on
FI in order to construct an image of the state of FI of a country. The data provision will
assist with an overview that enables government agents and other stakeholders to
increase the competence of the financial industry, in that way promoting
socioeconomic development. Therefore, such exercises provide information for
agents involved in FI efforts, including investigators, academics and other
stakeholders that have an interest in FI.
The current study also supports the growth of business, as well as the prospects
designed to meet the requirements of the populace. The collection of relevant data in
all parts of Africa will enable the design of gradually more perfect and comprehensive
public policies. As FI is an indispensable component of a coherent national financial
industry, it is anticipated that the findings and recommendations thereof will result in
more efficiency in financial systems. Relevant data also gives a broader perspective
in observing and evaluating the effects of FI policies and activities in selected African
countries. Consequently, it becomes a significant device for refining the strategies,
and developing and employing innovative ingenuity over a period of time.
On a final note, studies show that religion is an important factor influencing FI. In a
study to investigate the effect of an individual belonging to the Muslim community on
the use of official savings, credit and accounts, Demirguc-Kunt et al. (2013) found that
Muslims are less likely to use conventional official financial facilities than people from
other religions. The research utilised a sample of 65 000 people from 64 nations.
Therefore, religion may influence financial inclusion (Zins et al. 2016; Demirguc-Kunt
et al., 2013). In a study done in Norway, Brekke (2018) reported that there are real
possibilities that religious norms against conventional banking can influence FI.
However, the research did not focus on the actual use of conventional banks.
In another study to find out if Islamic banking can increase FI, Naceur et al. (2015:25)
found that in Muslim countries, there are significantly more religious reasons for
financial exclusion than are found in other countries. However, the use of services did
not increase as quickly, even though the accessibility to official financial facilities had
developed speedily in the OIC nations. Furthermore, regression analysis showed proof

249
of a progressive correlation to loans to family units and corporations for funding
investments but the empirical connection was tentative and comparatively weak.
Therefore, there is still need to investigate the influence of religion on FI in selected
African countries.
250
REFERENCES
Adams, D. 1978. “Mobilizing household savings through rural financial markets”. In: J.D. Von
Pischke & D.A.G. Donald (Eds.). Rural Financial Markets in Developing Countries: Their
Use and Abuse. Johns Hopkins University Press, Baltimore.
Adams, D. & West, S. 2015. Asset Building among Low Income Adults: An Exploratory Study
with Participants in an Emergency Savings Program. Journal of Community Practice,
23(3-4): 436-461
ADB (Asian Development Bank). 2009. Key Indicators for Asia and the Pacific 2009, Manila.
Available from https://www.adb.org/publications/key-indicators-asia-and-pacific-2009
[Accessed on 16/12/2020].
ADB. 2013. Promoting Environmentally Sustainable Growth in Asia and the Pacific. Pp. 1-53.
Available from https://www.adb.org/sites/default/files/institutional-document/42741/ adb-
annual-report-2013.pdf [Accessed on 12/10/20018].
Adeoye, B.W. 2015. Exchange rate Volatility and Inclusive Growth: The Nigerian Experience,
A paper presented at the 56th Annual Conference of the Nigerian Economic Society (NES)
with the theme “Attaining Inclusive Growth in Nigeria: Prospects and Challenges” held at
Sheraton Abuja Hotel between October 11 and 14.
Adeoye, B.W. & Sangosanya, A.O. 2015. Monetary Policy and Inclusive Growth: The Case of
Nigeria. A paper presented at the 56th Annual Conference of the Nigerian Economic
Society (NES) with the theme “Attaining Inclusive Growth in Nigeria: Prospects and
Challenges” held at Sheraton Abuja Hotel between October 11 and 14.
Adeoye, B.W. & Saibu, M.O. 2014. Monetary Policy Shocks and Exchange Rate Volatility in
Nigeria. Asian Economic and Financial Review, 4(4): 544 – 562.
Adewale, A.A. 2011. “A Measurement Model of the Determinants of Financial Exclusion
among Micro Entrepreneurs in Ilorin Nigeria”. The 8th International Conference on Islamic
Economics and Finance, pp 1-17.
Adewale, A.A. & Afolabi, B. 2013. The Effects of ICT on the Growth of Nigerian Banking
Industry: (A Case Study of Five Quoted Banks in Nigeria). pp. 1-44.
AfDB (African Development Bank). 2013. Financial Inclusion in Africa. African Development
Bank, pp.1-10. Available from www.afdb.org/fileadmin/project.pdf [Accessed on
16/12/2013].
AfDB. 2017. Annual Report 2017. African Development Bank. Available from www.afdb.org ›
afdb › Documents › Generic-Documents.pdf [Accessed on 23/7/2018].
251
Agenor, P.A., Canuto, O. & Jelenic, M. 2014. Access to Finance, Product Innovation, and
Middle Income Growth Traps. Poverty Reduction and Economic Management Network.
The World Bank. Available from www.worldbank.org/economicpremise [Accessed on 6
/06/15].
Agenor, P. & da Silva, L.A. 2013. Inflation Targeting and Financial Stability: A Perspective
from the Developing World. Banco Central do Brasil, Working Paper Series, 324.
Aggarwal, R. 2014. Financial Inclusion in India: Challenges and opportunities. International
Journal of Research, 1(4): 557-567.
Aghion, P. & Bolton, P. 1997. A Theory of Trickle-Down Growth and Development. Review of
Economic Studies, 64: 151–72.
Aghion, P. & Howitt, P. 1992. A Model of Growth through Creative Destruction. Econometrica,
60(2): 323–51.
Aghion, P. & Howitt, P. 1998. Endogenous Growth Theory. Cambridge, MA: MIT Press.
Agresta, S. & Bonin Bough, B. 2011.Perspectives on social media marketing. Boston: Course
Technology, Cengage Learning.
Ahmeti, F. & Prenaj, B. 2015. A critical review of Modigliani and Miller’s theorem of capital
structure. International Journal of Economics, Commerce and Management, III(6).
Ajzen, I. 1985. “From intentions to actions: A theory of planned behaviour”. In J. Kuhl & J.
Beckman (Eds.), Action-control: From cognition to behavior. Pp. 11–39. Heidelberg,
Germany: Springer.
Ajzen, I. 1987. Attitudes, Traits and Actions: Dispositional Prediction of Behavior in Personality
and Social Psychology. Advances in Experimental Social Psychology, 20: 1-63.
Ajzen, I. 1991. The theory of planned behaviour. Organizational Behavior and Human Decision
Processes, 50: 179–211.
Ajzen, I. & Fishbein, M. 1980. Understanding attitudes and predicting social behaviour.
Englewood Cliffs, NJ: Prentice-Hall.
Akar, E. & Topcu, B. 2011. An examination of the factors influencing consumers’ attitudes
toward social media marketing. Journal of Internet Commerce, 10(1): 35–67.
Alesina, A. & Rodrik, D. 1994. Distributive Politics and Economic Growth. The Quarterly
Journal of Economics, 109(2): 465-490.
Aliber, M. 2015. Reducing poverty and inequality through redistributing assets, securing rights,
and democratizing decision-making in rural areas. [Online]. Available from
252
https://www.un.org/development/desa/dspd/wp-content/uploads/sites/22/2017/04/
Michael-Aliber-Paper.pdf [Accessed on 16/03/2016].
Aliyu, A.A. & Tasmin, R.B. 2012. The Impact of Information and Communication Technology
on Banks’ Performance and Customer Service Delivery in the Banking Industry. Journal
of Latest Trends in Finance and Economic Sciences, 1(March 2012): 80-90.
Allen, F., Demirquc-Kunt, A., Klapper, L. & Peria, M.S.M. 2012. The Foundations of financial
Inclusion: Understanding Ownership and use of formal accounts. World Bank Policy.
Research Working Paper 6290, pp. 1-30.
Allen, F. & Gale, D. 2004a. Financial intermediaries and markets. Econometrica, 72: 1023–
1061.
Allen, F. & Gale, D. 2004b. Competition and financial stability. Journal Money, Credit, Banking,
36: 453–480.
Allen, F. & Santomero, A.M. 2001. What do financial intermediaries do? Journal of Banking &
Finance, 25(2001), 271–294.
Allen, F., Carletti, E., Cull, R., Qian, J., Senbet, L. & Valenzuela, P. 2013. The African financial
development and financial inclusion gaps. Working Paper, Wharton Financial Institutions
Centre, University of Pennsylvania.
Altunbas, Y., Thornton, J. & Kara, A. 2010. What determines Financial Exclusion? Evidence
from Bolivian Household Data. Bangor Business School Working Paper No.
BBSWP/10/018, pp.1-11.
Altrichter, H., Kemmis, S., McTaggart, R. & Zuber-Skerritt, O. 2002. The concept of action
research. The Learning Organization, 9(3): 125-131.
Ambrus, A., Mobius, M. & Szeidl, A. 2014. Consumption Risk-Sharing in Social Networks.
American Economic Review, 104(1): 149–82.
American Bankers Association. 2017. The State of Social Banking. Results of an American
Bankers Association Research Study. [Online]. Available from https://www.aba.com/
Products/Endorsed/Documents/ABASocialMedia_Report.pdf [Accessed on 13/06/2018].
Amidzic, G., Massara, A. & Mialou, A. 2014. Assessing Countries’ Financial Inclusion
Standing-A new Composite Index. IMF Working Paper. WP/14/36.pp. 1-31.
Ando, A. & Modigliani, F. 1963. The ‘life-cycle’ hypothesis of saving: aggregate implications
and tests. American Economic Review, 53(1): 55–84.
Andrianaivo, M. & Kpodar, K. 2012. Mobile Phones, Financial Inclusion, and Growth. Review
of Economics and Institutions, 3(2): 1-30.
253
Andrianova, S. & Demetriades, P. 2008. “Sources and Effectiveness of Financial
Development: What We Know and What We Need to Know”. In B. Guha-Khasnobis & G.
Mavrotas (Eds.). Financial Development, Institutions, Growth and Poverty Reduction.
UNU-WIDER Studies in Development Economics and Policy.
Ang, J.B. 2010. Finance and Inequality: The Case of India. Southern Economic Journal, 76(3):
738-761.
Ang J.B. 2011. Financial Development, Liberalization and Technological Deepening.
European Economic Review, 55 (June 2011): 688-701.
Anson, J., Berthaud, A., Klapper, L. & Singer, D. 2013. Financial inclusion and the role of the
post office. Policy Research Working Paper 6630, World Bank, Washington, DC.
Antonakis, J., Bendahan, S., Jacquart, P. & Lalive, R. 2014. “Causality and endogeneity:
Problems and solutions”. In D.V. Day (Ed.), The Oxford Handbook of Leadership and
Organizations. Pp. 93-117. New York: Oxford University Press.
Antonakis, J. & Dietz, J. 2011. More on testing for validity instead of looking for it. Personality
and Individual Differences, 50(3): 418-421.
Aportela, A. 1999. Effects of Financial Access on Savings by Low-Income People. Banco de
México.
Arestis, P. & Demetriades, P. 1997. Financial development and economic growth. Economic
Journal, 107: 783–799.
Armendáriz, B. & Morduch, J. 2010. The Economics of Microfinance. 2nd ed. Cambridge, MA:
MIT Press.
Armitage, C.J. & Conner, M. 2000. Social cognition models and health behaviour: A structured
review. Psychology and Health, 15:173–189.
Arner, D. 2007. Financial Stability, Economic Growth, and the Role of Law. New York:
Cambridge University Press.
Arrow, K.J. 1964. The Role of Securities in the Optimal Allocation of Risk Bearing. Review of
Economic Studies, 2: 91–96.
Aschheim, J. 1959. Open-Market Operations versus Reserve-Requirement Variation.
Economic Journal, December 1959, pp. 1-29.
Ashley, C. & Tutan, T. 2015. Creative strategies in social media marketing: An exploratory
study of branded social content and consumer engagement. Psychology & Marketing,
32(1): 15-27.
254
Ashman, R., Solomon, M.R. & Wolny, J. 2015. An old model for a new age: Consumer decision
making in participatory digital culture. Journal of Customer Behaviour, 14(2): 127-146.
Ashraf, N., Karlan, D. & Yin, W. 2006. Household Decision Making and Savings Impacts:
Further Evidence from a Commitment Savings Product in the Philippines. Economic
Growth Center Yale University.
Ashraf, N., Karlan, D.S. & Yin, W. 2007. Female Empowerment: Impact of a Commitment
Savings Product in the Philippines. World Development, 38(3): 333-344.
Asteriou, D & Hall, S.G. 2007. Applied Econometrics. New York: Palgrave Macmillan.
Aterido, R., Beck, T. & Iacovone, L. 2013. Access to finance in Sub-Saharan Africa: Is there a
gender gap? World Development, 47: 102–120.
Atkinson, A. 2008. Evidence of Impact: an overview of financial education evaluations.
[Online]. Consumer Research 68 Financial Services Authority, UK. Available from
http://www.bris.ac.uk/geography/research/pfrc/themes/fincap/pfrc0810.pdf [Accessed on
12/12/2018].
Atkinson, A. & Messy, F. 2012. Measuring financial literacy: results of the OECD / International
Network on Financial Education (INFE) Pilot Study [Working Paper n. 15]. OECD
Publishing. [Online]. Available from http://dx.doi.org/10.1787/5k9csfs90fr4-en [Accessed
on 05/04/2018],
Atkinson, A. & Messy, F. 2013. Promoting Financial Inclusion through Financial Education:
OECD/INFE Evidence, Policies and Practice. OECD Working Papers on Finance,
Insurance and Private Pensions, No. 34. [Online]. Available from
http://dx.doi.org/10.1787/5k3xz6m88smp-en [Accessed on 17/06/2017].
Ayadi, R., Llewellyn, D., Schmidt, R.H., Arbak, E. & de Groen, W.P. 2010. Investigating
Diversity in the Banking Sector in Europe: Key Developments, Performance and Role of
Cooperative Banks. Brussels: Centre for European Policy Studies.
Ayyagari, M., Demirgüç-Kunt, A. & Maksimovic, V. 2011. Firm Innovation in Emerging
Markets: The Roles of Governance and Finance. Journal of Financial and Quantitative
Analysis, 46: 1545-1580.
Babbie, E.R. 2014. The Practice of Social Research. Boston, MA: Cengage.
Babu, R. 2015. Analysis of the Level of Financial Literacy and Financial Inclusion among Rural
Households in Krishna District: Andhra Pradesh. IOSR Journal of Economics and
Finance, 6(4. Ver. I): 38-42.
255
Bagehot, W. 1873. Lombard Street: A Description of the Money Market. London: Henry S.
King and Co.
Bai, J., Philippon, T. & Savov, A. 2016. Have financial markets become more informative?
Journal of Financial Economics, 122(3): 625-654.
Bakari, I.H., Idi, A. & Ibrahim, Y. 2018. Innovation Determinants of Financial Inclusion in Top
Ten African Countries: a System GMM Approach. Marketing and Management of
Innovations, 4: 98-106. http://doi.org/10.21272/mmi.2018.4-09
Baltensperger, E. 1980. Alternative approaches to the theory of the banking firm. Journal of
Monetary Economics, 6: 1–37.
Bane, M.J. 2009. “Poverty, Politics and Policy”. In S. Danzinger & M. Cancian (Eds.).
Changing Poverty, Changing Policy. New York: Russell Sage Foundation.
Banerjee, A. & Newman, A. 1993. Occupational Choice and the Process of Development.
Journal of Political Economy, 101: 274-298.
Banerjee, A., Deaton, A., Lustig, N., Rogoff, K. & Hsu, E. 2006. An Evaluation of World Bank
Research, 1998-2005. World Bank, Washington, DC. World Bank.
https://openknowledge.worldbank.org/handle/10986/17896 License: CC BY 3.0 IGO.”
Banerjee, A. & Duflo, E. 2009. The Experimental Approach to Development Economics.
Annual Review of Economics, 1: 151–78
Bankable Frontier Associates. 2007. Financial Service Access and Usage in Southern and
East Africa: What do Finscope Surveys Tell us? [Online]. Available from
http://www.finsope.co.za [Accessed on 13/11/2014].
Bapat, D. & Bhattacharyay, B.N. 2016. Determinants of Financial Inclusion of Urban Poor in
India: An Empirical Analysis. Cesifo Working Paper No. 6096. Category 13. pp. 1-31.
Bardhan, P., Bowles, S. & Gintis, H. 2000. Wealth inequality, wealth constraints and economic
performance Anthony Barnes Atkinson, François Bourguignon (Eds.), Handbook of
Income Distribution, 1 (2000): 541-603.
Barnett, W.A. & Solow, R. 2000. An Interview With Franco Modigliani." Macroeconomic
Dynamics, Cambridge University Press, 4(2): 222-256.
Barr, M., Mullainathan, S. & Shafir, E. 2008. Behaviorally Informed Financial Services
Regulation. New America Foundation. Asset Building Program Policy Paper, pp. 1-29.
Baylis, J., Smith, S. & Owens, P. 2011. The Globalization of World Politics: An Introduction to
International Relations. Oxford: Oxford University Press.
256
Beck, T., Buyukkarabacak, B., Rioja, F.K. & Valev, N.T. 2012. Who Gets the Credit? And Does
It Matter? Household vs. Firm Lending Across Countries. The B.E. Journal of
Macroeconomics, 12(1, Article 2).
Beck, T. & Cull, R. 2015. Banking in Africa. The Oxford Handbook of Banking. Oxford: Oxford
University Press.
Beck, T., Demirgüç-Kunt, A. & Maksimovic, V. 2005. Financial and Legal Constraints to Firm
Growth: Does Firm Size Matter? Journal of Finance, 60(1):137–77.
Beck, T., Demirgüç-Kunt, A., Laeven, L. & Levine, R. 2004. Finance, Firm Size and Growth.
NBER Working Paper No. 10983, National Bureau of Economic Research, Cambridge,
MA.
Beck, T.A., Levine, R. & Loayza, N. 2000. Finance and the Sources of Growth. Journal of
Financial Economics, 58: 261-300.
Beck, T. & de la Torre, A. 2006. The basic analysis of access to financial services. WPS 4026,
World Bank Memo, pp. 1-8.
Beck, T., Senbet, L. & Simbanegavi, W. 2014. Financial Inclusion and Innovation in Africa: An
Overview, Journal of African Economies, 24(1): i3–i11. https://doi.org/10.1093/jae/eju031
Behl A. & Pal A. 2016. Analyzing the barriers towards sustainable financial inclusion using
mobile banking in rural India. Indian Journal of Science and Technology, 9(15): 1–7.
Bell, C. 1990. Interactions between Institutional and Informal Credit Agencies in Rural India.
World Bank Economics Review, 4(3): 297-327.
Bell, C. & Rousseau, P.L. 2001. Post-independence India: A case of finance-led
industrialization? Journal of Development Economics, 65(2): 153–75.
Bencivenga, V.R. & Smith, B.D. 1991. Financial Intermediation and Endogenous Growth.
Review of Economic Studies, 58(2): 195–209.
Bencivenga, V.R. & Smith, B.D. 1993. Some Consequences of Credit Rationing in an
Endogenous Growth Model. Journal of Economic Dynamics and Control, 17(1/2): 97–
122.
Bencivenga, V.R., Smith, B.D. & Starr, R.M. 1995. Transactions Costs, Technological Choice,
and Endogenous Growth. Journal of Economic Theory, 67(1): 153–77.
Bending, M., Giesbert, L. & Steiner, S. 2009. Savings, Credit and Insurance: Household
Demand for Formal Financial Services in Rural Ghana. GIGA WP 94/2009. pp. 1-32.
257
Benston, G.W. & Smith C.W. 1976. A Transactions Cost Approach to the Theory of Financial
Intermediation. Journal of Finance, 31: 215-231.
Berger, C.S. & Messerschmidt, M.C. 2009. Babbling before banking? Online communities and
pre-purchase information seeking. International Journal of Bank Marketing, 2(6): 78-88.
Bernanke, B. & Gertler, M. 1990. Financial Fragility and Economic Performance. Quarterly
Journal of Economics, 105(1): 87–114.
Bernanke, B. & Gertler, M. 1995. The Credit Channel of Monetary Policy Transmission. The
Journal of Economic Perspectives, 9(4): 27-48.
Besley, T. 1994. How do Market Failures Justify Interventions in Rural Credit Markets? The
World Bank Research Observer, 9(1): 27-47.
Bhuvana, M. & Vasantha, S. 2016. Dimensions for Measuring Financial Inclusion in the Rural
Areas of Tamil Nadu. Indian Journal of Science and Technology, 9(32): 1-9.
Biasutti, M. & Frate, S. 2016. A Validity and Reliability Study of the Attitudes Toward
Sustainable Development scale. Journal Environmental Education Research, 23(2)
http://dx.doi.org/10.1080/13504622.2016.1146660
Biswas, S. 2010. India’s micro-finance suicide epidemic. BBC News, Medak, Andhra Pradesh
Updated 16 Dec. 2010. [Online]. Available from http://www.bbc.co.uk/news/world-
southasia-11997571. [Accessed on 06/10/2011].
Black, B.S. & Gilson, R.J. 1998. Venture Capital and the Structure of Capital Markets: Banks
Versus Stock Markets. Journal of Financial Economics, 47: 243–277.
Boianovsky, M. 2015. Beyond capital fundamentalism: Harrod, Domar and the history of
development economics. CHOPE Working Paper No. 2015-12: 1-45
Bollen, K.A., Guilkey, D.K. & Mroz, T.A. 1995. Binary outcomes and endogenous explanatory
variables: Tests and solutions with an application to the demand for contraceptive use in
Tunisia. Demography 32: 111–131. https://doi.org/10.2307/2061900.
Bonin, J. & Wachtel, P. 2003. Financial sector development in transition economies: Lessons
from the first decade. Financial Markets, Institutions and Instruments, 12(1): 1–66.
Bonson, E. & Flores, F. 2011. Social media and corporate dialogue: the response of global
financial institutions, Online Information Review, 35(1): 34-49.
Braucher, J. 2001. An empirical study of debtor education in bankruptcy: Impact on Chapter
13 completion not shown [Electronic version]. American Bankruptcy Institute Law Review.
258
Brekke, T. 2018. Halal Money: Financial inclusion and demand for Islamic banking in Norway.
Research and Politics, 5(1): 1-7 https://doi.org/10.1177/2053168018757624.
Breusch, T.S. & Pagan, A.R. 1979. A simple test for heteroscedasticity and random coefficient
variation. Econometrica, 47(5): 1287–1294. doi: 10.2307/1911963.
Brevoort, K.P. & Wolken, J.D. 2008. Does Distance Matter in Banking. Finance and
Economics Discussion Series. Divisions of Research and Statistics and Monetary Affairs.
Federal Reserve Board, Washington DC, pp 1-35.
Brink, H.I.L. 1996. Validity and reliability in qualitative research. Paper delivered at SA Society
of Nurse Researchers’ Workshop. Curationis, 16(2): 35-38.
Bristow, B.J. 1997. Promoting financial well-being: Running a successful Money 2000
campaign. Ithaca, NY: Cornell Cooperative Extension.
Browning, M. & Lusardi, A. 1996. Household Saving: Micro Theories and Micro Facts. Journal
of Economic Literature, 34(4): 1797-1855.
Bruhn, M. & Bilal, Z. 2011. Stimulating Managerial Capital in Emerging Markets: The Impact
of Business and Financial Literacy for Young Entrepreneurs. Policy Research Working
Paper No. 5642.World Bank, Washington, DC.
Bruhn, M. & Love, I. 2014 The Real Impact of Improved Access to Finance: Evidence from
Mexico. Journal of Finance, American Finance Association, 69(3): 1347-1376.
Burgess, R. & Pande, R. 2005. Do Rural Banks Matter? Evidence from the Indian Social
Banking Experiment. American Economic Review, 95: 780-790.
Burhouse, S., Gambrell, D. & Harris, A. 2004. Delivery systems for financial education in
theory and practice. FYI: An update on emerging issues in banking. [Online]. Available
from http://www.fdic.gov/bank/analytical/fyi/2004/092204fyi.html [Accessed on
04/05/2010].
Burkett I. & Sheehan G. 2009. From the margins to the mainstream, Brotherhood of St.
Laurence. [Online]. Available from http://library.bsl.org.au/showitem.php?handle=1/6175
[Accessed on 27/04/2015].
Caldieraro, F., Zhang, J.Z., Cunha, M.Jr. & Shulman, J.D. 2018. Strategic Information
Transmission in Peer-to-Peer Lending Markets. Journal of Marketing, 82: 42–63.
Cámara, N. & Tuesta, D. 2014. Measuring Financial Inclusion: A Multidimensional Index.
Working Paper, No 14/26 Madrid, September 2014.
Cameron, A.C. & Trivedi, P.K. 2005. Microeconometrics: Methods and applications. New
York: Cambridge University Press.
259
Cano, C., Esguerra, M., García, N., Rueda, L. & Velasco, A. 2013. Acceso a Servicios
financieros en Colombia. Borradores de Economía, No. 776 2013. Banco de la
República.
Caporale, G.M., Rault, C, Sova, S. & Sova, A. 2009. Financial Development and Economic
Growth: Evidence from Ten New EU Members. Discussion Papers of DIW Berlin 940,
DIW Berlin. German Institute for Economic Research.
Carbo-Valverde, S. & Rodriguez-Fernandez, F. 2014. Financial Regulation in Spain. Journal
of Economic Literature: 1-53. Available from http://fessud.eu/wp-content/uploads/
2013/04/Financial-Regulation-in-Spain_Working-Paper-59.pdf [Accessed on 14/11/18].
Carpenter, J.R., Kenward, M.G. & Vansteelandt, S. 2006 A comparison of multiple imputation
and doubly robust estimation for analyses with missing data. Journal of Research in
Statistics. 169(Part 3): 1-14.
Carruthers, C.P & Hood, C. 2004. The power of the positive: Leisure and wellbeing.
Therapeutic Recreation Journal, 38(2): 225-245.
Casaló, L.V., Flavián, C. & Guinalíu, M. 2010. Determinants of the intention to participate in
firm-hosted online travel communities and effects on consumer behavioural intentions.
Tourism Management, 31(6): 898–911.
Casaló, L.V., Carlos, F. & Guinalíu, M. 2011. Understanding the intention to follow the advice
obtained in an online travel community. Computers in Human Behaviour, 2792: 622–633.
Casu, B. & Girardone, C. 2006. Bank competition, concentration and efficiency in the single
European market. The Manchester School, 74(4), 441–468.
Center for Financial Inclusion. 2020. Financial Inclusion Glossary. [Online]. Available from
www.centerforfinancialinclusion.org› financial-inclusion. [Accessed on 15/06/2020].
Central Bank of Brazil (BCB). 2011. Brazil Report on Financial Inclusion. Available from
http://www.bcb.gov.br/%5Cpre%5Cacordos_e_convenios% 5Cacordo_de_cooperacao_
tecnia_BACEN_MTE_SENAES.pdf?idioma=P.
CGAP. 2013. Global Standard-Setting Bodies and Financial Inclusion for the Poor: Toward
Proportionate Standards and Guidance. White paper prepared on behalf of the G-20
Global Partnership for Financial Inclusion. Washington, D.C.: CGAP.
Chai, S., Chen, Y., Huang, B. & Ye, D. 2018. Social Networks and Informal Inclusion of the
People’s Republic of China. ADBI Working Paper 802. Tokyo: Asian Development Bank
Institute. [Online]. Available from https://www.adb.org/publications/social-networks-and-
informal-inclusion-prc
260
Chakraborty, I. 2010. Capital structure in an emerging stock market: The case of India,
Research in International Business and Finance, 24: 295-314.
Chandavarkar, A. 1992. Of Finance and Development: Neglected and Unsettled Questions.
World Development, 20(1): 133–42
Chang, H.H. & Chuang, S.S. 2011. Social capital and individual motivations on knowledge
sharing: Participant involvement as a moderator. Information & Management, 48(1): 9–
18.
Chang, Y.P. & Zhu, D.H. 2011. Understanding social networking sites adoption in China: A
comparison of pre-adoption and post-adoption. Computers in Human Behaviour, 27(5):
1840–1848.
Chao-Béroff, R. 2007. Regulation and supervision of member-owned institutions in remote
rural areas. Research paper commissioned by Ford Foundation. Antigonish, NS: Coady
International Institute.
Cheema, A.R. & Sial, M.H. 2012. Poverty, Income Inequality, and Growth in Pakistan: A
Pooled Regression Analysis. The Lahore Journal of Economics, 17(2): 137–157.
Chen, G.M. 2010. Tweet this: A uses and gratifications perspective on how active Twitter use
gratifies a need to connect with others. Computers in Human Behaviour, 27(2): 755–762.
Chen, Y., Fay, S. & Wang, Q. 2011. The role of marketing in social media: How online
consumer reviews evolve. Journal of Interactive Marketing, 25(2): 85–94.
Chen, Y., Gong, X., Chu, C. & Cao, Y. 2018. Access to the Internet and Access to Finance:
Theory and Evidence. Sustainability 2018, 10: 2534. doi:10.3390/su10072534.
Cheung, C.M.K. & Lee, M.K.O. 2010. A theoretical model of intentional social action in online
social networks. Decision Support Systems, 49(1): 24–30.
Chhikara, K.S. & Kodan, A.S. 2011. Financial inclusion, development and its determinants:
An evidence of Indian state, Asian Economic Review, April 2011: 18-31.
Chithra, N. & Selvam, M. 2013. Determinants of Financial Inclusion: An Empirical Study on
the Inter-State Variations in India. Emerging Markets: Finance e Journal: 1-15.
Claessens, S. 2006. Access to Financial Services: A Review of the Issues and Public Policy
Objectives. The World Bank Research Observer, 21(2): 207-240.
Claessens, S., Evenett, S. & Hoekman, B. 2010. Rebalancing the Global Economy: A Primer
for Policymaking. Centre for Economic Policy Research (CEPR). London.
261
Clamara, N., Pena, X. & Tuesta, D. 2014. Factors that Matter for Financial Inclusion: Evidence
from Peru. BBVA Research, 14/09 Working Paper, pp 1-26.
Cochran, J.P. & Steven T.C. 1998. The Role of Fractional-Reserve Banking and Financial
Intermediation in the Money Supply Process: Keynes and the Austrians. Quarterly
Journal of Austrian Economics, 1(3): 29–40.
Colliander, J. & Dahlén, M. 2011. Following the fashionable friend: The power of social media.
Journal of Advertising Research, 51(1): 313–320.
Collins, D., Morduch, J., Rutherford, S. & Ruthven, O. 2009. Portfolios of the Poor: How the
World’s Poor Live on $2 a Day. Princeton: Princeton University Press.
Collins, J.M. & O’Rourke, C. 2009. Still holding out promise: A Review of Financial Literacy
Education and Financial Counselling Studies. Presentation at Improving Financial
Literacy and Reshaping Financial Behaviour conference, Indianapolis, IN. Available from
http://www.networksfinancialinstitute.org/News/Documents/Collins.pdf [Accessed on
04/05/2010].
Correa, T., Hinsley, A.W. & de Zúniga, H.G. 2010. Who interacts on the Web? The intersection
of users’ personality and social media use. Computers in Human Behaviour, 26(2): 247–
253.
Cosh, A.D., Cumming, D. & Hughes, A. 2009. Outside Entrepreneurial Capital. The Economic
Journal, 119(540): 1494 – 1533. DOI:10.1111/j.1468-0297.2009.02270.x
Crick, W.F. 1927. The genesis of bank deposits. Economica: 191-202.
Crotty, M. 1998. The Foundations of Social Research: Meaning and Perspective in the
Research Process. London: Sage.
Culbertson, J. 1958. Intermediaries and monetary theory: A criticism of the Gurley-Shaw
Theory, American Economic Review, 48 (1958): 119-131
Cull, R., Demirquc-Kunt, A. & Lyman, T. 2012. Financial Inclusion and Stability: What does
research show? Washington DC: CGAP.
Cull, R., Demirgüç-Kunt, A. & Morduch, J. 2014. Banks and Microbanks. Journal of Financial
Services Research, 46(1): 1-53.
Cynamon, B.Z. & Fazzari, S.M. 2008. Household Debt in the Consumer Age: Source of
Growth — Risk of Collapse. Capitalism and Society, 3(2, Article 3).
Dai-Won, K., Jung-Suk, Y. & Hassan, M.K. 2018. The influence of religion and social inequality
on financial inclusion. The Singapore Economic Review.
doi.org/10.1142/S0217590817460031
262
Davis, F.D. 1989. Perceived Usefulness, Perceived Ease of Use, and User Acceptance of
Information Technology. MIS Quarterly, 13(3): 319–340.
Dahl. T. 2008. Contributing to the academic conversation: A study of new knowledge claims
in economics and linguistics, Journal of Pragmatics, 40: 1184-1201.
Datt, G. & Ravallion, M. 1992. Growth and Redistribution Components of Changes in Poverty
Measures: A Decomposition with Applications to Brazil and India in the 1980s. Journal of
Development Economics, 38(2): 275–95.
Davenport, H.J. 1913. The Economics of Enterprise. New York: Augustus M. Kelley.
Davis, K. & Moore, W.E. 1945. “Some Principles of Stratification”. American Sociological
Review. In B. Barber. 1993. Constructing the Social System: Sociology Science. P. 312.
Piscataway, NJ.: Transaction Publishers.
Deaton, A.S. 1997 The Analysis of Household Surveys: Microeconometric analysis for
development policy. Baltimore, MD: Johns Hopkins University Press.
Deaton, A.S. 2005. Franco Modigliani and the Life Cycle Theory of Consumption. Economic
and Political Weekly, 42(6): 1-22.
De Grauwe, P. 2009. Lessons from the banking crisis: A return to narrow banking. Journal for
Institutional Change, 7(2): 19-23.
Debreu, G. 1959. Theory of value. New Haven and London: Yale University Press. Available
from http://digamo.free.fr/debreu59.pdf [Accessed on 16/07/2014].
Degryse, H. & Ongena, S. 2005. Distance, Lending Relationships, and Competition. Journal
of Finance, 60 (1): 231-66.
Degryse, H., Laeven, L. & Ongena, S. 2006. The Impact of Organizational Structure and
Lending Technology on Banking Competition. Tilburg University Center for Economic
Research Discussion. Paper 67.
Deininger, K. & Squire, L. 1998. New Ways of Looking at Old Issues: Inequality and Growth.
Journal of Development Economics, 57(2): 259–87.
De Jonghe, O. 2010. Back to the basics in banking? A micro-analysis of banking stability,
Journal of Financial Intermediation, 19: 387-417.
De Koker, L. & Jentzsch, N. 2013. Financial inclusion and financial integrity: aligned
incentives? World Development, 44: 267–280.
263
De Long, J.B. 1991. “Did J.P. Morgan’s Men Add Value? An Economist’s Perspective on
Financial Capitalism” In P. Temin (Ed.). Inside the business enterprise: Historical
perspectives on the use of information. Chicago: University of Chicago Press.
De los Ríos, J. & Trivelli, C. 2011. Savings Mobilization in Conditional Cash Transfer
Programs: Seeking Midterm Impacts. Instituto de Estudios Peruanos, pp. 1-36.
De Valck, K., van Bruggen, G. H. & Wierenga, B. 2009. Virtual communities: A marketing
perspective. Decision Support Systems, 47(3): 185–203.
Demetriades, P. O. & Hussein, K.A. 1996. Does Financial Development Causes Economic
Growth? Time Series Evidence from 16 Countries. Journal of Development Economics:
387-411.
Demetriades, P. & Andrianova, S. 2004. “Finance and growth: what we know and what we
need to know”. In Financial Development and Economic Growth. Pp. 38-65. Baingstoke,
UK: Palgrave Macmillan UK.
Demirguc-Kunt, A. & Detragiache, E. 2005. Cross-Country Empirical Studies of Systemic
Bank Distress: A Survey. IMF Working Paper No. 05/96, pp. 1-32.
Dermirquc-Kunt, A. & Klapper, L. 2012. Measuring Financial Inclusion: The Global Findex
Database. Policy Research Working Paper. The World Bank, No. WPS 6025.
Demirguc-Kunt, A., Klapper, L. & Randall, D. 2013. Islamic finance and financial inclusion:
measuring use of and demand for formal financial services among Muslim adults. World
Bank Policy Research Working Paper 6642.
Demirguc-Kunt, A., Klapper, L. & Singer, D. 2013. Financial Inclusion and Legal Discrimination
Against Women: Evidence From Developing Countries. Policy Research Working Paper
No. 6416. The World Bank, Washington, DC.
Demirguc-Kunt, A., Klapper, L. & Singer, D. 2017. Financial Inclusion and Inclusive Growth A
Review of Recent Empirical Evidence, Policy Research Working Paper 8040. World Bank
Group.
Demirguc-Kunt, A. & Levine, R. 2001. Financial Structures and Economic Growth: A Cross-
Country Comparison of Banks, Markets, and Development. Cambridge, MA: MIT Press.
Demirguc-Kunt A. & Levine R. 2007. Finance and economic opportunity. Brown University,
pp. 1-348.
Demirguc-Kunt, A & Levine, R. 2008. Finance and economic opportunity. Policy Research
Working Paper Series 4468. The World Bank.
264
Demirguc-Kunt, A., Love, I. & Maksimovic, V. 2006. Business Environment and the
Incorporation Decision. Journal of Banking and Finance 30 (11): 2967–93.
Demirguc-Kunt, A. & Maksimovic, V. 1998. Law, finance and firm growth. Journal of Finance,
53(6): 2107-2137.
De Soto, J.H. 1998. Money, Bank Credit, and Economic Cycles. Ludwig von Mises Institute,
pp. 1-356.
Devereux, M.B. & Smith, G. W. 1994. International Risk Sharing and Economic Growth.
International Economics Review, Aug. 1994, 35(4): 535–50.
Dewatripont, M., Rochet, J-C. & Tirole, J. 2010. Balancing the Banks: Global lessons from the
financial crisis. Princeton: Princeton University Press.
Diamond, D.W. 1984. Financial Intermediation and Delegated Monitoring. Review Economic
Studies, July 1984, 51(3): 393–414
Diamond, D.W. 1991. Monitoring and reputation: The choice between bank loans and directly
placed debt. Journal of Political Economy, 99(4): 689–721.
Diamond, D.W. 1997. Liquidity, banks, and markets. Journal of Political Economy, 105(5):
928–956.
Diamond, D.W. & Rajan, R.G. 2000. A Theory of Bank Capital. Journal of Finance, 2000:55(6,
Dec): 2431-2465.
Diamond, D.W. & Rajan, R.G. 2001. Banks, short-term debt and financial crises: Theory,
policy implications and applications. Carnegie-Rochester Conference Series on Public
Policy, 54(1). pp. 37–71. Elsevier
Diamond, D.W. & Verrecchia, R.E. 1982. Optimal Managerial Contracts and Equilibrium
Security Prices. Journal of Finance, May 1982, 37: 275–87.
Diamond, D.W. & Dybvig, P.H. 1983. Bank Runs, Deposit Insurance, and Liquidity. Journal of
Political Economics, June 1983, 91(3): 401–19.
Digman, J.M. 1990. Personality structure: Emergence of the five-factor model. Annual Review
of Psychology, 41: 417–440.
Dimitriu, R. & Guesalaga, R. 2017. Consumers’ Social Media Brand Behaviours: Uncovering
Underlying Motivators and Deriving Meaningful Consumer Segments. Psychology and
Marketing Journal, 34: 580-592.
265
Dittus, P. & Klein, M.U. 2011 On Harnessing the Potential of Financial Inclusion. BIS Working
Paper No. 347, pp. 1-23. [Online]. Available from http://dx.doi.org/10.2139/ssrn.1859412
[Accessed on 16/07/2018].
Divya, J. 2014. A Study on Financial Inclusion and Financial Literacy. International Journal of
Business and Administration. Research review, 2(4): 126-134
Dollar, D. & Kraay, A. 2002. Growth is good for the poor. Journal of Economic Growth, 7: 195-
225.
Domar, E. 1947. Expansion and employment. American Economic Review (1947) March.
Donovan, K. 2012. Chapter 4. Mobile Money for Financial Inclusion. Chapter 4, World Bank,
pp. 61-73. Available from http://siteresources.worldbank.org/EXTIN FORMATIONAND
COMMUNICATIONANDTECHNOLOGIES/Resources/IC4D-2012-Chapter-4.pdf
[Accessed on 23/05/18].
Dos Santos, P.L. 2009. At the Heart of the Matter: Household Debt in Contemporary Banking
and the International Crisis. Research on Money and Finance. EKONOMIAZ. Revista
vasca de Economía, Gobierno Vasco / Eusko Jaurlaritza / Basque Government,
Discussion Paper no. 11, 72(03): 54-79. Available from www.soas.ac.uk/rmf [Accessed
on 15/01/2018].
Dos Santos, P.L. 2011. Production and Consumption Credit in a Continuous-time Model of
the Circuit of Capital. International Review of Economics, 62(4): 729-758. DOI:
10.1111/j.1467-999X.2011.04139.x
Drakos, K. 2002. Imperfect competition in banking and macroeconomic performance:
evidence from the transition economies, paper presented at the Bank of Finland, pp. 35-
47.
Driver, R. & Erickson, G. 2008. Theories-in-Action: Some Theoretical and Empirical Issues in
the Study of Students' Conceptual Frameworks in Science. Journal Studies in Science
Education, 10(1): 37-60 Available from http://dx.doi.org/10.1080/03057268308559904
[Accessed on 04/08/2017].
Duesenberry, J. 1949. Income, Saving and the Theory of Consumer Behaviour. Cambridge,
MA: Harvard University Press.
Dupas, P. & Robinson, J. 2013. Why Don’t the Poor Save More? Evidence from Health
Savings Experiments. American Economic Review, 103(4): 1138–1171.
Eastwood, R. & Kohli, R. 1999. Directed credit and investment in small-scale industry in India:
Evidence from firm-level data, 1965-1978. Journal of Development Studies, 35(4): 138-
149.
266
Easterly, W., Islam, R. & Stiglitz, J. 2000. Shaken and Stirred: Explaining Growth Volatility. In
Macroeconomic Paradigms for Less Developed Countries. World Bank, Washington, DC
Eatwell, J., Milgate, M. & Newman, P. (Eds.). 1989. The New Palgrave Money. Basingstoke:
Macmillan.
Economics Help. 1915. Helping to Simplify Economics. [Online]. Available from
https://www.economicshelp.org/ [Accessed on 15/12/2019].
Eighmey, J. & McCord, L. 1998. Adding value in the information age: Uses and gratifications
of sites on the World Wide Web. Journal of Business Research, 41(3): 87–194.
El-Dereny, M. & Rashwan, N. 2011. Solving multicollinearity problem Using Ridge Regression
Models. International Journal of Contemporary Mathematical. Sciences, 12: 585 – 600
Elliehausen, G.E. & Wolken, J.D. 1990. Banking Markets and the Use of Financial Services
by Small and Medium-Sized Businesses. Board of Governors of the Federal Reserve
System Staff Study #160.
Elliott, J.E. 1985. Schumpeter's Theory of Economic Development and Social Change:
Exposition and Assessment. International Journal of Social Economics, 12(6/7): 6-33.
https://doi.org/10.1108/eb013992
Ellison, A., Whyley, C. & Forster, R. 2010. Realising Banking Inclusion: The Achievements
and Challenges. Financial Inclusion Task Force. HM Treasury, London, pp. 1-33.
European Commission (EU). 2008. Financial Services Provision and Prevention of Financial
Exclusion Report. Directorate-General for Employment, Social Affairs and Equal
Opportunities, Brussels: European Commission, pp 1-136.
Evans, O. & Adeoye, B. 2016. Determinants of Financial Inclusion in in Africa: A Dynamic
Panel Data Approach. University of Mauritius Research Journal, 22-16: 1-23.
Fama, E.F. 1980. Banking in the theory of finance. Journal of Monetary Economics, 6(1): 39-
57.
Fama, E.F. 1990. Stock Returns, Expected Returns, and Real Activity. The Journal of Finance.
45(4): 1089-1108.
Fernando, N.A. 2006. Understanding and dealing with high interest rates on microcredit. Metro
Manila: Asian Development Bank.
Festre, A. & Nasica, E. 2009. Schumpeter on money, banking and finance: An institutionalist
perspective. European Journal of the History of Economic Thought, 16(2): 325-356.
267
Feltham, G.A. & Hofmann, C. 2007. Limited Commitment in Multi-agent Contracting.
Contemporary Accounting Residue, 24: 345–375.
Fethi, S. & Katircioglu, S. 2015. The role of the financial sector in the UK economy: Evidence
from a Seasonal Cointegration Analysis. Journal of Economic Research, 28(1): 717-737.
Field, A. 2009. Discovering Statistics Using SPSS, (Introducing Statistical Methods.) 3rd Ed.
SAGE Publications.
Fields, G. 2001. Distribution and Development: A New Look at the Developing World. NY:
Russell Sage Foundation, and Cambridge, MA: MIT Press.
Figueiredo Filho, D.B., Silva, J.A. & Rocha, E. 2015. What is R² all about? Leviathan –
Cadernos de Pesquisa Política, n. 3: 60-68.
Fink, G., Haiss, P. & Vuksic, G. 2005. Importance of financial sectors for growth in accession
Countries. Conference on European Economic Integration 2005 (CEEI), Vienna
Finscope Consumer Surveys. 2015-2016. Surveys conducted by FinMark Trust and other
Development Partners. Full Detail can be obtained from www.finmark.org.za.
Fischer, E. & Reuber, A.R. 2011. Social interaction via new social media: (How) can
interactions on Twitter affect effectual thinking and behavior? Journal of Business
Venturing 26(1): 1-18. DOI:10.1016/j.jbusvent.2010.09.002
Fishbein, M. & Ajzen, I. 1975. Belief, attitude, intention, and behavior: An introduction to theory
and research. Reading, MA: Addison-Wesley.
Fisher, T., Mayo, E. & Rogaly, B. 1999. “Conclusions”. In B. Rogaly, T. Fisher & E. Mayo
(Eds.). Poverty, social exclusion and microfinance in Britain. Pp. 131–144. Oxford and
London: Oxfam Publishing and New Economics Foundation.
Fitzpatrick, B. & Kingston, I. 2008. Older People’s Access to Financial Services. The Equality
Commission for Northern Ireland. [Online]. Available from http://www.equalityni.org/
ECNI/media/ECNI/Publications/Delivering%20Equality/OLDERPEOPLEFinancialservice
s(F).pdf [Accessed on 13/04/2019].
Foster, A. & Rosenzweig, M. 2001. Technological Changes and the Distribution of Schooling:
Evidence from Green Revolution in India. Development Economics: 1-32.
Fox, J.J., Bartholomae, S. & Lee, J. 2005. Building the case for financial education. Journal of
Consumer Affairs, 39: 195-214.
Franklin, A., Demirguç-Kunt, A., Klapper, L. & Peria, M.S.M. 2012. The Foundations of
Financial Inclusion: Understanding Owner ship and Use of Formal Accounts. World Bank
Policy Research Working Paper, no. 6290. Washington.
268
Freberg, K., Graham, K., McGaughey, K. & Freberg, L.A. 2011. Who are the social media
influencers? A study of public perceptions of personality. Public Relations Review, 37(1):
90–92.
French, J.R.P. & Raven, B. 1959. “The bases of social power”. In D. Cartwright (Ed.). Oxford,
England: University of Michigan, pp. 150–167.
Friedman, M. 1957. The Permanent Income Hypothesis. A Theory of the Consumption
Function. Princeton, NJ: Princeton University Press.
Frost, A. & Sullivan, F. 2009: Scalable and sustainable financial inclusion strategy, in NCR
white paper on financial inclusion. NCR Corporation, pp. 54-61.
Fungácová, Z. & Weill, L. 2015. Understanding financial inclusion in China. China Economic
Review, 34: 196–206.
Galor, O. & Tsiddon, D. 1996. Income Distribution and Growth: The Kuznets Hypothesis
Revisited. Economica, 63: 103–17.
Galor, O. & Zeira, J. 1993. Income Distribution and Macroeconomics. Review of Economics
Studies, 60(1): 35-52.
Gale, D. & Hellwig, M. 1985. Incentive-Compatible Debt Contracts: The One Period Problem.
Review Economics Studies, 52(4): 647–63.
Gans, H. 1972. The Positive Functions of Poverty. American Journal of Sociology, 78(2): 275-
289.
Gardner, A. 1961. Macroeconomic Theory. New York: The Macmillan Co.
Germidis, D., Kessler, D. & Meghir, R. 1991. Financial Systems and Development: What Role
for the Formal and Informal Financial Sectors? Paris: OECD Development Centre.
Gersovitz, M. 1988. Chapter 10 “Saving and development”. In H. Chenery & T.N. Srinivasan
(Eds.). Handbook of Development Economics, Volume 1, Pp. 381-424. Amsterdam,
Netherlands: Elsevier Science Publishers.
Gertler, M. & Kiyotaki, N. 2011. “Financial Intermediation and Credit Policy in Business Cycle
Analysis”. In B. Friedman & M. Woodford (Eds.). Handbook of Monetary Economics, 3A,
Pp 547-599. Amsterdam, Netherlands: Elsevier
Ghatak, A. 2013. Demand Side Factors Affecting Financial Inclusion. Research Journal of
Social Science and Management, 3(1): 176-185.
Ghosh, J. 2016. Microfinance and the challenge of financial inclusion for development.
Cambridge Journal of Economics, 37(6): 1203-1219.
269
Ghosh, S. & Vinod, D. 2016. What Constrains Financial Inclusion for Women? Evidence from
Indian Micro data. World Development, 92: 60–81.
Gill, I. & Kharas, H. 2007. An East Asian Renaissance: Ideas for Economic Growth. The
International Bank for Reconstruction and Development. The World Bank.
Global Findex. 2019. The Global Financial Inclusion Database. The World Bank. Available
from http://econ.worldbank.org/WBSITE/EXTERNAL/EXTDEC/EXTRESEARCH/
EXTPROGRAMS/EXTFINRES/EXTGLOBALFIN/0,,content.html [Accessed on
15/04/2014].
Goldsmith, R.W. 1969. Financial Structure and Development. The Economic Journal, 80(318):
365-367. https://doi.org/10.2307/2230134
Goodhart, C.A.E. 2004. Some new directions for financial stability? Bank for International
Settlements, 27: 1-39.
Gordon, D. 2006. “The Concept and Measurement of Poverty” In C. Pantazis, D. Gordon & R.
Levitas (Eds.). Poverty and Social Exclusion in Britain. Pp. 29-69. Bristol: The Policy
Press.
Gorton, G. 2010. Slapped by the invisible hand: The panic of 2007. Oxford: Oxford University
Press.
Gorton, G. & Pennacchi, G. 1990. Financial Intermediaries and Liquidity Creation. Journal of
Finance, 45(1): 49–71.
Greenwood, J. & Smith, B. 1997. Financial Markets in Development, and the Development of
Financial Markets. Journal of Economics Dynamics and Control, 21(1): 145–81.
Grogger, J. 2009. Welfare Reform, Returns to Experience, and Wages: Using Reservation
Wages to Account for Sample Selection Bias. Review of Economics and Statistics, 91
(August): 490-502.
Grossman, S.J. & Stiglitz, J.E. 1980. On the Impossibility of Informationally Efficient Markets.
American Economics Review, June 1980, 70(3): 393–408.
Gupte, R., Venkataramani, B. & Gupta, D. 2012. Computation of Financial Inclusion Index for
India. International Conference of Emerging Economies-Prospects and Challenges.
Procedia- Social and Behavioural Sciences, 37(2012): 133-149.
Gurley, J.G. & Shaw, E.S. 1955. Financial aspects of economic development. American
Economic Review, 45: 515–528.
Gurley, J.G. & Shaw, E.S. 1960. Money in a Theory of Finance. Washington: The Brookings
Institution.
270
Gurtner, J.M., Jaeger, M. & Ory, J,N. 2002. Le statut de coopérative est-il source d’efficacité
dans le secteur th bancaire’, Revue d’Economie Financière, 67: 133-163.
Guth, J.L. 2008. Militant and Cooperative Internationalism Among American Religious Publics.
Annual BISA Working Group Conference on US Foreign Policy, pp. 1-32.
Guttentag, J.M. & Lindsay, R. 1968. The uniqueness of commercial banks. Journal of Political
Economy, 71: 991-1014.
Gwalani, H. & Parkhi, S. 2014. Financial Inclusion–Building a Success Model in the Indian
Context. Procedia-Social and Behavioral Sciences, 133: 372-378.
Hai, D.P. 2010. Process of public policy formulation in developing countries. Graduate
Academy of Social Science (GASS). pp. 1-12. Available from
http://archives.ippapublicpolicy.org/IMG/pdf/panel_11_s1_hai_phu_do.pdf [Accessed on
17/06/2017.
Hagemann, H. 2003. Schumpeter’s early contributions on crisis theory and business cycle
theory. History of economic ideas, XI (1): 47-67.
Hampden-Turner, C. & Trompenaars, F. 2000. Building Cross-Cultural Competence: How to
create wealth from conflicting values. John Wiley & Sons, p.8.
Han, R. & Melecky, M. 2013. Financial Inclusion for Financial Stability: Access to Bank
Deposits and the Growth of Deposits in the Global Financial Crisis. World Bank Policy
Research Working Paper No. 6577, pp. 1-26. Washington, DC: World Bank.
Hanna, R., Rohm, A. & Crittenden, V.L. 2011. We’re all connected: The power of the social
media ecosystem. Business Horizons, 54(3): 265–273.
Hannig, A. & Jansen, S. 2010. Financial Inclusion and Financial Stability: Current Policy
Issues. ADBI Working Paper 259. Tokyo: Asian Development Bank Institute. Available:
http://www.adbi.org/workingpaper/2010/12/21/4272.financial.inclusion.stability.policy.iss
ues
Haber, S.H. 2004. Mexico’s Experiments with Bank Privatization and Liberalization, 1991–
2004. Journal of Banking and Finance, 29: 2325–53.
Hair, J.F., Anderson, R.E., Babin, B.J. & Black, W.C. 2010. Multivariate data analysis: A global
perspective (Vol. 7). Upper Saddle River, NJ: Pearson.
Hall, R.E. & Mishkin, F.S. 1982. The Sensitivity of Consumption to Transitory Income:
Estimates from Panel Data on Households. Econometrica, 50: 461–481.
Harrod, R. 1939. An essay in dynamic theory. Economic Journal, 49 (1939, March): 14-33.
271
Hathaway, I. & Khatiwada, S. 2008. Do financial education programs work? Working Paper
0803, Federal Reserve Bank of Cleveland.
Hau, Y.S. & Kim, Y.G. 2011. Why would online gamers share their innovation-conducive
knowledge in the online game user community? Integrating individual motivations and
social capital perspectives. Computers in Human Behaviour, 27(2): 956–970.
Hayduk, L.A. 1996. LISREL issues, debates, and strategies. Baltimore: Johns Hopkins
University Press, pp. 1-256.
Hayes, A.F. & Cai, L. 2007. Using heteroskedasticity-consistent standard error estimators in
OLS regression: An introduction and software implementation. Behavior Research
Methods, 39(4): 709-722.
Hawtrey, R.G. 1919. Currency and Credit. Longmans, Green and Co, pp. 1-412.
HBOS PLC. 2004. Annual Report and Accounts. Bank of Scotland community banking gains
Treasury seal of approval. [Online]. Available from www.hbosplc.com/media/press
releases/ articles/bos/2004.20200.asp?fs=/media/press_releases.asp. [Accessed on
13/12/2014].
He, W., Zha, S. & Li, L. 2013. Social media competitive analysis and text mining: A case study
in the pizza industry. International Journal of Information Management, 33(3), 464–472.
Heckman, J. 1974. Shadow Prices, Market Wages, and Labour Supply. Econometrica, 42(4):
679-94.
Hesse, H. & Cihak, M. 2007. Cooperative banks and financial stability. IMF Working Paper
07/02, January. Washington, DC: International Monetary Fund, pp. 1-38.
Hicks, J. 1969. A Theory of Economic History. Oxford: Oxford University Press.
Higgins, M. & Williamson, J. 1999. Explaining Inequality the World Round: Cohort Size,
Kuznets Curves, and Openness. Journal of Political Economy, 99: 1029-59.
Hilgert, M.A., Hogarth, J.M. & Beverly, S.G. 2003. Household financial management: The
connection between knowledge and behaviour. Federal Reserve Bulletin (July), pp. 309-
322.
Hirschland, M., Chao-Béroff, R., Harper, M. & Lee, N. 2008. Reaching the Hard to Reach:
Comparative Study of Member-Owned Financial Institutions in Remote Rural Areas.
[Online]. Available from http://www.findevgateway.org/sites/ default/files/mfg-en-paper-
financial-services-in-remote-rural-areas-findings-from-seven-member-owned-
institutions-synthesis-jun-2008_0.pdf [Accessed on 29/03/2019].
Hölmstrom, B. 1979. Moral Hazard and Observability. Bell Journal of Economics, 10: 74–91.
272
Hogarth, J. 2006. Financial education and economic development. Paper presented at the G8
29-30 November 2006. International Conference on Improving Financial Literacy,
Moscow, pp. 1-34.
Hogarth, J.M., Beverly, S.G. & Hilgert, M. 2003. “Patterns of financial behaviors: Implications
for community educators and policy makers” (Discussion Draft- February 2003). Paper
presented at the Community Affairs Research Conference, Federal Reserve Board.
[Online]. Available from http://www.federalreserve.gov/communityaffairs/national/
CA_Conf_SusComm Dev/pdf/hogarthjeanne.pdf [Accessed on 05/05/2010].
Hogarth, J. & O’Donnell, K. 1999. Banking Relationships of Lower-Income Families and the
Governmental Trend toward Electronic Payment. Federal Reserve Bulletin, Board of
Governors of the Federal Reserve System (U.S.), issue July: 459-473.
Holden, K., Kalish, C., Scheinholtz, L., Dietrich, D. & Novak, B. 2009. Financial literacy
programs targeted on pre-school children: Development and evaluation. Credit Union
National Association, [Online]. Available from http://www.cunapfi.org/download/
168_CUNA_Report_PHASE_ONE_FINAL_4-289.pdf [Accessed on 04/05/2010].
Holmstrom, B. & Tirole, J. 1993. Market Liquidity and Performance Monitoring. Journal of
Political Economics, 101(4): 678–709.
Holmstrom B. & Tirole, J. 1997. Financial Intermediation, Loanable Funds and the Real Sector.
The Quarterly Journal of Economics, 112: 663-691.
Honohan, P. 2004a. Financial Development, Growth and Poverty: How Close are the Links?
Based on a talk presented at the British Association Festival of Science, Salford
University, Manchester, England. pp. 1-31.
Honohan, P. 2004b. Financial Sector Policy and the Poor. Selected Findings and Issues.
World Bank Working Paper No. 43, World Bank, Washington, DC, pp. 1-90. [Online].
Available from www-wds.worldbank.org/servlet/WDSContentServer/WDSP/IB/2004/ 03/
30/000160016_20040330143253/Rendered/PDF/wps3203.pdf [Accessed on
16/08/2017.
Honohan, P. 2008. Partial Credit Guarantees – Principles and Practice. IIIS Discussion Paper
244, Trinity College Dublin, pp.1-28.
Honohan, P. & King, M. 2009. Cause and Effect of Financial Access: Cross Country Evidence
from the Finscope Surveys. World Bank Mimeo.
Hoppe, H, Hülsmann, J.G. & Block, W. 1998. Against Fiduciary Media. Quarterly Journal of
Austrian Economics, 1(1): 19–50.
273
Horlacher, D.E. 2002. Aging in Japan: Causes and Consequences. Part II: Economic Issues.
International Institute for Applied Systems Analysis.
Hossain, L. & de Silva, A. 2009. Exploring user acceptance of technology using social
networks. Journal of High Technology Management Research, 20(1): 1–18.
Houthakker, H.S. 1965. “On Some Determinants of Saving in Developed and Underdeveloped
countries”. In E.A.G. Robinson (Ed.). Problems in Economic Development, pp. 1-43.
London: Macmillan.
Hsiao, K.L., Lin, J.C.C., Wang, X.Y., Lu, H.P. & Yu, H. 2010. Antecedents and consequences
of trust in online product recommendations. Online Information Review, 34(6): 935–953.
Hsu, C.L. & Lin, J.C.C. 2008. Acceptance of blog usage: The roles of technology acceptance,
social influence and knowledge sharing motivation. Information and Management, 45(1):
65–74.
Hu, F. & Chen, Y.Y. 2012. Social Networks and Informal Lending for Rural Households.
Journal of Financial Research 12: 178–192.
Huang, C.Y., Chou, C.J. & Lin, P.C. 2010. Involvement theory in constructing bloggers’
intention to purchase travel products. Tourism Management, 31(4): 513–526.
Hulsmann, J.G. 2003. The aPriori Foundations of Property Economics. The Quarterly Journal
of Austrian Economics, 7: 41–68.
Hussain, F. & Chakraborty, D.K. 2012. Causal Between Financial Development and Economic
Growth: Evidence from Indian State. The Romanian Economic Journal, 27-47.
IFC (International Finance Corporation). 2011. Financial Access 2011: An Overview of the
Supply-Side Data Landscape. [Online]. Available from https://www.ifc.org/wps/
wcm/connect/2ed7e2804bc259069c3bff1be6561834/Forum+Financial+Access+2011.p
df?MOD=AJPERES [Accessed on 24/05/2018].
IFIC (Investment Funds Institute of Canada). 2010. The Value of Advice Report. [Online].
Available from https://www.ific.ca/wp-content/uploads/2010/07/IFIC-Value-of-Advice-
Report-2010-July-2010.pdf [Accessed on 13/06/2018].
IFIC. 2011. The Value of Advice Report. [Online]. Available from https://www.ific.ca/wp-
content/uploads/2011/07/IFIC-Value-of-Advice-Report-2011-July-2011.pdf [Accessed on
13/06/2018].
IMF (International Monetary Fund). 2015. Financial Inclusion: Can it Meet Multiple
Macroeconomic Goals? Discussion Note. [Online]. Available from
http:www.imf.org/pubs.pdf [Accessed on 17/02/2018].
274
Jack, W. & Suri, T. 2009. Mobile money: The economics of M-PESA. Georgetown University,
[Online]. Available from http://www.mit.edu/~tavneet/M-PESA.pdf [Accessed on
13/12/19].
Jack, W., Suri, T. & Townsend, R. 2010. Monetary theory and electronic money: Reflections
on the Kenyan experience. Economic Quarterly, 96(1): 83-122.
Jagadesh, D. 2015. The Impact of Savings in Economic Growth: An Empirical Study Based
on Botswana. International Journal of Research in Business Studies and Management,
2(9): 10-21.
Jakobsen, J.C., Gluud, C., Wetterslev, J. & Winke, P. 2017. When and how should multiple
imputation be used for handling missing data in randomised clinical trials – a practical
guide with flowcharts. BMC Medical Research Methodology, 7: 162.
https://doi.org/10.1186/s12874-017-0442-1.
Japelli, T. & Modigliani, F. 1998. The Age-Saving Profile and the Life-Cycle Hypothesis. CSEF
Working Papers 09, Centre for Studies in Economics and Finance (CSEF), University of
Naples, Italy.
Jappelli, T. & Pagano, M. 1994. Saving, Growth, and Liquidity Constraints. Quarterly Journal
of Economics, 109(1): 83–109.
Jensen, M. & Meckling, W.R. 1976. Theory of the Firm: Managerial Behavior, Agency Costs,
and Ownership Structure. Journal of Financial of Economics, 3(4): 305–60.
Jensen, M.C. & Murphy, K.J. 1990. Performance Pay and Top-Management Incentives.
Journal Political Economics, 98(2): 225–64.
Jin, A. 2012. The virtual malleable self and the virtual identity discrepancy model: Investigative
frameworks for virtual possible selves and others in avatar-based identity construction
and social interaction. Computers in Human Behaviour, 28(6): 2160-2168.
Jonson, S. & Arnold, S. 2012. Inclusive financial markets: Is transformation under way in
Kenya? Bath Papers in International Development and Well-Being, Development Policy
Review, Working Paper no. 14, pp. 1-34.
Johnson, R.B. & Turner, L. 2003. “Data collection strategies in mixed methods research”. In
A.M. Tashakkori & C.B. Teddlie (Eds.). Handbook of Mixed Methods in Social and
Behavioral Research, pp. 67-94. Newcastle upon Tyne, UK: SAGE.
Johnston, D. & Morduch, J. 1999. “Sequencing Financial Sector Reforms. Financial Sector
Assessment.” In S. Financial (Ed.). A Handbook, pp. 317-324.
275
Johnston, D. & Morduch, J. 2008. The unbanked: evidence from Indonesia. World Bank
Economic Review, 22(3): 517-537.
Johnson, S. & Nino-Zarazua, M. 2011. Financial Access and Exclusion in Kenya and Uganda,
The Journal of Development Studies, 47:3: 475-496, DOI:
10.1080/00220388.2010.492857
Jukan, M.K. & Softić, A. 2016. Comparative Analysis of Financial Inclusion in Developing
Regions around the World. Economic Review – Journal of Economics and Business,
XIV(2): 58-65.
Justin, S., Sara, E., Yonca, G. & Marco, P. 2016. Exploring the linkages between youth
financial inclusion and job creation: evidence from the ILO school-to-work transition
surveys. Geneva: International Labour Office, 2016. Work4Youth publication series; No.
42, pp. 1-65.
Kakwani, N. 2000. On Measuring Growth and Inequality Components of Poverty with
Application to Thailand. Journal of Quantitative Economics, 16: 67–79.
Kakwani, N. & Pernia, E. 2000. What is Pro-poor Growth? Asian Development Review, 18(1):
1-16.
Kaldor, N. 1957. A Model of Economic Growth. The Economic Journal, 67(268): 591-624.
Kanbur, R. & Lustig, N. 1999. Why is Inequality Back on the Agenda? Paper presented at the
Annual World Bank Conference on Development Economics, Washington D.C. on April
28-30, 1999, World Bank, Washington, DC, pp. 1-38.
Kang, I., Lee, K.C., Lee, S. & Choi, J. 2007. Investigation of online community voluntary
behaviour using cognitive map. Computers in Human Behaviour, 23(1): 111–126.
Kaplan, A.M. & Haenlein, M. 2010. Users of the world, unite! The challenges and opportunities
of Social Media. Business Horizons, 53(1): 59–68.
Karakaya, F. & Barnes, N.G. 2010. Impact of online reviews of customer care experience on
brand or company selection. Journal of Consumer Marketing, 27(5): 447–457.
Karlan, D. & Morduch, J. 2009. “Access to Finance”. In D. Rodrik & M.R. Rosenzweig (Eds.).
Handbook of Development Economics, pp.1-87. Elsevier.
Karimo, T.M. & Ogbonna, O.E. 2017. Financial Deepening and Economic Growth Nexus in
Nigeria: Supply-Leading or Demand-Following? Economies, 5(1): 4.
doi:10.3390/economies5010004.
Karp, N. & Nash-Stacey, B.W. 2015. Technology, opportunity, & access: Understanding
financial inclusion in the U.S. Working Paper No. 15/25. BBVA Research. [Online].
276
Available from https://www.bbvaresearch.com/wpcontent/uploads/2015/07/WP1525_
FinancialInclusion_pdf [Accessed on 13/05/2018].
Karpowicz, I. 2014. Financial Inclusion Growth and Inequality: A Model Application to
Columbia. IMF Working Paper, WP/14/166. pp. 1-31.
Kasavana M.L., Nusair, K. & Teodosic, K. 2010. Online social networking: Redefining the
human web. Journal of Hospitality and Tourism Technology, 1(1): 68-82. DOI:
10.1108/17579881011023025
Kashyap, A., Rajan, R. & Stein, J. 2002. Banks as liquidity providers: An explanation for the
coexistence of lending and deposit-taking. Journal of Finance, 57: 33–73.
Katz, E., Blumler, J.G. & Gurevitch, M. 1974. Uses and gratifications research. Public Opinion
Quarterly, 37(4): 509-524.
Kedir, A. 2003. Determinants of Access to Credit and Loan Amount: Household-level Evidence
from Urban Ethiopia. International Conference on Development Studies in Ethiopia, July
11-12, 2003, Addis Ababa, Ethiopia. Centre for African Development Policy Research,
pp.1-22.
Kelman, H.C. 1958. Compliance, identification, and internalization three processes of attitude
change. Journal of Conflict Resolution, 2(1): 51-60.
https://doi.org/10.1177/002200275800200106
Kempson, E. 1998. Savings and low income and ethnic minority households. London:
Personal Investment Authority.
Kempson, E. & Whyley, C. 1999. Kept Out or Opted Out? Understanding and Combating
Financial Exclusion. Bristol: Policy Press.
Kerkman, B.C. 1998. Motivation and stages of change in financial counselling: An application
of a transtheoretical model from counselling psychology. Financial Counselling and
Planning, 9(1): 13–20.
Keynes, J.M. 1930. A Treatise on Money. London: Macmillan.
Keynes, J.M. 1936. The General Theory of Employment. Interest and Money. London:
Macmillan. International Relations and Security Network.
Keynes, J.M. & Moggridge, D.E. 1983. Collected writings XI, economic articles and
correspondence: Academic, collected works of Keynes, p. 419.
Khan, H.R. 2011. ‘Financial Inclusion and Financial Stability: Are They Two Sides of the Same
Coin?’ Address by Shri H. R. Khan, Deputy Governor of the Reserve Bank of India, at
277
Bancon 2011, organized by the Indian Bankers Association and Indian Overseas Bank,
Chennai, India, 4 November 2011, pp. 1-34.
Khandker, S.R. 1995. Grameen Bank: Performance and Sustainability. Washington: World
Bank Discussion Papers.
Khwaja, A. 2009. Lin Roundtable: Is Small Really Beautiful? The Economist, pp. 1-2. Available
from http://www.economist.com/blogs/freeexchange/lin_roundtable [Accessed on
15/08/2018].
King, B. 2010. Bank 2.0: How Customer Behaviour and Technology will Change the Future of
Financial Services. Singapore: Marshall Cavendish Business.
King, M. 1985. “The economics of saving: A survey of recent contributions”. In K. Arrow & S.
Hankapohja (Eds.). Handbook of Development Economics, Pp. 381-424. Oxford: Basil
Blackwell.
King, M. 2011. The Unbanked Four-Fifths: Barriers to Financial Services in Nigeria. World
Bank Blogs, p. 1. [Online]. Available from http://michaelking.ie/wp-
content/uploads/2011/11/The-Unbanked-Four-Fifths-Barriers-to-Banking-Services-in-
Nigeria-Novermber-2011-Final.pdf [Accessed on 23/03/2018].
King, R.G. & Levine, R. 1993a. Finance and Growth: Schumpeter Might be Right. The
Quarterly Journal of Economics, 108(3): 717–37.
King, R. & Levine, R. 1993b. Finance, entrepreneurship and growth: Theory and evidence.
Journal of Monetary Economics, 32(3): 513–542.
King, R.G. & Plosser, C.I. 1986. Money as the Mechanism of Exchange. Journal of Monetary
Economics, 17(1): 93–115.
King, G. & Roberts, M. 2015. How Robust Standard Errors Expose Methodological Problems
They Do Not Fix, and What to Do About It. Political Analysis, 23(2), 159-179.
Klapper, L. & Singer, D. 2013. The Role of Informal Financial Services in Africa. Journal of
African Economies, 24(1): i12-i31
Koch, K., Stupnytska, A., MacBeath, A., Lawson, S. & Matsui, K. 2014. Giving Credit where it
is due; How Closing the Credit Gap for Women-Owned SMEs can Drive Global Growth.
New York: Goldman Sachs Global Markets Institute.
Kodan-Kablana, A.S. & Chhikara, K.S. 2013. A Theoretical and Quantitative Analysis of
Financial Inclusion and Economic Growth. Management and Labour Studies, 38(1 & 2):
103-133.
278
Kohli, A.K. & Jaworski, B.J. 1990. Market orientation: The construct, research propositions,
and managerial implications. Journal of Marketing, 54(2): 1–18.
Korczyński, A. 2018. Review of methods for data sets with missing values and practical
applications. Śląski Przegląd Statystyczny Nr, 12(18): 83-104. DOI:
10.15611/sps.2014.12.05
Kozinets, R.V., de Valck, K., Wojnicki, A.C. & Wilner, S.J.S. 2010. Networked Narratives:
Understanding Word-of-Mouth Marketing in Online Communities. Journal of Marketing
[e-journal], 74(2): 2-19.
Krugman, P. 2009. How Did Economists Get It So Wrong? The New York Times Magazine, 6
September 2009, pp. 1-25.
Kumar, R. 2005. Research methodology. Newcastle upon Tyne, UK: SAGE Publications,
Science and Education.
Kumar, N. 2013. Financial Inclusion and its determinants: Evidence from state level empirical
analysis in India. Journal of Financial Economic Policy, 5(1): 4-19.
Kumbhakar, S. & Mavrotas, G. 2008. “Financial Sector Development and Productivity
Growth”. In B. Guha-Khasnobis & G. Mavrotas (Eds.). Financial Development,
Institutions, Growth and Poverty Reduction. pp. 34-49. UNU-WIDER Studies in
Development Economics and Policy. Oxford: Oxford University Press.
Krasa, S. & Villamil, A.P. 1992. Monitoring the Monitor: An Incentive Structure for a Financial
Intermediary. Journal of Economic Theory, 57(1): 197–221.
Kuznets, S. 1955. Economic Growth and Income Inequality. American Economic Review, 45:
1–28.
Kuznets, S. 1963. Quantitative Aspects of the Economic Growth of Nations. Economic
Development and Cultural Change, 11(1): 1–80.
Kvangraven, I.H. & dos Santos, P. 2016. Financial Inclusion and its Discontents. The New
School for Social Research. [Accessed on 15/01/2018].
Kwon, O. & Wen, Y. 2010. An empirical study of the factors affecting social network service
use. Computers in Human Behaviour, 26(2): 254–263.
Kyle, A.S. 1984. “Market Structure, Information, Futures Markets, and Price Formation”. In
C.E. Smith (Ed.). International agricultural trade: Advanced readings in price formation,
market structure, and price instability, Pp. 45–64. Boulder, CO: Westview.
Labrecque, L.I., Markos, E. & Milne, G.R. 2010. Online personal branding: Processes,
challenges, and implications. Journal of Interactive Marketing, 25(1): 37–50.
279
Laha A. & Kuri, P.V. 2011. Determinants of financial inclusion: A study of some selected
districts of West Bengal, India. Selected Works, 5(8): 1–28.
Lal, R. & Sachdev, I. 2015. Mobile Money Services - Design and Development for Financial
Inclusion. Harvard Business School, Working Paper, 15-083. pp 1-49.
Lamoreaux, N.R. 1994. Insider lending: Banks, personal connections, and economic
development in industrial New England. New York: Cambridge University Press.
Lamoreaux, N. & Sokoloff, K.L. 1996. Long-Term Change in the Organization of Inventive
Activity. Proceedings of the National Academy of Science, Nov. 1996, 93: 12686– 92.
Laroche, M., Habibi, M.R. & Richard, M-O. 2013. To be or not to be in social media: How
brand loyalty is affected by social media? International Journal of Information
Management, 33(1): 76–82.
Latané, B., Williams, K. & Harkins, S. 1979. Many hands make light the work: The causes and
consequences of social loafing. Journal of Personality and Social Psychology, 37(6): 822-
832.
Lederle, N. 2009. Exploring the impact of improved financial inclusion on the lives of
disadvantaged people. Unpublished PhD thesis, Heriot-Watt University, Edinburgh,
Scotland. Available from from www.ros.hw.ac.uk/handle/10399/2218
Leland, H.E. & Pyle, D.H. 1977. Informational asymmetries, financial structure, and financial
intermediation. [Papers and Proceedings of the Thirty-Fifth Annual Meeting of the
American Finance Association, Atlantic City, New Jersey, September 16-18, 1976] in The
Journal of Finance, 32(2): 371-387.
Lenka, S.K. & Barik, R. 2018. Has expansion of mobile phone and internet use spurred
financial inclusion in the SAARC countries? Financial Innovation (2018) 4(5): 1-19.
Lessambo F.I. 2015. The Bank for International Settlement. In: International Financial
Institutions and Their Challenges. New York: Palgrave Macmillan.
https://doi.org/10.1057/9781137522702_8
Levhari, D. & Srinivasan, T.N. 1969. Optimal Savings under Uncertainty. Review of Economic
Studies, 36(1): 153–63
Levin, G. 2012. Critique of Microcredit as a Development Model. Pursuit - The Journal of
Undergraduate Research at the University of Tennessee, 4(1), Article 9: 108-117.
Levine, R. 1991. Stock Markets, Growth, and Tax Policy. Journal Finance, 46(4): 1445–65.
Levine, R. 1997. Financial development and economic growth: Views and agenda. Journal of
Economic Literature, XXXV: 688–726.
280
Levine, E. 2009. Lin Roundtable: Function, Not Form. Free Exchange, Economist.com blogs,
1-4. [Online]. Available from www.economist.com/blogs/freeexchange/lin_roundtable
Levine, R. & Zervos, S. 1998. Stock Markets, Banks, and Economic Growth. The American
Economic Review, 88: 537–58.
Levine, R., Loayza, N. & Beck, T. 2000. Financial Intermediation and Growth: Causality and
Causes. Journal of Monetary Economics, 46: 31–77.
Lewis, S. & Lindley, D. 2015. Financial Inclusion, Financial Education, and Financial
Regulation in the United Kingdom. ADBI Working Paper 544. Tokyo: Asian Development
Bank Institute. Available from: http://www.adb.org/publications/financial-inclusion-
financialeducation-and-financial-regulation-united-kingdom/ 3/03/2018.
Lewis, R., Villasenor, J. & Wes, D.M. 2016. Assessing financial inclusion advances in sub-
Saharan Africa. Brookings Institution. [Online]. Available from https://www.brookings.edu/
blog/africa-in-focus/2016/09/13/assessing-financial-inclusion-advances-in-sub-saharan-
africa/ [Accessed on 07/06/2017].
Lin, J. 2009. Walk, Don’t Run. The Economist, pp. 14-16. [Online]. Available from
www.economist.com/businessfinance/economicsfocus/displaystory.cfm?story_id=13986
299.
Little, R.J. & Rubin, D.B. 2002. Statistical Analysis with Missing Data. 2nd ed. Hoboken, NJ:
John Wiley & Sons.
Loayza, N. & Ranciere, R. 2005. Financial Development, Financial Fragility, and Growth.
World Bank Policy Research Working Paper 3431.
Loibl, C. & Hira, T.K. 2007. New insights into advising female clients on investment decisions.
Journal of Financial Planning. [Online]. Available from http://www.fpanet.org/
journal/articles/2007Issues/jfp0307-art9.cfm [Accessed on 20/07/2007].
Lu, H.O. & Hsiao, K.L. 2010. The influence of extro/introversion on the intention to pay for
social networking sites. Information & Management, 47(3): 150–157.
Lucas, R.E., Jr. 1988. On the Mechanics of Economic Development. Journal of Monetary
Economics, 22(1): 3–42.
Lusardi, A. 2008. Financial Literacy: An Essential Tool for Informed Consumer Choice? NBER
Working Paper No. w14084, pp. 1-85 Available from http://www.dartmouth.edu/
~alusardi/Papers/Lusardi_Informed_Consumer.pdf [Accessed on 16/05/2018].
Lustig, N., Arias, O. & Rigolini, J. 2002. Poverty Reduction and Economic Growth: A Two-Way
Causality. Sustainable Development. Department Technical Papers Series, Inter-
281
American Development Bank, Washington, DC. Available from
www.iadb.org/sds/doc/GrowthIneqDualCaus.pdf-
Lydall, H. 1968. The Structure of Earnings. Oxford: Clarendon Press.
Lyons, A.C., Chang, Y. & Scherpf, E. 2006. Translating financial education into behaviour
change for low-income populations. Financial Counselling and Planning, 17(2): 27-45.
Mabic, M., Gaspar, D. & Lucovic, D. 2017. Presence of Banks on Social Networks in Bosnia
and Herzegovina. Business Systems Research, 8(2): 59-70.
MacLeod, H.D. 1856. The Theory and Practice of Banking. London: Longman, Greens and
Co.
Mader, P. 2017. Contesting Financial Inclusion. Development and Change. Institute of
Development Studies, 49: 461-483 Available from http://doi.org/10.111/dech.12368
[Accessed on 17/02/2018].
Madestam, A. 2014. Informal Finance: A Theory of Moneylenders. Journal of Development
Economics, 107: 157-174.
Makinde, T. 2005. Problem of Policy Implementation in Developing Nations. Journal of Social
Sciences, 11(1): 63-69.
Malkiel, B.G. 2003. The Efficient Market Hypothesis and its Critics. CEPS Working Paper No.
91, pp. 1-47.
Mandell, L. 2008. “Financial literacy in high school”. In A. Lusardi (Ed.). Overcoming the saving
slump: How to increase the effectiveness of financial education and saving programs. pp.
257-279. Chicago: University of Chicago Press.
Mandell, L. & Klein, L.S. 2009. The impact of financial literacy education on subsequent
financial behavior. Journal of Financial Counseling and Planning, 20(1): 15-24.
Martinez, C.H., Hidalgo, X.P. & Tuetsa, D. 2013. Demand Factors that Influence Financial
Inclusion in Mexico: analysis of the barriers based on the ENIF survey. BBVA Research.
Working Paper No. 13/37. Mexico City.
Martin, M. 2007. A literature review on the effectiveness of financial education (Working Paper
07-03). Richmond, VA: Federal Reserve of Richmond. [Online]. Available from
http://www.richmondfed.org/publications/research/working_papers/2007/wp_07-3.cfm
[Accessed on 13/03/2018].
Mas-Tur, A. 2016. Social Media Marketing For Adolescents. Psychology and Marketing,
33(12): 1119-1125. doi.org/10.1002/mar.20947

282
Mason, C.H. & Perreault, W.D. 2016. Collinearity, Power, and Interpretation of Multiple
Regression Analysis. Journal of Marketing Research, 28(3): 268-280.
Mathwick, C. 2002. Understanding the online consumer: A typology of online relational norms
and behaviour. Journal of Interactive Marketing, 16(1): 40–55.
Matthews, K. & Thompson, J. 2005. The Economics of Banking. 3rd ed. Chichester: John Wiley
and Sons.
McBride, M. 2001. Relative-income effects on subjective well-being in the cross-section.
Journal of Economic Behavior & Organization, 45(3): 251-278.
McCombs, M. & Guo, L. 2014. Agenda-setting Influence of the Media in the Public Sphere.
The Handbook of Media and Mass Communication Theory. DOI:
10.1002/9781118591178.ch14
McCormick, M.H. 2008. The effectiveness of youth financial education. Washington, DC: New
America Foundation. Available from http://newamerica.net/publications/policy/
effectiveness_youth_financial_education_0 [Accessed on 13/06/2018.
McFall, L. 1987. Integrity. Ethics, 98: 5-20
McKinnon, R. 1973. Money and Capital in Economic Development. Washington: The
Brookings Institution.
Mehrotra, N., Puhazhendhi, V., Nair, G. & Sahoo, B. 2009. Financial inclusion - an Overview.
(Occasional Paper – 48), Department of Economic Analysis and Research & National
Bank for Agriculture and Rural Development, Mumbai, 2009, pp. 1-24.
Meier, G.M. & Seers, D. 1984. Pioneers in development. New York: Oxford Press.
Mercieca, S, Sckaeck, K. & Wolfe, S. 2007. Small European banks: benefits from
diversification? Journal of Banking and Finance, 31(7): 1975-98.
Merton, R.C. 1987. A Simple Model of Capital Market Equilibrium with Incomplete. Information.
Journal of Finance, 42(3): 483–510.
Merton, R.C. 1995. Financial Innovation and the Management and Regulation of Financial
Institutions. Journal of Banking and Finance, 19(3-4): 461-482.
Merton, R.C. & Bodie, Z. 1995. “A Conceptual Framework for Analyzing the Financial
Environment.” In D.B. Crane et al. (Eds.). The global financial system: A functional
perspective, pp. 3–32. Boston, MA: Harvard Business School Press.
283
Messy, F. & Monticone, C. 2012. The Status of Financial Education in Africa. OECD Working
Papers on Finance, Insurance and Private Pensions, No. 25, OECD Publishing, pp. 1-93.
doi: 10.1787/5k94cqqx90wl-en
Mettenheim, K.V. & Butzbach, O. 2012. Alternative banking: Theory and evidence from
Europe. Brazilian Journal of Political Economy, 32(4): 580-596.
Mihasonirina, A. & Kangni, K. 2011. ICT, Financial Inclusion, and Growth: Evidence from
African Countries. IMF Working Paper. WP/11/73, pp. 1-45.
Min-Sook, P., Jong-Kuk, S. & Yong, J. 2015. A Taxonomy of Social Networking Site Users:
Social Surveillance and Self-surveillance Perspective. Psychology & Marketing, 32(6):
601-610.
Mirdala, R. 2011. Financial deepening and economic growth in the European transition
economies. Journal of Applied Economic Sciences, 6(2): 177-194.
Modigliani, F. & Ando, A.K. 1957. Tests of the Life Cycle Hypothesis of Savings. Oxford
Bulletin of Economics & Statistics, 19(2): 99–124.
Modigliani, F. & Brumberg, R.H. 1954. “Utility analysis and the consumption function: an
interpretation of cross-section data”. In K.K. Kurihara (Ed.). Post Keynesian Economics.
Pp. 388-436. New Brunswick, NJ: Rutgers University Press.
Modigliani, F. & Miller, M. 1958. The Cost of Capital, Corporation Finance and the Theory of
Investment. American Economic Review, 48(3): 261–297.
Montmarquette, C. & Vietnnot-Briot, N. 2012. Econometric Models on the Value of Advice of
a Financial Advisor. Project Report. CIRANO, pp. 3-86. Available from
http://www.cirano.qc.ca/pdf/publication/2012RP [Accessed on 13/02/18].
Moreno, M.A. & Koff, R. 2016. “Media theories and the Facebook Influence Model”. In G. Riva,
B.K. Wiederhold & P. Cipresso. (Eds.). The Psychology of Social Networking. Personal
Experience in Online Communities. Pp. 130-142. Berlin: De Gruyter Open.
Morgan, P. & Pontines, V. 2014. Financial Stability and Financial Inclusion. ADBI Working
Paper 488. Tokyo: Asian Development Bank Institute. [Online]. Available from
http://www.adbi.org/working-paper/2014/07/07/6353.financial.stability.inclusion/
[Accessed on 13/11/2017].
Morgan, P. & Pontines, V. 2017. Financial Stability and Financial Inclusion: Case of SME
Lending. UNESCAP Workshop on small and medium enterprises (SME) financing and
the role of development banks in Asia and the Pacific and Latin America. Bangkok, 27-
28 September 2017, pp. 1-17. Available from http://www.unescap.org/sites/
default/files/Session%202_Peter%20Morgan.pdf [Accessed on 13/01/2017].
284
Morgan, T. 1969. Investment versus economic growth. Economic Development and Cultural
Change. 17. Economic Development and Cultural Change, 17(3): 392-414.
Moss, T. 2009. Lin Roundtable: The Value of Stock Markets. Free Exchange, Economist blog.
[Online]. Available: http://www.economist.com/blogs/freeexchange/lin_roundtable.
Mucan, B. & Ozelturkay, E.Y. 2014. Social Media Creates Competitive Advantages: How
Turkish Banks Use This Power? A Content Analysis of Turkish Banks through. Procedia
- Social and Behavioural Sciences, 148: 137–145.
Mugo, M. & Kilonzo, E. 2017. Community–level impact of financial inclusion in Kenya with
particular focus on poverty eradication and employment creation. Central Bank of Kenya.
Muraleedharan, D. 2009. Modern Banking: Theory and Practice. Prentice-Hall of India, Pty
Ltd.
Musiał, K. & Kazienko, P. 2013. Social networks on the Internet. World Wide Web (16): 31–
72.
Myers, S.C. & Rajan, R.G. 1998. The Paradox of Liquidity. The Quarterly Journal of
Economics, 113(3): 733–771.
Naceur, M.S.B., Barajas, M.A. & Massara, M.A. 2015. Can Islamic Banking Increase Financial
Inclusion? (No. 15-31). International Monetary Fund.
Nambisan, P. & Watt, J.H. 2010. Managing customer experiences in online product
communities. Journal of Business Research, 64(8): 889–895.
Narasimhan, C.R.L. 2014. The Challenge of Financial Inclusion. The Reserve Bank of India.
[Online]. Available from www.thehindus.com/opinion/columns/CRL_Narasimhan/
[Accessed on 11/01/2018].
Narayan, D., Pritchet, L. & Kapoor, S. 2009. Success from the bottom up. London: Palgrave
Macmillan.
Njanike K. 2010. Introduction of Islamic Banking in Zimbabwe: Problems and Challenges.
Journal of Sustainable Development in Africa, 12(8): 70-78.
Njanike, K. 2018. An investigation on the determinants of opening a bank account in
Zimbabwe. Journal of Development Southern Africa, 36(4): 426-442.
Nowak, A., Ross, A. & Yencha, C. 2008. Small Business Borrowing and Peer-to-peer Lending:
Evidence from Lending Club. Contemporary Economic Policy, 36: 318–336.
Nurkse, R. 1953. Classical Development Economics and its Relevance for Today. Anthem
Press, pp.183-202.
285
Nutley, S. 2003. “Bridging the Policy/Research Divide: Reflection and Lessons from UK”.
Keynote Paper at National Institute of Governance Conference. The Research Unit for
Research Utilisation, University of St Andrews.
Obstfeld, M. 1994. Risk-Taking, Global Diversification, and Growth. American Economic
Review, American Economic Association, 84(5): 1310-1329.
OECD (Organisation for Economic Co-operation and Development). 2013. The role of
financial education in financial inclusion. OECD, INFE Evidence, Policies and Illustrative
Case Studies. Financial Literacy and Education Trust Fund.
Olaniyi, E. & Adeoye, B. 2016. Determinants of Financial Inclusion in Africa: A Dynamic Panel
Data Approach. University of Mauritius Research Journal, 22: 310-336.
Olit, B.F. 2011. Financial Inclusion in Spain: Comparative Study among Banks, Savings Banks
and Cooperative Banks. [Online]. Available from https://www.wsbi-esbg.org/
SiteCollectionDocuments/Perspectives%2065.pdf [Accessed on 16/08/2017].
Omarini, A. 2011. Retail Banking and Banks: Re-Start from a Service Perspective
Management to Increase Profitability, Stability and Customer Retention. Economic and
Management Review, 6: 83-106.
Omarini, A. 2017. The Digital Transformation in Banking and the Role of FinTechs in the New
Financial Intermediation Scenario. MPRA Paper 85225, University Library of Munich,
Germany. Available from https://mpra.ub.uni-muenchen.de/85228/ [Accessed on
29/03/2019].
O’Neill, B. 2001. Updated MONEY 2000TM: Impact data. Message to MONEY 2000TMelec-
tronic mail group. Available from https://[email protected].
O’Neill, B. & Xiao, J.J. 2006. Financial fitness quiz findings: Strengths, weaknesses, and
disconnects. Journal of Extension, 44(1): 1-14.
Osei-Assibey, E. 2009. Financial Exclusion: What Drives Supply and Demand for Basic
Financial Services in Ghana? Savings and Development Journal, 3(2009 – XXXIII): 207-
238.
Ozili, P.K. 2020. Theories of Financial Inclusion. MPRA Paper 101810, University Library of
Munich, Germany.
Ouma, S.A., Odongo, F.M. & Were, N. 2017. Mobile financial services and financial inclusion:
Is it a boon for savings mobilization? Review of Development Finance, 7(1): 29-35.
Pallant, J. 2010. SPSS Survival Manual: A Step by Step Guide to Data Analysis Using SPSS.
New York: McGraw Hill.
286
Pantazis, C., Gordon, D. & Levitas, R. 2006. Poverty and Social Exclusion in Britain. Bristol,
UK: The Policy Press.
Paramasivan C. & Ganeshkumar, V. 2013. Overview of Financial Inclusion in India.
International Journal of Management and Development Studies, 2(3): 45-49.
Park, C.Y. & Mercado, R.V. 2015. Financial Inclusion, Poverty, and Income Inequality in
Developing Asia. Asian Development Bank Working Papers. Series No. 426, pp. 1-25.
Available from https://www.adb.org/sites/default/files/publication/153143/ewp-426.pdf
[Accessed on 13/11/2017].
Parra-López, E., Bulchand-Gidumal, J., Gutiérrez-Tano, D. & Díaz-Armas, R. 2011. Intentions
to use social media in organizing and taking vacation trips. Computers in Human
Behaviour, 27(2): 640–654.
Peachey, S. & Roe, A. 2004. Access to finance: A study for the World Bank Savings Institute,
The World Bank. Available from www.savings-banks.com [Accessed on 15/04/2019].
Peppler, K.A. & Solomou, M. 2011. Building creativity: Collaborative learning and creativity in
social media environments. On the Horizon, 19(1): 13–23.
Perroti, R. 1993. Political Equilibrium, Income Distribution, and Growth. Review of Economic
Studies, 60(4): 755–76.
Persson, T. & Tabellini, G. 1994. Is Inequality Harmful for Growth? American Economic
Review, 84: 600-21.
Petkovski, M. & Kjosevski, J. 2014. Economic Research-Ekonomska Istraživanja. 27(1): 55–
66.
Phillips, C.A. 1920. Bank Credit. New York: Macmillan.
Piketty, T. 2014. Capital in the Twenty-First Century: a multidimensional approach to the
history of capital and social classes. The Journal British of Sociology, 65 (14): 736-747.
Platt, A., Singh, A., Bansal, S., Giri, A. & Tiwari, A.J. 2011. No Thrills –Dormancy in NFA
Accounts. Microsave India, Lucknow, pp. 34-48.
Pollara, P. 2011. Mobile technology and student learning: What does current research reveal?
International Journal of Mobile and Blended Learning, 3(3): 34-42
Popper, K.R. 1976. “The myth of the framework”. In E. Freeman (Ed.). The abdication of
philosophy—Philosophy and the public good: Essays in honor of Paul Arthur Schilpp, pp.
23-48.
287
Porter, C.E. & Donthu, N. 2008. Cultivating trust and harvesting value. Virtual communities.
Management Science, 54(1): 113–128.
Portes, A. 1998. Social capital: Its origins and applications in modern sociology. Annual
Review of Sociology, 24: 1–24.
Posner, R.A. 1973. Economic Justice and the Economist. Discussion. The Public Interest:
New York, 33: 109.
Potrich, A.C., Vieira, K.M. & Kirch, G. 2015. Determinants of Financial Literacy: Analysis of
the Influence of Socioeconomic and Demographic Variables. Paper presented at the 38th
AnPAD Meeting, Rio de Janeiro, Brazil, 2014. pp. 362-377. Available from DOI:
10.1590/1808-057x201501040 [Accessed on 13/05/2018].
Prochaska, J.O., DiClemente, C.C. & Norcross, J.C. 1992. In search of how people change:
Applications to addictive behaviors. American Psychologist, 47(9): 1102–1114.
Quinton, S. & Harridge-March, S. 2010. Relationships in online communities: the potential for
marketers. Journal of Research in Interactive Marketing, 4(1): 56-73.
Ragui, M. 2017. Mobile Banking: A Strategic Approach to Promote Financial. Journal of
Business and Management, 19(7, Ver. II): 48-54.
Rajan, R.G. 1998. The past and future of commercial banking viewed through an incomplete
contract lens. Journal of Money, Credit and Banking, 30(3): 524–550.
Rajan, R.G. & Zingales, L. 2003. The Great Reversals: The Politics of Financial Development
in the Twentieth Century. Journal of Financial Economics, 69(1): 5–50
Rajan, R. & Zingales, L. 2004. Saving capitalism from the capitalists. Princeton: Princeton
University Press.
Rama, P. & Pal, R. 2012. Income related inequality in financial inclusion and role of banks:
Evidence on financial exclusion in India. Indira Gandhi Institute of Development
Research, Mumbai Working Papers 2012-013.
Ray, D. 2010. Uneven Growth: A Framework for Research in Development Economics.
Journal of Economic Perspectives, 24 (3): 45–60.
Rasheed, B., Law, S.H., Chin, L. & Habibullah, M.S. 2016. The Role of Financial Inclusion in
Financial Development: International Evidence. Abasyn University Journal of Social
Sciences, 9(Special Issue-ceif): 330-347.
Ravallion, M. & Chen, S. 1997. What Can New Survey Data Tell Us about Recent Changes
in Distribution and Poverty? World Bank Economic Review, 11(2): 357–382.
288
RBI (Reserve Bank of India). 2008. Report on currency and finance. Mumbai: RB.
Rebelo, S.T. 1991. Long-Run Policy Analysis and Long-Run Growth. Journal of Political
Economics, 99(3): 500–21.
Regan, S. & Paxton, W. 2003. Beyond bank accounts: Full financial inclusion. London:
Institute for Public Policy Research (IPPR).
Romer, P.M. 1986. Increasing Returns and Long-run Growth. Journal of Political Economics,
94(5): 1002–37.
Romer, P.M. 1990. Endogenous Technological Change. Journal of Political Economics, 98(5,
Pt. 2): S71–102.
Robinson, J. 1952. The Generalization of the General Theory. In The Rate of Interest and
Other Essays. London: MacMillan.
Rose, M.E. 1972. The Relief of Poverty: 1834-1914. London: Macmillan.
Rosenzweig, M.R. 2001. Savings Behaviour in Low-Income Countries. Oxford Review of
Economic Policy, 17(1): 40-54.
Rowntree, B.S. 1901. Poverty: A Study of Town Life. London: Macmillan.
Rutherford, S. 2000. The poor and their money. New Delhi: Oxford University Press.
Rykov, V.V., Balakrishnan, N. & Nikulin, M.S. 2010. Mathematical and Statistical Models and
Methods in Reliability: Applications to Medicine, Finance, and Quality Control. Basel,
Switzerland: Birkhäuser.
Sahoo, A.K., Pradhan, B.B. & Sahu, N.C. 2017. Determinants of Financial Inclusion in Tribal
Districts of Odisha: An Empirical Investigation. Journal of Social Change, 47(1): 1-20.
Saint-Paul, G. 1992. Technological Choice, Financial Markets and Economic Development.
Europe Economics Review, 36(4): 763–81.
Sajeda, A., Rai, A.S. & Topa, G. 2003. Does microcredit reach the poor and vulnerable?
Evidence from northern Bangladesh. Journal of Development Economics, 70(1): 59-82.
Samaniego, P. & Tejerina, L. 2010. Financial Inclusion through the Bono de Desarrollo
Humano in Ecuador: Exploring Options and Beneficiary Readiness. Inter-American
Development Bank.
Samuelson, P. 1948. Economics. New York: McGraw-Hill.
Sarantakos, S. 2005. Social Research. 3rd Ed. New York: Palgrave MacMillan.
289
Sarma, M. 2012. Index of Financial Inclusion – A measure of financial sector inclusiveness.
Berlin Working Papers on Money, Finance, Trade and Development, Working Paper No.
07/2012, pp. 1-43.
Sarma, M. & Pais, J. 2010. Financial Inclusion and Development: A Cross Country Analysis.
[Online]. Available from www.icrier.org [Accessed on 10/03/2014].
Saunders, M., Lewis, P. & Thornhill, A. 2012. Research Methods for Business Students. 6th
Ed. London: Pearson Education Limited.
Scharfstein, D. 1988. The Disciplinary Role of Takeovers. Review of Economics Studies,
55(2): 185–99.
Schneider, F. & Enste, D.H. 2000. Shadow economies: size, causes, and consequences.
Journal of Economic Literature, 38: 77–114.
Schreiner, M. & Nagarajan, G. 1998. Predicting creditworthiness with publicly observable
characteristic: evidence from ASCRAS and ROCAS in the Gambia. Journal of Savings
and Development, 22: 399-414.
Schoar, A. 2009. Lin Roundtable: Scale Matters. Free Exchange, Economist.com blogs.
[Online]. Available:http://www.economist.com/blogs/freeexchange/lin_roundtable.
Schorr, A.L. 1964. The Non Culture of Poverty. American Journal of Orthopsychiatry, 34(5):
55-71.
Schuchardt, J., Hanna, S.D., Hira, T.K., Lyons, A.C., Palmer, L. & Xiao, J.J. 2009. Financial
literacy and education research priorities. Journal of Financial Counseling and Planning,
20(1): 84-95.
Schumpeter, J.A. 1911. The Theory of Economic Development. Cambridge, MA: Harvard
University Press.
Schumpeter, J.A. 1912. The theory of economic development. Leipzig: Dunker & Humblot,
1912, translated by Redvers Opie. Cambridge, MA: Harvard U. Press, 1934.
Schumpeter, J.A. 1956. Money and the Social Product. Translated from German by A.W.
Marget, in International Economic Papers No. 6. London: Macmillan.
Schutz, M. & Rainer, A. 2016. J.A. Schumpeter and T.B. Veblen on economic evolution: the
dichotomy between statics and dynamics, The European Journal of the History of
Economic Thought, 23:5: 718-742, DOI: 10.1080/09672567.2015.1018294
Scotland, J. 2012. Exploring the Philosophical Underpinnings of Research: Relating Ontology
and Epistemology to the Methodology and Methods of the Scientific, Interpretive, and
Critical Research Paradigms. English Language Teaching, 5(9): 9-16.
290
Sealey, C. & Lindley, J.T. 1977. Inputs, outputs and a theory of production and cost at
depositary financial institutions. Journal of Finance, 32: 1251–1266.
Sekaran, U. & Bougie, R. 2010. Research methods for business: A skill-building approach. 5th
ed. Haddington: John Wiley & Sons.
Seng, K. & Lay, S.H. 2018. Financial Inclusion: Are Mobile Phones Helpful in Cambodia? NBC
Working Paper Final. pp. 1-44. [Online]. Available from
https://www.nbc.org.kh/download.../NBC_Working_Paper_Final_19.11.2018.pdf
[Accessed on 01/02/2019].
Setterfield, M. 2010. Real Wages, Aggregate Demand and the Macroeconomic Travails of the
U.S. Economy: Diagnosis and Prognosis. Trinity College Department of Economics
Working Paper, pp. 10–05.
Sharma, R.K., Jain, V. & Gupta, S. 2014. Financial Inclusion in Rural Oman: A Demand and
Supply Analysis. International Journal of Management and International Business
Studies, 4(3): 339-348.
Shihadeh, F.H. 2018. How individual’s characteristics influence financial inclusion: evidence
from MENAP. International Journal of Islamic and Middle Eastern Finance and
Management, 11(4): 553-574. https://doi.org/10.1108/IMEFM-06-2017-0153
Sharma, A. & Kukreja, S. 2013. An Analytical Study: Relevance of Financial Inclusion for
Developing Nations. Research Inventory: International Journal Of Engineering And
Science, 2(6): 15-20.
Sharpe, S.A. 1990. Asymmetric Information, Bank Lending, and Implicit Contracts: A Stylized
Model of Customer Relationships. Journal of Finance, 45(4): 1069–87.
Shaw, E.S. 1973. Financial Deepening in Economic Development. New York: Oxford
University Press.
Sherraden, M.S. 2010. Financial Capability: What is It, and How Can It Be Created? Center
for Social Development. CSD Working Papers. No. 10-17, pp. 1-30.
Shiller, R.J. 2008. The Subprime Solution: How Today's Global Financial Crisis Happened,
and What to Do about It. Princetown: Princetown University Press.
Shiue, Y.C., Chiu, C.M. & Chang, C.C. 2010. Exploring and mitigating social loafing in online
communities. Computers in Human Behaviour, 26(4): 768–777.
Shockey, S.S. & Seiling, S.B. 2004. Moving into action: Application of the trans-theoretical
model of behavior change to financial education. Financial Counselling and Planning,
15(1): 41–52.
291
Siraj, S. & Bengali, K. 2007. Estimation of the Harrod-Domar Growth Equation: Pakistan’s
Case. Journal of Independent Studies and Research, 5(2): 45-51.
Sirri, E.R. & Tufano, P. 1995. The Economics of Pooling, in the global financial system: A
functional perspective. Boston, MA: Harvard Business School Press.
Smith, N.A., Sabat, I.E., Martinez, L.R., Weaver, K. & Xu, S. 2015. A convenient solution:
Using MTurk to sample from hard-to-reach populations. Industrial and Organizational
Psychology, 8(2): 220-228.
Smith, P.F. 1966. Concepts of money and commercial banks, Journal of Finance, 21: 635-
648.
Smith, W. 1959. Financial intermediaries and monetary controls, Quarterly Journal of
Economics, 73: 533-553.
Solo, C.S. 1951. Innovation in the Capitalist Process: A Critique of the Schumpeterian Theory.
The Quarterly Journal of Economics, 65(3): 417–428. https://doi.org/10.2307/1882222
Solomon, E. 1959. Financial institutions in the savings–investment process. Conference on
Savings and Residential Financing, U.S. Savings and Loan League, Chicago, pp. 10-55.
Somashekar, N.T. 2009. Banking. New Delhi: New Age International.
Song, Q. & Shepperd, M. 2007. Missing Data Imputation Techniques. International Journal of
Business Intelligence and Data Mining, 2(3): 261-291.
Soumare, I, Tchana, F.T. & Kengne, T.M. 2016. Analysis of the determinants of financial
inclusion in Central and West Africa. Transnational Corporations Review, 8(4): 231–24.
Speak, S. & Graham, S. 2000. Service not included. Social implications of private sector,
31(11): 1985-2001.
Srinivas, H. 2016a. 14 Reasons why the Informal Credit Market is used by the Poor: Policy
Implications for Microcredit Programmes in Developing Countries. Case Study Series E-
111, pp. 1-22.
Srinivas, H. 2016b. Microfinance - Credit Lending Models. GDRC Research Output E-059.
Kobe, Japan: Global Development Research Center, 1-31. Available from
https://www.gdrc.org/icm/model/model-fulldoc.html [Accessed on 26/02/2018].
Stanley, D. & Bhattacharya, R. 2008. The informal financial sector in the U.S.: The role of
remittances. The Quarterly Review of Economics and Finance, 48: 1–21.
Stein, J.C. 1988. Takeover Threats and Managerial Myopia. Journal of Political Economics,
96(1): 61–80.
292
Stein, J.C. 2014. Banks as patient debt investors. Philadelphia, Pennsylvania: American
Economic Association/American Finance Association. Joint Luncheon speech delivered
on 3 January 2014, pp. 1-2.
Stern, J.M. & Chew, D.H. 2003. The revolution in corporate finance. 4th ed. USA: Wiley
Blackwell.
Stern, N. 1989. The Economics of Development: A Survey. Economics Journal, 99(397): 597–
685
Steyn, P., Salehi-Sangari, E., Pitt, L., Parent, M. & Berthon, P. 2010. The social media release
as a public relations tool: Intentions to use among B2B bloggers. Public Relations Review,
36(1): 87–89.
Stiglitz, J.E. & Weiss, A. 1981. Credit Rationing in Markets with Imperfect Information. The
American Economic Review, 71: 393-410.
Stiglitz, J.E. 1985. Credit Markets and the Control of Capital. Journal of Money, Credit,
Banking, 17(2): 133–52.
Stiglitz, J.E. 2014. New Theoretical Perspectives on the Distribution of Income and Wealth
Among Individuals, paper presented to the International Economic Association World
Congress, Dead Sea, June, and forthcoming in Inequality and Growth: Patterns and
Policy, Volume 1: Concepts and Analysis, to be published by Palgrave MacMillan, pp. 1-
24.
Stiroh, K.J. 2004. Diversification and banking: Is noninterest income the answer? Journal of
Money, Credit, and Banking, 36(5): 853-82.
Swani, K., Milne, G. & Brown, B. 2013. Spreading the word through likes on Facebook:
Evaluating the message strategy effectiveness of Fortune 500 companies. Journal of
Research in Interactive Marketing, 7(4): 269-294.
Tang, Q., Gu, B. & Whinston, A. 2012. Content Contribution for Revenue Sharing and
Reputation in Social Media: A Dynamic Structural Model. Journal of Management
Information Systems, 29(2): 41–75.
Thanawala, K. 1994. Schumpeter's Theory of Economic Development and Development
Economics. Review of Social Economy, 52(4): 1-17.
Thapur, A. 2013. A study on the effectiveness of the financial inclusion program in India.
International Journal of Business and Management Research, 3(6): 1-28.
293
Thoma, M. 2009. Lin Roundtable: Small Banks Need Help. Free Exchange, Economist.com
blogs, pp. 1-2. [Online]. Available from http://www.economist.com/blogs/
freeexchange/lin_ roundtable [Accessed on 13/07/2016].
Thurow, L.C. 1969. Studies in Social Economics: Poverty and Discrimination. Oxford: Oxford
University Press.
Thurow, L.C. 1981. Strengthening the Economy: Studies in Productivity. Center for
Democratic Policies, pp. 1-40.
Timpone, R.J. 2003. Concerns with Endogeneity in Statistical Analysis: Modeling the
Interdependence between Economic Ties and Conflict. [Online]. Available from
https://www.researchgate.net/publication/237473187 [Accessed on 16/11/2019].
Tobin, J. 1963. “Commercial banks as creators of money”, Cowles Foundation Paper 205
reprinted. In D. Carson (Ed.). Banking and Monetary Studies. Irwin: Homewood.
Tobin, J. 1967. “Life-cycle saving and balanced growth”. In W. Fellner et al. (Eds.). Ten
Economic Essays in the Tradition of Irving Fisher. P. 284. New York: Wiley.
Tobin, J. 1969. A general equilibrium approach to monetary theory. Journal of Money, Credit
and Banking: 15–29.
Tobia, O. & Stephen, A.T. 2013. Intrinsic vs. Image-related Utility in Social Media: Why do
People Contribute Content to Twitter? Marketing Science, 32(3): 368-392.
Todaro, M. 1997. Economic Development. 6th ed. New York, NY: Addison Wesley Longman
Ltd.
Trivelli, C. 2013. Social Inclusion Cannot be Achieved Without Financial Inclusion. CGAP, pp.
1-54. [Online]. Available from http://www.cgap.org/blog/social-inclusion-cannot-be-
achieved-without-financial-inclusion [Accessed on 25/03/18].
Tuesta, D., Sorensen, G., Haring, A. & Cámara, N. 2015. Financial inclusion and its
determinants: the Argentine case. BBVA. Research Paper No. 15/03, pp. 1-28.
Tuli, F. 2010. The Basis of Distinction between Qualitative and Quantitative Research in Social
Science: Reflection on Ontological, Epistemological and Methodological Perspectives.
Ethiopian Journal of Education and Science, 6(1): 97-108.
UK Essays. 2013. The Criticism of the Modigliani and Miller Hypothesis Finance Essay. UK
Essays, Available from https://www.ukessays.com/essays/finance/the-criticism-of-the-
modigliani-and-miller-hypothesis-finance-essay.php?cref=1 [Accessed 13/11/2017].
UNDP. 2014. UN Study to Help Build a Financial Inclusion Road Map for Myanmar. UNDP.
Press Release. Available from http://www.mm.undp.org/content/myanmar/en/
294
home/presscenter/pressreleases/2014/05/un-study-to-help-build-a-financial-inclusion-
road-map/ [Accessed on 15 June 2014].
Urzúa, C.M. 2013. Distributive and Regional Effects of Monopoly Power. Economía Mexicana
Nueva Época, XXII(2): 1-14. Available from http://www.economiamexicana.cide.
edu/num_anteriores/XXII-2/02EM_Carlos_M_Urzua.pdf. [Accessed on 16/07/2017].
Vashisht, A. & Wadhwa, B. 2015 Financial Inclusion and Social Change. Arabian. Journal of
Business Management Review, 5: 144.
Villas-Boas, J.M. & Winer, R.S. 1999. Endogeneity in Brand Choice Models. Management
Sciences, 45(10): 1289-1462.
Von Hayek, F.A. 1929. “Prices and production and other works” in F.A. Hayek (Ed.) On money,
the business cycle, and the gold standard. Ludwig von Mises Institute.
Von Mises, L. 1912. Theorie des Geldes und der Umlaufsmittel. Leipzig: Duncker und
Humblot.
Wachtel, P. 2001. Growth and finance – What do we know and how do we know it? Journal
International Finance, 4: 335–362.
Wallace, A. & Quilgars, D. 2005. Homelessness and financial exclusion: A literature review.
Centre for Housing Policy, New York. Policy and Politics, 32: 455–470.
Wang, Q., Fink, E.L. & Cai, D.A. 2008. Loneliness, Gender, and Parasocial Interaction: A Uses
and Gratifications Approach. Communication Quarterly, 56(1): 87–109.
Webb, B. 1926. My Apprenticeship. 2nd ed. London: Longmans. Green, pp 177.
Wei, L. 2009. Filter blogs vs. personal journals: Understanding the knowledge production gap
on the Internet. Journal of Computer-Mediated Communication, 14(3): 532–559.
Werner, R.A. 2005. New Paradigm in Macroeconomics. Basingstoke: Palgrave Macmillan.
Werner, R.A. 2016. A lost century in economics: Three theories of banking and the conclusive
evidence. International Review of Financial Analysis, 46 (2016): 361–379.
White, H. 1980. A heteroskedasticity-consistent covariance matrix estimator and a direct test
for heteroskedasticity. Econometrica, 48(4): 817–838. doi:10.2307/1912934. JSTOR
1912934.
Whittlesey, C.R. 1944. Problems of our domestic money and banking system, The American
Economic Review, 34(1): 245–259.
295
Williamson, S. & Wright, R. 1994. Barter and Monetary Exchange Under Private Information.
American Economics Review, 84(1): 104–23.
Wilson, J. 2010. Essentials of Business Research: A Guide to Doing Your Research Project.
Newcastle-upon-Tyne, UK: SAGE Publications.
Wooldrige, J.M. 2002. Econometric analysis of cross section and panel data. Cambridge, MA:
MIT Press.
Wooldridge, J.M. 2013. Introductory econometrics: A modern approach. 4th ed. USA: South-
Western Cengage Learning.
World Bank. 2006. Policy Research Report (PRR) on Access to Finance: Measurement,
Impact and Policy Concept Note. World Bank Development Research Group, pp 1-40.
World Bank. 2011. World Development Report 2011: Conflict, Security, and Development.
Washington, DC: World Bank, pp. 1-72.
World Bank. 2013. Rethinking the Role of the State in Finance. Global Financial Department
Report 2013, pp. 175-194. Available from http://elibrary.worldbank.org/doi_BM
[Accessed on 13/12/2013].
World Bank. 2014. Global financial development report: financial inclusion. [Online]. Available
from http://siteresources.worldbank.org/EXTGLOBALFINREPORT/Resources/8816096-
1361 888425203/9062080-1364927957721/GFDR2014_Complete_Report.pdf
[Accessed on 05/04/2015].
World Bank. 2015. Financial Inclusion. [Online]. Available from http://www.worldbank.org/
en/topic/financiainclusion [Accessed on 15/06/15].
World Bank. 2017a. Financial Inclusion. The World Bank Group. Available from
http://www.worldbank.org/en/topic/financialinclusion [Accessed on 20/06/2017].
World Bank. 2017b. The Gini Index. [Online]. Available from http://data.worldbank.org/
indicator/SI.POV.GINI?locations=ZW [Accessed on 29/03/2017].
World Bank. 2017c. Enhancing Governance for Development: Why Policies Fail. January 23,
2017. [Online]. Available from https://doi.org/10.1596/978-1-4648-0950-7 [Accessed on
17/05/2017].
World Bank. 2017d. Information and Communication Technologies: Overview. [Online].
Available from www.worldbank.org/en/topic/ict/overview [Accessed on 13/01/2018].
World Bank. 2018. Financial Inclusion Overview. [Online]. Available from
https://www.worldbank.org/en/topic/financialinclusion/overview [Accessed on
13/06/2020].
296
World Bank. 2019. Poverty in a Rising Africa. Africa Poverty Report. Available from
https://www.worldbank.org/en/region/afr/publication/poverty-rising-africa-poverty-report
[Accessed on 20/01/2020].
World Bank. 2020. Financial Inclusion. Financial inclusion is a key enabler to reducing poverty
and boosting prosperity. Available from https://www.worldbank.org/en/topic/
financialinclusion [Accessed on 23/04/2020].
Wright, G.A.N., Chopra, P., Mehta, S. & Shukla, V. 2013. Financial Inclusion Through Digital
Financial Services: A Guided Tour Linked To Resources. [Online]. Available from
http://www.microsave.net/files/pdf/ [Accessed on 17/11/17].
Wright, G.A.N. & Muteesassira, K. 2001. The relative risks to the savings of poor people. Small
Enterprise Development, 12(3): 33-45
Xiao, J.J., Newman, B.M., Prochaska, J.M., Leon, B., Bassett, R. L. & Johnson, J.L. 2004.
Applying the transtheoretical model of change to consumer debt behavior. Financial
Counselling and Planning, 15(2): 89-100.
Xiao, J.J., Sorhaindo, B. & Garman, E.T. 2006. Financial behavior of consumers in credit
counselling. International Journal of Consumer Studies, 30(2): 108–121.
Xiao, J.J., O’Neill, B., Prochaska, J.M., Kerbal, C.M., Brennan, P. & Bristow, B.J. 2004. A
consumer education program based on the transtheoretical model of change.
International Journal of Consumer Studies, 28(1): 55–65.
Yannick, B. 2020. Symmetric effects of changes in the saving rate on the investment rate in
Norway: 1830–2017. Applied Economics Letters, pp. 1-9.
Yao, R. & Hanna, S.D. 2004. The effect of gender and marital status on financial risk tolerance.
Academy of Marketing Science Review, (8): 1-22.
Yates, D. & Paquette, S. 2011. Emergency knowledge management and social media
technologies: A case study of the 2010 Haitian earthquake. International Journal of
Information Management, 31(61): 6-13.
Yoshino, N. & Morgan, P. 2016. Asian Development Bank Institute. ADBI Working Paper
Series. No. 591 September 2016. pp 1-30.
Young, C. & Kroeger, K. 2015. Model Uncertainty and Robustness: A Computational
Framework for Multi-Model Analysis. Stanford University. [Online]. Available from
https://web.stanford.edu/~cy10/public/mrobust/Model_Robustness.pdf [Accessed on
12/12/2020].
297
Yunus, M. 2007. Creating a World without Poverty: Social Business and the Future of
Capitalism. Public Affairs, New York.
Zeller, M. & Manohar, S. 2002. “Access to and Demand for Financial Services by the Rural
Poor: A Multicountry Synthesis”. In: M. Zeller & R.L. Meyer (Eds.). The Triangle of
Microfinance: Financial Sustainability, Outreach, and Impact. pp. 19-45. Baltimore and
London: Johns Hopkins University Press.
Zhong, B., Hardin, M. & Sun, T. 2011. Less effortful thinking leads to more social networking?
The associations between the use of social network sites and personality traits.
Computers in Human Behaviour, 27(3): 1265–1271.
Zhuang J., Herath G., Yoko, N., Muhammad, E.K., Yi, J., Rana, H., Niny, K., Lagman-Martin,
A.S., Bracey, P. & Huang, B. 2009. Financial Sector Development, Economic Growth,
and Poverty Reduction: A Literature Review. ADB Economics Working Paper Series No.
173 October 2009, pp. 1-37.
Zingales, L. 2009. Lin Roundtable: Leave Room for Growth. Free Exchange, Economist.com
blogs, pp. 1-2 [Online]. Available from: http://www.economist.com/blogs/freeexchange/
lin_roundtable [Accessed on 17/07/2017].
Zins, A. & Weill, L. 2016. The determinants of financial inclusion in Africa. Review of
Development Finance, 6(1): 46-57.
Zmyślona B. 2011. Uwagi na temat własności estymatorów wyznaczanych na bazie
niepełnychdanych, Ekonometria, (30): 83–93.

298
APPENDIX A:
ETHICAL CLEARANCE CERTIFICATE

299
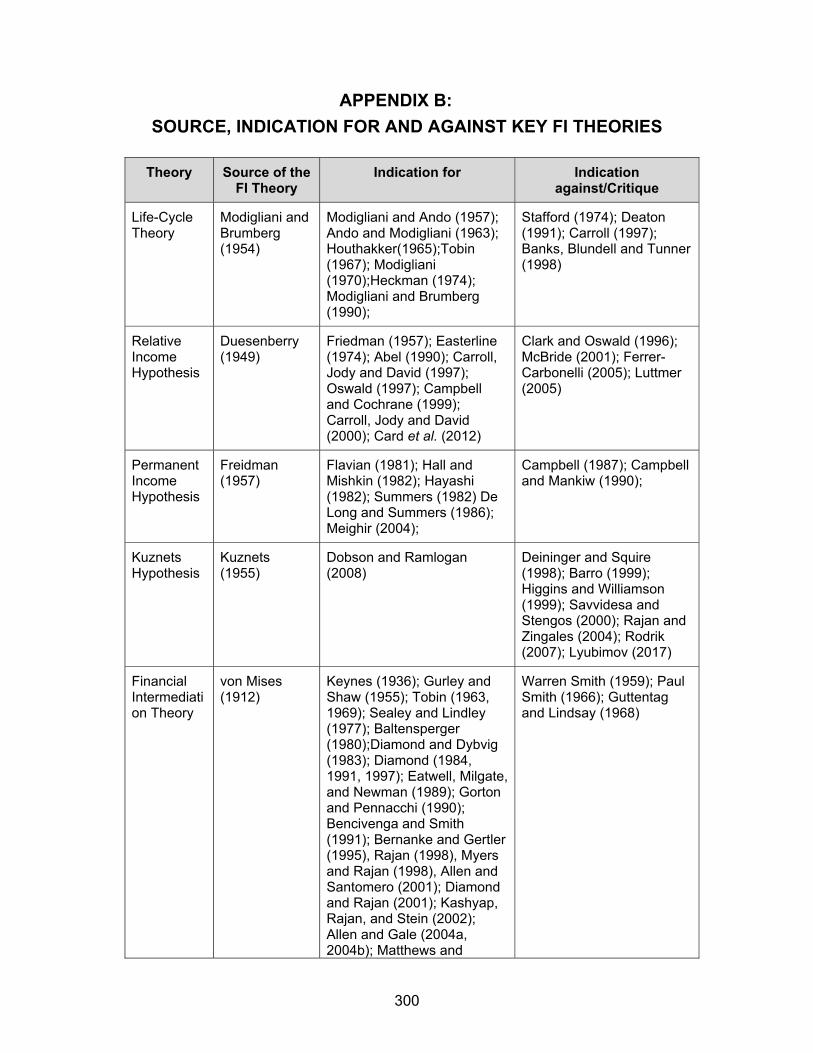
300
APPENDIX B:
SOURCE, INDICATION FOR AND AGAINST KEY FI THEORIES
Theory Source of the FI Theory
Indication for Indication against/Critique
Life-Cycle Theory
Modigliani and Brumberg (1954)
Modigliani and Ando (1957); Ando and Modigliani (1963); Houthakker(1965);Tobin (1967); Modigliani (1970);Heckman (1974); Modigliani and Brumberg (1990);
Stafford (1974); Deaton (1991); Carroll (1997); Banks, Blundell and Tunner (1998)
Relative Income Hypothesis
Duesenberry (1949)
Friedman (1957); Easterline (1974); Abel (1990); Carroll, Jody and David (1997); Oswald (1997); Campbell and Cochrane (1999); Carroll, Jody and David (2000); Card et al. (2012)
Clark and Oswald (1996); McBride (2001); Ferrer-Carbonelli (2005); Luttmer (2005)
Permanent Income Hypothesis
Freidman (1957)
Flavian (1981); Hall and Mishkin (1982); Hayashi (1982); Summers (1982) De Long and Summers (1986); Meighir (2004);
Campbell (1987); Campbell and Mankiw (1990);
Kuznets Hypothesis
Kuznets (1955)
Dobson and Ramlogan (2008)
Deininger and Squire (1998); Barro (1999); Higgins and Williamson (1999); Savvidesa and Stengos (2000); Rajan and Zingales (2004); Rodrik (2007); Lyubimov (2017)
Financial Intermediation Theory
von Mises (1912)
Keynes (1936); Gurley and Shaw (1955); Tobin (1963, 1969); Sealey and Lindley (1977); Baltensperger (1980);Diamond and Dybvig (1983); Diamond (1984, 1991, 1997); Eatwell, Milgate, and Newman (1989); Gorton and Pennacchi (1990); Bencivenga and Smith (1991); Bernanke and Gertler (1995), Rajan (1998), Myers and Rajan (1998), Allen and Santomero (2001); Diamond and Rajan (2001); Kashyap, Rajan, and Stein (2002); Allen and Gale (2004a, 2004b); Matthews and
Warren Smith (1959); Paul Smith (1966); Guttentag and Lindsay (1968)

301
Thompson (2005); Casu and Girardone (2006); Dewatripont et al. (2010); Gertler and Kiyotaki (2011) and Stein (2014)
The Fractional Reserve Theory
Culbertson (1958); Aschheim (1959)
Crick (1927); Keynes (1930);Whittlesey (1944); Solomon (1959); Warren Smith (1959);Paul Smith (1966); Guttentag and Lindsay (1968);
Werner (2005)
Credit Creation Theory
Macleod (1856)
Davenport (1913); Hawtrey (1919);Samuelson (1948); Keynes and Moggridge (1983) Werner (2016);
Crick (1927) ; Keynes (1930);Whittlesey (1944)
Harrod-Domar Model
Harrod (1939); Domar (1947)
Jagadeesh (2015) Nurkse (1953); Morgan (1969); Boianovsky (2015); Siraj and Bengali (2007)
Banerjee and Newman’s Model
Banerajee and Newman (1993)
Galor and Zeira (1993); Picketty (1997); Ghatak and Jiang (2002);
Chittenden, Hall and Hutchinson (1996); Black and Gilson (1998); Muller and Zimmermann (2008)
Galor and Zeira Model
Galor and Zeira (1993)
Banerjee and Newman (1993); Ghatak and Jiang (2002)
Modigliani-Miller Theorem
Modigliani-Miller (1958)
Modigliani and Milller (1963:433)
Stern and Chen (2003); Ahmeti and Prenaj (2015)
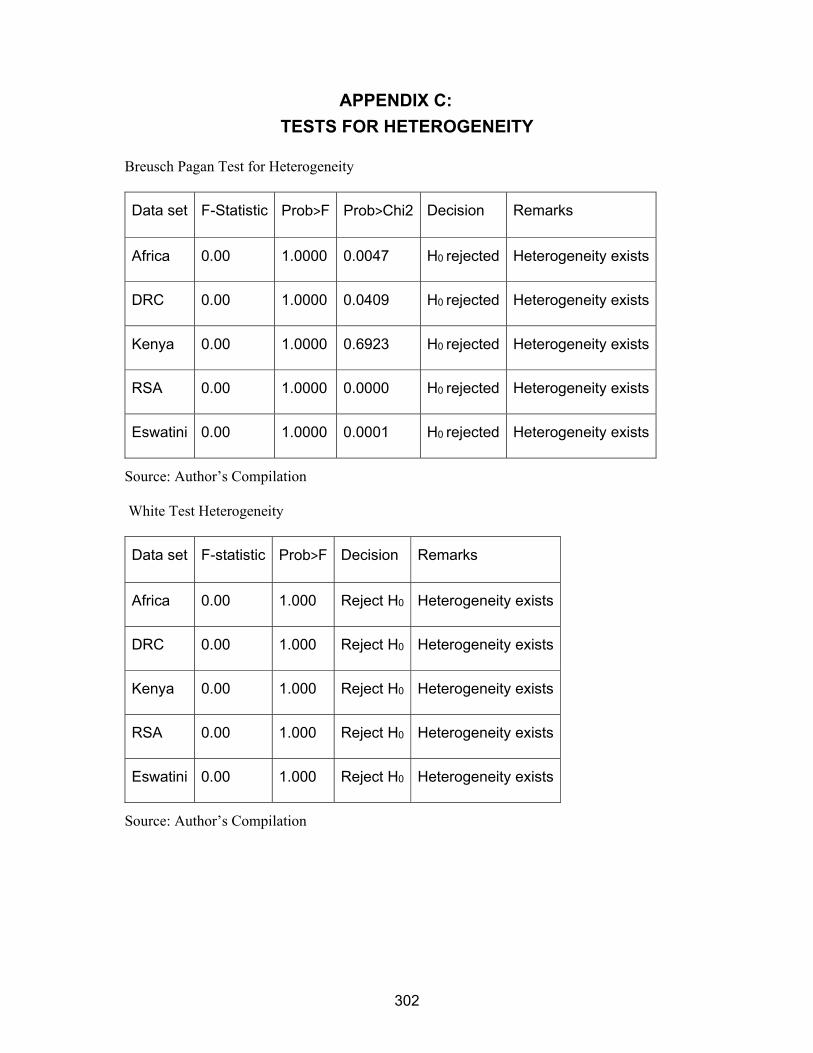
302
APPENDIX C:
TESTS FOR HETEROGENEITY
Breusch Pagan Test for Heterogeneity
Data set F-Statistic Prob>F Prob>Chi2 Decision Remarks
Africa 0.00 1.0000 0.0047 H0 rejected Heterogeneity exists
DRC 0.00 1.0000 0.0409 H0 rejected Heterogeneity exists
Kenya 0.00 1.0000 0.6923 H0 rejected Heterogeneity exists
RSA 0.00 1.0000 0.0000 H0 rejected Heterogeneity exists
Eswatini 0.00 1.0000 0.0001 H0 rejected Heterogeneity exists
Source: Author’s Compilation
White Test Heterogeneity
Data set F-statistic Prob>F Decision Remarks
Africa 0.00 1.000 Reject H0 Heterogeneity exists
DRC 0.00 1.000 Reject H0 Heterogeneity exists
Kenya 0.00 1.000 Reject H0 Heterogeneity exists
RSA 0.00 1.000 Reject H0 Heterogeneity exists
Eswatini 0.00 1.000 Reject H0 Heterogeneity exists
Source: Author’s Compilation
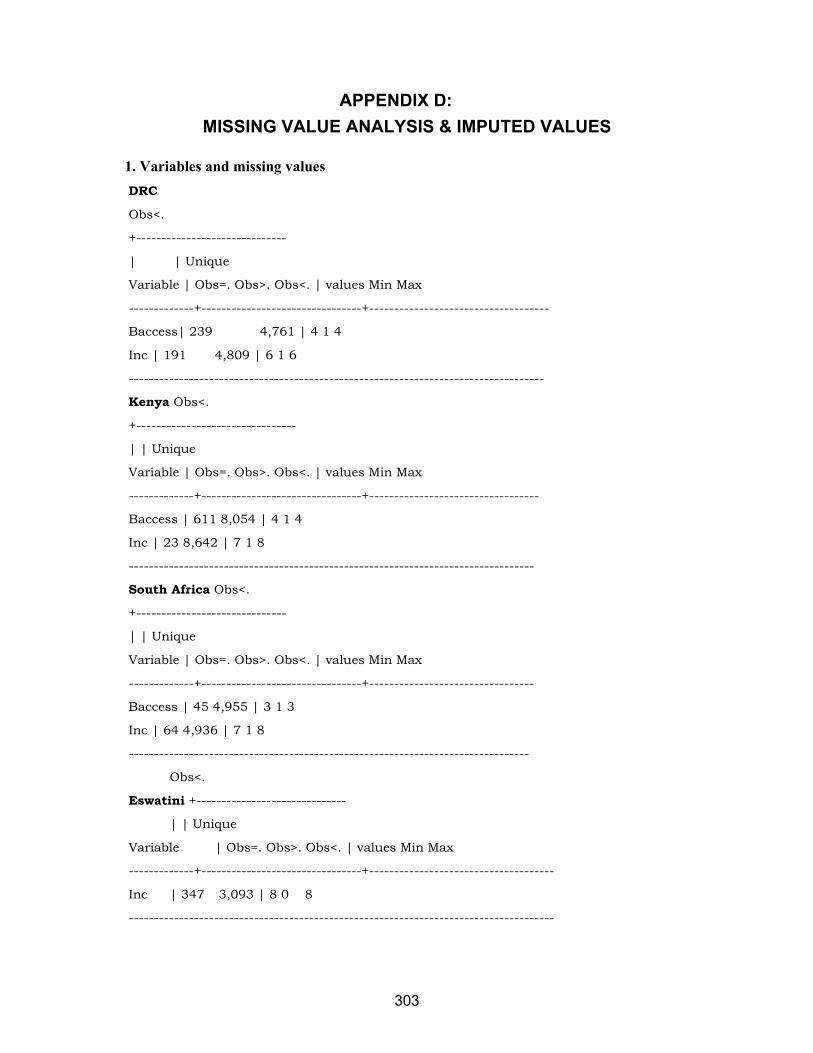
303
APPENDIX D:
MISSING VALUE ANALYSIS & IMPUTED VALUES
1. Variables and missing values
DRC
Obs<.
+------------------------------
| | Unique
Variable | Obs=. Obs>. Obs<. | values Min Max
-------------+--------------------------------+------------------------------------
Baccess| 239 4,761 | 4 1 4
Inc | 191 4,809 | 6 1 6
-----------------------------------------------------------------------------------
Kenya Obs<.
+--------------------------------
| | Unique
Variable | Obs=. Obs>. Obs<. | values Min Max
-------------+--------------------------------+----------------------------------
Baccess | 611 8,054 | 4 1 4
Inc | 23 8,642 | 7 1 8
---------------------------------------------------------------------------------
South Africa Obs<.
+------------------------------
| | Unique
Variable | Obs=. Obs>. Obs<. | values Min Max
-------------+--------------------------------+---------------------------------
Baccess | 45 4,955 | 3 1 3
Inc | 64 4,936 | 7 1 8
--------------------------------------------------------------------------------
Obs<.
Eswatini +------------------------------
| | Unique
Variable | Obs=. Obs>. Obs<. | values Min Max
-------------+--------------------------------+-------------------------------------
Inc | 347 3,093 | 8 0 8
-------------------------------------------------------------------------------------
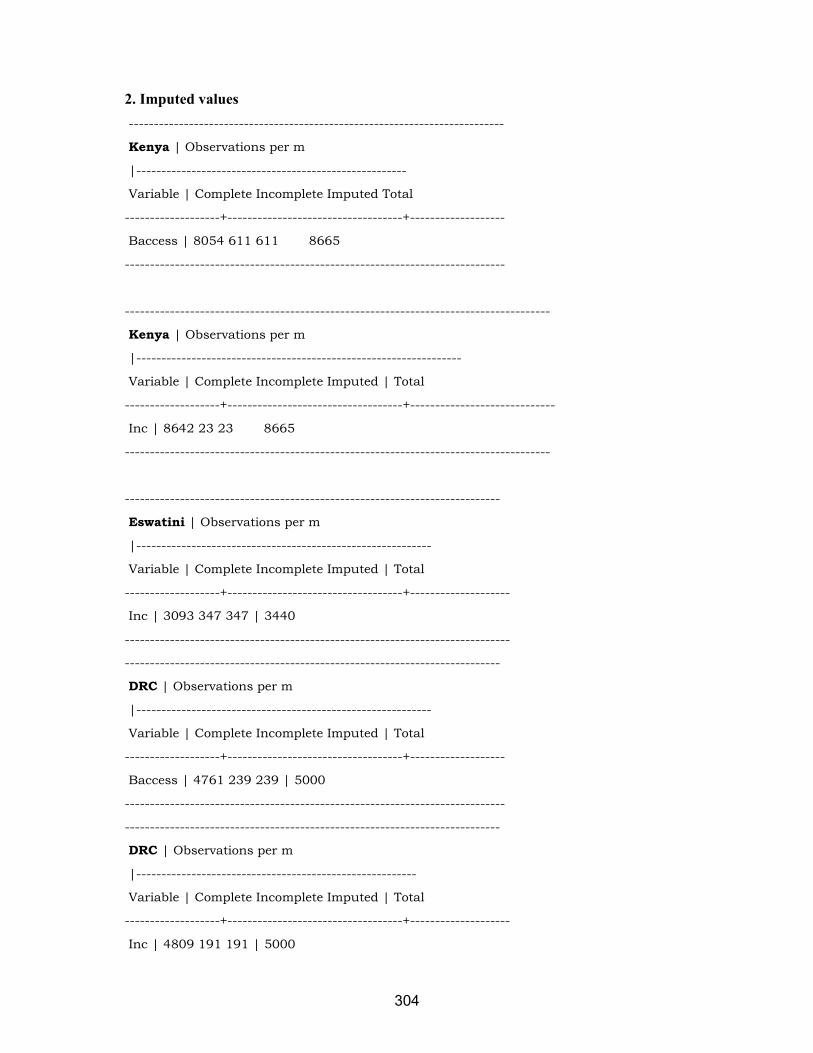
304
2. Imputed values
---------------------------------------------------------------------------
Kenya | Observations per m
|------------------------------------------------------
Variable | Complete Incomplete Imputed Total
-------------------+-----------------------------------+-------------------
Baccess | 8054 611 611 8665
----------------------------------------------------------------------------
-------------------------------------------------------------------------------------
Kenya | Observations per m
|-----------------------------------------------------------------
Variable | Complete Incomplete Imputed | Total
-------------------+-----------------------------------+-----------------------------
Inc | 8642 23 23 8665
-------------------------------------------------------------------------------------
---------------------------------------------------------------------------
Eswatini | Observations per m
|-----------------------------------------------------------
Variable | Complete Incomplete Imputed | Total
-------------------+-----------------------------------+--------------------
Inc | 3093 347 347 | 3440
-----------------------------------------------------------------------------
---------------------------------------------------------------------------
DRC | Observations per m
|-----------------------------------------------------------
Variable | Complete Incomplete Imputed | Total
-------------------+-----------------------------------+-------------------
Baccess | 4761 239 239 | 5000
----------------------------------------------------------------------------
---------------------------------------------------------------------------
DRC | Observations per m
|--------------------------------------------------------
Variable | Complete Incomplete Imputed | Total
-------------------+-----------------------------------+--------------------
Inc | 4809 191 191 | 5000
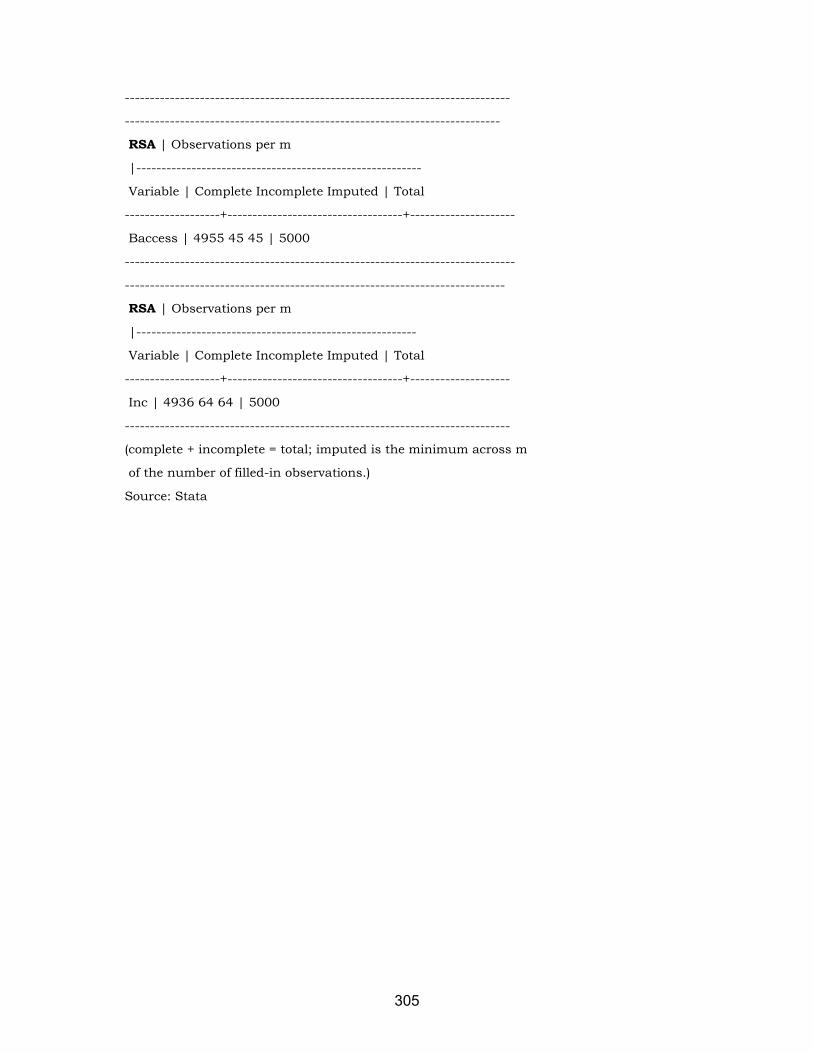
305
-----------------------------------------------------------------------------
---------------------------------------------------------------------------
RSA | Observations per m
|---------------------------------------------------------
Variable | Complete Incomplete Imputed | Total
-------------------+-----------------------------------+---------------------
Baccess | 4955 45 45 | 5000
------------------------------------------------------------------------------
----------------------------------------------------------------------------
RSA | Observations per m
|--------------------------------------------------------
Variable | Complete Incomplete Imputed | Total
-------------------+-----------------------------------+--------------------
Inc | 4936 64 64 | 5000
-----------------------------------------------------------------------------
(complete + incomplete = total; imputed is the minimum across m
of the number of filled-in observations.)
Source: Stata
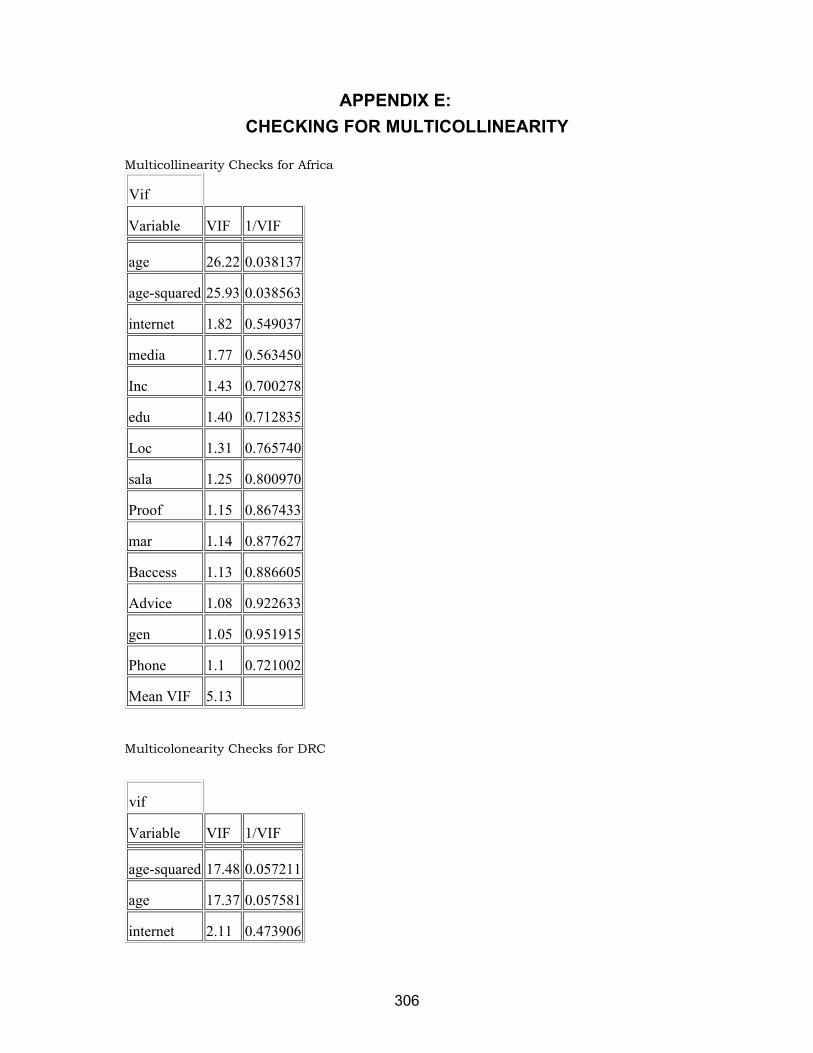
306
APPENDIX E:
CHECKING FOR MULTICOLLINEARITY
Multicollinearity Checks for Africa
Vif
Variable VIF 1/VIF
age 26.22 0.038137
age-squared 25.93 0.038563
internet 1.82 0.549037
media 1.77 0.563450
Inc 1.43 0.700278
edu 1.40 0.712835
Loc 1.31 0.765740
sala 1.25 0.800970
Proof 1.15 0.867433
mar 1.14 0.877627
Baccess 1.13 0.886605
Advice 1.08 0.922633
gen 1.05 0.951915
Phone 1.1 0.721002
Mean VIF 5.13
Multicolonearity Checks for DRC
vif
Variable VIF 1/VIF
age-squared 17.48 0.057211
age 17.37 0.057581
internet 2.11 0.473906

307
media 2.06 0.484986
Loc 1.26 0.794468
edu 1.26 0.796763
Inc 1.19 0.837639
phone 1.15 0.871095
Baccess 1.13 0.888433
sala 1.11 0.897402
mar 1.10 0.911004
gen 1.08 0.929119
Proof 1.07 0.937995
Advice 1.03 0.966775
Mean VIF 3.60
Multicolonearity Checks for Kenya
vif
Variable VIF 1/VIF
age 27.11 0.036889
age-squared 26.57 0.037636
internet 1.97 0.508672
media 1.95 0.512536
edu 1.56 0.639097
Loc 1.48 0.673989
Inc 1.37 0.728479
Proof 1.35 0.743043
phone 1.26 0.790872
Baccess 1.26 0.795525
mar 1.19 0.841818

308
sala 1.09 0.918951
gen 1.08 0.925859
Advice 1.04 0.961619
Mean VIF 5.02
Multicolonearity Checks for RSA
Multicollinearity Checks for Eswatini
. vif
Variable VIF 1/VIF
age 35.12 0.028473
. vif
Variable VIF 1/VIF
age 31.04 0.032218
age-squared 29.82 0.033539
Inc 2.23 0.448635
sala 1.77 0.566447
internet 1.74 0.573735
media 1.64 0.609618
edu 1.40 0.714671
Proof 1.33 0.753568
Loc 1.29 0.775111
Baccess 1.24 0.809081
Advice 1.20 0.830069
mar 1.18 0.846828
gen 1.04 0.957187
Phone 1.13 0.780032
Mean VIF 5.92

309
age-squared 34.68 0.028838
media 1.85 0.541160
Inc 1.70 0.589848
internet 1.66 0.602551
sala 1.63 0.614818
edu 1.46 0.686629
Loc 1.23 0.815793
mar 1.21 0.826394
phone 1.20 0.834871
Proof 1.11 0.899939
gen 1.08 0.925767
Advice 1.08 0.928768
Baccess 1.07 0.938331
Mean VIF 6.15
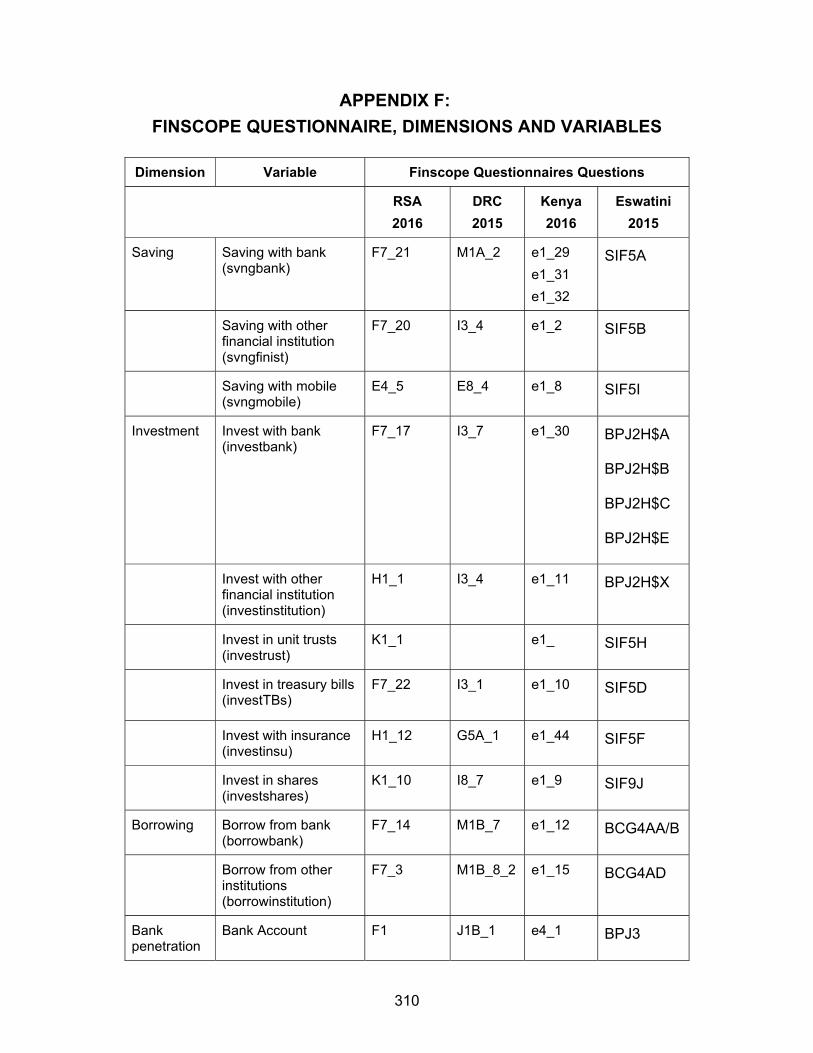
310
APPENDIX F:
FINSCOPE QUESTIONNAIRE, DIMENSIONS AND VARIABLES
Dimension Variable Finscope Questionnaires Questions
RSA
2016
DRC
2015
Kenya
2016
Eswatini
2015
Saving Saving with bank (svngbank)
F7_21 M1A_2 e1_29
e1_31
e1_32
SIF5A
Saving with other financial institution (svngfinist)
F7_20 I3_4 e1_2 SIF5B
Saving with mobile (svngmobile)
E4_5 E8_4 e1_8 SIF5I
Investment Invest with bank (investbank)
F7_17 I3_7 e1_30
BPJ2H$A
BPJ2H$B
BPJ2H$C
BPJ2H$E
Invest with other financial institution (investinstitution)
H1_1 I3_4 e1_11
BPJ2H$X
Invest in unit trusts (investrust)
K1_1 e1_ SIF5H
Invest in treasury bills (investTBs)
F7_22 I3_1 e1_10
SIF5D
Invest with insurance (investinsu)
H1_12 G5A_1 e1_44 SIF5F
Invest in shares (investshares)
K1_10 I8_7 e1_9 SIF9J
Borrowing Borrow from bank (borrowbank)
F7_14 M1B_7 e1_12 BCG4AA/B
Borrow from other institutions (borrowinstitution)
F7_3 M1B_8_2 e1_15 BCG4AD
Bank penetration
Bank Account F1 J1B_1 e4_1 BPJ3
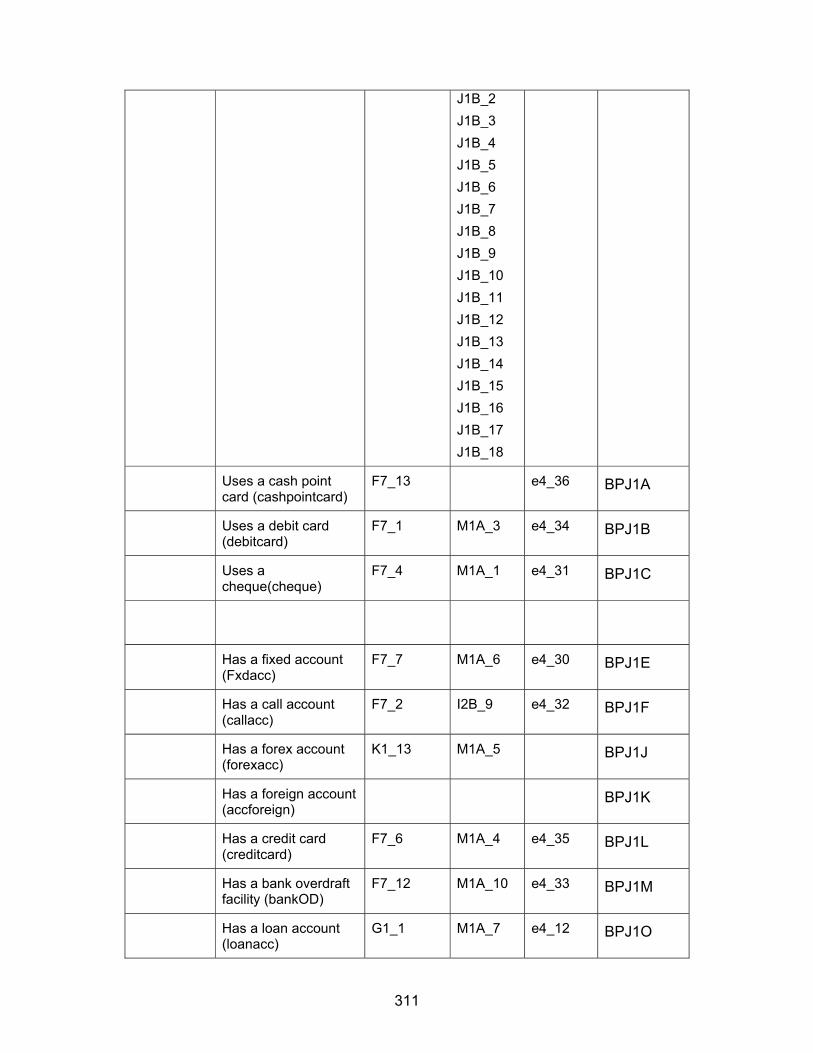
311
J1B_2
J1B_3
J1B_4
J1B_5
J1B_6
J1B_7
J1B_8
J1B_9
J1B_10
J1B_11
J1B_12
J1B_13
J1B_14
J1B_15
J1B_16
J1B_17
J1B_18
Uses a cash point card (cashpointcard)
F7_13 e4_36 BPJ1A
Uses a debit card (debitcard)
F7_1 M1A_3 e4_34 BPJ1B
Uses a cheque(cheque)
F7_4 M1A_1 e4_31 BPJ1C
Has a fixed account (Fxdacc)
F7_7 M1A_6 e4_30 BPJ1E
Has a call account (callacc)
F7_2 I2B_9 e4_32 BPJ1F
Has a forex account (forexacc)
K1_13 M1A_5 BPJ1J
Has a foreign account (accforeign)
BPJ1K
Has a credit card (creditcard)
F7_6 M1A_4 e4_35 BPJ1L
Has a bank overdraft facility (bankOD)
F7_12 M1A_10 e4_33 BPJ1M
Has a loan account (loanacc)
G1_1 M1A_7 e4_12 BPJ1O

312
Uses internet banking (internet banking)
E4_2 M3_2 e10_1_5 BPJ1P
Uses cellphone banking (cell banking)
E5_13 M1A_11 e10_1_3 BPJ1O
Source: Researcher’s own compilation
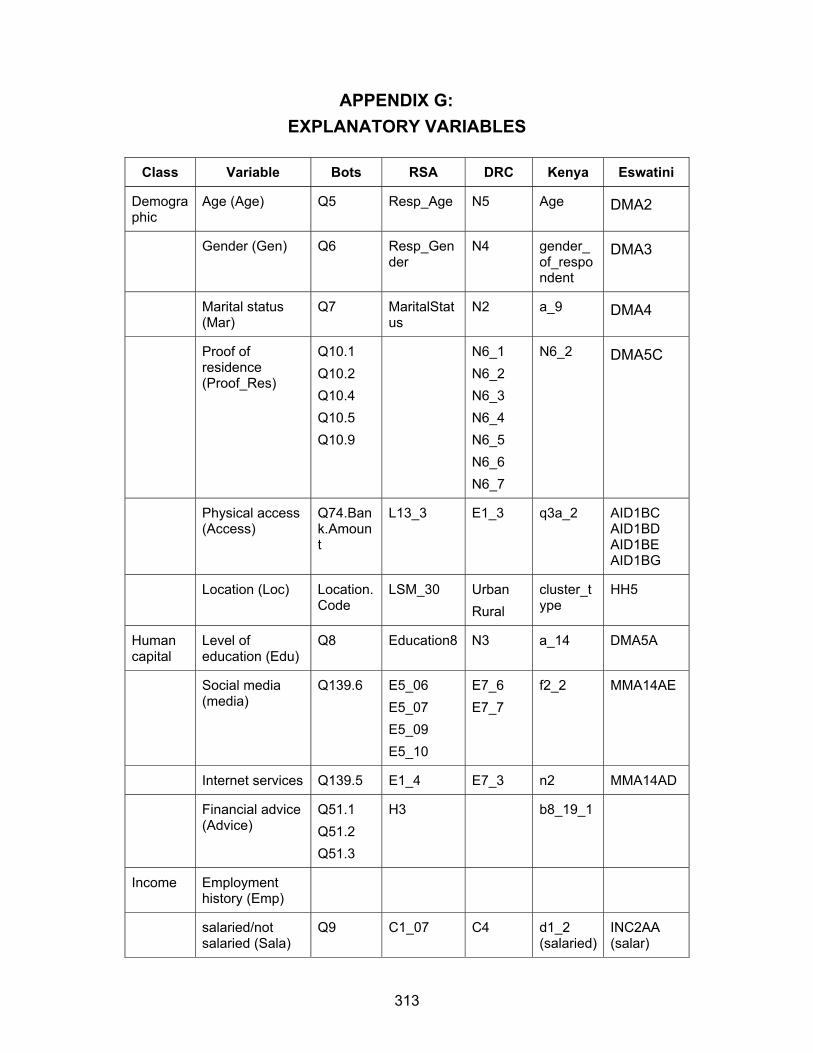
313
APPENDIX G:
EXPLANATORY VARIABLES
Class Variable Bots RSA DRC Kenya Eswatini
Demographic
Age (Age) Q5 Resp_Age N5 Age DMA2
Gender (Gen) Q6 Resp_Gender
N4 gender_of_respondent
DMA3
Marital status (Mar)
Q7 MaritalStatus
N2 a_9 DMA4
Proof of residence (Proof_Res)
Q10.1
Q10.2
Q10.4
Q10.5
Q10.9
N6_1
N6_2
N6_3
N6_4
N6_5
N6_6
N6_7
N6_2 DMA5C
Physical access (Access)
Q74.Bank.Amount
L13_3 E1_3 q3a_2 AID1BC AID1BD AID1BE AID1BG
Location (Loc) Location.Code
LSM_30 Urban
Rural
cluster_type
HH5
Human capital
Level of education (Edu)
Q8 Education8 N3 a_14 DMA5A
Social media (media)
Q139.6 E5_06
E5_07
E5_09
E5_10
E7_6
E7_7
f2_2 MMA14AE
Internet services Q139.5 E1_4 E7_3 n2 MMA14AD
Financial advice (Advice)
Q51.1
Q51.2
Q51.3
H3 b8_19_1
Income Employment history (Emp)
salaried/not salaried (Sala)
Q9 C1_07 C4 d1_2 (salaried)
INC2AA (salar)
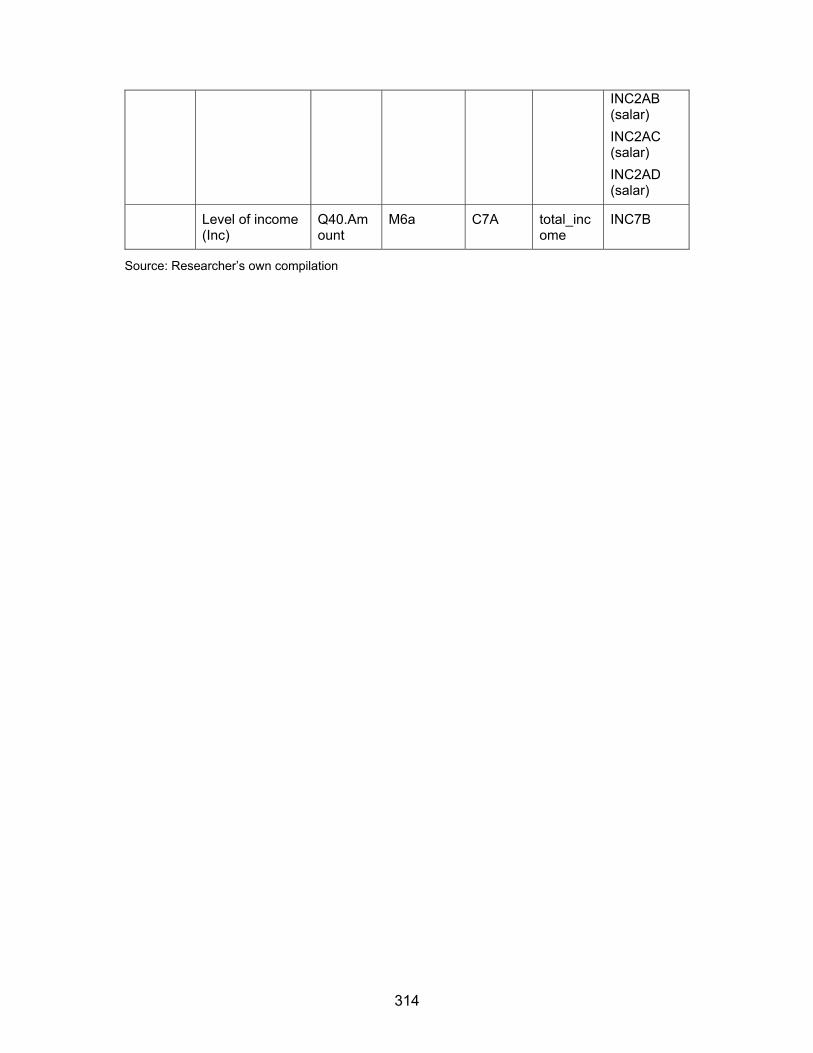
314
INC2AB (salar)
INC2AC (salar)
INC2AD (salar)
Level of income (Inc)
Q40.Amount
M6a C7A total_income
INC7B
Source: Researcher’s own compilation
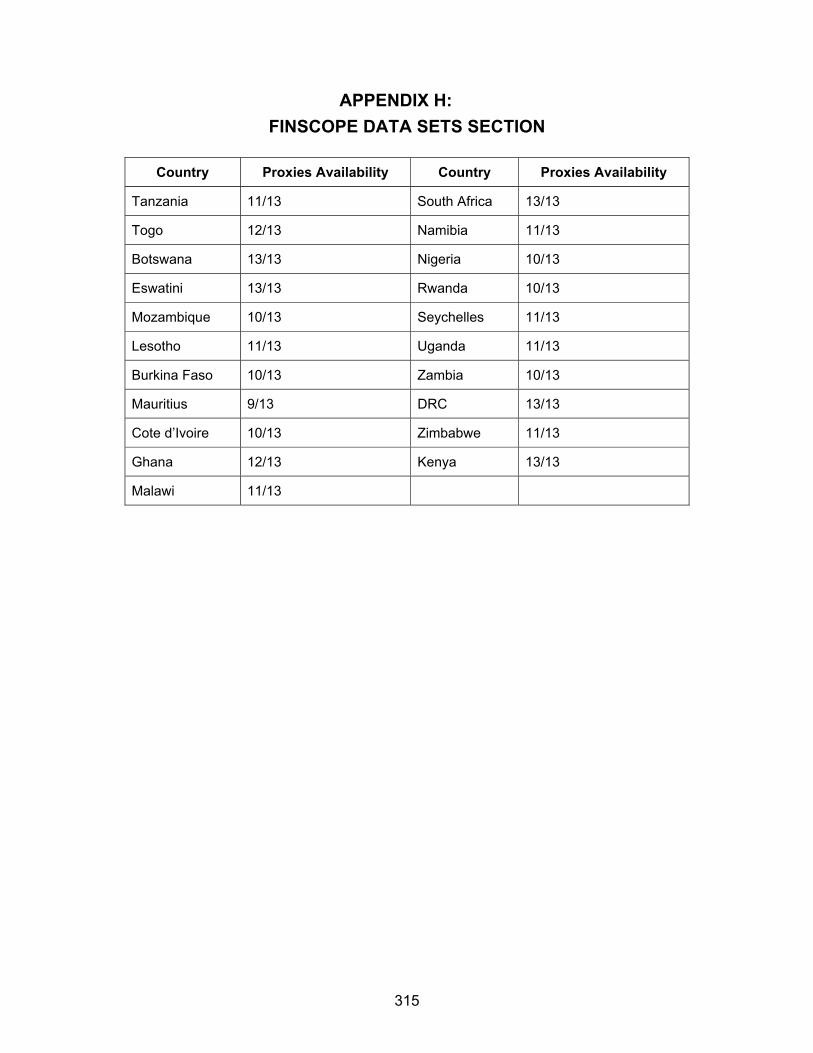
315
APPENDIX H:
FINSCOPE DATA SETS SECTION
Country Proxies Availability Country Proxies Availability
Tanzania 11/13 South Africa 13/13
Togo 12/13 Namibia 11/13
Botswana 13/13 Nigeria 10/13
Eswatini 13/13 Rwanda 10/13
Mozambique 10/13 Seychelles 11/13
Lesotho 11/13 Uganda 11/13
Burkina Faso 10/13 Zambia 10/13
Mauritius 9/13 DRC 13/13
Cote d’Ivoire 10/13 Zimbabwe 11/13
Ghana 12/13 Kenya 13/13
Malawi 11/13

316
APPENDIX I:
DECLARATION OF PROFESSIONAL EDIT