FOXO3/FKHRL1 is activated by 5-aza-2-deoxycytidine and induces silenced caspase-8 in neuroblastoma

Development of New Deoxycytidine Kinase Inhibitors andNoninvasive in Vivo Evaluation Using Positron Emission TomographyJennifer M. Murphy,‡,†,§, ○ Amanda L. Armijo,‡,†,§ Julian Nomme,‡,∥ Chi Hang Lee,†,§
Quentin A. Smith,⊥ Zheng Li,†,§ Dean O. Campbell,†,§,▲ Hsiang-I Liao,†,§ David A. Nathanson,†,§
Wayne R. Austin,†,§ Jason T. Lee,†,§,◆ Ryan Darvish,†,§ Liu Wei,†,§ Jue Wang,†,§ Ying Su,∥
Robert Damoiseaux,# Saman Sadeghi,†,§ Michael E. Phelps,† Harvey R. Herschman,†,△
Johannes Czernin,†,§ Anastassia N. Alexandrova,⊥ Michael E. Jung,⊥ Arnon Lavie,*,∥and Caius G. Radu*,†,§
†Department of Molecular and Medical Pharmacology, §Ahmanson Translational Imaging Division, ⊥Department of Chemistry andBiochemistry, #California NanoSystems Institute, △Department of Biological Chemistry, University of California, Los Angeles, 650Charles E. Young Dr. S., Los Angeles, California 90095, United States∥Department of Biochemistry and Molecular Genetics, University of Illinois at Chicago, 900 S. Ashland Avenue, M/C 669, Chicago,Illinois 60607, United States
*S Supporting Information
ABSTRACT: Combined inhibition of ribonucleotide reductase and deoxycytidine kinase (dCK)in multiple cancer cell lines depletes deoxycytidine triphosphate pools leading to DNA replicationstress, cell cycle arrest, and apoptosis. Evidence implicating dCK in cancer cell proliferation andsurvival stimulated our interest in developing small molecule dCK inhibitors. Following a highthroughput screen of a diverse chemical library, a structure−activity relationship study was carriedout. Positron Emission Tomography (PET) using 18F-L-1-(2!-deoxy-2!-FluoroArabinofuranosyl)Cytosine (18F-L-FAC), a dCK-specific substrate, was used to rapidly rank lead compounds basedon their ability to inhibit dCK activity in vivo. Evaluation of a subset of the most potentcompounds in cell culture (IC50 = ∼1−12 nM) using the 18F-L-FAC PET pharmacodynamic assayidentified compounds demonstrating superior in vivo efficacy.
! INTRODUCTIONMammalian cells rely on two major pathways for theproduction and maintenance of deoxyribonucleotide triphos-phates (dNTPs) for DNA replication and repair: the de novopathway and the nucleoside salvage pathway.1 The de novopathway produces dNTPs from glucose and amino acids. Thenucleoside salvage pathway produces dNTPs from preformeddeoxyribonucleosides present in the extracellular environment.1
The first enzymatic step in the cytosolic deoxyribonucleosidesalvage pathway is catalyzed by deoxycytidine kinase (dCK)and by thymidine kinase 1 (TK1).2 dCK catalyzes 5!-phosphorylation of deoxycytidine (dC), deoxyguanosine(dG), and deoxyadenosine (dA) to their monophosphateforms, exhibiting the highest affinity for dC.3 The mono-phosphate deoxyribonucleotides are subsequently phosphory-lated to their corresponding di- and triphosphate forms byother kinases.4,5 We have shown that dCK and TK1 playimportant roles in hematopoiesis by regulating dNTP biosyn-thesis in lymphoid and erythroid progenitors.6,7 In addition toits physiological role in nucleotide metabolism, dCKphosphorylates several clinically important antiviral andanticancer nucleoside analog prodrugs (e.g., gemcitabine,
decitabine, fludarabine, cytarabine, clofarabine); phosphoryla-tion by dCK is critically required for the activation of theseprodrugs.8 Recently, dCK was implicated in the regulation ofthe G2/M checkpoint in cancer cells in response to DNAdamage.9 The role of dCK in hematopoiesis and cancer has ledto our interest in developing a small molecule inhibitor of thiskinase. Such dCK inhibitors could represent new therapeuticagents for malignancies and immune disorders. To ourknowledge, few dCK inhibitors have been reported,10−12 andonly one13 has been demonstrated to inhibit dCK activity invivo.Positron emission tomography (PET) is a noninvasive in
vivo imaging technique widely used for diagnosing, staging,restaging, and therapy monitoring of various diseases.14,15
While PET using the radiotracer 2-18F-fluoro-2-deoxy-D-glucose(18F-FDG)16,17 has become an important diagnostic andtreatment monitoring tool in cancer,18−21 another emergingapplication of PET concerns its use in drug discovery anddevelopment. Thus, by facilitating faster and more effective
Received: March 28, 2013
Article
pubs.acs.org/jmc
© XXXX American Chemical Society A dx.doi.org/10.1021/jm400457y | J. Med. Chem. XXXX, XXX, XXX−XXX

decision-making early in the drug discovery/developmentprocess, PET could accelerate the advancement of promisingcandidates and reduce failures.22−24 For instance, PET can beused to demonstrate the need to modify lead candidates earlyin the drug discovery process by enabling noninvasive
evaluations of drug pharmacodynamic (PD) and/or pharma-cokinetic (PK) properties. In the specific context of our drugdiscovery and development program centered on dCK, PETcould play a particularly important role given the availability ofvalidated PET biomarkers to assess dCK activity in vivo. These
Figure 1. Structures and IC50 values determined using the3H-dC uptake assay in L1210 cells for the initial HTS hits (1 and 2) and for commercially
available compounds containing similar structural scaffolds (3−7).
Table 1. In Vitro Biological Data in L1210 and CEM Cells for Compounds 8−14a
IC50 (μM) L1210 cells IC50 (μM) CEM cells
compd R1 R2 R3 R4 a Y = CH b Y = N a Y = CH b Y = N
8 H OCH2CH2F OCH3 H 0.808 (±0.406) 1.612 (±0.543) 0.421 (±0.075) 0.534 (±0.012)9 H OCH3 OCH2CH2F H 0.538 (±0.014) 0.528 (±0.015) 0.230 (±0.042) 0.506 (±0.138)10 H OCH2CH3 OCH2CH2F H 0.513 (±0.100) 1.226 (±0.450) 0.251 (±0.020) 0.512 (±0.409)11 H CH3 OCH2CH2F H 2.381 (±0.042) 3.201 (±0.566) 1.960 (±1.001) 1.922 (±0.573)12 H OCH3 OCH2CH2CH2F H 0.330 (±0.160) 0.603 (±0.140) 0.197 (±0.109) 0.297 (±0.020)13 OCH3 H OCH2CH2F H 1.445 (±0.060) 2.649 (±0.902) 1.041 (±0.084) 0.849 (±0.183)14 H OCH2CH2F H OCH3 5.469 (±1.336) NDb 2.367 (±0.238) NDb
aInhibitory activity measured by 3H-deoxycytidine (3H-dC) uptake in murine L1210 cells and in CCRF-CEM human cells. Values reported are themean ± SD of at least n = 2 independent experiments. bND = not determined (compound was not synthesized).
Journal of Medicinal Chemistry Article
dx.doi.org/10.1021/jm400457y | J. Med. Chem. XXXX, XXX, XXX−XXXB

PET PD biomarkers of dCK activity include a series of 18F-fluoro-arabinofuranosylcytosine analogs substrates of dCKdeveloped by our group25 which include 18F-1-(2!-deoxy-2!-FluoroArabinofuranosyl) Cytosine (18F-FAC)26 and 18F-L-1-(2!-deoxy-2!-FluoroArabinofuranosyl) Cytosine (18F-L-FAC).27Herein we describe the development of potent dCK inhibitorsand demonstrate their in vivo efficacy using 18F-L-FAC PET asa noninvasive and clinically applicable PD biomarker.
! RESULTS AND DISCUSSIONIdentification of Lead Compound 15c. To identify new
small molecule inhibitors of dCK, we performed a highthroughput screen (HTS) of a set of selected chemical librariestotaling ∼90,000 small molecules. We screened the library fordCK inhibitory function using a Firefly luciferase-coupled assaywith recombinant human dCK enzyme.28 In this assay,inhibition of dCK prevents ATP depletion by dCK, thusresulting in higher luminescent signals in positive wells. Thescreen yielded two hit compounds, 1 and 2, which werevalidated to inhibit the uptake of tritiated deoxycytidine (3H-dC) with micromolar potency in the L1210 murine leukemiacell line (Figure 1).Based on these results, five commercially available com-
pounds containing similar structural scaffolds were tested; theirIC50 values against L1210 cells were determined by measuringinhibition of 3H-dC uptake (Figure 1). Strikingly, compounds 6and 7 were inactive, suggesting that the bis-amino functionalityon the pyrimidine ring is crucial for dCK inhibition. Based onthese results, we initiated a structure−activity relationship(SAR) study to develop a lead structure, which could be furtheroptimized to compounds with potent in vivo activity.We initially studied two main structural classes of
compounds, pyrimidines and 1,3,5-triazines (Table 1). Twocell lines were used to determine the IC50 values: the L1210murine leukemia cells and the CCRF-CEM human acute T-lymophoblastic leukemia cells. In nearly all cases, substitutionof the pyrimidine ring with the 1,3,5-triazine motif reduceddCK inhibitory activity; in some instances an approximate 2-fold reduction in potency was observed. Consequently, thepyrimidine motif was utilized as the preferred scaffold toadvance. At this stage of the SAR, the presence of a
fluoroethoxy side-chain on the phenyl ring was considered foreventual 18F-radiolabeling purposes. Substitutions around thephenyl ring with respect to the position of the fluoroethoxyside-chain were also examined. Moving the fluoroethoxy side-chain from the para position in 8a to the meta position in 9aincreased the inhibitory activity approximately 2-fold. It wasalso apparent that alkoxy substituents in the para position werebetter than alkyl moieties, since compound 11a hadsubstantially lower activity than either the methoxy 9a orethoxy 10a analogs. Compound 12a, which contains a side-chain that was extended by one carbon to give a fluoropropoxygroup at the meta position, gave slightly greater inhibitoryactivity, albeit not a significant increase from compounds 9aand 10a. Substitution at the ortho position of the phenyl ring,e.g. in compounds 13a and 14a, resulted in substantially lowerdCK inhibitory activity, an approximate 10-fold decrease inpotency was observed for compound 14a when compared to9a. A general synthetic scheme for compounds in Table 1 canbe found in the Supporting Information (Scheme S2).While the presence of fluorine in the small molecule may
eventually enable the synthesis of an 18F-isotopolog of the dCKinhibitor, fluorine introduction also affects nearly all thephysical and ADME (adsorption, distribution, metabolism,and excretion) properties of a compound.29 The capacity offluorine to enhance metabolic stability has become increasinglyapparent in recent years.30 Thus, a series of compounds weresynthesized which contained fluorine attached directly on thearomatic ring of the inhibitors rather than linked by an ethoxyside-chain (compounds 16−18, Table 2). For each compoundin this series, a set of three derivatives (a−c) were synthesized;in each case the group on the 5-position of the thiazole waseither a methyl, ethyl, or propyl substituent. For compounds15a−c the fluoroethoxy side-chain was retained at the metaposition of the phenyl ring, as was a methoxy group at the paraposition due to the favorable inhibitory results from the initialSAR in Table 1.Increasing nonpolar functionality at the 5-position of the
thiazole resulted in increasing inhibitory activity (Table 2). TheIC50 values in CCRF-CEM cells illustrate the same trend inpotency as observed in L1210 cells with one exception; set 16shows little difference between the methyl, ethyl, or propyl
Table 2. In Vitro Biological Data in L1210 and CEM Cells for Compounds 15−18a
IC50 (μM) L1210 cells IC50 (μM) CEM cells
compd R1 R2 R3 a Y = Me b Y = Et c Y = Pr a Y = Me b Y = Et c Y = Pr
15 H OCH3 OCH2CH2F 0.035 (±0.015) 0.030 (±0.077) 0.003 (±0.000) 0.018 (±0.012) 0.007 (±0.002) 0.003 (±0.000)16 F H F 0.595 (±0.163) 0.620 (±0.170) 0.385 (±0.262) 0.150 (±0.099) 0.162 (±0.019) 0.173 (±0.157)17 H F H 0.395 (±0.134) 0.265 (±0.163) 0.170 (±0.099) 0.230 (±0.134) 0.083 (±0.043) 0.037 (±0.020)18 H H F 0.255 (±0.021) 0.510 (±0.014) 0.175 (±0.007) 0.092 (±0.048) 0.011 (±0.038) 0.031 (±0.024)
aInhibitory activity measured by 3H-deoxycytidine (3H-dC) uptake in murine L1210 and in CCRF-CEM human cells. Values reported are the mean± SD of at least n = 2 independent experiments.
Journal of Medicinal Chemistry Article
dx.doi.org/10.1021/jm400457y | J. Med. Chem. XXXX, XXX, XXX−XXXC

substituents. However, for all compounds tested against L1210cells, the propyl substituent yielded better inhibitory activitythan the corresponding methyl derivatives. The best example inL1210 cells was the 12-fold increase in activity when comparingcompound 15c to compound 15a. In addition, comparisonsbetween the propyl substituents against their respective methylderivatives in CCRF-CEM cells also showed an increasinginhibitory trend in activity: 6-fold (compare 17c to 17a) or 3-fold (compare 18c to 18a). The most drastic effect frommodifications at the 5-position of the thiazole ring was thechange exhibited from 9a in Table 1 to 15c in Table 2, wherethe substitution of a hydrogen for a propyl moiety resulted in a180-fold increase in potency in L1210 cells. In addition,
removal of the fluoroethoxy side-chain (e.g., compound series16−18) resulted in a significant decrease in potency in both celllines. Compound 15c, the most potent compound in this series,contains both the fluoroethoxy side-chain at the meta positionon the phenyl ring and also a propyl group at the 5-position ofthe thiazole ring.
Synthesis. Compounds 15a−c were synthesized in six steps(Scheme 1). The commercially available 3-hydroxy-4-methox-ybenzonitrile 19 was functionalized via alkylation with 1-bromo-2-fluoroethane in DMF with cesium carbonate as thebase to obtain the nitrile 20 in 99% yield. Subjection of 20 to anaqueous ammonium sulfide solution under basic conditionsafforded the thioamide 21 in excellent yield.31 Cyclization to
Scheme 1. Synthesis of Compounds 15a−ca
aaReagents and conditions: (a) 1-bromo-2-fluoroethane, Cs2CO3, DMF, 99%; (b) (NH4)2S (20% in H2O), pyridine, Et3N, quantitative; (c) ethyl 3-bromo-2-oxobutanoate, EtOH; (d) ethyl 3-bromo-2-oxopentanoate, EtOH; (e) ethyl 3-bromo-2-oxohexanoate, EtOH; (f) DIBAL-H, CH2Cl2; (g)1,1,1,3,3,3-hexabromoacetone, PPh3, CH3CN; (h) 4,6-diamino-2-mercaptopyrimidine, NaOH, EtOH.
Figure 2. Binding of 15a to human dCK. (A) Ribbon diagram of a dCK monomer (light blue) with the two observed molecules of 15a bound (blueand cyan spheres, respectively) at the active site. The nucleotide UDP (red) was also present in the complex. (B) The interactions between 15a anddCK. Polar interactions are indicated as broken black lines. The two phosphate groups of UDP (top right) demonstrate the relative orientation of15a-I (blue) and 15a-II (cyan) to the nucleotide. (C) The methyl group of the 15a-I and 15a-II thiazole ring (red arrows) stack against each other,occupying a hydrophobic pocket.
Journal of Medicinal Chemistry Article
dx.doi.org/10.1021/jm400457y | J. Med. Chem. XXXX, XXX, XXX−XXXD
form the thiazole core of 15a−c was achieved via condensationof thioamide 21 with the respective ethyl 3-bromo-2-oxoalkanoate32 in refluxing ethanol.33 Reduction of theresulting compounds with diisobutylaluminum hydride affordedthe respective alcohols 23a−c in 88−99% yield. The alcohols23a−c were converted to the respective bromides 24a−c undermild conditions34 in 74−80% yield. Finally, nucleophilicdisplacement of the bromide with 4,6-diamino-2-mercaptopyr-imidine35 generated the desired products 15a−c in 71−87%yield.X-ray Crystal Structure of Compound 15a Bound to
Human dCK. X-ray crystallographic studies of compound 15awere initiated to obtain information about its binding to dCK.Detailed analysis of the dCK-inhibitor interactions for thisseries of compounds was performed (Nomme, unpublishedresults). In short, the crystal structure of the dCK:15a complexwas solved at 1.9 Å resolution (Figure 2). Human dCK, a dimerof two identical subunits with a molecular weight of ∼30 kDaper monomer, can bind either ATP or UTP as the phosphoryldonor for catalysis; in addition, dCK can adopt an open orclosed conformation.36,37,3 In complex with 15a, the enzymeadopts the open conformation. We observed two 15amolecules in each protomer of the dimeric enzyme (shownin blue (15a-I) and cyan (15a-II), Figure 2A). Note thatbinding of 15a to dCK does not preclude nucleotide binding(UDP is shown in red, Figure 2A). The parallel orientationbetween 15a-I and 15a-II allows for optimal π−π stackinginteractions between the phenyl and thiazole rings of eachmolecule.While two molecules of 15a bind in the active site, it appears
that 15a-I forms more key interactions and shorter hydrogenbond distances than 15a-II (Figure 2B). The extensivehydrogen-bond network that exists between the pyrimidine
moiety of 15a-I and residues E53, Q97, and D133 in the dCKnucleoside binding site are illustrated in Figure 2B. Figure 2Cillustrates the hydrophobic pocket that exists, via V55, L82, andF96, around the methyl group of compound 15a. This figuredemonstrates that the pocket will accept larger substituents,explaining the increased trend in potency obtained forcompounds 15b and 15c.
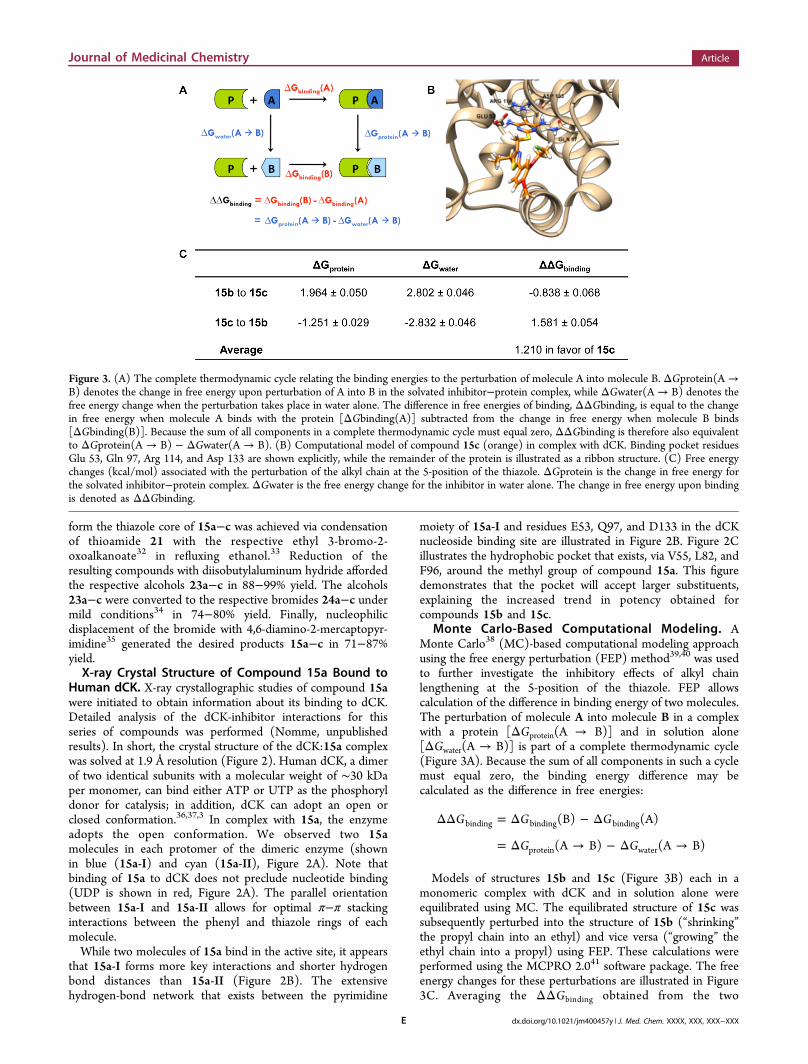
Monte Carlo-Based Computational Modeling. AMonte Carlo38 (MC)-based computational modeling approachusing the free energy perturbation (FEP) method39,40 was usedto further investigate the inhibitory effects of alkyl chainlengthening at the 5-position of the thiazole. FEP allowscalculation of the difference in binding energy of two molecules.The perturbation of molecule A into molecule B in a complexwith a protein [ΔGprotein(A ! B)] and in solution alone[ΔGwater(A ! B)] is part of a complete thermodynamic cycle(Figure 3A). Because the sum of all components in such a cyclemust equal zero, the binding energy difference may becalculated as the difference in free energies:
ΔΔ = Δ − Δ
= Δ → − Δ →
G G G
G G
(B) (A)
(A B) (A B)
binding binding binding
protein water
Models of structures 15b and 15c (Figure 3B) each in amonomeric complex with dCK and in solution alone wereequilibrated using MC. The equilibrated structure of 15c wassubsequently perturbed into the structure of 15b (“shrinking”the propyl chain into an ethyl) and vice versa (“growing” theethyl chain into a propyl) using FEP. These calculations wereperformed using the MCPRO 2.041 software package. The freeenergy changes for these perturbations are illustrated in Figure3C. Averaging the ΔΔGbinding obtained from the two
Figure 3. (A) The complete thermodynamic cycle relating the binding energies to the perturbation of molecule A into molecule B. ΔGprotein(A !B) denotes the change in free energy upon perturbation of A into B in the solvated inhibitor−protein complex, while ΔGwater(A ! B) denotes thefree energy change when the perturbation takes place in water alone. The difference in free energies of binding, ΔΔGbinding, is equal to the changein free energy when molecule A binds with the protein [ΔGbinding(A)] subtracted from the change in free energy when molecule B binds[ΔGbinding(B)]. Because the sum of all components in a complete thermodynamic cycle must equal zero, ΔΔGbinding is therefore also equivalentto ΔGprotein(A ! B) − ΔGwater(A ! B). (B) Computational model of compound 15c (orange) in complex with dCK. Binding pocket residuesGlu 53, Gln 97, Arg 114, and Asp 133 are shown explicitly, while the remainder of the protein is illustrated as a ribbon structure. (C) Free energychanges (kcal/mol) associated with the perturbation of the alkyl chain at the 5-position of the thiazole. ΔGprotein is the change in free energy forthe solvated inhibitor−protein complex. ΔGwater is the free energy change for the inhibitor in water alone. The change in free energy upon bindingis denoted as ΔΔGbinding.
Journal of Medicinal Chemistry Article
dx.doi.org/10.1021/jm400457y | J. Med. Chem. XXXX, XXX, XXX−XXXE

simulations indicates that the propyl chain of 15c confers a1.210 kcal/mol more favorable free energy of binding incomparison to the ethyl chain of 15b; this favorable effect isdue to desolvation. The change in free energy upon extensionof the alkyl chain is unfavorable both in the complex with theprotein and in water alone (positive ΔG for chain lengthening,negative ΔG for chain shortening); however, the magnitude ofthe unfavorable ΔG is larger in solvent. The fact that thisproduces an overall favorable ΔΔG of binding suggests that thepropyl chain is better able to exclude water from the interiorcavity of the protein, allowing a greater association between theprotein and the inhibitor.Lead Optimization and SAR. Based on the potency trend
in Table 2 and the existence of a hydrophobic pocket aroundthe 5-position of the thiazole ring of 15a, all further compoundsin the SAR were made with the propyl chain installed at thatposition, to increase nonpolar interactions between the dCKenzyme pocket and the inhibitors. The fluorine atomterminating the ethoxy side-chain was substituted for a hydroxylor sulfonamide group, with the goal of improving themolecule’s solubility properties as well as potential hydrogenbonding interactions that might exist in the active site.Moreover, since inhibitory activity in L1210 and CCRF-CEMcells demonstrated the same trend in potency, the SAR for allsubsequently synthesized compounds were examined only inCCRF-CEM cells. The results are summarized in Table 3.Compounds 25−27 showed excellent (1−2 nM) potency
against CCRF-CEM cells (Table 3). Substitution of the end-chain hydroxyl for a methyl sulfonamide resulted in a decreasein inhibitory activity of about 3-fold (compare 27 to 29) or 5-fold (compare 25 to 28). The initial SAR in Table 1 indicatedthat the presence of an alkoxy substituent at the para position
led to increased inhibitory activity; therefore, the methoxygroup was reinstalled at the para position. As expected, removalof the ethoxy side-chain (e.g., compound 31) resulted in asubstantially lower inhibitory activity, reinforcing the dataobserved for compounds 16−18 (Table 2). The presence ofthe methoxy moiety at the para position, in addition to thehydroxylethoxy side chain at the meta position, generatedcompound 33, which has an inhibitory potency of 1 nM. Toour surprise, removal of one of the amino groups from thepyrimidine ring led to a mere 2.5-fold decrease in inhibitoryactivity (compare 33 to 34). Initially, we observed that removalof both amino groups from the pyrimidine ring resulted incomplete loss of inhibitory activity (compounds 6 and 7, Figure1); however, the presence of one amino group can providesuitable key hydrogen bonding interactions to inhibit theenzyme. Compound 32, which contains a side-chain that hasbeen extended by one carbon to give a hydroxylpropoxy group,was also synthesized. However, this modification resulted inslightly decreased inhibitory activity in comparison with thehydroxylethoxy group. While compound 33 was a potentcompound in cell culture, the presence of a primary hydroxylgroup in the molecule raised concerns of a metabolic liability asa consequence of potential oxidation or glucuronidation.42
Thus, compounds 35−37 were synthesized to decrease thepossibility of metabolic degradation of 33. Eight of thesecompounds in Table 3, whose IC50 values were lower than 15aand whose structural properties suggested that they would havethe best in vivo efficacy, were selected for further investigation.
Steady-State Kinetic Analysis of Selected dCKInhibitors. In order to confirm that the cell-based valuestruly reflect the potency of the compounds we also determinedthe Ki
app values for select compounds using steady-state kinetic
Table 3. In Vitro Biological Data in CEM Cells for Compounds 25−37a
compd R1 R2 R3 Y IC50 (nM) CEM cells
25 H H OCH2CH2OH NH2 2.45 (±0.778)26 H F OCH2CH2OH NH2 1.07 (±0.230)27 F H OCH2CH2OH NH2 2.83 (±1.628)28 H H OCH2CH2NHSO2CH3 NH2 11.58 (±3.353)29 F H OCH2CH2NHSO2CH3 NH2 8.01 (±0.230)30 H OCH2CH2OH OCH2CH2OH NH2 2.59 (±1.146)31 H OCH3 OH NH2 18.62b
32 H OCH3 OCH2CH2CH2OH NH2 1.55 (±0.354)33 H OCH3 OCH2CH2OH NH2 1.15 (±0.762)34 H OCH3 OCH2CH2OH H 2.90 (±0.300)35 H OCH3 OCH2CH(CH3)OH NH2 2.85 (±0.071)36 H OCH3 OCH2C(CH3)2OH NH2 1.44 (±0.538)37 H OCH3 OCH2CH2NHSO2CH3 NH2 4.89 (±2.014)
aInhibitory activity measured by 3H-deoxycytidine (3H-dC) uptake in CCRF-CEM human cells. Values reported are the mean ± SD of at least n = 2independent experiments. bValue reported for n = 1.
Journal of Medicinal Chemistry Article
dx.doi.org/10.1021/jm400457y | J. Med. Chem. XXXX, XXX, XXX−XXXF

assays. The cell-based assays indicated that compound 15a was6−12-fold (depending on the cell line used for the assay) lesspotent than compound 15c (Table 2). Correspondingly, thesteady-state data showed a 6-fold higher Ki
app value forcompound 15a (Table 4). Likewise, the low nanomolar IC50
observed in CEM cells for compounds 36 and 37 (Table 3) wasrecapitulated in the steady-state kinetics derived Ki
app values forthese compounds (Table 4). Hence, we conclude that our cell-based assays are providing us with relatively accurate data as tothe strength of the interactions between the compounds anddCK.Evaluation of in Vivo Inhibition of dCK Activity via a
New PET PD Assay. The nucleoside analog PET probe 18F-L-FAC is a high affinity substrate for dCK, which can be used tononinvasively estimate dCK enzymatic activity in vivo.27 Aschematic depicting the mechanism by which 18F-L-FACaccumulates in cells in a dCK-specific manner is shown inFigure 4A. We reasoned that 18F-L-FAC PET could be used torapidly identify the most potent dCK inhibitors based on theireffectiveness at inhibiting the accumulation of the 18F-labeleddCK substrate PET tracer in various tissues. For the in vivoPET PD assay we selected dCK inhibitors that demonstrated1−12 nM inhibitory activity in the cell culture 3H-dC uptakeassay (Table 3). Mice were treated with a single dose (50 mg/kg) of a given dCK inhibitor administered by intraperitonealinjection. Control mice received vehicle (40% Captisol inwater) injections. Four hours later, treated mice were injectedintravenously with 18F-L-FAC; one hour after probe injection,mice were imaged by mPET/CT. The readout for the PET PDassay was the reduction in the accumulation of 18F-L-FAC indCK-positive tissues in dCK inhibitor versus vehicle treatedmice. Previously, we showed that 18F-L-FAC accumulates in adCK-dependent manner into various tissues such as thethymus, spleen, bone marrow, and liver.27 Accumulation inthe bladder is a result of nonenzymatic renal clearance of theunmetabolized probe. Since the reproducibility in the dCK-dependent tissue retention of 18F-L-FAC was most consistentin the liver,27 we chose to quantify 18F-L-FAC liver retention inorder to compare the in vivo efficacy of the various dCKinhibitors. Optimal conditions for the PET PD assay weredetermined by performing a dose escalation and time coursestudy using compound 33 (Supporting Figure S4).Results from the 18F-L-FAC mPET/CT scans are summar-
ized in Figure 4. Transverse PET images of the 18F-L-FAC liverscans for mice treated with either vehicle or compounds 15a,36, or 37 are shown in Figure 4B. Figure 4C illustrates theuptake of 18F-L-FAC in the livers of mice treated dCKinhibitors. The more efficacious compounds induced a greaterreduction in the 18F-L-FAC uptake relative to vehicle treatment,as a result of their greater inhibition of dCK-mediatedphosphorylation of its 18F-labeled substrate. Note theapproximate 30% decrease in 18F-L-FAC signal compared tovehicle control induced by compounds 28, 29, 36, and 37,
indicating their superior in vivo efficacy relative to the otherdCK inhibitor candidates. In addition, compounds 30 and 32show about a 20% decrease in probe uptake. Compound 33,one of the most potent dCK inhibitors in the cell culture assay(Table 3), showed poor in vivo efficacy in the 18F-L-FAC liverPET assay, presumably due to its poor PK properties. Ashypothesized, substitution of the hydroxyl group at the end ofthe ethoxy chain (e.g., compound 33) for the metabolicallystable methylsulfonamide (compounds 28, 29, and 37) orhindering the hydroxyl group (compound 36) proved advanta-geous for in vivo efficacy. Compounds 36 and 37 have the
Table 4. Steady-State Kinetics of Selected dCK Inhibitors
compd Kiapp (nM) error (nM) R2
15aa 9.5 2.3 0.97415ca 1.5 0.3 0.99836 0.8 0.7 0.98237 0.5 0.5 0.988
aData from Nomme et al.
Figure 4. In vivo evaluation of dCK inhibitors via PET analysis. (A)Schematic of the mechanism by which 18F-L-FAC accumulates in dCKexpressing cells. (B) Representative transverse images of 18F-L-FACPET/CT liver scans of C57Bl/6 mice treated with compounds 15a,36, and 37. (C) Quantification of 18F-L-FAC uptake in the liver for asample of inhibitors with low nanomolar in vitro potency. Data aremean values ± SEM for at least n = 3 mice/group. *, P < 0.03. (D)Representative images and quantification of 18F-L-FAC PET/CT scansof CCRF-CEM tumor bearing NSG mice that were treated withvehicle or compound 36. Data are displayed as box and whisker plotsfor at least n = 4 mice/group. *, P < 0.0012.
Journal of Medicinal Chemistry Article
dx.doi.org/10.1021/jm400457y | J. Med. Chem. XXXX, XXX, XXX−XXXG

lowest IC50 values among all the efficacious compounds andwere chosen for further study. Here we focus on compound 36,while compound 37 will be described in a subsequentpublication (Nathanson, unpublished results).Next we determined the efficacy of compound 36 at
inhibiting dCK activity in tumor tissues in vivo. Mice bearingCCRF-CEM tumor xenografts were treated with compound 36four hours prior to injection of 18F-L-FAC (Figure 4D). Onehour after the 18F-L-FAC injection, mice were imaged bymPET/CT. The retention of 18F-L-FAC in tumor xenograftsfrom mice treated with compound 36 was reduced by about30% compared to the retention of 18F-L-FAC in tumors fromvehicle treated mice (Figure 4D). To complement the PETassay, the pharmacokinetics of compound 36 was determinedusing standard analytical techniques, and the approximatedvalues are reported in Figure 5.
X-ray Crystal Structure of Compound 36 Bound toHuman dCK. X-ray crystallographic studies of compound 36were initiated to obtain information about its binding to dCK.The crystal structure of the dCK:36 complex was solved at 1.94Å resolution (Figure 6 and Table 5). Similar to ourobservations for compound 15a (Figure 2), in the case of 36,the enzyme also adopts the open conformation. We observedone 36 molecule (green) in each protomer of the dimericenzyme (Figure 6A). This is in contrast to the observation oftwo molecules bound per active site when the substituent at the5-position is smaller than the propyl present in 36 (Figure 2,determinants of single versus double molecule binding to thedCK active site was analyzed by Nomme, unpublished results).Note that binding of 36 to dCK does not preclude nucleotidebinding (UDP is shown in red, Figure 6A). The specificdCK:36 interactions are shown in Figure 6B. These include anextensive hydrogen-bond network between the pyrimidinemoiety of 36 and residues E53, Q97, and D133 in the dCKnucleoside binding site, as well as several hydrophobicinteractions.
! CONCLUSIONThe identification of potent small molecule human dCKinhibitors that demonstrate in vivo target inhibition is reported.Optimization of inhibitory activity was achieved by extendingan alkyl chain from the 5-position of the thiazole ring. In vivoefficacy was improved by manipulation of the ethoxy side-chainpresent at the meta position of the phenyl ring. The utility ofPET as a powerful tool for noninvasive measure of targetinhibition and, consequently, as a measure of lack of targetinhibition (most likely due to substrate metabolism in vivo) isalso presented. Although the major clinical applications of PETare primarily for central nervous system (CNS) and oncology-based diagnostics/therapeutics, PET is playing an increasinglyimportant role in drug development, given the capability of thismolecular imaging platform to address key challenges thatinclude evaluation of biodistribution, absorption, target affinity,plasma binding, metabolism, and dosing.43 Here we used the
Figure 5. Pharmacokinetic profile of compound 36. C57Bl/6 femalemice were dosed with compound 36 via intraperitoneal injection. Doseformulation: 10% DMSO and 40% Captisol in water. Data are meanvalues ± SEM for n = 4 mice/time point.
Figure 6. Crystal structure of the dCK:36 complex. (A) Ribbon diagram of a dCK monomer (light blue) with the single observed molecule of 36bound (green spheres) at the active site. The nucleotide UDP (red spheres) was also present in the complex. (B) Detail of the interactions between36 and dCK. dCK residues involved in polar and hydrophobic interactions with 36 are colored in light blue and gray, respectively. Polar interactionsare indicated as broken black lines.
Journal of Medicinal Chemistry Article
dx.doi.org/10.1021/jm400457y | J. Med. Chem. XXXX, XXX, XXX−XXXH

radiotracer 18F-L-FAC as a PET PD biomarker to compare thein vivo efficacies of candidate dCK inhibitors, first identifiedand characterized by potency in cell culture assays. Moreover,we used PET to provide estimates of in vivo target inhibition inCCRF-CEM xenograft mouse models by one of our mostpromising compounds, 36. The ability of another promisingcompound, 37, to elicit a significant pharmacological responseagainst CCRF-CEM tumors with minimal toxicity to normaltissues was evaluated by our group and is described in aseparate publication. Further optimization offering improve-ments to the PK and solubility properties of our best dCKinhibitors will be addressed in subsequent studies. In addition,the presence of fluorine on the aromatic ring of one of our mostpromising dCK inhibitors, 29, makes it amenable to 18Fradiolabeling. Synthesizing a small molecule dCK inhibitor with
an 18F radioisotope could generate a positron-emitting versionof the therapeutic candidate that can be detected and quantifiednoninvasively throughout the body of living individuals by PETimaging. This work will be the subject of a futurecommunication.
! EXPERIMENTAL SECTIONHigh-Throughput Screen. Recombinant human dCK at a
concentration of 1 μM was incubated with 10 μM of drug, 10 μMof dC, and 0.5 μM ATP with 50 mM Tris (pH 7.6), 5 mM MgCl2, and2 mM DTT. The reaction was incubated at 37 °C for 4 h beforeadding CellTiter-Glo (Promega): Briefly, 40 μL of dCK enzyme weredispensed into 384 well plates (Greiner, Bahlingen, Germany) using amultidrop 384 (Thermo, Turku, Finnland) at concentration of 12.5μg/mL; compounds were added using a Beckman-Coulter Biomek FX(Beckman Coulter, Brea, CA) equipped with a 500 nL custom pin tool(V&P Scientific, San Diego, CA). Columns 1, 2, 23, and 24 receivedonly DMSO instead of any drugs. In addition, no dCK was added tocolumn 23 and 24 as these columns served as additional controls (seebelow). After 30 min incubation at 37 °C, dC and ATP were added toa final concentration of 10 μM and 0.5 μM, respectively, for columns1−22 using the multidrop in a volume of 10 μL. For columns 23 and24 the following controls were used: 10 μL of a 2.5 μM ATP solutioncontaining the following additional controls was added: for wells A-D23 1 μM dCTP, for wells E-H23 10 μM dCTP, for wells I-L23 10μM L-FAC, for wells F-P23 10 μM FAC, for wells A-D24 0.5 μM ATPstandard, for wells E-H24 0.1 μM ATP standard, for wells I-L24 1 μMDCK only, and for wells F-P24 10 μM UTP was added, respectively.These controls were included on each plate to exclude equipmentfailure. This was followed by a 4 h incubation at 37 °C and addition of25 μL of Cell titer glo reagent (Promega, Fitchburg, WI) by multidropfollowed by reading on an Acquest plate reader (Molecular Devices,Sunnyvale, CA). The libraries used were custom sets of compoundsfrom the compound manufacturers Asinex (Winston-Salem, NC) andEnamine (Monmouth Jct., NJ). These sets consisted of compoundsselected extensively for drug-likeness using the Lipinski rule of five,rotatable bonds, and maximal diversity using custom clusteringalgorithms.
Chemistry. General Procedures. Unless otherwise noted,reactions were carried out in oven-dried glassware under anatmosphere of nitrogen using commercially available anhydroussolvents. Solvents used for extractions and chromatography were notanhydrous. 4,6-Diamino-2-mercaptopyrimidine was obtained fromdrying the hydrate over dynamic vacuum at 110 °C for 20 h. All otherreagents obtained from commercial suppliers were reagent grade andused without further purification unless specified. Reactions andchromatography fractions were analyzed by thin-layer chromatography(TLC) using Merck precoated silica gel 60 F254 glass plates (250 μm).Visualization was carried out with ultraviolet light, vanillin stain,permanganate stain, or p-anisaldehyde stain. Flash column chromatog-raphy was performed using E. Merck silica gel 60 (230−400 mesh)with compressed air. 1H and 13C NMR spectra were recorded onARX500 (500 MHz) or Avance500 (500 MHz) spectrometers.Chemical shifts are reported in parts per million (ppm, δ) using theresidual solvent peak as the reference. DMSO-d6 (δ 2.50 ppm for 1H;δ 39.5 ppm for 13C) was used as the solvent and reference standardsunless otherwise noted. The coupling constants, J, are reported inHertz (Hz), and the resonance patterns are reported with notations asthe following: br (broad), s (singlet), d (doublet), t (triplet), q(quartet), and m (multiplet). Electrospray mass spectrometry datawere collected with a Waters LCT Premier XE time-of-flightinstrument controlled by MassLynx 4.1 software. Samples weredissolved in methanol and infused using direct loop injection from aWaters Acquity UPLC into the Multi-Mode Ionization source. Thepurity of all final compounds was determined to be >95%. AnalyticalHPLC analysis was performed on a Knauer Smartline HPLC systemwith a Phenomenex reverse-phase Luna column (5 μm, 4.6 ! 250mm) with inline Knauer UV (254 nm) detector. Mobile phase: A:0.1% TFA in H2O, B: 0.1% TFA in MeCN. Eluent gradient is specified
Table 5. Data Collection and Refinement Statistics
parameter comments
complex 36 + UDPPDB codes 4L5Bdata collection statisticsX-ray source and detector LS-CAT ID-G
MARCCD 300wavelength (Å) 0.97856temperature (K) 100resolutiona (Å) 1.94 (1.94−2.05)number of reflections
observed 206005unique 40954
completeness (%) 99.2 (98.1)Rsym (%) 4.5 (71.8)average I/σ(I) 17.05 (2.05)space group P 41unit cell (Å)
a = b 68.67c 120.02
refinement statisticsrefinement program REFMAC5twinning fraction 0.5
Rcryst (%) 18.8Rfree (%) 23.3
resolution range (Å) 30−1.94protein molecules per a.u. 2number of atoms
protein (ProtA, ProtB) 1932, 1925inhibitor 32 ! 2UDP 25 ! 2water 75
r.m.s. deviation from idealbond length (Å) 0.011bond angles (deg) 1.647
average B-factors (Å2) /chainprotein (ProtA, ProtB) 47.1, 47.3inhibitor (ProtA, ProtB) 45.1, 43.4UDP (ProtA, ProtB) 47.8, 44.7waters 42.9
Ramachandran plot (%)most favored regions 89.1additionally allowed regions 10.5generously allowed regions 0.5disallowed regions 0.0
aLast shell in parentheses.
Journal of Medicinal Chemistry Article
dx.doi.org/10.1021/jm400457y | J. Med. Chem. XXXX, XXX, XXX−XXXI

for each described compound in the Supporting Information. Allchromatograms were collected by a GinaStar (raytest USA, Inc.;Wilmington, NC, USA) analog to digital converter and GinaStarsoftware (raytest USA, Inc.).General Procedure for the Synthesis of Compounds 15a−c.
3-(2-Fluoroethoxy)-4-methoxybenzonitrile (20). To a solution of3-hydroxy-4-methoxybenzonitrile 19 (3.0 g, 20.1 mmol) in DMF (100mL) was added Cs2CO3 (10.5 g, 32.2 mmol) and 1-bromo-2-fluoroethane (5.1 g, 40.2 mmol). The mixture was stirred for 18 h at50 °C. After concentration to remove residual solvent, the resultingresidue was washed with brine and extracted with ethyl acetate. Theorganic layer was washed with water three times, dried over anhydrousMgSO4 and concentrated in vacuo to yield crude 20 (3.91 g, 20.03mmol, 99%) as a cream-colored solid. 1H NMR (500 MHz, CDCl3) δ:7.28 (dd, J = 8.5, 2.0 Hz, 1H), 7.10 (d, J = 2.0 Hz, 1H), 6.90 (d, J = 8.5Hz, 1H), 4.83−4.81 (m, 1H), 4.73−4.71 (m, 1H), 4.28−4.26 (m, 1H),4.23−4.21 (m, 1H), 3.89 (s, 3H); 13C NMR (125 MHz, CDCl3) δ:153.6, 148.1, 127.3, 119.1, 116.5, 111.9, 103.8, 82.3 (d, JCF = 170.5Hz), 68.7 (d, JCF = 20.3 Hz), 56.1.3-(2-Fluoroethoxy)-4-methoxybenzothioamide (21). To a
mixture of 20 (3.86 g, 19.8 mmol) in pyridine (41 mL) andtriethylamine (3 mL) was added ammonium sulfide solution (20% wt.in H2O, 13.52 mL, 39.6 mmol). The mixture was stirred for 18 h at 60°C. The reaction mixture was cooled and concentrated in vacuo toremove residual solvent. The resulting residue was washed with brineand extracted with ethyl acetate. The organic layer was dried overanhydrous MgSO4 and concentrated in vacuo to yield 21 (4.5 g, 19.8mmol, quantitative) as a yellow-orange solid. 1H NMR (500 MHz,acetone-d6) δ: 8.81 (brs, 1H), 8.74 (brs, 1H), 7.73 (s, 1H), 7.72 (dd, J= 8.5, 2.0 Hz, 1H), 7.00 (d, J = 8.0 Hz, 1H), 4.79 (dt, J = 48.0, 4.0 Hz,2H), 4.32 (dt, J = 29.5, 4.0 Hz, 2H), 3.89 (s, 3H); 13C NMR (125MHz, acetone-d6) δ: 200.4, 152.9, 147.2, 131.8, 121.5, 113.6, 110.8,82.7 (d, JCF = 167.3 Hz), 68.5 (d, JCF = 19.6 Hz), 55.4.Ethyl 2-(3-(2-Fluoroethoxy)-4-methoxyphenyl)-5-methyl-
thiazole-4-carboxylate (22a). A mixture of thioamide 21 (1.50 g,6.5 mmol) and ethyl 3-bromo-2-oxobutanoate (2.72 g, 13.0 mmol) inethanol (32 mL) was stirred under refluxing conditions for 2.5 h. Theresulting mixture was cooled and concentrated in vacuo to removeresidual solvent. The crude residue was purified by flash columnchromatography over silica gel (10:3 hexanes:ethyl acetate) to yieldthe desired thiazole intermediate 22a (1.45 g, 4.3 mmol, 65%) as alight brown solid. 1H NMR (500 MHz, DMSO-d6) δ: 7.40 (dd, J =8.5, 2.0 Hz, 1H), 7.37 (d, J = 2.0 Hz, 1H), 7.04 (d, J = 8.5 Hz, 1H),4.72 (dt, J = 48.0, 4.0 Hz, 2H), 4.31−4.22 (m, 2H), 4.28 (q, J = 7.0 Hz,2H), 3.81 (s, 3H), 2.67 (s, 3H), 1.28 (t, J = 7.0 Hz, 3H); 13C NMR(125 MHz, DMSO-d6) δ: 162.9, 162.1, 151.4, 148.2, 143.9, 141.9,125.5, 120.5, 112.6, 110.8, 83.1 (d, JCF = 165.9 Hz), 68.3 (d, JCF = 19.0Hz), 60.8, 56.0, 14.5, 13.3.(2-(3-(2-Fluoroethoxy)-4-methoxyphenyl)-5-methylthiazol-
4-yl)methanol (23a). To a stirred solution of intermediate 22a (860mg, 2.5 mmol) in CH2Cl2 (30 mL) cooled to 0 °C was added slowlydiisobutylaluminum hydride (1.0 M in THF, 10 mmol, 10 mL). Thereaction was allowed to warm to 23 °C and stirred for 1 h. Themixture was cooled to 0 °C and slowly quenched with a saturatedaqueous solution of Rochelle’s salt. The cloudy solution was stirred for1 h at 23 °C until the solution became clear again. The resultingsolution was extracted with ethyl acetate, washed with brine, dried overanhydrous magnesium sulfate, and concentrated in vacuo to give thedesired alcohol 23a (654 mg, 2.2 mmol, 88%) as a pale yellow solid.1H NMR (500 MHz, DMSO-d6) δ: 7.39 (d, J = 2.0 Hz, 1H), 7.36 (dd,J = 8.5, 2.0 Hz, 1H), 7.02 (d, J = 8.5 Hz, 1H), 5.04 (t, J = 5.5 Hz, 1H),4.73 (dt, J = 48.0, 3.5 Hz, 2H), 4.46 (d, J = 5.5 Hz, 2H), 4.25 (dt, J =30.0, 3.5 Hz, 2H), 3.79 (s, 3H), 2.41 (s, 3H); 13C NMR (125 MHz,DMSO-d6) δ: 162.7, 153.2, 150.8, 148.2, 129.5, 126.5, 119.8, 112.5,110.4, 83.1 (d, JCF = 165.9 Hz), 68.4 (d, JCF = 18.5 Hz), 57.3, 55.9,11.2.4-(Bromomethyl)-2-(3-(2-fluoroethoxy)-4-methoxyphenyl)-
5-methylthiazole (24a). To a solution of 23a (1.90 g, 6.4 mmol) inacetonitrile (30 mL) was added PPh3 (2.5 g, 9.6 mmol) followed byhexabromoacetone (1.70 g, 3.2 mmol) at 23 °C. The mixture was
stirred for 1 h at 40 °C when, by TLC analysis, all starting material hadbeen consumed. The solvent was removed in vacuo, and the cruderesidue was purified by flash column chromatography over silica gel(10:3 hexanes:ethyl acetate) to give the desired bromide 24a (1.84 g,5.1 mmol, 80%) as a light brown solid. 1H NMR (500 MHz, CDCl3)δ: 7.50 (d, J = 2.0 Hz, 1H), 7.40 (dd, J = 8.5, 2.0 Hz, 1H), 6.88 (d, J =8.0 Hz, 1H), 4.81 (dt, J = 47.0, 4.0 Hz, 2H), 4.59 (s, 2H), 4.36 (dt, J =27.5, 4.0 Hz, 2H), 3.90 (s, 3H), 2.46 (s, 3H); 13C NMR (125 MHz,CDCl3) δ: 164.1, 151.2, 148.1, 148.0, 131.7, 126.4, 120.4, 111.6, 111.5,82.4 (d, JCF = 169.9 Hz), 68.4 (d, JCF = 20.5 Hz), 55.9, 25.8, 11.4.
2-(((2-(3-(2-Fluoroethoxy)-4-methoxyphenyl)-5-methylthia-zol-4-yl)methyl)thio)pyrimidine-4,6-diamine (15a). 4,6-Diami-no-2-mercaptopyrimidine (336 mg, 2.36 mmol) and NaOH (94 mg,2.36 mmol) were stirred in ethanol (20 mL) for 10 min at 23 °C. Tothe reaction mixture was added a solution of bromide 24a (710 mg,1.97 mmol) in hot ethanol (16 mL), and the resulting mixture wasstirred for 3 h at 70 °C. The solution was cooled, concentrated invacuo, and purified by flash column chromatography over silica gel(100:5 dichloromethane:methanol) to give the desired product 15a(590 mg, 1.40 mmol, 71%) as a pale yellow solid. 1H NMR (500 MHz,DMSO-d6) δ: 7.36 (s, 1H), 7.34 (d, J = 8.0 Hz, 1H), 7.02 (d, J = 8.5Hz, 1H), 6.09 (brs, 4H), 5.12 (s, 1H), 4.72 (dt, J = 48.0, 3.5 Hz, 2H),4.32 (s, 2H), 4.25 (dt, J = 30.5, 3.5 Hz, 2H), 3.78 (s, 3H), 2.43 (s,3H); 13C NMR (125 MHz, DMSO-d6) δ: 168.3, 163.9 (2), 163.3,150.9, 149.5, 148.3, 129.1, 126.4, 119.9, 112.7, 110.5, 83.2 (d, JCF =165.9 Hz), 79.5, 68.5 (d, JCF = 18.7 Hz), 56.1, 27.9, 11.7; HRMS-ESI(m/z) [M + H]+ calcd for C18H20FN5O2S2 H, 422.1121; found422.1136.
2-(((5-Ethyl-2-(3-(2-fluoroethoxy)-4-methoxyphenyl)thiazol-4-yl)methyl)thio)pyrimidine-4,6-diamine (15b). 1H NMR (500MHz, DMSO-d6) δ: 7.37 (dd, J = 8.0, 2.0 Hz, 1H), 7.36 (s, 1H), 7.02(d, J = 8.5 Hz, 1H), 6.13 (brs, 4H), 5.13 (s, 1H), 4.72 (dt, J = 47.5, 4.0Hz, 2H), 4.34 (s, 1H), 4.25 (dt, J = 30.5, 4.0 Hz, 2H), 3.79 (s, 3H),2.87 (q, J = 7.5 Hz, 2H), 1.17 (t, J = 7.5 Hz, 3H); 13C NMR (125MHz, DMSO-d6) δ: 168.2, 163.8 (2), 163.5, 151.0, 148.4, 148.3, 136.9,126.5, 119.9, 112.7, 110.5, 83.3 (d, JCF = 165.9 Hz), 79.5, 68.5 (d, JCF =18.8 Hz), 56.1, 28.0, 19.9, 17.1; HRMS-ESI (m/z) [M + H]+ calcd forC19H22FN5O2S2 H, 436.1277; found 436.1263.
2-(((2-(3-(2-Fluoroethoxy)-4-methoxyphenyl)-5-propylthia-zol-4-yl)methyl)thio)pyrimidine-4,6-diamine (15c). 1H NMR(500 MHz, acetone-d6) δ: 7.53 (d, J = 2.0 Hz, 1H), 7.46 (dd, J =8.5, 2.0 Hz, 1H), 7.03 (d, J = 8.5 Hz, 1H), 5.63 (brs, 4H), 5.38 (s, 1H),4.80 (dt, J = 48.0, 4.0 Hz, 2H), 4.45 (s, 2H), 4.34 (dt, J = 29.5, 4.0 Hz,2H), 3.87 (s, 3H), 2.91 (t, J = 7.5 Hz, 1H), 1.66 (qt, J = 7.5, 7.5 Hz,2H), 0.97 (t, J = 7.5 Hz, 3H); 13C NMR (125 MHz, acetone-d6) δ:169.2, 164.0 (2), 163.9, 163.6, 151.4, 149.0, 148.5, 134.6, 126.9, 119.8,112.1, 111.1, 82.8 (d, JCF = 167.5 Hz), 79.5, 68.6 (d, JCF = 19.5 Hz),55.3, 28.1, 25.2, 13.0; HRMS-ESI (m/z) [M + H]+ calcd forC20H24FN5O2S2 H, 450.1434; found 450.1432.
1-(5-(4-(((4,6-Diaminopyrimidin-2-yl)thio)methyl)-5-pro-pylthiazol-2-yl)-2-methoxyphenoxy)-2-methylpropan-2-ol(36). 1H NMR (500 MHz, MeOD) δ: 7.51 (d, J = 2.0 Hz, 1H), 7.39(dd, J = 8.5, 2.0 Hz, 1H), 7.00 (d, J = 8.5 Hz, 1H), 5.48 (s, 1H), 5.32(s, 1H), 4.48 (s, 2H), 3.89 (s, 3H), 3.86 (s, 2H), 2.88 (t, J = 7.5 Hz,2H), 1.67 (qt, J = 7.5, 7.5 Hz, 2H), 1.33 (s, 6H), 0.98 (t, J = 7.5 Hz,3H); 13C NMR (125 MHz, MeOD) δ: 168.8, 165.2, 163.8 (2), 151.2,148.9, 148.0, 135.4, 126.4, 119.7, 111.8, 110.7, 79.2, 77.0, 69.6, 55.2,48.4, 27.9, 27.8, 25.0, 24.9, 12.6; HRMS-ESI (m/z) [M + H]+ calcd forC22H29N5O3S2 H, 476.1790; found 476.1772.
N-(2-(5-(4-(((4,6-Diaminopyrimidin-2-yl)thio)methyl)-5-pro-p y l t h i a z o l - 2 - y l ) - 2 - m e t h o x y p h e n o x y ) e t h y l ) -methanesulfonamide (37). 1H NMR (500 MHz, DMSO-d6) δ:7.41 (dd, J = 7.5, 2.0 Hz, 1H), 7.39 (s, 1H), 7.25 (t, J = 6.0 Hz, 1H),7.05 (d, J = 8.5 Hz, 1H), 6.13 (brs, 4H), 5.15 (s, 1H), 4.39 (s, 2H),4.07 (t, J = 5.5 Hz, 2H), 3.80 (s, 3H), 3.36 (dt, J = 5.5, 5.5 Hz, 2H),3.15 (d, J = 5.5 Hz, 1H), 2.98 (s, 3H), 2.84 (t, J = 7.5 Hz, 2H), 1.58(qt, J = 7.5, 7.5 Hz, 2H), 0.91 (t, J = 7.5 Hz, 3H); 13C NMR (125MHz, DMSO-d6) δ: 168.3, 163.9 (2), 163.7, 151.1,149.1, 148.3, 135.0,126.5, 119.9, 112.7, 110.6, 79.5, 68.3, 60.2, 42.4, 31.2, 28.2, 28.0, 25.4,
Journal of Medicinal Chemistry Article
dx.doi.org/10.1021/jm400457y | J. Med. Chem. XXXX, XXX, XXX−XXXJ

13.9; HRMS-ESI (m/z) [M + H]+ calcd for C21H28N6O4S3 H,525.1412; found 525.1404.dCK Uptake Assay Performed in Cell Culture. The murine
leukemic line L1210 was a gift from Charles Dumontet (Universite Claude Bernard Lyon I, Lyon, France). The human lymphoma lineCCRF-CEM was provided by Margaret Black (Washington StateUniversity). All L1210 and CCRF-CEM cell lines were cultured inRPMI medium 1640, supplemented with 5% FCS in a 5% CO2 37 °Cincubator. For the uptake assays cells were seeded at a density of50,000 cells/well in Millipore MultiScreen GV 96 well plates. 0.25 μCiof 3H-dC (Moravek Biochemicals) were added to the cellssimultaneously with concentrations of dCK inhibitor at a final volumeof 100 μL/well. After 1 h at 37 °C, cells were washed four times withice cold phosphate-buffered saline (PBS) using the Millipore VacuumManifold. The amount of incorporated probe was measured byscintillation counting with the PerkinElmer Microbeta.Protein Expression and Purification. Details on C4S S74E dCK
variant expression and purification are detailed in Nomme et al.Crystallization, X-ray Data Collection, and Refinement.
Crystallization, data collection, and structure determination of dCKin complex with 15a and 36 were performed following the generalprocedure as detailed in Nomme et al. Specifically for compound 36,crystals of dCK in complex with UDP, MgCl2 and a 2.5-fold excess ofthe 36 inhibitor were grown using the hanging drop vapor diffusionmethod at 12 °C. The reservoir solution contained 0.9−1.5 Mtrisodium citrate dehydrate and 25 mM HEPES (pH 7.5). Diffractiondata were collected at the Advanced Photon Source, Argonne NationalLaboratory on Life Sciences-Collaborative Access Team (LS-CAT)beamlines 21 ID-G.Kinetic Assay. Steady-state kinetic assay and data fitting were
performed as described in Nomme et al.Computational Modeling. All simulations were performed using
the MCPRO 2.0 package.41 Initial coordinates were obtained from theX-ray structure of dCK in complex with compound 15c. The proteinwas solvated in a 30 Å water cap, represented by the TIP4P44 classicalwater model. Solute atoms represented by the OPLS-AA force field45
were used. Equilibrations were performed using Metropolis MonteCarlo (MC) in the NPT ensemble at 25 °C and 1 atm. The backboneof the protein and all bond lengths within the protein were fixed;angles and torsions within 11 Å from the center of the bound moleculewere sampled. All degrees of freedom of the inhibitor compound weresampled during equilibration simulations. Equilibration consisted of 5! 106 configurations of sampling in which only solvent moves wereallowed and of 10 ! 106 subsequent configurations for the protein-inhibitor complex and for the lone inhibitor in solution. Theequilibrated systems were then subject to free energy perturbation(FEP)/MC simulations. These simulations consisted of 14 perturbingsteps of double-wide sampling. During FEP, the system underwent 5 !106 configurations of solvent equilibration, followed by 10 ! 106
configurations of full equilibration, and 25 ! 106 configurations of datacollection. All degrees of freedom of the inhibitor were sampled exceptthose bonds undergoing perturbation. The perturbed bond lengthswere systematically varied from the original to the final length.In Vivo MicroPET/CT Imaging Studies. Animal studies were
approved by the UCLA Animal Research Committee and were carriedout according to the guidelines of the Department of LaboratoryAnimal Medicine at UCLA. For the PET liver assay, C57BL/6 micewere intraperitoneally (i.p.) injected with the indicated amounts ofdCK inhibitor (resuspended in 40% Captisol) 4 h prior to intravenousinjection of 70 μCi of 18F-L-FAC. For the tumor xenograft assay, NODscid IL-2 receptor gamma chain knockout (NSG) bearing subcuta-neous CCRF-CEM tumor xenografts were injected with 50 mg/kg ofcompound 36 or vehicle. Four hours post-treatment mice wereinjected intravenously with 70 μCi of 18F-L-FAC. For all mPET/CTstudies, a 1 h interval was allowed between probe administration andmPET/CT scanning (Inveon, Siemens Medical Solutions USA Inc.;microCAT, Imtek Inc.). Static mPET images were acquired for 600 s.Images were analyzed using OsiriX Imaging Software Version 3.8.Pharmacokinetic Studies. C57Bl/6 female mice, 8 weeks of age,
were injected with a single dose of indicated compounds (50 mg/kg,
i.p.). Blood samples (approximately 70 μL) were collected throughretro-orbital bleeding into heparinized tubes at 5 min, 15 min, 30 min,35 min, 40 min, 45 min, 1 h, 2 h, 4 h, and 6 h. The blood samples werecentrifuged at 20,000g for 5 min to isolate plasma. One mL ofacetonitrile was added to 30 μL of plasma. The supernatant wastransferred to new tubes and was evaporated using a SpeedVac.Samples were then resuspended in 50 μL of neat DMSO, andsupernatant was transferred to LC/MS sample vials. Samples werethen run on an Agilent 6460 Triple Quad LC/MS.
Statistical Analyses. All statistics presented as means of biologicalreplicates with standard error of the mean (±SEM), standard deviation(±SD), or box plots with max and min whiskers. P-value significanceswere calculated using one sample Student’s t test function in GraphPadPrism 5 (GraphPad Software).
! ASSOCIATED CONTENT*S Supporting InformationExperimental details and spectroscopic data for compounds 8−14, 16−18, and 25−36; synthetic schemes for 8a, 8b, and 37;dose escalation/time course for PET assay. This material isavailable free of charge via the Internet at http://pubs.acs.org.Accession CodesFigures 2 and 3: dCK + 15a + UDP Code: 4JLK; Figure 6:dCK + 36 + UDP Code: 4L5B
! AUTHOR INFORMATIONCorresponding Author*Phone: 310-825-1205. E-mail: [email protected](C.G.R.). Phone: 312-355-5029. E-mail: [email protected] (A.L.).Present Addresses○UCLA, Crump Institute for Molecular Imaging CNSI, 570Westwood Plaza, Building 114, Box 951770, Mail Code:177010, Los Angeles, CA 90095-1770.▲Agensys, Inc. 1800 Stewart Ave, Santa Monica, CA, 90404.◆Department of Radiology, Memorial Sloan-Kettering CancerCenter, New York, NY 10021, USA.Author Contributions‡These authors contributed equally.NotesThe authors declare the following competing financialinterest(s): C.G.R., J.C. and M.E.P. are co-founders of SofieBiosciences, a molecular diagnostic company. They hold equityin Sofie Biosciences. The University of California also holdsequity in Sofie Biosciences. Intellectual property that C.G.R.and J.C. invented and which was patented by the University ofCalifornia has been licensed to Sofie Biosciences. TheUniversity of California has patented additional intellectualproperty invented by C.G.R., J.C., H.L., D.N., J.M.M., A.L.A.,M.E.J., and A.L.
! ACKNOWLEDGMENTSWe are extremely grateful to Dr. Nagichettiar Satyamurthy forhis expert chemistry advice and support in designing thesynthetic schemes, without his help this project would not havebeen possible. We thank Larry Pang and Michelle Tom fortheir assistance with PET/CT imaging studies, the UCLABiomedical Cyclotron crew for producing 18F-L-FAC, andRadha Bathala for her assistance in synthesizing compoundintermediates. We would also like to acknowledge Jong Lee atthe UCLA Molecular Screening Shared Resource for assistancewith the high-throughput screening. J.M.M. and D.N. thank theScholars in Oncologic Molecular Imaging program forpostdoctoral fellowships. This work was funded by In Vivo
Journal of Medicinal Chemistry Article
dx.doi.org/10.1021/jm400457y | J. Med. Chem. XXXX, XXX, XXX−XXXK

Cellular and Molecular Imaging Centers DevelopmentalProject Award National Institutes of Health P50 CA86306(C. G. Radu, H. R. Herschman, and W. R. Austin) and the USNational Cancer Institute grant 5U54 CA119347 (C. G. Radu).R.D. would like to acknowledge support for the MolecularScreening Shared Resource from the National Cancer CenterSupport grant P3016042-35 (J. Gasson).
! ABREVIATIONS USEDADA, adenosine deaminase; dCK, deoxycytidine kinase; dNTP,deoxyribonucleotide triphosphate; 18F-FAC, 18F-1-(2!-deoxy-2!-FluoroArabinofuranosyl) Cytosine; TK1, thymidine kinase1; HTS, high throughput screen; dC, deoxycytidine; dG,deoxyguanosine; dA, deoxyadenosine; 18F-FDG, 2-18F-fluoro-2-deoxy-D-glucose; 18F-L-FAC, 18F-L-1-(2!-deoxy-2!-FluoroArabi-nofuranosyl) Cytosine; 3H-dC, 3H-deoxycytidine; ATP, ad-enosine triphosphate; UTP, uridine triphosphate; UDP, uridinediphosphate; E53, glutamic acid 53; D133, aspartic acid 133;Q97, glutamine 97; V55, valine 55; L82, leucine 82; F96,phenylalanine 96; mPET/CT, micro positron emissiontomography/computed tomography; PK, pharmacokinetic;PD, pharmacodynamic; DMF, dimethylformamide; DIBAL-H,diisobutylaluminum hydride; EtOH, ethanol; Rochelle’s Salt,sodium potassium tartrate; DMSO, dimethylsulfoxide; PBS,phosphate-buffered saline; FCS, fetal calf serum
! REFERENCES(1) Reichard, P. Interactions between Deoxyribonucleotide and DNASynthesis. Annu. Rev. Biochem. 1988, 57, 349−374.(2) Arner, E. S. J.; Eriksson, S. Mammalian DeoxyribonucleosideKinases. Pharmacol. Ther. 1995, 67, 155−186.(3) Sabini, E.; Hazra, S.; Ort, S.; Konrad, M.; Lavie, A. StructuralBasis for Substrate Promiscuity of dCK. J. Mol. Biol. 2008, 378, 607−621.(4) Pasti, C.; Gallois-Montbrun, S.; Munier-Lehmann, H.; Vernon,M.; Gilles, A. M.; Deville-Bonne, D. Reaction of Human UMP-CMPKinase with Natural and Analog Substrates. Eur. J. Biochem. 2003, 270,1784−1790.(5) Krishnan, P.; Gullen, E. A.; Lam, W.; Dutschman, G. E.; Grill, S.P.; Cheng, Y. C. Novel Role of 3-Phosphoglycerate Kinase, aGlycolytic Enzyme, in the Activation of L-Nucleoside Analogs, aNew Class of Anticancer and Antiviral Agents. J. Biol. Chem. 2003,278, 36726−36732.(6) Toy, G.; Austin, W. R.; Liao, H.-I.; Cheng, D.; Singh, A.;Campbell, D. O.; Ishikawa, T.-o.; Lehmann, L. W.; Satyamurthy, N.;Phelps, M. E.; Herschman, H. R.; Czernin, J.; Witte, O. N.; Radu, C.G. Requirement for Deoxycytidine Kinase in T and B LymphocyteDevelopment. Proc. Natl. Acad. Sci. U.S.A. 2010, 107, 5551−5556.(7) Austin, W. R.; Armijo, A. L.; Campbell, D. O.; Singh, A. S.; Hsieh,T.; Nathanson, D.; Herschman, H. R.; Phelps, M. E.; Witte, O. N.;Czernin, J.; Radu, C. G. Nucleoside Salvage Pathway Kinases RegulateHematopoiesis by Linking Nucleotide Metabolism with ReplicationStress. J. Exp. Med. 2012, 209, 2215−2228.(8) Van Rompay, A. R.; Johansson, M.; Karlsson, A. SubstrateSpecificity and Phosphorylation of Antiviral and Anticancer Nucleo-side Analogs by Human Deoxyribonucleoside Kinases and Ribonu-cleoside Kinases. Pharmacol. Ther. 2003, 100, 119−139.(9) Yang, C.; Lee, M.; Hao, J.; Cui, X.; Guo, X.; Smal, C.; Bontemps,F.; Ma, S.; Liu, X.; Engler, D.; Parker, W. B.; Xu, B. DeoxycytidineKinase Regulates the G2/M Checkpoint through Interaction withCyclin-Dependent Kinase 1 in Response to DNA Damage. NucleicAcids Res. 2012, 40 (19), 9621−32.(10) Tarver, J. E.; Jessop, T. C.; Carlsen, M.; Augeri, D. J.; Fu, Q.;Healy, J. P.; Heim-Riether, A.; Xu, A.; Taylor, J. A.; Shen, M.; Keyes, P.E.; Kimball, S. D.; Yu, X.-C.; Miranda, M.; Liu, Q.; Swaffield, J. C.;Nouraldeen, A.; Wilson, A. G. E.; Rinch, R.; Jhaver, K.; Foushee, A. M.
D.; Anderson, S.; Oravecz, T.; Carson, K. G. 5-FluorocytosineDerivatives as Inhibitors of Deoxycytidine Kinase. Bioorg. Med. Chem.Lett. 2009, 19, 6780−6783.(11) Yu, X.-C.; Miranda, M.; Liu, Z.; Patel, S.; Nguyen, N.; Carson,K.; Liu, Q.; Swaffield, J. C. Novel Potent Inhibitors of DeoxycytidineKinase Identified and Compared by Multiple Assays. J. Biomol.Screening 2010, 15, 72−79.(12) Ward, A. D.; Baker, B. R. Irreversible Enzyme Inhibitors: Active-Site-Directed Inhibitors of Deoxycytidine Kinase. J. Med. Chem. 1977,20, 88−92.(13) Jessop, T. C.; Tarver, J. E.; Carlsen, M.; Xu, A.; Healy, J. P.;Heim-Riether, A.; Fu, Q.; Taylor, J. A.; Augeri, D. J.; Shen, M.; Stouch,T. R.; Swanson, R. V.; Tari, L. W.; Hunger, M.; Hoffman, I.; Keyes, P.E.; Yu, X.-C.; Miranda, M.; Liu, Q.; Swaffield, J. C.; Kimball, S. D.;Nouraldeen, A.; Wilson, A. G. E.; Foushee, A. M. D.; Jhaver, K.; Finch,R.; Anderson, S.; Oravecz, T.; Carson, K. G. Lead Optimization andStructure-based Design of Potent and Bioavailable DeoxycytidineKinase Inhibitors. Bioorg. Med. Chem. Lett. 2009, 19, 6784−6787.(14) Weber, W. A.; Grosu, A. L.; Czernin, J. Technology Insight:Advances in Molecular Imaging and an Appraisal of PET/CTScanning. Nat. Clin. Pract. Oncol. 2008, 5, 160−170.(15) Czernin, J.; Benz, M. R.; Allen-Auerbach, M. S. PET/CTImaging: The Incremental Value of Assessing the Glucose MetabolicPhenotype and the Structure of Cancers in a Single Examination. Eur.J. Radiol. 2010, 73, 470−480.(16) Gambhir, S. S. Molecular Imaging of Cancer with PositronEmission Tomography. Nat. Rev. Cancer 2002, 2, 683−693.(17) Rigo, P.; Paulus, P.; Kaschten, B. J.; Hustinx, R.; Bury, T.;Jerusalem, G.; Benoit, T.; Foidart Willems, J. Oncological Applicationof Positron Emission Tomography with Fluorine-18. Eur. J. Nucl. Med.1996, 23, 1641−1674.(18) Wood, K. A.; Hoskin, P. J.; Saunders, M. I. Positron EmissionTomography in Oncology: A Review. Clin. Oncol. 2007, 19, 237−255.(19) Weber, W. A. Positron Emission Tomography as an ImagingBiomarker. J. Clin. Oncol. 2006, 24, 3282−3292.(20) Oriuchi, N.; Higuchi, T.; Ishikita, T.; Miyakubo, M.; Hanaoka,H.; Iida, Y.; Endo, K. Present Role and Future Prospects of PositronEmission Tomography in Clinical Oncology. Cancer Sci. 2006, 97,1291−1297.(21) Jadvar, H.; Alavi, A.; Gambhir, S. S. 18F-FDG Uptake in Lung,Breast, and Colon Cancers: Molecular Biology Correlates and DiseaseCharacterization. J. Nucl. Med. 2009, 50, 1820−1827.(22) Hargreaves, R. J. The Role of Molecular Imaging in DrugDiscovery and Development. Clin. Pharmacol. Ther. 2008, 83, 349−353.(23) Wang, J. L.; Maurer, L. Positron Emission Tomography:Applications in Drug Discovery and Drug Development. Curr. Top.Med. Chem. 2005, 5, 1053−1075.(24) Wagner, C. C.; Muller, M.; Lappin, G.; Langer, O. PositronEmission Tomography for Use in Microdosing Studies. Curr. Opin.Drug Discovery Dev. 2008, 11, 104−110.(25) Laing, R. E.; Walter, M. A.; Campbell, D. O.; Herschman, H. R.;Satyamurthy, N.; Phelps, M. E.; Czernin, J.; Witte, O. N.; Radu, C. R.Noninvasive Prediction of Tumor Responses to Gemcitabine usingPositron Emission Tomography. Proc. Natl. Acad. Sci. U.S.A. 2009,106, 2847−2852.(26) Radu, C. G.; Shu, C. J.; Nair-Gill, E.; Shelly, S. M.; Barrio, J. R.;Satyamurthy, N.; Phelps, M. E.; Witte, O. N. Molecular Imaging ofLymphoid Organs and Immune Activation by Positron EmissionTomography with a New [18F]-Labeled 2’-Deoxycytidine Analog. Nat.Med. 2008, 14, 783−788.(27) Shu, C. J.; Campbell, D. O.; Lee, J. T.; Tran, A. Q.; Wengrod, J.C.; Witte, O. N.; Phelps, M. E.; Satyamurthy, N.; Czernin, J.; Radu, C.R.; Novel, P. E. T. Probes Specific for Deoxycytidine Kinase. J. Nucl.Med. 2010, 51, 1092−1098.(28) Fan, F.; Wood, K. V. Bioluminescent Assays for High-Throughput Screening. Assay Drug Dev. Technol. 2007, 5, 127−136.(29) Muller, K.; Faeh, C.; Diederich, F. Fluorine in Pharmaceuticals:Looking Beyond Intuition. Science 2007, 317, 1881−1886.
Journal of Medicinal Chemistry Article
dx.doi.org/10.1021/jm400457y | J. Med. Chem. XXXX, XXX, XXX−XXXL

(30) Park, B. K.; Kitteringham, N. R.; O’Neill, P. M. Metabolism ofFluorine-Containing Drugs. Annu. Rev. Pharmacol. Toxicol. 2001, 41,443−470.(31) Crane, L. J.; Anastassiadou, M.; Stigliani, J.-L.; Baziard-Mouysset, G.; Payard, M. Reactions of Some Ortho and ParaHalogenated Aromatic Nitriles with Ethylenediamine: SelectiveSynthesis of Imidazolines. Tetrahedron 2004, 60, 5325−5330.(32) Okonya, J. F.; Hoffman, R. V.; Johnson, M. C. Synthesis of 2-Oxazolone-4-Carboxylates from 3-Nosyloxy- and 3-Bromo-2-ketoest-ers. J. Org. Chem. 2002, 67, 1102−1108.(33) Trullinger, T. K.; Hunter, R.; Garizi, N.; Yap, M. C. H.; Buysse,A. M.; Pernich, D.; Johnson, T. C.; Bryan, K.; Deamicis, C.; Zhang, Y.;Niyaz, N. M.; McLeod, C. L.; Ross, R.; Zhu, Y.; Johnson, P. L.;Eckelbarger, J. D.; Parker, M. H. Pesticidal Compositions. Patentapplication US 2010/0292253 A1.(34) Joseph, K. M.; Larraza-Sanchez, I. Synthesis of Benzyl Bromideswith Hexabromoacetone: An Alternative Path to Drug Intermediates.Tetrahedron Lett. 2011, 52, 13−16.(35) Laxer, A.; Major, D. T.; Gottlieb, H. E.; Fischer, B. (15N5)-Labeled Adenine Derivatives: Synthesis and Studies of Tautomerismby 15N NMR Spectroscopy and Theoretical Calculations. J. Org. Chem.2001, 66, 5463−5481.(36) Chottiner, E. G.; Shewach, D. S.; Datta, N. S.; Ashcraft, E.;Gribbin, D.; Ginsburg, D.; Fox, I. H.; Mitchell, B. S. Cloning andExpression of Human Deoxycytidine Kinase cDNA. Proc. Natl. Acad.Sci. U.S.A. 1991, 88, 1531−1535.(37) Shewach, D. S.; Reynolds, K. K.; Hertel, L. NucleotideSpecificity of Human Deoxycytidine Kinase. Mol. Pharmacol. 1992,42, 518−524.(38) Metropolis, N.; Ulam, S. The Monte Carlo Method. J. Am. Stat.Assoc. 1949, 44, 335−341.(39) Zwanzig, R. W. High-Temperature Equation of State by aPerturbation Method. J. Chem. Phys. 1954, 22, 1420−1426.(40) Jorgensen, W. L.; Thomas, L. L. Perspective on Free-EnergyPerturbation Calculations for Chemical Equilibria. J. Chem. TheoryComput. 2008, 4, 869−876.(41) Jorgensen, W. L.; Tirado-Rives, J. Molecular Modeling ofOrganic and Biomolecular Systems Using BOSS and MCPRO. J.Comput. Chem. 2005, 26, 1689−1700.(42) Shu, Y. Z.; Johnson, B. M.; Yang, T. J. Role of BiotransformationStudies in Minimizing Metabolism-Related Liabilities in DrugDiscovery. AAPS J. 2008, 10, 178−192.(43) Bhattacharyya, S. Application of Positron Emission Tomographyin Drug Development. Biochem. Pharmacol. 2012, 1, 1000e128.(44) Jorgensen, W. L.; Chandrasekhar, J.; Madura, J. D.; Impey, R.W.; Klein, M. L. Comparison of Simple Potential Functions forSimulating Liquid Water. J. Chem. Phys. 1983, 79, 926−935.(45) Jorgensen, W. L.; Maxwell, D. S.; Tirado-Rives, J. Developmentand Testing of the OPLS All-Atom Force Field on ConformationalEnergetics and Properties of Organic Liquids. J. Am. Chem. Soc. 1996,118, 11225−11236.
Journal of Medicinal Chemistry Article
dx.doi.org/10.1021/jm400457y | J. Med. Chem. XXXX, XXX, XXX−XXXM
Copyright © 2022 FDOKUMEN