Noninvasive electromechanical wave imaging and conduction-relevant velocity estimation in vivo
8
Noninvasive electromechanical wave imaging and conduction-relevant velocity estimation in vivo Elisa E. Konofagou a,b, * , Jianwen Luo a , Deepak Saluja c , Daniel O. Cervantes c , James Coromilas c , Kana Fujikura b a Department of Biomedical Engineering, Columbia University, New York, NY, USA b Department of Radiology, Columbia University, New York, NY, USA c Department of Medicine, Columbia University, New York, NY, USA article info Article history: Received 9 July 2009 Received in revised form 25 September 2009 Accepted 25 September 2009 Available online 2 October 2009 Keywords: Cross-correlation Displacement Electromechanical Left ventricle Myocardial Pacing abstract Electromechanical wave imaging is a novel technique for the noninvasive mapping of conduction waves in the left ventricle through the combination of ECG gating, high frame rate ultrasound imaging and radio-frequency (RF)-based displacement estimation techniques. In this paper, we describe this new technique and characterize the origin and velocity of the wave under distinct pacing schemes. First, in vivo imaging (30 MHz) was performed on anesthetized, wild-type mice (n = 12) at high frame rates in order to take advantage of the transient electromechanical coupling occurring in the myocardium. The RF signal acquisition in a long-axis echocardiographic view was gated between consecutive R-wave peaks of the mouse electrocardiogram (ECG) and yielded an ultra-high RF frame rate of 8000 frames/s (fps). The ultrasound RF signals in each frame were digitized at 160 MHz. Axial, frame-to-frame displace- ments were estimated using 1D cross-correlation (window size of 240 lm, overlap of 90%). Three pacing protocols were sequentially applied in each mouse: (1) sinus rhythm (SR), (2) right-atrial (RA) pacing and (3) right-ventricular (RV) pacing. Pacing was performed using an eight-electrode catheter placed into the right side of the heart with the capability of pacing from any adjacent bipole. During a cardiac cycle, sev- eral waves were depicted on the electromechanical wave images that propagated transmurally and/or from base to apex, or apex to base, depending on the type of pacing and the cardiac phase. Through com- parison between the ciné-loops and their corresponding ECG obtained at different pacing protocols, we were able to identify and separate the electrically induced, or contraction, waves from the hemodynamic (or, blood-wall coupling) waves. In all cases, the contraction wave was best observed along the posterior wall starting at the S-wave of the ECG, which occurs after Purkinje fiber, and during myocardial, activa- tion. The contraction wave was identified based on the fact that it changed direction only when the pac- ing origin changed, i.e., it propagated from the apex to the base at SR and RA pacing and from base to apex at RV pacing. This reversal in the wave propagation direction was found to be consistent in all mice scanned and the wave velocity values fell within the previously reported conduction wave range with statistically significant differences between SR/RA pacing (0.85 ± 0.22 m/s and 0.84 ± 0.20 m/s, respec- tively) and RV pacing (0.52 ± 0.31 m/s; p < 0.0001). This study thus shows that imaging the electrome- chanical function of the heart noninvasively is feasible. It may therefore constitute a unique noninvasive method for conduction wave mapping of the entire left ventricle. Such a technology can be extended to 3D mapping and/or used for early detection of dyssynchrony, arrhythmias, left-bundle branch block, or other conduction abnormalities as well as diagnosis and treatment thereof. Ó 2009 Elsevier B.V. All rights reserved. 1. Introduction The emergence of cardiac resynchronization therapy (CRT) as a commonly used treatment modality has focused attention on the development of noninvasive techniques that can precisely map electrical propagation and the resulting contractile patterns of the left ventricle in order to better assess a patient’s candidacy for such a device. While direct imaging of electrical propagation would be ideal, currently available methods are unsuitably inva- sive [1–6]. Attention has therefore turned to contractile imaging techniques such as M-mode and tissue Doppler echocardiography [7]. However, these modalities have the disadvantage of having limited spatial and temporal resolution. There is currently no imaging modality that can directly and noninvasively map the conduction wave in the entire heart or its disruption in the presence of an abnormality or disease. Standard 0041-624X/$ - see front matter Ó 2009 Elsevier B.V. All rights reserved. doi:10.1016/j.ultras.2009.09.026 * Corresponding author. Address: Department of Biomedical Engineering, Colum- bia University, New York, NY, USA. E-mail address: [email protected] (E.E. Konofagou). Ultrasonics 50 (2010) 208–215 Contents lists available at ScienceDirect Ultrasonics journal homepage: www.elsevier.com/locate/ultras
-
Upload
independent -
Category
Documents
-
view
3 -
download
0
Transcript of Noninvasive electromechanical wave imaging and conduction-relevant velocity estimation in vivo

Ultrasonics 50 (2010) 208–215
Contents lists available at ScienceDirect
Ultrasonics
journal homepage: www.elsevier .com/ locate/ul t ras
Noninvasive electromechanical wave imaging and conduction-relevant velocityestimation in vivo
Elisa E. Konofagou a,b,*, Jianwen Luo a, Deepak Saluja c, Daniel O. Cervantes c, James Coromilas c,Kana Fujikura b
a Department of Biomedical Engineering, Columbia University, New York, NY, USAb Department of Radiology, Columbia University, New York, NY, USAc Department of Medicine, Columbia University, New York, NY, USA
a r t i c l e i n f o a b s t r a c t
Article history:Received 9 July 2009Received in revised form 25 September2009Accepted 25 September 2009Available online 2 October 2009
Keywords:Cross-correlationDisplacementElectromechanicalLeft ventricleMyocardialPacing
0041-624X/$ - see front matter � 2009 Elsevier B.V.doi:10.1016/j.ultras.2009.09.026
* Corresponding author. Address: Department of Biobia University, New York, NY, USA.
E-mail address: [email protected] (E.E. Konof
Electromechanical wave imaging is a novel technique for the noninvasive mapping of conduction wavesin the left ventricle through the combination of ECG gating, high frame rate ultrasound imaging andradio-frequency (RF)-based displacement estimation techniques. In this paper, we describe this newtechnique and characterize the origin and velocity of the wave under distinct pacing schemes. First,in vivo imaging (30 MHz) was performed on anesthetized, wild-type mice (n = 12) at high frame ratesin order to take advantage of the transient electromechanical coupling occurring in the myocardium.The RF signal acquisition in a long-axis echocardiographic view was gated between consecutive R-wavepeaks of the mouse electrocardiogram (ECG) and yielded an ultra-high RF frame rate of 8000 frames/s(fps). The ultrasound RF signals in each frame were digitized at 160 MHz. Axial, frame-to-frame displace-ments were estimated using 1D cross-correlation (window size of 240 lm, overlap of 90%). Three pacingprotocols were sequentially applied in each mouse: (1) sinus rhythm (SR), (2) right-atrial (RA) pacing and(3) right-ventricular (RV) pacing. Pacing was performed using an eight-electrode catheter placed into theright side of the heart with the capability of pacing from any adjacent bipole. During a cardiac cycle, sev-eral waves were depicted on the electromechanical wave images that propagated transmurally and/orfrom base to apex, or apex to base, depending on the type of pacing and the cardiac phase. Through com-parison between the ciné-loops and their corresponding ECG obtained at different pacing protocols, wewere able to identify and separate the electrically induced, or contraction, waves from the hemodynamic(or, blood-wall coupling) waves. In all cases, the contraction wave was best observed along the posteriorwall starting at the S-wave of the ECG, which occurs after Purkinje fiber, and during myocardial, activa-tion. The contraction wave was identified based on the fact that it changed direction only when the pac-ing origin changed, i.e., it propagated from the apex to the base at SR and RA pacing and from base to apexat RV pacing. This reversal in the wave propagation direction was found to be consistent in all micescanned and the wave velocity values fell within the previously reported conduction wave range withstatistically significant differences between SR/RA pacing (0.85 ± 0.22 m/s and 0.84 ± 0.20 m/s, respec-tively) and RV pacing (�0.52 ± 0.31 m/s; p < 0.0001). This study thus shows that imaging the electrome-chanical function of the heart noninvasively is feasible. It may therefore constitute a unique noninvasivemethod for conduction wave mapping of the entire left ventricle. Such a technology can be extended to3D mapping and/or used for early detection of dyssynchrony, arrhythmias, left-bundle branch block, orother conduction abnormalities as well as diagnosis and treatment thereof.
� 2009 Elsevier B.V. All rights reserved.
1. Introduction the left ventricle in order to better assess a patient’s candidacy
The emergence of cardiac resynchronization therapy (CRT) as acommonly used treatment modality has focused attention on thedevelopment of noninvasive techniques that can precisely mapelectrical propagation and the resulting contractile patterns of
All rights reserved.
medical Engineering, Colum-
agou).
for such a device. While direct imaging of electrical propagationwould be ideal, currently available methods are unsuitably inva-sive [1–6]. Attention has therefore turned to contractile imagingtechniques such as M-mode and tissue Doppler echocardiography[7]. However, these modalities have the disadvantage of havinglimited spatial and temporal resolution.
There is currently no imaging modality that can directly andnoninvasively map the conduction wave in the entire heart or itsdisruption in the presence of an abnormality or disease. Standard

E.E. Konofagou et al. / Ultrasonics 50 (2010) 208–215 209
techniques such as electrocardiography (ECG) can be inconclusiveand/or insensitive. The situation is particularly grave for patientswith heart failure (HF), where morbidity and mortality rates re-main exceptionally high [1]. Fifty percent of patients die within5 years of being diagnosed. Among the HF population, the mostcommon electromechanical disorder is the left bundle branchblock (LBBB) and intraventricular conduction delays (IVCD). LBBBand IVCD result in dyssynchronous ventricular activation and car-diac resynchronization therapy (CRT) is now a mainstay of treat-ment of HF in patients with LBBB or IVCD. However, not allpatients respond to this therapy. The presence of LBBB or IVCDon an ECG does not define the precise sequence of activation sincethese patterns may arise from delayed as well as altered activationsequences and understanding the precise pattern of electrical acti-vation that occurs with LBBB or IVCD may allow us to identifythose patients who would respond to CRT.
However, currently, there are no noninvasive electrical conduc-tion mapping techniques of the heart that can be applied diagnos-tically in a clinical setting. The only methods currently available forconduction mapping in vivo involve the use of contact electrode ar-rays, either by mounting an electrode sock around the heartthrough open-heart surgery [2,3] or reconstruction from body sur-face potentials [4] to map the epicardial activation or, using a bal-loon electrode catheter through catheterization for endocardialmapping [5,6]. However, none of the medical imaging techniquesclinically available provide conduction mapping, since, as indicatedabove, this would require invasive procedures, which are not typ-ically used diagnostically. Conventional echocardiography usingM-mode, Tissue Doppler and other methods offer the capabilityof assessing electromechanical dyssynchrony as an indication ofarrhythmia and is used to monitor the performance of such treat-ments such as CRT [7]. M-mode echocardiography is often effectivein examining intraventricular dyssynchrony [7]. For example, it ispossible to compare the activation times of the posterior and septalwalls by noting the times of peak contraction in the case of a left-bundle branch block (LBBB). Due to electromechanical coupling, amechanical delay is a direct consequence of a delayed electricalactivation – a chief symptom of LBBB. Although no single standardexists, a septal-to-posterior wall motion delay of 130 ms has beensuggested as a marker of intraventricular dyssynchrony [7]. TissueDoppler is another ultrasound-based technique used to indirectlydetect conduction abnormalities by successfully identifying timedelays, at which peak displacement or strain rate occurs in distinctsegments of the heart [7]. After treatment, these delays are used asindices to verify whether they were reduced to minimal or normalrange values. However, none of the aforementioned techniqueimages the conduction wave or directly characterizes the electricalfunction.
The only non-contact imaging technique that can directly mapthe conduction wave is optical imaging. Optical imaging tech-niques use voltage-sensitive dyes, which bind to cardiac cell mem-branes and following illumination, fluoresce if the cell undergoeselectrical activation, thus allowing the assessment of the cardiacelectrical function. Optical imaging techniques are capable of reli-ably mapping the conduction wave as well as re-entrant activity inthe epicardial and subepicardial cell layers [8,9]. These techniquescan be applied at the organ, cellular, and subcellular levels. How-ever, due to the fact that optical imaging techniques are affectedby mechanical artifacts, they require the use of an electromechan-ical decoupler that inhibits cardiac contraction during imaging. Asa result, conduction mapping using optical imaging can only be ap-plied in excised hearts. Typically, an isolated, Langendorff-perfusedanimal (e.g., mouse, rabbit, pig) heart is stimulated by an electrodeat the right atrium or epicardium in order to simulate the sinusrhythm or pacing. The action potentials on the epicardial surfaceare recorded in a specific imaging field of view (e.g., from
2 � 2 mm2 to 3 � 3 cm2, although panoramic imaging systemsrecording from the entire anterior or posterior surface of the hearthave recently been implemented), after perfusion with voltage-sensitive dyes. The isochronal, or isophasis, maps of activation, ordepolarization, sequence, conduction direction and velocity are ob-tained through spatiotemporal analysis [10,11]. Due to depth pen-etration and mechanical artifact limitations, optical imaging istypically performed on the epicardial surface of ex vivo perfusionmodels and cannot map the cardiac electrical activity in vivo[8,9]. Therefore, optical imaging cannot be used as a diagnostictechnique in humans.
In summary, 2D conduction mapping has been restricted toin vivo invasive techniques that entail the use of epicardial elec-trode measurements or to perfused heart models using opticalimaging. The main reason for the lack of noninvasive techniquesfor accurate electrical mapping lies in the fact that standard imag-ing modalities are either limited by the penetration depth (i.e.,optical techniques) or by the frame rate required (conventionalultrasound or MRI). In other words, the currently available nonin-vasive techniques cannot map the electrical conduction or depictthe propagation of the conduction during systole or diastole dueto low frame rates and inadequate precision of the motion estima-tion techniques.
Electromechanical wave imaging has been shown capable ofnoninvasively mapping contractile wavefronts in the left ventriclesof mice with a temporal and spatial resolution that exceeds cur-rently available echocardiographic techniques [12–15]. Prelimin-ary feasibility of applying this technique to human subjects hasalso been shown [15]. In this paper, we aim at accurately identify-ing and confirming the nature and origin of the imaged contractilewavefronts in the mouse heart.
2. Methods
2.1. Animal preparation
In this study, approved by the Institutional Animal Care and UseCommittee of Columbia University, 12 wild-type C57BL/6 micewere anesthetized with 50 mg/kg intraperitoneal injection of so-dium pentobarbitol. Each mouse was placed supine on an ECG plat-form and the ECG was simultaneously and continuously acquiredduring the entire imaging process (Fig. 2a). Under a microscope,the skin of the mouse was incised and using a combination of bluntand sharp dissection, the internal jugular vein was exposed. It wasthen tied off distally, and a purse string suture was placed proxi-mally. Pacing was achieved after catheterization through the rightside of the heart (Fig. 2c). Using microscissors, a veinotomy wasperformed and an octapolar catheter was introduced into the inter-nal jugular vein and then into the heart. The catheter carried eightelectrodes (Fig. 2b) that could be separately activated for varyingthe pacing location (Fig. 2c). Once the position of the catheterwas confirmed using a combination of the morphology of the intra-cardiac electrograms and surface ECG morphology during ventric-ular pacing, the catheter was secured by tying down the proximalsuture. In some of the ultrasound scans, the catheter could be de-tected within the imaging field of view, allowing thus imaging ofthe pacing location and the resulting wave.
2.2. Ultrasound RF data acquisition and pacing protocols
A previously developed high frame-rate data acquisition systemwas used in this study [16,17]. After hair removal, a 30 MHz ultra-sound sector probe (Vevo 770, VisualSonics Inc., Toronto, ON, Can-ada) was placed on the mouse chest in the parasternal position toobtain a longitudinal (long-axis) view of the murine left ventricle

Fig. 1. The cardiac conduction system (www.americanheart,org; Purkinje networkis shown in yellow) of the heart indicating the three pacing origins (small bluerectangles) and the left-ventricular ultrasound imaging plane (green rectangle)used in the study. (For interpretation of the references to colour in this figurelegend, the reader is referred to the web version of this article.)
210 E.E. Konofagou et al. / Ultrasonics 50 (2010) 208–215
(Fig. 2a). Degassed ultrasound gel (Aquasonic 100, Parker laborato-ries, Inc., Orange, Fairfield, NJ) was used as a coupling medium. Thefield of view was equal to 12 � 12 mm2, the axial resolution wasequal to 50 lm and the lateral resolution was equal to 115 lm.In order to align the image acquisition orientation with the pathof electrical activation (Fig. 1), long-axis views of the left ventriclewere used as shown in Fig. 1.
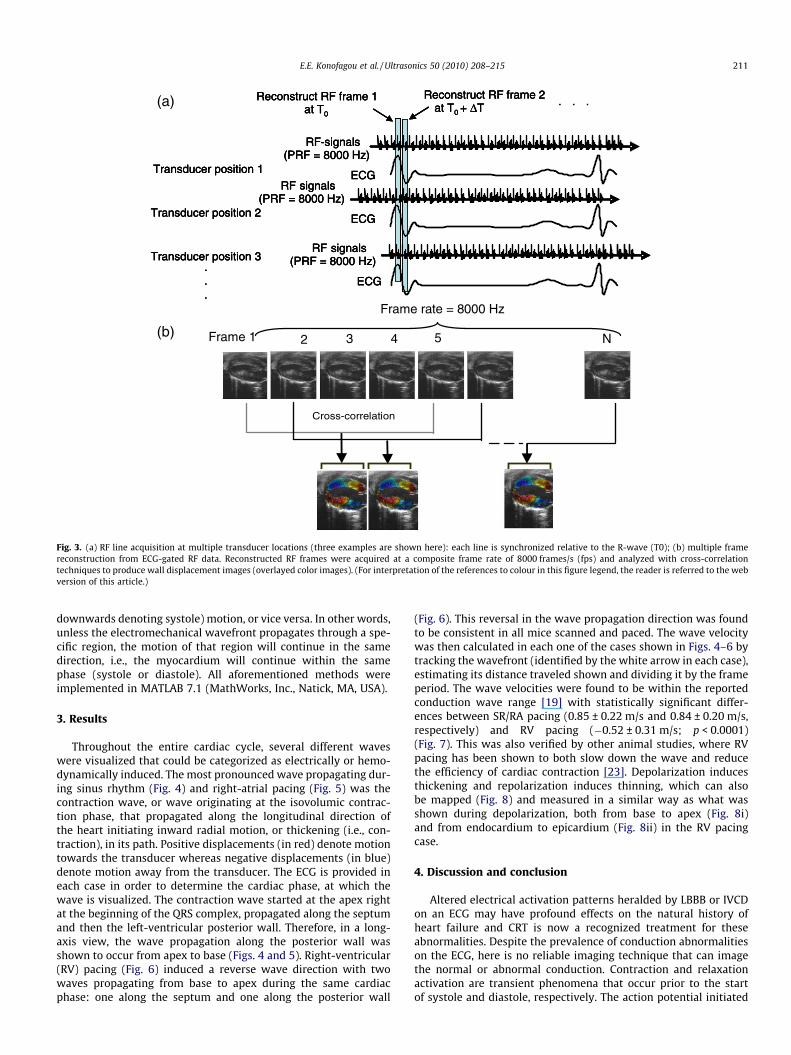
In the EKVTM (ECG-based kilohertz visualization) mode providedby the Vevo system, the transducer worked on a line-by-line basis,i.e., the ultrasound RF signals were acquired at a pulse-repetitionfrequency (PRF) of 8 kHz at each position of the transducer(Fig. 3). After acquisition over one cardiac cycle, the transducer ele-ment changed position and the same acquisition was repeated atthe new position. This was repeated sequentially until the entirefield of view, i.e., long-axis view of the left ventricle, was com-pleted. Synchronization of the individual RF signals was achievedthrough retrospective ECG gating (Fig. 3A). Using this technique,a total of 190 RF signals were acquired at the pulse-repetition fre-quency (PRF) of 8 kHz over the course of approximately 7 min,yielding an RF frame rate of 8000 frames/s (or, temporal resolutionof 0.125 ms). A two-channel, 14-bit waveform digitizer (Compu-Scope 14200, Gage Applied Technologies, Inc., Lachine, QC, Canada)was used to simultaneously acquire the RF signals and the
Fig. 2. (a) Picture of the setup used in the mouse experiments; (b) illustration of the 8-eleon the right showing all eight electrodes and (c) localization of the 8-electrode catheter inPurkinje network. (For interpretation of the references to colour in this figure legend, th
corresponding ECG at 160 M Samples/s at each transducer location.The average heart rate of the mice was on the order of 350 beats/minute (bpm). All acquired RF signals were gated between twoconsecutive R-waves in the ECG to reconstruct the entire RF imagesequence corresponding to a complete cardiac cycle at the extre-mely high frame rate of 8000 frames/s (fps) [16,17]. This allowedfor calculation of wave speeds up to 96 m/s in a 12 x 12 mm2 fieldof view [18], which was well above the speeds of the physiologicalwaves to be imaged in the heart (0.5–1 m/s) [19]. Each one of the12 mice underwent all three protocols sequentially, i.e., it was ini-tially imaged during sinus rhythm (SR) (i.e., at the natural pacing ofthe heart with a period of 170 ms), then right-atrial (RA) pacing (at120 ms) and, finally, right-ventricular (RV) pacing (at 120 ms)(Fig. 1). When pacing, shorter periods are typically used in orderto override the sinus rhythm period so that the natural and in-duced pacing of the heart do not counteract one another. An inter-mittent period of 1–2 min was used between consecutive pacingschemes to allow for normal myocardial function to be reinstated.
2.3. Ultrasound RF data processing
The axial displacement between consecutive RF frames (Fig. 3)was estimated off-line using a 1D normalized cross-correlationfunction [20]. In the ultrasonic view selected (i.e., long-axis),except at the apex, the axial direction corresponded to the radialorientation, i.e., in the direction towards the centroid of the left-ventricular cavity in the image plane used. The RF window sizewas equal to 240 lm, while the window overlap was equal to90%, deemed high enough to retain high axial resolution [21]. Axialresolution of the resulting displacement image has been shown tobe highly dependent on the window overlap used. The aforemen-tioned displacements were the instantaneous, or incremental, dis-placements (Fig. 3) occurring between two frames, at a timeinterval of 0.5 ms. The frame rate was kept at 8000 fps as everyRF frame was used for motion estimation. In addition, using a pre-viously developed technique by our group, manually-initializedendocardial borders in the left ventricle could be automaticallytracked throughout the entire cardiac cycle to better delineatethe myocardial wall region [22]. In this method, the pre-definedborders are automatically tracked based on the previously esti-mated displacements. Ciné-loops of the incremental displacementswere generated to map the wave propagation and overlayed ontothe corresponding B-mode images for visualization. In the regionsimaged, the propagating wavefront was identified as the changefrom positive (i.e., upwards denoting diastole) to negative (i.e.,
ctrode catheter used with magnification in the white rectangle shown on the imagethe right ventricle of the mouse heart during the experiments. In blue is denoted thee reader is referred to the web version of this article.)
Frame 1 2 3 4 5 N
Frame rate = 8000 Hz
Cross-correlation
. . .
RF-signals(PRF = 8000 Hz)
Reconstruct RF frame 2 at T0 + ΔT
ECGTransducer position 1
Transducer position 2
Transducer position 3...
RF signals(PRF = 8000 Hz)
ECG
RF signals(PRF = 8000 Hz)
ECG
Reconstruct RF frame 1 at T0
(a)
(b)
. . .
RF-signals(PRF = 8000 Hz)
Reconstruct RF frame 2 at T0 + ΔT
ECGTransducer position 1
Transducer position 2
Transducer position 3...
RF signals(PRF = 8000 Hz)
ECG
RF signals(PRF = 8000 Hz)
ECG
Reconstruct RF frame 1 at T0
RF-signals(PRF = 8000 Hz)
Reconstruct RF frame 2 at T0 + ΔT
ECGTransducer position 1
Transducer position 2
Transducer position 3...
RF signals(PRF = 8000 Hz)
ECG
RF signals(PRF = 8000 Hz)
ECG
Reconstruct RF frame 1 at T0
Fig. 3. (a) RF line acquisition at multiple transducer locations (three examples are shown here): each line is synchronized relative to the R-wave (T0); (b) multiple framereconstruction from ECG-gated RF data. Reconstructed RF frames were acquired at a composite frame rate of 8000 frames/s (fps) and analyzed with cross-correlationtechniques to produce wall displacement images (overlayed color images). (For interpretation of the references to colour in this figure legend, the reader is referred to the webversion of this article.)
E.E. Konofagou et al. / Ultrasonics 50 (2010) 208–215 211
downwards denoting systole) motion, or vice versa. In other words,unless the electromechanical wavefront propagates through a spe-cific region, the motion of that region will continue in the samedirection, i.e., the myocardium will continue within the samephase (systole or diastole). All aforementioned methods wereimplemented in MATLAB 7.1 (MathWorks, Inc., Natick, MA, USA).
3. Results
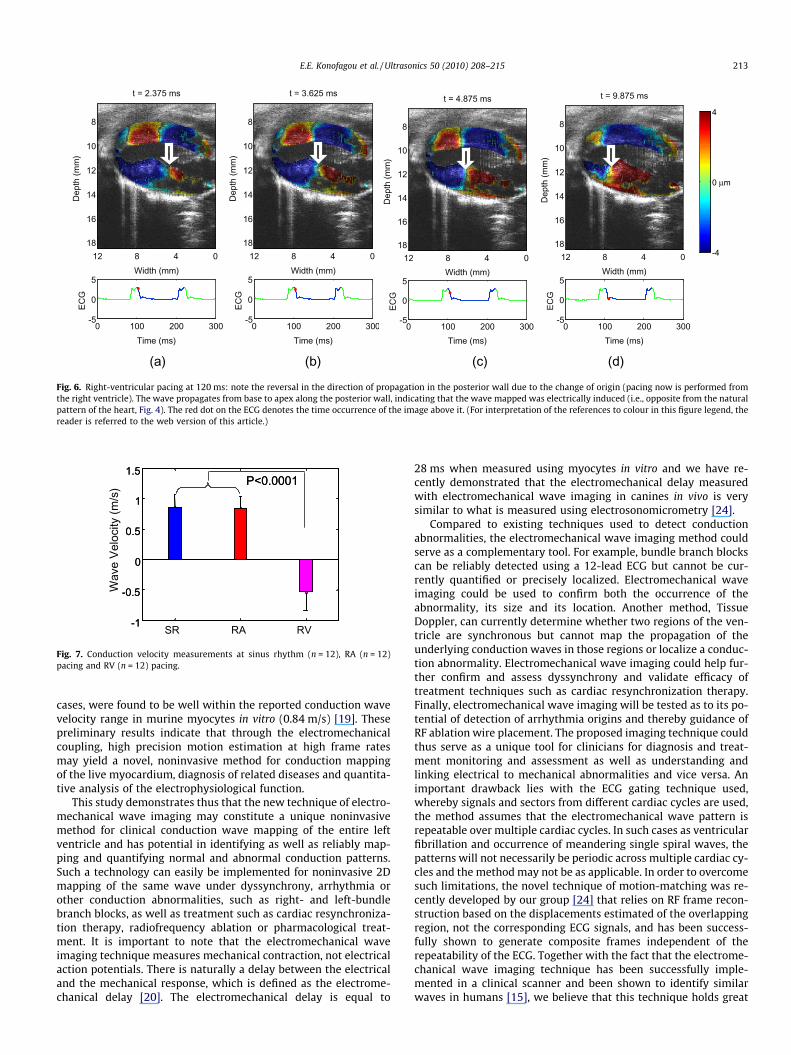
Throughout the entire cardiac cycle, several different waveswere visualized that could be categorized as electrically or hemo-dynamically induced. The most pronounced wave propagating dur-ing sinus rhythm (Fig. 4) and right-atrial pacing (Fig. 5) was thecontraction wave, or wave originating at the isovolumic contrac-tion phase, that propagated along the longitudinal direction ofthe heart initiating inward radial motion, or thickening (i.e., con-traction), in its path. Positive displacements (in red) denote motiontowards the transducer whereas negative displacements (in blue)denote motion away from the transducer. The ECG is provided ineach case in order to determine the cardiac phase, at which thewave is visualized. The contraction wave started at the apex rightat the beginning of the QRS complex, propagated along the septumand then the left-ventricular posterior wall. Therefore, in a long-axis view, the wave propagation along the posterior wall wasshown to occur from apex to base (Figs. 4 and 5). Right-ventricular(RV) pacing (Fig. 6) induced a reverse wave direction with twowaves propagating from base to apex during the same cardiacphase: one along the septum and one along the posterior wall
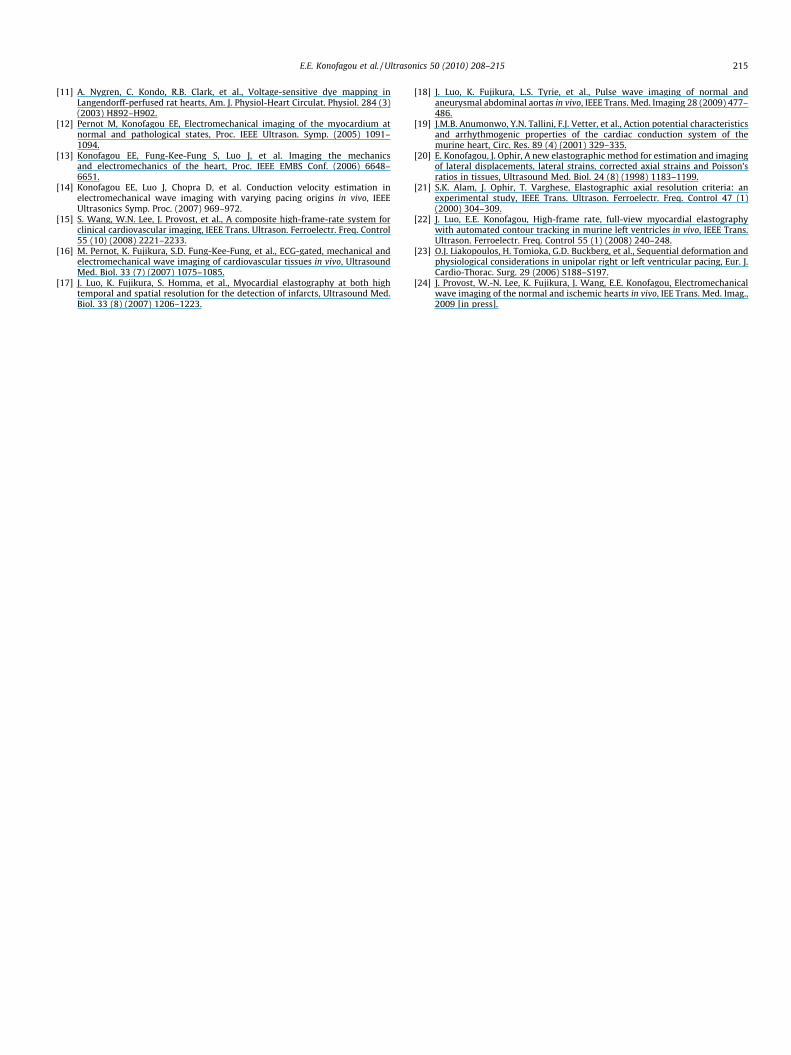
(Fig. 6). This reversal in the wave propagation direction was foundto be consistent in all mice scanned and paced. The wave velocitywas then calculated in each one of the cases shown in Figs. 4–6 bytracking the wavefront (identified by the white arrow in each case),estimating its distance traveled shown and dividing it by the frameperiod. The wave velocities were found to be within the reportedconduction wave range [19] with statistically significant differ-ences between SR/RA pacing (0.85 ± 0.22 m/s and 0.84 ± 0.20 m/s,respectively) and RV pacing (�0.52 ± 0.31 m/s; p < 0.0001)(Fig. 7). This was also verified by other animal studies, where RVpacing has been shown to both slow down the wave and reducethe efficiency of cardiac contraction [23]. Depolarization inducesthickening and repolarization induces thinning, which can alsobe mapped (Fig. 8) and measured in a similar way as what wasshown during depolarization, both from base to apex (Fig. 8i)and from endocardium to epicardium (Fig. 8ii) in the RV pacingcase.
4. Discussion and conclusion
Altered electrical activation patterns heralded by LBBB or IVCDon an ECG may have profound effects on the natural history ofheart failure and CRT is now a recognized treatment for theseabnormalities. Despite the prevalence of conduction abnormalitieson the ECG, here is no reliable imaging technique that can imagethe normal or abnormal conduction. Contraction and relaxationactivation are transient phenomena that occur prior to the startof systole and diastole, respectively. The action potential initiated

Dep
th (m
m)
Width (mm)
t = 5.500 ms
04812
8
10
12
14
16
18
0 100 200 300 4000
0.5
1
Time (ms)
ECG
Dep
th (m
m)
Width (mm)
t = 6.750 ms
04812
8
10
12
14
16
18
0 100 200 300 4000
0.5
1
Time (ms)
ECG
Dep
th (m
m)
Width (mm)
t = 8.000 ms
04812
8
10
12
14
16
18-4
0 μm
4
0 100 200 300 4000
0.5
1
Time (ms)
ECG
Dep
th (m
m)
Width (mm)
t = 10.500 ms
04812
8
10
12
14
16
18-4
0 μm
4
0 100 200 300 4000
0.5
1
Time (ms)
ECG
(a) (b) (c) (d)
Fig. 4. Sinus rhythm (170 ms): Red denotes motion upwards while blue denotes motion downwards, indicating sequence of contraction of the myocardium from (a) to (d).Note that the contraction starts at the apex (left-most tip of the left ventricle) in (a) and propagates along the posterior wall (not the septum), finally covering the entireposterior wall in (d). (top: septum, bottom: posterior wall). The red dot on the ECG denotes the time occurrence of the corresponding image. (For interpretation of thereferences to colour in this figure legend, the reader is referred to the web version of this article.)
Dep
th (m
m)
Width (mm)
t = 5.500 ms
04812
8
10
12
14
16
18
0 100 200 3000
0.5
1
Time (ms)
ECG
Dep
th (m
m)
Width (mm)
t = 6.750 ms
04812
8
10
12
14
16
18
0 100 200 3000
0.5
1
Time (ms)
ECG
Dep
th (m
m)
Width (mm)
t = 8.000 ms
04812
8
10
12
14
16
18
0 100 200 3000
0.5
1
Time (ms)
EC
G
Dep
th (m
m)
Width (mm)
t = 9.250 ms
04812
8
10
12
14
16
18-4
0 μm
4
0 100 200 3000
0.5
1
Time (ms)
EC
G
(a) (b) (c) (d)
Fig. 5. Right-atrial pacing at 120 ms: note the slight difference in the propagation due to the change of origin (pacing now is from a region closer to the middle of the rightatrium, i.e., below the sinoatrial node) and the field of view. A similar wave to that seen propagating along the posterior wall in Fig. 4 can also be seen from (a) to (d),indicating that the origin is similar to the case in Fig. 4. The red dot on the ECG denotes the time occurrence of the image above it. (For interpretation of the references tocolour in this figure legend, the reader is referred to the web version of this article.)
212 E.E. Konofagou et al. / Ultrasonics 50 (2010) 208–215
by the sinoatrial node travels along the bundle of His to the rightand left bundles and finally to the Purkinje fibers at an approxi-mate speed of �0.5 m/s, inducing depolarization, and hence con-traction, in its path. In systole, this occurs during isovolumiccontraction (IVC), which lasts approximately 10 ms and 80 ms inmice and humans, respectively. In diastole, repolarization occursduring isovolumic relaxation (IVR), which typically has similardurations as IVC. In order to map the resulting wave, and therebyits potential blocks or re-entries, ultra-fast imaging needs to beperformed in order to ‘capture’ the wave during propagation. Opti-cal imaging can achieve such frame rates. However, for clinical,diagnostic imaging, in addition to high temporal resolution, nonin-vasive and deep-penetrating imaging is required. Despite the ur-gent need for properly diagnosing aforementioned pathologiesand subsequent efficacy of their treatment, currently availableimaging techniques do not directly map the conduction wavesand instead are limited to depicting an indirect, overall functionalabnormality or are restricted by depth penetration constraints.
In this paper, an ultra-high frame rate imaging study was car-ried out and the localized motion of the myocardium resultingfrom electromechanical coupling during both depolarization(end-diastole) and repolarization (end-systole) was imaged inmice. The transient nature of the wave captured on the electrome-chanical wave images is in sharp contrast to strain imaging tech-niques that typically accumulate the incremental strain, or strainrate, in the myocardium and ignore the transient effects or electri-cal activation altogether. In mice, strong contraction waves wereimaged at 8000 fps in the septum and the posterior wall and weredepicted to maintain or change direction depending on the pacingscheme induced. The contraction wave changed direction onlywhen the pacing origin changed, i.e., it propagated from apex tobase in the posterior wall at SR and RA pacing and from base toapex at RV pacing. This reversal in the wave propagation directionwas reproducible in all 12 mice used in the study. More impor-tantly, the wave velocities, which were measured to averagearound 0.84 m/s (±0.21 m/s) in the sinus rhythm and RA pacing
Dep
th (m
m)
Width (mm)
t = 2.375 ms
04812
8
10
12
14
16
18
0 100 200 300-5
0
5
Time (ms)
ECG
Dep
th (m
m)
Width (mm)
t = 3.625 ms
04812
8
10
12
14
16
18
0 100 200 300-5
0
5
Time (ms)
ECG
Dep
th (m
m)
Width (mm)
t = 4.875 ms
04812
8
10
12
14
16
18
0 100 200 300-5
0
5
Time (ms)
ECG
Dep
th (m
m)
Width (mm)
t = 9.875 ms
04812
8
10
12
14
16
18
0 100 200 300-5
0
5
Time (ms)
ECG
-4
0 μm
4
(a) (b) (c) (d)
Fig. 6. Right-ventricular pacing at 120 ms: note the reversal in the direction of propagation in the posterior wall due to the change of origin (pacing now is performed fromthe right ventricle). The wave propagates from base to apex along the posterior wall, indicating that the wave mapped was electrically induced (i.e., opposite from the naturalpattern of the heart, Fig. 4). The red dot on the ECG denotes the time occurrence of the image above it. (For interpretation of the references to colour in this figure legend, thereader is referred to the web version of this article.)
P<0.0001
-1
-0.5
0
0.5
1
1.5P<0.0001
SR RA RV-1
-0.5
0
0.5
1
1.5
Wav
e Ve
loci
ty (m
/s)
Fig. 7. Conduction velocity measurements at sinus rhythm (n = 12), RA (n = 12)pacing and RV (n = 12) pacing.
E.E. Konofagou et al. / Ultrasonics 50 (2010) 208–215 213
cases, were found to be well within the reported conduction wavevelocity range in murine myocytes in vitro (0.84 m/s) [19]. Thesepreliminary results indicate that through the electromechanicalcoupling, high precision motion estimation at high frame ratesmay yield a novel, noninvasive method for conduction mappingof the live myocardium, diagnosis of related diseases and quantita-tive analysis of the electrophysiological function.
This study demonstrates thus that the new technique of electro-mechanical wave imaging may constitute a unique noninvasivemethod for clinical conduction wave mapping of the entire leftventricle and has potential in identifying as well as reliably map-ping and quantifying normal and abnormal conduction patterns.Such a technology can easily be implemented for noninvasive 2Dmapping of the same wave under dyssynchrony, arrhythmia orother conduction abnormalities, such as right- and left-bundlebranch blocks, as well as treatment such as cardiac resynchroniza-tion therapy, radiofrequency ablation or pharmacological treat-ment. It is important to note that the electromechanical waveimaging technique measures mechanical contraction, not electricalaction potentials. There is naturally a delay between the electricaland the mechanical response, which is defined as the electrome-chanical delay [20]. The electromechanical delay is equal to
28 ms when measured using myocytes in vitro and we have re-cently demonstrated that the electromechanical delay measuredwith electromechanical wave imaging in canines in vivo is verysimilar to what is measured using electrosonomicrometry [24].
Compared to existing techniques used to detect conductionabnormalities, the electromechanical wave imaging method couldserve as a complementary tool. For example, bundle branch blockscan be reliably detected using a 12-lead ECG but cannot be cur-rently quantified or precisely localized. Electromechanical waveimaging could be used to confirm both the occurrence of theabnormality, its size and its location. Another method, TissueDoppler, can currently determine whether two regions of the ven-tricle are synchronous but cannot map the propagation of theunderlying conduction waves in those regions or localize a conduc-tion abnormality. Electromechanical wave imaging could help fur-ther confirm and assess dyssynchrony and validate efficacy oftreatment techniques such as cardiac resynchronization therapy.Finally, electromechanical wave imaging will be tested as to its po-tential of detection of arrhythmia origins and thereby guidance ofRF ablation wire placement. The proposed imaging technique couldthus serve as a unique tool for clinicians for diagnosis and treat-ment monitoring and assessment as well as understanding andlinking electrical to mechanical abnormalities and vice versa. Animportant drawback lies with the ECG gating technique used,whereby signals and sectors from different cardiac cycles are used,the method assumes that the electromechanical wave pattern isrepeatable over multiple cardiac cycles. In such cases as ventricularfibrillation and occurrence of meandering single spiral waves, thepatterns will not necessarily be periodic across multiple cardiac cy-cles and the method may not be as applicable. In order to overcomesuch limitations, the novel technique of motion-matching was re-cently developed by our group [24] that relies on RF frame recon-struction based on the displacements estimated of the overlappingregion, not the corresponding ECG signals, and has been success-fully shown to generate composite frames independent of therepeatability of the ECG. Together with the fact that the electrome-chanical wave imaging technique has been successfully imple-mented in a clinical scanner and been shown to identify similarwaves in humans [15], we believe that this technique holds great

Dep
th (m
m)
Width (mm)
t = 53.000 ms
04812
8
10
12
14
16
18
0 100 200 300-5
0
5
Time (ms)
EC
G
Dep
th (m
m)
Width (mm)
t = 55.500 ms
04812
8
10
12
14
16
18
0 100 200 300-5
0
5
Time (ms)
EC
G
Dep
th (m
m)
Width (mm)
t = 58.000 ms
04812
8
10
12
14
16
18
0 100 200 300-5
0
5
Time (ms)
EC
G
Dep
th (m
m)
Width (mm)
t = 61.750 ms
04812
8
10
12
14
16
18
0 100 200 300-5
0
5
Time (ms)
EC
G
-4
0 μm
4
0
(a) (b) (c) (d) (i)
Dep
th (m
m)
Width (mm)
t = 75.500 ms
04812
8
10
12
14
16
18
0 100 200 300-5
0
5
Time (ms)
EC
G
Dep
th (m
m)
Width (mm)
t = 78.000 ms
04812
8
10
12
14
16
18
0 100 200 300-5
0
5
Time (ms)
EC
G
Dep
th (m
m)
Width (mm)
t = 80.500 ms
04812
8
10
12
14
16
18
0 100 200 300-5
0
5
Time (ms)
EC
G
Dep
th (m
m)
Width (mm)
t = 83.000 ms
04812
8
10
12
14
16
18
0 100 200 300-5
0
5
Time (ms)
EC
G
(a) (b) (c) (d) (ii)
Fig. 8. Repolarization waves during right-ventricular pacing (120 ms): Red denotes motion upwards while blue denotes motion downwards, indicating relaxation of themyocardium from (a) to (d). Note that the relaxation in (i) starts at mid-level in (a) and propagates along the posterior wall finally covering the entire wall in (d) while in (ii) itpropagates from the endo- to the epicardial level. The same mouse was used in both (i) and (ii). The wave from base to apex along the posterior wall occurs first (i) followedby the transmural propagation in the septum (ii). (For interpretation of the references to colour in this figure legend, the reader is referred to the web version of this article.)
214 E.E. Konofagou et al. / Ultrasonics 50 (2010) 208–215
promise and offers a unique opportunity for noninvasively map-ping the conduction patterns in the heart across different species,both at its normal and pathological state and during treatment.
Acknowledgements
This study was supported in part by the American Heart Asso-ciation (SDG 0435444T), the Wallace H. Coulter Foundation (WHCFCU02650301) and the National Institutes of Health (R01-EB006042). We wish to express our sincere appreciation to Shuni-chi Homma, M.D., Department of Medicine at Columbia Universityfor kindly allowing us access to the Vevo 770 scanner and ViktorGamarnik, B.S., Department of Biomedical Engineering at ColumbiaUniversity for assistance with the literature search.
References
[1] A. Auricchio, C. Fantoni, et al., Characterization of left ventricular activation inpatients with heart failure and left bundle-branch block, Circulation 109 (9)(2004) 1133–1139.
[2] N. Chattipakorn, B.H. KenKnight, J.M. Rogers, et al., Locally propagatedactivation immediately after internal defibrillation, Circulation 97 (14)(1998) 1401–1410.
[3] N. Chattipakorn, P.C. Fotuhi, S.C. Chattipakorn, et al., Three-dimensionalmapping of earliest activation after near-threshold ventricular defibrillationshocks, J. Cardiovasc. Electrophysiol. 14 (1) (2003) 65–69.
[4] C. Ramanathan, R.N. Ghanem, P. Jia, et al., Noninvasive electrocardiographicimaging for cardiac electrophysiology and arrhythmia, Nat. Med. 10 (4) (2004)422–428.
[5] R.J. Schilling, N.S. Peters, W. Davies, Simultaneous endocardial mapping in thehuman left ventricle using a noncontact catheter – comparison of contact andreconstructed electrograms during sinus rhythm, Circulation 98 (9) (1998)887–898.
[6] A.M. Yue, J.R. Paisey, S. Robinson, et al., Determination of human ventricularrepolarization by noncontact mapping – validation with monophasic actionpotential recordings, Circulation 110 (11) (2004) 1343–1350.
[7] J.J. Bax, D. Poldermans, J.D. Schuijf, et al., Imaging to differentiate betweenischemic and nonischemic cardiomyopathy 2 (2) (2006) 205–214.
[8] I.R. Efimov, V.P. Nikolski, G. Salama, Optical imaging of the heart, Circ. Res. 95(1) (2004) 21–33.
[9] E.M.C. Hillman, O. Bernus, E. Pease, et al., Depth-resolved optical imaging oftransmural electrical propagation in perfused heart, Opt. Express 15 (26)(2007) 17827–17841.
[10] A. Nygren, R.B. Clark, D.D. Belke, et al., Voltage-sensitive dye mapping ofactivation and conduction in adult mouse hearts, Ann. Biomed. Eng. 28 (8)(2000) 958–967.
E.E. Konofagou et al. / Ultrasonics 50 (2010) 208–215 215
[11] A. Nygren, C. Kondo, R.B. Clark, et al., Voltage-sensitive dye mapping inLangendorff-perfused rat hearts, Am. J. Physiol-Heart Circulat. Physiol. 284 (3)(2003) H892–H902.
[12] Pernot M, Konofagou EE, Electromechanical imaging of the myocardium atnormal and pathological states, Proc. IEEE Ultrason. Symp. (2005) 1091–1094.
[13] Konofagou EE, Fung-Kee-Fung S, Luo J, et al. Imaging the mechanicsand electromechanics of the heart, Proc. IEEE EMBS Conf. (2006) 6648–6651.
[14] Konofagou EE, Luo J, Chopra D, et al. Conduction velocity estimation inelectromechanical wave imaging with varying pacing origins in vivo, IEEEUltrasonics Symp. Proc. (2007) 969–972.
[15] S. Wang, W.N. Lee, J. Provost, et al., A composite high-frame-rate system forclinical cardiovascular imaging, IEEE Trans. Ultrason. Ferroelectr. Freq. Control55 (10) (2008) 2221–2233.
[16] M. Pernot, K. Fujikura, S.D. Fung-Kee-Fung, et al., ECG-gated, mechanical andelectromechanical wave imaging of cardiovascular tissues in vivo, UltrasoundMed. Biol. 33 (7) (2007) 1075–1085.
[17] J. Luo, K. Fujikura, S. Homma, et al., Myocardial elastography at both hightemporal and spatial resolution for the detection of infarcts, Ultrasound Med.Biol. 33 (8) (2007) 1206–1223.
[18] J. Luo, K. Fujikura, L.S. Tyrie, et al., Pulse wave imaging of normal andaneurysmal abdominal aortas in vivo, IEEE Trans. Med. Imaging 28 (2009) 477–486.
[19] J.M.B. Anumonwo, Y.N. Tallini, F.J. Vetter, et al., Action potential characteristicsand arrhythmogenic properties of the cardiac conduction system of themurine heart, Circ. Res. 89 (4) (2001) 329–335.
[20] E. Konofagou, J. Ophir, A new elastographic method for estimation and imagingof lateral displacements, lateral strains, corrected axial strains and Poisson’sratios in tissues, Ultrasound Med. Biol. 24 (8) (1998) 1183–1199.
[21] S.K. Alam, J. Ophir, T. Varghese, Elastographic axial resolution criteria: anexperimental study, IEEE Trans. Ultrason. Ferroelectr. Freq. Control 47 (1)(2000) 304–309.
[22] J. Luo, E.E. Konofagou, High-frame rate, full-view myocardial elastographywith automated contour tracking in murine left ventricles in vivo, IEEE Trans.Ultrason. Ferroelectr. Freq. Control 55 (1) (2008) 240–248.
[23] O.J. Liakopoulos, H. Tomioka, G.D. Buckberg, et al., Sequential deformation andphysiological considerations in unipolar right or left ventricular pacing, Eur. J.Cardio-Thorac. Surg. 29 (2006) S188–S197.
[24] J. Provost, W.-N. Lee, K. Fujikura, J. Wang, E.E. Konofagou, Electromechanicalwave imaging of the normal and ischemic hearts in vivo, IEE Trans. Med. Imag.,2009 [in press].