Excitable Er fraction and quenching phenomena in Er-doped SiO2 layers containing Si nanoclusters
15
Excitable Er fraction and quenching phenomena in Er-doped SiO 2 layers containing Si nanoclusters B. Garrido, C. García, S.-Y. Seo, and P. Pellegrino EME, Departament d’Electrònica, IN2UB, Universitat de Barcelona, Martí i Franquès 1, 08028, Barcelona, Spain D. Navarro-Urrios, N. Daldosso, and L. Pavesi Dipartimento di Fisica, Università di Trento, Via Sommarive 14, I-38050 Povo (Trento), Italy F. Gourbilleau and R. Rizk SIFCOM, UMR CNRS 6176, ENSICAEN, 6 Boulevard Maréchal Juin, 14050 CAEN, France Received 17 April 2007; revised manuscript received 18 July 2007; published 7 December 2007 This paper investigates the interaction between Si nanoclusters Si-nc and Er in SiO 2 , reports on the optical characterization and modeling of this system, and attempts to clarify its effectiveness as a gain material for optical waveguide amplifiers at 1.54 m. Silicon-rich silicon oxide layers with an Er content of 4 – 6 10 20 at. / cm 3 were deposited by reactive magnetron sputtering. The films with Si excess of 6 – 7 at. %, and postannealed at 900 ° C showed the best Er 3+ photoluminescence PL intensity and lifetime, and were used for the study. The annealing duration was varied up to 60 min to engineer the size and density of Si-nc and optimize Si-nc and Er coupling. PL investigations under resonant 488 nm and nonresonant 476 nm pump- ing show that an Er effective excitation cross section is similar to that of Si-nc 10 -17 –10 -16 cm 2 at low pumping flux 10 16 –10 17 cm -2 s -1 , while it drops at high flux 10 18 cm -2 s -1 . We found a maximum fraction of excited Er of about 2% of the total Er content. This is far from the 50% needed for optical transparency and achievement of population inversion and gain. Detrimental phenomena that cause depletion of Er inversion, such as cooperative up conversion, excited-stated absorption, and Auger deexcitations are modeled, and their impact in lowering the amount of excitable Er is found to be relatively small. Instead, Auger-type short-range energy transfer from Si-nc to Er is found, with a characteristic interaction length of 0.4 nm. Based on such results, numerical and analytical Er as a quasi-two-level system coupled rate equa- tions have been developed to determine the optimum conditions for Er inversion. The modeling predicts that interaction is quenched for high photon flux and that only a small fraction of Er 0.2–2 % is excitable through Si-nc. Hence, the low density of sensitizers Si-nc and the short range of the interaction are the explanation of the low fraction of Er coupled. Efficient ways to improve Er-doped Si-nc thin films for the realization of practical optical amplifiers are also discussed. DOI: 10.1103/PhysRevB.76.245308 PACS numbers: 42.70.Nq, 71.35.Gg, 78.55.Ap, 78.67.Bf I. INTRODUCTION Er 3+ ions in silicate matrices have a long lived first ex- cited state 4 I 13/2 and emit in a small range of wavelengths around 1.54 m. These two facts make Er in silicates useful for optical fiber amplifiers because this spectral range corre- sponds to the minimum attenuation in silica-based optical fibers losses of 0.2 dB / km which are widely used for long distance optical communications. Er-doped fiber amplifiers EDFAs are used for the regeneration of signals in this op- tical domain and have set the standard for long-haul optical communications. 1,2 Nevertheless, reducing their size and cost for integration in local area networks LANs presents seri- ous difficulties. In order to get reasonable gain outputs 20–30 dB the use of long fibers becomes mandatory, due to the moderate Er content to avoid concentration quenching effects and the small absorption cross section of Er 10 -21 cm 2 . 2 These effects, combined with the discrete na- ture of the electronic energy levels in Er ions, imply that high power and thus expensive and bulky laser diodes at 980 or 1480 nm must be used for the excitation. Although other glasses have been used as matrices and Yb as sensitizer, 3 the pumping constraints have not been completely relaxed and thus there is still the need to develop an appropriate material to produce Er-doped waveguide amplifiers EDWAs of small size, low cost, and compatible with Si technology. This accomplishment would allow their integration in LANs to- gether with other silicon photonic components. It was discovered in 1994 that Er emission is strongly enhanced by using Si nanocrystals as sensitizers in silica when codoped with Er. 4 This material system can be ob- tained from standard silicon compatible processes, e.g., ion implantation of Si in SiO 2 or deposition of Si-rich silicon oxide layers SiO x , followed by high temperature annealing to induce Si nanocrystal formation. Si nanocrystals in SiO 2 have been extensively studied for more than a decade for the visible photo- and electroluminescence PL,EL originated from quantum confinement effects, 5–10 and for the use of Si nanocrystals as nanosize charge-storing elements in flash memories. 11,12 For materials codoped with Er, it was recently shown that amorphous Si nanoclusters Si-nc are as efficient sensitizers as Si nanocrystals. 13 In such codoped systems with either Si nanocrystals or nanoclusters as sensitizers, an increase of more than four orders of magnitude of an Er- effective excitation cross section was observed. This value turns out to be that of the Si-nc 10 -17 –10 -16 cm 2 . 13–16 PHYSICAL REVIEW B 76, 245308 2007 1098-0121/2007/7624/24530815 ©2007 The American Physical Society 245308-1
Transcript of Excitable Er fraction and quenching phenomena in Er-doped SiO2 layers containing Si nanoclusters

Excitable Er fraction and quenching phenomena in Er-doped SiO2 layerscontaining Si nanoclusters
B. Garrido, C. García, S.-Y. Seo, and P. PellegrinoEME, Departament d’Electrònica, IN2UB, Universitat de Barcelona, Martí i Franquès 1, 08028, Barcelona, Spain
D. Navarro-Urrios, N. Daldosso, and L. PavesiDipartimento di Fisica, Università di Trento, Via Sommarive 14, I-38050 Povo (Trento), Italy
F. Gourbilleau and R. RizkSIFCOM, UMR CNRS 6176, ENSICAEN, 6 Boulevard Maréchal Juin, 14050 CAEN, France
�Received 17 April 2007; revised manuscript received 18 July 2007; published 7 December 2007�
This paper investigates the interaction between Si nanoclusters �Si-nc� and Er in SiO2, reports on the opticalcharacterization and modeling of this system, and attempts to clarify its effectiveness as a gain material foroptical waveguide amplifiers at 1.54 �m. Silicon-rich silicon oxide layers with an Er content of 4–6�1020 at. /cm3 were deposited by reactive magnetron sputtering. The films with Si excess of 6–7 at. %, andpostannealed at 900 °C showed the best Er3+ photoluminescence �PL� intensity and lifetime, and were used forthe study. The annealing duration was varied up to 60 min to engineer the size and density of Si-nc andoptimize Si-nc and Er coupling. PL investigations under resonant �488 nm� and nonresonant �476 nm� pump-ing show that an Er effective excitation cross section is similar to that of Si-nc ��10−17–10−16 cm2� at lowpumping flux ��1016–1017 cm−2 s−1�, while it drops at high flux ��1018 cm−2 s−1�. We found a maximumfraction of excited Er of about 2% of the total Er content. This is far from the 50% needed for opticaltransparency and achievement of population inversion and gain. Detrimental phenomena that cause depletionof Er inversion, such as cooperative up conversion, excited-stated absorption, and Auger deexcitations aremodeled, and their impact in lowering the amount of excitable Er is found to be relatively small. Instead,Auger-type short-range energy transfer from Si-nc to Er is found, with a characteristic interaction length of0.4 nm. Based on such results, numerical and analytical �Er as a quasi-two-level system� coupled rate equa-tions have been developed to determine the optimum conditions for Er inversion. The modeling predicts thatinteraction is quenched for high photon flux and that only a small fraction of Er �0.2–2 %� is excitable throughSi-nc. Hence, the low density of sensitizers �Si-nc� and the short range of the interaction are the explanation ofthe low fraction of Er coupled. Efficient ways to improve Er-doped Si-nc thin films for the realization ofpractical optical amplifiers are also discussed.
DOI: 10.1103/PhysRevB.76.245308 PACS number�s�: 42.70.Nq, 71.35.Gg, 78.55.Ap, 78.67.Bf
I. INTRODUCTION
Er3+ ions in silicate matrices have a long lived first ex-cited state �4I13/2� and emit in a small range of wavelengthsaround 1.54 �m. These two facts make Er in silicates usefulfor optical fiber amplifiers because this spectral range corre-sponds to the minimum attenuation in silica-based opticalfibers �losses of 0.2 dB /km� which are widely used for longdistance optical communications. Er-doped fiber amplifiers�EDFAs� are used for the regeneration of signals in this op-tical domain and have set the standard for long-haul opticalcommunications.1,2 Nevertheless, reducing their size and costfor integration in local area networks �LANs� presents seri-ous difficulties. In order to get reasonable gain outputs�20–30 dB� the use of long fibers becomes mandatory, dueto the moderate Er content �to avoid concentration quenchingeffects� and the small absorption cross section of Er��10−21 cm2�.2 These effects, combined with the discrete na-ture of the electronic energy levels in Er ions, imply that highpower and thus expensive and bulky laser diodes at 980 or1480 nm must be used for the excitation. Although otherglasses have been used as matrices and Yb as sensitizer,3 thepumping constraints have not been completely relaxed and
thus there is still the need to develop an appropriate materialto produce Er-doped waveguide amplifiers �EDWAs� ofsmall size, low cost, and compatible with Si technology. Thisaccomplishment would allow their integration in LANs to-gether with other silicon photonic components.
It was discovered in 1994 that Er emission is stronglyenhanced by using Si nanocrystals as sensitizers in silicawhen codoped with Er.4 This material system can be ob-tained from standard silicon compatible processes, e.g., ionimplantation of Si in SiO2 or deposition of Si-rich siliconoxide layers �SiOx�, followed by high temperature annealingto induce Si nanocrystal formation. Si nanocrystals in SiO2have been extensively studied for more than a decade for thevisible photo- and electroluminescence �PL,EL� originatedfrom quantum confinement effects,5–10 and for the use of Sinanocrystals as nanosize charge-storing elements in flashmemories.11,12 For materials codoped with Er, it was recentlyshown that amorphous Si nanoclusters �Si-nc� are as efficientsensitizers as Si nanocrystals.13 In such codoped systems�with either Si nanocrystals or nanoclusters as sensitizers�, anincrease of more than four orders of magnitude of an Er-effective excitation cross section was observed. This valueturns out to be that of the Si-nc ��10−17–10−16 cm2�.13–16
PHYSICAL REVIEW B 76, 245308 �2007�
1098-0121/2007/76�24�/245308�15� ©2007 The American Physical Society245308-1

Additionally, the broad absorption band of the Si clusters,used in this case to excite indirectly Er, should enable the useof cheap flash lamps or light-emitting diodes �LEDs� for sidepumping, efficiently replacing the expensive pumping lasers.Furthermore, the increase of the refractive index produced bythe Si-nc can be used to provide the index contrast necessaryfor waveguiding. These properties offer the possibility tofabricate a compact, Si-compatible, integrated, and cost-effective erbium-doped waveguide amplifier �EDWA�, wherethe active layer is composed by silica codoped with Si-ncand Er.
The expectations were high, especially when some au-thors reported the increase of almost two orders of magni-tude �8�10−20 cm2� of the Er emission cross section at1.54 �m in the codoped material with respect to that in puresilica ��2�10−21 cm2�.14 This increase would allow theachievement of a gain as high as 7 dB /cm for Er concentra-tions NEr as low as 1�1019 cm−3. In this range of concen-tration the ion-ion interactions that induce concentrationquenching and up-conversion effects remain quite weak.2,17
Then another paper seemed to confirm these figures and theauthors claimed to have reached in their EDWAs signal en-hancements of 4 dB /cm and attainable gains of up to7 dB /cm for Er doping of �1�1019 cm−3.18 The experi-ments were done by top pumping with a laser at 476 nm andwith a flux of �4�1018 cm−2 s−1. This relatively low flux isattainable with commercial LEDs and the same authors re-cently reported to have obtained signal enhancement by toppumping with an array of GaN LEDs.19
Recently, we have reported results on EDWAs fabricatedwith similar samples used in this work �NEr�4–6�1020 cm−3� demonstrating that losses dominate at lowpump powers, whereas a signal enhancement reaching1.06 dB /cm is detected in strong pumping conditions �6�1021 cm−2 s−1, 488 nm pump�.20 Furthermore, insertionlosses in the infrared Er absorption band allowed one to de-termine an Er3+ absorption cross section �abs�5�10−21 cm2, a result that has been recently confirmed byother authors.21 This seems to have closed the debate aboutthe enhancement of the emission cross section if one consid-ers that �abs��em. Then, the gain reported in Ref. 18 re-mains unexplained. On the other hand, one could rely onincreasing the Er concentration up to NEr=4�1020 cm−3 toget those 7 dB /cm quoted above, once inverting the wholeEr population. However, a signal enhancement of1.06 dB /cm corresponds to a fraction of inverted Er ions ofless than 10%. Additionally, most of them were directly ex-cited as we pumped with the resonant 488 nm line.20 Increas-ing furthermore the Er concentration would become prob-lematic since, by means of imaging experiments with atomicresolution, we have demonstrated that for NEr�6�1020 cm−3 and annealing temperatures of 1000 °C a sig-nificant part of the Er is clusterized, while for annealing at900 °C there is no evidence of such a clustering.22 Boththese latter experiments and the optical waveguide measure-ments reported in Ref. 20 allow one to infer that most of theEr ions are optically active after a 900 °C anneal while onlya small fraction of them can be excited through the Si-nc.
Many aspects of the exact nature of the interaction be-tween Si-nc and Er are still controversial. In principle, even
with the absence of an enhanced emission cross section, andprovided that all Er could be inverted, the potential benefitsof the Si-nc and Er codoping would still remain, thanks tothe huge absorption cross section of Si-nc. However, for areported effective excitation cross sections of Er �eff�2�10−16 cm2 �i.e., that of Si-nc�23 and PL lifetimes �Er�5 ms one would expect to get optical transparency �inver-sion of 50% of Er ions within a quasi-two-level system� forpumping with �1�1018 photons cm−2 s−1 ��1/2=1 /�eff�Er�.Thus, the proportion of inverted Er reported so far needs tobe greatly improved, especially those benefiting from thesensitizing action of Si-nc. The main aim of this paper is toaddress in depth the physics of this problem and attempt anexplanation of such a strong Er quenching when excitedthrough the Si-nc. Several authors have suggested differentchannels for the quenching of the Er emission, such as co-operative up conversion �CUC�,15 excited-state absorption�ESA�24 and Auger deexcitation but, as we shall show after-wards, even though being important, none of these mecha-nisms accounts for the small fraction of excitable Er throughthe Si-nc. An alternative �or additional� explanation was re-cently reported by us in Ref. 25. A short-range distance-dependent interaction between the Si-nc and the Er, and asmall amount of sensitizers �Si-nc� are shown as the mainlimiting factors. A short-range, Auger-type kind of interac-tion is typical between semiconductors and dopant impuri-ties, while the interaction between rare earths in silica �e.g.,up conversion or energy migration� is a long-range dipole-dipole one.
Hence, this paper is an attempt to address the complicatednature of the interaction between Si-nc and Er in SiO2 fromboth an experimental and theoretical point of view. It is donewith the aim of answering the important question of howmany Er ions are coupled to the Si-nc and the impact of thisissue on the maximum attainable gain. Section II reports onsample preparation, compositional and morphological stud-ies, including quantification of the density of Si-nc. SectionIII introduces rate-equation modeling of the most relevantinteractions. Section IV reports detailed optical results andquantification of the amount of Er that can be excited viaSi-nc, limited to about 2%, in the most favorable case. Dif-ferent quenching mechanisms are considered and, despite be-ing of considerable importance, fail to explain such lowvalue of excitable Er. Section V develops a model for theinteraction, based on the fact that the Si-nc and Er interactionis essentially of short-range exponential nature, with a char-acteristic distance of about 0.4 nm. The physics and model-ing of this interaction is discussed in detail. We demonstratethat the energy transfer coefficient between Si-nc and Er de-pends on the Si-nc/Er distance and, therefore, is stronglydependent on the excitation flux. Thus, only those Er in closeproximity to the Si-nc can be excited and the amount ofexcitable Er heavily depends on the Si-nc density �few1017 cm−3�. For such a low Si-nc density the model predictsan Er excitable fraction in the range of a few percent, as weexperimentally quantified. Finally, conclusions in Sec. VI ac-count for the low density of sensitizers �Si-nc� and the shortrange of the interaction as the prominent explanation of thelow fraction of Er coupled.
GARRIDO et al. PHYSICAL REVIEW B 76, 245308 �2007�
245308-2

II. EXPERIMENT
A. Sample fabrication
A series of Er-doped Si-rich silica layers were depositedby reactive magnetron cosputtering on thermal silicon oxidegrown on Si substrates. The Er content ��4–6�1020 cm−3� was adjusted through the number of the cosput-tered Er2O3 pellets placed on top of the silica target, whilethe Si excess �6–7 at. % � was adjusted by the H content�rH=60% � in the plasma �mixed with Ar�. The total plasmapressure was kept at 10−2 Torr. The Si substrates were notintentionally heated during the deposition. The H content inthe plasma was found critical for the efficiency of the Eremission as it increases the density of nucleation centers andthe concentration of Si-nc.26 Annealing at 900 °C was foundto maximize Er PL emission, while keeping amorphous allthe Si precipitates.26
Thus, the layers studied in this work belong to a series ofsamples optimized to find a compromise between �i� maxi-mizing Er PL emission and lifetime and �ii� reducing carrierabsorption to minimize optical losses in waveguides. Thesamples were annealed at 900 °C under N2 flux for differentdurations, from 1 min up to 60 min. The increase of anneal-ing time provided Si-nc with increased size so that long ther-mal treatments promoted complete phase separation.27 Acomprehensive study of the signal enhancement onwaveguides fabricated with these same materials is providedelsewhere.20,27 The samples under study and their character-istics are summarized in Table I. The Si, O, and Er contenthave been determined by Rutherford backscattering spectros-copy �RBS� measurements. Thickness and refractive indexwere measured by m-lines spectroscopy.
B. Quantification of the density of Si-nc
An accurate determination of the amount of clusters isextremely important, as any physical modeling of thecoupled Si-nc and Er ions system requires quantificationof both of them. It has been obtained from an in-depth studyof the energy-filtered transmission-electron-microscopy�EFTEM� pictures. The average diameter of the Si clusters isestimated around 3.2 nm. Nevertheless, the density of clus-ters in the field of view of the objective is too low for a directestimation of the density. Dedicated samples with higher Siexcess �15–25 at. % � have been prepared and studied forquantification. A typical EFTEM picture is shown in Fig. 1.
We used an electron probe diameter of about 2.5 nm toobtain the electron energy loss spectra �EELS� from0 to 100 eV at the marked points in the EFTEM micrographin Fig. 1. No objective aperture was used and the collectionsemiangle � was of about �100 mrad. The value of conver-gence semiangle � is irrelevant as it is smaller than � whenworking in image mode without objective aperture.
We used the GATAN digital micrograph �DM� software tocalculate the layer thickness from the EELS spectra, obtain-ing 52, 36, 34, and 39 nm at point 1, 2, 3 and 4, respectively.The window delimited between these points has a dimensionof 87�88 nm. The total analyzed volume can be calculatedusing these data and corresponds to 3.08�10−16 cm3. Then,we counted the number of precipitates found within this vol-ume and deduced the density of precipitates per volume unit,dv. In this case dv=5�1017 cm−3 �the uncertainty in thevalue is below 35%�. Taking this value into account we canestimate for the samples studied in this work an upper valueof 3�1017 cm−3 for the Si-nc density. The values obtainedhere are similar to those obtained by Iacona et al.28 insamples with similar Si excess. In a recently published paper,Izeddin et al.29 have measured the density of sensitizers �Si-nc� by optically pumping with intense laser pulses of a fewns, a shorter duration than the transfer time of the excitation��1 �s�. Hence, by quantifying the emitting Er they deduce
TABLE I. Main physical parameters of the samples studied within this chapter. Si excess and Er contentwere determined from RBS measurements.
Annealing time TimeSi excess
�at.%�NEr
��1020 cm−3�Thickness
�nm�Refractive
index
900 °C 60� 7 4.0 750 1.545
900 °C 30� 7 5.4 840 1.516
900 °C 10� 7 6.5 855 1.482
900 °C 5� 7 6.5 890 1.468
900 °C 1� 7 5.3 880 1.463
4
3 2
1
FIG. 1. �Color online� Energy filtered transmission electron mi-croscopy �EFTEM� picture of one of the calibration samples used todetermine the concentration of Si-nc. The numbers indicate thepoints where the thickness of the observed region has been deter-mined from the electron energy loss �EELS�.
EXCITABLE Er FRACTION AND QUENCHING PHENOMENA… PHYSICAL REVIEW B 76, 245308 �2007�
245308-3
about 3�1017 sensitizers /cm3, the same value we found bythe EFTEM quantification. Such a coincidence is remark-able, even considering that the error bars are large �35%�.
C. Photoluminescence spectra and lifetimes
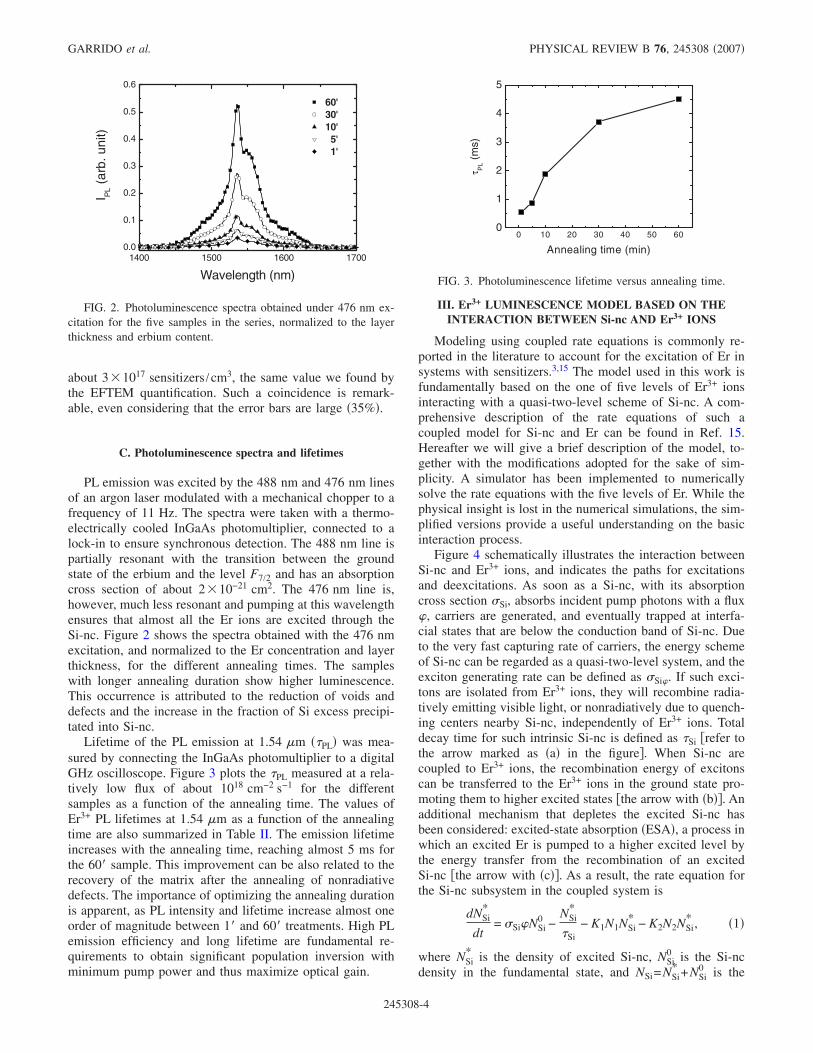
PL emission was excited by the 488 nm and 476 nm linesof an argon laser modulated with a mechanical chopper to afrequency of 11 Hz. The spectra were taken with a thermo-electrically cooled InGaAs photomultiplier, connected to alock-in to ensure synchronous detection. The 488 nm line ispartially resonant with the transition between the groundstate of the erbium and the level F7/2 and has an absorptioncross section of about 2�10−21 cm2. The 476 nm line is,however, much less resonant and pumping at this wavelengthensures that almost all the Er ions are excited through theSi-nc. Figure 2 shows the spectra obtained with the 476 nmexcitation, and normalized to the Er concentration and layerthickness, for the different annealing times. The sampleswith longer annealing duration show higher luminescence.This occurrence is attributed to the reduction of voids anddefects and the increase in the fraction of Si excess precipi-tated into Si-nc.
Lifetime of the PL emission at 1.54 �m ��PL� was mea-sured by connecting the InGaAs photomultiplier to a digitalGHz oscilloscope. Figure 3 plots the �PL measured at a rela-tively low flux of about 1018 cm−2 s−1 for the differentsamples as a function of the annealing time. The values ofEr3+ PL lifetimes at 1.54 �m as a function of the annealingtime are also summarized in Table II. The emission lifetimeincreases with the annealing time, reaching almost 5 ms forthe 60� sample. This improvement can be also related to therecovery of the matrix after the annealing of nonradiativedefects. The importance of optimizing the annealing durationis apparent, as PL intensity and lifetime increase almost oneorder of magnitude between 1� and 60� treatments. High PLemission efficiency and long lifetime are fundamental re-quirements to obtain significant population inversion withminimum pump power and thus maximize optical gain.
III. Er3+ LUMINESCENCE MODEL BASED ON THEINTERACTION BETWEEN Si-nc AND Er3+ IONS
Modeling using coupled rate equations is commonly re-ported in the literature to account for the excitation of Er insystems with sensitizers.3,15 The model used in this work isfundamentally based on the one of five levels of Er3+ ionsinteracting with a quasi-two-level scheme of Si-nc. A com-prehensive description of the rate equations of such acoupled model for Si-nc and Er can be found in Ref. 15.Hereafter we will give a brief description of the model, to-gether with the modifications adopted for the sake of sim-plicity. A simulator has been implemented to numericallysolve the rate equations with the five levels of Er. While thephysical insight is lost in the numerical simulations, the sim-plified versions provide a useful understanding on the basicinteraction process.
Figure 4 schematically illustrates the interaction betweenSi-nc and Er3+ ions, and indicates the paths for excitationsand deexcitations. As soon as a Si-nc, with its absorptioncross section �Si, absorbs incident pump photons with a flux�, carriers are generated, and eventually trapped at interfa-cial states that are below the conduction band of Si-nc. Dueto the very fast capturing rate of carriers, the energy schemeof Si-nc can be regarded as a quasi-two-level system, and theexciton generating rate can be defined as �Si�. If such exci-tons are isolated from Er3+ ions, they will recombine radia-tively emitting visible light, or nonradiatively due to quench-ing centers nearby Si-nc, independently of Er3+ ions. Totaldecay time for such intrinsic Si-nc is defined as �Si �refer tothe arrow marked as �a� in the figure�. When Si-nc arecoupled to Er3+ ions, the recombination energy of excitonscan be transferred to the Er3+ ions in the ground state pro-moting them to higher excited states �the arrow with �b��. Anadditional mechanism that depletes the excited Si-nc hasbeen considered: excited-state absorption �ESA�, a process inwhich an excited Er is pumped to a higher excited level bythe energy transfer from the recombination of an excitedSi-nc �the arrow with �c��. As a result, the rate equation forthe Si-nc subsystem in the coupled system is
dNSi*
dt= �Si�NSi
0 −NSi
*
�Si− K1N1NSi
* − K2N2NSi* , �1�
where NSi* is the density of excited Si-nc, NSi
0 is the Si-ncdensity in the fundamental state, and NSi=NSi
* +NSi0 is the
1400 1500 1600 17000.0
0.1
0.2
0.3
0.4
0.5
0.6
I PL
(arb
.uni
t)
Wavelength (nm)
60'30'10'5'1'
FIG. 2. Photoluminescence spectra obtained under 476 nm ex-citation for the five samples in the series, normalized to the layerthickness and erbium content.
0 10 20 30 40 50 600
1
2
3
4
5
τ PL
(ms)
Annealing time (min)
FIG. 3. Photoluminescence lifetime versus annealing time.
GARRIDO et al. PHYSICAL REVIEW B 76, 245308 �2007�
245308-4

total number of Si-nc; K1 is the coupling constant betweenSi-nc and Er in the ground state, and K2 is the coefficient forESA. It is worth noting that the recombination within theSi-nc and the energy transfer to Er ions �the second, third,and last term on the right-hand side� are competing mecha-nisms; N2 and N1 are the densities of the first excited andfundamental states of Er, respectively. We assume that strongand fast Auger interaction between excitons in a single Si-ncprevents the creation of more than one exciton per Si-nc insteady-state regime.
Let consider the dynamics of Er ions. The N1 ions in theground state are excited by energy transfer from excitons andthe excited Er3+ at higher lying levels decay fast to the firstexcited state �within 1–2 �s�. Similarly to Si-nc, these ex-cited Er3+ ions can radiatively decay by emitting photons at1.54 �m or nonradiatively decay due to quenching centers, ifother deexcitation processes are negligible. Again such in-trinsic Er3+ decay lifetime is described as �2 �see the arrowsmarked �i��. One of the most frequently reported deexcitationprocesses is the cooperative up conversion �CUC� that con-cerns the interaction of two Er ions, both in the first excitedlevel �4I13/2�. Such an interaction might result in the promo-tion of one ion to the third excited level �4I9/2� and the de-excitation of the other to the ground state �the arrow marked�ii��. Subsequently, the excited ion decays rapidly to the sec-ond level and then nonradiatively through the emission ofphonons to the first excited level in few �s, or radiatively tothe fundamental state with a low branching ratio �weak lu-minescence from the second excited level can be detected at
980 nm�. Additionally, the deexcitation of N2 by Auger ex-citation of excitons �AEE� is also included in our model.This deexcitation involves N2 and NSi
* similarly to ESA, butwith the difference that the energy of N2 is transferred to NSi
*
promoting them to a higher energy level �the arrow marked�iii��.
In fact, ESA and CUC populate other higher excited statesof Er3+ ions �i.e., 2H11/2 and 4I9/2 for ESA and CUC, respec-tively�. Additionally, it is still unclear to which state Er willbe excited through the energy transfer from Si-nc, consider-ing the controversy about the quasiresonant excitation ofEr3+.30 Because of that, the inclusion of higher excited Er3+
energy states, as in the base model suggested by Pacifici etal., would make our model more accurate. Nevertheless,since the nonradiative transition rate of 4H11/2→ 4I9/2, 4I9/2→ 4I11/2, and 4I11/2→ 4I13/2 of Er3+ 4f energy levels are as fastas �1�107, �1�107, and �4�105 s−1, respectively, theEr3+ ions in other higher excited states are expected to bequickly relaxed to the first excited state. This implies thatEr3+ ions exist mainly either in the ground state or in the firstexcited state during the interaction with Si-nc, allowing us toregard the energy scheme of Er3+ as a quasi-two-level systemfor practical purposes. In this way, we can assume that theCUC effect will cause the depletion of only one Er3+ ion, ofthe two involved in the process.
As a result, the rate equation for Er3+ ions in the firstexcited state in the coupled system for a quasi-two-levelscheme is
dN2
dt= K1NSi
* N1 −N2
�2− CupN2
2 − CANSi* N2, �2�
where Cup and CA are the CUC and AEE coefficients, respec-tively. The total number of Er ions NEr now becomes equal toN1 plus N2 �NEr=N1+N2�. The last three terms of the right-hand side of Eq. �2� indicate that the intrinsic decay, CUC,and AEE induced deexcitation will compete with each otherin the deexcitation process of the excited Er3+ ions.
Moreover, by comparing the dynamics of excited Si-ncand excited Er3+ ions, one will deduce that the overall pro-cess of photogeneration of excitons in Si-nc plus energytransfer to Er3+ ions is much faster than the excitation anddeexcitation of Er3+ ions. Because of that, when the pumpflux is raised, Si-nc will very quickly reach the steady-stateequilibrium and its rate equation becomes equal to zero.
TABLE II. Experimental values of the total number of doped Er ions, the maximum excitable Er fraction,1.54 �m Er3+ PL lifetimes, and the effective excitation cross section for the samples studied in this work.
Annealingtime
NEr
��1020 cm−3�N2 max
��1018 cm−3�N2 max /NEr
�%��PL
�msec�a�eff
��10−17 cm2�b
60� 4.0 7.02 1.76 4.5 0.73
30� 5.4 6.17 1.14 3.7 0.78
10� 6.5 2.35 0.36 1.9 1.40
5� 6.5 1.85 0.28 0.9 2.44
1� 5.3 0.70 0.15 0.6 3.12
aAt � of �1018 cm2 /s.bAt � of 5�1018 cm2 /s.
FIG. 4. Schematic description for the interaction model betweenSi-nc and Er3+ ions, and the excitations and deexcitations of them.The model of energy level both for Si-nc and Er3+ ions was re-garded as a quasi-two-level system in the modeling equations.
EXCITABLE Er FRACTION AND QUENCHING PHENOMENA… PHYSICAL REVIEW B 76, 245308 �2007�
245308-5
Thus, it is more convenient to handle the dynamics of Er3+
by introducing their own effective excitation cross section�eff instead of dealing with Si-nc and Er3+, individually. Thisassumption allows one to write
dNSi*
dt→ 0,
dN2
dt= �eff�N1 −
N2
�2− CupN2
2 − CANSi* N2, �3�
where
�eff � �SiK1NSi
�Si� +1
�Si+ K1N1 + K2N2
. �4�
Note that all parameters of Eq. �4� are derived from Eq. �3��the steady state of Si-nc�, and N1 and N2 in steady state areconsequently time independent, but a function of the pumpflux. A detailed discussion about �eff will be provided in thefollowing section.
By analyzing the low pump flux regime, it is clear thatmost Er3+ ions are at the ground state and related deexcita-tion processes of excited Er3+ are small. Then excited Er3+
ions are expected to monotonically decay with the experi-mentally measured PL lifetime �PL that includes as secondorder terms the CUC and AEE �we used �PL in order todistinguish it from the intrinsic decay �2�. In such a case, Eq.�3� is simplified to
dN2
dt= �eff�N1 −
N2
�PL. �5�
In steady-state conditions �dN2 /dt=0�, the population of ex-cited Er3+ in the low pump regime is finally given by
N2 =NEr�
� +1
�eff�PL
, �6�
which is the typical sigmoidal curve that defines the popula-tion of a simplified two-level system. Note that even at highpump flux �eff has the physical meaning of a cross sectionfor Er excitation and �PL of Er deexcitation time, althoughthey will be flux dependent when other deexcitation pro-cesses start to affect N2.
IV. RESULTS AND DISCUSSION
A. Density of excited Er and effective excitation cross section
Quantitative measurements of the photon flux emitted bythe samples were performed by using a reference calibratedsample whose emission has been independently evaluatedand quantified. This sample was a soda-lime glass, 1.3 mmthick, supplied by Corning Inc., doped with Er3+ to a densityof 2�1020 cm−3. The large thickness ensures that PL emis-sion, upon 488 nm excitation, can be directly measured witha calibrated optical multimeter, coupled to an integratingsphere. Geometrical, absorption, and internal reflection ef-
fects were carefully considered, in order to determine theactual emission of the sample. At a pump flux �=1.3�1020 cm−2 s−1, the emission of the reference sample wasfound to be 0.598 mW, corresponding to a density of excitedEr3+ ions equal to 6.3�1017 cm−3. This value is quite closeto the expected one, as calculated from the rate equation �fordirect excitation of Er the used photon flux can be consideredas low� as follows:
N2 =NEr�
� +1
�448�PL
� NEr�488�PL� = 4.2 � 1017 cm−3. �7�
For the calculation we have used the measured lifetime �PL=8 ms and �488=2�10−21 cm2. The agreement demonstratesthat the calibration is correct. Using the calibrated sample asa reference, we were able to determine the collection lossesand detector response in our PL setup, allowing the conver-sion of the photomultiplier signal into the emitted photonflux, which, in turn, is related to N2 through
�emitted =N2
�radAd , �8�
where d is the layer thickness, A is the illuminated area, and�rad is the radiative lifetime, a parameter determined by Dal-dosso et al. on the same set of samples.20 For the sampleannealed at 60�, �rad takes the highest value of 10 ms. Thisvalue is smaller than the one in SiO2 �18 ms�, which has alower refractive index than silicon-rich silica. The sampleswere excited with the 476 and 488 nm lines of an Ar laser, toa maximum laser power of 215 and 430 mW, respectively.Since the dimension of the laser spot depends on the emittedpower, we maintained the spot size on the samples at�10−3 cm2 by keeping maximum and constant the laseremission and modifying its intensity on the sample by a setof neutral density filters.
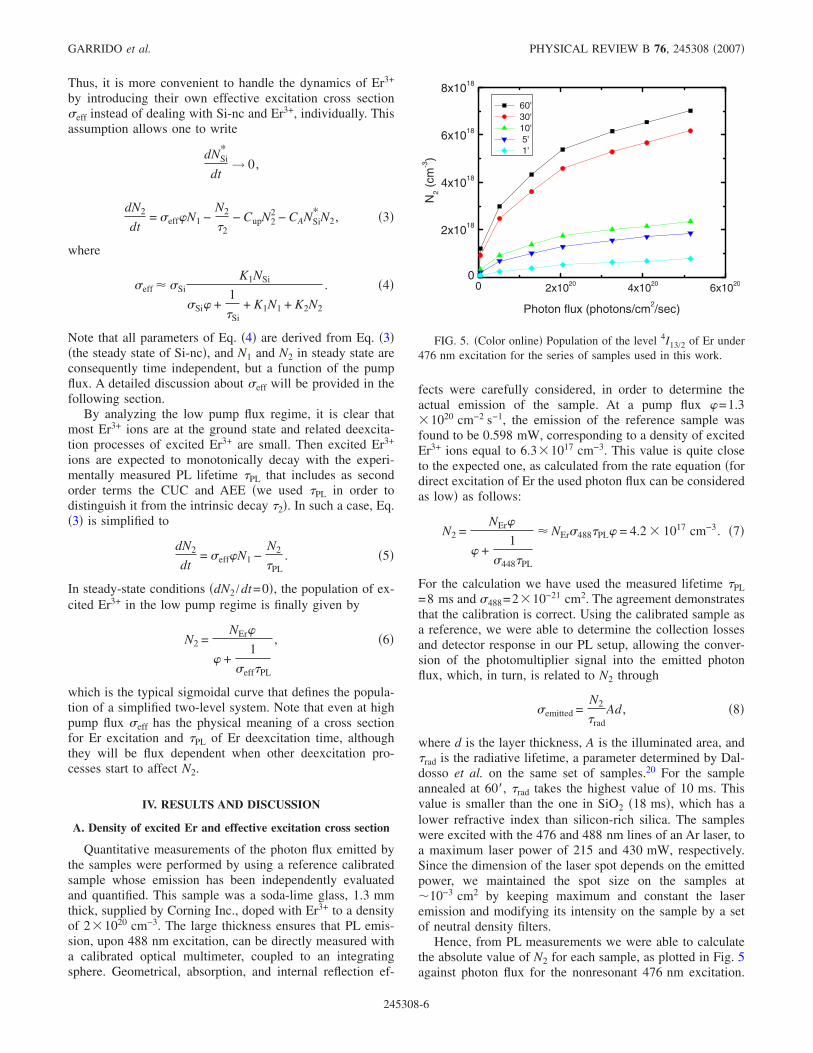
Hence, from PL measurements we were able to calculatethe absolute value of N2 for each sample, as plotted in Fig. 5against photon flux for the nonresonant 476 nm excitation.
0 2x10²⁰ 4x10²⁰ 6x10200
2x10¹⁸
4x10¹⁸
6x10¹⁸
8x10¹⁸
N2
(cm
-3)
Photon flux (photons/cm2/sec)
60'30'10'5'1'
FIG. 5. �Color online� Population of the level 4I13/2 of Er under476 nm excitation for the series of samples used in this work.
GARRIDO et al. PHYSICAL REVIEW B 76, 245308 �2007�
245308-6
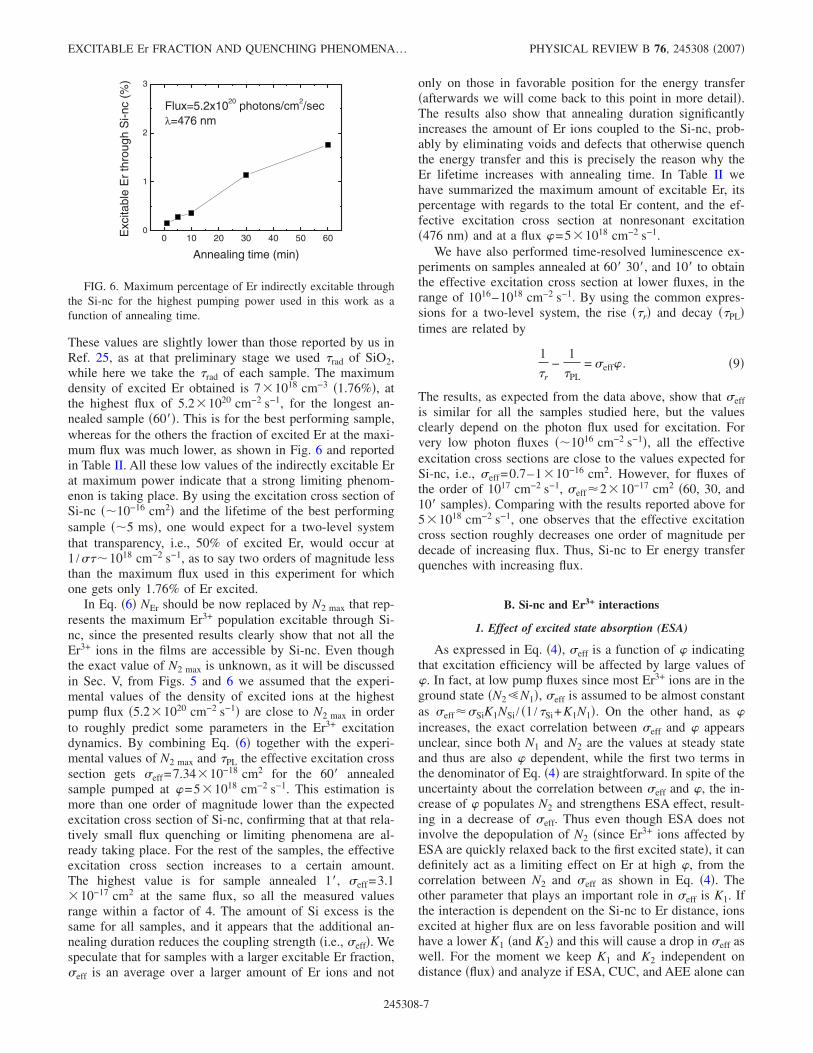
These values are slightly lower than those reported by us inRef. 25, as at that preliminary stage we used �rad of SiO2,while here we take the �rad of each sample. The maximumdensity of excited Er obtained is 7�1018 cm−3 �1.76%�, atthe highest flux of 5.2�1020 cm−2 s−1, for the longest an-nealed sample �60��. This is for the best performing sample,whereas for the others the fraction of excited Er at the maxi-mum flux was much lower, as shown in Fig. 6 and reportedin Table II. All these low values of the indirectly excitable Erat maximum power indicate that a strong limiting phenom-enon is taking place. By using the excitation cross section ofSi-nc ��10−16 cm2� and the lifetime of the best performingsample ��5 ms�, one would expect for a two-level systemthat transparency, i.e., 50% of excited Er, would occur at1 /���1018 cm−2 s−1, as to say two orders of magnitude lessthan the maximum flux used in this experiment for whichone gets only 1.76% of Er excited.
In Eq. �6� NEr should be now replaced by N2 max that rep-resents the maximum Er3+ population excitable through Si-nc, since the presented results clearly show that not all theEr3+ ions in the films are accessible by Si-nc. Even thoughthe exact value of N2 max is unknown, as it will be discussedin Sec. V, from Figs. 5 and 6 we assumed that the experi-mental values of the density of excited ions at the highestpump flux �5.2�1020 cm−2 s−1� are close to N2 max in orderto roughly predict some parameters in the Er3+ excitationdynamics. By combining Eq. �6� together with the experi-mental values of N2 max and �PL the effective excitation crosssection gets �eff=7.34�10−18 cm2 for the 60� annealedsample pumped at �=5�1018 cm−2 s−1. This estimation ismore than one order of magnitude lower than the expectedexcitation cross section of Si-nc, confirming that at that rela-tively small flux quenching or limiting phenomena are al-ready taking place. For the rest of the samples, the effectiveexcitation cross section increases to a certain amount.The highest value is for sample annealed 1�, �eff=3.1�10−17 cm2 at the same flux, so all the measured valuesrange within a factor of 4. The amount of Si excess is thesame for all samples, and it appears that the additional an-nealing duration reduces the coupling strength �i.e., �eff�. Wespeculate that for samples with a larger excitable Er fraction,�eff is an average over a larger amount of Er ions and not
only on those in favorable position for the energy transfer�afterwards we will come back to this point in more detail�.The results also show that annealing duration significantlyincreases the amount of Er ions coupled to the Si-nc, prob-ably by eliminating voids and defects that otherwise quenchthe energy transfer and this is precisely the reason why theEr lifetime increases with annealing time. In Table II wehave summarized the maximum amount of excitable Er, itspercentage with regards to the total Er content, and the ef-fective excitation cross section at nonresonant excitation�476 nm� and at a flux �=5�1018 cm−2 s−1.
We have also performed time-resolved luminescence ex-periments on samples annealed at 60� 30�, and 10� to obtainthe effective excitation cross section at lower fluxes, in therange of 1016–1018 cm−2 s−1. By using the common expres-sions for a two-level system, the rise ��r� and decay ��PL�times are related by
1
�r−
1
�PL= �eff� . �9�
The results, as expected from the data above, show that �effis similar for all the samples studied here, but the valuesclearly depend on the photon flux used for excitation. Forvery low photon fluxes ��1016 cm−2 s−1�, all the effectiveexcitation cross sections are close to the values expected forSi-nc, i.e., �eff=0.7–1�10−16 cm2. However, for fluxes ofthe order of 1017 cm−2 s−1, �eff�2�10−17 cm2 �60, 30, and10� samples�. Comparing with the results reported above for5�1018 cm−2 s−1, one observes that the effective excitationcross section roughly decreases one order of magnitude perdecade of increasing flux. Thus, Si-nc to Er energy transferquenches with increasing flux.
B. Si-nc and Er3+ interactions
1. Effect of excited state absorption (ESA)
As expressed in Eq. �4�, �eff is a function of � indicatingthat excitation efficiency will be affected by large values of�. In fact, at low pump fluxes since most Er3+ ions are in theground state �N2N1�, �eff is assumed to be almost constantas �eff��SiK1NSi / �1 /�Si+K1N1�. On the other hand, as �increases, the exact correlation between �eff and � appearsunclear, since both N1 and N2 are the values at steady stateand thus are also � dependent, while the first two terms inthe denominator of Eq. �4� are straightforward. In spite of theuncertainty about the correlation between �eff and �, the in-crease of � populates N2 and strengthens ESA effect, result-ing in a decrease of �eff. Thus even though ESA does notinvolve the depopulation of N2 �since Er3+ ions affected byESA are quickly relaxed back to the first excited state�, it candefinitely act as a limiting effect on Er at high �, from thecorrelation between N2 and �eff as shown in Eq. �4�. Theother parameter that plays an important role in �eff is K1. Ifthe interaction is dependent on the Si-nc to Er distance, ionsexcited at higher flux are on less favorable position and willhave a lower K1 �and K2� and this will cause a drop in �eff aswell. For the moment we keep K1 and K2 independent ondistance �flux� and analyze if ESA, CUC, and AEE alone can
0 10 20 30 40 50 600
1
2
3
Exc
itabl
eE
rth
roug
hS
i-nc
(%)
Annealing time (min)
Flux=5.2x10²⁰ photons/cm2/secλ=476 nm
FIG. 6. Maximum percentage of Er indirectly excitable throughthe Si-nc for the highest pumping power used in this work as afunction of annealing time.
EXCITABLE Er FRACTION AND QUENCHING PHENOMENA… PHYSICAL REVIEW B 76, 245308 �2007�
245308-7

explain the low amount of excited Er. Although ESA in-volves an isolated Er and is not dependent on the Er concen-tration, actually it strongly depends on � and the absorptioncross section of the excited level to the pumping photons.Some recent reports have emphasized the importance ofESA, pointing out the resonant character of the energy trans-fer from Si-nc to Er at around 750 nm �emission of Si nano-crystals�, for which the excited level N2 has a significantcross section.24
As shown in Eq. �4� again, �eff is determined by the com-petition between the energy transfer to Er3+ and the ESAeffect. Thus the comparison between these two phenomena�K2N2 /K1N1� will reveal the predominance of the ESA effectin Er3+ excitation or deexcitation dynamics. In order to con-sider an extreme case, one can consider the sample annealed60� for which the maximum concentration is N2=7�1018 cm−3 and K2=1�10−15 cm3 /s, as to say the largestvalue ever reported �Ref. 24�. This latter value is used eventhough it is similar to K1=3�10−15 cm3 /s �Ref. 15� andmuch larger than K2 of less than 3�10−19 cm3 /s �see alsoRef. 15�.
Finally, the ratio K2N2 /K1N1 is found to be as low as5.9�10−3. Hence, the impact of ESA in the effective excita-tion cross section for such a low population of excited Er isnegligible if we consider all the Er population coupled to theSi-nc. Nevertheless, as K1 and K2 get comparable in thesecalculations, ESA can have a significant impact once a highpopulation inversion is achieved and its main effect will be ashift in the transparency limit to higher pumping powers. Asfor transparency N1=N2, if one makes comparable both co-efficients K1�K2, then ESA will at most shift the transpar-ency limit by a factor of 2 in the required pumping flux.
2. Effect of cooperative conversion
Cooperative up conversion �CUC� has been previouslystudied in SiO2 doped with Si-nc and Er by a certain numberof authors15,17 and is known to play a significant role whenboth or either Er concentration and/or pumping flux are high.As stated above, CUC refers to the interaction of two Er ionsin the first excited level, resulting in one remaining in thefirst excited state �after a few �s of decay from upper levels�and the deexcitation of the other to the fundamental level.The first excited state will be, therefore, depleted and thusCUC can affect significantly the pumping flux regime neededfor population inversion. CUC is usually modeled throughthe up-conversion coefficient Cup as indicated above.
dN2
dt= �effN1� −
N2
�2− CupN2
2. �10�
The approximate quasi-two-level model is justified by thefact that the N4 level populated by CUC returns to the firstexcited state in 1 �s at most, i.e., three orders of magnitudelower than the ms lifetime for N2.
When pump beam is turned off ��=0�, Eq. �10� is nowsimplified as
dN2�t�dt
= −N2�t�
�2− CupN2
2�t� . �11�
Note that N2 is a function of time and the CUC processinvolves two excited erbium ions at the same time. Afteranalytical calculation, a time-dependent normalized numberof excited Er3+ ions f�t� is found as follows:
N2�t�N2�0�
=
exp�−t
�2�
1 + Cup�2N2�0�1 − exp�−t
�2� = f�t� . �12�
We now define the PL lifetime �PL as the integrated value off �t� from t=0 to �a single exponential with the same area�.
�PL��� = �0
N2�t�N2�0�
dt =ln�1 + N2�0��2Cup�
N2�0�Cup. �13�
Note that �PL is a function of � since N2�0� is also � depen-dent.
Figure 7 shows the dependence of the lifetime with thepumping flux at nonresonant excitation �476 nm� for thethree most emitting samples �60�, 30�, and 10� annealingtime�. A strong decrease of the lifetime is observed in allthree samples, followed by some stabilization for pump pow-ers over 1020 cm−2 s−1. For comparison �not shown� we alsopumped the soda-lime bulk reference sample and we couldnot detect variations in the Er lifetime for that range offluxes. Figure 8 compares the evolution of the PL decay ratewith the density of inverted ions, to that expected from Eq.�13�. The only fitting parameter is the Cup coefficient and theagreement between experimental and calculated data impliesthat CUC is indeed responsible for the observed variation inthe lifetime versus the pump power. A simplified version ofEq. �13� is deduced from the rate equation of Eq. �10� as1 /�PL�1 /�2+CupN2, which emphasizes the linear depen-dence shown in Fig. 8. The up-conversion coefficients in ourset of samples have been estimated by a linear regression of
0 1x10²⁰ 2x10²⁰ 3x10²⁰ 4x10²⁰ 5x10201.5
2.0
2.5
3.0
3.5
4.0
τ PL
(ms)
ϕ (phot/cm2/sec)
60'30'10'
FIG. 7. Dependence of the lifetime with the pumping flux forsamples annealed at 60�, 30�, and 10�.
GARRIDO et al. PHYSICAL REVIEW B 76, 245308 �2007�
245308-8

the curves in Fig. 8. The values obtained are between 1.7 and5.5�10−17 cm3 s−1, with the lowest value corresponding tothe longest annealing duration �60��. These Cup values areconsistent with previous results from Er-doped Si-nc embed-ded in SiO2.15
Let us evaluate now the role of CUC in quenching the Erexcitation for the 60� sample as an example. After Eq. �10�,the contribution of CUC to the rate equation is CupN2
2 andcompetes with the intrinsic deexcitation N2 /�2. For the high-est flux �when excited Er reaches its maximum� the deexci-tation to the fundamental state is still higher than the up-conversion term by roughly a factor of 2. Consequently,CUC is playing a significant role in depleting N2 but it can-not account for the extremely low fraction of excitable Er�1.76%�.
An interesting way to examine the CUC mechanism is toevaluate how it affects the pumping flux needed for transpar-ency �50% inversion of Er�. By exactly solving Eq. �10� forsteady state it is found that Cup stretches the typical sigmoi-dal curve of Eq. �6�. The net effect of CUC is to significantlyincrease the pumping flux needed for transparency and gain.By neglecting Cup the flux for transparency would be just�1/2=1 /�eff�2, while with Cup it turns out to be
�1/2 =1
�eff�2�1
2NErCup�2 + 1� . �14�
By inserting in Eq. �14� the parameters of the 60� sample,one finds that the transparency flux is �1/2�2.5�1018 cm−2 s−1 without considering without up conversion,while it becomes �1/2�3.5�1019 cm−2 s−1, roughly one or-der of magnitude higher, when it is included. Thus, for amaterial with 100% of excitable Er, up conversion will be amatter of serious concern. Including the effect of ESA calcu-lated in the previous section, the transparency limit withCUC and ESA combined will be shifted to almost 1�1020 cm−2 s−1. Finally, we have tried to reproduce N2 as afunction of pumping flux �results plotted in Fig. 5�, by solv-ing Eq. �10� in steady-state regime and using the values cal-culated for �eff, Cup, and �2. The results are displayed in Fig.
9. The experimental N2��� can be reproduced quite well onlyif one introduces an ad hoc factor that reduces the amount ofEr indirectly excitable by the Si-nc to roughly 1.8%. Thegraph also displays the curves with and without CUC if100% of the Er were excitable through the Si-nc. The shift ofthe flux needed for transparency is shown for the curve withup conversion.
3. Effect of Auger deexcitations
In principle, the evolution of lifetimes in Figs. 7 and 8could be also explained by an Auger effect �AEE�, a nonra-diative deexcitation of excited Er ions giving back the energyto excitons in the Si-nc. However, when the pump beam isturned off, the excitons recombine within a few �s whileexcited Er ions decay within a few ms, making difficult anyestimate of AEE effect from Er3+ PL decay traces. However,in steady-state conditions, excitons always exist and an Au-ger effect is expected to be rather active, especially for highpump regime where the population of excitons becomes verydense. Although detailed investigations are needed, such asthe double-pulse pumping, to deeply investigate the Augereffect,30–32 we introduce here a simple approach to examinethe weight of AEE among other deexcitation processes ofexcited Er3+ ions.
The last three terms in Eq. �3� can be rewritten as
− N2� 1
�2+ CupN2 + CANSi
*� . �15�
Note that the terms between parentheses in Eq. �15� reflectdifferent deexcitation processes: excited Er3+ ions includingCUC with CupN2 and Auger deexcitation with CANSi
* . Apartfrom 1 /�2, which is assumed to be invariant on either � andNEr, the predominance of the Auger effect over CUC�CANSi
* �CupN2� requires a population of excited Si-nc more
0.0 3.0x10¹⁸ 6.0x10¹⁸ 9.0x10¹⁸ 1.2x10¹⁹ 1.5x1019200
300
400
500
600
700
( )( )( )up
up
PL CN
CN
02
2
01ln
01
ττ +=
10'
30'
τ PL-1
(s-1)
N2
(cm-3)
10' : Cup
= 5.5 x10⁻¹⁷ cm3s-1
30' : Cup
= 2.5 x10⁻¹⁷ cm3s -1
60' : Cup
= 1.7 x10⁻¹⁷ cm3s-1
60'
FIG. 8. Inverse of the PL lifetime plotted against the density ofexcited Er ions and the up-conversion coefficients.
1017 1018 1019 1020 10211017
1018
1019
1020
1021
αααα = 1.8%
Cup
= 0 cm3/sec
Cup
=1.3x10⁻¹⁷ cm3/sec
Sample annealed 60'
N2
(at/
cm3 )
ϕϕϕϕ (photons/cm2/sec)
αααα = 100%transparency density
FIG. 9. Experimental data and simulation of the number of Eratoms in the excited state for a sample annealed at 60�. Solid curvesaccount for the evolution without up conversion and a differentpercentage of Er coupled to the Si nanoclusters. Dashed curvesincluded up-conversion effects.
EXCITABLE Er FRACTION AND QUENCHING PHENOMENA… PHYSICAL REVIEW B 76, 245308 �2007�
245308-9

than two orders of magnitude higher than that of excited Er3+
ions, assuming a comparable magnitude of CA and Cup. Forexample �see Fig. 5�, almost 1018 Er cm−3 can be usuallyexcited in a moderate pump regime ��1019 cm−2 s−1�, imply-ing the CUC rate as high as �10 s−1.
On the other hand, when the value of CA for Er-dopedSi-nc is assumed to be �10−19 cm3 s−1 �Ref. 15�, the maxi-mum deexcitation rate by the Auger effect rarely exceeds10−2 s−1 even when all Si-nc are excited. This value is muchsmaller than 1 /�2, which is �200 s−1 for our films, and evensmaller than the CUC rate as well. Furthermore, K. Imakitaet al.33 reported a measurement of the Auger coefficient di-rectly from the PL decays after doping the Si-nc with shal-low impurities �P or B�. They got an upper value of CA=6.1�10−17 cm3 s−1. Even by assuming that the interactionof an excited Er with an exciton is comparable to that of theshallow impurity, the resulting Auger deexcitation rate isabout 2 s−1, still much lower than the CUC. Thus we believethat the Auger effect is not as active as the CUC in thesteady-state regime, and does not considerably represent alimiting factor for the determination of excited Er3+ ionsnumbers.
C. Optically active Er ions
1. Direct absorption versus indirect excitation
The PL experiment was repeated under the exact sameconditions with the resonant 488 nm line. The resulting totalemission versus flux is slightly higher than that for the476 nm line. The comparison between the two excitations isshown for samples annealed for 60� and 10� in Fig. 10.While the PL emission tends to saturate under high nonreso-nant pumping, it continues growing rather linearly whenpumped with the 488 nm line. This is observed in allsamples, and allows one to infer that, while the energy trans-fer from the Si-nc tend to quench at high flux, Er can still bedirectly excited by the 488 nm line. This finding is of greatimportance, as it indicates that the quenching problem is not
residing in an eventual inactive character of the Er popula-tion, but rather in the ineffectiveness of the energy transfer.
The comparison between resonant and nonresonant exci-tation allows one to calculate the fraction of optically activeions in the sample, which we define as the amount of Er thatcan be excited resonantly. For doing this, we have just sub-tracted the population N2 of the first excited level after exci-tation with 488 nm from that after 476 nm pumping�N2@488−N2@476�. Assuming that the amount of Er excitedvia the Si-nc is the same when pumping at 488 and 476 nm,this subtraction will separate the contributions of directly andindirectly excited Er. This subtraction is shown in Fig. 11 forthe sample annealed 60� and results in a straight line, N2=NEr�488�PL�, as expected for direct excitation at low pump-ing �transparency for direct pumping is accomplished at aflux of about 1 /�488�PL�1023 photons /cm2 s, i.e. muchhigher than the one used here�.
Due to the broad Er3+ 4F7/2→ 4I15/2 absorption band peak-ing at �488 nm, it is also possible that some Er ions can beresonantly excited even under 476 nm pumping. However,we found a much smaller �476 optical absorption cross sec-tion of Er ions at 476 nm, as low as �476�10−22 cm2, asevaluated from PL and visible absorption measurements onEr-doped glasses. This allowed one to neglect the contribu-tion of excited Er ions by direct optical absorption under a476 nm pump. In fact, by including the contribution under a476 nm pump, but almost the same results were drawn. Thelinear fitting of this subtraction allows one to obtain NEr, herethe total amount of optically active Er. The slope of the fit�NEr�488�PL� is �2.4�10−3 s cm−1, and when solving forNEr, we estimated a value of 2.7�1020 cm−3.
The excitable Er3+ density we found from Fig. 11 is ratherconsistent with the amount measured by RBS �see Table I�;so, the conclusion is straightforward: most of the Er is opti-cally active in the samples but only a tiny percentage of itcan be excited through the Si-nc. This observation stronglysupports our previous suggestions of assigning the signalenhancement obtained under resonant pumping conditions��6�1021 cm−2 s−1 at 488 nm� to a dominant direct excita-tion of Er.20
0.0 2.0x10²⁰ 4.0x10²⁰ 6.0x10200.0
2.0x10⁻³
4.0x10⁻³
6.0x10⁻³
8.0x10⁻³
1.0x10⁻²
10'
Sam
ple
Em
issi
on(m
W)
Photon Flux (ϕ; photons/cm2/sec)
λλλλexc
= 476 nm
λλλλexc
= 488 nm 60'
FIG. 10. Emission of the samples annealed at 60� and 10�, as afunction of the pump photon flux, for resonant �488 nm� and non-resonant �476 nm� excitation.
0 1x10²⁰ 2x10²⁰ 3x10²⁰ 4x10²⁰ 5x10²⁰ 6x10200.0
2.0x10¹⁸
4.0x10¹⁸
6.0x10¹⁸
8.0x10¹⁸
Indirectly ExcitedDirectly Excited
Exc
ited
Er3+
ions
(cm
-3)
ϕ(photons/cm2/sec)
FIG. 11. �Color online� Contribution of the direct and indirectexcitation to the density of excited Er ions when pumping at488 nm after subtracting the excitation at 476 nm.
GARRIDO et al. PHYSICAL REVIEW B 76, 245308 �2007�
245308-10

2. Experimental evidences of a distance-dependent interaction
In a recent paper we have demonstrated that the low frac-tion of potentially excitable Er through the Si-nc can be ex-plained by assuming that the energy transfer between Si-ncand Er ions is strongly dependent on their mutual distance.25
Our paper introduced a distance-dependent interaction modelthat we will develop in detail in the following sections, to-gether with experimental evidences of such a distance-dependent interaction. In Eq. �10� we have previously de-fined the effective excitation cross section �eff, whichactually is the rate allowing a given pumping relay to exciteEr. Thus, the lower is the �eff, the more difficult it is to excitefurther Er ions; �eff is of about 10−16 cm2 at a low flux of�1016 cm−2 s−1 �see above�, so as to say a large cross sectioncomparable to that of the Si-nc. So, it means that the firstpumped Er ions are excited at a very high rate and efficientlyfrom the pump; from the calculations above for the sampleannealed at 60� we are able to estimate that only about �5�1016 Er ions benefit from that high cross section. Theseprivileged Er ions are located on the appropriate locationwith regards to the excitation of the Si-nc, probably in thetransition region between the Si-nc and the matrix.34 Thoseprivileged Er ions emit and are thus observable in routine PLexperiments at low pumping flux. From such observations, itwas assumed that all Er present in the sample would showsimilar behavior, allowing the use of Si-nc+Er materials as ahigh gain medium with low power pumping sources. How-ever, even at moderate pumping fluxes of 5�1018 cm−2 s−1,i.e., those of a high power LED, the �eff has decreased to the10−18 cm2 order of magnitude �60� sample, see Table II� andthe amount of Er excited is only �2�1018 cm−3, which isroughly 1 over 200 ions.
From Eq. �10�, we can calculate �eff for higher fluxeswithout making any assumption on the mechanism by whichEr is pumped. Figure 12 represents �eff for all samples as afunction of flux over the five decades of fluxes range. It isworth remarking that �eff has been calculated in this work byconsidering only the Er coupled to the Si-nc �N2 max in Fig. 6and Table II�. The obtained values reflect, therefore, someaveraging of the pumping efficiency among the whole indi-
rectly excitable Er ions �but not all existing Er as in Ref. 25�.The trends of Fig. 12 are clear hints of a distance-
dependent interaction. First of all, all the curves show thesignificant decrease of �eff with increasing pumping flux, i.e.,when additional Er is excited. In fact, �eff as defined in Eq.�10� is the result of the energy transfer from excited Si-nc�NSi
* �. Excited Si-nc pump Er ions at a rate K1NSi* N1, so they
are related by
�eff = K1NSi
*
�. �16�
Since NSi* is expected to linearly increase with � at low or
moderate pump flux, Eq. �16� is clearly illustrating that, asseen in Fig. 12, the dependence of �eff on � is mainly attrib-uted to the pump flux-dependent K1. While other quenchingmechanisms failed to explain the low amount of excitable Er,the results of Fig. 12 thus indicate that the coupling constantbetween Si-nc and Er �K1� should rapidly drop with the in-creasing flux, as both are intimately related.
Additional Er ions involved might imply their location ata longer distance from the sensitizer �Si-nc�. Then if we as-sume that each Si-nc transfers its excitation to the closestunexcited Er ions, it is possible to define an effective volumeVeff around each Si-nc that contains the excited Er ions.Thus, the density of Er ions in such Veff is the product of thetotal volume of Veff and the density of Er ions in the film, as
N2 = NSiVeffNEr. �17�
Veff can be evaluated as the subtraction of the volume ofSi-nc from the interaction sphere with interaction radius R as
R = � 3
4�
N2
NSiNEr� + Rnc
3 1/3
. �18�
Figure 13 schematically explains the calculation of R. Theaverage radius Rnc of the Si-nc has been determined fromEFTEM measurements and the value obtained is 1.6 nm. Themeasurement of the concentration of Si-nc has been consid-ered in the experimental section as was found to be �3�1017 cm−3. However, for the purpose of this section it isenough to calculate the volume occupied by the absolute
1016 1017 1018 1019 1020 102110-19
10-18
10-17
10-16
Effe
ctiv
eex
cita
tion
cros
sse
ctio
n(c
m2 )
Photon flux (photons/cm2/sec)
60'30'10'5'1'
FIG. 12. �Color online� Effective excitation cross section as afunction of pumping flux of photons at 476 nm for all the samplesstudied in this work; the legend refers to the annealing time.
RncR0
R
3
3
4ncnc RV
π=
nc-Si
ExcitableEr3+ ions
3
34
RVR
π=
( )33
3
4RRV ncEff −= π
Non-ExcitableEr3+ ions
FIG. 13. Schematic explanation for Eqs. �17� and �18�. OnlyEr3+ ions within interaction radius R can be excited via energytransfer from Si-nc �black circles� and Er3+ ions outside of interac-tion sphere with a volume of 4�R3 /3 are hindered from the excita-tion �gray circles�.
EXCITABLE Er FRACTION AND QUENCHING PHENOMENA… PHYSICAL REVIEW B 76, 245308 �2007�
245308-11

number N2 and then translate �eff��� into �eff �NSi1/3R�. The
result is shown in Fig. 14 and displays a clear exponentialdependence; the fit of the experimental data to an exponen-tial decay �eff=�0 exp�−NSi
1/3R /�� results in �0=4.36�10−16 cm2 and �=0.0217. One can get also an estimateof NSi by assuming that for the lowest flux used in this ex-periment, the few Er ions excited are very close to the sur-face of the Si-nc. Thus, the value estimated is NSi�1.7�1017 cm−3, quite close to the experimental value obtainedby EFTEM. Using this value and the fitting parameter �, wecan also estimate a characteristic interaction length betweenthe Si-nc and the Er that is R0�0.4 nm. This distance-dependent interaction has been also suggested earlier in theliterature with similar R0 values.35,36
V. MODELING AND DISCUSSION
Starting from the Si-nc and the Er3+ ions rate equations�1� and �2�, and using the above reported results, we developthe rate equations describing the distance-dependent interac-tion between Si-nc and Er. The main objective is to deter-mine the maximum amount of Er ions that can be excitedthrough the Si-nc once the concentration of exciting clustersis known. To achieve this, we have built up a computer codein which we have modeled the Si-nc as a quasi-two-levelsystem and considered a multilevel scheme for the Er ions.However, for the sake of a better physical insight, hereafterwe work out in detail an analytical simplified version of thecoupled rate equations in which Er ions are taken as a quasi-two-level system. The refinement provided by the five-levelsscheme is marginal and in the following we shall mentiononly the analytical approach.
The simplified coupled equations are basically the sameas those developed and justified above using Eqs. �1� and �2�,but include some modifications: �i� ESA and AEE are ne-glected, �ii� CUC is considered by introducing �PL��� of Eq.�13�, and �iii� the excitation coefficient K1 is assumed depen-dent on the distance between the Si-nc and Er3+ ion. As aresult, the set of rate equation for the Si-nc subsystem andEr3+ ion in the coupled system can be simplified from Eqs.�1� and �2� as
dNSi*
dt= �SiNSi
0 � −NSi
*
�Si− K1NSi
* N1,
dN2
dt= K1NSi
* N1 −N2
�PL���. �19�
The excitation cross sections of Si-nc and Er, lifetimes of Erin the first excited state, CUC coefficients, and Er and Si-ncconcentrations have been measured for our materials and theresults were described in the previous experimental sections.For the other parameters we have used the values reported inthe literature.14,15,17,19
In steady-state pumping conditions, the time derivativesare zero and the density of excited Si-nc is
NSi* =
NSi�
� +1
�Si�Si+
K1N1
�Si
. �20�
Since �eff�=K1NSi* , we noted in previous sections that �eff
gets flux dependent as soon as NSi* departs from the linear
dependence versus flux, even by considering K1 as a con-stant, independent of the interaction distance. This is clearlydue to the fact that Er excitation comes from the transfer of atwo-level system that can be saturated, and not directly fromthe pumping photons. Figure 15 illustrates the dependenceof NSi
* versus the pumping flux over a wide range of1017–1024 photons /cm2 s. As shown in the inset in linearscale, departure from linearity starts well above 5�1020 cm−2 s−1, the maximum experimental flux used in thiswork for nonresonant excitation. This clearly demonstratesthat the progressive drop in �eff with increasing pump is notdue to the saturation of absorbers �Si-nc�, and therefore itsdefinition is meaningful.
By solving Eq. �19� in steady state, the fraction of Er inthe first excited state becomes
0.08 0.10 0.12 0.14 0.16
2.0x10⁻¹⁸
4.0x10⁻¹⁸
6.0x10⁻¹⁸
8.0x10⁻¹⁸
1.0x10⁻¹⁷
σ eff(c
m2 )
The value of NSi
1/3R (no unit)
FIG. 14. Exponential dependence of the effective excitationcross section as a function of the interaction radius.
10-3 10-2 10-1 100 101 102 103 1040.0
0.2
0.4
0.6
0.8
1.0
0 1 2 3 4 50.00
0.02
0.04
0.06
0.08
0.10
Fra
ctio
nof
inve
rted
Si-n
c,N
Si* /N
Si(c
m-3)
Pumping flux φ (1020 photons/cm2/sec)
Parameters used:τ
Si=50 µs
σSi=2x10-16 cm2
K1=3x10-15 cm-2 s-1
NEr
=4x1020 cm-3
N* S
i/NS
i(c
m-3)
ϕ (1020 photons/cm2/sec)
FIG. 15. �Color online� Fraction of excited Si-nc as a functionof photon flux in the range 1017–1024 photons /cm2 s. The insetshows in linear scale the range up to 5�1020 photons /cm2 s toillustrate the linear dependence of excited Si-nc up to this highphoton flux.
GARRIDO et al. PHYSICAL REVIEW B 76, 245308 �2007�
245308-12

N2
NEr=
1
1 +1
�PLK1NSi*
. �21�
At this point one can insert the excited population of Si-ncgiven by Eq. �20� into Eq. �21� and rearrange all the terms toget the typical sigmoidal curve of a two-level system. Simi-larly to Eq. �6�, by expressing the sigmoid �18� in the stan-dard way, he gets to
N2
NEr�
�
� + 1/�eff�PL� �� �
� + 1/�eff* �PL
� . �22�
This expression owns a proportionality factor ���, that re-sults from the fact that excitation of Er is an indirect process.Therefore the pumping is limited by the saturation of absorb-ers �Si-nc� and competes with the intrinsic deexcitation of Er.This allows one to define the maximum excitable Er fraction���, and redefine the effective excitation cross section �eff
*
that replaces �eff for the coupled system as follows:
� =K1NSi
1
�PL+ K1NSi
, �23�
�eff* = �Si
1
�PL+ K1NSi
1
�Si+ K1N1
� . �24�
Equation �24� enlightens that in a regime of low pumpingflux, where transfer dominates over intrinsic deexcitations,�eff
* ��SiNSi /NEr and thus it scales with the density ratio be-tween Si-nc and Er. Consequently, it is convenient to equal-ize both concentrations to take full advantage of the largecross section of Si-nc. The coefficient � is just the maximumamount of Er ions that can be inverted, i.e., the balance be-tween the maximum possible pumping from Si-nc �all Si-ncexcited� and the Er deexcitation as follows:
� = lim�→
N2
NEr. �25�
This implies a fraction �1−��NEr that will never be inverted.These latter expressions depend on the energy transfer coef-ficient K1 and thus will depend on the way K1 varies withpumping flux and interaction distance. Results in Sec. IV Cand Fig. 14 have revealed that the transfer term K1 can bedescribed as a decreasing exponential with an estimatedcharacteristic distance R0�0.4 nm, so that we postulate
K1�R� = K0e−�R−Rnc�/R0, �26�
where Rnc is the radius of the Si-nc and K0 is the energytransfer coefficient for low fluxes, i.e., when the transferoccurs for the Er ions that are the closest to the Si-nc. Wetake for this coefficient the literature value K0=3�10−15 cm3 s−1 calculated from the measurement of transfertimes 1 �s.15 Then, for the closest Er ions �R=Rnc� and bytaking NSi�3�1017 cm−3, K0NSi�1�103 s−1 and compar-
ing with �Er−1�200 s−1, one can observe that even if the
whole Er population were coupled with that coefficient, theSi-nc would be able to pump a maximum of 83% of the Erions. As K1 quickly drops with increasing the relative dis-tance, ��R� will drop as well and will tend to zero after fewinteraction lengths. Thus, by looking at Eqs. �23� and �26�, itis apparent that both the density of Si-nc �NSi� and the char-acteristic length of the interaction �R0� are the crucial param-eters that rule the amount of excitable Er.
Let us express in Eq. �19� the dependence of the param-eters with interaction distance �see Fig. 13 for a schematicview� as follows:
N2
NEr= f��,R� =
��R��
� +1
�eff* �R��PL
. �27�
Then, the total population N2 as a function of flux can becalculated by spatial integration of Eq. �23� over the volumeof influence of each Si-nc �NSi
−1 cm3� as follows:
f��� = 4�NSi�Rnc
Rmax
f��,R�R2dR . �28�
By integrating ��R� one obtains the maximum fraction ofexcitable Er as follows:
� = 4�NSi�Rnc
Rmax R2dR
1 +1
K0NSi�PLe�R−Rnc�/R0
. �29�
This integral cannot be analytically resolved and it resemblesthe Fermi-Dirac integrals in statistics. All the parameters in-side the integral have been measured and discussed before.The density of Si-nc is about 3�1017 cm−3 although, by tak-ing into account the large error bars of the EFTEM measure-ments and the fact that tiny Si-nc can escape observation, wewill let NSi vary around this value and present all the resultsas a function of NSi.
In order to set up an upper limit for the Er excited wecarry out the calculations for the best performing sample, theone annealed for 1 h. All the other samples show a muchlower �PL and their excitable Er fraction scales accordingly.After numerically calculating the integral, we found ��1.23% for NSi�3�1017 cm−3, quite close to the experi-mental value of 1.76%. In Fig. 16 the maximum excitable Erfraction is depicted as a function of the Si-nc density. Byletting NSi vary from 1�1017 to 1�1018 cm−3 one finds that� moves from 0.2 up to 7.8%, still a value clearly unsatis-factory. In order to get a high � value, useful to reach opticalgain, such as, for instance 75%, NSi should increase up to2�1019 cm−3. This density value, for the range of Si excessused in this work, means that Si clusters should not includemore than 175 atoms, which is equivalent to a diameter ofabout 1.6 nm �average size in this work is 3.2 nm�.
Whether it is possible or not to engineer a material withsuch high density of very small clusters is just mere specu-lation. In principle, cluster nucleation density depends on thedeposition method �clusters are already present in the as-deposited material� and on the postprocessing annealing step.
EXCITABLE Er FRACTION AND QUENCHING PHENOMENA… PHYSICAL REVIEW B 76, 245308 �2007�
245308-13

Among several Si-nc thin film fabrication methods, filmdeposition at high temperature promotes Si diffusion andclustering during film growth and is thus not desirable forsmaller clusters. SiOx materials deposited at low temperaturewith defects such as voids and H impurities can provide alarge number of nucleation centers. Such deposition meth-ods, combined with flash lamp annealing or rapid thermalprocesses could succeed in forming small clusters with thedesired diameter. Nevertheless, it is under question if such ahypothetical large amount of small clusters would still havethe large excitation cross section that is the most importantand distinctive feature of large clusters.
VI. CONCLUSIONS
Detailed investigations have been performed on Er-dopedsilicon-rich silicon oxide thin films to determine their feasi-bility as a gain material for optical amplifiers. Once demon-strated that the emission cross section of Er is of the sameorder as that in pure silica, i.e., �10−21 cm2, the only advan-tage of introducing Si-nc is the high absorption cross section��10−16 cm2� and the broad absorption in visible range. Thestudies have been done for materials with optimum Si excess�7%� and Er concentration �4�1020 cm−3� annealed different
durations. A density of clusters of about 3�1017 cm−3 andan average size of 3.2 nm was obtained from EFTEM mea-surements. Er effective excitation cross section is compa-rable to that of Si-nc only for very small pumping flux��1016 cm−2 s−1�, it drops roughly one order of magnitudeper decade of increasing flux. The quantification of the lightemission of the samples has allowed one to determine amaximum of excitable Er around the 2% at high pumpingphoton flux ��1021 cm−2 s−1�, implying that only a tiny frac-tion of all the Er is thus coupled to the Si-nc. The effect ofdeexcitation phenomena that cause depletion of Er inversionsuch as cooperative up conversion, excited-state absorption,and Auger deexcitations has been quantified. Their impact onEr inversion would be significant only if a high fraction of Ercould be inverted, while it is marginal for the materials stud-ied here.
Instead, Auger-type short-range energy transfer fromSi-nc to Er with a characteristic interaction distance of �0.4was found. Then a model based on the rate equations hasbeen developed for the interaction of Si-nc with Er, which isdependent on the mutual distance taking into account an en-ergy transfer process whose strength exponentially decreaseswith the distance. The model predicts that the transfer isquenched for high photon fluxes and that only 1–2 % of Eremitters is excitable in our materials. A low Si-nc density andthe short-range character of the energy transfer imply that asignificant fraction of the Er ions is out of reach by Si-nc.According to the simulation, in order to obtain a large frac-tion of Er ions coupled as high as 75%, Si-nc density shouldincrease to �1019 cm−3. This density value, for the range ofSi excess used in this work, means that Si-nc should have anaverage diameter of about 1.6 nm. Therefore we concludethat the main limitation to obtain gain in such a system is thelow density of sensitizers and the short range of the interac-tion.
ACKNOWLEDGMENTS
This work has been partially supported by EU throughIST LANCER project and by the Spanish Ministry of Edu-cation through the MILES-SILUZ project. The authors wishto thank Josep Carreras for writing of the MATLAB code andOlivier Jambois and Youcef Lebour for useful discussions.
1 E. Desurvive, J. R. Simpson, and P. C. Becker, Opt. Lett. 12, 888�1987�.
2 W. J. Miniscalco, J. Lightwave Technol. 9, 234 �1991�.3 A. Kévorkian, in Fiber Optic Communication Devices, edited by
N. Grote and H. Venghaus �Springer-Verlag, Berlin, 2001�,Chap. 6.
4 A. J. Kenyon, P. F. Trwoga, M. Federighi, and C. W. Pitt, J. Phys.:Condens. Matter 6, L319 �1994�.
5 T. Shimizu-Iwayama, K. Fujita, S. Nakao, K. Saitoh, T. Fujita,and N. Itoh, J. Appl. Phys. 75, 7779 �1994�.
6 Y. Kanemitsu, T. Ogawa, K. Shiraishi, and K. Takeda, Phys. Rev.
B 48, 4883 �1993�.7 K. S. Min, K. V. Shcheglov, C. M. Yang, H. A. Atwater, M. L.
Brongersma, and A. Polman, Appl. Phys. Lett. 69, 2033 �1996�.8 B. Garrido, M. López, O. González, A. Pérez-Rodríguez, J. R.
Morante, and C. Bonafos, Appl. Phys. Lett. 77, 3143 �2000�.9 M. Perálvarez, C. García, M. López, B. Garrido, J. Barreto, C.
Domínguez, and J. A. Rodríguez, Appl. Phys. Lett. 89, 051112�2006�.
10 M. V. Wölkin, J. Jorne, P. M. Fauchet, G. Allan, and C. Delerue,Phys. Rev. Lett. 82, 197 �1999�.
11 S. Tiwari, Appl. Phys. Lett. 68, 1377 �1996�.
1017 10180.1
1
10
100
α(%
)
NSi
(cm-3)
NSi
= 3 x 1017 cm-3
α = 1.23 %
FIG. 16. Excitable Er fraction as a function of the concentrationof sensitizers �Si nanoclusters� calculated from the distance- depen-dent interaction model developed in this work. The input param-eters of the simulation correspond to the sample annealed at 60�.
GARRIDO et al. PHYSICAL REVIEW B 76, 245308 �2007�
245308-14

12 O. González-Varona, B. Garrido, S. Cheylan, A. Pérez-Rodríguez, A. Cuadras, and J. R. Morante, Appl. Phys. Lett. 82,2151 �2003�.
13 G. Franzó, S. Bonitelli, D. Pacifici, F. Priolo, F. Iacona, and C.Bongiorno, Appl. Phys. Lett. 82, 3871 �2003�.
14 P. G. Kik, M. L. Brongersma, and A. Polman, Appl. Phys. Lett.76, 2325 �2000�.
15 D. Pacifici, G. Franzó, F. Priolo, F. Iacona, and L. Dal Negro,Phys. Rev. B 67, 245301 �2003�.
16 H. S. Han, S. Y. Seo, J. H. Shin, and D. S. Kim, J. Appl. Phys. 88,2160 �2000�.
17 E. Snoecks, G. N. van den Hoven, and A. Polman, IEEE J. Quan-tum Electron. 32, 1680 �1996�.
18 H. S. Han, S. Y. Seo, and J. H. Shin, Appl. Phys. Lett. 79, 4568�2001�.
19 J. H. Shin, J. Lee, H. S. Han, J. H. Jhe, J. S. Chang, S. Y. Seo, H.Lee, and N. Park, IEEE J. Sel. Top. Quantum Electron. 12, 783�2006�.
20 N. Daldosso, D. Navarro-Urrios, M. Melchiorri, L. Pavesi, F.Gourbilleau, M. Carrada, R. Rizk, C. Garcia, P. Pellegrino, B.Garrido, and L. Gognolato, Appl. Phys. Lett. 86, 261103�2005�; 88, 161901 �2006�.
21 H. Mertens, A. Polman, I. M. P. Aarts, W. M. M. Kessels, and M.C. M. van den Sanden, Appl. Phys. Lett. 86, 241109 �2005�.
22 P. Pellegrino, B. Garrido, J. Arbiol, C. Garcia, Y. Lebour, and J.R. Morante, Appl. Phys. Lett. 88, 121915 �2006�.
23 C. Garcia, B. Garrido, P. Pellegrino, R. Ferré, J. A. Moreno, J. R.Morante, L. Pavesi, and M. Cazzanelli, Appl. Phys. Lett. 82,1595 �2003�.
24 C. J. Oton, W. H. Loh, and A. J. Kenyon, Appl. Phys. Lett. 89,
031116 �2006�.25 B. Garrido, C. García, P. Pellegrino, D. Navarro-Urrios, N. Dal-
dosso, L. Pavesi, F. Gourbilleau, and R. Rizk, Appl. Phys. Lett.89, 163103 �2006�.
26 F. Gourbilleau, L. Levalois, C. Dufour, J. Vicens, and R. Rizk, J.Appl. Phys. 95, 3717 �2004�.
27 N. Daldosso, D. Navarro-Urrios, M. Melchiorri, C. Garcia, P.Pellegrino, B. Garrido, C. Sada, G. Battaglin, F. Gourbilleau, R.Rizk, and L. Pavesi, IEEE J. Sel. Top. Quantum Electron. 12,1607 �2006�.
28 F. Iacona, C. Bongiorno, C. Spinella, S. Boninelli, and F. Priolo,J. Appl. Phys. 95, 3723 �2004�.
29 I. Izeddin, A. S. Moskalenko, I. N. Yassievich, M. Fujii, and T.Gregorkiewicz, Phys. Rev. Lett. 97, 207401 �2006�.
30 K. Watanabe, M. Fujii, and S. Hayashi, J. Appl. Phys. 90, 4761�2001�.
31 J. Palm, F. Gan, B. Zheng, J. Michel, and L. C. Kimerling, Phys.Rev. B 54, 17603 �1996�.
32 S.-Y. Seo and J. H. Shin, Appl. Phys. Lett. 75, 4070 �1999�.33 K. Imakita, M. Fujii, Y. Yamaguchi, and S. Hayashi, Phys. Rev. B
71, 115440 �2005�.34 N. Daldosso, M. Luppi, S. Ossicini, E. Degoli, R. Magri, G.
Dalba, P. Fornasini, R. Grisenti, F. Rocca, L. Pavesi, S. Bon-inelli, F. Priolo, C. Spinella, and F. Iacona, Phys. Rev. B 68,085327 �2003�.
35 J. H. Jhe, J. H. Shin, K. J. Kim, and D. W. Moon, Appl. Phys.Lett. 82, 4489 �2003�.
36 F. Gourbilleau, R. Madelon, C. Dufour, and R. Rizk, Opt. Mater.�Amsterdam, Neth.� 27, 868 �2005�.
EXCITABLE Er FRACTION AND QUENCHING PHENOMENA… PHYSICAL REVIEW B 76, 245308 �2007�
245308-15


![Saugu[!] Asmundar, er kalladur er Kappabani :](https://static.fdokumen.com/doc/165x107/63264a17051fac18490dae0e/saugu-asmundar-er-kalladur-er-kappabani-.jpg)