Predictions of diffusion rates of organic molecules in ...
24
1 Predictions of diffusion rates of organic molecules in secondary organic aerosols using the Stokes-Einstein and fractional Stokes- Einstein relations Erin Evoy 1 , Adrian M. Maclean 1 , Grazia Rovelli 2,a , Ying Li 3 , Alexandra P. Tsimpidi 4,5 , Vlassis A. Karydis 4,6 , Saeid Kamal 1 , Jos Lelieveld 4,7 , Manabu Shiraiwa 3 , Jonathan P. Reid 2 , and Allan K. Bertram 1 5 1 Department of Chemistry, University of British Columbia, 2036 Main Mall, Vancouver, BC, V6T 1Z1, Canada 2 School of Chemistry, University of Bristol, Bristol, BS8 1TS, UK 3 Department of Chemistry, University of California, Irvine, California, 92697-2025, USA 4 Atmospheric Chemistry Department, Max Planck Institute for Chemistry, 55128 Mainz, Germany 10 5 National Observatory of Athens, Institute for Environmental Research & Sustainable Development, 15236 Palea Penteli, Greece 6 Forschungszentrum Jülich, Institute of Energy & Climate Research, IEK-8, D-52425 Jülich, Germany 7 The Cyprus Institute, Nicosia 1645, Cyprus a Now at: Chemical Science Division, Lawrence Berkeley National Laboratory, Berkeley, California, 94611, USA 15 Correspondence to: Allan Bertram ([email protected]) Abstract. Information on the rate of diffusion of organic molecules within secondary organic aerosol (SOA) is needed to accurately predict the effects of SOA on climate and air quality. Often, researchers have predicted diffusion rates of organic molecules within SOA using measurements of viscosity and the Stokes-Einstein relation (D ∝ 1/ where D is the diffusion coefficient and η is viscosity). However, the accuracy of this relation for predicting diffusion in SOA remains uncertain. We 20 measured diffusion coefficients over eight orders in magnitude in proxies of SOA including citric acid, sorbitol, and a sucrose- citric acid mixture. These results were combined with literature data to evaluate the Stokes-Einstein relation for predicting diffusion of organic molecules in SOA. Although almost all the data agrees with the Stokes-Einstein relation within a factor of ten, a fractional Stokes-Einstein relation (D ∝ C/ t ) with t = 0.93 and C = 1.66 is a better model for predicting diffusion of organic molecules in the SOA proxies studied. In addition, based on the output from a chemical transport model, the Stokes- 25 Einstein relation can over predict mixing times of organic molecules within SOA by as much as one order of magnitude at an altitude 3 km, compared to the fractional Stokes-Einstein relation with t = 0.93 and C = 1.66. These differences can be important for predicting growth, evaporation, and reaction rates of SOA in the middle and upper part of the troposphere. These results also have implications for other areas where diffusion of organic molecules within organic-water matrices is important. 1 Introduction 30 Atmospheric aerosols, suspensions of micrometer and sub-micrometer particles in the Earth’s atmosphere, modify climate by interacting with incoming solar radiation and by altering cloud formation and cloud properties (Stocker et al., 2013). These Atmos. Chem. Phys. Discuss., https://doi.org/10.5194/acp-2019-191 Manuscript under review for journal Atmos. Chem. Phys. Discussion started: 1 March 2019 c Author(s) 2019. CC BY 4.0 License.
-
Upload
khangminh22 -
Category
Documents
-
view
2 -
download
0
Transcript of Predictions of diffusion rates of organic molecules in ...

1
Predictions of diffusion rates of organic molecules in secondary
organic aerosols using the Stokes-Einstein and fractional Stokes-
Einstein relations
Erin Evoy1, Adrian M. Maclean1, Grazia Rovelli2,a, Ying Li3, Alexandra P. Tsimpidi4,5, Vlassis A.
Karydis4,6, Saeid Kamal1, Jos Lelieveld4,7, Manabu Shiraiwa3, Jonathan P. Reid2, and Allan K. Bertram1 5
1 Department of Chemistry, University of British Columbia, 2036 Main Mall, Vancouver, BC, V6T 1Z1, Canada 2 School of Chemistry, University of Bristol, Bristol, BS8 1TS, UK 3 Department of Chemistry, University of California, Irvine, California, 92697-2025, USA 4 Atmospheric Chemistry Department, Max Planck Institute for Chemistry, 55128 Mainz, Germany 10 5 National Observatory of Athens, Institute for Environmental Research & Sustainable Development, 15236 Palea Penteli,
Greece 6 Forschungszentrum Jülich, Institute of Energy & Climate Research, IEK-8, D-52425 Jülich, Germany 7 The Cyprus Institute, Nicosia 1645, Cyprus
a Now at: Chemical Science Division, Lawrence Berkeley National Laboratory, Berkeley, California, 94611, USA 15
Correspondence to: Allan Bertram ([email protected])
Abstract. Information on the rate of diffusion of organic molecules within secondary organic aerosol (SOA) is needed to
accurately predict the effects of SOA on climate and air quality. Often, researchers have predicted diffusion rates of organic
molecules within SOA using measurements of viscosity and the Stokes-Einstein relation (D ∝ 1/ where D is the diffusion
coefficient and η is viscosity). However, the accuracy of this relation for predicting diffusion in SOA remains uncertain. We 20
measured diffusion coefficients over eight orders in magnitude in proxies of SOA including citric acid, sorbitol, and a sucrose-
citric acid mixture. These results were combined with literature data to evaluate the Stokes-Einstein relation for predicting
diffusion of organic molecules in SOA. Although almost all the data agrees with the Stokes-Einstein relation within a factor
of ten, a fractional Stokes-Einstein relation (D ∝ C/t) with t = 0.93 and C = 1.66 is a better model for predicting diffusion of
organic molecules in the SOA proxies studied. In addition, based on the output from a chemical transport model, the Stokes-25
Einstein relation can over predict mixing times of organic molecules within SOA by as much as one order of magnitude at an
altitude 3 km, compared to the fractional Stokes-Einstein relation with t = 0.93 and C = 1.66. These differences can be
important for predicting growth, evaporation, and reaction rates of SOA in the middle and upper part of the troposphere. These
results also have implications for other areas where diffusion of organic molecules within organic-water matrices is important.
1 Introduction 30
Atmospheric aerosols, suspensions of micrometer and sub-micrometer particles in the Earth’s atmosphere, modify climate by
interacting with incoming solar radiation and by altering cloud formation and cloud properties (Stocker et al., 2013). These
Atmos. Chem. Phys. Discuss., https://doi.org/10.5194/acp-2019-191Manuscript under review for journal Atmos. Chem. Phys.Discussion started: 1 March 2019c© Author(s) 2019. CC BY 4.0 License.

2
aerosols also negatively impact air quality and may facilitate the long-range transport of pollutants (Friedman et al., 2014; Mu
et al., 2018; Shrivastava et al., 2017a; Vaden et al., 2011; Zelenyuk et al., 2012).
A large fraction of atmospheric aerosols are classified as secondary organic aerosol (SOA). SOA is formed in the atmosphere
when volatile organic molecules, emitted from both anthropogenic and natural sources, are oxidized and partition to the particle
phase (Ervens et al., 2011; Hallquist et al., 2009). The exact chemical composition of SOA remains uncertain; however, 5
measurements have shown that SOA contains 1000s of different organic molecules and the average oxygen-to-carbon (O:C)
ratio of organic molecules in SOA ranges from 0.3 – 1.0 or even higher (Aiken et al., 2008; Cappa and Wilson, 2012; Chen et
al., 2009; DeCarlo et al., 2008; Ditto et al., 2018; Hawkins et al., 2010; Heald et al., 2010; Jimenez et al., 2009; Laskin et al.,
2018; Ng et al., 2010; Nozière et al., 2015; Takahama et al., 2011; Tsimpidi et al., 2018). SOA also contains a range of organic
functional groups including alcohols and carboxylic acids (Claeys et al., 2004, 2007; Edney et al., 2005; Fisseha et al., 2004; 10
Glasius et al., 2000; Liu et al., 2011; Surratt et al., 2006, 2010).
In order to accurately predict the impacts of SOA on climate, air quality, and the long-range transport of pollutants, information
on the rate of diffusion of organic molecules within SOA is needed. For example, predictions of SOA mass, which has major
implications for climate and air quality, can vary by an order of magnitude when the molecular diffusion rate of organic
molecules in SOA is varied in models (Shiraiwa and Seinfeld, 2012). Predictions of SOA particle size, which has implications 15
for climate and visibility, also varies significantly in simulations as the diffusion rate of organic molecules is varied (Zaveri et
al., 2014, 2018). Reactivity and photochemistry in SOA can also depend on diffusion rates (Davies and Wilson, 2015; Hinks
et al., 2016; Lakey et al., 2016; Li et al., 2015; Lignell et al., 2014; Liu et al., 2018; Shiraiwa et al., 2011; Zhang et al., 2018;
Zhou et al., 2013).
In some cases, diffusion rates of organic molecules in SOA have been measured or inferred from experiments (Abramson et 20
al., 2013; Liu et al., 2016; Perraud et al., 2012; Ullmann et al., 2019; Ye et al., 2016). However, in most cases researchers have
predicted diffusion rates of organic molecules within SOA using measurements of viscosities and the Stokes-Einstein relation
(Booth et al., 2014; Hosny et al., 2013; Koop et al., 2011; Maclean et al., 2017; Power et al., 2013; Renbaum-Wolff et al.,
2013; Shiraiwa et al., 2011; Song et al., 2015, 2016a). This is due to the development and application of several techniques
which can measure viscosity of ambient aerosol or small volumes in the laboratory (Grayson et al., 2015; Pajunoja et al., 2014; 25
Renbaum-Wolff et al., 2013; Song et al., 2016b; Virtanen et al., 2010). The Stokes-Einstein relation (Eq. 1) states that diffusion
is inversely related to viscosity:
𝐷 =𝑘𝑇
6𝜋𝜂𝑅𝐻 (1)
30
where D is the diffusion coefficient, k is the Boltzmann constant, T is the temperature in Kelvin, RH is the hydrodynamic radius
of the diffusing species, and η is the viscosity of the matrix. Until now, only a few studies have investigated the accuracy of
the Stokes-Einstein relation for predicting diffusion coefficients of organic molecules in SOA, and almost all of these studies
Atmos. Chem. Phys. Discuss., https://doi.org/10.5194/acp-2019-191Manuscript under review for journal Atmos. Chem. Phys.Discussion started: 1 March 2019c© Author(s) 2019. CC BY 4.0 License.

3
relied on sucrose as a proxy for SOA particles (Bastelberger et al., 2017; Chenyakin et al., 2017; Price et al., 2016). Sucrose
was used as a proxy for SOA in these studies because 1) sucrose has an O:C ratio similar to that of highly oxidized components
of SOA and 2) viscosity and diffusion data for sucrose existed in the literature (mainly from the food science literature, as well
as from Power et al. (2013), who reported viscosities far outside the range of what had previously been reported. However,
studies with other proxies of SOA are required to determine if the Stokes-Einstein relation can accurately represent the 5
diffusion of organic molecules in SOA, and to more accurately predict the role of SOA in climate, air quality, and transport of
pollutants (Reid et al., 2018; Shrivastava et al., 2017b).
In the following we expand on the previous studies with sucrose matrices by testing the Stokes-Einstein relation in the
following proxies for SOA: 2-hydroxypropane-1,2,3-tricarboxylic acid (i.e. citric acid), 1,2,3,4,5,6-hexanol (i.e. sorbitol), and
a mixture of citric acid and sucrose. These proxies have functional groups that have been identified in SOA, and O:C ratios 10
similar to those ratios found in the most highly oxidized components of SOA in the atmosphere (1.16, 1.0, and 0.92 for citric
acid, sorbitol, and sucrose respectively). To test the Stokes-Einstein relation, we first determined diffusion coefficients of
fluorescent organic molecules as a function of water activity (aw) in these SOA proxies using rectangular area fluorescence
recovery after photobleaching (rFRAP; Deschout et al., 2010). Studies as a function of aw are critical because as the relative
humidity (RH) changes in the atmosphere, aw (and hence water content) in SOA will change to maintain equilibrium with the 15
gas phase. The diffusing organic molecules studied in this work were the fluorescent organic molecules rhodamine 6G and
cresyl violet (Fig. S1). Details of the experiments are given in the Methods section. The measured diffusion coefficients are
compared with predictions using literature viscosities (Rovelli et al., n.d.; Song et al., 2016b) and the Stokes-Einstein relation.
The results from the current study are then combined with literature diffusion (Champion et al., 1997; Chenyakin et al., 2017;
Price et al., 2016; Rampp et al., 2000; Ullmann et al., 2019) and viscosity (Först et al., 2002; Grayson et al., 2017; Green and 20
Perry, 2007; Haynes, 2015; Lide, 2001; Migliori et al., 2007; Power et al., 2013; Quintas et al., 2006; Rovelli et al., n.d.;
Swindells et al., 1958; Telis et al., 2007; Ullmann et al., 2019) data to assess the ability of the Stokes-Einstein relation to
predict diffusion of organic molecules in atmospheric SOA. The ability of the fractional Stokes-Einstein relation (see below)
to predict diffusion is also tested.
In addition to atmospheric applications, the results from this study have implications for other areas where diffusion of organic 25
molecules within organic-water matrices is important, such as the cryopreservation of proteins (Cicerone and Douglas, 2012;
Fox, 1995; Miller et al., 1998), the storage of food products (Champion et al., 1997; van der Sman and Meinders, 2013), and
the viability of pharmaceutical formulations (Shamblin et al., 1999). The results also have implications for our understanding
of the properties of deeply supercooled and supersaturated glass forming solutions, which are important for a wide range of
applications and technologies (Angell, 1995; Debenedetti and Stillinger, 2001; Ediger, 2000). 30
Atmos. Chem. Phys. Discuss., https://doi.org/10.5194/acp-2019-191Manuscript under review for journal Atmos. Chem. Phys.Discussion started: 1 March 2019c© Author(s) 2019. CC BY 4.0 License.

4
2 Methods
2.1 Preparation of fluorescent organic-water films
The technique used here to measure diffusion coefficients required thin films containing the organic matrix (i.e. citric acid or
sorbitol or a mixture of citric acid and sucrose), water, and trace amounts of the diffusing organic molecules (i.e. fluorescent
organic molecules). Citric acid (≥ 99 % purity) and sorbitol (≥ 98 % purity) were purchased from Sigma-Aldrich and used as 5
received. Rhodamine 6G chloride (≥ 99 % purity), and cresyl violet acetate (≥75 % purity) were purchased from Acros
Organics and Santa Cruz Biotechnology respectively, and used as received. Solutions containing the organic matrix, water,
and the diffusing molecules were prepared gravimetrically. 55 weight percent citric acid solutions and 30 weight percent
sorbitol and sucrose-citric acid solutions were used to prepare the citric acid, sorbitol, and sucrose-citric acid thin films,
respectively. A mass ratio of 60:40 sucrose to citric acid was used for the sucrose-citric acid matrix. The concentrations of 10
rhodamine 6G and cresyl violet in the solutions were 0.06 mM and 0.08 mM, respectively. After the solutions were prepared
gravimetrically, the solutions were passed through a 0.02 µm filter (Whatman™) to eliminate impurities. Droplets of the
solution were placed on cleaned siliconized hydrophobic slides (Hampton Research), by either nebulizing the bulk solution or
using the tip of a sterilized needle (BD PrecisionGlide Needle, BD, Franklin Lakes, NJ, USA). The generated droplets ranged
in diameter from 100 to 1300 µm. After the droplets were located on the hydrophobic slides, the hydrophobic slides were 15
placed inside sealed glass containers with a controlled water activity (aw). The aw was set by placing saturated inorganic salt
solutions with known aw values within the sealed glass containers. The aw values used ranged from 0.14 to 0.86. When the aw
values were higher than 0.86 recovery times were too fast to measure with the rFRAP setup. When the aw values were lower
than 0.14 or 0.23, depending on the organic solute, solution droplets often crystallized. The slides holding the droplets were
left inside the sealed glass containers for an extended period of time to allow the droplets to equilibrate with the surrounding 20
aw. The method used to calculate equilibration times is explained in Section S1, and conditioning times for all samples are
given in Tables S1-S4. Experimental times for conditioning were a minimum of three times longer than calculated equilibration
times.
After the droplets on the slides reached equilibrium with the aw of the airspace over the salt solution, the sealed glass containers
holding the slides and conditioned droplets were brought into a Glove Bag™ (Glas-Col). The aw within the Glove Bag was 25
controlled using a humidified flow of N2 gas and monitored using a handheld hygrometer. The aw within the Glove Bag™ was
set to the same aw as used to condition the droplets, to prevent the droplets from being exposed to an unknown and uncontrolled
aw. To form a thin film, aluminum spacers were placed on the siliconized glass slide holding the droplets, followed by another
siliconized glass slide, which sandwiched the droplets and the aluminum spacers. The thickness of the aluminum spacers (30-
50 µm) determined the thickness of the thin film. The two slides were sealed together by vacuum grease spread around the 30
perimeter of one slide before sandwiching (see Fig. S2 in the Supplement for details).
The organic matrices were often supersaturated with respect to crystalline citric acid or sorbitol. Nevertheless, crystallization
was not observed in most cases until aw values ≲ 0.14 - 0.23, depending on the organic matrix, because the solutions were
Atmos. Chem. Phys. Discuss., https://doi.org/10.5194/acp-2019-191Manuscript under review for journal Atmos. Chem. Phys.Discussion started: 1 March 2019c© Author(s) 2019. CC BY 4.0 License.

5
passed through a 0.02 µm filter and the glass slides used to make the thin films were covered with a hydrophobic coating.
Filtration likely removed heterogeneous nuclei that could initiate crystallization and the hydrophobic coating reduced the
ability of these surfaces to promote heterogeneous nucleation (Bodsworth et al., 2010; Pant et al., 2006; Price et al., 2014;
Wheeler and Bertram, 2012). In the cases where crystallization was observed, determined using optical microscopy, the films
were not used in rFRAP experiments. An image demonstrating the difference in appearance between crystallized and non-5
crystallized droplets is given in Figure S3.
2.2 Rectangular area fluorescence recovery after photobleaching (rFRAP) technique and extraction of diffusion
coefficients
Diffusion coefficients were measured using the rFRAP technique reported by Deschout et al. (2010). The technique uses a 10
confocal laser scanning microscope to photobleach fluorescent molecules in a specified volume of an organic thin film
containing fluorescent molecules. The photobleaching event initially reduces the fluorescence intensity within the bleached
volume. Afterward, the fluorescence intensity within the photobleached volume recovers due to the diffusion of fluorescent
molecules from outside of the bleached region. From the time-dependent recovery of the fluorescence intensity, diffusion
coefficients are determined. All diffusion coefficients reported here were measured at 295 ± 1 K. 15
The rFRAP experiments were performed on a Zeiss Axio Observer LSM 510MP laser scanning microscope with a 10X, 0.3
NA objective and a pinhole setting between 80 and 120 μm. Photobleaching and the subsequent acquisition of recovery images
were done using a 543 nm helium–neon (HeNe) laser. The bleach parameters (e.g. laser intensity, iterations, laser speed) were
varied for each experiment so that the fraction of fluorescent molecules being photobleached in the bleach region was about
30%. A photobleaching of about 30% was suggested by Deschout et al. (2010), who report that diffusion coefficients measured 20
with the rFRAP technique are independent of the extent of photobleaching up to a bleach depth of 50%.
Bleached areas ranged from 20 µm2 to 400 µm2. The geometry of the photobleached region was a square with sides of length
lx and ly ranging from 4.5 to 20 µm. Smaller bleach areas were used in experiments where diffusion was slower in order to
shorten recovery times. Chenyakin et al. (2017) showed that measured diffusion coefficients varied by less than the
experimental uncertainty when the bleach area was varied from 1 µm2 to 2500 µm2 in sucrose-water films. Similarly, Deschout 25
et al. (2010) demonstrated that diffusion coefficients varied by less than the experimental uncertainty when the bleach area
was varied from approximately 4 µm2 to 144 µm2 in sucrose-water films. The images collected during a rFRAP experiment
represent fluorescence intensities as a function of x and y coordinates, and are taken at regular time intervals after
photobleaching. An example of images recorded during a rFRAP experiment are shown in Fig. S4. Every image taken
following the photobleaching event is normalized relative to an image taken before photobleaching. To reduce noise, all images 30
are downsized by averaging from a resolution of 512x512 pixels to 128x128 pixels.
The mathematical description of the fluorescence intensity as a function of position (x and y) and time (t) after photobleaching
a rectangular area in a thin film, was given by Deschout et al. (2010):
Atmos. Chem. Phys. Discuss., https://doi.org/10.5194/acp-2019-191Manuscript under review for journal Atmos. Chem. Phys.Discussion started: 1 March 2019c© Author(s) 2019. CC BY 4.0 License.

6
𝐹(𝑥,𝑦,𝑡)
𝐹0(𝑥,𝑦)= [1 −
𝐾0
4· (erf (
𝑥+𝑙𝑥2
√𝑟2+4𝐷𝑡) − erf (
𝑥−𝑙𝑥2
√𝑟2+4𝐷𝑡)) · (erf (
𝑦+𝑙𝑦
2
√𝑟2+4𝐷𝑡) − erf (
𝑦−𝑙𝑦
2
√𝑟2+4𝐷𝑡))] (2)
where F(x,y,t) is the fluorescence intensity at position x and y after a time t, F0(x,y) corresponds to the initial intensity at
position x and y before photobleaching, K0 is related to the initial fraction of photobleached molecules in the bleach region, 5
and lx and ly correspond to the size (length) of the bleach region in the x and y directions. The parameter r represents the
resolution of the microscope, t is the time after photobleaching, and D is the diffusion coefficient.
The images collected during a rFRAP experiment were fit to Eq. (2) using a Matlab script (The Mathworks, Natick, MA,
USA), with the terms K0, and r2 + 4Dt left as free parameters. An additional normalization factor was also left as a free
parameter, and returned a value close to 1, since images recorded after photobleaching were normalized to the pre-bleach 10
image before fitting. To determine the bleach width (lx, ly), Eq. (2) was fit to the first five images recorded after photobleaching
a film with the bleach width (lx, ly) left as a free parameter. The bleach width returned by the fit to the first five frames was
then used as input in Eq. (2) to analyze the full set of images.
From the fitting procedure, a value for r2+4Dt was determined for each image, and was plotted as a function of time after
photobleaching. A straight line was then fit to the r2+4Dt vs. t plot, and from the slope of the line D was calculated. An example 15
is shown in Fig. S5. As the intensity of the fluorescence in the bleached region recovers, the noise in the data become large
relative to the difference in fluorescence intensity between the bleached and non-bleached regions (i.e. signal). To ensure we
only use data with a reasonable signal to noise, images were not used if this signal was less than 3 the standard deviation of
the noise.
Figure S6 shows a cross section of the fluorescence intensity along the x direction from the data in Fig. S4. To generate the 20
cross-sectional view, at each position x, the measured fluorescence intensity is averaged over the width of the photobleached
region in the y direction (black squares). Also included in Fig. S6 are cross-sectional views of the calculated fluorescence
intensity along the x direction generated from the fitting procedure (solid red lines). To generate the line, Eq. (2) was first fit
to the images. The resulting fit was then averaged over the width of the photobleached region in the y direction. The good
agreement between the measured cross section and the predicted cross section illustrates that Eq. (2) describes the rFRAP data 25
well.
Equation (2) assumes that there is no net diffusion in the axial direction (i.e. z-direction). Deschout et al. (2010) have shown
that Eq. (2) gives accurate diffusion coefficients when the numerical aperture of the microscope is low (≤ 0.45) and the
thickness of the fluorescent films is small (≤ 120 m), which is consistent with the numerical aperture of 0.30 and film thickness
of 30–50 μm used here. 30
Atmos. Chem. Phys. Discuss., https://doi.org/10.5194/acp-2019-191Manuscript under review for journal Atmos. Chem. Phys.Discussion started: 1 March 2019c© Author(s) 2019. CC BY 4.0 License.

7
3 Results and Discussion
3.1 Diffusion coefficients of organic molecules in citric acid, sorbitol, and sucrose-citric acid matrices
The measured diffusion coefficients of organic molecules in matrices of citric acid, sorbitol, and sucrose-citric acid as a
function of water activity (aw) are shown in Fig. 1 (and listed in Tables S1-S4). The measured diffusion coefficients depend
strongly on aw for all three proxies of SOA. As aw increases from 0.23 (0.14 in one case) to 0.86, diffusion coefficients increase 5
by between five and eight orders of magnitude. This dependence on aw arises from the plasticizing influence of water on these
matrices; as aw increases (and hence the water content increases) the viscosity decreases (Koop et al., 2011). In addition, the
measured diffusion coefficients varied significantly from matrix to matrix at the same aw (Fig. 1). As an example, at aw = 0.23
the diffusion coefficient of rhodamine 6G is about four orders of magnitude larger in citric acid compared to the sucrose-citric
acid mixture. 10
We also considered the relationship between log (D) – log (kT/6πRH) and log (η), a comparison that allows the identification
of deviations from the Stokes-Einstein relation (Fig. 2). By plotting log (D) – log (kT/6πRH) we account for differences in
hydrodynamic radii of diffusing species and small differences in temperature (within a range of 6 K). The viscosity
corresponding to each measured diffusion coefficient was determined from relationships between aw and viscosity developed
from literature data (Figs. S7-S9). The solid line in Fig. 2 corresponds to the relationship between log (D) – log (kT/6πRH) 15
and log (η) if the Stokes-Einstein relation (Eq. 1) is obeyed. Figure 2 shows that the diffusion coefficients of the fluorescent
organic molecules depend strongly on viscosity, with the diffusion coefficients varying by approximately eight orders of
magnitude as viscosity varied by eight orders of magnitude. If the uncertainties of the measurements are considered, all the
data points except three (89 % of the data) are consistent with predictions from the Stokes-Einstein relation (meaning that the
error bars on the measurements overlap with the solid line in Fig. 2) over eight orders of magnitude change in diffusion 20
coefficients. This finding is remarkable considering the assumptions inherent in the Stokes-Einstein relation (e.g. the diffusing
species is a hard sphere that experiences the fluid as a homogeneous continuum and no slip at the boundary of the diffusing
species).
3.2 Comparison with relevant literature data
Previous studies have used sucrose to evaluate the ability of the Stokes-Einstein relation to predict diffusion coefficients of 25
organic molecules in SOA (Bastelberger et al., 2017; Chenyakin et al., 2017; Price et al., 2016). In addition, a recent study
(Ullmann et al., 2019) used SOA generated in the laboratory from the oxidation of limonene, subsequently exposed to NH3 (g)
(i.e. brown limonene SOA) to evaluate the Stokes-Einstein relation. Although studies with SOA generated in the laboratory
are especially interesting, that previous study was limited to relatively low viscosities (≤ 102 Pa s), where a breakdown of the
Stokes-Einstein relation is less expected. In Fig. 3a we have combined the results from the current study (i.e. the results from 30
Fig. 2) with previous studies of diffusion and viscosity in sucrose and brown limonene SOA (Champion et al., 1997; Chenyakin
et al., 2017; Price et al., 2016; Rampp et al., 2000; Ullmann et al., 2019). To be consistent with the current study, we have not
Atmos. Chem. Phys. Discuss., https://doi.org/10.5194/acp-2019-191Manuscript under review for journal Atmos. Chem. Phys.Discussion started: 1 March 2019c© Author(s) 2019. CC BY 4.0 License.

8
included data in Fig. 3a if the diffusion coefficients and viscosities were measured at, or calculated using, temperatures outside
the range of 292 – 298 K and if the radius of the diffusing molecule was smaller than to the radius of the molecules in the fluid
matrix. Previous work has shown that the Stokes-Einstein relation is not applicable when the radius of the diffusing molecule
is less than the radius of the matrix molecules, and those cases are beyond the scope of this work (Bastelberger et al., 2017;
Davies and Wilson, 2016; Marshall et al., 2016; Power et al., 2013; Price et al., 2016; Shiraiwa et al., 2011). Additional details 5
for the data shown in Fig. 3a are included in section S2 and Table S5.
Based on Fig. 3a the diffusion coefficients of the organic molecules in sucrose matrices and matrices consisting of SOA
generated in the laboratory depend strongly on viscosity, similar to the results shown in Fig. 2. In addition, almost all the data
agree with the Stokes-Einstein relation (solid line in Fig. 3a) within a factor of ten. This finding is in stark contrast with the 10
diffusion of water in organic-water mixtures, where much larger deviations between measured and predicted diffusion
coefficients were observed over the same viscosity range (Davies and Wilson, 2016; Marshall et al., 2016; Price et al., 2016).
In Fig. 3b, we show the differences between the measured values and the solid line in Fig. 3a as a function of viscosity. If the
Stokes-Einstein relation describes the data well, these differences (i.e. residuals) should be scattered symmetrically about zero,
while the magnitude of the residuals should be less than or equal to the uncertainty in the measurements. However, the residuals 15
are skewed to be positive, especially as viscosity increases, with measured diffusion faster than expected based on the Stokes-
Einstein relation. Figure 3b suggests that the Stokes-Einstein relation may not be the optimal model for predicting diffusion
coefficients in SOA, particularly at high viscosities.
3.3 Fractional Stokes-Einstein relation
When deviation from the Stokes-Einstein relation has been observed in the past, a fractional Stokes-Einstein relation (D ∝ 20
1/t, where t is an empirical fit parameter) has often been used to quantify the relationship between diffusion and viscosity.
For example, Price et al. (2016) showed that a fractional Stokes-Einstein relation can accurately represent the diffusion of
sucrose in a sucrose matrix over a wide range of viscosities (from roughly 100 – 106 Pa s) with t = 0.90. Building on that work,
the data in Fig. 3a were fit to the following fractional Stokes-Einstein relation:
𝐷 = 𝐶𝑘𝑇
6𝜋𝜂𝑡𝑅𝐻 (3) 25
where t and C are empirical fit parameters. When fitting Eq. 3 to the data, we used the additional constraint that log (D) – log
(kT/6πRH) equals 3 when the viscosity is 10-3 Pa s, which is equivalent to assuming the Stokes-Einstein relation is valid at a
viscosity of 10-3 Pa s (roughly the viscosity of water). The best fit to the data (represented by the dashed line in Fig. 3a) resulted
in a t value of 0.93 and a C value of 1.66.
In Fig. 3c, we plotted the difference between the measured values shown in Fig. 3a and the predicted values using the fractional 30
Stokes-Einstein relation (dashed line in Fig. 3a). These residuals are more symmetrically scattered about zero compared to
the residuals plotted in Fig. 3b. In addition, the sum-of-squared residuals (r2) in Fig 3c was less than the sum-of-squared
Atmos. Chem. Phys. Discuss., https://doi.org/10.5194/acp-2019-191Manuscript under review for journal Atmos. Chem. Phys.Discussion started: 1 March 2019c© Author(s) 2019. CC BY 4.0 License.

9
residuals in Fig. 3b (r2 = 10.8 compared to 19.7). This suggests that the fractional Stokes-Einstein relation with an exponent
value of t = 0.93 and C = 1.66 may be the better model for predicting diffusion coefficients of organic molecules in SOA
compared to the traditional Stokes-Einstein relation.
3.4 Implications for atmospheric mixing times
To investigate the atmospheric implications of these results, we considered the mixing times of organic molecules within SOA 5
in the atmosphere as a function of viscosity using both the Stokes-Einstein relation (Eq. 1) and the fractional Stokes-Einstein
relation (Eq. 3) with t = 0.93 and C = 1.66. Mixing times were calculated with the following equation (Seinfeld and Pandis,
2006; Shiraiwa et al., 2011):
𝜏𝑚𝑖𝑥 =𝑑𝑝
2
4𝜋2𝐷 (4)
where τmix is the characteristic mixing time, dp is the SOA particle diameter, and D is the diffusion coefficient. τmix corresponds 10
to the time at which the concentration of the diffusing molecules at the centre of the particle deviates by less than a factor of
1/e from the equilibrium concentration. We assumed a dp of 200 nm, which is roughly the median diameter in the volume
distribution of ambient SOA (Martin et al., 2010; Pöschl et al., 2010; Riipinen et al., 2011). We assumed a value of 0.38 nm
for RH based on literature values for molecular weight (175 g mol-1; Huff Hartz et al., 2005) and the density (1.3 g cm-3; Chen
and Hopke, 2009; Saathoff et al., 2009) of SOA molecules, and assuming a spherical symmetry of the diffusing species. 15
Figure 4 shows the calculated mixing times of 200 nm particles as a function of the viscosity of the matrix. The mixing time
of 1 hour is highlighted, since when calculating the growth and evaporation of SOA and the long-range transport of pollutants
using chemical transport models, a mixing times of < 1 hour for organic molecules within SOA is often assumed (Hallquist et
al., 2009). At a viscosity of 5 x 10⁶ Pa s, the mixing time is > 1 hour based on the Stokes-Einstein relation, but remains < 1
hour based on the fractional Stokes-Einstein relation. Furthermore, at high viscosities > 5 x 10⁶ Pa s, the mixing times predicted 20
with the traditional Stokes-Einstein relation are at least a factor of 5 greater than those predicted with the fractional Stokes-
Einstein relation.
Recently, Shiraiwa et al. (2017) estimated mixing times of organic molecules in SOA particles in the global atmosphere using
the global chemistry climate model EMAC (Jöckel et al., 2006) and the organic module ORACLE (Tsimpidi et al., 2014).
Glass transition temperatures of SOA compounds were predicted based on molar mass and the O:C ratio of SOA components, 25
followed by predictions of viscosity. Diffusion coefficients and mixing times were predicted using the Stokes-Einstein
relation. To further explore the implications of our results, we calculated mixing times of organic molecules in SOA globally
using the same approach as Shiraiwa et al. (2017) and compared predictions using the Stokes-Einstein relation and predictions
using the fractional Stokes-Einstein relation with t = 0.93 and C = 1.66. Shown in Fig. 5 are results from these calculations.
At all latitudes at the surface, the mixing times are well below the 1 hour often assumed in chemical transport models, 30
regardless if the Stokes-Einstein relation or the fractional Stokes-Einstein relation is used (Fig. 5a). On the other hand, at an
altitude of approximately 1.4 km, the latitudes where the mixing times exceed 1 hr will depend on whether the Stokes-Einstein
Atmos. Chem. Phys. Discuss., https://doi.org/10.5194/acp-2019-191Manuscript under review for journal Atmos. Chem. Phys.Discussion started: 1 March 2019c© Author(s) 2019. CC BY 4.0 License.
10
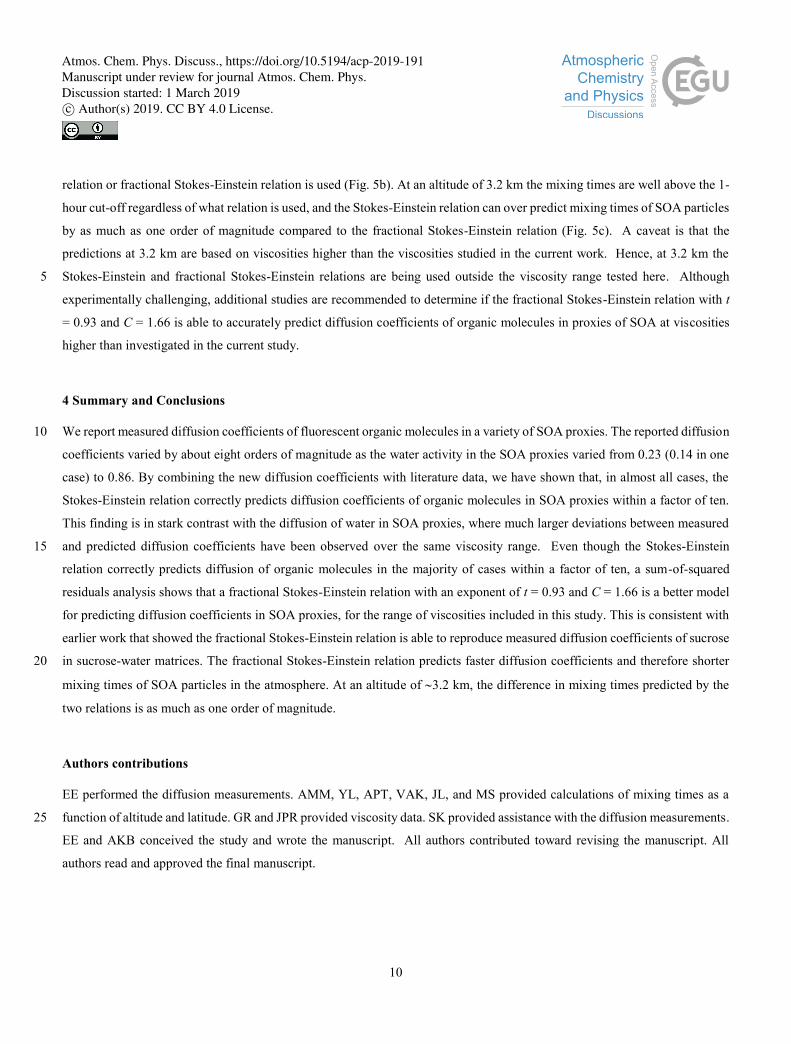
relation or fractional Stokes-Einstein relation is used (Fig. 5b). At an altitude of 3.2 km the mixing times are well above the 1-
hour cut-off regardless of what relation is used, and the Stokes-Einstein relation can over predict mixing times of SOA particles
by as much as one order of magnitude compared to the fractional Stokes-Einstein relation (Fig. 5c). A caveat is that the
predictions at 3.2 km are based on viscosities higher than the viscosities studied in the current work. Hence, at 3.2 km the
Stokes-Einstein and fractional Stokes-Einstein relations are being used outside the viscosity range tested here. Although 5
experimentally challenging, additional studies are recommended to determine if the fractional Stokes-Einstein relation with t
= 0.93 and C = 1.66 is able to accurately predict diffusion coefficients of organic molecules in proxies of SOA at viscosities
higher than investigated in the current study.
4 Summary and Conclusions
We report measured diffusion coefficients of fluorescent organic molecules in a variety of SOA proxies. The reported diffusion 10
coefficients varied by about eight orders of magnitude as the water activity in the SOA proxies varied from 0.23 (0.14 in one
case) to 0.86. By combining the new diffusion coefficients with literature data, we have shown that, in almost all cases, the
Stokes-Einstein relation correctly predicts diffusion coefficients of organic molecules in SOA proxies within a factor of ten.
This finding is in stark contrast with the diffusion of water in SOA proxies, where much larger deviations between measured
and predicted diffusion coefficients have been observed over the same viscosity range. Even though the Stokes-Einstein 15
relation correctly predicts diffusion of organic molecules in the majority of cases within a factor of ten, a sum-of-squared
residuals analysis shows that a fractional Stokes-Einstein relation with an exponent of t = 0.93 and C = 1.66 is a better model
for predicting diffusion coefficients in SOA proxies, for the range of viscosities included in this study. This is consistent with
earlier work that showed the fractional Stokes-Einstein relation is able to reproduce measured diffusion coefficients of sucrose
in sucrose-water matrices. The fractional Stokes-Einstein relation predicts faster diffusion coefficients and therefore shorter 20
mixing times of SOA particles in the atmosphere. At an altitude of 3.2 km, the difference in mixing times predicted by the
two relations is as much as one order of magnitude.
Authors contributions
EE performed the diffusion measurements. AMM, YL, APT, VAK, JL, and MS provided calculations of mixing times as a
function of altitude and latitude. GR and JPR provided viscosity data. SK provided assistance with the diffusion measurements. 25
EE and AKB conceived the study and wrote the manuscript. All authors contributed toward revising the manuscript. All
authors read and approved the final manuscript.
Atmos. Chem. Phys. Discuss., https://doi.org/10.5194/acp-2019-191Manuscript under review for journal Atmos. Chem. Phys.Discussion started: 1 March 2019c© Author(s) 2019. CC BY 4.0 License.

11
Conflicts of interest
There are no conflicts of interest to declare.
Acknowledgements
This work was funded by the Natural Sciences and Engineering Research Council of Canada. Diffusion measurements were
performed in the LASIR facility at UBC, funded by the Canadian Foundation for Innovation. APT acknowledges support from 5
a DFG individual grant program (project reference TS 335/2-1). GR and JPR gratefully acknowledge support from NERC
through the award of grants NE/N013700/1 and NE/M004600/1. MS and YL acknowledge funding from the U.S. National
Science Foundation (AGS-1654104) and the U.S. Department of Energy (DE-SC0018349).
Atmos. Chem. Phys. Discuss., https://doi.org/10.5194/acp-2019-191Manuscript under review for journal Atmos. Chem. Phys.Discussion started: 1 March 2019c© Author(s) 2019. CC BY 4.0 License.

12
Figures
Figure 1. Measured diffusion coefficients of fluorescent organic molecules in various organic matrices as a function of water activity
(aw). X-error bars represent the uncertainty in the measured aw (0.025) and y-error bars correspond to two times the standard
deviation in the diffusion measurements. Each data point is the average of a minimum of four measurements. Indicated in the legend 5 are the fluorescent organic molecules studied and the corresponding matrices.
Atmos. Chem. Phys. Discuss., https://doi.org/10.5194/acp-2019-191Manuscript under review for journal Atmos. Chem. Phys.Discussion started: 1 March 2019c© Author(s) 2019. CC BY 4.0 License.

13
Figure 2. Plot of log (D) – log (kT/6πRH) as a function of log () for measurements shown in Fig. 1. Viscosities () were determined
from relationships between viscosity and aw (Figs. S7 –S9). T corresponds to the experimental temperature and RH corresponds to
the radius of each diffusing species (see Table S5). The x-error bars were calculated using the uncertainty in aw at which the samples
were conditioned (± 0.025) and uncertainties in the viscosity-aw parameterizations. The y-error bars represent 2 times the standard 5 deviation of the diffusion measurements. The black line represents the relationship between log (D) – log (kT/6πRH) and log ()
predicted by the Stokes-Einstein relation (slope = -1). Shown at the bottom of the figure are various substances and their approximate
room temperature viscosities to provide context, as in Koop et al. (2011). The image of tar pitch is part of an image from the pitch
drop experiment (image courtesy of Wikimedia Commons, GNU Free Documentation License, University of Queensland, John
Mainstone). 10
Atmos. Chem. Phys. Discuss., https://doi.org/10.5194/acp-2019-191Manuscript under review for journal Atmos. Chem. Phys.Discussion started: 1 March 2019c© Author(s) 2019. CC BY 4.0 License.

14
Figure 3. a) Plot of log (D) – log (kT/6πRH) as a function of log () for new measurements reported in this work and literature data.
Indicated in the legend are the diffusing organic molecules studied and the corresponding matrices. T corresponds to the
experimental temperature of each diffusion measurement and RH corresponds to the radius of each diffusing species (Section S2 and
Table S5). The symbols represent measured data points. The solid line represents the relationship between log (D) – log (kT/6πRH) 5 and log () predicted by the Stokes-Einstein relation, while the dashed line represents the relationship between log (D) – log
(kT/6πRH) and log () predicted by a fractional Stokes-Einstein relation with slope = -0.93 and intercept 0.219 (equal to the log of
the C value, 1.66). Panels b) and c) are plots of the differences (i.e. residuals) between measured and predicted values of log (D) –
log(kT/6πRH) using the Stokes-Einstein relation and the fractional Stokes-Einstein relation, respectively. The sum-of-squared
residuals for the Stokes-Einstein relation is 19.7 and the sum-of-squared residuals for the fractional Stokes-Einstein relation is 10.8. 10
Atmos. Chem. Phys. Discuss., https://doi.org/10.5194/acp-2019-191Manuscript under review for journal Atmos. Chem. Phys.Discussion started: 1 March 2019c© Author(s) 2019. CC BY 4.0 License.

15
Figure 4. Mixing times of organic molecules within a 200 nm particle as a function of viscosity using the Stokes-Einstein relation
(black line) and a fractional Stokes-Einstein relation (red line). The dashed lines indicate that the relations were extrapolated to
viscosities beyond the tested range of viscosities (≥ 4 x 10⁶ Pa s).
Atmos. Chem. Phys. Discuss., https://doi.org/10.5194/acp-2019-191Manuscript under review for journal Atmos. Chem. Phys.Discussion started: 1 March 2019c© Author(s) 2019. CC BY 4.0 License.

16
Figure 5. Mixing times (in hours) of organic molecules in 200 nm SOA particles at a) the surface, b) 850 hPa or 1.4 km altitude,
and c) 700 hPa or 3.2 km altitude, using diffusion coefficients calculated with the Stokes-Einstein relation (solid black lines) and
the fractional Stokes-Einstein relation (dashed black lines). A one-hour mixing time, which is often assumed in chemical transport
models, is also indicated in each figure with a horizontal dotted line. 5
References
Abramson, E., Imre, D., Beránek, J., Wilson, J. and Zelenyuk, A.: Experimental determination of chemical diffusion within
secondary organic aerosol particles., Phys. Chem. Chem. Phys., 15(8), 2983–2991, doi:10.1039/c2cp44013j, 2013.
Aiken, A. C., Decarlo, P. F., Kroll, J. H., Worsnop, D. R., Huffman, J. A., Docherty, K. S., Ulbrich, I. M., Mohr, C., Kimmel,
J. R., Sueper, D., Sun, Y., Zhang, Q., Trimborn, A., Northway, M., Ziemann, P. J., Canagaratna, M. R., Onasch, T. B., Alfarra, 10
M. R., Prevot, A. S. H., Dommen, J., Duplissy, J., Metzger, A., Baltensperger, U. and Jimenez, J. L.: O/C and OM/OC ratios
of primary, secondary, and ambient organic aerosols with high-resolution time-of-flight aerosol mass spectrometry, Environ.
Sci. Technol., 42(12), 4478–4485, doi:10.1021/es703009q, 2008.
Angell, C. A.: Formation of Glasses Fom Liquids and Biopolymers, Science, 267(5206), 1924–1935,
doi:10.1126/science.267.5206.1924, 1995. 15
Bastelberger, S., Krieger, U. K., Luo, B. and Peter, T.: Diffusivity measurements of volatile organics in levitated viscous
aerosol particles, Atmos. Chem. Phys., 17(13), 8453–8471, doi:10.5194/acp-17-8453-2017, 2017.
Bodsworth, A., Zobrist, B. and Bertram, A. K.: Inhibition of efflorescence in mixed organic-inorganic particles at temperatures
less than 250 K., Phys. Chem. Chem. Phys., 12(38), 12259–12266, doi:10.1039/c0cp00572j, 2010.
Booth, A. M., Murphy, B., Riipinen, I., Percival, C. J. and Topping, D. O.: Connecting bulk viscosity measurements to kinetic 20
limitations on attaining equilibrium for a model aerosol composition, Environ. Sci. Technol., 48(16), 9298–9305,
doi:10.1021/es501705c, 2014.
Cappa, C. D. and Wilson, K. R.: Multi-generation gas-phase oxidation, equilibrium partitioning, and the formation and
Atmos. Chem. Phys. Discuss., https://doi.org/10.5194/acp-2019-191Manuscript under review for journal Atmos. Chem. Phys.Discussion started: 1 March 2019c© Author(s) 2019. CC BY 4.0 License.
17
evolution of secondary organic aerosol, Atmos. Chem. Phys., 12(20), 9505–9528, doi:10.5194/acp-12-9505-2012, 2012.
Champion, D., Hervet, H., Blond, G., LeMeste, M. and Simatos, D.: Translational diffusion in sucrose solutions in the vicinity
of their glass transition temperature, J. Phys. Chem. B., 101, 10674–10679, doi:10.1021/jp971899i, 1997.
Chen, Q., Farmer, D. K., Schneider, J., Zorn, S. R., Heald, C. L., Karl, T. G., Guenther, A., Allan, J. D., Robinson, N., Coe,
H., Kimmel, J. R., Pauliquevis, T., Borrmann, S., Pöschl, U., Andreae, M. O., Artaxo, P., Jimenez, J. L. and Martin, S. T.: 5
Mass spectral characterization of submicron biogenic organic particles in the Amazon Basin, Geophys. Res. Lett., 36(20),
L20806, doi:10.1029/2009GL039880, 2009.
Chen, X. and Hopke, P. K.: Secondary organic aerosol from α-pinene ozonolysis in dynamic chamber system, Indoor Air,
19(4), 335–345, doi:10.1111/j.1600-0668.2009.00596.x, 2009.
Chenyakin, Y., Ullmann, D. A., Evoy, E., Renbaum-Wolff, L., Kamal, S. and Bertram, A. K.: Diffusion coefficients of organic 10
molecules in sucrose-water solutions and comparison with Stokes-Einstein predictions, Atmos. Chem. Phys., 17, 2423–2435,
doi:10.5194/acp-17-2423-2017, 2017.
Cicerone, M. T. and Douglas, J. F.: Beta-Relaxation governs protein stability in sugar-glass matrices, Soft Matter, 8, 2983–
2991, doi:10.1039/c2sm06979b, 2012.
Claeys, M., Graham, B., Vas, G., Wang, W., Vermeylen, R., Pashynska, V., Cafmeyer, J., Guyon, P., Andreae, M. O., Artaxo, 15
P. and Maenhaut, W.: Formation of secondary organic aerosols through photooxidation of isoprene, Science, 303(5661), 1173–
1176, doi:10.1126/science.1092805, 2004.
Claeys, M., Szmigielski, R., Kourtchev, I., Van Der Veken, P., Vermeylen, R., Maenhaut, W., Jaoui, M., Kleindienst, T. E.,
Lewandowski, M., Offenberg, J. H. and Edney, E. O.: Hydroxydicarboxylic acids: Markers for secondary organic aerosol from
the photooxidation of α-pinene, Environ. Sci. Technol., 41(5), 1628–1634, doi:10.1021/es0620181, 2007. 20
Davies, J. F. and Wilson, K. R.: Nanoscale interfacial gradients formed by the reactive uptake of OH radicals onto viscous
aerosol surfaces, Chem. Sci., 6(12), 7020–7027, doi:10.1039/c5sc02326b, 2015.
Davies, J. F. and Wilson, K. R.: Raman Spectroscopy of Isotopic Water Diffusion in Ultraviscous, Glassy, and Gel States in
Aerosol by Use of Optical Tweezers, Anal. Chem., 88(4), 2361–2366, doi:10.1021/acs.analchem.5b04315, 2016.
Debenedetti, P. G. and Stillinger, F. H.: Supercooled liquids and the glass transition, Nature, 410, 259–267, 25
doi:10.1038/35065704, 2001.
DeCarlo, P. F., Dunlea, E. J., Kimmel, J. R., Aiken, A. C., Sueper, D., Crounse, J., Wennberg, P. O., Emmons, L., Shinozuka,
Y., Clarke, A., Zhou, J., Tomlinson, J., Collins, D. R., Knapp, D., Weinheimer, A. J., Montzka, D. D., Campos, T. and Jimenez,
J. L.: Fast airborne aerosol size and chemistry measurements above Mexico City and Central Mexico during the MILAGRO
campaign, Atmos. Chem. Phys., 8(14), 4027–4048, doi:10.5194/acp-8-4027-2008, 2008. 30
Deschout, H., Hagman, J., Fransson, S., Jonasson, J., Rudemo, M., Lorén, N. and Braeckmans, K.: Straightforward FRAP for
quantitative diffusion measurements with a laser scanning microscope., Opt. Express, 18(22), 22886–22905,
doi:10.1364/OE.18.022886, 2010.
Ditto, J. C., Barnes, E. B., Khare, P., Takeuchi, M., Joo, T., Bui, A. A. T., Lee-Taylor, J., Eris, G., Chen, Y., Aumont, B.,
Atmos. Chem. Phys. Discuss., https://doi.org/10.5194/acp-2019-191Manuscript under review for journal Atmos. Chem. Phys.Discussion started: 1 March 2019c© Author(s) 2019. CC BY 4.0 License.

18
Jimenez, J. L., Ng, N. L., Griffin, R. J. and Gentner, D. R.: An omnipresent diversity and variability in the chemical
composition of atmospheric functionalized organic aerosol, Commun. Chem., 1(1), 75, doi:10.1038/s42004-018-0074-3, 2018.
Ediger, M. D.: Spatially Heterogeneous Dynamics in Supercooled Liquids, Annu. Rev. Phys. Chem., 51, 99–128,
doi:10.1146/annurev.physchem.51.1.99, 2000.
Edney, E. O., Kleindienst, T. E., Jaoui, M., Lewandowski, M., Offenberg, J. H., Wang, W. and Claeys, M.: Formation of 2-5
methyl tetrols and 2-methylglyceric acid in secondary organic aerosol from laboratory irradiated isoprene/NOX/SO2/air
mixtures and their detection in ambient PM2.5 samples collected in the eastern United States, Atmos. Environ., 39(29), 5281–
5289, doi:10.1016/j.atmosenv.2005.05.031, 2005.
Ervens, B., Turpin, B. J. and Weber, R. J.: Secondary organic aerosol formation in cloud droplets and aqueous particles
(aqSOA): A review of laboratory, field and model studies, Atmos. Chem. Phys., 11(21), 11069–11102, doi:10.5194/acp-11-10
11069-2011, 2011.
Fisseha, R., Dommen, J., Sax, M., Paulsen, D., Kalberer, M., Maurer, R., Höfler, F., Weingartner, E. and Baltensperger, U.:
Identification of organic acids in secondary organic aerosol and the corresponding gas phase from chamber experiments, Anal.
Chem., 76(22), 6535–6540, doi:10.1021/ac048975f, 2004.
Först, P., Werner, F. and Delgado, A.: On the pressure dependence of the viscosity of aqueous sugar solutions, Rheol. Acta, 15
41(4), 369–374, doi:10.1007/s00397-002-0238-y, 2002.
Fox, K. C.: Putting Proteins Under Glass, Science, 267(5206), 1922–1923, doi:10.1126/science.7701317, 1995.
Friedman, C. L., Pierce, J. R. and Selin, N. E.: Assessing the influence of secondary organic versus primary carbonaceous
aerosols on long-range atmospheric polycyclic aromatic hydrocarbon transport, Environ. Sci. Technol., 48(6), 3293–3302,
doi:10.1021/es405219r, 2014. 20
Glasius, M., Lahaniati, M., Calogirou, A., Di Bella, D., Jensen, N. R., Hjorth, J., Kotzias, D. and Larsen, B. R.: Carboxylic
acids in secondary aerosols from oxidation of cyclic monoterpenes by ozone, Environ. Sci. Technol., 34(6), 1001–1010,
doi:10.1021/es990445r, 2000.
Grayson, J. W., Song, M., Sellier, M. and Bertram, A. K.: Validation of the poke-flow technique combined with simulations
of fluid flow for determining viscosities in samples with small volumes and high viscosities, Atmos. Meas. Tech., 8(6), 2463–25
2472, doi:10.5194/amt-8-2463-2015, 2015.
Grayson, J. W., Evoy, E., Song, M., Chu, Y., Maclean, A., Nguyen, A., Upshur, M. A., Ebrahimi, M., Chan, C. K., Geiger, F.
M., Thomson, R. J. and Bertram, A. K.: The effect of hydroxyl functional groups and molar mass on the viscosity of non-
crystalline organic and organic-water particles, Atmos. Chem. Phys., 17(13), 8509–8524, doi:10.5194/acp-17-8509-2017,
2017. 30
Green, D. W. and Perry, R. H.: Perry’s Chemical Engineers’ Handbook, 8th ed., The McGraw-Hill Companies, New York,
NY., 2007.
Hallquist, M., Wenger, J. C., Baltensperger, U., Rudich, Y., Simpson, D., Claeys, M., Dommen, J., Donahue, N. M., George,
C., Goldstein, a. H., Hamilton, J. F., Herrmann, H., Hoffmann, T., Iinuma, Y., Jang, M., Jenkin, M. E., Jimenez, J. L., Kiendler-
Atmos. Chem. Phys. Discuss., https://doi.org/10.5194/acp-2019-191Manuscript under review for journal Atmos. Chem. Phys.Discussion started: 1 March 2019c© Author(s) 2019. CC BY 4.0 License.

19
Scharr, A., Maenhaut, W., McFiggans, G., Mentel, T. F., Monod, A., Prévôt, a. S. H., Seinfeld, J. H., Surratt, J. D., Szmigielski,
R. and Wildt, J.: The formation, properties and impact of secondary organic aerosol: current and emerging issues, Atmos.
Chem. Phys., 9(14), 5155–5236, doi:10.5194/acp-9-5155-2009, 2009.
Hawkins, L. N., Russell, L. M., Covert, D. S., Quinn, P. K. and Bates, T. S.: Carboxylic acids, sulfates, and organosulfates in
processed continental organic aerosol over the southeast Pacific Ocean during VOCALS-REx 2008, J. Geophys. Res., 115, 5
D13201, doi:10.1029/2009JD013276, 2010.
Haynes, W. M.: CRC Handbook of Chemistry and Physics, 96th ed., CRC Press/Taylor and Francis Group, Boca Raton, FL.,
2015.
Heald, C. L., Kroll, J. H., Jimenez, J. L., Docherty, K. S., Decarlo, P. F., Aiken, A. C., Chen, Q., Martin, S. T., Farmer, D. K.
and Artaxo, P.: A simplified description of the evolution of organic aerosol composition in the atmosphere, Geophys. Res. 10
Lett., 37(8), L08803, doi:10.1029/2010GL042737, 2010.
Hinks, M. L., Brady, M. V, Lignell, H., Song, M., Grayson, J. W., Bertram, A., Lin, P., Laskin, A., Laskin, J. and Nizkorodov,
S. A.: Effect of Viscosity on Photodegradation Rates in Complex Secondary Organic Aerosol Materials, Phys. Chem. Chem.
Phys., 18(13), 8785–8793, doi:10.1039/C5CP05226B, 2016.
Hosny, N. A., Fitzgerald, C., Tong, C., Kalberer, M., Kuimova, M. K. and Pope, F. D.: Fluorescent lifetime imaging of 15
atmospheric aerosols: a direct probe of aerosol viscosity, Faraday Discuss., 165, 343–356, doi:10.1039/c3fd00041a, 2013.
Huff Hartz, K. E., Rosenørn, T., Ferchak, S. R., Raymond, T. M., Bilde, M., Donahue, N. M. and Pandis, S. N.: Cloud
condensation nuclei activation of monoterpene and sesquiterpene secondary organic aerosol, J. Geophys. Res. D Atmos.,
110(14), 1–8, doi:10.1029/2004JD005754, 2005.
Jimenez, J. L., Canagaratna, M. R., Donahue, N. M., Prevot, A. S. H., Zhang, Q., Kroll, J. H., DeCarlo, P. F., Allan, J. D., Coe, 20
H., Ng, N. L., Aiken, A. C., Docherty, K. S., Ulbrich, I. M., Grieshop, A. P., Robinson, A. L., Duplissy, J., Smith, J. D., Wilson,
K. R., Lanz, V. A., Hueglin, C., Sun, Y. L., Tian, J., Laaksonen, A., Raatikainen, T., Rautiainen, J., Vaattovaara, P., Ehn, M.,
Kumala, M., Tomlinson, J. M., Collins, D. R., Cubison, M. J., Dunlea, E. J., Huffman, J. A., Onasch, T. B., Alfarra, M. R.,
Williams, P. I., Bower, K., Kondo, Y., Schneider, J., Drewnick, F., Borrmann, S., Weimer, S., Demerjian, K., Salcedo, D.,
Cottrell, L., Griffin, R., Takami, A., Miyoshi, T., Hatakeyama, S., Shimono, A., Sun, J. Y., Zhang, Y. M., Dzepina, K., Kimmel, 25
J. R., Sueper, D., Jayne, J. T., Herndon, S. C., Trimborn, A. M., Williams, L. R., Wood, E. C., Middlebrook, A. M., Kolb, C.
E., Baltensperger, U. and Worsnop, D. R.: Evolution of Organic Aerosols in the Atmosphere, Science, 326(5959), 1525–1529,
doi:10.1126/science.1180353, 2009.
Jöckel, P., Tost, H., Pozzer, A., Brühl, C., Buchholz, J., Ganzeveld, L., Hoor, P., Kerkweg, A., Lawrence, M. G., Sander, R.,
Steil, B., Stiller, G., Tanarhte, M., Taraborrelli, D., van Aardenne, J. and Lelieveld, J.: The atmospheric chemistry general 30
circulation model ECHAM5/MESSy1: consistent simulation of ozone from the surface to the mesosphere, Atmos. Chem. Phys.
Discuss., 6(4), 6957–7050, doi:10.5194/acp-6-5067-2006, 2006.
Koop, T., Bookhold, J., Shiraiwa, M. and Pöschl, U.: Glass transition and phase state of organic compounds: dependency on
molecular properties and implications for secondary organic aerosols in the atmosphere, Phys. Chem. Chem. Phys., 13(43),
Atmos. Chem. Phys. Discuss., https://doi.org/10.5194/acp-2019-191Manuscript under review for journal Atmos. Chem. Phys.Discussion started: 1 March 2019c© Author(s) 2019. CC BY 4.0 License.

20
19238–19255, doi:10.1039/c1cp22617g, 2011.
Lakey, P. S. J., Berkemeier, T., Krapf, M., Dommen, J., Steimer, S. S., Whalley, L. K., Ingham, T., Baeza-Romero, M. T.,
Pöschl, U., Shiraiwa, M., Ammann, M. and Heard, D. E.: The effect of viscosity and diffusion on the HO2uptake by sucrose
and secondary organic aerosol particles, Atmos. Chem. Phys., 16(20), 13035–13047, doi:10.5194/acp-16-13035-2016, 2016.
Laskin, J., Laskin, A. and Nizkorodov, S. A.: Mass Spectrometry Analysis in Atmospheric Chemistry, Anal. Chem., 90(1), 5
166–189, doi:10.1021/acs.analchem.7b04249, 2018.
Li, Y. J., Liu, P., Gong, Z., Wang, Y., Bateman, A. P., Bergoend, C., Bertram, A. K. and Martin, S. T.: Chemical reactivity
and liquid/nonliquid states of secondary organic material, Environ. Sci. Technol., 49(22), 13264–13274,
doi:10.1021/acs.est.5b03392, 2015.
Lide, D. R., Ed.: CRC Handbook of Chemistry and Physics, 82nd ed., CRC Press, Boca Raton, FL., 2001. 10
Lignell, H., Hinks, M. L. and Nizkorodov, S. A.: Exploring matrix effects on photochemistry of organic aerosols, Proc. Natl.
Acad. Sci. U. S. A., 111(38), 13780–13785, doi:10.1073/pnas.1322106111, 2014.
Liu, P., Li, Y. J., Wang, Y., Gilles, M. K., Zaveri, R. A., Bertram, A. K. and Martin, S. T.: Lability of secondary organic
particulate matter, Proc. Natl. Acad. Sci., 113(45), 12643–12648, doi:10.1073/pnas.1603138113, 2016.
Liu, P., Li, Y. J., Wang, Y., Bateman, A. P., Zhang, Y., Gong, Z., Bertram, A. K. and Martin, S. T.: Highly Viscous States 15
Affect the Browning of Atmospheric Organic Particulate Matter, ACS Cent. Sci., 4(2), 207–215,
doi:10.1021/acscentsci.7b00452, 2018.
Liu, S., Day, D. A., Shields, J. E. and Russell, L. M.: Ozone-driven daytime formation of secondary organic aerosol containing
carboxylic acid groups and alkane groups, Atmos. Chem. Phys., 11(16), 8321–8341, doi:10.5194/acp-11-8321-2011, 2011.
Maclean, A. M., Butenhoff, C. L., Grayson, J. W., Barsanti, K., Jimenez, J. L. and Bertram, A. K.: Mixing times of organic 20
molecules within secondary organic aerosol particles: A global planetary boundary layer perspective, Atmos. Chem. Phys.,
17(21), 13037–13048, doi:10.5194/acp-17-13037-2017, 2017.
Marshall, F. H., Miles, R. E. H., Song, Y.-C., Ohm, P. B., Power, R. M., Reid, J. P. and Dutcher, C. S.: Diffusion and reactivity
in ultraviscous aerosol and the correlation with particle viscosity, Chem. Sci., 7(2), 1298–1308, doi:10.1039/C5SC03223G,
2016. 25
Martin, S. T., Andreae, M. O., Althausen, D., Artaxo, P., Baars, H., Borrmann, S., Chen, Q., Farmer, D. K., Guenther, A.,
Gunthe, S. S., Jimenez, J. L., Karl, T., Longo, K., Manzi, A., Müller, T., Pauliquevis, T., Petters, M. D., Prenni, A. J., Pöschl,
U., Rizzo, L. V., Schneider, J., Smith, J. N., Swietlicki, E., Tota, J., Wang, J., Wiedensohler, A. and Zorn, S. R.: An overview
of the Amazonian Aerosol Characterization Experiment 2008 (AMAZE-08), Atmos. Chem. Phys., 10(23), 11415–11438,
doi:10.5194/acp-10-11415-2010, 2010. 30
Migliori, M., Gabriele, D., Di Sanzo, R., De Cindio, B. and Correra, S.: Viscosity of multicomponent solutions of simple and
complex sugars in water, J. Chem. Eng. Data, 52, 1347–1353, doi:10.1021/je700062x, 2007.
Miller, D. P., Anderson, R. E. and De Pablo, J. J.: Stabilization of lactate dehydrogenase following freeze-thawing and vacuum-
drying in the presence of trehalose and borate, Pharm. Res., 15(8), 1215–1221, doi:10.1023/A:1011987707515, 1998.
Atmos. Chem. Phys. Discuss., https://doi.org/10.5194/acp-2019-191Manuscript under review for journal Atmos. Chem. Phys.Discussion started: 1 March 2019c© Author(s) 2019. CC BY 4.0 License.

21
Mu, Q., Shiraiwa, M., Octaviani, M., Ma, N., Ding, A., Su, H., Lammel, G., Pöschl, U. and Cheng, Y.: Temperature effect on
phase state and reactivity controls atmospheric multiphase chemistry and transport of PAHs, Sci. Adv., 4(3),
doi:10.1126/sciadv.aap7314, 2018.
Ng, N. L., Canagaratna, M. R., Zhang, Q., Jimenez, J. L., Tian, J., Ulbrich, I. M., Kroll, J. H., Docherty, K. S., Chhabra, P. S.,
Bahreini, R., Murphy, S. M., Seinfeld, J. H., Hildebrandt, L., Donahue, N. M., Decarlo, P. F., Lanz, V. A., Prévôt, A. S. H., 5
Dinar, E., Rudich, Y. and Worsnop, D. R.: Organic aerosol components observed in Northern Hemispheric datasets from
Aerosol Mass Spectrometry, Atmos. Chem. Phys., 10(10), 4625–4641, doi:10.5194/acp-10-4625-2010, 2010.
Nozière, B., Kalberer, M., Claeys, M., Allan, J., D’Anna, B., Decesari, S., Finessi, E., Glasius, M., Grgić, I., Hamilton, J. F.,
Hoffmann, T., Iinuma, Y., Jaoui, M., Kahnt, A., Kampf, C. J., Kourtchev, I., Maenhaut, W., Marsden, N., Saarikoski, S.,
Schnelle-Kreis, J., Surratt, J. D., Szidat, S., Szmigielski, R. and Wisthaler, A.: The Molecular Identification of Organic 10
Compounds in the Atmosphere: State of the Art and Challenges, Chem. Rev., 115(10), 3919–3983, doi:10.1021/cr5003485,
2015.
Pajunoja, A., Malila, J., Hao, L., Joutsensaari, J., Lehtinen, K. E. J. and Virtanen, A.: Estimating the Viscosity Range of SOA
Particles Based on Their Coalescence Time, Aerosol Sci. Technol., 48(2), doi:10.1080/02786826.2013.870325, 2014.
Pant, A., Parsons, M. T. and Bertram, A. K.: Crystallization of aqueous ammonium sulfate particles internally mixed with soot 15
and kaolinite: Crystallization relative humidities and nucleation rates, J. Phys. Chem. A, 110(28), 8701–8709,
doi:10.1021/jp060985s, 2006.
Perraud, V., Bruns, E. A., Ezell, M. J., Johnson, S. N., Yu, Y., Alexander, M. L., Zelenyuk, A., Imre, D., Chang, W. L.,
Dabdub, D., Pankow, J. F. and Finlayson-Pitts, B. J.: Nonequilibrium atmospheric secondary organic aerosol formation and
growth, Proc. Natl. Acad. Sci. U. S. A., 109, 2836–2841, doi:10.1073/pnas.1119909109, 2012. 20
Pöschl, U., Martin, S. T., Sinha, B., Chen, Q., Gunthe, S. S., Huffman, J. A., Borrmann, S., Farmer, D. K., Garland, R. M.,
Helas, G., Jimenez, J. L., King, S. M., Manzi, A., Mikhailov, E., Pauliquevis, T., Petters, M. D., Prenni, A. J., Roldin, P., Rose,
D., Schneider, J., Su, H., Zorn, S. R., Artaxo, P. and Andreae, M. O.: Rainforest Aerosols as Biogenic Nuclei of Clouds and
Precipitation in the Amazon, Science, 329, 1513–1517, doi:10.1126/science.1191056, 2010.
Power, R. M., Simpson, S. H., Reid, J. P. and Hudson, A. J.: The transition from liquid to solid-like behaviour in ultrahigh 25
viscosity aerosol particles, Chem. Sci., 4(6), 2597–2604, doi:10.1039/C3SC50682G, 2013.
Price, H. C., Murray, B. J., Mattsson, J., O’Sullivan, D., Wilson, T. W., Baustian, K. J. and Benning, L. G.: Quantifying water
diffusion in high-viscosity and glassy aqueous solutions using a Raman isotope tracer method, Atmos. Chem. Phys. Discuss.,
14, 3817–3830, doi:10.5194/acpd-13-29375-2013, 2014.
Price, H. C., Mattsson, J. and Murray, B. J.: Sucrose diffusion in aqueous solution, Phys. Chem. Chem. Phys., 18, 19207–30
19216, doi:10.1039/C6CP03238A, 2016.
Quintas, M., Brandão, T. R. S., Silva, C. L. M. and Cunha, R. L.: Rheology of supersaturated sucrose solutions, J. Food Eng.,
77(4), 844–852, doi:10.1016/j.jfoodeng.2005.08.011, 2006.
Rampp, M., Buttersack, C. and Luedemann, H. D.: c,T-dependence of the viscosity and the self-diffusion coefficients in some
Atmos. Chem. Phys. Discuss., https://doi.org/10.5194/acp-2019-191Manuscript under review for journal Atmos. Chem. Phys.Discussion started: 1 March 2019c© Author(s) 2019. CC BY 4.0 License.

22
aqueous carbohydrate solutions, Carbohydr. Res., 328, 561–572, doi:10.1016/S0008-6215(00)00141-5, 2000.
Reid, J. P., Bertram, A. K., Topping, D. O., Laskin, A., Martin, S. T., Petters, M. D., Pope, F. D. and Rovelli, G.: The viscosity
of atmospherically relevant organic particles, Nat. Commun., 9, 1–14, doi:10.1038/s41467-018-03027-z, 2018.
Renbaum-Wolff, L., Grayson, J. W., Bateman, A. P., Kuwata, M., Sellier, M., Murray, B. J., Shilling, J. E., Martin, S. T. and
Bertram, A. K.: Viscosity of α-pinene secondary organic material and implications for particle growth and reactivity., Proc. 5
Natl. Acad. Sci. U. S. A., 110(20), 8014–8019, doi:10.1073/pnas.1219548110, 2013.
Riipinen, I., Pierce, J. R., Yli-Juuti, T., Nieminen, T., Haekkinen, S., Ehn, M., Junninen, H., Lehtipalo, K., Petaejae, T., Slowik,
J., Chang, R., Shantz, N. C., Abbatt, J., Leaitch, W. R., Kerminen, V. M., Worsnop, D. R., Pandis, S. N., Donahue, N. M. and
Kulmala, M.: Organic condensation: A vital link connecting aerosol formation to cloud condensation nuclei (CCN)
concentrations, Atmos. Chem. Phys., 11, 3865–3878, doi:10.5194/acp-11-3865-2011, 2011. 10
Rovelli, G., Song, Y. C., Maclean, A. M., Topping, D. O., Bertram, A. K. and Reid, J. P.: Comparison of Approaches for
Measuring and Predicting the Viscosity of Ternary Component Aerosol Particles, Submitted to Anal. Chem., n.d.
Saathoff, H., Naumann, K.-H., Möhler, O., Jonsson, Å. M., Hallquist, M., Kiendler-Scharr, A., Mentel, T. F., Tillmann, R. and
Schurath, U.: Temperature dependence of yields of secondary organic aerosols from the ozonolysis of α-pinene and limonene,
Atmos. Chem. Phys. Discuss., 8(4), 15595–15664, doi:10.5194/acpd-8-15595-2008, 2009. 15
Seinfeld, J. H. and Pandis, S. N.: Atmospheric Chemistry and Physics: From Air Pollution to Climate Change, Wiley-
Interscience, Hoboken, New Jersey., 2006.
Shamblin, S. L., Tang, X., Chang, L., Hancock, B. C. and Pikal, M. J.: Characterization of the time scales of molecular motion
in pharmaceutically important glasses, J. Phys. Chem. B, 103(20), 4113–4121, doi:10.1021/jp983964+, 1999.
Shiraiwa, M. and Seinfeld, J. H.: Equilibration timescale of atmospheric secondary organic aerosol partitioning, Geophys. Res. 20
Lett., 39(24), 1–6, doi:10.1029/2012GL054008, 2012.
Shiraiwa, M., Ammann, M., Koop, T. and Poschl, U.: Gas uptake and chemical aging of semisolid organic aerosol particles,
Proc. Natl. Acad. Sci. U. S. A., 108(27), 11003–11008, doi:10.1073/pnas.1103045108, 2011.
Shiraiwa, M., Li, Y., Tsimpidi, A. P., Karydis, V. A., Berkemeier, T., Pandis, S. N., Lelieveld, J., Koop, T. and Pöschl, U.:
Global distribution of particle phase state in atmospheric secondary organic aerosols, Nat. Commun., 8, 1–7, 25
doi:10.1038/ncomms15002, 2017.
Shrivastava, M., Lou, S., Zelenyuk, A., Easter, R. C., Corley, R. A., Thrall, B. D., Rasch, P. J., Fast, J. D., Massey Simonich,
S. L., Shen, H. and Tao, S.: Global long-range transport and lung cancer risk from polycyclic aromatic hydrocarbons shielded
by coatings of organic aerosol, Proc. Natl. Acad. Sci., 114(6), 1246–1251, doi:10.1073/pnas.1618475114, 2017.
Shrivastava, M., Cappa, C. D., Fan, J., Goldstein, A. H., Guenther, A. B., Jimenez, J. L., Kuang, C., Laskin, A., Martin, S. T., 30
Ng, N. L., Petaja, T., Pierce, J. R., Rasch, P. J., Roldin, P., Seinfeld, J. H., Shilling, J., Smith, J. N., Thornton, J. A., Volkamer,
R., Wang, J., Worsnop, D. R., Zaveri, R. A., Zelenyuk, A. and Zhang, Q.: Recent advances in understanding secondary organic
aerosol: Implications for global climate forcing, Rev. Geophys., 55(2), 509–559, doi:10.1002/2016RG000540, 2017.
van der Sman, R. G. M. and Meinders, M. B. J.: Moisture diffusivity in food materials, Food Chem., 138, 1265–1274,
Atmos. Chem. Phys. Discuss., https://doi.org/10.5194/acp-2019-191Manuscript under review for journal Atmos. Chem. Phys.Discussion started: 1 March 2019c© Author(s) 2019. CC BY 4.0 License.

23
doi:http://dx.doi.org/10.1016/j.foodchem.2012.10.062, 2013.
Song, M., Liu, P. F., Hanna, S. J., Li, Y. J., Martin, S. T. and Bertram, A. K.: Relative humidity-dependent viscosities of
isoprene-derived secondary organic material and atmospheric implications for isoprene-dominant forests, Atmos. Chem. Phys.,
15(9), 5145–5159, doi:10.5194/acp-15-5145-2015, 2015.
Song, M., Liu, P. F., Hanna, S. J., Zaveri, R. A., Potter, K., You, Y., Martin, S. T. and Bertram, A. K.: Relative humidity-5
dependent viscosity of secondary organic material from toluene photo-oxidation and possible implications for organic
particulate matter over megacities, Atmos. Chem. Phys., 16(14), 8817–8830, doi:10.5194/acp-16-8817-2016, 2016a.
Song, Y. C., Haddrell, A. E., Bzdek, B. R., Reid, J. P., Bannan, T., Topping, D. O., Percival, C. and Cai, C.: Measurements
and predictions of binary component aerosol particle viscosity, J. Phys. Chem. A, 120(41), 8123–8137,
doi:10.1021/acs.jpca.6b07835, 2016b. 10
Stocker, T. F., Qin, D., Plattner, G.-K., Tignor, M. M. B., Allen, S. K., Boschung, J., Nauels, A., Xia, Y., Bex, V. and Midgely,
P. M., Eds.: IPCC Climate Change 2013: The Physical Science Basis. Contribution of Working Group I to the Fifth Assessment
Report of the Intergovernmental Panel on Climate Change, Cambridge University Press, Cambridge, United Kingdom and
New York, NY, USA., 2013.
Surratt, J. D., Murphy, S. M., Kroll, J. H., Ng, N. L., Hildebrandt, L., Sorooshian, A., Szmigielski, R., Vermeylen, R., 15
Maenhaut, W., Claeys, M., Flagan, R. C. and Seinfeld, J. H.: Chemical composition of secondary organic aerosol formed from
the photooxidation of isoprene, J. Phys. Chem. A, 110(31), 9665–9690, doi:10.1021/jp061734m, 2006.
Surratt, J. D., Chan, A. W., Eddingsaas, N. C., Chan, M., Loza, C. L., Kwan, a J., Hersey, S. P., Flagan, R. C., Wennberg, P.
O. and Seinfeld, J. H.: Reactive intermediates revealed in secondary organic aerosol formation from isoprene, Proc. Natl. Acad.
Sci. U. S. A., 107(15), 6640–6645, doi:10.1073/pnas.0911114107, 2010. 20
Swindells, J. F., Snyder, C. F., Hardy, R. C. and Golden, P. E.: Viscosities of sucrose solutions at various temperatures: Tables
of recalculated values., 1958.
Takahama, S., Schwartz, R. E., Russell, L. M., MacDonald, A. M., Sharma, S. and Leaitch, W. R.: Organic functional groups
in aerosol particles from burning and non-burning forest emissions at a high-elevation mountain site, Atmos. Chem. Phys.,
11(13), 6367–6386, doi:10.5194/acp-11-6367-2011, 2011. 25
Telis, V. R. N., Telis-Romero, J., Mazzotti, H. B. and Gabas, A. L.: Viscosity of aqueous carbohydrate solutions at different
temperatures and concentrations, Int. J. Food Prop., 10(1), 185–195, doi:10.1080/10942910600673636, 2007.
Tsimpidi, A. P., Karydis, V. A., Pozzer, A., Pandis, S. N. and Lelieveld, J.: ORACLE (v1.0): Module to simulate the organic
aerosol composition and evolution in the atmosphere, Geosci. Model Dev., 7(6), 3153–3172, doi:10.5194/gmd-7-3153-2014,
2014. 30
Tsimpidi, A. P., Karydis, V. A., Pozzer, A., Pandis, S. N. and Lelieveld, J.: ORACLE 2-D (v2.0): An efficient module to
compute the volatility and oxygen content of organic aerosol with a global chemistry-climate model, Geosci. Model Dev.,
11(8), 3369–3389, doi:10.5194/gmd-11-3369-2018, 2018.
Ullmann, D. A., Hinks, M. L., Maclean, A., Butenhoff, C., Grayson, J., Barsanti, K., Jimenez, J. L., Nizkorodov, S. A., Kamal,
Atmos. Chem. Phys. Discuss., https://doi.org/10.5194/acp-2019-191Manuscript under review for journal Atmos. Chem. Phys.Discussion started: 1 March 2019c© Author(s) 2019. CC BY 4.0 License.

24
S. and Bertram, A. K.: Viscosities, diffusion coefficients, and mixing times of intrinsic fluorescent organic molecules in brown
limonene secondary organic aerosol and tests of the Stokes-Einstein equation, Atmos. Chem. Phys., 19, 1491–1503,
doi:10.5194/acp-19-1491-2019, 2019.
Vaden, T. D., Imre, D., Beránek, J., Shrivastava, M. and Zelenyuk, A.: Evaporation kinetics and phase of laboratory and
ambient secondary organic aerosol., Proc. Natl. Acad. Sci. U. S. A., 108(6), 2190–2195, doi:10.1073/pnas.1013391108, 2011. 5
Virtanen, A., Joutsensaari, J., Koop, T., Kannosto, J., Yli-Pirilä, P., Leskinen, J., Mäkelä, J. M., Holopainen, J. K., Pöschl, U.,
Kulmala, M., Worsnop, D. R. and Laaksonen, A.: An amorphous solid state of biogenic secondary organic aerosol particles,
Nature, 467(7317), 824–827, doi:10.1038/nature09455, 2010.
Wheeler, M. J. and Bertram, A. K.: Deposition nucleation on mineral dust particles: A case against classical nucleation theory
with the assumption of a single contact angle, Atmos. Chem. Phys., 12(2), 1189–1201, doi:10.5194/acp-12-1189-2012, 2012. 10
Ye, Q., Robinson, E. S., Ding, X., Ye, P., Sullivan, R. C. and Donahue, N. M.: Mixing of secondary organic aerosols versus
relative humidity, Proc. Natl. Acad. Sci., 113(45), 12649–12654, doi:10.1073/pnas.1604536113, 2016.
Zaveri, R. A., Easter, R. C., Shilling, J. E. and Seinfeld, J. H.: Modeling kinetic partitioning of secondary organic aerosol and
size distribution dynamics: Representing effects of volatility, phase state, and particle-phase reaction, Atmos. Chem. Phys.,
14(10), 5153–5181, doi:10.5194/acp-14-5153-2014, 2014. 15
Zaveri, R. A., Shilling, J. E., Zelenyuk, A., Liu, J., Bell, D. M., D’Ambro, E. L., Gaston, C. J., Thornton, J. A., Laskin, A.,
Lin, P., Wilson, J., Easter, R. C., Wang, J., Bertram, A. K., Martin, S. T., Seinfeld, J. H. and Worsnop, D. R.: Growth Kinetics
and Size Distribution Dynamics of Viscous Secondary Organic Aerosol, Environ. Sci. Technol., 52(3), 1191–1199,
doi:10.1021/acs.est.7b04623, 2018.
Zelenyuk, A., Imre, D., Beránek, J., Abramson, E., Wilson, J. and Shrivastava, M.: Synergy between secondary organic 20
aerosols and long-range transport of polycyclic aromatic hydrocarbons., Environ. Sci. Technol., 46(22), 12459–12466,
doi:10.1021/es302743z, 2012.
Zhang, Y., Chen, Y., Lambe, A. T., Olson, N. E., Lei, Z., Craig, R. L., Zhang, Z., Gold, A., Onasch, T. B., Jayne, J. T.,
Worsnop, D. R., Gaston, C. J., Thornton, J. A., Vizuete, W., Ault, A. P. and Surratt, J. D.: Effect of the Aerosol-Phase State
on Secondary Organic Aerosol Formation from the Reactive Uptake of Isoprene-Derived Epoxydiols (IEPOX), Environ. Sci. 25
Technol. Lett., 5(3), 167–174, doi:10.1021/acs.estlett.8b00044, 2018.
Zhou, S., Shiraiwa, M., McWhinney, R. D., Pöschl, U. and Abbatt, J. P. D.: Kinetic limitations in gas-particle reactions arising
from slow diffusion in secondary organic aerosol, Faraday Discuss., 165, 391, doi:10.1039/c3fd00030c, 2013.
Atmos. Chem. Phys. Discuss., https://doi.org/10.5194/acp-2019-191Manuscript under review for journal Atmos. Chem. Phys.Discussion started: 1 March 2019c© Author(s) 2019. CC BY 4.0 License.