ING Group Annual Report
424
2013 ING Group Annual Report Simpler, stronger, sustainable
-
Upload
khangminh22 -
Category
Documents
-
view
1 -
download
0
Transcript of ING Group Annual Report
WWW.ING.COM
2013ING Group Annual Report
Simpler, stronger, sustainable


> Continued focus on customer centricity
> Sustainability of our business model solidified
> Our funding position improved and our capital and liquidity positions remained strong
> ING posted 2013 underlying net profit of EUR 3,255 million, up 22% from 2012
> Risk costs up in a weak economic year in many of the markets in which we operate
> Significant progress made with our restructuring programme in 2013. We have reached the final stage of this process
NN Group N.V., formerly called ING Insurance Topholding N.V., merged with ING Verzekeringen N.V. effective as of 1 March 2014. As a result the legal entity ING Verzekeringen N.V. ceased to exist and NN Group N.V. became the legal successor of ING Verzekeringen N.V. as the holding company of the European and Japanese insurance and investment management operations. In this Annual Report, NN Group will be used to indicate these operations.
1 Wh
o w
e are2 R
epo
rt of th
e Executive B
oard
3 Co
rpo
rate go
vernan
ce4 C
on
solid
ated an
nu
al accou
nts
5 Parent co
mp
any an
nu
al accou
nts
6 Oth
er info
rmatio
n7 A
dd
ition
al info
rmatio
n
Message of the CEO 4ING at a glance 6Key figures 8Composition of the Boards 9ING share 10
Financial and regulatory environment 12Strategy 16Capital management 21Risk management 23Information technology 25
Banking overview 27– Retail Banking 32– Commercial Banking 41Insurance overview 46– NN Group 50
Report of the Supervisory Board 58Corporate governance 62Report of ING Trust Office 74Report of ING Continuity Foundation 77Conformity statement 78
Section 404 Sarbanes-Oxley Act 79Remuneration report 81Works councils 88
Consolidated balance sheet 90Consolidated profit and loss account 91Consolidated statement of comprehensive income 93Consolidated statement of cash flows 94Consolidated statement of changes in equity 96Notes to the consolidated annual accounts 98– Notes to the accounting policies 98 – Notes to the consolidated balance sheet 120
– Notes to the consolidated profit and loss account 156– Notes to the consolidated statement of cash flows 170– Segment reporting 171– Additional notes to the consolidated annual accounts 183Risk management 237Capital management 335
Parent company balance sheet 345Parent company profit and loss account 346Parent company statement of changes in equity 347Accounting policies for the parent company annual accounts 348Notes to the parent company annual accounts 349
Independent auditor’s report 354Proposed appropriation of result 355
Risk factors 356Additional Pillar 3 information 380Financial glossary 411General information 419
3
Contents

Dear reader,Our customers are at the heart of what we do. What they want and what they expect determine the changes and improvements we make. We want to demonstrate with our product and service offering that we can support and advise our customers when it comes to the financial choices they make and the issues they face. We want to make a difference and help our customers get ahead. In doing so, we can contribute to economic growth in the countries where we operate.
to manage their procurement and sales processes. It is a similar story in insurance, where we are introducing new ways of serving customers and improving processes. Insurance Europe is building a multichannel distribution platform to service customers across all channels. In the Czech Republic and Spain we introduced For You, a concept of breast cancer insurance and related services.
Our role as a bank and insurance company goes beyond our primary function of providing financial services. We are part of society, and as such we are committed to help build a financially healthy and sustainable society for citizens, businesses and other organisations. We are committed to be part of the communities we operate in and believe that through the sustainable choices we make today, we can help shape the society of the future.
There are various ways of doing this. For example through our global range of responsible investment funds or responsible investment solutions, or offering products like the ING Savings Account for UNICEF which allows people to save and simultaneously support UNICEF. In our project finance portfolio we focus on renewable sources of energy. We finance companies that want to operate sustainably. An example is the financing of the Butendiek offshore wind farm in Germany, which supplies green energy and makes a major contribution to Germany’s conversion to renewable energy. So we are meeting the growing demand for products that generate good financial returns, while at the same time investing in society and the environment.
Over the past few years, ING Group has made a huge effort to restructure and change, and we continue to do so. This transformation was pursued vigorously by my predecessor, Jan Hommen, whom I succeeded in October.
While working diligently to strengthen our business, we have consistently placed our highest priority on customer centricity and have gained more customers along the way. ING-DiBa for example, welcomed its eight millionth customer in 2013 and is the third-largest retail bank in Germany by number of customers. ING Spain opened its millionth payment account, eight years after the first account was opened there. We are proud that customers choose to do business with us.
Winning The Banker magazine’s “Bank of the Year 2013” awards for the Netherlands, Belgium and Western Europe is a good signal that we are on the right path. Our commercial bank won several high-profile deals and closed major transactions. These are a demonstration of our customers’ trust in our capabilities. Commercial Banking maintained good positions in the league tables and won awards like the “Corporate Deal of the Year Award (Europe)” and “Best Structured Commodity Finance Bank (Global)”.
Also NN Group received several awards, for example in Poland, it was the most customer friendly life insurance company in the Gazeta Bankowa 2013 contest. Investment Management in the Netherlands was awarded for a second year in a row the People’s Choice award for “Best Fund Manager”. All these awards are a recognition of our commitment to support our customers throughout the challenging financial environment.
Internet and mobile banking are expanding rapidly. We are constantly innovating these delivery channels, and now have around 3 million mobile banking customers in 14 countries. We are seeing a transformation in customer interaction, sparked by the growth of online services, and this is just the beginning. This is paving the way for new forms of customer communication. For example, ING Bank Slaski is the first bank in Poland to introduce an online platform for businesses
4 ING Group Annual Report 2013
Message of the CEO

1 Wh
o w
e are2 R
epo
rt of th
e Executive B
oard
3 Co
rpo
rate go
vernan
ce4 C
on
solid
ated an
nu
al accou
nts
5 Parent co
mp
any an
nu
al accou
nts
6 Oth
er info
rmatio
n7 A
dd
ition
al info
rmatio
n
SimplerStrongerSustainableWe entered the final phase of our restructuring
programme in 2013. We successfully listed ING U.S. on the New York Stock Exchange. We also largely completed our Asian insurance and investment management divestment programme. Furthermore, we have made significant progress in preparing our European and Japanese insurance and investment management business for an IPO (initial public offering) as a base case in 2014.
A new brand for our insurance and investment management businesses was announced in October: NN. NN Investment Partners will be the future name for Investment Management. Nationale-Nederlanden Bank in the Netherlands significantly expanded its operations and raised its profile after some parts of WestlandUtrecht Bank had been integrated with Nationale-Nederlanden Bank. Furthermore, we reached an agreement with the Dutch State about the settlement of the Alt-A facility – which we completed in February 2014 – and we are also well on our way to repaying the core Tier 1 securities in full.
We also had to take some painful but necessary decisions to divest businesses and lay off people. However, our employees kept on supporting our customers and delivering them the exceptional service they deserve.
In anticipation of tougher capital requirements we have strengthened our capital position, but if these requirements are tightened further, our ability to lend to the economy may come under pressure and this will at the same time affect our global competitive position. Moreover, we are pushing for a European level playing field to guarantee a robust competitive position for banks.
We are a customer-centric organisation, but that does not mean that we always execute what the customer wants us to do. That may sound contradictory. We have a duty of care to provide customers with the correct information and to ensure we really act in their interest.
Another dilemma is striking a fair balance between the interests of our customers, employees, shareholders and society at large. The interests and requirements of our various stakeholders are not always compatible and sometimes even conflicting. This often makes it difficult and challenging to satisfy everybody, which is why we are in constant dialogue with all our stakeholders to listen and to give them an insight into how we operate and manage our company.
In spite of the weak economic climate, we have seen an improvement in the operating performance in 2013 of both the bank and the insurance business. We have also significantly strengthened our capital and liquidity positions, ensuring we meet the new and tougher national and international supervisory and regulatory requirements.
These steps have given us greater control over our future as a bank, as well as the standalone future of the insurance business. We have emerged as a stronger company, as well as a less complex one. We have simplified our business significantly, reducing our product offering and streamlining processes to drive down costs and make our services and products quicker and easier to use.
We have made great headway in 2013 and are well positioned for 2014 and onwards. ING Bank is a major player in its European domestic markets, such as the Netherlands, Belgium, Luxembourg, Germany, Poland, Romania and Turkey, and in Asia. We have a presence in more than 40 countries, allowing us to support global businesses. NN Group today is a leading, predominantly European insurance and investment management company with a strong presence in 18 countries.
We are busy redefining what kind of bank and what kind of insurance business we want to be, what more we can do to help our customers get ahead, and what we can contribute to society. We are aware that we are not there yet and there is still a lot of work to do, but I am proud of what we have achieved so far. Today’s ING is different from yesterday’s ING. The future will bring even more change. That change and our future are in our own hands. With a refined and sharpened strategy for ING Bank to be presented in the first half of 2014 and a scheduled IPO base case for the insurance and investment management business, 2014 is set to be an important year for ING and all our stakeholders.
Ralph HamersChief Executive Officer of ING Group
March 2014
5ING Group Annual Report 2013
Message of the CEO
OUR PROFILEING is a global financial institution of Dutch origin, currently offering banking, investments, life insurance and retirement services. We draw on our experience and expertise, our commitment to excellent service and our global scale to meet the needs of a broad customer base, comprising individuals, families, small businesses, large corporations, institutions and governments. The strength of the company is, among other things, based on its relatively high customer satisfaction levels, solid financial position, multi-channel distribution strategy and international network. Moreover, ING is a sustainability leader in its sector.
ING currently serves more than 48 million customers in over 40 countries. ING has more than 75,000 employees.
OUR FOCUSING’s focus is on increasing customer satisfaction, simplifying its organisation and product offering, strengthening its financial position and solidifying the sustainability of its business model.
OUR STAKEHOLDERSING conducts business on the basis of clearly defined business principles. In all our activities, we carefully weigh the interests of our various stakeholders such as customers, employees, supervisors, shareholders, civil society organisations and regulators.
As required by Dutch law since 2013, ING’s Supervisory and Executive Boards, but also a broad group of directors committed to a set of behavioural principles, known as the “Banker’s Oath”.
OUR STRATEGYING has strategic priorities at the Group, Bank and Insurance (NN Group) levels. All are ultimately in line with our mission.ING Group’s strategic priorities in 2013 were: strengthening our financial position, restructuring, repaying the remaining state aid and building both stronger and sustainable banking and insurance/investment management businesses.
ING Bank’s strategic aim is to be a strong, predominantly European bank for its customers. ING Bank wants to be a leading domestic full-service bank in attractive, stable home markets, as well as a leading commercial bank in the Benelux with a strong position in Central and Eastern Europe. A refined and sharpened Bank strategy for 2014 and onwards will be presented in the first half of 2014.
NN Group’s focus is on service to customers, generating capital, growing profitability and improving efficiency. Its strategy is about offering appealing and easy-to-understand products and services, multi-access distribution and efficient and effective operations in the 18 countries in which it is active.
OUR CORPORATE RESPONSIBILITYING wants to build its future on sustainable profit based on sound business ethics and respect for its stakeholders. Our Business
Principles prescribe the corporate values and the responsibilities we have towards society and the environment: we act with integrity, we are open and clear, we respect each other and we are socially and environmentally responsible.ING managed to further solidify the sustainability of its business model in 2013, by taking steps towards greater transparency and by growing our sustainable products offerings across all our business lines.
OUR PROGRESS ON RESTRUCTURINGING has substantially completed the separation of its banking and insurance operations. This is required by the European Commission (EC), but ING also thinks it is in the interests of all stakeholders, especially of our customers. The main reason is that it simplifies the organisation, which makes it easier to manage it. We made significant progress with our restructuring programme in 2013. As a result, we have now reached the final stage of this process.
During 2013, ING reached several milestones, for example:• The unwinding of the illiquid assets back-up facility (“IABF”)
was agreed upon in 2013. It was completed early 2014.• A successful initial public offering (IPO) of the US insurance
business (ING U.S.).• Completion of the divestment of ING Insurance/IM Asia.• An agreement in November 2013 with the EC on revised
timelines for the European and Japanese Insurance divestments, which together formed ING Insurance and were renamed NN Group on 1 March 2014.
• In 2013, ING Insurance revealed its future brand name: NN.The preparations for the base case IPO of NN Group are progressing well, which is expected to allow us to go to the market in 2014.
OUR REPAYMENT TO THE DUTCH STATEING is grateful for the support the Dutch State extended during the financial crisis years 2008 and 2009. Milestones in 2013 were:• An agreement with the Dutch State on the unwinding of the
IABF. The unwinding was completed early 2014 and resulted in a cash profit for the Dutch State of EUR 1.4 billion.
• ING received EUR 10 billion in state aid in November 2008. Including the latest repayment in November 2013, ING has so far repaid EUR 11.3 billion, including EUR 8.5 billion in principal and EUR 2.8 billion in interest and premiums. The final tranches are scheduled to be paid by March 2014 and by May 2015. The total annualised return for the Dutch State is expected to be 12.5%.
The total contribution to the Dutch State to date of EUR 4.9 billionincludes premiums and interest on the repayment of core Tier 1securities, the unwinding of the IABF, guarantee fees paid on thegovernment guaranteed bonds issued in 2009 and bank levies.
OUR FINANCIAL POSITIONING places great importance on strengthening its financial position in order to put itself in the best position to facilitate the economy. In 2013 we gained in financial strength. Our funding position improved, our capital and liquidity position remained strong and earnings remained resilient. However, risk costs went up slightly in a weak economic year in many of the markets in which we operate.
OUR FUTUREThe ING of tomorrow will definitely be different from the ING of today. With a refined and sharpenend strategy for ING Bank to be presented in the first half of 2014 and a scheduled IPO for the insurance business, 2014 is set to be an important year for ING and all our stakeholders.
OUR MISSION
To set the standard in helping our customers manage their financial future. ING aims to deliver financial products and services in the way our customers want them: with exemplary service, convenience and at competitive prices.
6 ING Group Annual Report 2013
ING at a glance
46,000000
78,700001
61.2 60.356.8
2011 2012 2013
Underlying cost/income ratio (%)
30
44
44.0
36.1 37.2
2011 2012 2013
Cost/income ratio ongoing business (%)
0
3
1,953
47883
2011 2012 2013
Result before tax (EUR million)
0
16
9.0 7.0 9.0
2011 2012 2013
Underlying return on equity (%)***
0
7
4.2 3.6 4.3
2011 2012 2013
Underlying result before tax (EUR billion)
0
3
1,132 833 886
2011 2012 2013
Operating result ongoing business (EUR million)
1 Wh
o w
e are2 R
epo
rt of th
e Executive B
oard
3 Co
rpo
rate go
vernan
ce4 C
on
solid
ated an
nu
al accou
nts
5 Parent co
mp
any an
nu
al accou
nts
6 Oth
er info
rmatio
n7 A
dd
ition
al info
rmatio
n
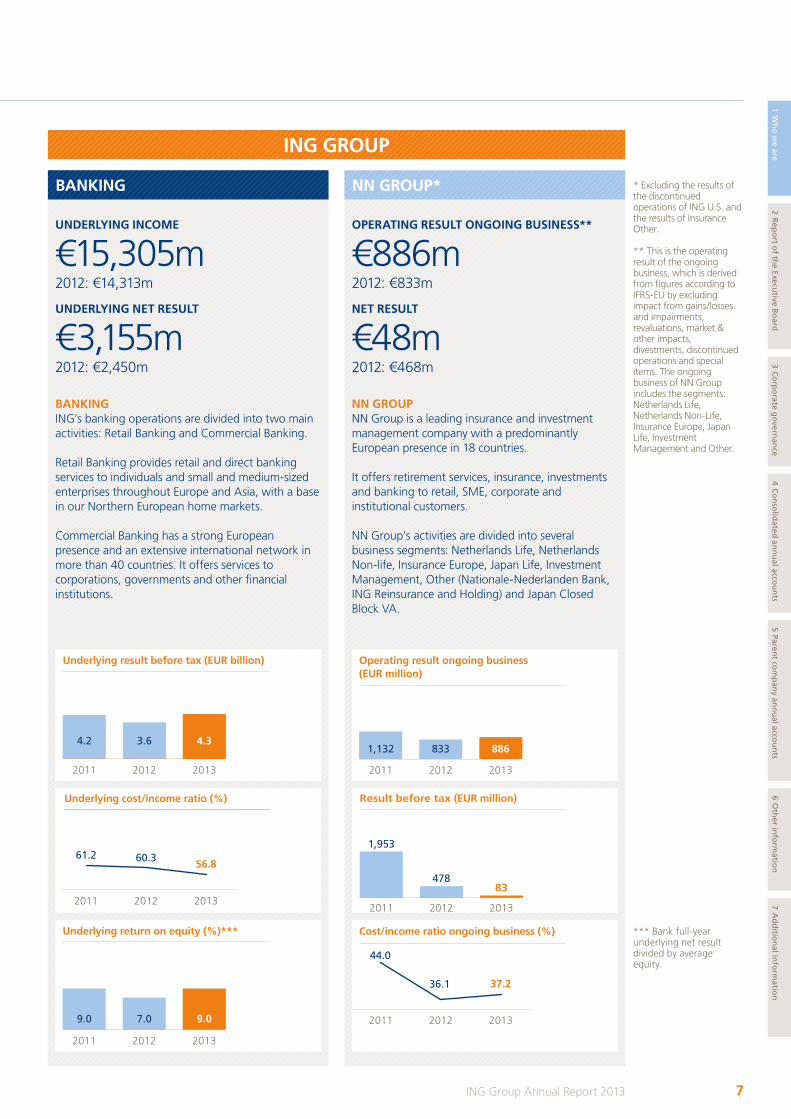
UNDERLYING INCOME
€15,305m2012: €14,313m
OPERATING RESULT ONGOING BUSINESS**
€886m2012: €833m
UNDERLYING NET RESULT
€3,155m2012: €2,450m
NET RESULT
€48m2012: €468m
BANKINGING’s banking operations are divided into two main activities: Retail Banking and Commercial Banking. Retail Banking provides retail and direct banking services to individuals and small and medium-sizedenterprises throughout Europe and Asia, with a base in our Northern European home markets.
Commercial Banking has a strong European presence and an extensive international network in more than 40 countries. It offers services to corporations, governments and other financial institutions.
NN GROUPNN Group is a leading insurance and investment management company with a predominantly European presence in 18 countries.
It offers retirement services, insurance, investments and banking to retail, SME, corporate and institutional customers.
NN Group’s activities are divided into several business segments: Netherlands Life, Netherlands Non-life, Insurance Europe, Japan Life, Investment Management, Other (Nationale-Nederlanden Bank, ING Reinsurance and Holding) and Japan Closed Block VA.
*** Bank full-year underlying net result divided by average equity.
** This is the operating result of the ongoing business, which is derived from figures according to IFRS-EU by excluding impact from gains/losses and impairments, revaluations, market & other impacts, divestments, discontinued operations and special items. The ongoing business of NN Group includes the segments: Netherlands Life, Netherlands Non-Life, Insurance Europe, Japan Life, Investment Management and Other.
* Excluding the results of the discontinued operations of ING U.S. and the results of Insurance Other.
7ING Group Annual Report 2013
ING at a glance
BANKING NN GROUP*
ING GROUP
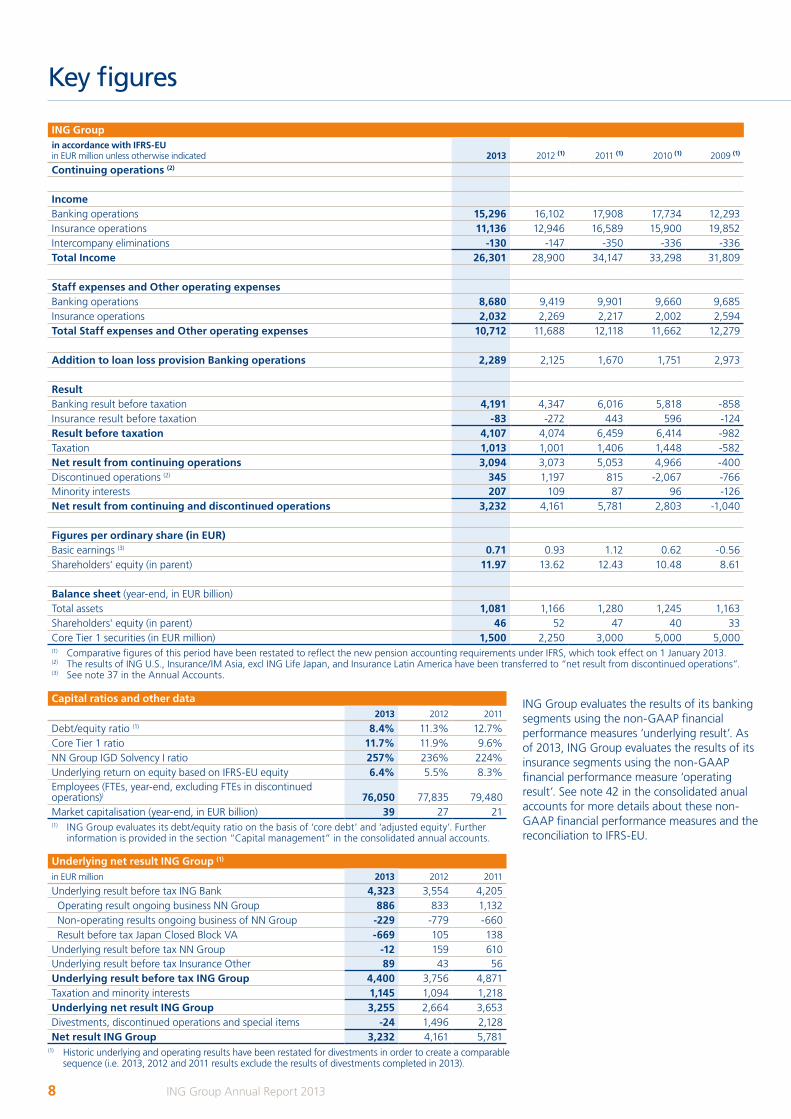
ING Groupin accordance with IFRS-EUin EUR million unless otherwise indicated 2013 2012 (1) 2011 (1) 2010 (1) 2009 (1)
Continuing operations (2)
Income Banking operations 15,296 16,102 17,908 17,734 12,293Insurance operations 11,136 12,946 16,589 15,900 19,852Intercompany eliminations -130 -147 -350 -336 -336Total Income 26,301 28,900 34,147 33,298 31,809
Staff expenses and Other operating expensesBanking operations 8,680 9,419 9,901 9,660 9,685Insurance operations 2,032 2,269 2,217 2,002 2,594Total Staff expenses and Other operating expenses 10,712 11,688 12,118 11,662 12,279
Addition to loan loss provision Banking operations 2,289 2,125 1,670 1,751 2,973
ResultBanking result before taxation 4,191 4,347 6,016 5,818 -858Insurance result before taxation -83 -272 443 596 -124Result before taxation 4,107 4,074 6,459 6,414 -982Taxation 1,013 1,001 1,406 1,448 -582Net result from continuing operations 3,094 3,073 5,053 4,966 -400Discontinued operations (2) 345 1,197 815 -2,067 -766Minority interests 207 109 87 96 -126Net result from continuing and discontinued operations 3,232 4,161 5,781 2,803 -1,040
Figures per ordinary share (in EUR)Basic earnings (3) 0.71 0.93 1.12 0.62 -0.56Shareholders' equity (in parent) 11.97 13.62 12.43 10.48 8.61
Balance sheet (year-end, in EUR billion)Total assets 1,081 1,166 1,280 1,245 1,163Shareholders' equity (in parent) 46 52 47 40 33Core Tier 1 securities (in EUR million) 1,500 2,250 3,000 5,000 5,000(1) Comparative figures of this period have been restated to reflect the new pension accounting requirements under IFRS, which took effect on 1 January 2013. (2) The results of ING U.S., Insurance/IM Asia, excl ING Life Japan, and Insurance Latin America have been transferred to “net result from discontinued operations”.(3) See note 37 in the Annual Accounts.
Underlying net result ING Group (1)
in EUR million 2013 2012 2011
Underlying result before tax ING Bank 4,323 3,554 4,205 Operating result ongoing business NN Group 886 833 1,132 Non-operating results ongoing business of NN Group -229 -779 -660 Result before tax Japan Closed Block VA -669 105 138Underlying result before tax NN Group -12 159 610Underlying result before tax Insurance Other 89 43 56Underlying result before tax ING Group 4,400 3,756 4,871Taxation and minority interests 1,145 1,094 1,218Underlying net result ING Group 3,255 2,664 3,653Divestments, discontinued operations and special items -24 1,496 2,128Net result ING Group 3,232 4,161 5,781
ING Group evaluates the results of its banking segments using the non-GAAP financial performance measures ‘underlying result’. As of 2013, ING Group evaluates the results of its insurance segments using the non-GAAP financial performance measure ‘operating result’. See note 42 in the consolidated anual accounts for more details about these non-GAAP financial performance measures and the reconciliation to IFRS-EU.
Capital ratios and other data2013 2012 2011
Debt/equity ratio (1) 8.4% 11.3% 12.7%Core Tier 1 ratio 11.7% 11.9% 9.6%NN Group IGD Solvency I ratio 257% 236% 224%Underlying return on equity based on IFRS-EU equity 6.4% 5.5% 8.3%Employees (FTEs, year-end, excluding FTEs in discontinued operations)) 76,050 77,835 79,480Market capitalisation (year-end, in EUR billion) 39 27 21(1) ING Group evaluates its debt/equity ratio on the basis of ‘core debt’ and ‘adjusted equity’. Further
information is provided in the section “Capital management” in the consolidated annual accounts.
(1) Historic underlying and operating results have been restated for divestments in order to create a comparable sequence (i.e. 2013, 2012 and 2011 results exclude the results of divestments completed in 2013).
8 ING Group Annual Report 2013
Key figures

1 Wh
o w
e are2 R
epo
rt of th
e Executive B
oard
3 Co
rpo
rate go
vernan
ce4 C
on
solid
ated an
nu
al accou
nts
5 Parent co
mp
any an
nu
al accou
nts
6 Oth
er info
rmatio
n7 A
dd
ition
al info
rmatio
n
Non-financial key figures2013 2012
Sustainable Business Sustainable assets allocated (in EUR million) (1) 6,570 5,725
Improved environmental footprint – C02 emissions per FTE (in kilotonne) Bank (2)
– CO2 emissions per FTE (in kilotonne) Insurance10929
11752
Top Employer – Employee engagement scores Bank (3)
– Employee engagement scores Insurance74%67%
73%70%
Investing in communities Donations to UNICEF (in EUR thousand) (4) 3,154 2,774
(1) As a bank and asset manager, ING allocates assets to a wide range of companies, projects and funds. Increasingly, we include sustainability criteria in our capital allocation choices. For reporting purposes, we combine all the assets from our financing and investment activities under the heading Sustainable assets allocated. Sustainability criteria have been applied to these assets.
(2) Our absolute carbon emissions performance.(3) Annually, we survey the level of employee engagement. We define employee engagement as the extent to which our employees are committed to
contributing to our business performance and are willing to walk the extra mile to achieve ING’s success. Given the operational split of ING Bank and NN Group, different employee engagement surveys have been held at both companies.
(4) Targets have been set to raise adequate funds between 2005-2015 to facilitate access to education by one million children through our partnership with UNICEF.
R.A.J.G. (Ralph) Hamers (47), CEO and chairmanP.G. (Patrick) Flynn (53), CFO W.F. (Wilfred) Nagel (57), CRO
* You can find more information on the members of the Executive Board on page 69 and on the members of the Supervisory Board on pages 72-73.
J. (Jeroen) van der Veer (66), chairmanP.A.F.W. (Peter) Elverding (65), vice-chairmanJ.P. (Tineke) Bahlmann (63)H.W. (Henk) Breukink (63) I. (Isabel) Martín Castellá (66) C.W. (Carin) Gorter (51)J.H. (Jan) Holsboer (67) H.J.M. (Hermann-Josef) Lamberti (57)J.C.L. (Joost) Kuiper (66) R.W.P. (Robert) Reibestein (57) Y.C.M.T. (Yvonne) van Rooy (62) L.A.C.P. (Luc) Vandewalle (69)
COMMITTEES OF THE SUPERVISORY BOARD (1)
on 31 December 2013
Audit CommitteeJ.C.L. (Joost) Kuiper, chairman J.P. (Tineke) Bahlmann I. (Isabel) Martín CastelláC.W. (Carin) GorterJ.H. (Jan) Holsboer R.W.P. (Robert) Reibestein L.A.C.P. (Luc) Vandewalle
Risk CommitteeR.W.P. (Robert) Reibestein, chairmanJ.P. (Tineke) Bahlmann J.H. (Jan) HolsboerJ.C.L. (Joost) KuiperH.J.M. (Hermann-Josef) LambertiL.A.C.P. (Luc) Vandewalle J. (Jeroen) van der Veer
Insurance Europe(2) CommitteeJ.H. (Jan) Holsboer,chairmanY.C.M.T. (Yvonne) van RooyJ.C.L. (Joost) Kuiper,temporary memberR.W.P. (Robert) Reibestein,temporary member
(1) The current composition of the Supervisory Board Committees can be found on the Company’s website (www.ing.com).
(2) This is a temporary committee.
Remuneration CommitteeP.A.F.W. (Peter) Elverding, chairman H.W. (Henk) BreukinkY.C.M.T. (Yvonne) van RooyJ. (Jeroen) van der Veer
Nomination CommitteeJ. (Jeroen) van der Veer, chairmanH.W. (Henk) BreukinkP.A.F.W. (Peter) ElverdingY.C.M.T. (Yvonne) van RooyCorporate Governance CommitteeH.W. (Henk) Breukink, chairman C.W. (Carin) GorterJ. (Jeroen) van der Veer
9ING Group Annual Report 2013
Key figures
Composition of the Boards* on 31 December 2013
EXECUTIVE BOARD
SUPERVISORY BOARD
EUR 50 million, will be used to increase the next repayment of core Tier 1 securities to the Dutch State, scheduled for March 2014. The final payment to the Dutch State, scheduled for May 2015 will be lowered by the same amount. The total amount of the repayment to the Dutch State remains unchanged.
It remains ING’s ambition to repay the remaining support as quickly as possible and ING aspires to accelerate repayments if possible and prudent under the prevailing economic circumstances. Given the weak macro economy in the eurozone and increasing regulatory capital requirements, ING needs to take a cautious approach and to maintain strong capital ratios in the Bank as it builds towards the implementation of Capital Requirements Regulation and Directive IV (CRR/CRD IV). Each subsequent repayment to the Dutch State requires prior approval from DNB, at the time ING decides to propose such repayment.
LISTINGS Depositary receipts for ING Group ordinary shares are listed on the stock exchanges of Amsterdam, Brussels and New York (NYSE). Options on ING Group ordinary shares (or the depositary receipts thereof) are traded on the NYSE Euronext Amsterdam Derivative Markets and the Chicago Board Options Exchange.
SHAREHOLDERS AND DEPOSITARY-RECEIPT HOLDERS WITH STAKES OF 3% OR MORE More than 99.9% of the ordinary shares issued by ING Groep N.V. is held by Stichting ING Aandelen (ING Trust Office). In exchange for these shares, ING Trust Office has issued depositary receipts in bearer form for these shares. The depositary receipts are listed on various stock exchanges. For the report of the board of Stichting ING Aandelen, please refer to pages 74-76.
Authorised and issued capital
in EUR millionYear-end
2013Year-end
2012
Ordinary shares– authorised 3,480 3,480– issued 921 919Cumulative preference shares– authorised 1,080 1,080– issued – –
Shares in issue and shares outstanding in the market
in millionsYear-end
2013Year-end
2012
(Depositary receipts for) ordinary shares of EUR 0.24 nominal value 3,840.9 3,831.6(Depositary receipts for) own ordinary shares held by ING Group and its subsidiaries 4.0 30.1(Depositary receipts for) ordinary shares 3,836.9 3,801.5
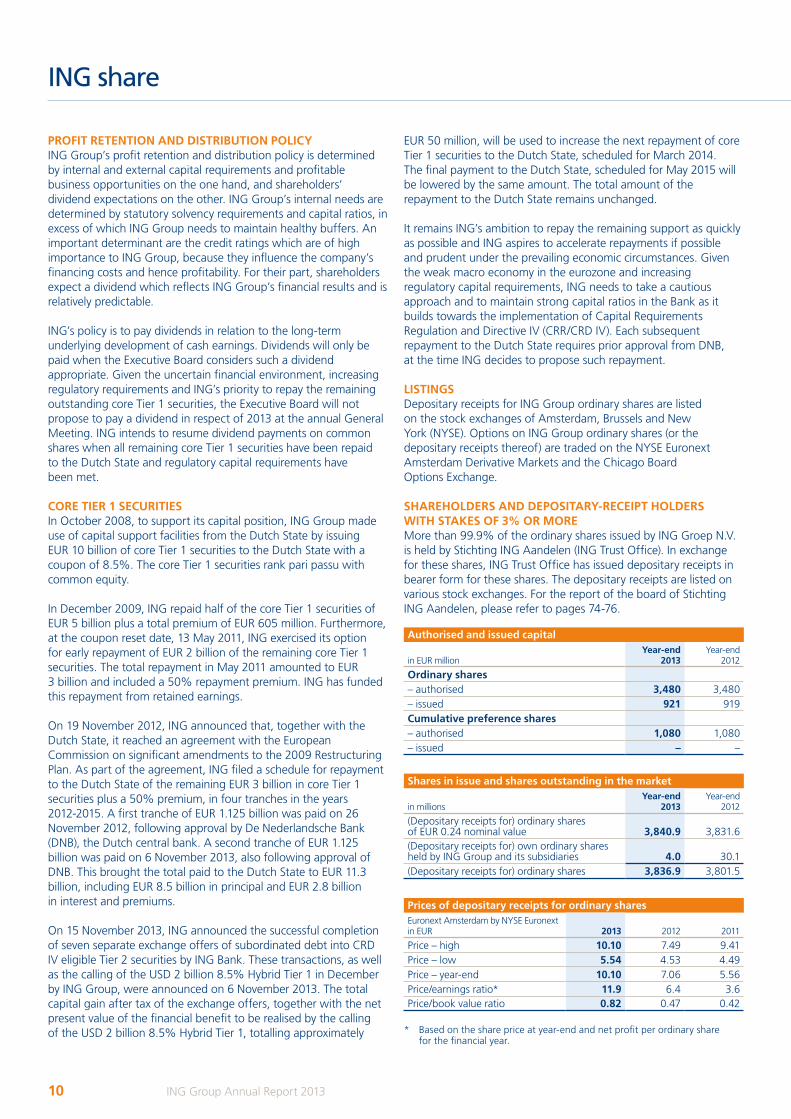
Prices of depositary receipts for ordinary sharesEuronext Amsterdam by NYSE Euronext in EUR 2013 2012 2011
Price – high 10.10 7.49 9.41Price – low 5.54 4.53 4.49Price – year-end 10.10 7.06 5.56Price/earnings ratio* 11.9 6.4 3.6Price/book value ratio 0.82 0.47 0.42
* Based on the share price at year-end and net profit per ordinary share for the financial year.
PROFIT RETENTION AND DISTRIBUTION POLICY ING Group’s profit retention and distribution policy is determined by internal and external capital requirements and profitable business opportunities on the one hand, and shareholders’ dividend expectations on the other. ING Group’s internal needs are determined by statutory solvency requirements and capital ratios, in excess of which ING Group needs to maintain healthy buffers. An important determinant are the credit ratings which are of high importance to ING Group, because they influence the company’s financing costs and hence profitability. For their part, shareholders expect a dividend which reflects ING Group’s financial results and is relatively predictable.
ING’s policy is to pay dividends in relation to the long-term underlying development of cash earnings. Dividends will only be paid when the Executive Board considers such a dividend appropriate. Given the uncertain financial environment, increasing regulatory requirements and ING’s priority to repay the remaining outstanding core Tier 1 securities, the Executive Board will not propose to pay a dividend in respect of 2013 at the annual General Meeting. ING intends to resume dividend payments on common shares when all remaining core Tier 1 securities have been repaid to the Dutch State and regulatory capital requirements have been met.
CORE TIER 1 SECURITIES In October 2008, to support its capital position, ING Group made use of capital support facilities from the Dutch State by issuing EUR 10 billion of core Tier 1 securities to the Dutch State with a coupon of 8.5%. The core Tier 1 securities rank pari passu with common equity.
In December 2009, ING repaid half of the core Tier 1 securities of EUR 5 billion plus a total premium of EUR 605 million. Furthermore, at the coupon reset date, 13 May 2011, ING exercised its option for early repayment of EUR 2 billion of the remaining core Tier 1 securities. The total repayment in May 2011 amounted to EUR 3 billion and included a 50% repayment premium. ING has funded this repayment from retained earnings.
On 19 November 2012, ING announced that, together with the Dutch State, it reached an agreement with the European Commission on significant amendments to the 2009 Restructuring Plan. As part of the agreement, ING filed a schedule for repayment to the Dutch State of the remaining EUR 3 billion in core Tier 1 securities plus a 50% premium, in four tranches in the years 2012-2015. A first tranche of EUR 1.125 billion was paid on 26 November 2012, following approval by De Nederlandsche Bank (DNB), the Dutch central bank. A second tranche of EUR 1.125 billion was paid on 6 November 2013, also following approval of DNB. This brought the total paid to the Dutch State to EUR 11.3 billion, including EUR 8.5 billion in principal and EUR 2.8 billion in interest and premiums.
On 15 November 2013, ING announced the successful completion of seven separate exchange offers of subordinated debt into CRD IV eligible Tier 2 securities by ING Bank. These transactions, as well as the calling of the USD 2 billion 8.5% Hybrid Tier 1 in December by ING Group, were announced on 6 November 2013. The total capital gain after tax of the exchange offers, together with the net present value of the financial benefit to be realised by the calling of the USD 2 billion 8.5% Hybrid Tier 1, totalling approximately
10 ING Group Annual Report 2013
ING share
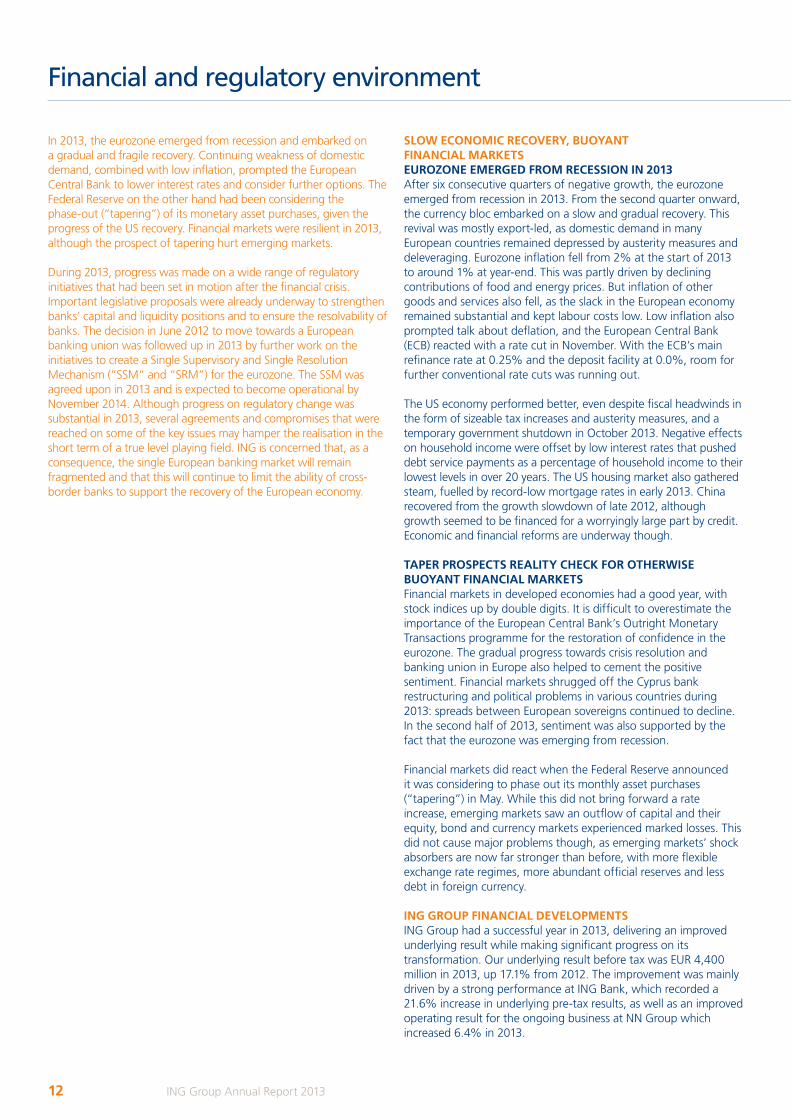
01/13 03/13 05/13 07/13 09/13 01/1411/13
140
70
80
90
100
110
120
130
One-year price development ING depositary receipts for shares
Index 1 January 2013 = 100
ING FTSE 300 Banks FTSE 300 Life Insurance
in percentages
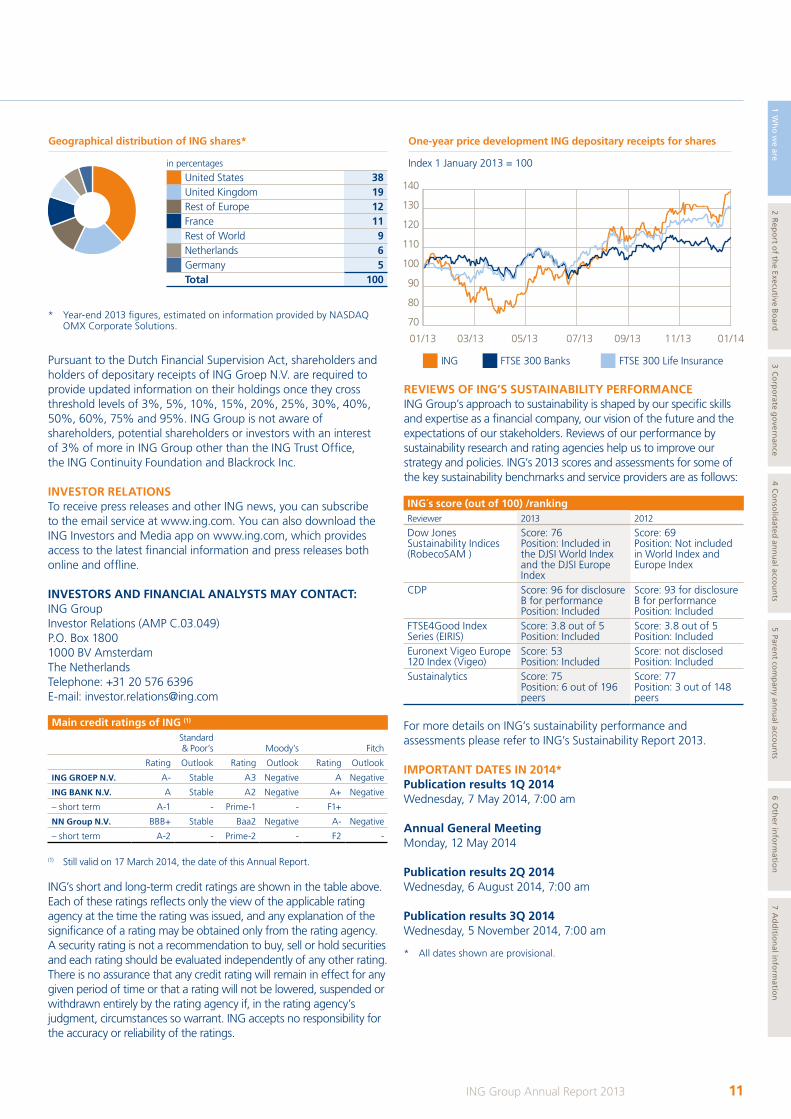
United States 38 United Kingdom 19 Rest of Europe 12 France 11 Rest of World 9 Netherlands 6 Germany 5 Total 100
Geographical distribution of ING shares*
1 Wh
o w
e are2 R
epo
rt of th
e Executive B
oard
3 Co
rpo
rate go
vernan
ce4 C
on
solid
ated an
nu
al accou
nts
5 Parent co
mp
any an
nu
al accou
nts
6 Oth
er info
rmatio
n7 A
dd
ition
al info
rmatio
n
* Year-end 2013 figures, estimated on information provided by NASDAQ OMX Corporate Solutions.
Pursuant to the Dutch Financial Supervision Act, shareholders and holders of depositary receipts of ING Groep N.V. are required to provide updated information on their holdings once they cross threshold levels of 3%, 5%, 10%, 15%, 20%, 25%, 30%, 40%, 50%, 60%, 75% and 95%. ING Group is not aware of shareholders, potential shareholders or investors with an interest of 3% of more in ING Group other than the ING Trust Office, the ING Continuity Foundation and Blackrock Inc.
INVESTOR RELATIONSTo receive press releases and other ING news, you can subscribe to the email service at www.ing.com. You can also download the ING Investors and Media app on www.ing.com, which provides access to the latest financial information and press releases both online and offline.
INVESTORS AND FINANCIAL ANALYSTS MAY CONTACT:ING GroupInvestor Relations (AMP C.03.049)P.O. Box 18001000 BV AmsterdamThe NetherlandsTelephone: +31 20 576 6396E-mail: [email protected]
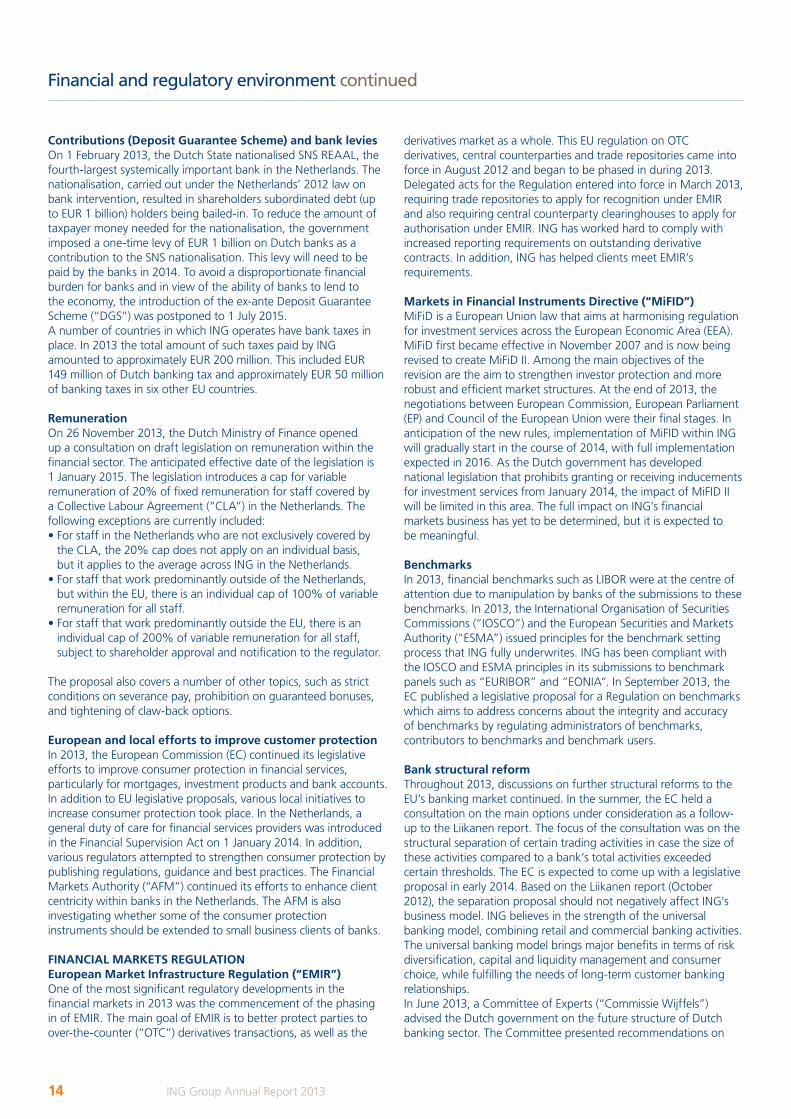
Main credit ratings of ING (1)
Standard & Poor’s Moody’s Fitch
Rating Outlook Rating Outlook Rating Outlook
ING GROEP N.V. A- Stable A3 Negative A Negative
ING BANK N.V. A Stable A2 Negative A+ Negative
– short term A-1 - Prime-1 - F1+
NN Group N.V. BBB+ Stable Baa2 Negative A- Negative
– short term A-2 - Prime-2 - F2 -
(1) Still valid on 17 March 2014, the date of this Annual Report.
ING’s short and long-term credit ratings are shown in the table above. Each of these ratings reflects only the view of the applicable rating agency at the time the rating was issued, and any explanation of the significance of a rating may be obtained only from the rating agency. A security rating is not a recommendation to buy, sell or hold securities and each rating should be evaluated independently of any other rating. There is no assurance that any credit rating will remain in effect for any given period of time or that a rating will not be lowered, suspended or withdrawn entirely by the rating agency if, in the rating agency’s judgment, circumstances so warrant. ING accepts no responsibility for the accuracy or reliability of the ratings.
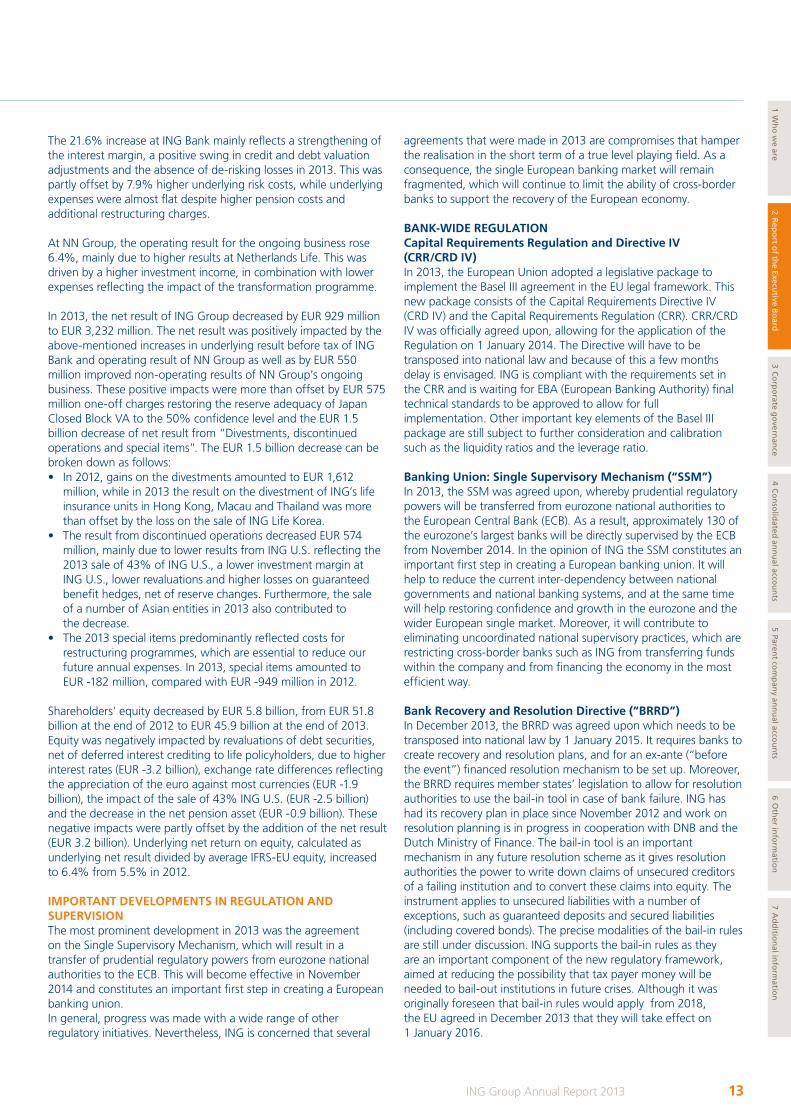
ING´s score (out of 100) /rankingReviewer 2013 2012
Dow Jones Sustainability Indices (RobecoSAM )
Score: 76 Position: Included in the DJSI World Index and the DJSI Europe Index
Score: 69Position: Not included in World Index and Europe Index
CDP Score: 96 for disclosureB for performancePosition: Included
Score: 93 for disclosure B for performancePosition: Included
FTSE4Good Index Series (EIRIS)
Score: 3.8 out of 5Position: Included
Score: 3.8 out of 5Position: Included
Euronext Vigeo Europe 120 Index (Vigeo)
Score: 53Position: Included
Score: not disclosedPosition: Included
Sustainalytics Score: 75Position: 6 out of 196 peers
Score: 77 Position: 3 out of 148 peers
REVIEWS OF ING’S SUSTAINABILITY PERFORMANCE ING Group’s approach to sustainability is shaped by our specific skills and expertise as a financial company, our vision of the future and the expectations of our stakeholders. Reviews of our performance by sustainability research and rating agencies help us to improve our strategy and policies. ING’s 2013 scores and assessments for some of the key sustainability benchmarks and service providers are as follows:
For more details on ING’s sustainability performance and assessments please refer to ING’s Sustainability Report 2013.
11ING Group Annual Report 2013
ING share
IMPORTANT DATES IN 2014*Publication results 1Q 2014Wednesday, 7 May 2014, 7:00 am
Annual General MeetingMonday, 12 May 2014
Publication results 2Q 2014Wednesday, 6 August 2014, 7:00 am
Publication results 3Q 2014Wednesday, 5 November 2014, 7:00 am
* All dates shown are provisional.
In 2013, the eurozone emerged from recession and embarked on a gradual and fragile recovery. Continuing weakness of domestic demand, combined with low inflation, prompted the European Central Bank to lower interest rates and consider further options. The Federal Reserve on the other hand had been considering the phase-out (“tapering”) of its monetary asset purchases, given the progress of the US recovery. Financial markets were resilient in 2013, although the prospect of tapering hurt emerging markets.
During 2013, progress was made on a wide range of regulatory initiatives that had been set in motion after the financial crisis. Important legislative proposals were already underway to strengthen banks’ capital and liquidity positions and to ensure the resolvability of banks. The decision in June 2012 to move towards a European banking union was followed up in 2013 by further work on the initiatives to create a Single Supervisory and Single Resolution Mechanism (“SSM“ and “SRM”) for the eurozone. The SSM was agreed upon in 2013 and is expected to become operational by November 2014. Although progress on regulatory change was substantial in 2013, several agreements and compromises that were reached on some of the key issues may hamper the realisation in the short term of a true level playing field. ING is concerned that, as a consequence, the single European banking market will remain fragmented and that this will continue to limit the ability of cross-border banks to support the recovery of the European economy.
SLOW ECONOMIC RECOVERY, BUOYANT FINANCIAL MARKETSEUROZONE EMERGED FROM RECESSION IN 2013After six consecutive quarters of negative growth, the eurozone emerged from recession in 2013. From the second quarter onward, the currency bloc embarked on a slow and gradual recovery. This revival was mostly export-led, as domestic demand in many European countries remained depressed by austerity measures and deleveraging. Eurozone inflation fell from 2% at the start of 2013 to around 1% at year-end. This was partly driven by declining contributions of food and energy prices. But inflation of other goods and services also fell, as the slack in the European economy remained substantial and kept labour costs low. Low inflation also prompted talk about deflation, and the European Central Bank (ECB) reacted with a rate cut in November. With the ECB’s main refinance rate at 0.25% and the deposit facility at 0.0%, room for further conventional rate cuts was running out.
The US economy performed better, even despite fiscal headwinds in the form of sizeable tax increases and austerity measures, and a temporary government shutdown in October 2013. Negative effects on household income were offset by low interest rates that pushed debt service payments as a percentage of household income to their lowest levels in over 20 years. The US housing market also gathered steam, fuelled by record-low mortgage rates in early 2013. China recovered from the growth slowdown of late 2012, although growth seemed to be financed for a worryingly large part by credit. Economic and financial reforms are underway though.
TAPER PROSPECTS REALITY CHECK FOR OTHERWISE BUOYANT FINANCIAL MARKETS Financial markets in developed economies had a good year, with stock indices up by double digits. It is difficult to overestimate the importance of the European Central Bank’s Outright Monetary Transactions programme for the restoration of confidence in the eurozone. The gradual progress towards crisis resolution and banking union in Europe also helped to cement the positive sentiment. Financial markets shrugged off the Cyprus bank restructuring and political problems in various countries during 2013: spreads between European sovereigns continued to decline. In the second half of 2013, sentiment was also supported by the fact that the eurozone was emerging from recession.
Financial markets did react when the Federal Reserve announced it was considering to phase out its monthly asset purchases (“tapering”) in May. While this did not bring forward a rate increase, emerging markets saw an outflow of capital and their equity, bond and currency markets experienced marked losses. This did not cause major problems though, as emerging markets’ shock absorbers are now far stronger than before, with more flexible exchange rate regimes, more abundant official reserves and less debt in foreign currency.
ING GROUP FINANCIAL DEVELOPMENTSING Group had a successful year in 2013, delivering an improved underlying result while making significant progress on its transformation. Our underlying result before tax was EUR 4,400 million in 2013, up 17.1% from 2012. The improvement was mainly driven by a strong performance at ING Bank, which recorded a 21.6% increase in underlying pre-tax results, as well as an improved operating result for the ongoing business at NN Group which increased 6.4% in 2013.
12 ING Group Annual Report 2013
Financial and regulatory environment
The 21.6% increase at ING Bank mainly reflects a strengthening of the interest margin, a positive swing in credit and debt valuation adjustments and the absence of de-risking losses in 2013. This was partly offset by 7.9% higher underlying risk costs, while underlying expenses were almost flat despite higher pension costs and additional restructuring charges.
At NN Group, the operating result for the ongoing business rose 6.4%, mainly due to higher results at Netherlands Life. This was driven by a higher investment income, in combination with lower expenses reflecting the impact of the transformation programme.
In 2013, the net result of ING Group decreased by EUR 929 million to EUR 3,232 million. The net result was positively impacted by the above-mentioned increases in underlying result before tax of ING Bank and operating result of NN Group as well as by EUR 550 million improved non-operating results of NN Group’s ongoing business. These positive impacts were more than offset by EUR 575 million one-off charges restoring the reserve adequacy of Japan Closed Block VA to the 50% confidence level and the EUR 1.5 billion decrease of net result from “Divestments, discontinued operations and special items”. The EUR 1.5 billion decrease can be broken down as follows:• In 2012, gains on the divestments amounted to EUR 1,612
million, while in 2013 the result on the divestment of ING’s life insurance units in Hong Kong, Macau and Thailand was more than offset by the loss on the sale of ING Life Korea.
• The result from discontinued operations decreased EUR 574 million, mainly due to lower results from ING U.S. reflecting the 2013 sale of 43% of ING U.S., a lower investment margin at ING U.S., lower revaluations and higher losses on guaranteed benefit hedges, net of reserve changes. Furthermore, the sale of a number of Asian entities in 2013 also contributed to the decrease.
• The 2013 special items predominantly reflected costs for restructuring programmes, which are essential to reduce our future annual expenses. In 2013, special items amounted to EUR -182 million, compared with EUR -949 million in 2012.
Shareholders’ equity decreased by EUR 5.8 billion, from EUR 51.8 billion at the end of 2012 to EUR 45.9 billion at the end of 2013. Equity was negatively impacted by revaluations of debt securities, net of deferred interest crediting to life policyholders, due to higher interest rates (EUR -3.2 billion), exchange rate differences reflecting the appreciation of the euro against most currencies (EUR -1.9 billion), the impact of the sale of 43% ING U.S. (EUR -2.5 billion) and the decrease in the net pension asset (EUR -0.9 billion). These negative impacts were partly offset by the addition of the net result (EUR 3.2 billion). Underlying net return on equity, calculated as underlying net result divided by average IFRS-EU equity, increased to 6.4% from 5.5% in 2012.
IMPORTANT DEVELOPMENTS IN REGULATION AND SUPERVISIONThe most prominent development in 2013 was the agreement on the Single Supervisory Mechanism, which will result in a transfer of prudential regulatory powers from eurozone national authorities to the ECB. This will become effective in November 2014 and constitutes an important first step in creating a European banking union.In general, progress was made with a wide range of other regulatory initiatives. Nevertheless, ING is concerned that several
agreements that were made in 2013 are compromises that hamper the realisation in the short term of a true level playing field. As a consequence, the single European banking market will remain fragmented, which will continue to limit the ability of cross-border banks to support the recovery of the European economy.
BANK-WIDE REGULATIONCapital Requirements Regulation and Directive IV (CRR/CRD IV)In 2013, the European Union adopted a legislative package to implement the Basel III agreement in the EU legal framework. This new package consists of the Capital Requirements Directive IV (CRD IV) and the Capital Requirements Regulation (CRR). CRR/CRD IV was officially agreed upon, allowing for the application of the Regulation on 1 January 2014. The Directive will have to be transposed into national law and because of this a few months delay is envisaged. ING is compliant with the requirements set in the CRR and is waiting for EBA (European Banking Authority) final technical standards to be approved to allow for full implementation. Other important key elements of the Basel III package are still subject to further consideration and calibration such as the liquidity ratios and the leverage ratio.
Banking Union: Single Supervisory Mechanism (“SSM”)In 2013, the SSM was agreed upon, whereby prudential regulatory powers will be transferred from eurozone national authorities to the European Central Bank (ECB). As a result, approximately 130 of the eurozone’s largest banks will be directly supervised by the ECB from November 2014. In the opinion of ING the SSM constitutes an important first step in creating a European banking union. It will help to reduce the current inter-dependency between national governments and national banking systems, and at the same time will help restoring confidence and growth in the eurozone and the wider European single market. Moreover, it will contribute to eliminating uncoordinated national supervisory practices, which are restricting cross-border banks such as ING from transferring funds within the company and from financing the economy in the most efficient way.
Bank Recovery and Resolution Directive (“BRRD”) In December 2013, the BRRD was agreed upon which needs to be transposed into national law by 1 January 2015. It requires banks to create recovery and resolution plans, and for an ex-ante (“before the event”) financed resolution mechanism to be set up. Moreover, the BRRD requires member states’ legislation to allow for resolution authorities to use the bail-in tool in case of bank failure. ING has had its recovery plan in place since November 2012 and work on resolution planning is in progress in cooperation with DNB and the Dutch Ministry of Finance. The bail-in tool is an important mechanism in any future resolution scheme as it gives resolution authorities the power to write down claims of unsecured creditors of a failing institution and to convert these claims into equity. The instrument applies to unsecured liabilities with a number of exceptions, such as guaranteed deposits and secured liabilities (including covered bonds). The precise modalities of the bail-in rules are still under discussion. ING supports the bail-in rules as they are an important component of the new regulatory framework, aimed at reducing the possibility that tax payer money will be needed to bail-out institutions in future crises. Although it was originally foreseen that bail-in rules would apply from 2018, the EU agreed in December 2013 that they will take effect on 1 January 2016.
13ING Group Annual Report 2013
1 Wh
o w
e are2 R
epo
rt of th
e Executive B
oard
3 Co
rpo
rate go
vernan
ce4 C
on
solid
ated an
nu
al accou
nts
5 Parent co
mp
any an
nu
al accou
nts
6 Oth
er info
rmatio
n7 A
dd
ition
al info
rmatio
n
Financial and regulatory environment
derivatives market as a whole. This EU regulation on OTC derivatives, central counterparties and trade repositories came into force in August 2012 and began to be phased in during 2013. Delegated acts for the Regulation entered into force in March 2013, requiring trade repositories to apply for recognition under EMIR and also requiring central counterparty clearinghouses to apply for authorisation under EMIR. ING has worked hard to comply with increased reporting requirements on outstanding derivative contracts. In addition, ING has helped clients meet EMIR’s requirements.
Markets in Financial Instruments Directive (“MiFID”) MiFiD is a European Union law that aims at harmonising regulation for investment services across the European Economic Area (EEA). MiFiD first became effective in November 2007 and is now being revised to create MiFiD II. Among the main objectives of the revision are the aim to strengthen investor protection and more robust and efficient market structures. At the end of 2013, the negotiations between European Commission, European Parliament (EP) and Council of the European Union were their final stages. In anticipation of the new rules, implementation of MiFID within ING will gradually start in the course of 2014, with full implementation expected in 2016. As the Dutch government has developed national legislation that prohibits granting or receiving inducements for investment services from January 2014, the impact of MiFID II will be limited in this area. The full impact on ING’s financial markets business has yet to be determined, but it is expected to be meaningful.
Benchmarks In 2013, financial benchmarks such as LIBOR were at the centre of attention due to manipulation by banks of the submissions to these benchmarks. In 2013, the International Organisation of Securities Commissions (“IOSCO”) and the European Securities and Markets Authority (“ESMA”) issued principles for the benchmark setting process that ING fully underwrites. ING has been compliant with the IOSCO and ESMA principles in its submissions to benchmark panels such as “EURIBOR” and ”EONIA”. In September 2013, the EC published a legislative proposal for a Regulation on benchmarks which aims to address concerns about the integrity and accuracy of benchmarks by regulating administrators of benchmarks, contributors to benchmarks and benchmark users.
Bank structural reformThroughout 2013, discussions on further structural reforms to the EU’s banking market continued. In the summer, the EC held a consultation on the main options under consideration as a follow-up to the Liikanen report. The focus of the consultation was on the structural separation of certain trading activities in case the size of these activities compared to a bank’s total activities exceeded certain thresholds. The EC is expected to come up with a legislative proposal in early 2014. Based on the Liikanen report (October 2012), the separation proposal should not negatively affect ING’s business model. ING believes in the strength of the universal banking model, combining retail and commercial banking activities. The universal banking model brings major benefits in terms of risk diversification, capital and liquidity management and consumer choice, while fulfilling the needs of long-term customer banking relationships.In June 2013, a Committee of Experts (“Commissie Wijffels”) advised the Dutch government on the future structure of Dutch banking sector. The Committee presented recommendations on
Contributions (Deposit Guarantee Scheme) and bank levies On 1 February 2013, the Dutch State nationalised SNS REAAL, the fourth-largest systemically important bank in the Netherlands. The nationalisation, carried out under the Netherlands’ 2012 law on bank intervention, resulted in shareholders subordinated debt (up to EUR 1 billion) holders being bailed-in. To reduce the amount of taxpayer money needed for the nationalisation, the government imposed a one-time levy of EUR 1 billion on Dutch banks as a contribution to the SNS nationalisation. This levy will need to be paid by the banks in 2014. To avoid a disproportionate financial burden for banks and in view of the ability of banks to lend to the economy, the introduction of the ex-ante Deposit Guarantee Scheme (“DGS”) was postponed to 1 July 2015. A number of countries in which ING operates have bank taxes in place. In 2013 the total amount of such taxes paid by ING amounted to approximately EUR 200 million. This included EUR 149 million of Dutch banking tax and approximately EUR 50 million of banking taxes in six other EU countries.
Remuneration On 26 November 2013, the Dutch Ministry of Finance opened up a consultation on draft legislation on remuneration within the financial sector. The anticipated effective date of the legislation is 1 January 2015. The legislation introduces a cap for variable remuneration of 20% of fixed remuneration for staff covered by a Collective Labour Agreement (“CLA”) in the Netherlands. The following exceptions are currently included:• For staff in the Netherlands who are not exclusively covered by
the CLA, the 20% cap does not apply on an individual basis, but it applies to the average across ING in the Netherlands.
• For staff that work predominantly outside of the Netherlands, but within the EU, there is an individual cap of 100% of variable remuneration for all staff.
• For staff that work predominantly outside the EU, there is an individual cap of 200% of variable remuneration for all staff, subject to shareholder approval and notification to the regulator.
The proposal also covers a number of other topics, such as strict conditions on severance pay, prohibition on guaranteed bonuses, and tightening of claw-back options.
European and local efforts to improve customer protectionIn 2013, the European Commission (EC) continued its legislative efforts to improve consumer protection in financial services, particularly for mortgages, investment products and bank accounts. In addition to EU legislative proposals, various local initiatives to increase consumer protection took place. In the Netherlands, a general duty of care for financial services providers was introduced in the Financial Supervision Act on 1 January 2014. In addition, various regulators attempted to strengthen consumer protection by publishing regulations, guidance and best practices. The Financial Markets Authority (“AFM”) continued its efforts to enhance client centricity within banks in the Netherlands. The AFM is also investigating whether some of the consumer protection instruments should be extended to small business clients of banks.
FINANCIAL MARKETS REGULATIONEuropean Market Infrastructure Regulation (“EMIR”) One of the most significant regulatory developments in the financial markets in 2013 was the commencement of the phasing in of EMIR. The main goal of EMIR is to better protect parties to over-the-counter (“OTC”) derivatives transactions, as well as the
14 ING Group Annual Report 2013
Financial and regulatory environment continued
how to make it more resilient and how to improve its ability to service the economy. Taking into account the Committee’s recommendations, the Dutch government released a vision document on the Dutch banking industry in August 2013. The main features of this vision are the need for a higher leverage ratio of at least 4% in EU negotiations; a reduction in the maximum loan-to-value (i.e. mortgage loan to house value) to 100% in 2018, and 80% in the longer term; and further support, in principle, for a more co-ordinated EU approach towards regulating the industry.
Banker’s oathIn 2013, members of ING’s Supervisory and Executive Boards anda broad group of directors of various ING entities signed afinancial institutions oath, commonly referred to as the “Banker’sOath”. Since 1 January 2013 Dutch law requires that Supervisoryand Executive Board members of financial institutions in theNetherlands take this oath and thus commit to a set of behaviouralprinciples that reconfirms the industry’s commitment to ethicalbehaviour.
RETAIL BANKING REGULATIONMortgage lending In early 2013, the Council of the European Union approved the Mortgage Credit Directive, which aims at preventing irresponsible lending and maintaining financial stability. The measure also standardises how loans are advertised to help borrowers compare them but allows member states to keep existing national regulation intact. The final text of the Directive was published in December 2013. The deadline for EU member states to transpose it into national law is expected to be mid-2015. ING offers mortgages in several European countries and will therefore have to comply with different regulations in each.
Payment accounts In May 2013, the EC published a draft of the Basic Payment Accounts Directive. This Directive aims to increase the comparability of fees and services, and make it easier to switch accounts. The measure would also oblige banks to open a basic payment accounts for any EU resident who applies for one, irrespective of his or her financial condition. The legislative process is expected to be finalised before the European Parliamentary elections in May 2014, after which the Directive needs to be transposed into national law by mid-2015.Depending on the adoption of cross-border switching and account opening measures, the Directive will have limited impact on ING’s payments account processes. ING already offers payment accounts at transparent low fees in several EU member states and facilitates easy switching. INSURANCE REGULATIONSolvency IIThroughout 2013, the European Commission, European Parliament and the Council (“the trilogue partners”) continued their efforts to develop the capital adequacy framework for the insurance sector, Solvency II. In November 2013, the trilogue partners reached a milestone with an agreement on key elements of the framework, but several other important elements are not expected to be finalised until the second half of 2014. Solvency II’s implementation is planned for 1 January 2016.
The European supervisory authority for insurers, “EIOPA”, published “interim measures” for member states, explaining to national
supervisors how they can translate certain elements of Solvency II into their national laws in 2014. The measures include requirements on the system of governance, an annual assessment of own risks, extensive supervisory reporting requirements and guidelines for a formalised process for internal model applications. As the interim measures are generally aligned with Solvency II requirements, implementation of these measures is part of our broader efforts to become Solvency II compliant.
ComFrameComFrame, short for Common Framework for the Supervision of Internationally Active Insurance Groups (“IAIGs”), is a global initiative started by the International Association of Insurance Supervisors (“IAIS”) in 2010. It aims to develop methods for the group-wide supervision of internationally active insurance companies, established to create a comprehensive framework for supervisors to address group-wide activities and risks, and to foster global convergence. The IAIS continued its public consultation of ComFrame in 2013 and it is on schedule for adoption in 2018.In October 2013, the IAIS said it would develop a risk-based global Insurance Capital Standard (“ICS”), using ComFrame as the vehicle for its implementation. ICS development will start in 2016, with implementation by 2019.
As ING is an IAIG, it is closely monitoring the development of ComFrame and ICS.
Consumer protection packageIn July 2012, the European Commission published legislative proposals to improve consumer protection in financial services. With the package, the Commission aims to address lack of transparency, low awareness of risks and poor handling of conflicts of interest. The package is composed of three legislative proposals: a regulation on key information documents for Packaged Retail Investment Products (“PRIPS”), a revision of the Insurance Mediation Directive (IMD2), and better protection for buyers of Undertakings for Collective Investments in Transferable Securities (“UCITS”) funds.
In 2013, the package was discussed in the European Parliament and the Council. The legislation may have a considerable impact on the distribution of insurance and retail investment products by setting higher standards for transparency and selling practices. ING will continue to monitor developments on the consumer package closely. Since we hold consumer protection in high regard, ING welcomes this initiative and will follow its further development closely.
Dutch solvency rulesDuring 2013, the Dutch Ministry of Finance developed legislation which adapts local capital adequacy rules for life insurance companies. The legislation, the so-called “Besluit Prudentiële Regels” (“BPR“) 2014, became effective on 1 January 2014. BPR 2014 will leave the current calculation method of the Solvency I Wft (“Wet op het financieel toezicht’) with the Ultimate Forward Rate (“UFR”) ratio untouched, but introduces a new metric for discussion with the supervisor which will not be disclosed. This Theoretical Solvency Criterion (“TSC”) needs to be met by the insurer. If the solvency position of the relevant NN Group life insurance entity isbelow the TSC, DNB is entitled to require that a declaration of noobjection be obtained from DNB before making any distributions ofcapital (including dividends) and reserves to the Issuer and DNB is also entitled to require that the relevant entity submit a recovery plan.
15ING Group Annual Report 2013
1 Wh
o w
e are2 R
epo
rt of th
e Executive B
oard
3 Co
rpo
rate go
vernan
ce4 C
on
solid
ated an
nu
al accou
nts
5 Parent co
mp
any an
nu
al accou
nts
6 Oth
er info
rmatio
n7 A
dd
ition
al info
rmatio
n
ING continues to focus on increasing customer satisfaction, simplifying its organisation and product offering, strengthening its financial position and solidifying the sustainability of its business model. This is taking place against the backdrop of fast-changing technology and customer expectations, subdued economic growth and an uncertain regulatory environment.
ING has substantially completed the separation of its banking andinsurance operations. This is required by the European Commission, but ING also thinks it is in the interests of all stakeholders, especially of our customers. The main reason is that it simplifies the organisation. We made significant progress with our restructuring programme in 2013. As a result, we have now reached the final stage of this process. A refined and sharpened Bank strategy for 2014 and onwards will be presented in the first half of 2014.
STRATEGIC PRIORITIES AT THREE LEVELSING has strategic priorities at the Group, Bank and Insurance levels. All are ultimately in line with our mission: To set the standard in helping our customers manage their financial future. ING aims to deliver financial products and services in the way our customers want them: with exemplary service, convenience and at competitive prices.
ING Group’s strategic priorities in 2013 were: strengthening our financial position, restructuring, repaying the remaining state aid and building both stronger and sustainable banking and insurance/investment management businesses.
ING Bank’s strategic aim is to be a strong, predominantly European bank for its customers. ING Bank wants to be a leading domestic full-service bank in attractive, stable home markets, as well as a leading commercial bank in the Benelux with a strong position in Central and Eastern Europe.
On the insurance side, the focus is on service to customers, generating capital, growing profitability and improving efficiency. NN Group’s strategy is therefore about offering appealing and easy to understand products and services, multi-access distribution and efficient and effective operations in the 18 countries in which it is active.
In the following, we will report on the progress that was made in 2013 on these strategic priorities.
STRATEGIC CONTEXTAt ING we believe that a focus on our customers is a good basis for contributing to the creation of a healthy economy and stable society. It gives clear direction to our employees and we believe that it helps to provide good returns for our shareholders.
Our goals are to help people and businesses build their future, to realise their ambitions and to help them manage their financial risks. We want to be a financial institution our customers are comfortable with and are eager to refer to friends, colleagues, business partners and family. We put the customer first, offering her or him superior experiences at attractive costs and giving employees opportunities to grow and go the extra mile for customers.
The strength of the company is, among other things, based on its relatively high customer satisfaction levels, solid financial position, multi-channel distribution strategy and international network. ING is a sustainability leader in its sector. Bank-specific strengths are a strong brand awareness in countries where we are active, and the fact that we are a pioneer in digital banking.
ING invests in building solid relationships with its customers, based on the quality of service and sound financials. We believe opportunities can arise if we continue to work hard on regaining trust, demonstrating that we care, explaining better why certain strategic choices are made and also on getting more out of the wealth of talent we have within our workforce.
16 ING Group Annual Report 2013
Strategy
Our strong funding position enabled us to continue supporting our customers through lending in 2013.
Strong cost control continues to be a priority at the Bank in order to remain competitive and to be able to face external factors, such as high regulatory costs and bank taxes. The underlying cost/income ratio improved from 60.3% in 2012 to 56.8% in 2013.
Results at NN Group showed significant improvement in 2013, on an operating basis. The improvement reflects a higher investment margin following the partial transfer of assets and liabilities from WestlandUtrecht Bank to Nationale-Nederlanden Bank, lower expenses resulting from the transformation programme in the Benelux, improved results in the non-life business and lower funding costs.
STRONG PROGRESS ON RESTRUCTURING PLAN AND REVISION OF TIMELINESDuring 2013, ING made progress on its Restructuring Plan to fullyseparate its banking and insurance and investment managementactivities. We reached several milestones, for example:• A successful initial public offering (IPO) of the US insurance
business (ING U.S.).• Completion of the divestment of ING Insurance/IM Asia.• An agreement in November 2013 with the EC on revised
timelines for the European and Japanese Insurance divestments, which together formed ING Insurance and were renamed NN Group on 1 March 2014.
The preparations for the base case IPO of NN Group are progressing well, which is expected to allow us to go to the market in 2014.
DELIVERING ON RESTRUCTURINGING continued to make strong progress on its restructuring programme in 2013, entering the end-phase of its transformation.
To meet the agreement with the European Commission (EC) of November 2012, ING had to divest more than 50% of its Asian and 25% of its US insurance and investment management activities by 2013. Both requirements were met:• The divestment of the Asian insurance and investment
management activities was effectively completed in 2013. ING Life Japan will be included in the scope of the NN Group base case IPO in 2014. In May 2013 ING U.S. started trading on the New York Stock Exchange under the ticker symbol VOYA. The successful sale of 38 million ING U.S. shares in October 2013 brought ING’s stake down to 57%. The divested 43% was more than the required 25% and moved ING closer to meeting the required divestment of over 50% by the end of 2014. 100% has to be reached by year-end 2016.
ING was also able to reduce the core debt from EUR 7.1 billion at year-end 2012 to EUR 5.0 billion at year-end 2013. This was due to strong capital generation within ING Bank, allowing an upstream payment to the Group, as well as to proceeds from the US IPO and the sale of part of the direct stake in the Brazilian insurer Sul América S.A. (SulAmérica).As ING has committed to eliminate core debt, proceeds from the divestments will be used to that end, provided they are not needed to maintain the leverage of the remaining insurance businesses. The value of the remaining 57% stake in ING U.S., the remaining stake
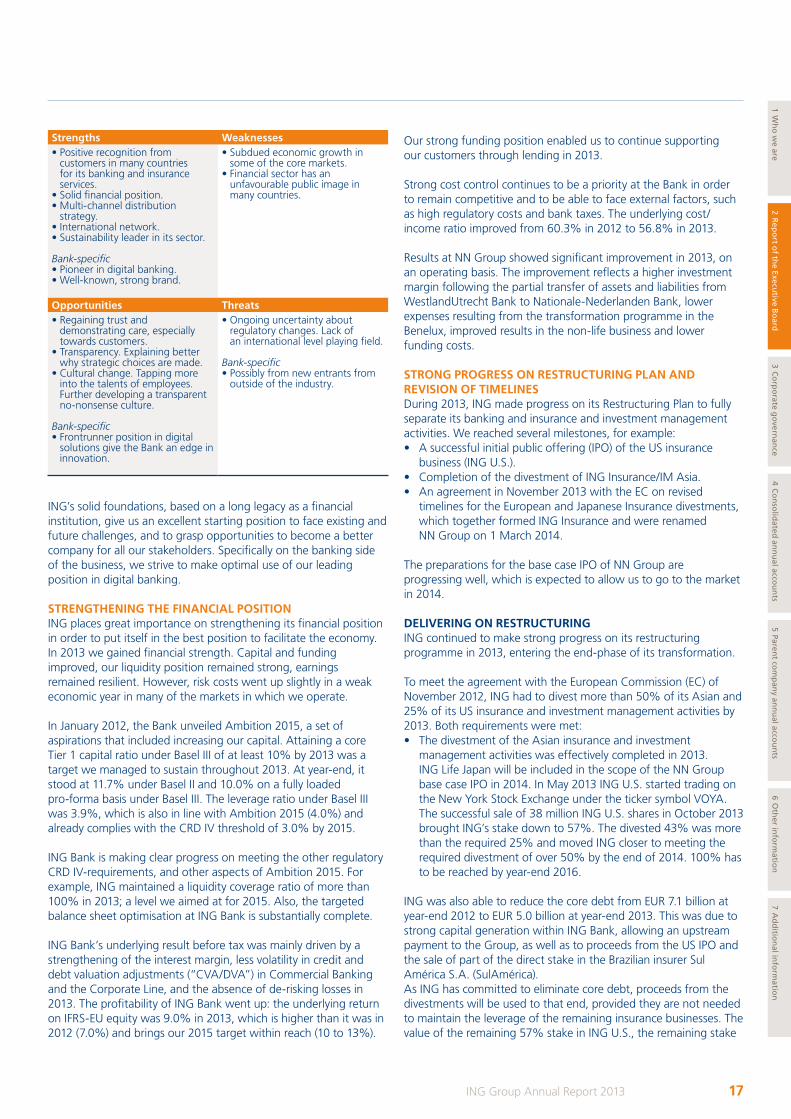
Strengths Weaknesses• Positive recognition from
customers in many countries for its banking and insurance services.
• Solid financial position.• Multi-channel distribution
strategy. • International network.• Sustainability leader in its sector.
Bank-specific• Pioneer in digital banking.• Well-known, strong brand.
• Subdued economic growth in some of the core markets.
• Financial sector has an unfavourable public image in many countries.
Opportunities Threats• Regaining trust and
demonstrating care, especially towards customers.
• Transparency. Explaining better why strategic choices are made.
• Cultural change. Tapping more into the talents of employees. Further developing a transparent no-nonsense culture.
Bank-specific• Frontrunner position in digital
solutions give the Bank an edge in innovation.
• Ongoing uncertainty about regulatory changes. Lack of an international level playing field.
Bank-specific• Possibly from new entrants from
outside of the industry.
ING’s solid foundations, based on a long legacy as a financial institution, give us an excellent starting position to face existing and future challenges, and to grasp opportunities to become a better company for all our stakeholders. Specifically on the banking side of the business, we strive to make optimal use of our leading position in digital banking.
STRENGTHENING THE FINANCIAL POSITIONING places great importance on strengthening its financial position in order to put itself in the best position to facilitate the economy. In 2013 we gained financial strength. Capital and funding improved, our liquidity position remained strong, earnings remained resilient. However, risk costs went up slightly in a weak economic year in many of the markets in which we operate.
In January 2012, the Bank unveiled Ambition 2015, a set of aspirations that included increasing our capital. Attaining a core Tier 1 capital ratio under Basel III of at least 10% by 2013 was a target we managed to sustain throughout 2013. At year-end, it stood at 11.7% under Basel II and 10.0% on a fully loaded pro-forma basis under Basel III. The leverage ratio under Basel III was 3.9%, which is also in line with Ambition 2015 (4.0%) and already complies with the CRD IV threshold of 3.0% by 2015.
ING Bank is making clear progress on meeting the other regulatory CRD IV-requirements, and other aspects of Ambition 2015. For example, ING maintained a liquidity coverage ratio of more than 100% in 2013; a level we aimed at for 2015. Also, the targeted balance sheet optimisation at ING Bank is substantially complete.
ING Bank’s underlying result before tax was mainly driven by a strengthening of the interest margin, less volatility in credit and debt valuation adjustments (“CVA/DVA”) in Commercial Banking and the Corporate Line, and the absence of de-risking losses in 2013. The profitability of ING Bank went up: the underlying return on IFRS-EU equity was 9.0% in 2013, which is higher than it was in 2012 (7.0%) and brings our 2015 target within reach (10 to 13%).
17ING Group Annual Report 2013
1 Wh
o w
e are2 R
epo
rt of th
e Executive B
oard
3 Co
rpo
rate go
vernan
ce4 C
on
solid
ated an
nu
al accou
nts
5 Parent co
mp
any an
nu
al accou
nts
6 Oth
er info
rmatio
n7 A
dd
ition
al info
rmatio
n
expected to add approximately 10 basis points to ING Bank’s core Tier 1 ratio. As a result of the unwinding, the restrictions as part of the IABF-agreement will no longer be applicable, including the right of the Dutch State to nominate two members for appointment to the Supervisory Board. The current State nominated member of the Supervisory Board will no longer have special approval rights regarding certain decisions and will have a position equal to the other members of the Supervisory Board. The unwinding was completed early 2014 and resulted in a cash profit for the Dutch State of EUR 1.4 billion.
• Strong capital generation at the Bank facilitated the payment of another tranche of core Tier 1 securities on 6 November 2013, reducing the principal amount of outstanding State aid to EUR 1.5 billion. ING received EUR 10 billion in state aid from the Dutch State in November 2008. Including the latest repayment in November 2013, ING has so far repaid EUR 11.3 billion to the Dutch State, including EUR 8.5 billion in principal and EUR 2.8 billion in interest and premiums. The final tranches of EUR 1.175 and EUR 1.075 billion are scheduled to be paid by March 2014 and by May 2015. The total annualised return for the Dutch State is expected to be 12.5%.
The total contribution to the Dutch State to date of EUR 4.9 billionincludes premiums and interest on the repayment of core Tier 1securities, the unwinding of the IABF, guarantee fees paid on thegovernment guaranteed bonds issued in 2009 and bank levies.
ING also reduced the Dutch State guaranteed funding by EUR 3.6 billion to EUR 2.5 billion at year-end 2013. The remaining bonds matured in March 2014.
STRENGTHENING THE BUSINESSESOn the surface, the business of a financial institution such as ING may seem to be principally about money. In reality, ING’s business is centred on people and trust. Only by acting with professionalism and integrity can we maintain our stakeholders’ confidence and build the company’s reputation. At the heart of our values are the ING Business Principles, which are the global standard for the behaviour expected of every employee at ING:
> We act with integrity. > We are open and clear. > We respect each other. > We are environmentally and socially responsible.
Based on these Business Principles are the five ING “Customer Golden Rules” which form a key component in our approach towards customer suitability for our banking and insurance operations. ING has been using the Customer Golden Rules since 2009 and made them an integral part of our Product Approval and Review Process (“PARP”). Through this process, ING attempts to make sure that all newly developed and existing products and services meet the set requirements for doing business.
in SulAmérica and the European Insurance business will be more than sufficient to cover the residual core debt of the Group.
Other divestments announced and/or completed in 2013 were:• ING’s 26% interest in Vysya Life Insurance. Insurance units in
Hong Kong, Macau and Thailand.• ING’s investment management business in Taiwan.• ING’s 49% stake in Korean insurance venture KB Life Insurance
Company Ltd. (KB Life). • ING’s investment management business in South Korea.• ING Life Korea, which was ING’s wholly-owned life insurance
business in South Korea. • ING’s 70% stake in the Malaysian investment management
business.• The Thai investment management units.• ING’s 50% stake in its Chinese insurance joint venture ING-BOB
Life Insurance Company.• ING’s 33% stake in China Merchants Fund.• The Mexican mortgage business.
The divestments in 2013 made ING a simpler, smaller and stronger company.
REVISION OF TIMELINESOn 6 November 2013 ING announced that, together with the Dutch State, it had reached an agreement with the EC on revised timelines for the European and Japanese insurance and investment management divestments:• The timeline to divest more than 50% of these businesses
remains unchanged at year-end 2015.• The deadline to divest 100% of these businesses was accelerated
from year-end 2018 to year-end 2016. • The entity for the base case IPO of ING’s European insurance
and investment management activities, will include ING Life Japan. ING Life Japan is therefore to be divested in line with timelines for the European insurance and investment management businesses.
The reason for the amendments was that a standalone sale of ING Life Japan was not considered feasible in a manner that meets the demands of ING’s stakeholders. After carefully exploring and evaluating the options available for the divestment of ING Life Japan, the outcome was its inclusion in the entity for the base case IPO. As part of the revised agreement, ING will accelerate the timeline as described to year-end 2016. This provides further clarity on the base case IPO of NN Group. The preparations for this are progressing well, which is expected to allow us to go to the market in 2014.
REPAYING STATE AIDING is grateful for the support the Dutch State extended during the financial crisis years 2008 and 2009. In 2013 two major milestones were reached:• An agreement was reached with the Dutch State on the
unwinding of the Illiquid Assets Back-Up Facility (“IABF”). The facility was established in 2009, at the depth of the financial crisis, in order to reduce the risk and uncertainty for ING from a portfolio of US Alt-A mortgage securities. Market developments allowed the unwinding of the facility, including the start of the sale of the securities, with an expected cash profit for the Dutch State of approximately EUR 0.4 billion. Unwinding the IABF also freed up EUR 2 billion of ING Bank’s risk-weighted assets and is
18 ING Group Annual Report 2013
Strategy continued
Two examples show how this translates into business practice:• In the first quarter of 2013, ING took another step towards
greater transparency by publishing its Environmental and Social Risk (ESR) Framework online. ING has applied its ESR policies to its business activities since 2003. ING’s ESR Framework is applied at both the client and transaction levels at ING Bank. For NN Group the framework includes two policies that specifically address responsible investing: the ING Voting Policy and the ING Defence Policy. This ensures informed decision-making that is compliant with ING’s Business Principles.
• In keeping with our clients’ expectations, our sustainable products offerings grew across all our business lines in 2013. There was growth in renewable energy project finance, green lending, charity related savings accounts and sustainable mandates in our investment services.
ING’s efforts were publicly recognised in 2013. ING was included in the DJSI World Index and the DJSI Europe Index. The DJSI World Index lists the top 10% of companies within the ordinary Dow Jones Index in terms of best-in-class performance across economic, environmental and social criteria. ING’s inclusion in these indexes underscores its standing as one of the leading sustainable companies within the diversified financial sector. ING’s 2013 score of 76 is 32 points higher than the sector average of 44 points, placing ING in the 99th percentile for the sector. This implies that only 1% of diversified financials score higher than ING. The improvement demonstrates ING’s increased performance in integrating sustainability into its business activities.
For a more comprehensive overview of ING’s sustainability strategy and performance, please see the ING Group Sustainability Report 2013.
The strength of a company is also determined by the quality of its workforce. ING is a great place to work, as surveys have shown. Among other factors, remuneration needs to be well-balanced to retain and recruit highly qualified staff. Therefore, ING ensures that its remuneration policy in general, but especially for senior management, the Executive Board and the Supervisory Board maintains a balance between short-term and long-term value creation. ING also makes sure that the remuneration policy is properly correlated with our risk profile and the interests of all stakeholders. A comprehensive overview of this framework can be found in the Remuneration chapter in this Annual Report.
BANKThe essence of our strategy is built around the customer. In our view customers basically want a solid bank they can trust. ING Bank focuses on the safety of depositors’ money. We believe that ING Bank has strong deposit gathering capabilities and a good funding mix. ING aims to maintain a solid capital base, smooth and low-cost deposit raising and a careful, environmentally and socially responsible investment selection.
The customer is also looking for ease of use and corporate responsibility. The Net Promoter Scores (“NPS”) methodology measures if customers recommend a company to their family and friends. ING Bank’s NPS for 2013 shows that customer satisfaction with our services is quite high in the countries in which we are active. In 11 countries in which ING Bank operates with retail banking activities, it is number 1 or 2 in a peer group comparison.
ING Bank adapts to the changing needs of its customers, who increasingly want insight into their financial situation and future. Security of data is, of course, a prerequisite. Customers want to make more use of digital banking services and especially of mobile services. Therefore, ING has made mobile banking services available for retail customers in all countries where it is present. Now, millions of customers carry ING Bank in their pockets. This also contributes to a paperless delivery of our products and services, reducing our own and our customer’s environmental footprint. The rapid shift to mobile is starting to move from the retail world into Commercial Banking as well.
To serve customers, ING Bank’s strategy is also built around operational excellence and balance sheet optimisation. In 2013, we made progress towards operational excellence by improving our service and by streamlining our organisation and systems. In order to remain competitive and strong, cost control continues to be a priority at the Bank. ING Bank is used to operating in lean, competitive markets which has helped it become a leader in innovative distribution. It has a prominent position in internet banking with a “direct first, advice when needed” model and a relationship-driven commercial bank offering competitive products in terms of price, efficiency and effectiveness. Nevertheless, there is room to further improve the efficiency of our processes. The mobile and digital revolution means customers now expect fast and simple solutions tailored to their individual needs and an offering that is constantly evolving.
In 2013, ING Bank further optimised its balance sheet, for example through balance sheet integration. This is to address the mismatch in the funding gap and surplus across all key countries within the Bank. The focus is on generating local lending assets for local funds entrusted, while growing global Commercial Banking assets. For more details, please see the Banking overview chapter in this Annual Report.
It is important to have motivated and engaged employees who are able to adapt quickly enough to the new demands of our customers and who can build and foster long-term relationships with them. ING Bank made progress in 2013 in being a top employer. A few examples demonstrate this:• ING Bank’s annual engagement survey was conducted in
September and October 2013, and had a high response rate of 81%. Compared with 2012, the results show an increased confidence in the long-term future of the company and the
ING’s 5 Customer Golden Rules1. We strive to meet customers’ needs throughout their life cycle.
Through the right products and proper advice, we will keep customers happy.
2. We offer fair value to customers. Depending upon the customer’s motivation, offering appropriate risk coverage or monetary value will be the only way to achieve sustained success.
3. We explain the risks, returns and costs of our products and services. Transparency and easy-to-understand language are crucial to our business.
4. We regularly assess products, services and sales practices. Only through constant checks and balances can we ensure that we are giving customers what they want and need most.
5. We work only with professional and licensed distributors. Our partners and distributors are a reflection of us. We will make sure that anyone selling our products is properly trained, qualified and licensed.
19ING Group Annual Report 2013
1 Wh
o w
e are2 R
epo
rt of th
e Executive B
oard
3 Co
rpo
rate go
vernan
ce4 C
on
solid
ated an
nu
al accou
nts
5 Parent co
mp
any an
nu
al accou
nts
6 Oth
er info
rmatio
n7 A
dd
ition
al info
rmatio
n
on-going commitment to customer focus. There were also improvements in career development and retention.
• ING Bank received “Great Place to Work” awards in Luxembourg, Germany and Spain. ”Great Place to Work” is the world’s largest employee satisfaction study, surveying employees at about 5,500 companies and conducted by “Great Place to Work”. According to this survey, ING was the only financial institution in the top-25 of best multinational workplaces in Europe.
• ING Bank also received external recognition as a top employer in France, Poland, Belgium and Italy.
A refined and sharpened Bank strategy for 2014 and onwards will be presented in the first half of 2014.
INSURANCE/INVESTMENT MANAGEMENTIn September 2013, NN Group presented an overview of its business, strategy, capital framework, executive team and how it is preparing for the base case IPO in 2014. NN Group is a leading insurance and investment management company with a strong, predominantly European presence in 18 countries. With more than 12,000 employees, it offers retirement services, insurance, investments and banking to retail, SME, corporate and institutional customers. In 2013, its future brand name was revealed: NN.
In November 2013, it was announced that the base case IPO of ING’s European insurance and investment management activities, will include ING Life Japan. More information is provided in the Insurance chapters in this Annual Report.
NN Group N.V., formerly called ING Insurance Topholding N.V., merged with ING Verzekeringen N.V. effective as of 1 March 2014. As a result the legal entity ING Verzekeringen N.V. ceased to exist and NN Group N.V. became the legal successor of ING Verzekeringen N.V. as the holding company of the European and Japanese insurance and investment management operations. In this Annual Report, NN Group will be used to indicate these operations.
NN Group’s focus is on customers, on generating capital, on growing profitability and on improving efficiency. NN Group’s strategy will therefore be about offering appealing and easy to understand products and services, multi-access distribution and efficient and effective operations in the 18 countries in which it is active.
In line with its ambition to be a leading, responsible and customer-centric organisation NN Group introduced its new corporate values, which are connected to its roots, heritage and common purpose:• “We care”: We see our customers as the starting point of
everything we do. We respect each other and believe working together leads to better results. We take our role in society seriously.
• “We are clear”: We are easy to understand, transparent and accessible. We listen carefully and take action accordingly. We keep our promises.
• “We commit”: We take responsibility for what we do. We act with integrity. We focus on our long-term objectives.
CONCLUSIONS AND AMBITIONSING focuses on implementing strategic measures that are robust under all circumstances, and on being flexible in order to be able to adapt to change.
In 2013, ING was able to make good progress on the strategic priorities for ING Group: strengthening the financial position, restructuring, repaying state aid and building both stronger and sustainable banking and insurance and investment management businesses.
ING reached several milestones that demonstrate clear progress on its Restructuring Plan to fully separate its banking and insurance and investment management activities. Most marked were the successful IPO of the US insurance business, further divestments of Asian insurance and investment management businesses and the announcement of the agreement with the EC on revised, quicker timelines for the European and Japanese Insurance divestments.
The preparations for the base case IPO of NN Group are progressing well, which is expected to allow us to go to the market in 2014. In 2013, the future brand name was revealed: NN. We believe NN Group has a strong position as a provider of retirement services, insurance, investments and banking in 18 countries and is well-positioned to capitalise on socio-economic trends.
Once the restructuring of the Group is complete by the end of 2016 and the Bank is a stand-alone business, ING Bank aims to produce a competitive return on IFRS-EU equity of 10% to 13% through low costs and with a low-risk balance sheet. ING aims to build on its leading position as a predominantly European bank with a strong international network focused on providing customers with consistently high-quality services. ING’s main priority is to finance the economy, even in a volatile economic and regulatory environment.
All in all, in 2013 ING became simpler, stronger and better positioned to serve its customers in a sustainable way.
20 ING Group Annual Report 2013
Strategy continued
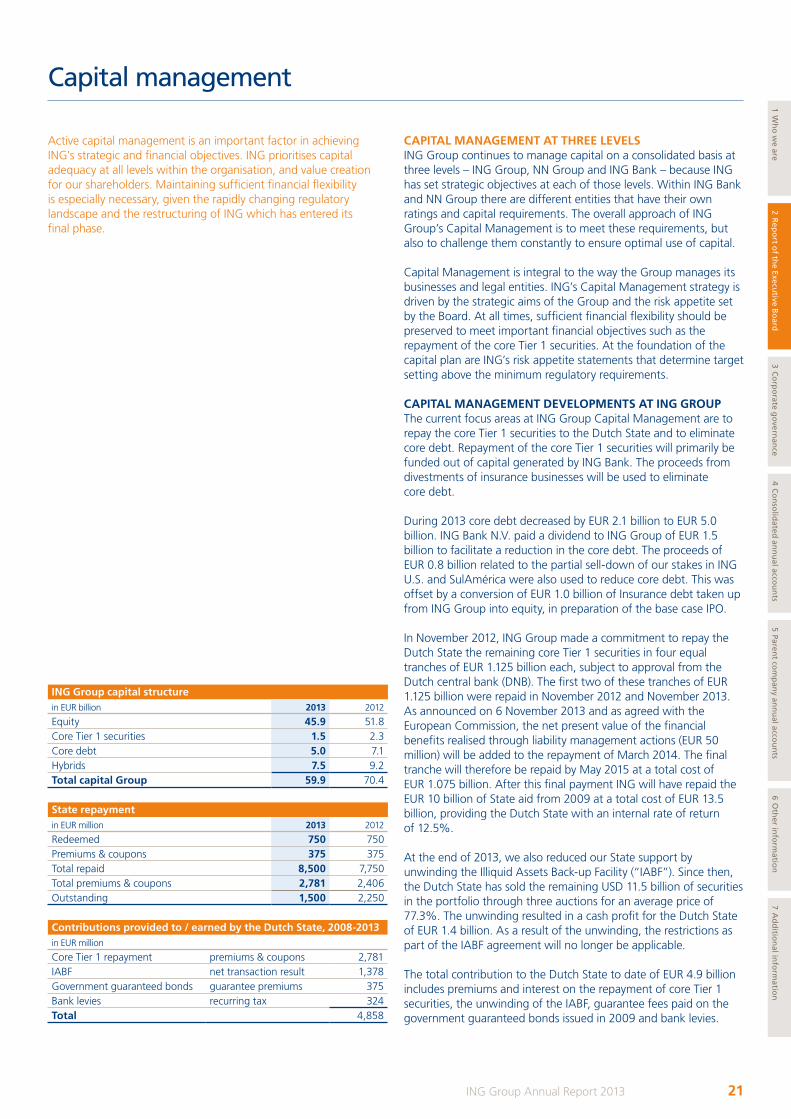
Active capital management is an important factor in achieving ING’s strategic and financial objectives. ING prioritises capital adequacy at all levels within the organisation, and value creation for our shareholders. Maintaining sufficient financial flexibility is especially necessary, given the rapidly changing regulatory landscape and the restructuring of ING which has entered its final phase.
CAPITAL MANAGEMENT AT THREE LEVELSING Group continues to manage capital on a consolidated basis at three levels – ING Group, NN Group and ING Bank – because ING has set strategic objectives at each of those levels. Within ING Bank and NN Group there are different entities that have their own ratings and capital requirements. The overall approach of ING Group’s Capital Management is to meet these requirements, but also to challenge them constantly to ensure optimal use of capital.
Capital Management is integral to the way the Group manages its businesses and legal entities. ING’s Capital Management strategy is driven by the strategic aims of the Group and the risk appetite set by the Board. At all times, sufficient financial flexibility should be preserved to meet important financial objectives such as the repayment of the core Tier 1 securities. At the foundation of the capital plan are ING’s risk appetite statements that determine target setting above the minimum regulatory requirements.
CAPITAL MANAGEMENT DEVELOPMENTS AT ING GROUPThe current focus areas at ING Group Capital Management are to repay the core Tier 1 securities to the Dutch State and to eliminate core debt. Repayment of the core Tier 1 securities will primarily be funded out of capital generated by ING Bank. The proceeds from divestments of insurance businesses will be used to eliminate core debt.
During 2013 core debt decreased by EUR 2.1 billion to EUR 5.0 billion. ING Bank N.V. paid a dividend to ING Group of EUR 1.5 billion to facilitate a reduction in the core debt. The proceeds of EUR 0.8 billion related to the partial sell-down of our stakes in ING U.S. and SulAmérica were also used to reduce core debt. This was offset by a conversion of EUR 1.0 billion of Insurance debt taken up from ING Group into equity, in preparation of the base case IPO.
In November 2012, ING Group made a commitment to repay the Dutch State the remaining core Tier 1 securities in four equal tranches of EUR 1.125 billion each, subject to approval from the Dutch central bank (DNB). The first two of these tranches of EUR 1.125 billion were repaid in November 2012 and November 2013. As announced on 6 November 2013 and as agreed with the European Commission, the net present value of the financial benefits realised through liability management actions (EUR 50 million) will be added to the repayment of March 2014. The final tranche will therefore be repaid by May 2015 at a total cost of EUR 1.075 billion. After this final payment ING will have repaid the EUR 10 billion of State aid from 2009 at a total cost of EUR 13.5 billion, providing the Dutch State with an internal rate of return of 12.5%.
At the end of 2013, we also reduced our State support by unwinding the Illiquid Assets Back-up Facility (“IABF”). Since then, the Dutch State has sold the remaining USD 11.5 billion of securities in the portfolio through three auctions for an average price of 77.3%. The unwinding resulted in a cash profit for the Dutch State of EUR 1.4 billion. As a result of the unwinding, the restrictions as part of the IABF agreement will no longer be applicable.
The total contribution to the Dutch State to date of EUR 4.9 billion includes premiums and interest on the repayment of core Tier 1 securities, the unwinding of the IABF, guarantee fees paid on the government guaranteed bonds issued in 2009 and bank levies.
ING Group capital structurein EUR billion 2013 2012
Equity 45.9 51.8Core Tier 1 securities 1.5 2.3Core debt 5.0 7.1Hybrids 7.5 9.2Total capital Group 59.9 70.4
State repaymentin EUR million 2013 2012
Redeemed 750 750Premiums & coupons 375 375Total repaid 8,500 7,750 Total premiums & coupons 2,781 2,406 Outstanding 1,500 2,250
Contributions provided to / earned by the Dutch State, 2008-2013in EUR million
Core Tier 1 repayment premiums & coupons 2,781IABF net transaction result 1,378Government guaranteed bonds guarantee premiums 375Bank levies recurring tax 324Total 4,858
21ING Group Annual Report 2013
1 Wh
o w
e are2 R
epo
rt of th
e Executive B
oard
3 Co
rpo
rate go
vernan
ce4 C
on
solid
ated an
nu
al accou
nts
5 Parent co
mp
any an
nu
al accou
nts
6 Oth
er info
rmatio
n7 A
dd
ition
al info
rmatio
n
Capital management
During 2013, ING Group received dividends from ING Bank and NN Group which it used to reduce core debt. In the second quarter, NN Group paid a dividend to ING Group of EUR 775 million; this included the EUR 0.6 billion proceeds from the IPO of the US Insurance business, ING U.S. (Voya) and proceeds from the sale of part of the stake in the Brazilian insurer Sul América S.A. (SulAmérica). In addition, ING Bank paid a dividend to ING Group of EUR 1.5 billion to facilitate a further reduction of the Group core debt. Other dividend flows from ING Bank to ING Group in 2013, next to the dividend for the core Tier 1 repayment of November, were a EUR 330 million dividend payment to finance the capital injection into Nationale-Nederlanden Bank.
The remaining stake in ING U.S. was transferred to ING Group from NN Group on 30 September 2013. The subsequent sale of another tranche of 15% shares in ING U.S. took place in October. This reduces the ING Group’s stake to approximately 57%. The sale proceeds were EUR 800 million and will be used to reduce core debt at the Group.
At the end of 2013, another tranche of the SulAmérica stake was sold by ING Group. The proceeds of EUR 110 million were upstreamed to ING Group as a dividend payment to further reduce core debt. Early 2014, ING closed the sale of a subsequent tranche of the SulAmérica stake to Swiss Re. The proceeds of EUR 180 million brought ING’s stake to 9.7%.
Finally, ING Group converted EUR 1,000 million of intercompany debt with NN Group into equity, to help prepare the NN Group balance sheet for the planned IPO (initial public offering) in 2014. This increased core debt by the same amount. During the whole of 2013, the net capital flows enabled ING Group to reduce the core debt significantly from EUR 7.1 billion at the end of 2012 to EUR 5.0 billion at the end of 2013.
ING took actions in 2013 to reduce volatility in IFRS equity:• The ING Pension Fund became financially independent on
1 January 2014, reducing volatility for ING Group, ING Bank and NN Group.
• NN Group refined the market interest rate assumption that is used in determining certain components of the insurance liabilities for the separate account pension business in the Netherlands in the fourth quarter of 2013.
NN Group moved towards fair value accounting on the reserves for Guaranteed Minimum Death Benefits of the Japan Closed Block VA in the first quarter of 2014.
CAPITAL MANAGEMENT DEVELOPMENTS AT NN GROUPThe most important development during 2013 was the successful IPO of 28.8% of Voya in May and the subsequent sell-down to 57% in October. Total proceeds of these transactions amount to EUR 1,433 million and were used to reduce core debt at ING Group. Since the initial IPO price of USD 19.50, the share price has seen a strong performance ending the year at USD 35.15. The value of the remaining stake is EUR 3.8 billion. From 30 September the remaining stake has been directly held at the Group level.
During the year, ING was able to close the divestment of its life insurance units in Hong Kong, Macau and Thailand. On 24 December, ING closed its divestment of ING Life Korea. After exploring and evaluating the options for the divestment of ING Life
Japan, the conclusion was that a standalone sale of this business was not feasible so it will be included in the NN Group IPO.The base case scenario for NN Group is to become a standalone business through an IPO in 2014. The timing will depend on market conditions, readiness and performance. To be ready for an IPO NN Group needs to be capitalised in line with its peers. Another key requirement is that NN Group has access to the debt markets on a standalone basis with its own ratings, whereas financial entanglements with ING Group entities need to be at arm’s length.
For more details, see the Strategy and Insurance overview chapters in this Annual Report.
CAPITAL MANAGEMENT DEVELOPMENTS AT ING BANKING Bank manages its capital position primarily based on its published core Tier 1 ratio, which is the main constraining factor and the most widely used variable to assess the capitalisation of banks. The published ratio up till now was the Basel 2.5 ratio, but at the start of 2014 it moved to the Basel III ratio. ING Bank has set an ambitious target for its core Tier 1 ratio of 10% under Basel III, based on ING’s risk appetite and which compares well to its peer group. In 2013 it achieved that ratio on a fully loaded pro-forma basis.
ING needs to take into account other constraints, including:• Other regulatory capital requirements: such as the amount of
additional capital, lower Tier 2 capital, the impact of the Basel I floor and the leverage ratio (as part of Basel III).
• Economic capital requirements: although it is currently not a constraining factor, economic capital is used to manage the Bank’s risk profile and to set limits.
• Rating agency considerations: each rating agency provides a different analysis and specific topics may need to be addressed.
ING Bank’s capital position has been significantly strengthened over the last few years. During 2013, capital generation was again strong, enabling ING Bank to pay EUR 3.0 billion in dividends to the Group. Apart from the EUR 1.5 billion extraordinary dividend in the second quarter, these dividends pertained to a transfer of EUR 330 million into Nationale-Nederlanden Bank and the repayment of EUR 1,125 million of core Tier 1 securities in November.
In addition, ING Bank issued USD 2 billion CRD IV-compliant Tier 2 securities. Next to that, ING Bank called its USD 2 billion 8.5% Tier 1 hybrid on 15 December 2013 and executed a successful exchange offer on EUR 4.7 billion of existing Tier 2 securities for new CRD IV-compliant Tier 2 securities. The pick-up of this transaction came out at 55% and resulted in EUR 2.6 billion extra Tier 2 capital.
The unwinding of the IABF added approximately 10 basis points to ING Bank’s core Tier 1 ratio. At the end of 2013, ING Bank’s core Tier 1 ratio was strong at 11.7%. The fully loaded pro-forma Basel III core Tier 1 ratio at the end of 2013 stood at 10.0%, while the phased in ratio came out at 10.7%.
Over the coming years the guiding principles for ING’s capital management will be cash capital generation, optimising the capital structure and financial flexibility. ING Bank believes that it will enter the Basel III era well-prepared with a strong capital position to withstand financial market challenges, new regulations and weak economic conditions.
22 ING Group Annual Report 2013
Capital management continued
Like every financial services company, ING is exposed to a variety of risks which can have a negative impact. As a financial intermediary performing a “transformation” function, ING cannot operate without taking measured and managed risks. Therefore, strong and integrated risk management in the daily business activities and strategic planning is a must for sustainable value creation. An important element of strong and sustainable risk management is transparency which is reflected in the further enhancement of our risk disclosures.
The essence of our business is transformation, which takes many forms and serves various customer needs. In our retail banking operations, for example, we transform on-demand entrusted deposits into long-dated mortgage loans. Through our payments and cash management operations we make money available when and where customers need it. Geographic transformation takes place through our international commercial banking network when we help corporate customers fund their international business plans. Our insurance business provides products and services in retirement services, insurance, investments and banking to help customers secure their financial future.
THREE LINES OF DEFENCEThe key objective of risk management at ING is to make sure that all risks are managed in the best possible way for all relevant stakeholders. To this end, we have built a strong risk culture that supports appropriate behaviours and judgements within a strong risk governance and a comprehensive risk appetite framework. As part of this ING applies a “three lines of defence” governance model for risk management, whereby ownership for risk is taken at three levels in the organisation.
The commercial departments form the first line of defence and they have primary responsibility for the day-to-day risk management. They originate loans, deposits, insurance and wealth management products and other products to help our customers manage their financial future. They know our customers well and are well positioned to act in both the customers’ and ING’s best interest. The second line of defence consists of oversight functions with a major role for the risk management organisation headed by the chief risk officer (CRO). The membership of the CRO on the Bank and Insurance boards ensures that risk management issues are heard and discussed at the highest level, thus establishing the appropriate tone at the top. The CRO steers a functional, independent risk organisation, which supports the commercial departments in their decision-making. Also importantly, it has sufficient countervailing power to prevent risk concentrations and other forms of excessive risks. The third line of defence is the corporate audit function, which independently assesses and ensures the functioning and effectiveness of the first two lines.
MANAGING CHANGESThe essence of risk management is the power to limit the impact of unfavourable events, being either expected or unexpected. Within ING Bank we continuously challenge understanding, measurement, and management of risk using advanced technology and common sense in a manner that supports our strategy and retains trust among all our stakeholders. This is becoming more important as the world in which we operate changes rapidly.
With respect to developments in financial regulation and accounting standards, ING is following these closely and is taking action to ensure the Bank and Insurance units can cope with the changes. In 2013, ING Bank took further steps to prepare for the improved regulatory capital and liquidity framework for banks – Basel III, and within the EU, CRR/CRD IV – and is well positioned to operate under this new framework. Furthermore, the Bank supports the European Commission’s creation of a banking union for eurozone banks, where the Single Supervisory Mechanism and the Single Resolution Mechanism will strengthen banks. NN Group has strengthened the balance sheet by ensuring the business becomes less susceptible to the market environment. In addition, the Insurance company has continued preparations to ensure compliance with forthcoming Solvency II regulations.
Both within the Bank and the Insurance company, ING has a risk appetite framework in place that projects and restricts the impact of adverse markets on ING’s capital and liquidity position, based on a number of different risk metrics. An important element of such a risk appetite framework is the monitoring and reporting, which not only includes internal reporting but also external disclosures. Therefore, in 2013 the Bank reaffirmed its commitment to the Enhanced Disclosure Task Force (“EDTF”), by extending the implementation of the EDTF recommendations. ING is a member
23ING Group Annual Report 2013
1 Wh
o w
e are2 R
epo
rt of th
e Executive B
oard
3 Co
rpo
rate go
vernan
ce4 C
on
solid
ated an
nu
al accou
nts
5 Parent co
mp
any an
nu
al accou
nts
6 Oth
er info
rmatio
n7 A
dd
ition
al info
rmatio
n
Risk management
of this taskforce, which consists of a collaboration between users and preparers of financial reports, such as global financial institutions, investors, rating agencies and external auditors. In addition, ING increasingly conducts company-wide and portfolio-specific stress tests as a supplementary tool to assess resilience to adverse market conditions and to act upon if mitigating actions are deemed necessary. Customer behaviour and demographics have an important bearing on risk management and are consequently modelled and incorporated in our risk appetite framework. Given the continuously changing environment, the underlying assumptions are regularly reviewed, as are all relevant metrics.
Despite some signs of recovery, the weak macroeconomic environment persisted through 2013. Against this backdrop, ING’s risk position continued to hold up well. This position was driven by active risk management, but also by on-going restructuring and reform programs in both the banking and the insurance businesses. Both the Bank and the Insurance operations continued to optimise and de-risk their balance sheet. The total exposure in the GIIPSC (Greece, Ireland, Italy, Portugal, Spain and Cyprus) countries decreased by EUR 5.5 billion to EUR 62.3 billion. In addition, the Bank continued to transform its debt securities portfolio into a liquidity book as part of the strategy to optimise the balance sheet.
The weak economic environment continued to contribute to elevated levels of risk costs in 2013, while the percentage of non-performing loans increased to 2.8% which represents EUR 15.9 billion lending credit outstanding. The additions to the provisions for loan losses rose by 8% year-on-year to EUR 2,289 million, resulting in ING Bank’s stock of provisions rising to EUR 6.2 billion at the end of 2013. ING Bank’s overall provision coverage ratio defined as the stock of provisions divided by the non-performing loans, improved from 36.9% at year-end 2012 to 38.6%. Next to additional provisioning, several other mitigating actions were taken. In 2013, the Bank further included the impact of the deteriorated market circumstances in the regulatory capital models by including recent observations in the various portfolios. Despite these measures the Bank maintains a strong capital position, with the Bank’s core Tier 1 ratio on a fully loaded Basel III basis remaining stable at 10.0% at year-end 2013, meeting ING’s Ambition 2015. Other contributing factors were strong capital generation, selective de-risking and divestments. The strong capital position enabled ING Bank not only to repay another tranche to the Dutch State, but also allowed ING Bank to use capital to further reduce the Group’s core debt. Further, in 2013 DNB performed an Asset Quality Review for commercial real estate primarily focusing on relevant income producing real estate portfolios. Provisions and Pillar I capital levels for ING Bank for the portfolios in scope were in line with the results of the Asset Quality Review.
The Bank improved its funding profile and ensured its liquidity position stayed within regulatory and internal targets. The full-year 2013 long term debt issuance totalled EUR 25.7 billion compared with EUR 33.1 billion issued in 2012. The issuance volume was lower due to a combination of an asset growth slowdown and increasing funds entrusted. As a result, ING Bank’s loan-to-deposit ratio, excluding securities that are recorded at amortised costs in loans and advances and excluding the IABF government receivable, improved in 2013 from 1.13 at 2012 year-end to 1.04%, thereby already complying with ING’s 2015 Ambition of below 1.10.
Over the year, NN Group strengthened its balance sheet by refining asset/liability management to optimise risk-reward trade-offs. As a result, the Insurance business is less susceptible to market movements and is well positioned for selectively increasing investment returns. In addition, with the implementation of Solvency II expected in 2016 – following agreement on Omnibus II – NN Group has continued preparations to comply with Solvency II strengthening risk models, risk assessment and risk governance. Non-financial risk issues continuously demand our attention since they can seriously impact the functioning of our different businesses. These issues differ for each business activity and require tailored approaches to counter them. ING, for example, monitors possible new fraud methods and practices that can emerge following the introduction of new retail payment methods and products, and continues to expand anti-fraud programmes in our insurance and lending acceptance processes. A concrete action has been the implementation of geo-blocking in the Netherlands, whereby debit cards are blocked outside the EU unless the customer requests otherwise. In combination with a new type of chip integrated into cards this has significantly mitigated the risk of criminal skimming activities. Furthermore, as a result of lessons learned from other events, such as the manipulation of financial benchmarks, ING Bank is strengthening its own methodologies and procedures.
The growth of electronic distribution and communication channels has increased the speed and convenience with which our customers can conduct their banking business with us. We are committed to providing this convenience without compromising security standards. ING has implemented and continues to implement comprehensive prevention, detection and responsive measures to defend its customers, its information and its systems against cyber attacks and reduce the level of any losses. The Distributed Denial of Service (“DDoS”) attacks on (Dutch) banks in April 2013 made it clear that the investments ING Bank is making in this domain are more necessary than ever and deliver positive results.
By virtue of its function as a financial intermediary ING plays an important role in society. We are continuously developing our products according to our customers’ changing demands and ensure that they comply with our proper values and principles, through, for example, sales suitability programmes. As part of its risk culture, ING continued refining the integrated sustainability objectives in its business strategies and activities and managing the related social and environmental risks. ING took another step towards greater transparency in 2013 by publishing its Environmental and Social Risk (ESR) Framework online, which includes ESR policies that ING has applied to its business activities since 2003 and further expanded in 2013. Furthermore, in line with European Union requirements, risk management plays an important role in evaluating the performance and determining the remuneration of senior management, ensuring that remuneration is properly correlated with our risk profile and the interests of all stakeholders.
All these changes make the company stronger, simpler and more sustainable as it focuses on retail banking in Europe, its world-class commercial banking network, and being a preferred supplier of protection products for our Bank and Insurance customers. A comprehensive, more detailed chapter on ING Group’s risk management practices is contained later in this Annual Report.
24 ING Group Annual Report 2013
Risk management continued
Information technology (IT) has vastly transformed the way both the banking and insurance industries interact with their customers. Mobile, particularly in banking, and direct channels in general have become a significant force in distribution. Increasingly, the innovative use of technology will be essential in creating a superior customer experience and will more and more play a leading role in the way ING does business. By continuously investing in innovative technology, developing superior IT skills and putting the customer’s interest first in everything we do, ING aims to distinguish itself as a leading financial services company.
Information technology plays a crucial role in ensuring ING remains a competitive and an innovative financial services player. It underpins ING’s banking and insurance business propositions.
In 2013, new and existing IT projects supported ING in its strategy to be a strong, simple and sustainable business.
SEPARATIONBoth IT departments at the Bank and the Insurer continued to work on separation projects in the IT Readiness Program which began in 2010, and which was established because of the planned separation of ING Group’s Bank and Insurance operations into standalone businesses.
By the end of 2013, the separation of Bank and Insurance IT systems was almost complete. Both the Bank and Insurance worked towards completing the last projects required to complete disentanglement. From early January 2014, the Bank will no longer be involved in meeting the IT infrastructure needs of Insurance (with the exception of Insurance Belgium). In the process hundreds of servers and internal connections were decommissioned. A new Insurance/Investment Management data centre was established, more than 700 applications have been migrated and a new network has been put in place with additional security capabilities and services. In addition, a new workplace environment for Insurance/Investment Management was established which hosts 10,000 users.
BANKAt the Bank, ING announced its new IT strategy “Creating value for our customers through six strategic pillars – the power of IT.” The strategy is aimed at meeting customer needs such as reliability, security and customer centricity by being agile, efficient and working collaboratively.
The new strategy is in line with ING’s vision that technology and innovation play a crucial role in the future of ING Bank.
ING aims to further strengthen its ability to replicate applications and reuse solutions across different countries and business units. An example of this was the creation of responsive websites (no matter what device customers use, the content of the site will always fit perfectly on the screen) in several countries, which was developed through sharing knowledge, applications and expertise across countries.
The IT department remains committed to further embedding an agile way of working throughout its whole organisation as a core principle in the way it works, because ING’s aim is to respond swiftly and efficiently to changing customer demands. Also, IT will continue to further automate IT processes, where possible. This results in products and services coming to market faster and at lower IT cost.
ING began a programme involving outside experts and ING resources to further strengthen ING’s resilience to cybercrime attacks and will bring this to a higher level and make it a continuous point of attention. In 2013, in the Netherlands, ING Bank came under a serious Distributed Denial of Service (“DDoS”) attack, causing service outage and hindering access to online banking for customers. ING Bank regretted the temporary loss of service and worked intensively to defend its infrastructure and to
25ING Group Annual Report 2013
1 Wh
o w
e are2 R
epo
rt of th
e Executive B
oard
3 Co
rpo
rate go
vernan
ce4 C
on
solid
ated an
nu
al accou
nts
5 Parent co
mp
any an
nu
al accou
nts
6 Oth
er info
rmatio
n7 A
dd
ition
al info
rmatio
n
Information technology
make it more resilient to DDoS attacks, not only in the Netherlands but on a global scale. In parallel, it worked with the Dutch justice department to investigate the source of the attacks.
ING Bank finalised the construction of a new data centre in Roosendaal, which will enable the consolidation of data centres in the Netherlands and in Commercial Banking.
INSURANCEInformation technology plays a crucial role in supporting NN Group as a leading insurance and investment management organisation. In 2013, NN Group made significant progress in restructuring its operations in preparation for a standalone future.
The IT department worked towards laying the foundation for Insurance’s independent future. The IT strategy (excellent technology products and services, collaboration across the value chain and efficient and effective operations) was refined during 2013 and a multi-year IT transformation programme has been launched to support the strategy. The programme’s aim is to restructure the IT environment so it becomes even more effective and efficient in support of the NN Group businesses and their customers into the future.
Security and stability of IT systems remains paramount. Armed with new insights into bolstering websites following the DDoS attacks on ING Bank in the Netherlands, websites and portals were boosted against external threats. IT maintains a strong focus on enhancing IT security, resulting in effective and integrated risk mitigation, and to also stay ahead of security fraud developments.As multi-channel distribution and the importance of client-facing applications are increasing, an improvement programme was initiated to increase system availability. The programme will result in significantly greater availability for both internal and external users from the first quarter of 2014.
In 2013, Investment Management successfully completed its two-year programme to establish a standardised global platform for front, mid and back office operations. Most investment centres across three continents now use this platform. It has led to a significant simplification of the IT landscape for Investment Management. In 2014, Investment Management intends to introduce direct execution, where customers can make buy/sell transactions and view their portfolios online.
Improving the customer experience is a core priority at NN Group. In Europe outside the Netherlands, IT worked in conjunction with the business to introduce a direct servicing channel. It will enable customers to communicate directly with ING anytime and anywhere.
Within Nationale-Nederlanden Bank, NN Group invested in portals to enable more straight-through processing and to also streamline their use. It also invested in Customer Relationship Management tooling and analytics, to among other things, personalise the customer experience.
26 ING Group Annual Report 2013
Information technology continued
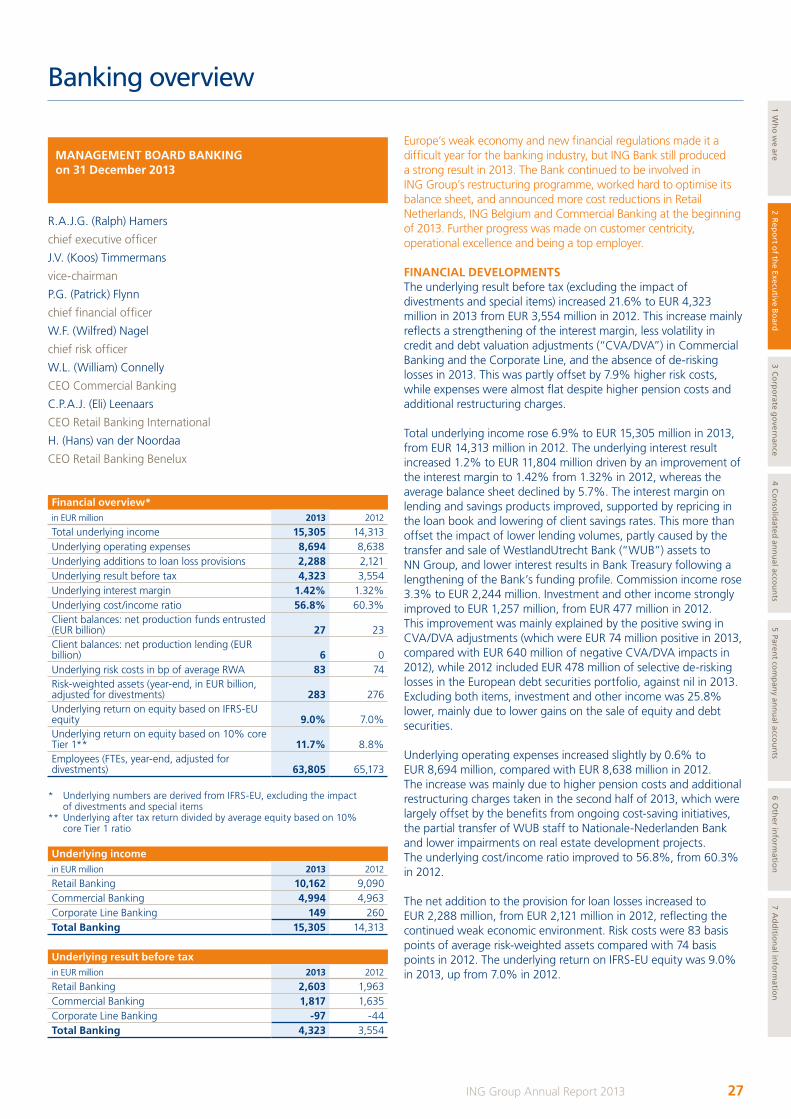
MANAGEMENT BOARD BANKINGon 31 December 2013
Financial overview*in EUR million 2013 2012
Total underlying income 15,305 14,313Underlying operating expenses 8,694 8,638Underlying additions to loan loss provisions 2,288 2,121Underlying result before tax 4,323 3,554Underlying interest margin 1.42% 1.32%Underlying cost/income ratio 56.8% 60.3%Client balances: net production funds entrusted (EUR billion) 27 23Client balances: net production lending (EUR billion) 6 0Underlying risk costs in bp of average RWA 83 74Risk-weighted assets (year-end, in EUR billion, adjusted for divestments) 283 276Underlying return on equity based on IFRS-EU equity 9.0% 7.0%Underlying return on equity based on 10% core Tier 1** 11.7% 8.8%Employees (FTEs, year-end, adjusted for divestments) 63,805 65,173
* Underlying numbers are derived from IFRS-EU, excluding the impact of divestments and special items
** Underlying after tax return divided by average equity based on 10% core Tier 1 ratio
Underlying incomein EUR million 2013 2012
Retail Banking 10,162 9,090Commercial Banking 4,994 4,963Corporate Line Banking 149 260Total Banking 15,305 14,313
Underlying result before taxin EUR million 2013 2012
Retail Banking 2,603 1,963Commercial Banking 1,817 1,635Corporate Line Banking -97 -44Total Banking 4,323 3,554
R.A.J.G. (Ralph) Hamers
chief executive officer
J.V. (Koos) Timmermans
vice-chairman
P.G. (Patrick) Flynn
chief financial officer
W.F. (Wilfred) Nagel
chief risk officer
W.L. (William) Connelly
CEO Commercial Banking
C.P.A.J. (Eli) Leenaars
CEO Retail Banking International
H. (Hans) van der Noordaa
CEO Retail Banking Benelux
Europe’s weak economy and new financial regulations made it a difficult year for the banking industry, but ING Bank still produced a strong result in 2013. The Bank continued to be involved in ING Group’s restructuring programme, worked hard to optimise its balance sheet, and announced more cost reductions in Retail Netherlands, ING Belgium and Commercial Banking at the beginning of 2013. Further progress was made on customer centricity, operational excellence and being a top employer. FINANCIAL DEVELOPMENTSThe underlying result before tax (excluding the impact of divestments and special items) increased 21.6% to EUR 4,323 million in 2013 from EUR 3,554 million in 2012. This increase mainly reflects a strengthening of the interest margin, less volatility in credit and debt valuation adjustments (“CVA/DVA”) in Commercial Banking and the Corporate Line, and the absence of de-risking losses in 2013. This was partly offset by 7.9% higher risk costs, while expenses were almost flat despite higher pension costs and additional restructuring charges.
Total underlying income rose 6.9% to EUR 15,305 million in 2013, from EUR 14,313 million in 2012. The underlying interest result increased 1.2% to EUR 11,804 million driven by an improvement of the interest margin to 1.42% from 1.32% in 2012, whereas the average balance sheet declined by 5.7%. The interest margin on lending and savings products improved, supported by repricing in the loan book and lowering of client savings rates. This more than offset the impact of lower lending volumes, partly caused by the transfer and sale of WestlandUtrecht Bank (“WUB”) assets to NN Group, and lower interest results in Bank Treasury following a lengthening of the Bank’s funding profile. Commission income rose 3.3% to EUR 2,244 million. Investment and other income strongly improved to EUR 1,257 million, from EUR 477 million in 2012. This improvement was mainly explained by the positive swing in CVA/DVA adjustments (which were EUR 74 million positive in 2013, compared with EUR 640 million of negative CVA/DVA impacts in 2012), while 2012 included EUR 478 million of selective de-risking losses in the European debt securities portfolio, against nil in 2013. Excluding both items, investment and other income was 25.8% lower, mainly due to lower gains on the sale of equity and debt securities.
Underlying operating expenses increased slightly by 0.6% to EUR 8,694 million, compared with EUR 8,638 million in 2012. The increase was mainly due to higher pension costs and additional restructuring charges taken in the second half of 2013, which were largely offset by the benefits from ongoing cost-saving initiatives, the partial transfer of WUB staff to Nationale-Nederlanden Bank and lower impairments on real estate development projects. The underlying cost/income ratio improved to 56.8%, from 60.3% in 2012.
The net addition to the provision for loan losses increased to EUR 2,288 million, from EUR 2,121 million in 2012, reflecting the continued weak economic environment. Risk costs were 83 basis points of average risk-weighted assets compared with 74 basis points in 2012. The underlying return on IFRS-EU equity was 9.0% in 2013, up from 7.0% in 2012.
27ING Group Annual Report 2013
1 Wh
o w
e are2 R
epo
rt of th
e Executive B
oard
3 Co
rpo
rate go
vernan
ce4 C
on
solid
ated an
nu
al accou
nts
5 Parent co
mp
any an
nu
al accou
nts
6 Oth
er info
rmatio
n7 A
dd
ition
al info
rmatio
n
Banking overview
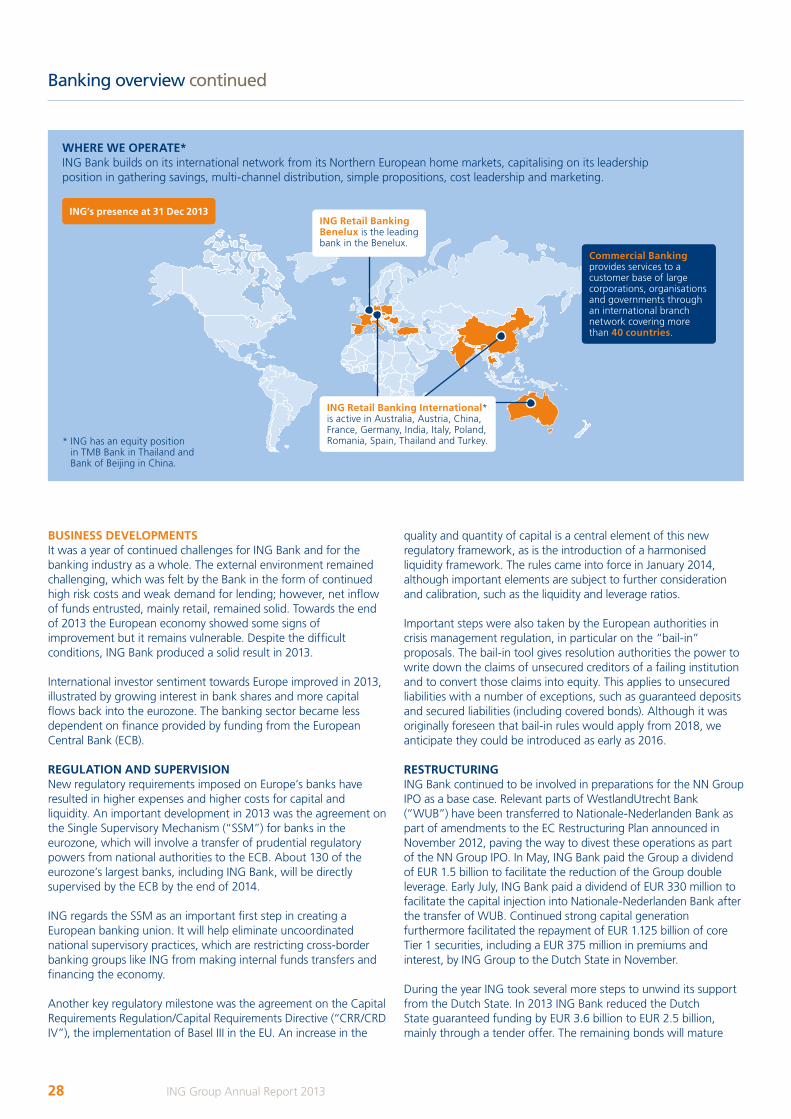
WHERE WE OPERATE*ING Bank builds on its international network from its Northern European home markets, capitalising on its leadership position in gathering savings, multi-channel distribution, simple propositions, cost leadership and marketing.
ING Retail Banking Benelux is the leading bank in the Benelux.
Commercial Banking provides services to a customer base of large corporations, organisations and governments through an international branch network covering more than 40 countries.
ING’s presence at 31 Dec 2013
ING Retail Banking International* is active in Australia, Austria, China, France, Germany, India, Italy, Poland, Romania, Spain, Thailand and Turkey.
quality and quantity of capital is a central element of this new regulatory framework, as is the introduction of a harmonised liquidity framework. The rules came into force in January 2014, although important elements are subject to further consideration and calibration, such as the liquidity and leverage ratios.
Important steps were also taken by the European authorities in crisis management regulation, in particular on the “bail-in” proposals. The bail-in tool gives resolution authorities the power to write down the claims of unsecured creditors of a failing institution and to convert those claims into equity. This applies to unsecured liabilities with a number of exceptions, such as guaranteed deposits and secured liabilities (including covered bonds). Although it was originally foreseen that bail-in rules would apply from 2018, we anticipate they could be introduced as early as 2016.
RESTRUCTURINGING Bank continued to be involved in preparations for the NN Group IPO as a base case. Relevant parts of WestlandUtrecht Bank (“WUB”) have been transferred to Nationale-Nederlanden Bank as part of amendments to the EC Restructuring Plan announced in November 2012, paving the way to divest these operations as part of the NN Group IPO. In May, ING Bank paid the Group a dividend of EUR 1.5 billion to facilitate the reduction of the Group double leverage. Early July, ING Bank paid a dividend of EUR 330 million to facilitate the capital injection into Nationale-Nederlanden Bank after the transfer of WUB. Continued strong capital generation furthermore facilitated the repayment of EUR 1.125 billion of core Tier 1 securities, including a EUR 375 million in premiums and interest, by ING Group to the Dutch State in November.
During the year ING took several more steps to unwind its support from the Dutch State. In 2013 ING Bank reduced the Dutch State guaranteed funding by EUR 3.6 billion to EUR 2.5 billion, mainly through a tender offer. The remaining bonds will mature
BUSINESS DEVELOPMENTSIt was a year of continued challenges for ING Bank and for the banking industry as a whole. The external environment remained challenging, which was felt by the Bank in the form of continued high risk costs and weak demand for lending; however, net inflow of funds entrusted, mainly retail, remained solid. Towards the end of 2013 the European economy showed some signs of improvement but it remains vulnerable. Despite the difficult conditions, ING Bank produced a solid result in 2013.
International investor sentiment towards Europe improved in 2013, illustrated by growing interest in bank shares and more capital flows back into the eurozone. The banking sector became less dependent on finance provided by funding from the European Central Bank (ECB).
REGULATION AND SUPERVISIONNew regulatory requirements imposed on Europe’s banks have resulted in higher expenses and higher costs for capital and liquidity. An important development in 2013 was the agreement on the Single Supervisory Mechanism (“SSM”) for banks in the eurozone, which will involve a transfer of prudential regulatory powers from national authorities to the ECB. About 130 of the eurozone’s largest banks, including ING Bank, will be directly supervised by the ECB by the end of 2014.
ING regards the SSM as an important first step in creating a European banking union. It will help eliminate uncoordinated national supervisory practices, which are restricting cross-border banking groups like ING from making internal funds transfers and financing the economy.
Another key regulatory milestone was the agreement on the Capital Requirements Regulation/Capital Requirements Directive (“CRR/CRD IV”), the implementation of Basel III in the EU. An increase in the
* ING has an equity position in TMB Bank in Thailand and Bank of Beijing in China.
28 ING Group Annual Report 2013
Banking overview continued
in March 2014. In November 2013, ING announced that it had reached an agreement with the Dutch State on the unwinding of the Illiquid Assets Back-up Facility (“IABF”). In February 2014 ING and the Dutch State completed the unwinding of IABF.
BALANCE SHEET OPTIMISATIONING Bank worked hard to optimise its capital structure and met most of the CRD IV requirements before they were implemented. In November ING Bank announced and also executed a number of liability management actions to optimise the capital structure in anticipation of the upcoming CRD IV implementation.
ING Bank’s balance sheet has also been reduced and strengthened. The balance sheet declined following the transfer and sale of EUR 8.3 billion of assets and EUR 3.7 billion of liabilities from WUB to Nationale-Nederlanden Bank, and the sale of EUR 2.2 billion of Dutch mortgages and EUR 1.0 billon of US Real Estate Finance (“REF”) Loans. The balance sheet was also impacted by the divestment of ING Direct UK in the first quarter of 2013 and the sale of EUR 0.8 billion mortgage portfolio in Australia in the second quarter of 2013.
ING Bank is on track to reach the target of EUR 54 billion balance sheet integration (excluding off-balance positions) by 2015. Balance sheet integration refers to the continuous efforts we put into trying to minimise balance sheet inefficiencies that may arise because of the fact that our client asset base and our client liability base do not always grow at the same pace over time and across countries. This also includes looking for synergies between different ING units that have different balance sheet structures (some are client deposit driven, others are client asset driven).Since 2011, we have completed EUR 48 billion of balance sheet integration to optimise local balance sheets, of which EUR 14 billion was realised in 2013.
ING Bank attracted a net inflow of funds entrusted (adjusted for WUB transfers, the divestment of ING Direct UK and currency impacts) of EUR 27.3 billion during the year. Retail Banking generated EUR 18.8 billion of net inflow, driven by continued growth outside of the Netherlands. Total net lending grew by EUR 5.5 billion (also adjusted for the sale of Dutch mortgages and US REF loans), despite muted demand and pricing discipline.
COST CONTAINMENTIn February 2013 a second phase of ING Bank’s Retail Netherlands’ cost reduction programme was announced on top of the programme announced in November 2011, followed by an extension of the existing cost-saving programme in the fourth quarter of 2013. Including this extension, total headcount reductions are 4,400 FTEs and will result in EUR 460 million annual cost savings by 2015. Since the start of the programme, there has been a reduction of about 2,900 FTEs and EUR 279 million has been saved.
The projects announced by ING Belgium at the beginning of 2013 to align its products and services with the new mobile banking environment are on course. ING Belgium’s cost-saving target by 2015 is EUR 160 million. By the end of 2013 cost savings of EUR 41 million have been achieved.Commercial Banking’s restructuring programme is also on track and by the end of 2013 cost savings of EUR 138 million were realised.Commercial Banking continued with its global change programmes
which aim to save EUR 260 million by 2015 and at the same time improve product delivery and enhance the One Bank client experience. An example is the integrated client coverage approach, focusing on unifying the sales force and harmonising client services. For more information see the chapter on Commercial Banking. The previously announced cost-saving initiatives are expected to reduce expenses at ING Bank by EUR 880 million by 2015, of which EUR 458 million has already been achieved since the start of the programmes.
CUSTOMER CENTRICITYAs a bank we play an important role in helping our retail and commercial customers make the right decisions by providing them with products and services that meet their needs. Our role is to support the economy; ING Bank can only achieve long-term business success if it contributes towards economic development, a healthy environment and a stable society.
We strive to meet growing demand from customers for products that not only generate good financial results, but also serve social and environmental objectives. We do this by integrating sustainability considerations into our business and by managing the socio-environmental risks of our transactions and engagements. We updated our Environmental and Social Risk Framework and embedded client screening as part of the client on-boarding process.
Some of our products help relieve social and environmental problems. For example, we offer retail customers in the Netherlands an ING Savings Account for UNICEF which supports UNICEF, the UN children’s charity; and in India we offer farmers products to cover their credit needs before, during and after harvest time.
In our lending and saving activities, ING’s Groenbank helps businesses make their activities more sustainable. ING Groenbank is the number two green bank in the Netherlands and was the lead arranger of a record EUR 100 million green loan to a Dutch energy company in 2013. ING has also created a Sustainable Lending team to identify and support sustainable business opportunities within commercial banking. The team has a global mandate, to identify and promote growth areas in the sustainability arena.
Microfinance can help under-banked communities gain access to financial services, contributing to poverty reduction. ING’s microfinance portfolio, financed by ING Groenbank, is active in India, Africa and, since 2013, in Turkey. ING Turkey’s microfinance activities are facilitated by an ING Groenbank loan of EUR 30 million which is part of the total microfinance portfolio of EUR 75 million.
We continue to innovate. In 2013 we launched “responsive” websites for example at ING Austria, ING Czech Republic and ING Italy. These are sites where no matter what device is being used (smartphone, tablet or PC), the site content will always fit in the screen.
ING Vysya Bank introduced an iPhone-based mobile app to extend its reach into remote cities and rural areas. ING Bank Slaski was the first bank in Poland, and one of the first in the world, to offer contactless ATM technology, increasing the number of contactless ATMs. Using best practices from around the ING world, ING Turkey
29ING Group Annual Report 2013
1 Wh
o w
e are2 R
epo
rt of th
e Executive B
oard
3 Co
rpo
rate go
vernan
ce4 C
on
solid
ated an
nu
al accou
nts
5 Parent co
mp
any an
nu
al accou
nts
6 Oth
er info
rmatio
n7 A
dd
ition
al info
rmatio
n
introduced an innovative and award-winning branch concept to respond to changing customer demands. In these newly designed branches, customer centricity is brought to the fore, with ample room for customer interaction by means of, for example, self-service facilities. The bank also introduced an iPad mobile banking app which helps sales teams service customers across retail and commercial banking.
Customers in Belgium have been embracing new technologies faster than anticipated, leading to greater use of digital services and prompting further process automation. In the Netherlands, the number of mobile log-ons at ING exceeded online banking log-ons for the first time in the third quarter of 2013.
Addressing the problem of the subdued housing market in the Netherlands, ING Bank introduced an online “stress test” which helps homeowners see whether their financial planning can be improved. ING Netherlands also launched an online tool (Afloswijzer) to help customers decide whether to save or pay off their mortgage.
Customer-led change is at the heart of ING Bank. In Retail Banking, our full service franchises in the Netherlands and Belgium are evolving as online and mobile channels grow in importance. And in our direct franchises we are expanding our product range.
Commercial Banking is restructuring its organisation to provide a more consistent customer experience across sales, servicing and back office support.
We are becoming the primary bank for more customers. ING Spain, for instance, started 14 years ago only with savings; now it is well on the way to becoming the primary bank for many customers, and a multi-product bank.
In 2013 we enjoyed a number of key milestones and external recognition. ING-DiBa, for example, surpassed EUR 100 billion funds entrusted and ING Spain surpassed one million payments accounts.
Customers voted ING Direct Australia as the Best Bank in Australia and ING-DiBa was named Germany’s most admired bank for the seventh year in a row. ING was named “Bank of the Year 2013” in Western Europe by The Banker, the global financial magazine which is part of the Financial Times Group; The Banker also named ING “Bank of the Year” in Belgium, and “Bank of the Year” in the Netherlands for the third year in a row. Commercial Banking received several awards in recognition of ING’s capabilities in trade finance and structured finance. High profile deals demonstrated Commercial Banking’s skill in combining its expertise to create tailored solutions for clients across countries and industries sectors.
OPERATIONAL EXCELLENCEOperational excellence is a key priority at ING Bank. We align our systems, structure and processes to deliver the best customer experience in a cost-effective way. The big transformations we have initiated in the Netherlands and Belgium, and in Commercial Banking, are laying the groundwork for a lower cost base.
ING in the Netherlands is improving its customer services by focusing on easy-to-use operational processes. To reach this goal,
ING applied 10 simple principles for each operational process, such as “never ask the customer for information we already have”. In Belgium, customers can now request business loans online. ING Turkey in 2013 became the first bank in the country to offer an electronic invoicing solution which reduces paper and other costs.ING Romania launched Fast Track Light Automation, an application to handle loan applications for new Mid Corporate Business customers within 48 hours.
TOP EMPLOYERRemaining a top employer is a key priority at ING Bank. Having motivated employees is essential for success because they build lasting relationships with customers.
Top Employer teams are organised in each business line, with responsibility for executing at a local level the bank-wide Top Employer action plan.
Across the banking businesses, best practices are shared in the three global priorities identified to bring more focus and consistency to the Top Employer programme: performance management, development, and efficient & effective collaboration.
ING France, ING Italy, ING Poland, ING Belgium and ING Spain received local Top Employer Awards. ING Luxembourg, Interhyp, ING-DiBa and ING Spain have also received European “Great Place to Work Awards”, placing them in the top-25 of Best Multinational Workplaces in Europe. ING is the only financial institution in this European ranking. This success strengthens our employer branding and demonstrates that we are on track with our Top Employer programme.
However, there are several challenges facing us as an employer. First, the general sentiment towards banks is still not positive. Second, we had to lower the headcount at ING Bank to reduce costs and keep our organisation flexible. These measures (also from previous years with an impact on 2013) resulted in a total reduction of internal staff at ING Bank by 2,022 FTEs in 2013 despite growth in Retail International. Third, we tightened up our remuneration policy in the Netherlands. Despite these challenges, the outcome of our annual employee engagement survey showed an increased confidence in the long-term future of the company which illustrates the resilience of our staff in a difficult environment.
CONCLUSIONS AND AMBITIONSING Bank made good progress during the year towards its Ambition 2015 targets, despite the difficult banking market and economic conditions. The underlying net profit of ING Bank improved to EUR 3.2 billion in 2013. This was due to a strengthening of the interest margin, good cost control, and supported by the absence of de-risking losses in 2013 and less volatility from CVA/DVA impacts. The funding profile of the bank improved, which enabled us to continue to support our customers, although demand for assets remained subdued.
We continued to deliver on our strategic priorities: sharpening our business focus; reducing costs; making capital, funding and liquidity more robust; and meeting customers’ demand.
We include sustainability criteria in our business decision-making. We have witnessed a continued increase in the volume of sustainable portfolios across all our operations. For more details
30 ING Group Annual Report 2013
Banking overview continued
see the business chapter in ING’s Sustainability Report. We achieved what we set out to do on the balance sheet: increasing the leverage ratio, strengthening the funding profile and meeting our Basel III capital ratio target.
We kept a steady course, and serving customers’ needs remained at the heart of our business. ING will continue to pursue technological innovation to support retail customers’ needs, and we will use our expertise and international network as a leading commercial banking for our corporate clients, both inside and outside Europe.
Our main ambition is to finalise our disentanglement from the Dutch state. Our longer-term ambition is to develop a mature banking model in each country where we operate.
Above all, ING Bank aims to build on its leading position as a predominantly European bank with a strong international network focused on providing customers with consistently high-quality services.
31ING Group Annual Report 2013
1 Wh
o w
e are2 R
epo
rt of th
e Executive B
oard
3 Co
rpo
rate go
vernan
ce4 C
on
solid
ated an
nu
al accou
nts
5 Parent co
mp
any an
nu
al accou
nts
6 Oth
er info
rmatio
n7 A
dd
ition
al info
rmatio
n

Retail Banking provides banking services to individuals and small and medium-sized enterprises in Europe, Asia and Australia. A full range of products and services is provided, albeit offerings may vary according to local demand. Retail Banking has leading positions in the Netherlands, Belgium, Luxembourg, Germany, Australia and Poland. It also has solid positions in its other markets – Spain, France, Austria, Italy, Romania, Turkey and India – where it challenges the established players. It has equity positions in TMB Bank (Thailand) and Bank of Beijing (China). Every country has the same strategic focus: to provide easy and fair banking, at low costs, according to the “direct if possible, advice when needed” principle.
In addition to putting the customer first, operational excellence and being a top employer, the focus in 2013 was on “digital first”, providing customers with a consistent and improved experience across all channels and on maintaining a safe electronic banking environment. Although in many areas the economic and social uncertainty persisted in 2013, Retail Banking’s performance was strong.
FINANCIAL DEVELOPMENTSRetail Banking’s underlying result before tax rose 32.6% to EUR 2,603 million in 2013 from EUR 1,963 million in 2012, mainly due to higher interest results following improved margins on lending and savings, and the absence of de-risking losses on the investment portfolio, which were prominent in 2012. This was in part offset by higher expenses and increased risk costs.
Underlying income rose 11.8% to EUR 10,162 million. The interest result was 6.3% higher, driven by improved margins on lending and savings, the latter following reductions in customer savings rates, which more than offset the impact of the transfer and sale of portfolios, mainly related to the partial transfer of WestlandUtrecht Bank (“WUB”) to Nationale-Nederlanden Bank. Adjusted for currency impacts and the aforementioned transfers and sales, net inflow in funds entrusted was EUR 18.8 billion, predominantly in Germany and Rest of World. Net lending growth was EUR 5.8 billion, of which EUR 4.2 billion was in residential mortgages. Commission income rose 3.0% due to higher fees from the securities business. Investment and other income improved to EUR 396 million from a loss of EUR 137 million in 2012, mainly due to the absence of losses from the selective sale of European debt securities, which dampened income by EUR 462 million in 2012, and higher dividend from Bank of Beijing.
Underlying operating expenses increased 3.0% to EUR 6,138 million, mainly due to higher pension costs and additional restructuring charges recorded in the Netherlands as part of the existing efficiency programmes. This was largely offset by the benefits from the ongoing cost-savings initiatives and the partial transfer of WUB staff to Nationale-Nederlanden Bank. The underlying cost/income ratio improved to 60.4%, from 65.6% in 2012.
The additions to the provision for loan losses increased by 21.9% to EUR 1,421 million, or 100 basis points of average risk-weighted assets compared with 82 basis points in 2012. The increase was mainly caused by higher risk costs in the Dutch mortgage and business lending portfolio, as well as in India and Turkey.
The underlying return on equity, based on a 10% core Tier 1 ratio, rose to 13.2% from 9.5% in 2012 due to higher results, while
Customer First, Digital First
> Continued focus on customer needs with easy and fair products at low costs
> Providing fast and innovative responses in a rapidly changing banking environment
> Digital innovation a top priority
Financial overview*in EUR million 2013 2012
Total underlying income 10,162 9,090Underlying operating expenses 6,138 5,961Underlying additions to loan loss provisions 1,421 1,166Underlying result before tax 2,603 1,963Underlying cost/income ratio 60.4% 65.6%Customer balances: net production funds entrusted (EUR billion) 19 28Customer balances: net production lending (EUR billion) 6 12Underlying risk costs in bp of average risk-weighted assets 100 82Risk-weighted assets (year-end, EUR billion, adjusted for divestments) 152 143Underlying return on equity based on 10% core Tier 1** 13.2% 9.5%
* Underlying numbers are derived from IFRS-EU, excluding the impact of divestments and special items.
** Underlying after tax return divided by average equity based on 10% core Tier 1 ratio.
Underlying incomein EUR million 2013 2012
Retail Netherlands 4,079 3,897Retail Belgium 2,321 2,194Retail Germany 1,388 1,193Retail Rest of World 2,374 1,807Total Retail Banking 10,162 9,090
Underlying result before taxin EUR million 2013 2012
Retail Netherlands 872 983Retail Belgium 663 601Retail Germany 598 441Retail Rest of World 471 -62Total Retail Banking 2,603 1,963
32 ING Group Annual Report 2013
Retail Banking
average risk-weighted assets remained stable. In 2013, however, total risk-weighted assets increased by EUR 9 billion to EUR 152 billion at year-end, mainly caused by adjusted parameters to reflect the ongoing weakness of the Dutch economy and its impact on the mortgage and business lending portfolio, and despite early signs of an improvement in the Dutch housing market in the last quarter.
RETAIL BANKINGBUSINESS DEVELOPMENTSIn a rapidly changing banking environment, both from a consumer, regulatory and technology point of view, our customers remain at the heart of what we do. We maintain a dialogue with them and are constantly adapting and improving our products, services and processes. Everything is geared to achieving our goal: to be the preferred bank for our customers, a goal that is driven by customer centricity, operational excellence, balance sheet optimisation and being a top employer. We can only be successful when we respond to our customers.
ING’s retail banks have different roots: some have their origins in traditional, universal banks, while others were set up as new businesses, such as the former ING Direct units. In 2013, ING continued to combine these two retail models, with all business units following the same strategy and converging to the same model: easy and fair, and at low costs. The product and service range is thereby tailored to local customers and circumstances, with a focus on “digital first”. Around the world, customers are increasingly interacting with ING through digital channels, with mobile taking the lead. We think that mobile banking is the future of retail banking. Therefore, we are sharing mobile banking best practices across business units, so we can respond quickly to changing needs and bring new solutions to our customers as fast as possible, shorten the time to market and be more efficient. Consumers worldwide are also increasingly self-directed and empowered. They look for fair pricing and transparent terms and conditions from their bank and compare these with what other banks offer. They also want a seamless experience, whether they use a mobile, tablet, PC, phone or visit a branch. All business units therefore continued to invest in IT in order to respond rapidly to recent innovations.
In each of the sections below, we outline some of the main social, economic and regulatory developments of 2013, and show how we responded to them to help customers make the right financial decisions.
The overall approach is driven by our Retail Standards Board, which is composed of the most senior leaders in the Retail Banking organisation. It sets standards in retail banking, creating and nurturing a sustainable knowledge-sharing culture throughout the Bank. Its priorities in 2013 were device-independent online banking, security and fighting cybercrime, social media and business/customer intelligence.
Our customer-centric focus has resulted in most countries achieving first or second place in Net Promoter Scores (NPS) compared with competitors. ING applies the NPS methodology in nearly all countries to measure customer engagement and the results are used to improve customer services and internal processes.
To achieve our vision of becoming the preferred bank for our customers, we must have employees who are committed and
motivated. A Top Employer programme was launched in 2011 and since then Top Employer teams in every country where we operate have been steadily working to meet common standards. The programme will be continued in 2014.
As for sustainability, we are meeting the increasing demand for products and services that not only generate good financial returns, but also meet clear social, environmental and ethical objectives. Furthermore, we aim to offer our product offering to all society segments, including young people, the physically challenged and the economically disadvantaged. That is why we offer micro finance to entrepreneurs and proactive assistance to mortgage holders in financial distress. We are increasing the number of branches that have barrier-free access and are reaching out to “under-banked”communities in India. In 2013, many of our business units offered products and services to people with special needs. Our sustainable activities are embedded in the activities of all our business units.
RETAIL NETHERLANDSFINANCIAL DEVELOPMENTS The underlying result before tax of Retail Netherlands decreased 11.3% to EUR 872 million in 2013 compared with EUR 983 million in 2012, due to additional restructuring charges and an increase in risk costs.
Underlying income rose 4.7% to EUR 4,079 million in 2013, reflecting higher interest results on lending and savings due to an improvement in margins, supported by a reduction in customer savings rates. These improvements were partly offset by lower volumes following the transfer and sale of EUR 8.3 billion of assets and EUR 3.7 billion of liabilities from WestlandUtrecht Bank (WUB) to NN Group, together with the sale of another EUR 2.2 billion of mortgages. Excluding these sales and transfers, net production of mortgages was EUR -0.4 billion in 2013, while other lending, mainly business lending, decreased by EUR 2.2 billion. Net production in funds entrusted was nil, mainly caused by new legislation for local governments to place surplus cash at the National Treasury and an acceleration of redemptions on mortgages.
Operating expenses increased 3.6% to EUR 2,330 million in 2013, including EUR 97 million of additional restructuring charges taken in the second half of the year, which were part of an extension of the efficiency programmes currently running. Excluding the restructuring charges, expenses decreased 0.7% from 2012, despite higher pension costs, reflecting the benefits of the efficiency programmes and the transfer of WUB staff to Nationale-Nederlanden Bank as from mid-2013. Net additions to loan loss provisions rose to EUR 877 million from EUR 665 million in 2012, mainly due to higher risk costs on mortgages and to a lesser extent business lending, reflecting the continued weakness in the Dutch economy.
BUSINESS DEVELOPMENTSAs was the case in most European countries, the Netherlands had to cope with strong economic headwinds in 2013. There was a sharp increase in unemployment in the Netherlands, particularly in the first half of 2013, and a record high in corporate bankruptcies. The housing market remained weak but began to stabilise in the second half of the year, with house prices declining at a less rapid rate and demand picking up. In the course of 2013, the economy began to show signs of improvement as the country emerged from
33ING Group Annual Report 2013
1 Wh
o w
e are2 R
epo
rt of th
e Executive B
oard
3 Co
rpo
rate go
vernan
ce4 C
on
solid
ated an
nu
al accou
nts
5 Parent co
mp
any an
nu
al accou
nts
6 Oth
er info
rmatio
n7 A
dd
ition
al info
rmatio
n
Retail Banking
a year-long recession, with a pickup in externally-orientated sectors such as industry and transport helping to offset continued weak domestic demand. The overall performance of Retail Netherlands (Retail NL) was good, despite the ongoing adverse economic circumstances. Income has improved despite the current low interest rate environment in combination with a weak demand for business loans and a still fragile housing market. Underlying expenses were slightly down, when not taking into account the strong increase in pension costs. The poor economic climate, however, is also reflected by higher risk costs.
Retail NL has a top two market position in the Netherlands, serving almost eight million retail and private banking customers and nearly 700,000 SME and Mid-Corporate customers. Although customer demand for digital banking services continued to increase, ING maintained a substantial physical presence with 268 branches and 375 ING Service Points. Retail NL’s mortgage market share declined by 1.4%-point, mainly due to the transfer and sale of part of the WUB portfolio. The full-year net production in mortgages (excluding transfers and sales) was EUR -0.4 billion (2012: EUR 1.8 billion). The non-performing loans ratio increased to 1.9% (2012: 1.4%) of total mortgage loans, which is still relatively low.
In recent years we have substantially reduced, among other things, the number of savings and related products from over 60 to a much smaller and more convenient product range. We kept improving our product range by screening and review product processes, making them simpler and more customer-friendly.
We have to constantly adapt to changing market circumstances and control costs in order to remain efficient. Following the measures announced, the number of full-time employees (FTEs) will be reduced by 4,400 by the end of 2015. So far, the headcount has been reduced by 2,900 FTEs.
Customer centricityWe make daily banking easy and stand by customers at decisive moments in their lives by providing personal, active and service-oriented solutions. To this end, we have launched a new campaign, “Orange Banking” (Orange is ING), illustrating our engagement with Dutch society. This campaign, which is driven by the needs of our customers, was rolled out in 2013 and will be continued in 2014.
Based on the principle “Customer Interest First”, Retail NL maintains a customer-centric organisation. A programme has been in place for several years to ensure that the customer’s interest is always at the centre of our activities. This programme aims at simplifying customer processes, improving our products and services and motivating employees to put the customer’s interest first. These Customer Interest First-focused objectives are also included in the Key Performance Indicators for all our employees, including those of management.
We are in a constant and meaningful dialogue with customers and regulators to get their feedback and improve our performance. For example, customer feedback told us that SME customers would appreciate more personal contact with ING. As a result, in 2013, a further 30,000 SME customers were given access to a relationship
manager. Under our Net Promoter Score (“NPS”) programme, which has been in place since 2009, some 250,000 customers a year give us their opinion on their customer experience. We also get customer feedback from several Customer Advisory Boards. We let customers know how we follow-up on their feedback via a dedicated page on our website.
We also get in touch with our customers via online media, from online seminars on topics such as housing, business lending, and the Single Euro Payments Area (SEPA) to the use of social media. In November, the CEO of ING Netherlands used Google Hangout, the instant messaging and live video chat platform, to talk with customers about various issues, including mobile banking, online communications with the bank and the future of banking.
We are also constantly improving our successful mobile banking apps for retail and corporate customers by adding functionalities requested by them. We achieved an important milestone in the third quarter of 2013 when mobile log-ons exceeded internet banking log-ons for the first time. Mobile traffic increased from over 25 million at year-end 2012 to over 41 million visits a month at the end of 2013.
We have introduced a number of tools that help customers make the right financial decisions, such as the Mortgage Stress Test (Hypotheken Stress-test) and the Buffer Calculator (Buffer-berekenaar). ING has also introduced the Mortgage Repayment Calculator (Afloswijzer) – an online tool to help consumers decide whether it is better to save or repay their mortgage. As part of our social engagement efforts, we also offer customers who face an involuntary and substantial decline in income a mortgage repayment scheme called the Interest Payment Freeze (Hypotheek Rentepauze) to help them out.
At ING Zakelijk (ING Corporate), we launched the Entrepreneurial Financing (Ondernemend financieren) campaign in 2013 which, among other things, allows relationship managers to have a dialogue with customers about the various credit options.
We hosted a number of roundtable sessions with SME and Mid-Corporate customers in 2013 on relevant topics during which we shared our financial and sector knowledge. ING Mid-Corporate, together with ING Private Banking, launched a platform for family-owned businesses to share knowledge and provide benefits to the customer from the expertise of these two business lines.
ING Private Banking started a strategy to enhance customer centricity internally and the customer experience externally. This involved relocating staff to branches to increase our local presence and increasing the number of Client Service Teams. We opened our first Private Banking branch in Wassenaar and nine more will be added in 2014.
Another initiative to support Dutch businesses is the Orange Trade Mission Fund (Oranje Handelsmissiefonds), founded by ING, KLM and MKB-Nederland in collaboration with the Ministry of Foreign Affairs. Each year, the fund offers 10 businesses the opportunity to develop their international plans with an Orange Trade Mission package, which provides fully-supported participation in official trade delegations, a customised trade mission or participation in international fairs. The 10 winners in 2013 are being monitored and their know-how, experience and stories will eventually be shared as an example for other Dutch businesses.
34 ING Group Annual Report 2013
Retail Banking continued
In September, several customers of ING Private Wealth & Asset Management, together with ING and other Dutch companies, launched the Dutch Orange Capital Enterprise Fund (Ondernemend Oranje Kapitaal). The Fund makes capital, expertise and advice available to SMEs. The objective is to give the Dutch economy a much-needed boost, and at the same time offer investors an attractive and sustainable commercial return. Reaffirming ING’s commitment to sustainable lending and saving, ING’s Groenbank (Green Bank) was the lead arranger of a record EUR 100 million syndicated green loan to Dutch energy company Eneco. One of the primary objectives of ING Groenbank is to stimulate sustainable entrepreneurship by offering interest-rate reductions for sustainable projects, ranging from solar panels to wind turbines and waste factories. ING Groenbank also attracts green saving deposits from retail customers in the Netherlands – Groen spaardeposito’s – and allocates these funds to provide green lending services to SMEs, Mid-Corporates and Corporate Clients, and to provide microfinance lending to ING subsidiaries. At year-end 2013, ING Groenbank had a balance sheet total of EUR 769 million.
In October, ING introduced the ING Savings Account for UNICEF. ING donates 0.10% per annum calculated over the total average savings balance on these accounts. This money is used to support a UNICEF-led education project in Madagascar.
The ING Socially Responsible Investment portfolios consider social and environmental criteria when investing the funds of retail and private-banking customers. These criteria have been integrated into the investment-decision process of the ING Investment Office. The process also includes an analysis of both the financial and sustainability performance. Since its introduction in 2008, the ING Socially Responsbile Investing Index has outperformed the MSCI World Index and the Dow Jones Sustainability Index.
Customer centricity has become an integral part of various bank employee courses, such as the general Enter@ING programme for new employees, as well as for specific positions like SME relationship managers. Educating and training staff to give them the skills to help customers and ensure that customers remain at the centre of our attention is a key goal.
Our efforts have been recognised by various organisations, confirming that we are well on the way to become our customers’ preferred bank. ING won several awards in 2013, including three “Bank of the Year” awards for the Netherlands, Belgium and Western Europe from The Banker, part of the Financial Times Group; the “Best Bank in the Netherlands” award from Global Finance; the Mobile Banking Campaign “Penny for your thoughts” won the SAN Accent 2012 Award in the category Financial Service Industry; the “Gouden Oor Erkenning” for complaints management; and the “Complain Online”award for the fastest and best handling of complaints. ING achieved second position in the Social Media Monitor’s “Best Bank in the Netherlands”. ING Private Banking was “highly commended” by the Financial Times.
Operational excellenceWe have improved customer service since 2012 by focusing on easy-to-use operational processes and making it easier for customers to change their personal data. We apply 10 simple principles for each operational customer process, such as: “never
ask the customer for information we already have”. Furthermore, customers should always receive confirmation of changes made in their data and customer satisfaction has to be measured for all processes. These principles force us to improve and to introduce our solutions as easy as possible, from the customer point of view. In 2013, we realised the first results of simplifying our customer operational processs. For example, the child and youth account opening process is now shortened from 28 questions to 4 clicks.
In September, ING and other parties piloted a new smartphone payment method. During the three-month trial in the city centre of Leiden, around 1,000 consumers paid for goods and services using their smartphone at 180 retail shops with the amount to be paid debited directly from their bank account. Pilot results showed that for the majority of the participating consumers mobile payments exceeded their expectations. Based on customer and retailer feedback, ING was able to improve this process even further. A first nationwide market introduction is scheduled for the second half of 2014. Also in 2013, ING set up a system with Chambers of Commerce, whereby if a business changes its address or other details with its local chamber, the details of the change are relayed automatically by the chamber to ING. There is no need for the business separately to notify ING of the change.
Cyber security is a growing concern for all banks. ING has therefore been working with the Dutch Ministry of Justice, other banks, consumer organisations and businesses to discuss better ways of combatting cyber attacks. Retail NL suffered several attacks in 2012 and has improved its defensive measures since. However, also ING experienced Distributed Denial-of-Service (“DDoS”) attacks in 2013, during which its website was bombarded with data traffic and, as a result, Mijn ING, the Mobile Banking app and iDEAL payments were blocked for some time. We have since taken further counter measures to block unwanted traffic. At no point during these attacks have customer details been compromised.
Top EmployerSeveral Top Employer initiatives were launched in the Netherlands in 2013. They included a new career platform, “Steer Your Career”, which helps employees determine their strengths and passions, what they want in their business life and how to achieve it. Physical wellbeing is supported by the introduction of Energy@ING, which teaches employees to manage their energy level. More than 4,000 have signed up to the programme. The scope of The New Way of Working (Het Nieuwe Werken), was extended and is now available to over 5,000 employees at head office locations, creating flexible working conditions and the opportunity to have a better work/life balance. ING employees have asked to be given more flexibility over how they use their staff benefits. As a result, the Benefits Budget (Keuzebudget) has been introduced as from 2014, giving them better control over some of their benefits.Top Employer initiatives will continue to be developed in 2014.
WestlandUtrecht BankFollowing a European Commission decision in November 2012 the banking activities of WestlandUtrecht Bank were partly combined with those of Nationale-Nederlanden, which is to be divested as part of NN Group. The resulting retail bank (Nationale-Nederlanden Bank) manages its funding and distribution strategy in the Dutch market independently from ING Bank.
35ING Group Annual Report 2013
1 Wh
o w
e are2 R
epo
rt of th
e Executive B
oard
3 Co
rpo
rate go
vernan
ce4 C
on
solid
ated an
nu
al accou
nts
5 Parent co
mp
any an
nu
al accou
nts
6 Oth
er info
rmatio
n7 A
dd
ition
al info
rmatio
n

WestlandUtrecht Bank continues to service remaining portfolios within ING Retail Banking Netherlands.
RETAIL BELGIUMFINANCIAL DEVELOPMENTS The underlying result before tax of Retail Belgium increased 10.3% compared with 2012 to EUR 663 million, due to higher income supported by volume growth.Underlying income rose 5.8% to EUR 2,321 million, from EUR 2,194 million in 2012, mainly reflecting higher interest results driven by further growth in customer balances, while margins on current accounts declined. In 2013, net production in funds entrusted was EUR 3.7 billion. The net mortgage production was EUR 1.0 billion, while other lending grew slightly by EUR 0.1 billion. Operating expenses increased 3.6% compared with 2012 to EUR 1,476 million, mainly due to higher expenses for the deposit guarantee scheme and inflation-driven cost increases, which were partly offset by the benefits from the efficiency programmes. Risk costs were EUR 183 million, or 89 basis points of average risk-weighted assets. This is an increase of 8.9% on 2012, reflecting higher additions for business lending and mortgages, though the latter still remained relatively low.
BUSINESS DEVELOPMENTSFollowing the 2012 recession, economic growth picked up in Belgium in 2013, with gross domestic product increasing by 0.2%. Private consumption started to recover in 2013, increasing by 0.6% in real terms, and house price growth stabilised just above the inflation rate. The improvement in household confidence implied a slightly higher risk appetite. As a result, savings deposits increased, but at a lower pace than in the years before 2013. The ING investor barometer showed improved confidence among retail investors throughout the year.
ING Belgium (ING BE), one of the largest retail banks in the country, provides its 2,400,000 (year-end 2013) private and business customers with a full range of banking products and services. It continued to carry out its “direct if possible, advice when needed” strategy. It maintained its leading position as a strongly customer focused bank. This was evidenced by, among other things, winning the 2013 “Bank of the Year – Belgium” award from The Banker in recognition for “its solid financial and commercial performance” and “its strategy for investing in new channels”.
The Bank continually responds to the fast-changing customer behaviours and expectations and adopts new technologies to meet their needs. It improved its direct channels, both for private and business customers. It launched, for example, a new app for tablets and, in September, ING BE became the first bank in Belgium where business customers can sign and activate their business lending contract online. ING BE’s specialist advisers were equipped with a new computer device that enables customers to sign for advice-related products such as investment or lending products outside the branch, for example at home. This project, which started in 2013, will be further rolled out in 2014.Over the past four years, direct sales of simple online products have more than doubled, accounting for more than 40% of ING BE’s total simple product sales. Coupled with the increasing number of cumulated downloads of its mobile application since 2011 (448,000), this confirms the increasing use of direct banking by its customers. Daily mobile transactions more than tripled year-on-year in 2013.
ING BE also continued the transformation programme for its branch network and 63 branches were renovated. By year-end, more than 600 out of 748 branches had been completely refurbished into open and more customer-friendly branches. The branches are at the crossroads of advice and online banking in ING BE’s distribution model.
Private Banking, which has a top three position in Belgium, was awarded “Best Private Bank in Belgium” by the magazine World Finance. The total amount of Private Banking funds entrusted and assets under management in Retail Belgium was EUR 17.6 billion(+ 4.9% since 2012).
The Bank’s continuous efforts to make banking easy paid off. For the 7th year in a row, ING Belgium experienced a net year-on-year growth of its customer base. The net growth of active customers amounted to 62,000, to a total of nearly 500,000 active customers since the introduction in 2007 of its “direct if possible, advice when needed” strategy.
Moreover, for the first time, more than 100,000 ING Lion accounts, the Bank’s free online current account, were opened in one year.
As a result of fundamental changes in customer behaviour, in particular the greater use of online and mobile banking, ING BE announced in early 2013 a plan to reduce the number of employees between then and the end of 2015. While the number of employees in Belgium decreased, mainly as a result of natural attrition, the Bank continued to hire new people. In 2013, 314 new FTEs were welcomed at ING BE. Given the external challenges, the Bank raised its focus on cost containment. While continuing to invest in innovative customer-oriented solutions, ING BE ensured that other expenses were either frozen or reduced.
The new Collective Labour Agreement, which was signed at the end of 2013, aims to moderate the rise in salaries until 2016.
Customer centricityING BE continued to offer products and services that best meet customers’ needs and to improve access through new mobile banking facilities. ING BE’s mobile banking app, Smart Banking, was launched for tablets in 2013, providing a user experience in line with customer expectations for a tablet device. With this app customers can easily manage their income and expenditure with the “My budget” tool, and make transfers to any beneficiary.
ING BE’s open guided architecture fund range regrouping high quality funds from selected investment companies experienced a consistent above-the-market performance. The open-guided architecture fund offer was enlarged with the launch of the ING Core Fund. This Fund, which groups a limited selection of funds from several investment companies with a Morningstar rating of three stars or more, witnessed the strongest increase in funds entrusted of all funds over the past five years.Since 2013, all branches have also been equipped with Wifi and iPads, to help ING BE’s customers discover the multiple advantages of online and mobile banking.
The Bank invested in new customer intelligence and lead-management solutions, enabling it to offer the right product to the right customer, at the right moment, and through the right channel.
36 ING Group Annual Report 2013
Retail Banking continued
Through its corporate social responsibility (CSR) policy ING BE aims to manage its business not solely on the basis of financial criteria but also by giving the necessary weight to the environment, ethical considerations and the needs of society in general.Against this background, ING BE committed itself to improve the accessibility of its branches for physically challenged people. By the year-end, more than 600 branches had been renovated to meet this objective. The Bank also strives to reduce its carbon footprint every year. Branches and ING BE’s two main buildings have been “carbon neutral” since 2007. They use 100% green electricity and foster a strict waste-recycling policy. Various projects aimed at reducing the use of paper, such as paper cheques and paper payment orders, were started in 2013, in coordination with efforts to improve the ease of use of electronic alternatives, such as Home’Bank. On top of these initiatives, sustainability is also embedded in ING BE’s product offering to private customers. While the growth of real-estate eco loans to private customers stabilised in 2013, eco car loans increased by close to 5% year-on-year.
ING BE’s employees participated in various initiatives enabling to raise funds for children and education (ING Run for UNICEF, Special Olympics and Ekiden Run). The ING Solidarity Award represented one of ING BE’s strongest CSR initiatives throughout the year. More than 1,400 organisations participated in this contest, with over 200,000 voters on the Award platform. In total, 70 non-profit organisations throughout the country were rewarded with financial support from ING BE.
Operational excellenceING BE launched a new version of Home’Bank, the Bank’s online banking service, which is fully integrated with the ing.be website. It provides easier navigation, more product information and a clear overview of the different functions. Business customers were also given a more complete online banking service during the year.From 2013, legal entities have been able to open accounts and manage mandates within the Home’Bank Plus and Telelink Online. Business customers can also manage a more complete range of professional accounts on Smart Banking for smartphones and tablets.
Top Employer In a fast-changing world, ING BE strives to give its employees the means to develop themselves, and to create a working environment that favours well-being, performance, mobility, flexibility and growth. The local Top Employer programme implemented a new induction course for newly recruited staff. It also rejuvenated its Performance Management Approach to ensure continuous constructive feedback. This new approach supports employees in developing their employability and managers in their people-coaching role while reinforcing the role of HR as a strategic business partner. For the seventh year in a row, ING BE received a Top Employer Certification from the CRF institute. It also won the Corporate HR Award at the annual HR Excellence Awards ceremony, in recognition of its efforts to increase its employees’ employability. ING BE created the ING Mobility Centre in 2013. It helps employees whose positions were made redundant find other jobs in ING BE or elsewhere. The Bank organised an ING Day in October for all employees to celebrate success, prepare for future challenges and reinforce company pride.
Record BankRetail Belgium includes Record Bank, the fourth-largest retail savings institution in the country, with close to 730,000 customers (up from 700,000 in 2012). Record Bank serves retail, professional and small business customers with safe, simple and transparent savings and lending products. Its strength is the personal approach taken by its network of around 1,500 independent agents, credit brokers and vendors. Its funds entrusted volumes went up by 8% compared with 2012, with a strong increase in savings and deposits of EUR 1.3 billion, as a result of its excellent position in the Belgian savings market.The Bank continues to invest in online facilities to support its various distribution channels. In December, it launched its Mobile App for smartphones – Record Bank Mobile – giving customers the ability to check account balances and make bank transfers. Under the Belgian government’s Bank Switch Service (Bankoverstapdienst) customers should be able to switch banks within eight working days. The service has proved to be a great success for Record Bank, which has welcomed about 11% of the people switching in 2013. They have been attracted by Record’s free current account, competitive savings rates, and personal contact with a local banking agent.
ING LuxembourgThe Luxembourg economy showed signs of gradual recovery in 2013, with an expected GDP growth rate of around 2.0%. Against this background, ING Luxembourg – a top five, full universal bank in the country – delivered a solid performance. The Bank has a local as well as a wide international customer base, with 114,000 customers, of which 84,000 are retail, and 16 branches. It is fourth in the mid-corporate market and third in the corporate market. Its funds entrusted have grown by 10% since year-end 2012, driven by Commercial Banking (+14% in net funds entrusted). There was also an increase in retail funds entrusted in 2013 (+4%): Retail Banking benefited from the success of its savings campaign, focusing on all the savings solutions proposed by ING Luxembourg.
ING Luxembourg reduced by 80% the time it takes for corporate customers to access the Bank’s website and improved the online account opening process for retail customers with “First time right”. The bank also launched an improved version (2.0) of ING Mobile, ING Luxembourg’s mobile app for mobile devices. As for its Top Employer ambitions, ING Luxembourg was in 2013 again included in the “Great Place to Work” ranking for Luxembourg. The Bank was awarded “Best Multinational Workplace in Europe” in the ranking of 100 Best Companies to Work for in Europe. ING Private Banking was awarded “Best Private Bank” in Luxembourg.
On 10 April 2013, Luxembourg announced its intention to switch, from 1 January 2015, to the automatic exchange of information under the European Savings Tax Directive, thus following a general international trend. ING Luxembourg continually informs its customers of any changes in regulation, in this case an obligation by both the bank and the customer to comply with local tax regulation. ING Luxembourg further advises its customers to contact a tax adviser if necessary and (re-)affirm that they comply with local tax regulations following the European Savings Tax Directive.
37ING Group Annual Report 2013
1 Wh
o w
e are2 R
epo
rt of th
e Executive B
oard
3 Co
rpo
rate go
vernan
ce4 C
on
solid
ated an
nu
al accou
nts
5 Parent co
mp
any an
nu
al accou
nts
6 Oth
er info
rmatio
n7 A
dd
ition
al info
rmatio
n
RETAIL GERMANYFINANCIAL DEVELOPMENTS Retail Germany’s underlying result before tax rose 35.6% to EUR 598 million in 2013, compared with EUR 441 million in 2012, due to continued volume growth in most products and improved margins on savings.
Underlying income increased by 16.3% to EUR 1,388 million, compared with EUR 1,193 million in 2012. The increase reflects higher interest results stemming from higher lending and savings balances and increased margins on savings supported by a reduction of the core savings rate in the beginning of 2013. Commission income rose by EUR 27 million from 2012, reflecting higher income from security brokerage. Investment and other income was slightly down, as the absence of de-risking losses in 2013 was offset by increased negative hedge ineffectiveness. Funds entrusted grew by EUR 9.2 billion in 2013. Lending growth was EUR 2.7 billion, of which EUR 2.2 billion was in mortgages.
Operating expenses increased 6.0% compared with 2012, due to higher personnel expenses reflecting an increase in headcount and increased expenses for the deposit guarantee scheme, in line with the growth of the business. The cost/income ratio improved to 51.1% from 56.1% in 2012. The additions to the provision for loan losses slightly declined in 2013 to EUR 82 million (or 37 basis points of average risk-weighted assets), from EUR 83 million (or 38 basis points of average risk-weighted assets) in 2012.
BUSINESS DEVELOPMENTSRetail Germany consists of ING-DiBa Germany, ING-DiBa Austria and Interhyp.
After a weak start, Germany’s economy gained momentum in the course of 2013. At year-end, its unemployment rate was at 6.8% and gross domestic product had risen by 0.5% over the entire year, despite the weakening of most economies in Europe. Germany’s export industry gained volume and private household consump-tions increased as well. Due to the stable economic conditions, housing prices are solid and actually showing growth, especially in and around large cities. The Austrian economy is also on a positive track, benefitting from its close ties with Germany. The economy grew by 0.3% year-on-year in 2013 and should accelerate further in 2014.
In Germany, ING-DiBa is a fast growing bank, and the third largest by number of customers, with a continuous focus on the customer. Its customer satisfaction ratings remain high, which is contributing to strong business growth. An easy-to-understand product range, with only 10 different products, offered with the highest service, 24 hours a day, are the ingredients for meeting all main needs of a retail banking customer. ING-DiBa remained committed to its mission to be simple and uncomplicated, giving it the opportunity to increase its market position in the still very fragmented German banking market. It continued to show consistent growth in 2013 in all products. In September, ING-DiBa in Germany and Austria attracted its eight millionth customer, and the total number of customers in 2013 increased by 300,000. Total customer balances in 2013 rose by EUR 12.6 bilion and now exceed EUR 179 billion, of which total funds entrusted amount to EUR 105.9 billion. During 2013 the one millionth payment account was opened and Consumer Lending surpassed EUR 4 billion in volume.
In the area of knowledge sharing, ING-DiBa profited from the experience in social media in the Netherlands and Spain by implementing their best practices on listening to and engaging with customers through social media.
The folding of ING’s Commercial Banking activities in Germany into ING-DiBa in 2011 has given the Bank more scope to contribute to ING’s balance sheet optimisation programme. Synergies are achieved by Retail Banking providing funding at a competitive level, while Commercial Banking is generating an additional sources of high quality assets.
ING-DiBa Austria, which is reported under Retail Germany, had 521,000 customers at the end of 2013, up slightly from 515,000 at the end of 2012. Total retail balances at year-end 2013 amounted to EUR 7.6 billion, an increase of EUR 0.3 billion, of which total funds entrusted were EUR 7.4 billion.
Interhyp, Germany’s biggest mortgage broker, was awarded “Best Mortgage Financer” by renowned Euro magazine, for the eighth year running, for best service, advice and price. Interhyp increased its local branch and tied-agent network to almost 70 in 2013.
Customer centricityING-DiBa is a socially responsible bank. First of all, it treats customers fairly by offering easy-to-understand products with no strings attached. ING-DiBa Germany, for example, launched an initiative, aiming at making all its letters and e-mail templates easier to understand. This, in turn, should lead to fewer additional inquiries and, consequently, to a better customer experience. Prior to the launch, many workshops were held, an electronic handbook was published and an ongoing newsfeed set up. A survey showed ING-DiBa is well on track reaching targeted aims. Second, it is a caring employer, providing staff with a range of ancillary, non-work related benefits such as sports classes, cooking classes and child care provision. Third, it gives something back to society. ING-DiBa Austria, for example, launched the Club Thousand (Vereinstausender ) initiative in 2013, which involves donating EUR 1,000 to 50 Austrian non-profit clubs. More than 900 clubs and their members participated in this campaign by applying to be one of the 50 clubs to which the donations were granted. This raised ING-DiBa’s brand awareness significantly.
ING-DiBa Germany has the Customers Gain Customers (Kunden werben Kunden) initiative to give current customers an incentive to recommend ING to their friends and family. For every new customer, the recommender can choose to donate EUR 40 to UNICEF or receive a premium instead.
Operational excellenceING-DiBa continued to focus on improving its product and service efficiency to help customers manage their finances. For example, in 2013 ING-DiBa Germany launched a new internet banking site that is easier to use with all types of device – computer, smartphone or tablet.ING-DiBa Austria also launched a new website, along with online and mobile banking tools, to improve service and delivery.
Top EmployerING-DiBa considers its staff to be a distinguishing asset and maintaining a strong corporate culture is a key success factor.
38 ING Group Annual Report 2013
Retail Banking continued
Consequently, high priority is placed on being a Top Employer and a “Great Place to Work”. As part of its corporate social responsibility commitments, ING-DiBa runs special educational programmes for staff aged over 50 and initiatives for hiring disabled and socially disadvantaged people. It introduced additional support to help staff with childcare and healthcare. For example, young parents are given EUR 150 a month for childcare and all employees are offered a professional, fully paid-for health check-up.
ING-DiBa Germany and Austria, as well as Interhyp, were recognised as one of the best national employers in 2013 by the renowned Great Place to Work Institute. ING-DiBa Germany was also named a “Best Workplace in Europe 2013”. The results of the ING-DiBa annual employee survey are discussed at the Bank’s leadership summit and at other levels as a way of strengthening our corporate culture. AwardsING-DiBa Germany received several awards in recognition of its high service and quality standards in 2013. It won the Deutschlands Beliebteste Bank (Germany’s Most Preferred Bank) award, from the readers of German Euro magazine for the seventh year in a row. It was also elected “Online broker of the Year” for the fourth time in a row by Börse Online. Mobile brokerage accounts for only a low percentage of trades executed by ING-DiBa, but it is increasing. ING-DiBa Austria received the “Recommender 2013 Awards” in May 2013 for its excellent customer focus.
RETAIL REST OF WORLDFINANCIAL DEVELOPMENTSThe underlying result before tax of Retail Rest of World rose to EUR 471 million, compared with a loss of EUR 62 million in 2012, when results were impacted by EUR 441 million of losses related to selective de-risking of the investment portfolio.Underlying income increased to EUR 2,374 million from EUR 1,807 million in 2012. Excluding de-risking losses, income rose 5.6% mainly due to improved commercial results in most countries, and a higher dividend received from the Bank of Beijing. The interest result increased 2.2% due to higher margins, partly offset by currency impacts. Excluding currency effects and adjusted for divestments and the sale of a mortgage portfolio in Australia, net production in mortgages was EUR 1.4 billion, while the net growth in other lending was EUR 3.2 billion in 2013. Funds entrusted reported a net inflow of EUR 5.8 billion.
Operating expenses increased slightly by 0.3% to EUR 1,623 million in 2013 from EUR 1,618 million in 2012, as higher expenses due to business growth were largely offset by favourable currency impacts. Risk costs rose to EUR 280 million, or 64 basis points of average risk-weighted assets, compared with EUR 250 million, or 50 basis points of average risk-weighted assets, in 2012. The increase in risk costs was mainly in India and Turkey reflecting the economic turmoil, partly offset by lower additions in Romania and the UK legacy portfolio.
BUSINESS DEVELOPMENTSRetail Rest of World comprises ING Australia, ING France, ING Italy, ING Romania, ING Bank Slaski (Poland), ING Spain, ING Turkey and ING Vysya Bank (India), as well as TMB Bank (Thailand) and Bank of Beijing (China) in which ING has equity positions. ING Direct UK was sold in March 2013 but Retail Rest of World still includes a UK legacy portfolio which is in run-off.
The economic picture in the “rest of the world” is mixed. Activity in most of the remaining big eurozone countries, is now firming. Spain is showing promising signs of leaving the crisis behind, thanks to a strong export performance, and Italy is also slowly turning up. The recovery in France is also expected to moderately gain pace during 2014. In emerging markets, the picture is also mixed. The Chinese authorities are focusing on stability, and are prepared to tolerate a slightly slower pace of activity as this goal is achieved. Australia has been buffeted by volatile markets, but has been helped by central bank easing, and should deliver robust growth in 2014/15. Meanwhile, political developments in Turkey and Thailand have coloured a deteriorating investor sentiment towards emerging markets, with rate increases in Turkey likely to weigh on growth. In contrast India’s central bank response to market unrest has been far better received and is likely to generate less of a drag on growth. Both Poland and Romania are on track for reasonable growth in 2014, though market sentiment to Central and Eastern Europe has been tempered by political unrest elsewhere in the region.
In India, Poland, Romania and Turkey, we offer products and services to all customer segments, whereas in Australia, Italy, France and Spain we focus on retail customers. However, in 2013, ING launched a pilot to serve small businesses in Spain.
All businesses continued to converge to the same model: easy and fair, with a focus on “digital first”. Progress was made in building the preferred bank and establishing a primary relationship with our customers, in which our payment account serves as the “anchor” product. In 2013, 1.2 million payment accounts were added, resulting in a total of more than 12 million payment accounts. ING Spain reached the milestone of one million payment accounts. In ING Italy, almost half of customers out of one million customers, have a payment account. In 2013, ING Australia passed the 1.5 million customer milestone. Rest of World welcomed close to 900,000 new customers, bringing the total at year-end to 14.3 million, excluding Bank of Beijing and TMB Bank. ING in Spain, Turkey and France were one of the first banks in the world to launch “responsive” websites, which provide customers with a consistent experience regardless of the device used.
Driven by the Retail Standards Board, progress was made in exchanging best practices and knowledge-sharing. For example, seven business units now use the same tool for listening to social media conversations. The webcare teams in all business units have been organised along the same lines, using the Netherlands’ model. As for mobile banking, ING France’s app was considered a best practice and copied by numerous units, thereby saving time and development costs. In most countries, the ING app is highly rated by its users.
Further progress was made with the One Bank strategy in Spain, Italy and France. According to plan, this brings together the retail and commercial banking lines of business within a country. As a result, these units now operate as One Bank, with the legal formalisation still to be finalised, except for ING France, which successfully merged ING Direct, ING Commercial Banking and ING Real Estate Finance in 2013.
Customer centricityWe continued to put our customers first by having simple products and services that best meet their needs at fair pricing and focusing on digital channels.
39ING Group Annual Report 2013
1 Wh
o w
e are2 R
epo
rt of th
e Executive B
oard
3 Co
rpo
rate go
vernan
ce4 C
on
solid
ated an
nu
al accou
nts
5 Parent co
mp
any an
nu
al accou
nts
6 Oth
er info
rmatio
n7 A
dd
ition
al info
rmatio
n
There were a number of mobile banking and digitalisation developments in 2013. ING Romania launched an app for making contactless payments by smartphone, called ING Pay; ING Australia’s new mobile app won the 2013 “Mobile Award”; ING Vysya Bank released an app that increases its reach into remote cities and rural areas; and ING Italy’s mobile app is now used by 50% of its customers within a year after launch.
In line with our strategy to serve customers through their channel of choice, ING in Spain, Italy and France now have 28, 13 and 2 branches, respectively. At TMB Bank in Thailand, a simplified process allows customers to complete transactions quickly; account opening in a branch, for example, takes only 15 minutes.
ING Turkey launched a ground-breaking social media campaign for consumer loans called #BirTweetimeBakar, which offers customers tangible benefits: the more they tweet, the lower the loan interest rate. Using best practices from around the ING world, Turkey also introduced an innovative, award-winning branch concept which includes self-service facilities and greater improves customer interaction. By the year-end it had been introduced to 40 branches, and our aim is to convert all branches within the next three years.
In India, as part of our corporate social responsibility, ING offers farmers a range of products, including the Kisan Credit Card, to cover their credit requirements at the pre- and post-harvest stages. We also offer customised products for various agricultural activities.
ING Bank Slaski published its first corporate social responsibility (CSR) report – ING The Art of Responsibility – a follow-up to the CSR strategy it adopted in May 2012. It describes how the bank achieves its business objectives by building sustainable, transparent and ethical relationships with customers, employees, business partners, investors and vendors.
ING Italy launched BitBumBam, a contest aimed at supporting projects and ideas that help new generations learn and develop through the innovative use of technology. ING France launched a programme to manage money during the “back to school” period and ING Turkey started “Orange Drops”, a programme for eight to nine-year-olds to educate them about the importance of saving. This helps to build the case for including financial education in the nation’s school curriculum.
ING Vysya Bank worked on providing banking services to the “unbanked” residents of villages with less than 2,000 inhabitants, most of whom are illiterate, as part of its financial inclusion initiatives.
ING Australia launched Dreamstarter, Australia’s first crowdfunding initiative, specifically focused on bringing the ideas of social entrepreneurs to life. This online initiative uses the power of social
media and community collaboration to raise the profile of people with innovative ideas for social change.
Operational excellenceAll business units around the world focus on operational excellence to provide a superior customer experience at optimised costs. In Poland, ING Bank Slaski was the first bank in the country to offer contactless ATM withdrawals. It also launched a commerce
and auction platform called ALEO for Polish entrepreneurs; by the year-end more than 10,000 companies had registered for it.
ING Romania introduced Fast Track Light Automation, a frequently used credit facility for new mid-corporate customers which processes transactions within 48 hours. ING Vysya Bank improved its infrastructure facilities and created a uniform “look and feel” fo its 527 branches.
Security and anti-cybercrime efforts remained an important priority in all business units. In 2013, ING’s Cybercrime Taskforce was launched, creating a common framework and implementing best practices for combatting cybercrime and e-banking fraud.
Top EmployerMany Top Employer initiatives were continued around the world. ING Australia ran workshops to identify which tools and processes should be improved. ING Romania helped staff develop their careers by, for example, creating a mentoring framework. ING Turkey implemented a performance management system to monitor training for, and communication with, all employees. The CRF Institute awarded Top Employer certificates to ING Spain, ING France, ING Bank Slaski and ING Italy. ING Spain also received a European Great Place to Work Award. “Great Place to Work” is the world’s largest employee satisfaction study, surveying about 5,500 companies. In 2013, 1.35 million employees were surveyed across 19 countries in Europe.
Awards We won a number of awards during the year, most notably in the field of customer centricity and digital leadership. For instance, ING Australia was chosen Australia’s most beloved bank by customers at the Mozo People’s Choice Awards and ranked in the top 10 of national brands as the only bank. ING Spain won a “Digital Executive Award” for internet distribution, while ING Turkey led with direct banking innovation and an award-winning new branch concept – to name a few.
CONCLUSIONS AND AMBITIONSAll business units will continue to focus on the customers’ needs with easy and fair products, with a focus on “digital first”. They will also continue to provide fast and innovative responses, when and where required, with digital innovation remaining a top priority. This is all part of ING’s overall aim to help customers manage their finances, now and for the future. Our aim is also to make a positive contribution to society and the environment. We therefore respond to society’s increasing demand for products and services that meet clear social, environmental and ehtical objectives. We will continue to do so in 2014. In 2014, continued attention will be spent on the local Top Employer programme, as we need committed and motivated employees to help realise our ambition to become the customer’s preferred bank.
40 ING Group Annual Report 2013
Retail Banking continued
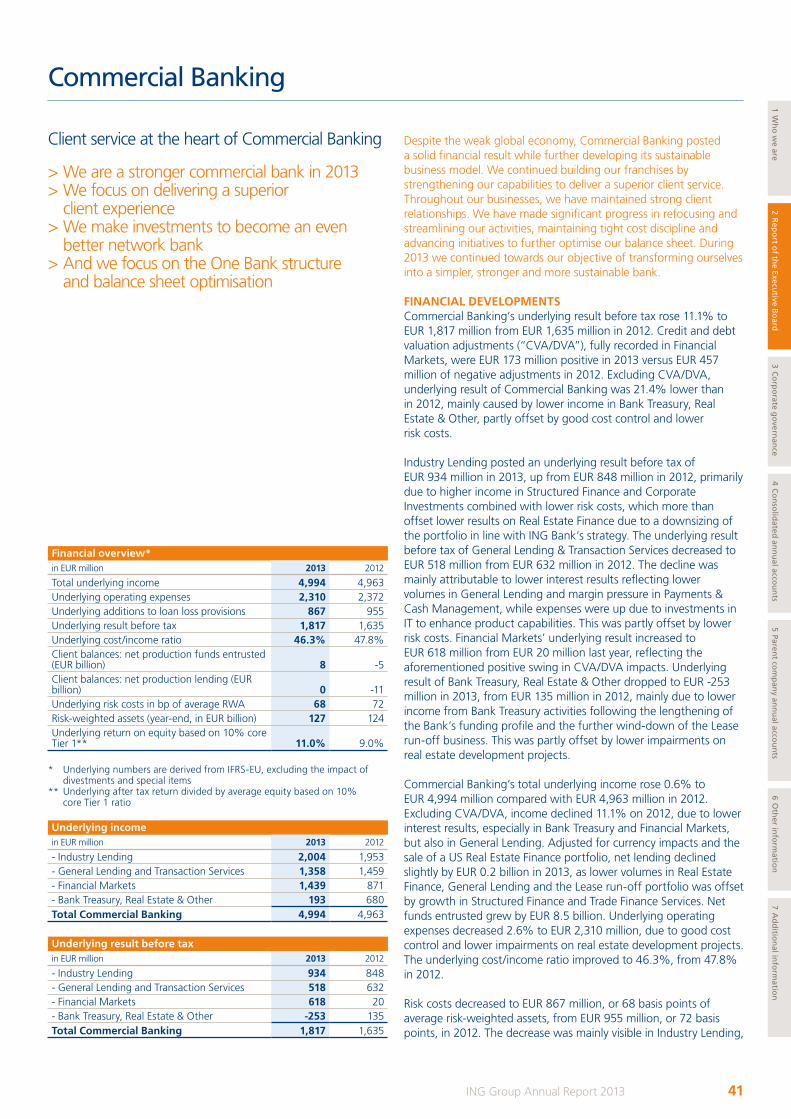
Client service at the heart of Commercial Banking
> We are a stronger commercial bank in 2013 > We focus on delivering a superior client experience
> We make investments to become an even better network bank
> And we focus on the One Bank structure and balance sheet optimisation
Despite the weak global economy, Commercial Banking posted a solid financial result while further developing its sustainable business model. We continued building our franchises by strengthening our capabilities to deliver a superior client service. Throughout our businesses, we have maintained strong client relationships. We have made significant progress in refocusing and streamlining our activities, maintaining tight cost discipline and advancing initiatives to further optimise our balance sheet. During 2013 we continued towards our objective of transforming ourselves into a simpler, stronger and more sustainable bank.
FINANCIAL DEVELOPMENTS Commercial Banking’s underlying result before tax rose 11.1% to EUR 1,817 million from EUR 1,635 million in 2012. Credit and debt valuation adjustments (“CVA/DVA”), fully recorded in Financial Markets, were EUR 173 million positive in 2013 versus EUR 457 million of negative adjustments in 2012. Excluding CVA/DVA, underlying result of Commercial Banking was 21.4% lower than in 2012, mainly caused by lower income in Bank Treasury, Real Estate & Other, partly offset by good cost control and lower risk costs.
Industry Lending posted an underlying result before tax of EUR 934 million in 2013, up from EUR 848 million in 2012, primarily due to higher income in Structured Finance and Corporate Investments combined with lower risk costs, which more than offset lower results on Real Estate Finance due to a downsizing of the portfolio in line with ING Bank’s strategy. The underlying result before tax of General Lending & Transaction Services decreased to EUR 518 million from EUR 632 million in 2012. The decline was mainly attributable to lower interest results reflecting lower volumes in General Lending and margin pressure in Payments & Cash Management, while expenses were up due to investments in IT to enhance product capabilities. This was partly offset by lower risk costs. Financial Markets’ underlying result increased to EUR 618 million from EUR 20 million last year, reflecting the aforementioned positive swing in CVA/DVA impacts. Underlying result of Bank Treasury, Real Estate & Other dropped to EUR -253 million in 2013, from EUR 135 million in 2012, mainly due to lower income from Bank Treasury activities following the lengthening of the Bank’s funding profile and the further wind-down of the Lease run-off business. This was partly offset by lower impairments on real estate development projects.
Commercial Banking’s total underlying income rose 0.6% to EUR 4,994 million compared with EUR 4,963 million in 2012. Excluding CVA/DVA, income declined 11.1% on 2012, due to lower interest results, especially in Bank Treasury and Financial Markets, but also in General Lending. Adjusted for currency impacts and the sale of a US Real Estate Finance portfolio, net lending declined slightly by EUR 0.2 billion in 2013, as lower volumes in Real Estate Finance, General Lending and the Lease run-off portfolio was offset by growth in Structured Finance and Trade Finance Services. Net funds entrusted grew by EUR 8.5 billion. Underlying operating expenses decreased 2.6% to EUR 2,310 million, due to good cost control and lower impairments on real estate development projects. The underlying cost/income ratio improved to 46.3%, from 47.8% in 2012.
Risk costs decreased to EUR 867 million, or 68 basis points of average risk-weighted assets, from EUR 955 million, or 72 basis points, in 2012. The decrease was mainly visible in Industry Lending,
Financial overview*in EUR million 2013 2012
Total underlying income 4,994 4,963Underlying operating expenses 2,310 2,372Underlying additions to loan loss provisions 867 955Underlying result before tax 1,817 1,635Underlying cost/income ratio 46.3% 47.8%Client balances: net production funds entrusted (EUR billion) 8 -5Client balances: net production lending (EUR billion) 0 -11Underlying risk costs in bp of average RWA 68 72Risk-weighted assets (year-end, in EUR billion) 127 124Underlying return on equity based on 10% core Tier 1** 11.0% 9.0%
* Underlying numbers are derived from IFRS-EU, excluding the impact of divestments and special items
** Underlying after tax return divided by average equity based on 10% core Tier 1 ratio
Underlying incomein EUR million 2013 2012
- Industry Lending 2,004 1,953- General Lending and Transaction Services 1,358 1,459- Financial Markets 1,439 871- Bank Treasury, Real Estate & Other 193 680Total Commercial Banking 4,994 4,963
Underlying result before taxin EUR million 2013 2012
- Industry Lending 934 848- General Lending and Transaction Services 518 632- Financial Markets 618 20- Bank Treasury, Real Estate & Other -253 135Total Commercial Banking 1,817 1,635
41ING Group Annual Report 2013
1 Wh
o w
e are2 R
epo
rt of th
e Executive B
oard
3 Co
rpo
rate go
vernan
ce4 C
on
solid
ated an
nu
al accou
nts
5 Parent co
mp
any an
nu
al accou
nts
6 Oth
er info
rmatio
n7 A
dd
ition
al info
rmatio
n
Commercial Banking
It is our ambition to be the best bank for our clients and to provide the highest quality of service; to be a bank that delivers the products and services in the way clients want to receive them; with greater standardisation, uniformity in products and pricing across borders.
GENERAL LENDING AND TRANSACTION SERVICES GENERAL LENDINGWithin our General Lending business, the challenge is to maintain margins and volumes within our established risk appetite while competition intensifies, in particular in markets where large domestic banks protect their core franchises. General Lending has maintained its position as market leader in the Benelux and Central and Eastern Europe (CEE) as bookrunner in the syndicated loan market, and continued to support our corporate clients through our international network. We constantly strive to improve our corporate lending products to ensure these remain in alignment with changes in client needs, market developments and regulation. To deal with these changes in an effective way, further standardisation of our product offering and streamlining of lending processes and documentation across countries is in progress.
TRANSACTION SERVICESWe offer Transaction Services through integrated advice and solution selling. These activities require a strong emphasis on technology and operational processing. To remain competitive and to enhance our capabilities, we are continuing with our investment programme. Most notably, Payments & Cash Management is undertaking a multi-year programme to improve cost efficiency, improve client service across borders, implement market-competitive new technology and comply with new regulatory obligations. The Single Euro Payments Area (“SEPA”) implementation was a high priority area in 2013. SEPA will also remain high on the agenda in 2014 given the announcement by the European Commission, early January 2014, to extend the 1 February 2014 deadline with an additional six-month transition period to 1 August 2014.
Included within Transaction Services is Bank Mendes Gans (BMG) and Trade Finance Services (TFS). BMG is a market-leading provider of specialist liquidity management solutions, including global cash-pooling and netting, to multi-national corporations.TFS finances, settles and mitigates risks of international trade for clients in all markets globally, but primarily in Asia, Central and Eastern Europe, Latin America, Africa and the Middle East.
For corporate clients, our Working Capital Solutions team has established ING as a recognised provider of receivables and payables solutions. It was awarded several prestigious client mandates in 2013, and in 2014 it will concentrate on further strengthening its market position and execution capabilities.
INDUSTRY LENDING We have Industry Lending teams specialising in different sectors and competing in selective markets across the world. These are grouped between Structured Finance (“SF”) and Real Estate Finance (“REF”) businesses.
STRUCTURED FINANCEThe Structured Finance division aims for a consistent top-10 position globally in the markets in which it competes. We have three structured commercial lending services groups.
although risk costs in Real Estate Finance slightly increased. In General Lending risk costs were also lower.
The underlying return on equity, based on a 10% core Tier 1 ratio, increased to 11.0% from 9.0% in 2012 due to higher results and lower average risk-weighted assets. At year-end 2013, however, risk-weighted assets were 2.8% higher than a year ago, mainly due to lower foreclosure values of real estate assets partly offset by lower volumes and currency impacts.
BUSINESS DEVELOPMENTS Commercial Banking is a strong European bank with a market leading franchise in the Benelux and a good position in the rest of Europe, in particular in Central and Eastern Europe. We have a global franchise and market leading positions in selected areas in Industry Lending and in liquidity management, as well as focused and efficient global Trade Finance Services and Financial Markets businesses.
We are a relationship bank for clients around the world and serve a range of organisations, including multinational corporations, governments, financial institutions and supranational organisations, through an extensive network of offices in more than 40 countries. We provide a range of products and services to support our clients’ needs. Our lending capabilities anchor most of our client relationships. Transaction Services products, such as International Payments & Cash Management, Trade Banking and Working Capital Solutions are tailored, through integrated solutions and advice, to meet our clients’ short- and long-term banking and liquidity requirements. Financial Markets, as the Bank’s gateway to the professional markets of the world, services our client’s every day needs in treasury services through to capital markets, risk management and structured financial products.
Over many years, ING has built a high quality Industry Lending business, operating within sectors in which we add value. We provide specialised commercial lending, originating well-structured loans that strike the right balance between what clients want and achieving good risk adjusted returns. We are leaders in many different industries and are acknowledged for our commitment to clients and excellent quality of service.
We are simplifying our internal organisation, harmonising and streamlining the way in which we service clients across products and countries. We continue to invest in our operating platforms, upgrading our technology and strengthening our processing capabilities. This new operating model will lead to faster and better service, fewer points of contact, better tailored solutions and an enhanced experience for clients. It will improve our overall connectivity, by harmonising processes and practices throughout our business, enabling seamless service delivery and better collaboration with colleagues around the world. This integrated approach to services, better management information and a more efficient way of working, will create an enhanced “One Bank” client experience across our network.
Our continued balance sheet optimisation efforts in 2013 provided additional capacity for us to support clients. We progressed with building integrated domestic banks by combining Retail Banking’s deposit gathering capabilities with Commercial Banking’s origination capabilities, resulting in a further strengthening of our business model.
42 ING Group Annual Report 2013
Commercial Banking continued
Credit exposure of derivatives are revalued for counterparties and for notes issued by ING and these elements, referred to as CVA/DVA, are included in the trading results of FM. As the results of these movements are not actively managed, these CVA/DVA results are not considered in the core results of the underlying trading and sales business. In 2013 these non-core results were positive, against negative non-core results in 2012.
During 2013, FM enhanced its offering through the introduction of new specialised services, the introduction of a sales trading function, renewed focus on technological automation for client execution and the introduction of a global sales Client Relationship Management system.
In addition to market structure changes, new capital rules continue to increase the capital required to support trading businesses, and dilute return on capital. As a consequence, FM will continually analyse and re-assess its business profile to ensure that we continue to maintain and outperform ING’s return targets.
BANK TREASURY, REAL ESTATE & OTHERBANK TREASURYTo adapt to new regulations and to execute ING’s balance sheet optimisation strategy, ING has been coordinating treasury activities across all business lines within the Bank. This has been made possible through significant asset transfers across countries to guarantee an optimal use of our internal funding.
Bank Treasury (BT) has helped improve ING’s liquidity position and supported the development of a strong Funds Entrusted base which will support future asset origination within Commercial Banking. Through its investment portfolio management arm, BT is continuously transforming the bank investment portfolio into a liquid asset buffer, applying selective de-risking while maintaining the net interest margin of the portfolio.
Finally, BT continues to closely monitor developments concerning the future European banking union and other regulatory changes that will affect the Bank’s liquidity profile. Balance sheet optimisation will remain a priority for ING in the coming years.
REAL ESTATE & OTHERCommercial Banking has a separate unit involved in the run-off and closure of non-core activities. The Real Estate & Other (“RE&O”) division consists of the residual assets of the legacy businesses sold or discontinued within the former Real Estate Development and Real Estate Investment Management businesses. It also includes General Lease operations outside ING’s home markets which have been placed in run-off. A dedicated organisation was established to oversee the discontinuation of operations ensuring the necessary control and management oversight.
RE&O continued to reduce its exposure substantially despite the ongoing challenging market. RE&O also succeeded in accelerating the wind down of several lease operations by the sale of lease portfolios. Although impairments and risk costs are still at considerable levels, the portfolio is adequately provisioned and being wound down in a controlled manner.
The Energy, Transport and Infrastructure Group (ETIG) specialises in capital-intensive industry sectors such as oil and gas, mining, offshore services, shipping, utilities and power, and infrastructure. ETIG performed well in 2013. The structured metals and energy finance business has continued to develop business in CEE and in Latin America. The utilities and power team continued to do business in North America and worked on renewable projects in Europe. Container finance remained a market with reasonable opportunities, although in shipping markets supply continues to exceed demand. Our approach to the shipping market has been cautious for many years and the loan book is performing within expectations.
The Specialised Financing Group comprises a number of global teams largely engaged in arranging, underwriting and lending against business cash flows in sectors such as telecommunications, media and technology. In 2013 our clients have been able to take advantage of excess supply of credit in the market, which has made it challenging to retain asset levels.
International Trade and Export Finance supports international trade in basic commodities such as oil, oil products, metals, grain, sugar and cotton. We also finance the export of capital goods and offer services to clients with long-term financing supported by export credit agencies. ING maintained its consistent support and high service levels in the commodity finance business, and continued to grow the Structured Export Finance hub in Germany. ING has become the leading bank in the syndicated loan market for companies in the commodities business.
Sustainable business practices A Sustainable Lending team was established within Industry Lending at the end of 2012 to help ING become the preferred bank for fulfilling clients’ sustainability agendas, explore new business opportunities in sustainable areas and build expertise in niche markets. It supports the re-balancing of our lending portfolio towards companies that follow sustainable business practices.
In 2013, the Sustainable Lending team worked with various experts and clients to facilitate a better understanding of the potential business opportunities in sustainable markets and build the necessary capacity to partner with clients in financing their sustainability needs.
REAL ESTATE FINANCEReal Estate Finance’s (“REF”) primary activity is lending to investors in income-producing real estate backed by first mortgages. During 2013, REF sought to maintain the quality of its credit portfolio, while reducing its total exposure to this asset class, which was reduced significantly over the year. The volume of loan assets decreased to EUR 24 billion in 2013 reaching the target previously set for 2015. REF’s loan portfolio was the subject of two asset quality reviews by the DNB, the Dutch central bank, which validated our own assessment of its credit quality.
FINANCIAL MARKETSFM is a well-diversified business exposed to developed markets and fast-growing economies and focused on rates and currencies more than credit. In this business unit we offer a broad range of global solutions to assist our clients in the management of their exposures to foreign exchange, interest rate, equity, commodity or credit movements. FM also acts as ING’s interface to these markets.
43ING Group Annual Report 2013
1 Wh
o w
e are2 R
epo
rt of th
e Executive B
oard
3 Co
rpo
rate go
vernan
ce4 C
on
solid
ated an
nu
al accou
nts
5 Parent co
mp
any an
nu
al accou
nts
6 Oth
er info
rmatio
n7 A
dd
ition
al info
rmatio
n
Clients appreciated ING’s hands-on, creative approach, ability to co-ordinate a complex blend of products in a time-critical manner, structuring expertise and our seamlessly delivered support.
• ING Corporate Finance, for example, acted as joint financial adviser to Heathrow (AH) Ltd, in the sale of Stansted airport to Manchester Airports Group for GBP 1.5 billion. The largest shareholder of Heathrow (AH) Ltd is the Spanish conglomerate Ferrovial with which ING has enjoyed a longstanding relationship.
• ING won several mandates for the refinancing of Clondalkin’s core debt financing of approximately EUR 585 million, primarily in fixed and floating rate notes. The transactions, which included a receivables securitisation programme alongside a USD Term Loan, have transformed the structure of the Clondalkin Group, an international producer of high value-added packaging products and services, and resulted in a positive outlook from rating agencies.
• ING played a leading role in the GBP 3.6 billion whole business securitisation for Arqiva, a top communications infrastructure and media services company in the UK. Included was an innovative financing structure and security package, in which a wide range of ING products was involved (Structured Finance, Financial Markets and Debt Capital Markets), enabling Arqiva to secure a BBB rating on senior bonds from Standard & Poor’s and Fitch. This transaction has received a Project Finance International Award in the category Europe, Corporate Deal of the Year.
• ING also acted as Mandated Lead Arranger in the landmark EUR 1 billion project finance facility for the 288 megawatt Butendiek offshore wind park, contributing to the Commercial Banking portfolio of renewable power project financings. The Butendiek project will make an important contribution to Germany’s transition towards renewable energy.
The increase in the volume of sustainable business across our Commercial Banking activities echoes the global trend for an increase in sustainable investments, lending and finance. We strive to meet the growing demand from clients for products with clear social and environmental objectives. From our financing and lending activities to payroll and cash management, we witness first-hand how trends can impact our business and that of our clients. “Financing Sustainability” was the theme of ING Commercial Banking’s marketing campaign, highlighting environmentally friendly transactions in 2013, such as the above- mentioned Butendiek transaction, that helped finance the transformation towards a more sustainable economy.
OPERATIONAL EXCELLENCECommercial Banking is now in the execution phase of a strategic investment programme to improve the client experience, enhance product delivery and achieve business efficiency by creating a robust, cost-effective operating model that will support the business and streamline technology across all product lines and countries over the coming years. The initiative includes greater investment in mobile solutions and global IT applications and a move to more hub-based booking and processing of Commercial Banking business.
This will improve the overall flexibility of our Commercial Banking business model, while supporting further balance sheet optimisation. The establishment of two new Global Services &
CUSTOMER CENTRICITY, OPERATIONAL EXCELLENCE, TOP EMPLOYER CUSTOMER CENTRICITYClient service remains at the heart of Commercial Banking and market leadership positions were maintained within our core franchise areas.
Since 2010, hundreds of clients have participated annually in the Net Promoter Score (NPS) programme of Commercial Banking. The detailed client feedback received through this programme is used to monitor and improve clients’ experiences, optimising our services and internal processes. The NPS programme has been implemented in selected countries and will be further rolled out in Europe and the US in 2014.
In the Netherlands, customer surveys carried out by Greenwich Associates confirmed Commercial Banking’s number one position for the fourth consecutive year. The Greenwich results show that ING has a primary position in term of lead relationships, followed at some distance by other large banks in the Netherlands.
ING was also recognised by Euromoney and Global Finance as “Best Bank in the Netherlands”. The Banker awarded ING Bank the “Bank of the Year in the Netherlands” accolade for the third year in a row, “Bank of the Year in Belgium“ and “Bank of the Year in Western Europe”. These awards are a true recognition of our commitment to support our clients during this challenging financial period.
Structured Finance maintained its strong positions in its markets and was successful in seven categories of the annual Project Finance International awards, including the “Corporate Deal of the Year (Europe)”, the “PPP Deal of the Year (Europe)” and “Rail Deal of the Year (Europe)”. Trade and Commodity Finance maintained a top three position in its markets and won awards from Trade Finance for example “Best Structured Commodity Finance Bank (Global)”.
In addition ING is number-one bookrunner for Offshore Services syndicated loans in 2013 according to Dealogic’s Global Bookrunner league tables.
We also retained our number one position in key areas such as Mandated Lead Arranger (MLA) for syndicated loans in the Netherlands by number of deals and number one MLA and bookrunner in the Benelux by number of deals. For the fourth consecutive year ING Commercial Banking received recognition as the “Best Equity Broker in the Benelux” in the Extel Survey.
Similarly in Central and Eastern Europe (CEE), ING maintained its strong market position, supporting its key client base. Many important transactions were closed and again Commercial Banking was ranked number one in CEE league tables as MLA and bookrunner by number of deals. For the second consecutive year, readers of Treasury Management International magazine (TMI) named ING Commercial Banking as “Best Cash Management Bank in Eastern Europe”.
While market conditions have been challenging, ING executed major benchmark transactions for our clients, strengthening our relationships through our consistent support and by excelling in high value-added advice and creative financing solutions.
44 ING Group Annual Report 2013
Commercial Banking continued
Operations (“GSO”) hubs was completed in 2013. The GSOs will support multiple locations across Commercial Banking, delivering standardised, shared booking and processing in a high quality, cost-effective manner. This will result in greater agility, consistency of services for clients and management of risk. Overall, Commercial Banking aims to deliver superior client experience.
TOP EMPLOYERBanking is all about people: our people’s engagement, sustainable performance and strong development are key drivers for successful client servicing. With continued pressure on our cost base in 2013, we had to make difficult decisions in several areas. At the same time, we had to keep employees engaged and motivated. Commercial Banking therefore made it a priority to continue to build a learning organisation in 2013. We enhanced our offerings both in technical training for all staff as well as in specific leadership programmes.
One example was the development of international learning curriculums, offered through global learning portals. We combined this with the launch of our “Heart of Orange Leadership” programme, in which leaders take time to reflect on what drives them, learn to mobilise competent teams and share experiences. These initiatives are contributing to a strong and agile workforce. We remain a people business.
CONCLUSIONS AND AMBITIONSDespite the weak global economy, Commercial Banking posted a solid financial result, deepened its client relationships and strengthened its capabilities.
We are transforming into a simpler, stronger and more sustainable bank. We continued to refocus and streamline our activities, maintained cost discipline and pursued our initiatives on balance sheet optimisation.
Our ambition is not only to become a stronger bank, but also a better bank for our clients, who increasingly choose banking relationships based on the quality of solutions offered, combined with effective service delivery. To become that better bank we have reconfirmed our target customer base and the products we offer, and are adapting the way we serve and deliver products to them. We have launched a number of initiatives to optimise our business model across products and countries, streamlining our operational infrastructure and renewing our IT platform.
In summary, we are profitable, we are developing our already impressive capabilities in Europe and elsewhere and, most important of all, we are delivering what clients want.
45ING Group Annual Report 2013
1 Wh
o w
e are2 R
epo
rt of th
e Executive B
oard
3 Co
rpo
rate go
vernan
ce4 C
on
solid
ated an
nu
al accou
nts
5 Parent co
mp
any an
nu
al accou
nts
6 Oth
er info
rmatio
n7 A
dd
ition
al info
rmatio
n
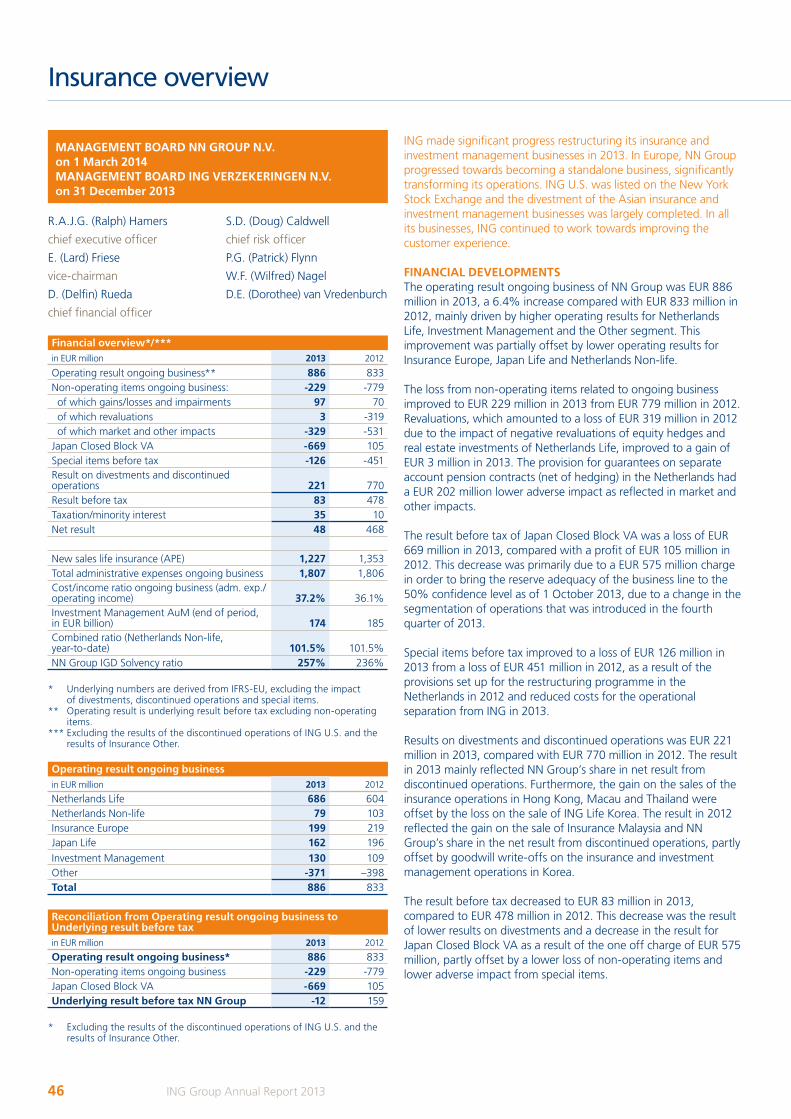
MANAGEMENT BOARD NN GROUP N.V.on 1 March 2014MANAGEMENT BOARD ING VERZEKERINGEN N.V. on 31 December 2013
Financial overview*/***in EUR million 2013 2012
Operating result ongoing business** 886 833Non-operating items ongoing business: -229 -779 of which gains/losses and impairments 97 70 of which revaluations 3 -319 of which market and other impacts -329 -531Japan Closed Block VA -669 105Special items before tax -126 -451Result on divestments and discontinued operations 221 770Result before tax 83 478Taxation/minority interest 35 10Net result 48 468
New sales life insurance (APE) 1,227 1,353Total administrative expenses ongoing business 1,807 1,806Cost/income ratio ongoing business (adm. exp./operating income) 37.2% 36.1%Investment Management AuM (end of period, in EUR billion) 174 185Combined ratio (Netherlands Non-life, year-to-date) 101.5% 101.5%NN Group IGD Solvency ratio 257% 236%
* Underlying numbers are derived from IFRS-EU, excluding the impact of divestments, discontinued operations and special items.
** Operating result is underlying result before tax excluding non-operating items.
*** Excluding the results of the discontinued operations of ING U.S. and the results of Insurance Other.
Operating result ongoing businessin EUR million 2013 2012
Netherlands Life 686 604Netherlands Non-life 79 103Insurance Europe 199 219Japan Life 162 196
Investment Management 130 109Other -371 –398Total 886 833
Reconciliation from Operating result ongoing business to Underlying result before taxin EUR million 2013 2012
Operating result ongoing business* 886 833Non-operating items ongoing business -229 -779Japan Closed Block VA -669 105Underlying result before tax NN Group -12 159
* Excluding the results of the discontinued operations of ING U.S. and the results of Insurance Other.
R.A.J.G. (Ralph) Hamers
chief executive officer
E. (Lard) Friese
vice-chairman
D. (Delfin) Rueda
chief financial officer
S.D. (Doug) Caldwell
chief risk officer
P.G. (Patrick) Flynn
W.F. (Wilfred) Nagel
D.E. (Dorothee) van Vredenburch
ING made significant progress restructuring its insurance and investment management businesses in 2013. In Europe, NN Group progressed towards becoming a standalone business, significantly transforming its operations. ING U.S. was listed on the New York Stock Exchange and the divestment of the Asian insurance and investment management businesses was largely completed. In all its businesses, ING continued to work towards improving the customer experience.
FINANCIAL DEVELOPMENTSThe operating result ongoing business of NN Group was EUR 886 million in 2013, a 6.4% increase compared with EUR 833 million in 2012, mainly driven by higher operating results for Netherlands Life, Investment Management and the Other segment. This improvement was partially offset by lower operating results for Insurance Europe, Japan Life and Netherlands Non-life.
The loss from non-operating items related to ongoing business improved to EUR 229 million in 2013 from EUR 779 million in 2012. Revaluations, which amounted to a loss of EUR 319 million in 2012 due to the impact of negative revaluations of equity hedges and real estate investments of Netherlands Life, improved to a gain of EUR 3 million in 2013. The provision for guarantees on separate account pension contracts (net of hedging) in the Netherlands had a EUR 202 million lower adverse impact as reflected in market and other impacts.
The result before tax of Japan Closed Block VA was a loss of EUR 669 million in 2013, compared with a profit of EUR 105 million in 2012. This decrease was primarily due to a EUR 575 million charge in order to bring the reserve adequacy of the business line to the 50% confidence level as of 1 October 2013, due to a change in the segmentation of operations that was introduced in the fourth quarter of 2013.
Special items before tax improved to a loss of EUR 126 million in 2013 from a loss of EUR 451 million in 2012, as a result of the provisions set up for the restructuring programme in the Netherlands in 2012 and reduced costs for the operational separation from ING in 2013.
Results on divestments and discontinued operations was EUR 221 million in 2013, compared with EUR 770 million in 2012. The result in 2013 mainly reflected NN Group’s share in net result from discontinued operations. Furthermore, the gain on the sales of the insurance operations in Hong Kong, Macau and Thailand were offset by the loss on the sale of ING Life Korea. The result in 2012 reflected the gain on the sale of Insurance Malaysia and NN Group’s share in the net result from discontinued operations, partly offset by goodwill write-offs on the insurance and investment management operations in Korea.
The result before tax decreased to EUR 83 million in 2013, compared to EUR 478 million in 2012. This decrease was the result of lower results on divestments and a decrease in the result for Japan Closed Block VA as a result of the one off charge of EUR 575 million, partly offset by a lower loss of non-operating items and lower adverse impact from special items.
46 ING Group Annual Report 2013
Insurance overview
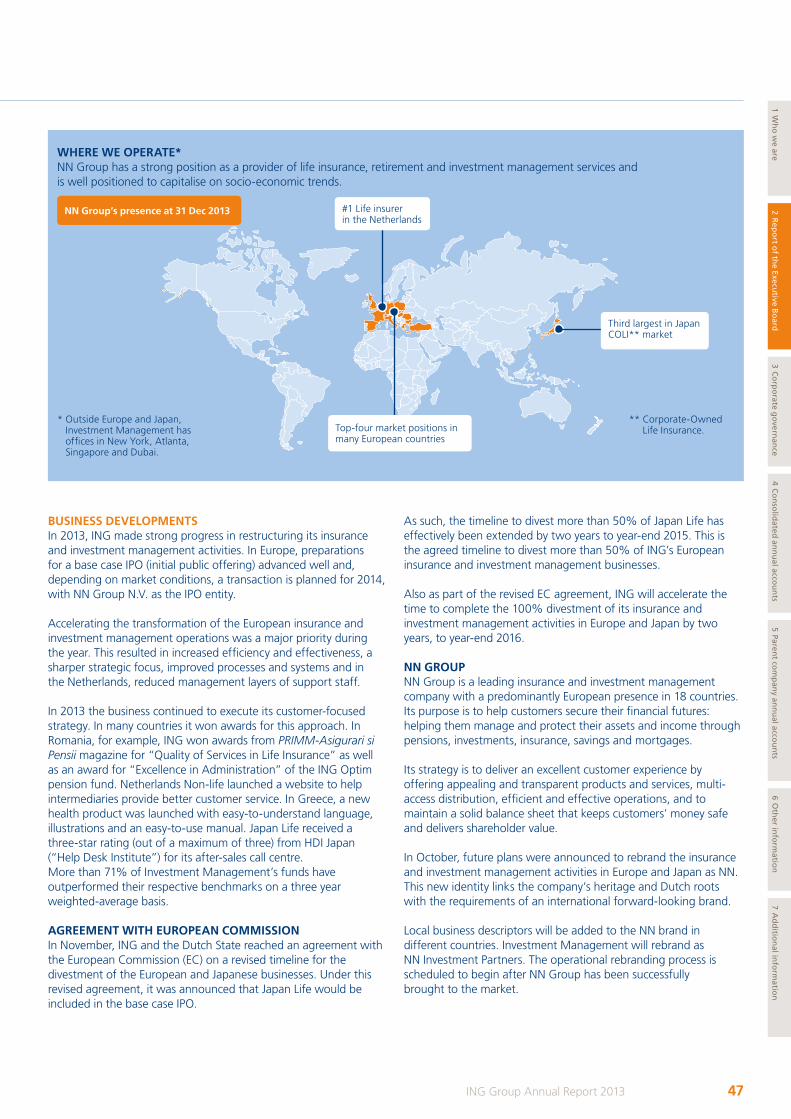
BUSINESS DEVELOPMENTS In 2013, ING made strong progress in restructuring its insurance and investment management activities. In Europe, preparations for a base case IPO (initial public offering) advanced well and, depending on market conditions, a transaction is planned for 2014, with NN Group N.V. as the IPO entity.
Accelerating the transformation of the European insurance and investment management operations was a major priority during the year. This resulted in increased efficiency and effectiveness, a sharper strategic focus, improved processes and systems and in the Netherlands, reduced management layers of support staff.
In 2013 the business continued to execute its customer-focused strategy. In many countries it won awards for this approach. In Romania, for example, ING won awards from PRIMM-Asigurari si Pensii magazine for “Quality of Services in Life Insurance” as well as an award for “Excellence in Administration” of the ING Optim pension fund. Netherlands Non-life launched a website to help intermediaries provide better customer service. In Greece, a new health product was launched with easy-to-understand language, illustrations and an easy-to-use manual. Japan Life received a three-star rating (out of a maximum of three) from HDI Japan (“Help Desk Institute”) for its after-sales call centre. More than 71% of Investment Management’s funds have outperformed their respective benchmarks on a three year weighted-average basis.
AGREEMENT WITH EUROPEAN COMMISSIONIn November, ING and the Dutch State reached an agreement with the European Commission (EC) on a revised timeline for the divestment of the European and Japanese businesses. Under this revised agreement, it was announced that Japan Life would be included in the base case IPO.
As such, the timeline to divest more than 50% of Japan Life has effectively been extended by two years to year-end 2015. This is the agreed timeline to divest more than 50% of ING’s European insurance and investment management businesses.
Also as part of the revised EC agreement, ING will accelerate the time to complete the 100% divestment of its insurance and investment management activities in Europe and Japan by two years, to year-end 2016.
NN GROUP NN Group is a leading insurance and investment management company with a predominantly European presence in 18 countries. Its purpose is to help customers secure their financial futures: helping them manage and protect their assets and income through pensions, investments, insurance, savings and mortgages.
Its strategy is to deliver an excellent customer experience by offering appealing and transparent products and services, multi-access distribution, efficient and effective operations, and to maintain a solid balance sheet that keeps customers’ money safe and delivers shareholder value. In October, future plans were announced to rebrand the insurance and investment management activities in Europe and Japan as NN. This new identity links the company’s heritage and Dutch roots with the requirements of an international forward-looking brand.
Local business descriptors will be added to the NN brand in different countries. Investment Management will rebrand as NN Investment Partners. The operational rebranding process is scheduled to begin after NN Group has been successfully brought to the market.
* Outside Europe and Japan, Investment Management has offices in New York, Atlanta, Singapore and Dubai.
** Corporate-Owned Life Insurance.
WHERE WE OPERATE*NN Group has a strong position as a provider of life insurance, retirement and investment management services and is well positioned to capitalise on socio-economic trends.
Third largest in Japan COLI** market
#1 Life insurer in the Netherlands
Top-four market positions in many European countries
NN Group’s presence at 31 Dec 2013
47ING Group Annual Report 2013
1 Wh
o w
e are2 R
epo
rt of th
e Executive B
oard
3 Co
rpo
rate go
vernan
ce4 C
on
solid
ated an
nu
al accou
nts
5 Parent co
mp
any an
nu
al accou
nts
6 Oth
er info
rmatio
n7 A
dd
ition
al info
rmatio
n
Insurance overview
The board of NN Group N.V. consists of:• Ralph Hamers, CEO • Lard Friese, vice-chairman• Delfin Rueda, CFO• Doug Caldwell, CRO• Patrick Flynn• Wilfred Nagel• Dorothee van Vredenburch
GOVERNANCE ING U.S.Prior to the completion of its initial public offering (“IPO”) in May 2013, ING U.S., Inc. (“ING U.S.”) was an indirect wholly owned subsidiary of ING Group. Following the ING U.S. IPO, and consistent with the terms of its shareholder agreement with ING U.S., ING Group retained control of a majority of the ING U.S. board of directors and ING U.S. continued to be part of ING Group’s consolidated business operations. ING U.S. has announced that it expects to rebrand over the course of 2014 to Voya Financial, Inc. and to change its legal name to Voya Financial, Inc. in April 2014. In May 2014 the ING U.S. Investment Management and Employee Benefits businesses also will begin using the Voya Financial brand.
ING U.S. has elected to be treated as a “controlled company” for purposes of NYSE corporate governance rules, and accordingly, for as long as ING Group owns more than 50% of the ING U.S. outstanding common stock, ING U.S. will not be subject to the requirement that a majority of its directors be “independent” as defined under such rules.
The board of ING U.S., Inc. consists of:• Rodney Martin, Jr., chairman• John Boers• Patrick Flynn• Barry Griswell• Dick Harryvan• Frederick Hubbell• Henny Koemans• Wilfred Nagel• David Zwiener
CUSTOMER EXPERIENCENN Group’s aim is to help customers secure their financial future. NN Group’s strategy focuses on offering appealing and easy-to-understand products and services, multi-access distribution and efficient and effective operations. In line with its ambition to be a leading, responsible and customer-centric organisation.
Enhancing the customer experience means being accessible, listening to the needs of customers, following-up on their expectations, and offering them products and services that are suitable to their needs. The result is that we help create a stronger financial future for our customers.
In 2013, new corporate values were introduced which place the customer first and put emphasis on products being easy to understand, transparent and accessible. NN Group cares about its customers, aims to be clear, and commits to them.
As part of the preparations to become a standalone company through a base case IPO, changes were made to the reporting segmentation in the fourth quarter of 2013, as follows: • Netherlands Life• Netherlands Non-life• Insurance Europe• Japan Life• Investment Management• Other• Japan Closed Block VA
AMERICAN DIVESTMENT In May, ING U.S. listed on the New York Stock Exchange and began operating as a publicly traded company. The listing initially reduced ING Group’s stake in ING U.S. to 71%.
In September, the remaining stake in ING U.S. was transferred from NN Group to ING Group. Later in the year, ING Group successfully sold a second tranche of shares, reducing its stake further to 57%.
The 2012 Amended Restructuring Plan requires ING Group to divest at least 25% of ING U.S. by 31 December 2013; more than 50% by 31 December 2014; and 100% by 31 December 2016.
ASIAN DIVESTMENTGood progress was made in 2013 in divesting the Asian Insurance and Investment Management businesses. By year-end, most of these businesses, including ING’s life insurance companies in South Korea, Hong Kong, Macau and Thailand, its 26% interest in ING Vysya Life Insurance Company Ltd and its 49% stake in South Korean insurer KB Life had been divested. An agreement had also been announced to sell a 50% stake in the Chinese insurance joint venture ING-BOB Life Insurance Company. It also completed the sale of its 33% stake in China Merchants Fund, which was announced in 2012. Investment Management businesses in Malaysia, Thailand and South Korea were also sold. The sale of the interest in the joint venture ING Financial Services Private Limited to Hathway Investments was completed. In early 2014, an agreement was reached to sell the investment management business in Taiwan. ING resolved the remaining divestment of its Asian insurance and investment management operations with the inclusion of ING Life Japan in the base case IPO of NN Group.
GOVERNANCE NN GROUPOn 28 February 2014, before the finalisation of the 2013 consolidated financial statements, ING Insurance Topholding N.V. legally merged with its wholly-owned subsidiary ING Verzekeringen N.V. The legal merger became effective as of 1 March 2014 and on that date the merged entity was renamed NN Group N.V. Through this merger, the legal entity ING Verzekeringen N.V. ceased to exist and NN Group N.V. became the legal successor of ING Verzekeringen N.V.
NN Group N.V. became the entity for the base case IPO for the European and Japanese insurance and investment management operations. Until 1 March 2014 these operations were conducted under the umbrella of ING Verzekeringen N.V. In this Annual Report, NN Group will be used to indicate these operations.
48 ING Group Annual Report 2013
Insurance overview continued
SUPPORTING AND DEVELOPING EMPLOYEES For a customer-focused organisation such as NN Group, engaged employees are the key to success. This means attracting the right people, empowering them, giving them clear accountability and ensuring that they focus on continuous development and set ambitious but realistic goals.
Employees are encouraged to invest in themselves and in their employment prospects. Employees are given, for example, training, coaching and internships. In the Netherlands they are also offered retraining advice if they are made redundant.
2013 was a year of major transition for the insurance and investment management operations in the Netherlands. As announced in November 2012, the transformation programme in the Netherlands is expected to result in an estimated headcount reduction of 1,350 FTEs over the period 2013-2014. By the end of 2013, a reduction of 818 FTE was realised.
The restructuring has resulted in stronger governance, better integrated support functions, and three distinct Dutch business lines: Netherlands Life, Netherlands Non-life and Nationale-Nederlanden Bank. Supporting employees through this transition was a key priority for the company.
A three-year collective labour agreement was signed, which included the goal of stabilising labour costs as well as integrating WestlandUtrecht employees into Nationale-Nederlanden Bank. Despite the turbulence of the past few years, employee engagement remained high. This was also reflected in employees’ willingness to involve themselves in community activities outside the company in many countries.
SUSTAINABILITYEmbedding sustainability in core activities and processes remained a key priority. The businesses strive – in their daily actions and decision making – to strike a balance between financial interest and their impact on society and the environment. This entails – amongst others – offering products and services that are suitable, transparent and contribute to the financial wellbeing of our customers.
NN Group’s ambition is to play a leading role in improving industry standards. Its aim is to be a trusted partner in financial matters, providing guidance and financial education so consumers better understand and secure their financial future. Efforts to become an even stronger company for stakeholders, for example by continuing to make things easier and simpler for customers, are a significant aspect of its business strategy.
In the field of responsible investing, Investment Management has taken significant steps in integrating environmental, social and governance (“ESG”) aspects into the investment process. Sustainable assets under management increased by 8.3% to EUR 3.5 billion. In line with being an active investor, Investment Management also attends shareholder meetings of its investee companies. In 2013 it introduced the publication of quarterly Active Ownership reports on its voting and engagement activities.
ING became one of the founding signatories of the United Nations Principles for Sustainable Insurance (PSI) in 2012, which underlines its commitment to embedding ESG considerations into strategy and
decision making. In 2013, the PSI strategy for the coming years was written and approved by all PSI members. NN Group takes its role in society seriously. Activities range from financial education to health and wellbeing initiatives. They involve raising funds and employees volunteering their time for special projects.
SOLVENCY IIThroughout 2013, the insurance business worked towards meeting the European Union’s Solvency II Directive’s requirements, particularly with respect to adapting ING’s risk measurement, risk management and reporting to the levels required.
The trial Internal Model Application Package (“IMAP”) was submitted to DNB, the Dutch regulator, in 2013. The submission was a first step towards gaining approval for an internal model for the quantification of NN Group’s capital requirements. The review of the IMAP by the College of Supervisors (a group of international supervisors) and the further firming up of Solvency II measures will form the basis of ING’s implementation efforts.
In November, a major milestone was reached in Brussels. The European Parliament, Council and European Commission reached a political deal on the Omnibus II Directive – amending the 2009 Solvency II Framework Directive. Solvency II’s implementation is planned for 1 January 2016.
NN Group will continue to play a role in discussions with the industry and with regulators on developing Solvency II so that it is robust and helps life insurance companies continue to meet the long-term financial needs of their customers.
CONCLUSIONS AND AMBITIONS In 2013 strong progress was made in the European and Japanese insurance and investment management restructuring programme and on improving the customer experience and operational performance.
NN Group’s overall ambition is for customers to choose its products and services based on their previous positive experience with its businesses. The priorities for the business are to be a strong, sustainable company, delivering excellent customer service and transparent products. The priorities also include providing multi-access distribution, having efficient and effective operations and generating capital.
49ING Group Annual Report 2013
1 Wh
o w
e are2 R
epo
rt of th
e Executive B
oard
3 Co
rpo
rate go
vernan
ce4 C
on
solid
ated an
nu
al accou
nts
5 Parent co
mp
any an
nu
al accou
nts
6 Oth
er info
rmatio
n7 A
dd
ition
al info
rmatio
n
> Leading insurance and investment management company with a predominantly European presence
> NN to be the future brand name > Strong presence across mature and growth markets
> Focused on delivering a superior customer experience and operational excellence
NN Group is a leading insurance and investment management company with a strong, predominantly European presence in 18 countries. With more than 12,000 employees, it offers retirement services, insurance, investments and banking to retail, SME, corporate and institutional customers. NN Group’s aim is to help customers secure their financial future. In 2013, it leveraged its scale in mature markets and delivered profitable growth in emerging markets. In many countries NN Group won awards for its customer-focused approach, and for making things easier and simpler for customers.
NETHERLANDS LIFE
> Responding to changes in the Dutch life insurance market
> Delivering operational excellence in the group pensions and life businesses to create a customer-driven organisation
> Lowered costs and improved capital position
Netherlands Life’s aim is help its customers make the right decisions about their financial future, by providing effective and easy-to-understand products. In 2013, the individual life insurance market continued to go through major change. In response to this, Netherlands Life is lowering costs by streamlining its processes and systems. In pensions it is well positioned to capture more opportunities in the growing Defined Contribution market. In all its businesses, Netherlands Life is committed to improving the customer experience.
FINANCIAL DEVELOPMENTSThe operating result for Netherlands Life was EUR 686 million in 2013 compared with EUR 604 million in 2012, mainly due to a higher technical margin partly offset by lower fees and premium based revenues.
The investment margin decreased to EUR 535 million in 2013 from EUR 542 million in 2012, after a slight decline in investment income mainly due to lower dividends on equity securities.
Compared with 2012, fees and premium-based revenues in 2013 decreased by EUR 47 million to EUR 461 million, mainly due to the run-off of the individual life closed book portfolio as well as lower cost charges to clients within individual unit-linked insurance policies from 2013 onwards.
In 2013 the technical margin was EUR 237 million, a 68.1% increase from EUR 141 million in 2012, mainly driven by non-recurring movements in technical provisions in both years.
Administrative expenses decreased to EUR 472 million in 2013 compared with EUR 495 million in 2012, mainly due to the transformation programme in the Netherlands partly offset by higher pension expenses.
DAC amortisation and trail commissions declined 18.5% to EUR 75 million in 2013, in line with the decline in new life sales and reduced acquisition costs, as a result of the commission ban on complex products in the Netherlands.
Gains/losses and impairments decreased to a EUR 43 million loss in 2013 from a gain of EUR 138 million in 2012. The loss in 2013 was mainly due to impairments on real estate, while the gain in 2012 was mainly driven by realised gains on equities.
Revaluations improved to a gain of EUR 27 million compared to a loss of EUR 296 million in 2012. Negative real estate revaluations in 2013 were more than offset by positive revaluations of private equity. The loss in 2012 included a EUR 206 million loss on equity hedges and a EUR 149 million negative revaluation of real estate, partly offset by a EUR 20 million positive revaluation of private equity.
The 2013 loss of EUR 329 million in market and other impacts was mainly a result of the change in the provision for guarantees on separate account pension contracts (net of hedging). This included a non-recurring loss of EUR 177 million from a refinement of the market interest rate assumption to further align the accounting and the hedging for the separate account pension business. In 2012, the loss from the change in the provision for guarantees on separate account pension contracts (net of hedging) was EUR 530 million.
Special items were a loss of EUR 22 million in 2013, primarily due to preparation costs for the base case IPO. This compared to a loss of EUR 225 million in 2012 which primarily reflected reorganisation provisions related to the transformation programme announced in late 2012 as well as expenses related to the operational separation from ING Group.
Result on divestment was a gain of EUR 6 million in 2013, compared with a loss of EUR 25 million in 2012. The loss in 2012 was related to the final settlement of the divestment of group pension contracts which were transferred to an industry wide pension fund.
The result before tax was a gain of EUR 325 million in 2013, compared with a loss of EUR 335 million in 2012, driven by an improvement in non-operating items and lower adverse impact from special items as well as the increase in operating result.
BUSINESS DEVELOPMENTSNetherlands Life offers a range of group life and individual life insurance products. Its group life policies are primarily group pension products. Its individual life insurance business primarily consists of the closed-block operation of the individual life portfolios (comprising a range of discontinued products sold prior to 2012) of Nationale-Nederlanden, RVS and ING Verzekeringen Retail, formerly known as Postbank Insurance. Netherlands Life also provides pension administration and management services through its AZL brand. Netherlands Life was the largest life insurer in the Netherlands as measured by Gross Written Premiums (GWP) in 2012, the most recent year of official figures, collected by DNB.
50 ING Group Annual Report 2013
NN Group
In the pensions market, the persistently low-interest rate environment and longevity risk have increased employers’ funding costs for pension schemes. Through Netherlands Life’s Pensions division, Netherlands Life provides pension solutions to businesses of all sizes. It offers insured and non-insured pension solutions, bundled and unbundled options, and works in close collaboration with pension administrator AZL and ING Investment Management. Netherlands Life Pensions is able to help existing and new customers move from Defined Benefit to Defined Contribution pension schemes, giving employers greater certainty over the funding cost of their pension schemes and at the same time reducing risk and capital requirements for Netherlands Life.
The individual life insurance market is going through major change, driven in part by the economic downturn which is affecting consumer confidence and spending patterns, and by new regulations related to commissions on how individual life insurance products are sold. A major shift towards bank annuity products is taking place. In response to these developments, Netherlands Life is lowering costs by streamlining its processes and systems, and improving the customer experience. Netherlands Life is focused on providing excellent service to clients who have purchased individual contracts in previous years. It will continue to provide simple solutions by offering term life and direct annuities to prospective retail customers.
In 2012, Netherlands Life stepped up its efforts in compensating customers with individual unit-linked policies based on the compensation scheme with two consumer protection organisations and also based on additional measures (‘’flankerend beleid”) that comply with the “Best in Class” criteria as formulated by the Dutch Minister of Finance. By early 2013, all policyholders of an individual unit-linked policy were informed about their compensation. The agreements with the two consumer protection organisations are not binding on policyholders. For more information, please refer to ‘Legal proceedings’ in the Accounts section of this Annual Report.
CUSTOMER EXPERIENCENetherlands Life measures and analyses its Net Promoter Score (NPS) results and complaints. It adjusts processes in line with customers’ feedback and expectations.
In pensions, its objective is to help customers make informed decisions about their financial future throughout their lives. In 2013, Netherlands Life improved the quality of its communication with customers. For example, it introduced a new website www.thuisinpensioen.nl where customers can find answers to questions about pensions.
PRODUCTSNetherlands Life launched a Defined Contribution (DC) pension product (Essentie Pensioen) in 2012 which bundles insurance from Nationale-Nederlanden, pension administration by AZL and investment management services from Investment Management. It launched another DC product (Bewust Pensioen) in 2013, which is based on a straight-through-processing framework and offers guarantees and investment opportunities. With these two products, Netherlands Life is well positioned to capture more opportunities in the growing DC market.
DISTRIBUTIONAs a result of the legislative ban in 2013 on commissions for complex financial products and stricter requirements for certification, there has been a reduction in the number of intermediaries in the Dutch market. At the same time new distributors have appeared, who are expanding their services, and distributing pension products together with financial advice to their clients.
In group life, Netherlands Life is increasingly offering DC propositions, both insured and non-insured, alongside its full service Defined Benefit (DB) pension solutions. Furthermore, due to the greater use of digital tools, processes are becoming more efficient for customers.
CONCLUSIONS AND AMBITIONSNetherlands Life’s ambition is to help its customers make the right decisions about their financial future and it will achieve this by guiding them through effective and easy-to-understand products.
NETHERLANDS NON-LIFE
> The profitability of income protection products improves
> Run rate expenses are decreasing due to product and process innovation
> Customer service is improving
Netherlands Non-life’s aim is to lower expenses, create innovate products and to further improve customer and intermediary service levels. It continues to sell its products through multiple distribution channels. Intermediaries continue to play an important role, but bancassurance and direct channels are also an integral part of Netherlands Non-life’s distribution strategy.
FINANCIAL DEVELOPMENTSThe operating result for Netherlands Non-life was EUR 79 million in 2013, a 23.3% decline compared with EUR 103 million in 2012, mainly due to a lower operating result in the Property & Casualty (P&C) segment partly offset by a higher operating result in the Disability & Accident (D&A) segment.
Operating income was EUR 1,729 million in 2013, a 6.2% decrease compared with EUR 1,844 million in 2012. This decrease was largely driven by lower earned premiums in the SME P&C and D&A segments due to the challenging economic conditions and an underwriting focus on value and return over volume. Other income comprising commission income earned by NN Group’s wholly-owned insurance brokers, Mandema and Zicht, showed a decrease as a result of the new legislation prohibiting insurance companies to pay commissions to brokers, which became effective in 2013.
Expenditure improved to EUR 1,651 million in 2013 compared with EUR 1,741 million in 2012. This improvement was driven by a significant reduction in claims frequency for disability and accident insurance products following the implementation of a recovery programme in 2011 and 2012. The recovery was also strengthened by a significant improvement in the claims experience for short-term disability products. The restored profitability of the Income business was partly offset by a relatively high volume of significant claims in the fire product line and several large storms in the fourth
51ING Group Annual Report 2013
1 Wh
o w
e are2 R
epo
rt of th
e Executive B
oard
3 Co
rpo
rate go
vernan
ce4 C
on
solid
ated an
nu
al accou
nts
5 Parent co
mp
any an
nu
al accou
nts
6 Oth
er info
rmatio
n7 A
dd
ition
al info
rmatio
n
NN Group
quarter of 2013, which increased expenditures in the P&C market segment. Administrative expenses increased by EUR 19 million mainly as a result of higher pension expenses, which more than offset the impact of the transformation programme in the Netherlands.
The result from non-operating items was a gain of EUR 4 million in 2013 compared with a loss of EUR 15 million in 2012. The positive result reflects improved revaluations of both real estate and private equity assets in 2013 and negative revaluations of the direct equity hedge in 2012.
Special items were a loss of EUR 16 million in 2013, primarily due to preparation costs for the base case IPO. This compared to a loss of EUR 140 million in 2012, which mainly reflected reorganisation provisions related to the transformation programme announced in late 2012 and expenses for the operational separation from ING Group.
The result before tax increased to a gain of EUR 66 million in 2013 from a loss of EUR 51 million in 2012. The decrease in operating result was more than offset by an improvement in non-operating items and special items.
BUSINESS DEVELOPMENTSNetherlands Non-life offers a broad range of non-life insurance products – motor, transport, fire, liability, travel and disability and accident insurance – to retail, self-employed, SME (small and medium-sized enterprise) and corporate customers. It does this through multi-channel distribution such as regular and mandated brokers, ING Bank and direct via the internet. Its Movir brand offers individual disability insurance to specific groups in the medical and business professions. In the Netherlands, Netherlands Non-Life was the third largest provider of non-life insurance products (excluding healthcare insurance) measured by Gross Written Premiums (GWP) in 2012, the most recent year of official figures, as collected by DNB.
The economic downturn continued to affect the non-life business in 2013, most visibly in disability and accident insurance. Netherlands Non-life is gradually increasing the profitability of this product line having adjusted premiums and having made operational improvements in the claims process.
Furthermore, by innovating products and processes it lowered run rate expenses. In the property and casualty business, it downsized the product portfolio in line with the focus on retail, SMEs and the self-employed.
PRODUCTS AND SERVICES Netherlands Non-life broadened its non-life insurance package for companies in 2013. It introduced, for example, cover for disruption to web shops such as cybercrime, and launched an insurance package to protect employers and their businesses against illness and disability. The broadened range of insurance also supports intermediaries who are able to offer their business customers more insurance options. In the retail space, Netherlands Non-life began to offer online travel insurance and cover against unexpected legal expenses. A new website was launched for intermediaries (www.adviseur. nn.nl) which includes a tool to select customers for mailing promotions.
Netherlands Non-life is constantly improving its processes by implementing straight-through-processing (STP). This not only enhances the customer experience but reduces manual work, errors and costs.
DISTRIBUTION DEVELOPMENTS Netherlands Non-life continues to distribute its products through third-party channels, but in 2012 it started to provide retail products via its own direct channels, and it enhanced these channels in 2013. In the SME market for income protection and for property and casualty products, the intermediary channel remained the dominant distribution channel because of the complexity and the need-for-advice nature of the products. Distribution via ING Bank continued to deliver encouraging results in the Property and Casualty market.
CONCLUSIONS AND AMBITIONSThe weak economic environment continued to affect the business, but Netherlands Non-life is on track with profit recovery. It continues to improve its products and processes, enhance the customer experience and to lower expenses.
INSURANCE EUROPE
> Accelerated portfolio growth by improving the customer experience
> Focus on protection and investment products and building a multi-channel distribution platform
> Priority on cost containment
In spite of the challenging macroeconomic environment in many European countries, Insurance Europe achieved growth in 2013 by increasing multi-channel distribution and improving service levels, which resulted in higher NPS scores. Insurance Europe has a strong focus on profitable growth.
FINANCIAL DEVELOPMENTSThe operating result for Insurance Europe was EUR 199 million in 2013, a 9.1% decline compared with EUR 219 million in 2012. Lower investment margin and a lower technical margin were partly offset by lower administrative expenses.
The investment margin for 2013 was EUR 105 million, compared with EUR 122 million for 2012. This decline reflects lower re-investment yields and the impact of a regulatory change, both in the Czech Republic.
Fees and premium-based revenues decreased slightly from EUR 514 million in 2012 to EUR 507 million in 2013, mainly due to lower unit-linked premiums in Belgium and Luxembourg.
The technical margin decreased to EUR 191 million in 2013 from EUR 210 million in 2012, mainly due to lower surrender results in Greece and lower morbidity margin in Romania and Greece. These declines were partly offset by a EUR 10 million reclassification of the Belgian crisis tax, booked in the technical margin in 2012, to DAC amortisation and trail commissions in 2013.
52 ING Group Annual Report 2013
NN Group continued
Administrative expenses were EUR 310 million in 2013, a 7.2% decrease compared with EUR 334 million in 2012. This decrease partly reflects the incurrence of a one-off financial institution tax in Hungary of EUR 15 million in 2012 and tight cost control throughout the region in 2013, the impact of the latter partly offset by investments in new business in Turkey.
DAC amortisation and trail commissions decreased slightly to EUR 319 million in 2013 from EUR 321 million in 2012. DAC amortisation and trail commissions in Belgium decreased due to a new commission agreement with distributor ING Bank Belgium as well as lower sales, offset by the reclassification of the Belgian crisis tax.
Non-operating items increased to a gain of EUR 53 million in 2013 from a loss of EUR 66 million in 2012. This increase reflects a EUR 48 million gain on the sale of Dutch and German government bonds in Belgium in 2013, as compared with capital losses and impairments on financial and government bonds in Belgium and Spain in 2012.
Special items were a loss of EUR 9 million in 2013, primarily related to expenses for a regional transformation programme. This compared with a loss of EUR 38 million in 2012, which included expenses related to the operational separation from ING, expenses for the transformation programme and expenses related to the base case IPO.
The result before tax increased to EUR 243 million in 2013 from EUR 115 million in 2012. The decrease in operating result was more than offset by an improvement in non-operating items and special items.
BUSINESS DEVELOPMENTSInsurance Europe primarily offers life insurance, mainly to retail, self-employed, SME and corporate customers in 11 countries: Poland, Turkey, Czech Republic, Slovak Republic, Romania, Hungary, Bulgaria, Belgium, Spain, Greece and Luxembourg. It also offers pensions in some of these markets and non-life insurance in Belgium and Spain, and healthcare insurance in Greece.
In Europe, Insurance Europe was in 2012 the largest provider of life insurance in Romania and Hungary, and had top-four positions in the Czech Republic and Greece – in each case measured in GWP. It was the largest provider of mandatory pensions in Poland, Slovak Republic, Romania and Hungary, and voluntary pensions in Romania – in each case measured by assets under management.
CUSTOMER FOCUSInsurance Europe is making clear progress in improving the customer experience and received awards for this in several countries. In Poland an electronic application for customers significantly reduced online claims handling and service time. In Romania new functions in MyING, the first self-service portal in the local life insurance market, were introduced. Spain launched a new customer website including a self-service portal with improved functionality; policies can now be delivered within two days from application. In the Czech Republic, about 80% of claims are processed within five days. In Belgium the car insurance claim process was redesigned to make it clearer for customers. In Turkey the website was re-launched with more functions, and the customer portal’s self-service capability was enhanced; in addition, a mobile
application was introduced to give customers access to their accounts at any time and wherever they are.
In Bulgaria annual pension statements can now be received by email, which brings convenience and reduces paper usage.
PRODUCTSInsurance Europe offers both protection and investment products. It introduced several customer initiatives in 2013 in line with its strategy to improve the customer experience. In January Greece launched its new health product, Orange Cross, with plain language, illustrations and an easy-to-use manual. In December 2012, ING in the Czech Republic launched For You, breast cancer insurance cover for women which includes online access to information and help about cancer prevention. For You has been well received by customers, achieving an excellent NPS score. In 2013 Spain became the second country to offer For You.
Spain signed a collaboration agreement with Mutua Madrileña Group, and started selling its car insurance with special benefits for ING customers. Poland achieved success with its ”Insure yourself and trick the cancer“ campaign, which was voted the best campaign in the finance category of the Zloty Spinacz awards, a prestigious public relations award. The campaign was recognised for its corporate responsibility features, including cancer prevention and education about healthy living and the importance of regular medical examinations. Romania launched the country’s first online life insurance service. Turkey introduced a long-term life product, using online and offline distribution channels. Luxembourg launched a unit-linked life insurance solution for the French market.
DISTRIBUTIONInsurance Europe is building a multi-channel distribution platform to serve customers across all channels. It continues to invest in tied agents via the Tangerine programme which pools ING’s regional know-how and provides a best-practice template on how to run a tied agent sales force. Tangerine is being introduced country-by-country and is already increasing tied agent productivity. Insurance Europe is also investing in the broker channel, especially in Turkey.
In bancassurance, Insurance Europe is signing up more banking partners as well as working closer with existing partners. In November a partnership was announced with Anadolubank in Turkey, where bancassurance arrangements performed well in 2013. NN Group in Luxembourg is building partnerships in France and Italy.
Turkey launched a pilot network of retail insurance shops selling ING products and those of its competitors. In Spain, a pilot network of insurance agents (Orange Points) in the country’s smaller cities was established to reach new and existing customers not covered by the company’s branch network, which is located in the large cities.
CONCLUSIONS AND AMBITIONSInsurance Europe made clear progress in improving the customer experience and broadening its distribution base in 2013. New products and value propositions were introduced. Its customer focus approach resulted in increasing NPS scores and several awards.
53ING Group Annual Report 2013
1 Wh
o w
e are2 R
epo
rt of th
e Executive B
oard
3 Co
rpo
rate go
vernan
ce4 C
on
solid
ated an
nu
al accou
nts
5 Parent co
mp
any an
nu
al accou
nts
6 Oth
er info
rmatio
n7 A
dd
ition
al info
rmatio
n
JAPAN LIFE
> Market leader in niche Corporate Owned Life Insurance (COLI) segment
> Production innovation and distribution strength result in improved market adaptability
> Strong profitability and cash generation
The Japanese life insurance market is the second largest market in the world. Although it is mature, it has attractive growth opportunities in some large segments and channels. In November 2013, ING announced Japan Life would be included within the base case IPO of NN Group.
FINANCIAL DEVELOPMENTSThe operating result for Japan Life was EUR 162 million in 2013, a 17.3% decline compared with EUR 196 million in 2012, due to the 27% depreciation of the Japanese yen against the euro in 2013.
Fees and premium-based revenues were EUR 436 million in 2013, a 11.0% decrease compared with EUR 490 million in 2012, due to the depreciation of the Japanese yen against the euro. Excluding this currency effect, fees and premium based revenues increased by 10.0% driven by strong COLI sales and favourable persistency.
The technical margin decreased to EUR 2 million in 2013 compared with EUR 23 million in 2012, as the 2012 technical margin included strong mortality and morbidity results, while surrender results declined in 2013 following improved persistency in the portfolio.
Administrative expenses were EUR 106 million in 2013, a 18.5% decrease compared with EUR 130 million in 2012, due to the depreciation of the Japanese yen against the euro. Excluding currency effects, administrative expenses remained broadly stable, increasing by 1.0% compared to 2012.
DAC amortisation and trail commissions decreased to EUR 177 million in 2013 compared to EUR 197 million in 2012. Excluding currency effects, DAC amortisation and trail commissions increased by 11.7% due to higher in-force volume.
Gains/losses and impairments increased to EUR 42 million in 2013 from EUR 4 million in the prior year, mainly caused by asset rebalancing. Revaluations decreased to a loss of EUR 11 million in 2013 from a gain of EUR 10 million in the previous year.
The result before tax decreased to EUR 192 million in 2013 from EUR 209 million in 2012, due to the decrease in operating result. This was partly offset by an improvement in non-operating items. assumption.
BUSINESS DEVELOPMENTSIn Japan, NN Group primarily offers a range of COLI (“Corporate-Owned Life Insurance”) products to SMEs and owners and employees of SMEs through independent agents and bancassurance. COLI products are traditional life insurance policies that a company, typically an SME, takes out on the lives of executives or employees, whereby the company is both the policyholder and the beneficiary of the policy. COLI products are designed to address the protection, savings, and retirement
preparation needs of SMEs and owners and employees of SMEs in a tax-efficient manner.
In 2012, Japan Life was Japan’s third largest provider of COLI products measured by Annual Premium Equivalent (APE). Japan Life believes that customer centricity is crucial to its success. Continuously improving the customer experience is one of its priorities. Key improvements in 2013 included the redesign of approximately 200 application and request forms, and the improvement of the interactive voice response process at the call centre.
In 2013, Japan Life received a three-star rating (out of a maximum of three) for its after-sales call centre from the service and support industry organisation, HDI-Japan (“Help Desk Institute”), emphasising the company’s commitment to deliver superior service to its customers and distribution partners.
CONCLUSIONS AND AMBITIONSThe continued shift towards professional distribution channels, such as independent brokers and banks, is creating growth opportunities for Japan Life. Its aim is to grow faster than the market boosted by its strong presence in these channels.
INVESTMENT MANAGEMENT
> Global asset manager with EUR 174 billion in assets under management (AuM)
> Investing responsibly and effectively with 71% of funds above benchmark
> Focus on growing third party business
Investment Management operates from a strong middle and back office, enabling solid investment performance and room for further growth in assets under management. It is preparing for the base case IPO of NN Group, making its business simpler by streamlining its governance and divesting several activities in Asia.
FINANCIAL DEVELOPMENTS The operating result for Investment Management was EUR 130 million in 2013, a 19.3% increase compared with EUR 109 million in 2012, driven by higher fees and lower administrative expenses.
Fees were EUR 444 million in 2013, a 3.3% increase compared with EUR 430 million in 2012, as outflows in lower yielding proprietary assets were offset by inflows in higher margin products. As a result, the ratio of fees to average AuM improved slightly from 24.5 basis points in 2012 to 24.8 basis points in 2013.
Administrative expenses were EUR 314 million in 2013, a 2.2% decrease compared with EUR 321 million in 2012, primarily due to non-recurring costs incurred at the end of 2012. The result before tax increased to EUR 131 million in 2013 from EUR 105 million in 2012, as a result of the increase in operating result.
BUSINESS DEVELOPMENTSInvestment Management offers a wide variety of actively managed investment products and advisory services to retail and institutional customers in all major asset classes and investment styles. In addition, it manages the assets of NN Group’s businesses.
54 ING Group Annual Report 2013
NN Group continued
Investment Management offers its products and services globally through regional centres in several countries across Europe, the United States, the Middle East and Asia, with the Netherlands as its main investment hub. As at 31 December 2013, Investment Management had EUR 174 billion of AuM, of which EUR 104 billion was managed for third party retail and institutional customers and the remaining EUR 70 billion for the general account of NN Group’s businesses.
In 2013, Investment Management continued to simplify and streamline its operations, in line with the separate divestment of the Asian insurance and investment management businesses. During the year, ING completed the divestment of its 33.3% stake in China Merchant Fund, ING Funds Berhad in Malaysia, ING IM Thailand, and ING IM Korea. It also closed down its regional office in Hong Kong. The offices in Singapore and Japan are part of the Investment Management organisation and as such included in the base case IPO. In early 2014, an agreement was reached to sell the investment management business in Taiwan.
In 2013, Investment Management again scored highly compared to the industry average in its annual client satisfaction survey. It received various awards that highlighted its customer centricity. On the operational side, it completed the transformation of its infrastructure to a simpler, more advanced environment that enables even better investment performance and that further improves the customer experience.
PRODUCTS AND DISTRIBUTIONInvestment Management produces and distributes its products globally. It operates from a modern middle and back office with sufficient capacity to increase its operations without infrastructure constraints. It has a global distribution network across various distribution channels. This network will help it grow its third-party business in the future.
This expansion will be also driven by successful products. More than 71% of its funds have outperformed their respective benchmarks on a three-year asset-weighted basis as at 31 December 2013. 43% of Investment Management’s investment funds had a four- or five-star Morningstar rating, which was above the industry average.
INVESTING RESPONSIBLY In managing investments, Investment Management is committed to the UN Principles for Responsible Investment. In 2013, it integrated environmental, social and governance (ESG) factors as a screening criterion into all its investment strategies. These factors can have a significant impact on long-term performance. Sustainable assets under management increased by 8.3% to EUR 3.5 billion. In line with being an active investor, Investment Management visits shareholder meetings of its investee companies. In 2013, it introduced the publication of quarterly active ownership reports on its voting and engagement activities. For more information on these and other sustainability-related subjects, please refer to the ING Group Sustainability Report.
CONCLUSIONS AND AMBITIONSInvestment Management aims to partner with its customers for the long run. It will continue to focus on delivering best-in-class performance and services for its customers. It has a strong focus on growing its third-party business. Its future name will be NN
Investment Partners which signifies its ambition to be a partner to its customers rather than a general supplier of products.
OTHER
> Nationale-Nederlanden Bank offers integrated wealth management solutions and successfully introduced two savings products
> Solvency II provides ING Re with opportunities to improve NN Group’s capital allocation
“Other” comprises the business of Nationale-Nederlanden Bank and ING Re (NN Group’s internal reinsurer), the results of the holding and other results.
Nationale-Nederlanden Bank accelerated efforts to become a one-stop shop for integrated financial solutions for retail customers, supported by the integration with a part of WestlandUtrecht Bank (“WUB”) as well as the launch of new savings products. As of 1 July 2013, the profitable operations of WUB, including assets and liabilities, were partially transferred to Nationale-Nederlanden Bank.Solvency II will provide ING Re with new business opportunities.
FINANCIAL DEVELOPMENTSThe operating result for the Other segment was a loss of EUR 371 million in 2013, compared with a loss of EUR 398 million in 2012. The improvement largely reflects lower funding costs offset by a lower result from the reinsurance business.
Holding result was a loss of EUR 345 million in 2013, an improvement of 15.6% compared with a loss of EUR 409 million in 2012, largely due to lower interest expense on hybrids and debt. Interest expense on hybrids and debt was EUR 167 million in 2013, a decrease of 23.0% compared with EUR 217 million in 2012, mainly reflecting a EUR 2 billion senior debt refinancing by ING Group in September 2013.
Operating result reinsurance business was a loss of EUR 15 million in 2013, compared with a gain of EUR 22 million in 2012. The 2013 result was negatively impacted by a EUR 31 million one-off loss on a specific reinsurance contract.
Operating result Nationale-Nederlanden Bank was a loss of EUR 11 million in 2013, compared with a loss of EUR 14 million in 2012, due to start-up and integration expenses.
Non-operating items was a gain of EUR 29 million in 2013, compared with a loss of EUR 24 million in 2012, due to improvements in gains/losses and impairments, reflecting the reallocation of the investment portfolio of ING Re in 2013, and lower losses from revaluations.Special items amounted to a loss of EUR 79 million in 2013, compared with a loss of EUR 43 million in 2012. The loss in 2013 was primarily due to expenses related to the restructuring and integration of WestlandUtrecht Bank operations at Nationale-Nederlanden Bank. The 2012 loss included EUR 94 million in expenses related to the operational separation from ING Group and preparation costs for the base case IPO, EUR 56 million in goodwill impairments, and a EUR 26 million reorganisation provision. These negative items were largely offset by a pension provision release of EUR 133 million.
55ING Group Annual Report 2013
1 Wh
o w
e are2 R
epo
rt of th
e Executive B
oard
3 Co
rpo
rate go
vernan
ce4 C
on
solid
ated an
nu
al accou
nts
5 Parent co
mp
any an
nu
al accou
nts
6 Oth
er info
rmatio
n7 A
dd
ition
al info
rmatio
n
CONCLUSIONS AND AMBITIONSNationale-Nederlanden Bank aims to become a one-stop shop for integrated financial solutions for retail customers. With its portfolio of integrated solutions, a strong brand and its extensive distribution base it aims to have a competitive presence in the Dutch financial sector. ING Re will continue to support NN Group businesses by providing reinsurance services.
JAPAN CLOSED BLOCK VA
> The Closed Block primarily consists of single premium variable annuities sold from 2001 to 2009
> Focus on managing risks, cost and efficiency management
Japan Closed Block VA primarily consists of single premium variable annuities (SPVA) sold from 2001 to 2009. In 2009, ING in Japan ceased the sale of SPVA products in Japan, placed the portfolio in run-off and classified it as closed-block business.
FINANCIAL DEVELOPMENTSThe operating result of Japan Closed Block VA was EUR 80 million in 2013, a 5.9% decrease compared with EUR 85 million in 2012. Excluding currency effects, the operating result increased by 19.1%, mainly driven by higher operating income.
Fees and premium based revenues were EUR 136 million in 2013, a decrease of 8.1% compared with EUR 148 million in 2012, due to the 27% depreciation of the Japanese yen against the euro during 2013. Excluding currency effects, operating income increased by 15.0% due to the strong performance of the Japanese equity markets which boosted the account value of the closed-block annuity portfolio.
The increase in administrative expenses to EUR 18 million in 2013 from EUR 13 million in the prior year was due to preparation for business restructuring as a part of the ING Group divestment plan.
DAC amortization and trail commissions fell to EUR 38 million in 2013, compared with EUR 50 million in 2012, as DAC related to the annuity portfolio was written-down entirely on 1 October 2013, as part of the charge to restore the reserve adequacy of the business line to the 50% confidence level, due to the change in segmentation.
Non-operating items were a loss of EUR 749 million in 2013 compared with a gain of EUR 21 million in 2012. The loss in 2013 was primarily the result of the EUR 575 million charge taken to bring the reserve adequacy of the business line to the 50% confidence level as of 1 October 2013.
The result before tax was a loss of EUR 669 million in 2013, compared with a gain of EUR 105 million in 2012. This decrease was primarily due to the incurrence of the EUR 575 million charge to restore the reserve adequacy to the 50% confidence level.
Result on divestments was a loss of EUR 50 million in 2013, primarily reflecting a EUR 62 million loss on the sale of the Mexican mortgage business.
The result before tax was a loss of EUR 471 million in 2013, compared with a loss of EUR 452 million in 2012, as improvements in the operating result and non-operating items were more than offset by higher special items and a lower result on divestments.
BUSINESS DEVELOPMENTSNationale-Nederlanden Bank offers a range of banking products, especially mortgages and savings, to retail customers in the Netherlands. In addition, it coordinates the distribution of Nationale-Nederlanden’s individual life and retail non-life insurance products in the Netherlands to enable a comprehensive product offering to retail customers in the Netherlands.
It distributes these products through intermediaries, Nationale-Nederlanden’s direct channel and ING Bank. Nationale-Nederlanden Bank aims to build a high quality mortgage book and it has a strong and well-capitalised balance sheet.
In June, Nationale-Nederlanden Bank launched two savings products: one with a floating interest rate and the other with fixed interest rate and term. It also introduced an innovative mortgage pledge service (Hypotheektoezegging), where customers are given a mortgage commitment before buying a house. The commitment is conditional upon the absence of subsequent changes in the personal circumstances and the acceptance of the house as collateral for the mortgage.
In 2013, it became apparent that consumers increasingly favoured self-directed business, execution-only services via call centres and online rather than financial advice-related services.
The Bank expanded service capacity in its direct channels, set up a web-care team to communicate with customers through social media and introduced www.adviseur.nn.nl, a portal for intermediaries, so they can better service their customers.
ING REING Re is NN Group’s internal reinsurer located in the Netherlands. ING Re primarily offers reinsurance to NN Group’s businesses. It manages its risks through ceding excess insurance risk to external reinsurers and hedging (a major part of) its market risks. ING Re also reinsures the minimum guarantee obligations of the Japan Closed Block VA. In the segment reporting, the results from this reinsurance agreement are reported by ING Re under the Japan Closed Block VA segment (whilst the rest of ING Re results are reported under the Other segment).
In 2013, ING Re reviewed its key processes and strengthened its governance in preparation for Solvency II and to increase efficiency. Solvency II provides ING Re with new opportunities to improve NN Group’s capital allocation. By reinsuring risks from NN Group’s business lines and pooling them centrally at ING Re, diversification benefits can be achieved, resulting in capital efficiencies for NN Group.
56 ING Group Annual Report 2013
NN Group continued
BUSINESS DEVELOPMENTSJapan Closed Block VA comprises NN Group’s closed-block single premium variable annuity (SPVA) individual life insurance portfolio in Japan. This portfolio consists of SPVA products with substantial minimum guarantee obligations sold predominantly from 2001 to 2009. In 2009 ING ceased the sale of these products and placed this portfolio in run-off. This portfolio has been classified as a closed-block and is managed as a separate segment.
Over 90% of the portfolio is projected to run off by 2019, due to the short-term maturity profile of the SPVA products.
The minimum guarantee obligations of Japan Life under the closed-block portfolio are fully reinsured by ING’s internal reinsurer, ING Re. ING Re manages this risk through a sophisticated hedging programme. Japan Life is responsible for managing the policies, the relationships with customers, the distribution partners and the Japanese regulatory authority.
CONCLUSIONS AND AMBITIONSThe majority of the closed-block SPVA portfolio is projected to run off relatively quickly. The focus is on prudently managing risks via hedging to release capital, as well as on cost and efficiency management.
REPORT OF THE EXECUTIVE BOARD
The Corporate governance section starting on page 62 and the paragraphs of the Remuneration report “Remuneration policy for senior management” and “2013 remuneration structure senior management” on pages 81-87 are incorporated by reference in this Report of the Executive Board.
AMSTERDAM, 17 MARCH 2014THE EXECUTIVE BOARD
57ING Group Annual Report 2013
1 Wh
o w
e are2 R
epo
rt of th
e Executive B
oard
3 Co
rpo
rate go
vernan
ce4 C
on
solid
ated an
nu
al accou
nts
5 Parent co
mp
any an
nu
al accou
nts
6 Oth
er info
rmatio
n7 A
dd
ition
al info
rmatio
n
The Supervisory Board and the Executive Board held eight regular meetings and two additional meetings in 2013. The progress in executing the Restructuring Plan of the European Commission including the progress on the divestment of various insurance and investment management businesses of ING in Asia, as well as the preparation of the initial public offerings (IPOs) for ING U.S. and NN Group were important topics on the agenda.
The Committees of the Supervisory Board discussed a range of subjects on which the Supervisory Board received information, the main ones being the quarterly results, risk management, corporate governance and human resources.
GENERAL SUPERVISORY BOARD MEETINGSThe Supervisory Board met ten times in 2013 of which eight meetings were regular meetings. On average, 96% of the Supervisory Board members were present at the scheduled meetings. For the two ad hoc meetings the average presence was 91%. Apart from closely monitoring the financial results in 2013, the Supervisory Board also monitored the progress in executing the Restructuring Plan of the European Commission (EC), including the progress on the divestment of various insurance and investment management businesses of ING in Asia, the preparation of the initial public offerings (IPOs) for ING U.S. and NN Group as well as the repayment of the outstanding core Tier 1 securities to the Dutch State and the intended unwinding of the Illiquid Asset Back-up Facility.
At the annual Supervisory Board Knowledge Day in January 2013, presentations were given on ING’s Customer Golden Rules & customer-centric regulations, internal audit landscape, integrity and its role in building sustainability in the finance sector, as well as a workshop on ING’s product approval process. Several other educational sessions on specific topics were organised for the Supervisory Board during the year.
Also in January, the Supervisory Board held its annual meeting on ING’s strategy as well as the medium-term plan (MTP) 2013-2016 and related risks. The MTP addresses the plans and the financial and non-financial targets for the banking and the insurance businesses and for the Group as a whole. The Supervisory Board discussed the strategic ambitions for ING Bank, NN Group, ING U.S. and ING Group while taking into account the regulatory changes, the economic developments, the volatility on the financial markets, the situation in the eurozone, the execution of the EC Restructuring Plan and the intended repayments of the outstanding core Tier 1 securities to the Dutch State. The Supervisory Board approved the MTPs and the proposed strategic directions for ING Bank, NN Group as well as for ING Group.
The fourth quarter and annual figures for 2012 were discussed in February, including the related reports from the external auditors and the assessment of the Executive Board of the adequacy and effectiveness of ING’s risk management and control systems. The Supervisory Board supported the proposal not to pay a dividend over 2012 given the uncertain financial environment, increasing regulatory requirements and ING’s priority to repurchase the remaining outstanding core Tier 1 securities. The draft agenda of the annual General Meeting was discussed and approved, including the publication on the application of the Dutch Banking Code and the Dutch Insurers’ Code. The Supervisory Board also approved an adjusted internal ING Group decision structure for ING Group.
The successive quarterly results and figures of 2013 were reviewed and discussed in May, August and November, respectively. The Annual Accounts and the SOX 404 sign-off were approved in March. In April an extra Supervisory Board meeting was organised to discuss and approve a mandate to launch the initial public offering of ING U.S. An update on the divestment of the ING insurance and investment management businesses was also presented.
58 ING Group Annual Report 2013
Report of the Supervisory Board
review in June and August, whereby the composition of the Management Board Insurance was discussed in great depth given the intended IPO of NN Group.
In August, the Supervisory Board approved the appointment of Lard Friese as vice-chairman of the Management Board NN Group as per 1 October 2013. An adjusted mandate for the Remuneration Committee regarding remuneration proposals for Identified staff was approved.
In the second half of 2013, the Supervisory Board discussed the future composition of the Supervisory Board several times and specifically the formation and start of a future independent Supervisory Board for NN Group. A special Insurance Europe Committee was set up given the IPO process for NN Group and to commence the search for candidates for the future NN Group Supervisory Board.
In November, the format for the 2013 Supervisory Board self-assessment was approved. The action points resulting from the 2012 self-assessment were acted upon during the year. For the 2013 self-assessment of the Supervisory Board, its Committees and its members, which was conducted in December, an external consultant drafted the questionnaires as well as the report based on the outcome of the questionnaires. Furthermore, bilateral meetings were held between the chairman and each Supervisory Board member (concerning the chairman: a bilateral meeting between the vice-chairman and the chairman). The self-assessment resulted in action points concerning the meeting documents, strategy discussions and HR topics.
Audit Committee meetingsIn 2013 the Audit Committee met five times with no absentees to discuss the quarterly results, the Annual Report, the Form 20-F and the reports from the external auditor.
The Audit Committee regularly discussed financial reporting, internal controls over financial reporting, capital management and regulatory matters. The shareholders agreement between ING Group and ING U.S. as well as the Form S-1 registration statement, which was submitted to the US SEC concerning the IPO of ING U.S., was discussed regularly by the Audit Committee. Nationale-Nederlanden Life actuarial and risk reporting, the developments in the unit-linked products case and the capital plan for NN Group were also topics of frequent discussion during the year.
Furthermore, risk costs and cost trends in general, solvency volatility, deferred tax assets, the ING risk management programme, lapse assumption models, pension changes and the governance of the insurance activities in the Asian Pacific region were discussed several times. In addition, the Audit Committee discussed the IT incidents (DDoS attacks) at ING Bank, the Dutch mortgage portfolio and the DNB asset quality review of the ING Real Estate portfolio among other topics.
Given the new legislation which required ING to change its external auditor as of January 2016, the Audit Committee selected a small Audit Committee delegation to advise the Supervisory Board further on the external auditor tender process. The Audit Committee discussed and confirmed the topics mentioned in the management letter by Ernst & Young in the March 2014 meeting. Directly following the Audit Committee meetings, the members of
In May, the Supervisory Board discussed self-regulation proposed by the Dutch Banking Association and its associated “Bankers’ Oath” before taking the Oath in June.
The possible unwinding by the Dutch State of the Illiquid Asset Back-up Facility was also discussed. The Supervisory Board was updated on the capital plans for ING Insurance EurAsia and ING Group in May and June whereby various possible divestments were presented. A report to align staff functions with the adjusted size of ING was presented.
A legal restructuring, in preparation for the possible IPO of NN Group, was approved in August, including the consequences for the governance structure. The first proposed equity narrative for the NN Group IPO was presented and extensively discussed by the Supervisory Board. The annual risk appetite statements for Bank and NN Group were approved. An updated capital plan for ING Bank was presented whereby several divestment transactions for ING Bank were proposed. The Supervisory Board mandated the Executive Board to execute those transactions within the terms and conditions approved. The Supervisory Board was informed on the scheduled EUR 1.125 billion repayment on the outstanding core Tier 1 securities to the Dutch State as well as the intention to transfer all future funding and indexation obligations under ING’s current closed Defined Benefit (DB) Pension Plan in the Netherlands to the ING Pension Fund.
In September, the Supervisory Board visited the ING banking and insurance businesses in the Netherlands. During this visit the Supervisory Board was informed about ING’s various operations in the Netherlands and on the IT strategy and IT infrastructure of ING Bank. Furthermore, an update on the developments regarding the Illiquid Asset Back-up Facility was given. A high level planning for the NN Group IPO was presented and the future brand name for the company was approved.
The Supervisory Board was further updated in November on the preparation for the NN Group IPO, including the proposal to include Japan Life in the scope of the IPO, which the Supervisory Board approved.
In December, the Supervisory Board met to discuss the first drafts of the NN Group MTP. The Supervisory Board was informed that ING had completed the agreement with the Dutch State on the unwinding of the Illiquid Assets Back-up Facility (IABF). An update was given on the proposal to transfer all future funding and indexation obligations under ING’s current closed Defined Benefit (DB) Pension Plan in the Netherlands to the ING Pension Fund. An agreement was reached with the pension fund in January 2014 and it became effective in February 2014.
During the internal meetings of the Supervisory Board – which the CEO joined, except when the annual evaluation of the Supervisory Board was tabled or matters concerning the CEO were discussed – the Executive Board 2013 performance assessments and the Executive Board performance objectives for 2013 were approved.
All decisions regarding the variable remuneration proposals over 2012 were discussed and decided in February and March. The ING U.S. remuneration policy was discussed and approved in April. Succession planning and talent management were tabled for
59ING Group Annual Report 2013
1 Wh
o w
e are2 R
epo
rt of th
e Executive B
oard
3 Co
rpo
rate go
vernan
ce4 C
on
solid
ated an
nu
al accou
nts
5 Parent co
mp
any an
nu
al accou
nts
6 Oth
er info
rmatio
n7 A
dd
ition
al info
rmatio
n
Report of the Supervisory Board
discussed the variable remuneration pool and reviewed the performance assessment and variable remuneration proposal for the Executive Board and Management Boards.
The proposed hurdles for the 2013 capital test were discussed. The remuneration proposals for Identified Staff were reviewed in February and March, including potential cases for holdback of deferred compensation by way of malus. In February and April the remuneration package for the future CEO was discussed.
In February, March and April the remuneration policy for ING U.S. was discussed and supported in light of the post IPO situation and taking into account the CRD III remuneration regulation. In August an adjusted governance mandate for the Remuneration Committee was positively advised. The regulatory developments, including the proposed legislation regarding a 20% bonus constraint in the Netherlands and the possible implications for ING were discussed several times as well. The annual review of the remuneration frameworks for ING Bank, NN Group, ING Group and ING U.S. took place as well as the annual risk analyses of the remuneration policy. The Identified staff selection criteria and the list of Identified staff for ING Bank, ING Group and ING U.S. were reviewed and approved.
Corporate Governance Committee meetingsThe Corporate Governance Committee met twice in 2013. In February the Corporate Governance Committee discussed the agenda for the 2013 annual General Meeting, including the publication on the application of the Dutch Banking Code by ING Bank N.V and the implementation of the Dutch Insurers’ Code by NN Group N.V. The Committee also discussed the legal restructuring of NN Group and the annual review of the charters of the Supervisory Board and the Executive Board. In November the Committee advised on various recommendations regarding the 2014 annual General Meeting.
Insurance Europe Committee The Supervisory Board decided to set up an additional Insurance Europe Committee to advise and assist the Supervisory Board on the preparation of the proposed IPO of NN Group. Jan Holsboer and Yvonne van Rooy became respectively chairman and member of this committee. For their coordination and experience as chairmen of the Audit and Risk Committees respectively, Joost Kuiper and Robert Reibestein became members of the Insurance Europe Committee on a temporary basis. The committee met formally on a monthly basis from November, as well as many individual meetings.
COMPOSITION OF THE EXECUTIVE AND THE MANAGEMENT BOARDS At the General Meeting of Shareholders in May, Ralph Hamers became a member of the Executive Board, Management Board Banking and Management Board NN Group (formerly called ING Insurance Topholding N.V.) and Management Board ING Verzekeringen N.V. as per AGM of 13 May 2013 and CEO of ING Bank, NN Group, ING Group and ING Verzekeringen N.V. as per 1 October 2013. Jan Hommen remained as CEO until 1 October 2013. Patrick Flynn was appointed as a member of the Executive Board for a consecutive period of four years. On 1 October 2013, Ralph Hamers succeeded Jan Hommen as CEO.
the Audit Committee met with the internal and external auditors to confirm that all relevant topics were discussed in the Audit Committee meeting.
Risk Committee meetingsThe Risk Committee met four times in 2013 with no absentees. At each Risk Committee meeting the financial risk and the non-financial risk reports for banking and insurance were discussed in detail. In May the Risk Committee discussed the ING Bank Recovery Report and was updated on the draft resolution plan for banking. An outline of the NN Group Recovery Plan was provided. In May and September the IT issues (DDoS attacks) and issues with the payment infrastructure were discussed in detail. Various stress test scenarios for ING Bank as well as NN Group were discussed in August and a presentation on the risk costs of the business lending portfolio was given followed by a presentation on the smaller accounts and the SME segment in November. The annual risk appetite statements for Bank and NN Group were supported. In November a risk management function review for the Bank and for NN Group was presented to the Risk Committee. During the year the Risk Committee closely monitored the progress of various projects regarding control risk within NN Group. As part of the 2013 permanent education programme, the Risk Committee was informed in depth on new risks in the financial sector. Each meeting ended with a general discussion on possible future risks.
Nomination Committee meetingsThe Nomination Committee met six times in 2013 with no absentees, to discuss succession matters for the Executive Board, specifically the CEO succession and the Management Boards. A specific committee for the CEO succession reported to the Nomination Committee and the Supervisory Board in January and February 2013. The Nomination Committee advised to nominate Ralph Hamers as a member of the Executive Board, Management Board Banking and Management Board NN Group as per the AGM of 13 May 2013 and CEO of ING Bank, NN Group and ING Group as per 1 October 2013.
The Nomination Committee also advised on the re-appointment of various Supervisory Board members, the nomination of three Supervisory Board candidates as well as on the future composition of the Supervisory Board including a future independent Supervisory Board for NN Group. The Nomination Committee requested an executive search firm to search for possible NN Group Supervisory Board candidates with financial expertise, preferably in the field of insurance, while also aiming to meet the ambition to have at least 30% female Supervisory Board members. Several candidates were interviewed by members of the Nomination Committee and the Supervisory Board. The Nomination Committee advised the Supervisory Board on the nomination of external candidates for the future Supervisory Board for NN Group.
Remuneration Committee meetingsIn 2013, the Remuneration Committee met seven times with one absentee at one meeting. Throughout the year the Remuneration Committee approved Identified Staff related remuneration matters, based upon the governance framework. The functioning of the Executive Board and the Management Boards was discussed regularly. The proposed 2013 performance objectives for the Board were reviewed and positively advised in January. In February, the Remuneration Committee approved the thresholds over which the pool for variable remuneration becomes available. It
60 ING Group Annual Report 2013
Report of the Supervisory Board continued
ANNUAL ACCOUNTS AND DIVIDENDThe Executive Board has prepared the Annual Accounts and discussed these with the Supervisory Board. The Annual Accounts will be submitted for adoption at the 2014 annual General Meeting as part of the Annual Report. ING will not propose to pay a dividend over 2013 at the 2014 annual General Meeting.
APPRECIATION FOR THE EXECUTIVE BOARD ANDING EMPLOYEESThe Supervisory Board would like to express its gratitude to the members of the Executive Board and the Management Boards for their work in 2013. During 2013, decisive steps were once more taken in executing the European Commission restructuring agreement. The Supervisory Board would also like to thank all employees of ING who continue to serve the interests of customers, shareholders and other stakeholders of ING and have shown continued commitment in the past year.
ADDITIONAL INFORMATIONFor more information, see the section on Corporate governance (pages 62-73) and the Remuneration report (pages 81-87), which are deemed to be incorporated by reference here.
AMSTERDAM, 17 MARCH 2014THE SUPERVISORY BOARD
COMPOSITION OF THE SUPERVISORY BOARD Jeroen van der Veer was reappointed to the Supervisory Board for a consecutive period of four years. Tineke Bahlmann, the state-nominated Supervisory Board member, was reappointed to the Supervisory Board for a consecutive period of four years, concluding after the annual General Meeting in 2017.
Isabel Martín Castellá, Carin Gorter and Hermann-Josef Lamberti were appointed to the Supervisory Board on 13 May 2013 by the annual General Meeting. Following the annual General Meeting, Carin Gorter and Isabel Martín Castellá joined the Audit Committee. Carin Gorter also joined the Corporate Governance Committee.
Hermann-Josef Lamberti joined the Risk Committee. Henk Breukink and Yvonne van Rooy stepped down from the Audit Committee and joined the Remuneration and the Nomination committees. Please see page 9 for the composition of the Supervisory Board Committees at year-end 2013.
As a result of the unwinding of the IABF agreement, the governance restrictions as part of the IABF agreement will no longer be applicable, including the right of the Dutch State to nominate two members for appointment to the Supervisory Board and the special approval rights of the state-nominees regarding certain decisions of the Supervisory Board.
The Nomination Committee and the Supervisory Board will continue to strive for an adequate and balanced composition of the Supervisory Board when selecting and nominating new members for appointment.
Currently, only one Supervisory Board member, Luc Vandewalle qualifies as “non-independent” as defined in best practice provision III.2.2 of the Dutch Corporate Governance Code. Luc Vandewalle is considered to be not independent because of his previous position at ING Bank Belgium.
61ING Group Annual Report 2013
1 Wh
o w
e are2 R
epo
rt of th
e Executive B
oard
3 Co
rpo
rate go
vernan
ce4 C
on
solid
ated an
nu
al accou
nts
5 Parent co
mp
any an
nu
al accou
nts
6 Oth
er info
rmatio
n7 A
dd
ition
al info
rmatio
n

RECENT DEVELOPMENTS LEGISLATIVE AND REGULATORY DEVELOPMENTSOn 1 January 2013, a law on the revision of the corporate investigative procedure (wet in verband met de aanpassing van het recht van enquête) and a law clarifying the law on Management and Supervision (wet aanpassing regels over bestuur en toezicht in naamloze en besloten vennootschappen) came into force. A law on corporate governance (wijziging van de Wet op het financieel toezicht, de Wet giraal effectenverkeer en het Burgerlijk Wetboek naar aanleiding van het advies van de Monitoring Commissie Corporate Governance Code van 30 mei 2007) came into force on 1 July 2013.
A legislative proposal on revision and claw back of executive bonuses and profit-sharing of directors and persons determining the day-to-day policy (wetsvoorstel aanpassing en terugvordering van bonussen en winstdelingen van bestuurders en dagelijks beleidsbepalers) was adopted by the Upper House of the Dutch Parliament on 10 December 2013 and came into force on 1 January 2014.
TRANSACTIONS WITH THE DUTCH STATEOn 12 November 2008, ING Group issued 1 billion core Tier 1 securities (“Securities”) for a total consideration of EUR 10 billion to the Dutch State. Following the repurchase of 500 million Securities on 21 December 2009, the repurchase of 200 million Securities on 13 May 2011, the repurchase and/or redemption of a total number of 75 million Securities on 26 November 2012, and the repurchase and/or redemption of 75 million Securities on 6 November 2013, another 150 million of Securities representing EUR 1.50 billion remain outstanding. The Securities do not form part of ING Group’s share capital; accordingly they do not carry voting rights in the shareholders’ meeting of ING Group (“General Meeting”). The financial entitlements of the Securities are described in note 33 to the consolidated annual accounts.
On 17 December 2013, ING Group announced that it had completed the agreement with the Dutch State on the unwinding of the Illiquid Assets Back-up Facility (“IABF”) as announced on 1 November 2013. ING Group and the Dutch State formed the IABF on 26 January 2009 and ING Bank N.V. issued various series of debt instruments during 2009 under the 2008 Credit Guarantee Scheme of the Dutch State, for the first time on 30 January 2009. The terms of the agreement to unwind the IABF have been approved by the European Commission. The IABF is further described in note 33 to the consolidated annual accounts.
As part of the aforementioned transactions, certain arrangements with respect to corporate governance and remuneration were agreed with the Dutch State. These arrangements had to remain in place as long as the IABF continued.
These arrangements entailed, among other things, that the Dutch State could recommend two candidates (“State Nominees”) for appointment to the Supervisory Board. Certain decisions of the Supervisory Board required approval of the State Nominees. At the annual General Meeting in 2013, one State Nominee decided to step down and not be eligible for reappointment. The Dutch State
(1) Dutch Bulletin of Acts (Staatsblad) 2009, 154.
This section discusses the application by ING Groep N.V. (“ING Group”) of the Dutch Corporate Governance Code effective as from 1 January 2009 (“Corporate Governance Code”) and provides information on the share capital and control, the Executive Board, the Supervisory Board and the external auditor.
This section, including the parts of this Annual Report incorporated by reference, together with the separate publication “ING’s implementation of the Dutch Corporate Governance Code” dated April 2010, on the website of ING Group (www.ing.com), also serves as the “corporate governance statement“ referred to in section 2a of the Decree with respect to the contents of the annual report (Besluit tot vaststelling van nadere voorschriften omtrent de inhoud van het jaarverslag).(1)
62 ING Group Annual Report 2013
Corporate governance
DUTCH BANKING CODEThe Dutch Banking Code (“Banking Code”) is applicable to ING Bank N.V. and not to ING Group. The Banking Code can be downloaded from the website of the Dutch Banking Association (www.nvb.nl). The principles of the Banking Code as a whole are considered as a reference by ING Bank N.V. and their application is described in the publication “Application of the Dutch Banking Code by ING Bank N.V.”, available on the website of ING Group (www.ing.com). ING Group voluntarily applies the principles of the Banking Code regarding remuneration with respect to the members of its Executive Board and considers these principles as a reference for its own corporate governance. ING Group’s remuneration policy for the Executive Board and senior management is compliant with these principles.
DUTCH INSURERS’ CODEThe Dutch Insurers’ Code (“Insurers’ Code”) is applicable to the Dutch subsidiaries of NN Group N.V. pursuing insurance business and not to ING Group, ING Verzekeringen N.V. or NN Group N.V. The Insurers’ Code can be downloaded from the website of the Dutch Association of Insurers (www.verzekeraars.nl). However, insurance companies that are part of a group (“concern”) can decide whether to apply all or parts of the Insurers’ Code at the group level. The remuneration policy for the Management Board and senior management is compliant with the corporate governance-related principles of the Insurers’ Code and is voluntarily applied on group level. The application of the Insurers’ Code principles is described in the publication “Application of the Insurers’ Code by ING Insurance Eurasia” available on the website of ING Group (www.ing.com).
DIFFERENCES BETWEEN DUTCH AND US CORPORATE GOVERNANCE PRACTICESIn accordance with the requirements of the US Securities and Exchange Commission, ING Group, as a foreign private issuer whose securities are listed on the New York Stock Exchange (“NYSE”), must disclose in its Annual Report on Form 20-F any significant differences between its corporate governance practices and those applicable to US domestic companies under the NYSE listing standards.
ING Group believes the following to be the significant differences between its corporate governance practices and NYSE corporate governance rules applicable to US companies:• ING Group has a two-tier board structure, in contrast to the
one-tier board structure used by most US companies. In the Netherlands, a public limited liability company (naamloze vennootschap) with a two-tier board structure has an executive board as its management body and a supervisory board which advises and supervises the executive board. In general, members of the executive board are employees of the company while members of the supervisory board are not. The latter are often former state or business leaders and sometimes former members of the executive board. Members of the executive board and other officers or employees of the company cannot simultaneously be a member of the supervisory board. The supervisory board must approve specified decisions of the executive board. Under the Corporate Governance Code, all members of the supervisory board with the exception of not more than one person, should be independent. All members of ING Group’s Supervisory Board, with the exception of Luc Vandewalle, are independent within the meaning of the Corporate Governance Code. The definition of independence
indicated to not use its right to recommend a second candidate for appointment as a member of the Supervisory Board. As a result of the agreement completed in December 2013 with the Dutch State on the unwinding of the IABF as described above these arrangements have expired. Furthermore, in line with these arrangements a sustainable remuneration policy for the Executive Board and Senior Management was introduced in 2010, which contains certain specific arrangements in relation to the remuneration of members of the Executive Board.
For more information on the State Nominees, please refer to the section on the Supervisory Board; for more information on ING’s remuneration policy, please refer to the Remuneration report, starting on page 81.
SHAREHOLDER PARTICIPATION AND POSITION OF ING TRUST OFFICE (STICHTING ING AANDELEN)During the years 2010–2013, participation of shareholders, excluding the ING Trust Office, and holders of depositary receipts in the decision-making in annual General Meetings consistently increased from 41.3% to 51.4%.
ING Group’s depositary-receipts structure was evaluated by the Executive Board and the Supervisory Board in 2010. On the basis of this evaluation, the Executive Board and the Supervisory Board concluded that it would be premature to change or abolish ING Group’s depositary-receipts structure in 2010 and that it would be appropriate to reconsider this as part of a re-evaluation of ING Group’s entire governance structure following the current restructuring of ING Group and the completion of the divestments approved by the 2009 extraordinary General Meeting. The outcome of the aforementioned evaluation was discussed in the 2010 annual General Meeting.
In the 2013 annual General Meeting, it was discussed that under the original agreement between ING Group and the European Commission, the restructuring was initially expected to be completed by the end of 2013, so that any reconsideration would be done in 2014. However, ING Group, together with the Dutch State, reached an agreement with the European Commission on an amended restructuring plan, in November 2012, part of which was an extended deadline for the aforementioned divestments.
As ING Group was still in the implementation phase of the amended restructuring plan, ING did not regard it as an opportune moment to reconsider its governance and depositary- receipts structure.
CORPORATE GOVERNANCE CODESCOMPLIANCE WITH THE CORPORATE GOVERNANCE CODEFor its corporate governance structure and practices, ING Group uses the Corporate Governance Code as reference. The Corporate Governance Code can be downloaded from the website of the Dutch Corporate Governance Code Monitoring Committee (www.commissiecorporategovernance.nl).
The application of the Corporate Governance Code by ING is described in the publication “ING’s implementation of the Dutch Corporate Governance Code”, dated April 2010, on the website of ING Group (www.ing.com), which is to be read in conjunction with this section and is deemed to be incorporated into this section.An update of the aforementioned publication is forthcoming.
63ING Group Annual Report 2013
1 Wh
o w
e are2 R
epo
rt of th
e Executive B
oard
3 Co
rpo
rate go
vernan
ce4 C
on
solid
ated an
nu
al accou
nts
5 Parent co
mp
any an
nu
al accou
nts
6 Oth
er info
rmatio
n7 A
dd
ition
al info
rmatio
n
Corporate governance
members who are independent of ING Group. No Executive Board member or former Executive Board member, Supervisory Board member or former Supervisory Board member, ING Group employee or former ING Group employee or permanent advisor or former permanent advisor to ING Group is on the Board of ING Continuity Foundation. The Board of ING Continuity Foundation appoints its own members, after consultation with the Supervisory Board of ING Group, but without any requirement for approval by ING Group. For more information on ING Continuity Foundation, see page 77.
DEPOSITARY RECEIPTSMore than 99.9% of the issued ordinary shares are held by ING Trust Office (Stichting ING Aandelen). In exchange for these shares, ING Trust Office has issued depositary receipts in bearer form for these shares. The depositary receipts are listed on various stock exchanges (see page 10 for an overview of the listings). Depositary receipts can be exchanged upon request of the holders of depositary receipts for non-listed ordinary shares, without any restriction, other than payment of an administrative fee of one eurocent (EUR 0.01) per depositary receipt with a minimum of twenty-five euros (EUR 25.00) per exchange transaction.
The holder of a depositary receipt is entitled to receive from ING Trust Office payment of dividends and other distributions corresponding to the dividends and other distributions received by ING Trust Office on an ordinary share.
The Board of ING Trust Office currently comprises six members who are independent from ING Group. No Executive Board member or former Executive Board member, Supervisory Board member or former Supervisory Board member, ING Group employee or former ING Group employee or permanent advisor or former permanent advisor to ING Group is on the Board of ING Trust Office. The Board of ING Trust Office appoints its own members, without any requirement for approval by ING Group.
The Board of ING Trust Office reports on its activities through an annual report, which has been included on pages 74-76.
ISSUANCE OF SHARESING Group’s authorised capital is the maximum amount of capital allowed to be issued under the terms of the Articles of Association. New shares in excess of this amount can only be issued if the Articles of Association are amended. For reasons of flexibility, ING Group seeks to set the authorised capital in the Articles of Association at the highest level permitted by law.
Share issuances are to be decided by the General Meeting, which may also delegate its authority. Each year, the General Meeting is asked to delegate authority to the Executive Board to issue new ordinary shares or to grant rights to subscribe for new ordinary shares, both with and without pre-emptive rights to existing shareholders. The powers delegated to the Executive Board are limited:• in time: powers are delegated for a period of 18 months;• by number: insofar as a sufficient number of unissued ordinary
shares is available in the authorised capital, ordinary shares may be issued up to a maximum of 10% of the issued share capital, or, in the event of a merger or takeover or to safeguard or conserve the capital position of ING Group, up to a maximum of 20% of the issued capital; and
under the Corporate Governance Code, however, differs in its details from the definitions of independence under the NYSE listing standards. In some cases, the Dutch requirements are stricter and in other cases the NYSE listing standards are the stricter of the two. The Audit Committee, Risk Committee, Remuneration Committee, Nomination Committee and Corporate Governance Committee of ING Group are comprised of members of the Supervisory Board. Furthermore, a temporary committee, the Insurance Europe Committee, was established on 1 October 2013. This Committee is also comprised of members of the Supervisory Board and assists the Supervisory Board with the performance of its duties in relation to the preparation and execution of the initial public offering process and/or spin-off of (part of) NN Group.
• In contrast to the Sarbanes-Oxley Act of 2002, the Corporate Governance Code contains a “comply-or-explain” principle, offering the possibility to deviate from the Corporate Governance Code as long as any such deviations are explained. To the extent that such deviations are approved by the General Meeting, the company is deemed to be in full compliance with the Corporate Governance Code.
• Dutch law requires that ING Group’s external auditors be appointed at the General Meeting and not by the Audit Committee. In addition, new legislation on the accountancy profession (Wet op het accountantsberoep) will establish a system of mandatory audit firm rotation by 1 January 2016.
• The articles of association of ING Group (‘Articles of Association’) provide that there are no quorum requirements to hold a General Meeting, although certain shareholder actions and certain resolutions may require a quorum.
• The shareholder approval requirements for equity compensation plans under Dutch law and the Corporate Governance Code differ from those applicable to US companies which are subject to NYSE’s listing rules that require a shareholder vote on all equity compensation plans applicable to any employee, director or other service provider of a company. The results of such votes are advisory in nature rather than binding. Under Dutch company law and the Corporate Governance Code, binding shareholder approval is only required for equity compensation plans (or changes thereto) for members of the executive board and supervisory board, and not for equity compensation plans for other groups of employees.
CAPITAL AND SHARESCAPITAL STRUCTURE, SHARESThe authorised capital of ING Group consists of ordinary shares and cumulative preference shares. Currently, only ordinary shares are issued, while a call option to acquire cumulative preference shares has been granted to ING Continuity Foundation (Stichting Continuïteit ING). The acquisition of cumulative preference shares pursuant to the call option is subject to the restriction that, immediately after the issuance of cumulative preference shares, the total amount of cumulative preference shares outstanding may not exceed one-third of the total issued share capital of ING Group (see page 77). The purpose of this call option is to protect the independence, the continuity and the identity of ING Group against influences which are contrary to the interests of ING Group, its enterprise and the enterprises of its subsidiaries and all stakeholders (including, but not limited to, hostile takeovers). The ordinary shares are not used for protective purposes. The ordinary shares, which are all registered shares, are not listed on a stock exchange.The Board of ING Continuity Foundation currently comprises four
64 ING Group Annual Report 2013
Corporate governance continued
cash-settled, such as call or put options, warrants, swaps or any other similar contract, reaches, exceeds or falls below certain thresholds, is required to notify in writing the Dutch Authority for the Financial Markets (Autoriteit Financiële Markten) immediately after the acquisition or disposal of the triggering interest in ING Group’s share capital. These thresholds are 3%, 5%, 10%, 15%, 20%, 25%, 30%, 40%, 50%, 60%, 75% or 95% of the issued share capital of ING Group.
Details of investors, if any, who have reported their interest in ING Group pursuant to the Dutch Financial Supervision Act (or the predecessor of this legislation), are shown on page 10. ING Group is not aware of shareholders, potential shareholders or investors with an interest of 3% or more in ING Group other than the ING Trust Office, the ING Continuity Foundation and Blackrock Inc.
Pursuant to the Regulation (EU) no. 236/2012 of the European Parliament and the Council on short selling and certain aspects of credit default swaps, any person who acquires or disposes of a net short position relating to the issued share capital of ING Group, whether by a transaction in shares, depositary receipts or American depositary receipts, or by a transaction creating or relating to any financial instrument where the effect or one of the effects of the transaction is to confer a financial advantage on the person entering into that transaction in the event of a change in the price of such shares, depositary receipts or American depositary receipts is required to notify, in accordance with the provisions of the above-mentioned Regulation:a. The Dutch Authority for the Financial Markets (Autoriteit
Financiële Markten) if, as a result of which acquisition or disposal his net short position reaches, exceeds or falls below 0.2% of the issued share capital of ING Group and each 0.1% above that.
b. ING Group if, as a result of which acquisition or disposal his net short position reaches, exceeds or falls below 0.5% of the issued share capital of ING Group and each 0.1% above that.
INVESTOR RELATIONS AND BILATERAL CONTACTS WITH INVESTORSING Group encourages and recognises the importance of bilateral communication with the investment community. Communications with current and potential shareholders, holders of depositary receipts, bondholders, and industry analysts is actively managed by the Investor Relations department.
ING Group strives to provide clear, accurate and timely financial information that is in strict compliance with the applicable rules and regulations, in particular those concerning selective disclosure, price sensitive information and equal treatment. In addition to the annual General Meeting, ING Group communicates with its shareholders and the investment community through earnings announcements, presentations, and meetings with analysts or investors.
ING Group publishes a comprehensive quarterly disclosure package which includes extensive and detailed financial figures with relevant explanatory remarks. This information is discussed thoroughly during press and analyst and investor conference calls on the day of the earnings release, which are broadly accessible to interested parties. The publication dates of quarterly earnings releases are announced in advance on ING Group’s corporate website(www.ing.com).
• in terms of control: resolutions by the Executive Board to issue shares require the approval of the Supervisory Board.
Approval by the General Meeting would be required for any share issuances exceeding these limits.
The purpose of this delegation of authority is to allow ING Group to respond promptly to developments in the financial markets. Without such delegation, if ING Group wished to issue new shares, there would be an increased risk that conditions in the financial markets may have changed during the time needed for convening a general meeting, especially due to the 42-day statutory convocation period. In view of the importance of flexibility with respect to the issuance of shares, the Executive Board and the Supervisory Board will periodically evaluate the delegation of authority to issue shares and, if necessary, make adjusted proposals to the General Meeting.
TRANSFER OF SHARES AND DEPOSITARY RECEIPTS AND TRANSFER RESTRICTIONSShares are transferred by means of a deed of transfer between the transferor and the transferee. To become effective, ING Group has to acknowledge the transfer, unless ING Group itself is a party to the transfer. The Articles of Association do not restrict the transfer of ordinary shares, whereas the transfer of cumulative preference shares is subject to prior approval of the Executive Board. The Articles of Association and the trust conditions for registered shares in the share capital of ING Group (“Trust Conditions”) do not restrict the transfer of depositary receipts for shares. ING Group is not aware of the existence of any agreement pursuant to which the transfer of ordinary shares or depositary receipts for such shares is restricted.
REPURCHASE OF SHARESING Group may repurchase outstanding shares and depositary receipts for such shares. Although the power to repurchase shares and depositary receipts for shares is vested in the Executive Board subject to the approval of the Supervisory Board, prior authorisation from the General Meeting is required for these repurchases. Under Dutch law, this authorisation lapses after 18 months. Each year, the General Meeting is asked to approve the Executive Board’s authority to repurchase shares.
When repurchasing shares, the Executive Board must observe the price ranges prescribed in the authorisation. For the ordinary shares and depositary receipts for such shares, the authorisation currently in force stipulates a minimum price of one eurocent and a maximum price equal to the highest stock price on Euronext Amsterdam by NYSE Euronext on the date on which the purchase agreement is concluded or on the preceding day of stock market trading.
SPECIAL RIGHTS OF CONTROLNo special rights of control referred to in Article 10 of the directive of the European Parliament and the Council on takeover bids (2004/25/EC) are attached to any share.
SHAREHOLDERS’ STRUCTUREPursuant to the Dutch Financial Supervision Act (Wet op het financieel toezicht), any person who, directly or indirectly acquires or disposes of an interest in the voting rights and/or the capital of ING Group as a result of which acquisition or disposal the percentage of his voting rights or capital interest, whether through ownership of shares, depositary receipts, American depositary shares or any other financial instrument whether stock-settled or
65ING Group Annual Report 2013
1 Wh
o w
e are2 R
epo
rt of th
e Executive B
oard
3 Co
rpo
rate go
vernan
ce4 C
on
solid
ated an
nu
al accou
nts
5 Parent co
mp
any an
nu
al accou
nts
6 Oth
er info
rmatio
n7 A
dd
ition
al info
rmatio
n
The geographical distribution of ING Group’s investor base is diverse – an estimated 38% of shares outstanding are held in the US, 19% in the UK, 11% in France, 6% in the Netherlands, 5% in Germany, 12% in Rest of Europe and 9% in the Rest of World. For more information, see the ING share chapter on page 10.
GENERAL MEETINGFREQUENCY, NOTICE AND AGENDA OF GENERAL MEETINGSGeneral Meetings are normally held each year in April or May, to discuss the course of business in the preceding financial year on the basis of the reports prepared by the Executive Board and the Supervisory Board, and to decide on the distribution of dividends or other distributions, the appointment and/or reappointment of members of the Executive Board and the Supervisory Board, if any, other items requiring shareholder approval under Dutch law, and any other matters proposed by the Supervisory Board, the Executive Board or shareholders or holders of depositary receipts in accordance with the Articles of Association.
General Meetings are convened by public notice via the website of ING Group (www.ing.com) no later than on the forty-second day before the day of the General Meeting. As of the date of convening a General Meeting, all information relevant for shareholders and holders of depositary receipts is made available to them on this website and at the ING Group head office.
Such information includes the notice for the General Meeting, the agenda, the place and time of the meeting, the address of the website of ING Group, the verbatim text of the proposals with an explanation and instructions on how to participate in the meeting (either in person or by proxy), as well as the reports of the Executive Board and the Supervisory Board. More complex proposals such as proposals to amend the Articles of Association are normally not included in the notice but are made available separately on the website of ING Group and at the ING Group head office.
PROPOSALS BY SHAREHOLDERS AND HOLDERS OF DEPOSITARY RECEIPTSProposals to include items on the agenda for a General Meeting that have been adequately substantiated under applicable Dutch law can be made by shareholders and holders of depositary receipts representing a joint total of at least 0.1% of the issued share capital or representing together, on the basis of the stock prices on Euronext Amsterdam by NYSE Euronext, a share value of at least EUR 50 million. Given the periods of notice required for proxy voting, proposals have to be submitted in writing at least 60 days before the date of the meeting.
DIALOGUE WITH SHAREHOLDERS AND HOLDERS OF DEPOSITARY RECEIPTSIn 2013, shareholders and holders of depositary receipts were allowed to ask questions about items on the agenda for the annual General Meeting and they will similarly be allowed to do so in 2014. Shareholders and holders of depositary receipts can visit the website of ING Group (www.ing.com) to submit their questions.
RECORD DATEPursuant to Dutch law, the record date for attending a general meeting and voting on the proposals at that general meeting is the twenty-eighth day before the day of the general meeting. Shareholders and holders of depositary receipts who hold shares
ING Group participates in several industry conferences and generally hosts one Investor Relations Day each year. These events are announced in advance on ING Group’s website, and presentation materials are made available in real time on the website. This is in accordance with the applicable regulatory requirements intended to ensure that all shareholders and other market participants may have equal and simultaneous access to information that could potentially influence the price of the company’s securities. ING Group’s Investor Relations Days can be accessed by means of live webcasts or telephone conferencing. No Investor Relations Day or conference in which ING Group participates is held shortly before the publication of quarterly financial information.
ING Group strives to maintain an open and constructive dialogue with current and potential investors, and with industry analysts. The scope of such bilateral communication may range from single investor queries via email, to more elaborate discussions with analysts or institutional investors that take place via telephone or face-to-face. These meetings are not announced in advance, nor can they be followed by webcast or any other means. ING Group’s Investor Relations department is the main point of contact for these communications. However, Executive Board members also participate in investor meetings. Information provided during such occasions is always limited to that which is already in the public domain, and no bilateral contacts take place shortly before the publication of regular quarterly results releases. If bilateral communication between ING Group and investors is organised and/or facilitated through a broker, an analyst or specialist salesperson representing the broker may be present in the meeting. ING Group does not provide brokers with any form of compensation pertaining to such meeting organisation and/or facilitation services.
In the event that non-public price sensitive information is inadvertently disclosed during any bilateral contacts, ING Group will publicly announce such information as soon as possible.
ING Group may decide not to accommodate or accept any requests or invitations to enter into a dialogue with potential investors, or to accommodate or accept such request or invitation under certain conditions.
Approximately 25 analysts actively cover and frequently issue reports on ING Group. A list of these analysts can be found under “Analyst Coverage” of the Investor Relations section of ING Group’s website. During 2013, ING Group did not provide any form of compensation to parties that are directly or indirectly involved in the production or publication of analysts’ reports, with the exception of credit-rating agencies.
ING Group presented at 6 industry conferences throughout the course of the year. In total, there were 104 Fixed income and 408 Equity meetings (including conference calls) with institutional investors and/or analysts. Combined, conference presentations and face-to-face meetings with investors and/or analysts took place in 38 different cities across the globe.
In 2013, ING Group did not host any Investor Days. However, ING Group provided an update on the preparations for an IPO of NN Groep N.V. at a meeting with investors and analysts in London, on 19 September 2013.
66 ING Group Annual Report 2013
Corporate governance continued
to the ordinary shares. ING Trust Office will follow such instructions for such number of ordinary shares equal to the number of depositary receipts for shares held by the relevant holder of depositary receipts.
VOTING ON THE ORDINARY SHARES BY ING TRUST OFFICEING Trust Office has discretion to vote in respect of shares for which it has not issued voting proxies to holders of depositary receipts and has not received any voting instructions.
According to its articles of association and the Trust Conditions, ING Trust Office is guided primarily by the interests of the holders of depositary receipts, taking into account the interests of ING Group and its affiliated enterprises.
ING Trust Office promotes the solicitation of specific proxies or voting instructions of holders of depositary receipts. ING Trust Office encourages the greatest possible participation of holders of depositary receipts and promotes the execution of voting rights in a transparent way. At the same time it prevents that a minority of shareholders and holders of depositary receipts could use a chance majority of votes to the disadvantage of the shareholders and holders of depositary receipts present nor represented at a General Meeting of ING Group.
PROXY VOTING FACILITIESIn 2013, ING Group was a participant in the Shareholder Communication Channel (Stichting Communicatiekanaal aandeelhouders), through which participating holders of depositary receipts could give voting instructions to ING Trust Office. Following the fact that the law on corporate governance (wijziging van de Wet op het financieel toezicht, de Wet giraal effectenverkeer en het Burgerlijk Wetboek naar aanleiding van het advies van de Monitoring Commissie Corporate Governance Code van 30 mei 2007) came into force, the Shareholder Communication Channel concluded that its function had ended. Therefore, it ceased to exist in 2013. ING Group continues to provide proxy voting facilities to its investors via its website and solicits proxies from its ADS holders in line with common practice in the US.
Proxy voting forms for shareholders and voting instruction forms for holders of depositary receipts are made available on the website of ING Group (www.ing.com). The submission of these forms is subject to additional conditions specified on such forms.
MAIN POWERS OF THE GENERAL MEETINGThe main powers of the General Meeting are to decide on:• the appointment, suspension and dismissal of members of the
Executive Board and members of the Supervisory Board, subject to a binding nomination or a proposal of the Supervisory Board as set forth in the Articles of Association;
• the adoption of the annual accounts;• the declaration of dividends, subject to the power of the
Executive Board to allocate part of or all of the profits to the reserves – with approval of the Supervisory Board – and the declaration of other distributions, subject to a proposal by the Executive Board which was approved by the Supervisory Board;
• the appointment of the external auditor;• an amendment of the Articles of Association, a legal merger or
division of ING Group, and winding-up of ING Group, all subject to a proposal made by the Executive Board upon approval by the Supervisory Board;
and/or depositary receipts for shares at the record date are entitled to attend the general meeting and to exercise other rights related to the general meeting in question on the basis of their holding at the record date, notwithstanding a subsequent sale or purchase of shares or depositary receipts for shares. The record date is published in the notice for the general meeting. In accordance with US requirements, the depositary sets a record date for the American Depositary Shares (“ADSs”), which date determines which ADSs are entitled to give voting instructions. This record date can differ from the record date set by ING Group for shareholders and holders of depositary receipts.
ATTENDING GENERAL MEETINGSFor logistical reasons, attendance at a General Meeting by shareholders and holders of depositary receipts, either in person or by proxy, is subject to the requirement that ING Group is notified in advance. Instructions to that effect are included in the notice for the General Meeting.
General Meetings are webcasted via ING Group’s website (www.ing.com), so that shareholders and holders of depositary receipts who do not attend the General Meeting in person, may nevertheless follow the course of affairs in the meeting by internet webcast.
VOTING RIGHTS ON SHARESEach share entitles the holder to cast one vote at the General Meeting. The Articles of Association do not restrict the voting rights on any class of shares. ING Group is not aware of any agreement pursuant to which voting rights on any class of its shares are restricted.
VOTING ON THE ORDINARY SHARES BY HOLDERS OF DEPOSITARY RECEIPTS AS PROXY OF ING TRUST OFFICEAlthough the depositary receipts for shares do not formally carry any voting rights, holders of depositary receipts, in practice, rank equally with shareholders with regard to voting. ING Trust Office will, subject to certain restrictions, grant a proxy to a holder of depositary receipts allowing such holder, in the name of ING Trust Office, to exercise the voting rights attached to the number of ordinary shares that corresponds to the number of depositary receipts held by such holder of depositary receipts. On the basis of such a proxy, the holder of depositary receipts may vote such shares according to his or her own discretion.
The following restrictions apply in respect of grants of voting proxies to holders of depositary receipts by ING Trust Office:• the relevant holder of depositary receipts must have announced
his or her intention to attend the General Meeting observing the provisions laid down in the Articles of Association; and
• the relevant holder of depositary receipts may delegate the powers conferred upon him or her by means of the voting proxy, provided that the relevant holder of depositary receipts has announced his or her intention to do so to ING Trust Office observing a term before the commencement of the General Meeting, which term will be determined by ING Trust Office.
VOTING INSTRUCTIONS OF HOLDERS OF DEPOSITARY RECEIPTS TO ING TRUST OFFICEHolders of depositary receipts not attending a General Meeting are entitled to give binding instructions to ING Trust Office, concerning ING Trust Office’s exercise of the voting rights attached
67ING Group Annual Report 2013
1 Wh
o w
e are2 R
epo
rt of th
e Executive B
oard
3 Co
rpo
rate go
vernan
ce4 C
on
solid
ated an
nu
al accou
nts
5 Parent co
mp
any an
nu
al accou
nts
6 Oth
er info
rmatio
n7 A
dd
ition
al info
rmatio
n
accountable for the performance of these duties to the Supervisory Board and the General Meeting. The responsibility for the management of ING Group is vested in the Executive Board collectively. The organisation, powers and modus operandi of the Executive Board are detailed in the Executive Board Charter, which was approved by the Supervisory Board. The Executive Board Charter is available on the website of ING Group (www.ing.com). ING Group indemnifies the members of the Executive Board against direct financial losses in connection with claims from third parties as far as permitted by law on the conditions laid down in an indemnity statement. ING Group has also taken out liability insurance for the members of the Executive Board.
PROFILE OF MEMBERS OF THE EXECUTIVE BOARDThe Supervisory Board has drawn up a profile to be used as a basis for selecting members of the Executive Board. It is available on the website of ING Group (www.ing.com) and at the ING Group head office.
ING Group aims to have an adequate and balanced composition of its Executive Board. Thereto, annually, the Supervisory Board assesses the composition of the Executive Board. In the context of such assessment, ING Group aims to have a gender balance by having at least 30% men and at least 30% women amongst its Executive Board members.
However, because of the fact that ING Group needs to balance several relevant selection criteria when composing its Executive Board, the composition of the Executive Board did not meet the above-mentioned gender balance in 2013 (0% women). ING Group will continue to strive for an adequate and balanced composition of its Executive Board in future appointments, by taking into account all relevant selection criteria including but not limited to gender balance, executive experience, experience in corporate governance of large stock-listed companies and experience in the political and social environment.
REMUNERATION AND SHARE OWNERSHIPMembers of the Executive Board are permitted to hold shares and depositary receipts for shares in the share capital of ING Group for long-term investment purposes. Transactions by members of the Executive Board in these shares and these depositary receipts for shares are subject to the ING regulations for insiders. These regulations are available on the website of ING Group (www.ing.com). Details of the remuneration of members of the Executive Board, including shares granted to them, together with additional information thereto, are provided in the Remuneration report, starting on page 81.
ANCILLARY POSITIONS/CONFLICTING INTERESTSNo member of the Executive Board has corporate directorships at listed companies outside ING. This is in accordance with ING Group’s policy to avoid conflicts of interest.
TRANSACTIONS INVOLVING ACTUAL OR POTENTIAL CONFLICTS OF INTERESTIn accordance with the Corporate Governance Code, transactions with members of the Executive Board in which there are significant conflicting interests will be disclosed in the Annual Report. In deviation from the Corporate Governance Code however, this does not apply if (i) such disclosure would be against the law; (ii) the confidential, share-price sensitive or competition-sensitive character
• the issuance of shares or rights to subscribe for shares, the restriction or exclusion of pre-emptive rights of shareholders, and delegation of these powers to the Executive Board, subject to a proposal by the Executive Board which was approved by the Supervisory Board; and
• the authorisation of a repurchase of outstanding shares and/or a cancellation of shares.
Moreover, the approval of the General Meeting is required for Executive Board decisions that would be considered to greatly change the identity or nature of ING Group or its enterprise. This includes resolutions to transfer or otherwise assign all or substantially all of the enterprise of ING Group or its subsidiaries as a consequence of which such resolutions ING Group or the group of companies over which ING Group exercises control would cease to engage in either insurance or banking activities.
REPORTINGResolutions adopted at a General Meeting are generally published on the website of ING Group (www.ing.com) within one week after the meeting. The draft minutes of the General Meeting are, in accordance with the Corporate Governance Code, made available to shareholders and holders of depositary receipts on the website of ING Group (www.ing.com) no later than three months after the meeting. Shareholders and holders of depositary receipts may react to the draft minutes in the following three months, after which the final minutes will be adopted by the chairman of the meeting in question and by a shareholder or holder of depositary receipts appointed by that meeting. The final minutes are made available on the website of ING Group (www.ing.com). In a deviation from the default provisions of the Corporate Governance Code shareholders and holders of depositary receipts will not have the opportunity to react to the minutes of a General Meeting if a notarial report of the meeting is made, as this would be in conflict with the laws applicable to such notarial report.
EXECUTIVE BOARDAPPOINTMENT AND DISMISSALMembers of the Executive Board are appointed by the General Meeting from a binding list to be drawn up by the Supervisory Board. The list will be rendered non-binding if a resolution of the General Meeting to that effect is adopted by an absolute majority of the votes cast which majority represents more than one-third of the issued share capital. Candidates for appointment to the Executive Board must comply with the suitability and reliability requirements set out in the Dutch Financial Supervision Act and must continue to meet these while in office.
Members of the Executive Board may be suspended or dismissed at any time by a majority resolution of the General Meeting. A resolution to suspend or dismiss members of the Executive Board that has not been proposed by the Supervisory Board may only be adopted by the General Meeting by an absolute majority of the votes cast, which majority represents more than one-third of the issued share capital.
FUNCTION OF THE EXECUTIVE BOARDThe Executive Board is charged with the management of ING Group, which means, among other things, that it is responsible for the setting and achieving of ING Group’s objectives, strategy and policies, as well as the ensuing delivery of results. It also includes the day-to-day management of ING Group. The Executive Board is
68 ING Group Annual Report 2013
Corporate governance continued
General Meeting to that effect is adopted by an absolute majority of the votes cast, which majority represents more than one-third of the issued share capital. Candidates for appointment to the Supervisory Board must comply with the suitability and reliability requirements set out in the Dutch Financial Supervision Act and must continue to meet these while in office.
Members of the Supervisory Board may be suspended or dismissed at any time by a majority resolution of the General Meeting. A resolution to suspend or dismiss members of the Supervisory Board that has not been proposed by the Supervisory Board may only be adopted by the General Meeting by an absolute majority of the votes cast, which majority represents more than one-third of the issued share capital.
In connection with the issuance of the Securities to the Dutch State and the IABF, ING Group and the Dutch State agreed that the Dutch State could recommend candidates for appointment to the Supervisory Board in such a way that upon appointment of all recommended candidates by the General Meeting, the Supervisory Board would comprise two State Nominees among its members. The Dutch State could recommend a Supervisory Board member already in office.
The recommendation right of the Dutch State was subject to applicable law and to corporate governance practices, generally accepted under stock exchange listing regimes applicable to ING Group and continued as long as the IABF was in place. As a result of the agreement completed between ING Group and the Dutch State in December 2013 on the unwinding of the IABF, the recommendation right of the Dutch State expired. State Nominee Tineke Bahlmann was recommended for re-appointment by the Dutch State and reappointed by the annual General Meeting on 13 May 2013. State Nominee Lodewijk de Waal decided not to apply for re-appointment at the 2013 annual General Meeting and the Dutch state indicated not to use its right to recommend a second candidate for appointment as a member of the Supervisory Board at the time.
FUNCTION OF THE SUPERVISORY BOARDThe function of the Supervisory Board is to supervise the policy of the Executive Board and the general course of events of ING Group and its business, as well as to provide advice to the Executive Board. In line with Dutch company law, the Corporate Governance Code and the Articles of Association, the Supervisory Board Charter requires all members of the Supervisory Board, including the State Nominee, to act in accordance with the interests of ING Group and the business connected with it, taking into account the relevant interests of all stakeholders of ING Group, to perform their duties without mandate and independent of any interest in the business of ING Group, and to refrain from supporting one interest without regard to the other interests involved.
Certain resolutions of the Executive Board, specified in the Articles of Association, the Executive Board Charter and in the Supervisory Board Charter, are subject to approval of the Supervisory Board.
Furthermore, as long as the IABF continued, certain resolutions of the Supervisory Board were subject to the condition that no State Nominee should have voted against the proposal. These rights became effective as from the 2009 annual General Meeting. These resolutions related to the following matters:
of the transaction prevents disclosure; and/or (iii) the information is so competition-sensitive that the disclosure could damage the competitive position of ING Group.
Significant conflicting interests are considered to be absent and are not reported if a member of the Executive Board obtains financial products and services, other than loans, which are provided by ING Group subsidiaries in the ordinary course of their business on terms that apply to all employees. In connection with the foregoing, ‘loans’ does not include financial products in which the granting of credit is of a subordinated nature, e.g. credit cards and overdrafts in current account, because of a lack of materiality. For an overview of loans granted to members of the Executive Board, see page 83.
INFORMATION ON MEMBERS OF THE EXECUTIVE BOARDR.A.J.G. (RALPH) HAMERS, CHIEF EXECUTIVE OFFICER(Born 1966, Dutch nationality, male; appointed in 2013, term expires in 2017)Ralph Hamers has been a member of the Executive Board of ING Group since 13 May 2013, and was appointed chairman of the Executive Board on 1 October 2013. He joined ING in 1991 and has held various positions including Global Head Commercial Banking Network from 2007 to 2010, Head of Network Management for Retail Banking Direct & International from 2010 to 2011, and CEO of ING Belgium and Luxembourg from 2011 to 2013. He holds a Master of Science degree in Business Econometrics/Operations Research from Tilburg University, the Netherlands.
P.G. (PATRICK) FLYNN, CHIEF FINANCIAL OFFICER(Born 1960, Irish nationality, male; appointed in 2009, term expires in 2017)Patrick Flynn is a Chartered Accountant and a member of the Association of Corporate Treasurers in the UK. He also holds a bachelor’s degree in Business Studies from Trinity College Dublin. He was appointed a member of the Executive Board of ING Groupon 27 April 2009. He is responsible for ING’s finance departments and Investor Relations.
W.F. (WILFRED) NAGEL, CHIEF RISK OFFICER(Born 1956, Dutch nationality, male; appointed in 2012, term expires in 2016)Wilfred Nagel was chief executive officer of ING Bank Turkey until his appointment as a member of the Management Board Banking and the Management Board Insurance as of 5 October 2011. He joined ING in 1991 and has held various positions including Global Head Credit Risk Management from 2002 to 2005 and CEO Wholesale Banking in Asia from 2005 to 2010. He was appointed a member of the Executive Board of ING Group on 14 May 2012. He is responsible for ING’s risk departments including compliance.
CHANGES IN THE COMPOSITIONJan Hommen stepped down from the Executive Board on 1 October 2013. His role as chairman of the Executive Board was succeeded by Ralph Hamers, who was appointed to theExecutive Board on 13 May 2013. Patrick Flynn was reappointed by the General Meeting on 13 May 2013.
SUPERVISORY BOARDAPPOINTMENT AND DISMISSALMembers of the Supervisory Board are appointed by the General Meeting from a binding list to be drawn up by the Supervisory Board. The list will be rendered non-binding if a resolution of the
69ING Group Annual Report 2013
1 Wh
o w
e are2 R
epo
rt of th
e Executive B
oard
3 Co
rpo
rate go
vernan
ce4 C
on
solid
ated an
nu
al accou
nts
5 Parent co
mp
any an
nu
al accou
nts
6 Oth
er info
rmatio
n7 A
dd
ition
al info
rmatio
n
After being appointed to the Supervisory Board, a former member of the Executive Board may also be appointed to one of the Supervisory Board’s committees. However, appointment to the position of chairman of a committee is only possible if the individual in question resigned from the Executive Board at least four years prior to such appointment.
ING Group needs to balance several relevant selection criteria when composing its Supervisory Board but strives for an adequate and balanced composition thereof, by taking into account all relevant selection criteria including but not limited to experience in retail and wholesale banking, insurance, gender balance, executive experience, experience in corporate governance and experience in the political and social environment. Annually, the Nomination Committee assesses the composition of the Supervisory Board. In the context of such assessment, ING Group aims to have a gender balance by having at least 30% men and at least 30% women amongst its Supervisory Board members. In 2013, the composition of the Supervisory Board met the above-mentioned gender balance (33.3% women).
TERM OF APPOINTMENT OF MEMBERS OF THE SUPERVISORY BOARDA member of the Supervisory Board retires no later than at the end of the first General Meeting held four years after his or her last appointment or reappointment. In accordance with the Corporate Governance Code, members of the Supervisory Board may as a general rule be reappointed for two additional four-year terms. Under special circumstances however, the Supervisory Board may deviate from this general rule, among others in order to maintain a balanced composition of the Supervisory Board and/or to preserve valuable expertise and experience. As a general rule, members of the Supervisory Board shall also resign at the end of an annual General Meeting in the year in which they attain the age of 70 and shall not be reappointed. The schedule for resignation by rotation is available on the website of ING Group (www.ing.com).
ANCILLARY POSITIONS/CONFLICTING INTERESTSMembers of the Supervisory Board may hold various other directorships, paid positions and ancillary positions and are asked to provide details on these positions. Such positions may not conflict with the interests of ING Group. It is the responsibility of the individual member of the Supervisory Board and the Corporate Governance Committee to ensure that the directorship duties are performed properly and are not affected by any other positions that the individual may hold outside ING Group.
Members of the Supervisory Board are to disclose material conflicts of interest and potential conflicts of interest and to provide all information relevant thereto. Thereupon the Supervisory Board – without the member concerned taking part – decides whether a conflict of interest exists.
In case of a conflict of interest, the relevant member of the Supervisory Board abstains from discussions and decision-making on the topic or the transaction in relation to which he or she has a conflict of interest with ING Group.
TRANSACTIONS INVOLVING ACTUAL OR POTENTIAL CONFLICTS OF INTERESTIn accordance with the Corporate Governance Code, transactions with members of the Supervisory Board in which there are
a. the issuance or acquisition of its own shares by ING Group, other than related to the Securities issuance (including, for the avoidance of doubt, for the purpose of conversion or financing of a repurchase of Securities), as part of regular hedging operations or in connection with employment schemes;
b. the cooperation by ING Group in the issuance of depositary receipts for shares;
c. the application for listing on or removal from the price list of any stock exchange of the securities referred to in a. or b.;
d. the entry into or termination of a lasting cooperation between ING Group or a dependent company and another legal entity or partnership or a general partner in a limited partnership or general partnership where such cooperation or termination thereof has a material significance for ING Group, i.e. amounting to one-quarter or more of ING Group’s issued capital and reserves as disclosed in its balance sheet and notes thereto;
e. the acquisition by ING Group or a dependent company of a participating interest in the capital of another company amounting to one-quarter or more of ING Group’s issued capital and reserves as disclosed in its balance sheet and notes thereto or a material increase or decrease in the magnitude of such participating interest;
f. investments involving an amount equal to one-quarter or more of ING Group’s issued capital and reserves as disclosed in its balance sheet and notes thereto;
g. a proposal to wind up ING Group;h. filing of a petition for bankruptcy or moratorium of ING Group;i. a proposal to reduce the issued capital of ING Group (other
than related to the Securities issuance);j. a proposal for merger, split-off or dissolution of ING Group;k. a proposal to change ING Group’s remuneration policy; andl. appointment of the chief executive officer of the
Executive Board.
The voting rights of the State Nominee as described above no longer apply given the unwinding of the IABF as described above.
ING Group indemnifies the members of the Supervisory Board against direct financial losses in connection with claims from third parties as far as permitted by law on the conditions laid down in an indemnity statement. ING Group has also taken out a liability insurance for the members of the Supervisory Board.
PROFILE OF MEMBERS OF THE SUPERVISORY BOARDThe Supervisory Board has drawn up a profile to be used as a basis for its composition. It is available on the website of ING Group (www.ing.com) and at the ING Group head office.
In view of their experience and the valuable contribution that former members of the Executive Board can make to the Supervisory Board, it has been decided, taking into account the size of the Supervisory Board and ING’s wide range of activities that such individuals may become members of the Supervisory Board of ING Group. There is, however, a restriction in that only one in every five other members of the Supervisory Board may be a former member of the Executive Board. In addition, this member must wait at least one year after resigning from the Executive Board before becoming eligible for appointment to the Supervisory Board. Former members of the Executive Board are not eligible for appointment to the position of chairman or vice-chairman of the Supervisory Board.
70 ING Group Annual Report 2013
Corporate governance continued
due to his relevant knowledge and experience. Joost Kuiper was appointed as the chairman of the Audit Committee on 9 May 2011.
The Risk Committee assists and advises the Supervisory Board in monitoring the risk profile of ING as a whole as well as the structure and operation of the internal risk management andcontrol systems. On 31 December 2013, the members of the Risk Committee were: Robert Reibestein (chairman), Tineke Bahlmann, Jan Holsboer, Joost Kuiper, Hermann-Josef Lamberti, Luc Vandewalle and Jeroen van der Veer.
The Remuneration Committee advises the Supervisory Board, among other things, on the terms and conditions of employment (including remuneration) of the members of the Executive Board and on the policies and general principles on which the terms and conditions of employment of the members of the Executive Board and of senior managers of ING Group and its subsidiaries are based. On 31 December 2013, the members of the Remuneration Committee were: Peter Elverding (chairman), Henk Breukink, Yvonne van Rooy and Jeroen van der Veer.
The Nomination Committee advises the Supervisory Board, among other things, on the composition of the Supervisory Board and Executive Board. On 31 December 2013, the members of the Nomination Committee were: Jeroen van der Veer (chairman), Henk Breukink, Peter Elverding and Yvonne van Rooy.
The Corporate Governance Committee assists the Supervisory Board in monitoring and evaluating the corporate governance of ING as a whole and the reporting thereon in the Annual Report and to the General Meeting and advises the Supervisory Board on improvements. On 31 December 2013, the members of the Corporate Governance Committee were: Henk Breukink (chairman), Carin Gorter and Jeroen van der Veer.
The current composition of the Supervisory Board Committees can be found on ING Group’s website (www.ing.com), which is updated on a regular basis.
REMUNERATION AND SHARE OWNERSHIPThe remuneration of the members of the Supervisory Board is determined by the General Meeting and is not dependent on the results of ING Group. Details of the remuneration are provided in the Remuneration report on pages 81-87. Members of the Supervisory Board are permitted to hold shares and depositary receipts for shares in the share capital of ING Group for long-term investment purposes. Details are given on page 86. Transactions by members of the Supervisory Board in these shares and depositary receipts for shares are subject to the ING regulations regarding insiders. These regulations are available on the website of ING Group (www.ing.com).
INFORMATION ON MEMBERS OF THE SUPERVISORY BOARDThis section provides an overview of the most relevant directorships, paid positions and ancillary positions, held by members of the Supervisory Board.
significant conflicting interests will be disclosed in the Annual Report. In deviation from the Corporate Governance Code however, this does not apply if (i) such disclosure would be against the law; (ii) the confidential, share-price sensitive or competition-sensitive character of the transaction prevents such disclosure; and/or (iii) the information is so competition-sensitive that disclosure could damage the competitive position of ING Group.
Significant conflicting interests are considered to be absent in case of a relationship that a member of the Supervisory Board may have with ING Group subsidiaries as an ordinary, private individual, with the exception of any loans that may have been granted. For an overview of loans granted to members of the Supervisory Board, see page 86.
INDEPENDENCEAnnually, the members of the Supervisory Board are requested to assess whether the criteria of dependence set out in the Corporate Governance Code do not apply to them and to confirm this in writing. On the basis of these criteria, all members of the Supervisory Board, with the exception of Luc Vandewalle, are to be regarded as independent on 31 December 2013. Luc Vandewalle is not to be considered independent because of his former position at ING Belgium. Members of the Supervisory Board to whom the independence criteria of the Corporate Governance Code do not apply, and members of the Supervisory Board to whom the criteria do apply but who can explain why this does not undermine their independence, are deemed to be independent.
COMPANY SECRETARYING Group’s company secretary is Jan-Willem Vink, general counsel of ING Group.
COMMITTEES OF THE SUPERVISORY BOARDOn 31 December 2013, the Supervisory Board had five standing committees: the Audit Committee, the Risk Committee, the Remuneration Committee, the Nomination Committee and the Corporate Governance Committee. Furthermore, a temporarily committee, the Insurance Europe Committee was established on 1 October 2013. This Committee assists the Supervisory Board with the performance of its duties in relation to the preparation and execution of the initial public offering process and/or spin-off of (part of) NN Group.
The organisation, powers and conduct of the Supervisory Board are detailed in the Supervisory Board Charter. Separate charters have been drawn up for the Audit Committee, the Risk Committee, the Remuneration Committee, the Nomination Committee and the Corporate Governance Committee. These charters are available on the website of ING Group (www.ing.com). A short description of the duties for the five Committees follows below.
The Audit Committee assists the Supervisory Board in monitoring the integrity of the financial statements of ING Group, NN Groep N.V. and ING Bank N.V., in monitoring the compliance with legal and regulatory requirements and in monitoring the independence and performance of ING Group’s internal and external auditors. On 31 December 2013, the members of the Audit Committee were: Joost Kuiper (chairman), Tineke Bahlmann, Isabel Martín Castellá, Carin Gorter, Jan Holsboer, Robert Reibestein and Luc Vandewalle.The Supervisory Board has determined that Joost Kuiper is a financial expert as referred to in the Corporate Governance Code,
71ING Group Annual Report 2013
1 Wh
o w
e are2 R
epo
rt of th
e Executive B
oard
3 Co
rpo
rate go
vernan
ce4 C
on
solid
ated an
nu
al accou
nts
5 Parent co
mp
any an
nu
al accou
nts
6 Oth
er info
rmatio
n7 A
dd
ition
al info
rmatio
n
J.H. (JAN) HOLSBOER(Born 1946, Dutch nationality, male; appointed in 2012, term expires in 2016)Former member of the Executive Board of Univar N.V. and former member of the Executive Boards of ING Group and Nationale-Nederlanden. Other business activities: non-executive (senior independent) director of PartnerRe Ltd. (Bermuda) (listed company). Chairman of the Supervisory Board of TD Bank N.V. Member of the Supervisory Board of YAM Invest N.V. Non-executive director of YAFA S.p.A. (Turin, Italy). Chairman of the Board of Foundation Imtech. Chairman of the Supervisory Board Vithèr Hyperthermia B.V.
J.C.L. (JOOST) KUIPER(Born 1947, Dutch nationality, male; appointed in 2011, term expires in 2015)Former member of the Executive Board of ABN AMRO Bank N.V.Other business activities: chairman of the Supervisory Board of IMC B.V. Member of the Supervisory Board of Foundation Bewaarbedrijf Abete.
H.J.M. (HERMANN-JOSEF) LAMBERTI(Born 1956, German nationality, male; appointed in 2013, term expires in 2017)Former chief operating officer of Deutsche Bank AG. Other business activities: member of the Board of EADS. Member of the Advisory Board Barmenia Versicherungen. Member of the Supervisory Board Open-Xchange AG.
R.W.P. (ROBERT) REIBESTEIN(Born 1956, Dutch nationality, male; appointed in 2012 as an observer, full member as of 2013, term expires in 2017)Former senior partner of McKinsey & Company.Other business activities: member of the Supervisory Board of IMC B.V. Chairman of the Board of Royal Concertgebouw Orchestra Member of the Supervisory Board of Stichting World Wildlife Fund.
Y.C.M.T. (YVONNE) VAN ROOY(Born 1951, Dutch nationality, female; appointed in 2012, term expires in 2016)Former Minister of Foreign Trade, member of the Dutch Parliament and member of the European Parliament. Former president of Utrecht University.Other business activities: chairman of Nederlandse Vereniging van Ziekenhuizen (Dutch association of hospitals). Member of the Board of Royal Concertgebouw Orchestra.
L.A.C.P. (LUC) VANDEWALLE(Born 1944, Belgian nationality, male; appointed in 2011, term expires in 2014)Former chairman and non-executive member of ING Belgium NV/SA.Other business activities: chairman of the Supervisory Board of Holding Maatschappij P. Bakker Hillegom B.V. Chairman of the Supervisory Board of Plu Holding.
INFORMATION ON MEMBERS OF THE SUPERVISORY BOARDJ. (JEROEN) VAN DER VEER (CHAIRMAN)(Born 1947, Dutch nationality, male; appointed in 2009, term expires in 2017)Former chief executive officer of Royal Dutch Shell plc.Other business activities: chairman of the Supervisory Board of Koninklijke Philips Electronics N.V. (listed company). Member of the Supervisory Board of Het Concertgebouw N.V. Chairman of the Supervisory Council of Nederlands Openluchtmuseum. Member of the Board of Nationale Toneel (theatre). Chairman of the Supervisory Council of Platform Betatechniek. Chairman of the Supervisory Council of the Technical University of Delft.
P.A.F.W. (PETER) ELVERDING (VICE-CHAIRMAN)(Born 1948, Dutch nationality, male; appointed in 2007, term expires in 2015)Former chairman of the Managing Board of Directors of Koninklijke DSM N.V. Former vice-chairman of the Supervisory Board of De Nederlandsche Bank N.V. (Dutch Central Bank).Other business activities: chairman of the Supervisory Board of Koninklijke BAM Groep N.V. (listed company). Vice-chairman of the Supervisory Board of SHV Holdings N.V. Chairman of the Supervisory Board of Q-Park N.V. Member of the Supervisory Board of Koninklijke FrieslandCampina N.V. Chairman of the Supervisory Board Camille Oostwegel Holding.
J.P. (TINEKE) BAHLMANN(Born 1950, Dutch nationality, female; appointed in 2009, term expires in 2017)Professor in Business Administration, University of Utrecht. Other business activities: member of the Supervisory Board of Stedin Netbeheer B.V. Member of the Supervisory Board of Maatschappelijk Verantwoord Ondernemen Nederland (CSR). Chairman of the Supervisory Board of Maasstad Ziekenhuis (hospital).
H.W. (HENK) BREUKINK(Born 1950, Dutch nationality, male; appointed in 2007, term expires in 2015)Former managing director of F&C and country head for F&C Netherlands (asset management firm).Other business activities: chairman of the Supervisory Board of NSI N.V. (real estate fund) (listed company). Non-executive director of Brink Groep B.V. and of Heembouw Holding B.V. Chairman of the Supervisory Board of Inholland University.
I. (ISABEL) MARTÍN CASTELLÁ(Born 1947, Spanish nationality, female; appointed in 2013, term expires in 2017)Former Vice-President and member of the Management Committee of the European Investment Bank.Other business activities: member of the Advisory Board of Madrid Network. Non-executive Board member of Foundation Konecta.
C.W. (CARIN) GORTER(Born 1963, Dutch nationality, female; appointed in 2013, term expires in 2017)Former member of the Monitoring Committee DutchBanking Code and Senior Executive Vice-President Compliance, Legal and Security ABN AMRO Bank N.V.Other business activities: member of the Supervisory BoardCooperation of VGZ and Cooperation TVM. Member of theSupervisory Council of CBR (driving license agency).
72 ING Group Annual Report 2013
Corporate governance continued
staatsgesteunde ondernemingen) prohibits financial institutions to grant severance payments to members of the Executive Board in case of state aid to such financial institution.
AMENDMENT OF THE ARTICLES OF ASSOCIATIONThe General Meeting may resolve to amend the Articles of Association, provided that the resolution is adopted on a proposal of the Executive Board, which has been approved by the Supervisory Board. Such a resolution of the General Meeting requires a majority of at least two-thirds of the votes cast at a General Meeting, whereby at least two-thirds of the issued share capital is represented. An amendment of the Articles of Association has to be passed by notarial deed.
EXTERNAL AUDITORAt the annual General Meeting held on 14 May 2012, Ernst & Young Accountants LLP (EY) was appointed to audit the financial statements of ING Group for the financial years 2012 and 2013, to report on the outcome of these audits to the Executive Board and the Supervisory Board and to provide an audit opinion on the financial statements of ING Group. In the 2013 annual General Meeting, the appointment of EY as auditor of ING Group was extended by two more years, i.e. for the financial years 2014 and 2015. ING Group started a project with the objective of changing its external audit firm as of the financial year 2016.
Furthermore, EY also audited and reported on the effectiveness of internal control over financial reporting on 31 December 2013.
The external auditor may be questioned at the annual General Meeting in relation to its audit opinion on the annual accounts. The external auditor will therefore attend and be entitled to address this meeting. The external auditor attended the meetings of the Audit Committee and of the Risk Committee and attended and addressed the 2013 annual General Meeting, wherein the external auditor was questioned on the audit opinion.
New legislation on the accountancy profession (Wet op het accountantsberoep) came into force as of 1 January 2013 which prohibits certain services from being conducted by an external audit firm. The ING Group’s policy on external auditor independence has been updated to reflect the new legislation on the accountancy profession as of 1 January 2013. The external auditor may only provide services to ING Group and its subsidiaries with the permission of the Audit Committee. ING Group provides the Audit Committee with a full overview of all services provided by the external auditor, including related fees, supported by sufficiently detailed information. This overview is periodically evaluated by the Audit Committee throughout the year.
More information on ING Group’s policy on external auditor independence is available on the website of ING Group (www.ing.com).
CHANGES IN THE COMPOSITIONIn May 2013 the General Meeting appointed Isabel Martín Castellá, Carin Gorter and Hermann-Josef Lamberti to the Supervisory Board. Furthermore, the General Meeting reappointed Jeroen van der Veer and Tineke Bahlmann to the Supervisory Board. Tineke Bahlmann was recommended as State Nominee. Piet Klaver and Sjoerd van Keulen retired from the Supervisory Board.
FINANCIAL REPORTINGA description of the main features of ING Group’s internal control and risk management systems in relation to the financial reporting process is included in the statement with respect to Section 404 of the Sarbanes-Oxley Act on pages 79-80, which is deemed to be incorporated by reference herein.
CHANGE OF CONTROL PROVISIONSLEGAL PROVISIONSPursuant to the terms of the Dutch Financial Supervision Act a declaration of no objection from the Dutch central bank (“DNB”) must be obtained by anyone wishing to obtain or hold a participating interest of at least 10% in ING Group and to exercise control attached to such a participating interest. Similarly, on the basis of indirect change of control statutes in the various jurisdictions where subsidiaries of ING Group are operating, permission from or notification to local regulatory authorities may be required for the acquisition of a substantial interest in ING Group.
CHANGE OF CONTROL CLAUSES IN MATERIAL AGREEMENTSING Group is not a party to any material agreement that becomes effective or is required to be amended or terminated, in case of a change of control of ING Group following a public bid as defined in section 5:70 of the Dutch Financial Supervision Act. ING Group subsidiaries may have customary change of control arrangements included in agreements related to various business activities, such as joint venture agreements, letters of credit and other credit facilities, ISDA-agreements, hybrid capital and debt instruments, reinsurance agreements and futures and option trading agreements. Following a change of control of ING Group (as the result of a public bid or otherwise), such agreements may be amended or terminated, leading, for example, to an obligatory transfer of the interest in the joint venture, early repayment of amounts due, loss of credit facilities or reinsurance cover and liquidation of outstanding futures and option trading positions.
SEVERANCE PAYMENTS TO MEMBERS OF THE EXECUTIVE BOARDThe contracts entered into with the members of the Executive Board provide for severance payments, which become due upon termination of the applicable Executive Board member’s contract in connection with a public bid as defined in section 5:70 of the Dutch Financial Supervision Act. For purposes of calculating the amounts due, it is not relevant whether or not termination of the employment contract is related to a public bid. Severance payments to the members of the Executive Board are limited to a maximum of one year’s fixed salary, in line with the Corporate Governance Code. Dutch legislation (Law on the limitation of liability of supervisors of financial markets and rules on remuneration of persons who determine the day-to-day policy (“dagelijkse beleidsbepalers”) of financial institutions receiving state aid) (Wet aansprakelijkheidsbeperking DNB en AFM en bonusverbod
73ING Group Annual Report 2013
1 Wh
o w
e are2 R
epo
rt of th
e Executive B
oard
3 Co
rpo
rate go
vernan
ce4 C
on
solid
ated an
nu
al accou
nts
5 Parent co
mp
any an
nu
al accou
nts
6 Oth
er info
rmatio
n7 A
dd
ition
al info
rmatio
n
The following report is issued in compliance with the provisions of article 14 of the trust conditions for registered shares in the share capital of ING Groep N.V. and best-practice provision IV.2.6 of the Dutch Corporate Governance Code.
OBJECTPursuant to its articles of association (the “Articles of Association”), the object of Stichting ING Aandelen, a foundation organised under the laws of the Netherlands, with its registered seat in Amsterdam (“ING Trust Office”) is:a. to acquire and administer for the purpose of management
registered shares in the capital of ING Groep N.V., a public limited company with its registered office in Amsterdam (“ING Group”) and any bonus shares which may be distributed thereon or shares acquired as stock dividend or by the exercise of subscription rights and to issue exchangeable depositary receipts for these shares, to exercise voting rights and all other rights attaching to the shares, to exercise subscription rights and to receive dividends and other distributions, including proceeds of liquidation, subject to the obligation to distribute the income to the holders of depositary receipts, save that depositary receipts shall be issued for bonus shares, shares acquired as stock dividend and shares acquired on behalf of holders of depositary receipts by virtue of the exercise of subscription rights;
b. to promote the exchange of information between ING Group on the one hand and the holders of depositary receipts and shareholders in ING Group on the other;
c. to promote the solicitation of proxies of shareholders other than the foundation itself and of specific proxies and/or voting instructions of holders of depositary receipts, and further to engage in any activity which may be related to the foregoing in the widest sense, whereby all activities which entail commercial risk shall be excluded from the foundation’s object.
ACTIVITIESBOARD MEETINGS During the 2013 reporting year, the board of ING Trust Office (the “Board”) held six meetings.In these meetings, among other things, the following topics were discussed:- The preparation of the meeting of holders of depositary receipts
of 27 November 2013.- The annual General Meeting of ING Group of 13 May 2013
(“AGM”), the items on the agenda of the AGM, the proxy voting results and the voting by ING Trust Office.
- The functioning of ING Trust Office, the composition of the Board, the 2012 balance sheet and statement of income and expenses of ING Trust Office.
MEETINGS WITH ING GROUPDuring the 2013 reporting year, the Board had five meetings with the chairmen of the Executive Board and the Supervisory Board of ING Group. In these meetings, among other things, the following topics were discussed:- The state of affairs of ING Group in 2012 on the basis of the
press release of 13 February 2013 and the 2012 figures, the state of affairs of ING Group over the first six months of 2013 on the basis of the press release of 7 August 2013 and the state of affairs of ING Group over the first nine months of 2013 on the basis of the press release of 6 November 2013.
- Several items on the agenda of the AGM.- The progress in the restructuring of ING Group.
74 ING Group Annual Report 2013
Report of ING Trust Office
request the Board in writing, setting out the matters to be considered in detail, to convene a meeting of holders of depositary receipts.
The Board convened a meeting of holders of depositary receipts, which was held on 27 November 2013. 0.11% of the total number of depositary receipts issued was present or represented during this meeting. During the meeting a report was made on the activities of ING Trust Office. In addition, the Board answered various questions of holders of depositary receipts attending the meeting. The minutes of the aforementioned meeting are published on the website of ING Trust Office (www.ingtrustoffice.com).
DEPOSITARY-RECEIPT STRUCTUREDuring the years 2010-2013, participation of shareholders, excluding ING Trust Office, and holders of depositary receipts in the decision-making in annual general meetings of ING Group, consistently increased from 41.3% to 51.4%.
In 2010, ING evaluated the depositary-receipts structure and concluded that it would be premature to change or abolish the depositary-receipts structure in 2010 and that it would be appropriate to reconsider this as part of a re-evaluation of ING Group’s entire governance structure following the current restructuring of ING Group and the completion of the divestments approved by the extraordinary General Meeting in 2009. The outcome of the aforementioned evaluation was discussed in the annual General Meeting of 27 April 2010.
In the 2013 annual General Meeting, it was discussed that under the original agreement between ING Group and the European Commission, the restructuring was initially expected to be completed by the end of 2013, so that any reconsideration would be done in 2014. However, ING Group, together with the Dutch State, reached an agreement with the European Commission on an amended Restructuring Plan, in November 2012, part of which was an extended deadline for the aforementioned divestments. As ING Group was still in the implementation phase of the amended restructuring plan, ING did not regard it as an opportune moment to reconsider its governance and depositary-receipt structure.
OUTSTANDING DEPOSITARY RECEIPTSOn 31 December 2013, the nominal value of administered ordinary shares amounted to EUR 921,682,613.76 for which 3,840,344,224 depositary receipts were issued, each with a nominal value of EUR 0.24. During the reporting year, the net number of depositary receipts increased with 10,069,970.
The increase came about as follows:add:conversion of shares into depositary receipts 10,071,120less:conversion of depositary receipts into shares 1,150
COMPOSITION AND REMUNERATION BOARDThe members of the Board are appointed by the Board itself for a maximum term of four years and may be reappointed two times. Holders of depositary receipts may make recommendations to the Board on persons to be appointed as members of the Board. The Board informs them for such purpose and in good time when, for what reason and according to which profile a vacancy must be filled and in which manner a recommendation should take place.
ANNUAL GENERAL MEETING ING GROUP, VOTES CAST AND VOTING BEHAVIOURING Trust Office attended the AGM and during this meeting ING Trust Office asked the Executive Board and the Supervisory Board of ING Group various questions. These questions are included in the adopted minutes of the AGM, available on the website of ING Group (www.ing.com).
51.4% of the total votes that might be cast at the AGM were voted by registered shareholders (excluding ING Trust Office) and holders of depositary receipts, by attending the AGM in person, by being represented by a third party or by giving binding voting instructions to ING Trust Office.
ING Trust Office granted proxies to holders of depositary receipts who attended the AGM in person or who were represented by a third party, to vote at their own discretion on such a number of shares equal to the number of depositary receipts held by the relevant holder of depositary receipts on the record date, with due observance of the Articles of Association and the Trust Conditions.
Holders of depositary receipts who did not attend the AGM in person or who were not represented by a third party, were entitled to give binding voting instructions to ING Trust Office for a number of shares equal to the number of depositary receipts held by the relevant holder of depositary receipts on the record date. Over 60% of the voting holders of depositary receipts gave binding voting instructions to ING Trust Office for a number of shares equal to the number of depositary receipts held by the relevant holder of depositary receipts on the record date. During the AGM, ING Trust Office voted on these shares in accordance with the voting instructions given. A more detailed overview of these voting results can be found on de website of ING Group (www.ing.com).
In accordance with the Articles of Association and the Trust Conditions, ING Trust Office voted at its own discretion on the shares for which it did not issue voting proxies and did not receive voting instructions, representing 48.6% of the total votes that might be cast at the AGM. In voting such shares, ING Trust Office was guided primarily by the interests of all holders of depositary receipts, taking into account the interests of ING Group and its affiliated enterprise. As a result, ING Trust Office voted on these shares in favour of all voting items on the agenda of the AGM.
ING Trust Office promotes the solicitation of proxies of shareholders of ING Group other than ING Trust Office itself and of specific proxies or voting instructions of holders of depositary receipts. ING Trust Office encourages the greatest possible participation in the decision-making process in annual general meetings of shareholders and holders of depositary receipts and promotes the execution of voting rights in a transparent way. At the same time it prevents that a minority of shareholders and holders of depositary receipts could use a chance majority of votes to the disadvantage of the shareholders and holders of depositary receipts present nor represented at a general meeting of ING Group.
MEETING OF HOLDERS OF DEPOSITARY RECEIPTSAccording to the Trust Conditions, ING Trust Office may consult holders of depositary receipts in a separate meeting if and when it considers this necessary or desirable. In addition, one or more holders of depositary receipts who jointly hold at least 10% of the total number of depositary receipts issued by ING Trust Office, may
75ING Group Annual Report 2013
1 Wh
o w
e are2 R
epo
rt of th
e Executive B
oard
3 Co
rpo
rate go
vernan
ce4 C
on
solid
ated an
nu
al accou
nts
5 Parent co
mp
any an
nu
al accou
nts
6 Oth
er info
rmatio
n7 A
dd
ition
al info
rmatio
n
The Board currently consists of Jan Veraart, chairman, Mick den Boogert, Paul Frentrop, Herman Hazewinkel, Harrie Noy and Jolanda Poots-Bijl.
The Board has appointed Herman Hazewinkel as chairman of the Board, effective 1 June 2014. He will succeed Jan Veraart, who was reappointed on 1 May 2013 and will step down as chairman of the Board as of 1 June 2014. Jolanda Poots-Bijl was appointed as a member of the Board as of 1 January 2014 for a term ending per 1 January 2018.
A profile and an overview of relevant positions held by the members of the Board can be found on the website of ING Trust Office (www.ingtrustoffice.com).
All members of the Board stated that they meet the conditions regarding independence as referred to in the Articles of Association and in the Dutch Corporate Governance Code.
The annual remuneration for the chairman of the Board amounts to EUR 25,000.00 and for the other members of the Board to EUR 20,000.00.
COSTSIn 2013, the costs of the activities of ING Trust Office amounted to EUR 456,204.78
OTHERThe activities involved in the administration of shares are performed by Administratiekantoor van het Algemeen Administratie- en Trustkantoor B.V., Amsterdam.
CONTACT DETAILSThe contact details of ING Trust Office are:Hilde MulderTelephone + 31 20 5761924E-mail: [email protected]: www.ingtrustoffice.com
AMSTERDAM, 17 MARCH 2014BOARD OF STICHTING ING AANDELEN
76 ING Group Annual Report 2013
Report of ING Trust Office continued
Stichting Continuïteit ING (“ING Continuity Foundation”), a foundation organized under the laws of the Netherlands, established in Amsterdam, was founded on 22 January 1991.
A call-option agreement concluded between ING Continuity Foundation and ING Groep N.V. (“ING Group”) vests ING Continuity Foundation with the right to acquire cumulative preference shares in the share capital of ING Group up to a maximum of 4.5 billion cumulative preference shares. The acquisition of cumulative preference shares by ING Continuity Foundation is subject to the restriction that, immediately after the issue of cumulative preference shares, the total amount of cumulative preference shares may not exceed one-third of the total issued share capital of ING Group. If new shares other than cumulative preference shares are subsequently issued, ING Continuity Foundation may again exercise its right, subject to the provisions of the preceding sentence. On acquisition of cumulative preference shares, at least 25% of the nominal value must be paid on said shares.
In 2013 the board of ING Continuity Foundation (the “Board”) held two meetings, on 18 April and 29 November.
The composition of the Board is currently as follows: Sebastian Kortmann, chairman of the Board, who was reappointed as of 13 May 2013, Rob van den Bergh, Allard Metzelaar, and Wim van Vonno.
All members of the Board stated that they meet the conditions regarding independence as referred to in the Articles of Association of ING Continuity Foundation.
AMSTERDAM, 17 MARCH 2014BOARD OF STICHTING CONTINUITEIT ING
77ING Group Annual Report 2013
1 Wh
o w
e are2 R
epo
rt of th
e Executive B
oard
3 Co
rpo
rate go
vernan
ce4 C
on
solid
ated an
nu
al accou
nts
5 Parent co
mp
any an
nu
al accou
nts
6 Oth
er info
rmatio
n7 A
dd
ition
al info
rmatio
n
Report of ING Continuity Foundation

The Executive Board is required to prepare the Annual Accounts and the Annual Report of ING Groep N.V. for each financial year in accordance with applicable Dutch law and those International Financial Reporting Standards (IFRS) that were endorsed by the European Union.
CONFORMITY STATEMENT PURSUANT TO SECTION 5:25C PARAGRAPH 2(C) OF THE DUTCH FINANCIAL SUPERVISION ACT (WET OP HET FINANCIEEL TOEZICHT).
The Executive Board is responsible for maintaining proper accounting records, for safeguarding assets and for taking reasonable steps to prevent and detect fraud and other irregularities. It is responsible for selecting suitable accounting policies and applying them on a consistent basis, making judgements and estimates that are prudent and reasonable.It is also responsible for establishing and maintaining internal procedures which ensure that all major financial information is known to the Executive Board, so that the timeliness, completeness and correctness of the external financial reporting are assured.
As required by section 5:25c paragraph 2(c) of the Dutch Financial Supervision Act, each of the signatories hereby confirms that to the best of his or her knowledge:the ING Groep N.V. 2013 Annual Accounts give a true and fair view of the assets, liabilities, financial position and profit or loss of ING Groep N.V. and the enterprises included in the consolidation taken as a whole;the ING Groep N.V. 2013 Annual Report gives a true and fair view of the position at the balance sheet date, the development and performance of the business during the financial year 2013 of ING Groep N.V. and the enterprises included in the consolidation taken as a whole, together with a description of the principal risks ING Groep N.V. is being confronted with.
AMSTERDAM, 17 MARCH 2014
R.A.J.G. (Ralph) HamersCEO, CHAIRMAN OF THE EXECUTIVE BOARD
P.G. (Patrick) FlynnCFO, MEMBER OF THE EXECUTIVE BOARD
W.F. (Wilfred) NagelCRO, MEMBER OF THE EXECUTIVE BOARD
78 ING Group Annual Report 2013
Conformity Statement
Internal control over financial reporting
Due to the listing of ING shares on the New York Stock Exchange, ING Group is required to comply with the SEC regulations adopted pursuant to Section 404 of the Sarbanes-Oxley Act, or SOX 404. These regulations require that the CEO (the chairman of the Executive Board) and the CFO of ING Group report and certify on an annual basis on the effectiveness of ING Group’s internal controls over financial reporting. Furthermore, the external auditors are required to provide an opinion on the effectiveness of ING Group’s internal controls over financial reporting. ING Group has long-established Business Principles and a strong internal control culture, which all staff must adhere to. SOX 404 activities are organised along the lines of the governance structure, and involve the participation of senior management across ING. Following the SOX 404 process, ING is in the position to publish an unqualified statement which denotes that the Company’s internal control over financial reporting is effective as of 31 December 2013. The SOX 404 statement by the Executive Board is included on this page, followed by the report of the external auditor.
REPORT OF THE EXECUTIVE BOARD ON INTERNAL CONTROL OVER FINANCIAL REPORTINGThe Executive Board is responsible for establishing and maintaining adequate internal control over financial reporting. ING’s internal control over financial reporting is a process designed under the supervision of our principal executive and principal financial officers to provide reasonable assurance regarding the reliability of financial reporting and the preparation of financial statements for external purposes in accordance with generally accepted accounting principles.
Our internal control over financial reporting includes those policies and procedures that:• pertain to the maintenance of records that, in reasonable detail,
accurately and fairly reflect the transactions and dispositions of the assets of ING;
• provide reasonable assurance that transactions are recorded as necessary to permit preparation of financial statements in accordance with generally accepted accounting principles, and that our receipts and expenditures are being made only in accordance with authorisations of our management and directors; and
• provide reasonable assurance regarding prevention or timely detection of unauthorised acquisition, use or disposition of our assets that could have a material effect on our financial statements.
Because of its inherent limitations, internal control over financial reporting may not prevent or detect misstatements. Also, projections of any evaluation of effectiveness to future periods are subject to the risk that controls may become inadequate because of changes in conditions, or that the degree of compliance with the policies or procedures may deteriorate.
The Executive Board assessed the effectiveness of our internal control over financial reporting as of 31 December 2013. In making this assessment, the Executive Board performed tests based onthe criteria of the Committee of Sponsoring Organizations of the Treadway Commission (“COSO”) in Internal Control – Integrated Framework (1992 framework). Based on the Executive Board’s assessment and those criteria, the Executive Board concluded that the Company’s internal control over financial reporting is effective as of 31 December 2013.
Our independent registered public accounting firm has audited and issued their report on ING’s internal control over financial reporting, which appears on the following page.
AMSTERDAM, 17 MARCH 2014
R.A.J.G. (Ralph) HamersCEO, CHAIRMAN OF THE EXECUTIVE BOARD
P.G. (Patrick) FlynnCFO, MEMBER OF THE EXECUTIVE BOARD
79ING Group Annual Report 2013
1 Wh
o w
e are2 R
epo
rt of th
e Executive B
oard
3 Co
rpo
rate go
vernan
ce4 C
on
solid
ated an
nu
al accou
nts
5 Parent co
mp
any an
nu
al accou
nts
6 Oth
er info
rmatio
n7 A
dd
ition
al info
rmatio
n
Section 404 Sarbanes-Oxley Act
We also have audited, in accordance with the standards of the Public Company Accounting Oversight Board (United States), the consolidated balance sheet of ING Groep N.V. as of 31 December2013, the consolidated profit and loss account, consolidated statement of comprehensive income, consolidated statement of cash flows and consolidated statement of changes in equity for the year then ended. Our report dated 17 March 2014 expressed an unqualified opinion thereon.
AMSTERDAM, 17 MARCH 2014ERNST & YOUNG ACCOUNTANTS LLP
REPORT OF INDEPENDENT REGISTERED PUBLIC ACCOUNTING FIRM
TO THE SHAREHOLDERS, THE SUPERVISORY BOARD AND THE EXECUTIVE BOARD OF ING GROEP N.V.
We have audited ING Groep N.V.’s internal control over financial reporting as of 31 December 2013, based on criteria established in Internal Control – Integrated Framework issued by the Committee of Sponsoring Organizations of the Treadway Commission (1992 framework) (“the COSO criteria”). ING Groep N.V.’s management is responsible for maintaining effective internal control over financial reporting, and for its assessment of the effectiveness of internal control over financial reporting included in the accompanying Report of the Executive Board on Internal Control Over Financial Reporting. Our responsibility is to express an opinion on the company’s internal control over financial reporting based on our audit.
We conducted our audit in accordance with the standards of the Public Company Accounting Oversight Board (United States). Those standards require that we plan and perform the audit to obtain reasonable assurance about whether effective internal control over financial reporting was maintained in all material respects. Our audit included obtaining an understanding of internal control over financial reporting, assessing the risk that a material weakness exists, testing and evaluating the design and operating effectiveness of internal control based on the assessed risk, and performing such other procedures as we considered necessary in the circumstances. We believe that our audit provides a reasonable basis for our opinion.
A company’s internal control over financial reporting is a process designed to provide reasonable assurance regarding the reliability of financial reporting and the preparation of financial statements for external purposes in accordance with generally accepted accounting principles. A company’s internal control over financial reporting includes those policies and procedures that (1) pertain to the maintenance of records that, in reasonable detail, accurately and fairly reflect the transactions and dispositions of the assets of the company; (2) provide reasonable assurance that transactions are recorded as necessary to permit preparation of financial statements in accordance with generally accepted accounting principles, and that receipts and expenditures of the company are being made only in accordance with authorisations of management and directors of the company; and (3) provide reasonable assurance regarding prevention or timely detection of unauthorised acquisition, use or disposition of the company’s assets that could have a material effect on the financial statements. Because of its inherent limitations, internal control over financial reporting may not prevent or detect misstatements. Also, projections of any evaluation of effectiveness to future periods are subject to the risk that controls may become inadequate because of changes in conditions, or that the degree of compliance with the policies or procedures may deteriorate.
In our opinion, ING Groep N.V. maintained, in all material respects, effective internal control over financial reporting as of 31 December 2013, based on the COSO criteria.
80 ING Group Annual Report 2013
Section 404 Sarbanes-Oxley Act continued
variable component can be increased from target to maximum, not exceeding 100% of base salary at the time of allocation.
Increased emphasis on long-term value creation The remuneration policy for the Executive Board combines the short and long-term variable components into one structure. This structure intends to support both long-term value creation and short-term company objectives. The emphasis on long-term performance indicators within the variable component of the compensation package is increased by means of deferral, a reasonableness test and claw back mechanisms.
The allocation of variable remuneration is conditional on the achievement of a number of performance objectives. The short-term component, at maximum 40% of total variable remuneration, is equally divided between cash and stock and awarded in the year following the performance year.
The other 60% of the total variable remuneration is deferred and also equally divided between cash and stock. This long-term component is intended to serve the objective of retaining the members of the Executive Board for a longer period of time. The value of the stock award is set such that total variable remuneration at the time that the maximum number of shares to be granted is determined stays within the 100% limit. The component is subject to a tiered vesting on the first, second and third anniversary of the grant date (one-third per annum). The entire long-term component is subject to an ex-post performance assessment by the Supervisory Board. The ex-post performance assessment cannot lead to an upward adjustment of the value of the cash deferred portion or the number of deferred shares.
To all share awards granted to Executive Board members in their capacity as Board member, a retention period of five years from the grant date is applicable. However, they are allowed to sell part of their depositary receipts at the date of vesting to pay tax over the vested share award.
Increased focus on risk and non-financial performance Variable remuneration is linked to risk and non-financial performance and takes both individual and company performance criteria into consideration. Performance measurement accounts for estimated risks and costs of capital. In addition to financial indicators, performance is assessed based on non-financial drivers, by means of a number of targets regarding economic, environmental, customer satisfaction and social criteria.
This chapter sets out the remuneration for the Executive Board and the Supervisory Board. The remuneration policy for the Executive Board was adopted by the annual General Meeting (AGM) on 27 April 2010; amendments to the remuneration policy in line with new regulatory developments were adopted by the AGM on 9 May 2011.
In addition, the Remuneration report provides information on the remuneration paid for 2013. The base salary level of the Executive Board remained at the 2010 level and for the fifth consecutive year no variable compensation was paid to the Executive Board.
REMUNERATION POLICYThe primary objective of the remuneration policy is to enable ING to retain and recruit qualified and expert leaders, senior staff and other highly qualified employees.
ING endeavours to match compensation of the Company’s leadership appropriately against a variety of factors, such as the complexity of functions, the scope of responsibilities, the alignment of risks and rewards, local and international legislation and the long-term objectives of the company and its stakeholders, which is all the more important given the changing international standards regarding responsible remuneration. These factors differ for each role, line of business and country. As much as possible for a global financial institution of this size, ING aims to take account of all these differences and also of the standards applied within similar financial institutions in the various countries in which it operates.
REMUNERATION POLICY FOR THE EXECUTIVE BOARDAccording to the remuneration policy of the Executive Board as adopted by the AGM on 27 April 2010 and amended by the AGM on 9 May 2011, remuneration of Executive Board members consists of a combination of fixed compensation (base salary) and variable remuneration (together “total direct compensation”), pension arrangements and benefits as described below.
Total direct compensation: reduced emphasis on variable remuneration Total direct compensation levels are based on market data that include peers both inside and outside the financial sector in the international context in which ING operates. Total direct compensation is benchmarked against a peer group of companies that, in the opinion of the Supervisory Board, are comparable with ING in terms of size and scope. In line with the foregoing, the Supervisory Board has determined that the peer group consists of the companies in the Dow Jones EURO STOXX 50 index. These are 50 companies, in a range of financial and non-financial industries, which are based in countries within the economic and monetary union of the European Union. ING’s remuneration policy for the Executive Board is in accordance with the Dutch Banking Code.
In addition, the remuneration policy provides for a balanced mix between fixed and variable remuneration. Variable remuneration may not exceed 100% of fixed salary at the time of allocation. Fixed compensation (i.e. the base salary levels) is determined in line with the relevant market environment as an integral part of total direct compensation, and will be reviewed from time to time by the Supervisory Board. The policy provides for an at target variable remuneration of 40% in cash and 40% in stock (in total 80%) of base salary if performance criteria are met. If performance criteria (as predetermined by the Supervisory Board) are exceeded, the
Financial performance indicators include:
Non-financial performance indicators include:
1. Underlying net profit for ING Group
2. Reduce double leverage in ING Group
3. Reduce the loan-to-deposit ratio of ING Bank
4. Reduce leverage in ING U.S. in preparation for IPO base case
5. Reduce leverage in Insurance EurAsia to prepare for standalone future
1. Reinforce “Customer First / Suitability” culture of transparency, honesty, integrity and societal awareness
2. Strengthen key stakeholder relationships
3. Improve employee engagement across the Banking and Insurance operations
4. Improve leadership capabilities and strengthen leadership pipeline
5. On sustainability: improve sustainable business practices
6. Align operational excellence Group-wide
81ING Group Annual Report 2013
1 Wh
o w
e are2 R
epo
rt of th
e Executive B
oard
3 Co
rpo
rate go
vernan
ce4 C
on
solid
ated an
nu
al accou
nts
5 Parent co
mp
any an
nu
al accou
nts
6 Oth
er info
rmatio
n7 A
dd
ition
al info
rmatio
n
Remuneration report
Pensions Executive Board membersMembers of the Executive Board who are employed on the basis of a Dutch employment contract, participate in the defined contribution pension plans introduced in 2010 as part of the remuneration policy. Individual board members participating in the pension plan that existed before the introduction of the 2010 plans were given the choice to keep their existing pension arrangement. This existing pension arrangement, approved by the 2006 AGM, is based on a defined contribution plan. Alternatively, they can switch to the 2010 arrangements.
Members of the Executive Board are required to pay a contribution to their pension premium in line with the contributions under ING’s Collective Labour Agreement (“CLA”) in the Netherlands.
Members of the Executive Board working on a non-Dutch employment contract are offered pensions in line with local practices.
BenefitsExecutive Board members continue to be eligible for additional benefits (e.g. the use of company cars, contributions to company savings plans and, if applicable, expatriate allowances) which apply to other comparable employees. Executive Board members may obtain banking and insurance services from ING Group subsidiaries in the ordinary course of their business and on comparable terms that apply to most other employees of ING in the Netherlands. In addition, tax and financial planning services are provided to ensure compliance with the relevant legislative requirements.
TenureMembers of the Executive Board who were appointed prior to 2013, have an employment agreement with ING Group N.V. Members who are appointed as of 2013 have a commission contract. The employment agreement and the commission contract for Executive Board members provide for an appointment for a period of four years and allow re-appointment by the General Meeting. In the case of an involuntary exit, Executive Board members are eligible for an exit-arrangement limited to one-year base salary.
OTHER ITEMS FOR SUPERVISORY BOARD DISCRETIONCLAW BACK AND ADJUSTMENTSThe Supervisory Board has the authority to reclaim variable remuneration allocated to a member of the Executive Board based on inaccurate data and/or behaviour that led to significant harm to the company. The Supervisory Board also has the authority to adjust variable remuneration if application of the predetermined performance criteria results in undesired outcomes. Accordingly, the Supervisory Board has decision authority in situations not addressed in the policy.
SPECIAL EMPLOYMENT CONDITIONSSpecial employment conditions, such as commitments made to secure the recruitment of new executives, may be used in exceptional circumstances subject to strict control by the Supervisory Board.
SUPERVISORY BOARD DISCRETION TO REVIEW THE POLICY AND THE REMUNERATION PAIDING is expected to undergo significant changes during the coming years. Also, the regulatory environment is still in a state of flux
(upcoming Capital Requirements Directive IV and local Dutch legislation on 20% cap on variable remuneration). In order to ensure that ING can adapt to these uncertain factors, the Supervisory Board indicated in the previous years that it may re-evaluate at a later stage whether the remuneration policy adopted in 2010 and amended on 9 May 2011 is in line with the long-term objectives of the Company, the relevant international context, as well as the societal perception of ING as a financial institution. However, since the internal restructuring has not been completed yet and the proposed legislation has not been fully developed, the Supervisory Board may re-evaluate the remuneration policy in 2015.
Should it become clear, after such evaluation, that the remuneration policy has led to an unintended or inequitable outcome, the Supervisory Board has the discretion to correct the previously allocated variable remuneration, in line with the Dutch Banking Code and the Capital Requirements Directive III.
2013 REMUNERATIONThe Executive Board remuneration for 2013 is based on the remuneration policy approved by the 2010 AGM and amended by the 2011 AGM. It is the responsibility of ING’s Remuneration Committee to take into account the interests of all stakeholders, including shareholders and employees, as well as business continuity and sustainable growth, when overseeing the company’s remuneration policy.
2013 REMUNERATION EXECUTIVE BOARD 2013 Executive Board base salary The base salary of all Executive Board members was set at the time of the introduction of the remuneration policy in 2010. The base salary of the Executive Board has not been raised since 2010 as the Executive Board decided voluntarily not to accept a base salary increase until ING has repaid outstanding core Tier 1 securities from the Dutch State along with the restrictions put in force by the new Dutch legislation in 2012. As a consequence the base salary level remained also in 2013 at the 2010 level.
2013 Executive Board variable remuneration In 2011, the Executive Board decided that it would not accept variable remuneration for that year. Since 2012 it is also prohibited by Dutch Law applicable to financial institutions that have received state support such as ING, to grant variable remuneration (in cash or otherwise) to Executive Board Members and/ or to increase fixed salaries for Executive Board Members. As such the Executive Board did not receive any variable remuneration in relation to performance year 2013.
In 2013 there was no claw-back applied to paid or vested variable remuneration from any of the Executive Board members.The total direct compensation of former members of the Executive Board received in their capacity as Executive Board members amounted to nil for 2013, nil for 2012 and EUR 563,000 for 2011.
One-off crisis levy of taxable income In 2012, the Dutch Government imposed an additional levy of 16% on the income in excess of EUR 150,000 on each employee who is subject to Dutch income tax. The levy is charged to the company and does not affect the remuneration of involved staff. This levy is also applicable for 2013. For members of the Executive Board this amounts to EUR 518,000, which is not included in the table on the next page.
82 ING Group Annual Report 2013
Remuneration report continued
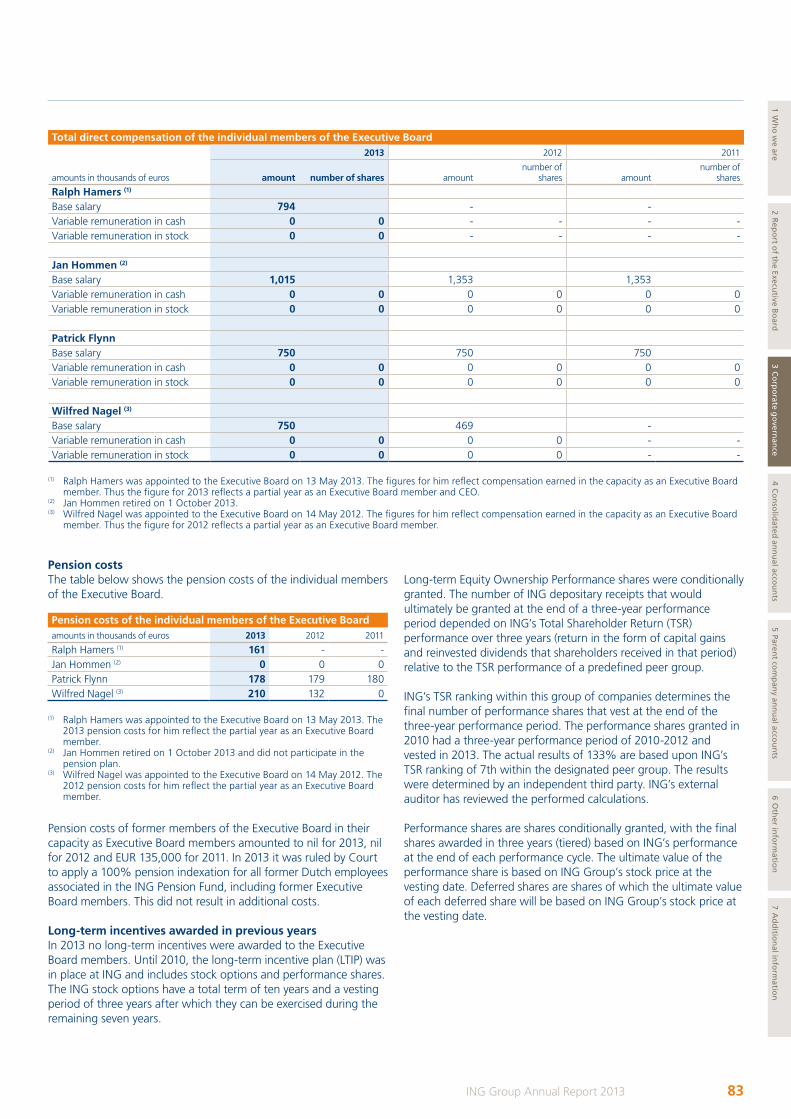
Pension costs The table below shows the pension costs of the individual members of the Executive Board.
Pension costs of the individual members of the Executive Board amounts in thousands of euros 2013 2012 2011
Ralph Hamers (1) 161 - -Jan Hommen (2) 0 0 0Patrick Flynn 178 179 180Wilfred Nagel (3) 210 132 0
(1) Ralph Hamers was appointed to the Executive Board on 13 May 2013. The 2013 pension costs for him reflect the partial year as an Executive Board member.
(2) Jan Hommen retired on 1 October 2013 and did not participate in the pension plan.
(3) Wilfred Nagel was appointed to the Executive Board on 14 May 2012. The 2012 pension costs for him reflect the partial year as an Executive Board member.
Pension costs of former members of the Executive Board in their capacity as Executive Board members amounted to nil for 2013, nil for 2012 and EUR 135,000 for 2011. In 2013 it was ruled by Court to apply a 100% pension indexation for all former Dutch employees associated in the ING Pension Fund, including former Executive Board members. This did not result in additional costs.
Long-term incentives awarded in previous years In 2013 no long-term incentives were awarded to the Executive Board members. Until 2010, the long-term incentive plan (LTIP) was in place at ING and includes stock options and performance shares. The ING stock options have a total term of ten years and a vesting period of three years after which they can be exercised during the remaining seven years.
Long-term Equity Ownership Performance shares were conditionally granted. The number of ING depositary receipts that would ultimately be granted at the end of a three-year performance period depended on ING’s Total Shareholder Return (TSR) performance over three years (return in the form of capital gains and reinvested dividends that shareholders received in that period) relative to the TSR performance of a predefined peer group.
ING’s TSR ranking within this group of companies determines the final number of performance shares that vest at the end of the three-year performance period. The performance shares granted in 2010 had a three-year performance period of 2010-2012 and vested in 2013. The actual results of 133% are based upon ING’s TSR ranking of 7th within the designated peer group. The results were determined by an independent third party. ING’s external auditor has reviewed the performed calculations.
Performance shares are shares conditionally granted, with the final shares awarded in three years (tiered) based on ING’s performance at the end of each performance cycle. The ultimate value of the performance share is based on ING Group’s stock price at the vesting date. Deferred shares are shares of which the ultimate value of each deferred share will be based on ING Group’s stock price at the vesting date.
Total direct compensation of the individual members of the Executive Board
amounts in thousands of euros
2013 2012 2011
amount number of shares amountnumber of
shares amountnumber of
shares
Ralph Hamers (1) Base salary 794 - - Variable remuneration in cash 0 0 - - - -Variable remuneration in stock 0 0 - - - - Jan Hommen (2) Base salary 1,015 1,353 1,353 Variable remuneration in cash 0 0 0 0 0 0Variable remuneration in stock 0 0 0 0 0 0 Patrick Flynn Base salary 750 750 750 Variable remuneration in cash 0 0 0 0 0 0Variable remuneration in stock 0 0 0 0 0 0 Wilfred Nagel (3) Base salary 750 469 - Variable remuneration in cash 0 0 0 0 - -Variable remuneration in stock 0 0 0 0 - -
(1) Ralph Hamers was appointed to the Executive Board on 13 May 2013. The figures for him reflect compensation earned in the capacity as an Executive Board member. Thus the figure for 2013 reflects a partial year as an Executive Board member and CEO.
(2) Jan Hommen retired on 1 October 2013.(3) Wilfred Nagel was appointed to the Executive Board on 14 May 2012. The figures for him reflect compensation earned in the capacity as an Executive Board
member. Thus the figure for 2012 reflects a partial year as an Executive Board member.
83ING Group Annual Report 2013
1 Wh
o w
e are2 R
epo
rt of th
e Executive B
oard
3 Co
rpo
rate go
vernan
ce4 C
on
solid
ated an
nu
al accou
nts
5 Parent co
mp
any an
nu
al accou
nts
6 Oth
er info
rmatio
n7 A
dd
ition
al info
rmatio
n
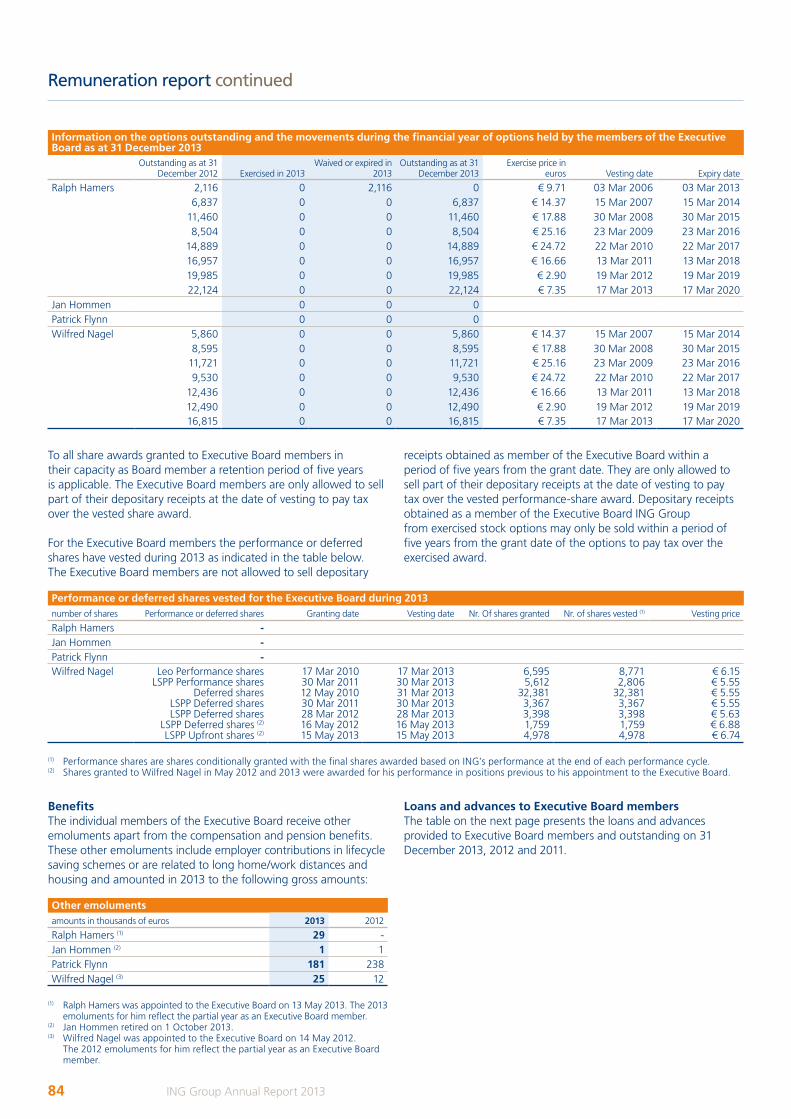
To all share awards granted to Executive Board members in their capacity as Board member a retention period of five years is applicable. The Executive Board members are only allowed to sell part of their depositary receipts at the date of vesting to pay tax over the vested share award.
For the Executive Board members the performance or deferred shares have vested during 2013 as indicated in the table below.The Executive Board members are not allowed to sell depositary
receipts obtained as member of the Executive Board within a period of five years from the grant date. They are only allowed to sell part of their depositary receipts at the date of vesting to pay tax over the vested performance-share award. Depositary receipts obtained as a member of the Executive Board ING Group from exercised stock options may only be sold within a period of five years from the grant date of the options to pay tax over the exercised award.
Information on the options outstanding and the movements during the financial year of options held by the members of the Executive Board as at 31 December 2013
Outstanding as at 31 December 2012 Exercised in 2013
Waived or expired in 2013
Outstanding as at 31 December 2013
Exercise price in euros Vesting date Expiry date
Ralph Hamers 2,116 0 2,116 0 € 9.71 03 Mar 2006 03 Mar 20136,837 0 0 6,837 € 14.37 15 Mar 2007 15 Mar 2014
11,460 0 0 11,460 € 17.88 30 Mar 2008 30 Mar 20158,504 0 0 8,504 € 25.16 23 Mar 2009 23 Mar 2016
14,889 0 0 14,889 € 24.72 22 Mar 2010 22 Mar 201716,957 0 0 16,957 € 16.66 13 Mar 2011 13 Mar 201819,985 0 0 19,985 € 2.90 19 Mar 2012 19 Mar 201922,124 0 0 22,124 € 7.35 17 Mar 2013 17 Mar 2020
Jan Hommen 0 0 0Patrick Flynn 0 0 0Wilfred Nagel 5,860 0 0 5,860 € 14.37 15 Mar 2007 15 Mar 2014
8,595 0 0 8,595 € 17.88 30 Mar 2008 30 Mar 201511,721 0 0 11,721 € 25.16 23 Mar 2009 23 Mar 20169,530 0 0 9,530 € 24.72 22 Mar 2010 22 Mar 2017
12,436 0 0 12,436 € 16.66 13 Mar 2011 13 Mar 201812,490 0 0 12,490 € 2.90 19 Mar 2012 19 Mar 201916,815 0 0 16,815 € 7.35 17 Mar 2013 17 Mar 2020
Performance or deferred shares vested for the Executive Board during 2013number of shares Performance or deferred shares Granting date Vesting date Nr. Of shares granted Nr. of shares vested (1) Vesting price
Ralph Hamers -Jan Hommen -Patrick Flynn -Wilfred Nagel Leo Performance shares
LSPP Performance sharesDeferred shares
LSPP Deferred sharesLSPP Deferred shares
LSPP Deferred shares (2)
LSPP Upfront shares (2)
17 Mar 201030 Mar 201112 May 201030 Mar 201128 Mar 201216 May 201215 May 2013
17 Mar 201330 Mar 201331 Mar 201330 Mar 201328 Mar 201316 May 201315 May 2013
6,5955,612
32,3813,3673,3981,7594,978
8,7712,806
32,3813,3673,3981,7594,978
€ 6.15€ 5.55€ 5.55€ 5.55€ 5.63€ 6.88€ 6.74
(1) Performance shares are shares conditionally granted with the final shares awarded based on ING’s performance at the end of each performance cycle.(2) Shares granted to Wilfred Nagel in May 2012 and 2013 were awarded for his performance in positions previous to his appointment to the Executive Board.
Benefits The individual members of the Executive Board receive other emoluments apart from the compensation and pension benefits. These other emoluments include employer contributions in lifecycle saving schemes or are related to long home/work distances and housing and amounted in 2013 to the following gross amounts:
Other emolumentsamounts in thousands of euros 2013 2012
Ralph Hamers (1) 29 -Jan Hommen (2) 1 1Patrick Flynn 181 238Wilfred Nagel (3) 25 12
(1) Ralph Hamers was appointed to the Executive Board on 13 May 2013. The 2013 emoluments for him reflect the partial year as an Executive Board member.
(2) Jan Hommen retired on 1 October 2013.(3) Wilfred Nagel was appointed to the Executive Board on 14 May 2012.
The 2012 emoluments for him reflect the partial year as an Executive Board member.
Loans and advances to Executive Board members The table on the next page presents the loans and advances provided to Executive Board members and outstanding on 31 December 2013, 2012 and 2011.
84 ING Group Annual Report 2013
Remuneration report continued
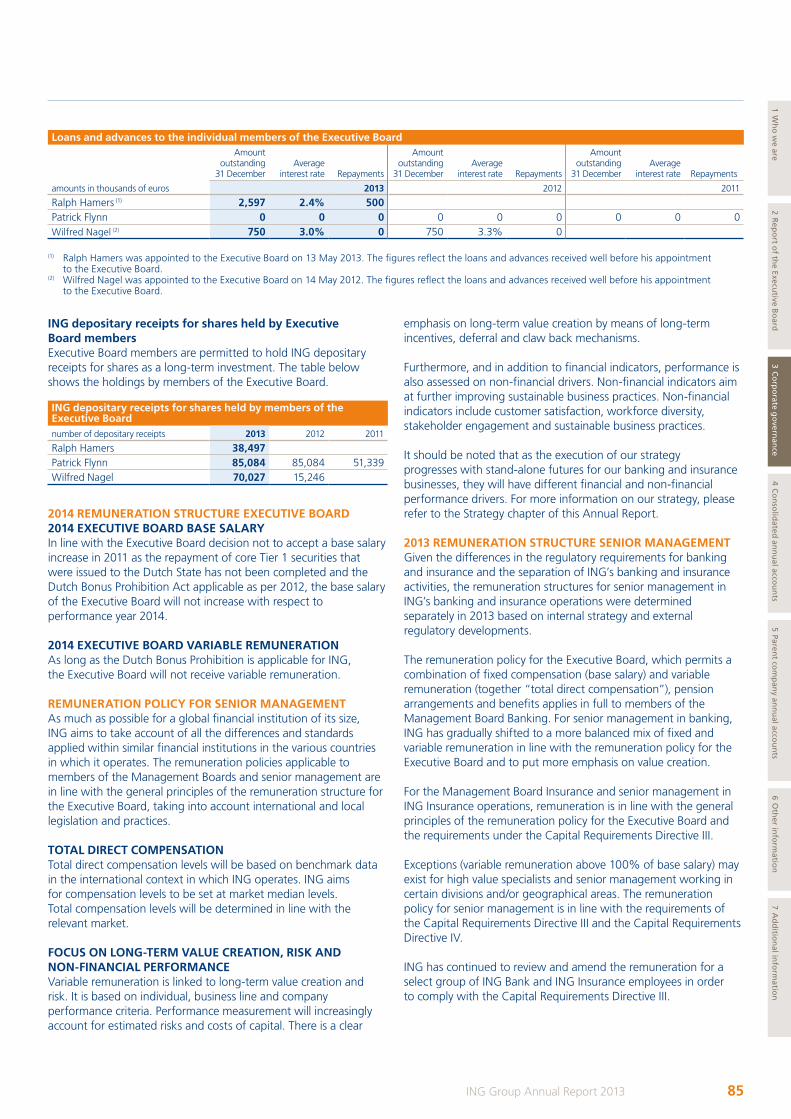
ING depositary receipts for shares held by Executive Board membersExecutive Board members are permitted to hold ING depositary receipts for shares as a long-term investment. The table below shows the holdings by members of the Executive Board.
ING depositary receipts for shares held by members of the Executive Boardnumber of depositary receipts 2013 2012 2011
Ralph Hamers 38,497Patrick Flynn 85,084 85,084 51,339Wilfred Nagel 70,027 15,246
2014 REMUNERATION STRUCTURE EXECUTIVE BOARD 2014 EXECUTIVE BOARD BASE SALARY In line with the Executive Board decision not to accept a base salary increase in 2011 as the repayment of core Tier 1 securities that were issued to the Dutch State has not been completed and the Dutch Bonus Prohibition Act applicable as per 2012, the base salary of the Executive Board will not increase with respect to performance year 2014.
2014 EXECUTIVE BOARD VARIABLE REMUNERATION As long as the Dutch Bonus Prohibition is applicable for ING, the Executive Board will not receive variable remuneration.
REMUNERATION POLICY FOR SENIOR MANAGEMENT As much as possible for a global financial institution of its size, ING aims to take account of all the differences and standards applied within similar financial institutions in the various countries in which it operates. The remuneration policies applicable to members of the Management Boards and senior management are in line with the general principles of the remuneration structure for the Executive Board, taking into account international and local legislation and practices.
TOTAL DIRECT COMPENSATIONTotal direct compensation levels will be based on benchmark data in the international context in which ING operates. ING aims for compensation levels to be set at market median levels. Total compensation levels will be determined in line with the relevant market.
FOCUS ON LONG-TERM VALUE CREATION, RISK AND NON-FINANCIAL PERFORMANCE Variable remuneration is linked to long-term value creation and risk. It is based on individual, business line and company performance criteria. Performance measurement will increasingly account for estimated risks and costs of capital. There is a clear
emphasis on long-term value creation by means of long-term incentives, deferral and claw back mechanisms.
Furthermore, and in addition to financial indicators, performance is also assessed on non-financial drivers. Non-financial indicators aim at further improving sustainable business practices. Non-financial indicators include customer satisfaction, workforce diversity, stakeholder engagement and sustainable business practices.
It should be noted that as the execution of our strategy progresses with stand-alone futures for our banking and insurance businesses, they will have different financial and non-financial performance drivers. For more information on our strategy, please refer to the Strategy chapter of this Annual Report.
2013 REMUNERATION STRUCTURE SENIOR MANAGEMENT Given the differences in the regulatory requirements for banking and insurance and the separation of ING’s banking and insurance activities, the remuneration structures for senior management in ING’s banking and insurance operations were determined separately in 2013 based on internal strategy and external regulatory developments.
The remuneration policy for the Executive Board, which permits a combination of fixed compensation (base salary) and variable remuneration (together “total direct compensation”), pension arrangements and benefits applies in full to members of the Management Board Banking. For senior management in banking, ING has gradually shifted to a more balanced mix of fixed and variable remuneration in line with the remuneration policy for the Executive Board and to put more emphasis on value creation.
For the Management Board Insurance and senior management in ING Insurance operations, remuneration is in line with the general principles of the remuneration policy for the Executive Board and the requirements under the Capital Requirements Directive III.
Exceptions (variable remuneration above 100% of base salary) may exist for high value specialists and senior management working in certain divisions and/or geographical areas. The remuneration policy for senior management is in line with the requirements of the Capital Requirements Directive III and the Capital Requirements Directive IV.
ING has continued to review and amend the remuneration for a select group of ING Bank and ING Insurance employees in order to comply with the Capital Requirements Directive III.
Loans and advances to the individual members of the Executive Board
amounts in thousands of euros
Amount outstanding
31 DecemberAverage
interest rate Repayments
Amount outstanding
31 DecemberAverage
interest rate Repayments
Amount outstanding
31 DecemberAverage
interest rate Repayments
2013 2012 2011
Ralph Hamers (1) 2,597 2.4% 500 Patrick Flynn 0 0 0 0 0 0 0 0 0Wilfred Nagel (2) 750 3.0% 0 750 3.3% 0
(1) Ralph Hamers was appointed to the Executive Board on 13 May 2013. The figures reflect the loans and advances received well before his appointment to the Executive Board.
(2) Wilfred Nagel was appointed to the Executive Board on 14 May 2012. The figures reflect the loans and advances received well before his appointment to the Executive Board.
85ING Group Annual Report 2013
1 Wh
o w
e are2 R
epo
rt of th
e Executive B
oard
3 Co
rpo
rate go
vernan
ce4 C
on
solid
ated an
nu
al accou
nts
5 Parent co
mp
any an
nu
al accou
nts
6 Oth
er info
rmatio
n7 A
dd
ition
al info
rmatio
n
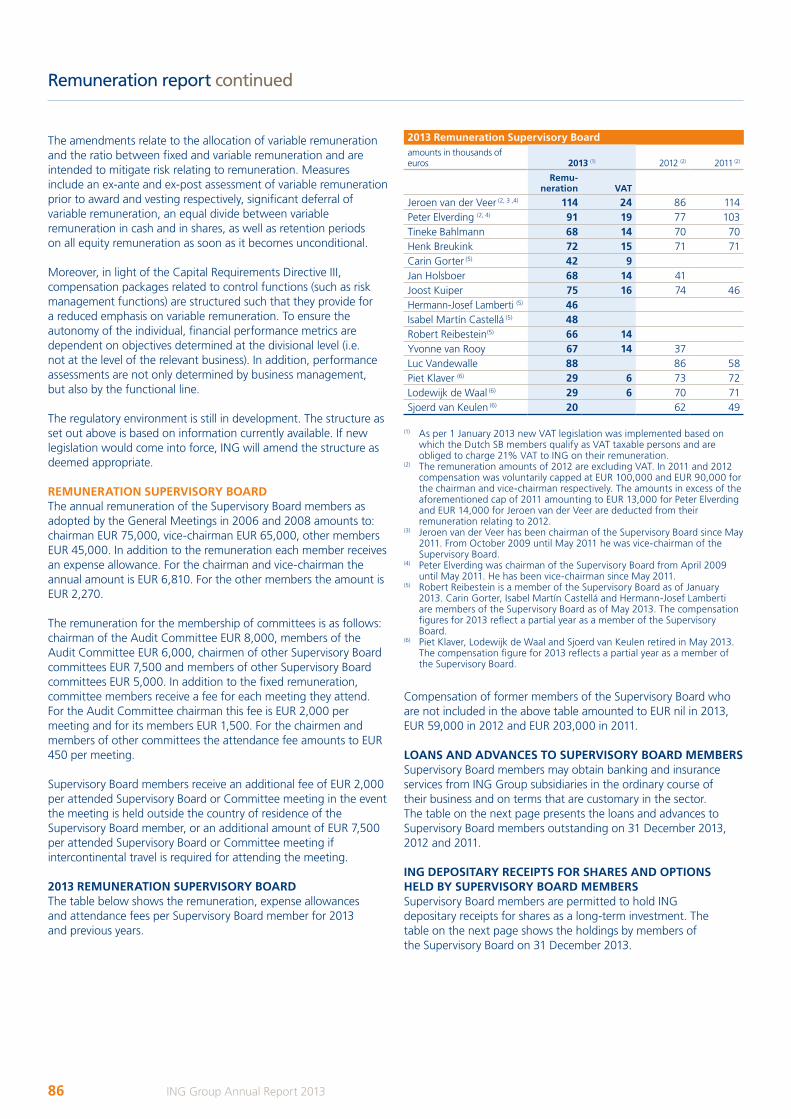
2013 Remuneration Supervisory Boardamounts in thousands of euros 2013 (1) 2012 (2) 2011 (2)
Remu- neration VAT
Jeroen van der Veer (2, 3 ,4) 114 24 86 114Peter Elverding (2, 4) 91 19 77 103Tineke Bahlmann 68 14 70 70Henk Breukink 72 15 71 71Carin Gorter (5) 42 9Jan Holsboer 68 14 41Joost Kuiper 75 16 74 46Hermann-Josef Lamberti (5) 46Isabel Martín Castellá (5) 48Robert Reibestein(5) 66 14Yvonne van Rooy 67 14 37Luc Vandewalle 88 86 58Piet Klaver (6) 29 6 73 72Lodewijk de Waal (6) 29 6 70 71Sjoerd van Keulen (6) 20 62 49
(1) As per 1 January 2013 new VAT legislation was implemented based on which the Dutch SB members qualify as VAT taxable persons and are obliged to charge 21% VAT to ING on their remuneration.
(2) The remuneration amounts of 2012 are excluding VAT. In 2011 and 2012 compensation was voluntarily capped at EUR 100,000 and EUR 90,000 for the chairman and vice-chairman respectively. The amounts in excess of the aforementioned cap of 2011 amounting to EUR 13,000 for Peter Elverding and EUR 14,000 for Jeroen van der Veer are deducted from their remuneration relating to 2012.
(3) Jeroen van der Veer has been chairman of the Supervisory Board since May 2011. From October 2009 until May 2011 he was vice-chairman of the Supervisory Board.
(4) Peter Elverding was chairman of the Supervisory Board from April 2009 until May 2011. He has been vice-chairman since May 2011.
(5) Robert Reibestein is a member of the Supervisory Board as of January 2013. Carin Gorter, Isabel Martín Castellá and Hermann-Josef Lamberti are members of the Supervisory Board as of May 2013. The compensation figures for 2013 reflect a partial year as a member of the Supervisory Board.
(6) Piet Klaver, Lodewijk de Waal and Sjoerd van Keulen retired in May 2013. The compensation figure for 2013 reflects a partial year as a member of the Supervisory Board.
Compensation of former members of the Supervisory Board who are not included in the above table amounted to EUR nil in 2013, EUR 59,000 in 2012 and EUR 203,000 in 2011.
LOANS AND ADVANCES TO SUPERVISORY BOARD MEMBERSSupervisory Board members may obtain banking and insurance services from ING Group subsidiaries in the ordinary course of their business and on terms that are customary in the sector. The table on the next page presents the loans and advances to Supervisory Board members outstanding on 31 December 2013, 2012 and 2011.
ING DEPOSITARY RECEIPTS FOR SHARES AND OPTIONS HELD BY SUPERVISORY BOARD MEMBERSSupervisory Board members are permitted to hold ING depositary receipts for shares as a long-term investment. The table on the next page shows the holdings by members of the Supervisory Board on 31 December 2013.
The amendments relate to the allocation of variable remuneration and the ratio between fixed and variable remuneration and are intended to mitigate risk relating to remuneration. Measures include an ex-ante and ex-post assessment of variable remuneration prior to award and vesting respectively, significant deferral of variable remuneration, an equal divide between variable remuneration in cash and in shares, as well as retention periods on all equity remuneration as soon as it becomes unconditional.
Moreover, in light of the Capital Requirements Directive III, compensation packages related to control functions (such as risk management functions) are structured such that they provide for a reduced emphasis on variable remuneration. To ensure the autonomy of the individual, financial performance metrics are dependent on objectives determined at the divisional level (i.e. not at the level of the relevant business). In addition, performance assessments are not only determined by business management, but also by the functional line.
The regulatory environment is still in development. The structure as set out above is based on information currently available. If new legislation would come into force, ING will amend the structure as deemed appropriate.
REMUNERATION SUPERVISORY BOARDThe annual remuneration of the Supervisory Board members as adopted by the General Meetings in 2006 and 2008 amounts to: chairman EUR 75,000, vice-chairman EUR 65,000, other members EUR 45,000. In addition to the remuneration each member receives an expense allowance. For the chairman and vice-chairman the annual amount is EUR 6,810. For the other members the amount is EUR 2,270.
The remuneration for the membership of committees is as follows: chairman of the Audit Committee EUR 8,000, members of the Audit Committee EUR 6,000, chairmen of other Supervisory Board committees EUR 7,500 and members of other Supervisory Board committees EUR 5,000. In addition to the fixed remuneration, committee members receive a fee for each meeting they attend. For the Audit Committee chairman this fee is EUR 2,000 per meeting and for its members EUR 1,500. For the chairmen and members of other committees the attendance fee amounts to EUR 450 per meeting.
Supervisory Board members receive an additional fee of EUR 2,000 per attended Supervisory Board or Committee meeting in the event the meeting is held outside the country of residence of the Supervisory Board member, or an additional amount of EUR 7,500 per attended Supervisory Board or Committee meeting if intercontinental travel is required for attending the meeting.
2013 REMUNERATION SUPERVISORY BOARD The table below shows the remuneration, expense allowances and attendance fees per Supervisory Board member for 2013 and previous years.
86 ING Group Annual Report 2013
Remuneration report continued

ING shares and depositary receipts for shares held by members of the Supervisory Board (1)
number of shares 2013 2012 2011
Jeroen van der Veer 119,469 119,469 119,469Luc Vandewalle (2) 85,250 85,250 80,000Jan Holsboer 74,738 74,738Hermann-Josef Lamberti (3) 5,700
(1) The numbers of depositary receipt for shares reflect the shares held by the members of the Supervisory Board and their partners.
(2) The ING depositary receipts held by Luc Vandewalle are currently held in usufruct.
(3) Hermann-Josef Lamberti is a member of the Supervisory Board as of May 2013.
Loans and advances to members of the Supervisory Board
amounts in thousands of euros
Amount outstanding
31 DecemberAverage
interest rate Repayments
Amount outstanding
31 DecemberAverage
interest rate Repayments
Amount outstanding
31 DecemberAverage
interest rate Repayments
2013 2012 2011
Jeroen van der Veer (1) 0 0 282 282 8.6%
(1) The amount reflects a housing mortgage loan granted in 1992, well before Jeroen van der Veer’s appointment to the Supervisory Board (effective as of 1 July 2009).
Stock options on ING Group N.V. shares held by members of the Supervisory BoardOutstanding as at
31 DecemberExpired in
2013Outstanding as at
31 DecemberExpired in
2012Outstanding as at
31 DecemberExpired in
2011 (2)
number of stock options 2013 2012 2011
Luc Vandewalle (1) 92,959 20,837 113,796 29,953 143,749
(1) The options held by Mr. Vandewalle were granted during his position at ING Bank Belgium S.A. and are currently out of the money. Due to an omission these options were not reported in the Annual Report of earlier years.
(2) Luc Vandewalle was appointed to the Supervisory Board in May 2011. No options expired since his appointment to the Supervisory Board until 31 December 2011.
The following table contains information on the options outstanding and movements during the financial year by the members of the Supervisory Board.
87ING Group Annual Report 2013
1 Wh
o w
e are2 R
epo
rt of th
e Executive B
oard
3 Co
rpo
rate go
vernan
ce4 C
on
solid
ated an
nu
al accou
nts
5 Parent co
mp
any an
nu
al accou
nts
6 Oth
er info
rmatio
n7 A
dd
ition
al info
rmatio
n
CENTRAL WORKS COUNCILon 31 December 2013
M.L.R. (Michel) Vonk, chairman L.G. (Bert) Woltheus, deputy-chairman J.R.H.M. (Job) van Luyken, secretary H.P. (Hennie) Post, deputy secretary J.H. (Hans) de Boer, G. (Goof) Bode, J. (Yoap) Brugmann, A. (Aad) Kant
EUROPEAN WORKS COUNCILon 31 December 2013
N. (Norbert) Lucas, chairman, Germany R. (Rene) De Meij, secretary, Belgium
J.P. (Jean Pierre) Lambert, chairman Bank, Belgium C.M. (Mihai) Ailincai, secretary Bank, Romania
A. (Aad) Kant, chairman Insurance, the Netherlands R. (Reinoud) Rijpkema, secretary Insurance, the NetherlandsH. (Havva) Tasgil, secretary Insurance, the Netherlands
O. (Otmar) Haneder, AustriaF. (Franck) Goethals, D. (Dirk) Verstrepen, Belgium N. (Nikolay) Mladenski, B. (Biliana) Petrova, BulgariaM. (Martina) Jezkova, P. (Petr) Ullmann, Czech Republic M. (Mourad) Benzaaza, FranceU. (Ulrich) Probst, Germany N. (Nikolaos) Ploumis, GreeceG. (Géza) Bodor, C. (Csilla) Dobos, Hungary G. (Gianluigi) Spina, N. (Nicola) Cerruti, ItalyC. (Christophe) Guissart, A. (Alain) Back, LuxembourgJ.R. (Jeffrey) Dinsbach, G.J. (Gerard) Veldman, L.F.F. (Leo) Teunissen, L.S.A. (Lea) De Weerd, J. (Jennifer) Wirjosemito, the NetherlandsA. (Anna) Potajallo, M. (Mieczyslaw) Bielawski, K. (Krzystov) Burnat, M. (Mariusz) Cieslik, PolandV. (Valerica) Chirila, C.M. (Mihai) Ailincai, D. (Daniela) Plopsoreanu, Romania M. (Marcel) Forisek, L. (Lukas) Motovsky, SlovakiaD. (Deiane) Vicente Coira, M.A. (Miguel) Hernandez Fernandez, N. (Nadia) Belajard Moya, Spain S. (Sam) Chaudhuri, R. (Rina) Goldenberg, UK.
Works councils
88 ING Group Annual Report 2013
Contents
4 Consolidated annual accounts
Consolidated balance sheet 90Consolidated profit and loss account 91Consolidated statement of comprehensive income 93Consolidated statement of cash flows 94Consolidated statement of changes in equity 96
Notes to the consolidated annual accounts Notes to the accounting policies 1 Accounting policies 98
Notes to the consolidated balance sheet 2 Cash and balances with central banks 1203 Amounts due from banks 1204 Financial assets at fair value through
profit and loss 1205 Investments 1226 Loans and advances to customers 1297 Investments in associates 1318 Real estate investments 1329 Property and equipment 13310 Intangible assets 13511 Deferred acquisition costs 13612 Assets and liabilities held for sale 13713 Other assets 13914 Shareholders’ equity (parent)/non-voting equity
securities 14015 Subordinated loans 14616 Debt securities in issue 14717 Other borrowed funds 14818 Insurance and investment contracts,
Reinsurance contracts 14919 Amounts due to banks 15220 Customer deposits and other funds on deposit 15221 Financial liabilities at fair value through
profit and loss 15322 Other liabilities 154
Notes to the consolidated profit and loss account 23 Interest result banking operations 15624 Gross premium income 15725 Investment income 15826 Result on disposals of group companies 15927 Commission income 15928 Valuation results on non-trading derivatives 16029 Net trading income 16130 Other income 16131 Underwriting expenditure 16232 Intangible amortisation and other impairments 16333 Staff expenses 16434 Other interest expenses 16735 Other operating expenses 16736 Discontinued operations 16837 Earnings per ordinary share 16938 Dividend per ordinary share 170
Notes to the consolidated statement of cash flows39 Net cash flow from investing activities 17040 Interest and dividend included in net cash flow 17041 Cash and cash equivalents 171
5 Parent company annual accounts
Parent company balance sheet 345Parent company profit and loss account 346Parent company statement of changes in equity 347Accounting policies for the parent company annual accounts 348Notes to the parent company annual accounts 349
6 Other information
Independent auditor’s report 354Proposed appropriation of result and subsequent events 355
7 Additional information
Risk factors 356Additional Pillar 3 information 380Financial glossary 411General information 419
Segment reporting 42 Segments 17143 Information on geographical areas 182
Additional notes to the consolidated annual accounts44 Pension and other post-employment benefits 18345 Taxation 18946 Fair value of assets and liabilities 19347 Derivatives and hedge accounting 20648 Assets by contractual maturity 20849 Liabilities by maturity 20950 Assets not freely disposable 21051 Transfer of financial assets 21152 Offsetting financial assets and liabilities 21253 Contingent liabilities and commitments 21454 Legal proceedings 21555 Companies and businesses acquired and divested 21756 Principal subsidiaries 22357 Structured entities 22358 Related parties 22759 Other events 23460 Subsequent events 236 Risk management 237Capital management 335
89ING Group Annual Report 2013
1 Wh
o w
e are2 R
epo
rt of th
e Executive B
oard
3 Co
rpo
rate go
vernan
ce4 C
on
solid
ated an
nu
al accou
nts
5 Parent co
mp
any an
nu
al accou
nts
6 Oth
er info
rmatio
n7 A
dd
ition
al info
rmatio
n
ING_2013_deel1_v1.indd 89 19/03/2014 18:57:50

amounts in millions of euros 2013 2012 2011
ASSETSCash and balances with central banks 2 13,316 17,657 31,194Amounts due from banks 3 43,012 39,053 45,323Financial assets at fair value through profit and loss 4– trading assets 114,247 114,895 123,688– investments for risk of policyholders 39,589 98,765 116,438 – non-trading derivatives 8,546 13,951 17,159– designated as at fair value through profit and loss 2,790 4,760 5,437Investments 5– available-for-sale 137,897 193,584 208,539– held-to-maturity 3,098 6,545 8,868Loans and advances to customers 6 531,663 563,404 602,525Reinsurance contracts 18 252 5,290 5,870Investments in associates 7 1,749 2,203 2,370Real estate investments 8 1,142 1,288 1,670Property and equipment 9 2,446 2,674 2,886Intangible assets 10 1,841 2,639 3,558Deferred acquisition costs 11 1,353 4,549 10,204Assets held for sale 12 156,114 68,472 62,483Other assets 13 21,569 26,462 31,675Total assets 1,080,624 1,166,191 1,279,887
EQUITY 14Shareholders’ equity (parent) 45,941 51,777 47,038Non-voting equity securities 1,500 2,250 3,000
47,441 54,027 50,038Minority interests 5,402 1,081 777Total equity 52,843 55,108 50,815
LIABILITIESSubordinated loans 15 6,889 8,786 8,858Debt securities in issue 16 127,727 143,436 139,861Other borrowed funds 17 13,706 16,723 19,684Insurance and investment contracts 18 111,551 229,950 278,833Amounts due to banks 19 27,257 38,704 72,233Customer deposits and other funds on deposit 20 474,320 455,003 467,547Financial liabilities at fair value through profit and loss 21– trading liabilities 73,491 83,652 107,682– non-trading derivatives 11,155 18,752 22,165– designated as at fair value through profit and loss 13,855 13,399 13,021Liabilities held for sale 12 146,142 69,899 64,265Other liabilities 22 21,688 32,779 34,923Total liabilities 1,027,781 1,111,083 1,229,072
Total equity and liabilities 1,080,624 1,166,191 1,279,887
Amounts for 2012 and 2011 have been restated to reflect the changes in accounting policies for defined benefit pension schemes as disclosed in the section ‘Changes in accounting policies in 2013’ on page 98.
The comparison of the balance sheets is impacted by the classification as held for sale of ING U.S. (as of 2013) and the insurance and investment management businesses in Asia (as of 2012) and the classification to continuing operations of ING Group’s business in Japan (as of 2013) as disclosed in the section ‘Other significant changes in 2013’ on page 100.
References relate to the notes starting on page 98. These form an integral part of the consolidated annual accounts.
Consolidated balance sheet of ING Groupas at 31 December
90 ING Group Annual Report 2013
ING_2013_deel1_v1.indd 90 19/03/2014 18:57:51
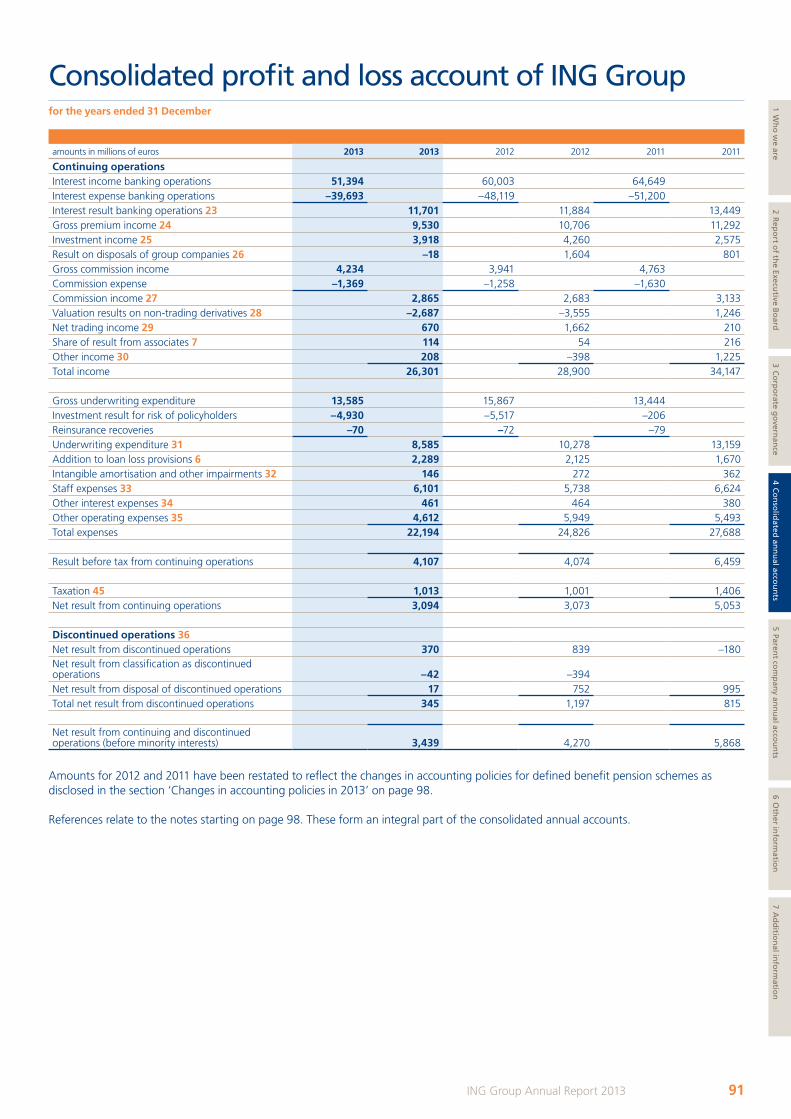
Consolidated profit and loss account of ING Groupfor the years ended 31 December
amounts in millions of euros 2013 2013 2012 2012 2011 2011
Continuing operationsInterest income banking operations 51,394 60,003 64,649Interest expense banking operations –39,693 –48,119 –51,200Interest result banking operations 23 11,701 11,884 13,449Gross premium income 24 9,530 10,706 11,292Investment income 25 3,918 4,260 2,575Result on disposals of group companies 26 –18 1,604 801Gross commission income 4,234 3,941 4,763Commission expense –1,369 –1,258 –1,630Commission income 27 2,865 2,683 3,133Valuation results on non-trading derivatives 28 –2,687 –3,555 1,246Net trading income 29 670 1,662 210Share of result from associates 7 114 54 216Other income 30 208 –398 1,225Total income 26,301 28,900 34,147
Gross underwriting expenditure 13,585 15,867 13,444Investment result for risk of policyholders –4,930 –5,517 –206Reinsurance recoveries –70 –72 –79Underwriting expenditure 31 8,585 10,278 13,159Addition to loan loss provisions 6 2,289 2,125 1,670Intangible amortisation and other impairments 32 146 272 362Staff expenses 33 6,101 5,738 6,624Other interest expenses 34 461 464 380Other operating expenses 35 4,612 5,949 5,493Total expenses 22,194 24,826 27,688
Result before tax from continuing operations 4,107 4,074 6,459
Taxation 45 1,013 1,001 1,406Net result from continuing operations 3,094 3,073 5,053
Discontinued operations 36Net result from discontinued operations 370 839 –180Net result from classification as discontinued operations –42 –394Net result from disposal of discontinued operations 17 752 995Total net result from discontinued operations 345 1,197 815
Net result from continuing and discontinued operations (before minority interests) 3,439 4,270 5,868
Amounts for 2012 and 2011 have been restated to reflect the changes in accounting policies for defined benefit pension schemes as disclosed in the section ‘Changes in accounting policies in 2013’ on page 98.
References relate to the notes starting on page 98. These form an integral part of the consolidated annual accounts.
91ING Group Annual Report 2013
1 Wh
o w
e are2 R
epo
rt of th
e Executive B
oard
3 Co
rpo
rate go
vernan
ce4 C
on
solid
ated an
nu
al accou
nts
5 Parent co
mp
any an
nu
al accou
nts
6 Oth
er info
rmatio
n7 A
dd
ition
al info
rmatio
n
ING_2013_deel1_v1.indd 91 19/03/2014 18:57:51
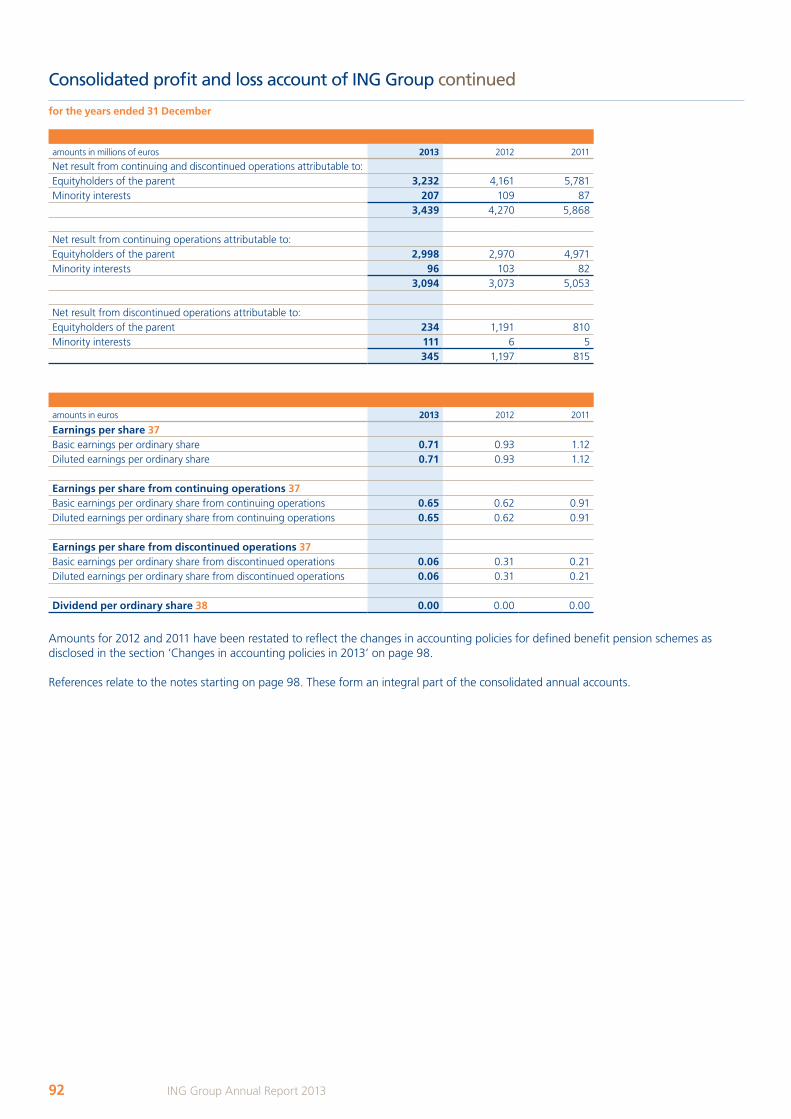
Consolidated profit and loss account of ING Group continued
for the years ended 31 December
amounts in euros 2013 2012 2011
Earnings per share 37Basic earnings per ordinary share 0.71 0.93 1.12Diluted earnings per ordinary share 0.71 0.93 1.12
Earnings per share from continuing operations 37Basic earnings per ordinary share from continuing operations 0.65 0.62 0.91Diluted earnings per ordinary share from continuing operations 0.65 0.62 0.91
Earnings per share from discontinued operations 37Basic earnings per ordinary share from discontinued operations 0.06 0.31 0.21Diluted earnings per ordinary share from discontinued operations 0.06 0.31 0.21
Dividend per ordinary share 38 0.00 0.00 0.00
Amounts for 2012 and 2011 have been restated to reflect the changes in accounting policies for defined benefit pension schemes as disclosed in the section ‘Changes in accounting policies in 2013’ on page 98.
References relate to the notes starting on page 98. These form an integral part of the consolidated annual accounts.
amounts in millions of euros 2013 2012 2011
Net result from continuing and discontinued operations attributable to:Equityholders of the parent 3,232 4,161 5,781Minority interests 207 109 87
3,439 4,270 5,868
Net result from continuing operations attributable to:Equityholders of the parent 2,998 2,970 4,971Minority interests 96 103 82
3,094 3,073 5,053
Net result from discontinued operations attributable to:Equityholders of the parent 234 1,191 810Minority interests 111 6 5
345 1,197 815
92 ING Group Annual Report 2013
ING_2013_deel1_v1.indd 92 19/03/2014 18:57:51
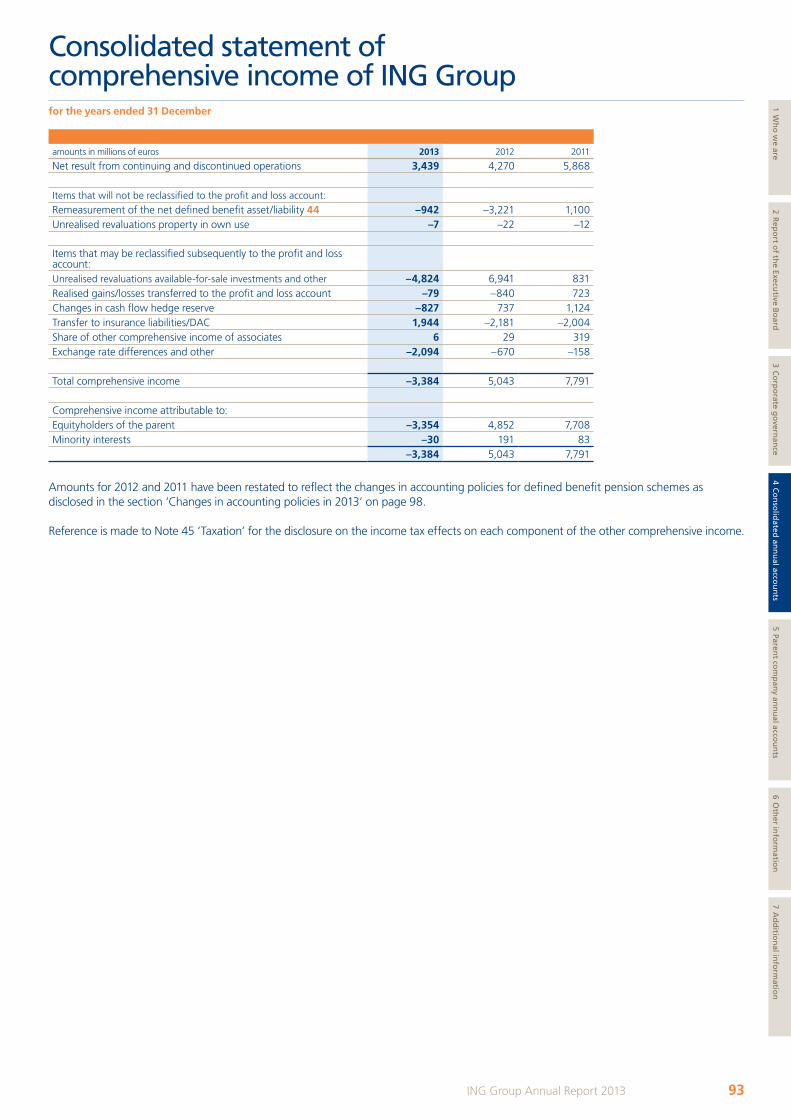
amounts in millions of euros 2013 2012 2011
Net result from continuing and discontinued operations 3,439 4,270 5,868
Items that will not be reclassified to the profit and loss account:
Remeasurement of the net defined benefit asset/liability 44 –942 –3,221 1,100Unrealised revaluations property in own use –7 –22 –12
Items that may be reclassified subsequently to the profit and loss account:Unrealised revaluations available-for-sale investments and other –4,824 6,941 831Realised gains/losses transferred to the profit and loss account –79 –840 723Changes in cash flow hedge reserve –827 737 1,124Transfer to insurance liabilities/DAC 1,944 –2,181 –2,004Share of other comprehensive income of associates 6 29 319Exchange rate differences and other –2,094 –670 –158
Total comprehensive income –3,384 5,043 7,791
Comprehensive income attributable to:Equityholders of the parent –3,354 4,852 7,708Minority interests –30 191 83
–3,384 5,043 7,791
Amounts for 2012 and 2011 have been restated to reflect the changes in accounting policies for defined benefit pension schemes as disclosed in the section ‘Changes in accounting policies in 2013’ on page 98.
Reference is made to Note 45 ‘Taxation’ for the disclosure on the income tax effects on each component of the other comprehensive income.
Consolidated statement of comprehensive income of ING Groupfor the years ended 31 December
93ING Group Annual Report 2013
1 Wh
o w
e are2 R
epo
rt of th
e Executive B
oard
3 Co
rpo
rate go
vernan
ce4 C
on
solid
ated an
nu
al accou
nts
5 Parent co
mp
any an
nu
al accou
nts
6 Oth
er info
rmatio
n7 A
dd
ition
al info
rmatio
n
ING_2013_deel1_v1.indd 93 19/03/2014 18:57:52
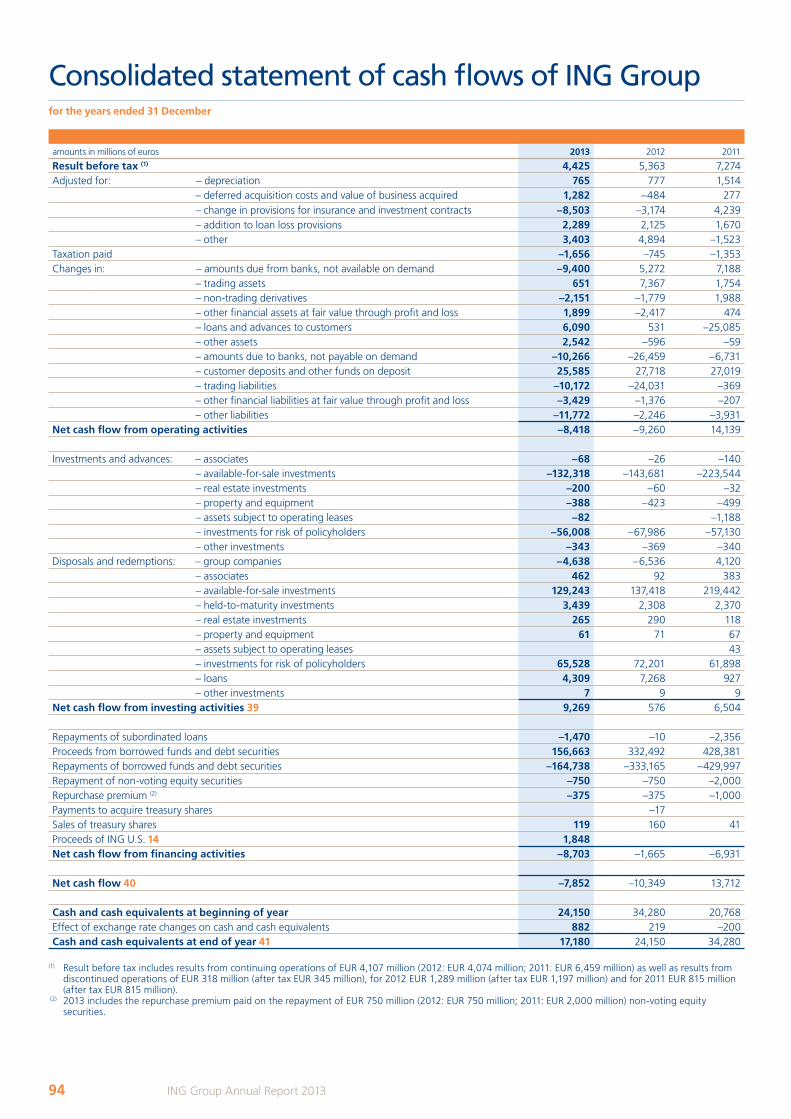
Consolidated statement of cash flows of ING Groupfor the years ended 31 December
amounts in millions of euros 2013 2012 2011
Result before tax (1) 4,425 5,363 7,274Adjusted for: – depreciation 765 777 1,514
– deferred acquisition costs and value of business acquired 1,282 –484 277– change in provisions for insurance and investment contracts –8,503 –3,174 4,239– addition to loan loss provisions 2,289 2,125 1,670– other 3,403 4,894 –1,523
Taxation paid –1,656 –745 –1,353Changes in: – amounts due from banks, not available on demand –9,400 5,272 7,188
– trading assets 651 7,367 1,754– non-trading derivatives –2,151 –1,779 1,988– other financial assets at fair value through profit and loss 1,899 –2,417 474– loans and advances to customers 6,090 531 –25,085– other assets 2,542 –596 –59– amounts due to banks, not payable on demand –10,266 –26,459 –6,731– customer deposits and other funds on deposit 25,585 27,718 27,019– trading liabilities –10,172 –24,031 –369– other financial liabilities at fair value through profit and loss –3,429 –1,376 –207– other liabilities –11,772 –2,246 –3,931
Net cash flow from operating activities –8,418 –9,260 14,139
Investments and advances: – associates –68 –26 –140– available-for-sale investments –132,318 –143,681 –223,544– real estate investments –200 –60 –32– property and equipment –388 –423 –499– assets subject to operating leases –82 –1,188– investments for risk of policyholders –56,008 –67,986 –57,130– other investments –343 –369 –340
Disposals and redemptions: – group companies –4,638 –6,536 4,120– associates 462 92 383– available-for-sale investments 129,243 137,418 219,442– held-to-maturity investments 3,439 2,308 2,370– real estate investments 265 290 118– property and equipment 61 71 67– assets subject to operating leases 43– investments for risk of policyholders 65,528 72,201 61,898– loans 4,309 7,268 927– other investments 7 9 9
Net cash flow from investing activities 39 9,269 576 6,504
Repayments of subordinated loans –1,470 –10 –2,356Proceeds from borrowed funds and debt securities 156,663 332,492 428,381Repayments of borrowed funds and debt securities –164,738 –333,165 –429,997Repayment of non-voting equity securities –750 –750 –2,000Repurchase premium (2) –375 –375 –1,000Payments to acquire treasury shares –17 Sales of treasury shares 119 160 41Proceeds of ING U.S. 14 1,848Net cash flow from financing activities –8,703 –1,665 –6,931
Net cash flow 40 –7,852 –10,349 13,712
Cash and cash equivalents at beginning of year 24,150 34,280 20,768Effect of exchange rate changes on cash and cash equivalents 882 219 –200Cash and cash equivalents at end of year 41 17,180 24,150 34,280
(1) Result before tax includes results from continuing operations of EUR 4,107 million (2012: EUR 4,074 million; 2011: EUR 6,459 million) as well as results from discontinued operations of EUR 318 million (after tax EUR 345 million), for 2012 EUR 1,289 million (after tax EUR 1,197 million) and for 2011 EUR 815 million (after tax EUR 815 million).
(2) 2013 includes the repurchase premium paid on the repayment of EUR 750 million (2012: EUR 750 million; 2011: EUR 2,000 million) non-voting equity securities.
94 ING Group Annual Report 2013
ING_2013_deel1_v1.indd 94 19/03/2014 18:57:52
Consolidated statement of cash flows of ING Group continued
As at 31 December 2013 Cash and cash equivalents includes cash and balances with central banks of EUR 13,316 million (2012: EUR 17,657 million; 2011: EUR 31,194 million). Reference is made to Note 41 ‘Cash and Cash equivalents’.
Amounts for 2012 and 2011 have been restated to reflect the changes in accounting policies for defined benefit pension schemes as disclosed in the section ‘Changes in accounting policies in 2013’ on page 98.
References relate to the notes starting on page 98. These form an integral part of the consolidated annual accounts.
95ING Group Annual Report 2013
1 Wh
o w
e are2 R
epo
rt of th
e Executive B
oard
3 Co
rpo
rate go
vernan
ce4 C
on
solid
ated an
nu
al accou
nts
5 Parent co
mp
any an
nu
al accou
nts
6 Oth
er info
rmatio
n7 A
dd
ition
al info
rmatio
n
ING_2013_deel1_v1.indd 95 19/03/2014 18:57:52
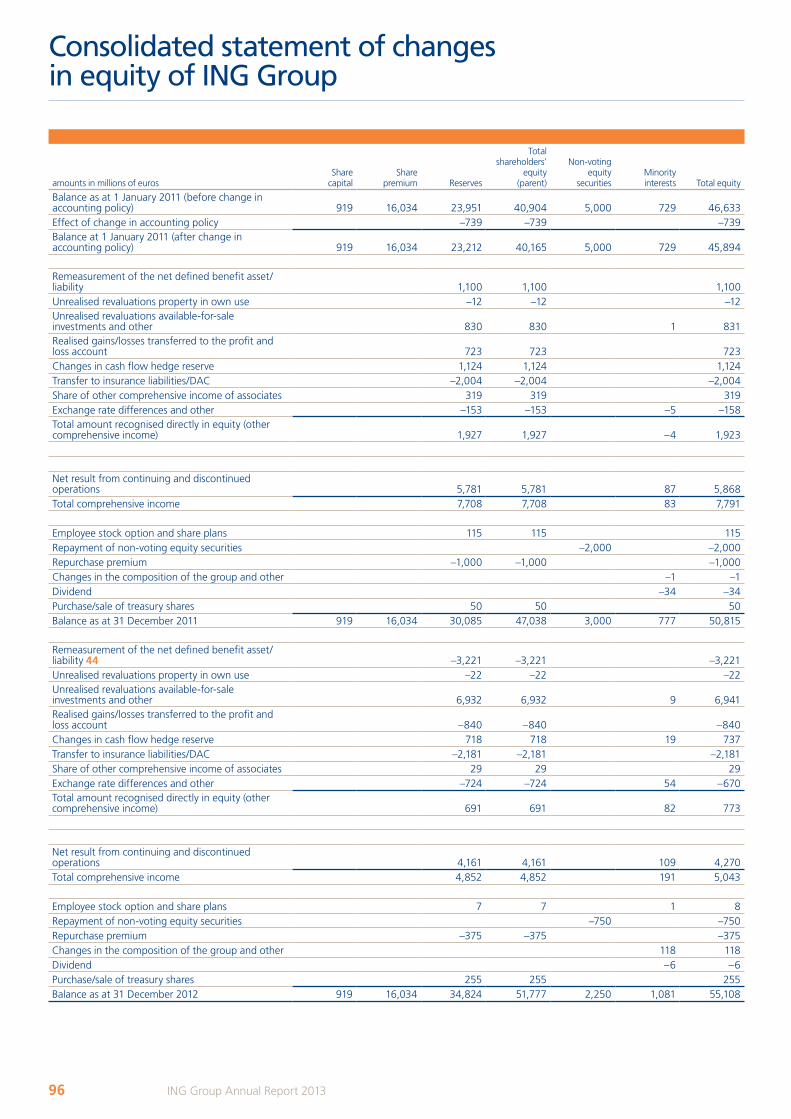
Consolidated statement of changes in equity of ING Group
amounts in millions of eurosShare
capitalShare
premium Reserves
Total shareholders’
equity (parent)
Non-voting equity
securitiesMinority interests Total equity
Balance as at 1 January 2011 (before change in accounting policy) 919 16,034 23,951 40,904 5,000 729 46,633Effect of change in accounting policy –739 –739 –739Balance at 1 January 2011 (after change in accounting policy) 919 16,034 23,212 40,165 5,000 729 45,894
Remeasurement of the net defined benefit asset/liability 1,100 1,100 1,100Unrealised revaluations property in own use –12 –12 –12Unrealised revaluations available-for-sale investments and other 830 830 1 831Realised gains/losses transferred to the profit and loss account 723 723 723Changes in cash flow hedge reserve 1,124 1,124 1,124Transfer to insurance liabilities/DAC –2,004 –2,004 –2,004Share of other comprehensive income of associates 319 319 319Exchange rate differences and other –153 –153 –5 –158Total amount recognised directly in equity (other comprehensive income) 1,927 1,927 –4 1,923
Net result from continuing and discontinued operations 5,781 5,781 87 5,868Total comprehensive income 7,708 7,708 83 7,791
Employee stock option and share plans 115 115 115Repayment of non-voting equity securities –2,000 –2,000Repurchase premium –1,000 –1,000 –1,000Changes in the composition of the group and other –1 –1Dividend –34 –34Purchase/sale of treasury shares 50 50 50Balance as at 31 December 2011 919 16,034 30,085 47,038 3,000 777 50,815
Remeasurement of the net defined benefit asset/liability 44 –3,221 –3,221 –3,221Unrealised revaluations property in own use –22 –22 –22Unrealised revaluations available-for-sale investments and other 6,932 6,932 9 6,941Realised gains/losses transferred to the profit and loss account –840 –840 –840Changes in cash flow hedge reserve 718 718 19 737Transfer to insurance liabilities/DAC –2,181 –2,181 –2,181Share of other comprehensive income of associates 29 29 29Exchange rate differences and other –724 –724 54 –670Total amount recognised directly in equity (other comprehensive income) 691 691 82 773
Net result from continuing and discontinued operations 4,161 4,161 109 4,270Total comprehensive income 4,852 4,852 191 5,043
Employee stock option and share plans 7 7 1 8Repayment of non-voting equity securities –750 –750Repurchase premium –375 –375 –375Changes in the composition of the group and other 118 118Dividend –6 –6Purchase/sale of treasury shares 255 255 255Balance as at 31 December 2012 919 16,034 34,824 51,777 2,250 1,081 55,108
96 ING Group Annual Report 2013
ING_2013_deel1_v1.indd 96 19/03/2014 18:57:53
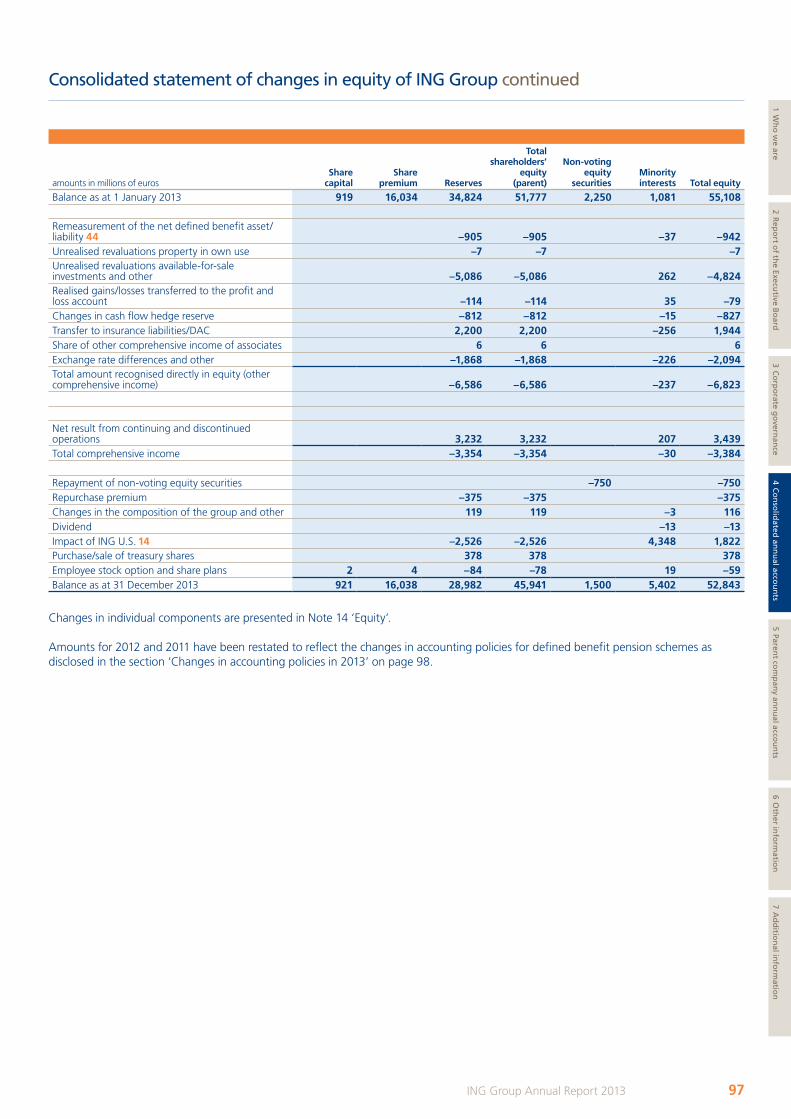
Consolidated statement of changes in equity of ING Group continued
amounts in millions of eurosShare
capitalShare
premium Reserves
Total shareholders’
equity (parent)
Non-voting equity
securitiesMinority interests Total equity
Balance as at 1 January 2013 919 16,034 34,824 51,777 2,250 1,081 55,108
Remeasurement of the net defined benefit asset/liability 44 –905 –905 –37 –942Unrealised revaluations property in own use –7 –7 –7Unrealised revaluations available-for-sale investments and other –5,086 –5,086 262 –4,824Realised gains/losses transferred to the profit and loss account –114 –114 35 –79Changes in cash flow hedge reserve –812 –812 –15 –827Transfer to insurance liabilities/DAC 2,200 2,200 –256 1,944Share of other comprehensive income of associates 6 6 6Exchange rate differences and other –1,868 –1,868 –226 –2,094Total amount recognised directly in equity (other comprehensive income) –6,586 –6,586 –237 –6,823
Net result from continuing and discontinued operations 3,232 3,232 207 3,439Total comprehensive income –3,354 –3,354 –30 –3,384
Repayment of non-voting equity securities –750 –750Repurchase premium –375 –375 –375Changes in the composition of the group and other 119 119 –3 116Dividend –13 –13Impact of ING U.S. 14 –2,526 –2,526 4,348 1,822Purchase/sale of treasury shares 378 378 378Employee stock option and share plans 2 4 –84 –78 19 –59Balance as at 31 December 2013 921 16,038 28,982 45,941 1,500 5,402 52,843
Changes in individual components are presented in Note 14 ‘Equity’.
Amounts for 2012 and 2011 have been restated to reflect the changes in accounting policies for defined benefit pension schemes as disclosed in the section ‘Changes in accounting policies in 2013’ on page 98.
97ING Group Annual Report 2013
1 Wh
o w
e are2 R
epo
rt of th
e Executive B
oard
3 Co
rpo
rate go
vernan
ce4 C
on
solid
ated an
nu
al accou
nts
5 Parent co
mp
any an
nu
al accou
nts
6 Oth
er info
rmatio
n7 A
dd
ition
al info
rmatio
n
ING_2013_deel1_v1.indd 97 19/03/2014 18:57:53
Notes to the consolidated annual accounts of ING Groupamounts in millions of euros, unless stated otherwise
NOTES TO THE ACCOUNTING POLICIESAUTHORISATION OF ANNUAL ACCOUNTSThe consolidated annual accounts of ING Groep N.V. for the year ended 31 December 2013 were authorised for issue in accordance with a resolution of the Executive Board on 17 March 2014. The Executive Board may decide to amend the annual accounts as long as these are not adopted by the General Meeting of Shareholders. The General Meeting of Shareholders may decide not to adopt the annual accounts, but may not amend these. ING Groep N.V. is incorporated and domiciled in Amsterdam, the Netherlands. The principal activities of ING Group are described in the section ‘ING at a glance’ in section 1.
1 ACCOUNTING POLICIESING Group applies International Financial Reporting Standards as adopted by the European Union ‘IFRS-EU’. In the annual accounts the term ‘IFRS-EU’ is used to refer to International Financial Reporting Standards as adopted by the EU, including the decisions ING Group made with regard to the options available under IFRS-EU.
IFRS-EU provides several options in accounting policies. The key areas in which IFRS-EU allows accounting policy choices, and the related ING accounting policy, are summarised as follows:• As explained in the section ‘Principles of valuation and determination of results’ and in Note 47 ‘Derivatives and hedge accounting’ ING
Group applies fair value hedge accounting to portfolio hedges of interest rate risk (macro hedging) under the EU ‘carve out’ of IFRS-EU;• Under IFRS 4, an insurer may continue its existing pre-IFRS accounting policies for insurance contracts, provided that certain minimum
requirements are met. Upon adoption of IFRS in 2005, ING Group decided to continue the then existing accounting principles for insurance contracts under IFRS. ING Group operates in many different countries and the accounting principles for insurance contracts follow local practice in these countries. ING’s businesses in the Netherlands apply accounting standards generally accepted in the Netherlands (Dutch GAAP) for its provisions for liabilities under insurance contracts; similarly, ING’s businesses in the United States apply accounting standards generally accepted in the United States (US GAAP);
• ING’s accounting policy for Real estate investments is fair value, with changes in fair value reflected immediately in the profit and loss account;
• ING’s accounting policy for Property for own use is fair value, with changes in fair value reflected in the revaluation reserve in equity (‘Other comprehensive income’). A net negative revaluation on individual properties is reflected immediately in the profit and loss account; and
• ING’s accounting policy for joint ventures is proportionate consolidation.
ING Group’s accounting policies under IFRS-EU and its decision on the options available are included in the section ‘Principles of valuation and determination of results’ below. Except for the options included above, the principles in section ‘Principles of valuation and determination of results’ are IFRS-EU and do not include other significant accounting policy choices made by ING. The accounting policies that are most significant to ING are included in section ‘Critical accounting policies’.
CHANGES IN ACCOUNTING POLICIES IN 2013The following new and/or amended IFRS-EU standards were implemented by ING Group in 2013:• Amendments to IAS 19 ‘Employee Benefits’;• Amendments to IAS 1 ‘Presentation of Financial Statements’;• Amendments to IFRS 7 ‘Financial instruments: Disclosures’; and• IFRS 13 ‘Fair Value Measurement’.
Amendments to IAS 19 ‘Employee Benefits’The most significant change of the revised IAS 19 ‘Employee Benefits’ relates to the accounting for defined benefit pension obligations and the corresponding plan assets. The amendments require immediate recognition in Other comprehensive income (i.e. in equity) of changes in the defined benefit obligation and in the fair value of plan assets due to actuarial gains and losses. The deferral of actuarial gains and losses through the ‘corridor approach’, which was applied under the previous version of IAS 19 until the end of 2012, is no longer allowed. As a related consequence, deferred actuarial gains and losses are no longer released to the profit and loss account upon curtailment. Furthermore, the amendments require the return on plan assets for the purpose of calculating the pension expense to be determined using a high-quality corporate bond rate, equal to the discount rate of the defined benefit obligation; until 2012 management’s best estimate was applied. The amendments also introduce a number of other changes and extended disclosure requirements. The implementation of the amendments to IAS 19 resulted in the recognition of accumulated actuarial gains and losses in equity as at 1 January 2013; more information is provided in Note 44 ‘Pension and other post-employment benefits’. As a result, Shareholders’ equity decreased with EUR 2.6 billion after tax (EUR 3.5 billion before tax) on 1 January 2013. The recognition of actuarial gains and losses in equity will create volatility in equity going forward. The changes in IAS 19 are implemented retrospectively; as a result, comparative figures for previous years have been restated and are presented as if the new requirements were always applied.
98 ING Group Annual Report 2013
ING_2013_deel1_v1.indd 98 19/03/2014 18:57:53
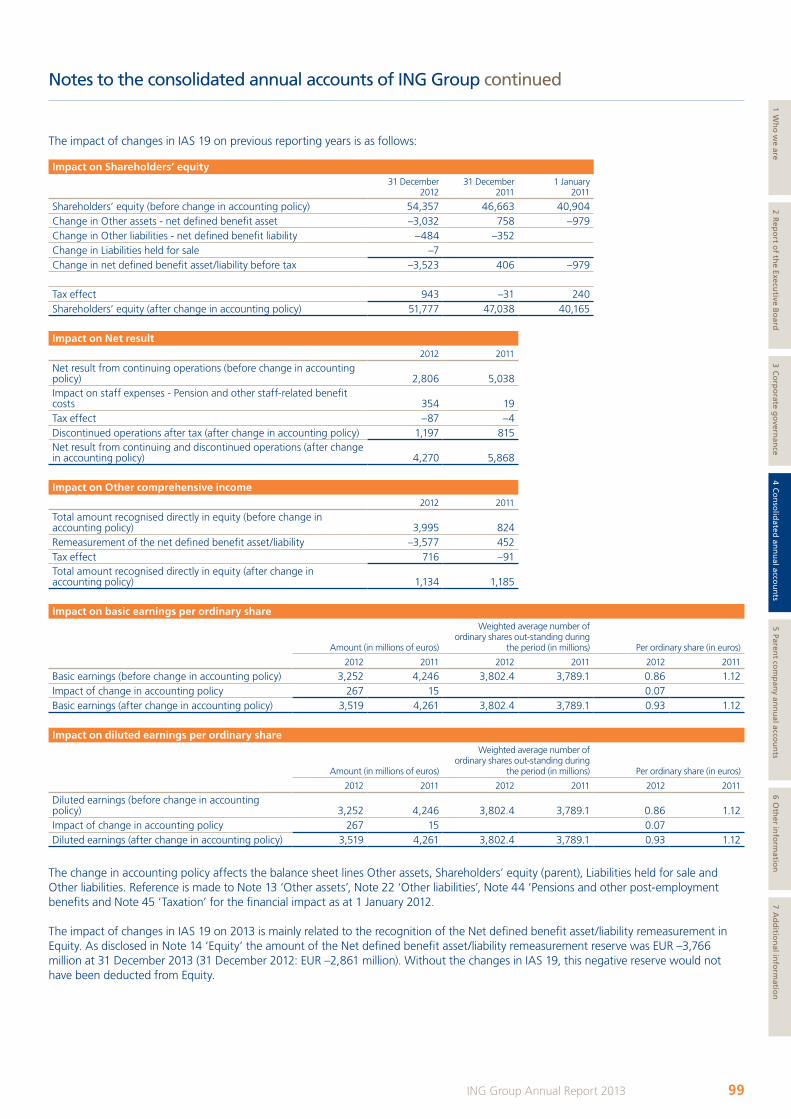
Notes to the consolidated annual accounts of ING Group continued
The impact of changes in IAS 19 on previous reporting years is as follows:
Impact on Shareholders’ equity31 December
201231 December
20111 January
2011
Shareholders’ equity (before change in accounting policy) 54,357 46,663 40,904Change in Other assets - net defined benefit asset –3,032 758 –979Change in Other liabilities - net defined benefit liability –484 –352Change in Liabilities held for sale –7Change in net defined benefit asset/liability before tax –3,523 406 –979
Tax effect 943 –31 240Shareholders’ equity (after change in accounting policy) 51,777 47,038 40,165
Impact on Net result2012 2011
Net result from continuing operations (before change in accounting policy) 2,806 5,038Impact on staff expenses - Pension and other staff-related benefit costs 354 19Tax effect –87 –4Discontinued operations after tax (after change in accounting policy) 1,197 815Net result from continuing and discontinued operations (after change in accounting policy) 4,270 5,868
Impact on Other comprehensive income2012 2011
Total amount recognised directly in equity (before change in accounting policy) 3,995 824Remeasurement of the net defined benefit asset/liability –3,577 452Tax effect 716 –91Total amount recognised directly in equity (after change in accounting policy) 1,134 1,185
Impact on basic earnings per ordinary share
Amount (in millions of euros)
Weighted average number of ordinary shares out-standing during
the period (in millions) Per ordinary share (in euros)
2012 2011 2012 2011 2012 2011
Basic earnings (before change in accounting policy) 3,252 4,246 3,802.4 3,789.1 0.86 1.12Impact of change in accounting policy 267 15 0.07Basic earnings (after change in accounting policy) 3,519 4,261 3,802.4 3,789.1 0.93 1.12
Impact on diluted earnings per ordinary share
Amount (in millions of euros)
Weighted average number of ordinary shares out-standing during
the period (in millions) Per ordinary share (in euros)
2012 2011 2012 2011 2012 2011
Diluted earnings (before change in accounting policy) 3,252 4,246 3,802.4 3,789.1 0.86 1.12Impact of change in accounting policy 267 15 0.07Diluted earnings (after change in accounting policy) 3,519 4,261 3,802.4 3,789.1 0.93 1.12
The change in accounting policy affects the balance sheet lines Other assets, Shareholders’ equity (parent), Liabilities held for sale and Other liabilities. Reference is made to Note 13 ‘Other assets’, Note 22 ‘Other liabilities’, Note 44 ‘Pensions and other post-employment benefits and Note 45 ‘Taxation’ for the financial impact as at 1 January 2012.
The impact of changes in IAS 19 on 2013 is mainly related to the recognition of the Net defined benefit asset/liability remeasurement in Equity. As disclosed in Note 14 ‘Equity’ the amount of the Net defined benefit asset/liability remeasurement reserve was EUR –3,766 million at 31 December 2013 (31 December 2012: EUR –2,861 million). Without the changes in IAS 19, this negative reserve would not have been deducted from Equity.
99ING Group Annual Report 2013
1 Wh
o w
e are2 R
epo
rt of th
e Executive B
oard
3 Co
rpo
rate go
vernan
ce4 C
on
solid
ated an
nu
al accou
nts
5 Parent co
mp
any an
nu
al accou
nts
6 Oth
er info
rmatio
n7 A
dd
ition
al info
rmatio
n
ING_2013_deel1_v1.indd 99 19/03/2014 18:57:53
Notes to the consolidated annual accounts of ING Group continued
Amendments to IAS 1 ‘Presentation of Financial Statements’The amendments to IAS 1 ‘Presentation of Financial Statements’ resulted in changes to the presentation in the Consolidated Statement of Other Comprehensive income, including a split of Other comprehensive income into items that may be recognised in the profit and loss account in future periods and items that will never be recognised in the profit and loss account. There is no impact on Total equity, Net result and/or Other comprehensive income.
Amendments to IFRS 7 ‘Financial instruments: Disclosures’ The amendments to IFRS 7 ‘Financial instruments: Disclosures’ introduced additional disclosures on offsetting (netting) of financial instruments in the balance sheet and on the potential effect of netting arrangements. There is no impact on Total equity, Net result and/or Other comprehensive income. Reference is made to Note 52 ‘Offsetting financial assets and liabilities’.
IFRS 13 ‘Fair Value Measurement’IFRS 13 ‘Fair Value Measurement’ brings together in one standard all guidance on how to determine fair value. It does not change the scope of assets/liabilities that are measured at fair value. ING Group’s interpretation of fair value measurement was not significantly different from the guidance in IFRS 13. Therefore, the implementation of IFRS 13 ‘Fair Value Measurement’ at 1 January 2013 did not have a significant impact on Total equity, Net result and/or Other comprehensive income. In addition, IFRS 13 introduces an extended scope for the disclosure of the fair value hierarchy by level of fair value for non-financial assets and liabilities. Reference is made to Note 46 ‘Fair value of assets and liabilities’.
As a result of the retrospective change in accounting policies set out above, the Consolidated balance sheet of ING Group includes an additional balance sheet as at 31 December 2011.
OTHER SIGNIFICANT CHANGES IN 2013ING U.S.In May 2013, ING U.S. was successfully listed on the NYSE. As a result of the IPO, ING’s ownership interest in ING U.S. was reduced from 100% to 71.25%. In October 2013, the sale of a second tranche further reduced ING Group’s interest in ING U.S. to approximately 56.7%. In light of ING’s intention to divest its remaining interest in ING U.S. over time ING U.S. is classified as held for sale and discontinued operations. Reference is made to Note 59 ‘Other events’.
ING JapanAfter carefully exploring and evaluating the options available for the divestment of ING Life Japan, it was concluded that a standalone divestment of ING Life Japan, including its Corporate Owned Life Insurance (COLI) and Closed Block VA businesses, is not feasible in a manner that would appropriately meet the demands of regulators and other stakeholders in ING Group and ING Life Japan. Therefore, ING Life Japan will be included with ING’s European insurance and investment management businesses in the base case IPO of NN Group in 2014. As a result, ING Life Japan and the Japanese Closed Block VA guarantees reinsured to ING Re (‘ING Japan’) are no longer classified as held for sale and discontinued operations. Reference is made to Note 59 ‘Other events’.
Based on the above events, changes were made to the segment reporting as disclosed in Note 42 ‘Segments’.
Establishment of NN GroupUntil recently, ING Verzekeringen N.V. (‘ING Insurance’) was the holding company of the insurance and investment management activities of ING. As such, ING Insurance prepared consolidated financial statements under IFRS-EU that included ING Insurance and all its subsidiaries. ING Insurance was a wholly owned subsidiary of ING Insurance Topholding N.V. (‘ING Topholding’), a wholly owned subsidiary of the ultimate parent ING Groep N.V. ING Topholding was a holding company with no other assets, liabilities and activities than its 100% holding ING Insurance.
On 28 February 2014, before the finalisation of the 2013 consolidated financial statements, ING Insurance and ING Topholding legally merged. Through this merger, the legal entity ING Insurance ceased to exist. The legal merger became effective on 1 March 2014 and on that date the merged entity was renamed NN Group N.V. (‘NN Group’).
The merged entity NN Group N.V. is in substance a continuation of ING Insurance. As of 2013, NN Group prepares consolidated financial statements under IFRS-EU in which all assets and liabilities of ING Insurance and its subsidiaries are included at their existing carrying values. The parent company financial statements are those of NN Group N.V. As ING Topholding was a holding company with no other assets, liabilities and activities than its 100% holding ING Insurance, the financial position and results of NN Group are not significantly different from what these would have been for ING Insurance.
Other The comparison of balance sheet items between 31 December 2013 and 31 December 2012 is impacted by the Initial Public Offering (‘IPO’) and second tranche sale of ING U.S, Inc, ING’s U.S.-based retirement, investment and insurance business (‘ING U.S.’), the classification of ING U.S. as held for sale and discontinued operations, the classification to continuing operations of ING Life Japan and the Japanese Closed Block VA guarantees reinsured to ING Re (‘ING Japan’), the divestment of companies as disclosed in Note 55 ‘Companies and businesses acquired and divested’ and by the held for sale classification as disclosed in Note 12 ‘Assets and liabilities held for sale’ and Note 36 ‘Discontinued operations’.
100 ING Group Annual Report 2013
ING_2013_deel1_v1.indd 100 19/03/2014 18:57:53
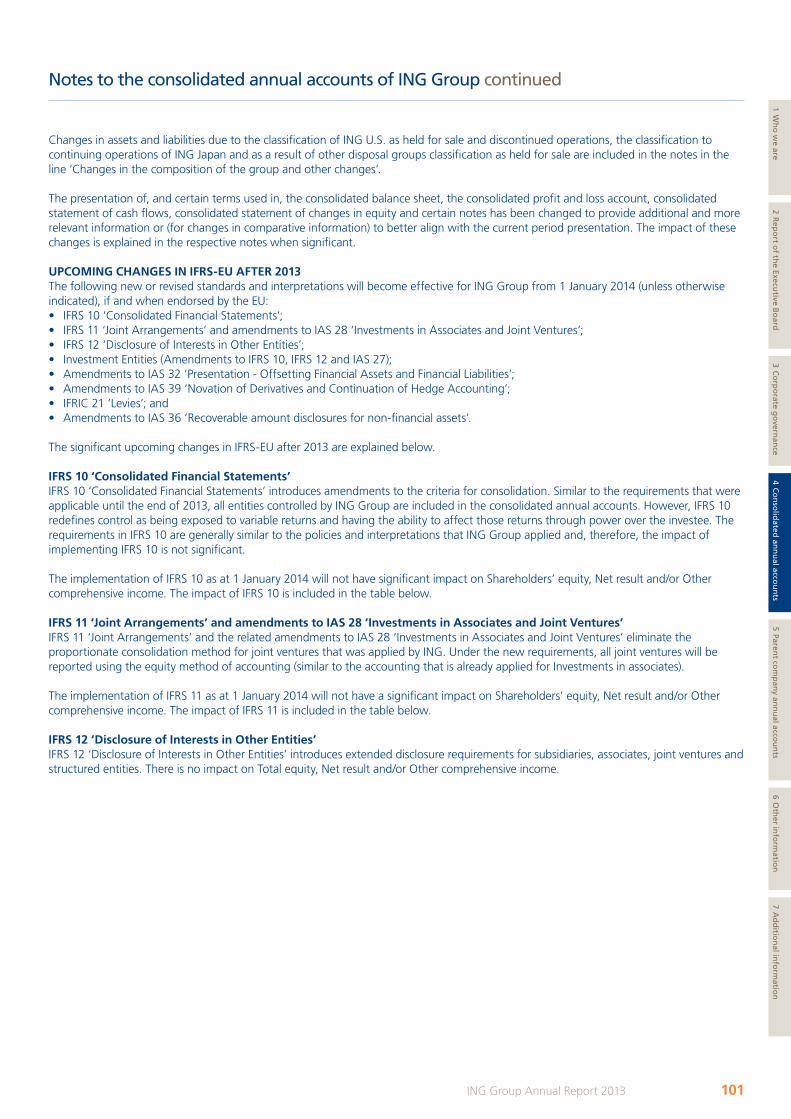
Changes in assets and liabilities due to the classification of ING U.S. as held for sale and discontinued operations, the classification to continuing operations of ING Japan and as a result of other disposal groups classification as held for sale are included in the notes in the line ‘Changes in the composition of the group and other changes’.
The presentation of, and certain terms used in, the consolidated balance sheet, the consolidated profit and loss account, consolidated statement of cash flows, consolidated statement of changes in equity and certain notes has been changed to provide additional and more relevant information or (for changes in comparative information) to better align with the current period presentation. The impact of these changes is explained in the respective notes when significant.
UPCOMING CHANGES IN IFRS-EU AFTER 2013The following new or revised standards and interpretations will become effective for ING Group from 1 January 2014 (unless otherwise indicated), if and when endorsed by the EU: • IFRS 10 ‘Consolidated Financial Statements’;• IFRS 11 ‘Joint Arrangements’ and amendments to IAS 28 ‘Investments in Associates and Joint Ventures’; • IFRS 12 ‘Disclosure of Interests in Other Entities’;• Investment Entities (Amendments to IFRS 10, IFRS 12 and IAS 27);• Amendments to IAS 32 ‘Presentation - Offsetting Financial Assets and Financial Liabilities’;• Amendments to IAS 39 ‘Novation of Derivatives and Continuation of Hedge Accounting’;• IFRIC 21 ‘Levies’; and• Amendments to IAS 36 ‘Recoverable amount disclosures for non-financial assets’.
The significant upcoming changes in IFRS-EU after 2013 are explained below.
IFRS 10 ‘Consolidated Financial Statements’IFRS 10 ‘Consolidated Financial Statements’ introduces amendments to the criteria for consolidation. Similar to the requirements that were applicable until the end of 2013, all entities controlled by ING Group are included in the consolidated annual accounts. However, IFRS 10 redefines control as being exposed to variable returns and having the ability to affect those returns through power over the investee. The requirements in IFRS 10 are generally similar to the policies and interpretations that ING Group applied and, therefore, the impact of implementing IFRS 10 is not significant.
The implementation of IFRS 10 as at 1 January 2014 will not have significant impact on Shareholders’ equity, Net result and/or Other comprehensive income. The impact of IFRS 10 is included in the table below.
IFRS 11 ‘Joint Arrangements’ and amendments to IAS 28 ‘Investments in Associates and Joint Ventures’IFRS 11 ‘Joint Arrangements’ and the related amendments to IAS 28 ‘Investments in Associates and Joint Ventures’ eliminate the proportionate consolidation method for joint ventures that was applied by ING. Under the new requirements, all joint ventures will be reported using the equity method of accounting (similar to the accounting that is already applied for Investments in associates).
The implementation of IFRS 11 as at 1 January 2014 will not have a significant impact on Shareholders’ equity, Net result and/or Other comprehensive income. The impact of IFRS 11 is included in the table below.
IFRS 12 ‘Disclosure of Interests in Other Entities’IFRS 12 ‘Disclosure of Interests in Other Entities’ introduces extended disclosure requirements for subsidiaries, associates, joint ventures and structured entities. There is no impact on Total equity, Net result and/or Other comprehensive income.
Notes to the consolidated annual accounts of ING Group continued
101ING Group Annual Report 2013
1 Wh
o w
e are2 R
epo
rt of th
e Executive B
oard
3 Co
rpo
rate go
vernan
ce4 C
on
solid
ated an
nu
al accou
nts
5 Parent co
mp
any an
nu
al accou
nts
6 Oth
er info
rmatio
n7 A
dd
ition
al info
rmatio
n
ING_2013_deel1_v1.indd 101 19/03/2014 18:57:53
Summary of impact as at 1 January 2014The above mentioned impact of changes of IFRS requirements that are implemented as of 1 January 2014 is summarised as follows:
Upcoming changes in IFRS-EU in 2014IFRS 10
‘Consolidated Financial
Statements’
IFRS 11 ‘Joint
Arrangements’ Total
Assets held for sale 1,213 –442 771Assets – other –95 –95Impact on Total assets 1,213 –537 676
Liabilities held for sale 702 –442 260Liabilities – other –95 –95Impact on Total liabilities 702 –537 165
Impact on Minority interests 511 511
Impact on Shareholders' equity 0 0 0
IFRS 9 ‘Financial Instruments’ was originally issued in November 2009, reissued in October 2010, and then amended in November 2013. Further amendments are expected to be finalised in 2014. The current version of IFRS 9 does not include a mandatory effective date. An effective date will be added when all phases of the project are complete and a final version of IFRS 9 is issued. The mandatory effective date of IFRS 9 is expected to be 2018. IFRS 9 is also not yet endorsed by the EU. Implementation of IFRS 9, if and when finalised and endorsed by the EU, may have a significant impact on Shareholders’ equity, Net result and/or Other comprehensive income.
UPCOMING OTHER CHANGES IN ACCOUNTING POLICIES IN 2014Accounting for GMDB in Japan Closed Block VANN Group has moved towards fair value accounting on the reserves for Guaranteed Minimum Death Benefits (GMDB) of the Japan Closed Block VA as of 1 January 2014. Reference is made to Note 60 ‘Subsequent events’.
CRITICAL ACCOUNTING POLICIESING Group has identified the accounting policies that are most critical to its business operations and to the understanding of its results. These critical accounting policies are those which involve the most complex or subjective decisions or assessments, and relate to insurance provisions, deferred acquisition costs and value of business acquired, loan loss provisions, the determination of the fair values of real estate and financial assets and liabilities, impairments and employee benefits. In each case, the determination of these items is fundamental to the financial condition and results of operations, and requires management to make complex judgements based on information and financial data that may change in future periods. As a result, determinations regarding these items necessarily involve the use of assumptions and subjective judgements as to future events and are subject to change, as the use of different assumptions or data could produce significantly different results. For a further discussion of the application of these accounting policies, reference is made to the applicable notes to the consolidated financial statements and the information below under ‘Principles of valuation and determination of results’.
Insurance provisions, Deferred Acquisition Costs (DAC) and Value of Business Acquired (VOBA)The establishment of insurance provisions, DAC and VOBA is an inherently uncertain process, involving assumptions about factors such as court decisions, changes in laws, social, economic and demographic trends, inflation, investment returns, policyholder behaviour and other factors, and, in the life insurance business, assumptions concerning mortality and morbidity trends. Specifically, assumptions related to these items that could have a significant impact on financial results include interest rates, mortality, morbidity, property and casualty claims, investment yields on equity and real estate, foreign currency exchange rates and reserve adequacy assumptions.
The use of different assumptions about these factors could have a significant effect on insurance provisions and underwriting expenditure. Changes in assumptions may lead to changes in the insurance provisions over time. Furthermore, some of these assumptions can be volatile.
In addition, the adequacy of insurance provisions, net of DAC and VOBA, is evaluated regularly. The test involves comparing the established insurance provision with current best estimate assumptions about factors such as court decisions, changes in laws, social, economic and demographic trends, inflation, investment returns, policyholder behaviour, mortality and morbidity trends and other factors. The use of different assumptions in this test could lead to a different outcome.
Insurance provisions also include the impact of minimum guarantees which are contained within certain variable annuity products. This impact is dependent upon the difference between the potential minimum benefits payable and the total account balance, expected mortality and surrender rates. The determination of the potential minimum benefits payable also involves the use of assumptions about factors such as inflation, investment returns, policyholder behaviour, and mortality morbidity trends and other factors. The use of different assumptions about these factors could have a significant effect on insurance provisions and underwriting expenditure.
Notes to the consolidated annual accounts of ING Group continued
102 ING Group Annual Report 2013
ING_2013_deel1_v1.indd 102 19/03/2014 18:57:54
The process of defining methodologies and assumptions for insurance provisions, DAC and VOBA is governed by NN Group risk management as described in the ‘Risk management’ section.
Reference is made to the ‘Risk management’ section for a sensitivity analysis of net result to insurance, interest rate, equity, foreign currency and real estate risks. These sensitivities are based on changes in assumptions that management considers reasonably likely at the balance sheet date.
Loan loss provisionsLoan loss provisions are recognised based on an incurred loss model. Considerable judgement is exercised in determining the extent of the loan loss provision (impairment) and is based on the management’s evaluation of the risk in the portfolio, current economic conditions, loss experience in recent years and credit, industry, geographical and concentration trends. Changes in such judgements and analyses may lead to changes in the loan loss provisions over time.
The identification of impairment and the determination of the recoverable amount are an inherently uncertain processes involving various assumptions and factors including the financial condition of the counterparty, expected future cash flows, observable market prices and expected net selling prices.
Future cash flows in a portfolio of financial assets that are collectively evaluated for impairment are estimated on the basis of the contractual cash flows of the assets in the portfolio and historical loss experience for assets with credit risk characteristics similar to those in the portfolio. Historical loss experience is adjusted on the basis of current observable data to reflect the effects of current conditions that did not affect the period on which the historical loss experience is based and to remove the effects of conditions in the historical period that do not exist currently. Current observable data may include changes in unemployment rates, property prices and commodity prices. The methodology and assumptions used for estimating future cash flows are reviewed regularly to reduce any differences between loss estimates and actual loss experience.
Fair values of real estateReal estate investments are reported at fair value. The fair value of real estate investments is based on regular appraisals by independent qualified valuers. The fair values are established using valuation methods such as: comparable market transactions, capitalisation of income methods or discounted cash flow calculations. The underlying assumption used in the valuation is that the properties are let or sold to third parties based on the actual letting status. The discounted cash flow analyses and capitalisation of income method are based on calculations of the future rental income in accordance with the terms in existing leases and estimations of the rental values for new leases when leases expire and incentives like rental free periods. The cash flows are discounted using market based interest rates that reflect appropriately the risk characteristics of real estate.
Market conditions in recent years have led to a reduced level of real estate transactions. Transaction values were significantly impacted by low volumes of actual transactions. As a result comparable market transactions have been used less in valuing ING’s real estate investments by independent qualified valuers. More emphasis has been placed on discounted cash flow analysis and capitalisation of income method.
Reference is made to Note 46 ‘Fair value of assets and liabilities’ for more disclosure on fair values of real estate investments.
The valuation of real estate involves various assumptions and techniques. The use of different assumptions and techniques could produce significantly different valuations. Consequently, the fair values presented may not be indicative of the net realisable value. In addition, the calculation of the estimated fair value is based on market conditions at a specific point in time and may not be indicative of future fair values. To illustrate the uncertainty of our real estate investments valuation, a sensitivity analysis on the changes in fair value of real estate is provided in the ‘Risk management’ section.
Fair values of financial assets and liabilitiesFair values of financial assets and liabilities are based on unadjusted quoted market prices where available. Such quoted market prices are primarily obtained from exchange prices for listed instruments. Where an exchange price is not available, market prices may be obtained from independent market vendors, brokers or market makers. In general, positions are valued taking the bid price for a long position and the offer price for a short position. In some cases where positions are marked at mid-market prices, a fair value adjustment is calculated.
When markets are less liquid there may be a range of prices for the same security from different price sources, selecting the most appropriate price requires judgement and could result in different estimates of fair value.
For certain financial assets and liabilities quoted market prices are not available. For these financial assets and liabilities, fair value is determined using valuation techniques. These valuation techniques range from discounting of cash flows to valuation models, where relevant pricing factors including the market price of underlying reference instruments, market parameters (volatilities, correlations and credit ratings) and customer behaviour are taken into account. All valuation techniques used are subject to internal review and approval. Most data used in these valuation techniques are validated on a daily basis.
Notes to the consolidated annual accounts of ING Group continued
103ING Group Annual Report 2013
1 Wh
o w
e are2 R
epo
rt of th
e Executive B
oard
3 Co
rpo
rate go
vernan
ce4 C
on
solid
ated an
nu
al accou
nts
5 Parent co
mp
any an
nu
al accou
nts
6 Oth
er info
rmatio
n7 A
dd
ition
al info
rmatio
n
ING_2013_deel1_v1.indd 103 19/03/2014 18:57:54
To include credit risk in the fair valuation, ING applies both credit and debit valuation adjustments (CVA, DVA). Own issued debt and structured notes that are valued at fair value are adjusted for credit risk by means of a DVA. Additionally, derivatives valued at fair value are adjusted for credit risk by a CVA. The CVA is of a bilateral nature as both the credit risk on the counterparty as well as the credit risk on ING are included in the adjustment. All market data that is used in the determination of the CVA is based on market implied data. Additionally, wrong-way risk (when exposure to a counterparty is increasing and the credit quality of that counterparty decreases) and right way risk (when exposure to a counterparty is decreasing and the credit quality of that counterparty increases) are included in the adjustment. ING also applies CVA for pricing credit risk into new external trades with counterparties.
Valuation techniques are subjective in nature and significant judgement is involved in establishing fair values for certain financial assets and liabilities. Valuation techniques involve various assumptions regarding pricing factors. The use of different valuation techniques and assumptions could produce significantly different estimates of fair value.
Price testing is performed to assess whether the process of valuation has led to an appropriate fair value of the position and to an appropriate reflection of these valuations in the profit and loss account. Price testing is performed to minimise the potential risks for economic losses due to incorrect or misused models.
Reference is made to Note 46 ‘Fair value of assets and liabilities’ and the ‘Risk management’ section for the basis of the determination of the fair value of financial instruments and related sensitivities.
ImpairmentsImpairment evaluation is a complex process that inherently involves significant judgements and uncertainties that may have a significant impact on ING Group’s consolidated financial statements. Impairments are especially relevant in two areas: Available-for-sale debt and equity securities and Goodwill/Intangible assets.
All debt and equity securities (other than those carried at fair value through profit and loss) are subject to impairment testing every reporting period. The carrying value is reviewed in order to determine whether an impairment loss has been incurred. Evaluation for impairment includes both quantitative and qualitative considerations. For debt securities, such considerations include actual and estimated incurred credit losses indicated by payment default, market data on (estimated) incurred losses and other current evidence that the issuer may be unlikely to pay amounts when due. Equity securities are impaired when management believes that, based on a significant or prolonged decline of the fair value below the acquisition price, there is sufficient reason to believe that the acquisition cost may not be recovered. ‘Significant’ and ‘prolonged’ are interpreted on a case-by-case basis for specific equity securities. Generally 25% and 6 months are used as triggers. Upon impairment, the full difference between the (acquisition) cost and fair value is removed from equity and recognised in net result. Impairments on debt securities may be reversed if there is a decrease in the amount of the impairment which can be objectively related to an observable event. Impairments on equity securities cannot be reversed.
Impairments on other debt instruments (Loans and held-to-maturity investments) are part of the loan loss provision as described above.
Impairment reviews with respect to goodwill and intangible assets are performed at least annually and more frequently if events indicate that impairments may have occurred. Goodwill is tested for impairment by comparing the carrying value (including goodwill) of the reporting unit to the best estimate of the recoverable amount of that reporting unit. The carrying value is determined as the IFRS-EU net asset value including goodwill. The recoverable amount is estimated as the higher of fair value less cost to sell and value in use. Several methodologies are applied to arrive at the best estimate of the recoverable amount. A reporting unit is the lowest level at which goodwill is monitored. Intangible assets are tested for impairment by comparing the carrying value with the best estimate of the recoverable amount.
The identification of impairment is an inherently uncertain process involving various assumptions and factors, including financial condition of the counterparty, expected future cash flows, statistical loss data, discount rates, observable market prices, etc. Estimates and assumptions are based on management’s judgement and other information available prior to the issuance of the financial statements. Significantly different results can occur as circumstances change and additional information becomes known.
Employee benefitsGroup companies operate various defined benefit retirement plans covering a significant number of ING’s employees.
The net defined benefit asset/liability recognised in the balance sheet in respect of the defined benefit pension plans is the fair value of the plan assets less the present value of the defined benefit obligation at the balance sheet date.
The determination of the defined benefit obligation is based on internal and external actuarial models and calculations. The defined benefit obligation is calculated using the projected unit credit method. Inherent in these actuarial models are assumptions including discount rates (in particular based on market yields on high quality corporate bonds), rates of increase in future salary and benefit levels, mortality rates, trend rates in health care costs and consumer price index and are updated on a quarterly basis.
Notes to the consolidated annual accounts of ING Group continued
104 ING Group Annual Report 2013
ING_2013_deel1_v1.indd 104 19/03/2014 18:57:54
The actuarial assumptions may differ significantly from the actual results due to changes in market conditions, economic and mortality trends, and other assumptions. Any changes in these assumptions could have a significant impact on the net defined benefit asset/liabilities and future pension costs. Reference is made to Note 44 ‘Pension and other post-employment benefits’ for the weighted averages of basic actuarial assumptions in connection with pension and other post-employment benefits.
PRINCIPLES OF VALUATION AND DETERMINATION OF RESULTSConsolidationING Group (‘the Group’) comprises ING Groep N.V. (‘the Company’), NN Group N.V., ING Bank N.V. and all other subsidiaries. The consolidated financial statements of ING Group comprise the accounts of ING Groep N.V. and all entities in which it either owns, directly or indirectly, more than half of the voting power or over which it has control of their operating and financial policies through situations including, but not limited to:• Ability to appoint or remove the majority of the board of directors;• Power to govern such policies under statute or agreement; and• Power over more than half of the voting rights through an agreement with other investors.
A list of principal subsidiaries is included in Note 56 ‘Principal subsidiaries’.
The existence and effect of potential voting rights that are currently exercisable or convertible are considered in assessing whether the Group controls another entity.
For interests in investment vehicles, the existence of control is determined taking into account both ING Group’s financial interests for own risk and its role as investment manager. Financial interests for risk of policyholders are not taken into account when the policyholders decide on the investment allocations of their insurance policies and assume all risks and benefits on these investments.
The results of the operations and the net assets of subsidiaries are included in the profit and loss account and the balance sheet from the date control is obtained until the date control is lost. On disposal, the difference between the sales proceeds, net of directly attributable transaction costs, and the net assets is included in net result.
A subsidiary which ING Group has agreed to sell but is still legally owned by ING Group may still be controlled by ING Group at the balance sheet date and, therefore, still be included in the consolidation. Such a subsidiary may be presented as a held for sale disposal group if certain conditions are met.
All intercompany transactions, balances and unrealised surpluses and deficits on transactions between group companies are eliminated. Where necessary, the accounting policies used by subsidiaries are changed to ensure consistency with group policies. In general, the reporting dates of subsidiaries are the same as the reporting date of ING Groep N.V.
ING Groep N.V. and its Dutch group companies are subject to legal restrictions regarding the amount of dividends they can pay to their shareholders. The Dutch Civil Code contains the restriction that dividends can only be paid up to an amount equal to the excess of the company’s own funds over the sum of the paid-up capital and reserves required by law. Additionally, certain Group companies are subject to restrictions on the amount of funds they may transfer in the form of dividends, or otherwise, to the parent company.
Furthermore, in addition to the restrictions in respect of minimum capital requirements that are imposed by industry regulators in the countries in which the subsidiaries operate, other limitations exist in certain countries.
ING Group’s interests in jointly controlled entities are accounted for using proportionate consolidation. ING Group proportionately consolidates its share of the joint ventures’ individual income and expenses, assets and liabilities, and cash flows on a line-by-line basis with similar items in ING Group’s financial statements. ING Group recognises the portion of gains or losses on the sale of assets to the joint venture that is attributable to the other venturers. ING Group does not recognise its share of profits or losses from the joint venture that results from the purchase of assets by ING Group from the joint venture until it resells the assets to a third party. However, if a loss on the transaction provides evidence of a reduction in the net realisable value of current assets or an impairment loss, the loss is recognised immediately.
Disposal groups held for sale and discontinued operationsDisposal groups (and groups of non-current assets) are classified as held for sale if their carrying amount will be recovered principally through a sale transaction rather than through continuing use. This is only the case when the sale is highly probable and the disposal group (or group of assets) is available for immediate sale in its present condition; management must be committed to the sale, which is expected to occur within one year from the date of classification as held for sale.
Upon classification as held for sale, the carrying amount of the disposal group (or group of assets) is compared to their fair value less cost to sell. If the fair value less cost to sell is lower than the carrying value, this expected loss is recognised through a reduction of the carrying value of any goodwill related to the disposal group or the carrying value of certain other non-current non-financial assets to the extent that the carrying value of those assets exceeds their fair value. Any excess of the expected loss over the reduction of the carrying amount of these relevant assets is not recognised upon classification as held for sale, but is recognised as part of the result on disposal if and when a divestment transaction occurs.
Notes to the consolidated annual accounts of ING Group continued
105ING Group Annual Report 2013
1 Wh
o w
e are2 R
epo
rt of th
e Executive B
oard
3 Co
rpo
rate go
vernan
ce4 C
on
solid
ated an
nu
al accou
nts
5 Parent co
mp
any an
nu
al accou
nts
6 Oth
er info
rmatio
n7 A
dd
ition
al info
rmatio
n
ING_2013_deel1_v1.indd 105 19/03/2014 18:57:54

Classification into or out of held for sale does not result in restating comparative amounts in the balance sheet.
When a group of assets that is classified as held for sale represents a major line of business or geographical area the disposal group classifies as discontinued operations. In the consolidated profit and loss account, the income and expenses from discontinued operations are reported separately from income and expenses from continuing operations, down to the level of result after tax for both the current and for comparative years.
Use of estimates and assumptionsThe preparation of the consolidated financial statements necessitates the use of estimates and assumptions. These estimates and assumptions affect the reported amounts of the assets and liabilities and the amounts of the contingent liabilities at the balance sheet date, as well as reported income and expenses for the year. The actual outcome may differ from these estimates.
The process of setting assumptions is subject to internal control procedures and approvals, and takes into account internal and external studies, industry statistics, environmental factors and trends, and regulatory requirements.
Segment reportingA segment is a distinguishable component of the Group, engaged in providing products or services, subject to risks and returns that are different from those of other segments. A geographical area is a distinguishable component of the Group engaged in providing products or services within a particular economic environment that is subject to risks and returns that are different from those of segments operating in other economic environments. The geographical analyses are based on the location of the office from which the transactions are originated.
Analysis of insurance businessWhere amounts in respect of insurance business are analysed into ‘life’ and ‘non-life’, health and disability insurance business which is similar in nature to life insurance business is included in ‘life’.
Foreign currency translationFunctional and presentation currencyItems included in the financial statements of each of the Group’s entities are measured using the currency of the primary economic environment in which the entity operates (‘the functional currency’). The consolidated financial statements are presented in euros, which is ING Group’s functional and presentation currency.
Transactions and balancesForeign currency transactions are translated into the functional currency using the exchange rate prevailing at the date of the transactions. Exchange rate differences resulting from the settlement of such transactions and from the translation at year-end exchange rates of monetary assets and liabilities denominated in foreign currencies are recognised in the profit and loss account, except when deferred in equity as part of qualifying cash flow hedges or qualifying net investment hedges.
Exchange rate differences on non-monetary items, measured at fair value through profit and loss, are reported as part of the fair value gain or loss. Non-monetary items are retranslated at the date fair value is determined. Exchange rate differences on non-monetary items measured at fair value through the revaluation reserve are included in the revaluation reserve in equity.
Exchange rate differences in the profit and loss account are generally included in Net trading income. Reference is made to Note 29 ‘Net trading income’, which discloses the amounts included in the profit and loss account. Exchange rate differences relating to the disposal of available-for-sale debt and equity securities are considered to be an inherent part of the capital gains and losses recognised in Investment income. As mentioned below in Group companies relating to the disposals of group companies, any exchange rate difference deferred in equity is recognised in the profit and loss account in Result on disposals of group companies. Reference is also made to Note 14 ‘Equity’, which discloses the amounts included in the profit and loss account.
Group companiesThe results and financial positions of all group companies that have a functional currency different from the presentation currency are translated into the presentation currency as follows:• Assets and liabilities included in each balance sheet are translated at the closing rate at the date of that balance sheet;• Income and expenses included in each profit and loss account are translated at average exchange rates (unless this average is not a
reasonable approximation of the cumulative effect of the rates prevailing on the transaction dates, in which case income and expenses are translated at the dates of the transactions); and
• All resulting exchange rate differences are recognised in a separate component of equity.
On consolidation, exchange rate differences arising from the translation of a monetary item that forms part of the net investment in a foreign operation, and of borrowings and other instruments designated as hedges of such investments, are taken to shareholders’ equity. When a foreign operation is sold, the corresponding exchange rate differences are recognised in the profit and loss account as part of the gain or loss on sale.
Notes to the consolidated annual accounts of ING Group continued
106 ING Group Annual Report 2013
ING_2013_deel1_v1.indd 106 19/03/2014 18:57:54
Goodwill and fair value adjustments arising from the acquisition of a foreign operation are treated as assets and liabilities of the foreign operation and translated at the exchange rate prevailing at the balance sheet date.
Fair values of financial assets and liabilitiesThe fair values of financial instruments are based on quoted market prices at the balance sheet date where available. The quoted market price used for financial assets held by the Group is the current bid price; the quoted market price used for financial liabilities is the current ask price.
The fair value of financial instruments that are not traded in an active market are determined using valuation techniques. The Group uses a variety of methods and makes assumptions that are based on market conditions existing at each balance sheet date.
Reference is made to Note 46 ‘Fair value of assets and liabilities’ for the basis of the determination of the fair value of financial instruments.
Recognition and derecognition of financial instrumentsRecognition of financial assetsAll purchases and sales of financial assets classified as fair value through profit and loss (excluding investments for risk of policyholders), held-to-maturity and available-for-sale that require delivery within the time frame established by regulation or market convention (‘regular way’ purchases and sales) are recognised at trade date, which is the date on which the Group commits to purchase or sell the asset. Loans and receivables are recognised at settlement date, which is the date on which the Group receives or delivers the asset.
Derecognition of financial assetsFinancial assets are derecognised when the rights to receive cash flows from the financial assets have expired or where the Group has transferred substantially all risks and rewards of ownership. If the Group neither transfers nor retains substantially all the risks and rewards of ownership of a financial asset, it derecognises the financial asset if it no longer has control over the asset.
Financial liabilitiesDebt securities in issue are recognised and derecognised at trade date.
Realised gains and losses on investmentsRealised gains and losses on investments are determined as the difference between the sale proceeds and (amortised) cost. For equity securities, the cost is determined using a weighted average per portfolio. For debt securities, the cost is determined by specific identification.
Classification of financial instrumentsFinancial assets at fair value through profit and lossFinancial assets at fair value through profit and loss include equity securities, debt securities, derivatives, loans and receivables and other, and comprise the following sub-categories: trading assets, non-trading derivatives, financial assets designated at fair value through profit and loss by management and investments for risk of policyholders.
A financial asset is classified as at fair value through profit and loss if acquired principally for the purpose of selling in the short term or if designated by management as such. Management will make this designation only if this eliminates a measurement inconsistency or if the related assets and liabilities are managed on a fair value basis.
Investments for risk of policyholders are investments against insurance liabilities for which all changes in fair value of invested assets are offset by similar changes in insurance liabilities.
Transaction costs on initial recognition are expensed as incurred. Interest income from debt securities and loans and receivables classified as at fair value through profit and loss is recognised in Interest income banking operations and Investment income in the profit and loss account, using the effective interest method.
Dividend income from equity instruments classified as at fair value through profit and loss is generally recognised in Investment income in the profit and loss account when dividend has been declared. Investment result from investments for risk of policyholders is recognised in investment result for risk of policyholders. For derivatives reference is made to the ‘Derivatives and hedge accounting’ section. For all other financial assets classified as at fair value through profit and loss changes in fair value are recognised in Net trading income.
InvestmentsInvestments (including loans quoted in active markets) are classified either as held-to-maturity or available-for-sale and are initially recognised at fair value plus transaction costs. Investment debt securities and loans quoted in active markets with fixed maturity where management has both the intent and the ability to hold to maturity are classified as held-to-maturity. Investment securities and actively traded loans intended to be held for an indefinite period of time, which may be sold in response to needs for liquidity or changes in interest rates, exchange rates or equity prices, are classified as available-for-sale.
Notes to the consolidated annual accounts of ING Group continued
107ING Group Annual Report 2013
1 Wh
o w
e are2 R
epo
rt of th
e Executive B
oard
3 Co
rpo
rate go
vernan
ce4 C
on
solid
ated an
nu
al accou
nts
5 Parent co
mp
any an
nu
al accou
nts
6 Oth
er info
rmatio
n7 A
dd
ition
al info
rmatio
n
ING_2013_deel1_v1.indd 107 19/03/2014 18:57:54

Available-for-sale financial assetsAvailable-for-sale financial assets include available-for-sale debt securities and available-for-sale equity securities. Available-for-sale financial assets are initially recognised at fair value plus transaction costs. For available-for-sale debt securities, the difference between cost and redemption value is amortised. Interest income is recognised using the effective interest method. Available-for-sale financial assets are subsequently measured at fair value. Interest income from debt securities classified as available-for-sale is recognised in Interest income banking operations and Investment income in the profit and loss account. Dividend income from equity instruments classified as available-for-sale is generally recognised in Investment income in the profit and loss account when the dividend has been declared. Unrealised gains and losses arising from changes in the fair value are recognised in equity. When the securities are disposed of, the related accumulated fair value adjustments are included in the profit and loss account as Investment income. For impairments of available-for-sale financial assets reference is made to the section ‘Impairments of other financial assets’. Investments in prepayment sensitive securities such as Interest-Only and Principal-Only strips are generally classified as available-for-sale.
Held-to-maturity investmentsNon-derivative financial assets with fixed or determinable payments and fixed maturity for which the Group has the positive intent and ability to hold to maturity and which are designated by management as held-to-maturity assets are initially recognised at fair value plus transaction costs. Subsequently, they are carried at amortised cost using the effective interest method less any impairment losses. Interest income from debt securities classified as held-to-maturity is recognised in Interest income in the profit and loss account using the effective interest method. Held-to-maturity investments include only debt securities.
Loans and receivablesLoans and receivables are non-derivative financial assets with fixed or determinable payments that are not quoted in an active market. They are initially recognised at fair value plus transaction costs. Subsequently, they are carried at amortised cost using the effective interest method less any impairment losses. Loans and receivables include Cash and balances with central banks, Amounts due from banks, Loans and advances to customers and Other assets and are reflected in these balance sheet lines. Interest income from loans and receivables is recognised in Interest income and Investment income in the profit and loss account using the effective interest method.
Credit risk management classificationCredit risk management disclosures are provided in the section ‘Risk management’. The relationship between credit risk classifications in that section and the consolidated balance sheet classifications above is explained below:• Lending risk arises when ING Group grants a loan to a customer, or issues guarantees on behalf of a customer and mainly relates to the
balance sheet classification Loans and advances to customers and off balance sheet items e.g. obligations under financial guarantees and letters of credit;
• Investment risk comprises the credit default and migration risk that is associated with ING Group’s investment portfolio and mainly relates to the balance sheet classification Investments (available-for-sale and held-to-maturity);
• Money market risk arises when ING Group places short term deposits with a counterparty in order to manage excess liquidity and among others relates to the balance sheet classifications Amounts due from banks and Loans and advances to customers;
• Pre-settlement risk arises when a counterparty defaults on a transaction before settlement and ING Group has to replace the contract by a trade with another counterparty at the then prevailing (possibly unfavourable) market price. The pre-settlement risk classification mainly relates to the balance sheet classification Financial assets at fair value through profit and loss (trading assets and non-trading derivatives) and to securities financing; and
• Settlement risk arises when there is an exchange of value (funds, instruments or commodities) for the same or different value dates and receipt is not verified or expected until ING Group has paid or delivered its side of the trade. Settlement risk mainly relates to the risk arising on disposal of financial instruments that are classified in the balance sheet as Financial assets at fair value through profit and loss (trading assets and non-trading derivatives) and Investments (available-for-sale and held-to-maturity).
Maximum credit risk exposureThe maximum credit risk exposure for items on the balance sheet is generally the carrying value for the relevant financial assets. For the off-balance sheet items the maximum credit exposure is the maximum amount that could be required to be paid. Reference is made to Note 53 ‘Contingent liabilities and commitments’ for these off-balance sheet items. Collateral received is not taken into account when determining the maximum credit risk exposure.
The manner in which ING Group manages credit risk and determines credit risk exposures for that purpose is explained in the ‘Risk management’ section.
Derivatives and hedge accountingDerivatives are initially recognised at fair value on the date on which a derivative contract is entered into and are subsequently measured at fair value. Fair values are obtained from quoted market prices in active markets, including recent market transactions and valuation techniques (such as discounted cash flow models and option pricing models), as appropriate. All derivatives are carried as assets when their fair value is positive and as liabilities when their fair values are negative.
Some credit protection contracts that take the legal form of a derivative, such as certain credit default swaps, are accounted for as financial guarantees.
Notes to the consolidated annual accounts of ING Group continued
108 ING Group Annual Report 2013
ING_2013_deel1_v1.indd 108 19/03/2014 18:57:54
Certain derivatives embedded in other contracts are measured as separate derivatives when their economic characteristics and risks are not closely related to those of the host contract, the host contract is not carried at fair value through profit and loss, and if a separate instrument with the same terms as the embedded derivative would meet the definition of a derivative. These embedded derivatives are measured at fair value with changes in fair value recognised in the profit and loss account. An assessment is carried out when the Group first becomes party to the contract. A reassessment is carried out only when there is a change in the terms of the contract that significantly modifies the expected cash flows.
The method of recognising the resulting fair value gain or loss depends on whether the derivative is designated as a hedging instrument and, if so, the nature of the item being hedged. The Group designates certain derivatives as hedges of the fair value of recognised assets or liabilities or firm commitments (fair value hedge), hedges of highly probable future cash flows attributable to a recognised asset or liability or a forecast transaction (cash flow hedge), or hedges of a net investment in a foreign operation. Hedge accounting is used for derivatives designated in this way provided certain criteria are met.
At the inception of the transaction ING Group documents the relationship between hedging instruments and hedged items, its risk management objective, together with the methods selected to assess hedge effectiveness. The Group also documents its assessment, both at hedge inception and on an ongoing basis, of whether the derivatives that are used in hedging transactions are highly effective in offsetting changes in fair values or cash flows of the hedged items.
ING Group applies fair value hedge accounting to portfolio hedges of interest rate risk (macro hedging) under the EU ‘carve out’ of IFRS-EU. The EU ‘carve-out’ macro hedging enables a group of derivatives (or proportions) to be viewed in combination and jointly designated as the hedging instrument and removes some of the limitations in fair value hedge accounting relating to hedging core deposits and under-hedging strategies. Under the IFRS-EU ‘carve-out’, hedge accounting may be applied to core deposits and ineffectiveness only arises when the revised estimate of the amount of cash flows in scheduled time buckets falls below the designated amount of that bucket.
ING Group applies fair value hedge accounting for portfolio hedges of interest rate risk (macro hedging) under the EU ‘carve-out’ to its retail operations. The net exposures of retail funding (savings and current accounts) and retail lending (mortgages) are hedged. The hedging activities are designated under a portfolio fair value hedge on the mortgages. Changes in the fair value of the derivatives are recognised in the profit and loss account, together with the fair value adjustment on the mortgages (hedged items) insofar as attributable to interest rate risk (the hedged risk).
Fair value hedgesChanges in the fair value of derivatives that are designated and qualify as fair value hedges are recognised in the profit and loss account, together with fair value adjustments to the hedged item attributable to the hedged risk. If the hedge relationship no longer meets the criteria for hedge accounting, the cumulative adjustment of the hedged item is, in the case of interest bearing instruments, amortised through the profit and loss account over the remaining term of the original hedge or recognised directly when the hedged item is derecognised. For non-interest bearing instruments, the cumulative adjustment of the hedged item is recognised in the profit and loss account only when the hedged item is derecognised.
Cash flow hedgesThe effective portion of changes in the fair value of derivatives that are designated and qualify as cash flow hedges are recognised in equity. The gain or loss relating to the ineffective portion is recognised immediately in the profit and loss account. Amounts accumulated in equity are recycled to the profit and loss account in the periods in which the hedged item affects net result. When a hedging instrument expires or is sold, or when a hedge no longer meets the criteria for hedge accounting, any cumulative gain or loss existing in equity at that time remains in equity and is recognised when the forecast transaction is ultimately recognised in the profit and loss account. When a forecast transaction is no longer expected to occur, the cumulative gain or loss that was reported in equity is transferred immediately to the profit and loss account.
Net investment hedgesHedges of net investments in foreign operations are accounted for in a similar way to cash flow hedges. Any gain or loss on the hedging instrument relating to the effective portion of the hedge is recognised in equity and the gain or loss relating to the ineffective portion is recognised immediately in the profit and loss account. Gains and losses accumulated in equity are included in the profit and loss account when the foreign operation is disposed.
Non-trading derivatives that do not qualify for hedge accountingDerivative instruments that are used by the Group as part of its risk management strategies, but which do not qualify for hedge accounting under ING Group’s accounting policies, are presented as non-trading derivatives. Non-trading derivatives are measured at fair value with changes in the fair value taken to the profit and loss account.
Offsetting of financial assets and financial liabilitiesFinancial assets and financial liabilities are offset, and the net amount reported, in the balance sheet when the Group has a current legally enforceable right to set off the recognised amounts and intends to either settle on a net basis or to realise the asset and settle the liability
Notes to the consolidated annual accounts of ING Group continued
109ING Group Annual Report 2013
1 Wh
o w
e are2 R
epo
rt of th
e Executive B
oard
3 Co
rpo
rate go
vernan
ce4 C
on
solid
ated an
nu
al accou
nts
5 Parent co
mp
any an
nu
al accou
nts
6 Oth
er info
rmatio
n7 A
dd
ition
al info
rmatio
n
ING_2013_deel1_v1.indd 109 19/03/2014 18:57:55
simultaneously. Offsetting is applied to certain interest rate swaps for which the services of a central clearing house are used. Furthermore, offsetting is also applied to certain current accounts for which the product features and internal procedures allow net presentation under IFRS-EU.
Repurchase transactions and reverse repurchase transactionsSecurities sold subject to repurchase agreements (‘repos’) are retained in the consolidated financial statements. The counterparty liability is included in Amounts due to banks, Other borrowed funds, Customer deposits and other funds on deposit, or Trading as appropriate.
Securities purchased under agreements to resell (‘reverse repos’) are recognised as Loans and advances to customers, Amounts due from banks, or Financial assets at fair value through profit and loss - Trading assets, as appropriate. The difference between the sale and repurchase price is treated as interest and amortised over the life of the agreement using the effective interest method.
Impairments of loans and advances to customers (loan loss provisions)ING Group assesses periodically and at each balance sheet date whether there is objective evidence that a financial asset or group of financial assets is impaired. A financial asset or a group of financial assets is impaired and impairment losses are incurred if, and only if, there is objective evidence of impairment as a result of one or more events that occurred after the initial recognition of the asset, but before the balance sheet date, (a ‘loss event’) and that loss event (or events) has an impact on the estimated future cash flows of the financial asset or group of financial assets that can be reliably estimated. The following circumstances, among others, are considered objective evidence that a financial asset or group of assets is impaired:• The borrower has sought or has been placed in bankruptcy or similar protection and this leads to the avoidance of or delays in
repayment of the financial asset;• The borrower has failed in the repayment of principal, interest or fees and the payment failure has remained unsolved for a certain
period;• The borrower has demonstrated significant financial difficulty, to the extent that it will have a negative impact on the expected future
cash flows of the financial asset;• The credit obligation has been restructured for non-commercial reasons. ING Group has granted concessions, for economic or legal
reasons relating to the borrower’s financial difficulty, the effect of which is a reduction in the expected future cash flows of the financial asset; and
• Historical experience, updated for current events where necessary, provides evidence that a proportion of a group of assets is impaired although the related events that represent impairment triggers are not yet captured by the Group’s credit risk systems.
In certain circumstances ING grants borrowers postponement and/or reduction of loan principal and/or interest payments for a temporary period of time to maximise collection opportunities and, if possible, avoid default, foreclosure or repossession. When such postponement and/or reduction of loan principal and/or interest payments is executed based on credit concerns it is also referred to as ‘forbearance’. In general, forbearance represents an impairment trigger under IFRS-EU. In such cases, the net present value of the postponement and/or reduction of loan and/or interest payments is taken into account in the determination of the appropriate level of Loan loss provisioning as described below. If the forbearance results in a substantial modification of the terms of the loan, the original loan is derecognised and a new loan is recognised at its fair value at the modification date.
The Group does not consider events that may be expected to occur in the future as objective evidence, and consequently they are not used as a basis for concluding that a financial asset or group of assets is impaired.
In determining the impairment, expected future cash flows are estimated on the basis of the contractual cash flows of the assets in the portfolio and historical loss experience for assets with credit risk characteristics similar to those in the portfolio. Historical loss experience is adjusted on the basis of current observable data to reflect the effects of current conditions that did not affect the period on which the historical loss experience is based and to remove the effects of conditions in the historical period that do not currently exist. Losses expected as a result of future events, no matter how likely, are not recognised.
The Group first assesses whether objective evidence of impairment exists individually for financial assets that are individually significant, and then individually or collectively for financial assets that are not individually significant. If the Group determines that no objective evidence of impairment exists for an individually assessed financial asset, whether significant or not, it includes the asset in a group of financial assets with similar credit risk characteristics and collectively assesses them for impairment. Assets that are individually assessed for impairment and for which an impairment loss is or continues to be recognised are not included in a collective assessment of impairment.
If there is objective evidence that an impairment loss on an asset carried at amortised cost has been incurred, the amount of the loss is measured as the difference between the asset’s carrying amount and the present value of estimated future cash flows (excluding future credit losses that have not been incurred) discounted at the financial asset’s original effective interest rate. The carrying amount of the asset is reduced through the use of an allowance account (‘Loan loss provision’) and the amount of the loss is recognised in the profit and loss account under ‘Addition to loan loss provision’. If the asset has a variable interest rate, the discount rate for measuring any impairment loss is the current effective interest rate determined under the contract.
Notes to the consolidated annual accounts of ING Group continued
110 ING Group Annual Report 2013
ING_2013_deel1_v1.indd 110 19/03/2014 18:57:55
For the purposes of a collective evaluation of impairment, financial assets are grouped on the basis of similar credit risk characteristics. Those characteristics are relevant to the estimation of future cash flows for groups of such assets by being indicative of the debtors’ ability to pay all amounts due according to the contractual terms of the assets being evaluated. The collective evaluation of impairment includes the application of a ‘loss confirmation period’ to default probabilities. The loss confirmation period is a concept which recognises that there is a period of time between the emergence of impairment triggers and the point in time at which those events are captured by the Group’s credit risk systems. Accordingly, the application of the loss confirmation period ensures that impairments that are incurred but not yet identified are adequately reflected in the Group’s loan loss provision. Although the loss confirmation periods are inherently uncertain, the Group applies estimates to sub-portfolios (e.g. large corporations, small and medium size enterprises and retail portfolios) that reflect factors such as the frequency with which customers in the sub-portfolio disclose credit risk sensitive information and the frequency with which they are subject to review by the Group’s account managers. Generally, the frequency increases in relation to the size of the borrower. Loss confirmation periods are based on historical experience and are validated, and revised where necessary, through regular back-testing to ensure that they reflect recent experience and current events.
If, in a subsequent period, the amount of the impairment loss decreases and the decrease can be related objectively to an event occurring after the impairment was recognised (such as an improvement in the debtor’s credit rating), the previously recognised impairment loss is reversed by adjusting the provision. The amount of the reversal is recognised in the profit and loss account.
When a loan is uncollectable, it is written off against the related loan loss provision. Such loans are written off after all the necessary procedures have been completed and the amount of the loss has been determined. Subsequent recoveries of amounts previously written off are recognised in the profit and loss account.
In most Retail portfolios, ING Bank has a write-off policy that requires 100% provision for all retail exposure after 2 years (3 years for mortgages) following the last default date.
Impairment of other financial assetsAt each balance sheet date, the Group assesses whether there is objective evidence that a financial asset or a group of financial assets is impaired. In the specific case of equity investments classified as available-for-sale, a significant or prolonged decline in the fair value of the security below its cost is considered in determining whether the assets are impaired. ‘Significant’ and ‘prolonged’ are interpreted on a case-by-case basis for specific equity securities; generally 25% and 6 months are used as triggers. If any objective evidence exists for available-for-sale debt and equity investments, the cumulative loss – measured as the difference between the acquisition cost and the current fair value, less any impairment loss on that financial asset previously recognised in net result – is removed from equity and recognised in the profit and loss account. Impairment losses recognised on equity instruments can never be reversed. If, in a subsequent period, the fair value of a debt instrument classified as available-for-sale increases and the increase can be objectively related to an event occurring after the impairment loss was recognised in the profit and loss account, the impairment loss is reversed through the profit and loss account.
Investments in associatesAssociates are all entities over which the Group has significant influence but not control. Significant influence generally results from a shareholding of between 20% and 50% of the voting rights, but also is the ability to participate in the financial and operating policies through situations including, but not limited to one or more of the following:• Representation on the board of directors;• Participation in the policymaking process; and• Interchange of managerial personnel.
Investments in associates are initially recognised at cost and subsequently accounted for using the equity method of accounting.
The Group’s investment in associates (net of any accumulated impairment loss) includes goodwill identified on acquisition. The Group’s share of its associates’ post-acquisition profits or losses is recognised in the profit and loss account, and its share of post-acquisition changes in reserves is recognised in equity. The cumulative post-acquisition changes are adjusted against the carrying amount of the investment. When the Group’s share of losses in an associate equals or exceeds its interest in the associate, including any other unsecured receivables, the Group does not recognise further losses, unless it has incurred obligations or made payments on behalf of the associate.
Unrealised gains on transactions between the Group and its associates are eliminated to the extent of the Group’s interest in the associates. Unrealised losses are also eliminated unless they provide evidence of an impairment of the asset transferred. Accounting policies of associates have been changed where necessary to ensure consistency with the policies adopted by the Group. The reporting dates of all significant associates are consistent with the reporting date of the Group.
For interests in investment vehicles the existence of significant influence is determined taking into account both the Group’s financial interests for own risk and its role as investment manager.
Notes to the consolidated annual accounts of ING Group continued
111ING Group Annual Report 2013
1 Wh
o w
e are2 R
epo
rt of th
e Executive B
oard
3 Co
rpo
rate go
vernan
ce4 C
on
solid
ated an
nu
al accou
nts
5 Parent co
mp
any an
nu
al accou
nts
6 Oth
er info
rmatio
n7 A
dd
ition
al info
rmatio
n
ING_2013_deel1_v1.indd 111 19/03/2014 18:57:55
Real estate investmentsReal estate investments are recognised at fair value at the balance sheet date. Changes in the carrying amount resulting from revaluations are recognised in the profit and loss account. On disposal the difference between the sale proceeds and carrying value is recognised in the profit and loss account.
The fair value of real estate investments is based on regular appraisals by independent qualified valuers. For each reporting period every property is valued either by an independent valuer or internally. Indexation is used when a property is valued internally. The index is based on the results of the independent valuations carried out in that period. Market transactions and disposals made by ING Group are monitored as part of the validation procedures to test the indexation methodology. Valuations performed earlier in the year are updated if necessary to reflect the situation at the year-end. All properties are valued independently at least every five years and more frequently if necessary.
The fair values represent the estimated amount for which the property could be exchanged on the date of valuation between a willing buyer and willing seller in an at-arm’s-length transaction after proper marketing wherein the parties each acted knowledgeably, prudently and without compulsion. Fair values are based on appraisals using valuation methods such as: comparable market transactions, capitalisation of income methods or discounted cash flow calculations. The underlying assumption used in the valuation is that the properties are let or sold to third parties based on the actual letting status. The discounted cash flow analyses and capitalisation of income method are based on calculations of the future rental income in accordance with the terms in existing leases and estimations of the rental values for new leases when leases expire and incentives like rent free periods. The cash flows are discounted using market based interest rates that reflect appropriately the risk characteristics of real estate.
ING Group owns a real estate portfolio, diversified by region, by investment segment (Office, Retail and Residential) and by investment type. The valuation of different investments is performed using different discount rates (‘yields’), dependent on specific characteristics of each property, including occupancy, quality of rent payments and specific local market circumstances. For ING’s direct properties in its main locations, the yields applied in the 2013 year-end valuation generally are in the range of 5% to 8%.
The valuation of real estate investments takes (expected) vacancies into account. Occupancy rates differ significantly from investment to investment.
For real estate investments held through (minority shares in) real estate investment funds, the valuations are performed under the responsibility of the funds’ asset manager.
Subsequent expenditures are recognised as part of the asset’s carrying amount only when it is probable that future economic benefits associated with the item will flow to ING Group and the cost can be measured reliably. All other repairs and maintenance costs are recognised in the profit and loss account.
Property and equipmentProperty in own useLand and buildings held for own use are stated at fair value at the balance sheet date. Increases in the carrying amount arising on revaluation of land and buildings held for own use are credited to the revaluation reserve in shareholders’ equity. Decreases in the carrying amount that offset previous increases of the same asset are charged against the revaluation reserve directly in equity; all other decreases are charged to the profit and loss account. Increases that reverse a revaluation decrease on the same asset previously recognised in net result are recognised in the profit and loss account. Depreciation is recognised based on the fair value and the estimated useful life (in general 20–50 years). Depreciation is calculated on a straight-line basis. On disposal the related revaluation reserve is transferred to retained earnings.
The fair values of land and buildings are based on regular appraisals by independent qualified valuers or internally, similar to appraisals of real estate investments. Subsequent expenditure is included in the asset’s carrying amount when it is probable that future economic benefits associated with the item will flow to the Group and the cost of the item can be measured reliably.
Property obtained from foreclosuresProperty obtained from foreclosures is stated at the lower of cost and net realisable value. Net realisable value is the estimated selling price in the ordinary course of business, less applicable variable selling expenses. Property obtained from foreclosures is included in Other assets - Property development and obtained from foreclosures.
Property developmentProperty developed and under development for which ING Group has the intention to sell the property after its completion is included in Other assets – Property development and obtained from foreclosures.
Property developed and under development for which ING Group has the intention to sell the property under development after its completion and where there is not yet a specifically negotiated contract is measured at direct construction cost incurred up to the balance sheet date, including borrowing costs incurred during construction and ING Group’s own directly attributable development and
Notes to the consolidated annual accounts of ING Group continued
112 ING Group Annual Report 2013
ING_2013_deel1_v1.indd 112 19/03/2014 18:57:55
supervision expenses less any impairment losses. Profit is recognised using the completed contract method (on sale date of the property). Impairment is recognised if the estimated selling price in the ordinary course of business, less applicable variable selling expenses is lower than carrying value.
Property under development for which ING Group has the intention to sell the property under development after its completion and where there is a specifically negotiated contract is valued using the percentage of completion method (pro rata profit recognition). The stage of completion is measured by reference to costs incurred to date as percentage of total estimated costs for each contract.
Property under development is stated at fair value (with changes in fair value recognised in the profit and loss account) if ING Group has the intention to recognise the property under development after completion as real estate investments.
EquipmentEquipment is stated at cost less accumulated depreciation and any impairment losses. The cost of the assets is depreciated on a straight line basis over their estimated useful lives, which are generally as follows: for data processing equipment two to five years, and four to ten years for fixtures and fittings. Expenditure incurred on maintenance and repairs is recognised in the profit and loss account as incurred. Expenditure incurred on major improvements is capitalised and depreciated.
Assets under operating leasesAssets leased out under operating leases in which ING Group is the lessor are stated at cost less accumulated depreciation and any impairment losses. The cost of the assets is depreciated on a straight-line basis over the lease term.
DisposalsThe difference between the proceeds on disposal and net carrying value is recognised in the profit and loss account under Other income.
Borrowing costsBorrowing costs incurred for the construction of any qualifying asset are capitalised during the period of time that is required to complete and prepare the asset for its intended use. Borrowing costs are determined at the weighted average cost of capital of the project.
LeasesThe determination of whether an arrangement is or contains a lease is based on the substance of the arrangement at inception date.
ING Group as the lesseeThe leases entered into by ING Group are primarily operating leases. The total payments made under operating leases are recognised in the profit and loss account on a straight-line basis over the period of the lease.
When an operating lease is terminated before the lease period has expired, any penalty payment to be made to the lessor is recognised as an expense in the period in which termination takes place.
ING Group as the lessorWhen assets are held subject to a finance lease, the present value of the lease payments is recognised as a receivable under Loans and advances to customers or Amounts due from banks. The difference between the gross receivable and the present value of the receivable is unearned lease finance income. Lease income is recognised over the term of the lease using the net investment method (before tax), which reflects a constant periodic rate of return. When assets are held subject to an operating lease, the assets are included under Assets under operating leases.
Acquisitions, goodwill and other intangible assetsAcquisitions and goodwillING Group’s acquisitions are accounted for using the acquisition method of accounting. The consideration for each acquisition is measured at the aggregate of the fair values (at the date of exchange) of assets given, liabilities incurred or assumed, and equity instruments issued in exchange for control of the acquiree. Goodwill, being the difference between the cost of the acquisition (including assumed debt) and the Group’s interest in the fair value of the acquired assets, liabilities and contingent liabilities as at the date of acquisition, is capitalised as an intangible asset. The results of the operations of the acquired companies are included in the profit and loss account from the date control is obtained.
Where applicable, the consideration for the acquisition includes any asset or liability resulting from a contingent consideration arrangement, measured at its acquisition-date fair value. Subsequent changes in the fair value of contingent consideration classified as an asset or liability are accounted for in accordance with relevant IFRSs, taking into account the initial accounting period below. Changes in the fair value of the contingent consideration classified as equity are not recognised.
Where a business combination is achieved in stages, ING Group’s previously held interests in the assets and liabilities of the acquired entity are remeasured to fair value at the acquisition date (i.e. the date ING Group obtains control) and the resulting gain or loss, if any, is recognised in the profit and loss account. Amounts arising from interests in the acquiree prior to the acquisition date that have previously
Notes to the consolidated annual accounts of ING Group continued
113ING Group Annual Report 2013
1 Wh
o w
e are2 R
epo
rt of th
e Executive B
oard
3 Co
rpo
rate go
vernan
ce4 C
on
solid
ated an
nu
al accou
nts
5 Parent co
mp
any an
nu
al accou
nts
6 Oth
er info
rmatio
n7 A
dd
ition
al info
rmatio
n
ING_2013_deel1_v1.indd 113 19/03/2014 18:57:55
been recognised in other comprehensive income are reclassified to the profit and loss account, where such treatment would be appropriate if that interest were disposed of. Acquisition-related costs are recognised in the profit and loss account as incurred and presented in the profit and loss account as Other operating expenses.
Until 2009, before IFRS 3 ‘Business Combinations’ was revised, the accounting of previously held interests in the assets and liabilities of the acquired entity were not remeasured at the acquisition date and the acquisition-related costs were considered to be part of the total consideration.
The initial accounting for the fair value of the net assets of the companies acquired during the year may be determined only provisionally as the determination of the fair value can be complex and the time between the acquisition and the preparation of the Annual Accounts can be limited. The initial accounting shall be completed within a year after acquisition.
Goodwill is only capitalised on acquisitions after the implementation date of IFRS-EU (1 January 2004). Accounting for acquisitions before that date has not been restated; goodwill and internally generated intangibles on these acquisitions were recognised directly in shareholders’ equity. Goodwill is allocated to reporting units for the purpose of impairment testing. These reporting units represent the lowest level at which goodwill is monitored for internal management purposes. This test is performed annually or more frequently if there are indicators of impairment. Under the impairment tests, the carrying value of the reporting units (including goodwill) is compared to its recoverable amount which is the higher of its fair value less costs to sell and its value in use.
Adjustments to the fair value as at the date of acquisition of acquired assets and liabilities that are identified within one year after acquisition are recognised as an adjustment to goodwill; any subsequent adjustment is recognised as income or expense. On disposal of group companies, the difference between the sale proceeds and carrying value (including goodwill) and the unrealised results (including the currency translation reserve in equity) is included in the profit and loss account.
Computer softwareComputer software that has been purchased or generated internally for own use is stated at cost less amortisation and any impairment losses. Amortisation is calculated on a straight-line basis over its useful life. This period will generally not exceed three years. Amortisation is included in Other operating expenses.
Value of business acquired (VOBA)VOBA is an asset that reflects the present value of estimated net cash flows embedded in the insurance contracts of an acquired company, which existed at the time the company was acquired. It represents the difference between the fair value of insurance liabilities and their carrying value. VOBA is amortised in a similar manner to the amortisation of deferred acquisition costs as described in the section ‘Deferred acquisition costs’.
Other intangible assetsOther intangible assets are capitalised and amortised over their expected economic life, which is generally between three and ten years. Intangible assets with an indefinite life are not amortised.
Deferred acquisition costsDeferred acquisition costs (DAC) are an asset and represent costs of acquiring insurance and investment contracts that are deferred and amortised. The deferred costs, all of which vary with (and are primarily related to) the production of new and renewal business, consist principally of commissions, certain underwriting and contract issuance expenses, and certain agency expenses.
For traditional life insurance contracts, certain types of flexible life insurance contracts, and non-life contracts, DAC is amortised over the premium payment period in proportion to the premium revenue recognised.
For other types of flexible life insurance contracts DAC is amortised over the lives of the policies in relation to the emergence of estimated gross profits. Amortisation is adjusted when estimates of current or future gross profits, to be realised from a group of products, are revised. The estimates and the assumptions are reassessed at the end of each reporting period. Higher/lower expected profits (e.g. reflecting stock market performance or a change in the level of assets under management) may cause a lower/higher balance of DAC due to the catch-up of amortisation in previous and future years. This process is known as DAC unlocking. The impact of the DAC unlocking is recognised in the profit and loss account of the period in which the unlocking occurs..
DAC is evaluated for recoverability at issue. Subsequently it is tested on a regular basis together with the provision for life insurance liabilities and VOBA. The test for recoverability is described in the section ‘Insurance, Investment and Reinsurance Contracts’.
For certain products DAC is adjusted for the impact of unrealised results on allocated investments through equity.
TaxationIncome tax on the result for the year comprises current and deferred tax. Income tax is recognised in the profit and loss account but it is recognised directly in equity if the tax relates to items that are recognised directly in equity.
Notes to the consolidated annual accounts of ING Group continued
114 ING Group Annual Report 2013
ING_2013_deel1_v1.indd 114 19/03/2014 18:57:55
Deferred income taxDeferred income tax is provided in full, using the liability method, on temporary differences arising between the tax bases of assets and liabilities and their carrying amounts in the consolidated financial statements. Deferred income tax is determined using tax rates (and laws) that have been enacted or substantially enacted by the balance sheet date and are expected to apply when the related deferred income tax asset is realised or the deferred income tax liability is settled. Deferred tax assets and liabilities are not discounted.
Deferred tax assets are recognised where it is probable that future taxable profit will be available against which the temporary differences can be utilised. Deferred income tax is provided on temporary differences arising from investments in subsidiaries and associates, except where the timing of the reversal of the temporary difference is controlled by the Group and it is probable that the difference will not reverse in the foreseeable future. The tax effects of income tax losses available for carry forward are recognised as an asset where it is probable that future taxable profits will be available against which these losses can be utilised.
Deferred tax related to fair value remeasurement of available-for-sale investments and cash flow hedges, which are recognised directly in equity, is also recognised directly in equity and is subsequently recognised in the profit and loss account together with the deferred gain or loss.
Financial liabilitiesFinancial liabilities at amortised costFinancial liabilities at amortised cost include the following sub-categories: preference shares, other borrowed funds, debt securities in issue, subordinated loans, amounts due to banks and customer deposits and other funds on deposit.
Borrowings are recognised initially at their issue proceeds (fair value of consideration received) net of transaction costs incurred. Borrowings are subsequently stated at amortised cost; any difference between proceeds, net of transaction costs, and the redemption value is recognised in the profit and loss account over the period of the borrowings using the effective interest method.
If the Group purchases its own debt, it is removed from the balance sheet, and the difference between the carrying amount of the liability and the consideration paid is included in the profit and loss account.
Financial liabilities at fair value through profit and lossFinancial liabilities at fair value through profit and loss comprise the following sub-categories: trading liabilities, non-trading derivatives and other financial liabilities designated at fair value through profit and loss by management. Trading liabilities include equity securities, debt securities, funds on deposit and derivatives. Designation by management will take place only if it eliminates a measurement inconsistency or if the related assets and liabilities are managed on a fair value basis. ING Group has designated an insignificant part of the issued debt, related to market-making activities, at fair value through profit and loss. This issued debt consists mainly of own bonds. The designation as fair value through profit and loss eliminates the inconsistency in the timing of the recognition of gains and losses. All other financial liabilities are measured at amortised cost.
Financial guarantee contractsFinancial guarantee contracts are contracts that require the issuer to make specified payments to reimburse the holder for a loss it incurs because a specified debtor fails to make payments when due, in accordance with the terms of a debt instrument. Such financial guarantees are initially recognised at fair value and subsequently measured at the higher of the discounted best estimate of the obligation under the guarantee and the amount initially recognised less cumulative amortisation to reflect revenue recognition principles.
Insurance, investment and reinsurance contractsProvisions for liabilities under insurance contracts are established in accordance with IFRS 4 ‘Insurance Contracts’. Under IFRS 4, an insurer may continue its existing pre-IFRS-EU accounting policies for insurance contracts, provided that certain minimum requirements are met. Upon adoption of IFRS in 2005, ING Group decided to continue the then existing accounting principles for insurance contracts under IFRS-EU. ING Group operates in many different countries and the accounting principles for insurance contracts follow local practice in these countries. ING’s businesses in the Netherlands apply accounting standards generally accepted in the Netherlands (Dutch GAAP) for its provisions for liabilities under insurance contracts; similarly, ING’s businesses in the United States apply accounting standards generally accepted in the United States (US GAAP).
Changes in those local accounting standards (including Dutch GAAP and US GAAP) subsequent to the adoption of IFRS-EU are considered for adoption on a case-by-case basis. If adopted, the impact thereof is accounted for as a change in accounting policy under IFRS-EU.
In addition, for certain specific products or components thereof, ING applies the option in IFRS 4 to measure (components of) the provisions for liabilities under insurance contracts using market consistent interest rates and other current estimates and assumptions. This relates mainly to Guaranteed Minimum Withdrawal Benefits for Life on the Insurance US Closed Block VA book and certain guarantees embedded in insurance contracts in Japan.
Notes to the consolidated annual accounts of ING Group continued
115ING Group Annual Report 2013
1 Wh
o w
e are2 R
epo
rt of th
e Executive B
oard
3 Co
rpo
rate go
vernan
ce4 C
on
solid
ated an
nu
al accou
nts
5 Parent co
mp
any an
nu
al accou
nts
6 Oth
er info
rmatio
n7 A
dd
ition
al info
rmatio
n
ING_2013_deel1_v1.indd 115 19/03/2014 18:57:55
Insurance contractsInsurance policies which bear significant insurance risk and/or contain discretionary participation features are presented as insurance contracts. Provisions for liabilities under insurance contracts represent estimates of future payouts that will be required for life and non-life insurance claims, including expenses relating to such claims. For some insurance contracts the measurement reflects current market assumptions. Unless indicated otherwise below all changes in the insurance provisions are recognised in the profit and loss account.
Provision for life insuranceThe Provision for life insurance is generally calculated on the basis of a prudent prospective actuarial method, taking into account the conditions for current insurance contracts. Specific methodologies may differ between business units as they may reflect local regulatory requirements and local practices for specific product features in the local markets.
Insurance provisions on traditional life policies are calculated using various assumptions, including assumptions on mortality, morbidity, expenses, investment returns and surrenders. Assumptions for insurance provisions on traditional life insurance contracts, including traditional whole life and term life insurance contracts, are based on best estimate assumptions including margins for adverse deviations. Generally, the assumptions are set initially at the policy issue date and remain constant throughout the life of the policy.
Insurance provisions for universal life, variable life and annuity contracts, unit-linked contracts, etc. are generally set equal to the balance that accrues to the benefit of the policyholders. Certain variable annuity products contain minimum guarantees on the amounts payable upon death and/or maturity. The insurance provisions include the impact of these minimum guarantees, taking into account the difference between the potential minimum benefit payable and the total account balance, expected mortality and surrender rates.
The as yet unamortised interest rate rebates on periodic and single premium contracts are deducted from the Provision for life insurance. Interest rate rebates granted during the year are capitalised and amortised in conformity with the anticipated recovery pattern and are recognised in the profit and loss account.
Provision for unearned premiums and unexpired insurance risksThe provision is calculated in proportion to the unexpired periods of risk. For insurance policies covering a risk increasing during the term of the policy at premium rates independent of age, this risk is taken into account when determining the provision. Further provisions are made to cover claims under unexpired insurance contracts, which may exceed the unearned premiums and the premiums due in respect of these contracts.
Claims provisionThe claims provision is calculated on a case-by-case basis or by approximation on the basis of experience. Provisions have also been made for claims incurred but not reported (IBNR) and for future claims handling expenses. The adequacy of the Claims provision is evaluated each year using standard actuarial techniques. In addition, IBNR reserves are set to recognise the estimated cost of losses that have occurred but which have not yet been notified to the Group.
Deferred profit sharingFor insurance contracts with discretionary participation features a deferred profit sharing amount is recognised for the full amount of the unrealised revaluation on allocated investments. Upon realisation, the profit sharing on unrealised revaluation is reversed and a deferred profit sharing amount is recognised for the share of realised results on allocated investments that is expected to be shared with policyholders. The deferred profit sharing amount is reduced by the actual allocation of profit sharing to individual policyholders. The change in the deferred profit sharing amount on unrealised revaluation (net of deferred tax) is recognised in equity in the Revaluation reserve.
Provisions for life insurance for risk of policyholdersFor insurance contracts for risk of policyholders the provisions are generally shown at the balance sheet value of the related investments.
Reinsurance contractsReinsurance premiums, commissions and claim settlements, as well as the reinsurance element of technical provisions are accounted for in the same way as the original contracts for which the reinsurance was concluded. If the reinsurers are unable to meet their obligations, the Group remains liable to its policyholders for the portion reinsured. Consequently, provisions are made for receivables on reinsurance contracts which are deemed uncollectable.
Adequacy testThe adequacy of the provision for life insurance, net of unamortised interest rate rebates, DAC and VOBA (the net insurance liabilities), is evaluated regularly by each business unit for the business originated in that business unit. The test considers current estimates of all contractual and related cash flows, and future developments. It includes investment income on the same basis as it is included in the profit and loss account.
If, for any business unit, it is determined, using a best estimate (50%) confidence level, that a shortfall exists, and there are no offsetting amounts within other business units in the same segment (Business Line), the shortfall is recognised immediately in the profit and loss account.
Notes to the consolidated annual accounts of ING Group continued
116 ING Group Annual Report 2013
ING_2013_deel1_v1.indd 116 19/03/2014 18:57:55
If, for any business unit, the net insurance liabilities are not adequate using a prudent (90%) confidence level, but there are offsetting amounts within other Group business units, then the business unit is allowed to take measures to strengthen the net insurance liabilities over a period no longer than the expected life of the policies. To the extent that there are no offsetting amounts within other Group business units, any shortfall at the 90% confidence level is recognised immediately in the profit and loss account.
If the net insurance liabilities are determined to be adequate at above the 90% confidence level, no reduction in the net insurance liabilities is recognised.
The adequacy test continues to be applied to businesses that are presented as discontinued operations; the relevant businesses continue to be evaluated as part of the adequacy test of the business line in which these were included before classification as discontinued operations.
Investment contractsInsurance policies without discretionary participation features which do not bear significant insurance risk are presented as Investment contracts. Provisions for liabilities under investment contracts are determined either at amortised cost, using the effective interest method (including certain initial acquisition expenses) or at fair value.
Other liabilitiesDefined benefit plansThe net defined benefit asset or liability recognised in the balance sheet in respect of defined benefit pension plans is the fair value of the plan assets less the present value of the defined benefit obligation at the balance sheet date.
Plan assets are measured at fair value at the balance sheet date. For determining the pension expense, the return on plan assets is determined using a high quality corporate bond rate identical to the discount rate used in determining the defined benefit obligation.
Changes in plan assets that effect Shareholders’ equity and/or Net result, include mainly:• return on plan assets using a high quality corporate bond rate at the start of the reporting period which are recognised as staff costs in
the profit and loss account; and• remeasurements which are recognised in Other comprehensive income (equity).
The defined benefit obligation is calculated by internal and external actuaries through actuarial models and calculations using the projected unit credit method. This method considers expected future payments required to settle the obligation resulting from employee service in the current and prior periods, discounted using a high quality corporate bond rate. Inherent in these actuarial models are assumptions including discount rates, rates of increase in future salary and benefit levels, mortality rates, trend rates in health care costs, consumer price index and the expected level of indexation. The assumptions are based on available market data as well as management expectations and are updated regularly. The actuarial assumptions may differ significantly from the actual results due to changes in market conditions, economic and mortality trends, and other assumptions. Any changes in these assumptions could have a significant impact on the defined benefit plan obligation and future pension costs.
Changes in the defined benefit obligation that effects Shareholders’ equity and/or Net result, include mainly:• service cost which are recognised as staff costs in the profit and loss account;• interest expenses using a high quality corporate bond rate at the start of the period which are recognised as staff costs in the profit and
loss account; and• remeasurements which are recognised in Other comprehensive income (equity).
Remeasurements recognised in other comprehensive income are not recycled to profit and loss. Any past service cost relating to a plan amendment is recognised in profit or loss in the period of the plan amendment. Gains and losses on curtailments and settlements are recognised in the profit and loss account when the curtailment or settlement occurs.
The recognition of a net defined benefit asset in the consolidated balance sheet is limited to the present value of any economic benefits available in the form of refunds from the plans or reductions in future contributions to the plans.
Defined contribution plansFor defined contribution plans, the Group pays contributions to publicly or privately administered pension insurance plans on a mandatory, contractual or voluntary basis. The Group has no further payment obligations once the contributions have been paid. The contributions are recognised as staff expenses in the profit and loss when they are due. Prepaid contributions are recognised as an asset to the extent that a cash refund or a reduction in the future payments is available.
Other post-employment obligationsSome group companies provide post-employment healthcare and other benefits to certain employees and former employees. The entitlement to these benefits is usually conditional on the employee remaining in service up to retirement age and the completion of a minimum service period. The expected costs of these benefits are accrued over the period of employment using an accounting methodology similar to that for defined benefit pension plans.
Notes to the consolidated annual accounts of ING Group continued
117ING Group Annual Report 2013
1 Wh
o w
e are2 R
epo
rt of th
e Executive B
oard
3 Co
rpo
rate go
vernan
ce4 C
on
solid
ated an
nu
al accou
nts
5 Parent co
mp
any an
nu
al accou
nts
6 Oth
er info
rmatio
n7 A
dd
ition
al info
rmatio
n
ING_2013_deel1_v1.indd 117 19/03/2014 18:57:55
Other provisionsA provision involves a present obligation arising from past events, the settlement of which is expected to result in an outflow from the company of resources embodying economic benefits, however the timing or the amount is uncertain. Provisions are discounted when the effect of the time value of money is significant using a before tax discount rate. The determination of provisions is an inherently uncertain process involving estimates regarding amounts and timing of cash flows.
Reorganisation provisions include employee termination benefits when the Group is demonstrably committed to either terminating the employment of current employees according to a detailed formal plan without possibility of withdrawal, or providing termination benefits as a result of an offer made to encourage voluntary redundancy.
Income recognitionGross premium incomePremiums from life insurance policies are recognised as income when due from the policyholder. For non-life insurance policies, gross premium income is recognised on a pro-rata basis over the term of the related policy coverage. Receipts under investment contracts are not recognised as gross premium income.
InterestInterest income and expense are recognised in the profit and loss account using the effective interest method. The effective interest method is a method of calculating the amortised cost of a financial asset or a financial liability and of allocating the interest income or interest expense over the relevant period. The effective interest rate is the rate that exactly discounts estimated future cash payments or receipts through the expected life of the financial instrument or, when appropriate, a shorter period to the net carrying amount of the financial asset or financial liability. When calculating the effective interest rate, the Group estimates cash flows considering all contractual terms of the financial instrument (for example, prepayment options) but does not consider future credit losses. The calculation includes all fees and points paid or received between parties to the contract that are an integral part of the effective interest rate, transaction costs and all other premiums or discounts. Once a financial asset or a group of similar financial assets has been written down as a result of an impairment loss, interest income is recognised using the rate of interest used to discount the future cash flows for the purpose of measuring the impairment loss.
All interest income and expenses from trading positions and non-trading derivatives are classified as interest income and interest expenses in the profit and loss account. Changes in the ‘clean fair value’ are included in Net trading income and Valuation results on non-trading derivatives.
Fees and commissionsFees and commissions are generally recognised as the service is provided. Loan commitment fees for loans that are likely to be drawn down are deferred (together with related direct costs) and recognised as an adjustment to the effective interest rate on the loan. Loan syndication fees are recognised as income when the syndication has been completed and the Group has retained no part of the loan package for itself or has retained a part at the same effective interest rate as the other participants. Commission and fees arising from negotiating, or participating in the negotiation of, a transaction for a third party – such as the arrangement of the acquisition of shares or other securities or the purchase or sale of businesses – are recognised on completion of the underlying transaction. Portfolio and other management advisory and service fees are recognised based on the applicable service contracts as the service is provided. Asset management fees related to investment funds and investment contract fees are recognised on a pro-rata basis over the period the service is provided. The same principle is applied for wealth management, financial planning and custody services that are continuously provided over an extended period of time. Fees received and paid between banks for payment services are classified as commission income and expenses.
Lease incomeThe proceeds from leasing out assets under operating leases are recognised on a straight-line basis over the life of the lease agreement. Lease payments received in respect of finance leases when ING Group is the lessor are divided into an interest component (recognised as interest income) and a repayment component.
Expense recognitionExpenses are recognised in the profit and loss account as incurred or when a decrease in future economic benefits related to a decrease in an asset or an increase in a liability has arisen that can be measured reliably.
Share-based paymentsShare-based payment expenses are recognised as a staff expense over the vesting period. A corresponding increase in equity is recognised for equity-settled share-based payment transactions. A liability is recognised for cash-settled share-based payment transactions. The fair value of equity-settled share-based payment transactions is measured at the grant date and the fair value of cash-settled share-based payment transactions is measured at each balance sheet date. Rights granted will remain valid until the expiry date, even if the share based payment scheme is discontinued. The rights are subject to certain conditions, including a pre-determined continuous period of service.
Notes to the consolidated annual accounts of ING Group continued
118 ING Group Annual Report 2013
ING_2013_deel1_v1.indd 118 19/03/2014 18:57:55
Government grantsGovernment grants are recognised where there is reasonable assurance that the grant will be received and all attached conditions will be complied with. When the grant relates to an expense item, the grant is recognised over the period necessary to match the grant on a systematic basis to the expense that it is intended to compensate. In such case, the grant is deducted from the related expense in the profit and loss account.
Earnings per ordinary shareEarnings per ordinary share is calculated on the basis of the weighted average number of ordinary shares outstanding. In calculating the weighted average number of ordinary shares outstanding:• Own shares held by group companies are deducted from the total number of ordinary shares in issue;• The computation is based on daily averages; and• In case of exercised warrants, the exercise date is taken into consideration.
The non-voting equity securities are not ordinary shares, because their terms and conditions (especially with regard to coupons and voting rights) are significantly different. Therefore, the weighted average number of ordinary shares outstanding during the period is not impacted by the non-voting equity securities.
Diluted earnings per share data are computed as if all convertible instruments outstanding at year-end were exercised at the beginning of the period. It is also assumed that ING Group uses the assumed proceeds thus received to buy its own shares against the average market price in the financial year. The net increase in the number of shares resulting from the exercise is added to the average number of shares used to calculate diluted earnings per share.
Share options with fixed or determinable terms are treated as options in the calculation of diluted earnings per share, even though they may be contingent on vesting. They are treated as outstanding on the grant date. Performance-based employee share options are treated as contingently issuable shares because their issue is contingent upon satisfying specified conditions in addition to the passage of time.
Fiduciary activitiesThe Group commonly acts as trustee and in other fiduciary capacities that result in the holding or placing of assets on behalf of individuals, trusts, retirement benefit plans and other institutions. These assets and income arising thereon are excluded from these financial statements, as they are not assets of the Group.
STATEMENT OF CASH FLOWSThe statement of cash flows is prepared in accordance with the indirect method, classifying cash flows as cash flows from operating, investing and financing activities. In the net cash flow from operating activities, the result before tax is adjusted for those items in the profit and loss account, and changes in balance sheet items, which do not result in actual cash flows during the year.
For the purposes of the statement of cash flows, Cash and cash equivalents comprise balances with less than three months’ maturity from the date of acquisition, including cash and non-restricted balances with central banks, treasury bills and other eligible bills, amounts due from other banks and amounts due to banks. Investments qualify as a cash equivalent if they are readily convertible to a known amount of cash and are subject to an insignificant risk of changes in value.
Cash flows arising from foreign currency transactions are translated into the functional currency using the exchange rates at the date of the cash flows.
The net cash flow shown in respect of Loans and advances to customers relates only to transactions involving actual payments or receipts. The Addition to loan loss provision which is deducted from the item Loans and advances to customers in the balance sheet has been adjusted accordingly from the result before tax and is shown separately in the statement of cash flows.
The difference between the net cash flow in accordance with the statement of cash flows and the change in Cash and cash equivalents in the balance sheet is due to exchange rate differences and is accounted for separately as part of the reconciliation of the net cash flow and the balance sheet change in Cash and cash equivalents.
Notes to the consolidated annual accounts of ING Group continued
119ING Group Annual Report 2013
1 Wh
o w
e are2 R
epo
rt of th
e Executive B
oard
3 Co
rpo
rate go
vernan
ce4 C
on
solid
ated an
nu
al accou
nts
5 Parent co
mp
any an
nu
al accou
nts
6 Oth
er info
rmatio
n7 A
dd
ition
al info
rmatio
n
ING_2013_deel1_v1.indd 119 19/03/2014 18:57:56
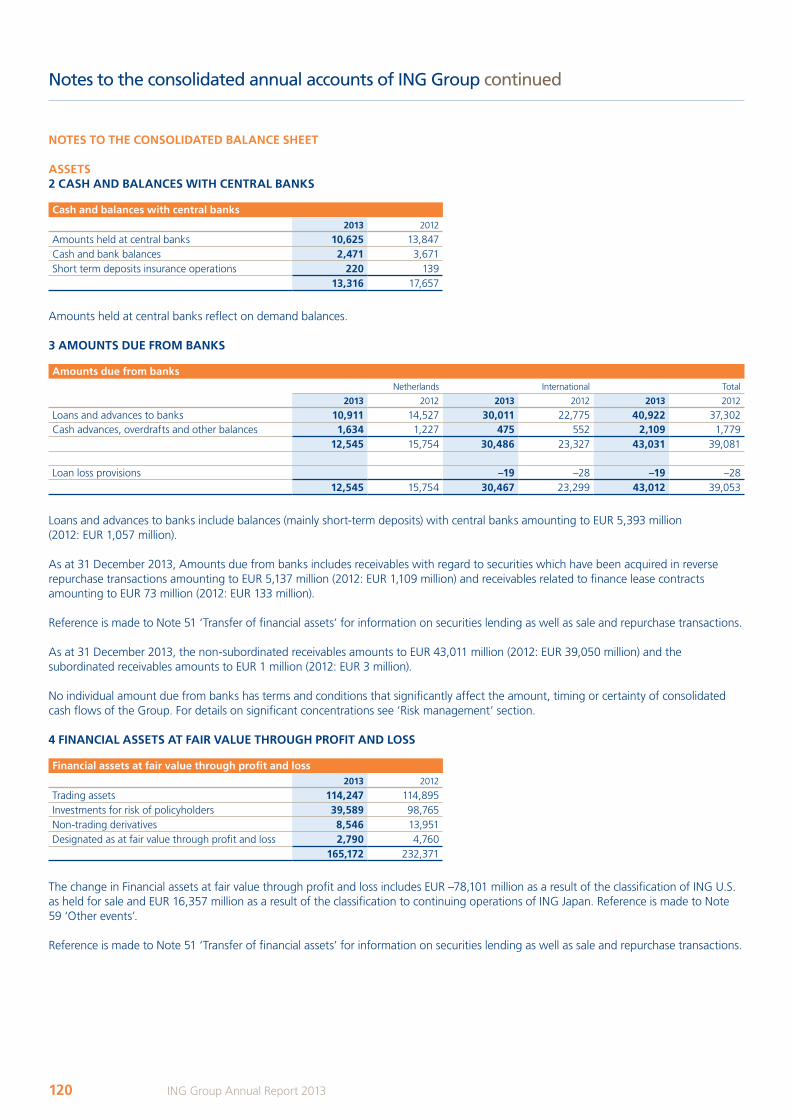
NOTES TO THE CONSOLIDATED BALANCE SHEET
ASSETS2 CASH AND BALANCES WITH CENTRAL BANKS
Cash and balances with central banks2013 2012
Amounts held at central banks 10,625 13,847Cash and bank balances 2,471 3,671Short term deposits insurance operations 220 139
13,316 17,657
Amounts held at central banks reflect on demand balances.
3 AMOUNTS DUE FROM BANKS
Amounts due from banksNetherlands International Total
2013 2012 2013 2012 2013 2012
Loans and advances to banks 10,911 14,527 30,011 22,775 40,922 37,302Cash advances, overdrafts and other balances 1,634 1,227 475 552 2,109 1,779
12,545 15,754 30,486 23,327 43,031 39,081
Loan loss provisions –19 –28 –19 –2812,545 15,754 30,467 23,299 43,012 39,053
Loans and advances to banks include balances (mainly short-term deposits) with central banks amounting to EUR 5,393 million (2012: EUR 1,057 million).
As at 31 December 2013, Amounts due from banks includes receivables with regard to securities which have been acquired in reverse repurchase transactions amounting to EUR 5,137 million (2012: EUR 1,109 million) and receivables related to finance lease contracts amounting to EUR 73 million (2012: EUR 133 million).
Reference is made to Note 51 ‘Transfer of financial assets’ for information on securities lending as well as sale and repurchase transactions.
As at 31 December 2013, the non-subordinated receivables amounts to EUR 43,011 million (2012: EUR 39,050 million) and the subordinated receivables amounts to EUR 1 million (2012: EUR 3 million).
No individual amount due from banks has terms and conditions that significantly affect the amount, timing or certainty of consolidated cash flows of the Group. For details on significant concentrations see ‘Risk management’ section.
4 FINANCIAL ASSETS AT FAIR VALUE THROUGH PROFIT AND LOSS
Financial assets at fair value through profit and loss2013 2012
Trading assets 114,247 114,895Investments for risk of policyholders 39,589 98,765Non-trading derivatives 8,546 13,951Designated as at fair value through profit and loss 2,790 4,760
165,172 232,371
The change in Financial assets at fair value through profit and loss includes EUR –78,101 million as a result of the classification of ING U.S. as held for sale and EUR 16,357 million as a result of the classification to continuing operations of ING Japan. Reference is made to Note 59 ‘Other events’.
Reference is made to Note 51 ‘Transfer of financial assets’ for information on securities lending as well as sale and repurchase transactions.
Notes to the consolidated annual accounts of ING Group continued
120 ING Group Annual Report 2013
ING_2013_deel1_v1.indd 120 19/03/2014 18:57:56
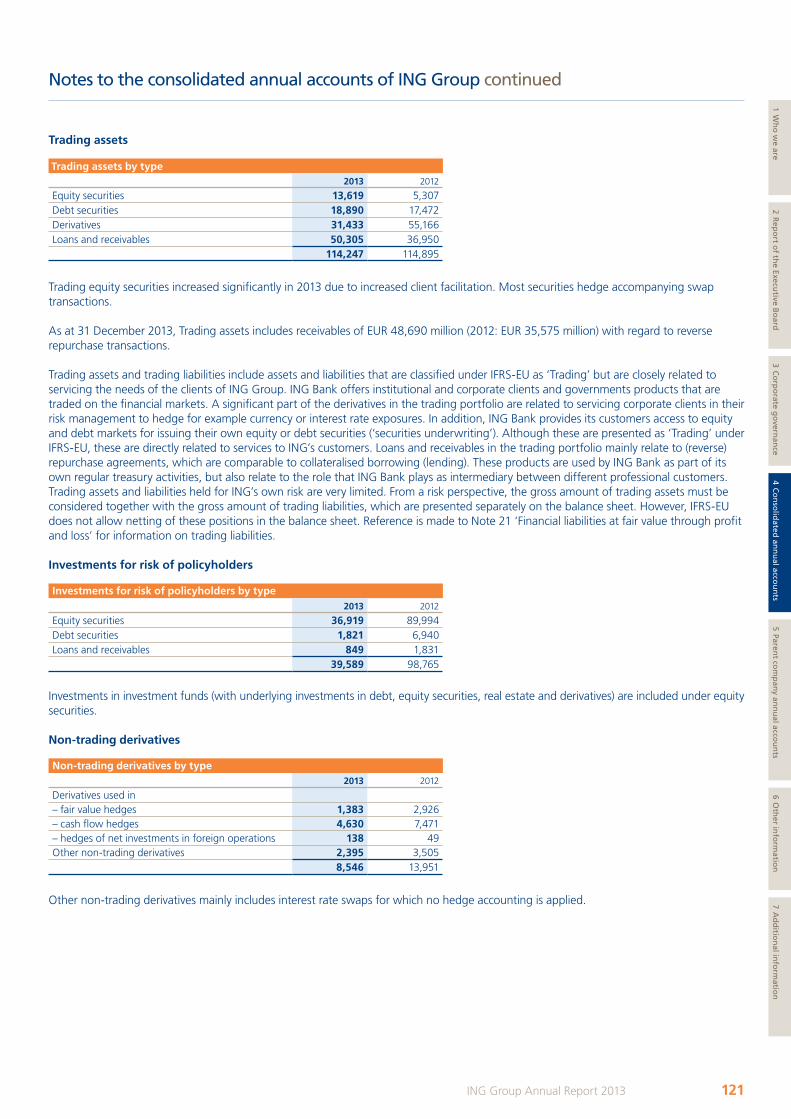
Trading assets
Trading assets by type2013 2012
Equity securities 13,619 5,307Debt securities 18,890 17,472Derivatives 31,433 55,166Loans and receivables 50,305 36,950
114,247 114,895
Trading equity securities increased significantly in 2013 due to increased client facilitation. Most securities hedge accompanying swap transactions.
As at 31 December 2013, Trading assets includes receivables of EUR 48,690 million (2012: EUR 35,575 million) with regard to reverse repurchase transactions.
Trading assets and trading liabilities include assets and liabilities that are classified under IFRS-EU as ‘Trading’ but are closely related to servicing the needs of the clients of ING Group. ING Bank offers institutional and corporate clients and governments products that are traded on the financial markets. A significant part of the derivatives in the trading portfolio are related to servicing corporate clients in their risk management to hedge for example currency or interest rate exposures. In addition, ING Bank provides its customers access to equity and debt markets for issuing their own equity or debt securities (‘securities underwriting’). Although these are presented as ‘Trading’ under IFRS-EU, these are directly related to services to ING’s customers. Loans and receivables in the trading portfolio mainly relate to (reverse) repurchase agreements, which are comparable to collateralised borrowing (lending). These products are used by ING Bank as part of its own regular treasury activities, but also relate to the role that ING Bank plays as intermediary between different professional customers. Trading assets and liabilities held for ING’s own risk are very limited. From a risk perspective, the gross amount of trading assets must be considered together with the gross amount of trading liabilities, which are presented separately on the balance sheet. However, IFRS-EU does not allow netting of these positions in the balance sheet. Reference is made to Note 21 ‘Financial liabilities at fair value through profit and loss’ for information on trading liabilities.
Investments for risk of policyholders
Investments for risk of policyholders by type2013 2012
Equity securities 36,919 89,994Debt securities 1,821 6,940Loans and receivables 849 1,831
39,589 98,765
Investments in investment funds (with underlying investments in debt, equity securities, real estate and derivatives) are included under equity securities.
Non-trading derivatives
Non-trading derivatives by type2013 2012
Derivatives used in– fair value hedges 1,383 2,926– cash flow hedges 4,630 7,471– hedges of net investments in foreign operations 138 49Other non-trading derivatives 2,395 3,505
8,546 13,951
Other non-trading derivatives mainly includes interest rate swaps for which no hedge accounting is applied.
Notes to the consolidated annual accounts of ING Group continued
121ING Group Annual Report 2013
1 Wh
o w
e are2 R
epo
rt of th
e Executive B
oard
3 Co
rpo
rate go
vernan
ce4 C
on
solid
ated an
nu
al accou
nts
5 Parent co
mp
any an
nu
al accou
nts
6 Oth
er info
rmatio
n7 A
dd
ition
al info
rmatio
n
ING_2013_deel1_v1.indd 121 19/03/2014 18:57:56

Designated as at fair value through profit and loss
Designated as at fair value through profit and loss by type2013 2012
Equity securities 437 13Debt securities 1,289 2,682Loans and receivables 1,052 1,169Other 12 896
2,790 4,760
Included in the Financial assets designated as at fair value through profit and loss is a portfolio of loans and receivables which is economically hedged by credit derivatives. The hedges do not meet the criteria for hedge accounting and the loans are recorded at fair value to avoid an accounting mismatch. The maximum credit exposure of the loans and receivables included in Financial assets designated as at fair value through profit and loss approximates its carrying value. The cumulative change in fair value of the loans attributable to changes in credit risk is not significant.
The notional value of the related credit derivatives is EUR 111 million (2012: EUR 61 million). The change in fair value of the credit derivatives attributable to changes in credit risk since the loans were first designated amounts was EUR –4 million (2012: EUR –6 million) and the change for the current year was EUR 2 million (2012: EUR –3 million).
The changes in fair value of the (designated) loans attributable to changes in credit risk have been calculated by determining the changes in credit spread implicit in the fair value of bonds issued by entities with similar credit characteristics.
Other includes investments in private equity funds, hedge funds, other non-traditional investment vehicles and limited partnerships.
5 INVESTMENTS
Investments by type 2013 2012
Available-for-sale– equity securities 7,265 7,707– debt securities 130,632 185,877
137,897 193,584
Held-to-maturity– debt securities 3,098 6,545
3,098 6,545
140,995 200,129
Equity securities in 2013 include EUR 1,832 million shares in ING managed investment funds and EUR 1,759 million shares in third party managed investment funds.
Exposure to debt securitiesING Group’s exposure to debt securities is included in the following balance sheet lines:
Debt securities2013 2012
Available-for-sale investments 130,632 185,877Held-to-maturity investments 3,098 6,545Loans and advances to customers 21,914 26,945Amounts due from banks 3,059 3,386Available-for-sale investments and Assets at amortised cost 158,703 222,753
Trading assets 18,890 17,472Investments for risk of policyholders 1,821 6,940Designated as at fair value through profit and loss 1,289 2,682Financial assets at fair value through profit and loss 22,000 27,094
180,703 249,847
Notes to the consolidated annual accounts of ING Group continued
122 ING Group Annual Report 2013
ING_2013_deel1_v1.indd 122 19/03/2014 18:57:56
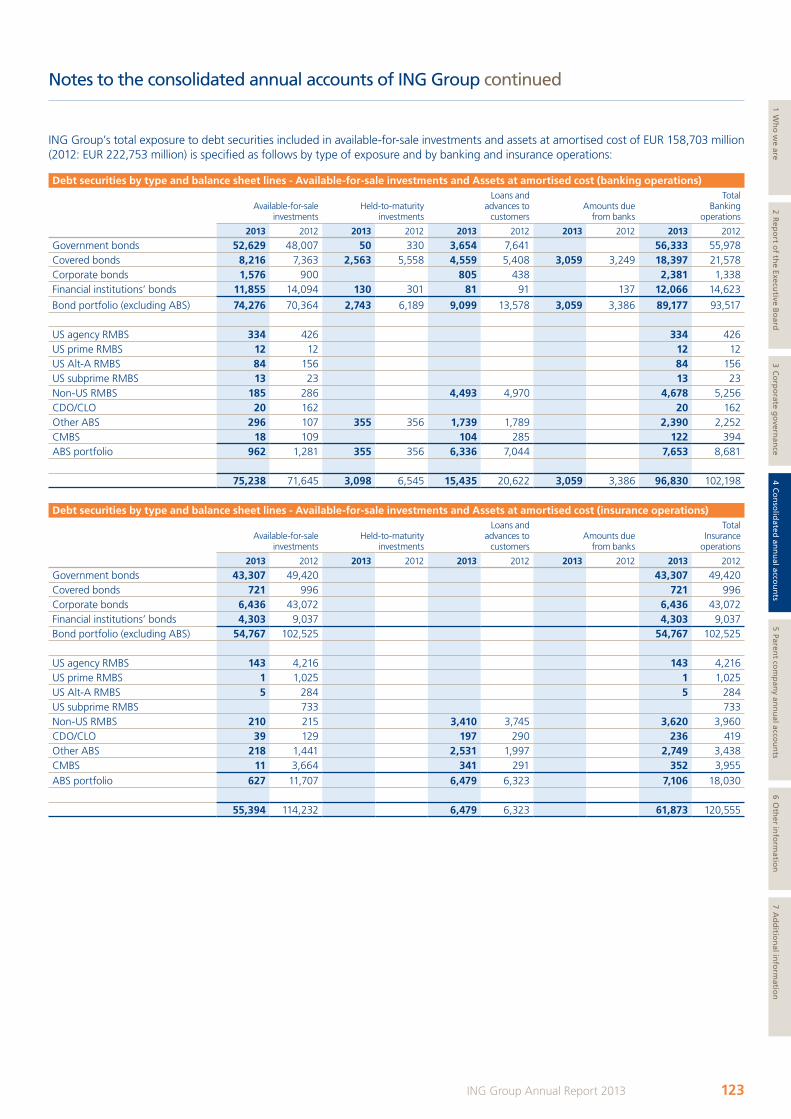
ING Group’s total exposure to debt securities included in available-for-sale investments and assets at amortised cost of EUR 158,703 million (2012: EUR 222,753 million) is specified as follows by type of exposure and by banking and insurance operations:
Debt securities by type and balance sheet lines - Available-for-sale investments and Assets at amortised cost (banking operations)
Available-for-sale investments
Held-to-maturity investments
Loans and advances to
customersAmounts due
from banks
Total Banking
operations
2013 2012 2013 2012 2013 2012 2013 2012 2013 2012
Government bonds 52,629 48,007 50 330 3,654 7,641 56,333 55,978Covered bonds 8,216 7,363 2,563 5,558 4,559 5,408 3,059 3,249 18,397 21,578Corporate bonds 1,576 900 805 438 2,381 1,338Financial institutions’ bonds 11,855 14,094 130 301 81 91 137 12,066 14,623
Bond portfolio (excluding ABS) 74,276 70,364 2,743 6,189 9,099 13,578 3,059 3,386 89,177 93,517
US agency RMBS 334 426 334 426US prime RMBS 12 12 12 12US Alt-A RMBS 84 156 84 156US subprime RMBS 13 23 13 23Non-US RMBS 185 286 4,493 4,970 4,678 5,256CDO/CLO 20 162 20 162Other ABS 296 107 355 356 1,739 1,789 2,390 2,252CMBS 18 109 104 285 122 394ABS portfolio 962 1,281 355 356 6,336 7,044 7,653 8,681
75,238 71,645 3,098 6,545 15,435 20,622 3,059 3,386 96,830 102,198
Debt securities by type and balance sheet lines - Available-for-sale investments and Assets at amortised cost (insurance operations)
Available-for-sale investments
Held-to-maturity investments
Loans and advances to
customersAmounts due
from banks
Total Insurance
operations
2013 2012 2013 2012 2013 2012 2013 2012 2013 2012
Government bonds 43,307 49,420 43,307 49,420Covered bonds 721 996 721 996Corporate bonds 6,436 43,072 6,436 43,072Financial institutions’ bonds 4,303 9,037 4,303 9,037Bond portfolio (excluding ABS) 54,767 102,525 54,767 102,525
US agency RMBS 143 4,216 143 4,216US prime RMBS 1 1,025 1 1,025US Alt-A RMBS 5 284 5 284US subprime RMBS 733 733Non-US RMBS 210 215 3,410 3,745 3,620 3,960CDO/CLO 39 129 197 290 236 419Other ABS 218 1,441 2,531 1,997 2,749 3,438CMBS 11 3,664 341 291 352 3,955ABS portfolio 627 11,707 6,479 6,323 7,106 18,030
55,394 114,232 6,479 6,323 61,873 120,555
Notes to the consolidated annual accounts of ING Group continued
123ING Group Annual Report 2013
1 Wh
o w
e are2 R
epo
rt of th
e Executive B
oard
3 Co
rpo
rate go
vernan
ce4 C
on
solid
ated an
nu
al accou
nts
5 Parent co
mp
any an
nu
al accou
nts
6 Oth
er info
rmatio
n7 A
dd
ition
al info
rmatio
n
ING_2013_deel1_v1.indd 123 19/03/2014 18:57:57
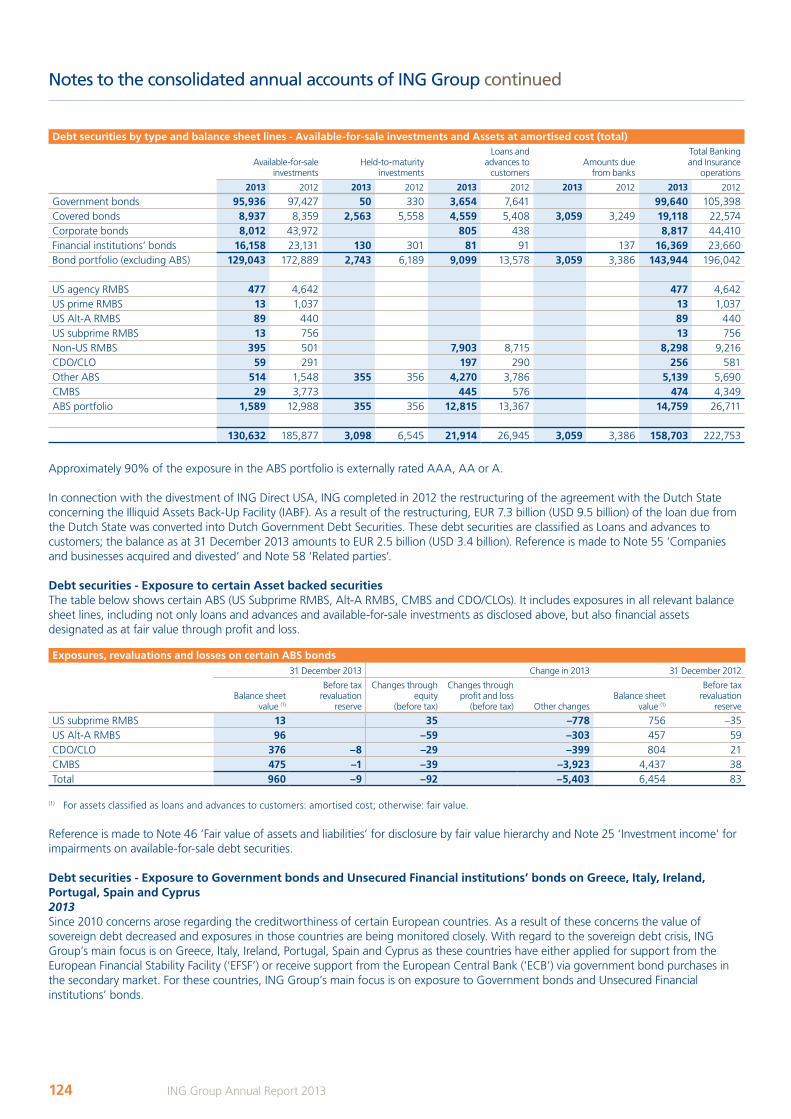
Debt securities by type and balance sheet lines - Available-for-sale investments and Assets at amortised cost (total)
Available-for-sale investments
Held-to-maturity investments
Loans and advances to
customersAmounts due
from banks
Total Banking and Insurance
operations
2013 2012 2013 2012 2013 2012 2013 2012 2013 2012
Government bonds 95,936 97,427 50 330 3,654 7,641 99,640 105,398Covered bonds 8,937 8,359 2,563 5,558 4,559 5,408 3,059 3,249 19,118 22,574Corporate bonds 8,012 43,972 805 438 8,817 44,410Financial institutions’ bonds 16,158 23,131 130 301 81 91 137 16,369 23,660Bond portfolio (excluding ABS) 129,043 172,889 2,743 6,189 9,099 13,578 3,059 3,386 143,944 196,042
US agency RMBS 477 4,642 477 4,642US prime RMBS 13 1,037 13 1,037US Alt-A RMBS 89 440 89 440US subprime RMBS 13 756 13 756Non-US RMBS 395 501 7,903 8,715 8,298 9,216CDO/CLO 59 291 197 290 256 581Other ABS 514 1,548 355 356 4,270 3,786 5,139 5,690CMBS 29 3,773 445 576 474 4,349ABS portfolio 1,589 12,988 355 356 12,815 13,367 14,759 26,711
130,632 185,877 3,098 6,545 21,914 26,945 3,059 3,386 158,703 222,753
Approximately 90% of the exposure in the ABS portfolio is externally rated AAA, AA or A.
In connection with the divestment of ING Direct USA, ING completed in 2012 the restructuring of the agreement with the Dutch State concerning the Illiquid Assets Back-Up Facility (IABF). As a result of the restructuring, EUR 7.3 billion (USD 9.5 billion) of the loan due from the Dutch State was converted into Dutch Government Debt Securities. These debt securities are classified as Loans and advances to customers; the balance as at 31 December 2013 amounts to EUR 2.5 billion (USD 3.4 billion). Reference is made to Note 55 ‘Companies and businesses acquired and divested’ and Note 58 ‘Related parties’.
Debt securities - Exposure to certain Asset backed securitiesThe table below shows certain ABS (US Subprime RMBS, Alt-A RMBS, CMBS and CDO/CLOs). It includes exposures in all relevant balance sheet lines, including not only loans and advances and available-for-sale investments as disclosed above, but also financial assets designated as at fair value through profit and loss.
Exposures, revaluations and losses on certain ABS bonds31 December 2013 Change in 2013 31 December 2012
Balance sheet value (1)
Before tax revaluation
reserve
Changes through equity
(before tax)
Changes through profit and loss
(before tax) Other changesBalance sheet
value (1)
Before tax revaluation
reserve
US subprime RMBS 13 35 –778 756 –35US Alt-A RMBS 96 –59 –303 457 59CDO/CLO 376 –8 –29 –399 804 21CMBS 475 –1 –39 –3,923 4,437 38Total 960 –9 –92 –5,403 6,454 83
(1) For assets classified as loans and advances to customers: amortised cost; otherwise: fair value.
Reference is made to Note 46 ‘Fair value of assets and liabilities’ for disclosure by fair value hierarchy and Note 25 ‘Investment income’ for impairments on available-for-sale debt securities.
Debt securities - Exposure to Government bonds and Unsecured Financial institutions’ bonds on Greece, Italy, Ireland, Portugal, Spain and Cyprus2013Since 2010 concerns arose regarding the creditworthiness of certain European countries. As a result of these concerns the value of sovereign debt decreased and exposures in those countries are being monitored closely. With regard to the sovereign debt crisis, ING Group’s main focus is on Greece, Italy, Ireland, Portugal, Spain and Cyprus as these countries have either applied for support from the European Financial Stability Facility (‘EFSF’) or receive support from the European Central Bank (‘ECB’) via government bond purchases in the secondary market. For these countries, ING Group’s main focus is on exposure to Government bonds and Unsecured Financial institutions’ bonds.
Notes to the consolidated annual accounts of ING Group continued
124 ING Group Annual Report 2013
ING_2013_deel1_v1.indd 124 19/03/2014 18:57:57
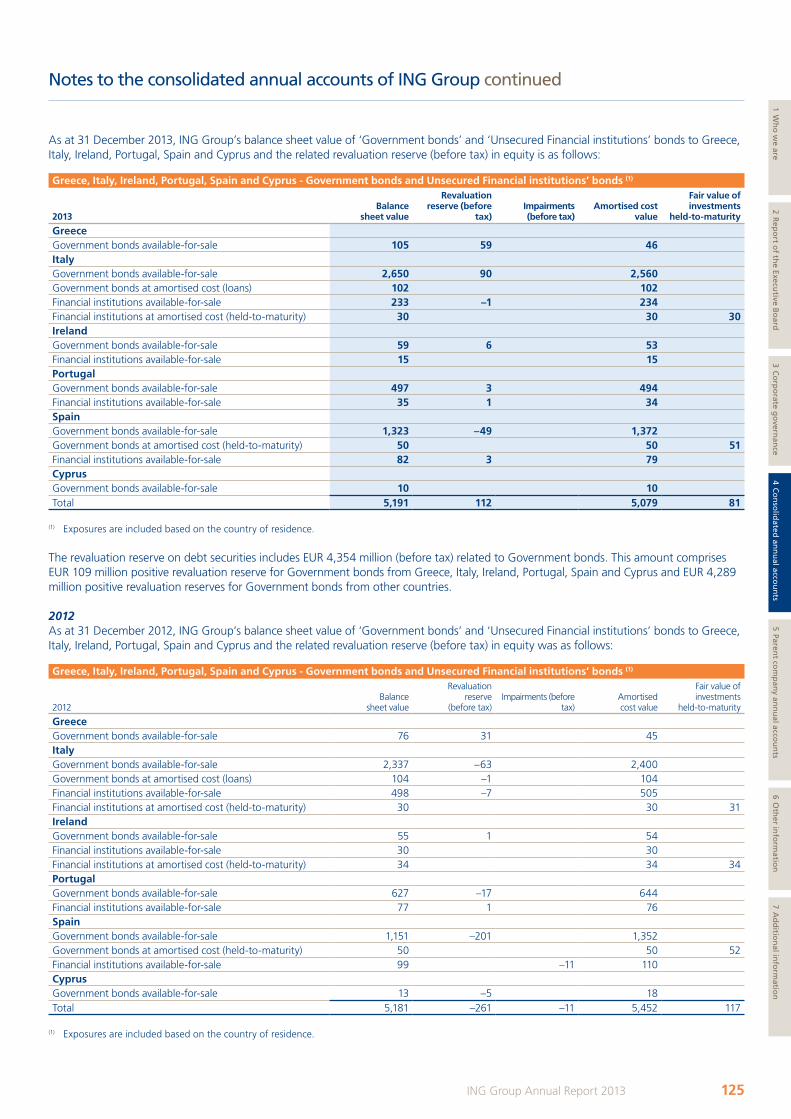
As at 31 December 2013, ING Group’s balance sheet value of ‘Government bonds’ and ‘Unsecured Financial institutions’ bonds to Greece, Italy, Ireland, Portugal, Spain and Cyprus and the related revaluation reserve (before tax) in equity is as follows:
Greece, Italy, Ireland, Portugal, Spain and Cyprus - Government bonds and Unsecured Financial institutions’ bonds (1)
2013Balance
sheet value
Revaluation reserve (before
tax)Impairments (before tax)
Amortised cost value
Fair value of investments
held-to-maturity
GreeceGovernment bonds available-for-sale 105 59 46 ItalyGovernment bonds available-for-sale 2,650 90 2,560 Government bonds at amortised cost (loans) 102 102 Financial institutions available-for-sale 233 –1 234 Financial institutions at amortised cost (held-to-maturity) 30 30 30IrelandGovernment bonds available-for-sale 59 6 53 Financial institutions available-for-sale 15 15 PortugalGovernment bonds available-for-sale 497 3 494 Financial institutions available-for-sale 35 1 34 SpainGovernment bonds available-for-sale 1,323 –49 1,372 Government bonds at amortised cost (held-to-maturity) 50 50 51Financial institutions available-for-sale 82 3 79 CyprusGovernment bonds available-for-sale 10 10 Total 5,191 112 5,079 81
(1) Exposures are included based on the country of residence.
The revaluation reserve on debt securities includes EUR 4,354 million (before tax) related to Government bonds. This amount comprises EUR 109 million positive revaluation reserve for Government bonds from Greece, Italy, Ireland, Portugal, Spain and Cyprus and EUR 4,289 million positive revaluation reserves for Government bonds from other countries.
2012As at 31 December 2012, ING Group’s balance sheet value of ‘Government bonds’ and ‘Unsecured Financial institutions’ bonds to Greece, Italy, Ireland, Portugal, Spain and Cyprus and the related revaluation reserve (before tax) in equity was as follows:
Greece, Italy, Ireland, Portugal, Spain and Cyprus - Government bonds and Unsecured Financial institutions’ bonds (1)
2012Balance
sheet value
Revaluation reserve
(before tax)Impairments (before
tax)Amortised cost value
Fair value of investments
held-to-maturity
GreeceGovernment bonds available-for-sale 76 31 45 ItalyGovernment bonds available-for-sale 2,337 –63 2,400 Government bonds at amortised cost (loans) 104 –1 104 Financial institutions available-for-sale 498 –7 505 Financial institutions at amortised cost (held-to-maturity) 30 30 31IrelandGovernment bonds available-for-sale 55 1 54 Financial institutions available-for-sale 30 30 Financial institutions at amortised cost (held-to-maturity) 34 34 34PortugalGovernment bonds available-for-sale 627 –17 644 Financial institutions available-for-sale 77 1 76 SpainGovernment bonds available-for-sale 1,151 –201 1,352 Government bonds at amortised cost (held-to-maturity) 50 50 52Financial institutions available-for-sale 99 –11 110 CyprusGovernment bonds available-for-sale 13 –5 18 Total 5,181 –261 –11 5,452 117
(1) Exposures are included based on the country of residence.
Notes to the consolidated annual accounts of ING Group continued
125ING Group Annual Report 2013
1 Wh
o w
e are2 R
epo
rt of th
e Executive B
oard
3 Co
rpo
rate go
vernan
ce4 C
on
solid
ated an
nu
al accou
nts
5 Parent co
mp
any an
nu
al accou
nts
6 Oth
er info
rmatio
n7 A
dd
ition
al info
rmatio
n
ING_2013_deel1_v1.indd 125 20/03/2014 14:42:12
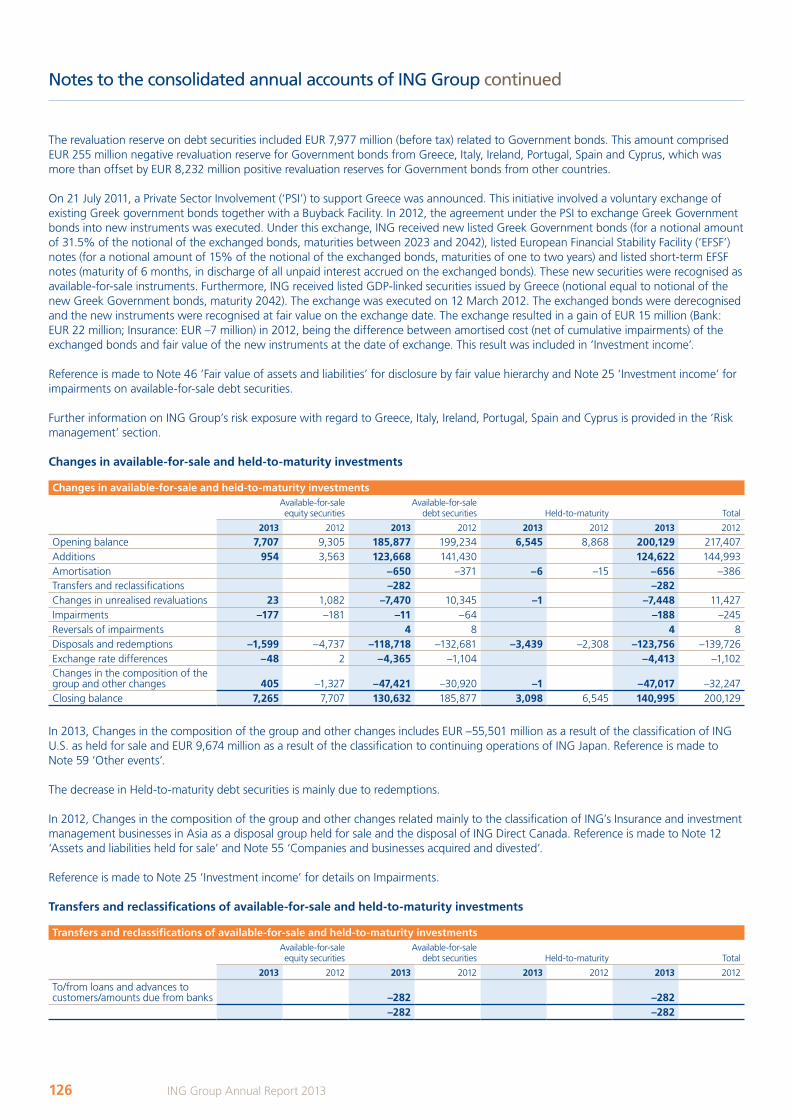
The revaluation reserve on debt securities included EUR 7,977 million (before tax) related to Government bonds. This amount comprised EUR 255 million negative revaluation reserve for Government bonds from Greece, Italy, Ireland, Portugal, Spain and Cyprus, which was more than offset by EUR 8,232 million positive revaluation reserves for Government bonds from other countries.
On 21 July 2011, a Private Sector Involvement (‘PSI’) to support Greece was announced. This initiative involved a voluntary exchange of existing Greek government bonds together with a Buyback Facility. In 2012, the agreement under the PSI to exchange Greek Government bonds into new instruments was executed. Under this exchange, ING received new listed Greek Government bonds (for a notional amount of 31.5% of the notional of the exchanged bonds, maturities between 2023 and 2042), listed European Financial Stability Facility (‘EFSF’) notes (for a notional amount of 15% of the notional of the exchanged bonds, maturities of one to two years) and listed short-term EFSF notes (maturity of 6 months, in discharge of all unpaid interest accrued on the exchanged bonds). These new securities were recognised as available-for-sale instruments. Furthermore, ING received listed GDP-linked securities issued by Greece (notional equal to notional of the new Greek Government bonds, maturity 2042). The exchange was executed on 12 March 2012. The exchanged bonds were derecognised and the new instruments were recognised at fair value on the exchange date. The exchange resulted in a gain of EUR 15 million (Bank: EUR 22 million; Insurance: EUR –7 million) in 2012, being the difference between amortised cost (net of cumulative impairments) of the exchanged bonds and fair value of the new instruments at the date of exchange. This result was included in ‘Investment income’.
Reference is made to Note 46 ‘Fair value of assets and liabilities’ for disclosure by fair value hierarchy and Note 25 ‘Investment income’ for impairments on available-for-sale debt securities.
Further information on ING Group’s risk exposure with regard to Greece, Italy, Ireland, Portugal, Spain and Cyprus is provided in the ‘Risk management’ section.
Changes in available-for-sale and held-to-maturity investments
Changes in available-for-sale and held-to-maturity investmentsAvailable-for-saleequity securities
Available-for-saledebt securities Held-to-maturity Total
2013 2012 2013 2012 2013 2012 2013 2012
Opening balance 7,707 9,305 185,877 199,234 6,545 8,868 200,129 217,407Additions 954 3,563 123,668 141,430 124,622 144,993Amortisation –650 –371 –6 –15 –656 –386Transfers and reclassifications –282 –282Changes in unrealised revaluations 23 1,082 –7,470 10,345 –1 –7,448 11,427Impairments –177 –181 –11 –64 –188 –245Reversals of impairments 4 8 4 8Disposals and redemptions –1,599 –4,737 –118,718 –132,681 –3,439 –2,308 –123,756 –139,726Exchange rate differences –48 2 –4,365 –1,104 –4,413 –1,102Changes in the composition of the group and other changes 405 –1,327 –47,421 –30,920 –1 –47,017 –32,247Closing balance 7,265 7,707 130,632 185,877 3,098 6,545 140,995 200,129
In 2013, Changes in the composition of the group and other changes includes EUR –55,501 million as a result of the classification of ING U.S. as held for sale and EUR 9,674 million as a result of the classification to continuing operations of ING Japan. Reference is made to Note 59 ‘Other events’.
The decrease in Held-to-maturity debt securities is mainly due to redemptions.
In 2012, Changes in the composition of the group and other changes related mainly to the classification of ING’s Insurance and investment management businesses in Asia as a disposal group held for sale and the disposal of ING Direct Canada. Reference is made to Note 12 ‘Assets and liabilities held for sale’ and Note 55 ‘Companies and businesses acquired and divested’.
Reference is made to Note 25 ‘Investment income’ for details on Impairments.
Transfers and reclassifications of available-for-sale and held-to-maturity investments
Transfers and reclassifications of available-for-sale and held-to-maturity investmentsAvailable-for-saleequity securities
Available-for-saledebt securities Held-to-maturity Total
2013 2012 2013 2012 2013 2012 2013 2012
To/from loans and advances to customers/amounts due from banks –282 –282
–282 –282
Notes to the consolidated annual accounts of ING Group continued
126 ING Group Annual Report 2013
ING_2013_deel1_v1.indd 126 19/03/2014 18:57:58

Notes to the consolidated annual accounts of ING Group continued
In 2013, To/from loans and advances to customers/amounts due from banks in relation to Available-for-sale debt securities relates to a debt security that was reclassified to Loans and advances to customers because there is no active market.
Reclassifications to Loans and advances to customers and Amounts due from banks (2009 and 2008)Reclassifications out of available-for-sale investments to loans and receivables are allowed under IFRS-EU as of the third quarter of 2008. In the second and first quarter of 2009 and in the fourth quarter of 2008 ING Group reclassified certain financial assets from Investments available-for-sale to Loans and advances to customers and Amounts due from banks. The Group identified assets, eligible for reclassification, for which at the reclassification date it had the intention to hold for the foreseeable future. The table below provides information on the three reclassifications made in the fourth quarter of 2008 and the first and second quarter of 2009. Information is provided for each of the three reclassifications (see columns) as at the date of reclassification and as at the end of the subsequent reporting periods (see rows). This information is disclosed under IFRS-EU as long as the reclassified assets continue to be recognised in the balance sheet.
In 2012, the decrease in the carrying value of the reclassified Loans and advances compared to 2011 was mainly due to disposals.
Reclassifications to Loans and advances to customers and Amounts due from banksQ2 2009 Q1 2009 Q4 2008
As per reclassification dateFair value 6,135 22,828 1,594Range of effective interest rates (weighted average) 1.4%–24.8% 2.1%–11.7% 4.1%–21%Expected recoverable cash flows 7,118 24,052 1,646Unrealised fair value losses in shareholders’ equity (before tax) –896 –1,224 –69Recognised fair value gains (losses) in shareholders’ equity (before tax) between the beginning of the year in which the reclassification took place and the reclassification date 173 nil –79Recognised fair value gains (losses) in shareholders’ equity (before tax) in the year prior to reclassification –971 –192 –20Recognised impairment (before tax) between the beginning of the year in which the reclassification took place and the reclassification date nil nil nilRecognised impairment (before tax) in the year prior to reclassification nil nil nil
Impact on the financial years after reclassification:2013Carrying value as at 31 December 1,098 7,461 366Fair value as at 31 December 1,108 7,215 422Unrealised fair value losses recognised in shareholders’ equity (before tax) as at 31 December 111 –137 nilEffect on shareholders’ equity (before tax) as at 31 December if reclassification had not been made 10 –246 56Effect on result (before tax) if reclassification had not been made nil nil nilEffect on result (before tax) for the year (interest income and sales results) –10 188 20Recognised impairments (before tax) nil nil nilRecognised provision for credit losses (before tax) nil nil nil
2012Carrying value as at 31 December 1,694 8,707 443Fair value as at 31 December 1,667 8,379 512Unrealised fair value losses recognised in shareholders’ equity (before tax) as at 31 December –186 –221 –2Effect on shareholders’ equity (before tax) as at 31 December if reclassification had not been made –27 –328 69Effect on result (before tax) if reclassification had not been made nil nil nilEffect on result (before tax) for the year (interest income and sales results) –47 –164 22Recognised impairments (before tax) nil nil nilRecognised provision for credit losses (before tax) nil nil nil
2011Carrying value as at 31 December 3,057 14,419 633Fair value as at 31 December 2,883 13,250 648Unrealised fair value losses recognised in shareholders’ equity (before tax) as at 31 December –307 –446 –8Effect on shareholders’ equity (before tax) as at 31 December if reclassification had not been made –174 –1,169 15Effect on result (before tax) if reclassification had not been made nil nil nilEffect on result (before tax) for the year (mainly interest income) 90 390 28Recognised impairments (before tax) nil nil nilRecognised provision for credit losses (before tax) nil nil nil
127ING Group Annual Report 2013
1 Wh
o w
e are2 R
epo
rt of th
e Executive B
oard
3 Co
rpo
rate go
vernan
ce4 C
on
solid
ated an
nu
al accou
nts
5 Parent co
mp
any an
nu
al accou
nts
6 Oth
er info
rmatio
n7 A
dd
ition
al info
rmatio
n
ING_2013_deel1_v1.indd 127 19/03/2014 18:57:58
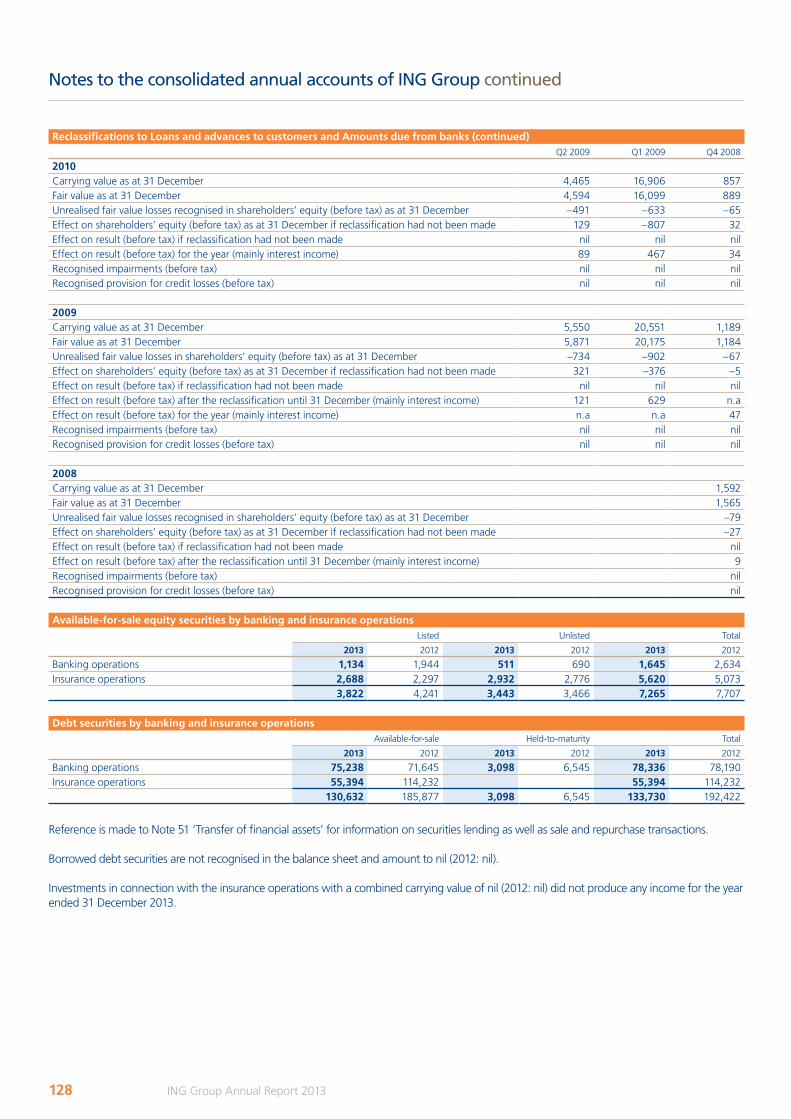
Notes to the consolidated annual accounts of ING Group continued
Reclassifications to Loans and advances to customers and Amounts due from banks (continued)Q2 2009 Q1 2009 Q4 2008
2010Carrying value as at 31 December 4,465 16,906 857Fair value as at 31 December 4,594 16,099 889Unrealised fair value losses recognised in shareholders’ equity (before tax) as at 31 December –491 –633 –65Effect on shareholders’ equity (before tax) as at 31 December if reclassification had not been made 129 –807 32Effect on result (before tax) if reclassification had not been made nil nil nilEffect on result (before tax) for the year (mainly interest income) 89 467 34Recognised impairments (before tax) nil nil nilRecognised provision for credit losses (before tax) nil nil nil
2009Carrying value as at 31 December 5,550 20,551 1,189Fair value as at 31 December 5,871 20,175 1,184Unrealised fair value losses in shareholders’ equity (before tax) as at 31 December –734 –902 –67Effect on shareholders’ equity (before tax) as at 31 December if reclassification had not been made 321 –376 –5Effect on result (before tax) if reclassification had not been made nil nil nilEffect on result (before tax) after the reclassification until 31 December (mainly interest income) 121 629 n.aEffect on result (before tax) for the year (mainly interest income) n.a n.a 47Recognised impairments (before tax) nil nil nilRecognised provision for credit losses (before tax) nil nil nil
2008Carrying value as at 31 December 1,592Fair value as at 31 December 1,565Unrealised fair value losses recognised in shareholders’ equity (before tax) as at 31 December –79Effect on shareholders’ equity (before tax) as at 31 December if reclassification had not been made –27Effect on result (before tax) if reclassification had not been made nilEffect on result (before tax) after the reclassification until 31 December (mainly interest income) 9Recognised impairments (before tax) nilRecognised provision for credit losses (before tax) nil
Available-for-sale equity securities by banking and insurance operationsListed Unlisted Total
2013 2012 2013 2012 2013 2012
Banking operations 1,134 1,944 511 690 1,645 2,634Insurance operations 2,688 2,297 2,932 2,776 5,620 5,073
3,822 4,241 3,443 3,466 7,265 7,707
Debt securities by banking and insurance operationsAvailable-for-sale Held-to-maturity Total
2013 2012 2013 2012 2013 2012
Banking operations 75,238 71,645 3,098 6,545 78,336 78,190Insurance operations 55,394 114,232 55,394 114,232
130,632 185,877 3,098 6,545 133,730 192,422
Reference is made to Note 51 ‘Transfer of financial assets’ for information on securities lending as well as sale and repurchase transactions.
Borrowed debt securities are not recognised in the balance sheet and amount to nil (2012: nil).
Investments in connection with the insurance operations with a combined carrying value of nil (2012: nil) did not produce any income for the year ended 31 December 2013.
128 ING Group Annual Report 2013
ING_2013_deel1_v1.indd 128 19/03/2014 18:57:59
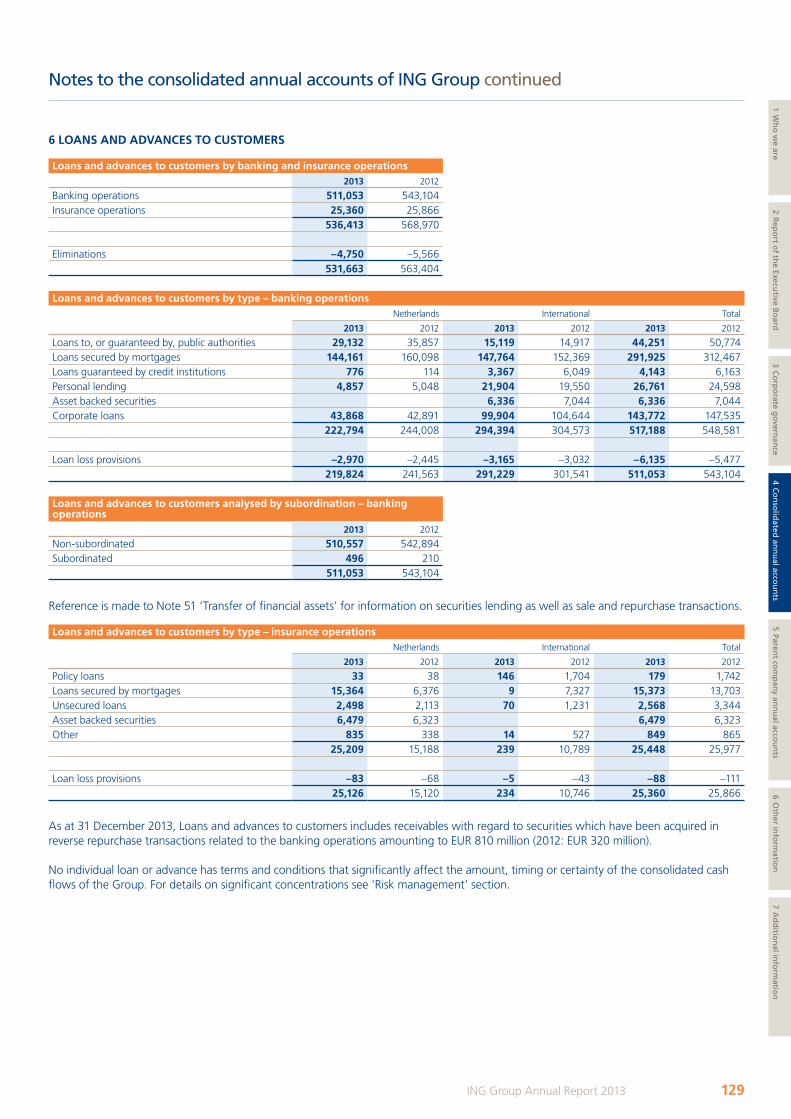
Notes to the consolidated annual accounts of ING Group continued
6 LOANS AND ADVANCES TO CUSTOMERS
Loans and advances to customers by banking and insurance operations2013 2012
Banking operations 511,053 543,104Insurance operations 25,360 25,866
536,413 568,970
Eliminations –4,750 –5,566531,663 563,404
Loans and advances to customers by type – banking operationsNetherlands International Total
2013 2012 2013 2012 2013 2012
Loans to, or guaranteed by, public authorities 29,132 35,857 15,119 14,917 44,251 50,774Loans secured by mortgages 144,161 160,098 147,764 152,369 291,925 312,467Loans guaranteed by credit institutions 776 114 3,367 6,049 4,143 6,163Personal lending 4,857 5,048 21,904 19,550 26,761 24,598Asset backed securities 6,336 7,044 6,336 7,044Corporate loans 43,868 42,891 99,904 104,644 143,772 147,535
222,794 244,008 294,394 304,573 517,188 548,581
Loan loss provisions –2,970 –2,445 –3,165 –3,032 –6,135 –5,477219,824 241,563 291,229 301,541 511,053 543,104
Loans and advances to customers analysed by subordination – banking operations
2013 2012
Non-subordinated 510,557 542,894Subordinated 496 210
511,053 543,104
Reference is made to Note 51 ‘Transfer of financial assets’ for information on securities lending as well as sale and repurchase transactions.
Loans and advances to customers by type – insurance operationsNetherlands International Total
2013 2012 2013 2012 2013 2012
Policy loans 33 38 146 1,704 179 1,742Loans secured by mortgages 15,364 6,376 9 7,327 15,373 13,703Unsecured loans 2,498 2,113 70 1,231 2,568 3,344Asset backed securities 6,479 6,323 6,479 6,323Other 835 338 14 527 849 865
25,209 15,188 239 10,789 25,448 25,977
Loan loss provisions –83 –68 –5 –43 –88 –11125,126 15,120 234 10,746 25,360 25,866
As at 31 December 2013, Loans and advances to customers includes receivables with regard to securities which have been acquired in reverse repurchase transactions related to the banking operations amounting to EUR 810 million (2012: EUR 320 million).
No individual loan or advance has terms and conditions that significantly affect the amount, timing or certainty of the consolidated cash flows of the Group. For details on significant concentrations see ‘Risk management’ section.
129ING Group Annual Report 2013
1 Wh
o w
e are2 R
epo
rt of th
e Executive B
oard
3 Co
rpo
rate go
vernan
ce4 C
on
solid
ated an
nu
al accou
nts
5 Parent co
mp
any an
nu
al accou
nts
6 Oth
er info
rmatio
n7 A
dd
ition
al info
rmatio
n
ING_2013_deel1_v1.indd 129 19/03/2014 18:57:59

Loans and advances to customers and Amounts due from banks include finance lease receivables, are detailed as follows:
Finance lease receivables2013 2012
Maturities of gross investment in finance lease receivables– within 1 year 3,924 4,969– more than 1 year but less than 5 years 7,239 8,926– more than 5 years 4,949 5,497
16,112 19,392
Unearned future finance income on finance leases –2,364 –2,996Net investment in finance leases 13,748 16,396
Maturities of net investment in finance lease receivables– within 1 year 3,424 4,310– more than 1 year but less than 5 years 6,283 7,673– more than 5 years 4,041 4,413
13,748 16,396
Included in Amounts due from banks 73 133Included in Loans and advances to customers 13,675 16,263
13,748 16,396
The allowance for uncollectable finance lease receivables includes in the loan loss provisions amount to EUR 344 million as at 31 December 2013 (2012: EUR 322 million).
No individual finance lease receivable has terms and conditions that significantly affect the amount, timing or certainty of the consolidated cash flows of the Group.
Loan loss provisions analysed by type – banking operationsNetherlands International Total
2013 2012 2013 2012 2013 2012
Loans to, or guaranteed by, public authorities 2 2 2 2Loans secured by mortgages 1,265 878 630 710 1,895 1,588Loans guaranteed by credit institutions 22 30 22 30Personal lending 139 144 672 650 811 794Asset backed securities 142 76 142 76Corporate loans 1,566 1,423 1,716 1,592 3,282 3,015
2,970 2,445 3,184 3,060 6,154 5,505
The closing balance is included in– Amounts due from banks 19 28 19 28– Loans and advances to customers 2,970 2,445 3,165 3,032 6,135 5,477
2,970 2,445 3,184 3,060 6,154 5,505
Changes in loan loss provisionsBanking operations Insurance operations Total
2013 2012 2013 2012 2013 2012
Opening balance 5,505 4,950 111 124 5,616 5,074Write-offs –1,609 –1,682 –31 –39 –1,640 –1,721Recoveries 116 142 1 117 142Increase in loan loss provisions 2,289 2,125 42 29 2,331 2,154Exchange rate differences –109 20 –2 1 –111 21Changes in the composition of the group and other changes –38 –50 –33 –4 –71 –54Closing balance 6,154 5,505 88 111 6,242 5,616
In 2013, Changes in the composition of the group and other changes includes EUR –5 million as a result of the classification of ING U.S. as held for sale and nil as a result of the classification to continuing operations of ING Japan. Reference is made to Note 59 ‘Other events’. Furthermore Changes in the composition of the group and other changes relates to the sale of ING’s mortgage business in Mexico. Reference is made to Note 55 ‘Companies and businesses acquired and divested’.
Notes to the consolidated annual accounts of ING Group continued
130 ING Group Annual Report 2013
ING_2013_deel1_v1.indd 130 19/03/2014 18:57:59
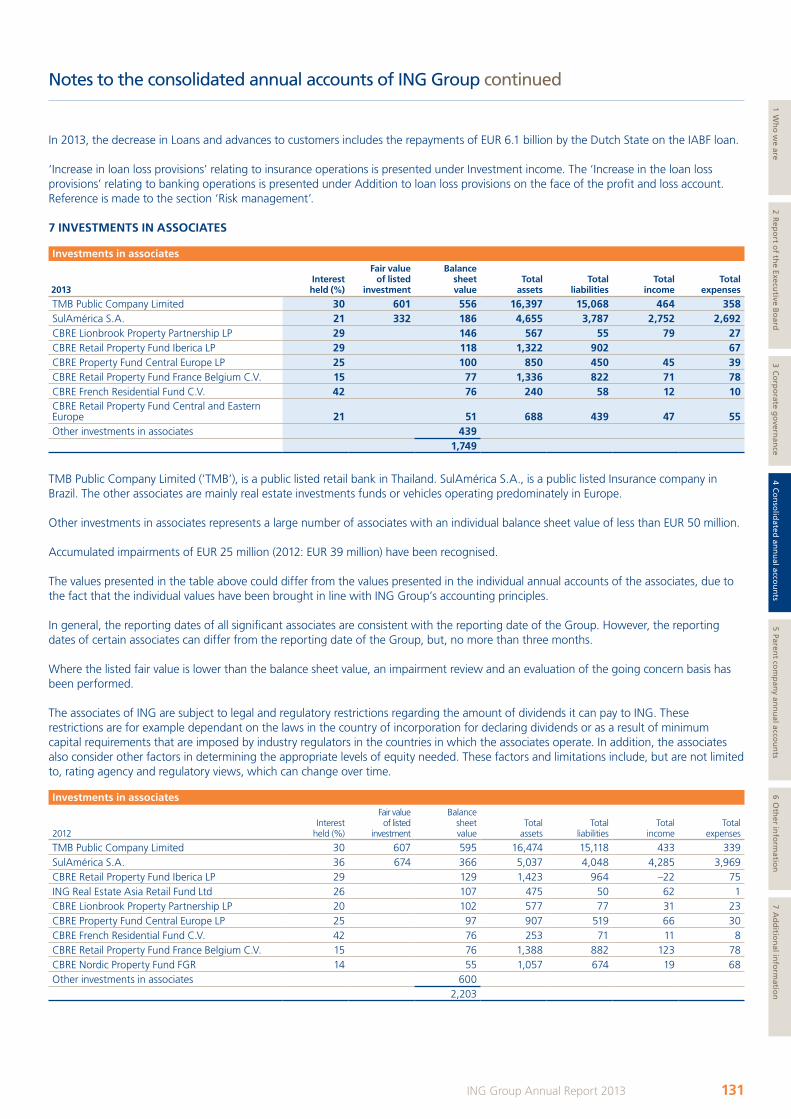
In 2013, the decrease in Loans and advances to customers includes the repayments of EUR 6.1 billion by the Dutch State on the IABF loan.
‘Increase in loan loss provisions’ relating to insurance operations is presented under Investment income. The ‘Increase in the loan loss provisions’ relating to banking operations is presented under Addition to loan loss provisions on the face of the profit and loss account. Reference is made to the section ‘Risk management’.
7 INVESTMENTS IN ASSOCIATES
Investments in associates
2013Interest held (%)
Fair value of listed
investment
Balance sheet value
Total assets
Total liabilities
Total income
Total
expenses
TMB Public Company Limited 30 601 556 16,397 15,068 464 358SulAmérica S.A. 21 332 186 4,655 3,787 2,752 2,692CBRE Lionbrook Property Partnership LP 29 146 567 55 79 27CBRE Retail Property Fund Iberica LP 29 118 1,322 902 67CBRE Property Fund Central Europe LP 25 100 850 450 45 39CBRE Retail Property Fund France Belgium C.V. 15 77 1,336 822 71 78CBRE French Residential Fund C.V. 42 76 240 58 12 10CBRE Retail Property Fund Central and Eastern Europe 21 51 688 439 47 55Other investments in associates 439
1,749
TMB Public Company Limited (‘TMB’), is a public listed retail bank in Thailand. SulAmérica S.A., is a public listed Insurance company in Brazil. The other associates are mainly real estate investments funds or vehicles operating predominately in Europe.
Other investments in associates represents a large number of associates with an individual balance sheet value of less than EUR 50 million.
Accumulated impairments of EUR 25 million (2012: EUR 39 million) have been recognised.
The values presented in the table above could differ from the values presented in the individual annual accounts of the associates, due to the fact that the individual values have been brought in line with ING Group’s accounting principles.
In general, the reporting dates of all significant associates are consistent with the reporting date of the Group. However, the reporting dates of certain associates can differ from the reporting date of the Group, but, no more than three months.
Where the listed fair value is lower than the balance sheet value, an impairment review and an evaluation of the going concern basis has been performed.
The associates of ING are subject to legal and regulatory restrictions regarding the amount of dividends it can pay to ING. These restrictions are for example dependant on the laws in the country of incorporation for declaring dividends or as a result of minimum capital requirements that are imposed by industry regulators in the countries in which the associates operate. In addition, the associates also consider other factors in determining the appropriate levels of equity needed. These factors and limitations include, but are not limited to, rating agency and regulatory views, which can change over time.
Investments in associates
2012Interest
held (%)
Fair value of listed
investment
Balancesheetvalue
Totalassets
Totalliabilities
Totalincome
Total
expenses
TMB Public Company Limited 30 607 595 16,474 15,118 433 339SulAmérica S.A. 36 674 366 5,037 4,048 4,285 3,969CBRE Retail Property Fund Iberica LP 29 129 1,423 964 –22 75ING Real Estate Asia Retail Fund Ltd 26 107 475 50 62 1CBRE Lionbrook Property Partnership LP 20 102 577 77 31 23CBRE Property Fund Central Europe LP 25 97 907 519 66 30CBRE French Residential Fund C.V. 42 76 253 71 11 8CBRE Retail Property Fund France Belgium C.V. 15 76 1,388 882 123 78CBRE Nordic Property Fund FGR 14 55 1,057 674 19 68Other investments in associates 600
2,203
Notes to the consolidated annual accounts of ING Group continued
131ING Group Annual Report 2013
1 Wh
o w
e are2 R
epo
rt of th
e Executive B
oard
3 Co
rpo
rate go
vernan
ce4 C
on
solid
ated an
nu
al accou
nts
5 Parent co
mp
any an
nu
al accou
nts
6 Oth
er info
rmatio
n7 A
dd
ition
al info
rmatio
n
ING_2013_deel1_v1.indd 131 19/03/2014 18:57:59
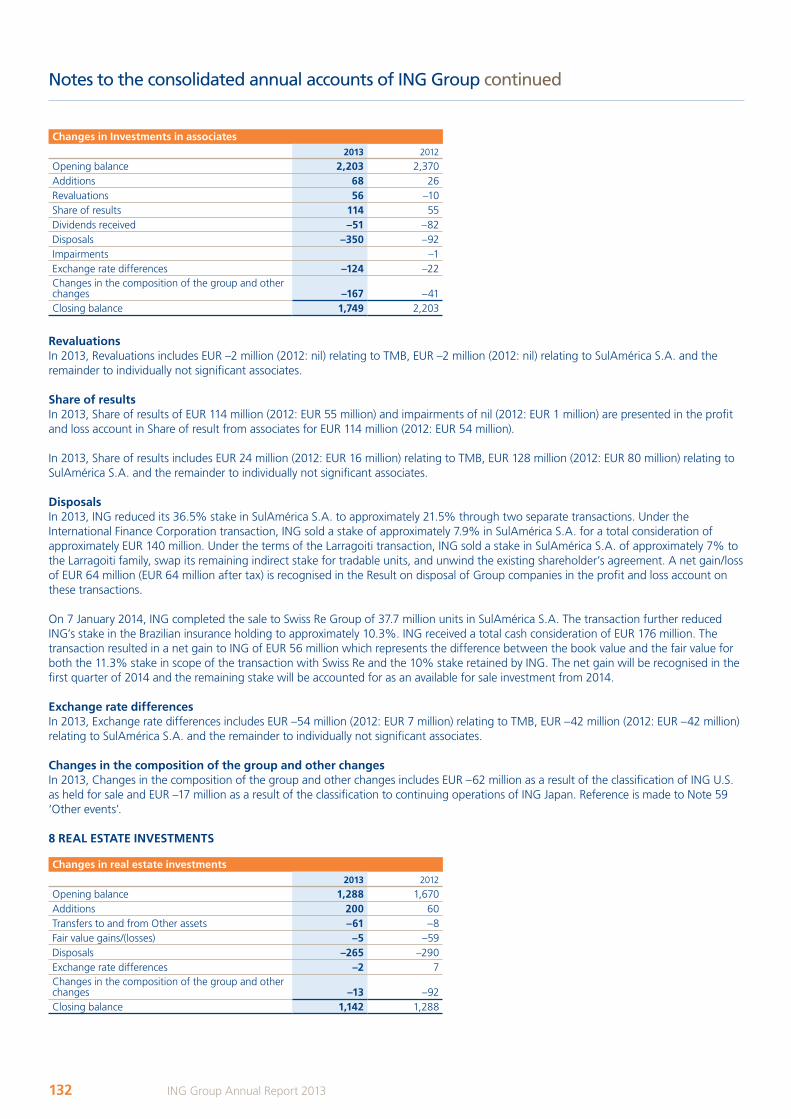
Changes in Investments in associates2013 2012
Opening balance 2,203 2,370Additions 68 26Revaluations 56 –10Share of results 114 55Dividends received –51 –82Disposals –350 –92Impairments –1Exchange rate differences –124 –22Changes in the composition of the group and other changes –167 –41Closing balance 1,749 2,203
RevaluationsIn 2013, Revaluations includes EUR –2 million (2012: nil) relating to TMB, EUR –2 million (2012: nil) relating to SulAmérica S.A. and the remainder to individually not significant associates.
Share of resultsIn 2013, Share of results of EUR 114 million (2012: EUR 55 million) and impairments of nil (2012: EUR 1 million) are presented in the profit and loss account in Share of result from associates for EUR 114 million (2012: EUR 54 million).
In 2013, Share of results includes EUR 24 million (2012: EUR 16 million) relating to TMB, EUR 128 million (2012: EUR 80 million) relating to SulAmérica S.A. and the remainder to individually not significant associates.
DisposalsIn 2013, ING reduced its 36.5% stake in SulAmérica S.A. to approximately 21.5% through two separate transactions. Under the International Finance Corporation transaction, ING sold a stake of approximately 7.9% in SulAmérica S.A. for a total consideration of approximately EUR 140 million. Under the terms of the Larragoiti transaction, ING sold a stake in SulAmérica S.A. of approximately 7% to the Larragoiti family, swap its remaining indirect stake for tradable units, and unwind the existing shareholder’s agreement. A net gain/loss of EUR 64 million (EUR 64 million after tax) is recognised in the Result on disposal of Group companies in the profit and loss account on these transactions.
On 7 January 2014, ING completed the sale to Swiss Re Group of 37.7 million units in SulAmérica S.A. The transaction further reduced ING’s stake in the Brazilian insurance holding to approximately 10.3%. ING received a total cash consideration of EUR 176 million. The transaction resulted in a net gain to ING of EUR 56 million which represents the difference between the book value and the fair value for both the 11.3% stake in scope of the transaction with Swiss Re and the 10% stake retained by ING. The net gain will be recognised in the first quarter of 2014 and the remaining stake will be accounted for as an available for sale investment from 2014.
Exchange rate differencesIn 2013, Exchange rate differences includes EUR –54 million (2012: EUR 7 million) relating to TMB, EUR –42 million (2012: EUR –42 million) relating to SulAmérica S.A. and the remainder to individually not significant associates.
Changes in the composition of the group and other changesIn 2013, Changes in the composition of the group and other changes includes EUR –62 million as a result of the classification of ING U.S. as held for sale and EUR –17 million as a result of the classification to continuing operations of ING Japan. Reference is made to Note 59 ‘Other events’.
8 REAL ESTATE INVESTMENTS
Changes in real estate investments2013 2012
Opening balance 1,288 1,670Additions 200 60Transfers to and from Other assets –61 –8Fair value gains/(losses) –5 –59Disposals –265 –290Exchange rate differences –2 7Changes in the composition of the group and other changes –13 –92Closing balance 1,142 1,288
Notes to the consolidated annual accounts of ING Group continued
132 ING Group Annual Report 2013
ING_2013_deel1_v1.indd 132 19/03/2014 18:58:03
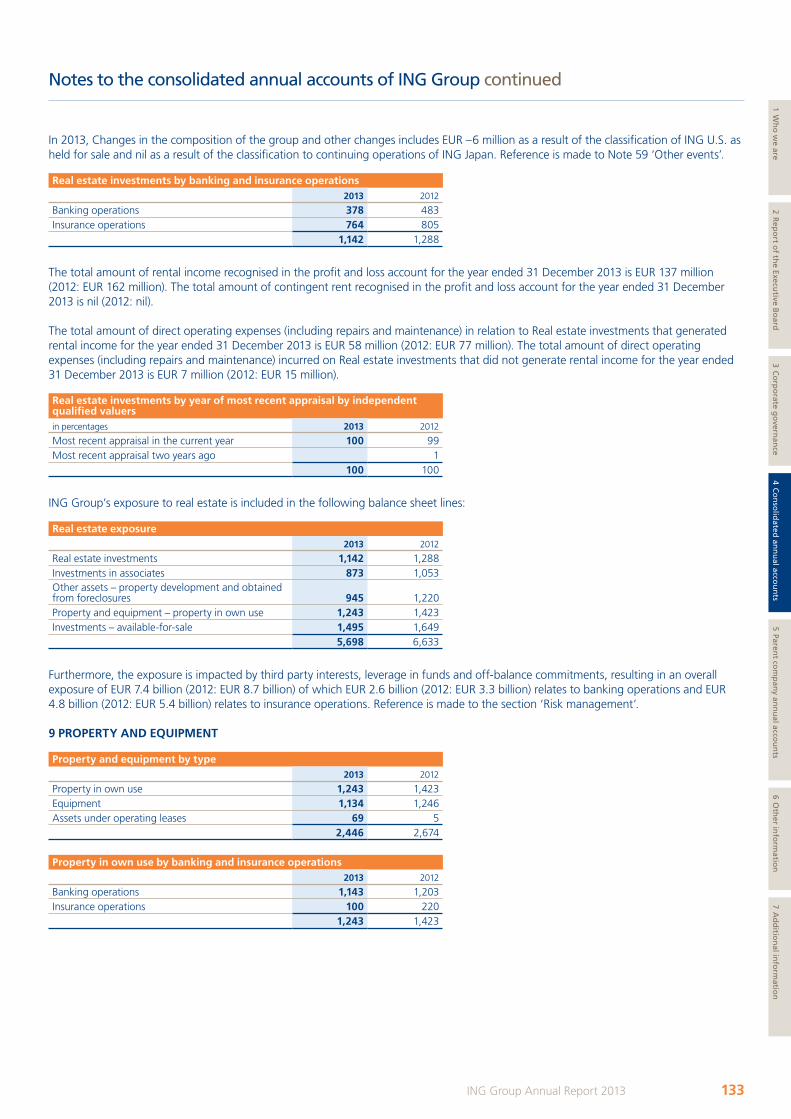
In 2013, Changes in the composition of the group and other changes includes EUR –6 million as a result of the classification of ING U.S. as held for sale and nil as a result of the classification to continuing operations of ING Japan. Reference is made to Note 59 ‘Other events’.
Real estate investments by banking and insurance operations2013 2012
Banking operations 378 483Insurance operations 764 805
1,142 1,288
The total amount of rental income recognised in the profit and loss account for the year ended 31 December 2013 is EUR 137 million (2012: EUR 162 million). The total amount of contingent rent recognised in the profit and loss account for the year ended 31 December 2013 is nil (2012: nil).
The total amount of direct operating expenses (including repairs and maintenance) in relation to Real estate investments that generated rental income for the year ended 31 December 2013 is EUR 58 million (2012: EUR 77 million). The total amount of direct operating expenses (including repairs and maintenance) incurred on Real estate investments that did not generate rental income for the year ended 31 December 2013 is EUR 7 million (2012: EUR 15 million).
Real estate investments by year of most recent appraisal by independent qualified valuersin percentages 2013 2012
Most recent appraisal in the current year 100 99Most recent appraisal two years ago 1
100 100
ING Group’s exposure to real estate is included in the following balance sheet lines:
Real estate exposure2013 2012
Real estate investments 1,142 1,288Investments in associates 873 1,053Other assets – property development and obtained from foreclosures 945 1,220Property and equipment – property in own use 1,243 1,423Investments – available-for-sale 1,495 1,649
5,698 6,633
Furthermore, the exposure is impacted by third party interests, leverage in funds and off-balance commitments, resulting in an overall exposure of EUR 7.4 billion (2012: EUR 8.7 billion) of which EUR 2.6 billion (2012: EUR 3.3 billion) relates to banking operations and EUR 4.8 billion (2012: EUR 5.4 billion) relates to insurance operations. Reference is made to the section ‘Risk management’.
9 PROPERTY AND EQUIPMENT
Property and equipment by type2013 2012
Property in own use 1,243 1,423Equipment 1,134 1,246Assets under operating leases 69 5
2,446 2,674
Property in own use by banking and insurance operations2013 2012
Banking operations 1,143 1,203Insurance operations 100 220
1,243 1,423
Notes to the consolidated annual accounts of ING Group continued
133ING Group Annual Report 2013
1 Wh
o w
e are2 R
epo
rt of th
e Executive B
oard
3 Co
rpo
rate go
vernan
ce4 C
on
solid
ated an
nu
al accou
nts
5 Parent co
mp
any an
nu
al accou
nts
6 Oth
er info
rmatio
n7 A
dd
ition
al info
rmatio
n
ING_2013_deel1_v1.indd 133 19/03/2014 18:58:03

Changes in property in own use2013 2012
Opening balance 1,423 1,535Additions 39 30Transfers to and from Other assets –2 –1Depreciation –24 –25Revaluations –4 –30Impairments –30 –24Reversal of impairments 5 7Disposals –34 –49Exchange rate differences –26 5Changes in the composition of the group and other changes –104 –25Closing balance 1,243 1,423
Gross carrying amount as at 31 December 2,128 2,276Accumulated depreciation as at 31 December –696 –682Accumulated impairments as at 31 December –189 –171Net carrying value as at 31 December 1,243 1,423
Revaluation surplusOpening balance 470 498Revaluation in the year –5 –27Released in the year –16 –1Closing balance 449 470
In 2013, Changes in the composition of the group and other changes includes EUR –104 million as a result of the classification of ING U.S. as held for sale and nil as a result of the classification to continuing operations of ING Japan. Reference is made to Note 59 ‘Other events’.
The cost or the purchase price amounted to EUR 1,680 million (2012: EUR 1,806 million). Cost or the purchase price less accumulated depreciation and impairments would have been EUR 794 million (2012: EUR 953 million) had property in own use been valued at cost instead of at fair value.
Property in own use by year of most recent appraisal by independent qualified valuersin percentages 2013 2012
Most recent appraisal in the current year 63 63Most recent appraisal one year ago 17 11Most recent appraisal two years ago 10 13Most recent appraisal three years ago 4 8Most recent appraisal four years ago 6 5
100 100
Changes in equipment
Data processing equipmentFixtures and fittings
and other equipment
Total
2013 2012 2013 2012 2013 2012
Opening balance 338 363 908 982 1,246 1,345Additions 175 187 169 206 344 393Disposals –18 –7 –9 –15 –27 –22Depreciation –161 –181 –215 –226 –376 –407Impairments –1 –1 –2Exchange rate differences –10 4 –14 6 –24 10Changes in the composition of the group and other changes –10 –27 –19 –44 –29 –71Closing balance 314 338 820 908 1,134 1,246
Gross carrying amount as at 31 December 1,347 1,623 2,498 2,579 3,845 4,202Accumulated depreciation as at 31 December –1,032 –1,284 –1,678 –1,671 –2,710 –2,955Accumulated impairments as at 31 December –1 –1 –1 –1Net carrying value as at 31 December 314 338 820 908 1,134 1,246
Notes to the consolidated annual accounts of ING Group continued
134 ING Group Annual Report 2013
ING_2013_deel1_v1.indd 134 19/03/2014 18:58:03
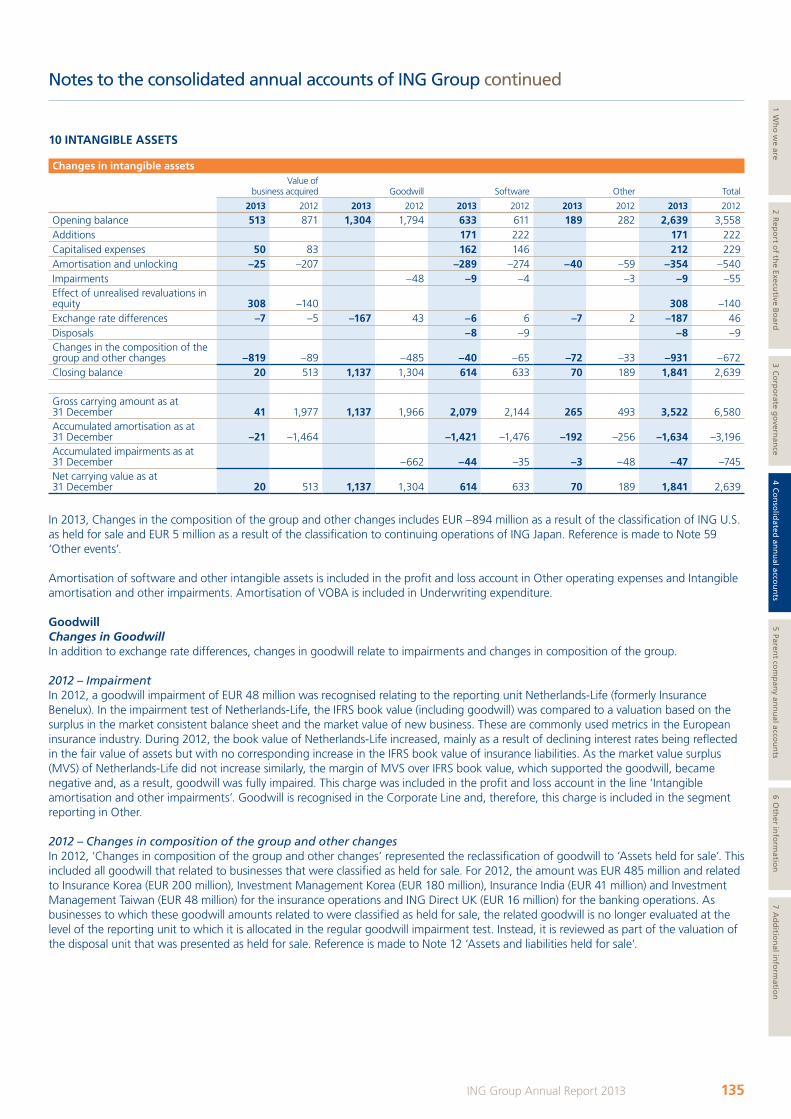
10 INTANGIBLE ASSETS
Changes in intangible assetsValue of
business acquired Goodwill Software Other Total
2013 2012 2013 2012 2013 2012 2013 2012 2013 2012
Opening balance 513 871 1,304 1,794 633 611 189 282 2,639 3,558Additions 171 222 171 222Capitalised expenses 50 83 162 146 212 229Amortisation and unlocking –25 –207 –289 –274 –40 –59 –354 –540Impairments –48 –9 –4 –3 –9 –55Effect of unrealised revaluations in equity 308 –140 308 –140Exchange rate differences –7 –5 –167 43 –6 6 –7 2 –187 46Disposals –8 –9 –8 –9Changes in the composition of the group and other changes –819 –89 –485 –40 –65 –72 –33 –931 –672Closing balance 20 513 1,137 1,304 614 633 70 189 1,841 2,639
Gross carrying amount as at 31 December 41 1,977 1,137 1,966 2,079 2,144 265 493 3,522 6,580Accumulated amortisation as at 31 December –21 –1,464 –1,421 –1,476 –192 –256 –1,634 –3,196Accumulated impairments as at 31 December –662 –44 –35 –3 –48 –47 –745Net carrying value as at 31 December 20 513 1,137 1,304 614 633 70 189 1,841 2,639
In 2013, Changes in the composition of the group and other changes includes EUR –894 million as a result of the classification of ING U.S. as held for sale and EUR 5 million as a result of the classification to continuing operations of ING Japan. Reference is made to Note 59 ‘Other events’.
Amortisation of software and other intangible assets is included in the profit and loss account in Other operating expenses and Intangible amortisation and other impairments. Amortisation of VOBA is included in Underwriting expenditure.
GoodwillChanges in GoodwillIn addition to exchange rate differences, changes in goodwill relate to impairments and changes in composition of the group.
2012 – Impairment In 2012, a goodwill impairment of EUR 48 million was recognised relating to the reporting unit Netherlands-Life (formerly Insurance Benelux). In the impairment test of Netherlands-Life, the IFRS book value (including goodwill) was compared to a valuation based on the surplus in the market consistent balance sheet and the market value of new business. These are commonly used metrics in the European insurance industry. During 2012, the book value of Netherlands-Life increased, mainly as a result of declining interest rates being reflected in the fair value of assets but with no corresponding increase in the IFRS book value of insurance liabilities. As the market value surplus (MVS) of Netherlands-Life did not increase similarly, the margin of MVS over IFRS book value, which supported the goodwill, became negative and, as a result, goodwill was fully impaired. This charge was included in the profit and loss account in the line ‘Intangible amortisation and other impairments’. Goodwill is recognised in the Corporate Line and, therefore, this charge is included in the segment reporting in Other.
2012 – Changes in composition of the group and other changes In 2012, ‘Changes in composition of the group and other changes’ represented the reclassification of goodwill to ‘Assets held for sale’. This included all goodwill that related to businesses that were classified as held for sale. For 2012, the amount was EUR 485 million and related to Insurance Korea (EUR 200 million), Investment Management Korea (EUR 180 million), Insurance India (EUR 41 million) and Investment Management Taiwan (EUR 48 million) for the insurance operations and ING Direct UK (EUR 16 million) for the banking operations. As businesses to which these goodwill amounts related to were classified as held for sale, the related goodwill is no longer evaluated at the level of the reporting unit to which it is allocated in the regular goodwill impairment test. Instead, it is reviewed as part of the valuation of the disposal unit that was presented as held for sale. Reference is made to Note 12 ‘Assets and liabilities held for sale’.
Notes to the consolidated annual accounts of ING Group continued
135ING Group Annual Report 2013
1 Wh
o w
e are2 R
epo
rt of th
e Executive B
oard
3 Co
rpo
rate go
vernan
ce4 C
on
solid
ated an
nu
al accou
nts
5 Parent co
mp
any an
nu
al accou
nts
6 Oth
er info
rmatio
n7 A
dd
ition
al info
rmatio
n
ING_2013_deel1_v1.indd 135 19/03/2014 18:58:04
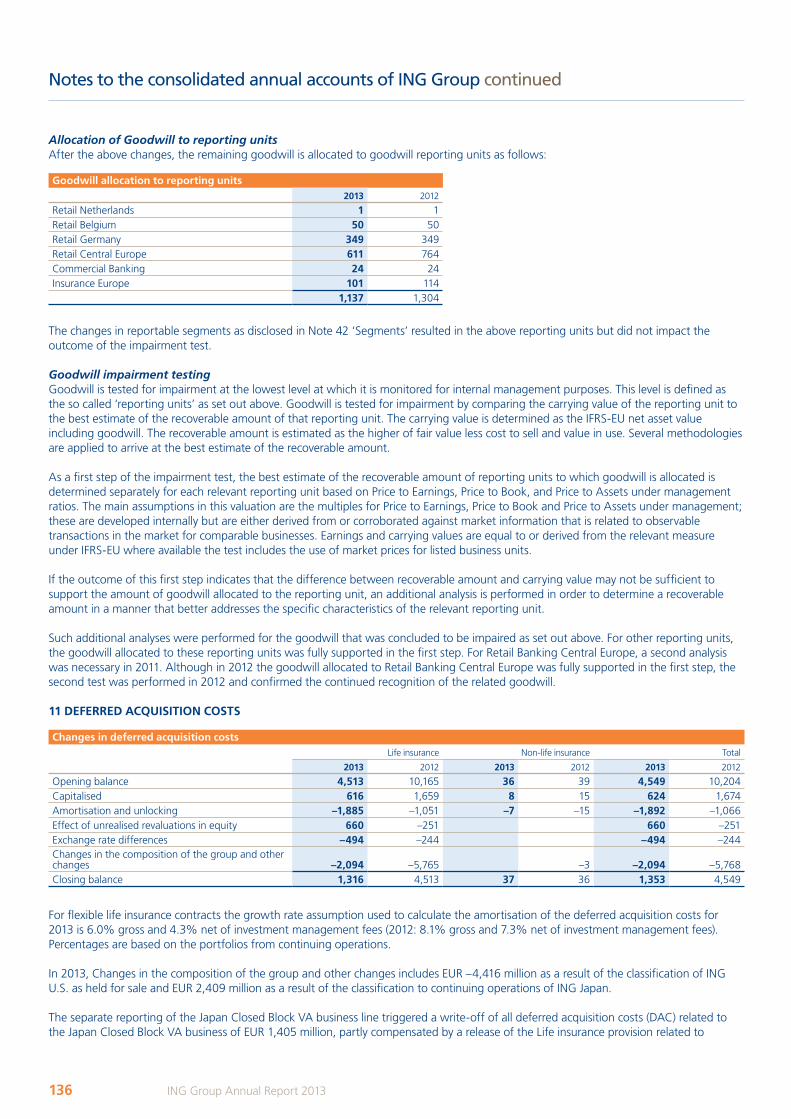
Allocation of Goodwill to reporting unitsAfter the above changes, the remaining goodwill is allocated to goodwill reporting units as follows:
Goodwill allocation to reporting units2013 2012
Retail Netherlands 1 1Retail Belgium 50 50Retail Germany 349 349Retail Central Europe 611 764Commercial Banking 24 24Insurance Europe 101 114
1,137 1,304
The changes in reportable segments as disclosed in Note 42 ‘Segments’ resulted in the above reporting units but did not impact the outcome of the impairment test.
Goodwill impairment testingGoodwill is tested for impairment at the lowest level at which it is monitored for internal management purposes. This level is defined as the so called ‘reporting units’ as set out above. Goodwill is tested for impairment by comparing the carrying value of the reporting unit to the best estimate of the recoverable amount of that reporting unit. The carrying value is determined as the IFRS-EU net asset value including goodwill. The recoverable amount is estimated as the higher of fair value less cost to sell and value in use. Several methodologies are applied to arrive at the best estimate of the recoverable amount.
As a first step of the impairment test, the best estimate of the recoverable amount of reporting units to which goodwill is allocated is determined separately for each relevant reporting unit based on Price to Earnings, Price to Book, and Price to Assets under management ratios. The main assumptions in this valuation are the multiples for Price to Earnings, Price to Book and Price to Assets under management; these are developed internally but are either derived from or corroborated against market information that is related to observable transactions in the market for comparable businesses. Earnings and carrying values are equal to or derived from the relevant measure under IFRS-EU where available the test includes the use of market prices for listed business units.
If the outcome of this first step indicates that the difference between recoverable amount and carrying value may not be sufficient to support the amount of goodwill allocated to the reporting unit, an additional analysis is performed in order to determine a recoverable amount in a manner that better addresses the specific characteristics of the relevant reporting unit.
Such additional analyses were performed for the goodwill that was concluded to be impaired as set out above. For other reporting units, the goodwill allocated to these reporting units was fully supported in the first step. For Retail Banking Central Europe, a second analysis was necessary in 2011. Although in 2012 the goodwill allocated to Retail Banking Central Europe was fully supported in the first step, the second test was performed in 2012 and confirmed the continued recognition of the related goodwill.
11 DEFERRED ACQUISITION COSTS
Changes in deferred acquisition costsLife insurance Non-life insurance Total
2013 2012 2013 2012 2013 2012
Opening balance 4,513 10,165 36 39 4,549 10,204Capitalised 616 1,659 8 15 624 1,674Amortisation and unlocking –1,885 –1,051 –7 –15 –1,892 –1,066Effect of unrealised revaluations in equity 660 –251 660 –251Exchange rate differences –494 –244 –494 –244Changes in the composition of the group and other changes –2,094 –5,765 –3 –2,094 –5,768Closing balance 1,316 4,513 37 36 1,353 4,549
For flexible life insurance contracts the growth rate assumption used to calculate the amortisation of the deferred acquisition costs for 2013 is 6.0% gross and 4.3% net of investment management fees (2012: 8.1% gross and 7.3% net of investment management fees). Percentages are based on the portfolios from continuing operations.
In 2013, Changes in the composition of the group and other changes includes EUR –4,416 million as a result of the classification of ING U.S. as held for sale and EUR 2,409 million as a result of the classification to continuing operations of ING Japan.
The separate reporting of the Japan Closed Block VA business line triggered a write-off of all deferred acquisition costs (DAC) related to the Japan Closed Block VA business of EUR 1,405 million, partly compensated by a release of the Life insurance provision related to
Notes to the consolidated annual accounts of ING Group continued
136 ING Group Annual Report 2013
ING_2013_deel1_v1.indd 136 19/03/2014 18:58:04
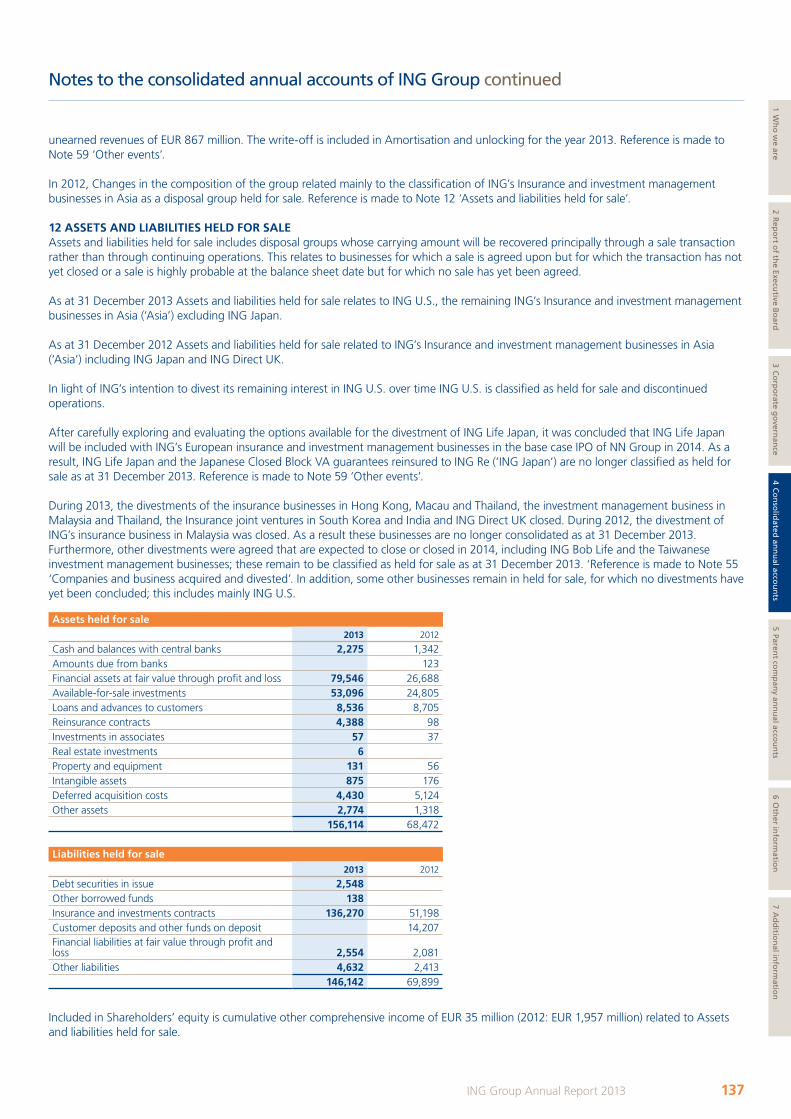
unearned revenues of EUR 867 million. The write-off is included in Amortisation and unlocking for the year 2013. Reference is made to Note 59 ‘Other events’.
In 2012, Changes in the composition of the group related mainly to the classification of ING’s Insurance and investment management businesses in Asia as a disposal group held for sale. Reference is made to Note 12 ‘Assets and liabilities held for sale’.
12 ASSETS AND LIABILITIES HELD FOR SALEAssets and liabilities held for sale includes disposal groups whose carrying amount will be recovered principally through a sale transaction rather than through continuing operations. This relates to businesses for which a sale is agreed upon but for which the transaction has not yet closed or a sale is highly probable at the balance sheet date but for which no sale has yet been agreed.
As at 31 December 2013 Assets and liabilities held for sale relates to ING U.S., the remaining ING’s Insurance and investment management businesses in Asia (‘Asia’) excluding ING Japan.
As at 31 December 2012 Assets and liabilities held for sale related to ING’s Insurance and investment management businesses in Asia (‘Asia’) including ING Japan and ING Direct UK.
In light of ING’s intention to divest its remaining interest in ING U.S. over time ING U.S. is classified as held for sale and discontinued operations.
After carefully exploring and evaluating the options available for the divestment of ING Life Japan, it was concluded that ING Life Japan will be included with ING’s European insurance and investment management businesses in the base case IPO of NN Group in 2014. As a result, ING Life Japan and the Japanese Closed Block VA guarantees reinsured to ING Re (‘ING Japan’) are no longer classified as held for sale as at 31 December 2013. Reference is made to Note 59 ‘Other events’.
During 2013, the divestments of the insurance businesses in Hong Kong, Macau and Thailand, the investment management business in Malaysia and Thailand, the Insurance joint ventures in South Korea and India and ING Direct UK closed. During 2012, the divestment of ING’s insurance business in Malaysia was closed. As a result these businesses are no longer consolidated as at 31 December 2013. Furthermore, other divestments were agreed that are expected to close or closed in 2014, including ING Bob Life and the Taiwanese investment management businesses; these remain to be classified as held for sale as at 31 December 2013. ‘Reference is made to Note 55 ‘Companies and business acquired and divested’. In addition, some other businesses remain in held for sale, for which no divestments have yet been concluded; this includes mainly ING U.S.
Assets held for sale2013 2012
Cash and balances with central banks 2,275 1,342Amounts due from banks 123Financial assets at fair value through profit and loss 79,546 26,688Available-for-sale investments 53,096 24,805Loans and advances to customers 8,536 8,705Reinsurance contracts 4,388 98Investments in associates 57 37Real estate investments 6Property and equipment 131 56Intangible assets 875 176Deferred acquisition costs 4,430 5,124Other assets 2,774 1,318
156,114 68,472
Liabilities held for sale2013 2012
Debt securities in issue 2,548Other borrowed funds 138Insurance and investments contracts 136,270 51,198Customer deposits and other funds on deposit 14,207Financial liabilities at fair value through profit and loss 2,554 2,081Other liabilities 4,632 2,413
146,142 69,899
Included in Shareholders’ equity is cumulative other comprehensive income of EUR 35 million (2012: EUR 1,957 million) related to Assets and liabilities held for sale.
Notes to the consolidated annual accounts of ING Group continued
137ING Group Annual Report 2013
1 Wh
o w
e are2 R
epo
rt of th
e Executive B
oard
3 Co
rpo
rate go
vernan
ce4 C
on
solid
ated an
nu
al accou
nts
5 Parent co
mp
any an
nu
al accou
nts
6 Oth
er info
rmatio
n7 A
dd
ition
al info
rmatio
n
ING_2013_deel1_v1.indd 137 19/03/2014 18:58:04
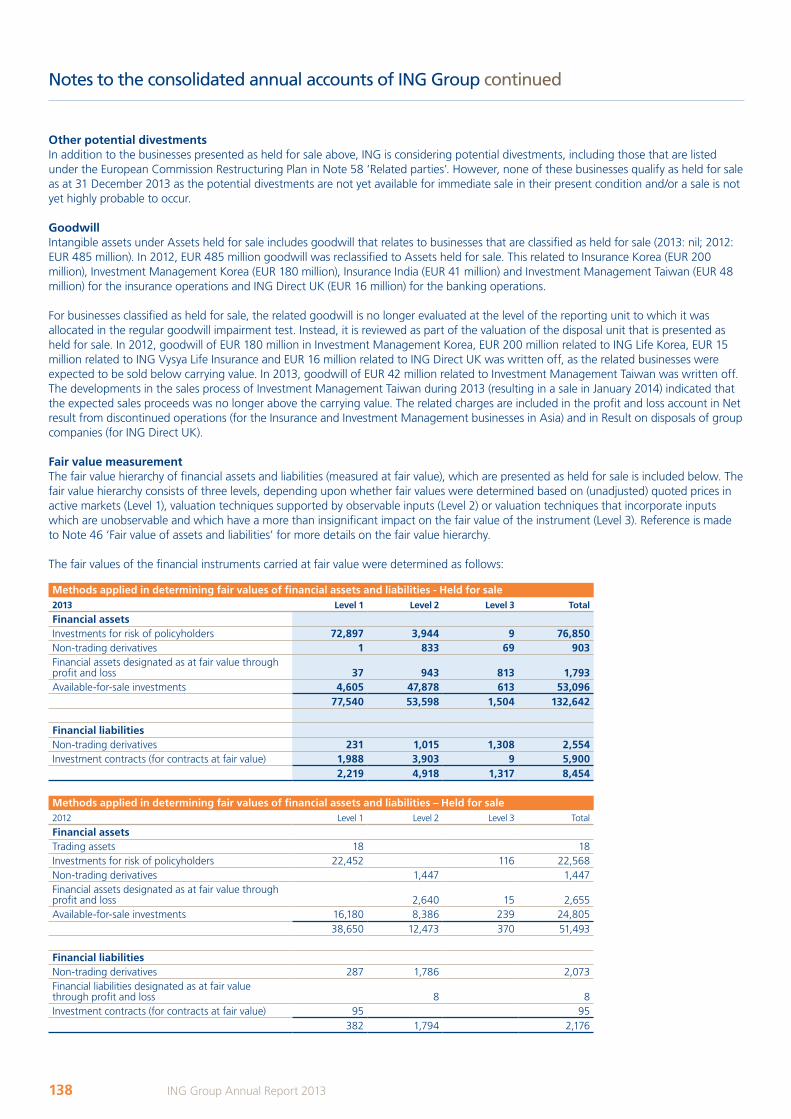
Other potential divestmentsIn addition to the businesses presented as held for sale above, ING is considering potential divestments, including those that are listed under the European Commission Restructuring Plan in Note 58 ‘Related parties’. However, none of these businesses qualify as held for sale as at 31 December 2013 as the potential divestments are not yet available for immediate sale in their present condition and/or a sale is not yet highly probable to occur.
Goodwill Intangible assets under Assets held for sale includes goodwill that relates to businesses that are classified as held for sale (2013: nil; 2012: EUR 485 million). In 2012, EUR 485 million goodwill was reclassified to Assets held for sale. This related to Insurance Korea (EUR 200 million), Investment Management Korea (EUR 180 million), Insurance India (EUR 41 million) and Investment Management Taiwan (EUR 48 million) for the insurance operations and ING Direct UK (EUR 16 million) for the banking operations.
For businesses classified as held for sale, the related goodwill is no longer evaluated at the level of the reporting unit to which it was allocated in the regular goodwill impairment test. Instead, it is reviewed as part of the valuation of the disposal unit that is presented as held for sale. In 2012, goodwill of EUR 180 million in Investment Management Korea, EUR 200 million related to ING Life Korea, EUR 15 million related to ING Vysya Life Insurance and EUR 16 million related to ING Direct UK was written off, as the related businesses were expected to be sold below carrying value. In 2013, goodwill of EUR 42 million related to Investment Management Taiwan was written off. The developments in the sales process of Investment Management Taiwan during 2013 (resulting in a sale in January 2014) indicated that the expected sales proceeds was no longer above the carrying value. The related charges are included in the profit and loss account in Net result from discontinued operations (for the Insurance and Investment Management businesses in Asia) and in Result on disposals of group companies (for ING Direct UK).
Fair value measurementThe fair value hierarchy of financial assets and liabilities (measured at fair value), which are presented as held for sale is included below. The fair value hierarchy consists of three levels, depending upon whether fair values were determined based on (unadjusted) quoted prices in active markets (Level 1), valuation techniques supported by observable inputs (Level 2) or valuation techniques that incorporate inputs which are unobservable and which have a more than insignificant impact on the fair value of the instrument (Level 3). Reference is made to Note 46 ‘Fair value of assets and liabilities’ for more details on the fair value hierarchy.
The fair values of the financial instruments carried at fair value were determined as follows:
Methods applied in determining fair values of financial assets and liabilities - Held for sale 2013 Level 1 Level 2 Level 3 Total
Financial assetsInvestments for risk of policyholders 72,897 3,944 9 76,850Non-trading derivatives 1 833 69 903Financial assets designated as at fair value through profit and loss 37 943 813 1,793Available-for-sale investments 4,605 47,878 613 53,096
77,540 53,598 1,504 132,642
Financial liabilitiesNon-trading derivatives 231 1,015 1,308 2,554Investment contracts (for contracts at fair value) 1,988 3,903 9 5,900
2,219 4,918 1,317 8,454
Methods applied in determining fair values of financial assets and liabilities – Held for sale2012 Level 1 Level 2 Level 3 Total
Financial assetsTrading assets 18 18Investments for risk of policyholders 22,452 116 22,568Non-trading derivatives 1,447 1,447Financial assets designated as at fair value through profit and loss 2,640 15 2,655Available-for-sale investments 16,180 8,386 239 24,805
38,650 12,473 370 51,493
Financial liabilitiesNon-trading derivatives 287 1,786 2,073Financial liabilities designated as at fair value through profit and loss 8 8Investment contracts (for contracts at fair value) 95 95
382 1,794 2,176
Notes to the consolidated annual accounts of ING Group continued
138 ING Group Annual Report 2013
ING_2013_deel1_v1.indd 138 19/03/2014 18:58:05
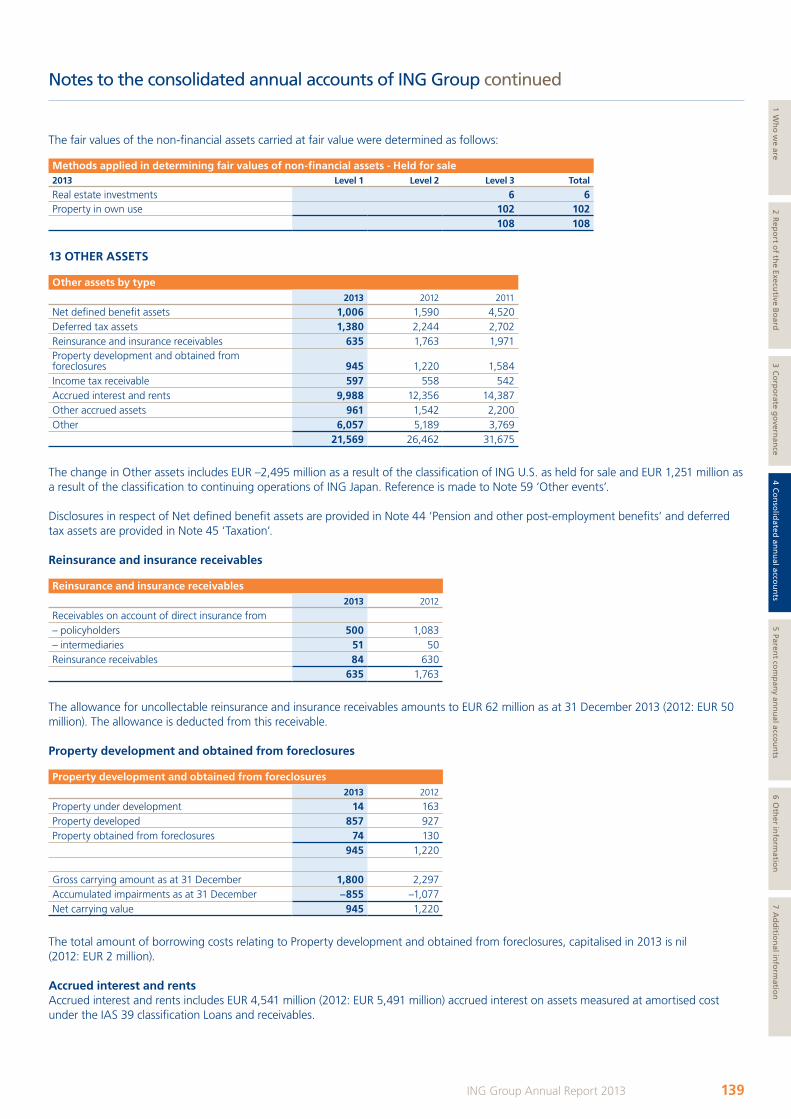
The fair values of the non-financial assets carried at fair value were determined as follows:
Methods applied in determining fair values of non-financial assets - Held for sale 2013 Level 1 Level 2 Level 3 Total
Real estate investments 6 6Property in own use 102 102
108 108
13 OTHER ASSETS
Other assets by type2013 2012 2011
Net defined benefit assets 1,006 1,590 4,520Deferred tax assets 1,380 2,244 2,702Reinsurance and insurance receivables 635 1,763 1,971Property development and obtained from foreclosures 945 1,220 1,584Income tax receivable 597 558 542Accrued interest and rents 9,988 12,356 14,387Other accrued assets 961 1,542 2,200Other 6,057 5,189 3,769
21,569 26,462 31,675
The change in Other assets includes EUR –2,495 million as a result of the classification of ING U.S. as held for sale and EUR 1,251 million as a result of the classification to continuing operations of ING Japan. Reference is made to Note 59 ‘Other events’.
Disclosures in respect of Net defined benefit assets are provided in Note 44 ‘Pension and other post-employment benefits’ and deferred tax assets are provided in Note 45 ‘Taxation’.
Reinsurance and insurance receivables Reinsurance and insurance receivables
2013 2012
Receivables on account of direct insurance from– policyholders 500 1,083– intermediaries 51 50Reinsurance receivables 84 630
635 1,763
The allowance for uncollectable reinsurance and insurance receivables amounts to EUR 62 million as at 31 December 2013 (2012: EUR 50 million). The allowance is deducted from this receivable.
Property development and obtained from foreclosures
Property development and obtained from foreclosures2013 2012
Property under development 14 163Property developed 857 927Property obtained from foreclosures 74 130
945 1,220
Gross carrying amount as at 31 December 1,800 2,297Accumulated impairments as at 31 December –855 –1,077Net carrying value 945 1,220
The total amount of borrowing costs relating to Property development and obtained from foreclosures, capitalised in 2013 is nil (2012: EUR 2 million).
Accrued interest and rentsAccrued interest and rents includes EUR 4,541 million (2012: EUR 5,491 million) accrued interest on assets measured at amortised cost under the IAS 39 classification Loans and receivables.
Notes to the consolidated annual accounts of ING Group continued
139ING Group Annual Report 2013
1 Wh
o w
e are2 R
epo
rt of th
e Executive B
oard
3 Co
rpo
rate go
vernan
ce4 C
on
solid
ated an
nu
al accou
nts
5 Parent co
mp
any an
nu
al accou
nts
6 Oth
er info
rmatio
n7 A
dd
ition
al info
rmatio
n
ING_2013_deel1_v1.indd 139 19/03/2014 18:58:05
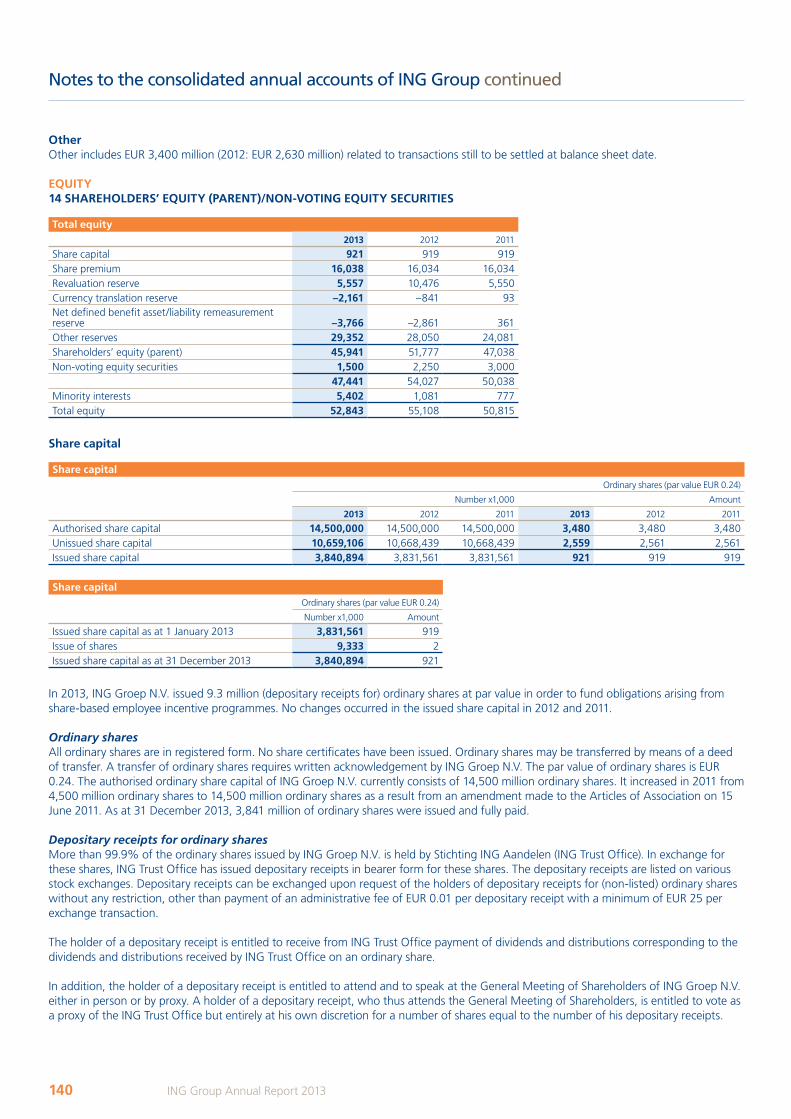
OtherOther includes EUR 3,400 million (2012: EUR 2,630 million) related to transactions still to be settled at balance sheet date.
EQUITY14 SHAREHOLDERS’ EQUITY (PARENT)/NON-VOTING EQUITY SECURITIES
Total equity2013 2012 2011
Share capital 921 919 919Share premium 16,038 16,034 16,034Revaluation reserve 5,557 10,476 5,550Currency translation reserve –2,161 –841 93Net defined benefit asset/liability remeasurement reserve –3,766 –2,861 361Other reserves 29,352 28,050 24,081Shareholders’ equity (parent) 45,941 51,777 47,038Non-voting equity securities 1,500 2,250 3,000
47,441 54,027 50,038Minority interests 5,402 1,081 777Total equity 52,843 55,108 50,815
Share capital
Share capitalOrdinary shares (par value EUR 0.24)
Number x1,000 Amount
2013 2012 2011 2013 2012 2011
Authorised share capital 14,500,000 14,500,000 14,500,000 3,480 3,480 3,480Unissued share capital 10,659,106 10,668,439 10,668,439 2,559 2,561 2,561Issued share capital 3,840,894 3,831,561 3,831,561 921 919 919
Share capitalOrdinary shares (par value EUR 0.24)
Number x1,000 Amount
Issued share capital as at 1 January 2013 3,831,561 919Issue of shares 9,333 2Issued share capital as at 31 December 2013 3,840,894 921
In 2013, ING Groep N.V. issued 9.3 million (depositary receipts for) ordinary shares at par value in order to fund obligations arising from share-based employee incentive programmes. No changes occurred in the issued share capital in 2012 and 2011.
Ordinary sharesAll ordinary shares are in registered form. No share certificates have been issued. Ordinary shares may be transferred by means of a deed of transfer. A transfer of ordinary shares requires written acknowledgement by ING Groep N.V. The par value of ordinary shares is EUR 0.24. The authorised ordinary share capital of ING Groep N.V. currently consists of 14,500 million ordinary shares. It increased in 2011 from 4,500 million ordinary shares to 14,500 million ordinary shares as a result from an amendment made to the Articles of Association on 15 June 2011. As at 31 December 2013, 3,841 million of ordinary shares were issued and fully paid.
Depositary receipts for ordinary sharesMore than 99.9% of the ordinary shares issued by ING Groep N.V. is held by Stichting ING Aandelen (ING Trust Office). In exchange for these shares, ING Trust Office has issued depositary receipts in bearer form for these shares. The depositary receipts are listed on various stock exchanges. Depositary receipts can be exchanged upon request of the holders of depositary receipts for (non-listed) ordinary shares without any restriction, other than payment of an administrative fee of EUR 0.01 per depositary receipt with a minimum of EUR 25 per exchange transaction.
The holder of a depositary receipt is entitled to receive from ING Trust Office payment of dividends and distributions corresponding to the dividends and distributions received by ING Trust Office on an ordinary share.
In addition, the holder of a depositary receipt is entitled to attend and to speak at the General Meeting of Shareholders of ING Groep N.V. either in person or by proxy. A holder of a depositary receipt, who thus attends the General Meeting of Shareholders, is entitled to vote as a proxy of the ING Trust Office but entirely at his own discretion for a number of shares equal to the number of his depositary receipts.
Notes to the consolidated annual accounts of ING Group continued
140 ING Group Annual Report 2013
ING_2013_deel1_v1.indd 140 19/03/2014 18:58:05
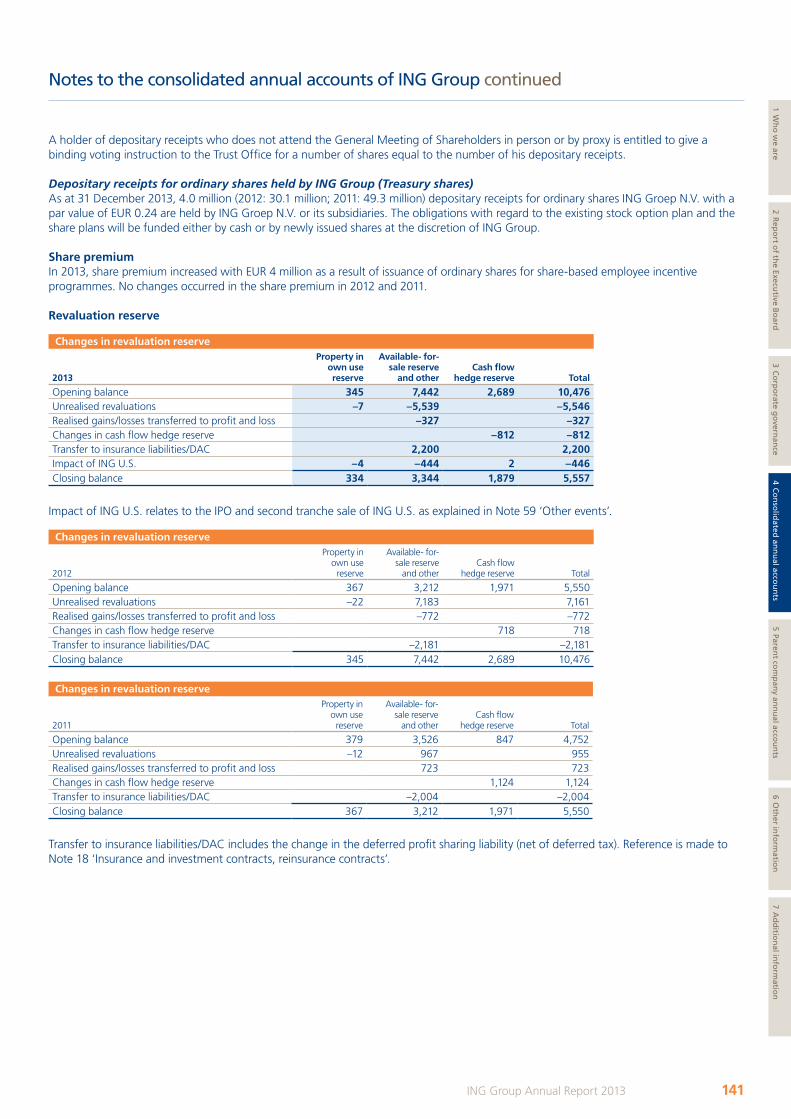
A holder of depositary receipts who does not attend the General Meeting of Shareholders in person or by proxy is entitled to give a binding voting instruction to the Trust Office for a number of shares equal to the number of his depositary receipts.
Depositary receipts for ordinary shares held by ING Group (Treasury shares)As at 31 December 2013, 4.0 million (2012: 30.1 million; 2011: 49.3 million) depositary receipts for ordinary shares ING Groep N.V. with a par value of EUR 0.24 are held by ING Groep N.V. or its subsidiaries. The obligations with regard to the existing stock option plan and the share plans will be funded either by cash or by newly issued shares at the discretion of ING Group.
Share premiumIn 2013, share premium increased with EUR 4 million as a result of issuance of ordinary shares for share-based employee incentive programmes. No changes occurred in the share premium in 2012 and 2011.
Revaluation reserve
Changes in revaluation reserve
2013
Property in own use reserve
Available- for-sale reserve
and otherCash flow
hedge reserve Total
Opening balance 345 7,442 2,689 10,476Unrealised revaluations –7 –5,539 –5,546Realised gains/losses transferred to profit and loss –327 –327Changes in cash flow hedge reserve –812 –812Transfer to insurance liabilities/DAC 2,200 2,200Impact of ING U.S. –4 –444 2 –446Closing balance 334 3,344 1,879 5,557
Impact of ING U.S. relates to the IPO and second tranche sale of ING U.S. as explained in Note 59 ‘Other events’.
Changes in revaluation reserve
2012
Property in own use
reserve
Available- for- sale reserve
and otherCash flow
hedge reserve Total
Opening balance 367 3,212 1,971 5,550Unrealised revaluations –22 7,183 7,161Realised gains/losses transferred to profit and loss –772 –772Changes in cash flow hedge reserve 718 718Transfer to insurance liabilities/DAC –2,181 –2,181Closing balance 345 7,442 2,689 10,476
Changes in revaluation reserve
2011
Property in own use
reserve
Available- for- sale reserve
and otherCash flow
hedge reserve Total
Opening balance 379 3,526 847 4,752Unrealised revaluations –12 967 955Realised gains/losses transferred to profit and loss 723 723Changes in cash flow hedge reserve 1,124 1,124Transfer to insurance liabilities/DAC –2,004 –2,004Closing balance 367 3,212 1,971 5,550
Transfer to insurance liabilities/DAC includes the change in the deferred profit sharing liability (net of deferred tax). Reference is made to Note 18 ‘Insurance and investment contracts, reinsurance contracts’.
Notes to the consolidated annual accounts of ING Group continued
141ING Group Annual Report 2013
1 Wh
o w
e are2 R
epo
rt of th
e Executive B
oard
3 Co
rpo
rate go
vernan
ce4 C
on
solid
ated an
nu
al accou
nts
5 Parent co
mp
any an
nu
al accou
nts
6 Oth
er info
rmatio
n7 A
dd
ition
al info
rmatio
n
ING_2013_deel1_v1.indd 141 19/03/2014 18:58:05
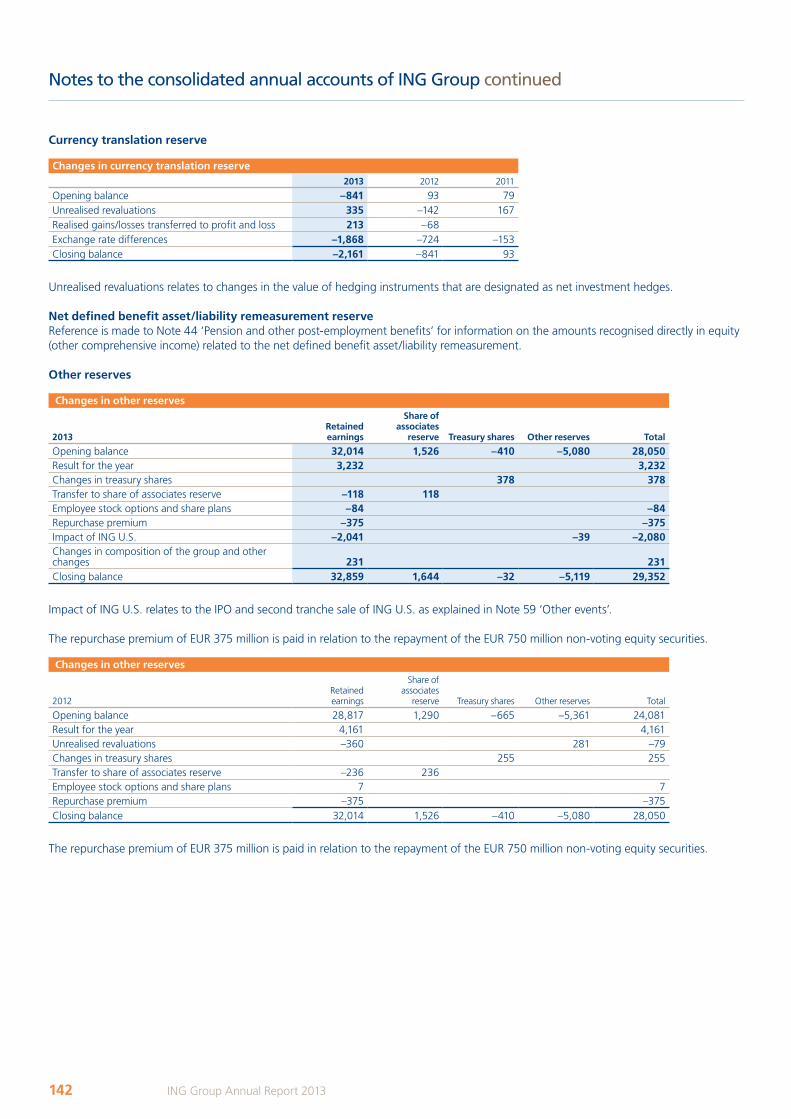
Currency translation reserve
Changes in currency translation reserve2013 2012 2011
Opening balance –841 93 79Unrealised revaluations 335 –142 167Realised gains/losses transferred to profit and loss 213 –68Exchange rate differences –1,868 –724 –153Closing balance –2,161 –841 93
Unrealised revaluations relates to changes in the value of hedging instruments that are designated as net investment hedges.
Net defined benefit asset/liability remeasurement reserveReference is made to Note 44 ‘Pension and other post-employment benefits’ for information on the amounts recognised directly in equity (other comprehensive income) related to the net defined benefit asset/liability remeasurement.
Other reserves
Changes in other reserves
2013Retained earnings
Share of associates
reserve Treasury shares Other reserves Total
Opening balance 32,014 1,526 –410 –5,080 28,050Result for the year 3,232 3,232Changes in treasury shares 378 378Transfer to share of associates reserve –118 118Employee stock options and share plans –84 –84Repurchase premium –375 –375Impact of ING U.S. –2,041 –39 –2,080Changes in composition of the group and other changes 231 231Closing balance 32,859 1,644 –32 –5,119 29,352
Impact of ING U.S. relates to the IPO and second tranche sale of ING U.S. as explained in Note 59 ‘Other events’.
The repurchase premium of EUR 375 million is paid in relation to the repayment of the EUR 750 million non-voting equity securities.
Changes in other reserves
2012Retained earnings
Share of associates
reserve Treasury shares Other reserves Total
Opening balance 28,817 1,290 –665 –5,361 24,081Result for the year 4,161 4,161Unrealised revaluations –360 281 –79Changes in treasury shares 255 255Transfer to share of associates reserve –236 236 Employee stock options and share plans 7 7Repurchase premium –375 –375Closing balance 32,014 1,526 –410 –5,080 28,050
The repurchase premium of EUR 375 million is paid in relation to the repayment of the EUR 750 million non-voting equity securities.
Notes to the consolidated annual accounts of ING Group continued
142 ING Group Annual Report 2013
ING_2013_deel1_v1.indd 142 19/03/2014 18:58:06
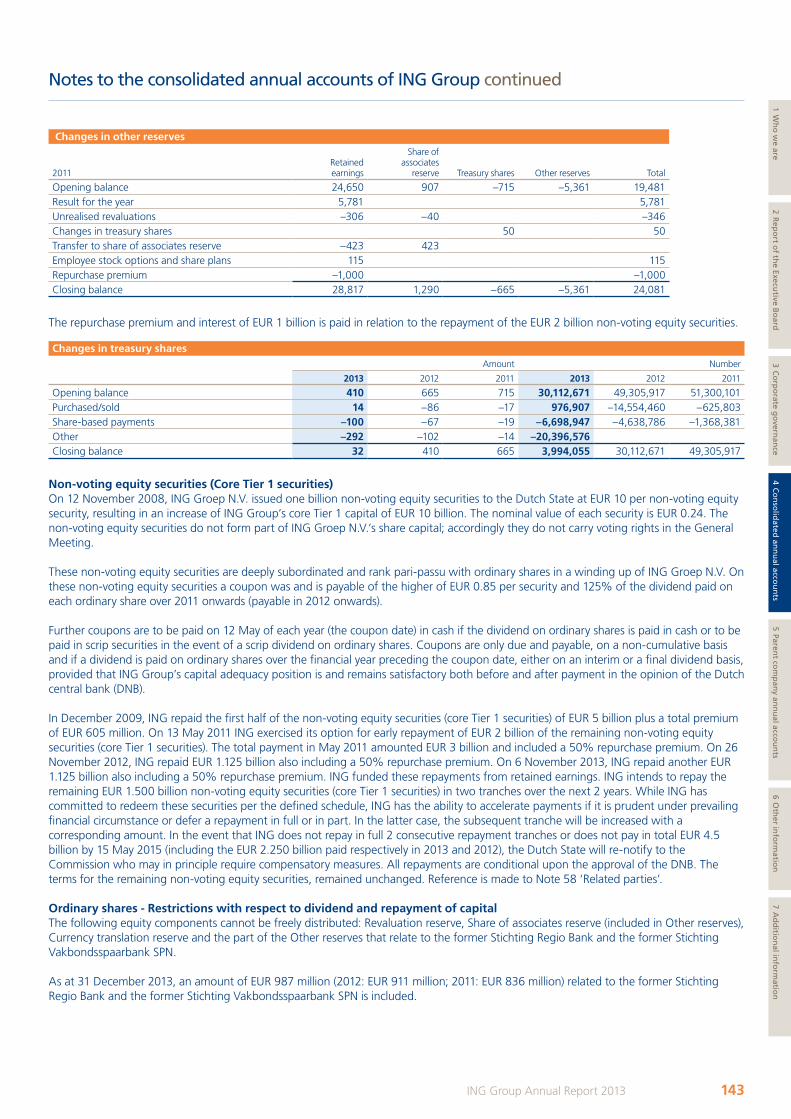
Changes in other reserves
2011Retained earnings
Share of associates
reserve Treasury shares Other reserves Total
Opening balance 24,650 907 –715 –5,361 19,481Result for the year 5,781 5,781Unrealised revaluations –306 –40 –346Changes in treasury shares 50 50Transfer to share of associates reserve –423 423 Employee stock options and share plans 115 115Repurchase premium –1,000 –1,000Closing balance 28,817 1,290 –665 –5,361 24,081
The repurchase premium and interest of EUR 1 billion is paid in relation to the repayment of the EUR 2 billion non-voting equity securities.
Changes in treasury shares Amount Number
2013 2012 2011 2013 2012 2011
Opening balance 410 665 715 30,112,671 49,305,917 51,300,101Purchased/sold 14 –86 –17 976,907 –14,554,460 –625,803Share-based payments –100 –67 –19 –6,698,947 –4,638,786 –1,368,381Other –292 –102 –14 –20,396,576 Closing balance 32 410 665 3,994,055 30,112,671 49,305,917
Non-voting equity securities (Core Tier 1 securities)On 12 November 2008, ING Groep N.V. issued one billion non-voting equity securities to the Dutch State at EUR 10 per non-voting equity security, resulting in an increase of ING Group’s core Tier 1 capital of EUR 10 billion. The nominal value of each security is EUR 0.24. The non-voting equity securities do not form part of ING Groep N.V.’s share capital; accordingly they do not carry voting rights in the General Meeting.
These non-voting equity securities are deeply subordinated and rank pari-passu with ordinary shares in a winding up of ING Groep N.V. On these non-voting equity securities a coupon was and is payable of the higher of EUR 0.85 per security and 125% of the dividend paid on each ordinary share over 2011 onwards (payable in 2012 onwards).
Further coupons are to be paid on 12 May of each year (the coupon date) in cash if the dividend on ordinary shares is paid in cash or to be paid in scrip securities in the event of a scrip dividend on ordinary shares. Coupons are only due and payable, on a non-cumulative basis and if a dividend is paid on ordinary shares over the financial year preceding the coupon date, either on an interim or a final dividend basis, provided that ING Group’s capital adequacy position is and remains satisfactory both before and after payment in the opinion of the Dutch central bank (DNB).
In December 2009, ING repaid the first half of the non-voting equity securities (core Tier 1 securities) of EUR 5 billion plus a total premium of EUR 605 million. On 13 May 2011 ING exercised its option for early repayment of EUR 2 billion of the remaining non-voting equity securities (core Tier 1 securities). The total payment in May 2011 amounted EUR 3 billion and included a 50% repurchase premium. On 26 November 2012, ING repaid EUR 1.125 billion also including a 50% repurchase premium. On 6 November 2013, ING repaid another EUR 1.125 billion also including a 50% repurchase premium. ING funded these repayments from retained earnings. ING intends to repay the remaining EUR 1.500 billion non-voting equity securities (core Tier 1 securities) in two tranches over the next 2 years. While ING has committed to redeem these securities per the defined schedule, ING has the ability to accelerate payments if it is prudent under prevailing financial circumstance or defer a repayment in full or in part. In the latter case, the subsequent tranche will be increased with a corresponding amount. In the event that ING does not repay in full 2 consecutive repayment tranches or does not pay in total EUR 4.5 billion by 15 May 2015 (including the EUR 2.250 billion paid respectively in 2013 and 2012), the Dutch State will re-notify to the Commission who may in principle require compensatory measures. All repayments are conditional upon the approval of the DNB. The terms for the remaining non-voting equity securities, remained unchanged. Reference is made to Note 58 ‘Related parties’.
Ordinary shares - Restrictions with respect to dividend and repayment of capitalThe following equity components cannot be freely distributed: Revaluation reserve, Share of associates reserve (included in Other reserves), Currency translation reserve and the part of the Other reserves that relate to the former Stichting Regio Bank and the former Stichting Vakbondsspaarbank SPN.
As at 31 December 2013, an amount of EUR 987 million (2012: EUR 911 million; 2011: EUR 836 million) related to the former Stichting Regio Bank and the former Stichting Vakbondsspaarbank SPN is included.
Notes to the consolidated annual accounts of ING Group continued
143ING Group Annual Report 2013
1 Wh
o w
e are2 R
epo
rt of th
e Executive B
oard
3 Co
rpo
rate go
vernan
ce4 C
on
solid
ated an
nu
al accou
nts
5 Parent co
mp
any an
nu
al accou
nts
6 Oth
er info
rmatio
n7 A
dd
ition
al info
rmatio
n
ING_2013_deel1_v1.indd 143 19/03/2014 18:58:06
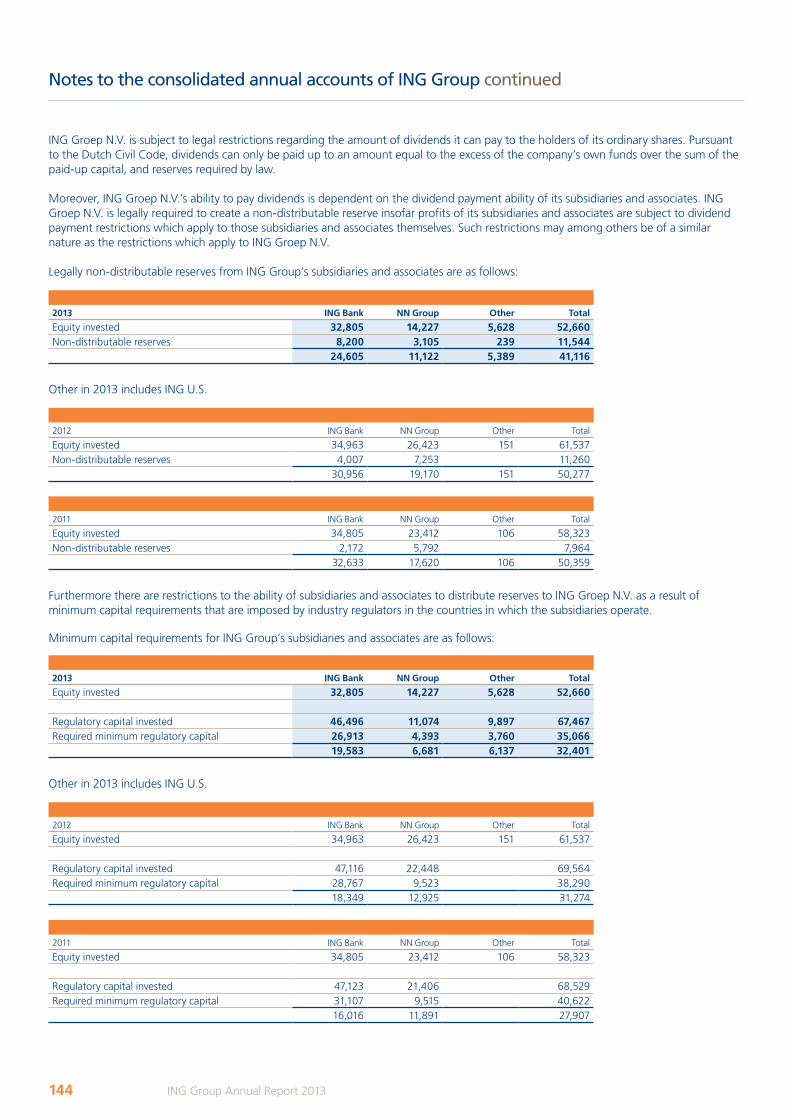
ING Groep N.V. is subject to legal restrictions regarding the amount of dividends it can pay to the holders of its ordinary shares. Pursuant to the Dutch Civil Code, dividends can only be paid up to an amount equal to the excess of the company’s own funds over the sum of the paid-up capital, and reserves required by law.
Moreover, ING Groep N.V.’s ability to pay dividends is dependent on the dividend payment ability of its subsidiaries and associates. ING Groep N.V. is legally required to create a non-distributable reserve insofar profits of its subsidiaries and associates are subject to dividend payment restrictions which apply to those subsidiaries and associates themselves. Such restrictions may among others be of a similar nature as the restrictions which apply to ING Groep N.V.
Legally non-distributable reserves from ING Group’s subsidiaries and associates are as follows:
2013 ING Bank NN Group Other Total
Equity invested 32,805 14,227 5,628 52,660Non-distributable reserves 8,200 3,105 239 11,544
24,605 11,122 5,389 41,116
Other in 2013 includes ING U.S.
2012 ING Bank NN Group Other Total
Equity invested 34,963 26,423 151 61,537Non-distributable reserves 4,007 7,253 11,260
30,956 19,170 151 50,277
2011 ING Bank NN Group Other Total
Equity invested 34,805 23,412 106 58,323Non-distributable reserves 2,172 5,792 7,964
32,633 17,620 106 50,359
Furthermore there are restrictions to the ability of subsidiaries and associates to distribute reserves to ING Groep N.V. as a result of minimum capital requirements that are imposed by industry regulators in the countries in which the subsidiaries operate.
Minimum capital requirements for ING Group’s subsidiaries and associates are as follows:
2013 ING Bank NN Group Other Total
Equity invested 32,805 14,227 5,628 52,660
Regulatory capital invested 46,496 11,074 9,897 67,467Required minimum regulatory capital 26,913 4,393 3,760 35,066
19,583 6,681 6,137 32,401
Other in 2013 includes ING U.S.
2012 ING Bank NN Group Other Total
Equity invested 34,963 26,423 151 61,537
Regulatory capital invested 47,116 22,448 69,564Required minimum regulatory capital 28,767 9,523 38,290
18,349 12,925 31,274
2011 ING Bank NN Group Other Total
Equity invested 34,805 23,412 106 58,323
Regulatory capital invested 47,123 21,406 68,529Required minimum regulatory capital 31,107 9,515 40,622
16,016 11,891 27,907
Notes to the consolidated annual accounts of ING Group continued
144 ING Group Annual Report 2013
ING_2013_deel1_v1.indd 144 19/03/2014 18:58:06

In addition to the legal and regulatory restrictions on distributing dividends from subsidiaries and associates to ING Groep N.V. there are various other considerations and limitations that are taken into account in determining the appropriate levels of equity in the Group’s subsidiaries and associates. These considerations and limitations include, but are not restricted to, rating agency and regulatory views, which can change over time; it is not possible to disclose a reliable quantification of these limitations. Reference is also made to the ‘Capital Management’ section.
Without prejudice to the authority of the Executive Board to allocate profits to reserves and to the fact that the ordinary shares are the most junior securities issued by ING Groep N.V., no specific dividend payment restrictions with respect to ordinary shares exist.
Furthermore, ING Groep N.V. is subject to legal restrictions with respect to repayment of capital to holders of ordinary shares. Capital may be repaid to the holders of ordinary shares pursuant to an amendment of ING Groep N.V.’s Articles of Association whereby the ordinary shares are written down.
Pursuant to the Dutch Civil Code, capital may only be repaid if none of ING Groep N.V.’s creditors opposes such a repayment within two months following the announcement of a resolution to that effect.
On a distribution of a dividend ING Groep N.V. is in principle required to withhold an income tax on dividends at a rate of 15%.
Minority interestIn 2013, minority interests increased with EUR 4,358 million due to the IPO and second tranche sale of ING U.S., as explained in Note 59 ‘Other events .́ This amount represents approximately 43% of the net asset value under IFRS-EU of ING U.S. The proportional interests held and key information on ING U.S. is included in the tables below.
ING U.S., Inc - Balance sheet
2013Interest held (%)
Total assets
Total liabilities
Total equity
Minority interests
ING U.S. - total 100 155,499 145,609 9,890ING Group's share 56.5 5,532 4,358
ING U.S., Inc - Profit and loss account
2013Interest held
(%)Total
incomeTotal
expenses Net resultMinority interests
ING U.S. - total 100 13,232 13,082 150ING Group's share 56.5 39 111
ING U.S., Inc - Statement of Comprehensive income
2013Interest held
(%)Comprehensive
incomeMinority interests
ING U.S. - total 100 –1,187ING Group's share 56.5 –1,124 –63
Total assets and Total liabilities as presented above, to which the minority interest in ING U.S. relates, are all presented in the Consolidated balance sheet in Assets held-for-sale and Liabilities held-for-sale. Total income and Total expenses as presented above, to which the minority interest in ING U.S. relates, are all presented in the Consolidated profit and loss account in Net result from discontinued operations.
Cumulative preference shares (not issued)Pursuant to the Articles of Association of ING Groep N.V. the authorised cumulative preference share capital consists of 4.5 billion cumulative preference shares, of which none have been issued. The par value of these cumulative preference shares is EUR 0.24.
The cumulative preference shares rank before the ordinary shares in entitlement to dividend and to distributions upon liquidation of ING Groep N.V.
The dividend on the cumulative preference shares will be equal to a percentage, calculated on the amount compulsorily paid up or yet to be paid up. This percentage shall be equal to the average of the Euro OverNight Index Average (EONIA) as calculated by the European Central Bank. During the financial year for which the distribution is made, this percentage is weighted on the basis of the number of days for which it applies, increased by 2.5 percentage points.
If and to the extent that the profit available for distribution is not sufficient to pay the dividend referred to above in full, the shortfall will be made up from the reserves insofar as possible. If, and to the extent that, the dividend distribution cannot be made from the reserves, the profits earned in subsequent years shall first be used to make up the shortfall before any distribution may be made on shares of any other category.
Notes to the consolidated annual accounts of ING Group continued
145ING Group Annual Report 2013
1 Wh
o w
e are2 R
epo
rt of th
e Executive B
oard
3 Co
rpo
rate go
vernan
ce4 C
on
solid
ated an
nu
al accou
nts
5 Parent co
mp
any an
nu
al accou
nts
6 Oth
er info
rmatio
n7 A
dd
ition
al info
rmatio
n
ING_2013_deel1_v1.indd 145 19/03/2014 18:58:07
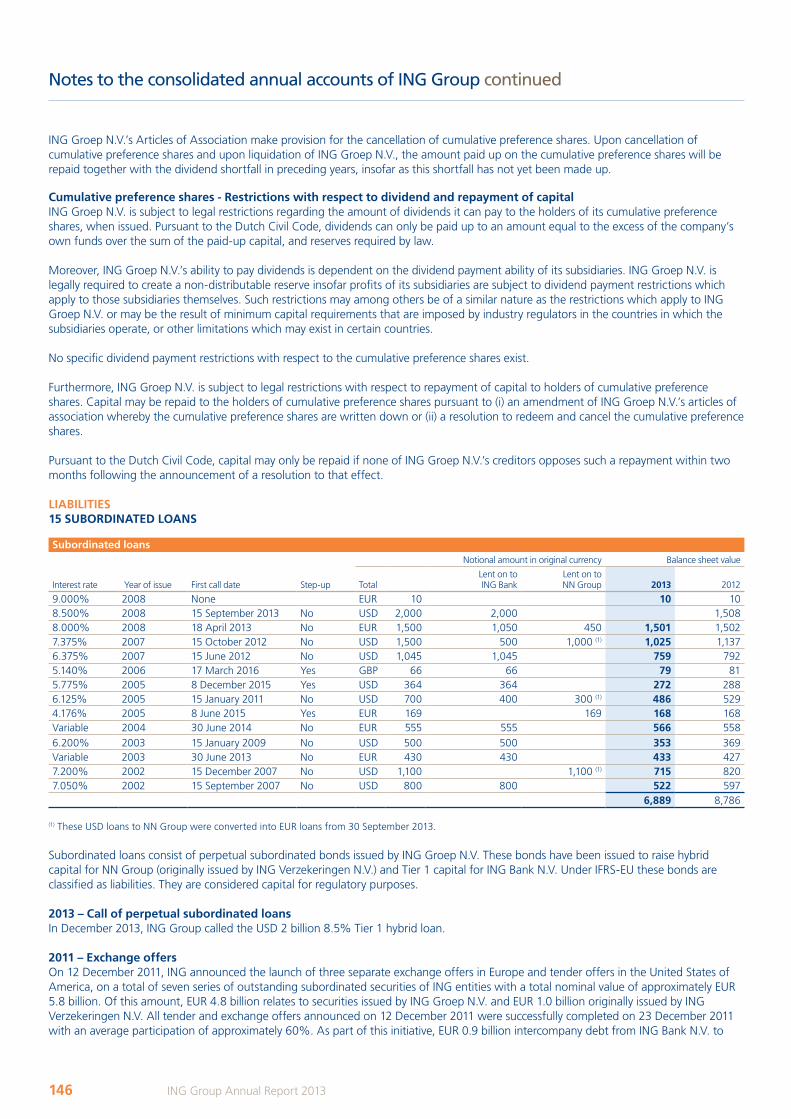
ING Groep N.V.’s Articles of Association make provision for the cancellation of cumulative preference shares. Upon cancellation of cumulative preference shares and upon liquidation of ING Groep N.V., the amount paid up on the cumulative preference shares will be repaid together with the dividend shortfall in preceding years, insofar as this shortfall has not yet been made up.
Cumulative preference shares - Restrictions with respect to dividend and repayment of capitalING Groep N.V. is subject to legal restrictions regarding the amount of dividends it can pay to the holders of its cumulative preference shares, when issued. Pursuant to the Dutch Civil Code, dividends can only be paid up to an amount equal to the excess of the company’s own funds over the sum of the paid-up capital, and reserves required by law.
Moreover, ING Groep N.V.’s ability to pay dividends is dependent on the dividend payment ability of its subsidiaries. ING Groep N.V. is legally required to create a non-distributable reserve insofar profits of its subsidiaries are subject to dividend payment restrictions which apply to those subsidiaries themselves. Such restrictions may among others be of a similar nature as the restrictions which apply to ING Groep N.V. or may be the result of minimum capital requirements that are imposed by industry regulators in the countries in which the subsidiaries operate, or other limitations which may exist in certain countries.
No specific dividend payment restrictions with respect to the cumulative preference shares exist.
Furthermore, ING Groep N.V. is subject to legal restrictions with respect to repayment of capital to holders of cumulative preference shares. Capital may be repaid to the holders of cumulative preference shares pursuant to (i) an amendment of ING Groep N.V.’s articles of association whereby the cumulative preference shares are written down or (ii) a resolution to redeem and cancel the cumulative preference shares.
Pursuant to the Dutch Civil Code, capital may only be repaid if none of ING Groep N.V.’s creditors opposes such a repayment within two months following the announcement of a resolution to that effect.
LIABILITIES15 SUBORDINATED LOANS
Subordinated loansNotional amount in original currency Balance sheet value
Interest rate Year of issue First call date Step-up Total Lent on to ING Bank
Lent on to NN Group 2013 2012
9.000% 2008 None EUR 10 10 108.500% 2008 15 September 2013 No USD 2,000 2,000 1,5088.000% 2008 18 April 2013 No EUR 1,500 1,050 450 1,501 1,5027.375% 2007 15 October 2012 No USD 1,500 500 1,000 (1) 1,025 1,1376.375% 2007 15 June 2012 No USD 1,045 1,045 759 7925.140% 2006 17 March 2016 Yes GBP 66 66 79 815.775% 2005 8 December 2015 Yes USD 364 364 272 2886.125% 2005 15 January 2011 No USD 700 400 300 (1) 486 5294.176% 2005 8 June 2015 Yes EUR 169 169 168 168Variable 2004 30 June 2014 No EUR 555 555 566 5586.200% 2003 15 January 2009 No USD 500 500 353 369Variable 2003 30 June 2013 No EUR 430 430 433 4277.200% 2002 15 December 2007 No USD 1,100 1,100 (1) 715 8207.050% 2002 15 September 2007 No USD 800 800 522 597
6,889 8,786
(1) These USD loans to NN Group were converted into EUR loans from 30 September 2013.
Subordinated loans consist of perpetual subordinated bonds issued by ING Groep N.V. These bonds have been issued to raise hybrid capital for NN Group (originally issued by ING Verzekeringen N.V.) and Tier 1 capital for ING Bank N.V. Under IFRS-EU these bonds are classified as liabilities. They are considered capital for regulatory purposes.
2013 – Call of perpetual subordinated loans In December 2013, ING Group called the USD 2 billion 8.5% Tier 1 hybrid loan.
2011 – Exchange offersOn 12 December 2011, ING announced the launch of three separate exchange offers in Europe and tender offers in the United States of America, on a total of seven series of outstanding subordinated securities of ING entities with a total nominal value of approximately EUR 5.8 billion. Of this amount, EUR 4.8 billion relates to securities issued by ING Groep N.V. and EUR 1.0 billion originally issued by ING Verzekeringen N.V. All tender and exchange offers announced on 12 December 2011 were successfully completed on 23 December 2011 with an average participation of approximately 60%. As part of this initiative, EUR 0.9 billion intercompany debt from ING Bank N.V. to
Notes to the consolidated annual accounts of ING Group continued
146 ING Group Annual Report 2013
ING_2013_deel1_v1.indd 146 19/03/2014 18:58:07
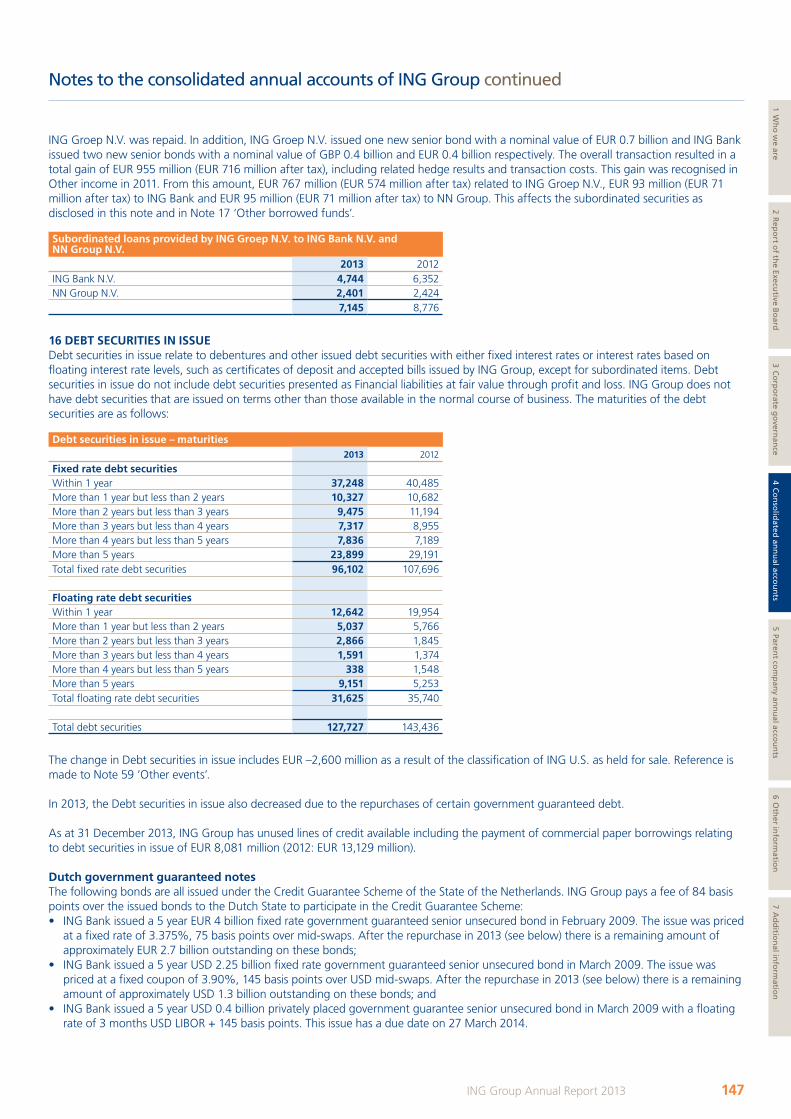
ING Groep N.V. was repaid. In addition, ING Groep N.V. issued one new senior bond with a nominal value of EUR 0.7 billion and ING Bank issued two new senior bonds with a nominal value of GBP 0.4 billion and EUR 0.4 billion respectively. The overall transaction resulted in a total gain of EUR 955 million (EUR 716 million after tax), including related hedge results and transaction costs. This gain was recognised in Other income in 2011. From this amount, EUR 767 million (EUR 574 million after tax) related to ING Groep N.V., EUR 93 million (EUR 71 million after tax) to ING Bank and EUR 95 million (EUR 71 million after tax) to NN Group. This affects the subordinated securities as disclosed in this note and in Note 17 ‘Other borrowed funds’.
Subordinated loans provided by ING Groep N.V. to ING Bank N.V. and NN Group N.V.
2013 2012ING Bank N.V. 4,744 6,352NN Group N.V. 2,401 2,424
7,145 8,776
16 DEBT SECURITIES IN ISSUEDebt securities in issue relate to debentures and other issued debt securities with either fixed interest rates or interest rates based on floating interest rate levels, such as certificates of deposit and accepted bills issued by ING Group, except for subordinated items. Debt securities in issue do not include debt securities presented as Financial liabilities at fair value through profit and loss. ING Group does not have debt securities that are issued on terms other than those available in the normal course of business. The maturities of the debt securities are as follows:
Debt securities in issue – maturities2013 2012
Fixed rate debt securitiesWithin 1 year 37,248 40,485More than 1 year but less than 2 years 10,327 10,682More than 2 years but less than 3 years 9,475 11,194More than 3 years but less than 4 years 7,317 8,955More than 4 years but less than 5 years 7,836 7,189More than 5 years 23,899 29,191Total fixed rate debt securities 96,102 107,696
Floating rate debt securitiesWithin 1 year 12,642 19,954More than 1 year but less than 2 years 5,037 5,766More than 2 years but less than 3 years 2,866 1,845More than 3 years but less than 4 years 1,591 1,374More than 4 years but less than 5 years 338 1,548More than 5 years 9,151 5,253Total floating rate debt securities 31,625 35,740
Total debt securities 127,727 143,436
The change in Debt securities in issue includes EUR –2,600 million as a result of the classification of ING U.S. as held for sale. Reference is made to Note 59 ‘Other events’.
In 2013, the Debt securities in issue also decreased due to the repurchases of certain government guaranteed debt.
As at 31 December 2013, ING Group has unused lines of credit available including the payment of commercial paper borrowings relating to debt securities in issue of EUR 8,081 million (2012: EUR 13,129 million).
Dutch government guaranteed notesThe following bonds are all issued under the Credit Guarantee Scheme of the State of the Netherlands. ING Group pays a fee of 84 basis points over the issued bonds to the Dutch State to participate in the Credit Guarantee Scheme:• ING Bank issued a 5 year EUR 4 billion fixed rate government guaranteed senior unsecured bond in February 2009. The issue was priced
at a fixed rate of 3.375%, 75 basis points over mid-swaps. After the repurchase in 2013 (see below) there is a remaining amount of approximately EUR 2.7 billion outstanding on these bonds;
• ING Bank issued a 5 year USD 2.25 billion fixed rate government guaranteed senior unsecured bond in March 2009. The issue was priced at a fixed coupon of 3.90%, 145 basis points over USD mid-swaps. After the repurchase in 2013 (see below) there is a remaining amount of approximately USD 1.3 billion outstanding on these bonds; and
• ING Bank issued a 5 year USD 0.4 billion privately placed government guarantee senior unsecured bond in March 2009 with a floating rate of 3 months USD LIBOR + 145 basis points. This issue has a due date on 27 March 2014.
Notes to the consolidated annual accounts of ING Group continued
147ING Group Annual Report 2013
1 Wh
o w
e are2 R
epo
rt of th
e Executive B
oard
3 Co
rpo
rate go
vernan
ce4 C
on
solid
ated an
nu
al accou
nts
5 Parent co
mp
any an
nu
al accou
nts
6 Oth
er info
rmatio
n7 A
dd
ition
al info
rmatio
n
ING_2013_deel1_v1.indd 147 19/03/2014 18:58:07
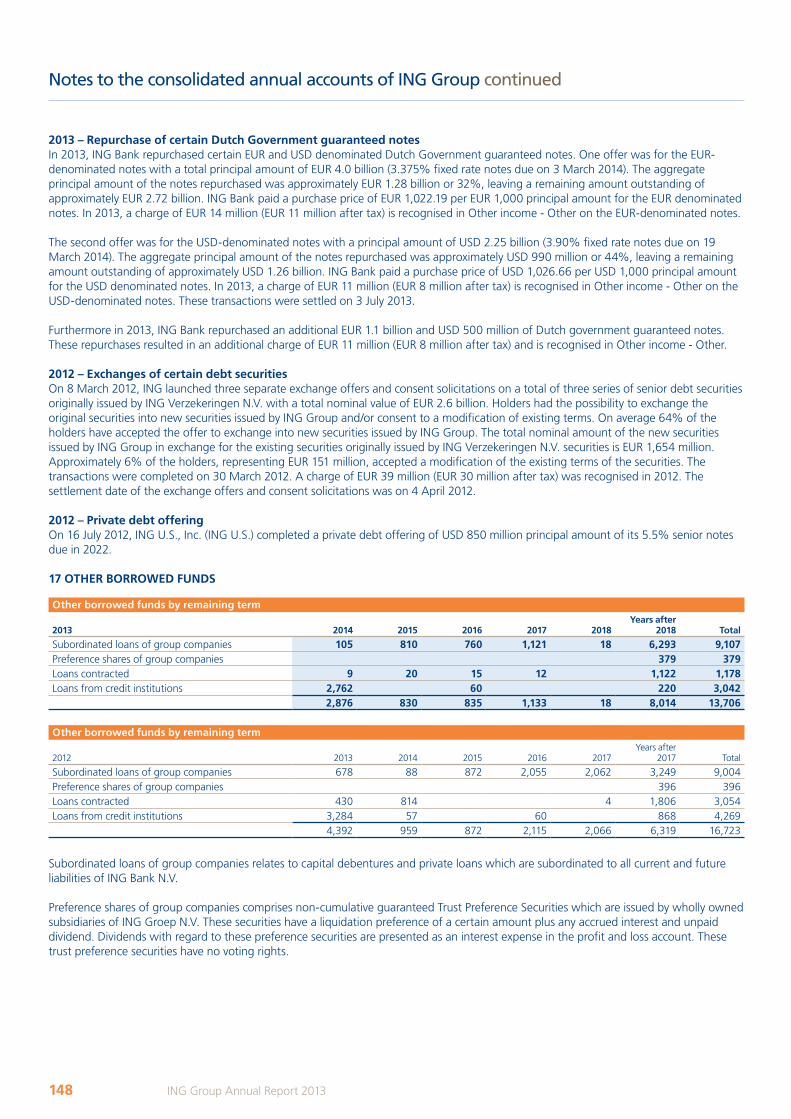
2013 – Repurchase of certain Dutch Government guaranteed notesIn 2013, ING Bank repurchased certain EUR and USD denominated Dutch Government guaranteed notes. One offer was for the EUR-denominated notes with a total principal amount of EUR 4.0 billion (3.375% fixed rate notes due on 3 March 2014). The aggregate principal amount of the notes repurchased was approximately EUR 1.28 billion or 32%, leaving a remaining amount outstanding of approximately EUR 2.72 billion. ING Bank paid a purchase price of EUR 1,022.19 per EUR 1,000 principal amount for the EUR denominated notes. In 2013, a charge of EUR 14 million (EUR 11 million after tax) is recognised in Other income - Other on the EUR-denominated notes.
The second offer was for the USD-denominated notes with a principal amount of USD 2.25 billion (3.90% fixed rate notes due on 19 March 2014). The aggregate principal amount of the notes repurchased was approximately USD 990 million or 44%, leaving a remaining amount outstanding of approximately USD 1.26 billion. ING Bank paid a purchase price of USD 1,026.66 per USD 1,000 principal amount for the USD denominated notes. In 2013, a charge of EUR 11 million (EUR 8 million after tax) is recognised in Other income - Other on the USD-denominated notes. These transactions were settled on 3 July 2013.
Furthermore in 2013, ING Bank repurchased an additional EUR 1.1 billion and USD 500 million of Dutch government guaranteed notes. These repurchases resulted in an additional charge of EUR 11 million (EUR 8 million after tax) and is recognised in Other income - Other.
2012 – Exchanges of certain debt securitiesOn 8 March 2012, ING launched three separate exchange offers and consent solicitations on a total of three series of senior debt securities originally issued by ING Verzekeringen N.V. with a total nominal value of EUR 2.6 billion. Holders had the possibility to exchange the original securities into new securities issued by ING Group and/or consent to a modification of existing terms. On average 64% of the holders have accepted the offer to exchange into new securities issued by ING Group. The total nominal amount of the new securities issued by ING Group in exchange for the existing securities originally issued by ING Verzekeringen N.V. securities is EUR 1,654 million. Approximately 6% of the holders, representing EUR 151 million, accepted a modification of the existing terms of the securities. The transactions were completed on 30 March 2012. A charge of EUR 39 million (EUR 30 million after tax) was recognised in 2012. The settlement date of the exchange offers and consent solicitations was on 4 April 2012.
2012 – Private debt offeringOn 16 July 2012, ING U.S., Inc. (ING U.S.) completed a private debt offering of USD 850 million principal amount of its 5.5% senior notes due in 2022.
17 OTHER BORROWED FUNDS
Other borrowed funds by remaining term
2013 2014 2015 2016 2017 2018Years after
2018 Total
Subordinated loans of group companies 105 810 760 1,121 18 6,293 9,107Preference shares of group companies 379 379Loans contracted 9 20 15 12 1,122 1,178Loans from credit institutions 2,762 60 220 3,042
2,876 830 835 1,133 18 8,014 13,706
Other borrowed funds by remaining term
2012 2013 2014 2015 2016 2017Years after
2017 Total
Subordinated loans of group companies 678 88 872 2,055 2,062 3,249 9,004Preference shares of group companies 396 396Loans contracted 430 814 4 1,806 3,054Loans from credit institutions 3,284 57 60 868 4,269
4,392 959 872 2,115 2,066 6,319 16,723
Subordinated loans of group companies relates to capital debentures and private loans which are subordinated to all current and future liabilities of ING Bank N.V.
Preference shares of group companies comprises non-cumulative guaranteed Trust Preference Securities which are issued by wholly owned subsidiaries of ING Groep N.V. These securities have a liquidation preference of a certain amount plus any accrued interest and unpaid dividend. Dividends with regard to these preference securities are presented as an interest expense in the profit and loss account. These trust preference securities have no voting rights.
Notes to the consolidated annual accounts of ING Group continued
148 ING Group Annual Report 2013
ING_2013_deel1_v1.indd 148 19/03/2014 18:58:08
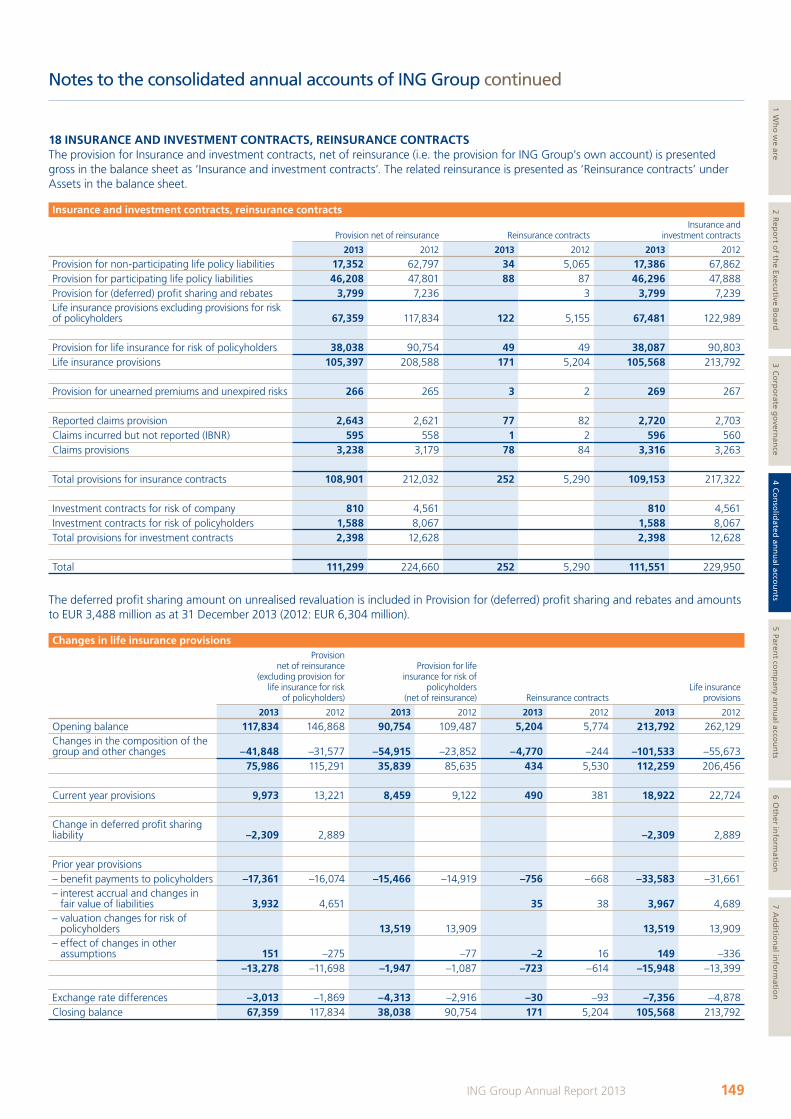
18 INSURANCE AND INVESTMENT CONTRACTS, REINSURANCE CONTRACTSThe provision for Insurance and investment contracts, net of reinsurance (i.e. the provision for ING Group’s own account) is presented gross in the balance sheet as ‘Insurance and investment contracts’. The related reinsurance is presented as ‘Reinsurance contracts’ under Assets in the balance sheet.
Insurance and investment contracts, reinsurance contracts
Provision net of reinsurance Reinsurance contracts Insurance and
investment contracts
2013 2012 2013 2012 2013 2012
Provision for non-participating life policy liabilities 17,352 62,797 34 5,065 17,386 67,862Provision for participating life policy liabilities 46,208 47,801 88 87 46,296 47,888Provision for (deferred) profit sharing and rebates 3,799 7,236 3 3,799 7,239Life insurance provisions excluding provisions for risk of policyholders 67,359 117,834 122 5,155 67,481 122,989
Provision for life insurance for risk of policyholders 38,038 90,754 49 49 38,087 90,803Life insurance provisions 105,397 208,588 171 5,204 105,568 213,792
Provision for unearned premiums and unexpired risks 266 265 3 2 269 267
Reported claims provision 2,643 2,621 77 82 2,720 2,703Claims incurred but not reported (IBNR) 595 558 1 2 596 560Claims provisions 3,238 3,179 78 84 3,316 3,263
Total provisions for insurance contracts 108,901 212,032 252 5,290 109,153 217,322
Investment contracts for risk of company 810 4,561 810 4,561Investment contracts for risk of policyholders 1,588 8,067 1,588 8,067Total provisions for investment contracts 2,398 12,628 2,398 12,628
Total 111,299 224,660 252 5,290 111,551 229,950
The deferred profit sharing amount on unrealised revaluation is included in Provision for (deferred) profit sharing and rebates and amounts to EUR 3,488 million as at 31 December 2013 (2012: EUR 6,304 million).
Changes in life insurance provisionsProvision
net of reinsurance(excluding provision for
life insurance for risk of policyholders)
Provision for lifeinsurance for risk of
policyholders (net of reinsurance) Reinsurance contracts
Life insuranceprovisions
2013 2012 2013 2012 2013 2012 2013 2012
Opening balance 117,834 146,868 90,754 109,487 5,204 5,774 213,792 262,129Changes in the composition of the group and other changes –41,848 –31,577 –54,915 –23,852 –4,770 –244 –101,533 –55,673
75,986 115,291 35,839 85,635 434 5,530 112,259 206,456
Current year provisions 9,973 13,221 8,459 9,122 490 381 18,922 22,724
Change in deferred profit sharing liability –2,309 2,889 –2,309 2,889
Prior year provisions– benefit payments to policyholders –17,361 –16,074 –15,466 –14,919 –756 –668 –33,583 –31,661– interest accrual and changes in
fair value of liabilities 3,932 4,651 35 38 3,967 4,689– valuation changes for risk of
policyholders 13,519 13,909 13,519 13,909– effect of changes in other
assumptions 151 –275 –77 –2 16 149 –336–13,278 –11,698 –1,947 –1,087 –723 –614 –15,948 –13,399
Exchange rate differences –3,013 –1,869 –4,313 –2,916 –30 –93 –7,356 –4,878Closing balance 67,359 117,834 38,038 90,754 171 5,204 105,568 213,792
Notes to the consolidated annual accounts of ING Group continued
149ING Group Annual Report 2013
1 Wh
o w
e are2 R
epo
rt of th
e Executive B
oard
3 Co
rpo
rate go
vernan
ce4 C
on
solid
ated an
nu
al accou
nts
5 Parent co
mp
any an
nu
al accou
nts
6 Oth
er info
rmatio
n7 A
dd
ition
al info
rmatio
n
ING_2013_deel1_v1.indd 149 19/03/2014 18:58:08
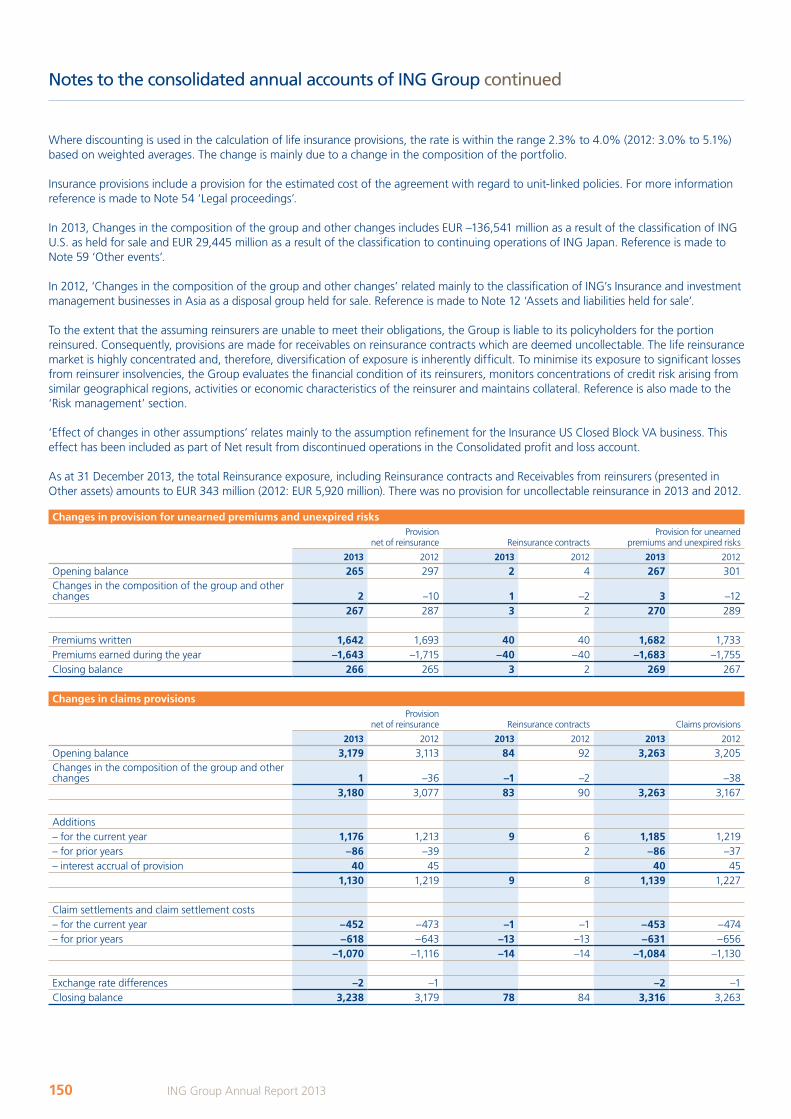
Where discounting is used in the calculation of life insurance provisions, the rate is within the range 2.3% to 4.0% (2012: 3.0% to 5.1%) based on weighted averages. The change is mainly due to a change in the composition of the portfolio.
Insurance provisions include a provision for the estimated cost of the agreement with regard to unit-linked policies. For more information reference is made to Note 54 ‘Legal proceedings’.
In 2013, Changes in the composition of the group and other changes includes EUR –136,541 million as a result of the classification of ING U.S. as held for sale and EUR 29,445 million as a result of the classification to continuing operations of ING Japan. Reference is made to Note 59 ‘Other events’.
In 2012, ‘Changes in the composition of the group and other changes’ related mainly to the classification of ING’s Insurance and investment management businesses in Asia as a disposal group held for sale. Reference is made to Note 12 ‘Assets and liabilities held for sale’.
To the extent that the assuming reinsurers are unable to meet their obligations, the Group is liable to its policyholders for the portion reinsured. Consequently, provisions are made for receivables on reinsurance contracts which are deemed uncollectable. The life reinsurance market is highly concentrated and, therefore, diversification of exposure is inherently difficult. To minimise its exposure to significant losses from reinsurer insolvencies, the Group evaluates the financial condition of its reinsurers, monitors concentrations of credit risk arising from similar geographical regions, activities or economic characteristics of the reinsurer and maintains collateral. Reference is also made to the ‘Risk management’ section.
‘Effect of changes in other assumptions’ relates mainly to the assumption refinement for the Insurance US Closed Block VA business. This effect has been included as part of Net result from discontinued operations in the Consolidated profit and loss account.
As at 31 December 2013, the total Reinsurance exposure, including Reinsurance contracts and Receivables from reinsurers (presented in Other assets) amounts to EUR 343 million (2012: EUR 5,920 million). There was no provision for uncollectable reinsurance in 2013 and 2012.
Changes in provision for unearned premiums and unexpired risksProvision
net of reinsurance Reinsurance contractsProvision for unearned
premiums and unexpired risks
2013 2012 2013 2012 2013 2012
Opening balance 265 297 2 4 267 301Changes in the composition of the group and other changes 2 –10 1 –2 3 –12
267 287 3 2 270 289
Premiums written 1,642 1,693 40 40 1,682 1,733Premiums earned during the year –1,643 –1,715 –40 –40 –1,683 –1,755Closing balance 266 265 3 2 269 267
Changes in claims provisionsProvision
net of reinsurance Reinsurance contracts Claims provisions
2013 2012 2013 2012 2013 2012
Opening balance 3,179 3,113 84 92 3,263 3,205Changes in the composition of the group and other changes 1 –36 –1 –2 –38
3,180 3,077 83 90 3,263 3,167
Additions– for the current year 1,176 1,213 9 6 1,185 1,219– for prior years –86 –39 2 –86 –37– interest accrual of provision 40 45 40 45
1,130 1,219 9 8 1,139 1,227
Claim settlements and claim settlement costs– for the current year –452 –473 –1 –1 –453 –474– for prior years –618 –643 –13 –13 –631 –656
–1,070 –1,116 –14 –14 –1,084 –1,130
Exchange rate differences –2 –1 –2 –1Closing balance 3,238 3,179 78 84 3,316 3,263
Notes to the consolidated annual accounts of ING Group continued
150 ING Group Annual Report 2013
ING_2013_deel1_v1.indd 150 19/03/2014 18:58:09
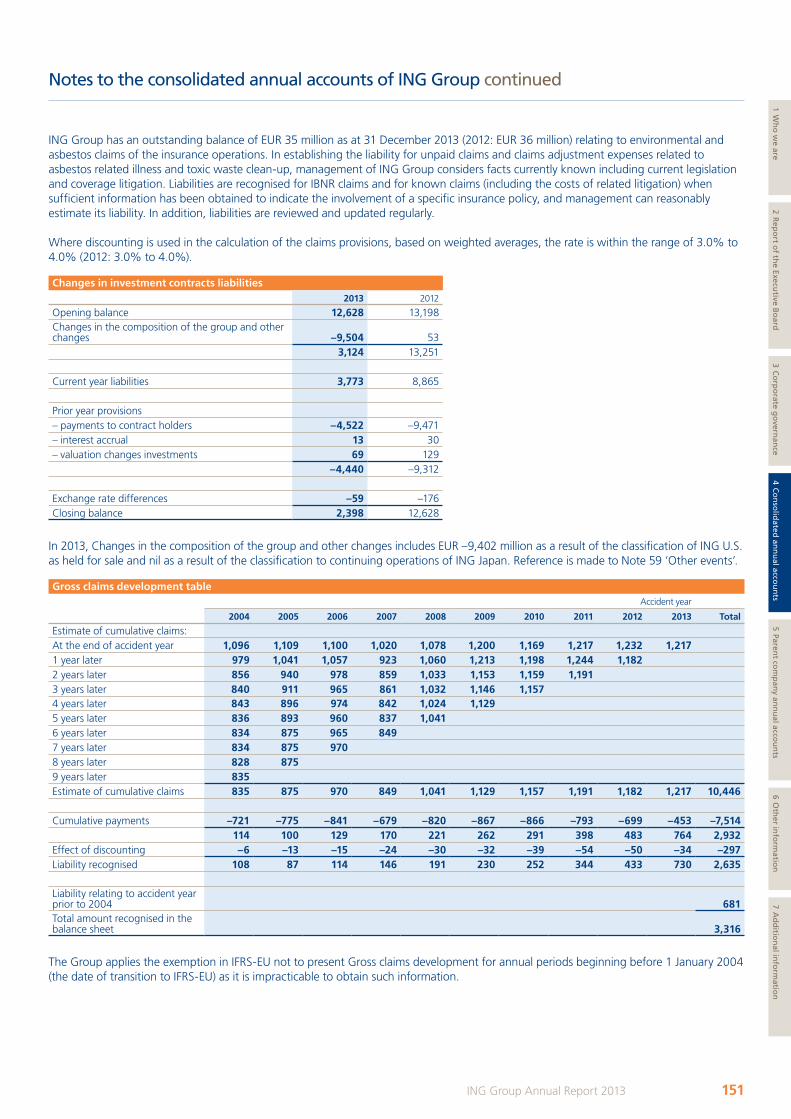
ING Group has an outstanding balance of EUR 35 million as at 31 December 2013 (2012: EUR 36 million) relating to environmental and asbestos claims of the insurance operations. In establishing the liability for unpaid claims and claims adjustment expenses related to asbestos related illness and toxic waste clean-up, management of ING Group considers facts currently known including current legislation and coverage litigation. Liabilities are recognised for IBNR claims and for known claims (including the costs of related litigation) when sufficient information has been obtained to indicate the involvement of a specific insurance policy, and management can reasonably estimate its liability. In addition, liabilities are reviewed and updated regularly.
Where discounting is used in the calculation of the claims provisions, based on weighted averages, the rate is within the range of 3.0% to 4.0% (2012: 3.0% to 4.0%).
Changes in investment contracts liabilities2013 2012
Opening balance 12,628 13,198Changes in the composition of the group and other changes –9,504 53
3,124 13,251
Current year liabilities 3,773 8,865
Prior year provisions– payments to contract holders –4,522 –9,471– interest accrual 13 30– valuation changes investments 69 129
–4,440 –9,312
Exchange rate differences –59 –176Closing balance 2,398 12,628
In 2013, Changes in the composition of the group and other changes includes EUR –9,402 million as a result of the classification of ING U.S. as held for sale and nil as a result of the classification to continuing operations of ING Japan. Reference is made to Note 59 ‘Other events’.
Gross claims development tableAccident year
2004 2005 2006 2007 2008 2009 2010 2011 2012 2013 Total
Estimate of cumulative claims:At the end of accident year 1,096 1,109 1,100 1,020 1,078 1,200 1,169 1,217 1,232 1,217 1 year later 979 1,041 1,057 923 1,060 1,213 1,198 1,244 1,182 2 years later 856 940 978 859 1,033 1,153 1,159 1,191 3 years later 840 911 965 861 1,032 1,146 1,157 4 years later 843 896 974 842 1,024 1,129 5 years later 836 893 960 837 1,041 6 years later 834 875 965 849 7 years later 834 875 970 8 years later 828 875 9 years later 835 Estimate of cumulative claims 835 875 970 849 1,041 1,129 1,157 1,191 1,182 1,217 10,446
Cumulative payments –721 –775 –841 –679 –820 –867 –866 –793 –699 –453 –7,514114 100 129 170 221 262 291 398 483 764 2,932
Effect of discounting –6 –13 –15 –24 –30 –32 –39 –54 –50 –34 –297Liability recognised 108 87 114 146 191 230 252 344 433 730 2,635
Liability relating to accident year prior to 2004 681Total amount recognised in the balance sheet 3,316
The Group applies the exemption in IFRS-EU not to present Gross claims development for annual periods beginning before 1 January 2004 (the date of transition to IFRS-EU) as it is impracticable to obtain such information.
Notes to the consolidated annual accounts of ING Group continued
151ING Group Annual Report 2013
1 Wh
o w
e are2 R
epo
rt of th
e Executive B
oard
3 Co
rpo
rate go
vernan
ce4 C
on
solid
ated an
nu
al accou
nts
5 Parent co
mp
any an
nu
al accou
nts
6 Oth
er info
rmatio
n7 A
dd
ition
al info
rmatio
n
ING_2013_deel1_v1.indd 151 19/03/2014 18:58:09
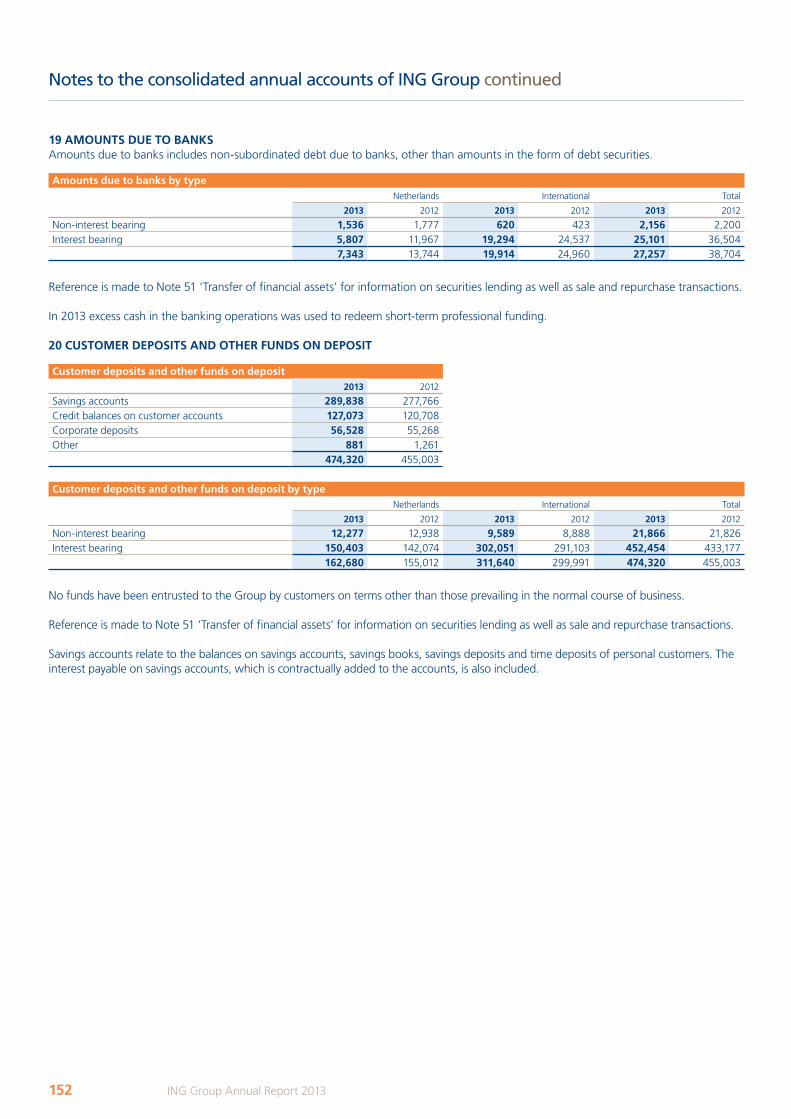
19 AMOUNTS DUE TO BANKSAmounts due to banks includes non-subordinated debt due to banks, other than amounts in the form of debt securities.
Amounts due to banks by typeNetherlands International Total
2013 2012 2013 2012 2013 2012
Non-interest bearing 1,536 1,777 620 423 2,156 2,200Interest bearing 5,807 11,967 19,294 24,537 25,101 36,504
7,343 13,744 19,914 24,960 27,257 38,704
Reference is made to Note 51 ‘Transfer of financial assets’ for information on securities lending as well as sale and repurchase transactions.
In 2013 excess cash in the banking operations was used to redeem short-term professional funding.
20 CUSTOMER DEPOSITS AND OTHER FUNDS ON DEPOSIT
Customer deposits and other funds on deposit2013 2012
Savings accounts 289,838 277,766Credit balances on customer accounts 127,073 120,708Corporate deposits 56,528 55,268Other 881 1,261
474,320 455,003
Customer deposits and other funds on deposit by typeNetherlands International Total
2013 2012 2013 2012 2013 2012
Non-interest bearing 12,277 12,938 9,589 8,888 21,866 21,826Interest bearing 150,403 142,074 302,051 291,103 452,454 433,177
162,680 155,012 311,640 299,991 474,320 455,003
No funds have been entrusted to the Group by customers on terms other than those prevailing in the normal course of business.
Reference is made to Note 51 ‘Transfer of financial assets’ for information on securities lending as well as sale and repurchase transactions.
Savings accounts relate to the balances on savings accounts, savings books, savings deposits and time deposits of personal customers. The interest payable on savings accounts, which is contractually added to the accounts, is also included.
Notes to the consolidated annual accounts of ING Group continued
152 ING Group Annual Report 2013
ING_2013_deel1_v1.indd 152 19/03/2014 18:58:09
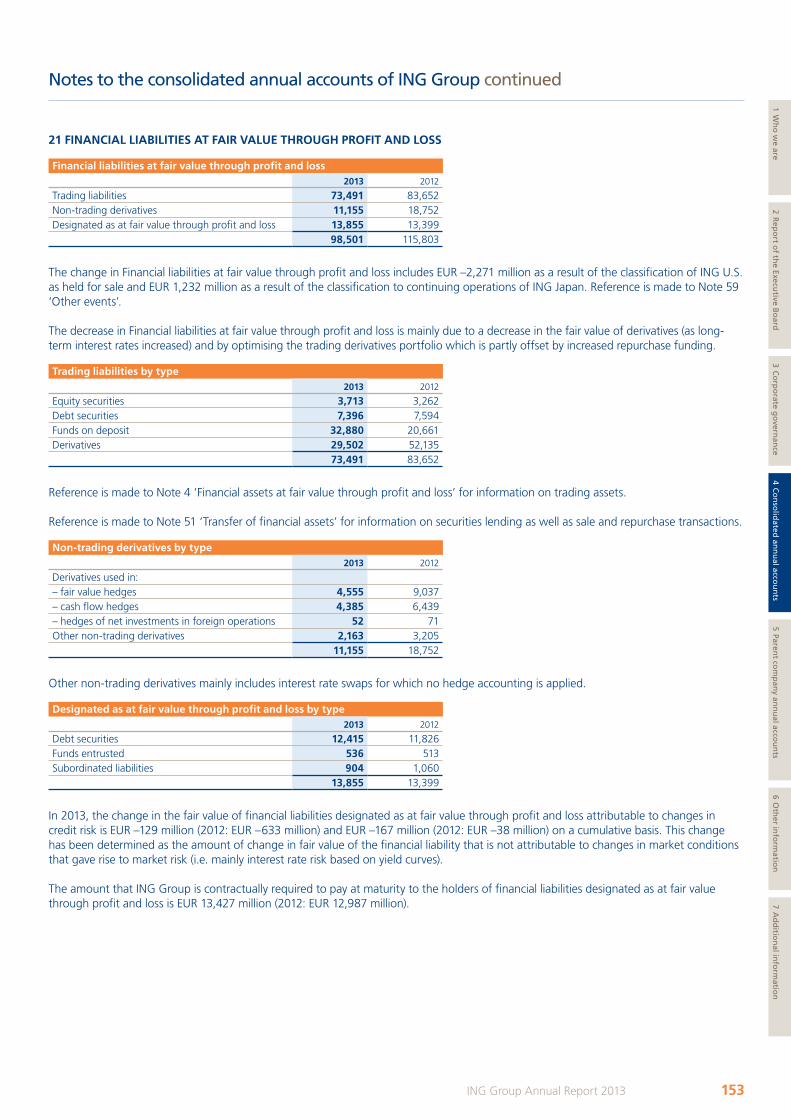
Notes to the consolidated annual accounts of ING Group continued
21 FINANCIAL LIABILITIES AT FAIR VALUE THROUGH PROFIT AND LOSS
Financial liabilities at fair value through profit and loss2013 2012
Trading liabilities 73,491 83,652Non-trading derivatives 11,155 18,752Designated as at fair value through profit and loss 13,855 13,399
98,501 115,803
The change in Financial liabilities at fair value through profit and loss includes EUR –2,271 million as a result of the classification of ING U.S. as held for sale and EUR 1,232 million as a result of the classification to continuing operations of ING Japan. Reference is made to Note 59 ‘Other events’.
The decrease in Financial liabilities at fair value through profit and loss is mainly due to a decrease in the fair value of derivatives (as long-term interest rates increased) and by optimising the trading derivatives portfolio which is partly offset by increased repurchase funding. Trading liabilities by type
2013 2012
Equity securities 3,713 3,262Debt securities 7,396 7,594Funds on deposit 32,880 20,661Derivatives 29,502 52,135
73,491 83,652
Reference is made to Note 4 ‘Financial assets at fair value through profit and loss’ for information on trading assets.
Reference is made to Note 51 ‘Transfer of financial assets’ for information on securities lending as well as sale and repurchase transactions.
Non-trading derivatives by type2013 2012
Derivatives used in:– fair value hedges 4,555 9,037– cash flow hedges 4,385 6,439– hedges of net investments in foreign operations 52 71Other non-trading derivatives 2,163 3,205
11,155 18,752
Other non-trading derivatives mainly includes interest rate swaps for which no hedge accounting is applied.
Designated as at fair value through profit and loss by type2013 2012
Debt securities 12,415 11,826Funds entrusted 536 513Subordinated liabilities 904 1,060
13,855 13,399
In 2013, the change in the fair value of financial liabilities designated as at fair value through profit and loss attributable to changes in credit risk is EUR –129 million (2012: EUR –633 million) and EUR –167 million (2012: EUR –38 million) on a cumulative basis. This change has been determined as the amount of change in fair value of the financial liability that is not attributable to changes in market conditions that gave rise to market risk (i.e. mainly interest rate risk based on yield curves).
The amount that ING Group is contractually required to pay at maturity to the holders of financial liabilities designated as at fair value through profit and loss is EUR 13,427 million (2012: EUR 12,987 million).
153ING Group Annual Report 2013
1 Wh
o w
e are2 R
epo
rt of th
e Executive B
oard
3 Co
rpo
rate go
vernan
ce4 C
on
solid
ated an
nu
al accou
nts
5 Parent co
mp
any an
nu
al accou
nts
6 Oth
er info
rmatio
n7 A
dd
ition
al info
rmatio
n
ING_2013_deel1_v1.indd 153 19/03/2014 18:58:09

22 OTHER LIABILITIES
Other liabilities by type2013 2012 2011
Deferred tax liabilities 1,056 2,813 3,611Income tax payable 440 956 858Net defined benefit liability 336 799 654Other post-employment benefits 136 220 255Other staff-related liabilities 558 650 1,111Other taxation and social security contributions 833 918 898Deposits from reinsurers 58 869 1,015Accrued interest 7,876 10,569 11,698Costs payable 1,749 2,160 2,401Amounts payable to brokers 4 50 72Amounts payable to policyholders 464 2,139 2,171Reorganisation provisions 575 919 600Other provisions 367 622 634Share-based payment plan liabilities 44 47 39Prepayments received under property under development 21 83Amounts to be settled 4,258 4,832 5,442Other 2,934 4,195 3,381
21,688 32,779 34,923
The change in Other liabilities includes is EUR –4,451 million as a result of the classification of ING U.S. as held for sale and is EUR 1,093 million as a result of the classification to continuing operations of ING Japan. Reference is made to Note 59 ‘Other events’.
Disclosures in respect of Net defined benefit liabilities are provided in Note 44 ‘Pension and other post-employment benefits’ and deferred tax liabilities are provided in Note 45 ‘Taxation’.
The provision for the estimated cost of the agreement with regard to unit-linked policies is included in Note 18 ‘Insurance and investment contracts, reinsurance contracts’.
Other staff-related liabilities Other staff-related liabilities includes vacation leave provisions, variable compensation provisions, jubilee provisions and disability/illness provisions.
Reorganisation provisions
Changes in reorganisation provision2013 2012
Opening balance 919 600Additions 320 837Releases –66 –23Charges –580 –485Exchange rate differences –4 2Changes in the composition of the group and other changes –14 –12Closing balance 575 919
In general, Reorganisation provisions are of a short-term nature.
In 2013, Changes in the composition of the group and other changes includes EUR –10 million as a result of the classification of ING U.S. as held for sale and nil as a result of the classification to continuing operations of ING Japan. Reference is made to Note 59 ‘Other events’.Additions to the reorganisation provision are mainly related to the restructurings for Retail banking in the Netherlands, Commercial banking.
In 2013, a reorganisation provision of EUR 167 million is recognised in the segment Retail Netherlands and Commercial Banking as a result of further measures that have been taken to accelerate the cost savings program. These measures are expected to result in a further reduction of the workforce of around 300 FTEs.
Notes to the consolidated annual accounts of ING Group continued
154 ING Group Annual Report 2013
ING_2013_deel1_v1.indd 154 19/03/2014 18:58:10
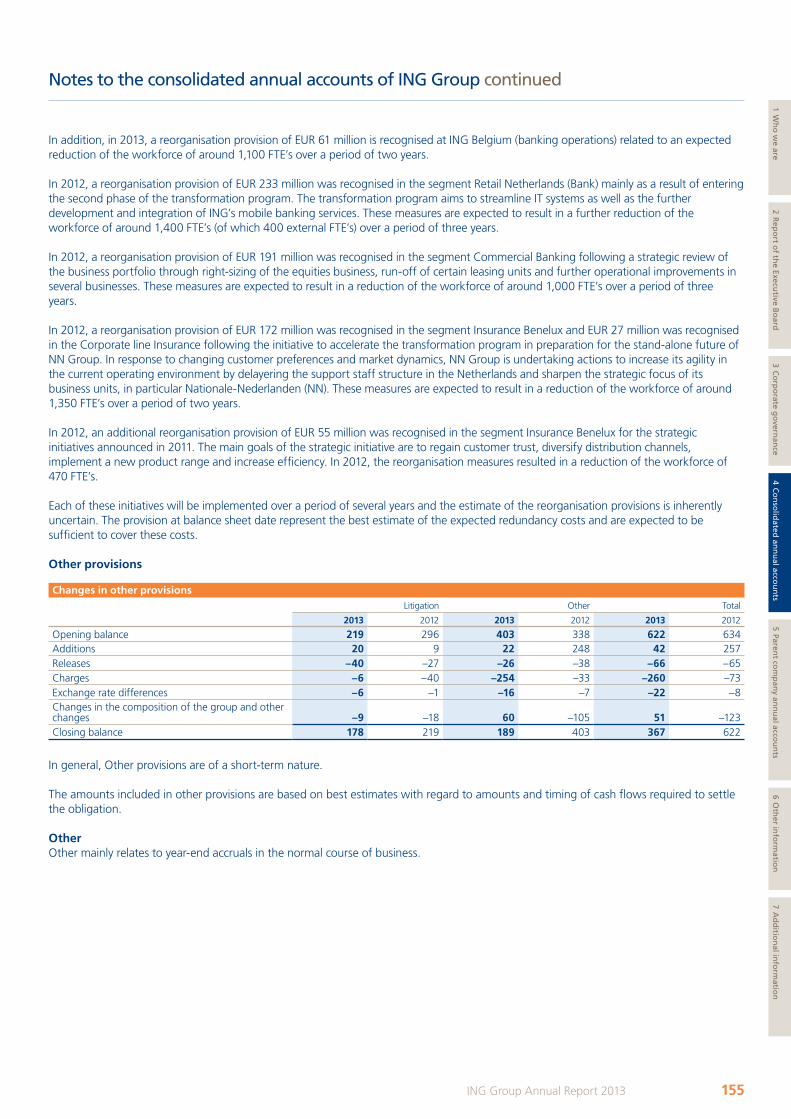
In addition, in 2013, a reorganisation provision of EUR 61 million is recognised at ING Belgium (banking operations) related to an expected reduction of the workforce of around 1,100 FTE’s over a period of two years.
In 2012, a reorganisation provision of EUR 233 million was recognised in the segment Retail Netherlands (Bank) mainly as a result of entering the second phase of the transformation program. The transformation program aims to streamline IT systems as well as the further development and integration of ING’s mobile banking services. These measures are expected to result in a further reduction of the workforce of around 1,400 FTE’s (of which 400 external FTE’s) over a period of three years.
In 2012, a reorganisation provision of EUR 191 million was recognised in the segment Commercial Banking following a strategic review of the business portfolio through right-sizing of the equities business, run-off of certain leasing units and further operational improvements in several businesses. These measures are expected to result in a reduction of the workforce of around 1,000 FTE’s over a period of three years.
In 2012, a reorganisation provision of EUR 172 million was recognised in the segment Insurance Benelux and EUR 27 million was recognised in the Corporate line Insurance following the initiative to accelerate the transformation program in preparation for the stand-alone future of NN Group. In response to changing customer preferences and market dynamics, NN Group is undertaking actions to increase its agility in the current operating environment by delayering the support staff structure in the Netherlands and sharpen the strategic focus of its business units, in particular Nationale-Nederlanden (NN). These measures are expected to result in a reduction of the workforce of around 1,350 FTE’s over a period of two years.
In 2012, an additional reorganisation provision of EUR 55 million was recognised in the segment Insurance Benelux for the strategic initiatives announced in 2011. The main goals of the strategic initiative are to regain customer trust, diversify distribution channels, implement a new product range and increase efficiency. In 2012, the reorganisation measures resulted in a reduction of the workforce of 470 FTE’s.
Each of these initiatives will be implemented over a period of several years and the estimate of the reorganisation provisions is inherently uncertain. The provision at balance sheet date represent the best estimate of the expected redundancy costs and are expected to be sufficient to cover these costs. Other provisions
Changes in other provisionsLitigation Other Total
2013 2012 2013 2012 2013 2012
Opening balance 219 296 403 338 622 634Additions 20 9 22 248 42 257Releases –40 –27 –26 –38 –66 –65Charges –6 –40 –254 –33 –260 –73Exchange rate differences –6 –1 –16 –7 –22 –8Changes in the composition of the group and other changes –9 –18 60 –105 51 –123Closing balance 178 219 189 403 367 622
In general, Other provisions are of a short-term nature.
The amounts included in other provisions are based on best estimates with regard to amounts and timing of cash flows required to settle the obligation.
Other Other mainly relates to year-end accruals in the normal course of business.
Notes to the consolidated annual accounts of ING Group continued
155ING Group Annual Report 2013
1 Wh
o w
e are2 R
epo
rt of th
e Executive B
oard
3 Co
rpo
rate go
vernan
ce4 C
on
solid
ated an
nu
al accou
nts
5 Parent co
mp
any an
nu
al accou
nts
6 Oth
er info
rmatio
n7 A
dd
ition
al info
rmatio
n
ING_2013_deel1_v1.indd 155 19/03/2014 18:58:10
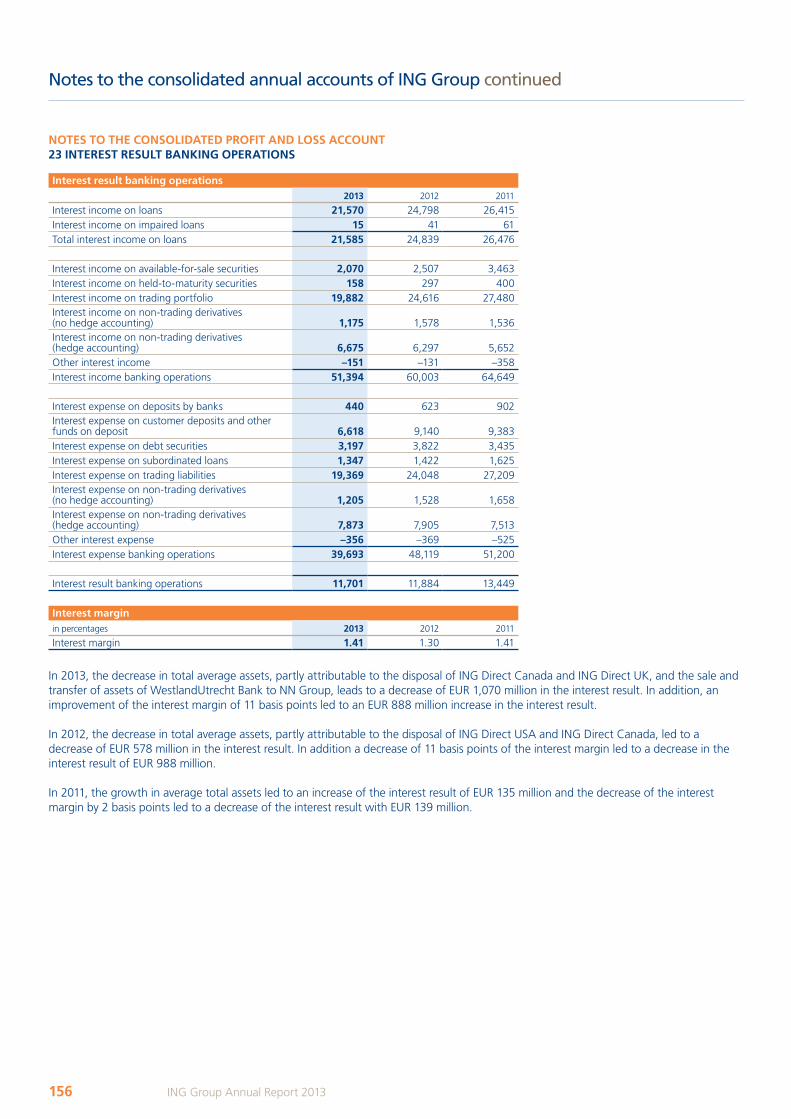
Notes to the consolidated annual accounts of ING Group continued
NOTES TO THE CONSOLIDATED PROFIT AND LOSS ACCOUNT 23 INTEREST RESULT BANKING OPERATIONS
Interest result banking operations2013 2012 2011
Interest income on loans 21,570 24,798 26,415Interest income on impaired loans 15 41 61Total interest income on loans 21,585 24,839 26,476
Interest income on available-for-sale securities 2,070 2,507 3,463Interest income on held-to-maturity securities 158 297 400Interest income on trading portfolio 19,882 24,616 27,480Interest income on non-trading derivatives (no hedge accounting) 1,175 1,578 1,536Interest income on non-trading derivatives (hedge accounting) 6,675 6,297 5,652Other interest income –151 –131 –358Interest income banking operations 51,394 60,003 64,649
Interest expense on deposits by banks 440 623 902Interest expense on customer deposits and other funds on deposit 6,618 9,140 9,383Interest expense on debt securities 3,197 3,822 3,435Interest expense on subordinated loans 1,347 1,422 1,625Interest expense on trading liabilities 19,369 24,048 27,209Interest expense on non-trading derivatives (no hedge accounting) 1,205 1,528 1,658Interest expense on non-trading derivatives (hedge accounting) 7,873 7,905 7,513Other interest expense –356 –369 –525Interest expense banking operations 39,693 48,119 51,200
Interest result banking operations 11,701 11,884 13,449
Interest marginin percentages 2013 2012 2011
Interest margin 1.41 1.30 1.41
In 2013, the decrease in total average assets, partly attributable to the disposal of ING Direct Canada and ING Direct UK, and the sale and transfer of assets of WestlandUtrecht Bank to NN Group, leads to a decrease of EUR 1,070 million in the interest result. In addition, an improvement of the interest margin of 11 basis points led to an EUR 888 million increase in the interest result.
In 2012, the decrease in total average assets, partly attributable to the disposal of ING Direct USA and ING Direct Canada, led to a decrease of EUR 578 million in the interest result. In addition a decrease of 11 basis points of the interest margin led to a decrease in the interest result of EUR 988 million.
In 2011, the growth in average total assets led to an increase of the interest result of EUR 135 million and the decrease of the interest margin by 2 basis points led to a decrease of the interest result with EUR 139 million.
156 ING Group Annual Report 2013
ING_2013_deel2&3_v2A.indd 156 19/03/2014 19:11:48
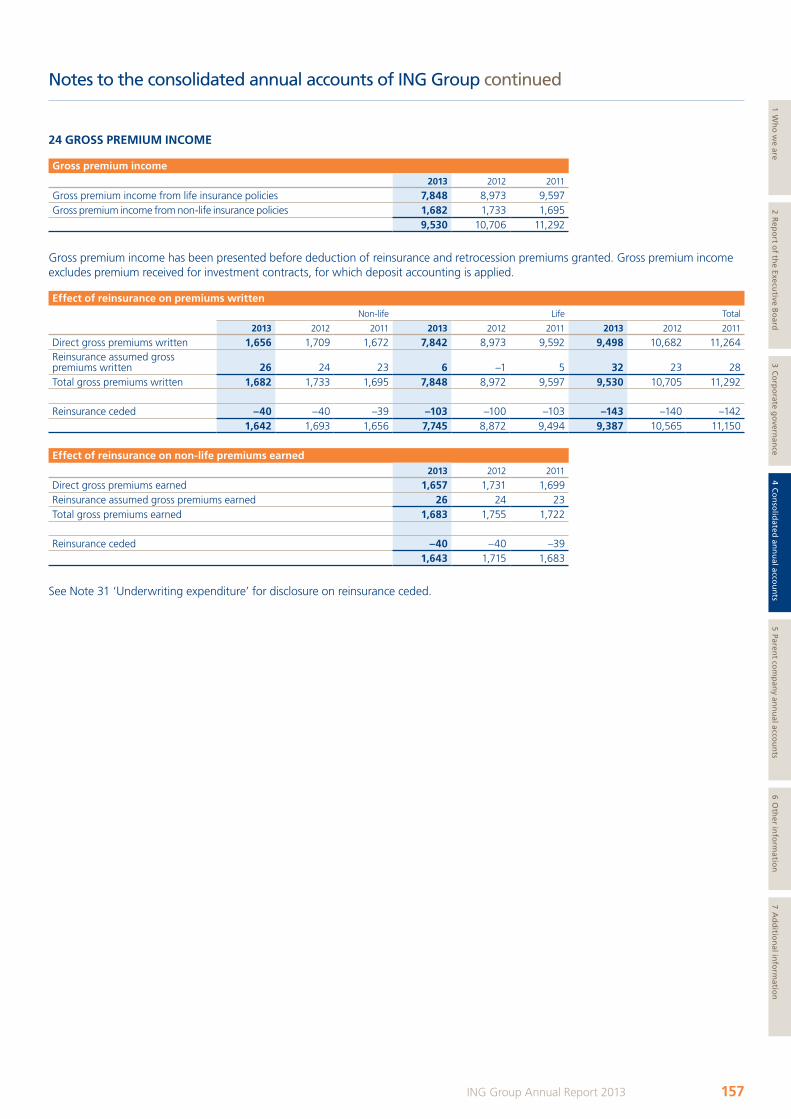
Notes to the consolidated annual accounts of ING Group continued
24 GROSS PREMIUM INCOME
Gross premium income2013 2012 2011
Gross premium income from life insurance policies 7,848 8,973 9,597Gross premium income from non-life insurance policies 1,682 1,733 1,695
9,530 10,706 11,292
Gross premium income has been presented before deduction of reinsurance and retrocession premiums granted. Gross premium income excludes premium received for investment contracts, for which deposit accounting is applied.
Effect of reinsurance on premiums writtenNon-life Life Total
2013 2012 2011 2013 2012 2011 2013 2012 2011
Direct gross premiums written 1,656 1,709 1,672 7,842 8,973 9,592 9,498 10,682 11,264Reinsurance assumed gross premiums written 26 24 23 6 –1 5 32 23 28Total gross premiums written 1,682 1,733 1,695 7,848 8,972 9,597 9,530 10,705 11,292
Reinsurance ceded –40 –40 –39 –103 –100 –103 –143 –140 –1421,642 1,693 1,656 7,745 8,872 9,494 9,387 10,565 11,150
Effect of reinsurance on non-life premiums earned2013 2012 2011
Direct gross premiums earned 1,657 1,731 1,699Reinsurance assumed gross premiums earned 26 24 23Total gross premiums earned 1,683 1,755 1,722
Reinsurance ceded –40 –40 –391,643 1,715 1,683
See Note 31 ‘Underwriting expenditure’ for disclosure on reinsurance ceded.
157ING Group Annual Report 2013
1 Wh
o w
e are2 R
epo
rt of th
e Executive B
oard
3 Co
rpo
rate go
vernan
ce4 C
on
solid
ated an
nu
al accou
nts
5 Parent co
mp
any an
nu
al accou
nts
6 Oth
er info
rmatio
n7 A
dd
ition
al info
rmatio
n
ING_2013_deel2&3_v2A.indd 157 19/03/2014 19:11:49
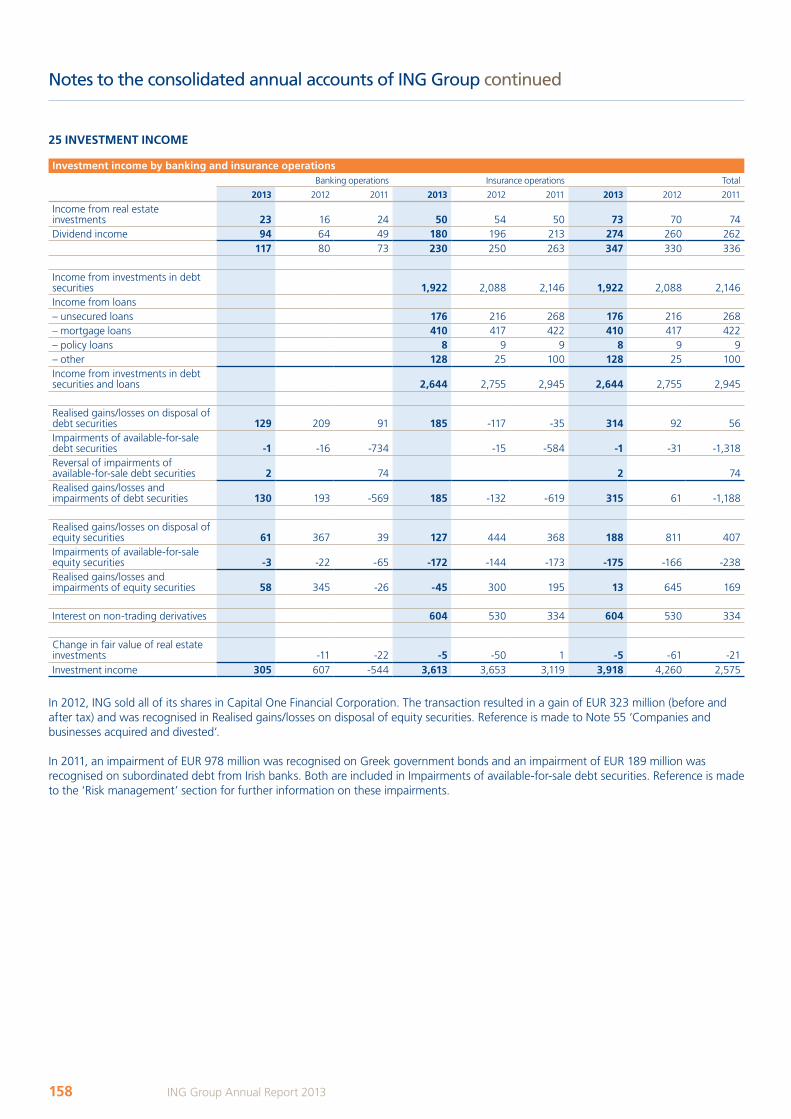
Notes to the consolidated annual accounts of ING Group continued
25 INVESTMENT INCOME
Investment income by banking and insurance operationsBanking operations Insurance operations Total
2013 2012 2011 2013 2012 2011 2013 2012 2011
Income from real estate investments 23 16 24 50 54 50 73 70 74Dividend income 94 64 49 180 196 213 274 260 262
117 80 73 230 250 263 347 330 336
Income from investments in debt securities 1,922 2,088 2,146 1,922 2,088 2,146Income from loans– unsecured loans 176 216 268 176 216 268– mortgage loans 410 417 422 410 417 422– policy loans 8 9 9 8 9 9– other 128 25 100 128 25 100Income from investments in debt securities and loans 2,644 2,755 2,945 2,644 2,755 2,945
Realised gains/losses on disposal of debt securities 129 209 91 185 -117 -35 314 92 56Impairments of available-for-sale debt securities -1 -16 -734 -15 -584 -1 -31 -1,318Reversal of impairments of available-for-sale debt securities 2 74 2 74Realised gains/losses and impairments of debt securities 130 193 -569 185 -132 -619 315 61 -1,188
Realised gains/losses on disposal of equity securities 61 367 39 127 444 368 188 811 407Impairments of available-for-sale equity securities -3 -22 -65 -172 -144 -173 -175 -166 -238Realised gains/losses and impairments of equity securities 58 345 -26 -45 300 195 13 645 169
Interest on non-trading derivatives 604 530 334 604 530 334
Change in fair value of real estate investments -11 -22 -5 -50 1 -5 -61 -21Investment income 305 607 -544 3,613 3,653 3,119 3,918 4,260 2,575
In 2012, ING sold all of its shares in Capital One Financial Corporation. The transaction resulted in a gain of EUR 323 million (before and after tax) and was recognised in Realised gains/losses on disposal of equity securities. Reference is made to Note 55 ‘Companies and businesses acquired and divested’.
In 2011, an impairment of EUR 978 million was recognised on Greek government bonds and an impairment of EUR 189 million was recognised on subordinated debt from Irish banks. Both are included in Impairments of available-for-sale debt securities. Reference is made to the ‘Risk management’ section for further information on these impairments.
158 ING Group Annual Report 2013
ING_2013_deel2&3_v2A.indd 158 19/03/2014 19:11:49

Notes to the consolidated annual accounts of ING Group continued
Impairments and reversals of impairments on investments are presented within Investment income, which is part of Total income. This can be specified for each segment as follows:
Impairments/ reversals of impairments on investments per segmentImpairments Reversal of impairments
2013 2012 2011 2013 2012 2011
Retail Belgium –1 –22 Retail Germany –135 Retail Rest of World –328 30Commercial Banking –3 –26 –301 2 44Netherlands Life –156 –131 –281 Netherlands Non-life –10 –9 –42 Insurance Europe –3 –16 –425 Japan Life –1 Corporate Line Banking –1 –11 –13 Insurance Other –3 –2 –9
–176 –197 –1,556 2 74
26 RESULT ON DISPOSALS OF GROUP COMPANIES
Result on disposals of group companies2013 2012 2011
ING Hipotecaria –64ING Direct USA 5 743ING Direct Canada 1 1,124ING Direct UK 10 –260Clarion Real Estate Securities 182ING REIM Asia and Europe 245ING Car Lease 347Clarion Partners 39Other 30 –3 –12
–18 1,604 801
In 2013, the result on the disposal of the insurance and investment management business in Hong Kong, Macau and Thailand and ING Life Korea (2012: Malaysian operations; 2011: Latin American operations) is not included above but included in the Result on disposal of discontinued operations. Reference is made to Note 36 ‘Discontinued operations’ and Note 55 ‘Companies and businesses acquired and divested’.
27 COMMISSION INCOME
Gross fee and commission incomeBanking operations Insurance operations Total
2013 2012 2011 2013 2012 2011 2013 2012 2011
Funds transfer 982 956 916 982 956 916Securities business 529 511 681 529 511 681Insurance broking 152 164 161 89 97 99 241 261 260Asset management fees 113 90 310 716 687 755 829 777 1,065Brokerage and advisory fees 334 337 347 3 6 6 337 343 353Other 1,193 1,009 1,012 123 84 476 1,316 1,093 1,488
3,303 3,067 3,427 931 874 1,336 4,234 3,941 4,763
Asset management fees related to the management of investments held for the risk of policyholders of EUR 36 million (2012: EUR 7 million; 2011: EUR 7 million) are included in Commission income. The decrease in asset management fees in 2012 is explained by the sale of ING REIM in 2011.
Other includes commission fees of EUR 215 million (2012: EUR 230 million; 2011: EUR 183 million) in respect of bank guarantees and commission fees of EUR 27 million (2012: EUR 17 million; 2011: EUR 26 million) in respect of underwriting syndication loans.
159ING Group Annual Report 2013
1 Wh
o w
e are2 R
epo
rt of th
e Executive B
oard
3 Co
rpo
rate go
vernan
ce4 C
on
solid
ated an
nu
al accou
nts
5 Parent co
mp
any an
nu
al accou
nts
6 Oth
er info
rmatio
n7 A
dd
ition
al info
rmatio
n
ING_2013_deel2&3_v2A.indd 159 19/03/2014 19:11:49
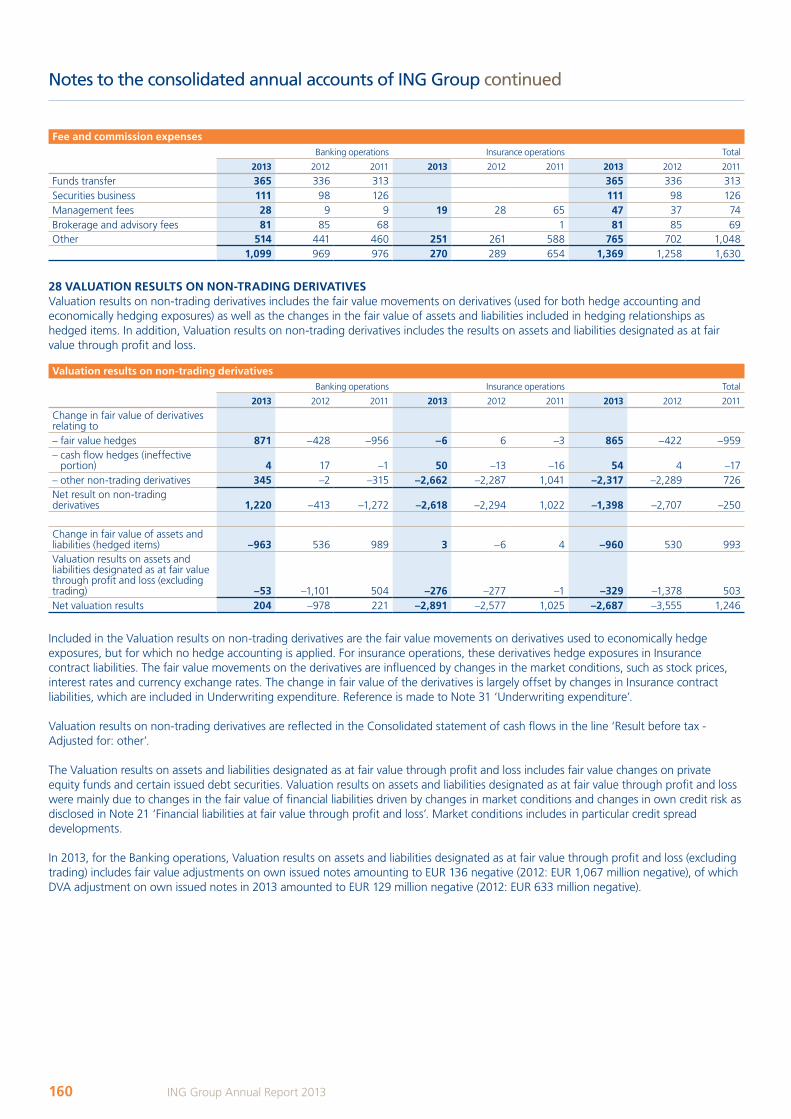
Notes to the consolidated annual accounts of ING Group continued
Fee and commission expensesBanking operations Insurance operations Total
2013 2012 2011 2013 2012 2011 2013 2012 2011
Funds transfer 365 336 313 365 336 313Securities business 111 98 126 111 98 126Management fees 28 9 9 19 28 65 47 37 74Brokerage and advisory fees 81 85 68 1 81 85 69Other 514 441 460 251 261 588 765 702 1,048
1,099 969 976 270 289 654 1,369 1,258 1,630
28 VALUATION RESULTS ON NON-TRADING DERIVATIVESValuation results on non-trading derivatives includes the fair value movements on derivatives (used for both hedge accounting and economically hedging exposures) as well as the changes in the fair value of assets and liabilities included in hedging relationships as hedged items. In addition, Valuation results on non-trading derivatives includes the results on assets and liabilities designated as at fair value through profit and loss.
Valuation results on non-trading derivativesBanking operations Insurance operations Total
2013 2012 2011 2013 2012 2011 2013 2012 2011
Change in fair value of derivatives relating to– fair value hedges 871 –428 –956 –6 6 –3 865 –422 –959– cash flow hedges (ineffective
portion) 4 17 –1 50 –13 –16 54 4 –17– other non-trading derivatives 345 –2 –315 –2,662 –2,287 1,041 –2,317 –2,289 726Net result on non-trading derivatives 1,220 –413 –1,272 –2,618 –2,294 1,022 –1,398 –2,707 –250
Change in fair value of assets and liabilities (hedged items) –963 536 989 3 –6 4 –960 530 993Valuation results on assets and liabilities designated as at fair value through profit and loss (excluding trading) –53 –1,101 504 –276 –277 –1 –329 –1,378 503Net valuation results 204 –978 221 –2,891 –2,577 1,025 –2,687 –3,555 1,246
Included in the Valuation results on non-trading derivatives are the fair value movements on derivatives used to economically hedge exposures, but for which no hedge accounting is applied. For insurance operations, these derivatives hedge exposures in Insurance contract liabilities. The fair value movements on the derivatives are influenced by changes in the market conditions, such as stock prices, interest rates and currency exchange rates. The change in fair value of the derivatives is largely offset by changes in Insurance contract liabilities, which are included in Underwriting expenditure. Reference is made to Note 31 ‘Underwriting expenditure’.
Valuation results on non-trading derivatives are reflected in the Consolidated statement of cash flows in the line ‘Result before tax - Adjusted for: other’.
The Valuation results on assets and liabilities designated as at fair value through profit and loss includes fair value changes on private equity funds and certain issued debt securities. Valuation results on assets and liabilities designated as at fair value through profit and loss were mainly due to changes in the fair value of financial liabilities driven by changes in market conditions and changes in own credit risk as disclosed in Note 21 ‘Financial liabilities at fair value through profit and loss’. Market conditions includes in particular credit spread developments.
In 2013, for the Banking operations, Valuation results on assets and liabilities designated as at fair value through profit and loss (excluding trading) includes fair value adjustments on own issued notes amounting to EUR 136 negative (2012: EUR 1,067 million negative), of which DVA adjustment on own issued notes in 2013 amounted to EUR 129 million negative (2012: EUR 633 million negative).
160 ING Group Annual Report 2013
ING_2013_deel2&3_v2A.indd 160 19/03/2014 19:11:49
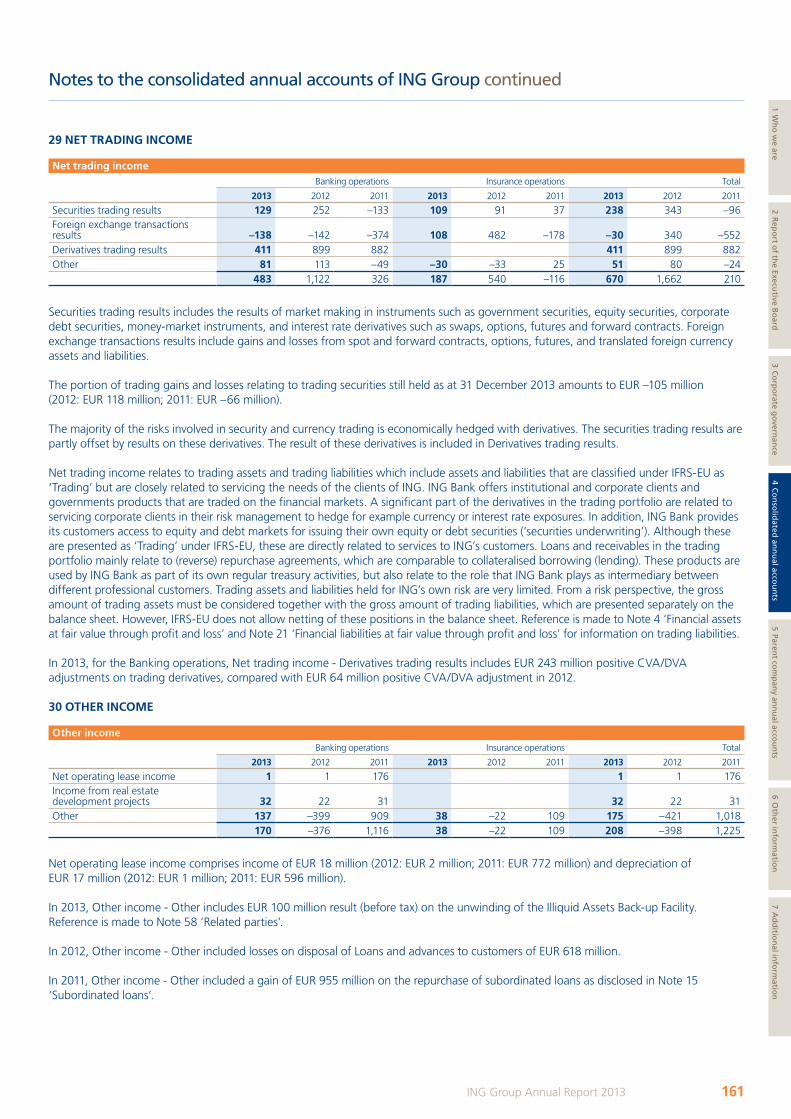
Notes to the consolidated annual accounts of ING Group continued
29 NET TRADING INCOME
Net trading incomeBanking operations Insurance operations Total
2013 2012 2011 2013 2012 2011 2013 2012 2011
Securities trading results 129 252 –133 109 91 37 238 343 –96Foreign exchange transactions results –138 –142 –374 108 482 –178 –30 340 –552Derivatives trading results 411 899 882 411 899 882Other 81 113 –49 –30 –33 25 51 80 –24
483 1,122 326 187 540 –116 670 1,662 210
Securities trading results includes the results of market making in instruments such as government securities, equity securities, corporate debt securities, money-market instruments, and interest rate derivatives such as swaps, options, futures and forward contracts. Foreign exchange transactions results include gains and losses from spot and forward contracts, options, futures, and translated foreign currency assets and liabilities.
The portion of trading gains and losses relating to trading securities still held as at 31 December 2013 amounts to EUR –105 million (2012: EUR 118 million; 2011: EUR –66 million).
The majority of the risks involved in security and currency trading is economically hedged with derivatives. The securities trading results are partly offset by results on these derivatives. The result of these derivatives is included in Derivatives trading results.
Net trading income relates to trading assets and trading liabilities which include assets and liabilities that are classified under IFRS-EU as ‘Trading’ but are closely related to servicing the needs of the clients of ING. ING Bank offers institutional and corporate clients and governments products that are traded on the financial markets. A significant part of the derivatives in the trading portfolio are related to servicing corporate clients in their risk management to hedge for example currency or interest rate exposures. In addition, ING Bank provides its customers access to equity and debt markets for issuing their own equity or debt securities (‘securities underwriting’). Although these are presented as ‘Trading’ under IFRS-EU, these are directly related to services to ING’s customers. Loans and receivables in the trading portfolio mainly relate to (reverse) repurchase agreements, which are comparable to collateralised borrowing (lending). These products are used by ING Bank as part of its own regular treasury activities, but also relate to the role that ING Bank plays as intermediary between different professional customers. Trading assets and liabilities held for ING’s own risk are very limited. From a risk perspective, the gross amount of trading assets must be considered together with the gross amount of trading liabilities, which are presented separately on the balance sheet. However, IFRS-EU does not allow netting of these positions in the balance sheet. Reference is made to Note 4 ‘Financial assets at fair value through profit and loss’ and Note 21 ‘Financial liabilities at fair value through profit and loss’ for information on trading liabilities.
In 2013, for the Banking operations, Net trading income - Derivatives trading results includes EUR 243 million positive CVA/DVA adjustments on trading derivatives, compared with EUR 64 million positive CVA/DVA adjustment in 2012.
30 OTHER INCOME
Other incomeBanking operations Insurance operations Total
2013 2012 2011 2013 2012 2011 2013 2012 2011
Net operating lease income 1 1 176 1 1 176Income from real estate development projects 32 22 31 32 22 31Other 137 –399 909 38 –22 109 175 –421 1,018
170 –376 1,116 38 –22 109 208 –398 1,225
Net operating lease income comprises income of EUR 18 million (2012: EUR 2 million; 2011: EUR 772 million) and depreciation of EUR 17 million (2012: EUR 1 million; 2011: EUR 596 million).
In 2013, Other income - Other includes EUR 100 million result (before tax) on the unwinding of the Illiquid Assets Back-up Facility. Reference is made to Note 58 ‘Related parties’.
In 2012, Other income - Other included losses on disposal of Loans and advances to customers of EUR 618 million.
In 2011, Other income - Other included a gain of EUR 955 million on the repurchase of subordinated loans as disclosed in Note 15 ‘Subordinated loans’.
161ING Group Annual Report 2013
1 Wh
o w
e are2 R
epo
rt of th
e Executive B
oard
3 Co
rpo
rate go
vernan
ce4 C
on
solid
ated an
nu
al accou
nts
5 Parent co
mp
any an
nu
al accou
nts
6 Oth
er info
rmatio
n7 A
dd
ition
al info
rmatio
n
ING_2013_deel2&3_v2A.indd 161 19/03/2014 19:11:50
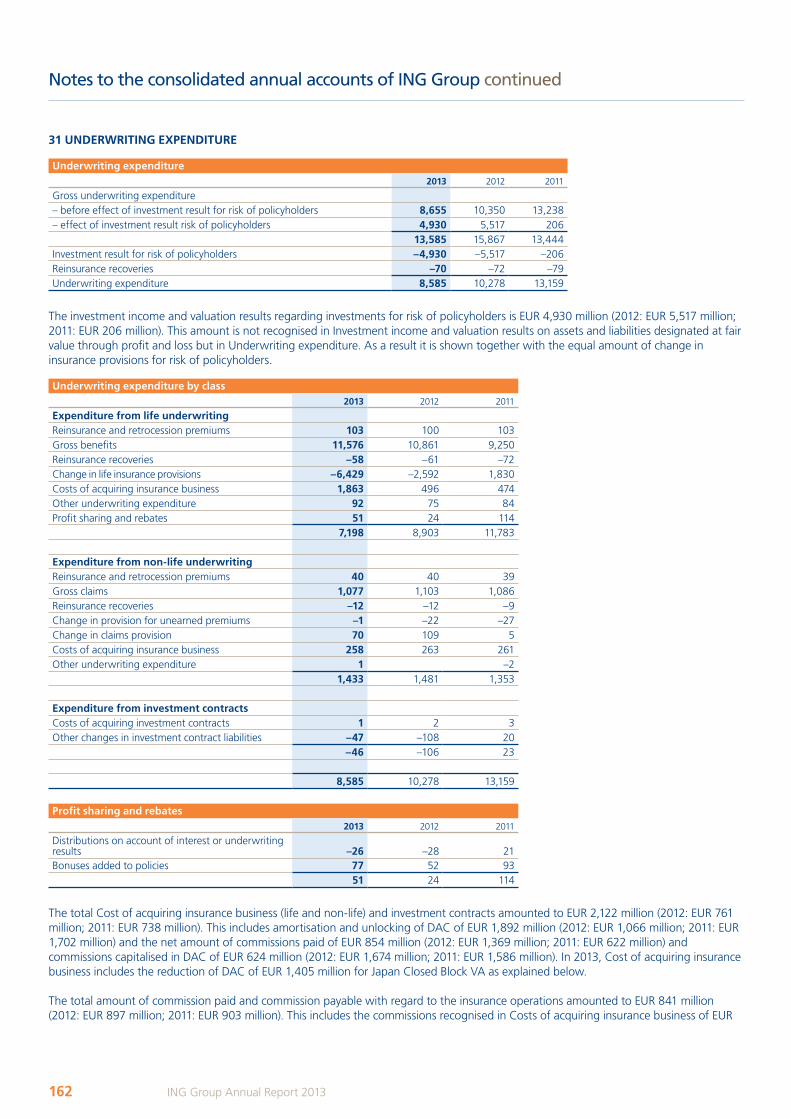
Notes to the consolidated annual accounts of ING Group continued
31 UNDERWRITING EXPENDITURE
Underwriting expenditure2013 2012 2011
Gross underwriting expenditure– before effect of investment result for risk of policyholders 8,655 10,350 13,238– effect of investment result risk of policyholders 4,930 5,517 206
13,585 15,867 13,444Investment result for risk of policyholders –4,930 –5,517 –206Reinsurance recoveries –70 –72 –79Underwriting expenditure 8,585 10,278 13,159
The investment income and valuation results regarding investments for risk of policyholders is EUR 4,930 million (2012: EUR 5,517 million; 2011: EUR 206 million). This amount is not recognised in Investment income and valuation results on assets and liabilities designated at fair value through profit and loss but in Underwriting expenditure. As a result it is shown together with the equal amount of change in insurance provisions for risk of policyholders.
Underwriting expenditure by class2013 2012 2011
Expenditure from life underwritingReinsurance and retrocession premiums 103 100 103Gross benefits 11,576 10,861 9,250Reinsurance recoveries –58 –61 –72Change in life insurance provisions –6,429 –2,592 1,830Costs of acquiring insurance business 1,863 496 474Other underwriting expenditure 92 75 84Profit sharing and rebates 51 24 114
7,198 8,903 11,783
Expenditure from non-life underwritingReinsurance and retrocession premiums 40 40 39Gross claims 1,077 1,103 1,086Reinsurance recoveries –12 –12 –9Change in provision for unearned premiums –1 –22 –27Change in claims provision 70 109 5Costs of acquiring insurance business 258 263 261Other underwriting expenditure 1 –2
1,433 1,481 1,353
Expenditure from investment contractsCosts of acquiring investment contracts 1 2 3Other changes in investment contract liabilities –47 –108 20
–46 –106 23
8,585 10,278 13,159
Profit sharing and rebates2013 2012 2011
Distributions on account of interest or underwriting results –26 –28 21Bonuses added to policies 77 52 93
51 24 114
The total Cost of acquiring insurance business (life and non-life) and investment contracts amounted to EUR 2,122 million (2012: EUR 761 million; 2011: EUR 738 million). This includes amortisation and unlocking of DAC of EUR 1,892 million (2012: EUR 1,066 million; 2011: EUR 1,702 million) and the net amount of commissions paid of EUR 854 million (2012: EUR 1,369 million; 2011: EUR 622 million) and commissions capitalised in DAC of EUR 624 million (2012: EUR 1,674 million; 2011: EUR 1,586 million). In 2013, Cost of acquiring insurance business includes the reduction of DAC of EUR 1,405 million for Japan Closed Block VA as explained below.
The total amount of commission paid and commission payable with regard to the insurance operations amounted to EUR 841 million (2012: EUR 897 million; 2011: EUR 903 million). This includes the commissions recognised in Costs of acquiring insurance business of EUR
162 ING Group Annual Report 2013
ING_2013_deel2&3_v2A.indd 162 19/03/2014 19:11:50
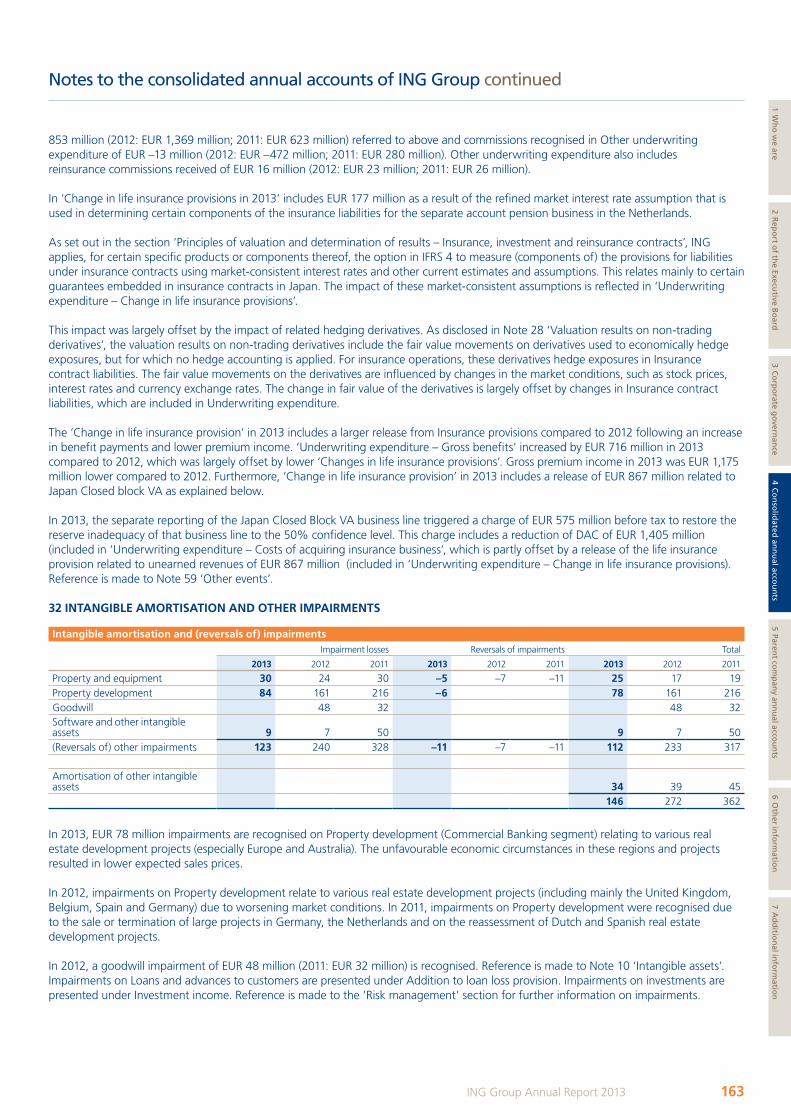
Notes to the consolidated annual accounts of ING Group continued
853 million (2012: EUR 1,369 million; 2011: EUR 623 million) referred to above and commissions recognised in Other underwriting expenditure of EUR –13 million (2012: EUR –472 million; 2011: EUR 280 million). Other underwriting expenditure also includes reinsurance commissions received of EUR 16 million (2012: EUR 23 million; 2011: EUR 26 million).
In ‘Change in life insurance provisions in 2013’ includes EUR 177 million as a result of the refined market interest rate assumption that is used in determining certain components of the insurance liabilities for the separate account pension business in the Netherlands.
As set out in the section ‘Principles of valuation and determination of results – Insurance, investment and reinsurance contracts’, ING applies, for certain specific products or components thereof, the option in IFRS 4 to measure (components of) the provisions for liabilities under insurance contracts using market-consistent interest rates and other current estimates and assumptions. This relates mainly to certain guarantees embedded in insurance contracts in Japan. The impact of these market-consistent assumptions is reflected in ‘Underwriting expenditure – Change in life insurance provisions’.
This impact was largely offset by the impact of related hedging derivatives. As disclosed in Note 28 ‘Valuation results on non-trading derivatives’, the valuation results on non-trading derivatives include the fair value movements on derivatives used to economically hedge exposures, but for which no hedge accounting is applied. For insurance operations, these derivatives hedge exposures in Insurance contract liabilities. The fair value movements on the derivatives are influenced by changes in the market conditions, such as stock prices, interest rates and currency exchange rates. The change in fair value of the derivatives is largely offset by changes in Insurance contract liabilities, which are included in Underwriting expenditure.
The ‘Change in life insurance provision’ in 2013 includes a larger release from Insurance provisions compared to 2012 following an increase in benefit payments and lower premium income. ‘Underwriting expenditure – Gross benefits’ increased by EUR 716 million in 2013 compared to 2012, which was largely offset by lower ‘Changes in life insurance provisions’. Gross premium income in 2013 was EUR 1,175 million lower compared to 2012. Furthermore, ‘Change in life insurance provision’ in 2013 includes a release of EUR 867 million related to Japan Closed block VA as explained below.
In 2013, the separate reporting of the Japan Closed Block VA business line triggered a charge of EUR 575 million before tax to restore the reserve inadequacy of that business line to the 50% confidence level. This charge includes a reduction of DAC of EUR 1,405 million (included in ‘Underwriting expenditure – Costs of acquiring insurance business’, which is partly offset by a release of the life insurance provision related to unearned revenues of EUR 867 million (included in ‘Underwriting expenditure – Change in life insurance provisions). Reference is made to Note 59 ‘Other events’.
32 INTANGIBLE AMORTISATION AND OTHER IMPAIRMENTS
Intangible amortisation and (reversals of) impairmentsImpairment losses Reversals of impairments Total
2013 2012 2011 2013 2012 2011 2013 2012 2011
Property and equipment 30 24 30 –5 –7 –11 25 17 19Property development 84 161 216 –6 78 161 216Goodwill 48 32 48 32Software and other intangible assets 9 7 50 9 7 50(Reversals of) other impairments 123 240 328 –11 –7 –11 112 233 317
Amortisation of other intangible assets 34 39 45
146 272 362
In 2013, EUR 78 million impairments are recognised on Property development (Commercial Banking segment) relating to various real estate development projects (especially Europe and Australia). The unfavourable economic circumstances in these regions and projects resulted in lower expected sales prices.
In 2012, impairments on Property development relate to various real estate development projects (including mainly the United Kingdom, Belgium, Spain and Germany) due to worsening market conditions. In 2011, impairments on Property development were recognised due to the sale or termination of large projects in Germany, the Netherlands and on the reassessment of Dutch and Spanish real estate development projects. In 2012, a goodwill impairment of EUR 48 million (2011: EUR 32 million) is recognised. Reference is made to Note 10 ‘Intangible assets’.Impairments on Loans and advances to customers are presented under Addition to loan loss provision. Impairments on investments are presented under Investment income. Reference is made to the ‘Risk management’ section for further information on impairments.
163ING Group Annual Report 2013
1 Wh
o w
e are2 R
epo
rt of th
e Executive B
oard
3 Co
rpo
rate go
vernan
ce4 C
on
solid
ated an
nu
al accou
nts
5 Parent co
mp
any an
nu
al accou
nts
6 Oth
er info
rmatio
n7 A
dd
ition
al info
rmatio
n
ING_2013_deel2&3_v2A.indd 163 19/03/2014 19:11:50
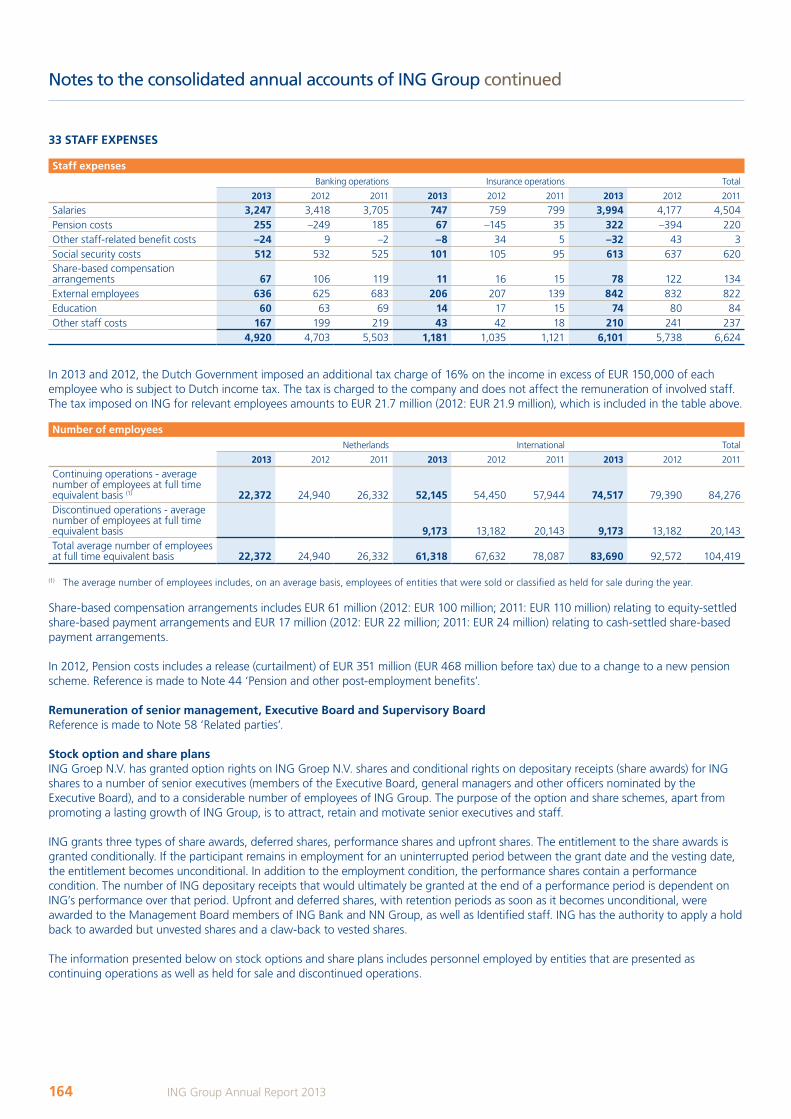
Notes to the consolidated annual accounts of ING Group continued
33 STAFF EXPENSES
Staff expensesBanking operations Insurance operations Total
2013 2012 2011 2013 2012 2011 2013 2012 2011
Salaries 3,247 3,418 3,705 747 759 799 3,994 4,177 4,504Pension costs 255 –249 185 67 –145 35 322 –394 220Other staff-related benefit costs –24 9 –2 –8 34 5 –32 43 3Social security costs 512 532 525 101 105 95 613 637 620Share-based compensation arrangements 67 106 119 11 16 15 78 122 134External employees 636 625 683 206 207 139 842 832 822Education 60 63 69 14 17 15 74 80 84Other staff costs 167 199 219 43 42 18 210 241 237
4,920 4,703 5,503 1,181 1,035 1,121 6,101 5,738 6,624
In 2013 and 2012, the Dutch Government imposed an additional tax charge of 16% on the income in excess of EUR 150,000 of each employee who is subject to Dutch income tax. The tax is charged to the company and does not affect the remuneration of involved staff. The tax imposed on ING for relevant employees amounts to EUR 21.7 million (2012: EUR 21.9 million), which is included in the table above.
Number of employeesNetherlands International Total
2013 2012 2011 2013 2012 2011 2013 2012 2011
Continuing operations - average number of employees at full time equivalent basis (1) 22,372 24,940 26,332 52,145 54,450 57,944 74,517 79,390 84,276Discontinued operations - average number of employees at full time equivalent basis 9,173 13,182 20,143 9,173 13,182 20,143Total average number of employees at full time equivalent basis 22,372 24,940 26,332 61,318 67,632 78,087 83,690 92,572 104,419
(1) The average number of employees includes, on an average basis, employees of entities that were sold or classified as held for sale during the year.
Share-based compensation arrangements includes EUR 61 million (2012: EUR 100 million; 2011: EUR 110 million) relating to equity-settled share-based payment arrangements and EUR 17 million (2012: EUR 22 million; 2011: EUR 24 million) relating to cash-settled share-based payment arrangements.
In 2012, Pension costs includes a release (curtailment) of EUR 351 million (EUR 468 million before tax) due to a change to a new pension scheme. Reference is made to Note 44 ‘Pension and other post-employment benefits’.
Remuneration of senior management, Executive Board and Supervisory BoardReference is made to Note 58 ‘Related parties’.
Stock option and share plansING Groep N.V. has granted option rights on ING Groep N.V. shares and conditional rights on depositary receipts (share awards) for ING shares to a number of senior executives (members of the Executive Board, general managers and other officers nominated by the Executive Board), and to a considerable number of employees of ING Group. The purpose of the option and share schemes, apart from promoting a lasting growth of ING Group, is to attract, retain and motivate senior executives and staff.
ING grants three types of share awards, deferred shares, performance shares and upfront shares. The entitlement to the share awards is granted conditionally. If the participant remains in employment for an uninterrupted period between the grant date and the vesting date, the entitlement becomes unconditional. In addition to the employment condition, the performance shares contain a performance condition. The number of ING depositary receipts that would ultimately be granted at the end of a performance period is dependent on ING’s performance over that period. Upfront and deferred shares, with retention periods as soon as it becomes unconditional, were awarded to the Management Board members of ING Bank and NN Group, as well as Identified staff. ING has the authority to apply a hold back to awarded but unvested shares and a claw-back to vested shares.
The information presented below on stock options and share plans includes personnel employed by entities that are presented as continuing operations as well as held for sale and discontinued operations.
164 ING Group Annual Report 2013
ING_2013_deel2&3_v2A.indd 164 20/03/2014 12:44:45
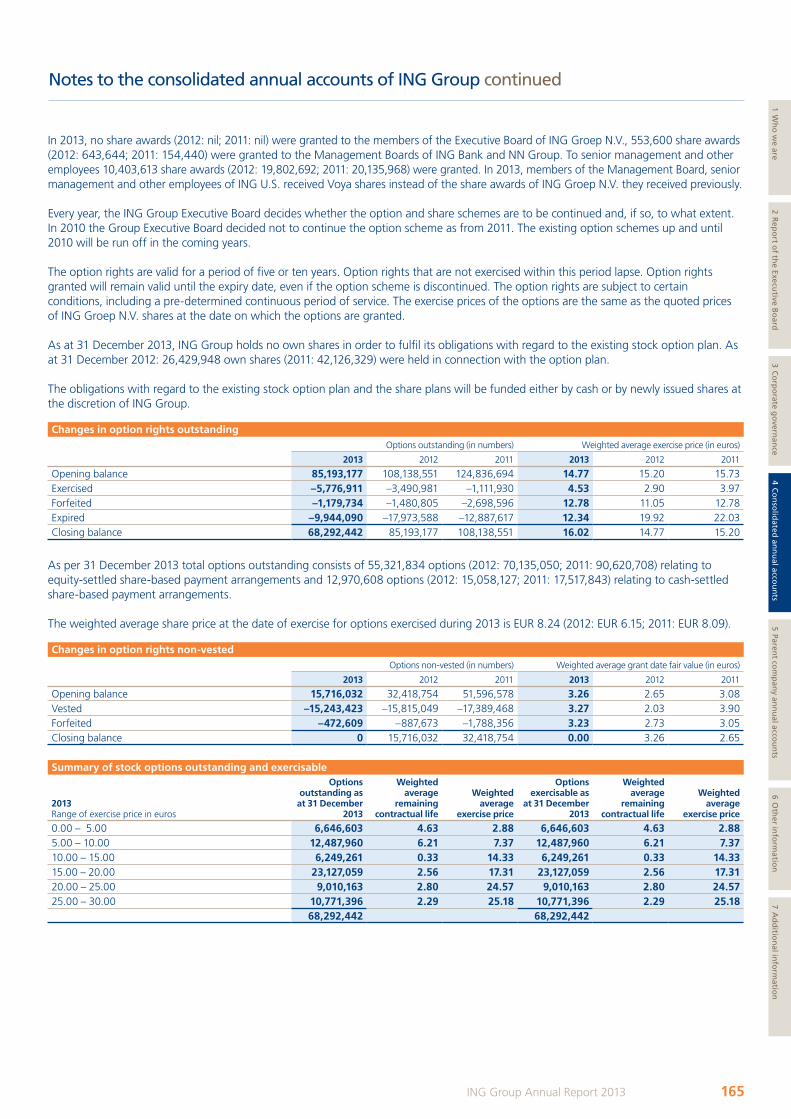
Notes to the consolidated annual accounts of ING Group continued
In 2013, no share awards (2012: nil; 2011: nil) were granted to the members of the Executive Board of ING Groep N.V., 553,600 share awards (2012: 643,644; 2011: 154,440) were granted to the Management Boards of ING Bank and NN Group. To senior management and other employees 10,403,613 share awards (2012: 19,802,692; 2011: 20,135,968) were granted. In 2013, members of the Management Board, senior management and other employees of ING U.S. received Voya shares instead of the share awards of ING Groep N.V. they received previously.
Every year, the ING Group Executive Board decides whether the option and share schemes are to be continued and, if so, to what extent. In 2010 the Group Executive Board decided not to continue the option scheme as from 2011. The existing option schemes up and until 2010 will be run off in the coming years.
The option rights are valid for a period of five or ten years. Option rights that are not exercised within this period lapse. Option rights granted will remain valid until the expiry date, even if the option scheme is discontinued. The option rights are subject to certain conditions, including a pre-determined continuous period of service. The exercise prices of the options are the same as the quoted prices of ING Groep N.V. shares at the date on which the options are granted.
As at 31 December 2013, ING Group holds no own shares in order to fulfil its obligations with regard to the existing stock option plan. As at 31 December 2012: 26,429,948 own shares (2011: 42,126,329) were held in connection with the option plan.
The obligations with regard to the existing stock option plan and the share plans will be funded either by cash or by newly issued shares at the discretion of ING Group.
Changes in option rights outstandingOptions outstanding (in numbers) Weighted average exercise price (in euros)
2013 2012 2011 2013 2012 2011
Opening balance 85,193,177 108,138,551 124,836,694 14.77 15.20 15.73Exercised –5,776,911 –3,490,981 –1,111,930 4.53 2.90 3.97Forfeited –1,179,734 –1,480,805 –2,698,596 12.78 11.05 12.78Expired –9,944,090 –17,973,588 –12,887,617 12.34 19.92 22.03Closing balance 68,292,442 85,193,177 108,138,551 16.02 14.77 15.20
As per 31 December 2013 total options outstanding consists of 55,321,834 options (2012: 70,135,050; 2011: 90,620,708) relating to equity-settled share-based payment arrangements and 12,970,608 options (2012: 15,058,127; 2011: 17,517,843) relating to cash-settled share-based payment arrangements.
The weighted average share price at the date of exercise for options exercised during 2013 is EUR 8.24 (2012: EUR 6.15; 2011: EUR 8.09).
Changes in option rights non-vestedOptions non-vested (in numbers) Weighted average grant date fair value (in euros)
2013 2012 2011 2013 2012 2011
Opening balance 15,716,032 32,418,754 51,596,578 3.26 2.65 3.08Vested –15,243,423 –15,815,049 –17,389,468 3.27 2.03 3.90Forfeited –472,609 –887,673 –1,788,356 3.23 2.73 3.05Closing balance 0 15,716,032 32,418,754 0.00 3.26 2.65
Summary of stock options outstanding and exercisable
2013 Range of exercise price in euros
Options outstanding as
at 31 December 2013
Weighted average
remaining contractual life
Weighted average
exercise price
Options exercisable as
at 31 December 2013
Weighted average
remaining contractual life
Weighted average
exercise price
0.00 – 5.00 6,646,603 4.63 2.88 6,646,603 4.63 2.885.00 – 10.00 12,487,960 6.21 7.37 12,487,960 6.21 7.3710.00 – 15.00 6,249,261 0.33 14.33 6,249,261 0.33 14.3315.00 – 20.00 23,127,059 2.56 17.31 23,127,059 2.56 17.3120.00 – 25.00 9,010,163 2.80 24.57 9,010,163 2.80 24.5725.00 – 30.00 10,771,396 2.29 25.18 10,771,396 2.29 25.18
68,292,442 68,292,442
165ING Group Annual Report 2013
1 Wh
o w
e are2 R
epo
rt of th
e Executive B
oard
3 Co
rpo
rate go
vernan
ce4 C
on
solid
ated an
nu
al accou
nts
5 Parent co
mp
any an
nu
al accou
nts
6 Oth
er info
rmatio
n7 A
dd
ition
al info
rmatio
n
ING_2013_deel2&3_v2A.indd 165 19/03/2014 19:11:51
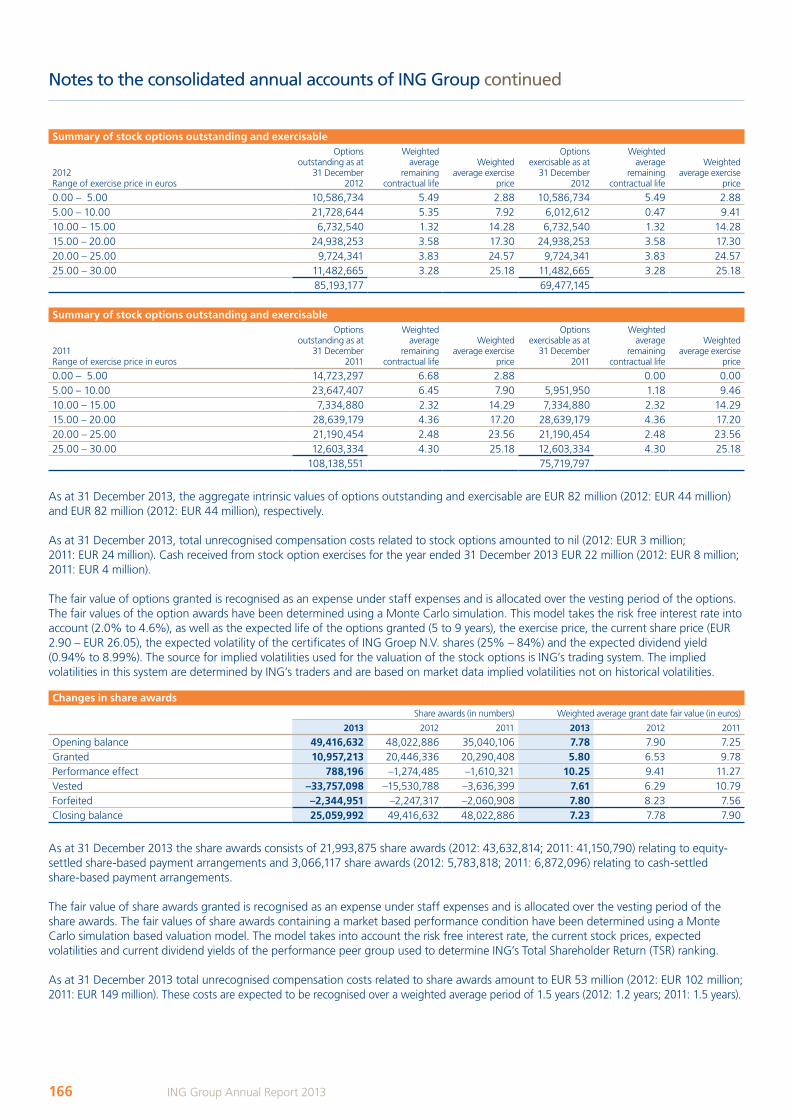
Notes to the consolidated annual accounts of ING Group continued
Summary of stock options outstanding and exercisable
2012Range of exercise price in euros
Options outstanding as at
31 December 2012
Weighted average
remaining contractual life
Weighted average exercise
price
Options exercisable as at
31 December 2012
Weighted average
remaining contractual life
Weighted average exercise
price
0.00 – 5.00 10,586,734 5.49 2.88 10,586,734 5.49 2.885.00 – 10.00 21,728,644 5.35 7.92 6,012,612 0.47 9.4110.00 – 15.00 6,732,540 1.32 14.28 6,732,540 1.32 14.2815.00 – 20.00 24,938,253 3.58 17.30 24,938,253 3.58 17.3020.00 – 25.00 9,724,341 3.83 24.57 9,724,341 3.83 24.5725.00 – 30.00 11,482,665 3.28 25.18 11,482,665 3.28 25.18
85,193,177 69,477,145
Summary of stock options outstanding and exercisable
2011Range of exercise price in euros
Options outstanding as at
31 December 2011
Weighted average
remaining contractual life
Weighted average exercise
price
Options exercisable as at
31 December 2011
Weighted average
remaining contractual life
Weighted average exercise
price
0.00 – 5.00 14,723,297 6.68 2.88 0.00 0.005.00 – 10.00 23,647,407 6.45 7.90 5,951,950 1.18 9.4610.00 – 15.00 7,334,880 2.32 14.29 7,334,880 2.32 14.2915.00 – 20.00 28,639,179 4.36 17.20 28,639,179 4.36 17.2020.00 – 25.00 21,190,454 2.48 23.56 21,190,454 2.48 23.5625.00 – 30.00 12,603,334 4.30 25.18 12,603,334 4.30 25.18
108,138,551 75,719,797
As at 31 December 2013, the aggregate intrinsic values of options outstanding and exercisable are EUR 82 million (2012: EUR 44 million) and EUR 82 million (2012: EUR 44 million), respectively.
As at 31 December 2013, total unrecognised compensation costs related to stock options amounted to nil (2012: EUR 3 million; 2011: EUR 24 million). Cash received from stock option exercises for the year ended 31 December 2013 EUR 22 million (2012: EUR 8 million; 2011: EUR 4 million).
The fair value of options granted is recognised as an expense under staff expenses and is allocated over the vesting period of the options. The fair values of the option awards have been determined using a Monte Carlo simulation. This model takes the risk free interest rate into account (2.0% to 4.6%), as well as the expected life of the options granted (5 to 9 years), the exercise price, the current share price (EUR 2.90 – EUR 26.05), the expected volatility of the certificates of ING Groep N.V. shares (25% – 84%) and the expected dividend yield (0.94% to 8.99%). The source for implied volatilities used for the valuation of the stock options is ING’s trading system. The implied volatilities in this system are determined by ING’s traders and are based on market data implied volatilities not on historical volatilities.
Changes in share awardsShare awards (in numbers) Weighted average grant date fair value (in euros)
2013 2012 2011 2013 2012 2011
Opening balance 49,416,632 48,022,886 35,040,106 7.78 7.90 7.25Granted 10,957,213 20,446,336 20,290,408 5.80 6.53 9.78Performance effect 788,196 –1,274,485 –1,610,321 10.25 9.41 11.27Vested –33,757,098 –15,530,788 –3,636,399 7.61 6.29 10.79Forfeited –2,344,951 –2,247,317 –2,060,908 7.80 8.23 7.56Closing balance 25,059,992 49,416,632 48,022,886 7.23 7.78 7.90
As at 31 December 2013 the share awards consists of 21,993,875 share awards (2012: 43,632,814; 2011: 41,150,790) relating to equity-settled share-based payment arrangements and 3,066,117 share awards (2012: 5,783,818; 2011: 6,872,096) relating to cash-settled share-based payment arrangements.
The fair value of share awards granted is recognised as an expense under staff expenses and is allocated over the vesting period of the share awards. The fair values of share awards containing a market based performance condition have been determined using a Monte Carlo simulation based valuation model. The model takes into account the risk free interest rate, the current stock prices, expected volatilities and current dividend yields of the performance peer group used to determine ING’s Total Shareholder Return (TSR) ranking.
As at 31 December 2013 total unrecognised compensation costs related to share awards amount to EUR 53 million (2012: EUR 102 million; 2011: EUR 149 million). These costs are expected to be recognised over a weighted average period of 1.5 years (2012: 1.2 years; 2011: 1.5 years).
166 ING Group Annual Report 2013
ING_2013_deel2&3_v2A.indd 166 19/03/2014 19:11:51
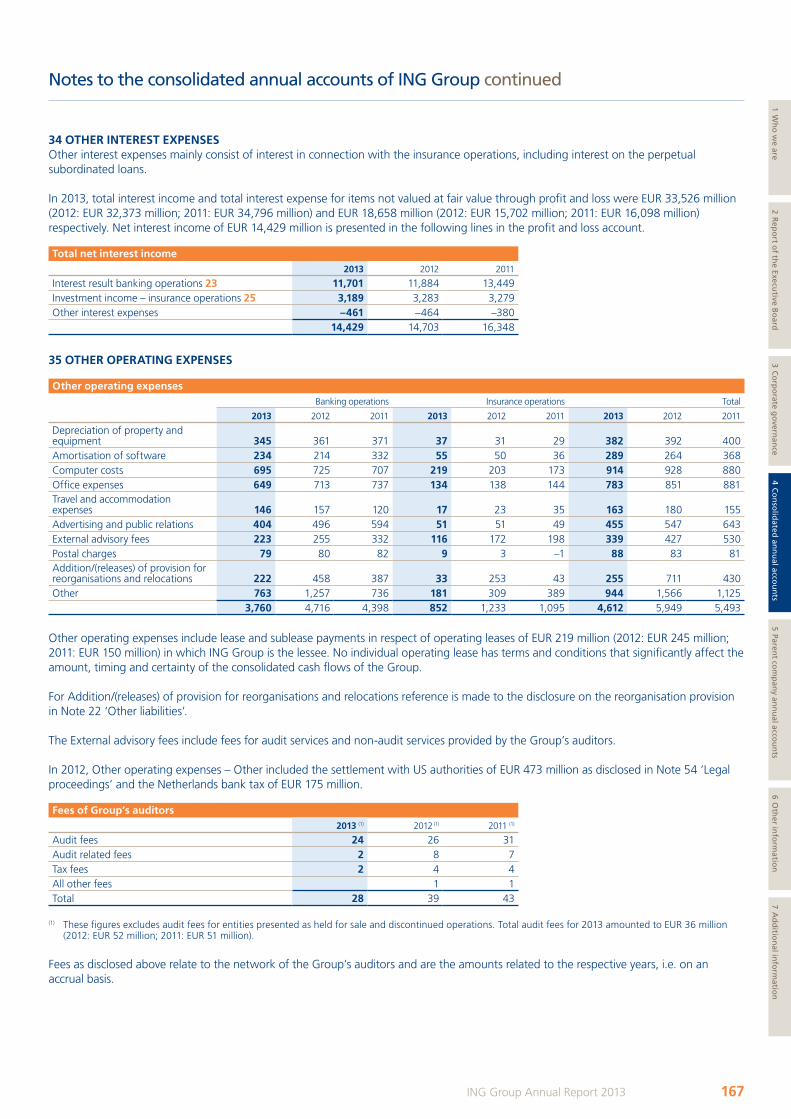
Notes to the consolidated annual accounts of ING Group continued
34 OTHER INTEREST EXPENSESOther interest expenses mainly consist of interest in connection with the insurance operations, including interest on the perpetual subordinated loans.
In 2013, total interest income and total interest expense for items not valued at fair value through profit and loss were EUR 33,526 million (2012: EUR 32,373 million; 2011: EUR 34,796 million) and EUR 18,658 million (2012: EUR 15,702 million; 2011: EUR 16,098 million) respectively. Net interest income of EUR 14,429 million is presented in the following lines in the profit and loss account.
Total net interest income2013 2012 2011
Interest result banking operations 23 11,701 11,884 13,449Investment income – insurance operations 25 3,189 3,283 3,279Other interest expenses –461 –464 –380
14,429 14,703 16,348
35 OTHER OPERATING EXPENSES
Other operating expensesBanking operations Insurance operations Total
2013 2012 2011 2013 2012 2011 2013 2012 2011
Depreciation of property and equipment 345 361 371 37 31 29 382 392 400Amortisation of software 234 214 332 55 50 36 289 264 368Computer costs 695 725 707 219 203 173 914 928 880Office expenses 649 713 737 134 138 144 783 851 881Travel and accommodation expenses 146 157 120 17 23 35 163 180 155Advertising and public relations 404 496 594 51 51 49 455 547 643External advisory fees 223 255 332 116 172 198 339 427 530Postal charges 79 80 82 9 3 –1 88 83 81Addition/(releases) of provision for reorganisations and relocations 222 458 387 33 253 43 255 711 430Other 763 1,257 736 181 309 389 944 1,566 1,125
3,760 4,716 4,398 852 1,233 1,095 4,612 5,949 5,493
Other operating expenses include lease and sublease payments in respect of operating leases of EUR 219 million (2012: EUR 245 million; 2011: EUR 150 million) in which ING Group is the lessee. No individual operating lease has terms and conditions that significantly affect the amount, timing and certainty of the consolidated cash flows of the Group.
For Addition/(releases) of provision for reorganisations and relocations reference is made to the disclosure on the reorganisation provision in Note 22 ‘Other liabilities’.
The External advisory fees include fees for audit services and non-audit services provided by the Group’s auditors.
In 2012, Other operating expenses – Other included the settlement with US authorities of EUR 473 million as disclosed in Note 54 ‘Legal proceedings’ and the Netherlands bank tax of EUR 175 million.
Fees of Group’s auditors2013 (1) 2012 (1) 2011 (1)
Audit fees 24 26 31Audit related fees 2 8 7Tax fees 2 4 4All other fees 1 1Total 28 39 43
(1) These figures excludes audit fees for entities presented as held for sale and discontinued operations. Total audit fees for 2013 amounted to EUR 36 million (2012: EUR 52 million; 2011: EUR 51 million).
Fees as disclosed above relate to the network of the Group’s auditors and are the amounts related to the respective years, i.e. on an accrual basis.
167ING Group Annual Report 2013
1 Wh
o w
e are2 R
epo
rt of th
e Executive B
oard
3 Co
rpo
rate go
vernan
ce4 C
on
solid
ated an
nu
al accou
nts
5 Parent co
mp
any an
nu
al accou
nts
6 Oth
er info
rmatio
n7 A
dd
ition
al info
rmatio
n
ING_2013_deel2&3_v2A.indd 167 19/03/2014 19:11:51
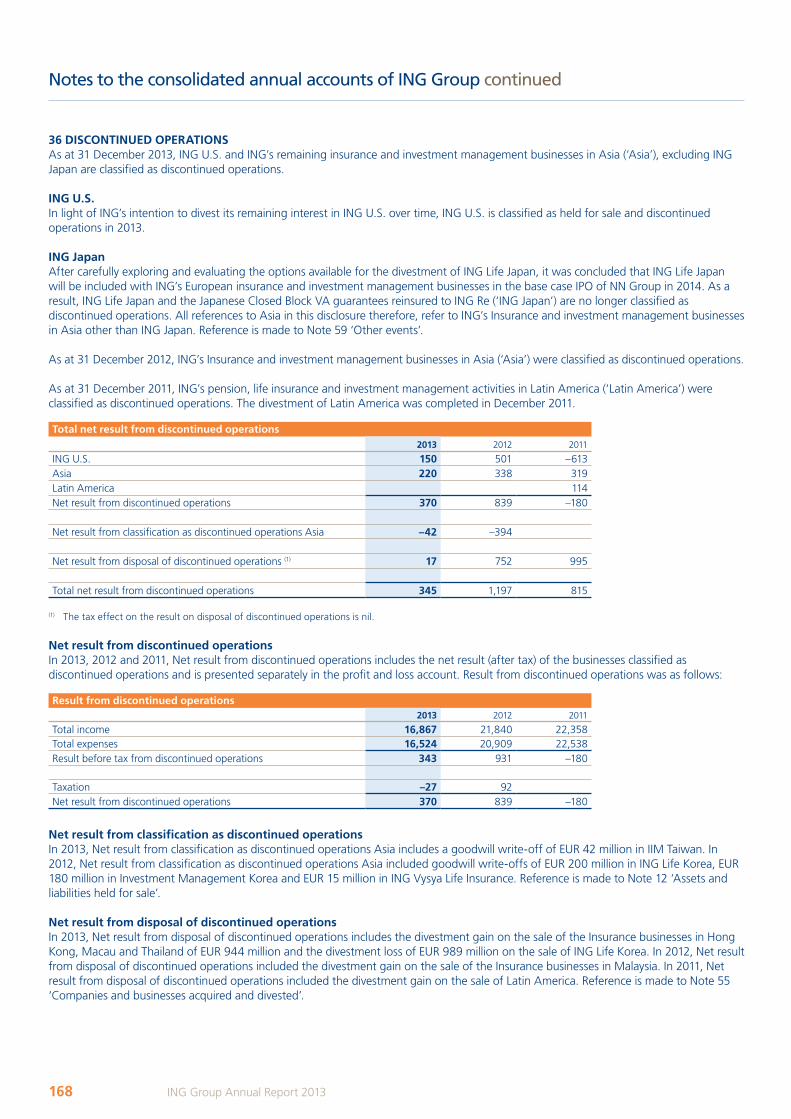
Notes to the consolidated annual accounts of ING Group continued
36 DISCONTINUED OPERATIONSAs at 31 December 2013, ING U.S. and ING’s remaining insurance and investment management businesses in Asia (‘Asia’), excluding ING Japan are classified as discontinued operations.
ING U.S.In light of ING’s intention to divest its remaining interest in ING U.S. over time, ING U.S. is classified as held for sale and discontinued operations in 2013.
ING JapanAfter carefully exploring and evaluating the options available for the divestment of ING Life Japan, it was concluded that ING Life Japan will be included with ING’s European insurance and investment management businesses in the base case IPO of NN Group in 2014. As a result, ING Life Japan and the Japanese Closed Block VA guarantees reinsured to ING Re (‘ING Japan’) are no longer classified as discontinued operations. All references to Asia in this disclosure therefore, refer to ING’s Insurance and investment management businesses in Asia other than ING Japan. Reference is made to Note 59 ‘Other events’.
As at 31 December 2012, ING’s Insurance and investment management businesses in Asia (‘Asia’) were classified as discontinued operations.
As at 31 December 2011, ING’s pension, life insurance and investment management activities in Latin America (‘Latin America’) were classified as discontinued operations. The divestment of Latin America was completed in December 2011.
Total net result from discontinued operations2013 2012 2011
ING U.S. 150 501 –613Asia 220 338 319Latin America 114Net result from discontinued operations 370 839 –180
Net result from classification as discontinued operations Asia –42 –394
Net result from disposal of discontinued operations (1) 17 752 995
Total net result from discontinued operations 345 1,197 815
(1) The tax effect on the result on disposal of discontinued operations is nil.
Net result from discontinued operationsIn 2013, 2012 and 2011, Net result from discontinued operations includes the net result (after tax) of the businesses classified as discontinued operations and is presented separately in the profit and loss account. Result from discontinued operations was as follows:
Result from discontinued operations2013 2012 2011
Total income 16,867 21,840 22,358Total expenses 16,524 20,909 22,538Result before tax from discontinued operations 343 931 –180
Taxation –27 92Net result from discontinued operations 370 839 –180
Net result from classification as discontinued operationsIn 2013, Net result from classification as discontinued operations Asia includes a goodwill write-off of EUR 42 million in IIM Taiwan. In 2012, Net result from classification as discontinued operations Asia included goodwill write-offs of EUR 200 million in ING Life Korea, EUR 180 million in Investment Management Korea and EUR 15 million in ING Vysya Life Insurance. Reference is made to Note 12 ‘Assets and liabilities held for sale’.
Net result from disposal of discontinued operationsIn 2013, Net result from disposal of discontinued operations includes the divestment gain on the sale of the Insurance businesses in Hong Kong, Macau and Thailand of EUR 944 million and the divestment loss of EUR 989 million on the sale of ING Life Korea. In 2012, Net result from disposal of discontinued operations included the divestment gain on the sale of the Insurance businesses in Malaysia. In 2011, Net result from disposal of discontinued operations included the divestment gain on the sale of Latin America. Reference is made to Note 55 ‘Companies and businesses acquired and divested’.
168 ING Group Annual Report 2013
ING_2013_deel2&3_v2A.indd 168 19/03/2014 19:11:52
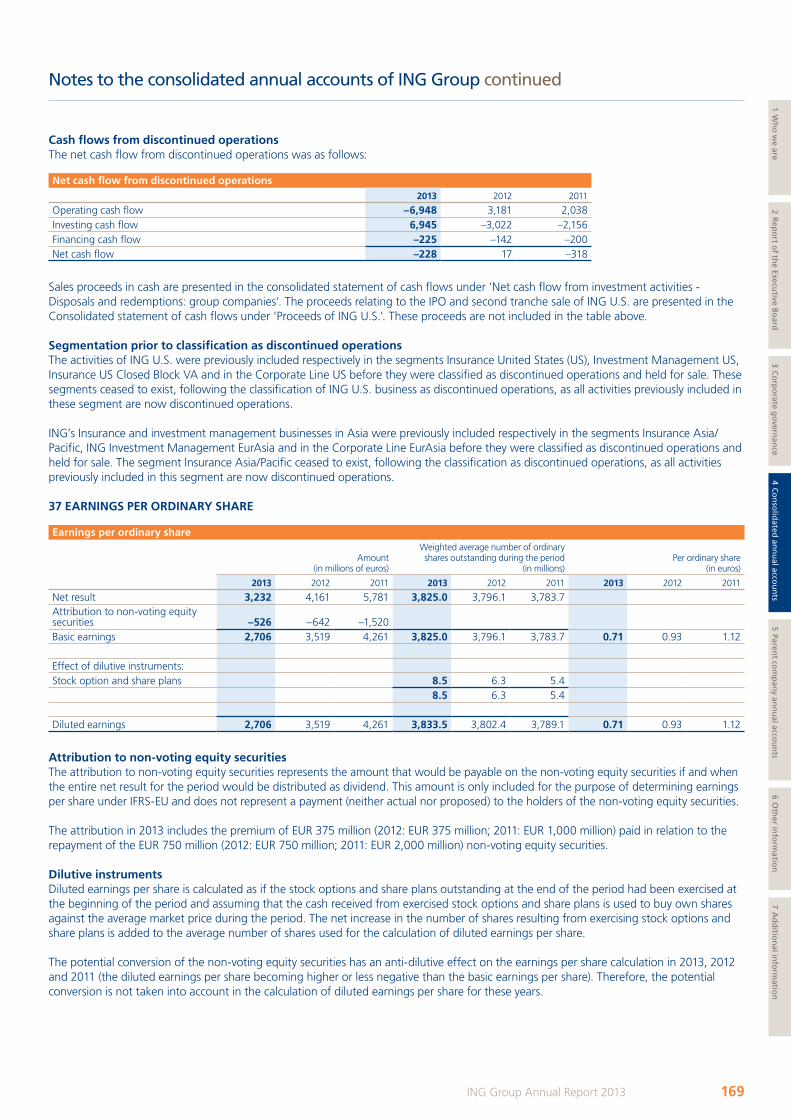
Notes to the consolidated annual accounts of ING Group continued
Cash flows from discontinued operations The net cash flow from discontinued operations was as follows:
Net cash flow from discontinued operations 2013 2012 2011
Operating cash flow –6,948 3,181 2,038Investing cash flow 6,945 –3,022 –2,156Financing cash flow –225 –142 –200Net cash flow –228 17 –318
Sales proceeds in cash are presented in the consolidated statement of cash flows under ‘Net cash flow from investment activities - Disposals and redemptions: group companies’. The proceeds relating to the IPO and second tranche sale of ING U.S. are presented in the Consolidated statement of cash flows under ‘Proceeds of ING U.S.’. These proceeds are not included in the table above.
Segmentation prior to classification as discontinued operationsThe activities of ING U.S. were previously included respectively in the segments Insurance United States (US), Investment Management US, Insurance US Closed Block VA and in the Corporate Line US before they were classified as discontinued operations and held for sale. These segments ceased to exist, following the classification of ING U.S. business as discontinued operations, as all activities previously included in these segment are now discontinued operations.
ING’s Insurance and investment management businesses in Asia were previously included respectively in the segments Insurance Asia/Pacific, ING Investment Management EurAsia and in the Corporate Line EurAsia before they were classified as discontinued operations and held for sale. The segment Insurance Asia/Pacific ceased to exist, following the classification as discontinued operations, as all activities previously included in this segment are now discontinued operations.
37 EARNINGS PER ORDINARY SHARE
Earnings per ordinary share
Amount (in millions of euros)
Weighted average number of ordinary shares outstanding during the period
(in millions)Per ordinary share
(in euros)
2013 2012 2011 2013 2012 2011 2013 2012 2011
Net result 3,232 4,161 5,781 3,825.0 3,796.1 3,783.7Attribution to non-voting equity securities –526 –642 –1,520Basic earnings 2,706 3,519 4,261 3,825.0 3,796.1 3,783.7 0.71 0.93 1.12
Effect of dilutive instruments:Stock option and share plans 8.5 6.3 5.4
8.5 6.3 5.4
Diluted earnings 2,706 3,519 4,261 3,833.5 3,802.4 3,789.1 0.71 0.93 1.12
Attribution to non-voting equity securitiesThe attribution to non-voting equity securities represents the amount that would be payable on the non-voting equity securities if and when the entire net result for the period would be distributed as dividend. This amount is only included for the purpose of determining earnings per share under IFRS-EU and does not represent a payment (neither actual nor proposed) to the holders of the non-voting equity securities.
The attribution in 2013 includes the premium of EUR 375 million (2012: EUR 375 million; 2011: EUR 1,000 million) paid in relation to the repayment of the EUR 750 million (2012: EUR 750 million; 2011: EUR 2,000 million) non-voting equity securities.
Dilutive instrumentsDiluted earnings per share is calculated as if the stock options and share plans outstanding at the end of the period had been exercised at the beginning of the period and assuming that the cash received from exercised stock options and share plans is used to buy own shares against the average market price during the period. The net increase in the number of shares resulting from exercising stock options and share plans is added to the average number of shares used for the calculation of diluted earnings per share.
The potential conversion of the non-voting equity securities has an anti-dilutive effect on the earnings per share calculation in 2013, 2012 and 2011 (the diluted earnings per share becoming higher or less negative than the basic earnings per share). Therefore, the potential conversion is not taken into account in the calculation of diluted earnings per share for these years.
169ING Group Annual Report 2013
1 Wh
o w
e are2 R
epo
rt of th
e Executive B
oard
3 Co
rpo
rate go
vernan
ce4 C
on
solid
ated an
nu
al accou
nts
5 Parent co
mp
any an
nu
al accou
nts
6 Oth
er info
rmatio
n7 A
dd
ition
al info
rmatio
n
ING_2013_deel2&3_v2A.indd 169 19/03/2014 19:11:52

Notes to the consolidated annual accounts of ING Group continued
Earnings per ordinary share from continuing operations (in euros)
Amount (in millions of euros)
Weighted average number of ordinary shares outstanding during the period
(in millions)Per ordinary share
(in euros)
2013 2012 2011 2013 2012 2011 2013 2012 2011
Basic earnings 2,706 3,519 4,261 3,825.0 3,796.1 3,783.7Less: Net result from discontinued operations 234 1,191 810Basic earnings from continuing operations 2,472 2,328 3,451 3,825.0 3,796.1 3,783.7 0.65 0.62 0.91
Effect of dilutive instruments:Stock option and share plans 8.5 6.3 5.4
8.5 6.3 5.4
Diluted earnings from continuing operations 2,472 2,328 3,451 3,833.5 3,802.4 3,789.1 0.65 0.62 0.91
Earnings per ordinary share from discontinued operations
Amount (in millions of euros)
Weighted average number of ordinary shares outstanding during the period
(in millions)Per ordinary share
(in euros)
2013 2012 2011 2013 2012 2011 2013 2012 2011
Net result from discontinued operations 259 833 –185Net result from classification as discontinued operations –42 –394Net result from disposal of discontinued operations 17 752 995Total net result from discontinued operations 234 1,191 810 3,825.0 3,796.1 3,783.7
Basic earnings from discontinued operations 234 1,191 810 3,825.0 3,796.1 3,783.7 0.06 0.31 0.21
Effect of dilutive instruments:Stock option and share plans 8.5 6.3 5.4
8.5 6.3 5.4
Diluted earnings from discontinued operations 234 1,191 810 3,833.5 3,802.4 3,789.1 0.06 0.31 0.21
38 DIVIDEND PER ORDINARY SHAREIn 2013, 2012 and 2011 no dividend was declared, therefore the dividend per ordinary share was nil. The Executive Board, with the approval of the Supervisory Board, has proposed, subject to the ratification by the General Meeting of Shareholders, not to pay a cash dividend for the year 2013.
NOTES TO THE CONSOLIDATED STATEMENT OF CASH FLOWS39 NET CASH FLOW FROM INVESTING ACTIVITIESInformation on the impact of companies acquired or disposed is presented in Note 55 ‘Companies and businesses acquired and divested’.
40 INTEREST AND DIVIDEND INCLUDED IN NET CASH FLOW
Interest and dividend received and paid2013 2012 2011
Interest received 57,582 65,590 69,799Interest paid –42,795 –49,625 –52,964
14,787 15,965 16,835
Dividend received 327 341 436
Interest received, interest paid and dividends received are included in operating activities in the cash flow statement.
170 ING Group Annual Report 2013
ING_2013_deel2&3_v2A.indd 170 19/03/2014 19:11:52
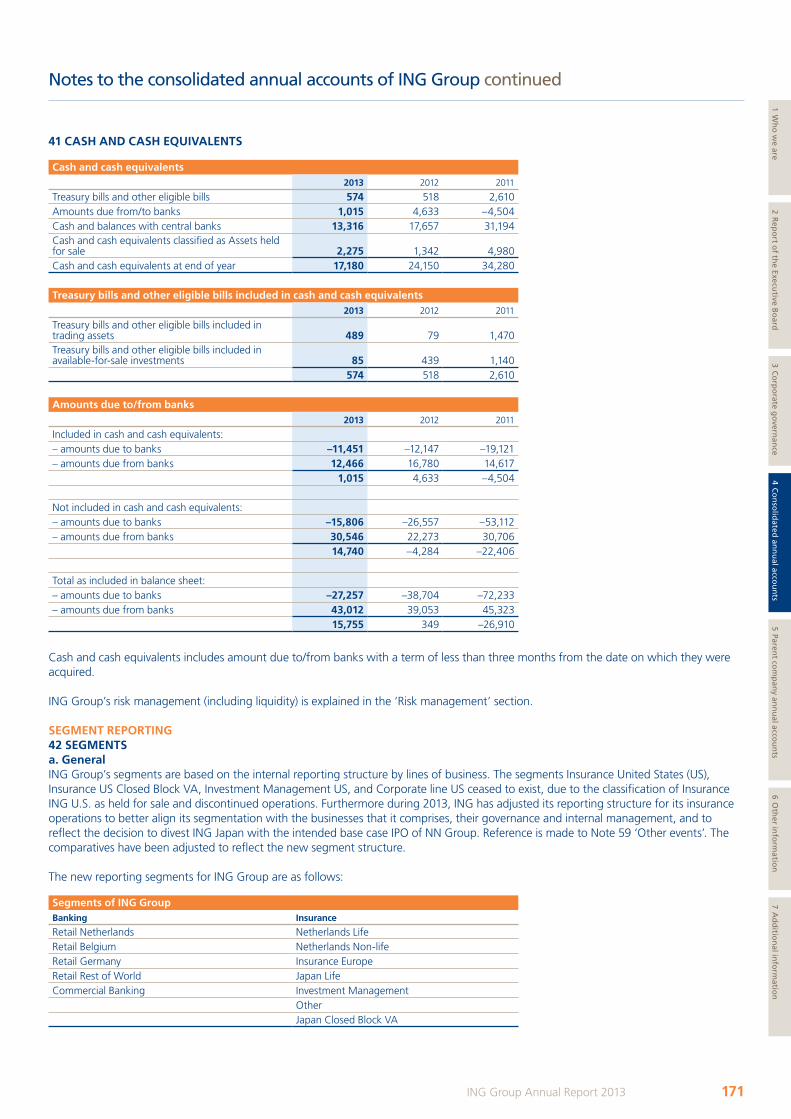
Notes to the consolidated annual accounts of ING Group continued
41 CASH AND CASH EQUIVALENTS
Cash and cash equivalents2013 2012 2011
Treasury bills and other eligible bills 574 518 2,610Amounts due from/to banks 1,015 4,633 –4,504Cash and balances with central banks 13,316 17,657 31,194Cash and cash equivalents classified as Assets held for sale 2,275 1,342 4,980Cash and cash equivalents at end of year 17,180 24,150 34,280
Treasury bills and other eligible bills included in cash and cash equivalents2013 2012 2011
Treasury bills and other eligible bills included in trading assets 489 79 1,470Treasury bills and other eligible bills included in available-for-sale investments 85 439 1,140
574 518 2,610
Amounts due to/from banks2013 2012 2011
Included in cash and cash equivalents:– amounts due to banks –11,451 –12,147 –19,121– amounts due from banks 12,466 16,780 14,617
1,015 4,633 –4,504
Not included in cash and cash equivalents:– amounts due to banks –15,806 –26,557 –53,112– amounts due from banks 30,546 22,273 30,706
14,740 –4,284 –22,406
Total as included in balance sheet:– amounts due to banks –27,257 –38,704 –72,233– amounts due from banks 43,012 39,053 45,323
15,755 349 –26,910
Cash and cash equivalents includes amount due to/from banks with a term of less than three months from the date on which they were acquired.
ING Group’s risk management (including liquidity) is explained in the ‘Risk management’ section.
SEGMENT REPORTING42 SEGMENTSa. GeneralING Group’s segments are based on the internal reporting structure by lines of business. The segments Insurance United States (US), Insurance US Closed Block VA, Investment Management US, and Corporate line US ceased to exist, due to the classification of Insurance ING U.S. as held for sale and discontinued operations. Furthermore during 2013, ING has adjusted its reporting structure for its insurance operations to better align its segmentation with the businesses that it comprises, their governance and internal management, and to reflect the decision to divest ING Japan with the intended base case IPO of NN Group. Reference is made to Note 59 ‘Other events’. The comparatives have been adjusted to reflect the new segment structure.
The new reporting segments for ING Group are as follows:
Segments of ING GroupBanking Insurance
Retail Netherlands Netherlands LifeRetail Belgium Netherlands Non-lifeRetail Germany Insurance EuropeRetail Rest of World Japan LifeCommercial Banking Investment Management
Other Japan Closed Block VA
171ING Group Annual Report 2013
1 Wh
o w
e are2 R
epo
rt of th
e Executive B
oard
3 Co
rpo
rate go
vernan
ce4 C
on
solid
ated an
nu
al accou
nts
5 Parent co
mp
any an
nu
al accou
nts
6 Oth
er info
rmatio
n7 A
dd
ition
al info
rmatio
n
ING_2013_deel2&3_v2A.indd 171 19/03/2014 19:11:52
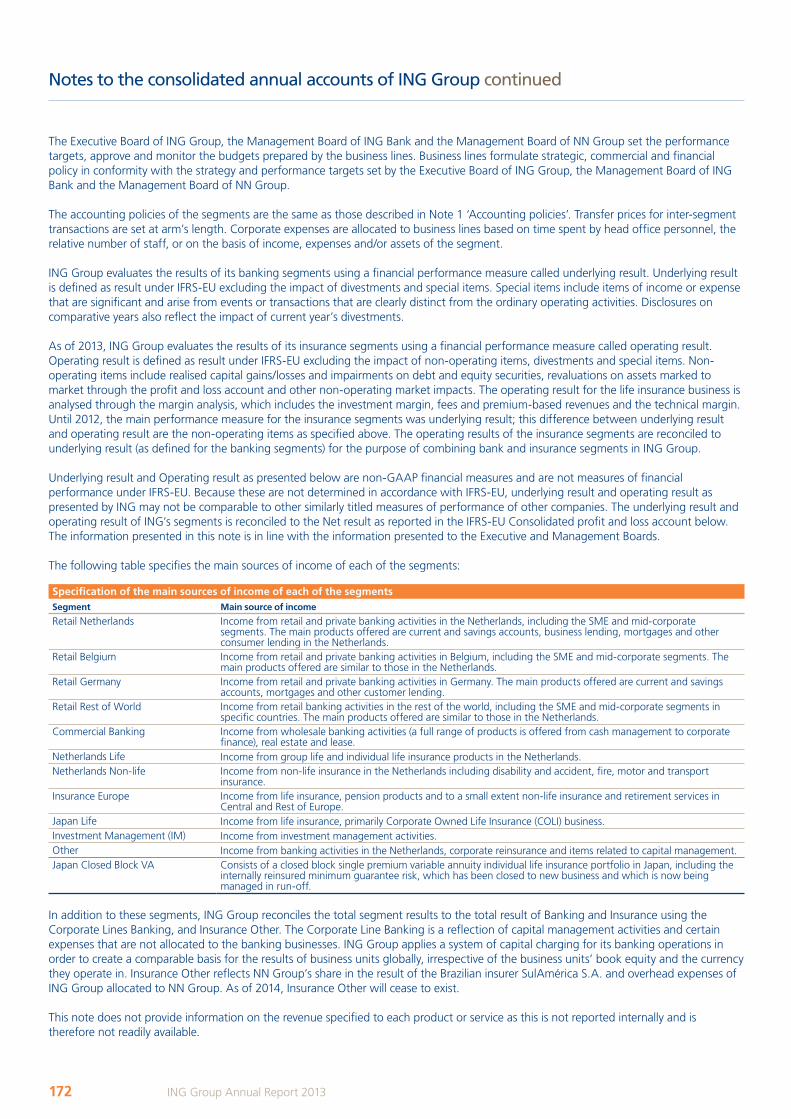
Notes to the consolidated annual accounts of ING Group continued
The Executive Board of ING Group, the Management Board of ING Bank and the Management Board of NN Group set the performance targets, approve and monitor the budgets prepared by the business lines. Business lines formulate strategic, commercial and financial policy in conformity with the strategy and performance targets set by the Executive Board of ING Group, the Management Board of ING Bank and the Management Board of NN Group.
The accounting policies of the segments are the same as those described in Note 1 ‘Accounting policies’. Transfer prices for inter-segment transactions are set at arm’s length. Corporate expenses are allocated to business lines based on time spent by head office personnel, the relative number of staff, or on the basis of income, expenses and/or assets of the segment.
ING Group evaluates the results of its banking segments using a financial performance measure called underlying result. Underlying result is defined as result under IFRS-EU excluding the impact of divestments and special items. Special items include items of income or expense that are significant and arise from events or transactions that are clearly distinct from the ordinary operating activities. Disclosures on comparative years also reflect the impact of current year’s divestments.
As of 2013, ING Group evaluates the results of its insurance segments using a financial performance measure called operating result. Operating result is defined as result under IFRS-EU excluding the impact of non-operating items, divestments and special items. Non-operating items include realised capital gains/losses and impairments on debt and equity securities, revaluations on assets marked to market through the profit and loss account and other non-operating market impacts. The operating result for the life insurance business is analysed through the margin analysis, which includes the investment margin, fees and premium-based revenues and the technical margin. Until 2012, the main performance measure for the insurance segments was underlying result; this difference between underlying result and operating result are the non-operating items as specified above. The operating results of the insurance segments are reconciled to underlying result (as defined for the banking segments) for the purpose of combining bank and insurance segments in ING Group.
Underlying result and Operating result as presented below are non-GAAP financial measures and are not measures of financial performance under IFRS-EU. Because these are not determined in accordance with IFRS-EU, underlying result and operating result as presented by ING may not be comparable to other similarly titled measures of performance of other companies. The underlying result and operating result of ING’s segments is reconciled to the Net result as reported in the IFRS-EU Consolidated profit and loss account below. The information presented in this note is in line with the information presented to the Executive and Management Boards.
The following table specifies the main sources of income of each of the segments:
Specification of the main sources of income of each of the segmentsSegment Main source of income
Retail Netherlands Income from retail and private banking activities in the Netherlands, including the SME and mid-corporate segments. The main products offered are current and savings accounts, business lending, mortgages and other consumer lending in the Netherlands.
Retail Belgium Income from retail and private banking activities in Belgium, including the SME and mid-corporate segments. The main products offered are similar to those in the Netherlands.
Retail Germany Income from retail and private banking activities in Germany. The main products offered are current and savings accounts, mortgages and other customer lending.
Retail Rest of World Income from retail banking activities in the rest of the world, including the SME and mid-corporate segments in specific countries. The main products offered are similar to those in the Netherlands.
Commercial Banking Income from wholesale banking activities (a full range of products is offered from cash management to corporate finance), real estate and lease.
Netherlands Life Income from group life and individual life insurance products in the Netherlands.Netherlands Non-life Income from non-life insurance in the Netherlands including disability and accident, fire, motor and transport
insurance.Insurance Europe Income from life insurance, pension products and to a small extent non-life insurance and retirement services in
Central and Rest of Europe.Japan Life Income from life insurance, primarily Corporate Owned Life Insurance (COLI) business.Investment Management (IM) Income from investment management activities.Other Income from banking activities in the Netherlands, corporate reinsurance and items related to capital management.Japan Closed Block VA Consists of a closed block single premium variable annuity individual life insurance portfolio in Japan, including the
internally reinsured minimum guarantee risk, which has been closed to new business and which is now being managed in run-off.
In addition to these segments, ING Group reconciles the total segment results to the total result of Banking and Insurance using the Corporate Lines Banking, and Insurance Other. The Corporate Line Banking is a reflection of capital management activities and certain expenses that are not allocated to the banking businesses. ING Group applies a system of capital charging for its banking operations in order to create a comparable basis for the results of business units globally, irrespective of the business units’ book equity and the currency they operate in. Insurance Other reflects NN Group’s share in the result of the Brazilian insurer SulAmérica S.A. and overhead expenses of ING Group allocated to NN Group. As of 2014, Insurance Other will cease to exist.
This note does not provide information on the revenue specified to each product or service as this is not reported internally and is therefore not readily available.
172 ING Group Annual Report 2013
ING_2013_deel2&3_v2A.indd 172 19/03/2014 19:11:52
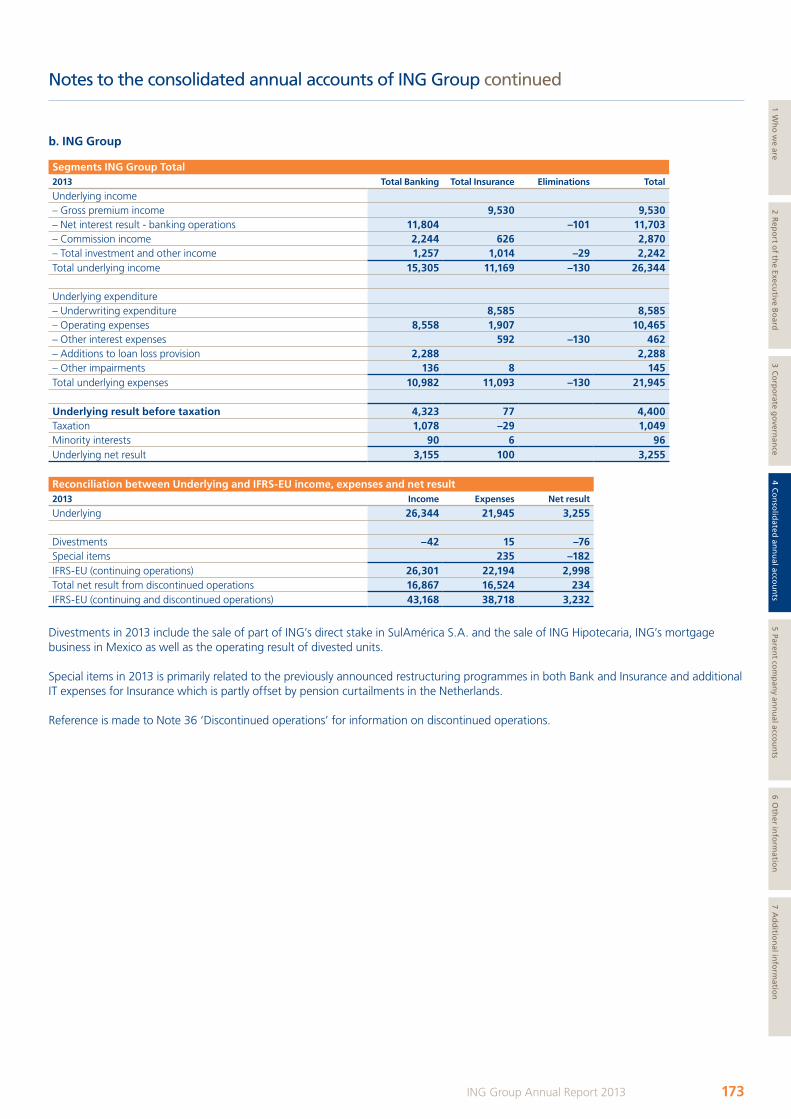
Notes to the consolidated annual accounts of ING Group continued
b. ING Group
Segments ING Group Total2013 Total Banking Total Insurance Eliminations Total
Underlying income– Gross premium income 9,530 9,530– Net interest result - banking operations 11,804 –101 11,703– Commission income 2,244 626 2,870– Total investment and other income 1,257 1,014 –29 2,242Total underlying income 15,305 11,169 –130 26,344
Underlying expenditure– Underwriting expenditure 8,585 8,585– Operating expenses 8,558 1,907 10,465– Other interest expenses 592 –130 462– Additions to loan loss provision 2,288 2,288– Other impairments 136 8 145Total underlying expenses 10,982 11,093 –130 21,945
Underlying result before taxation 4,323 77 4,400Taxation 1,078 –29 1,049Minority interests 90 6 96Underlying net result 3,155 100 3,255
Reconciliation between Underlying and IFRS-EU income, expenses and net result2013 Income Expenses Net result
Underlying 26,344 21,945 3,255
Divestments –42 15 –76Special items 235 –182IFRS-EU (continuing operations) 26,301 22,194 2,998Total net result from discontinued operations 16,867 16,524 234IFRS-EU (continuing and discontinued operations) 43,168 38,718 3,232
Divestments in 2013 include the sale of part of ING’s direct stake in SulAmérica S.A. and the sale of ING Hipotecaria, ING’s mortgage business in Mexico as well as the operating result of divested units.
Special items in 2013 is primarily related to the previously announced restructuring programmes in both Bank and Insurance and additional IT expenses for Insurance which is partly offset by pension curtailments in the Netherlands.
Reference is made to Note 36 ‘Discontinued operations’ for information on discontinued operations.
173ING Group Annual Report 2013
1 Wh
o w
e are2 R
epo
rt of th
e Executive B
oard
3 Co
rpo
rate go
vernan
ce4 C
on
solid
ated an
nu
al accou
nts
5 Parent co
mp
any an
nu
al accou
nts
6 Oth
er info
rmatio
n7 A
dd
ition
al info
rmatio
n
ING_2013_deel2&3_v2A.indd 173 19/03/2014 19:11:53
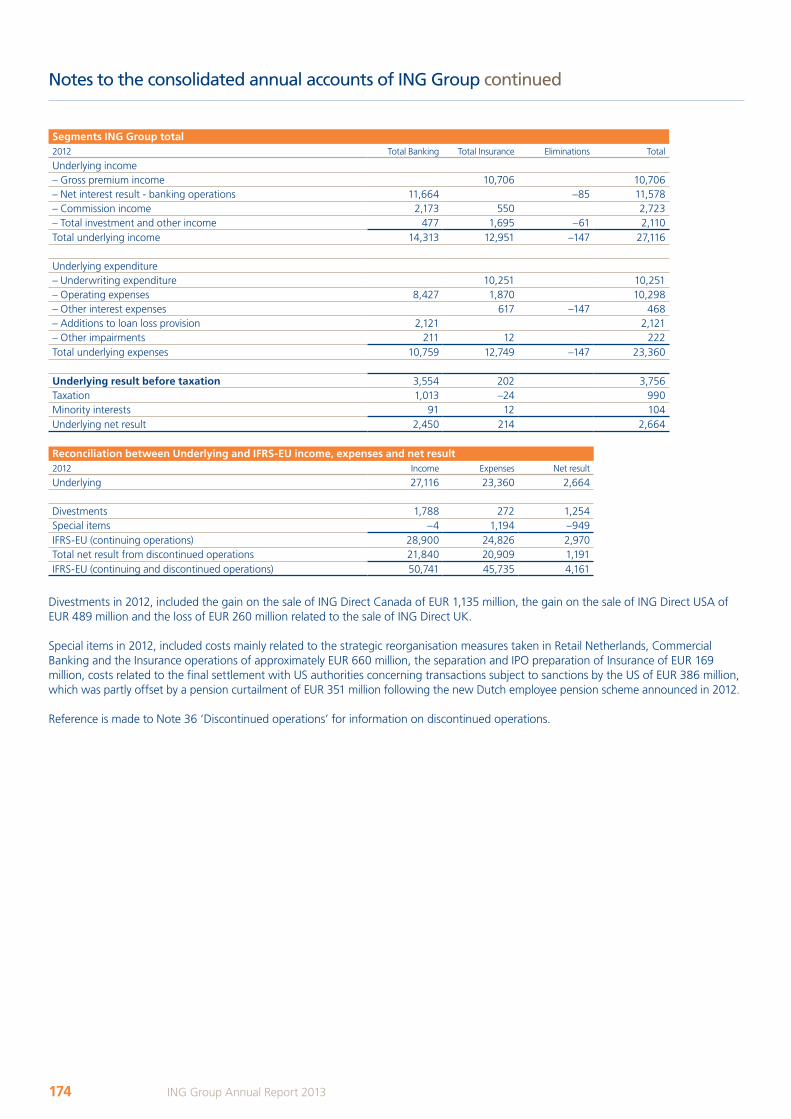
Notes to the consolidated annual accounts of ING Group continued
Segments ING Group total2012 Total Banking Total Insurance Eliminations Total
Underlying income– Gross premium income 10,706 10,706– Net interest result - banking operations 11,664 –85 11,578– Commission income 2,173 550 2,723– Total investment and other income 477 1,695 –61 2,110Total underlying income 14,313 12,951 –147 27,116
Underlying expenditure– Underwriting expenditure 10,251 10,251– Operating expenses 8,427 1,870 10,298– Other interest expenses 617 –147 468– Additions to loan loss provision 2,121 2,121– Other impairments 211 12 222Total underlying expenses 10,759 12,749 –147 23,360
Underlying result before taxation 3,554 202 3,756Taxation 1,013 –24 990Minority interests 91 12 104Underlying net result 2,450 214 2,664
Reconciliation between Underlying and IFRS-EU income, expenses and net result2012 Income Expenses Net result
Underlying 27,116 23,360 2,664
Divestments 1,788 272 1,254Special items –4 1,194 –949IFRS-EU (continuing operations) 28,900 24,826 2,970Total net result from discontinued operations 21,840 20,909 1,191IFRS-EU (continuing and discontinued operations) 50,741 45,735 4,161
Divestments in 2012, included the gain on the sale of ING Direct Canada of EUR 1,135 million, the gain on the sale of ING Direct USA of EUR 489 million and the loss of EUR 260 million related to the sale of ING Direct UK.
Special items in 2012, included costs mainly related to the strategic reorganisation measures taken in Retail Netherlands, Commercial Banking and the Insurance operations of approximately EUR 660 million, the separation and IPO preparation of Insurance of EUR 169 million, costs related to the final settlement with US authorities concerning transactions subject to sanctions by the US of EUR 386 million, which was partly offset by a pension curtailment of EUR 351 million following the new Dutch employee pension scheme announced in 2012.
Reference is made to Note 36 ‘Discontinued operations’ for information on discontinued operations.
174 ING Group Annual Report 2013
ING_2013_deel2&3_v2A.indd 174 19/03/2014 19:11:53
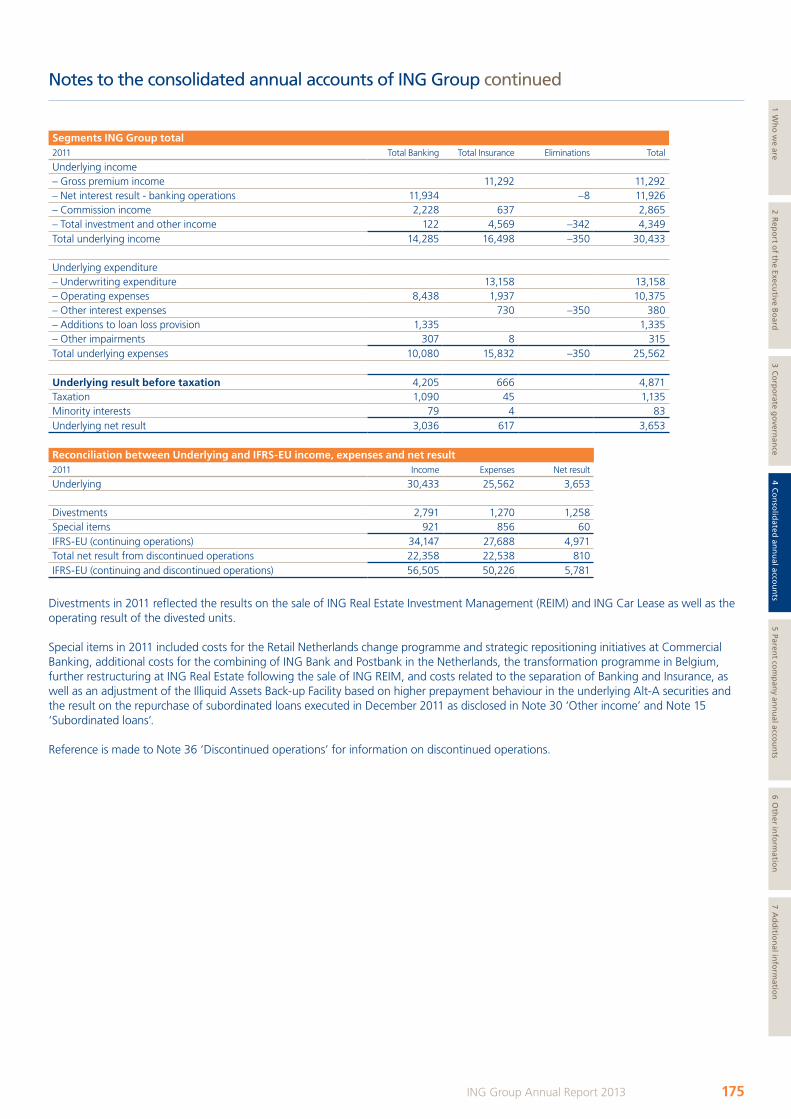
Notes to the consolidated annual accounts of ING Group continued
Segments ING Group total2011 Total Banking Total Insurance Eliminations Total
Underlying income– Gross premium income 11,292 11,292– Net interest result - banking operations 11,934 –8 11,926– Commission income 2,228 637 2,865– Total investment and other income 122 4,569 –342 4,349Total underlying income 14,285 16,498 –350 30,433
Underlying expenditure– Underwriting expenditure 13,158 13,158– Operating expenses 8,438 1,937 10,375– Other interest expenses 730 –350 380– Additions to loan loss provision 1,335 1,335– Other impairments 307 8 315Total underlying expenses 10,080 15,832 –350 25,562
Underlying result before taxation 4,205 666 4,871Taxation 1,090 45 1,135Minority interests 79 4 83Underlying net result 3,036 617 3,653
Reconciliation between Underlying and IFRS-EU income, expenses and net result2011 Income Expenses Net result
Underlying 30,433 25,562 3,653
Divestments 2,791 1,270 1,258Special items 921 856 60IFRS-EU (continuing operations) 34,147 27,688 4,971Total net result from discontinued operations 22,358 22,538 810IFRS-EU (continuing and discontinued operations) 56,505 50,226 5,781
Divestments in 2011 reflected the results on the sale of ING Real Estate Investment Management (REIM) and ING Car Lease as well as the operating result of the divested units.
Special items in 2011 included costs for the Retail Netherlands change programme and strategic repositioning initiatives at Commercial Banking, additional costs for the combining of ING Bank and Postbank in the Netherlands, the transformation programme in Belgium, further restructuring at ING Real Estate following the sale of ING REIM, and costs related to the separation of Banking and Insurance, as well as an adjustment of the Illiquid Assets Back-up Facility based on higher prepayment behaviour in the underlying Alt-A securities and the result on the repurchase of subordinated loans executed in December 2011 as disclosed in Note 30 ‘Other income’ and Note 15 ‘Subordinated loans’.
Reference is made to Note 36 ‘Discontinued operations’ for information on discontinued operations.
175ING Group Annual Report 2013
1 Wh
o w
e are2 R
epo
rt of th
e Executive B
oard
3 Co
rpo
rate go
vernan
ce4 C
on
solid
ated an
nu
al accou
nts
5 Parent co
mp
any an
nu
al accou
nts
6 Oth
er info
rmatio
n7 A
dd
ition
al info
rmatio
n
ING_2013_deel2&3_v2A.indd 175 19/03/2014 19:11:53
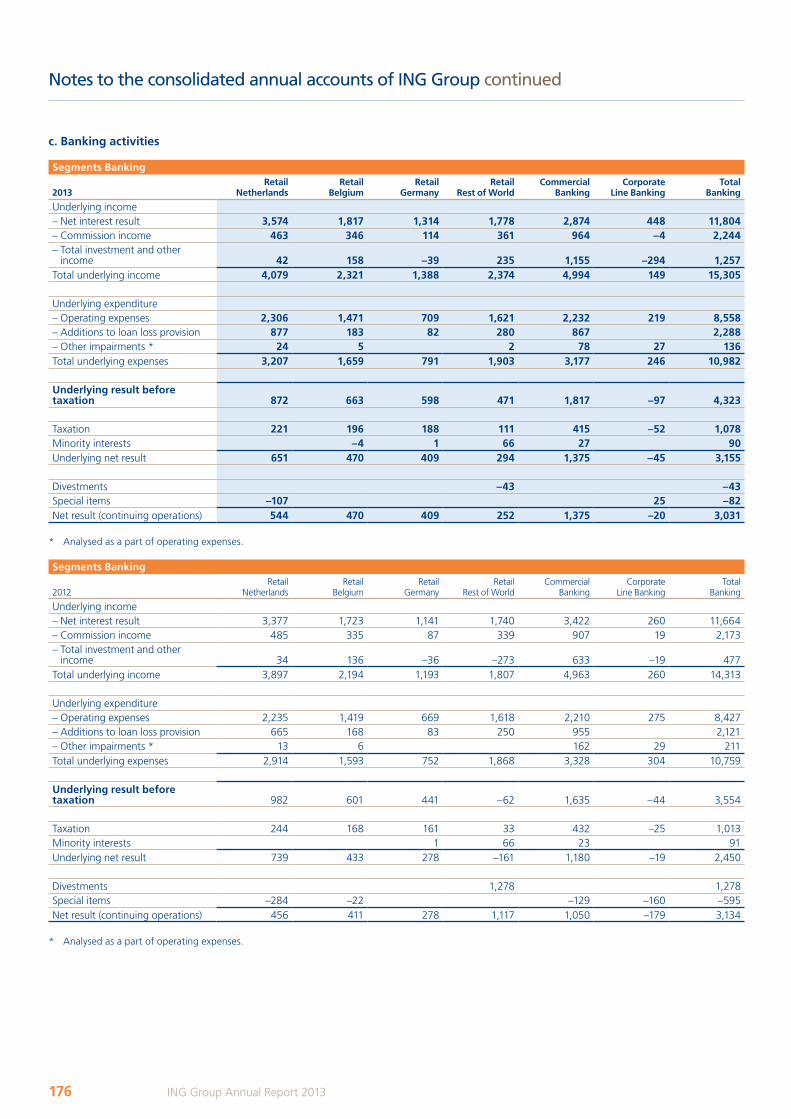
Notes to the consolidated annual accounts of ING Group continued
c. Banking activities
Segments Banking
2013Retail
NetherlandsRetail
BelgiumRetail
GermanyRetail
Rest of WorldCommercial
Banking Corporate
Line BankingTotal
Banking
Underlying income– Net interest result 3,574 1,817 1,314 1,778 2,874 448 11,804– Commission income 463 346 114 361 964 –4 2,244– Total investment and other
income 42 158 –39 235 1,155 –294 1,257Total underlying income 4,079 2,321 1,388 2,374 4,994 149 15,305
Underlying expenditure– Operating expenses 2,306 1,471 709 1,621 2,232 219 8,558– Additions to loan loss provision 877 183 82 280 867 2,288– Other impairments * 24 5 2 78 27 136Total underlying expenses 3,207 1,659 791 1,903 3,177 246 10,982
Underlying result before taxation 872 663 598 471 1,817 –97 4,323
Taxation 221 196 188 111 415 –52 1,078Minority interests –4 1 66 27 90Underlying net result 651 470 409 294 1,375 –45 3,155
Divestments –43 –43Special items –107 25 –82Net result (continuing operations) 544 470 409 252 1,375 –20 3,031
* Analysed as a part of operating expenses.
Segments Banking
2012Retail
NetherlandsRetail
BelgiumRetail
GermanyRetail
Rest of WorldCommercial
Banking Corporate
Line BankingTotal
Banking
Underlying income– Net interest result 3,377 1,723 1,141 1,740 3,422 260 11,664– Commission income 485 335 87 339 907 19 2,173– Total investment and other
income 34 136 –36 –273 633 –19 477Total underlying income 3,897 2,194 1,193 1,807 4,963 260 14,313
Underlying expenditure– Operating expenses 2,235 1,419 669 1,618 2,210 275 8,427– Additions to loan loss provision 665 168 83 250 955 2,121– Other impairments * 13 6 162 29 211Total underlying expenses 2,914 1,593 752 1,868 3,328 304 10,759
Underlying result before taxation 982 601 441 –62 1,635 –44 3,554
Taxation 244 168 161 33 432 –25 1,013Minority interests 1 66 23 91Underlying net result 739 433 278 –161 1,180 –19 2,450
Divestments 1,278 1,278Special items –284 –22 –129 –160 –595Net result (continuing operations) 456 411 278 1,117 1,050 –179 3,134
* Analysed as a part of operating expenses.
176 ING Group Annual Report 2013
ING_2013_deel2&3_v2A.indd 176 19/03/2014 19:11:53
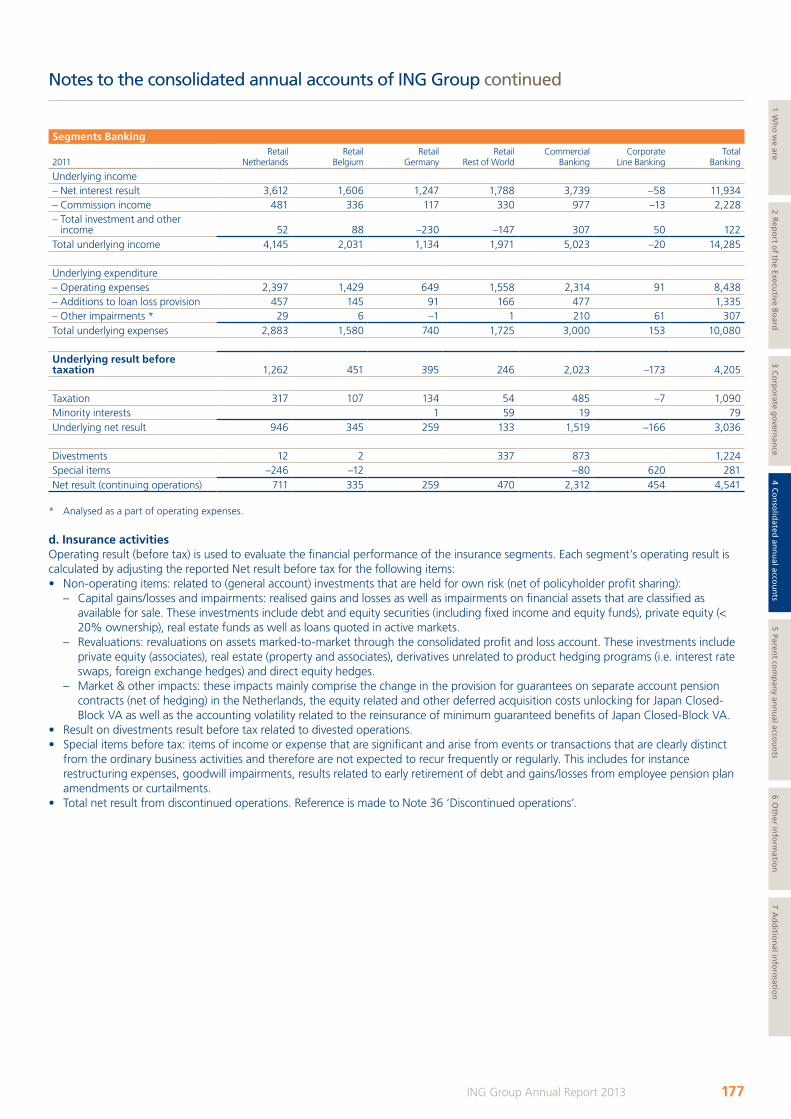
Notes to the consolidated annual accounts of ING Group continued
Segments Banking
2011Retail
NetherlandsRetail
BelgiumRetail
GermanyRetail
Rest of WorldCommercial
Banking Corporate
Line BankingTotal
Banking
Underlying income– Net interest result 3,612 1,606 1,247 1,788 3,739 –58 11,934– Commission income 481 336 117 330 977 –13 2,228– Total investment and other
income 52 88 –230 –147 307 50 122Total underlying income 4,145 2,031 1,134 1,971 5,023 –20 14,285
Underlying expenditure– Operating expenses 2,397 1,429 649 1,558 2,314 91 8,438– Additions to loan loss provision 457 145 91 166 477 1,335– Other impairments * 29 6 –1 1 210 61 307Total underlying expenses 2,883 1,580 740 1,725 3,000 153 10,080
Underlying result before taxation 1,262 451 395 246 2,023 –173 4,205
Taxation 317 107 134 54 485 –7 1,090Minority interests 1 59 19 79Underlying net result 946 345 259 133 1,519 –166 3,036
Divestments 12 2 337 873 1,224Special items –246 –12 –80 620 281Net result (continuing operations) 711 335 259 470 2,312 454 4,541
* Analysed as a part of operating expenses.
d. Insurance activitiesOperating result (before tax) is used to evaluate the financial performance of the insurance segments. Each segment’s operating result is calculated by adjusting the reported Net result before tax for the following items:• Non-operating items: related to (general account) investments that are held for own risk (net of policyholder profit sharing):
– Capital gains/losses and impairments: realised gains and losses as well as impairments on financial assets that are classified as available for sale. These investments include debt and equity securities (including fixed income and equity funds), private equity (< 20% ownership), real estate funds as well as loans quoted in active markets.
– Revaluations: revaluations on assets marked-to-market through the consolidated profit and loss account. These investments include private equity (associates), real estate (property and associates), derivatives unrelated to product hedging programs (i.e. interest rate swaps, foreign exchange hedges) and direct equity hedges.
– Market & other impacts: these impacts mainly comprise the change in the provision for guarantees on separate account pension contracts (net of hedging) in the Netherlands, the equity related and other deferred acquisition costs unlocking for Japan Closed-Block VA as well as the accounting volatility related to the reinsurance of minimum guaranteed benefits of Japan Closed-Block VA.
• Result on divestments result before tax related to divested operations.• Special items before tax: items of income or expense that are significant and arise from events or transactions that are clearly distinct
from the ordinary business activities and therefore are not expected to recur frequently or regularly. This includes for instance restructuring expenses, goodwill impairments, results related to early retirement of debt and gains/losses from employee pension plan amendments or curtailments.
• Total net result from discontinued operations. Reference is made to Note 36 ‘Discontinued operations’.
177ING Group Annual Report 2013
1 Wh
o w
e are2 R
epo
rt of th
e Executive B
oard
3 Co
rpo
rate go
vernan
ce4 C
on
solid
ated an
nu
al accou
nts
5 Parent co
mp
any an
nu
al accou
nts
6 Oth
er info
rmatio
n7 A
dd
ition
al info
rmatio
n
ING_2013_deel2&3_v2A.indd 177 19/03/2014 19:11:54
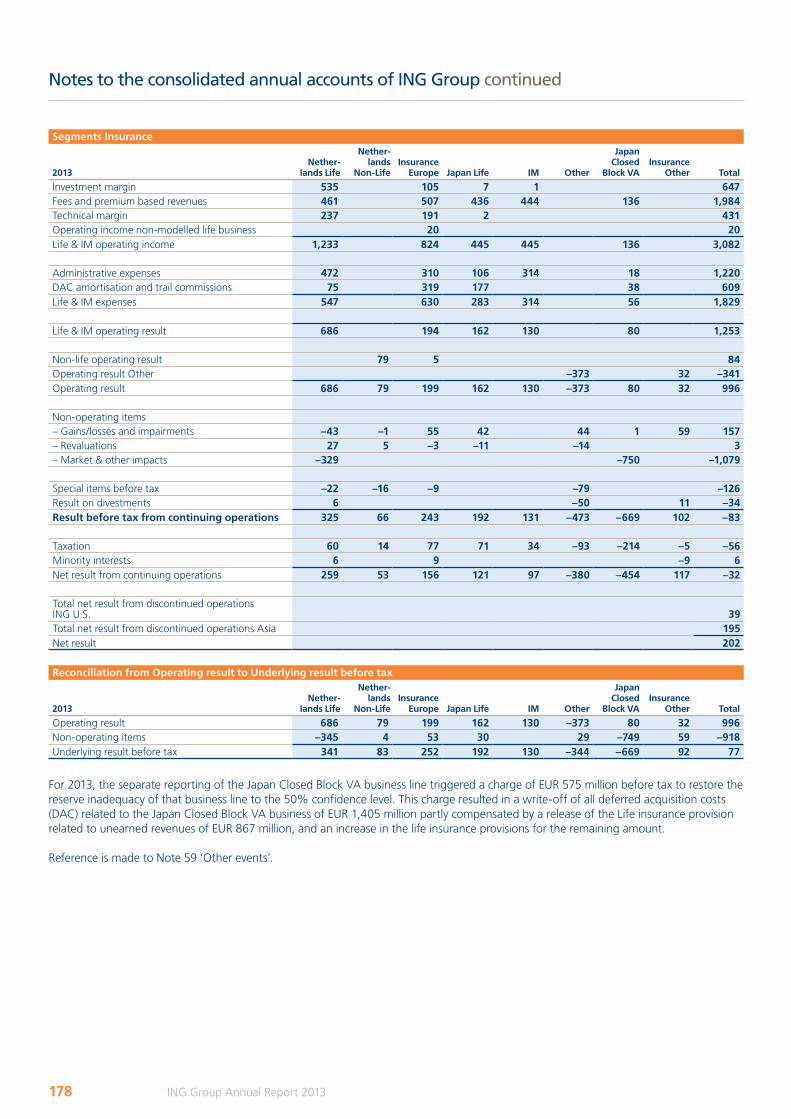
Notes to the consolidated annual accounts of ING Group continued
Segments Insurance
2013Nether-
lands Life
Nether-lands
Non-LifeInsurance
Europe Japan Life IM Other
Japan Closed
Block VA Insurance
Other Total
Investment margin 535 105 7 1 647Fees and premium based revenues 461 507 436 444 136 1,984Technical margin 237 191 2 431Operating income non-modelled life business 20 20Life & IM operating income 1,233 824 445 445 136 3,082
Administrative expenses 472 310 106 314 18 1,220DAC amortisation and trail commissions 75 319 177 38 609Life & IM expenses 547 630 283 314 56 1,829
Life & IM operating result 686 194 162 130 80 1,253
Non-life operating result 79 5 84Operating result Other –373 32 –341Operating result 686 79 199 162 130 –373 80 32 996
Non-operating items– Gains/losses and impairments –43 –1 55 42 44 1 59 157– Revaluations 27 5 –3 –11 –14 3– Market & other impacts –329 –750 –1,079
Special items before tax –22 –16 –9 –79 –126Result on divestments 6 –50 11 –34Result before tax from continuing operations 325 66 243 192 131 –473 –669 102 –83
Taxation 60 14 77 71 34 –93 –214 –5 –56Minority interests 6 9 –9 6Net result from continuing operations 259 53 156 121 97 –380 –454 117 –32
Total net result from discontinued operations ING U.S. 39Total net result from discontinued operations Asia 195Net result 202
Reconciliation from Operating result to Underlying result before tax
2013Nether-
lands Life
Nether-lands
Non-LifeInsurance
Europe Japan Life IM Other
Japan Closed
Block VA Insurance
Other Total
Operating result 686 79 199 162 130 –373 80 32 996Non-operating items –345 4 53 30 29 –749 59 –918Underlying result before tax 341 83 252 192 130 –344 –669 92 77
For 2013, the separate reporting of the Japan Closed Block VA business line triggered a charge of EUR 575 million before tax to restore the reserve inadequacy of that business line to the 50% confidence level. This charge resulted in a write-off of all deferred acquisition costs (DAC) related to the Japan Closed Block VA business of EUR 1,405 million partly compensated by a release of the Life insurance provision related to unearned revenues of EUR 867 million, and an increase in the life insurance provisions for the remaining amount.
Reference is made to Note 59 ‘Other events’.
178 ING Group Annual Report 2013
ING_2013_deel2&3_v2A.indd 178 19/03/2014 19:11:54

Notes to the consolidated annual accounts of ING Group continued
Segments Insurance
2012Nether-
lands Life
Nether-lands
Non-LifeInsurance
Europe Japan Life IM Other
Japan Closed
Block VA Insurance
Other Total
Investment margin 542 122 10 674Fees and premium based revenues 508 514 490 430 148 2,090Technical margin 141 210 23 374Operating income non-modelled life business 20 20Life & IM operating income 1,191 866 523 430 148 3,159
Administrative expenses 495 334 130 321 13 1,293DAC amortisation and trail commissions 92 321 197 50 660Life & IM expenses 587 654 328 321 64 1,954
Life & IM operating result 604 212 196 109 85 1,205
Non-life operating result 103 7 110Operating result Other –398 43 –355Operating result 604 103 219 196 109 –398 85 43 960
Non-operating items– Gains/losses and impairments 138 1 –82 4 1 10 70– Revaluations –296 –15 17 10 –34 –319– Market & other impacts –530 –1 21 –510
Special items before tax –225 –140 –38 –6 –43 –10 –462Result on divestments –25 13 –12Result before tax from continuing operations –335 –51 115 209 105 –452 105 33 –272
Taxation –168 –16 25 69 29 –85 33 –12 –123Minority interests 12 9 –9 12Net result from continuing operations –178 –35 81 140 76 –367 72 54 –161
Total net result from discontinued operations ING U.S. 495Total net result from discontinued operations Asia 696Net result 1,030
Reconciliation from Operating result to Underlying result before tax
2012Nether-
lands Life
Nether-lands
Non-LifeInsurance
Europe Japan Life IM Other
Japan Closed
Block VA Insurance
Other Total
Operating result 604 103 219 196 109 –398 85 43 960Non-operating items –689 –15 –66 13 1 –24 21 –759Underlying result before tax –85 89 153 209 110 –422 105 43 202
179ING Group Annual Report 2013
1 Wh
o w
e are2 R
epo
rt of th
e Executive B
oard
3 Co
rpo
rate go
vernan
ce4 C
on
solid
ated an
nu
al accou
nts
5 Parent co
mp
any an
nu
al accou
nts
6 Oth
er info
rmatio
n7 A
dd
ition
al info
rmatio
n
ING_2013_deel2&3_v2A.indd 179 19/03/2014 19:11:54
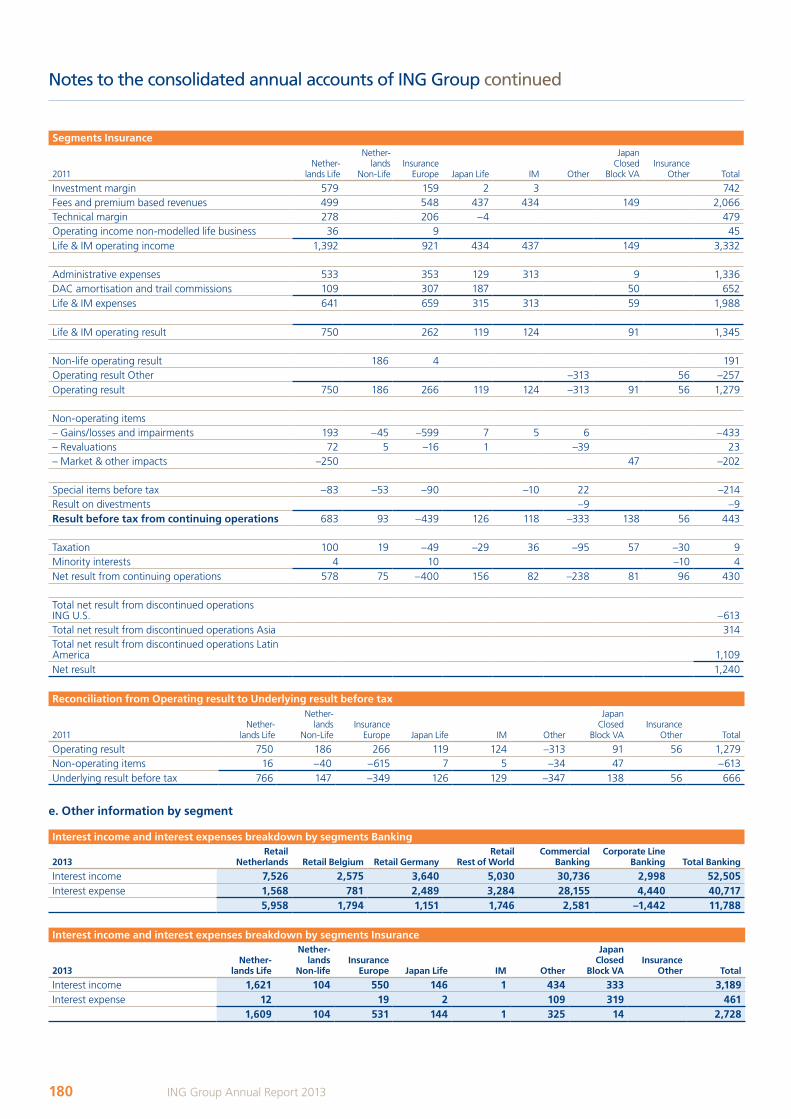
Notes to the consolidated annual accounts of ING Group continued
Segments Insurance
2011Nether-
lands Life
Nether-lands
Non-LifeInsurance
Europe Japan Life IM Other
Japan Closed
Block VA Insurance
Other Total
Investment margin 579 159 2 3 742Fees and premium based revenues 499 548 437 434 149 2,066Technical margin 278 206 –4 479Operating income non-modelled life business 36 9 45Life & IM operating income 1,392 921 434 437 149 3,332
Administrative expenses 533 353 129 313 9 1,336DAC amortisation and trail commissions 109 307 187 50 652Life & IM expenses 641 659 315 313 59 1,988
Life & IM operating result 750 262 119 124 91 1,345
Non-life operating result 186 4 191Operating result Other –313 56 –257Operating result 750 186 266 119 124 –313 91 56 1,279
Non-operating items– Gains/losses and impairments 193 –45 –599 7 5 6 –433– Revaluations 72 5 –16 1 –39 23– Market & other impacts –250 47 –202
Special items before tax –83 –53 –90 –10 22 –214Result on divestments –9 –9Result before tax from continuing operations 683 93 –439 126 118 –333 138 56 443
Taxation 100 19 –49 –29 36 –95 57 –30 9Minority interests 4 10 –10 4Net result from continuing operations 578 75 –400 156 82 –238 81 96 430
Total net result from discontinued operations ING U.S. –613Total net result from discontinued operations Asia 314Total net result from discontinued operations Latin America 1,109Net result 1,240
Reconciliation from Operating result to Underlying result before tax
2011Nether-
lands Life
Nether-lands
Non-LifeInsurance
Europe Japan Life IM Other
Japan Closed
Block VA Insurance
Other Total
Operating result 750 186 266 119 124 –313 91 56 1,279Non-operating items 16 –40 –615 7 5 –34 47 –613Underlying result before tax 766 147 –349 126 129 –347 138 56 666
e. Other information by segment
Interest income and interest expenses breakdown by segments Banking
2013Retail
Netherlands Retail Belgium Retail GermanyRetail
Rest of WorldCommercial
BankingCorporate Line
Banking Total Banking
Interest income 7,526 2,575 3,640 5,030 30,736 2,998 52,505Interest expense 1,568 781 2,489 3,284 28,155 4,440 40,717
5,958 1,794 1,151 1,746 2,581 –1,442 11,788
Interest income and interest expenses breakdown by segments Insurance
2013Nether-
lands Life
Nether-lands
Non-lifeInsurance
Europe Japan Life IM Other
Japan Closed
Block VA Insurance
Other Total
Interest income 1,621 104 550 146 1 434 333 3,189Interest expense 12 19 2 109 319 461
1,609 104 531 144 1 325 14 2,728
180 ING Group Annual Report 2013
ING_2013_deel2&3_v2A.indd 180 19/03/2014 19:11:55
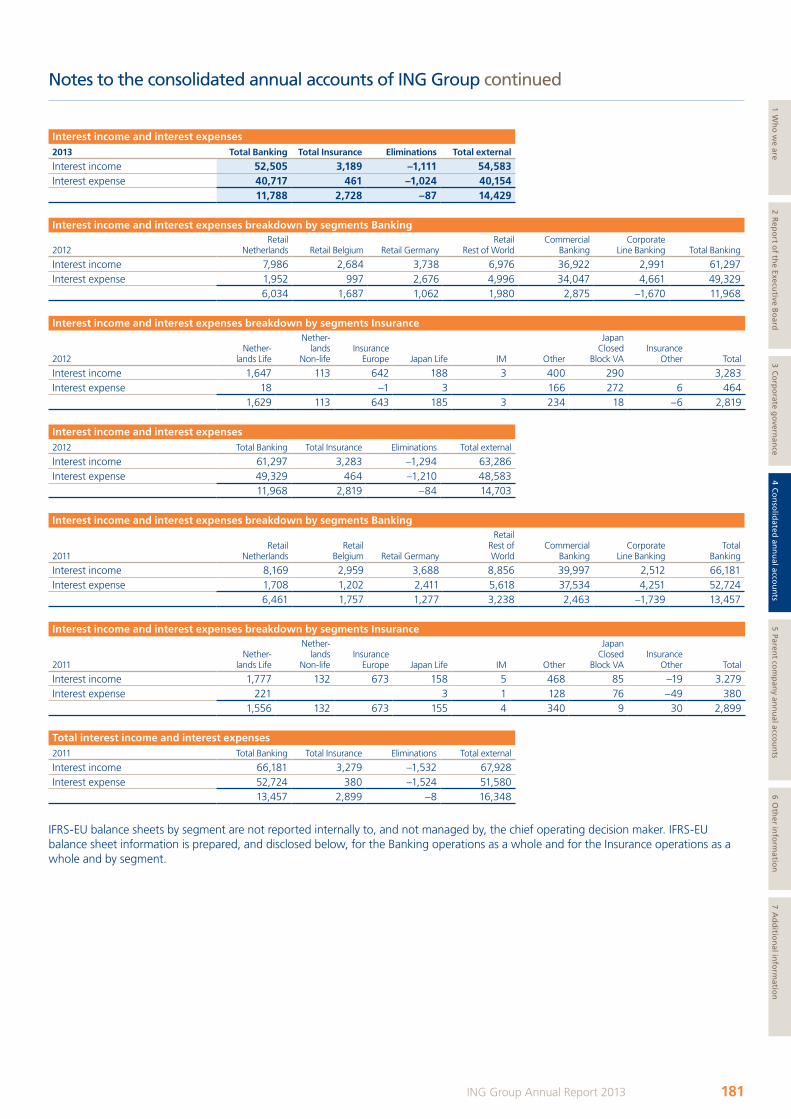
Notes to the consolidated annual accounts of ING Group continued
Interest income and interest expenses2013 Total Banking Total Insurance Eliminations Total external
Interest income 52,505 3,189 –1,111 54,583Interest expense 40,717 461 –1,024 40,154
11,788 2,728 –87 14,429
Interest income and interest expenses breakdown by segments Banking
2012Retail
Netherlands Retail Belgium Retail GermanyRetail
Rest of WorldCommercial
Banking Corporate
Line Banking Total Banking
Interest income 7,986 2,684 3,738 6,976 36,922 2,991 61,297Interest expense 1,952 997 2,676 4,996 34,047 4,661 49,329
6,034 1,687 1,062 1,980 2,875 –1,670 11,968
Interest income and interest expenses breakdown by segments Insurance
2012Nether-
lands Life
Nether-lands
Non-lifeInsurance
Europe Japan Life IM Other
Japan Closed
Block VA Insurance
Other Total
Interest income 1,647 113 642 188 3 400 290 3,283Interest expense 18 –1 3 166 272 6 464
1,629 113 643 185 3 234 18 –6 2,819
Interest income and interest expenses2012 Total Banking Total Insurance Eliminations Total external
Interest income 61,297 3,283 –1,294 63,286Interest expense 49,329 464 –1,210 48,583
11,968 2,819 –84 14,703
Interest income and interest expenses breakdown by segments Banking
2011Retail
NetherlandsRetail
Belgium Retail Germany
Retail Rest of World
Commercial Banking
Corporate Line Banking
Total Banking
Interest income 8,169 2,959 3,688 8,856 39,997 2,512 66,181Interest expense 1,708 1,202 2,411 5,618 37,534 4,251 52,724
6,461 1,757 1,277 3,238 2,463 –1,739 13,457
Interest income and interest expenses breakdown by segments Insurance
2011Nether-
lands Life
Nether-lands
Non-lifeInsurance
Europe Japan Life IM Other
Japan Closed
Block VA Insurance
Other Total
Interest income 1,777 132 673 158 5 468 85 –19 3.279Interest expense 221 3 1 128 76 –49 380
1,556 132 673 155 4 340 9 30 2,899
Total interest income and interest expenses 2011 Total Banking Total Insurance Eliminations Total external
Interest income 66,181 3,279 –1,532 67,928Interest expense 52,724 380 –1,524 51,580
13,457 2,899 –8 16,348
IFRS-EU balance sheets by segment are not reported internally to, and not managed by, the chief operating decision maker. IFRS-EU balance sheet information is prepared, and disclosed below, for the Banking operations as a whole and for the Insurance operations as a whole and by segment.
181ING Group Annual Report 2013
1 Wh
o w
e are2 R
epo
rt of th
e Executive B
oard
3 Co
rpo
rate go
vernan
ce4 C
on
solid
ated an
nu
al accou
nts
5 Parent co
mp
any an
nu
al accou
nts
6 Oth
er info
rmatio
n7 A
dd
ition
al info
rmatio
n
ING_2013_deel2&3_v2A.indd 181 19/03/2014 19:11:55
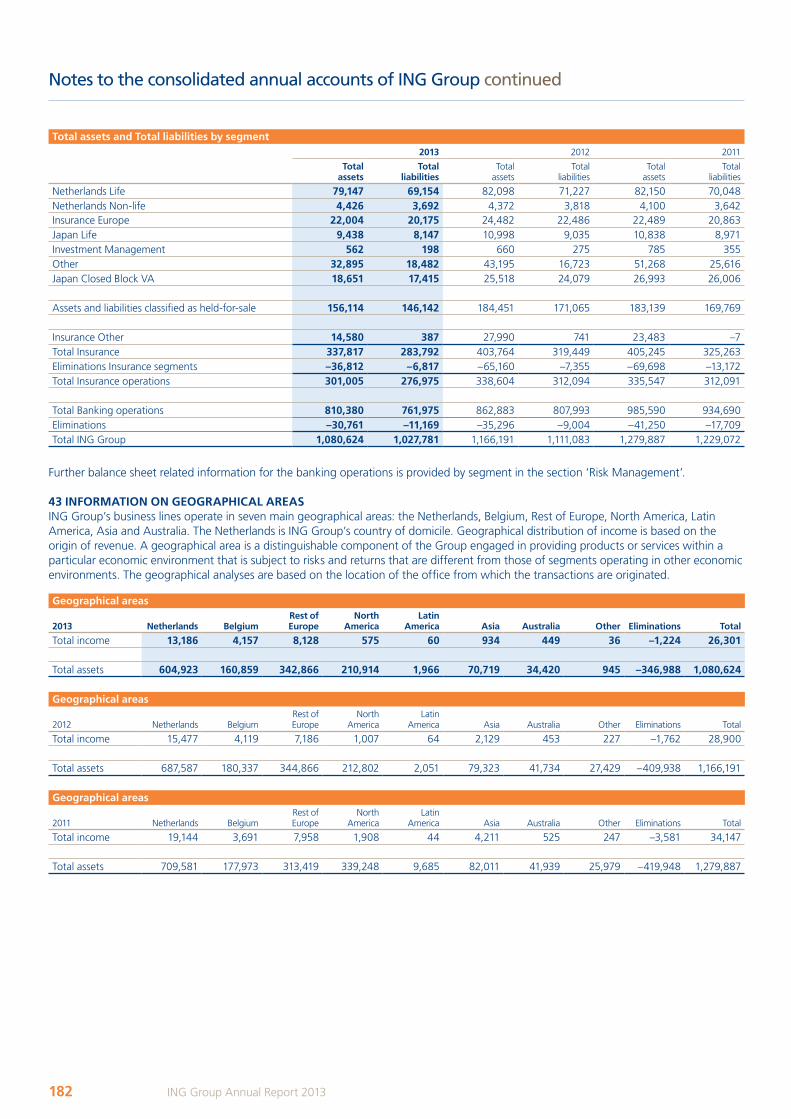
Notes to the consolidated annual accounts of ING Group continued
Total assets and Total liabilities by segment2013 2012 2011
Total assets
Total liabilities
Total assets
Total liabilities
Total assets
Total liabilities
Netherlands Life 79,147 69,154 82,098 71,227 82,150 70,048Netherlands Non-life 4,426 3,692 4,372 3,818 4,100 3,642Insurance Europe 22,004 20,175 24,482 22,486 22,489 20,863Japan Life 9,438 8,147 10,998 9,035 10,838 8,971Investment Management 562 198 660 275 785 355Other 32,895 18,482 43,195 16,723 51,268 25,616Japan Closed Block VA 18,651 17,415 25,518 24,079 26,993 26,006
Assets and liabilities classified as held-for-sale 156,114 146,142 184,451 171,065 183,139 169,769
Insurance Other 14,580 387 27,990 741 23,483 –7Total Insurance 337,817 283,792 403,764 319,449 405,245 325,263Eliminations Insurance segments –36,812 –6,817 –65,160 –7,355 –69,698 –13,172Total Insurance operations 301,005 276,975 338,604 312,094 335,547 312,091
Total Banking operations 810,380 761,975 862,883 807,993 985,590 934,690Eliminations –30,761 –11,169 –35,296 –9,004 –41,250 –17,709Total ING Group 1,080,624 1,027,781 1,166,191 1,111,083 1,279,887 1,229,072
Further balance sheet related information for the banking operations is provided by segment in the section ‘Risk Management’.
43 INFORMATION ON GEOGRAPHICAL AREASING Group’s business lines operate in seven main geographical areas: the Netherlands, Belgium, Rest of Europe, North America, Latin America, Asia and Australia. The Netherlands is ING Group’s country of domicile. Geographical distribution of income is based on the origin of revenue. A geographical area is a distinguishable component of the Group engaged in providing products or services within a particular economic environment that is subject to risks and returns that are different from those of segments operating in other economic environments. The geographical analyses are based on the location of the office from which the transactions are originated.
Geographical areas
2013 Netherlands BelgiumRest of Europe
North America
Latin America Asia Australia Other Eliminations Total
Total income 13,186 4,157 8,128 575 60 934 449 36 –1,224 26,301
Total assets 604,923 160,859 342,866 210,914 1,966 70,719 34,420 945 –346,988 1,080,624
Geographical areas
2012 Netherlands BelgiumRest of Europe
North America
Latin America Asia Australia Other Eliminations Total
Total income 15,477 4,119 7,186 1,007 64 2,129 453 227 –1,762 28,900
Total assets 687,587 180,337 344,866 212,802 2,051 79,323 41,734 27,429 –409,938 1,166,191
Geographical areas
2011 Netherlands BelgiumRest of Europe
North America
Latin America Asia Australia Other Eliminations Total
Total income 19,144 3,691 7,958 1,908 44 4,211 525 247 –3,581 34,147
Total assets 709,581 177,973 313,419 339,248 9,685 82,011 41,939 25,979 –419,948 1,279,887
182 ING Group Annual Report 2013
ING_2013_deel2&3_v2A.indd 182 19/03/2014 19:11:56
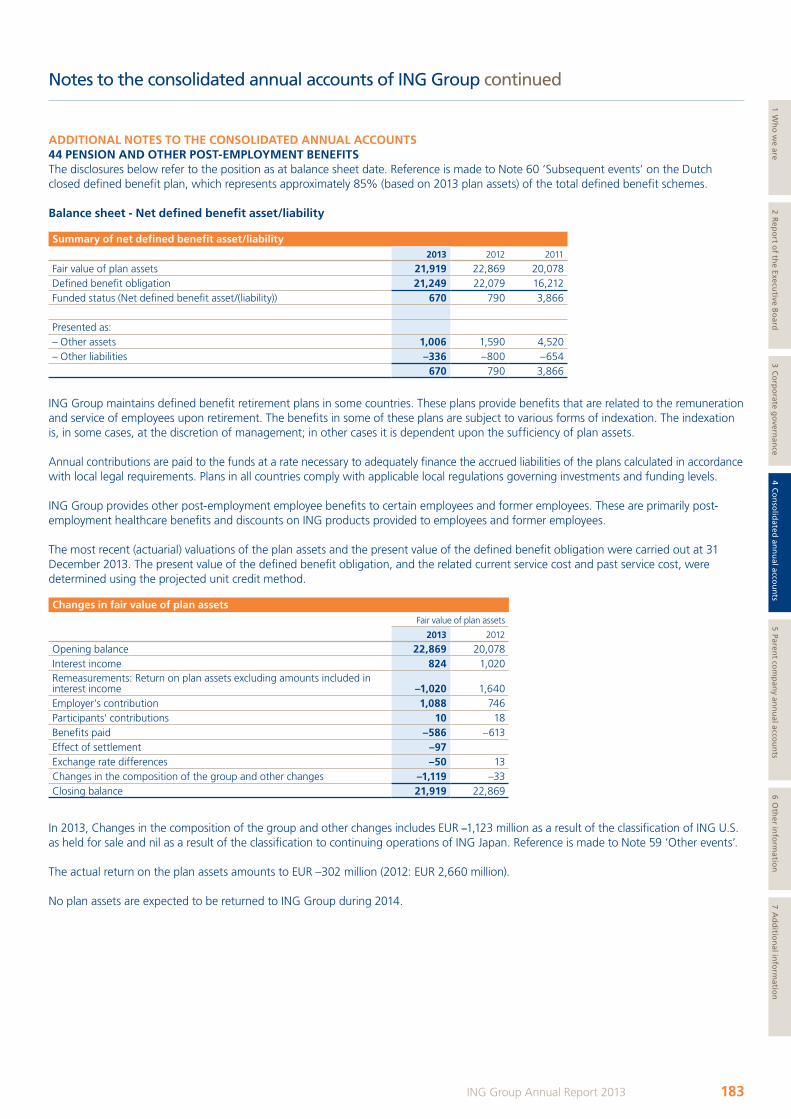
Notes to the consolidated annual accounts of ING Group continued
ADDITIONAL NOTES TO THE CONSOLIDATED ANNUAL ACCOUNTS44 PENSION AND OTHER POST-EMPLOYMENT BENEFITSThe disclosures below refer to the position as at balance sheet date. Reference is made to Note 60 ‘Subsequent events’ on the Dutch closed defined benefit plan, which represents approximately 85% (based on 2013 plan assets) of the total defined benefit schemes.
Balance sheet - Net defined benefit asset/liability
Summary of net defined benefit asset/liability2013 2012 2011
Fair value of plan assets 21,919 22,869 20,078Defined benefit obligation 21,249 22,079 16,212Funded status (Net defined benefit asset/(liability)) 670 790 3,866
Presented as:– Other assets 1,006 1,590 4,520– Other liabilities –336 –800 –654
670 790 3,866
ING Group maintains defined benefit retirement plans in some countries. These plans provide benefits that are related to the remuneration and service of employees upon retirement. The benefits in some of these plans are subject to various forms of indexation. The indexation is, in some cases, at the discretion of management; in other cases it is dependent upon the sufficiency of plan assets.
Annual contributions are paid to the funds at a rate necessary to adequately finance the accrued liabilities of the plans calculated in accordance with local legal requirements. Plans in all countries comply with applicable local regulations governing investments and funding levels.
ING Group provides other post-employment employee benefits to certain employees and former employees. These are primarily post-employment healthcare benefits and discounts on ING products provided to employees and former employees.
The most recent (actuarial) valuations of the plan assets and the present value of the defined benefit obligation were carried out at 31 December 2013. The present value of the defined benefit obligation, and the related current service cost and past service cost, were determined using the projected unit credit method. Changes in fair value of plan assets
Fair value of plan assets
2013 2012
Opening balance 22,869 20,078Interest income 824 1,020Remeasurements: Return on plan assets excluding amounts included in interest income –1,020 1,640Employer’s contribution 1,088 746Participants' contributions 10 18Benefits paid –586 –613Effect of settlement –97Exchange rate differences –50 13Changes in the composition of the group and other changes –1,119 –33Closing balance 21,919 22,869
In 2013, Changes in the composition of the group and other changes includes EUR –1,123 million as a result of the classification of ING U.S. as held for sale and nil as a result of the classification to continuing operations of ING Japan. Reference is made to Note 59 ‘Other events’.
The actual return on the plan assets amounts to EUR –302 million (2012: EUR 2,660 million).
No plan assets are expected to be returned to ING Group during 2014.
183ING Group Annual Report 2013
1 Wh
o w
e are2 R
epo
rt of th
e Executive B
oard
3 Co
rpo
rate go
vernan
ce4 C
on
solid
ated an
nu
al accou
nts
5 Parent co
mp
any an
nu
al accou
nts
6 Oth
er info
rmatio
n7 A
dd
ition
al info
rmatio
n
ING_2013_deel2&3_v2A.indd 183 19/03/2014 19:11:56
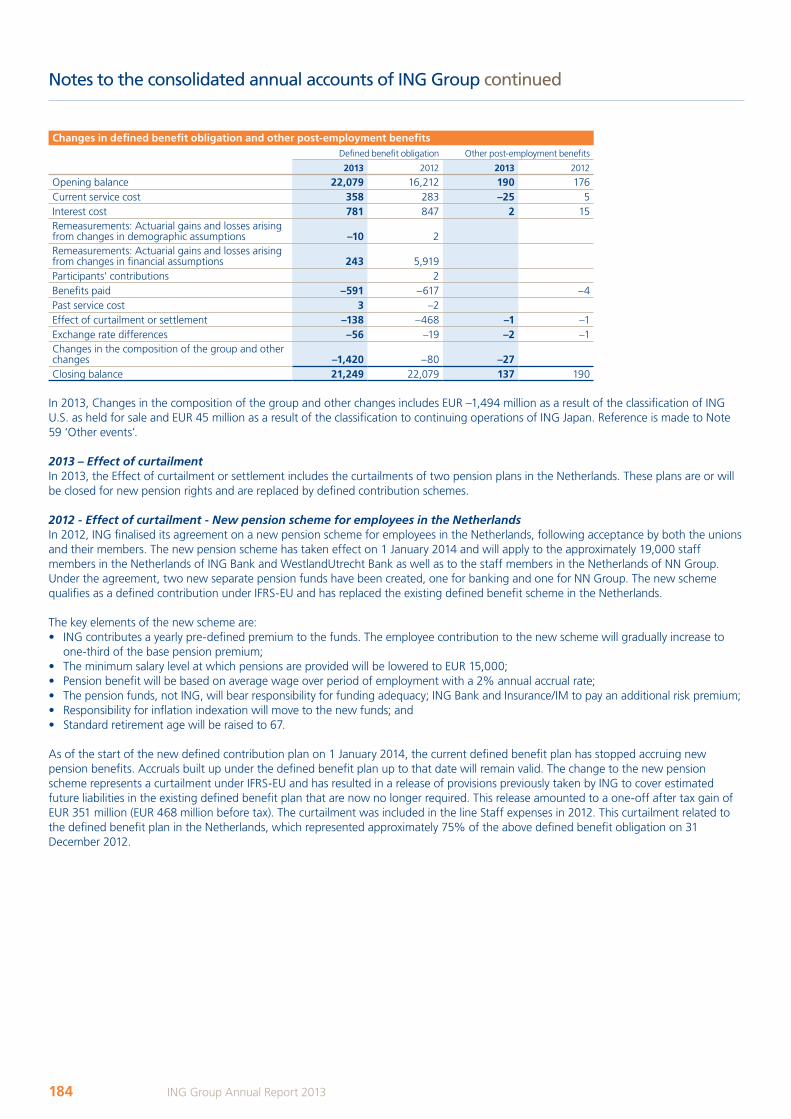
Notes to the consolidated annual accounts of ING Group continued
Changes in defined benefit obligation and other post-employment benefitsDefined benefit obligation Other post-employment benefits
2013 2012 2013 2012
Opening balance 22,079 16,212 190 176Current service cost 358 283 –25 5Interest cost 781 847 2 15Remeasurements: Actuarial gains and losses arising from changes in demographic assumptions –10 2 Remeasurements: Actuarial gains and losses arising from changes in financial assumptions 243 5,919 Participants' contributions 2 Benefits paid –591 –617 –4Past service cost 3 –2 Effect of curtailment or settlement –138 –468 –1 –1Exchange rate differences –56 –19 –2 –1Changes in the composition of the group and other changes –1,420 –80 –27Closing balance 21,249 22,079 137 190
In 2013, Changes in the composition of the group and other changes includes EUR –1,494 million as a result of the classification of ING U.S. as held for sale and EUR 45 million as a result of the classification to continuing operations of ING Japan. Reference is made to Note 59 ‘Other events’.
2013 – Effect of curtailmentIn 2013, the Effect of curtailment or settlement includes the curtailments of two pension plans in the Netherlands. These plans are or will be closed for new pension rights and are replaced by defined contribution schemes.
2012 - Effect of curtailment - New pension scheme for employees in the NetherlandsIn 2012, ING finalised its agreement on a new pension scheme for employees in the Netherlands, following acceptance by both the unions and their members. The new pension scheme has taken effect on 1 January 2014 and will apply to the approximately 19,000 staff members in the Netherlands of ING Bank and WestlandUtrecht Bank as well as to the staff members in the Netherlands of NN Group. Under the agreement, two new separate pension funds have been created, one for banking and one for NN Group. The new scheme qualifies as a defined contribution under IFRS-EU and has replaced the existing defined benefit scheme in the Netherlands.
The key elements of the new scheme are:• ING contributes a yearly pre-defined premium to the funds. The employee contribution to the new scheme will gradually increase to
one-third of the base pension premium;• The minimum salary level at which pensions are provided will be lowered to EUR 15,000;• Pension benefit will be based on average wage over period of employment with a 2% annual accrual rate;• The pension funds, not ING, will bear responsibility for funding adequacy; ING Bank and Insurance/IM to pay an additional risk premium; • Responsibility for inflation indexation will move to the new funds; and• Standard retirement age will be raised to 67.
As of the start of the new defined contribution plan on 1 January 2014, the current defined benefit plan has stopped accruing new pension benefits. Accruals built up under the defined benefit plan up to that date will remain valid. The change to the new pension scheme represents a curtailment under IFRS-EU and has resulted in a release of provisions previously taken by ING to cover estimated future liabilities in the existing defined benefit plan that are now no longer required. This release amounted to a one-off after tax gain of EUR 351 million (EUR 468 million before tax). The curtailment was included in the line Staff expenses in 2012. This curtailment related to the defined benefit plan in the Netherlands, which represented approximately 75% of the above defined benefit obligation on 31 December 2012.
184 ING Group Annual Report 2013
ING_2013_deel2&3_v2A.indd 184 19/03/2014 19:11:56
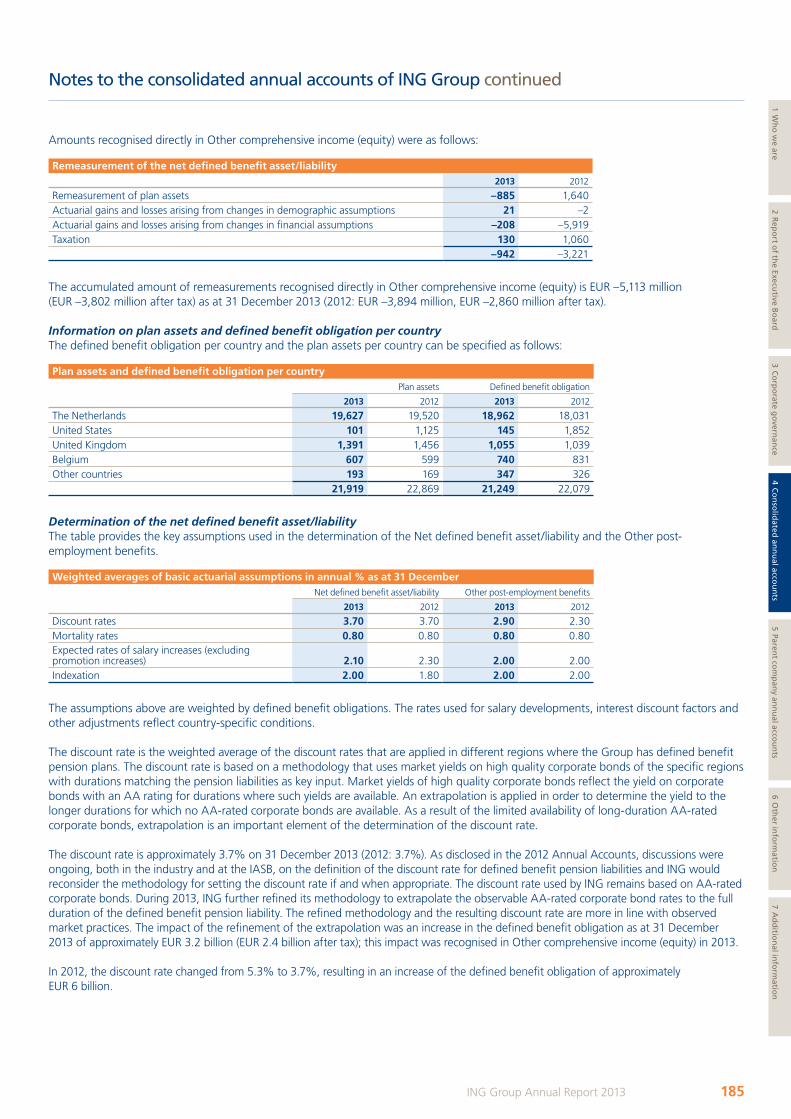
Notes to the consolidated annual accounts of ING Group continued
Amounts recognised directly in Other comprehensive income (equity) were as follows: Remeasurement of the net defined benefit asset/liability
2013 2012
Remeasurement of plan assets –885 1,640Actuarial gains and losses arising from changes in demographic assumptions 21 –2Actuarial gains and losses arising from changes in financial assumptions –208 –5,919Taxation 130 1,060
–942 –3,221
The accumulated amount of remeasurements recognised directly in Other comprehensive income (equity) is EUR –5,113 million (EUR –3,802 million after tax) as at 31 December 2013 (2012: EUR –3,894 million, EUR –2,860 million after tax).
Information on plan assets and defined benefit obligation per countryThe defined benefit obligation per country and the plan assets per country can be specified as follows:
Plan assets and defined benefit obligation per countryPlan assets Defined benefit obligation
2013 2012 2013 2012
The Netherlands 19,627 19,520 18,962 18,031United States 101 1,125 145 1,852United Kingdom 1,391 1,456 1,055 1,039Belgium 607 599 740 831Other countries 193 169 347 326
21,919 22,869 21,249 22,079
Determination of the net defined benefit asset/liabilityThe table provides the key assumptions used in the determination of the Net defined benefit asset/liability and the Other post-employment benefits.
Weighted averages of basic actuarial assumptions in annual % as at 31 DecemberNet defined benefit asset/liability Other post-employment benefits
2013 2012 2013 2012
Discount rates 3.70 3.70 2.90 2.30Mortality rates 0.80 0.80 0.80 0.80Expected rates of salary increases (excluding promotion increases) 2.10 2.30 2.00 2.00Indexation 2.00 1.80 2.00 2.00
The assumptions above are weighted by defined benefit obligations. The rates used for salary developments, interest discount factors and other adjustments reflect country-specific conditions.
The discount rate is the weighted average of the discount rates that are applied in different regions where the Group has defined benefit pension plans. The discount rate is based on a methodology that uses market yields on high quality corporate bonds of the specific regions with durations matching the pension liabilities as key input. Market yields of high quality corporate bonds reflect the yield on corporate bonds with an AA rating for durations where such yields are available. An extrapolation is applied in order to determine the yield to the longer durations for which no AA-rated corporate bonds are available. As a result of the limited availability of long-duration AA-rated corporate bonds, extrapolation is an important element of the determination of the discount rate.
The discount rate is approximately 3.7% on 31 December 2013 (2012: 3.7%). As disclosed in the 2012 Annual Accounts, discussions were ongoing, both in the industry and at the IASB, on the definition of the discount rate for defined benefit pension liabilities and ING would reconsider the methodology for setting the discount rate if and when appropriate. The discount rate used by ING remains based on AA-rated corporate bonds. During 2013, ING further refined its methodology to extrapolate the observable AA-rated corporate bond rates to the full duration of the defined benefit pension liability. The refined methodology and the resulting discount rate are more in line with observed market practices. The impact of the refinement of the extrapolation was an increase in the defined benefit obligation as at 31 December 2013 of approximately EUR 3.2 billion (EUR 2.4 billion after tax); this impact was recognised in Other comprehensive income (equity) in 2013.
In 2012, the discount rate changed from 5.3% to 3.7%, resulting in an increase of the defined benefit obligation of approximately EUR 6 billion.
185ING Group Annual Report 2013
1 Wh
o w
e are2 R
epo
rt of th
e Executive B
oard
3 Co
rpo
rate go
vernan
ce4 C
on
solid
ated an
nu
al accou
nts
5 Parent co
mp
any an
nu
al accou
nts
6 Oth
er info
rmatio
n7 A
dd
ition
al info
rmatio
n
ING_2013_deel2&3_v2A.indd 185 19/03/2014 19:11:56
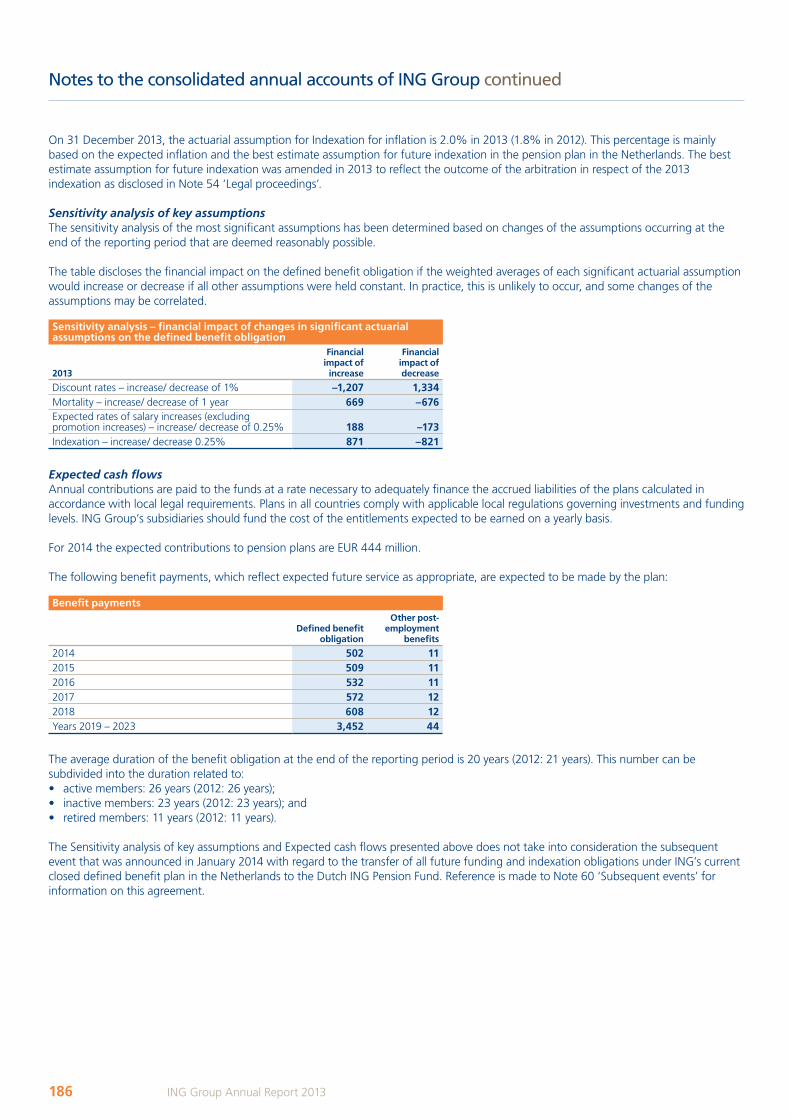
Notes to the consolidated annual accounts of ING Group continued
On 31 December 2013, the actuarial assumption for Indexation for inflation is 2.0% in 2013 (1.8% in 2012). This percentage is mainly based on the expected inflation and the best estimate assumption for future indexation in the pension plan in the Netherlands. The best estimate assumption for future indexation was amended in 2013 to reflect the outcome of the arbitration in respect of the 2013 indexation as disclosed in Note 54 ‘Legal proceedings’.
Sensitivity analysis of key assumptionsThe sensitivity analysis of the most significant assumptions has been determined based on changes of the assumptions occurring at the end of the reporting period that are deemed reasonably possible.
The table discloses the financial impact on the defined benefit obligation if the weighted averages of each significant actuarial assumption would increase or decrease if all other assumptions were held constant. In practice, this is unlikely to occur, and some changes of the assumptions may be correlated.
Sensitivity analysis – financial impact of changes in significant actuarial assumptions on the defined benefit obligation
2013
Financial impact of
increase
Financial impact of decrease
Discount rates – increase/ decrease of 1% –1,207 1,334Mortality – increase/ decrease of 1 year 669 –676Expected rates of salary increases (excluding promotion increases) – increase/ decrease of 0.25% 188 –173Indexation – increase/ decrease 0.25% 871 –821
Expected cash flowsAnnual contributions are paid to the funds at a rate necessary to adequately finance the accrued liabilities of the plans calculated in accordance with local legal requirements. Plans in all countries comply with applicable local regulations governing investments and funding levels. ING Group’s subsidiaries should fund the cost of the entitlements expected to be earned on a yearly basis.
For 2014 the expected contributions to pension plans are EUR 444 million.
The following benefit payments, which reflect expected future service as appropriate, are expected to be made by the plan:
Benefit payments
Defined benefit obligation
Other post-employment
benefits
2014 502 112015 509 112016 532 112017 572 122018 608 12Years 2019 – 2023 3,452 44
The average duration of the benefit obligation at the end of the reporting period is 20 years (2012: 21 years). This number can be subdivided into the duration related to:• active members: 26 years (2012: 26 years);• inactive members: 23 years (2012: 23 years); and • retired members: 11 years (2012: 11 years).
The Sensitivity analysis of key assumptions and Expected cash flows presented above does not take into consideration the subsequent event that was announced in January 2014 with regard to the transfer of all future funding and indexation obligations under ING’s current closed defined benefit plan in the Netherlands to the Dutch ING Pension Fund. Reference is made to Note 60 ‘Subsequent events’ for information on this agreement.
186 ING Group Annual Report 2013
ING_2013_deel2&3_v2A.indd 186 19/03/2014 19:11:57
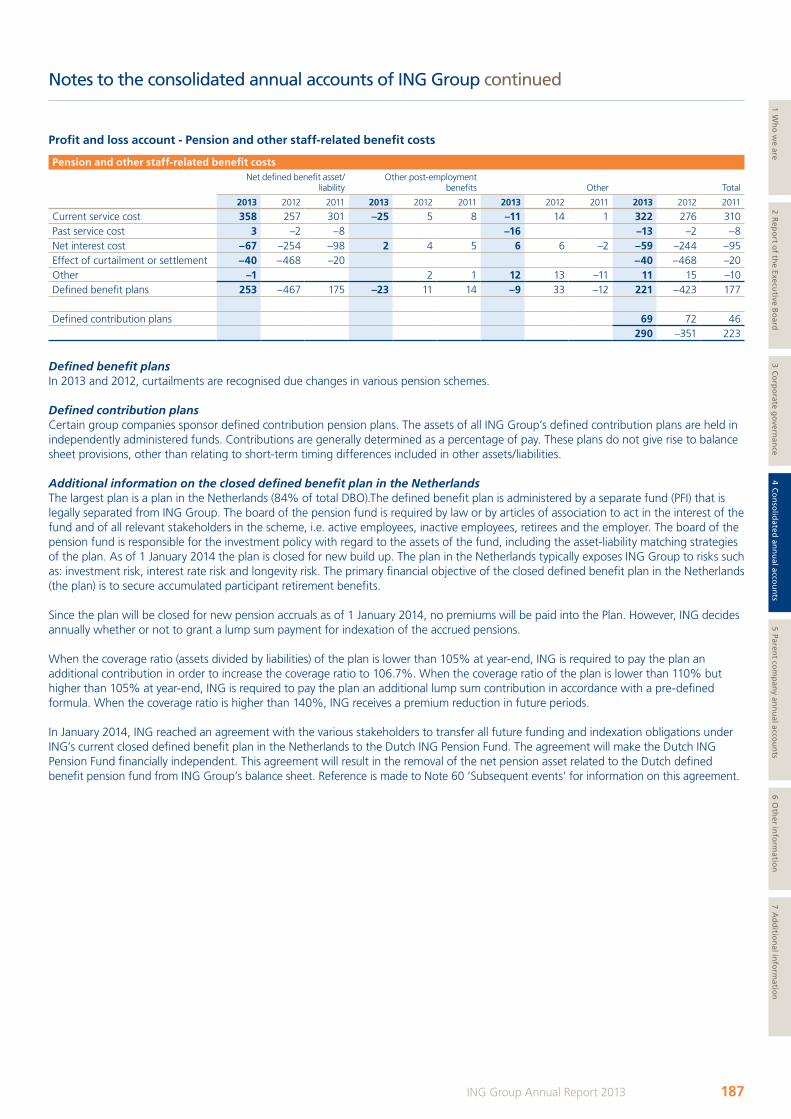
Notes to the consolidated annual accounts of ING Group continued
Profit and loss account - Pension and other staff-related benefit costs
Pension and other staff-related benefit costsNet defined benefit asset/
liabilityOther post-employment
benefits Other Total
2013 2012 2011 2013 2012 2011 2013 2012 2011 2013 2012 2011
Current service cost 358 257 301 –25 5 8 –11 14 1 322 276 310Past service cost 3 –2 –8 –16 –13 –2 –8Net interest cost –67 –254 –98 2 4 5 6 6 –2 –59 –244 –95Effect of curtailment or settlement –40 –468 –20 –40 –468 –20Other –1 2 1 12 13 –11 11 15 –10Defined benefit plans 253 –467 175 –23 11 14 –9 33 –12 221 –423 177
Defined contribution plans 69 72 46290 –351 223
Defined benefit plansIn 2013 and 2012, curtailments are recognised due changes in various pension schemes.
Defined contribution plansCertain group companies sponsor defined contribution pension plans. The assets of all ING Group’s defined contribution plans are held in independently administered funds. Contributions are generally determined as a percentage of pay. These plans do not give rise to balance sheet provisions, other than relating to short-term timing differences included in other assets/liabilities.
Additional information on the closed defined benefit plan in the NetherlandsThe largest plan is a plan in the Netherlands (84% of total DBO).The defined benefit plan is administered by a separate fund (PFI) that is legally separated from ING Group. The board of the pension fund is required by law or by articles of association to act in the interest of the fund and of all relevant stakeholders in the scheme, i.e. active employees, inactive employees, retirees and the employer. The board of the pension fund is responsible for the investment policy with regard to the assets of the fund, including the asset-liability matching strategies of the plan. As of 1 January 2014 the plan is closed for new build up. The plan in the Netherlands typically exposes ING Group to risks such as: investment risk, interest rate risk and longevity risk. The primary financial objective of the closed defined benefit plan in the Netherlands (the plan) is to secure accumulated participant retirement benefits.
Since the plan will be closed for new pension accruals as of 1 January 2014, no premiums will be paid into the Plan. However, ING decides annually whether or not to grant a lump sum payment for indexation of the accrued pensions.
When the coverage ratio (assets divided by liabilities) of the plan is lower than 105% at year-end, ING is required to pay the plan an additional contribution in order to increase the coverage ratio to 106.7%. When the coverage ratio of the plan is lower than 110% but higher than 105% at year-end, ING is required to pay the plan an additional lump sum contribution in accordance with a pre-defined formula. When the coverage ratio is higher than 140%, ING receives a premium reduction in future periods.
In January 2014, ING reached an agreement with the various stakeholders to transfer all future funding and indexation obligations under ING’s current closed defined benefit plan in the Netherlands to the Dutch ING Pension Fund. The agreement will make the Dutch ING Pension Fund financially independent. This agreement will result in the removal of the net pension asset related to the Dutch defined benefit pension fund from ING Group’s balance sheet. Reference is made to Note 60 ‘Subsequent events’ for information on this agreement.
187ING Group Annual Report 2013
1 Wh
o w
e are2 R
epo
rt of th
e Executive B
oard
3 Co
rpo
rate go
vernan
ce4 C
on
solid
ated an
nu
al accou
nts
5 Parent co
mp
any an
nu
al accou
nts
6 Oth
er info
rmatio
n7 A
dd
ition
al info
rmatio
n
ING_2013_deel2&3_v2A.indd 187 19/03/2014 19:11:57
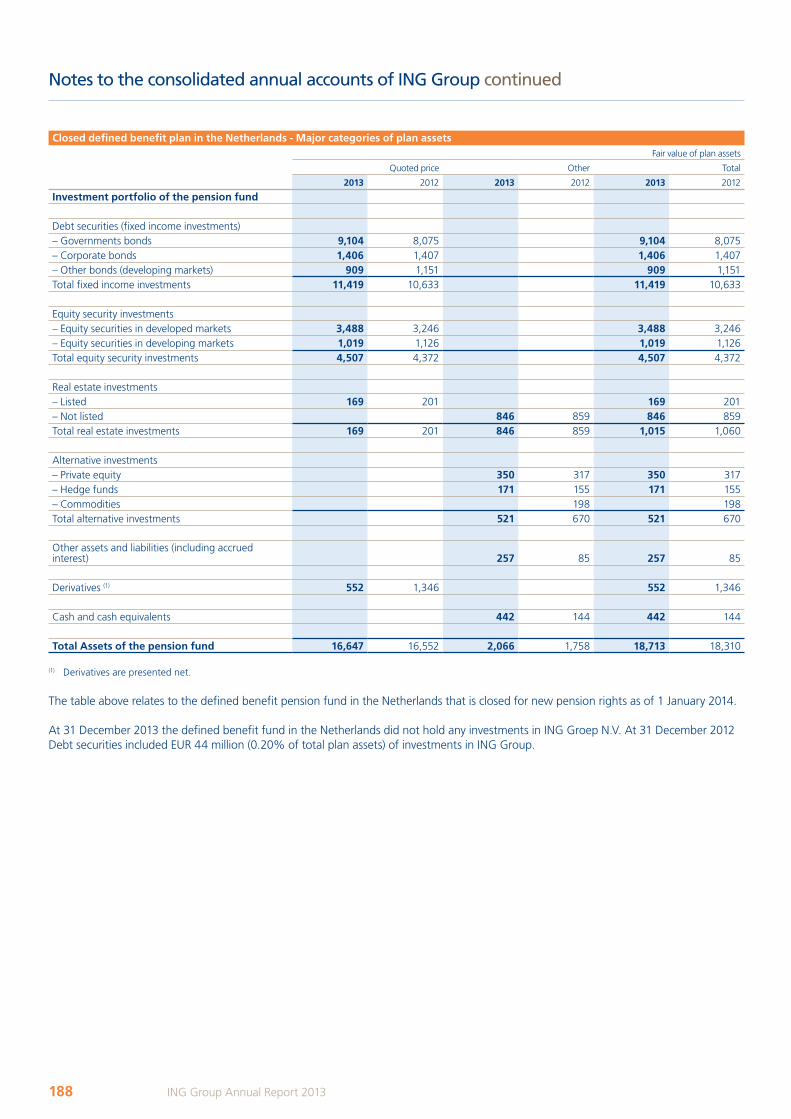
Notes to the consolidated annual accounts of ING Group continued
Closed defined benefit plan in the Netherlands - Major categories of plan assetsFair value of plan assets
Quoted price Other Total
2013 2012 2013 2012 2013 2012
Investment portfolio of the pension fund
Debt securities (fixed income investments)– Governments bonds 9,104 8,075 9,104 8,075– Corporate bonds 1,406 1,407 1,406 1,407– Other bonds (developing markets) 909 1,151 909 1,151Total fixed income investments 11,419 10,633 11,419 10,633
Equity security investments– Equity securities in developed markets 3,488 3,246 3,488 3,246– Equity securities in developing markets 1,019 1,126 1,019 1,126Total equity security investments 4,507 4,372 4,507 4,372
Real estate investments– Listed 169 201 169 201– Not listed 846 859 846 859Total real estate investments 169 201 846 859 1,015 1,060
Alternative investments– Private equity 350 317 350 317– Hedge funds 171 155 171 155– Commodities 198 198Total alternative investments 521 670 521 670
Other assets and liabilities (including accrued interest) 257 85 257 85
Derivatives (1) 552 1,346 552 1,346
Cash and cash equivalents 442 144 442 144
Total Assets of the pension fund 16,647 16,552 2,066 1,758 18,713 18,310
(1) Derivatives are presented net.
The table above relates to the defined benefit pension fund in the Netherlands that is closed for new pension rights as of 1 January 2014.
At 31 December 2013 the defined benefit fund in the Netherlands did not hold any investments in ING Groep N.V. At 31 December 2012 Debt securities included EUR 44 million (0.20% of total plan assets) of investments in ING Group.
188 ING Group Annual Report 2013
ING_2013_deel2&3_v2A.indd 188 19/03/2014 19:11:57
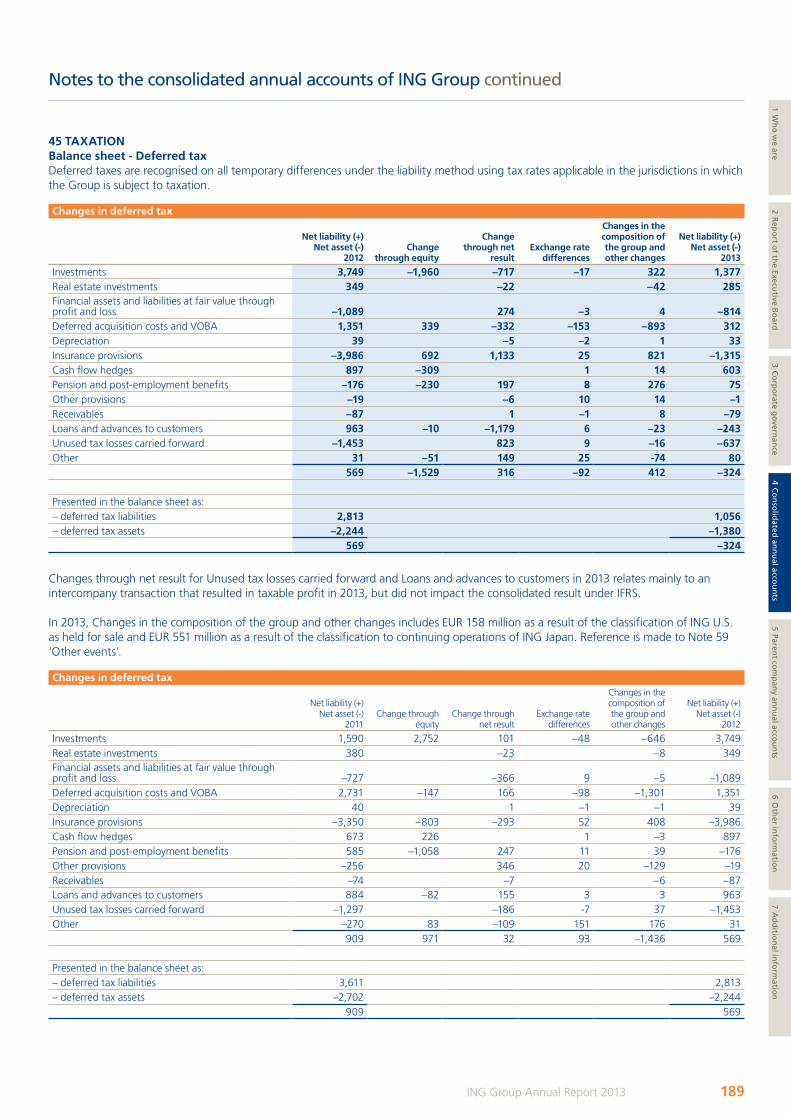
Notes to the consolidated annual accounts of ING Group continued
45 TAXATIONBalance sheet - Deferred taxDeferred taxes are recognised on all temporary differences under the liability method using tax rates applicable in the jurisdictions in which the Group is subject to taxation.
Changes in deferred tax
Net liability (+) Net asset (-)
2012Change
through equity
Change through net
resultExchange rate
differences
Changes in the composition of the group and other changes
Net liability (+) Net asset (-)
2013
Investments 3,749 –1,960 –717 –17 322 1,377Real estate investments 349 –22 –42 285Financial assets and liabilities at fair value through profit and loss –1,089 274 –3 4 –814Deferred acquisition costs and VOBA 1,351 339 –332 –153 –893 312Depreciation 39 –5 –2 1 33Insurance provisions –3,986 692 1,133 25 821 –1,315Cash flow hedges 897 –309 1 14 603Pension and post-employment benefits –176 –230 197 8 276 75Other provisions –19 –6 10 14 –1Receivables –87 1 –1 8 –79Loans and advances to customers 963 –10 –1,179 6 –23 –243Unused tax losses carried forward –1,453 823 9 –16 –637Other 31 –51 149 25 -74 80
569 –1,529 316 –92 412 –324
Presented in the balance sheet as:– deferred tax liabilities 2,813 1,056– deferred tax assets –2,244 –1,380
569 –324
Changes through net result for Unused tax losses carried forward and Loans and advances to customers in 2013 relates mainly to an intercompany transaction that resulted in taxable profit in 2013, but did not impact the consolidated result under IFRS.
In 2013, Changes in the composition of the group and other changes includes EUR 158 million as a result of the classification of ING U.S. as held for sale and EUR 551 million as a result of the classification to continuing operations of ING Japan. Reference is made to Note 59 ‘Other events’.
Changes in deferred tax
Net liability (+) Net asset (-)
2011Change through
equityChange through
net resultExchange rate
differences
Changes in the composition of the group and other changes
Net liability (+) Net asset (-)
2012
Investments 1,590 2,752 101 –48 –646 3,749Real estate investments 380 –23 –8 349Financial assets and liabilities at fair value through profit and loss –727 –366 9 –5 –1,089Deferred acquisition costs and VOBA 2,731 –147 166 –98 –1,301 1,351Depreciation 40 1 –1 –1 39Insurance provisions –3,350 –803 –293 52 408 –3,986Cash flow hedges 673 226 1 –3 897Pension and post-employment benefits 585 –1,058 247 11 39 –176Other provisions –256 346 20 –129 –19Receivables –74 –7 –6 –87Loans and advances to customers 884 –82 155 3 3 963Unused tax losses carried forward –1,297 –186 -7 37 –1,453Other –270 83 –109 151 176 31
909 971 32 93 –1,436 569
Presented in the balance sheet as:– deferred tax liabilities 3,611 2,813– deferred tax assets –2,702 –2,244
909 569
189ING Group Annual Report 2013
1 Wh
o w
e are2 R
epo
rt of th
e Executive B
oard
3 Co
rpo
rate go
vernan
ce4 C
on
solid
ated an
nu
al accou
nts
5 Parent co
mp
any an
nu
al accou
nts
6 Oth
er info
rmatio
n7 A
dd
ition
al info
rmatio
n
ING_2013_deel2&3_v2A.indd 189 19/03/2014 19:11:58
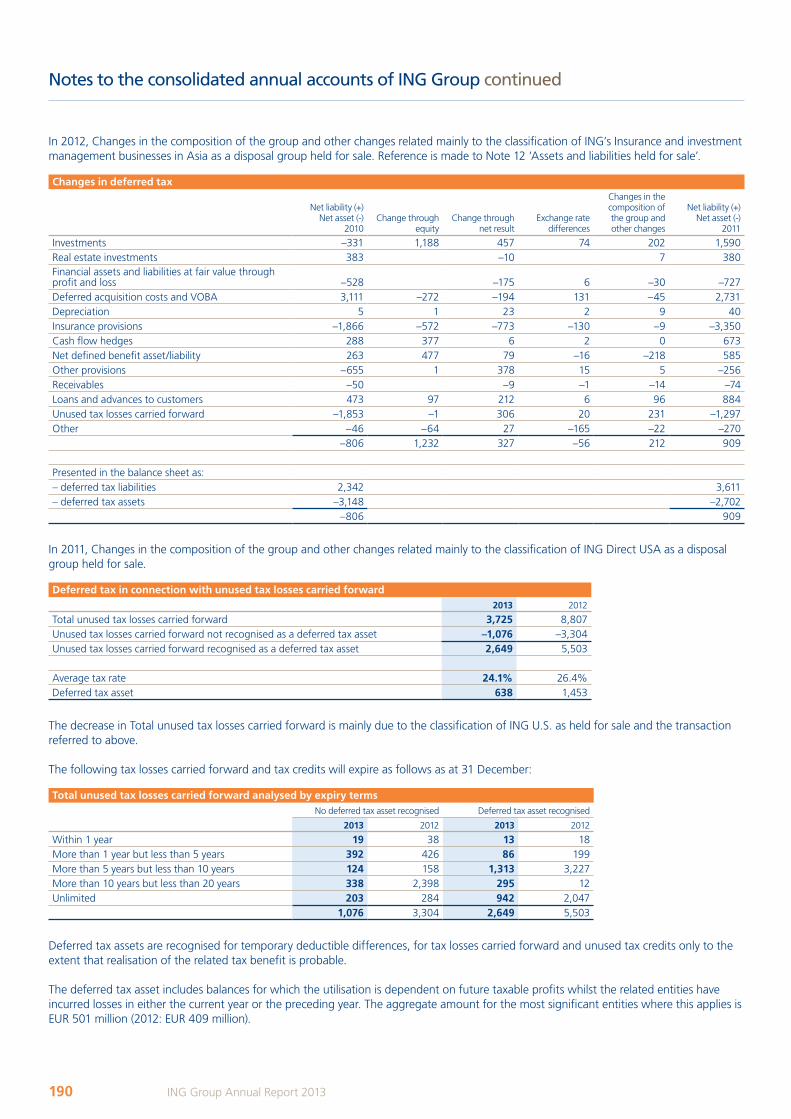
Notes to the consolidated annual accounts of ING Group continued
In 2012, Changes in the composition of the group and other changes related mainly to the classification of ING’s Insurance and investment management businesses in Asia as a disposal group held for sale. Reference is made to Note 12 ‘Assets and liabilities held for sale’.
Changes in deferred tax
Net liability (+) Net asset (-)
2010Change through
equityChange through
net resultExchange rate
differences
Changes in the composition of the group and other changes
Net liability (+) Net asset (-)
2011
Investments –331 1,188 457 74 202 1,590Real estate investments 383 –10 7 380Financial assets and liabilities at fair value through profit and loss –528 –175 6 –30 –727Deferred acquisition costs and VOBA 3,111 –272 –194 131 –45 2,731Depreciation 5 1 23 2 9 40Insurance provisions –1,866 –572 –773 –130 –9 –3,350Cash flow hedges 288 377 6 2 0 673Net defined benefit asset/liability 263 477 79 –16 –218 585Other provisions –655 1 378 15 5 –256Receivables –50 –9 –1 –14 –74Loans and advances to customers 473 97 212 6 96 884Unused tax losses carried forward –1,853 –1 306 20 231 –1,297Other –46 –64 27 –165 –22 –270
–806 1,232 327 –56 212 909
Presented in the balance sheet as:– deferred tax liabilities 2,342 3,611– deferred tax assets –3,148 –2,702
–806 909
In 2011, Changes in the composition of the group and other changes related mainly to the classification of ING Direct USA as a disposal group held for sale.
Deferred tax in connection with unused tax losses carried forward2013 2012
Total unused tax losses carried forward 3,725 8,807Unused tax losses carried forward not recognised as a deferred tax asset –1,076 –3,304Unused tax losses carried forward recognised as a deferred tax asset 2,649 5,503
Average tax rate 24.1% 26.4%Deferred tax asset 638 1,453
The decrease in Total unused tax losses carried forward is mainly due to the classification of ING U.S. as held for sale and the transaction referred to above.
The following tax losses carried forward and tax credits will expire as follows as at 31 December:
Total unused tax losses carried forward analysed by expiry termsNo deferred tax asset recognised Deferred tax asset recognised
2013 2012 2013 2012
Within 1 year 19 38 13 18More than 1 year but less than 5 years 392 426 86 199More than 5 years but less than 10 years 124 158 1,313 3,227More than 10 years but less than 20 years 338 2,398 295 12Unlimited 203 284 942 2,047
1,076 3,304 2,649 5,503
Deferred tax assets are recognised for temporary deductible differences, for tax losses carried forward and unused tax credits only to the extent that realisation of the related tax benefit is probable.
The deferred tax asset includes balances for which the utilisation is dependent on future taxable profits whilst the related entities have incurred losses in either the current year or the preceding year. The aggregate amount for the most significant entities where this applies is EUR 501 million (2012: EUR 409 million).
190 ING Group Annual Report 2013
ING_2013_deel2&3_v2A.indd 190 19/03/2014 19:11:58
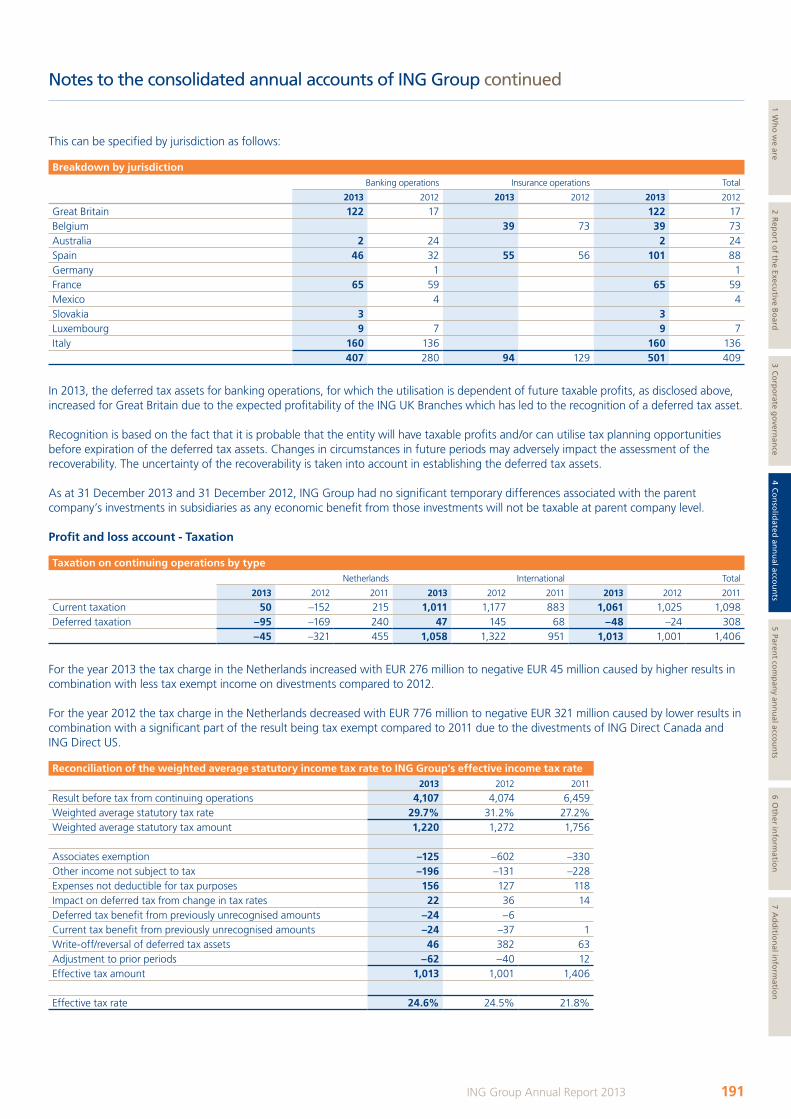
Notes to the consolidated annual accounts of ING Group continued
This can be specified by jurisdiction as follows:
Breakdown by jurisdictionBanking operations Insurance operations Total
2013 2012 2013 2012 2013 2012
Great Britain 122 17 122 17Belgium 39 73 39 73Australia 2 24 2 24Spain 46 32 55 56 101 88Germany 1 1France 65 59 65 59Mexico 4 4Slovakia 3 3Luxembourg 9 7 9 7Italy 160 136 160 136
407 280 94 129 501 409
In 2013, the deferred tax assets for banking operations, for which the utilisation is dependent of future taxable profits, as disclosed above, increased for Great Britain due to the expected profitability of the ING UK Branches which has led to the recognition of a deferred tax asset.
Recognition is based on the fact that it is probable that the entity will have taxable profits and/or can utilise tax planning opportunities before expiration of the deferred tax assets. Changes in circumstances in future periods may adversely impact the assessment of the recoverability. The uncertainty of the recoverability is taken into account in establishing the deferred tax assets.
As at 31 December 2013 and 31 December 2012, ING Group had no significant temporary differences associated with the parent company’s investments in subsidiaries as any economic benefit from those investments will not be taxable at parent company level.
Profit and loss account - Taxation
Taxation on continuing operations by type Netherlands International Total
2013 2012 2011 2013 2012 2011 2013 2012 2011
Current taxation 50 –152 215 1,011 1,177 883 1,061 1,025 1,098Deferred taxation –95 –169 240 47 145 68 –48 –24 308
–45 –321 455 1,058 1,322 951 1,013 1,001 1,406
For the year 2013 the tax charge in the Netherlands increased with EUR 276 million to negative EUR 45 million caused by higher results in combination with less tax exempt income on divestments compared to 2012.
For the year 2012 the tax charge in the Netherlands decreased with EUR 776 million to negative EUR 321 million caused by lower results in combination with a significant part of the result being tax exempt compared to 2011 due to the divestments of ING Direct Canada and ING Direct US.
Reconciliation of the weighted average statutory income tax rate to ING Group’s effective income tax rate2013 2012 2011
Result before tax from continuing operations 4,107 4,074 6,459Weighted average statutory tax rate 29.7% 31.2% 27.2%Weighted average statutory tax amount 1,220 1,272 1,756
Associates exemption –125 –602 –330Other income not subject to tax –196 –131 –228Expenses not deductible for tax purposes 156 127 118Impact on deferred tax from change in tax rates 22 36 14Deferred tax benefit from previously unrecognised amounts –24 –6Current tax benefit from previously unrecognised amounts –24 –37 1Write-off/reversal of deferred tax assets 46 382 63Adjustment to prior periods –62 –40 12Effective tax amount 1,013 1,001 1,406
Effective tax rate 24.6% 24.5% 21.8%
191ING Group Annual Report 2013
1 Wh
o w
e are2 R
epo
rt of th
e Executive B
oard
3 Co
rpo
rate go
vernan
ce4 C
on
solid
ated an
nu
al accou
nts
5 Parent co
mp
any an
nu
al accou
nts
6 Oth
er info
rmatio
n7 A
dd
ition
al info
rmatio
n
ING_2013_deel2&3_v2A.indd 191 19/03/2014 19:11:58
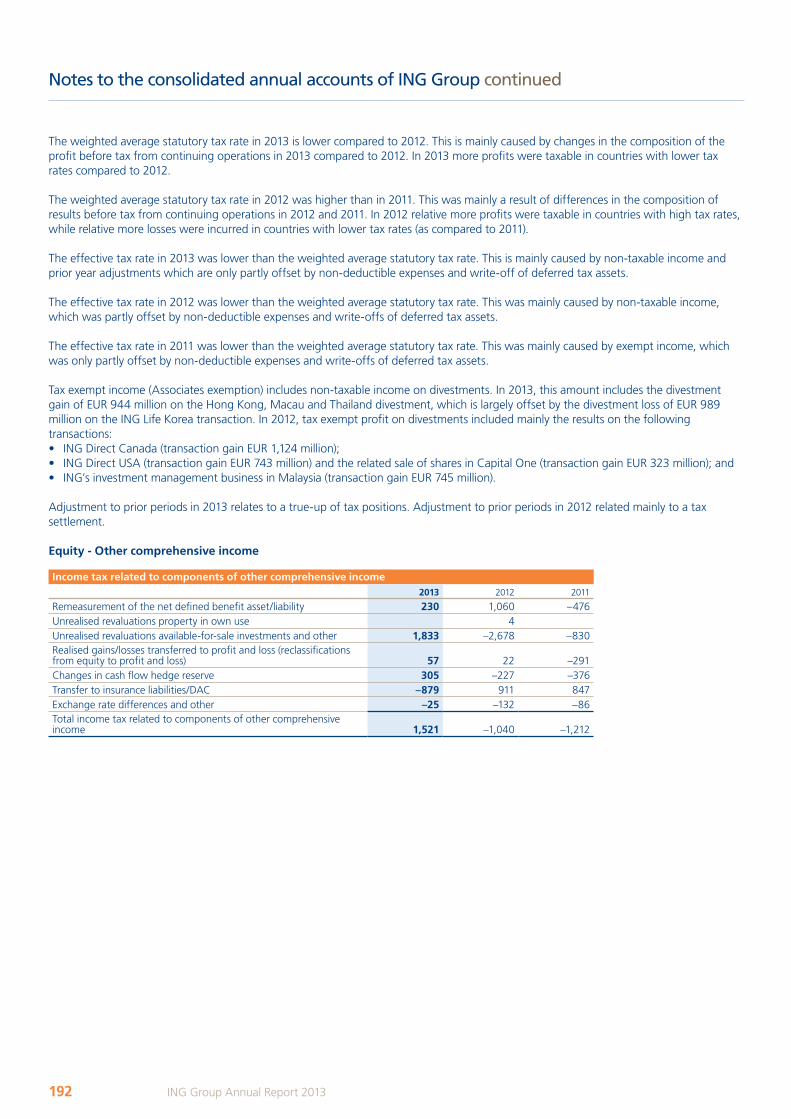
Notes to the consolidated annual accounts of ING Group continued
The weighted average statutory tax rate in 2013 is lower compared to 2012. This is mainly caused by changes in the composition of the profit before tax from continuing operations in 2013 compared to 2012. In 2013 more profits were taxable in countries with lower tax rates compared to 2012.
The weighted average statutory tax rate in 2012 was higher than in 2011. This was mainly a result of differences in the composition of results before tax from continuing operations in 2012 and 2011. In 2012 relative more profits were taxable in countries with high tax rates, while relative more losses were incurred in countries with lower tax rates (as compared to 2011).
The effective tax rate in 2013 was lower than the weighted average statutory tax rate. This is mainly caused by non-taxable income and prior year adjustments which are only partly offset by non-deductible expenses and write-off of deferred tax assets.
The effective tax rate in 2012 was lower than the weighted average statutory tax rate. This was mainly caused by non-taxable income, which was partly offset by non-deductible expenses and write-offs of deferred tax assets.
The effective tax rate in 2011 was lower than the weighted average statutory tax rate. This was mainly caused by exempt income, which was only partly offset by non-deductible expenses and write-offs of deferred tax assets.
Tax exempt income (Associates exemption) includes non-taxable income on divestments. In 2013, this amount includes the divestment gain of EUR 944 million on the Hong Kong, Macau and Thailand divestment, which is largely offset by the divestment loss of EUR 989 million on the ING Life Korea transaction. In 2012, tax exempt profit on divestments included mainly the results on the following transactions:• ING Direct Canada (transaction gain EUR 1,124 million);• ING Direct USA (transaction gain EUR 743 million) and the related sale of shares in Capital One (transaction gain EUR 323 million); and • ING’s investment management business in Malaysia (transaction gain EUR 745 million).
Adjustment to prior periods in 2013 relates to a true-up of tax positions. Adjustment to prior periods in 2012 related mainly to a tax settlement.
Equity - Other comprehensive income
Income tax related to components of other comprehensive income2013 2012 2011
Remeasurement of the net defined benefit asset/liability 230 1,060 –476Unrealised revaluations property in own use 4Unrealised revaluations available-for-sale investments and other 1,833 –2,678 –830Realised gains/losses transferred to profit and loss (reclassifications from equity to profit and loss) 57 22 –291Changes in cash flow hedge reserve 305 –227 –376Transfer to insurance liabilities/DAC –879 911 847Exchange rate differences and other –25 –132 –86Total income tax related to components of other comprehensive income 1,521 –1,040 –1,212
192 ING Group Annual Report 2013
ING_2013_deel2&3_v2A.indd 192 19/03/2014 19:11:59
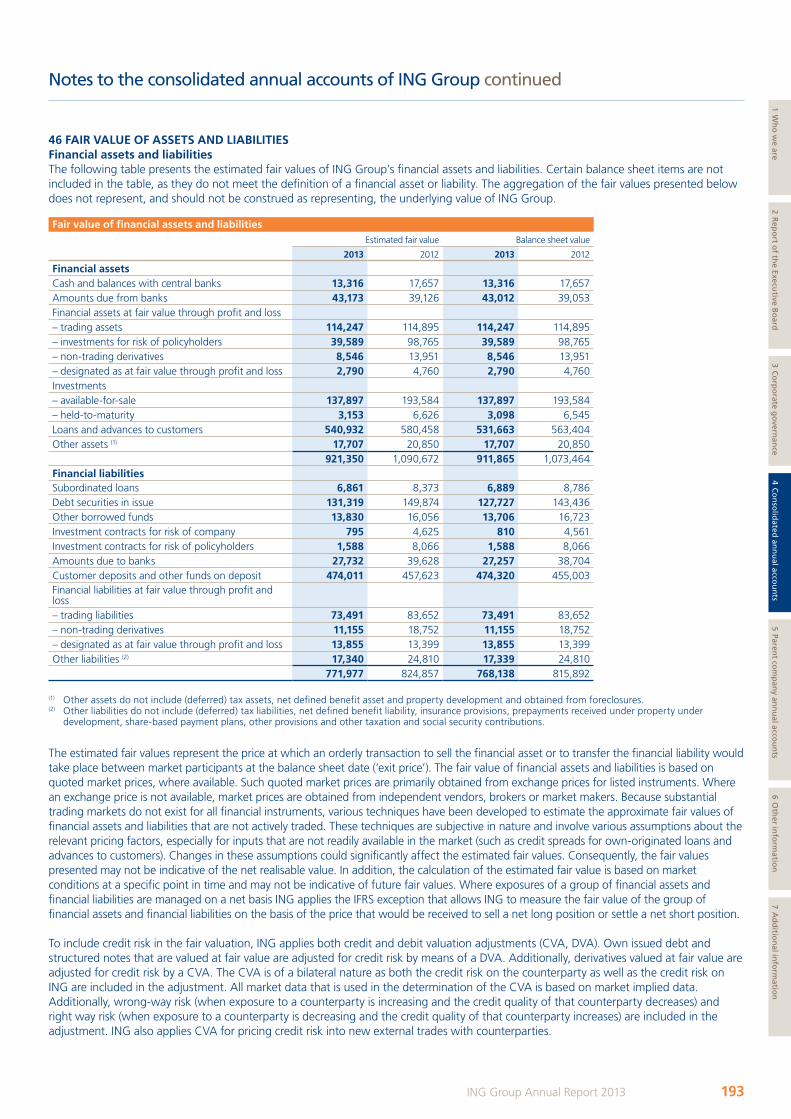
Notes to the consolidated annual accounts of ING Group continued
46 FAIR VALUE OF ASSETS AND LIABILITIESFinancial assets and liabilities The following table presents the estimated fair values of ING Group’s financial assets and liabilities. Certain balance sheet items are not included in the table, as they do not meet the definition of a financial asset or liability. The aggregation of the fair values presented below does not represent, and should not be construed as representing, the underlying value of ING Group.
Fair value of financial assets and liabilitiesEstimated fair value Balance sheet value
2013 2012 2013 2012
Financial assetsCash and balances with central banks 13,316 17,657 13,316 17,657Amounts due from banks 43,173 39,126 43,012 39,053Financial assets at fair value through profit and loss– trading assets 114,247 114,895 114,247 114,895– investments for risk of policyholders 39,589 98,765 39,589 98,765– non-trading derivatives 8,546 13,951 8,546 13,951– designated as at fair value through profit and loss 2,790 4,760 2,790 4,760Investments– available-for-sale 137,897 193,584 137,897 193,584– held-to-maturity 3,153 6,626 3,098 6,545Loans and advances to customers 540,932 580,458 531,663 563,404Other assets (1) 17,707 20,850 17,707 20,850
921,350 1,090,672 911,865 1,073,464Financial liabilitiesSubordinated loans 6,861 8,373 6,889 8,786Debt securities in issue 131,319 149,874 127,727 143,436Other borrowed funds 13,830 16,056 13,706 16,723Investment contracts for risk of company 795 4,625 810 4,561Investment contracts for risk of policyholders 1,588 8,066 1,588 8,066Amounts due to banks 27,732 39,628 27,257 38,704Customer deposits and other funds on deposit 474,011 457,623 474,320 455,003Financial liabilities at fair value through profit and loss– trading liabilities 73,491 83,652 73,491 83,652– non-trading derivatives 11,155 18,752 11,155 18,752– designated as at fair value through profit and loss 13,855 13,399 13,855 13,399Other liabilities (2) 17,340 24,810 17,339 24,810
771,977 824,857 768,138 815,892
(1) Other assets do not include (deferred) tax assets, net defined benefit asset and property development and obtained from foreclosures.(2) Other liabilities do not include (deferred) tax liabilities, net defined benefit liability, insurance provisions, prepayments received under property under
development, share-based payment plans, other provisions and other taxation and social security contributions.
The estimated fair values represent the price at which an orderly transaction to sell the financial asset or to transfer the financial liability would take place between market participants at the balance sheet date (‘exit price’). The fair value of financial assets and liabilities is based on quoted market prices, where available. Such quoted market prices are primarily obtained from exchange prices for listed instruments. Where an exchange price is not available, market prices are obtained from independent vendors, brokers or market makers. Because substantial trading markets do not exist for all financial instruments, various techniques have been developed to estimate the approximate fair values of financial assets and liabilities that are not actively traded. These techniques are subjective in nature and involve various assumptions about the relevant pricing factors, especially for inputs that are not readily available in the market (such as credit spreads for own-originated loans and advances to customers). Changes in these assumptions could significantly affect the estimated fair values. Consequently, the fair values presented may not be indicative of the net realisable value. In addition, the calculation of the estimated fair value is based on market conditions at a specific point in time and may not be indicative of future fair values. Where exposures of a group of financial assets and financial liabilities are managed on a net basis ING applies the IFRS exception that allows ING to measure the fair value of the group of financial assets and financial liabilities on the basis of the price that would be received to sell a net long position or settle a net short position.
To include credit risk in the fair valuation, ING applies both credit and debit valuation adjustments (CVA, DVA). Own issued debt and structured notes that are valued at fair value are adjusted for credit risk by means of a DVA. Additionally, derivatives valued at fair value are adjusted for credit risk by a CVA. The CVA is of a bilateral nature as both the credit risk on the counterparty as well as the credit risk on ING are included in the adjustment. All market data that is used in the determination of the CVA is based on market implied data. Additionally, wrong-way risk (when exposure to a counterparty is increasing and the credit quality of that counterparty decreases) and right way risk (when exposure to a counterparty is decreasing and the credit quality of that counterparty increases) are included in the adjustment. ING also applies CVA for pricing credit risk into new external trades with counterparties.
193ING Group Annual Report 2013
1 Wh
o w
e are2 R
epo
rt of th
e Executive B
oard
3 Co
rpo
rate go
vernan
ce4 C
on
solid
ated an
nu
al accou
nts
5 Parent co
mp
any an
nu
al accou
nts
6 Oth
er info
rmatio
n7 A
dd
ition
al info
rmatio
n
ING_2013_deel2&3_v2A.indd 193 19/03/2014 19:11:59
Notes to the consolidated annual accounts of ING Group continued
The following methods and assumptions were used by ING Group to estimate the fair value of the financial instruments:
Financial assetsCash and balances with central banksThe carrying amount of cash approximates its fair value.
Amounts due from banksThe fair values of receivables from banks are generally based on quoted market prices or, if unquoted, on estimates based on discounting future cash flows using available market interest rates offered for receivables with similar characteristics, similar to Loans and advances to customers described below.
Financial assets at fair value through profit and loss and InvestmentsDerivativesDerivatives contracts can either be exchange-traded or over the counter (OTC). The fair value of exchange-traded derivatives is determined using quoted market prices in an active market and those derivatives are classified in Level 1 of the fair value hierarchy. For those instruments not actively traded, fair values are estimated based on valuation techniques. OTC derivatives and derivatives trading in an inactive market are valued using valuation techniques because quoted market prices in an active market are not available for such instruments. The valuation techniques and inputs depend on the type of derivative and the nature of the underlying instruments. The principal techniques used to value these instruments are based on discounted cash flows, Black-Scholes option models and Monte Carlo simulation. These valuation models calculate the present value of expected future cash flows, based on ‘no-arbitrage’ principles. These models are commonly used in the financial industry. Inputs to valuation models are determined from observable market data where possible. Certain inputs may not be observable in the market directly, but can be determined from observable prices via valuation model calibration procedures. The inputs used include prices available from exchanges, dealers, brokers or providers of pricing, yield curves, credit spreads, default rates, recovery rates, dividend rates, volatility of underlying interest rates, equity prices and foreign currency exchange rates. These inputs are determined with reference to quoted prices, recently executed trades, independent market quotes and consensus data, where available.
Equity securitiesThe fair values of publicly traded equity securities are based on quoted market prices when available. Where no quoted market prices are available, fair value is determined based on quoted prices for similar securities or other valuation techniques.
The fair value of private equity is based on quoted market prices, if available. In the absence of quoted prices in an active market, fair value is estimated on the basis of an analysis of the investee’s financial position and results, risk profile, prospects, price, earnings comparisons and revenue multiples and by reference to market valuations for similar entities quoted in an active market.
Debt securitiesFair values for debt securities are based on quoted market prices, where available. Quoted market prices may be obtained from an exchange, dealer, broker, industry group, pricing service or regulatory service. If quoted prices in an active market are not available, fair value is based on an analysis of available market inputs, which may include values obtained from one or more pricing services or by a valuation technique that discounts expected future cash flows using a market interest rate curves, referenced credit spreads, maturity of the investment and estimated prepayment rates where applicable.
Loans and receivablesReference is made to Loans and advances to customers below.
Loans and advances to customersFor loans and advances that are repriced frequently and have had no significant changes in credit risk, carrying amounts represent a reasonable estimate of fair values. The fair values of other loans are estimated by discounting expected future cash flows using interest rates offered for similar loans to borrowers with similar credit ratings.
The fair values of mortgage loans are estimated by taking into account prepayment behaviour and discounting future cash flows using interest rates currently being offered for similar loans to borrowers with similar credit ratings. The fair values of fixed rate policy loans are estimated by discounting cash flows at the interest rates charged on policy loans of similar policies currently being issued. Loans with similar characteristics are aggregated for calculations purposes. The carrying values of variable rate policy loans approximate their fair value.
Other assetsThe other assets are stated at their carrying value which is not significantly different from their fair value.
194 ING Group Annual Report 2013
ING_2013_deel2&3_v2A.indd 194 19/03/2014 19:11:59
Notes to the consolidated annual accounts of ING Group continued
Financial liabilitiesSubordinated loansThe fair value of the subordinated loans is estimated using discounted cash flows based on interest rates and credit spreads that apply to similar instruments.
Investment contractsFor investment contracts for risk of the company the fair values have been estimated using a discounted cash flow approach based on interest rates currently being offered for similar contracts with maturities consistent with those remaining for the contracts being valued. For investment contracts for risk of policyholders the fair value generally equals the fair value of the underlying assets.
Amounts due to banksThe fair values of payables to banks are generally based on quoted market prices or, if not available, on estimates based on discounting future cash flows using available market interest rates and credit spreads for payables to banks with similar characteristics.
Customer deposits and other funds on depositThe carrying values of customer deposits and other funds on deposit with no stated maturity approximate their fair values. The fair values of deposits with stated maturities have been estimated based on discounting future cash flows using the interest rates currently applicable to deposits of similar maturities.
Financial liabilities at fair value through profit and lossThe fair values of securities in the trading portfolio and other liabilities at fair value through profit and loss are based on quoted market prices, where available. For those securities not actively traded, fair values are estimated based on internal discounted cash flow valuation techniques using interest rates and credit spreads that apply to similar instruments. Reference is made to Financial assets at fair value through profit and loss above.
Debt securities in issue and other borrowed fundsThe fair value of debt securities in issue and other borrowed funds is generally based on quoted market prices or, if not available, on estimated prices by discounting expected future cash flows using a current market interest rate and credit spreads applicable to the yield, credit quality and maturity.
Other liabilitiesThe other liabilities are stated at their carrying value which is not significantly different from their fair value.
Fair value hierarchy ING Group has categorised its financial instruments that are either measured in the balance sheet at fair value or of which the fair value is disclosed, into a three level hierarchy based on the priority of the inputs to the valuation. The fair value hierarchy gives the highest priority to (unadjusted) quoted prices in active markets for identical assets or liabilities and the lowest priority to valuation techniques supported by unobservable inputs. An active market for the asset or liability is a market in which transactions for the asset or liability occur with sufficient frequency and volume to provide reliable pricing information on an ongoing basis. The fair value hierarchy consists of three levels, depending upon whether fair values were determined based on (unadjusted) quoted prices in an active market (Level 1), valuation techniques with observable inputs (Level 2) or valuation techniques that incorporate inputs which are unobservable and which have a more than insignificant impact on the fair value of the instrument (Level 3). Financial assets in Level 3 include for example illiquid debt securities, complex OTC and credit derivatives, certain complex loans (for which current market information about similar assets to use as observable, corroborated data for all significant inputs into a valuation model is not available), private equity instruments and investments in real estate funds.
Observable inputs reflect market data obtained from independent sources. Unobservable inputs are inputs which are based on the Group’s own assumptions about the factors that market participants would use in pricing an asset or liability, developed based on the best information available in the circumstances. Unobservable inputs may include volatility, correlation, spreads to discount rates, default rates and recovery rates, prepayment rates and certain credit spreads. Transfers into and transfers out of fair value hierarchy levels are recognised as of the date of the event or change in circumstances that caused the transfer.
195ING Group Annual Report 2013
1 Wh
o w
e are2 R
epo
rt of th
e Executive B
oard
3 Co
rpo
rate go
vernan
ce4 C
on
solid
ated an
nu
al accou
nts
5 Parent co
mp
any an
nu
al accou
nts
6 Oth
er info
rmatio
n7 A
dd
ition
al info
rmatio
n
ING_2013_deel2&3_v2A.indd 195 19/03/2014 19:11:59
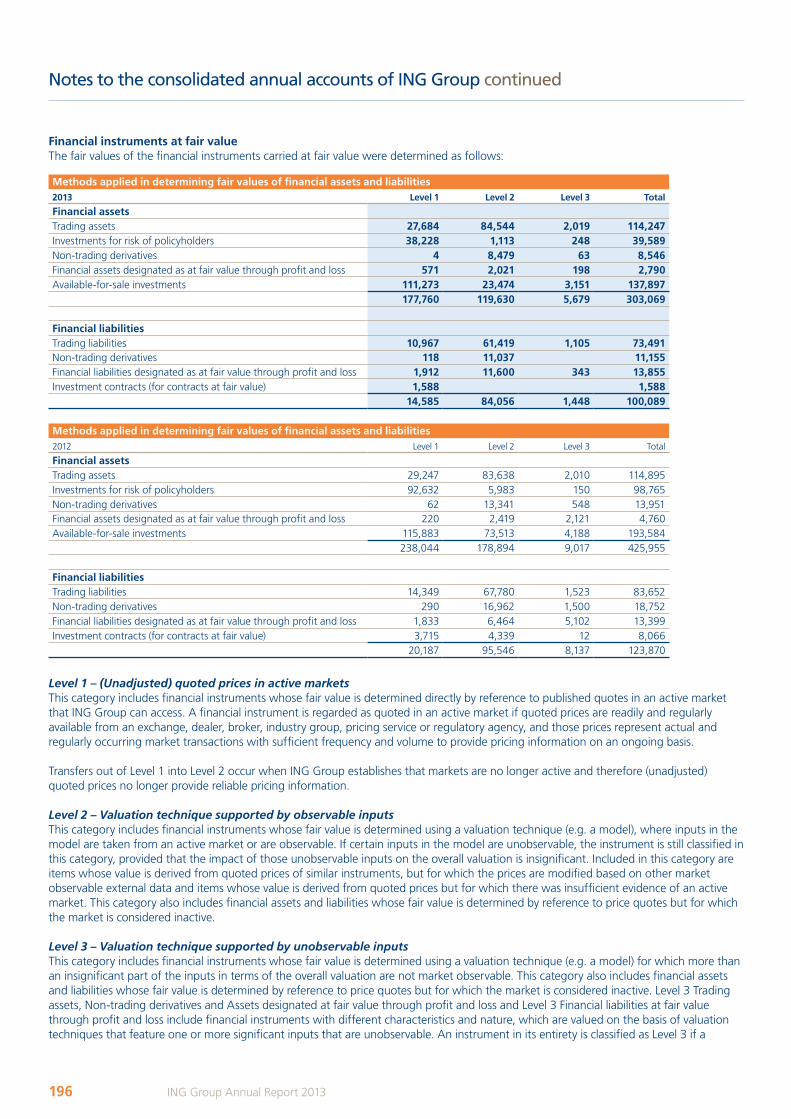
Notes to the consolidated annual accounts of ING Group continued
Financial instruments at fair valueThe fair values of the financial instruments carried at fair value were determined as follows:
Methods applied in determining fair values of financial assets and liabilities2013 Level 1 Level 2 Level 3 Total
Financial assetsTrading assets 27,684 84,544 2,019 114,247Investments for risk of policyholders 38,228 1,113 248 39,589Non-trading derivatives 4 8,479 63 8,546Financial assets designated as at fair value through profit and loss 571 2,021 198 2,790Available-for-sale investments 111,273 23,474 3,151 137,897
177,760 119,630 5,679 303,069
Financial liabilitiesTrading liabilities 10,967 61,419 1,105 73,491Non-trading derivatives 118 11,037 11,155Financial liabilities designated as at fair value through profit and loss 1,912 11,600 343 13,855Investment contracts (for contracts at fair value) 1,588 1,588
14,585 84,056 1,448 100,089
Methods applied in determining fair values of financial assets and liabilities2012 Level 1 Level 2 Level 3 Total
Financial assetsTrading assets 29,247 83,638 2,010 114,895Investments for risk of policyholders 92,632 5,983 150 98,765Non-trading derivatives 62 13,341 548 13,951Financial assets designated as at fair value through profit and loss 220 2,419 2,121 4,760Available-for-sale investments 115,883 73,513 4,188 193,584
238,044 178,894 9,017 425,955
Financial liabilitiesTrading liabilities 14,349 67,780 1,523 83,652Non-trading derivatives 290 16,962 1,500 18,752Financial liabilities designated as at fair value through profit and loss 1,833 6,464 5,102 13,399Investment contracts (for contracts at fair value) 3,715 4,339 12 8,066
20,187 95,546 8,137 123,870
Level 1 – (Unadjusted) quoted prices in active marketsThis category includes financial instruments whose fair value is determined directly by reference to published quotes in an active market that ING Group can access. A financial instrument is regarded as quoted in an active market if quoted prices are readily and regularly available from an exchange, dealer, broker, industry group, pricing service or regulatory agency, and those prices represent actual and regularly occurring market transactions with sufficient frequency and volume to provide pricing information on an ongoing basis.
Transfers out of Level 1 into Level 2 occur when ING Group establishes that markets are no longer active and therefore (unadjusted) quoted prices no longer provide reliable pricing information.
Level 2 – Valuation technique supported by observable inputsThis category includes financial instruments whose fair value is determined using a valuation technique (e.g. a model), where inputs in the model are taken from an active market or are observable. If certain inputs in the model are unobservable, the instrument is still classified in this category, provided that the impact of those unobservable inputs on the overall valuation is insignificant. Included in this category are items whose value is derived from quoted prices of similar instruments, but for which the prices are modified based on other market observable external data and items whose value is derived from quoted prices but for which there was insufficient evidence of an active market. This category also includes financial assets and liabilities whose fair value is determined by reference to price quotes but for which the market is considered inactive.
Level 3 – Valuation technique supported by unobservable inputsThis category includes financial instruments whose fair value is determined using a valuation technique (e.g. a model) for which more than an insignificant part of the inputs in terms of the overall valuation are not market observable. This category also includes financial assets and liabilities whose fair value is determined by reference to price quotes but for which the market is considered inactive. Level 3 Trading assets, Non-trading derivatives and Assets designated at fair value through profit and loss and Level 3 Financial liabilities at fair value through profit and loss include financial instruments with different characteristics and nature, which are valued on the basis of valuation techniques that feature one or more significant inputs that are unobservable. An instrument in its entirety is classified as Level 3 if a
196 ING Group Annual Report 2013
ING_2013_deel2&3_v2A.indd 196 19/03/2014 19:11:59

Notes to the consolidated annual accounts of ING Group continued
significant portion of the instrument’s fair value is driven by unobservable inputs. Unobservable in this context means that there is little or no current market data available from which the price at which an arm’s length transaction would be likely to occur can be derived. More details on the determination of the fair value of these instruments is included above under ‘Derivatives’, ‘Debt securities’ and ‘Loans and advances to customers’.
Changes in Level 3 Financial assets
2013 Trading assets
Investments for risk of
policy-holdersNon-trading
derivatives
Financial assets designated as
at fair value through profit
and loss
Available- for-sale
investments Total
Opening balance 2,010 150 549 2,121 4,188 9,018Amounts recognised in the profit and loss account during the year 146 9 409 –253 –103 208Revaluation recognised in equity during the year –34 –34Purchase of assets 558 154 334 263 672 1,981Sale of assets –704 –52 –322 –562 –575 –2,215Maturity/settlement –242 –20 –465 –227 –954Transfers into Level 3 264 2 86 407 759Transfers out of Level 3 –158 –9 –832 –129 –165 –1,293Exchange rate differences 38 –29 9Changes in the composition of the group and other changes 145 –6 –55 –901 –983 –1,800Closing balance 2,019 248 63 198 3,151 5,679
In 2013, Changes in the composition of the group and other changes includes EUR –1,654 million as a result of the classification of ING U.S. as held for sale and nil as a result of the classification to continuing operations of ING Japan. Reference is made to Note 59 ‘Other events’.
Main changes in fair value hierarchy in 2013The decrease in Available-for-sale investments (level 2) reflects the presentation of ING U.S. as held for sale.
There were no significant transfers between Level 1 and 2.
Changes in Level 3 Financial assets
2012 Trading assets
Investments for risk of
policy-holdersNon-trading
derivatives
Financial assets designated as
at fair value through profit
and loss
Available- for-sale
investments Total
Opening balance 1,383 140 960 2,886 5,724 11,093Amounts recognised in the profit and loss account during the year 192 2 –375 –246 –50 –477Revaluation recognised in equity during the year 14 14Purchase of assets 1,143 83 170 815 507 2,718Sale of assets –330 –15 –195 –1,021 –661 –2,222Maturity/settlement –313 –2 –378 –1,096 –1,789Transfers into Level 3 135 67 11 1 487 701Transfers out of Level 3 –202 –6 –21 –2 –462 –693Exchange rate differences –1 –5 –2 –18 –21 –47Changes in the composition of the group and other changes 3 –116 2 84 –254 –281Closing balance 2,010 150 548 2,121 4,188 9,018
Main changes in fair value hierarchy in 2012There were no significant transfers between Level 1 and 2.
197ING Group Annual Report 2013
1 Wh
o w
e are2 R
epo
rt of th
e Executive B
oard
3 Co
rpo
rate go
vernan
ce4 C
on
solid
ated an
nu
al accou
nts
5 Parent co
mp
any an
nu
al accou
nts
6 Oth
er info
rmatio
n7 A
dd
ition
al info
rmatio
n
ING_2013_deel2&3_v2A.indd 197 19/03/2014 19:12:00
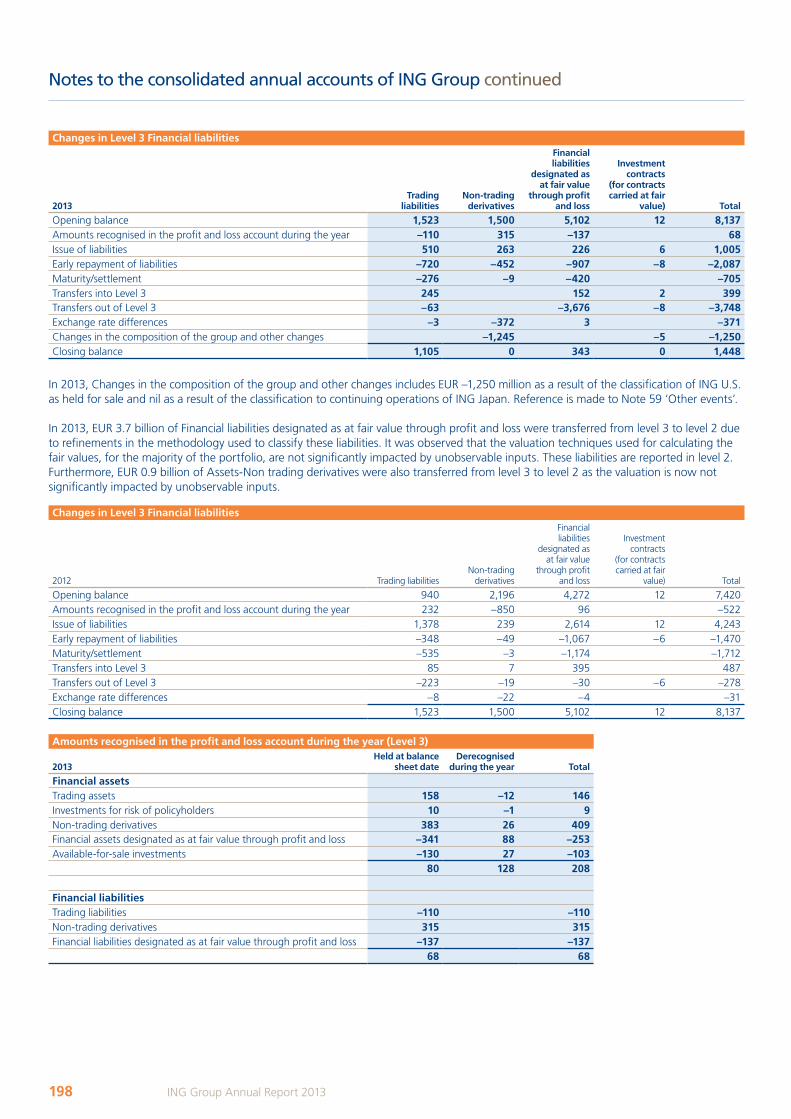
Notes to the consolidated annual accounts of ING Group continued
Changes in Level 3 Financial liabilities
2013Trading
liabilitiesNon-trading
derivatives
Financial liabilities
designated as at fair value
through profit and loss
Investment contracts
(for contracts carried at fair
value) Total
Opening balance 1,523 1,500 5,102 12 8,137Amounts recognised in the profit and loss account during the year –110 315 –137 68Issue of liabilities 510 263 226 6 1,005Early repayment of liabilities –720 –452 –907 –8 –2,087Maturity/settlement –276 –9 –420 –705Transfers into Level 3 245 152 2 399Transfers out of Level 3 –63 –3,676 –8 –3,748Exchange rate differences –3 –372 3 –371Changes in the composition of the group and other changes –1,245 –5 –1,250Closing balance 1,105 0 343 0 1,448
In 2013, Changes in the composition of the group and other changes includes EUR –1,250 million as a result of the classification of ING U.S. as held for sale and nil as a result of the classification to continuing operations of ING Japan. Reference is made to Note 59 ‘Other events’.
In 2013, EUR 3.7 billion of Financial liabilities designated as at fair value through profit and loss were transferred from level 3 to level 2 due to refinements in the methodology used to classify these liabilities. It was observed that the valuation techniques used for calculating the fair values, for the majority of the portfolio, are not significantly impacted by unobservable inputs. These liabilities are reported in level 2. Furthermore, EUR 0.9 billion of Assets-Non trading derivatives were also transferred from level 3 to level 2 as the valuation is now not significantly impacted by unobservable inputs.
Changes in Level 3 Financial liabilities
2012 Trading liabilitiesNon-trading
derivatives
Financial liabilities
designated as at fair value
through profit and loss
Investment contracts
(for contracts carried at fair
value) Total
Opening balance 940 2,196 4,272 12 7,420Amounts recognised in the profit and loss account during the year 232 –850 96 –522 Issue of liabilities 1,378 239 2,614 12 4,243Early repayment of liabilities –348 –49 –1,067 –6 –1,470Maturity/settlement –535 –3 –1,174 –1,712Transfers into Level 3 85 7 395 487Transfers out of Level 3 –223 –19 –30 –6 –278Exchange rate differences –8 –22 –4 –31Closing balance 1,523 1,500 5,102 12 8,137
Amounts recognised in the profit and loss account during the year (Level 3)
2013Held at balance
sheet dateDerecognised
during the year Total
Financial assetsTrading assets 158 –12 146Investments for risk of policyholders 10 –1 9Non-trading derivatives 383 26 409Financial assets designated as at fair value through profit and loss –341 88 –253Available-for-sale investments –130 27 –103
80 128 208
Financial liabilitiesTrading liabilities –110 –110Non-trading derivatives 315 315Financial liabilities designated as at fair value through profit and loss –137 –137
68 68
198 ING Group Annual Report 2013
ING_2013_deel2&3_v2A.indd 198 19/03/2014 19:12:00
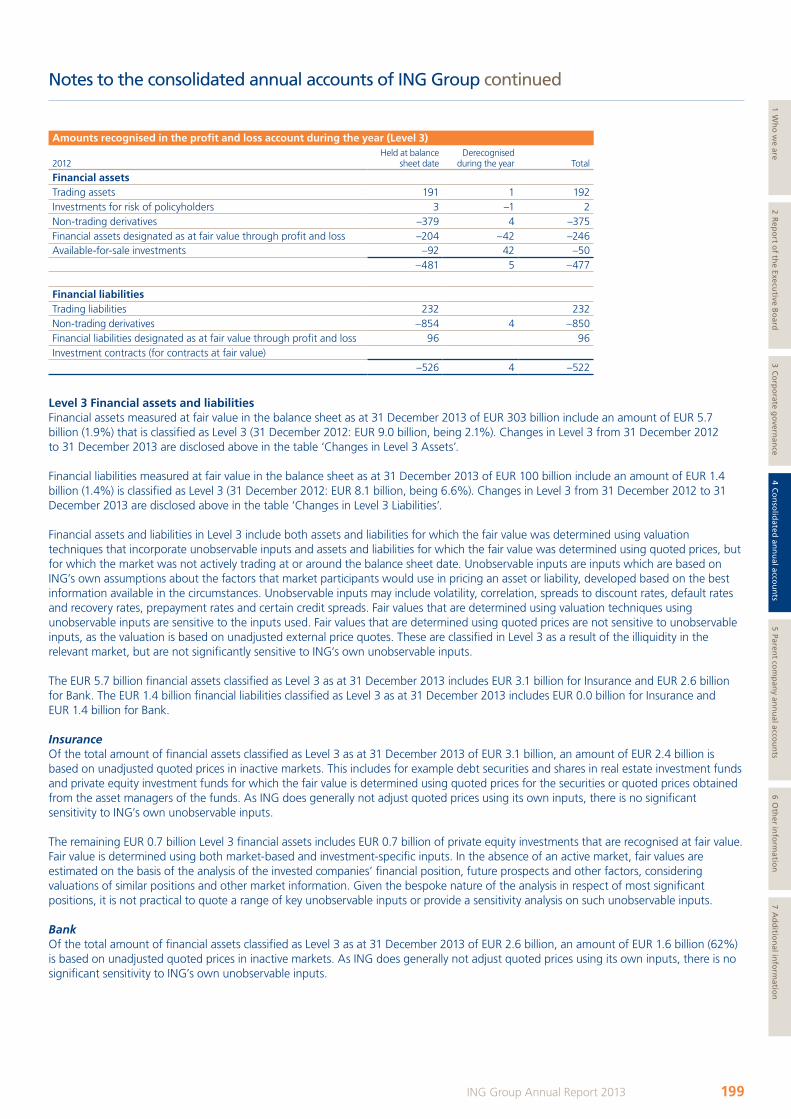
Notes to the consolidated annual accounts of ING Group continued
Amounts recognised in the profit and loss account during the year (Level 3)
2012Held at balance
sheet dateDerecognised
during the year Total
Financial assetsTrading assets 191 1 192Investments for risk of policyholders 3 –1 2Non-trading derivatives –379 4 –375Financial assets designated as at fair value through profit and loss –204 –42 –246Available-for-sale investments –92 42 –50
–481 5 –477
Financial liabilitiesTrading liabilities 232 232Non-trading derivatives –854 4 –850Financial liabilities designated as at fair value through profit and loss 96 96Investment contracts (for contracts at fair value)
–526 4 –522
Level 3 Financial assets and liabilitiesFinancial assets measured at fair value in the balance sheet as at 31 December 2013 of EUR 303 billion include an amount of EUR 5.7 billion (1.9%) that is classified as Level 3 (31 December 2012: EUR 9.0 billion, being 2.1%). Changes in Level 3 from 31 December 2012 to 31 December 2013 are disclosed above in the table ‘Changes in Level 3 Assets’.
Financial liabilities measured at fair value in the balance sheet as at 31 December 2013 of EUR 100 billion include an amount of EUR 1.4 billion (1.4%) is classified as Level 3 (31 December 2012: EUR 8.1 billion, being 6.6%). Changes in Level 3 from 31 December 2012 to 31 December 2013 are disclosed above in the table ‘Changes in Level 3 Liabilities’.
Financial assets and liabilities in Level 3 include both assets and liabilities for which the fair value was determined using valuation techniques that incorporate unobservable inputs and assets and liabilities for which the fair value was determined using quoted prices, but for which the market was not actively trading at or around the balance sheet date. Unobservable inputs are inputs which are based on ING’s own assumptions about the factors that market participants would use in pricing an asset or liability, developed based on the best information available in the circumstances. Unobservable inputs may include volatility, correlation, spreads to discount rates, default rates and recovery rates, prepayment rates and certain credit spreads. Fair values that are determined using valuation techniques using unobservable inputs are sensitive to the inputs used. Fair values that are determined using quoted prices are not sensitive to unobservable inputs, as the valuation is based on unadjusted external price quotes. These are classified in Level 3 as a result of the illiquidity in the relevant market, but are not significantly sensitive to ING’s own unobservable inputs.
The EUR 5.7 billion financial assets classified as Level 3 as at 31 December 2013 includes EUR 3.1 billion for Insurance and EUR 2.6 billion for Bank. The EUR 1.4 billion financial liabilities classified as Level 3 as at 31 December 2013 includes EUR 0.0 billion for Insurance and EUR 1.4 billion for Bank.
InsuranceOf the total amount of financial assets classified as Level 3 as at 31 December 2013 of EUR 3.1 billion, an amount of EUR 2.4 billion is based on unadjusted quoted prices in inactive markets. This includes for example debt securities and shares in real estate investment funds and private equity investment funds for which the fair value is determined using quoted prices for the securities or quoted prices obtained from the asset managers of the funds. As ING does generally not adjust quoted prices using its own inputs, there is no significant sensitivity to ING’s own unobservable inputs.
The remaining EUR 0.7 billion Level 3 financial assets includes EUR 0.7 billion of private equity investments that are recognised at fair value. Fair value is determined using both market-based and investment-specific inputs. In the absence of an active market, fair values are estimated on the basis of the analysis of the invested companies’ financial position, future prospects and other factors, considering valuations of similar positions and other market information. Given the bespoke nature of the analysis in respect of most significant positions, it is not practical to quote a range of key unobservable inputs or provide a sensitivity analysis on such unobservable inputs.
BankOf the total amount of financial assets classified as Level 3 as at 31 December 2013 of EUR 2.6 billion, an amount of EUR 1.6 billion (62%) is based on unadjusted quoted prices in inactive markets. As ING does generally not adjust quoted prices using its own inputs, there is no significant sensitivity to ING’s own unobservable inputs.
199ING Group Annual Report 2013
1 Wh
o w
e are2 R
epo
rt of th
e Executive B
oard
3 Co
rpo
rate go
vernan
ce4 C
on
solid
ated an
nu
al accou
nts
5 Parent co
mp
any an
nu
al accou
nts
6 Oth
er info
rmatio
n7 A
dd
ition
al info
rmatio
n
ING_2013_deel2&3_v2A.indd 199 19/03/2014 19:12:00

Notes to the consolidated annual accounts of ING Group continued
Furthermore, Level 3 financial assets includes approximately EUR 0.2 billion which relates to financial assets that are part of structures that are designed to be fully neutral in terms of market risk. Such structures include various financial assets and liabilities for which the overall sensitivity to market risk is insignificant. Whereas the fair value of individual components of these structures may be determined using different techniques and the fair value of each of the components of these structures may be sensitive to unobservable inputs, the overall sensitivity is by design not significant.
The remaining EUR 0.8 billion of the fair value classified in Level 3 financial assets is established using valuation techniques that incorporates certain inputs that are unobservable. This relates mainly to assets that are classified as Available-for-sale investments, for which changes in fair value are recognised in shareholders’ equity and do not directly impact profit and loss.
Of the total amount of financial liabilities classified as Level 3 as at 31 December of EUR 1.4 billion, an amount of EUR 0.5 billion (36%) is based on unadjusted quoted prices in inactive markets. As ING does generally not adjust quoted prices using its own inputs, there is no significant sensitivity to ING’s own unobservable inputs.
Furthermore, Level 3 financial liabilities includes approximately EUR 0.0 billion which relates to financial liabilities that are part of structures that are designed to be fully neutral in terms of market risk. As explained above, the fair value of each of the components of these structures may be sensitive to unobservable inputs, but the overall sensitivity is by design not significant.
The remaining EUR 0.9 billion of the fair value classified in Level 3 financial liabilities is established using valuation techniques that incorporates certain inputs that are unobservable.
200 ING Group Annual Report 2013
ING_2013_deel2&3_v2A.indd 200 19/03/2014 19:12:00
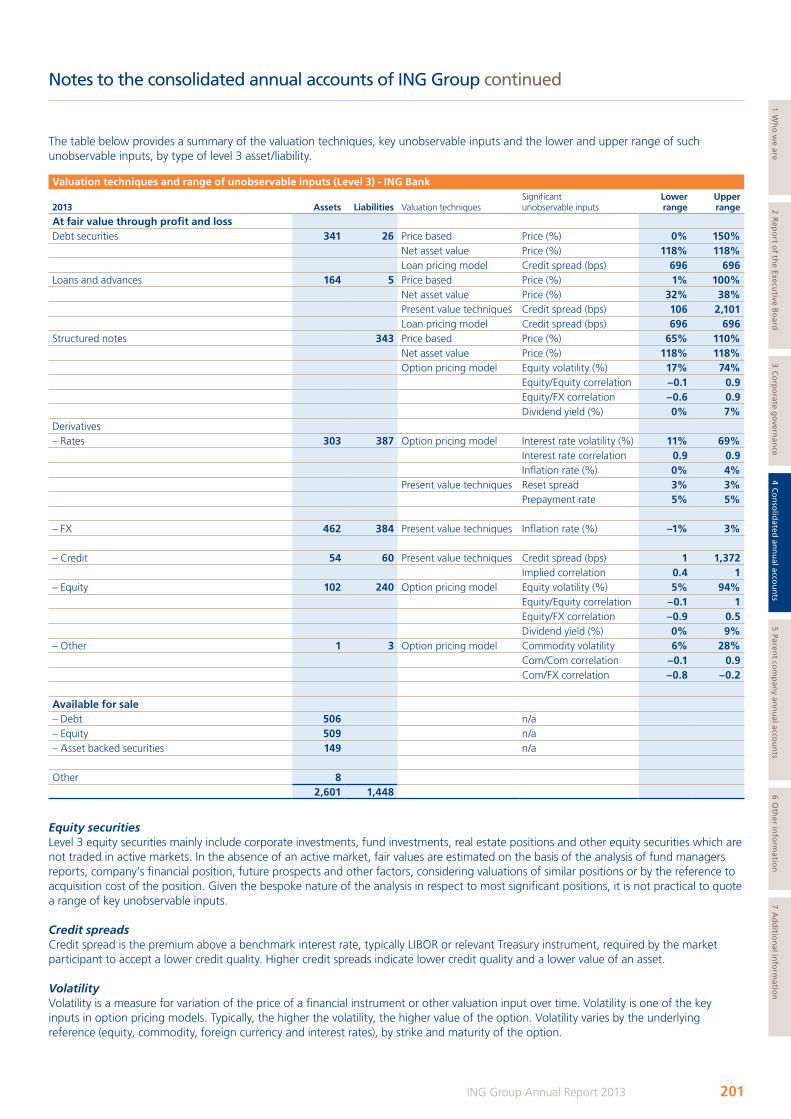
Notes to the consolidated annual accounts of ING Group continued
The table below provides a summary of the valuation techniques, key unobservable inputs and the lower and upper range of such unobservable inputs, by type of level 3 asset/liability.
Valuation techniques and range of unobservable inputs (Level 3) - ING Bank
2013 Assets Liabilities Valuation techniquesSignificant unobservable inputs
Lower range
Upper range
At fair value through profit and lossDebt securities 341 26 Price based Price (%) 0% 150%
Net asset value Price (%) 118% 118%Loan pricing model Credit spread (bps) 696 696
Loans and advances 164 5 Price based Price (%) 1% 100%Net asset value Price (%) 32% 38%Present value techniques Credit spread (bps) 106 2,101Loan pricing model Credit spread (bps) 696 696
Structured notes 343 Price based Price (%) 65% 110%Net asset value Price (%) 118% 118%Option pricing model Equity volatility (%) 17% 74%
Equity/Equity correlation –0.1 0.9Equity/FX correlation –0.6 0.9Dividend yield (%) 0% 7%
Derivatives– Rates 303 387 Option pricing model Interest rate volatility (%) 11% 69%
Interest rate correlation 0.9 0.9Inflation rate (%) 0% 4%
Present value techniques Reset spread 3% 3%Prepayment rate 5% 5%
– FX 462 384 Present value techniques Inflation rate (%) –1% 3%
– Credit 54 60 Present value techniques Credit spread (bps) 1 1,372Implied correlation 0.4 1
– Equity 102 240 Option pricing model Equity volatility (%) 5% 94%Equity/Equity correlation –0.1 1Equity/FX correlation –0.9 0.5Dividend yield (%) 0% 9%
– Other 1 3 Option pricing model Commodity volatility 6% 28%Com/Com correlation –0.1 0.9Com/FX correlation –0.8 –0.2
Available for sale– Debt 506 n/a– Equity 509 n/a– Asset backed securities 149 n/a
Other 82,601 1,448
Equity securitiesLevel 3 equity securities mainly include corporate investments, fund investments, real estate positions and other equity securities which are not traded in active markets. In the absence of an active market, fair values are estimated on the basis of the analysis of fund managers reports, company’s financial position, future prospects and other factors, considering valuations of similar positions or by the reference to acquisition cost of the position. Given the bespoke nature of the analysis in respect to most significant positions, it is not practical to quote a range of key unobservable inputs.
Credit spreadsCredit spread is the premium above a benchmark interest rate, typically LIBOR or relevant Treasury instrument, required by the market participant to accept a lower credit quality. Higher credit spreads indicate lower credit quality and a lower value of an asset.
VolatilityVolatility is a measure for variation of the price of a financial instrument or other valuation input over time. Volatility is one of the key inputs in option pricing models. Typically, the higher the volatility, the higher value of the option. Volatility varies by the underlying reference (equity, commodity, foreign currency and interest rates), by strike and maturity of the option.
201ING Group Annual Report 2013
1 Wh
o w
e are2 R
epo
rt of th
e Executive B
oard
3 Co
rpo
rate go
vernan
ce4 C
on
solid
ated an
nu
al accou
nts
5 Parent co
mp
any an
nu
al accou
nts
6 Oth
er info
rmatio
n7 A
dd
ition
al info
rmatio
n
ING_2013_deel2&3_v2A.indd 201 19/03/2014 19:12:01
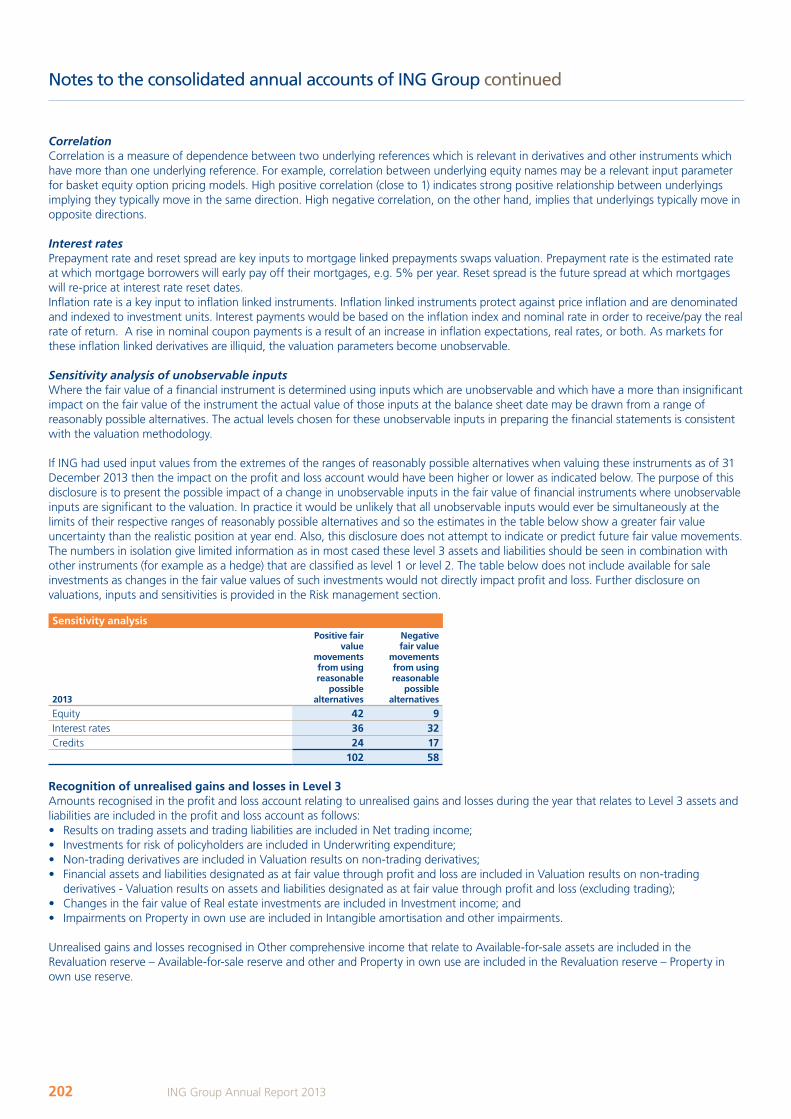
Notes to the consolidated annual accounts of ING Group continued
CorrelationCorrelation is a measure of dependence between two underlying references which is relevant in derivatives and other instruments which have more than one underlying reference. For example, correlation between underlying equity names may be a relevant input parameter for basket equity option pricing models. High positive correlation (close to 1) indicates strong positive relationship between underlyings implying they typically move in the same direction. High negative correlation, on the other hand, implies that underlyings typically move in opposite directions.
Interest ratesPrepayment rate and reset spread are key inputs to mortgage linked prepayments swaps valuation. Prepayment rate is the estimated rate at which mortgage borrowers will early pay off their mortgages, e.g. 5% per year. Reset spread is the future spread at which mortgages will re-price at interest rate reset dates.Inflation rate is a key input to inflation linked instruments. Inflation linked instruments protect against price inflation and are denominated and indexed to investment units. Interest payments would be based on the inflation index and nominal rate in order to receive/pay the real rate of return. A rise in nominal coupon payments is a result of an increase in inflation expectations, real rates, or both. As markets for these inflation linked derivatives are illiquid, the valuation parameters become unobservable.
Sensitivity analysis of unobservable inputsWhere the fair value of a financial instrument is determined using inputs which are unobservable and which have a more than insignificant impact on the fair value of the instrument the actual value of those inputs at the balance sheet date may be drawn from a range of reasonably possible alternatives. The actual levels chosen for these unobservable inputs in preparing the financial statements is consistent with the valuation methodology.
If ING had used input values from the extremes of the ranges of reasonably possible alternatives when valuing these instruments as of 31 December 2013 then the impact on the profit and loss account would have been higher or lower as indicated below. The purpose of this disclosure is to present the possible impact of a change in unobservable inputs in the fair value of financial instruments where unobservable inputs are significant to the valuation. In practice it would be unlikely that all unobservable inputs would ever be simultaneously at the limits of their respective ranges of reasonably possible alternatives and so the estimates in the table below show a greater fair value uncertainty than the realistic position at year end. Also, this disclosure does not attempt to indicate or predict future fair value movements. The numbers in isolation give limited information as in most cased these level 3 assets and liabilities should be seen in combination with other instruments (for example as a hedge) that are classified as level 1 or level 2. The table below does not include available for sale investments as changes in the fair value values of such investments would not directly impact profit and loss. Further disclosure on valuations, inputs and sensitivities is provided in the Risk management section.
Sensitivity analysis
2013
Positive fair value
movements from using reasonable
possible alternatives
Negative fair value
movements from using reasonable
possible alternatives
Equity 42 9Interest rates 36 32Credits 24 17
102 58
Recognition of unrealised gains and losses in Level 3Amounts recognised in the profit and loss account relating to unrealised gains and losses during the year that relates to Level 3 assets and liabilities are included in the profit and loss account as follows:• Results on trading assets and trading liabilities are included in Net trading income;• Investments for risk of policyholders are included in Underwriting expenditure;• Non-trading derivatives are included in Valuation results on non-trading derivatives;• Financial assets and liabilities designated as at fair value through profit and loss are included in Valuation results on non-trading
derivatives - Valuation results on assets and liabilities designated as at fair value through profit and loss (excluding trading); • Changes in the fair value of Real estate investments are included in Investment income; and• Impairments on Property in own use are included in Intangible amortisation and other impairments.
Unrealised gains and losses recognised in Other comprehensive income that relate to Available-for-sale assets are included in the Revaluation reserve – Available-for-sale reserve and other and Property in own use are included in the Revaluation reserve – Property in own use reserve.
202 ING Group Annual Report 2013
ING_2013_deel2&3_v2A.indd 202 19/03/2014 19:12:01
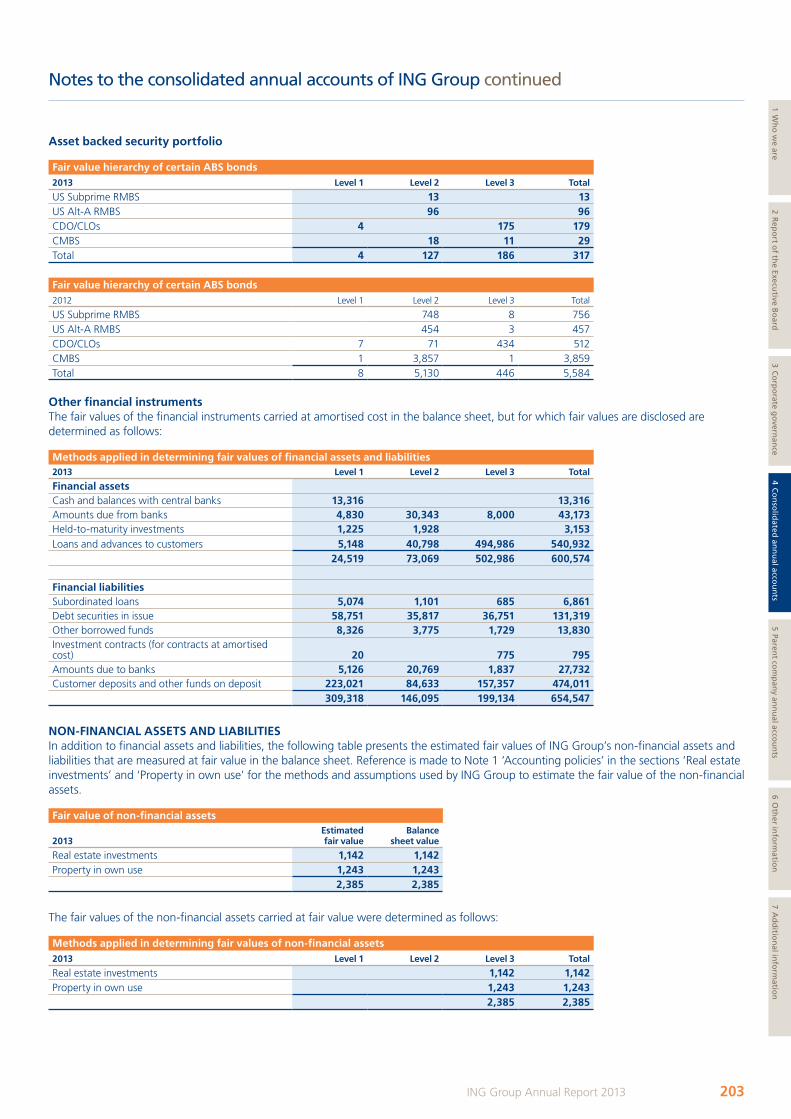
Notes to the consolidated annual accounts of ING Group continued
Asset backed security portfolio
Fair value hierarchy of certain ABS bonds2013 Level 1 Level 2 Level 3 Total
US Subprime RMBS 13 13US Alt-A RMBS 96 96CDO/CLOs 4 175 179CMBS 18 11 29Total 4 127 186 317
Fair value hierarchy of certain ABS bonds2012 Level 1 Level 2 Level 3 Total
US Subprime RMBS 748 8 756US Alt-A RMBS 454 3 457CDO/CLOs 7 71 434 512CMBS 1 3,857 1 3,859Total 8 5,130 446 5,584
Other financial instrumentsThe fair values of the financial instruments carried at amortised cost in the balance sheet, but for which fair values are disclosed are determined as follows:
Methods applied in determining fair values of financial assets and liabilities2013 Level 1 Level 2 Level 3 Total
Financial assetsCash and balances with central banks 13,316 13,316Amounts due from banks 4,830 30,343 8,000 43,173Held-to-maturity investments 1,225 1,928 3,153Loans and advances to customers 5,148 40,798 494,986 540,932
24,519 73,069 502,986 600,574
Financial liabilitiesSubordinated loans 5,074 1,101 685 6,861Debt securities in issue 58,751 35,817 36,751 131,319Other borrowed funds 8,326 3,775 1,729 13,830Investment contracts (for contracts at amortised cost) 20 775 795Amounts due to banks 5,126 20,769 1,837 27,732Customer deposits and other funds on deposit 223,021 84,633 157,357 474,011
309,318 146,095 199,134 654,547
NON-FINANCIAL ASSETS AND LIABILITIESIn addition to financial assets and liabilities, the following table presents the estimated fair values of ING Group’s non-financial assets and liabilities that are measured at fair value in the balance sheet. Reference is made to Note 1 ‘Accounting policies’ in the sections ‘Real estate investments’ and ‘Property in own use’ for the methods and assumptions used by ING Group to estimate the fair value of the non-financial assets.
Fair value of non-financial assets
2013Estimated fair value
Balance sheet value
Real estate investments 1,142 1,142Property in own use 1,243 1,243
2,385 2,385
The fair values of the non-financial assets carried at fair value were determined as follows:
Methods applied in determining fair values of non-financial assets2013 Level 1 Level 2 Level 3 Total
Real estate investments 1,142 1,142Property in own use 1,243 1,243
2,385 2,385
203ING Group Annual Report 2013
1 Wh
o w
e are2 R
epo
rt of th
e Executive B
oard
3 Co
rpo
rate go
vernan
ce4 C
on
solid
ated an
nu
al accou
nts
5 Parent co
mp
any an
nu
al accou
nts
6 Oth
er info
rmatio
n7 A
dd
ition
al info
rmatio
n
ING_2013_deel2&3_v2A.indd 203 19/03/2014 19:12:01
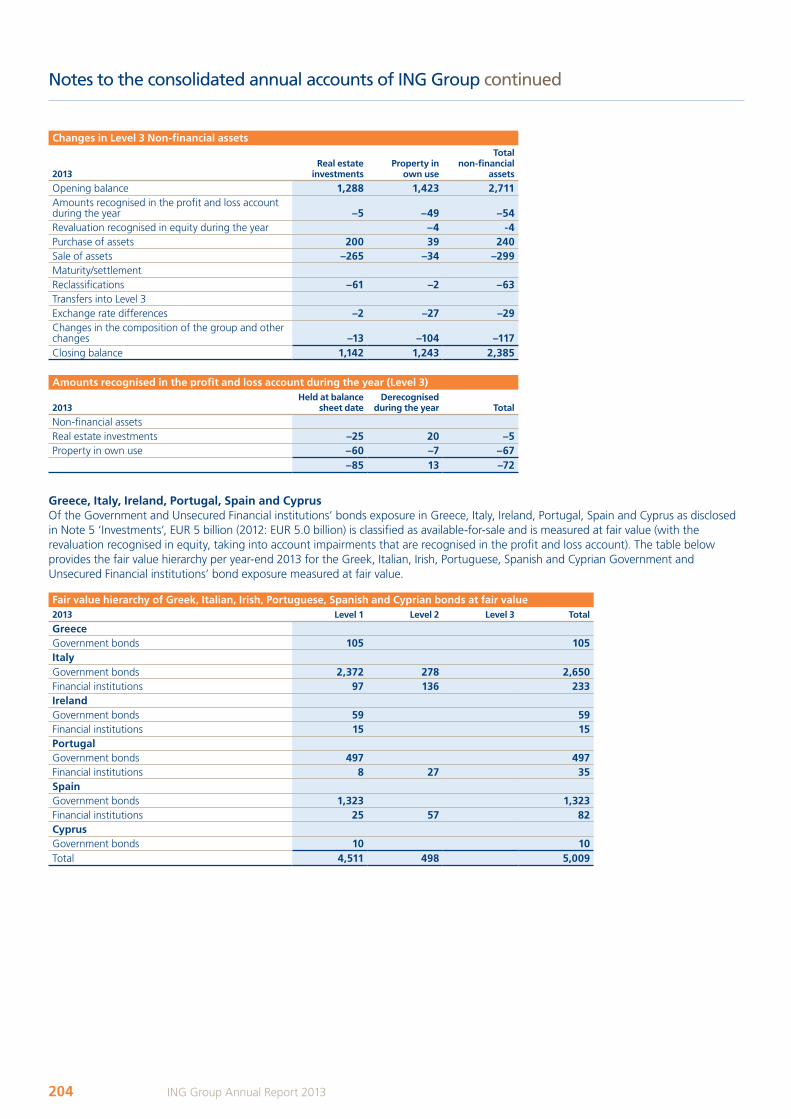
Notes to the consolidated annual accounts of ING Group continued
Changes in Level 3 Non-financial assets
2013Real estate
investmentsProperty in
own use
Total non-financial
assets
Opening balance 1,288 1,423 2,711Amounts recognised in the profit and loss account during the year –5 –49 –54Revaluation recognised in equity during the year –4 -4Purchase of assets 200 39 240Sale of assets –265 –34 –299Maturity/settlementReclassifications –61 –2 –63Transfers into Level 3Exchange rate differences –2 –27 –29Changes in the composition of the group and other changes –13 –104 –117Closing balance 1,142 1,243 2,385
Amounts recognised in the profit and loss account during the year (Level 3)
2013Held at balance
sheet dateDerecognised
during the year Total
Non-financial assetsReal estate investments –25 20 –5Property in own use –60 –7 –67
–85 13 –72
Greece, Italy, Ireland, Portugal, Spain and CyprusOf the Government and Unsecured Financial institutions’ bonds exposure in Greece, Italy, Ireland, Portugal, Spain and Cyprus as disclosed in Note 5 ‘Investments’, EUR 5 billion (2012: EUR 5.0 billion) is classified as available-for-sale and is measured at fair value (with the revaluation recognised in equity, taking into account impairments that are recognised in the profit and loss account). The table below provides the fair value hierarchy per year-end 2013 for the Greek, Italian, Irish, Portuguese, Spanish and Cyprian Government and Unsecured Financial institutions’ bond exposure measured at fair value.
Fair value hierarchy of Greek, Italian, Irish, Portuguese, Spanish and Cyprian bonds at fair value2013 Level 1 Level 2 Level 3 Total
GreeceGovernment bonds 105 105ItalyGovernment bonds 2,372 278 2,650Financial institutions 97 136 233IrelandGovernment bonds 59 59Financial institutions 15 15PortugalGovernment bonds 497 497Financial institutions 8 27 35SpainGovernment bonds 1,323 1,323Financial institutions 25 57 82CyprusGovernment bonds 10 10Total 4,511 498 5,009
204 ING Group Annual Report 2013
ING_2013_deel2&3_v2A.indd 204 19/03/2014 19:12:02
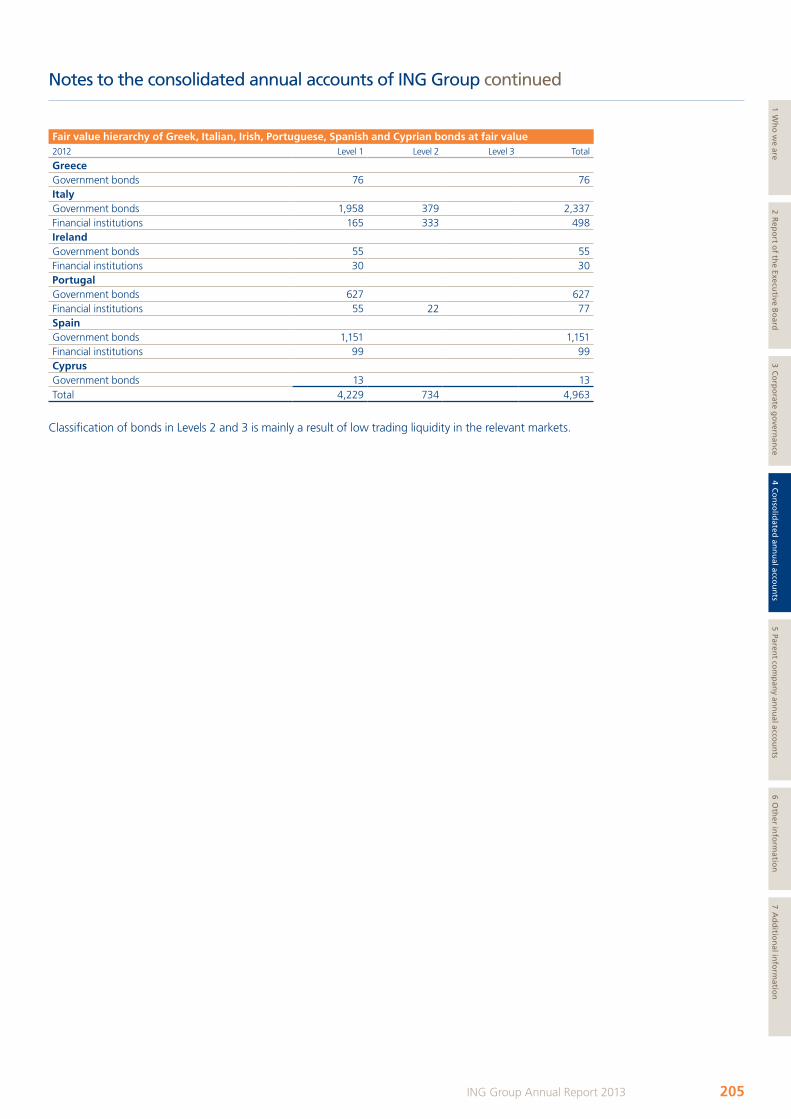
Notes to the consolidated annual accounts of ING Group continued
Fair value hierarchy of Greek, Italian, Irish, Portuguese, Spanish and Cyprian bonds at fair value2012 Level 1 Level 2 Level 3 Total
GreeceGovernment bonds 76 76ItalyGovernment bonds 1,958 379 2,337Financial institutions 165 333 498IrelandGovernment bonds 55 55Financial institutions 30 30PortugalGovernment bonds 627 627Financial institutions 55 22 77SpainGovernment bonds 1,151 1,151Financial institutions 99 99CyprusGovernment bonds 13 13Total 4,229 734 4,963
Classification of bonds in Levels 2 and 3 is mainly a result of low trading liquidity in the relevant markets.
205ING Group Annual Report 2013
1 Wh
o w
e are2 R
epo
rt of th
e Executive B
oard
3 Co
rpo
rate go
vernan
ce4 C
on
solid
ated an
nu
al accou
nts
5 Parent co
mp
any an
nu
al accou
nts
6 Oth
er info
rmatio
n7 A
dd
ition
al info
rmatio
n
ING_2013_deel2&3_v2A.indd 205 19/03/2014 19:12:02
Notes to the consolidated annual accounts of ING Group continued
47 DERIVATIVES AND HEDGE ACCOUNTINGUse of derivatives and hedge accountingAs described in the ‘Risk management’ section, ING Group uses derivatives (principally interest rate swaps and cross currency interest rate swaps) for economic hedging purposes in the management of its asset and liability portfolios and structural positions. The objective of economic hedging is to enter into positions with an opposite risk profile to an identified exposure to reduce that exposure. The impact of ING Group’s hedging activities is to optimise the overall cost to the Group of accessing debt capital markets and to mitigate the market risk which would otherwise arise from structural imbalances in the duration and other profiles of its assets and liabilities. In addition, hedging activities are undertaken to hedge against the interest rate risk in the mortgage offer period in relation to retail mortgages and to lock in the interest margin in relation to interest bearing assets and the related funding.
The accounting treatment of hedge transactions varies according to the nature of the instrument hedged and whether the hedge qualifies under the IFRS-EU hedge accounting rules. Derivatives that qualify for hedge accounting under IFRS-EU are classified and accounted for in accordance with the nature of the instrument hedged and the type of IFRS-EU hedge model that is applicable. The three models applicable under IFRS-EU are: fair value hedge accounting, cash flow hedge accounting and net investment hedge accounting. These are described under the relevant headings below. The company’s detailed accounting policies for these three hedge models are set out in Note 1 ‘Accounting policies’ in the section ‘Principles of valuation and determination of results’.
To qualify for hedge accounting under IFRS-EU, strict criteria must be met. Certain hedges that are economically effective from a risk management perspective do not qualify for hedge accounting under IFRS-EU. The fair value changes of derivatives relating to such non-qualifying hedges are taken to the profit and loss account. However, in certain cases, the Group mitigates the profit and loss account volatility by designating hedged assets and liabilities at fair value through profit and loss. If hedge accounting is applied under IFRS-EU, it is possible that during the hedge a hedge relationship no longer qualifies for hedge accounting and hedge accounting cannot be continued, even if the hedge remains economically effective. As a result, the volatility arising from undertaking economic hedging in the profit and loss account may be higher than would be expected from an economic point of view.
With respect to exchange rate and interest rate derivative contracts, the notional or contractual amount of these instruments is indicative of the nominal value of transactions outstanding at the balance sheet date; however they do not represent amounts at risk. ING Group uses credit derivatives to manage its exposure to credit risk, including total return swaps and credit default swaps, to sell or buy protection for credit risk exposures in the loan, investment and trading portfolios. Hedge accounting is not applied in relation to credit derivatives.
Fair value hedge accountingING Group’s fair value hedges principally consist of interest rate swaps and cross-currency interest rate swaps that are used to protect against changes in the fair value of fixed-rate instruments due to movements in market interest rates.
Gains and losses on derivatives designated under fair value hedge accounting are recognised in the profit and loss account. The effective portion of the fair value change on the hedged item is also recognised in the profit and loss account. As a result, only the net accounting ineffectiveness has an impact on the net result.
For the year ended 31 December 2013, ING Group recognised EUR 865 million (2012: EUR –422 million) of fair value changes on derivatives designated under fair value hedge accounting in the profit and loss account. This amount was partly offset by EUR –960 million (2012: EUR 530 million) fair value changes recognised on hedged items. This resulted in EUR –95 million (2012: EUR 108 million) net accounting ineffectiveness recognised in the profit and loss account. As at 31 December 2013, the fair values of outstanding derivatives designated under fair value hedge accounting was EUR –3,172 million (2012: EUR –6,111 million), presented in the balance sheet as EUR 1,383 million (2012: EUR 2,926 million) positive fair values under assets and EUR 4,555 million (2012: EUR 9,037 million) negative fair values under liabilities.
ING Group applies fair value hedge accounting for portfolio hedges of interest rate risk (macro hedging) under the EU ‘carve out’ of IFRS-EU. The EU ‘carve-out’ for macro hedging enables a group of derivatives (or proportions) to be viewed in combination and jointly designated as the hedging instrument and removes some of the limitations in fair value hedge accounting relating to hedging core deposits and under-hedging strategies. Under the IFRS-EU ‘carve-out’, hedge accounting may be applied to core deposits and ineffectiveness only arises when the revised estimate of the amount of cash flows in scheduled time buckets falls below the designated amount of that bucket. ING Group applies the IFRS-EU ‘carve-out’ to its retail operations in which the net exposure of retail funding (savings and current accounts) and retail lending (mortgages) is hedged. The hedging activities are designated under a portfolio fair value hedge on the mortgages, using the IFRS-EU provisions.
Cash flow hedge accountingING Group’s cash flow hedges principally consist of (forward) interest rate swaps and cross-currency interest rate swaps that are used to protect against its exposure to variability in future interest cash flows on non-trading assets and liabilities that bear interest at variable rates or are expected to be refunded or reinvested in the future. The amounts and timing of future cash flows, representing both principal and interest flows, are projected for each portfolio of financial assets and liabilities, based on contractual terms and other relevant factors including estimates of prepayments and defaults. The aggregate principal balances and interest cash flows for the respective portfolios form the basis for identifying the notional amount subject to interest rate risk that is designated under cash flow hedge accounting.
206 ING Group Annual Report 2013
ING_2013_deel2&3_v2A.indd 206 19/03/2014 19:12:02
Notes to the consolidated annual accounts of ING Group continued
Gains and losses on the effective portions of derivatives designated under cash flow hedge accounting are recognised in Shareholders’ equity. Interest cash flows on these derivatives are recognised in the profit and loss account in interest result consistent with the manner in which the forecast cash flows affect net result. The gains and losses on ineffective portions of such derivatives are recognised immediately in the profit and loss account.
For the year ended 31 December 2013, ING Group recognised EUR –812 million (2012: EUR 716 million) after tax in equity as effective fair value changes on derivatives under cash flow hedge accounting. As a consequence, the balance of the cash flow hedge reserve in equity as at 31 December 2013 was EUR 2,448 million (2012: EUR 3,558 million) gross and EUR 1,879 million (2012: EUR 2,689 million) after deferred tax. This cash flow hedge reserve will fluctuate with the fair value changes of the underlying derivatives and will be reflected in the profit and loss account under Interest income/expense over the remaining term of the underlying hedged items. The cash flow hedge reserve relates to a large number of derivatives and hedged items with varying maturities, up to 44 years for insurance operations and 40 years for banking operations, with the largest concentrations in the range of 1 to 8 years for insurance operations and 5 to 20 years for banking operations. Accounting ineffectiveness on derivatives designated under cash flow hedge accounting resulted in a gain of EUR 54 million (2012: EUR 4 million gain) which was recognised in the profit and loss account.
As at 31 December 2013, the fair value of outstanding derivatives designated under cash flow hedge accounting was EUR 245 million (2012: EUR 1,032 million), presented in the balance sheet as EUR 4,630 million (2012: EUR 7,471 million) positive fair values under assets and EUR 4,385 million (2012: EUR 6,439 million) negative fair values under liabilities.
As at 31 December 2013, the fair value of outstanding non-derivatives designated as hedging instruments for cash flow hedge accounting purposes was EUR –299 million (2012: EUR 267 million).
Included in Interest income and interest expense on non-trading derivatives is EUR 3,456 million (2012: EUR 2,598 million) and EUR 3,220 million (2012: EUR 2,620 million), respectively, relating to derivatives used in cash flow hedges.
Hedges of net investments in foreign operationsING Group’s net investment hedges principally consist of derivatives (including currency forwards and swaps) and non-derivative financial instruments such as foreign currency denominated funding that are used to protect against foreign currency exposures on foreign subsidiaries.
Gains and losses on the effective portions of derivatives designated under net investment hedge accounting are recognised in Shareholders’ equity. The balance in equity is recognised in the profit and loss account when the related foreign subsidiary is disposed. The gains and losses on ineffective portions are recognised immediately in the profit and loss account.
As at 31 December 2013, the fair value of outstanding derivatives designated under net investment hedge accounting was EUR 86 million (2012: EUR –22 million), presented in the balance sheet as EUR 138 million (2012: EUR 49 million) positive fair values under assets and EUR 52 million (2012: EUR 71 million) negative fair values under liabilities.
As at 31 December 2013, the fair value of outstanding non-derivatives designated under net investment hedge accounting was EUR 491 million (2012: EUR –1,133 million).
Accounting ineffectiveness recognised in the profit and loss account for the year ended 31 December 2013 on derivatives and non-derivatives designated under net investment hedge accounting was nil (2012: nil).
207ING Group Annual Report 2013
1 Wh
o w
e are2 R
epo
rt of th
e Executive B
oard
3 Co
rpo
rate go
vernan
ce4 C
on
solid
ated an
nu
al accou
nts
5 Parent co
mp
any an
nu
al accou
nts
6 Oth
er info
rmatio
n7 A
dd
ition
al info
rmatio
n
ING_2013_deel2&3_v2A.indd 207 19/03/2014 19:12:02
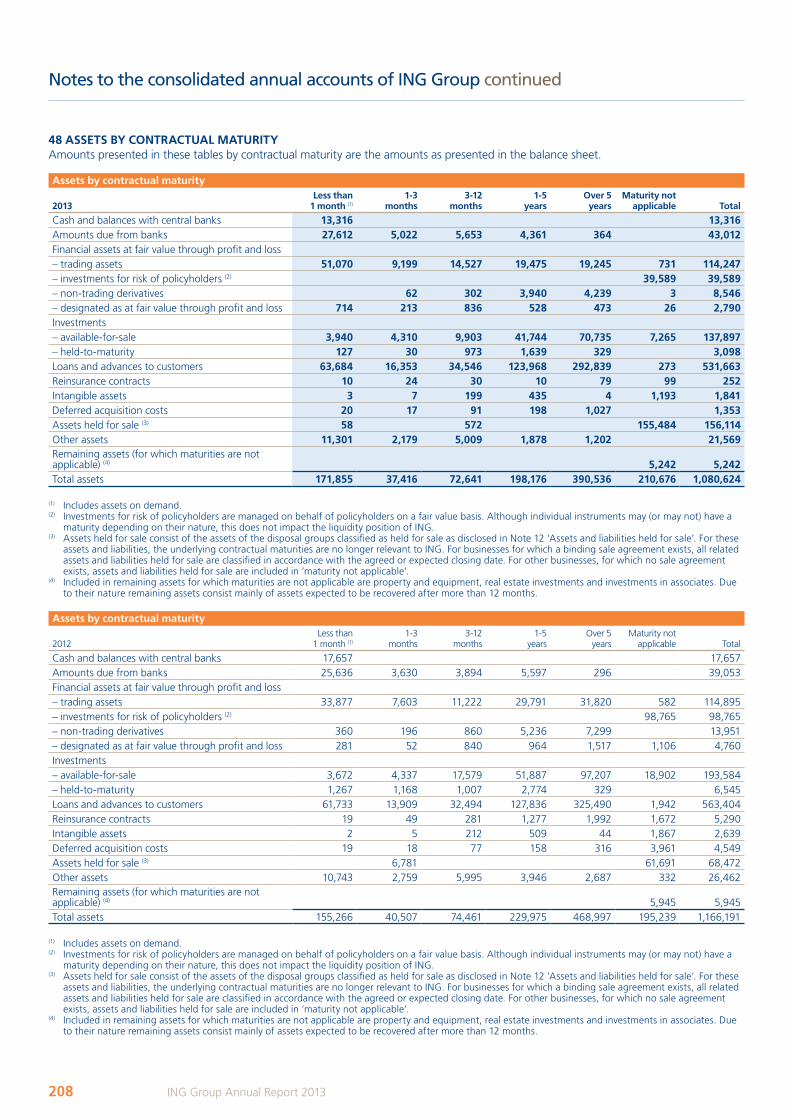
Notes to the consolidated annual accounts of ING Group continued
48 ASSETS BY CONTRACTUAL MATURITYAmounts presented in these tables by contractual maturity are the amounts as presented in the balance sheet.
Assets by contractual maturity
2013Less than
1 month (1)1-3
months3-12
months1-5
yearsOver 5
yearsMaturity not
applicable Total
Cash and balances with central banks 13,316 13,316Amounts due from banks 27,612 5,022 5,653 4,361 364 43,012Financial assets at fair value through profit and loss– trading assets 51,070 9,199 14,527 19,475 19,245 731 114,247– investments for risk of policyholders (2) 39,589 39,589– non-trading derivatives 62 302 3,940 4,239 3 8,546– designated as at fair value through profit and loss 714 213 836 528 473 26 2,790Investments– available-for-sale 3,940 4,310 9,903 41,744 70,735 7,265 137,897– held-to-maturity 127 30 973 1,639 329 3,098Loans and advances to customers 63,684 16,353 34,546 123,968 292,839 273 531,663Reinsurance contracts 10 24 30 10 79 99 252Intangible assets 3 7 199 435 4 1,193 1,841Deferred acquisition costs 20 17 91 198 1,027 1,353Assets held for sale (3) 58 572 155,484 156,114Other assets 11,301 2,179 5,009 1,878 1,202 21,569Remaining assets (for which maturities are not applicable) (4) 5,242 5,242Total assets 171,855 37,416 72,641 198,176 390,536 210,676 1,080,624
(1) Includes assets on demand.(2) Investments for risk of policyholders are managed on behalf of policyholders on a fair value basis. Although individual instruments may (or may not) have a
maturity depending on their nature, this does not impact the liquidity position of ING.(3) Assets held for sale consist of the assets of the disposal groups classified as held for sale as disclosed in Note 12 ‘Assets and liabilities held for sale’. For these
assets and liabilities, the underlying contractual maturities are no longer relevant to ING. For businesses for which a binding sale agreement exists, all related assets and liabilities held for sale are classified in accordance with the agreed or expected closing date. For other businesses, for which no sale agreement exists, assets and liabilities held for sale are included in ‘maturity not applicable’.
(4) Included in remaining assets for which maturities are not applicable are property and equipment, real estate investments and investments in associates. Due to their nature remaining assets consist mainly of assets expected to be recovered after more than 12 months.
Assets by contractual maturity
2012Less than
1 month (1)1-3
months3-12
months1-5
yearsOver 5
yearsMaturity not
applicable Total
Cash and balances with central banks 17,657 17,657Amounts due from banks 25,636 3,630 3,894 5,597 296 39,053Financial assets at fair value through profit and loss– trading assets 33,877 7,603 11,222 29,791 31,820 582 114,895– investments for risk of policyholders (2) 98,765 98,765– non-trading derivatives 360 196 860 5,236 7,299 13,951– designated as at fair value through profit and loss 281 52 840 964 1,517 1,106 4,760Investments– available-for-sale 3,672 4,337 17,579 51,887 97,207 18,902 193,584– held-to-maturity 1,267 1,168 1,007 2,774 329 6,545Loans and advances to customers 61,733 13,909 32,494 127,836 325,490 1,942 563,404Reinsurance contracts 19 49 281 1,277 1,992 1,672 5,290Intangible assets 2 5 212 509 44 1,867 2,639Deferred acquisition costs 19 18 77 158 316 3,961 4,549Assets held for sale (3) 6,781 61,691 68,472Other assets 10,743 2,759 5,995 3,946 2,687 332 26,462Remaining assets (for which maturities are not applicable) (4) 5,945 5,945Total assets 155,266 40,507 74,461 229,975 468,997 195,239 1,166,191
(1) Includes assets on demand.(2) Investments for risk of policyholders are managed on behalf of policyholders on a fair value basis. Although individual instruments may (or may not) have a
maturity depending on their nature, this does not impact the liquidity position of ING.(3) Assets held for sale consist of the assets of the disposal groups classified as held for sale as disclosed in Note 12 ‘Assets and liabilities held for sale’. For these
assets and liabilities, the underlying contractual maturities are no longer relevant to ING. For businesses for which a binding sale agreement exists, all related assets and liabilities held for sale are classified in accordance with the agreed or expected closing date. For other businesses, for which no sale agreement exists, assets and liabilities held for sale are included in ‘maturity not applicable’.
(4) Included in remaining assets for which maturities are not applicable are property and equipment, real estate investments and investments in associates. Due to their nature remaining assets consist mainly of assets expected to be recovered after more than 12 months.
208 ING Group Annual Report 2013
ING_2013_deel2&3_v2A.indd 208 19/03/2014 19:12:02

Notes to the consolidated annual accounts of ING Group continued
49 LIABILITIES BY MATURITYThe tables below include all financial liabilities by maturity based on contractual, undiscounted cash flows. Furthermore, the undiscounted future coupon interest on financial liabilities payable is included in a separate line and in the relevant maturity bucket. Derivative liabilities are included on a net basis if cash flows are settled net. For other derivative liabilities the contractual gross cash flow payable is included.
Non-financial liabilities are included based on a breakdown of the balance sheet amounts by expected maturity. Reference is made to the liquidity risk paragraph in the ‘Risk Management’ section for a description on how liquidity risk is managed.
Liabilities by maturity
2013Less than
1 month (1)1-3
months3-12
months1-5
yearsOver 5
yearsMaturity not
applicable Adjustment (2) Total
Subordinated loans 7,104 –215 6,889Debt securities in issue 5,204 25,865 18,822 44,627 31,300 1,909 127,727Other borrowed funds 2,592 1 284 2,882 12,812 –6,768 1,903 13,706Amounts due to banks 16,305 1,834 1,755 2,891 4,472 27,257Customer deposits and other funds on deposit 411,647 27,067 25,336 2,912 3,201 3,856 301 474,320Financial liabilities at fair value through profit and loss– other trading liabilities 32,561 2,022 2,201 1,767 4,716 722 43,989– trading derivatives 903 1,910 5,515 15,154 13,657 –7,637 29,502– non-trading derivatives 353 443 1,727 5,870 –4,439 7,201 11,155– designated as at fair value
through profit and loss 198 216 1,282 5,967 5,991 201 13,855Financial liabilities 469,763 59,358 56,922 82,070 71,710 4,192 4,385 748,400
Insurance and investment contracts 806 1,115 5,486 17,586 47,038 39,520 111,551Liabilities held for sale (3) 14 453 145,675 146,142Other liabilities 10,572 2,049 5,863 1,083 1,761 360 21,688Non-financial liabilities 11,392 3,164 11,802 18,669 48,799 185,555 279,381
Total liabilities 481,155 62,522 68,724 100,739 120,509 189,747 4,385 1,027,781
Coupon interest due on financial liabilities 1,316 1,159 4,148 9,525 38,167 54,315
(1) Includes liabilities on demand.(2) This column reconciles the contractual undiscounted cash flows on financial liabilities to the balance sheet values. The adjustments mainly relate to the impact
of discounting and, for derivatives, to the fact that the contractual cash flows are presented on a gross basis (unless the cash flows are actually settled net).(3) Liabilities held for sale consist of the liabilities of the disposal groups classified as held for sale as disclosed in Note 12 ‘Assets and liabilities held for sale’. For
these assets and liabilities, the underlying contractual maturities are no longer relevant to ING. For businesses for which a binding sale agreement exists, all related assets and liabilities held for sale are classified in accordance with the agreed or expected closing date. For other businesses, for which no sale agreement exists, assets and liabilities held for sale are included in ‘maturity not applicable’.
209ING Group Annual Report 2013
1 Wh
o w
e are2 R
epo
rt of th
e Executive B
oard
3 Co
rpo
rate go
vernan
ce4 C
on
solid
ated an
nu
al accou
nts
5 Parent co
mp
any an
nu
al accou
nts
6 Oth
er info
rmatio
n7 A
dd
ition
al info
rmatio
n
ING_2013_deel2&3_v2A.indd 209 19/03/2014 19:12:03
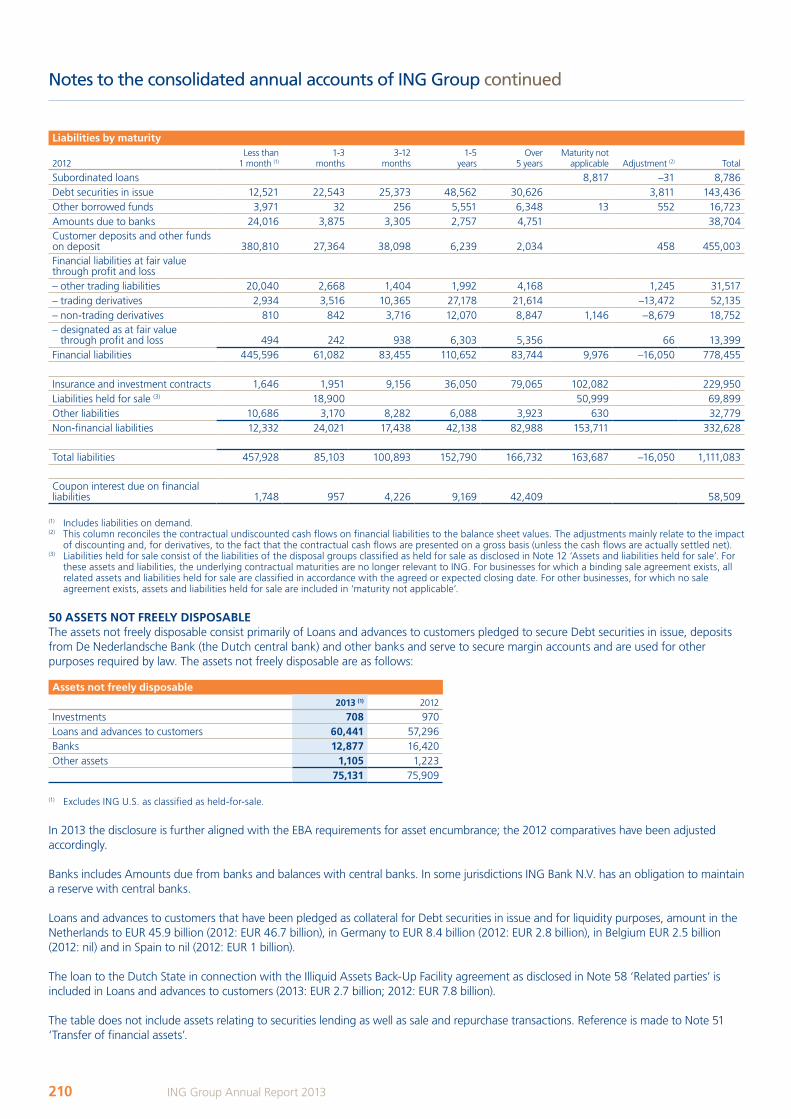
Notes to the consolidated annual accounts of ING Group continued
Liabilities by maturity
2012Less than
1 month (1)1-3
months3-12
months1-5
yearsOver
5 yearsMaturity not
applicable Adjustment (2) Total
Subordinated loans 8,817 –31 8,786Debt securities in issue 12,521 22,543 25,373 48,562 30,626 3,811 143,436Other borrowed funds 3,971 32 256 5,551 6,348 13 552 16,723Amounts due to banks 24,016 3,875 3,305 2,757 4,751 38,704Customer deposits and other funds on deposit 380,810 27,364 38,098 6,239 2,034 458 455,003Financial liabilities at fair value through profit and loss– other trading liabilities 20,040 2,668 1,404 1,992 4,168 1,245 31,517– trading derivatives 2,934 3,516 10,365 27,178 21,614 –13,472 52,135– non-trading derivatives 810 842 3,716 12,070 8,847 1,146 –8,679 18,752– designated as at fair value
through profit and loss 494 242 938 6,303 5,356 66 13,399Financial liabilities 445,596 61,082 83,455 110,652 83,744 9,976 –16,050 778,455
Insurance and investment contracts 1,646 1,951 9,156 36,050 79,065 102,082 229,950Liabilities held for sale (3) 18,900 50,999 69,899Other liabilities 10,686 3,170 8,282 6,088 3,923 630 32,779Non-financial liabilities 12,332 24,021 17,438 42,138 82,988 153,711 332,628
Total liabilities 457,928 85,103 100,893 152,790 166,732 163,687 –16,050 1,111,083
Coupon interest due on financial liabilities 1,748 957 4,226 9,169 42,409 58,509
(1) Includes liabilities on demand.(2) This column reconciles the contractual undiscounted cash flows on financial liabilities to the balance sheet values. The adjustments mainly relate to the impact
of discounting and, for derivatives, to the fact that the contractual cash flows are presented on a gross basis (unless the cash flows are actually settled net).(3) Liabilities held for sale consist of the liabilities of the disposal groups classified as held for sale as disclosed in Note 12 ‘Assets and liabilities held for sale’. For
these assets and liabilities, the underlying contractual maturities are no longer relevant to ING. For businesses for which a binding sale agreement exists, all related assets and liabilities held for sale are classified in accordance with the agreed or expected closing date. For other businesses, for which no sale agreement exists, assets and liabilities held for sale are included in ‘maturity not applicable’.
50 ASSETS NOT FREELY DISPOSABLEThe assets not freely disposable consist primarily of Loans and advances to customers pledged to secure Debt securities in issue, deposits from De Nederlandsche Bank (the Dutch central bank) and other banks and serve to secure margin accounts and are used for other purposes required by law. The assets not freely disposable are as follows:
Assets not freely disposable2013 (1) 2012
Investments 708 970Loans and advances to customers 60,441 57,296Banks 12,877 16,420Other assets 1,105 1,223
75,131 75,909
(1) Excludes ING U.S. as classified as held-for-sale.
In 2013 the disclosure is further aligned with the EBA requirements for asset encumbrance; the 2012 comparatives have been adjusted accordingly.
Banks includes Amounts due from banks and balances with central banks. In some jurisdictions ING Bank N.V. has an obligation to maintain a reserve with central banks.
Loans and advances to customers that have been pledged as collateral for Debt securities in issue and for liquidity purposes, amount in the Netherlands to EUR 45.9 billion (2012: EUR 46.7 billion), in Germany to EUR 8.4 billion (2012: EUR 2.8 billion), in Belgium EUR 2.5 billion (2012: nil) and in Spain to nil (2012: EUR 1 billion).
The loan to the Dutch State in connection with the Illiquid Assets Back-Up Facility agreement as disclosed in Note 58 ‘Related parties’ is included in Loans and advances to customers (2013: EUR 2.7 billion; 2012: EUR 7.8 billion).
The table does not include assets relating to securities lending as well as sale and repurchase transactions. Reference is made to Note 51 ‘Transfer of financial assets’.
210 ING Group Annual Report 2013
ING_2013_deel2&3_v2A.indd 210 19/03/2014 19:12:03
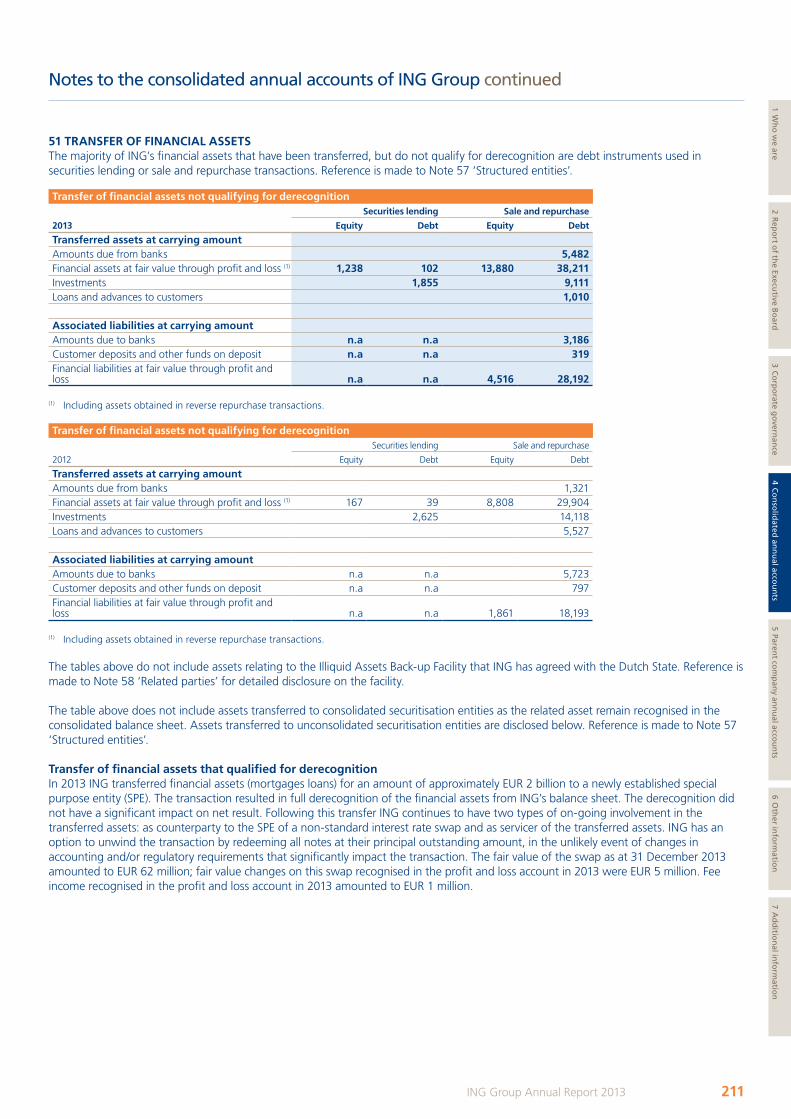
Notes to the consolidated annual accounts of ING Group continued
51 TRANSFER OF FINANCIAL ASSETSThe majority of ING’s financial assets that have been transferred, but do not qualify for derecognition are debt instruments used in securities lending or sale and repurchase transactions. Reference is made to Note 57 ‘Structured entities’.
Transfer of financial assets not qualifying for derecognitionSecurities lending Sale and repurchase
2013 Equity Debt Equity Debt
Transferred assets at carrying amountAmounts due from banks 5,482Financial assets at fair value through profit and loss (1) 1,238 102 13,880 38,211Investments 1,855 9,111Loans and advances to customers 1,010
Associated liabilities at carrying amountAmounts due to banks n.a n.a 3,186Customer deposits and other funds on deposit n.a n.a 319Financial liabilities at fair value through profit and loss n.a n.a 4,516 28,192
(1) Including assets obtained in reverse repurchase transactions.
Transfer of financial assets not qualifying for derecognitionSecurities lending Sale and repurchase
2012 Equity Debt Equity Debt
Transferred assets at carrying amountAmounts due from banks 1,321Financial assets at fair value through profit and loss (1) 167 39 8,808 29,904Investments 2,625 14,118Loans and advances to customers 5,527
Associated liabilities at carrying amountAmounts due to banks n.a n.a 5,723Customer deposits and other funds on deposit n.a n.a 797Financial liabilities at fair value through profit and loss n.a n.a 1,861 18,193
(1) Including assets obtained in reverse repurchase transactions.
The tables above do not include assets relating to the Illiquid Assets Back-up Facility that ING has agreed with the Dutch State. Reference is made to Note 58 ‘Related parties’ for detailed disclosure on the facility.
The table above does not include assets transferred to consolidated securitisation entities as the related asset remain recognised in the consolidated balance sheet. Assets transferred to unconsolidated securitisation entities are disclosed below. Reference is made to Note 57 ‘Structured entities’.
Transfer of financial assets that qualified for derecognitionIn 2013 ING transferred financial assets (mortgages loans) for an amount of approximately EUR 2 billion to a newly established special purpose entity (SPE). The transaction resulted in full derecognition of the financial assets from ING’s balance sheet. The derecognition did not have a significant impact on net result. Following this transfer ING continues to have two types of on-going involvement in the transferred assets: as counterparty to the SPE of a non-standard interest rate swap and as servicer of the transferred assets. ING has an option to unwind the transaction by redeeming all notes at their principal outstanding amount, in the unlikely event of changes in accounting and/or regulatory requirements that significantly impact the transaction. The fair value of the swap as at 31 December 2013 amounted to EUR 62 million; fair value changes on this swap recognised in the profit and loss account in 2013 were EUR 5 million. Fee income recognised in the profit and loss account in 2013 amounted to EUR 1 million.
211ING Group Annual Report 2013
1 Wh
o w
e are2 R
epo
rt of th
e Executive B
oard
3 Co
rpo
rate go
vernan
ce4 C
on
solid
ated an
nu
al accou
nts
5 Parent co
mp
any an
nu
al accou
nts
6 Oth
er info
rmatio
n7 A
dd
ition
al info
rmatio
n
ING_2013_deel2&3_v2A.indd 211 19/03/2014 19:12:03
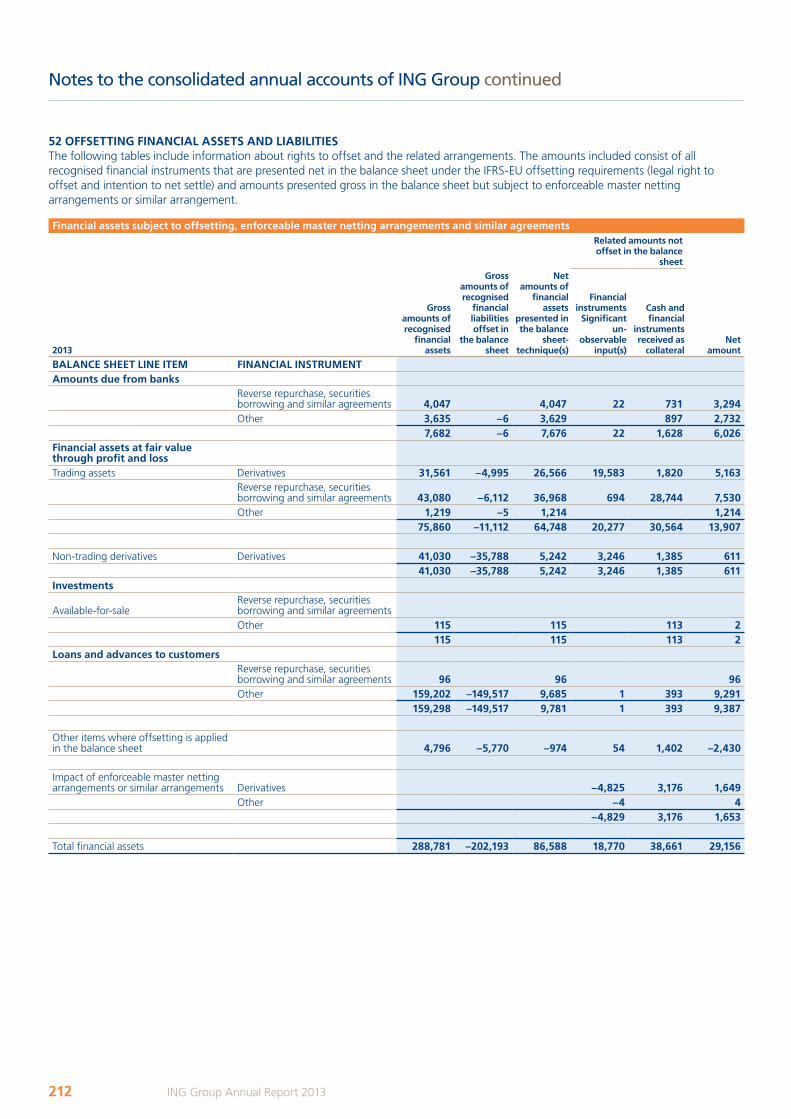
Notes to the consolidated annual accounts of ING Group continued
52 OFFSETTING FINANCIAL ASSETS AND LIABILITIESThe following tables include information about rights to offset and the related arrangements. The amounts included consist of all recognised financial instruments that are presented net in the balance sheet under the IFRS-EU offsetting requirements (legal right to offset and intention to net settle) and amounts presented gross in the balance sheet but subject to enforceable master netting arrangements or similar arrangement.
Financial assets subject to offsetting, enforceable master netting arrangements and similar agreementsRelated amounts not offset in the balance
sheet
2013
Gross amounts of recognised
financial assets
Gross amounts of recognised
financial liabilities offset in
the balance sheet
Net amounts of
financial assets
presented in the balance
sheet-technique(s)
Financial instruments
Significant un-
observable input(s)
Cash and financial
instruments received as
collateral Net
amount
BALANCE SHEET LINE ITEM FINANCIAL INSTRUMENTAmounts due from banks
Reverse repurchase, securities borrowing and similar agreements 4,047 4,047 22 731 3,294Other 3,635 –6 3,629 897 2,732
7,682 –6 7,676 22 1,628 6,026Financial assets at fair value through profit and lossTrading assets Derivatives 31,561 –4,995 26,566 19,583 1,820 5,163
Reverse repurchase, securities borrowing and similar agreements 43,080 –6,112 36,968 694 28,744 7,530Other 1,219 –5 1,214 1,214
75,860 –11,112 64,748 20,277 30,564 13,907
Non-trading derivatives Derivatives 41,030 –35,788 5,242 3,246 1,385 61141,030 –35,788 5,242 3,246 1,385 611
Investments
Available-for-sale Reverse repurchase, securities borrowing and similar agreements Other 115 115 113 2
115 115 113 2Loans and advances to customers
Reverse repurchase, securities borrowing and similar agreements 96 96 96Other 159,202 –149,517 9,685 1 393 9,291
159,298 –149,517 9,781 1 393 9,387
Other items where offsetting is applied in the balance sheet 4,796 –5,770 –974 54 1,402 –2,430
Impact of enforceable master netting arrangements or similar arrangements Derivatives –4,825 3,176 1,649
Other –4 4 –4,829 3,176 1,653
Total financial assets 288,781 –202,193 86,588 18,770 38,661 29,156
212 ING Group Annual Report 2013
ING_2013_deel2&3_v2A.indd 212 19/03/2014 19:12:03
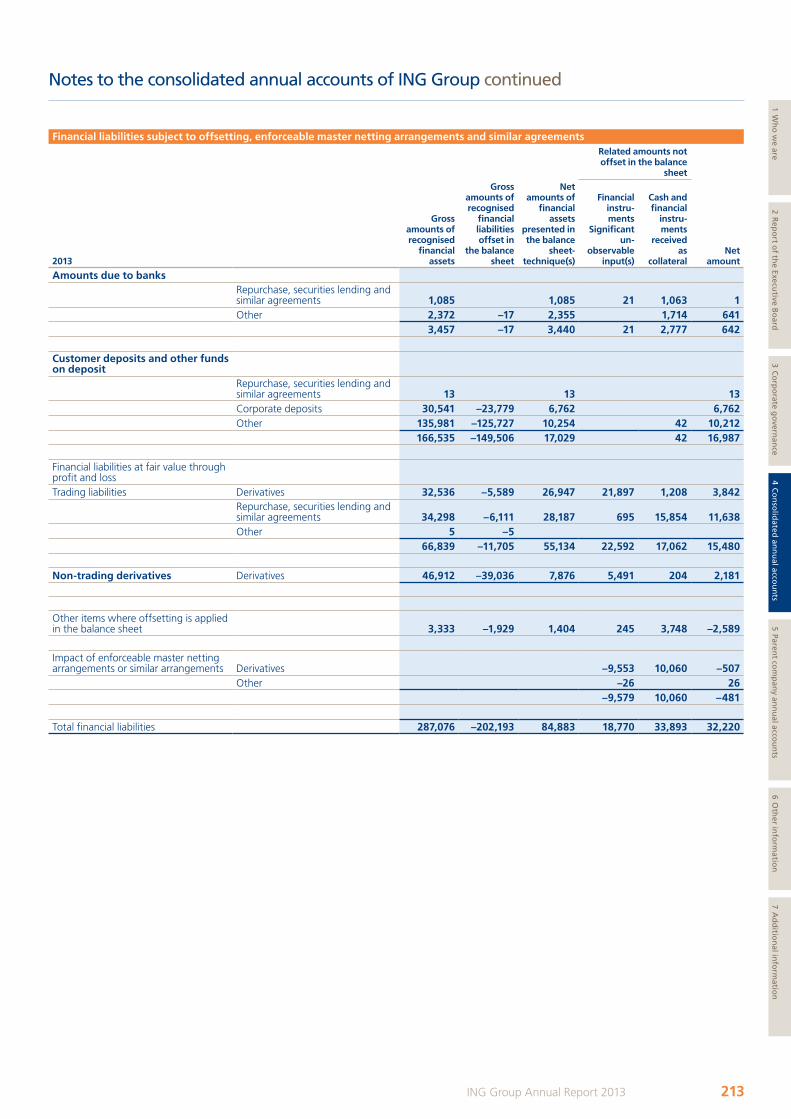
Notes to the consolidated annual accounts of ING Group continued
Financial liabilities subject to offsetting, enforceable master netting arrangements and similar agreementsRelated amounts not offset in the balance
sheet
2013
Gross amounts of recognised
financial assets
Gross amounts of recognised
financial liabilities offset in
the balance sheet
Net amounts of
financial assets
presented in the balance
sheet-technique(s)
Financial instru-ments
Significant un-
observable input(s)
Cash and financial
instru-ments
received as
collateral Net
amount
Amounts due to banksRepurchase, securities lending and similar agreements 1,085 1,085 21 1,063 1 Other 2,372 –17 2,355 1,714 641
3,457 –17 3,440 21 2,777 642
Customer deposits and other funds on deposit
Repurchase, securities lending and similar agreements 13 13 13Corporate deposits 30,541 –23,779 6,762 6,762Other 135,981 –125,727 10,254 42 10,212
166,535 –149,506 17,029 42 16,987
Financial liabilities at fair value through profit and lossTrading liabilities Derivatives 32,536 –5,589 26,947 21,897 1,208 3,842
Repurchase, securities lending and similar agreements 34,298 –6,111 28,187 695 15,854 11,638Other 5 –5
66,839 –11,705 55,134 22,592 17,062 15,480
Non-trading derivatives Derivatives 46,912 –39,036 7,876 5,491 204 2,181
Other items where offsetting is applied in the balance sheet 3,333 –1,929 1,404 245 3,748 –2,589
Impact of enforceable master netting arrangements or similar arrangements Derivatives –9,553 10,060 –507
Other –26 26 –9,579 10,060 –481
Total financial liabilities 287,076 –202,193 84,883 18,770 33,893 32,220
213ING Group Annual Report 2013
1 Wh
o w
e are2 R
epo
rt of th
e Executive B
oard
3 Co
rpo
rate go
vernan
ce4 C
on
solid
ated an
nu
al accou
nts
5 Parent co
mp
any an
nu
al accou
nts
6 Oth
er info
rmatio
n7 A
dd
ition
al info
rmatio
n
ING_2013_deel2&3_v2A.indd 213 19/03/2014 19:12:04
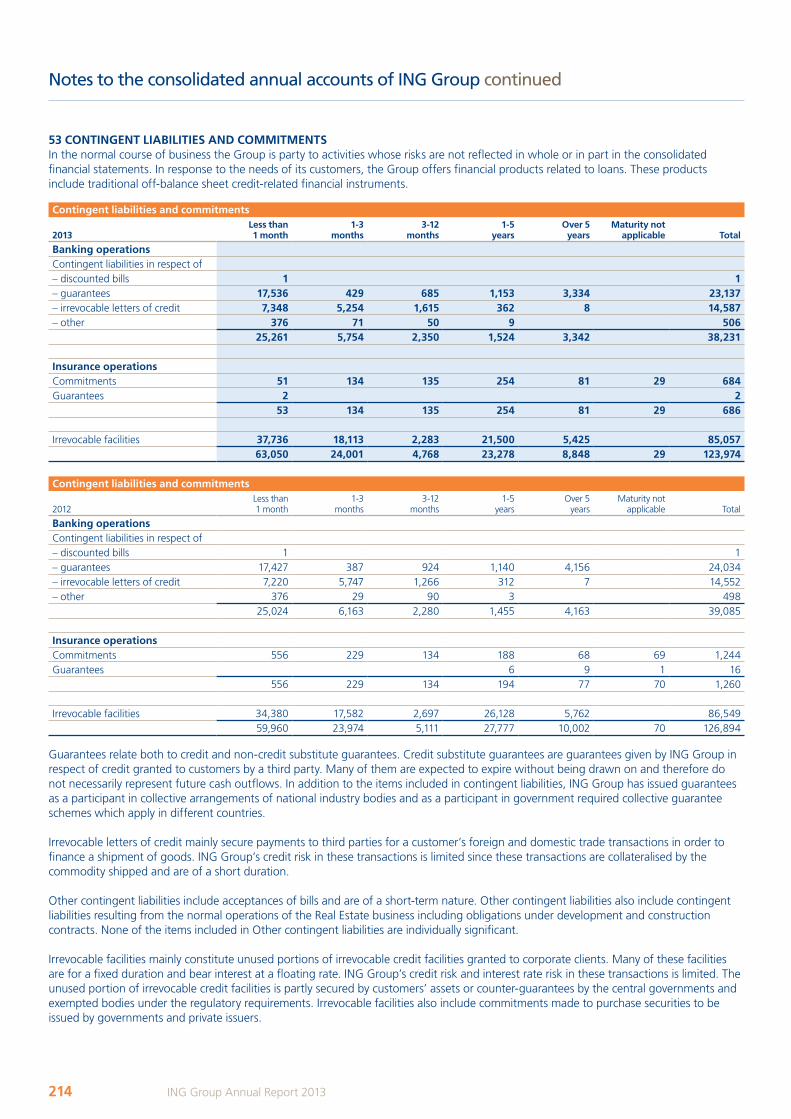
Notes to the consolidated annual accounts of ING Group continued
53 CONTINGENT LIABILITIES AND COMMITMENTSIn the normal course of business the Group is party to activities whose risks are not reflected in whole or in part in the consolidated financial statements. In response to the needs of its customers, the Group offers financial products related to loans. These products include traditional off-balance sheet credit-related financial instruments.
Contingent liabilities and commitments
2013Less than 1 month
1-3 months
3-12 months
1-5 years
Over 5 years
Maturity not applicable Total
Banking operationsContingent liabilities in respect of– discounted bills 1 1– guarantees 17,536 429 685 1,153 3,334 23,137– irrevocable letters of credit 7,348 5,254 1,615 362 8 14,587– other 376 71 50 9 506
25,261 5,754 2,350 1,524 3,342 38,231
Insurance operationsCommitments 51 134 135 254 81 29 684Guarantees 2 2
53 134 135 254 81 29 686
Irrevocable facilities 37,736 18,113 2,283 21,500 5,425 85,05763,050 24,001 4,768 23,278 8,848 29 123,974
Contingent liabilities and commitments
2012Less than 1 month
1-3 months
3-12 months
1-5 years
Over 5 years
Maturity not applicable Total
Banking operationsContingent liabilities in respect of– discounted bills 1 1– guarantees 17,427 387 924 1,140 4,156 24,034– irrevocable letters of credit 7,220 5,747 1,266 312 7 14,552– other 376 29 90 3 498
25,024 6,163 2,280 1,455 4,163 39,085
Insurance operationsCommitments 556 229 134 188 68 69 1,244Guarantees 6 9 1 16
556 229 134 194 77 70 1,260
Irrevocable facilities 34,380 17,582 2,697 26,128 5,762 86,54959,960 23,974 5,111 27,777 10,002 70 126,894
Guarantees relate both to credit and non-credit substitute guarantees. Credit substitute guarantees are guarantees given by ING Group in respect of credit granted to customers by a third party. Many of them are expected to expire without being drawn on and therefore do not necessarily represent future cash outflows. In addition to the items included in contingent liabilities, ING Group has issued guarantees as a participant in collective arrangements of national industry bodies and as a participant in government required collective guarantee schemes which apply in different countries.
Irrevocable letters of credit mainly secure payments to third parties for a customer’s foreign and domestic trade transactions in order to finance a shipment of goods. ING Group’s credit risk in these transactions is limited since these transactions are collateralised by the commodity shipped and are of a short duration.
Other contingent liabilities include acceptances of bills and are of a short-term nature. Other contingent liabilities also include contingent liabilities resulting from the normal operations of the Real Estate business including obligations under development and construction contracts. None of the items included in Other contingent liabilities are individually significant.
Irrevocable facilities mainly constitute unused portions of irrevocable credit facilities granted to corporate clients. Many of these facilities are for a fixed duration and bear interest at a floating rate. ING Group’s credit risk and interest rate risk in these transactions is limited. The unused portion of irrevocable credit facilities is partly secured by customers’ assets or counter-guarantees by the central governments and exempted bodies under the regulatory requirements. Irrevocable facilities also include commitments made to purchase securities to be issued by governments and private issuers.
214 ING Group Annual Report 2013
ING_2013_deel2&3_v2A.indd 214 19/03/2014 19:12:04
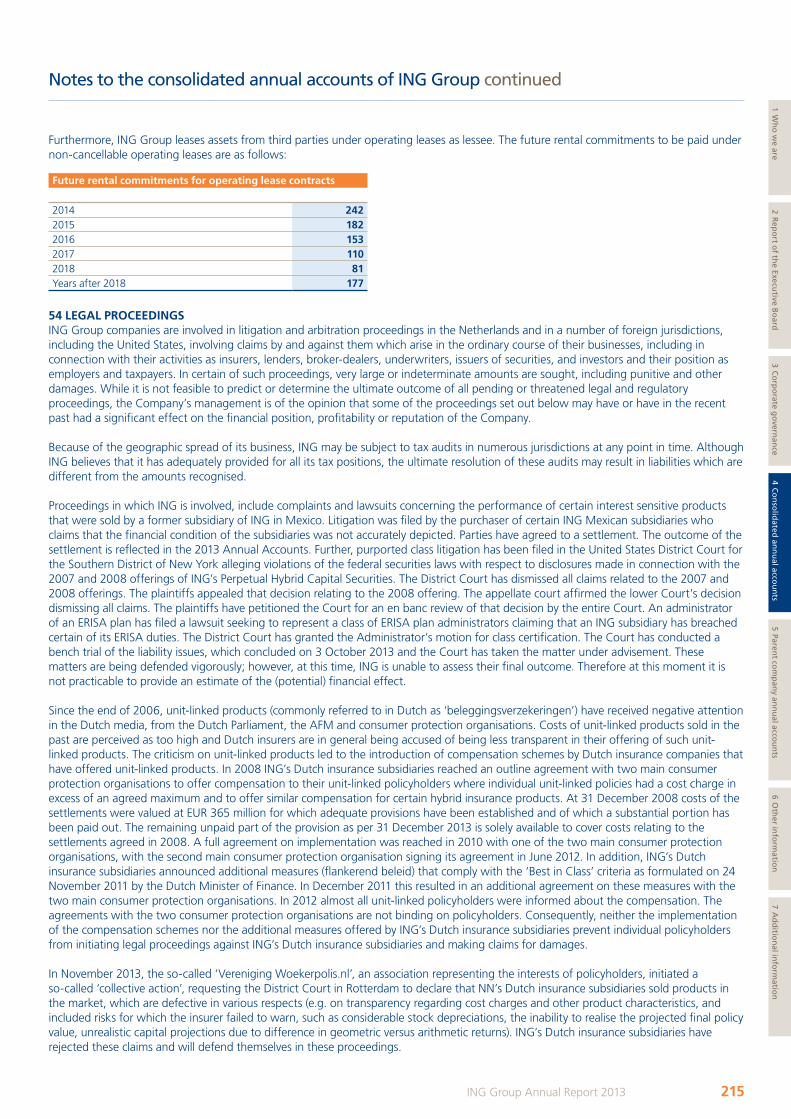
Notes to the consolidated annual accounts of ING Group continued
Furthermore, ING Group leases assets from third parties under operating leases as lessee. The future rental commitments to be paid under non-cancellable operating leases are as follows:
Future rental commitments for operating lease contracts
2014 2422015 1822016 1532017 1102018 81Years after 2018 177
54 LEGAL PROCEEDINGS ING Group companies are involved in litigation and arbitration proceedings in the Netherlands and in a number of foreign jurisdictions, including the United States, involving claims by and against them which arise in the ordinary course of their businesses, including in connection with their activities as insurers, lenders, broker-dealers, underwriters, issuers of securities, and investors and their position as employers and taxpayers. In certain of such proceedings, very large or indeterminate amounts are sought, including punitive and other damages. While it is not feasible to predict or determine the ultimate outcome of all pending or threatened legal and regulatory proceedings, the Company’s management is of the opinion that some of the proceedings set out below may have or have in the recent past had a significant effect on the financial position, profitability or reputation of the Company.
Because of the geographic spread of its business, ING may be subject to tax audits in numerous jurisdictions at any point in time. Although ING believes that it has adequately provided for all its tax positions, the ultimate resolution of these audits may result in liabilities which are different from the amounts recognised.
Proceedings in which ING is involved, include complaints and lawsuits concerning the performance of certain interest sensitive products that were sold by a former subsidiary of ING in Mexico. Litigation was filed by the purchaser of certain ING Mexican subsidiaries who claims that the financial condition of the subsidiaries was not accurately depicted. Parties have agreed to a settlement. The outcome of the settlement is reflected in the 2013 Annual Accounts. Further, purported class litigation has been filed in the United States District Court for the Southern District of New York alleging violations of the federal securities laws with respect to disclosures made in connection with the 2007 and 2008 offerings of ING’s Perpetual Hybrid Capital Securities. The District Court has dismissed all claims related to the 2007 and 2008 offerings. The plaintiffs appealed that decision relating to the 2008 offering. The appellate court affirmed the lower Court’s decision dismissing all claims. The plaintiffs have petitioned the Court for an en banc review of that decision by the entire Court. An administrator of an ERISA plan has filed a lawsuit seeking to represent a class of ERISA plan administrators claiming that an ING subsidiary has breached certain of its ERISA duties. The District Court has granted the Administrator’s motion for class certification. The Court has conducted a bench trial of the liability issues, which concluded on 3 October 2013 and the Court has taken the matter under advisement. These matters are being defended vigorously; however, at this time, ING is unable to assess their final outcome. Therefore at this moment it is not practicable to provide an estimate of the (potential) financial effect.
Since the end of 2006, unit-linked products (commonly referred to in Dutch as ‘beleggingsverzekeringen’) have received negative attention in the Dutch media, from the Dutch Parliament, the AFM and consumer protection organisations. Costs of unit-linked products sold in the past are perceived as too high and Dutch insurers are in general being accused of being less transparent in their offering of such unit-linked products. The criticism on unit-linked products led to the introduction of compensation schemes by Dutch insurance companies that have offered unit-linked products. In 2008 ING’s Dutch insurance subsidiaries reached an outline agreement with two main consumer protection organisations to offer compensation to their unit-linked policyholders where individual unit-linked policies had a cost charge in excess of an agreed maximum and to offer similar compensation for certain hybrid insurance products. At 31 December 2008 costs of the settlements were valued at EUR 365 million for which adequate provisions have been established and of which a substantial portion has been paid out. The remaining unpaid part of the provision as per 31 December 2013 is solely available to cover costs relating to the settlements agreed in 2008. A full agreement on implementation was reached in 2010 with one of the two main consumer protection organisations, with the second main consumer protection organisation signing its agreement in June 2012. In addition, ING’s Dutch insurance subsidiaries announced additional measures (flankerend beleid) that comply with the ‘Best in Class’ criteria as formulated on 24 November 2011 by the Dutch Minister of Finance. In December 2011 this resulted in an additional agreement on these measures with the two main consumer protection organisations. In 2012 almost all unit-linked policyholders were informed about the compensation. The agreements with the two consumer protection organisations are not binding on policyholders. Consequently, neither the implementation of the compensation schemes nor the additional measures offered by ING’s Dutch insurance subsidiaries prevent individual policyholders from initiating legal proceedings against ING’s Dutch insurance subsidiaries and making claims for damages.
In November 2013, the so-called ‘Vereniging Woekerpolis.nl’, an association representing the interests of policyholders, initiated a so-called ‘collective action’, requesting the District Court in Rotterdam to declare that NN’s Dutch insurance subsidiaries sold products in the market, which are defective in various respects (e.g. on transparency regarding cost charges and other product characteristics, and included risks for which the insurer failed to warn, such as considerable stock depreciations, the inability to realise the projected final policy value, unrealistic capital projections due to difference in geometric versus arithmetic returns). ING’s Dutch insurance subsidiaries have rejected these claims and will defend themselves in these proceedings.
215ING Group Annual Report 2013
1 Wh
o w
e are2 R
epo
rt of th
e Executive B
oard
3 Co
rpo
rate go
vernan
ce4 C
on
solid
ated an
nu
al accou
nts
5 Parent co
mp
any an
nu
al accou
nts
6 Oth
er info
rmatio
n7 A
dd
ition
al info
rmatio
n
ING_2013_deel2&3_v2A.indd 215 19/03/2014 19:12:04
Notes to the consolidated annual accounts of ING Group continued
Apart from the aforementioned ‘collective action’, several other claim organisations and initiatives were established on behalf of policyholders, such as the organisation Wakkerpolis. This organisation primarily concentrates on the recovery of initial costs for policyholders, based on an interim ruling of the KiFiD issued on 13 May 2013 in an individual case. In this case, the KiFiD concluded that there is no contractual basis for charging initial costs (which are costs charged to the policy during a limited period of time). Apart from the initial costs, it can be derived from the interim ruling – in accordance with past rulings of the KiFiD – that an insurer is obliged to warn against the leverage and capital consumption effect (which is the effect caused by the dependency of life insurance premium on the value of the policy; the lower the value of the policy, the higher the life insurance premium). NN Group N.V. (‘NN’) and ING believe that this interim ruling is incorrect on several legal grounds.
In proceedings pending before the District Court in Rotterdam, the Court has upon the request of the parties, including NN, submitted prejudicial questions to the European Court of Justice to obtain clarity on principal legal questions with respect to cost transparency related to unit-linked policies. The main prejudicial question is whether European law allows for the application of information requirements based on general principles of Dutch law that extend beyond information requirements as explicitly prescribed by laws and regulations in force at the time the policy was written. Although the European Court does not decide on the applicable standards in specific cases, NN and ING believe the ruling of the Court of Justice can give clarification on this question of legal principle which is subject of other legal proceedings in the Netherlands. It is expected that the European Court of Justice will render its judgment at the earliest in 2014.
ING’s Dutch insurance subsidiaries have issued, sold or advised on approximately one million individual unit-linked policies. There has been for some time and there continues to be political, regulatory and public attention focused on the unit-linked issue in general. Elements of unit-linked policies are being challenged or may be challenged on multiple legal grounds in current and future legal proceedings. There is a risk that one or more of those legal challenges will succeed. The financial consequences of any of the aforementioned factors or a combination thereof can be substantial for the Dutch insurance business of ING and may affect ING, both financially and reputationally. However, these consequences cannot be reliably estimated or quantified at this point.
In January 2010, ING lodged an appeal with the General Court of the European Union against specific elements of the European Commission’s decision regarding ING’s restructuring plan. In its appeal, ING contested the way the Commission has calculated the amount of state aid ING received and the disproportionality of the price leadership restrictions specifically and the disproportionality of restructuring requirements in general. On 2 March 2012, the General Court handed down its judgment in relation to ING Group’s appeal and annulled part of the EC’s state aid decision. Subsequently, the EC filed an appeal against the General Court’s judgment before the Court of Justice of the European Union. In parallel, the EC adopted a decision on 11 May 2012 that re-approved the state aid granted to ING Group as compatible with the internal market on the basis of ING Group’s 2009 Restructuring Plan. On the same date, the EC adopted an interim decision which opened an investigation concerning certain amendments and elements of the 2009 Restructuring Plan.
On 24 July 2012, ING announced that the Dutch State and ING were in dialogue with the European Commission on an amended and updated Restructuring Plan to be submitted to the European Commission. However, in order to safeguard its legal rights, ING filed an appeal with the General Court of the European Union against the European Commission’s decision of 11 May 2012, which re-approved ING’s Restructuring Plan that ING submitted in 2009.
On 19 November 2012, ING Group and the EC announced that the EC had approved amendments to the 2009 Restructuring Plan (the ‘2012 Amended Restructuring Plan’). With the approval, the Commission has closed its Investigation as announced on 11 May 2012 and ING has withdrawn its appeal at the General Court of the European Union that it filed in July 2012. For principal legal reasons the European Commission will continue with its appeal against the General Court ruling of March 2012. However, the outcome of this Appeal will not affect the EC approval of the 2012 Amended Restructuring plan. It is expected that this judgment will be rendered in April 2014.
In January 2011 the Association of Stockholders (Vereniging van Effectenbezitters, ‘VEB’) has issued a writ alleging that investors were misled by the prospectus that was issued with respect to the September 2007 rights issue of Fortis N.V. (now: Ageas N.V.) against Ageas N.V., the underwriters of such rights issue, including ING Bank, and former directors of Fortis N.V. According to the VEB the prospectus shows substantive incorrect and misleading information. The VEB states that the impact and the risks of the subprime crisis for Fortis and Fortis’ liquidity position have been reflected incorrectly in the prospectus. The VEB requests a declaratory decision stating that the summoned parties have acted wrongfully and are therefore responsible for the damages suffered by the investors in Fortis. The amount of damages of EUR 18 billion has not been substantiated yet. ING is defending itself against this claim; at this time ING is not able to assess the outcome of the court proceeding. Therefore, at this moment it is not practicable to provide an estimate of the (potential) financial effect of such action.
In July 2011, the Dutch ING Pensioners’ Collective Action Foundation (Stichting Collectieve Actie Pensioengerechtigden ING Nederland), together with two trade unions (FNV Bondgenoten and CNV Dienstenbond) and a number of individual pensioners, instituted legal proceedings against ING’s decision not to provide funding for indexing pensions insured the Dutch ING Pension Fund (Stichting Pensioenfonds ING) in 2009, 2010 and 2011. This claim was rejected by the district court of Amsterdam on 9 November 2012. An appeal was lodged against this court decision. In July 2011, also the Interest Group ING General Managers’ Pensions (Belangenvereniging ING-Directiepensioenen), together with a number of individual retired Dutch General Managers of ING, instituted legal proceedings against ING’s decision not to provide funding for indexing Dutch General Managers’ pensions directly insured with Nationale-Nederlanden in 2010 and 2011. This claim was rejected by the district court of Amsterdam on 22 October 2012. An appeal was lodged against this court decision. It is not feasible to predict the ultimate outcome of these legal proceedings. The ultimate outcome of these proceedings may result in liabilities and provisions for such liabilities which are different from the amounts recognised. At this moment it is not practicable to provide an estimate of the (potential) financial effect of such proceedings.
216 ING Group Annual Report 2013
ING_2013_deel2&3_v2A.indd 216 19/03/2014 19:12:04
Notes to the consolidated annual accounts of ING Group continued
In April 2013, the ING Pension Fund started arbitration proceedings to adjudicate a dispute with ING concerning the adjusted mortality tables used in the calculation of premiums and provisions. In 2013 ING decided to lower its contributions by 1.7% as a result of ING not accepting the adjustments made by the ING Pension Fund resulting from the mortality tables used. In February 2014 the ING Pension Fund and ING agreed that the ING Pension Fund will remain using a surcharge of 1.7% and the ING Pension Fund and ING will share the costs of the 1.7% surcharge over 2013. The payment of 50% of the surcharge 2013 by ING is included in the payment by ING of the one-time lump sum to the ING Pension Fund, which was closed for the accrual of new pension benefits as of 1 January 2014, of EUR 379 million to release ING from future financial obligations. More information is provided in Note 60 of the Annual Accounts.
In July 2013, the ING Pension Fund started arbitration proceedings against ING’s decision not to provide funding (for a total amount of EUR 197.5 million) for indexing pensions insured with the ING Pension Fund as of 1 January 2013. During the arbitration proceedings the ING Pension Fund added a claim in the amount of EUR 38.8 million for funding the indexation as of 1 August 2013. On 20 December 2013 the arbitrators ruled in favour of the ING Pension Fund and concluded that ING will have to provide full funding for both the indexation as of 1 January 2013 and the indexation as of 1 August 2013. The outcome of the arbitration is reflected in the 2013 Annual Accounts.
On 12 June 2012, ING Bank entered into a Settlement Agreement with U.S. Department of the Treasury’s Office of Foreign Assets Control (OFAC) and Deferred Prosecution Agreements with the Department of Justice, the United States Attorney’s Office for the District of Columbia and the District Attorney of the County of New York (together the ‘U.S. Authorities’) in relation to the investigation by those agencies into compliance with U.S. economic sanctions and U.S. dollar payment practices until 2007. The Agreements have expired as of 12 December 2013 and the motion against ING Bank N.V. has been dismissed by the US District Court of Columbia.
In addition, like many other companies in the insurance industry, several of ING’s subsidiaries in the U.S. have received formal requests for information from various governmental and regulatory agencies regarding whether and to what extent they proactively ascertain whether customers have deceased, pay benefits even where no claim has been made, and comply with state laws pertaining to unclaimed or abandoned property. On 6 June 2013, ING U.S. executed a Global Resolution Agreement, which became effective 26 July 2013, establishing a process to resolve an audit of compliance with unclaimed property laws being conducted by a majority of the states. On 13 August 2013, ING U.S. executed a Regulatory Settlement Agreement (‘RSA’), which became effective on 14 September 2013, that settles with Departments of Insurance of forty seven states, two territories and the District of Columbia a multi-state market conduct examination regarding benefit payment practices, procedures and policy administration relating to claims, including efforts to identify owners and beneficiaries of unclaimed benefits.
In December 2005, Interadvies N.V., at the time a subsidiary of ING Bank N.V. (together ‘ING’) sold Arenda Holding B.V. and five subsidiaries (together ‘Arenda’) to Amodo Europe N.V. (‘Amodo’). In November 2006, Amodo instituted legal proceedings against ING. Amodo claimed that ING informed them incorrectly with respect to the current and future financial status of Arenda at the time of the sale. This claim was rejected by the Court on 1 September 2010 but Amodo lodged an appeal against that Court decision. On 6 November 2012, the Court of Appeal partly awarded the claim of Amodo in an interlocutory judgement. In the interlocutory judgement, the Court of Appeal also instructed both ING and Amodo to submit a calculation of the damages involved to the Court of Appeal. Based on both calculations the Court of Appeal will make a final judgement. In January 2014, Amodo has filed a new document to substantiate its claim. ING has until the end of March 2014 to file counter arguments, therefore a final judgment will probably not be given before the end of the second quarter of 2014. ING has the possibility to appeal against the legal grounds on which the final judgement is based. At this moment it is not practicable to provide an estimate of the (potential) financial effect of this proceeding.
Following a recent broad industry review by the Dutch regulator DNB, Nationale-Nederlanden Schadeverzekering Maatschappij N.V. was instructed to strengthen its policies and procedures in respect of sanctions-related customer screening and related compliance matters. Nationale-Nederlanden Schadeverzekering Maatschappij N.V. is currently in the process of implementing DNB’s recommendations.
55 COMPANIES AND BUSINESSES ACQUIRED AND DIVESTEDAcquisitions effective in 2013There were no significant acquisitions in 2013.
Divestments announced in 2014ING’s Taiwanese investment management business On 10 January 2014, ING announced that it has reached an agreement to sell ING Investment Management (IM) Taiwan, its Taiwanese asset management business, to Japan-based Nomura Asset Management in partnership with a group of investors. The transaction is not expected to have a significant impact on ING Group results. The transaction is subject to regulatory approval and expected to close in the second quarter of 2014.
Partial divestments effective in 2013 – ING U.S.In May 2013, ING U.S. was successfully listed on the NYSE reducing ING’s ownership interest from 100% to approximately 71.25%. In October 2013, the sale of a second tranche further reduced ING Group’s interest in ING U.S. to approximately 57%. Reference is made to Note 59 ‘Other events’.
217ING Group Annual Report 2013
1 Wh
o w
e are2 R
epo
rt of th
e Executive B
oard
3 Co
rpo
rate go
vernan
ce4 C
on
solid
ated an
nu
al accou
nts
5 Parent co
mp
any an
nu
al accou
nts
6 Oth
er info
rmatio
n7 A
dd
ition
al info
rmatio
n
ING_2013_deel2&3_v2A.indd 217 19/03/2014 19:12:04
Notes to the consolidated annual accounts of ING Group continued
Divestments effective in 2013 and divestments announced in 2013 but not closed in 2013 – Asia In 2012, ING’s Insurance and investment management businesses in Asia and the (internally) reinsured Japan SPVA business in corporate reinsurance were classified as held for sale and discontinued operations. Various individual divestment transactions were agreed. The specifics of these transactions are included below. The Asian Insurance and Investment Management businesses and the (internally) reinsured Japan SPVA businesses in Corporate Reinsurance were previously included respectively in the segments Insurance Asia/Pacific, Investment Management and Other before they were classified as discontinued operations. After carefully exploring and evaluating the options available for the divestment of ING Life Japan, it was concluded that a standalone divestment of ING Life Japan, including its Corporate Owned Life Insurance (COLI) and Closed Block VA businesses, is not feasible in a manner that would meet the demands of regulators and other interest holders. As a result, ING Life Japan and the Japanese Closed Block VA guarantees reinsured to ING Re (‘ING Japan’) are no longer classified as held for sale and discontinued operations in 2013. Reference is made to Note 12 ‘Assets and liabilities held for sale’, Note 36 ‘Discontinued operations’ and Note 59 ‘Other events’.
Joint venture China Merchants FundIn October 2012, ING reached an agreement to sell its 33.3% stake in China Merchants Fund, an investment management joint venture, to its joint venture partners China Merchants Bank Co., Ltd., and China Merchants Securities Co., Ltd. Under the terms agreed, ING received a total cash consideration of EUR 98 million. The transaction realised a net gain of EUR 59 million. The transaction closed on 3 December 2013.
Insurance in Hong Kong, Macau, ThailandIn October 2012, ING reached an agreement to sell its life insurance, general insurance, pension and financial planning units in Hong Kong and Macau, and its life insurance operation in Thailand to Pacific Century Group for a combined consideration of EUR 1.6 billion (USD 2.1 billion) in cash. A net gain of EUR 945 million is recognised in 2013. The transaction closed on 28 February 2013.
ING’s investment management business in ThailandIn November 2012, ING reached an agreement to sell its investment management business in Thailand to UOB Asset Management Ltd. ING received a total cash consideration of EUR 10 million for the investment management business in Thailand. The transaction closed on 3 May 2013.
ING’s investment management business in MalaysiaIn December 2012, ING reached an agreement to sell its 70%-stake in ING Funds Berhad (IFB), ING’s investment management business in Malaysia, to Kenanga Investors Berhad (Kenanga Investors), a wholly owned subsidiary of K & N Kenanga Holdings Berhad (Kenanga). Tab Inter-Asia Services Sdn Berhad has also agreed to sell its 30% stake in IFB to Kenanga Investors. The transaction closed on 19 April 2013.
Joint venture ING Vysya Life In January 2013, ING agreed to sell its full interest in ING Vysya Life Insurance Company Ltd. to its joint venture partner Exide Industries Ltd. ING’s exit from the Indian life insurance joint venture is part of the previously announced intended divestment of ING’s Insurance and investment management businesses in Asia. The transaction resulted in a net loss of EUR 15 million which was recognised in 2012. The transaction closed on 22 March 2013.
Joint venture KB LifeIn April 2013, ING agreed to sell its 49% stake in Korean insurance venture KB Life Insurance Company Ltd. (KB Life) to joint venture partner KB Financial Group. ING received a total cash consideration of EUR 115 million (KRW 166.5 billion) for its 49% stake in KB Life. The transaction closed 20 June 2013.
Joint venture ING-BOB Life In July 2013, ING agreed to sell its 50% stake in its Chinese insurance joint venture ING-BOB Life Insurance Company to BNP Paribas Cardif, the insurance arm of BNP Paribas. The transaction, which is subject to regulatory approval, is not expected to have a significant impact on ING Group results. This announcement does not affect ING Bank’s 13.7% stake in Bank of Beijing, nor does it affect ING’s Commercial Banking activities in China.
ING’s investment management business in South Korea In July 2013, ING reached an agreement to sell its investment management business in South Korea to Macquarie Group, an Australia-based, global provider of financial services. The transaction did not have a significant impact on ING Group results. The transaction closed on 2 December 2013.
ING Life KoreaIn August 2013, ING announced that it has reached an agreement to sell ING Life Korea, its wholly owned life insurance business in South Korea, to MBK Partners for a total purchase price of EUR 1.24 billion (KRW 1.84 trillion). Under the terms of the agreement, ING will hold an indirect stake of approximately 10% in ING Life Korea for an amount of EUR 80 million (KRW 120 billion). ING has also reached a licensing agreement that will allow ING Life Korea to continue to operate under the ING brand for a maximum period of five years. In addition, over the course of one year, ING will continue to provide technical support and advice to ING Life Korea. The transaction resulted in an after tax loss for ING Group of EUR 1.0 billion. This transaction closed on 24 December 2013.
218 ING Group Annual Report 2013
ING_2013_deel2&3_v2A.indd 218 19/03/2014 19:12:04
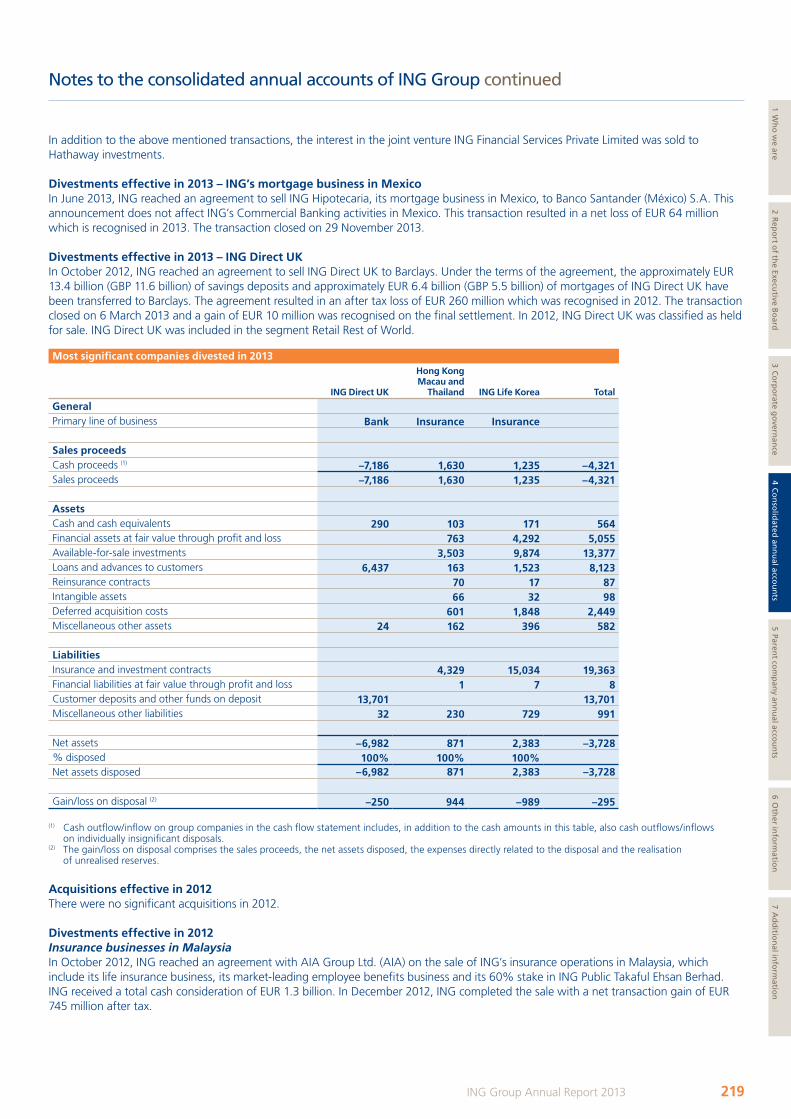
Notes to the consolidated annual accounts of ING Group continued
In addition to the above mentioned transactions, the interest in the joint venture ING Financial Services Private Limited was sold to Hathaway investments.
Divestments effective in 2013 – ING’s mortgage business in MexicoIn June 2013, ING reached an agreement to sell ING Hipotecaria, its mortgage business in Mexico, to Banco Santander (México) S.A. This announcement does not affect ING’s Commercial Banking activities in Mexico. This transaction resulted in a net loss of EUR 64 million which is recognised in 2013. The transaction closed on 29 November 2013.
Divestments effective in 2013 – ING Direct UKIn October 2012, ING reached an agreement to sell ING Direct UK to Barclays. Under the terms of the agreement, the approximately EUR 13.4 billion (GBP 11.6 billion) of savings deposits and approximately EUR 6.4 billion (GBP 5.5 billion) of mortgages of ING Direct UK have been transferred to Barclays. The agreement resulted in an after tax loss of EUR 260 million which was recognised in 2012. The transaction closed on 6 March 2013 and a gain of EUR 10 million was recognised on the final settlement. In 2012, ING Direct UK was classified as held for sale. ING Direct UK was included in the segment Retail Rest of World.
Most significant companies divested in 2013
ING Direct UK
Hong Kong Macau and
Thailand ING Life Korea Total
GeneralPrimary line of business Bank Insurance Insurance
Sales proceedsCash proceeds (1) –7,186 1,630 1,235 –4,321Sales proceeds –7,186 1,630 1,235 –4,321
AssetsCash and cash equivalents 290 103 171 564Financial assets at fair value through profit and loss 763 4,292 5,055Available-for-sale investments 3,503 9,874 13,377Loans and advances to customers 6,437 163 1,523 8,123Reinsurance contracts 70 17 87Intangible assets 66 32 98Deferred acquisition costs 601 1,848 2,449Miscellaneous other assets 24 162 396 582
LiabilitiesInsurance and investment contracts 4,329 15,034 19,363Financial liabilities at fair value through profit and loss 1 7 8Customer deposits and other funds on deposit 13,701 13,701Miscellaneous other liabilities 32 230 729 991
Net assets –6,982 871 2,383 –3,728% disposed 100% 100% 100%Net assets disposed –6,982 871 2,383 –3,728
Gain/loss on disposal (2) –250 944 –989 –295
(1) Cash outflow/inflow on group companies in the cash flow statement includes, in addition to the cash amounts in this table, also cash outflows/inflows on individually insignificant disposals.
(2) The gain/loss on disposal comprises the sales proceeds, the net assets disposed, the expenses directly related to the disposal and the realisation of unrealised reserves.
Acquisitions effective in 2012There were no significant acquisitions in 2012.
Divestments effective in 2012Insurance businesses in MalaysiaIn October 2012, ING reached an agreement with AIA Group Ltd. (AIA) on the sale of ING’s insurance operations in Malaysia, which include its life insurance business, its market-leading employee benefits business and its 60% stake in ING Public Takaful Ehsan Berhad. ING received a total cash consideration of EUR 1.3 billion. In December 2012, ING completed the sale with a net transaction gain of EUR 745 million after tax.
219ING Group Annual Report 2013
1 Wh
o w
e are2 R
epo
rt of th
e Executive B
oard
3 Co
rpo
rate go
vernan
ce4 C
on
solid
ated an
nu
al accou
nts
5 Parent co
mp
any an
nu
al accou
nts
6 Oth
er info
rmatio
n7 A
dd
ition
al info
rmatio
n
ING_2013_deel2&3_v2A.indd 219 19/03/2014 19:12:05
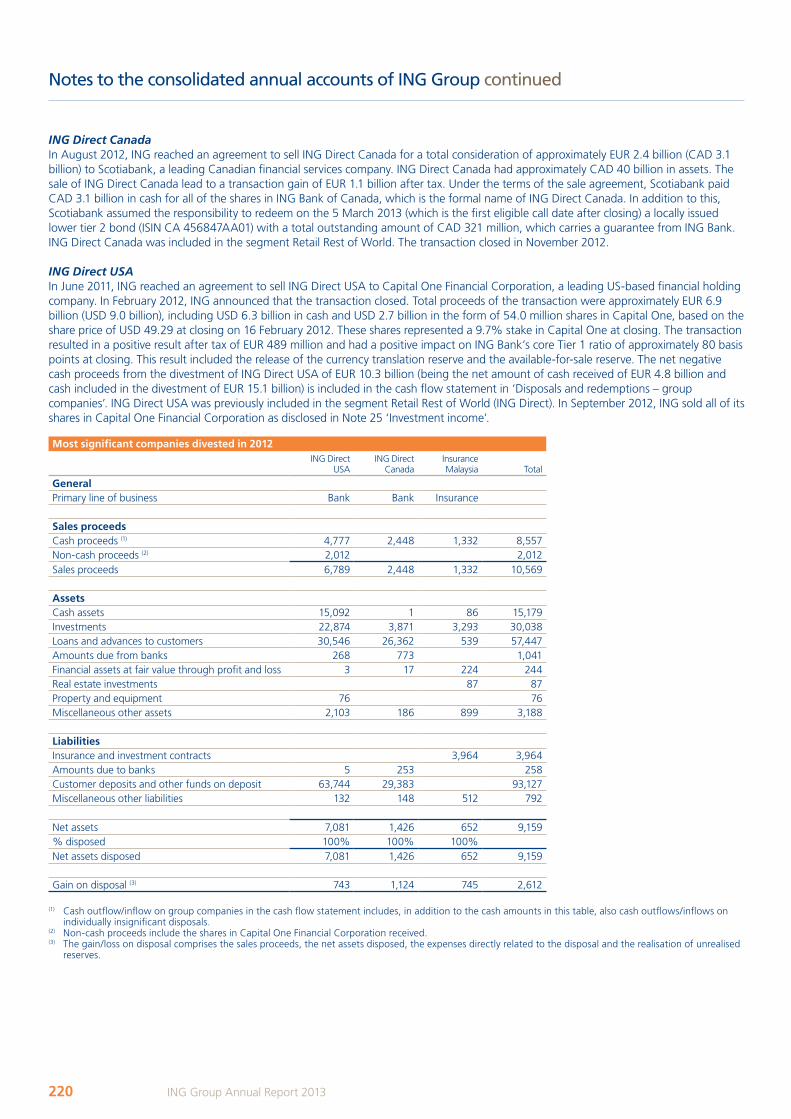
Notes to the consolidated annual accounts of ING Group continued
ING Direct Canada In August 2012, ING reached an agreement to sell ING Direct Canada for a total consideration of approximately EUR 2.4 billion (CAD 3.1 billion) to Scotiabank, a leading Canadian financial services company. ING Direct Canada had approximately CAD 40 billion in assets. The sale of ING Direct Canada lead to a transaction gain of EUR 1.1 billion after tax. Under the terms of the sale agreement, Scotiabank paid CAD 3.1 billion in cash for all of the shares in ING Bank of Canada, which is the formal name of ING Direct Canada. In addition to this, Scotiabank assumed the responsibility to redeem on the 5 March 2013 (which is the first eligible call date after closing) a locally issued lower tier 2 bond (ISIN CA 456847AA01) with a total outstanding amount of CAD 321 million, which carries a guarantee from ING Bank. ING Direct Canada was included in the segment Retail Rest of World. The transaction closed in November 2012.
ING Direct USAIn June 2011, ING reached an agreement to sell ING Direct USA to Capital One Financial Corporation, a leading US-based financial holding company. In February 2012, ING announced that the transaction closed. Total proceeds of the transaction were approximately EUR 6.9 billion (USD 9.0 billion), including USD 6.3 billion in cash and USD 2.7 billion in the form of 54.0 million shares in Capital One, based on the share price of USD 49.29 at closing on 16 February 2012. These shares represented a 9.7% stake in Capital One at closing. The transaction resulted in a positive result after tax of EUR 489 million and had a positive impact on ING Bank’s core Tier 1 ratio of approximately 80 basis points at closing. This result included the release of the currency translation reserve and the available-for-sale reserve. The net negative cash proceeds from the divestment of ING Direct USA of EUR 10.3 billion (being the net amount of cash received of EUR 4.8 billion and cash included in the divestment of EUR 15.1 billion) is included in the cash flow statement in ‘Disposals and redemptions – group companies’. ING Direct USA was previously included in the segment Retail Rest of World (ING Direct). In September 2012, ING sold all of its shares in Capital One Financial Corporation as disclosed in Note 25 ‘Investment income’.
Most significant companies divested in 2012ING Direct
USAING Direct
CanadaInsurance Malaysia Total
GeneralPrimary line of business Bank Bank Insurance
Sales proceedsCash proceeds (1) 4,777 2,448 1,332 8,557Non-cash proceeds (2) 2,012 2,012Sales proceeds 6,789 2,448 1,332 10,569
AssetsCash assets 15,092 1 86 15,179Investments 22,874 3,871 3,293 30,038Loans and advances to customers 30,546 26,362 539 57,447Amounts due from banks 268 773 1,041Financial assets at fair value through profit and loss 3 17 224 244Real estate investments 87 87Property and equipment 76 76Miscellaneous other assets 2,103 186 899 3,188
LiabilitiesInsurance and investment contracts 3,964 3,964Amounts due to banks 5 253 258Customer deposits and other funds on deposit 63,744 29,383 93,127Miscellaneous other liabilities 132 148 512 792
Net assets 7,081 1,426 652 9,159% disposed 100% 100% 100% Net assets disposed 7,081 1,426 652 9,159
Gain on disposal (3) 743 1,124 745 2,612
(1) Cash outflow/inflow on group companies in the cash flow statement includes, in addition to the cash amounts in this table, also cash outflows/inflows on individually insignificant disposals.
(2) Non-cash proceeds include the shares in Capital One Financial Corporation received.(3) The gain/loss on disposal comprises the sales proceeds, the net assets disposed, the expenses directly related to the disposal and the realisation of unrealised
reserves.
220 ING Group Annual Report 2013
ING_2013_deel2&3_v2A.indd 220 19/03/2014 19:12:05
Notes to the consolidated annual accounts of ING Group continued
Acquisitions effective in 2011There were no significant acquisitions in 2011.
Divestments effective in 2011Pacific Antai Life Insurance Company Ltd.In June 2011, ING completed the sale of its entire stake in China’s Pacific Antai Life Insurance Company Ltd. (PALIC) to China Construction Bank for a consideration of EUR 82 million, and a net profit of EUR 28 million. The stake in PALIC was previously included in the former segment Insurance Asia/Pacific.
ING REIM Europe, ING REIM Asia and Clarion Real Estate Securities (CRES)In July 2011, ING completed the sale of Clarion Real Estate Securities (CRES) to CB Richard Ellis. The sale resulted in a net gain on divestment of EUR 182 million. CRES was previously included in the former segment ING Real Estate.
In October 2011, ING completed the sale of REIM’s Asian and European operations to US-based CBRE Group Inc., thereby completing the divestment of ING REIM. The divestment of ING REIM resulted in an after-tax gain on disposal of approximately EUR 245 million. As a result of the agreement at closing ING continues to have certain contingent income and expenses, however no significant impact on the result on divestment is expected. REIM’s Asian and European operations were previously included in the segment Commercial banking (ING Real Estate).
Clarion PartnersIn June 2011, ING completed the sale of the private market real estate investment manager of its US operations, Clarion Partners, to Clarion Partners management in partnership with Lightyear Capital LLC for USD 100 million. The sale resulted in a net gain on divestment of EUR 39 million. Clarion Partners was previously included in the segment Commercial banking (ING Real Estate).
ING Investment Management AustraliaIn October 2011, ING completed the sale of ING Investment Management (ING IM) Australia to UBS AG. ING IM Australia’s business provided a number of investment strategies and products directly to the Australian institutional and wholesale markets. ING IM Australia was previously included in the segment ING Investment Management.
Latin American pensions, life insurance and investment management operationsIn December 2011, ING completed the sale of its Latin American pensions, life insurance and investment management operations (‘Latin American operations’) for a total consideration of EUR 2,637 million to Grupo de Inversiones Suramericana (‘GRUPOSURA’). The sale was the first major step in the divestment of ING’s insurance and investment management activities. Under the terms of the agreement, ING received EUR 2,572 million in cash and GRUPOSURA assumed EUR 65 million in debt. The sale resulted in a net profit of EUR 995 million. Included in the transaction were the mandatory pension and voluntary savings businesses in Chile, Colombia, Mexico, Uruguay and ING’s 80% stake in AFP Integra S.A. in Peru; the life insurance businesses in Chile and Peru; As part of this transaction ING sold its 33.7% stake in Peruvian InVita Seguros de Vida S.A. to the Wiese Family. The transaction also included the local investment management capabilities in these five countries. Not included in the transaction was ING’s 36% stake in the leading Brazilian insurer SulAmérica SA.
The Latin American operations were previously included in the segments Insurance Latin America and ING Investment Management before they were classified as discontinued operations. The segment Insurance Latin America ceased to exist following this transaction as the majority of assets and liabilities have been sold. The net result from discontinued operations is presented separately in the consolidated profit and loss account. Reference is made to Note 36 ‘Discontinued operations’ for more detailed disclosures.
ING Car LeaseIn September 2011, ING completed the sale of ING Car Lease to BMW Group fleet management division Alphabet for total proceeds of EUR 696 million and a net transaction result of EUR 347 million. ING Car Lease was previously partly included in both Commercial and Retail Banking.
221ING Group Annual Report 2013
1 Wh
o w
e are2 R
epo
rt of th
e Executive B
oard
3 Co
rpo
rate go
vernan
ce4 C
on
solid
ated an
nu
al accou
nts
5 Parent co
mp
any an
nu
al accou
nts
6 Oth
er info
rmatio
n7 A
dd
ition
al info
rmatio
n
ING_2013_deel2&3_v2A.indd 221 19/03/2014 19:12:05
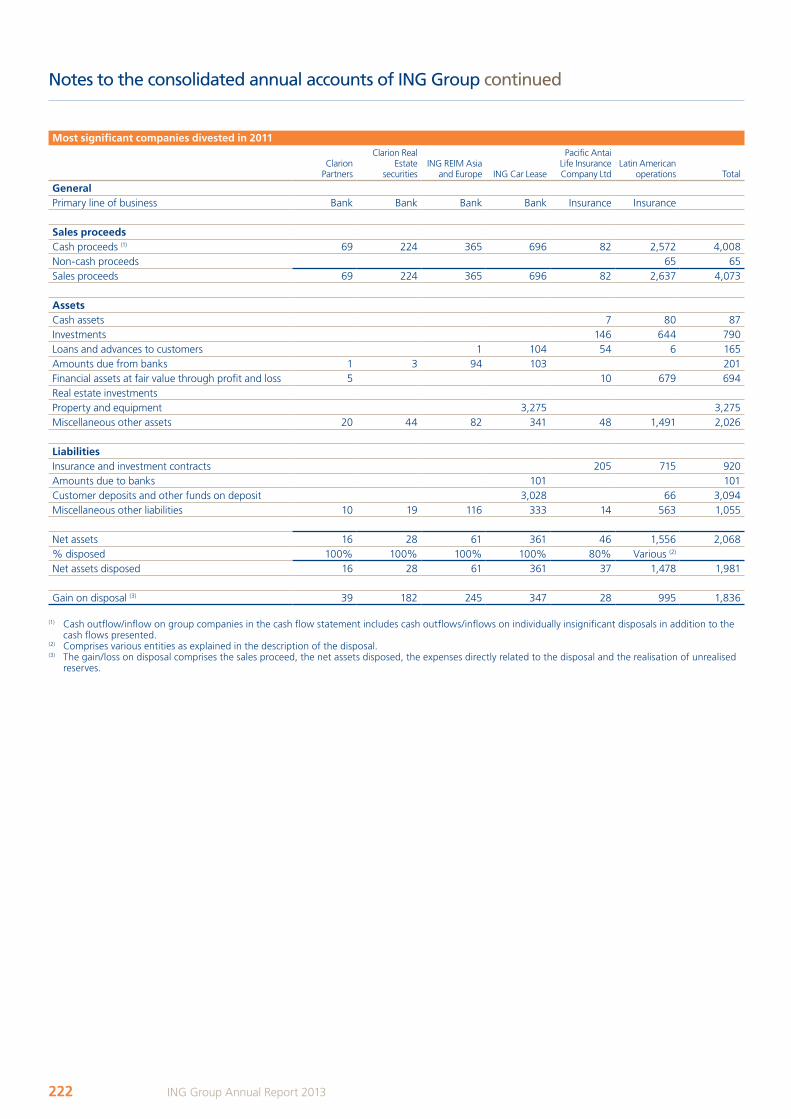
Notes to the consolidated annual accounts of ING Group continued
Most significant companies divested in 2011
Clarion Partners
Clarion Real Estate
securitiesING REIM Asia
and Europe ING Car Lease
Pacific Antai Life Insurance Company Ltd
Latin American operations Total
GeneralPrimary line of business Bank Bank Bank Bank Insurance Insurance
Sales proceedsCash proceeds (1) 69 224 365 696 82 2,572 4,008Non-cash proceeds 65 65Sales proceeds 69 224 365 696 82 2,637 4,073
AssetsCash assets 7 80 87Investments 146 644 790Loans and advances to customers 1 104 54 6 165Amounts due from banks 1 3 94 103 201Financial assets at fair value through profit and loss 5 10 679 694Real estate investments Property and equipment 3,275 3,275Miscellaneous other assets 20 44 82 341 48 1,491 2,026
LiabilitiesInsurance and investment contracts 205 715 920Amounts due to banks 101 101Customer deposits and other funds on deposit 3,028 66 3,094Miscellaneous other liabilities 10 19 116 333 14 563 1,055
Net assets 16 28 61 361 46 1,556 2,068% disposed 100% 100% 100% 100% 80% Various (2) Net assets disposed 16 28 61 361 37 1,478 1,981
Gain on disposal (3) 39 182 245 347 28 995 1,836
(1) Cash outflow/inflow on group companies in the cash flow statement includes cash outflows/inflows on individually insignificant disposals in addition to the cash flows presented.
(2) Comprises various entities as explained in the description of the disposal.(3) The gain/loss on disposal comprises the sales proceed, the net assets disposed, the expenses directly related to the disposal and the realisation of unrealised
reserves.
222 ING Group Annual Report 2013
ING_2013_deel2&3_v2A.indd 222 19/03/2014 19:12:05
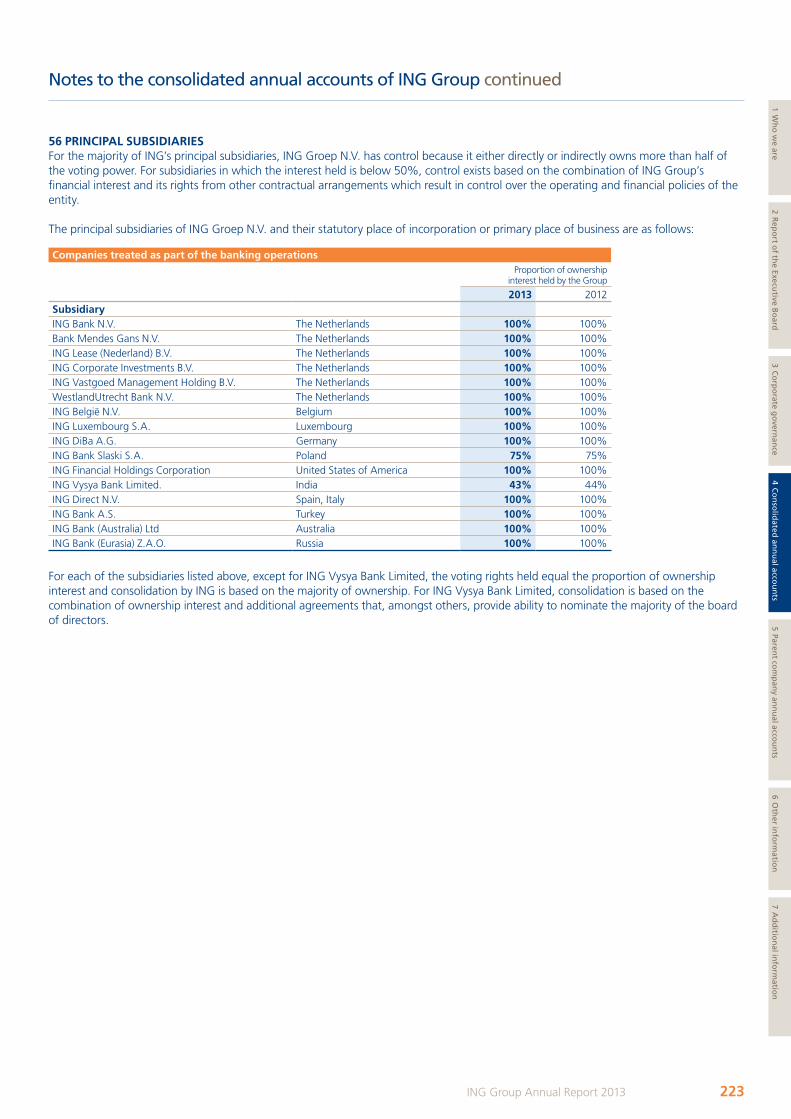
Notes to the consolidated annual accounts of ING Group continued
56 PRINCIPAL SUBSIDIARIESFor the majority of ING’s principal subsidiaries, ING Groep N.V. has control because it either directly or indirectly owns more than half of the voting power. For subsidiaries in which the interest held is below 50%, control exists based on the combination of ING Group’s financial interest and its rights from other contractual arrangements which result in control over the operating and financial policies of the entity.
The principal subsidiaries of ING Groep N.V. and their statutory place of incorporation or primary place of business are as follows:
Companies treated as part of the banking operationsProportion of ownership
interest held by the Group
2013 2012SubsidiaryING Bank N.V. The Netherlands 100% 100%Bank Mendes Gans N.V. The Netherlands 100% 100%ING Lease (Nederland) B.V. The Netherlands 100% 100%ING Corporate Investments B.V. The Netherlands 100% 100%ING Vastgoed Management Holding B.V. The Netherlands 100% 100%WestlandUtrecht Bank N.V. The Netherlands 100% 100%ING België N.V. Belgium 100% 100%ING Luxembourg S.A. Luxembourg 100% 100%ING DiBa A.G. Germany 100% 100%ING Bank Slaski S.A. Poland 75% 75%ING Financial Holdings Corporation United States of America 100% 100%ING Vysya Bank Limited. India 43% 44%ING Direct N.V. Spain, Italy 100% 100%ING Bank A.S. Turkey 100% 100%ING Bank (Australia) Ltd Australia 100% 100%ING Bank (Eurasia) Z.A.O. Russia 100% 100%
For each of the subsidiaries listed above, except for ING Vysya Bank Limited, the voting rights held equal the proportion of ownership interest and consolidation by ING is based on the majority of ownership. For ING Vysya Bank Limited, consolidation is based on the combination of ownership interest and additional agreements that, amongst others, provide ability to nominate the majority of the board of directors.
223ING Group Annual Report 2013
1 Wh
o w
e are2 R
epo
rt of th
e Executive B
oard
3 Co
rpo
rate go
vernan
ce4 C
on
solid
ated an
nu
al accou
nts
5 Parent co
mp
any an
nu
al accou
nts
6 Oth
er info
rmatio
n7 A
dd
ition
al info
rmatio
n
ING_2013_deel2&3_v2A.indd 223 19/03/2014 19:12:05
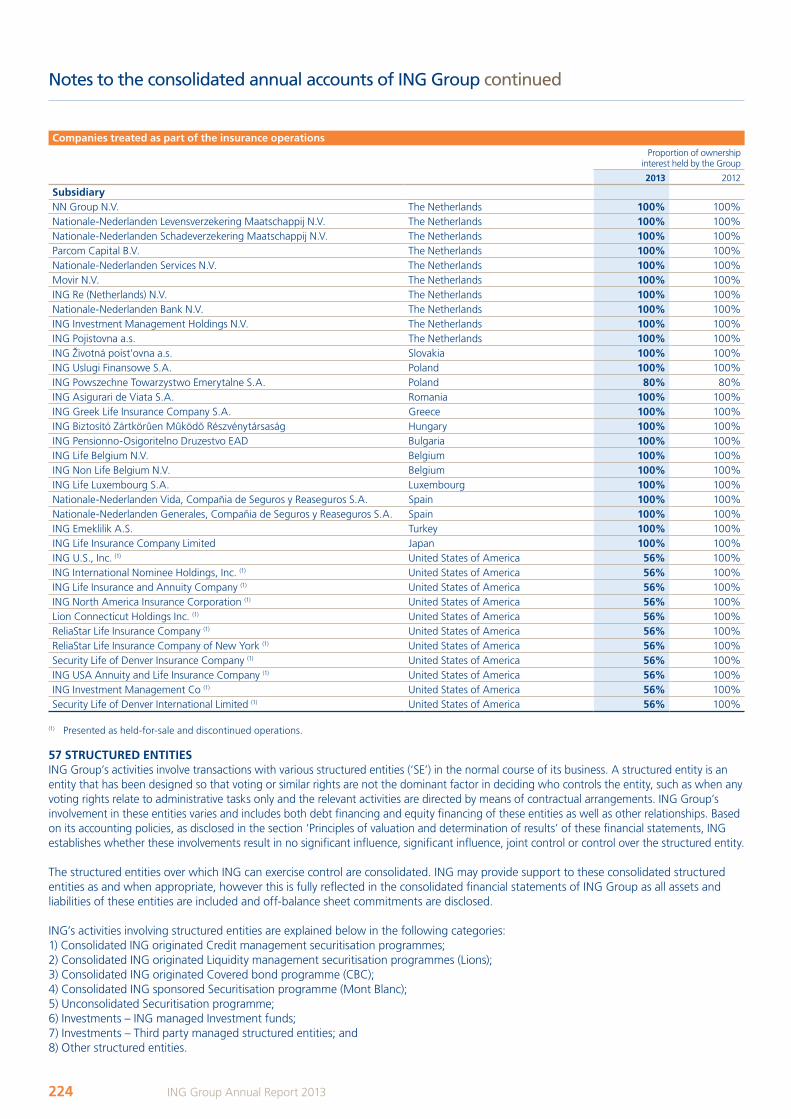
Notes to the consolidated annual accounts of ING Group continued
Companies treated as part of the insurance operationsProportion of ownership
interest held by the Group
2013 2012
SubsidiaryNN Group N.V. The Netherlands 100% 100%Nationale-Nederlanden Levensverzekering Maatschappij N.V. The Netherlands 100% 100%Nationale-Nederlanden Schadeverzekering Maatschappij N.V. The Netherlands 100% 100%Parcom Capital B.V. The Netherlands 100% 100%Nationale-Nederlanden Services N.V. The Netherlands 100% 100%Movir N.V. The Netherlands 100% 100%ING Re (Netherlands) N.V. The Netherlands 100% 100%Nationale-Nederlanden Bank N.V. The Netherlands 100% 100%ING Investment Management Holdings N.V. The Netherlands 100% 100%ING Pojistovna a.s. The Netherlands 100% 100%ING Životná poist'ovna a.s. Slovakia 100% 100%ING Uslugi Finansowe S.A. Poland 100% 100%ING Powszechne Towarzystwo Emerytalne S.A. Poland 80% 80%ING Asigurari de Viata S.A. Romania 100% 100%ING Greek Life Insurance Company S.A. Greece 100% 100%ING Biztosító Zártkörûen Mûködõ Részvénytársaság Hungary 100% 100%ING Pensionno-Osigoritelno Druzestvo EAD Bulgaria 100% 100%ING Life Belgium N.V. Belgium 100% 100%ING Non Life Belgium N.V. Belgium 100% 100%ING Life Luxembourg S.A. Luxembourg 100% 100%Nationale-Nederlanden Vida, Compañia de Seguros y Reaseguros S.A. Spain 100% 100%Nationale-Nederlanden Generales, Compañia de Seguros y Reaseguros S.A. Spain 100% 100%ING Emeklilik A.S. Turkey 100% 100%ING Life Insurance Company Limited Japan 100% 100%ING U.S., Inc. (1) United States of America 56% 100%ING International Nominee Holdings, Inc. (1) United States of America 56% 100%ING Life Insurance and Annuity Company (1) United States of America 56% 100%ING North America Insurance Corporation (1) United States of America 56% 100%Lion Connecticut Holdings Inc. (1) United States of America 56% 100%ReliaStar Life Insurance Company (1) United States of America 56% 100%ReliaStar Life Insurance Company of New York (1) United States of America 56% 100%Security Life of Denver Insurance Company (1) United States of America 56% 100%ING USA Annuity and Life Insurance Company (1) United States of America 56% 100%ING Investment Management Co (1) United States of America 56% 100%Security Life of Denver International Limited (1) United States of America 56% 100%
(1) Presented as held-for-sale and discontinued operations.
57 STRUCTURED ENTITIESING Group’s activities involve transactions with various structured entities (‘SE’) in the normal course of its business. A structured entity is an entity that has been designed so that voting or similar rights are not the dominant factor in deciding who controls the entity, such as when any voting rights relate to administrative tasks only and the relevant activities are directed by means of contractual arrangements. ING Group’s involvement in these entities varies and includes both debt financing and equity financing of these entities as well as other relationships. Based on its accounting policies, as disclosed in the section ‘Principles of valuation and determination of results’ of these financial statements, ING establishes whether these involvements result in no significant influence, significant influence, joint control or control over the structured entity.
The structured entities over which ING can exercise control are consolidated. ING may provide support to these consolidated structured entities as and when appropriate, however this is fully reflected in the consolidated financial statements of ING Group as all assets and liabilities of these entities are included and off-balance sheet commitments are disclosed.
ING’s activities involving structured entities are explained below in the following categories:1) Consolidated ING originated Credit management securitisation programmes;2) Consolidated ING originated Liquidity management securitisation programmes (Lions);3) Consolidated ING originated Covered bond programme (CBC); 4) Consolidated ING sponsored Securitisation programme (Mont Blanc);5) Unconsolidated Securitisation programme; 6) Investments – ING managed Investment funds; 7) Investments – Third party managed structured entities; and8) Other structured entities.
224 ING Group Annual Report 2013
ING_2013_deel2&3_v2A.indd 224 19/03/2014 19:12:08
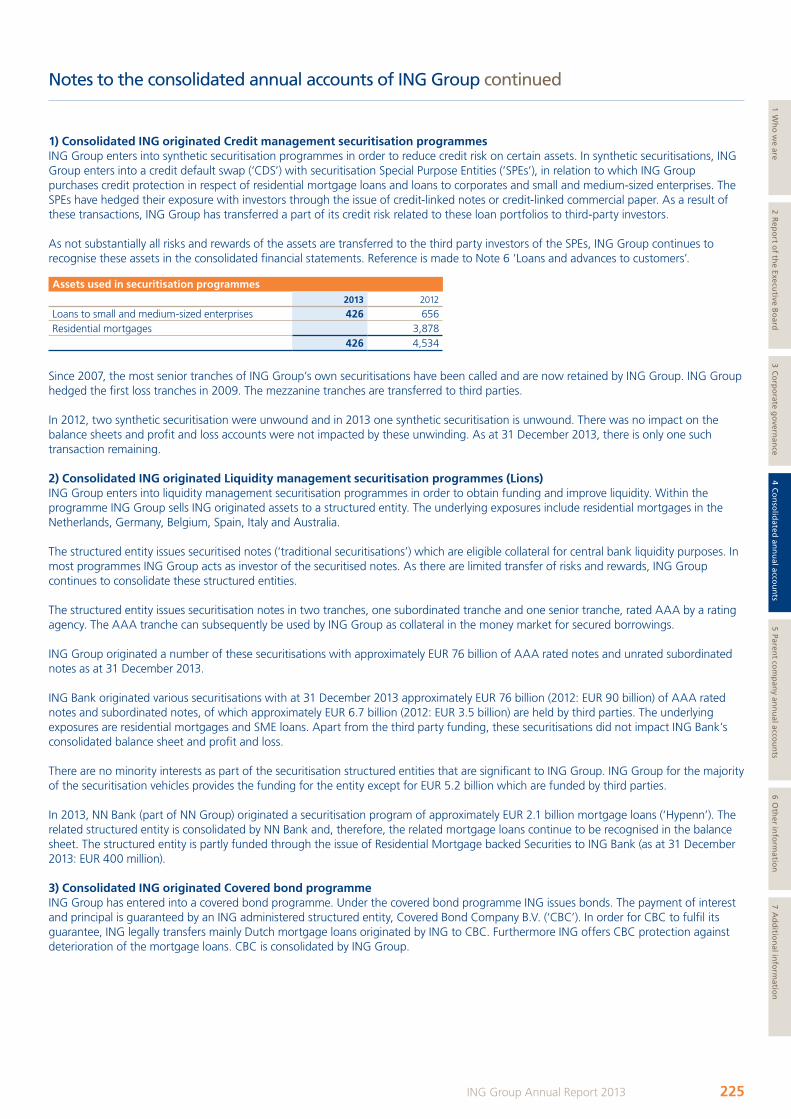
Notes to the consolidated annual accounts of ING Group continued
1) Consolidated ING originated Credit management securitisation programmesING Group enters into synthetic securitisation programmes in order to reduce credit risk on certain assets. In synthetic securitisations, ING Group enters into a credit default swap (‘CDS’) with securitisation Special Purpose Entities (’SPEs’), in relation to which ING Group purchases credit protection in respect of residential mortgage loans and loans to corporates and small and medium-sized enterprises. The SPEs have hedged their exposure with investors through the issue of credit-linked notes or credit-linked commercial paper. As a result of these transactions, ING Group has transferred a part of its credit risk related to these loan portfolios to third-party investors.
As not substantially all risks and rewards of the assets are transferred to the third party investors of the SPEs, ING Group continues to recognise these assets in the consolidated financial statements. Reference is made to Note 6 ‘Loans and advances to customers’.
Assets used in securitisation programmes2013 2012
Loans to small and medium-sized enterprises 426 656Residential mortgages 3,878
426 4,534
Since 2007, the most senior tranches of ING Group’s own securitisations have been called and are now retained by ING Group. ING Group hedged the first loss tranches in 2009. The mezzanine tranches are transferred to third parties.
In 2012, two synthetic securitisation were unwound and in 2013 one synthetic securitisation is unwound. There was no impact on the balance sheets and profit and loss accounts were not impacted by these unwinding. As at 31 December 2013, there is only one such transaction remaining.
2) Consolidated ING originated Liquidity management securitisation programmes (Lions)ING Group enters into liquidity management securitisation programmes in order to obtain funding and improve liquidity. Within the programme ING Group sells ING originated assets to a structured entity. The underlying exposures include residential mortgages in the Netherlands, Germany, Belgium, Spain, Italy and Australia.
The structured entity issues securitised notes (‘traditional securitisations’) which are eligible collateral for central bank liquidity purposes. In most programmes ING Group acts as investor of the securitised notes. As there are limited transfer of risks and rewards, ING Group continues to consolidate these structured entities.
The structured entity issues securitisation notes in two tranches, one subordinated tranche and one senior tranche, rated AAA by a rating agency. The AAA tranche can subsequently be used by ING Group as collateral in the money market for secured borrowings.
ING Group originated a number of these securitisations with approximately EUR 76 billion of AAA rated notes and unrated subordinated notes as at 31 December 2013. ING Bank originated various securitisations with at 31 December 2013 approximately EUR 76 billion (2012: EUR 90 billion) of AAA rated notes and subordinated notes, of which approximately EUR 6.7 billion (2012: EUR 3.5 billion) are held by third parties. The underlying exposures are residential mortgages and SME loans. Apart from the third party funding, these securitisations did not impact ING Bank’s consolidated balance sheet and profit and loss.
There are no minority interests as part of the securitisation structured entities that are significant to ING Group. ING Group for the majority of the securitisation vehicles provides the funding for the entity except for EUR 5.2 billion which are funded by third parties.
In 2013, NN Bank (part of NN Group) originated a securitisation program of approximately EUR 2.1 billion mortgage loans (‘Hypenn’). The related structured entity is consolidated by NN Bank and, therefore, the related mortgage loans continue to be recognised in the balance sheet. The structured entity is partly funded through the issue of Residential Mortgage backed Securities to ING Bank (as at 31 December 2013: EUR 400 million).
3) Consolidated ING originated Covered bond programmeING Group has entered into a covered bond programme. Under the covered bond programme ING issues bonds. The payment of interest and principal is guaranteed by an ING administered structured entity, Covered Bond Company B.V. (‘CBC’). In order for CBC to fulfil its guarantee, ING legally transfers mainly Dutch mortgage loans originated by ING to CBC. Furthermore ING offers CBC protection against deterioration of the mortgage loans. CBC is consolidated by ING Group.
225ING Group Annual Report 2013
1 Wh
o w
e are2 R
epo
rt of th
e Executive B
oard
3 Co
rpo
rate go
vernan
ce4 C
on
solid
ated an
nu
al accou
nts
5 Parent co
mp
any an
nu
al accou
nts
6 Oth
er info
rmatio
n7 A
dd
ition
al info
rmatio
n
ING_2013_deel2&3_v2A.indd 225 19/03/2014 19:12:08
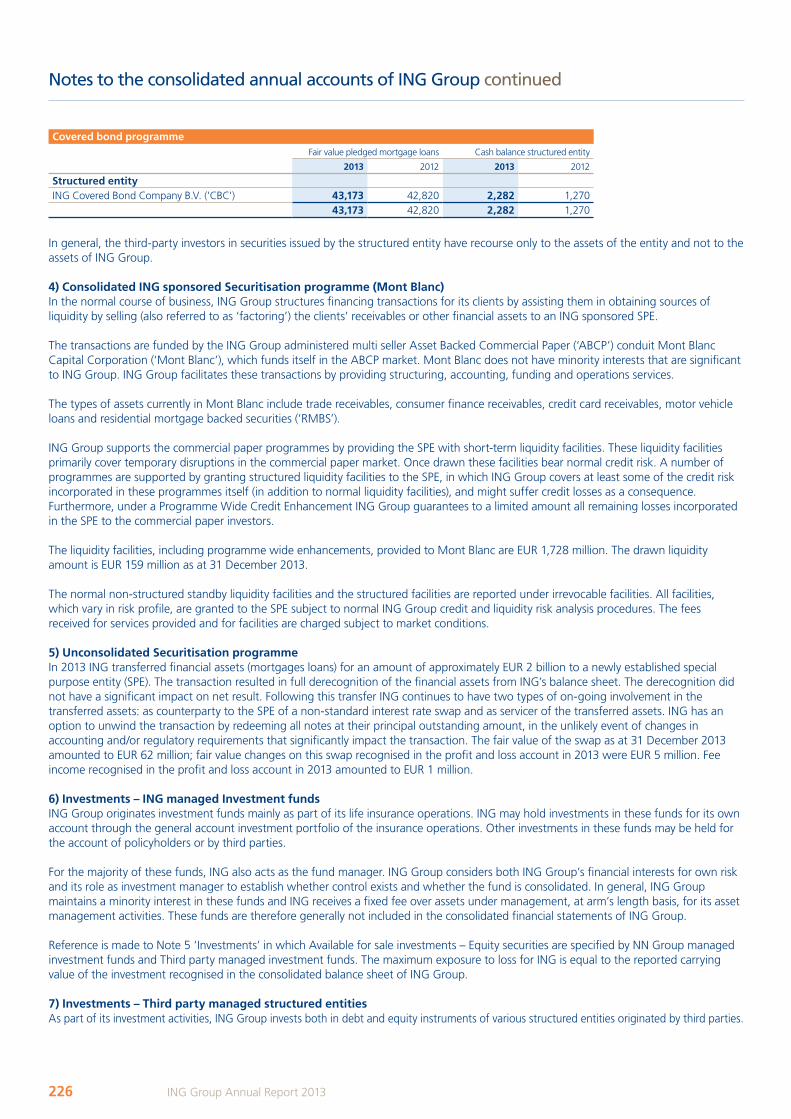
Notes to the consolidated annual accounts of ING Group continued
Covered bond programmeFair value pledged mortgage loans Cash balance structured entity
2013 2012 2013 2012
Structured entityING Covered Bond Company B.V. ('CBC') 43,173 42,820 2,282 1,270
43,173 42,820 2,282 1,270
In general, the third-party investors in securities issued by the structured entity have recourse only to the assets of the entity and not to the assets of ING Group.
4) Consolidated ING sponsored Securitisation programme (Mont Blanc)In the normal course of business, ING Group structures financing transactions for its clients by assisting them in obtaining sources of liquidity by selling (also referred to as ‘factoring’) the clients’ receivables or other financial assets to an ING sponsored SPE.
The transactions are funded by the ING Group administered multi seller Asset Backed Commercial Paper (‘ABCP’) conduit Mont Blanc Capital Corporation (‘Mont Blanc’), which funds itself in the ABCP market. Mont Blanc does not have minority interests that are significant to ING Group. ING Group facilitates these transactions by providing structuring, accounting, funding and operations services.
The types of assets currently in Mont Blanc include trade receivables, consumer finance receivables, credit card receivables, motor vehicle loans and residential mortgage backed securities (‘RMBS’).
ING Group supports the commercial paper programmes by providing the SPE with short-term liquidity facilities. These liquidity facilities primarily cover temporary disruptions in the commercial paper market. Once drawn these facilities bear normal credit risk. A number of programmes are supported by granting structured liquidity facilities to the SPE, in which ING Group covers at least some of the credit risk incorporated in these programmes itself (in addition to normal liquidity facilities), and might suffer credit losses as a consequence. Furthermore, under a Programme Wide Credit Enhancement ING Group guarantees to a limited amount all remaining losses incorporated in the SPE to the commercial paper investors.
The liquidity facilities, including programme wide enhancements, provided to Mont Blanc are EUR 1,728 million. The drawn liquidity amount is EUR 159 million as at 31 December 2013.
The normal non-structured standby liquidity facilities and the structured facilities are reported under irrevocable facilities. All facilities, which vary in risk profile, are granted to the SPE subject to normal ING Group credit and liquidity risk analysis procedures. The fees received for services provided and for facilities are charged subject to market conditions.
5) Unconsolidated Securitisation programmeIn 2013 ING transferred financial assets (mortgages loans) for an amount of approximately EUR 2 billion to a newly established special purpose entity (SPE). The transaction resulted in full derecognition of the financial assets from ING’s balance sheet. The derecognition did not have a significant impact on net result. Following this transfer ING continues to have two types of on-going involvement in the transferred assets: as counterparty to the SPE of a non-standard interest rate swap and as servicer of the transferred assets. ING has an option to unwind the transaction by redeeming all notes at their principal outstanding amount, in the unlikely event of changes in accounting and/or regulatory requirements that significantly impact the transaction. The fair value of the swap as at 31 December 2013 amounted to EUR 62 million; fair value changes on this swap recognised in the profit and loss account in 2013 were EUR 5 million. Fee income recognised in the profit and loss account in 2013 amounted to EUR 1 million.
6) Investments – ING managed Investment fundsING Group originates investment funds mainly as part of its life insurance operations. ING may hold investments in these funds for its own account through the general account investment portfolio of the insurance operations. Other investments in these funds may be held for the account of policyholders or by third parties.
For the majority of these funds, ING also acts as the fund manager. ING Group considers both ING Group’s financial interests for own risk and its role as investment manager to establish whether control exists and whether the fund is consolidated. In general, ING Group maintains a minority interest in these funds and ING receives a fixed fee over assets under management, at arm’s length basis, for its asset management activities. These funds are therefore generally not included in the consolidated financial statements of ING Group.
Reference is made to Note 5 ‘Investments’ in which Available for sale investments – Equity securities are specified by NN Group managed investment funds and Third party managed investment funds. The maximum exposure to loss for ING is equal to the reported carrying value of the investment recognised in the consolidated balance sheet of ING Group.
7) Investments – Third party managed structured entitiesAs part of its investment activities, ING Group invests both in debt and equity instruments of various structured entities originated by third parties.
226 ING Group Annual Report 2013
ING_2013_deel2&3_v2A.indd 226 19/03/2014 19:12:08
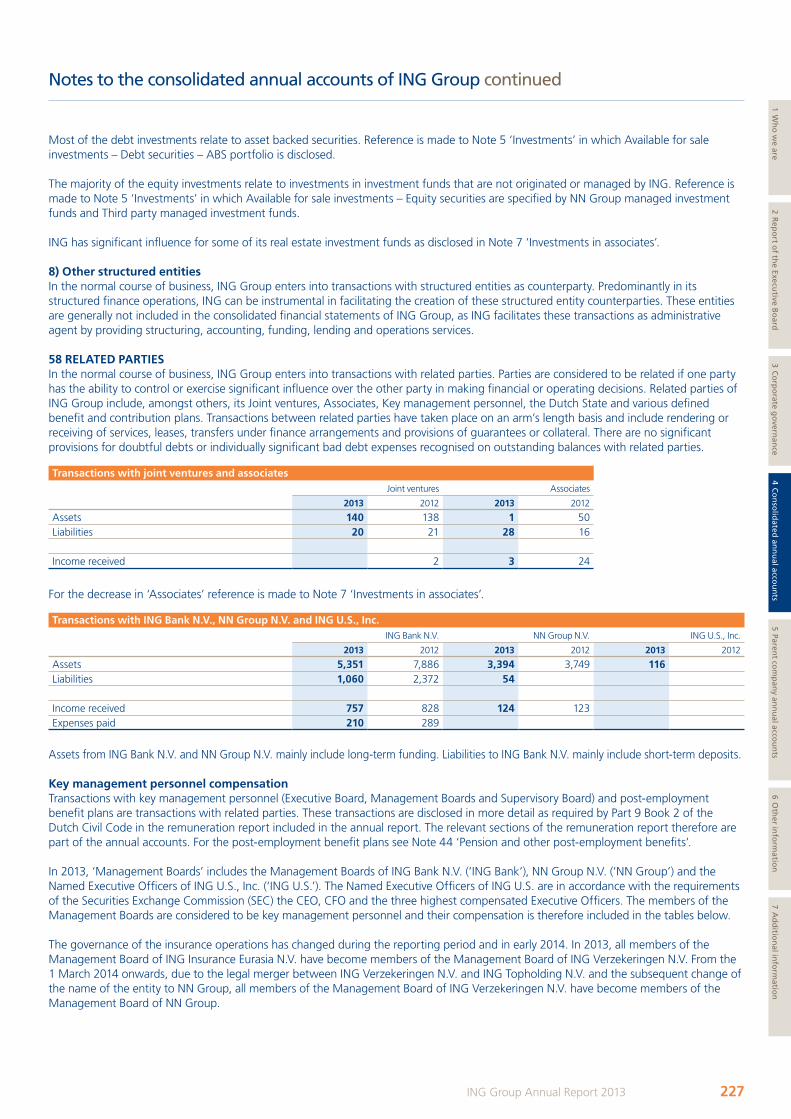
Notes to the consolidated annual accounts of ING Group continued
Most of the debt investments relate to asset backed securities. Reference is made to Note 5 ‘Investments’ in which Available for sale investments – Debt securities – ABS portfolio is disclosed.
The majority of the equity investments relate to investments in investment funds that are not originated or managed by ING. Reference is made to Note 5 ‘Investments’ in which Available for sale investments – Equity securities are specified by NN Group managed investment funds and Third party managed investment funds.
ING has significant influence for some of its real estate investment funds as disclosed in Note 7 ‘Investments in associates’.
8) Other structured entitiesIn the normal course of business, ING Group enters into transactions with structured entities as counterparty. Predominantly in its structured finance operations, ING can be instrumental in facilitating the creation of these structured entity counterparties. These entities are generally not included in the consolidated financial statements of ING Group, as ING facilitates these transactions as administrative agent by providing structuring, accounting, funding, lending and operations services.
58 RELATED PARTIESIn the normal course of business, ING Group enters into transactions with related parties. Parties are considered to be related if one party has the ability to control or exercise significant influence over the other party in making financial or operating decisions. Related parties of ING Group include, amongst others, its Joint ventures, Associates, Key management personnel, the Dutch State and various defined benefit and contribution plans. Transactions between related parties have taken place on an arm’s length basis and include rendering or receiving of services, leases, transfers under finance arrangements and provisions of guarantees or collateral. There are no significant provisions for doubtful debts or individually significant bad debt expenses recognised on outstanding balances with related parties.
Transactions with joint ventures and associatesJoint ventures Associates
2013 2012 2013 2012
Assets 140 138 1 50Liabilities 20 21 28 16
Income received 2 3 24
For the decrease in ‘Associates’ reference is made to Note 7 ‘Investments in associates’.
Transactions with ING Bank N.V., NN Group N.V. and ING U.S., Inc.ING Bank N.V. NN Group N.V. ING U.S., Inc.
2013 2012 2013 2012 2013 2012
Assets 5,351 7,886 3,394 3,749 116 Liabilities 1,060 2,372 54
Income received 757 828 124 123 Expenses paid 210 289
Assets from ING Bank N.V. and NN Group N.V. mainly include long-term funding. Liabilities to ING Bank N.V. mainly include short-term deposits.
Key management personnel compensationTransactions with key management personnel (Executive Board, Management Boards and Supervisory Board) and post-employment benefit plans are transactions with related parties. These transactions are disclosed in more detail as required by Part 9 Book 2 of the Dutch Civil Code in the remuneration report included in the annual report. The relevant sections of the remuneration report therefore are part of the annual accounts. For the post-employment benefit plans see Note 44 ‘Pension and other post-employment benefits’.
In 2013, ‘Management Boards’ includes the Management Boards of ING Bank N.V. (‘ING Bank’), NN Group N.V. (‘NN Group’) and the Named Executive Officers of ING U.S., Inc. (‘ING U.S.’). The Named Executive Officers of ING U.S. are in accordance with the requirements of the Securities Exchange Commission (SEC) the CEO, CFO and the three highest compensated Executive Officers. The members of the Management Boards are considered to be key management personnel and their compensation is therefore included in the tables below.
The governance of the insurance operations has changed during the reporting period and in early 2014. In 2013, all members of the Management Board of ING Insurance Eurasia N.V. have become members of the Management Board of ING Verzekeringen N.V. From the 1 March 2014 onwards, due to the legal merger between ING Verzekeringen N.V. and ING Topholding N.V. and the subsequent change of the name of the entity to NN Group, all members of the Management Board of ING Verzekeringen N.V. have become members of the Management Board of NN Group.
227ING Group Annual Report 2013
1 Wh
o w
e are2 R
epo
rt of th
e Executive B
oard
3 Co
rpo
rate go
vernan
ce4 C
on
solid
ated an
nu
al accou
nts
5 Parent co
mp
any an
nu
al accou
nts
6 Oth
er info
rmatio
n7 A
dd
ition
al info
rmatio
n
ING_2013_deel2&3_v2A.indd 227 19/03/2014 19:12:09
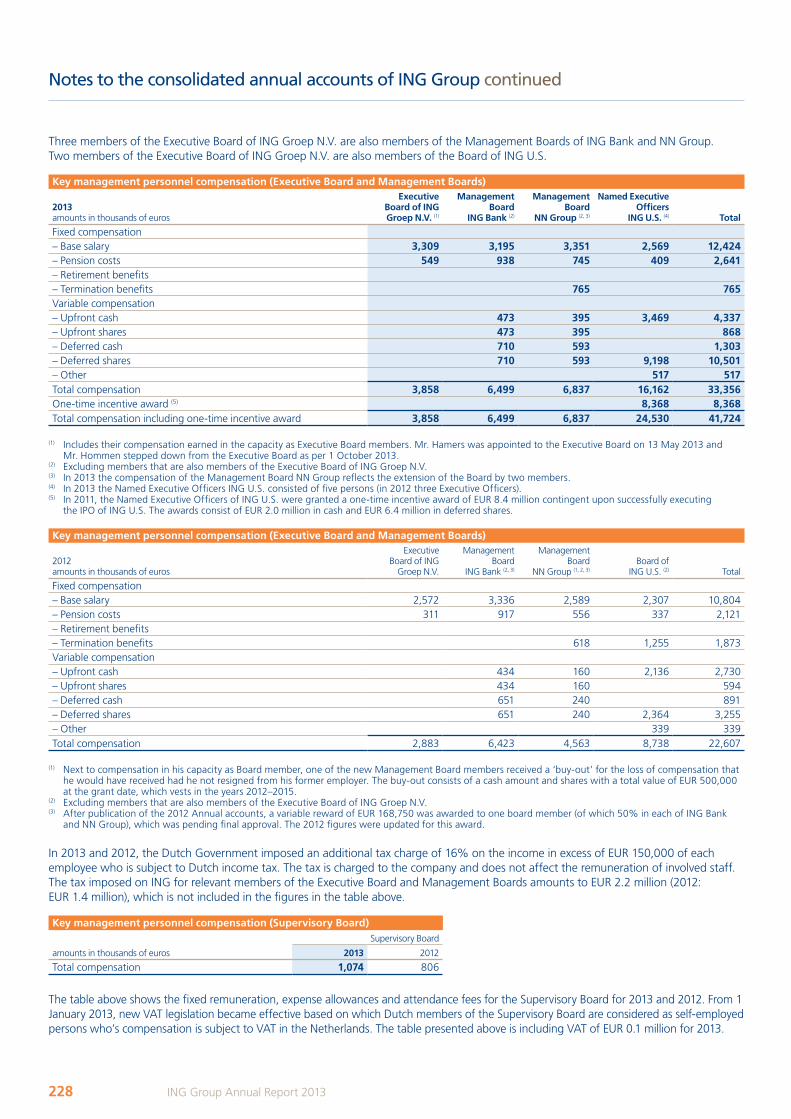
Notes to the consolidated annual accounts of ING Group continued
Three members of the Executive Board of ING Groep N.V. are also members of the Management Boards of ING Bank and NN Group. Two members of the Executive Board of ING Groep N.V. are also members of the Board of ING U.S.
Key management personnel compensation (Executive Board and Management Boards)
2013 amounts in thousands of euros
Executive Board of ING Groep N.V. (1)
Management Board
ING Bank (2)
Management Board
NN Group (2, 3)
Named Executive Officers
ING U.S. (4) Total
Fixed compensation– Base salary 3,309 3,195 3,351 2,569 12,424 – Pension costs 549 938 745 409 2,641 – Retirement benefits– Termination benefits 765 765 Variable compensation – Upfront cash 473 395 3,469 4,337 – Upfront shares 473 395 868 – Deferred cash 710 593 1,303 – Deferred shares 710 593 9,198 10,501 – Other 517 517 Total compensation 3,858 6,499 6,837 16,162 33,356 One-time incentive award (5) 8,368 8,368 Total compensation including one-time incentive award 3,858 6,499 6,837 24,530 41,724
(1) Includes their compensation earned in the capacity as Executive Board members. Mr. Hamers was appointed to the Executive Board on 13 May 2013 and Mr. Hommen stepped down from the Executive Board as per 1 October 2013.
(2) Excluding members that are also members of the Executive Board of ING Groep N.V.(3) In 2013 the compensation of the Management Board NN Group reflects the extension of the Board by two members.(4) In 2013 the Named Executive Officers ING U.S. consisted of five persons (in 2012 three Executive Officers). (5) In 2011, the Named Executive Officers of ING U.S. were granted a one-time incentive award of EUR 8.4 million contingent upon successfully executing
the IPO of ING U.S. The awards consist of EUR 2.0 million in cash and EUR 6.4 million in deferred shares.
Key management personnel compensation (Executive Board and Management Boards)
2012 amounts in thousands of euros
Executive Board of ING
Groep N.V.
Management Board
ING Bank (2, 3)
Management Board
NN Group (1, 2, 3)Board of
ING U.S. (2) Total
Fixed compensation – Base salary 2,572 3,336 2,589 2,307 10,804 – Pension costs 311 917 556 337 2,121 – Retirement benefits– Termination benefits 618 1,255 1,873 Variable compensation – Upfront cash 434 160 2,136 2,730 – Upfront shares 434 160 594 – Deferred cash 651 240 891 – Deferred shares 651 240 2,364 3,255 – Other 339 339 Total compensation 2,883 6,423 4,563 8,738 22,607
(1) Next to compensation in his capacity as Board member, one of the new Management Board members received a ‘buy-out’ for the loss of compensation that he would have received had he not resigned from his former employer. The buy-out consists of a cash amount and shares with a total value of EUR 500,000 at the grant date, which vests in the years 2012–2015.
(2) Excluding members that are also members of the Executive Board of ING Groep N.V. (3) After publication of the 2012 Annual accounts, a variable reward of EUR 168,750 was awarded to one board member (of which 50% in each of ING Bank
and NN Group), which was pending final approval. The 2012 figures were updated for this award.
In 2013 and 2012, the Dutch Government imposed an additional tax charge of 16% on the income in excess of EUR 150,000 of each employee who is subject to Dutch income tax. The tax is charged to the company and does not affect the remuneration of involved staff. The tax imposed on ING for relevant members of the Executive Board and Management Boards amounts to EUR 2.2 million (2012: EUR 1.4 million), which is not included in the figures in the table above.
Key management personnel compensation (Supervisory Board)
amounts in thousands of euros
Supervisory Board
2013 2012
Total compensation 1,074 806
The table above shows the fixed remuneration, expense allowances and attendance fees for the Supervisory Board for 2013 and 2012. From 1 January 2013, new VAT legislation became effective based on which Dutch members of the Supervisory Board are considered as self-employed persons who’s compensation is subject to VAT in the Netherlands. The table presented above is including VAT of EUR 0.1 million for 2013.
228 ING Group Annual Report 2013
ING_2013_deel2&3_v2A.indd 228 20/03/2014 12:43:09
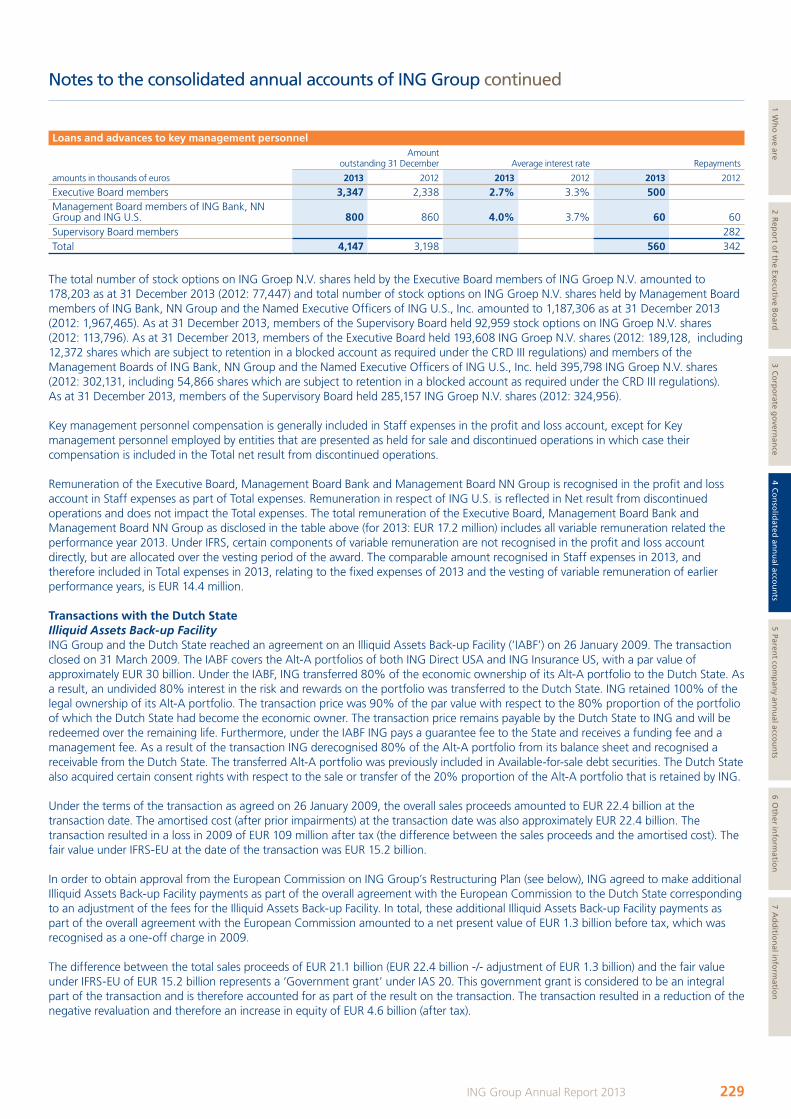
Notes to the consolidated annual accounts of ING Group continued
Loans and advances to key management personnelAmount
outstanding 31 December Average interest rate Repayments
amounts in thousands of euros 2013 2012 2013 2012 2013 2012
Executive Board members 3,347 2,338 2.7% 3.3% 500 Management Board members of ING Bank, NN Group and ING U.S. 800 860 4.0% 3.7% 60 60Supervisory Board members 282Total 4,147 3,198 560 342
The total number of stock options on ING Groep N.V. shares held by the Executive Board members of ING Groep N.V. amounted to 178,203 as at 31 December 2013 (2012: 77,447) and total number of stock options on ING Groep N.V. shares held by Management Board members of ING Bank, NN Group and the Named Executive Officers of ING U.S., Inc. amounted to 1,187,306 as at 31 December 2013 (2012: 1,967,465). As at 31 December 2013, members of the Supervisory Board held 92,959 stock options on ING Groep N.V. shares (2012: 113,796). As at 31 December 2013, members of the Executive Board held 193,608 ING Groep N.V. shares (2012: 189,128, including 12,372 shares which are subject to retention in a blocked account as required under the CRD III regulations) and members of the Management Boards of ING Bank, NN Group and the Named Executive Officers of ING U.S., Inc. held 395,798 ING Groep N.V. shares (2012: 302,131, including 54,866 shares which are subject to retention in a blocked account as required under the CRD III regulations). As at 31 December 2013, members of the Supervisory Board held 285,157 ING Groep N.V. shares (2012: 324,956).
Key management personnel compensation is generally included in Staff expenses in the profit and loss account, except for Key management personnel employed by entities that are presented as held for sale and discontinued operations in which case their compensation is included in the Total net result from discontinued operations.
Remuneration of the Executive Board, Management Board Bank and Management Board NN Group is recognised in the profit and loss account in Staff expenses as part of Total expenses. Remuneration in respect of ING U.S. is reflected in Net result from discontinued operations and does not impact the Total expenses. The total remuneration of the Executive Board, Management Board Bank and Management Board NN Group as disclosed in the table above (for 2013: EUR 17.2 million) includes all variable remuneration related the performance year 2013. Under IFRS, certain components of variable remuneration are not recognised in the profit and loss account directly, but are allocated over the vesting period of the award. The comparable amount recognised in Staff expenses in 2013, and therefore included in Total expenses in 2013, relating to the fixed expenses of 2013 and the vesting of variable remuneration of earlier performance years, is EUR 14.4 million.
Transactions with the Dutch State Illiquid Assets Back-up Facility ING Group and the Dutch State reached an agreement on an Illiquid Assets Back-up Facility (‘IABF’) on 26 January 2009. The transaction closed on 31 March 2009. The IABF covers the Alt-A portfolios of both ING Direct USA and ING Insurance US, with a par value of approximately EUR 30 billion. Under the IABF, ING transferred 80% of the economic ownership of its Alt-A portfolio to the Dutch State. As a result, an undivided 80% interest in the risk and rewards on the portfolio was transferred to the Dutch State. ING retained 100% of the legal ownership of its Alt-A portfolio. The transaction price was 90% of the par value with respect to the 80% proportion of the portfolio of which the Dutch State had become the economic owner. The transaction price remains payable by the Dutch State to ING and will be redeemed over the remaining life. Furthermore, under the IABF ING pays a guarantee fee to the State and receives a funding fee and a management fee. As a result of the transaction ING derecognised 80% of the Alt-A portfolio from its balance sheet and recognised a receivable from the Dutch State. The transferred Alt-A portfolio was previously included in Available-for-sale debt securities. The Dutch State also acquired certain consent rights with respect to the sale or transfer of the 20% proportion of the Alt-A portfolio that is retained by ING.
Under the terms of the transaction as agreed on 26 January 2009, the overall sales proceeds amounted to EUR 22.4 billion at the transaction date. The amortised cost (after prior impairments) at the transaction date was also approximately EUR 22.4 billion. The transaction resulted in a loss in 2009 of EUR 109 million after tax (the difference between the sales proceeds and the amortised cost). The fair value under IFRS-EU at the date of the transaction was EUR 15.2 billion.
In order to obtain approval from the European Commission on ING Group’s Restructuring Plan (see below), ING agreed to make additional Illiquid Assets Back-up Facility payments as part of the overall agreement with the European Commission to the Dutch State corresponding to an adjustment of the fees for the Illiquid Assets Back-up Facility. In total, these additional Illiquid Assets Back-up Facility payments as part of the overall agreement with the European Commission amounted to a net present value of EUR 1.3 billion before tax, which was recognised as a one-off charge in 2009.
The difference between the total sales proceeds of EUR 21.1 billion (EUR 22.4 billion -/- adjustment of EUR 1.3 billion) and the fair value under IFRS-EU of EUR 15.2 billion represents a ‘Government grant’ under IAS 20. This government grant is considered to be an integral part of the transaction and is therefore accounted for as part of the result on the transaction. The transaction resulted in a reduction of the negative revaluation and therefore an increase in equity of EUR 4.6 billion (after tax).
229ING Group Annual Report 2013
1 Wh
o w
e are2 R
epo
rt of th
e Executive B
oard
3 Co
rpo
rate go
vernan
ce4 C
on
solid
ated an
nu
al accou
nts
5 Parent co
mp
any an
nu
al accou
nts
6 Oth
er info
rmatio
n7 A
dd
ition
al info
rmatio
n
ING_2013_deel2&3_v2A.indd 229 19/03/2014 19:12:11
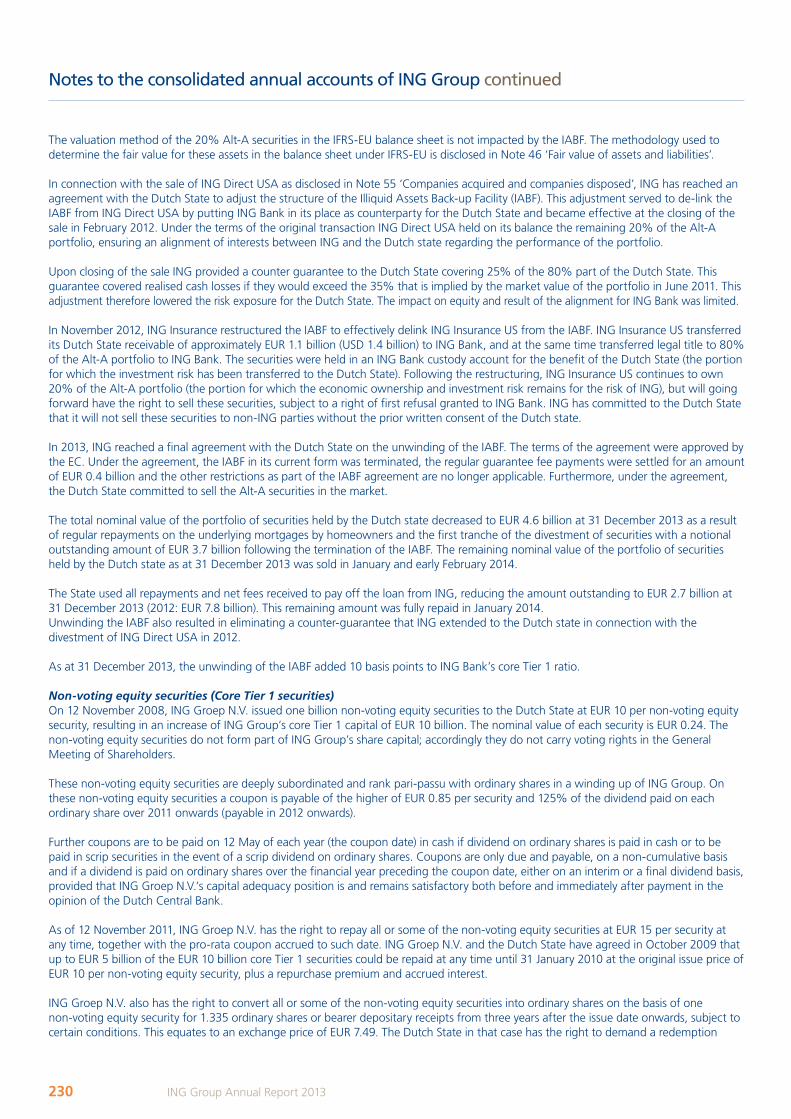
Notes to the consolidated annual accounts of ING Group continued
The valuation method of the 20% Alt-A securities in the IFRS-EU balance sheet is not impacted by the IABF. The methodology used to determine the fair value for these assets in the balance sheet under IFRS-EU is disclosed in Note 46 ‘Fair value of assets and liabilities’.
In connection with the sale of ING Direct USA as disclosed in Note 55 ‘Companies acquired and companies disposed’, ING has reached an agreement with the Dutch State to adjust the structure of the Illiquid Assets Back-up Facility (IABF). This adjustment served to de-link the IABF from ING Direct USA by putting ING Bank in its place as counterparty for the Dutch State and became effective at the closing of the sale in February 2012. Under the terms of the original transaction ING Direct USA held on its balance the remaining 20% of the Alt-A portfolio, ensuring an alignment of interests between ING and the Dutch state regarding the performance of the portfolio.
Upon closing of the sale ING provided a counter guarantee to the Dutch State covering 25% of the 80% part of the Dutch State. This guarantee covered realised cash losses if they would exceed the 35% that is implied by the market value of the portfolio in June 2011. This adjustment therefore lowered the risk exposure for the Dutch State. The impact on equity and result of the alignment for ING Bank was limited.
In November 2012, ING Insurance restructured the IABF to effectively delink ING Insurance US from the IABF. ING Insurance US transferred its Dutch State receivable of approximately EUR 1.1 billion (USD 1.4 billion) to ING Bank, and at the same time transferred legal title to 80% of the Alt-A portfolio to ING Bank. The securities were held in an ING Bank custody account for the benefit of the Dutch State (the portion for which the investment risk has been transferred to the Dutch State). Following the restructuring, ING Insurance US continues to own 20% of the Alt-A portfolio (the portion for which the economic ownership and investment risk remains for the risk of ING), but will going forward have the right to sell these securities, subject to a right of first refusal granted to ING Bank. ING has committed to the Dutch State that it will not sell these securities to non-ING parties without the prior written consent of the Dutch state.
In 2013, ING reached a final agreement with the Dutch State on the unwinding of the IABF. The terms of the agreement were approved by the EC. Under the agreement, the IABF in its current form was terminated, the regular guarantee fee payments were settled for an amount of EUR 0.4 billion and the other restrictions as part of the IABF agreement are no longer applicable. Furthermore, under the agreement, the Dutch State committed to sell the Alt-A securities in the market.
The total nominal value of the portfolio of securities held by the Dutch state decreased to EUR 4.6 billion at 31 December 2013 as a result of regular repayments on the underlying mortgages by homeowners and the first tranche of the divestment of securities with a notional outstanding amount of EUR 3.7 billion following the termination of the IABF. The remaining nominal value of the portfolio of securities held by the Dutch state as at 31 December 2013 was sold in January and early February 2014.
The State used all repayments and net fees received to pay off the loan from ING, reducing the amount outstanding to EUR 2.7 billion at 31 December 2013 (2012: EUR 7.8 billion). This remaining amount was fully repaid in January 2014.Unwinding the IABF also resulted in eliminating a counter-guarantee that ING extended to the Dutch state in connection with the divestment of ING Direct USA in 2012.
As at 31 December 2013, the unwinding of the IABF added 10 basis points to ING Bank’s core Tier 1 ratio.
Non-voting equity securities (Core Tier 1 securities)On 12 November 2008, ING Groep N.V. issued one billion non-voting equity securities to the Dutch State at EUR 10 per non-voting equity security, resulting in an increase of ING Group’s core Tier 1 capital of EUR 10 billion. The nominal value of each security is EUR 0.24. The non-voting equity securities do not form part of ING Group’s share capital; accordingly they do not carry voting rights in the General Meeting of Shareholders.
These non-voting equity securities are deeply subordinated and rank pari-passu with ordinary shares in a winding up of ING Group. On these non-voting equity securities a coupon is payable of the higher of EUR 0.85 per security and 125% of the dividend paid on each ordinary share over 2011 onwards (payable in 2012 onwards).
Further coupons are to be paid on 12 May of each year (the coupon date) in cash if dividend on ordinary shares is paid in cash or to be paid in scrip securities in the event of a scrip dividend on ordinary shares. Coupons are only due and payable, on a non-cumulative basis and if a dividend is paid on ordinary shares over the financial year preceding the coupon date, either on an interim or a final dividend basis, provided that ING Groep N.V.’s capital adequacy position is and remains satisfactory both before and immediately after payment in the opinion of the Dutch Central Bank.
As of 12 November 2011, ING Groep N.V. has the right to repay all or some of the non-voting equity securities at EUR 15 per security at any time, together with the pro-rata coupon accrued to such date. ING Groep N.V. and the Dutch State have agreed in October 2009 that up to EUR 5 billion of the EUR 10 billion core Tier 1 securities could be repaid at any time until 31 January 2010 at the original issue price of EUR 10 per non-voting equity security, plus a repurchase premium and accrued interest.
ING Groep N.V. also has the right to convert all or some of the non-voting equity securities into ordinary shares on the basis of one non-voting equity security for 1.335 ordinary shares or bearer depositary receipts from three years after the issue date onwards, subject to certain conditions. This equates to an exchange price of EUR 7.49. The Dutch State in that case has the right to demand a redemption
230 ING Group Annual Report 2013
ING_2013_deel2&3_v2A.indd 230 19/03/2014 19:12:11
Notes to the consolidated annual accounts of ING Group continued
payment of EUR 10 per non-voting equity security, together with the pro-rata coupon, if due, accrued to such date. Both repayment and conversion of the securities must be approved by the Dutch Central Bank.
Repayment non-voting equity sharesIn December 2009, ING repaid the first half of the non-voting equity securities (core Tier 1 securities) of EUR 5 billion plus a total premium of EUR 605 million. On 13 May 2011 ING exercised its option for early repayment of EUR 2 billion of the remaining non-voting equity securities (core Tier 1 securities). The total payment in May 2011 amounted to EUR 3 billion and included a 50% repurchase premium. ING funded this repayment from retained earnings. In November 2012 ING reached an agreement with the European Commission on an amended Restructuring Plan. As part of the amended Restructuring Plan, ING submitted a repayment schedule for the remaining EUR 3 billion non-voting equity securities (core Tier 1 securities) at a total cost of EUR 4.5 billion in four tranches in the next three years, translating into an overall internal rate of return (IRR) for the Dutch State on the core Tier 1 securities of exactly 12.5%. In accordance with this agreement ING repaid EUR 0.75 billion of the remaining non-voting equity securities (Core Tier 1 securities) respectively in November 2012 and November 2013. The payments in November 2012 and November 2013 amounted to EUR 1.125 billion each including premiums and interest. On the basis of the repayment schedule, ING aims to repay a third tranche by March 2014 and a final tranche ultimately by May 2015, provided that the total capital gain after tax, together with the net present value of the financial benefit to be realised by the calling of the USD 2 billion 8.5% Hybrid Tier 1, totalling approximately EUR 50 million, will be used to increase the next repayment of core Tier 1 securities to the Dutch State, scheduled for March 2014. The final payment to the Dutch State, scheduled for May 2015 will be lowered by the same amount. The total amount of the repayment to the Dutch State remains unchanged. While ING has committed to redeem these securities per the defined schedule, ING has the ability to accelerate payments if it is prudent under prevailing financial circumstance or defer a repayment in full or in part. In the latter case, the subsequent tranche will be increased with a corresponding amount. In the event that ING does not repay in full 2 consecutive repayment tranches or does not pay in total EUR 4.5 billion by 15 May 2015, the Dutch State will re-notify to the Commission who may in principle require compensatory measures. All repayments are conditional upon the approval of the Dutch central bank (DNB).
ING has indicated that it remains its ambition to repay the remaining support as quickly as possible and ING intends to accelerate repayments if possible and prudent under the prevailing economic circumstances. All actual repayments are conditional upon the approval of the Dutch central bank at the time ING decides to propose such payment.
European Commission Restructuring PlanIn 2009, ING Groep N.V. submitted a Restructuring Plan to the European Commission as part of the process to receive approval for the government support measures. By decision of 18 November 2009, the European Commission, formally approved the Restructuring Plan. The main elements of the Restructuring Plan as announced on 26 October 2009 are as follows:• elimination of double leverage and significant reduction of ING’s balance sheet;• divestment of all Insurance and Investment Management activities;• divestment of ING Direct USA;• creation of a new company in the Dutch retail market composed of Interadvies (including Westland Utrecht and the mortgage activities
of Nationale-Nederlanden) and the existing consumer lending portfolio of ING Retail in the Netherlands. This business, once separated, needs to be divested;
• restriction to be a price leader in any EU country for certain retail and SME banking products and restriction to acquire financial institutions or other businesses that would delay the repayment of the non-voting equity securities.
These restrictions will apply for the shorter period of three years or until the non-voting equity securities have been repaid in full to the Dutch State;• an agreement with the Dutch State to alter the repayment terms of 50% of the non-voting equity securities;• repayment of EUR 5 billion of the non-voting equity securities issued in November 2008 to the Dutch State;• additional Illiquid Assets Back-up Facility payments as part of the overall agreement with the European Commission will have to be
made to the Dutch State in the form of fee adjustments relating to the Illiquid Assets Back-Up Facility which resulted in a one-off pre-tax charge to ING of EUR 1.3 billion in the fourth quarter of 2009;
• launch of a EUR 7.5 billion rights issue, in order to finance the repayment of 50% of the non-voting equity securities and a mitigation of the capital impact of the additional Illiquid Assets Back-up Facility payment as part of the overall agreement with the European Commission to the Dutch State of EUR 1.3 billion;
• execution of the Restructuring Plan before the end of 2013;• if the overall return on the (remaining) non-voting equity securities (core Tier 1 securities) issued to the Dutch State is expected to be
lower than 10% p.a., the European Commission may consider the imposition of additional behavioural constraints; and• The calling of Tier 2 capital and Tier 1 hybrids will in the future be proposed case by case to the Commission for authorisation, for the
shorter period of three years starting from the date of the Commission decision or up to the date on which ING has fully repaid the non-voting equity securities (core Tier 1 securities) to the Dutch State (including the relevant accrued interest of core Tier 1 coupons and exit premium fees).
ING announced in November 2012 that, together with the Dutch State, it had submitted significant amendments to the 2009 Restructuring Plan to the European Commission. The European Commission approved these amendments by Decision of 16 November 2012.
231ING Group Annual Report 2013
1 Wh
o w
e are2 R
epo
rt of th
e Executive B
oard
3 Co
rpo
rate go
vernan
ce4 C
on
solid
ated an
nu
al accou
nts
5 Parent co
mp
any an
nu
al accou
nts
6 Oth
er info
rmatio
n7 A
dd
ition
al info
rmatio
n
ING_2013_deel2&3_v2A.indd 231 19/03/2014 19:12:12
Notes to the consolidated annual accounts of ING Group continued
Amendments to the Restructuring Plan in 2012The amendments to the 2009 Restructuring Plan as announced in November 2012 extended the time horizon and increase the flexibility for the completion of divestments and have adjusted other commitments in light of the market circumstances, economic climate and more stringent regulatory requirements.
Under the amendments announced in 2012, the ultimate dates for divesting the insurance and investment management businesses changed as follows:• The divestment of more than 50% of ING’s interest in its Asian insurance and investment management operations has to be completed
by year-end 2013, with the remaining interest divested by year-end 2016;• The divestment of at least 25% of ING’s interest in ING U.S. has to be completed by year-end 2013, more than 50% has to be divested
by year-end 2014, with the remaining interest divested by year-end 2016; • The divestment of more than 50% of ING’s interest in its European insurance and investment management activities has to be
completed by year-end 2015, with the remaining interest divested by year-end 2018; and • As ING has committed to eliminate double leverage, proceeds from the divestments will be used to that end while ensuring adequate
leverage ratios of the insurance holding companies.
A divestment of more than 50% of ING’s interest as mentioned in this paragraph and furthermore below also means that ING Group (a) no longer has a majority of representatives on the Boards of these operations and (b) has deconsolidated these operations from ING Group’s financial statements in line with IFRS accounting rules.
Under the terms of the original Restructuring Plan, ING was required to divest WestlandUtrecht Bank. However, due to market circumstances and changing regulatory requirements, a divestment of WestlandUtrecht has not occurred. Instead, under the amended Restructuring Plan, the commercial operations of WestlandUtrecht Bank were combined with the retail banking activities of Nationale-Nederlanden, which is to be divested as part of ING’s insurance and investment management operations in Europe. The result has to be that Nationale-Nederlanden Bank is a viable and competitive business, which stands alone and is separate from the businesses retained by ING. To this end ING already needs to ring-fence Nationale-Nederlanden Bank up to the divestment of more than 50% of NN Group.
On 1 July 2013 EUR 3.8 billion of WestlandUtrecht Bank’s Dutch mortgage portfolio, EUR 0.1 billion of consumer lending and EUR 3.7 billion of Dutch savings portfolio were transferred to Nationale-Nederlanden Bank. In addition approximately 400 of WestlandUtrecht Bank’s employees were transferred to Nationale-Nederlanden Bank. All assets and liabilities were transferred at the existing carrying value as included in ING Bank’s balance sheet. This transaction was completed on 1 July 2013.
ING has committed, amongst others, that Nationale-Nederlanden Bank will reach certain targets for mortgage production and consumer credit until the date on which more than 50% of the Insurance/IM Europe operations has been divested, or until 31 December 2015 if the European Commission requires so. Furthermore, ING has agreed to a maximum ratio for mortgage production at ING Retail Banking Netherlands in relation to mortgage production of Nationale-Nederlanden Bank until year-end 2015.
The 2009 Restructuring Plan included restrictions on acquisitions and price leadership for certain products in EU markets. These restrictions will continue to apply until 18 November 2015 or until the date on which more than 50% of each of the Insurance/IM operations has been divested, whichever date comes first.
The price leadership restrictions in Europe have been amended to reflect specific conditions in various local markets. Under the amendments, the constraint no longer applies in the Netherlands, and ING Direct in the EU will refrain from offering more favourable prices than its best priced direct competitor among the ten financial institutions having the largest market share in the respective countries.
The calling or buy-back of Tier 2 capital and Tier 1 Hybrid Securities will continue to be proposed for authorisation to the European Commission on a case by case basis until ING has fully repaid the core Tier 1 securities to the Dutch State, but ultimately until 18 November 2014, whichever date comes first. Notwithstanding this restriction, ING was allowed to call the EUR 1.25 billion Hybrid originally issued by ING Verzekeringen N.V. on 21 December 2012.
The 2012 amended Restructuring Plan includes a repayment schedule for the remaining core Tier 1 securities to the Dutch State as described in the above-mentioned section ‘Repayment non-voting equity shares’.
The implementation of the commitments and obligations set out in the (amended) Restructuring Plan will be monitored by a monitoring trustee who is independent of ING until 31 December 2015.
The 2012 amended Restructuring Plan was formally approved by the European Commission, by decision of 16 November 2012. As a result, the Commission closed its formal investigations as announced on 11 May 2012 and ING also withdrew its appeal at the General Court of the European Union, filed in July 2012. For principal legal reasons, the European Commission has continued with its appeal against the General Court ruling of March 2012. However, ING, the Dutch State and the European Commission agreed that any outcome of this procedure will not affect the approval of the amended Restructuring Plan. It is expected that this judgment will be rendered in April 2014.
232 ING Group Annual Report 2013
ING_2013_deel2&3_v2A.indd 232 19/03/2014 19:12:12
Notes to the consolidated annual accounts of ING Group continued
Amendments to the Restructuring Plan in 2013In November 2013 ING announced further amendments to the Restructuring Plan. ING announced that it will expand the scope of the base case Initial Public Offering (IPO) of NN Group to include ING Life Japan. In that context, ING and the Dutch State have reached an agreement with the European Commission (EC) on revised timelines for the divestment process of ING Life Japan and ING’s European insurance and investment management activities.
As part of the previously announced amended restructuring agreement with the EC in 2012, ING planned to divest more than 50% of ING’s Asian insurance and investment management businesses by the end of 2013. ING successfully divested most of these businesses over the course of the past year. Under the revised timelines announced, ING will divest ING Life Japan in line with the divestment timeline for ING’s European insurance and investment management activities. This means that the timeline to divest more than 50% of ING Life Japan has effectively been extended by two years to year-end 2015, which is also the unchanged timeline to divest more than 50% of ING’s European insurance and investment management businesses. As part of the revised 2013 agreement, ING will accelerate the timeline to complete the divestment of 100% of ING’s European insurance and investment management activities by two years to year-end 2016. Preparations for the base case IPO of NN Group in 2014 are on track.
The amendments to the restructuring plan of 2013 were formally approved by the European Commission by decision of 5 November 2013.
Credit Guarantee SchemeAs part of the measures adopted to protect the financial sector, the Dutch State introduced a EUR 200 billion credit guarantee scheme for the issuance of medium term debt instruments by banks (the Credit Guarantee Scheme). ING Bank N.V. issued government guaranteed debt instruments under this Credit Guarantee Scheme (‘Government Guaranteed Bonds’) as part of its regular medium-term funding operations. The relevant Rules of the Credit Guarantee Scheme set forth the rules applicable to any issues under the Credit Guarantee Scheme and include information such as scope, denomination, tenor and fees payable by the banks. ING Group pays a fee of 84 basis points over the issued bonds to the Dutch State to participate in the Credit Guarantee Scheme. Reference is made to Note 16 ‘Debt securities in issue’.
OtherFollowing the transactions as disclosed in this note, the Dutch State is a related party of ING Group. All other transactions between ING Group and the Dutch State are of a normal business nature and at arm’s length.
In the framework of the transactions with the Dutch State disclosed in this note, certain arrangements with respect to corporate governance and executive remuneration were agreed with the Dutch State which were in place until the Illiquid Assets Back-up Facility was unwound. The State Nominees will stay in office for the term for which they were appointed.
Master claim agreementIn 2012, ING Groep N.V., ING U.S., Inc. and ING Insurance Eurasia N.V. entered into a master claim agreement to (a) allocate existing claims between these three parties and (b) agree on criteria for how to allocate future claims between the three parties. The master claim agreement contains further details on claim handling, conduct of litigation and dispute resolution.
Indemnification and allocation agreement with ING Insurance Eurasia N.V.ING Groep N.V. and NN Group N.V. have entered into an indemnification and allocation agreement, in which ING Group has agreed to indemnify NN Group for certain liabilities that relate to the business of or control over certain (former) U.S. and Latin American subsidiaries of the Company in the period until 30 September 2013 or, if the relevant subsidiary was divested by NN Group after 30 September 2013, such later date of divestment. These liabilities mainly include contingent liabilities that may arise as a result of the initial public offering of ING U.S. (such as prospectus liability) and the sales of the Latin American businesses (such as claims under warranties and other buyer protection clauses), and the liabilities for the claims concerning the performance of certain interest-sensitive products that were sold by a former subsidiary of NN Group in Mexico and the claims filed by the purchaser of certain Mexican subsidiaries of NN Group claiming that the financial condition of the subsidiaries was not accurately depicted.
Shareholder agreement and other agreements ING U.S., IncIn connection with the initial public offering of ING U.S., Inc, ING Groep N.V. entered into a shareholder agreement with ING U.S., Inc. that governs certain aspects of our continuing relationship. In particular, the shareholder agreement addresses the composition of the ING. U.S., Inc. board of directors and its committees, other corporate governance matters, ING Groep N.V. approval and consent rights with respect to certain business and corporate actions ING U.S., Inc. may take, mutual rights that ING U.S., Inc and ING Groep N.V. will have with respect to business and financial information and financial accounting matters and ING Groep N.V. rights with respect to subsequent sales of the common stock of ING U.S., Inc.
In addition, in connection with the initial public offering, of ING U.S., Inc., ING Groep N.V. entered into several other agreements with ING.U.S., Inc. such as a transitional intellectual property license agreement, a joinder agreement and an equity administration agreement.
233ING Group Annual Report 2013
1 Wh
o w
e are2 R
epo
rt of th
e Executive B
oard
3 Co
rpo
rate go
vernan
ce4 C
on
solid
ated an
nu
al accou
nts
5 Parent co
mp
any an
nu
al accou
nts
6 Oth
er info
rmatio
n7 A
dd
ition
al info
rmatio
n
ING_2013_deel2&3_v2A.indd 233 19/03/2014 19:12:12
Notes to the consolidated annual accounts of ING Group continued
59 OTHER EVENTS ING U.S. IPO of ING U.S. in May 2013 In May 2013, ING sold approximately 65.2 million ordinary shares in the Initial Public Offering (‘IPO’) of ING U.S., Inc., its U.S.-based retirement, investment and insurance business (‘ING U.S.’). Furthermore, on 29 May 2013, the underwriters of the IPO exercised in full their option to purchase approximately 9.8 million additional shares of ING U.S. from ING Group.
The total net proceeds of these transactions were EUR 1,061 million (USD 1,385 million). The IPO reduced the ownership of ING in ING U.S. from 100% to 71.25%.
These transactions did not impact the profit and loss account of ING Group, as ING U.S. continued to be fully consolidated. The transactions had a negative impact of EUR 1,894 million on Shareholders’ equity (parent) of ING Group, including EUR 19 million transaction costs after tax. This amount reflected the difference between the net proceeds of this offering to ING Group and the IFRS-EU book value of the 28.75% interest divested in this IPO. This amount was recognised in ‘Other reserves’.
Minority interests at that date increased with EUR 2,954 million due to the IPO of ING U.S. This amount represented 28.75% of the net asset value under IFRS-EU of ING U.S.
As a result, the total impact on ING Group’s Total equity was EUR 1,060 million.
Second tranche sale in October 2013 In October 2013, ING sold approximately 33 million ordinary shares in ING U.S. at a price of USD 29.50 per share. Furthermore, the underwriters exercised in full their option to purchase approximately 4.95 million additional shares of ING U.S. from ING Group. These transactions closed on 29 October 2013. ING Group is subject to a lock-up period of 90 days from 24 October 2013.
The total net proceeds of these transactions were EUR 786 million (USD 944 million). As a result, ING’s ownership interest in Insurance ING U.S. was further reduced from approximately 71.25% to 56.7%.
These transactions did not impact the profit and loss account of ING Group. These transactions had a negative impact of EUR 632 million on the Shareholders’ Equity (parent) of ING Group, including EUR 26 million transaction costs after tax. This amount reflects the difference between the net proceeds to ING Group and the IFRS-EU carrying value of the 14.5% stake divested through these transactions. This amount was recognised in ‘Other reserves’.
Minority interests increased with EUR 1,394 million due to these transactions. This amount represents 14.5% of the net asset value under IFRS-EU of ING U.S.
The total proceeds of the transactions in May and October was EUR 1,847 million (USD 2,329 million). These transactions did not impact the profit and loss account of ING Group. These transactions had a negative impact of EUR 2,526 million on Shareholders’ equity (parent) of ING Group that was recognised in ‘Other reserves’. Minority interests increased with EUR 4,348 million due to these transactions. This amount represents 43.3% of the net asset value under IFRS-EU of ING U.S. Reference is made to Note 14 ‘Equity’.
Classification of ING U.S.In light of ING’s intention to divest its remaining stake in ING U.S. over time Insurance ING U.S, is classified as held for sale and discontinued operations in 2013. Reference is made Note 12 ‘Assets and liabilities held for sale’ and Note 36 ‘Discontinued operations’.
ING Group is divesting its insurance and investment management businesses as part of the amended Restructuring Plan agreed with the European Commission. ING intends to divest its remaining stake in ING U.S. over time, in line with the timeline set out in the amended Restructuring Plan as disclosed in Note 58 ‘Related parties’.
Upon a future transaction that results in the deconsolidation of ING U.S. by ING Group, a divestment loss will be recognised in the profit and loss account. This loss will reflect ING Group’s remaining share (at the transaction date) in the difference between the carrying value of ING U.S. and the fair value, plus ING Group’s share in unrealised revaluations in equity plus the currency translation reserve related to ING U.S. Reference is made to Note 60 ‘Subsequent events’.
ING JapanAfter carefully exploring and evaluating the options available for the divestment of ING Life Japan, it was concluded that a standalone divestment of ING Life Japan, including its Corporate Owned Life Insurance (COLI) and Closed Block VA businesses, is not feasible in a manner that would appropriately meet the demands of regulators and other interest holders in ING Group and ING Life Japan. Therefore, ING Life Japan will be included with ING’s European insurance and investment management businesses in the base case IPO of NN Group in 2014.
As a result, ING Life Japan and the Japanese Closed Block VA guarantees reinsured to ING Re (‘ING Japan’) are no longer classified as held for sale and discontinued operations. The individual assets and liabilities of ING Japan are therefore classified out of Assets and liabilities
234 ING Group Annual Report 2013
ING_2013_deel2&3_v2A.indd 234 19/03/2014 19:12:12
Notes to the consolidated annual accounts of ING Group continued
held for sale and presented in the usual consolidated balance sheet line items. The individual income and expenses of ING Japan will be classified out of Net result from discontinued operations and presented in the usual consolidated profit and loss account line items.
The comparative periods for the balance sheet have not been restated and therefore the assets and liabilities of ING Japan are still included in Assets and liabilities held for sale for the year 2012. All comparative periods in the Consolidated profit and loss account have been restated for this decision and therefore income and expenses of ING Japan are included in the continuing operations part of the statement for the years 2012 and 2011.
ING has adjusted its reporting structure to better align its segmentation according to the businesses that it comprises, their governance and internal management, and to reflect the decision to divest ING Life Japan with the IPO of NN Group. The new reporting segments for NN Group are as follows:• Netherlands Life;• Netherlands Non-life;• Insurance Europe;• Japan Life;• Japan Closed Block VA;• Investment Management; and• Other.
Reference is made to Note 42 ‘Segments’.
Japan Life, representing COLI business, and the Japan Closed Block VA, are reported separately to reflect the distinct nature of these two Japanese businesses. Under ING’s existing accounting policies, the net insurance liability of any business line must be adequate at the 50% confidence level. The Japan Closed Block VA business had a reserve inadequacy at the 50% confidence level in October 2013. This inadequacy used to be offset by surplus adequacies in other businesses in the same business line that the Japan Closed Block VA business used to be part off. The separate reporting of the Japan Closed Block VA business line therefore triggered a charge of EUR 575 million before tax to restore the reserve inadequacy. This charge resulted in a write-off of all deferred acquisition costs (DAC) related to the Japan Closed Block VA business of EUR 1,405 million partly compensated by a release of the Life insurance provision related to unearned revenues of EUR 867 million, and an increase in the life insurance provisions for the remaining amount.
SNS Reaal nationalisationIn 2013, the nationalisation of SNS Reaal, a Dutch financial institution, was announced. As a consequence of the arrangements made by the Dutch government, ING Bank and other Dutch banks will be required to pay a one-time levy of EUR 1 billion in 2014. For ING this will result in a charge of EUR 304 million in 2014. There is no impact from this 2014 levy on the result of 2013.
Sale of custody services in seven European countries In 2013, ING reached an agreement to transfer its local custody services business in seven countries in Central and Eastern Europe to Citi. The transaction did not have a significant impact on ING’s results. The full migration of the clients business is expected to be finalised in the second quarter of 2014.
235ING Group Annual Report 2013
1 Wh
o w
e are2 R
epo
rt of th
e Executive B
oard
3 Co
rpo
rate go
vernan
ce4 C
on
solid
ated an
nu
al accou
nts
5 Parent co
mp
any an
nu
al accou
nts
6 Oth
er info
rmatio
n7 A
dd
ition
al info
rmatio
n
ING_2013_deel2&3_v2A.indd 235 19/03/2014 19:12:12
Notes to the consolidated annual accounts of ING Group continued
60 SUBSEQUENT EVENTSDefined Benefits Pension Fund in The NetherlandsIn February 2014 ING reached final agreement with the trade unions, the ING Pension Fund, the Central Works Council and the Association of Retired ING Employees (VSI) to transfer all future funding and indexation obligations under ING’s current closed defined benefit plan in the Netherlands to the Dutch ING Pension Fund. The agreement makes the ING Pension Fund financially independent from ING.
The key elements of the agreement are:• Responsibility for future indexation and funding thereof is transferred to the Dutch ING Pension Fund; • ING’s obligation to restore the coverage ratio of the Dutch ING Pension Fund ceased; • The cross guarantees between ING Bank and NN Group to jointly and severally fund the obligations of the Dutch ING Pension Fund are
terminated; • ING pays EUR 549 million (before tax) to the Dutch ING Pension Fund for the removal of these obligations; and • ING will reduce the employees’ own contribution to the pension premium under the new defined contribution plan by approximately
EUR 80 million over a 6 year period.
As part of the agreement, ING Bank and NN Group are released from all financial obligations arising out of the Dutch defined benefit plan. Accordingly, this plan will no longer be accounted for as a defined benefit plan and, consequently, it will be removed from ING’s balance sheet. The removal of the net pension asset related to the Dutch defined benefit pension fund from ING’s balance sheet of approximately EUR 0.6 billion after tax and the payment to the Dutch ING Pension Fund of EUR 549 million (EUR 412 million after tax) will result in a charge of approximately EUR 1.1 billion after tax to be recognised in 2014. Of this impact, EUR 0.7 billion is attributed to ING Bank and EUR 0.4 billion to NN Group.
Accounting for GMDB in Japan Closed Block VANN Group has moved towards fair value accounting on the reserves for Guaranteed Minimum Death Benefits (GMDB) of the Japan Closed Block VA as of 1 January 2014. This improves the alignment of the book value of the GMDB reserves with their market value, better reflects the economic value of these guarantees and improves the alignment of the accounting for the guarantees with the accounting for the related hedges. Furthermore, such a move makes the accounting for the GMDB consistent with the accounting on the reserves for Guaranteed Minimum Accumulation and Withdrawal benefits.
As at the end of the fourth quarter of 2013, the difference between the current book value and the estimated fair value of the GMDB reserves was EUR 219 million (before tax). Implementation of fair value accounting for GMDB represents a change in accounting policy under IFRS with a transitional impact of EUR 165 million after tax being reflected only in shareholders’ equity as of 1 January 2014. Results for comparative periods will be restated accordingly.
These measures have eliminated the DAC balance and improve the reserve adequacy on the Japan Closed Block VA. The accounting for the Japan Closed Block VA guarantees is consistent and more in line with the related hedges.
ING U.S.On 10 March 2014, ING Group announced that ING U.S., Inc., the U.S.-based retirement, investment and insurance businesses subsidiary, has filed a registration statement with the U.S. Securities and Exchange Commission (SEC) which is required to accommodate possible future transactions to further reduce the current 56% interest of ING Group in ING U.S. The final structure, timing, size and offer price for the possible transactions have not yet been determined at the date of this Annual Report and remain subject to market and other conditions. If the possible transaction would result in deconsolidation of ING U.S. by ING Group, a divestment loss will be recognised in the profit and loss account. This loss will reflect ING Group’s currently remaining share in the difference between the carrying value of ING U.S. and the fair value (based on the transaction price), plus ING Group’s share in unrealised revaluations in equity plus the net currency translation reserve related to ING U.S. Based on the quoted share price of ING U.S. and the reserves in equity (both as at 31 December 2013) such divestment loss is estimated to be approximately EUR 2 billion (before tax). The actual divestment loss may differ from this estimate due to changes between 31 December 2013 and the date of deconsolidation.
236 ING Group Annual Report 2013
ING_2013_deel2&3_v2A.indd 236 19/03/2014 19:12:12
Contents Risk Management
Group Risk Management
Mission 238Group risk management function 238Risk developments in 2013 239
Bank Risk Management
Mission 246Risk governance 247Business model and risk profile 250Economic capital 256Ongoing changes in the regulatory environment 258Risk developments in 2013 259Credit risk 260Market risk 293Funding and liquidity risk 305Non-financial risk 308Business risk 311
Insurance Risk Management
Introduction 312Organisational risk management structure 312Risk management framework 313Risk management policies, standards and processes 314Risk profile 316Insurance risk 318Business risk 319Market and credit risk: general account 321Market and credit risk: separate account 328Liquidity risk 330Operational risk 331Compliance risk 331Economic capital for entities outside NN’s internal model 332Regulatory capital and IFRS Result before tax sensitivities 333
237ING Group Annual Report 2013
1 Wh
o w
e are2 R
epo
rt of th
e Executive B
oard
3 Co
rpo
rate go
vernan
ce4 C
on
solid
ated an
nu
al accou
nts
5 Parent co
mp
any an
nu
al accou
nts
6 Oth
er info
rmatio
n7 A
dd
ition
al info
rmatio
n
ING_2013_deel4a&b_v2.indd 237 19/03/2014 19:22:47
RISK MANAGEMENTTaking measured risks is the core of ING Group’s business. As a financial services company active in banking, investments, life and non-life insurance and retirement services, ING Group is naturally exposed to a variety of risks.To ensure measured risk-taking throughout the organisation, ING Group operates through a comprehensive risk management framework and integrated risk management in its daily business activities and strategic planning. This ensures the identification, measurement and control of risks at all levels of the organisation so that ING Group’s financial strength is safeguarded.
Risk management formulates with the various management boards the risk appetite, strategies, policies and limits and provides a review, oversight and support function throughout ING Group on risk-related issues. The main financial risks ING Group is exposed to are credit risk (including transfer risk), market risk (including interest rate, equity, real estate and foreign exchange risks), insurance risk, liquidity & funding risk and business risk. In addition, ING Group is exposed to non-financial risks, e.g. operational and compliance risks. The way ING Group manages these risks on a day-to-day basis is described in this Risk Management section.
As a result of the decision to manage ING Bank and NN Group separately, ING has implemented two distinct risk appetite frameworks for both Bank and Insurance. The common concept however is that risk appetite is expressed as the tolerance to allow key capital and liquidity ratios to deviate from their target levels under adverse scenarios. These frameworks are discussed in more detail in the specific chapters of this risk management section.
Both ING Bank and NN Group need to prepare for significant changes in the regulatory requirements. For ING Bank the most important one is the implementation of Basel III (for European banks as ING implemented via Capital Requirements Directive (CRD) IV which is effective per 1 January 2014), while NN Group runs an extensive programme to allow the implementation of Solvency II (which is the fundamental reform of European insurance solvency and risk governance legislation; announced to be effective as of 1 January 2014 but delays in legislation imply that it will not be effective before 1 January 2016). Additionally, both in Bank and Insurance, ING continued its stress testing efforts, with stress testing becoming more important and more embedded in the risk culture.
MISSIONThe mission of ING Group’s risk management function is to support ING Group’s mission to set the standard in helping customers manage their financial future, by safeguarding ING’s current and future financial strengths. The following principles support this mission:• The risk management function is embedded in all levels of ING Group’s organisation and is part of the daily business activities and
strategic planning to have a sustainable competitive advantage;• Products and portfolios are structured, underwritten, priced, approved and managed appropriately and compliance with internal and
external rules and guidelines are monitored;• Delegated authorities are consistent with the overall Group strategy and risk appetite;• Transparent communication to internal and external stakeholders on risk management.
Risk management benefits ING and its stakeholders directly by providing more efficient capitalisation and lower costs of risk and funding. The cost of capital and funding is reduced by working closely with rating agencies and regulators in satisfying their requirements in aligning capital and liquidity to risks. Risk Management helps business units with lower funding costs, the latest risk management tools and skills, and lower strategic risk, allowing them to focus on their core expertise with the goal of keeping ING’s businesses competitive in their markets.
GROUP RISK MANAGEMENT FUNCTIONThe ING Group CRO is supported by the Risk functions of ING Group and by the Group functions Corporate Legal and the Functional Controller Insurance. As a result of the decision to manage ING Bank and NN Group separately, ING Group Chief Risk Officer has delegated day-to-day Risk Management within ING Bank, NN Group and ING US to the respective CROs. The remaining Risk functions that are specific for the Group function have been delegated to ING Bank.
ING Group uses an integrated risk management approach for both its banking activities and for its insurance activities. With the operational separation of ING Bank and NN Group, the focus of ING’s risk management practices is now located in the bank and insurance companies. The remainder of this Risk paragraph discusses these practices for ING Group, ING Bank and NN Group, respectively.
ING U.S. RISK MANAGEMENT GOVERNANCEAs of 31 December 2013 ING Group has a 57% stake in ING U.S., Inc. ING manages risk within ING U.S. through its majority membership in the ING U.S., Inc. Board and through participation in Board committees. Furthermore, ING has the right to appoint observers to some important Management risk committees. The activities of ING U.S. are classified as held for sale and as discontinued operations. They are not further discussed in the remainder of this section.
Risk management ING Groupamounts in millions of euros, unless stated otherwise
238 ING Group Annual Report 2013
ING_2013_deel4a&b_v2.indd 238 19/03/2014 19:22:47
Risk management continued ING Group
RISK DEVELOPMENTS IN 2013Risk developments listed below are defined as the risks which may have a significant impact on our business and it is difficult to quantify this potential impact on the organisation. They are triggered in general by unexpected events and may introduce volatility in earnings or impact ING’s long-term strategy. The sequence in which the top risks are presented below is not indicative of their likelihood of occurrence or the potential magnitude of their financial consequences.
Monitoring exposures and Eurozone developmentsThe problems in the Eurozone have been a top priority for risk management throughout 2013, and will continue to be a top priority in 2014. ING closely monitors the exposures in debt securities, lending and credit derivatives, and regularly assesses whether the positions continue to be in line with its risk appetite. This assessment is supported by internal stress tests.
Throughout 2013, ING has continued to selectively optimise its balance sheet, including reducing its positions in especially covered bonds, asset backed securities (ABS) securities and committed facilities for some of the weaker countries as a result of these risk analyses. Several European countries have been downgraded in 2013 due to a weak and uncertain economic environment. As the Eurozone countries are going through a recession period. The Southern European countries seem to slowly emerge from the recession, while the strong countries were showing some signs of recovery although growth is fragile. Furthermore, the chairman of the European Central Bank (ECB) announced twice the reduction of the main refinancing rate by 25 basis points respectively in May and November 2013 to a final rate of 0.25% down from 0.75% at the end of 2012. In September, the ECB by his chairman announced that it was ready to use any instrument, including long-term refinancing operations (LTROs), to push down the money market interest rates.
Despite the ECB efforts and weak signs of recovery, the Eurozone is not yet out of the doldrums, as many of the fundamental problems still remain. There is no guarantee that the weaker countries will succeed in making their economies more competitive, which is a prerequisite for long-term debt sustainability. Risks and concerns remain with respect to Europe and, given a potential prolonged slowdown scenario, could have a detrimental impact on the global economic recovery, sovereign and non-sovereign debt in Europe and the financial condition of European financial institutions, including ING.
Greece, Italy, Ireland, Portugal, Spain and Cyprus (GIIPSC)Since 2010 concerns arose regarding the creditworthiness of certain European countries. As a result of these concerns the fair value of sovereign debt decreased and those exposures are being monitored more closely. With regard to the sovereign debt crisis, ING’s main focus has been on Greece, Italy, Ireland, Portugal, Spain and Cyprus as these countries have either applied for support from the European Financial Stability Facility (‘EFSF’) or receive support from the ECB via government bond purchases in the secondary market. Further details on exposure to Government bonds and Unsecured Financial institutions’ bonds are included in Note 5 ‘Investments’.
The table below provides information on ING’s risk exposure with regard to Greece, Italy, Ireland, Portugal, Spain and Cyprus. Unless otherwise indicated, the amounts represent risk exposure values and exposures are included based on the country of residence of the direct Obligor to which ING has primary recourse of repayment of the obligations, except most residential mortgage backed securities (RMBS), which exposures are based on country of risk.
239ING Group Annual Report 2013
1 Wh
o w
e are2 R
epo
rt of th
e Executive B
oard
3 Co
rpo
rate go
vernan
ce4 C
on
solid
ated an
nu
al accou
nts
5 Parent co
mp
any an
nu
al accou
nts
6 Oth
er info
rmatio
n7 A
dd
ition
al info
rmatio
n
ING_2013_deel4a&b_v2.indd 239 19/03/2014 19:22:47
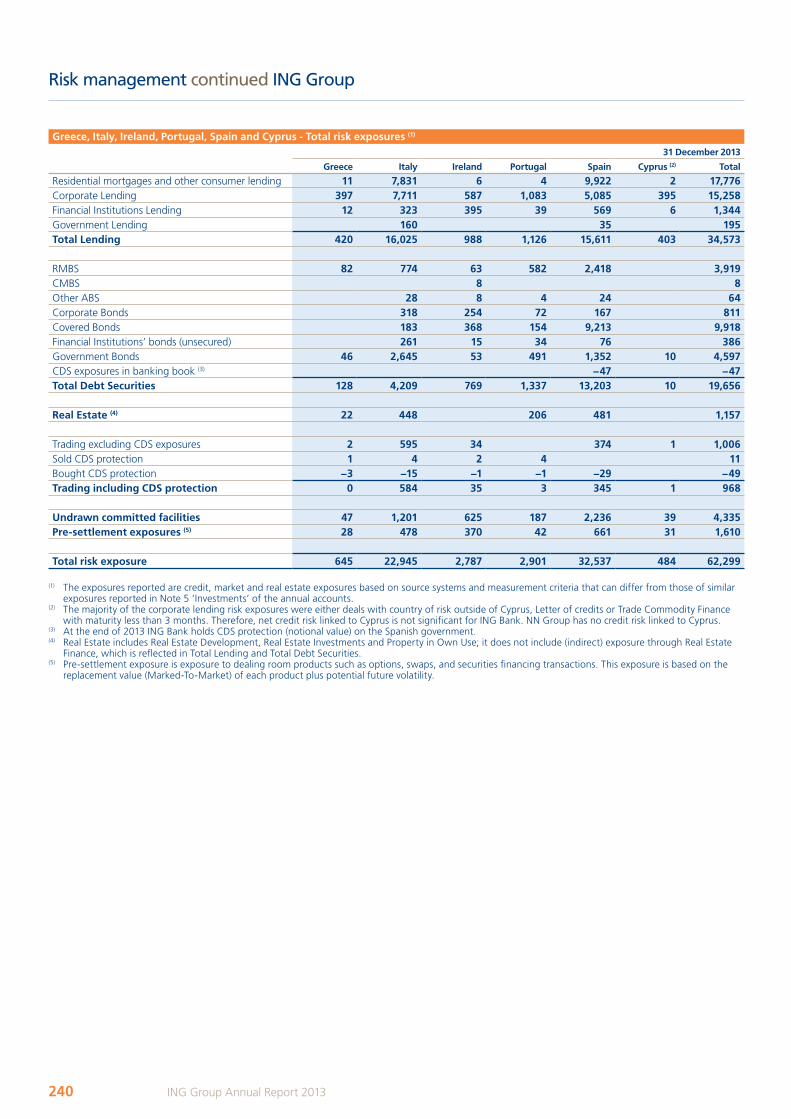
Risk management continued ING Group
Greece, Italy, Ireland, Portugal, Spain and Cyprus - Total risk exposures (1)
31 December 2013
Greece Italy Ireland Portugal Spain Cyprus (2) Total
Residential mortgages and other consumer lending 11 7,831 6 4 9,922 2 17,776Corporate Lending 397 7,711 587 1,083 5,085 395 15,258Financial Institutions Lending 12 323 395 39 569 6 1,344Government Lending 160 35 195Total Lending 420 16,025 988 1,126 15,611 403 34,573 RMBS 82 774 63 582 2,418 3,919CMBS 8 8Other ABS 28 8 4 24 64Corporate Bonds 318 254 72 167 811Covered Bonds 183 368 154 9,213 9,918Financial Institutions’ bonds (unsecured) 261 15 34 76 386Government Bonds 46 2,645 53 491 1,352 10 4,597CDS exposures in banking book (3) −47 −47Total Debt Securities 128 4,209 769 1,337 13,203 10 19,656
Real Estate (4) 22 448 206 481 1,157 Trading excluding CDS exposures 2 595 34 374 1 1,006Sold CDS protection 1 4 2 4 11Bought CDS protection −3 −15 −1 −1 −29 −49Trading including CDS protection 0 584 35 3 345 1 968
Undrawn committed facilities 47 1,201 625 187 2,236 39 4,335Pre-settlement exposures (5) 28 478 370 42 661 31 1,610 Total risk exposure 645 22,945 2,787 2,901 32,537 484 62,299
(1) The exposures reported are credit, market and real estate exposures based on source systems and measurement criteria that can differ from those of similar exposures reported in Note 5 ‘Investments’ of the annual accounts.
(2) The majority of the corporate lending risk exposures were either deals with country of risk outside of Cyprus, Letter of credits or Trade Commodity Finance with maturity less than 3 months. Therefore, net credit risk linked to Cyprus is not significant for ING Bank. NN Group has no credit risk linked to Cyprus.
(3) At the end of 2013 ING Bank holds CDS protection (notional value) on the Spanish government.(4) Real Estate includes Real Estate Development, Real Estate Investments and Property in Own Use; it does not include (indirect) exposure through Real Estate
Finance, which is reflected in Total Lending and Total Debt Securities.(5) Pre-settlement exposure is exposure to dealing room products such as options, swaps, and securities financing transactions. This exposure is based on the
replacement value (Marked-To-Market) of each product plus potential future volatility.
240 ING Group Annual Report 2013
ING_2013_deel4a&b_v2.indd 240 19/03/2014 19:22:48
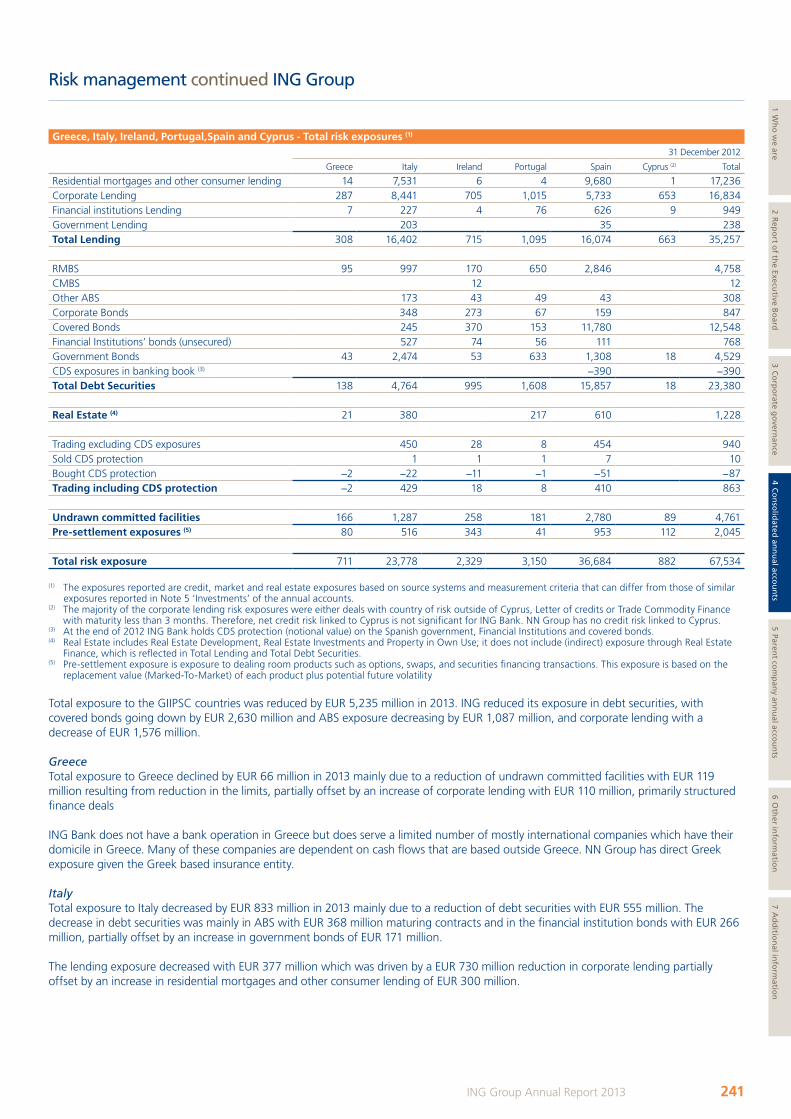
Risk management continued ING Group
Greece, Italy, Ireland, Portugal,Spain and Cyprus - Total risk exposures (1)
31 December 2012
Greece Italy Ireland Portugal Spain Cyprus (2) Total
Residential mortgages and other consumer lending 14 7,531 6 4 9,680 1 17,236Corporate Lending 287 8,441 705 1,015 5,733 653 16,834Financial institutions Lending 7 227 4 76 626 9 949Government Lending 203 35 238Total Lending 308 16,402 715 1,095 16,074 663 35,257 RMBS 95 997 170 650 2,846 4,758CMBS 12 12Other ABS 173 43 49 43 308Corporate Bonds 348 273 67 159 847Covered Bonds 245 370 153 11,780 12,548Financial Institutions’ bonds (unsecured) 527 74 56 111 768Government Bonds 43 2,474 53 633 1,308 18 4,529CDS exposures in banking book (3) −390 −390Total Debt Securities 138 4,764 995 1,608 15,857 18 23,380
Real Estate (4) 21 380 217 610 1,228 Trading excluding CDS exposures 450 28 8 454 940Sold CDS protection 1 1 1 7 10Bought CDS protection −2 −22 −11 −1 −51 −87Trading including CDS protection −2 429 18 8 410 863
Undrawn committed facilities 166 1,287 258 181 2,780 89 4,761Pre-settlement exposures (5) 80 516 343 41 953 112 2,045 Total risk exposure 711 23,778 2,329 3,150 36,684 882 67,534
(1) The exposures reported are credit, market and real estate exposures based on source systems and measurement criteria that can differ from those of similar exposures reported in Note 5 ‘Investments’ of the annual accounts.
(2) The majority of the corporate lending risk exposures were either deals with country of risk outside of Cyprus, Letter of credits or Trade Commodity Finance with maturity less than 3 months. Therefore, net credit risk linked to Cyprus is not significant for ING Bank. NN Group has no credit risk linked to Cyprus.
(3) At the end of 2012 ING Bank holds CDS protection (notional value) on the Spanish government, Financial Institutions and covered bonds.(4) Real Estate includes Real Estate Development, Real Estate Investments and Property in Own Use; it does not include (indirect) exposure through Real Estate
Finance, which is reflected in Total Lending and Total Debt Securities.(5) Pre-settlement exposure is exposure to dealing room products such as options, swaps, and securities financing transactions. This exposure is based on the
replacement value (Marked-To-Market) of each product plus potential future volatility Total exposure to the GIIPSC countries was reduced by EUR 5,235 million in 2013. ING reduced its exposure in debt securities, with covered bonds going down by EUR 2,630 million and ABS exposure decreasing by EUR 1,087 million, and corporate lending with a decrease of EUR 1,576 million.
GreeceTotal exposure to Greece declined by EUR 66 million in 2013 mainly due to a reduction of undrawn committed facilities with EUR 119 million resulting from reduction in the limits, partially offset by an increase of corporate lending with EUR 110 million, primarily structured finance deals
ING Bank does not have a bank operation in Greece but does serve a limited number of mostly international companies which have their domicile in Greece. Many of these companies are dependent on cash flows that are based outside Greece. NN Group has direct Greek exposure given the Greek based insurance entity.
ItalyTotal exposure to Italy decreased by EUR 833 million in 2013 mainly due to a reduction of debt securities with EUR 555 million. The decrease in debt securities was mainly in ABS with EUR 368 million maturing contracts and in the financial institution bonds with EUR 266 million, partially offset by an increase in government bonds of EUR 171 million.
The lending exposure decreased with EUR 377 million which was driven by a EUR 730 million reduction in corporate lending partially offset by an increase in residential mortgages and other consumer lending of EUR 300 million.
241ING Group Annual Report 2013
1 Wh
o w
e are2 R
epo
rt of th
e Executive B
oard
3 Co
rpo
rate go
vernan
ce4 C
on
solid
ated an
nu
al accou
nts
5 Parent co
mp
any an
nu
al accou
nts
6 Oth
er info
rmatio
n7 A
dd
ition
al info
rmatio
n
ING_2013_deel4a&b_v2.indd 241 19/03/2014 19:22:48
Risk management continued ING Group
IrelandTotal exposure to Ireland increased by EUR 458 million in 2013 mainly due to an increase of the lending book of EUR 273 million and undrawn committed facilities of EUR 367 million. The increase was partially offset by a reduction in debt securities of EUR 226 million.
The increase in the lending book and the undrawn committed facilities is driven by additional outstandings and facilities to existing customers.
PortugalTotal exposure to Portugal declined by EUR 249 million in 2013 mainly in debt securities by EUR 271 million. The decrease was mainly in the government bonds of EUR 142 million.
SpainING’s total exposure to Spain was reduced by EUR 4,147 million in 2013 to EUR 32,537 million. The debt securities portfolio decreased by EUR 2,654 million mainly due to covered bonds maturing by EUR 2,567 million and a decrease in RMBS by EUR 428 million.
The lending book declined by EUR 463 million to EUR 15,611 million. This decrease was driven by a EUR 648 million reduction in corporate lending, partly offset by a EUR 242 million increase in residential mortgages and other consumer lending.
CyprusTotal exposure to Cyprus decreased by EUR 398 million in 2013 mainly due to a decrease in corporate lending of EUR 258 million. The reduction is driven by the repayment of loans.
DerivativesIn these countries, ING Bank has limited derivative exposure and largely enters derivative transactions to help clients reduce exposure to interest and currency movements. Many of these transactions are covered either via CSA agreements or as part of the collateral of the underlying financing. The key credit risk ING Bank faces in these derivative transactions is movements in markets creating an uncollateralised exposure to a counterparty or that the collateral is not sufficient. ING monitors these mark to market movements on a daily basis.
Impact of low interest rate environmentInterest rates in the Eurozone but also in the other main home countries decreased from already low levels to unprecedented low levels. Central bank rates are still at very low levels as well, thereby negatively impacting the short term money market rates, and also long term rates decreased to very low levels in 2013. The on-going Eurozone crisis in combination with uncertainty on the growth potential of the world economy were the main reasons for this development.
Impact for ING BankThe typical interest rate position for ING Bank implies that the duration of the assets is somewhat higher than the duration of the liabilities. Given this mismatch, decreasing interest rates are initially favourable for ING Bank’s income: liabilities re-price quicker than assets, and therefore the average coupon of liabilities adapts quicker to lower interest rates. This should support ING Bank’s interest rate margin and subsequently our interest income.
However, the current situation of low interest rates levels is caused by the eruption of the financial crisis. Therefore interest rates are on a low level for more than 4 years now. A sustained low interest rate environment can put ING Bank’s interest income under pressure. New client assets are produced at lower rates, which impacts the average yield in the credit portfolio, but also implies lower prepayment rates and thus lengthening of the portfolio duration. This results in lower yielding assets that reprice more slowly. On the other side of the balance sheet savings coupons do not reflect the low interest rate environment fully. Due to high liquidity spreads as a consequence of the crisis and strong competition in the savings market savings coupons only marginally track lower interest rates. On balance these factors may put ING Bank’s interest rate margin under pressure. This situation will endure until structural economic recovery, which will lead to an environment with interest rate increases. As there is much uncertainty when this period of recovery will emerge, ING Bank closely monitors markets in order to be positioned adequately in anticipation of either a prolonged period of a low interest rates or a potential increase of short term and long term interest rates.
Impact NN GroupSince on the insurance side ING is mainly a life insurance company with long-term commitments to its clients, it is exposed to risk from low(er) interest rates. Other risks, such as longevity risk, will further increase this risk.
The NN Group entities have an asset liability management (ALM) process in place where investments are bought that largely match the duration profile of the liabilities. The remaining interest rate exposure is mitigated through derivative portfolios. In several currencies, asset durations matching the liabilities are not available. In these cases ING runs non-hedgeable interest rate risks. Options embedded in the products, which are difficult to hedge, expose ING to further risks.
242 ING Group Annual Report 2013
ING_2013_deel4a&b_v2.indd 242 19/03/2014 19:22:48

Risk management continued ING Group
The exact impact of low interest rates differs per entity and per product. In the IFRS-EU P&L accounts, lower interest rates will gradually reduce investment income. In most cases there is no direct impact on life insurance provisions as, to a large extent, these provisions are based on fixed interest rates. However, lower interest has an impact on the outcome of the reserve adequacy test (RAT) and indirectly may impact the provisions held. Lower interest rates have a direct impact on metrics that are market value based, such as the market value of the liabilities (MVL) and the available financial resources (AFR). Furthermore in the Netherlands regulatory required provisions and capital are market value based. In the near future Solvency II requirements will also be market value based.
Interest rate risks are well-known within ING’s risk appetite as these risks are part of doing life insurance business, and within market risk limits defined and monitored on a quarterly basis.
Impact ING GroupThe impact of the low interest rate environment for Bank and Insurance goes further than earnings and reserves, that are described in the sections above. Low interest rates result in addition to provisions for guarantees that are included in life insurance and variable annuity contracts, as the guarantees become more valuable to policy holders. Thereby the solvency position of the Insurance businesses is negatively impacted, which can also impact the proceeds of the Insurance divestment. The proceeds of the Insurance divestments are to be used to pay back the double-leverage. In case the Insurance proceeds are not sufficient to do so, ING Bank may need to upstream extra dividend to ING Group. Note however, that when future Bank earnings and future capital position are negatively impacted such capital up-streams are difficult to establish. This can be further hampered by the on-going increasing capital requirements for banks in general. In November 2013 ING repaid EUR 1.125 billion to the Dutch State. This was the second tranche of a series of four tranches thare are part of the amended EC Restructuring Plan which was announced on 19 November 2012
A continuation of the current low interest rate environment would also negatively affect our financial performance. For example, should new money investment rates remain at approximately the same level observed over 2013, we estimate that would reduce our current operating result by less than 5% in each of 2014, 2015 and 2016, in each case as compared to our current projections for such year. This estimated reduction in operating earnings primarily reflects lower investment income, as we invest new premiums and reinvest proceeds from maturing investments at rates lower than the yield on our current investment portfolio, and, in certain businesses, higher amortisation of DAC/VOBA. We believe reduced rates in the insurance policies offset the lower investment income, but such reductions would only be partially effective due to the presence of fixed or minimum rates on many of our products. Under this scenario, we do not currently expect that our reserve adequacy testing will result in charges to the profit and loss account. These estimates do not assume any changes to other assumptions and do not reflect significant management actions, other than reductions to the rates in our policies where relevant.
243ING Group Annual Report 2013
1 Wh
o w
e are2 R
epo
rt of th
e Executive B
oard
3 Co
rpo
rate go
vernan
ce4 C
on
solid
ated an
nu
al accou
nts
5 Parent co
mp
any an
nu
al accou
nts
6 Oth
er info
rmatio
n7 A
dd
ition
al info
rmatio
n
ING_2013_deel4a&b_v2.indd 243 19/03/2014 19:22:48
Risk management ING Bank
RISK MANAGEMENT ING bANKIntroductionTaking measured risks is the core of ING Bank’s business. ING Bank operates through a comprehensive risk management framework to ensure the risks are identified, well understood, accurately measured, controlled and pro-actively managed at all levels of the organisation so that ING Bank’s financial strength is safeguarded.
ING Bank uses risk assessment and measurement models to guide decision making. To guard the quality of these risk models there is a governance process for approval of risk models, methods and parameters. This ensures compliance with business and regulatory requirements, via a clear assignment of responsibility and accountability. Nevertheless, users of the disclosed information in the risk management section should bear in mind that the analyses provided are based on forward looking models that rely on assumptions and estimates of future events, some of which are considered extreme and therefore unlikely to occur. In the normal course of business ING Bank continues to develop, recalibrate and refine the various models, which may result in changes to the risk analyses as disclosed.
The risk management section describes the ING Bank business model, and the key risks that arise from it. It explains how the risk management function is embedded within the organisation based on the ‘three lines of defence’. This includes front office as ‘first line of defence’, risk management as independent observer in the ‘second line of defence’ and the internal audit function in the ‘third line’. The key risks resulting from the bank’s business model are managed by dedicated and specific risk management departments that each covers their own area of expertise. Each of these departments explains the respective governance framework, relevant risks and how they are expressed on a qualitative and quantitative basis within this report.
ING Bank’s risk management disclosures provides qualitative and quantitative disclosures about credit, market, liquidity and non-financial risks based on International Financial Reporting Standards as adopted by the European Union ‘IFRS-EU’. The risk management section is in line with the accounting standards relating to the nature and the extent of the risks as required by IFRS7 ‘Financial Instruments: Disclosures’ as approved by the EU and covered by the opinion of the Statutory Auditors as being part of the notes to the consolidated financial statements. Pillar 3 information is from a regulatory perspective largely based on internal modelled risk metrics under the Basel rules and not addressed for verification to the statutory auditors.
Enhanced disclosure task forceAlthough ING Bank strives towards a reporting basis that is consistent over time, the risk management section is subject to enhancements and improvements. These are needed to reflect the continuous developments that take place in ING Bank’s risk function and on-going (macro-) economic developments that require additional disclosures. Also the continuing changes in the environment in which ING Bank operates like new regulations but also voluntary initiatives from the banks themselves need to be reflected. ING is a member of the ‘Enhanced Disclosure Task Force’ (EDTF), a private sector group established by the Financial Stability Board (‘FSB’) and composed of members representing both the users and preparers of financial reports, which released a report with recommendations for improving bank risk disclosures in the areas of among others usability, risk governance and risk management, capital adequacy, liquidity and funding, market risk, credit risk.
As ING Bank strives to generate the same high-quality and transparent description of its risk, it immediately embraced the EDTF principles and recommendations and largely implemented them to further fine-tune its practise on risk disclosures. ING Bank is of the opinion that disclosures should be clear, balanced and understandable by external observers, and that risk information is disclosed on a timely basis. The latter not only applies for the Annual Accounts and the risk management paragraph but also for the concurrent publication of the Pillar 3 section.
In August 2013, FSB published a progress report on the level and quality of the implementation of the recommendations in the major banks’ 2012 annual reports. The report, based on a self-assessment of global systemically important banks (G-SIBs) and domestic systemically important banks (D-SIBs), demonstrated that the recommendations are beginning to make a positive impact on the reporting practises of global banks. The banks’ self-assessment stated that they have implemented 50% of the EDTF recommendations in aggregate in 2012 disclosures, which is a considerable increase from 34% in 2011; and they expect to implement 72% of the recommendations within their 2013 disclosures. Besides the banks ‘self-assessment, the users of the annual reports, investors and analysts, within the EDTF undertook a further review of the disclosures, which indicated however a lower degree of implementation than banks’ self-assessment, particularly for recommendations where they expect more granular, quantitative disclosures. Despite these differences, both banks and investors and analysts in the EDTF see an opportunity to engage and discuss the recommendations for further enhancing risk disclosures. For ING Bank, the implementation efforts were rewarded by including some of the templates in the examples of leading disclosures practices in the FSB progress report.
For 2013 ING Bank reaffirms its commitment to the EDTF report by implementing additional recommendations. Although it is ING Bank’s ambition to disclose all risk related items in one comprehensive section, this is in practice not always possible. Therefore, a global overview of our approach on risk management is provided to ensure transparent and easily navigable disclosures. The table below provides clear cross-referencing between the Risk management and Pillar 3 sections within the Annual Report. This navigation table enables users to locate and navigate across the different risk topics and disclosures. The sequence in which the risk disclosures are presented below is not indicative of their likelihood of occurrence or the potential magnitude of their financial consequences.
244 ING Group Annual Report 2013
ING_2013_deel4a&b_v2.indd 244 19/03/2014 19:22:49
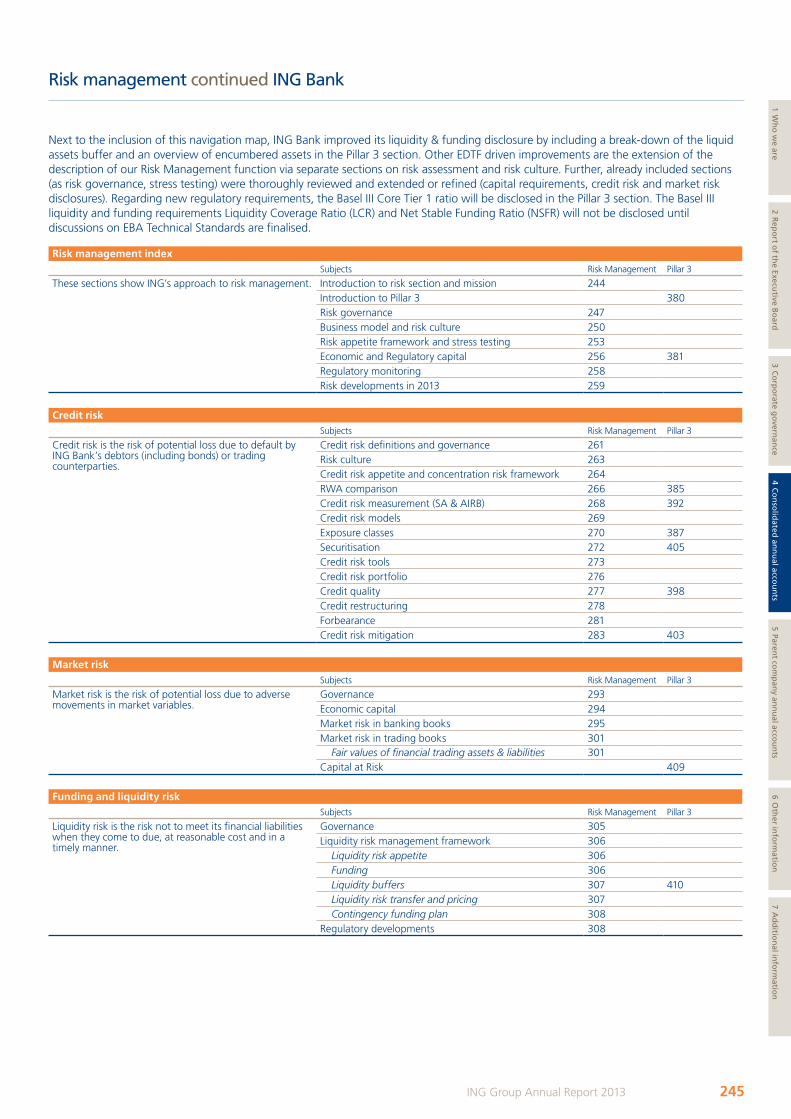
Risk management continued ING Bank
Next to the inclusion of this navigation map, ING Bank improved its liquidity & funding disclosure by including a break-down of the liquid assets buffer and an overview of encumbered assets in the Pillar 3 section. Other EDTF driven improvements are the extension of the description of our Risk Management function via separate sections on risk assessment and risk culture. Further, already included sections (as risk governance, stress testing) were thoroughly reviewed and extended or refined (capital requirements, credit risk and market risk disclosures). Regarding new regulatory requirements, the Basel III Core Tier 1 ratio will be disclosed in the Pillar 3 section. The Basel III liquidity and funding requirements Liquidity Coverage Ratio (LCR) and Net Stable Funding Ratio (NSFR) will not be disclosed until discussions on EBA Technical Standards are finalised.
Risk management indexSubjects Risk Management Pillar 3
These sections show ING’s approach to risk management. Introduction to risk section and mission 244Introduction to Pillar 3 380Risk governance 247Business model and risk culture 250Risk appetite framework and stress testing 253Economic and Regulatory capital 256 381Regulatory monitoring 258Risk developments in 2013 259
Credit riskSubjects Risk Management Pillar 3
Credit risk is the risk of potential loss due to default by ING Bank’s debtors (including bonds) or trading counterparties.
Credit risk definitions and governance 261Risk culture 263Credit risk appetite and concentration risk framework 264RWA comparison 266 385Credit risk measurement (SA & AIRB) 268 392Credit risk models 269Exposure classes 270 387Securitisation 272 405Credit risk tools 273Credit risk portfolio 276Credit quality 277 398Credit restructuring 278Forbearance 281Credit risk mitigation 283 403
Market riskSubjects Risk Management Pillar 3
Market risk is the risk of potential loss due to adverse movements in market variables.
Governance 293Economic capital 294Market risk in banking books 295Market risk in trading books 301 Fair values of financial trading assets & liabilities 301Capital at Risk 409
Funding and liquidity riskSubjects Risk Management Pillar 3
Liquidity risk is the risk not to meet its financial liabilities when they come to due, at reasonable cost and in a timely manner.
Governance 305Liquidity risk management framework 306 Liquidity risk appetite 306 Funding 306 Liquidity buffers 307 410 Liquidity risk transfer and pricing 307 Contingency funding plan 308Regulatory developments 308
245ING Group Annual Report 2013
1 Wh
o w
e are2 R
epo
rt of th
e Executive B
oard
3 Co
rpo
rate go
vernan
ce4 C
on
solid
ated an
nu
al accou
nts
5 Parent co
mp
any an
nu
al accou
nts
6 Oth
er info
rmatio
n7 A
dd
ition
al info
rmatio
n
ING_2013_deel4a&b_v2.indd 245 19/03/2014 19:22:49
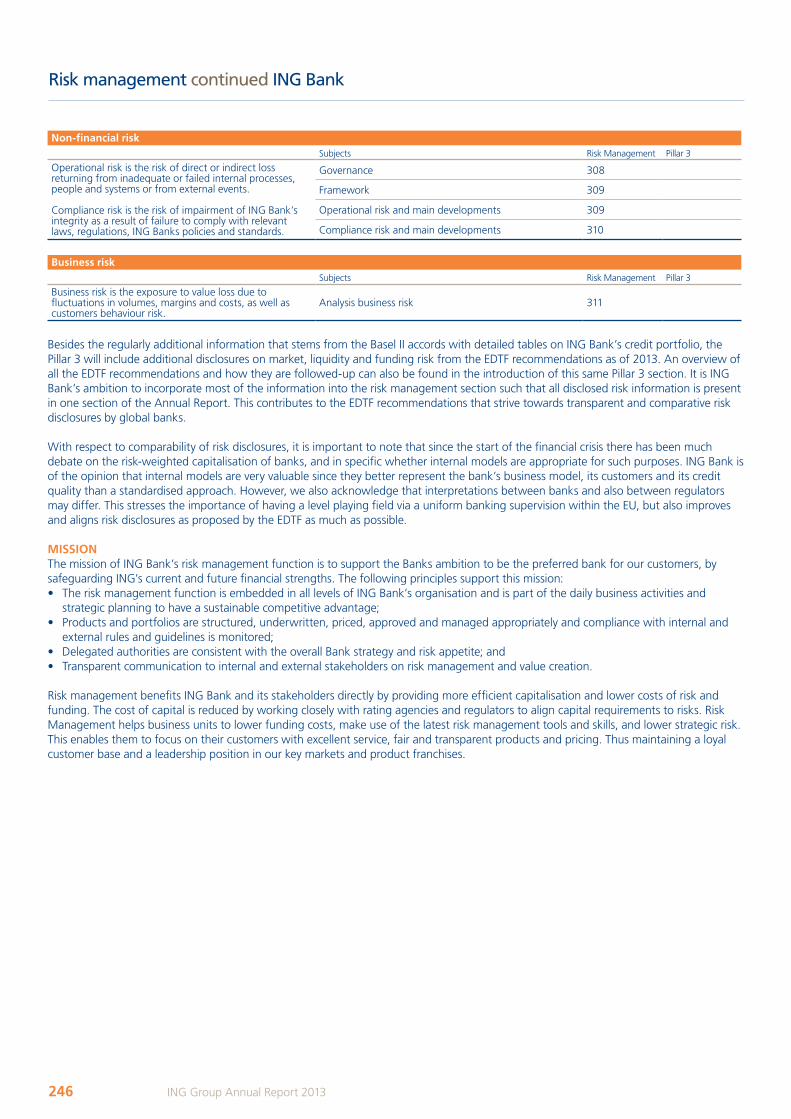
Risk management continued ING Bank
Non-financial riskSubjects Risk Management Pillar 3
Operational risk is the risk of direct or indirect loss returning from inadequate or failed internal processes, people and systems or from external events.
Compliance risk is the risk of impairment of ING Bank’s integrity as a result of failure to comply with relevant laws, regulations, ING Banks policies and standards.
Governance 308
Framework 309
Operational risk and main developments 309
Compliance risk and main developments 310
business riskSubjects Risk Management Pillar 3
Business risk is the exposure to value loss due to fluctuations in volumes, margins and costs, as well as customers behaviour risk.
Analysis business risk 311
Besides the regularly additional information that stems from the Basel II accords with detailed tables on ING Bank’s credit portfolio, the Pillar 3 will include additional disclosures on market, liquidity and funding risk from the EDTF recommendations as of 2013. An overview of all the EDTF recommendations and how they are followed-up can also be found in the introduction of this same Pillar 3 section. It is ING Bank’s ambition to incorporate most of the information into the risk management section such that all disclosed risk information is present in one section of the Annual Report. This contributes to the EDTF recommendations that strive towards transparent and comparative risk disclosures by global banks.
With respect to comparability of risk disclosures, it is important to note that since the start of the financial crisis there has been much debate on the risk-weighted capitalisation of banks, and in specific whether internal models are appropriate for such purposes. ING Bank is of the opinion that internal models are very valuable since they better represent the bank’s business model, its customers and its credit quality than a standardised approach. However, we also acknowledge that interpretations between banks and also between regulators may differ. This stresses the importance of having a level playing field via a uniform banking supervision within the EU, but also improves and aligns risk disclosures as proposed by the EDTF as much as possible.
MISSIONThe mission of ING Bank’s risk management function is to support the Banks ambition to be the preferred bank for our customers, by safeguarding ING’s current and future financial strengths. The following principles support this mission:• The risk management function is embedded in all levels of ING Bank’s organisation and is part of the daily business activities and
strategic planning to have a sustainable competitive advantage;• Products and portfolios are structured, underwritten, priced, approved and managed appropriately and compliance with internal and
external rules and guidelines is monitored;• Delegated authorities are consistent with the overall Bank strategy and risk appetite; and• Transparent communication to internal and external stakeholders on risk management and value creation.
Risk management benefits ING Bank and its stakeholders directly by providing more efficient capitalisation and lower costs of risk and funding. The cost of capital is reduced by working closely with rating agencies and regulators to align capital requirements to risks. Risk Management helps business units to lower funding costs, make use of the latest risk management tools and skills, and lower strategic risk. This enables them to focus on their customers with excellent service, fair and transparent products and pricing. Thus maintaining a loyal customer base and a leadership position in our key markets and product franchises.
246 ING Group Annual Report 2013
ING_2013_deel4a&b_v2.indd 246 19/03/2014 19:22:49
Risk management continued ING Bank
RISK GOVERNANCEING Bank’s risk management framework is based on a ‘three lines of defence’ governance model, whereby each line has a specific role and defined responsibilities and at the same time work closely together to identify, assess and mitigate risks. This governance framework ensures that risk is managed in line with the risk appetite as defined by the Management Board Bank (MBB), ratified by the Supervisory Board (SB) and is cascaded throughout ING Bank.
The commercial departments form the first line of defence and they have primary responsibility for the day-to-day risk management. They originate loans, deposits and other products, they know our customers well and are well-positioned to act in both the customers’ and ING’s best interest.
The second line of defence consists of oversight functions with a major role for the risk management organisation, headed by the Chief Risk Officer (CRO), and the corporate legal function. The membership of the CRO on the MBB ensures that risk management issues are heard and discussed at the highest level, thus establishing the appropriate tone at the top. The CRO steers a functional, independent risk organisation both at bank and regional/local level, which supports the commercial departments in their decision-making, but which also has sufficient countervailing power to prevent risk concentrations and other forms of excessive risks.
The internal audit function provides an on-going independent (i.e. outside of the risk organisation) and objective assessment of the effectiveness of internal controls of the first two lines, including financial and non-financial risk management and forms the third line of defence.
247ING Group Annual Report 2013
1 Wh
o w
e are2 R
epo
rt of th
e Executive B
oard
3 Co
rpo
rate go
vernan
ce4 C
on
solid
ated an
nu
al accou
nts
5 Parent co
mp
any an
nu
al accou
nts
6 Oth
er info
rmatio
n7 A
dd
ition
al info
rmatio
n
ING_2013_deel4a&b_v2.indd 247 19/03/2014 19:22:49
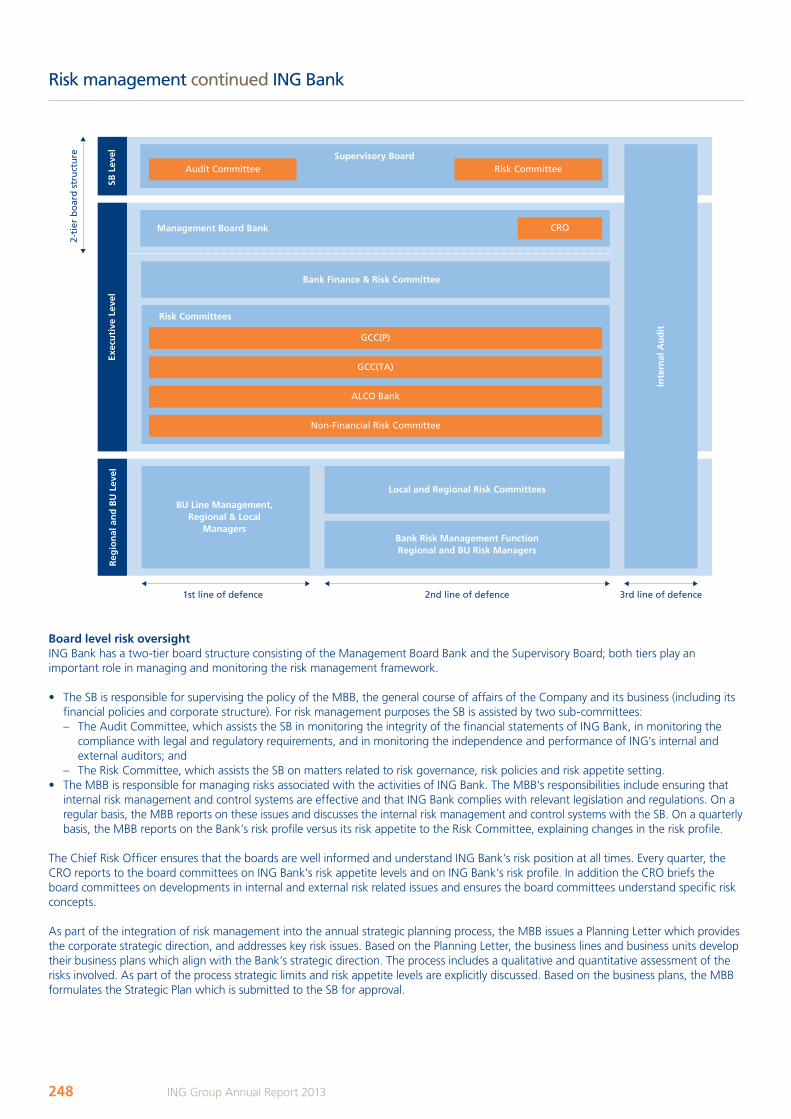
Risk management continued ING Bank
board level risk oversightING Bank has a two-tier board structure consisting of the Management Board Bank and the Supervisory Board; both tiers play an important role in managing and monitoring the risk management framework.
• The SB is responsible for supervising the policy of the MBB, the general course of affairs of the Company and its business (including its financial policies and corporate structure). For risk management purposes the SB is assisted by two sub-committees: – The Audit Committee, which assists the SB in monitoring the integrity of the financial statements of ING Bank, in monitoring the
compliance with legal and regulatory requirements, and in monitoring the independence and performance of ING’s internal and external auditors; and
– The Risk Committee, which assists the SB on matters related to risk governance, risk policies and risk appetite setting. • The MBB is responsible for managing risks associated with the activities of ING Bank. The MBB’s responsibilities include ensuring that
internal risk management and control systems are effective and that ING Bank complies with relevant legislation and regulations. On a regular basis, the MBB reports on these issues and discusses the internal risk management and control systems with the SB. On a quarterly basis, the MBB reports on the Bank’s risk profile versus its risk appetite to the Risk Committee, explaining changes in the risk profile.
The Chief Risk Officer ensures that the boards are well informed and understand ING Bank’s risk position at all times. Every quarter, the CRO reports to the board committees on ING Bank’s risk appetite levels and on ING Bank’s risk profile. In addition the CRO briefs the board committees on developments in internal and external risk related issues and ensures the board committees understand specific risk concepts.
As part of the integration of risk management into the annual strategic planning process, the MBB issues a Planning Letter which provides the corporate strategic direction, and addresses key risk issues. Based on the Planning Letter, the business lines and business units develop their business plans which align with the Bank’s strategic direction. The process includes a qualitative and quantitative assessment of the risks involved. As part of the process strategic limits and risk appetite levels are explicitly discussed. Based on the business plans, the MBB formulates the Strategic Plan which is submitted to the SB for approval.
Group Level
1st line of defence 2nd line of defence 3rd line of defence
Supervisory Board
Risk Committees
GCC(P)
ALCO Bank
GCC(TA)
BU Line Management, Regional & Local
Managers
Inte
rnal
Au
dit
Management Board Bank CRO
Local and Regional Risk Committees
Bank Risk Management FunctionRegional and BU Risk Managers
Non-Financial Risk Committee
Bank Finance & Risk Committee
SB L
evel
Exec
uti
ve L
evel
Reg
ion
al a
nd
BU
Lev
el
2-ti
er b
oar
d s
tru
ctu
re
Risk CommitteeAudit Committee
248 ING Group Annual Report 2013
ING_2013_deel4a&b_v2.indd 248 19/03/2014 19:22:50
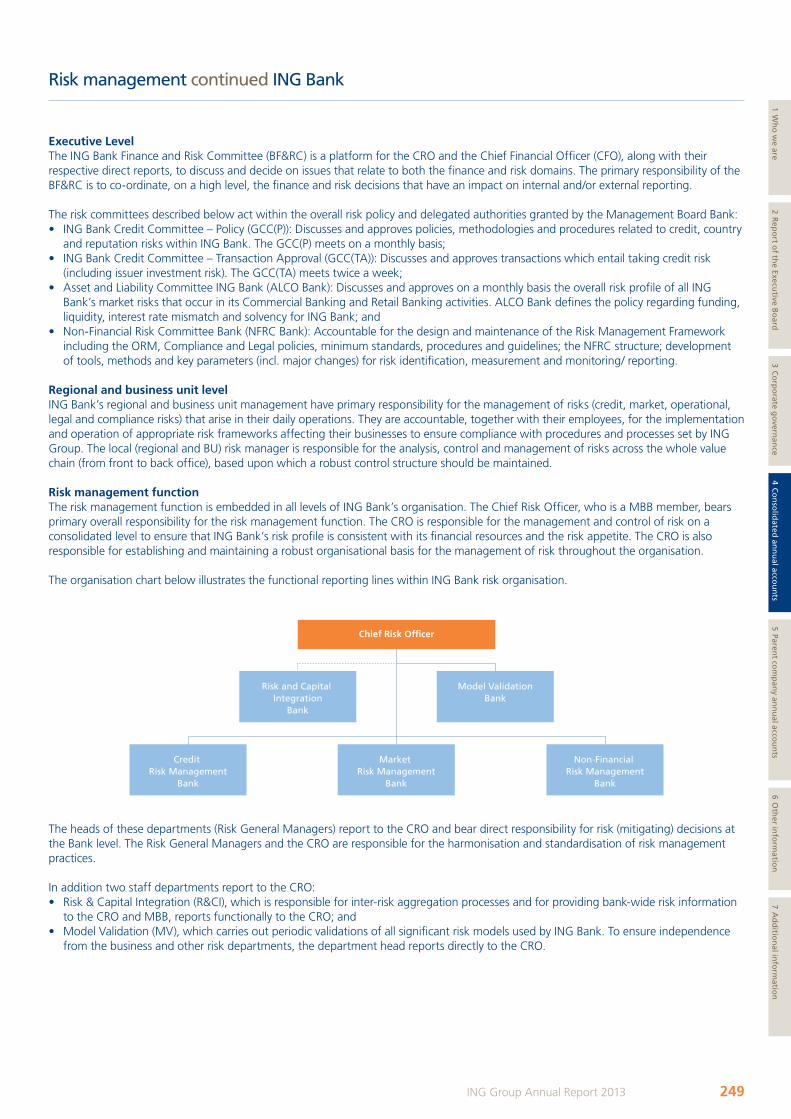
Risk management continued ING Bank
Executive LevelThe ING Bank Finance and Risk Committee (BF&RC) is a platform for the CRO and the Chief Financial Officer (CFO), along with their respective direct reports, to discuss and decide on issues that relate to both the finance and risk domains. The primary responsibility of the BF&RC is to co-ordinate, on a high level, the finance and risk decisions that have an impact on internal and/or external reporting.
The risk committees described below act within the overall risk policy and delegated authorities granted by the Management Board Bank:• ING Bank Credit Committee – Policy (GCC(P)): Discusses and approves policies, methodologies and procedures related to credit, country
and reputation risks within ING Bank. The GCC(P) meets on a monthly basis;• ING Bank Credit Committee – Transaction Approval (GCC(TA)): Discusses and approves transactions which entail taking credit risk
(including issuer investment risk). The GCC(TA) meets twice a week;• Asset and Liability Committee ING Bank (ALCO Bank): Discusses and approves on a monthly basis the overall risk profile of all ING
Bank’s market risks that occur in its Commercial Banking and Retail Banking activities. ALCO Bank defines the policy regarding funding, liquidity, interest rate mismatch and solvency for ING Bank; and
• Non-Financial Risk Committee Bank (NFRC Bank): Accountable for the design and maintenance of the Risk Management Framework including the ORM, Compliance and Legal policies, minimum standards, procedures and guidelines; the NFRC structure; development of tools, methods and key parameters (incl. major changes) for risk identification, measurement and monitoring/ reporting.
Regional and business unit levelING Bank’s regional and business unit management have primary responsibility for the management of risks (credit, market, operational, legal and compliance risks) that arise in their daily operations. They are accountable, together with their employees, for the implementation and operation of appropriate risk frameworks affecting their businesses to ensure compliance with procedures and processes set by ING Group. The local (regional and BU) risk manager is responsible for the analysis, control and management of risks across the whole value chain (from front to back office), based upon which a robust control structure should be maintained.
Risk management functionThe risk management function is embedded in all levels of ING Bank’s organisation. The Chief Risk Officer, who is a MBB member, bears primary overall responsibility for the risk management function. The CRO is responsible for the management and control of risk on a consolidated level to ensure that ING Bank’s risk profile is consistent with its financial resources and the risk appetite. The CRO is also responsible for establishing and maintaining a robust organisational basis for the management of risk throughout the organisation.
The organisation chart below illustrates the functional reporting lines within ING Bank risk organisation.
Chief Risk Officer
Risk and Capital Integration
Bank
Model ValidationBank
Market Risk Management
Bank
Credit Risk Management
Bank
Non-Financial Risk Management
Bank
The heads of these departments (Risk General Managers) report to the CRO and bear direct responsibility for risk (mitigating) decisions at the Bank level. The Risk General Managers and the CRO are responsible for the harmonisation and standardisation of risk management practices.
In addition two staff departments report to the CRO:• Risk & Capital Integration (R&CI), which is responsible for inter-risk aggregation processes and for providing bank-wide risk information
to the CRO and MBB, reports functionally to the CRO; and• Model Validation (MV), which carries out periodic validations of all significant risk models used by ING Bank. To ensure independence
from the business and other risk departments, the department head reports directly to the CRO.
249ING Group Annual Report 2013
1 Wh
o w
e are2 R
epo
rt of th
e Executive B
oard
3 Co
rpo
rate go
vernan
ce4 C
on
solid
ated an
nu
al accou
nts
5 Parent co
mp
any an
nu
al accou
nts
6 Oth
er info
rmatio
n7 A
dd
ition
al info
rmatio
n
ING_2013_deel4a&b_v2.indd 249 19/03/2014 19:22:50
Risk management continued ING Bank
Risk policies, procedures and standardsING Bank has a framework of risk management policies, procedures and standards in place to create consistency throughout the organisation, and to define minimum requirements that are binding to all business units. The governance framework of the business units aligns with the Bank’s level framework and meets local (regulatory) requirements. Senior management is responsible to ensure policies, procedures and standards are implemented and adhered to. Policies, procedures and standards are regularly reviewed and updated via the relevant risk committees to reflect changes in markets, products and emerging best practices.
Risk model governance and model validationAll risk models are built according to the internal risk modelling methodology standards and model life cycle, in line with regulatory requirements. After thorough review of the documentation by model development departments and MV, specific model risk committees for each risk type approve the models. After approval by the dedicated risk committee, a risk model is implemented and entitled for usage. In addition, MV validates each model on a regular basis. The validation results and its capital impact are reported on a quarterly basis to senior management and to De Nederlandsche Bank (DNB).
An independent model validation department is one of the cornerstones of ING Bank’s risk model governance. It consists of the process of determining that a model is appropriate for its intended use. It is an on-going process whereby the reliability of the model is verified at different stages during its lifecycle: at conception, before approval, periodically after implementation, and when significant changes are made to the model. The validation process contains a mix of developmental evidence, process verification and outcome analysis. To ensure the independence of MV, this department reports directly to the CRO.
The MV department undertakes back testing of all existing risk models. In addition to evaluating the underlying model parameters, ensuring continued applicability of the models for the relevant portfolios, and discussing the model performance with front office and risk users of the models, MV also tests the observed performance of a model (and its components) with the predicted level. A model where the observed results deviate from the predicted results is a candidate for either re-calibration or re-development.
bUSINESS MODEL AND RISK PROFILEbusiness ModelING Bank is a large European retail bank with a strong world-class commercial banking franchise operating an extensive network with presence in over 40 countries. Next to the operations in its historic markets of the Benelux, ING has developed a strong (internet) banking franchise in a number of European countries and in Asia and Australia.
This business model is translated into the following specific ambitions: • Retail Banking will pursue the One Bank approach by combining retail and commercial banking and converge to one retail model: Easy,
fair, and at low costs. • Optimise the balance sheet by better match assets and liabilities across the Bank and limit growth and risk of the balance sheet,• Remain financially healthy by improving cost efficiency and strengthen risk management. Additionally, Basel III requirements have to be
met and there should be a focus on improving capital, funding and liquidity.• Build on the ambition to be a predominantly European Bank with growth options elsewhere to strengthen leadership positions in ING’s
home markets.
Key RisksING Bank recognises the following key risks (financial as well as non-financial risks) that are associated with its business activities.
Financial risks:• Credit risk: the risk of potential loss due to default by ING Bank’s debtors (including bond issuers) or trading counterparties;• Market risk: the risk of potential loss due to adverse movements in market variables. Market risks include interest rate, equity, real
estate, implied volatility, credit spread, and foreign exchange risks;• Liquidity risk: the risk that ING Bank or one of its subsidiaries cannot meet its financial liabilities when they come due, at reasonable cost
and in a timely manner. Liquidity risk can materialise both through trading and non-trading positions; and• Business risk: the exposure to value loss due to fluctuations in volumes, margins and costs, as well as customer behaviour risk. These
fluctuations can occur because of internal, industry, or wider market factors. It is the risk inherent to strategy decisions and internal efficiency, and as such strategic risk is included in business risk.
Non-financial risks:• Operational risk: the risk of direct or indirect loss resulting from inadequate or failed internal processes, people and systems or from
external events. It includes reputational risk, as well as legal risk; and• Compliance risk: the risk of impairment of ING Bank’s integrity as a result of failure (or perceived failure) to comply with relevant laws,
regulations, ING Bank policies and standards as in ING Bank Business Principles.
250 ING Group Annual Report 2013
ING_2013_deel4a&b_v2.indd 250 19/03/2014 19:22:50
Risk management continued ING Bank
Risk cultureIn the current social and economic environment risk culture is a critical factor in the success or failure of a bank’s risk management. Issues relating to risk culture are consequently of interest to all stakeholders of ING Bank. ING considers the good reputation and integrity of its organisation as key requirements to operate successfully in the financial world.
The risk management framework based on the three lines of defence governance model is effective when a strong risk culture is present on all levels. ING promotes awareness of collectively shared values, ideas and goals but also of potential threats and it ensures alignment of individual performance objectives with the short- and long-term strategy. By making ING’s risk responsibilities more transparent within the different levels of the organisation and holding every employee accountable for his acts, the risk culture and awareness are embedded in the organisation which leads to effective risk management.
As explained in the risk governance, the risk function at the regional and business units is independent from the commercial departments which allow its criteria and opinions to be heard and taken into account. At the Bank level it is represented by the CRO in the MBB which ensures sufficient countervailing power in the decision-making processes to prevent excessive risks.
DefinitionRisk culture and risk awareness are not only issues for senior management during their strategy decisions, but something that every employee has to be aware of and consider in his daily business. It is promoting and being aware of collectively shared values, ideas and goals towards the organisational objectives and mitigating opportunities for unfavourable events to occur that can impact the ability of the organisation to achieve its objectives. Risk awareness is to be alert on potential threats which can occur in day-to-day business, which can be specific to the sector, the region or the clients ING is doing business with.
Commonly seen as norms and traditions of behaviour of individuals and of groups within an organisation, risk culture determines the way in which employees identify, understand, discuss, and act on the risks the organisation confronts and the risks it takes. This is a long term commitment and journey which cannot be reached overnight. Therefore, ING initiated different programmes and manuals have been issued within the organisation as statement of what the organisation objectives are.
AccountabilityIn 2009 ING Bank introduced the Promoting Integrity Programme (PIP) a long term, global, educational and behavioural change programme for the ING employees. The PIP has been developed to support integrity by focusing on ING values and is fully supported by the ING Group Executive Board. The role of the Board in the oversight of corporate culture and successful implementation of the risk culture change is essential in this process.
With the programme ING gains a sound risk culture and ensures that every employee in every part of the organisation understands how his actions and behaviour can help earn and retain customer and stakeholder trust. This programme is divided into several mandatory modules among others business principles, customer trust, fraud awareness, Financial Economic Crime and IT security. To enhance risk awareness these topics are discussed between managers and employees through dialogue sessions that managers organise within their teams to create clear and consistent understanding. The endorsement from the executive level and the emphasis in the communication strengthen the culture.
CompensationDue to economic and financial turmoil, concerns were raised in different countries following the bailout of different financial and industrial companies. The link between the risk taken and the compensation was one of the major topics in the public and political spheres. Several public institutions and initiatives advocated aligning risk and reward in risk-based compensation policies.
The performance management process within ING is linked to remuneration to prevent rewarding for failure and to address the long term sustainability within the risk appetite framework. To establish relevant performance objectives, the ING financial and strategy plan is determined annually and translated into relevant business objectives. The business objectives of the Executive Board are cascaded to the rest of the Identified Staff and subsequent layers in the organisation. This process ensures the alignment of individual performance objectives with the short-term and long-term strategy of ING and involves input from control functions to ensure appropriate risk adjustment of the performance objectives on each level. In light of the Capital Requirements Directive (CRD) III compensation packages related to control functions, such as risk management, are structured such that they provide for a reduced emphasis on variable remuneration in order to mitigate risk relating to remuneration.
For further information with regards to the compensation policies please refer to the remuneration report in the corporate governance section of the annual report.
251ING Group Annual Report 2013
1 Wh
o w
e are2 R
epo
rt of th
e Executive B
oard
3 Co
rpo
rate go
vernan
ce4 C
on
solid
ated an
nu
al accou
nts
5 Parent co
mp
any an
nu
al accou
nts
6 Oth
er info
rmatio
n7 A
dd
ition
al info
rmatio
n
ING_2013_deel4a&b_v2.indd 251 19/03/2014 19:22:50
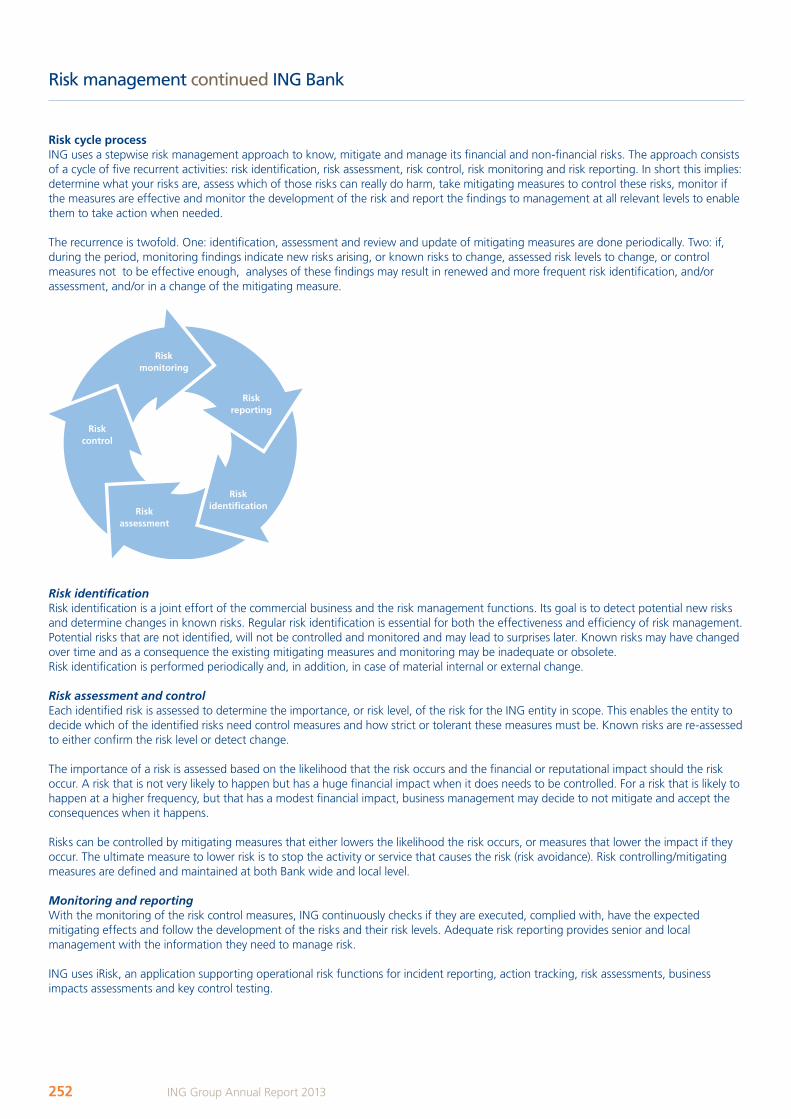
Risk management continued ING Bank
Risk cycle processING uses a stepwise risk management approach to know, mitigate and manage its financial and non-financial risks. The approach consists of a cycle of five recurrent activities: risk identification, risk assessment, risk control, risk monitoring and risk reporting. In short this implies: determine what your risks are, assess which of those risks can really do harm, take mitigating measures to control these risks, monitor if the measures are effective and monitor the development of the risk and report the findings to management at all relevant levels to enable them to take action when needed.
The recurrence is twofold. One: identification, assessment and review and update of mitigating measures are done periodically. Two: if, during the period, monitoring findings indicate new risks arising, or known risks to change, assessed risk levels to change, or control measures not to be effective enough, analyses of these findings may result in renewed and more frequent risk identification, and/or assessment, and/or in a change of the mitigating measure.
Riskmonitoring
Riskreporting
RiskidentificationRisk
assessment
Riskcontrol
Risk identificationRisk identification is a joint effort of the commercial business and the risk management functions. Its goal is to detect potential new risks and determine changes in known risks. Regular risk identification is essential for both the effectiveness and efficiency of risk management. Potential risks that are not identified, will not be controlled and monitored and may lead to surprises later. Known risks may have changed over time and as a consequence the existing mitigating measures and monitoring may be inadequate or obsolete. Risk identification is performed periodically and, in addition, in case of material internal or external change.
Risk assessment and controlEach identified risk is assessed to determine the importance, or risk level, of the risk for the ING entity in scope. This enables the entity to decide which of the identified risks need control measures and how strict or tolerant these measures must be. Known risks are re-assessed to either confirm the risk level or detect change.
The importance of a risk is assessed based on the likelihood that the risk occurs and the financial or reputational impact should the risk occur. A risk that is not very likely to happen but has a huge financial impact when it does needs to be controlled. For a risk that is likely to happen at a higher frequency, but that has a modest financial impact, business management may decide to not mitigate and accept the consequences when it happens.
Risks can be controlled by mitigating measures that either lowers the likelihood the risk occurs, or measures that lower the impact if they occur. The ultimate measure to lower risk is to stop the activity or service that causes the risk (risk avoidance). Risk controlling/mitigating measures are defined and maintained at both Bank wide and local level.
Monitoring and reportingWith the monitoring of the risk control measures, ING continuously checks if they are executed, complied with, have the expected mitigating effects and follow the development of the risks and their risk levels. Adequate risk reporting provides senior and local management with the information they need to manage risk.
ING uses iRisk, an application supporting operational risk functions for incident reporting, action tracking, risk assessments, business impacts assessments and key control testing.
252 ING Group Annual Report 2013
ING_2013_deel4a&b_v2.indd 252 19/03/2014 19:22:52
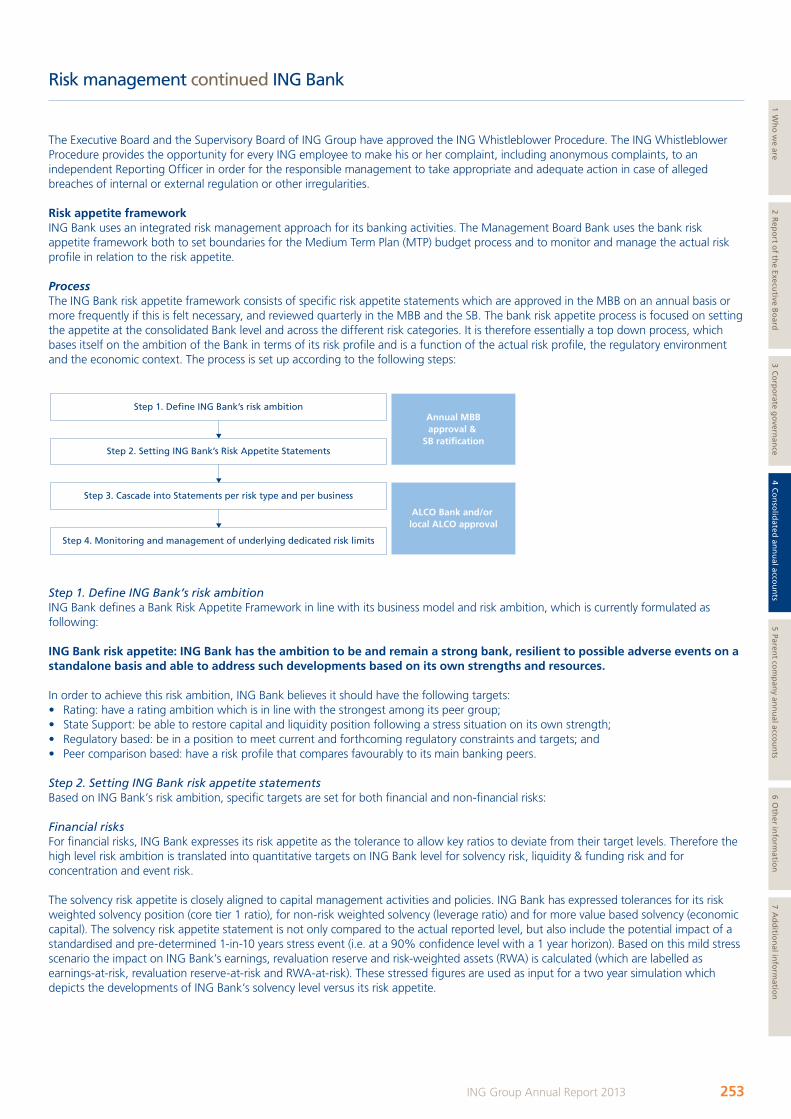
Risk management continued ING Bank
The Executive Board and the Supervisory Board of ING Group have approved the ING Whistleblower Procedure. The ING Whistleblower Procedure provides the opportunity for every ING employee to make his or her complaint, including anonymous complaints, to an independent Reporting Officer in order for the responsible management to take appropriate and adequate action in case of alleged breaches of internal or external regulation or other irregularities.
Risk appetite frameworkING Bank uses an integrated risk management approach for its banking activities. The Management Board Bank uses the bank risk appetite framework both to set boundaries for the Medium Term Plan (MTP) budget process and to monitor and manage the actual risk profile in relation to the risk appetite.
ProcessThe ING Bank risk appetite framework consists of specific risk appetite statements which are approved in the MBB on an annual basis or more frequently if this is felt necessary, and reviewed quarterly in the MBB and the SB. The bank risk appetite process is focused on setting the appetite at the consolidated Bank level and across the different risk categories. It is therefore essentially a top down process, which bases itself on the ambition of the Bank in terms of its risk profile and is a function of the actual risk profile, the regulatory environment and the economic context. The process is set up according to the following steps:
Step 4. Monitoring and management of underlying dedicated risk limits
ALCO Bank and/or local ALCO approval
Step 3. Cascade into Statements per risk type and per business
Step 2. Setting ING Bank’s Risk Appetite Statements
Step 1. Define ING Bank’s risk ambitionAnnual MBBapproval &
SB ratification
Step 1. Define ING Bank’s risk ambition ING Bank defines a Bank Risk Appetite Framework in line with its business model and risk ambition, which is currently formulated as following:
ING bank risk appetite: ING bank has the ambition to be and remain a strong bank, resilient to possible adverse events on a standalone basis and able to address such developments based on its own strengths and resources.
In order to achieve this risk ambition, ING Bank believes it should have the following targets:• Rating: have a rating ambition which is in line with the strongest among its peer group;• State Support: be able to restore capital and liquidity position following a stress situation on its own strength;• Regulatory based: be in a position to meet current and forthcoming regulatory constraints and targets; and• Peer comparison based: have a risk profile that compares favourably to its main banking peers.
Step 2. Setting ING Bank risk appetite statements Based on ING Bank’s risk ambition, specific targets are set for both financial and non-financial risks:
Financial risksFor financial risks, ING Bank expresses its risk appetite as the tolerance to allow key ratios to deviate from their target levels. Therefore the high level risk ambition is translated into quantitative targets on ING Bank level for solvency risk, liquidity & funding risk and for concentration and event risk.
The solvency risk appetite is closely aligned to capital management activities and policies. ING Bank has expressed tolerances for its risk weighted solvency position (core tier 1 ratio), for non-risk weighted solvency (leverage ratio) and for more value based solvency (economic capital). The solvency risk appetite statement is not only compared to the actual reported level, but also include the potential impact of a standardised and pre-determined 1-in-10 years stress event (i.e. at a 90% confidence level with a 1 year horizon). Based on this mild stress scenario the impact on ING Bank’s earnings, revaluation reserve and risk-weighted assets (RWA) is calculated (which are labelled as earnings-at-risk, revaluation reserve-at-risk and RWA-at-risk). These stressed figures are used as input for a two year simulation which depicts the developments of ING Bank’s solvency level versus its risk appetite.
253ING Group Annual Report 2013
1 Wh
o w
e are2 R
epo
rt of th
e Executive B
oard
3 Co
rpo
rate go
vernan
ce4 C
on
solid
ated an
nu
al accou
nts
5 Parent co
mp
any an
nu
al accou
nts
6 Oth
er info
rmatio
n7 A
dd
ition
al info
rmatio
n
ING_2013_deel4a&b_v2.indd 253 19/03/2014 19:22:53
Risk management continued ING Bank
Liquidity and funding risk have two dimensions: where liquidity focuses on having a sufficient buffer to cope with the short term situation, managing the funding profile ensures long term compliance to both internal and external targets. Managing liquidity and funding risk focuses on both ‘business as usual’ (based on the run-off profile to show the stickiness of deposits combined with the run-off of assets without new production) and a stressed situation. There we define liquidity risk as the time to survive a specific scenario, while for funding risk we focus on the maximum funding gap allowed.
The concentration and event risk appetite set at ING Bank level are directly translated into corresponding limits in the underlying credit, market and liquidity & funding risk appetite statements.
Non-financial risksTo ensure robust non-financial risk management, ING Bank monitors the implementation of ING Bank’s Risk Policies and Minimum Standards. Business units have to demonstrate that the appropriate steps have been taken to control their operational, compliance and legal risks. ING Bank applies Key Control testing scorecards to measure the quality of the internal controls within a business unit, which are based on the ability to demonstrate that the required risk management processes are in place and effective within the business units.
Key Control testing scorecards form one of the inputs of the Non-Financial Risk Dashboard (NFRD) which is a report that is discussed each quarter in the MBB and the Risk Committee. NFRD provides management at all organisational levels with information on their key operational, compliance and legal risks. NFRD is based on their risk tolerance within their business and a clear description of the risks and responses enabling management to prioritise and to manage operational, compliance and legal risks.
Step 3. Cascade into statements per risk type and per businessThe Bank Risk Appetite is translated per risk type, which is further cascaded down through the organisation to the lowest level needed. The risk appetite statements are then translated into dedicated underlying risk limits which are used for day-to-day monitoring and management of ING Bank’s risks.
For financial risks a sequence of different risk appetite frameworks are implemented to address the most significant risks. This implies that a whole framework of credit risk limits is in place that monitors the overall quality of the ING Bank credit portfolio and that of all the underlying portfolios as well. In addition, specific concentration risk appetites are defined on product level, geographic level and (single name) counterparty level which are cascaded down into the organisation. For market risk, the risk appetite for the trading book activities within Financial Markets is accompanied by a risk appetite framework for market risks in the banking books. For both types of market risk, limits at Bank level are translated into the organisation. The liquidity & funding risk appetite statements that are defined on ING Bank level are translated down into the organisation, taking the liquidity & funding specific situation of each (solo) unit into account.
The non-financial risk appetite framework that is described under the previous step is cascaded down into the organisation without any need to make specific adjustments for each of the reporting solo entity.
Step 4. Monitoring and management of underlying risk limitsIn order to verify that it remains within the risk appetite framework as it is executing its budget, ING reports monthly through regular reporting towards senior management committees as ALCO Bank. The Risk and Capital Management Report reflecting the exposure of ING Bank against the risk appetite targets is submitted to the MBB and to the (Risk Committee of the) SB.
Stress testingStress testing is an important risk management tool which supports the MBB with respect to strategic and capital planning. The purpose of stress testing is to investigate whether or not ING Bank will be able to meet its solvency and liquidity requirements in severe but plausible stress scenarios. Stress tests provide insight into vulnerabilities of certain portfolios, given certain assumptions related to the economy, financial markets and the political climate. Stress testing is also used to assess if the risk profile of ING Bank is in line with risk appetite.
Types of stress testsWithin ING Bank, various different types of stress tests are performed. The most comprehensive type of stress tests are the firm-wide scenario analyses, which involve setting scenario assumptions for the relevant macro-economic and market variables in all countries where ING Bank is active. These assumptions are usually complemented by a narrative which provides background for the scenario. Next to firm-wide scenario analyses, ING Bank also executes scenario analyses for a specific country or asset class. Furthermore, sensitivity analyses are performed, which focus on stressing one or more relevant risk drivers; usually without an underlying scenario narrative. The 1-in-10-year stress used in the risk appetite framework is an example of a sensitivity analysis. Finally, ING Bank also performs reverse stress tests, which aim to determine the circumstances which would lead to a pre-defined severe adverse outcome.
254 ING Group Annual Report 2013
ING_2013_deel4a&b_v2.indd 254 19/03/2014 19:22:53
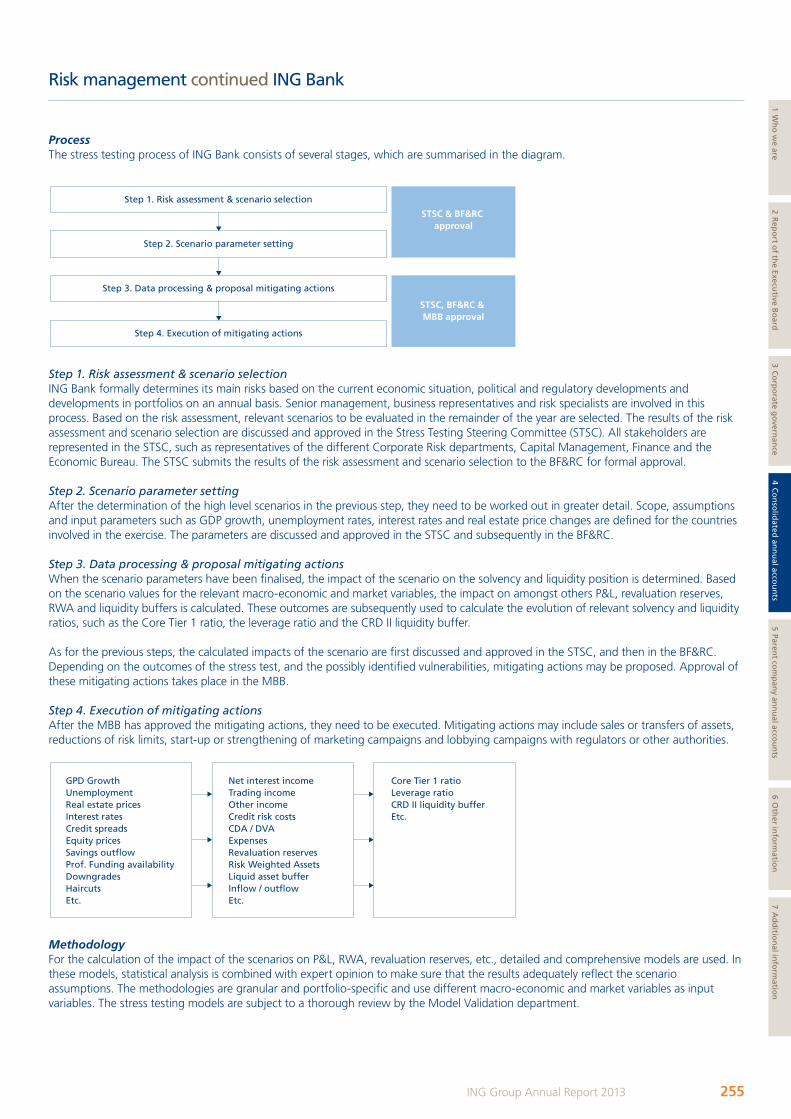
Risk management continued ING Bank
ProcessThe stress testing process of ING Bank consists of several stages, which are summarised in the diagram.
Step 4. Execution of mitigating actions
STSC, BF&RC & MBB approval
Step 3. Data processing & proposal mitigating actions
Step 2. Scenario parameter setting
Step 1. Risk assessment & scenario selection
STSC & BF&RC approval
Step 1. Risk assessment & scenario selectionING Bank formally determines its main risks based on the current economic situation, political and regulatory developments and developments in portfolios on an annual basis. Senior management, business representatives and risk specialists are involved in this process. Based on the risk assessment, relevant scenarios to be evaluated in the remainder of the year are selected. The results of the risk assessment and scenario selection are discussed and approved in the Stress Testing Steering Committee (STSC). All stakeholders are represented in the STSC, such as representatives of the different Corporate Risk departments, Capital Management, Finance and the Economic Bureau. The STSC submits the results of the risk assessment and scenario selection to the BF&RC for formal approval.
Step 2. Scenario parameter settingAfter the determination of the high level scenarios in the previous step, they need to be worked out in greater detail. Scope, assumptions and input parameters such as GDP growth, unemployment rates, interest rates and real estate price changes are defined for the countries involved in the exercise. The parameters are discussed and approved in the STSC and subsequently in the BF&RC.
Step 3. Data processing & proposal mitigating actionsWhen the scenario parameters have been finalised, the impact of the scenario on the solvency and liquidity position is determined. Based on the scenario values for the relevant macro-economic and market variables, the impact on amongst others P&L, revaluation reserves, RWA and liquidity buffers is calculated. These outcomes are subsequently used to calculate the evolution of relevant solvency and liquidity ratios, such as the Core Tier 1 ratio, the leverage ratio and the CRD II liquidity buffer.
As for the previous steps, the calculated impacts of the scenario are first discussed and approved in the STSC, and then in the BF&RC. Depending on the outcomes of the stress test, and the possibly identified vulnerabilities, mitigating actions may be proposed. Approval of these mitigating actions takes place in the MBB.
Step 4. Execution of mitigating actionsAfter the MBB has approved the mitigating actions, they need to be executed. Mitigating actions may include sales or transfers of assets, reductions of risk limits, start-up or strengthening of marketing campaigns and lobbying campaigns with regulators or other authorities.
GPD GrowthUnemploymentReal estate pricesInterest ratesCredit spreadsEquity pricesSavings outflowProf. Funding availabilityDowngradesHaircutsEtc.
Net interest incomeTrading incomeOther incomeCredit risk costsCDA / DVAExpensesRevaluation reservesRisk Weighted AssetsLiquid asset bufferInflow / outflowEtc.
Core Tier 1 ratioLeverage ratioCRD II liquidity bufferEtc.
MethodologyFor the calculation of the impact of the scenarios on P&L, RWA, revaluation reserves, etc., detailed and comprehensive models are used. In these models, statistical analysis is combined with expert opinion to make sure that the results adequately reflect the scenario assumptions. The methodologies are granular and portfolio-specific and use different macro-economic and market variables as input variables. The stress testing models are subject to a thorough review by the Model Validation department.
255ING Group Annual Report 2013
1 Wh
o w
e are2 R
epo
rt of th
e Executive B
oard
3 Co
rpo
rate go
vernan
ce4 C
on
solid
ated an
nu
al accou
nts
5 Parent co
mp
any an
nu
al accou
nts
6 Oth
er info
rmatio
n7 A
dd
ition
al info
rmatio
n
ING_2013_deel4a&b_v2.indd 255 19/03/2014 19:22:54
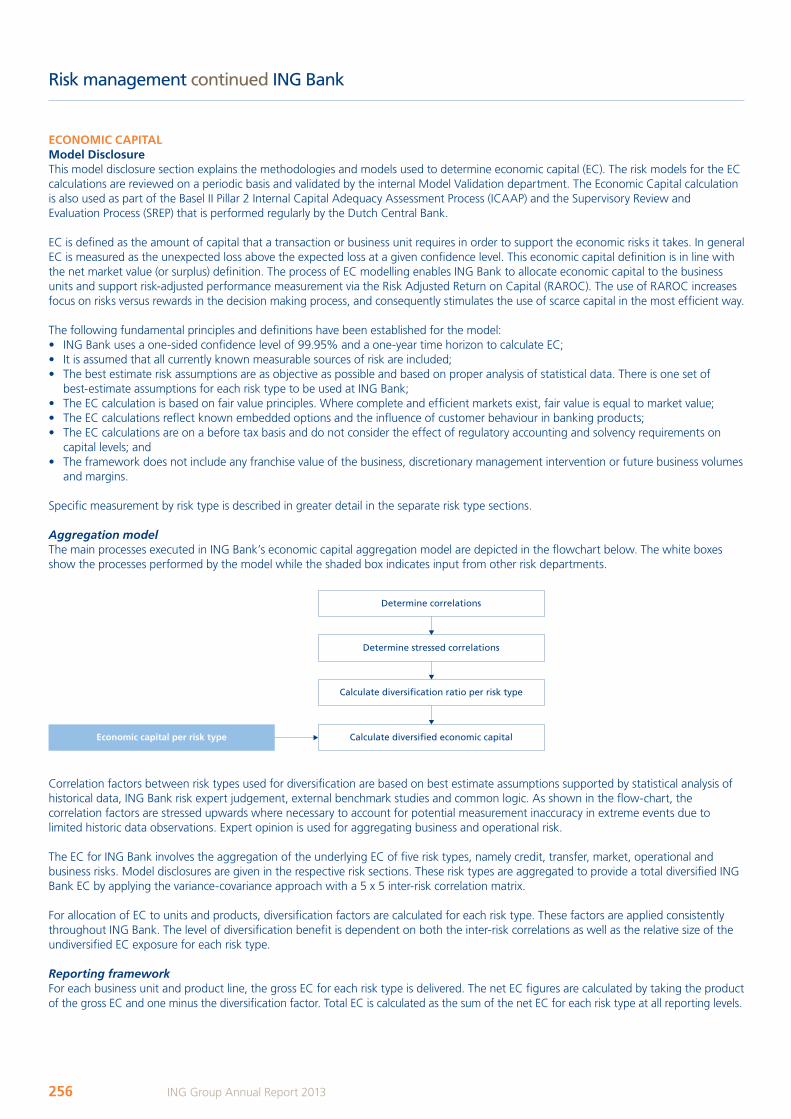
Risk management continued ING Bank
ECONOMIC CAPITAL Model DisclosureThis model disclosure section explains the methodologies and models used to determine economic capital (EC). The risk models for the EC calculations are reviewed on a periodic basis and validated by the internal Model Validation department. The Economic Capital calculation is also used as part of the Basel II Pillar 2 Internal Capital Adequacy Assessment Process (ICAAP) and the Supervisory Review and Evaluation Process (SREP) that is performed regularly by the Dutch Central Bank.
EC is defined as the amount of capital that a transaction or business unit requires in order to support the economic risks it takes. In general EC is measured as the unexpected loss above the expected loss at a given confidence level. This economic capital definition is in line with the net market value (or surplus) definition. The process of EC modelling enables ING Bank to allocate economic capital to the business units and support risk-adjusted performance measurement via the Risk Adjusted Return on Capital (RAROC). The use of RAROC increases focus on risks versus rewards in the decision making process, and consequently stimulates the use of scarce capital in the most efficient way.
The following fundamental principles and definitions have been established for the model:• ING Bank uses a one-sided confidence level of 99.95% and a one-year time horizon to calculate EC;• It is assumed that all currently known measurable sources of risk are included;• The best estimate risk assumptions are as objective as possible and based on proper analysis of statistical data. There is one set of
best-estimate assumptions for each risk type to be used at ING Bank;• The EC calculation is based on fair value principles. Where complete and efficient markets exist, fair value is equal to market value;• The EC calculations reflect known embedded options and the influence of customer behaviour in banking products;• The EC calculations are on a before tax basis and do not consider the effect of regulatory accounting and solvency requirements on
capital levels; and• The framework does not include any franchise value of the business, discretionary management intervention or future business volumes
and margins.
Specific measurement by risk type is described in greater detail in the separate risk type sections.
Aggregation modelThe main processes executed in ING Bank’s economic capital aggregation model are depicted in the flowchart below. The white boxes show the processes performed by the model while the shaded box indicates input from other risk departments.
Correlation factors between risk types used for diversification are based on best estimate assumptions supported by statistical analysis of historical data, ING Bank risk expert judgement, external benchmark studies and common logic. As shown in the flow-chart, the correlation factors are stressed upwards where necessary to account for potential measurement inaccuracy in extreme events due to limited historic data observations. Expert opinion is used for aggregating business and operational risk.
The EC for ING Bank involves the aggregation of the underlying EC of five risk types, namely credit, transfer, market, operational and business risks. Model disclosures are given in the respective risk sections. These risk types are aggregated to provide a total diversified ING Bank EC by applying the variance-covariance approach with a 5 x 5 inter-risk correlation matrix.
For allocation of EC to units and products, diversification factors are calculated for each risk type. These factors are applied consistently throughout ING Bank. The level of diversification benefit is dependent on both the inter-risk correlations as well as the relative size of the undiversified EC exposure for each risk type.
Reporting frameworkFor each business unit and product line, the gross EC for each risk type is delivered. The net EC figures are calculated by taking the product of the gross EC and one minus the diversification factor. Total EC is calculated as the sum of the net EC for each risk type at all reporting levels.
Calculate diversified economic capitalEconomic capital per risk type
Calculate diversification ratio per risk type
Determine stressed correlations
Determine correlations
256 ING Group Annual Report 2013
ING_2013_deel4a&b_v2.indd 256 19/03/2014 19:22:55
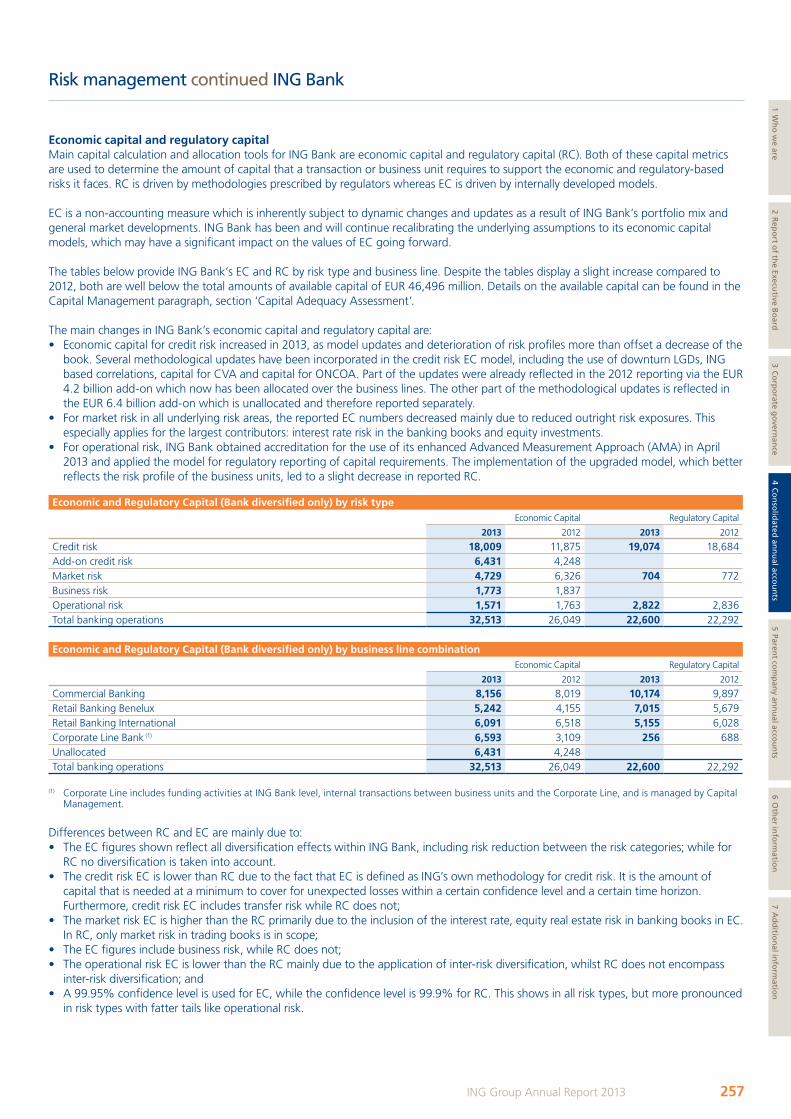
Risk management continued ING Bank
Economic capital and regulatory capitalMain capital calculation and allocation tools for ING Bank are economic capital and regulatory capital (RC). Both of these capital metrics are used to determine the amount of capital that a transaction or business unit requires to support the economic and regulatory-based risks it faces. RC is driven by methodologies prescribed by regulators whereas EC is driven by internally developed models.
EC is a non-accounting measure which is inherently subject to dynamic changes and updates as a result of ING Bank’s portfolio mix and general market developments. ING Bank has been and will continue recalibrating the underlying assumptions to its economic capital models, which may have a significant impact on the values of EC going forward.
The tables below provide ING Bank’s EC and RC by risk type and business line. Despite the tables display a slight increase compared to 2012, both are well below the total amounts of available capital of EUR 46,496 million. Details on the available capital can be found in the Capital Management paragraph, section ‘Capital Adequacy Assessment’.
The main changes in ING Bank’s economic capital and regulatory capital are:• Economic capital for credit risk increased in 2013, as model updates and deterioration of risk profiles more than offset a decrease of the
book. Several methodological updates have been incorporated in the credit risk EC model, including the use of downturn LGDs, ING based correlations, capital for CVA and capital for ONCOA. Part of the updates were already reflected in the 2012 reporting via the EUR 4.2 billion add-on which now has been allocated over the business lines. The other part of the methodological updates is reflected in the EUR 6.4 billion add-on which is unallocated and therefore reported separately.
• For market risk in all underlying risk areas, the reported EC numbers decreased mainly due to reduced outright risk exposures. This especially applies for the largest contributors: interest rate risk in the banking books and equity investments.
• For operational risk, ING Bank obtained accreditation for the use of its enhanced Advanced Measurement Approach (AMA) in April 2013 and applied the model for regulatory reporting of capital requirements. The implementation of the upgraded model, which better reflects the risk profile of the business units, led to a slight decrease in reported RC.
Economic and Regulatory Capital (bank diversified only) by risk typeEconomic Capital Regulatory Capital
2013 2012 2013 2012
Credit risk 18,009 11,875 19,074 18,684Add-on credit risk 6,431 4,248Market risk 4,729 6,326 704 772Business risk 1,773 1,837 Operational risk 1,571 1,763 2,822 2,836Total banking operations 32,513 26,049 22,600 22,292
Economic and Regulatory Capital (bank diversified only) by business line combinationEconomic Capital Regulatory Capital
2013 2012 2013 2012
Commercial Banking 8,156 8,019 10,174 9,897Retail Banking Benelux 5,242 4,155 7,015 5,679Retail Banking International 6,091 6,518 5,155 6,028Corporate Line Bank (1) 6,593 3,109 256 688Unallocated 6,431 4,248Total banking operations 32,513 26,049 22,600 22,292
(1) Corporate Line includes funding activities at ING Bank level, internal transactions between business units and the Corporate Line, and is managed by Capital Management.
Differences between RC and EC are mainly due to:• The EC figures shown reflect all diversification effects within ING Bank, including risk reduction between the risk categories; while for
RC no diversification is taken into account. • The credit risk EC is lower than RC due to the fact that EC is defined as ING’s own methodology for credit risk. It is the amount of
capital that is needed at a minimum to cover for unexpected losses within a certain confidence level and a certain time horizon. Furthermore, credit risk EC includes transfer risk while RC does not;
• The market risk EC is higher than the RC primarily due to the inclusion of the interest rate, equity real estate risk in banking books in EC. In RC, only market risk in trading books is in scope;
• The EC figures include business risk, while RC does not; • The operational risk EC is lower than the RC mainly due to the application of inter-risk diversification, whilst RC does not encompass
inter-risk diversification; and• A 99.95% confidence level is used for EC, while the confidence level is 99.9% for RC. This shows in all risk types, but more pronounced
in risk types with fatter tails like operational risk.
257ING Group Annual Report 2013
1 Wh
o w
e are2 R
epo
rt of th
e Executive B
oard
3 Co
rpo
rate go
vernan
ce4 C
on
solid
ated an
nu
al accou
nts
5 Parent co
mp
any an
nu
al accou
nts
6 Oth
er info
rmatio
n7 A
dd
ition
al info
rmatio
n
ING_2013_deel4a&b_v2.indd 257 19/03/2014 19:22:55
Risk management continued ING Bank
The above risk metrics and risk appetite framework do not cover liquidity risk: the risk that ING Bank or one of its subsidiaries cannot meet its financial liabilities, at reasonable cost and in a timely manner, when they come due. ING Bank has a separate liquidity management framework in place to manage this risk, which is described in the liquidity risk section of ING Bank.
ONGOING CHANGES IN THE REGULATORY ENVIRONMENTAfter the turmoil in the financial markets and the consequent need for governments to provide aid to financial institutions, financial institutions have been under more scrutiny from the public, supervisors and regulators. This has resulted in more stringent regulations intended to avoid future crises in the financial system and taxpayers’ aid in the future.
To accomplish this, a new Basel accord (Basel III) was adopted in 2010 and consequently translated into regulation by the EU in the Capital Requirement Regulation (CRR) and a Capital Requirement Directive IV. The CRR is binding for all EU member states and became effective per 1 January 2014. The CRR/CRD IV directs all EU member states to implement certain components of Basel III in their own law, in the Netherlands in the Wet Financieel Toezicht (WFT). Main objectives are:• Better alignment of risk taking and loss absorbing capacity of financial institutions through a narrower definition of core Tier 1 and Tier
1 capital, back-stops on a bank’s leverage via a ratio that should become part of Pillar 1 of the Basel framework.• A reduction of ‘pro-cyclicality’ to avoid that banks would be required to increase their capital in difficult financial times when it is most scarce.• Additional capital requirements for counterparty credit risk.• Higher loss absorbency capacity and special resolution regimes for ‘systemically important banks’ (SIBs). ING Bank has been designated
as a global SIB (G-SIB) by FSB and a domestic SIB (D-SIB) by DNB. In accordance with FSB requirements, ING Bank is required to disclose its ‘Indicators of global systemic importance’, which will be done in the course of 2014 via a separate document on ing.com.
• Liquidity and funding requirements via the so-called Liquidity Coverage Ratio and the Net Stable Funding Ratio. The aim of the first metric is to monitor a bank’s capability to survive a short-term liquidity stress, where the latter aims to ensure that long term asset activities are similarly funded.
Separate from, but in line with the Basel III proposal, on a country level local regulators are becoming more stringent on the maximum credit risk bank subsidiaries and branches are allowed to have on their holding companies. In the absence of a supranational harmonisation this leads to so-called trapped pools of liquidity, i.e. excess liquidity in a country that cannot merely be transferred (unsecured) to a central treasury in another country.
The Basel III accord was originally intended to enter its first phase of implementation on 1 January 2013. In 2013, CRR/CRD IV was officially agreed upon, allowing for the application of the Regulation on 1 January 2014. The Directive will have to be transposed into national law and because of this a few months delay is envisaged. Like other banks, ING Bank participated in semi-annual Basel III monitoring exercises in order to prepare for the functioning of all Basel III elements. Significant management actions have been undertaken to adjust the business model and exposure to certain asset classes to better meet the new Basel III requirements for both the liquidity and capital. Examples include reducing short-term funding and shifting significant derivative settlement to central clearing parties. Although not all definitions and parameters of the CRR/CRD IV have been finalised, ING Bank has been making impact analyses of the proposed changes continuously. The overall impact of Basel III on ING Bank’s capital and liquidity ratios, even before management actions, is considered to be lower than for most peers. The key principles of Basel III have been included in both the solvency and liquidity risk appetite framework that are continuously monitored by senior management.
The strategy of the Bank focuses on effective balance sheet management in order to meet all the new requirements. The stricter capital requirements will be met by combining strong continued capital generation with RWA containment. To underpin this, ING Bank maintains a Basel III fully loaded Core Tier 1 ratio ambition of at least 10% and a Basel III Leverage Ratio ambition of at least 4%. To adhere to the new liquidity and funding requirements strong funds entrusted generation and increased long-term funding will be combined with reduced reliance on short-term professional funding and the transformation of the investment book into a liquidity portfolio.
Next to the implementation of these new requirements, ING Bank is preparing for the upcoming Banking Union whereby as part of the Single Supervisory Mechanism (SSM) prudential regulatory powers will be transferred from Eurozone national authorities to the European Central Bank (ECB). As a result, approximately 130 of the Eurozone’s largest banks will be directly supervised by the ECB from November 2014. In the opinion of ING the SSM constitutes an important first step in creating a European banking union. It will help to reduce the current inter-dependency between national governments and national banking systems, and at the same time will help restoring confidence and growth in the Eurozone and the wider European single market.
Before assuming its new responsibilities, the ECB conducts a comprehensive assessment of 130 Eurozone banks in collaboration with the European Banking Authority (EBA). The exercise comprises three complementary pillars:• Supervisory risk assessment, addressing key risks in the banks’ balance sheets, including liquidity, leverage and funding via quantitative
and qualitative analysis based on backward and forward-looking information, including position in relation to peers.• The ECB Asset Quality Review (AQR) will consist of a wide ranging and thorough review of specific parts of the balance sheet, ensuring
that credit exposures are sufficiently provisioned, collateral is appropriately valued and complex instruments and high-risk assets are sufficiently valued
• Stress test, building on the AQR by providing a forward-looking view of banks’ shock-absorption capacity under stress. The EBA and the ECB will closely cooperate for defining the methodological as well as the procedural aspects of this EU-wide stress test.
258 ING Group Annual Report 2013
ING_2013_deel4a&b_v2.indd 258 19/03/2014 19:22:55
Risk management continued ING Bank
Although not everything is known on the ECB AQR and the EU-wide stress test in terms of set-up and scope, ING Bank is already preparing for this exercise. ING Bank gained experience with the Commercial Real Estate AQR organised by DNB that also focused on very granular data requests and with the series of EU-wide and other stress tests which have been included in ING Bank’s risk management framework.
Another important element of the regulatory reforms is the Bank Recovery and Resolution Directive (BRRD) which will enter into force on 1 January 2015. The aim of this directive is to make EU banks more resilient and to reduce the possibility of having bank bailed out using public money, The new rules provide authorities with the means to intervene decisively both before problems occur and early on in the process if they do. If, despite these preventive measures, the financial situation of a bank deteriorates beyond repair, the new law ensures that shareholders and creditors of the banks have to pay their share, reflected via the bail-in requirements which will enter into force on 1 January 2016. ING supports the bail-in rules as they are an important component of the new regulatory framework, aimed at reducing the possibility that tax payer money will be needed to bail-out institutions in future crises.
In response to the crisis ING Bank has set up an all-encompassing Recovery Plan to enhance the bank’s readiness and decisiveness to tackle financial crises on its own strength. Furthermore, ING Bank is diligently working towards providing information on the basis of which the Dutch Resolution Authorities will be able to develop a Resolution Plan.
In 2013, the Basel Committee published new requirements for effective risk data aggregation and risk reporting. The requirements aim to strengthen risk data aggregation and risk reporting practices at banks to improve their risk management practices. Banks indicated as global SIB – including ING Bank - are required to implement the Principles by 2016. As a first step of the implementation, ING performed a ‘stocktaking’ self-assessment survey in 2013 that displays that ING Bank is on track of fulfilling these requirements. These new principles coincide with several projects and programs to strengthen risk data aggregation and risk reporting practices that were already underway before these new requirements were published.
For a further update on the ongoing changes in the regulatory environment, refer to the Financial and Regulatory Environment Chapter.
RISK DEVELOPMENTS IN 2013Risk developments listed below are defined as the risks which may have potentially a significant impact on our business and difficult to quantify the impact on the organisation. They are triggered in general by unexpected events, and they may introduce volatility in earnings or impact ING’s long-term strategy. The sequence in which the top risks are presented below is not indicative of their likelihood of occurrence or the potential magnitude of their financial consequences.
Liquidity riskFunding and liquidity risk management remained in 2013 an important topic for senior management and the Asset and Liability Committee Bank. During the year further implementation steps were undertaken in implementing and finalising the funding and liquidity risk management framework, whilst working in parallel on new regulatory requirements which were published in 2013 by the BCBS, EC and EBA. External market developments improved in comparison with the previous year, but both in the Eurozone and globally economic developments are sluggish and at times still volatile. Therefore, market developments, regulatory developments and internal financial developments are closely monitored. Stress testing and measurement of early warning indicators are, among others, used to provide additional management information. In 2013 the funding and liquidity risk appetite statements were reviewed and updated. The appetite statement is set and allocated throughout ING Bank. In addition, funding and liquidity usage is steered by means of funds transfer pricing thus embedding funding and liquidity risk management in the total organisation.
The Bank improved its funding profile and ensured its liquidity position stayed within regulatory and internal targets. The full-year 2013 long term debt issuance totalled EUR 25.7 billion compared with EUR 33.1 billion issued in 2012. The issuance volume was lower due to a combination of an asset growth slowdown and increasing funds entrusted. As a result, ING Bank’s loan-to-deposit ratio, excluding securities that are recognised at amortised costs in loans and advances and excluding the IABF government receivable, improved in 2013 from 1.13 at 2012 year-end to 1.04, thereby already complying with ING’s 2015 Ambition of below 1.10.
Dutch mortgagesIn 2013 the Dutch housing market remained fragile due to the economic downturn, however a cautious recovery was observed towards the end of the year. The stricter tax and acceptation rules seem to be accepted. The biggest change to the tax rules is that interest on new mortgages is only tax deductible if there is at least an annuity repayment schedule. The Dutch housing market is historically characterised by a housing shortage, high income tax with deductibility of interest on mortgages, and tax driven mortgage products.
Although the house prices decreased, the Dutch payment behaviour is good, reflected in a slightly elevated but still low percentage of non-performing loans (NPL) by the end of 2013. Given the significant amount of mortgages in our credit portfolio, ING Bank closely follows all developments related to the Dutch housing market and its mortgage portfolio.
business lending beneluxING Bank’s Business Lending, defined as lending to corporates in the business line Retail Banking, is concentrated within the Benelux. The weak economic environment was reflected by increased risk costs and elevated percentage of non-performing loans. The Netherlands
259ING Group Annual Report 2013
1 Wh
o w
e are2 R
epo
rt of th
e Executive B
oard
3 Co
rpo
rate go
vernan
ce4 C
on
solid
ated an
nu
al accou
nts
5 Parent co
mp
any an
nu
al accou
nts
6 Oth
er info
rmatio
n7 A
dd
ition
al info
rmatio
n
ING_2013_deel4a&b_v2.indd 259 19/03/2014 19:22:55
Risk management continued ING Bank
showed increased non-performing loan amounts, which was mainly driven by the sectors transportation logistics and media. The non-performing loan amounts in Belgium and Luxembourg decreased slightly over 2013.
Real estate financeReal Estate Finance (REF) is the ING Bank’s commercial real estate financer with a global portfolio. It is active in all the core real estate sectors: offices, retail, residential, industrial and logistics. REF financing policy is based on cash flow generating prime real estate portfolio, senior secured facilities, relatively low starting Loan-to-Value (LTV) and conservative covenant setting.
In 2013, the continued weak and challenging European commercial real estate markets were reflected in the risk costs and non-performing loans. Further, in 2013 DNB performed an Asset Quality Review for Commercial Real Estate (CRE) primarily focusing on relevant Income Producing Real Estate portfolios (IPRE) at ING Bank globally, including Private Banking. This project consisted of two phases with the first phase dedicated to processes and methodologies and the second phase concentrating on the appropriate level of both capital and provisioning. The second phase assessment was executed by DNB with assistance of BlackRock included data delivery of IPRE exposure of in total EUR 40 billion, of which The Netherlands, Spain and Italy were selected for detailed analysis. This selection totals EUR 24 billion of which the majority is managed by ING REF (approximately 77%).
Provisions and Pillar I capital levels for ING for the portfolios in scope are in line with the results of the Asset Quality Review CRE. In 2014, the ECB will also conduct an AQR for the total bank and the CRE portfolio will be included again.
CybercrimeCybercrime is an increasing threat to companies in general and to financial institutions specifically. Both the frequency and the intensity of attacks are increasing at a global scale. In April 2013 Dutch banks, including ING Bank were targeted by Distributed Denial of Service (DDoS) attacks which resulted in some noticeable unavailability of services.
Following the establishment of a Cybercrime Task Force in 2012, ING Bank has set up a Cybercrime Resilience Program in 2013 to structurally address the cybercrime threats. Within the programme, ING Bank has defined a wide range of measures, on top of existing IT security measures, to strengthen ING’s resilience against e-banking fraud, DDoS and targeted attacks (also called Advanced Persistent Threats). To monitor and to respond to cybercrime effectively across ING Bank, a permanent central CyberCrime Emergency Response Team has been established.
ING Bank is continuously working on strengthening its global cybercrime resilience including strengthened collaboration against cybercrime with the financial industry, law enforcement authorities, government (e.g. National Cyber Security Center) and Internet Service Providers (ISPs).
CREDIT RISKIntroductionThe credit risk section provides information on how ING Bank manages, measures and monitors credit risk and will give an insight into the ING Bank portfolio from a credit risk perspective. Prior to providing insight into the portfolio, we will explain how ING Bank ensures that credit risk is properly addressed and managed within ING Bank.
The ING Bank business model is to be a strong predominantly European bank, with leading positions in attractive, stable home markets, with options for future growth beyond Europe. ING Bank primarily extends credit to two types of customers; Retail customers made up largely of individuals and small businesses and Commercial Banking made up of larger corporate, financial, and sovereign counterparties. In general, Retail customers tend to be served by country specific organisations while Commercial Banking counterparties are often multi-jurisdictional and even global. Therefore, it is important that the credit risk management department has both local product knowledge as well as understanding of global industries.
In order to properly assess, monitor, and manage the credit risks over such a broad spectrum of products, industries, and geographies, Credit Risk Management (CRM) is organised both locally and centrally. The local risk management teams have knowledge of specific geographic markets and the products and their risk characteristics. The central risk team focuses on more global industries and customers. The central risk team is also responsible for setting the ING Bank credit risk policies and standards. The local and central credit risk teams strive to have a consistent risk appetite which is facilitated by a robust credit risk infrastructure that supports the entire credit lifecycle.
The overall credit risk appetite framework allows ING Bank to manage the portfolio and avoid undesired concentrations of credit risk. CRM is supported by dedicated credit risk information systems and internal credit risk measurement methodologies for all types of counterparties. CRM creates consistency throughout the credit risk organisation by providing common credit risk policies, methodologies, and tools across the ING Bank. Credit risk managers use these tools and processes to manage credit risk within ING Bank.
CRM has a responsibility to ensure a common understanding of the contribution of credit risk to ING Bank’s strategy and the diverse aspects of credit risk throughout ING Bank. To accommodate this CRM actively involves stakeholders from the business and other risk departments, but in addition CRM promotes assignments and exchange of employees to facilitate a shared understanding and create an environment of co-operation. CRM informs the ING Bank community about new developments and insights in multiple manners, ranging from presentations, workshops and news alerts.
260 ING Group Annual Report 2013
ING_2013_deel4a&b_v2.indd 260 19/03/2014 19:22:56
Risk management continued ING Bank
Credit risk definitionsCredit risk is the risk of loss from the default and/or credit rating deterioration of counterparties (including bond issuers). Credit risks arise in ING Bank’s lending, financial market and investment activities. Credit risk exposure is the total amount of outstanding plus the unused portion of commitments. It can be measured on various levels, such as customer, legal or economic one obligor group, product, portfolio, customer type, industry, and country. Each level can in turn be broken down from the consolidated ING Bank NV level to a local branch/unit level. As the distribution of the exposures is of great importance in correctly managing the credit risk exposure, ING Bank has established the credit risk appetite and concentration framework.
CRM uses risk categories to differentiate between the different types of credit risk exposures. All products within ING Bank are aggregated to one of the following risk categories:• Pre-settlement risk: arises when a counterparty defaults on a transaction before settlement and ING Bank has to replace the contract
by a trade with another counterparty at the then prevailing (possibly unfavourable) market price. The pre-settlement risk (potential or expected risk) is the cost of ING Bank replacing a trade in the market. This credit risk category is associated with dealing room products such as options, swaps, and securities financing transactions. Where there is a mutual exchange of value, the amount of credit risk outstanding is generally based on the replacement value (mark-to-market) plus a potential future volatility concept, using a 3-7 year historical time horizon and a 97.5% confidence level.
• Money market risk: arises when ING Bank places short-term deposits with a counterparty in order to manage excess liquidity. As such, money market deposits tend to be short-term in nature. In the event of a counterparty default, ING Bank may lose the deposit placed. Money market risk is measured as the notional value of the deposit, excluding any accrued and unpaid interest or the effect of any impairment.
• Lending risk: arises when ING Bank grants a loan to a counterparty, or issues guarantees on behalf of a counterparty. This includes term loans, mortgages, revolving credits, overdrafts, guarantees, letters of credit, etc. The risk is measured as the notional amount of the financial obligation that the counterparty has to repay to ING Bank, excluding any accrued and unpaid interest, discount/premium amortisations or impairments.
• Investment risk: is the credit default and risk rating migration risk that is associated with ING Bank’s investments in bonds, commercial paper, securitisations, and other similar publicly traded securities. This can be viewed as the worst-case loss that ING Bank may incur as a result of holding a position in underlying securities whose Issuer’s credit quality deteriorates or defaults. All investments in the banking book are classified in the investment risk category. The primary purpose of ING Bank’s investments in the banking books is for liquidity management.
• Settlement risk: is the risk that a counterparty will fail to deliver on financial markets (PS or MM) transaction/contract at settlement and ING Bank could lose up to 100% of the value expected to be delivered. Settlement Risk arises when there is an exchange of value (funds or instruments) for the same value date or different value dates and receipt is not verified or expected until after ING has given irrevocable instructions to pay or has paid or delivered its side of the trade. The risk is that ING Bank delivers but does not receive delivery from ING Bank’s counterparty. ING manages settlement risk in the same way as other risks including a per borrower risk limit structure. However, because of the short term nature and per definition double count of settlement risk, ING Bank does not hold provisions or capital for specific settlement risk. Although a relatively low risk, ING increasingly uses DVP (Delivery versus Payment) and FITO (First in then Out) payment techniques to reduce settlement risk.
For the reconciliation between credit risk outstandings categories and financial assets we refer to the section ’Credit risk management classification’ as included in the chapter ‘Accounting policies for the consolidated annual accounts’
GovernanceCRM within ING Bank belongs to the second line of defence (the front office being the first, internal audit the third) and aligns the credit risk taking with the strategic planning of ING Bank. It is responsible for reviewing and managing credit risk including environmental and social risk for all types of counterparties. CRM consists of line credit risk managers who are responsible for their business lines and manage specific portfolios and experts who support both the line credit risk manager as well as the business with tools like credit risk systems, policies, models and reporting. To ensure the independence of the risk function the CRM General Manager is functionally responsible for the global network of credit risk staff and the heads of the credit risk management functions for the business lines.
ING Bank’s credit policy is to maintain an internationally diversified loan and bond portfolio, while avoiding large risk concentrations. The emphasis is on managing business developments within the business lines by means of the top-down risk appetite framework, which sets concentration limits for countries, individual counterparties and counterparty groups and investment activities. The aim is to expand relationship-banking activities, while maintaining stringent internal risk/reward guidelines and controls. To ensure a proper risk reward balance in our portfolios, the risk appetite framework is linked to the MTP budget process.
Credit analysis at portfolio level is a function of different concentration levels and various metrics like Economic Capital, Regulatory Capital, Exposure at Default, Probability of Default and Loss Given Default. The risk/reward is monitored and managed at portfolio level to ensure efficient use of ING Bank’s capital. Credit analysis at facility level is also risk/reward-oriented in that the level of credit analysis is a function of the risk amount, tenor, structure (e.g. covers received) of the facility, and the risks entered into. RAROC-based tools are used internally to ensure a proper balance of risk and reward within the portfolio and concentration parameters. ING Bank’s credit analysts make use of publicly available information in combination with in-house analysis based on information provided by the counterparty, peer group comparisons, industry comparisons and other quantitative techniques and tools.
261ING Group Annual Report 2013
1 Wh
o w
e are2 R
epo
rt of th
e Executive B
oard
3 Co
rpo
rate go
vernan
ce4 C
on
solid
ated an
nu
al accou
nts
5 Parent co
mp
any an
nu
al accou
nts
6 Oth
er info
rmatio
n7 A
dd
ition
al info
rmatio
n
ING_2013_deel4a&b_v2.indd 261 19/03/2014 19:22:56
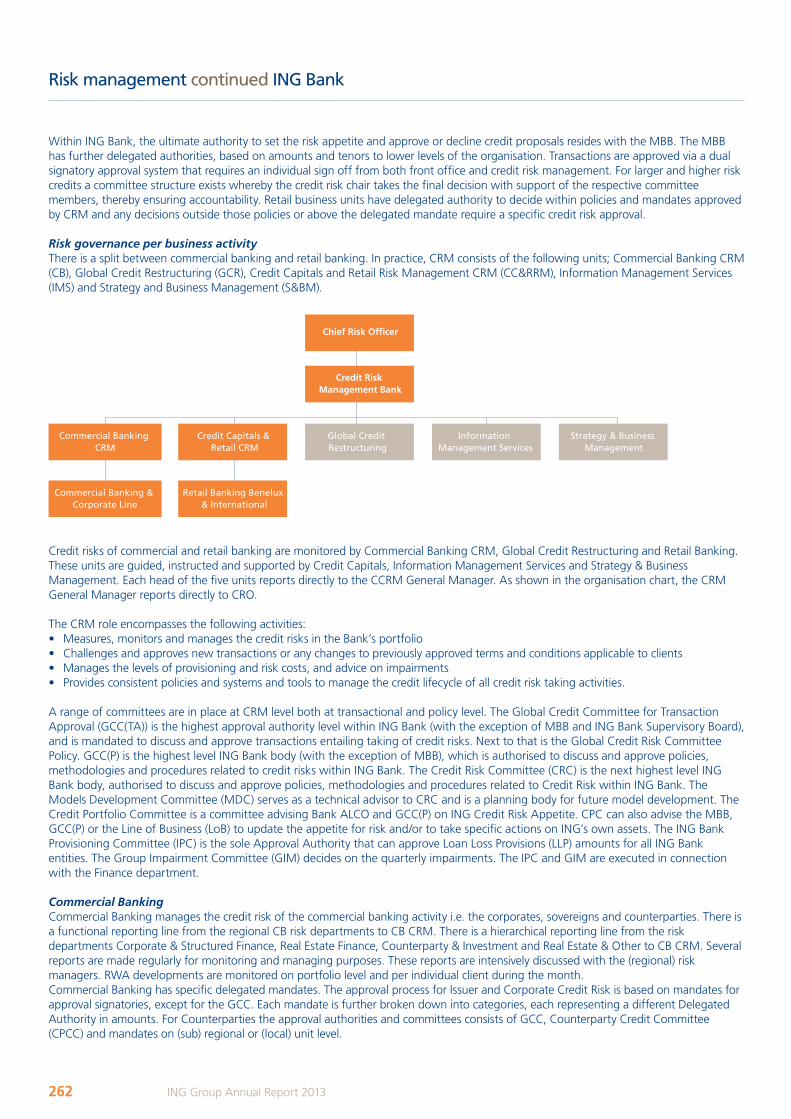
Risk management continued ING Bank
Within ING Bank, the ultimate authority to set the risk appetite and approve or decline credit proposals resides with the MBB. The MBB has further delegated authorities, based on amounts and tenors to lower levels of the organisation. Transactions are approved via a dual signatory approval system that requires an individual sign off from both front office and credit risk management. For larger and higher risk credits a committee structure exists whereby the credit risk chair takes the final decision with support of the respective committee members, thereby ensuring accountability. Retail business units have delegated authority to decide within policies and mandates approved by CRM and any decisions outside those policies or above the delegated mandate require a specific credit risk approval.
Risk governance per business activityThere is a split between commercial banking and retail banking. In practice, CRM consists of the following units; Commercial Banking CRM (CB), Global Credit Restructuring (GCR), Credit Capitals and Retail Risk Management CRM (CC&RRM), Information Management Services (IMS) and Strategy and Business Management (S&BM).
Chief Risk Officer
Credit Risk Management Bank
Commercial Banking CRM
Global Credit Restructuring
Information Management Services
Strategy & Business Management
Commercial Banking & Corporate Line
Retail Banking Benelux & International
Credit Capitals & Retail CRM
Credit risks of commercial and retail banking are monitored by Commercial Banking CRM, Global Credit Restructuring and Retail Banking. These units are guided, instructed and supported by Credit Capitals, Information Management Services and Strategy & Business Management. Each head of the five units reports directly to the CCRM General Manager. As shown in the organisation chart, the CRM General Manager reports directly to CRO.
The CRM role encompasses the following activities:• Measures, monitors and manages the credit risks in the Bank’s portfolio • Challenges and approves new transactions or any changes to previously approved terms and conditions applicable to clients • Manages the levels of provisioning and risk costs, and advice on impairments • Provides consistent policies and systems and tools to manage the credit lifecycle of all credit risk taking activities.
A range of committees are in place at CRM level both at transactional and policy level. The Global Credit Committee for Transaction Approval (GCC(TA)) is the highest approval authority level within ING Bank (with the exception of MBB and ING Bank Supervisory Board), and is mandated to discuss and approve transactions entailing taking of credit risks. Next to that is the Global Credit Risk Committee Policy. GCC(P) is the highest level ING Bank body (with the exception of MBB), which is authorised to discuss and approve policies, methodologies and procedures related to credit risks within ING Bank. The Credit Risk Committee (CRC) is the next highest level ING Bank body, authorised to discuss and approve policies, methodologies and procedures related to Credit Risk within ING Bank. The Models Development Committee (MDC) serves as a technical advisor to CRC and is a planning body for future model development. The Credit Portfolio Committee is a committee advising Bank ALCO and GCC(P) on ING Credit Risk Appetite. CPC can also advise the MBB, GCC(P) or the Line of Business (LoB) to update the appetite for risk and/or to take specific actions on ING’s own assets. The ING Bank Provisioning Committee (IPC) is the sole Approval Authority that can approve Loan Loss Provisions (LLP) amounts for all ING Bank entities. The Group Impairment Committee (GIM) decides on the quarterly impairments. The IPC and GIM are executed in connection with the Finance department.
Commercial Banking Commercial Banking manages the credit risk of the commercial banking activity i.e. the corporates, sovereigns and counterparties. There is a functional reporting line from the regional CB risk departments to CB CRM. There is a hierarchical reporting line from the risk departments Corporate & Structured Finance, Real Estate Finance, Counterparty & Investment and Real Estate & Other to CB CRM. Several reports are made regularly for monitoring and managing purposes. These reports are intensively discussed with the (regional) risk managers. RWA developments are monitored on portfolio level and per individual client during the month. Commercial Banking has specific delegated mandates. The approval process for Issuer and Corporate Credit Risk is based on mandates for approval signatories, except for the GCC. Each mandate is further broken down into categories, each representing a different Delegated Authority in amounts. For Counterparties the approval authorities and committees consists of GCC, Counterparty Credit Committee (CPCC) and mandates on (sub) regional or (local) unit level.
262 ING Group Annual Report 2013
ING_2013_deel4a&b_v2.indd 262 19/03/2014 19:22:56
Risk management continued ING Bank
Retail risk The Retail banking business line covers Retail Banking Benelux and Retail Banking International. There is a functional reporting line from the business units to the Retail Risk Management (RRM) department. The retail risk portfolio is defined as a group of homogeneous credit assets, where a set of policies and processes for approving high volumes of counterparties and transactions can be applied. Exposures are pooled and managed through a set of standard policies and procedures over its entire life cycle. Several reports are made regularly for monitoring and managing purposes. These reports are intensively discussed with the (regional) risk managers. RWA and other key credit risk metric developments are monitored on portfolio level during the month.RRM has two specific delegated mandates: RRM has the mandate to re-allocate retail risk appetite statement boundaries between different segments. Secondly, RRM has the mandate to approve the annual update for the PD, LGD, and EAD parameters for the Basel II Standardised portfolio.
Global Credit RestructuringGlobal Credit Restructuring is the dedicated and independent corporate department within CRM that deals with non-performing loans and loans that hold a reasonable probability that ING will end up with a loss, if no specific action is taken. Clients can be transferred to GCR from both Retail and Commercial Banking but are usually the larger customers and often it concerns clients from Commercial Banking. A more detailed description regarding the Regional Restructuring Units, GCR and its specific characteristics are shown in the credit quality chapter at the end of this section.
Risk cultureApart from supporting and promoting ING’s Business Principles, CRM has identified a number of areas that helps establish and develop sound risk culture. Key areas where CRM puts its focus on are:
Risk awarenessVarious activities are coordinated within CRM with the goal to update, inform and educate CRM employees and create awareness on factors that influence its activities e.g. Credit Risk Alerts address actual credit risk issues relevant to ING. The alerts are published on various ING intranet portals and distributed by email. Credit risk academies where senior leaders and financial specialists address topics ranging from local unit developments to specific credit risk related strategies are held on a regular basis. Short term assignments within risk and finance are promoted to allow experienced employees to heighten their risk awareness.
EngagementCRM, as a Top Employer, finds it is important to engage staff, and link with society. CRM organises annually a strategy project in which a large deal of interaction between (senior) manager and employees takes place. Regular town hall meetings are organised which bring employees and senior management closer. Topics usually include a reflection on the quarterly results of ING but also touch upon HR, ethics, compliance and other subjects. Also, CRM whole heartedly embraces the Winning Performance Culture scan, in which the employee satisfaction is measured and monitored. CRM also promotes support of charity funds like Chances for Children
IntegritySpecific training on ‘good banker-ship’ is obligatory. These courses, approximately three per year are known as the Personal Integrity Programme. Each CRM employee, senior managers included, needs to pass these courses within defined time frames. For specific roles within CRM, the Insider regulation applies. Those employees are obliged to adhere to certain rulings in trading in shares and confidentially restrictions. All new CCRM staff must attend an ORM/Compliance introduction workshop. Results and involvement are monitored and a quarterly update is provided to the management team in the ORM/Compliance Quarterly Report.
CommunicationNew methods to improve communication are regularly created and implemented. For example, a network of news brokers has been established. These are dedicated employees, who are kept informed of activities and changes within CRM and are responsible for informing their teams. Additionally they provide bottom up information and carry information from the teams back to the management team. CRM also has its own dedicated intranet site, providing Credit Risk Alerts and the Policy House.
263ING Group Annual Report 2013
1 Wh
o w
e are2 R
epo
rt of th
e Executive B
oard
3 Co
rpo
rate go
vernan
ce4 C
on
solid
ated an
nu
al accou
nts
5 Parent co
mp
any an
nu
al accou
nts
6 Oth
er info
rmatio
n7 A
dd
ition
al info
rmatio
n
ING_2013_deel4a&b_v2.indd 263 19/03/2014 19:22:56
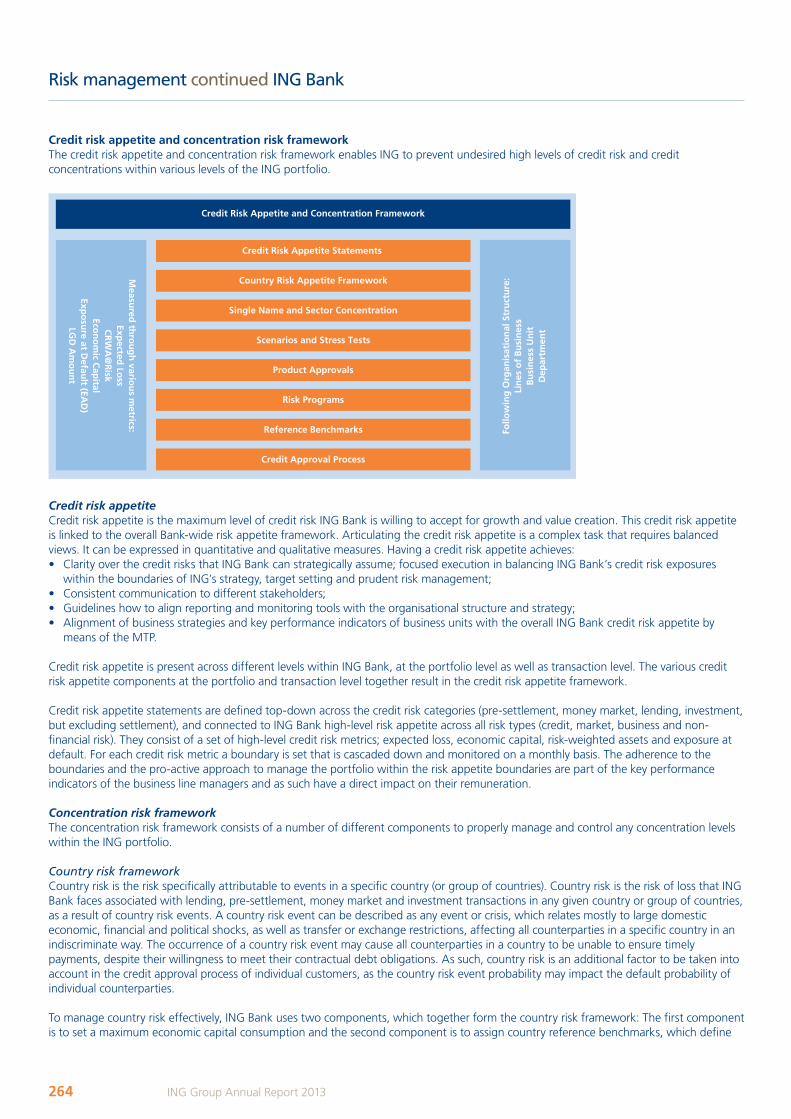
Risk management continued ING Bank
Credit risk appetite and concentration risk frameworkThe credit risk appetite and concentration risk framework enables ING to prevent undesired high levels of credit risk and credit concentrations within various levels of the ING portfolio.
Credit Risk Appetite Statements
Single Name and Sector Concentration
Country Risk Appetite Framework
Follo
win
g O
rgan
isat
ion
al S
tru
ctu
re:
Lin
es o
f B
usi
nes
sB
usi
nes
s U
nit
Dep
artm
ent
Scenarios and Stress Tests
Credit Risk Appetite and Concentration Framework
Measu
red th
rou
gh
variou
s metrics:
Expected
Loss
CR
WA
@R
iskEco
no
mic C
apital
Expo
sure at D
efault (EA
D)
LGD
Am
ou
nt
Product Approvals
Reference Benchmarks
Risk Programs
Credit Approval Process
Credit risk appetiteCredit risk appetite is the maximum level of credit risk ING Bank is willing to accept for growth and value creation. This credit risk appetite is linked to the overall Bank-wide risk appetite framework. Articulating the credit risk appetite is a complex task that requires balanced views. It can be expressed in quantitative and qualitative measures. Having a credit risk appetite achieves:• Clarity over the credit risks that ING Bank can strategically assume; focused execution in balancing ING Bank’s credit risk exposures
within the boundaries of ING’s strategy, target setting and prudent risk management;• Consistent communication to different stakeholders;• Guidelines how to align reporting and monitoring tools with the organisational structure and strategy;• Alignment of business strategies and key performance indicators of business units with the overall ING Bank credit risk appetite by
means of the MTP.
Credit risk appetite is present across different levels within ING Bank, at the portfolio level as well as transaction level. The various credit risk appetite components at the portfolio and transaction level together result in the credit risk appetite framework.
Credit risk appetite statements are defined top-down across the credit risk categories (pre-settlement, money market, lending, investment, but excluding settlement), and connected to ING Bank high-level risk appetite across all risk types (credit, market, business and non-financial risk). They consist of a set of high-level credit risk metrics; expected loss, economic capital, risk-weighted assets and exposure at default. For each credit risk metric a boundary is set that is cascaded down and monitored on a monthly basis. The adherence to the boundaries and the pro-active approach to manage the portfolio within the risk appetite boundaries are part of the key performance indicators of the business line managers and as such have a direct impact on their remuneration.
Concentration risk frameworkThe concentration risk framework consists of a number of different components to properly manage and control any concentration levels within the ING portfolio.
Country risk frameworkCountry risk is the risk specifically attributable to events in a specific country (or group of countries). Country risk is the risk of loss that ING Bank faces associated with lending, pre-settlement, money market and investment transactions in any given country or group of countries, as a result of country risk events. A country risk event can be described as any event or crisis, which relates mostly to large domestic economic, financial and political shocks, as well as transfer or exchange restrictions, affecting all counterparties in a specific country in an indiscriminate way. The occurrence of a country risk event may cause all counterparties in a country to be unable to ensure timely payments, despite their willingness to meet their contractual debt obligations. As such, country risk is an additional factor to be taken into account in the credit approval process of individual customers, as the country risk event probability may impact the default probability of individual counterparties.
To manage country risk effectively, ING Bank uses two components, which together form the country risk framework: The first component is to set a maximum economic capital consumption and the second component is to assign country reference benchmarks, which define
264 ING Group Annual Report 2013
ING_2013_deel4a&b_v2.indd 264 19/03/2014 19:22:57
Risk management continued ING Bank
the maximum appetite for credit risk, that ING Bank has per country to ensure that exposures and potential future losses do not exceed a certain agreed level. The country reference benchmark is based on the country’s GDP and the funds entrusted locally in that country. In countries where ING Bank is active, the relevant country’s risk profile is regularly evaluated, resulting in a country rating, which is used to set the country reference benchmark. Based on these two components country limits are set and exposures derived from lending, investment, pre-settlement and money market activities are then measured and reported against these country limits on a daily basis.
Single name and sector concentrationING Bank has established the concentration risk framework in order to identify, measure monitor concentrations at country, portfolio and/or counterparty level. It consists of single name concentration i.e. losses due to the unexpected default of a single counterparty. Sector concentration (systemic risk): substantial increase of the ING Bank risk profile (expressed in increased risk weighted assets) due to the joint deterioration of a group of correlated counterparty/transactions, sensitive to the same external (macro-economic) factor(s) related to their geographic location, exposure class or industry. The LGD of a single name concentration is measured against a maximum LGD amount. Country concentrations are also managed and monitored via the Country Risk Framework. Every country where ING has exposure has a country limit which is reviewed monthly and updated quarterly. When exposure reaches 90% of the limit level, a review process is initiated. The Country Limit is a function of various factors including amount of capital consumption, GDP of the country, internal rating, and amount of funds entrusted generated.
Scenarios and stress testsStress testing is a valuable risk management tool. Stress testing evaluates the bank’s financial stability under severe but plausible stress scenarios and assists in decision-making that assures the bank to remain a financially-healthy on-going concern after a severe event occurs. In addition to the bank-wide stress test framework as described in the risk profile section of ING Bank, CRM performs stress tests on a monthly basis in order to continually assess the portfolio risks and concentrations. These monthly stress tests are consistent with the stress scenario as established in the ING Bank wide credit risk appetite framework. The monthly stress tests are reviewed in the Credit Portfolio Committee (CPC) and potential management actions are proposed if necessary.
ING Bank performs periodical stress tests based on a standardised and pre-determined 1-in-10 year-stress event (i.e. at 90% confidence level and 1 year horizon) which is similar to the one applied in the solvency risk appetite. Based on this confidence level, a through the cycle rating migration for the entire portfolio is simulated. For this simulated portfolio, provisions, RWA and EC are recalculated to assess what the combined impact of such a year would be. The additional Credit RWA that ING should allocate in such an event is named Credit RWA-at-Risk. These stress test results are submitted to CPC on a periodical basis, in which the results are explained and discussed. If needed actions are formulated.
Next to the periodical pre-determined stress test related to Credit RWA-at-Risk, CRM performs ad-hoc stress tests based on severe but plausible scenarios. These stress tests can be for internal purposes or at the request of the regulators and are input for future credit risk appetite setting. Stress testing is used as an additional safety net within CRM. Through stress tests the impact of severe but plausible downturn scenarios are determined, which might not be captured in the regular rating models (Probability of Default, Loss Given Default and Exposure at Default). Therefore, next to the Pillar 1 and Pillar 2 capital calculations, based on the results of various stress test, ING Bank ensures that adequate levels of capital (and liquidity) are available to sustain such severe but plausible scenarios.
Product approvalsAcross ING Bank the product approval and review process ensures effective management of risks associated with products. It ensures that sound due diligence is performed by relevant stakeholders to ensure that risks (credit, operational, legal etc.) are mitigated.
Risk programs Within ING we distinguish between risk programs for retail banking and risk programs for commercial banking business.
The retail risk portfolio program is defined as a set of policies and processes, which are laid down to manage a retail risk portfolio within a predefined risk appetite statement. A retail risk portfolio is defined as a group of sufficiently homogeneous credit assets, where:• A consistent set of credit policies and processes for approving a high volume of counterparties and transactions could be applied,• Exposures could be pooled and managed through a set of standard policies and procedures over its entire life cycle.A risk appetite statement in the context of a retail risk portfolio program is a pre-defined set of minimum performance criteria.
The Commercial banking risk program is a detailed analysis of a defined product and/or industry that identifies the major risk drivers and mitigants, the internal business mandate, and proposes the minimum risk (including business) parameters – and potentially the maximum product and/or portfolio limit - to undertake that business. A risk program is always prepared by the front office responsible for the internal business mandate and requires an approval from the Global Credit Committee (unless specifically delegated to a region).
Reference benchmarksA reference benchmark defines the appetite for credit risk per obligor or related group of obligor’s counterparty group. It is expressed as an EAD Exposure at the concentration risk level, which corresponds to a (maximum) internal capital consumption for credit risk. It is used as a reference amount tool in the credit approval process and can be waived on the basis of proper arguments but requires consent from a higher approval authority.
265ING Group Annual Report 2013
1 Wh
o w
e are2 R
epo
rt of th
e Executive B
oard
3 Co
rpo
rate go
vernan
ce4 C
on
solid
ated an
nu
al accou
nts
5 Parent co
mp
any an
nu
al accou
nts
6 Oth
er info
rmatio
n7 A
dd
ition
al info
rmatio
n
ING_2013_deel4a&b_v2.indd 265 19/03/2014 19:22:57
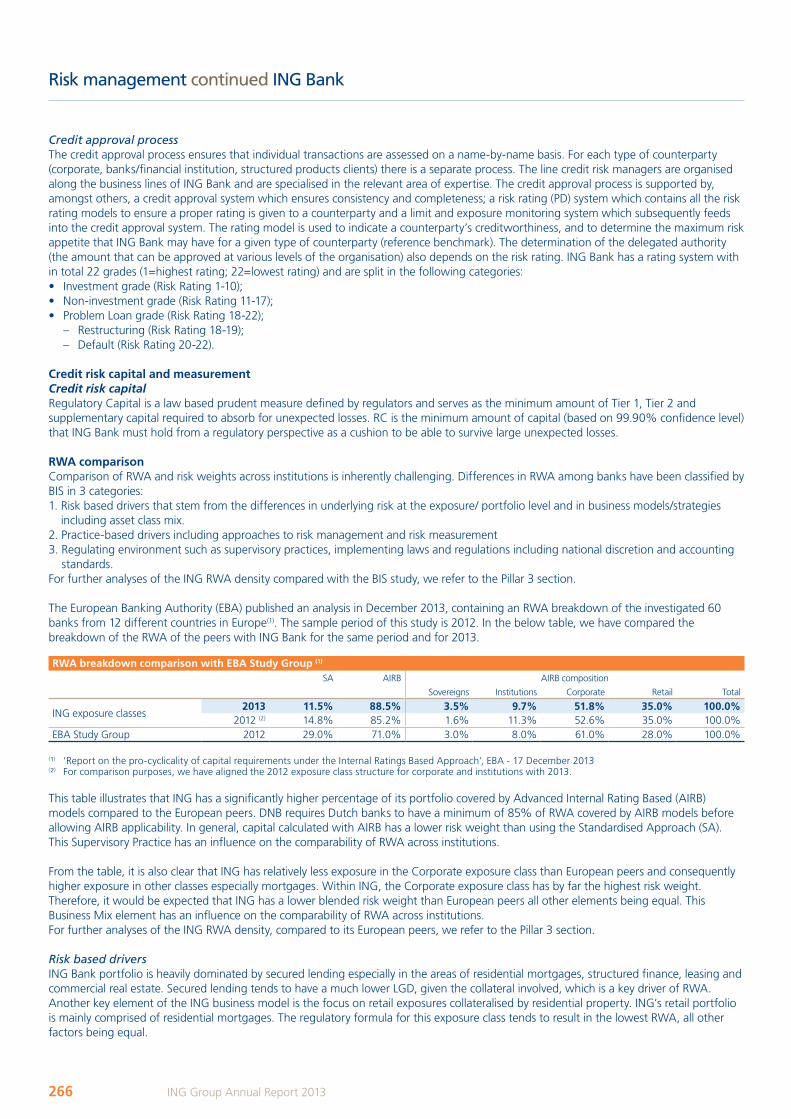
Risk management continued ING Bank
Credit approval processThe credit approval process ensures that individual transactions are assessed on a name-by-name basis. For each type of counterparty (corporate, banks/financial institution, structured products clients) there is a separate process. The line credit risk managers are organised along the business lines of ING Bank and are specialised in the relevant area of expertise. The credit approval process is supported by, amongst others, a credit approval system which ensures consistency and completeness; a risk rating (PD) system which contains all the risk rating models to ensure a proper rating is given to a counterparty and a limit and exposure monitoring system which subsequently feeds into the credit approval system. The rating model is used to indicate a counterparty’s creditworthiness, and to determine the maximum risk appetite that ING Bank may have for a given type of counterparty (reference benchmark). The determination of the delegated authority (the amount that can be approved at various levels of the organisation) also depends on the risk rating. ING Bank has a rating system with in total 22 grades (1=highest rating; 22=lowest rating) and are split in the following categories:• Investment grade (Risk Rating 1-10); • Non-investment grade (Risk Rating 11-17);• Problem Loan grade (Risk Rating 18-22);
– Restructuring (Risk Rating 18-19); – Default (Risk Rating 20-22).
Credit risk capital and measurementCredit risk capitalRegulatory Capital is a law based prudent measure defined by regulators and serves as the minimum amount of Tier 1, Tier 2 and supplementary capital required to absorb for unexpected losses. RC is the minimum amount of capital (based on 99.90% confidence level) that ING Bank must hold from a regulatory perspective as a cushion to be able to survive large unexpected losses.
RWA comparisonComparison of RWA and risk weights across institutions is inherently challenging. Differences in RWA among banks have been classified by BIS in 3 categories:1. Risk based drivers that stem from the differences in underlying risk at the exposure/ portfolio level and in business models/strategies
including asset class mix.2. Practice-based drivers including approaches to risk management and risk measurement3. Regulating environment such as supervisory practices, implementing laws and regulations including national discretion and accounting
standards.For further analyses of the ING RWA density compared with the BIS study, we refer to the Pillar 3 section.
The European Banking Authority (EBA) published an analysis in December 2013, containing an RWA breakdown of the investigated 60 banks from 12 different countries in Europe(1). The sample period of this study is 2012. In the below table, we have compared the breakdown of the RWA of the peers with ING Bank for the same period and for 2013.
RWA breakdown comparison with EbA Study Group (1)
SA AIRB AIRB composition
Sovereigns Institutions Corporate Retail Total
ING exposure classes 2013 11.5% 88.5% 3.5% 9.7% 51.8% 35.0% 100.0%
2012 (2) 14.8% 85.2% 1.6% 11.3% 52.6% 35.0% 100.0%EBA Study Group 2012 29.0% 71.0% 3.0% 8.0% 61.0% 28.0% 100.0%
(¹) ‘Report on the pro-cyclicality of capital requirements under the Internal Ratings Based Approach’, EBA - 17 December 2013(²) For comparison purposes, we have aligned the 2012 exposure class structure for corporate and institutions with 2013.
This table illustrates that ING has a significantly higher percentage of its portfolio covered by Advanced Internal Rating Based (AIRB) models compared to the European peers. DNB requires Dutch banks to have a minimum of 85% of RWA covered by AIRB models before allowing AIRB applicability. In general, capital calculated with AIRB has a lower risk weight than using the Standardised Approach (SA). This Supervisory Practice has an influence on the comparability of RWA across institutions.
From the table, it is also clear that ING has relatively less exposure in the Corporate exposure class than European peers and consequently higher exposure in other classes especially mortgages. Within ING, the Corporate exposure class has by far the highest risk weight. Therefore, it would be expected that ING has a lower blended risk weight than European peers all other elements being equal. This Business Mix element has an influence on the comparability of RWA across institutions.For further analyses of the ING RWA density, compared to its European peers, we refer to the Pillar 3 section.
Risk based driversING Bank portfolio is heavily dominated by secured lending especially in the areas of residential mortgages, structured finance, leasing and commercial real estate. Secured lending tends to have a much lower LGD, given the collateral involved, which is a key driver of RWA. Another key element of the ING business model is the focus on retail exposures collateralised by residential property. ING’s retail portfolio is mainly comprised of residential mortgages. The regulatory formula for this exposure class tends to result in the lowest RWA, all other factors being equal.
266 ING Group Annual Report 2013
ING_2013_deel4a&b_v2.indd 266 19/03/2014 19:22:57
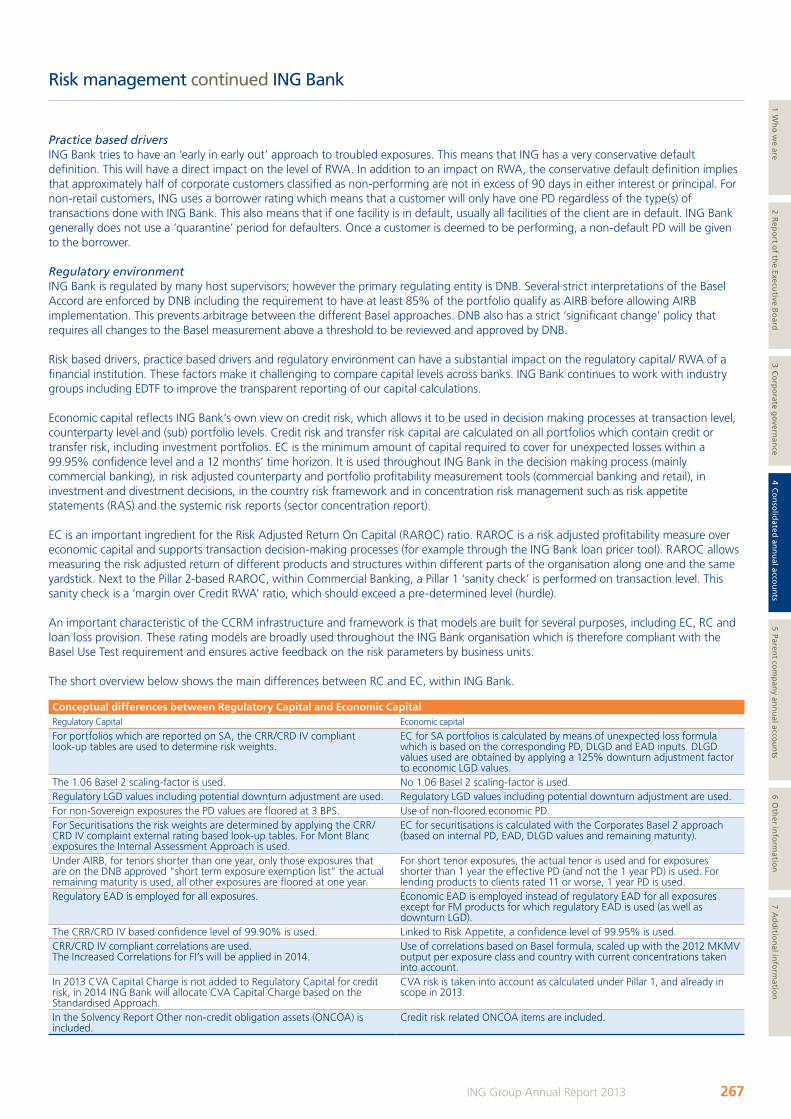
Risk management continued ING Bank
Practice based driversING Bank tries to have an ‘early in early out’ approach to troubled exposures. This means that ING has a very conservative default definition. This will have a direct impact on the level of RWA. In addition to an impact on RWA, the conservative default definition implies that approximately half of corporate customers classified as non-performing are not in excess of 90 days in either interest or principal. For non-retail customers, ING uses a borrower rating which means that a customer will only have one PD regardless of the type(s) of transactions done with ING Bank. This also means that if one facility is in default, usually all facilities of the client are in default. ING Bank generally does not use a ‘quarantine’ period for defaulters. Once a customer is deemed to be performing, a non-default PD will be given to the borrower.
Regulatory environmentING Bank is regulated by many host supervisors; however the primary regulating entity is DNB. Several strict interpretations of the Basel Accord are enforced by DNB including the requirement to have at least 85% of the portfolio qualify as AIRB before allowing AIRB implementation. This prevents arbitrage between the different Basel approaches. DNB also has a strict ‘significant change’ policy that requires all changes to the Basel measurement above a threshold to be reviewed and approved by DNB.
Risk based drivers, practice based drivers and regulatory environment can have a substantial impact on the regulatory capital/ RWA of a financial institution. These factors make it challenging to compare capital levels across banks. ING Bank continues to work with industry groups including EDTF to improve the transparent reporting of our capital calculations.
Economic capital reflects ING Bank’s own view on credit risk, which allows it to be used in decision making processes at transaction level, counterparty level and (sub) portfolio levels. Credit risk and transfer risk capital are calculated on all portfolios which contain credit or transfer risk, including investment portfolios. EC is the minimum amount of capital required to cover for unexpected losses within a 99.95% confidence level and a 12 months’ time horizon. It is used throughout ING Bank in the decision making process (mainly commercial banking), in risk adjusted counterparty and portfolio profitability measurement tools (commercial banking and retail), in investment and divestment decisions, in the country risk framework and in concentration risk management such as risk appetite statements (RAS) and the systemic risk reports (sector concentration report).
EC is an important ingredient for the Risk Adjusted Return On Capital (RAROC) ratio. RAROC is a risk adjusted profitability measure over economic capital and supports transaction decision-making processes (for example through the ING Bank loan pricer tool). RAROC allows measuring the risk adjusted return of different products and structures within different parts of the organisation along one and the same yardstick. Next to the Pillar 2-based RAROC, within Commercial Banking, a Pillar 1 ‘sanity check’ is performed on transaction level. This sanity check is a ‘margin over Credit RWA’ ratio, which should exceed a pre-determined level (hurdle).
An important characteristic of the CCRM infrastructure and framework is that models are built for several purposes, including EC, RC and loan loss provision. These rating models are broadly used throughout the ING Bank organisation which is therefore compliant with the Basel Use Test requirement and ensures active feedback on the risk parameters by business units.
The short overview below shows the main differences between RC and EC, within ING Bank.
Conceptual differences between Regulatory Capital and Economic CapitalRegulatory Capital Economic capital
For portfolios which are reported on SA, the CRR/CRD IV compliant look-up tables are used to determine risk weights.
EC for SA portfolios is calculated by means of unexpected loss formula which is based on the corresponding PD, DLGD and EAD inputs. DLGD values used are obtained by applying a 125% downturn adjustment factor to economic LGD values.
The 1.06 Basel 2 scaling-factor is used. No 1.06 Basel 2 scaling-factor is used.Regulatory LGD values including potential downturn adjustment are used. Regulatory LGD values including potential downturn adjustment are used.For non-Sovereign exposures the PD values are floored at 3 BPS. Use of non-floored economic PD.For Securitisations the risk weights are determined by applying the CRR/CRD IV complaint external rating based look-up tables. For Mont Blanc exposures the Internal Assessment Approach is used.
EC for securitisations is calculated with the Corporates Basel 2 approach (based on internal PD, EAD, DLGD values and remaining maturity).
Under AIRB, for tenors shorter than one year, only those exposures that are on the DNB approved "short term exposure exemption list" the actual remaining maturity is used, all other exposures are floored at one year.
For short tenor exposures, the actual tenor is used and for exposures shorter than 1 year the effective PD (and not the 1 year PD) is used. For lending products to clients rated 11 or worse, 1 year PD is used.
Regulatory EAD is employed for all exposures. Economic EAD is employed instead of regulatory EAD for all exposures except for FM products for which regulatory EAD is used (as well as downturn LGD).
The CRR/CRD IV based confidence level of 99.90% is used. Linked to Risk Appetite, a confidence level of 99.95% is used.CRR/CRD IV compliant correlations are used. The Increased Correlations for FI’s will be applied in 2014.
Use of correlations based on Basel formula, scaled up with the 2012 MKMV output per exposure class and country with current concentrations taken into account.
In 2013 CVA Capital Charge is not added to Regulatory Capital for credit risk, in 2014 ING Bank will allocate CVA Capital Charge based on the Standardised Approach.
CVA risk is taken into account as calculated under Pillar 1, and already in scope in 2013.
In the Solvency Report Other non-credit obligation assets (ONCOA) is included.
Credit risk related ONCOA items are included.
267ING Group Annual Report 2013
1 Wh
o w
e are2 R
epo
rt of th
e Executive B
oard
3 Co
rpo
rate go
vernan
ce4 C
on
solid
ated an
nu
al accou
nts
5 Parent co
mp
any an
nu
al accou
nts
6 Oth
er info
rmatio
n7 A
dd
ition
al info
rmatio
n
ING_2013_deel4a&b_v2.indd 267 19/03/2014 19:22:57
Risk management continued ING Bank
EC is calculated using the economic values of rating models (PD, EAD and LGD). In line with regulatory requirements, so-called ‘significant changes’ to these rating models are communicated to the regulator for approval. Significant changes relate to the impact on Credit RWA (Pillar 1) or to the significance (size) of the model for the ING Bank portfolio.
Credit risk measurementThere are two broad ways to measure credit risk within ING Bank’s portfolio, depending on whether the exposure is booked under an ING office which is permitted by the DNB to use the Advanced Internal Rating Based (AIRB) approach, or if it falls under the Standardised (SA) approach. ING Bank does not use the Basel Foundation (FIRB) approach for any portfolio.
Standardised ApproachUnlike the AIRB approach, the standardised approach applies a fixed risk weight to each asset as dictated by the Financial Supervisory Authorities, and is based on the exposure class to which the exposure is assigned. As such, the Standardised Approach is the least sophisticated of the Basel II methodologies and is not as sensitive as the risk-based approach. Where external rating agency ratings are available, they may be used as a substitute to using the fixed risk weightings assigned by the Financial Supervisory Authorities. Because the underlying obligors are relatively small, the underlying obligors tend not to have external ratings.
Advanced Internal Rating Based ApproachThere are four elements which drive the Basel II ‘risk-based approach’ to the determination of the capital base. Probability of Default (PD): The first is the counterparty’s probability of default, which measures a counterparty’s creditworthiness in terms of likelihood to go into default. The result of this calculation attempts to measure the senior, unsecured standalone creditworthiness of an organisation without consideration of structural elements of the underlying transactions, such as collateral, pricing, or maturity. Each borrower should have a rating which translates to a PD.
Exposure at Default (EAD): The second element is the counterparty’s exposure at default. These models are intended to estimate the outstanding amount or obligation at the moment of default in the future. Since the fact that a counterparty will go into default is not known, and the level of outstandings that may occur on that date is also not known, ING Bank uses a combination of statistical, expert and hybrid models to estimate the Exposure at Default. With the exception of guarantees and letters of credit, the EAD is always equal to or higher than the associated credit risk outstandings, under the assumption that counterparties tend to absorb liquidity from available credit resources before financial problems become apparent to the counterparty’s creditors. The EAD is largely a function of the type of credit facility (revolving, overdraft, term) offered to the borrower.
Loss Given Default (LGD): The third element is the loss given default. These models are intended to estimate the amount ING Bank will lose when liquidating collateral pledged in association with a given loan or financial obligation, or alternatively, liquidating the company as a whole, as part of a workout process. LGD models are based on cover types, estimated recovery rates given orderly liquidation, and (in) direct cost of liquidation.
Maturity (M): The fourth element is the time to the maturity of the underlying financial obligation. Basel II caps the maturity element at five years, despite the fact that many obligations extend longer than five years.
Expected Loss (EL): The expected loss provides a measure of the value of the credit losses that ING Bank may reasonably expect to incur on its portfolio. ING Bank must hold a reserve (as part of its capital base) to cover the expected losses in its credit portfolio. In its basic form, the expected loss can be represented as:
EL = PD * EAD * LGD
Additionally, ING Bank must also maintain a capital buffer against unexpected losses in order to protect itself against credit losses associated with unusual market events outside of the statistical norms.
SecuritisationsING Bank has implemented the AIRB approach for credit risk. As a consequence, ING Bank uses the Rating Based Approach (RBA) for investments in tranches of ABS and mortgage-backed securities (MBS) which have been rated by external rating agencies. Rating agencies which are used by ING Bank under the RBA include: Standard & Poor’s, Fitch, Moody’s and DBRS.
Under the RBA, the RWA are determined by multiplying the amount of the exposure by the appropriate regulatory risk weights, which depend on:• The external rating or an available inferred rating;• The seniority of the position; and• The granularity of the position.
ING Bank uses the Internal Assessment Approach for the support facilities it provides to Asset Backed Commercial Paper (ABCP) conduit Mont Blanc Capital Corp., based on externally published rating agency methodologies.
268 ING Group Annual Report 2013
ING_2013_deel4a&b_v2.indd 268 19/03/2014 19:22:57
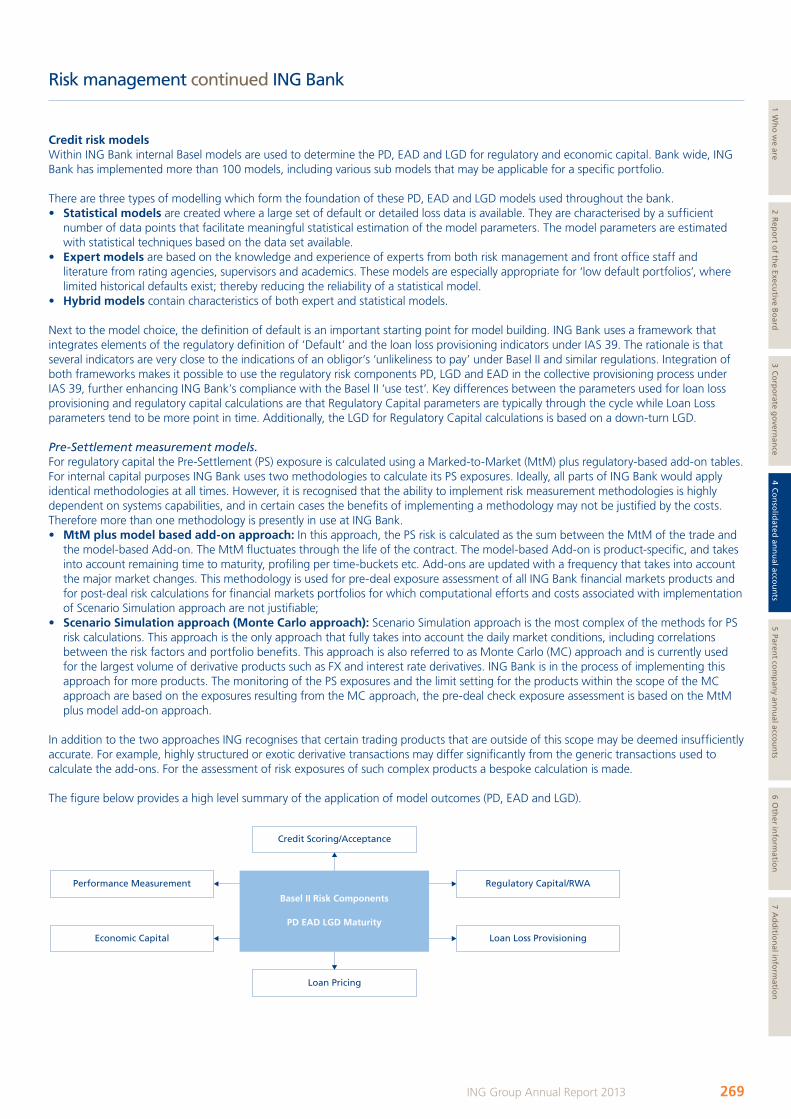
Risk management continued ING Bank
Credit risk modelsWithin ING Bank internal Basel models are used to determine the PD, EAD and LGD for regulatory and economic capital. Bank wide, ING Bank has implemented more than 100 models, including various sub models that may be applicable for a specific portfolio.
There are three types of modelling which form the foundation of these PD, EAD and LGD models used throughout the bank.• Statistical models are created where a large set of default or detailed loss data is available. They are characterised by a sufficient
number of data points that facilitate meaningful statistical estimation of the model parameters. The model parameters are estimated with statistical techniques based on the data set available.
• Expert models are based on the knowledge and experience of experts from both risk management and front office staff and literature from rating agencies, supervisors and academics. These models are especially appropriate for ‘low default portfolios’, where limited historical defaults exist; thereby reducing the reliability of a statistical model.
• Hybrid models contain characteristics of both expert and statistical models.
Next to the model choice, the definition of default is an important starting point for model building. ING Bank uses a framework that integrates elements of the regulatory definition of ‘Default’ and the loan loss provisioning indicators under IAS 39. The rationale is that several indicators are very close to the indications of an obligor’s ‘unlikeliness to pay’ under Basel II and similar regulations. Integration of both frameworks makes it possible to use the regulatory risk components PD, LGD and EAD in the collective provisioning process under IAS 39, further enhancing ING Bank’s compliance with the Basel II ‘use test’. Key differences between the parameters used for loan loss provisioning and regulatory capital calculations are that Regulatory Capital parameters are typically through the cycle while Loan Loss parameters tend to be more point in time. Additionally, the LGD for Regulatory Capital calculations is based on a down-turn LGD.
Pre-Settlement measurement models. For regulatory capital the Pre-Settlement (PS) exposure is calculated using a Marked-to-Market (MtM) plus regulatory-based add-on tables. For internal capital purposes ING Bank uses two methodologies to calculate its PS exposures. Ideally, all parts of ING Bank would apply identical methodologies at all times. However, it is recognised that the ability to implement risk measurement methodologies is highly dependent on systems capabilities, and in certain cases the benefits of implementing a methodology may not be justified by the costs. Therefore more than one methodology is presently in use at ING Bank.• MtM plus model based add-on approach: In this approach, the PS risk is calculated as the sum between the MtM of the trade and
the model-based Add-on. The MtM fluctuates through the life of the contract. The model-based Add-on is product-specific, and takes into account remaining time to maturity, profiling per time-buckets etc. Add-ons are updated with a frequency that takes into account the major market changes. This methodology is used for pre-deal exposure assessment of all ING Bank financial markets products and for post-deal risk calculations for financial markets portfolios for which computational efforts and costs associated with implementation of Scenario Simulation approach are not justifiable;
• Scenario Simulation approach (Monte Carlo approach): Scenario Simulation approach is the most complex of the methods for PS risk calculations. This approach is the only approach that fully takes into account the daily market conditions, including correlations between the risk factors and portfolio benefits. This approach is also referred to as Monte Carlo (MC) approach and is currently used for the largest volume of derivative products such as FX and interest rate derivatives. ING Bank is in the process of implementing this approach for more products. The monitoring of the PS exposures and the limit setting for the products within the scope of the MC approach are based on the exposures resulting from the MC approach, the pre-deal check exposure assessment is based on the MtM plus model add-on approach.
In addition to the two approaches ING recognises that certain trading products that are outside of this scope may be deemed insufficiently accurate. For example, highly structured or exotic derivative transactions may differ significantly from the generic transactions used to calculate the add-ons. For the assessment of risk exposures of such complex products a bespoke calculation is made.
The figure below provides a high level summary of the application of model outcomes (PD, EAD and LGD).
Loan Pricing
Loan Loss Provisioning
Regulatory Capital/RWA
Credit Scoring/Acceptance
Basel II Risk Components
PD EAD LGD Maturity
Economic Capital
Performance Measurement
269ING Group Annual Report 2013
1 Wh
o w
e are2 R
epo
rt of th
e Executive B
oard
3 Co
rpo
rate go
vernan
ce4 C
on
solid
ated an
nu
al accou
nts
5 Parent co
mp
any an
nu
al accou
nts
6 Oth
er info
rmatio
n7 A
dd
ition
al info
rmatio
n
ING_2013_deel4a&b_v2.indd 269 19/03/2014 19:22:58
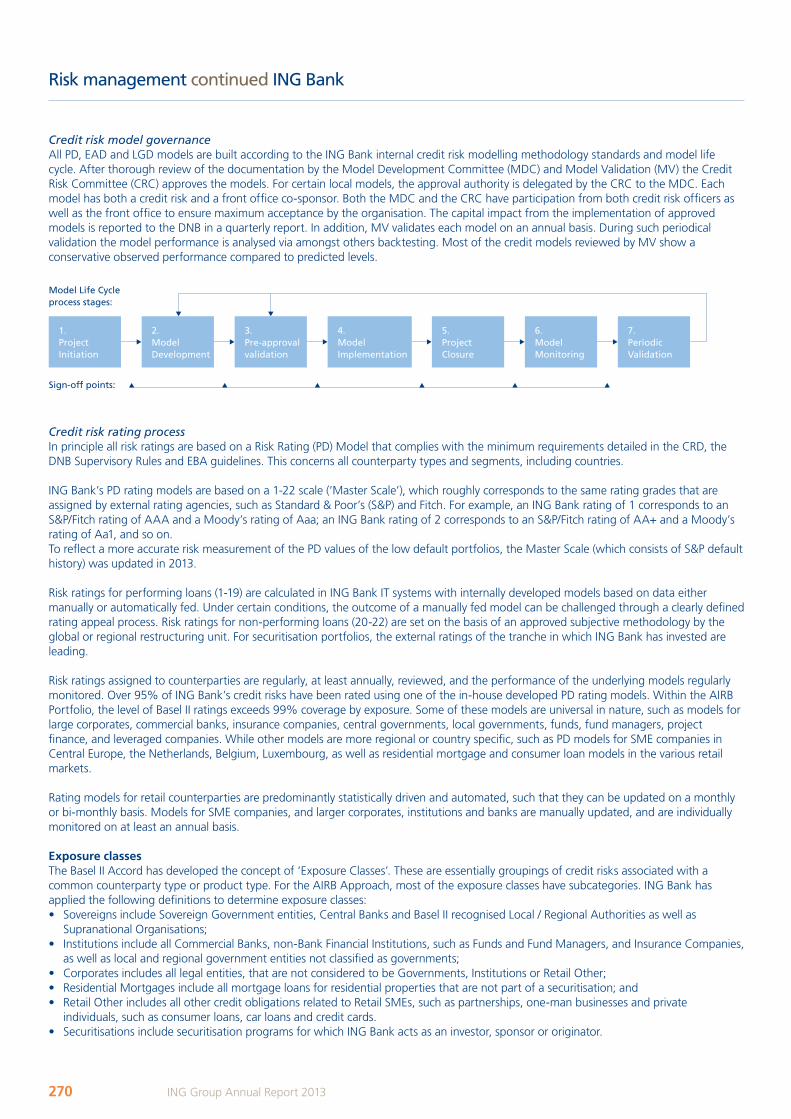
Risk management continued ING Bank
Credit risk model governanceAll PD, EAD and LGD models are built according to the ING Bank internal credit risk modelling methodology standards and model life cycle. After thorough review of the documentation by the Model Development Committee (MDC) and Model Validation (MV) the Credit Risk Committee (CRC) approves the models. For certain local models, the approval authority is delegated by the CRC to the MDC. Each model has both a credit risk and a front office co-sponsor. Both the MDC and the CRC have participation from both credit risk officers as well as the front office to ensure maximum acceptance by the organisation. The capital impact from the implementation of approved models is reported to the DNB in a quarterly report. In addition, MV validates each model on an annual basis. During such periodical validation the model performance is analysed via amongst others backtesting. Most of the credit models reviewed by MV show a conservative observed performance compared to predicted levels.
1. Project Initiation
2.Model Development
3.Pre-approvalvalidation
4.ModelImplementation
5.ProjectClosure
6. ModelMonitoring
7.PeriodicValidation
Model Life Cycle process stages:
Sign-off points:
Credit risk rating processIn principle all risk ratings are based on a Risk Rating (PD) Model that complies with the minimum requirements detailed in the CRD, the DNB Supervisory Rules and EBA guidelines. This concerns all counterparty types and segments, including countries.
ING Bank’s PD rating models are based on a 1-22 scale (‘Master Scale’), which roughly corresponds to the same rating grades that are assigned by external rating agencies, such as Standard & Poor’s (S&P) and Fitch. For example, an ING Bank rating of 1 corresponds to an S&P/Fitch rating of AAA and a Moody’s rating of Aaa; an ING Bank rating of 2 corresponds to an S&P/Fitch rating of AA+ and a Moody’s rating of Aa1, and so on.To reflect a more accurate risk measurement of the PD values of the low default portfolios, the Master Scale (which consists of S&P default history) was updated in 2013.
Risk ratings for performing loans (1-19) are calculated in ING Bank IT systems with internally developed models based on data either manually or automatically fed. Under certain conditions, the outcome of a manually fed model can be challenged through a clearly defined rating appeal process. Risk ratings for non-performing loans (20-22) are set on the basis of an approved subjective methodology by the global or regional restructuring unit. For securitisation portfolios, the external ratings of the tranche in which ING Bank has invested are leading.
Risk ratings assigned to counterparties are regularly, at least annually, reviewed, and the performance of the underlying models regularly monitored. Over 95% of ING Bank’s credit risks have been rated using one of the in-house developed PD rating models. Within the AIRB Portfolio, the level of Basel II ratings exceeds 99% coverage by exposure. Some of these models are universal in nature, such as models for large corporates, commercial banks, insurance companies, central governments, local governments, funds, fund managers, project finance, and leveraged companies. While other models are more regional or country specific, such as PD models for SME companies in Central Europe, the Netherlands, Belgium, Luxembourg, as well as residential mortgage and consumer loan models in the various retail markets.
Rating models for retail counterparties are predominantly statistically driven and automated, such that they can be updated on a monthly or bi-monthly basis. Models for SME companies, and larger corporates, institutions and banks are manually updated, and are individually monitored on at least an annual basis.
Exposure classesThe Basel II Accord has developed the concept of ‘Exposure Classes’. These are essentially groupings of credit risks associated with a common counterparty type or product type. For the AIRB Approach, most of the exposure classes have subcategories. ING Bank has applied the following definitions to determine exposure classes:• Sovereigns include Sovereign Government entities, Central Banks and Basel II recognised Local / Regional Authorities as well as
Supranational Organisations;• Institutions include all Commercial Banks, non-Bank Financial Institutions, such as Funds and Fund Managers, and Insurance Companies,
as well as local and regional government entities not classified as governments;• Corporates includes all legal entities, that are not considered to be Governments, Institutions or Retail Other;• Residential Mortgages include all mortgage loans for residential properties that are not part of a securitisation; and• Retail Other includes all other credit obligations related to Retail SMEs, such as partnerships, one-man businesses and private
individuals, such as consumer loans, car loans and credit cards.• Securitisations include securitisation programs for which ING Bank acts as an investor, sponsor or originator.
270 ING Group Annual Report 2013
ING_2013_deel4a&b_v2.indd 270 19/03/2014 19:22:58
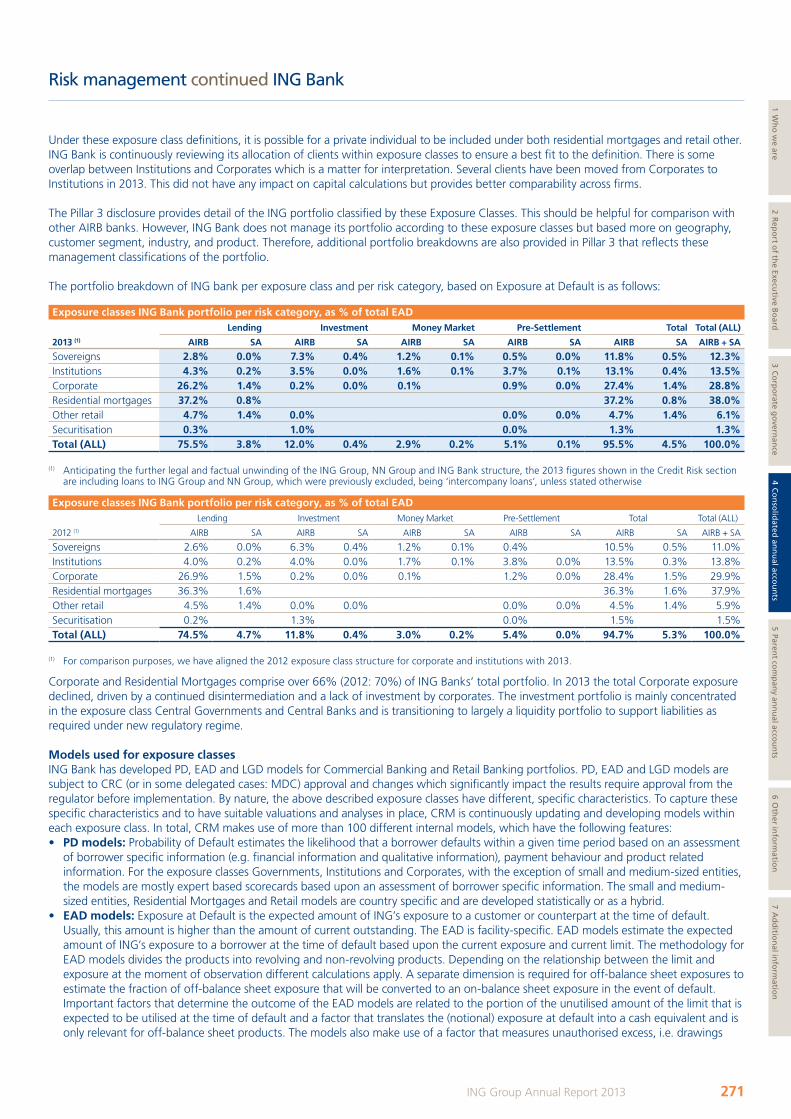
Risk management continued ING Bank
Under these exposure class definitions, it is possible for a private individual to be included under both residential mortgages and retail other.ING Bank is continuously reviewing its allocation of clients within exposure classes to ensure a best fit to the definition. There is some overlap between Institutions and Corporates which is a matter for interpretation. Several clients have been moved from Corporates to Institutions in 2013. This did not have any impact on capital calculations but provides better comparability across firms.
The Pillar 3 disclosure provides detail of the ING portfolio classified by these Exposure Classes. This should be helpful for comparison with other AIRB banks. However, ING Bank does not manage its portfolio according to these exposure classes but based more on geography, customer segment, industry, and product. Therefore, additional portfolio breakdowns are also provided in Pillar 3 that reflects these management classifications of the portfolio.
The portfolio breakdown of ING bank per exposure class and per risk category, based on Exposure at Default is as follows:
Exposure classes ING bank portfolio per risk category, as % of total EAD
2013 (1)
Lending Investment Money Market Pre-Settlement Total Total (ALL)
AIRb SA AIRb SA AIRb SA AIRb SA AIRb SA AIRb + SA
Sovereigns 2.8% 0.0% 7.3% 0.4% 1.2% 0.1% 0.5% 0.0% 11.8% 0.5% 12.3%Institutions 4.3% 0.2% 3.5% 0.0% 1.6% 0.1% 3.7% 0.1% 13.1% 0.4% 13.5%Corporate 26.2% 1.4% 0.2% 0.0% 0.1% 0.9% 0.0% 27.4% 1.4% 28.8%Residential mortgages 37.2% 0.8% 37.2% 0.8% 38.0%Other retail 4.7% 1.4% 0.0% 0.0% 0.0% 4.7% 1.4% 6.1%Securitisation 0.3% 1.0% 0.0% 1.3% 1.3%Total (ALL) 75.5% 3.8% 12.0% 0.4% 2.9% 0.2% 5.1% 0.1% 95.5% 4.5% 100.0%
(1) Anticipating the further legal and factual unwinding of the ING Group, NN Group and ING Bank structure, the 2013 figures shown in the Credit Risk section are including loans to ING Group and NN Group, which were previously excluded, being ‘intercompany loans’, unless stated otherwise
Exposure classes ING bank portfolio per risk category, as % of total EAD
2012 (1)
Lending Investment Money Market Pre-Settlement Total Total (ALL)
AIRB SA AIRB SA AIRB SA AIRB SA AIRB SA AIRB + SA
Sovereigns 2.6% 0.0% 6.3% 0.4% 1.2% 0.1% 0.4% 10.5% 0.5% 11.0%Institutions 4.0% 0.2% 4.0% 0.0% 1.7% 0.1% 3.8% 0.0% 13.5% 0.3% 13.8%Corporate 26.9% 1.5% 0.2% 0.0% 0.1% 1.2% 0.0% 28.4% 1.5% 29.9%Residential mortgages 36.3% 1.6% 36.3% 1.6% 37.9%Other retail 4.5% 1.4% 0.0% 0.0% 0.0% 0.0% 4.5% 1.4% 5.9%Securitisation 0.2% 1.3% 0.0% 1.5% 1.5%Total (ALL) 74.5% 4.7% 11.8% 0.4% 3.0% 0.2% 5.4% 0.0% 94.7% 5.3% 100.0%
(1) For comparison purposes, we have aligned the 2012 exposure class structure for corporate and institutions with 2013.
Corporate and Residential Mortgages comprise over 66% (2012: 70%) of ING Banks’ total portfolio. In 2013 the total Corporate exposure declined, driven by a continued disintermediation and a lack of investment by corporates. The investment portfolio is mainly concentrated in the exposure class Central Governments and Central Banks and is transitioning to largely a liquidity portfolio to support liabilities as required under new regulatory regime.
Models used for exposure classesING Bank has developed PD, EAD and LGD models for Commercial Banking and Retail Banking portfolios. PD, EAD and LGD models are subject to CRC (or in some delegated cases: MDC) approval and changes which significantly impact the results require approval from the regulator before implementation. By nature, the above described exposure classes have different, specific characteristics. To capture these specific characteristics and to have suitable valuations and analyses in place, CRM is continuously updating and developing models within each exposure class. In total, CRM makes use of more than 100 different internal models, which have the following features: • PD models: Probability of Default estimates the likelihood that a borrower defaults within a given time period based on an assessment
of borrower specific information (e.g. financial information and qualitative information), payment behaviour and product related information. For the exposure classes Governments, Institutions and Corporates, with the exception of small and medium-sized entities, the models are mostly expert based scorecards based upon an assessment of borrower specific information. The small and medium-sized entities, Residential Mortgages and Retail models are country specific and are developed statistically or as a hybrid.
• EAD models: Exposure at Default is the expected amount of ING’s exposure to a customer or counterpart at the time of default. Usually, this amount is higher than the amount of current outstanding. The EAD is facility-specific. EAD models estimate the expected amount of ING’s exposure to a borrower at the time of default based upon the current exposure and current limit. The methodology for EAD models divides the products into revolving and non-revolving products. Depending on the relationship between the limit and exposure at the moment of observation different calculations apply. A separate dimension is required for off-balance sheet exposures to estimate the fraction of off-balance sheet exposure that will be converted to an on-balance sheet exposure in the event of default. Important factors that determine the outcome of the EAD models are related to the portion of the unutilised amount of the limit that is expected to be utilised at the time of default and a factor that translates the (notional) exposure at default into a cash equivalent and is only relevant for off-balance sheet products. The models also make use of a factor that measures unauthorised excess, i.e. drawings
271ING Group Annual Report 2013
1 Wh
o w
e are2 R
epo
rt of th
e Executive B
oard
3 Co
rpo
rate go
vernan
ce4 C
on
solid
ated an
nu
al accou
nts
5 Parent co
mp
any an
nu
al accou
nts
6 Oth
er info
rmatio
n7 A
dd
ition
al info
rmatio
n
ING_2013_deel4a&b_v2.indd 271 19/03/2014 19:22:59
Risk management continued ING Bank
beyond the approved Facility Limit, if any. In addition to product type, EAD is also influenced by the approach to risk management. ING Bank has a pro-active risk management approach with active Watch list management that can influence EAD.
• LGD models: Loss Given Default is the measure of anticipated economic losses in a given Event of Default, taking into account the time value of money and includes both direct as well as indirect costs. LGD is facility-specific and expressed as a percentage of the EAD. LGD is largely a function of default scenarios, collateral, and guarantees obtained. Unsecured facilities typically have much higher anticipated loss ratios than secured facilities.
ING distinguishes four types of post default scenarios: – No Loss – Cure: the Borrower pays all overdue amounts (to the extend ING Bank is legally entitled to) and the asset becomes
non-defaulted again. ING Bank does not experience any loss in the process. The relationship is not terminated. The borrower returns back to performing.
– No Loss – Exit without loss: ING Bank (or the borrower) liquidates collaterals and calls guarantees in order to recover the exposure or the Borrower fully repays. Thereafter the relationship is terminated. ING Bank does not experience any loss in the process.
– Loss – Exit with loss: ING Bank (or the borrower) liquidates collaterals and calls guarantees in order to recover the exposure. Thereafter the relationship is terminated. ING Bank suffers loss in the process.
– Loss – Distressed Restructuring: ING Bank restructures the loan agreement so as to recover the exposure after allowing some discount. The relationship with the borrower continues after the restructuring. ING Bank suffers some loss in the process.
Changes in 2013 to credit risk modelsThe credit risk models are updated on a regular basis by taking into account more recent data, regulatory requirements and MV recommendations. In 2013 model changes have been implemented to various important AIRB models across all exposure classes leading to an increase in RWA of EUR 9.1 billion of which the major changes are:• Governments: A new EAD model not only applicable to Governments, but also to Institutions and Corporates (excluding small and
medium-sized entities) was implemented. Besides that new LGD models were implemented for the Central and Local Government portfolio. These changes lead to a net increase in RWA.
• Institutions: The main model change was the new EAD model leading to a decrease in RWA. • Corporates: A new LGD model and EAD model was implemented for the Corporates Large portfolio leading to a decrease in RWA. The
Commercial Property Finance portfolio had an update in the PD and LGD models creating a RWA increase. For the Small and Medium Sized entities updates have taken place in the Netherlands PD and LGD models, in the Belgium LGD model and in the Central Eastern Europe PD, LGD and EAD models, leading to an increase in RWA.
• Residential Mortgages: The PD and LGD models for the Dutch Mortgages portfolio have been updated to better reflect current market circumstances, leading to an increase in RWA.
• Retail Other: Main changes were to Private Individuals Belgium PD model and NL Unsecured PD, EAD and LGD models. The several model changes had plus and minus effects which on a net basis were not significant.
For further details regarding model changes and the subsequent RWA migration in 2013 we refer to the chapter ‘Risk Weighted Migration Analysis’ in the Pillar 3 section.
SecuritisationsING Bank primarily plays three roles in its exposure to securitisations programs which are:
ING Bank as InvestorING Direct had been the primary investor in securitisation transactions within ING Bank. Its core strategy was gathering customer deposits and providing lending products to its retail customers. The savings product is typically the first product to be launched in a country followed by mortgages and other retail products (current accounts, unsecured loans, credit cards etc.). The difference between retail liabilities and own originated retail assets is invested in high quality bonds and when appropriate in certain internal assets originated by other ING Bank entities. The ING Bank strategy has evolved to create more universal banks from the retail operations. In addition, the regulatory requirements for liquidity have become clarified over the last couple of years which decreases the attractiveness of securitisations as a form of liquid buffer. Therefore, ING Bank has greatly reduced its securitisation portfolio over the last years and the remaining portfolio is likely to run-off without replacement.
ING Bank as OriginatorING Bank occasionally originated own securitisation transactions for economic and regulatory capital purposes, as well as liquidity and funding purposes. Securitisations originated by a company may only be considered for balance sheet de-recognition when the requirements for significant credit risk transfer have been fulfilled. However, for a securitisation transaction to be recognised as for RWA reduction, risk transfer alone may be insufficient due to the increasing impact of the maturity mismatch formula. As a consequence, the RWA of the retained tranches for one of the transactions would be higher than the total RWA of the underlying pool before securitisation. In such cases the RWA calculation for the transaction is performed as if it was not securitised. ING Bank had done a very limited number of transactions as Originator. These have all expired, been unwound, or will likely be unwound shortly.
272 ING Group Annual Report 2013
ING_2013_deel4a&b_v2.indd 272 19/03/2014 19:22:59
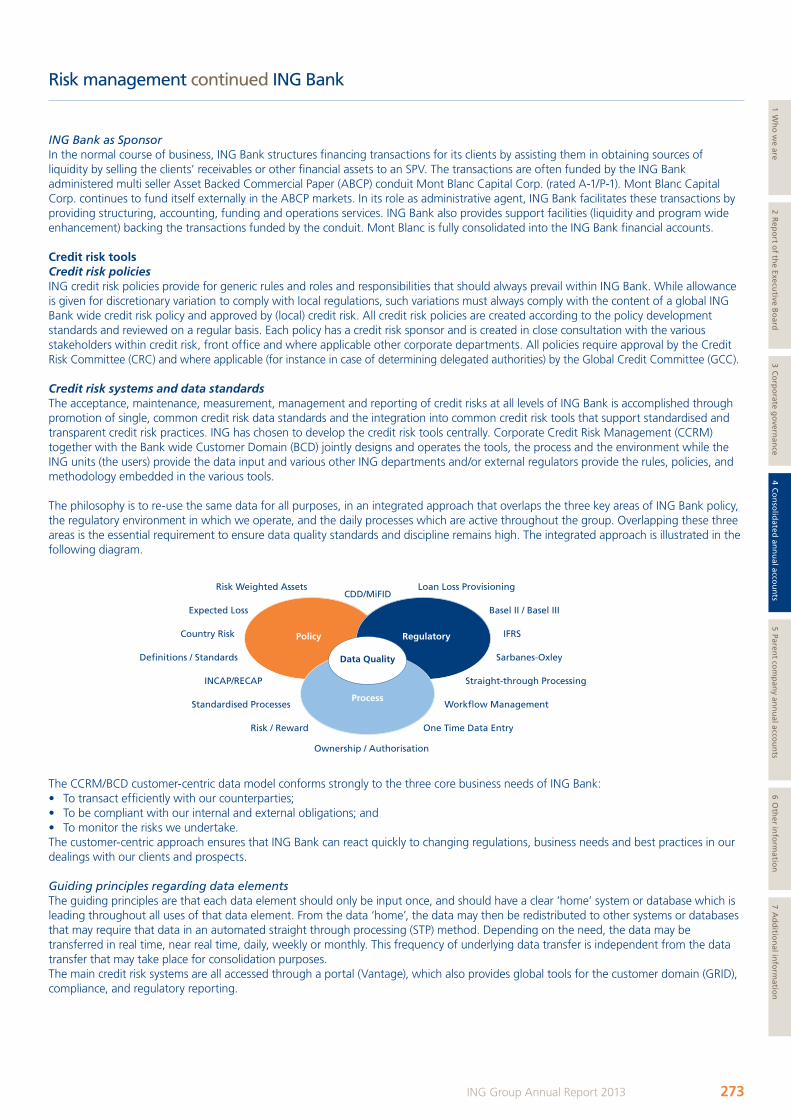
Risk management continued ING Bank
ING Bank as SponsorIn the normal course of business, ING Bank structures financing transactions for its clients by assisting them in obtaining sources of liquidity by selling the clients’ receivables or other financial assets to an SPV. The transactions are often funded by the ING Bank administered multi seller Asset Backed Commercial Paper (ABCP) conduit Mont Blanc Capital Corp. (rated A-1/P-1). Mont Blanc Capital Corp. continues to fund itself externally in the ABCP markets. In its role as administrative agent, ING Bank facilitates these transactions by providing structuring, accounting, funding and operations services. ING Bank also provides support facilities (liquidity and program wide enhancement) backing the transactions funded by the conduit. Mont Blanc is fully consolidated into the ING Bank financial accounts.
Credit risk toolsCredit risk policiesING credit risk policies provide for generic rules and roles and responsibilities that should always prevail within ING Bank. While allowance is given for discretionary variation to comply with local regulations, such variations must always comply with the content of a global ING Bank wide credit risk policy and approved by (local) credit risk. All credit risk policies are created according to the policy development standards and reviewed on a regular basis. Each policy has a credit risk sponsor and is created in close consultation with the various stakeholders within credit risk, front office and where applicable other corporate departments. All policies require approval by the Credit Risk Committee (CRC) and where applicable (for instance in case of determining delegated authorities) by the Global Credit Committee (GCC).
Credit risk systems and data standardsThe acceptance, maintenance, measurement, management and reporting of credit risks at all levels of ING Bank is accomplished through promotion of single, common credit risk data standards and the integration into common credit risk tools that support standardised and transparent credit risk practices. ING has chosen to develop the credit risk tools centrally. Corporate Credit Risk Management (CCRM) together with the Bank wide Customer Domain (BCD) jointly designs and operates the tools, the process and the environment while the ING units (the users) provide the data input and various other ING departments and/or external regulators provide the rules, policies, and methodology embedded in the various tools.
The philosophy is to re-use the same data for all purposes, in an integrated approach that overlaps the three key areas of ING Bank policy, the regulatory environment in which we operate, and the daily processes which are active throughout the group. Overlapping these three areas is the essential requirement to ensure data quality standards and discipline remains high. The integrated approach is illustrated in the following diagram.
Loan Loss Provisioning
Policy Regulatory
Process
Data Quality
Basel II / Basel III
IFRS
Sarbanes-Oxley
Straight-through Processing
Workflow Management
One Time Data Entry
Ownership / Authorisation
Risk Weighted AssetsCDD/MiFID
Expected Loss
Country Risk
Definitions / Standards
INCAP/RECAP
Standardised Processes
Risk / Reward
The CCRM/BCD customer-centric data model conforms strongly to the three core business needs of ING Bank:• To transact efficiently with our counterparties;• To be compliant with our internal and external obligations; and• To monitor the risks we undertake.The customer-centric approach ensures that ING Bank can react quickly to changing regulations, business needs and best practices in our dealings with our clients and prospects.
Guiding principles regarding data elementsThe guiding principles are that each data element should only be input once, and should have a clear ‘home’ system or database which is leading throughout all uses of that data element. From the data ‘home’, the data may then be redistributed to other systems or databases that may require that data in an automated straight through processing (STP) method. Depending on the need, the data may be transferred in real time, near real time, daily, weekly or monthly. This frequency of underlying data transfer is independent from the data transfer that may take place for consolidation purposes.The main credit risk systems are all accessed through a portal (Vantage), which also provides global tools for the customer domain (GRID), compliance, and regulatory reporting.
273ING Group Annual Report 2013
1 Wh
o w
e are2 R
epo
rt of th
e Executive B
oard
3 Co
rpo
rate go
vernan
ce4 C
on
solid
ated an
nu
al accou
nts
5 Parent co
mp
any an
nu
al accou
nts
6 Oth
er info
rmatio
n7 A
dd
ition
al info
rmatio
n
ING_2013_deel4a&b_v2.indd 273 19/03/2014 19:22:59
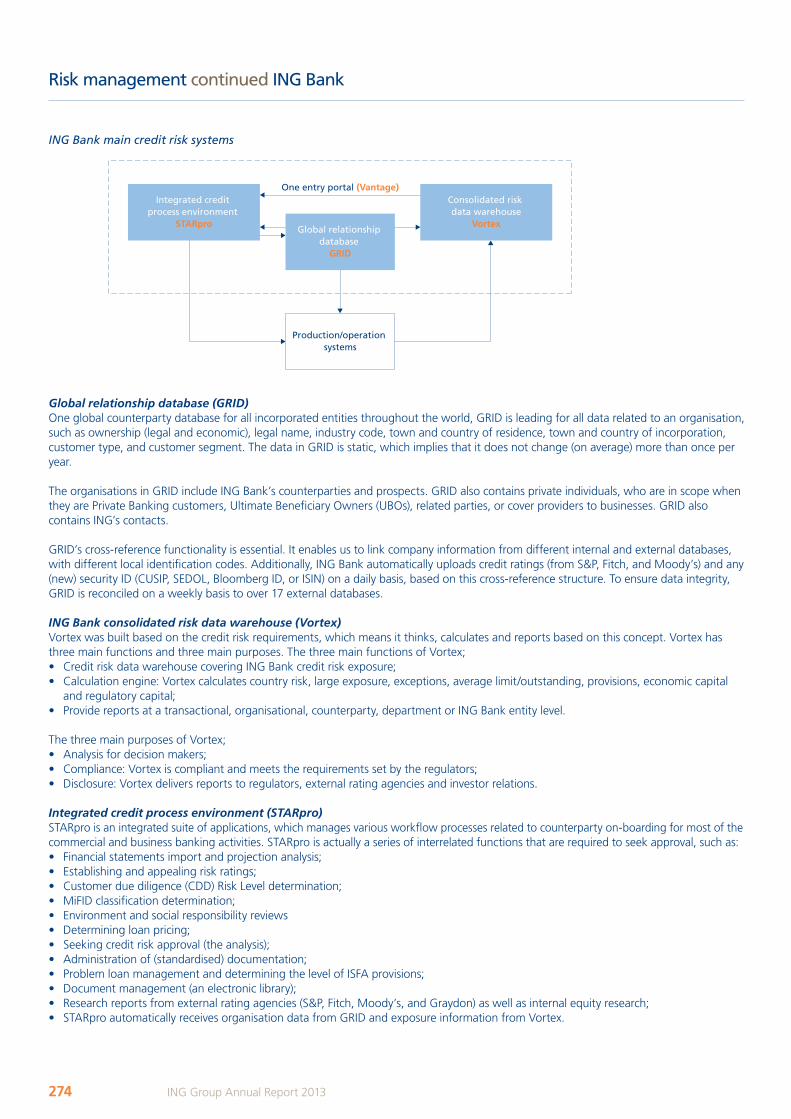
Risk management continued ING Bank
ING Bank main credit risk systems
Production/operation systems
Integrated credit process environment
STARpro
Consolidated risk data warehouse
VortexGlobal relationship
database GRID
One entry portal (Vantage)
Global relationship database (GRID)One global counterparty database for all incorporated entities throughout the world, GRID is leading for all data related to an organisation, such as ownership (legal and economic), legal name, industry code, town and country of residence, town and country of incorporation, customer type, and customer segment. The data in GRID is static, which implies that it does not change (on average) more than once per year.
The organisations in GRID include ING Bank’s counterparties and prospects. GRID also contains private individuals, who are in scope when they are Private Banking customers, Ultimate Beneficiary Owners (UBOs), related parties, or cover providers to businesses. GRID also contains ING’s contacts.
GRID’s cross-reference functionality is essential. It enables us to link company information from different internal and external databases, with different local identification codes. Additionally, ING Bank automatically uploads credit ratings (from S&P, Fitch, and Moody’s) and any (new) security ID (CUSIP, SEDOL, Bloomberg ID, or ISIN) on a daily basis, based on this cross-reference structure. To ensure data integrity, GRID is reconciled on a weekly basis to over 17 external databases.
ING Bank consolidated risk data warehouse (Vortex) Vortex was built based on the credit risk requirements, which means it thinks, calculates and reports based on this concept. Vortex has three main functions and three main purposes. The three main functions of Vortex;• Credit risk data warehouse covering ING Bank credit risk exposure;• Calculation engine: Vortex calculates country risk, large exposure, exceptions, average limit/outstanding, provisions, economic capital
and regulatory capital;• Provide reports at a transactional, organisational, counterparty, department or ING Bank entity level.
The three main purposes of Vortex;• Analysis for decision makers;• Compliance: Vortex is compliant and meets the requirements set by the regulators; • Disclosure: Vortex delivers reports to regulators, external rating agencies and investor relations.
Integrated credit process environment (STARpro)STARpro is an integrated suite of applications, which manages various workflow processes related to counterparty on-boarding for most of the commercial and business banking activities. STARpro is actually a series of interrelated functions that are required to seek approval, such as:• Financial statements import and projection analysis;• Establishing and appealing risk ratings;• Customer due diligence (CDD) Risk Level determination;• MiFID classification determination;• Environment and social responsibility reviews• Determining loan pricing;• Seeking credit risk approval (the analysis);• Administration of (standardised) documentation;• Problem loan management and determining the level of ISFA provisions;• Document management (an electronic library);• Research reports from external rating agencies (S&P, Fitch, Moody’s, and Graydon) as well as internal equity research;• STARpro automatically receives organisation data from GRID and exposure information from Vortex.
274 ING Group Annual Report 2013
ING_2013_deel4a&b_v2.indd 274 19/03/2014 19:23:00
Risk management continued ING Bank
The financial statements module provides the user with the ability not only to register a company’s financial statements in a common (IFRS-EU based) format, but also to project the company’s future financial position as a result of the transactions contemplated. This allows the common view on the company’s financial status to be communicated throughout ING and to form a consistent basis on decision making processes relying on financial information. This data is then aggregated and presented on the (read-only) browser-based Financial Statements component of STARpro.Financial Statements data is automatically forwarded to Risk Rater, where it is incorporated into one of the various probabilities of default rating models. Risk Rater contains two kinds of rating models:• Automated, whereby the data for a large number of counterparties is automatically processed from the source systems on a periodic
(usually monthly) basis to determine new risk ratings; and• Manual ratings, which are calculated on an individual basis and where the user is required to also answer additional qualitative
questions in order to create a rating.
Once a rating is approved the rating results are forwarded in real time to GRID. GRID then redistributes the rating (update) to the subscribing systems.The Loan Pricer module is used to price loans and investments. It accesses existing data from within Vantage for existing deals and uses this data in the loan pricing component, a tool which assists the user in structuring and optimising a deal, while determining if the transaction meets ING Bank’s internal risk/reward requirements. Functionality includes the ability to create and compare different scenarios, and to search for break-even values. The Approval Package module supports the credit approval process by automating the creation and management of credit application documents and routing them to reviewers and approvers. Approval Package is the tool that collects the data from all of the other modules (including data received from other STARpro modules and all exposure data from Vortex), in order to put together the credit application package. For annual reviews, the user is required to check the existing data (sourced from their local tools via Vortex), and make any requested changes. For new deals, the user (usually an account manager) inputs the entire deal structure (using local source system codes) directly into Approval Package. The tool then has a workflow function to guide the credit application through the credit approval process.The Problem Loans module is used to create provisions for organisations where the rating is set to 20, 21 or 22 and the outstanding is equal or bigger than the threshold (in general 1 million Euro, in individual cases or for certain units, the threshold could be lower). It also records detailed information on organisations in default. In addition the Problem Loan tool supports the non-performing loan provisioning process by automating the creation of problem loan applications and routing provisioning proposals to designated reviewers and approvers. It also provides a centralised ING Bank-wide repository for problem loan applications. All relevant policies, regulations and methodologies are as much incorporated in the systems as possible, providing an integrated approach.
Credit risk reportingCredit risk reporting is an important element of credit risk management. Regulators and ING Bank’s management increasingly recognise the value of risk-reporting systems and accessibility of data to monitor trends as well as to keep consistency and credibility in published data. A dedicated credit risk reporting department addresses various reporting requirements as well as key reporting principles.
Role of reporting departmentThe credit risk reporting department contributes in the following ways to CRM:• Provides periodic overviews of credit capital, migration of risk weighted assets, concentration overviews by industry/sector/counterparty
names required or requested by the DNB and other European regulators;• Participate in the various exercises/simulations conducted by regulators and other policy-makers by being transparent in the data and
analysis shared, to allow useful results and work towards more stable and efficient financial markets; • Provides senior management and other risk departments an insight showing trends and quantitative as well as qualitative analysis in
significant risk areas within ING Bank in a comprehensive and simplified manner to facilitate informed decision-making;• Addresses ad-hoc requests from regulators, analysts and rating agencies and other external stakeholders which are driven by current
market events impacting specific regions, portfolios or counterparties; and• Serves as a control function by analysing various portfolios and comparing them to certain risk policies. In addition, significant monthly
portfolio changes are analysed and reviewed.
Reporting principlesThe Basel Committee published in January 2013 new ‘Principles for Effective Data Aggregation and Risk Reporting’ which outline 11 key principles that global SIBs have to implement by 2016. As a first step of the implementation, ING performed a ‘stocktaking’ self-assessment survey in 2013. Based on this survey Credit Risk Reporting can rate itself satisfactory on all principles, including their key principles: Accuracy, Timelines, Completeness, Adaptability and Auditability. Nonetheless, gaps have been identified in certain sub-portfolios and actions are being planned to further improve the credit information technology and reporting.
275ING Group Annual Report 2013
1 Wh
o w
e are2 R
epo
rt of th
e Executive B
oard
3 Co
rpo
rate go
vernan
ce4 C
on
solid
ated an
nu
al accou
nts
5 Parent co
mp
any an
nu
al accou
nts
6 Oth
er info
rmatio
n7 A
dd
ition
al info
rmatio
n
ING_2013_deel4a&b_v2.indd 275 19/03/2014 19:23:00
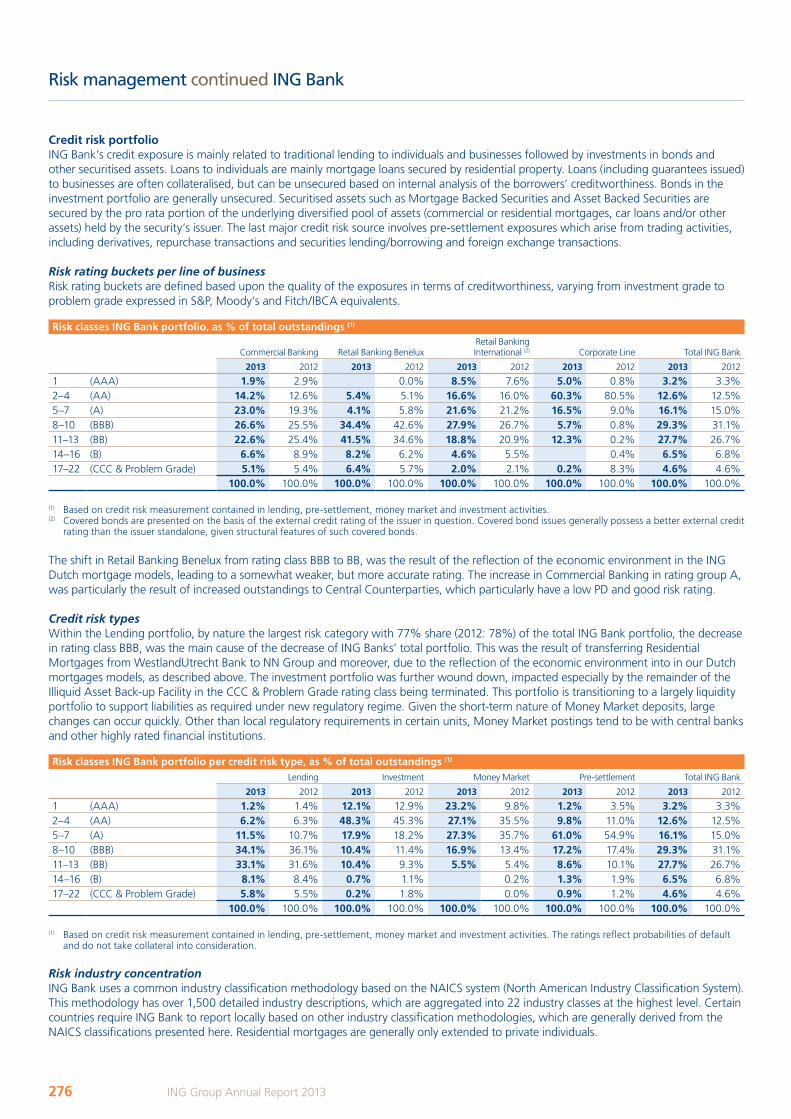
Risk management continued ING Bank
Credit risk portfolioING Bank’s credit exposure is mainly related to traditional lending to individuals and businesses followed by investments in bonds and other securitised assets. Loans to individuals are mainly mortgage loans secured by residential property. Loans (including guarantees issued) to businesses are often collateralised, but can be unsecured based on internal analysis of the borrowers’ creditworthiness. Bonds in the investment portfolio are generally unsecured. Securitised assets such as Mortgage Backed Securities and Asset Backed Securities are secured by the pro rata portion of the underlying diversified pool of assets (commercial or residential mortgages, car loans and/or other assets) held by the security‘s issuer. The last major credit risk source involves pre-settlement exposures which arise from trading activities, including derivatives, repurchase transactions and securities lending/borrowing and foreign exchange transactions.
Risk rating buckets per line of businessRisk rating buckets are defined based upon the quality of the exposures in terms of creditworthiness, varying from investment grade to problem grade expressed in S&P, Moody’s and Fitch/IBCA equivalents.
Risk classes ING bank portfolio, as % of total outstandings (1)
Commercial Banking Retail Banking BeneluxRetail Banking International (2) Corporate Line Total ING Bank
2013 2012 2013 2012 2013 2012 2013 2012 2013 2012
1 (AAA) 1.9% 2.9% 0.0% 8.5% 7.6% 5.0% 0.8% 3.2% 3.3%2–4 (AA) 14.2% 12.6% 5.4% 5.1% 16.6% 16.0% 60.3% 80.5% 12.6% 12.5%5–7 (A) 23.0% 19.3% 4.1% 5.8% 21.6% 21.2% 16.5% 9.0% 16.1% 15.0%8–10 (BBB) 26.6% 25.5% 34.4% 42.6% 27.9% 26.7% 5.7% 0.8% 29.3% 31.1%11–13 (BB) 22.6% 25.4% 41.5% 34.6% 18.8% 20.9% 12.3% 0.2% 27.7% 26.7%14–16 (B) 6.6% 8.9% 8.2% 6.2% 4.6% 5.5% 0.4% 6.5% 6.8%17–22 (CCC & Problem Grade) 5.1% 5.4% 6.4% 5.7% 2.0% 2.1% 0.2% 8.3% 4.6% 4.6%
100.0% 100.0% 100.0% 100.0% 100.0% 100.0% 100.0% 100.0% 100.0% 100.0%
(1) Based on credit risk measurement contained in lending, pre-settlement, money market and investment activities.(2) Covered bonds are presented on the basis of the external credit rating of the issuer in question. Covered bond issues generally possess a better external credit
rating than the issuer standalone, given structural features of such covered bonds.
The shift in Retail Banking Benelux from rating class BBB to BB, was the result of the reflection of the economic environment in the ING Dutch mortgage models, leading to a somewhat weaker, but more accurate rating. The increase in Commercial Banking in rating group A, was particularly the result of increased outstandings to Central Counterparties, which particularly have a low PD and good risk rating.
Credit risk typesWithin the Lending portfolio, by nature the largest risk category with 77% share (2012: 78%) of the total ING Bank portfolio, the decrease in rating class BBB, was the main cause of the decrease of ING Banks’ total portfolio. This was the result of transferring Residential Mortgages from WestlandUtrecht Bank to NN Group and moreover, due to the reflection of the economic environment into in our Dutch mortgages models, as described above. The investment portfolio was further wound down, impacted especially by the remainder of the Illiquid Asset Back-up Facility in the CCC & Problem Grade rating class being terminated. This portfolio is transitioning to a largely liquidity portfolio to support liabilities as required under new regulatory regime. Given the short-term nature of Money Market deposits, large changes can occur quickly. Other than local regulatory requirements in certain units, Money Market postings tend to be with central banks and other highly rated financial institutions.
Risk classes ING bank portfolio per credit risk type, as % of total outstandings (1)
Lending Investment Money Market Pre-settlement Total ING Bank
2013 2012 2013 2012 2013 2012 2013 2012 2013 2012
1 (AAA) 1.2% 1.4% 12.1% 12.9% 23.2% 9.8% 1.2% 3.5% 3.2% 3.3%2–4 (AA) 6.2% 6.3% 48.3% 45.3% 27.1% 35.5% 9.8% 11.0% 12.6% 12.5%5–7 (A) 11.5% 10.7% 17.9% 18.2% 27.3% 35.7% 61.0% 54.9% 16.1% 15.0%8–10 (BBB) 34.1% 36.1% 10.4% 11.4% 16.9% 13.4% 17.2% 17.4% 29.3% 31.1%11–13 (BB) 33.1% 31.6% 10.4% 9.3% 5.5% 5.4% 8.6% 10.1% 27.7% 26.7%14–16 (B) 8.1% 8.4% 0.7% 1.1% 0.2% 1.3% 1.9% 6.5% 6.8%17–22 (CCC & Problem Grade) 5.8% 5.5% 0.2% 1.8% 0.0% 0.9% 1.2% 4.6% 4.6%
100.0% 100.0% 100.0% 100.0% 100.0% 100.0% 100.0% 100.0% 100.0% 100.0%
(1) Based on credit risk measurement contained in lending, pre-settlement, money market and investment activities. The ratings reflect probabilities of default and do not take collateral into consideration.
Risk industry concentrationING Bank uses a common industry classification methodology based on the NAICS system (North American Industry Classification System). This methodology has over 1,500 detailed industry descriptions, which are aggregated into 22 industry classes at the highest level. Certain countries require ING Bank to report locally based on other industry classification methodologies, which are generally derived from the NAICS classifications presented here. Residential mortgages are generally only extended to private individuals.
276 ING Group Annual Report 2013
ING_2013_deel4a&b_v2.indd 276 19/03/2014 19:23:01
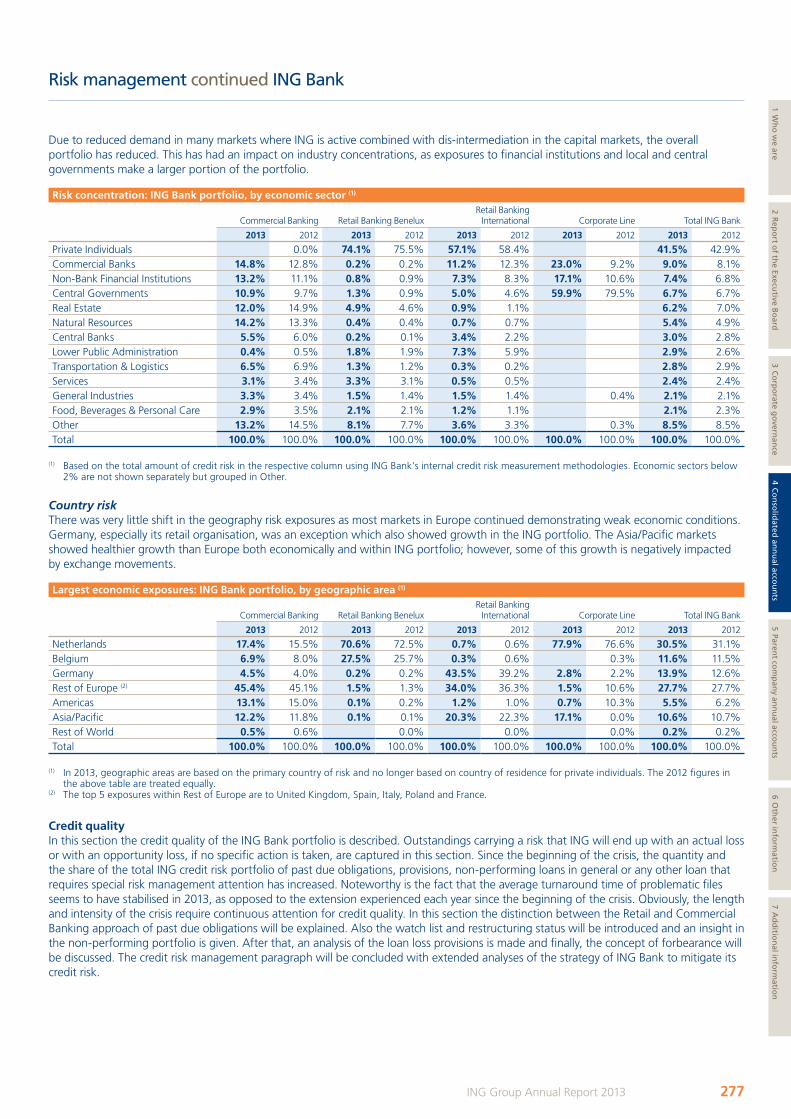
Risk management continued ING Bank
Due to reduced demand in many markets where ING is active combined with dis-intermediation in the capital markets, the overall portfolio has reduced. This has had an impact on industry concentrations, as exposures to financial institutions and local and central governments make a larger portion of the portfolio.
Risk concentration: ING bank portfolio, by economic sector (1)
Commercial Banking Retail Banking BeneluxRetail Banking
International Corporate Line Total ING Bank
2013 2012 2013 2012 2013 2012 2013 2012 2013 2012
Private Individuals 0.0% 74.1% 75.5% 57.1% 58.4% 41.5% 42.9%Commercial Banks 14.8% 12.8% 0.2% 0.2% 11.2% 12.3% 23.0% 9.2% 9.0% 8.1%Non-Bank Financial Institutions 13.2% 11.1% 0.8% 0.9% 7.3% 8.3% 17.1% 10.6% 7.4% 6.8%Central Governments 10.9% 9.7% 1.3% 0.9% 5.0% 4.6% 59.9% 79.5% 6.7% 6.7%Real Estate 12.0% 14.9% 4.9% 4.6% 0.9% 1.1% 6.2% 7.0%Natural Resources 14.2% 13.3% 0.4% 0.4% 0.7% 0.7% 5.4% 4.9%Central Banks 5.5% 6.0% 0.2% 0.1% 3.4% 2.2% 3.0% 2.8%Lower Public Administration 0.4% 0.5% 1.8% 1.9% 7.3% 5.9% 2.9% 2.6%Transportation & Logistics 6.5% 6.9% 1.3% 1.2% 0.3% 0.2% 2.8% 2.9%Services 3.1% 3.4% 3.3% 3.1% 0.5% 0.5% 2.4% 2.4%General Industries 3.3% 3.4% 1.5% 1.4% 1.5% 1.4% 0.4% 2.1% 2.1%Food, Beverages & Personal Care 2.9% 3.5% 2.1% 2.1% 1.2% 1.1% 2.1% 2.3%Other 13.2% 14.5% 8.1% 7.7% 3.6% 3.3% 0.3% 8.5% 8.5%Total 100.0% 100.0% 100.0% 100.0% 100.0% 100.0% 100.0% 100.0% 100.0% 100.0%
(1) Based on the total amount of credit risk in the respective column using ING Bank’s internal credit risk measurement methodologies. Economic sectors below 2% are not shown separately but grouped in Other.
Country riskThere was very little shift in the geography risk exposures as most markets in Europe continued demonstrating weak economic conditions. Germany, especially its retail organisation, was an exception which also showed growth in the ING portfolio. The Asia/Pacific markets showed healthier growth than Europe both economically and within ING portfolio; however, some of this growth is negatively impacted by exchange movements.
Largest economic exposures: ING bank portfolio, by geographic area (1)
Commercial Banking Retail Banking BeneluxRetail Banking
International Corporate Line Total ING Bank
2013 2012 2013 2012 2013 2012 2013 2012 2013 2012
Netherlands 17.4% 15.5% 70.6% 72.5% 0.7% 0.6% 77.9% 76.6% 30.5% 31.1%Belgium 6.9% 8.0% 27.5% 25.7% 0.3% 0.6% 0.3% 11.6% 11.5%Germany 4.5% 4.0% 0.2% 0.2% 43.5% 39.2% 2.8% 2.2% 13.9% 12.6%Rest of Europe (2) 45.4% 45.1% 1.5% 1.3% 34.0% 36.3% 1.5% 10.6% 27.7% 27.7%Americas 13.1% 15.0% 0.1% 0.2% 1.2% 1.0% 0.7% 10.3% 5.5% 6.2%Asia/Pacific 12.2% 11.8% 0.1% 0.1% 20.3% 22.3% 17.1% 0.0% 10.6% 10.7%Rest of World 0.5% 0.6% 0.0% 0.0% 0.0% 0.2% 0.2%Total 100.0% 100.0% 100.0% 100.0% 100.0% 100.0% 100.0% 100.0% 100.0% 100.0%
(1) In 2013, geographic areas are based on the primary country of risk and no longer based on country of residence for private individuals. The 2012 figures in the above table are treated equally.
(2) The top 5 exposures within Rest of Europe are to United Kingdom, Spain, Italy, Poland and France.
Credit qualityIn this section the credit quality of the ING Bank portfolio is described. Outstandings carrying a risk that ING will end up with an actual loss or with an opportunity loss, if no specific action is taken, are captured in this section. Since the beginning of the crisis, the quantity and the share of the total ING credit risk portfolio of past due obligations, provisions, non-performing loans in general or any other loan that requires special risk management attention has increased. Noteworthy is the fact that the average turnaround time of problematic files seems to have stabilised in 2013, as opposed to the extension experienced each year since the beginning of the crisis. Obviously, the length and intensity of the crisis require continuous attention for credit quality. In this section the distinction between the Retail and Commercial Banking approach of past due obligations will be explained. Also the watch list and restructuring status will be introduced and an insight in the non-performing portfolio is given. After that, an analysis of the loan loss provisions is made and finally, the concept of forbearance will be discussed. The credit risk management paragraph will be concluded with extended analyses of the strategy of ING Bank to mitigate its credit risk.
277ING Group Annual Report 2013
1 Wh
o w
e are2 R
epo
rt of th
e Executive B
oard
3 Co
rpo
rate go
vernan
ce4 C
on
solid
ated an
nu
al accou
nts
5 Parent co
mp
any an
nu
al accou
nts
6 Oth
er info
rmatio
n7 A
dd
ition
al info
rmatio
n
ING_2013_deel4a&b_v2.indd 277 19/03/2014 19:23:01
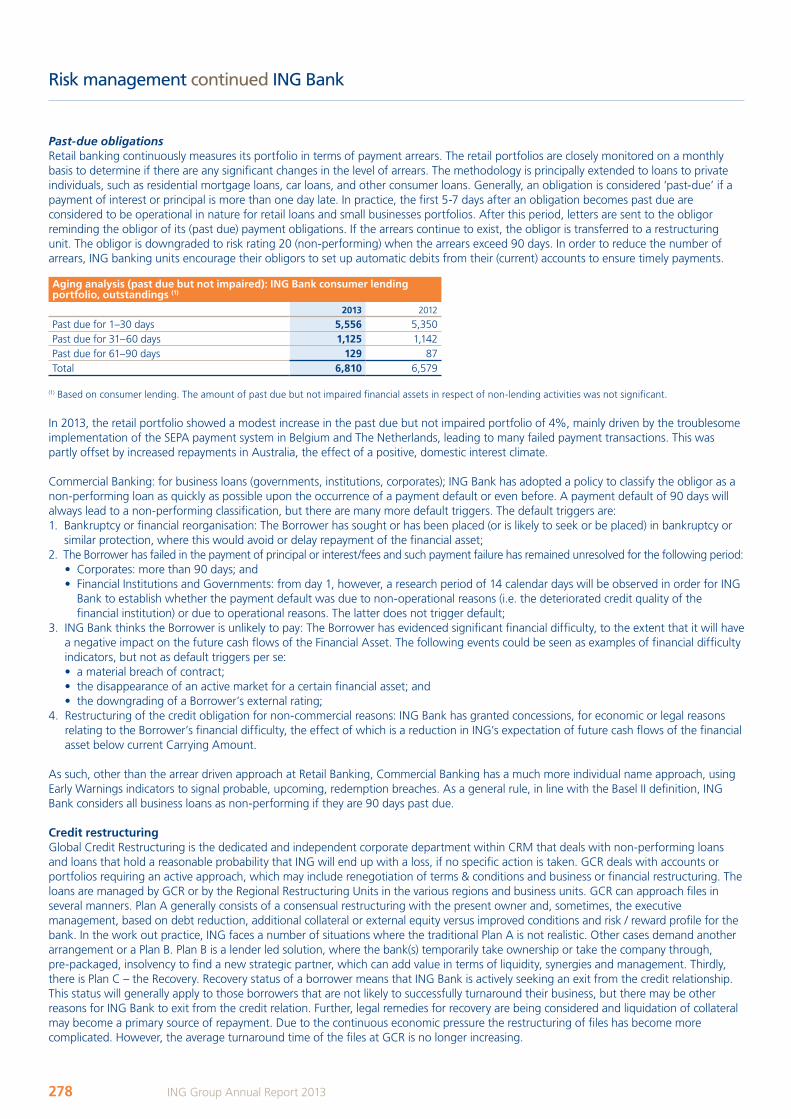
Risk management continued ING Bank
Past-due obligationsRetail banking continuously measures its portfolio in terms of payment arrears. The retail portfolios are closely monitored on a monthly basis to determine if there are any significant changes in the level of arrears. The methodology is principally extended to loans to private individuals, such as residential mortgage loans, car loans, and other consumer loans. Generally, an obligation is considered ‘past-due’ if a payment of interest or principal is more than one day late. In practice, the first 5-7 days after an obligation becomes past due are considered to be operational in nature for retail loans and small businesses portfolios. After this period, letters are sent to the obligor reminding the obligor of its (past due) payment obligations. If the arrears continue to exist, the obligor is transferred to a restructuring unit. The obligor is downgraded to risk rating 20 (non-performing) when the arrears exceed 90 days. In order to reduce the number of arrears, ING banking units encourage their obligors to set up automatic debits from their (current) accounts to ensure timely payments.
Aging analysis (past due but not impaired): ING bank consumer lending portfolio, outstandings (1)
2013 2012
Past due for 1–30 days 5,556 5,350Past due for 31–60 days 1,125 1,142Past due for 61–90 days 129 87Total 6,810 6,579
(1) Based on consumer lending. The amount of past due but not impaired financial assets in respect of non-lending activities was not significant.
In 2013, the retail portfolio showed a modest increase in the past due but not impaired portfolio of 4%, mainly driven by the troublesome implementation of the SEPA payment system in Belgium and The Netherlands, leading to many failed payment transactions. This was partly offset by increased repayments in Australia, the effect of a positive, domestic interest climate.
Commercial Banking: for business loans (governments, institutions, corporates); ING Bank has adopted a policy to classify the obligor as a non-performing loan as quickly as possible upon the occurrence of a payment default or even before. A payment default of 90 days will always lead to a non-performing classification, but there are many more default triggers. The default triggers are:1. Bankruptcy or financial reorganisation: The Borrower has sought or has been placed (or is likely to seek or be placed) in bankruptcy or
similar protection, where this would avoid or delay repayment of the financial asset;2. The Borrower has failed in the payment of principal or interest/fees and such payment failure has remained unresolved for the following period: • Corporates: more than 90 days; and • Financial Institutions and Governments: from day 1, however, a research period of 14 calendar days will be observed in order for ING
Bank to establish whether the payment default was due to non-operational reasons (i.e. the deteriorated credit quality of the financial institution) or due to operational reasons. The latter does not trigger default;
3. ING Bank thinks the Borrower is unlikely to pay: The Borrower has evidenced significant financial difficulty, to the extent that it will have a negative impact on the future cash flows of the Financial Asset. The following events could be seen as examples of financial difficulty indicators, but not as default triggers per se:
• a material breach of contract; • the disappearance of an active market for a certain financial asset; and • the downgrading of a Borrower’s external rating;4. Restructuring of the credit obligation for non-commercial reasons: ING Bank has granted concessions, for economic or legal reasons
relating to the Borrower’s financial difficulty, the effect of which is a reduction in ING’s expectation of future cash flows of the financial asset below current Carrying Amount.
As such, other than the arrear driven approach at Retail Banking, Commercial Banking has a much more individual name approach, using Early Warnings indicators to signal probable, upcoming, redemption breaches. As a general rule, in line with the Basel II definition, ING Bank considers all business loans as non-performing if they are 90 days past due.
Credit restructuringGlobal Credit Restructuring is the dedicated and independent corporate department within CRM that deals with non-performing loans and loans that hold a reasonable probability that ING will end up with a loss, if no specific action is taken. GCR deals with accounts or portfolios requiring an active approach, which may include renegotiation of terms & conditions and business or financial restructuring. The loans are managed by GCR or by the Regional Restructuring Units in the various regions and business units. GCR can approach files in several manners. Plan A generally consists of a consensual restructuring with the present owner and, sometimes, the executive management, based on debt reduction, additional collateral or external equity versus improved conditions and risk / reward profile for the bank. In the work out practice, ING faces a number of situations where the traditional Plan A is not realistic. Other cases demand another arrangement or a Plan B. Plan B is a lender led solution, where the bank(s) temporarily take ownership or take the company through, pre-packaged, insolvency to find a new strategic partner, which can add value in terms of liquidity, synergies and management. Thirdly, there is Plan C – the Recovery. Recovery status of a borrower means that ING Bank is actively seeking an exit from the credit relationship. This status will generally apply to those borrowers that are not likely to successfully turnaround their business, but there may be other reasons for ING Bank to exit from the credit relation. Further, legal remedies for recovery are being considered and liquidation of collateral may become a primary source of repayment. Due to the continuous economic pressure the restructuring of files has become more complicated. However, the average turnaround time of the files at GCR is no longer increasing.
278 ING Group Annual Report 2013
ING_2013_deel4a&b_v2.indd 278 19/03/2014 19:23:01
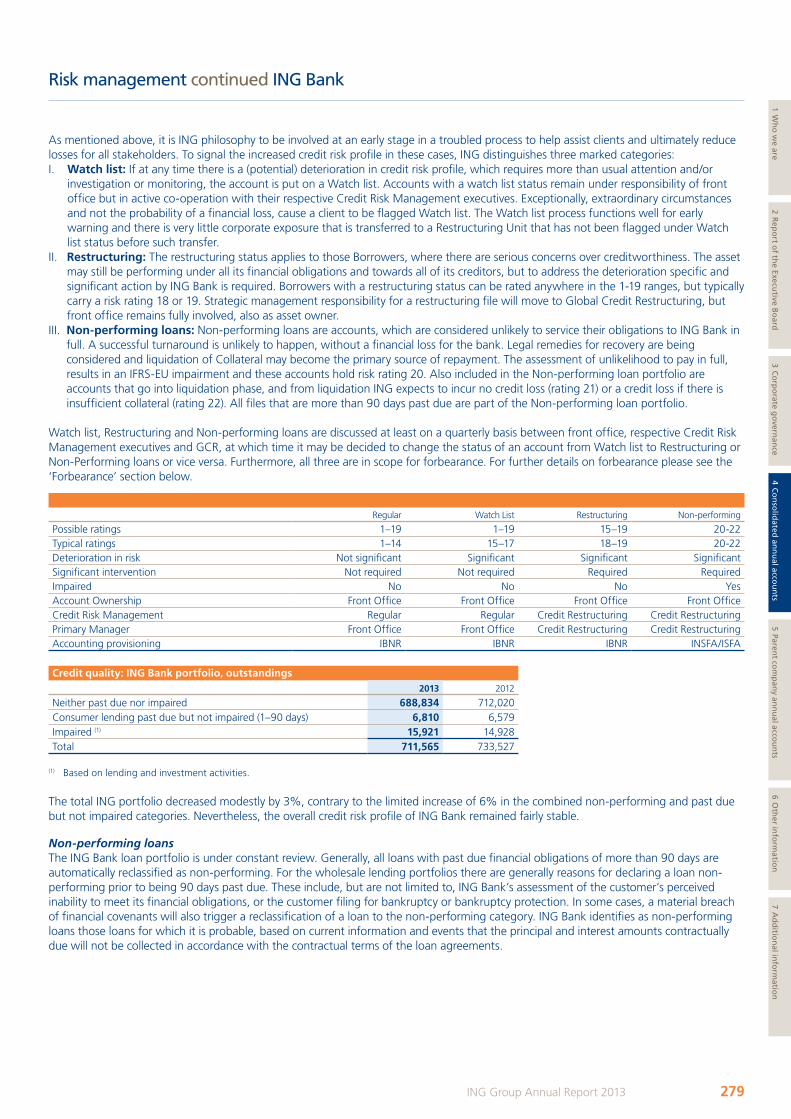
Risk management continued ING Bank
As mentioned above, it is ING philosophy to be involved at an early stage in a troubled process to help assist clients and ultimately reduce losses for all stakeholders. To signal the increased credit risk profile in these cases, ING distinguishes three marked categories:I. Watch list: If at any time there is a (potential) deterioration in credit risk profile, which requires more than usual attention and/or
investigation or monitoring, the account is put on a Watch list. Accounts with a watch list status remain under responsibility of front office but in active co-operation with their respective Credit Risk Management executives. Exceptionally, extraordinary circumstances and not the probability of a financial loss, cause a client to be flagged Watch list. The Watch list process functions well for early warning and there is very little corporate exposure that is transferred to a Restructuring Unit that has not been flagged under Watch list status before such transfer.
II. Restructuring: The restructuring status applies to those Borrowers, where there are serious concerns over creditworthiness. The asset may still be performing under all its financial obligations and towards all of its creditors, but to address the deterioration specific and significant action by ING Bank is required. Borrowers with a restructuring status can be rated anywhere in the 1-19 ranges, but typically carry a risk rating 18 or 19. Strategic management responsibility for a restructuring file will move to Global Credit Restructuring, but front office remains fully involved, also as asset owner.
III. Non-performing loans: Non-performing loans are accounts, which are considered unlikely to service their obligations to ING Bank in full. A successful turnaround is unlikely to happen, without a financial loss for the bank. Legal remedies for recovery are being considered and liquidation of Collateral may become the primary source of repayment. The assessment of unlikelihood to pay in full, results in an IFRS-EU impairment and these accounts hold risk rating 20. Also included in the Non-performing loan portfolio are accounts that go into liquidation phase, and from liquidation ING expects to incur no credit loss (rating 21) or a credit loss if there is insufficient collateral (rating 22). All files that are more than 90 days past due are part of the Non-performing loan portfolio.
Watch list, Restructuring and Non-performing loans are discussed at least on a quarterly basis between front office, respective Credit Risk Management executives and GCR, at which time it may be decided to change the status of an account from Watch list to Restructuring or Non-Performing loans or vice versa. Furthermore, all three are in scope for forbearance. For further details on forbearance please see the ‘Forbearance’ section below.
Regular Watch List Restructuring Non-performing
Possible ratings 1–19 1–19 15–19 20-22Typical ratings 1–14 15–17 18–19 20-22Deterioration in risk Not significant Significant Significant SignificantSignificant intervention Not required Not required Required RequiredImpaired No No No YesAccount Ownership Front Office Front Office Front Office Front OfficeCredit Risk Management Regular Regular Credit Restructuring Credit RestructuringPrimary Manager Front Office Front Office Credit Restructuring Credit RestructuringAccounting provisioning IBNR IBNR IBNR INSFA/ISFA
Credit quality: ING bank portfolio, outstandings2013 2012
Neither past due nor impaired 688,834 712,020Consumer lending past due but not impaired (1–90 days) 6,810 6,579Impaired (1) 15,921 14,928Total 711,565 733,527
(1) Based on lending and investment activities.
The total ING portfolio decreased modestly by 3%, contrary to the limited increase of 6% in the combined non-performing and past due but not impaired categories. Nevertheless, the overall credit risk profile of ING Bank remained fairly stable.
Non-performing loans The ING Bank loan portfolio is under constant review. Generally, all loans with past due financial obligations of more than 90 days are automatically reclassified as non-performing. For the wholesale lending portfolios there are generally reasons for declaring a loan non-performing prior to being 90 days past due. These include, but are not limited to, ING Bank’s assessment of the customer’s perceived inability to meet its financial obligations, or the customer filing for bankruptcy or bankruptcy protection. In some cases, a material breach of financial covenants will also trigger a reclassification of a loan to the non-performing category. ING Bank identifies as non-performing loans those loans for which it is probable, based on current information and events that the principal and interest amounts contractually due will not be collected in accordance with the contractual terms of the loan agreements.
279ING Group Annual Report 2013
1 Wh
o w
e are2 R
epo
rt of th
e Executive B
oard
3 Co
rpo
rate go
vernan
ce4 C
on
solid
ated an
nu
al accou
nts
5 Parent co
mp
any an
nu
al accou
nts
6 Oth
er info
rmatio
n7 A
dd
ition
al info
rmatio
n
ING_2013_deel4a&b_v2.indd 279 19/03/2014 19:23:02
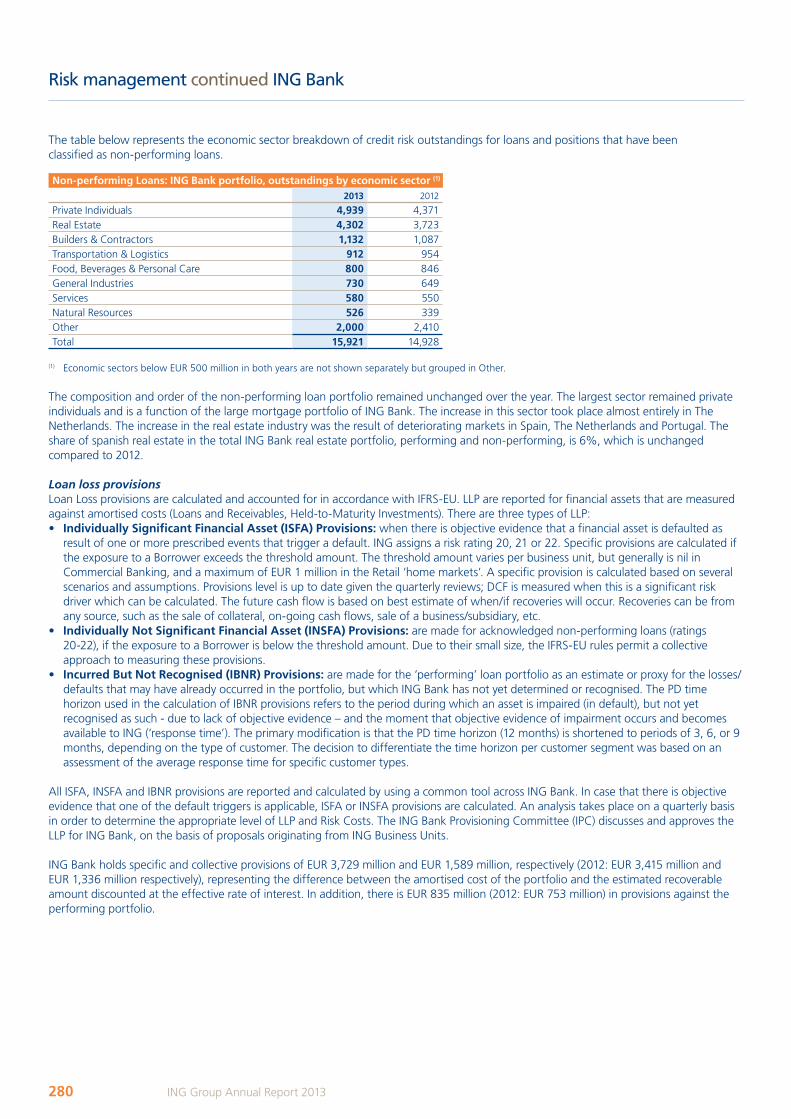
Risk management continued ING Bank
The table below represents the economic sector breakdown of credit risk outstandings for loans and positions that have been classified as non-performing loans.
Non-performing Loans: ING bank portfolio, outstandings by economic sector (1)
2013 2012
Private Individuals 4,939 4,371Real Estate 4,302 3,723Builders & Contractors 1,132 1,087Transportation & Logistics 912 954Food, Beverages & Personal Care 800 846General Industries 730 649Services 580 550Natural Resources 526 339Other 2,000 2,410Total 15,921 14,928
(1) Economic sectors below EUR 500 million in both years are not shown separately but grouped in Other.
The composition and order of the non-performing loan portfolio remained unchanged over the year. The largest sector remained private individuals and is a function of the large mortgage portfolio of ING Bank. The increase in this sector took place almost entirely in The Netherlands. The increase in the real estate industry was the result of deteriorating markets in Spain, The Netherlands and Portugal. The share of spanish real estate in the total ING Bank real estate portfolio, performing and non-performing, is 6%, which is unchanged compared to 2012.
Loan loss provisionsLoan Loss provisions are calculated and accounted for in accordance with IFRS-EU. LLP are reported for financial assets that are measured against amortised costs (Loans and Receivables, Held-to-Maturity Investments). There are three types of LLP:• Individually Significant Financial Asset (ISFA) Provisions: when there is objective evidence that a financial asset is defaulted as
result of one or more prescribed events that trigger a default. ING assigns a risk rating 20, 21 or 22. Specific provisions are calculated if the exposure to a Borrower exceeds the threshold amount. The threshold amount varies per business unit, but generally is nil in Commercial Banking, and a maximum of EUR 1 million in the Retail ‘home markets’. A specific provision is calculated based on several scenarios and assumptions. Provisions level is up to date given the quarterly reviews; DCF is measured when this is a significant risk driver which can be calculated. The future cash flow is based on best estimate of when/if recoveries will occur. Recoveries can be from any source, such as the sale of collateral, on-going cash flows, sale of a business/subsidiary, etc.
• Individually Not Significant Financial Asset (INSFA) Provisions: are made for acknowledged non-performing loans (ratings 20-22), if the exposure to a Borrower is below the threshold amount. Due to their small size, the IFRS-EU rules permit a collective approach to measuring these provisions.
• Incurred but Not Recognised (IbNR) Provisions: are made for the ‘performing’ loan portfolio as an estimate or proxy for the losses/defaults that may have already occurred in the portfolio, but which ING Bank has not yet determined or recognised. The PD time horizon used in the calculation of IBNR provisions refers to the period during which an asset is impaired (in default), but not yet recognised as such - due to lack of objective evidence – and the moment that objective evidence of impairment occurs and becomes available to ING (‘response time’). The primary modification is that the PD time horizon (12 months) is shortened to periods of 3, 6, or 9 months, depending on the type of customer. The decision to differentiate the time horizon per customer segment was based on an assessment of the average response time for specific customer types.
All ISFA, INSFA and IBNR provisions are reported and calculated by using a common tool across ING Bank. In case that there is objective evidence that one of the default triggers is applicable, ISFA or INSFA provisions are calculated. An analysis takes place on a quarterly basis in order to determine the appropriate level of LLP and Risk Costs. The ING Bank Provisioning Committee (IPC) discusses and approves the LLP for ING Bank, on the basis of proposals originating from ING Business Units.
ING Bank holds specific and collective provisions of EUR 3,729 million and EUR 1,589 million, respectively (2012: EUR 3,415 million and EUR 1,336 million respectively), representing the difference between the amortised cost of the portfolio and the estimated recoverable amount discounted at the effective rate of interest. In addition, there is EUR 835 million (2012: EUR 753 million) in provisions against the performing portfolio.
280 ING Group Annual Report 2013
ING_2013_deel4a&b_v2.indd 280 19/03/2014 19:23:02
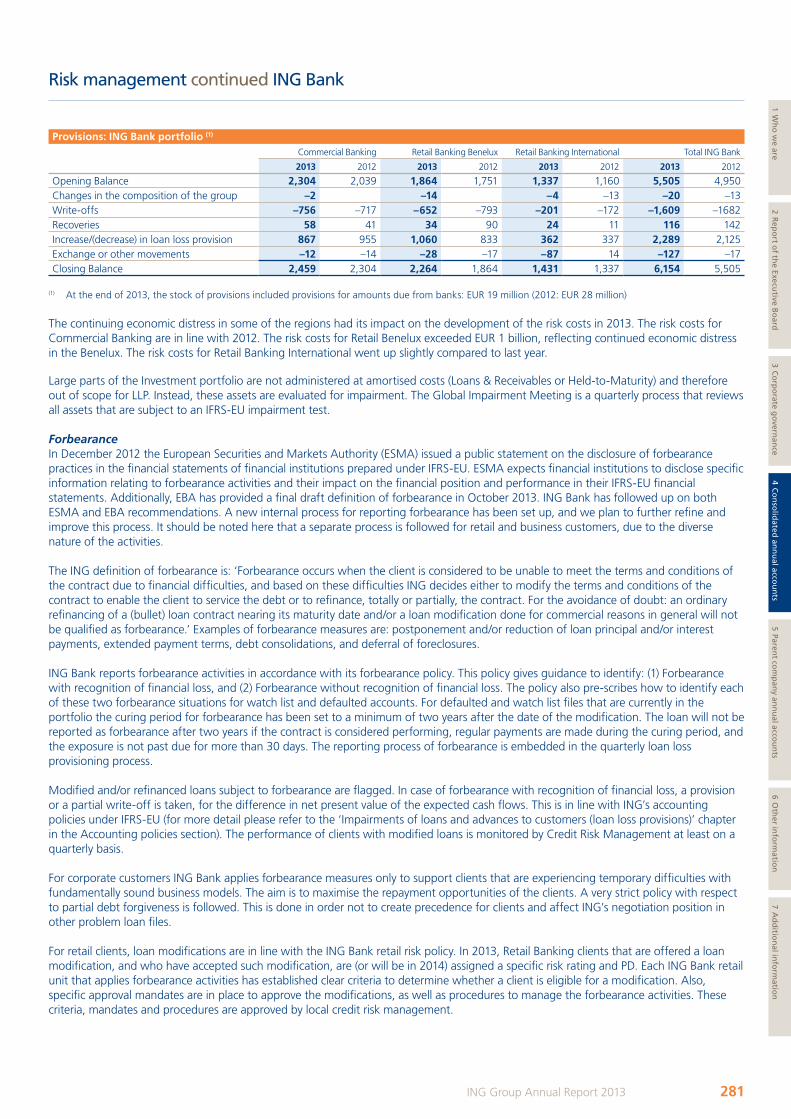
Risk management continued ING Bank
Provisions: ING bank portfolio (1)
Commercial Banking Retail Banking Benelux Retail Banking International Total ING Bank
2013 2012 2013 2012 2013 2012 2013 2012
Opening Balance 2,304 2,039 1,864 1,751 1,337 1,160 5,505 4,950Changes in the composition of the group –2 –14 –4 –13 –20 –13Write-offs –756 –717 –652 –793 –201 –172 –1,609 –1682Recoveries 58 41 34 90 24 11 116 142Increase/(decrease) in loan loss provision 867 955 1,060 833 362 337 2,289 2,125Exchange or other movements –12 –14 –28 –17 –87 14 –127 –17Closing Balance 2,459 2,304 2,264 1,864 1,431 1,337 6,154 5,505
(1) At the end of 2013, the stock of provisions included provisions for amounts due from banks: EUR 19 million (2012: EUR 28 million)
The continuing economic distress in some of the regions had its impact on the development of the risk costs in 2013. The risk costs for Commercial Banking are in line with 2012. The risk costs for Retail Benelux exceeded EUR 1 billion, reflecting continued economic distress in the Benelux. The risk costs for Retail Banking International went up slightly compared to last year.
Large parts of the Investment portfolio are not administered at amortised costs (Loans & Receivables or Held-to-Maturity) and therefore out of scope for LLP. Instead, these assets are evaluated for impairment. The Global Impairment Meeting is a quarterly process that reviews all assets that are subject to an IFRS-EU impairment test.
ForbearanceIn December 2012 the European Securities and Markets Authority (ESMA) issued a public statement on the disclosure of forbearance practices in the financial statements of financial institutions prepared under IFRS-EU. ESMA expects financial institutions to disclose specific information relating to forbearance activities and their impact on the financial position and performance in their IFRS-EU financial statements. Additionally, EBA has provided a final draft definition of forbearance in October 2013. ING Bank has followed up on both ESMA and EBA recommendations. A new internal process for reporting forbearance has been set up, and we plan to further refine and improve this process. It should be noted here that a separate process is followed for retail and business customers, due to the diverse nature of the activities.
The ING definition of forbearance is: ‘Forbearance occurs when the client is considered to be unable to meet the terms and conditions of the contract due to financial difficulties, and based on these difficulties ING decides either to modify the terms and conditions of the contract to enable the client to service the debt or to refinance, totally or partially, the contract. For the avoidance of doubt: an ordinary refinancing of a (bullet) loan contract nearing its maturity date and/or a loan modification done for commercial reasons in general will not be qualified as forbearance.’ Examples of forbearance measures are: postponement and/or reduction of loan principal and/or interest payments, extended payment terms, debt consolidations, and deferral of foreclosures.
ING Bank reports forbearance activities in accordance with its forbearance policy. This policy gives guidance to identify: (1) Forbearance with recognition of financial loss, and (2) Forbearance without recognition of financial loss. The policy also pre-scribes how to identify each of these two forbearance situations for watch list and defaulted accounts. For defaulted and watch list files that are currently in the portfolio the curing period for forbearance has been set to a minimum of two years after the date of the modification. The loan will not be reported as forbearance after two years if the contract is considered performing, regular payments are made during the curing period, and the exposure is not past due for more than 30 days. The reporting process of forbearance is embedded in the quarterly loan loss provisioning process.
Modified and/or refinanced loans subject to forbearance are flagged. In case of forbearance with recognition of financial loss, a provision or a partial write-off is taken, for the difference in net present value of the expected cash flows. This is in line with ING’s accounting policies under IFRS-EU (for more detail please refer to the ‘Impairments of loans and advances to customers (loan loss provisions)’ chapter in the Accounting policies section). The performance of clients with modified loans is monitored by Credit Risk Management at least on a quarterly basis.
For corporate customers ING Bank applies forbearance measures only to support clients that are experiencing temporary difficulties with fundamentally sound business models. The aim is to maximise the repayment opportunities of the clients. A very strict policy with respect to partial debt forgiveness is followed. This is done in order not to create precedence for clients and affect ING’s negotiation position in other problem loan files.
For retail clients, loan modifications are in line with the ING Bank retail risk policy. In 2013, Retail Banking clients that are offered a loan modification, and who have accepted such modification, are (or will be in 2014) assigned a specific risk rating and PD. Each ING Bank retail unit that applies forbearance activities has established clear criteria to determine whether a client is eligible for a modification. Also, specific approval mandates are in place to approve the modifications, as well as procedures to manage the forbearance activities. These criteria, mandates and procedures are approved by local credit risk management.
281ING Group Annual Report 2013
1 Wh
o w
e are2 R
epo
rt of th
e Executive B
oard
3 Co
rpo
rate go
vernan
ce4 C
on
solid
ated an
nu
al accou
nts
5 Parent co
mp
any an
nu
al accou
nts
6 Oth
er info
rmatio
n7 A
dd
ition
al info
rmatio
n
ING_2013_deel4a&b_v2.indd 281 19/03/2014 19:23:02
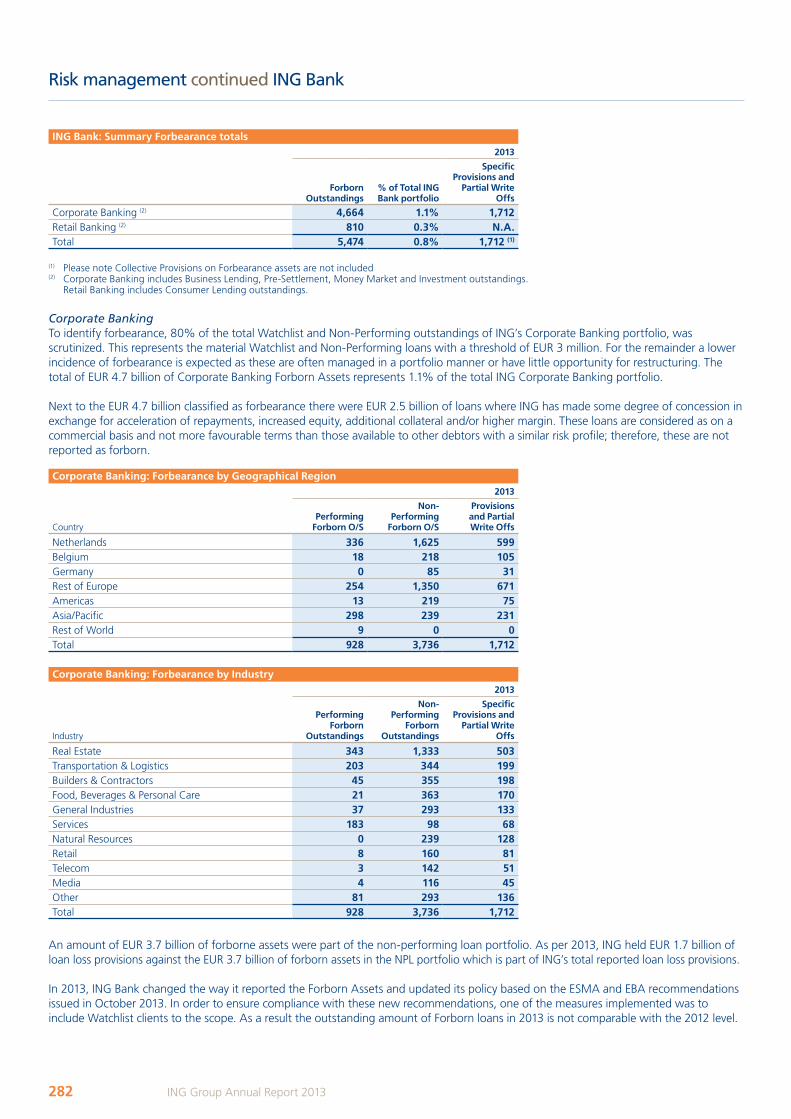
Risk management continued ING Bank
ING bank: Summary Forbearance totals2013
Forborn Outstandings
% of Total ING bank portfolio
Specific Provisions and
Partial Write Offs
Corporate Banking (2) 4,664 1.1% 1,712Retail Banking (2) 810 0.3% N.A.Total 5,474 0.8% 1,712 (1)
(1) Please note Collective Provisions on Forbearance assets are not included(2) Corporate Banking includes Business Lending, Pre-Settlement, Money Market and Investment outstandings. Retail Banking includes Consumer Lending outstandings.
Corporate BankingTo identify forbearance, 80% of the total Watchlist and Non-Performing outstandings of ING’s Corporate Banking portfolio, was scrutinized. This represents the material Watchlist and Non-Performing loans with a threshold of EUR 3 million. For the remainder a lower incidence of forbearance is expected as these are often managed in a portfolio manner or have little opportunity for restructuring. The total of EUR 4.7 billion of Corporate Banking Forborn Assets represents 1.1% of the total ING Corporate Banking portfolio.
Next to the EUR 4.7 billion classified as forbearance there were EUR 2.5 billion of loans where ING has made some degree of concession in exchange for acceleration of repayments, increased equity, additional collateral and/or higher margin. These loans are considered as on a commercial basis and not more favourable terms than those available to other debtors with a similar risk profile; therefore, these are not reported as forborn.
Corporate banking: Forbearance by Geographical Region2013
CountryPerforming
Forborn O/S
Non-Performing
Forborn O/S
Provisions and Partial Write Offs
Netherlands 336 1,625 599Belgium 18 218 105Germany 0 85 31Rest of Europe 254 1,350 671Americas 13 219 75Asia/Pacific 298 239 231Rest of World 9 0 0Total 928 3,736 1,712
Corporate banking: Forbearance by Industry2013
Industry
Performing Forborn
Outstandings
Non-Performing
Forborn Outstandings
Specific Provisions and
Partial Write Offs
Real Estate 343 1,333 503Transportation & Logistics 203 344 199Builders & Contractors 45 355 198Food, Beverages & Personal Care 21 363 170General Industries 37 293 133Services 183 98 68Natural Resources 0 239 128Retail 8 160 81Telecom 3 142 51Media 4 116 45Other 81 293 136Total 928 3,736 1,712
An amount of EUR 3.7 billion of forborne assets were part of the non-performing loan portfolio. As per 2013, ING held EUR 1.7 billion of loan loss provisions against the EUR 3.7 billion of forborn assets in the NPL portfolio which is part of ING’s total reported loan loss provisions.
In 2013, ING Bank changed the way it reported the Forborn Assets and updated its policy based on the ESMA and EBA recommendations issued in October 2013. In order to ensure compliance with these new recommendations, one of the measures implemented was to include Watchlist clients to the scope. As a result the outstanding amount of Forborn loans in 2013 is not comparable with the 2012 level.
282 ING Group Annual Report 2013
ING_2013_deel4a&b_v2.indd 282 19/03/2014 19:23:03
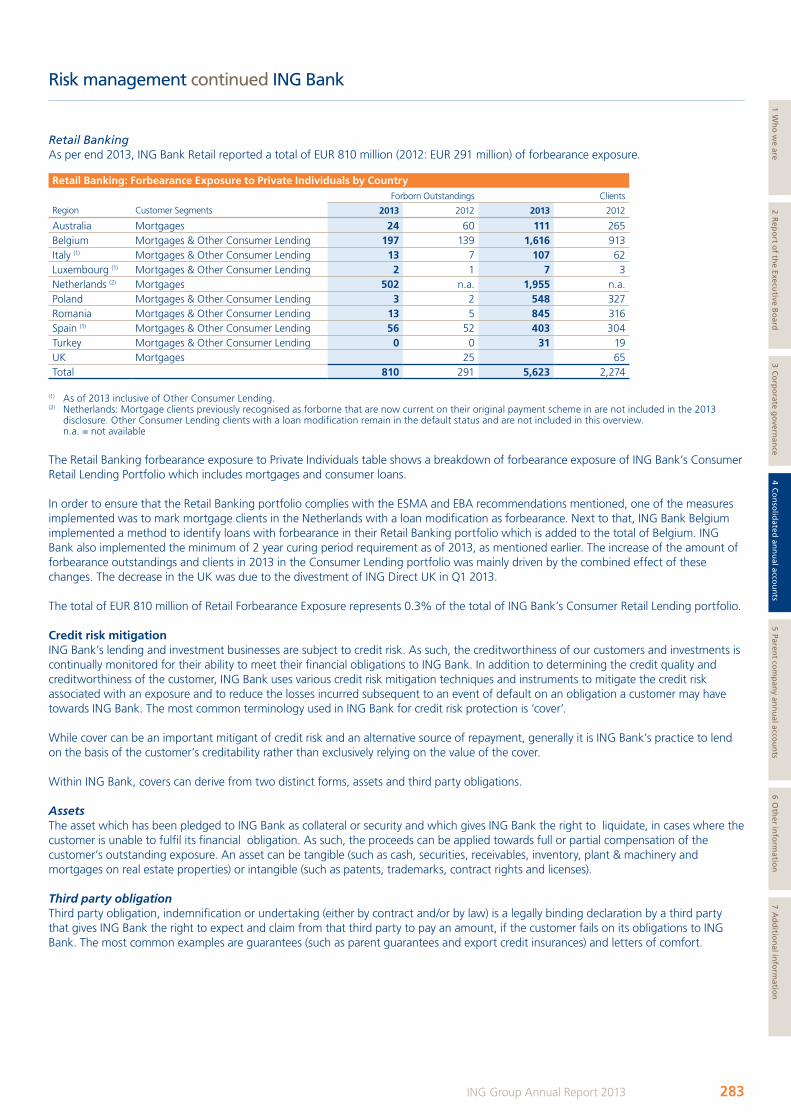
Risk management continued ING Bank
Retail BankingAs per end 2013, ING Bank Retail reported a total of EUR 810 million (2012: EUR 291 million) of forbearance exposure.
Retail banking: Forbearance Exposure to Private Individuals by CountryForborn Outstandings Clients
Region Customer Segments 2013 2012 2013 2012
Australia Mortgages 24 60 111 265Belgium Mortgages & Other Consumer Lending 197 139 1,616 913Italy (1) Mortgages & Other Consumer Lending 13 7 107 62Luxembourg (1) Mortgages & Other Consumer Lending 2 1 7 3Netherlands (2) Mortgages 502 n.a. 1,955 n.a.Poland Mortgages & Other Consumer Lending 3 2 548 327Romania Mortgages & Other Consumer Lending 13 5 845 316Spain (1) Mortgages & Other Consumer Lending 56 52 403 304Turkey Mortgages & Other Consumer Lending 0 0 31 19UK Mortgages 25 65Total 810 291 5,623 2,274
(1) As of 2013 inclusive of Other Consumer Lending.(2) Netherlands: Mortgage clients previously recognised as forborne that are now current on their original payment scheme in are not included in the 2013
disclosure. Other Consumer Lending clients with a loan modification remain in the default status and are not included in this overview. n.a. = not available
The Retail Banking forbearance exposure to Private Individuals table shows a breakdown of forbearance exposure of ING Bank’s Consumer Retail Lending Portfolio which includes mortgages and consumer loans.
In order to ensure that the Retail Banking portfolio complies with the ESMA and EBA recommendations mentioned, one of the measures implemented was to mark mortgage clients in the Netherlands with a loan modification as forbearance. Next to that, ING Bank Belgium implemented a method to identify loans with forbearance in their Retail Banking portfolio which is added to the total of Belgium. ING Bank also implemented the minimum of 2 year curing period requirement as of 2013, as mentioned earlier. The increase of the amount of forbearance outstandings and clients in 2013 in the Consumer Lending portfolio was mainly driven by the combined effect of these changes. The decrease in the UK was due to the divestment of ING Direct UK in Q1 2013.
The total of EUR 810 million of Retail Forbearance Exposure represents 0.3% of the total of ING Bank’s Consumer Retail Lending portfolio.
Credit risk mitigationING Bank’s lending and investment businesses are subject to credit risk. As such, the creditworthiness of our customers and investments is continually monitored for their ability to meet their financial obligations to ING Bank. In addition to determining the credit quality and creditworthiness of the customer, ING Bank uses various credit risk mitigation techniques and instruments to mitigate the credit risk associated with an exposure and to reduce the losses incurred subsequent to an event of default on an obligation a customer may have towards ING Bank. The most common terminology used in ING Bank for credit risk protection is ‘cover’.
While cover can be an important mitigant of credit risk and an alternative source of repayment, generally it is ING Bank’s practice to lend on the basis of the customer’s creditability rather than exclusively relying on the value of the cover.
Within ING Bank, covers can derive from two distinct forms, assets and third party obligations.
AssetsThe asset which has been pledged to ING Bank as collateral or security and which gives ING Bank the right to liquidate, in cases where the customer is unable to fulfil its financial obligation. As such, the proceeds can be applied towards full or partial compensation of the customer’s outstanding exposure. An asset can be tangible (such as cash, securities, receivables, inventory, plant & machinery and mortgages on real estate properties) or intangible (such as patents, trademarks, contract rights and licenses).
Third party obligationThird party obligation, indemnification or undertaking (either by contract and/or by law) is a legally binding declaration by a third party that gives ING Bank the right to expect and claim from that third party to pay an amount, if the customer fails on its obligations to ING Bank. The most common examples are guarantees (such as parent guarantees and export credit insurances) and letters of comfort.
283ING Group Annual Report 2013
1 Wh
o w
e are2 R
epo
rt of th
e Executive B
oard
3 Co
rpo
rate go
vernan
ce4 C
on
solid
ated an
nu
al accou
nts
5 Parent co
mp
any an
nu
al accou
nts
6 Oth
er info
rmatio
n7 A
dd
ition
al info
rmatio
n
ING_2013_deel4a&b_v2.indd 283 19/03/2014 19:23:03
Risk management continued ING Bank
General guidelines on cover valuationGeneral guidelines for cover valuation are established to ensure consistency of the application within ING Bank. These general guidelines also require that the value of the cover need to be monitored on regular basis and in principle at least annually. Covers shall be revalued accordingly and whenever it has reason to believe that the market is subject to significant changes in conditions. The frequency of monitoring and revaluation depends on the type of covers.
The valuation method also depends on the type of covers. For asset collateral, the valuation sources can be the customer’s balance sheet (e.g. inventory, machinery, and equipment), nominal value (e.g. cash, receivables), market value (e.g. securities and commodities), independent valuer (commercial real estate) and market indices (residential real estate). For third party obligation, the valuation is based on the value which is attributed to the contract between ING Bank and that third party.
Cover values by risk categoryThis section provides insight on the type of cover and to which extent the loan is collateralised. The cover disclosures are presented by risk category: Lending, Investment, Money-Market and Pre-settlement. For each risk category, the cover amounts are presented by the most relevant collateral forms, being mortgages and financial collateral (including cash), and the most relevant third party obligation being guarantees. ING Bank obtains covers which are compliant to CRR/CRD IV, as well as those that are not compliant.
The cover values are presented for the total portfolio of ING Bank. In the last year’s disclosure, only the AIRB portfolio was presented with covers in detail while in this year’s disclosure, the covers of both AIRB and SA portfolios are presented in detail reflecting the complete ING Bank’s portfolio. Next to that, detailed information is provided on the cover coverage for the performing and non-performing portfolio. The non-performing loan definition is explained in detail in the section ‘Credit Restructuring’. To increase the understanding of the reader on the nature of the collateralised loans, insight is given in the industry and geography breakdown of the ING Bank portfolio as well. Another improvement is that in addition to the lending risk category, the cover valuation tables now also give insight in the risk categories of Investment, Money Market and Pre-settlement. For comparability reasons, outstandings is used to show the ING Bank’s portfolio instead of READ. Exposures are categorised into different Value to Loan (VTL) buckets which gives insight in the level of collateralisation of ING Bank’s portfolio. VTL is calculated as the cover value divided by the outstandings at the balance sheet date. The cover values are pre-haircut but indexed values and exclude any cost of liquidation. Covers can either be valid for all limits, sublimits or a particular outstanding of a borrower, the latter being the most common. To prevent erroneously inflating the level of collateralisation, the coverage of all outstandings is capped at 100% if there is over-collateralisation on a certain outstanding. As a result, the coverage levels disclosed are conservative. Each limit is subsequently assigned to one of the six defined VTL buckets: no cover/data not available, >0% - 25%, >25% to 50%, >50% to 75%, >75% to <100%, and ≥ 100%. As the nature of the pre-settlement portfolio determines that collateral is netted, these VTL buckets are not shown for the pre-settlement portfolio.
The first two tables give a comprehensive overview of the collateralisation of the total portfolio of ING Bank.
284 ING Group Annual Report 2013
ING_2013_deel4a&b_v2.indd 284 19/03/2014 19:23:03
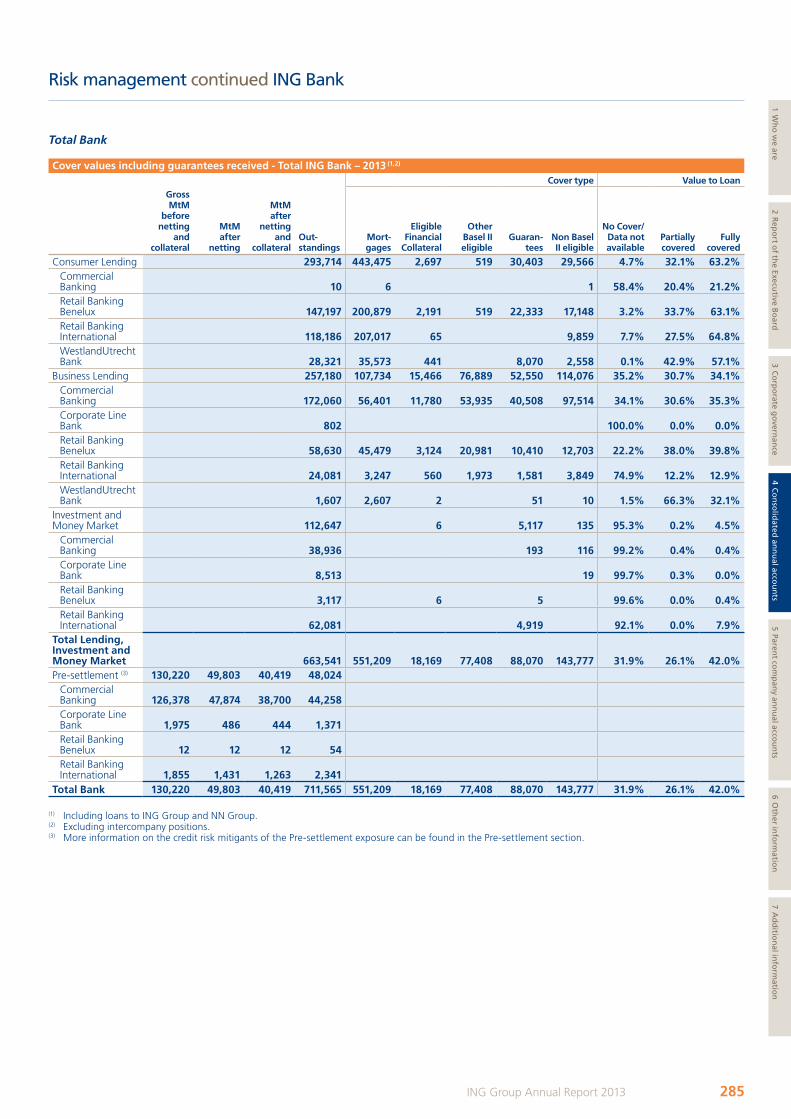
Risk management continued ING Bank
Total Bank
Cover values including guarantees received - Total ING bank – 2013 (1,2)
Cover type Value to Loan
Gross MtM
before netting
and collateral
MtM after
netting
MtM after
netting and
collateralOut-standings
Mort- gages
Eligible Financial
Collateral
Other basel II eligible
Guaran-tees
Non basel II eligible
No Cover/ Data not available
Partially covered
Fully covered
Consumer Lending 293,714 443,475 2,697 519 30,403 29,566 4.7% 32.1% 63.2%Commercial Banking 10 6 1 58.4% 20.4% 21.2%Retail Banking Benelux 147,197 200,879 2,191 519 22,333 17,148 3.2% 33.7% 63.1%Retail Banking International 118,186 207,017 65 9,859 7.7% 27.5% 64.8%WestlandUtrecht Bank 28,321 35,573 441 8,070 2,558 0.1% 42.9% 57.1%
Business Lending 257,180 107,734 15,466 76,889 52,550 114,076 35.2% 30.7% 34.1%Commercial Banking 172,060 56,401 11,780 53,935 40,508 97,514 34.1% 30.6% 35.3%Corporate Line Bank 802 100.0% 0.0% 0.0%Retail Banking Benelux 58,630 45,479 3,124 20,981 10,410 12,703 22.2% 38.0% 39.8%Retail Banking International 24,081 3,247 560 1,973 1,581 3,849 74.9% 12.2% 12.9%WestlandUtrecht Bank 1,607 2,607 2 51 10 1.5% 66.3% 32.1%
Investment and Money Market 112,647 6 5,117 135 95.3% 0.2% 4.5%
Commercial Banking 38,936 193 116 99.2% 0.4% 0.4%Corporate Line Bank 8,513 19 99.7% 0.3% 0.0%Retail Banking Benelux 3,117 6 5 99.6% 0.0% 0.4%Retail Banking International 62,081 4,919 92.1% 0.0% 7.9%
Total Lending, Investment and Money Market 663,541 551,209 18,169 77,408 88,070 143,777 31.9% 26.1% 42.0%Pre-settlement (3) 130,220 49,803 40,419 48,024
Commercial Banking 126,378 47,874 38,700 44,258Corporate Line Bank 1,975 486 444 1,371Retail Banking Benelux 12 12 12 54Retail Banking International 1,855 1,431 1,263 2,341
Total bank 130,220 49,803 40,419 711,565 551,209 18,169 77,408 88,070 143,777 31.9% 26.1% 42.0%
(1) Including loans to ING Group and NN Group.(2) Excluding intercompany positions.(3) More information on the credit risk mitigants of the Pre-settlement exposure can be found in the Pre-settlement section.
285ING Group Annual Report 2013
1 Wh
o w
e are2 R
epo
rt of th
e Executive B
oard
3 Co
rpo
rate go
vernan
ce4 C
on
solid
ated an
nu
al accou
nts
5 Parent co
mp
any an
nu
al accou
nts
6 Oth
er info
rmatio
n7 A
dd
ition
al info
rmatio
n
ING_2013_deel4a&b_v2.indd 285 19/03/2014 19:23:04
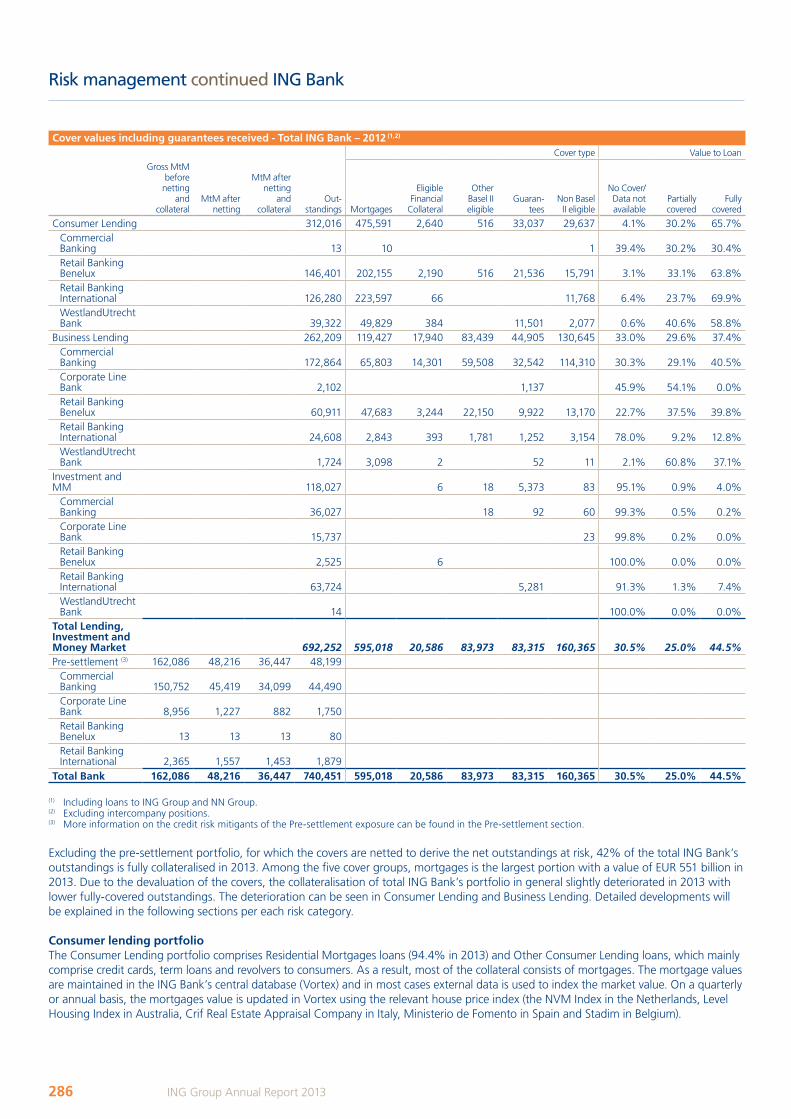
Risk management continued ING Bank
Cover values including guarantees received - Total ING bank – 2012 (1,2)
Cover type Value to Loan
Gross MtM before
netting and
collateralMtM after
netting
MtM after netting
and collateral
Out-standings Mortgages
Eligible Financial
Collateral
Other Basel II eligible
Guaran-tees
Non Basel II eligible
No Cover/ Data not available
Partially covered
Fully covered
Consumer Lending 312,016 475,591 2,640 516 33,037 29,637 4.1% 30.2% 65.7%Commercial Banking 13 10 1 39.4% 30.2% 30.4%Retail Banking Benelux 146,401 202,155 2,190 516 21,536 15,791 3.1% 33.1% 63.8%Retail Banking International 126,280 223,597 66 11,768 6.4% 23.7% 69.9%WestlandUtrecht Bank 39,322 49,829 384 11,501 2,077 0.6% 40.6% 58.8%
Business Lending 262,209 119,427 17,940 83,439 44,905 130,645 33.0% 29.6% 37.4%Commercial Banking 172,864 65,803 14,301 59,508 32,542 114,310 30.3% 29.1% 40.5%Corporate Line Bank 2,102 1,137 45.9% 54.1% 0.0%Retail Banking Benelux 60,911 47,683 3,244 22,150 9,922 13,170 22.7% 37.5% 39.8%Retail Banking International 24,608 2,843 393 1,781 1,252 3,154 78.0% 9.2% 12.8%WestlandUtrecht Bank 1,724 3,098 2 52 11 2.1% 60.8% 37.1%
Investment and MM 118,027 6 18 5,373 83 95.1% 0.9% 4.0%
Commercial Banking 36,027 18 92 60 99.3% 0.5% 0.2%Corporate Line Bank 15,737 23 99.8% 0.2% 0.0%Retail Banking Benelux 2,525 6 100.0% 0.0% 0.0%Retail Banking International 63,724 5,281 91.3% 1.3% 7.4%WestlandUtrecht Bank 14 100.0% 0.0% 0.0%
Total Lending, Investment and Money Market 692,252 595,018 20,586 83,973 83,315 160,365 30.5% 25.0% 44.5%Pre-settlement (3) 162,086 48,216 36,447 48,199
Commercial Banking 150,752 45,419 34,099 44,490Corporate Line Bank 8,956 1,227 882 1,750Retail Banking Benelux 13 13 13 80Retail Banking International 2,365 1,557 1,453 1,879
Total bank 162,086 48,216 36,447 740,451 595,018 20,586 83,973 83,315 160,365 30.5% 25.0% 44.5%
(1) Including loans to ING Group and NN Group.(2) Excluding intercompany positions.(3) More information on the credit risk mitigants of the Pre-settlement exposure can be found in the Pre-settlement section.
Excluding the pre-settlement portfolio, for which the covers are netted to derive the net outstandings at risk, 42% of the total ING Bank’s outstandings is fully collateralised in 2013. Among the five cover groups, mortgages is the largest portion with a value of EUR 551 billion in 2013. Due to the devaluation of the covers, the collateralisation of total ING Bank’s portfolio in general slightly deteriorated in 2013 with lower fully-covered outstandings. The deterioration can be seen in Consumer Lending and Business Lending. Detailed developments will be explained in the following sections per each risk category.
Consumer lending portfolioThe Consumer Lending portfolio comprises Residential Mortgages loans (94.4% in 2013) and Other Consumer Lending loans, which mainly comprise credit cards, term loans and revolvers to consumers. As a result, most of the collateral consists of mortgages. The mortgage values are maintained in the ING Bank’s central database (Vortex) and in most cases external data is used to index the market value. On a quarterly or annual basis, the mortgages value is updated in Vortex using the relevant house price index (the NVM Index in the Netherlands, Level Housing Index in Australia, Crif Real Estate Appraisal Company in Italy, Ministerio de Fomento in Spain and Stadim in Belgium).
286 ING Group Annual Report 2013
ING_2013_deel4a&b_v2.indd 286 19/03/2014 19:23:06
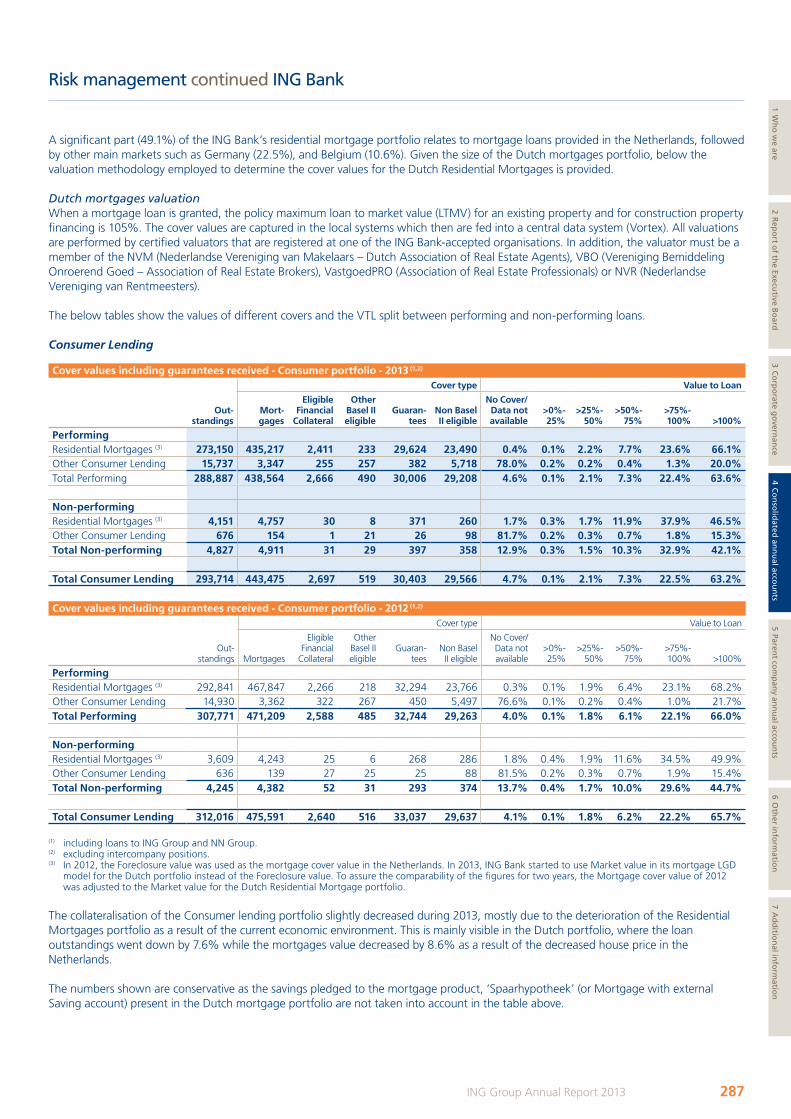
Risk management continued ING Bank
A significant part (49.1%) of the ING Bank’s residential mortgage portfolio relates to mortgage loans provided in the Netherlands, followed by other main markets such as Germany (22.5%), and Belgium (10.6%). Given the size of the Dutch mortgages portfolio, below the valuation methodology employed to determine the cover values for the Dutch Residential Mortgages is provided.
Dutch mortgages valuation When a mortgage loan is granted, the policy maximum loan to market value (LTMV) for an existing property and for construction property financing is 105%. The cover values are captured in the local systems which then are fed into a central data system (Vortex). All valuations are performed by certified valuators that are registered at one of the ING Bank-accepted organisations. In addition, the valuator must be a member of the NVM (Nederlandse Vereniging van Makelaars – Dutch Association of Real Estate Agents), VBO (Vereniging Bemiddeling Onroerend Goed – Association of Real Estate Brokers), VastgoedPRO (Association of Real Estate Professionals) or NVR (Nederlandse Vereniging van Rentmeesters).
The below tables show the values of different covers and the VTL split between performing and non-performing loans.
Consumer Lending
Cover values including guarantees received - Consumer portfolio - 2013 (1,2)
Cover type Value to Loan
Out-standings
Mort-gages
Eligible Financial
Collateral
Other basel II eligible
Guaran-tees
Non basel II eligible
No Cover/ Data not available
>0%- 25%
>25%- 50%
>50%- 75%
>75%- 100% >100%
PerformingResidential Mortgages (3) 273,150 435,217 2,411 233 29,624 23,490 0.4% 0.1% 2.2% 7.7% 23.6% 66.1%Other Consumer Lending 15,737 3,347 255 257 382 5,718 78.0% 0.2% 0.2% 0.4% 1.3% 20.0%Total Performing 288,887 438,564 2,666 490 30,006 29,208 4.6% 0.1% 2.1% 7.3% 22.4% 63.6%
Non-performingResidential Mortgages (3) 4,151 4,757 30 8 371 260 1.7% 0.3% 1.7% 11.9% 37.9% 46.5%Other Consumer Lending 676 154 1 21 26 98 81.7% 0.2% 0.3% 0.7% 1.8% 15.3%Total Non-performing 4,827 4,911 31 29 397 358 12.9% 0.3% 1.5% 10.3% 32.9% 42.1%
Total Consumer Lending 293,714 443,475 2,697 519 30,403 29,566 4.7% 0.1% 2.1% 7.3% 22.5% 63.2%
Cover values including guarantees received - Consumer portfolio - 2012 (1,2)
Cover type Value to Loan
Out-standings Mortgages
Eligible Financial
Collateral
Other Basel II eligible
Guaran-tees
Non Basel II eligible
No Cover/ Data not available
>0%- 25%
>25%- 50%
>50%- 75%
>75%- 100% >100%
PerformingResidential Mortgages (3) 292,841 467,847 2,266 218 32,294 23,766 0.3% 0.1% 1.9% 6.4% 23.1% 68.2%Other Consumer Lending 14,930 3,362 322 267 450 5,497 76.6% 0.1% 0.2% 0.4% 1.0% 21.7%Total Performing 307,771 471,209 2,588 485 32,744 29,263 4.0% 0.1% 1.8% 6.1% 22.1% 66.0%
Non-performingResidential Mortgages (3) 3,609 4,243 25 6 268 286 1.8% 0.4% 1.9% 11.6% 34.5% 49.9%Other Consumer Lending 636 139 27 25 25 88 81.5% 0.2% 0.3% 0.7% 1.9% 15.4%Total Non-performing 4,245 4,382 52 31 293 374 13.7% 0.4% 1.7% 10.0% 29.6% 44.7%
Total Consumer Lending 312,016 475,591 2,640 516 33,037 29,637 4.1% 0.1% 1.8% 6.2% 22.2% 65.7%
(1) including loans to ING Group and NN Group.(2) excluding intercompany positions.(3) In 2012, the Foreclosure value was used as the mortgage cover value in the Netherlands. In 2013, ING Bank started to use Market value in its mortgage LGD
model for the Dutch portfolio instead of the Foreclosure value. To assure the comparability of the figures for two years, the Mortgage cover value of 2012 was adjusted to the Market value for the Dutch Residential Mortgage portfolio.
The collateralisation of the Consumer lending portfolio slightly decreased during 2013, mostly due to the deterioration of the Residential Mortgages portfolio as a result of the current economic environment. This is mainly visible in the Dutch portfolio, where the loan outstandings went down by 7.6% while the mortgages value decreased by 8.6% as a result of the decreased house price in the Netherlands.
The numbers shown are conservative as the savings pledged to the mortgage product, ‘Spaarhypotheek’ (or Mortgage with external Saving account) present in the Dutch mortgage portfolio are not taken into account in the table above.
287ING Group Annual Report 2013
1 Wh
o w
e are2 R
epo
rt of th
e Executive B
oard
3 Co
rpo
rate go
vernan
ce4 C
on
solid
ated an
nu
al accou
nts
5 Parent co
mp
any an
nu
al accou
nts
6 Oth
er info
rmatio
n7 A
dd
ition
al info
rmatio
n
ING_2013_deel4a&b_v2.indd 287 19/03/2014 19:23:07
Risk management continued ING Bank
The downward impact of the Dutch portfolio on the coverage quality of the ING Bank’s mortgage portfolio was alleviated by the improvement in the portfolio in Belgium, where the house price experienced an upward trend in 2013. This development was mirrored in the 5.1% increase in the mortgages cover value whilst the outstandings increased by 3.3%. Beside the improved housing market, another element ameliorating the collateralisation quality is the reduced presence of the bullet mortgages in the portfolio.
For the Residential Mortgages portfolio, the guarantees relate to mortgages covered by governmental insurers under the Nationale Hypotheek Garantie (NHG) in the Netherlands. The NHG guarantees the repayment of a loan in case of a forced property sale.
business Lending portfolio Business Lending is an important business of ING Bank, accounting for 36.1% of the total ING Bank’s outstandings. In line with our objective to give stakeholders insight into the portfolio, we present the Business Lending portfolio per Industry breakdown in accordance with the NAICS definition and per Region and main market. Business Lending presented in this section does not include Pre-settlement and Investment & Money Market exposures, which are separately exhibited in the next sections.
The table below provides the ING Bank’s portfolio broken down per NAICS Industry code. The Business Lending portfolio comprises for 16.5% of the Industry type Real Estate. This cannot be completely compared with ING Bank’s Real Estate Finance portfolio as the scope and definition are differently determined.
The REF portfolio has not stabilised since the deterioration of the economic environment which started in 2008. As a result of this, in the recent years, ING Bank aims to be more selective in the financing of Real Estate. As this sector has proven to be significantly impacted during the crisis, the value of collaterals for this portfolio is of specific importance. The REF portfolio, which mostly focuses on the business whereby ING Bank finances or refinances income producing real estate in office, retail, residential and industrial (logistics) segments or a mix of commercial properties, presents approximately 56.4% of the Real Estate sector’s outstanding.
Cover valuation for REF portfolioThe cover valuation policy and governance within ING Bank ensures that the cover values reflect the current fair value on the date of the valuation. All commercial properties financed by ING Bank need to be (re)-valued within three years’ period or more frequently if market conditions or the risk profile deteriorates. Non-performing loans and high risk Watch-list REF files are re-valued at least annually.
The valuation of financed properties at origination of a REF deal or the revaluation is always performed by a real estate appraiser. For commercial properties located in the Netherlands, an internal real estate appraiser (80% of the assets) or an external real estate appraiser (20% of the assets) performs the (re)valuation while for properties outside the Netherlands, the (re)-valuation is always performed through an external real estate appraiser.
During this three-year cycle, for properties located in the Netherlands, if the risk profile remains stable or improves, only yearly indexation is performed. The indices used are from ROZ/IPD (Vereniging Raad voor Onroerende Zaken – Association of Real Estate Council/Investment Property Databank). If the risk profile deteriorates, a revaluation is required.
The assessment of risk profile is performed based on certain defined factors, such as external drivers including macro developments (GDP, unemployment rate, Consumer confidence rate, Interest rate) and meso indicators (Real Estate quarterly data from Real Estate institution) and internal drivers including micro deteriorations (such as vacancy, weighted average lease expiry or WALE, and EBITDA) and individual deteriorations (being Watch listed, Credit event, suspension of payments, bankruptcy of a major tenant, actual or expected increase in vacancy level).
For financing properties outside the Netherlands, the revaluation cycle is also set to three years. In case the agreed LTV covenants are not met, an annual or bi-annual revaluation will take place. The outcome of the re-valuation or indexed value is updated accordingly in the cover REF database.
288 ING Group Annual Report 2013
ING_2013_deel4a&b_v2.indd 288 19/03/2014 19:23:07
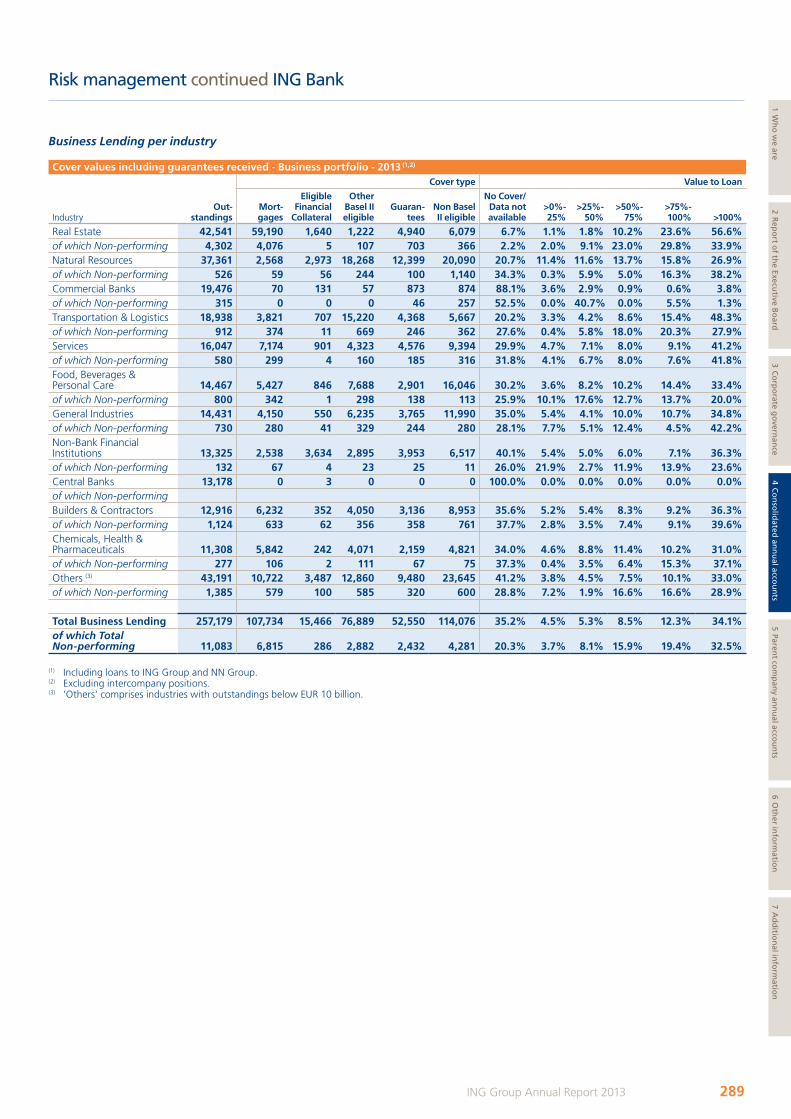
Risk management continued ING Bank
Business Lending per industry
Cover values including guarantees received - business portfolio - 2013 (1,2)
Cover type Value to Loan
IndustryOut-
standingsMort- gages
Eligible Financial
Collateral
Other basel II eligible
Guaran-tees
Non basel II eligible
No Cover/ Data not available
>0%- 25%
>25%- 50%
>50%- 75%
>75%- 100% >100%
Real Estate 42,541 59,190 1,640 1,222 4,940 6,079 6.7% 1.1% 1.8% 10.2% 23.6% 56.6%of which Non-performing 4,302 4,076 5 107 703 366 2.2% 2.0% 9.1% 23.0% 29.8% 33.9%Natural Resources 37,361 2,568 2,973 18,268 12,399 20,090 20.7% 11.4% 11.6% 13.7% 15.8% 26.9%of which Non-performing 526 59 56 244 100 1,140 34.3% 0.3% 5.9% 5.0% 16.3% 38.2%Commercial Banks 19,476 70 131 57 873 874 88.1% 3.6% 2.9% 0.9% 0.6% 3.8%of which Non-performing 315 0 0 0 46 257 52.5% 0.0% 40.7% 0.0% 5.5% 1.3%Transportation & Logistics 18,938 3,821 707 15,220 4,368 5,667 20.2% 3.3% 4.2% 8.6% 15.4% 48.3%of which Non-performing 912 374 11 669 246 362 27.6% 0.4% 5.8% 18.0% 20.3% 27.9%Services 16,047 7,174 901 4,323 4,576 9,394 29.9% 4.7% 7.1% 8.0% 9.1% 41.2%of which Non-performing 580 299 4 160 185 316 31.8% 4.1% 6.7% 8.0% 7.6% 41.8%Food, Beverages & Personal Care 14,467 5,427 846 7,688 2,901 16,046 30.2% 3.6% 8.2% 10.2% 14.4% 33.4%of which Non-performing 800 342 1 298 138 113 25.9% 10.1% 17.6% 12.7% 13.7% 20.0%General Industries 14,431 4,150 550 6,235 3,765 11,990 35.0% 5.4% 4.1% 10.0% 10.7% 34.8%of which Non-performing 730 280 41 329 244 280 28.1% 7.7% 5.1% 12.4% 4.5% 42.2%Non-Bank Financial Institutions 13,325 2,538 3,634 2,895 3,953 6,517 40.1% 5.4% 5.0% 6.0% 7.1% 36.3%of which Non-performing 132 67 4 23 25 11 26.0% 21.9% 2.7% 11.9% 13.9% 23.6%Central Banks 13,178 0 3 0 0 0 100.0% 0.0% 0.0% 0.0% 0.0% 0.0%of which Non-performingBuilders & Contractors 12,916 6,232 352 4,050 3,136 8,953 35.6% 5.2% 5.4% 8.3% 9.2% 36.3%of which Non-performing 1,124 633 62 356 358 761 37.7% 2.8% 3.5% 7.4% 9.1% 39.6%Chemicals, Health & Pharmaceuticals 11,308 5,842 242 4,071 2,159 4,821 34.0% 4.6% 8.8% 11.4% 10.2% 31.0%of which Non-performing 277 106 2 111 67 75 37.3% 0.4% 3.5% 6.4% 15.3% 37.1%Others (3) 43,191 10,722 3,487 12,860 9,480 23,645 41.2% 3.8% 4.5% 7.5% 10.1% 33.0%of which Non-performing 1,385 579 100 585 320 600 28.8% 7.2% 1.9% 16.6% 16.6% 28.9% Total business Lending 257,179 107,734 15,466 76,889 52,550 114,076 35.2% 4.5% 5.3% 8.5% 12.3% 34.1%of which Total Non-performing 11,083 6,815 286 2,882 2,432 4,281 20.3% 3.7% 8.1% 15.9% 19.4% 32.5%
(1) Including loans to ING Group and NN Group.(2) Excluding intercompany positions.(3) ’Others‘ comprises industries with outstandings below EUR 10 billion.
289ING Group Annual Report 2013
1 Wh
o w
e are2 R
epo
rt of th
e Executive B
oard
3 Co
rpo
rate go
vernan
ce4 C
on
solid
ated an
nu
al accou
nts
5 Parent co
mp
any an
nu
al accou
nts
6 Oth
er info
rmatio
n7 A
dd
ition
al info
rmatio
n
ING_2013_deel4a&b_v2.indd 289 19/03/2014 19:23:07
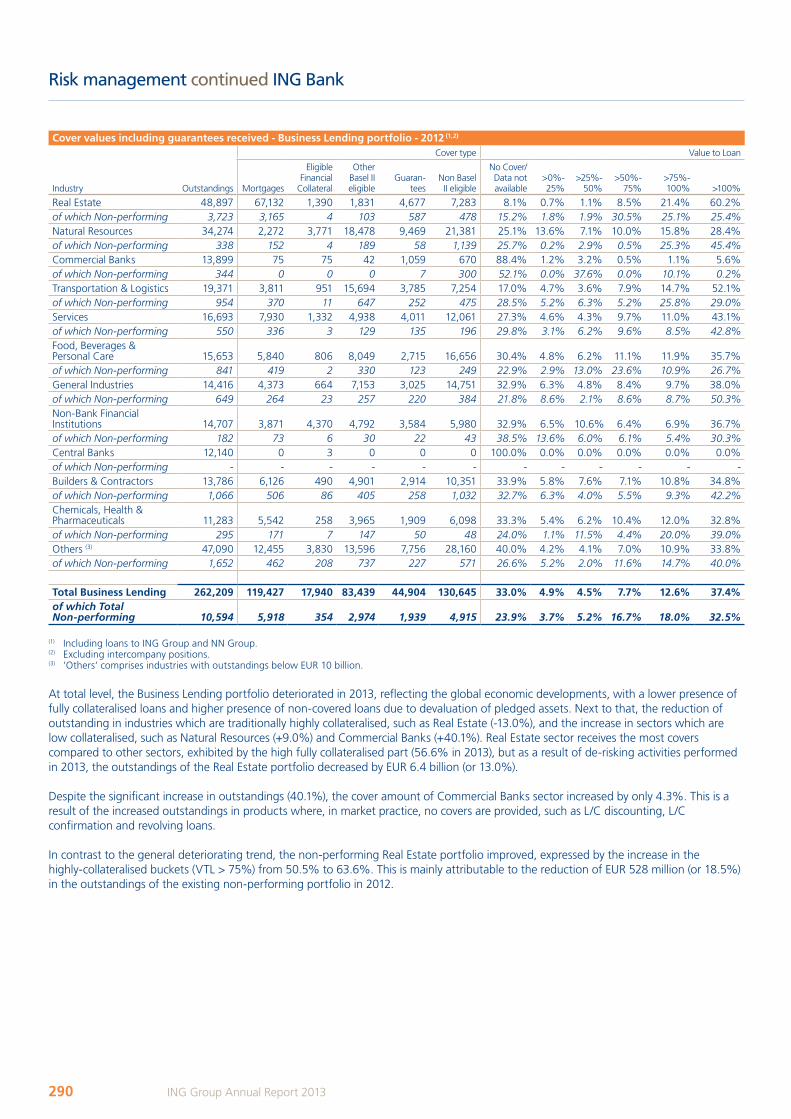
Risk management continued ING Bank
Cover values including guarantees received - business Lending portfolio - 2012 (1,2)
Cover type Value to Loan
Industry Outstandings Mortgages
Eligible Financial
Collateral
Other Basel II eligible
Guaran-tees
Non Basel II eligible
No Cover/ Data not available
>0%- 25%
>25%- 50%
>50%- 75%
>75%- 100% >100%
Real Estate 48,897 67,132 1,390 1,831 4,677 7,283 8.1% 0.7% 1.1% 8.5% 21.4% 60.2%of which Non-performing 3,723 3,165 4 103 587 478 15.2% 1.8% 1.9% 30.5% 25.1% 25.4%Natural Resources 34,274 2,272 3,771 18,478 9,469 21,381 25.1% 13.6% 7.1% 10.0% 15.8% 28.4%of which Non-performing 338 152 4 189 58 1,139 25.7% 0.2% 2.9% 0.5% 25.3% 45.4%Commercial Banks 13,899 75 75 42 1,059 670 88.4% 1.2% 3.2% 0.5% 1.1% 5.6%of which Non-performing 344 0 0 0 7 300 52.1% 0.0% 37.6% 0.0% 10.1% 0.2%Transportation & Logistics 19,371 3,811 951 15,694 3,785 7,254 17.0% 4.7% 3.6% 7.9% 14.7% 52.1%of which Non-performing 954 370 11 647 252 475 28.5% 5.2% 6.3% 5.2% 25.8% 29.0%Services 16,693 7,930 1,332 4,938 4,011 12,061 27.3% 4.6% 4.3% 9.7% 11.0% 43.1%of which Non-performing 550 336 3 129 135 196 29.8% 3.1% 6.2% 9.6% 8.5% 42.8%Food, Beverages & Personal Care 15,653 5,840 806 8,049 2,715 16,656 30.4% 4.8% 6.2% 11.1% 11.9% 35.7%of which Non-performing 841 419 2 330 123 249 22.9% 2.9% 13.0% 23.6% 10.9% 26.7%General Industries 14,416 4,373 664 7,153 3,025 14,751 32.9% 6.3% 4.8% 8.4% 9.7% 38.0%of which Non-performing 649 264 23 257 220 384 21.8% 8.6% 2.1% 8.6% 8.7% 50.3%Non-Bank Financial Institutions 14,707 3,871 4,370 4,792 3,584 5,980 32.9% 6.5% 10.6% 6.4% 6.9% 36.7%of which Non-performing 182 73 6 30 22 43 38.5% 13.6% 6.0% 6.1% 5.4% 30.3%Central Banks 12,140 0 3 0 0 0 100.0% 0.0% 0.0% 0.0% 0.0% 0.0%of which Non-performing - - - - - - - - - - - -Builders & Contractors 13,786 6,126 490 4,901 2,914 10,351 33.9% 5.8% 7.6% 7.1% 10.8% 34.8%of which Non-performing 1,066 506 86 405 258 1,032 32.7% 6.3% 4.0% 5.5% 9.3% 42.2%Chemicals, Health & Pharmaceuticals 11,283 5,542 258 3,965 1,909 6,098 33.3% 5.4% 6.2% 10.4% 12.0% 32.8%of which Non-performing 295 171 7 147 50 48 24.0% 1.1% 11.5% 4.4% 20.0% 39.0%Others (3) 47,090 12,455 3,830 13,596 7,756 28,160 40.0% 4.2% 4.1% 7.0% 10.9% 33.8%of which Non-performing 1,652 462 208 737 227 571 26.6% 5.2% 2.0% 11.6% 14.7% 40.0% Total business Lending 262,209 119,427 17,940 83,439 44,904 130,645 33.0% 4.9% 4.5% 7.7% 12.6% 37.4%of which Total Non-performing 10,594 5,918 354 2,974 1,939 4,915 23.9% 3.7% 5.2% 16.7% 18.0% 32.5%
(1) Including loans to ING Group and NN Group.(2) Excluding intercompany positions.(3) ’Others‘ comprises industries with outstandings below EUR 10 billion.
At total level, the Business Lending portfolio deteriorated in 2013, reflecting the global economic developments, with a lower presence of fully collateralised loans and higher presence of non-covered loans due to devaluation of pledged assets. Next to that, the reduction of outstanding in industries which are traditionally highly collateralised, such as Real Estate (-13.0%), and the increase in sectors which are low collateralised, such as Natural Resources (+9.0%) and Commercial Banks (+40.1%). Real Estate sector receives the most covers compared to other sectors, exhibited by the high fully collateralised part (56.6% in 2013), but as a result of de-risking activities performed in 2013, the outstandings of the Real Estate portfolio decreased by EUR 6.4 billion (or 13.0%).
Despite the significant increase in outstandings (40.1%), the cover amount of Commercial Banks sector increased by only 4.3%. This is a result of the increased outstandings in products where, in market practice, no covers are provided, such as L/C discounting, L/C confirmation and revolving loans.
In contrast to the general deteriorating trend, the non-performing Real Estate portfolio improved, expressed by the increase in the highly-collateralised buckets (VTL > 75%) from 50.5% to 63.6%. This is mainly attributable to the reduction of EUR 528 million (or 18.5%) in the outstandings of the existing non-performing portfolio in 2012.
290 ING Group Annual Report 2013
ING_2013_deel4a&b_v2.indd 290 19/03/2014 19:23:08
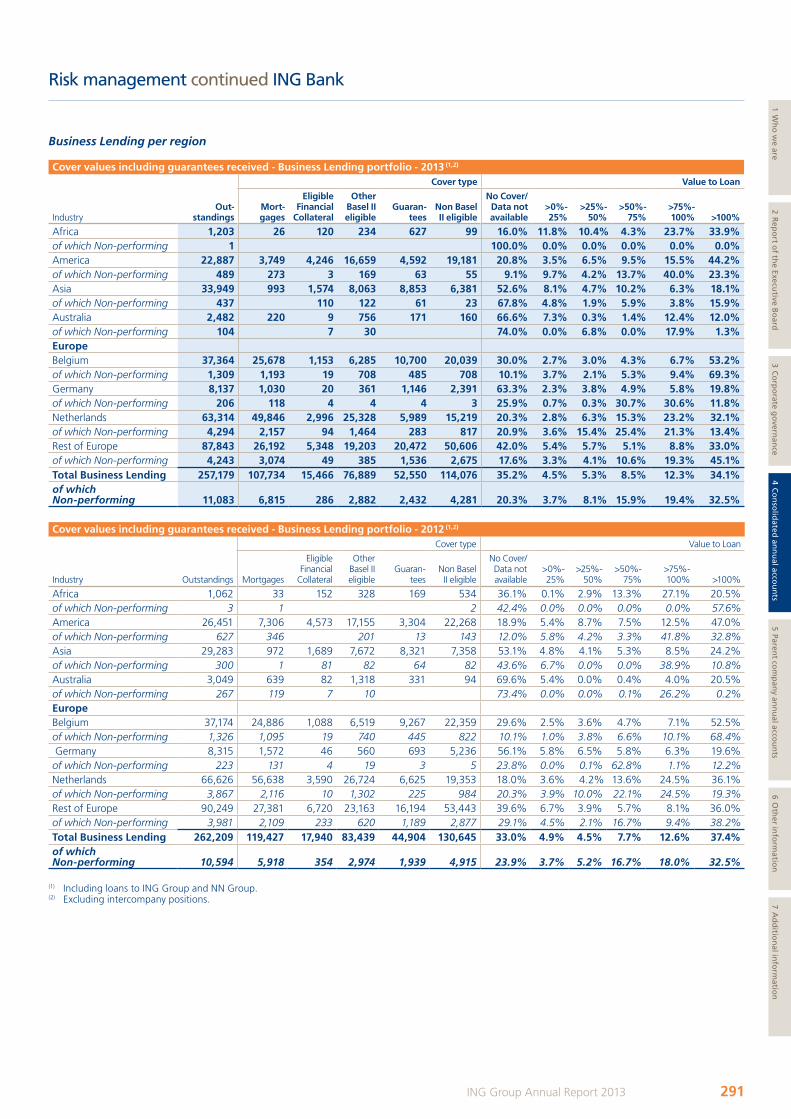
Risk management continued ING Bank
Business Lending per region
Cover values including guarantees received - business Lending portfolio - 2013 (1,2)
Cover type Value to Loan
IndustryOut-
standingsMort-gages
Eligible Financial
Collateral
Other basel II eligible
Guaran-tees
Non basel II eligible
No Cover/ Data not available
>0%- 25%
>25%- 50%
>50%- 75%
>75%- 100% >100%
Africa 1,203 26 120 234 627 99 16.0% 11.8% 10.4% 4.3% 23.7% 33.9%of which Non-performing 1 100.0% 0.0% 0.0% 0.0% 0.0% 0.0%America 22,887 3,749 4,246 16,659 4,592 19,181 20.8% 3.5% 6.5% 9.5% 15.5% 44.2%of which Non-performing 489 273 3 169 63 55 9.1% 9.7% 4.2% 13.7% 40.0% 23.3%Asia 33,949 993 1,574 8,063 8,853 6,381 52.6% 8.1% 4.7% 10.2% 6.3% 18.1%of which Non-performing 437 110 122 61 23 67.8% 4.8% 1.9% 5.9% 3.8% 15.9%Australia 2,482 220 9 756 171 160 66.6% 7.3% 0.3% 1.4% 12.4% 12.0%of which Non-performing 104 7 30 74.0% 0.0% 6.8% 0.0% 17.9% 1.3%EuropeBelgium 37,364 25,678 1,153 6,285 10,700 20,039 30.0% 2.7% 3.0% 4.3% 6.7% 53.2%of which Non-performing 1,309 1,193 19 708 485 708 10.1% 3.7% 2.1% 5.3% 9.4% 69.3% Germany 8,137 1,030 20 361 1,146 2,391 63.3% 2.3% 3.8% 4.9% 5.8% 19.8%of which Non-performing 206 118 4 4 4 3 25.9% 0.7% 0.3% 30.7% 30.6% 11.8%Netherlands 63,314 49,846 2,996 25,328 5,989 15,219 20.3% 2.8% 6.3% 15.3% 23.2% 32.1%of which Non-performing 4,294 2,157 94 1,464 283 817 20.9% 3.6% 15.4% 25.4% 21.3% 13.4%Rest of Europe 87,843 26,192 5,348 19,203 20,472 50,606 42.0% 5.4% 5.7% 5.1% 8.8% 33.0%of which Non-performing 4,243 3,074 49 385 1,536 2,675 17.6% 3.3% 4.1% 10.6% 19.3% 45.1%Total business Lending 257,179 107,734 15,466 76,889 52,550 114,076 35.2% 4.5% 5.3% 8.5% 12.3% 34.1% of which Non-performing 11,083 6,815 286 2,882 2,432 4,281 20.3% 3.7% 8.1% 15.9% 19.4% 32.5%
Cover values including guarantees received - business Lending portfolio - 2012 (1,2)
Cover type Value to Loan
Industry Outstandings Mortgages
Eligible Financial
Collateral
Other Basel II eligible
Guaran-tees
Non Basel II eligible
No Cover/ Data not available
>0%- 25%
>25%- 50%
>50%- 75%
>75%- 100% >100%
Africa 1,062 33 152 328 169 534 36.1% 0.1% 2.9% 13.3% 27.1% 20.5%of which Non-performing 3 1 2 42.4% 0.0% 0.0% 0.0% 0.0% 57.6%America 26,451 7,306 4,573 17,155 3,304 22,268 18.9% 5.4% 8.7% 7.5% 12.5% 47.0%of which Non-performing 627 346 201 13 143 12.0% 5.8% 4.2% 3.3% 41.8% 32.8%Asia 29,283 972 1,689 7,672 8,321 7,358 53.1% 4.8% 4.1% 5.3% 8.5% 24.2%of which Non-performing 300 1 81 82 64 82 43.6% 6.7% 0.0% 0.0% 38.9% 10.8%Australia 3,049 639 82 1,318 331 94 69.6% 5.4% 0.0% 0.4% 4.0% 20.5%of which Non-performing 267 119 7 10 73.4% 0.0% 0.0% 0.1% 26.2% 0.2%EuropeBelgium 37,174 24,886 1,088 6,519 9,267 22,359 29.6% 2.5% 3.6% 4.7% 7.1% 52.5%of which Non-performing 1,326 1,095 19 740 445 822 10.1% 1.0% 3.8% 6.6% 10.1% 68.4% Germany 8,315 1,572 46 560 693 5,236 56.1% 5.8% 6.5% 5.8% 6.3% 19.6%of which Non-performing 223 131 4 19 3 5 23.8% 0.0% 0.1% 62.8% 1.1% 12.2%Netherlands 66,626 56,638 3,590 26,724 6,625 19,353 18.0% 3.6% 4.2% 13.6% 24.5% 36.1%of which Non-performing 3,867 2,116 10 1,302 225 984 20.3% 3.9% 10.0% 22.1% 24.5% 19.3%Rest of Europe 90,249 27,381 6,720 23,163 16,194 53,443 39.6% 6.7% 3.9% 5.7% 8.1% 36.0%of which Non-performing 3,981 2,109 233 620 1,189 2,877 29.1% 4.5% 2.1% 16.7% 9.4% 38.2%Total business Lending 262,209 119,427 17,940 83,439 44,904 130,645 33.0% 4.9% 4.5% 7.7% 12.6% 37.4%of which Non-performing 10,594 5,918 354 2,974 1,939 4,915 23.9% 3.7% 5.2% 16.7% 18.0% 32.5%
(1) Including loans to ING Group and NN Group.(2) Excluding intercompany positions.
291ING Group Annual Report 2013
1 Wh
o w
e are2 R
epo
rt of th
e Executive B
oard
3 Co
rpo
rate go
vernan
ce4 C
on
solid
ated an
nu
al accou
nts
5 Parent co
mp
any an
nu
al accou
nts
6 Oth
er info
rmatio
n7 A
dd
ition
al info
rmatio
n
ING_2013_deel4a&b_v2.indd 291 19/03/2014 19:23:09
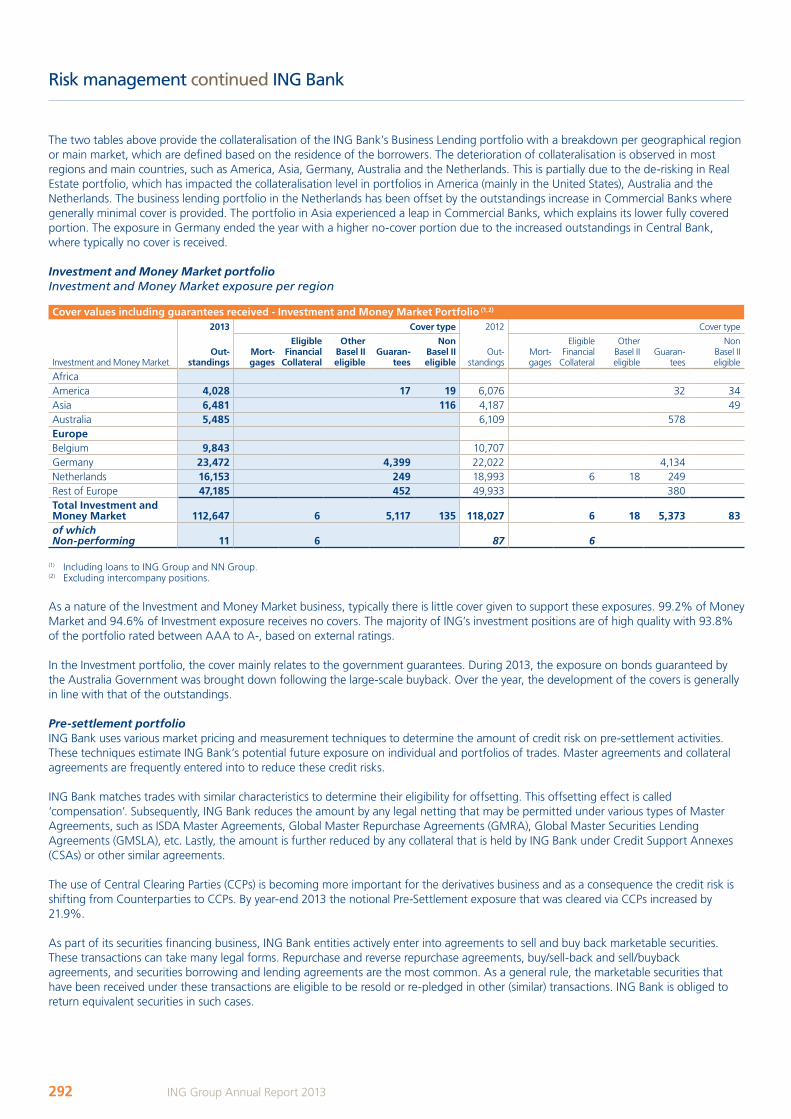
Risk management continued ING Bank
The two tables above provide the collateralisation of the ING Bank’s Business Lending portfolio with a breakdown per geographical region or main market, which are defined based on the residence of the borrowers. The deterioration of collateralisation is observed in most regions and main countries, such as America, Asia, Germany, Australia and the Netherlands. This is partially due to the de-risking in Real Estate portfolio, which has impacted the collateralisation level in portfolios in America (mainly in the United States), Australia and the Netherlands. The business lending portfolio in the Netherlands has been offset by the outstandings increase in Commercial Banks where generally minimal cover is provided. The portfolio in Asia experienced a leap in Commercial Banks, which explains its lower fully covered portion. The exposure in Germany ended the year with a higher no-cover portion due to the increased outstandings in Central Bank, where typically no cover is received.
Investment and Money Market portfolioInvestment and Money Market exposure per region
Cover values including guarantees received - Investment and Money Market Portfolio (1,2)
2013 Cover type 2012 Cover type
Investment and Money MarketOut-
standingsMort-gages
Eligible Financial
Collateral
Other basel II eligible
Guaran-tees
Non basel II eligible
Out-standings
Mort-gages
Eligible Financial
Collateral
Other Basel II eligible
Guaran-tees
Non Basel II eligible
AfricaAmerica 4,028 17 19 6,076 32 34Asia 6,481 116 4,187 49Australia 5,485 6,109 578EuropeBelgium 9,843 10,707Germany 23,472 4,399 22,022 4,134Netherlands 16,153 249 18,993 6 18 249Rest of Europe 47,185 452 49,933 380Total Investment and Money Market 112,647 6 5,117 135 118,027 6 18 5,373 83of which Non-performing 11 6 87 6
(1) Including loans to ING Group and NN Group.(2) Excluding intercompany positions.
As a nature of the Investment and Money Market business, typically there is little cover given to support these exposures. 99.2% of Money Market and 94.6% of Investment exposure receives no covers. The majority of ING’s investment positions are of high quality with 93.8% of the portfolio rated between AAA to A-, based on external ratings.
In the Investment portfolio, the cover mainly relates to the government guarantees. During 2013, the exposure on bonds guaranteed by the Australia Government was brought down following the large-scale buyback. Over the year, the development of the covers is generally in line with that of the outstandings.
Pre-settlement portfolioING Bank uses various market pricing and measurement techniques to determine the amount of credit risk on pre-settlement activities. These techniques estimate ING Bank’s potential future exposure on individual and portfolios of trades. Master agreements and collateral agreements are frequently entered into to reduce these credit risks.
ING Bank matches trades with similar characteristics to determine their eligibility for offsetting. This offsetting effect is called ‘compensation’. Subsequently, ING Bank reduces the amount by any legal netting that may be permitted under various types of Master Agreements, such as ISDA Master Agreements, Global Master Repurchase Agreements (GMRA), Global Master Securities Lending Agreements (GMSLA), etc. Lastly, the amount is further reduced by any collateral that is held by ING Bank under Credit Support Annexes (CSAs) or other similar agreements.
The use of Central Clearing Parties (CCPs) is becoming more important for the derivatives business and as a consequence the credit risk is shifting from Counterparties to CCPs. By year-end 2013 the notional Pre-Settlement exposure that was cleared via CCPs increased by 21.9%.
As part of its securities financing business, ING Bank entities actively enter into agreements to sell and buy back marketable securities. These transactions can take many legal forms. Repurchase and reverse repurchase agreements, buy/sell-back and sell/buyback agreements, and securities borrowing and lending agreements are the most common. As a general rule, the marketable securities that have been received under these transactions are eligible to be resold or re-pledged in other (similar) transactions. ING Bank is obliged to return equivalent securities in such cases.
292 ING Group Annual Report 2013
ING_2013_deel4a&b_v2.indd 292 19/03/2014 19:23:09
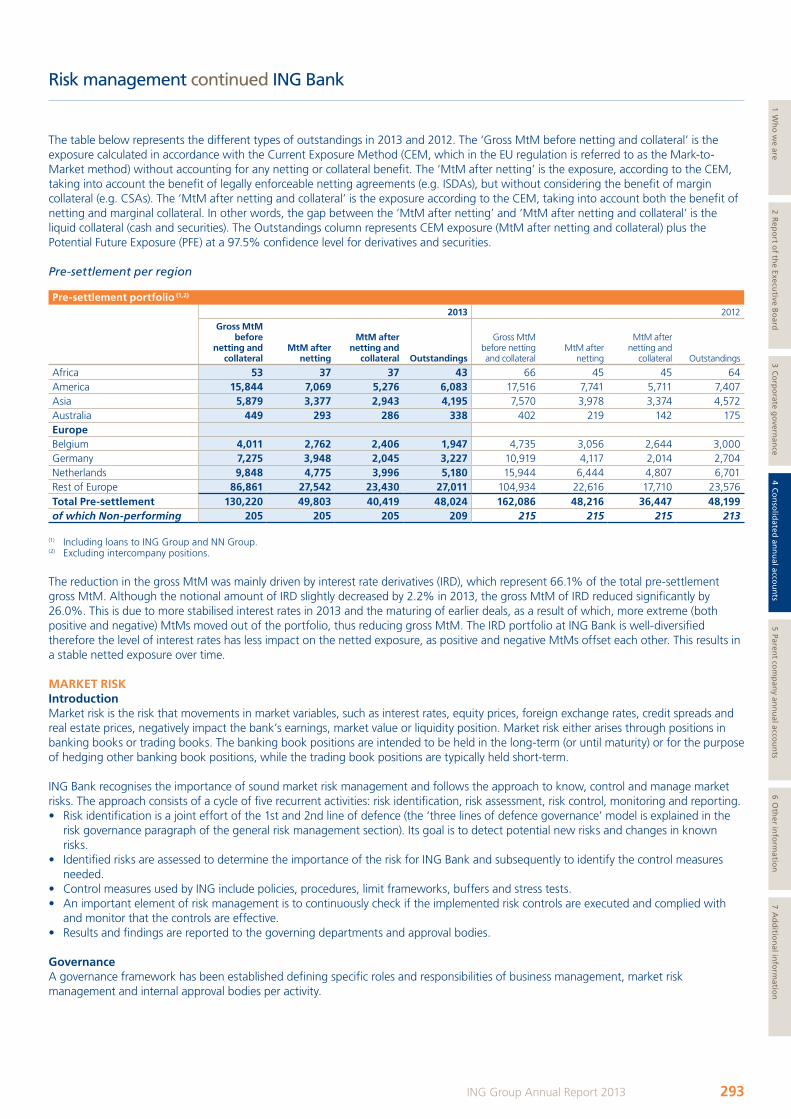
Risk management continued ING Bank
The table below represents the different types of outstandings in 2013 and 2012. The ‘Gross MtM before netting and collateral’ is the exposure calculated in accordance with the Current Exposure Method (CEM, which in the EU regulation is referred to as the Mark-to-Market method) without accounting for any netting or collateral benefit. The ‘MtM after netting’ is the exposure, according to the CEM, taking into account the benefit of legally enforceable netting agreements (e.g. ISDAs), but without considering the benefit of margin collateral (e.g. CSAs). The ‘MtM after netting and collateral’ is the exposure according to the CEM, taking into account both the benefit of netting and marginal collateral. In other words, the gap between the ‘MtM after netting’ and ‘MtM after netting and collateral’ is the liquid collateral (cash and securities). The Outstandings column represents CEM exposure (MtM after netting and collateral) plus the Potential Future Exposure (PFE) at a 97.5% confidence level for derivatives and securities.
Pre-settlement per region
Pre-settlement portfolio (1,2)
2013 2012
Gross MtM before
netting and collateral
MtM after netting
MtM after netting and
collateral Outstandings
Gross MtM before netting and collateral
MtM after netting
MtM after netting and
collateral Outstandings
Africa 53 37 37 43 66 45 45 64America 15,844 7,069 5,276 6,083 17,516 7,741 5,711 7,407Asia 5,879 3,377 2,943 4,195 7,570 3,978 3,374 4,572Australia 449 293 286 338 402 219 142 175EuropeBelgium 4,011 2,762 2,406 1,947 4,735 3,056 2,644 3,000Germany 7,275 3,948 2,045 3,227 10,919 4,117 2,014 2,704Netherlands 9,848 4,775 3,996 5,180 15,944 6,444 4,807 6,701Rest of Europe 86,861 27,542 23,430 27,011 104,934 22,616 17,710 23,576Total Pre-settlement 130,220 49,803 40,419 48,024 162,086 48,216 36,447 48,199of which Non-performing 205 205 205 209 215 215 215 213
(1) Including loans to ING Group and NN Group.(2) Excluding intercompany positions.
The reduction in the gross MtM was mainly driven by interest rate derivatives (IRD), which represent 66.1% of the total pre-settlement gross MtM. Although the notional amount of IRD slightly decreased by 2.2% in 2013, the gross MtM of IRD reduced significantly by 26.0%. This is due to more stabilised interest rates in 2013 and the maturing of earlier deals, as a result of which, more extreme (both positive and negative) MtMs moved out of the portfolio, thus reducing gross MtM. The IRD portfolio at ING Bank is well-diversified therefore the level of interest rates has less impact on the netted exposure, as positive and negative MtMs offset each other. This results in a stable netted exposure over time.
MARKET RISKIntroductionMarket risk is the risk that movements in market variables, such as interest rates, equity prices, foreign exchange rates, credit spreads and real estate prices, negatively impact the bank’s earnings, market value or liquidity position. Market risk either arises through positions in banking books or trading books. The banking book positions are intended to be held in the long-term (or until maturity) or for the purpose of hedging other banking book positions, while the trading book positions are typically held short-term.
ING Bank recognises the importance of sound market risk management and follows the approach to know, control and manage market risks. The approach consists of a cycle of five recurrent activities: risk identification, risk assessment, risk control, monitoring and reporting. • Risk identification is a joint effort of the 1st and 2nd line of defence (the ‘three lines of defence governance’ model is explained in the
risk governance paragraph of the general risk management section). Its goal is to detect potential new risks and changes in known risks.
• Identified risks are assessed to determine the importance of the risk for ING Bank and subsequently to identify the control measures needed.
• Control measures used by ING include policies, procedures, limit frameworks, buffers and stress tests. • An important element of risk management is to continuously check if the implemented risk controls are executed and complied with
and monitor that the controls are effective. • Results and findings are reported to the governing departments and approval bodies.
GovernanceA governance framework has been established defining specific roles and responsibilities of business management, market risk management and internal approval bodies per activity.
293ING Group Annual Report 2013
1 Wh
o w
e are2 R
epo
rt of th
e Executive B
oard
3 Co
rpo
rate go
vernan
ce4 C
on
solid
ated an
nu
al accou
nts
5 Parent co
mp
any an
nu
al accou
nts
6 Oth
er info
rmatio
n7 A
dd
ition
al info
rmatio
n
ING_2013_deel4a&b_v2.indd 293 19/03/2014 19:23:10
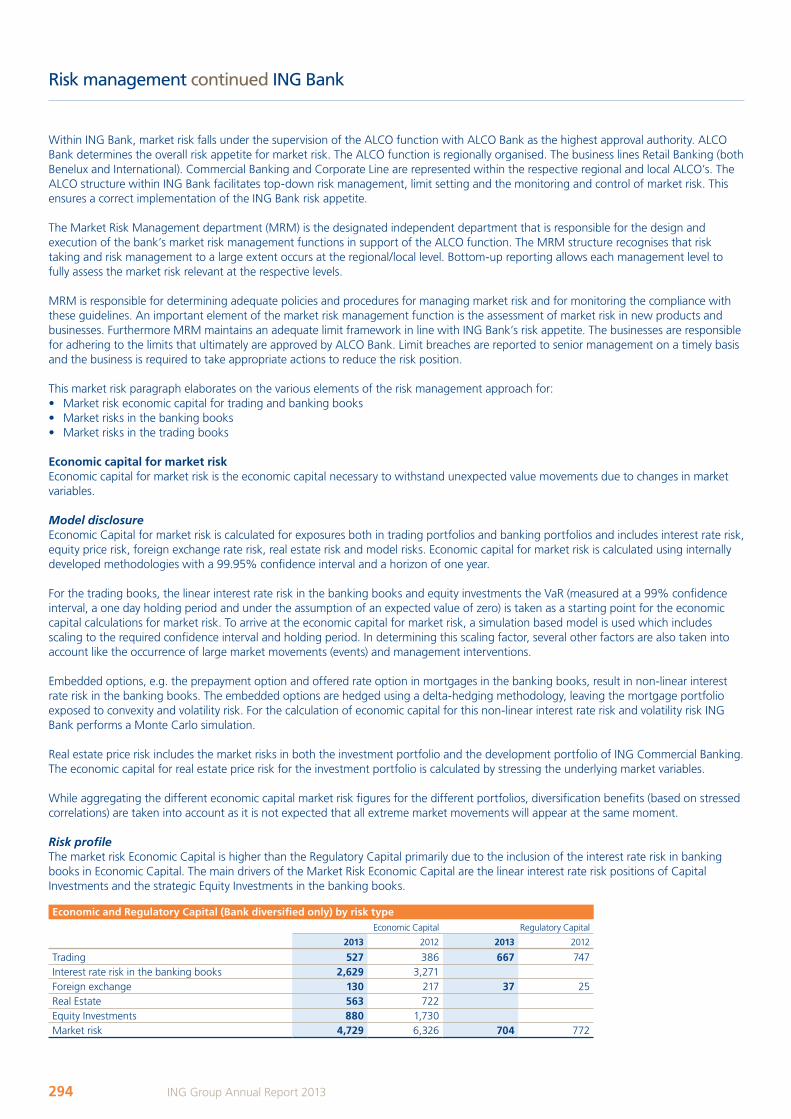
Risk management continued ING Bank
Within ING Bank, market risk falls under the supervision of the ALCO function with ALCO Bank as the highest approval authority. ALCO Bank determines the overall risk appetite for market risk. The ALCO function is regionally organised. The business lines Retail Banking (both Benelux and International). Commercial Banking and Corporate Line are represented within the respective regional and local ALCO’s. The ALCO structure within ING Bank facilitates top-down risk management, limit setting and the monitoring and control of market risk. This ensures a correct implementation of the ING Bank risk appetite.
The Market Risk Management department (MRM) is the designated independent department that is responsible for the design and execution of the bank’s market risk management functions in support of the ALCO function. The MRM structure recognises that risk taking and risk management to a large extent occurs at the regional/local level. Bottom-up reporting allows each management level to fully assess the market risk relevant at the respective levels.
MRM is responsible for determining adequate policies and procedures for managing market risk and for monitoring the compliance with these guidelines. An important element of the market risk management function is the assessment of market risk in new products and businesses. Furthermore MRM maintains an adequate limit framework in line with ING Bank’s risk appetite. The businesses are responsible for adhering to the limits that ultimately are approved by ALCO Bank. Limit breaches are reported to senior management on a timely basis and the business is required to take appropriate actions to reduce the risk position.
This market risk paragraph elaborates on the various elements of the risk management approach for:• Market risk economic capital for trading and banking books• Market risks in the banking books • Market risks in the trading books
Economic capital for market riskEconomic capital for market risk is the economic capital necessary to withstand unexpected value movements due to changes in market variables.
Model disclosure Economic Capital for market risk is calculated for exposures both in trading portfolios and banking portfolios and includes interest rate risk, equity price risk, foreign exchange rate risk, real estate risk and model risks. Economic capital for market risk is calculated using internally developed methodologies with a 99.95% confidence interval and a horizon of one year.
For the trading books, the linear interest rate risk in the banking books and equity investments the VaR (measured at a 99% confidence interval, a one day holding period and under the assumption of an expected value of zero) is taken as a starting point for the economic capital calculations for market risk. To arrive at the economic capital for market risk, a simulation based model is used which includes scaling to the required confidence interval and holding period. In determining this scaling factor, several other factors are also taken into account like the occurrence of large market movements (events) and management interventions.
Embedded options, e.g. the prepayment option and offered rate option in mortgages in the banking books, result in non-linear interest rate risk in the banking books. The embedded options are hedged using a delta-hedging methodology, leaving the mortgage portfolio exposed to convexity and volatility risk. For the calculation of economic capital for this non-linear interest rate risk and volatility risk ING Bank performs a Monte Carlo simulation.
Real estate price risk includes the market risks in both the investment portfolio and the development portfolio of ING Commercial Banking. The economic capital for real estate price risk for the investment portfolio is calculated by stressing the underlying market variables.
While aggregating the different economic capital market risk figures for the different portfolios, diversification benefits (based on stressed correlations) are taken into account as it is not expected that all extreme market movements will appear at the same moment.
Risk profileThe market risk Economic Capital is higher than the Regulatory Capital primarily due to the inclusion of the interest rate risk in banking books in Economic Capital. The main drivers of the Market Risk Economic Capital are the linear interest rate risk positions of Capital Investments and the strategic Equity Investments in the banking books.
Economic and Regulatory Capital (bank diversified only) by risk typeEconomic Capital Regulatory Capital
2013 2012 2013 2012
Trading 527 386 667 747Interest rate risk in the banking books 2,629 3,271Foreign exchange 130 217 37 25Real Estate 563 722Equity Investments 880 1,730Market risk 4,729 6,326 704 772
294 ING Group Annual Report 2013
ING_2013_deel4a&b_v2.indd 294 19/03/2014 19:23:10
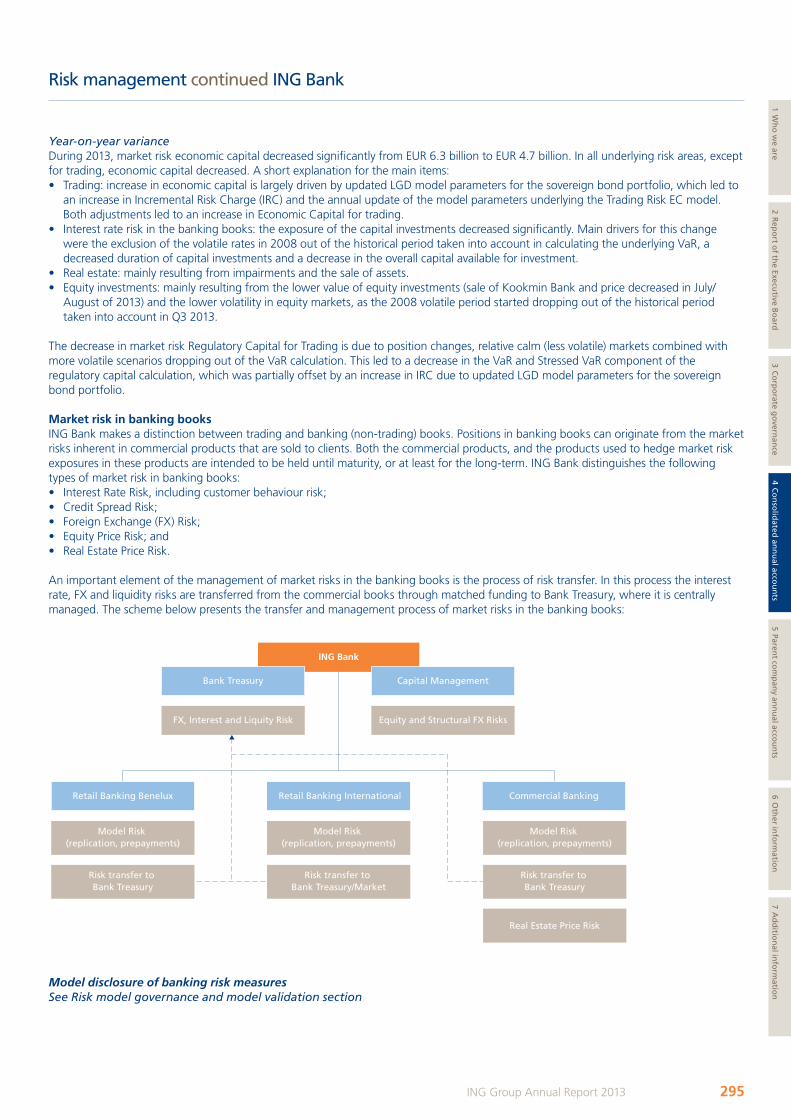
Risk management continued ING Bank
Year-on-year varianceDuring 2013, market risk economic capital decreased significantly from EUR 6.3 billion to EUR 4.7 billion. In all underlying risk areas, except for trading, economic capital decreased. A short explanation for the main items:• Trading: increase in economic capital is largely driven by updated LGD model parameters for the sovereign bond portfolio, which led to
an increase in Incremental Risk Charge (IRC) and the annual update of the model parameters underlying the Trading Risk EC model. Both adjustments led to an increase in Economic Capital for trading.
• Interest rate risk in the banking books: the exposure of the capital investments decreased significantly. Main drivers for this change were the exclusion of the volatile rates in 2008 out of the historical period taken into account in calculating the underlying VaR, a decreased duration of capital investments and a decrease in the overall capital available for investment.
• Real estate: mainly resulting from impairments and the sale of assets.• Equity investments: mainly resulting from the lower value of equity investments (sale of Kookmin Bank and price decreased in July/
August of 2013) and the lower volatility in equity markets, as the 2008 volatile period started dropping out of the historical period taken into account in Q3 2013.
The decrease in market risk Regulatory Capital for Trading is due to position changes, relative calm (less volatile) markets combined with more volatile scenarios dropping out of the VaR calculation. This led to a decrease in the VaR and Stressed VaR component of the regulatory capital calculation, which was partially offset by an increase in IRC due to updated LGD model parameters for the sovereign bond portfolio.
Market risk in banking booksING Bank makes a distinction between trading and banking (non-trading) books. Positions in banking books can originate from the market risks inherent in commercial products that are sold to clients. Both the commercial products, and the products used to hedge market risk exposures in these products are intended to be held until maturity, or at least for the long-term. ING Bank distinguishes the following types of market risk in banking books:• Interest Rate Risk, including customer behaviour risk;• Credit Spread Risk;• Foreign Exchange (FX) Risk;• Equity Price Risk; and• Real Estate Price Risk.
An important element of the management of market risks in the banking books is the process of risk transfer. In this process the interest rate, FX and liquidity risks are transferred from the commercial books through matched funding to Bank Treasury, where it is centrally managed. The scheme below presents the transfer and management process of market risks in the banking books:
Model disclosure of banking risk measures See Risk model governance and model validation section
ING Bank
Retail Banking International Commercial BankingRetail Banking Benelux
Model Risk (replication, prepayments)
Risk transfer to Bank Treasury
Model Risk (replication, prepayments)
Risk transfer to Bank Treasury/Market
Model Risk (replication, prepayments)
Risk transfer to Bank Treasury
Real Estate Price Risk
Bank Treasury Capital Management
FX, Interest and Liquity Risk Equity and Structural FX Risks
295ING Group Annual Report 2013
1 Wh
o w
e are2 R
epo
rt of th
e Executive B
oard
3 Co
rpo
rate go
vernan
ce4 C
on
solid
ated an
nu
al accou
nts
5 Parent co
mp
any an
nu
al accou
nts
6 Oth
er info
rmatio
n7 A
dd
ition
al info
rmatio
n
ING_2013_deel4a&b_v2.indd 295 19/03/2014 19:23:10
Risk management continued ING Bank
Interest rate risk in banking bookInterest rate risk in the banking books is defined as the exposure of a bank’s financial condition to adverse movements in interest rates originated from positions in the banking books.
GovernanceThe management of interest rate risk follows the interest rate risk in the banking book framework as approved by ALCO Bank. This framework describes roles and responsibilities, risk metrics, and policies and procedures related to interest rate risk management are defined. Furthermore, on an overall level, a risk appetite for interest rate risk is set, which is translated into limits for interest rate risk metrics.
The ING Bank approach to interest rate risk management, as set forth in this framework, is centralisation of risks from commercial books (that capture the products sold to clients) to central interest rate risk books. This enables a clear demarcation between commercial business results and results on unhedged interest rate positions.
ING Bank distinguishes three types of activities that generate interest rate risk in the banking books: • Investment of own capital (by Capital Management); • Commercial business (e.g. retail business); and• The strategic interest rate position (Bank Treasury).
Below the three activities are described in more detail:
Capital Management is responsible for managing the investment of own funds (core capital), more information can be found in the Capital Management section. Capital is invested for longer periods, targeting to maximise return, while keeping earnings stable at the same time.
Commercial activities result in interest rate risk, as for example repricing tenors of assets differ from those of liabilities. Linear interest rate risk is transferred from the commercial business to the treasury books (Bank Treasury), based on estimations of customer behaviour. The originating commercial business is ultimately responsible for estimating customer behaviour, leaving convexity risk and (unexpected) customer behaviour risk with the commercial business.
Risk measurement and the risk transfer process take place on a monthly basis, but more often if deemed necessary, for instance in volatile markets. The customer behaviour in relation to mortgages, loans, savings and demand deposits is modelled by MRM, based on extensive research. Model parameters are determined from historical data and expert opinion. Models and parameters are backtested at least semi-annually and updated when deemed necessary. In the modelling of savings and current accounts different elements play a role: pricing strategies, outstanding and expected volumes and the level and shape of the yield curve. The analyses result in an investment rule for the various portfolios. With respect to mortgages and loans, interest rate dependent prepayment behaviour is modelled, as well as the interest sensitivity of embedded offered rate options.
Customer behaviour risk is defined as the potential future value loss due to uncertainty in the behaviour of clients towards embedded options in commercial products. Customer behaviour risk is reported as part of business risk Economic Capital.General sources of customer behaviour risk include the state of the economy, competition, changes in regulation, legislation and tax regime, and developments in the housing market. Since these risk factors cannot be (fully) mitigated, ING holds capital to be able to absorb possible losses as a result of changed customer behaviour.
Convexity risk is defined as the sensitivity towards interest volatility and second order changes in the interest rate. Convexity risk is a result of products that contain embedded options, like mortgages. In some cases, convexity risk is transferred from the commercial books to treasury books using swaption and cap/floor contracts.
Bank Treasury manages the strategic interest rate position. The main objective is to maximise the economic value of the book and to generate adequate and stable annual earnings within the risk appetite boundaries set by ALCO Bank.
Risk profileIn the following sections, the interest rate risk exposures in the banking books are presented. ING Bank uses risk measures based on both an earnings and a value perspective. Earnings Sensitivity (ES) is used to provide the earnings perspective and the Net Present Value (NPV)-at-Risk and Basis Point Value (BPV) figures provide the value perspective.
Earnings Sensitivity (ES)ES measures the impact of changing interest rates on (before tax) net interest income. The ES figures in the tables below reflect an instantaneous shock of 1% and a time horizon of one year. Management interventions are not incorporated in these calculations.
296 ING Group Annual Report 2013
ING_2013_deel4a&b_v2.indd 296 19/03/2014 19:23:10
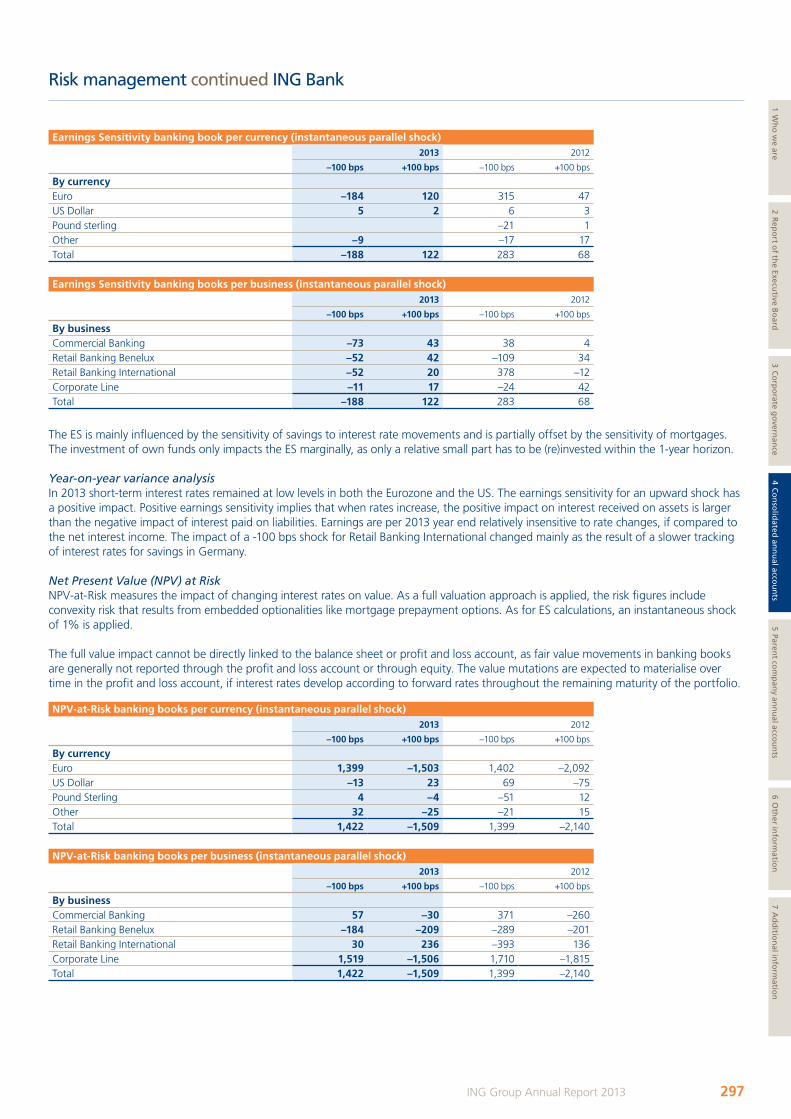
Risk management continued ING Bank
Earnings Sensitivity banking book per currency (instantaneous parallel shock)2013 2012
–100 bps +100 bps –100 bps +100 bps
by currencyEuro –184 120 315 47US Dollar 5 2 6 3Pound sterling –21 1Other –9 –17 17Total –188 122 283 68
Earnings Sensitivity banking books per business (instantaneous parallel shock)2013 2012
–100 bps +100 bps –100 bps +100 bps
by businessCommercial Banking –73 43 38 4Retail Banking Benelux –52 42 –109 34Retail Banking International –52 20 378 –12Corporate Line –11 17 –24 42Total –188 122 283 68
The ES is mainly influenced by the sensitivity of savings to interest rate movements and is partially offset by the sensitivity of mortgages. The investment of own funds only impacts the ES marginally, as only a relative small part has to be (re)invested within the 1-year horizon.
Year-on-year variance analysisIn 2013 short-term interest rates remained at low levels in both the Eurozone and the US. The earnings sensitivity for an upward shock has a positive impact. Positive earnings sensitivity implies that when rates increase, the positive impact on interest received on assets is larger than the negative impact of interest paid on liabilities. Earnings are per 2013 year end relatively insensitive to rate changes, if compared to the net interest income. The impact of a -100 bps shock for Retail Banking International changed mainly as the result of a slower tracking of interest rates for savings in Germany.
Net Present Value (NPV) at RiskNPV-at-Risk measures the impact of changing interest rates on value. As a full valuation approach is applied, the risk figures include convexity risk that results from embedded optionalities like mortgage prepayment options. As for ES calculations, an instantaneous shock of 1% is applied.
The full value impact cannot be directly linked to the balance sheet or profit and loss account, as fair value movements in banking books are generally not reported through the profit and loss account or through equity. The value mutations are expected to materialise over time in the profit and loss account, if interest rates develop according to forward rates throughout the remaining maturity of the portfolio.
NPV-at-Risk banking books per currency (instantaneous parallel shock)2013 2012
–100 bps +100 bps –100 bps +100 bps
by currencyEuro 1,399 –1,503 1,402 –2,092US Dollar –13 23 69 –75Pound Sterling 4 –4 –51 12Other 32 –25 –21 15Total 1,422 –1,509 1,399 –2,140
NPV-at-Risk banking books per business (instantaneous parallel shock)2013 2012
–100 bps +100 bps –100 bps +100 bps
by businessCommercial Banking 57 –30 371 –260Retail Banking Benelux –184 –209 –289 –201Retail Banking International 30 236 –393 136Corporate Line 1,519 –1,506 1,710 –1,815Total 1,422 –1,509 1,399 –2,140
297ING Group Annual Report 2013
1 Wh
o w
e are2 R
epo
rt of th
e Executive B
oard
3 Co
rpo
rate go
vernan
ce4 C
on
solid
ated an
nu
al accou
nts
5 Parent co
mp
any an
nu
al accou
nts
6 Oth
er info
rmatio
n7 A
dd
ition
al info
rmatio
n
ING_2013_deel4a&b_v2.indd 297 19/03/2014 19:23:11
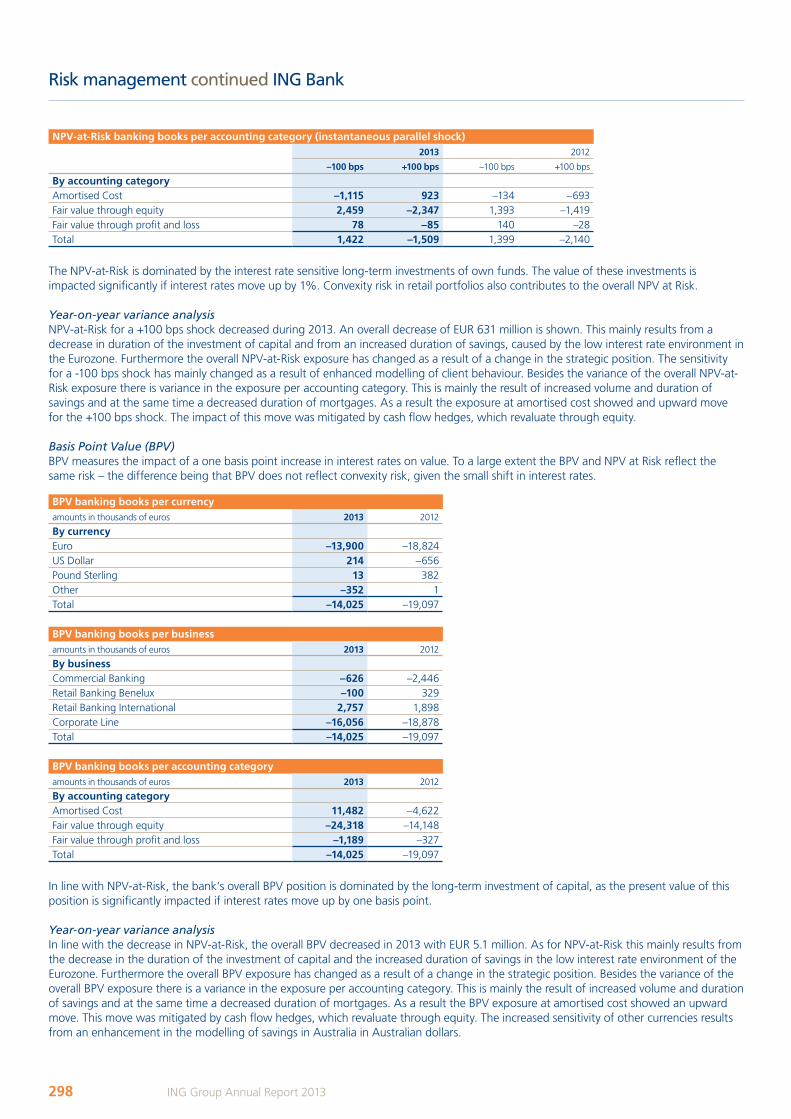
Risk management continued ING Bank
NPV-at-Risk banking books per accounting category (instantaneous parallel shock)2013 2012
–100 bps +100 bps –100 bps +100 bps
by accounting categoryAmortised Cost –1,115 923 –134 –693Fair value through equity 2,459 –2,347 1,393 –1,419Fair value through profit and loss 78 –85 140 –28Total 1,422 –1,509 1,399 –2,140
The NPV-at-Risk is dominated by the interest rate sensitive long-term investments of own funds. The value of these investments is impacted significantly if interest rates move up by 1%. Convexity risk in retail portfolios also contributes to the overall NPV at Risk.
Year-on-year variance analysisNPV-at-Risk for a +100 bps shock decreased during 2013. An overall decrease of EUR 631 million is shown. This mainly results from a decrease in duration of the investment of capital and from an increased duration of savings, caused by the low interest rate environment in the Eurozone. Furthermore the overall NPV-at-Risk exposure has changed as a result of a change in the strategic position. The sensitivity for a -100 bps shock has mainly changed as a result of enhanced modelling of client behaviour. Besides the variance of the overall NPV-at-Risk exposure there is variance in the exposure per accounting category. This is mainly the result of increased volume and duration of savings and at the same time a decreased duration of mortgages. As a result the exposure at amortised cost showed and upward move for the +100 bps shock. The impact of this move was mitigated by cash flow hedges, which revaluate through equity.
Basis Point Value (BPV)BPV measures the impact of a one basis point increase in interest rates on value. To a large extent the BPV and NPV at Risk reflect the same risk – the difference being that BPV does not reflect convexity risk, given the small shift in interest rates.
bPV banking books per currencyamounts in thousands of euros 2013 2012
by currencyEuro –13,900 –18,824US Dollar 214 –656Pound Sterling 13 382Other –352 1Total –14,025 –19,097
bPV banking books per businessamounts in thousands of euros 2013 2012
by businessCommercial Banking –626 –2,446Retail Banking Benelux –100 329Retail Banking International 2,757 1,898Corporate Line –16,056 –18,878Total –14,025 –19,097
bPV banking books per accounting categoryamounts in thousands of euros 2013 2012
by accounting categoryAmortised Cost 11,482 –4,622Fair value through equity –24,318 –14,148Fair value through profit and loss –1,189 –327Total –14,025 –19,097
In line with NPV-at-Risk, the bank’s overall BPV position is dominated by the long-term investment of capital, as the present value of this position is significantly impacted if interest rates move up by one basis point.
Year-on-year variance analysisIn line with the decrease in NPV-at-Risk, the overall BPV decreased in 2013 with EUR 5.1 million. As for NPV-at-Risk this mainly results from the decrease in the duration of the investment of capital and the increased duration of savings in the low interest rate environment of the Eurozone. Furthermore the overall BPV exposure has changed as a result of a change in the strategic position. Besides the variance of the overall BPV exposure there is a variance in the exposure per accounting category. This is mainly the result of increased volume and duration of savings and at the same time a decreased duration of mortgages. As a result the BPV exposure at amortised cost showed an upward move. This move was mitigated by cash flow hedges, which revaluate through equity. The increased sensitivity of other currencies results from an enhancement in the modelling of savings in Australia in Australian dollars.
298 ING Group Annual Report 2013
ING_2013_deel4a&b_v2.indd 298 19/03/2014 19:23:11
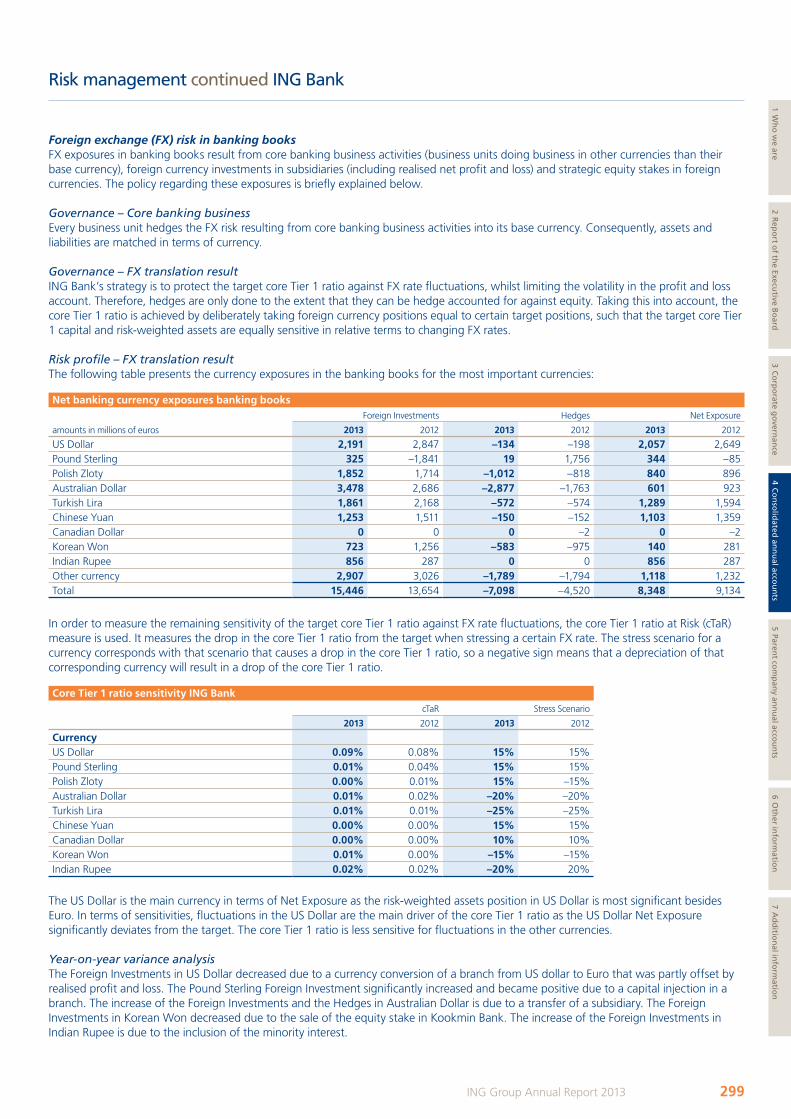
Risk management continued ING Bank
Foreign exchange (FX) risk in banking booksFX exposures in banking books result from core banking business activities (business units doing business in other currencies than their base currency), foreign currency investments in subsidiaries (including realised net profit and loss) and strategic equity stakes in foreign currencies. The policy regarding these exposures is briefly explained below.
Governance – Core banking businessEvery business unit hedges the FX risk resulting from core banking business activities into its base currency. Consequently, assets and liabilities are matched in terms of currency.
Governance – FX translation resultING Bank’s strategy is to protect the target core Tier 1 ratio against FX rate fluctuations, whilst limiting the volatility in the profit and loss account. Therefore, hedges are only done to the extent that they can be hedge accounted for against equity. Taking this into account, the core Tier 1 ratio is achieved by deliberately taking foreign currency positions equal to certain target positions, such that the target core Tier 1 capital and risk-weighted assets are equally sensitive in relative terms to changing FX rates.
Risk profile – FX translation resultThe following table presents the currency exposures in the banking books for the most important currencies:
Net banking currency exposures banking booksForeign Investments Hedges Net Exposure
amounts in millions of euros 2013 2012 2013 2012 2013 2012
US Dollar 2,191 2,847 –134 –198 2,057 2,649Pound Sterling 325 –1,841 19 1,756 344 –85Polish Zloty 1,852 1,714 –1,012 –818 840 896Australian Dollar 3,478 2,686 –2,877 –1,763 601 923Turkish Lira 1,861 2,168 –572 –574 1,289 1,594Chinese Yuan 1,253 1,511 –150 –152 1,103 1,359Canadian Dollar 0 0 0 –2 0 –2Korean Won 723 1,256 –583 –975 140 281Indian Rupee 856 287 0 0 856 287Other currency 2,907 3,026 –1,789 –1,794 1,118 1,232Total 15,446 13,654 –7,098 –4,520 8,348 9,134
In order to measure the remaining sensitivity of the target core Tier 1 ratio against FX rate fluctuations, the core Tier 1 ratio at Risk (cTaR) measure is used. It measures the drop in the core Tier 1 ratio from the target when stressing a certain FX rate. The stress scenario for a currency corresponds with that scenario that causes a drop in the core Tier 1 ratio, so a negative sign means that a depreciation of that corresponding currency will result in a drop of the core Tier 1 ratio.
Core Tier 1 ratio sensitivity ING bankcTaR Stress Scenario
2013 2012 2013 2012
CurrencyUS Dollar 0.09% 0.08% 15% 15%Pound Sterling 0.01% 0.04% 15% 15%Polish Zloty 0.00% 0.01% 15% –15%Australian Dollar 0.01% 0.02% –20% –20%Turkish Lira 0.01% 0.01% –25% –25%Chinese Yuan 0.00% 0.00% 15% 15%Canadian Dollar 0.00% 0.00% 10% 10%Korean Won 0.01% 0.00% –15% –15%Indian Rupee 0.02% 0.02% –20% 20%
The US Dollar is the main currency in terms of Net Exposure as the risk-weighted assets position in US Dollar is most significant besides Euro. In terms of sensitivities, fluctuations in the US Dollar are the main driver of the core Tier 1 ratio as the US Dollar Net Exposure significantly deviates from the target. The core Tier 1 ratio is less sensitive for fluctuations in the other currencies.
Year-on-year variance analysisThe Foreign Investments in US Dollar decreased due to a currency conversion of a branch from US dollar to Euro that was partly offset by realised profit and loss. The Pound Sterling Foreign Investment significantly increased and became positive due to a capital injection in a branch. The increase of the Foreign Investments and the Hedges in Australian Dollar is due to a transfer of a subsidiary. The Foreign Investments in Korean Won decreased due to the sale of the equity stake in Kookmin Bank. The increase of the Foreign Investments in Indian Rupee is due to the inclusion of the minority interest.
299ING Group Annual Report 2013
1 Wh
o w
e are2 R
epo
rt of th
e Executive B
oard
3 Co
rpo
rate go
vernan
ce4 C
on
solid
ated an
nu
al accou
nts
5 Parent co
mp
any an
nu
al accou
nts
6 Oth
er info
rmatio
n7 A
dd
ition
al info
rmatio
n
ING_2013_deel4a&b_v2.indd 299 19/03/2014 19:23:11
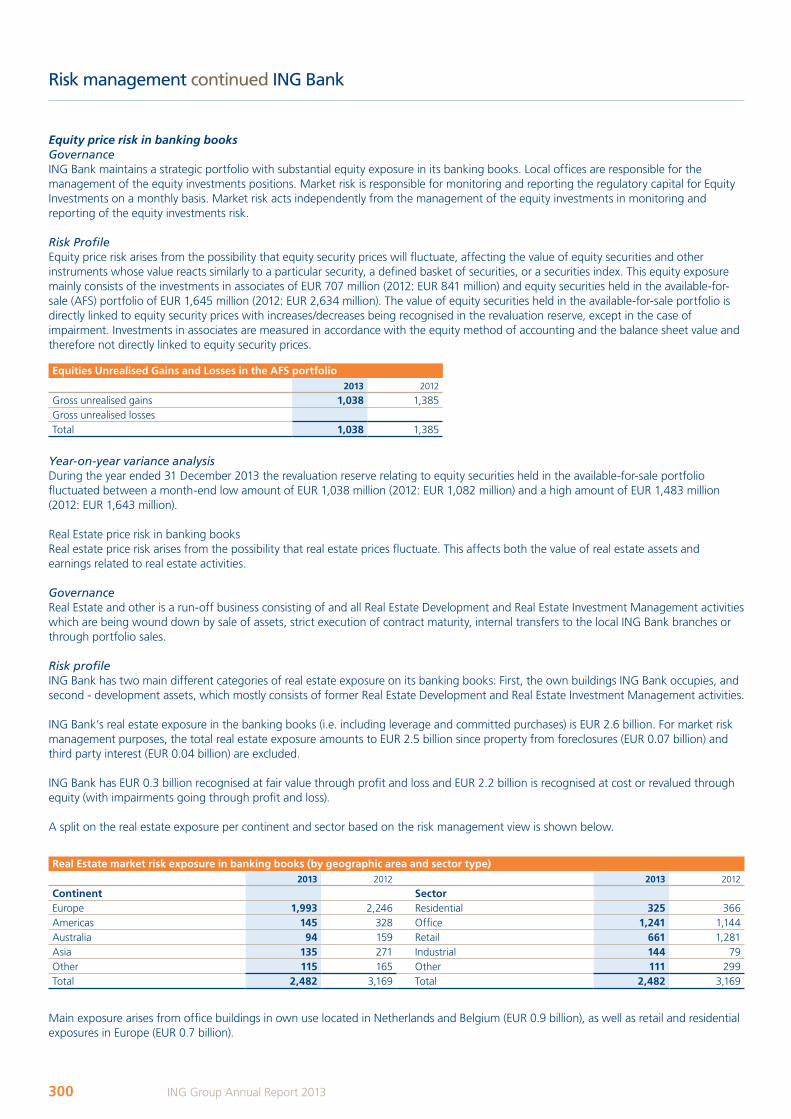
Risk management continued ING Bank
Equity price risk in banking booksGovernanceING Bank maintains a strategic portfolio with substantial equity exposure in its banking books. Local offices are responsible for the management of the equity investments positions. Market risk is responsible for monitoring and reporting the regulatory capital for Equity Investments on a monthly basis. Market risk acts independently from the management of the equity investments in monitoring and reporting of the equity investments risk.
Risk ProfileEquity price risk arises from the possibility that equity security prices will fluctuate, affecting the value of equity securities and other instruments whose value reacts similarly to a particular security, a defined basket of securities, or a securities index. This equity exposure mainly consists of the investments in associates of EUR 707 million (2012: EUR 841 million) and equity securities held in the available-for-sale (AFS) portfolio of EUR 1,645 million (2012: EUR 2,634 million). The value of equity securities held in the available-for-sale portfolio is directly linked to equity security prices with increases/decreases being recognised in the revaluation reserve, except in the case of impairment. Investments in associates are measured in accordance with the equity method of accounting and the balance sheet value and therefore not directly linked to equity security prices.
Equities Unrealised Gains and Losses in the AFS portfolio2013 2012
Gross unrealised gains 1,038 1,385Gross unrealised lossesTotal 1,038 1,385
Year-on-year variance analysisDuring the year ended 31 December 2013 the revaluation reserve relating to equity securities held in the available-for-sale portfolio fluctuated between a month-end low amount of EUR 1,038 million (2012: EUR 1,082 million) and a high amount of EUR 1,483 million (2012: EUR 1,643 million).
Real Estate price risk in banking booksReal estate price risk arises from the possibility that real estate prices fluctuate. This affects both the value of real estate assets and earnings related to real estate activities.
GovernanceReal Estate and other is a run-off business consisting of and all Real Estate Development and Real Estate Investment Management activities which are being wound down by sale of assets, strict execution of contract maturity, internal transfers to the local ING Bank branches or through portfolio sales.
Risk profileING Bank has two main different categories of real estate exposure on its banking books: First, the own buildings ING Bank occupies, and second - development assets, which mostly consists of former Real Estate Development and Real Estate Investment Management activities.
ING Bank’s real estate exposure in the banking books (i.e. including leverage and committed purchases) is EUR 2.6 billion. For market risk management purposes, the total real estate exposure amounts to EUR 2.5 billion since property from foreclosures (EUR 0.07 billion) and third party interest (EUR 0.04 billion) are excluded.
ING Bank has EUR 0.3 billion recognised at fair value through profit and loss and EUR 2.2 billion is recognised at cost or revalued through equity (with impairments going through profit and loss).
A split on the real estate exposure per continent and sector based on the risk management view is shown below.
Real Estate market risk exposure in banking books (by geographic area and sector type)2013 2012 2013 2012
Continent SectorEurope 1,993 2,246 Residential 325 366Americas 145 328 Office 1,241 1,144Australia 94 159 Retail 661 1,281Asia 135 271 Industrial 144 79Other 115 165 Other 111 299Total 2,482 3,169 Total 2,482 3,169
Main exposure arises from office buildings in own use located in Netherlands and Belgium (EUR 0.9 billion), as well as retail and residential exposures in Europe (EUR 0.7 billion).
300 ING Group Annual Report 2013
ING_2013_deel4a&b_v2.indd 300 19/03/2014 19:23:11
Risk management continued ING Bank
Year-on-year variance analysisIn total, real estate market risk exposure in the banking books decreased by EUR 0.7 billion mainly as a result of divestments (EUR 0.54 billion). The rest is due to impairments and negative fair value changes.
Market Risk in trading booksWithin the trading portfolios, positions are maintained in the professional financial markets. These positions are often the result of transactions with clients and may serve to benefit from short-term price movements. Market risk arises in the trading portfolios through the exposure to various market risk factors, including interest rates, equity prices, foreign exchange rates and credit spreads.
GovernanceThe Financial Markets Risk Committee (FMRC) is the market risk committee that, within the risk appetite set by ALCO Bank, sets market risk limits both on an aggregated level and on a desk level, and approves new products. MRM advises both the FMRC and ALCO Bank on the market risk appetite of trading activities.
With respect to the trading portfolios, MRM focuses on the management of market risks of Commercial Banking (mainly Financial Markets) as this is the only business line where trading activities take place. Trading activities include facilitation of client business and market making. MRM is responsible for the development and implementation of trading risk policies and risk measurement methodologies, the reporting and monitoring of risk exposures against approved trading limits and the validation of pricing models. MRM also reviews trading mandates and limits, and performs the gatekeeper role in the product review process. The management of trading market risk is performed at various organisational levels, from MRM overall down to specific business areas and trading offices.
Fair values of financial trading assets and liabilitiesFair values of financial assets and liabilities that are quoted in active markets are determined by using quoted market prices. Where quoted prices are not available, other pricing sources and valuation techniques are used to determine fair value.
Other pricing sources can be independent market vendors, brokers or market makers, or recent transactions. The range of prices obtained from these pricing sources can diverge. The choice of one or the other pricing source can therefore result in different estimates of fair value. Selecting the most appropriate price within this range requires expertise and judgement.
Valuation techniques range from discounting of cash flows to valuation models. Such models are based on relevant factors such as the market price of underlying reference instruments, market parameters (volatilities, correlations and credit ratings) and customer behaviour. Some of these price factors require various assumptions which imply that valuation models are subjective by nature. According to what valuation technique is used and what assumptions are made, the obtained fair value can be different.
All valuation techniques used are subject to a model governance framework. Model governance refers to a set of policies and procedures that have to be strictly followed and that cover the complete lifecycle of a model, i.e. its development, validation, approval, implementation and maintenance. The pillars of model governance are independent validation and periodic review. Such a review aims to determine whether a model still is appropriate for its intended use. Where models are used for valuation, there can be uncertainty on the assumptions of the underlying models and/or parameters. In those cases where significant uncertainty on assumptions arises, a model risk valuation adjustment is applied.
In general, positions are valued taking the bid price for a long position and the offer price for a short position. In cases where positions are marked at mid-market prices, a fair value adjustment is calculated.
To include credit risk in the fair valuation, ING applies both credit and debit valuation adjustments (hereafter referred to as CVA respectively DVA). Own issued debt and structured notes that are valued at fair value are adjusted for credit risk by means of a debit valuation adjustment. Additionally, derivatives valued at fair value are adjusted for credit risk by a credit valuation adjustment. This credit valuation adjustment is of a bilateral nature; both the credit risk on the counterparty as well as the credit risk on ING are included in the adjustment. All market data that is used in the determination of the CVA is based on market implied data. Additionally, wrong-way risk (when exposure to a counterparty is increasing and the credit quality of that counterparty decreases) and right way risk (when exposure to a counterparty is decreasing and the credit quality of that counterparty increases) are included in the adjustment. ING applies CVA also for pricing credit risk into new external trades with counterparties. Risk limits and controls are in place to monitor and anticipate CVA risk on a daily basis. The CVA function operates under a global risk governance, where the risk limits and controls for CVA are managed and monitored on a global level. Our approach on CVA risk management is driven by increased control, cost efficiency and the global scope of CVA.
Market Risk Management Product Control has the role to identify or challenge market data and pricing sources as well as determining the parameters that will be used in the valuation models. When using valuation techniques, identified market data and sources used for the calculations are independently challenged, reviewed and validated on a regular basis, most of it daily. In order to guarantee the highest quality and consistency in market data inputs, ING started this year migrating these activities into one single source for consistent validated market data inputs across ING. ING uses an in house developed infrastructure for this purpose and has started to upgrade this application phase-wise with enhanced validation techniques to apply to the market data obtained from external data vendors (e.g. Bloomberg, Reuters and others). ING expects to have completed the migration in 2014.
301ING Group Annual Report 2013
1 Wh
o w
e are2 R
epo
rt of th
e Executive B
oard
3 Co
rpo
rate go
vernan
ce4 C
on
solid
ated an
nu
al accou
nts
5 Parent co
mp
any an
nu
al accou
nts
6 Oth
er info
rmatio
n7 A
dd
ition
al info
rmatio
n
ING_2013_deel4a&b_v2.indd 301 19/03/2014 19:23:12
Risk management continued ING Bank
In this context, global and local parameter committees have been set up. Finance, Market Risk Management Product Control and Front Office are represented in these committees and discuss numerous topics regarding the product valuation and decide on the outcome of price testing as well as valuation adjustments.
To secure segregation of duties between Front Office and Market Risk Management Product Control, the systems for pricing and price testing are secured in order to prevent unauthorised access.
Reference is made to Note 46 ‘Fair value of assets and liabilities’ for the basis of the determination of the fair values of the financial instruments and related sensitivities.
Model disclosure of trading risk measuresValue at RiskMRM uses the historical simulation Value at Risk (VaR) methodology as its primary risk measure. The VaR for market risk quantifies, with a one-sided confidence level of 99%, the maximum overnight loss that could occur due to changes in risk factors (e.g. interest rates, equity prices, foreign exchange rates, credit spreads, implied volatilities) if positions remain unchanged for a time period of one day. Next to general market movements in these risk factors, VaR also takes into account market data movements for specific moves in e.g. the underlying issuer of securities. The impact of historical market movements on today’s portfolio is estimated, based on equally weighted observed market movements of the previous year. ING Bank uses VaR with a 1-day horizon for internal risk measurement, control and backtesting, and VaR with a 10-day horizon for determining regulatory capital.
LimitationsVaR has some limitations. VaR uses historical data to forecast future price behaviour. Future price behaviour could differ substantially from past behaviour. Moreover, the use of a one-day holding period (or ten days for regulatory capital calculations) assumes that all positions in the portfolio can be liquidated or hedged in one day. In periods of illiquidity or market events, this assumption may not hold. Also, the use of 99% confidence level means that VaR does not take into account any losses that occur beyond this confidence level.
BacktestingBacktesting is a technique for the on-going monitoring of the plausibility of the VaR model in use. Although VaR models estimate potential future results, estimates are based on historical market data. In a backtest, the actual daily result is compared with the 1-day VaR. In addition to using actual results for backtesting, ING Bank also uses hypothetical results, which measure results excluding the effect of intraday trading, fees and commissions. When the actual or hypothetical loss exceeds the VaR an ‘outlier’ occurs. Based on ING Bank’s one-sided confidence level of 99% an outlier is expected once in every 100 business days. In 2013, like in 2012, there was no occurrence where a daily trading loss exceeded the daily consolidated VaR of ING Commercial Banking. ING Bank reports the results of this backtesting to DNB on a quarterly basis.
Basel Committee/CRD IIIAs of 31 December 2011 the Basel requirements on Stressed VaR and the Incremental Risk Charge have come into force in European legislation (CRD III), complementing the use of VaR. ING follows this framework for its regulatory capital calculations since Q4 2011.
Stressed VaRThe Stressed VaR (SVaR) is intended to replicate a VaR calculation that would be generated on the bank’s current portfolio with inputs calibrated to the historical data from a continuous 12-month period of significant financial stress relevant to the bank’s portfolio. To calculate SVaR, ING Bank uses the same model that is used for VaR (historical simulation). The historical data period used includes the height of the credit crisis around the fall of Lehman brothers, and is reviewed regularly.
Incremental Risk ChargeWith the Incremental Risk Charge (IRC) ING Bank calculates an estimate of default and migration risk for unsecuritised credit products in the trading book over a one-year capital horizon at a 99.9% confidence level. For the calculation of IRC ING Bank performs a Monte Carlo simulation based on a Gaussian copula model. For all issuers the rating is simulated over the different liquidity horizons (time required to liquidate the position or hedge all significant risks) within one year. The financial impact is then determined based on the migration to default (based on LGD), or migration to a different rating category (based on credit spread changes).
The liquidity horizon has been set to the regulatory minimum of three months for all positions in scope. Given the types of products in ING Bank’s trading portfolio ING considers this horizon to be conservative. We have demonstrated that ING Bank could still actively trade its positions that are significant for IRC under stressed market circumstances, allowing ING Bank to fully redeem its positions within three months.
Event riskEvent risk is a valuable risk management tool. Event risk evaluates the bank’s financial stability under severe but plausible stress scenarios and assists in decision-making that assures the bank to remain a financially-healthy on-going concern after a severe event occurs. In addition to the bank-wide stress test framework as described in the ING Bank risk profile section, MRM performs separate stressed scenario tests to monitor market risks under extreme market conditions. Since VaR in general does not produce an estimate of the potential losses that can occur as a result of extreme market movements, ING Bank uses structured stressed scenario tests for monitoring
302 ING Group Annual Report 2013
ING_2013_deel4a&b_v2.indd 302 19/03/2014 19:23:12
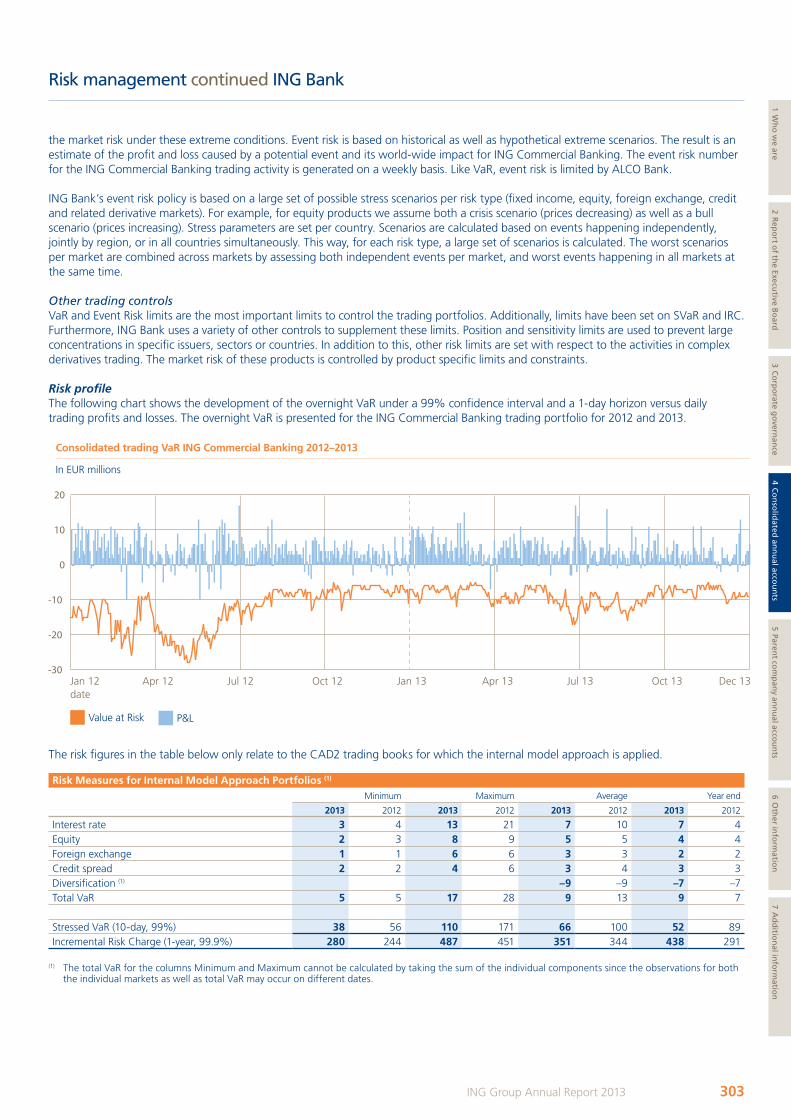
Risk management continued ING Bank
the market risk under these extreme conditions. Event risk is based on historical as well as hypothetical extreme scenarios. The result is an estimate of the profit and loss caused by a potential event and its world-wide impact for ING Commercial Banking. The event risk number for the ING Commercial Banking trading activity is generated on a weekly basis. Like VaR, event risk is limited by ALCO Bank.
ING Bank’s event risk policy is based on a large set of possible stress scenarios per risk type (fixed income, equity, foreign exchange, credit and related derivative markets). For example, for equity products we assume both a crisis scenario (prices decreasing) as well as a bull scenario (prices increasing). Stress parameters are set per country. Scenarios are calculated based on events happening independently, jointly by region, or in all countries simultaneously. This way, for each risk type, a large set of scenarios is calculated. The worst scenarios per market are combined across markets by assessing both independent events per market, and worst events happening in all markets at the same time.
Other trading controlsVaR and Event Risk limits are the most important limits to control the trading portfolios. Additionally, limits have been set on SVaR and IRC. Furthermore, ING Bank uses a variety of other controls to supplement these limits. Position and sensitivity limits are used to prevent large concentrations in specific issuers, sectors or countries. In addition to this, other risk limits are set with respect to the activities in complex derivatives trading. The market risk of these products is controlled by product specific limits and constraints.
Risk profileThe following chart shows the development of the overnight VaR under a 99% confidence interval and a 1-day horizon versus daily trading profits and losses. The overnight VaR is presented for the ING Commercial Banking trading portfolio for 2012 and 2013.
Jan 12date
Apr 12 Jul 12 Oct 12 Jan 13 Apr 13 Jul 13 Oct 13 Dec 13-30
-20
-10
0
10
20
Consolidated trading VaR ING Commercial Banking 2012–2013
In EUR millions
Value at Risk P&L
The risk figures in the table below only relate to the CAD2 trading books for which the internal model approach is applied.
Risk Measures for Internal Model Approach Portfolios (1)
Minimum Maximum Average Year end
2013 2012 2013 2012 2013 2012 2013 2012
Interest rate 3 4 13 21 7 10 7 4Equity 2 3 8 9 5 5 4 4Foreign exchange 1 1 6 6 3 3 2 2Credit spread 2 2 4 6 3 4 3 3Diversification (1) –9 –9 –7 –7Total VaR 5 5 17 28 9 13 9 7 Stressed VaR (10-day, 99%) 38 56 110 171 66 100 52 89Incremental Risk Charge (1-year, 99.9%) 280 244 487 451 351 344 438 291
(1) The total VaR for the columns Minimum and Maximum cannot be calculated by taking the sum of the individual components since the observations for both the individual markets as well as total VaR may occur on different dates.
303ING Group Annual Report 2013
1 Wh
o w
e are2 R
epo
rt of th
e Executive B
oard
3 Co
rpo
rate go
vernan
ce4 C
on
solid
ated an
nu
al accou
nts
5 Parent co
mp
any an
nu
al accou
nts
6 Oth
er info
rmatio
n7 A
dd
ition
al info
rmatio
n
ING_2013_deel4a&b_v2.indd 303 19/03/2014 19:23:13
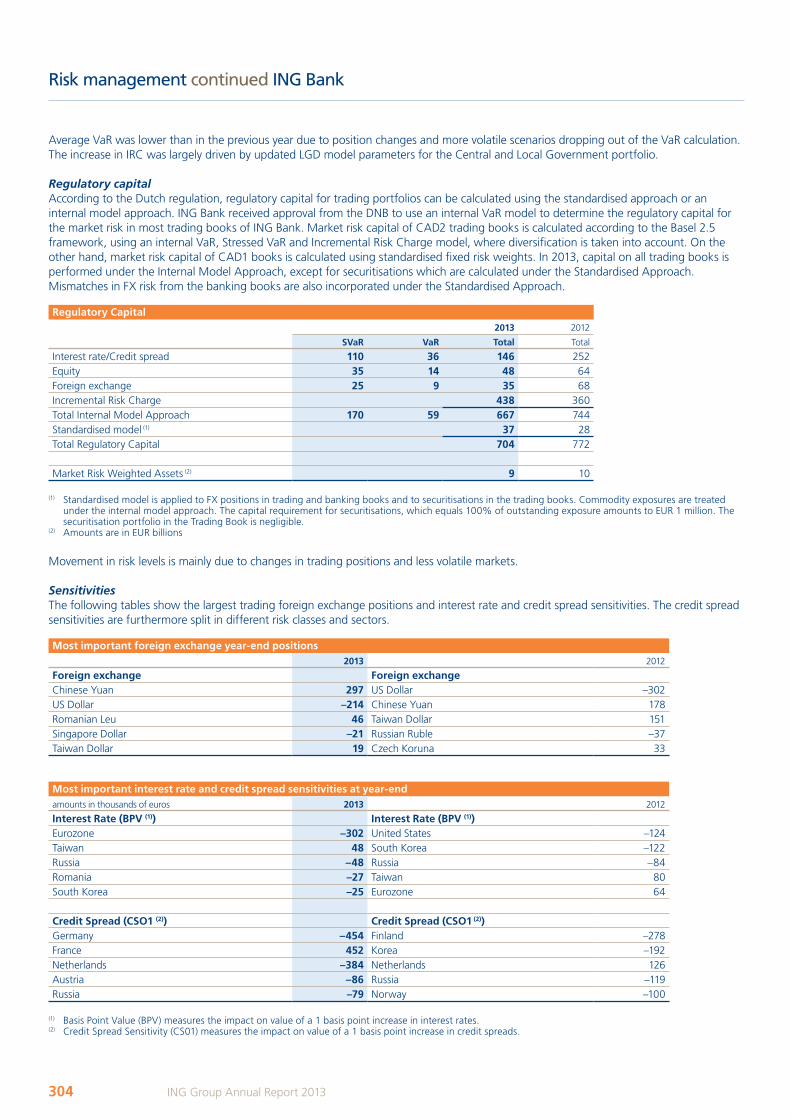
Risk management continued ING Bank
Average VaR was lower than in the previous year due to position changes and more volatile scenarios dropping out of the VaR calculation. The increase in IRC was largely driven by updated LGD model parameters for the Central and Local Government portfolio.
Regulatory capitalAccording to the Dutch regulation, regulatory capital for trading portfolios can be calculated using the standardised approach or an internal model approach. ING Bank received approval from the DNB to use an internal VaR model to determine the regulatory capital for the market risk in most trading books of ING Bank. Market risk capital of CAD2 trading books is calculated according to the Basel 2.5 framework, using an internal VaR, Stressed VaR and Incremental Risk Charge model, where diversification is taken into account. On the other hand, market risk capital of CAD1 books is calculated using standardised fixed risk weights. In 2013, capital on all trading books is performed under the Internal Model Approach, except for securitisations which are calculated under the Standardised Approach. Mismatches in FX risk from the banking books are also incorporated under the Standardised Approach.
Regulatory Capital2013 2012
SVaR VaR Total Total
Interest rate/Credit spread 110 36 146 252Equity 35 14 48 64Foreign exchange 25 9 35 68Incremental Risk Charge 438 360Total Internal Model Approach 170 59 667 744Standardised model (1) 37 28Total Regulatory Capital 704 772
Market Risk Weighted Assets (2) 9 10
(1) Standardised model is applied to FX positions in trading and banking books and to securitisations in the trading books. Commodity exposures are treated under the internal model approach. The capital requirement for securitisations, which equals 100% of outstanding exposure amounts to EUR 1 million. The securitisation portfolio in the Trading Book is negligible.
(2) Amounts are in EUR billions
Movement in risk levels is mainly due to changes in trading positions and less volatile markets.
SensitivitiesThe following tables show the largest trading foreign exchange positions and interest rate and credit spread sensitivities. The credit spread sensitivities are furthermore split in different risk classes and sectors.
Most important foreign exchange year-end positions2013 2012
Foreign exchange Foreign exchangeChinese Yuan 297 US Dollar –302US Dollar –214 Chinese Yuan 178Romanian Leu 46 Taiwan Dollar 151Singapore Dollar –21 Russian Ruble –37Taiwan Dollar 19 Czech Koruna 33
Most important interest rate and credit spread sensitivities at year-endamounts in thousands of euros 2013 2012
Interest Rate (bPV (1)) Interest Rate (bPV (1))Eurozone –302 United States –124Taiwan 48 South Korea –122Russia –48 Russia –84Romania –27 Taiwan 80South Korea –25 Eurozone 64
Credit Spread (CSO1 (2)) Credit Spread (CSO1 (2))Germany –454 Finland –278France 452 Korea –192Netherlands –384 Netherlands 126Austria –86 Russia –119Russia –79 Norway –100
(1) Basis Point Value (BPV) measures the impact on value of a 1 basis point increase in interest rates.(2) Credit Spread Sensitivity (CS01) measures the impact on value of a 1 basis point increase in credit spreads.
304 ING Group Annual Report 2013
ING_2013_deel4a&b_v2.indd 304 19/03/2014 19:23:13
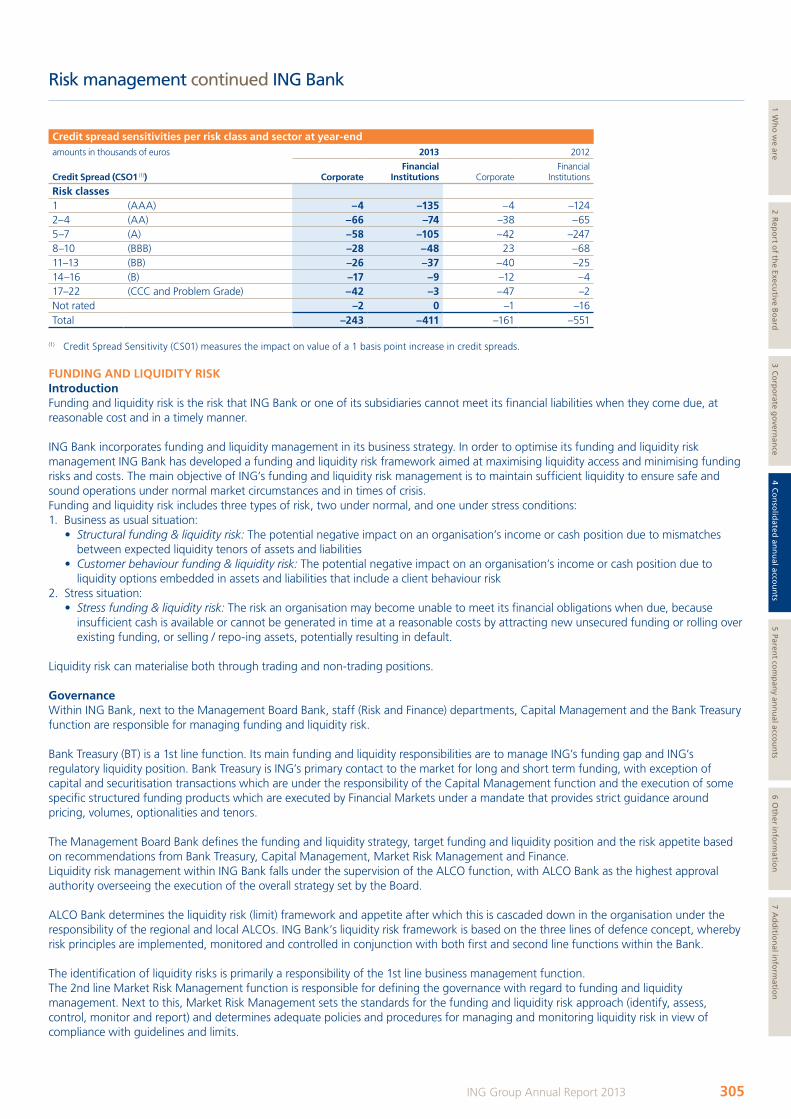
Risk management continued ING Bank
Credit spread sensitivities per risk class and sector at year-endamounts in thousands of euros 2013 2012
Credit Spread (CSO1 (1)) CorporateFinancial
Institutions CorporateFinancial
Institutions
Risk classes1 (AAA) –4 –135 –4 –1242–4 (AA) –66 –74 –38 –655–7 (A) –58 –105 –42 –2478–10 (BBB) –28 –48 23 –6811–13 (BB) –26 –37 –40 –2514–16 (B) –17 –9 –12 –417–22 (CCC and Problem Grade) –42 –3 –47 –2Not rated –2 0 –1 –16Total –243 –411 –161 –551
(1) Credit Spread Sensitivity (CS01) measures the impact on value of a 1 basis point increase in credit spreads.
FUNDING AND LIQUIDITY RISKIntroductionFunding and liquidity risk is the risk that ING Bank or one of its subsidiaries cannot meet its financial liabilities when they come due, at reasonable cost and in a timely manner.
ING Bank incorporates funding and liquidity management in its business strategy. In order to optimise its funding and liquidity risk management ING Bank has developed a funding and liquidity risk framework aimed at maximising liquidity access and minimising funding risks and costs. The main objective of ING’s funding and liquidity risk management is to maintain sufficient liquidity to ensure safe and sound operations under normal market circumstances and in times of crisis.Funding and liquidity risk includes three types of risk, two under normal, and one under stress conditions:1. Business as usual situation: • Structural funding & liquidity risk: The potential negative impact on an organisation’s income or cash position due to mismatches
between expected liquidity tenors of assets and liabilities • Customer behaviour funding & liquidity risk: The potential negative impact on an organisation’s income or cash position due to
liquidity options embedded in assets and liabilities that include a client behaviour risk2. Stress situation: • Stress funding & liquidity risk: The risk an organisation may become unable to meet its financial obligations when due, because
insufficient cash is available or cannot be generated in time at a reasonable costs by attracting new unsecured funding or rolling over existing funding, or selling / repo-ing assets, potentially resulting in default.
Liquidity risk can materialise both through trading and non-trading positions.
GovernanceWithin ING Bank, next to the Management Board Bank, staff (Risk and Finance) departments, Capital Management and the Bank Treasury function are responsible for managing funding and liquidity risk.
Bank Treasury (BT) is a 1st line function. Its main funding and liquidity responsibilities are to manage ING’s funding gap and ING’s regulatory liquidity position. Bank Treasury is ING’s primary contact to the market for long and short term funding, with exception of capital and securitisation transactions which are under the responsibility of the Capital Management function and the execution of some specific structured funding products which are executed by Financial Markets under a mandate that provides strict guidance around pricing, volumes, optionalities and tenors.
The Management Board Bank defines the funding and liquidity strategy, target funding and liquidity position and the risk appetite based on recommendations from Bank Treasury, Capital Management, Market Risk Management and Finance.Liquidity risk management within ING Bank falls under the supervision of the ALCO function, with ALCO Bank as the highest approval authority overseeing the execution of the overall strategy set by the Board.
ALCO Bank determines the liquidity risk (limit) framework and appetite after which this is cascaded down in the organisation under the responsibility of the regional and local ALCOs. ING Bank’s liquidity risk framework is based on the three lines of defence concept, whereby risk principles are implemented, monitored and controlled in conjunction with both first and second line functions within the Bank.
The identification of liquidity risks is primarily a responsibility of the 1st line business management function.The 2nd line Market Risk Management function is responsible for defining the governance with regard to funding and liquidity management. Next to this, Market Risk Management sets the standards for the funding and liquidity risk approach (identify, assess, control, monitor and report) and determines adequate policies and procedures for managing and monitoring liquidity risk in view of compliance with guidelines and limits.
305ING Group Annual Report 2013
1 Wh
o w
e are2 R
epo
rt of th
e Executive B
oard
3 Co
rpo
rate go
vernan
ce4 C
on
solid
ated an
nu
al accou
nts
5 Parent co
mp
any an
nu
al accou
nts
6 Oth
er info
rmatio
n7 A
dd
ition
al info
rmatio
n
ING_2013_deel4a&b_v2.indd 305 19/03/2014 19:23:13

Risk management continued ING Bank
Liquidity risk management frameworkING’s liquidity risk management framework incorporates all relevant risk principles with regard to the daily and on-going management of funding and liquidity risk. The framework contains the following key elements:• Liquidity risk appetite: This is set by Management Board Bank in line with ING’s complexity, business mix and liquidity risk profile and is
reviewed on an annual basis by ALCO Bank and forms part of the input of business units in their medium term business plans. The defined risk appetite is allocated to the regional ALCO’s.
• Funding: The Bank Treasury function will set and update the funding strategy and funding planning, taking into account diversification in sources and tenor of funding.
• Intraday Liquidity Management: Bank Treasury actively manages its short term liquidity positions and risks to meet payment and settlement obligations on a timely basis under both normal and stressed conditions.
• Collateral Position Management: Bank Treasury actively manages the liquidity risk of its collateral positions to meet ING’s collateral needs, and resources, under both normal and stressed conditions and in accordance with all internal and regulatory rules.
• Liquidity buffers: ALCO Bank ensures that sufficient liquidity is maintained, in accordance with Bank- and regulatory rules and standards, including a buffer of unencumbered, high quality liquid assets, to withstand stress events, such as those involving the loss or impairment of both unsecured and secured funding sources.
• Liquidity risk transfer and pricing: ALCO Bank sets and maintains a Funds Transfer Pricing (FTP) framework that optimises Bank-wide funding and liquidity risk management, whereby all business units must transfer their structural funding and liquidity risks to Bank Treasury whilst managing their own customer behaviour liquidity risk costs.
• Stress testing: ALCO ensures that liquidity stress tests are planned, designed, conducted and reviewed, to identify sources of potential liquidity strain, to determine how these can and will be addressed and to ensure that current exposures remain within the established liquidity risk tolerance.
• Contingency Funding Plan: ALCO ensures the design, regular test and maintenance of formal Contingency Funding planning, setting out the strategies for addressing liquidity shortfalls in emergency situations, outlining procedures to manage these situations, establishing clear lines of responsibility, and articulating clear implementation and escalation procedures.
Implementation of the frameworkLiquidity risk appetiteING’s liquidity risk appetite is expressed in a set of limits to manage the level of liquidity risk ING is willing to take in the pursuit of its strategic objectives. These limits are embedded in risk appetite statements (RAS) which reflect three pillars of addressing risk:• Structural sources of risk:
– Limits on liquidity mismatches – Limits on exposures to short term professional money markets – Defining target Loan-to-Deposit ratios
• Levels of liquidity: – Compliance with regulatory requirements – Adequate levels related to defined stress scenarios
• Funding diversification: – Limiting or reducing dependency on single providers – Concentration limits per funding sources
Based on the above, ING Bank has defined the following funding and liquidity risk management risk appetite statements:• The structural mismatch in expected liquidity tenors of ING Bank’s assets and liabilities per significant currency is manageable. • Home/host regulatory liquidity limits should be pro-actively complied with.• The time-to-survive in a funding stress situation should extend over multiple quarters.• Funding of all longer-term assets and investments should be done by stable and longer-term liabilities. • Geographical dependencies with respect to intra-group funding are to be limited or decreased.• Diversification should be in place of funding profile, across funds providers, instrument types, geographic markets, tenors and currencies.Also refer to Note 48 in which ‘Assets by contractual maturity’ are shown.The risk appetite statements are also directly linked to liquidity stress testing.
FundingIn detailing the activities of the bank regarding utilisation of professional market funding sources, the following key principles apply: • Maintaining adequate market access in both normal and stressed but operable market conditions.• Managing risk by adhering to internally and externally imposed risk limits and balance sheet ratios. • Optimising the cost of funding under the principles above.
With respect to funding sources, ING Bank manages its balance sheet prudently, whereby short-term funding is primarily utilised for short-term assets. The bank aims to fund all longer term assets and investments by stable and longer term liabilities. In the third quarter of 2013, the uncertainty with regard to the US debt ceiling outcome gave rise to increased monitoring of the USD positions. Monitoring and control of this funding is effectuated through a dedicated USD funding and liquidity risk framework which includes limits and measures in case of contingencies. ING Bank reviews its funding plan on at least a quarterly basis, assessing market developments and funding requirements.
306 ING Group Annual Report 2013
ING_2013_deel4a&b_v2.indd 306 19/03/2014 19:23:13
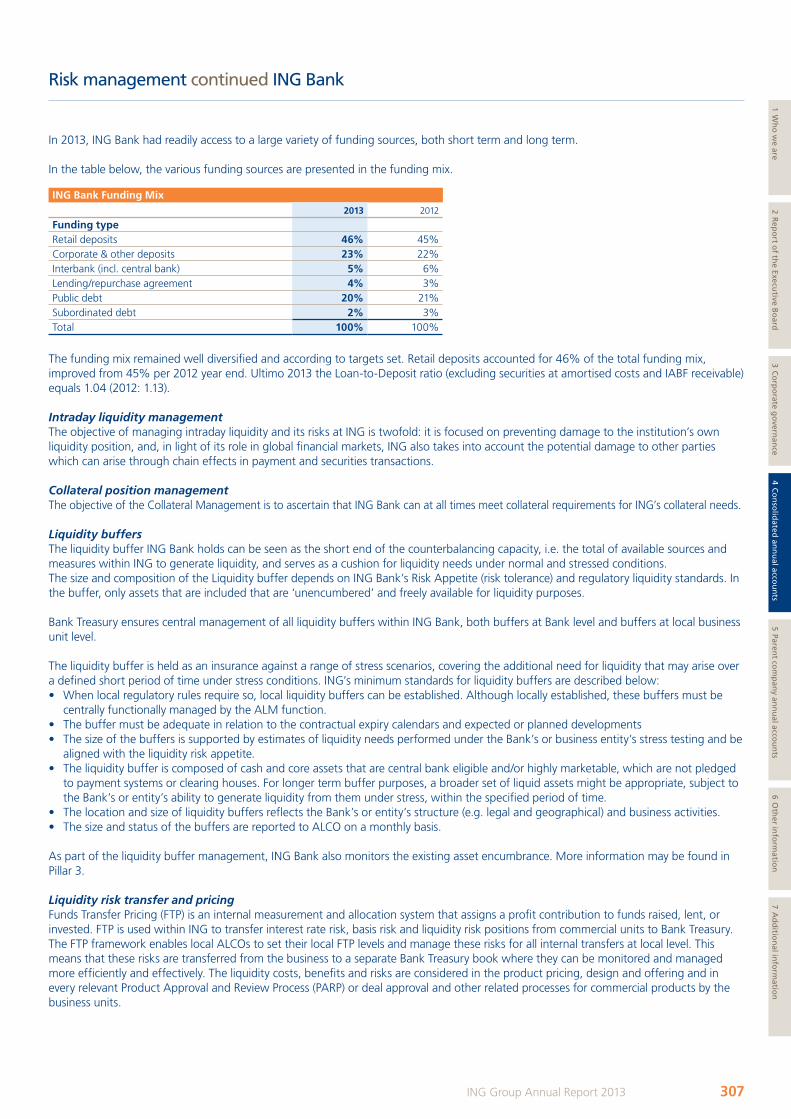
Risk management continued ING Bank
In 2013, ING Bank had readily access to a large variety of funding sources, both short term and long term.
In the table below, the various funding sources are presented in the funding mix.
ING bank Funding Mix2013 2012
Funding typeRetail deposits 46% 45%Corporate & other deposits 23% 22%Interbank (incl. central bank) 5% 6%Lending/repurchase agreement 4% 3%Public debt 20% 21%Subordinated debt 2% 3%Total 100% 100%
The funding mix remained well diversified and according to targets set. Retail deposits accounted for 46% of the total funding mix, improved from 45% per 2012 year end. Ultimo 2013 the Loan-to-Deposit ratio (excluding securities at amortised costs and IABF receivable) equals 1.04 (2012: 1.13).
Intraday liquidity managementThe objective of managing intraday liquidity and its risks at ING is twofold: it is focused on preventing damage to the institution’s own liquidity position, and, in light of its role in global financial markets, ING also takes into account the potential damage to other parties which can arise through chain effects in payment and securities transactions.
Collateral position managementThe objective of the Collateral Management is to ascertain that ING Bank can at all times meet collateral requirements for ING’s collateral needs.
Liquidity buffersThe liquidity buffer ING Bank holds can be seen as the short end of the counterbalancing capacity, i.e. the total of available sources and measures within ING to generate liquidity, and serves as a cushion for liquidity needs under normal and stressed conditions. The size and composition of the Liquidity buffer depends on ING Bank’s Risk Appetite (risk tolerance) and regulatory liquidity standards. In the buffer, only assets that are included that are ‘unencumbered’ and freely available for liquidity purposes. Bank Treasury ensures central management of all liquidity buffers within ING Bank, both buffers at Bank level and buffers at local business unit level.
The liquidity buffer is held as an insurance against a range of stress scenarios, covering the additional need for liquidity that may arise over a defined short period of time under stress conditions. ING’s minimum standards for liquidity buffers are described below:• When local regulatory rules require so, local liquidity buffers can be established. Although locally established, these buffers must be
centrally functionally managed by the ALM function. • The buffer must be adequate in relation to the contractual expiry calendars and expected or planned developments• The size of the buffers is supported by estimates of liquidity needs performed under the Bank’s or business entity’s stress testing and be
aligned with the liquidity risk appetite. • The liquidity buffer is composed of cash and core assets that are central bank eligible and/or highly marketable, which are not pledged
to payment systems or clearing houses. For longer term buffer purposes, a broader set of liquid assets might be appropriate, subject to the Bank’s or entity’s ability to generate liquidity from them under stress, within the specified period of time.
• The location and size of liquidity buffers reflects the Bank’s or entity’s structure (e.g. legal and geographical) and business activities.• The size and status of the buffers are reported to ALCO on a monthly basis.
As part of the liquidity buffer management, ING Bank also monitors the existing asset encumbrance. More information may be found in Pillar 3.
Liquidity risk transfer and pricingFunds Transfer Pricing (FTP) is an internal measurement and allocation system that assigns a profit contribution to funds raised, lent, or invested. FTP is used within ING to transfer interest rate risk, basis risk and liquidity risk positions from commercial units to Bank Treasury. The FTP framework enables local ALCOs to set their local FTP levels and manage these risks for all internal transfers at local level. This means that these risks are transferred from the business to a separate Bank Treasury book where they can be monitored and managed more efficiently and effectively. The liquidity costs, benefits and risks are considered in the product pricing, design and offering and in every relevant Product Approval and Review Process (PARP) or deal approval and other related processes for commercial products by the business units.
307ING Group Annual Report 2013
1 Wh
o w
e are2 R
epo
rt of th
e Executive B
oard
3 Co
rpo
rate go
vernan
ce4 C
on
solid
ated an
nu
al accou
nts
5 Parent co
mp
any an
nu
al accou
nts
6 Oth
er info
rmatio
n7 A
dd
ition
al info
rmatio
n
ING_2013_deel4a&b_v2.indd 307 19/03/2014 19:23:13
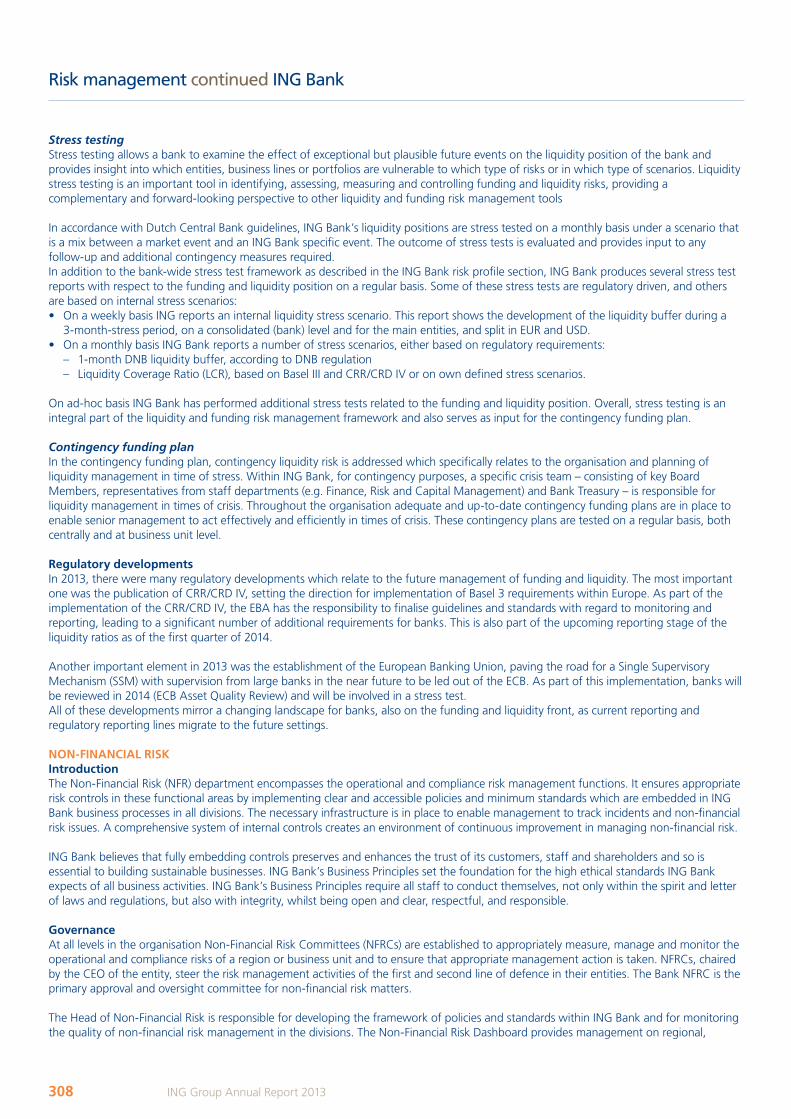
Risk management continued ING Bank
Stress testingStress testing allows a bank to examine the effect of exceptional but plausible future events on the liquidity position of the bank and provides insight into which entities, business lines or portfolios are vulnerable to which type of risks or in which type of scenarios. Liquidity stress testing is an important tool in identifying, assessing, measuring and controlling funding and liquidity risks, providing a complementary and forward-looking perspective to other liquidity and funding risk management tools
In accordance with Dutch Central Bank guidelines, ING Bank’s liquidity positions are stress tested on a monthly basis under a scenario that is a mix between a market event and an ING Bank specific event. The outcome of stress tests is evaluated and provides input to any follow-up and additional contingency measures required.In addition to the bank-wide stress test framework as described in the ING Bank risk profile section, ING Bank produces several stress test reports with respect to the funding and liquidity position on a regular basis. Some of these stress tests are regulatory driven, and others are based on internal stress scenarios: • On a weekly basis ING reports an internal liquidity stress scenario. This report shows the development of the liquidity buffer during a
3-month-stress period, on a consolidated (bank) level and for the main entities, and split in EUR and USD.• On a monthly basis ING Bank reports a number of stress scenarios, either based on regulatory requirements:
– 1-month DNB liquidity buffer, according to DNB regulation – Liquidity Coverage Ratio (LCR), based on Basel III and CRR/CRD IV or on own defined stress scenarios.
On ad-hoc basis ING Bank has performed additional stress tests related to the funding and liquidity position. Overall, stress testing is an integral part of the liquidity and funding risk management framework and also serves as input for the contingency funding plan.
Contingency funding planIn the contingency funding plan, contingency liquidity risk is addressed which specifically relates to the organisation and planning of liquidity management in time of stress. Within ING Bank, for contingency purposes, a specific crisis team – consisting of key Board Members, representatives from staff departments (e.g. Finance, Risk and Capital Management) and Bank Treasury – is responsible for liquidity management in times of crisis. Throughout the organisation adequate and up-to-date contingency funding plans are in place to enable senior management to act effectively and efficiently in times of crisis. These contingency plans are tested on a regular basis, both centrally and at business unit level.
Regulatory developmentsIn 2013, there were many regulatory developments which relate to the future management of funding and liquidity. The most important one was the publication of CRR/CRD IV, setting the direction for implementation of Basel 3 requirements within Europe. As part of the implementation of the CRR/CRD IV, the EBA has the responsibility to finalise guidelines and standards with regard to monitoring and reporting, leading to a significant number of additional requirements for banks. This is also part of the upcoming reporting stage of the liquidity ratios as of the first quarter of 2014.
Another important element in 2013 was the establishment of the European Banking Union, paving the road for a Single Supervisory Mechanism (SSM) with supervision from large banks in the near future to be led out of the ECB. As part of this implementation, banks will be reviewed in 2014 (ECB Asset Quality Review) and will be involved in a stress test. All of these developments mirror a changing landscape for banks, also on the funding and liquidity front, as current reporting and regulatory reporting lines migrate to the future settings.
NON-FINANCIAL RISKIntroductionThe Non-Financial Risk (NFR) department encompasses the operational and compliance risk management functions. It ensures appropriate risk controls in these functional areas by implementing clear and accessible policies and minimum standards which are embedded in ING Bank business processes in all divisions. The necessary infrastructure is in place to enable management to track incidents and non-financial risk issues. A comprehensive system of internal controls creates an environment of continuous improvement in managing non-financial risk.
ING Bank believes that fully embedding controls preserves and enhances the trust of its customers, staff and shareholders and so is essential to building sustainable businesses. ING Bank’s Business Principles set the foundation for the high ethical standards ING Bank expects of all business activities. ING Bank’s Business Principles require all staff to conduct themselves, not only within the spirit and letter of laws and regulations, but also with integrity, whilst being open and clear, respectful, and responsible.
GovernanceAt all levels in the organisation Non-Financial Risk Committees (NFRCs) are established to appropriately measure, manage and monitor the operational and compliance risks of a region or business unit and to ensure that appropriate management action is taken. NFRCs, chaired by the CEO of the entity, steer the risk management activities of the first and second line of defence in their entities. The Bank NFRC is the primary approval and oversight committee for non-financial risk matters.
The Head of Non-Financial Risk is responsible for developing the framework of policies and standards within ING Bank and for monitoring the quality of non-financial risk management in the divisions. The Non-Financial Risk Dashboard provides management on regional,
308 ING Group Annual Report 2013
ING_2013_deel4a&b_v2.indd 308 19/03/2014 19:23:14
Risk management continued ING Bank
divisional and Bank level with an overview of key risks within the NFR risk areas including compliance risks, information security risks, continuity risks, governance and control risks, fraud and unauthorised activities risks and personal and physical security risks, enabling management to focus and set priorities.
The Chief Compliance Officer (CCO) is the general manager of the compliance risk management department and the Head of the Compliance function within the Bank. This is an independent function responsible for developing and establishing the Bank-wide compliance risk management charter & framework which establishes the minimum standards for managing compliance risks. The CCO assists and supports the Management Board Bank in managing ING Bank’s compliance risks and control framework.
The non-financial risk department uses a layered functional approach within divisions to ensure systematic and consistent implementation of the Bank framework, policies and minimum standards. To avoid potential conflicts of interests, it is imperative that the staff working in the department is impartial and objective when advising business management on non-financial risk matters in their business unit or business line. To facilitate this, a strong functional reporting line to the next higher level within NFR is in place. The functional reporting line has clear accountabilities with regard to objective setting, remuneration, performance management and appointment of new staff as well as obligations to veto and escalate.
FrameworkING Bank has a comprehensive framework for operational and compliance risks. This supports and governs the process of identifying, measuring, mitigating and monitoring non-financial risks thus reflecting the stages described in the Enterprise Risk Management model of COSO (Committee of Sponsoring Organisations of the Treadway Commission).
The risk appetite (defined as the acceptable and authorised maximum level of risk) is set in each of the NFR risk areas and must be adhered to. Adherence to this risk appetite is monitored quarterly through the Non-Financial Risk Dashboard which reports the key non-financial risk exposures.
Processes are in place to identify key threats, vulnerabilities and the associated risks which might cause adverse events. Event identification is performed proactively and precedes a risk assessment. Different techniques for event identification exist within ING Bank, e.g. Risk & Control Self-Assessments, scenario analysis, external events inventories, internal incident analyses (e.g. lessons learned based on information from incident reporting), key risk indicators and threat scans.
Business units and departments perform regular Business Environment Assessments (BEAs) and Risk & Control Self-Assessments (RCSAs) to identify and assess risks. These are conducted with involvement of the business and their Operational Risk, Compliance and Legal departments. Based on the results of the risk assessment, response measures must be determined for the identified risks beyond the risk appetite. Risk response actions balance the expected cost for implementing these measures with the expected benefits regarding the risk reduction. Risk response can be achieved through several combinations of mitigation strategies, for example reducing likelihood of occurrence, reducing impact, risk avoidance, risk acceptance or through the transfer of risk. Tracking takes place through ING Bank’s central risk management system.
The yearly objective setting process for both business management and NFR professionals aims to keep improving the management of NFR risk throughout ING Bank to ensure that ING Bank stays in control of its current and future NFR risks.
Operational risk Operational risk is defined as the risk of direct or indirect loss resulting from inadequate or failed internal processes, people and systems or from external events. It includes the related risk of reputation loss, as well as legal risk but strategic risks are not included. Effective operational risk management leads to more stable business processes (including IT systems) and lower costs.
Main developments in 2013Internal and external fraudING Bank continues its strong commitment to preventing any involvement in fraud. In line with its peers, ING Bank is exposed to many types of fraud, from internal fraud, such as the embezzlement of corporate funds, to external fraud whereby clients or others misuse the financial products of ING Bank. To mitigate the staff involvement with fraudulent payments, preventive organisational controls for payment processes have been redefined for implementation by the entities. The controls include key control testing requirements.
In the Netherlands the risk of criminal skimming activities of debit cards has been significantly mitigated in 2013. This is due to the introduction of Geo-blocking, which prevents criminals using data from skimmed cards, in combination with the EMV chip, the global standard for credit and debit payment cards. ING Bank continues to stringently monitor possible new fraud methodologies that can emerge following the introduction of new payment methods and products.
Cybercrime Cybercrime is an increasing threat to companies in general and to financial institutions specifically. Both the frequency and the intensity of attacks are increasing at a global scale. In April 2013 Dutch banks, including ING Bank were targeted by Distributed Denial of Service (DDoS) attacks which resulted in some noticeable unavailability of services.
309ING Group Annual Report 2013
1 Wh
o w
e are2 R
epo
rt of th
e Executive B
oard
3 Co
rpo
rate go
vernan
ce4 C
on
solid
ated an
nu
al accou
nts
5 Parent co
mp
any an
nu
al accou
nts
6 Oth
er info
rmatio
n7 A
dd
ition
al info
rmatio
n
ING_2013_deel4a&b_v2.indd 309 19/03/2014 19:23:14
Risk management continued ING Bank
Following the establishment of a Cybercrime Task Force in 2012, ING Bank has set up a Cybercrime Resilience Program in 2013 to structurally address the cybercrime threats. Within the programme, ING Bank has defined a wide range of measures, on top of existing IT security measures, to strengthen ING’s resilience against e-banking fraud, DDoS and targeted attacks (also called Advanced Persistent Threats). To monitor and to respond to cybercrime effectively across ING Bank, a permanent central CyberCrime Emergency Response Team has been established.
ING Bank is continuously working on strengthening its global cybercrime resilience including strengthened collaboration against cybercrime with the financial industry, law enforcement authorities, government (e.g. National Cyber Security Center) and Internet Service Providers (ISPs).
Advanced Measurement Approach (AMA) ING Bank has an Operational Risk Capital model in place in which the risk profile is closely tailored to the internal profile of ING Bank and its divisions by using scenario data for capturing severe risks and internal loss and Risk & Control Self-Assessment data for capturing day-to-day risks. The business has a strong role in assessing scenario severities and the Operational Risk Management function in validating the results. In 2013 workshops were held at the regional level and the scenario coverage has been expanded by introducing more relevant scenario topics. The internal data based calculation is combined with an external loss data (ORX) based calculation. The better scenario coverage is demonstrated for a unit of measure, the more weighting is given to scenarios in the calculation.
In April 2013 ING Bank obtained accreditation for use of its enhanced AMA model for regulatory supervision purposes. ING Bank is reporting the regulatory capital numbers on a quarterly basis. The AMA capital for the fourth quarter of 2013 amounts to EUR 2,822 million. For the fourth quarter of 2012 the AMA capital amounted to EUR 2,836 million.
Compliance riskCompliance risk is defined as the risk of impairment of ING Bank’s integrity as a result of failure (or perceived failure) to comply with relevant laws, regulations, ING Bank policies and standards and the ING Bank Business Principles. In addition to reputational damage, failure to effectively manage compliance risks could expose ING Bank to fines, civil and criminal penalties, and payment of damages, court orders and suspension or revocation of licenses, which would adversely impact customers, staff, shareholders and other stakeholders of ING Bank.
The compliance risk management function supports management in mitigating the compliance risks and by establishing a compliance control framework derived from laws, regulations and standards. The compliance risk management function actively educates and supports the business in managing compliance risks related, but not limited to, money laundering, terrorist financing, sanction and export control compliance, conflicts of interest, mis-selling, bribery and protection of customer interests.
ING Bank categorises compliance risk into four conduct-related integrity risk areas: client conduct, personal conduct, organisational conduct and financial conduct. ING Bank has a Whistleblower Policy which encourages staff to speak up if they know or suspect a breach of external regulations, internal policies or Business Principles.
Financial Economic Crime (’FEC‘) policyThe ING Bank FEC Policy provides a clear statement of what is required by all ING Bank entities in order to guard against any involvement in criminal activity, and to participate in international efforts to combat money laundering and the funding of terrorist and criminal activities. The requirements in the ING Bank FEC Policy cover minimum standards and controls related to: money laundering, terrorist financing, export trade controls, proliferation financing, sanctions (economic, financial and trade) and countries designated by ING Bank as Ultra High Risk Countries (UHRC).
The ING Bank FEC Policy directly reflects relevant national and international laws, regulations and industry standards. The ING Bank FEC Policy is mandatory and applies to all ING banking entities, majority owned ING business, businesses under management control, staff departments, product lines and to all client engagements and transactions.
Management of ING Bank entities introduce appropriate local procedures that enable them to comply with local laws, regulations and the relevant ING Bank FEC Policy. Where local laws and regulations are more stringent, the local laws and regulations are applied. Likewise the FEC Policy prevails when the standards therein are stricter than local laws and regulations.
As a result of frequent evaluation of all businesses from economic, strategic and risk perspectives ING Bank continues to believe that for business reasons doing business involving certain specified countries should be discontinued. In that respect, ING has a policy not to enter into new relationships with clients from these countries and processes remain in place to discontinue existing relationships involving these countries. At present these countries are Myanmar, North Korea, Sudan, South Sudan, Syria, Iran and Cuba. Each of these countries is subject to a variety of EU, US and other sanctions regimes. Cuba, Iran, Sudan, and Syria are identified by the US as state sponsors of terrorism and are subject to U.S. economic sanctions and export controls.
310 ING Group Annual Report 2013
ING_2013_deel4a&b_v2.indd 310 19/03/2014 19:23:14
Risk management continued ING Bank
Regulatory measures and law enforcement agencies investigationsAgreement with U.S. AuthoritiesOn 12 June 2012, ING Bank entered into a Settlement Agreement with U.S. Department of the Treasury’s Office of Foreign Assets Control (OFAC) and Deferred Prosecution Agreements with the Department of Justice, the United States Attorney’s Office for the District of Columbia and the District Attorney of the County of New York (together the ‘U.S. Authorities’) in relation to the investigation by those agencies into compliance with U.S. economic sanctions and U.S. dollar payment practices until 2007.
The Agreements have expired as of 12 December 2013 and the related proceedings against ING Bank N.V. have been dismissed by the US District Court of Columbia.
SingaporeThe Monetary Authority of Singapore (MAS) announced on 14 June 2013 that it has reviewed banks’ processes for setting rates for various financial benchmarks in Singapore. ING Bank participated in the setting of Non-Deliverable Forward FX rates (NDFs). MAS has found 20 banks, including ING Bank, to have deficiencies in their processes and directed the banks to adopt measures to address their deficiencies, report on the progress and requires them to hold additional statutory reserves. ING Bank fully cooperated with the review as it is committed to conducting its business with the highest levels of integrity, including strict compliance with all applicable laws, regulations and standards in each of the markets and jurisdictions in which it operates. Furthermore ING Bank has taken a number of remedial actions, amongst other actions, to enhance our procedures for submitting rates, and will continue to monitor these processes and train staff.
Main developments in 2013ING Group Whistleblower PolicyING Group issued a revised ING Group Whistleblower Policy. The Policy covers reports of employees about actual or suspected irregularity of a general, operational or financial nature within ING. Employees are encouraged to report any of these behaviours through the specific Whistleblowing channels, including anonymously.
Regulator relationshipsBank Compliance Risk Management continued its policy of investing in pro-active relationship building with regulators in the jurisdictions where ING Bank operates, by striving for an open two-way approach to communication and cooperation in identifying and mitigating compliance risks for ING Bank as well as seeking to contribute to the regulatory debate going forwards.
Awareness Promoting Integrity ProgrammeThe Promoting Integrity Programme was started in 2010 and is an innovative programme consisting of e-modules on key bank-wide topics and follow-up dialogue sessions in which managers discuss the issues raised with their teams. The programme is sponsored by board members and senior managers and is created to ensure that every employee in every part of ING understands how their actions and behaviour can help earn and retain customer and stakeholder trust. The modules consist of several case studies and real life examples which require staff to think about various aspects of the issue. Each module also starts with an opening statement from a senior manager. The topics covered in 2013 were:
• ’Think before you post‘ looking at the use of email and social media. This topic provided a way of ensuring staff were aware of the risks and clear on what they should and should not do, online or when using e-mail. The focus was on staff identifying actions that they can take to protect themselves and ING Bank.
• ’Legal but harmful‘ which highlighted the need to look beyond what is strictly legal and think about the wider implications. It challenged staff to think not just ’can I do this?‘, but ’should I do this?‘ and to think about the longer term implications of their actions.
LearningGlobal education and awareness training was provided on topics such as sanctions and competition law and on other specialist topics in face to face sessions and e-learning modules. This included training in introduction programmes for new staff and talent programmes. Compliance Risk Management also continued its mandatory global Compliance Officer Training programme for all new compliance officers in ING Bank.
bUSINESS RISKBusiness Risk for ING Bank has been defined as the exposure to value loss due to fluctuations in volumes, margins and costs, as well as customer behaviour risk. It is the risk inherent to strategy decisions and internal efficiency. The calculation of business risk capital is done by calculation of two components,I Expense risk relates to the (in)flexibility to adjust expenses, when that is needed.II Customer behaviour risk relates to clients behaving differently than expected and the effect that this behaviour can have on customer
deposits and mortgage pre-payments. The customer behaviour risk is calculated by stressing the underlying assumptions in the models for behavioural assets and liabilities.
Each of these components is calculated separately, and combined to one business risk figure via the variance-covariance methodology.
311ING Group Annual Report 2013
1 Wh
o w
e are2 R
epo
rt of th
e Executive B
oard
3 Co
rpo
rate go
vernan
ce4 C
on
solid
ated an
nu
al accou
nts
5 Parent co
mp
any an
nu
al accou
nts
6 Oth
er info
rmatio
n7 A
dd
ition
al info
rmatio
n
ING_2013_deel4a&b_v2.indd 311 19/03/2014 19:23:14

Risk ManageMent nn gRoupintroductionRisk taking is integral to the business model for insurance, investment management, and banking organisations such as NN. NN has developed and implemented a risk management structure that is designed to identify, assess, control and monitor the risks associated with its business. Through its risk management practices, NN seeks to meet its obligations to policyholders and other customers and creditors, manage its capital efficiently, and comply with applicable laws and regulations.
NN’s approach to risk management is based on the following components:• Risk management structure and governance systems. NN’s risk management structure and governance systems follow the ‘three
lines of defence’ model, which outlines the decision-making, execution and oversight responsibilities for the implementation of NN’s risk management. These structure and governance systems are embedded in each of NN’s organisational layers, from the holding level to the individual business units.
• Risk management framework. NN’s risk management framework takes into account the relevant elements of risk management, including its integration into NN’s strategic planning cycle, the management information generated, and a granular risk assessment.
• Risk management policies, standards and processes. NN has a comprehensive set of risk management policies, standards and processes, which are updated regularly to align with market leading practices, applicable laws and regulations, and to changes in NN’s business and risk profile. These risk management policies, standards and processes apply throughout NN and are used by NN to establish, define, and evaluate NN’s risk tolerance levels and risk control processes and to ensure that the tolerance levels and policies are communicated throughout the organisational structure.
oRganisationaL Risk ManageMent stRuCtuReManagement Board and its (sub)committeesThe Management Board is responsible for defining, installing, and monitoring the risk management organisation in order to ensure its control systems are effective. The Management Board or its subcommittees approve all risk management policies as well as the quantitative and qualitative elements of NN’s risk appetite. The Management Board reports and discusses these topics with the Risk Committee, which is a sub-committee of the Supervisory Board, on a quarterly basis.
While the Management Board retains ultimate responsibility for NN’s risk management, it has delegated certain responsibilities to a committee of the Management Board, the Risk and Finance Committee, which is responsible for day-to-day risk and finance related risk management decision-making, processes and controls. The Risk and Finance Committee has further delegated certain tasks to sub-committees, which advise the Risk and Finance Committee on risk and finance-related topics. These sub-committees are the Asset and Liability Committee, the Non-Financial Risk Committee, the Product Risk Committee, the Model Committee, the Finance Committee, the Investment Committee, and the Crisis Committee.
Chief risk officerThe chief risk officer of NN (the CRo) is a member of the Management Board. The CRO bears primary and overall responsibility for NN’s risk management. The CRO must ensure that both the Management Board and the Supervisory Board are at all times informed of, and understand, the material risks to which NN is exposed. Each business unit has its own chief risk officer, who reports (directly or indirectly) to the CRO.
The CRO is primarily responsible for: • setting risk policies; • formulating NN’s risk management strategy and ensuring that it is implemented throughout NN; • monitoring compliance with NN’s overall risk policies; • supervising the operation of NN’s risk management and business control systems;• reporting of NN’s risks and the processes and internal business controls; and• making risk management decisions with regard to matters which may have an impact on the financial results of NN or its reputation, without limiting the responsibility of each individual member of the Management Board in relation to risk management.
supervisory Board and its committeesThe Supervisory Board is responsible for supervising the Management Board and the general affairs of the Company and its business. For risk management purposes the Supervisory Board is assisted by two committees:• Risk Committee. The Risk Committee assists the Supervisory Board in supervising and advising the Management Board with respect
to NN’s risk management strategy and policies.• audit Committee. The Audit Committee reviews and assesses the applicable accounting standards and the Company’s compliance
therewith, the going concern assumption, significant financial risk exposures, significant adjustments resulting from audit, compliance with statutory and legal requirements and regulations, tax and tax planning matters with a material impact on the financial statements, and detection of fraud and other illegal acts.
Risk management NN Group‘
’
“
”
312 ING Group Annual Report 2013
ING_2013_deel4c&d_v2.indd 312 19/03/2014 19:33:09

Risk management continued NN Group
three lines of defence modelThe three lines of defence model, on which NN’s risk management structure and governance is based, defines three risk management levels, each with distinct roles, decision authorities, execution responsibilities, and oversight responsibilities. This framework ensures that risk is managed in line with the risk appetite as defined by the Management Board, ratified by the Supervisory Board, and cascaded throughout NN.• First line of defence: the CEOs of the business units of NN and the other management board members of the business units have
primary accountability for the performance of the business, operations, compliance and effective control of risks affecting their businesses. They underwrite the insurance products that reflect local needs and thus know their customers and are well-positioned to act in both the customers’ and NN’s best interest.
• second line of defence: oversight functions at the Head Office and at the business units with a major role for the risk management organisation, headed by the CRO and the corporate legal and compliance function. The membership of the CRO on the Management Board ensures that risk management issues are heard and discussed at the highest level. The CRO steers a functional, independent risk organisation, which supports the commercial departments in their decision-making, but which also has sufficient countervailing power to prevent risk concentrations and other forms of unwanted or excessive risks. These oversight functions: – develop the policies and guidance for their specific risk and control area; – encourage and objectively challenge/monitor sound risk management throughout the organisation and coordinate the reporting of risks; – support the first line of defence in making proper risk-return trade-offs; – have escalation/veto power in relation to business activities that are judged to present unacceptable risks to NN.
• third line of defence: corporate audit services (Cas). CAS provides an independent assessment of the standard of internal control with respect to NN’s business and support processes, including governance, risk management and internal controls.
Risk ManageMent FRaMeWoRkNN’s risk management framework comprises a series of sequential steps, through which NN seeks to identify, measure and manage the risks to which it is exposed. The diagram below sets out these steps.
• objective setting. Business planning and priority setting is undertaken through an annual medium term planning (MTP) process, which is integrated with NN’s own risk and solvency assessment (oRsa) process. At the start of the MTP process, NN establishes strategic objectives at a holding level. Those strategic objectives are used to establish and define NN’s risk appetite, which consists of quantitative and qualitative statements defining those risks NN wishes to acquire, to avoid, to retain and/or to remove. The strategic objectives are cascaded through the enterprise and business unit plans and evaluated against the risk appetite. Targets and risk limits for the business units are derived from NN’s overall strategy and risk appetite framework.
• event identification. NN identifies events that may potentially impact its risk position, recognising that uncertainties exist, and that NN cannot know with certainty which events will occur and when,, or what the outcome or impact would be if it did occur. As part of event identification, NN considers both external and internal factors that affect event occurrence. External factors include economic, business, natural environment, political, demographic, social and technological factors. Internal factors reflect NN’s choices and concern such matters as infrastructure, personnel, process and technology.
• Risk assessment. NN, centrally at the executive level and at the business unit level, considers how events identified in the previous step might affect the achievement of NN’s strategic objectives. Key risks are assessed on a regular basis and, where appropriate, this analysis is supported by models (such as for NN’s economic capital calculation; see also ‘NN’s Risk Profile—Economic capital’). NN conducts regular top-down assessments of its key risks, both at the holding level and at the level of the individual business units.
Monitoring
Objective setting
Event identificationRisk
assessment
Risk response & control
Information &communication
Monitoring
Objective setting
Event identification
Risk assessment
Risk response & control
Information &communication
313ING Group Annual Report 2013
1 Wh
o w
e are2 R
epo
rt of th
e Executive B
oard
3 Co
rpo
rate go
vernan
ce4 C
on
solid
ated an
nu
al accou
nts
5 Parent co
mp
any an
nu
al accou
nts
6 Oth
er info
rmatio
n7 A
dd
ition
al info
rmatio
n
ING_2013_deel4c&d_v2.indd 313 19/03/2014 19:33:09

Risk management continued NN Group
• Risk response and control. Once a risk is assessed, NN identifies potential responses to those risks and analyses the mitigating impact of those responses. Taking into account the risk tolerances set out in the risk appetite framework NN designs its response for each assessed risk. Risk and control activities are performed throughout NN, at all organisational levels.
• information and communication. Communication of information is a key part of NN’s risk management framework. Risk management officers, departments, and committees within NN are informed regularly of NN’s position compared to its strategic objectives and its risk appetite to enable them to monitor developments and to timely take appropriate decisions. Comprehensive reports on NN’s financial and insurance risks, and on its non-financial risks, are prepared and discussed every quarter. These reports analyse, amongst others, developments in financial markets and their impact on NN’s capital position, the effectiveness of NN’s hedge positions, and any incidents that may have occurred.
• Monitoring. The effectiveness of NN’s risk management itself is also monitored. Regular monitoring ensures that risk management is maintained at all organisational levels of NN and is carried out by all three lines of defence.
Risk ManageMent poLiCies, stanDaRDs anD pRoCessesNN has a comprehensive set of risk management policies, standards and processes in place. These policies, standards and processes are regularly updated to align with industry practices and changes in NN’s business profile, and to comply with applicable laws and regulations. Key areas of risk management for which NN has established policies, standards and processes are set out below.
Risk appetite frameworkNN’s risk appetite framework determines which risks NN wishes to take, to avoid, to retain and/or to remove. The risk appetite framework consists of qualitative and quantitative statements as to risk preferences, risk tolerances, risk limits and risk controls. The risk appetite framework is based on three key quantitative measures that aim to:• ensure cash capital is sufficient following a 1 in 20 annual risk sensitivity; NN quantifies this using regulatory capital sensitivities and
potential capital management actions.• ensure economic solvency is sufficient following a 1 in 20 annual risk sensitivity; NN quantifies this risk using available financial
resources/economic capital and related sensitivities. Available financial resources (AFR) is a before tax market value surplus defined as market value of assets less market value of liabilities.
• ensure IFRS results before tax are sufficient following a 1 in 20 annual risk sensitivity; NN quantifies this risk using sensitivities on the IFRS results before tax.
In addition to the key quantitative measures, qualitative statements form part of the risk appetite framework that serve to guide risk taking for conduct in the areas of underwriting, Asset and Liability management (aLM), investing and operations. These statements support NN’s strategy, contribute to avoiding unwanted or excessive risk taking, and aim to further optimise the use of capital. The qualitative risk appetite statements are organised under the following categories:• Managing underwriting. Underwriting and product development is paramount to the insurance business. NN strives for appealing,
easy to understand and transparent value-for-money products that can be effectively risk-managed over the expected life of the contract. • aLM. NN aims to match its asset portfolio to its liabilities with optimal strategic asset allocation and by limiting any mis-matches to an
acceptable degree. The ALM process is integral in ensuring adequate liquidity for policyholder obligations.• Managing investments. NN has an appetite for investments that will provide an appropriate risk and return for NN’s policyholders
and shareholders. • Managing operations. Under this category, NN stipulates requirements for managing reputation, business continuity, processes and
controls, as well as providing a safe and engaging work environment for a competent workforce.
Risk policy frameworkNN’s risk policy framework ensures that all risks are managed consistently and that NN as a whole operates within its risk tolerances. The policies/minimum standards focus on risk measurement, risk management and risk governance. To ensure that policies are efficient and effective they are governed by the risk committee structure. Potential waivers to the policies have to be approved through the respective risk committees.
Risk limitsThe quantitative risk appetite statement is translated into quantitative risk limits for the business units. The business units report regularly on their risk profile compared to applicable risk appetite and risk limits.
product approval and review processThe product approval and review process (paRp) has been developed to enable effective design, underwriting, and pricing of all products as well as to ensure that they can be managed throughout their lifetime. This process establishes requirements as to the product risk profile features to ensure that products are aligned with NN’s strategy. The PARP takes into account customer benefits and product suitability, expected sales volumes, value-oriented pricing metrics and relevant policies. It includes requirements and standards to assess risks as per the risk categories, as well as the assessment of the administration and accounting aspects of the product.
new investment class and investment mandate processNN maintains a new investment class approval and review process (niCaRp) for approving new investment classes of assets. At the holding level, NN establishes a global list of asset classes in which the business units may invest. Each business unit also maintains a local
314 ING Group Annual Report 2013
ING_2013_deel4c&d_v2.indd 314 19/03/2014 19:33:10
Risk management continued NN Group
asset list that is a subset of the global asset list. The local asset list includes asset allocation parameters, which prescribe the relative proportions in which the relevant business unit may invest in different asset classes, as well as asset, industry, regional, and credit concentration limits.
own Risk and solvency assessment and internal Capital adequacy assessment processNN (and each of its regulated insurance subsidiaries) produces an own risk and solvency assessment (oRsa) at least once a year. In the ORSA, NN articulates its strategy and risk appetite, describes its key risks and how they are managed, analyses whether or not its risks and capital are appropriately modelled and how susceptible the capital position is to shocks through stress and scenario testing. Stress testing examines the effect of exceptional but plausible scenarios on the capital position of NN. Stress testing can also be initiated outside ORSA, either internally or by external parties such as De Nederlandsche Bank (DNB) and European Insurance and Occupational Pensions Authority (EIOPA). The ORSA includes an overall assessment of NN’s solvency position in light of the risks it holds. NN’s banking and investment management operations, at least once a year, run an internal capital adequacy assessment process (iCaap) in conformity with Basel II requirements. ICAAP tests whether current capital positions are adequate for the financial risks that the relevant NN entities bear.
iFRs reserve adequacy test All of NN’s operating insurance entities need to ensure that their IFRS insurance reserves are tested for adequacy taking into account the insurance premium rate levels and the uncertainty of future returns on investments. The reserve adequacy test is executed by evaluating insurance liabilities on current best estimate actuarial assumptions plus a risk margin to ensure that the reserves remain adequate based on these assumptions. The assumed investment earnings are a combination of the run-off of portfolio yields on existing assets, anticipated new premiums and reinvestment rates in relation to maturing assets.
non-financial risk dashboard Non-financial risks are monitored through the non-financial risk dashboard (nFRD) process at all levels in the organisation. The NFRD is one tool which provides management at all organisational levels with information about key operational, compliance and legal risks and incidents. The exposure of NN to non-financial risks is regularly assessed through risk assessments and monitoring. After identification of the risks, each risk is assessed as to its likelihood of occurrence as well its potential impact should it occur. Actions required to mitigate the risks are identified and tracked until the risk is either reduced, if such a reduction is possible, or accepted as a residual risk if the risk cannot be mitigated.
Model governance and validation NN’s model governance and validation function seeks to ensure that NN’s models achieve their intended purpose. Models and their disclosed metrics are approved by the Model Committee. The findings of the model validation function are also reported regularly to the Model committee. This committee is responsible for modelling policies, processes, methodologies, and parameters which are applied within NN. Furthermore, the model validation function carries out validations of internal models related to Solvency II. To ensure independence from the business and other risk departments, the model validation department head reports directly to the CRO.
Recovery planning NN has determined a set of measures for early detection of and potential response to a crisis should it occur. These include monitoring indicators which are expected to provide early-warning of emerging crises, advance preparation of options to raise or release capital, and allocation of roles and responsibilities in case of a crisis, and other practical arrangements that may be required depending on the type of crisis.
315ING Group Annual Report 2013
1 Wh
o w
e are2 R
epo
rt of th
e Executive B
oard
3 Co
rpo
rate go
vernan
ce4 C
on
solid
ated an
nu
al accou
nts
5 Parent co
mp
any an
nu
al accou
nts
6 Oth
er info
rmatio
n7 A
dd
ition
al info
rmatio
n
ING_2013_deel4c&d_v2.indd 315 19/03/2014 19:33:10
Risk management continued NN Group
Risk pRoFiLeMain types of risksThe following principle types of risk are associated with NN’s business:• insurance risk. Insurance risks are the risks related to the events insured by NN and comprise actuarial and underwriting risks such as
mortality, longevity, morbidity, and non-life insurance risks, which result from the pricing and acceptance of insurance contracts.• Business risk. Business risks are the risks related to the management and development of the insurance portfolio but excludes risks
directly connected to insured events. Business risk includes policyholder behaviour risks and expense risks. Business risks can occur because of internal, industry, or wider market factors.
• Market and credit risk. Market risk is the risk of potential losses due to adverse movements in financial market variables. Counterparty default risk is the risk of potential losses due to default by NN’s debtors (including bond issuers), trading counterparties or mortgage holders. In relation to market and credit risk, NN distinguishes between its general account businesses and its separate account businesses. – General account businesses. The general account businesses are those in which NN bears the market and credit risk. NN’s earnings
from the general account businesses depend not only on underwriting, but also on the performance of NN’s investment portfolio. The general account includes NN’s life insurance and non-life insurance businesses. Market and credit risks include (i) equity risk, (ii) real estate risk, (iii) interest rate risk, (iv) credit spread risk, (v) counterparty default risk and (vi) foreign exchange risk.
– Separate account businesses. The separate account businesses are those in which the policyholder bears the market and credit risk. NN’s earnings from the separate account businesses are primarily driven by fee income. However, in the case of variable annuities and the guaranteed separate account pension business in the Netherlands, NN retains risk associated with the guarantees provided to its policyholders. Businesses in this category are (i) the variable annuities (Va) portfolio, (ii) the group pension business in the Netherlands for which guarantees are provided, and (iii) other separate account business, primarily the unit linked business.
• Liquidity risk. Liquidity risk is the risk that one of NN’s entities does not have sufficient liquid assets to meet its financial obligations when they become due and payable, at reasonable cost and in a timely manner.
• operational risk. Operational risk is a non-financial risk that includes direct or indirect losses resulting from inadequate or failed internal processes (including as a result of fraud and other misconduct), systems failure (including information technology and communications systems), human error, and certain external events.
• Compliance risk. Compliance risk is the risk of impairment of NN’s integrity. It is a failure (or perceived failure) to comply with NN’s Business Principles and the Compliance Risk-related laws, regulations and standards that are relevant to the specific financial services offered by a business or its ensuing activities, which could damage NN’s reputation and lead to legal or regulatory sanctions and financial loss.
economic capitalEconomic capital is NN’s internal measurement of the amount of capital required for the risks that NN is exposed to through its balance sheet, its business and its daily operations.
NN determines economic capital as the amount of additional assets it must hold above the market value of its liabilities in order to withstand adverse movements in one year, based on a 99.5% level of confidence and before any adjustment for tax impact. A 99.5% level of confidence means that NN would be able to fulfil its obligations to its policyholders without requiring additional capital in 199 out of 200 annual scenarios. NN’s economic capital is calculated in three steps.• In the first step, NN models the market and credit risks to which NN’s balance sheet is exposed using 50,000 stochastic real-world
scenarios over a one-year time horizon, which are calibrated to historically observed market data. The model then quantifies the extent to which NN’s assets must exceed its liabilities to ensure it is able to fulfil its policyholder obligations at a 99.5% level of confidence. This constitutes the economic capital for market and credit risk.
• In the second step, NN models insurance and business risk by defining stress scenarios at a 99.5% confidence interval using empirical data, when available, and expert judgement on the characteristics of NN’s portfolio. With regards to longevity and expense risk, these stress scenarios are measured over a multi-year horizon. Mortality, morbidity, and property and casualty (P&C) risks are measured over a one-year horizon. These measurements are made at the individual business unit level and are modelled to capture the offsetting of certain risks, which occurs where certain risk events preclude the possibility of others. For example, if risk capital is based on the risk event that people will live longer (longevity risk), then the risk event that the same people will die earlier (mortality risk) is precluded. These risks are also aggregated with each other, as well as with the market and credit risk calculated in step one, using correlations based on expert judgement. As a result of this aggregation, the economic capital for the aggregate risk is less than the sum of the economic capital for the individual risks because the probability of all of the various risks materialising concurrently is less than 0.5%. This difference is the diversification benefit, reflecting the benefits of NN’s risk pooling.
• In the third step, NN adds economic capital for operational risks and for business units that are not reflected in the internal model, without recognising any further diversification benefit. The economic capital for operational risk is based on the draft of the standard formula set out in Solvency II. Certain business units do not form part of NN’s internal model. Depending on the type of business, the economic capital for these business units is approximated using commercial capital requirements, the Insurance Group Directive, local regulatory capital requirements or IFRS equity net of intangibles. See ‘-Economic capital for entities outside of NN’s internal model’.
NN’s internal model uses, among others, statistics, observed historical market data, insurance policy terms and conditions, and NN’s own judgment, expertise and experience, and includes assumptions as to the levels and timing of payment of premiums, benefits, claims, expenses, interest rates, credit spreads, investment portfolio performance (including equity market and debt market returns), longevity,
316 ING Group Annual Report 2013
ING_2013_deel4c&d_v2.indd 316 19/03/2014 19:33:10
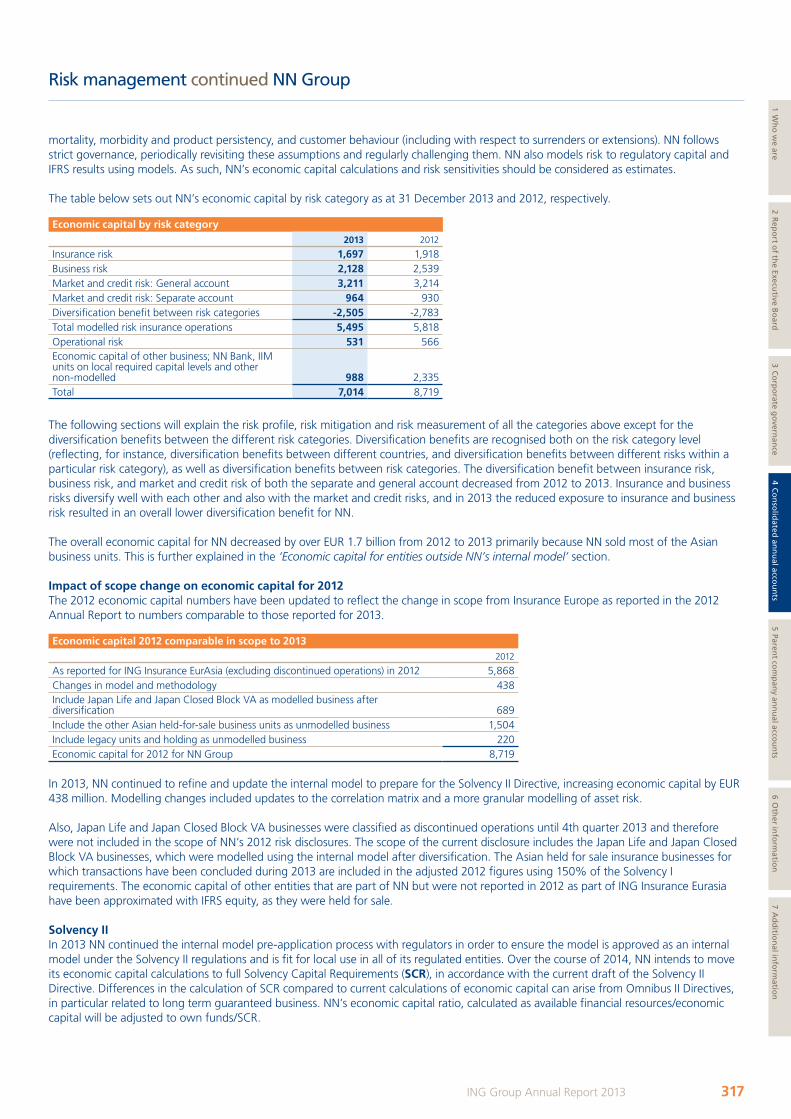
Risk management continued NN Group
mortality, morbidity and product persistency, and customer behaviour (including with respect to surrenders or extensions). NN follows strict governance, periodically revisiting these assumptions and regularly challenging them. NN also models risk to regulatory capital and IFRS results using models. As such, NN’s economic capital calculations and risk sensitivities should be considered as estimates.
The table below sets out NN’s economic capital by risk category as at 31 December 2013 and 2012, respectively.
economic capital by risk category2013 2012
Insurance risk 1,697 1,918Business risk 2,128 2,539Market and credit risk: General account 3,211 3,214Market and credit risk: Separate account 964 930Diversification benefit between risk categories -2,505 -2,783Total modelled risk insurance operations 5,495 5,818Operational risk 531 566Economic capital of other business; NN Bank, IIM units on local required capital levels and other non-modelled 988 2,335Total 7,014 8,719
The following sections will explain the risk profile, risk mitigation and risk measurement of all the categories above except for the diversification benefits between the different risk categories. Diversification benefits are recognised both on the risk category level (reflecting, for instance, diversification benefits between different countries, and diversification benefits between different risks within a particular risk category), as well as diversification benefits between risk categories. The diversification benefit between insurance risk, business risk, and market and credit risk of both the separate and general account decreased from 2012 to 2013. Insurance and business risks diversify well with each other and also with the market and credit risks, and in 2013 the reduced exposure to insurance and business risk resulted in an overall lower diversification benefit for NN.
The overall economic capital for NN decreased by over EUR 1.7 billion from 2012 to 2013 primarily because NN sold most of the Asian business units. This is further explained in the ‘Economic capital for entities outside NN’s internal model’ section.
impact of scope change on economic capital for 2012 The 2012 economic capital numbers have been updated to reflect the change in scope from Insurance Europe as reported in the 2012 Annual Report to numbers comparable to those reported for 2013.
economic capital 2012 comparable in scope to 20132012
As reported for ING Insurance EurAsia (excluding discontinued operations) in 2012 5,868Changes in model and methodology 438Include Japan Life and Japan Closed Block VA as modelled business after diversification 689Include the other Asian held-for-sale business units as unmodelled business 1,504Include legacy units and holding as unmodelled business 220Economic capital for 2012 for NN Group 8,719
In 2013, NN continued to refine and update the internal model to prepare for the Solvency II Directive, increasing economic capital by EUR 438 million. Modelling changes included updates to the correlation matrix and a more granular modelling of asset risk.
Also, Japan Life and Japan Closed Block VA businesses were classified as discontinued operations until 4th quarter 2013 and therefore were not included in the scope of NN’s 2012 risk disclosures. The scope of the current disclosure includes the Japan Life and Japan Closed Block VA businesses, which were modelled using the internal model after diversification. The Asian held for sale insurance businesses for which transactions have been concluded during 2013 are included in the adjusted 2012 figures using 150% of the Solvency I requirements. The economic capital of other entities that are part of NN but were not reported in 2012 as part of ING Insurance Eurasia have been approximated with IFRS equity, as they were held for sale.
solvency iiIn 2013 NN continued the internal model pre-application process with regulators in order to ensure the model is approved as an internal model under the Solvency II regulations and is fit for local use in all of its regulated entities. Over the course of 2014, NN intends to move its economic capital calculations to full Solvency Capital Requirements (sCR), in accordance with the current draft of the Solvency II Directive. Differences in the calculation of SCR compared to current calculations of economic capital can arise from Omnibus II Directives, in particular related to long term guaranteed business. NN’s economic capital ratio, calculated as available financial resources/economic capital will be adjusted to own funds/SCR.
317ING Group Annual Report 2013
1 Wh
o w
e are2 R
epo
rt of th
e Executive B
oard
3 Co
rpo
rate go
vernan
ce4 C
on
solid
ated an
nu
al accou
nts
5 Parent co
mp
any an
nu
al accou
nts
6 Oth
er info
rmatio
n7 A
dd
ition
al info
rmatio
n
ING_2013_deel4c&d_v2.indd 317 19/03/2014 19:33:10
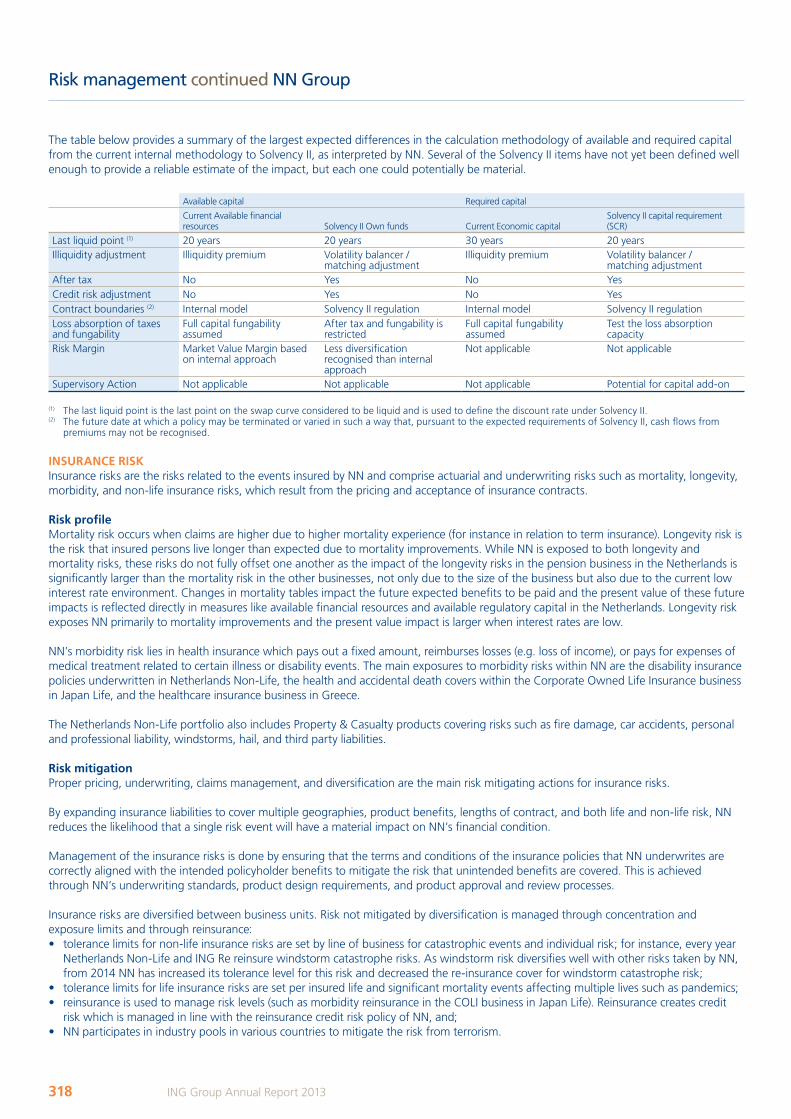
Risk management continued NN Group
The table below provides a summary of the largest expected differences in the calculation methodology of available and required capital from the current internal methodology to Solvency II, as interpreted by NN. Several of the Solvency II items have not yet been defined well enough to provide a reliable estimate of the impact, but each one could potentially be material.
Available capital Required capital
Current Available financial resources Solvency II Own funds Current Economic capital
Solvency II capital requirement (SCR)
Last liquid point (1) 20 years 20 years 30 years 20 yearsIlliquidity adjustment Illiquidity premium Volatility balancer /
matching adjustmentIlliquidity premium Volatility balancer /
matching adjustmentAfter tax No Yes No YesCredit risk adjustment No Yes No YesContract boundaries (2) Internal model Solvency II regulation Internal model Solvency II regulationLoss absorption of taxes and fungability
Full capital fungability assumed
After tax and fungability is restricted
Full capital fungability assumed
Test the loss absorption capacity
Risk Margin Market Value Margin based on internal approach
Less diversification recognised than internal approach
Not applicable Not applicable
Supervisory Action Not applicable Not applicable Not applicable Potential for capital add-on
(1) The last liquid point is the last point on the swap curve considered to be liquid and is used to define the discount rate under Solvency II.(2) The future date at which a policy may be terminated or varied in such a way that, pursuant to the expected requirements of Solvency II, cash flows from
premiums may not be recognised.
insuRanCe RiskInsurance risks are the risks related to the events insured by NN and comprise actuarial and underwriting risks such as mortality, longevity, morbidity, and non-life insurance risks, which result from the pricing and acceptance of insurance contracts.
Risk profileMortality risk occurs when claims are higher due to higher mortality experience (for instance in relation to term insurance). Longevity risk is the risk that insured persons live longer than expected due to mortality improvements. While NN is exposed to both longevity and mortality risks, these risks do not fully offset one another as the impact of the longevity risks in the pension business in the Netherlands is significantly larger than the mortality risk in the other businesses, not only due to the size of the business but also due to the current low interest rate environment. Changes in mortality tables impact the future expected benefits to be paid and the present value of these future impacts is reflected directly in measures like available financial resources and available regulatory capital in the Netherlands. Longevity risk exposes NN primarily to mortality improvements and the present value impact is larger when interest rates are low.
NN’s morbidity risk lies in health insurance which pays out a fixed amount, reimburses losses (e.g. loss of income), or pays for expenses of medical treatment related to certain illness or disability events. The main exposures to morbidity risks within NN are the disability insurance policies underwritten in Netherlands Non-Life, the health and accidental death covers within the Corporate Owned Life Insurance business in Japan Life, and the healthcare insurance business in Greece.
The Netherlands Non-Life portfolio also includes Property & Casualty products covering risks such as fire damage, car accidents, personal and professional liability, windstorms, hail, and third party liabilities.
Risk mitigationProper pricing, underwriting, claims management, and diversification are the main risk mitigating actions for insurance risks.
By expanding insurance liabilities to cover multiple geographies, product benefits, lengths of contract, and both life and non-life risk, NN reduces the likelihood that a single risk event will have a material impact on NN’s financial condition.
Management of the insurance risks is done by ensuring that the terms and conditions of the insurance policies that NN underwrites are correctly aligned with the intended policyholder benefits to mitigate the risk that unintended benefits are covered. This is achieved through NN’s underwriting standards, product design requirements, and product approval and review processes.
Insurance risks are diversified between business units. Risk not mitigated by diversification is managed through concentration and exposure limits and through reinsurance:• tolerance limits for non-life insurance risks are set by line of business for catastrophic events and individual risk; for instance, every year
Netherlands Non-Life and ING Re reinsure windstorm catastrophe risks. As windstorm risk diversifies well with other risks taken by NN, from 2014 NN has increased its tolerance level for this risk and decreased the re-insurance cover for windstorm catastrophe risk;
• tolerance limits for life insurance risks are set per insured life and significant mortality events affecting multiple lives such as pandemics;• reinsurance is used to manage risk levels (such as morbidity reinsurance in the COLI business in Japan Life). Reinsurance creates credit
risk which is managed in line with the reinsurance credit risk policy of NN, and;• NN participates in industry pools in various countries to mitigate the risk from terrorism.
318 ING Group Annual Report 2013
ING_2013_deel4c&d_v2.indd 318 19/03/2014 19:33:11
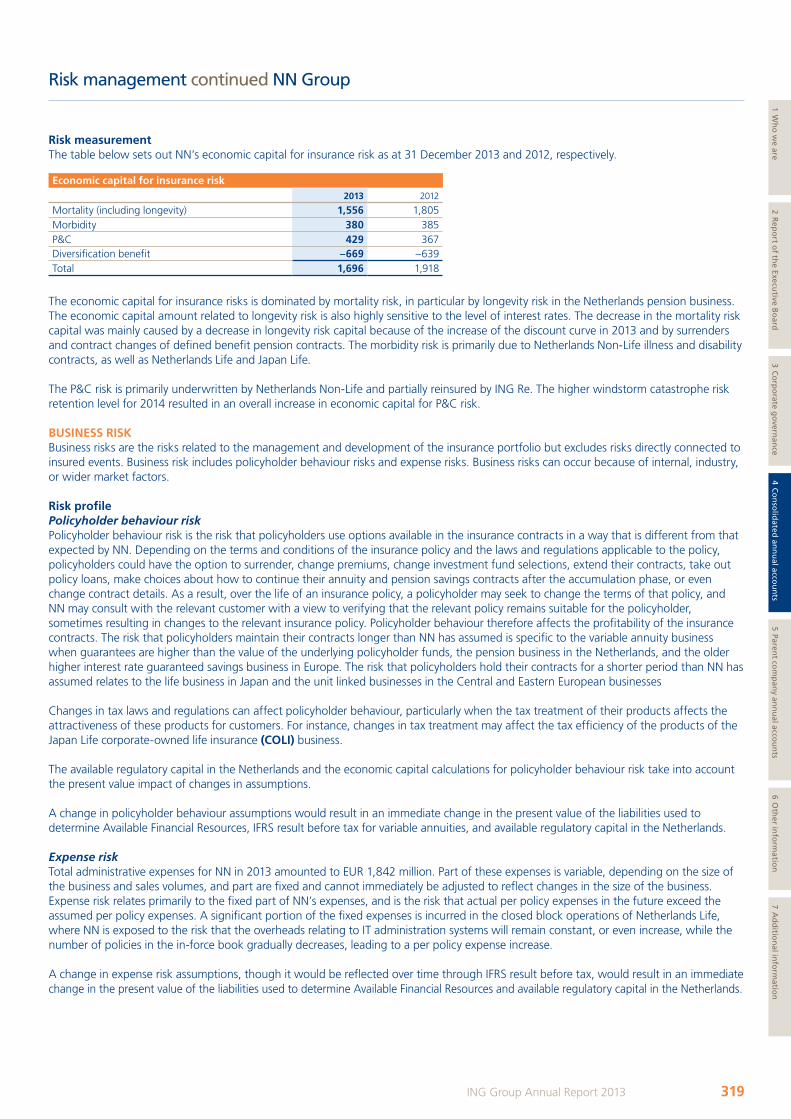
Risk management continued NN Group
Risk measurementThe table below sets out NN’s economic capital for insurance risk as at 31 December 2013 and 2012, respectively.
economic capital for insurance risk2013 2012
Mortality (including longevity) 1,556 1,805Morbidity 380 385P&C 429 367Diversification benefit –669 –639Total 1,696 1,918
The economic capital for insurance risks is dominated by mortality risk, in particular by longevity risk in the Netherlands pension business. The economic capital amount related to longevity risk is also highly sensitive to the level of interest rates. The decrease in the mortality risk capital was mainly caused by a decrease in longevity risk capital because of the increase of the discount curve in 2013 and by surrenders and contract changes of defined benefit pension contracts. The morbidity risk is primarily due to Netherlands Non-Life illness and disability contracts, as well as Netherlands Life and Japan Life.
The P&C risk is primarily underwritten by Netherlands Non-Life and partially reinsured by ING Re. The higher windstorm catastrophe risk retention level for 2014 resulted in an overall increase in economic capital for P&C risk.
Business RiskBusiness risks are the risks related to the management and development of the insurance portfolio but excludes risks directly connected to insured events. Business risk includes policyholder behaviour risks and expense risks. Business risks can occur because of internal, industry, or wider market factors.
Risk profilePolicyholder behaviour risk Policyholder behaviour risk is the risk that policyholders use options available in the insurance contracts in a way that is different from that expected by NN. Depending on the terms and conditions of the insurance policy and the laws and regulations applicable to the policy, policyholders could have the option to surrender, change premiums, change investment fund selections, extend their contracts, take out policy loans, make choices about how to continue their annuity and pension savings contracts after the accumulation phase, or even change contract details. As a result, over the life of an insurance policy, a policyholder may seek to change the terms of that policy, and NN may consult with the relevant customer with a view to verifying that the relevant policy remains suitable for the policyholder, sometimes resulting in changes to the relevant insurance policy. Policyholder behaviour therefore affects the profitability of the insurance contracts. The risk that policyholders maintain their contracts longer than NN has assumed is specific to the variable annuity business when guarantees are higher than the value of the underlying policyholder funds, the pension business in the Netherlands, and the older higher interest rate guaranteed savings business in Europe. The risk that policyholders hold their contracts for a shorter period than NN has assumed relates to the life business in Japan and the unit linked businesses in the Central and Eastern European businesses
Changes in tax laws and regulations can affect policyholder behaviour, particularly when the tax treatment of their products affects the attractiveness of these products for customers. For instance, changes in tax treatment may affect the tax efficiency of the products of the Japan Life corporate-owned life insurance (CoLi) business.
The available regulatory capital in the Netherlands and the economic capital calculations for policyholder behaviour risk take into account the present value impact of changes in assumptions.
A change in policyholder behaviour assumptions would result in an immediate change in the present value of the liabilities used to determine Available Financial Resources, IFRS result before tax for variable annuities, and available regulatory capital in the Netherlands.
Expense riskTotal administrative expenses for NN in 2013 amounted to EUR 1,842 million. Part of these expenses is variable, depending on the size of the business and sales volumes, and part are fixed and cannot immediately be adjusted to reflect changes in the size of the business. Expense risk relates primarily to the fixed part of NN’s expenses, and is the risk that actual per policy expenses in the future exceed the assumed per policy expenses. A significant portion of the fixed expenses is incurred in the closed block operations of Netherlands Life, where NN is exposed to the risk that the overheads relating to IT administration systems will remain constant, or even increase, while the number of policies in the in-force book gradually decreases, leading to a per policy expense increase.
A change in expense risk assumptions, though it would be reflected over time through IFRS result before tax, would result in an immediate change in the present value of the liabilities used to determine Available Financial Resources and available regulatory capital in the Netherlands.
319ING Group Annual Report 2013
1 Wh
o w
e are2 R
epo
rt of th
e Executive B
oard
3 Co
rpo
rate go
vernan
ce4 C
on
solid
ated an
nu
al accou
nts
5 Parent co
mp
any an
nu
al accou
nts
6 Oth
er info
rmatio
n7 A
dd
ition
al info
rmatio
n
ING_2013_deel4c&d_v2.indd 319 19/03/2014 19:33:11
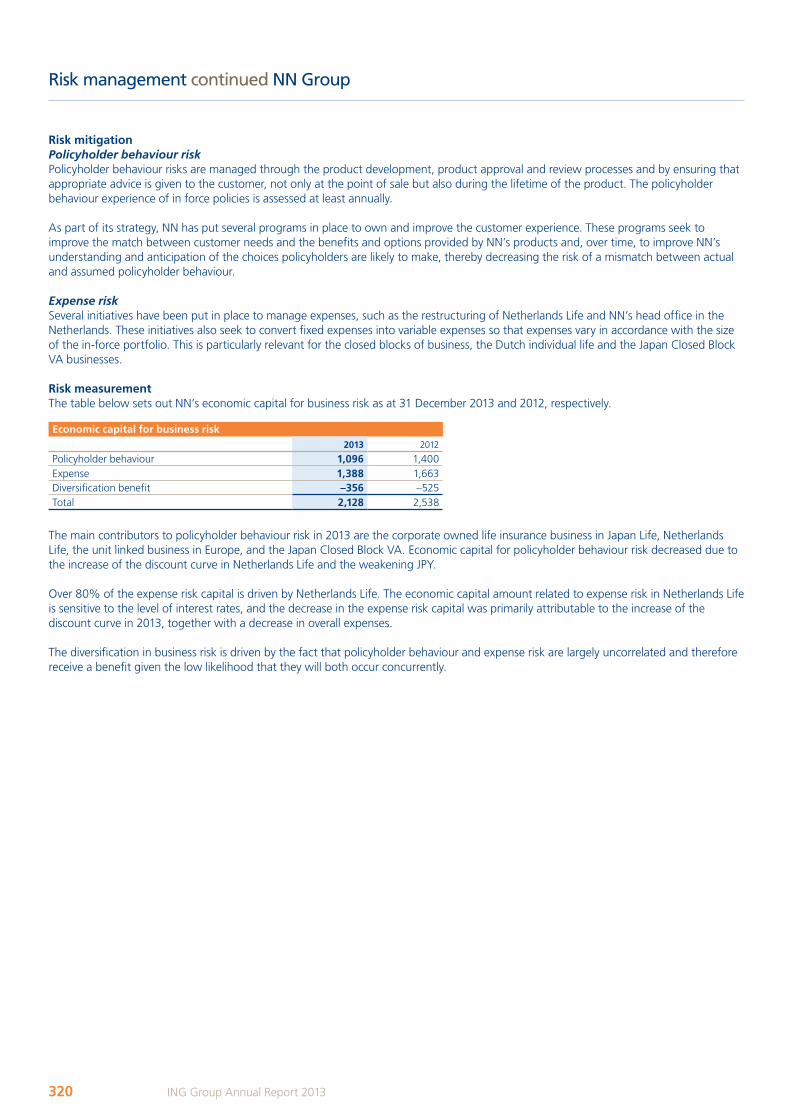
Risk management continued NN Group
Risk mitigationPolicyholder behaviour risk Policyholder behaviour risks are managed through the product development, product approval and review processes and by ensuring that appropriate advice is given to the customer, not only at the point of sale but also during the lifetime of the product. The policyholder behaviour experience of in force policies is assessed at least annually.
As part of its strategy, NN has put several programs in place to own and improve the customer experience. These programs seek to improve the match between customer needs and the benefits and options provided by NN’s products and, over time, to improve NN’s understanding and anticipation of the choices policyholders are likely to make, thereby decreasing the risk of a mismatch between actual and assumed policyholder behaviour.
Expense riskSeveral initiatives have been put in place to manage expenses, such as the restructuring of Netherlands Life and NN’s head office in the Netherlands. These initiatives also seek to convert fixed expenses into variable expenses so that expenses vary in accordance with the size of the in-force portfolio. This is particularly relevant for the closed blocks of business, the Dutch individual life and the Japan Closed Block VA businesses.
Risk measurementThe table below sets out NN’s economic capital for business risk as at 31 December 2013 and 2012, respectively.
economic capital for business risk2013 2012
Policyholder behaviour 1,096 1,400Expense 1,388 1,663Diversification benefit –356 –525Total 2,128 2,538
The main contributors to policyholder behaviour risk in 2013 are the corporate owned life insurance business in Japan Life, Netherlands Life, the unit linked business in Europe, and the Japan Closed Block VA. Economic capital for policyholder behaviour risk decreased due to the increase of the discount curve in Netherlands Life and the weakening JPY.
Over 80% of the expense risk capital is driven by Netherlands Life. The economic capital amount related to expense risk in Netherlands Life is sensitive to the level of interest rates, and the decrease in the expense risk capital was primarily attributable to the increase of the discount curve in 2013, together with a decrease in overall expenses.
The diversification in business risk is driven by the fact that policyholder behaviour and expense risk are largely uncorrelated and therefore receive a benefit given the low likelihood that they will both occur concurrently.
320 ING Group Annual Report 2013
ING_2013_deel4c&d_v2.indd 320 19/03/2014 19:33:11
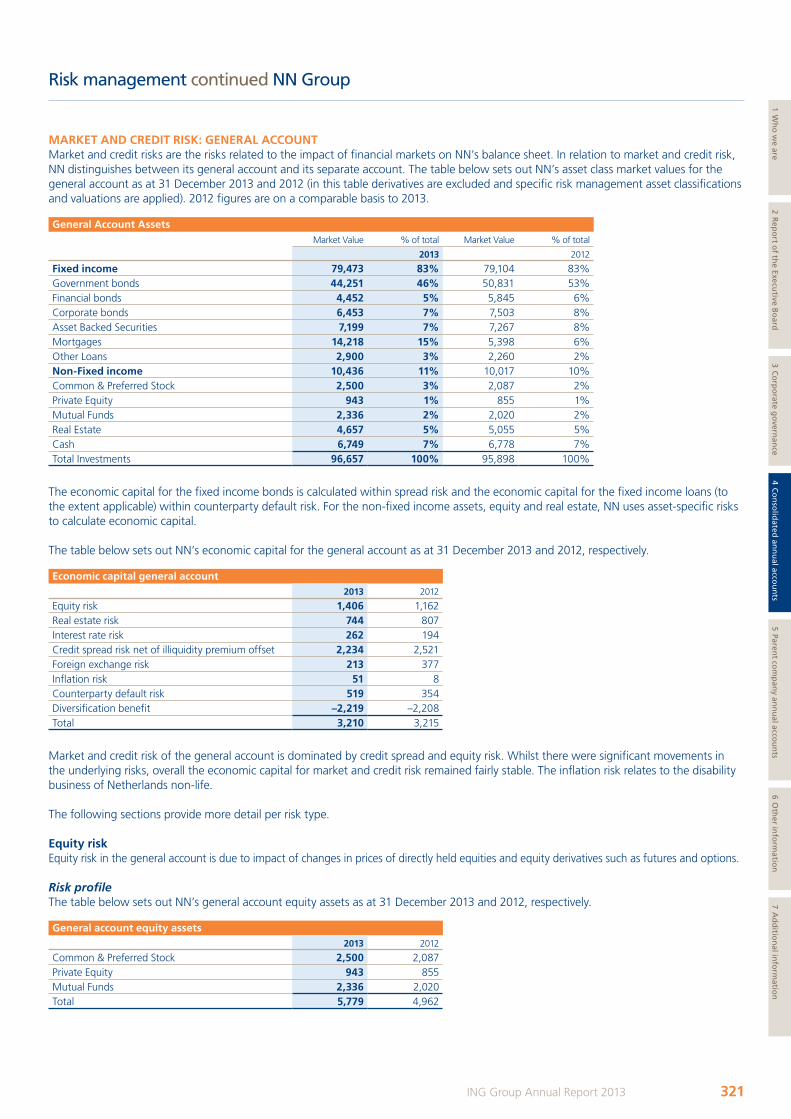
Risk management continued NN Group
MaRket anD CReDit Risk: geneRaL aCCountMarket and credit risks are the risks related to the impact of financial markets on NN’s balance sheet. In relation to market and credit risk, NN distinguishes between its general account and its separate account. The table below sets out NN’s asset class market values for the general account as at 31 December 2013 and 2012 (in this table derivatives are excluded and specific risk management asset classifications and valuations are applied). 2012 figures are on a comparable basis to 2013.
general account assetsMarket Value % of total Market Value % of total
2013 2012
Fixed income 79,473 83% 79,104 83%Government bonds 44,251 46% 50,831 53%Financial bonds 4,452 5% 5,845 6%Corporate bonds 6,453 7% 7,503 8%Asset Backed Securities 7,199 7% 7,267 8%Mortgages 14,218 15% 5,398 6%Other Loans 2,900 3% 2,260 2%non-Fixed income 10,436 11% 10,017 10%Common & Preferred Stock 2,500 3% 2,087 2%Private Equity 943 1% 855 1%Mutual Funds 2,336 2% 2,020 2%Real Estate 4,657 5% 5,055 5%Cash 6,749 7% 6,778 7%Total Investments 96,657 100% 95,898 100%
The economic capital for the fixed income bonds is calculated within spread risk and the economic capital for the fixed income loans (to the extent applicable) within counterparty default risk. For the non-fixed income assets, equity and real estate, NN uses asset-specific risks to calculate economic capital.
The table below sets out NN’s economic capital for the general account as at 31 December 2013 and 2012, respectively.
economic capital general account2013 2012
Equity risk 1,406 1,162Real estate risk 744 807Interest rate risk 262 194Credit spread risk net of illiquidity premium offset 2,234 2,521Foreign exchange risk 213 377Inflation risk 51 8Counterparty default risk 519 354Diversification benefit –2,219 –2,208Total 3,210 3,215
Market and credit risk of the general account is dominated by credit spread and equity risk. Whilst there were significant movements in the underlying risks, overall the economic capital for market and credit risk remained fairly stable. The inflation risk relates to the disability business of Netherlands non-life.
The following sections provide more detail per risk type.
equity riskEquity risk in the general account is due to impact of changes in prices of directly held equities and equity derivatives such as futures and options.
Risk profileThe table below sets out NN’s general account equity assets as at 31 December 2013 and 2012, respectively.
general account equity assets2013 2012
Common & Preferred Stock 2,500 2,087 Private Equity 943 855Mutual Funds 2,336 2,020Total 5,779 4,962
321ING Group Annual Report 2013
1 Wh
o w
e are2 R
epo
rt of th
e Executive B
oard
3 Co
rpo
rate go
vernan
ce4 C
on
solid
ated an
nu
al accou
nts
5 Parent co
mp
any an
nu
al accou
nts
6 Oth
er info
rmatio
n7 A
dd
ition
al info
rmatio
n
ING_2013_deel4c&d_v2.indd 321 19/03/2014 19:33:11

Risk management continued NN Group
Overall equity exposure increased due to positive revaluations and net purchases of equities in line with strategic asset allocation.
The equity investments held in the Netherlands are part of the so-called ‘5% holdings’, in which investors who hold 5% or more of the outstanding shares of a stock receive favourable tax treatment in the Netherlands. About EUR 2.3 billion is invested in these 5% holdings. For these equity investments, NN may not be able to liquidate its position quickly because of the size of these holdings.
NN invests in private equity through its holding of Parcom Capital Management. Parcom Capital Management is a captive mid-market private equity firm active in the Netherlands, France and Germany.
Price changes in equity holdings and equity-related derivatives are directly reflected in Available Financial Resources, the IFRS balance sheet and in the regulatory available capital in the jurisdictions in which NN has general account equity holdings. Only value movements of derivatives and impairments of equity holdings are reflected in the IFRS result before tax.
Risk mitigationEquity exposures belong to a well-diversified asset portfolio of an insurance company with long term illiquid liabilities. The concentration risk on individual issuers is mitigated under relevant investment mandates.
From time to time, NN protects the downside risk of the general account equity portfolio by buying put options and other hedge instruments. The most recent occasion on which NN did so was during the euro crisis in 2011-2012.
Risk measurementEconomic capital for equity risk in the general account increased from EUR 1,162 million in 2012 to EUR 1,406 million in 2013. This exposure includes mutual funds with both fixed income and equity underlying positions. On a look-through basis in the overall exposure, the weighting of equities, which requires a higher economic capital than fixed income investments, increased due to stock market developments. Real estate risk
Real estate risk is the risk of loss of market value of real estate assets due to a change in rental prices, required investor yield, or other factors.
Risk profileNN’s general account real estate exposure decreased from EUR 5,055 million at 31 December 2012 to EUR 4,657 million as at 31 December 2013. The real estate exposure is mainly present in Netherlands Life and Netherlands Non-Life. NN has two different categories of real estate: (i) investments in real estate funds and real estate directly owned, and (ii) investments in buildings occupied by NN. Several of the real estate funds owned by NN include leverage and therefore the actual real estate exposure is larger than NN’s positions in these funds. During 2013, the gross real estate exposure decreased mainly as a result of market value decreases.
The general account real estate portfolio is held for the long term and is illiquid. Furthermore there are no hedge instruments available in the market to effectively reduce the impact of market volatility.
The table below sets out NN’s real estate exposure by sector type excluding leverage as at 31 December 2013 and 2012, respectively. Real estate is valued at fair value in the economic capital model and the available regulatory capital calculations in the Netherlands. Fair value revaluations of 53% of the real estate portfolio directly affect the IFRS result before tax.
general account real estate assets by sector Revalued
through P&LNot revalued through P&L
Revalued through P&L
Not revalued through P&L
2013 2012
Residential 3% 17% 2% 17%Office 10% 9% 14% 10%Retail 30% 9% 28% 7%Industrial 9% 0% 8% 0%Other 2% 12% 3% 11%Total 54% 47% 55% 45%
Risk mitigationReal estate exposures belong to a well-diversified asset portfolio of an insurance company holding long term illiquid liabilities. The concentration risk on individual issuers is mitigated under relevant investment mandates.
Risk measurement Economic capital for real estate risk decreased from EUR 807 million at year-end 2012 to EUR 744 million at year-end 2013 due to reduced real estate exposures and lower leverage in the real estate funds.
322 ING Group Annual Report 2013
ING_2013_deel4c&d_v2.indd 322 19/03/2014 19:33:11
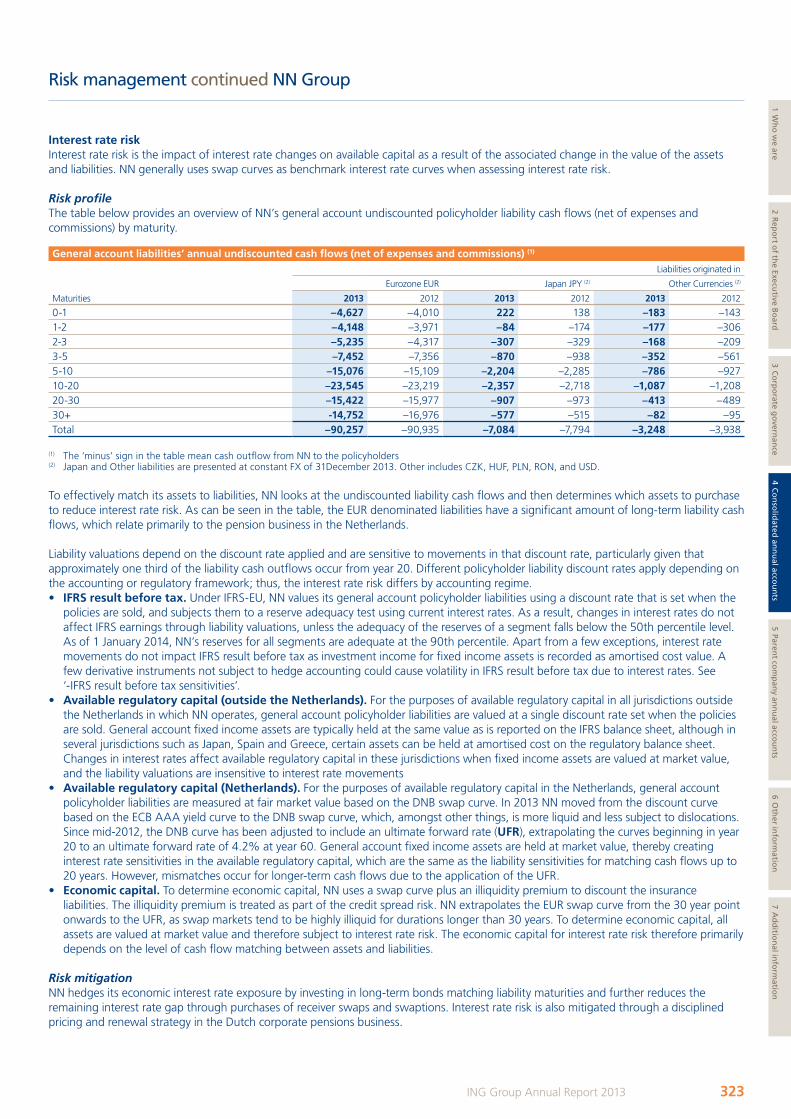
Risk management continued NN Group
interest rate riskInterest rate risk is the impact of interest rate changes on available capital as a result of the associated change in the value of the assets and liabilities. NN generally uses swap curves as benchmark interest rate curves when assessing interest rate risk.
Risk profile The table below provides an overview of NN’s general account undiscounted policyholder liability cash flows (net of expenses and commissions) by maturity.
general account liabilities’ annual undiscounted cash flows (net of expenses and commissions) (1)
Liabilities originated in
Eurozone EUR Japan JPY (2) Other Currencies (2)
Maturities 2013 2012 2013 2012 2013 2012
0-1 –4,627 –4,010 222 138 –183 –143 1-2 –4,148 –3,971 –84 –174 –177 –306 2-3 –5,235 –4,317 –307 –329 –168 –209 3-5 –7,452 –7,356 –870 –938 –352 –561 5-10 –15,076 –15,109 –2,204 –2,285 –786 –927 10-20 –23,545 –23,219 –2,357 –2,718 –1,087 –1,208 20-30 –15,422 –15,977 –907 –973 –413 –489 30+ -14,752 –16,976 –577 –515 –82 –95 Total –90,257 –90,935 –7,084 –7,794 –3,248 –3,938
(1) The ‘minus’ sign in the table mean cash outflow from NN to the policyholders(2) Japan and Other liabilities are presented at constant FX of 31December 2013. Other includes CZK, HUF, PLN, RON, and USD.
To effectively match its assets to liabilities, NN looks at the undiscounted liability cash flows and then determines which assets to purchase to reduce interest rate risk. As can be seen in the table, the EUR denominated liabilities have a significant amount of long-term liability cash flows, which relate primarily to the pension business in the Netherlands.
Liability valuations depend on the discount rate applied and are sensitive to movements in that discount rate, particularly given that approximately one third of the liability cash outflows occur from year 20. Different policyholder liability discount rates apply depending on the accounting or regulatory framework; thus, the interest rate risk differs by accounting regime.• iFRs result before tax. Under IFRS-EU, NN values its general account policyholder liabilities using a discount rate that is set when the
policies are sold, and subjects them to a reserve adequacy test using current interest rates. As a result, changes in interest rates do not affect IFRS earnings through liability valuations, unless the adequacy of the reserves of a segment falls below the 50th percentile level. As of 1 January 2014, NN’s reserves for all segments are adequate at the 90th percentile. Apart from a few exceptions, interest rate movements do not impact IFRS result before tax as investment income for fixed income assets is recorded as amortised cost value. A few derivative instruments not subject to hedge accounting could cause volatility in IFRS result before tax due to interest rates. See ‘-IFRS result before tax sensitivities’.
• available regulatory capital (outside the netherlands). For the purposes of available regulatory capital in all jurisdictions outside the Netherlands in which NN operates, general account policyholder liabilities are valued at a single discount rate set when the policies are sold. General account fixed income assets are typically held at the same value as is reported on the IFRS balance sheet, although in several jurisdictions such as Japan, Spain and Greece, certain assets can be held at amortised cost on the regulatory balance sheet. Changes in interest rates affect available regulatory capital in these jurisdictions when fixed income assets are valued at market value, and the liability valuations are insensitive to interest rate movements
• available regulatory capital (netherlands). For the purposes of available regulatory capital in the Netherlands, general account policyholder liabilities are measured at fair market value based on the DNB swap curve. In 2013 NN moved from the discount curve based on the ECB AAA yield curve to the DNB swap curve, which, amongst other things, is more liquid and less subject to dislocations. Since mid-2012, the DNB curve has been adjusted to include an ultimate forward rate (uFR), extrapolating the curves beginning in year 20 to an ultimate forward rate of 4.2% at year 60. General account fixed income assets are held at market value, thereby creating interest rate sensitivities in the available regulatory capital, which are the same as the liability sensitivities for matching cash flows up to 20 years. However, mismatches occur for longer-term cash flows due to the application of the UFR.
• economic capital. To determine economic capital, NN uses a swap curve plus an illiquidity premium to discount the insurance liabilities. The illiquidity premium is treated as part of the credit spread risk. NN extrapolates the EUR swap curve from the 30 year point onwards to the UFR, as swap markets tend to be highly illiquid for durations longer than 30 years. To determine economic capital, all assets are valued at market value and therefore subject to interest rate risk. The economic capital for interest rate risk therefore primarily depends on the level of cash flow matching between assets and liabilities.
Risk mitigationNN hedges its economic interest rate exposure by investing in long-term bonds matching liability maturities and further reduces the remaining interest rate gap through purchases of receiver swaps and swaptions. Interest rate risk is also mitigated through a disciplined pricing and renewal strategy in the Dutch corporate pensions business.
323ING Group Annual Report 2013
1 Wh
o w
e are2 R
epo
rt of th
e Executive B
oard
3 Co
rpo
rate go
vernan
ce4 C
on
solid
ated an
nu
al accou
nts
5 Parent co
mp
any an
nu
al accou
nts
6 Oth
er info
rmatio
n7 A
dd
ition
al info
rmatio
n
ING_2013_deel4c&d_v2.indd 323 19/03/2014 19:33:12
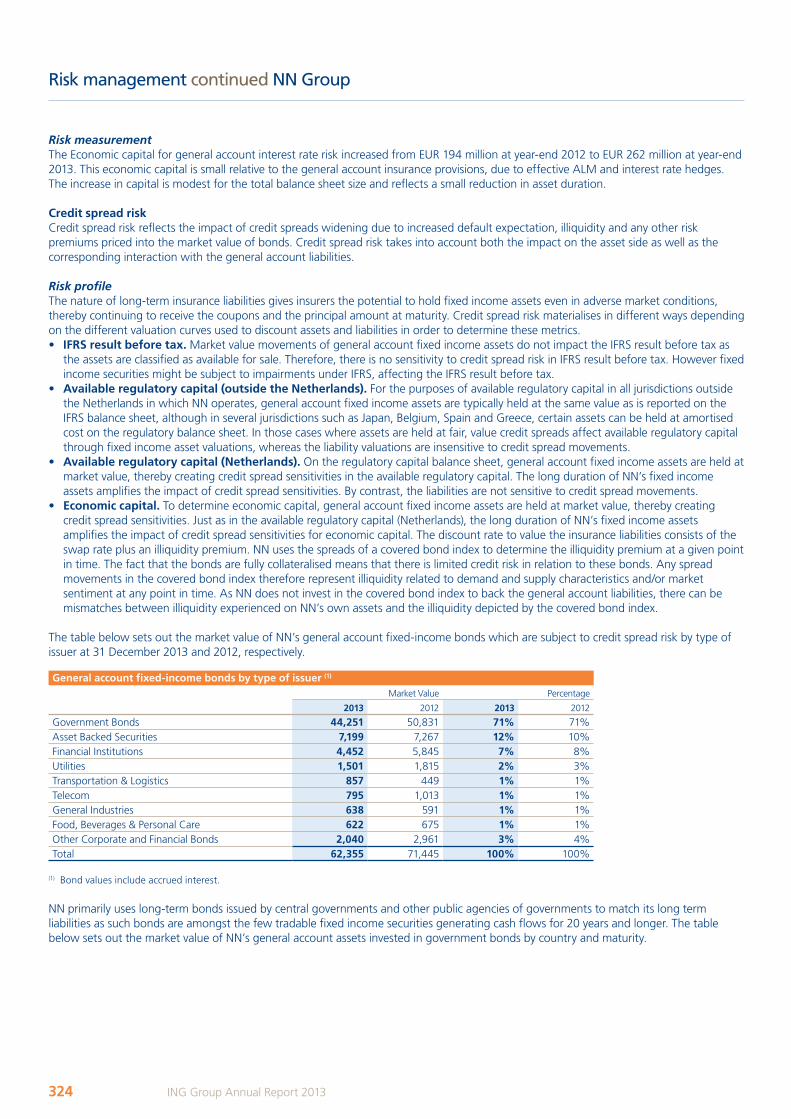
Risk management continued NN Group
Risk measurementThe Economic capital for general account interest rate risk increased from EUR 194 million at year-end 2012 to EUR 262 million at year-end 2013. This economic capital is small relative to the general account insurance provisions, due to effective ALM and interest rate hedges. The increase in capital is modest for the total balance sheet size and reflects a small reduction in asset duration.
Credit spread riskCredit spread risk reflects the impact of credit spreads widening due to increased default expectation, illiquidity and any other risk premiums priced into the market value of bonds. Credit spread risk takes into account both the impact on the asset side as well as the corresponding interaction with the general account liabilities.
Risk profileThe nature of long-term insurance liabilities gives insurers the potential to hold fixed income assets even in adverse market conditions, thereby continuing to receive the coupons and the principal amount at maturity. Credit spread risk materialises in different ways depending on the different valuation curves used to discount assets and liabilities in order to determine these metrics.• iFRs result before tax. Market value movements of general account fixed income assets do not impact the IFRS result before tax as
the assets are classified as available for sale. Therefore, there is no sensitivity to credit spread risk in IFRS result before tax. However fixed income securities might be subject to impairments under IFRS, affecting the IFRS result before tax.
• available regulatory capital (outside the netherlands). For the purposes of available regulatory capital in all jurisdictions outside the Netherlands in which NN operates, general account fixed income assets are typically held at the same value as is reported on the IFRS balance sheet, although in several jurisdictions such as Japan, Belgium, Spain and Greece, certain assets can be held at amortised cost on the regulatory balance sheet. In those cases where assets are held at fair, value credit spreads affect available regulatory capital through fixed income asset valuations, whereas the liability valuations are insensitive to credit spread movements.
• available regulatory capital (netherlands). On the regulatory capital balance sheet, general account fixed income assets are held at market value, thereby creating credit spread sensitivities in the available regulatory capital. The long duration of NN’s fixed income assets amplifies the impact of credit spread sensitivities. By contrast, the liabilities are not sensitive to credit spread movements.
• economic capital. To determine economic capital, general account fixed income assets are held at market value, thereby creating credit spread sensitivities. Just as in the available regulatory capital (Netherlands), the long duration of NN’s fixed income assets amplifies the impact of credit spread sensitivities for economic capital. The discount rate to value the insurance liabilities consists of the swap rate plus an illiquidity premium. NN uses the spreads of a covered bond index to determine the illiquidity premium at a given point in time. The fact that the bonds are fully collateralised means that there is limited credit risk in relation to these bonds. Any spread movements in the covered bond index therefore represent illiquidity related to demand and supply characteristics and/or market sentiment at any point in time. As NN does not invest in the covered bond index to back the general account liabilities, there can be mismatches between illiquidity experienced on NN’s own assets and the illiquidity depicted by the covered bond index.
The table below sets out the market value of NN’s general account fixed-income bonds which are subject to credit spread risk by type of issuer at 31 December 2013 and 2012, respectively.
general account fixed-income bonds by type of issuer (1) Market Value Percentage
2013 2012 2013 2012
Government Bonds 44,251 50,831 71% 71%Asset Backed Securities 7,199 7,267 12% 10%Financial Institutions 4,452 5,845 7% 8%Utilities 1,501 1,815 2% 3%Transportation & Logistics 857 449 1% 1%Telecom 795 1,013 1% 1%General Industries 638 591 1% 1%Food, Beverages & Personal Care 622 675 1% 1%Other Corporate and Financial Bonds 2,040 2,961 3% 4%Total 62,355 71,445 100% 100%
(1) Bond values include accrued interest.
NN primarily uses long-term bonds issued by central governments and other public agencies of governments to match its long term liabilities as such bonds are amongst the few tradable fixed income securities generating cash flows for 20 years and longer. The table below sets out the market value of NN’s general account assets invested in government bonds by country and maturity.
324 ING Group Annual Report 2013
ING_2013_deel4c&d_v2.indd 324 19/03/2014 19:33:12
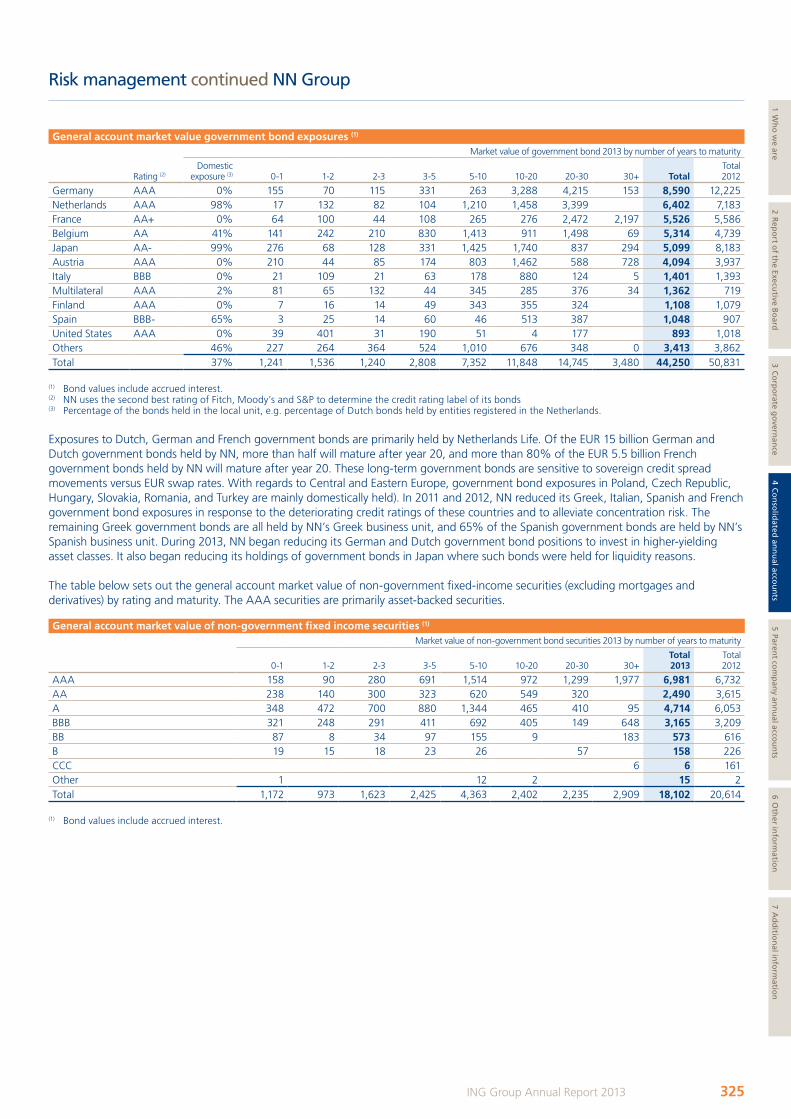
Risk management continued NN Group
general account market value government bond exposures (1)
Market value of government bond 2013 by number of years to maturity
Rating (2)Domestic
exposure (3) 0-1 1-2 2-3 3-5 5-10 10-20 20-30 30+ totalTotal 2012
Germany AAA 0% 155 70 115 331 263 3,288 4,215 153 8,590 12,225 Netherlands AAA 98% 17 132 82 104 1,210 1,458 3,399 6,402 7,183 France AA+ 0% 64 100 44 108 265 276 2,472 2,197 5,526 5,586 Belgium AA 41% 141 242 210 830 1,413 911 1,498 69 5,314 4,739 Japan AA- 99% 276 68 128 331 1,425 1,740 837 294 5,099 8,183 Austria AAA 0% 210 44 85 174 803 1,462 588 728 4,094 3,937 Italy BBB 0% 21 109 21 63 178 880 124 5 1,401 1,393 Multilateral AAA 2% 81 65 132 44 345 285 376 34 1,362 719 Finland AAA 0% 7 16 14 49 343 355 324 1,108 1,079 Spain BBB- 65% 3 25 14 60 46 513 387 1,048 907 United States AAA 0% 39 401 31 190 51 4 177 893 1,018 Others 46% 227 264 364 524 1,010 676 348 0 3,413 3,862 Total 37% 1,241 1,536 1,240 2,808 7,352 11,848 14,745 3,480 44,250 50,831
(1) Bond values include accrued interest. (2) NN uses the second best rating of Fitch, Moody’s and S&P to determine the credit rating label of its bonds(3) Percentage of the bonds held in the local unit, e.g. percentage of Dutch bonds held by entities registered in the Netherlands.
Exposures to Dutch, German and French government bonds are primarily held by Netherlands Life. Of the EUR 15 billion German and Dutch government bonds held by NN, more than half will mature after year 20, and more than 80% of the EUR 5.5 billion French government bonds held by NN will mature after year 20. These long-term government bonds are sensitive to sovereign credit spread movements versus EUR swap rates. With regards to Central and Eastern Europe, government bond exposures in Poland, Czech Republic, Hungary, Slovakia, Romania, and Turkey are mainly domestically held). In 2011 and 2012, NN reduced its Greek, Italian, Spanish and French government bond exposures in response to the deteriorating credit ratings of these countries and to alleviate concentration risk. The remaining Greek government bonds are all held by NN’s Greek business unit, and 65% of the Spanish government bonds are held by NN’s Spanish business unit. During 2013, NN began reducing its German and Dutch government bond positions to invest in higher-yielding asset classes. It also began reducing its holdings of government bonds in Japan where such bonds were held for liquidity reasons.
The table below sets out the general account market value of non-government fixed-income securities (excluding mortgages and derivatives) by rating and maturity. The AAA securities are primarily asset-backed securities.
general account market value of non-government fixed income securities (1)
Market value of non-government bond securities 2013 by number of years to maturity
0-1 1-2 2-3 3-5 5-10 10-20 20-30 30+total 2013
Total 2012
AAA 158 90 280 691 1,514 972 1,299 1,977 6,981 6,732 AA 238 140 300 323 620 549 320 2,490 3,615 A 348 472 700 880 1,344 465 410 95 4,714 6,053 BBB 321 248 291 411 692 405 149 648 3,165 3,209 BB 87 8 34 97 155 9 183 573 616 B 19 15 18 23 26 57 158 226 CCC 6 6 161 Other 1 12 2 15 2 Total 1,172 973 1,623 2,425 4,363 2,402 2,235 2,909 18,102 20,614
(1) Bond values include accrued interest.
325ING Group Annual Report 2013
1 Wh
o w
e are2 R
epo
rt of th
e Executive B
oard
3 Co
rpo
rate go
vernan
ce4 C
on
solid
ated an
nu
al accou
nts
5 Parent co
mp
any an
nu
al accou
nts
6 Oth
er info
rmatio
n7 A
dd
ition
al info
rmatio
n
ING_2013_deel4c&d_v2.indd 325 19/03/2014 19:33:13
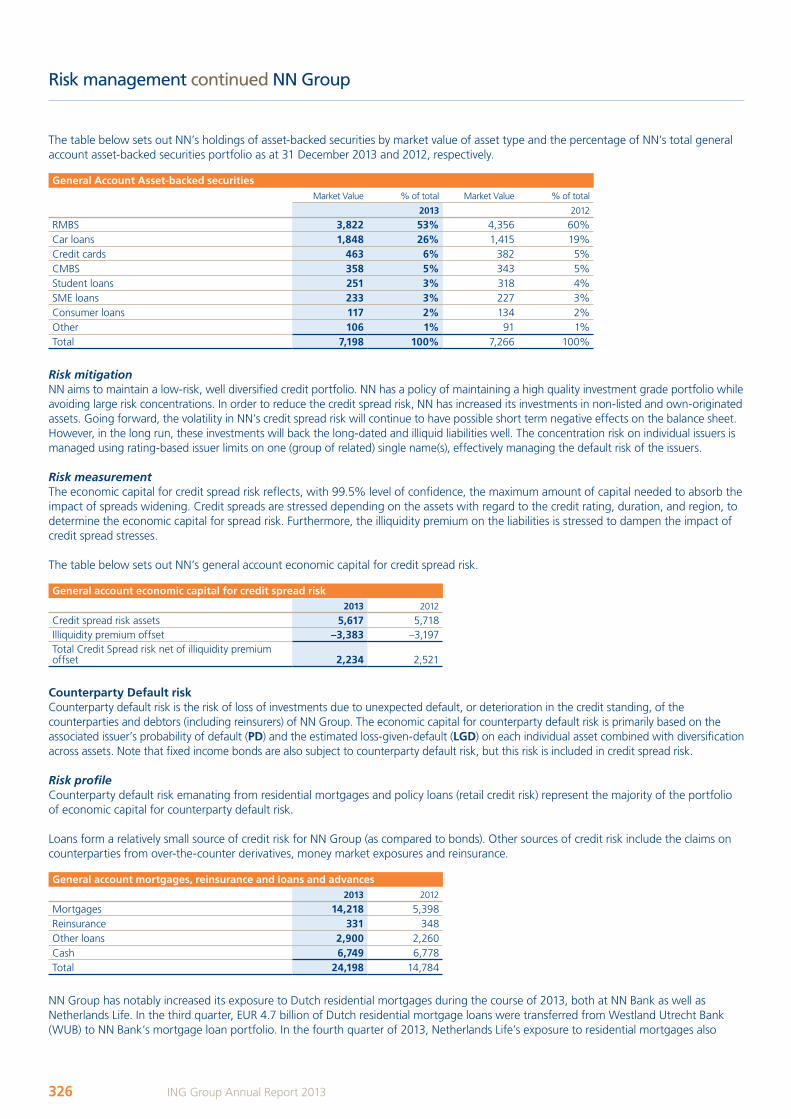
Risk management continued NN Group
The table below sets out NN’s holdings of asset-backed securities by market value of asset type and the percentage of NN’s total general account asset-backed securities portfolio as at 31 December 2013 and 2012, respectively.
general account asset-backed securitiesMarket Value % of total Market Value % of total
2013 2012
RMBS 3,822 53% 4,356 60%Car loans 1,848 26% 1,415 19%Credit cards 463 6% 382 5%CMBS 358 5% 343 5%Student loans 251 3% 318 4%SME loans 233 3% 227 3%Consumer loans 117 2% 134 2%Other 106 1% 91 1%Total 7,198 100% 7,266 100%
Risk mitigation NN aims to maintain a low-risk, well diversified credit portfolio. NN has a policy of maintaining a high quality investment grade portfolio while avoiding large risk concentrations. In order to reduce the credit spread risk, NN has increased its investments in non-listed and own-originated assets. Going forward, the volatility in NN’s credit spread risk will continue to have possible short term negative effects on the balance sheet. However, in the long run, these investments will back the long-dated and illiquid liabilities well. The concentration risk on individual issuers is managed using rating-based issuer limits on one (group of related) single name(s), effectively managing the default risk of the issuers. Risk measurementThe economic capital for credit spread risk reflects, with 99.5% level of confidence, the maximum amount of capital needed to absorb the impact of spreads widening. Credit spreads are stressed depending on the assets with regard to the credit rating, duration, and region, to determine the economic capital for spread risk. Furthermore, the illiquidity premium on the liabilities is stressed to dampen the impact of credit spread stresses.
The table below sets out NN’s general account economic capital for credit spread risk.
general account economic capital for credit spread risk2013 2012
Credit spread risk assets 5,617 5,718Illiquidity premium offset –3,383 –3,197Total Credit Spread risk net of illiquidity premium offset 2,234 2,521
Counterparty Default riskCounterparty default risk is the risk of loss of investments due to unexpected default, or deterioration in the credit standing, of the counterparties and debtors (including reinsurers) of NN Group. The economic capital for counterparty default risk is primarily based on the associated issuer’s probability of default (pD) and the estimated loss-given-default (LgD) on each individual asset combined with diversification across assets. Note that fixed income bonds are also subject to counterparty default risk, but this risk is included in credit spread risk.
Risk profileCounterparty default risk emanating from residential mortgages and policy loans (retail credit risk) represent the majority of the portfolio of economic capital for counterparty default risk.
Loans form a relatively small source of credit risk for NN Group (as compared to bonds). Other sources of credit risk include the claims on counterparties from over-the-counter derivatives, money market exposures and reinsurance.
general account mortgages, reinsurance and loans and advances2013 2012
Mortgages 14,218 5,398Reinsurance 331 348Other loans 2,900 2,260Cash 6,749 6,778Total 24,198 14,784
NN Group has notably increased its exposure to Dutch residential mortgages during the course of 2013, both at NN Bank as well as Netherlands Life. In the third quarter, EUR 4.7 billion of Dutch residential mortgage loans were transferred from Westland Utrecht Bank (WUB) to NN Bank’s mortgage loan portfolio. In the fourth quarter of 2013, Netherlands Life’s exposure to residential mortgages also
326 ING Group Annual Report 2013
ING_2013_deel4c&d_v2.indd 326 19/03/2014 19:33:13
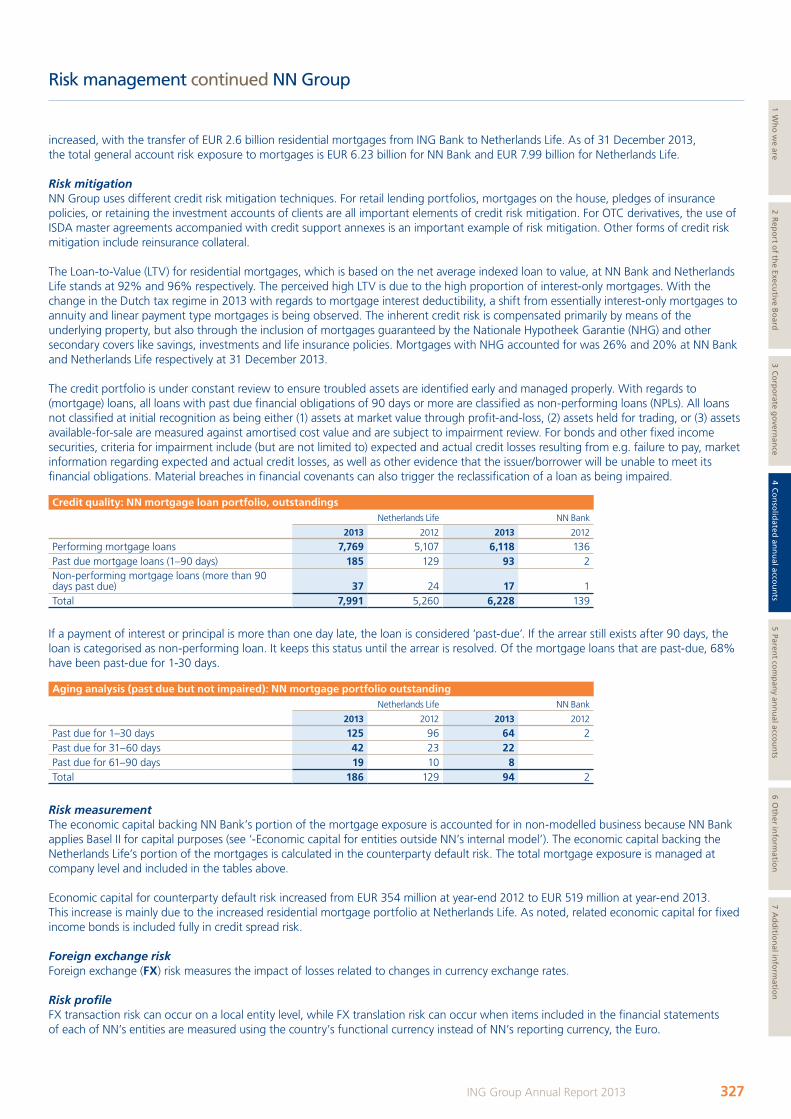
Risk management continued NN Group
increased, with the transfer of EUR 2.6 billion residential mortgages from ING Bank to Netherlands Life. As of 31 December 2013, the total general account risk exposure to mortgages is EUR 6.23 billion for NN Bank and EUR 7.99 billion for Netherlands Life.
Risk mitigation NN Group uses different credit risk mitigation techniques. For retail lending portfolios, mortgages on the house, pledges of insurance policies, or retaining the investment accounts of clients are all important elements of credit risk mitigation. For OTC derivatives, the use of ISDA master agreements accompanied with credit support annexes is an important example of risk mitigation. Other forms of credit risk mitigation include reinsurance collateral.
The Loan-to-Value (LTV) for residential mortgages, which is based on the net average indexed loan to value, at NN Bank and Netherlands Life stands at 92% and 96% respectively. The perceived high LTV is due to the high proportion of interest-only mortgages. With the change in the Dutch tax regime in 2013 with regards to mortgage interest deductibility, a shift from essentially interest-only mortgages to annuity and linear payment type mortgages is being observed. The inherent credit risk is compensated primarily by means of the underlying property, but also through the inclusion of mortgages guaranteed by the Nationale Hypotheek Garantie (NHG) and other secondary covers like savings, investments and life insurance policies. Mortgages with NHG accounted for was 26% and 20% at NN Bank and Netherlands Life respectively at 31 December 2013.
The credit portfolio is under constant review to ensure troubled assets are identified early and managed properly. With regards to (mortgage) loans, all loans with past due financial obligations of 90 days or more are classified as non-performing loans (NPLs). All loans not classified at initial recognition as being either (1) assets at market value through profit-and-loss, (2) assets held for trading, or (3) assets available-for-sale are measured against amortised cost value and are subject to impairment review. For bonds and other fixed income securities, criteria for impairment include (but are not limited to) expected and actual credit losses resulting from e.g. failure to pay, market information regarding expected and actual credit losses, as well as other evidence that the issuer/borrower will be unable to meet its financial obligations. Material breaches in financial covenants can also trigger the reclassification of a loan as being impaired.
Credit quality: nn mortgage loan portfolio, outstandingsNetherlands Life NN Bank
2013 2012 2013 2012
Performing mortgage loans 7,769 5,107 6,118 136Past due mortgage loans (1–90 days) 185 129 93 2Non-performing mortgage loans (more than 90 days past due) 37 24 17 1Total 7,991 5,260 6,228 139
If a payment of interest or principal is more than one day late, the loan is considered ‘past-due’. If the arrear still exists after 90 days, the loan is categorised as non-performing loan. It keeps this status until the arrear is resolved. Of the mortgage loans that are past-due, 68% have been past-due for 1-30 days.
aging analysis (past due but not impaired): nn mortgage portfolio outstandingNetherlands Life NN Bank
2013 2012 2013 2012
Past due for 1–30 days 125 96 64 2Past due for 31–60 days 42 23 22Past due for 61–90 days 19 10 8Total 186 129 94 2
Risk measurementThe economic capital backing NN Bank’s portion of the mortgage exposure is accounted for in non-modelled business because NN Bank applies Basel II for capital purposes (see ‘-Economic capital for entities outside NN’s internal model’). The economic capital backing the Netherlands Life’s portion of the mortgages is calculated in the counterparty default risk. The total mortgage exposure is managed at company level and included in the tables above.
Economic capital for counterparty default risk increased from EUR 354 million at year-end 2012 to EUR 519 million at year-end 2013. This increase is mainly due to the increased residential mortgage portfolio at Netherlands Life. As noted, related economic capital for fixed income bonds is included fully in credit spread risk.
Foreign exchange riskForeign exchange (FX) risk measures the impact of losses related to changes in currency exchange rates.
Risk profileFX transaction risk can occur on a local entity level, while FX translation risk can occur when items included in the financial statements of each of NN’s entities are measured using the country’s functional currency instead of NN’s reporting currency, the Euro.
327ING Group Annual Report 2013
1 Wh
o w
e are2 R
epo
rt of th
e Executive B
oard
3 Co
rpo
rate go
vernan
ce4 C
on
solid
ated an
nu
al accou
nts
5 Parent co
mp
any an
nu
al accou
nts
6 Oth
er info
rmatio
n7 A
dd
ition
al info
rmatio
n
ING_2013_deel4c&d_v2.indd 327 19/03/2014 19:33:13
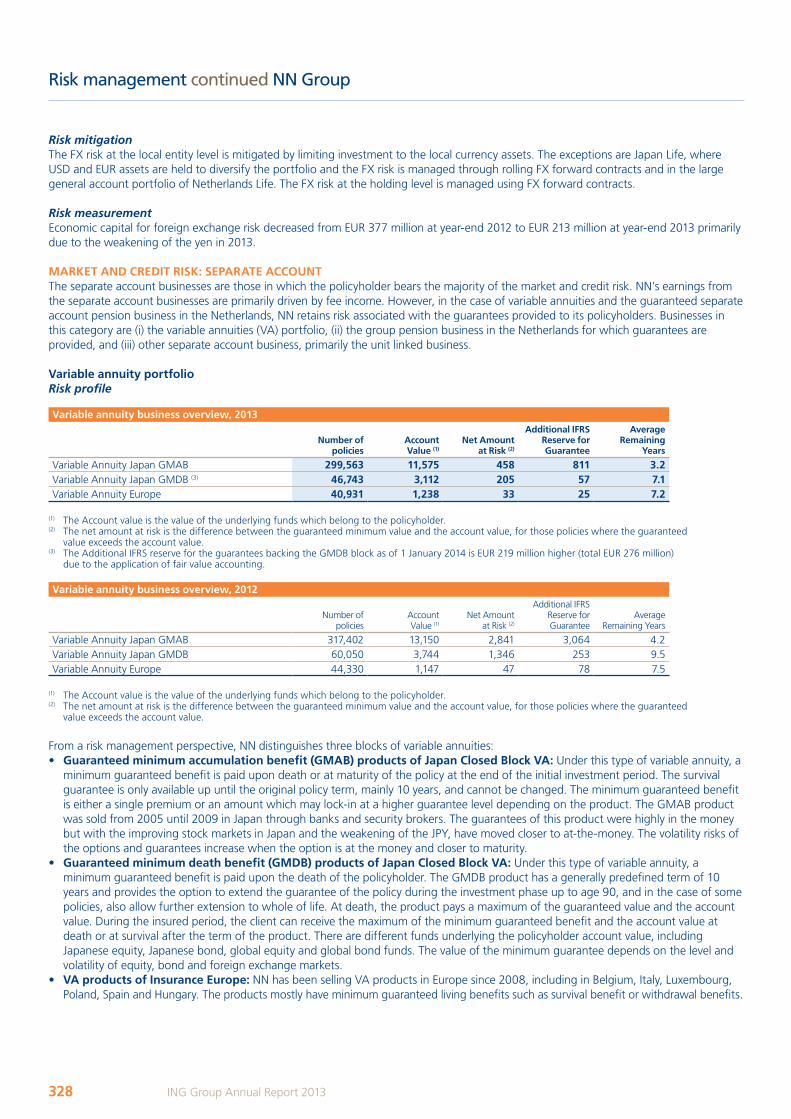
Risk management continued NN Group
Risk mitigationThe FX risk at the local entity level is mitigated by limiting investment to the local currency assets. The exceptions are Japan Life, where USD and EUR assets are held to diversify the portfolio and the FX risk is managed through rolling FX forward contracts and in the large general account portfolio of Netherlands Life. The FX risk at the holding level is managed using FX forward contracts.
Risk measurementEconomic capital for foreign exchange risk decreased from EUR 377 million at year-end 2012 to EUR 213 million at year-end 2013 primarily due to the weakening of the yen in 2013.
MaRket anD CReDit Risk: sepaRate aCCountThe separate account businesses are those in which the policyholder bears the majority of the market and credit risk. NN’s earnings from the separate account businesses are primarily driven by fee income. However, in the case of variable annuities and the guaranteed separate account pension business in the Netherlands, NN retains risk associated with the guarantees provided to its policyholders. Businesses in this category are (i) the variable annuities (VA) portfolio, (ii) the group pension business in the Netherlands for which guarantees are provided, and (iii) other separate account business, primarily the unit linked business.
Variable annuity portfolioRisk profile
Variable annuity business overview, 2013
number of policies
account Value (1)
net amount at Risk (2)
additional iFRs Reserve for guarantee
average Remaining
Years
Variable Annuity Japan GMAB 299,563 11,575 458 811 3.2Variable Annuity Japan GMDB (3) 46,743 3,112 205 57 7.1Variable Annuity Europe 40,931 1,238 33 25 7.2
(1) The Account value is the value of the underlying funds which belong to the policyholder.(2) The net amount at risk is the difference between the guaranteed minimum value and the account value, for those policies where the guaranteed
value exceeds the account value.(3) The Additional IFRS reserve for the guarantees backing the GMDB block as of 1 January 2014 is EUR 219 million higher (total EUR 276 million)
due to the application of fair value accounting.
Variable annuity business overview, 2012
Number of policies
Account Value (1)
Net Amount at Risk (2)
Additional IFRS Reserve for Guarantee
Average Remaining Years
Variable Annuity Japan GMAB 317,402 13,150 2,841 3,064 4.2Variable Annuity Japan GMDB 60,050 3,744 1,346 253 9.5Variable Annuity Europe 44,330 1,147 47 78 7.5
(1) The Account value is the value of the underlying funds which belong to the policyholder.(2) The net amount at risk is the difference between the guaranteed minimum value and the account value, for those policies where the guaranteed
value exceeds the account value.
From a risk management perspective, NN distinguishes three blocks of variable annuities:• guaranteed minimum accumulation benefit (gMaB) products of Japan Closed Block Va: Under this type of variable annuity, a
minimum guaranteed benefit is paid upon death or at maturity of the policy at the end of the initial investment period. The survival guarantee is only available up until the original policy term, mainly 10 years, and cannot be changed. The minimum guaranteed benefit is either a single premium or an amount which may lock-in at a higher guarantee level depending on the product. The GMAB product was sold from 2005 until 2009 in Japan through banks and security brokers. The guarantees of this product were highly in the money but with the improving stock markets in Japan and the weakening of the JPY, have moved closer to at-the-money. The volatility risks of the options and guarantees increase when the option is at the money and closer to maturity.
• guaranteed minimum death benefit (gMDB) products of Japan Closed Block Va: Under this type of variable annuity, a minimum guaranteed benefit is paid upon the death of the policyholder. The GMDB product has a generally predefined term of 10 years and provides the option to extend the guarantee of the policy during the investment phase up to age 90, and in the case of some policies, also allow further extension to whole of life. At death, the product pays a maximum of the guaranteed value and the account value. During the insured period, the client can receive the maximum of the minimum guaranteed benefit and the account value at death or at survival after the term of the product. There are different funds underlying the policyholder account value, including Japanese equity, Japanese bond, global equity and global bond funds. The value of the minimum guarantee depends on the level and volatility of equity, bond and foreign exchange markets.
• Va products of insurance europe: NN has been selling VA products in Europe since 2008, including in Belgium, Italy, Luxembourg, Poland, Spain and Hungary. The products mostly have minimum guaranteed living benefits such as survival benefit or withdrawal benefits.
328 ING Group Annual Report 2013
ING_2013_deel4c&d_v2.indd 328 19/03/2014 19:33:14
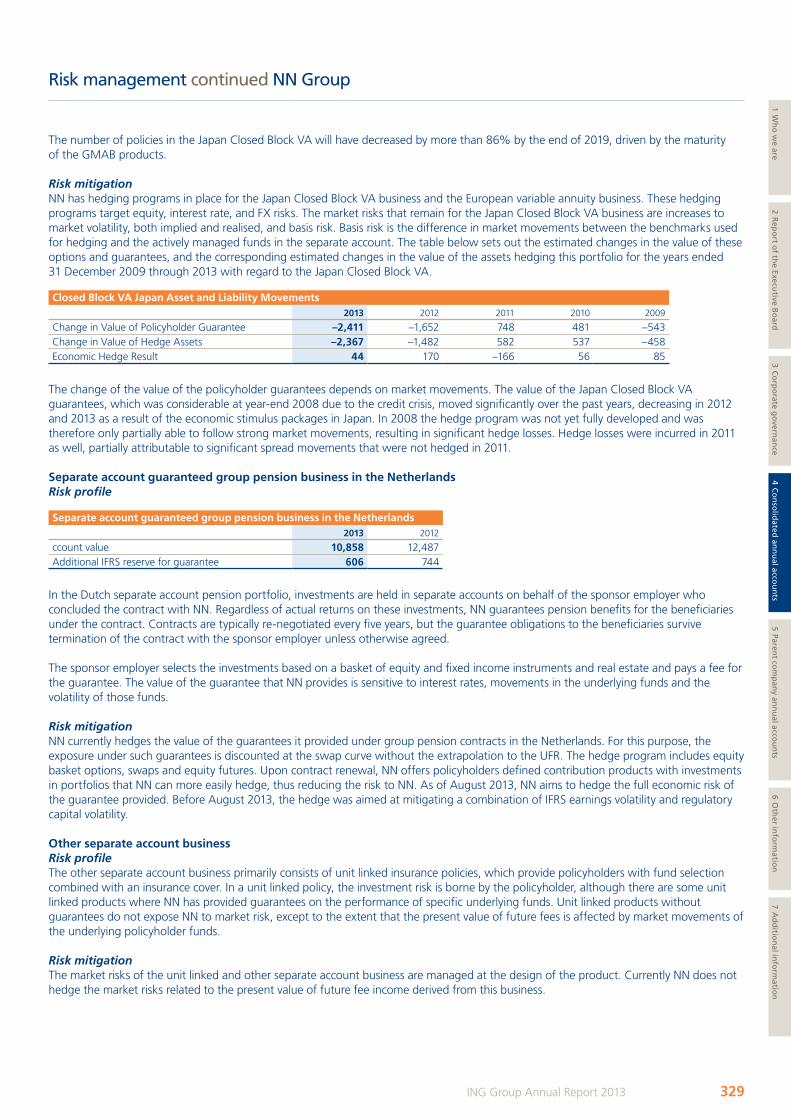
Risk management continued NN Group
The number of policies in the Japan Closed Block VA will have decreased by more than 86% by the end of 2019, driven by the maturity of the GMAB products.
Risk mitigationNN has hedging programs in place for the Japan Closed Block VA business and the European variable annuity business. These hedging programs target equity, interest rate, and FX risks. The market risks that remain for the Japan Closed Block VA business are increases to market volatility, both implied and realised, and basis risk. Basis risk is the difference in market movements between the benchmarks used for hedging and the actively managed funds in the separate account. The table below sets out the estimated changes in the value of these options and guarantees, and the corresponding estimated changes in the value of the assets hedging this portfolio for the years ended 31 December 2009 through 2013 with regard to the Japan Closed Block VA.
Closed Block Va Japan asset and Liability Movements2013 2012 2011 2010 2009
Change in Value of Policyholder Guarantee –2,411 –1,652 748 481 –543Change in Value of Hedge Assets –2,367 –1,482 582 537 –458Economic Hedge Result 44 170 –166 56 85
The change of the value of the policyholder guarantees depends on market movements. The value of the Japan Closed Block VA guarantees, which was considerable at year-end 2008 due to the credit crisis, moved significantly over the past years, decreasing in 2012 and 2013 as a result of the economic stimulus packages in Japan. In 2008 the hedge program was not yet fully developed and was therefore only partially able to follow strong market movements, resulting in significant hedge losses. Hedge losses were incurred in 2011 as well, partially attributable to significant spread movements that were not hedged in 2011.
separate account guaranteed group pension business in the netherlandsRisk profile
separate account guaranteed group pension business in the netherlands 2013 2012
ccount value 10,858 12,487 Additional IFRS reserve for guarantee 606 744
In the Dutch separate account pension portfolio, investments are held in separate accounts on behalf of the sponsor employer who concluded the contract with NN. Regardless of actual returns on these investments, NN guarantees pension benefits for the beneficiaries under the contract. Contracts are typically re-negotiated every five years, but the guarantee obligations to the beneficiaries survive termination of the contract with the sponsor employer unless otherwise agreed.
The sponsor employer selects the investments based on a basket of equity and fixed income instruments and real estate and pays a fee for the guarantee. The value of the guarantee that NN provides is sensitive to interest rates, movements in the underlying funds and the volatility of those funds.
Risk mitigationNN currently hedges the value of the guarantees it provided under group pension contracts in the Netherlands. For this purpose, the exposure under such guarantees is discounted at the swap curve without the extrapolation to the UFR. The hedge program includes equity basket options, swaps and equity futures. Upon contract renewal, NN offers policyholders defined contribution products with investments in portfolios that NN can more easily hedge, thus reducing the risk to NN. As of August 2013, NN aims to hedge the full economic risk of the guarantee provided. Before August 2013, the hedge was aimed at mitigating a combination of IFRS earnings volatility and regulatory capital volatility.
other separate account businessRisk profileThe other separate account business primarily consists of unit linked insurance policies, which provide policyholders with fund selection combined with an insurance cover. In a unit linked policy, the investment risk is borne by the policyholder, although there are some unit linked products where NN has provided guarantees on the performance of specific underlying funds. Unit linked products without guarantees do not expose NN to market risk, except to the extent that the present value of future fees is affected by market movements of the underlying policyholder funds.
Risk mitigationThe market risks of the unit linked and other separate account business are managed at the design of the product. Currently NN does not hedge the market risks related to the present value of future fee income derived from this business.
329ING Group Annual Report 2013
1 Wh
o w
e are2 R
epo
rt of th
e Executive B
oard
3 Co
rpo
rate go
vernan
ce4 C
on
solid
ated an
nu
al accou
nts
5 Parent co
mp
any an
nu
al accou
nts
6 Oth
er info
rmatio
n7 A
dd
ition
al info
rmatio
n
ING_2013_deel4c&d_v2.indd 329 19/03/2014 19:33:14
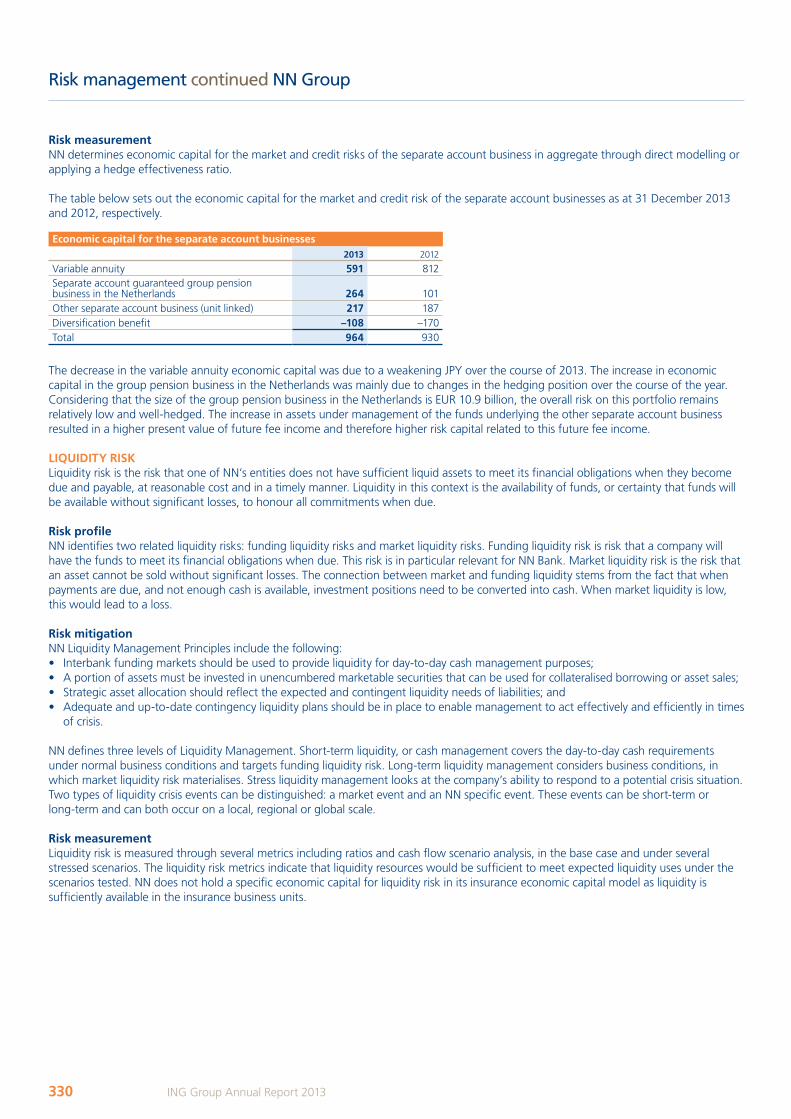
Risk management continued NN Group
Risk measurementNN determines economic capital for the market and credit risks of the separate account business in aggregate through direct modelling or applying a hedge effectiveness ratio.
The table below sets out the economic capital for the market and credit risk of the separate account businesses as at 31 December 2013 and 2012, respectively.
economic capital for the separate account businesses2013 2012
Variable annuity 591 812Separate account guaranteed group pension business in the Netherlands 264 101Other separate account business (unit linked) 217 187Diversification benefit –108 –170Total 964 930
The decrease in the variable annuity economic capital was due to a weakening JPY over the course of 2013. The increase in economic capital in the group pension business in the Netherlands was mainly due to changes in the hedging position over the course of the year. Considering that the size of the group pension business in the Netherlands is EUR 10.9 billion, the overall risk on this portfolio remains relatively low and well-hedged. The increase in assets under management of the funds underlying the other separate account business resulted in a higher present value of future fee income and therefore higher risk capital related to this future fee income.
LiQuiDitY RiskLiquidity risk is the risk that one of NN’s entities does not have sufficient liquid assets to meet its financial obligations when they become due and payable, at reasonable cost and in a timely manner. Liquidity in this context is the availability of funds, or certainty that funds will be available without significant losses, to honour all commitments when due.
Risk profileNN identifies two related liquidity risks: funding liquidity risks and market liquidity risks. Funding liquidity risk is risk that a company will have the funds to meet its financial obligations when due. This risk is in particular relevant for NN Bank. Market liquidity risk is the risk that an asset cannot be sold without significant losses. The connection between market and funding liquidity stems from the fact that when payments are due, and not enough cash is available, investment positions need to be converted into cash. When market liquidity is low, this would lead to a loss.
Risk mitigationNN Liquidity Management Principles include the following:• Interbank funding markets should be used to provide liquidity for day-to-day cash management purposes;• A portion of assets must be invested in unencumbered marketable securities that can be used for collateralised borrowing or asset sales;• Strategic asset allocation should reflect the expected and contingent liquidity needs of liabilities; and• Adequate and up-to-date contingency liquidity plans should be in place to enable management to act effectively and efficiently in times
of crisis.
NN defines three levels of Liquidity Management. Short-term liquidity, or cash management covers the day-to-day cash requirements under normal business conditions and targets funding liquidity risk. Long-term liquidity management considers business conditions, in which market liquidity risk materialises. Stress liquidity management looks at the company’s ability to respond to a potential crisis situation. Two types of liquidity crisis events can be distinguished: a market event and an NN specific event. These events can be short-term or long-term and can both occur on a local, regional or global scale.
Risk measurementLiquidity risk is measured through several metrics including ratios and cash flow scenario analysis, in the base case and under several stressed scenarios. The liquidity risk metrics indicate that liquidity resources would be sufficient to meet expected liquidity uses under the scenarios tested. NN does not hold a specific economic capital for liquidity risk in its insurance economic capital model as liquidity is sufficiently available in the insurance business units.
330 ING Group Annual Report 2013
ING_2013_deel4c&d_v2.indd 330 19/03/2014 19:33:14

Risk management continued NN Group
opeRationaL RiskRisk profileOperational risk is a non-financial risk that includes direct or indirect losses resulting from inadequate or failed internal processes (including as a result of fraud and other misconduct), systems failure (including information technology and communications systems), human error, and certain external events.
The operational risk management areas can be defined as given below:• Control and processing risk: the risk due to non-adherence with business policies or guidelines as well as the risk of loss due to
unintentional human error during (transaction) processing. • Fraud risk: the risk of loss due to abuse of procedures, systems, assets, products or services of NN by those who intend to unlawfully
benefit themselves or others. • information (technology) risk: the risk of financial or reputational loss due to inadequate information security, resulting in a loss of
data confidentiality, integrity and availability. • Continuity and security risk: the risk of threats that might endanger the continuity of business operations and the security of our
employees.• unauthorised activity risk: the risk of misuse of procedures, systems, assets, products and services. • employment practise risk: the risk of loss due to acts inconsistent with employment, health or safety laws, agreements and from
payment of personal injury claims or diversity/discrimination events.
Risk mitigationFor operational risk NN has developed a framework governing the process of identifying, assessing, mitigating, monitoring and reporting operational risks.
Operational risk assessments are done not only based on historic data but also on a forward looking basis in order to capture future risks. Once mitigating measures have been implemented and proven to be effective through monitoring and testing, the residual risk becomes the managed risk.
Mitigation of operational risks can be preventive in nature (e.g. training and education of employees, preventive controls, etc.) or can be implemented upon discovery of a risk (e.g. enforcement of controls, disciplinary measures against employees). Risk mitigating actions or controls are based on a balance between the expected cost of implementation and the expected benefits.
NN conducts regular risk and control monitoring to measure and evaluate the effectiveness of the key risks and key controls. It determines whether the risks are within the norms for risk appetite and in line with the ambition levels and policies and standards.
The business process owners are responsible for the actual execution of the controls and for assessing the adequacy of their internal controls. Operational risk management, as part of the second line of defence, is responsible for providing management with an objective assessment of the effectiveness and efficiency of NN risks and controls.
Risk measurementNN’s economic capital for operational risk was EUR 531 million and EUR 566 million as at 31 December 2013 and 2012, respectively. The economic capital is calculated based on the standard formula for Solvency II. As it is additive to the total economic capital, then it should be considered as net of diversification with other NN Group risks.
CoMpLianCe RiskRisk profileCompliance risk is the risk of impairment of NN’s integrity. It is a failure (or perceived failure) to comply with NN’s Business Principles and the Compliance Risk-related laws, regulations and standards that are relevant to the specific financial services offered by a business or its ensuing activities, which could damage NN’s reputation and lead to legal or regulatory sanctions and financial loss.
Risk mitigationNN’s compliance function has developed a framework governing the process of identifying, assessing, mitigating, monitoring and reporting compliance risks. The compliance function works with a scorecard process to annually evaluate the level to which the compliance risk management framework is embedded in each business. NN continuously enhances its compliance risk management program to ensure that NN complies with international standards and laws.
NN separates compliance risk into four risk areas: client conduct, personal conduct, organisational conduct, and financial services conduct. In addition to effective reporting systems, NN has a whistle blower procedure which protects and encourages staff to speak up if they know of or suspect a breach of external regulations, internal policies or business principles. NN also has policies and procedures regarding anti-money laundering, sanctions and anti-terrorist financing, gifts and entertainment, anti-bribery, customer suitability, Chinese walls and confidential and inside information, as well as a code of conduct for its personnel.
331ING Group Annual Report 2013
1 Wh
o w
e are2 R
epo
rt of th
e Executive B
oard
3 Co
rpo
rate go
vernan
ce4 C
on
solid
ated an
nu
al accou
nts
5 Parent co
mp
any an
nu
al accou
nts
6 Oth
er info
rmatio
n7 A
dd
ition
al info
rmatio
n
ING_2013_deel4c&d_v2.indd 331 19/03/2014 19:33:14
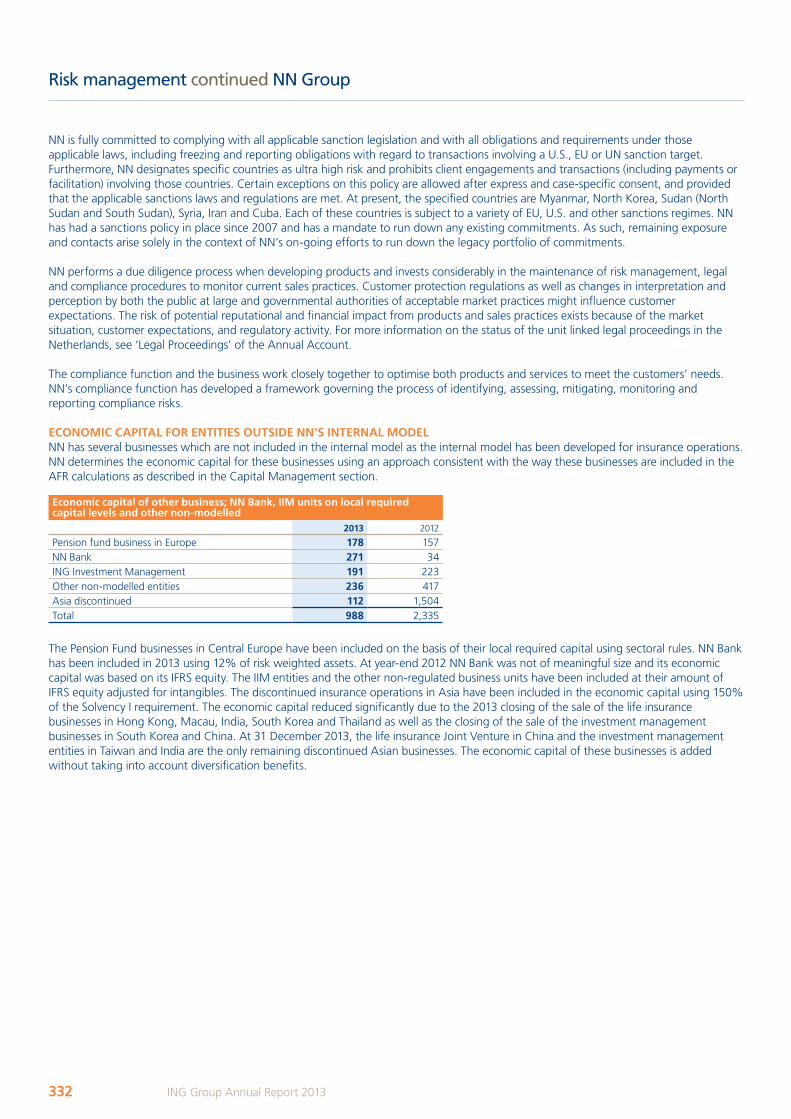
Risk management continued NN Group
NN is fully committed to complying with all applicable sanction legislation and with all obligations and requirements under those applicable laws, including freezing and reporting obligations with regard to transactions involving a U.S., EU or UN sanction target. Furthermore, NN designates specific countries as ultra high risk and prohibits client engagements and transactions (including payments or facilitation) involving those countries. Certain exceptions on this policy are allowed after express and case-specific consent, and provided that the applicable sanctions laws and regulations are met. At present, the specified countries are Myanmar, North Korea, Sudan (North Sudan and South Sudan), Syria, Iran and Cuba. Each of these countries is subject to a variety of EU, U.S. and other sanctions regimes. NN has had a sanctions policy in place since 2007 and has a mandate to run down any existing commitments. As such, remaining exposure and contacts arise solely in the context of NN’s on-going efforts to run down the legacy portfolio of commitments.
NN performs a due diligence process when developing products and invests considerably in the maintenance of risk management, legal and compliance procedures to monitor current sales practices. Customer protection regulations as well as changes in interpretation and perception by both the public at large and governmental authorities of acceptable market practices might influence customer expectations. The risk of potential reputational and financial impact from products and sales practices exists because of the market situation, customer expectations, and regulatory activity. For more information on the status of the unit linked legal proceedings in the Netherlands, see ‘Legal Proceedings’ of the Annual Account.
The compliance function and the business work closely together to optimise both products and services to meet the customers’ needs. NN’s compliance function has developed a framework governing the process of identifying, assessing, mitigating, monitoring and reporting compliance risks.
eConoMiC CapitaL FoR entities outsiDe nn’s inteRnaL MoDeLNN has several businesses which are not included in the internal model as the internal model has been developed for insurance operations. NN determines the economic capital for these businesses using an approach consistent with the way these businesses are included in the AFR calculations as described in the Capital Management section.
economic capital of other business; nn Bank, iiM units on local required capital levels and other non-modelled
2013 2012
Pension fund business in Europe 178 157NN Bank 271 34ING Investment Management 191 223Other non-modelled entities 236 417Asia discontinued 112 1,504Total 988 2,335
The Pension Fund businesses in Central Europe have been included on the basis of their local required capital using sectoral rules. NN Bank has been included in 2013 using 12% of risk weighted assets. At year-end 2012 NN Bank was not of meaningful size and its economic capital was based on its IFRS equity. The IIM entities and the other non-regulated business units have been included at their amount of IFRS equity adjusted for intangibles. The discontinued insurance operations in Asia have been included in the economic capital using 150% of the Solvency I requirement. The economic capital reduced significantly due to the 2013 closing of the sale of the life insurance businesses in Hong Kong, Macau, India, South Korea and Thailand as well as the closing of the sale of the investment management businesses in South Korea and China. At 31 December 2013, the life insurance Joint Venture in China and the investment management entities in Taiwan and India are the only remaining discontinued Asian businesses. The economic capital of these businesses is added without taking into account diversification benefits.
332 ING Group Annual Report 2013
ING_2013_deel4c&d_v2.indd 332 19/03/2014 19:33:14
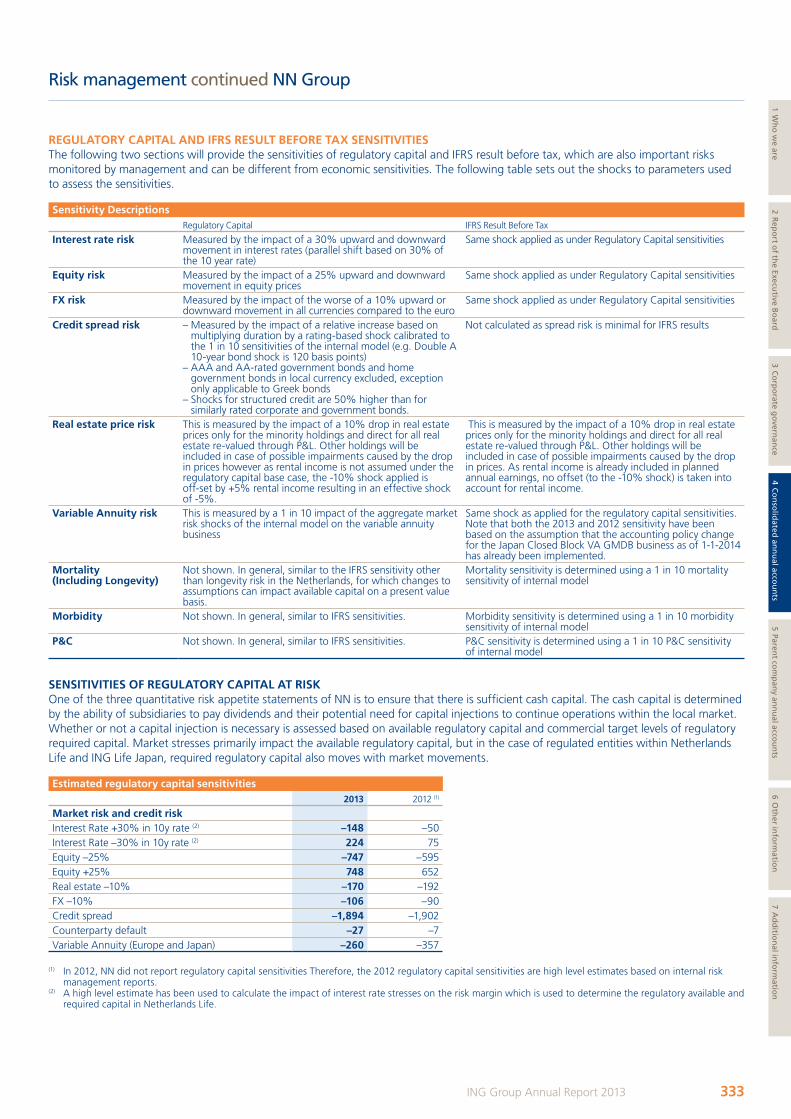
Risk management continued NN Group
ReguLatoRY CapitaL anD iFRs ResuLt BeFoRe taX sensitiVitiesThe following two sections will provide the sensitivities of regulatory capital and IFRS result before tax, which are also important risks monitored by management and can be different from economic sensitivities. The following table sets out the shocks to parameters used to assess the sensitivities.
sensitivity Descriptions Regulatory Capital IFRS Result Before Tax
interest rate risk Measured by the impact of a 30% upward and downward movement in interest rates (parallel shift based on 30% of the 10 year rate)
Same shock applied as under Regulatory Capital sensitivities
equity risk Measured by the impact of a 25% upward and downward movement in equity prices
Same shock applied as under Regulatory Capital sensitivities
FX risk Measured by the impact of the worse of a 10% upward or downward movement in all currencies compared to the euro
Same shock applied as under Regulatory Capital sensitivities
Credit spread risk – Measured by the impact of a relative increase based on multiplying duration by a rating-based shock calibrated to the 1 in 10 sensitivities of the internal model (e.g. Double A 10-year bond shock is 120 basis points)
– AAA and AA-rated government bonds and home government bonds in local currency excluded, exception only applicable to Greek bonds
– Shocks for structured credit are 50% higher than for similarly rated corporate and government bonds.
Not calculated as spread risk is minimal for IFRS results
Real estate price risk This is measured by the impact of a 10% drop in real estate prices only for the minority holdings and direct for all real estate re-valued through P&L. Other holdings will be included in case of possible impairments caused by the drop in prices however as rental income is not assumed under the regulatory capital base case, the -10% shock applied is off-set by +5% rental income resulting in an effective shock of -5%.
This is measured by the impact of a 10% drop in real estate prices only for the minority holdings and direct for all real estate re-valued through P&L. Other holdings will be included in case of possible impairments caused by the drop in prices. As rental income is already included in planned annual earnings, no offset (to the -10% shock) is taken into account for rental income.
Variable annuity risk This is measured by a 1 in 10 impact of the aggregate market risk shocks of the internal model on the variable annuity business
Same shock as applied for the regulatory capital sensitivities. Note that both the 2013 and 2012 sensitivity have been based on the assumption that the accounting policy change for the Japan Closed Block VA GMDB business as of 1-1-2014 has already been implemented.
Mortality (including Longevity)
Not shown. In general, similar to the IFRS sensitivity other than longevity risk in the Netherlands, for which changes to assumptions can impact available capital on a present value basis.
Mortality sensitivity is determined using a 1 in 10 mortality sensitivity of internal model
Morbidity Not shown. In general, similar to IFRS sensitivities. Morbidity sensitivity is determined using a 1 in 10 morbidity sensitivity of internal model
p&C Not shown. In general, similar to IFRS sensitivities. P&C sensitivity is determined using a 1 in 10 P&C sensitivity of internal model
sensitiVities oF ReguLatoRY CapitaL at RiskOne of the three quantitative risk appetite statements of NN is to ensure that there is sufficient cash capital. The cash capital is determined by the ability of subsidiaries to pay dividends and their potential need for capital injections to continue operations within the local market. Whether or not a capital injection is necessary is assessed based on available regulatory capital and commercial target levels of regulatory required capital. Market stresses primarily impact the available regulatory capital, but in the case of regulated entities within Netherlands Life and ING Life Japan, required regulatory capital also moves with market movements.
estimated regulatory capital sensitivities 2013 2012 (1)
Market risk and credit riskInterest Rate +30% in 10y rate (2) –148 –50Interest Rate –30% in 10y rate (2) 224 75Equity –25% –747 –595Equity +25% 748 652Real estate –10% –170 –192FX –10% –106 –90Credit spread –1,894 –1,902Counterparty default –27 –7Variable Annuity (Europe and Japan) –260 –357
(1) In 2012, NN did not report regulatory capital sensitivities Therefore, the 2012 regulatory capital sensitivities are high level estimates based on internal risk management reports.
(2) A high level estimate has been used to calculate the impact of interest rate stresses on the risk margin which is used to determine the regulatory available and required capital in Netherlands Life.
333ING Group Annual Report 2013
1 Wh
o w
e are2 R
epo
rt of th
e Executive B
oard
3 Co
rpo
rate go
vernan
ce4 C
on
solid
ated an
nu
al accou
nts
5 Parent co
mp
any an
nu
al accou
nts
6 Oth
er info
rmatio
n7 A
dd
ition
al info
rmatio
n
ING_2013_deel4c&d_v2.indd 333 19/03/2014 19:33:14
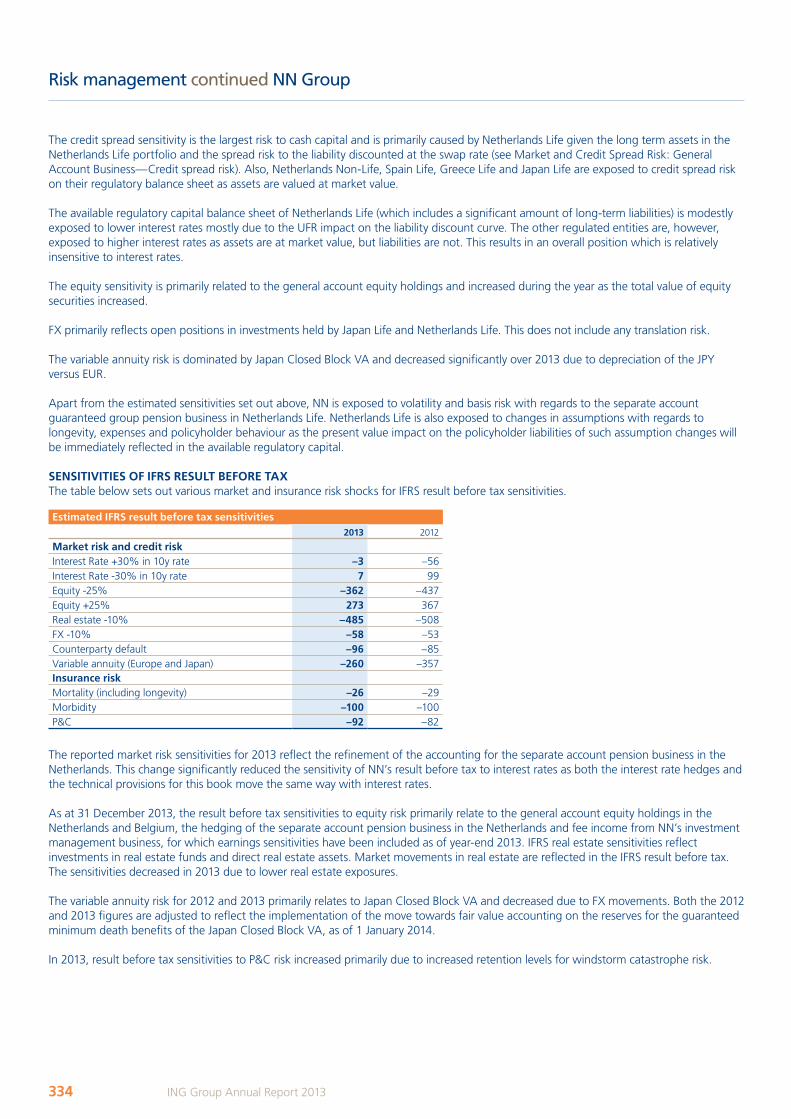
Risk management continued NN Group
The credit spread sensitivity is the largest risk to cash capital and is primarily caused by Netherlands Life given the long term assets in the Netherlands Life portfolio and the spread risk to the liability discounted at the swap rate (see Market and Credit Spread Risk: General Account Business—Credit spread risk). Also, Netherlands Non-Life, Spain Life, Greece Life and Japan Life are exposed to credit spread risk on their regulatory balance sheet as assets are valued at market value.
The available regulatory capital balance sheet of Netherlands Life (which includes a significant amount of long-term liabilities) is modestly exposed to lower interest rates mostly due to the UFR impact on the liability discount curve. The other regulated entities are, however, exposed to higher interest rates as assets are at market value, but liabilities are not. This results in an overall position which is relatively insensitive to interest rates.
The equity sensitivity is primarily related to the general account equity holdings and increased during the year as the total value of equity securities increased.
FX primarily reflects open positions in investments held by Japan Life and Netherlands Life. This does not include any translation risk.
The variable annuity risk is dominated by Japan Closed Block VA and decreased significantly over 2013 due to depreciation of the JPY versus EUR.
Apart from the estimated sensitivities set out above, NN is exposed to volatility and basis risk with regards to the separate account guaranteed group pension business in Netherlands Life. Netherlands Life is also exposed to changes in assumptions with regards to longevity, expenses and policyholder behaviour as the present value impact on the policyholder liabilities of such assumption changes will be immediately reflected in the available regulatory capital.
sensitiVities oF iFRs ResuLt BeFoRe taXThe table below sets out various market and insurance risk shocks for IFRS result before tax sensitivities.
estimated iFRs result before tax sensitivities2013 2012
Market risk and credit riskInterest Rate +30% in 10y rate –3 –56Interest Rate -30% in 10y rate 7 99Equity -25% –362 –437Equity +25% 273 367Real estate -10% –485 –508FX -10% –58 –53Counterparty default –96 –85Variable annuity (Europe and Japan) –260 –357insurance riskMortality (including longevity) –26 –29Morbidity –100 –100P&C –92 –82
The reported market risk sensitivities for 2013 reflect the refinement of the accounting for the separate account pension business in the Netherlands. This change significantly reduced the sensitivity of NN’s result before tax to interest rates as both the interest rate hedges and the technical provisions for this book move the same way with interest rates.
As at 31 December 2013, the result before tax sensitivities to equity risk primarily relate to the general account equity holdings in the Netherlands and Belgium, the hedging of the separate account pension business in the Netherlands and fee income from NN’s investment management business, for which earnings sensitivities have been included as of year-end 2013. IFRS real estate sensitivities reflect investments in real estate funds and direct real estate assets. Market movements in real estate are reflected in the IFRS result before tax. The sensitivities decreased in 2013 due to lower real estate exposures.
The variable annuity risk for 2012 and 2013 primarily relates to Japan Closed Block VA and decreased due to FX movements. Both the 2012 and 2013 figures are adjusted to reflect the implementation of the move towards fair value accounting on the reserves for the guaranteed minimum death benefits of the Japan Closed Block VA, as of 1 January 2014.
In 2013, result before tax sensitivities to P&C risk increased primarily due to increased retention levels for windstorm catastrophe risk.
334 ING Group Annual Report 2013
ING_2013_deel4c&d_v2.indd 334 19/03/2014 19:33:15

Capital managementamounts in millions of euros, unless stated otherwise
oBJeCtiVesING Group Capital Management (Capital Management) is responsible for the sufficient capitalisation of ING Group entities at all times in order to manage the risk associated with ING’s business activities. This involves the management, planning and allocation of capital within ING Group. ING’s Capital Treasury is part of Capital Management. It executes the necessary capital market transactions, term (capital) funding and risk management transactions. Capital Management monitors and plans capital adequacy on a consolidated basis at three levels: ING Group, NN Group and ING Bank. ING takes an integrated approach to assessing the adequacy of its capital position in relation to its risk profile and its operating environment. This implies taking into account the interests of its various stakeholders. Capital Management takes into account the metrics and requirements of regulators (Insurance Group Directive (IGD) Solvency I, Tier 1 and BIS ratios and limits for hybrid capital), rating agencies (leverage ratios, Adjusted Equity and fixed coverage ratio) and internal metrics such as Available Financial Resources (AFR) and Economic Capital (EC).
ING applies the following main capital definitions:• Adjusted Equity (ING Group) – This rating agency concept is defined as shareholders’ equity plus core Tier 1 securities, hybrid capital
and prudential filters. See ‘Capital Base’ disclosures in this section. This capital definition is applied in comparing available capital to core debt for ING Group;
• Core Tier 1 capital, Tier 1 capital and total BIS capital (ING Bank) – Tier 1 capital is defined as shareholders’ equity including core Tier 1 securities plus hybrid capital less certain prudential filters and deductible items. Core Tier 1, Tier 1 and BIS capital divided by risk-weighted assets equal the Core Tier 1, Tier 1 and BIS ratio respectively. Core Tier 1 capital is equal to Tier 1 capital excluding hybrid capital;
• Insurance Group Directive capital (NN Group) – This regulatory concept is defined as shareholders’ equity plus hybrid capital, prudential filters and certain adjustments. IGD capital is calculated in accordance with method 3 ‘method based on accounting consolidation’ of the Dutch Act on Financial Supervision. In this method the solvency margin is calculated on the basis of the consolidated accounts and is the difference of (i) the assets eligible for the inclusion in the calculation of the solvency margin based on the consolidated data; and (ii) the minimum amount of the solvency margin calculated on the basis of the consolidated data. In applying this method a solvency deficit of an insurance subsidiary, if any, is taken into account, as well as regulatory adjustments of the Dutch insurance subsidiaries based on the Dutch Act on Financial Supervision. See ‘Capital Base’ disclosures in this section. This capital definition is applied in comparing IGD capital to EU required capital base. As of 30 September 2013, the IGD ratio for NN Group was adjusted for the transfer of ING U.S. Inc. from ING Verzekeringen N.V. to ING Groep N.V. and a change in the calculation methodology. Prior period has not been restated to reflect these adjustments, as the impact is not material.
• AFR (NN Group excluding US Insurance business) –This is a pre-tax market value concept, defined for the insurance operations in scope of the IPO as the market value of assets (MVA) less the market value of liabilities (MVL) on the balance sheet. The liabilities valuation includes an adjustment for liquidity premium. For other businesses a proxy is used for AFR, i.e. statutory net equity for third party pension funds and NN Bank, and IFRS Equity adjusted for Goodwill for Asian divestments and Investment Management companies. The qualifying perpetual hybrid capital is considered equity and included in AFR. AFR is used as the measure of available capital in comparison with EC employed.
• EC (NN Group excluding US Insurance business) – This is the pre-tax required capital for the insurance operations in scope of the IPO, based on a 99.5% confidence interval on a one-year horizon. This is considered an interim step to the Solvency II capital framework. The EC for other businesses is based on a proxy, i.e. sectoral rules for third party pension funds and NN Bank, 150% EU required capital for Asian divestments, and (adjusted) IFRS Equity (adjusted for Goodwill) for Investment Management companies.
• Regulatory Capital framework – Insurance and Investment Management legal entities have to comply with local statutory capital frameworks that are under supervision of local regulators. Most of these frameworks for insurance businesses in Europe are based on Solvency I principles and are expected to migrate to Solvency II starting in 2016.
• Financial Leverage (NN Group). Financial Leverage is the sum of hybrid capital, sub-debt and net financial debt.
DeVeLopMentsIn 2013 Capital Management’s main focus remained the strengthening of the capital position of ING Group, ING Bank and NN Group. ING’s capital is well prepared to withstand financial market challenges, new regulations and the ambition to repay the remaining outstanding Core Tier 1 securities. ING aims to ensure that it has sufficient loss-absorbing capacity to cope with severe unexpected losses without jeopardising its business-as-usual franchise.
In November 2013, ING repaid EUR 750 million of the Core Tier 1 securities issued in November 2008. ING paid EUR 1.125 billion to the Dutch State, including a EUR 750 million repayment of Core Tier 1 securities and EUR 375 million in premiums and interest.
The payment of EUR 1.125 billion is the second tranche of a series of four tranches that are part of the amended EC Restructuring Plan which was announced on 19 November 2012. The third tranche is scheduled to be paid in March 2014 and the final tranche is scheduled to be paid ultimately in May 2015.
ING has reached an agreement with the Dutch State on the unwinding of the Illiquid Assets Back-Up Facility (IABF). The unwinding of the IABF added approximately 10 basis points to ING Bank’s core Tier 1 ratio. ING Bank called its USD 2 billion 8.5% Tier 1 hybrid per call date 15 December 2013 and launched an exchange offer on EUR 4.7 billion existing Tier 2 securities for new CRD IV compliant Tier 2 securities.This transaction was successfully completed on 15 November 2013 at an average participation of 55% (take-up rate). Through the offers, ING Bank issued EUR 2.6 billion of new CRD-IV eligible Tier 2 securities.
335ING Group Annual Report 2013
1 Wh
o w
e are2 R
epo
rt of th
e Executive B
oard
3 Co
rpo
rate go
vernan
ce4 C
on
solid
ated an
nu
al accou
nts
5 Parent co
mp
any an
nu
al accou
nts
6 Oth
er info
rmatio
n7 A
dd
ition
al info
rmatio
n
ING_2013_deel4c&d_v2.indd 335 19/03/2014 19:33:15
Capital management continued
In May 2013, the US Insurance business was successfully separated and listed (VOYA) on the NYSE. ING Group has partly divested this business in several tranches. In May ING Group sold approximately 28% shares in Voya and succesfully completed the secondary offering of Voya with proceeds of EUR 644 million. On September 30th NN Group transferred its remaining shares of the US Insurance business to ING Group. In October 2013, ING Group sold another tranche of approximately 15% shares in Voya with proceeds of EUR 788 million. At the end of 2013, ING Group still owns 56.7% of the US Insurance business.
The proceeds from the Initial Public Offering of the US Insurance business and from the partial divestment of Sul América S.A. in Brazil to GrupoSura and to the Larragoiti family were fully paid up to ING Group and used to reduce core debt at the Group.
NN Group reduced its financial leverage substantially, from 31% by the end of 2012 to 26% ultimo 2013. This was mainly driven by the proceeds from the sale of its Asian Insurance business o.w. Hong Kong, Korea, Thailand and India, a capital injection from ING Group, the transfer of the US business from NN Group to ING Group and dividends from operating companies, offset by capital injections into operating companies, including a cash capital requirement for IPO purposes and holding company interest costs and expenses. In September NN Group N.V. redeemed senior debt of EUR 1.3 billon and an intercompany loan from ING Group of EUR 0.7 billion. The redemptions were funded by a new short-term intercompany loan of EUR 2 billion from ING Group, which was reduced to EUR 1 billion in December following a capital injection from ING Group.
Nationale Nederlanden Bank N.V. (part of NN Group) acquired parts of Westland-Utrecht Bank (owned by ING Bank) per July 1st, 2013. This acquisition was funded by a capital injection from ING Group and therefore not increasing financial leverage of NN Group. ING Bank paid a dividend to ING Group to finance the capital injection into National Nederlanden Bank.
In order to comply with the obligations toward the European Commission, ING Group largely finalised the divestment of its Asian business, US business and Brazilian business; the total proceeds from divestments in 2013 were EUR 4.1 billon.
Additionally, ING Group is in process of preparing NN Group for a separate listing in 2014. As part of those preparations to become a stand-alone company, ING Group injected EUR 1 billion of capital to further strengthen capitalisation.
In 2013 ING Bank issued EUR 25.7 billion of debt. This amount is split in EUR 1.9 billion with an original tenor up to two years and EUR 23.8 billion with an original tenor of more than two years. This includes a USD 2 billion Lower Tier 2 that was executed by ING Bank (including subsidiaries).Furthermore, ING reduced the amount outstanding by executing Government Guaranteed Bond buy-backs, leading to a total net issuance in 2013 of EUR 19.7 billion.
In 2012 ING Bank issued EUR 33 billion of debt with an original tenor of more than one year, compared with EUR 18 billion of long-term debt maturing in the whole of 2012, successfully covering its 2012 funding needs and prefunding its 2013 requirements. ING Bank (including subsidiaries) has EUR 21 billion of debt with an original tenor of more than one year maturing in 2013.
poLiCiesThe activities of Capital Management are executed on the basis of established policies, guidelines and procedures. For the Capital Treasury there are additional policies and limits that guide the management of the balance sheets and the execution of capital market transactions.
pRoCesses FoR Managing CapitaLIn addition to measuring capital adequacy, Capital Management also ensures that sufficient capital is available through setting targets and limits relevant to the above mentioned metrics for ING Group, ING Bank, and NN Group and ensuring adherence to the set limits and targets through planning and executing capital management transactions. The ongoing assessment and monitoring of capital adequacy is embedded in Capital Management’s capital planning process. Following the annual budgeting process, each year a capital plan is prepared for the Group as a whole and each of its material businesses. This plan is updated on a quarterly basis and it is assessed to what extent additional management actions are required. At all times maintaining sufficient financial flexibility should be preserved to meet important financial objectives. At the foundation of the capital plan are ING’s risk appetite statements that determine target setting. These constraints are being cascaded to the different businesses in line with our risk management strategy.
Important inputs to the capital planning and management process are provided by stress testing that is performed on a regular basis. These stress tests focus on topical issues and the sensitivity of the Group’s capital position to certain risks. These analyses provide input that help to steer strategic direction. Setting policies for recovery planning and resolution are a natural extension of ING’s capital management policies and follow ING’s risk management framework seamlessly.
A key priority of Capital Management is to ensure that strong stand-alone companies are created for banking and insurance in preparation of the separation. All operating entities need to stay adequately capitalised based on local regulatory and rating agency requirements and interdependencies should be reduced to a minimum. The entities should also be able to access capital markets independently.
336 ING Group Annual Report 2013
ING_2013_deel4c&d_v2.indd 336 19/03/2014 19:33:15
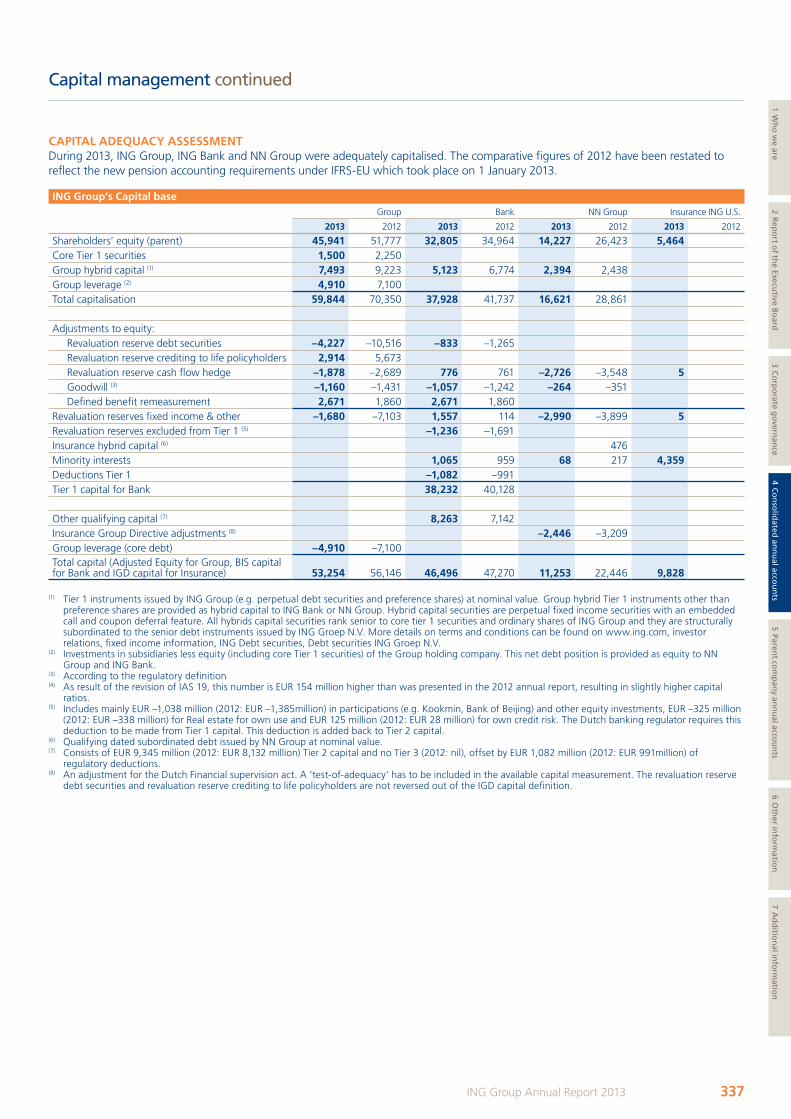
Capital management continued
CapitaL aDeQuaCY assessMentDuring 2013, ING Group, ING Bank and NN Group were adequately capitalised. The comparative figures of 2012 have been restated to reflect the new pension accounting requirements under IFRS-EU which took place on 1 January 2013.
ing group’s Capital baseGroup Bank NN Group Insurance ING U.S.
2013 2012 2013 2012 2013 2012 2013 2012
Shareholders’ equity (parent) 45,941 51,777 32,805 34,964 14,227 26,423 5,464 Core Tier 1 securities 1,500 2,250 Group hybrid capital (1) 7,493 9,223 5,123 6,774 2,394 2,438 Group leverage (2) 4,910 7,100Total capitalisation 59,844 70,350 37,928 41,737 16,621 28,861
Adjustments to equity:Revaluation reserve debt securities –4,227 –10,516 –833 –1,265Revaluation reserve crediting to life policyholders 2,914 5,673Revaluation reserve cash flow hedge –1,878 –2,689 776 761 –2,726 –3,548 5Goodwill (3) –1,160 –1,431 –1,057 –1,242 –264 –351Defined benefit remeasurement 2,671 1,860 2,671 1,860
Revaluation reserves fixed income & other –1,680 –7,103 1,557 114 –2,990 –3,899 5Revaluation reserves excluded from Tier 1 (5) –1,236 –1,691Insurance hybrid capital (6) 476Minority interests 1,065 959 68 217 4,359Deductions Tier 1 –1,082 –991Tier 1 capital for Bank 38,232 40,128
Other qualifying capital (7) 8,263 7,142Insurance Group Directive adjustments (8) –2,446 –3,209Group leverage (core debt) –4,910 –7,100Total capital (Adjusted Equity for Group, BIS capital for Bank and IGD capital for Insurance) 53,254 56,146 46,496 47,270 11,253 22,446 9,828
(1) Tier 1 instruments issued by ING Group (e.g. perpetual debt securities and preference shares) at nominal value. Group hybrid Tier 1 instruments other than preference shares are provided as hybrid capital to ING Bank or NN Group. Hybrid capital securities are perpetual fixed income securities with an embedded call and coupon deferral feature. All hybrids capital securities rank senior to core tier 1 securities and ordinary shares of ING Group and they are structurally subordinated to the senior debt instruments issued by ING Groep N.V. More details on terms and conditions can be found on www.ing.com, investor relations, fixed income information, ING Debt securities, Debt securities ING Groep N.V.
(2) Investments in subsidiaries less equity (including core Tier 1 securities) of the Group holding company. This net debt position is provided as equity to NN Group and ING Bank.
(3) According to the regulatory definition(4) As result of the revision of IAS 19, this number is EUR 154 million higher than was presented in the 2012 annual report, resulting in slightly higher capital
ratios.(5) Includes mainly EUR –1,038 million (2012: EUR –1,385million) in participations (e.g. Kookmin, Bank of Beijing) and other equity investments, EUR –325 million
(2012: EUR –338 million) for Real estate for own use and EUR 125 million (2012: EUR 28 million) for own credit risk. The Dutch banking regulator requires this deduction to be made from Tier 1 capital. This deduction is added back to Tier 2 capital.
(6) Qualifying dated subordinated debt issued by NN Group at nominal value.(7) Consists of EUR 9,345 million (2012: EUR 8,132 million) Tier 2 capital and no Tier 3 (2012: nil), offset by EUR 1,082 million (2012: EUR 991million) of
regulatory deductions.(8) An adjustment for the Dutch Financial supervision act. A ‘test-of-adequacy’ has to be included in the available capital measurement. The revaluation reserve
debt securities and revaluation reserve crediting to life policyholders are not reversed out of the IGD capital definition.
337ING Group Annual Report 2013
1 Wh
o w
e are2 R
epo
rt of th
e Executive B
oard
3 Co
rpo
rate go
vernan
ce4 C
on
solid
ated an
nu
al accou
nts
5 Parent co
mp
any an
nu
al accou
nts
6 Oth
er info
rmatio
n7 A
dd
ition
al info
rmatio
n
ING_2013_deel4c&d_v2.indd 337 19/03/2014 19:33:15
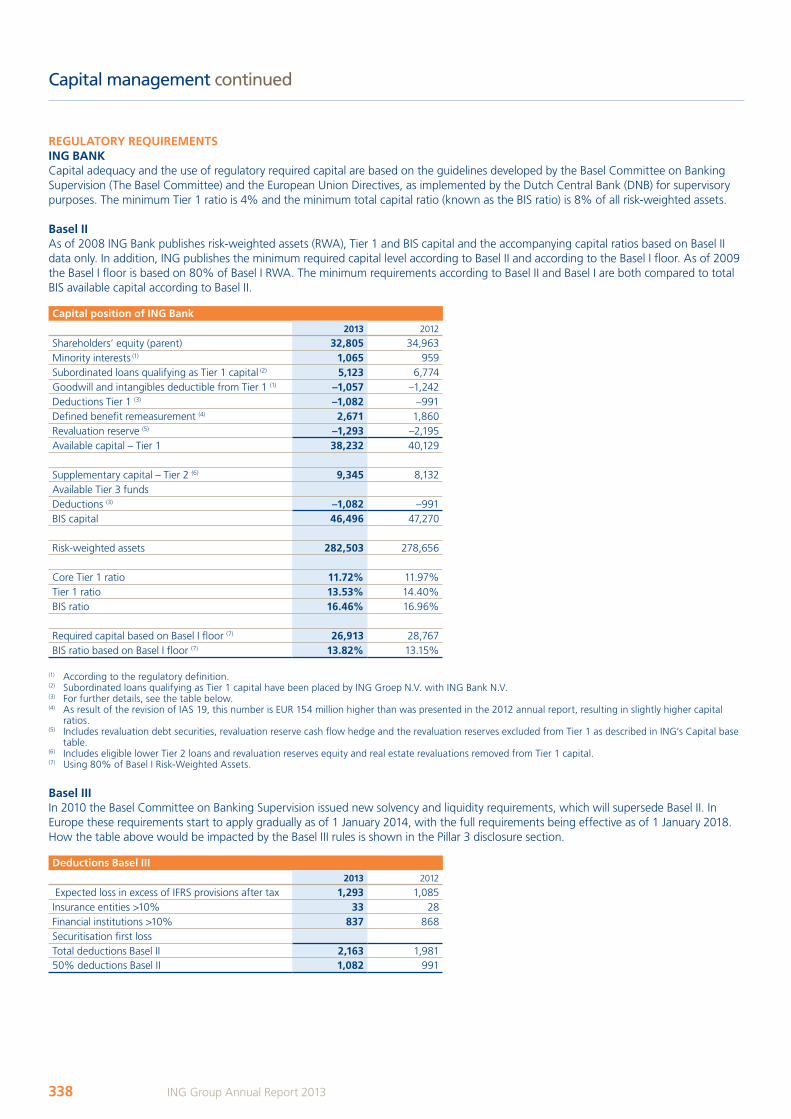
Capital management continued
ReguLatoRY ReQuiReMentsing BankCapital adequacy and the use of regulatory required capital are based on the guidelines developed by the Basel Committee on Banking Supervision (The Basel Committee) and the European Union Directives, as implemented by the Dutch Central Bank (DNB) for supervisory purposes. The minimum Tier 1 ratio is 4% and the minimum total capital ratio (known as the BIS ratio) is 8% of all risk-weighted assets.
Basel iiAs of 2008 ING Bank publishes risk-weighted assets (RWA), Tier 1 and BIS capital and the accompanying capital ratios based on Basel II data only. In addition, ING publishes the minimum required capital level according to Basel II and according to the Basel I floor. As of 2009 the Basel I floor is based on 80% of Basel I RWA. The minimum requirements according to Basel II and Basel I are both compared to total BIS available capital according to Basel II.
Capital position of ing Bank2013 2012
Shareholders’ equity (parent) 32,805 34,963Minority interests (1) 1,065 959Subordinated loans qualifying as Tier 1 capital (2) 5,123 6,774Goodwill and intangibles deductible from Tier 1 (1) –1,057 –1,242Deductions Tier 1 (3) –1,082 –991Defined benefit remeasurement (4) 2,671 1,860Revaluation reserve (5) –1,293 –2,195Available capital – Tier 1 38,232 40,129
Supplementary capital – Tier 2 (6) 9,345 8,132Available Tier 3 fundsDeductions (3) –1,082 –991BIS capital 46,496 47,270
Risk-weighted assets 282,503 278,656
Core Tier 1 ratio 11.72% 11.97%Tier 1 ratio 13.53% 14.40%BIS ratio 16.46% 16.96%
Required capital based on Basel I floor (7) 26,913 28,767BIS ratio based on Basel I floor (7) 13.82% 13.15%
(1) According to the regulatory definition.(2) Subordinated loans qualifying as Tier 1 capital have been placed by ING Groep N.V. with ING Bank N.V.(3) For further details, see the table below.(4) As result of the revision of IAS 19, this number is EUR 154 million higher than was presented in the 2012 annual report, resulting in slightly higher capital
ratios.(5) Includes revaluation debt securities, revaluation reserve cash flow hedge and the revaluation reserves excluded from Tier 1 as described in ING’s Capital base
table.(6) Includes eligible lower Tier 2 loans and revaluation reserves equity and real estate revaluations removed from Tier 1 capital.(7) Using 80% of Basel I Risk-Weighted Assets.
Basel iiiIn 2010 the Basel Committee on Banking Supervision issued new solvency and liquidity requirements, which will supersede Basel II. In Europe these requirements start to apply gradually as of 1 January 2014, with the full requirements being effective as of 1 January 2018. How the table above would be impacted by the Basel III rules is shown in the Pillar 3 disclosure section.
Deductions Basel iii2013 2012
Expected loss in excess of IFRS provisions after tax 1,293 1,085Insurance entities >10% 33 28Financial institutions >10% 837 868Securitisation first lossTotal deductions Basel II 2,163 1,98150% deductions Basel II 1,082 991
338 ING Group Annual Report 2013
ING_2013_deel4c&d_v2.indd 338 19/03/2014 19:33:16
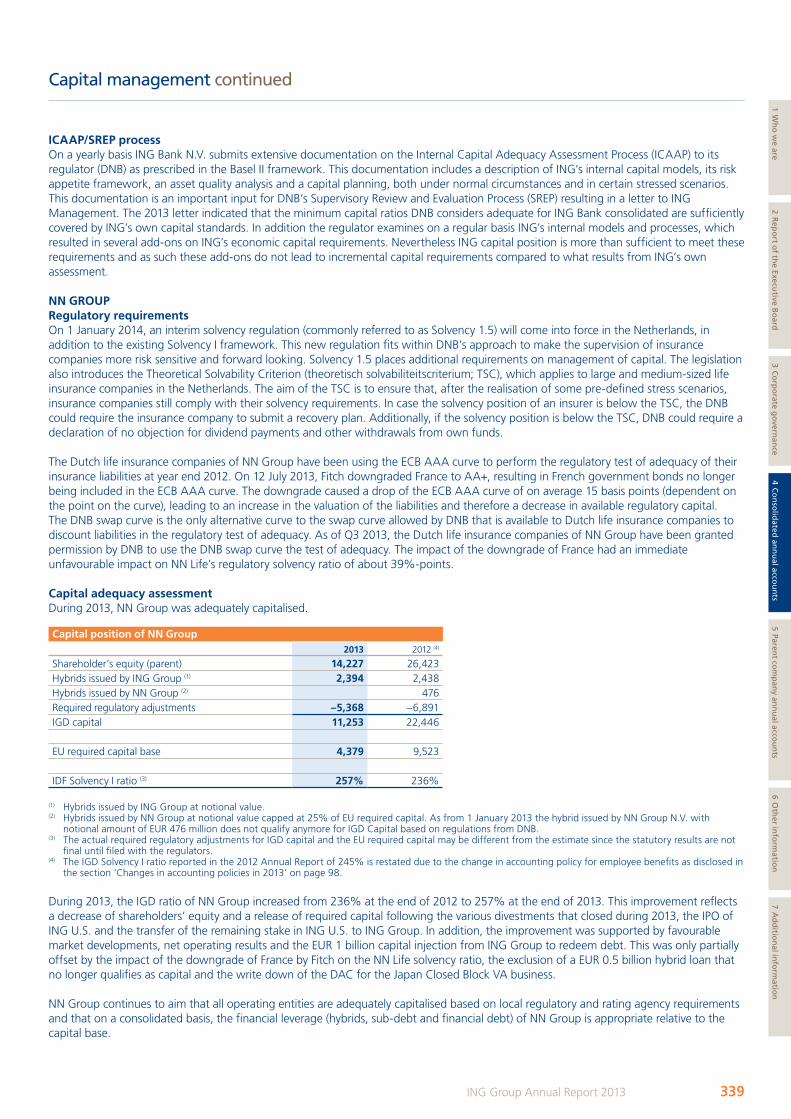
iCaap/sRep processOn a yearly basis ING Bank N.V. submits extensive documentation on the Internal Capital Adequacy Assessment Process (ICAAP) to its regulator (DNB) as prescribed in the Basel II framework. This documentation includes a description of ING’s internal capital models, its risk appetite framework, an asset quality analysis and a capital planning, both under normal circumstances and in certain stressed scenarios. This documentation is an important input for DNB’s Supervisory Review and Evaluation Process (SREP) resulting in a letter to ING Management. The 2013 letter indicated that the minimum capital ratios DNB considers adequate for ING Bank consolidated are sufficiently covered by ING’s own capital standards. In addition the regulator examines on a regular basis ING’s internal models and processes, which resulted in several add-ons on ING’s economic capital requirements. Nevertheless ING capital position is more than sufficient to meet these requirements and as such these add-ons do not lead to incremental capital requirements compared to what results from ING’s own assessment. nn gRoupRegulatory requirementsOn 1 January 2014, an interim solvency regulation (commonly referred to as Solvency 1.5) will come into force in the Netherlands, in addition to the existing Solvency I framework. This new regulation fits within DNB’s approach to make the supervision of insurance companies more risk sensitive and forward looking. Solvency 1.5 places additional requirements on management of capital. The legislation also introduces the Theoretical Solvability Criterion (theoretisch solvabiliteitscriterium; TSC), which applies to large and medium-sized life insurance companies in the Netherlands. The aim of the TSC is to ensure that, after the realisation of some pre-defined stress scenarios, insurance companies still comply with their solvency requirements. In case the solvency position of an insurer is below the TSC, the DNB could require the insurance company to submit a recovery plan. Additionally, if the solvency position is below the TSC, DNB could require a declaration of no objection for dividend payments and other withdrawals from own funds.
The Dutch life insurance companies of NN Group have been using the ECB AAA curve to perform the regulatory test of adequacy of their insurance liabilities at year end 2012. On 12 July 2013, Fitch downgraded France to AA+, resulting in French government bonds no longer being included in the ECB AAA curve. The downgrade caused a drop of the ECB AAA curve of on average 15 basis points (dependent on the point on the curve), leading to an increase in the valuation of the liabilities and therefore a decrease in available regulatory capital. The DNB swap curve is the only alternative curve to the swap curve allowed by DNB that is available to Dutch life insurance companies to discount liabilities in the regulatory test of adequacy. As of Q3 2013, the Dutch life insurance companies of NN Group have been granted permission by DNB to use the DNB swap curve the test of adequacy. The impact of the downgrade of France had an immediate unfavourable impact on NN Life’s regulatory solvency ratio of about 39%-points.
Capital adequacy assessmentDuring 2013, NN Group was adequately capitalised.
Capital position of nn group2013 2012 (4)
Shareholder’s equity (parent) 14,227 26,423Hybrids issued by ING Group (1) 2,394 2,438Hybrids issued by NN Group (2) 476Required regulatory adjustments –5,368 –6,891IGD capital 11,253 22,446
EU required capital base 4,379 9,523
IDF Solvency I ratio (3) 257% 236%
(1) Hybrids issued by ING Group at notional value.(2) Hybrids issued by NN Group at notional value capped at 25% of EU required capital. As from 1 January 2013 the hybrid issued by NN Group N.V. with
notional amount of EUR 476 million does not qualify anymore for IGD Capital based on regulations from DNB.(3) The actual required regulatory adjustments for IGD capital and the EU required capital may be different from the estimate since the statutory results are not
final until filed with the regulators.(4) The IGD Solvency I ratio reported in the 2012 Annual Report of 245% is restated due to the change in accounting policy for employee benefits as disclosed in
the section ‘Changes in accounting policies in 2013’ on page 98.
During 2013, the IGD ratio of NN Group increased from 236% at the end of 2012 to 257% at the end of 2013. This improvement reflects a decrease of shareholders’ equity and a release of required capital following the various divestments that closed during 2013, the IPO of ING U.S. and the transfer of the remaining stake in ING U.S. to ING Group. In addition, the improvement was supported by favourable market developments, net operating results and the EUR 1 billion capital injection from ING Group to redeem debt. This was only partially offset by the impact of the downgrade of France by Fitch on the NN Life solvency ratio, the exclusion of a EUR 0.5 billion hybrid loan that no longer qualifies as capital and the write down of the DAC for the Japan Closed Block VA business.
NN Group continues to aim that all operating entities are adequately capitalised based on local regulatory and rating agency requirements and that on a consolidated basis, the financial leverage (hybrids, sub-debt and financial debt) of NN Group is appropriate relative to the capital base.
Capital management continued
339ING Group Annual Report 2013
1 Wh
o w
e are2 R
epo
rt of th
e Executive B
oard
3 Co
rpo
rate go
vernan
ce4 C
on
solid
ated an
nu
al accou
nts
5 Parent co
mp
any an
nu
al accou
nts
6 Oth
er info
rmatio
n7 A
dd
ition
al info
rmatio
n
ING_2013_deel4c&d_v2.indd 339 19/03/2014 19:33:16
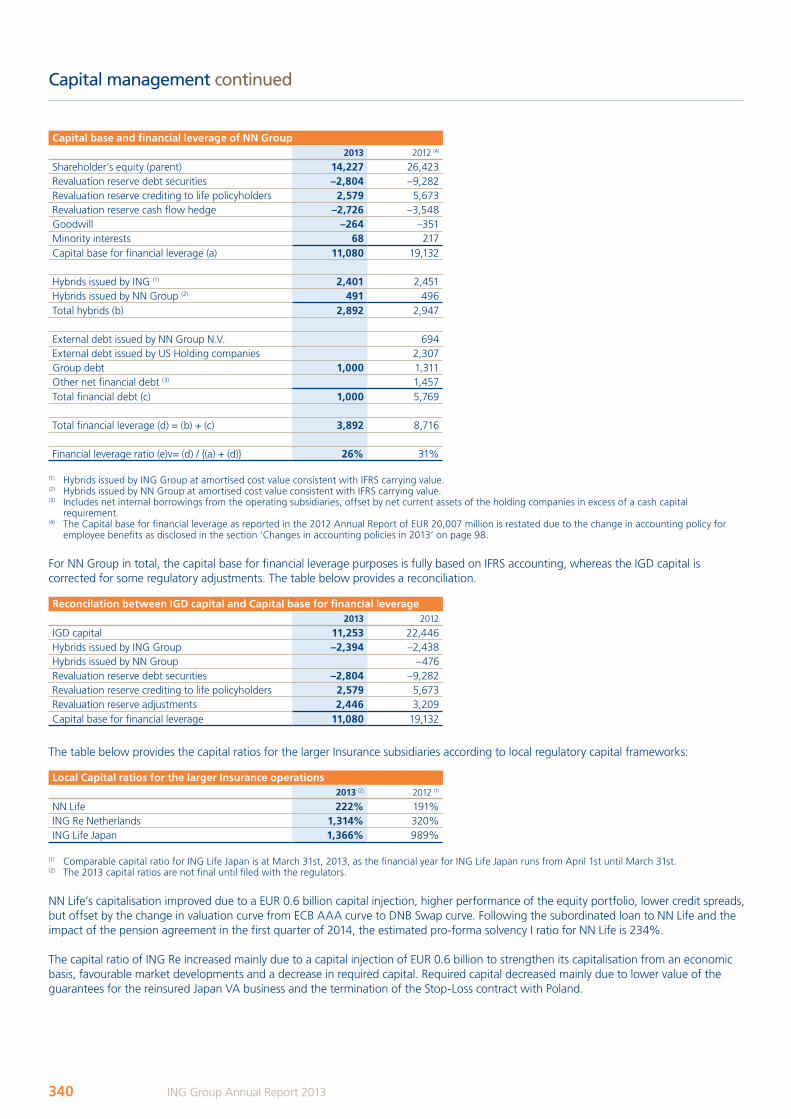
Capital management continued
Capital base and financial leverage of nn group2013 2012 (4)
Shareholder’s equity (parent) 14,227 26,423Revaluation reserve debt securities –2,804 –9,282Revaluation reserve crediting to life policyholders 2,579 5,673Revaluation reserve cash flow hedge –2,726 –3,548Goodwill –264 –351Minority interests 68 217Capital base for financial leverage (a) 11,080 19,132
Hybrids issued by ING (1) 2,401 2,451Hybrids issued by NN Group (2) 491 496Total hybrids (b) 2,892 2,947
External debt issued by NN Group N.V. 694External debt issued by US Holding companies 2,307Group debt 1,000 1,311Other net financial debt (3) 1,457Total financial debt (c) 1,000 5,769
Total financial leverage (d) = (b) + (c) 3,892 8,716
Financial leverage ratio (e)v= (d) / {(a) + (d)} 26% 31%
(1) Hybrids issued by ING Group at amortised cost value consistent with IFRS carrying value.(2) Hybrids issued by NN Group at amortised cost value consistent with IFRS carrying value.(3) Includes net internal borrowings from the operating subsidiaries, offset by net current assets of the holding companies in excess of a cash capital
requirement. (4) The Capital base for financial leverage as reported in the 2012 Annual Report of EUR 20,007 million is restated due to the change in accounting policy for
employee benefits as disclosed in the section ‘Changes in accounting policies in 2013’ on page 98.
For NN Group in total, the capital base for financial leverage purposes is fully based on IFRS accounting, whereas the IGD capital is corrected for some regulatory adjustments. The table below provides a reconciliation.
Reconcilation between igD capital and Capital base for financial leverage2013 2012
IGD capital 11,253 22,446Hybrids issued by ING Group –2,394 –2,438Hybrids issued by NN Group –476Revaluation reserve debt securities –2,804 –9,282Revaluation reserve crediting to life policyholders 2,579 5,673Revaluation reserve adjustments 2,446 3,209Capital base for financial leverage 11,080 19,132
The table below provides the capital ratios for the larger Insurance subsidiaries according to local regulatory capital frameworks:
Local Capital ratios for the larger insurance operations2013 (2) 2012 (1)
NN Life 222% 191%ING Re Netherlands 1,314% 320%ING Life Japan 1,366% 989%
(1) Comparable capital ratio for ING Life Japan is at March 31st, 2013, as the financial year for ING Life Japan runs from April 1st until March 31st.(2) The 2013 capital ratios are not final until filed with the regulators.
NN Life’s capitalisation improved due to a EUR 0.6 billion capital injection, higher performance of the equity portfolio, lower credit spreads, but offset by the change in valuation curve from ECB AAA curve to DNB Swap curve. Following the subordinated loan to NN Life and the impact of the pension agreement in the first quarter of 2014, the estimated pro-forma solvency I ratio for NN Life is 234%.
The capital ratio of ING Re increased mainly due to a capital injection of EUR 0.6 billion to strengthen its capitalisation from an economic basis, favourable market developments and a decrease in required capital. Required capital decreased mainly due to lower value of the guarantees for the reinsured Japan VA business and the termination of the Stop-Loss contract with Poland.
340 ING Group Annual Report 2013
ING_2013_deel4c&d_v2.indd 340 19/03/2014 19:33:16
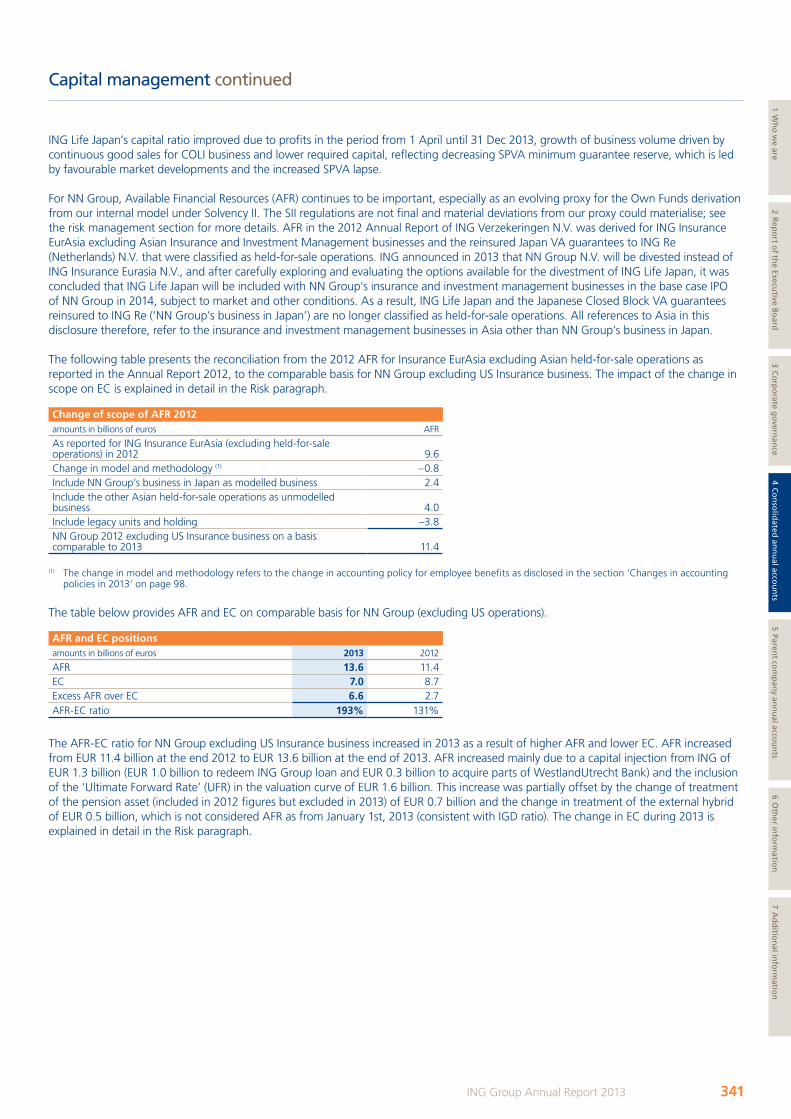
ING Life Japan’s capital ratio improved due to profits in the period from 1 April until 31 Dec 2013, growth of business volume driven by continuous good sales for COLI business and lower required capital, reflecting decreasing SPVA minimum guarantee reserve, which is led by favourable market developments and the increased SPVA lapse.
For NN Group, Available Financial Resources (AFR) continues to be important, especially as an evolving proxy for the Own Funds derivation from our internal model under Solvency II. The SII regulations are not final and material deviations from our proxy could materialise; see the risk management section for more details. AFR in the 2012 Annual Report of ING Verzekeringen N.V. was derived for ING Insurance EurAsia excluding Asian Insurance and Investment Management businesses and the reinsured Japan VA guarantees to ING Re (Netherlands) N.V. that were classified as held-for-sale operations. ING announced in 2013 that NN Group N.V. will be divested instead of ING Insurance Eurasia N.V., and after carefully exploring and evaluating the options available for the divestment of ING Life Japan, it was concluded that ING Life Japan will be included with NN Group’s insurance and investment management businesses in the base case IPO of NN Group in 2014, subject to market and other conditions. As a result, ING Life Japan and the Japanese Closed Block VA guarantees reinsured to ING Re (‘NN Group’s business in Japan’) are no longer classified as held-for-sale operations. All references to Asia in this disclosure therefore, refer to the insurance and investment management businesses in Asia other than NN Group’s business in Japan.
The following table presents the reconciliation from the 2012 AFR for Insurance EurAsia excluding Asian held-for-sale operations as reported in the Annual Report 2012, to the comparable basis for NN Group excluding US Insurance business. The impact of the change in scope on EC is explained in detail in the Risk paragraph.
Change of scope of aFR 2012 amounts in billions of euros AFR
As reported for ING Insurance EurAsia (excluding held-for-sale operations) in 2012 9.6Change in model and methodology (1) –0.8Include NN Group’s business in Japan as modelled business 2.4Include the other Asian held-for-sale operations as unmodelled business 4.0Include legacy units and holding –3.8NN Group 2012 excluding US Insurance business on a basis comparable to 2013 11.4
(1) The change in model and methodology refers to the change in accounting policy for employee benefits as disclosed in the section ‘Changes in accounting policies in 2013’ on page 98.
The table below provides AFR and EC on comparable basis for NN Group (excluding US operations).
aFR and eC positionsamounts in billions of euros 2013 2012
AFR 13.6 11.4EC 7.0 8.7Excess AFR over EC 6.6 2.7AFR-EC ratio 193% 131%
The AFR-EC ratio for NN Group excluding US Insurance business increased in 2013 as a result of higher AFR and lower EC. AFR increased from EUR 11.4 billion at the end 2012 to EUR 13.6 billion at the end of 2013. AFR increased mainly due to a capital injection from ING of EUR 1.3 billion (EUR 1.0 billion to redeem ING Group loan and EUR 0.3 billion to acquire parts of WestlandUtrecht Bank) and the inclusion of the ‘Ultimate Forward Rate’ (UFR) in the valuation curve of EUR 1.6 billion. This increase was partially offset by the change of treatment of the pension asset (included in 2012 figures but excluded in 2013) of EUR 0.7 billion and the change in treatment of the external hybrid of EUR 0.5 billion, which is not considered AFR as from January 1st, 2013 (consistent with IGD ratio). The change in EC during 2013 is explained in detail in the Risk paragraph.
Capital management continued
341ING Group Annual Report 2013
1 Wh
o w
e are2 R
epo
rt of th
e Executive B
oard
3 Co
rpo
rate go
vernan
ce4 C
on
solid
ated an
nu
al accou
nts
5 Parent co
mp
any an
nu
al accou
nts
6 Oth
er info
rmatio
n7 A
dd
ition
al info
rmatio
n
ING_2013_deel4c&d_v2.indd 341 19/03/2014 19:33:16

ing gRoupThe debt/equity ratio of ING Group as at 31 December 2013 was 8.4% (2012: 11.2%).
ING Group reports to the Dutch Central Bank as required under the Dutch implementation of the financial conglomerates directive (FICO). The directive mainly covers risk concentrations in the group, intra-group transactions and an assessment of the capital adequacy of the Group.
In the following table, we show the Group’s FICO ratio on the following basis:• Insurance required capital from applying European Solvency I rules to all NN Group entities globally (regardless of local capital
requirements);• Bank required capital based on applying Basel II with the Basel I floor (80% of Basel I Risk Weighted Assets);• Group FICO capital using an approach similar to that used for Bank BIS capital and Insurance IGD capital whereby Group leverage
is deducted.
Regulatory capital adequacy ing group2013 2012
BIS capital 46,496 47,270IGD capital Insurance operations 20,903 22,447Group leverage (core debt) –4,910 –7,100Regulatory capital 62,490 62,619
Required capital banking operations 26,913 28,767Required capital insurance operations 8,153 9,523Total required capital 35,066 38,290
FICO ratio 178% 164%
Capital adequacy and ratios
Quantitative disclosures on capital measurements and ratiosGroup Bank NN Group
2013 2012 2013 2012 2013 2012
Core tier 1 ratio (Bank)Year-end actual Tier 1 ratio 11.72% 11.97%Regulatory minimum Tier 1 ratio 2.00% 2.00%Target minimum Tier 1 ratio 10.00% 10.00%
tier 1 ratio (Bank)Year-end actual Tier 1 ratio 13.53% 14.40%Regulatory minimum Tier 1 ratio 4.00% 4.00%Target minimum Tier 1 ratio 11.50% 10.00%
Bis ratio (Bank)Year-end actual BIS ratio 16.46% 16.96%Regulatory minimum BIS ratio 8.00% 8.00%Target minimum BIS ratio 15.00% 10.00%
insurance groups DirectiveYear-end actual Capital coverage ratio 257% 236%Required capital 100% 100%Target ratio 150% 150%
Debt/equity ratio (group)Debt/Equity ratio 8.44% 11.23%Target maximum Debt/Equity ratio 15.00% 15.00%
The Tier 1 ratio and the BIS ratio are regulatory requirements. Internally ING manages on the Core Tier 1 ratio. The actual ratios were 11.97% at the end of 2012 and 11.72% at the end of 2013.
Capital management continued
342 ING Group Annual Report 2013
ING_2013_deel4c&d_v2.indd 342 19/03/2014 19:33:17
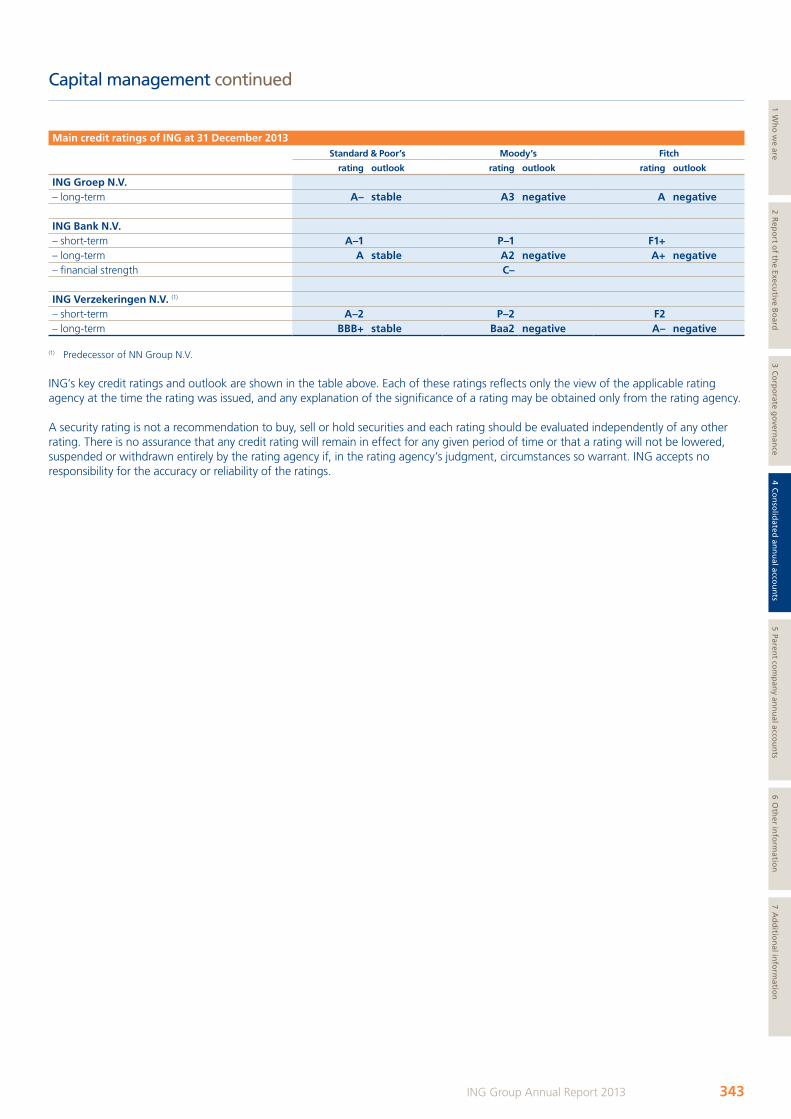
Capital management continued
Main credit ratings of ing at 31 December 2013 standard & poor’s Moody’s Fitch
rating outlook rating outlook rating outlook
ing groep n.V.– long-term a– stable a3 negative a negative
ing Bank n.V.– short-term a–1 p–1 F1+– long-term a stable a2 negative a+ negative– financial strength C–
ing Verzekeringen n.V. (1)
– short-term a–2 p–2 F2– long-term BBB+ stable Baa2 negative a– negative
(1) Predecessor of NN Group N.V.
ING’s key credit ratings and outlook are shown in the table above. Each of these ratings reflects only the view of the applicable rating agency at the time the rating was issued, and any explanation of the significance of a rating may be obtained only from the rating agency.
A security rating is not a recommendation to buy, sell or hold securities and each rating should be evaluated independently of any other rating. There is no assurance that any credit rating will remain in effect for any given period of time or that a rating will not be lowered, suspended or withdrawn entirely by the rating agency if, in the rating agency’s judgment, circumstances so warrant. ING accepts no responsibility for the accuracy or reliability of the ratings.
343ING Group Annual Report 2013
1 Wh
o w
e are2 R
epo
rt of th
e Executive B
oard
3 Co
rpo
rate go
vernan
ce4 C
on
solid
ated an
nu
al accou
nts
5 Parent co
mp
any an
nu
al accou
nts
6 Oth
er info
rmatio
n7 A
dd
ition
al info
rmatio
n
ING_2013_deel4c&d_v2.indd 343 19/03/2014 19:33:17
Capital management continued
autHoRisation oF annuaL aCCountsamsterdam, 17 March 2014
tHe supeRVisoRY BoaRD tHe eXeCutiVe BoaRDJ. (Jeroen) van der Veer, chairman R.A.J.G. (Ralph) Hamers, CEO and chairmanP.A.F.W. (Peter) Elverding, vice-chairman P.G. (Patrick) Flynn, CFOJ.P. (Tineke) Bahlmann W.F. (Wilfred) Nagel, CROH.W.(Henk) BreukinkI. (Isabel) Martín CastelláC.W. (Carin) GorterJ.H. (Jan) HolsboerJ.Ch.L. (Joost) KuiperH.J. (Hermann-Josef) LambertiR.W.P. (Robert) ReibesteinY.C.M.T. (Yvonne) van RooyL.A.C.P. (Luc) Vandewalle
344 ING Group Annual Report 2013
ING_2013_deel4c&d_v2.indd 344 19/03/2014 19:33:17
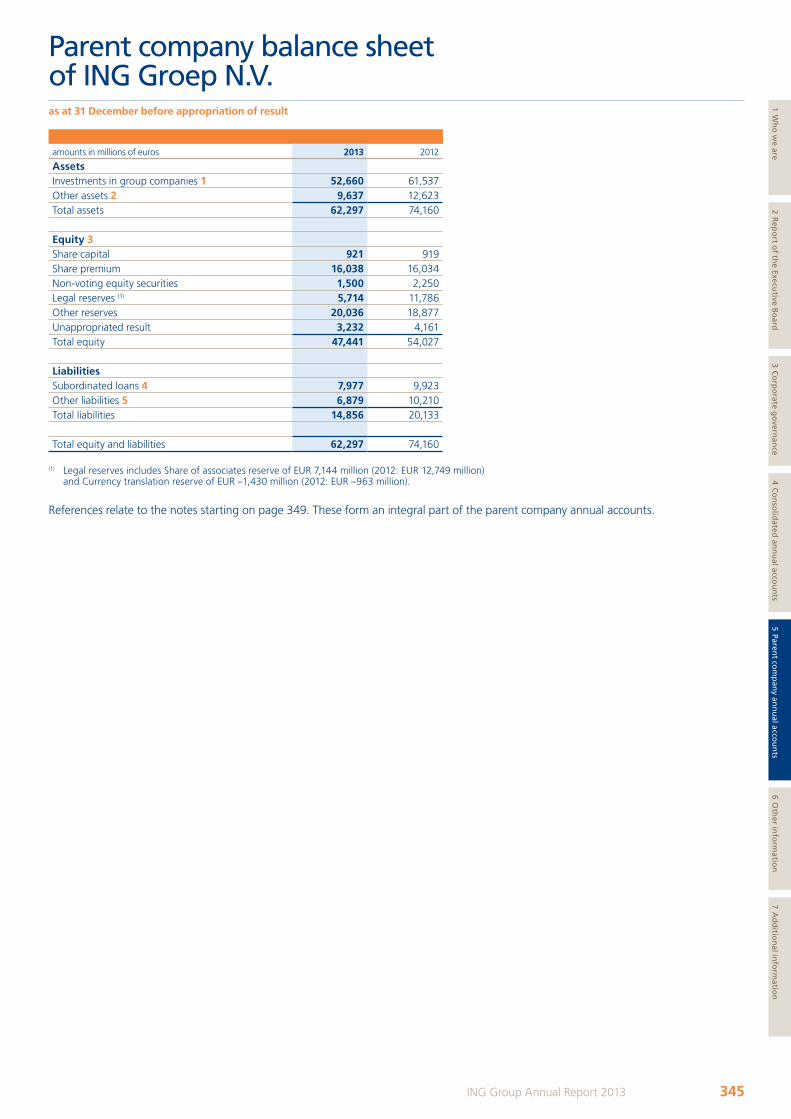
amounts in millions of euros 2013 2012
AssetsInvestments in group companies 1 52,660 61,537Other assets 2 9,637 12,623Total assets 62,297 74,160
Equity 3Share capital 921 919Share premium 16,038 16,034Non-voting equity securities 1,500 2,250Legal reserves (1) 5,714 11,786Other reserves 20,036 18,877Unappropriated result 3,232 4,161Total equity 47,441 54,027
LiabilitiesSubordinated loans 4 7,977 9,923Other liabilities 5 6,879 10,210Total liabilities 14,856 20,133
Total equity and liabilities 62,297 74,160
(1) Legal reserves includes Share of associates reserve of EUR 7,144 million (2012: EUR 12,749 million) and Currency translation reserve of EUR –1,430 million (2012: EUR –963 million).
References relate to the notes starting on page 349. These form an integral part of the parent company annual accounts.
Parent company balance sheet of ING Groep N.V.as at 31 December before appropriation of result
345ING Group Annual Report 2013
1 Wh
o w
e are2 R
epo
rt of th
e Executive B
oard
3 Co
rpo
rate go
vernan
ce4 C
on
solid
ated an
nu
al accou
nts
5 Parent co
mp
any an
nu
al accou
nts
6 Oth
er info
rmatio
n7 A
dd
ition
al info
rmatio
n
ING_2013_deel5_v1.indd 345 19/03/2014 19:45:11
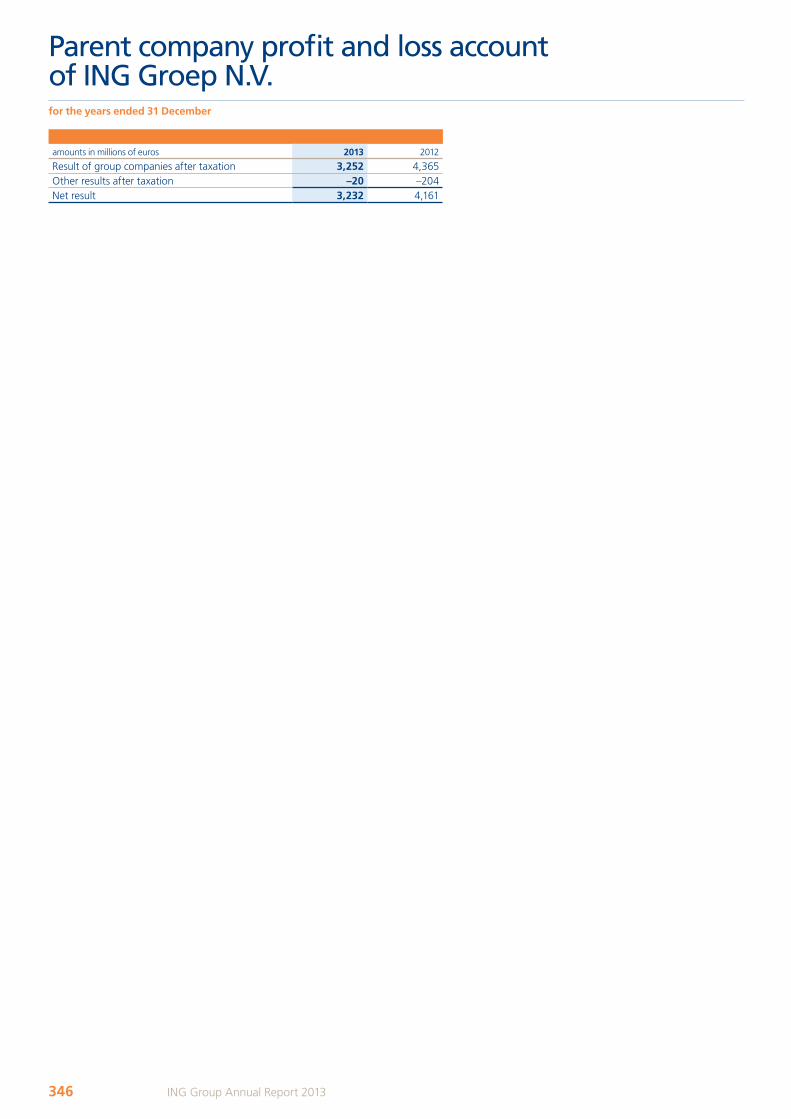
amounts in millions of euros 2013 2012
Result of group companies after taxation 3,252 4,365Other results after taxation –20 –204Net result 3,232 4,161
Parent company profit and loss account of ING Groep N.V.for the years ended 31 December
346 ING Group Annual Report 2013
ING_2013_deel5_v1.indd 346 19/03/2014 19:45:11
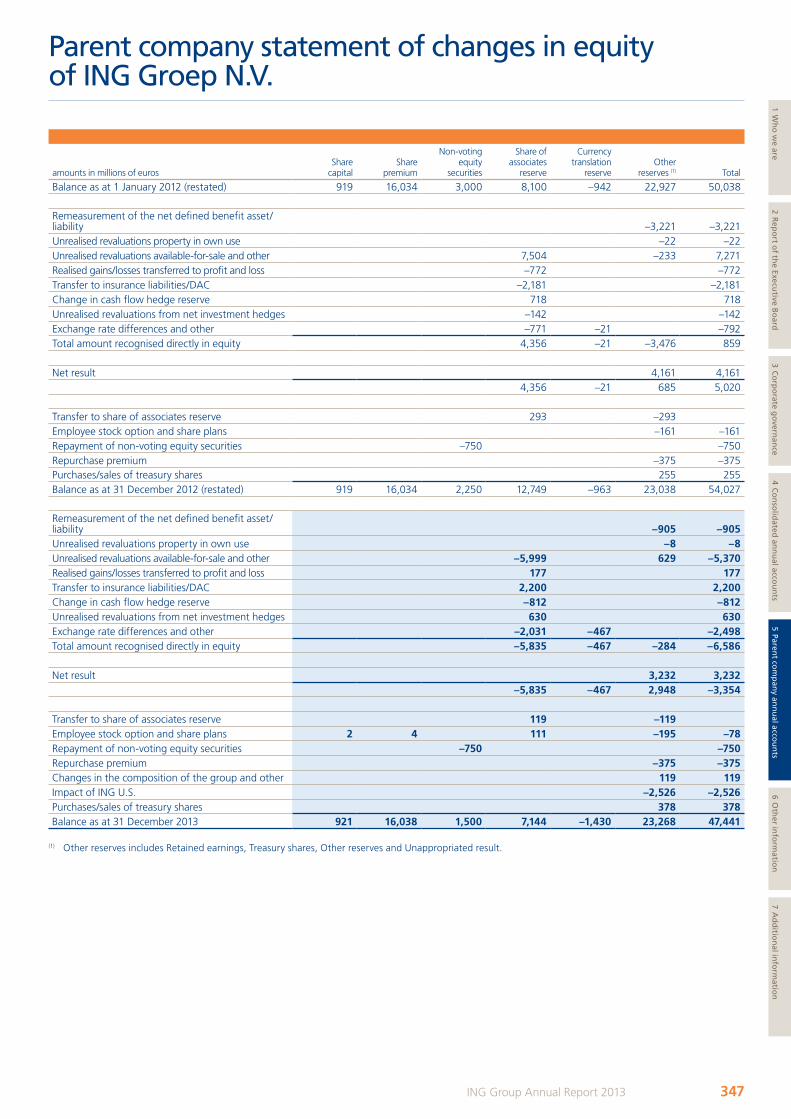
amounts in millions of eurosShare
capitalShare
premium
Non-voting equity
securities
Share of associates
reserve
Currency translation
reserveOther
reserves (1) Total
Balance as at 1 January 2012 (restated) 919 16,034 3,000 8,100 –942 22,927 50,038
Remeasurement of the net defined benefit asset/liability –3,221 –3,221Unrealised revaluations property in own use –22 –22Unrealised revaluations available-for-sale and other 7,504 –233 7,271Realised gains/losses transferred to profit and loss –772 –772Transfer to insurance liabilities/DAC –2,181 –2,181Change in cash flow hedge reserve 718 718Unrealised revaluations from net investment hedges –142 –142Exchange rate differences and other –771 –21 –792Total amount recognised directly in equity 4,356 –21 –3,476 859
Net result 4,161 4,161 4,356 –21 685 5,020
Transfer to share of associates reserve 293 –293 Employee stock option and share plans –161 –161Repayment of non-voting equity securities –750 –750Repurchase premium –375 –375Purchases/sales of treasury shares 255 255Balance as at 31 December 2012 (restated) 919 16,034 2,250 12,749 –963 23,038 54,027
Remeasurement of the net defined benefit asset/liability –905 –905Unrealised revaluations property in own use –8 –8 Unrealised revaluations available-for-sale and other –5,999 629 –5,370Realised gains/losses transferred to profit and loss 177 177Transfer to insurance liabilities/DAC 2,200 2,200Change in cash flow hedge reserve –812 –812Unrealised revaluations from net investment hedges 630 630Exchange rate differences and other –2,031 –467 –2,498Total amount recognised directly in equity –5,835 –467 –284 –6,586
Net result 3,232 3,232 –5,835 –467 2,948 –3,354
Transfer to share of associates reserve 119 –119Employee stock option and share plans 2 4 111 –195 –78Repayment of non-voting equity securities –750 –750Repurchase premium –375 –375Changes in the composition of the group and other 119 119 Impact of ING U.S. –2,526 –2,526Purchases/sales of treasury shares 378 378Balance as at 31 December 2013 921 16,038 1,500 7,144 –1,430 23,268 47,441
(1) Other reserves includes Retained earnings, Treasury shares, Other reserves and Unappropriated result.
Parent company statement of changes in equity of ING Groep N.V.
347ING Group Annual Report 2013
1 Wh
o w
e are2 R
epo
rt of th
e Executive B
oard
3 Co
rpo
rate go
vernan
ce4 C
on
solid
ated an
nu
al accou
nts
5 Parent co
mp
any an
nu
al accou
nts
6 Oth
er info
rmatio
n7 A
dd
ition
al info
rmatio
n
ING_2013_deel5_v1.indd 347 19/03/2014 19:45:12
BASIS OF PRESENTATIONThe parent company accounts of ING Groep N.V. are prepared in accordance with the financial reporting requirements included in Part 9 of Book 2 of the Dutch Civil Code. The accounting policies applicable to presentation and disclosures are in accordance with the financial reporting requirements included in Part 9 of Book 2 of the Dutch Civil Code. The principles of valuation and determination of results stated in connection with the consolidated balance sheet and profit and loss account are also applicable to the parent company balance sheet and profit and loss account with the exception of Investments in group companies and investments in associates which are recognised at net asset value with goodwill, if any, recorded under intangible assets.
The profit and loss account is drawn up in accordance with Section 402, Book 2 of the Dutch Civil Code.
A list containing the information referred to in Section 379 (1), Book 2 of the Dutch Civil Code has been filed with the office of the Commercial Register of Amsterdam, in accordance with Section 379 (5), Book 2 of the Dutch Civil Code.
Changes in balance sheet values due to changes in the Revaluation reserve of the associates are reflected in the Share of associates reserve, which forms part of Shareholders’ equity. Changes in balance sheet values due to the results of these associates, accounted for in accordance with ING Group accounting policies, are included in the profit and loss account. Other changes in the balance sheet value of these associates, other than those due to changes in share capital, are included in Share of associates reserve in Other reserves.
A legal reserve is carried at an amount equal to the share in the results of associates since their first inclusion at net asset value less the amount of profit distributions to which rights have accrued in the interim. Profit distributions which can be repatriated to the Netherlands without restriction are likewise deducted from the Share of associates reserve.
The comparative amounts for 2012 are restated for the change in accounting policy as disclosed in the section ‘Change in accounting policies in 2013’ in the Note 1 ‘Accounting policies’ of the consolidated annual accounts.
Accounting policies for the parent company annual accounts of ING Groep N.V.
348 ING Group Annual Report 2013
ING_2013_deel5_v1.indd 348 19/03/2014 19:45:12
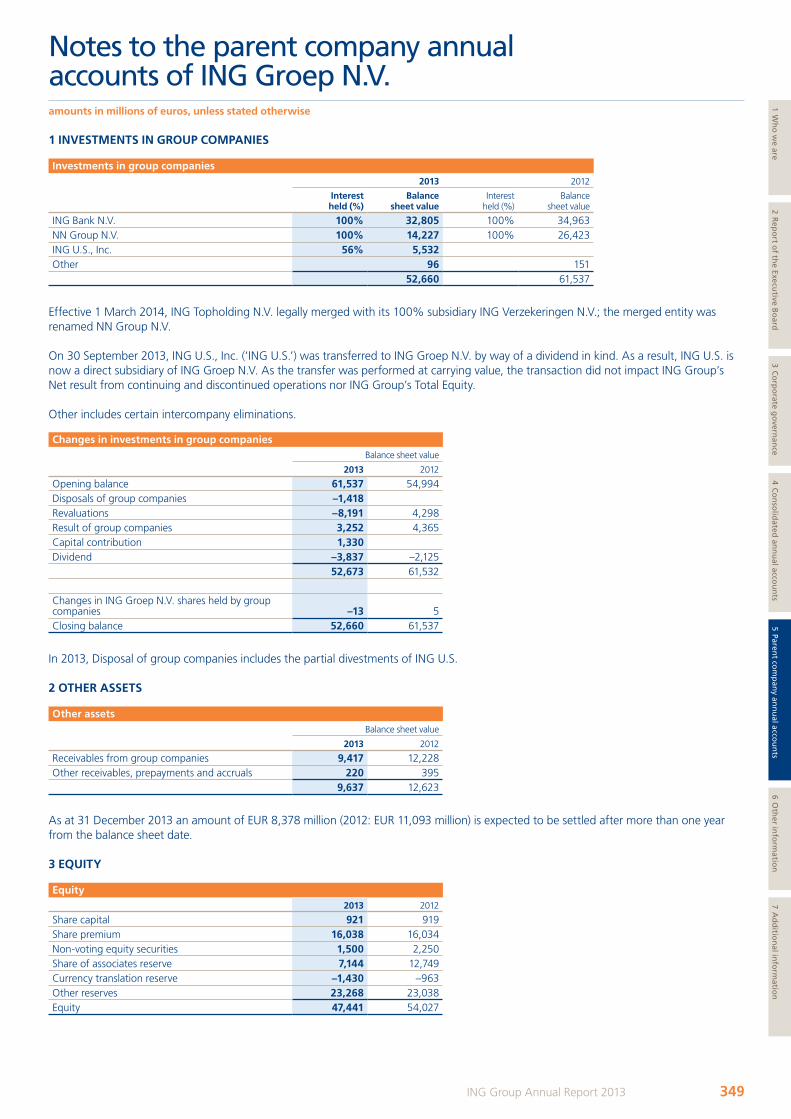
1 INVESTMENTS IN GROUP COMPANIES
Investments in group companies 2013 2012
Interest held (%)
Balance sheet value
Interest held (%)
Balance sheet value
ING Bank N.V. 100% 32,805 100% 34,963NN Group N.V. 100% 14,227 100% 26,423ING U.S., Inc. 56% 5,532Other 96 151
52,660 61,537
Effective 1 March 2014, ING Topholding N.V. legally merged with its 100% subsidiary ING Verzekeringen N.V.; the merged entity was renamed NN Group N.V.
On 30 September 2013, ING U.S., Inc. (‘ING U.S.’) was transferred to ING Groep N.V. by way of a dividend in kind. As a result, ING U.S. is now a direct subsidiary of ING Groep N.V. As the transfer was performed at carrying value, the transaction did not impact ING Group’s Net result from continuing and discontinued operations nor ING Group’s Total Equity.
Other includes certain intercompany eliminations.
Changes in investments in group companies Balance sheet value
2013 2012
Opening balance 61,537 54,994Disposals of group companies –1,418Revaluations –8,191 4,298Result of group companies 3,252 4,365Capital contribution 1,330Dividend –3,837 –2,125
52,673 61,532
Changes in ING Groep N.V. shares held by group companies –13 5Closing balance 52,660 61,537
In 2013, Disposal of group companies includes the partial divestments of ING U.S.
2 OTHER ASSETS
Other assetsBalance sheet value
2013 2012
Receivables from group companies 9,417 12,228Other receivables, prepayments and accruals 220 395
9,637 12,623
As at 31 December 2013 an amount of EUR 8,378 million (2012: EUR 11,093 million) is expected to be settled after more than one year from the balance sheet date.
3 EQUITY
Equity2013 2012
Share capital 921 919Share premium 16,038 16,034Non-voting equity securities 1,500 2,250Share of associates reserve 7,144 12,749Currency translation reserve –1,430 –963Other reserves 23,268 23,038Equity 47,441 54,027
Notes to the parent company annual accounts of ING Groep N.V.amounts in millions of euros, unless stated otherwise
349ING Group Annual Report 2013
1 Wh
o w
e are2 R
epo
rt of th
e Executive B
oard
3 Co
rpo
rate go
vernan
ce4 C
on
solid
ated an
nu
al accou
nts
5 Parent co
mp
any an
nu
al accou
nts
6 Oth
er info
rmatio
n7 A
dd
ition
al info
rmatio
n
ING_2013_deel5_v1.indd 349 19/03/2014 19:45:12
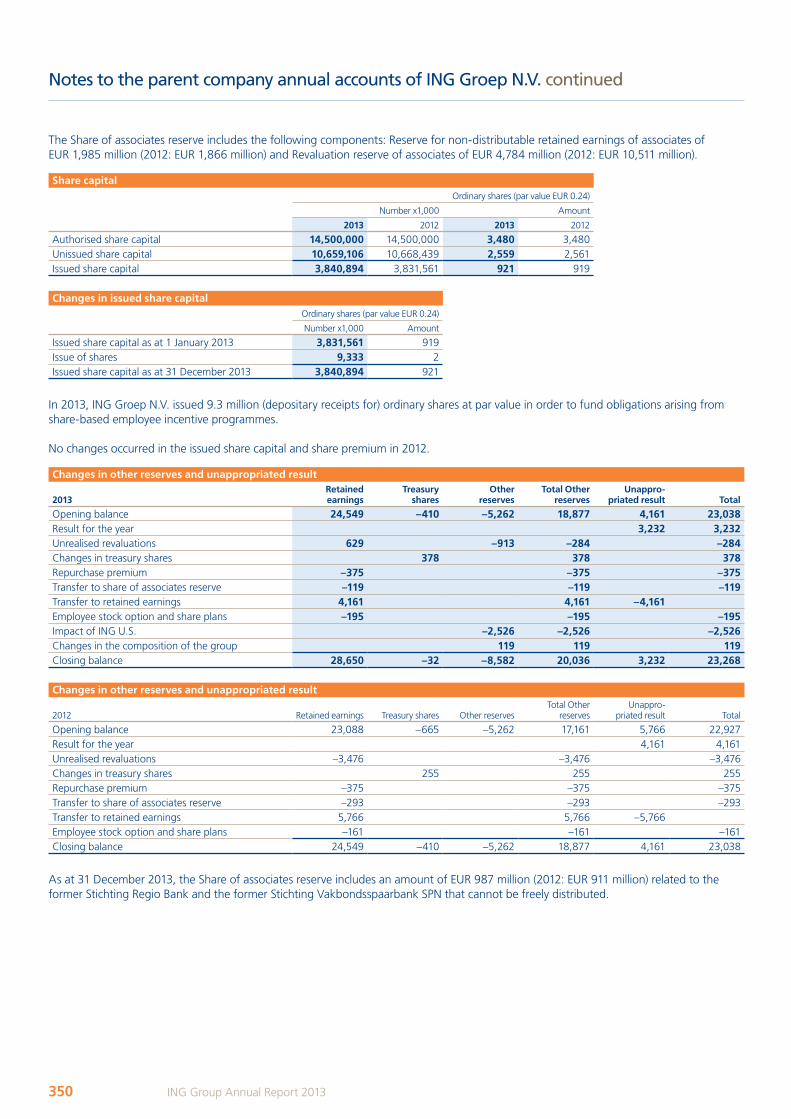
The Share of associates reserve includes the following components: Reserve for non-distributable retained earnings of associates of EUR 1,985 million (2012: EUR 1,866 million) and Revaluation reserve of associates of EUR 4,784 million (2012: EUR 10,511 million).
Share capitalOrdinary shares (par value EUR 0.24)
Number x1,000 Amount
2013 2012 2013 2012
Authorised share capital 14,500,000 14,500,000 3,480 3,480Unissued share capital 10,659,106 10,668,439 2,559 2,561Issued share capital 3,840,894 3,831,561 921 919
Changes in issued share capital Ordinary shares (par value EUR 0.24)
Number x1,000 Amount
Issued share capital as at 1 January 2013 3,831,561 919Issue of shares 9,333 2Issued share capital as at 31 December 2013 3,840,894 921
In 2013, ING Groep N.V. issued 9.3 million (depositary receipts for) ordinary shares at par value in order to fund obligations arising from share-based employee incentive programmes.
No changes occurred in the issued share capital and share premium in 2012.
Changes in other reserves and unappropriated result
2013Retained earnings
Treasury shares
Other reserves
Total Other reserves
Unappro-priated result Total
Opening balance 24,549 –410 –5,262 18,877 4,161 23,038Result for the year 3,232 3,232Unrealised revaluations 629 –913 –284 –284Changes in treasury shares 378 378 378Repurchase premium –375 –375 –375Transfer to share of associates reserve –119 –119 –119Transfer to retained earnings 4,161 4,161 –4,161 Employee stock option and share plans –195 –195 –195Impact of ING U.S. –2,526 –2,526 –2,526Changes in the composition of the group 119 119 119Closing balance 28,650 –32 –8,582 20,036 3,232 23,268
Changes in other reserves and unappropriated result
2012 Retained earnings Treasury shares Other reservesTotal Other
reservesUnappro-
priated result Total
Opening balance 23,088 –665 –5,262 17,161 5,766 22,927Result for the year 4,161 4,161Unrealised revaluations –3,476 –3,476 –3,476Changes in treasury shares 255 255 255Repurchase premium –375 –375 –375Transfer to share of associates reserve –293 –293 –293Transfer to retained earnings 5,766 5,766 –5,766 Employee stock option and share plans –161 –161 –161Closing balance 24,549 –410 –5,262 18,877 4,161 23,038
As at 31 December 2013, the Share of associates reserve includes an amount of EUR 987 million (2012: EUR 911 million) related to the former Stichting Regio Bank and the former Stichting Vakbondsspaarbank SPN that cannot be freely distributed.
Notes to the parent company annual accounts of ING Groep N.V. continued
350 ING Group Annual Report 2013
ING_2013_deel5_v1.indd 350 19/03/2014 19:45:13
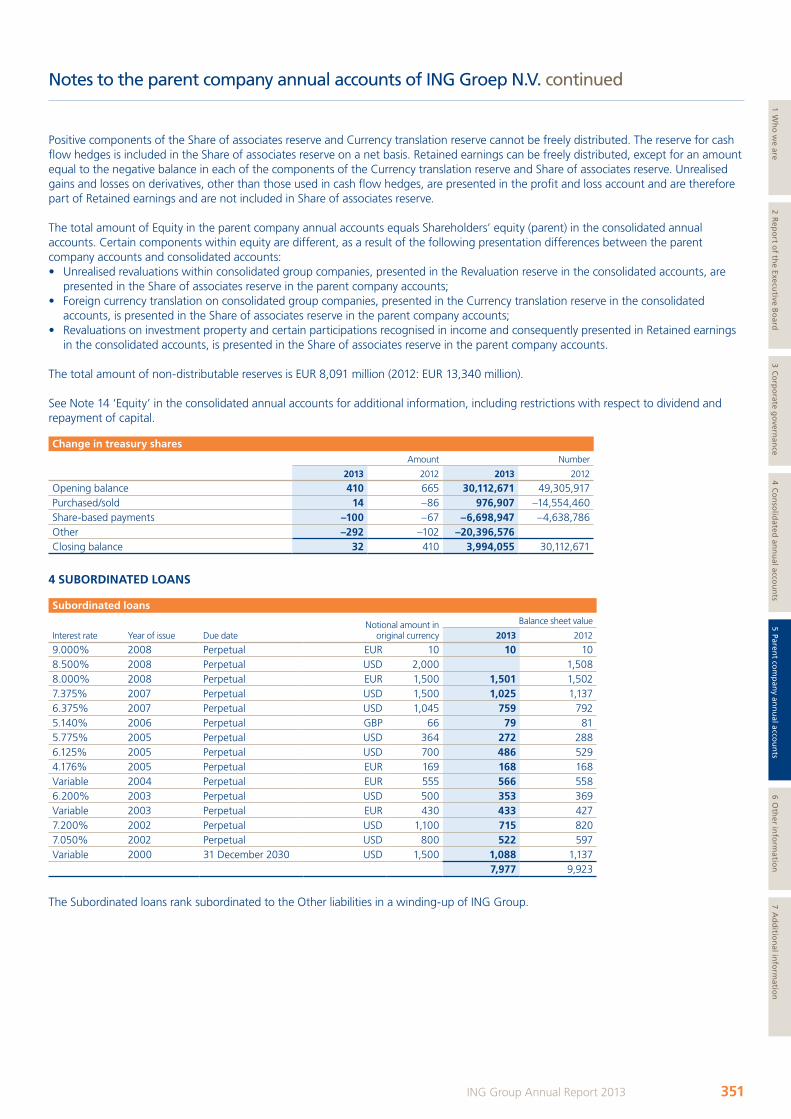
Positive components of the Share of associates reserve and Currency translation reserve cannot be freely distributed. The reserve for cash flow hedges is included in the Share of associates reserve on a net basis. Retained earnings can be freely distributed, except for an amount equal to the negative balance in each of the components of the Currency translation reserve and Share of associates reserve. Unrealised gains and losses on derivatives, other than those used in cash flow hedges, are presented in the profit and loss account and are therefore part of Retained earnings and are not included in Share of associates reserve.
The total amount of Equity in the parent company annual accounts equals Shareholders’ equity (parent) in the consolidated annual accounts. Certain components within equity are different, as a result of the following presentation differences between the parent company accounts and consolidated accounts:• Unrealised revaluations within consolidated group companies, presented in the Revaluation reserve in the consolidated accounts, are
presented in the Share of associates reserve in the parent company accounts;• Foreign currency translation on consolidated group companies, presented in the Currency translation reserve in the consolidated
accounts, is presented in the Share of associates reserve in the parent company accounts;• Revaluations on investment property and certain participations recognised in income and consequently presented in Retained earnings
in the consolidated accounts, is presented in the Share of associates reserve in the parent company accounts.
The total amount of non-distributable reserves is EUR 8,091 million (2012: EUR 13,340 million).
See Note 14 ‘Equity’ in the consolidated annual accounts for additional information, including restrictions with respect to dividend and repayment of capital.
Change in treasury sharesAmount Number
2013 2012 2013 2012
Opening balance 410 665 30,112,671 49,305,917Purchased/sold 14 –86 976,907 –14,554,460Share-based payments –100 –67 –6,698,947 –4,638,786Other –292 –102 –20,396,576 Closing balance 32 410 3,994,055 30,112,671
4 SUBORDINATED LOANS
Subordinated loans
Interest rate Year of issue Due dateNotional amount in
original currency
Balance sheet value
2013 2012
9.000% 2008 Perpetual EUR 10 10 108.500% 2008 Perpetual USD 2,000 1,5088.000% 2008 Perpetual EUR 1,500 1,501 1,5027.375% 2007 Perpetual USD 1,500 1,025 1,1376.375% 2007 Perpetual USD 1,045 759 7925.140% 2006 Perpetual GBP 66 79 815.775% 2005 Perpetual USD 364 272 2886.125% 2005 Perpetual USD 700 486 5294.176% 2005 Perpetual EUR 169 168 168Variable 2004 Perpetual EUR 555 566 5586.200% 2003 Perpetual USD 500 353 369Variable 2003 Perpetual EUR 430 433 4277.200% 2002 Perpetual USD 1,100 715 8207.050% 2002 Perpetual USD 800 522 597Variable 2000 31 December 2030 USD 1,500 1,088 1,137
7,977 9,923
The Subordinated loans rank subordinated to the Other liabilities in a winding-up of ING Group.
Notes to the parent company annual accounts of ING Groep N.V. continued
351ING Group Annual Report 2013
1 Wh
o w
e are2 R
epo
rt of th
e Executive B
oard
3 Co
rpo
rate go
vernan
ce4 C
on
solid
ated an
nu
al accou
nts
5 Parent co
mp
any an
nu
al accou
nts
6 Oth
er info
rmatio
n7 A
dd
ition
al info
rmatio
n
ING_2013_deel5_v1.indd 351 19/03/2014 19:45:13
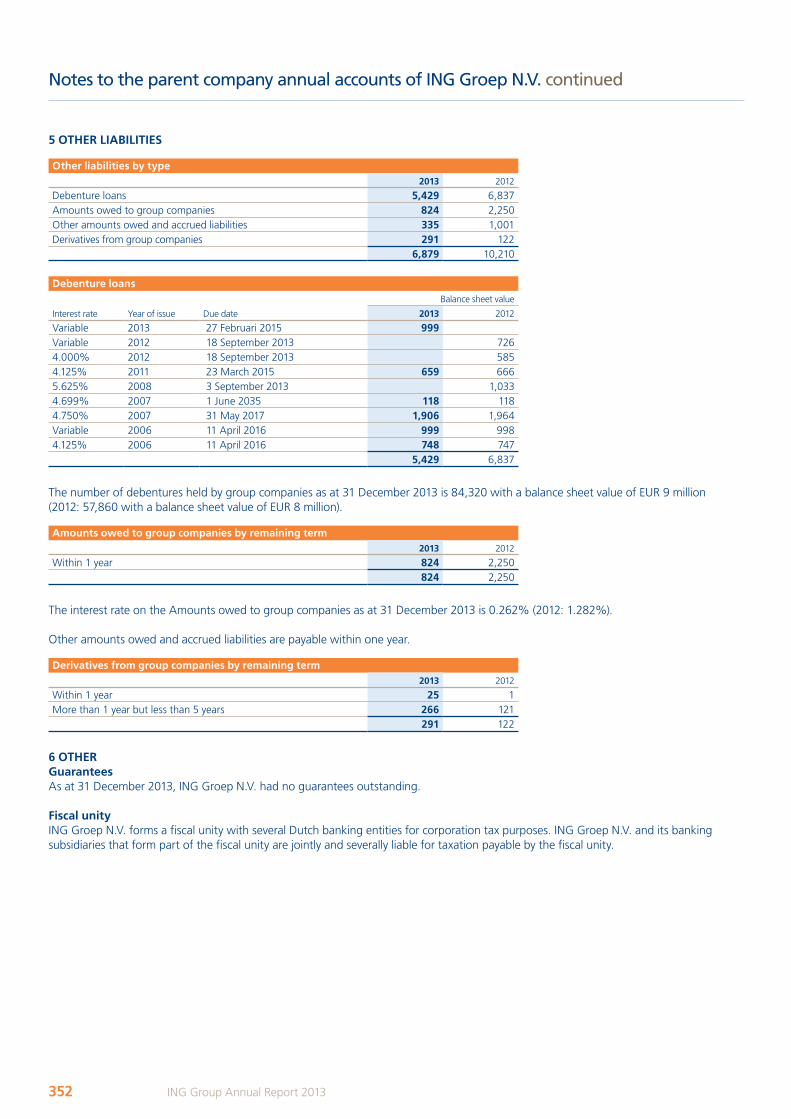
5 OTHER LIABILITIES
Other liabilities by type2013 2012
Debenture loans 5,429 6,837Amounts owed to group companies 824 2,250Other amounts owed and accrued liabilities 335 1,001Derivatives from group companies 291 122
6,879 10,210
Debenture loans
Interest rate Year of issue Due date
Balance sheet value
2013 2012
Variable 2013 27 Februari 2015 999Variable 2012 18 September 2013 7264.000% 2012 18 September 2013 5854.125% 2011 23 March 2015 659 6665.625% 2008 3 September 2013 1,0334.699% 2007 1 June 2035 118 1184.750% 2007 31 May 2017 1,906 1,964Variable 2006 11 April 2016 999 9984.125% 2006 11 April 2016 748 747
5,429 6,837
The number of debentures held by group companies as at 31 December 2013 is 84,320 with a balance sheet value of EUR 9 million (2012: 57,860 with a balance sheet value of EUR 8 million).
Amounts owed to group companies by remaining term2013 2012
Within 1 year 824 2,250824 2,250
The interest rate on the Amounts owed to group companies as at 31 December 2013 is 0.262% (2012: 1.282%).
Other amounts owed and accrued liabilities are payable within one year.
Derivatives from group companies by remaining term2013 2012
Within 1 year 25 1More than 1 year but less than 5 years 266 121
291 122
6 OTHER GuaranteesAs at 31 December 2013, ING Groep N.V. had no guarantees outstanding.
Fiscal unityING Groep N.V. forms a fiscal unity with several Dutch banking entities for corporation tax purposes. ING Groep N.V. and its banking subsidiaries that form part of the fiscal unity are jointly and severally liable for taxation payable by the fiscal unity.
Notes to the parent company annual accounts of ING Groep N.V. continued
352 ING Group Annual Report 2013
ING_2013_deel5_v1.indd 352 19/03/2014 19:45:13
REMUNERATION OF SENIOR MANAGEMENT, EXECUTIVE BOARD AND SUPERVISORY BOARDThe information on share-based payment plans and remuneration of the members of the Executive Board and the Supervisory Board is included in the Consolidated annual accounts (page 227 up to and including page 229).
AUTHORISATION OF PARENT COMPANY ANNUAL ACCOUNTSAmsterdam, 17 March 2014
THE SUPERVISORY BOARD THE EXECUTIVE BOARDJ. (Jeroen) van der Veer, chairman R.A.J.G. (Ralph) Hamers, CEO and chairmanP.A.F.W. (Peter) Elverding, vice-chairman P.G. (Patrick) Flynn, CFOJ.P. (Tineke) Bahlmann W.F. (Wilfred) Nagel, CROH.W.(Henk) BreukinkI. (Isabel) Martín CastelláC.W. (Carin) GorterJ.H. (Jan) HolsboerJ.Ch.L. (Joost) KuiperH.J. (Hermann-Josef) LambertiR.W.P. (Robert) ReibesteinY.C.M.T. (Yvonne) van RooyL.A.C.P. (Luc) Vandewalle
Notes to the parent company annual accounts of ING Groep N.V. continued
353ING Group Annual Report 2013
1 Wh
o w
e are2 R
epo
rt of th
e Executive B
oard
3 Co
rpo
rate go
vernan
ce4 C
on
solid
ated an
nu
al accou
nts
5 Parent co
mp
any an
nu
al accou
nts
6 Oth
er info
rmatio
n7 A
dd
ition
al info
rmatio
n
ING_2013_deel5_v1.indd 353 19/03/2014 19:45:13
To: the Shareholders, the Supervisory Board and the Executive Board of ING Groep N.V.
REPORT ON THE ANNUAL ACCOUNTSWe have audited the accompanying annual accounts 2013 of ING Groep N.V., Amsterdam (as set out on pages 90 to 353). The annual accounts include the consolidated annual accounts and the parent company annual accounts. The consolidated annual accounts comprise the consolidated balance sheet as at 31 December 2013, the profit and loss account, statement of comprehensive income, statement of cash flows and statement of changes in equity for the year then ended, and a summary of significant accounting policies and other explanatory notes. The parent company annual accounts comprise the parent company balance sheet as at 31 December 2013, the parent company profit and loss account for the year then ended and the notes, comprising a summary of significant accounting policies and other explanatory notes.
Management’s responsibilityManagement is responsible for the preparation and fair presentation of these annual accounts in accordance with International Financial Reporting Standards as adopted by the European Union and with Part 9 of Book 2 of the Dutch Civil Code, and for the preparation of the report of the Executive Board in accordance with Part 9 of Book 2 of the Dutch Civil Code. Furthermore management is responsible for such internal control as it determines is necessary to enable the preparation of the annual accounts that are free from material misstatement, whether due to fraud or error.
Auditor’s responsibilityOur responsibility is to express an opinion on these annual accounts based on our audit. We conducted our audit in accordance with Dutch law, including the Dutch Standards on Auditing, and the standards of the Public Company Accounting Oversight Board (United States). This requires that we comply with ethical requirements and plan and perform the audit to obtain reasonable assurance about whether the annual accounts are free from material misstatement.
An audit involves performing procedures to obtain audit evidence about the amounts and disclosures in the annual accounts. The procedures selected depend on the auditor’s judgment, including the assessment of the risks of material misstatement of the annual accounts, whether due to fraud or error.
In making those risk assessments, the auditor considers internal control relevant to the entity’s preparation and fair presentation of the annual accounts in order to design audit procedures that are appropriate in the circumstances. An audit also includes evaluating the appropriateness of accounting policies used and the reasonableness of accounting estimates made by management, as well as evaluating the overall presentation of the annual accounts.
We believe that the audit evidence we have obtained is sufficient and appropriate to provide a basis for our audit opinion.
Opinion with respect to the consolidated annual accountsIn our opinion, the consolidated annual accounts give a true and fair view of the financial position of ING Groep N.V. as at 31 December 2013 and of its result and its cash flows for the year then ended in accordance with International Financial Reporting Standards as adopted by the European Union and with Part 9 of Book 2 of the Dutch Civil Code.
Opinion with respect to the parent company annual accountsIn our opinion, the parent company annual accounts give a true and fair view of the financial position of ING Groep N.V. as at 31 December 2013 and of its result for the year then ended in accordance with Part 9 of Book 2 of the Dutch Civil Code.
REPORT ON OTHER LEGAL AND REGULATORY REQUIREMENTSPursuant to the legal requirement under Section 2:393 sub 5 at e and f of the Dutch Civil Code, we have no deficiencies to report as a result of our examination of whether the Report of the Executive Board, to the extent we can assess, has been prepared in accordance with Part 9 of Book 2 of this Code, and whether the information as required under Section 2:392 sub 1 at b-h has been annexed. Further we report that the Report of the Executive Board, to the extent we can assess, is consistent with the annual accounts as required by Section 2:391 sub 4 of the Dutch Civil Code.
Amsterdam, 17 March 2014
Ernst & Young Accountants LLP
signed by M.A. van Loo
Independent auditor’s report
354 ING Group Annual Report 2013
ING_2013_deel5_v1.indd 354 19/03/2014 19:45:14
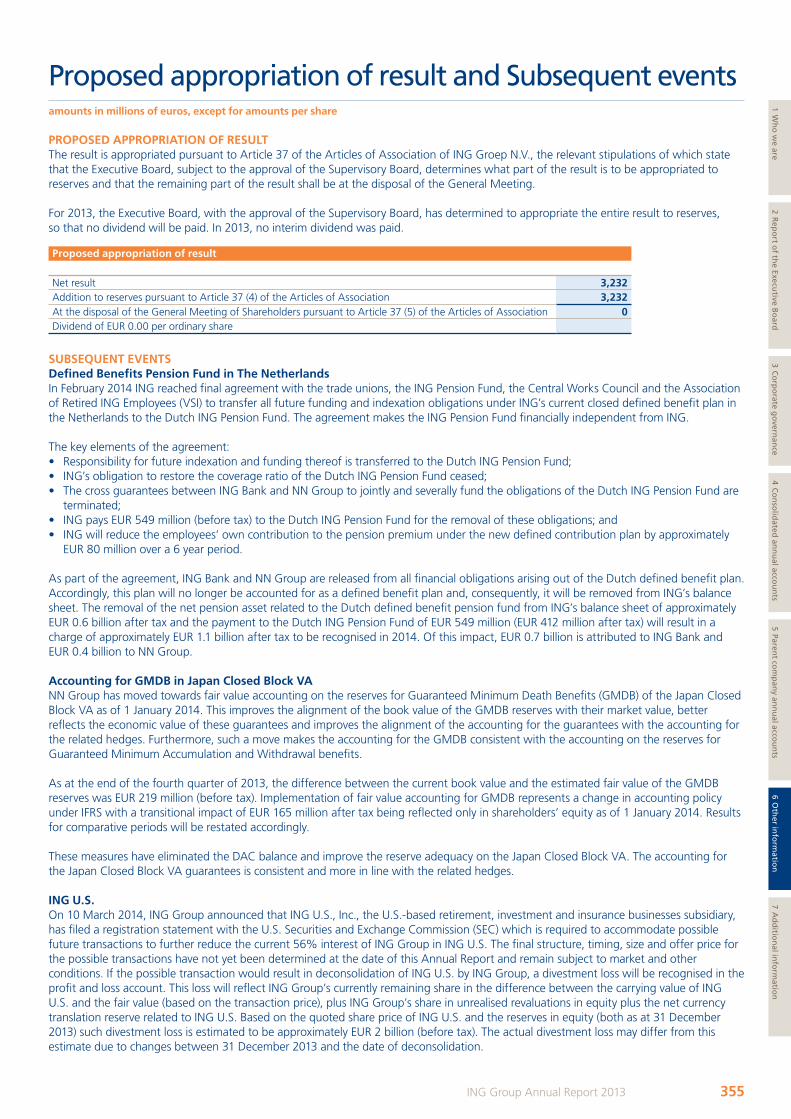
PROPOSED APPROPRIATION OF RESULTThe result is appropriated pursuant to Article 37 of the Articles of Association of ING Groep N.V., the relevant stipulations of which state that the Executive Board, subject to the approval of the Supervisory Board, determines what part of the result is to be appropriated to reserves and that the remaining part of the result shall be at the disposal of the General Meeting.
For 2013, the Executive Board, with the approval of the Supervisory Board, has determined to appropriate the entire result to reserves, so that no dividend will be paid. In 2013, no interim dividend was paid.
Proposed appropriation of result
Net result 3,232Addition to reserves pursuant to Article 37 (4) of the Articles of Association 3,232At the disposal of the General Meeting of Shareholders pursuant to Article 37 (5) of the Articles of Association 0 Dividend of EUR 0.00 per ordinary share
SUBSEQUENT EVENTSDefined Benefits Pension Fund in The NetherlandsIn February 2014 ING reached final agreement with the trade unions, the ING Pension Fund, the Central Works Council and the Association of Retired ING Employees (VSI) to transfer all future funding and indexation obligations under ING’s current closed defined benefit plan in the Netherlands to the Dutch ING Pension Fund. The agreement makes the ING Pension Fund financially independent from ING.
The key elements of the agreement:• Responsibility for future indexation and funding thereof is transferred to the Dutch ING Pension Fund; • ING’s obligation to restore the coverage ratio of the Dutch ING Pension Fund ceased; • The cross guarantees between ING Bank and NN Group to jointly and severally fund the obligations of the Dutch ING Pension Fund are
terminated; • ING pays EUR 549 million (before tax) to the Dutch ING Pension Fund for the removal of these obligations; and • ING will reduce the employees’ own contribution to the pension premium under the new defined contribution plan by approximately
EUR 80 million over a 6 year period.
As part of the agreement, ING Bank and NN Group are released from all financial obligations arising out of the Dutch defined benefit plan. Accordingly, this plan will no longer be accounted for as a defined benefit plan and, consequently, it will be removed from ING’s balance sheet. The removal of the net pension asset related to the Dutch defined benefit pension fund from ING’s balance sheet of approximately EUR 0.6 billion after tax and the payment to the Dutch ING Pension Fund of EUR 549 million (EUR 412 million after tax) will result in a charge of approximately EUR 1.1 billion after tax to be recognised in 2014. Of this impact, EUR 0.7 billion is attributed to ING Bank and EUR 0.4 billion to NN Group.
Accounting for GMDB in Japan Closed Block VANN Group has moved towards fair value accounting on the reserves for Guaranteed Minimum Death Benefits (GMDB) of the Japan Closed Block VA as of 1 January 2014. This improves the alignment of the book value of the GMDB reserves with their market value, better reflects the economic value of these guarantees and improves the alignment of the accounting for the guarantees with the accounting for the related hedges. Furthermore, such a move makes the accounting for the GMDB consistent with the accounting on the reserves for Guaranteed Minimum Accumulation and Withdrawal benefits.
As at the end of the fourth quarter of 2013, the difference between the current book value and the estimated fair value of the GMDB reserves was EUR 219 million (before tax). Implementation of fair value accounting for GMDB represents a change in accounting policy under IFRS with a transitional impact of EUR 165 million after tax being reflected only in shareholders’ equity as of 1 January 2014. Results for comparative periods will be restated accordingly.
These measures have eliminated the DAC balance and improve the reserve adequacy on the Japan Closed Block VA. The accounting for the Japan Closed Block VA guarantees is consistent and more in line with the related hedges.
ING U.S.On 10 March 2014, ING Group announced that ING U.S., Inc., the U.S.-based retirement, investment and insurance businesses subsidiary, has filed a registration statement with the U.S. Securities and Exchange Commission (SEC) which is required to accommodate possible future transactions to further reduce the current 56% interest of ING Group in ING U.S. The final structure, timing, size and offer price for the possible transactions have not yet been determined at the date of this Annual Report and remain subject to market and other conditions. If the possible transaction would result in deconsolidation of ING U.S. by ING Group, a divestment loss will be recognised in the profit and loss account. This loss will reflect ING Group’s currently remaining share in the difference between the carrying value of ING U.S. and the fair value (based on the transaction price), plus ING Group’s share in unrealised revaluations in equity plus the net currency translation reserve related to ING U.S. Based on the quoted share price of ING U.S. and the reserves in equity (both as at 31 December 2013) such divestment loss is estimated to be approximately EUR 2 billion (before tax). The actual divestment loss may differ from this estimate due to changes between 31 December 2013 and the date of deconsolidation.
Proposed appropriation of result and Subsequent eventsamounts in millions of euros, except for amounts per share
355ING Group Annual Report 2013
1 Wh
o w
e are2 R
epo
rt of th
e Executive B
oard
3 Co
rpo
rate go
vernan
ce4 C
on
solid
ated an
nu
al accou
nts
5 Parent co
mp
any an
nu
al accou
nts
6 Oth
er info
rmatio
n7 A
dd
ition
al info
rmatio
n
ING_2013_deel5_v1.indd 355 19/03/2014 19:45:14
Any of the risks described below could have a material adverse effect on the business activities, financial condition, results of operations and prospects of ING. The market price of ING shares could decline due to any of these risks, and investors could lose all or part of their investments. Additional risks of which the Company is not presently aware could also affect the business operations of ING and have a material adverse effect on ING’s business activities, financial condition, results of operations and prospects. In addition, the business of a multinational, broad-based financial services firm such as ING is inherently exposed to risks that only become apparent with the benefit of hindsight. The sequence in which the risk factors are presented below is not indicative of their likelihood of occurrence or the potential magnitude of their financial consequences.
RISKS RELATED TO FINANCIAL CONDITIONS, MARKET ENVIRONMENT AND GENERAL ECONOMIC TRENDS Because we are a financial services company conducting business on a global basis, our revenues and earnings are affected by the volatility and strength of the economic, business and capital markets environments specific to the geographic regions in which we conduct business. The ongoing turbulence and volatility of such factors have adversely affected, and may continue to adversely affect, the profitability and solvency of our insurance, banking and asset management business.Factors such as interest rates, securities prices, credit spreads, liquidity spreads, exchange rates, consumer spending, changes in client behaviour, business investment, real estate values and private equity valuations, government spending, inflation, the volatility and strength of the capital markets, political events and trends, and terrorism all impact the business and economic environment and, ultimately, our solvency, liquidity and the amount and profitability of business we conduct in a specific geographic region. In an economic downturn characterised by higher unemployment, lower family income, lower corporate earnings, higher corporate and private debt defaults, lower business investments and lower consumer spending, the demand for banking and insurance products is usually adversely affected and ING’s reserves and provisions typically would increase, resulting in overall lower earnings. Securities prices, real estate values and private equity valuations may also be adversely impacted, and any such losses would be realised through profit and loss and shareholders’ equity. Some insurance products contain minimum return or accumulation guarantees. If returns do not meet or exceed the guarantee levels, we may need to set up additional reserves to fund these future guaranteed benefits. In addition, we may experience an elevated incidence of claims and lapses or surrenders of policies. Our policyholders may choose to defer paying insurance premiums or stop paying insurance premiums altogether. Similarly, a downturn in the equity markets causes a reduction in commission income we earn from managing portfolios for third parties, income generated from our own proprietary portfolios, asset-based fee income on certain insurance products, and our capital base. We also offer a number of insurance and financial products that expose us to risks associated with fluctuations in interest rates, securities prices, corporate and private default rates, the value of real estate assets, exchange rates and credit spreads. See also ‘—Interest rate volatility and other interest rate changes may adversely affect our profitability’, ‘—Continued risk of resurgence of turbulence and ongoing volatility in the financial markets and the economy generally have adversely affected, and may continue to adversely affect, our business, financial condition and results of operations’, and ‘—Market conditions observed over the past few years may increase the risk of loans being impaired. We are exposed to declining property values on the collateral supporting residential and commercial real estate lending’ below.
In case one or more of the factors mentioned above adversely affects the profitability of our business, this might also result, among other things, in the following: • changes in the treatment of deferred acquisition costs (‘DAC’);• reserve inadequacies, which could ultimately be realised through profit and loss and shareholders’ equity;• the write-down of tax assets impacting net results and or equity;• impairment expenses related to goodwill and other intangible assets, impacting net results;• movements in risk weighted assets for the determination of required capital;• changes in credit valuation adjustments and debt valuation adjustments; and/or• additional costs related to maintenance of higher liquidity buffers.
Shareholders’ equity and our net result may be significantly impacted by turmoil and volatility in the worldwide financial markets. Negative developments in financial markets and/or economies may have a material adverse impact on shareholders’ equity and net result in future periods, including as a result of the potential consequences listed above. See ‘—Continued risk of resurgence of turbulence and ongoing volatility in the financial markets and the economy generally have adversely affected, and may continue to adversely affect, our business, financial condition and results of operations’ below.
Adverse capital and credit market conditions may impact our ability to access liquidity and capital, as well as the cost of liquidity, credit and capital. The capital and credit markets have continued to experience substantial volatility and disruption over the past few years, after having reached unprecedented levels in the second half of 2008 through most of 2010. Adverse capital market conditions may affect the availability and cost of borrowed funds, thereby impacting our ability to support and/or grow our businesses.
We need liquidity to pay our operating expenses, insurance claims, interest on our debt and dividends on our capital stock, maintain our securities lending activities and replace certain maturing liabilities. Without sufficient liquidity, we will be forced to curtail our operations and our business will suffer. The principal sources of our funding are deposit funds, insurance premiums, annuity considerations and cash flow from our investment portfolio and assets, consisting mainly of cash or assets that are readily convertible into cash. Sources of funding in normal markets may also include a variety of short- and long-term instruments, including repurchase agreements, commercial paper, medium- and long-term debt, subordinated debt securities, capital securities and stockholders’ equity.
Risk factors
356 ING Group Annual Report 2013
ING_2013_deel5_v1.indd 356 19/03/2014 19:45:14
In the event that our current resources do not satisfy our needs, we may need to seek additional financing. The availability of additional financing will depend on a variety of factors, such as market conditions, the general availability of credit, the volume of trading activities, the overall availability of credit to the financial services industry, our credit ratings and credit capacity, as well as the possibility that customers or lenders could develop a negative perception of our long- or short-term financial prospects. Similarly, our access to funds may be limited if regulatory authorities or rating agencies take negative actions against us. If our internal sources of liquidity prove to be insufficient, there is a risk that we may not be able to successfully obtain additional financing on favourable terms, or at all. Any actions we might take to access financing may, in turn, cause rating agencies to re-evaluate our ratings.
Disruptions, uncertainty or volatility in the capital and credit markets, including in relation to the ongoing European sovereign debt crisis, may also limit our access to capital. Such market conditions may in the future limit our ability to raise additional capital to support business growth, or to counterbalance the consequences of losses or increased regulatory capital and rating agency capital requirements. This could force us to (i) delay raising capital, (ii) reduce, cancel or postpone payment of dividends on our shares, (iii) reduce, cancel or postpone interest payments on our other securities, (iv) issue capital of different types or under different terms than we would otherwise, or (v) incur a higher cost of capital than in a more stable market environment. This would have the potential to decrease both our profitability and our financial flexibility. Our results of operations, financial condition, cash flows, regulatory capital and rating agency capital position could be materially adversely affected by disruptions in the financial markets.
In the course of 2008 and 2009, governments around the world, including the Dutch government, implemented unprecedented measures to provide assistance to financial institutions, in certain cases requiring (indirect) influence on or changes to governance and remuneration practices. In certain cases, governments nationalised companies or parts thereof. The measures adopted in the Netherlands include both emergency funding and capital reinforcement, and a Dutch Credit Guarantee Scheme. The liquidity and capital reinforcement measures expired on 10 October 2009, and the Credit Guarantee Scheme of the Netherlands expired on 31 December 2010. Our participation in certain of these measures has resulted in certain material restrictions on us, including those required by the European Commission (‘EC’) as part of our Restructuring Plan. See ‘Risks Related to the Restructuring Plan — The implementation of the Restructuring Plan and the divestments anticipated in connection with that plan will significantly alter the size and structure of the Group and involve significant costs and uncertainties that could materially impact the Group’. The Restructuring Plan, as well as any potential future transactions with the Dutch State or any other government, if any, or actions by such government regarding ING could adversely impact the position or rights of shareholders, bondholders, customers or creditors and our results, operations, solvency, liquidity and governance.
We are subject to the jurisdiction of a variety of banking and insurance regulatory bodies, some of which have proposed regulatory changes in recent years that, if implemented, would hinder our ability to manage our liquidity in a centralised manner. Furthermore, regulatory liquidity requirements in certain jurisdictions in which we operate are generally becoming more stringent, including those forming part of the ‘Basel III’ requirements discussed further below under ‘—We operate in highly regulated industries. Changes in laws and/or regulations governing financial services or financial institutions or the application of such laws and/or regulations governing our business may reduce our profitability’, undermining our efforts to maintain this centralised management of our liquidity. These developments may cause trapped pools of liquidity, resulting in inefficiencies in the cost of managing our liquidity, and hinder our efforts to integrate our balance sheet, which is an essential element of our Restructuring Plan.
The default of a major market participant could disrupt the markets. Within the financial services industry, the severe distress or default of any one institution (including sovereigns) could lead to defaults by, or the severe distress of, other market participants. Such distress of, or default by, an influential financial institution could disrupt securities markets or clearance and settlement systems and lead to a chain of defaults by other financial institutions because the commercial and financial soundness of many financial institutions may be closely related as a result of credit, trading, clearing or other relationships. Even the perceived lack of creditworthiness of a sovereign or financial institution (or a default by any such entity) may lead to market-wide liquidity problems and losses or defaults by us or by other institutions. This risk is sometimes referred to as ‘systemic risk’ and may adversely affect financial intermediaries, such as clearing agencies, clearing houses, banks, securities firms and exchanges with whom we interact on a daily basis and financial instruments of sovereigns in which we invest. Systemic risk could have a material adverse effect on our ability to raise new funding and on our business, financial condition, results of operations, liquidity and/or prospects. In addition, such distress or failure could impact future product sales as a potential result of reduced confidence in the financial services industry.
We may incur losses as a result of unforeseen and/or catastrophic events, which are inherently unpredictable, and the actual claim amount in our life and non-life insurance and reinsurance businesses may exceed our established reserves or we may experience an abrupt interruption of activities, each of which could result in lower net results and have an adverse effect on our financial condition and results of operations. In our life and non-life insurance and reinsurance businesses, we are subject to losses from natural and man-made catastrophic events. Such events include, without limitation, weather and other natural catastrophes such as hurricanes, floods, earthquakes and epidemics that may be more severe or difficult to predict as a result of variable climate conditions, as well as man-made disasters and core infrastructure failures such as acts of terrorism, military actions, power grid and telephone/Internet infrastructure failures and political and social unrest. The frequency and severity of such events, and the losses associated with them, are inherently unpredictable and cannot always be adequately reserved for. The occurrence of such events could create economic and financial disruptions and lead to operational difficulties that could impair our ability to manage our business and may adversely affect our assets under management (‘AUM’), results of
Risk factors continued
357ING Group Annual Report 2013
1 Wh
o w
e are2 R
epo
rt of th
e Executive B
oard
3 Co
rpo
rate go
vernan
ce4 C
on
solid
ated an
nu
al accou
nts
5 Parent co
mp
any an
nu
al accou
nts
6 Oth
er info
rmatio
n7 A
dd
ition
al info
rmatio
n
ING_2013_deel5_v1.indd 357 19/03/2014 19:45:14
operations and financial condition. Claims resulting from catastrophic events could also materially harm the financial condition of our reinsurers, which would increase the probability of default on reinsurance recoveries. Our ability to write new business could also be adversely affected.
In addition, we are subject to actuarial and underwriting risks such as mortality, longevity, morbidity, and adverse claims development which result from the pricing and acceptance of insurance contracts. In accordance with industry practices, modelling of natural catastrophes is performed and risk mitigation measures are taken. In case claims occur, reserves are established based on estimates using actuarial projection techniques. The process of estimating is based on information available at the time the reserves are originally established and includes updates when more information becomes available. Although we continually review the adequacy of the established claim reserves, there can be no assurance that our actual claim amount will not exceed our estimated claim reserves. If actual claim amounts exceed the estimated claim reserves, our earnings may be reduced and our financial condition and net results may be adversely affected.
There can be no assurance that our business continuation and crisis management plan or insurance coverage would be effective in mitigating any negative effects on operations or profitability in the event of a disaster, nor can we provide assurance that the business continuation and crisis management plans of the independent distributors and outside vendors on whom we rely for certain services and products would be effective in mitigating any negative effects on the provision of such services and products in the event of a disaster.
See below under ‘Risks Related to the Group’s Business, Operations, and Regulatory Environment — Operational risks, such as systems disruptions or failures, breaches of security, cyberattacks, human error, changes in operational practices or inadequate controls may adversely impact our business and reputation’ for more information on other operations risks we face.
We operate in highly regulated industries. Changes in laws and/or regulations governing financial services or financial institutions or the application of such laws and/or regulations governing our business may reduce our profitability. We are subject to detailed banking, insurance, asset management and other financial services laws and government regulation in the jurisdictions in which we conduct business. Regulatory agencies have broad administrative power over many aspects of our business, which may include liquidity, capital adequacy, permitted investments, ethical issues, money laundering, anti-terrorism measures, privacy, recordkeeping, product and sale suitability, marketing and sales practices, remuneration policies and our own internal governance practices. Also, regulators and other supervisory authorities in the European Union (‘EU’), the United States (‘U.S.’) and elsewhere continue to scrutinise payment processing and other transactions and activities of the financial services industry through laws and regulations governing such matters as money laundering, prohibited transactions with countries subject to sanctions, and bribery or other anti-corruption measures.
In light of current conditions in the global financial markets and the global economy, regulators around the world have increased their focus on the regulation of the financial services industry. Most of the principal markets where we conduct our business have adopted, or are currently in the implementation phase of, major legislative and/or regulatory initiatives in response to the financial crisis. Governmental and regulatory authorities in the Netherlands, the United Kingdom, the U.S. and elsewhere have implemented, or are in the process of implementing measures to increase regulatory control in their respective financial markets and financial services sectors, including, among others, in the areas of prudential rules, liquidity and capital requirements, executive compensation, crisis and contingency management, bank levies and financial reporting. Additionally, governmental and regulatory authorities in the Netherlands as well as in a multitude of jurisdictions where we conduct our business continue to consider new mechanisms to limit the occurrence and/or severity of future economic crises (including proposals to restrict the size of financial institutions operating in their jurisdictions and/or the scope of operations of such institutions).
Furthermore, we are subject to different tax regulations in each of the jurisdictions where we conduct business. Changes in tax laws could increase our taxes and our effective tax rates. Legislative changes could materially impact our tax receivables and liabilities as well as deferred tax assets and deferred tax liabilities, which could have a material adverse effect on our business, results of operations and financial condition. One such change relates to the current debate in the U.S. over corporate tax reform for multinational corporations and corporate tax rates. Changes in tax laws could also make certain ING products less attractive which could have adverse consequences for our businesses and results.
Compliance with applicable laws and regulations is time-consuming and personnel-intensive, and changes in laws and regulations may materially increase the cost of compliance and other expenses of doing business. We expect the scope and extent of regulation in the jurisdictions in which we conduct our business, as well as regulatory oversight and supervision, to generally continue to increase. However, we cannot predict whether or when future legislative or regulatory actions may be taken, or what impact, if any, actions taken to date or in the future could have on our business, results of operations and financial condition. Regulation is becoming increasingly more extensive and complex and the industries in which we operate are increasingly coming under the scrutiny of regulators, and affected companies, including ING, are required to meet the demands, which often necessitate additional resources. These regulations can limit our activities, among others, through stricter net capital, customer protection and market conduct requirements and restrictions on businesses in which we can operate or invest.
Despite our efforts to maintain effective compliance procedures and to comply with applicable laws and regulations, there are a number of risks in areas where applicable regulations may be unclear, subject to multiple interpretations or under development, or where
Risk factors continued
358 ING Group Annual Report 2013
ING_2013_deel5_v1.indd 358 19/03/2014 19:45:14
regulations may conflict with one another, or where regulators revise their previous guidance or courts overturn previous rulings, which could result in our failure to meet applicable standards. Regulators and other authorities have the power to bring administrative or judicial proceedings against us, which could result, among other things, in suspension or revocation of our licenses, cease and desist orders, fines, civil penalties, criminal penalties or other disciplinary action, which could materially harm our results of operations and financial condition. If we fail to address, or appear to fail to address, any of these matters appropriately, our reputation could be harmed and we could be subject to additional legal risk, which could, in turn, increase the size and number of claims and damages brought against us or subject us to enforcement actions, fines and penalties.
Basel III In December 2010, the Basel Committee on Banking Supervision (‘Basel Committee’) announced higher global minimum capital standards for banks and introduced a new global liquidity standard and a new leverage ratio. The Basel Committee’s package of reforms, collectively referred to as the ‘Basel III’ rules, will, among other requirements, increase the amount of common equity required to be held by subject banking institutions, prescribe the amount of liquid assets and the long-term funding a subject banking institution must hold at any given moment and limit leverage. Banks will be required to hold a ‘capital conservation buffer’ to withstand future periods of stress such that the total Tier 1 common equity ratio, when fully phased in on 1 January 2019, will rise to 7%. Basel III also introduced a ‘countercyclical buffer’ as an extension of the capital conservation buffer, which would allow national regulators to require banks to hold more capital during periods of high credit growth (to strengthen capital reserves and moderate the debt markets). Further, Basel III has strengthened the definition of capital that will have the effect of disqualifying many hybrid securities, including those issued by the Group, from inclusion in regulatory capital, as well as the higher capital requirements for trading, derivative and securitisation activities as part of a number of reforms to the Basel II framework. In addition, the Basel Committee and the Financial Stability Board (‘FSB’) published measures in October 2011 that would have the effect of requiring higher loss absorbency capacity, liquidity surcharges, exposure limits and special resolution regimes for, and instituting more intensive and effective supervision of, ‘systemically important financial institutions’ (‘SIFIs’) and so-called ‘Global’ SIFIs (‘G-SIFIs’), in addition to the Basel III requirements otherwise applicable to most financial institutions. The implementation of these measures began in 2012, and full implementation is targeted for 2019. ING Bank was designated by the Basel Committee and the FSB as one of the global systemically important banks (‘G-SIBs’), forming part of the G-SIFIs, in 2011, 2012 and 2013, and by the Dutch Central Bank (De Nederlandsche Bank N.V., ‘DNB’) and the Dutch Ministry of Finance as a domestic SIFI in November 2011. The Basel III proposals and their potential impact are monitored via semi-annual monitoring exercises in which ING Bank participates. As a result of such monitoring exercises and ongoing discussions within the regulatory environment, revisions have been made to the original Basel III proposals as was the case with the revised Liquidity Coverage Ratio in January 2013 and the revised Net Stable Funding Ratio and Leverage Ratio in January 2014. It remains to be seen whether further amendments to the 2010 framework and standards will be made by the Basel Committee in the coming years.
For European banks, the Basel III requirements will be implemented through the so-called Capital Requirements Regulation and Capital Requirements Directive IV (‘CRD IV Regulation’ and ‘CRD IV Directive’, respectively), which were adopted by the EC in June 2013 following approval by the European Parliament in April 2013. The CRD IV Regulation entered into force on 28 June 2013 and the CRD IV Directive on 17 July 2013, and all banks and investment firms in the EU (as opposed to the scope of the Basel III requirements, which apply to ‘internationally active banks’) are required to apply the new rules from 1 January 2014 in phases, with full implementation by 1 January 2019. While the full impact of these rules, and any additional requirements for SIFIs or G-SIFIs, if and as applicable to the Group, will depend on how the CRD IV Directive will be transposed into national laws in each Member State, including the extent to which national regulators and supervisors can set more stringent limits and additional capital requirements or surcharges, as well as on the economic and financial environment at the time of implementation and beyond, we expect these rules to have a material impact on ING’s operations and financial condition and they may require the Group to seek additional capital. Further, the International Accounting Standards Board (‘IASB’) has issued and proposed certain amendments to several IFRS standards during the course of 2012 and 2013, which changes include a package of amendments to the accounting requirements for financial instruments announced in November 2013, introducing a new hedge accounting model and allowing changes to address the so-called ‘own credit’ issue that were already included in IFRS 9 Financial Instruments that would replace IAS 39, the accounting standard heavily criticized in the wake of the financial crisis. Such changes could also have a material impact on our reported results and financial condition, as well as on how we manage our business, internal controls and disclosure.
Solvency II The European Council has agreed upon a full scale revision of the solvency framework and prudential regime applicable to insurance and reinsurance companies, known as ‘Solvency II’, which was adopted on 25 November 2009 (Directive 2009/138/EC). A key aspect of Solvency II is the closer alignment of the assessment of risks and capital requirements with economic capital methodologies. Under the Solvency II regime, insurance companies may be permitted to make use of an internal economic capital model as a basis for calculation of their capital needs and solvency position (in the Netherlands, such a model (including ING’s model) has to be approved by the DNB).
The final text of the Level I Framework Directive includes rules regarding, among other things, own funds, capital requirements, investments and group supervision. Following adoption of this Level I Framework Directive, the EC and European Insurance and Occupational Pensions Authority (‘EIOPA’), formerly CEIOPS, have initiated the development of detailed rules following the Lamfalussy process. Under this process, Directives related to financial institutions are developed on the basis of a four-level approach intended to complement the principles of the Level I Framework Directive. Level 2 measures will be issued by the EC (delegated acts and/or implementing technical standards proposed by EIOPA), and Level 3 guidance will be issued by EIOPA.
Risk factors continued
359ING Group Annual Report 2013
1 Wh
o w
e are2 R
epo
rt of th
e Executive B
oard
3 Co
rpo
rate go
vernan
ce4 C
on
solid
ated an
nu
al accou
nts
5 Parent co
mp
any an
nu
al accou
nts
6 Oth
er info
rmatio
n7 A
dd
ition
al info
rmatio
n
ING_2013_deel5_v1.indd 359 19/03/2014 19:45:14
Solvency II, if implemented, will effect a full revision of the insurance industry’s solvency framework and prudential regime and will impose group-level supervision mechanisms. On 14 November 2013, the EC announced that an agreement had been reached between the European Parliament, the EC and the European Council on the ‘Omnibus II Directive’, which, once adopted, will amend certain aspects of the original Solvency II Directive. Notably, the proposal for the Omnibus II Directive contains important provisions that would allow the insurance industry to continue offering long-term guaranteed products (typically life insurance policies being paid out in a lump sum when the policyholder reaches a certain age or in the form of annuities) and ensure that insurance companies in general and life assurance companies in particular can match these long-term liabilities with investments in long-term assets, such as infrastructure projects. The European Parliament and the EC further agreed that the new rules of Solvency II (including the amendments introduced by the Omnibus II Directive) should apply as of 1 January 2016. In addition, the EC is continuing to develop the detailed rules that will complement the high-level principles of the Solvency II Directive, referred to as ‘implementing measures’. The implementing measures are not currently expected to be finalised until the Omnibus II Directive has entered into force. There continues to be uncertainty regarding the timeline and final outcome of this process, and we are unable to predict precisely how the regulations resulting from such initiatives and proposals could affect the insurance industry generally or our results of operations, financial condition and liquidity in particular. Significant efforts towards establishing a more cohesive and streamlined European supervisory framework, including the establishment of the European Systemic Risk Board and the EIOPA, may also affect the Group’s operations.
Theoretical Solvency Criterion regulation in the Netherlands (also known as Solvency 1.5) In anticipation of the more risk-based approach under Solvency II, the Dutch legislator has, inter alia, subjected Dutch life insurance companies to the Theoretical Solvency Criterion (‘TSC’) (also known as Solvency 1.5), which reflects a minimum solvency margin required in certain stress scenarios. The TSC is calculated on an annual basis, and the scenario analysis is based on specific risks, including interest rate risk, equity risk, spread risk, property risk, longevity risk and mortality risk. The TSC applies to NN’s life insurance business in the Netherlands. If the solvency position of the relevant NN life insurance entity is below the TSC, DNB is entitled to require that a declaration of no objection be obtained from DNB before making any distributions of capital (including dividends) and reserves to the Company. In determining whether to give that approval, DNB must be satisfied that the life insurance company will have sufficient available regulatory capital for at least the following 12 months. Available regulatory capital is determined on a market-based basis under the Dutch Financial Supervision Act and is therefore subject to fluctuations. There is a risk that the entities that conduct NN’s life insurance business may not meet the TSC and that DNB may not permit those entities to distribute dividends or reserves to the Company. This could affect the Company’s ability to meet its obligations to its creditors. In addition, the TSC may make it more difficult for NN to attract capital than those of its peers that are not subject to such similar requirements under their local laws. DNB has used, and may use, its discretionary powers to give instructions on the application of the Company’s funds to strengthen the capital position of its Dutch regulated subsidiaries to levels above minimum regulatory capital requirements, which has affected, and will affect, the ability of the Company to meet its obligations to its creditors. The TSC is also relatively new legislation and there is uncertainty as to how it will be interpreted and implemented by DNB, with the risk that DNB interprets and implements the requirements in a manner that is more onerous for NN Group than NN Group currently anticipates.
EU Insurance Guarantee Scheme In July 2010, the EC released a white paper detailing the need to establish minimum levels of protection for consumers of life and non-life insurance products in the event that insurance companies in the EU with which they do business were to become insolvent. Though the mechanisms for providing any such protections remain under review by the EC, the European Parliament and the Member States, the EC may currently be considering providing this protection by (i) mandating the creation of (or harmonisation of existing) national-level insurance guarantee schemes and/or (ii) implementing an EU-wide insurance guarantee scheme, which such scheme(s) may require significant prefunding by insurance companies. As of 31 December 2013, no legislative proposal has been made at the EU level. However, the implementation of an insurance guarantee scheme requiring significant levels of prefunding (or, in the event that prefunding is not required, the occurrence of circumstances requiring the commencement of event-driven contributions) may have a material and adverse impact on the liquidity, financial condition and operations of companies engaged in the insurance business, including us.
Single Supervisory MechanismIn October 2013, the European Council adopted a single supervisory mechanism (‘SSM’), to be composed of national competent authorities and the European Central Bank (‘ECB’), as part of the prospective EU banking union. In the SSM, a significant part of the prudential regulatory powers will be transferred from national authorities of the participating Member States to the ECB and that the ECB will assume direct responsibility for a significant part of the prudential supervision of ING Bank and its holding company, ING Group. On 23 October 2013, the ECB announced details of a comprehensive assessment of large banks to be conducted in cooperation with national supervisory authorities of Member States participating in the SSM. The assessment, which consists of a risk assessment, an asset quality review and a stress test, started in November 2013 and is expected to be conducted over a twelve-month period in preparation of the ECB assuming full responsibility for supervision as part of the SSM in November 2014. ING Bank is among the seven Dutch institutions to be covered by the assessment (out of more than 120 institutions overall). The SSM will create a new system of financial supervision for countries within the Eurozone, with the possibility of non-Eurozone Member States participating by means of close cooperation. While it is at this stage difficult to identify what exact impact the SSM will have on ING Bank and ING Group, it is expected that the SSM will have a significant impact on the way ING’s banking operations are supervised in Europe.
Dodd-Frank Act On 21 July 2010, the Dodd-Frank Wall Street Reform and Consumer Protection Act (‘Dodd-Frank’ or ‘Dodd-Frank Act’) was signed into law in the U.S. The Dodd-Frank Act effects comprehensive changes to the regulation of financial services in the U.S. and has implications
Risk factors continued
360 ING Group Annual Report 2013
ING_2013_deel5_v1.indd 360 19/03/2014 19:45:15
for non-U.S. financial institutions with a U.S. presence, such as ING. Dodd-Frank directs existing and newly created government agencies and bodies to perform studies and promulgate a multitude of regulations implementing the law, a process that is underway and is expected to continue over the next few years. While some studies have already been completed and the rulemaking process is well underway, there continues to be significant uncertainty regarding the results of ongoing studies and the ultimate requirements of regulations that have not yet been adopted. We cannot predict with certainty how Dodd-Frank and such regulations will affect the financial markets generally and impact the Group’s business, credit or financial strength ratings, results of operations, cash flows or financial condition or liquidity. Key aspects of Dodd-Frank that we have identified to date as possibly having an impact on the Group include: • Title VII of Dodd-Frank creates a new framework for regulation of the over-the-counter derivatives markets and certain market
participants which could affect various activities of the Group and its subsidiaries. New margin and capital requirements for market participants that will be contained in final regulations to be adopted by the SEC and U.S. Commodity Futures Trading Commission (‘CFTC’) could substantially increase the cost of hedging and related operations, affect the profitability of our products or their attractiveness to our customers, or cause us to alter our hedging strategy or change the composition of risks that we do not hedge. In addition, new position limits requirements for market participants that may be contained in final regulations to be adopted by the CFTC could limit the scope of hedging activity that is permitted for commercial end users, limiting their ability to utilize certain of our products, and could also limit the scope of our ability to provide derivatives products for our non-end user customers.
• Pursuant to requirements of the Dodd-Frank Act, the SEC and CFTC are currently considering whether stable value contracts should be regulated as ‘swap’ derivative contracts. In the event that stable value contracts become subject to such regulation, certain aspects of our business could be adversely impacted, including issuance of stable value contracts and management of assets pursuant to stable value mandates.
• Dodd-Frank established the Federal Insurance Office (‘FIO’) within the U.S. Department of the Treasury (‘Treasury Department’) to be headed by a director appointed by the Secretary of the Treasury Department. While not having a general supervisory or regulatory authority over the business of insurance, the director of this office would perform various functions with respect to insurance, including participating in the FSOC’s decisions regarding insurers (potentially including the Group and its subsidiaries) to be designated for stricter regulation by the Federal Reserve. The FIO may recommend enhanced regulations to states.
• Dodd-Frank also established the Consumer Financial Protection Bureau (‘CFPB’) as an independent agency within the Federal Reserve to regulate consumer financial products and services offered primarily for personal, family or household purposes. The CFPB will have significant authority to implement and enforce federal consumer financial laws, including the new protections established under Dodd-Frank, as well as the authority to identify and prohibit unfair and deceptive acts and practices. In addition, the CFPB will have broad supervisory, examination and enforcement authority over certain consumer products, such as mortgage lending. Insurance products and services are not within the CFPB’s general jurisdiction, and broker-dealers and investment advisers are not subject to the CFPB’s jurisdiction when acting in their registered capacity.
• On December 10, 2013, various federal agencies approved a final rule implementing Section 619 of Dodd-Frank, commonly referred to as the ‘Volcker Rule’ and which places limitations and restrictions on the ability of U.S. FDIC insured depository institutions and non-U.S. banks with branches or agencies in the U.S. that become subject to the U.S. Bank Holding Company Act, as well as their affiliates, to engage in certain proprietary trading or sponsor and invest in private equity and hedge funds. Such organisations will have until 21 July 2015 to comply fully with most requirements of the Volcker Rule, with an important exception for organisations with significant trading activities, which will be required to report information on their trading activities beginning in July 2014. In the event that we or one of our affiliates becomes subject to the Volcker Rule, our investment activities could be so restricted. It is expected that we will experience significant additional compliance and operational costs and may be prohibited from engaging in certain activities we currently conduct if the Volcker Rule becomes applicable to us and our affiliates. For instance, ING Group’s wholly owned subsidiary, ING Bank, may from time to time consider whether to establish a branch office in the U.S. If ING Bank were to establish a U.S. branch, we would be subject to supervision and regulation by the Federal Reserve under various laws and various restrictions on our activities under those laws, including the Bank Holding Company Act of 1956, as amended, and the International Banking Act of 1978, and, as a consequence, such supervision and regulation, including such restrictions on activities could materially impact our operations. These would include, among others, the Volcker Rule and heightened supervisory requirements and prudential standards.
• Dodd-Frank also includes various securities law reforms that may affect the Group’s business practices and the liabilities and/or exposures associated therewith, including a provision intended to authorise the SEC to impose on broker-dealers fiduciary duties to their customers, as applies to investment advisers under existing law, which new standard could potentially expose certain of ING’s U.S. broker-dealers to increased risk of SEC enforcement actions and liability. In 2011, the SEC staff released a study on this issue, and members of the SEC’s Investor Advisory Committee voted in November 2013 to recommend the proposal implementing a uniform fiduciary standard for most brokers and registered investment advisers to the SEC.
Although the full impact of Dodd-Frank cannot be determined until the various studies mandated by the law are conducted and regulations are adopted and implemented, many of the legislation’s requirements could have profound and/or adverse consequences for the financial services industry, including for us. Dodd-Frank could make it more expensive for us to conduct business, require us to make changes to our business model or satisfy increased capital requirements, subject us to greater regulatory scrutiny or to potential increases in whistleblower claims in light of the increased awards available to whistleblowers under Dodd-Frank and have a material effect on our results of operations or financial condition.
Risk factors continued
361ING Group Annual Report 2013
1 Wh
o w
e are2 R
epo
rt of th
e Executive B
oard
3 Co
rpo
rate go
vernan
ce4 C
on
solid
ated an
nu
al accou
nts
5 Parent co
mp
any an
nu
al accou
nts
6 Oth
er info
rmatio
n7 A
dd
ition
al info
rmatio
n
ING_2013_deel5_v1.indd 361 19/03/2014 19:45:15
Foreign Account Tax Compliance Act Under the Foreign Account Tax Compliance Act (‘FATCA’), U.S. federal tax legislation passed in 2010, a 30% withholding tax will be imposed on ‘withholdable payments’ made to non-U.S. financial institutions (including non-U.S. investment funds and certain other non-U.S. financial entities) that fail (or, in some cases, that have 50% affiliates which are also non-U.S. financial institutions that fail) to provide certain information regarding their U.S. accountholders and/or certain U.S. investors (such U.S. accountholders and U.S. investors, ‘U.S. accountholders’) to the U.S. Internal Revenue Service (‘IRS’). For non-U.S. financial institutions that fail to comply, this withholding will generally apply without regard to whether the beneficial owner of a withholdable payment is a U.S. person or would otherwise be entitled to an exemption from U.S. federal withholding tax. ‘Withholdable payments’ generally include, among other items, payments of U.S.-source interest and dividends and the gross proceeds from the sale or other disposition of property that may produce U.S.-source interest and dividends. Furthermore, FATCA may also impose withholding on non-U.S. source payments by non-U.S. financial institutions that comply with FATCA to non-U.S. financial institutions that fail to comply with FATCA. This withholding will take effect on a ‘phased’ schedule, starting in July 2014 with withholding on non-U.S. source payments by non-U.S. financial institutions to start no earlier than January 2017. In general, non-publicly traded debt and equity interests in investment vehicles will be treated as ‘accounts’ and subject to these reporting requirements. In addition, certain insurance policies and annuities are considered accounts for these purposes.
Some countries, including the Netherlands, have entered into, and other countries are expected to enter into, agreements (‘intergovernmental agreements’ or ‘IGAs’) with the United States to facilitate the type of information reporting required under FATCA. While the existence of IGAs will not eliminate the risk of the withholding described above, these agreements are expected to reduce that risk for financial institutions and investors in countries that have entered into IGAs. IGAs will often require financial institutions in those countries to report some information on their U.S. accountholders to the taxing authorities of those countries, who will then pass the information to the IRS.
The Group closely monitors all present and new legislation that is or will be applicable for its organisation, and is currently investigating all implications of FATCA and legislation of countries that have entered into IGAs. While investigating these implications, the Group is and will be in close contact with all of its stakeholders, including its peers and financial industry representative organisations.
The Group intends to take all necessary steps to comply with FATCA (including entering into such agreements with the U.S. tax authorities as may be required), in accordance with the time frame set by the U.S. tax authorities. However, if the Group cannot enter into such agreements or satisfy the requirements thereunder (including as a result of local laws in non-IGA countries prohibiting information-sharing with the IRS, as a result of contracts or local laws prohibiting withholding on certain payments to accountholders, policyholders, annuitants or other investors, or as a result of the failure of accountholders, policyholders, annuitants or other investors to provide requested information), certain payments to the Group may be subject to withholding under FATCA. The possibility of such withholding and the need for accountholders, policyholders, annuitants and investors to provide certain information may adversely affect the sales of certain of the Group’s products. In addition, entering into agreements with the IRS and compliance with the terms of such agreements and with FATCA any regulations or other guidance promulgated thereunder or any legislation promulgated under an IGA may substantially increase the Group’s compliance costs. Because legislation and regulations implementing FATCA and the IGAs remain under development, the future impact of this law on the Group is uncertain.
Bank Recovery and Resolution Regimes In June 2012, the ‘Intervention Act’ (Wet bijzondere maatregelen financiële ondernemingen) came into force in the Netherlands, with retroactive effect from 20 January 2012. The Intervention Act mainly amends the Dutch Financial Supervision Act and the Dutch Insolvency Act and allows Dutch authorities to take certain actions when banks and insurers fail and cannot be wound up under ordinary insolvency rules due to concerns regarding the stability of the overall financial system. It is composed of two categories of measures. The first category of measures can be applied if a bank or insurer experiences serious financial problems and includes measures related to the timely and efficient liquidation of failing banks and insurers. This set gives the DNB the power to transfer customer deposits (only in the case of banks), assets and/or liabilities other than deposits and issued shares of an entity to third parties or to a bridge bank if the DNB deems that, in respect of the relevant bank or insurance company, there are signs of an adverse development with respect to its funds, solvency, liquidity or technical provisions and it can be reasonably foreseen that such development will not be sufficiently or timely reversed. The DNB was also granted the power to influence the internal decision-making of failing institutions through the appointment of an ‘undisclosed administrator’. The second category of measures can be applied if the stability of the financial system is in serious and immediate danger as a result of the situation of a Dutch financial institution and includes measures intended to safeguard the stability of the financial system as a whole. This set of measures grants the authority to the Minister of Finance to take immediate measures or proceed to expropriation of assets of or shares in the capital of failing financial institutions. For example, on 1 February 2013, the Dutch State nationalised the SNS Reaal bank and insurance group (‘SNS Reaal’) by expropriating shares, Core Tier 1 securities and other subordinated debts issued by SNS Reaal. The Dutch Ministry of Finance has stated that it will impose in 2014 an aggregate EUR 1 billion one-time levy on Dutch banks, including ING Bank, to share the costs of the SNS Reaal nationalisation. This resulted in a charge of EUR 304 million for ING Bank, to be paid in the first three quarters of 2014.
The Intervention Act also includes measures that limit the ability of counterparties to exercise their rights after any of the measures mentioned above has been put into place, with certain exceptions. Within the context of the resolution tools provided in the Intervention Act, holders of debt securities of a bank subject to resolution could also be affected by issuer substitution or replacement, transfer of debt, expropriation, modification of terms and/or suspension or termination of listings.
Risk factors continued
362 ING Group Annual Report 2013
ING_2013_deel5_v1.indd 362 19/03/2014 19:45:15
The Intervention Act will need to be amended following the implementation of the ‘Recovery and Resolution Directive’. This is a draft legislative proposal aimed at harmonising national rules on bank recovery and resolution and on which the European Council and the European Parliament reached a political agreement in December 2013. The Recovery and Resolution Directive includes, among other things, the obligation for institutions to draw up a recovery plan and the obligation for resolution authorities in the Member States to draw up a resolution plan, the resolution authorities’ power to take early intervention measures and the establishment of a European system of financing arrangements. The Recovery and Resolution Directive confers extensive resolution powers to the resolution authorities, including the power to require the sale of (part of a) business, to establish a bridge institution, to separate assets and to take bail-in measures. The draft Recovery and Resolution Directive will need to be formally adopted by the European Council and the European Parliament and is expected to enter into force on 1 January 2015. The stated aim of the Recovery and Resolution Directive is to provide supervisory authorities, including the relevant Dutch resolution authority, with common tools and powers to address banking crises pre-emptively in order to safeguard financial stability and minimise taxpayers’ exposure to losses.
Among the powers proposed to be granted to supervisory authorities under the Recovery and Resolution Directive include, among others, the introduction of a statutory ‘write-down and conversion’ power and a ‘bail-in’ power, which would give the relevant Dutch resolution authority the power to (i) cancel existing shares and/or dilute existing shareholders by converting relevant capital instruments or eligible liabilities into shares of the surviving entity and (ii) cancel all or a portion of the principal amount of, or interest on, certain unsecured liabilities (which could include certain securities that have been or will be issued by ING) of a failing financial institution and/or to convert certain debt claims (which could include certain securities that have been or will be issued by ING) into another security, including ordinary shares of the surviving group entity, if any. It is currently contemplated that the majority of measures (including the write-down and conversion powers relating to Tier 1 capital instruments and Tier 2 capital instruments) set out in the draft Recovery and Resolution Directive will be implemented with effect from 1 January 2015, with the bail-in power for other eligible liabilities (which could include any securities that have been issued or will be issued by ING, that are not Tier 1 or Tier 2 capital instruments) expected to be introduced by 1 January 2016. However, the draft Recovery and Resolution Directive is not in final form, and changes could be made to it in the course of the final legislative process and anticipated implementation dates could change.
In addition to a ‘write-down and conversion’ power and a ‘bail-in’ power, the powers currently proposed to be granted to the relevant Dutch resolution authority under the draft Recovery and Resolution Directive include the two categories of measures introduced by the Intervention Act, as described above. In addition, the draft Recovery and Resolution Directive proposes, among the broader powers proposed to be granted to the relevant resolution authority, to provide powers to the relevant resolution authority to amend the maturity date and/or any interest payment date of debt instruments or other eligible liabilities of the relevant financial institution and/or impose a temporary suspension of payments.
There remains uncertainty regarding the ultimate nature and scope of these powers and, when implemented, how they would affect us and the securities that have been issued or will be issued by us. Accordingly, it is not yet possible to assess the full impact of the draft Recovery and Resolution Directive on ING and on holders of any securities issued or to be issued by ING, and there can be no assurance that, once it is implemented, the manner in which it is implemented or the taking of any actions by the relevant Dutch resolution authority currently contemplated in the draft Recovery and Resolution Directive would not adversely affect the rights of holders of the securities issued or to be issued by ING, the price or value of an investment in such securities and/or ING’s ability to satisfy its obligations under such securities.
Further, the CRD IV Regulation states that if the Recovery and Resolution Directive is not adopted by 31 December 2015, the EC should review and report whether the CRD IV Regulation should be amended so as to include write-down and conversion powers in order to ensure that relevant capital instruments fully absorb losses at the point of non-viability of the issuing institution and before any other resolution action is taken. There is a risk that such an amendment would result in any securities issued or to be issued by ING that constitute relevant capital instruments being used to absorb losses on the occurrence of a non-viability event.
Finally, as part of the road towards a full banking union, on 10 July 2013, the EC published a draft Regulation for a Single Resolution Mechanism (‘SRM’) with the aim to have a Single Resolution Board to be responsible for key decisions on how a bank subject to SSM supervision is to be resolved if a bank has irreversible financial difficulties and cannot be wound up under normal insolvency proceedings without destabilizing the financial system. The SRM is expected to enter into force in 2015.
There are certain differences between the provisions of the Intervention Act, the Recovery and Resolution Directive proposal and the SRM Regulation proposal, which may further bring future changes to the law. We are unable to predict what specific effects the Intervention Act and the future adoption of the Recovery and Resolution Directive and the SRM Regulation may have on the financial system generally, our counterparties, holders of securities issued by or to be issued by us, or on us, our operations or our financial position.
ING Bank has set up an all-encompassing recovery planning process to enhance its readiness and decisiveness to tackle financial crises on its own strength. ING Bank’s recovery plan has been submitted to and approved by the DNB in November 2012 and is updated at least annually. Furthermore during 2013, ING Bank submitted information on the basis of which the Dutch Resolution Authorities will be able to develop a Resolution Plan.
Risk factors continued
363ING Group Annual Report 2013
1 Wh
o w
e are2 R
epo
rt of th
e Executive B
oard
3 Co
rpo
rate go
vernan
ce4 C
on
solid
ated an
nu
al accou
nts
5 Parent co
mp
any an
nu
al accou
nts
6 Oth
er info
rmatio
n7 A
dd
ition
al info
rmatio
n
ING_2013_deel5_v1.indd 363 19/03/2014 19:45:15
Financial Stability Board In addition to the adoption of the foregoing measures, regulators and lawmakers around the world are actively reviewing the causes of the financial crisis and exploring steps to avoid similar problems in the future. In many respects, this work is being led by the FSB, consisting of representatives of national financial authorities of the G20 nations. The G20 and the FSB have issued a series of papers and recommendations intended to produce significant changes in how financial companies, particularly companies that are members of large and complex financial groups, should be regulated. These proposals address such issues as financial group supervision, capital and solvency standards, systemic economic risk, corporate governance, including executive compensation, and a host of related issues associated with responses to the financial crisis. The lawmakers and regulatory authorities in a number of jurisdictions in which the Group’s subsidiaries conduct business have already begun introducing legislative and regulatory changes consistent with G20 and FSB recommendations, and the potential impact of such changes on our business, results of operations and financial condition remains unclear.
Additional Governmental Measures Governments in the Netherlands and abroad have also intervened over the past few years on an unprecedented scale, responding to stresses experienced in the global financial markets. Some of the measures adopted subject us and other institutions for which they were designed to additional restrictions, oversight or costs. Restrictions related to the Core Tier 1 Securities and the IABF (together, the ‘Dutch State Transactions’) and the Restructuring Plan are further described in — ‘Risks related to the Restructuring Plan’.
Sections 382 and 383 of the U.S. Internal Revenue Code, as amended, operate as anti-abuse rules, the general purpose of which is to prevent trafficking in tax losses and credits, but which can apply without regard to whether a ‘loss trafficking’ transaction occurs or is intended. These rules are triggered when an ‘ownership change’ — generally defined as when the ownership of a company, or its parent, changes by more than 50% (measured by value) on a cumulative basis in any three-year period — occurs. If triggered, the amount of the taxable income for any post-change year which may be offset by a pre-change loss is subject to an annual limitation. As of 31 December 2013, we believe that our U.S. subsidiaries have not had an ‘ownership change’ for purposes of Sections 382 and 383. However, this determination is subject to uncertainties and is based on various assumptions. Future increases of capital or other changes in ownership may adversely affect our cumulative ownership, and could trigger an ‘ownership change’, which could limit the ability of our U.S. subsidiaries to use tax attributes, and could correspondingly decrease the value of these attributes.
In February 2013, the EC adopted a proposal setting out the details of the financial transaction tax, which mirrors the scope of its original proposal of September 2011, to be levied on transactions in financial instruments by financial institutions if at least one of the parties to the transaction is located in the financial transaction tax zone (‘FTT-zone’), currently limited to 11 participating Member States (Austria, Belgium, Estonia, France, Germany, Greece, Italy, Portugal, Slovakia, Slovenia and Spain). The initial proposal foresaw the financial transaction tax for the 11 participating Member States entering into effect on 1 January 2014, which would have then required us to pay a tax on transactions in financial instruments with parties (including Group affiliates) located in such FTT-zone. However, in November 2013, it was agreed among the representatives of the 11 Member States that the tax would not come into force until 2015 as participating governments remain divided on key details of the levy. The actual implementation date would thus depend on the future approval by the European Council and consultation of other EU institutions, and the subsequent transposition into local law. Depending on its final form, the introduction of an FTT in the Netherlands or outside the Netherlands could have substantial adverse effect on ING’s business and results.
As of 1 October 2012, banks that are active in the Netherlands are subject to bank tax pursuant to a tax regulation that also includes measures to moderate bonuses awarded to executives at such banks. This tax results in increased taxes on ING’s Banking operations, which could negatively impact our operations, financial condition and liquidity.
In May 2012, the International Association of Insurance Supervisors (‘IAIS’), of which the DNB is a member, published a proposed assessment methodology for designating global systemically important insurers (‘G-SIIs’), as part of the global initiative to identify G-SIFIs. Insurers identified as G-SIIs would be subject to additional policy measures. The FSB published an initial list of G-SIIs in July 2013, which did not include NN Group. However, the group of G-SIIs is expected to be updated annually and published by the FSB each November based on new data, starting from November 2014, and there can be no assurance that we will be excluded from it in the future. The proposed policy measures, which are still under development and discussion and which would need to be implemented by legislation or regulation in relevant jurisdictions, include higher capital requirements (both for non-traditional and non-insurance activities and for G-SIIs overall), enhanced supervision (including more detailed and frequent reporting, removal of barriers to orderly resolution of the G-SII and reduction of the G-SII’s systemic risk over time), as well as additional measures to improve the degree of self-sufficiency of a G-SII’s different business segments (including separate legal structures for traditional insurance and non-traditional or non-insurance activities, and restrictions on intercompany subsidies). If ING were identified as a G-SII in the future, compliance costs will increase and its competitive position relative to other life insurers that were not designated as G-SIIs may be adversely affected.
Continued risk of resurgence of turbulence and ongoing volatility in the financial markets and the economy generally have adversely affected, and may continue to adversely affect, our business, financial condition and results of operations. General Our business and results of operations are materially affected by conditions in the global capital markets and the economy generally. Concerns over the slow economic recovery, the European sovereign debt crisis, the ability of certain countries to remain in the Eurozone, unemployment, the availability and cost of credit, credit spreads, the recent shutdown of the U.S. government and its plan to phase out
Risk factors continued
364 ING Group Annual Report 2013
ING_2013_deel5_v1.indd 364 19/03/2014 19:45:15
monetary asset purchases (‘tapering’), the level of U.S. national debt and the U.S. housing market, inflation levels, energy costs and geopolitical issues all have contributed to increased volatility and diminished expectations for the economy and the markets in recent years.
While certain of such conditions have improved during the period between 2011 and 2013, these conditions have generally resulted in greater volatility, widening of credit spreads and overall shortage of liquidity and tightening of financial markets throughout the world. In addition, prices for many types of asset-backed securities and other structured products have significantly deteriorated. These concerns have since expanded to include a broad range of fixed income securities, including those rated investment grade and especially the sovereign debt of some EEA countries and the U.S., the international credit and interbank money markets generally, and a wide range of financial institutions and markets, asset classes, such as public and private equity, and real estate sectors. As a result of these and other factors, sovereign governments across the globe, including in regions where the Group operates, have also experienced budgetary and other financial difficulties, which have resulted in austerity measures, downgrades in credit rating by credit agencies, planned or implemented bail-out measures and, on occasion, civil unrest (for further details regarding sovereign debt concerns, see ‘ —U.S. Sovereign Credit Rating’ and ‘ —European Sovereign Debt Crisis’ below). As a result, the market for fixed income instruments has experienced decreased liquidity, increased price volatility, credit downgrade events, and increased probability of default. In addition, the confluence of these and other factors has resulted in volatile foreign exchange markets. Securities that are less liquid are more difficult to value and may be hard to dispose of. International equity markets have also continued to experience heightened volatility and turmoil, with issuers, including ourselves, that have exposure to the real estate, mortgage, private equity and credit markets particularly affected. These events and market upheavals, including high levels of volatility, have had and may continue to have an adverse effect on our revenues and results of operations, in part because we have a large investment portfolio and extensive real estate activities around the world.
In addition, the confidence of customers in financial institutions is being tested. Consumer confidence in financial institutions may, for example, decrease due to our or our competitors’ failure to communicate to customers the terms of, and the benefits to customers of, complex or high-fee financial products. Reduced confidence could have an adverse effect on our revenues and results of operations, including through an increase of lapses or surrenders of policies and withdrawal of deposits. Because a significant percentage of our customer deposit base is originated via Internet banking, a loss of customer confidence may result in a rapid withdrawal of deposits over the Internet.
As a result of the ongoing and unprecedented volatility in the global financial markets since 2007, we incurred in past years substantial negative revaluations and impairments on our investment portfolio, which have impacted our shareholders’ equity and earnings. During 2011, 2012 and 2013, the revaluation reserve position improved substantially, positively impacting shareholders’ equity. Although we believe that, as of December 31, 2013, reserves for insurance liabilities were generally adequate at the Group, inadequacies in certain product areas have developed. The aforementioned developments in the global financial markets and, in particular, decreasing interest rates resulted in a decrease in our overall reserves adequacy and may further continue to produce reserves inadequacies in the future, potentially leading to reserve strengthening.
The aforementioned impacts have arisen primarily as a result of valuation and impairment issues arising in connection with our investments in real estate (both in and outside the U.S.) and private equity, exposures to European sovereign debt and to U.S. mortgage-related structured investment products, including sub-prime and ‘Alt-A’ residential and commercial mortgage-backed securities, collateralised debt obligations and collateralised loan obligations, monoline insurer guarantees, private equity and other investments. In many cases, the markets for investments and instruments have been and remain highly illiquid, and issues relating to counterparty credit ratings and other factors have exacerbated pricing and valuation uncertainties. Valuation of such investments and instruments is a complex process involving the consideration of market transactions, pricing models, management judgment and other factors, and is also impacted by external factors, such as underlying mortgage default rates, interest rates, rating agency actions and property valuations. Although we continue to monitor our exposures, there can be no assurance that we will not experience further negative impacts to our shareholders’ equity or profit and loss accounts in future periods.
U.S. Sovereign Credit Rating In 2011, Standard & Poor’s Ratings Services (‘S&P’) lowered its long-term sovereign credit rating on the U.S. from AAA to AA+. Although other ratings agencies have not similarly lowered the long-term sovereign credit rating of the U.S., they have put that credit rating on review. Amid the lingering uncertainty over the long-term outlook for the fiscal position and the future economic performance of the U.S. within the global economy and potential future budgetary restrictions in the U.S., as illustrated by the recent budget negotiations and partial shutdown of the U.S. government in October 2013, there continues to be a perceived risk of a future sovereign credit ratings downgrade of the U.S. government, including the rating of U.S. Treasury securities. On 15 October 2013, Fitch Ratings placed the U.S.’s AAA credit rating under ‘rating watch negative’ in response to the crisis, a step that would precede an actual downgrade. It is foreseeable that the ratings and perceived creditworthiness of instruments issued, insured or guaranteed by institutions, agencies or instrumentalities directly linked to the U.S. government could also be correspondingly affected by any such downgrade. Instruments of this nature are key assets on the balance sheets of financial institutions and are widely used as collateral by financial institutions to meet their day-to-day cash flows in the short-term debt market. The impact of any further downgrades to the sovereign credit rating of the U.S. government or a default by the U.S. government to satisfy its debt obligations likely would create broader financial turmoil and uncertainty, which would weigh heavily on the global financial system and could consequently result in a significant adverse impact to the Group.
Risk factors continued
365ING Group Annual Report 2013
1 Wh
o w
e are2 R
epo
rt of th
e Executive B
oard
3 Co
rpo
rate go
vernan
ce4 C
on
solid
ated an
nu
al accou
nts
5 Parent co
mp
any an
nu
al accou
nts
6 Oth
er info
rmatio
n7 A
dd
ition
al info
rmatio
n
ING_2013_deel5_v1.indd 365 19/03/2014 19:45:15
European Sovereign Debt Crisis In 2010, a financial crisis emerged in Europe, triggered by high budget deficits and rising direct and contingent sovereign debt in Greece, Ireland, Italy, Portugal and Spain, which created concerns about the ability of these EU ‘peripheral’ Member States to continue to service their sovereign debt obligations. Significant concerns regarding the sovereign debt of these countries, as well as certain other countries of the ‘core’ EU Member States are ongoing and, in some cases, have required countries to obtain emergency financing. These concerns impacted financial markets and resulted in high and volatile bond yields on the sovereign debt of many EU nations. If these or other countries require additional financial support or if sovereign credit ratings continue to decline, yields on the sovereign debt of certain countries may continue to increase, the cost of borrowing may increase and credit may become more limited. Despite assistance packages to Greece, Ireland, Portugal and Cyprus, the creation of a European Financial Stability Facility as a temporary rescue mechanism in May 2010, the approval of a further bail-out of Greece by the relevant government and monetary bodies of the Eurozone and the International Monetary Fund in March 2012, and the establishment of the European Stability Mechanism in October 2012 (which provided its first financial assistance in February 2013 for the recapitalisation of Spain’s banking sector), uncertainty over the outcome of the EU governments’ financial support programs and concerns regarding sovereign finances persisted during the course of 2013. Market concerns over the direct and indirect exposure of European banks and insurers to the EU sovereign debt further resulted in a widening of credit spreads and increased costs of funding for some European financial institutions. In December 2011, European leaders agreed to implement steps (and continue to meet regularly to review, amend and supplement such steps) to encourage greater long-term fiscal responsibility on the part of the individual Member States and bolster market confidence in the Euro and European sovereign debt, and the Treaty on Stability, Coordination and Governance (‘Fiscal Treaty’) was signed by 25 EU Member States in March 2012 and entered into force on 1 January 2013. However, the Fiscal Treaty needs to be incorporated into the existing EU treaties, which is expected to take many years, and, even if such steps are implemented, there is no guarantee that they will ultimately and finally resolve uncertainties regarding the ability of Eurozone states to continue to service their sovereign debt obligations. Further, despite such long-term structural adjustments and improvements being proposed and implemented, the future of the Euro in its current form, and with its current membership, remains uncertain. The financial turmoil in Europe continues to be a threat to global capital markets and remains a challenge to global financial stability.
Risks and ongoing concerns about the debt crisis in Europe, as well as the possible default by, or exit from, the Eurozone of one or more Member States and/or the replacement of the Euro by one or more successor currencies, could have a detrimental impact on the global economic recovery, sovereign and non-sovereign debt in these European countries and the financial condition of European and other financial institutions, including us. Additionally, the possibility of capital market volatility spreading through a highly integrated and interdependent banking system remains elevated. In the event of any default or similar event with respect to a sovereign issuer, some financial institutions may suffer significant losses, following which they would require additional capital, and such capital may not be available. Market and economic disruptions stemming from the crisis in Europe have affected, and may continue to affect, consumer confidence levels and spending, bankruptcy rates, levels of incurrence of, and default on, consumer debt and home prices, among other factors. There can be no assurance that the market disruptions in Europe, including the increased cost of funding for certain government and financial institutions, will not spread, nor can there be any assurance that future assistance packages will be available or, even if provided, will be sufficient to stabilise the affected countries and markets in Europe or elsewhere. To the extent uncertainty regarding the economic recovery continues to negatively impact consumer confidence and consumer credit factors, our business and results of operations could be significantly and adversely impacted. In addition, the possible exit from the Eurozone of one or more European states and/or the replacement of the Euro by one or more successor currencies could create significant uncertainties regarding the enforceability and valuation of Euro-denominated contracts to which we (or our counterparties) are a party and thereby materially and adversely affect our and/or our counterparties’ liquidity, financial condition and operations. Such uncertainties may include the risk that (i) an obligation that was expected to be paid in Euros is redenominated into a new currency (which may not be easily converted into other currencies without incurring significant cost), (ii) currencies in some Member States may depreciate relative to others, (iii) former Eurozone Member States may impose capital controls that would make it complicated or illegal to move capital out of such countries, and/or (iv) some courts (in particular, courts in countries that have left the Eurozone) may not recognise and/or enforce claims denominated in Euros (and/or in any replacement currency). The possible exit from the Eurozone of one or more Member States and/or the replacement of the Euro by one or more successor currencies could also cause other significant market dislocations and lead to other adverse economic and operational impacts that are inherently difficult to predict or evaluate, and otherwise have potentially materially adverse impacts on us and our counterparties, including our depositors, lenders, borrowers and other customers. These factors, combined with volatile oil prices, reduced business and consumer confidence and continued high unemployment, have negatively affected the economy of main geographic regions where we conduct our business. Our results of operations, liquidity position, capital position, investment portfolio and AUM are exposed to these risks and may be adversely affected as a result. In addition, in the event of extreme prolonged market events, such as the recent global credit crisis, we could incur significant losses.
On 13 January 2012, S&P proceeded to downgrade the credit ratings of France, Austria, Italy, Spain, Portugal and a handful of other EEA states (while reaffirming the credit ratings of Germany, the Netherlands, Ireland and other EEA states and changed the outlook to ‘negative’ for 15 Eurozone countries). Further related downgrades of European sovereign ratings and of corporate ratings have occurred since that date, including the recent downgrade of the Netherland’s sovereign debt rating from AAA to AA+ by S&P on 29 November 2013. These announcements, as well as any future changes are of high importance to the Group, because they affect our financing costs and, as a result, our profitability.
Risk factors continued
366 ING Group Annual Report 2013
ING_2013_deel5_v1.indd 366 19/03/2014 19:45:15
Because we operate in highly competitive markets, including our home market, we may not be able to increase or maintain our market share, which may have an adverse effect on our results of operations. There is substantial competition in the Netherlands and the other countries in which we do business for the types of insurance, commercial banking, investment banking, asset management and other products and services we provide. Customer loyalty and retention can be influenced by a number of factors, including brand recognition, reputation, relative service levels, investment performance of our products, the prices and attributes of products and services, scope of distribution, perceived financial strength, credit ratings and actions taken by competitors. A decline in our competitive position as to one or more of these factors could adversely impact our ability to maintain or further increase our market share, which would adversely affect our results of operations. Such competition is most pronounced in our more mature markets of the Netherlands, Belgium, the rest of Western Europe, the U.S. and Australia. In recent years, however, competition in emerging markets, such as Latin America, Asia and Central and Eastern Europe, has also increased as large financial services companies from more developed countries have sought to establish themselves in markets which are perceived to offer higher growth potential, and as local institutions have become more sophisticated and competitive and proceeded to form alliances, mergers or strategic relationships with our competitors. The Netherlands and the U.S. are our largest markets. Our main competitors in the banking sector in the Netherlands are ABN AMRO Bank and Rabobank. Our main competitors in the insurance sector in the Netherlands are Achmea, ASR, Delta Lloyd and Aegon Competition could also increase due to new entrants in the markets that may have new operating models that are not burdened by potentially costly legacy operations. Increasing competition in these or any of our other markets may significantly impact our results if we are unable to match the products and services offered by our competitors. Future economic turmoil may accelerate additional consolidation activity. Over time, certain sectors of the financial services industry have become more concentrated, as institutions involved in a broad range of financial services have been acquired by or merged into other firms or have declared bankruptcy. These developments could result in our competitors gaining greater access to capital and liquidity, expanding their ranges of products and services, or gaining geographic diversity. We may experience pricing pressures as a result of these factors in the event that some of our competitors seek to increase market share by reducing prices. In addition, under the Restructuring Plan, we were required to agree to certain restrictions imposed by the EC, including with respect to our price leadership in EU banking markets and our ability to make acquisitions of financial institutions and other businesses. See ‘Risks related to the Restructuring Plan — The limitations required by the EC on our ability to compete and to make acquisitions or call certain debt instruments could materially impact the Group’. Furthermore, if our financial strength and credit ratings are lower than those of our competitors, we may experience increased surrenders and/or a significant decline in sales of insurance and annuities products. Failure to effectively compete within the industry may thus have a material adverse impact on our business, results of operations and financial condition.
The inability of counterparties to meet their financial obligations could have a material adverse effect on our results of operations. General Third parties that owe us money, securities or other assets may not pay or perform under their obligations. These parties include the issuers and guarantors (including sovereigns) of securities we hold, borrowers under loans originated, reinsurers, customers, trading counterparties, securities lending and repurchase counterparties, counterparties under swaps, credit default and other derivative contracts, clearing agents, exchanges, clearing houses and other financial intermediaries. Defaults by one or more of these parties on their obligations to us due to bankruptcy, lack of liquidity, downturns in the economy or real estate values, operational failure or other factors, or even rumours about potential defaults by one or more of these parties or regarding a severe distress of the financial services industry generally, could have a material adverse effect on our results of operations, financial condition and liquidity. In light of experiences with significant constraints on liquidity and the high cost of funds in the interbank lending market, and given the high level of interdependence between financial institutions, we are and will continue to be subject to the risk of deterioration of the commercial and financial soundness, or perceived soundness, of sovereigns and other financial services institutions. This is particularly relevant to our franchise as an important and large counterparty in equity, fixed income and foreign exchange markets, including related derivatives, which would be then exposed to concentration risk.
We routinely execute a high volume of transactions, such as unsecured debt instruments, derivative transactions and equity investments with counterparties and customers in the financial services industry, including brokers and dealers, commercial and investment banks, mutual and hedge funds, insurance companies, institutional clients, futures clearing merchants, swap dealers, and other institutions, resulting in large periodic settlement amounts, which may result in our having significant credit exposure to one or more of such counterparties or customers. As a result, we face concentration risk with respect to liabilities or amounts we expect to collect from specific counterparties and customers. We are exposed to increased counterparty risk as a result of recent financial institution failures and weakness and will continue to be exposed to the risk of loss if counterparty financial institutions fail or are otherwise unable to meet their obligations. A default by, or even concerns about the creditworthiness of, one or more of these counterparties or customers or other financial services institutions could therefore have an adverse effect on our results of operations or liquidity.
With respect to secured transactions, our credit risk may be exacerbated when the collateral held by us cannot be realised, or is liquidated at prices not sufficient to recover the full amount of the loan or derivative exposure due us. We also have exposure to a number of financial institutions in the form of unsecured debt instruments, derivative transactions and equity investments. For example, we hold certain hybrid regulatory capital instruments issued by financial institutions which permit the issuer to defer coupon payments on the occurrence of certain events or at their option. The EC has indicated that, in certain circumstances, it may require these financial institutions to defer payment. If this were to happen, we expect that such instruments may experience ratings downgrades and/or a drop in value and we may have to treat them as impaired, which could result in significant losses. There is no assurance that losses on, or impairments to the carrying value of, these assets would not materially and adversely affect our business, results of operations or financial condition.
Risk factors continued
367ING Group Annual Report 2013
1 Wh
o w
e are2 R
epo
rt of th
e Executive B
oard
3 Co
rpo
rate go
vernan
ce4 C
on
solid
ated an
nu
al accou
nts
5 Parent co
mp
any an
nu
al accou
nts
6 Oth
er info
rmatio
n7 A
dd
ition
al info
rmatio
n
ING_2013_deel5_v1.indd 367 19/03/2014 19:45:15
In addition, we are subject to the risk that our rights against third parties may not be enforceable in all circumstances. The deterioration or perceived deterioration in the credit quality of third parties whose securities or obligations we hold could result in losses and/or adversely affect our ability to rehypothecate or otherwise use those securities or obligations for liquidity purposes. A significant downgrade in the credit ratings of our counterparties could also have a negative impact on our income and risk weighting, leading to increased capital requirements. While in many cases we are permitted to require additional collateral from counterparties that experience financial difficulty, disputes may arise as to the amount of collateral we are entitled to receive and the value of pledged assets. Our credit risk may also be exacerbated when the collateral we hold cannot be realised or is liquidated at prices not sufficient to recover the full amount of the loan or derivative exposure that is due to us, which is most likely to occur during periods of illiquidity and depressed asset valuations, such as those experienced during the recent financial crisis. The termination of contracts and the foreclosure on collateral may subject us to claims for the improper exercise of our rights under such contracts. Bankruptcies, downgrades and disputes with counterparties as to the valuation of collateral tend to increase in times of market stress and illiquidity. Any of these developments or losses could materially and adversely affect our business, financial condition, results of operations, liquidity and/or prospects.
Reinsurers Our insurance operations have bought protection for risks that exceed certain risk tolerance levels set for both our life and non-life businesses. This protection is bought through reinsurance arrangements in order to reduce possible losses. However, we remain liable to the underlying policyholders, even if the reinsurer defaults on its obligations. Because in most cases we must pay policyholders first before collecting the amount from the reinsurer, we are subject to credit risk with respect to each reinsurer for all such amounts. The inability or unwillingness of any one of these reinsurers to meet its financial obligations to us, or the insolvency of our reinsurers, could have a material adverse effect on our financial condition and results of operations.
Market conditions observed over the past few years may increase the risk of loans being impaired. We are exposed to declining property values on the collateral supporting residential and commercial real estate lending. We are exposed to the risk that our borrowers (including sovereigns) may not repay their loans according to their contractual terms and that the collateral securing the payment of these loans may be insufficient. We may continue to see adverse changes in the credit quality of our borrowers and counterparties, for example, as a result of their inability to refinance their indebtedness, with increasing delinquencies, defaults and insolvencies across a range of sectors. This may lead to impairment charges on loans and other assets, higher costs and additions to loan loss provisions. A significant increase in the size of our provision for loan losses could have a material adverse effect on our financial position and results of operations.
Economic and other factors could lead to further contraction in the residential mortgage and commercial lending market and to further decreases in residential and commercial property prices, which could generate substantial increases in impairment losses.
Interest rate volatility and other interest rate changes may adversely affect our profitability. Changes in prevailing interest rates may negatively affect our business, including the level of net interest revenue we earn, and for our banking business, the levels of deposits and the demand for loans. In a period of changing interest rates, interest expense may increase and interest credited to policyholders may change at different rates than the interest earned on assets. Accordingly, changes in interest rates could decrease net interest revenue. Changes in the interest rates may negatively affect the value of our assets and our ability to realise gains or avoid losses from the sale of those assets, all of which also ultimately affect earnings and capital. In addition, our insurance and annuity products and certain of our retirement and investment products are sensitive to inflation rate fluctuations. A sustained increase in the inflation rate in our principal markets may also negatively affect our business, financial condition and results of operations. For example, a sustained increase in the inflation rate may result in an increase in nominal market interest rates. A failure to accurately anticipate higher inflation and factor it into our product pricing assumptions may result in mispricing of our products, which could materially and adversely impact our results of operations.
Declining interest rates or a prolonged period of low interest rates may result in: • life insurance and annuity products being relatively more attractive to consumers due to minimum guarantees with respect to such
products that are frequently mandated by regulators;• increased premium payments on products with flexible premium features;• a higher percentage of insurance and annuity contracts remaining in force from year to year than we anticipated in our pricing,
potentially resulting in greater claims costs than we expected and creating asset-liability cash flow mismatches; • additional provisions for guarantees included in life insurance and annuity contracts, as the guarantees become more valuable to
policyholders; • lower investment earnings over time on existing investments, as premiums and reinvestments will earn lower rates; • reserve strengthening by affecting the results of our reserve adequacy testing in extreme cases of low interest rates; • potential impact on the solvency level under Solvency 1.5;• higher prepayment or redemption of mortgages and fixed maturity securities in our investment portfolios as borrowers seek to borrow
at lower interest rates. Consequently, we may be required to reinvest the proceeds in securities bearing lower interest rates; • lower profitability as the result of a decrease in the spread between interest rates charged to policyholders and savings/other liabilities
and returns on our investment portfolios; • higher costs for certain derivative instruments that may be used to hedge certain of our product risks; and/or • lower profitability, since we may not be able to fully track the decline in interest rates in our savings rate.
Risk factors continued
368 ING Group Annual Report 2013
ING_2013_deel5_v1.indd 368 19/03/2014 19:45:16
Accordingly, during periods of declining interest rates or a prolonged period of low interest rates, our profitability may suffer as the result of a decrease in the spread between interest rates credited to insurance policyholders and annuity contract owners. An extended period of declining interest rates or a prolonged period of low interest rates may also cause us to change our long-term view of the interest rates that we can earn on our investments. In addition, certain statutory capital and reserve requirements are based on formulas and models that consider interest rates, and an extended period of low interest rates may increase the statutory capital we are required to hold and the amount of assets we must maintain to support statutory reserves.
Rapidly increasing interest rates may result in: • a decrease in the demand for loans; • an increase in policy loans, and withdrawals from and/or surrenders of life insurance policies and fixed annuity contracts as
policyholders choose to forego insurance protection and seek higher investment returns. Obtaining cash to satisfy these obligations may require us to liquidate fixed maturity investments at a time when market prices for those assets are depressed because of increases in interest rates. This may result in realised investment losses. Regardless of whether we realise an investment loss, these cash payments would result in a decrease in total invested assets, and may decrease our net income. Premature withdrawals may also cause us to accelerate amortisation of deferred policy acquisition costs, which would also reduce our net income;
• prepayment losses if prepayment rates are lower than expected or if interest rates increase too rapidly to adjust the accompanying hedges; • higher interest rates to be paid on debt securities that we have issued or may issue on the financial markets from time to time to finance
our operations and on savings/other liabilities, which would increase our interest expenses and reduce our results of operations; • a material adverse effect on the value of our investment portfolio by, for example, decreasing the estimated fair values of the fixed
income securities within our investment portfolio; • (depending on the position) a significant collateral posting requirement associated with our interest rate hedge programs, which could
materially and adversely affect liquidity; and/or • decreased fee income associated with a decline in the value of variable annuity account balances invested in fixed income funds.
We may incur losses due to failures of banks falling under the scope of state compensation schemes. In the Netherlands and other jurisdictions, deposit guarantee schemes and similar funds (‘Compensation Schemes’) have been implemented from which compensation may become payable to customers of financial services firms in the event the financial service firm is unable to pay, or unlikely to pay, claims against it. In many jurisdictions in which we operate, these Compensation Schemes are funded, directly or indirectly, by financial services firms which operate and/or are licensed in the relevant jurisdiction. ING Bank is a participant in the Dutch Deposit Guarantee Scheme, which guarantees an amount of EUR 100,000 per person per bank (regardless of the number of accounts held). The costs involved with making compensation payments under the Dutch Deposit Guarantee Scheme are allocated among the participating banks by the DNB, based on an allocation key related to their market shares with respect to the deposits protected by the Dutch Deposit Guarantee Scheme. Given our size, we may incur significant compensation payments to be made under the Dutch Deposit Guarantee Scheme, which we may be unable to recover from the bankrupt estate. Such costs and the associated costs to be borne by us may have a material adverse effect on our results of operations and financial condition. As of 1 July 2015, the Dutch Deposit Guarantee Scheme is to change from an ex-post scheme, where we would have contributed after the failure of a firm, to an ex-ante scheme where we will pay quarterly risk-weighted contributions into a fund for the Dutch Deposit Guarantee Scheme. The fund is to grow to a target size of 1% of all deposits guaranteed under the Dutch Deposit Guarantee Scheme. The target size would have to be reached in 15 years. However, in December 2013, EU Member States and the European Parliament agreed on reforms to the EU Directive on Deposit Guarantee Scheme. Main characteristics include an ex-ante funding of up to 0.8% of the banking sector’s insured deposits for payouts, to be built up in 10 years, but ultimate contributions will be risk-based. It is yet unclear what this proposal will mean for the proposed Dutch changes.
The costs associated with potential future ex-ante contributions are today unknown and will depend on the methodology used to calculate risk-weighting, but, given our size, may be significant. See also ‘—We operate in highly regulated industries. Changes in laws and/or regulations governing financial services or financial institutions or the application of such laws and/or regulations governing our business may reduce our profitability — Bank Recovery and Resolution Regimes’.
Our business may be negatively affected by a sustained increase in inflation. A sustained increase in the inflation rate in our principal markets would have multiple impacts on us and may negatively affect our business, solvency position and results of operations. For example, a sustained increase in the inflation rate may result in an increase in market interest rates, which may: (1) decrease the estimated fair value of certain fixed income securities that we hold in our investment portfolios, resulting in:
– reduced levels of unrealised capital gains available to us, which could negatively impact our solvency position and net income, and/or – a decrease in collateral values,
(2) result in increased surrenders of certain life and savings products, particularly those with fixed rates below market rates, (3) actual claims payments significantly exceeding associated insurance reserves in the context of certain non-life risks, due to:
– claims inflation (which is an increase in the amount ultimately paid to settle claims several years after the policy coverage period or event giving rise to the claim), together with
– an underestimation of corresponding claims reserves at the time of establishment due to a failure to fully anticipate increased inflation and its effect on the amounts ultimately payable to policyholders, and, consequently,
– actual claims payments significantly exceeding associated insurance reserves,
Risk factors continued
369ING Group Annual Report 2013
1 Wh
o w
e are2 R
epo
rt of th
e Executive B
oard
3 Co
rpo
rate go
vernan
ce4 C
on
solid
ated an
nu
al accou
nts
5 Parent co
mp
any an
nu
al accou
nts
6 Oth
er info
rmatio
n7 A
dd
ition
al info
rmatio
n
ING_2013_deel5_v1.indd 369 19/03/2014 19:45:16
Risk factors continued
(4) require us, as an issuer of securities, to pay higher interest rates on debt securities that we issue in the financial markets from time to time to finance our operations, which would increase our interest expenses and reduce our results of operations, and/or
(5) result in decreased fee income associated with a decline in the variable annuity balances invested in fixed income funds.
A significant and sustained increase in inflation has historically also been associated with decreased prices for equity securities and sluggish performance of equity markets generally. A sustained decline in equity markets may: (1) result in impairment charges to equity securities that we hold in our investment portfolios and reduced levels of unrealised capital gains
available to us which would reduce our net income and negatively impact our solvency position, (2) negatively impact performance, future sales and surrenders of certain products where underlying investments are often allocated to
equity funds, (3) negatively impact the ability of our asset management subsidiaries to retain and attract AUM, as well as the value of assets they do
manage, which may negatively impact their results of operations, and/or (4) result in decreased fee income associated with a decline in the variable annuity balances invested in fixed income funds. (5) lower the value of our equity investments impacting our capital position.
In addition, a failure to accurately anticipate higher inflation and factor it into our product pricing and reserves assumptions may result in a systemic mispricing of our products, resulting in underwriting losses, which would negatively impact our results of operations.
RISKS RELATED TO THE GROUP’S BUSINESS, OPERATIONS AND REGULATORY ENVIRONMENT We may be unable to manage our risks successfully through derivatives. We employ various economic hedging strategies with the objective of mitigating the market risks that are inherent in our business and operations. These risks include currency fluctuations, changes in the fair value of our investments, the impact of interest rates, equity markets and credit spread changes, the occurrence of credit defaults and changes in mortality and longevity. We seek to control these risks by, among other things, entering into a number of derivative instruments, such as swaps, options, futures and forward contracts, including, from time to time, macro hedges for parts of our business, either directly as a counterparty or as a credit support provider to affiliate counterparties.
Developing an effective strategy for dealing with these risks is complex, and no strategy can completely insulate us from risks associated with those fluctuations. Our hedging strategies also rely on assumptions and projections regarding our assets, liabilities, general market factors and the creditworthiness of our counterparties that may prove to be incorrect or prove to be inadequate. Accordingly, our hedging activities may not have the desired beneficial impact on our results of operations or financial condition. Poorly designed strategies or improperly executed transactions could actually increase our risks and losses. Hedging strategies involve transaction costs and other costs, and if we terminate a hedging arrangement, we may also be required to pay additional costs, such as transaction fees or breakage costs. There have been periods in the past, and it is likely that there will be periods in the future, during which we have incurred or may incur losses on transactions, possibly significant, after taking into account our hedging strategies. Further, the nature and timing of our hedging transactions could actually increase our risk and losses. Hedging instruments we use to manage product and other risks might not perform as intended or expected, which could result in higher (un)realised losses, such as credit value adjustment risks or unexpected P&L effects, and unanticipated cash needs to collateralise or settle such transactions. Adverse market conditions can limit the availability and increase the costs of hedging instruments, and such costs may not be recovered in the pricing of the underlying products being hedged. In addition, hedging counterparties may fail to perform their obligations, resulting in unhedged exposures and losses on positions that are not collateralised. As such, our hedging strategies and the derivatives that we use or may use may not adequately mitigate or offset the risk of interest rate volatility, and our hedging transactions may result in losses.
Our hedging strategy additionally relies on the assumption that hedging counterparties remain able and willing to provide the hedges required by our strategy. Increased regulation, market shocks, worsening market conditions (whether due to the ongoing Euro crisis or otherwise), and/or other factors that affect or are perceived to affect the financial condition, liquidity and creditworthiness of ING may reduce the ability and/or willingness of such counterparties to engage in hedging contracts with us and/or other parties, affecting our overall ability to hedge our risks and adversely affecting our business, operations, financial condition and liquidity.
ING Group may be unable to retain key personnel. As a financial services enterprise with a decentralised management structure, ING Group relies to a considerable extent on the quality of local management in the various countries in which it operates. The success of ING Group’s operations is dependent, among other things, on its ability to attract and retain highly qualified professional personnel. Competition for key personnel in most countries in which ING Group operates is intense. ING Group’s ability to attract and retain key personnel, in particular senior officers, experienced portfolio managers, mutual fund managers and sales executives, is dependent on a number of factors, including prevailing market conditions and compensation packages offered by companies competing for the same talent.
As a part of their responses to the financial crisis of 2008, the EC and national governments throughout Europe have introduced and are expected to continue introducing various legislative initiatives that aim to ensure that financial institutions’ remuneration policies and practices are consistent with and promote sound and effective risk management, and that impose restrictions on the remuneration of personnel, in particular, senior management, with a focus on risk alignment of performance-related remuneration. Such initiatives include, among others, measures set out in Directive 2010/76/EU (CRD III) and Directive 2013/36/EU (CRD IV), the Guidelines on Remuneration
370 ING Group Annual Report 2013
ING_2013_deel5_v1.indd 370 19/03/2014 19:45:16
Risk factors continued
Policies and Practices published by (the predecessor of) the European Banking Authority, the Regulation of the DNB on Sound Remuneration Policies (Regeling beheerst beloningsbeleid Wft 2011), the Dutch law with respect to the limitation of liability of the DNB and AFM and the prohibition of the payment of variable remuneration to board members and day-to-day policy makers of financial institutions that receive state aid (Wet aansprakelijkheidsbeperking DNB en AFM en bonusverbod staatsgesteunde ondernemingen) and the Dutch legislative proposal submitted to the Dutch Parliament in November 2013 on remuneration for employees of financial institutions. The legislative proposal would, if adopted, introduce a variable remuneration cap at 20% on an aggregated level for all persons working in the financial sector in the Netherlands. Persons covered by a collective labour agreement in the Netherlands are subject to an individual cap of 20%. Other persons in the Netherlands are subject to the aggregated cap of 20% cap based on an aggregate level. For this group, as well as for persons working outside the Netherlands, (in the EU or outside the EU), exceptions are possible, in line with CRD IV, but only under strict conditions. In addition, the proposal limits exit compensation and retention compensation and prohibits guaranteed variable remuneration. It is currently expected that the proposal will result in legislation being adopted in the course of 2014 and becoming effective as of 2015. Since the financial crisis, ING has adapted its remuneration policies to the new national and international standards. No base salary increase in relation to 2014 has been proposed and, as of 31 December 2013, the remuneration level of ING Group’s Executive Board is far below the median of our EURO Stoxx 50 benchmark, which is made up of similar European financial and non-financial institutions. These restrictions will continue to have an impact on existing ING Group remuneration policies and individual remuneration packages for personnel and may restrict our ability to offer competitive compensation compared with companies that are not subject to such restrictions.
These restrictions, alone or in combination with the other factors described above, could adversely affect ING Group’s ability to retain or attract qualified employees.
We may not be able to protect our intellectual property and may be subject to infringement claims by third parties, which may have a material adverse effect on our business and results of operations. In the conduct of our business, we rely on a combination of contractual rights with third parties and copyright, trademark, trade name, patent and trade secret laws to establish and protect our intellectual property. Although we endeavour to protect our rights, third parties may infringe or misappropriate our intellectual property. We may have to litigate to enforce and protect our copyrights, trademarks, trade names, patents, trade secrets and know-how or to determine their scope, validity or enforceability. In that event, we may be required to incur significant costs, and our efforts may not prove successful. The inability to secure or protect our intellectual property assets could have a material adverse effect on our business and our ability to compete.
We may also be subject to claims made by third parties for (i) patent, trademark or copyright infringement, (ii) breach of copyright, trademark or licence usage rights, or (iii) misappropriation of trade secrets. Any such claims and any resulting litigation could result in significant expense and liability for damages. If we were found to have infringed or misappropriated a third-party patent or other intellectual property right, we could in some circumstances be enjoined from providing certain products or services to our customers or from utilizing and benefiting from certain methods, processes, copyrights, trademarks, trade secrets or licences. Alternatively, we could be required to enter into costly licensing arrangements with third parties or to implement a costly workaround. Any of these scenarios could have a material adverse effect on our business and results of operations.
Because we use assumptions about factors to calculate the amount of certain items, the use of different assumptions about these factors may have an adverse impact on our results of operations. The establishment of insurance provisions, including the impact of minimum guarantees which are contained within certain variable annuity products, the adequacy test performed on the provisions for life policies and the establishment of deferred acquisition costs (DAC) and value of business acquired (VOBA) are inherently uncertain processes involving assumptions about factors such as court decisions, changes in laws, social, economic and demographic trends, inflation, investment returns, policyholder behaviour (e.g., lapses, persistency, etc.) and other factors, and, in the insurance business, assumptions concerning mortality, longevity and morbidity trends. The use of different assumptions about these factors could have a material effect on insurance provisions and underwriting expense. Changes in assumptions may lead to changes in the insurance provisions over time. Furthermore, some of these assumptions can be volatile.
Because we use assumptions to model client behaviour for the purpose of our market risk calculations, the difference between the realisation and the assumptions may have an adverse impact on the risk figures and future results. We use assumptions in order to model client behaviour for the risk calculations in our banking and insurance books. Assumptions are used to determine insurance liabilities, the interest rate risk profile of savings and current accounts and to estimate the embedded option risk in the mortgage and investment portfolios. The realisation or use of different assumptions to determine client behaviour could have material adverse effect on the calculated risk figures and, ultimately, future results.
NN Group has a significant exposure to the take-up of policy options by policyholders. The exposure is greatest for variable annuity business with guarantees deeply in-the-money, policyholder behaviour is difficult to predict and small changes in the proportion of policyholders taking up an option can have a significant financial impact. Furthermore, assumptions about policyholder behaviour are sometimes made for new insurance business without a substantial amount of experiential data. These assumptions may prove imperfect, which may have a material impact on results. See ‘—Because we use assumptions about factors to calculate the amount of certain items, the use of different assumptions about these factors may have an adverse impact on our results of operations’.
371ING Group Annual Report 2013
1 Wh
o w
e are2 R
epo
rt of th
e Executive B
oard
3 Co
rpo
rate go
vernan
ce4 C
on
solid
ated an
nu
al accou
nts
5 Parent co
mp
any an
nu
al accou
nts
6 Oth
er info
rmatio
n7 A
dd
ition
al info
rmatio
n
ING_2013_deel5_v1.indd 371 19/03/2014 19:45:16
Risk factors continued
We may incur further liabilities in respect of our defined benefit retirement plans if the value of plan assets is not sufficient to cover potential obligations, including as a result of differences between results and underlying actuarial assumptions and models. ING Group companies operate various defined benefit retirement plans covering a significant number of our employees. The liability recognised in our consolidated balance sheet in respect of our defined benefit plans is the present value of the defined benefit obligations at the balance sheet date, less the fair value of each plan’s assets, together with adjustments for unrecognised actuarial gains and losses and unrecognised past service costs. We determine our defined benefit plan obligations based on internal and external actuarial models and calculations using the projected unit credit method. Inherent in these actuarial models are assumptions, including discount rates, rates of increase in future salary and benefit levels, mortality rates, trend rates in health care costs, consumer price index, and the expected return on plan assets. These assumptions are based on available market data and the historical performance of plan assets, and are updated annually. Nevertheless, the actuarial assumptions may differ significantly from actual results due to changes in market conditions, economic and mortality trends and other assumptions. Any changes in these assumptions could have a significant impact on our present and future liabilities to and costs associated with our defined benefit retirement plans.
Our risk management policies and guidelines may prove inadequate for the risks we face. We have developed risk management policies and procedures and will continue to review and develop these in the future. Nonetheless, our policies and procedures to identify, monitor and manage risks may not be fully effective, particularly during extremely turbulent times. The methods we use to manage, estimate and measure risk are partly based on historic market behaviour. The methods may, therefore, prove to be inadequate for predicting future risk exposure, which may be significantly greater than suggested by historical experience. For instance, these methods may not predict the losses seen in the stressed conditions in recent periods, and may also not adequately allow prediction of circumstances arising due to government interventions and stimulus packages, which increase the difficulty of evaluating risks. Other methods for risk management are based on evaluation of information regarding markets, customers, catastrophic occurrence or other information that is publicly known or otherwise available to us. Such information may not always be accurate, complete, updated or properly evaluated. Management of operational, legal and regulatory risks requires, among other things, policies and procedures to record and verify large numbers of transactions and events. These policies and procedures may not be fully effective.
We are subject to a variety of regulatory risks as a result of our operations in certain countries.In certain countries in which we operate, judiciary and dispute resolution systems may be less developed. As a result, in case of a breach of contract, we may have difficulties in making and enforcing claims against contractual counterparties and, if claims are made against us, we might encounter difficulties in mounting a defence against such allegations. If we become party to legal proceedings in a market with an insufficiently developed judicial system, it could have an adverse effect on our operations and net results.
In addition, as a result of our operations in certain countries, we are subject to risks of possible nationalisation, expropriation, price controls, exchange controls and other restrictive government actions, as well as the outbreak of hostilities, in these markets. In addition, the current economic environment in certain countries in which we operate may increase the likelihood for regulatory initiatives to enhance consumer protection or to protect homeowners from foreclosures. Any such regulatory initiative could have an adverse impact on our ability to protect our economic interest, for instance in the event of defaults on residential mortgages.
Holders of NN’s products where the customer bears all or part of the investment risk, or consumer protection organisations on their behalf, have filed claims or proceedings against NN and may continue to do so. A negative outcome of such claims and proceedings brought by customers or organisations acting on their behalf, actions taken by regulators or governmental authorities against NN or other insurers in respect of unit-linked products, settlements or any other actions for the benefit of customers by other insurers and sector-wide measures could substantially affect NN’s insurance business and, as a result, may have a material adverse effect on NN’s and ING’s business, reputation, revenues, results of operations, solvency and financial condition. In addition, claims and proceedings may be brought against NN in respect of other products with one or more similar product characteristics sold, issued or advised on by NN in and outside the Netherlands. In this risk factor NN means NN Group N.V. and its subsidiaries. Since the end of 2006, unit-linked products (commonly referred to in Dutch as ‘beleggingsverzekeringen’) have received negative attention in the Dutch media, from the Dutch Parliament, the AFM and consumer protection organisations. Costs of unit-linked products sold in the past are perceived as too high and Dutch insurers are in general being accused of being less transparent in their offering of such unit-linked products. The criticism on unit-linked products led to the introduction of compensation schemes by Dutch insurance companies that have offered unit-linked products. In 2008 ING’s Dutch insurance subsidiaries reached an outline agreement with two main consumer protection organisations to offer compensation to their unit-linked policyholders where individual unit-linked policies had a cost charge in excess of an agreed maximum and to offer similar compensation for certain hybrid insurance products. At 31 December 2008 costs of the settlements were valued at EUR 365 million for which adequate provisions have been established and of which a substantial portion has been paid out. The remaining unpaid part of the provision as per 31 December 2013 is solely available to cover costs relating to the settlements agreed in 2008. A full agreement on implementation was reached in 2010 with one of the two main consumer protection organisations, with the second main consumer protection organisation signing its agreement in June 2012. In addition, ING’s Dutch insurance subsidiaries announced additional measures (flankerend beleid) that comply with the ‘Best in Class’ criteria as formulated on 24 November 2011 by the Dutch Minister of Finance. In December 2011 this resulted in an additional agreement on these measures with the two main consumer protection organisations. In 2012 almost all unit-linked policyholders were informed about the compensation. The agreements with the two consumer protection organisations are not binding on policyholders. Consequently, neither the implementation of the compensation schemes nor the additional measures offered by NN prevent individual policyholders from initiating legal proceedings against INGs Dutch insurance subsidiaries and making claims for damages.
372 ING Group Annual Report 2013
ING_2013_deel5_v1.indd 372 19/03/2014 19:45:16
Risk factors continued
ING’s Dutch insurance subsidiaries have issued, sold or advised on approximately one million individual unit-linked policies. As noted above, there has been for some time and there continues to be political, regulatory and public attention focused on the unit-linked issue in general. Elements of unit-linked policies are being challenged or may be challenged on multiple legal grounds in current and future legal proceedings and there is a risk that one or more of these legal challenges will succeed. Customers of ING’s Dutch insurance subsidiaries have claimed, among others, that (a) the investment risk, costs charged or the risk premium was not, or not sufficiently, made clear to the customer, (b) the product costs charged on initial sale and on an on-going basis were so high that the expected return on investment was not realistically achievable, (c) the product sold to the customer contained specific risks that were not, or not sufficiently, made clear to the customer (such as the leverage capital consumption risk) or was not suited to his personal circumstances, (d) NN owed the customer a duty of care which NN has breached, or (e) the insurer failed to warn of the risk of not realising the projected policy values. These claims may be based on general standards of contract or securities law, such as reasonableness and fairness, error, duty of care, or standards for proper customer treatment or due diligence and may be made by customers, or on behalf of customers, holding active policies or whose policies have lapsed, matured or been surrendered. NN is currently subject to legal proceedings initiated by individual policyholders and is subject of a number of claims initiatives brought on behalf of policyholders by consumer protection organisations in which claims as set forth above or similar claims are being made. While to date less than 100 complaints are pending before the Dispute Committee of the Financial Services Complaints Board (the KiFiD), and less than 200 individual settlements were made, there is no assurance that further proceedings for damages will not be brought. As the current proceedings are only in early stages, the timing of reaching any finality on these legal claims and proceedings is uncertain and such uncertainty is likely to continue for some time. As a result, although the financial consequences of any of these factors or a combination thereof could be substantial for the Dutch insurance business of ING and, as a result, may have a material adverse effect on NN’s and ING’s reputation, results of operations, solvency and financial condition, it is not possible to reliably estimate or quantify NN’s and ING’s exposures at this time. See “Note 54 Legal Proceedings”.
Rulings or announcements made by courts, including the European Court of Justice and advisory opinions to be issued by the Attorney General to such Court on questions being considered by such Court, or decision-making bodies or actions taken by regulators or governmental authorities against NN or other Dutch insurance companies in respect of unit-linked products, or settlements or any other actions to the benefit of customers (including product improvements or repairs) by other Dutch insurance companies towards consumers, consumer protection organisations, regulatory or governmental authorities or other decision making bodies in respect of the unit-linked products may affect the (legal) position of NN and may force NN to take (financial) measures that could have a substantial impact on the financial condition, results of operations, solvency or reputation of NN and ING. As a result of the public and political attention the unit-linked issue has received, it is also possible that sector-wide measures may be imposed by governmental authorities or regulators in relation to unit-linked products in the Netherlands. The impact on NN of rulings made by courts or decision-making bodies, actions taken by regulators or governmental bodies against other Dutch insurance companies in respect of unit-linked products, or settlements or any other actions to the benefit of customers (including product improvements or repairs) may be determined not only by market share but also by product features, portfolio composition and other factors. Adverse decisions or the occurrence of any of the developments as described above could result in outcomes materially different than if NN or its products had been judged or negotiated solely on their own merits.
NN has in the past sold, issued or advised on unit-linked products in and outside the Netherlands, and in certain jurisdictions continues to do so. Moreover, NN has in the past, in the Netherlands and other countries, sold, issued or advised on large numbers of insurance or investment products of its own or of third parties (and in some jurisdictions continues to do so) that have one or more product characteristics similar to those unit-linked products that have been the subject of the scrutiny, adverse publicity and claims in the Netherlands. Given the continuous political, regulatory and public attention on the unit-linked issue in the Netherlands, the increase in legal proceedings and claim initiatives in the Netherlands or the legislative and regulatory developments in Europe to further increase and strengthen consumer protection in general, there is a risk that unit-linked products and other insurance and investment products sold, issued or advised on by NN, may become subject to the same or similar levels of regulatory or political scrutiny, publicity and claims or actions by consumers, consumer protection organisations, regulators or governmental authorities.
NN’s book of policies dates back many years, and in some cases several decades. Over time, the regulatory requirements and expectations of various stakeholders, including customers, regulators and the public at large, as well as standards and market practice, have developed and changed, increasing customer protection. As a result policyholders and consumer protection organisations have initiated and may in the future initiate proceedings against NN alleging that products sold in the past fail to meet current requirements and expectations. In any such proceedings, it cannot be excluded that the relevant court, regulator, governmental authority or other decision-making body will apply current norms, requirements, expectations, standards and market practices on laws and regulations to products sold, issued or advised on by NN.
Any of the developments described above could be substantial for NN and ING and as a result may have a material adverse effect on ING’s business, reputation, revenues, results of operations, solvency, financial condition and prospects.
ING is exposed to the risk of mis-selling claims. Mis-selling claims are claims from customers who allege that they have received misleading advice or other information from advisers (both internal and external) as to which products were most appropriate for them, or that the terms and conditions of the products, the nature of the products or the circumstances under which the products were sold, were misrepresented to them. When new financial products are brought to the market, ING engages in a product approval process in connection with the development of such products, including
373ING Group Annual Report 2013
1 Wh
o w
e are2 R
epo
rt of th
e Executive B
oard
3 Co
rpo
rate go
vernan
ce4 C
on
solid
ated an
nu
al accou
nts
5 Parent co
mp
any an
nu
al accou
nts
6 Oth
er info
rmatio
n7 A
dd
ition
al info
rmatio
n
ING_2013_deel5_v1.indd 373 19/03/2014 19:45:16
Risk factors continued
production of appropriate marketing and communication materials. Notwithstanding these processes, customers may make mis-selling claims against ING if the products do not generate the expected profit, or result in a loss, or otherwise do not meet expectations. Customer protection regulations, as well as changes in interpretation and perception by both the public at large and governmental authorities of acceptable market practices, influence customer expectations.
Products distributed through person-to-person sales forces have a higher exposure to mis-selling as the sales forces provide face-to-face financial planning and advisory services. Complaints may also arise if customers feel that they have not been treated reasonably or fairly, or that the duty of care has not been complied with. While a considerable amount of time and money has been invested in reviewing and assessing historical sales practices and products that were sold in the past, and in the maintenance of effective risk management, legal and compliance procedures (which in themselves may prove inadequate or otherwise ineffective) to monitor current sales practices, there can be no assurance that all of the issues associated with current and historical sales practices and products have been or will be identified, nor that any issues already identified will not be more widespread than presently estimated.
The negative publicity associated with any sales practices, any compensation payable in respect of any such issues and regulatory changes resulting from such issues, has had and could have a material adverse effect on our business, revenues, results of operations, financial condition and prospects.
Ratings are important to our business for a number of reasons. A downgrade or a potential downgrade in our financial strength or our credit ratings could have an adverse impact on our operations and net results. Credit ratings represent the opinions of rating agencies regarding an entity’s ability to repay its indebtedness. Our credit ratings are important to our ability to raise capital through the issuance of debt and to the cost of such financing. In the event of a downgrade, the cost of issuing debt will increase, having an adverse effect on net results. Certain institutional investors may also be obliged to withdraw their deposits from ING following a downgrade, which could have an adverse effect on our liquidity. We have credit ratings from S&P, Moody’s Investor Service and Fitch Ratings. Each of the rating agencies reviews its ratings and rating methodologies on a recurring basis and may decide on a downgrade at any time. For example, on 2 December 2013, S&P downgraded the long-term debt ratings of ING Groep N.V. from A to A- and ING Bank from A+ to A with stable outlook for both. At the same time, S&P cut the rating of NN Group N.V. from A+ to A.
Claims-paying ability, at the Group or subsidiary level, and financial strength ratings are factors in establishing the competitive position of insurers. A rating downgrade could elevate lapses or surrenders of policies requiring cash payments by current customers seeking companies with higher financial strength ratings, which might force us to sell assets at a price that may result in realised investment losses. Among others, total invested assets decreases and deferred acquisition costs might need to be accelerated, adversely impacting earnings. Furthermore, sales of assets to meet customer withdrawal demands could also result in losses, depending on market conditions. In addition, a downgrade in either our financial strength or credit ratings could potentially, among other things, increase our borrowing costs and make it more difficult to access financing; adversely affect access to the commercial paper market or the availability of letters of credit and other financial guarantees; result in additional collateral requirements, or other required payments or termination rights under derivative contracts or other agreements: and/or impair, or cause the termination of, our relationships with creditors, broker-dealers, distributors of our products and services and customers, reinsurers or trading counterparties, which could potentially negatively affect our profitability, new sales, liquidity, capital and/or our competitive position.
Furthermore, ING Bank’s assets are risk-weighted. Downgrades of these assets could result in a higher risk-weighting, which may result in higher capital requirements. This may impact net earnings and the return on capital, and may have an adverse impact on our competitive position. For ING’s insurance businesses in a number of jurisdictions, downgrades of assets will similarly affect the capital requirements for NN Group in those jurisdictions.
As rating agencies continue to evaluate the financial services industry, it is possible that rating agencies will heighten the level of scrutiny that they apply to financial institutions, increase the frequency and scope of their credit reviews, request additional information from the companies that they rate and potentially adjust upward the capital and other requirements employed in the rating agency models for maintenance of certain ratings levels. It is possible that the outcome of any such review of us would have additional adverse ratings consequences, which could have a material adverse effect on our results of operations, financial condition and liquidity. We may need to take actions in response to changing standards or capital requirements set by any of the rating agencies, which could cause our business and operations to suffer. We cannot predict what additional actions rating agencies may take, or what actions we may take in response to the actions of rating agencies.
Operational risks, such as systems disruptions or failures, breaches of security, cyberattacks, human error, changes in operational practices or inadequate controls may adversely impact our business, results of operation and reputation.Operational risks are inherent in our business. Our businesses depend on the ability to process a large number of transactions efficiently and accurately. Although we endeavour to safeguard our systems and processes, losses can result from inadequately trained or skilled personnel, IT failures (including failure to anticipate or prevent cyberattacks, which are deliberate attempts to gain unauthorised access to digital systems for purposes of misappropriating assets or sensitive information, corrupting data, or impairing operational performance, or security breaks by third parties), inadequate or failed internal control processes and systems, regulatory breaches, human errors, employee misconduct, including fraud, or from external events that interrupt normal business operations. We depend on the secure processing,
374 ING Group Annual Report 2013
ING_2013_deel5_v1.indd 374 19/03/2014 19:45:16
Risk factors continued
storage and transmission of confidential and other information in our computer systems and networks. The equipment and software used in our computer systems and networks may not always be capable of processing, storing or transmitting information as expected. Despite our business continuity plans and procedures, certain of our computer systems and networks may have insufficient recovery capabilities in the event of a malfunction or loss of data. In addition, whilst we have policies and processes to protect our systems and networks, they may be vulnerable to unauthorised access, computer viruses or other malicious code, cyberattacks and other external attacks or internal breaches that could have a security impact and jeopardise our confidential information or that of our clients or our counterparties. These events can potentially result in financial loss and harm to our reputation, and hinder our operational effectiveness.
We also face the risk that the design and operating effectiveness of our controls and procedures prove to be inadequate. Widespread outbreaks of communicable diseases, such as the outbreak of the H1N1 influenza virus, may impact the health of our employees, increasing absenteeism, or may cause a significant increase in the utilisation of health benefits offered to our employees, either or both of which could adversely impact our business. Unforeseeable and/or catastrophic events can lead to an abrupt interruption of activities, and our operations may be subject to losses resulting from such disruptions. Losses can result from destruction or impairment of property, financial assets, trading positions, and the loss of key personnel. If our business continuity plans are not able to be implemented or do not sufficiently take such events into account, losses may increase further. We have suffered losses from operational risk in the past and there can be no assurance that we will not suffer material losses from operational risk in the future.
Reinsurance may not be available, affordable or adequate to protect us against losses. We may also decide to reduce, eliminate or decline primary insurance or reinsurance coverage. As part of our overall risk and capacity management strategy, we purchase reinsurance for certain risks underwritten by our various insurance business segments. Market conditions beyond our control determine the availability and cost of the reinsurance protection we purchase. Accordingly, we may be forced to incur additional expenses for reinsurance or may not be able to obtain sufficient reinsurance on acceptable terms, which could adversely affect our ability to write future business.
In addition, we determine the appropriate level of primary insurance and reinsurance coverage based on a number of factors and from time to time decide to reduce, eliminate or decline coverage based on our assessment of the costs and benefits involved. In such cases, the uninsured risk remains with us.
Adverse publicity, claims and allegations, litigation and regulatory investigations and sanctions may have a material adverse effect on our business, revenues, results of operations, financial condition and/or prospects. We are subject to litigation, arbitration and other claims and allegations in the ordinary course of business, including in connection with our activities as financial services provider, insurer, employer, investor and taxpayer. Adverse publicity and damage to our reputation arising from our failure or perceived failure to comply with legal and regulatory requirements, financial reporting irregularities involving other large and well-known companies, possible findings of government authorities in various jurisdictions which are investigating several rate-setting processes, increasing regulatory and law enforcement scrutiny of ‘know your customer’ anti-money laundering, prohibited transactions with countries subject to sanctions, and bribery or other anti-corruption measures and anti-terrorist-financing procedures and their effectiveness, regulatory investigations of the mutual fund, banking and insurance industries, and litigation that arises from the failure or perceived failure by us to comply with legal, regulatory and compliance requirements could result in adverse publicity and reputational harm, lead to increased regulatory supervision, affect our ability to attract and retain customers and maintain access to the capital markets, result in cease and desist orders, claims, enforcement actions, fines and civil and criminal penalties, other disciplinary action or have other material adverse effects on us in ways that are not predictable. Some claims and allegations may be brought by or on behalf of a class and claimants may seek large or indeterminate amounts of damages, including compensatory, liquidated, treble and punitive damages. See ‘—ING is exposed to the risk of mis-selling claims’. Our reserves for litigation liabilities may prove to be inadequate. Claims and allegations, should they become public, need not be well founded, true or successful to have a negative impact on our reputation. In addition, press reports and other public statements that assert some form of wrongdoing could result in inquiries or investigations by regulators, legislators and law enforcement officials, and responding to these inquiries and investigations, regardless of their ultimate outcome, is time-consuming and expensive. Adverse publicity, claims and allegations, litigation and regulatory investigations and sanctions may have a material adverse effect on our business, revenues, results of operations, financial condition and/or prospects in any given period. For additional information with respect to specific proceedings, see note 54 to the consolidated financial statements of ING Group.
RISKS RELATED TO THE RESTRUCTURING PLAN The implementation of the Restructuring Plan and the divestments anticipated in connection with that plan will significantly alter the size and structure of the Group and involve significant costs and uncertainties that could materially impact the Group. In November 2008, the Dutch State purchased the Core Tier 1 Securities, and in the first quarter of 2009, we entered into the Illiquid Asset Back-up Facility (‘IABF’) with the Dutch State, the structure of which has been since then terminated as of 1 November 2013.
As a result of having received state aid through the Dutch State Transactions, we were required to submit a restructuring plan to the EC in connection with obtaining final approval for the Dutch State Transactions under the EC state aid rules. On 26 October 2009, we announced our restructuring plan (‘Initial Restructuring Plan’), pursuant to which we were required to divest by the end of 2013 all of our insurance business, including the investment management business, as well as ING Direct USA, which operated our direct banking business in the U.S., and certain portions of our retail banking business in the Netherlands. The EC’s approval of the Initial Restructuring Plan was issued on 18 November 2009. On 28 January 2010, ING lodged an appeal with the General Court of the European Union
375ING Group Annual Report 2013
1 Wh
o w
e are2 R
epo
rt of th
e Executive B
oard
3 Co
rpo
rate go
vernan
ce4 C
on
solid
ated an
nu
al accou
nts
5 Parent co
mp
any an
nu
al accou
nts
6 Oth
er info
rmatio
n7 A
dd
ition
al info
rmatio
n
ING_2013_deel5_v1.indd 375 19/03/2014 19:45:16
Risk factors continued
(‘General Court’) against specific elements of the EC’s decision regarding the Initial Restructuring Plan. On 2 March 2012, the General Court partially annulled the EC’s decision of 18 November 2009. Subsequently, the EC filed an appeal against the General Court’s judgment before the Court of Justice of the European Union. In parallel, the EC adopted a decision on 11 May 2012 that re-approved the state aid granted to ING Group as compatible with the internal market on the basis of the Initial Restructuring Plan. On the same date, the EC adopted an interim decision which opened an investigation concerning certain amendments and elements of the Initial Restructuring Plan. On 24 July 2012, ING announced that the Dutch State and ING were in dialogue with the EC on an amended and updated Restructuring Plan to be submitted to the EC. However, in order to safeguard its legal rights, ING filed an appeal with the General Court against the EC’s decision of 11 May 2012, which re-approved the Initial Restructuring Plan.
On 19 November 2012, ING and the Dutch State announced that they reached an agreement with the EC on significant amendments to the Initial Restructuring Plan (‘Amended Restructuring Plan’, and together with the Initial Restructuring Plan, ‘Restructuring Plan’). The Amended Restructuring Plan extended the time horizon and increased the flexibility for the completion of divestments and adjusted other commitments set forth in the Initial Restructuring Plan.
On 6 November 2013, ING and the Dutch State further announced the adoption of a revised timeline for certain required divestments As a result of the Amended Restructuring Plan, the EC has closed its formal investigations as announced on 11 May 2012, and ING has withdrawn its appeal with the General Court filed in July 2012. Although the EC’s appeal against the March 2012 ruling of the General Court continues, ING, the Dutch State and the EC have agreed that any outcome of this procedure will not affect the approval of the Amended Restructuring Plan. It is expected that this judgment will be rendered in April 2014. See Note 58 to the consolidated financial statements of ING Group for more information on and implications of the Amended Restructuring Plan.
Pursuant to the agreement to unwind the IABF, the IABF in its current form was terminated, regular guarantee fee payments have been settled for an amount of EUR 0.4 billion, the other restrictions as part of the IABF agreement are no longer applicable and the Dutch State intends to sell the Alt-A securities in the market. A first tranche has been sold in December 2013 and the remainder has been sold in February 2014. Unwinding the IABF also resulted in eliminating a counter-guarantee that ING extended to the Dutch state in connection with the divestment of ING Direct USA in 2012.
The restrictions imposed by the Restructuring Plan could adversely affect our ability to maintain or grow market share in key markets as well as our results of operations. See ‘Risks Related to the Restructuring Plan. See ‘—The limitations required by the EC on our ability to compete and to make acquisitions or call certain debt instruments could materially impact the Group’.
There can be no assurance that we will be able to implement the Restructuring Plan successfully or complete the remaining planned divestments on favourable terms or at all, particularly in light of market developments in general as well as the fact that other financial institutions may place similar assets for sale during the same time period and may seek to dispose of assets in the same manner. Any failure to successfully implement the Restructuring Plan may result in EC enforcement actions or EC procedures and may have a material adverse impact on the assets, profitability, capital adequacy and business operations of the Group. Moreover, in connection with the implementation of the Restructuring Plan, including any proposed divestments, we or potential buyers may need to obtain various approvals, including of shareholders, works councils and regulatory and competition authorities, and we and potential buyers may face difficulties in obtaining these approvals in a timely manner or at all. In addition, the implementation of the Restructuring Plan may strain relations with our employees, and specific proposals in connection with the implementation may be opposed by labour unions or works councils. Furthermore, following the announcement of the Initial Restructuring Plan, for example, several of our subsidiaries were downgraded or put on credit watch by rating agencies. See ‘Risks Related to the Group’s Business, Operations, and Regulatory Environment — Ratings are important to our business for a number of reasons. A downgrade or a potential downgrade in our financial strength or our credit ratings could have an adverse impact on our operations and net results’.
Other factors that may impede our ability to implement the Restructuring Plan successfully include an inability of prospective purchasers to obtain funding due to the deterioration of the credit markets, insufficient access to equity capital markets, a general unwillingness of prospective purchasers to commit capital in the current market environment, antitrust concerns, any adverse changes in market interest rates or other borrowing costs and any declines in the value of the assets to be divested. Similarly, it may also be difficult to divest all or part of our insurance or investment management business through one or more initial public offerings. There can also be no assurance that we could obtain favourable pricing for a sale of all or part of our insurance or investment management business in the public markets or succeed in turning the relevant subsidiaries into viable stand-alone businesses. A divestment may also release less regulatory capital than we would otherwise expect.
Any failure to complete the divestments on favourable terms could have a material adverse impact on our assets, profitability, capital adequacy and business operations. If we are unable to complete the announced divestments in a timely manner, we would be required to find alternative ways to reduce our leverage, and we could be subject to enforcement actions or proceedings by the EC. In case of material non-compliance with the Amended Restructuring Plan, in particular, if we do not succeed in completing divestitures as described in the Amended Restructuring Plan within the timelines set out therein or subsequently agreed upon, do not repay the Core Tier 1 Securities according to the schedule as included in the Amended Restructuring Plan, and/or do not succeed in satisfying the commitments with respect to Nationale-Nederlanden Bank upon divestment of more than 50% of our interest in NN Group c.q in Nationale-Nederlanden Bank and/or by year-end 2015 as described in the Amended Restructuring Plan, the Dutch State will re-notify this to the EC, which may
376 ING Group Annual Report 2013
ING_2013_deel5_v1.indd 376 19/03/2014 19:45:17
take enforcement actions against ING or require additional restructuring measures. A divestment of more than 50% of ING’s interest as mentioned in this paragraph also means that ING Group (a) no longer has a majority of representatives on the boards of these businesses and (b) has deconsolidated these businesses from ING Group’s financial statements in line with IFRS accounting rules.
The implementation of the divestments announced in connection with the Restructuring Plan, including the separation of our insurance and most of our investment management operations from our banking operations, will also give rise to additional costs related to the legal and financial assessment of potential transactions. The implementation may also result in increased operating and administrative costs. The process of completing the steps contemplated by the Restructuring Plan may be disruptive to our business and the businesses we are trying to divest and may cause an interruption or reduction of our business and the businesses to be sold or otherwise divested as a result of, among other factors, the loss of key employees or customers and the diversion of management’s attention from our day-to-day business as a result of the need to manage the divestment process as well as any disruptions or difficulties that arise during the course of the divestment process. We may face other difficulties in implementing the Restructuring Plan and completing the planned divestments. For instance, the divestments, individually or in the aggregate, may trigger provisions in various contractual obligations, including debt and capital instruments, which could require us to modify, restructure or refinance those or other related obligations. We may not be able to effect any such restructuring or refinancing on similar terms pursuant to the current contractual obligations or at all. In addition, the announced divestments could be the subject of claims or litigation, and a court or regulator could delay any of the divestment transactions or prohibit them from occurring on their proposed terms, or from occurring at all, which could adversely affect our ability to use the funds of the divestments to repay the remaining amount of the Core Tier 1 Securities, reduce or eliminate our double leverage and strengthen our capital ratios as anticipated and eliminate the constraints on competition imposed by the EC.
The limitations required by the EC on our ability to compete and to make acquisitions or redeem certain debt instruments could materially impact the Group.As part of our Restructuring Plan, we have undertaken with the EC to accept certain limitations on our ability to compete in certain retail, private and direct banking markets in the EU and on our ability to acquire (i) financial institutions and (ii) businesses, insofar as this would delay our repayment of the remaining Core Tier 1 Securities held by the Dutch State. These restrictions in principle apply until the earlier of (1) 18 November 2015, and (2) the date upon which more than 50% of ING´s interest in its insurance and investment management businesses has been divested. We were also required to agree to limitations on our ability to call Tier-2 capital and Tier-1 hybrid debt instruments, which remain subject to authorisations by the EC on a case-by-case basis until the earlier of 18 November 2014 or the repayment of the remaining Core Tier 1 Securities (including the relevant accrued interest on Core Tier 1 coupons and exit premium fees). If the EC does not approve the calling of Tier-2 capital and Tier-1 hybrid debt instruments in the future, this may have adverse consequences for us, result in additional payments on these instruments and limit our ability to seek refinancing on more favourable terms. ING is furthermore restricted to a maximum ratio for mortgage production at ING Retail Banking Netherlands in relation to the mortgage production of Nationale-Nederlanden Bank until ING has divested more than 50% of its interest in NN Group c.q. Nationale-Nederlanden Bank or until year-end 2015. A divestment of more than 50% of ING’s interest as mentioned in this paragraph also means that ING Group (a) no longer has a majority of representatives on the boards of these businesses and (b) has deconsolidated these businesses from ING Group’s financial statements in line with IFRS accounting rules. The limitations described above will impose significant restrictions on our banking business operations and on our ability to take advantage of market conditions and growth opportunities. Such restrictions could adversely affect our ability to maintain or grow market share in key markets, as well as our results of operations.
Upon the implementation of the Restructuring Plan, we will be less diversified and may experience competitive and other disadvantages. Following completion of the planned divestments under the Restructuring Plan, we expect to become a significantly smaller, regional financial institution focused on retail, direct and commercial banking in the Benelux region and certain other parts of Europe, as well as selected markets outside Europe. Although we will remain focused on banking operations, we may become a smaller bank than that represented by our current banking operations. In the highly competitive Benelux market and the other markets in which we operate, our competitors may be larger, more diversified and better capitalised and have greater geographical reach than us, which could have a material adverse effect on our ability to compete, as well as on our profitability. The divested businesses may also compete with the retained businesses, on their own or as part of the purchasers’ enlarged businesses. For example, Nationale-Nederlanden Bank is already competing before its planned divestment with our retail banking business in the Netherlands, as Nationale-Nederlanden Bank has been ring-fenced from ING Bank’s operations for this purpose. In addition, the restrictions on our ability to be a price leader and make acquisitions and on our compensation policies could further hinder our capacity to compete with competitors not burdened with such restrictions, which could have a material adverse effect on our results of operations. There can be no assurance that the implementation of the Restructuring Plan will not have a material adverse effect on the market share, business and growth opportunities and results of operations for our remaining core banking businesses.
Risk factors continued
377ING Group Annual Report 2013
1 Wh
o w
e are2 R
epo
rt of th
e Executive B
oard
3 Co
rpo
rate go
vernan
ce4 C
on
solid
ated an
nu
al accou
nts
5 Parent co
mp
any an
nu
al accou
nts
6 Oth
er info
rmatio
n7 A
dd
ition
al info
rmatio
n
ING_2013_deel5_v1.indd 377 19/03/2014 19:45:17
Our restructuring programs may not yield intended reductions in costs, risk and leverage. Projected cost savings and impact on our risk profile and capital associated with the Restructuring Plan are subject to a variety of risks, including: • actual costs to effect these initiatives may exceed estimates;• divestments planned in connection with the Restructuring Plan may not yield the level of net proceeds expected, as described under
‘Risks Related to the Restructuring Plan — The implementation of the Restructuring Plan and the divestments anticipated in connection with that plan will significantly alter the size and structure of the Group and involve significant costs and uncertainties that could materially impact the Group’;
• initiatives that we are contemplating may require consultation with various regulators as well as employees and labour representatives, and such consultations may influence the timing, costs and extent of expected savings;
• the loss of skilled employees in connection with the initiatives; and• projected savings may fall short of targets.
While we have begun and expect to continue to implement these strategies, there can be no assurance that we will be able to do so successfully or that we will realise the projected benefits of these and other restructuring and cost-saving initiatives. If we are unable to realise these anticipated cost reductions, our business may be adversely affected. Moreover, our continued implementation of restructuring and cost saving initiatives may have a material adverse effect on our business, financial condition, results of operations and cash flows.
Whenever the overall return on the (remaining) Core Tier 1 Securities issued to the Dutch State is expected to be lower than 10% p.a. and/or in the event that ING does not repay the remaining Core Tier 1 Securities in accordance with the repayment schedule that was submitted to the EC as part of the Amended Restructuring Plan, the EC may consider the imposition of additional behavioural constraints.As stated in the decision of the EC of 12 November 2008 (in State Aid N 528/2008 — The Netherlands), the Core Tier 1 state-aid measure must be (re)notified to the EC by the Dutch authorities if the overall return on the Core Tier 1 Securities of at least 10% p.a. is not expected to be achieved. In such a case, the EC may require additional (behavioural) constraints as a condition of the compatibility of the measure.
In 2011, ING reported to the Dutch authorities that ING has abstained from paying dividends on its shares for a period of two consecutive years (i.e., 2009 and 2010) as a result of which the EC opened an investigation into ING’s restructuring process. Following the approval of the Amended Restructuring Plan, the EC closed its formal investigations. Pursuant to the Amended Restructuring Plan, we had to repay the then outstanding amount of EUR 3 billion in four equal tranches. On 26 November 2012 and 6 November 2013, ING repaid the first two tranches of EUR 1,125 million each to the Dutch State. Each tranche consisted of EUR 750 million in repayment of Core Tier 1 Securities and EUR 375 million in premiums and interest. After the EUR 1,125 million payment made by ING on 6 November 2013, the remaining two tranches of approximately EUR 1,125 million each are expected to be paid in March 2014 and May 2015, respectively, translating into an overall internal rate of return of 12.5% p.a. Any repayment of the remaining Core Tier 1 Securities is conditional on approval from the DNB. Upon reaching the agreement on the Amended Restructuring Plan, ING indicated that it aims to repay the remaining Core Tier 1 Securities as soon as possible and accelerate repayments to the extent it is deemed prudent under prevailing financial circumstances. If the repayment of a tranche cannot be made in full or in part, ING will be required to make it up by a corresponding increase of the subsequent tranche to be repaid.
The Netherlands committed to re-notify the recapitalisation measure in the event that ING does not repay in full two consecutive tranches. Moreover, if ING does not repay a total of EUR 4.5 billion by 15 May 2015, the Dutch State commits to re-notify the recapitalisation measure.
If ING is unable to repay the remaining Core Tier 1 Securities according to the above-mentioned deadlines and other terms agreed with the EC, this could result in the EC imposing additional (behavioural) constraints on us or taking any enforcement action against us.
ADDITIONAL RISKS RELATING TO OWNERSHIP OF ING SHARES Because we are a Dutch company and because Stichting ING Aandelen holds more than 99.9% of our Ordinary Shares, the rights of our depositary receiptholders may differ from the rights of shareholders in other jurisdictions or companies that do not use a similar trust structure, which could affect your rights as an equity investor. While holders of our bearer depositary receipts are entitled to attend and speak at our General Meeting of Shareholders (‘General Meeting’), voting rights are not attached to the bearer depositary receipts. Stichting ING Aandelen (‘Trust’) holds more than 99.9% of our Ordinary Shares, and exercises the voting rights attached to the Ordinary Shares (for which bearer depositary receipts have been issued). Holders of bearer depositary receipts who attend — in person or by proxy — the General Meeting must obtain and are entitled to voting rights by proxy from the Trust. Holders of bearer depositary receipts and holders of the American Depositary Shares (‘ADSs’) representing the bearer depositary receipts who do not attend the General Meeting may give binding voting instructions to the Trust. The Trust is entitled to vote on any Ordinary Shares underlying the bearer depositary receipts for which the Trust has not granted voting proxies, or voting instructions have not been given to the Trust. In exercising its voting discretion, the Trust is required to be guided primarily by the interests of the holders of bearer depositary receipts, while also taking into account: • our interests, and• the interests of our affiliates.
Risk factors continued
378 ING Group Annual Report 2013
ING_2013_deel5_v1.indd 378 19/03/2014 19:45:17
The Trust may, but has no obligation to, consult with the holders of bearer depositary receipts in exercising its voting rights in respect of any Ordinary Shares for which it is entitled to vote. These arrangements differ from practices in other jurisdictions, and accordingly may affect the rights of the holders of bearer depositary receipts and their power to affect ING’s business and operations.
The share price of ING shares has been, and may continue to be, volatile. The share price of our bearer depositary receipts has experienced periods of volatility in the past, and the share price and trading volume of our bearer depositary receipts may be subject to significant fluctuations in the future, due, in part, to changes in our actual or forecast operating results and the inability to fulfil the profit expectations of securities analysts, as well as to the high volatility in the securities markets generally and more particularly in shares of financial institutions. Other factors, besides our financial results, that may impact our share price include, but are not limited to: • market expectations of the performance and capital adequacy of financial institutions in general; • investor perception of the success and impact of our strategies; • investor perception of our positions and risks; • a downgrade or review of our credit ratings; • the implementation and outcome of our Restructuring Plan; • potential litigation or regulatory action involving ING or sectors that we have exposure to through our insurance and banking activities; • announcements concerning financial problems or any investigations into the accounting practices of other financial institutions; and• general market circumstances. There can be no assurance that we will pay dividends on our Ordinary Shares in the future. It is ING’s policy to pay dividends in relation to the long-term underlying development of cash earnings. Dividends can only be declared by shareholders when the Executive Board considers such dividends appropriate, taking into consideration the financial conditions then prevailing and the longer-term outlook. Given the uncertain financial environment, ING did not pay an interim dividend in 2013 and intends to resume dividend payments when all remaining Core Tier 1 Securities have been repaid to the Dutch State and the regulatory capital requirements of Basel III have been met. However, there can be no assurance that we will pay dividends in the future.
The remaining Core Tier 1 Securities issued to the Dutch State may be converted into Ordinary Shares or bearer depositary receipts and dilute existing shareholders. The terms of the Core Tier 1 Securities permit us, on or after 12 November 2011, to convert any or all of the remaining Core Tier 1 Securities (EUR 1.5 billion per 6 November 2013) into Ordinary Shares or bearer depositary receipts on the basis of one Core Tier 1 Security for 1,335 Ordinary Shares on a one-for-one basis (subject to customary adjustments as may be necessary to preserve economic equivalence) or bearer depositary receipts. Any such conversion would dilute existing shareholders. If we exercise our conversion right, the Dutch State may opt to require us to redeem the Core Tier 1 Securities on the conversion date at the original issue price of EUR 10 per Core Tier 1 Security, together with the pro rata coupon, if due, accrued to such date.
Certain holders of ING shares may not be able to participate in future equity offerings with subscription rights. We may undertake future equity offerings with or without subscription rights. In case of equity offerings with subscription rights, holders of ING shares in certain jurisdictions, however, may not be entitled to exercise such rights unless the rights and the related shares are registered or qualified for sale under the relevant legislation or regulatory framework. Holders of ING shares in these jurisdictions may suffer dilution of their shareholding should they not be permitted to participate in future equity offerings with subscription rights.
Risk factors continued
379ING Group Annual Report 2013
1 Wh
o w
e are2 R
epo
rt of th
e Executive B
oard
3 Co
rpo
rate go
vernan
ce4 C
on
solid
ated an
nu
al accou
nts
5 Parent co
mp
any an
nu
al accou
nts
6 Oth
er info
rmatio
n7 A
dd
ition
al info
rmatio
n
ING_2013_deel5_v1.indd 379 19/03/2014 19:45:17
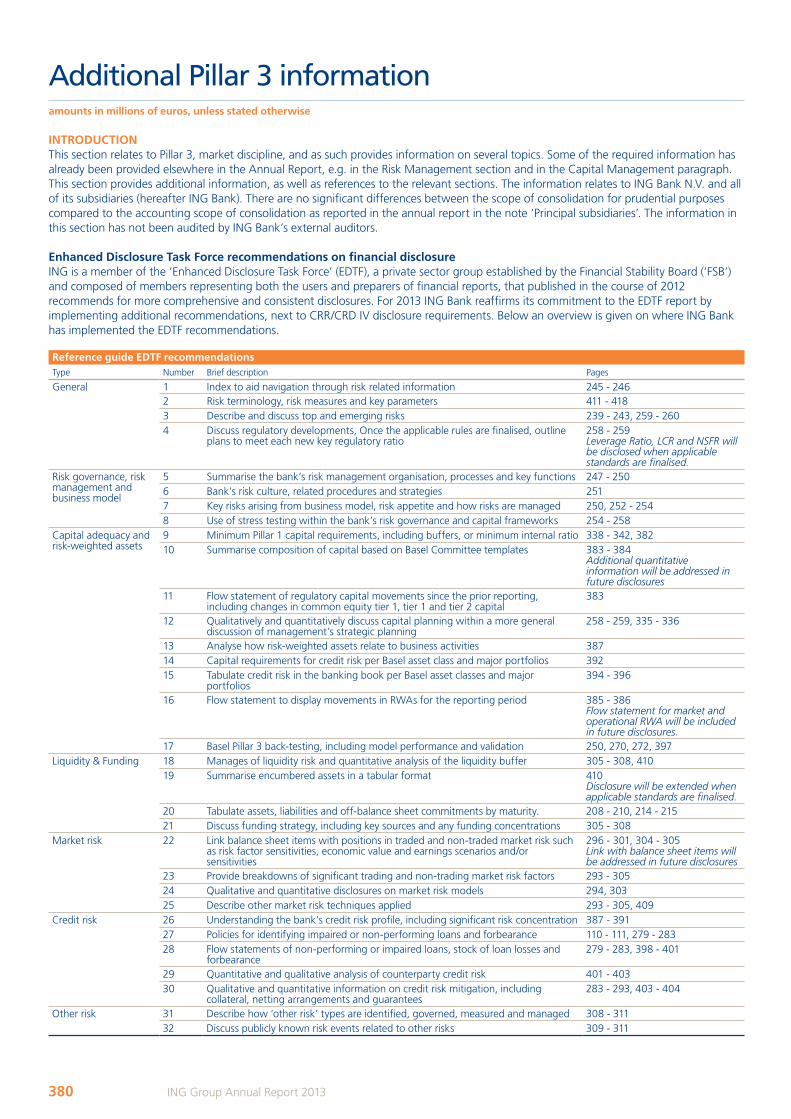
INTRODUCTION This section relates to Pillar 3, market discipline, and as such provides information on several topics. Some of the required information has already been provided elsewhere in the Annual Report, e.g. in the Risk Management section and in the Capital Management paragraph. This section provides additional information, as well as references to the relevant sections. The information relates to ING Bank N.V. and all of its subsidiaries (hereafter ING Bank). There are no significant differences between the scope of consolidation for prudential purposes compared to the accounting scope of consolidation as reported in the annual report in the note ‘Principal subsidiaries’. The information in this section has not been audited by ING Bank’s external auditors.
Enhanced Disclosure Task Force recommendations on financial disclosureING is a member of the ‘Enhanced Disclosure Task Force’ (EDTF), a private sector group established by the Financial Stability Board (‘FSB’) and composed of members representing both the users and preparers of financial reports, that published in the course of 2012 recommends for more comprehensive and consistent disclosures. For 2013 ING Bank reaffirms its commitment to the EDTF report by implementing additional recommendations, next to CRR/CRD IV disclosure requirements. Below an overview is given on where ING Bank has implemented the EDTF recommendations.
Reference guide EDTF recommendationsType Number Brief description Pages
General 1 Index to aid navigation through risk related information 245 - 2462 Risk terminology, risk measures and key parameters 411 - 4183 Describe and discuss top and emerging risks 239 - 243, 259 - 2604 Discuss regulatory developments, Once the applicable rules are finalised, outline
plans to meet each new key regulatory ratio258 - 259 Leverage Ratio, LCR and NSFR will be disclosed when applicable standards are finalised.
Risk governance, risk management and business model
5 Summarise the bank’s risk management organisation, processes and key functions 247 - 2506 Bank's risk culture, related procedures and strategies 2517 Key risks arising from business model, risk appetite and how risks are managed 250, 252 - 2548 Use of stress testing within the bank’s risk governance and capital frameworks 254 - 258
Capital adequacy and risk-weighted assets
9 Minimum Pillar 1 capital requirements, including buffers, or minimum internal ratio 338 - 342, 38210 Summarise composition of capital based on Basel Committee templates 383 - 384
Additional quantitative information will be addressed in future disclosures
11 Flow statement of regulatory capital movements since the prior reporting, including changes in common equity tier 1, tier 1 and tier 2 capital
383
12 Qualitatively and quantitatively discuss capital planning within a more general discussion of management’s strategic planning
258 - 259, 335 - 336
13 Analyse how risk-weighted assets relate to business activities 38714 Capital requirements for credit risk per Basel asset class and major portfolios 39215 Tabulate credit risk in the banking book per Basel asset classes and major
portfolios394 - 396
16 Flow statement to display movements in RWAs for the reporting period 385 - 386 Flow statement for market and operational RWA will be included in future disclosures.
17 Basel Pillar 3 back-testing, including model performance and validation 250, 270, 272, 397Liquidity & Funding 18 Manages of liquidity risk and quantitative analysis of the liquidity buffer 305 - 308, 410
19 Summarise encumbered assets in a tabular format 410 Disclosure will be extended when applicable standards are finalised.
20 Tabulate assets, liabilities and off-balance sheet commitments by maturity. 208 - 210, 214 - 21521 Discuss funding strategy, including key sources and any funding concentrations 305 - 308
Market risk 22 Link balance sheet items with positions in traded and non-traded market risk such as risk factor sensitivities, economic value and earnings scenarios and/or sensitivities
296 - 301, 304 - 305Link with balance sheet items will be addressed in future disclosures
23 Provide breakdowns of significant trading and non-trading market risk factors 293 - 30524 Qualitative and quantitative disclosures on market risk models 294, 30325 Describe other market risk techniques applied 293 - 305, 409
Credit risk 26 Understanding the bank’s credit risk profile, including significant risk concentration 387 - 39127 Policies for identifying impaired or non-performing loans and forbearance 110 - 111, 279 - 283 28 Flow statements of non-performing or impaired loans, stock of loan losses and
forbearance279 - 283, 398 - 401
29 Quantitative and qualitative analysis of counterparty credit risk 401 - 40330 Qualitative and quantitative information on credit risk mitigation, including
collateral, netting arrangements and guarantees283 - 293, 403 - 404
Other risk 31 Describe how ‘other risk’ types are identified, governed, measured and managed 308 - 31132 Discuss publicly known risk events related to other risks 309 - 311
Additional Pillar 3 informationamounts in millions of euros, unless stated otherwise
380 ING Group Annual Report 2013
ING_2013_deel5_v1.indd 380 19/03/2014 19:45:17
Additional Pillar 3 information continued
REGULATORY CAPITAL Capital Adequacy Rules – Basel II AccordThe rules on capital adequacy, also referred to as Regulatory Capital (RC), express the regulators’ and legislators’ opinions of how much capital a bank and other regulated credit institutions must retain in relation to the size and the type of risk taking expressed in the form of risk-weighted assets. The most important part of the capital base is the shareholders’ equity. In addition to equity, the institution may issue certain liabilities such as certain hybrid instruments to be included in the capital base. The legal minimum requirement stipulates that the capital base must correspond to at least 8% of the Risk-Weighted Assets (RWA). The Dutch government adopted the Capital Requirements Directive (CRD), the European reflection of the Basel II capital accord in December 2006.
The Pillar 3 information mostly relates to Credit Risk, but also to securitisations and Other Non-Credit Obligation Assets (ONCOA). The requirements are mainly for underlying exposure, risk weighted assets and regulatory capital. As such it relates primarily to the first Basel II pillar, the minimum capital requirement. These regulatory requirements are provided in the next section, including those for market risk and operational risk. The second pillar concerns Economic Capital (EC) and the underlying models used internally by banks and reviewed by supervisors. Economic Capital, and consequently Pillar 2, is disclosed extensively in the Risk Management section. As such, the text of this Pillar 3 section should be read in conjunction with statements made in the Risk Management section and Capital Management section of the annual accounts, where there is a comprehensive discussion of Risk Management and Capital Management.
Approaches applied by ING BankOn 1 January 2008, ING Bank adopted the Advanced Internal Ratings Based (AIRB) approach for the majority of its significant portfolios that contain credit risk in accordance with the approvals granted by DNB (Dutch Central Bank), and various local regulators, as required. However, there remains a small portion of the portfolio that is subject to the Standardised Approach (SA). Unlike many regulators, DNB requires institutions to aim for at least 85% (RWA weighted) of their portfolio on AIRB to qualify for the AIRB status. The majority of SA portfolios at ING Bank relate to subsidiaries where the home regulator does not have a robust AIRB framework or requirement. ING continues to explore opportunities to transition additional portfolios from SA to AIRB. ING Bank does not have any portfolios that use the Foundation Internal Ratings Based (FIRB) Approach.
During 2013 ING Bank’s SA portfolio decreased in terms of Regulatory Exposure at Default (READ) by 20.5% as a result of mainly the sale of ING Direct UK. At December 2013, the largest portfolios under SA are the Turkey, India (ING Vysya Bank) and part of the Poland (ING Bank Slaski) portfolios. ING Bank continues to work with local regulators especially in Poland to bring more portfolios to AIRB.
The AIRB and SA approaches are explained in more detail in the Credit Risk Measurement section of the Risk Management paragraph. An analysis on the AIRB and SA portfolios with their accompanying tables is provided in the SA and AIRB Approach sections of Pillar 3.
ING Bank uses the AIRB and the Internal Assessment Approach (IAA) for liquidity lines provided to Asset Backed Commercial Paper programmes and this is explained in more detail in the securitisation section.
Basel III AccordThe Basel III Accord was adopted in 2010 and consequently translated into regulation by the EU in the Capital Requirement Regulation (CRR) and a Capital Requirement Directive IV. The CRR is binding for all EU member states and became effective per 1 January 2014. For more information, please refer to the chapter ‘Ongoing changes in the regulatory environment’.
381ING Group Annual Report 2013
1 Wh
o w
e are2 R
epo
rt of th
e Executive B
oard
3 Co
rpo
rate go
vernan
ce4 C
on
solid
ated an
nu
al accou
nts
5 Parent co
mp
any an
nu
al accou
nts
6 Oth
er info
rmatio
n7 A
dd
ition
al info
rmatio
n
ING_2013_deel5_v1.indd 381 19/03/2014 19:45:17
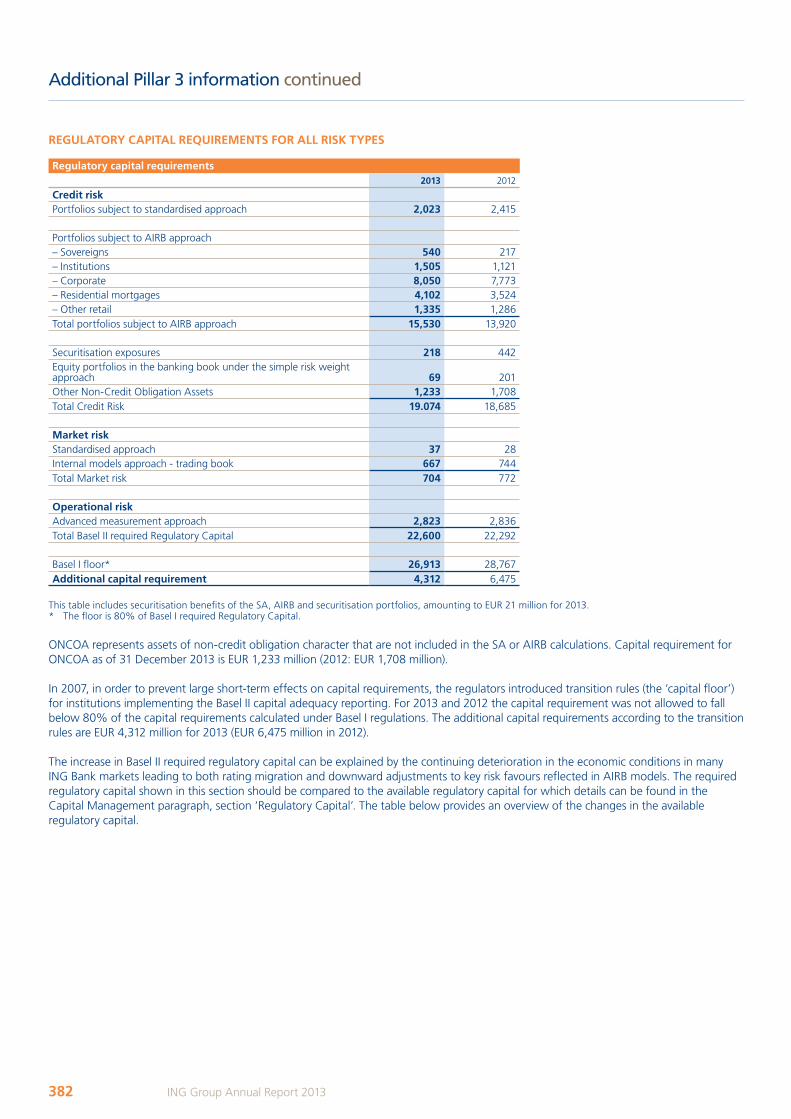
REGULATORY CAPITAL REQUIREMENTS FOR ALL RISK TYPES
Regulatory capital requirements2013 2012
Credit riskPortfolios subject to standardised approach 2,023 2,415
Portfolios subject to AIRB approach– Sovereigns 540 217– Institutions 1,505 1,121– Corporate 8,050 7,773– Residential mortgages 4,102 3,524– Other retail 1,335 1,286Total portfolios subject to AIRB approach 15,530 13,920
Securitisation exposures 218 442Equity portfolios in the banking book under the simple risk weight approach 69 201Other Non-Credit Obligation Assets 1,233 1,708Total Credit Risk 19.074 18,685
Market riskStandardised approach 37 28Internal models approach - trading book 667 744Total Market risk 704 772
Operational riskAdvanced measurement approach 2,823 2,836Total Basel II required Regulatory Capital 22,600 22,292
Basel I floor* 26,913 28,767Additional capital requirement 4,312 6,475
This table includes securitisation benefits of the SA, AIRB and securitisation portfolios, amounting to EUR 21 million for 2013. * The floor is 80% of Basel I required Regulatory Capital.
ONCOA represents assets of non-credit obligation character that are not included in the SA or AIRB calculations. Capital requirement for ONCOA as of 31 December 2013 is EUR 1,233 million (2012: EUR 1,708 million).
In 2007, in order to prevent large short-term effects on capital requirements, the regulators introduced transition rules (the ‘capital floor’) for institutions implementing the Basel II capital adequacy reporting. For 2013 and 2012 the capital requirement was not allowed to fall below 80% of the capital requirements calculated under Basel I regulations. The additional capital requirements according to the transition rules are EUR 4,312 million for 2013 (EUR 6,475 million in 2012).
The increase in Basel II required regulatory capital can be explained by the continuing deterioration in the economic conditions in many ING Bank markets leading to both rating migration and downward adjustments to key risk favours reflected in AIRB models. The required regulatory capital shown in this section should be compared to the available regulatory capital for which details can be found in the Capital Management paragraph, section ‘Regulatory Capital’. The table below provides an overview of the changes in the available regulatory capital.
Additional Pillar 3 information continued
382 ING Group Annual Report 2013
ING_2013_deel5_v1.indd 382 19/03/2014 19:45:18
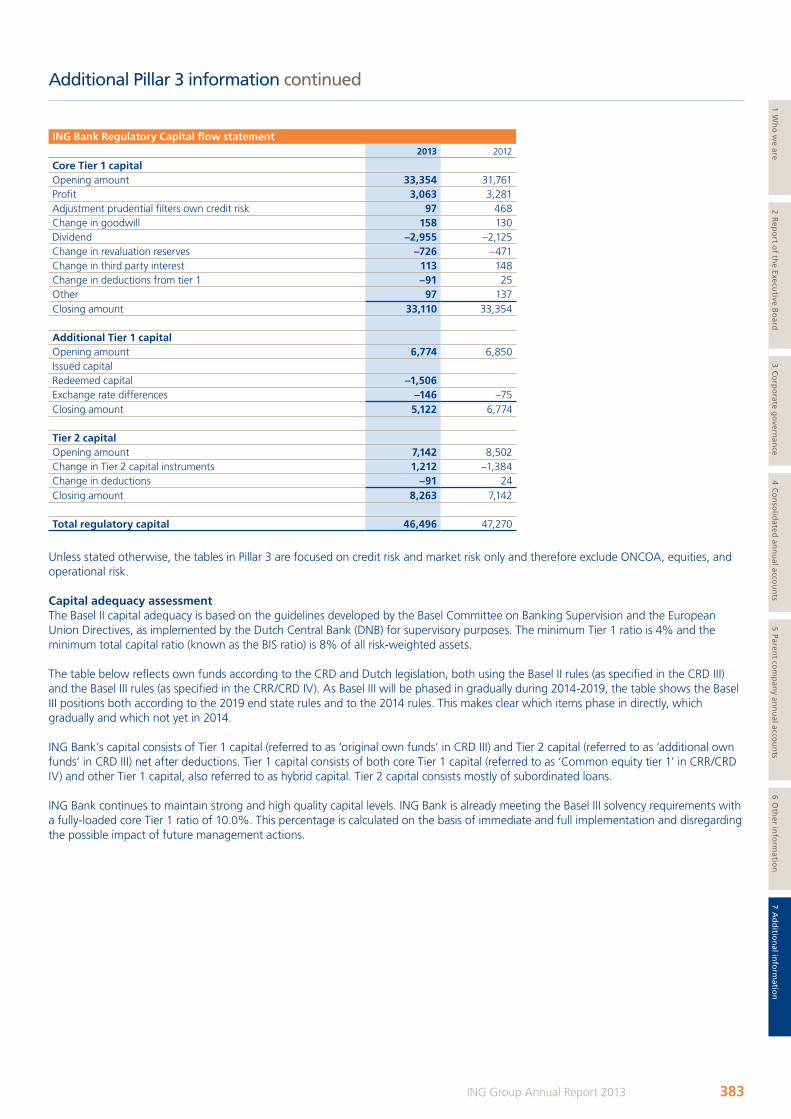
ING Bank Regulatory Capital flow statement2013 2012
Core Tier 1 capitalOpening amount 33,354 31,761Profit 3,063 3,281Adjustment prudential filters own credit risk 97 468Change in goodwill 158 130Dividend –2,955 –2,125Change in revaluation reserves –726 –471Change in third party interest 113 148Change in deductions from tier 1 –91 25Other 97 137Closing amount 33,110 33,354
Additional Tier 1 capital Opening amount 6,774 6,850Issued capitalRedeemed capital –1,506Exchange rate differences –146 –75Closing amount 5,122 6,774
Tier 2 capitalOpening amount 7,142 8,502Change in Tier 2 capital instruments 1,212 –1,384Change in deductions –91 24Closing amount 8,263 7,142
Total regulatory capital 46,496 47,270
Unless stated otherwise, the tables in Pillar 3 are focused on credit risk and market risk only and therefore exclude ONCOA, equities, and operational risk.
Capital adequacy assessmentThe Basel II capital adequacy is based on the guidelines developed by the Basel Committee on Banking Supervision and the European Union Directives, as implemented by the Dutch Central Bank (DNB) for supervisory purposes. The minimum Tier 1 ratio is 4% and the minimum total capital ratio (known as the BIS ratio) is 8% of all risk-weighted assets.
The table below reflects own funds according to the CRD and Dutch legislation, both using the Basel II rules (as specified in the CRD III) and the Basel III rules (as specified in the CRR/CRD IV). As Basel III will be phased in gradually during 2014-2019, the table shows the Basel III positions both according to the 2019 end state rules and to the 2014 rules. This makes clear which items phase in directly, which gradually and which not yet in 2014.
ING Bank’s capital consists of Tier 1 capital (referred to as ‘original own funds’ in CRD III) and Tier 2 capital (referred to as ‘additional own funds’ in CRD III) net after deductions. Tier 1 capital consists of both core Tier 1 capital (referred to as ‘Common equity tier 1’ in CRR/CRD IV) and other Tier 1 capital, also referred to as hybrid capital. Tier 2 capital consists mostly of subordinated loans.
ING Bank continues to maintain strong and high quality capital levels. ING Bank is already meeting the Basel III solvency requirements with a fully-loaded core Tier 1 ratio of 10.0%. This percentage is calculated on the basis of immediate and full implementation and disregarding the possible impact of future management actions.
Additional Pillar 3 information continued
383ING Group Annual Report 2013
1 Wh
o w
e are2 R
epo
rt of th
e Executive B
oard
3 Co
rpo
rate go
vernan
ce4 C
on
solid
ated an
nu
al accou
nts
5 Parent co
mp
any an
nu
al accou
nts
6 Oth
er info
rmatio
n7 A
dd
ition
al info
rmatio
n
ING_2013_deel5_v1.indd 383 19/03/2014 19:45:18
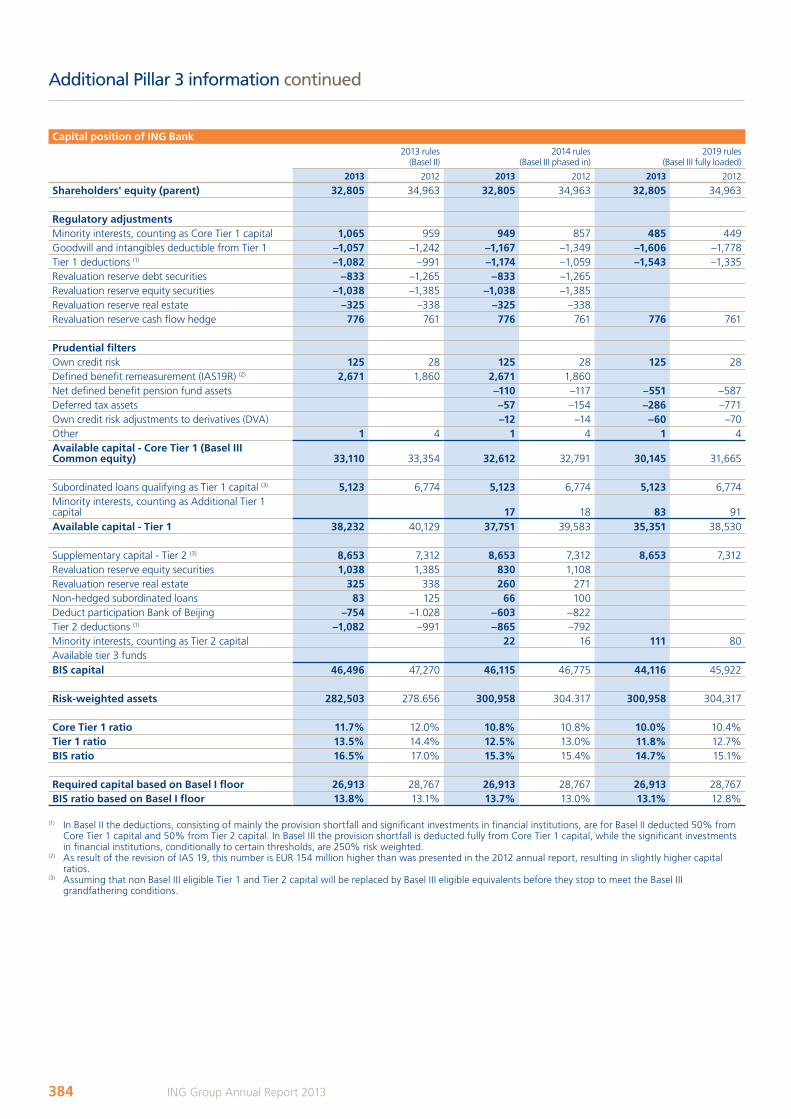
Capital position of ING Bank2013 rules
(Basel II)2014 rules
(Basel III phased in)2019 rules
(Basel III fully loaded)
2013 2012 2013 2012 2013 2012
Shareholders' equity (parent) 32,805 34,963 32,805 34,963 32,805 34,963
Regulatory adjustmentsMinority interests, counting as Core Tier 1 capital 1,065 959 949 857 485 449Goodwill and intangibles deductible from Tier 1 –1,057 –1,242 –1,167 –1,349 –1,606 –1,778Tier 1 deductions (1) –1,082 –991 –1,174 –1,059 –1,543 –1,335Revaluation reserve debt securities –833 –1,265 –833 –1,265Revaluation reserve equity securities –1,038 –1,385 –1,038 –1,385Revaluation reserve real estate –325 –338 –325 –338Revaluation reserve cash flow hedge 776 761 776 761 776 761
Prudential filtersOwn credit risk 125 28 125 28 125 28Defined benefit remeasurement (IAS19R) (2) 2,671 1,860 2,671 1,860Net defined benefit pension fund assets –110 –117 –551 –587Deferred tax assets –57 –154 –286 –771Own credit risk adjustments to derivatives (DVA) –12 –14 –60 –70Other 1 4 1 4 1 4Available capital - Core Tier 1 (Basel III Common equity) 33,110 33,354 32,612 32,791 30,145 31,665
Subordinated loans qualifying as Tier 1 capital (3) 5,123 6,774 5,123 6,774 5,123 6,774Minority interests, counting as Additional Tier 1 capital 17 18 83 91Available capital - Tier 1 38,232 40,129 37,751 39,583 35,351 38,530
Supplementary capital - Tier 2 (3) 8,653 7,312 8,653 7,312 8,653 7,312Revaluation reserve equity securities 1,038 1,385 830 1,108Revaluation reserve real estate 325 338 260 271Non-hedged subordinated loans 83 125 66 100Deduct participation Bank of Beijing –754 –1.028 –603 –822Tier 2 deductions (1) –1,082 –991 –865 –792Minority interests, counting as Tier 2 capital 22 16 111 80Available tier 3 fundsBIS capital 46,496 47,270 46,115 46,775 44,116 45,922
Risk-weighted assets 282,503 278.656 300,958 304.317 300,958 304,317
Core Tier 1 ratio 11.7% 12.0% 10.8% 10.8% 10.0% 10.4%Tier 1 ratio 13.5% 14.4% 12.5% 13.0% 11.8% 12.7%BIS ratio 16.5% 17.0% 15.3% 15.4% 14.7% 15.1%
Required capital based on Basel I floor 26,913 28,767 26,913 28,767 26,913 28,767BIS ratio based on Basel I floor 13.8% 13.1% 13.7% 13.0% 13.1% 12.8%
(1) In Basel II the deductions, consisting of mainly the provision shortfall and significant investments in financial institutions, are for Basel II deducted 50% from Core Tier 1 capital and 50% from Tier 2 capital. In Basel III the provision shortfall is deducted fully from Core Tier 1 capital, while the significant investments in financial institutions, conditionally to certain thresholds, are 250% risk weighted.
(2) As result of the revision of IAS 19, this number is EUR 154 million higher than was presented in the 2012 annual report, resulting in slightly higher capital ratios.
(3) Assuming that non Basel III eligible Tier 1 and Tier 2 capital will be replaced by Basel III eligible equivalents before they stop to meet the Basel III grandfathering conditions.
Additional Pillar 3 information continued
384 ING Group Annual Report 2013
ING_2013_deel5_v1.indd 384 19/03/2014 19:45:18
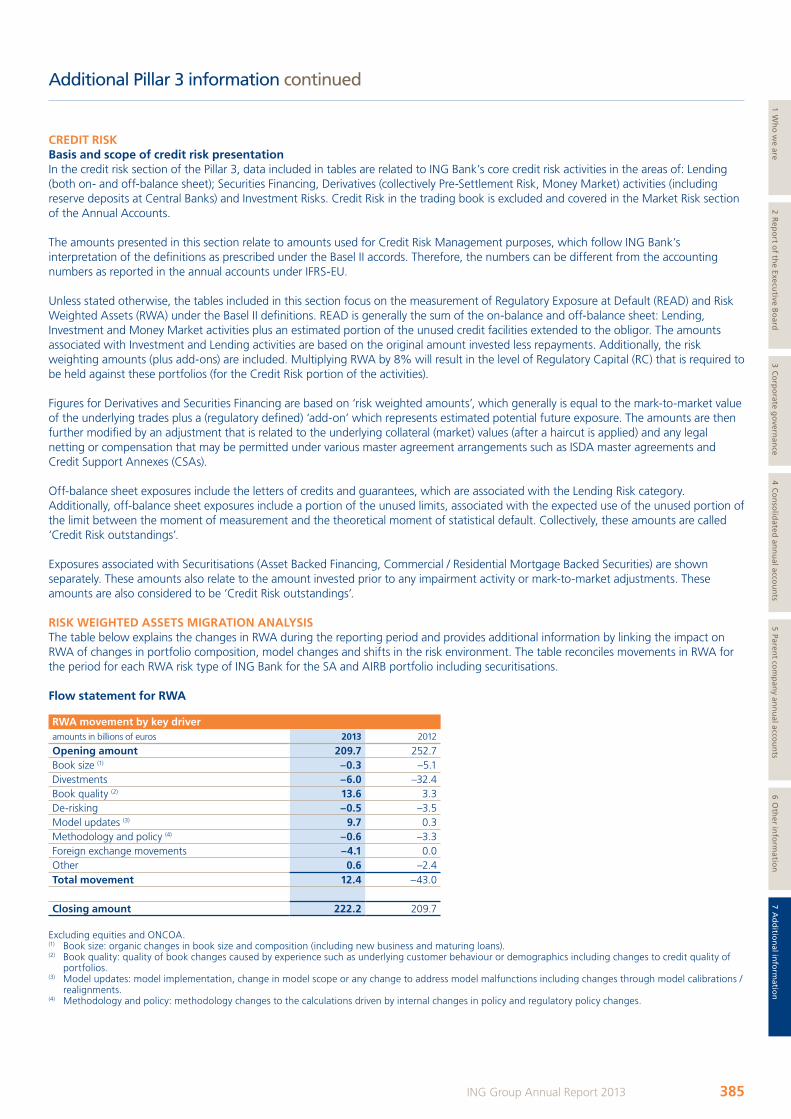
CREDIT RISKBasis and scope of credit risk presentationIn the credit risk section of the Pillar 3, data included in tables are related to ING Bank’s core credit risk activities in the areas of: Lending (both on- and off-balance sheet); Securities Financing, Derivatives (collectively Pre-Settlement Risk, Money Market) activities (including reserve deposits at Central Banks) and Investment Risks. Credit Risk in the trading book is excluded and covered in the Market Risk section of the Annual Accounts.
The amounts presented in this section relate to amounts used for Credit Risk Management purposes, which follow ING Bank’s interpretation of the definitions as prescribed under the Basel II accords. Therefore, the numbers can be different from the accounting numbers as reported in the annual accounts under IFRS-EU.
Unless stated otherwise, the tables included in this section focus on the measurement of Regulatory Exposure at Default (READ) and Risk Weighted Assets (RWA) under the Basel II definitions. READ is generally the sum of the on-balance and off-balance sheet: Lending, Investment and Money Market activities plus an estimated portion of the unused credit facilities extended to the obligor. The amounts associated with Investment and Lending activities are based on the original amount invested less repayments. Additionally, the risk weighting amounts (plus add-ons) are included. Multiplying RWA by 8% will result in the level of Regulatory Capital (RC) that is required to be held against these portfolios (for the Credit Risk portion of the activities).
Figures for Derivatives and Securities Financing are based on ‘risk weighted amounts’, which generally is equal to the mark-to-market value of the underlying trades plus a (regulatory defined) ‘add-on’ which represents estimated potential future exposure. The amounts are then further modified by an adjustment that is related to the underlying collateral (market) values (after a haircut is applied) and any legal netting or compensation that may be permitted under various master agreement arrangements such as ISDA master agreements and Credit Support Annexes (CSAs).
Off-balance sheet exposures include the letters of credits and guarantees, which are associated with the Lending Risk category. Additionally, off-balance sheet exposures include a portion of the unused limits, associated with the expected use of the unused portion of the limit between the moment of measurement and the theoretical moment of statistical default. Collectively, these amounts are called ‘Credit Risk outstandings’.
Exposures associated with Securitisations (Asset Backed Financing, Commercial / Residential Mortgage Backed Securities) are shown separately. These amounts also relate to the amount invested prior to any impairment activity or mark-to-market adjustments. These amounts are also considered to be ‘Credit Risk outstandings’.
RISK WEIGHTED ASSETS MIGRATION ANALYSISThe table below explains the changes in RWA during the reporting period and provides additional information by linking the impact on RWA of changes in portfolio composition, model changes and shifts in the risk environment. The table reconciles movements in RWA for the period for each RWA risk type of ING Bank for the SA and AIRB portfolio including securitisations.
Flow statement for RWA
RWA movement by key driveramounts in billions of euros 2013 2012
Opening amount 209.7 252.7Book size (1) –0.3 –5.1Divestments –6.0 –32.4Book quality (2) 13.6 3.3De-risking –0.5 –3.5Model updates (3) 9.7 0.3Methodology and policy (4) –0.6 –3.3Foreign exchange movements –4.1 0.0Other 0.6 –2.4Total movement 12.4 –43.0
Closing amount 222.2 209.7
Excluding equities and ONCOA.(1) Book size: organic changes in book size and composition (including new business and maturing loans).(2) Book quality: quality of book changes caused by experience such as underlying customer behaviour or demographics including changes to credit quality of
portfolios. (3) Model updates: model implementation, change in model scope or any change to address model malfunctions including changes through model calibrations /
realignments.(4) Methodology and policy: methodology changes to the calculations driven by internal changes in policy and regulatory policy changes.
Additional Pillar 3 information continued
385ING Group Annual Report 2013
1 Wh
o w
e are2 R
epo
rt of th
e Executive B
oard
3 Co
rpo
rate go
vernan
ce4 C
on
solid
ated an
nu
al accou
nts
5 Parent co
mp
any an
nu
al accou
nts
6 Oth
er info
rmatio
n7 A
dd
ition
al info
rmatio
n
ING_2013_deel5_v1.indd 385 19/03/2014 19:45:18
Key changes Over the year, RWA increased by EUR 12.4 billion to EUR 222.2 billion. A part of the increase in RWA resulted in a shift from ONCOA which does not impact capital ratio. In order to quickly implement complex, material capital changes, occasionally a top of the house adjustment is made to ONCOA before allocation to businesses and facilities. • The decreasing book size, excluding divestments and de-risking of the portfolio, reduced RWA by EUR 13.6 billion. The book size
decrease is a net result of primarily an increase in the DiBa mortgage portfolio and is offset by reductions in the Corporates book and the Lease run-off portfolio. Several smaller movements, both increases and decreases occurred in various portfolios throughout the year.
• The divestments in 2013 were mainly related to the sale of ING Direct UK to Barclays and the sale of primarily the commercial activities of WestlandUtrecht Bank portfolio to Nationale-Nederlanden Bank, which released EUR 2.4 billion and EUR 1.8 billion RWA respectively. Under the amended terms of the restructuring plan, the commercial operations of WestlandUtrecht Bank are to be combined with the retail banking activities of Dutch insurer Nationale-Nederlanden, which is to be divested as part of NN Group. WestlandUtrecht Bank’s mortgage portfolio is largely retained by ING Bank. The unwinding of the Illiquid Assets Back-up Facility (IABF) additionally reduced RWA by EUR 1.8 billion.
• The deterioration of the book quality increased RWA by EUR 8.8 billion and was mainly a result of the reflection of the deteriorated market circumstances in the regulatory capital models applied. As the market circumstances keep on deteriorating, the downturn factor has been adjusted accordingly for the impacted portfolio’s which are mainly the Dutch and Belgian Mortgage portfolios and the Small and Medium sized business. The downturn has also impacted the Cover Values negatively which resulted in higher Loss Given Default (LGD) for mainly the before mentioned Mortgage portfolios.
• De-risking in 2013 includes the sale of securitisations and the sale of ING’s Real Estate Finance (US) assets to Wells Fargo, which is in line with ING’s strategic objective of ensuring efficient use of capital across portfolios.
• There were several model updates through the year with a focus on mainly the Corporates portfolio and in particular the Commercial Property Finance portfolio. The key change relates to the determination of the LGD for this portfolio. The loss rate and the discount period taken into account now better reflect the current economic environment. The before mentioned change and multiple smaller changes resulted in an increase of EUR 9.7 billion.
• The overly cautious approach applied to off balance commitment calculations, which is a factor of the READ, has now been brought more in line with the actual experience for the best rated Corporates and Institutions portfolios, resulting in a significant READ decrease and reduced RWA. A long track record of a minimal amount of guarantees and LC’s which have been called, was the basis for this change. The before mentioned change and multiple smaller changes resulted in a decrease of EUR 0.6 billion due to Methodology and Policy changes.
• Over year, FX movements decreased RWA by EUR 4.1 billion which was mainly due to the depreciation of the US Dollar (–4.57%), the Turkish Lira (–20.53%) and the Australian Dollar (–17.52%) against the Euro
Overall, RWA management has a very high priority throughout ING in all aspects of our business. From product design, to pricing, to divestment decisions, RWA management is extensively monitored, reported, and managed at all levels of the organisation.
Additional Pillar 3 information continued
386 ING Group Annual Report 2013
ING_2013_deel5_v1.indd 386 19/03/2014 19:45:18

EXPOSURE CLASSESThe Basel Accord has developed the concept of ‘Exposure Classes’. These are essentially groupings of credit risks associated with a common obligor type or product type. For the AIRB Approach, most of the exposure classes have subcategories. ING Bank has applied the following definitions to determine Exposure Classes:• Central Governments & Central Banks (hereafter Sovereigns) include Sovereign Government entities, Central Banks and Basel II
recognized Local / Regional Authorities as well as Supranational Organisations;• Institutions include all Commercial Banks, non-Bank Financial Institutions, such as Leasing Companies, Funds and Fund Managers,
and Insurance Companies, as well as local and regional government entities not classified as governments;• Corporates include all legal entities, that are not considered to be Governments, Institutions or Retail;• Retail includes the following classes:
– Residential Mortgages include all mortgage loans for residential properties that are not part of a securitisation; and – Retail Other includes all other credit obligations related to Retail SMEs, such as partnerships, one-man businesses and private
individuals, such as consumer loans, car loans and credit cards.
Under these exposure class definitions, it is possible for a private individual to be included under both ResidentialMortgages and Retail Other. For other types of counterparties or issuers, there is no potential overlap.
In the tables below an overall picture is given of the ING Bank portfolio per exposure class, after which a breakdown per exposure class is given segmented by relevant factors. Securitisations segmentation is given in the Securitisation chapter.
Credit risk per exposure type and exposure classThe table below shows the total READ and RWA for ING Bank by Basel defined exposure types for both the SA and AIRB portfolio per exposure class.
Model approaches per exposure class Sovereigns Institutions Corporate Retail Total 2013 Total 2012
READ RWA READ RWA READ RWA READ RWA READ RWA READ RWA
SA approachOn-balance 3,713 2,472 1,887 998 8,640 8,557 14,442 9,025 28,682 21,051 36,085 24,762Off-balance 6 6 480 204 2,069 2,068 2,114 1,578 4,669 3,856 6,190 5,183Securities Financing 57 57 1 57 57Derivatives 14 14 413 187 125 127 2 1 553 329 425 245Total 3,790 2,548 2,781 1,389 10,834 10,752 16,557 10,605 33,961 25,294 42,699 30,190
AIRB approachOn-balance 80,120 6,170 57,420 10,057 144,965 75,041 299,760 65,014 582,264 156,282 606,155 132,278Off-balance 4,801 199 13,441 3,485 53,838 20,470 14,225 2,913 86,305 27,066 102,195 30,160Securities Financing 1,710 45 8,825 1,304 388 87 10,923 1,436 10,552 1,227Derivatives 1,744 333 18,845 3,962 6,383 5,025 56 27 27,028 9,347 33,280 10,340Total 88,374 6,747 98,530 18,808 205,575 100,623 314,041 67,954 706,520 194,131 752,182 174,006
SEC AIRBOn-balance 7,920 2,541 9,188 3,391Off balance 1,938 187 2,983 2,134Total 9,858 2,728 12,101 5,525
Total Bank 92,164 9,295 101,311 20,197 216,408 111,375 330,598 78,558 750,339 222,152 806,982 209,722
Includes both AIRB and SA portfolios; excludes equities and ONCOA.
The ING bank portfolio falls for 87.4% under the AIRB approach and for 12.6% under SA in terms of RWA. The total portfolio decreased in 2013 by EUR 56.6 billion in READ to EUR 750.3 billion while RWA increased by EUR 12.4 billion to EUR 222.2 billion. The increase in RWA is mainly a result of adjusting key risk factors in AIRB models to reflect the economic downturn environment, especially related to Dutch mortgages, SME clients in the Benelux and sovereign entities, while the decrease in READ is a result of the divestment of ING Direct UK, partially the WestlandUtrecht Bank portfolio and the targeted downsizing of the REF and securitisation portfolio. Next to the portfolio decline, a methodology change has also contributed significantly to the decrease in READ. The conservative approach of the off balance commitment calculations, which is a factor of the READ, has now been brought more in line with the actual exposure for the best rated Corporates and Institutions portfolios, resulting in a significant READ decrease.
Additional Pillar 3 information continued
387ING Group Annual Report 2013
1 Wh
o w
e are2 R
epo
rt of th
e Executive B
oard
3 Co
rpo
rate go
vernan
ce4 C
on
solid
ated an
nu
al accou
nts
5 Parent co
mp
any an
nu
al accou
nts
6 Oth
er info
rmatio
n7 A
dd
ition
al info
rmatio
n
ING_2013_deel5_v1.indd 387 19/03/2014 19:45:19
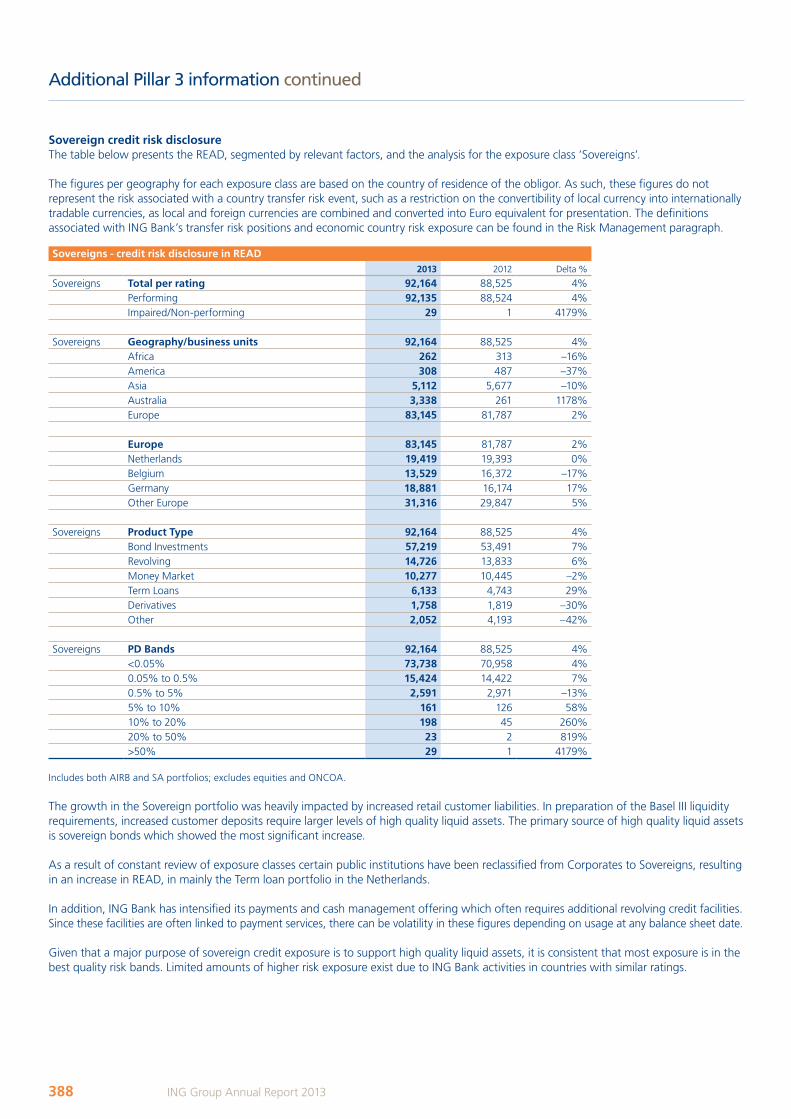
Sovereign credit risk disclosureThe table below presents the READ, segmented by relevant factors, and the analysis for the exposure class ‘Sovereigns’.
The figures per geography for each exposure class are based on the country of residence of the obligor. As such, these figures do not represent the risk associated with a country transfer risk event, such as a restriction on the convertibility of local currency into internationally tradable currencies, as local and foreign currencies are combined and converted into Euro equivalent for presentation. The definitions associated with ING Bank’s transfer risk positions and economic country risk exposure can be found in the Risk Management paragraph.
Sovereigns - credit risk disclosure in READ2013 2012 Delta %
Sovereigns Total per rating 92,164 88,525 4%Performing 92,135 88,524 4%Impaired/Non-performing 29 1 4179%
Sovereigns Geography/business units 92,164 88,525 4%
Africa 262 313 –16%America 308 487 –37%Asia 5,112 5,677 –10%Australia 3,338 261 1178%Europe 83,145 81,787 2%
Europe 83,145 81,787 2%Netherlands 19,419 19,393 0%Belgium 13,529 16,372 –17%Germany 18,881 16,174 17%Other Europe 31,316 29,847 5%
Sovereigns Product Type 92,164 88,525 4%
Bond Investments 57,219 53,491 7%Revolving 14,726 13,833 6%Money Market 10,277 10,445 –2%Term Loans 6,133 4,743 29%Derivatives 1,758 1,819 –30%Other 2,052 4,193 –42%
Sovereigns PD Bands 92,164 88,525 4%
<0.05% 73,738 70,958 4%0.05% to 0.5% 15,424 14,422 7%0.5% to 5% 2,591 2,971 –13%5% to 10% 161 126 58%10% to 20% 198 45 260%20% to 50% 23 2 819%>50% 29 1 4179%
Includes both AIRB and SA portfolios; excludes equities and ONCOA.
The growth in the Sovereign portfolio was heavily impacted by increased retail customer liabilities. In preparation of the Basel III liquidity requirements, increased customer deposits require larger levels of high quality liquid assets. The primary source of high quality liquid assets is sovereign bonds which showed the most significant increase.
As a result of constant review of exposure classes certain public institutions have been reclassified from Corporates to Sovereigns, resulting in an increase in READ, in mainly the Term loan portfolio in the Netherlands.
In addition, ING Bank has intensified its payments and cash management offering which often requires additional revolving credit facilities. Since these facilities are often linked to payment services, there can be volatility in these figures depending on usage at any balance sheet date.
Given that a major purpose of sovereign credit exposure is to support high quality liquid assets, it is consistent that most exposure is in the best quality risk bands. Limited amounts of higher risk exposure exist due to ING Bank activities in countries with similar ratings.
Additional Pillar 3 information continued
388 ING Group Annual Report 2013
ING_2013_deel5_v1.indd 388 19/03/2014 19:45:19
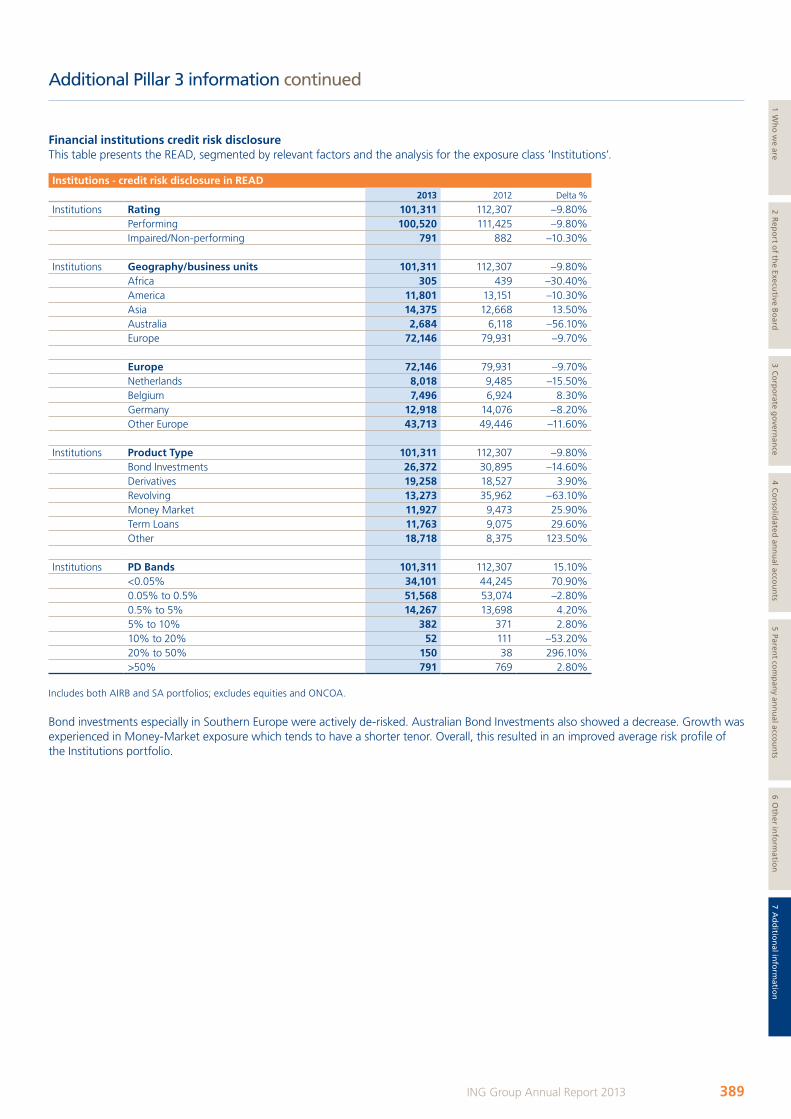
Financial institutions credit risk disclosureThis table presents the READ, segmented by relevant factors and the analysis for the exposure class ‘Institutions’.
Institutions - credit risk disclosure in READ 2013 2012 Delta %
Institutions Rating 101,311 112,307 –9.80%Performing 100,520 111,425 –9.80%Impaired/Non-performing 791 882 –10.30%
Institutions Geography/business units 101,311 112,307 –9.80%Africa 305 439 –30.40%America 11,801 13,151 –10.30%Asia 14,375 12,668 13.50%Australia 2,684 6,118 –56.10%Europe 72,146 79,931 –9.70%
Europe 72,146 79,931 –9.70%Netherlands 8,018 9,485 –15.50%Belgium 7,496 6,924 8.30%Germany 12,918 14,076 –8.20%Other Europe 43,713 49,446 –11.60%
Institutions Product Type 101,311 112,307 –9.80%Bond Investments 26,372 30,895 –14.60%Derivatives 19,258 18,527 3.90%Revolving 13,273 35,962 –63.10%Money Market 11,927 9,473 25.90%Term Loans 11,763 9,075 29.60%Other 18,718 8,375 123.50%
Institutions PD Bands 101,311 112,307 15.10%
<0.05% 34,101 44,245 70.90%0.05% to 0.5% 51,568 53,074 –2.80%0.5% to 5% 14,267 13,698 4.20%5% to 10% 382 371 2.80%10% to 20% 52 111 –53.20%20% to 50% 150 38 296.10%>50% 791 769 2.80%
Includes both AIRB and SA portfolios; excludes equities and ONCOA.
Bond investments especially in Southern Europe were actively de-risked. Australian Bond Investments also showed a decrease. Growth was experienced in Money-Market exposure which tends to have a shorter tenor. Overall, this resulted in an improved average risk profile of the Institutions portfolio.
Additional Pillar 3 information continued
389ING Group Annual Report 2013
1 Wh
o w
e are2 R
epo
rt of th
e Executive B
oard
3 Co
rpo
rate go
vernan
ce4 C
on
solid
ated an
nu
al accou
nts
5 Parent co
mp
any an
nu
al accou
nts
6 Oth
er info
rmatio
n7 A
dd
ition
al info
rmatio
n
ING_2013_deel5_v1.indd 389 19/03/2014 19:45:19
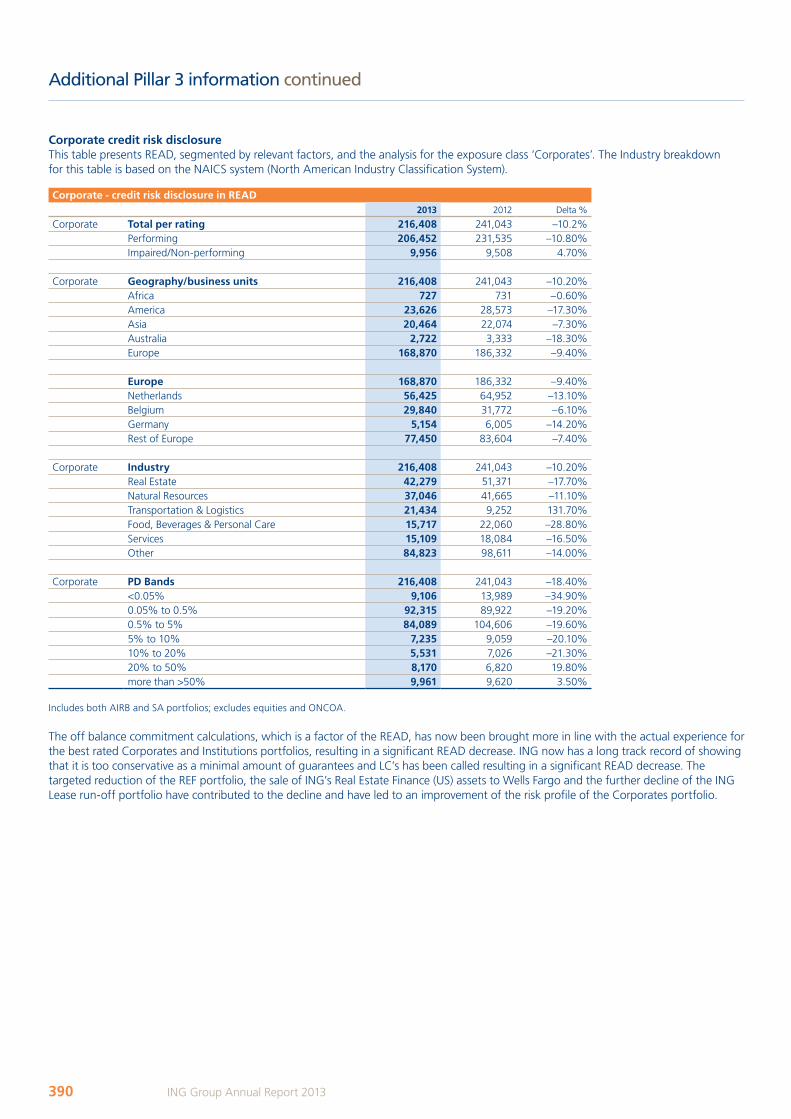
Corporate credit risk disclosureThis table presents READ, segmented by relevant factors, and the analysis for the exposure class ‘Corporates’. The Industry breakdown for this table is based on the NAICS system (North American Industry Classification System).
Corporate - credit risk disclosure in READ2013 2012 Delta %
Corporate Total per rating 216,408 241,043 –10.2%Performing 206,452 231,535 –10.80%Impaired/Non-performing 9,956 9,508 4.70%
Corporate Geography/business units 216,408 241,043 –10.20%Africa 727 731 –0.60%America 23,626 28,573 –17.30%Asia 20,464 22,074 –7.30%Australia 2,722 3,333 –18.30%Europe 168,870 186,332 –9.40% Europe 168,870 186,332 –9.40%Netherlands 56,425 64,952 –13.10%Belgium 29,840 31,772 –6.10%Germany 5,154 6,005 –14.20%Rest of Europe 77,450 83,604 –7.40%
Corporate Industry 216,408 241,043 –10.20%Real Estate 42,279 51,371 –17.70%Natural Resources 37,046 41,665 –11.10%Transportation & Logistics 21,434 9,252 131.70%Food, Beverages & Personal Care 15,717 22,060 –28.80%Services 15,109 18,084 –16.50%Other 84,823 98,611 –14.00%
Corporate PD Bands 216,408 241,043 –18.40%<0.05% 9,106 13,989 –34.90%0.05% to 0.5% 92,315 89,922 –19.20%0.5% to 5% 84,089 104,606 –19.60%5% to 10% 7,235 9,059 –20.10%10% to 20% 5,531 7,026 –21.30%20% to 50% 8,170 6,820 19.80%more than >50% 9,961 9,620 3.50%
Includes both AIRB and SA portfolios; excludes equities and ONCOA.
The off balance commitment calculations, which is a factor of the READ, has now been brought more in line with the actual experience for the best rated Corporates and Institutions portfolios, resulting in a significant READ decrease. ING now has a long track record of showing that it is too conservative as a minimal amount of guarantees and LC’s has been called resulting in a significant READ decrease. The targeted reduction of the REF portfolio, the sale of ING’s Real Estate Finance (US) assets to Wells Fargo and the further decline of the ING Lease run-off portfolio have contributed to the decline and have led to an improvement of the risk profile of the Corporates portfolio.
Additional Pillar 3 information continued
390 ING Group Annual Report 2013
ING_2013_deel5_v1.indd 390 19/03/2014 19:45:20
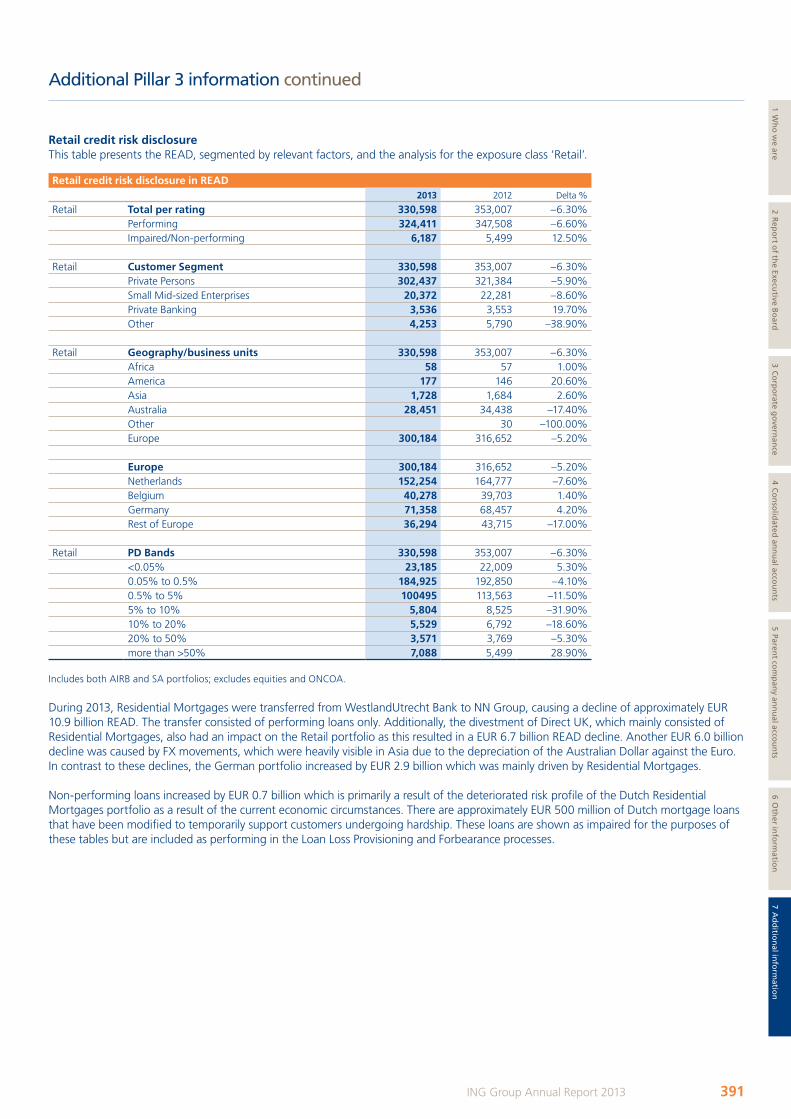
Retail credit risk disclosure This table presents the READ, segmented by relevant factors, and the analysis for the exposure class ‘Retail’.
Retail credit risk disclosure in READ2013 2012 Delta %
Retail Total per rating 330,598 353,007 –6.30%Performing 324,411 347,508 –6.60%Impaired/Non-performing 6,187 5,499 12.50%
Retail Customer Segment 330,598 353,007 –6.30%Private Persons 302,437 321,384 –5.90%Small Mid-sized Enterprises 20,372 22,281 –8.60%Private Banking 3,536 3,553 19.70%Other 4,253 5,790 –38.90%
Retail Geography/business units 330,598 353,007 –6.30%
Africa 58 57 1.00%America 177 146 20.60%Asia 1,728 1,684 2.60%Australia 28,451 34,438 –17.40%Other 30 –100.00%Europe 300,184 316,652 –5.20% Europe 300,184 316,652 –5.20%Netherlands 152,254 164,777 –7.60%Belgium 40,278 39,703 1.40%Germany 71,358 68,457 4.20%Rest of Europe 36,294 43,715 –17.00%
Retail PD Bands 330,598 353,007 –6.30%<0.05% 23,185 22,009 5.30%0.05% to 0.5% 184,925 192,850 –4.10%0.5% to 5% 100495 113,563 –11.50%5% to 10% 5,804 8,525 –31.90%10% to 20% 5,529 6,792 –18.60%20% to 50% 3,571 3,769 –5.30%more than >50% 7,088 5,499 28.90%
Includes both AIRB and SA portfolios; excludes equities and ONCOA.
During 2013, Residential Mortgages were transferred from WestlandUtrecht Bank to NN Group, causing a decline of approximately EUR 10.9 billion READ. The transfer consisted of performing loans only. Additionally, the divestment of Direct UK, which mainly consisted of Residential Mortgages, also had an impact on the Retail portfolio as this resulted in a EUR 6.7 billion READ decline. Another EUR 6.0 billion decline was caused by FX movements, which were heavily visible in Asia due to the depreciation of the Australian Dollar against the Euro. In contrast to these declines, the German portfolio increased by EUR 2.9 billion which was mainly driven by Residential Mortgages.
Non-performing loans increased by EUR 0.7 billion which is primarily a result of the deteriorated risk profile of the Dutch Residential Mortgages portfolio as a result of the current economic circumstances. There are approximately EUR 500 million of Dutch mortgage loans that have been modified to temporarily support customers undergoing hardship. These loans are shown as impaired for the purposes of these tables but are included as performing in the Loan Loss Provisioning and Forbearance processes.
Additional Pillar 3 information continued
391ING Group Annual Report 2013
1 Wh
o w
e are2 R
epo
rt of th
e Executive B
oard
3 Co
rpo
rate go
vernan
ce4 C
on
solid
ated an
nu
al accou
nts
5 Parent co
mp
any an
nu
al accou
nts
6 Oth
er info
rmatio
n7 A
dd
ition
al info
rmatio
n
ING_2013_deel5_v1.indd 391 19/03/2014 19:45:20
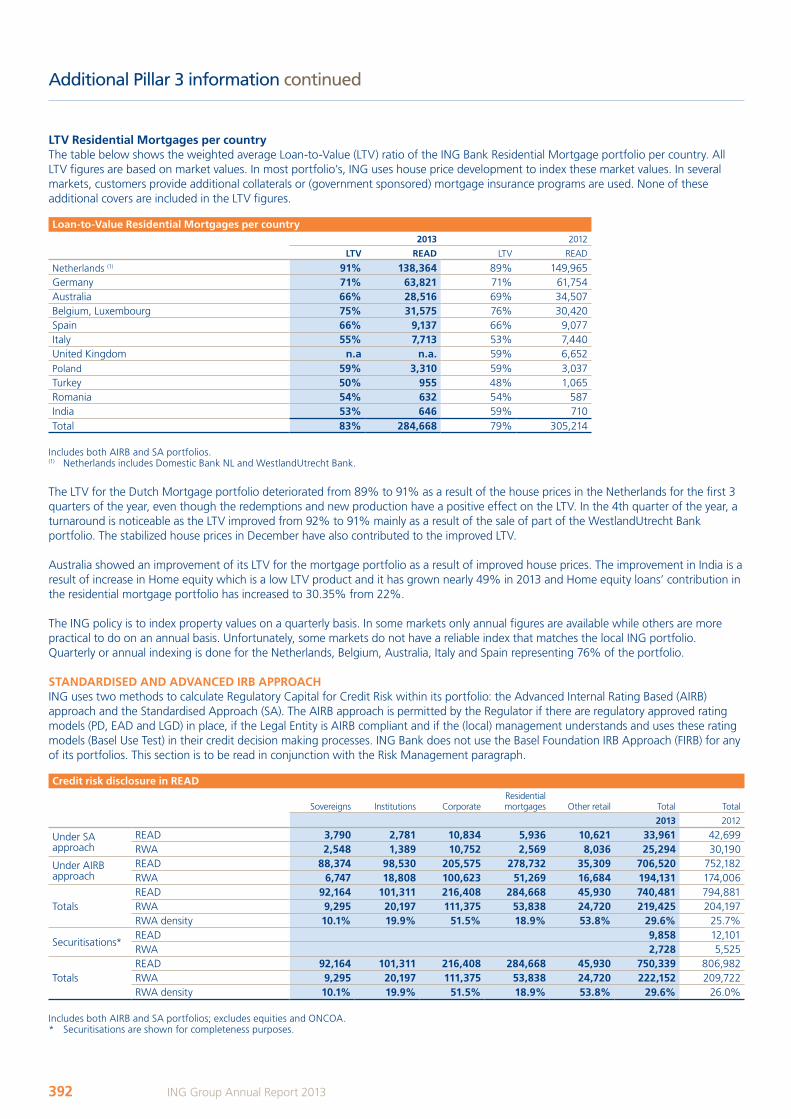
LTV Residential Mortgages per countryThe table below shows the weighted average Loan-to-Value (LTV) ratio of the ING Bank Residential Mortgage portfolio per country. All LTV figures are based on market values. In most portfolio’s, ING uses house price development to index these market values. In several markets, customers provide additional collaterals or (government sponsored) mortgage insurance programs are used. None of these additional covers are included in the LTV figures.
Loan-to-Value Residential Mortgages per country 2013 2012
LTV READ LTV READ
Netherlands (1) 91% 138,364 89% 149,965Germany 71% 63,821 71% 61,754Australia 66% 28,516 69% 34,507Belgium, Luxembourg 75% 31,575 76% 30,420Spain 66% 9,137 66% 9,077Italy 55% 7,713 53% 7,440United Kingdom n.a n.a. 59% 6,652Poland 59% 3,310 59% 3,037Turkey 50% 955 48% 1,065Romania 54% 632 54% 587India 53% 646 59% 710Total 83% 284,668 79% 305,214
Includes both AIRB and SA portfolios.(1) Netherlands includes Domestic Bank NL and WestlandUtrecht Bank.
The LTV for the Dutch Mortgage portfolio deteriorated from 89% to 91% as a result of the house prices in the Netherlands for the first 3 quarters of the year, even though the redemptions and new production have a positive effect on the LTV. In the 4th quarter of the year, a turnaround is noticeable as the LTV improved from 92% to 91% mainly as a result of the sale of part of the WestlandUtrecht Bank portfolio. The stabilized house prices in December have also contributed to the improved LTV.
Australia showed an improvement of its LTV for the mortgage portfolio as a result of improved house prices. The improvement in India is a result of increase in Home equity which is a low LTV product and it has grown nearly 49% in 2013 and Home equity loans’ contribution in the residential mortgage portfolio has increased to 30.35% from 22%.
The ING policy is to index property values on a quarterly basis. In some markets only annual figures are available while others are more practical to do on an annual basis. Unfortunately, some markets do not have a reliable index that matches the local ING portfolio. Quarterly or annual indexing is done for the Netherlands, Belgium, Australia, Italy and Spain representing 76% of the portfolio.
STANDARDISED AND ADVANCED IRB APPROACHING uses two methods to calculate Regulatory Capital for Credit Risk within its portfolio: the Advanced Internal Rating Based (AIRB) approach and the Standardised Approach (SA). The AIRB approach is permitted by the Regulator if there are regulatory approved rating models (PD, EAD and LGD) in place, if the Legal Entity is AIRB compliant and if the (local) management understands and uses these rating models (Basel Use Test) in their credit decision making processes. ING Bank does not use the Basel Foundation IRB Approach (FIRB) for any of its portfolios. This section is to be read in conjunction with the Risk Management paragraph.
Credit risk disclosure in READ
Sovereigns Institutions CorporateResidential mortgages Other retail Total Total
2013 2012
Under SA approach
READ 3,790 2,781 10,834 5,936 10,621 33,961 42,699RWA 2,548 1,389 10,752 2,569 8,036 25,294 30,190
Under AIRB approach
READ 88,374 98,530 205,575 278,732 35,309 706,520 752,182RWA 6,747 18,808 100,623 51,269 16,684 194,131 174,006
TotalsREAD 92,164 101,311 216,408 284,668 45,930 740,481 794,881RWA 9,295 20,197 111,375 53,838 24,720 219,425 204,197RWA density 10.1% 19.9% 51.5% 18.9% 53.8% 29.6% 25.7%
Securitisations*READ 9,858 12,101RWA 2,728 5,525
TotalsREAD 92,164 101,311 216,408 284,668 45,930 750,339 806,982RWA 9,295 20,197 111,375 53,838 24,720 222,152 209,722RWA density 10.1% 19.9% 51.5% 18.9% 53.8% 29.6% 26.0%
Includes both AIRB and SA portfolios; excludes equities and ONCOA.* Securitisations are shown for completeness purposes.
Additional Pillar 3 information continued
392 ING Group Annual Report 2013
ING_2013_deel5_v1.indd 392 19/03/2014 19:45:20
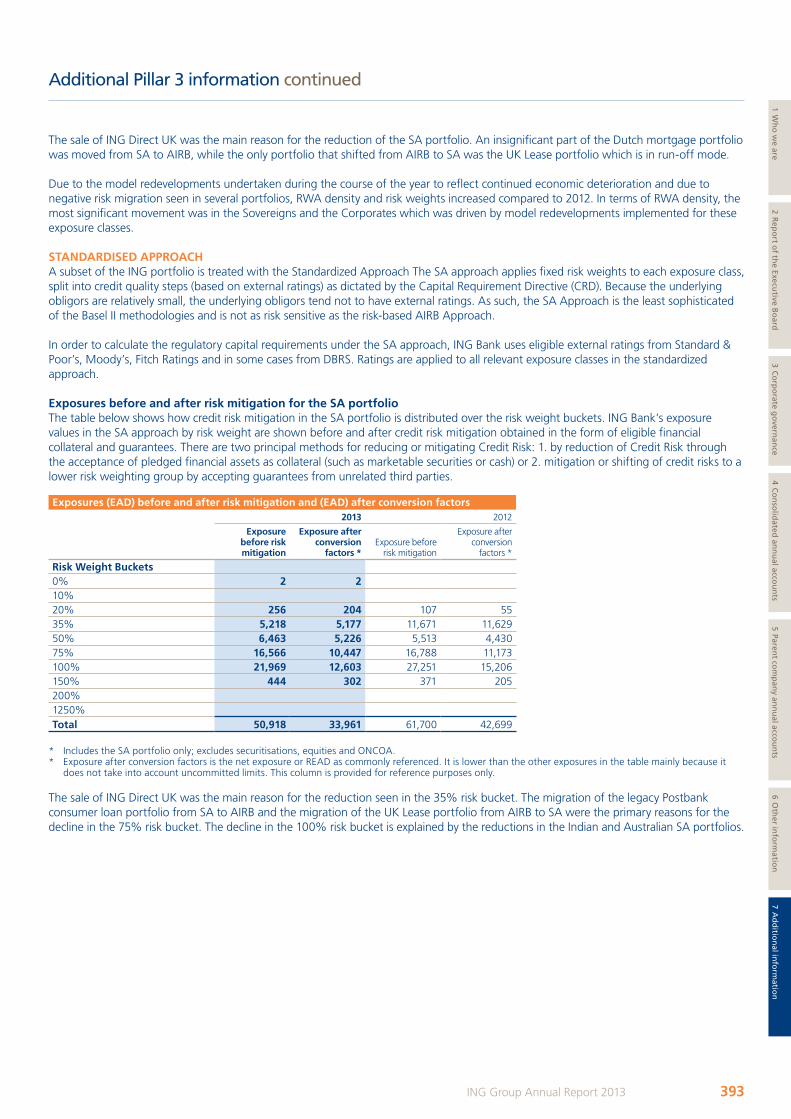
The sale of ING Direct UK was the main reason for the reduction of the SA portfolio. An insignificant part of the Dutch mortgage portfolio was moved from SA to AIRB, while the only portfolio that shifted from AIRB to SA was the UK Lease portfolio which is in run-off mode.
Due to the model redevelopments undertaken during the course of the year to reflect continued economic deterioration and due to negative risk migration seen in several portfolios, RWA density and risk weights increased compared to 2012. In terms of RWA density, the most significant movement was in the Sovereigns and the Corporates which was driven by model redevelopments implemented for these exposure classes.
STANDARDISED APPROACH A subset of the ING portfolio is treated with the Standardized Approach The SA approach applies fixed risk weights to each exposure class, split into credit quality steps (based on external ratings) as dictated by the Capital Requirement Directive (CRD). Because the underlying obligors are relatively small, the underlying obligors tend not to have external ratings. As such, the SA Approach is the least sophisticated of the Basel II methodologies and is not as risk sensitive as the risk-based AIRB Approach.
In order to calculate the regulatory capital requirements under the SA approach, ING Bank uses eligible external ratings from Standard & Poor’s, Moody’s, Fitch Ratings and in some cases from DBRS. Ratings are applied to all relevant exposure classes in the standardized approach.
Exposures before and after risk mitigation for the SA portfolio The table below shows how credit risk mitigation in the SA portfolio is distributed over the risk weight buckets. ING Bank’s exposure values in the SA approach by risk weight are shown before and after credit risk mitigation obtained in the form of eligible financial collateral and guarantees. There are two principal methods for reducing or mitigating Credit Risk: 1. by reduction of Credit Risk through the acceptance of pledged financial assets as collateral (such as marketable securities or cash) or 2. mitigation or shifting of credit risks to a lower risk weighting group by accepting guarantees from unrelated third parties.
Exposures (EAD) before and after risk mitigation and (EAD) after conversion factors 2013 2012
Exposure before risk mitigation
Exposure after conversion
factors *Exposure before
risk mitigation
Exposure after conversion
factors *
Risk Weight Buckets0% 2 210% 20% 256 204 107 5535% 5,218 5,177 11,671 11,62950% 6,463 5,226 5,513 4,43075% 16,566 10,447 16,788 11,173100% 21,969 12,603 27,251 15,206150% 444 302 371 205200% 1250% Total 50,918 33,961 61,700 42,699
* Includes the SA portfolio only; excludes securitisations, equities and ONCOA.* Exposure after conversion factors is the net exposure or READ as commonly referenced. It is lower than the other exposures in the table mainly because it
does not take into account uncommitted limits. This column is provided for reference purposes only.
The sale of ING Direct UK was the main reason for the reduction seen in the 35% risk bucket. The migration of the legacy Postbank consumer loan portfolio from SA to AIRB and the migration of the UK Lease portfolio from AIRB to SA were the primary reasons for the decline in the 75% risk bucket. The decline in the 100% risk bucket is explained by the reductions in the Indian and Australian SA portfolios.
Additional Pillar 3 information continued
393ING Group Annual Report 2013
1 Wh
o w
e are2 R
epo
rt of th
e Executive B
oard
3 Co
rpo
rate go
vernan
ce4 C
on
solid
ated an
nu
al accou
nts
5 Parent co
mp
any an
nu
al accou
nts
6 Oth
er info
rmatio
n7 A
dd
ition
al info
rmatio
n
ING_2013_deel5_v1.indd 393 19/03/2014 19:45:20
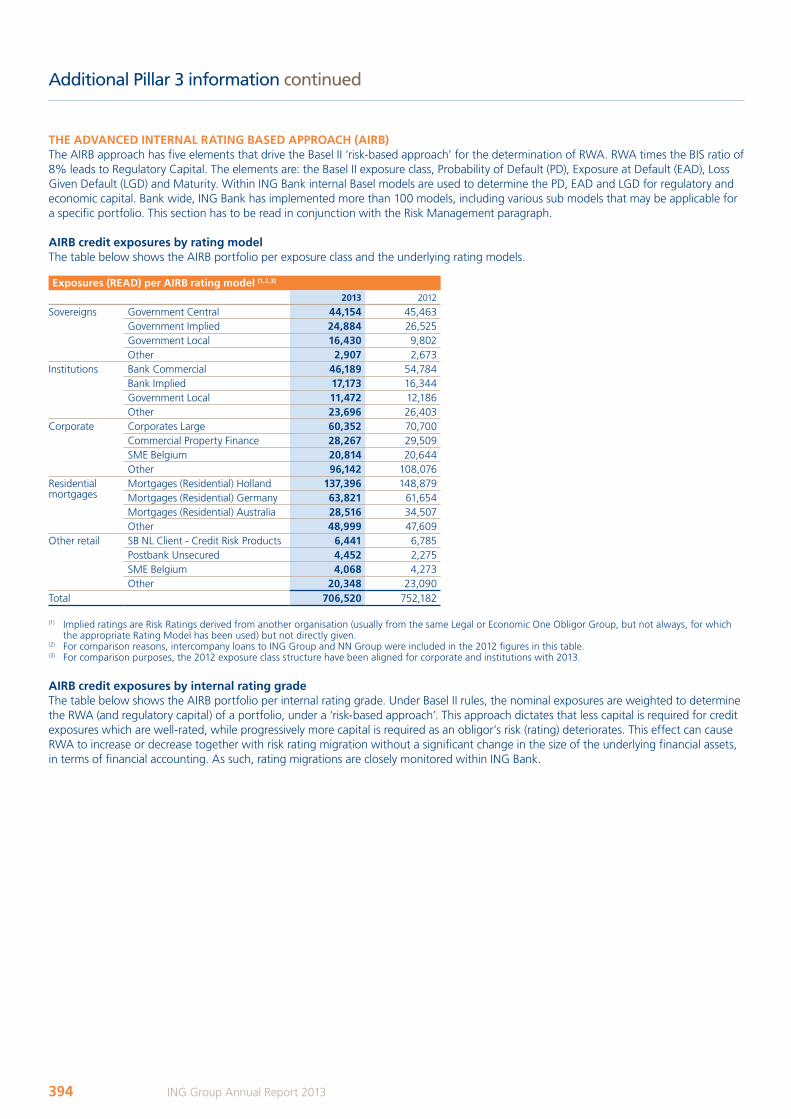
THE ADVANCED INTERNAL RATING BASED APPROACH (AIRB)The AIRB approach has five elements that drive the Basel II ‘risk-based approach’ for the determination of RWA. RWA times the BIS ratio of 8% leads to Regulatory Capital. The elements are: the Basel II exposure class, Probability of Default (PD), Exposure at Default (EAD), Loss Given Default (LGD) and Maturity. Within ING Bank internal Basel models are used to determine the PD, EAD and LGD for regulatory and economic capital. Bank wide, ING Bank has implemented more than 100 models, including various sub models that may be applicable for a specific portfolio. This section has to be read in conjunction with the Risk Management paragraph.
AIRB credit exposures by rating modelThe table below shows the AIRB portfolio per exposure class and the underlying rating models.
Exposures (READ) per AIRB rating model (1,2,3)
2013 2012
Sovereigns
Government Central 44,154 45,463Government Implied 24,884 26,525Government Local 16,430 9,802Other 2,907 2,673
Institutions
Bank Commercial 46,189 54,784Bank Implied 17,173 16,344Government Local 11,472 12,186Other 23,696 26,403
Corporate
Corporates Large 60,352 70,700Commercial Property Finance 28,267 29,509SME Belgium 20,814 20,644Other 96,142 108,076
Residential mortgages
Mortgages (Residential) Holland 137,396 148,879Mortgages (Residential) Germany 63,821 61,654Mortgages (Residential) Australia 28,516 34,507Other 48,999 47,609
Other retail
SB NL Client - Credit Risk Products 6,441 6,785Postbank Unsecured 4,452 2,275SME Belgium 4,068 4,273Other 20,348 23,090
Total 706,520 752,182
(1) Implied ratings are Risk Ratings derived from another organisation (usually from the same Legal or Economic One Obligor Group, but not always, for which the appropriate Rating Model has been used) but not directly given.
(2) For comparison reasons, intercompany loans to ING Group and NN Group were included in the 2012 figures in this table.(3) For comparison purposes, the 2012 exposure class structure have been aligned for corporate and institutions with 2013.
AIRB credit exposures by internal rating gradeThe table below shows the AIRB portfolio per internal rating grade. Under Basel II rules, the nominal exposures are weighted to determine the RWA (and regulatory capital) of a portfolio, under a ‘risk-based approach’. This approach dictates that less capital is required for credit exposures which are well-rated, while progressively more capital is required as an obligor’s risk (rating) deteriorates. This effect can cause RWA to increase or decrease together with risk rating migration without a significant change in the size of the underlying financial assets, in terms of financial accounting. As such, rating migrations are closely monitored within ING Bank.
Additional Pillar 3 information continued
394 ING Group Annual Report 2013
ING_2013_deel5_v1.indd 394 19/03/2014 19:45:21
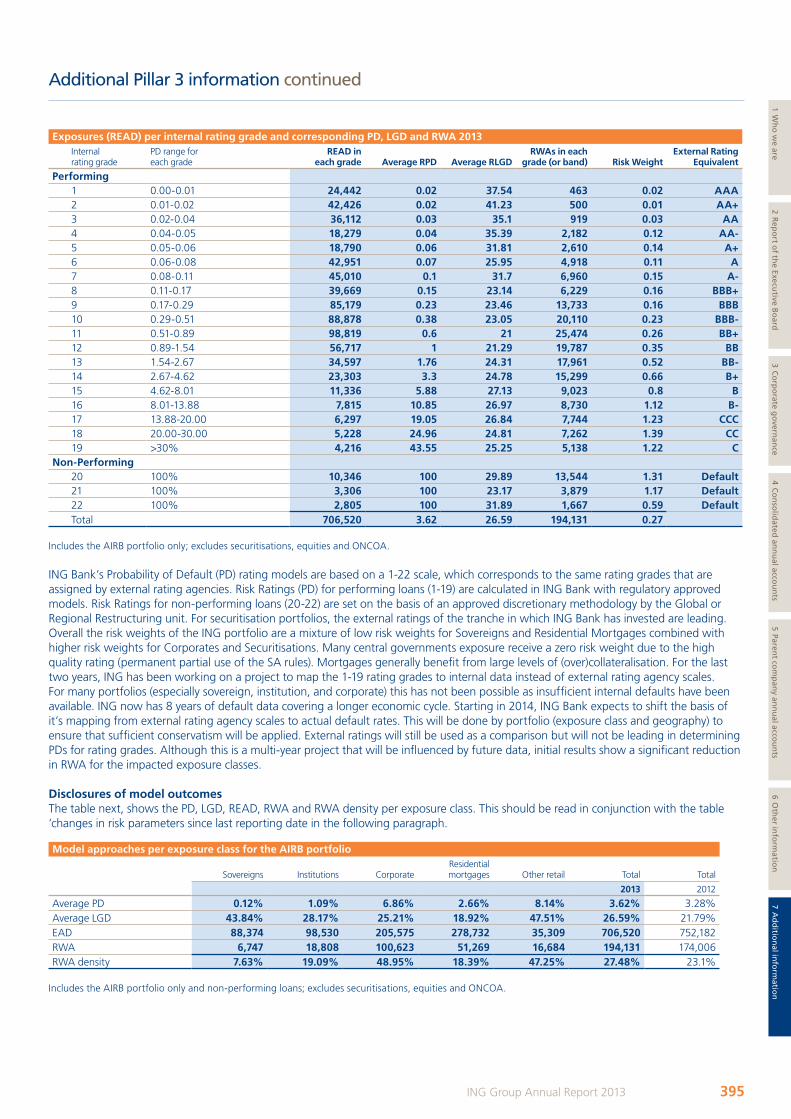
Exposures (READ) per internal rating grade and corresponding PD, LGD and RWA 2013Internal rating grade
PD range for each grade
READ in each grade Average RPD Average RLGD
RWAs in each grade (or band) Risk Weight
External Rating Equivalent
Performing1 0.00-0.01 24,442 0.02 37.54 463 0.02 AAA2 0.01-0.02 42,426 0.02 41.23 500 0.01 AA+3 0.02-0.04 36,112 0.03 35.1 919 0.03 AA4 0.04-0.05 18,279 0.04 35.39 2,182 0.12 AA-5 0.05-0.06 18,790 0.06 31.81 2,610 0.14 A+6 0.06-0.08 42,951 0.07 25.95 4,918 0.11 A7 0.08-0.11 45,010 0.1 31.7 6,960 0.15 A-8 0.11-0.17 39,669 0.15 23.14 6,229 0.16 BBB+9 0.17-0.29 85,179 0.23 23.46 13,733 0.16 BBB10 0.29-0.51 88,878 0.38 23.05 20,110 0.23 BBB-11 0.51-0.89 98,819 0.6 21 25,474 0.26 BB+12 0.89-1.54 56,717 1 21.29 19,787 0.35 BB13 1.54-2.67 34,597 1.76 24.31 17,961 0.52 BB-14 2.67-4.62 23,303 3.3 24.78 15,299 0.66 B+15 4.62-8.01 11,336 5.88 27.13 9,023 0.8 B16 8.01-13.88 7,815 10.85 26.97 8,730 1.12 B-17 13.88-20.00 6,297 19.05 26.84 7,744 1.23 CCC18 20.00-30.00 5,228 24.96 24.81 7,262 1.39 CC19 >30% 4,216 43.55 25.25 5,138 1.22 C
Non-Performing 20 100% 10,346 100 29.89 13,544 1.31 Default21 100% 3,306 100 23.17 3,879 1.17 Default22 100% 2,805 100 31.89 1,667 0.59 DefaultTotal 706,520 3.62 26.59 194,131 0.27
Includes the AIRB portfolio only; excludes securitisations, equities and ONCOA.
ING Bank’s Probability of Default (PD) rating models are based on a 1-22 scale, which corresponds to the same rating grades that are assigned by external rating agencies. Risk Ratings (PD) for performing loans (1-19) are calculated in ING Bank with regulatory approved models. Risk Ratings for non-performing loans (20-22) are set on the basis of an approved discretionary methodology by the Global or Regional Restructuring unit. For securitisation portfolios, the external ratings of the tranche in which ING Bank has invested are leading. Overall the risk weights of the ING portfolio are a mixture of low risk weights for Sovereigns and Residential Mortgages combined with higher risk weights for Corporates and Securitisations. Many central governments exposure receive a zero risk weight due to the high quality rating (permanent partial use of the SA rules). Mortgages generally benefit from large levels of (over)collateralisation. For the last two years, ING has been working on a project to map the 1-19 rating grades to internal data instead of external rating agency scales. For many portfolios (especially sovereign, institution, and corporate) this has not been possible as insufficient internal defaults have been available. ING now has 8 years of default data covering a longer economic cycle. Starting in 2014, ING Bank expects to shift the basis of it’s mapping from external rating agency scales to actual default rates. This will be done by portfolio (exposure class and geography) to ensure that sufficient conservatism will be applied. External ratings will still be used as a comparison but will not be leading in determining PDs for rating grades. Although this is a multi-year project that will be influenced by future data, initial results show a significant reduction in RWA for the impacted exposure classes.
Disclosures of model outcomesThe table next, shows the PD, LGD, READ, RWA and RWA density per exposure class. This should be read in conjunction with the table ‘changes in risk parameters since last reporting date in the following paragraph.
Model approaches per exposure class for the AIRB portfolio
Sovereigns Institutions CorporateResidential mortgages Other retail Total Total
2013 2012
Average PD 0.12% 1.09% 6.86% 2.66% 8.14% 3.62% 3.28%Average LGD 43.84% 28.17% 25.21% 18.92% 47.51% 26.59% 21.79%EAD 88,374 98,530 205,575 278,732 35,309 706,520 752,182RWA 6,747 18,808 100,623 51,269 16,684 194,131 174,006RWA density 7.63% 19.09% 48.95% 18.39% 47.25% 27.48% 23.1%
Includes the AIRB portfolio only and non-performing loans; excludes securitisations, equities and ONCOA.
Additional Pillar 3 information continued
395ING Group Annual Report 2013
1 Wh
o w
e are2 R
epo
rt of th
e Executive B
oard
3 Co
rpo
rate go
vernan
ce4 C
on
solid
ated an
nu
al accou
nts
5 Parent co
mp
any an
nu
al accou
nts
6 Oth
er info
rmatio
n7 A
dd
ition
al info
rmatio
n
ING_2013_deel5_v1.indd 395 19/03/2014 19:45:21
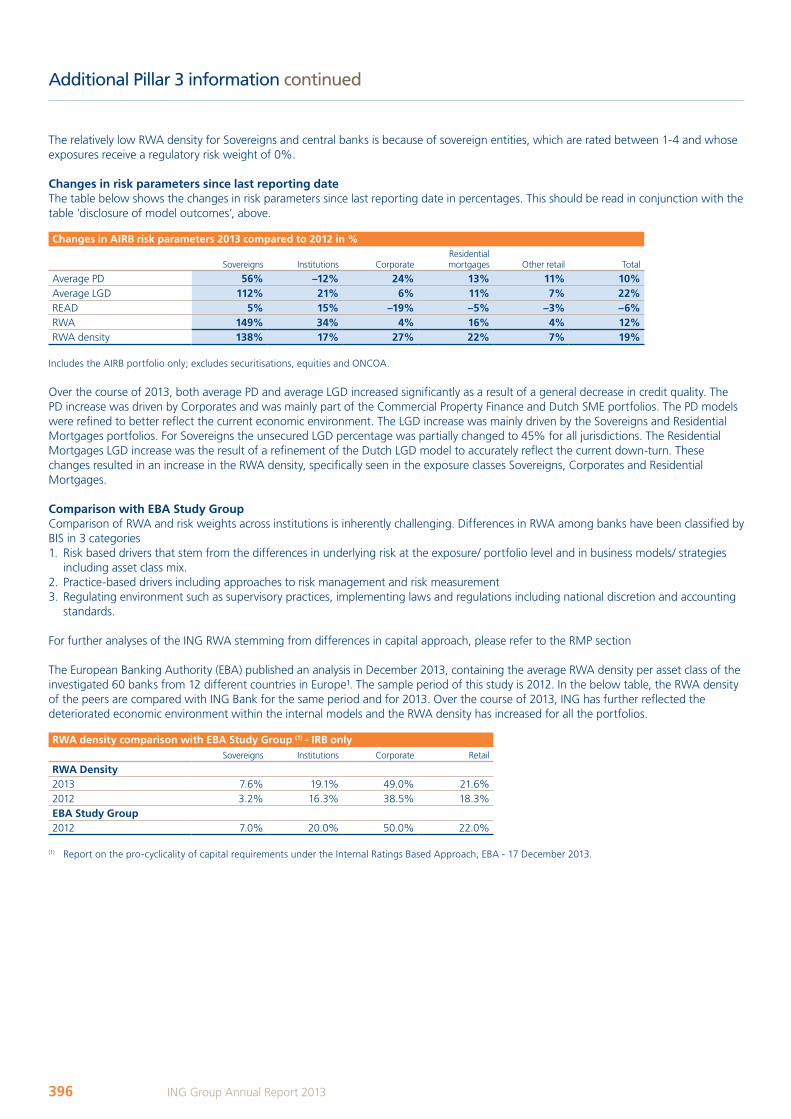
The relatively low RWA density for Sovereigns and central banks is because of sovereign entities, which are rated between 1-4 and whose exposures receive a regulatory risk weight of 0%.
Changes in risk parameters since last reporting dateThe table below shows the changes in risk parameters since last reporting date in percentages. This should be read in conjunction with the table ‘disclosure of model outcomes’, above.
Changes in AIRB risk parameters 2013 compared to 2012 in %
Sovereigns Institutions CorporateResidential mortgages Other retail Total
Average PD 56% –12% 24% 13% 11% 10%Average LGD 112% 21% 6% 11% 7% 22%READ 5% 15% –19% –5% –3% –6%RWA 149% 34% 4% 16% 4% 12%RWA density 138% 17% 27% 22% 7% 19%
Includes the AIRB portfolio only; excludes securitisations, equities and ONCOA.
Over the course of 2013, both average PD and average LGD increased significantly as a result of a general decrease in credit quality. The PD increase was driven by Corporates and was mainly part of the Commercial Property Finance and Dutch SME portfolios. The PD models were refined to better reflect the current economic environment. The LGD increase was mainly driven by the Sovereigns and Residential Mortgages portfolios. For Sovereigns the unsecured LGD percentage was partially changed to 45% for all jurisdictions. The Residential Mortgages LGD increase was the result of a refinement of the Dutch LGD model to accurately reflect the current down-turn. These changes resulted in an increase in the RWA density, specifically seen in the exposure classes Sovereigns, Corporates and Residential Mortgages.
Comparison with EBA Study GroupComparison of RWA and risk weights across institutions is inherently challenging. Differences in RWA among banks have been classified by BIS in 3 categories 1. Risk based drivers that stem from the differences in underlying risk at the exposure/ portfolio level and in business models/ strategies
including asset class mix. 2. Practice-based drivers including approaches to risk management and risk measurement 3. Regulating environment such as supervisory practices, implementing laws and regulations including national discretion and accounting
standards.
For further analyses of the ING RWA stemming from differences in capital approach, please refer to the RMP section
The European Banking Authority (EBA) published an analysis in December 2013, containing the average RWA density per asset class of the investigated 60 banks from 12 different countries in Europe¹. The sample period of this study is 2012. In the below table, the RWA density of the peers are compared with ING Bank for the same period and for 2013. Over the course of 2013, ING has further reflected the deteriorated economic environment within the internal models and the RWA density has increased for all the portfolios.
RWA density comparison with EBA Study Group (1) - IRB onlySovereigns Institutions Corporate Retail
RWA Density2013 7.6% 19.1% 49.0% 21.6%2012 3.2% 16.3% 38.5% 18.3%EBA Study Group2012 7.0% 20.0% 50.0% 22.0%
(1) Report on the pro-cyclicality of capital requirements under the Internal Ratings Based Approach, EBA - 17 December 2013.
Additional Pillar 3 information continued
396 ING Group Annual Report 2013
ING_2013_deel5_v1.indd 396 19/03/2014 19:45:21

Disclosure of estimated and actual loss parametersING has dedicated AIRB credit risk models per business unit, segment and country. An independent Model Validation department periodically reviews all AIRB models for compliance including back testing when possible. If a model is considered not to be robust or the backtesting indicates insufficient performance, than the model is either re-calibrated or re-developed. All model recommendations from Model Validation department are tracked via iRisk, the same internal database that management uses to track issues detected by the Internal Audit department, incidents and non-financial risk issues. All significant model changes are submitted to the Home Regulator (DNB) and implemented after regulatory approval. On average, 91% of the AIRB credit risk models in the validation cycle have had ‘No to Remote’ (58%) and ‘Minor’ (33%) model deficiencies.
The table below provides a backtesting of the PD models per exposure class. In order to better quantify the backtesting, ING has analysed the 31 December 2013 portfolio. The average PD of 31 December 2012 per portfolio is split per Basel II exposure class. The 31 December 2012 portfolio is followed through 2013 to determine the observed default rate. The models are based on long series of historical data. In the back-test the model based PD values are compared against the defaults observed in 2013. This back-test is only representative of the year end 2012 portfolio and can be influenced by small sample sizes or incidents. Nonetheless, the back-test gives a comparison of the predicted PD versus the observed default rate. In the next table, the default rate is based on the weighted average READ of the defaulted portfolio whereas the models are developed on an obligor basis.
Average estimated PD under the Advanced AIRB approach versus the actual default rate per exposure class
Sovereigns Institutions CorporateResidential mortgages Other retail Total
2013
Average PD 2012* 0.08% 0.35% 2.00% 1.13% 2.89% 1.29%Observed Default Rate 2013 0.00% 0.00% 1.95% 1.43% 2.96% 1.28%
Includes the AIRB portfolio only; excludes securitisations, equities and ONCOA.* Average PD 2012 includes performing loans only.
The table below gives insight in the Expected Loss rate and the Observed Loss rate per exposure class. The expected loss of 31 December 2012 for the performing portfolio is split per Basel II exposure class. The 31 December 2012 portfolio is followed through 2013 to determine the defaulted exposures. The models are based on long series of historical data. In the comparison, the expected loss rate is calculated by dividing the expected loss of the performing portfolio of December 2012 by the READ of the performing portfolio of the same period. The Observed Loss rate is a result of multiplying the observed defaulted exposures by its LGD. This back-test is only representative of the year end 2012 portfolio and can be influenced by small sample sizes or incidents. Nonetheless, the back-test gives a comparison of the Expected Loss rate PD versus the observed Loss rate.
Expected loss rate under the Advanced IRB approach versus the observed loss rate per exposure class
Sovereigns Institutions CorporateResidential mortgages Other retail Total
2013 2013
Expected loss rate 2012* 0.0118% 0.0678% 0.4367% 0.1907% 1.1235% 0.2694%Observed Loss Rate 2013 0.0000% 0.0003% 0.4368% 0.2425% 1.2113% 0.2833%
Includes the AIRB portfolio only; excludes securitisations, equities and ONCOA.* Expected loss rate 2012 includes performing loans only.
Both of the backtests show that the expectations are quite in line with the observed default rate and the observed loss rate. For the exposure classes Retail Other and the Residential mortgages portfolio, the default rates and the loss rates exceed the predicted values as a result of the challenging economic circumstances in mainly the Netherlands and Belgium portfolio.
Additional Pillar 3 information continued
397ING Group Annual Report 2013
1 Wh
o w
e are2 R
epo
rt of th
e Executive B
oard
3 Co
rpo
rate go
vernan
ce4 C
on
solid
ated an
nu
al accou
nts
5 Parent co
mp
any an
nu
al accou
nts
6 Oth
er info
rmatio
n7 A
dd
ition
al info
rmatio
n
ING_2013_deel5_v1.indd 397 19/03/2014 19:45:21
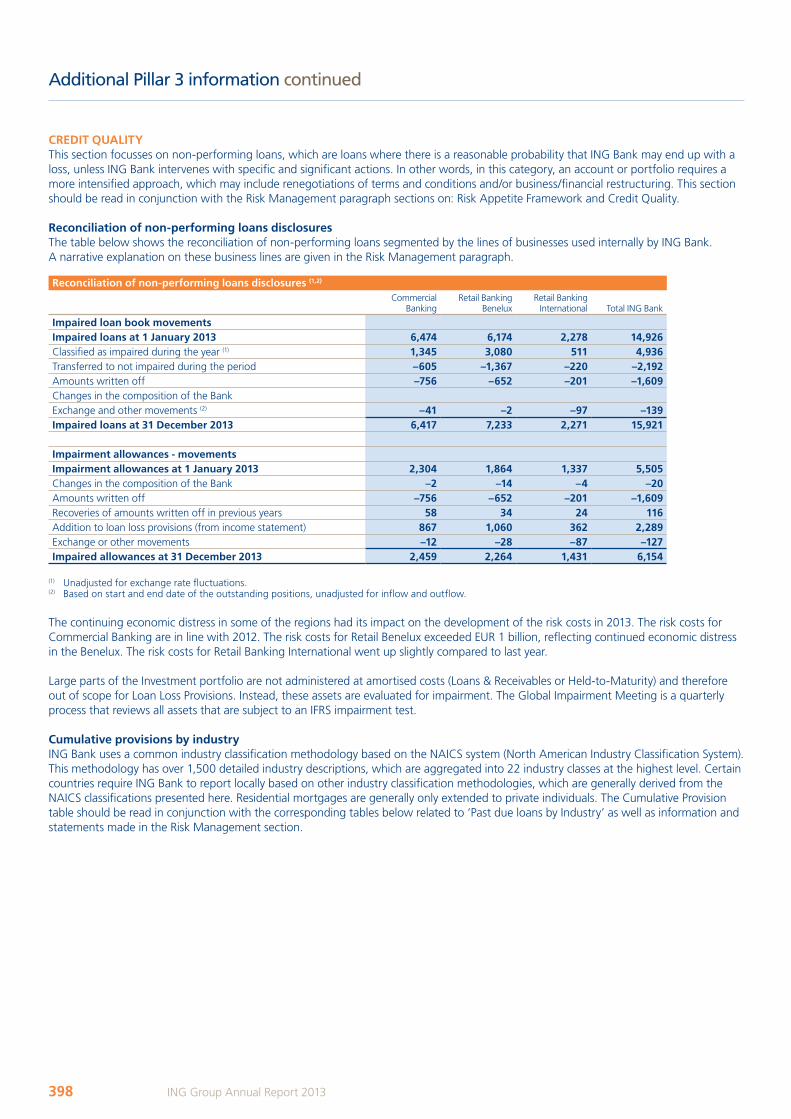
CREDIT QUALITYThis section focusses on non-performing loans, which are loans where there is a reasonable probability that ING Bank may end up with a loss, unless ING Bank intervenes with specific and significant actions. In other words, in this category, an account or portfolio requires a more intensified approach, which may include renegotiations of terms and conditions and/or business/financial restructuring. This section should be read in conjunction with the Risk Management paragraph sections on: Risk Appetite Framework and Credit Quality.
Reconciliation of non-performing loans disclosuresThe table below shows the reconciliation of non-performing loans segmented by the lines of businesses used internally by ING Bank. A narrative explanation on these business lines are given in the Risk Management paragraph.
Reconciliation of non-performing loans disclosures (1,2)
Commercial Banking
Retail Banking Benelux
Retail Banking International Total ING Bank
Impaired loan book movementsImpaired loans at 1 January 2013 6,474 6,174 2,278 14,926Classified as impaired during the year (1) 1,345 3,080 511 4,936Transferred to not impaired during the period –605 –1,367 –220 –2,192Amounts written off –756 –652 –201 –1,609Changes in the composition of the Bank Exchange and other movements (2) –41 –2 –97 –139Impaired loans at 31 December 2013 6,417 7,233 2,271 15,921
Impairment allowances - movementsImpairment allowances at 1 January 2013 2,304 1,864 1,337 5,505Changes in the composition of the Bank –2 –14 –4 –20Amounts written off –756 –652 –201 –1,609Recoveries of amounts written off in previous years 58 34 24 116Addition to loan loss provisions (from income statement) 867 1,060 362 2,289Exchange or other movements –12 –28 –87 –127Impaired allowances at 31 December 2013 2,459 2,264 1,431 6,154
(1) Unadjusted for exchange rate fluctuations.(2) Based on start and end date of the outstanding positions, unadjusted for inflow and outflow.
The continuing economic distress in some of the regions had its impact on the development of the risk costs in 2013. The risk costs for Commercial Banking are in line with 2012. The risk costs for Retail Benelux exceeded EUR 1 billion, reflecting continued economic distress in the Benelux. The risk costs for Retail Banking International went up slightly compared to last year.
Large parts of the Investment portfolio are not administered at amortised costs (Loans & Receivables or Held-to-Maturity) and therefore out of scope for Loan Loss Provisions. Instead, these assets are evaluated for impairment. The Global Impairment Meeting is a quarterly process that reviews all assets that are subject to an IFRS impairment test.
Cumulative provisions by industryING Bank uses a common industry classification methodology based on the NAICS system (North American Industry Classification System). This methodology has over 1,500 detailed industry descriptions, which are aggregated into 22 industry classes at the highest level. Certain countries require ING Bank to report locally based on other industry classification methodologies, which are generally derived from the NAICS classifications presented here. Residential mortgages are generally only extended to private individuals. The Cumulative Provision table should be read in conjunction with the corresponding tables below related to ‘Past due loans by Industry’ as well as information and statements made in the Risk Management section.
Additional Pillar 3 information continued
398 ING Group Annual Report 2013
ING_2013_deel5_v1.indd 398 19/03/2014 19:45:22
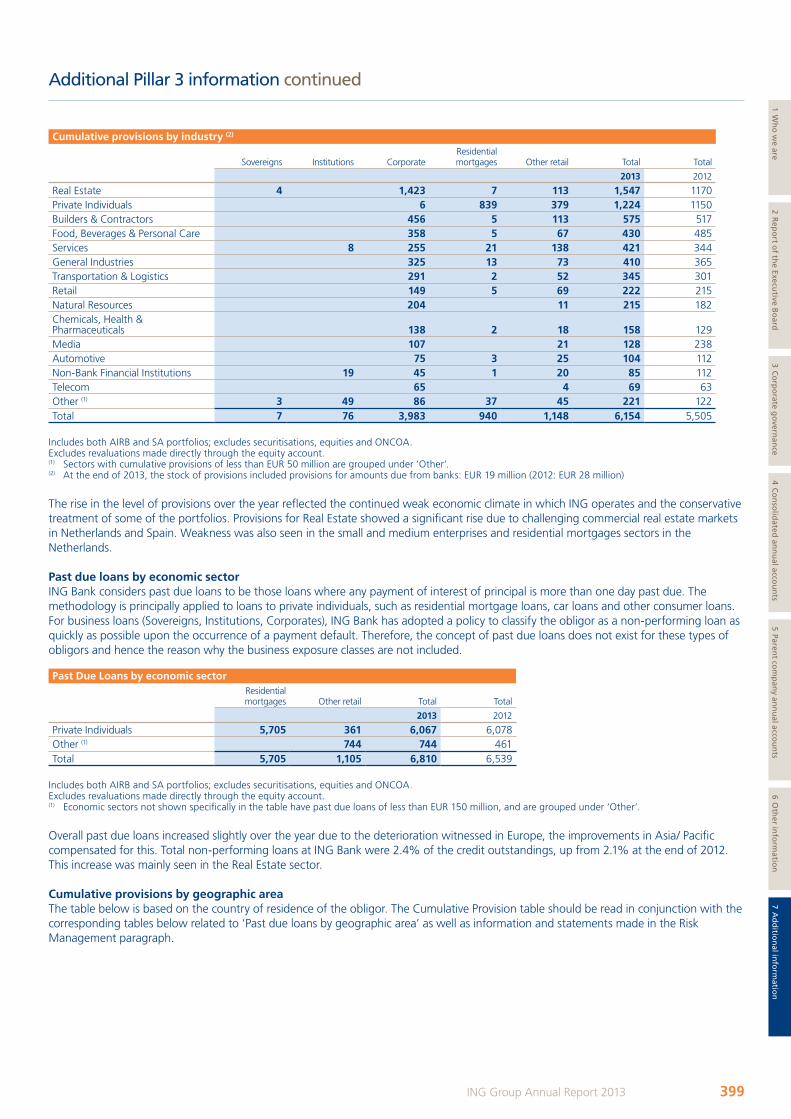
Cumulative provisions by industry (2)
Sovereigns Institutions CorporateResidential mortgages Other retail Total Total
2013 2012
Real Estate 4 1,423 7 113 1,547 1170Private Individuals 6 839 379 1,224 1150Builders & Contractors 456 5 113 575 517Food, Beverages & Personal Care 358 5 67 430 485Services 8 255 21 138 421 344General Industries 325 13 73 410 365Transportation & Logistics 291 2 52 345 301Retail 149 5 69 222 215Natural Resources 204 11 215 182Chemicals, Health & Pharmaceuticals 138 2 18 158 129Media 107 21 128 238Automotive 75 3 25 104 112Non-Bank Financial Institutions 19 45 1 20 85 112Telecom 65 4 69 63Other (1) 3 49 86 37 45 221 122Total 7 76 3,983 940 1,148 6,154 5,505
Includes both AIRB and SA portfolios; excludes securitisations, equities and ONCOA.Excludes revaluations made directly through the equity account.(1) Sectors with cumulative provisions of less than EUR 50 million are grouped under ‘Other’.(2) At the end of 2013, the stock of provisions included provisions for amounts due from banks: EUR 19 million (2012: EUR 28 million)
The rise in the level of provisions over the year reflected the continued weak economic climate in which ING operates and the conservative treatment of some of the portfolios. Provisions for Real Estate showed a significant rise due to challenging commercial real estate markets in Netherlands and Spain. Weakness was also seen in the small and medium enterprises and residential mortgages sectors in the Netherlands.
Past due loans by economic sectorING Bank considers past due loans to be those loans where any payment of interest of principal is more than one day past due. The methodology is principally applied to loans to private individuals, such as residential mortgage loans, car loans and other consumer loans. For business loans (Sovereigns, Institutions, Corporates), ING Bank has adopted a policy to classify the obligor as a non-performing loan as quickly as possible upon the occurrence of a payment default. Therefore, the concept of past due loans does not exist for these types of obligors and hence the reason why the business exposure classes are not included.
Past Due Loans by economic sectorResidential mortgages Other retail Total Total
2013 2012
Private Individuals 5,705 361 6,067 6,078Other (1) 744 744 461Total 5,705 1,105 6,810 6,539
Includes both AIRB and SA portfolios; excludes securitisations, equities and ONCOA.Excludes revaluations made directly through the equity account.(1) Economic sectors not shown specifically in the table have past due loans of less than EUR 150 million, and are grouped under ‘Other’.
Overall past due loans increased slightly over the year due to the deterioration witnessed in Europe, the improvements in Asia/ Pacific compensated for this. Total non-performing loans at ING Bank were 2.4% of the credit outstandings, up from 2.1% at the end of 2012. This increase was mainly seen in the Real Estate sector.
Cumulative provisions by geographic areaThe table below is based on the country of residence of the obligor. The Cumulative Provision table should be read in conjunction with the corresponding tables below related to ‘Past due loans by geographic area’ as well as information and statements made in the Risk Management paragraph.
Additional Pillar 3 information continued
399ING Group Annual Report 2013
1 Wh
o w
e are2 R
epo
rt of th
e Executive B
oard
3 Co
rpo
rate go
vernan
ce4 C
on
solid
ated an
nu
al accou
nts
5 Parent co
mp
any an
nu
al accou
nts
6 Oth
er info
rmatio
n7 A
dd
ition
al info
rmatio
n
ING_2013_deel5_v1.indd 399 19/03/2014 19:45:22
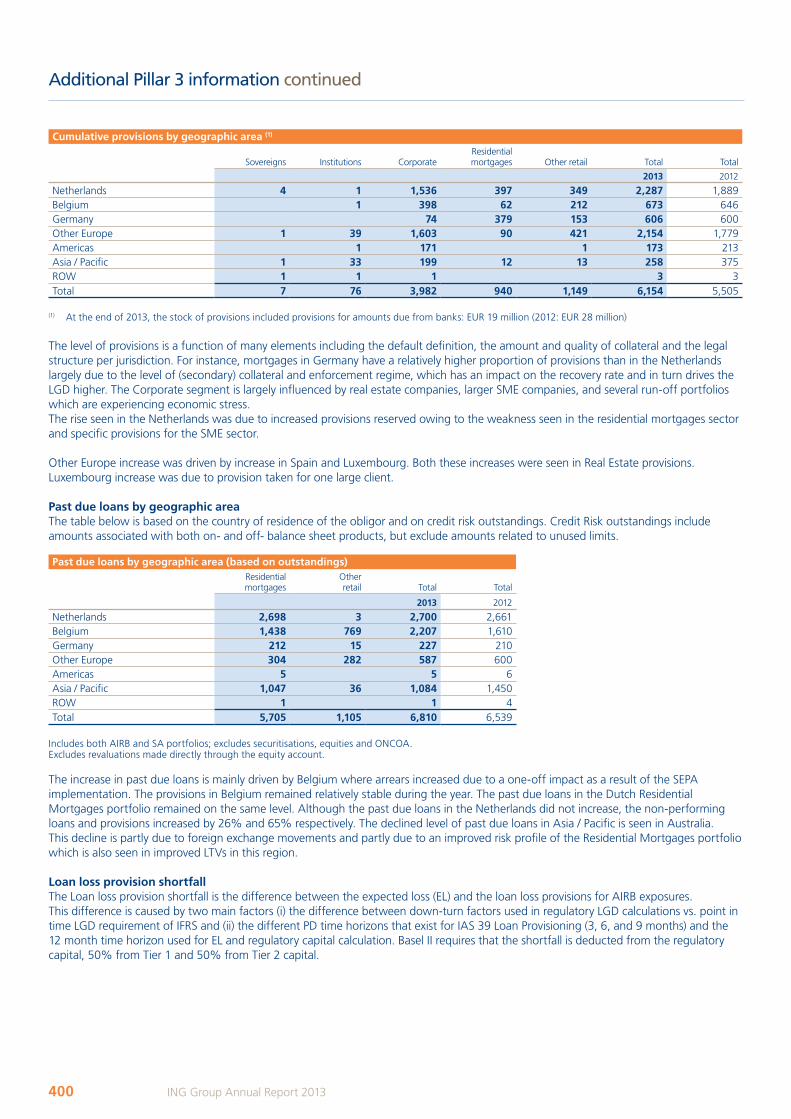
Cumulative provisions by geographic area (1)
Sovereigns Institutions CorporateResidential mortgages Other retail Total Total
2013 2012
Netherlands 4 1 1,536 397 349 2,287 1,889Belgium 1 398 62 212 673 646Germany 74 379 153 606 600Other Europe 1 39 1,603 90 421 2,154 1,779Americas 1 171 1 173 213Asia / Pacific 1 33 199 12 13 258 375ROW 1 1 1 3 3Total 7 76 3,982 940 1,149 6,154 5,505
(1) At the end of 2013, the stock of provisions included provisions for amounts due from banks: EUR 19 million (2012: EUR 28 million)
The level of provisions is a function of many elements including the default definition, the amount and quality of collateral and the legal structure per jurisdiction. For instance, mortgages in Germany have a relatively higher proportion of provisions than in the Netherlands largely due to the level of (secondary) collateral and enforcement regime, which has an impact on the recovery rate and in turn drives the LGD higher. The Corporate segment is largely influenced by real estate companies, larger SME companies, and several run-off portfolios which are experiencing economic stress.The rise seen in the Netherlands was due to increased provisions reserved owing to the weakness seen in the residential mortgages sector and specific provisions for the SME sector.
Other Europe increase was driven by increase in Spain and Luxembourg. Both these increases were seen in Real Estate provisions. Luxembourg increase was due to provision taken for one large client.
Past due loans by geographic areaThe table below is based on the country of residence of the obligor and on credit risk outstandings. Credit Risk outstandings include amounts associated with both on- and off- balance sheet products, but exclude amounts related to unused limits.
Past due loans by geographic area (based on outstandings)Residential mortgages
Other retail Total Total
2013 2012
Netherlands 2,698 3 2,700 2,661Belgium 1,438 769 2,207 1,610Germany 212 15 227 210Other Europe 304 282 587 600Americas 5 5 6Asia / Pacific 1,047 36 1,084 1,450ROW 1 1 4Total 5,705 1,105 6,810 6,539
Includes both AIRB and SA portfolios; excludes securitisations, equities and ONCOA.Excludes revaluations made directly through the equity account.
The increase in past due loans is mainly driven by Belgium where arrears increased due to a one-off impact as a result of the SEPA implementation. The provisions in Belgium remained relatively stable during the year. The past due loans in the Dutch Residential Mortgages portfolio remained on the same level. Although the past due loans in the Netherlands did not increase, the non-performing loans and provisions increased by 26% and 65% respectively. The declined level of past due loans in Asia / Pacific is seen in Australia. This decline is partly due to foreign exchange movements and partly due to an improved risk profile of the Residential Mortgages portfolio which is also seen in improved LTVs in this region.
Loan loss provision shortfallThe Loan loss provision shortfall is the difference between the expected loss (EL) and the loan loss provisions for AIRB exposures. This difference is caused by two main factors (i) the difference between down-turn factors used in regulatory LGD calculations vs. point in time LGD requirement of IFRS and (ii) the different PD time horizons that exist for IAS 39 Loan Provisioning (3, 6, and 9 months) and the 12 month time horizon used for EL and regulatory capital calculation. Basel II requires that the shortfall is deducted from the regulatory capital, 50% from Tier 1 and 50% from Tier 2 capital.
Additional Pillar 3 information continued
400 ING Group Annual Report 2013
ING_2013_deel5_v1.indd 400 19/03/2014 19:45:22
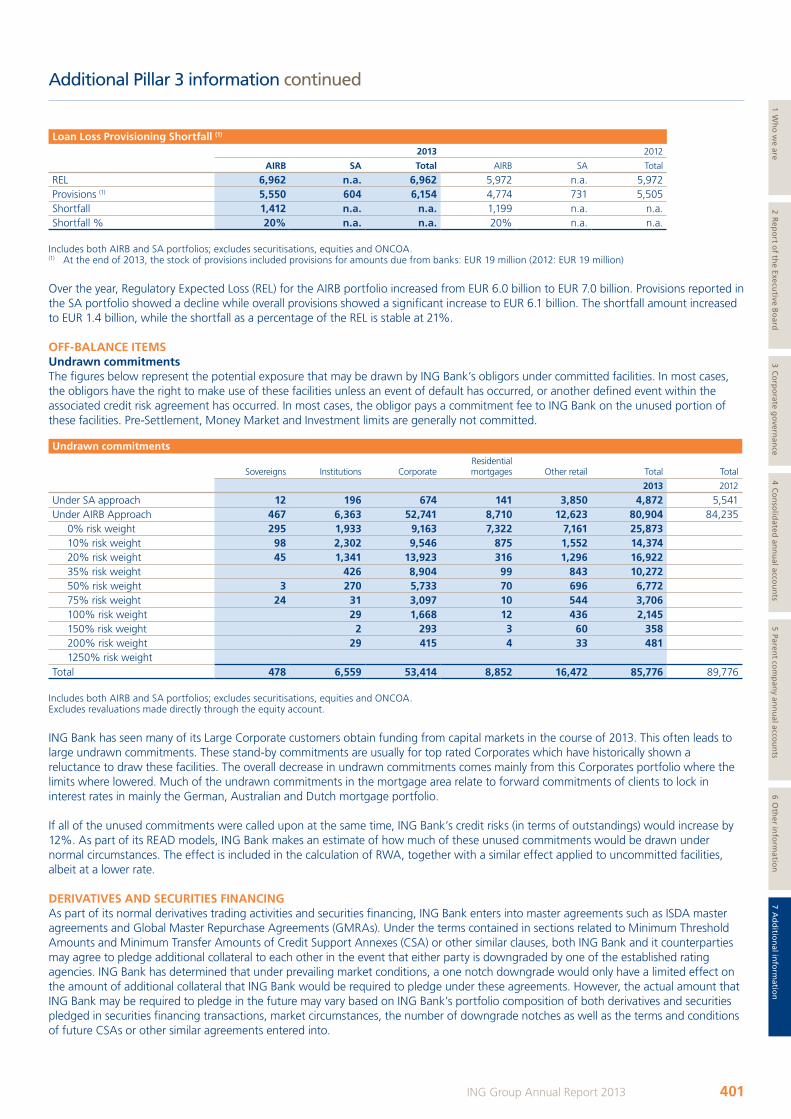
Loan Loss Provisioning Shortfall (1)
2013 2012
AIRB SA Total AIRB SA Total
REL 6,962 n.a. 6,962 5,972 n.a. 5,972Provisions (1) 5,550 604 6,154 4,774 731 5,505Shortfall 1,412 n.a. n.a. 1,199 n.a. n.a.Shortfall % 20% n.a. n.a. 20% n.a. n.a.
Includes both AIRB and SA portfolios; excludes securitisations, equities and ONCOA.(1) At the end of 2013, the stock of provisions included provisions for amounts due from banks: EUR 19 million (2012: EUR 19 million)
Over the year, Regulatory Expected Loss (REL) for the AIRB portfolio increased from EUR 6.0 billion to EUR 7.0 billion. Provisions reported in the SA portfolio showed a decline while overall provisions showed a significant increase to EUR 6.1 billion. The shortfall amount increased to EUR 1.4 billion, while the shortfall as a percentage of the REL is stable at 21%.
OFF-BALANCE ITEMSUndrawn commitmentsThe figures below represent the potential exposure that may be drawn by ING Bank’s obligors under committed facilities. In most cases, the obligors have the right to make use of these facilities unless an event of default has occurred, or another defined event within the associated credit risk agreement has occurred. In most cases, the obligor pays a commitment fee to ING Bank on the unused portion of these facilities. Pre-Settlement, Money Market and Investment limits are generally not committed.
Undrawn commitments
Sovereigns Institutions CorporateResidential mortgages Other retail Total Total
2013 2012
Under SA approach 12 196 674 141 3,850 4,872 5,541Under AIRB Approach 467 6,363 52,741 8,710 12,623 80,904 84,235
0% risk weight 295 1,933 9,163 7,322 7,161 25,87310% risk weight 98 2,302 9,546 875 1,552 14,37420% risk weight 45 1,341 13,923 316 1,296 16,92235% risk weight 426 8,904 99 843 10,27250% risk weight 3 270 5,733 70 696 6,77275% risk weight 24 31 3,097 10 544 3,706100% risk weight 29 1,668 12 436 2,145150% risk weight 2 293 3 60 358200% risk weight 29 415 4 33 4811250% risk weight
Total 478 6,559 53,414 8,852 16,472 85,776 89,776
Includes both AIRB and SA portfolios; excludes securitisations, equities and ONCOA.Excludes revaluations made directly through the equity account.
ING Bank has seen many of its Large Corporate customers obtain funding from capital markets in the course of 2013. This often leads to large undrawn commitments. These stand-by commitments are usually for top rated Corporates which have historically shown a reluctance to draw these facilities. The overall decrease in undrawn commitments comes mainly from this Corporates portfolio where the limits where lowered. Much of the undrawn commitments in the mortgage area relate to forward commitments of clients to lock in interest rates in mainly the German, Australian and Dutch mortgage portfolio.
If all of the unused commitments were called upon at the same time, ING Bank’s credit risks (in terms of outstandings) would increase by 12%. As part of its READ models, ING Bank makes an estimate of how much of these unused commitments would be drawn under normal circumstances. The effect is included in the calculation of RWA, together with a similar effect applied to uncommitted facilities, albeit at a lower rate.
DERIVATIVES AND SECURITIES FINANCINGAs part of its normal derivatives trading activities and securities financing, ING Bank enters into master agreements such as ISDA master agreements and Global Master Repurchase Agreements (GMRAs). Under the terms contained in sections related to Minimum Threshold Amounts and Minimum Transfer Amounts of Credit Support Annexes (CSA) or other similar clauses, both ING Bank and it counterparties may agree to pledge additional collateral to each other in the event that either party is downgraded by one of the established rating agencies. ING Bank has determined that under prevailing market conditions, a one notch downgrade would only have a limited effect on the amount of additional collateral that ING Bank would be required to pledge under these agreements. However, the actual amount that ING Bank may be required to pledge in the future may vary based on ING Bank’s portfolio composition of both derivatives and securities pledged in securities financing transactions, market circumstances, the number of downgrade notches as well as the terms and conditions of future CSAs or other similar agreements entered into.
Additional Pillar 3 information continued
401ING Group Annual Report 2013
1 Wh
o w
e are2 R
epo
rt of th
e Executive B
oard
3 Co
rpo
rate go
vernan
ce4 C
on
solid
ated an
nu
al accou
nts
5 Parent co
mp
any an
nu
al accou
nts
6 Oth
er info
rmatio
n7 A
dd
ition
al info
rmatio
n
ING_2013_deel5_v1.indd 401 19/03/2014 19:45:22
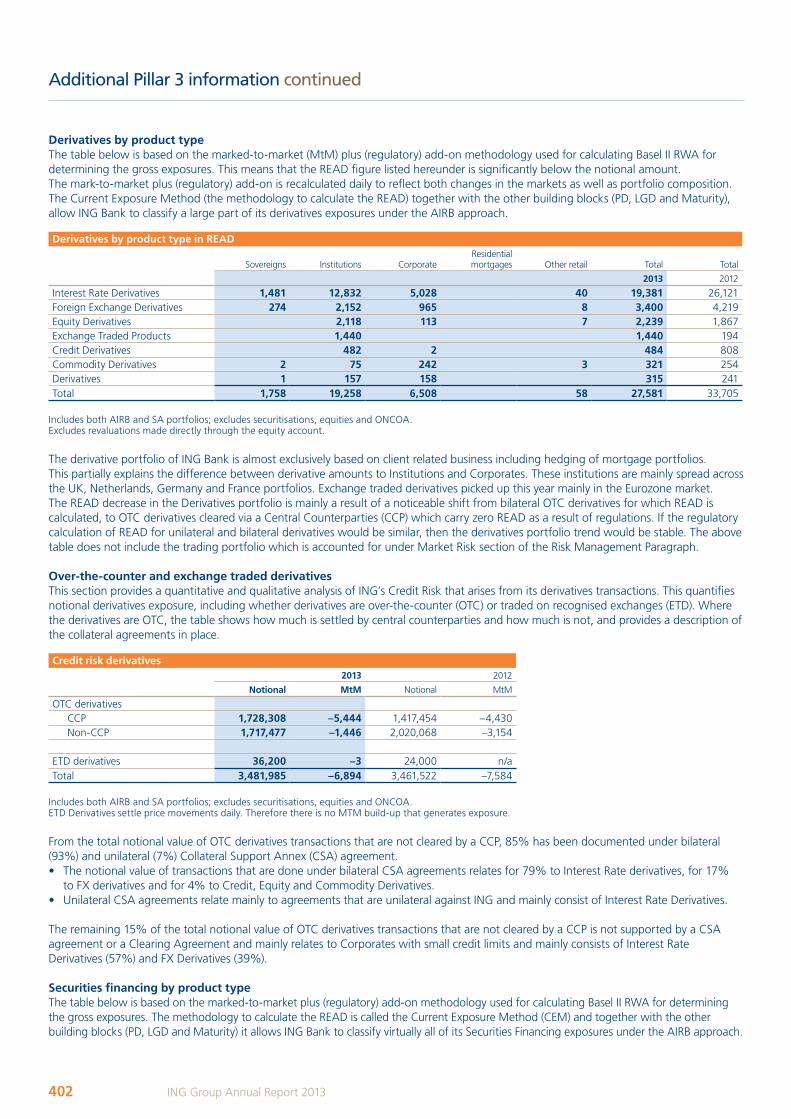
Derivatives by product typeThe table below is based on the marked-to-market (MtM) plus (regulatory) add-on methodology used for calculating Basel II RWA for determining the gross exposures. This means that the READ figure listed hereunder is significantly below the notional amount. The mark-to-market plus (regulatory) add-on is recalculated daily to reflect both changes in the markets as well as portfolio composition. The Current Exposure Method (the methodology to calculate the READ) together with the other building blocks (PD, LGD and Maturity), allow ING Bank to classify a large part of its derivatives exposures under the AIRB approach.
Derivatives by product type in READ
Sovereigns Institutions CorporateResidential mortgages Other retail Total Total
2013 2012
Interest Rate Derivatives 1,481 12,832 5,028 40 19,381 26,121Foreign Exchange Derivatives 274 2,152 965 8 3,400 4,219Equity Derivatives 2,118 113 7 2,239 1,867Exchange Traded Products 1,440 1,440 194Credit Derivatives 482 2 484 808Commodity Derivatives 2 75 242 3 321 254Derivatives 1 157 158 315 241Total 1,758 19,258 6,508 58 27,581 33,705
Includes both AIRB and SA portfolios; excludes securitisations, equities and ONCOA.Excludes revaluations made directly through the equity account.
The derivative portfolio of ING Bank is almost exclusively based on client related business including hedging of mortgage portfolios. This partially explains the difference between derivative amounts to Institutions and Corporates. These institutions are mainly spread across the UK, Netherlands, Germany and France portfolios. Exchange traded derivatives picked up this year mainly in the Eurozone market. The READ decrease in the Derivatives portfolio is mainly a result of a noticeable shift from bilateral OTC derivatives for which READ is calculated, to OTC derivatives cleared via a Central Counterparties (CCP) which carry zero READ as a result of regulations. If the regulatory calculation of READ for unilateral and bilateral derivatives would be similar, then the derivatives portfolio trend would be stable. The above table does not include the trading portfolio which is accounted for under Market Risk section of the Risk Management Paragraph.
Over-the-counter and exchange traded derivatives This section provides a quantitative and qualitative analysis of ING’s Credit Risk that arises from its derivatives transactions. This quantifies notional derivatives exposure, including whether derivatives are over-the-counter (OTC) or traded on recognised exchanges (ETD). Where the derivatives are OTC, the table shows how much is settled by central counterparties and how much is not, and provides a description of the collateral agreements in place.
Credit risk derivatives 2013 2012
Notional MtM Notional MtM
OTC derivatives CCP 1,728,308 –5,444 1,417,454 –4,430Non-CCP 1,717,477 –1,446 2,020,068 –3,154
ETD derivatives 36,200 –3 24,000 n/aTotal 3,481,985 –6,894 3,461,522 –7,584
Includes both AIRB and SA portfolios; excludes securitisations, equities and ONCOA.ETD Derivatives settle price movements daily. Therefore there is no MTM build-up that generates exposure.
From the total notional value of OTC derivatives transactions that are not cleared by a CCP, 85% has been documented under bilateral (93%) and unilateral (7%) Collateral Support Annex (CSA) agreement.• The notional value of transactions that are done under bilateral CSA agreements relates for 79% to Interest Rate derivatives, for 17%
to FX derivatives and for 4% to Credit, Equity and Commodity Derivatives.• Unilateral CSA agreements relate mainly to agreements that are unilateral against ING and mainly consist of Interest Rate Derivatives.
The remaining 15% of the total notional value of OTC derivatives transactions that are not cleared by a CCP is not supported by a CSA agreement or a Clearing Agreement and mainly relates to Corporates with small credit limits and mainly consists of Interest Rate Derivatives (57%) and FX Derivatives (39%).
Securities financing by product type The table below is based on the marked-to-market plus (regulatory) add-on methodology used for calculating Basel II RWA for determining the gross exposures. The methodology to calculate the READ is called the Current Exposure Method (CEM) and together with the other building blocks (PD, LGD and Maturity) it allows ING Bank to classify virtually all of its Securities Financing exposures under the AIRB approach.
Additional Pillar 3 information continued
402 ING Group Annual Report 2013
ING_2013_deel5_v1.indd 402 19/03/2014 19:45:23
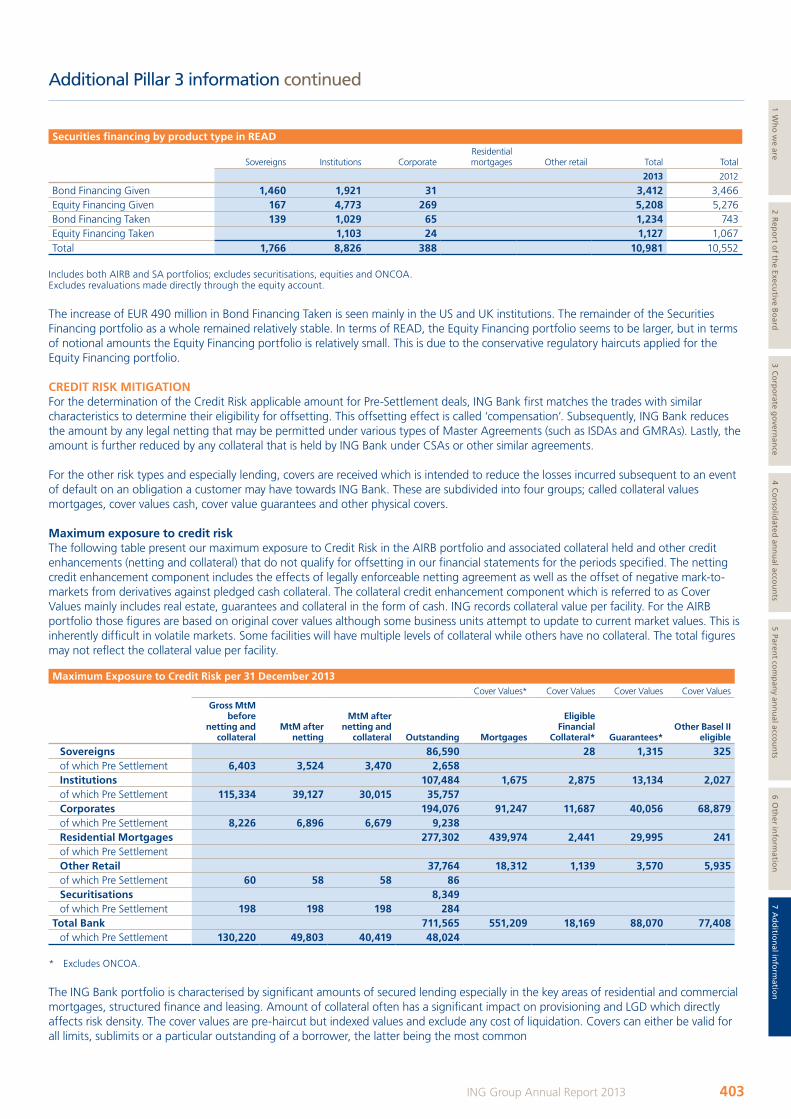
Securities financing by product type in READ
Sovereigns Institutions CorporateResidential mortgages Other retail Total Total
2013 2012
Bond Financing Given 1,460 1,921 31 3,412 3,466Equity Financing Given 167 4,773 269 5,208 5,276Bond Financing Taken 139 1,029 65 1,234 743Equity Financing Taken 1,103 24 1,127 1,067Total 1,766 8,826 388 10,981 10,552
Includes both AIRB and SA portfolios; excludes securitisations, equities and ONCOA.Excludes revaluations made directly through the equity account.
The increase of EUR 490 million in Bond Financing Taken is seen mainly in the US and UK institutions. The remainder of the Securities Financing portfolio as a whole remained relatively stable. In terms of READ, the Equity Financing portfolio seems to be larger, but in terms of notional amounts the Equity Financing portfolio is relatively small. This is due to the conservative regulatory haircuts applied for the Equity Financing portfolio.
CREDIT RISK MITIGATION For the determination of the Credit Risk applicable amount for Pre-Settlement deals, ING Bank first matches the trades with similar characteristics to determine their eligibility for offsetting. This offsetting effect is called ‘compensation’. Subsequently, ING Bank reduces the amount by any legal netting that may be permitted under various types of Master Agreements (such as ISDAs and GMRAs). Lastly, the amount is further reduced by any collateral that is held by ING Bank under CSAs or other similar agreements.
For the other risk types and especially lending, covers are received which is intended to reduce the losses incurred subsequent to an event of default on an obligation a customer may have towards ING Bank. These are subdivided into four groups; called collateral values mortgages, cover values cash, cover value guarantees and other physical covers.
Maximum exposure to credit risk The following table present our maximum exposure to Credit Risk in the AIRB portfolio and associated collateral held and other credit enhancements (netting and collateral) that do not qualify for offsetting in our financial statements for the periods specified. The netting credit enhancement component includes the effects of legally enforceable netting agreement as well as the offset of negative mark-to-markets from derivatives against pledged cash collateral. The collateral credit enhancement component which is referred to as Cover Values mainly includes real estate, guarantees and collateral in the form of cash. ING records collateral value per facility. For the AIRB portfolio those figures are based on original cover values although some business units attempt to update to current market values. This is inherently difficult in volatile markets. Some facilities will have multiple levels of collateral while others have no collateral. The total figures may not reflect the collateral value per facility.
Maximum Exposure to Credit Risk per 31 December 2013 Cover Values* Cover Values Cover Values Cover Values
Gross MtM before
netting and collateral
MtM after netting
MtM after netting and
collateral Outstanding Mortgages
Eligible Financial
Collateral* Guarantees*Other Basel II
eligible
Sovereigns 86,590 28 1,315 325of which Pre Settlement 6,403 3,524 3,470 2,658Institutions 107,484 1,675 2,875 13,134 2,027of which Pre Settlement 115,334 39,127 30,015 35,757Corporates 194,076 91,247 11,687 40,056 68,879of which Pre Settlement 8,226 6,896 6,679 9,238Residential Mortgages 277,302 439,974 2,441 29,995 241of which Pre SettlementOther Retail 37,764 18,312 1,139 3,570 5,935of which Pre Settlement 60 58 58 86Securitisations 8,349of which Pre Settlement 198 198 198 284
Total Bank 711,565 551,209 18,169 88,070 77,408of which Pre Settlement 130,220 49,803 40,419 48,024
* Excludes ONCOA.
The ING Bank portfolio is characterised by significant amounts of secured lending especially in the key areas of residential and commercial mortgages, structured finance and leasing. Amount of collateral often has a significant impact on provisioning and LGD which directly affects risk density. The cover values are pre-haircut but indexed values and exclude any cost of liquidation. Covers can either be valid for all limits, sublimits or a particular outstanding of a borrower, the latter being the most common
Additional Pillar 3 information continued
403ING Group Annual Report 2013
1 Wh
o w
e are2 R
epo
rt of th
e Executive B
oard
3 Co
rpo
rate go
vernan
ce4 C
on
solid
ated an
nu
al accou
nts
5 Parent co
mp
any an
nu
al accou
nts
6 Oth
er info
rmatio
n7 A
dd
ition
al info
rmatio
n
ING_2013_deel5_v1.indd 403 19/03/2014 19:45:23
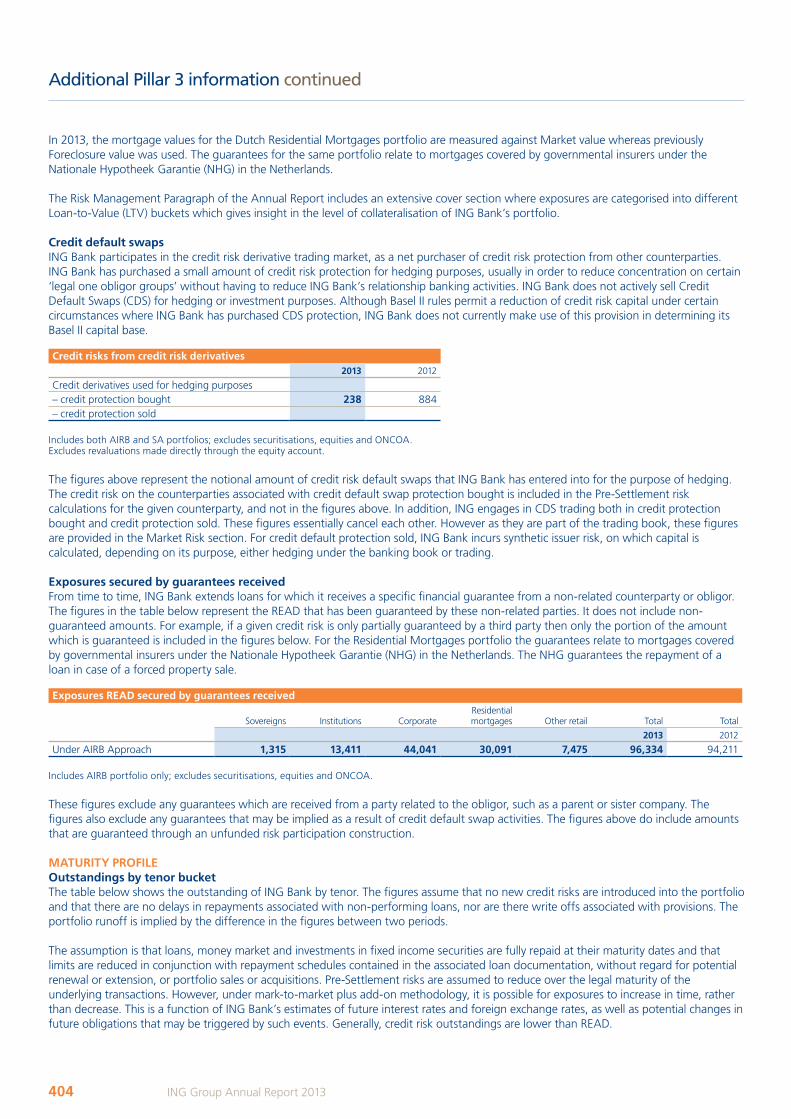
In 2013, the mortgage values for the Dutch Residential Mortgages portfolio are measured against Market value whereas previously Foreclosure value was used. The guarantees for the same portfolio relate to mortgages covered by governmental insurers under the Nationale Hypotheek Garantie (NHG) in the Netherlands.
The Risk Management Paragraph of the Annual Report includes an extensive cover section where exposures are categorised into different Loan-to-Value (LTV) buckets which gives insight in the level of collateralisation of ING Bank’s portfolio.
Credit default swapsING Bank participates in the credit risk derivative trading market, as a net purchaser of credit risk protection from other counterparties. ING Bank has purchased a small amount of credit risk protection for hedging purposes, usually in order to reduce concentration on certain ‘legal one obligor groups’ without having to reduce ING Bank’s relationship banking activities. ING Bank does not actively sell Credit Default Swaps (CDS) for hedging or investment purposes. Although Basel II rules permit a reduction of credit risk capital under certain circumstances where ING Bank has purchased CDS protection, ING Bank does not currently make use of this provision in determining its Basel II capital base.
Credit risks from credit risk derivatives2013 2012
Credit derivatives used for hedging purposes– credit protection bought 238 884– credit protection sold
Includes both AIRB and SA portfolios; excludes securitisations, equities and ONCOA.Excludes revaluations made directly through the equity account.
The figures above represent the notional amount of credit risk default swaps that ING Bank has entered into for the purpose of hedging. The credit risk on the counterparties associated with credit default swap protection bought is included in the Pre-Settlement risk calculations for the given counterparty, and not in the figures above. In addition, ING engages in CDS trading both in credit protection bought and credit protection sold. These figures essentially cancel each other. However as they are part of the trading book, these figures are provided in the Market Risk section. For credit default protection sold, ING Bank incurs synthetic issuer risk, on which capital is calculated, depending on its purpose, either hedging under the banking book or trading.
Exposures secured by guarantees receivedFrom time to time, ING Bank extends loans for which it receives a specific financial guarantee from a non-related counterparty or obligor. The figures in the table below represent the READ that has been guaranteed by these non-related parties. It does not include non-guaranteed amounts. For example, if a given credit risk is only partially guaranteed by a third party then only the portion of the amount which is guaranteed is included in the figures below. For the Residential Mortgages portfolio the guarantees relate to mortgages covered by governmental insurers under the Nationale Hypotheek Garantie (NHG) in the Netherlands. The NHG guarantees the repayment of a loan in case of a forced property sale.
Exposures READ secured by guarantees received
Sovereigns Institutions CorporateResidential mortgages Other retail Total Total
2013 2012
Under AIRB Approach 1,315 13,411 44,041 30,091 7,475 96,334 94,211
Includes AIRB portfolio only; excludes securitisations, equities and ONCOA.
These figures exclude any guarantees which are received from a party related to the obligor, such as a parent or sister company. The figures also exclude any guarantees that may be implied as a result of credit default swap activities. The figures above do include amounts that are guaranteed through an unfunded risk participation construction.
MATURITY PROFILEOutstandings by tenor bucketThe table below shows the outstanding of ING Bank by tenor. The figures assume that no new credit risks are introduced into the portfolio and that there are no delays in repayments associated with non-performing loans, nor are there write offs associated with provisions. The portfolio runoff is implied by the difference in the figures between two periods.
The assumption is that loans, money market and investments in fixed income securities are fully repaid at their maturity dates and that limits are reduced in conjunction with repayment schedules contained in the associated loan documentation, without regard for potential renewal or extension, or portfolio sales or acquisitions. Pre-Settlement risks are assumed to reduce over the legal maturity of the underlying transactions. However, under mark-to-market plus add-on methodology, it is possible for exposures to increase in time, rather than decrease. This is a function of ING Bank’s estimates of future interest rates and foreign exchange rates, as well as potential changes in future obligations that may be triggered by such events. Generally, credit risk outstandings are lower than READ.
Additional Pillar 3 information continued
404 ING Group Annual Report 2013
ING_2013_deel5_v1.indd 404 19/03/2014 19:45:23

Outstandings by tenor bucket (credit risk outstandings)
Sovereigns Institutions CorporateResidential mortgages Other retail Total Total
2013 2012
Current Outstandings 86,561 106,054 184,471 274,181 34,478 685,745 713,5821 month 76,006 82,960 177,069 273,633 33,882 643,551 668,8203 month 67,179 76,682 167,708 273,037 33,212 617,819 621,4766 month 64,859 69,646 155,853 272,206 32,148 594,712 603,8791 year 58,852 58,777 118,819 269,642 25,384 531,475 541,5702 years 56,461 49,363 92,213 265,183 21,022 484,241 485,2063 years 53,437 42,152 71,664 260,291 18,087 445,632 447,3245 years 43,194 23,214 41,242 249,624 12,228 369,501 372,6547 years 33,969 18,206 28,244 232,781 8,676 321,876 334,04910 years 17,248 6,560 17,082 204,661 5,661 251,212 273,138
Includes both AIRB and SA portfolios; excludes securitisations, equities and ONCOA.Non-performing Loans (rating 20-22) are excluded in the figures above.
The large decrease in current outstandings compared to last year is mainly related to the sale of ING Direct UK and part of the WestlandUtrecht Bank portfolio which is mainly visible in the 10 years tenor bucket. SECURITISATIONSThe following information is prepared taking into account the ‘Industry Good Practice Guidelines on Pillar 3 disclosure requirements for securitisations’ (the Guidelines) issued by the European Banking Federation and other industry associations on 31 January 2010 and the CRD disclosure requirements. It includes qualitative and quantitative disclosures addressing both the exposure securitised as well as securitisations positions held. While quantitative disclosures are limited to those securitisations that are used for the purpose of calculating the regulatory capital requirements under the CRD, qualitative information have a broader scope and give a view on ING Bank’s entire securitisation activity.
Depending on ING Bank’s role as investor, originator, or sponsor the objectives, the involvement and the rules applied may be different. ING Bank is primarily engaged in securitisation transactions in the role of investor (in securitisations arranged by others). To a lesser extent, ING Bank is also an originator or sponsor of securitisations that are usually traded in the public markets. ING does not re-securitise its securitisations exposure and even though ING bank hedges its securitisation positions, such instruments are not recognized as credit risk mitigants for regulatory capital purposes.
Valuation and accounting policiesING Bank’s activities regarding securitisations are described in Note 57 ’Structured entities’ in the annual accounts. The applicable accounting policies are included in the section ‘Accounting policies for the consolidated annual accounts of ING Bank’ in the annual accounts. The most relevant accounting policies for ING Bank’s own originated securitisation programmes are ‘Derecognition of financial assets’ and ‘Consolidation’. Where ING Bank acts as investor in securitisation positions, the most relevant accounting policy is ‘Classification of financial instruments’.
Regulatory capital method used and Rating AgenciesING Bank has implemented the AIRB approach for credit risk. As a consequence, ING Bank uses the Rating Based Approach (RBA) for investments in tranches of asset-backed securities (ABS) and mortgage-backed securities (MBS) which have been rated by external rating agencies. Rating agencies which are used by ING Bank under the RBA include Standard & Poor’s, Fitch, Moody’s and DBRS.
Under the RBA, the risk-weighted assets (RWA) are determined by multiplying the amount of the exposure by the appropriate regulatory risk weights, which depend on: the external rating or an available inferred rating; the seniority of the position; and the granularity of the position.
ING Bank uses the Internal Assessment Approach (IAA) for the support facilities it provides to Asset Backed Commercial Paper (ABCP) conduit Mont Blanc Capital Corp., based on externally published rating agency methodologies. Under the IAA approach, the unrated position is assigned by the institution to an internal rating grade, which is estimated using an ING developed model. The position is then attributed a derived rating by mapping the internal rating grade to an externally published credit assessments corresponding to that rating grade.
At ING, the investment policies define eligible product types, minimum ratings, maximum tenors and exposure caps, both at issuer level as well as for portfolios. Under Basel III most Securitisations no longer qualify as high quality liquid assets for the liquidity buffer and are hence no longer eligible assets under the investment policies. The ING Direct units no longer invest in Securitisations and have not been investing in Securitisations during 2013. The dominant product classes in the existing investment portfolio are RMBS and ABS. Prior to purchase, each investment proposal is analysed by Credit Risk Management and decided upon by authorised mandate holders pursuant to the signatory approval process in place at ING Bank. In 2013 ING Direct did not purchase any new securitisations.
Additional Pillar 3 information continued
405ING Group Annual Report 2013
1 Wh
o w
e are2 R
epo
rt of th
e Executive B
oard
3 Co
rpo
rate go
vernan
ce4 C
on
solid
ated an
nu
al accou
nts
5 Parent co
mp
any an
nu
al accou
nts
6 Oth
er info
rmatio
n7 A
dd
ition
al info
rmatio
n
ING_2013_deel5_v1.indd 405 19/03/2014 19:45:23
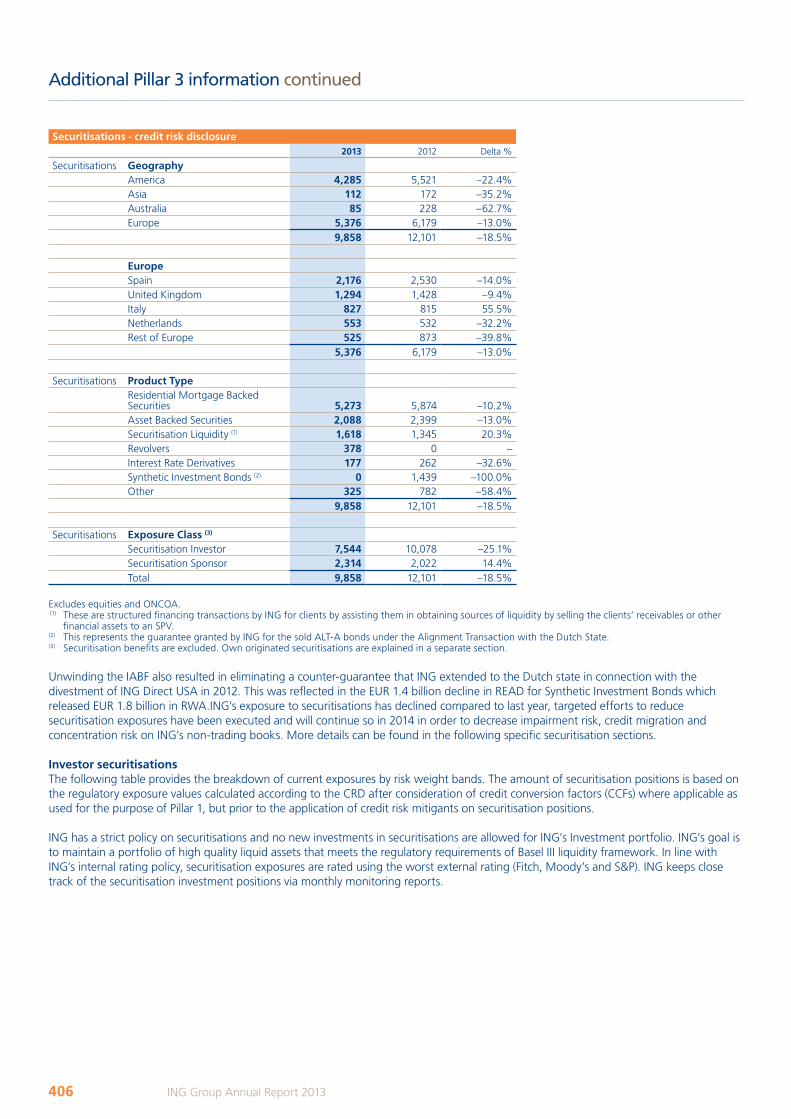
Securitisations - credit risk disclosure 2013 2012 Delta %
Securitisations GeographyAmerica 4,285 5,521 –22.4%Asia 112 172 –35.2%Australia 85 228 –62.7%Europe 5,376 6,179 –13.0%
9,858 12,101 –18.5%
EuropeSpain 2,176 2,530 –14.0%United Kingdom 1,294 1,428 –9.4%Italy 827 815 55.5%Netherlands 553 532 –32.2%Rest of Europe 525 873 –39.8%
5,376 6,179 –13.0%
Securitisations Product TypeResidential Mortgage Backed Securities 5,273 5,874 –10.2%Asset Backed Securities 2,088 2,399 –13.0%Securitisation Liquidity (1) 1,618 1,345 20.3%Revolvers 378 0 –Interest Rate Derivatives 177 262 –32.6%Synthetic Investment Bonds (2) 0 1,439 –100.0%Other 325 782 –58.4%
9,858 12,101 –18.5%
Securitisations Exposure Class (3)
Securitisation Investor 7,544 10,078 –25.1%Securitisation Sponsor 2,314 2,022 14.4%Total 9,858 12,101 –18.5%
Excludes equities and ONCOA. (1) These are structured financing transactions by ING for clients by assisting them in obtaining sources of liquidity by selling the clients’ receivables or other
financial assets to an SPV.(2) This represents the guarantee granted by ING for the sold ALT-A bonds under the Alignment Transaction with the Dutch State. (3) Securitisation benefits are excluded. Own originated securitisations are explained in a separate section.
Unwinding the IABF also resulted in eliminating a counter-guarantee that ING extended to the Dutch state in connection with the divestment of ING Direct USA in 2012. This was reflected in the EUR 1.4 billion decline in READ for Synthetic Investment Bonds which released EUR 1.8 billion in RWA.ING’s exposure to securitisations has declined compared to last year, targeted efforts to reduce securitisation exposures have been executed and will continue so in 2014 in order to decrease impairment risk, credit migration and concentration risk on ING’s non-trading books. More details can be found in the following specific securitisation sections.
Investor securitisationsThe following table provides the breakdown of current exposures by risk weight bands. The amount of securitisation positions is based on the regulatory exposure values calculated according to the CRD after consideration of credit conversion factors (CCFs) where applicable as used for the purpose of Pillar 1, but prior to the application of credit risk mitigants on securitisation positions.
ING has a strict policy on securitisations and no new investments in securitisations are allowed for ING’s Investment portfolio. ING’s goal is to maintain a portfolio of high quality liquid assets that meets the regulatory requirements of Basel III liquidity framework. In line with ING’s internal rating policy, securitisation exposures are rated using the worst external rating (Fitch, Moody’s and S&P). ING keeps close track of the securitisation investment positions via monthly monitoring reports.
Additional Pillar 3 information continued
406 ING Group Annual Report 2013
ING_2013_deel5_v1.indd 406 19/03/2014 19:45:23
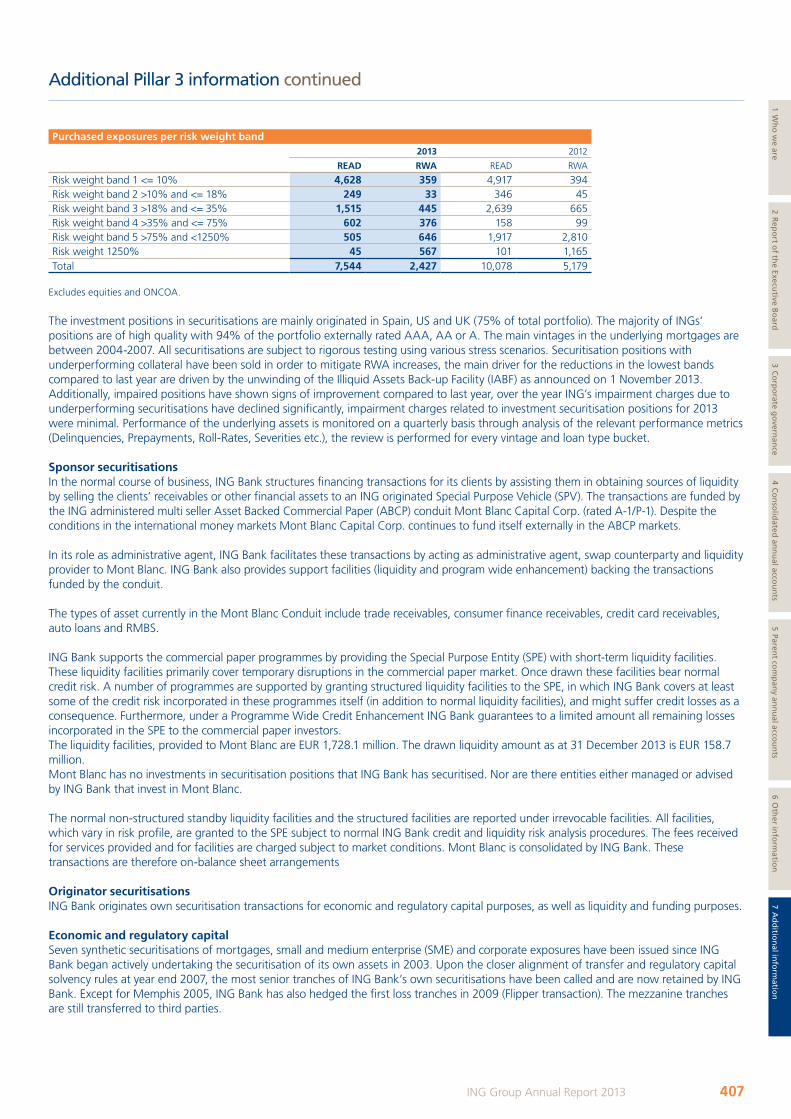
Purchased exposures per risk weight band2013 2012
READ RWA READ RWA
Risk weight band 1 <= 10% 4,628 359 4,917 394Risk weight band 2 >10% and <= 18% 249 33 346 45Risk weight band 3 >18% and <= 35% 1,515 445 2,639 665Risk weight band 4 >35% and <= 75% 602 376 158 99Risk weight band 5 >75% and <1250% 505 646 1,917 2,810Risk weight 1250% 45 567 101 1,165Total 7,544 2,427 10,078 5,179
Excludes equities and ONCOA.
The investment positions in securitisations are mainly originated in Spain, US and UK (75% of total portfolio). The majority of INGs’ positions are of high quality with 94% of the portfolio externally rated AAA, AA or A. The main vintages in the underlying mortgages are between 2004-2007. All securitisations are subject to rigorous testing using various stress scenarios. Securitisation positions with underperforming collateral have been sold in order to mitigate RWA increases, the main driver for the reductions in the lowest bands compared to last year are driven by the unwinding of the Illiquid Assets Back-up Facility (IABF) as announced on 1 November 2013. Additionally, impaired positions have shown signs of improvement compared to last year, over the year ING’s impairment charges due to underperforming securitisations have declined significantly, impairment charges related to investment securitisation positions for 2013 were minimal. Performance of the underlying assets is monitored on a quarterly basis through analysis of the relevant performance metrics (Delinquencies, Prepayments, Roll-Rates, Severities etc.), the review is performed for every vintage and loan type bucket.
Sponsor securitisationsIn the normal course of business, ING Bank structures financing transactions for its clients by assisting them in obtaining sources of liquidity by selling the clients’ receivables or other financial assets to an ING originated Special Purpose Vehicle (SPV). The transactions are funded by the ING administered multi seller Asset Backed Commercial Paper (ABCP) conduit Mont Blanc Capital Corp. (rated A-1/P-1). Despite the conditions in the international money markets Mont Blanc Capital Corp. continues to fund itself externally in the ABCP markets.
In its role as administrative agent, ING Bank facilitates these transactions by acting as administrative agent, swap counterparty and liquidity provider to Mont Blanc. ING Bank also provides support facilities (liquidity and program wide enhancement) backing the transactions funded by the conduit.
The types of asset currently in the Mont Blanc Conduit include trade receivables, consumer finance receivables, credit card receivables, auto loans and RMBS.
ING Bank supports the commercial paper programmes by providing the Special Purpose Entity (SPE) with short-term liquidity facilities. These liquidity facilities primarily cover temporary disruptions in the commercial paper market. Once drawn these facilities bear normal credit risk. A number of programmes are supported by granting structured liquidity facilities to the SPE, in which ING Bank covers at least some of the credit risk incorporated in these programmes itself (in addition to normal liquidity facilities), and might suffer credit losses as a consequence. Furthermore, under a Programme Wide Credit Enhancement ING Bank guarantees to a limited amount all remaining losses incorporated in the SPE to the commercial paper investors.The liquidity facilities, provided to Mont Blanc are EUR 1,728.1 million. The drawn liquidity amount as at 31 December 2013 is EUR 158.7 million. Mont Blanc has no investments in securitisation positions that ING Bank has securitised. Nor are there entities either managed or advised by ING Bank that invest in Mont Blanc.
The normal non-structured standby liquidity facilities and the structured facilities are reported under irrevocable facilities. All facilities, which vary in risk profile, are granted to the SPE subject to normal ING Bank credit and liquidity risk analysis procedures. The fees received for services provided and for facilities are charged subject to market conditions. Mont Blanc is consolidated by ING Bank. These transactions are therefore on-balance sheet arrangements
Originator securitisationsING Bank originates own securitisation transactions for economic and regulatory capital purposes, as well as liquidity and funding purposes.
Economic and regulatory capitalSeven synthetic securitisations of mortgages, small and medium enterprise (SME) and corporate exposures have been issued since ING Bank began actively undertaking the securitisation of its own assets in 2003. Upon the closer alignment of transfer and regulatory capital solvency rules at year end 2007, the most senior tranches of ING Bank’s own securitisations have been called and are now retained by ING Bank. Except for Memphis 2005, ING Bank has also hedged the first loss tranches in 2009 (Flipper transaction). The mezzanine tranches are still transferred to third parties.
Additional Pillar 3 information continued
407ING Group Annual Report 2013
1 Wh
o w
e are2 R
epo
rt of th
e Executive B
oard
3 Co
rpo
rate go
vernan
ce4 C
on
solid
ated an
nu
al accou
nts
5 Parent co
mp
any an
nu
al accou
nts
6 Oth
er info
rmatio
n7 A
dd
ition
al info
rmatio
n
ING_2013_deel5_v1.indd 407 19/03/2014 19:45:24
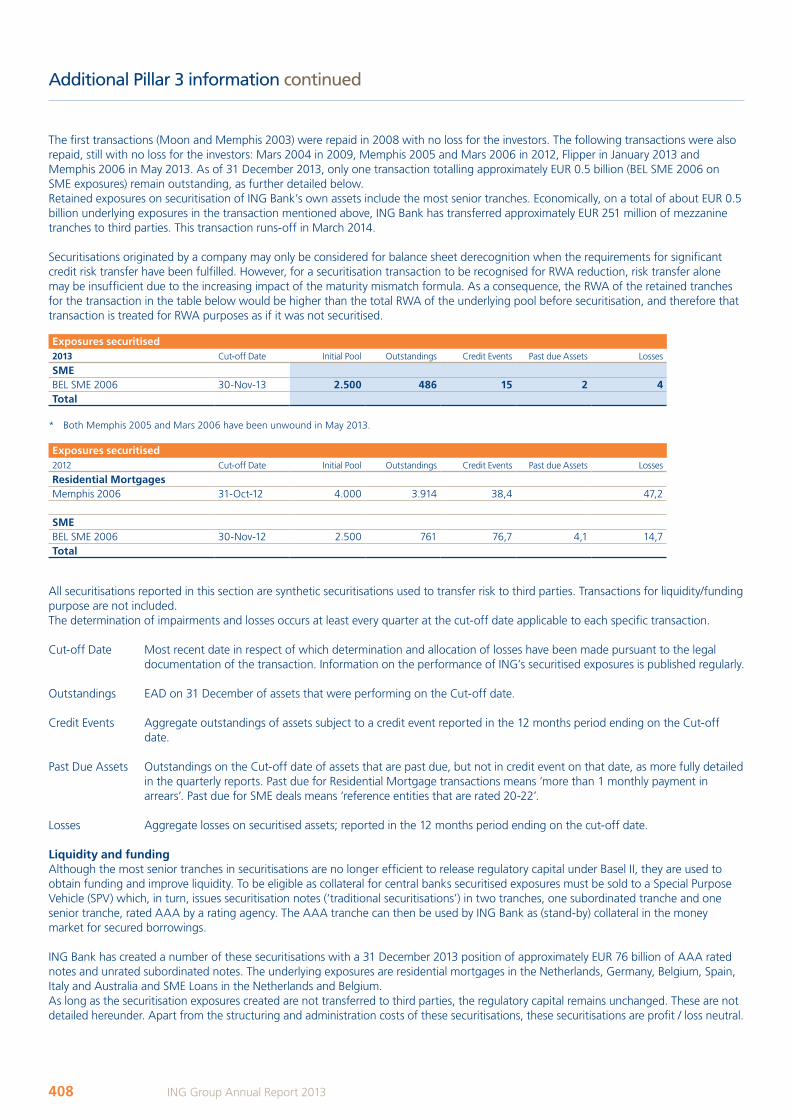
The first transactions (Moon and Memphis 2003) were repaid in 2008 with no loss for the investors. The following transactions were also repaid, still with no loss for the investors: Mars 2004 in 2009, Memphis 2005 and Mars 2006 in 2012, Flipper in January 2013 and Memphis 2006 in May 2013. As of 31 December 2013, only one transaction totalling approximately EUR 0.5 billion (BEL SME 2006 on SME exposures) remain outstanding, as further detailed below.Retained exposures on securitisation of ING Bank’s own assets include the most senior tranches. Economically, on a total of about EUR 0.5 billion underlying exposures in the transaction mentioned above, ING Bank has transferred approximately EUR 251 million of mezzanine tranches to third parties. This transaction runs-off in March 2014.
Securitisations originated by a company may only be considered for balance sheet derecognition when the requirements for significant credit risk transfer have been fulfilled. However, for a securitisation transaction to be recognised for RWA reduction, risk transfer alone may be insufficient due to the increasing impact of the maturity mismatch formula. As a consequence, the RWA of the retained tranches for the transaction in the table below would be higher than the total RWA of the underlying pool before securitisation, and therefore that transaction is treated for RWA purposes as if it was not securitised.
Exposures securitised2013 Cut-off Date Initial Pool Outstandings Credit Events Past due Assets Losses
SME BEL SME 2006 30-Nov-13 2.500 486 15 2 4Total
* Both Memphis 2005 and Mars 2006 have been unwound in May 2013.
Exposures securitised2012 Cut-off Date Initial Pool Outstandings Credit Events Past due Assets Losses
Residential MortgagesMemphis 2006 31-Oct-12 4.000 3.914 38,4 47,2 SME BEL SME 2006 30-Nov-12 2.500 761 76,7 4,1 14,7Total
All securitisations reported in this section are synthetic securitisations used to transfer risk to third parties. Transactions for liquidity/funding purpose are not included.The determination of impairments and losses occurs at least every quarter at the cut-off date applicable to each specific transaction.
Cut-off Date Most recent date in respect of which determination and allocation of losses have been made pursuant to the legal documentation of the transaction. Information on the performance of ING’s securitised exposures is published regularly.
Outstandings EAD on 31 December of assets that were performing on the Cut-off date.
Credit Events Aggregate outstandings of assets subject to a credit event reported in the 12 months period ending on the Cut-off date.
Past Due Assets Outstandings on the Cut-off date of assets that are past due, but not in credit event on that date, as more fully detailed in the quarterly reports. Past due for Residential Mortgage transactions means ‘more than 1 monthly payment in arrears’. Past due for SME deals means ‘reference entities that are rated 20-22’.
Losses Aggregate losses on securitised assets; reported in the 12 months period ending on the cut-off date.
Liquidity and fundingAlthough the most senior tranches in securitisations are no longer efficient to release regulatory capital under Basel II, they are used to obtain funding and improve liquidity. To be eligible as collateral for central banks securitised exposures must be sold to a Special Purpose Vehicle (SPV) which, in turn, issues securitisation notes (‘traditional securitisations’) in two tranches, one subordinated tranche and one senior tranche, rated AAA by a rating agency. The AAA tranche can then be used by ING Bank as (stand-by) collateral in the money market for secured borrowings.
ING Bank has created a number of these securitisations with a 31 December 2013 position of approximately EUR 76 billion of AAA rated notes and unrated subordinated notes. The underlying exposures are residential mortgages in the Netherlands, Germany, Belgium, Spain, Italy and Australia and SME Loans in the Netherlands and Belgium.As long as the securitisation exposures created are not transferred to third parties, the regulatory capital remains unchanged. These are not detailed hereunder. Apart from the structuring and administration costs of these securitisations, these securitisations are profit / loss neutral.
Additional Pillar 3 information continued
408 ING Group Annual Report 2013
ING_2013_deel5_v1.indd 408 19/03/2014 19:45:24
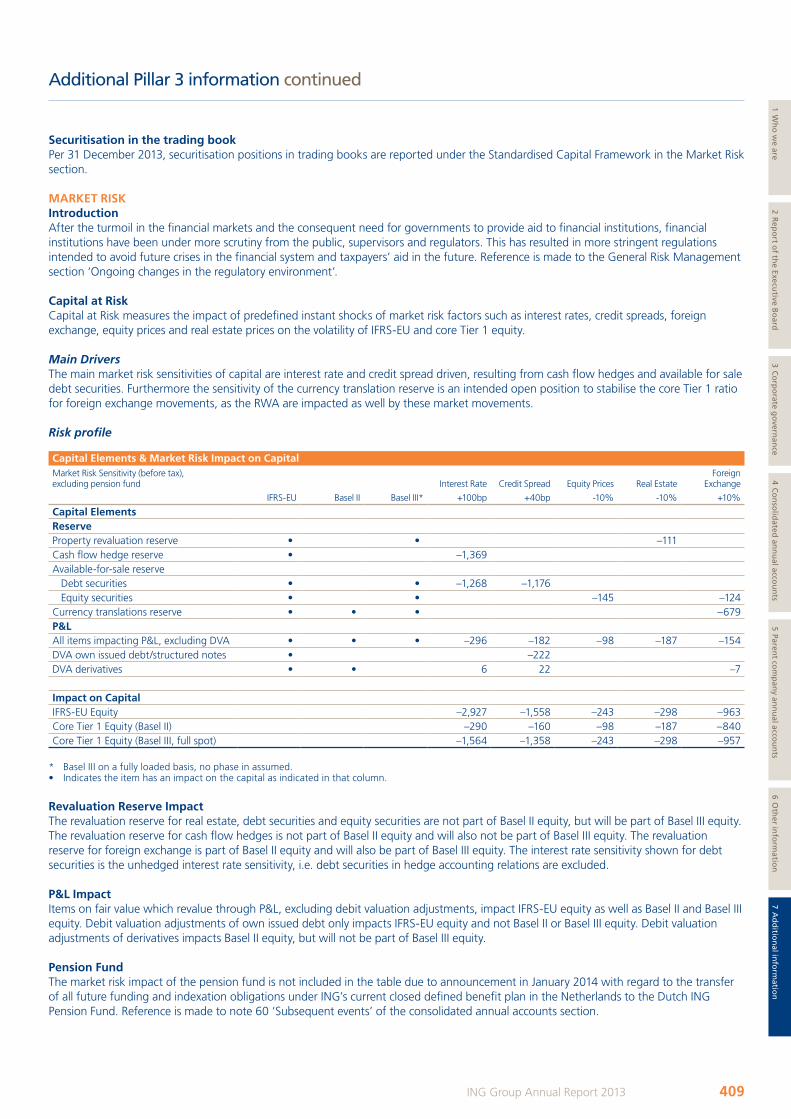
Securitisation in the trading bookPer 31 December 2013, securitisation positions in trading books are reported under the Standardised Capital Framework in the Market Risk section.
MARKET RISKIntroductionAfter the turmoil in the financial markets and the consequent need for governments to provide aid to financial institutions, financial institutions have been under more scrutiny from the public, supervisors and regulators. This has resulted in more stringent regulations intended to avoid future crises in the financial system and taxpayers’ aid in the future. Reference is made to the General Risk Management section ‘Ongoing changes in the regulatory environment’.
Capital at Risk Capital at Risk measures the impact of predefined instant shocks of market risk factors such as interest rates, credit spreads, foreign exchange, equity prices and real estate prices on the volatility of IFRS-EU and core Tier 1 equity.
Main DriversThe main market risk sensitivities of capital are interest rate and credit spread driven, resulting from cash flow hedges and available for sale debt securities. Furthermore the sensitivity of the currency translation reserve is an intended open position to stabilise the core Tier 1 ratio for foreign exchange movements, as the RWA are impacted as well by these market movements.
Risk profile
Capital Elements & Market Risk Impact on CapitalMarket Risk Sensitivity (before tax), excluding pension fund Interest Rate Credit Spread Equity Prices Real Estate
Foreign Exchange
IFRS-EU Basel II Basel III* +100bp +40bp -10% -10% +10%
Capital Elements Reserve Property revaluation reserve • • –111 Cash flow hedge reserve • –1,369 Available-for-sale reserve Debt securities • • –1,268 –1,176 Equity securities • • –145 –124Currency translations reserve • • • –679P&L All items impacting P&L, excluding DVA • • • –296 –182 –98 –187 –154DVA own issued debt/structured notes • –222 DVA derivatives • • 6 22 –7
Impact on Capital IFRS-EU Equity –2,927 –1,558 –243 –298 –963Core Tier 1 Equity (Basel II) –290 –160 –98 –187 –840Core Tier 1 Equity (Basel III, full spot) –1,564 –1,358 –243 –298 –957
* Basel III on a fully loaded basis, no phase in assumed.• Indicates the item has an impact on the capital as indicated in that column.
Revaluation Reserve ImpactThe revaluation reserve for real estate, debt securities and equity securities are not part of Basel II equity, but will be part of Basel III equity. The revaluation reserve for cash flow hedges is not part of Basel II equity and will also not be part of Basel III equity. The revaluation reserve for foreign exchange is part of Basel II equity and will also be part of Basel III equity. The interest rate sensitivity shown for debt securities is the unhedged interest rate sensitivity, i.e. debt securities in hedge accounting relations are excluded.
P&L ImpactItems on fair value which revalue through P&L, excluding debit valuation adjustments, impact IFRS-EU equity as well as Basel II and Basel III equity. Debit valuation adjustments of own issued debt only impacts IFRS-EU equity and not Basel II or Basel III equity. Debit valuation adjustments of derivatives impacts Basel II equity, but will not be part of Basel III equity.
Pension Fund The market risk impact of the pension fund is not included in the table due to announcement in January 2014 with regard to the transfer of all future funding and indexation obligations under ING’s current closed defined benefit plan in the Netherlands to the Dutch ING Pension Fund. Reference is made to note 60 ‘Subsequent events’ of the consolidated annual accounts section.
Additional Pillar 3 information continued
409ING Group Annual Report 2013
1 Wh
o w
e are2 R
epo
rt of th
e Executive B
oard
3 Co
rpo
rate go
vernan
ce4 C
on
solid
ated an
nu
al accou
nts
5 Parent co
mp
any an
nu
al accou
nts
6 Oth
er info
rmatio
n7 A
dd
ition
al info
rmatio
n
ING_2013_deel5_v1.indd 409 19/03/2014 19:45:24
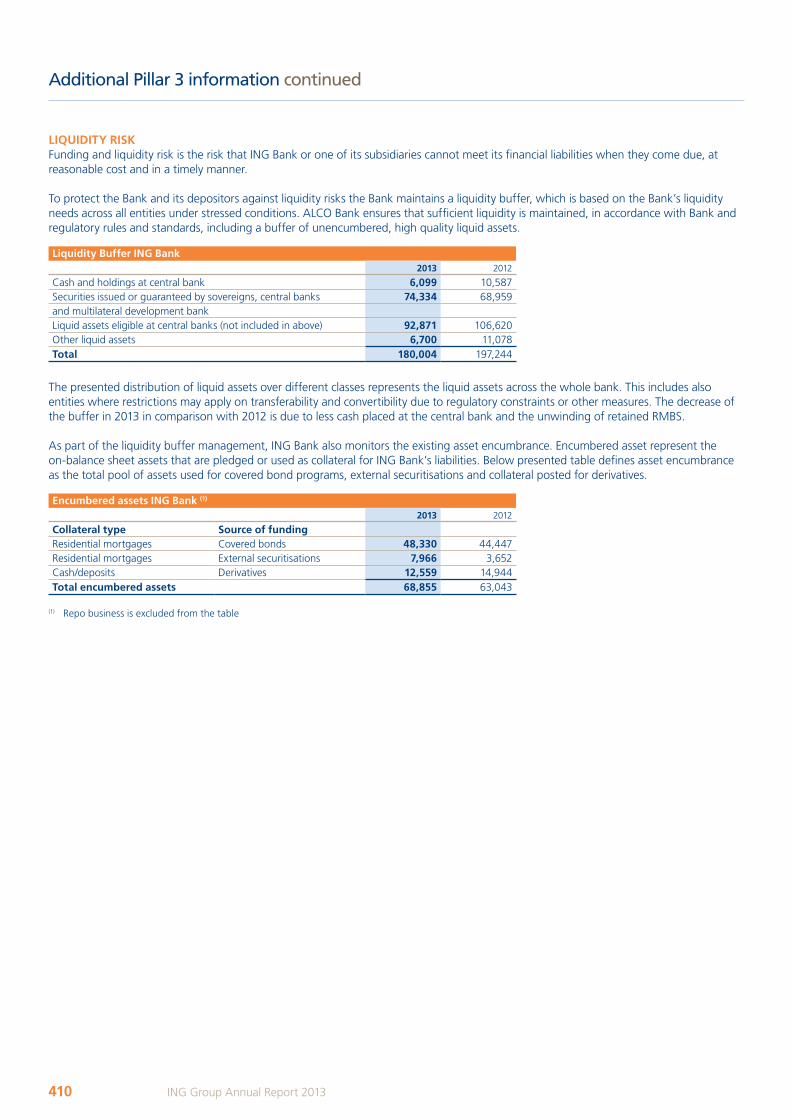
LIQUIDITY RISK Funding and liquidity risk is the risk that ING Bank or one of its subsidiaries cannot meet its financial liabilities when they come due, at reasonable cost and in a timely manner.
To protect the Bank and its depositors against liquidity risks the Bank maintains a liquidity buffer, which is based on the Bank’s liquidity needs across all entities under stressed conditions. ALCO Bank ensures that sufficient liquidity is maintained, in accordance with Bank and regulatory rules and standards, including a buffer of unencumbered, high quality liquid assets.
Liquidity Buffer ING Bank 2013 2012
Cash and holdings at central bank 6,099 10,587Securities issued or guaranteed by sovereigns, central banks 74,334 68,959and multilateral development bankLiquid assets eligible at central banks (not included in above) 92,871 106,620Other liquid assets 6,700 11,078Total 180,004 197,244
The presented distribution of liquid assets over different classes represents the liquid assets across the whole bank. This includes also entities where restrictions may apply on transferability and convertibility due to regulatory constraints or other measures. The decrease of the buffer in 2013 in comparison with 2012 is due to less cash placed at the central bank and the unwinding of retained RMBS.
As part of the liquidity buffer management, ING Bank also monitors the existing asset encumbrance. Encumbered asset represent the on-balance sheet assets that are pledged or used as collateral for ING Bank’s liabilities. Below presented table defines asset encumbrance as the total pool of assets used for covered bond programs, external securitisations and collateral posted for derivatives.
Encumbered assets ING Bank (1) 2013 2012
Collateral type Source of fundingResidential mortgages Covered bonds 48,330 44,447 Residential mortgages External securitisations 7,966 3,652 Cash/deposits Derivatives 12,559 14,944 Total encumbered assets 68,855 63,043
(1) Repo business is excluded from the table
Additional Pillar 3 information continued
410 ING Group Annual Report 2013
ING_2013_deel5_v1.indd 410 19/03/2014 19:45:24
ACCIDENT (CALENDER) YEAR All claims relating to events (insured losses) that occurred in a certain (calendar) year are grouped together, irrespective of when they are actually reported or paid and regardless of the year in which the insurance cover commenced. Accident year information matches claims incurred in a year with the premium earned in that year.
ACTUARIAL AND UNDERWRITING RISKThese risks (mortality, longevity, morbidity, adverse motor or home claims, etc.), result from the pricing and acceptance of insurance contracts. Actuarial risk is the risk that premium levels and provisions in respect of insurance risk may turn out to be (no longer) correct. Underwriting risk is the risk that an issuer will receive a claim under an insurance policy it issues/underwrites. Maximum underwriting exposures are limited through exclusions, cover limits and reinsurance.
ALT-A RESIDENTIAL MORTGAGE BACKED SECURITY (ALT-A RMBS)A type of United States residential mortgage which is considered riskier than ‘prime’ and less risky than ‘sub-prime’ mortgages. Parameters generally taken into account are borrower credit scores, residential property values and loan-to-value ratios. Alt-A mortgages are further characterised by a limited degree of income and/or asset verification.
AMORTISED COSTThe amount at which the financial asset or liability is measured at initial recognition less principal repayments, plus or minus the cumulative amortisation using the effective interest method of any difference between that initial amount and the maturity amount, and minus any reduction for impairment or uncollectability.
ASSET AND LIABILITY COMMITTEE (ALCO)Manages the balance sheet of ING, especially with regard to strategic non-trading risk. These risks comprise interest rate exposures, equity risk, real estate risk, liquidity, solvency and foreign exchange risk and fluctuations.
ASSET BACKED SECURITIES (ABS)A type of bond or note that is based on pools of assets, or collateralised by the cash flows from a specified pool of underlying assets.
ASSET LIABILITY MANAGEMENT (ALM)The practice of managing a business such that decisions on assets and liabilities are coordinated. It involves the ongoing process of formulating, implementing, monitoring and revising strategies related to assets and liabilities.
ASSET UNDER MANAGEMENT (AUM)Refers to the total market value of assets a financial company invests on behalf of its clients.
ASSOCIATEAn entity over which the Group has significant influence, generally accompanying a shareholding of between 20% and 50% of the voting rights, and that is not a subsidiary nor a joint venture.
AVAILABLE FINANCIAL RESOURCES (AFR)The available financial resources equal the market value of assets minus market value of liabilities, excluding hybrids issued by ING
Group which is counted as capital. ING’s policy is that the available financial resources should exceed economic capital for Bank, Insurance and Group.
AVAILABLE-FOR-SALE FINANCIAL ASSETSThose non-derivative financial assets that are designated as available-for-sale or are not classified as:• loans and receivables;• held-to-maturity investments; or• financial assets at fair value through profit and loss.
BANK FOR INTERNATIONAL SETTLEMENTS (BIS)An international organisation which fosters international monetary and financial co-operation and serves as a bank for central banks. BIS has set a minimum for the solvency ratio reflecting the relationship between capital and risk weighted assets. The ratio should be at least 8%.
BASEL IRegulatory requirements issued by the Basel Committee on Banking Supervision for the solvency calculation, which are superseded by Basel II, for ING, from 2008 onwards.
BASEL IIRegulatory requirements issued by the Basel Committee on Banking Supervision for the solvency calculation, which, for ING, apply from 2008 onwards. Basel II is an international standard for calculating the required capital based on internal models that take into account the financial and operational risks.
BASEL IIIRegulatory requirements issued by the Basel Committee on Banking Supervision for the solvency calculation and liquidity requirements, which will supersede Basel II. Basel III was adopted in 2010 and consequently translated by the EU in the Capital Requirement Regulation (CRR) and the Capital Requirement Directive IV (CRD IV). The CRR is binding for all EU member states and became effective per 1 January 2014, with the full requirements being effective as of 1 January 2018. The CRD IV directs all EU member states to implement certain components of Basel III in their own law, in the Netherlands in the Wet Financieel Toezicht (WFT).
BASIS POINT VALUE (BPV)The change in the Net Present Value of a cash flow or a pool of cash flows due to a one basis point change of the yield curve.
BUSINESS RISKThe exposure to value loss due to fluctuations in volumes, margins and costs. These fluctuations can occur because of internal, industry, or wider market factors. It is the risk inherent to strategy decisions and internal efficiency.
CAPITAL REQUIREMENT DIRECTIVE (CRD IV)For European banks the Basel III requirements will be implemented through Capital Requirement Regulation (CRR) and the Capital Requirement Directive IV (CRD IV). The CRD IV directs all EU member states to implement certain components of Basel III in their own law, taking into account transitional arrangements, in the Netherlands through amendments to the Wet Financieel Toezicht (WFT). Although the amended WFT is expected to be ready in the second half of 2014, banks are expected to behave according to the CRD IV already.
Financial glossary
411ING Group Annual Report 2013
1 Wh
o w
e are2 R
epo
rt of th
e Executive B
oard
3 Co
rpo
rate go
vernan
ce4 C
on
solid
ated an
nu
al accou
nts
5 Parent co
mp
any an
nu
al accou
nts
6 Oth
er info
rmatio
n7 A
dd
ition
al info
rmatio
n
ING_2013_deel5_v1.indd 411 19/03/2014 19:45:25
CAPITAL REQUIREMENT REGULATION For European banks the Basel III requirements will be implemented through Capital Requirement Regulation (CRR) and the Capital Requirement Directive IV (CRD IV). The CRR is binding for all EU member states and became effective per 1 January 2014, taking into account transitional arrangements, with the full requirements being effective as of 1 January 2018.
CENTRAL CLEARING PARTIES OR CENTRAL COUNTERPARTIES (CCP)A legal entity that interposes itself between two trade counterparties in a bilateral transaction. The parties legally assign their trades to the CCP (usually through novation), and the CCP becomes the counterparty to each, assuming all rights and responsibilities. Thus, from the point of view of the original counterparties, the counterparty credit risk exposure is shifted from the other original counterparty to the CCP.
COUNTRY OF RESIDENCEFrom the perspective of a given country, a resident is an individual or legal entity that has its major operations in the given country. All of ING’s customers and entities are said to be residents in only one country.
CREDIT RISK EXPOSURETotal amount of committed facilities to a designated borrower or an obligor group or, if higher, their outstanding balances, together with the outstanding balances of any related uncommitted facilities.
CLAIMA demand for payment of a policy benefit because of the occurrence of an insured event, such as the death or disability of the insured or the maturity of an endowment, the incurrence of hospital or medical bills, the destruction or damage of property and related deaths or injuries, defects in, liens on, or challenges to the title to real estate, or the occurrence of a surety loss.
COLLATERALISED DEBT OBLIGATION (CDO)A type of asset-backed security which provides investors exposure to the credit risk of a pool of fixed income assets.
COLLATERALISED LOAN OBLIGATION (CLO)A type of CDO which is backed primarily by leveraged bank loans.
COMMERCIAL PAPERPromissory note (issued by financial institutions or large firms) with very-short to short maturity period (usually 2 to 30 days, and not more than 270 days), and unsecured.
COMPLIANCE RISKCompliance risk is defined as the risk of damage to ING’s reputation as a result of failure or perceived failure to comply with relevant laws, regulations, internal policies and procedures or ethical standards.
CONCENTRATIONS OF CREDIT RISKConcentrations of credit risk exist when changes in economic, industry or geographical factors similarly affect groups of counterparties whose aggregate exposure is significant in relation to ING Group’s total exposure.
CONTINGENT LIABILITIESPossible obligations that arises from past events and whose existence will be confirmed only by the occurrence or non-occurrence of one or more uncertain future events not wholly within the control of the entity; or a present obligation that arises from past events but is not recognised because:• it is not probable that an outflow of resources embodying
economic benefits will be required to settle the obligation; or• the amount of the obligation cannot be measured with
sufficient reliability.
CONTROLThe power to govern the financial and operating policies of an entity so as to obtain benefits from its activities.
CONVEXITYThe non-linear relationship between changes in the interest rates and changes in bond prices and their Net Present Value. It is a very important market risk measure for portfolios containing (embedded) options.
CORE DEBTInvestments in ING Group subsidiaries minus the equity of the holding company including hybrids.
CORE TIER-1 CAPITALTier-1 capital excluding hybrid capital.
COST OF CAPITALThe costs related to owning capital. These can be split into the cost of equity, hybrids and debt, taking a target leverage into account.
COST RATIOUnderwriting costs expressed as a percentage of premiums written.
COUNTRY RISKThe risk that a government will not fulfil its obligations or obstructs the remittance of funds by debtors, either for financial reasons (transfer risk) or for other reasons (e.g. political risk).
CREDIT DEFAULT SWAP (CDS)A CDS is a financial derivative instrument which synthetically transfers the credit risk of a specific reference entity between two Counterparties. The protection buyer pays a fixed periodic fee, usually expressed in basis points per annum on the notional amount. The protection seller makes no payment unless some specified credit event relating to the reference entity occurs, in which case he is obligated to make a payment to compensate the loss incurred by the protection buyer.
CREDIT INSTITUTIONSAll institutions that are subject to banking supervision by public authorities, including mortgage banks, capital market institutions, multilateral development banks and the International Monetary Fund (IMF).
CREDIT RISKThe risk of loss from default by borrowers (including bond issuers) or counterparties. Credit risks arise in ING’s lending, pre-settlement and investment activities, as well as in its trading activities. Credit risk management is supported by dedicated credit risk information systems and internal rating methodologies for debtors and counterparties.
Financial glossary continued
412 ING Group Annual Report 2013
ING_2013_deel5_v1.indd 412 19/03/2014 19:45:25
CREDIT SUPPORT ANNEX (CSA)Supporting documentation for a collateral arrangement that accompanies a master agreement used in the execution of an over-the-counter derivative swap. The document clearly delineates the rules and procedures for the use of the collateral in the backing of the traded securities. A CSA may be executed as a separate document or can be part of the master agreement.
CREDIT VALUATION ADJUSTMENT (CVA)An adjustment to the valuation of OTC derivative contracts to reflect the creditworthiness of OTC derivative counterparties.
DEBIT VALUATION ADJUSTMENT (DVA)An adjustment made by ING to the valuation of OTC derivative liabilities to reflect within fair value ING’s own credit risk.
DEFERRED ACQUISITION COSTS (DAC)The costs an insurer spends to acquire a customer when it issues a policy, costs such as commissions paid to sales agents. Those costs are put on the balance sheet as an asset (‘capitalised’) and then paid off (‘amortised’) over the life of the policy as the premium is earned. The amount that is set to be paid off each year is pre-determined by the company based on estimated future returns.
DEFERRED TAX LIABILITIESThe amounts of income tax payable in future periods in respect of taxable temporary differences between carrying amounts of assets or liabilities in the balance sheet and tax base, based on tax rates that are expected to apply in the period when the assets are realised or the liabilities are settled.
DEFINED BENEFIT PLANPost-employment benefit plans other than defined contribution plans.
DEFINED CONTRIBUTION PLANPost-employment benefit plans under which an ING pays fixed contributions into a separate entity (a fund) and will have no legal or constructive obligation to pay further contributions if the fund does not hold sufficient assets to pay all employee benefits relating to employee service in the current and prior periods.
DEPOSITARY RECEIPTDepositary receipt for ordinary and preference shares, issued by the ING Trust Office, in exchange for ordinary and preference shares issued by ING Group.
DERIVATIVESFinancial instruments, which include forwards, futures, options and swaps, whose value is based on an underlying asset, index or reference rate.
DISCOUNTED BILLSBills that are sold under deduction of interest giving the owner the right to receive an amount of money on a given date.
DISCONTINUED OPERATIONSWhen a group of assets that is classified as held for sale represents a major line of business or geographical area the disposal group classifies as discontinued operations.
DISCRETIONARY PARTICIPATION FEATUREA contractual right to receive, as a supplement to guaranteed benefits, additional benefits that: are likely to be a significant portion of the total contractual benefits, whose amount or timing is contractually at the discretion of the insurer, that are contractually based on the performance of a specified pool or type of contract, (un)realised investment returns on a specified pool of assets held by the insurer, or the profit of the company, fund, or other entity that issues the contract.
EARNINGS SENSITIVITY (ES)Measures the impact on earnings resulting from changes in economic and financial conditions over a one-year horizon.
ECONOMIC CAPITAL (EC)The minimum amount of capital that is required to absorb unexpected losses in times of severe stress. ING Bank calculates economic capital requirements at a 99.95% level of confidence. This confidence level is derived from the historical default frequency of AA-rated companies (probability of default of 1 in 2000 years or 0.05%). For NN Group the economic capital is calculated based on a confidence level of 99.5%, which is aligned with the Solvency II.
ECONOMIC EXPOSURETotal of outstandings plus undrawn committed portions calculated on the basis of economic risk principles.
EFFECTIVE INTEREST METHODA method of calculating the amortised cost of a financial asset or liability and of allocating the interest income or interest expense over the relevant period.
ELIMINATIONA process by which intercompany transactions are matched with each other and deducted, so that the assets, liabilities, income and expenses are not inflated.
EMPLOYEE BENEFITSAll forms of consideration given by a company in exchange for service rendered by (current and former) employees.
EXPECTED LOSS (EL)Statistical average loss that is expected within a one-year horizon due to customers or counterparties defaulting. EL is calculated as Probability of Default x Loss Given Default x Exposure at Default. Collective provisions are taken to cover for Expected Losses.
EXPOSURE AT DEFAULT (EAD)Expected amount of ING’s exposure to a customer or counterpart at the moment of a client’s default.
FAIR VALUEThe price that would be received to sell an asset or paid to transfer a liability in an orderly transaction between market participants at the balance sheet date (‘exit price’).
FINANCE LEASEA lease that transfers substantially all the risks and rewards associated with ownership of an asset to the lessee. Title may or may not eventually be transferred.
Financial glossary continued
413ING Group Annual Report 2013
1 Wh
o w
e are2 R
epo
rt of th
e Executive B
oard
3 Co
rpo
rate go
vernan
ce4 C
on
solid
ated an
nu
al accou
nts
5 Parent co
mp
any an
nu
al accou
nts
6 Oth
er info
rmatio
n7 A
dd
ition
al info
rmatio
n
ING_2013_deel5_v1.indd 413 19/03/2014 19:45:25
FINANCIAL ASSETAny asset that is:• cash;• an equity instrument of another company;• a contractual right to;
– receive cash or another financial asset from another company; or
– exchange financial instruments with another company under conditions that are potentially favourable; or
– certain contract that will or may be settled in ING’s own equity instruments.
FINANCIAL INSTRUMENTSContracts that give rise to both a financial asset for one company and a financial liability or equity instrument for another company.
FINANCIAL LIABILITYAny liability that is a contractual obligation:• to deliver cash or another financial asset to another company; or• to exchange financial instruments with another company under
conditions that are potentially unfavourable; or• certain contracts that will or may be settled in ING’s own equity
instruments.
FIRST CALL DATE Perpetual subordinated loans have no set maturity. The first call date is the date on which ING has the option to repay and cancel the particular subordinated loan.
FORBEARANCE ACTIVITIESActivities that are employed in order to maximise collection opportunities and, if possible, avoid default, foreclosure or repossession. Such arrangements include extended payment terms, a reduction in interest and/or principal repayments, approved external debt management plans, debt consolidations, the deferral of foreclosures and other modifications.
FOREIGN EXCHANGE RATE RISKProbability of loss occurring from an adverse movement in foreign exchange rates.
FORWARD CONTRACTSCommitments to exchange currencies or to buy or sell other financial instruments at specified future dates.
FUTURE CONTRACTSCommitments to exchange currencies or to buy or sell other financial instruments at specified future dates. Exchanges act as intermediaries and require daily cash settlement and collateral deposits.
GROSS PREMIUMS WRITTENTotal premiums (whether or not earned) for insurance contracts written or assumed during a specific period, without deduction for premiums ceded.
HELD FOR SALEA business or group of assets for which the carrying amount will be recovered principally through a sale transaction rather than through continuing use. When a business or a group of assets are to be sold together in a single transaction, and the sale is considered to be highly probable, these are classified separately in the balance sheet
as Assets held for sale. A sale is highly probable when management is demonstrably committed to the sale, which is expected to occur within one year from the date of classification as held for sale. Liabilities directly associated with those assets, and that are included in the transaction are included in the balance sheet as ‘liabilities held for sale’.
HELD-TO-MATURITY INVESTMENTSNon-derivative financial assets with fixed or determinable payments and fixed maturity that ING Group has the positive intention and ability to hold to maturity other than:a. those that ING Group upon initial recognition designates as at
fair value through profit and loss;b. those that ING Group designates as available-for-sale; andc. those that meet the definition of loans and receivables.
HISTORICAL SIMULATIONA model to calculate Value at Risk, assuming that future changes in risk factors will have the same distribution as they had in the past taking into account the non-linear behaviour of financial products.
IMPAIRMENT LOSSThe amount by which the carrying amount of an asset exceeds its recoverable amount.
INTEREST BEARING INSTRUMENTA financial asset or a liability for which a time-proportionate compensation is paid or received in relation to a notional amount.
INTERNAL RATE OF RETURN (IRR)Internal rate of return is the discount rate at which the present value of distributable earnings from new business equals the investment in new business (i.e. the projected return on the investment in new business) is calculated.
INTEREST RATE REBATESProfit sharing for group life insurance business. A rebate granted to policyholders based on the discounted value of the difference between the interest rate used to calculate the premiums and the expected yield on investment. The profit sharing is granted by means of a premium discount related to the yield on government bonds.
INTEREST RATE RISKProbability that the market interest rates will rise significantly higher than the interest rate earned on investments such as bonds, resulting in their lower market value.
INTERNAL ASSESSMENT APPROACH (IAA) Method used to calculate credit risk capital requirements for securitisation exposures (including liquidity lines provided to asset backed commercial paper programmes and sponsored securitisations).
IN THE MONEYA call option is said to be in the money if the exercise price is lower than the price of the underlying value; a put option is said to be in the money if the exercise price is higher than the price of the underlying value.
Financial glossary continued
414 ING Group Annual Report 2013
ING_2013_deel5_v1.indd 414 19/03/2014 19:45:25
INVESTMENT RISKInvestment risk is the credit default and risk rating migration risk that is associated with ING Group’s investments in bonds, commercial paper, securitisations, and other similar publicly traded securities. Investment risk arises when ING purchases a (synthetic) bond with the intent to hold the bond for a longer period of time (generally through maturity).
INVESTMENT PORTFOLIOComprises those assets which are intended for use on a continuing basis, and have been identified as such. These investments are held in order to cover the insurance provisions and to manage interest rate, capital and liquidity risks.
IRREVOCABLE FACILITIESMainly constitute unused portions of irrevocable credit facilities granted to corporate clients and commitments made to purchase securities to be issued by governments and private issuers.
IRREVOCABLE LETTERS OF CREDITConcerns an obligation on behalf of a client to pay an amount of money under submission of a specific document or to accept a bill of exchange, subject to certain conditions. An irrevocable letter of credit cannot be cancelled or adjusted by the bank that has granted it during the duration of the agreement unless all those concerned agree.
JOINT VENTUREA contractual arrangement whereby two or more parties undertake an economic activity which is subject to joint control.
LEGAL RISKLegal risk is the risk related to: • a failure (or perceived failure) to adhere to applicable laws,
regulations and standards; • contractual liabilities or contractual obligations that are defaulted
or cannot be enforced as intended, or are enforced in an unexpected or adverse way; and
• liability (tort) towards third parties due to an act or omission contributable to ING; (potentially) resulting in impairment of ING’s integrity, leading to damage to ING’s reputation, legal or regulatory sanctions, or financial loss.
LENDING RISKLending risk arises when ING Group grants a loan to a customer, or issues guarantees on behalf of a customer. This is the most common risk category, and includes term loans, mortgages, revolving credits, overdrafts, guarantees, letters of credit, etc. The risk is measured at the notional amount of the financial obligation that the customer has to repay to ING, excluding any accrued and unpaid interest, or discount/premium amortisations or impairments.
LEVERAGE RATIOSimple measure for the solvency of banks, introduced under Basel III, defined as Total on balance sheet and off-balance sheet exposure / Tier 1 Capital.
LIQUIDITY COVERAGE RATIO (LCR)Regulatory measure for the liquidity of banks which compares the amount of liquid assets with a potential outflow over a one month period. The measure is introduced under Basel III. LCR is defined as: stock of liquid assets / assumed 30-days cash outflow.
LIQUIDITY PREMIUMIn order to correct the value of the liabilities for their illiquidity a premium is added to the risk free liability valuation curve. This premium reflects the price of illiquid long term funding which increases in stressed markets.
LIQUIDITY RISKThe risk that ING Group or one of its subsidiaries cannot meet its financial liabilities when they fall due, at reasonable costs and in a timely manner.
LOAN TO DEPOSIT RATIO (LTD RATIO)Measure for the liquidity of banks. The LtD ratio is defined as: own originated loans / own originated deposits.
LOSS GIVEN DEFAULT (LGD)Anticipated percentage loss in the event of a default of a customer of counterpart.
MARKET RISKMarket risk is the risk that movements in market variables, such as interest rates, equity prices, implied volatilities, foreign exchange rates, real estate prices negatively impact the earnings or market value.
MARKED TO MARKET (MTM)Valuing a security, portfolio or account against its market value instead of its carrying value.
MASTER AGREEMENTContract between parties in which agreements are reached for most of the terms and conditions of future transactions such that negotiations only focus on deal-specific terms. Well known master agreements are for example ISDA (for over-the-counter derivative transactions), GMRA (for repo or repurchase transactions) and GMSLA (for securities lending transactions).
MINIMUM CAPITAL REQUIREMENT (MCR)Is defined in the Solvency II legislation and represents the absolute minimum regulatory required capital for insurance companies.
MINORITY INTERESTSThe part of the profit and loss and net assets of a subsidiary attributable to an interest which is not owned, directly or indirectly, by the parent company.
MONETARY ASSETS AND LIABILITIESAssets and liabilities which are fixed in terms of units of currency by contract or otherwise. Examples are cash, short or long-term accounts, notes receivable in cash and notes payable in cash.
MONEY MARKET RISKMoney market risk arises when ING Group places short term deposits with a counterparty in order to manage excess liquidity, as such, money market deposits tend to be short term in nature (1-7 days is common). In the event of a counterparty default, ING Group may lose the deposit placed. Money market risk is therefore measured simply as the notional value of the deposit, excluding any accrued and unpaid interest or the effect of any impairment.
Financial glossary continued
415ING Group Annual Report 2013
1 Wh
o w
e are2 R
epo
rt of th
e Executive B
oard
3 Co
rpo
rate go
vernan
ce4 C
on
solid
ated an
nu
al accou
nts
5 Parent co
mp
any an
nu
al accou
nts
6 Oth
er info
rmatio
n7 A
dd
ition
al info
rmatio
n
ING_2013_deel5_v1.indd 415 19/03/2014 19:45:25
MONTE CARLO SIMULATIONA model to calculate Value at Risk, assuming that changes in risk factors are (jointly) normally distributed taking into account non-linear behaviour of financial products.
MORTGAGE BACKED SECURITIES (MBS)A security whose cash flows are backed by typically the principal and/ or interest payments of a pool of mortgages.
NEW SALESNew sales of life insurance, measured as Annual Premium Equivalent (APE), have been defined as the total of annual premiums and 10% of single premiums received on production in a given period.
NET ASSET VALUEUsed in the equity method of accounting. The initial net asset value of the investment is determined by the fair value of the assets and liabilities of the investee. After the initial valuation of assets and liabilities of the investee at fair value, the assets and liabilities of the investee are valued in accordance with the accounting policies of the investor. The profit and loss account reflects the investor’s share in the results of operations of the investee.
NET PREMIUMS WRITTENGross premiums written for a given period less premiums ceded to retrocessionaires during the given period.
NET PRESENT VALUE AT RISK (NPV-AT-RISK)Establishes what the value of future cash flows is in terms of today’s monetary value. NPV-at-Risk establishes the change in value of future cash flows as a result of interest rate changes in terms of today’s monetary value.
NON-VOTING EQUITY SECURITIESCore Tier 1 securities issued to the Dutch State in November 2008 for a total consideration of EUR 10 billion. In December 2009 EUR 5 billion, in May 2011 EUR 2 billion, in November 2012 EUR 750 million and in November 2013 EUR 750 million was repaid to the Dutch State. This capital injection qualifies as core Tier 1 capital for regulatory purposes.
NOTIONAL AMOUNTSRepresent units of account which, in respect of derivatives, reflect the relationship with the underlying assets. They do not reflect, however, the credit risks assumed by entering into derivative transactions.
OBLIGORCorporate borrower, counterparty or individual to which ING has recourse for repayment of the obligation.
OPERATING LEASEA lease other than a finance lease.
OPERATING RESULTOperating result is a measure to analyse the Insurance Underlying result. It is the underlying result before tax excluding realised gains/losses and impairments on debt and equity securities, revaluations and market and other impacts.
OPERATIONAL RISKThe risk of a direct or indirect loss resulting from inadequate or failed internal processes, people and systems or from external events.
ORDINARY SHAREAn equity instrument that is subordinate to all other classes of equity instruments. Ordinary shares participate in the net profit for the financial year after other types of shares such as preference shares.
OUTSTANDINGSTotal amount of all drawn portions of a facility and thus the sum of all transactions of a specific facility.
OVER-THE-COUNTER INSTRUMENTA non-standardised financial instrument not traded on a stock exchange but directly between market participants.
PERFORMING LOANS Loans for which clients currently meet and are expected to meet their financial obligations in full and on time.
PLAN ASSETSComprise assets held by a long-term employee benefit fund and qualifying insurance policies. Assets held by a long-term employee benefit fund are assets (other than non-transferable financial instruments issued by the reporting enterprise) that:• are held by an entity (a fund) that is legally separate from the
reporting enterprise and exists solely to pay or fund employee benefits; and
• are available to be used only to pay or fund employee benefits, are not available to the reporting enterprise’s own creditors (even in bankruptcy), and cannot be returned to the reporting enterprise, unless either the remaining assets of the fund are sufficient to meet all the related employee benefit obligations of the plan or the reporting enterprise or the assets are returned to the reporting enterprise to reimburse it for employee benefits already paid.
A qualifying insurance policy is an insurance policy issued by an insurer that is not a related party of the reporting enterprise, if the proceeds of the policy:• can be used only to pay or fund employee benefits under a
defined benefit plan; and• are not available to the reporting enterprise’s own creditors
(even in bankruptcy) and cannot be paid to the reporting enterprise, unless either the proceeds represent surplus assets that are not needed for the policy to meet all the related employee benefit obligations or the proceeds are returned to the reporting enterprise to reimburse it for employee benefits already paid.
POST-EMPLOYMENT BENEFIT PLANSFormal or informal arrangements under which a company provides post-employment benefits for one or more employees. Post-employment benefits are employee benefits other than termination benefits and equity compensation benefits, which are payable after the completion of employment.
PREFERENCE SHARESimilar to an ordinary share but carries certain preferential rights. These rights usually concern the guarantee of a fixed (cumulative) return to the shareholder or a guaranteed return on the investment.
Financial glossary continued
416 ING Group Annual Report 2013
ING_2013_deel5_v1.indd 416 19/03/2014 19:45:25
PREMIUMS EARNEDThe portion of net premiums written in current and past periods which applies to the expired portion of the policy period, calculated by subtracting movements in unearned premium reserves from net premiums.
PRE-SETTLEMENT RISKPre-settlement risk arises when a counterparty defaults on a transaction before settlement and ING Group has to replace the contract by a trade with another counterparty at the then prevailing (possibly unfavourable) market price. The pre-settlement risk (potential or expected risk) is the cost of ING Group replacing a trade in the market. This credit risk category is associated with dealing room products such as options, swaps, and securities financing transactions. Where there is a mutual exchange of value, the amount of outstanding is generally based on the replacement value (mark-to-market) plus potential future volatility concept, using an historical 7 year time horizon and a 99% confidence level.
PRIVATE PLACEMENTA placement in which newly issued shares or debentures come into possession of a limited group of subscribers who are prepared to buy the new securities.
PROJECTED UNIT CREDIT METHODAn actuarial valuation method that considers each period of service as giving rise to an additional unit of benefit entitlement and measures each unit separately to build up the final obligation.
PROBABILITY OF DEFAULT (PD)The likelihood that a customer or counterparty will default.
PROBLEM LOANS In line with the IFRS, after a payment default of an obligor of more than 90 days or the likelihood of a payment default of the client (the particular loan and all other positions) will be regarded as problem or non-performing loans.
RECOGNITIONThe process of incorporating in the balance sheet or profit and loss account an item that meets the definition of an element and satisfies the following criteria for recognition:• it is probable that any future economic benefit associated with
the item will flow to or from the enterprise; and• the item has a cost or value that can be measured reliably.
RECOVERABLE AMOUNTThe higher of an asset’s net selling price and its value in use.
RECOVERY PLANAs a consequence of the global financial crisis ING Bank has set up an all-encompassing recovery planning process to enhance the bank’s readiness and decisiveness to tackle financial crises on its own strength.
REDEMPTION VALUEWith respect to investments in fixed-interest securities, the amount payable on the maturity date.
REGULATORY CAPITAL (RC)The minimum amount of capital that a bank is required to hold in order to absorb unexpected losses. RC is calculated using regulatory approved internal models.
REINSURANCEThe practice whereby one party, called the reinsurer, in consideration for a premium paid to him, agrees to indemnify another party, called the reinsured or ceding company, for part or all of the liability assumed by the reinsured under a contract or contracts of insurance which the reinsured has issued. The reinsured may also be referred to as the original or primary insurer, the direct writing company, or the ceding company.
RESERVE ADEQUACY TESTTo ensure reserves remain adequate over time, the insurance liabilities (future claims and premium income) are tested against the projected investment yields. For many insurance portfolios stochastic testing is done taking the 90th percentile of the results as the required level at which adequacy should be ensured.
RETURN ON EQUITY (ROE)The return on equity is the net result as percentage of the average equity.
RISK-WEIGHTED ASSETS (‘RWA’ UNDER BASEL I)Assets which are weighted for credit risk according to a formula used by the Dutch central bank (De Nederlandsche Bank), which conforms to the capital adequacy guidelines of the BIS (Bank of International Settlements). On and off-balance-sheet items are weighted for risk, with off-balance-sheet items converted to balance-sheet equivalents (using credit-conversion factors) before being allocated a risk weight.
RISK-WEIGHTED ASSETS (‘RWA’ UNDER BASEL II)Assets which are weighted for credit and market risk in accordance with the Basel II methodology. The risk-weighted assets are calculated using internal models approved by The Dutch central bank (De Nederlandsche Bank). Regulatory capital requirements for operational risk are calculated without use of risk-weighted assets.
SETTLEMENT RISKSettlement risk arises when there is an exchange of value (funds, instruments or commodities) for the same or different value dates and receipt is not verified or expected until ING Group has paid or delivered its side of the trade. The risk is that ING Group delivers, but does not receive delivery from the counterparty.
SIGNIFICANT INFLUENCEThe power to participate in the financial and operating policy decisions of an entity, but not to have control over these policies. Significant influence may be gained by share ownership, statute or agreement.
SOLVENCY ISolvency I is the current prudential framework that lays out the amounts of regulatory capital an insurance undertaking must hold against unforeseen events.
Financial glossary continued
417ING Group Annual Report 2013
1 Wh
o w
e are2 R
epo
rt of th
e Executive B
oard
3 Co
rpo
rate go
vernan
ce4 C
on
solid
ated an
nu
al accou
nts
5 Parent co
mp
any an
nu
al accou
nts
6 Oth
er info
rmatio
n7 A
dd
ition
al info
rmatio
n
ING_2013_deel5_v1.indd 417 19/03/2014 19:45:25
SOLVENCY IISolvency II is a fundamental review of the prudential regime for insurance and reinsurance undertakings in the European Union. Solvency II must lead to a new solvability framework based on a market consistent valuation, in which the capital requirements adequately reflect the risks run by the insurer. It is still under discussion and is not expected to come into force before 1 January 2016.
STRESS TESTINGStress testing examines the effect of exceptional but plausible scenarios on the capital position of ING. Stress testing can be initiated internally or by external parties such as the Dutch central bank.
STRUCTURED ENTITYAn entity that has been designed so that voting or similar rights are not the dominant factor in deciding who controls the entity, such as when any voting rights relate to administrative tasks only and the relevant activities are directed by means of contractual arrangements.
SUB-PRIME MORTGAGESMortgage loans made to borrowers who cannot get a regular mortgage because they have a bad credit history or limited income.
SUBSIDIARYAn entity that is controlled by another entity.
SURRENDERThe termination of a life or retirement contract at the request of the policyholder after which the policyholder receives the cash surrender value, if any, on the contract.
SWAP CONTRACTSCommitments to settle in cash at a specified future date, based on differentials between specified financial indices as applied to a notional principal amount. Generally, no cash is exchanged at the outset of the contract and no principal payments are made by either party.
TIER-1 CAPITALTier-1 capital comprises paid up share capital, reserves excluding revaluation reserves, retained earnings, minority interests and hybrid capital. Where a reference is made to Basel III, we follow the definition of the Basel Committee on Banking Supervision, which means that revaluation reserves are included, but goodwill, intangibles, defined benefit pension fund assets and part of the deferred tax assets and minority interests are excluded.
TIER-1 RATIOReflecting the Tier 1 capital of ING Bank as a percentage of its total risk weighted assets. The minimum set by the Dutch central bank is 4%.
TIER-2 CAPITALTier-2 capital, or supplementary capital, consists of mainly subordinated debt meeting the conditions set by the Basel Commission and is a constituent of ING Bank’s capital base. The Basel III accord sets tighter conditions which ING Bank’s current Tier-2 capital instruments do not meet. However these instruments will be grandfathered under the Basel III accord in descending degree over the years 2013-2022.
TRADING PORTFOLIOComprises those financial instruments which are held to obtain short-term transaction results, to facilitate transactions on behalf of clients or to hedge other positions in the trading portfolio.
TRANSFER RISKProbability of loss due to currency conversion (exchange) restrictions imposed by a foreign government that make it impossible to move money out of the country.
TREASURY BILLSGenerally short-term debt certificates issued by a central government. Dutch Treasury Certificates are regarded as Dutch Treasury bills.
TREASURY SHARESAn entity’s own equity instruments, held by the entity or other members of the consolidated group.
UNDERLYING RESULTUnderlying result is a measure to evaluate the result of the segments. It is derived from the result in accordance with IFRS-EU by excluding the impact of divestments, discontinued operations and special items.
UNIT LINKEDA unit linked insurance product functions as a savings product but also offers coverage for specific life events. The policy holder invests in ‘units’ (stock, bonds, or mutual funds) and its return depends on the performance of these units. The insurance company may decide to provide guarantees on the return of the units.
VALUE AT RISK (VAR)Quantifies, with a one-sided confidence level of at least 99%, the maximum overnight loss in Net Present Value that could occur due to changes in risk factors (e.g. interest rates, foreign exchange rates, equity prices, credit spreads, implied volatilities) if positions remain unchanged for a time interval of one day. Statistically, a loss larger than the VaR figure can only occur once in every 100 days.
VALUE IN USEThe present value of estimated future cash flows expected to arise from the continuing use of an asset and from its disposal at the end of its useful life.
VARIANCE-COVARIANCEA model to calculate Value at Risk, assuming that changes in risk factors are (jointly) normally distributed and that the change in portfolio value is linearly dependent on all risk factor changes.
Financial glossary continued
418 ING Group Annual Report 2013
ING_2013_deel5_v1.indd 418 19/03/2014 19:45:25
DisclaimerCertain of the statements contained in this Annual Report are not historical facts, including, without limitation, certain statements made of future expectations and other forward-looking statements that are based on management’s current views and assumptions and involve known and unknown risks and uncertainties that could cause actual results, performance or events to differ materially from those expressed or implied in such statements. Actual results, performance or events may differ materially from those in such statements due to, without limitation: (1) changes in general economic conditions, in particular economic conditions in ING’s core markets, (2) changes in performance of financial markets, including developing markets, (3) consequences of a potential (partial) break-up of the euro, (4) the implementation of ING’s restructuring plan to separate banking and insurance operations, (5) changes in the availability of, and costs associated with, sources of liquidity such as interbank funding, as well as conditions in the credit markets generally, including changes in borrower and counterparty creditworthiness, (6) the frequency and severity of insured loss events, (7) changes affecting mortality and morbidity levels and trends, (8) changes affecting persistency levels, (9) changes affecting interest rate levels, (10) changes affecting currency exchange rates, (11) changes in investor, customer and policyholder behaviour, (12) changes in general competitive factors, (13) changes in laws and regulations, (14) changes in the policies of governments and/or regulatory authorities, (15) conclusions with regard to purchase accounting assumptions and methodologies, (16) changes in ownership that could affect the future availability to us of net operating loss, net capital and built-in loss carry forwards, (17) changes in credit ratings, (18) ING’s ability to achieve projected operational synergies and (19) the other risk factors and uncertainties detailed in the Risk Factors section contained in this Annual Report.
Any forward-looking statements made by or on behalf of ING speak only as of the date they are made, and, ING assumes no obligation to publicly update or revise any forward-looking statements, whether as a result of new information or for any other reason.
General information
ING PUBLICATIONS• Annual Report in English• Annual Report on Form 20-F, in English
(in accordance with SEC guidelines)• ING Bank Annual Report• NN Group N.V. Annual Report• ING Jaaroverzicht 2013
These publications are available on www.ing.com.The publications can be ordered on the internet:www.ing.com, button ‘Publications’,by fax: +31 411 652 125, orby mail: P.O. Box 258, 5280 AG Boxtel, the Netherlands.
This Annual Report contains the Reports of the Executive Board and Supervisory Board as well as the Annual Accounts and Other information for the financial year 2013 in their original language (English).
ING Groep N.V.Bijlmerplein 888, 1102 MG AmsterdamP.O. Box 1800, 1000 BV AmsterdamThe NetherlandsTelephone: +31 20 5639111Internet: www.ing.com
Commercial Register of Amsterdam, no. 33231073
WRITTEN AND PRODUCED BYING Groep N.V.
DESIGNED BYAddison Corporate Marketing, London
PRINTED BYDrukkerij Tesink, Zutphen
419ING Group Annual Report 2013
1 Wh
o w
e are2 R
epo
rt of th
e Executive B
oard
3 Co
rpo
rate go
vernan
ce4 C
on
solid
ated an
nu
al accou
nts
5 Parent co
mp
any an
nu
al accou
nts
6 Oth
er info
rmatio
n7 A
dd
ition
al info
rmatio
n
ING_2013_deel5_v1.indd 419 20/03/2014 14:21:28

ING_2013_deel5_v1.indd 420 19/03/2014 19:45:26

WWW.ING.COM
Printed withBio ink & varnish
© Drukkerij Tesink
©
We printCO2 neutrally
© Drukkerij Tesink
CO2neutral
WWW.ING.COM
232460
ING Groep N.V.Bijlmerplein 8881102 MG AmsterdamP.O. Box 1800, 1000 BV AmsterdamThe NetherlandsTelephone: +31 20 5639111Internet: www.ing.com
Commercial Register of Amsterdam, no. 33231073