Isaac, Bonad (2012) Thermo-mechanical characterisation of ...
Upload
khangminh22Category
view
18download
0
ARISTON GROUP N.V.
2021 ANNUAL REPORT
2
Index | Table of contents
1 About this report
2 Key Highlights
3 Corporate bodies
4 Directors’ Report for the year ending 31 December 2021
4.1 Reference Background and Investor information
4.2 Significant business event of the year
4.3 Subsequent events
4.4 Brand|Product performance
4.5 New Products, Services, Research and Development
4.6 Manufacturing & Supply Chain operations
4.7 Human Resources
4.8 Regulation
4.9 Group Financial Review
4.9.1 Net Revenue Performance
4.9.2 Reclassified income statement
4.9.3 Reclassified statement of financial position
4.9.4 Net Operating Working Capital
4.9.5 Reclassified statement of Cash flows
4.9.6 Net financial indebtedness
4.9.7 Capital Expenditures
4.9.8 Company and Group net profit and total equity
4.10 Full year 2021 conclusion and outlook
4.11 Definition and reconciliation of the Alternative Performance Measures (APMs or non GAAP measures) to
GAAP measures
4.12 Investor information
5 Governance
5.1 Risk management
5.2 Non Financial Disclosure
5.3 Corporate Governance
5.4 Remuneration Report
6 Ariston Holding N.V. Consolidated Report Financial Statements at 31 December 2021
7 Ariston Holding N.V. Company only Financial Statements at 31 December 2021
8 Other Information
Disclaimer
This is an unaudited PDF copy of the 2021 Annual report of Ariston Holding N.V. and has not been prepared in European single electronic reporting format specified by the European Commission in Regulatory Technical Standard on ESEF (Regulation (EU) 2019/815). The ESEF-compliant 2021 Annual Report of Ariston Holding N.V. (“ESEF Package”) will be available on the “Investor Relations” section of Ariston Holding's website www.aristongroup.com and will be filed with the Netherlands Authority for the Financial Markets (AFM) within the terms provided by law. In case of discrepancies between this PDF copy and the ESEF Package, the latter prevails.
The board report “bestuursverslag” consists of the section 2, 3, 4 and 5.
3
1. About this report
Note on presentation
The annual report at 31 December 2021 was prepared in in accordance with the International Financial Reporting Stand-
ards (IFRS), issued by the International Accounting Standards Board (IASB), as adopted by the European Union and with
Section 2:362 (8) of the Dutch Civil Code (‘DCC’), pursuant to Part 9 of Book 2. The IFRS designation also includes the
International Accounting Standards (‘IAS’) as well as all the interpretations of the International Financial Reporting Inter-
pretations Committee (‘IFRIC’), formerly the Standard Interpretations Committee (‘SIC’).
Adaptation plan pursuant to Articles 15 and 18 of the Market Regulations
In accordance with Article 15 of Consob Regulation 20249 of 28 December 2017 and subsequent amendments concerning
‘conditions for listing shares of companies that control companies established and governed by laws of non-EU countries’,
the Parent Company Ariston Holding N.V. (the ‘Company’ or ‘Parent Company’ or ‘Ariston’ and together with its subsidi-
aries the ‘Ariston Group’ or the ‘Group’) has identified its significant subsidiaries as defined in Article 15(2) of the above-
mentioned Regulation, and verified that the conditions set out in paragraphs a), b) and c) of Article 15 have been met.
Information on the figures presented
All the figures in this annual report are expressed in millions of euro to one decimal place, whereas the original data is
recorded and consolidated by the Group in euro. Similarly, all percentages relating to changes between two periods or
to percentages of net revenue or other indicators are always calculated using the original data in euro. The use of amounts
expressed in millions of euro may therefore result in apparent discrepancies in both absolute amounts and data expressed
as a percentage.
The language of this annual report is English. Certain legislative references and technical terms have been cited in their
original language in order to give them their correct technical meaning under applicable law.
European Single Electronic Format requirements
Pursuant to article 4 of the Transparency Directive, starting from 2021 reporting period, the financial statements schema,
in the annual financial report is prepared in XHTML format, in compliance with the European Single Electronic Format
(ESEF) as a company listed on a European Union regulated markets. In addition, issuers preparing IFRS consolidated fi-
nancial statements shall mark those up using Inline XBRL. Ariston Group manages ESEF by leveraging on a dedicated
outsourced IT software that allows the compliance with the new regulation.
4
2. Key Highlights
(mln €)
2021
2020
total change
organic change
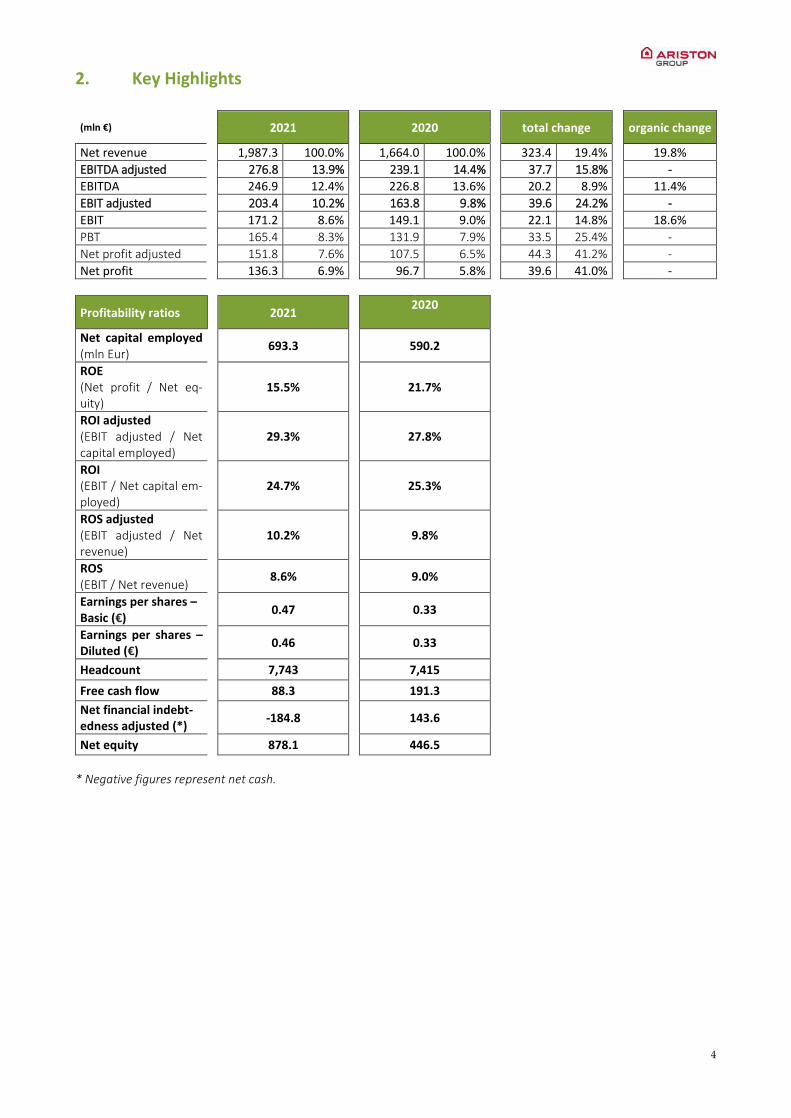
Net revenue 1,987.3 100.0% 1,664.0 100.0% 323.4 19.4% 19.8%
EBITDA adjusted 276.8 13.9% 239.1 14.4% 37.7 15.8% -
EBITDA 246.9 12.4% 226.8 13.6% 20.2 8.9% 11.4%
EBIT adjusted 203.4 10.2% 163.8 9.8% 39.6 24.2% -
EBIT 171.2 8.6% 149.1 9.0% 22.1 14.8% 18.6%
PBT 165.4 8.3% 131.9 7.9% 33.5 25.4% -
Net profit adjusted 151.8 7.6% 107.5 6.5% 44.3 41.2% -
Net profit 136.3 6.9% 96.7 5.8% 39.6 41.0% -
Profitability ratios
2021 2020
Net capital employed (mln Eur)
693.3
590.2
ROE (Net profit / Net eq-uity)
15.5%
21.7%
ROI adjusted (EBIT adjusted / Net capital employed)
29.3%
27.8%
ROI (EBIT / Net capital em-ployed)
24.7%
25.3%
ROS adjusted (EBIT adjusted / Net revenue)
10.2%
9.8%
ROS (EBIT / Net revenue)
8.6%
9.0%
Earnings per shares – Basic (€)
0.47
0.33
Earnings per shares – Diluted (€)
0.46
0.33
Headcount 7,743 7,415
Free cash flow 88.3 191.3
Net financial indebt-edness adjusted (*)
-184.8
143.6
Net equity 878.1 446.5
* Negative figures represent net cash.

5
3. Corporate bodies
Board of Directors
Paolo Merloni Executive Chairman Laurent Alexis Michel Henri Jacquemin CEO Sabrina Baggioni Roberto Guidetti Francesco Merloni Maria Francesca Merloni Lorenzo Pozza Ignazio Maria Rocco di Torrepadula Paolo Tanoni Andrea Silvestri Marinella Soldi Enrico Vita
External auditor
Ernst&Young Accountants LLP

6
2022: renewing our ambitions for sustainability and long-term value creation
Paolo Merloni, Executive Chairman
Dear Shareholders,
The year 2021 was characterized by a series of unprecedented events: the persisting of Covid-19 pandemic, the economic
recovery in many markets, growing public attention to the energy transition and sustainability, international trade ten-
sions, severe inflationary trends in raw materials and supply chain pressures.
For Ariston Group, 2021 was a year to be remembered for many reasons, that further reinforced our commitment to
sustainability and long-term value creation.
We reported all-time high revenues, of almost € 2 billion. The financial results – wholly driven by organic growth –
confirm once again the robustness of our vision: “Sustainable comfort for Everyone”. The continued growth of key refer-
ence markets, hot water and space heating, is underpinned by the urgency for sustainability and the resulting need for
renewable and high-efficiency solutions. The strong position we have built over the past years and decades in these
technologies, connected solutions and digitalization allowed us to achieve these results. In 2021, 74.6% of the products
we sold were based on renewable or high-efficiency technologies, up from 72% in 2020 and from 54% in 2016.
Ariston got listed on Euronext Milan on 26 November 2021. The listing was the natural evolution of our journey and
was a logical step for a Group that more than 15 years ago decided to adopt the best practices of public companies in
terms of governance and management. The listing will provide additional strategic flexibility to address future growth
objectives, while enhancing our profile and brand recognition so as to continue attracting talented individuals in the
future. The Group also moved the legal seat of its holding company in the Netherlands, to strengthen the governance
instruments available to long-term shareholders – while keeping its tax residence and its operating company in Italy
where our industrial heart and legacy lies.
We have continued to invest in our future, in renewable and high-efficiency technologies, connectivity and digitali-
zation. The Albacina plant, the Group’s largest production site for renewable products, added new capacity with auto-
mated processes to meet increasing demand. We prepared for the release in 2022 of an extensive and innovative range
of heat pump solutions: a new generation of Ariston-branded heating heat pumps, an innovative Gas Absorption Heat
Pump that targets the replacement market, and heat-pump water heaters dedicated to the U.S. market. Also, we contin-
ued and stepped up research and development into hydrogen to test and to certify growing shares of blending – up from
today’s certified 20%-30%. Moreover, we have continued to develop and test Demand Response services on our electric
storage water heaters, to increase the resilience of the power grid.
As for digitalization we completed two important projects: we launched OneTeam, the new platform dedicated to sup-
porting the day-to-day work of our professionals; and we scaled up the corporate cloud-based CRM for the automation
of key sales processes.
We have also significantly invested in developing our people and organization via the roll-out of a Global Leadership
Program and via a program dedicated to reinforcing the Group’s organization and operating model.
In this turbulent social and economic context influenced by the persisting of the Covid-19 pandemic, we continue
more than ever to stay true to our core values: sustainability, excellence, customers, people, integrity. In particular, the
safety of our people at all our offices and plants around the word has been a priority throughout the year, putting the
strongest possible precautionary measures in place. At the same time, our people were able to ensure the continuity of
our supply chain and operations thanks to their expertise, entrepreneurship, teamwork, dedication and ability to adapt.
We have continued to be very active in assessing and capturing inorganic opportunities. In October, we signed an
agreement for the acquisition of Chromagen, an Israeli leader in the provision of renewable hot water solutions. With
the addition of Chromagen, the Group further strengthens its position in the Israeli market and enters the Australian
market for the first time. The acquisition was finalized in January 2022.
Finally, our Group changed its name and became Ariston Group. The change emphasizes the legacy of the Company’s
founder – Aristide – and the concept of "best" in ancient Greek, as well as the central role of all the brands the Group has
acquired over its long history, brands and organizations that have enriched the Group’s offerings and its global presence
over time.
It has been a year full of events and remarkable achievements, all guided by the same principle enclosed in the words of
my grandfather, Aristide – “there is no value of economic success in any industrial initiative, unless there is also a
commitment to social progress”. We embrace future opportunities and challenges with renewed ambition – also sup-
ported by the listing – and with the certainty that our vision “Sustainable Comfort for Everyone” is more relevant now
than ever.

7

8
4. Directors’ Report for the year ending 31 December 2021
4.1 Reference Background and Investor information
Macroeconomic scenario
As the economic recovery continues, in October 2021 the International Monetary Fund (IMF) projected global growth at
5.9% and 4.9% in 2022. Those projections reflect some recent negative trends in advanced economies—in part due to
supply disruptions—and for low-income developing countries, largely due to the deteriorating pandemic situation. The
negative trends are partially offset by stronger near-term prospects for some commodity-exporting emerging market and
developing economies.
In this context, it should be noted that Italy is forecast to shift from -8.9% in 2020 to +5.8% in 2021 and +4.2% in 2022,
France from -8.0% to +6.3% and +3.9% respectively and Spain from -10.8% to +5.7% and +6.4% respectively.
In its October estimates, which are the latest available, the IMF anticipates a shift for Germany from -4.6% in 2020 to
+3.1% in 2021 and +4.6% in 2022, while United States would jump from -3.4% to +6.0% and +5.2%, respectively, in light
of the continuous stimulus to the economy delivered via monetary policies and demand-side support.
Vietnam, Turkey and China are the only three economies that recorded a positive growth in 2020, at +2.9%, +1.8% and
+2.3%, respectively, and they are estimated to continue growing by +3.8%, +9.0% and +8.0%, respectively.
A strong recovery is expected for India, Mexico and the United Kingdom in 2021 and 2022 after the severe declines
recorded in 2020 (-7.3%, -8.3%, and -9.8%).
Growth projections (GDP), annual percentage changes
Actual Projections
2020 2021 2022
World Output -3.1% 5.9% 4.9%
Belgium -6.3% 5.6% 3.1%
China 2.3% 8.0% 5.6%
France -8.0% 6.3% 3.9%
Germany -4.6% 3.1% 4.6%
India -7.3% 9.5% 8.5%
Indonesia -2.1% 3.2% 5.9%
Italy -8.9% 5.8% 4.2%
Mexico -8.3% 6.2% 4.0%
Poland -2.7% 5.1% 5.1%
Romania -3.9% 7.0% 4.8%
Russia -3.0% 4.7% 2.9%
Saudi Arabia -4.1% 2.8% 4.8%
South Africa -6.4% 5.0% 2.2%
Spain - 10.8% 5.7% 6.4%
Switzerland -2.5% 3.7% 3.0%
Turkey 1.8% 9.0% 3.3%
United Arab Emirates -6.1% 2.2% 3.0%
United Kingdom -9.8% 6.8% 5.0%
United States -3.4% 6.0% 5.2%
Vietnam 2.9% 3.8% 6.6% Source: IMF, World Economic Outlook, October 2021
9
Exchange rates
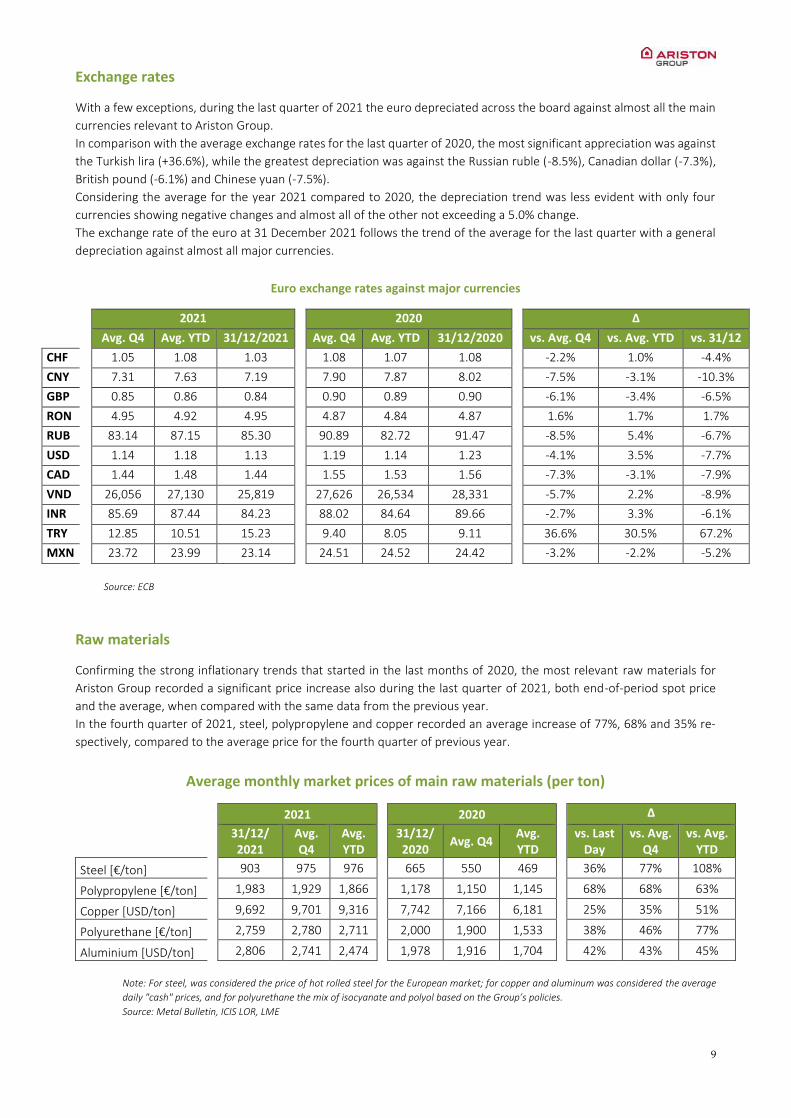
With a few exceptions, during the last quarter of 2021 the euro depreciated across the board against almost all the main
currencies relevant to Ariston Group.
In comparison with the average exchange rates for the last quarter of 2020, the most significant appreciation was against
the Turkish lira (+36.6%), while the greatest depreciation was against the Russian ruble (-8.5%), Canadian dollar (-7.3%),
British pound (-6.1%) and Chinese yuan (-7.5%).
Considering the average for the year 2021 compared to 2020, the depreciation trend was less evident with only four
currencies showing negative changes and almost all of the other not exceeding a 5.0% change.
The exchange rate of the euro at 31 December 2021 follows the trend of the average for the last quarter with a general
depreciation against almost all major currencies.
Euro exchange rates against major currencies
2021 2020 Δ
Avg. Q4 Avg. YTD 31/12/2021 Avg. Q4 Avg. YTD 31/12/2020 vs. Avg. Q4 vs. Avg. YTD vs. 31/12
CHF 1.05 1.08 1.03 1.08 1.07 1.08 -2.2% 1.0% -4.4%
CNY 7.31 7.63 7.19 7.90 7.87 8.02 -7.5% -3.1% -10.3%
GBP 0.85 0.86 0.84 0.90 0.89 0.90 -6.1% -3.4% -6.5%
RON 4.95 4.92 4.95 4.87 4.84 4.87 1.6% 1.7% 1.7%
RUB 83.14 87.15 85.30 90.89 82.72 91.47 -8.5% 5.4% -6.7%
USD 1.14 1.18 1.13 1.19 1.14 1.23 -4.1% 3.5% -7.7%
CAD 1.44 1.48 1.44 1.55 1.53 1.56 -7.3% -3.1% -7.9%
VND 26,056 27,130 25,819 27,626 26,534 28,331 -5.7% 2.2% -8.9%
INR 85.69 87.44 84.23 88.02 84.64 89.66 -2.7% 3.3% -6.1%
TRY 12.85 10.51 15.23 9.40 8.05 9.11 36.6% 30.5% 67.2%
MXN 23.72 23.99 23.14 24.51 24.52 24.42 -3.2% -2.2% -5.2%
Source: ECB
Raw materials
Confirming the strong inflationary trends that started in the last months of 2020, the most relevant raw materials for
Ariston Group recorded a significant price increase also during the last quarter of 2021, both end-of-period spot price
and the average, when compared with the same data from the previous year.
In the fourth quarter of 2021, steel, polypropylene and copper recorded an average increase of 77%, 68% and 35% re-
spectively, compared to the average price for the fourth quarter of previous year.
Average monthly market prices of main raw materials (per ton)
2021 2020 Δ
31/12/ 2021
Avg. Q4
Avg. YTD
31/12/ 2020
Avg. Q4 Avg. YTD
vs. Last Day
vs. Avg. Q4
vs. Avg. YTD
Steel [€/ton] 903 975 976 665 550 469 36% 77% 108%
Polypropylene [€/ton] 1,983 1,929 1,866 1,178 1,150 1,145 68% 68% 63%
Copper [USD/ton] 9,692 9,701 9,316 7,742 7,166 6,181 25% 35% 51%
Polyurethane [€/ton] 2,759 2,780 2,711 2,000 1,900 1,533 38% 46% 77%
Aluminium [USD/ton] 2,806 2,741 2,474 1,978 1,916 1,704 42% 43% 45%
Note: For steel, was considered the price of hot rolled steel for the European market; for copper and aluminum was considered the average
daily "cash" prices, and for polyurethane the mix of isocyanate and polyol based on the Group’s policies.
Source: Metal Bulletin, ICIS LOR, LME

10
4.2 Significant business events of the year
January
Ariston and Juventus F.C. announce a three-year regional partnership in China that will allow the two brands to join forces for a common goal: to win the challenge of the Chinese market. The two companies share a common mindset: pursuing demanding challenges, seeking great results, perseverance, teamwork, and leveraging their champions.
February
The presence of the Ariston brand in France grows stronger with the launch of the ONE Series range of condensing
boilers. The launch of Ariston heating solutions is further proof of the Group's commitment to the French market.
March
L’Economia the financial weekly of the Italian top-tier newspaper Corriere della Sera, dedicates a full section to Ariston
Group with an interview with Executive Chairman Paolo Merloni – addressing topics such as the Group's strategy, the
green transition, the investment in innovation and sustainable production capacity in Albacina (central Italy), the ongoing
green hydrogen project, as well as the continuous commitment to innovation, research and development.
April
Ariston Group publishes the 2020 financial results: despite a year made challenging by Covid-19, the Group confirms its
long-term focus, reporting a very solid performance. The annual Sustainability Report is also released: by increasing its
investment in Research and Development (R&D) dedicated to renewable solutions, the Group demonstrates once again
the fundamental role that innovation and sustainability play in its present and future development path.
June
Ariston presents the new generation of Velis, its innovative flat hot water storage product produced in St. Petersburg
(Russia), to the market, which was designed by well-known Italian architect Umberto Palermo.
The Group transfers the legal seat of the holding company (Ariston Holding N.V.) to the Netherlands, while the tax
residence and the operating company both remain unchanged in Italy.
The investments in the Albacina plant, the Group’s largest production site for renewables products, continue with the
addition of new capacity with automated processes.
Ariston Group acquires a minority interest in HAAS Heating B.V., a Dutch start-up offering hybrid heat pumps to private
Dutch individuals by leveraging the WKR scheme (a tax benefit that employers grant every year to their employees).
July
Following the very successful initiative in China, Ariston and Juventus F.C. launch a partnership in Indonesia with a
three-year agreement, reaffirming the claim “Challenges deserve Champions”. Teaming up with Juventus in Indonesia
confirms our commitment to the market, which we began serving more than 35 years ago in 1984.
Patrizia Valsesia joins the Group as its new Chief People Officer, joining it from CNH where she was HR President for the
Powertrain division. Patrizia brings with her over 30 years of experience in HR in a leading multinational environment.
August
Riccardo Gini joins the Group as its new Chief Financial Officer, joining from Stellantis where he was CFO of the Parts &
Services division. Over the course of his career, Riccardo has worked at Stellantis, FCA, and GE.
11
September
Ariston Group announces it is to partner with #Generation4universities and support young talents in building their future
career. "Generation4Universities" is an initiative promoted by The Generation Italy Foundation and McKinsey & Company.
October
The Group changes its name to Ariston Group. The change strengthens the “Ariston” company heritage, the legacy of
its founder, Aristide Merloni, and the concept of "best" in ancient Greek; it also emphasizes the central role of all the
brands the Group has acquired over its long history—brands and organizations that have enriched the Company's offer-
ings and its global presence over time.
The Ariston brand launches its brand-new communication campaign, “A sustainable comfort starts at home”, to estab-
lish itself as the specialist in heating and hot water solutions and to affirm its crucial role in the sustainability transition.
With this campaign, Ariston launches a new brand payoff “The home of sustainable comfort” and returns to television
with a commercial spot in Italy and France after many years.
The Group signs an agreement for the acquisition of Chromagen, an Israeli company who is a leader in renewable hot
water solutions. Chromagen is headquartered in Israel and has two subsidiaries in Australia and Spain, as well as a robust
network of distributors that help serve customers in about 35 countries worldwide. With the acquisition, the Group fur-
ther strengthens its competitive position in the renewable energy segment, acquiring a player with a leading position in
Israel and a solid footprint in Australia.
November
Ariston Group starts trading on Euronext Milan on 26 November after the traditional bell-ringing ceremony at Palazzo
Mezzanotte. It is the largest IPO on the Italian stock exchange in almost 3 years. The listing is a natural evolution of
Ariston’s journey and gives the Group even more options for its future.
Ariston launches OneTeam, the new platform dedicated to supporting the day-to-day work of our professionals. These
can find all the tools and exclusive services they may need, like online training, videos, and digital catalogues in one place.
The platform is initially available in Italy and will be deployed globally in 2022. OneTeam represents an important step to
further increase our support to our professionals and to improve their working life.
The World Class Manufacturing program is expanded to include Logistics, with the kick-off of the audits of the finished
goods warehouse in Namur (Belgium).
December
With its latest series of Velis EVO WiFi water heaters, Ariston confirms its pioneer position in developing demand re-
sponse services. Ariston’s proprietary technology could give a critical contribution to increase power grid resiliency and
ultimately support the integration of an increasing share of renewable sources.
Ariston Group launches a new corporate cloud-based CRM for the automation of key sales processes.
4.3 Subsequent events
On 5 January, Ariston announced the closing of the acquisition of Chromagen after all closing conditions were met,
including the clearance from Israeli Antitrust authorities. The asset purchase agreement reported a total value of NIS 130
million (Euro 37 million), comprehensive of the total net assets and liabilities of the legal entities in Israel and Spain and
the 51% of the Australian one.
Founded in 1962, Chromagen develops, manufactures, and markets renewable hot water solutions, with a strong herit-
age in solar thermal technology. Chromagen, which employs over 300 people, reported revenues of approximately NIS
400 million (Euro 122 million) and a mid-single digit EBIT adjusted margin in 2020. Ariston Group acquired 100% of the
shares and voting rights of the entity that operates in Israel and Spain. In Australia, Ariston Group acquired the shares

12
owned by Kibbutz Shaar Haamakim while confirming both the current management team as well as the governance
structure with the current minority shareholders.
Ariston Group attends the 2022 AHR Expo in Las Vegas (USA) with a dedicated booth showcasing heating and hot water
products for the North American market from the Group’s HTP Comfort Solutions and American Standard Water Heat-
ers brands.
Following the very successful initiatives in China (January 2021) and Indonesia (July 2021), Ariston and Juventus F.C.
launch a partnership spanning the entire African continent with a three-year agreement, reaffirming the claim “Chal-
lenges deserve Champions”. Teaming up with Juventus in the African continent confirms Ariston’s commitment to con-
tinue boosting its long-term growth outlook, targeting a continent with very significant long-term potential in the hot
water business, where in many markets Ariston has solid potential (South Africa, Nigeria, Tunisia, Morocco, and Egypt,
among others).
Regarding the developing situation involving the Russian Federation and Ukraine, the Group confirms to be characterized,
also for 2022, by a significant geographical diversification of consolidated Net Revenue per country. However, at the time
of writing, it is too early to evaluate the chance of any disruptive effect on the economic/financial figures, and on supply
chain operations.
4.4 Brand|Product performance
Market and business performance
In 2021, markets around the world confirmed a generalized growth in volumes and a recovery in demand following the
partial slowdown in 2020 caused by the Covid-19 emergency. In most markets, demand was even higher than in 2019,
the result of the strong rebound but also of green government subsidies and incentive programmes.
More specifically, hot water markets are estimated to have grown double-digit in the vast majority of Ariston Group’s
reference markets compared to 2020, especially in Western Europe and Asia-Pacific. Likewise, renewable solutions, and
in particular heat pumps, performed strongly.
In the Heating segment, growth was extremely solid in Western Europe. While the lion’s share of this growth came from
hydronic heat pumps, high-efficiency boilers also grew at a very rapid pace (strong double-digit), also thanks to govern-
ment support schemes. Boilers also saw significant growth in other geographies, such as Russia and North America.
Finally, Components and Burners also grew steadily across all markets and key geographies.
Brand activities
Taking care of our brands is more important than ever to sustain our value and growth. In 2021, Ariston Group focused
on three core areas: the refresh of the Ariston brand, the brand architecture in Mexico, and the Corporate Brand.
Ariston brand refresh. We decided to update the Ariston brand positioning and visual identity to bring it closer to its
values while remaining loyal to its heritage. Our new payoff, “The home of sustainable comfort”, clearly communicates a
renewed focus on HOME and COMFORT. It is also a natural expression of our Italian DNA and of our dedication to devel-
oping sustainable solutions, as specialist in heating and water heating.
Mexico post-acquisition brand strategy. When in 2018 Ariston Group broadened its brand portfolio with the acquisition
of Calorex in Mexico, we started working on the integration by leveraging both local resources and corporate capabilities.
As part of this process, in 2021 we reviewed our brand strategy in Mexico, defining a clear role, objectives, and plan for
each brand to provide stronger and more competitive offerings to all our customers and consumers.
Ariston Group establishment. In early October 2021, the Group updated its name to Ariston Group to emphasize even
more both the role of Ariston, our historical brand that draws its origin from the founder Aristide Merloni and the concept
of “best” (aristos) from ancient Greek, and of our Group, reflecting the central role of all the brands acquired over our
long history.
13
Hot water technologies
Renewable solutions
In Western Europe, in 2021 the market for hot water heat pump solutions saw very strong growth in volumes. In this
context, Ariston Group slightly improved its market share. Demand for heat pumps is estimated to have grown also in
Eastern Europe, where Ariston Group saw good market share growth compared to 2020.
Though still very small, in many key Asian markets the growth in demand for heat pumps was strong, and Ariston Group’s
market share performance was extremely solid.
Electric storage solutions
In 2021, the demand for electric storage water heaters grew double digit in the main European markets. In this context,
Ariston Group’s overall market share across European markets of interest is estimated to have slightly increased.
The trend in market demand was positive also in the main African, Middle Eastern, and Asian emerging geographies,
recovering from the slowdown registered in 2020—although in some countries the Covid-19 emergency is far from being
under control and new lockdowns were imposed during 2021 (e.g., Vietnam). In this context, Ariston Group’s market
share is estimated to have increased compared to the same period last year.
North America, and in particular the US, also showed a positive trend in demand for electric storage systems compared
to 2020, and Ariston Group improved its competitive position.
Gas solutions
In 2021, the main European markets where the Group operates saw steady growth in instant gas solutions, and in this
context Ariston Group’s overall volumes are estimated to have grown more than the market. Trends in North America
are also very positive, even if the Group did not perform as well as in Europe, on account of a product range that will be
significantly reviewed and improved in 2022.
As for gas storage solutions, the Group’s main markets are in North America (US and Mexico). In both geographies, mar-
kets are estimated to have significantly grown in 2021, and the Group’s market share performance was very solid.
Heating solutions and services
Renewable solutions
In 2021, renewable technologies (hydronic heat pumps) saw extremely strong growth in all European markets. Renewable
heating technologies have been supported by government interventions in the form of fiscal stimulus (e.g., in Italy,
France, Germany and, lately, in the UK, aimed at supporting in particular the replacement of the existing installed base
of conventional boilers) as well as building codes (primarily focused on heating regulations for new buildings).
Gas solutions
All across Europe, demand for gas systems was also quite strong compared to 2020, with double-digit growth in many
markets. Market demand in Italy saw record volumes thanks to the Ecobonus incentives, which give users access to very
attractive tax deductions for the replacement of old boilers. In this context, the Ariston Group’s market share trended
upwards, with a particularly positive performance in Italy.
North America saw a similarly positive trend for the market and Ariston Group. In Russia, instead, the market showed a
positive but more stable trend, and Ariston Group maintained its competitive position.
In China, the overall market for boilers shrank as the government discontinued “coal-to-gas” incentives; nevertheless,
the mix is moving towards more environmentally-friendly products, with the market for condensing gas boilers growing
faster than that for non-condensing boilers.
Burners
The European burner market was generally positive, with significant growth in Germany, Italy, France, UK, and Spain.
High-power gas burners continued growing. The trend was generally positive even in other non-European markets, led
by Russia, Turkey, and Malaysia – while the Chinese market was influenced by the government’s “Zero Covid-19” strategy
and stronger local competition, which combined with dealers’ high stocks from 2020.
Components

14
In 2021, demand for electric heaters and thermostats for water heaters grew double digit, especially in the Middle East,
Russia, and the main European countries. In this context, the Components division registered a positive trend, especially
in the Middle East.
Demand for electric heaters for professional and industrial applications also registered strong growth, mainly driven by
the catering sector, which returned to pre-Covid-19 levels, the industrial sector (in particular railway and manufacturing),
and the comfort and medical sector. In this context, the Components division outperformed 2019 sales and increased its
market share in the industrial sector.
Finally, demand for heaters for domestic appliances was relatively stable.
4.5 New Products, Services, Research and Development
Hot Water Technologies
Renewable Products
In 2021 the Ariston Group launched the new evolution of the NUOS PLUS range, a monoblock floor-standing heat pump
water heater, available in a capacity of 200 L and 250 L with single or double coil. The new range boasts a superior energy
efficiency and the fastest heating time in the market. This product is a first step towards a more connected range, allowing
for much more versatile control with easy access via the Aqua Ariston Net App. New features enrich the product, such as
the photovoltaic function, I-memory, time scheduling and the new Bridge Net® BUS protocol that allows the product to
be integrated with other solar or boiler heat generators and control the entire system through a single Sensys interface.
The product is ready for use with R513A refrigerant, moving towards a more sustainable future through the use of envi-
ronmentally friendly refrigerants.
In the third quarter of 2021, with the aim of taking advantage of the growth of the heat pump market in the Netherlands,
Ariston Group launched the ATAG-branded versions of the Lydos Hybrid and NUOS PLUS products.
In the solar thermal business, in November 2021, Ariston Group launched the new direct solar water heater ECO2 Series.
This range (available in 7 different configurations, with a capacity of 115 L to 300 L) was specifically developed for the
Vietnamese market, where renewable water heating solutions are quickly growing, especially in the South.
Starting from September 2021, the new THERMO HF-2 indirect solar water heater was launched in the European and
MEA markets. This new product features a more efficient indirect solar tank, plus a renewed horizontal solar collector,
benefits of the highest levels of performance according to the Solar Keymark certificate and is available in 4 different
versions (150-1, 200-1, 200-2, 300-2), all suitable both for pitched and flat roof installations.
In addition, last May Elco Italy launched the new range of solar ETC (vacuum tube collectors) WEISER POWER 2000 and
its specific installation accessories.
These new collectors, highly efficient thanks to specific technical features (rotatable tubes for the best tilt, large surface
absorber) and very easy to install, are Solar Keymark certified and represent a green solution to produce domestic hot
water or to integrate the heating system.
Moving to cylinders, during the third quarter 2021, Ariston Thermo US launched the new SSC-TC indirect water heater,
in order to consolidate its leading position in the US cylinders market.
This product, HTP-branded and available in 4 different versions (from 20 to 50 gallons), has been developed to provide a
turnkey water heating solution in combination with new residential gas wall-hung condensing boilers.
In addition, in the first half of 2021, the renewed BC cylinders were launched in the European markets, with the aim of
increasing the competitiveness of the Company in a highly price-sensitive segment. These products, available in 6 differ-
ent configurations (with a capacity from 200 L to 450 L), can be combined with gas boilers and solar thermal systems to
produce and store domestic hot water.
Electric Products
With regard to the electric storage product category, Ariston launched Andris2 in Russia, amplifying and evolving the
current offer of small water heaters in the country. With a modern and refreshing aesthetic, thanks to its small capacity,
Andris2 brings comfort to the user in the shortest amount of time.
Also in Russia, Ariston introduced the newest generation of the iconic Velis product, “the game changer electric water
heater”, with a brand new design and enhanced hot water and safety capabilities. With the new Velis 3, Ariston aims to
15
consolidate the Company's leadership in the premium segment where is already established as the reference brand
across major geographies.
In Vietnam, Ariston completed the offer with a new “Vitaly Prisma” model, aimed at expanding its presence in rural
areas, to bring comfort, high efficiency and high quality products everywhere.
In Indonesia, Ariston confirmed its leadership with the launch of a new model with the lowest power consumption in the
market. The new “Andris2 R low power” has been developed to give people, living in areas with a low level of electricity,
the chance to install an electric water heater for the first time and to take advantage of comfortable hot water usage.
In the United States, Ariston expanded its offer with new three capacity models (6, 12 and 20 gallons) supporting the
strategy to increase its presence in the second bigger electric storage water heater market in the world.
Finally, in line with the mission of increasing the energy efficiency of its products, Ariston refreshed its base line in Italy,
introducing a new innovative model, the “PRO1 ER”, powered by a full electronic control and falling in the highest
energy class. The heart of the product lies in the innovative thermostat which, in addition of improving the efficiency of
the electric water heater, maximizes performance and safety.
In the third quarter of 2021, Ariston Group launched the Aures Slim and Aures Multi electric instant water heaters in
Romania, enlarging and completing the offer of electric water heaters in this important market.
The Aures Multi models have been renewed in the course of 2021: the new range features updated aesthetics and er-
gonomics, it is easier to install thanks to the double entry power cable and new pipes layout, and is easier to maintain
thanks to the updated inner re-layout.
In the third quarter of 2021, Ariston Group also launched a number of models to expand its electric instant water heater
offer in the ASEAN markets: the new Aures EASY GR 4.5 kW, featuring a unique grey color, has been developed for the
Philippine market, while the new EASY 45E, with its efficient stepless power control, has been designed specifically for
the Vietnamese market.
Gas Products
In the gas instantaneous water heaters product category, in India, Racold completed the launch of the new Eco range
including new value propositions (in terms of usability and safety) and enhanced aesthetics for a more modern look. In
Russia, Ariston further expanded the FAST range, including the addition of a display version.
Heating Service and Solutions
Heat Pumps Systems and Solutions for the Residential Segment
Energy efficiency requires that all components of the heating installation work together as an optimized system. Systems
may vary significantly from country to country, depending on factors such as building regulations, type of buildings, cus-
tomer habits and combination with renewable energy.
To serve this diversity of systems, in 2021 Ariston inaugurated a new laboratory dedicated to systems, located in Osimo
(Italy), to reinforce its ability to respond to the market needs. This laboratory and the one already active in Hechingen
(Germany) allow the Company to test and validate different system solutions.
The first deliverable of the development process is the new Sensys HD modulating chronotermostat, which in its net-
work connected version can make a +4% contribution to space heating efficiency compared to a standard one. Profes-
sionals can easily set it up thanks to the availability of quick wizards. The new chronothermostat enhances the user ex-
perience: with a new design, made in Italy and a full-color display, it allows users to be in full control of their comfort and
of their energy consumption thanks to detailed reports.
Ariston Group relaunched the AEROTOP SG heat pump, the Elco Premium line of electric outdoor heat pumps in Swit-
zerland. Compared to the previous generation, the new AEROTOP SG heat pumps delivers improved performance in
terms of heat efficiency and noise. Impressive results have been achieved in terms of the increased nominal heating
capacity and the reduction in the maximum noise level. Moreover, Elco products are true “design icons”.
Ariston further extended its portfolio of system solutions in hybrid systems: a heat pump combined with a wall-hung
boiler, combinations of heat generators with solar thermal or Nuos heat pump water heaters.
AEROTOP M and L will boost Elco's presence in HHP arena, contributing to making the brand even more visible and
recognizable, as a leader of heating solutions and renewable energies.
High-Efficiency Boilers for the Residential Segment

16
Already in 2020, Ariston Group innovated and presented an Atag wall-hung boiler certified to work with up to 20% hy-
drogen. In 2021, with the One+ range, the Group launched additional products certified for hydrogen blends. As hy-
drogen is one of the solutions on the road to decarbonization, the Group will continue its investments in this field in the
next few years. The updated One+ range is adding new innovative features to the previous range. For example, the boiler
informs the consumer when the heating system needs to be refilled. A real benefit for the customers, powered by con-
nectivity and Artificial Intelligence.
Ariston also launched a new range of Entry Condensing boilers in Europe and further markets for both the Ariston and
Chaffoteaux brands. The most significant development is the new stainless steel heat exchanger, which makes this prod-
uct the essential condensing boiler: EASY to INSTALL, EASY to USE and EASY to MAINTAIN.
Solutions for the Commercial Segment
In 2021, the launch of the new high efficiency commercial gas condensing product range has been rolled out across all
the main markets, with the few remaining ones to be completed by early 2022. Feedback is quite positive and the Com-
pany's products have been welcomed by both internal and external stakeholders.
For commercial Heat Pumps, a new product launch has been accomplished for Germany, UK, Poland, Denmark and
France. A number of additional countries will be ready to launch in early 2022.
Services and Parts
Direct and Indirect Services
In Switzerland, Ariston launched a new full service contract for heat pumps and started to provide remote assistance to
its customers, using its proprietary connectivity platform. Additionally, as part of our digitalization journey, we rolled out
our Elco Service Solutions (our standard Service IT platform) in Belgium.
Parts
In 2021, the Group launched its first spare parts e-commerce solution in Germany, which is now ready to be rolled out in
other countries, allowing us to also provide a digital channel to our customer base.
Connected Services
Connected Home Services - HOMES GET SMARTER, LIFE GETS SIMPLER and the World Becomes Greener
Thanks to Data Science
Ariston Group continues to invest to enhance the level of innovative digital services offered to its customer base, both
consumers and professionals. Data science leverages on the large amount of data generated by Ariston Group's con-
nected products to enrich the three streams of connected services offered by the Company and to further increase their
intrinsic capability of reducing CO2 emissions:
Ariston Net – A consumer app that makes it possible to remotely control space and water heating solutions in
a simplified manner, reducing energy consumption, encouraging sustainable behaviour and continuously moni-
toring the operation of the system.
Ariston Net PRO – A remote web support platform for professionals, which helps boost operational efficiency
and customer loyalty while reducing the need for physical interventions and consequently the service costs, as
well as the carbon footprint.
Ariston Net OPEN – Integration of the Ariston services connected into smart home ecosystems and multi-brand
facility or maintenance management software systems.
Home Energy Management and Demand Response
Over the past few years, Ariston Group has constantly increased its focus on Home Energy Management and Demand
Response (“DR”) services and solutions.
In 2021, the Group consolidated its partnership with ThermoVault, an innovative Belgian start-up focused on turning
electric storage water heaters into energy-efficient storage devices that can provide the power networks with much
needed flexibility and, consequently, a dedicated internal team was structured.
17
The Group also initiated the development of a smart product metering to meet the needs of flexible services in some key
European markets, with commercial partnerships with DSOs and Utilities in the launch-pad.
Components
The Components Division focused on the development of new products, to stay at the forefront of new market trends.
• Flow heaters for HHP: The Group developed a range of electric heaters for HHP, serving a “back-up” function in case
of very cold outdoor temperatures and serving a “booster” function in case of the need for maximum performance.
• Connectivity: The Group developed a smart thermostat range enhanced with a Wi-Fi module, allowing for the pos-
sibility to remotely control water heaters/cylinders through a smartphone app.
• Stem thermostats for small water heaters: The Group developed an extension of the current range of PLUS thermo-
stats to fit small and compact water heaters.
Burners
The new EKEVO L-EOT 870-1450 kW light oil low NOx class 3 burner was launched to replace the obsolete EK 4.5 L,
reaching a performance (in terms of NOx emission) suitable for Switzerland and the other European markets.
The new RPD 70-100 N is a duo-block burner from 20 up to 65 MW replacing and improving the RPD range for standard
gas application. The new range has been optimized in terms of performance, increasing the competitiveness and provid-
ing a higher flexibility for the possible configurations, positively impacting the production delivery time.
In both the Pirna and Resana laboratories, the new low NOx combustion technology below 50 mg/Nm3 has been devel-
oped, to be applied to the gas burners range starting from 3 MW.
In the residential segment the new bio-Diesel range has been defined, aimed at OEM's customers and distribution suita-
ble for the future eco fuels that are expected to replace fossil fuels in European countries.
4.6 Manufacturing & Supply Chain operations
Procurement
During the course of 2021, material availability and cost have been a major challenge for our supply chain. Despite this,
thanks to our already existing multi-source strategy and to strong relations with our strategic suppliers, we have been
able to ensure a record year in terms of units produced, while mitigating the raw material inflation with cost takeout
actions and hedging strategies.
The Group launched the first step of our Supply Chain Digitalization campaign, which is expected to improve the data
exchange with our Suppliers, thus bringing efficiency along the flow of materials to our plants.
Manufacturing
Due to the strong market demand experienced in 2021, our production sites have been put to test from several perspec-
tives: overall volumes produced, flexibility to rapidly follow specific customer demand and cost efficiency, while always
ensuring the highest safety and quality standards. Manufacturing has relentlessly worked to continue in the journey of
eliminating waste and improving performance, following a World Class Manufacturing approach which the Company has
closely embraced since 2011.
The Group manufacturing Master Plan was updated with an even stronger focus on industrial investments in state-of-art
manufacturing technologies across all our production sites, including the ones integrated from recent acquisitions.
Supply Chain and Logistics
Supply Chain and Logistics conditions essentially worsened all year, as interrupted supply chains sought to restart amid
the ever-shifting capacity bottlenecks and demand swings. The persisting Covid-19 pandemic emergency was a core
18
source of continued instability across the global economy, driving an unprecedented bullwhip effect that created relent-
less chaotic conditions in most markets.
To face this extra-ordinary effect, Ariston Group created a task force to determine priorities, optimize resource allocation,
increase forecast capability and extend the forecast horizon. We accelerated the development of the digitally-enabled
platform to build a control tower for an end-to-end monitoring of the supply chain.
The year has also been characterized by an unpredictable crisis in the sea transport sector. Freight shipping operated in
the midst of a unique and unusual predicament. An unforeseen cascade of events caused by the pandemic forced Ariston
Group to face a worldwide container shortage crisis, with a ripple effect down the entire supply chain. To mitigate this
risk, Ariston Group created a central Global Replenishment Team that has been continuously monitoring and scouting
new suppliers and managing daily negotiations. To partially recover the higher costs in transportation, caused by the
crisis, the Group also re-designed the usual flows, giving priority to direct deliveries.
The Group also made long-term investments, continuing to invest in our “World Class Logistics” continuous improvement
program and focusing in some important European warehouses, with the goal of increasing the efficiency and the quality
of operations.
Quality
A Quality, Parts and Service Organization was established under a single EVP leadership to enhance a customer-oriented
approach based on an end-to-end logic. A quality focus across the Company's key areas/business was reinforced, to help
sustain transformations and growth.
In the second part of the year, a new quality roadmap was developed and deployed with the involvement of the whole
organization, defining the Group's mid-term priorities. At year end, further investment were started on testing facilities
for heat pumps in Albacina, to increase capacity.
4.7 Human Resources
Workforce
As of December 31, 2021 the Group's workforce stood at 7,743 employees, a significant increase compared to both
December 2020 and December 2019 (7,415 and 7,519 respectively).
Growth compared to the previous year was mainly associated with the strengthening of operations in our Mexican and
Serbian facilities, as well as growth in critical central functions (e.g. R&D, ICT, Digital).
In 2022, our new colleagues from Chromagen (300+ individuals) will also join and further reinforce our global workforce.
Talent Acquisition and Employer Branding
It is a strategic challenge for Ariston Group to be an attractive employer worldwide. We aim to retain qualified employees
over the long term, ensure their professional and personal development, while at the same time ensuring a solid pipeline
of new talented professionals from the outside.
For this reason, we pursue the goal of strengthening Ariston Group's employer branding and continually improving the
Company's name recognition. In 2021, we introduced a global recruitment platform to enhance our employer branding
through the whole candidate journey, while also strengthening our recruiting capabilities worldwide.
During the pandemic, Ariston Group continued to maintain the Company's visibility by holding digital career events in
cooperation with prestigious Universities. As we take responsibility for the growth of our next generation of talent, in
2021 Ariston Group launched two Career Programs – one in the Digital and one in the HR area – offering on-the-job-
experience and structured training in a number of business-related topics and on soft skills to newly graduated profes-
sionals.
Our global recruiting strategy continues to focus on injecting new critical competencies, to support the Company's growth
in a more digitalized environment and with the need to continuously innovate its range of products and solutions offered.

19
This is precisely why digital competencies, technical and engineering capabilities and project management skills rank at
the very top in terms of requirements. In 2021, 179 new employees and managers were hired as part of this effort.
Organizational Project
Back in 2020, notwithstanding the ongoing Covid-19 pandemic, the Group launched an important organizational project
(called the “One Team Program”). The program represented a critical milestone after a period of strong inorganic growth
coupled with significant internal initiatives such as product business units set up, development of the chief marketing
officer and chief digital officer functions. The project focused on the areas where the local, regional and global interfaces
were still for the most part closely tied with the ultimate goal to clarify accountabilities, roles and decision making, stream-
lining processes and reviewing local/global structures, alongside changing the organizational mind-set to evolve towards
a more cross-functional approach.
In 2021, we made further progress in this direction by aligning the Product Development and Marketing processes and
organization, deploying the new way of working worldwide through dedicated training initiatives and creating strong
functional communities, involving 500+ managers internationally to develop a “one team” approach in addressing main
decisions and in our core processes.
As part of this effort, the ICT organization was also reviewed to enhance its capability to match the ongoing digital chal-
lenges and to support an increasingly demanding internal customer need.
The “One Team” program will continue to move forward in 2022, involving HR, Finance and Supply Chain and Logistics,
to further evolve these areas into effective internal business partners.
Global Leadership Program (GLP)
The Global Leadership Program is a learning initiative aimed at activating, supporting and strengthening practices associ-
ated with the competences of the Corporate Leadership Model: LEAD CHANGE, LEAD BUSINESS and, most importantly,
LEAD PEOPLE. The feedback culture and the positioning of the Leader's role as a Coach are the threads that run across
the 5 different journeys customized by type of population – Executive, Senior Managers, Managers, Individual contribu-
tors and Blue Collars – from 25 countries.
Launched in 2021, this first fully digital edition of the program will last two years and is being deployed through virtual
classes and individual coaching sessions. Participants are provided with online content on the Ariston Group Learning
platform as part of a two-way process that includes their feedback on the effectiveness of the initiative. In addition, an
extensive communication campaign supports GLP to engage all employees and share, at all levels, the core concepts of
Leading Change, Leading Business and Leading People to support the Company's ability to face changes in an active and
effective manner.
20
4.8 Regulation
The Energy Transition conversation takes centre stage at global level
2021 has been a year of acceleration on energy- and climate-related legislation and regulation at both European and
international level.
With regards to the European Union, 2021 saw the adoption of the first-ever European Climate Law, which enshrined
the objective to reach carbon-neutrality by 2050 and negative emissions thereafter in the EU legislation. Furthermore,
the law also introduced an intermediate target of a reduction in greenhouse gas emissions of at least 55% compared to
1990 levels by 2030 (often referred to as “fit-for-55”). In order to achieve such an ambitious intermediate target, between
July and December the European Commission published a set of sweeping reforms on all major pieces of legislation across
energy efficiency, the energy performance of buildings, renewable energies, and carbon markets, to name but a few of
the legal texts that have an impact on the thermal comfort sector. This legal framework will enter into force once agreed
by the EU co-legislators, the European Parliament and the Council of the European Union. Meanwhile, the European
Commission continued its preparatory work ahead of the release of the new regulations for the eco-design and labelling
of space and water heaters, expected in late 2023. The latter type of regulations – the so-called standards for energy-
related products (ErP) – have also been in discussion in countries across the world, namely India, Mexico, Vietnam, Sin-
gapore, and Saudi Arabia.
The year culminated in the adoption of several ground-breaking initiatives at the United Nations’ Conference of Parties
26, held in Glasgow, UK, from 31 October through 12 November – known collectively as the Glasgow Climate Pact. In
particular, the Pact completed the Paris Agreement’s rulebook by:
1) securing net-zero pledges from 153 countries in the world, equal to 80% of global greenhouse gas emissions and
nearly 90% of world GDP;
2) introducing, for the first time-ever, the concept of phasing down coal power generation;
3) tackling methane emissions;
4) introducing standards for international carbon markets;
5) halting and reversing deforestation;
6) mobilising funds from developed nations and channelling them towards developing countries for mitigation and ad-
aptation measures.
Moreover, several countries in which Ariston Group operates have continued focusing on energy efficiency programmes,
including both incentives for the substitution of old and inefficient space and water heaters and building codes. By using
the funds stemming from the EU Resilience and Recovery Facility, the Italian government renewed a broad set of support
mechanisms to incentivise energy efficiency measures in buildings, at both a residential and public sector level. Another
noteworthy example is the United Kingdom, where the government unveiled the Heat and Buildings Strategy, a com-
prehensive set of proposals for the decarbonisation of homes as well as commercial, industrial, and public sector buildings
by 2050.
Finally, it must be noted that in 2021 several countries either started or carried on working on initiatives related to the
circular economy and the sustainability of products, with the aim of promoting the durability, reparability, reusability,
upgradability, and recyclability of products.

21
4.9 Group Financial Review 4.9.1 Net Revenue Performance
Overall performance
2021 2020
Thermal Comfort 1,807.0 90.9% 1,511.4 90.8%
Components 85.8 4.3% 68.7 4.1%
Burners 94.6 4.8% 83.9 5.0%
Total Net Revenue 1,987.3 100.0% 1,664.0 100.0%
Revenue by business line
Thermal Comfort. Serves both the Group's two main business categories, Hot Water and Heating, and represents the
Group's largest division, recording revenue of € 1,807 million, or 90.9% of total revenue, in 2021 compared to € 1,511
million, or 90.8%, in 2020, up € 296 million or 19.6%. The Thermal Comfort division stood out for the steady growth of its
European markets and all the key markets of the other geographical areas.
Components. Recorded net revenue of € 86 million for 2021, or 4.3% of total net revenue, compared to € 69 million, or
4.1%, in 2020. The increase in revenue by € 17.0 million or 24.9% was driven by the post-Covid-19 recovery of business
in 2020 as well as the positive trend in the water heating industry.
Burners. Recorded net revenue of € 95 million for 2021, or 4.8% of total net revenue, compared to € 84 million, or 5.0%
of total revenue, for 2020, up € 11 million or 12.7%. The increase was primarily related to the growth in some key markets
such as France, emerging markets (Malaysia, India), and OEM sales.
Net revenue by geographic area
Europe. Represents the Group's largest market, recording net revenue of € 1,323 million for 2021, or 66.5% of total
revenue, compared to € 1,120 million, or 67.3%, in 2020, up € 203 million or 18.1%. The increase was mainly driven by
the strong recovery from the Covid-19 pandemic’s impact on the first part of 2020 (spread among the Group's key Euro-
pean markets except for Switzerland and Germany, where Covid-19’s impact in 2020 was negligible), and the growth in
renewable products (particularly remarkable in heating).
Asia, Pacific & MEA. Represents the second largest market for the Group, recording net revenue of € 385 million for
2021, or 19.4% of total revenue, compared to € 320 million, or 19.3%, in 2020, up € 65 million or 20.3%. The increase
was mainly driven by the strong recovery from the Covid-19 pandemic’s impact on the first part of 2020, mainly in Africa,
India, and China.
Americas. Represents the Group's third largest market and reported the fastest year-on-year growth, recording revenue
of € 280 million for 2021, or 14.1% of total net revenue, compared to € 224 million, or 13.4%, in 2020, up € 56 million, or
24.9%. The increase was mainly due to the relevant growth in the water heaters business, mainly in the US and Mexico.
Perimeter variation
There is no perimeter variation in 2021, as compared with revenue in 2020.
Exchange rate effect

22
The exchange rate effect in December 2021 was negative at -0.4%, due to the weakness of some currencies that are
significant to the Group such as the US dollar, Russian Rouble, and Swiss Franc against the Euro in the first half of the
year. The exchange rate effect includes the impact of applying the IFRS guidance on managing hyperinflation in Argentina
to the conversion of all the profit or loss items expressed in Argentine Pesos into Euro at the spot exchange rate at the
end of the period.
The table below shows the average exchange rates for 2021 and the spot rates at 31 December 2021 for the Group’s
most important currencies, together with the percentage change against the Euro as compared with the same period in
2020 and at 31 December 2020.
Average Exchange Rates Spot Exchange Rates
Dec. YTD
2021 Dec. YTD
2020
appreciation/ (devaluation)
vs 2020
at
31/12/2021 at
31/12/2020
appreciation/ (devaluation)
vs 2020
Swiss Franc 1.081 1.070 -1.0% 1.033 1.080 4.4%
Chinese Yuan Renminbi 7.634 7.871 3.0% 7.195 8.023 10.3%
GB Pound 0.860 0.889 3.3% 0.840 0.899 6.5%
Hungarian Forint 358.464 351.204 -2.1% 369.190 363.890 -1.5%
Indonesian Rupiah 16,928.508 16,619.777 -1.9% 16,100.420 17,240.760 6.6%
Indian Rupiah 87.486 84.580 -3.4% 84.229 89.661 6.1%
Polish Zloty 4.564 4.443 -2.7% 4.597 4.560 -0.8%
US dollar 1.184 1.141 -3.7% 1.133 1.227 7.7%
New Romanian leu 4.921 4.838 -1.7% 4.949 4.868 -1.7%
Russian Rouble 87.232 82.645 -5.5% 85.300 91.467 6.7%
Vietnamese Dong 27,150.001 26,515.302 -2.4% 25,819.000 28,331.000 8.9%
South African Rand 17.479 18.768 6.9% 18.063 18.022 -0.2%
Canadian dollar 1.483 1.529 3.0% 1.439 1.563 7.9%
Mexican Pesos 23.990 24.512 2.1% 23.144 24.416 5.2%

23
4.9.2 Reclassified income statement The table below shows the income statement (1) for 2021, with a comparison to the previous year, and a breakdown of
the total change by organic growth, perimeter and exchange rate effects.
(€ million) 2021 2020 total change
% of which organic
%
of which perimeter
%
of which due to exchange rates and hyperinfla-
tion
%
NET REVENUE 1,987.3 100.0% 1,664.0 100.0% 323.4 19.4% 330.1 19.8% 0 0% -6.7 -0.4%
Other revenue and income
34.1 1.7% 27.9 1.7% 6.3 22.5%
Revenue and Income 2,021.5 101.7% 1,691.8 101.7% 329.6 19.5%
Operating income (expense)
-1,850.3 93.1% -1,542.8 92.7% -307.6 19.9%
OPERATING PROFIT (EBIT)
171.2 8.6% 149.1 9.0% 22.1 14.8% 27.7 18.6% 0 0% -5.7 -3.8%
Adjustment on operating income (expense)
32.3 1.6% 14.7 0.9% 17.6 119.2%
OPERATING PROFIT ADJUSTED (EBIT ADJUSTED)
203.4 10.2% 163.8 9.8% 39.6 24.2%
Financial Income and Expense
-3.9 -0.2% -15.8 -1.0% 12.0 -75.6%
Profit (loss) on investments
-1.9 -0.1% -1.3 -0.1% -0.6 43.8%
PROFIT BEFORE TAX 165.4 8.3% 131.9 7.9% 33.5 25.4%
TAXES -29.1 -1.5% -35.2 -2.1% 6.2 -17.5%
NET PROFIT 136.3 6.9% 96.7 5.8% 39.6 41.0%
Net profit attributable to non-controlling Interests
-0.2 0.0% 0.0% -0.2
Group Net profit 136.5 6.9% 96.7 5.8% 39.8 41.2%
Tax effect of Adjust-ment on operating income (expense)
-7.8 -0.4% -3.9 -0.2% -3.9 99.0%
Reversal of non-recurring taxation effect
-9.0 -0.5% 0.0 0.0% -9.0 100.0%
Tax adjustments -16.8 -0.8% -3.9 -0.2% -12.8 327.4%
NET PROFIT ADJUSTED
151.8 7.6% 107.5 6.5% 44.3 41.2%
Net profit attributable to non-controlling Interests
-0.2 0.0% 0.0% -0.2
Group Net profit adjusted
152.1 7.7% 107.5 6.5% 44.6 41.5%
Total depreciation and amortisation
75.8 3.8% 77.7 4.7% -1.9 -2.4%
EBITDA 246.9 12.4% 226.8 13.6% 20.2 8.9% 25.9 11.4% 0 0% -5.7 -2.5%
EBITDA ADJUSTED 276.8 13.9% 239.1 14.4% 37.7 15.8%
Ariston Group ended 2021 with € 1,987.3 million in consolidated Net revenue, up € 323.4 million and +19.4% from €
1,664.0 million in 2020. The increase is fully organic and negatively affected by exchange rates and hyperinflation, which
amounted to a negative € 6.7 million (-0.4%) compared to the previous year. Despite the Covid-19 pandemic’s global
negative impact, the Thermal Comfort division stood out for the strong growth spread among its European markets and
all the key markets of the other geographical areas, as well as in all business segments. It is worth noting the solid growth
in renewable energy heat pump solutions.
The Burners division also recovered from the decline in 2020 with double-digit growth, whilst the Components division,
which previously reported mixed performance across its different segments, decisively recovered with overall double-
digit growth.
24
Operating profit, or EBIT, rose steadily in all clusters driven by volumes, mix, and price. However, the latter just partially
offset the headwind from inflationary trends in the cost of raw materials. Fixed costs increased, affected by the growth
of business in absolute terms and the abnormal low levels attributable to Covid-19 in 2020 in percentage terms.
EBITDA amounted to € 246.9 million, 12.4% as a percentage of net revenue, compared to € 226.8 million and 13.6% in
2020.
EBITDA adjusted totalled € 276.8 million, 13.9% as a percentage of net revenue, compared to € 239.1 million and 14.4%
in 2020. The adjusted component amounted to € 29.9 million, compared to € 12.3 million in 2020.
Adjustment on operating expenses related to EBITDA for the period amounted to € 29.9 million, compared to € 12.3
million in the prior-year period. These expenses comprise primarily the costs incurred and posted as operating expenses
for the IPO process as well as the multi-year and strategic restructuring programs accounted for in the current year.
EBIT adjusted was up in both absolute terms as well as a percentage of net revenue, amounting to € 203.4 million and
10.2%, respectively, compared to € 163.8 million and 9.8% in 2020.
EBIT for the period amounted to € 171.2 million, 8.6% as a percentage of net revenue, compared to € 149.1 million (9.0%
of net revenue) in 2020.
The adjusted components, relevant to EBIT only, amounted to € 32.3 million (€ 14.7 million in 2020) and included the
amortization of intangibles arising from the 2019 acquisition of the Mexican Calorex Group, totalling € 2.4 million in both
2021 and 2020.
Overall, the Group reported € 3.9 million in financial income and expenses, with a € 12.0 million improvement compared
to the same period of the prior year. This was driven largely by lower financial expenses, lower utilisation of available
bank loans, and the positive effect of exchange rates totalling € 7.6 million.
Therefore, the operations generated € 165.4 million in Profit Before Tax, 8.3% as a percentage of net revenue, compared
to € 131.9 million and 7.9% in 2020.
Net profit reached € 136.3 million compared to € 96.7 million in 2020.
Group Net profit reached € 136.5 million, compared to € 96.7 million in 2020. It benefited from a positive contribution
from deferred taxation, mainly driven by the impact of Italian Law 104/2020, which resulted in a positive change in the
tax rate.
The Group Net profit adjusted for the period amounted to € 152.1 million, 7.7% as a percentage of net revenue, com-
pared to € 107.5 million, 6.5% of net revenue, in 2020.

25
4.9.3 Reclassified statement of financial position
The table below shows the financial position in a condensed and reclassified format, highlighting the structure of net
capital employed and financing sources.
Financial position (€ million)
2021
2020
total
change % of
which organic
% of which perimeter
% of which due to exchange rates and hyperinfla-
tion
%
Trade receivables 248.3 35.8%
235.8 40.0% 12.5 5.3% 8.4 3.6% 0.0 0.0% 4.1 32.7%
Inventories 382.0 55.1%
265.5 45.0%
116.5 43.9% 107.9 40.7% 0.0 0.0% 8.6 7.4%
Trade payables -486.2 -70.1%
-373.3 -63.3%
-112.8 30.2% -101.8 27.3% 0.0 0.0% -11.1 9.8%
Net operating working capital
144.1 20.8%
128.0 21.7%
16.2 12.6% 14.6 11.4% 0.0 0.0% 1.6 9.7%
% of Net revenue 7.3%
7.7%
Net fixed assets 780.2 112.5%
732.8 124.2%
47.4 6.5% 26.4 3.6% 0.0 0.0% 21.1 44.4%
Other non-current assets and liabilities
-54.5 -7.9%
-111.0 -18.8%
56.5 -50.9% 59.4 -53.6% 0.0 0.0% -2.9 -5.2%
Other current assets and li-abilities
-176.5 -25.5%
-159.6 -27.0%
-16.9 10.6% -3.0 1.9% 0.0 0.0% -13.9 82.3%
Net capital employed 693.3 100.0%
590.2 100.0%
103.1 17.5% 97.4 16.5% 0.0 0.0% 5.8 5.6%
Net financial indebtedness adjusted
-184.8 -26.7%
143.6 24.3%
-328.5 -228.7% -312.9 -217.9% 0.0 0.0% -15.6 4.7%
Net equity 878.1 126.7%
446.5 75.7%
431.6 96.7% 410.3 91.9% 0.0 0.0% 21.3 4.9%
Total financing sources 693.3 100.0%
590.2 100.0%
103.1 17.5% 97.4 16.5% 0.0 0.0% 5.8 5.6%
Financial position ratios 2021 2020
Gearing (Net equity / Net capital employed)
1.27 0.76
DSO (Days Sales Outstanding – going back)
41.3 43.0
DPO (Days Payable Outstanding – going back)
96.7 97.6
In 2021, Ariston Group reported € 693.3 million in Net capital employed, up from € 590.2 million in December 2020.
Net operating working capital increased in absolute value compared to December 2020 even though it decreased in
percentage terms, due to the very solid growth of business, and continues to be rigorously managed.
Net financial indebtedness adjusted improved by € 328.5 million compared to the previous year, as it was positively
impacted by the IPO process and organic cash generation.
The gearing ratio rose steadily to 1.27 from 0.76 in 2020.
Net fixed assets amounted to € 780.2 million, up from € 732.8 million in December 2020 mainly due to the upsurge in
investment plans after the slow-down in 2020. Meanwhile, the year-end exchange rate caused the value of Net Fixed
Assets to increase by € 21.1 million.
Other non-current assets and liabilities totalled € 54.5 million, versus € 111.0 million in December 2020, down € 56.5
million compared with the previous year. The change was mainly driven by deferred taxation, which reflected a € 44.1
million increase in assets due to Italian Law 104/2020. In 2020, the Put option balance related to the North American
subsidiary Ariston Thermo USA LLC (formerly HTP Comfort Solutions LLC) was classified under non-current liabilities,
whereas in 2021 it was reclassified to current liabilities; the amount involved was € 17.8 million. The other material
change is the reclassification of € 15.0 million related to the cash-based Long Term Incentive (LTI) plan balance as at
December 2020that was reclassified to equity according to IFRS 2, as the LTI shifted to a share-based plan.
Other current assets and liabilities totalled € 176.5 million, versus € 159.6 million in December 2020, up € 16.9 million
compared with the previous year. The change was mainly driven by the Put option related to the North American subsid-
iary Ariston Thermo USA LLC (formerly HTP Comfort Solutions LLC), which was classified under non-current liabilities in
2020, whereas in 2021 it was reclassified to current liabilities; the amount involved was € 17.8 million, which brings the
overall current Put liability up to € 24.5 million (for HTP Comfort Solutions LLC only). An additional material increase in
current assets was due to indirect taxes stemming from different subsidiaries, totalling € 16.0 million.
Net equity amounted to € 878.1 million, compared to € 446.5 million in the previous year.

26
The overall € 431.6 million increase was due to the € 300.0 million contribution from the IPO, the net profit for the period,
totalling € 136.3 million, less the € 48.3 million dividend pay-out, the € 21.3 million exchange rate effect for the translation
of equity within the scope of consolidation under IAS 21 – Effects of Changes in Foreign Exchange Rates, and the com-
bined effect of non-monetary reserves, totalling € 4.2 million.
4.9.4 Net Operating Working Capital
Net operating working capital (€ million)
2021
2020
total change of which organic
of which perimeter
of which due to exchange
rates and hyperinflation
Trade receivables 248.3 235.8 12.5 8.4 0.0 4.1
Inventories 382.0 265.5
116.5 107.9 0.0 8.6
Trade payables -486.2 -373.3
-112.8 -101.8 0.0 -11.1
Net operating working capital
144.1 128.0
16.2 14.6 0.0 1.6
% of Net revenue 7.3% 7.7%
Net operating working capital totalled € 144.1 million, 7.3% as a percentage of net revenue, compared to € 128.0 million
and 7.7% at the end of December 2020.
The management of working capital, even in a period that saw strong restocking—necessary to ensure the availability of
products amid challenging times, with high demand and constraints on the availability of raw materials—remained at the
lowest level ever in percentage terms as a result of the strong focus on both trade receivables and trade payables, and
also thanks to the positive trend in revenue.
Trade receivables totalled € 248.3 million and 12.5% as a percentage of net revenue, compared to € 235.8 million and
14.2% in December 2020, with Days Sales Outstanding at 41.3 and 43.0, respectively.
Inventories amounted to € 382.0 million and 19.2%, compared to 15.9% in December 2020.
Trade payables increased to € 486.2 million, 24.5% as a percentage of net revenue, compared to € 373.3 million and
22.4% in December 2020. Days Payable Outstanding were down to 96.7 from 97.6 in December 2020 as a result of the
careful management of procurement contracts and the relevant terms and conditions.
Organic change growth totalled € 14.6 million, while the exchange rate effect was a positive € 1.6 million.
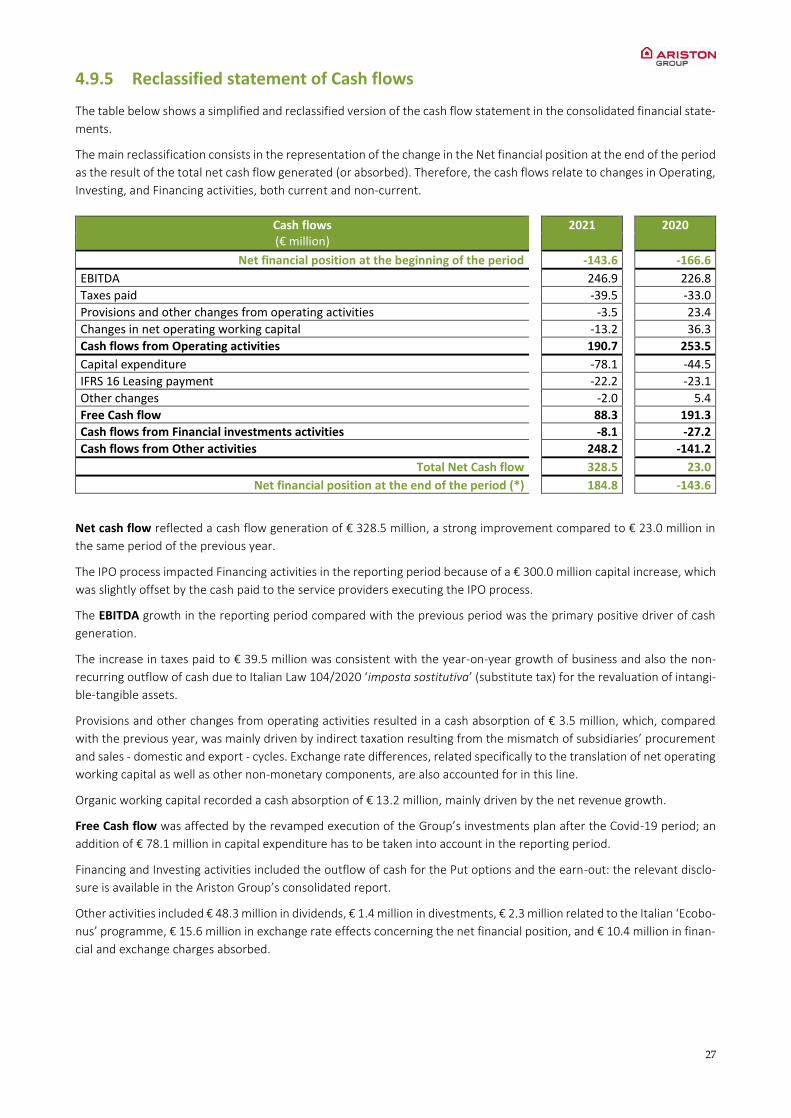
27
4.9.5 Reclassified statement of Cash flows
The table below shows a simplified and reclassified version of the cash flow statement in the consolidated financial state-
ments.
The main reclassification consists in the representation of the change in the Net financial position at the end of the period
as the result of the total net cash flow generated (or absorbed). Therefore, the cash flows relate to changes in Operating,
Investing, and Financing activities, both current and non-current.
Cash flows (€ million)
2021
2020
Net financial position at the beginning of the period -143.6 -166.6
EBITDA 246.9 226.8
Taxes paid -39.5 -33.0
Provisions and other changes from operating activities -3.5 23.4
Changes in net operating working capital -13.2 36.3
Cash flows from Operating activities 190.7 253.5
Capital expenditure -78.1 -44.5
IFRS 16 Leasing payment -22.2 -23.1
Other changes -2.0 5.4
Free Cash flow 88.3 191.3
Cash flows from Financial investments activities -8.1 -27.2
Cash flows from Other activities 248.2 -141.2
Total Net Cash flow 328.5 23.0
Net financial position at the end of the period (*) 184.8 -143.6
Net cash flow reflected a cash flow generation of € 328.5 million, a strong improvement compared to € 23.0 million in
the same period of the previous year.
The IPO process impacted Financing activities in the reporting period because of a € 300.0 million capital increase, which
was slightly offset by the cash paid to the service providers executing the IPO process.
The EBITDA growth in the reporting period compared with the previous period was the primary positive driver of cash
generation.
The increase in taxes paid to € 39.5 million was consistent with the year-on-year growth of business and also the non-
recurring outflow of cash due to Italian Law 104/2020 ‘imposta sostitutiva’ (substitute tax) for the revaluation of intangi-
ble-tangible assets.
Provisions and other changes from operating activities resulted in a cash absorption of € 3.5 million, which, compared
with the previous year, was mainly driven by indirect taxation resulting from the mismatch of subsidiaries’ procurement
and sales - domestic and export - cycles. Exchange rate differences, related specifically to the translation of net operating
working capital as well as other non-monetary components, are also accounted for in this line.
Organic working capital recorded a cash absorption of € 13.2 million, mainly driven by the net revenue growth.
Free Cash flow was affected by the revamped execution of the Group’s investments plan after the Covid-19 period; an
addition of € 78.1 million in capital expenditure has to be taken into account in the reporting period.
Financing and Investing activities included the outflow of cash for the Put options and the earn-out: the relevant disclo-
sure is available in the Ariston Group’s consolidated report.
Other activities included € 48.3 million in dividends, € 1.4 million in divestments, € 2.3 million related to the Italian ‘Ecobo-
nus’ programme, € 15.6 million in exchange rate effects concerning the net financial position, and € 10.4 million in finan-
cial and exchange charges absorbed.
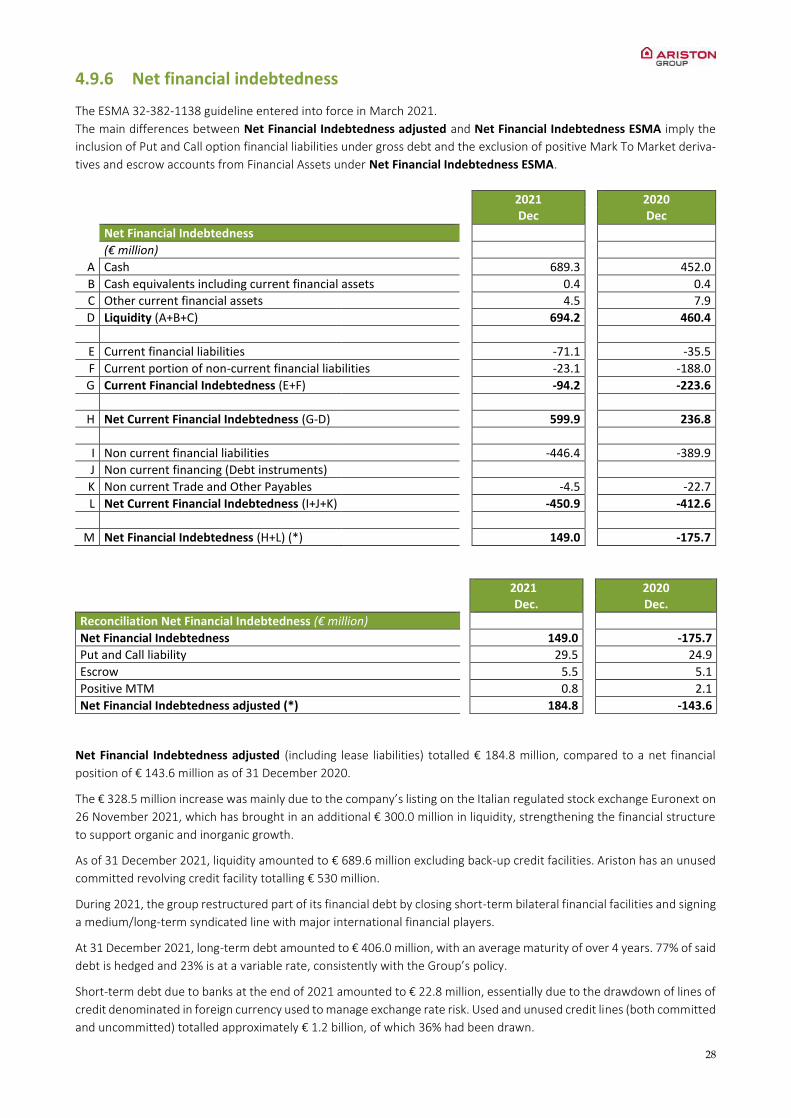
28
4.9.6 Net financial indebtedness
The ESMA 32-382-1138 guideline entered into force in March 2021.
The main differences between Net Financial Indebtedness adjusted and Net Financial Indebtedness ESMA imply the
inclusion of Put and Call option financial liabilities under gross debt and the exclusion of positive Mark To Market deriva-
tives and escrow accounts from Financial Assets under Net Financial Indebtedness ESMA.
2021 Dec
2020 Dec
Net Financial Indebtedness
(€ million)
A Cash 689.3 452.0
B Cash equivalents including current financial assets 0.4 0.4
C Other current financial assets 4.5 7.9
D Liquidity (A+B+C) 694.2 460.4
E Current financial liabilities -71.1 -35.5
F Current portion of non-current financial liabilities -23.1 -188.0
G Current Financial Indebtedness (E+F) -94.2 -223.6
H Net Current Financial Indebtedness (G-D) 599.9 236.8
I Non current financial liabilities -446.4 -389.9
J Non current financing (Debt instruments)
K Non current Trade and Other Payables -4.5 -22.7
L Net Current Financial Indebtedness (I+J+K) -450.9 -412.6
M Net Financial Indebtedness (H+L) (*) 149.0 -175.7
2021 Dec.
2020 Dec.
Reconciliation Net Financial Indebtedness (€ million)
Net Financial Indebtedness 149.0 -175.7
Put and Call liability 29.5 24.9
Escrow 5.5 5.1
Positive MTM 0.8 2.1
Net Financial Indebtedness adjusted (*) 184.8 -143.6
Net Financial Indebtedness adjusted (including lease liabilities) totalled € 184.8 million, compared to a net financial
position of € 143.6 million as of 31 December 2020.
The € 328.5 million increase was mainly due to the company’s listing on the Italian regulated stock exchange Euronext on
26 November 2021, which has brought in an additional € 300.0 million in liquidity, strengthening the financial structure
to support organic and inorganic growth.
As of 31 December 2021, liquidity amounted to € 689.6 million excluding back-up credit facilities. Ariston has an unused
committed revolving credit facility totalling € 530 million.
During 2021, the group restructured part of its financial debt by closing short-term bilateral financial facilities and signing
a medium/long-term syndicated line with major international financial players.
At 31 December 2021, long-term debt amounted to € 406.0 million, with an average maturity of over 4 years. 77% of said
debt is hedged and 23% is at a variable rate, consistently with the Group’s policy.
Short-term debt due to banks at the end of 2021 amounted to € 22.8 million, essentially due to the drawdown of lines of
credit denominated in foreign currency used to manage exchange rate risk. Used and unused credit lines (both committed
and uncommitted) totalled approximately € 1.2 billion, of which 36% had been drawn.
29
4.9.7 Capital Expenditures
In 2021, Ariston Group’s capital expenditure totalled € 78.1 million, 3.9% as a percentage of net revenue, compared with
€ 44.5 million in 2020, up 75.6% increase year-on-year.
It is worth observing that Ariston Group in 2020 slowed down some investment initiatives on account of the Covid-19
pandemic. These were then shifted to 2021, when the pace of investment was restored in order to ensure the continuity
of state-of-the-art technology for strategic products, such as renewables, production sites, infrastructures, and processes.
Investments include:
Investments in physical assets for a total of € 61.9 million.
The main projects during the year were related to the development of the Albacina site for the production of heat
pumps; the renovation and safety upgrades of plants at various sites in order to improve their efficiency (Osimo,
Genga, Cerreto, Arcevia, Resana, Chartres, Namur, Saltillo); the rationalization of the footprint (Hanoi, St. Peters-
burg, Lichtenvoorde, Svilajnac); the increase in production capacity to meet growing market demand (Albacina,
Wuxi, Saltillo); and the set-up and acquisition of new production and logistics sites (Follina, Borgo Tufico).
The Group made significant investments into new products. In the field of domestic water heating: Velis 3.0, water
pumps for the US market, new electrical and gas products for the US and Mexico. In space heating: new mainstream
HHP range and an innovative project focused on the heat pump with thermal drive (based on absorption technol-
ogy).
The Group also invested in various laboratories to equip them with state-of-the-art equipment for testing products
(Fabriano, Albacina, Osimo, Cambiago, Hanoi, Saltillo).
Finally, part of the spending was dedicated to commercial areas (training room, office renovation) and direct service
equipment.
R&D investments: € 3.6 million (in the intangible assets category – an additional € 3.5 million in progress did not
result in depreciation).
The Group capitalized water heating projects related to the development of new products: Velis 3.0, new domestic
water pump for the US, and the evolution of existing products. In environmental heating, the capitalized R&D costs
relate to both mainstream and high range HHP projects using the latest generation of refrigerant gas. In the Burners
Division, development concerns low environmental impact burners allowing to reduce C02 emissions.
ICT investments € 9.0 million.
During 2021, the Group continued implementing the ERP system in new areas: USA and Egypt. Work has also begun
on new evolved systems for Finance, product life cycle management, and digital management of the supply chain.
In the commercial area, the adoption of Group systems in the "customer relation" and installer management area
was extended to new countries. Finally, the Group developed websites in line with the most recent market expec-
tations for some of its brands (Elco and Thermowatt).
Lastly, investments for the right-of-use of third-party assets were related to tangible assets at 31 December 2021. The
yearly addition totalled € 26.1 million and was attributable to offices, buildings, plants and machinery, and vehicles, com-
pared to € 16.6 million in 2020.
4.9.8 Company and Group net profit and total equity
Regarding information on the Company Ariston Holding N.V.’s and the Group’s net profit and equity, prepared in accord-
ance with Part 9 of Book 2 of the Dutch Civil code and the International Financial Reporting Standards issued by the
30
International Accounting Standards Board (‘IASB’) and endorsed by the European Union (‘IFRS-EU’), please refer to the
paragraph ‘Shareholders’ equity’ in the company’s financial statements at 31 December 2021.
4.10 Full year 2021 conclusion and outlook
2021 was an extraordinary year due to a series of peculiar events. The COVID-19 pandemic, which started in early 2020,
continued to linger in all countries globally, producing a continuous array of lock-downs & limitations to social as well as
business life. However, the global effort towards vaccination helped spur an economic recovery in many markets, also
fuelled by significant fiscal stimulus schemes. As private and public spending increased substantially, global supply chains
and planning came under very severe stress, with huge consequences in terms of inflation and time-to-market. Finally,
and concerning more specifically our industry, public, political and regulatory attention (especially, once more, in Europe)
further increased.
For Ariston Group, 2021 was a landmark year for various reasons: the Group delivered outstanding results, fuelled by
extremely robust organic growth that delivered a record year of revenues (close to 2 billion euro) and profitability. In fall
2021, Ariston Group listed itself on Euronext Milan—the biggest IPO in Italy in almost 3 years.
The Group delivered a solid performance across all regions and business segments, and a special mention goes to our
growth in renewable heating solutions in Europe, our performance in hot water products in Europe and America, and the
very solid growth in both our Burners and Components divisions. Our supply chain, planning, and manufacturing base
delivered outstanding support to our performance, with a record year in terms of volumes despite the huge strains on
supply chains and raw material inflation globally.
At the M&A level, the Group acquired Chromagen in January 2022 – a milestone in our ambition in renewable hot water
and a solid move to extend our geographic reach to Israel and Australia, two extremely interesting markets. The strong
interest that the Ariston Group’s IPO attracted is a testimony to this performance.
Looking to 2022 and beyond, the Group remains confident about the long-term demand trends in our industry, fuelled
by the sustainability imperative, and by its key distinctive competitive features:
in Hot Water, our global leadership built on top of our legacy in electric storage and the category leadership journey
of the last few years. Also important is the pivotal role of innovation in renewables and high efficiency, and in making
the electric storage water heater potentially key to enabling the energy transition as part of demand response solu-
tions;
in Heating, our portfolio almost entirely made of renewable and high efficiency technologies, our investments in
innovation and capacity increase for heat pumps, as well as the recent pushes in the use of hydrogen. Also very im-
portant is the role that digital will play in terms of services, control of sophisticated heating systems, and the evolution
of the route-to-market;
in our industrial back-end, our international manufacturing footprint of 23 production sites and 25 centres of com-
petence for R&D and product development across the globe, ensuring supply chain flexibility, a competitive cost basis,
and customer proximity;
in our local go-to-market, with 43 markets where Ariston Group has direct commercial operations, with a sophisti-
cated push-pull approach on professional, retail, and online channels alike – which allows us to feel “at home around
the world”;
in our portfolio of premium and value-added brands, which remain resilient and very healthy with strong customer
pull.
4.11 Definition and reconciliation of the Alternative Performance Measures (APMs or non GAAP measures) to GAAP measures

31
In addition to the standard financial reporting formats and indicators required under IFRS, this document contains certain
financial performance measures that are not defined in IFRS standards (non-GAAP measures).
These measures, which are described below, are used to analyse the Group's business performance in the 'Key Highlights'
and ‘Report on operations’ sections and comply with the Guidelines on Alternative Performance Measures issued by the
European Securities and Markets Authority (‘ESMA’) in its communication ESMA/2015/1415.
The Alternative Performance Measures (APMs) listed below should be used to supplement the information required un-
der IFRS, helping readers of annual financial statements better understand the Group’s financial and economic perfor-
mance. They are applied to Group planning and reporting, and some are used for incentive purposes.
Financial measures used to measure Group operating performance
Organic change: calculated by excluding both the impact of currency movement against the euro (expressed at monthly
average exchange rates for the same period in the previous year) and the effects of business acquisitions and disposals.
In order to mitigate the effect of hyperinflationary economies, organic change for countries having to adopt the hyperin-
flationary methodology laid down in IFRS only includes the component attributable to volumes sold in relation to net
sales, while the effects associated with hyperinflation, including price index variation and price increases, are treated as
exchange rate effects.
Specifically:
the exchange rate effects are calculated by converting the figures for the current period at the monthly exchange
rates applicable in the comparative period of the previous year. The exchange rate includes the effects associated
with hyperinflationary economies;
the results attributable to businesses acquired during the current year are excluded from organic change for 12
months from the date on which the transaction is closed;
the results attributable to businesses acquired during the previous year are included in full in the figures for the pre-
vious year as from the closing date of the transaction, and are only included in the current period’s organic change
12 months after their conclusion;
the results from business disposals during the previous year are wholly excluded from the figures for that year and,
therefore, from organic change;
the results from business disposals during the current year are excluded from the figures for the previous year from
their corresponding date of disposal or termination.
The percentage organic change is the ratio of the absolute value of the organic change, calculated as described above, to
the absolute value of the measure in question for the previous period under comparison.
Adjustment on operating income (expense): relates to certain transactions or events identified by the Group as adjust-
ment components for the operating result, such as:
capital gains (losses) on the disposal of businesses/buildings;
impairment on tangible and intangible assets;
strategic multi-year restructuring and reorganization programme costs;
ancillary expenses associated with acquisitions/disposals of businesses/buildings or companies;
amortization of purchase price allocation from Merger & Acquisition activity.
These items are deducted from, or added to, the following measures: EBIT (Operating result), EBITDA, except the amor-
tization of purchase price allocation from Merger & Acquisition activity, profit before tax, and the Group’s net result for
the period.
In the financial year 2021, the Group considered the expenses related to the IPO process for the part posted in the Income
statement and the costs related to the application of Italian Law 104/2020 in adjusting operating income.
For a detailed reconciliation of the items that had an impact on the alternative performance measures referred to above
in the current and comparison years, see the appendix at the end of this section.
EBIT (Operating profit): calculated as the difference between net revenue and income and operating expenses.
EBIT (Operating profit) adjusted: the operating result for the period net of the adjustment on operating income (ex-
pense) mentioned above.
32
EBITDA: EBIT (operating profit) before depreciation and amortization of intangible and tangible fixed assets and
leased assets.
EBITDA adjusted: EBITDA as defined below, net of the adjustment on operating income (expense), less the amortization
of purchase price allocation from Merger & Acquisition activity.
Tax adjustments: include the tax effects of transactions or events identified by the Group as components adjusting
the taxation for the period related to events covering a single period or financial year, such as:
tax effects of Adjustment on operating income (expense)
positive/negative taxation effects associated with the adjustment on operating income (expense);
reversal of non-recurring taxation effect
non-recurring positive/(negative) taxation effects.
Group net profit adjusted: the result for the period attributable to the Group before adjustment on operating income
(expense), before the relevant taxation effect and before other positive/negative tax adjustments for the period.
Basic and diluted earnings per share (basic/diluted EPS): basic/diluted earnings per share (EPS).
ROE (return on equity): the ratio of the net result to equity at the end of the period.
ROI adjusted: the ratio of EBIT (operating profit) adjusted to net capital employed at the end of the period (see the
definition of net capital employed below).
ROI (return on investment): the ratio of EBIT (operating profit) for the period to net capital employed at the end of the
period (see the definition of net capital employed below).
ROS adjusted: the ratio of EBIT (operating profit) adjusted to net revenue and income for the period.
ROS (return on sales): the ratio of EBIT (operating profit) to net revenue and income for the period.
Reclassified statement of financial position
The items included in the statement of financial position are defined below as the algebraic sum of specific items con-
tained in the financial statements:
Net operating working capital, calculated as the algebraic sum of:
trade receivables;
inventories;
trade payables.
Net fixed assets, calculated as the algebraic sum of:
goodwill;
intangible assets with a finite life;
trademarks;
right-of-use assets;
property, plant and equipment.
Other non-current assets and liabilities, calculated as the algebraic sum of:
investments in associates and joint ventures;
deferred tax assets;
other non-current assets;
non-current tax receivables;
deferred tax liabilities;
non-current provisions for risks and charges;
net employee defined benefit liabilities;
other non-current liabilities;
non-current tax payables.
Other current assets and liabilities, calculated as the algebraic sum of:
33
other current assets;
current tax receivables;
assets held for sale;
current tax payable;
current provisions for risks and charges;
other current liabilities.
Net capital employed, calculated as the algebraic sum of the items listed above and in particular:
net operating working capital;
net fixed assets;
other non-current assets and liabilities;
other current assets and liabilities.
Net financial indebtedness adjusted
Net financial indebtedness is calculated as the algebraic sum of:
cash;
cash equivalents including current financial assets;
other current financial assets;
current financial liabilities;
current portion of non-current financial liabilities;
non-current financial liabilities;
non-current financing (debt instruments);
non- current trade and other payables.
It considers escrow, positive MTM, and put and call liabilities.
Gearing: the ratio of equity to net capital employed.
Days Sales Outstanding: Trade receivables net of advances going back to absorb gross revenue without VAT.
Days Payables Outstanding: Costs and capital expenditure (Capex) going back to cover accounts payable.
Capital expenditure (CapEx): this item includes cash flows from the purchase of intangible and tangible fixed assets.
Reclassified statement of cash flows: This item shows cash flow generation, excluding investments in marketable secu-
rities. The total cash flow generated (or used) in the period thus corresponds to the change in net financial indebtedness
adjusted.
Cash flows from Operating activities: It includes EBITDA, taxes paid, provisions, and other changes from operating activ-
ities and changes in net operating working capital.
Free cash flow: cash flow that measures the Group’s self-financing capacity on the basis of cash flows from Operating
activities, capital expenditure, IFRS16 lease payments, and other changes.
34
Appendix of Alternative Performance Measures
In 2021, EBITDA, the operating profit (EBIT), and Group Net profit were adjusted to take into account the items shown in
the table below.
2021 2020
Group Net profit 136.5 96.7
Adjustment on operating income (expense) -32.3 -14.7
Tax adjustments -16.8 -3.9
- Tax effect of Adjustment on operating income (expense) -7.8 -3.9
- Reversal of non-recurring taxation effect -9.0 0
Group Net profit adjusted 152.1 107.5
EBITDA 246.9 226.8
Adjustment on operating income (expense) on EBITDA -29.9 -12.3
EBITDA adjusted 276.8 239.1
EBIT 171.2 149.1
Adjustment on operating income (expense) on EBIT -32.3 -14.7
EBIT adjusted 203.4 163.8
4.12 Investor information
Ariston Group got listed on Euronext Milan, the Italian stock exchange, on 26 November 2021, with ticker symbol ARIS
and an offer price of € 10.25 per share.
The IPO was the biggest of the year in the Italian market; it was structured as a € 300 million capital increase coupled
with the net sale of 52,925,000 ordinary shares by the founding family after the end of the stabilization period, with a
partial exercise of the over-allotment option.
Pursuant to applicable EU regulations, the Group picked The Netherlands as its home member state.
Therefore, regulated information is stored using the “1info SDIR” repository (www.1info.it) authorized by Italy’s market
authority CONSOB, as well as filed with the AFM (Dutch Authority for the Financial Markets) through their “Loket” system.
In 2022, the Group plans to interact with the financial community through both one-to-one and group meetings with
investors and financial analysts, with the participation of the newly-established Investor Relations function - along with
members of top management on select occasions - on digital platforms and in person – as soon as it is safe to do so in
accordance with Covid-19 protocols.
Dividend
The Board of Directors voted to propose a dividend of € 0.140 per share to the Shareholders' Meeting for the year 2021,
gross of withholding taxes, representing a pay-out ratio equal to 33.82%.
The dividend will be paid on 25 May 2022 (with an ex-coupon date of 23 May 2022 in accordance with the Italian Stock
Exchange calendar, and a record date of 23 May 2022). The Board of Directors resolved to convene the Ordinary Share-
holders’ Meeting on 28 April 2022 to approve, inter alia, the financial statements for the year ended 31 December 2021.
35
5. Governance
Effective risk management, integrated into the governance system, is a key factor to protecting the Group’s value over
time. The Group’s Internal Control System has therefore been gradually developed, drawing inspiration from, among
other sources, the principles laid down in Article 6 of the Italian Corporate Governance Code for Listed Companies ap-
proved by the Corporate Governance Committee in January 2020, to the extent applicable.
Until the 1 June, effective date of the reverse merger by which Ariston Thermo Holding Spa merged into Ariston Thermo
International S.r.l., which simultaneously changed its name and corporate form into Aristo Thermo Holding S.p.A., as
described in the previous paragraph Main Atypical and/or Unusual Transactions, the corporate organization consisted of
management committees and/or internal committees within the Board of Directors of Ariston Thermo Holding S.p.A.,
organised as follows:
Board committees until 1 June 2021
The Strategic Committee, which supported the Board of Directors in setting guidelines concerning business strategies,
models and decisions regarding the Group’s footprint and industrial operations, marketing models, organizational
recommendations and operational criteria, as well as explore potential inorganic growth opportunities.
The Human Resources and Remuneration Committee, which supported the Board of Directors in assessing the ade-
quacy of the organization as well as management's growth plans, identifying and recommending potential organiza-
tional changes to make the organizational structure more efficient and effective; with respect to remuneration, this
committee submitted proposals to the Board on the remuneration policy for Directors and key management person-
nel and examined the proposals of the Executive Chairman and the Chief Executive Officer in this regard, made pro-
posals on the remuneration of the Executive Chairman and Chief Executive Officer as well as the performance targets
for variable pay, verified every year whether these were met; regularly assessed the overall adequacy and consistency,
as well as the actual implementation, of the remuneration policy.
Management committees until 1 June 2021
The Internal Audit Committee, which examined Internal Audit reports and the state of the art with respect to business
remediation plans on issues associated with the assessment and improvement of the internal control system.
This Committee also validated the annual audit plan—ensuring it was implemented—and was briefed on the annual audit
report, which the Chief Audit Executive presented at a meeting of the Board of Directors.
The Finance Committee, which analysed problems bearing on the Group’s finances and set the policies for managing the
related issues.
The Executive Chairman and/or CEO, in addition to other members of the Board of Directors of Ariston Thermo Holding
S.p.A. and/or the Group’s management, participated in each committee.
Business risks were monitored with at least monthly frequency through management meetings during which results,
opportunities and risks were analysed for all business segments and geographical areas in which the Group operates. The
measures deemed necessary to mitigate the risks identified were also determined in this venue.
The Internal Audit Function pursued, among others, the goal of assessing the adequacy of, and propose improvements
to, the control system by providing independent and objective assurance and risk assessments.
The annual audit plan and any mitigation plans issued in coordination with the head of business functions were the tools
through which the Internal Audit function operated. The function interacted with the Board of Directors, the Internal
Audit Committee, the Board of Statutory Auditors, and the Italian associates with respect to the risks associated with the
requirements as per Italian Legislative Decree 231/2001, independent auditors in order to exchange information, and the
business functions themselves.
In addition, the Parent Company and all the Group’s Italian subsidiaries complied with the requirements set forth by
Italian Legislative Decree 231/2001, appointing an “Organismo di Vigilanza” composed of three members, with an exter-
nal Chair, and adopted an Organization and Management Model that was constantly updated, complying with its proce-
dures and ensuring the information flows required to effectively implement it. At the meeting held on 1 June 2021, the
Board of Directors approved version number 1 of Ariston Thermo Holding S.p.A.'s Organization and Management Model,
updating the Model to reflect the relevant regulatory and organisational changes occurred since version number 12 of
36
Ariston Thermo Holding S.p.A. Model was approved on 7 November 2019. The Organismo di Vigilanza reported annually
to the Board of Directors, to which it submitted any critical issues identified, and it also constantly monitored problems
until they were completely resolved.
5.1 Risk management
5.1.1 Risk management framework
The Group, also for the purposes of the best practice provisions relating to internal risk management and control systems
as set out in the Dutch Corporate Governance Code, adopts a Risk Management model that designs and includes suitable
tools for identifying, measuring, managing and monitoring risks that could affect the achievement of strategic objectives.
In this context, uncertainty and risk are defined as:
Uncertainty: state of lack of information, understanding or knowledge;
Risk: a possible event whose occurrence can prevent the achievement of company objectives but which, if properly
analysed and managed, can also generate an opportunity.
The model integrated into the business processes is as much in line with the five references of the COSO (Committee of
Sponsoring Organizations of the Treadway Commission Report - Enterprise Risk Management model) principles (as Gov-
ernance & Culture, Strategy & objective setting, Performance, Review & revision and Information, communication & re-
porting). It identifies and classifies the main risks on the basis of strategic and operational objectives, defines the risk
profile, and defines an inherent communication process.
Ariston Group has implemented a tool to identify, assess and monitor corporate risks. This tool is based on the Self Risk
Assessment approach, which provides for self-assessment and direct participation by operational management and/or
other players responsible for risk assessment.
Risks are analysed, determining the likelihood of their occurrence and their impact, in order to establish their priority and
how they should be managed.
The risks are thus assessed in terms of inherent risk (risk in the absence of any intervention) and residual risk (risk after
the interventions to reduce it). Management selects the responses to risk (avoiding it, reducing it, sharing or accepting
it) by developing interventions to align the risks found with the levels of tolerance and acceptable risk (risk appetite).
The Framework was integrated within the Ariston Group’s organization and corporate governance. It supports the pro-
tection of corporate assets, the efficiency and effectiveness of business processes, the reliability of financial information,
and compliance with laws and regulations.
The process is monitored, and modified where necessary, with interventions integrated into normal business operations
or in separate and specific assessments and audits, which are eventually communicated to the organization and to the
relevant corporate bodies.
Furthermore, Ariston Group operates at three levels of internal control:
First Level: identifying operating areas, evaluating and monitoring applicable risks in individual processes, and estab-
lishing specific actions for managing such risks. The structures responsible for the individual risks, for their identifica-
tion, measurement and management, as well as for performing the necessary checks are included in this first level.
Second Level: departments responsible for supporting management in setting policies and procedures, developing
processes, and monitoring activities to manage risks and issues.
Third Level: it provides independent and objective assurance of the adequacy and effective operation of the first and
second levels of control and, in general, of the overall method for managing risks. This activity is carried out by the
Internal Audit function, which operates independently.
Current or planned improvements in the Ariston Group’s overall risk management system
The Group promotes the continuous improvement of risk management according to the evolution of strategies and in-
formation in the financial documents about both the main risks and uncertainties that occurred during the year and the
impacts on the Group, as well as the objectives and policies with respect to instruments for the management of financial
risks and for the assurance of economic results. We continued to engage the business in key risk areas, benchmark our

37
processes with peer companies, and explore opportunities for improvement, in order to strengthen and improve ERM
Governance, monitor risks in a more predictive way, and evaluate remediation plans.
Ariston Group will continue engaging the business in reviewing our management and monitoring activities for key risks
throughout the Group in the upcoming year. As we continue to evolve our Group ERM program, we will strive to identify
best practices and refine our processes to identify and escalate risk developments.
5.1.2 Risk appetite
The types of risks identified for the Group are classified as:
a) Strategic Risks:
Risk that may derive from the pursuit of the business plan, from strategic changes in the business con-
text, and / or from adverse strategic business decisions that could affect the Group’s long-term posi-
tioning and performance;
Appetite: the Group considers itself ready to take risks in a responsible way that takes into account the
interests of our stakeholders and is consistent with our business plan.
b) Operational Risks:
Risk that may affect internal processes, people, systems, and / or external resources, hindering the
Group's ability to pursue its strategy;
Appetite: the Group also pursues the goal of mitigating operational risks through projected cost / ben-
efit assessments.
c) Compliance Risks:
Risk of non-compliance with laws, regulations, local standards, the Code of Ethics, and internal policies
and procedures;
Appetite: the Group believes, like its employees, in acting with honesty, integrity and respect, including
compliance with its Code of Ethics as well as the laws and regulations applicable wherever it operates.
d) Financial Risks:
Risk relating to uncertainty of returns and potential financial losses due to financial performance; to-
gether with the risks concerning the reliability of the reported financial information;
Appetite: the Group takes a cautious approach to financial risks. Through debt capital market transac-
tions, cash balances, and bank credit line agreements, it tries to maintain a debt / capital structure
profile that allows investing in long-term objectives and rewarding stakeholders, as well as to represent
the economic and financial information provided correctly.
The Risk management and internal control system comprises a structured process aimed at addressing individual risk
categories, defining the main guidelines for risk appetite and the risk responses applied.
Risk Category description Risk appetite Risk response
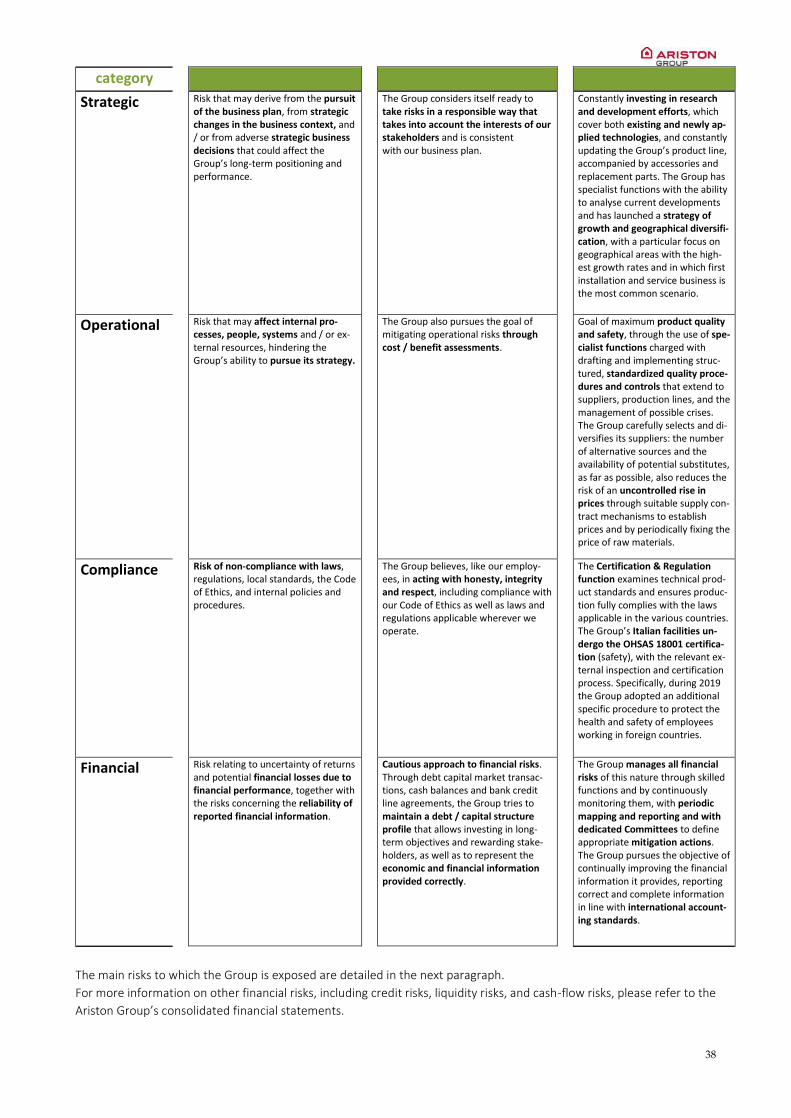
38
category
Strategic
Risk that may derive from the pursuit of the business plan, from strategic changes in the business context, and / or from adverse strategic business decisions that could affect the Group’s long-term positioning and performance.
The Group considers itself ready to take risks in a responsible way that takes into account the interests of our stakeholders and is consistent with our business plan.
Constantly investing in research and development efforts, which cover both existing and newly ap-plied technologies, and constantly updating the Group’s product line, accompanied by accessories and replacement parts. The Group has specialist functions with the ability to analyse current developments and has launched a strategy of growth and geographical diversifi-cation, with a particular focus on geographical areas with the high-est growth rates and in which first installation and service business is the most common scenario.
Operational
Risk that may affect internal pro-cesses, people, systems and / or ex-ternal resources, hindering the Group’s ability to pursue its strategy.
The Group also pursues the goal of mitigating operational risks through cost / benefit assessments.
Goal of maximum product quality and safety, through the use of spe-cialist functions charged with drafting and implementing struc-tured, standardized quality proce-dures and controls that extend to suppliers, production lines, and the management of possible crises. The Group carefully selects and di-versifies its suppliers: the number of alternative sources and the availability of potential substitutes, as far as possible, also reduces the risk of an uncontrolled rise in prices through suitable supply con-tract mechanisms to establish prices and by periodically fixing the price of raw materials.
Compliance
Risk of non-compliance with laws, regulations, local standards, the Code of Ethics, and internal policies and procedures.
The Group believes, like our employ-ees, in acting with honesty, integrity and respect, including compliance with our Code of Ethics as well as laws and regulations applicable wherever we operate.
The Certification & Regulation function examines technical prod-uct standards and ensures produc-tion fully complies with the laws applicable in the various countries. The Group’s Italian facilities un-dergo the OHSAS 18001 certifica-tion (safety), with the relevant ex-ternal inspection and certification process. Specifically, during 2019 the Group adopted an additional specific procedure to protect the health and safety of employees working in foreign countries.
Financial
Risk relating to uncertainty of returns and potential financial losses due to financial performance, together with the risks concerning the reliability of reported financial information.
Cautious approach to financial risks. Through debt capital market transac-tions, cash balances and bank credit line agreements, the Group tries to maintain a debt / capital structure profile that allows investing in long-term objectives and rewarding stake-holders, as well as to represent the economic and financial information provided correctly.
The Group manages all financial risks of this nature through skilled functions and by continuously monitoring them, with periodic mapping and reporting and with dedicated Committees to define appropriate mitigation actions. The Group pursues the objective of continually improving the financial information it provides, reporting correct and complete information in line with international account-ing standards.
The main risks to which the Group is exposed are detailed in the next paragraph.
For more information on other financial risks, including credit risks, liquidity risks, and cash-flow risks, please refer to the
Ariston Group’s consolidated financial statements.
39
5.1.3 Main risks and uncertainties to which the Group is exposed
The main risks and uncertainties to which the Group is exposed are reported below, classified according to the identified
types. The order in which they are listed does not reflect their relevance in terms of either probability of occurrence or
potential impact. As Ariston Group, we face a variety of risks in our business. The risks and uncertainties described below are not the only
ones facing us. Additional risks and uncertainties that we are unaware of, or that we currently believe to be immaterial,
may also become important factors that affect us.
a) Strategic risks
The Group depends on its ability to develop and maintain product offerings that are on pace with changes in end-user
demand and preferences.
The markets in which the Group competes are characterized by frequent new product introductions and enhancements,
shifting end-user preferences and demands, as well as changing industry standards and regulatory requirements. The
Group's future success will depend on its ability to consistently address changes in end-user demands and develop and
maintain product offerings that meet evolving customer preferences. In order to compete successfully, the Group must
proactively address changes in demand and end-user preferences in its research and development, its inventory levels,
and the mix of its product offerings. The Group may not adequately adapt to changes in end-user demands and prefer-
ences, and it may fail to adapt its product offerings in a timely manner. End-user preferences and demands may change
faster than the Group is able to adapt its product offerings, or there may be a sudden increase or decrease in demand,
causing the Group to have either insufficient or excessive inventory levels or an inadequate mix of available products.
The described risk showed a high/medium impact also in the last year on financial and economic results. The Group's
response actions that had a risk mitigation effect were mainly focused on evolving its product range and offering innova-
tive products compliant with regulatory and sustainability requirements. The Ariston Group leverages its in-depth
knowledge of the markets in order to tailor its propositions to local market needs and activate locally.
The Group depends on its ability to maintain the quality of its products and processes and to develop and manufacture
new products.
Many of the Group's products are highly technical, and its markets are characterized by changing technology and tech-
nical standards. Consequently, one of the determining factors in a customer's purchase decision is the quality of the
Group's product offerings and manufacturing processes. In order to remain competitive in the markets in which it oper-
ates, the Group must develop high-quality products that feature the latest technological advancements and must be able
to successfully integrate new technologies into its existing product offerings. The development, manufacturing and selling
of new technologies will often make existing ones outdated, which may lead in turn to a partial or total loss on the in-
vestments made. The main focus of the Group's research and development is to improve processes and support the
Group's ongoing development of high-efficiency and renewable products and solutions. Those activities are subject to
various risks and uncertainties the Group is not able to control, including changes in customer demand, industry standards
or regulatory requirements, and the introduction of new or superior technologies by others. Any failure by the Group in
the future to develop new technologies or react to changes in existing technologies in a timely manner could materially
delay the Group's development of new products, which could result in product obsolescence, decreased revenues, and
a loss of the Group's market share to competitors.
The described risk showed a high/medium impact also in the last year on financial and economic results. The Group's
response actions that had a risk mitigation effect were mainly focused on the enforcement of testing and quality control
procedures in both product development and manufacturing as strategic imperatives. Furthermore, our key suppliers are
certified, and the quality of the material received is regularly monitored to ensure that it meets the rigorous quality
standards that our products require. Ariston Group is driving its understanding of customer needs by improving processes
and tools in order to deliver integrated value propositions.
The Group faces intense competition, and its competitive position may deteriorate.
40
The markets for heating and hot water in which the Group operates are highly fragmented, with numerous and highly
competitive participants. The Group competes with both large international market participants and several smaller re-
gional and local competitors that vary by region and product. The markets in which the Group operates require significant
investments in research and development as well as in production and distribution capabilities. They are also character-
ized by technical complexity and loyalty to established brands throughout the supply chain, including third-party install-
ers, wholesalers, distributors, and end-users, in part due to the transaction costs associated with changing brands. While
this is advantageous for the Group for the purposes of defending its existing market positions, it creates the risk that the
Group may not be able to gain additional market share and improve its competitive position.
Furthermore, in addition to competing on the basis of product offerings, the Group faces intense competition on price,
which favours those who have the most flexible manufacturing capabilities and the most effective logistics footprint to
quickly meet local customer demand with lower operational costs and more competitive pricing. If the Group is unable
to quickly adapt its operational and logistics footprint as required to capture growth in certain fast-growing segments or
geographies, it may lose the ability to offer competitive prices and preserve margins and market share.
The described risk showed a medium impact on financial and economic results. The Group's response actions that had a
risk mitigation effect were mainly focused on increasing competitiveness and innovation ambitions across the entire value
chain, by accelerating the development of technologies and products. Furthermore, the Group constantly monitors the
initiatives taken by competitors.
The Group may not be able to successfully manage future growth.
The Group's future growth also depends on a successful execution of the Group's business plan, which, in turn, depends
on a number of assumptions. These relate to demand for the Group's products, the conditions of the markets in which
the Group operates or is planning to expand, the position of the Group's competitors in those markets, and the resources
available for planned growth initiatives and the related costs. If the assumptions underlying the Group's business plan for
future growth turn out to be materially inaccurate, or if the Group is otherwise unable to execute its business plan, the
Group may be unable to grow as planned and its business may be materially affected.
The Group's ability to manage growth and integrate operations, technologies, products, and personnel depends on the
Group's administrative, financial and operational controls, its ability to create the infrastructure necessary to exploit mar-
ket opportunities for the Group's products, and its financial capabilities.
The described risk showed a low impact on financial and economic results. The Group's response actions that had a risk
mitigation effect were mainly focused on continuing to monitor trends in the markets in which the Company operates
and that might affect its business in the future.
We focus on evolving customer needs by assessing behavioural patterns, actively engaging advisory boards to prepare
potential countermeasures.
The Group is exposed to local business risks in many different countries.
The Group's growth strategy focuses on continuing to expand within the Group's existing geographical markets, as well
as entering new markets. The Group's success as a multinational business depends upon its ability to anticipate and
effectively manage different legal, political, social and regulatory requirements, economic conditions, and unforeseeable
developments. The Group may not be able to succeed in developing and implementing policies and strategies that will
be effective in each location where it does business. In addition, the Group operates in emerging markets, where these
risks may be elevated, some of which, such as political and economic instability, few legal protections, and corruption,
can create a difficult business environment. This may also put the Group at a competitive disadvantage against competi-
tors that are not subject to, or do not comply with, the same regulations, thereby limiting the Group's growth prospects
in such countries. In addition, in some of the countries in which the Group operates, businesses are exposed to a height-
ened risk of loss due to fraud and criminal activity.
The described risk showed a high/medium impact on financial and economic results. The Group's response actions that
had a risk mitigation effect were mainly focused on continuously monitoring the geographical markets in which it oper-
ates, in order to anticipate and minimize any vulnerabilities and to adopt prudent measures to mitigate risks, as, for
example, broadening the product portfolio and strengthening geographical diversification.
The effects of global economic cycles could have a material adverse effect on the Group's business.

41
Global economic growth remains volatile and could stall or reverse course. A global economic downturn could adversely
affect consumer confidence and spending patterns, which could result in decreased demand for the products sold by the
Group, deferred purchases, increased price competition, or slower adoption of energy-efficient products or high-quality
heating and hot water products. This could negatively impact the Group's profitability and cash flows. In addition, a de-
terioration in current economic conditions could negatively impact the Group's distributors and customers, which could
result in an increase in bad debt expense, customer and distributor bankruptcies, interruptions or delays in supplies of
materials, or increased prices of such materials. This could negatively impact the Group's ability to distribute, market and
sell its products and the Group's business, results of operations, financial position, and prospects.
The Group derives most of its revenues from mature markets in Europe, where demand for replacements may be driven
by, among other factors, the age of existing devices, consumer's financial resources, or other government incentives to
move towards more efficient and environmentally friendly technology. Decreased demand during an economic down-
town in these mature markets can negatively affect profit margins on technologically advanced products. Decreased
demand in emerging markets where there is more interest in product diversification can negatively affect sales volumes
and profit margins on the Group's core product offerings. In both mature and emerging markets, in times of economic
downturn, consumers may either choose to delay replacing or installing household equipment or opt for lower-quality
and lower cost alternatives. This would reduce demand for the Group's products. If competitors can develop low- to
medium-end alternatives, especially in emerging markets, the Group may not be able to grow its market share, particu-
larly during an economic downturn.
The described risk showed a medium impact on financial and economic results. The Group's response actions that had a
risk mitigation effect were mainly focused on the agility of the organization required to align resources with the level of
business/market demand by optimizing the supply chain using forecasting analytics, in order to enable agile responses to
large and rapid shifts in demand, supplies, and potential risks (pandemics, natural disasters, emerging markets volatility).
Demand for the Group's products partially depends on the continued market trend toward greater sustainability and re-
lated government subsidies and other consumer incentives.
The Group's business is partially impacted by public policy incentives toward greater green sustainability, with reference,
in particular, to regulations or government programs aimed at requiring and/or incentivizing customers to upgrade their
hot water products. The present and projected demand for the Group's products is indeed partially driven by the need
to address the market trends deriving from such public policy incentives. These current and expected trends could change
due to a number of factors that are outside of the Group's control, including the modification or elimination of economic
incentives encouraging upgrades of hot water products, or the relaxation of regulatory requirements relating to green-
house gas emissions.
The described risk showed a high impact also in the last year on financial and economic results. The Group's response
actions that had a risk mitigation effect mainly consisted in monitoring the relevant political and macroeconomic issues
in terms of risks and opportunities, stepping up efforts to achieve the strongest possible “Quality & Sustainability Brand
Awareness” by establishing testing protocols focused on forced failure to identify product weaknesses. At the same time,
Ariston Group is aligning the organization with market conditions by monitoring and ensuring the agility of the organiza-
tion so as to align resources with the level of business demand.
Any failure to maintain, protect and enhance the Group's reputation and brand may adversely affect its business.
The recognition and reputation of the Group's brands among existing and potential customers and suppliers are critical
for the growth and continued success of its business as well as for its competitiveness in its markets. Maintaining a leading
brand is essential in the heating and hot water industry, as customers typically favour market participants with the most
recognisable and reputable brands. Therefore, any unfavourable developments that harm the Group's brands and repu-
tation could materially affect its business.
The described risk showed a medium impact on financial and economic results. The Group's response actions that had a
risk mitigation effect were mainly aimed at ranking among the top brands by diversifying the portfolio of products, in-
cluding investments in the success and growth of products, and maintaining adequate marketing spending to defend the
brand’s reputation.
The Group is exposed to risks relating to acquisitions and divestments.
42
The Group's growth strategy partly involves growing through acquisitions, including those already planned for the near
future. However, there is a risk that the Group will not be able to identify suitable acquisition targets or successfully
complete strategic acquisitions, for example due to competition from other potential buyers or difficulties experienced
in executing such acquisitions. This may lead to slower or reduced growth for the Group. Growth through acquisitions
also involves the risk of not being able to successfully integrate newly acquired businesses, their management and their
employees.
The Group may also incur significant acquisition and related expenses, including expenses for restructuring the acquired
business. In addition, the Group may face unexpected delays in completing, or may not be able to complete at all, any
future acquisitions or investments due to a failure to obtain the required regulatory approvals or other reasons, including
actual or threatened litigation, political opposition, and failure to obtain adequate debt or equity funding. Furthermore,
the synergies that the Group expects to generate from the integration of an acquired business may be lower than ex-
pected or take longer to materialize than estimated. Any of these circumstances may have a material adverse effect on
the Group's business, results of operations, financial position, and prospects.
The described risk showed a medium impact on financial and economic results. The Group's response actions that had a
risk mitigation effect were mainly focused on strengthening its acquisition allocation strategy and M&A roadmap. The
Company has strict strategic and financial criteria for acquiring new businesses. The Ariston Group’s investment decisions
are selective and focused on businesses with a proven track record for risks. We conduct broad-based due diligence of
acquisitions, using internal expertise and top external due diligence and legal professionals.
b) Operational risks
The Group depends on certain key raw materials and components to produce its products, including some for which only
a limited number of suppliers exist; any shortages in such materials, increases in their prices or lack of renewal of supplier
contracts would adversely impact the Group's sales and profit margins.
The Group is exposed to risks relating to the availability, quality, and cost of raw materials, component parts, and specific
finished products. In particular, the Group and the sub-contractors from which it buys component parts rely on various
raw materials for their products, such as steel, polyurethane, non-ferrous metals such as copper, nickel and aluminium,
as well as precious metals, such as silver, and electronic boards. Raw materials are used both directly by the Group in its
manufacturing processes and by sub-contractors for the component parts subsequently assembled by the Group into
finished products. The market price and availability of the materials that are used for the Group's operations can fluctuate
sharply depending on market conditions, technological evolution, and legislative changes. A shortage of raw materials,
components or energy sources could also arise from decreases in extraction and production due to local natural disasters
or political instability, or disruptive global events such as the Covid-19 pandemic. Furthermore, the Group is exposed to
risks relating to a potential supplier shortage. The Group relies for some components on a single source or a limited
number of suppliers. The Group does not consider itself to be materially dependent on any supplier, as it has systems in
place to replace each supplier without material disruption to its operations and has identified potential substitutes for
when they may be needed. Any shortage in, or material price increase of, the Group's key raw materials or any disruption
in its supply chain could have a material adverse effect on the Group's business, results of operations, financial position,
and prospects.
The described risk showed a high impact also in the last year on financial and economic results. The Group's response
actions that had a risk mitigation effect were mainly focused on developing a backup sourcing plan for the most critical
items, using some KPIs presented during procurement review. Furthermore, the Group established a bi-monthly steering
committee with the CEO to review the main critical issues and the action plan from both a supply and planning perspec-
tive, and a weekly routine between procurement and operations globally to review each critical issue for each plant.
The Group is subject to the risk of interruption to its production, development processes, supply chain and distribution
network, as well as inherent health and environmental risks for its employees.
The Group has a large number of production sites at which products are developed and assembled, thus posing specific
health and safety risks. Accidents at manufacturing sites, which involve the use of hazardous substances, or environmen-
tal incidents, could lead to employee injuries or deaths, or environmental and property damage, which could permanently
damage the Group's reputation in the public opinion, even if the Group was not actually responsible for causing such
damage and no fault on the Group's part has been proven. Such incidents could lead to substantial financial liabilities and
could affect the demand for the Group's products and services and have adverse financial consequences.

43
The Group may also be subject to interruptions to its supply chain due to a disruption of its relationship with suppliers or
sub-contractors, or due to disruptions of the operations of the suppliers themselves. If any of the Group's key suppliers
or sub-contractors is subject to a major disruption in its production to meet its obligations under its existing agreements
with the Group, the latter may be unable to obtain the necessary materials or component parts for its operations. The
occurrence of any accidents or operational disruptions in the Group's production and manufacturing processes could
increase the Group's operating costs and may impact its ability to sell its products, which would cause revenue to de-
crease, with a material adverse effect on the Group's business, results of operations, financial position, and prospects.
The described risk showed a medium impact on financial and economic results. The Group's response actions that had a
risk mitigation effect were mainly focused on implementing and improving prevention actions by strengthening the ability
to manage crises and incidents, according to Health & Safety Policies and other regulations; on guaranteeing Supply
Continuity and New Product Phase-in, by scouting alternative suppliers; and on avoiding the slowdown of some markets,
by pursuing geographical diversification.
The Group's success is highly dependent on its ability to retain the services of the members of its senior management team
and recruit and retain technical and other skilled personnel.
The Group depends to a significant degree on a number of key employees, both in the Group's management and its
operations, who have specialized skills and extensive experience in their respective fields, including in the Group's core
business of heating and hot water solutions, or in emerging spheres, such as digital solutions relating to the connected
products sphere. This applies both to employees in the Group's supply chain operations and its corporate department.
The Group's senior management team has extensive industry experience and the Group's success depends in part upon
the continued contributions of the members of that team.
The Group believes that the growth and success of its business will depend on its ability to attract highly skilled and
qualified employees with specialised know-how in the heating and hot water industry.
The described risk showed a high/medium impact on financial and economic results. The Group's response actions that
had a risk mitigation effect were mainly focused on strengthening talent and development programmes and retention
plans for key resources by introducing specific recruiting programs in order to build a strong talent pipeline, providing
internal training in order to ensure development and retention, and reviewing compensation packages and individual
development plans in order to stabilize growth.
The Group depends on the efficient and uninterrupted operation of its information and communication technology and its
ability to successfully manage increasing cybersecurity risks.
The operation of the Group's production facilities as well as sales, marketing and service activities depend on the efficient
and uninterrupted operation of complex and sophisticated computer, telecommunication and data processing systems.
In particular, the Group's call centre available for after sales follow-up with regards to logistics, delivery and invoices is
reliant on information and communication technology. Computer and data processing systems and related infrastructure
(data centres, hardware, and wide and local area networks) are generally exposed to the risk of disturbances, damage,
electricity failures, computer viruses, fire, other disasters, hacker attacks, and similar events.
The Group's manufacturing and supply chain infrastructure is also managed through a virtual connected system. Any
successful security breach could therefore also materially disrupt the Group's operations. Disruptions to or interruptions
in operations could also lead to production downtime which, in turn, could result in lost revenues and have a material
adverse effect on the Group's business, results of operations, financial position, and prospects. The Group is also exposed
to direct hacker attacks or ransomware aimed at the IT systems of its senior leadership which, if successful, may result in
an information leak or reputational issues.
Any failure of the Group's security measures, or any service outages or other interruptions to the Group's IT systems may
disrupt the Group's operations, harm its reputation, and have a significant adverse effect on the Group's business, finan-
cial position, results of operations, and prospects.
The described risk showed a high impact also in the last year on financial and economic results. The Group's response
actions that had a risk mitigation effect were mainly focused on protecting the group from external threats by actively
avoiding unknown threats, and taking active steps to mitigate IT and cybersecurity threats, by moving from a reactive to
a proactive approach and by taking planned actions (granting same communication security measures and preventing
data loss) and performed action (monitoring externally available information about the company). Ariston Group is also
focused on guaranteeing Service continuity by planning a Disaster Recovery feasibility study.
44
The global coronavirus (Covid-19) pandemic, or other global public health pandemics, may have an adverse effect on the
Group's business, results of operations, and financial position.
The Group's business, results of operations, and financial position may be adversely affected if a global public health
pandemic, including the current Covid-19 pandemic, interferes with the ability of the Group's employees, suppliers and
customers to perform the Group's and their respective responsibilities and obligations relative to the conduct of the
Group's business and operations. The Covid-19 pandemic has significantly impacted economic activity and markets
around the world, and while it has had a limited impact on the Group's operations in 2020 and 2021, including a reduction
in revenue by 2.7% between 2019 and 2020, it could have a material adverse effect on the Group's business and opera-
tions.
The described risk showed a high impact also in the last year on financial and economic results. The Group's response
actions that had a risk mitigation effect were mainly focused on preserving business continuity by implementing several
actions in line with the advice provided by the WHO (World Health Organization) and the public health measures imposed
in the countries in which the Group operates in order to contain the spread of the Covid-19 virus in the workplace, such
as smart working, Rapid Diagnostic Test (RDT) campaigns (introduction of shifts, review of business travel procedure,
definition of Group cleaning and sanitization procedures) in order to safeguard the health and safety of employees, and
the establishment of the Crisis Committee and a dedicated Country Operational Task Force.
c) Compliance Risks
Changes to government regulations that could require the Group to modify its current business practices, incur increased
costs, and subject it to potential liabilities could have a material and adverse effect on the Group's business, financial
position, or results of operations.
The Group operates in several countries and must comply with an extensive range of statutes, laws and regulations per-
taining to consumer protection, product safety, quality and liability, health and safety, the environment, fire prevention,
planning, landlord/tenant relationships, competition, advertising, taxes, data protection, employment practices (includ-
ing pensions), anti-money laundering, anti-bribery and anti-corruption, and other laws and regulations which apply to
retailers generally and/or govern the import, promotion and sale of products and the operation of retail stores and dis-
tribution centres.
If any of these statutes, laws or regulations were to change, the Group is unable to predict the ultimate cost of complying
with these requirements or their effect on its operations. In particular, any change to consumer protection and/or prod-
uct liability and health safety and/or environmental regulations could also reduce the rate at which the Group can develop
and produce new products and services.
The Group may be required to make significant expenditures or modify its business practices in order to comply with
amendments to existing laws and regulations and/or with future laws and regulations, which may increase its costs, limit
its ability to operate its business, and require investments in the research and development of new products or modifi-
cations of existing products.
The described risk showed a medium impact on financial and economic results. The Group's response actions that had a
risk mitigation effect were mainly focused on regularly reviewing its strategy in light of legislative and regulatory changes
in order to ensure Compliance.
Changes in regulations or standards could adversely affect the Group's business.
The Group's products are subject to a wide variety of statutory, regulatory and industry standards and requirements
related to, among other things, energy and water efficiency, environmental emissions, labelling, and safety. While the
Group believes its products and manufacturing processes are currently efficient, safe and environmentally friendly, na-
tional and local governments are adopting laws, regulations and codes that may require a transition to non-fossil fuel
based sources of energy production.
A significant shift or change in applicable laws, regulations and industry standards could lead to greater regulatory over-
sight or restrictions and changes to manufacturing processes and products, increase compliance and manufacturing
costs, impact the size and timing of demand for the Group's products, and affect the types of products the Group is able
to offer and their cost, any of which could harm the Group's business and have a material adverse effect on the Group's
financial position, results of operations, and prospects.
45
The described risk showed a medium impact on financial and economic results. The Group's response actions that had a
risk mitigation effect were mainly focused on maintaining the Group’s leadership by strengthening its readiness and pro-
activity to face market opportunities and regulatory changes; the Group monitors legislative developments and regula-
tory changes, including trade restrictions, to assess the potential impact on its businesses. Furthermore, Ariston Group is
committed to delivering top-quality products, services and solutions compliant with all applicable laws and standards by
investing in Quality Management Systems.
The Group could be liable for environmental law violations, regardless of whether it caused such violations.
The Group could be liable for fines, damages, or remedial costs for non-compliance with environmental laws and regula-
tions in the jurisdictions in which it operates and where its properties and premises are located. These laws and regula-
tions generally govern wastewater discharges, air emissions, public nuisance, the operation and removal of underground
and above-ground storage tanks, the use, conservation and protection of soil, the use, storage, treatment, transportation
and disposal of solid hazardous materials, the remediation of contaminated property associated with the disposal of solid
and hazardous materials, and other health and safety-related concerns. Some of these laws and regulations may impose
joint and several liabilities on tenants, owners or managers for the costs of the investigation or remediation of contami-
nated properties, regardless of fault or the legality of the original disposal.
There can be no assurance that future laws, ordinances or regulations will not impose any material environmental liability,
or that the environmental condition of the Group's properties and premises will not be affected by the operations of the
tenants, by the existing condition of the land, and by operations in the vicinity of the properties.
The described risk showed a medium impact on financial and economic results. The Group's response actions that had a
risk mitigation effect were mainly focused on maintaining the Group’s compliance with regulatory changes.
The Group may be unable to sufficiently protect the health and safety of its employees, in particular those located in its
manufacturing facilities.
The Group's employees can be exposed to different hazards in the workplace, in particular chemical, ergonomic and
physical hazards. These can cause harm or adverse effects which may take the form of work-related accidents and ill-
nesses.
Although the Group takes all measures required under applicable laws and regulations to monitor and manage such risks
as effectively as possible, and conducts a systematic assessment aimed at eliminating hazards and reducing their specific
risks, it cannot guarantee that all such risks have been entirely eliminated, or that accidents in its facilities will not occur.
The occurrence of workplace-related accidents or illnesses could entail interruptions or delays in production, with imme-
diate effects on the Group's ability to supply its products, and may expose the Group to lawsuits, reputational damage,
and increased costs and liabilities, which in turn could have a material adverse effect on the Group's business, results of
operations, reputation, financial position, and prospects.
The described risk showed a medium impact on financial and economic results. The Group's response actions that had a
risk mitigation effect were mainly focused on implementing the Group’s protocols in order to make the workplace a safe
working environment in accordance with the requirements of ISO standards. The Ariston Group’s HSE Function has per-
formed Context Analyses to determine external and internal issues and has defined the Roles and Responsibilities of
resources in order to guarantee interactions between Corporate and local structures, conducted risk assessments in or-
der to ensure emergency preparedness, conducted environmental impact assessments, defined a process that can pre-
emptively intercept and manage any issues related to change management activities, defined a process to ensure that all
applicable legal and regulatory requirements are identified and continuously updated, and conducted HSE internal audits
at planned intervals.
A failure to comply with data protection and privacy laws could harm the Group's reputation and give rise to fines.
The Group is subject to expansive regulations regarding the use of personal data. The Group collects and processes per-
sonal data (including name, address, age, bank and credit card details, and other personal data) from its employees,
customers and business partners as part of its business operations, and therefore it must comply with applicable data
protection and privacy laws. These laws generally impose certain requirements on the Group in respect of the collection,
retention, use and processing of such personal information. Failure to implement effective data collection controls could
potentially lead to regulatory censure, fines, and reputational and financial costs.
46
The Group seeks to ensure that procedures are in place to enforce compliance with relevant data protection regulations
by its employees and any third-party suppliers and service providers, and also to implement security measures to help
prevent cybertheft. Notwithstanding such efforts, the Group is exposed to the risk that this data could be wrongfully
appropriated, lost or disclosed, stolen or processed in breach of applicable data protection laws. In addition, the Group
may not have appropriate controls in place currently and may be unable to invest on an ongoing basis to ensure such
controls are up-to-date and keep pace with growing threats.
In particular, the Group is subject to the General Data Protection Regulation (EU) 2019/679 (GDPR), which has been in
effect since 25 May 2018.
The described risk showed a low impact on financial and economic results. The Group's response actions that had a risk
mitigation effect were mainly focused on moving from a reactive to a proactive approach: our legal and regulatory spe-
cialists are heavily involved in monitoring and reviewing our practices to provide reasonable assurance that we remain
aware of, and in line with, all relevant laws and legal obligations, including also GDPR developments and compliance.
The Group is subject to taxation in multiple jurisdictions which often requires subjective interpretation and determinations
and could expand into jurisdictions with less favourable tax regimes. As a result, the Group could be subject to additional
tax risks attributable to previous assessment periods or be subject to a higher effective tax rate in the future.
The Group is subject to many different forms of taxation including, but not limited to, corporation tax, withholding tax,
value added tax, property tax, and social security and other payroll related taxes, and has obligations to file tax returns
and pay tax across several different jurisdictions. Tax law and administration is complex and often requires subjective
interpretation and determinations. Although the Group considers itself in compliance with all relevant obligations, there
is a risk that it may inadvertently fail to comply with applicable laws and regulations in any jurisdiction in which it does
business. Additionally, tax authorities may not agree with the determinations that are made by the Group with respect
to the application of tax law, leading to potentially lengthy and costly disputes which could potentially result in the pay-
ment of substantial amounts for tax, interest and penalties.
Tax laws and regulations are also complex and subject to varying interpretations, and the Company is subject to regular
review and audit by tax authorities in jurisdictions around the world. Any adverse outcome of such a review or audit could
have a negative impact on the Company's effective tax rate, tax payments, financial position, or results of operations. In
addition, the determination of the Company's income tax provision and other tax liabilities requires significant judgement,
and there are many transactions and calculations, including in respect of intragroup transactions, where the ultimate tax
determination is uncertain. Although the Company believes that its estimates are reasonable, the ultimate tax determi-
nation may differ from the amounts recorded in the Company's financial statements and may materially affect the Com-
pany's results of operations in the period, or periods, for which such determination is made. Any significant failure to
comply with applicable tax laws and regulations in all relevant jurisdictions could give rise to substantial penalties and
liabilities.
The described risk showed a medium impact on financial and economic results. The Group's response actions that had a
risk mitigation effect were mainly focused on complying with applicable laws and regulations in any jurisdiction. The
Group’s Tax department is in charge of establishing, maintaining and overseeing tax policies. Potential risks and oppor-
tunities are carefully monitored and dealt with by tax specialists from the relevant areas.
The Group's products, services and know-how may not be fully protected by its intellectual property rights, which may be
infringed or challenged by third parties, and the Group may infringe third parties' intellectual property rights or be faced
with claims regarding infringement with regard to the use of intellectual property.
The Group owns almost three hundred patents as well as trademarks, domain names, know-how, utility models, regis-
tered designs, and similar intellectual property, which are significant to the Group's business, and it relies on trademark
and patent law and confidentiality, licensing, and proprietary rights agreements with its employees, customers, suppliers,
and others to protect its intellectual property rights. The granting of patents does not necessarily imply that they are
effective or that potential patent claims can be enforced to the degree required or desired. Additionally, the patents the
Group has applied for or intends to file for registration in connection with new technological developments may not be
granted in each of the countries where the Group considers this necessary or desirable. Third parties may infringe the
Group's patents and/or intellectual property rights and the Group may, for legal or factual reasons, be unable to halt such
infringements. Furthermore, if third parties challenge the Group's patent or applications for protection, the Group may
be required, in order to obtain the intellectual property right sought, to make public disclosures potentially enabling
47
competitors to patent corresponding technologies in other jurisdictions or to use the Group's know-how to develop com-
peting devices. If the Group is unable to protect its intellectual property, the Group may not be able to profit from the
advances in technology it has achieved, which could lead to a reduction in future results of operations. This could affect
the Group's competitive position and any resulting reduction in revenues would have a material adverse effect on the
Group's business, results of operations, financial position, and prospects.
The described risk showed a medium impact on financial and economic results. The Group's response actions that had a
risk mitigation effect were mainly focused on actively protecting its intellectual property rights to safeguard its portfolio
of information, software solutions and services. The Company relies on trademark, copyright, patent, and other intellec-
tual property laws to establish and protect its proprietary rights to these products and services.
d) Financial risks
Currency exchange rate fluctuations may have a significant impact on the Group's reported revenue, cash flows and earn-
ings.
The Group operates globally, holding assets, earning revenues, incurring liabilities, and paying expenses in various cur-
rencies other than the euro. The Group encounters currency transaction risk whenever one of its subsidiaries enters into
a transaction using a currency other than its operating currency. The Group incurs the majority of its expenses in euro,
while earning a significant portion of its revenues in currencies other than the euro.
In addition to transaction currency risk, changes in exchange rates affect the translation into euro of the revenues, costs,
assets, and liabilities of subsidiaries that use a currency other than the euro as their functional currency. A depreciation
of other currencies against the euro will mean that, despite constant sales volumes and nominally constant prices, the
Group will, after translation into euro, generate lower revenue and profits for the purposes of the Group's consolidated
or combined financial statements. A number of the Group's subsidiaries report their results in currencies other than the
euro, which requires the Group to convert the relevant items into euro when preparing its consolidated financial state-
ments. Any increase (or decrease) in the value of the euro against any foreign currency that is the functional currency of
any of the Group's operating subsidiaries will cause the Group to experience foreign currency translation losses (or gains,
as the case may be). In addition, changes in the exchange rate of foreign currencies may negatively influence the Group's
sales volume as well as its profit margins.
The described risk showed a high impact also in the last year on financial and economic results. The Group's response
actions that had a risk mitigation effect were mainly focused on reducing losses and the volatility of potential effects by
monitoring foreign exchange exposures, strengthening hedges, and continuously updating policies. Whenever possible,
the company tries to do this by creating natural hedges, matching the currency profile of income and expenses and of
assets and liabilities.
The Group is exposed to credit risk in respect of its outstanding trade receivables.
Payment terms, in particular due dates for payments by the Group's customers, vary depending on the type of transaction
and business division. The Group records revenue and the corresponding trade receivables when products are delivered
to customers, and, with respect to certain products, when customer acceptance occurs following delivery. Payments
received prior to product delivery, or customer acceptance, as applicable, are generally recorded as unearned revenue.
The Group may experience low trade receivables turnover and payment delays by certain customers. The significant
periods of time the Group's trade receivable would remain outstanding as a result may negatively impact the Group's
cash flow and liquidity and in turn affect the Group's business, results of operations, financial position, and prospects.
The described risk showed a medium impact on financial and economic results. The Group's response actions that had a
risk mitigation effect were mainly focused on reducing the Group’s exposure by keeping track of actual cash flows on a
short- and long-term basis, including regular reviews of liquidity. Furthermore, dedicated credit managers and specialists
support the business by assessing customers’ ability to pay their receivables and by defining their risk profile, recom-
mending appropriate levels of exposure.
In carrying out its business, the Group is also exposed to various financial risks or risks similar to credit, liquidity and market
risks for foreign exchange rates, commodity prices, and interest rates.

48
In carrying out its business, the Group is exposed to the financial risks associated with its operations, in particular to credit
risk, liquidity risk and market risk for foreign exchange rates, fluctuations in commodity prices, and interest rates (a ded-
icated section is presented in this financial statement).
The Group manages all risks of this nature through skilled functions and continuous supervision, regularly mapping and
reporting such risks and working with dedicated committees to define appropriate mitigation actions.
The described risk showed a high/medium impact also in the last year on financial and economic results. The Group's
response actions that had a risk mitigation effect were mainly focused on constantly monitoring the main financial risks,
in particular by maintaining an adequate level of liquidity to meet the Group’s potential needs for financial obligations
and investments. Liquidity is monitored by the Group’s Treasury department, which tracks actual cash flows on both a
short- and long-term basis.
5.1.4 Code of Ethics
The Group has adopted a Code of Ethics that applies to all of our employees, including our chief executive, financial, and
accounting officers. Our Code of Ethics is posted on our website. The Code of Ethics represents a set of values recognized,
upheld, and promoted by the Group, which understands that conduct based on the principles of diligence, integrity, and
fairness is an important driver of social and economic development.
The Code of Ethics applies to the Directors and all employees of the Company and its subsidiaries, as well as other indi-
viduals or companies that act in the name and on behalf of the Company or its subsidiaries.
The Group promotes the adoption of the Code of Ethics as a best practice standard of business conduct by partners,
suppliers, consultants, agents, dealers, and others with whom it has a long-term relationship. In fact, the Group’s con-
tracts around the world include specific clauses relating to the recognition and upholding of the principles underlying the
Code of Ethics and related guidelines, as well as compliance with local regulations, particularly those related to corrup-
tion, money-laundering, terrorism, and other crimes giving rise to liability for legal persons.
The Group closely monitors the effectiveness of, and compliance with, the Code of Ethics in accordance with whistle-
blowing management procedures and checks that form part of standard operating procedures.

49
5.2 Non-Financial Disclosure
This section addresses the requirements of the Dutch Civil Code, and of the Dutch Decree on Non-Financial Information
(Besluit bekendmaking niet-financiële informatie), which is a transposition of Directive 2014/95/EU ‘Disclosure of non-
financial and diversity information’ into Dutch law.
Global Sustainability Strategy – Road to 2022
For more than 15 years, the Group’ Vision has been: “Sustainable Comfort for Everyone”. In 2017-18, the Group designed
and committed to a sustainability strategy, the “Road to 2022”, with the engagement of the Group Senior Leadership
Team. Road to 2022 was framed along the 5 Company values, and included a set of specific targets.
Believe in sustainability
Ariston Group has placed energy efficiency at the heart of its sustainable growth strategy. Renewable and high efficiency
products, and solutions can make a decisive contribution reaching the environmental goals in the building sector and
reducing energy consumption, without sacrificing comfort.
80% of revenues from highly efficient and renewable solutions
3 million tons of CO2 equivalent avoided thanks to our most evolved technologies
Bringing comfort where it is hard or even impossible to find
Inspire through excellence
With a portfolio of world-class brands, highly sustainable and connected products and solutions, the Group strives to
continue delivering excellent results across all operations.
Double-digit profitable revenue growth
80% of turnover from innovative products (younger than 5 years)
Up to 800.000 ready-to-connect products sold
Start from customers
Our Quality culture starts from the ability to design and manufacture products that meet the highest quality standards
and the needs of our customers all over the world—and then involves all business processes, from supplier management
to support services, in order to continuously improve the experience of those relying on our solutions.
>95% of products require no technical interventions in their first 5 years of service
Net promoter score: being recognised as excellent by our customers at group level and in each country
People come first
People are at the center of our business: the leadership of Ariston Group is rooted in the work of motivated, qualified
people who are well aware of the social responsibility of their actions.
Local resources hold more than 80% of managerial positions
More than 60% of managers come from internal career paths
0 injuries at our production sites
Act with integrity
Ariston Group’s Governance has always been aligned to the highest standards, and set the goal to maximise the value
created for shareholders and all stakeholders by controlling business risks and ensuring the integrity and fairness of de-
cision-making processes.

50
Defining a structured model of sustainability governance
Training 100% of our people on Ariston Group’s ethics and integrity culture
Note on methodology
How this document was created
The reporting scope of this Non-Financial Declaration is the same used for the consolidated financial statements, and
includes the economic, environmental and social results from the activities of all Ariston Group companies at a global
level.
This document has been drafted according to the GRI Standards, which currently represent the main reference for non-
financial reporting at national and international level.
The materiality of information, i.e. the threshold beyond which a topic becomes important enough to be reported, is at
the core of the reporting process and reflects the organisation’s economic, environmental or social impacts that can
influence the decisions of stakeholders. The process that led to the definition of the material topics in 2018 consisted
of three stages:
Identification of the material topics or topics likely to be material, following the scenario analysis carried out accord-
ing to international standards (GRI, ISO 20400:2017 “Sustainable Procurement – Guidance”), international organisa-
tions (Sustainability Accounting Standards Board, RobecoSAM), and the relevant regulations.
Definition of the materiality of the identified topics, following the analysis of internal documents and corporate
policies, interviews with several corporate functions, and an assessment of the opinions and expectations of the main
stakeholders.
Selection of the material topics. Once selected—in a meeting that involved the whole top management— the topics
were arranged in a matrix according to their materiality and the assessment of their economic, environmental and
social impacts for the Group and all stakeholders.
All the data comes from internal documents, information emerged from benchmarking and sector analyses, and other
official sources mentioned in the Report. The contents were prepared in collaboration with the company’s employees,
who actively participated in collecting information and the relevant data. These data flows have been key to ensuring the
soundness of the adopted reporting model.
Ariston Group’s Materiality Matrix
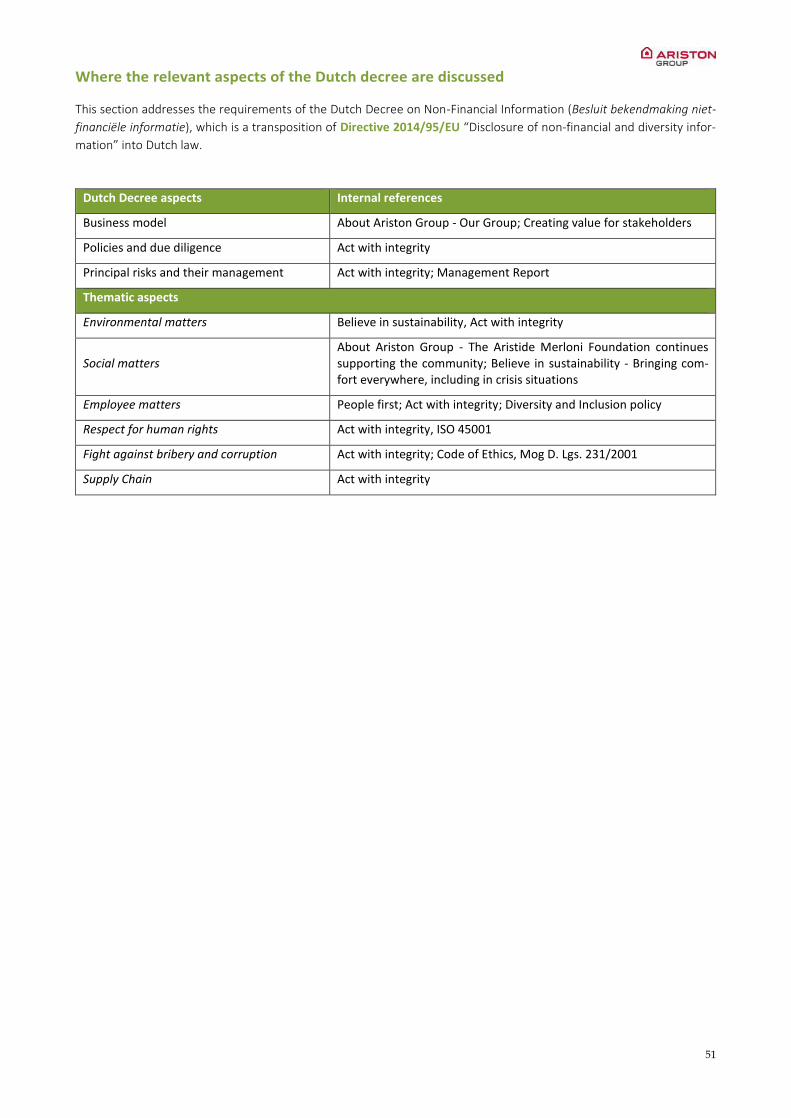
51
Where the relevant aspects of the Dutch decree are discussed
This section addresses the requirements of the Dutch Decree on Non-Financial Information (Besluit bekendmaking niet-
financiële informatie), which is a transposition of Directive 2014/95/EU “Disclosure of non-financial and diversity infor-
mation” into Dutch law.
Dutch Decree aspects Internal references
Business model About Ariston Group - Our Group; Creating value for stakeholders
Policies and due diligence Act with integrity
Principal risks and their management Act with integrity; Management Report
Thematic aspects
Environmental matters Believe in sustainability, Act with integrity
Social matters About Ariston Group - The Aristide Merloni Foundation continues supporting the community; Believe in sustainability - Bringing com-fort everywhere, including in crisis situations
Employee matters People first; Act with integrity; Diversity and Inclusion policy
Respect for human rights Act with integrity, ISO 45001
Fight against bribery and corruption Act with integrity; Code of Ethics, Mog D. Lgs. 231/2001
Supply Chain Act with integrity

52
About Ariston Group
A key step in our journey: the Initial Public Offering
On November 26th 2021, Ariston Group launched an Initial Public Offering and was admitted to listing and trading of its
ordinary shares on Euronext Milan, a regulated market organized and managed by Borsa Italiana. The share offered
represent approximately 27,11% of all shares issued by the company immediately after settlement. The Group’s Executive
Chairman, Paolo Merloni, thus commented this key milestone:
“As a listed company, we believe we will be able to fully capitalize on growth opportunities, continuing to complement our
strong organic growth with accretive acquisitions. We believe Ariston can and will play a key role in the consolidation
process of our industry, accelerating with M&A what we successfully accomplished in the last decade. We are focused on
being a preeminent global provider of sustainable comfort solutions in hot water and heating.”
Our Group
Our vision: SUSTAINABLE COMFORT FOR EVERYONE
Our purpose is to provide everyone, in every corner of the world, with high-quality heating and hot water solutions, while
protecting the environment.
Our mission: TO BE THE WORLD’S PREFERRED PARTNER IN DELIVERING ENERGY EFFICIENT AND RENEWABLE SOLUTIONS
FOR HEATING AND HOT WATER
To be able to understand the consumers’ needs and to satisfy them worldwide, with leading brands and an extensive
offer of products and services in the thermal comfort, burners and components sectors.
Our Group: A GLOBAL COMPANY WITH STRONG LOCAL ROOTS
68 operating companies and 5 representative offices in 42 countries, 23 production sites, 25 centres of competences and
R&D in 4 continents.
All over the world, Ariston Group is synonymous with comfort, energy efficiency and respect for the environment,
thanks to its renewable and high efficiency products, its plants in compliance with the most advanced production stand-
ards and excellent pre- and after-sales customer support services. The Group has now a leadership position in the global
thermal comfort market for residential and commercial spaces.
The Group by numbers
2021 highlights:
1.99 billion euro in sales
9 million products per year (and 40 million components)
Sales by geographic area: Europe 67%, MEA and Asia 19%, Americas 14%
7,743 employees
Employees by geographic area: Europe 62%, MEA and Asia 21%, Americas 17%
Employees by business segment: Thermal Comfort 88%, Components 8%, Burners 4%
Introduction to EU Taxonomy
On 18 June 2020, the European Parliament adopted EU Regulation 2020/852 on establishing a framework for sustainable
investment and amending the previous EU Regulation 2019/2088.
The Taxonomy Regulation represents a European response to the current climate and environmental challenges. It con-
tributes to the objectives of the European Green Deal by establishing a first classification system for sustainable economic
activities thus aiming to increase transparency and consistency in the classification of such activities and limiting the risk
of greenwashing and fragmentation in relevant markets.
The Regulation sets out the criteria for determining whether an economic activity can be considered environmentally
sustainable.
53
In compliance with Article 8 of the Delegated Act released on the 4th of June 2021, for this first year of application,
companies are required to analyse their potential contribution (“eligibility”) to the first two climate objectives: mitigation
and adaptation to climate change.
The Group’s contribution to the climate objectives
Ariston Group, as a leader in the global thermal comfort market for domestic, commercial and industrial spaces, has an
extensive range of products and services. Along with its products, the Group offers specific services for the installation
and maintenance of heating systems.
Its activities can be broken down into three main sectors:
Burners
Components
Thermal comfort, which can be classified into water heating products (i.e. heat pumps, solar, electric storage & elec-
tric instant water heaters, gas storage & gas instant water heaters, cylinders etc.) and space heating products (i.e.
boilers, heat pumps, hybrid systems, air conditioning, thermostats, direct services & parts).
Only the activities related to Thermal comfort sector were classified as “Taxonomy-eligible “or “eligible”, whereas Burners
and Components have been considered as ‘Taxonomy non-eligible, based on the fact that no perfect fit was identified
with Annexes I and II of the Climate Delegated Act.
The eligible activities of the Group are associated with the manufacturing of energy efficiency equipment for buildings,
with the installation, repair and maintenance of electric heat pumps, energy efficiency equipment, devices for meas-
uring, regulation and controlling energy performance of buildings and renewable energy technologies.
For this first year of reporting, the Group has evaluated its eligibility according to criteria outlined in the Climate Delegated
Act for the objective mitigation to climate change.
In terms of contribution to climate change mitigation, besides the installation and operation of electric heat pumps, all
the other eligible activities are classified as possible enablers1 for other activities to become low-carbon or to lead to
greenhouse gas reductions according to Article 10(1), point (i), of Regulation (EU) 2020/852. The Installation and opera-
tion of electric heat pumps is considered a transitional activity2, meaning that it directly contributes to climate change
mitigation.
The results of the analysis are represented in the table below.
1 According to Article 16 of the Regulation, enabling activities contribute substantially to one or more of the environmental objectives by directly enabling other target activities to make a substantial contribution to one or more of those objectives. Such activities play a crucial role in the decarbonisation of the economy by directly enabling other activities to be carried out at a low carbon level of envi-ronmental performance. 2 Transitional activities are those for which there are no technologically and economically feasible low-carbon alternatives, and which makes a substantial contribution to climate change mitigation by supporting the transition to a climate-neutral economy in line with a pathway to limit the temperature increase to 1.5 °C above pre-industrial levels.

54
To better estimate its eligibility and in consideration of the regulatory obligations for the coming years, Ariston Group has
decided to analyze the substantial contribution criteria that apply to all the Taxonomy-eligible activities.
Among the several substantial contribution criteria applicable for the activities stated in the previous table, the main
criteria that required further analysis were:
1. Household appliances, space heating, domestic hot water, cooling and ventilation systems rated in the highest
two populated classes of energy efficiency in accordance with Regulation (EU) 2017/1369 of the European Par-
liament and of the Council and delegated acts adopted under that Regulation;3
2. Electric heat pumps compliant with both of the following criteria:
Heat pumps compliant with the refrigerant threshold: Global Warming Potential does not exceed 675
Energy efficiency requirements laid down in the implementing regulations under Directive 2009/125/EC
are met.
The first criterion applies to all Ariston’s products identified as Taxonomy-eligible and included in the activity 3.5, namely
water heaters, boilers, air conditioners and solar thermal. The second criterion applies only to the heat pumps and to the
activity of installation and related operations.
For what concerns the other Taxonomy-eligible activities identified with the codes 4.16, 7.3, 7.5 and 7.6 that are related
to the service of installation and maintenance of individual components and systems, the substantial contribution
criteria are the same of the target products falling into the activity 3.5.
The analysis of the above-mentioned substantial contribution criteria was based on the segmentation of the main prod-
uct families and service sold, which have been broken down into different clusters based on type, specific features and
geographical area of sales.
KPI and calculation methodology
In compliance with Article 10 of the Delegated Act released on the 4th of June 2021, Ariston Group has calculated the
proportion of Taxonomy-eligible and Taxonomy non-eligible economic activities in their total turnover, capital, and oper-
ational expenditure.
3 Assuming an alignment with the market, Ariston Group has considered as the two highest populated classes the ones for which the Group, based on its own sales, has the largest number of product families in its portfolio.
Activity’s number
Activity Description of activity Climate Change Mitigation
3.5 Manufacture of energy efficiency equipment for buildings
Manufacturing of:
Water heaters
Boilers
Heat pumps
Air conditioners
Solar thermal
Thermostats
Connectivity
Enabling
4.16 Installation and operation of electric heat pumps
Installation and maintenance of heat pumps
Transitional
7.3 Installation, maintenance and repair of energy efficiency equipment
Individual renovation measures con-sisting in installation, maintenance or repair of air conditioners, boilers, wa-ter heaters
Enabling
7.5 Installation, maintenance and repair of instruments and devices for measuring, regulation and controlling energy per-formance of buildings
Installation, maintenance and repair of thermostats and connectivity for measuring, regulation and controlling energy performance of buildings
Enabling
7.6 Installation, maintenance and repair of renewable energy technologies
Installation, maintenance, and repair of heat pumps and relevant “after-services” activities.
Enabling
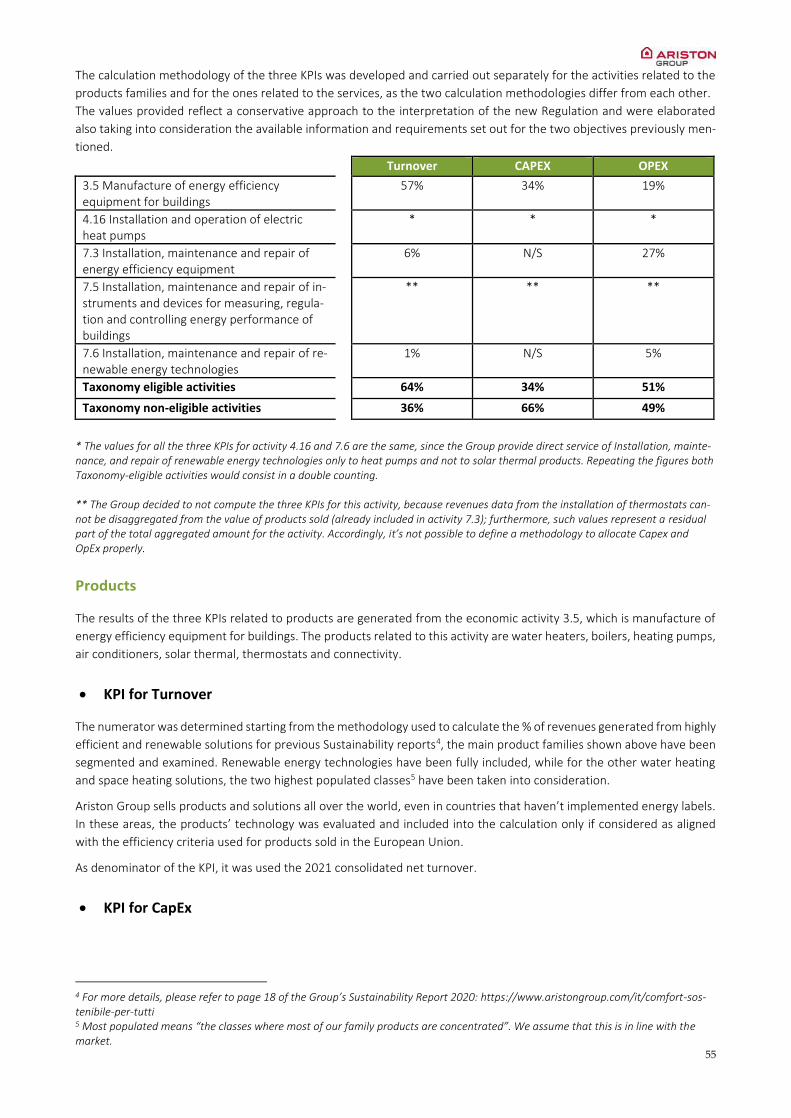
55
The calculation methodology of the three KPIs was developed and carried out separately for the activities related to the
products families and for the ones related to the services, as the two calculation methodologies differ from each other.
The values provided reflect a conservative approach to the interpretation of the new Regulation and were elaborated
also taking into consideration the available information and requirements set out for the two objectives previously men-
tioned.
Turnover CAPEX OPEX
3.5 Manufacture of energy efficiency equipment for buildings
57% 34% 19%
4.16 Installation and operation of electric heat pumps
* * *
7.3 Installation, maintenance and repair of energy efficiency equipment
6% N/S 27%
7.5 Installation, maintenance and repair of in-struments and devices for measuring, regula-tion and controlling energy performance of buildings
** ** **
7.6 Installation, maintenance and repair of re-newable energy technologies
1% N/S 5%
Taxonomy eligible activities 64% 34% 51%
Taxonomy non-eligible activities 36% 66% 49%
* The values for all the three KPIs for activity 4.16 and 7.6 are the same, since the Group provide direct service of Installation, mainte-nance, and repair of renewable energy technologies only to heat pumps and not to solar thermal products. Repeating the figures both Taxonomy-eligible activities would consist in a double counting. ** The Group decided to not compute the three KPIs for this activity, because revenues data from the installation of thermostats can-not be disaggregated from the value of products sold (already included in activity 7.3); furthermore, such values represent a residual part of the total aggregated amount for the activity. Accordingly, it’s not possible to define a methodology to allocate Capex and OpEx properly.
Products
The results of the three KPIs related to products are generated from the economic activity 3.5, which is manufacture of
energy efficiency equipment for buildings. The products related to this activity are water heaters, boilers, heating pumps,
air conditioners, solar thermal, thermostats and connectivity.
KPI for Turnover
The numerator was determined starting from the methodology used to calculate the % of revenues generated from highly
efficient and renewable solutions for previous Sustainability reports4, the main product families shown above have been
segmented and examined. Renewable energy technologies have been fully included, while for the other water heating
and space heating solutions, the two highest populated classes5 have been taken into consideration.
Ariston Group sells products and solutions all over the world, even in countries that haven’t implemented energy labels.
In these areas, the products’ technology was evaluated and included into the calculation only if considered as aligned
with the efficiency criteria used for products sold in the European Union.
As denominator of the KPI, it was used the 2021 consolidated net turnover.
KPI for CapEx
4 For more details, please refer to page 18 of the Group’s Sustainability Report 2020: https://www.aristongroup.com/it/comfort-sos-tenibile-per-tutti 5 Most populated means “the classes where most of our family products are concentrated”. We assume that this is in line with the market.
56
The numerator includes the total amount of CapEx associated to Taxonomy-eligible products related to the activity 3.5;
such investments can be segmented into three main categories:
Product: referring to product family projects;
Sustaining: referring to research and development aimed at developing minor projects, reducing costs, and improving
quality;
Laboratory: assets inside research labs (including property).
After having identified the family products to which each type of the above-mentioned investment refers, every single
investment has been multiplied by the percentage of eligibility of the associated product family.
Moreover, to calculate the final amount of CapEx, also the capital expenditures to the plants that improved the produc-
tion process of the eligible products, have been considered.
Denominator: The denominator contains other intangible assets; land and building; land and building Leasing; plant and
machinery; plant and machinery leasing; other property; plant and equipment; other property, plant and equipment
leasing.
KPI for OpEx
The numerator includes the total amount of operating expenditures of the group associated to Taxonomy-eligible prod-
ucts related to the activity 3.5; such expenditures can be segmented into the following categories:
Sustaining: referring to research and development aimed at developing minor projects, reducing costs, and improving
quality;
General expenses: structural expenditure to be incurred even if no activities are developed;
Electronic: it includes costs related to our 3 main research centers, which supports our Business Unit;
Innovation: it includes costs related to our research center that supports all other research centers in managing pa-
tents, systems, and virtual simulations.
Within the operating expenditures are included also the ones related to connectivity, such as costs for R&D, project
development, product marketing, platform and employees.
As in the methodology use for calculating CapEx, for each type of costs have been identified the corresponding product
family. In this way the costs, which include tax credits and grants but exclude amortization and depreciation, have been
multiplied by the % of eligibility of the associated product family.
Denominator: The denominator contains R&D costs not capitalized, Maintenance costs (not wages); Cleaning costs (ser-
vice cost, not also material); Leasing costs (not including the leasing under IFRS16); Payroll costs of Maintenance employ-
ees.
Services
The results of the three KPIs related to service are generated from the following activities:
Activity 4.16 - Installation and operation of electric heat pumps
Activity 7.3 - Installation, maintenance and repair of energy efficiency equipment
Activity 7.5 - Installation, maintenance and repair of instruments and devices for measuring, regulation and controlling
energy performance of buildings
Activity 7.6 – Installation, maintenance and repair of renewable energy technologies
In order to avoid any double counting in the calculation of the three KPIs, the Group decided not to compute the KPIs for
activity 7.5 - Installation, maintenance and repair of instruments and devices for measuring, regulation and controlling
energy performance of buildings. This because the revenue data from the installation of thermostats cannot be disaggre-
gated from the value of products sold (already included in activity 7.3). Furthermore, such values represent a residual
part of the total aggregated amount for the activity. Accordingly, it’s not possible to define a methodology to allocate the
three KPIs properly.

57
Moreover, since the Group provide direct service of installation, maintenance, and repair of renewable energy technol-
ogies only to heat pumps and not to solar thermal products, the KPIs’ values for activity 4.16 and 7.6 are the same.
Repeating the figures both Taxonomy-eligible activities would have consisted in a double counting.
KPI for Turnover
In order to calculate the turnover originated by the services carried out by Ariston Group, only the services conducted by
the companies or brands that offer direct after-sales services have been taken into account, namely Elco and Gastech.
The numerator of the turnover calculated from the service of installation, maintenance and repair on products previously
identified as eligible. In the calculation of turnover, also Spare Parts are included.
To define the eligibility of these replacements, the Group analysed the association between the selected Spare Parts and
the finished goods, subsequently figuring out their % of eligibility.
Lastly, to calculate the eligible turnover the percentage of eligibility of spare parts has been multiplied by the total turn-
over.
Denominator: As denominator of the KPI, it was used the 2021 consolidated net turnover.
KPI for CapEx
The numerator covers the total amount of CapEx related to the services of installation, maintenance and repair on prod-
ucts previously identified as eligible.
In this calculation, the CapEx coming from the installation of the Spare Parts haven’t been considered as they fall within
the scope of the CapEx of the finished product.
Denominator: The denominator contains other intangible assets; land and building; land and building leasing; plant and
machinery; plant and machinery leasing; other property; plant and equipment; other property, plant and equipment
leasing.
KPI for OpEx
The numerator includes technical staff salaries, car rental, fuel, etc. It was calculated as the residual of the average %
Gross Margin of the Service division. The resulting eco-sustainability percentages for each product category are applied
to this amount to calculate the total value of the numerator.
In this calculation, the OpEx coming from the installation of the Spare Parts haven’t been considered as they within the
scope of the OpEx of the finished product.
Denominator: The denominator contains direct non-capitalized costs that relate to research and development, building
renovation measures, short-term lease, maintenance and repair, and any other direct expenditures relating to the day-
to-day servicing of assets of property, plant and equipment by the undertaking or third party to whom activities are
outsourced that are necessary to ensure the continued and effective functioning of such assets.
Conclusion
The current available definitions as included in EU Taxonomy are broadly formulated which leads to companies having to
interpret how this applies to its business activities and the impact thereof on eligibility. To our knowledge and under-
standing, we applied judgment, interpretations and assumptions based on current available information to date.
The Group has already started to analyse all the other requirements and criteria (DNSH and Minimum Safeguards) nec-
essary to define the alignment with the EU Taxonomy.
An initial internal evaluation of such criteria with relevant departments is currently ongoing to identify the main gaps and
define what immediate actions are needed to ensure a better alignment with the criteria for next year of reporting.
Future guidance could result in more accurate definitions and other decision-making in meeting reporting obligations
that may come into force, which could impact future EU Taxonomy reporting.
Global vision, local action
Ariston Group is the world’s partner in renewable and energy efficient thermal comfort, with a strong and long-estab-
lished presence in Europe, and a growing exposure to North America and the emerging economies of Asia, Middle-East
and Africa.

58
Our history
Bring our values to life
Every company has its own story, culture, and system of values, which characterize its identity. The values of Ariston
Group are rooted in the cultural and industrial heritage of its founder, Aristide Merloni.
“There is no value in the economic success of any industrial initiative, unless it is accompanied by a commitment to
social progress”. This statement by Aristide Merloni has guided the development of the company since its foundation in
1930. Ever since, the Group has grown into a global leader in thermal comfort that has always been committed to making
the world more comfortable, while creating value for its stakeholders.
Sustainability
Excellence
Customers
People
Integrity
Aristide Merloni founds
the Industrie Merloni in
the Marche Region of It-
aly. The Ariston brand is
created and the Com-
pany becomes a leader
in the Italian water
heater segment.
The Group acquires Racold,
the largest water heating
company in India and a
number of historical compa-
nies and brands in the heat-
ing and burner industry, like
Chaffoteaux, ELCO, Cuenod
and Ecoflam.
Ariston Thermo signs an agree-
ment with Mexican conglomer-
ate Grupo Industrial Saltillo for
the acquisition of 100% of
Calorex, a leading company in
Mexico that offers water-heat-
ing solutions for residential and
commercial sectors.
Ariston Group signs an
agreement for the acquisi-
tion of Chromagen, an Is-
raeli company leading in the
provision of renewable hot
water solutions, and lists on
Euronext Milan.
By acquiring Cipag SA and Domotec AG,
Ariston Thermo confirms its leadership in
Switzerland. The Company acquires also
ATAG Heating, a Dutch high-end brand in
the heating industry, Heat Tech Geysers
(SA), the second player in the South Afri-
can market for water heaters and, in 2015,
debuts on the Danish market with the ac-
quisition of Gastech-Energi A/S.
The Company acquires NTI, the brand leader
in Canada and one of the leaders in the USA
in the condensing boiler segment, HTP, a
well-established brand on the US high-effi-
ciency thermal comfort market, and Atmor,
an Israeli company which distributes its in-
stantaneous electric water heaters in 40
countries worldwide.
1980-2000
2011-2015
2016-2017
2018-2019
2020-2021
1930-1970
59
Believe in sustainability “Think ahead. Energy efficiency and comfort are possible and necessary. It’s worth it.” Ariston Group believes in sus-
tainable growth and acts accordingly. We are committed to guaranteeing the maximum comfort at the minimum
energy cost. We contribute to the conservation of our planet by granting access to the most efficient technologies and
the best services all over the world.
Inspire through excellence
“Create opportunities and commit to making them happen. Explore, learn, improve.” Ariston Group pursues the goal
of being the leader in its field. We aim to constantly improve ourselves through innovation and the continuous gen-
eration of new ideas. We encourage our people to nurture a passion for learning and exploring new approaches to
find multiple solutions. We look for individuals that can ensure fast and accurate execution as well as adapt to con-
stantly shifting conditions and international contexts.
Start from customers
“Listen, stay tuned and care. Deliver solutions that exceed expectations.” Ariston Group makes customer satisfaction
a top priority, as it seeks to create value by offering products of the topmost quality and guaranteeing an excellent
service. We look after our customers, accommodating their needs and providing the best available solutions.
People come first
“Strength lies in diversity. Give people a chance. Pave the way to make them successful.” Ariston Group believes in
teamwork and diversity, fosters the encounter of different cultures, and welcomes new perspectives. We encourage
resourcefulness, participation, and accountability. We believe in merit and create growth opportunities, developing
the full potential of the Group’s best resources.
Act with integrity
“Operating with respect and honesty is not a choice. It’s a duty.” Ariston Group encourages its people to act according
to the highest standards of ethics and honesty. Everyone’s behavior must be based on respect and fairness towards
colleagues, customers, suppliers and business partners.
The Aristide Merloni Foundation
The Aristide Merloni Foundation was set up in 1963 at the behest of the eponymous founder with the goal of sup-
porting the creation of new businesses in the area surrounding Fabriano, where the first production sites were lo-
cated. Since 2016, the Foundation has been launching a series of projects aiming at enhancing local communities
through digital competencies and new technologies. The Foundation’s projects are reunited under the “Save the
Apps” initiative. Among the projects there are interactive digital maps to share information about critical conditions
across the territory, tele-medicine services, home-sharing apps, e-learning platform for digital entrepreneurs and local
food e-commerce. In 2021, such innovative initiatives have been pursued with various stakeholders, from the farmers
involved in local goods e-commerce to the University of Ascoli Piceno and San Ginesio’s major, who participated in
the home sharing project.
At the same time, 2021 saw the setting of HAMU, an Inter-regional innovation Hub involving Abruzzo, Marche and
Umbria. Overall, 10 research centers, business community members, universities and foundations brought HAMU to
life. The Hub, which has a no-profit business model, has three aims: contributing to the elaboration of strategic pro-
jects for the regions involved, creating meeting occasions for people with various backgrounds, from science to
technology to business and, finally, proposing policy orientations for the destination of Next Generation EU, Green
Deal and other EU funds in the three regions involved. HAMU’s current open projects are promoting the diffusion of
start-up and innovative entrepreneurship’s mindset, mapping financial tools to foster business in the HAMU perimeter
and studying the regions’ needs for strategic competencies for competitive business, starting from technical schools.
The values and the commitments on which the company's business and sustainability strategy are based also guide the
structure of the coming chapters of this document, which are divided as follows:
Act with integrity: how Ariston Group demands its people to act according to the highest standards of ethics
and honesty towards colleagues, customers, suppliers and business partners.
Believe in Sustainability: how Ariston Group believes in sustainable growth and acts accordingly, commits to
60
guaranteeing the maximum comfort at the minimum energy cost, contributes to the conservation of our planet
by granting access to the most efficient technologies and the best services all over the world.
People Come First: how Ariston Group believes in teamwork and diversity, fosters the encounter of different
cultures and welcomes new perspective, encourages resourcefulness, participation and accountability, believes
in merit and creates growth opportunities.
Creating value for stakeholders: how Ariston Group shares its value generation levers with its host communities
around the world, cultivating and strengthening relationships with its stakeholders.
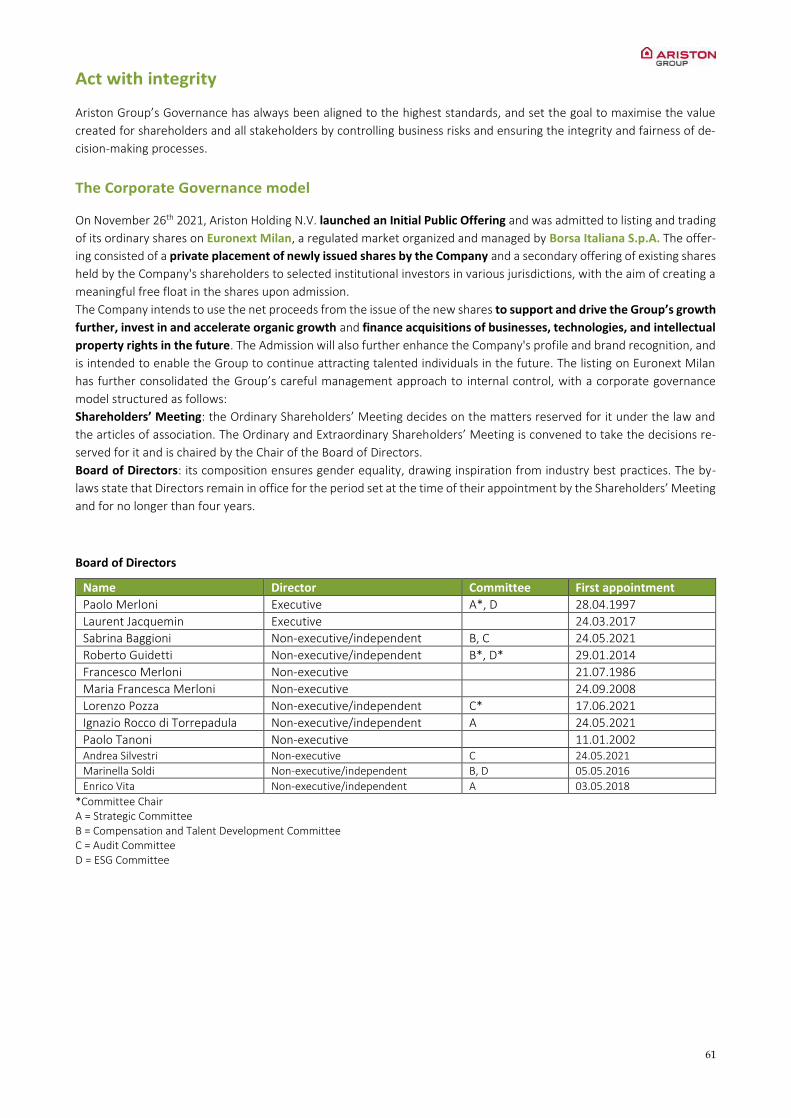
61
Act with integrity
Ariston Group’s Governance has always been aligned to the highest standards, and set the goal to maximise the value
created for shareholders and all stakeholders by controlling business risks and ensuring the integrity and fairness of de-
cision-making processes.
The Corporate Governance model
On November 26th 2021, Ariston Holding N.V. launched an Initial Public Offering and was admitted to listing and trading
of its ordinary shares on Euronext Milan, a regulated market organized and managed by Borsa Italiana S.p.A. The offer-
ing consisted of a private placement of newly issued shares by the Company and a secondary offering of existing shares
held by the Company's shareholders to selected institutional investors in various jurisdictions, with the aim of creating a
meaningful free float in the shares upon admission.
The Company intends to use the net proceeds from the issue of the new shares to support and drive the Group’s growth
further, invest in and accelerate organic growth and finance acquisitions of businesses, technologies, and intellectual
property rights in the future. The Admission will also further enhance the Company's profile and brand recognition, and
is intended to enable the Group to continue attracting talented individuals in the future. The listing on Euronext Milan
has further consolidated the Group’s careful management approach to internal control, with a corporate governance
model structured as follows:
Shareholders’ Meeting: the Ordinary Shareholders’ Meeting decides on the matters reserved for it under the law and
the articles of association. The Ordinary and Extraordinary Shareholders’ Meeting is convened to take the decisions re-
served for it and is chaired by the Chair of the Board of Directors.
Board of Directors: its composition ensures gender equality, drawing inspiration from industry best practices. The by-
laws state that Directors remain in office for the period set at the time of their appointment by the Shareholders’ Meeting
and for no longer than four years.
Board of Directors
Name Director Committee First appointment
Paolo Merloni Executive A*, D 28.04.1997
Laurent Jacquemin Executive 24.03.2017
Sabrina Baggioni Non-executive/independent B, C 24.05.2021
Roberto Guidetti Non-executive/independent B*, D* 29.01.2014
Francesco Merloni Non-executive 21.07.1986
Maria Francesca Merloni Non-executive 24.09.2008
Lorenzo Pozza Non-executive/independent C* 17.06.2021
Ignazio Rocco di Torrepadula Non-executive/independent A 24.05.2021
Paolo Tanoni Non-executive 11.01.2002 Andrea Silvestri Non-executive C 24.05.2021
Marinella Soldi Non-executive/independent B, D 05.05.2016
Enrico Vita Non-executive/independent A 03.05.2018
*Committee Chair A = Strategic Committee B = Compensation and Talent Development Committee C = Audit Committee D = ESG Committee

62
Figure 1: Board of Directors
Four committees have been set up within the Board of Directors of Ariston Holding N.V., organised as follows:
Strategic Committee: it is tasked with advising the Board of Directors on strategic business decisions, business models,
the organization, operational approaches, and growth opportunities.
Compensation and Talent Development Committee: it has the task of supporting the Board of Directors in defining
selection and assessment criteria, proposing remuneration policies, and drawing succession plans for the senior manage-
ment and Board Members.
Audit Committee: it supports the Board of Directors in supervising financial reporting, the risk management approach,
and the Control System. In addition, it coordinates and monitor matters related to internal and external audit, financial
resources, IT and Cybersecurity, and tax policy.
ESG Committee: it has the task of supporting the Board of Directors in defining the ESG vision and the plan of initiatives,
monitoring its implementation, supervising communication activities, and defining the Group's ESG culture.
The Group has also implemented the provisions of Legislative Decree no. 231/2001, appointing a “Organismo di Vigi-
lanza” composed of three members, with an external chair, adopting a constantly updated Organisation and Manage-
ment Model, and complying with the procedures and information flows required to effectively implement regulatory
provisions. The “Organismo di Vigilanza” reports annually to the Board of Directors, informing it of any critical issues
encountered, and constantly monitors problems until they are overcome. Legislative Decree 231/2001 has also been im-
plemented in the Group's Italian subsidiaries.
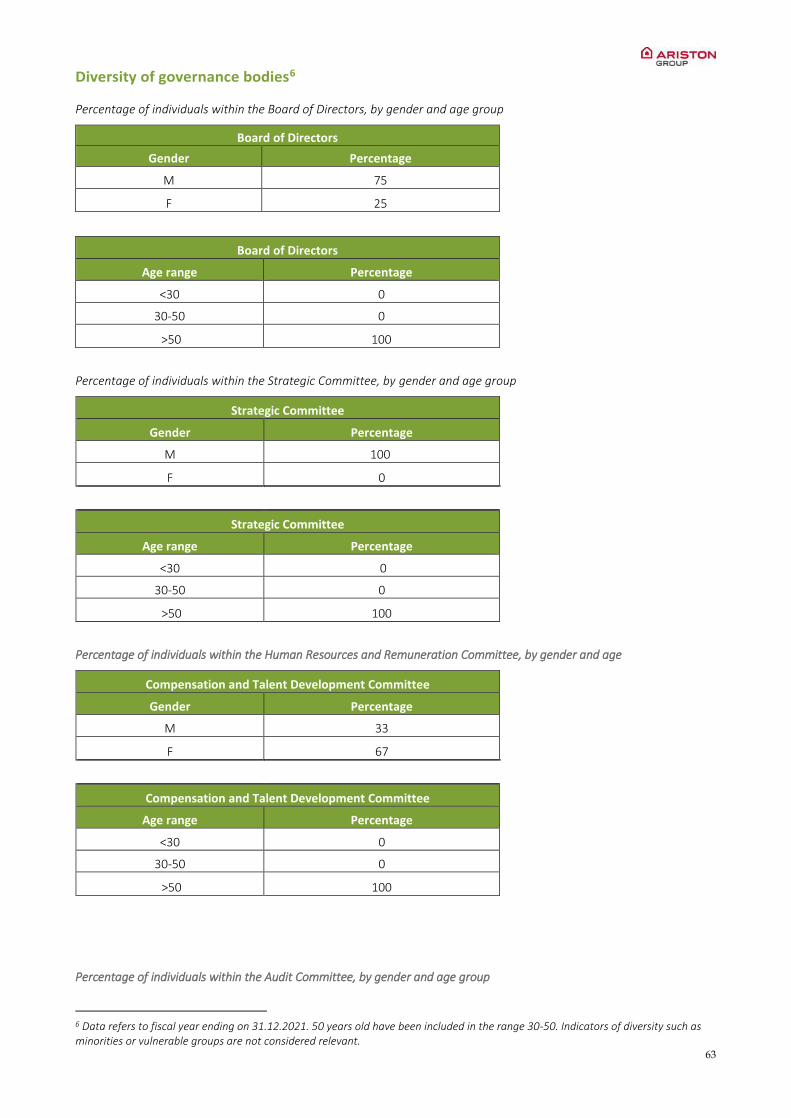
63
Diversity of governance bodies6
Percentage of individuals within the Board of Directors, by gender and age group
Board of Directors
Gender Percentage
M 75
F 25
Board of Directors
Age range Percentage
<30 0
30-50 0
>50 100
Percentage of individuals within the Strategic Committee, by gender and age group
Strategic Committee
Gender Percentage
M 100
F 0
Strategic Committee
Age range Percentage
<30 0
30-50 0
>50 100
Percentage of individuals within the Human Resources and Remuneration Committee, by gender and age
Compensation and Talent Development Committee
Gender Percentage
M 33
F 67
Compensation and Talent Development Committee
Age range Percentage
<30 0
30-50 0
>50 100
Percentage of individuals within the Audit Committee, by gender and age group
6 Data refers to fiscal year ending on 31.12.2021. 50 years old have been included in the range 30-50. Indicators of diversity such as minorities or vulnerable groups are not considered relevant.
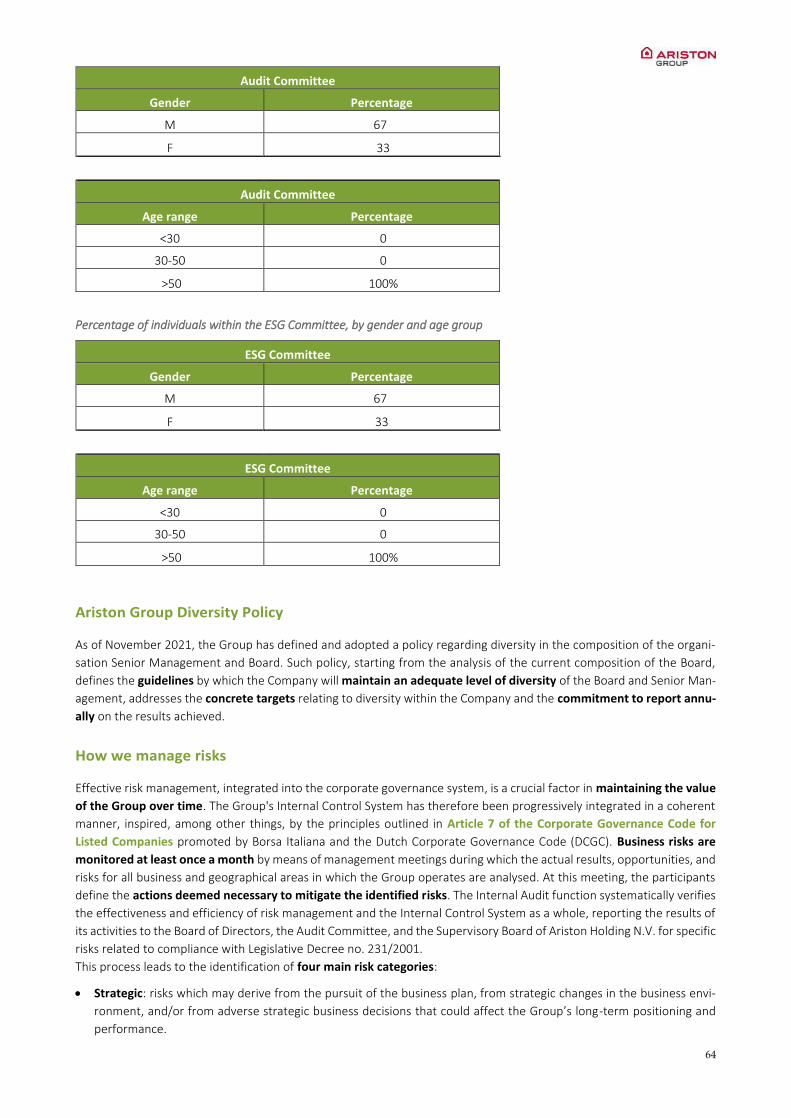
64
Audit Committee
Gender Percentage
M 67
F 33
Audit Committee
Age range Percentage
<30 0
30-50 0
>50 100%
Percentage of individuals within the ESG Committee, by gender and age group
ESG Committee
Gender Percentage
M 67
F 33
ESG Committee
Age range Percentage
<30 0
30-50 0
>50 100%
Ariston Group Diversity Policy
As of November 2021, the Group has defined and adopted a policy regarding diversity in the composition of the organi-
sation Senior Management and Board. Such policy, starting from the analysis of the current composition of the Board,
defines the guidelines by which the Company will maintain an adequate level of diversity of the Board and Senior Man-
agement, addresses the concrete targets relating to diversity within the Company and the commitment to report annu-
ally on the results achieved.
How we manage risks
Effective risk management, integrated into the corporate governance system, is a crucial factor in maintaining the value
of the Group over time. The Group's Internal Control System has therefore been progressively integrated in a coherent
manner, inspired, among other things, by the principles outlined in Article 7 of the Corporate Governance Code for
Listed Companies promoted by Borsa Italiana and the Dutch Corporate Governance Code (DCGC). Business risks are
monitored at least once a month by means of management meetings during which the actual results, opportunities, and
risks for all business and geographical areas in which the Group operates are analysed. At this meeting, the participants
define the actions deemed necessary to mitigate the identified risks. The Internal Audit function systematically verifies
the effectiveness and efficiency of risk management and the Internal Control System as a whole, reporting the results of
its activities to the Board of Directors, the Audit Committee, and the Supervisory Board of Ariston Holding N.V. for specific
risks related to compliance with Legislative Decree no. 231/2001.
This process leads to the identification of four main risk categories:
Strategic: risks which may derive from the pursuit of the business plan, from strategic changes in the business envi-
ronment, and/or from adverse strategic business decisions that could affect the Group’s long-term positioning and
performance.

65
Operational: risks which may affect internal processes, people, systems, and/or external resources that affect the
Group's ability to pursue its strategy.
Compliance: risks of non-compliance with laws, regulations, local standards, the Code of Ethics, internal policies, and
procedures.
Financial: risks relating to uncertainty over returns and the potential for financial losses due to financial performance,
together with the risks concerning the reliability of the financial information provided in reports.
For further information about specific Environmental, Social & Personnel risk that have been identified in the categories
listed above, please see the Risk Management dedicated chapter (5.1).
During 2021, the Group adopted a new ERM (Enterprise Risk Management) process. In this first step, the focus has been
on five risks considered high priorities for 2021. Further on, the risk mitigation methodology will be consistently extended
to manage all other identified risks. The five risks the Group has focused on in 2021 are:
Ability to expand its range of products, delivering innovative solutions to meet customer needs and preferences,
and compliant with regulatory requirements. The Group's future success will depend on its ability to consistently
address changes in end-user demands and develop and maintain a product range that meets evolving customer pref-
erences and that is in compliance with the latest local regulatory requirements.
Dependence on/Scarcity of raw materials and components. The Group must manage and mitigate the supply chain
pressures and inflationary trends related to the availability, quality, and cost of raw materials, component parts, and
specific finished products.
Employee health and safety. The Group strives to manage at best its employee health & safety, rigorously complying
with applicable laws.
Credit Risk. The Group aims to ensure the highest level of protection from the risk of insolvency on the part of cus-
tomers, especially in a critical period impacted by the Covid-19 pandemic.
The global Covid-19 pandemic, or other global public health pandemics, may have an adverse effect on the
Group's business, results of operations, and financial condition. The Group aims to ensure the highest level of safety
amid the Covid19 pandemic.
Environment, health and safety management
In order to identify and manage risks and improvement areas concerning Environmental, Health and Safety issues, Ariston
Group has implemented an Occupational Health and Safety Management System and an Environmental Management
System. Both are certified by the British Standards Institution certification in accordance, respectively, with the interna-
tional standards ISO 14001:2015 and ISO 45001:2018.
The two Management Systems, also integrated with the ISO 9001:2015 certified Quality Management System, lay the
basis of the company strategy for the continuous improvement of environmental policies and prevention policies for the
systematic control of risks.
The System, described in the HSE Management Manual, is structured according to a cyclical sequence of planning, imple-
mentation, monitoring and review phases and provides all levels of the organisation with harmonised tools and guidelines
to pursue the objectives expressed by the Group's HSE Policy and ensure legislative compliance.
In particular, the system is based on the following processes:
Context Analysis, to determine the external and internal factors relevant to the organization’s ambition and which
influence its ability to achieve the HSE Management System goals, but also the needs and expectations of interested
parties.
Roles and responsibilities definition, thanks to an organisational structure that guarantees interactions between the
Corporate and local structures in order to systematically ensure governance of HSE aspects.
Hazard identification and risk assessment through a methodology for risk assessment aimed at timely and continuous
identification of hazards and control of all risks to which workers, suppliers, visitors and any other person with access
to workplaces may be exposed.

66
Assessment of environmental aspects associated with production processes, products and services that the organi-
zation can control and those over which it can exert an influence.
Change management thanks to a process to preventively intercept and manage any change that could influence the
systems and processes, to control potential impacts on the environment, health and safety of workers.
Legislative compliance monitoring to ensure that all applicable legal and regulatory requirements are identified and
continuously updated in accordance with any changes that may occur.
HSE annual Internal Audit with the aim of verifying the effectiveness of the HSE Management System, guaranteeing
the correct application within the Organisation of the procedures identified by the Management System and guiding
the local structures in the identification of corrective actions and improvements necessary to guarantee legislative
compliance, the achievement of set objectives and continuous improvement.
Management Systems Review by Top Management at regularly planned intervals to ensure its suitability, adequacy
and effectiveness.
The Management Review outputs are translated into the update and planning of improvement actions and the definition
of goals.
In particular, during the last review in 2021, the following results were discussed, among others:
5% reduction in the injury frequency rate;
4% reduction in electricity rate: kWh/total production pieces;
1% reduction in gas rate: Nm3/ total production pieces.
231 Organisational model
Ariston kept the Organisation and Management Model required to Italian companies under Legislative Decree
231/2001 to prevent the commission of crimes and unethical conduct. Ariston Holding N.V.’s Organisation and Manage-
ment Model has been updated by the Board of Directors at the meeting held on 1 June 2021. This version incorporates
the organisational, regulatory, and corporate structural changes arising from the merger with Ariston Thermo Interna-
tional S.r.l. and the ensuing changes in the company’s form and name to Ariston Thermo Holding S.p.A., in a consistent
and harmonised manner. The model thus illustrates the general rules of conduct that all recipients must follow to
prevent the commission of the updated list of crimes provided by Legislative Decree 231/2001, as the Board of Directors
decided to keep the Company fully compliant with Legislative Decree 231/2001, in terms of both the aspects of the Or-
ganizational Model and the appointment of the Organismo di Vigilanza, even after the domiciliation of the Company in
the Netherlands. In fact, since it has its main place of business in Italy, and in accordance with Legislative Decree 231/2001
and the criminal code in terms of enforceability of these legal provisions, the Company decided to remain fully compliant
with these laws and will update its Organizational model in 2022 to include provisions related to its status as a listed
company after the listing on 26 November 2021.
Whistleblowing
In 2018 Ariston Group, being committed to the highest standards of Corporate Governance in all respects— ethics, in-
tegrity, impartiality, honesty, transparency, and accountability—started implementing its Whistleblowing system. The
aim of this tool and its related process is to provide the necessary level of accountability and allow employees and third
parties to report information that can help fight criminality and wrongdoing. To streamline the system even further
and allow internal and external people to communicate with the company, the Group made a dedicated section allowing
to file reports anonymously available on its website—a convenient and instant channel that fully protects the whistle-
blower’s privacy.
Antitrust regulation
Ariston Group runs its business fully compliant with competition rules and their foundational principles of merit, fair-
ness, and loyalty. The Group requires all employees worldwide to maintain a conduct that is fully consistent with the
provisions of national and international antitrust laws and regulations, in compliance with the Code of Conduct and the
67
Antitrust Vade mecum which form an integral part of the Group’s Code of Ethics. The Group’s organisation model allows
to promptly verify compliance with the relevant EU regulations. Since 2018, the Group has been performing a thorough
assessment and refreshing its antitrust programme, including a dedicated manual and guidelines, and is offering online
training to all employees concerned to raise awareness about applicable laws and the relevant principles.
Anti-money laundering and trade compliance
In 2019, the Company adopted an organisational model that allows to ensure the Group’s compliance with Anti Money
Laundering (AML) and International Trade Compliance regulations at national, European, and international level. Note-
worthy among them are the so-called Office of Foreign Assets Control (OFAC) Regulations of the United States and the
specific Regulations adopted by the European Union with respect to sanctions and restrictions against certain countries
and entities as well as to dual use—including Regulation 428/2009. The main tool adopted by the Company to this end
is the Trade Compliance Manual, which lists the various measures in place to prevent conduct contrary to Trade Compli-
ance regulations. These consist of specific conduct procedures that involve several checks and reviews throughout the
performance of sensitive business operations. In 2021, Ariston Group decided to purchase a new organisational tool for
Trade Compliance: software dedicated to running individual and collective checks on employees, customers, and sup-
pliers as well as conducting specific investigations where required. All such measures are referenced in the Code of
Ethics, of which they form an integral part. Twice a year, the Group, through a tool managed by an external supplier,
conducts a general review of 10,000 counterparties (including suppliers, customers, and employees), with respect to the
ones located in the so-called Sensitive Countries, to identify any person or entity sanctioned under OFAC, UN, and EU
Sanctions Lists. The Group analyses the findings and, if necessary, asks an external advisor to perform additional Due
Diligence, halting transactions where required. This process is repeated also before beginning a new business relationship
in a sensitive region. Moreover, in 2021 the Group conducted a general review about any potential dual use and/or
components with negative result assessed by an external advisor.
Anti-bribery
As clearly stated in its Code of Ethics, Ariston Group does not tolerate any acts of active or passive corruption involving
any public or private entity or individual. The Group’s Companies undertake to comply with and enforce applicable anti-
bribery legislation. Moreover, the Code explicitly forbids taking advantage or boasting of existing or alleged relationships
with Public Administration officials to give or promise money or other utilities to oneself or others as the price for illicit
mediation with the public official, or to compensate him or her with respect to the performance of his/her functions or
powers.
Respect for Human Rights
Ariston Group is aware that respect for human rights is a fundamental issue, especially for companies operating inter-
nationally and in close contact with countries characterised by complex socio-political scenarios and in which the rights
of workers and the relationships of partners and suppliers are not always disciplined by regulations equivalent to Euro-
pean standards.
The principles of legality, dignity and equality expressed in the Group's Code of Ethics and values, as well as the choice
of partners with proven reliability in managing local workers and suppliers, are the foundations on which the Group builds
its management of this issue. More specifically, no risks related to respect for human rights have emerged in the context
of Enterprise Risk Management activities and therefore, at the time being, no formalised policy or mitigation plan are in
place to manage the topic.
Given the value attributed to the topic and the efforts put in constantly operating in line with its values, the Group is
committed to undertaking a dedicated assessment to identify any residual risks concerning the respect of human rights
within the boundaries of its industrial back-end and, in case any evidence of unmanaged risks may arise, to develop a
related mitigation strategy.
Towards a governance of sustainability
To strengthen its commitment towards building a sustainable future, in 2020 the Group set out on a journey to define
the strategy and goals that will guide it in this direction over the upcoming years. Consistently with how strategic this

68
challenge is to the Company, three levels of responsibility on ESG topics were introduced: a ESG Committee at the Board
level, a ESG Council at the Group Executive level, and a dedicated ESG function reporting to the Chief Strategy Officer.
These three governance levels are fully dedicated to the topic, in line with the Group’s vision of Sustainable Comfort for
Everyone, and its goal of embedding sustainability into its corporate strategy and of strengthening accountability to all
stakeholders.
The ESG Committee has mandates in different areas: it provides guidance - to steer the Group’s strategy in terms of ESG
visions and commitment and approves the Group’s materiality matrix, activities and KPIs related to the achievement of
the targets linked to the material topics. The Committee has also a key role in the execution phase, in terms of monitoring
the targets’ achievement and progress of actions, including areas of work required by ESG rating agencies. Finally, it
approves the Group’s ESG Communication Plan and the reporting methods related to ESG issues, promotes the dissem-
ination of Sustainability Culture within the Group, and supervises the activities of listening, dialogue and involvement of
stakeholders.
The ESG Council is a cross-country and cross-functional roundtable for discussion and collaboration among some of the
Global Executive Committee members and the ESG Manager to discuss the challenges posed by Environmental, Social
and Governance topics and develop the strategies needed to surmount them. The Council is composed of 10 members,
including the Executive Chairman and the CEO; it validates the ESG Manager proposals before presenting them to the
ESG Committee.
The ESG function, led by a dedicated ESG Manager, works with all the internal functions and external stakeholders to
address the organization’s approach to Environmental, Social and Governance responsibility with the goal of minimizing
negative business impacts while maximising positive ones. The ESG Manager’s pivotal role includes: developing and over-
seeing the overall execution, mission, and effectiveness of the ESG strategy and goals, fostering cross-functional and
cross-country collaboration to facilitate performance evaluations that are timely and constructive, defining and imple-
menting organizational policies that address ESG concerns, promoting an ESG culture across the whole corporation at all
levels, and preparing all the external reporting required by national and international regulations.

69
Believe in sustainability
Ariston Group has placed energy efficiency at the heart of its sustainable growth strategy. Renewable and high efficiency
products and solutions can make a decisive contribution to reaching the environmental goals in the building sector and
reducing energy consumption, sacrificing comfort.
Our performance in 2021
CO2 reductions and savings - product 2019 2020 2021
Total energy saved through Ariston Group's Technologies [TWh]
2.18 3.07 4.06
Tons of CO2 emissions saved through Ariston Thermo Group's Technologies [tons of CO2 eq.]
430,341.79 615,915.93 831,049.60
Trees that would have to be planted to absorb the same amount of CO2
[unit] 35,861,816 51,326,328 69,254,133
Hectares of trees 35.862 51.326 69.254
Equivalent yearly automobiles [unit] 35,863,835 51,328,348 69,256,154
CO2 reductions and savings - process
2019 2020 2021
Total electricity saved through renewable and high efficiency in operations and buildings [TWh]
0.004
0.001
-0.013 due to significant
production increase vs 2020. Nevertheless efficiency has
improved: there was a 4% reduction in electricity
rate (kWh/total production pieces)
Tons of CO2 emissions saved through Ariston Thermo Group high efficiency in operations and buildings [tons of CO2 eq.]
1,985.68
640.10
-6,065.76 due to significant production increase vs 2020. Neverthe-less efficiency has improved: there was a 4% reduction in electricity rate (kWh/total
production pieces)
Trees that would have to be planted to absorb the same amount of CO2
[unit]
165,473.20
53,342.01
-505,479.74
Hectares of trees 165.5 53.3 -505.5
Equivalent yearly automobiles [unit] 472.78 152.41 -1,444.23
Total gas saved through high efficiency in operations and buildings [Nm3]
3,527,186
-636,897
-2,614,980.73 due to significant production increase vs 2020. Neverthe-less efficiency has improved: there was a 1% reduction in gas rate (Nm3/ total produc-
tion pieces)
Tons of CO2 emissions saved through Ariston Thermo Group high efficiency in operations and buildings [tons of CO2 eq.]
3,721.18
-671.93
-2,758.80 due to significant production increase vs 2020. Neverthe-less efficiency has improved: there was a 1% reduction in gas rate (Nm3/ total produc-
tion pieces)
Trees that would have to be planted to absorb the same amount of CO2 [unit]
310,098.42
-55,993.88
-229,900.39
Hectares of trees 310.1 -56.0 -229.9
Equivalent yearly automobiles [unit] 886.00 -159.98 -656.86
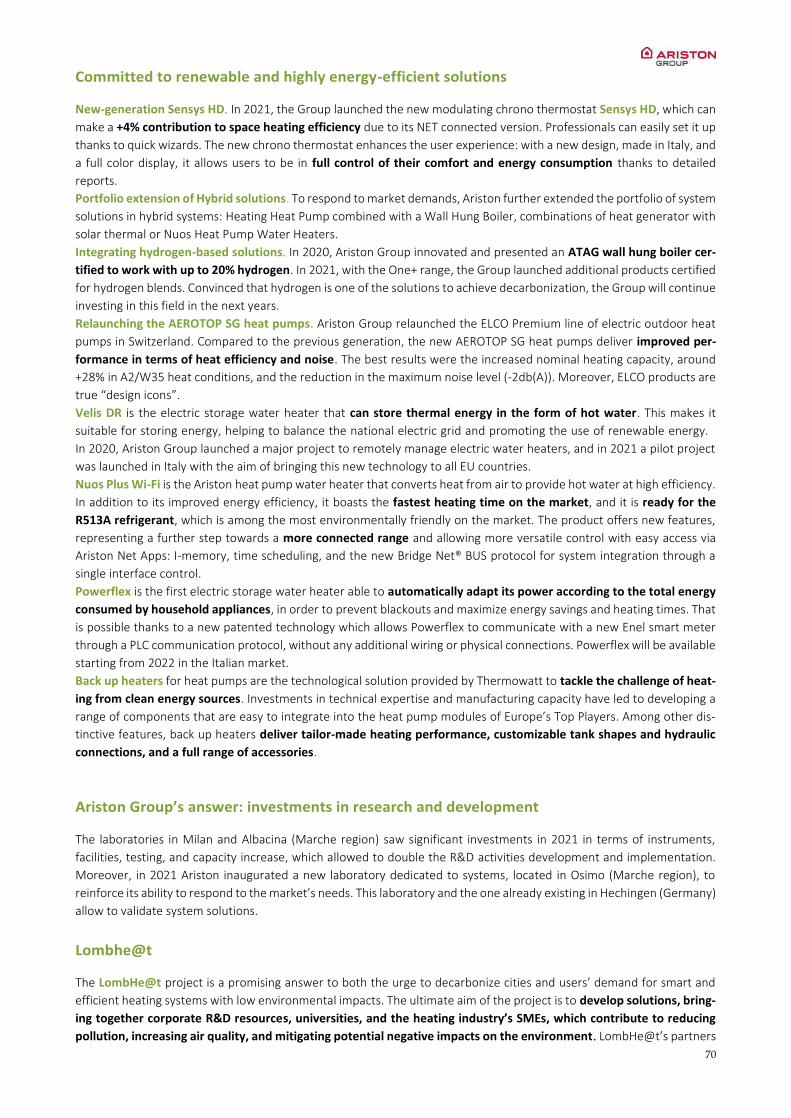
70
Committed to renewable and highly energy-efficient solutions
New-generation Sensys HD. In 2021, the Group launched the new modulating chrono thermostat Sensys HD, which can
make a +4% contribution to space heating efficiency due to its NET connected version. Professionals can easily set it up
thanks to quick wizards. The new chrono thermostat enhances the user experience: with a new design, made in Italy, and
a full color display, it allows users to be in full control of their comfort and energy consumption thanks to detailed
reports.
Portfolio extension of Hybrid solutions. To respond to market demands, Ariston further extended the portfolio of system
solutions in hybrid systems: Heating Heat Pump combined with a Wall Hung Boiler, combinations of heat generator with
solar thermal or Nuos Heat Pump Water Heaters.
Integrating hydrogen-based solutions. In 2020, Ariston Group innovated and presented an ATAG wall hung boiler cer-
tified to work with up to 20% hydrogen. In 2021, with the One+ range, the Group launched additional products certified
for hydrogen blends. Convinced that hydrogen is one of the solutions to achieve decarbonization, the Group will continue
investing in this field in the next years.
Relaunching the AEROTOP SG heat pumps. Ariston Group relaunched the ELCO Premium line of electric outdoor heat
pumps in Switzerland. Compared to the previous generation, the new AEROTOP SG heat pumps deliver improved per-
formance in terms of heat efficiency and noise. The best results were the increased nominal heating capacity, around
+28% in A2/W35 heat conditions, and the reduction in the maximum noise level (-2db(A)). Moreover, ELCO products are
true “design icons”.
Velis DR is the electric storage water heater that can store thermal energy in the form of hot water. This makes it
suitable for storing energy, helping to balance the national electric grid and promoting the use of renewable energy.
In 2020, Ariston Group launched a major project to remotely manage electric water heaters, and in 2021 a pilot project
was launched in Italy with the aim of bringing this new technology to all EU countries.
Nuos Plus Wi-Fi is the Ariston heat pump water heater that converts heat from air to provide hot water at high efficiency.
In addition to its improved energy efficiency, it boasts the fastest heating time on the market, and it is ready for the
R513A refrigerant, which is among the most environmentally friendly on the market. The product offers new features,
representing a further step towards a more connected range and allowing more versatile control with easy access via
Ariston Net Apps: I-memory, time scheduling, and the new Bridge Net® BUS protocol for system integration through a
single interface control.
Powerflex is the first electric storage water heater able to automatically adapt its power according to the total energy
consumed by household appliances, in order to prevent blackouts and maximize energy savings and heating times. That
is possible thanks to a new patented technology which allows Powerflex to communicate with a new Enel smart meter
through a PLC communication protocol, without any additional wiring or physical connections. Powerflex will be available
starting from 2022 in the Italian market. Back up heaters for heat pumps are the technological solution provided by Thermowatt to tackle the challenge of heat-
ing from clean energy sources. Investments in technical expertise and manufacturing capacity have led to developing a
range of components that are easy to integrate into the heat pump modules of Europe’s Top Players. Among other dis-
tinctive features, back up heaters deliver tailor-made heating performance, customizable tank shapes and hydraulic
connections, and a full range of accessories.
Ariston Group’s answer: investments in research and development
The laboratories in Milan and Albacina (Marche region) saw significant investments in 2021 in terms of instruments,
facilities, testing, and capacity increase, which allowed to double the R&D activities development and implementation.
Moreover, in 2021 Ariston inaugurated a new laboratory dedicated to systems, located in Osimo (Marche region), to
reinforce its ability to respond to the market’s needs. This laboratory and the one already existing in Hechingen (Germany)
allow to validate system solutions.
Lombhe@t
The LombHe@t project is a promising answer to both the urge to decarbonize cities and users’ demand for smart and
efficient heating systems with low environmental impacts. The ultimate aim of the project is to develop solutions, bring-
ing together corporate R&D resources, universities, and the heating industry’s SMEs, which contribute to reducing
pollution, increasing air quality, and mitigating potential negative impacts on the environment. LombHe@t’s partners

71
are: A2A Calore e Servizio, Ariston Group, Enersem, and Fondazione Politecnico. In the field of electric heat pumps, the
Group focused on implementing a dynamic model to improve energy efficiency, developing heat pumps with low GWP
refrigerators—and also reducing noise pollution. The results achieved so far have shown improved seasonal performance:
for every unit of electricity, 5 units of heat were transferred to the end user’s heating system (SCOP of 5)7, with an 80%
reduction in GHG emissions generated by Ariston’s products and a 75% reduction in noise pollution. Moreover, the Group
filed 4 patent applications in 2021.
LombHe@t also supported the development of thermally driven heat pumps (TDHP) in order to further develop of the
absorption technology that relies on natural refrigerant. The technology is targeted for the retrofit applications, and is
characterized by a high seasonal performance and a high level of quietness, to accommodate the most demanding
application environment. Indeed, such technology can contribute to the decarbonization path of the hard to abate exist-
ing building stock and to accelerate and exploit the potential of the green energy vectors. This work, planned to be com-
pleted by 2022, already led to filing a patent application.
The North America’s case: the importance of teamwork to develop innovation
The Ariston Group placed a significant focus on teamwork and the sharing of critical competencies between central and
local teams during 2021. This was especially true in North America, with the establishment of branding projects, invest-
ments in local staffing and office spaces, and the collaboration on bringing new and innovative products to market.
Central and local teams came together to design and bring several new products to market, including a new heat pump
water heater, a dual heat exchanger heating boiler, and a flexible capacity electric water heater. Local and central teams
have also embarked on projects to implement the SAP ERP in each region as a platform that supports growth and further
integration into the greater Ariston Group. This teamwork is combined with focused efforts by local sales and marketing
teams to increase brand awareness and continue to capture market share with the outstanding offering of more efficient
heating and water heating products. In 2021, the Group established collaborative foundations and systems that will be
the building blocks of its future success in North America.
Sustainability begins at production sites
After a pivotal period, the Group implemented an advanced energy management platform at the Genga, Cerreto and
Arcevia production sites. This is an energy consumption monitoring system, aimed at providing KPIs and reports on the
real-time consumption levels of each energy carrier. Thanks to these data, it is possible to analyse consumption, gener-
ating reliable reports and finding corrective actions to increase energy efficiency as well as optimize production processes
and energy supply contracts to slash costs. The Wuxi plant is also equipped with a consumption monitoring system, re-
cording energy, gas and water levels for each area and machine. Such recordings represent a starting point for efficiency-
increasing actions and implementations.
An additional effort to curb CO2 emissions comes from research activities the Group promoted in 2020, with the aim to
study alternatives to product painting on the surface of plastic materials—a process that is intrinsically energy intensive
and polluting. The pilot project launched in 2020 showed the potential to reduce emissions by an annual 1,800t of CO2,
a figure which is set to increase significantly when the initiative will be extended to a wider range of product categories.
The energy management platform is the innovative e-solution that the Group has chosen to monitor consumption. It can
collect energy data, visualize them in real time, and provide specific analyses to enable smart energy management.
Monthly consumption of the measuring point of one of the Group’s production sites
7 Seasonal Coefficient of Performance.
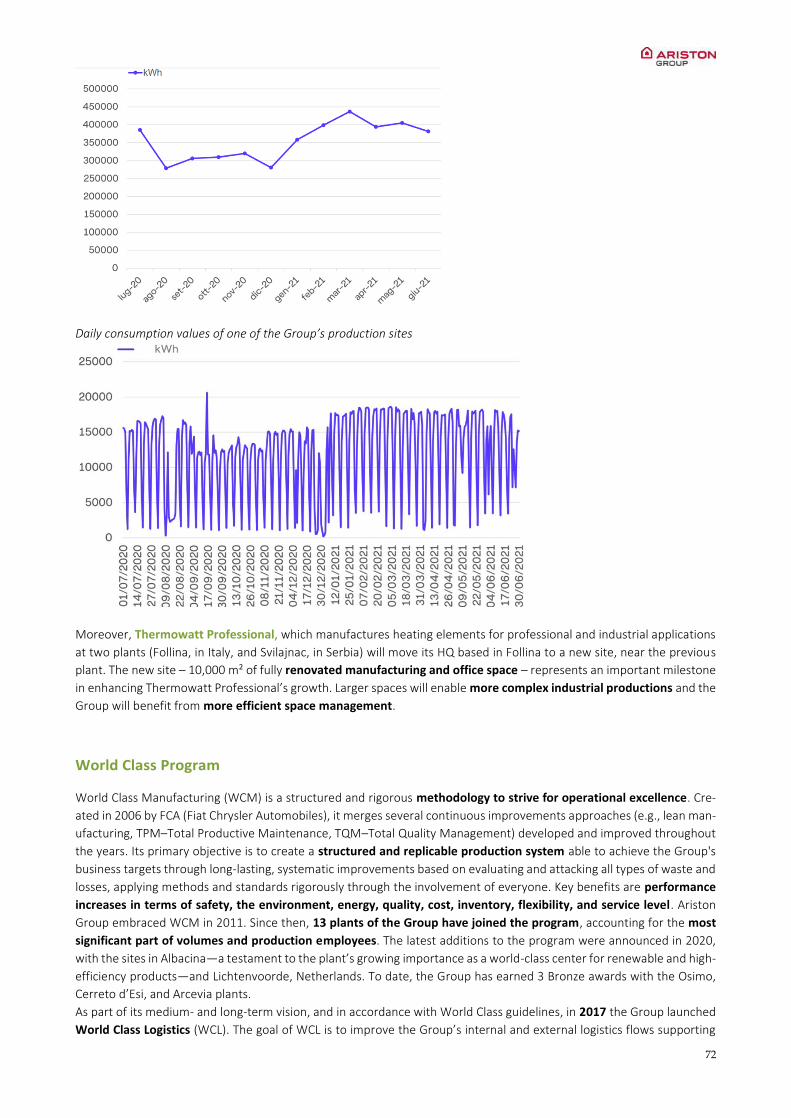
72
Daily consumption values of one of the Group’s production sites
Moreover, Thermowatt Professional, which manufactures heating elements for professional and industrial applications
at two plants (Follina, in Italy, and Svilajnac, in Serbia) will move its HQ based in Follina to a new site, near the previous
plant. The new site – 10,000 m² of fully renovated manufacturing and office space – represents an important milestone
in enhancing Thermowatt Professional’s growth. Larger spaces will enable more complex industrial productions and the
Group will benefit from more efficient space management.
World Class Program
World Class Manufacturing (WCM) is a structured and rigorous methodology to strive for operational excellence. Cre-
ated in 2006 by FCA (Fiat Chrysler Automobiles), it merges several continuous improvements approaches (e.g., lean man-
ufacturing, TPM–Total Productive Maintenance, TQM–Total Quality Management) developed and improved throughout
the years. Its primary objective is to create a structured and replicable production system able to achieve the Group's
business targets through long-lasting, systematic improvements based on evaluating and attacking all types of waste and
losses, applying methods and standards rigorously through the involvement of everyone. Key benefits are performance
increases in terms of safety, the environment, energy, quality, cost, inventory, flexibility, and service level. Ariston
Group embraced WCM in 2011. Since then, 13 plants of the Group have joined the program, accounting for the most
significant part of volumes and production employees. The latest additions to the program were announced in 2020,
with the sites in Albacina—a testament to the plant’s growing importance as a world-class center for renewable and high-
efficiency products—and Lichtenvoorde, Netherlands. To date, the Group has earned 3 Bronze awards with the Osimo,
Cerreto d’Esi, and Arcevia plants.
As part of its medium- and long-term vision, and in accordance with World Class guidelines, in 2017 the Group launched
World Class Logistics (WCL). The goal of WCL is to improve the Group’s internal and external logistics flows supporting

73
the digital transformation of the whole supply chain, as well as to find solutions to minimize energy consumption. To
this end, the Group is applying certain key requirements to all warehouses, such as standardizing safety and security
processes—monitoring risk statistics to prevent future incidents—and cost deployment, which involves adopting stand-
ardized tools to monitor operational costs. The initiatives implemented included also the launch of a program specifically
dedicated to making inventory management more efficient—defining a roadmap that, starting from Italy, will implement
automated inventory management at the largest European warehouses.
To nurture the continuous improvement mindset also in another core Group function, in 2019 Ariston Group launched
World Class Engineering (WCE) with the goal of improving its Research & Development processes. The program works
on several aspects of Product Development, first of all by enhancing the effectiveness of Product Planning through greater
and more detailed knowledge of customers and markets, as well as by developing innovative and distinctive technology
portfolios. In the Development area—the core of WCE—the program aims to support and enable the achievement of
project targets thanks to specific methodologies and tools, and to shift from a reactive to a proactive approach by lev-
eraging past learnings and quantified waste and losses. WCE started at our center of competence in Osimo (focusing on
Standard & High Efficiency Gas Heating) and will soon be expanded to the center of competence in Agrate (focusing on
Renewable Heating).
Closing the loop
It entails gradually decoupling economic activity from the consumption of finite resources, delivering a system in which
waste does not exist anymore and is “designed-out” of production processes. It is based on three principles: design out
waste and pollution, keep products and materials in use, and regenerate natural systems8. Therefore, the concept of the
circular economy lies at the centre of topics associated with sustainable development.
Renewable energy at production sites
In 2020, the Group entered into a 100% green energy purchase agreement for the plant in Namur (Belgium), covering
the period from 2021 to 2023. This commitment to environmental sustainability comes on top of the upgrades made to
the energy management systems used at production sites.
8 YouMatter, Circular Economy: Definition, Principles, Benefits And Barriers (2020)
74
Sustainable transportation
Since October 2020, the Group has been partnering with Geodis, a leader in international transportation and logistics, in
order to obtain a low-CO2-emission fleet of vehicles and to sustainably transport the company’s products around Italy.
Low-emission painting
The Italian site of Genga has experimented with using a new enamel that allows significantly reducing the amount used
in water heaters, contributing to an overall decrease in cobalt usage. After generating the report on the final actual sav-
ings, the Group’s ambition is to implement the project at other plants.
Fostering energy efficiency with innovative gas-absorption heating pumps (GAHP) technologies
The i-GAP project aims to develop technologies for designing and producing gas-absorption heating pumps (GAHP) for
residential use. These pumps have an innovative thermodynamic cycle and are designed for high-volume production.
GAHPs are easily integrated into the building-plant system. The innovative GAHP modules are equipped with sensors and
a user-friendly monitoring system for both professionals and end-users. The cycle and building-plant consumption per-
formance in which it is integrated are modelled. Thus, it is possible to quantify the energy, environmental and infra-
structure benefits of adopting such heating technology for all the stakeholders involved: end-users, energy policy mak-
ers, and utilities. The most significant impacts on S3 regional strategy topics concern the “eco-industry” area, with sea-
sonal energy efficiency reaching 150% (EN12309:2015).
Ariston Group is part of a European project, REHeatEU, that aims to promote GAHP technology across Europe. 24 or-
ganizations are involved, including universities, research centers, utilities, and infrastructure players interested in i-GAP
research topics.
The project was presented at the European Hydrogen Forum held by the European Commission.
Hydrogen as a potential alternative to natural gas: heading towards H2-readiness
While launching wall hung boiler certified to work with up to 30% hydrogen, also Elco Burners’ hydrogen high capacity
burners were developed in Germany and installed in industrial plants, mostly out of Europe, where hydrogen is available
coming from the industrial process. Far from being a novelty – the first hydrogen solution was sold in 1995 – such requests
are deeply tailored and have become important opportunities to challenge and innovate current technologies, heading
towards H2-readiness.
Life Cycle Analysis on our products
In early 2021, Ariston Group decided to develop Product Environmental Profiles for several of its products (heating heat
pumps, water heating heat pumps, condensing boilers, and hybrid solutions). The Environmental impact assessment for
products and solutions, which follows the LCA method (according to ISO 14040 and 14044), is a step forward in the
Group’s commitment to Sustainability, and will also allow achieving the PEPecopassport®, the international reference
program for environmental declarations of products from electric, electronic, and heating & cooling industries.
Closing the loop on steel
In 2021, Ariston Group partnered with Acciaieria Arvedi, one of Europe’s leading steelmakers most committed to decar-
bonization with a 90% by-product recycling rate, above the EU’s average. To reduce direct GHG emissions generated
during production, Arvedi is increasing its product circularity by classifying and recycling by-products. Ariston Group sells
its own scrap steel by-products to Arvedi, among others, and then buys them back as refined steel. Ariston’s Genga and
Cerreto plants sold over 2,000 tons of by-products in 2021 and will buy sheet metal partially produced with their own
scrap steel.
Product and Packaging recycling
Product recycling is a priority for Ariston Group, which has implemented techniques to recycle electronic devices more
efficiently, providing installers and distributors with a completely free recycling service. In Spain, several projects are
75
currently aiming to recover and recycle damaged products. Instead of being disposed of, such products are now put on
sale or disassembled to recycle specific components, while the rest of the product is refurbished and sold separately.
In Italy, there are ongoing pallet recycling projects. Moreover, pallets shipped to China are recycled as well, instead of
being disposed of.

76
People come first
People are at the center of our business: the leadership of Ariston Group is rooted in the work of motivated, qualified
people who are well aware of the social responsibility of their actions.
We are Ariston Group9
Total number of employees by employment contract (permanent and temporary), by gender
Gender 2019 2020 2021
December December December
Permanent Temporary Permanent Temporary Permanent Temporary
F 977 212 1,101 181 1,381 200
M 4,389 480 4,957 359 5,771 392
Total 5,366 692 6,059 540 7,152 592
Total number of employees by employment contract (permanent and temporary), by region
Region 2019 December
2020 December
2021 December
Permanent Temporary Permanent Temporary Permanent Temporary
Africa 172 23 169 37 174 43
America 6 - 681 - 1,298 -
Asia 1,177 582 1,232 382 1,379 366
Europe 4,011 87 3,977 121 4,301 183
Total 5,366 692 6,059 540 7,152 592
Total number of employees by employment type (full-time and part-time), by gender
Gender 2019 2020 2021
December December December
Full-time Part-time Full-time Part-time Full-time Part-time
F 1,070 119 1,172 110 1,448 132
M 4,794 75 5,238 79 6,068 95
Total 5,864 195 6,410 189 7,516 227
Percentage of senior management at significant locations of operation that are hired from the local
2019 2020 2021
Senior Manager 100% 100% 100%
Local Senior Manager 84% 84% 88%
Italian Local Senior Manager 57% 55% 52%
Total number and rate of new employee hires, by age group
9 Data refers to fiscal year ending on 31.12.2021. The following companies have been excluded: ATAG, NTI, HTP, ATMOR. The regions involved in the collection of data include the following countries:
- Africa: Egypt, Morocco, Nigeria, South Africa, Tunisia - America: Argentina, Brazil, Mexico - Asia: Bahrain, China, India, Indonesia, Kazakhstan, Russian Fed., Singapore, Turkey, Utd Arab Emirates, Vietnam - Europe: Austria, Belgium, Croatia, Czech Republic, Denmark, France, Germany, Hungary, Italy, Netherlands, Poland, Portugal,
Romania, Serbia, Spain, Switzerland, Ukraine, United Kingdom Employee turnover is calculated as the ratio between the total employee turnover and the average number of employees. Employees within the organisation are not affected by seasonal variations. All the significant portions of the organisation’s activities are per-formed by employees. Indicators of diversity such as minorities or vulnerable groups are not considered relevant. People having a job role within the first five managerial lines of the organisation in all the operating companies are referred to as "senior managers". "Lo-cal" is considered as the equivalent of "national".
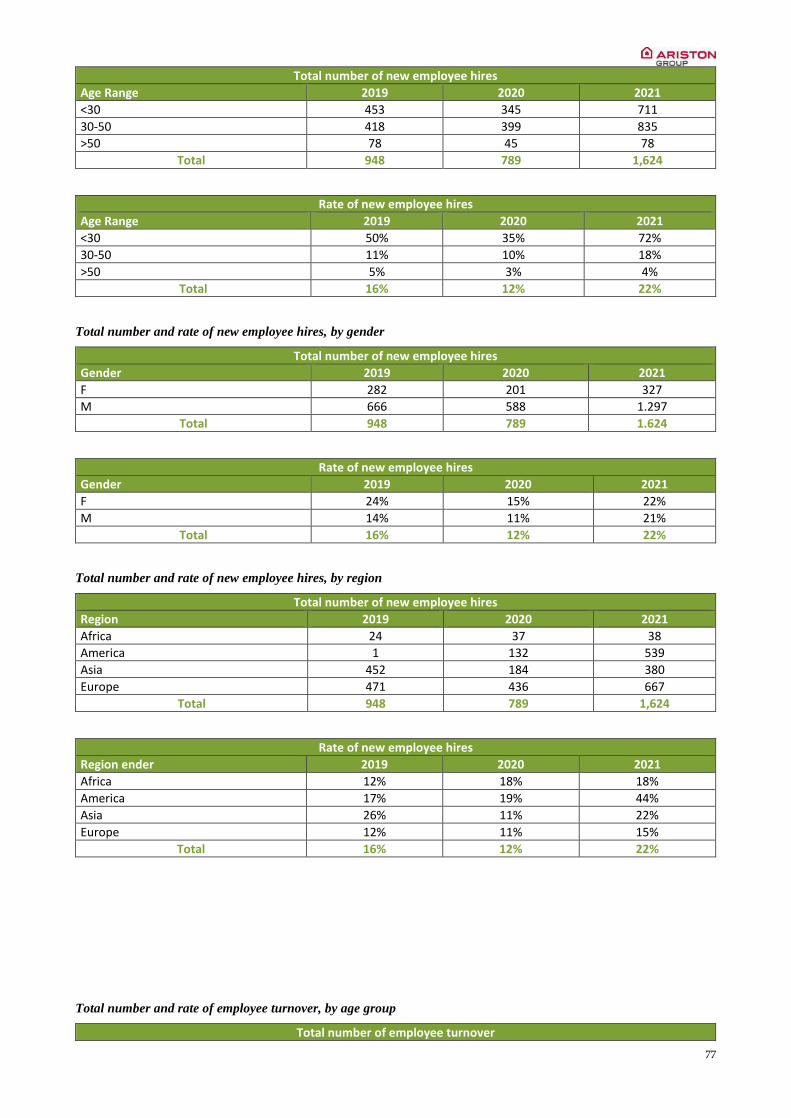
77
Total number of new employee hires
Age Range 2019 2020 2021
<30 453 345 711
30-50 418 399 835
>50 78 45 78
Total 948 789 1,624
Rate of new employee hires
Age Range 2019 2020 2021
<30 50% 35% 72%
30-50 11% 10% 18%
>50 5% 3% 4%
Total 16% 12% 22%
Total number and rate of new employee hires, by gender
Total number of new employee hires
Gender 2019 2020 2021
F 282 201 327
M 666 588 1.297
Total 948 789 1.624
Rate of new employee hires
Gender 2019 2020 2021
F 24% 15% 22%
M 14% 11% 21%
Total 16% 12% 22%
Total number and rate of new employee hires, by region
Total number of new employee hires
Region 2019 2020 2021
Africa 24 37 38
America 1 132 539
Asia 452 184 380
Europe 471 436 667
Total 948 789 1,624
Rate of new employee hires
Region ender 2019 2020 2021
Africa 12% 18% 18%
America 17% 19% 44%
Asia 26% 11% 22%
Europe 12% 11% 15%
Total 16% 12% 22%
Total number and rate of employee turnover, by age group
Total number of employee turnover

78
Age Range 2019 2020 2021
<30 347 256 559
30-50 486 398 710
>50 169 184 225
Total 1,002 838 1,493
Employee turnover (%)
Age Range 2019 2020 2021
<30 38% 26% 57%
30-50 13% 10% 15%
>50 11% 11% 11%
Total 17% 13% 20%
Total number and rate of employee turnover, by gender
Total number of employee turnover
Gender 2019 2020 2021
F 272 192 271
M 729 646 1.222
Total 1,002 838 1,493
Employee turnover (%)
Gender 2019 2020 2021
F 23% 15% 18%
M 15% 12% 20%
Total 17% 13% 20%
Total number and rate of employee turnover, by region
Total number of employee turnover
Region 2019 2020 2021
Africa 16 22 25
America - 161 578
Asia 536 301 435
Europe 450 354 455
Total 1,002 838 1,493
Employee turnover (%)
Region 2019 2020 2021
Africa 8% 11% 12%
America 0% 24% 47%
Asia 30% 18% 25%
Europe 11% 9% 10%
Total 17% 13% 20%
Percentage of employees per employee category (white collar and blue collar), by gender
Gender 2019 December
2020 December
2021 December
BC WC BC WC BC WC
F 9% 30% 9% 30% 11% 31%
M 91% 70% 91% 70% 89% 69%
Total 100% 100% 100% 100% 100% 100%
Percentage of employees per employee category (white collar and blue collar), by age group
Age Range 2019 2020 2021
December December December

79
BC WC BC WC BC WC
<30 15% 17% 16% 16% 17% 13%
30-50 56% 63% 56% 63% 55% 66%
>50 28% 21% 28% 21% 28% 22%
Total 100% 100% 100% 100% 100% 100%
Rooted in values
The Rooted in Values campaign was launched in 2019 to raise awareness about the Group’s Values among all employ-
ees. The 2020 campaign was fully dedicated to the PEOPLE value, while in 2021 the focus was on EXCELLENCE, CUSTOM-
ERS, and SUSTAINABILITY. The main goal of the first part of the campaign – with a focus on EXCELLENCE – was to bring
visibility to the various examples of it within the Group, in terms of both technical excellence and determination to win.
The focus on “Sales Excellence” was the bridge between EXCELLENCE and CUSTOMERS, the second value explored in
2021, pivoting on the 3 key moments of the Group’s relationship with the customers: “LISTEN, STAY TUNED, CARE”. The
second half of the year was dedicated to SUSTAINABILITY and showed how – to some varying degree – it encompasses
all the Group’s Values, being a cornerstone for the Group in the way it helped shaping its mission, vision and actions
throughout the history. The campaign remained focused on what SUSTAINABILITY means today, and why the Group be-
lieves in it and acts accordingly, through the end of 2021. All the activities implemented around this campaign were
designed to engage Ariston Group’s People, while enhancing a corporate culture that is rooted in the Group’s Values.
Cultivating the leadership model
The Global Leadership Program is a learning initiative aimed at activating, supporting, and strengthening practices asso-
ciated with the competences of the Corporate Leadership Model: LEAD CHANGE, LEAD BUSINESS and, most importantly,
LEAD PEOPLE. The feedback culture and the interpretation of the Leader’s role as Coach are the thread that run across
the different journeys, customized by type of population (Executive, Senior Managers, Managers, Individual contributors
and Blue Collars) from 25 countries. Launched in 2021, this first fully digital edition of the program will last two years
and use a variety of approaches and methods: webinars, pre- and post-virtual meeting activities, simulations, and one-
to-one coaching sessions. Participants are provided with online content on Ariston Group Learning Platform and asked
for their feedback to measure the impacts of the initiative. In addition, an extensive communication campaign supports
GLP to engage all employees. An “across-the-board-involvement” of all people in Change Management and Communica-
tion activities will boost the Group’s strategic positioning and its ability not only to be resilient, but also to face changes
actively and effectively.
Moreover, in 2021 the Group relaunched the WE ARE SMART initiative, with the aim of designing more flexible working
arrangements, in terms of both work organization and time scheduling, according to the peculiarities of the different
countries. Smart Working is becoming the norm for almost all companies worldwide: thus, the Group ran a preliminary
analysis in 2020, with approximately 1000 employees, to build its Global Smart Working Framework. As a follow-up, it
launched a training plan dedicated to effectively managing the performance of individuals and virtual teams. The first
round of training involved 10 countries, a number expected to rise to 14 by 2022, engaging more than 3000 employees
overall. This plan is designed for both managers and employees, creating opportunities for discussion as well as a constant
two-way dialogue. The training modules focus on several topics, from soft skills to time management techniques, from
the psychological impact of Smart Working to safety, also when working outside the office. Thanks to the level of com-
mitment achieved and its design, the plan has been recognized by Fondimpresa as a best practice and was included in
the “Storytelling” project, which focuses on companies that have successfully implemented training programs dedicated
to developing technological and/or process innovations.
80
Covid-19: together with our people
Throughout the second year of the Covid-19 pandemic, Ariston Group developed adaptive strategies to allow all people
to continue working while putting their own health and safety first. This way, the Group managed to ensure business
continuity while offering to workers to attend the offices as a voluntary option. Safety initiatives that were put into place
went from the adoption and offering of personal protective equipment at all sites to rapid tests and the reorganization
of spaces, in line with the Group’s distinctive value of putting people first, even in the most challenging times. Moreover,
workers were assisted while undergoing vaccination, and frequently tested while working on-site. In countries such as
Vietnam, during the most critical moments of the pandemic, the Group provided workers with all the logistic support
needed to ensure business continuity while protecting people. In India as well, the Group took several actions to assist
its people, through a dedicated Covid Support Group coordinated by the HR team. This took care of direct communica-
tion with affected employees and was able to provide additional welfare services, such as the reimbursement of Covid-
19 tests and the expansion of Covid-19 insurance coverage beyond employees to include also service and distributors'
staff. A Covid-19 recovery leave of 14 days was introduced for all affected employees, together with an additional Vac-
cination leave of 2 days. Furthermore, free facilities were made available for isolation and quarantine thanks to a part-
nership with a national hotel chain, alongside Free Online Medical Consultation (for both Covid-19 and non-Covid-19
cases) on PRACTO, the world's leading online healthcare platform.
Stronger together: our efforts in Russia
In Russia, the Group put a lot of effort into ensuring all workers at the Group’s facilities received the vaccine, with the
aim of having all resources vaccinated by December 2021. The Group has undertaken this process through several chan-
nels: raising awareness among workers and letting them get the vaccine at public health centers on their own; offering
support to directly make an appointment for the vaccine at affiliated clinics; organizing vaccination activities directly at
production sites for small groups of people.
Workplace health and safety
2021 has been a year of reflection and rethinking for the Ariston Group’s HSE organizational structure, at both the cor-
porate and local level. Projects were implemented to ensure that competencies, knowledge, and experience at the sites
are used to improve the quality and efficiency of HSE processes. 33 production sites were involved according to a priority
list: first, each site’s risk level was matched with the outputs of an HSE competence model, including both technical and
behavioral skills. As a result, the HSE and HR functions worked in synergy to launch key improvement actions: recruiting
HSE professionals, strengthening current HSE resources, and developing a dedicated training & coaching package for
technical expertise and safety leadership. Thanks to these initiatives, the Group will continue developing strong and up-
to-date expertise with respect to the constantly evolving HSE context.
This year the Group obtained the Sedex “Supplier” Membership for ethical trade service
providers, covering a total of 6 production sites: Genga, Cerreto, St. Petersburg, Wuxi, Na-
mur, and Chartres. The membership requires completing a self-assessment as well as un-
dergoing a Sedex Members Ethical Trade Audit for facilities in countries considered as
“high risk”. Such countries are then involved in programs to build a safer working environ-
ment for their employees. Reports are available for customers.
Our digital HR roadmap puts employees at the center
Recruitment, Development and Performance, the three pillars of the Group’s Human Resources strategy, are facing a
disruptive Digital Transformation. The digitalization of practices and processes has led to increasingly simplified, flexible,
and personalized growth paths within the Group, with an employee-centric approach. Recruitment and onboarding are
performed via dedicated websites and platforms, adopting digital assessment tools. Moreover, a dedicated platform
allows for online learning and training, with a high level of personalization based on employees’ needs and interests,
along with “institutional training” as well. The performance monitoring process has a strong focus on personal develop-
ment and is backed up by monitoring tools to track evolution and ambitions though time.
81
Ariston Group to be
(Digital) skills enhancement: graduate programs
The Ariston Group’s digital roadmap requires constantly innovating competencies and approaches, and the digitalization
of processes plays a fundamental role in this endeavour. For this reason, the launch of the Digital Process Specialist
Program constitutes a strategic investment for the Group. This initiative started off with an initial intense activity of
scouting and selection of freshly graduates who were interested in undertaking career paths in some specific areas within
Ariston's reality. Among the selected profiles, coming from many different countries around the globe, some took part
in programmes such as Digital Process Specialist Program, HR Career Program and Thermowatt Academy. Their introduc-
tion in specific business areas where, from the very first days, they have been exposed to a first-hand work experience
alongside our professionals, led to an extremely positive feedback and boast a strong retention rate . Following an
initial period during which the Group could assess the performance of each talent, more than 80% of the participants
were permanently employed by the company. The Group also offered a great number of internship opportunities in
engineering, project management, supply chain, logistics and ESG, becoming part of the talent pipelines for the future
growth of the organization.
Thermowatt Academy: attract and develop “local” competencies
The Thermowatt Academy project was launched in 2020 to develop professional paths specifically for the manufacturing
world, transferring technical know-how from the Thermowatt sites – Ariston’s premier component brand—to young
talents from Italian technical schools (namely, the ITS). The 1-month 2021 edition involved students coming from 4 local
schools and was focused on Operations. Through a combination of in-class and on-the-field training, the students had
the opportunity to learn more about the Company’s products and technologies. Currently, 75% of the students have been confirmed and are continuing training. For the 2022 edition, the Academy
might become the systematic way of onboarding young professionals from both ITS and undergraduate/pre-gradu-
ate programs. Given its success, The Thermowatt Academy will be expanded into other relevant areas of the Ariston
Group.
#Warmingyourtalent
Ariston Group is always searching for new skills and for the best professionals in the market, while also nurturing in-
house talent to be always at the forefront in facing challenges arising from the international and growing presence of
the Group. #Warmingyourtalent is a talent attraction and recruitment campaign, covering everything from engineering
through soft skills to the digital world, that aims to attract the best talents by introducing them to the Group and its
Values, thus letting them experience what working for the Ariston Group means.
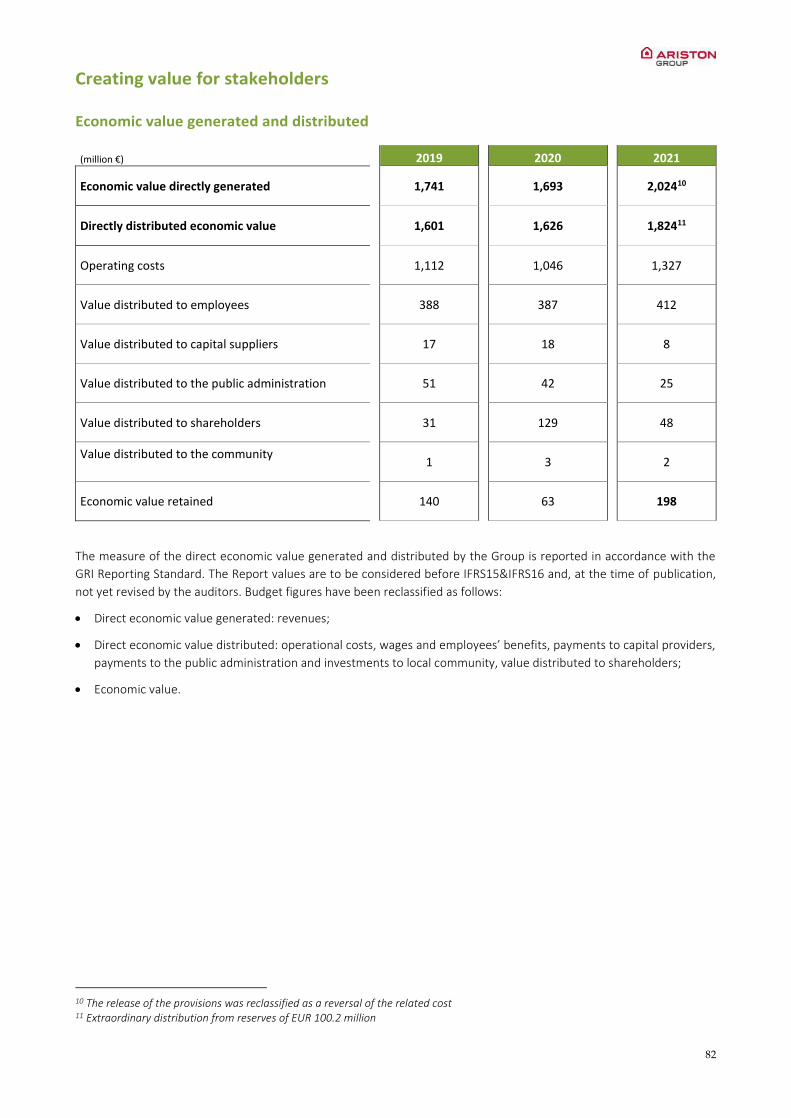
82
Creating value for stakeholders
Economic value generated and distributed
(million €) 2019 2020 2021
Economic value directly generated
1,741
1,693
2,02410
Directly distributed economic value
1,601
1,626
1,82411
Operating costs
1,112
1,046
1,327
Value distributed to employees
388
387
412
Value distributed to capital suppliers
17
18
8
Value distributed to the public administration
51
42
25
Value distributed to shareholders
31
129
48
Value distributed to the community
1
3
2
Economic value retained
140
63
198
The measure of the direct economic value generated and distributed by the Group is reported in accordance with the
GRI Reporting Standard. The Report values are to be considered before IFRS15&IFRS16 and, at the time of publication,
not yet revised by the auditors. Budget figures have been reclassified as follows:
Direct economic value generated: revenues;
Direct economic value distributed: operational costs, wages and employees’ benefits, payments to capital providers,
payments to the public administration and investments to local community, value distributed to shareholders;
Economic value.
10 The release of the provisions was reclassified as a reversal of the related cost 11 Extraordinary distribution from reserves of EUR 100.2 million
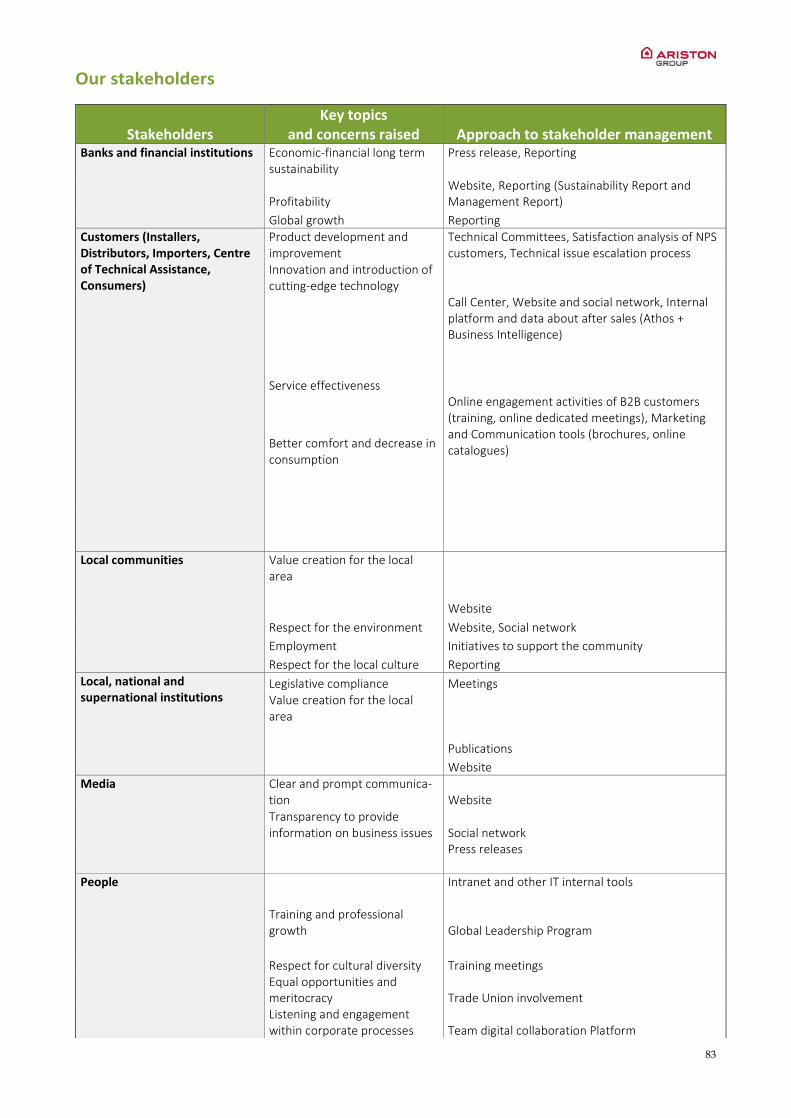
83
Our stakeholders
Stakeholders Key topics
and concerns raised Approach to stakeholder management Banks and financial institutions Economic-financial long term
sustainability Press release, Reporting
Profitability Website, Reporting (Sustainability Report and Management Report)
Global growth Reporting
Customers (Installers, Distributors, Importers, Centre of Technical Assistance, Consumers)
Product development and improvement
Technical Committees, Satisfaction analysis of NPS customers, Technical issue escalation process
Innovation and introduction of cutting-edge technology
Service effectiveness
Call Center, Website and social network, Internal platform and data about after sales (Athos + Business Intelligence)
Better comfort and decrease in consumption
Online engagement activities of B2B customers (training, online dedicated meetings), Marketing and Communication tools (brochures, online catalogues)
Local communities Value creation for the local
area
Website
Respect for the environment Website, Social network
Employment Initiatives to support the community
Respect for the local culture Reporting
Local, national and supernational institutions
Legislative compliance Meetings Value creation for the local area
Publications
Website Media Clear and prompt communica-
tion Website
Transparency to provide information on business issues Social network
Press releases
People
Training and professional growth
Intranet and other IT internal tools Global Leadership Program
Respect for cultural diversity Training meetings Equal opportunities and meritocracy Trade Union involvement Listening and engagement within corporate processes Team digital collaboration Platform
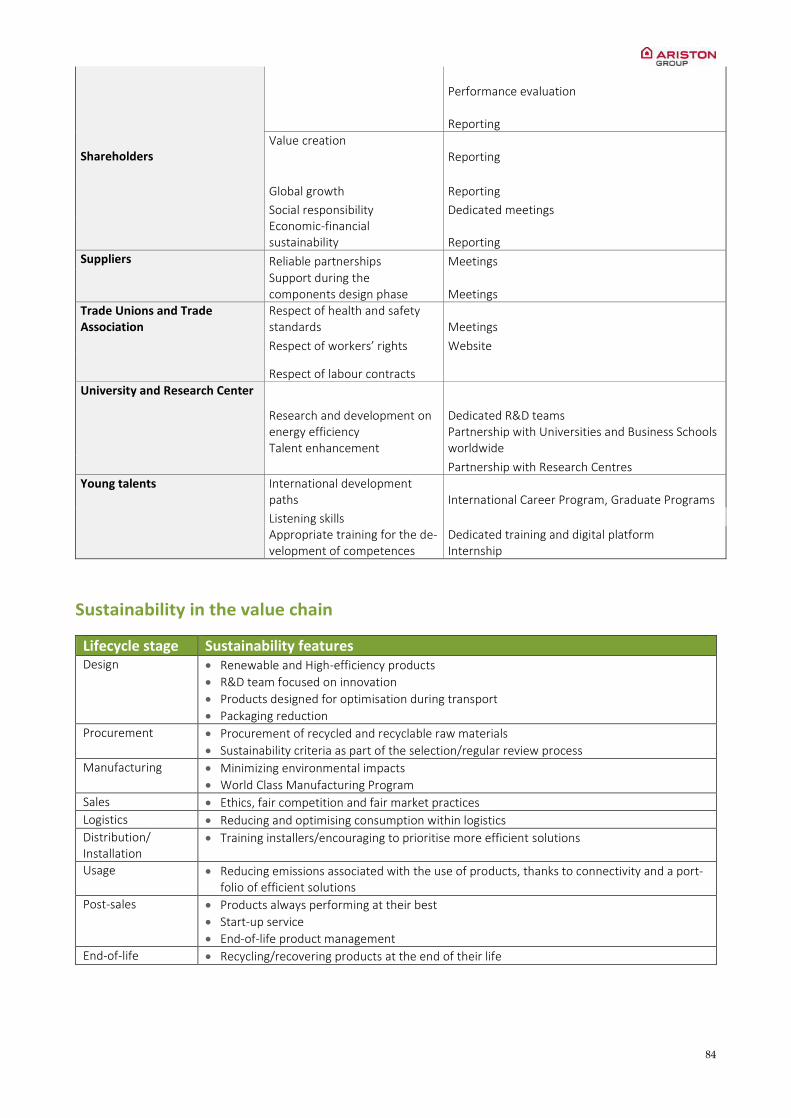
84
Shareholders
Performance evaluation Reporting
Value creation Reporting
Global growth Reporting
Social responsibility Dedicated meetings Economic-financial sustainability Reporting
Suppliers Reliable partnerships Meetings
Support during the components design phase Meetings
Trade Unions and Trade Association
Respect of health and safety standards Meetings
Respect of workers’ rights Website
Respect of labour contracts
University and Research Center
Research and development on energy efficiency Talent enhancement
Dedicated R&D teams Partnership with Universities and Business Schools worldwide
Partnership with Research Centres Young talents International development
paths International Career Program, Graduate Programs
Listening skills Appropriate training for the de-velopment of competences
Dedicated training and digital platform Internship
Sustainability in the value chain
Lifecycle stage Sustainability features Design Renewable and High-efficiency products
R&D team focused on innovation
Products designed for optimisation during transport
Packaging reduction
Procurement Procurement of recycled and recyclable raw materials
Sustainability criteria as part of the selection/regular review process
Manufacturing Minimizing environmental impacts
World Class Manufacturing Program
Sales Ethics, fair competition and fair market practices
Logistics Reducing and optimising consumption within logistics
Distribution/ Installation
Training installers/encouraging to prioritise more efficient solutions
Usage Reducing emissions associated with the use of products, thanks to connectivity and a port-folio of efficient solutions
Post-sales Products always performing at their best
Start-up service
End-of-life product management
End-of-life Recycling/recovering products at the end of their life
85
Bringing comfort everywhere, including in crisis situations
The health crisis due to Covid-19 highlighted the importance of “comfort”, in the sense of both safety and security.
Ariston Group is deeply committed to delivering comfort to everyone, when and where needed: that is Ariston’s mission
in all the communities where it operates.
In Italy, the project “Oceano e Clima” has been launched in partnership with the NGO Worldrise, with the goal of raising
awareness among citizens about the importance of ocean ecosystems in fighting climate change. Murals were painted
in many cities across the country and materials explaining the projects were released online through social campaigns,
dedicated landing pages, and press releases.
In Romania, an even larger and more powerful new edition of their local Ariston’s “comfort challenge” took place across
the country. Ariston supported the Romanian Red Cross, providing schools and hospitals with heating solutions (2,150
in 2021) and bringing hot water to the poorest and most isolated areas of Romania, as well as playing an important
role in Alpine rescue operations (helping 43% of national hubs).
Several actions took place in Mexico, where CaloRex adopts an all-round approach to the concept of sustainability – thus
ensuring low negative impacts on the environment and embracing positive impacts on the local communities where it
operates. Ariston’s “acciones” go from supporting communities affected by fires to fostering reforestation by planting
trees and organizing collective recycling and donations for children in difficult conditions.
In Spain, Fundación ONCE and Ariston have signed an agreement to join forces and collaborate to improve the accessi-
bility of their products and thus support the creation of sustainable and accessible homes for everyone. The main goal
of this 2-year partnership is to develop a universal accessibility program in the field of architecture and thermal comfort.
In Vietnam, the corporate vision of bringing comfort to everyone became an opportunity to spread positive energy,
especially during difficult lockdown times. Ariston Group donated products to the Tempt Hospital and contributed to
Covid-19 donation funds. Social networks have been used to organize cooking challenges to connect people across the
country during lockdowns. Moreover, the Work from Home policy has been extended to cover 100% of staff and Ariston
tried to get as many employees as possible vaccinated, including family members, when possible.
Finally, in Singapore, Ariston collaborates with Glyph, a charitable organization that accompanies 1,700 children in their
development journey. The joint project aims to provide warm showers for children and young adults from low-income
households and new heating comfort to households with a challenging family environment.
86
5.3 Corporate Governance
Introduction
The Company is a Dutch public company with limited liability existing under the laws of the Netherlands. The Company is
the legal successor of Ariston Thermo Holding S.p.A., incorporated as a joint-stock company (società per azioni) under
the laws of Italy on 21 July 1986 as Merloni Invest S.p.A. In June 2021, a reverse merger took place whereby Ariston
Thermo Holding S.p.A. disappeared into Ariston Thermo International as the surviving entity. Subsequently, Ariston
Thermo International was renamed Ariston Thermo Holding S.p.A. After this restructuring, the company was redomiciled
to the Netherlands, converted into a Dutch public company with limited liability (naamloze vennootschap) and renamed
Ariston Thermo Holding N.V. The redomiciliation became effective on 15 June 2021, upon registration of the Company in
the Dutch trade register. When this section refers to the Company, it solely refers to the current Ariston Holding N.V.
As part of the redomiciliation, the Company's articles of association were amended to create multiple voting shares,
conferring the right to cast 20 votes per multiple voting share to foster the involvement of its shareholders, Merloni
Holding S.p.A. and Amaranta S.r.l. On 16 September 2021, the Company's name was changed into Ariston Holding N.V.
On 26 September 2021, the Company's ordinary shares were admitted to listing and trading on Euronext Milan, a regu-
lated market organised and managed by Borsa Italiana S.p.A. The Company's articles of association were lastly amended
on 25 November 2021, immediately prior to the initial public offering of the Company.
Since the initial public offering of the Company, the Company has adopted, except as set out below, the best practice
provisions of the Dutch corporate governance code, which contains principles and best practice provisions for listed com-
panies that regulate relations between, inter alia, the board (the 'Board') and its committees and the relationship with
the general meeting of the Company.
In this governance report the Company addresses its overall corporate governance and discloses any departure from the
best practice provisions of the Dutch corporate governance code and the reasons for such departure.
The Netherlands is the Company’s home member state for the purposes of the EU Transparency Directive (Directive
2004/109/EC, as amended).
Board
Composition and powers
The Company maintains a one-tier Board consisting of executive directors and non-executive directors. The executive
directors are responsible for the day-to-day management of the Company. The non-executive directors supervise and
advise the executive directors. The Board as a whole is responsible for the strategy and the management of the Company.
As per 31 December 2021, the Board comprises two executive directors and ten non-executive directors.
The articles of association provide that directors can be appointed for a maximum period of four years ending at the end
of the annual general meeting which is held in the fourth year after the calendar year in which the director was appointed.
Directors may be reappointed. All directors currently in office shall retire at the end of their term after the annual general
meeting to be held in 2024.
As indicated above, the Company is the legal successor of Ariston Thermo Holding S.p.A. (old). In June 2021, a reverse
merger took place whereby Ariston Thermo Holding S.p.A. (old) disappeared into Ariston Thermo International S.r.l. as
the surviving entity. Subsequently, Ariston Thermo International S.r.l. was renamed Ariston Thermo Holding S.p.A. (new).
After this restructuring, Ariston Thermo Holding S.p.A. (new) was redomiciled to the Netherlands and renamed Ariston
Thermo Holding N.V. After the redomiciliation, Ariston Thermo Holding N.V. was renamed in Ariston Holding N.V. (the
Company).
The Company continued to be managed by a board of directors composed of the directors in office as of the effective
date of the redomiciliation on 11 March 2021, the board of directors of Ariston Thermo Holding S.p.A. (old) comprised
the following directors: Francesco Merloni, Paolo Merloni, Laurent Jacquemin, Marinella Soldi, Roberto Guidetti, Ma-
ria Francesca Merloni, Paolo Tanoni, Andrea Guerra, Sara Dethridge, Gianemilio Osculati and Enrico Vita;
87
on 13 April 2021, Ignazio Rocco di Torrepadula was appointed as director and the term of Andrea Guerra, Sara De-
thridge and Gianemilio Osculati expired on 13 April 2021;
on 1 June 2021, the reverse merger took place and Ariston Thermo Holding S.p.A. ceased to exist. Ariston Thermo
International S.r.l. as the surviving entity changed its name into Ariston Thermo Holding S.p.A. The following directors
have been appointed as directors of the surviving entity: Paolo Merloni, Laurent Jacquemin, Francesco Merloni, Mari-
nella Soldi, Roberto Guidetti, Maria Francesca Merloni, Paolo Tanoni, Ignazio Rocco di Torrepadula, Enrico Vita and
Sabrina Baggioni;
on 15 June 2021 (after redomiciliation), the Company appointed the following non-executive directors: Lorenzo Pozza
and Andrea Silvestri.
As at the date of this annual report, the Board comprises the following directors:
Name Year of birth
Nationality Position Start of term End of term
Paolo Merloni 1968 Italian Executive Director (Executive Chairman)
1 June 2021 2024
Laurent Jacquemin 1963 Belgian Executive Director (Chief Executive Officer)
1 June 2021 2024
Marinella Soldi 1966 Italian Non-Executive Director (Lead Non-Ex-ecutive Director) (independent)
1 June 2021 2024
Sabrina Baggioni 1967 Italian Non-Executive Director (independent) 1 June 2021 2024
Roberto Guidetti 1963 Italian Non-Executive Director (independent) 1 June 2021 2024
Francesco Merloni 1925 Italian Non-Executive Director 1 June 2021 2024
Maria Francesca Merloni
1963 Italian Non-Executive Director 1 June 2021 2024
Lorenzo Pozza 1966 Italian Non-Executive Director (independent) 15 June 2021 2024
Ignazio Rocco di Torrepadula
1962 Italian Non-Executive Director (independent) 1 June 2021 2024
Andrea Silvestri 1968 Italian Non-Executive Director 15 June 2021 2024
Paolo Tanoni 1957 Italian Non-Executive Director 1 June 2021 2024
Enrico Vita 1969 Italian Non-Executive Director (independent) 1 June 2021 2024
Biographies directors
Mr. Paolo Merloni has been with the Group since 1995 and became member of the board of Ariston Thermo Holding
S.p.A. (old) in 1997. Paolo has held several key positions over time, including director for the Group's operations in Central
and Eastern Europe and Italy and vice-president with delegation to the Heating division. He is also chairman of Merloni
Holding S.p.A., member of the Executive Council of EHI (Association of the European Heating Industry), member of the
Italian Board of Endeavour Global and of the board of the Aristide Merloni Foundation.
In 2020 he was appointed as Cavaliere del Lavoro by the President of the Republic Sergio Mattarella.
Mr. Laurent Jacquemin is the Group's Chief Executive Officer, has thirty years of articulated international experience and
has been with the Group since 1992 and became member of the board of Ariston Thermo Holding S.p.A. (old) in 2017.
He has held increasing positions in the commercial, marketing and sales areas, in relevant regions including Europe and
Asia.
Mr. Francesco Merloni. He has led the Group for over forty years. Since 1972, he has been a member of the Italian Senate
and Lower House seven times, during which he has taken a special interest in industrial policy, also acting as a member
of the Bi-Cameral Commission for industrial reconversion and State's shareholdings. He was designated Minister of Public
Works for the Government of Prime Minister Giuliano Amato in 1992, being confirmed in the same role under Prime
Minister Carlo Azeglio Ciampi in 1993. Mr. Merloni is also a non-executive director of Merloni Holding S.p.A., the Compa-
ny's controlling shareholder.
Mrs. Marinella Soldi joined the Group in 2016 and became member of the board of Ariston Thermo Holding S.p.A. (old)
in 2016. She was Chief Executive Officer of Discovery Networks Southern Europe for 10 years, and in addition chief strat-
egy officer for Discovery International for the last 18 months of her time there. She is currently non-executive chairman
88
of the Vodafone Foundation Italy and non-executive director and chairman of the nomination and remuneration com-
mittees for Nexi S.p.A., a listed Italian company, and Talent Garden S.p.A., a start-up company.
Nowadays is the Chair of Rai – Radiotelevisione Italiana S.p.A.'s Board of Directors.
Mrs. Sabrina Baggioni has been 5G Program Director at Vodafone Italia since September 2017. After joining Vodafone
Italia in 2000 as Head of Business Development, she has held various positions over the years, focusing on innovation,
online and digital and international roaming. In just a few years, she became the first person to take charge of integrated
communication services for businesses, before becoming Enterprise Marketing Director (2006-2014). Prior to Vodafone,
she worked as a consultant with Monitor Deloitte (1992- 2000) in London, Abu Dhabi and latterly Milan, managing inter-
national projects and clients and primarily with responsibility for strategy, internationalisation and the product portfolio.
Mr. Roberto Guidetti has held positions in business strategy and general management for the Coca-Cola Company in
China. He became vice-president for the Mainland China franchise, responsible for the operations of the company, man-
aging the joint ventures with Swire, COFCO and Bottling Investment Group. Since 2013 he has been in charge as group
CEO and director of Vitasoy International Holdings ltd., a beverage company listed on the Hong Kong Stock Exchange. He
became member of the board of Ariston Thermo Holding S.p.A. (old) in 2018.
Mrs. Maria Francesca Merloni has had an extensive career working in publicity for large manufacturing companies. As
founder and artistic director of Polesis Festival in Fabriano, Italy, she was awarded the UNESCO "Ombra della Sera" Prize
in 2013 for her cultural, social and humanitarian work. Mrs. Merloni is also a non-executive director of Merloni Holding
S.p.A., the Company's controlling shareholder and became member of the board of Ariston Thermo Holding S.p.A. (old)
in 2008.
Mr. Lorenzo Pozza is a chartered statutory auditor. He served as director for Italian companies Angel Capital Management
S.p.A. and Amplifon S.p.A., and a member of the board of statutory auditors of Italian companies Assicurazioni Generali,
Telecom Italia, Terna and Edison. Mr. Pozza was awarded an honourable mention from the Boston association Family
Firm Institute for best article in 2008 in the Family Business Review and a Research Excellence Award from the director
of Bocconi University in Milan, Italy.
Mr. Ignazio Rocco di Torrepadula is founder and CEO of Credimi S.p.A., a digital invoice financing platform for the financing
of Italian and European SMEs. He is also Senior Advisor at Tikehau Capital, a pan-European asset management group,
leader in the management of Corporate Credit Funds. Mr. Rocco di Torrepadula has more than 25 years' experience in
the financial services sector; he was the head of the Financial Institutions' practice of The Boston Consulting Group in the
Central Europe branch, and he previously dealt with Corporate Banking and Venture Capital in the Akros Group, in the
IMI Group and in 21 Investments.
Mr. Andrea Silvestri is registered in both the Association of Chartered Accountants and Statutory Auditors of Rome and
in the Lawyers' Milan Bar. Mr Silvestri is the coordinator of the Working Group on taxation of ASSTEL (Association of the
Telecommunication Enterprises in Italy) and Assomineria (Association of the Enterprises of the Oil and Mining sector in
Italy). He is a member of the board of statutory auditors and board of directors of a number of companies.
Mr. Paolo Tanoni has thirty years of experience in business law and extraordinary financing transactions, mergers and
acquisitions, over which time he developed a deep knowledge over the sector, being able to rely on an established net-
work of primary standing contacts with customers and operators both in the domestic and international market. He be-
came member of the board of Ariston Thermo Holding S.p.A. (old) in 2002. Mr. Tanoni was independent director and
chairman of the audit committee of risks at the Italian oil and gas company Maire Tecnimont until 2014, and currently
holds corporate offices in several companies and investment funds. Mr. Tanoni is also a non-executive director of Merloni
Holding S.p.A., the Company's controlling shareholder.
Mr. Enrico Vita has held positions with growing responsibility at the Italian manufacturing company Indesit both in Italy
and abroad, including as chief operating officer with responsibility in commercial, marketing and consumer after sale
services. In 2014 Mr. Vita joined the Amplifon Group as Executive Vice-President EMEA and in March 2015 he was ap-
pointed Chief Executive Officer with responsibility in the three regions where the company operates, as well as for cor-
porate functions of marketing, IT and supply chain. He became member of the board of directors of Ariston Thermo
Holding S.p.A. (old) in 2018.
89
Appointment, suspension and dismissal of directors
The directors are appointed by the general meeting pursuant to a binding nomination of the Board. The general meeting
may at all times overrule the binding nature of such a nomination by a resolution adopted by a majority of at least half of
the votes cast in the general meeting, provided that such majority represents more than half of the issued share capital
of the Company. If a nomination has not been duly made, the general meeting shall be free to appoint the directors at
its discretion. A resolution of the general meeting to appoint a director in accordance with a nomination by the Board
shall be adopted by absolute majority of the votes cast.
The articles of association provide that a director may be suspended or dismissed by the general meeting at any time. In
addition, an executive director may be suspended by the Board at any time. A resolution of the Board to suspend the
Executive Chairman must be adopted with a majority of two thirds of the votes cast in a meeting where all directors,
other than the Executive Chairman, are present or represented. A resolution of the general meeting to suspend or dismiss
a director other than on the proposal of the Board, requires a majority of the votes cast representing more than half of
the issued share capital of the Company.
Diversity policy
The Company recognises the benefits of having a diverse Board and sees diversity at Board level as an important element
in maintaining a competitive advantage. As such, the Board has adopted a diversity policy on 28 October 2021.
The diversity policy objectives are that that the Board is to create an environment of inclusion and acceptance within the
Company in which each person is treated equally without discrimination. The Company recognises that differences in
skills, experience, education, background, nationality, gender and other characteristics of people are important and ena-
ble both the Board and the Company as a whole to look at issues and to solve problems in different ways, to respond
differently to challenges, and to take more robust decisions. Pursuant to the diversity policy, the Board is committed to
ensuring diversity in skills, experience, education, background, nationality, gender and other characteristics of directors,
when selecting new candidates for the Board. At the same time, the Board will seek to retain the right balance of requisite
expertise, experience, diversity and affinity with the nature and culture of the business of the Company.
Since the date of adoption of the diversity policy, no directors have been appointed. However, the diversity policy will be
taken into account when considering the future appointment and reappointment of directors. The (re-)appointment of
directors is scheduled for the financial year 2024. The compensation and talent development committee will prepare the
nomination of new directors whilst taking into account the diversity, experience, independence, knowledge and skills the
Board as a whole requires to be effective.
On 1 January 2022, a new Dutch law entered into force which provides that certain large companies, such as the Com-
pany, have to set appropriate and ambitious goals in the form of a target to achieve a more balanced ratio between the
number of men and women on the Board as well as for a certain category of employees in management positions to be
determined by the Company. The Board has to set measurable objectives for achieving these diversity targets. In addition,
the Company will have to report to the Dutch Social and Economic Council (Sociaal Economische Raad) on an annual basis
on the number of men and women who are members of the Board and who are part of the category of employees in
management positions as determined by the Company as well as on the goal of the Company for diversity in the form of
concrete targets, the plan to achieve this goal and if one or more goals have not been achieved, the reasons for this.
Since the redomiciliation, the Board comprised ten non-executive directors, of which seven men (75%) and three women
(25%). The composition of the Board does not diverge from the objectives and (general) targets stipulated in the diversity
policy for the male/female ratio.
Board rules
The Board adopted rules with respect to the holding of meetings by and the decision-taking process of the Board and
other matters concerning the Board, its committees and the directors.
The Board rules provide that Board meetings shall generally be held at the office of the Company in Italy but may also
take place elsewhere. No meetings of the Board will take place in the Netherlands. In addition, Board meetings may be
90
held by conference call, video conference or by any other means of communication, provided all participants can com-
municate with each other simultaneously. However, no director will participate in a meeting of the Board (including a
meeting by conference call, video conference or by any other means of communication) whilst being in the Netherlands.
Where unanimity cannot be reached, all Board resolutions are adopted by an absolute majority of the votes cast. At a
meeting, the Board may only pass resolutions if the majority of the directors are present or represented. A director may
only be represented by another director authorised in writing. Each director shall have one vote.
Board resolutions may at all times be adopted outside of a meeting, in writing or otherwise, provided that the proposal
concerned is submitted to all directors then in office and none of them objects to this manner of adopting resolutions.
Indemnification
Under Dutch law, indemnification provisions may be included in the company's articles of association. Under the articles
of association, to the extent permissible by the rules and regulations applicable to the Company, the Company is required
to reimburse current and former directors for (i) the reasonable costs of conducting a defence against claims for damages
or of conducting defence in other legal proceedings, (ii) any damages payable by them and (iii) the reasonable costs of
appearing in other legal proceedings in which they are involved as current or former directors, except proceedings pri-
marily aimed at pursuing a claim on their own behalf, based on acts or failures to act in the exercise of their duties or any
other duties currently or previously performed by them at the Company's request, if and only if and to the extent the
relevant costs and damages are not reimbursed on account of said other duties.
There shall, however, be no entitlement to reimbursement and any person concerned will have to repay the reimbursed
amount if and to the extent that: (i) a Dutch court, or in the case of arbitration, an arbitrator, has established in a final
and conclusive decision that the act or failure to act of the person concerned may be characterised as wilful (opzettelijk),
intentionally reckless (bewust roekeloos) or seriously culpable (ernstig verwijtbaar) conduct, unless Dutch law provides
otherwise or this would, in view of the circumstances of the case, be unacceptable according to standards of reasonable-
ness and fairness; (ii) the costs or damages directly relate to or arise from legal proceedings between a current or former
director and the Company or its Group; or (iii) the costs or financial loss of the person concerned are covered by an
insurance and the insurer has paid out the costs or financial loss.
Conflicts of interest
Dutch law provides that a director may not participate in the adoption of resolutions (including deliberations in respect
of these) if he has a direct or indirect personal interest conflicting with the interests of the Company, which shall be
determined outside the presence of the director concerned. A conflict of interest exists in any event if in the situation at
hand the director is deemed to be unable to serve the interests of the Company and the business connected with it with
the required level of integrity and objectivity. Pursuant to the articles of association and the Board rules, any director
shall immediately report any (potential) conflict of interest to the other directors.
In addition, the Company endorses the principles and provisions of the Dutch corporate governance code that address
conflicts of interest between the Company and one or more directors. To this effect, provisions have been included in
the Board Regulations covering best practice provisions 2.7.1. through 2.7.6 of the Dutch corporate governance code,
which were adhered to in light of the conflicts of interest matter described hereafter.
If a director does not comply with the provisions on Conflict of Interest, the resolution concerned is subject to nullification
(vernietigbaar) and such director may be held liable towards the Company. As a general rule, the existence of a (potential)
conflict of interest does not affect the authority to represent the Company. Furthermore, as a general rule, agreements
and transactions entered into by the Company cannot be annulled on the grounds that a decision of its Board was adopted
with the participation of conflicted director. However, under certain circumstances, a company may annul such an agree-
ment or transaction if the counterparty misused the relevant conflict of interest.
During the year under review, no conflict of interests matters occurred with respect to the Company and its directors,
other than the Company's acquisition of the plant located in Borgo Tufico, previously used under a lease agreement
dating back to 2006, which plant is the central warehouse of Ariston Thermo S.p.A.'s industrial business ("Borgo Tufico
Plant"). The Borgo Tufico Plant was purchased from Janus Immobili per l'Industria S.r.l. (a company controlled by the
Merloni family). The transaction has been duly authorised by the Board (excluding the conflicted Merloni directors). The
91
purchase price was evaluated by a third-party independent expert as at arm's length and was equal to € 7 million. The
Group believes that the agreement was entered into on arm's length basis.
Related party transactions
The Company has a related party transactions policy providing for procedures for directors to notify a potential related
party transaction. Potential related party transactions shall be subject to review by and approval of the Board in accord-
ance with Dutch law. The Board may approve the related party transaction only if it determines that it is in the interests
of the Company and its affiliated business.
Related party transactions include transactions between the Group and "related parties" as defined in the related party
transactions policy, including, one or more shareholders representing 10% of the issued share capital in the Company, a
director and any parties qualifying as such in accordance with IFRS (IAS 24 – Related Party Disclosures).
In 2021 one material related party transaction took place, being the acquisition of the Borgo Tufico Plant (outlined in
section "Conflicts of Interest").
The Company believes that all transactions with subsidiaries and with companies of Merloni Holding S.p.A.'s group are
negotiated and executed on an arm's length basis and that the terms of these transactions are comparable to those
contracted with unrelated third-party suppliers and service providers.
In addition, in the course of its ordinary business activities, companies of the Group regularly enter into agreements with
other companies within the Group. The agreements between companies of the Group mainly relate to the rendering of
intra-group services, such as the provision of support services, in among others, the areas of accounting, internal audit
and risk, legal, company secretarial, data privacy, share scheme administration, human resources, tax, information tech-
nology, communications, software and treasury. The Group believes that such intra group agreements are immaterial
and, in any case, are negotiated and executed on an arm's length basis.
Related Parties
The following related parties of Ariston Holding N.V. are identified in accordance with IAS 24 (paragraph 9)
Par. 9 (a): person or a close member of that person's family
(i) has control or joint control over the reporting entity;
Paolo Merloni and close member of his family
(ii) has significant influence over the reporting entity;
Maria Francesca Merloni and close member of her family
(iii) is a member of the key management personnel of the reporting entity or of a parent of the reporting entity.
Board members, Board committee members of Ariston Holding N.V. and their close family members
Par. 9 (b): Entities
(i) The entity and the reporting entity are members of the same group (which means that each parent, subsidiary and
fellow subsidiary is related to the others).
Companies controlled by Ariston Holding N.V., listed in the attached table
Novacapital S.r.l.
Novapower S.r.l.
Novapower L2 S.r.l.
Kind art S.r.l.
Eliosuasa S.r.l.
San Lorenzo S.r.l.
Eu.ro.ma. S.r.l.
Merloni Holding S.p.A.
Pragma Invest S.r.l.
Pragma Uno S.r.l.
Domus V S.r.l.
Nova Re S.r.l.
Nova Fin S.r.l.

92
Thermovault B.V.
Zoiros Ltd.
P S.r.l.
PEM S.r.l.
(ii) One entity is an associate or joint venture of the other entity (or an associate or joint venture of a member of a group
of which the other entity is a member).
Sitam S.p.A. under liquidation
Dong Woo Mts Co Ltd under liquidation
Ariston Thermo Gulf Water Heating llc
Sedachim Sa (arrangement with creditors procedure)
(vi) The entity is controlled or jointly controlled by a person identified in (a).
Amaranta S.r.l.
Janus S.r.l.
Janus immobili per l’industria S.r.l.
Grand Soleil S.r.l.
Other entities controlled by members of the Board of Directors, members of committees of the Company and their
close family members
(vii) A person identified in (a)(i) has significant influence over the entity or is a member of the key management personnel
of the entity (or of a parent of the entity).
Fondazione Aristide Merloni
Fondazione Italia –Cina
Amplifon S.p.A.
Rai − Radiotelevisione italiana S.p.A.
Credimi S.p.A.
Other entities not listed above in which members of the Board of Directors, members of committees of the Company
and their close family members are member of the key management personnel
Board committees
The Board has four committees that discuss specific issues and prepare items on which the full Board takes decisions.
The chair of each committee reports on the main points of discussion and the resulting recommendations are discussed
at the subsequent Board meeting. The four committees are:
the audit committee
the compensation and talent development committee which acts as both the remuneration committee and the se-
lection and appointment committee;
the strategic committee; and
the environmental, social and governance (ESG) committee.
As a result of the redomiciliation, the Company’s board of statutory auditors ceased to hold office. The audit committee
and the compensation and talent development committee consist of non-executive directors. The strategic committee
and the ESG committee consist of three directors and Andrea Guerra, who is not a director.
Audit committee:
Lorenzo Pozza (Chairman)
Andrea Silvestri
Sabrina Baggioni.
On 5 August 2021, Lorenzo Pozza, Andrea Silvestri and Paolo Tanoni were appointed as members of the audit committee.
Paolo Tanoni resigned on 4 October 2021 and was replaced by Sabrina Baggioni on 9 October 2021.

93
Only Lorenzo Pozza and Sabrina Baggioni are considered to be independent within the meaning of the Dutch corporate
governance code and two members of the audit committee (Andrea Silvestri and Lorenzo Pozza) are financial experts.
The audit committee is charged in particular with: (i) the monitoring of the financial-accounting process and preparation
of proposals to safeguard the integrity of said process; (ii) the monitoring of the efficiency of the internal management
system, the internal audit system and the risk management system with respect to financial reporting; (iii) the monitoring
of the statutory audit of the annual accounts and consolidated accounts, and in particular the process of such audit (taking
into account the review of the AFM in accordance with Section 26 of EU Regulation 537/2014); (iv) the review and mon-
itoring of the independence of the external auditor, with a special focus on other services provided to the Company, in
accordance with the Company's external auditor independence policy; and (v) the adoption of a procedure for the selec-
tion of the external auditor and the nomination for appointment of the external auditor with respect to the statutory
audit of the annual accounts and consolidated accounts.
Unless decided otherwise by the audit committee, the chief financial officer, the head of the internal audit department
and the external auditor shall attend the audit committee meetings. The audit committee shall decide whether and, if so,
when the Chief Executive Officer shall attend audit committee meetings. The audit committee shall meet with the inde-
pendent auditor at least once a year outside the presence of the executive directors.
In 2021, the audit committee met three times. At these meetings several matters were discussed.
The main issues were related to the:
approval of Audit committee rules and the Company Secretary’s appointment;
approval of the updated Ariston Group whistleblowing policy;
information and approval of the new Ariston Group Memorandum “Sistema Controllo di Gestione” (SCG) and related
certification;
information and approval of the Enterprise Risk Management model (ERM) implemented by the Group;
information on the financial and economic situation of the Group;
information on the external audit firm activities and presentation of the Italian and Dutch partners and related teams;
presentation of the internal audit function, activities and related principles & methodologies with information on the
main audit activities 2021 and on the Audit Master Plan 2022.
Compensation and talent development committee:
Roberto Guidetti
Sabrina Baggioni
Marinella Soldi.
The aforementioned persons were appointed as members of the compensation and talent development committee on
5 August 2021.
The compensation and talent development committee is charged in particular with: (i) the preparation of the remunera-
tion policy for the Board; (ii) the preparation of proposals for the remuneration of the Directors; (iii) the preparation of
the remuneration report on the execution of the remuneration policy during the respective year, (iv) the preparation of
the selection criteria and appointment procedures for Directors; (v) periodically assessing the functioning of the individual
Directors and reporting on this to the non-executive directors; (vi) drawing up a plan for the succession of Directors; and
(vii) proposing appointments and reappointments of Directors. This committee, moreover, is charged with supporting
the Board in identifying incentive mechanisms for management and making strategic decisions relating to the organisa-
tion of the Group. The Board has combined the functions and the responsibilities of the remuneration committee and
the selection and appointment committee in the compensation and talent development committee. The Company feels
that there would be no benefits for the Company, given its size and its organisational structure, in splitting the Compen-
sation and Talent Development Committee as prescribed under the Dutch corporate governance code. All members of
the compensation and talent development committee are independent within the meaning of the Dutch corporate gov-
ernance code.
In 2021 the compensation and talent development committee met 4 times. At these meetings several matters were
discussed, including:
• Succession Planning and Talent Development;
• Reorganization Project (One Team);
94
• New HR Selection Process, LTI 2021;
• Short Term Incentive and Top Management Compensation for 2021;
• 2020 MBO Performance assessment of Band A & B Managers;
• 2021 Performance Indicators for MBO of Band A & B Managers;
• 2021 Top Management Compensation;
• Analysis of the Extraordinary Operation implications on LTI and their management;
• New LTI Plan, 2016 – 2021 LTI Conversion Plans;
• Review of the Remuneration Policy.
Strategic committee:
Paolo Merloni
Enrico Vita
Ignazio Rocco di Torrepadula
Andrea Guerra.
The aforementioned persons were appointed as members of the strategic committee on 5 August 2021.
The strategic committee is charged in particular with supporting the Board as regards business strategic decisions (in-
cluding external growth opportunities, be them integrative or transformative).
During the financial year 2021, the Strategic Committee met 2 times. At these meetings several matters were discussed,
including:
• the IPO project and its mid- to long-term consequences and opportunities;
• the analysis of the M&A strategy and potential;
• the evolution of the go-to-market with digital and downstream integration; and
• the ongoing growth and commitment to renewable technologies and the US development.
ESG Committee:
Paolo Merloni
Marinella Soldi
Roberto Guidetti.
The aforementioned persons were appointed as members of the ESG committee on 5 August 2021.
The ESG committee is charged in particular with supporting the Board as regards (i) providing guidance to steer the
strategy of the Group in terms of ESG visions and commitments; (ii) approving the Group's materiality matrix along with
the ESG plan (targets, activities and KPIs) the Group commits to engage on to deliver against the material topics; (iii)
monitoring the ESG plan execution, target achievement and progress of actions, including areas of work required by ESG
rating agencies; (iv) approving the Group's ESG communication plan and reporting methods related to ESG issues, such
as "Declaration on non-financial issues"; (v) promoting the dissemination of a culture of sustainability in the Group; (vi)
supervising the activities of listening, dialogue and involvement of stakeholders.
During the financial year 2021, the recently set-up ESG Committee was not convened. The Chairperson of the ESG Com-
mittee held 3 meetings with the ESG function to discuss the ongoing activities related to the current ESG Plan (“Road to
2022”), new reporting commitments (the EU Taxonomy) and the development of the new ESG Plan (“Road to 100”). Also,
the 2022 agenda was developed, along with main topics and commitments.
General meeting
Meetings of Shareholders
At least one annual general meeting shall be held every year, which meeting shall be held within six months after the
close of the financial year. Additional general meetings will be held as often as the Board considers such to be necessary
and within three months after the Board has considered it to be likely that the Company's equity has decreased to an
95
amount equal to or lower than one-half of its paid-up and called-up share capital, in order to discuss any requisite
measures.
Shareholders representing alone or in aggregate at least 10% of the issued and outstanding share capital may request
that a general meeting be convened. If no general meeting has been held within eight weeks of the shareholders making
such request, the shareholders making such request may, upon their request, be authorised by the district court in sum-
mary proceedings to convene a general meeting.
General meetings must be held in the Netherlands in Amsterdam, Rotterdam, The Hague, or Haarlemmermeer (including
Schiphol Airport).
All convocations of the general meetings and all announcements, notifications and communications to shareholders shall
be made available on the Company corporate website. Notice of a general meeting must be given by at least 42 days
prior to the day of the meeting. The notice convening any general meeting must include, among other items, the subjects
to be dealt with, the venue and time of the general meeting, the requirements for admittance to the general meeting,
the address of the Company's website, and such other information as may be required by Dutch law.
The agenda for the annual general meeting shall list which items are up for discussion and which items are to be voted
on. In addition, the agenda shall include such items as have been included therein by the Board or the shareholders.
Some items must be dealt with as separate agenda items, such as the adoption of the annual accounts, the discussion of
any substantial change in the corporate governance structure of the Company and the allocation of the profits, insofar
as these are at the disposal of the general meeting. If the agenda of the general meeting contains the item of granting
discharge to the directors concerning the performance of their duties in the financial year in question, the matter of the
discharge must be mentioned on the agenda as separate items for the executive directors and the non-executive direc-
tors respectively.
Shareholders holding at least 3% of the Company's issued and outstanding share capital may request, by a motivated
request, that an item is added to the agenda. Such requests must be made in writing, must either be substantiated or
include a proposal for a resolution, and must be received by the Executive Chairman at least 60 days before the day of
the general meeting. No resolutions may be adopted on items other than those that have been included in the agenda
(unless the resolution would be adopted unanimously during a meeting where the entire issued capital of the Company
is present or represented).
Pursuant to the Dutch corporate governance code, if one or more shareholders intend to request that an item be put on
the agenda for a general meeting that may result in a change in the Company's strategy, for example as a result of a
proposed dismissal of one or more executive directors or non-executive directors, the Board may invoke a reasonable
response time that does not exceed 180 days from the moment the Board is informed by one or more shareholders of
their intention to put an item on the agenda to the day of the general meeting at which the item is to be dealt with. The
relevant shareholder(s) should respect the response time invoked by the Board. The Board shall use the response time
for further deliberation and constructive consultation, in any event with the relevant shareholder(s) and shall explore
alternatives. At the end of the invoked response time, the Board shall report on the outcome of such deliberation and
consultation to the general meeting. The response time may only be invoked once for any given general meeting and
shall not apply to an item in respect of which the response time has previously been invoked, or to a general meeting
where a shareholder holds at least three-quarters of the issued capital as a consequence of a successful public offer.
Voting rights and adoption of resolutions
At general meetings, each ordinary share confers a right to cast one vote and each multiple voting share confers the right
to cast 20 votes. Pursuant to the articles of association, a shareholder casting a number of votes exceeding two times the
total number of ordinary shares issued and outstanding at the record date for the relevant general meeting (the “Voting
Threshold”) may never cast a number of votes on its shares exceeding the greater of:
the Voting Threshold; and
nine times the total number of ordinary shares issued and outstanding at the record date for the relevant general
meeting or, if multiple voting shares have been issued and are outstanding, nine times the total number of ordinary
shares issued and outstanding at the record date for the relevant general meeting multiplied by the percentage of
multiple voting shares held by the relevant shareholder compared to the total number of multiple voting shares issued
and outstanding at the record date for the relevant general meeting.
96
Pursuant to Dutch law, as a general rule, no votes may be cast at a general meeting in respect of shares which are held
by the Company. Resolutions of the general meeting are passed by an absolute majority of the votes cast at the general
meeting, except where Dutch law or the articles of association prescribe a greater majority. The voting rights attached to
the shares may only be amended by amendment to the articles of association. The general meeting may pass a resolution
to amend the articles of association, but only on a proposal of the Board. Furthermore, a resolution to amend a provision
relating to the multiple voting shares and/or the rights and/or obligations of the (meeting of) holders of multiple voting
shares is subject to the prior approval of the meeting of holders of multiple voting shares.
Issuance of shares
The Board is the competent body to issue shares for a period of five years from 25 November 2021 and this authorisation
can be withdrawn by the general meeting. This competence concerns all non-issued shares of the Company's authorised
capital from time to time.
After this five-year period, resolutions to issue shares shall be adopted by the general meeting or, if the general meeting
designated the Board to do so, by the Board. A resolution of the general meeting to issue shares or to designate the Board
as the competent body to issue shares, can only take place at the proposal of the Board and can only be adopted with an
absolute majority of the votes cast. The foregoing also applies to the granting of rights to subscribe for shares, such as
options, but does not apply to the issue of shares to a person exercising a previously acquired right to subscribe for shares.
An authorisation by the general meeting to designate the Board can be made each time for a maximum of five years and
can be extended each time for a maximum period of five years. An authorisation by the general meeting to designate the
Board must specify the number of shares of each class concerned which may be issued pursuant to a resolution of a
Board (which may be expressed as a percentage of the issued capital). The general meeting is not authorised to resolve
on the issuance of shares or the granting of rights to subscribe for shares to the extent it has authorised the Board as the
competent body for such purpose. A resolution of the general meeting to designate the Board cannot be withdrawn,
unless otherwise provided in the authorisation. The Company may not subscribe for its own shares on issue.
Pre-emptive rights
Upon the issue of both ordinary shares and multiple voting shares or the granting of rights to subscribe for ordinary
shares and multiple voting shares, each holder of shares shall have a pre-emptive right in respect of the shares to be
issued, in proportion to the aggregate amount of the shares held by it (relative to the entire issued share capital) with
the understanding that a holder of ordinary shares may only subscribe to acquire ordinary shares and a holder of multiple
voting shares may only subscribe to acquire multiple voting shares. No pre-emptive rights exist in respect of shares issued
to a person exercising a previously acquired right to subscribe for shares.
In respect of an issuance of only ordinary shares or the granting of rights to subscribe for ordinary shares, each holder of
shares will have a right of pre-emption proportionate to the aggregate amount of his shares (relative to the entire issued
share capital), subject to the relevant limitations prescribed by Dutch law and the other provisions pursuant to the articles
of association.
In respect of an issuance of only multiple voting shares, each holder of multiple voting shares will have a right of pre-
emption proportionate to the aggregate amount of his multiple voting shares (relative to the entire issued share capital),
subject to the relevant limitations prescribed by Dutch law and the other provisions pursuant to the articles of association.
Exceptions to these pre-emptive rights include: (i) the issue of shares against a contribution in kind other than in cash, (ii)
the issue of shares to employees of the Company or of a group company (groepsmaatschappij) pursuant to an employee
share scheme or as an employee benefit, and (iii) the issue of shares to persons exercising a previously granted right to
subscribe for shares.
The Board will be the competent body to restrict or exclude pre-emptive rights for a period of five years from 25 Novem-
ber 2021. After this five-year period, pre-emptive rights relating to shares may be restricted or excluded by the general
meeting or, if the general meeting designated the Board to do so, by the Board.
An authorisation by the general meeting to designate the Board can be made each time for a maximum of five years and
can be extended each time for a maximum period of five years. Unless otherwise provided in the authorisation, it may
not be withdrawn. A resolution of the general meeting to restrict or exclude pre-emptive rights or designate the Board
97
as the competent body to restrict or exclude pre-emptive rights requires a majority of not less than two-thirds of the
votes cast, if less than 50% of the issued share capital of the Company is represented at the meeting.
A resolution of the Board (or, if applicable, the general meeting) to restrict or exclude the pre-emptive rights relating to
multiple voting shares will be subject to the approval of the meeting of holders of multiple voting shares granted by
resolution adopted with more than 50% of the votes in the meeting of holders of multiple voting shares.
Major shareholders
At 31 December 2021, the voting rights attached to the issued shares in the capital of the Company are held by: Merloni
Holding S.p.A. for 73.96%, Amaranta S.r.l.: 18.68% (equating to 75.03% of the share capital). The market is entitled to
7.36% of the voting rights.
At 31 December 2021, the issued share capital of the Company is held by Merloni Holding S.p.A. for 66.03%, Amaranta
S.r.l. for 9.0% and the market for 24.962%.
For the foreseeable future, as a result of the dual-class share structure and the concentration of ownership, Merloni
Holding S.p.A. will continue to be able to control or substantially influence matters requiring approval by the general
meeting, including the appointment and dismissal of directors, directors' remuneration, dividends distributions, the
amendment of the articles of association, capital increases, mergers and consolidations, even where Merloni Holding
S.p.A. holds less than 50% of the ordinary shares.
Merloni Holding S.p.A. is controlled by Paolo Merloni, who is the Executive Chairman of the Company, and Amaranta S.r.l.
is controlled by Maria Francesca Merloni, who is a non-executive director of the Company. Paolo Merloni and Maria
Francesca Merloni are siblings. As directors, both Paolo Merloni and Maria Francesca Merloni owe a fiduciary duty to the
Company's stakeholders and they must act in a manner that they reasonably believe to be in the best interests of the
Company's stakeholders. As shareholders, Paolo Merloni and Maria Francesca Merloni are entitled to direct the vote of
their shares in their own interests, which may not always be in the interests of the Company's stakeholders generally.
The articles of association do not provide for any specific provisions beyond those required by applicable law and regula-
tion to ensure that control by the major or controlling shareholders is not abused.
Compliance with the Dutch corporate governance code
The Dutch corporate governance code applies to the Company as the Company has its seat in the Netherlands and its
ordinary shares are listed on Euronext Milan.
The Dutch corporate governance code is based on a 'comply or explain' (pas toe of leg uit) principle. Accordingly, compa-
nies are required to disclose in their board report whether or not they are complying with the various best practice
provisions of the Dutch corporate governance code that are addressed to the directors. If a company deviates from a
best practice provision in the Dutch corporate ode, the reason for such deviation must be properly explained in its direc-
tors' report.
As per 31 December 2021, the Company complies with the principles of the Dutch corporate governance code, except
for the following principles of the Dutch corporate governance code:
• Best practice provision 2.1.7 (independent directors): the Company deviates from best practice provision 2.1.7(iii)
which provides that, in order to safeguard its independence, there should be only one non-executive director affiliated
with each shareholder holding more than 10% of the shares in the Company. There are three non-executive directors
affiliated with Merloni Holding S.p.A.: Francesco Merloni, Maria Francesca Merloni and Paolo Tanoni. It is believed,
however, that the involvement of both Francesco Merloni and Maria Francesca Merloni proves the commitment of
the Merloni family to participate in the Company with spirit of homogeneity and compactness, in order to ensure
continuity of control over the Company. It is believed, that Paolo Tanoni's deep knowledge of the Company as well as
his overall knowledge of laws and regulations make him a most valuable non-executive director. In addition, Andrea
Silvestri is not considered independent pursuant to best practice provision 2.8(iii), since he acted as adviser to the
Group in the year prior to his appointment.
• Best practice provision 2.2.4 (succession): the Company partly deviates from best practice provision 2.2.4 which pro-
vides that the supervisory board should draw up a retirement schedule in order to avoid, as much as possible, super-
visory board members retiring simultaneously and that the retirement schedule should be published on the website.
98
All directors currently in office will retire simultaneously at the end of their term after the annual general meeting to
be held in 2024. The Company will not use a retirement schedule because the Company wishes to adhere to common
practice in Italy that all members of the Board are appointed for the same term of three years.
• Best practice provision 2.3.2 (establishment of committees): the Company does not comply with best practice provi-
sion 2.3.2, which provides that if the Board consists of more than four members, it shall appoint an audit committee,
a remuneration committee and a selection and appointment committee. The Board has combined the functions and
the responsibilities of the remuneration committee and the selection and appointment committee in one committee,
the compensation and talent development committee. The Company feels that there would be no benefits for the
Company, given its size and its organisational structure, in splitting the Compensation and Talent Development Com-
mittee as prescribed under the Dutch corporate governance code.
• Principle 2.3.6 of the Dutch corporate governance code (vice-chairman of the Board): the Company does not comply
with best practice provision 2.3.6, which provides that the vice-chairman of the Board should deputise for the Chair
when the occasion arises. Pursuant to the articles of association, the Board may designate one or more other directors
as vice-chair of the Board. However, so far, the Company feels that there would be no benefits for the Company, given
its size and its organisational structure, in such an appointment.
• Best practice provision 3.1.2 v. (variable remuneration): the Company does not fully comply with best practice provi-
sion 3.1.2, as the unvested phantom stock options have been converted into restricted share units to which no per-
formance metrics are applied. As the original phantom stock option plans were granted before the initial public offer-
ing of the Company, the Company elected to convert the outstanding unvested phantom stock options under the
2019 and 2020 plans into RSUs. The RSUs are intrinsically and functionally linked to the continuation of the Benefi-
ciary’s Relationship with the Company or its Subsidiaries at vesting. The Company believes a conversion into RSUs was
more appropriate given the nature of the existing plan. The converted RSUs are expected to vest in 2022 and 2023
and the Company intends to comply with the specific best practice provision after the converted RSUs have vested.
• Best practice provision 3.2.3 (severance payments): the Company does not comply with best practice provision 3.2.3,
which provides that the remuneration of executive directors in the event of dismissal should not exceed one year's
salary (the 'fixed' remuneration component). The employment agreement of the Executive Chairman provides for the
standard indemnity upon termination of the relationship as set out in the applicable collective bargaining agreement,
which pay-out depends on the duration of the employment agreement and could be more than one year salary. The
management agreement of the Chief Executive Officer provides that, upon termination by the Company and existing
certain conditions, the Chief Executive Officer is entitled to a one-off severance equal to an amount of up to two years
of his remuneration as manager (net of any amount paid as non-compete obligation consideration). The Company
wishes to respect the terms and conditions of the aforementioned agreements, since these agreements were entered
into by the Company before the initial public offering of the Company.
Disclosures pursuant to decree article 10 EU-Directive on takeovers
In accordance with the Dutch Takeover Directive (Article 10) Decree (Besluit artikel overnamerichtlijn, the "Decree"),
the Company makes the following disclosures:
a) At 31 December 2021, the issued share capital of the Company consisted of 104,268,292 ordinary shares with a par
value of € 0.01 each, representing approximately [2.26] % percent of the aggregate issued share capital, and
225,000,000 multiple voting shares with a nominal value of € 0.20 each, representing approximately [97.74] % of the
aggregate issued share capital.
For information on the rights attached to ordinary shares and multiple voting shares, reference is made to the articles
of association which can be found on the Company's website. To summarise, the rights attaching to ordinary shares
and multiple voting shares comprise pre-emptive rights upon the issue of shares, the right to attend to the general
meetings of shareholders of the Company and to speak and vote at such meetings and to resolve on and the entitle-
ment to the distribution of such amount of the Company's profit as remains after allocation to the reserves. Ordinary
shares and multiple voting shares rank pari passu and will have equal rights and obligations with respect to all matters,
with the exceptions as set out in the articles of association including the entitlement to voting rights as set out in
article 25.1 of the articles of association, the conversion reserve and the liquidation distribution referred to in article
35.3 of the articles of association.
99
b) The Company has imposed no limitations on the transfer of ordinary shares. Article 15 of the articles of association
provide for transfer restrictions for multiple voting shares (right of first refusal). If a holder of multiple voting shares
intends to transfer to any third party (be it a shareholder or not) one or more multiple voting shares, the transferor
shall have the obligation, in accordance with the procedure outlined in article 15 of the articles of association, to offer
a right of first refusal to the remaining holders of multiple voting shares.
c) For information on participations in the capital of the Company for which a disclosure obligation exists under Sections
5:34, 5:35 and 5:43 of the Dutch Financial Supervision Act (Wet op het financieel toezicht), please see the section
'Major shareholders' in this governance report. There you will find a list of shareholders who are known to the Com-
pany to have holdings of three percent or more at the stated date.
d) No special control rights or other rights accrue to shares in the capital of the Company other than that a multiple
voting share confers the right to cast 20 votes, all in accordance with the terms and conditions as set out in article
25.1 of the articles of association. Reference is made to paragraph "General Meeting"; subparagraph "Voting Rights
and adoption of resolutions" of this Corporate Governance section.
e) A mechanism for verifying compliance with a scheme allowing employees to subscribe for or to acquire shares in the
capital of the Company or a subsidiary if the employees do not arrange for such verification directly is not applicable
to the Company.
f) No restrictions apply to voting rights attached to the shares in the capital of the Company, nor are there any deadlines
for exercising voting rights other than the restriction of the number of votes that may be cast on multiple voting
shares as set out in article 25.1 of the articles of association describing the Voting Threshold and further explained in
paragraph "General Meeting"; subparagraph "Voting Rights and adoption of resolutions" of this Corporate Govern-
ance section. Except by virtue of the different voting rights attached to the ordinary shares and the multiple voting
shares and the application of the Voting Threshold, none of the shareholders will have any voting rights different from
any other shareholders.
g) The Company is not aware of the existence of any agreements with shareholders of the Company which may result
in restrictions on the transfer of shares or limitation or voting rights, other than a shareholders' agreement entered
into on 26 October 2021. The shareholders agreement provides as follows:
(i) Merloni Holding S.p.A. shall procure that one person indicated by Amaranta S.r.l. is appointed as director
so long as Amaranta S.r.l. holds at least 7% of issued share capital of the Company;
(ii) should Merloni Holding S.p.A.:
a. decide to sell a number of multiple voting shares so that it loses control over the Company, then Ama-
ranta S.r.l. will be entitled to tag its multiple voting shares to the sale of multiple voting shares held by
Merloni Holding S.p.A.;
b. receive an offer for the entirety of the outstanding multiple voting shares, then Merloni Holding S.p.A.
will be entitled to drag the multiple voting shares held by Amaranta S.r.l.;
(iii) Merloni Holding S.p.A. shall be entitled to acquire from Amaranta S.r.l. 6,000,000 multiple voting shares in
exchange for the same amount of ordinary shares by virtue of a call option; and
(iv) each of Merloni Holding S.p.A. and Amaranta S.r.l. shall inform the other party in case it wishes to convert
its multiple voting shares into ordinary shares.
h) The rules governing the appointment and dismissal of directors are stated in the articles of association. All directors
are appointed by the general meeting. The Board nominates a candidate for each vacant seat. A nomination by the
Board will be binding as described above in the section 'Board'. Directors are appointed for a period of time to be
determined by the general meeting, ending not sooner than immediately after the general meeting held in the first
year after the year of their appointment and not later than immediately after the general meeting held in the fourth
year after the year of their appointment.
i) The articles of association allow the Company to cooperate in the issuance of registered depositary receipts for
shares, but only pursuant to a resolution to that effect by the Board. No depositary receipts having been issued for
shares in its capital with the cooperation of the Company.
The general meeting may at any time dismiss or suspend any director. If the Board proposes the dismissal of a director
to the general meeting, the general meeting can resolve upon such dismissal by resolution adopted by an absolute
majority of the votes cast.
100
If the Board has not made a proposal for the dismissal of a director, the general meeting can only resolve upon the
dismissal of such director by resolution adopted by an absolute majority of the votes cast, representing more than
half of the issued capital of the Company. executive directors may at all times also be suspended by the Board. A
resolution of the Board to suspend the Executive Chairman must be adopted with a majority of two thirds of the votes
cast in a meeting where all directors, other than the Executive Chairman, are present or represented. If either the
Board or the general meeting has resolved upon a suspension of a director, the general meeting shall within three
months after the suspension has taken effect, resolve either to dismiss such director with due observance of the
provisions in the articles of association, or to terminate or continue the suspension, failing which the suspension shall
lapse. A resolution to continue the suspension may be adopted only once and in such event the suspension may be
continued for a maximum period of three months commencing on the day that the general meeting has adopted the
resolution to continue the suspension. If the general meeting has not decided to terminate or to continue the sus-
pension within the required period, the suspension shall lapse.
The rules governing an amendment of the articles of association are included in article 34 of the articles of association
and require a resolution of the general meeting, but only on a proposal by the Board. The prior approval of the meet-
ing of holders of multiple voting shares is required for an amendment of a provision relation to the multiple voting
shares and/or the rights and/or the obligations of the (meeting of) holders of multiple voting shares.
j) The general powers of the Board are stated in article 17 of the articles of association. Pursuant to article 21.1 of the
articles of association, the general authority to represent the Company is vested in the Board and the Executive Chair-
man. The Board has granted specific representation powers to Laurent Jacquemin, in his capacity of Chief Executive
Officer of the Company.
According to article 6.1 of the articles of association, the Board will be the competent corporate body to issue the
shares for a period of five years with effect from 25 November 2021. The Board is also authorised to limit or exclude
pre-emptive rights of shareholders on any issue of shares or granting rights to subscribe for shares, for the same term.
After the five-year term, shares may be issued pursuant to a resolution of the general meeting unless the Board is
designated to do so by the general meeting. Such designation can be made each time for a maximum period of five
years and can be extended each time for a maximum period of five year. A designation must determine the number
of shares of each class concerned which may be issued pursuant to a resolution of the Board. The resolution of the
general meeting to designate the Board as the body authorised to issue shares cannot be withdrawn by the general
meeting, unless otherwise provided in the authorisation. The body resolving to issue shares must determine the issue
price and the other conditions of issuance in the resolution to issue. After the five- year term, pre-emptive rights may
be restricted or excluded by a resolution of the general meeting. The general meeting may designate this competence
to the Board for a period not exceeding five years, provided that the general meeting has also authorised the Board
to issue shares. Unless otherwise stipulated at its grant, this authorisation cannot be withdrawn.
The Company is entitled to acquire fully paid-up shares in its capital. The terms and conditions for the acquisition of
shares by the Company in its capital are set out in article 9 of the articles of association.
k) The Company is not a party to any significant agreements which will take effect, will be altered or will be termination
upon a change of control of the Company as a result of a public offer within the meaning of section 5:70 of the Dutch
Financial Supervision Act (Wet op het financieel toezicht), provided that certain of the loan agreements entered into
by the Company contain clauses that, as is customary for financing agreements of similar type, may require early
repayment or termination in the event of a change of control of the Company.
l) The Company did not enter into any agreement with a director or employee of the Company providing for a payment
upon the termination of employment as a result of a public offer within the meaning of section 5:70 of the Dutch
Financial Supervision Act (Wet op het financieel toezicht).
Statements by the Board
Ariston's consolidated and company financial statements for 2021 have been prepared in accordance with IFRS as
adopted by the EU and with Part 9, Book 2 of the Dutch Civil Code.
In accordance with best practice 1.4.3 of the Dutch corporate governance code and based on the assessment performed,
the Board believes that, as at 31 December 2021, the Group’s and the Company’s internal control over financial reporting
is considered effective and that:
101
a) the Board report provides sufficient insights into any material weaknesses in the effectiveness of the internal risk
management and control systems (reference is made to section 5.1 “Risk management”);
b) the internal risk management and control systems are designed to provide reasonable assurance that the financial
reporting does not contain any material inaccuracies (reference is made to section 5.1 “Risk management”);
c) based on the current state of affairs, it is justified that the financial statements are prepared on a going concern basis
(reference is made to paragraph 3.i. of the “Notes to the consolidated financial statements"); and
d) the Board report states those material risks and uncertainties that are relevant to the expectation of the Company’s
continuity for the period of twelve months after the preparation of this annual report (section 5.1.3 “Main risks and
uncertainties to which the Group is exposed").
As required by Section 5:25c paragraph 2(c) of the Dutch Financial Supervision Act, the Board declares that, to the best
of its knowledge:
a) the financial statements provide a true and fair view of the assets, liabilities, financial positions and profit or loss for
the year of the Company and its subsidiaries;
b) the Board report provides a fair view of the position at the balance sheet date and developments during the year
under review of the Company and its subsidiaries, together with a description of the principal risks and uncertainties
that the Company and the Group face.
Paolo Merloni
Executive Chairman
Laurent Jacquemin
Chief Executive Officer
Francesco Merloni,
Non-executive director
Marinella Soldi
Lead non-executive director
Sabrina Baggioni
Non-executive director
Roberto Guidetti
Non-executive director
Maria Francesca Merloni
Non-executive director
Lorenzo Pozza
Non-executive director
Ignazio Rocco di Torrepadula
Non-executive director
Andrea Silvestri
Non-executive director
Paolo Tanoni
Non-executive director
Enrico Vita
Non-executive director
Report of the non-executive directors
This is the report of the non-executive directors of the Company over the financial year 2021, as referred to in best
practice provision 5.1.5 of the Dutch corporate governance code.

102
The Board is a one-tier board, comprising both members having responsibility for the day-to-day management of the
company (executive directors) and members not having such day-to-day responsibility (non-executive directors). The
tasks of the executive and non-executive directors in a one-tier board such as the board may be allocated under or pur-
suant to the articles of association, provided that the general meeting has stipulated whether such director is appointed
as executive or as non-executive director and furthermore provided that the task to supervise the performance by the
directors of their duties can only be performed by the non-executive directors. Regardless of an allocation of tasks, all
directors remain collectively responsible for the proper management and strategy of the company (including supervision
thereof in case of non-executive directors).
It is the responsibility of the non-executive directors to supervise the policies carried out by the executive directors and
the general affairs of the Company and its affiliated enterprise, including the implementation of the strategy of the Com-
pany regarding long-term value creation. In so doing, the non-executive directors act solely in the interest of the Com-
pany. With a view of maintaining supervision on the Company, the non-executive directors regularly discuss the long-
term business plans, the implementation of such plans and the risks associated with such plans with the executive direc-
tors.
Details of the current composition of the Board, including the non-executive directors, and its committees are set forth
in the sections “Board and Board committees”.
Supervision by the non-executive directors
The non-executive directors supervised the policies carried out by the executive directors and the general affairs of the
Company and its affiliated enterprise. In so doing, the non-executive directors have also focused on the effectiveness of
the Company’s internal risk management and control systems, the integrity and quality of the financial reporting and the
Company's long-term business plans, the implementation of such plans and the risks associated.
Furthermore, the non-executive directors have examined and monitored each and all stages of the redomiciliation pro-
cess and the listing of the ordinary shares on Euronext Milan and adopted all relevant resolutions.
The non-executive directors supervised the adoption and implementation of the strategies and policies by the Group,
reviewed this annual report, including the Group’s financial results, received updates on legal and compliance matters,
and they have been regularly involved in the review and approval of transactions entered into with related parties. The
non-executive directors have also reviewed the reports of the Board and its committees.
Committees
Furthermore, the Board has allocated certain specific responsibilities to the audit committee, the compensation and tal-
ent development committee, the strategic committee and the ESG committee.
The audit committee is tasked with supporting the Board with supervising financial reporting, risk management ap-
proach and Control System. In addition, supports on matters related to internal and external audit, financial resources,
IT and Cybersecurity, tax policy.
The compensation and talent development committee, which is tasked with supporting the Board with defining se-
lection and assessment criteria, proposing remuneration policy and drawing succession plan for senior management
and Board Members.
The strategic committee is tasked with supporting the Board with setting business development guidelines, as well as
with identifying and weighing the macro risks to which the Group is exposed. The strategic committee shall support
the in setting guidelines concerning business strategies, models and decisions regarding the Group’s footprint and
industrial operations, marketing models, organisational recommendations and operational criteria, as well as explore
potential integrative or transformative inorganic growth opportunities.
The ESG committee is tasked with supporting the Board with defining ESG vision, defining action plan, monitoring
implementation, supervising activities related to communication and to definition of Group ESG culture.
The non-executive directors have been regularly informed by each committee as referred to in best practice provision
2.3.5 of the Dutch corporate governance code and the conclusions of those committees were taken into account when
drafting this report of the non-executive directors.
The Company operated only a month as a listed company in 2021. The non-executive directors will evaluate and supervise
the performance of each of the committees for the first time in 2022.

103
Attendance at meetings
During the financial year 2021, there were seven meetings of the Board, including meetings of the board of directors of
the Company's predecessor Ariston Thermo Holding S.p.A. (before and after the reverse merger whereby Ariston Thermo
Holding S.p.A. disappeared into Ariston Thermo International S.r.l. and Ariston Thermo International S.r.l. was renamed
Ariston Thermo Holding S.p.A.).
The composition of the Board has changed several times during the financial year 2021 (before and after the Company's
redomiciliation) which explains the difference in the total number of meetings attended by some of the directors men-
tioned below.
On 11 March 2021, the board of directors of Ariston Thermo Holding S.p.A. comprised the following directors: Fran-
cesco Merloni, Paolo Merloni, Laurent Jacquemin, Marinella Soldi, Roberto Guidetti, Maria Francesca Merloni, Paolo
Tanoni, Andrea Guerra, Sara Dethridge, Gianemilio Osculati and Enrico Vita;
on 13 April 2021, Ignazio Rocco di Torrepadula was appointed a director and [the term of Andrea Guerra, Sara De-
thridge and Gianemilio Osculati ended on 13 April 2021;
on 1 June 2021, the reverse merger took place and the following directors have been appointed: Paolo Merloni, Lau-
rent Jacquemin, Francesco Merloni, Marinella Soldi, Roberto Guidetti, Maria Francesca Merloni, Paolo Tanoni, Ignazio
Rocco di Torrepadula and Sabrina Baggioni;
on 15 June 2021 (after redomiciliation), the Company appointed the following non-executive directors: Lorenzo Pozza
and Andrea Silvestri.
Before the redomiciliation took place, the business of the (predecessor) of the Company was conducted in Ariston
Thermo Holding S.p.A. (old) (and not in the surviving entity of the reverse merger Ariston Thermo International S.r.l.)
and therefore, the number of meetings of the board of directors of Ariston Thermo Holding S.p.A. (old) has been
taken into account below.
An overview of the attendance of the individual directors per meeting of the Board and its committees set out against
the total number of such meetings is set out below:
Name Board In % Audit
committee In %
Compensation and talent development
committee In %
Strategic committee
In % ESG
committee In %
Paolo Merloni [7/7] 100% - [2/2] [1/1] 100% [1/1] 100%
Laurent Jacquemin [7/7] 100% - - - -
Francesco Merloni [7/7] 100% - - - -
Marinella Soldi [5/7] 71% - [4/4] 100% - [1/1] 100%
Sabrina Baggioni [5/5] 100% [1/1] 100% [2/2] 100% - -
Roberto Guidetti [7/7] 100% - [4/4] 100% - [1/1] 100%
Maria Francesca Merloni [7/7] 100% - - - -
Lorenzo Pozza [3/4] 75% [1/1] 100% - - -
Ignazio Rocco di Torrepadula
[6/6] 100% - - [1/1] 100% -
Andrea Silvestri [4/4] 100% [1/1] 100% - - -
Paolo Tanoni [7/7] 100% - - - -
Andrea Guerra [0/1] 0% - - [1/1] 100% -
Sara Dethridge [1/1] 100%
Gianemilio Osculati [1/1] 100%
Enrico Vita [4/4] 100% - - [1/1] 100% -
Independence of the non-executive directors
Each non-executive director owes a duty to the Company to properly perform his duties and to act in the Company's
corporate interest. Under Dutch law, the Company's corporate interest extends to the interests of all its stakeholders,
including its shareholders, creditors and employees. Pursuant to best practice provisions 2.1.7 and 2.1.8 of the Dutch
corporate governance code, at most one non-executive director does not have to meet the independence criteria as set
out in the Dutch corporate governance code.
104
In addition, for each shareholder, or group of affiliated shareholders, who directly or indirectly hold more than 10% of
the shares in the Company, there is at most one non-executive director who may be affiliated with or representing such
shareholder. In total, the majority of the non-executive directors should be independent. The non-executive directors
have determined that seven of the ten non-executive directors qualify as independent in accordance with the Dutch
corporate governance code.
The Company deviates from best practice provision 2.1.7 (iii) which provides that, in order to safeguard its independence,
there should be only one non-executive director affiliated with each shareholder holding more than 10% of the shares in
the Company. There are three non-executive directors affiliated with Merloni Holding S.p.A.: Francesco Merloni, Maria
Francesca Merloni and Paolo Tanoni.
5.4 Remuneration report
Introduction
In June 2021, the Company was redomiciled to the Netherlands and was converted into a Dutch public company with
limited liability (naamloze vennootschap). In November 2021, the Company's ordinary shares were admitted to listing
and trading on Euronext Milan ("Admission"). In connection with Admission, the general meeting approved a remunera-
tion policy for the Directors.
This remuneration report summarises the guidelines and the principles followed by the Company in order to define and
implement the remuneration policy. In addition, this remuneration report provides the remuneration paid to Executive
Directors and Non-Executive Directors for the year ended 31 December 2021.
Both before and after Admission the remuneration of the Executive Directors comprises fixed remuneration (base salary,
fees, benefits and perquisites) and variable remuneration (short-term incentive and long-term incentive) and the remu-
neration of Non-Executive Directors comprises an annual fixed fee.
Until Admission, the Company's long-term incentive plan provided for the assignment of so-called phantom stock options
to Executive Directors, members of the senior management team and other selected eligible employees. Upon Admission
this plan was terminated and the outstanding phantom stock options were converted (a) at the option of the beneficiar-
ies, into ordinary shares or cash (in relation to vested phantom stock options) and (b) into restricted share units (in rela-
tion to unvested phantom stock options). In addition, a new long-term incentive plan has been approved by the general
meeting providing for awards in the form of performance share units.
The remuneration policy for the Directors was adopted by the general meeting on 28 October 2021 and became effective
on 26 November 2021, the date of Admission. The remuneration policy aims to contribute to the Group's business strat-
egy and is expected to enable the Company to achieve its business objectives. The Non-Executive Directors are responsi-
ble for the implementation and monitoring of the remuneration policy.
In accordance with Dutch law, the remuneration policy will be submitted to the general meeting at least every four years,
as well as each time in case of amendments to the remuneration policy. Pursuant to the Company's articles of association,
the resolution of the general meeting to adopt and amend the remuneration policy requires an absolute majority of the
votes cast.
The remuneration report will be submitted to the general meeting for an advisory vote as from 2022. The Company will
convey any information on how an advisory vote on the remuneration report has been taken into account in the next
annual report.
Remuneration Executive Directors
The objective of the remuneration policy for the Executive Directors is to attract, reward and retain the necessary lead-
ership talent, in order to support the execution of the Group's strategic objectives, and aims at rewarding Non-Executive
Directors appropriately for their work based on the market competitive fee levels.
The authority to establish the remuneration of the Executive Directors is vested with the Non-Executive Directors, with
due observance of the remuneration policy and applicable provisions of law. Even though the Company is not in principle
in favour of making exceptions to the principles underlying the remuneration policy, the Non-Executive Directors shall be
105
allowed to temporarily derogate from the remuneration policy in exceptional circumstances as defined by the Dutch Civil
Code, such as, for example, the need to attract and/or retain highly qualified key managerial competences and retain
market share in a highly competitive market, serving the long term interest and sustainability of the Company and ensur-
ing its viability.
Remuneration principles
The remuneration policy is built on the following six principles:
Align short- and long-term strategy: through the variable incentives for Executive Directors, the Company aims to
align the short-term yearly objectives with the long-term goals of the Group. This is reflected in the grant of long-term
variable incentives, taking into account a three-year vesting period and lock-up obligations.
Pay for performance: the remuneration must reinforce the performance driven culture by rewarding top performers.
Differentiating by experience and responsibility: the remuneration aligns with the responsibilities, experience, com-
petence and performance of the Directors. In addition, in determining the remuneration policy the employment con-
ditions of the Group are taken into account.
Simple and transparent: this principle is reflected through the remuneration policy being based on simple and custom
mechanisms. The Company is transparent in relation to the maximum remuneration that could we awarded to Direc-
tors. Furthermore, the achievement of the targets can be verified in publicly disclosed and easily accessible perfor-
mance results.
Risk prudence: the remuneration structure aims to avoid incentives that encourage unnecessary or excessive risks
that could threaten the Group's value.
Compliance: the remuneration policy complies with applicable laws and regulations. The Group adopts the highest
standards of corporate governance.
The remuneration policy is consistent with long-term sustainability objectives. The procedural and substantive conditions
under which the Company may exceptionally derogate from its remuneration policy are defined in the policy.
Market perspective
Although the Group pursues its remuneration policies independently and such policies are not benchmarked against a
group of peers, market perspective is one of the factors that the Non-Executive Directors take into account when deter-
mining adequate remuneration levels to attract and retain Executive Directors. The Company believes that the periodical
review of the remuneration policies adopted by companies of comparable size and economic performance may be a
useful tool to understand its competitive positioning on the labour market and attractiveness of high quality human cap-
ital, which the Company deems a key driver for growth, innovation and development.
The remuneration policy, even if defined based on the Company's strategy and long-term objectives, is nonetheless in
line with the Company's perception of the remuneration paid to top managers of companies of comparable size and
economic performance.
Remuneration components Executive Directors
The remuneration policy relating to Executive Directors constitutes the key strategic component to attract and retain
human capital in today's tight market. The compensation philosophy of the Group is to pay for performance, to be market
driven, and to be fair and objective.
In line with the fundamental objective of achieving the most effective reconciliation of 'profitability' and 'sustainability'
in the long term, the Executive Director's remuneration is aimed at supporting managerial growth strategies. These strat-
egies, directed at the long term, are key in the Group's reference market (i.e. sustainable comfort solutions for hot water
and space heating market), where research & development-projects require relevant investment in terms of time and
106
cost. In order to be successful in the long term, the Company aims to pursue these projects with continuity. Therefore,
the remuneration policy aims not only at the adequate remuneration of Executive Directors, but also on their adequate
retention, whereas the latter is considered to be an important element which is consistent with the fundamental objec-
tive of maximum sustainable profitability in the long term.
The remuneration policy for Executive Directors consists of:
(i) Fixed remuneration
- base salary and fees
- benefits and perquisites
(ii) Variable remuneration
- short-term incentive (the management by objective scheme (the "MBO")
- long-term incentive plan (the "LTI Plan")
The purpose and features of the different components of the remuneration structure for Executive Directors are outlined
below:
Component Purpose Terms and conditions Base salary and fees Compensate for the individual’s experi-
ence, skills, duties, responsibilities and
the contribution of the individual
within the Company
Fixed remuneration is:
1. internally consistent
2. externally competitive
3. reviewed periodically
Benefits and
perquisites
Provides value to the professional
working life in relation to status, role
complexity and grading
Benefits include health insurance, disability and
life insurance, a directors' and officers' liability
insurance (D&O), mobility allowance or travel
expenses when appropriate, and employee ben-
efits plans as offered at any given point
MBO Ensure Executive Director's alignment
with focus on the annual business plan
as set by the Board
The short-term incentive is conditional upon the
achievement of the following performance tar-
gets:
1. EBIT adjusted (60%)
2. Net Revenue (20%)
3. Product replacement rate (20%)
LTI Plan Achieve growth results in medium and
long term and align Executive Direc-
tors' interests with the pursuit of the
priority objective of sustainable crea-
tion of value for shareholders
The long-term incentive is conditional on the
achievement of the following performance tar-
gets:
1. EBIT adjusted/Net Revenue matrix (70%)
2. Relative TSR (15%)
3. ESG objective (15%) Note: the terminology Net Revenue, Turnover and Net Sales are to be considered equivalent
Fixed remuneration
The purpose of the fixed remuneration is to compensate the Executive Directors for their individual experience, skills,
duties responsibilities and their contribution to the Company. The fixed remuneration includes a base salary and fees
paid on a monthly basis.
The Company ensures that the base salary and fees are: (i) internally consistent (i.e. in line with the role), (ii) externally
competitive and (iii) reviewed periodically. To guarantee internal consistency, the Company has introduced and updates
a band system based on the Mercer IPE (Internal Position Evaluation) methodology to appreciate the relative value of
each job in the Group. Moreover, the introduction of this methodology has allowed the Company to analyse the remu-
neration through its organisations and geographies comparing them with the appropriate external market, to position
the Group in a strategic and competitive way versus its competitors.
Each year the Compensation and Talent Development Committee reviews the base salary and decides whether circum-
stances justify adjustments.
107
There are various factors that may be considered when determining any annual base salary change, including, but not
limited to, business performance, personal performance, the scope and nature of the role, salary increases of the Com-
pany's global workforce, relevant market benchmark data and local economic indicators, such as inflation and cost-of-
living changes, to ensure that the base salary is fair, sensible and market competitive.
The Executive Directors also receive benefits and perquisites in order to provide value to their professional working life
in relation to status, role complexity and grading. All Executive Directors are beneficiaries of a D&O insurance policy and
are entitled to other benefits such as health insurance, disability and life insurance, mobility allowance or travel expenses
and representation costs and to participate in all-employee benefits plans offered at any given point. Additional benefits
and perquisites may be offered to the Executive Directors in case of a relocation or an international assignment.
The Group does not grant personal loans, guarantees or advances to Executive Directors. Furthermore, the Executive
Directors will not be granted remission of loans.
Short-term incentive
The short-term incentive, the MBO, aims to ensure the Executive Directors' alignment with and focus on the annual
business plan as set by the Board. The MBO is designed to motivate the Executive Directors to achieve the Group's quan-
titative performance targets in the shorter-term.
At the beginning of each year, the Compensation and Talent Development Committee proposes to the Board (i) the base
amount of the bonus for each Executive Director and (ii) targets ranges. The pay-out can range from 50% to 150% of the
base amount depending on whether the actual performance is below target (however still reaching a certain performance
threshold), on target or above target.
At the beginning of the following year, the compensation and talent development committee reviews the performances
against the targets, based on the financial records of the Group as audited by the independent auditor, and submits it for
approval to the Board.
There are three performance indicators as follows:
(i) Target A identifies the Group EBIT adjusted (60% of the global performance target)
(ii) Target B identifies the Group net revenue (20% of the global performance target)
(iii) Target C identifies the product replacement rate, measuring the ratio between annual warranty intervention and
replacement, and annual sales (20% of the global performance target). This target is designed to push quality of
the products sold as sustainable quality contributes to the Group performance in the long run. Accordingly, a
portion of the short-term incentive contributes to the Group's strategy, the long-term interests of the Group and
its sustainability.
There is no minimum bonus pay-out. As a consequence, there will be no bonus pay out if none of the performance
thresholds are met. Additionally, there will be no pay-out if the net profit of the year, as reported in the consolidated
financial statement, will be equal to zero, or a net loss for the period is reported. If the short-term incentive targets are
met and the pay-out is possible on the basis of the net profit of the year, the short-term incentive is paid the year following
the relevant performance period, once the predetermined performance results are approved by the Board.
Long-term incentive
LTI Plan
The LTI Plan is intended to achieve growth results in the medium and long term. Additionally, the LTI Plan aims to align
Executive Directors' interests with the pursuit of the priority objective of sustainable creation of value for shareholders.
The long-term incentive awards under the LTI Plan are made available annually (rolling grants) in the form of performance
share units. At the beginning of each year, the compensation and talent development committee proposes to the Board
for each Executive Director: (i) the size of the grant, and (ii) the target pay-out opportunity.
The performance share units are conditional on: (i) a three-year vesting period, (ii) continuous engagement and (iii) per-
formance testing. The number of performance share units that vest after three years is dependent on the achievement
of selected targets.

108
There are three performance targets as follows:
(i) EBIT Adjusted /net revenue matrix (70% of the global performance target)
(ii) relative total shareholders return ("TSR"), measuring the performance of the ordinary shares vis-à-vis the shares
of selected competitors (15% of the global performance target)
(iii) an environmental social governance ("ESG") objective, measuring the percentage of renewables and high effi-
ciency products sold out of the total turnover generated from the sale of products (15% of the global performance
target).
At the beginning of each LTI Plan, the compensation and talent development committee proposes to the Board (i) the
base amount of the LTI for each Executive Director and (ii) targets ranges. The vesting can range from 0% to 150% of the
grant depending on whether the actual performance is below threshold or above target.
At the end of the three-year performance period, the compensation and talent development committee reviews the
performances against the targets, based on the financial records of the Group as audited by the independent auditor,
and submits it for approval to the Board of Directors.
The time frame for assessing performance foresees a three-year vesting period and a lock-up provision of two years on
an amount equal to 30% of the Shares accrued for the Executive Directors. As a result, the LTI plan is clearly linked to the
long-term interests of the Company.
Phantom stock option plan
Until Admission, the long-term incentive plan provided for the assignment of phantom stock options to Executive Direc-
tors. This benefit plan gave the Executive Directors a deferred cash bonus measured on the basis of the value of the
Company. The phantom stock options had a vesting period of three years with a subsequent exercise period of four years.
The pay-out was calculated on the increase of the equity of the Company over time.
Upon Admission this plan was terminated and the outstanding phantom stock options were converted (a) at the option
of the beneficiaries, into ordinary shares at the offer price of the Company's initial public offering or cash (in relation to
vested phantom stock options) and (b) into restricted share units (in relation to unvested phantom stock options), with a
vesting period of three years from the date of the original grant (phantom stock options granted in 2019 vest in 2022,
phantom stock options granted in 2020 vest in 2023). The Company believes a conversion into RSUs was more appropri-
ate given the nature of the existing plan, while a new long-term incentive plan has been approved by the general meeting
providing for awards in the form of performance share units for the 2021 LTI.
The Executive Directors have chosen to convert the vested phantom stock options entirely into ordinary shares.
Scenario analysis
When formulating the remuneration policy and before determining the individual remuneration of the Executive Direc-
tors, the Non-Executive Directors will conduct analyses of the possible results of the variable remuneration components
and the way in which this affects the remuneration of the Executive Directors.
The Non-Executive Directors believe the remuneration policy is effective in terms of establishing a correlation between
the Company's strategic goals and the chosen performance criteria, as the main key performance criteria of the LTI Plan
(i.e. EBT/net revenue matrix, TSR and an ESG objective), which represent a significant part of the Executive Directors'
remuneration package, support both the Company's strategy and value creation for the shareholders.
While the three performance indicators act as independent indicators, in the event that all three long-term threshold
performance targets are not achieved, there will be no variable pay vesting or pay-out for Executive Directors for the
relevant period.
Severance
The management agreement of the Chief Executive Officer was entered into on 4 May 2017, several years before the
Admission. The management agreement provides that, upon termination by the Company and subject to conditions, the
Chief Executive Officer is entitled to a one-off severance equal to an amount of up to two years of his remuneration as
manager (net of any amount paid as non-compete obligation consideration). The remuneration used for calculating the

109
severance includes the base salary and the short-term incentive. Following Admission, the Company has elected to re-
spect and maintain the agreement signed in 2017.
The employment agreement of the Executive Chairman provides for the standard indemnity upon termination of the
relationship as set out in the applicable collective bargaining agreement. The applicable collective bargaining agreement
provides that upon termination there are two kinds of pay-out:
a so-called 'trattamento di fine rapporto' whereby, regardless of the reason of termination, the Executive Chairman
is entitled to a pay-out, for each year of duration of the employment agreement, equal to the annual remuneration
(whether fixed or variable) paid each year divided by 13.5 unless redirected to the private collective pension scheme;
and
an additional indemnity in case of unjust dismissal, of an amount ranging from four to twenty-four monthly wages
depending upon the duration of the employment agreement.
Right to reclaim variable remuneration
In accordance with Dutch law, the Non-Executive Directors may adjust the outcome of variable compensation of the
Executive Directors if the pay-out would, in their view, be unacceptable based on reasonability and fairness criteria (a
'malus'). The Company can also claim back variable payments (in whole or in part) if the pay-out was based on incorrect
information about the achievement of the targets ('claw back').
2021 remuneration
The remuneration of the Executive Directors is in accordance with the remuneration policy. There are no loans, advances
or guarantees provided by the Company or any undertaking belonging to the same group of the Company to or on behalf
of an Executive Director.
Remuneration
The following table summarise the remuneration received by the Executive Directors for the years ended 31 December
2021 and 2020:
Director, Position, Year
Fixed remuneration Variable
remuneration Extraordinary
items Pension expense
Total remu-neration
Proportion of fixed and varia-ble remunera-
tion Base
salary Fees
Benefits and
Perquisites
Short-term
incentive
Long-term
incentive
Paolo Merloni 2021 900 70 33 720 1,114(1) - 42 2,879 36% Fixed – 64% Variable
Executive Chairman
2020 900 62 33 720 2,460(2) - 34 4,210 24% Fixed – 76% Variable
Laurent Jacquemin
2021 750 48 82 480 668(3) 100 - 2,128 41% Fixed – 59% Variable
Chief Executive Officer
2020 650 50 81 480 478(4) - - 1,738 45% Fixed – 55% Variable
Note: Base Salary includes: i. for the Executive Chairman, the employee gross salary as well as the Executive Director fee; ii. For the Chief Executive Officer the Executive Director fee. Fees include: for both the Non Executive Directors fees as well as the committee memberships remuneration; Short-term incentive includes: the pay-out for the year of performance; Long-term incentive includes value calculated as follows: for 2021, LTI is valued referring to the share price of December 30th 2021 at close of trade (€ 10.14) (and it refers to the vesting of the 2018 converted LTI phantom stock option plan) – for 2020, LTI is valued with the conversion factor (€ 3.1057) of the 2017 LTI phantom stock option plan vesting in 2020, as no share price is available prior to listing] (1) LTI value based on IFRS2 expenses is 1,125 € thousand (2) LTI value based on IFRS2 expenses is 2,460 € thousand (3) LTI value based on IFRS2 expenses is 678 € thousand (4) LTI value based on IFRS2 expenses is 478 € thousand

110
(5) Extraordinary item refers to a Special Award, approved by the Board on March 2, 2022 at the recommendation of the Compensation and Tal-ent Development Committee, in accordance with their authority to temporarily deviate from the Remuneration Policy in case of exceptional circumstances. The Company proposed such award to recognize extraordinary contribution and involvement of the CEO in the very peculiar circumstances of the preparation of a listing, successfully leading the Company through the challenges of an IPO.
Short-term incentive
To determine the Executive Directors’ short-term remuneration, the compensation and talent development committee
selected and proposed to the Board the following metrics as performed by the Executive Directors in 2021:
Bandwidth pay-out level
KPI 2021 Weight Minimum On-target Maximum
Group EBIT adjusted (€ million)
60%
Group turnover (€ million)
20%
Product replacement rate
20%
The outcome of the 2021 short-term incentive performance reflects the fact that the Board delivered on March 2nd, 2022.
Long-term incentive
Until Admission, the Executive Directors participated in the long-term incentive plan providing for phantom stock. Upon
Admission this plan was terminated and the outstanding phantom stock options were converted (a) at the option of the
beneficiaries, into ordinary shares at the offer price of the Company's initial public offering or cash (in relation to vested
phantom stock options) and (b) into restricted share units (in relation to unvested phantom stock options), with a vesting
period of three years from the date of the original grant (phantom stock options granted in 2019 vest in 2022, phantom
stock options granted in 2020 vest in 2023). In addition, a new long-term incentive plan has been approved by the general
meeting providing for awards in the form of performance share units for the 2021 LTI.
The Executive Directors have chosen to convert the vested phantom stock options entirely into ordinary shares.
The table below provides an overview of the conversion result of the phantom stock options granted in 2016, 2017 and
2018 that vested before Admission. Settlement of the conversion of these phantom stock options will take place in the
first half of 2022.
Executive Director Number of ordinary shares
Paolo Merloni 483,584
Laurent Jacquemin 347,817
The table below provides an overview of the conversion result for the phantom stock options granted in 2019 and 2020
that were unvested at Admission and converted into restricted share units at the offer price of the Company's initial
public offering and the 2021 grant of performance share units.
Director, Position
Main conditions of share unit plans
Information regarding 2021
Opening balance
During the year Closing balance
Plan Performance
period Award Date
End of Vesting Period
End of Lock-up Period
Share units on 1 Janu-ary 2021
Share units awarded
Share units vested
Share units unvested
Share units vested
Paolo Merloni Executive Chairman
2019 2019-2021 03.2019 03.2022 N.A. 0 176,268 0 176,268 0
2020 2020-2022 03.2020 03.2023 N.A. 0 156,737 0 156,737 0
2021 2021-2023 03.2021 03.2024 03.2026 0 112,000 0 112,000 0
Laurent Jacquemin Chief Execu-tive Officer
2019 2019-2021 03.2019 03.2022 N.A. 0 105,761 0 105,761 0
2020 2020-2022 03.2020 03.2023 N.A. 0 156,737 0 156,737 0
2021 2021-2023 03.2021 03.2024 03.2026 0 112,000 0 112,000 0

111
Remuneration Non-Executive Directors
The remuneration of Non-Executive Directors aims to reward the Non-Executive Directors for utilising their skills and
competences to the maximum extent possible to execute the tasks delegated to them. The General Meeting determines
the remuneration upon proposals of the Board, which periodically sends these proposals to the General Meeting.
Remuneration components Non-Executive Directors
The remuneration of the Non-Executive Directors reflects the size of the Group, as well as the responsibilities of the role
and the time spent. Since the nature of the responsibilities of the Non-Executive Directors is to function as independent
bodies, the remuneration is not tied to the performance of the group. Therefore, the remuneration of Non-Executive
Directors includes fixed compensations only. The annual fixed fee for Non-Executive Directors is €50,000. The chair and
the members of the Board's committees are provided with a supplementary committee fee for these additional respon-
sibilities as set out in the table below.
Committee Chair Member
Compensation and Talent Development Committee € 20,000 € 10,000
Audit Committee € 20,000 € 10,000
Strategic Committee € 20,000 € 10,000
ESG Committee € 20,000 € 10,000
The Non-Executive Directors (i) shall not be eligible to participate in any benefits programs offered by the Company, (ii)
will not be entitled to any severance pay, and (iii) are not eligible to participate in a pension scheme or other pension
related benefits. The Non-Executive Directors will, however, be reimbursed for all reasonable business expenses incurred
in the course of performing their duties. Furthermore, the Non-Executive Directors are beneficiaries of the D&O insurance
policy of the Executive Directors.
The Group does not grant personal loans, guarantees or advances to Non-Executive Directors. Additionally, loans of Non-
Executive Directors are not remitted.
2021 remuneration
In 2021 four Non-Executive Directors have commenced their first term as a member of the Board: Sabrina Baggioni,
Lorenzo Pozza, Ignazio Rocco di Torrepadula and Andrea Silvestri. In 2024 the term of all Directors will end. On 13 April
2021, the term of Sara Dethridge and Andrea Guerra expired.
The remuneration of the current, and former, Non-Executive Directors are in accordance with the remuneration policy.
There are no loans, advances or guarantees provided by the Company or any undertaking belonging to the same group
of the Company.
The following table summarise the remuneration received by the Non-Executive Directors for the years ended 31 Decem-
ber 2021 and 2020.
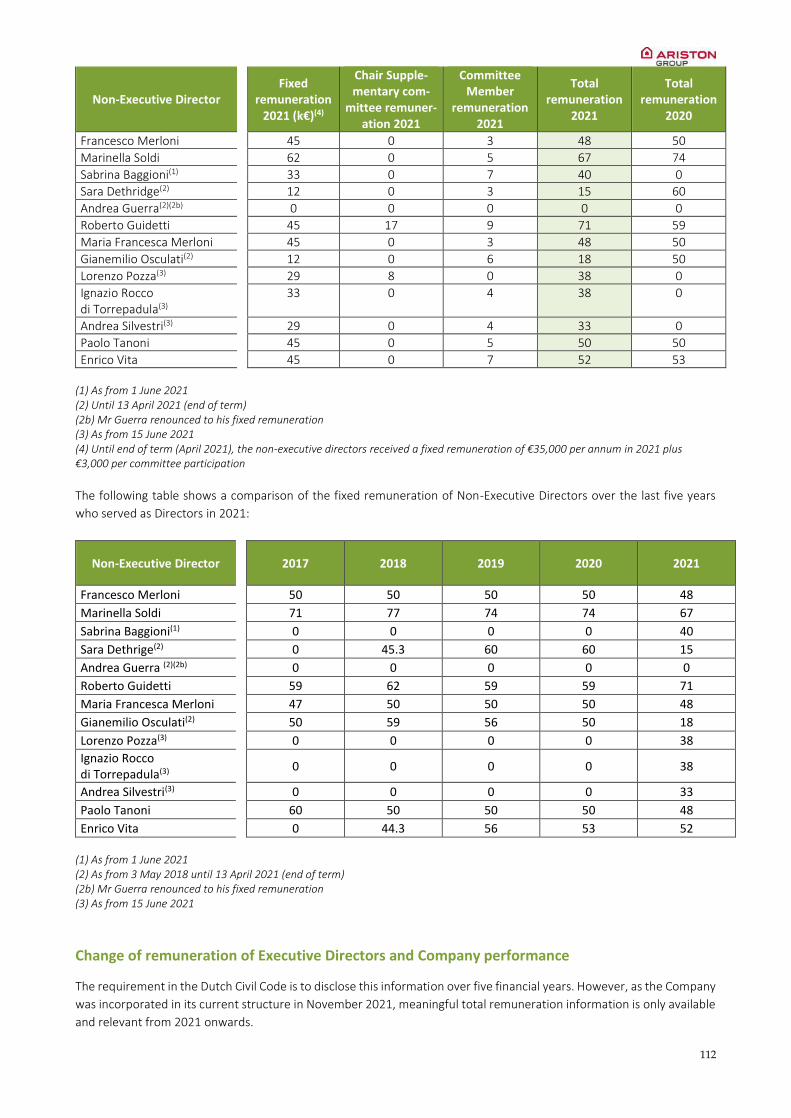
112
Non-Executive Director Fixed
remuneration 2021 (k€)(4)
Chair Supple-mentary com-
mittee remuner-ation 2021
Committee Member
remuneration 2021
Total remuneration
2021
Total remuneration
2020
Francesco Merloni 45 0 3 48 50
Marinella Soldi 62 0 5 67 74
Sabrina Baggioni(1) 33 0 7 40 0
Sara Dethridge(2) 12 0 3 15 60
Andrea Guerra(2)(2b) 0 0 0 0 0
Roberto Guidetti 45 17 9 71 59
Maria Francesca Merloni 45 0 3 48 50
Gianemilio Osculati(2) 12 0 6 18 50
Lorenzo Pozza(3) 29 8 0 38 0
Ignazio Rocco di Torrepadula(3)
33 0 4 38 0
Andrea Silvestri(3) 29 0 4 33 0
Paolo Tanoni 45 0 5 50 50
Enrico Vita 45 0 7 52 53 (1) As from 1 June 2021 (2) Until 13 April 2021 (end of term) (2b) Mr Guerra renounced to his fixed remuneration (3) As from 15 June 2021 (4) Until end of term (April 2021), the non-executive directors received a fixed remuneration of €35,000 per annum in 2021 plus €3,000 per committee participation
The following table shows a comparison of the fixed remuneration of Non-Executive Directors over the last five years
who served as Directors in 2021:
Non-Executive Director
2017 2018 2019 2020 2021
Francesco Merloni 50 50 50 50 48
Marinella Soldi 71 77 74 74 67
Sabrina Baggioni(1) 0 0 0 0 40
Sara Dethrige(2) 0 45.3 60 60 15
Andrea Guerra (2)(2b) 0 0 0 0 0
Roberto Guidetti 59 62 59 59 71
Maria Francesca Merloni 47 50 50 50 48
Gianemilio Osculati(2) 50 59 56 50 18
Lorenzo Pozza(3) 0 0 0 0 38
Ignazio Rocco di Torrepadula(3)
0 0 0 0 38
Andrea Silvestri(3) 0 0 0 0 33
Paolo Tanoni 60 50 50 50 48
Enrico Vita 0 44.3 56 53 52 (1) As from 1 June 2021 (2) As from 3 May 2018 until 13 April 2021 (end of term) (2b) Mr Guerra renounced to his fixed remuneration (3) As from 15 June 2021
Change of remuneration of Executive Directors and Company performance
The requirement in the Dutch Civil Code is to disclose this information over five financial years. However, as the Company
was incorporated in its current structure in November 2021, meaningful total remuneration information is only available
and relevant from 2021 onwards.
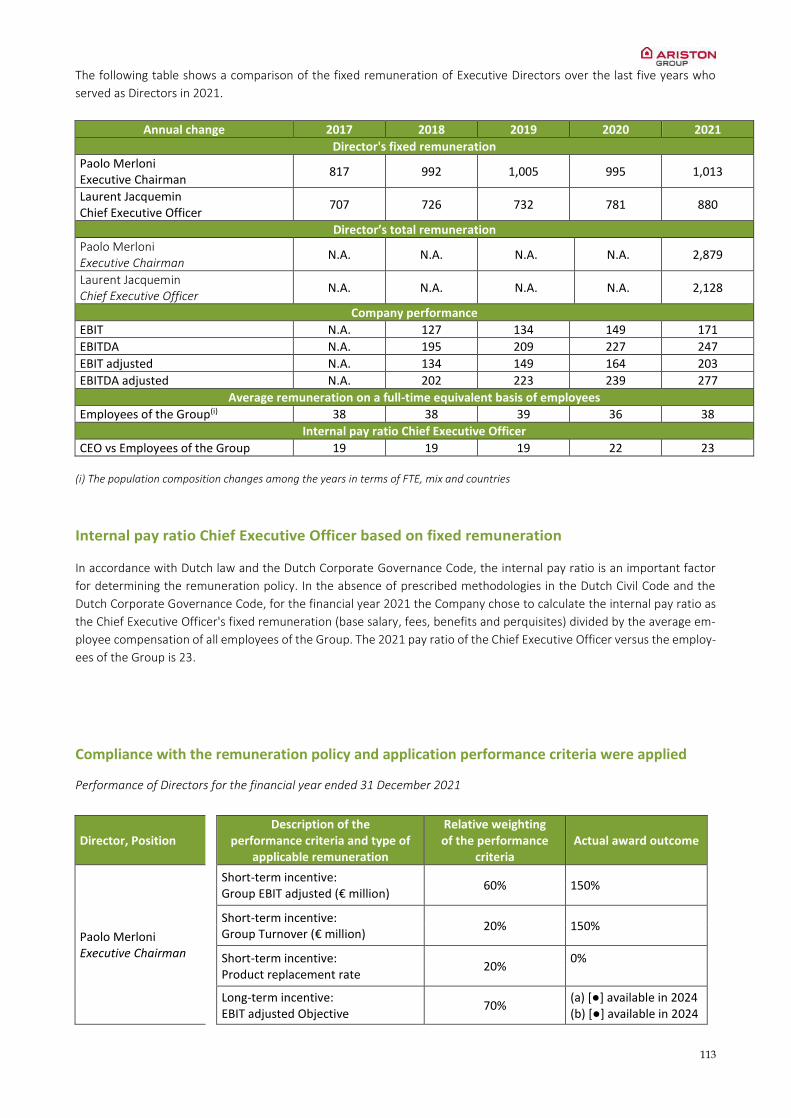
113
The following table shows a comparison of the fixed remuneration of Executive Directors over the last five years who
served as Directors in 2021.
Annual change 2017 2018 2019 2020 2021
Director's fixed remuneration
Paolo Merloni Executive Chairman
817 992 1,005 995 1,013
Laurent Jacquemin Chief Executive Officer
707 726 732 781 880
Director’s total remuneration
Paolo Merloni Executive Chairman
N.A. N.A. N.A. N.A. 2,879
Laurent Jacquemin Chief Executive Officer
N.A. N.A. N.A. N.A. 2,128
Company performance
EBIT N.A. 127 134 149 171
EBITDA N.A. 195 209 227 247
EBIT adjusted N.A. 134 149 164 203
EBITDA adjusted N.A. 202 223 239 277
Average remuneration on a full-time equivalent basis of employees
Employees of the Group(i) 38 38 39 36 38
Internal pay ratio Chief Executive Officer
CEO vs Employees of the Group 19 19 19 22 23 (i) The population composition changes among the years in terms of FTE, mix and countries
Internal pay ratio Chief Executive Officer based on fixed remuneration
In accordance with Dutch law and the Dutch Corporate Governance Code, the internal pay ratio is an important factor
for determining the remuneration policy. In the absence of prescribed methodologies in the Dutch Civil Code and the
Dutch Corporate Governance Code, for the financial year 2021 the Company chose to calculate the internal pay ratio as
the Chief Executive Officer's fixed remuneration (base salary, fees, benefits and perquisites) divided by the average em-
ployee compensation of all employees of the Group. The 2021 pay ratio of the Chief Executive Officer versus the employ-
ees of the Group is 23.
Compliance with the remuneration policy and application performance criteria were applied
Performance of Directors for the financial year ended 31 December 2021
Director, Position Description of the
performance criteria and type of applicable remuneration
Relative weighting of the performance
criteria Actual award outcome
Paolo Merloni Executive Chairman
Short-term incentive: Group EBIT adjusted (€ million)
60% 150%
Short-term incentive: Group Turnover (€ million)
20% 150%
Short-term incentive: Product replacement rate
20% 0%
Long-term incentive: EBIT adjusted Objective
70% (a) [] available in 2024 (b) [] available in 2024

114
and Net Revenue Objective
Long-term incentive: TSR Objective
15% (a) [] available in 2024 (b) [] available in 2024
Long-term incentive: Sustainability Objective
15% (a) [] available in 2024 (b) [] available in 2024
Laurent Jacquemin Chief Executive Officer
Short-term incentive: Group EBIT adjusted (€ million)
60% 150%
Short-term incentive: Group Net Revenue (€ million)
20% 150%
Short-term incentive: Product replacement rate
20% 0%
Long-term incentive: EBIT adjusted Objective and Net Revenue Objective
70% (a) [] available in 2024 (b) [] available in 2024
Long-term incentive: TSR Objective
15% (a) [] available in 2024 (b) [] available in 2024
Long-term incentive: Sustainability Objective
15% (a) [] available in 2024 (b) [] available in 2024
115
6. Ariston Holding N.V. Consolidated Report Financial Statements at 31 December 2021
INDEX – Consolidated Financial Statements
Ariston Holding N.V. – Consolidated Financial Statements at 31 December 2021
Consolidated primary statements
Consolidated income statement Consolidated statement of other comprehensive income Consolidated statement of financial position Consolidated statement of cash flows Consolidated statement of changes in shareholders’ equity
Notes to the consolidated financial statements
1. Corporate information 2. Significant events of the year 3. Basis of accounting preparation 4. Significant accounting policies 5. Changes in accounting standards 6. Disclosure to the Financial Statements
6.1 Income Statement 6.2 Statement of Financial Position – Assets 6.3 Statement of Financial Position – Liabilities and Equity 6.4 Other Information

116
Consolidated income statement as at 31 December 2021
(in million €) notes
2021
2020
REVENUE AND INCOME
Net revenue 1.1 1,987.3 100.0% 1,664.0 100.0% Other revenue and income 1.1 34.1 1.7% 27.9 1.7% Revenue and Income 1.1 2,021.5 101.7% 1,691.8 101.7%
OPERATING EXPENSES
Change in inventories 1.2 -107.5 -5.4% -4.1 -0.2% Raw materials, consumables and goods for resale 1.2 988.0 49.7% 705.9 42.4% Services 1.3 433.1 21.8% 329.0 19.8% Personnel 1.4 412.3 20.7% 387.1 23.3% Amortisation 2.1/2.2 75.8 3.8% 77.7 4.7% Provisions 1.5 19.7 1.0% 19.1 1.1% Write-downs 1.7 0.1% 0.2 0.0% Other operating expenses 1.6 27.3 1.4% 27.9 1.7% Operating expenses 1,850.3 93.1% 1,542.8 92.7%
OPERATING PROFIT 1.7 171.2 8.6% 149.1 9.0%
FINANCIAL INCOME AND EXPENSE
Financial Income 1.8 4.5 0.2% 2.2 0.1% Financial Expense 1.9 -12.4 -0.6% -14.6 -0.9% Exchange rate gains/losses 1.10 4.1 0.2% -3.5 -0.2% Financial Income and Expense -3.9 -0.2% -15.8 -1.0%
PROFIT (LOSS) ON INVESTMENTS
Other profit (loss) on investments -1.9 -0.1% -1.3 -0.1% Profit (loss) on investments 1.11 -1.9 -0.1% -1.3 -0.1%
PROFIT BEFORE TAX 165.4 8.3% 131.9 7.9%
TAXES 1.12 29.1 1.5% 35.2 2.1% 17.6% 26.7%
PROFIT (LOSS) FROM CONTINUING OPERATIONS 136.3 6.9% 96.7 5.8%
NET PROFIT 136.3 6.9% 96.7 5.8%
Net profit attributable to non-controlling Interests -0.2 0.0% 0,0%
Net profit attributable to the Group 136.5 6.9% 96.7 5.8%
Basic earnings per share (€) 0.47 0.33
Diluted earnings per share (€) 0.46 0.33
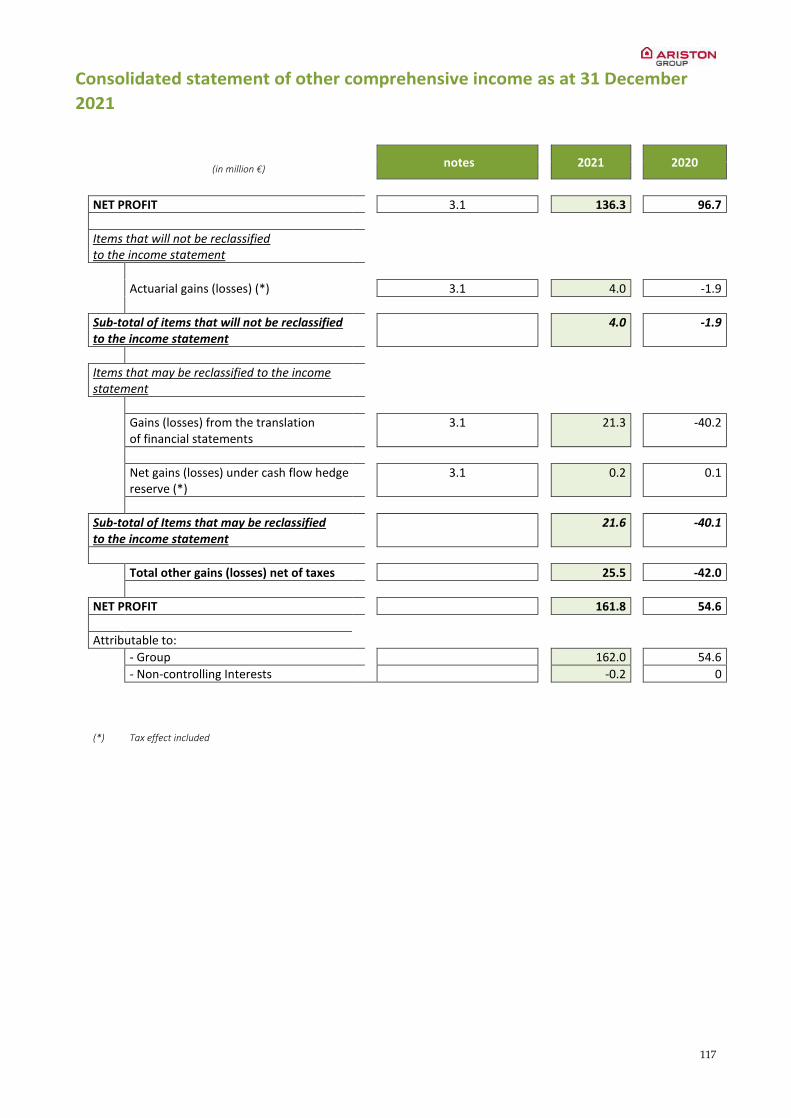
117
Consolidated statement of other comprehensive income as at 31 December
2021
notes
2021
2020
(in million €)
NET PROFIT 3.1 136.3 96.7
Items that will not be reclassified to the income statement
Actuarial gains (losses) (*) 3.1 4.0 -1.9
Sub-total of items that will not be reclassified to the income statement
4.0 -1.9
Items that may be reclassified to the income statement
Gains (losses) from the translation of financial statements
3.1 21.3 -40.2
Net gains (losses) under cash flow hedge reserve (*)
3.1 0.2 0.1
Sub-total of Items that may be reclassified to the income statement
21.6 -40.1
Total other gains (losses) net of taxes 25.5 -42.0
NET PROFIT 161.8 54.6
Attributable to:
- Group 162.0 54.6
- Non-controlling Interests -0.2 0
(*) Tax effect included
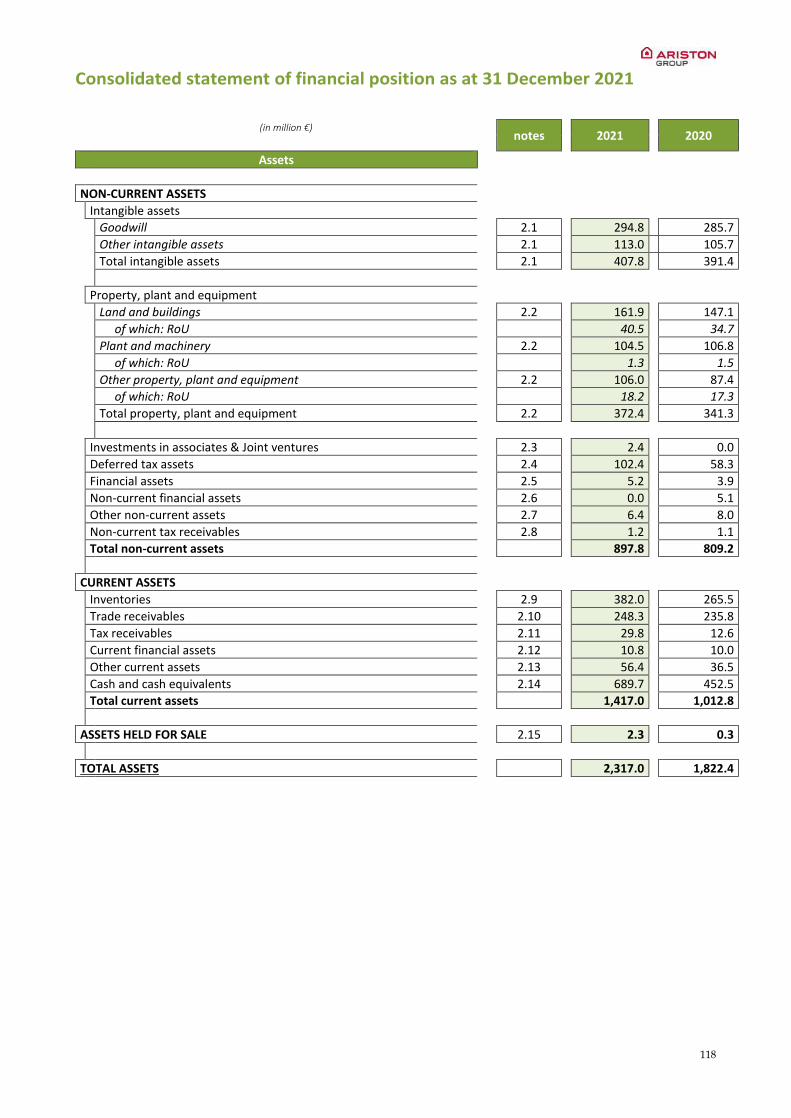
118
Consolidated statement of financial position as at 31 December 2021
(in million €)
notes
2021
2020
Assets
NON-CURRENT ASSETS
Intangible assets
Goodwill 2.1 294.8 285.7 Other intangible assets 2.1 113.0 105.7 Total intangible assets 2.1 407.8 391.4 Property, plant and equipment Land and buildings 2.2 161.9 147.1
of which: RoU 40.5 34.7 Plant and machinery 2.2 104.5 106.8
of which: RoU 1.3 1.5 Other property, plant and equipment 2.2 106.0 87.4
of which: RoU 18.2 17.3 Total property, plant and equipment 2.2 372.4 341.3 Investments in associates & Joint ventures 2.3 2.4 0.0 Deferred tax assets 2.4 102.4 58.3 Financial assets 2.5 5.2 3.9 Non-current financial assets 2.6 0.0 5.1 Other non-current assets 2.7 6.4 8.0 Non-current tax receivables 2.8 1.2 1.1 Total non-current assets 897.8 809.2
CURRENT ASSETS Inventories 2.9 382.0 265.5 Trade receivables 2.10 248.3 235.8 Tax receivables 2.11 29.8 12.6 Current financial assets 2.12 10.8 10.0 Other current assets 2.13 56.4 36.5 Cash and cash equivalents 2.14 689.7 452.5 Total current assets 1,417.0 1,012.8
ASSETS HELD FOR SALE 2.15 2.3 0.3
TOTAL ASSETS 2,317.0 1,822.4

119
Consolidated statement of financial position as at 31 December 2021
(in million €)
notes
2021
2020
Liabilities and Equity
NET EQUITY
Share capital 3.1 46.0 41.8 Share premium reserve 3.1 293.7 24.0 Retained earnings and other reserves 3.1 402.0 284.0 Net profit attributable to the Group 3.1 136.5 96.7 Net equity attributable to the Group 3.1 878.3 446.5 Non-controlling interests and reserves 0.0 0 Net profit attributable to non-controlling interests -0.2 0 Net equity attributable to non-controlling interests -0.2 0 Net equity 3.1 878.1 446.5
NON-CURRENT LIABILITIES Deferred tax liabilities 3.2 50.8 32.2 Non current provisions 3.3 56.9 51.8 Post employment benefits 3.4 51.7 58.3 Non current financing 3.5 446.4 389.9 Other non current liabilities 3.6 4.9 40.0 Non current tax liabilities 3.7 7.8 0.0 Total non current liabilities 618.5 572.1
CURRENT LIABILITIES Trade payables 3.8 477.2 364.1 Tax payables 3.9 45.1 21.6 Current provisions 3.10 33.5 31.3 Current financial liabilities 3.11 46.1 34.1 Current loans 3.12 23.1 187.2 Other current liabilities 3.13 195.4 165.4 Total current liabilities 820.4 803.8
LIABILITIES HELD FOR SALE 3.14 0 0
TOTAL LIABILITIES AND NET EQUITY 2,317.0 1,822.4

120
Consolidated statement of cash flows
(in million €) notes
2021
2020
CHANGES IN CASH AND CASH EQUIVALENTS
CASH AND CASH EQUIVALENTS AT THE BEGINNING OF THE PERIOD 430.7 295.8 Effect of changes in exchange rates 16.9 -15.4 Changes in short-term financial position 207.8 150.3 CASH AND CASH EQUIVALENTS AT THE END OF THE PERIOD 655.5 430.7
STATEMENT OF CASH FLOWS
CASH FLOW FROM OPERATING ACTIVITIES NET PROFIT 3.1 136.3 96.7 Adjustments for: - Taxes 1.12 29.1 35.2 - Income and expense from financing and investment activities 1.8/1.11 5.8 17.2 1 - OPERATING PROFIT 171.2 149.1 2 - Amortisation 2.1/2.2 75.8 77.7
of which: Amortisation for right-of-use fixed assets 2.2 21.3 23.7
3 - Provisions 1.5 19.7 19.3 4 - Other adjustments 1.7 -0.2 5 = GROSS OPERATING CASH FLOW (+1+2+3+4) 268.3 245.8 6 - Change in trade receivables 2.10 -17.5 1.3 7 - Change in inventories 2.9 -108.1 -3.3 8 - Change in trade payables 3.8 112.3 38.3 9 - Change in other short-term assets/liabilities -11.5 8.0 10 - Change in provisions -13.5 -3.7 11 - Tax paid -39.5 -33.0 12 = NET OPERATING CASH FLOW (+5+6+7+8+9+10+1) 190.7 253.5
CASH FLOW FROM INVESTMENT ACTIVITIES 13 - Investments in intangible assets 2.1 -19.1 -13.8 14 - Investments in property, plant and equipment 2.2 -59.0 -30.7 15 - Investments in financial assets -8.1 -26.9 16 - Change in the scope of consolidation 0.0 0.2 17 - Value of tangible and intangible assets sold 2.1/2.2 1.4 3.3 18 = CASH FLOW FROM INVESTMENT ACTIVITIES (+13+14+15+16+17) -84.7 -67.9
CASH FLOW FROM FINANCING ACTIVITIES 19 - Financial income/expense collected/paid -1.7 -6.8
of which: Financial expense pursuant to IFRS16 -1.4 -1.5 20 - Income/expense on exchange rate realized 1.10 -10.2 0.0 21 - Increase/decrease in short-term financial payables 3.5 -2.5 -6.8 22 - New loans 3.5 205.2 170.5 23 - Loans repayment 3.5 -334.7 -63.4 24 - Dividends 3.1 -48.3 -128.6 25 - Capital and reserves increase/distribution 0.0 0 26 - Proceeds from issue of ordinary shares 3.1 294.0 0 27 - Buyback/sale of treasury shares 0.0 0 28 = CASH FLOW FROM FINANCING ACTIVITIES (19+ / +27) 101.9 -35.2 29 = CASH FLOW FROM CONTINUING OPERATIONS (12+18+28) 207.8 150.3 30 = CASH FLOW FROM DISCONTINUED OPERATIONS 0 0
31 = TOTAL CASH FLOW (29+30) 207.8 150.3
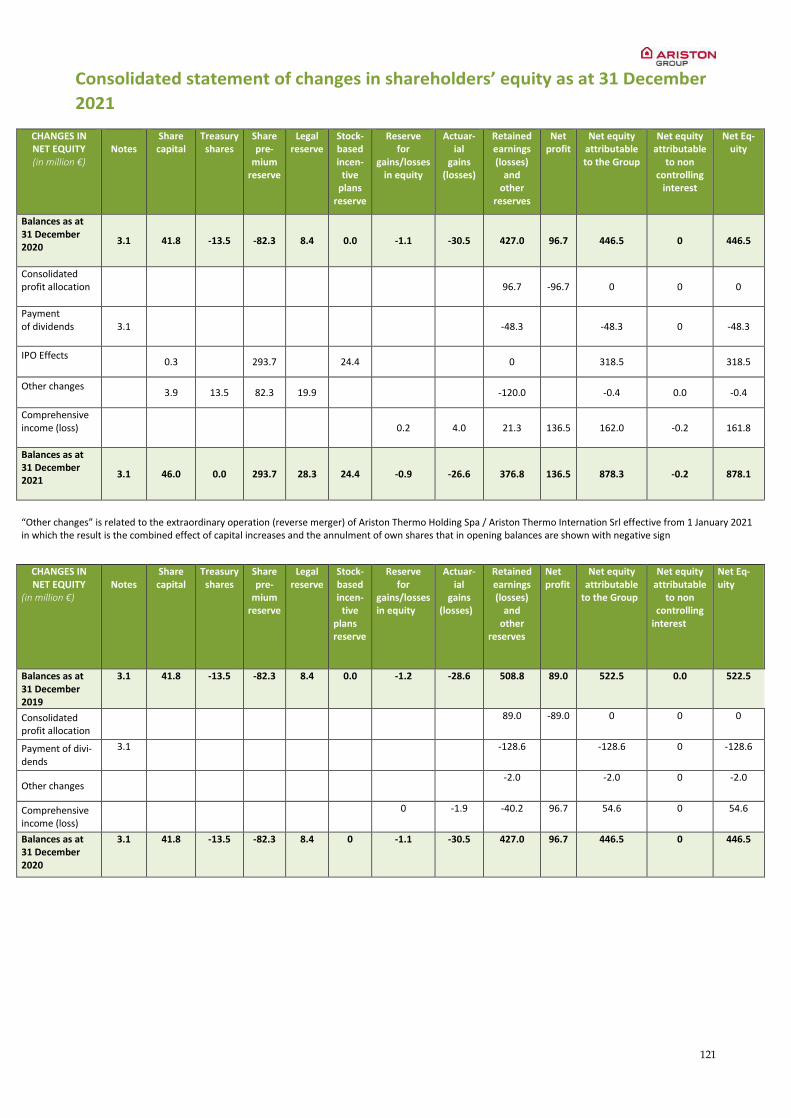
121
Consolidated statement of changes in shareholders’ equity as at 31 December
2021
CHANGES IN NET EQUITY (in million €)
Notes
Share capital
Treasury shares
Share pre-
mium reserve
Legal reserve
Stock-based incen-
tive plans
reserve
Reserve for
gains/losses in equity
Actuar-ial
gains (losses)
Retained earnings (losses)
and other
reserves
Net profit
Net equity attributable to the Group
Net equity attributable
to non controlling
interest
Net Eq-uity
Balances as at 31 December 2020
3.1 41.8 -13.5 -82.3 8.4 0.0 -1.1 -30.5 427.0 96.7 446.5 0 446.5
Consolidated profit allocation
96.7 -96.7 0 0 0
Payment of dividends
3.1 -48.3 -48.3 0 -48.3
IPO Effects
0.3 293.7 24.4 0 318.5 318.5
Other changes
3.9 13.5 82.3 19.9 -120.0 -0.4 0.0 -0.4
Comprehensive income (loss)
0.2 4.0 21.3 136.5 162.0 -0.2 161.8
Balances as at 31 December 2021
3.1 46.0 0.0 293.7 28.3 24.4 -0.9 -26.6 376.8 136.5 878.3 -0.2 878.1
“Other changes” is related to the extraordinary operation (reverse merger) of Ariston Thermo Holding Spa / Ariston Thermo Internation Srl effective from 1 January 2021 in which the result is the combined effect of capital increases and the annulment of own shares that in opening balances are shown with negative sign
CHANGES IN NET EQUITY
(in million €)
Notes
Share capital
Treasury shares
Share pre-
mium reserve
Legal reserve
Stock-based incen-
tive plans reserve
Reserve for
gains/losses in equity
Actuar-ial
gains (losses)
Retained earnings (losses)
and other
reserves
Net profit
Net equity attributable
to the Group
Net equity attributable
to non controlling
interest
Net Eq-uity
Balances as at 31 December 2019
3.1 41.8 -13.5 -82.3 8.4 0.0 -1.2 -28.6 508.8 89.0 522.5 0.0 522.5
Consolidated profit allocation
89.0 -89.0 0 0 0
Payment of divi-dends
3.1
-128.6
-128.6 0 -128.6
Other changes
-2.0
-2.0 0 -2.0
Comprehensive income (loss)
0 -1.9 -40.2 96.7 54.6 0 54.6
Balances as at 31 December 2020
3.1 41.8 -13.5 -82.3 8.4 0 -1.1 -30.5 427.0 96.7 446.5 0 446.5

122
Notes to the consolidated financial statements at 31 December 2021
1. Corporate information
Ariston Holding N.V. (hereafter also the “Parent Company”) is a Company listed in Euronext Milan, Italy, having its statu-
tory seat in The Netherlands and enrolled in the Chamber of Commerce – KVK – of Amsterdam (CCI no.83078738, RSIN
no. 862717589, Establishment no. 000049275437, VAT Code: 01527100422, Fiscal Code 00760810572), with a secondary
office in Via Broletto 44, Milano I-20121.
For purposes of its business operations in Italy, the Company has established a secondary seat with a permanent repre-
sentative office, within the meaning of article 2508 of the Italian Civil Code.
The Parent Company’s primary purpose is to be a holding company and, with it, the management and coordination of a
series of business processes for all the subsidiaries of the Group (hereinafter the “subsidiaries”). The Group, with its
subsidiaries, is active in the business of the production and distribution of hot water and space heating and service solu-
tions with a cutting edge technology serving market all around the world.
At 31 December 2021, voting rights are as follows: Merloni Holding S.p.A. 73.96% and Amaranta S.r.l. 18.68% (equating
to 75.03% of the share capital) meanwhile the market is entitled for the 7.36%.
The issued share capital of the Company is held by Merloni Holding S.p.A. for 66.03%, Amaranta S.r.l. for 9.01% and
market for 24.96%.
The consolidated financial statements of Ariston Group for the year ending 31 December 2021 were approved on 2 March
2022 by the Board of Directors of the Parent Company and recognized it for issue.
The Board of Directors reserves the right to amend the financial statements, up to the date of the Shareholders’ meeting
of the Parent Company, should any significant events occur that require changes to be made.
The consolidated financial statements comprise the following: income statement, statement of other comprehensive
income, statement of financial position, statement of cash flows, statement of changes equity (in euro million) and these
notes to the financial statements.
The statement of cash flows has been prepared using the “indirect method” and shows the changes that occurred, during
the period, in the “short-term financial position” which measures the cash and cash equivalents (short-term and high
liquidity financial investments promptly convertible and not subject to the risk of change in value), classifying the financial
flows according to their origins, from operating activities, investments or financing.
These financial statements have been prepared in euro, the currency used in most of the Group’s transactions. Transac-
tions with foreign companies are included in the consolidated financial statements in compliance with the standards
hereunder described.
2. Significant events of the year
Significant events during the year relating to corporate actions, acquisitions agreements and other significant events
impacting the results are reported in a dedicated section in the Director’s report of this annual report. We summarize
here below the main events related to acquisitions and listing:
In June Ariston Group acquires a minority interest in HAAS Heating B.V., a Dutch start-up offering hybrid heat pumps
to private Dutch individuals by leveraging the WKR scheme (a tax benefit that employers grant every year to their
employees);
In October Ariston Group signs an agreement for the acquisition of Chromagen, an Israeli company who is a leader in
renewable hot water solutions. Chromagen is headquartered in Israel and has two subsidiaries in Australia and Spain,
as well as a robust network of distributors that help serve customers in about 35 countries worldwide. With the ac-
quisition, the Group further strengthens its competitive position in the renewable energy segment, acquiring a player
with a leading position in Israel and a solid footprint in Australia;
Ariston Group starts trading on Euronext Milan on 26 November.
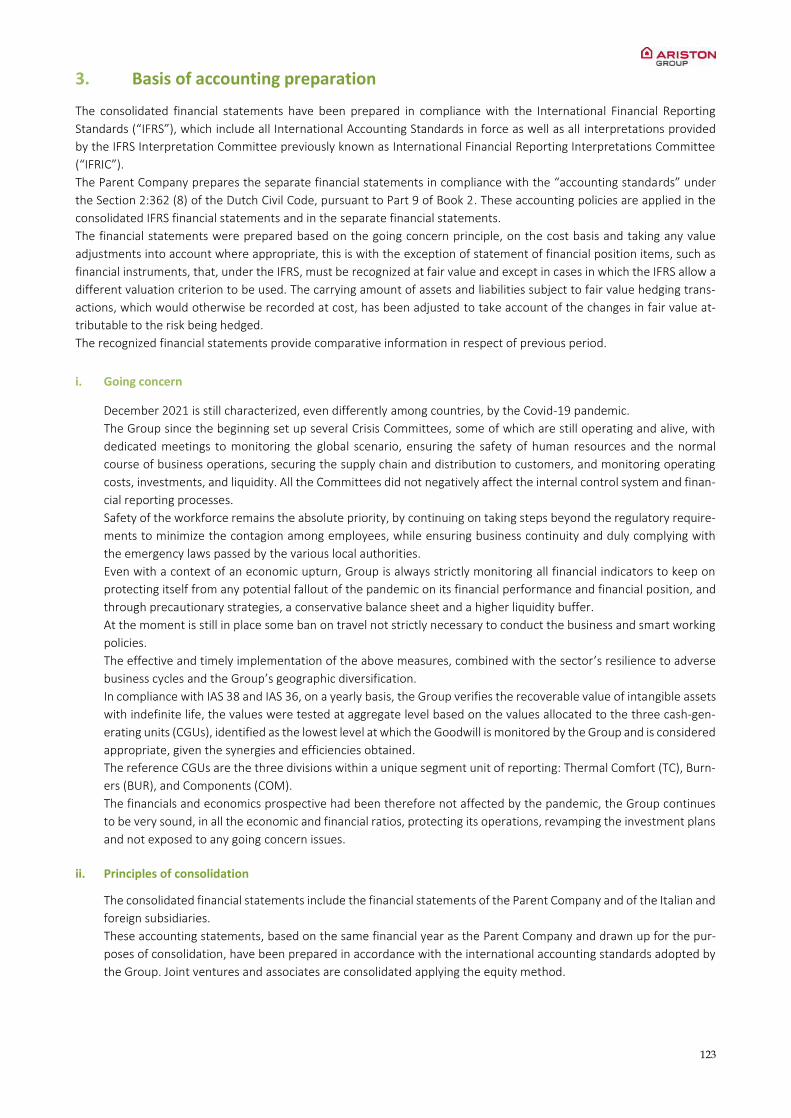
123
3. Basis of accounting preparation
The consolidated financial statements have been prepared in compliance with the International Financial Reporting
Standards (“IFRS”), which include all International Accounting Standards in force as well as all interpretations provided
by the IFRS Interpretation Committee previously known as International Financial Reporting Interpretations Committee
(“IFRIC”).
The Parent Company prepares the separate financial statements in compliance with the “accounting standards” under
the Section 2:362 (8) of the Dutch Civil Code, pursuant to Part 9 of Book 2. These accounting policies are applied in the
consolidated IFRS financial statements and in the separate financial statements.
The financial statements were prepared based on the going concern principle, on the cost basis and taking any value
adjustments into account where appropriate, this is with the exception of statement of financial position items, such as
financial instruments, that, under the IFRS, must be recognized at fair value and except in cases in which the IFRS allow a
different valuation criterion to be used. The carrying amount of assets and liabilities subject to fair value hedging trans-
actions, which would otherwise be recorded at cost, has been adjusted to take account of the changes in fair value at-
tributable to the risk being hedged.
The recognized financial statements provide comparative information in respect of previous period.
i. Going concern
December 2021 is still characterized, even differently among countries, by the Covid-19 pandemic.
The Group since the beginning set up several Crisis Committees, some of which are still operating and alive, with
dedicated meetings to monitoring the global scenario, ensuring the safety of human resources and the normal
course of business operations, securing the supply chain and distribution to customers, and monitoring operating
costs, investments, and liquidity. All the Committees did not negatively affect the internal control system and finan-
cial reporting processes.
Safety of the workforce remains the absolute priority, by continuing on taking steps beyond the regulatory require-
ments to minimize the contagion among employees, while ensuring business continuity and duly complying with
the emergency laws passed by the various local authorities.
Even with a context of an economic upturn, Group is always strictly monitoring all financial indicators to keep on
protecting itself from any potential fallout of the pandemic on its financial performance and financial position, and
through precautionary strategies, a conservative balance sheet and a higher liquidity buffer.
At the moment is still in place some ban on travel not strictly necessary to conduct the business and smart working
policies.
The effective and timely implementation of the above measures, combined with the sector’s resilience to adverse
business cycles and the Group’s geographic diversification.
In compliance with IAS 38 and IAS 36, on a yearly basis, the Group verifies the recoverable value of intangible assets
with indefinite life, the values were tested at aggregate level based on the values allocated to the three cash-gen-
erating units (CGUs), identified as the lowest level at which the Goodwill is monitored by the Group and is considered
appropriate, given the synergies and efficiencies obtained.
The reference CGUs are the three divisions within a unique segment unit of reporting: Thermal Comfort (TC), Burn-
ers (BUR), and Components (COM).
The financials and economics prospective had been therefore not affected by the pandemic, the Group continues
to be very sound, in all the economic and financial ratios, protecting its operations, revamping the investment plans
and not exposed to any going concern issues.
ii. Principles of consolidation
The consolidated financial statements include the financial statements of the Parent Company and of the Italian and
foreign subsidiaries.
These accounting statements, based on the same financial year as the Parent Company and drawn up for the pur-
poses of consolidation, have been prepared in accordance with the international accounting standards adopted by
the Group. Joint ventures and associates are consolidated applying the equity method.
124
iii. Form and content
In accordance with the format selected by the Ariston Group, the statement of income statement has been classified
by nature, and the statement of financial position is based on a distinction between current and non-current assets
and liabilities.
We consider that this format will provide a more meaningful representation of the items that have contributed to
the Group’s results and its assets and financial position.
iv. Basis of consolidation
The consolidated financial statements reflect the financial position and economic result of the Parent Company and
of its subsidiaries, both directly and indirectly controlled. In particular, the consolidated entities are those under the
control of Ariston Holding N.V. either through a direct or indirect equity ownership, with the majority of voting rights
at General Meeting, or through the exercise of a dominant influence over the financial and operating policies of the
companies/entities, thus obtaining the related benefits, even without regard to equity ownership.
Control is achieved when the Group is exposed, or has rights, to variable returns from its involvement with the
investee and has the ability to affect those returns through its power over the investee. Specifically, the Group
controls an investee if, and only if, the Group has:
Power over the investee (i.e., existing rights that give it the current ability to direct the relevant activities of
the investee)
Exposure, or rights, to variable returns from its involvement with the investee
The ability to use its power over the investee to affect its returns. Generally, there is a presumption that a
majority of voting rights results in control. To support this presumption and when the Group has less than a
majority of the voting or similar rights of an investee, the Group considers all relevant facts and circumstances
in assessing whether it has power over an investee, including: the contractual arrangement(s) with the other
vote holders of the investee; rights arising from other contractual arrangements and the Group’s voting rights
and potential voting rights.
The Group re-assesses whether or not it controls an investee if facts and circumstances indicate that there are
changes to one or more of the three elements of control. Consolidation of a subsidiary begins when the Group
obtains control over the subsidiary and ceases when the Group loses control of the subsidiary. Assets, liabilities,
income and expenses of a subsidiary acquired or disposed of during the year are included in the consolidated finan-
cial statements from the date the Group gains control until the date the Group ceases to control the subsidiary.
All subsidiaries are consolidated from the date when the Group acquired their control. The entities are excluded
from the consolidation area from the date when the Group ceases or lose the control them.
Income statement and each component of OCI are attributed to the equity holders of the parent of the Group and
to the non-controlling interests, even if this results in the non-controlling interests having a deficit balance.
When necessary, adjustments are made to the financial statements of subsidiaries to bring their accounting policies
in line with the Group’s accounting policies. All intra-group assets and liabilities, equity, income, expenses and cash
flows relating to transactions between members of the Group are eliminated in full on consolidation.
Compared to 31 December 2020, the scope of consolidation is changed due to the following transactions:
In February 2021, Ingrado S.r.l. was incorporated, fully owned by Ariston Thermo Holding N.V. The company
covers the On line sales channel. No material impact in the consolidated financial statements is brought by the
newly established company;
In June 2021, the parent company Ariston Thermo Holding S.p.A. merged by incorporation into the wholly-
owned subsidiary Ariston Thermo International S.r.l. that contextually was re-nominated as S.p.A. company
and taking the same name as the incorporated company. This operation was part of a broader corporate reor-
ganization, consisting of the shaping of Ariston Thermo Holding in a company exclusively engaged in the man-
agement of equity investments;
In June 2021, ATAG Heating B.V. acquired the 24.5% of Haas Heating B.V. Purchase price and earn out program
is defined as € 2.6 million. The company is defined as a joint venture, thus valuing the participation with the
equity method;
In August 2021, the Italian subsidiary Marchi e Brevetti S.r.l. merged by incorporation into Ariston Thermo
S.p.A. with retroactive accounting effects as of 1 January 2021;
125
In December 2021, the Italian subsidiary Ariston Thermo Innovative Technologies S.r.l. merged by incorpora-
tion into Ariston Thermo S.p.A. with retroactive accounting effects as of 1 January 2021;
In December 2021 ATM2 HR merged by incorporation into Calentadores de America SA de C.V. with accounting
effects from 1 December 2021.
For further details on transactions occurred in the year, reference should be made to the following section “Con-
solidation and translation principles”.
The tables list of the companies included in the basis of consolidation at 31 December 2021 is presented in “List of
companies at 31 December 2021”.
v. Consolidation and translation principles
For the purposes of preparing the IFRS-compliant consolidated financial statements, all consolidated companies
have prepared a specific reporting package, at the same reference date, based on the IFRS standards that the Group
has adopted and which are described below, entailing the reclassification and/or rectification of their accounting
data prepared for disclosure purposes on a local level.
Subsidiaries
The consolidated financial statements of Ariston Group include the financial statements of the Parent Company and of
its subsidiaries.
A subsidiary is a company where the financial and operating policies are determined by the Parent Company which aims
to benefit from their activities.
The economic result of the subsidiaries, whether acquired or transferred during the period, are included in the consoli-
dated income statement from the actual acquisition date to the actual transfer date.
The share of non-controlling interests in the net assets of the consolidated subsidiaries is identified separately from the
equity attributable to owners of the Parent. This share is determined based on their percentage of interest held:
a. in the fair values of the assets and liabilities recognized at the date of business combination. As regards the symmetric
put and call contracts connected to the new acquisitions, they have been represented by recognizing under financial
liabilities in the statement of financial position the fair value of the payable arising from the purchase and sale options
signed at the moment of the acquisition on all the shares held by the minority shareholders, and without the recog-
nition of the residual equity attributable to non-controlling interest (see the subsequent section: “Business combina-
tions”);
b. in the changes in equity after that date. Subsequently, the losses attributable to non-controlling interests exceeding
the equity attributable to them, are recognized under non-controlling interests.
Associates and joint ventures
The consolidated financial statements include the portion of associates’ economic results attributable to the Group. As-
sociates are companies on which the Group has a significant influence, in terms of financial and operating policies, alt-
hough not holding a control or joint control. The portion of these companies’ economic results attributable to the Group
is recognized according to the equity method, from the date when the significant influence starts until it ceases to exist.
If the portion of losses of an associate attributable to the Group exceeds the carrying value of the investment recognized
in the financial statements, the amount of this investment is waived and the portion of exceeding losses is not recognized,
except and to the extent of the obligations assumed by the Group.
A joint venture is a type of joint arrangement whereby the parties that have joint control of the arrangement have rights
to the net assets of the joint venture. Joint control is the contractually agreed sharing of control of an arrangement, which
exists only when decisions about the relevant activities require the unanimous consent of the parties sharing control.
The considerations made in determining significant influence or joint control are similar to those necessary to determine
control over subsidiaries. The Group’s investment in its associate and joint venture are accounted for using the equity
method. Under the equity method, the investment in an associate or a joint venture is initially recognized at cost.
The carrying amount of the investment is adjusted to recognize changes in the Group’s share of net assets of the associate
or joint venture since the acquisition date.

126
The income statement reflects the Group’s share of the results of operations of the associate or joint venture. Any change
in OCI of those investees is presented as part of the Group’s OCI. In addition, when there has been a change recognized
directly in the equity of the associate or joint venture, the Group recognized its share of any changes, when applicable,
in the statement of changes in equity. Unrealised gains and losses resulting from transactions between the Group and
the associate or joint venture are eliminated to the extent of the interest in the associate or joint venture.
The aggregate of the Group’s share of income statement of an associate and a joint venture is shown on the face of the
income statement outside operating profit and represents profit or loss after tax and non-controlling interests in the
subsidiaries of the associate or joint venture.
The financial statements of the associate or joint venture are prepared for the same reporting period as the Group. When
necessary, adjustments are made to bring the accounting policies in line with those of the Group.
After application of the equity method, the Group determines whether it is necessary to recognize an impairment loss
on its investment in its associate or joint venture. At each reporting date, the Group determines whether there is objective
evidence that the investment in the associate or joint venture is impaired. If there is such evidence, the Group calculates
the amount of impairment as the difference between the recoverable amount of the associate or joint venture and its
carrying value, and then recognizes the loss within ‘Share of profit of an associate and a joint venture’ in the income
statement.
Upon loss of significant influence over the associate or joint control over the joint venture, the Group measures and
recognizes any retained investment at its fair value. Any difference between the carrying amount of the associate or joint
venture upon loss of significant influence or joint control and the fair value of the retained investment and proceeds from
disposal is recognized in income statement.
Transactions excluded from the consolidation process
During the preparation of the consolidated financial statements, all intergroup balances, as well as gains and losses that
were generated on intergroup transactions, were not recognized. All realized gains and losses generated on transactions
with associates or jointly controlled companies were not recognized according to the Group’s interests in those compa-
nies.
Consolidation of foreign companies
All assets and liabilities of foreign companies in a functional currency other than the euro, falling within the consolidation
area, are converted using the exchange rates in effect at the reference date of the financial statements (method of the
current exchange rates). Income and expenses are converted at the average exchange rate for the period. Should it be
possible to identify the specific exchange rate for individual transactions, these items are converted at the related spot
rate.
The differences in the exchange rates on assets and liabilities of foreign companies in currencies other than the euro
arising from application of this method are recognized in OCI and under equity until the shareholding is transferred.
Goodwill and adjustments to the fair values generated by the acquisition of a foreign company, are recognized in their
currency and converted using the exchange rate at the end of the reporting period.
The following table contains the exchange rates against the euro applied in the translation of financial statements ex-
pressed in another currency: (exchange rate = euro/currency).
Currency 2021 2020
Average exch. Rate
Exch. Rate at 31/12
Average exch. Rate
Exch. Rate at 31/12
EMIRATI DIRHAM AED 4.3419 4.1595 4.2094 4.5065
ARGENTIN PESO ARS 116.3622 116.3622 103.2494 103.2494
NEW BELARUSIAN RUBLE BYN 3.0072 2.8860 2.7898 3.1646
CANADIAN DOLLAR CAD 1.4831 1.4393 1.5327 1.5633
SVISS FRANC CHF 1.0815 1.0331 1.0703 1.0802
CHINESE RENMINBI CNY 7.5688 7.1947 7.9112 8.0225
CZECH KORUNA CZK 25.6498 24.8580 26.4420 26.2420
DANISH CROWN DKK 7.4371 7.4364 7.4538 7.4409
EGYPTIAN POUND EGP 18.4796 17.8012 18.0394 19.3168
ENGLISH STERLING GBP 0.8603 0.8403 0.8892 0.8990

127
CROATIAN KUNA HRK 7.5277 7.5156 7.5340 7.5519
HUNGARIAN FORINT HUF 358.5748 369.1900 351.8861 363.8900
INDONESIAN RUPIAH IDR 16,922.4258 16,100.4200 16,600.4321 17,240.7600
INDIAN RUPIAH INR 87.2112 84.2292 85.8509 89.6605
KAZAKHSTANI TENGE KZT 502.3916 492.7500 474.9192 517.0400
MOROCCO DIRHAM MAD 10.6354 10.4830 10.8110 10.9190
MEXICAN PESO MXN 23.9546 23.1438 23.7134 22.8817
NIGERIAN NAIRA NGN 533.6500 484.9200 456.0900 538.2100
POLISH ZLOTY PLN 4.5673 4.5969 4.4375 4.5597
ROMANIAN NEW LEU RON 4.9256 4.9490 4.8445 4.8683
RUSSIAN RUBLE RUB 86.8960 85.3004 83.4888 91.4671
SINGAPORE DOLLAR SGD 1.5868 1.5279 1.5792 1.6218
TUNISIAN DINAR TND 3.2883 3.2603 3.1986 3.2943
TURKISH NEW LIRA TRY 10.5850 15.2335 8.1122 9.1131
UKRAINIAN HRYVNIA UAH 32.0743 30.9219 31.4753 34.7689
US DOLLAR USD 1.1802 1.1326 1.1471 1.2271
VIETNAM DONG VND 26,702.7754 25,819.0000 27,210.6982 28,331.0000
SOUTH AFRICAN RAND ZAR 17.4094 18.0625 18.6437 18.0219
The exchange rate used for the translation of the Nigerian naira into the presentation currency is that at which future
cash flows would be realized, in accordance with IAS 21.
Hyperinflation
If a subsidiary operates in a hyperinflationary economy, the related economic and financial results are adjusted in accord-
ance with the method established by IFRS, before being translated into the functional currency of the Group. The eco-
nomic and financial data are restated in local currency, taking into account the current purchasing power of the currency
on the financial statements date.
Argentina, reached the existence of the conditions which determine the presence of hyperinflation in accordance with
the IFRS (International Financial Reporting Standards). Consequently, as of 1 July 2018, all the companies operating in
Argentina have been required to apply IAS 29 – Financial Reporting in Hyperinflationary Economies in preparing the fi-
nancial reports.
With reference to the Group, the consolidated financial results at 31 December 2021 include the effects from the appli-
cation of the aforementioned accounting standard as in the prior year.
In accordance with the provisions of IAS 29, the remeasurement of the values in the financial statements overall requires
the application of specific procedures and a measurement process which the Group had already started in the final part
of 2018. In particular:
in relation to the income statement, costs and revenue were restated applying the change in the general consumer
price index, in order to reflect the fall in purchasing power experienced by the local currency at 31 December 2021.
For the purposes of the translation into euro of the income statement thus restated, the spot exchange rate at 31
December 2021 was consistently applied rather than the average exchange rate for the period. With reference to
consolidated net revenue in the period, the effect from the application of the standard entailed a negative change of
Argentine peso 110 million equal to € 0.9 million in 2021;
as regards the statement of financial position, the monetary elements were not restated, since they are already ex-
pressed in the current unit of measurement at the end date of the period; the non-monetary assets and liabilities
were instead restated to reflect the fall in purchasing power of the local currency that occurred from the date on
which the assets and liabilities were initially recorded, at the end of the period.
Business combinations
Business combinations are accounted for using the acquisition method.

128
The Group verifies that a business combination falls within the definition of the IFRS guidance hence only if it is an inte-
grated set of activities and assets that with the input and process, contribute to the output creation.
The cost of acquisition is calculated as the sum of payments transferred as part of a business combination, measured at
fair value, on the acquisition date and at the value of the portion of the shareholders’ equity relating to non-controlling
interests, measured at fair value of the net interest recognized for the acquired entity.
Ancillary costs related to the transactions are recorded in the income statement at the time they are incurred. The Group
determines that it has acquired a business when the acquired set of activities and assets include an input and a substan-
tive process that together significantly contribute to the ability to create outputs.
The acquired process is considered substantive if it is critical to the ability to continue producing outputs, and the inputs
acquired include an organized workforce with the necessary skills, knowledge, or experience to perform that process or
it significantly contributes to the ability to continue producing outputs and is considered unique or scarce or cannot be
replaced without significant cost, effort, or delay in the ability to continue producing outputs.
When the Group acquires a business, it assesses the financial assets and liabilities assumed for appropriate classification
and designation in accordance with the contractual terms, economic circumstances and pertinent conditions as at the
acquisition date. This includes the separation of embedded derivatives in host contracts by the acquiree.
In the case the business combination is made by instalments, the interest previously held by the Group in the acquired
business is revealed at fair value on the date of control is acquired, and any resulting gains or losses are recognized in the
statement of profit and loss.
Any contingent consideration to be transferred by the acquirer will be recognized at fair value at the acquisition date.
Contingent consideration classified as equity is not remeasured and its subsequent settlement is accounted for within
equity. Contingent consideration classified as an asset or liability that is a financial instrument and within the scope of
IFRS 9 Financial Instruments, is measured at fair value with the changes in fair value recognized in the income statement
in accordance with IFRS 9. Other contingent consideration that is not within the scope of IFRS 9 is remeasured at fair
value at each reporting date with changes in fair value recognized in profit or loss.
Any changes in fair value of the net assets acquired, occurring once further information are available during the meas-
urement period – 12 months from acquisition date – are included retrospectively in goodwill.
Goodwill acquired in business combinations is initially measured at cost, as the excess of the sum of payments transferred,
the value of the portion of shareholders’ equity relating to non-controlling interests and the fair value of any interest
previously held in the acquired business over the Group’s portion of the net fair value of the identifiable assets, liabilities
and contingent liabilities of the acquired company. If the value of the net assets acquired and liabilities assumed on the
acquisition date exceeds the sum of the transferred payments, the value of the non-controlling interest’ portion of share-
holders’ equity and the fair value of any interest previously held in the acquired business, this excess value is accounted
for in profit and loss as income from the transaction.
After initial recognition, goodwill is measured at cost less any accumulated impairment losses. For the purpose of impair-
ment testing, goodwill acquired in a business combination is, from the acquisition date, allocated to each of the Group’s
cash-generating units that are expected to benefit from the combination, irrespective of whether other assets or liabilities
of the acquiree are assigned to those units.
Recognition of non-controlling interests
Non-controlling interests relate to the portion of a subsidiary’s shareholders’ equity that is not directly or indirectly at-
tributable to the Group.
In case cross-mechanisms, which give the Group the right to acquire the non-controlling interests (call option agreement)
or rights to sell the same to the Group (put option agreement) or a combination of both (put and call option agreements)
are in place, an analysis is made as to whether the risks and benefits connected with the share of legal ownership of the
business to which the non-controlling interests pertain are broadly attributable to the latter or to the Group. These rights
to purchase or sell the non-controlling interests may be set at a fixed price, a variable price or a fair value, and may be
exercisable on a fixed date or at any time in the future. Each of these variables is examined to determine the effects on
the presentation of the accounts.
If the non-controlling interests have an effective involvement in the conduct of the business, those interest must continue
to be represented in addition to the Group’s shareholders’ equity and, at the same time, the financial liability relating to
the put and/or call option agreements must be recorded.
Accounting treatment of the Gastech-Energi A/S earn out

129
On 30 April 2015, 100% of the share capital of the Danish company Gastech was acquired.
The Sales and Purchase Agreement sets forth a mechanism for a subsequent adjustment of the price (earn-out) based on
the earning performance of the company at the specific dates set out in the agreement with a likely further payment.
Therefore, a liability equal to the current value of the estimated obligation as at the date of its possible exercise, was
recognized in the financial statements against a higher goodwill.
From the total amount paid by contract, there is still a balance of for € 2.4 million in regards of representations and
warranties foreseen in Sales and Purchase Agreement for which a definitive result has not yet come in force.
The liability, reviewed annually, is subject to subsequent recognition in the income statement of the identified valuation
differences.
Accounting treatment of the HTP Comfort Solutions LLC (now Ariston Thermo USA LLC) put and call option and earn out
On 28 July 2017, 51.0% of the shares of HTP Comfort Solutions LLC was acquired with the simultaneous subscription of a
put option in favour of the seller and a call option in favour of the buyer, relating to the residual 49.0% of the share
capital, has been represented by recognizing under other long-term liabilities in the statement of financial position the
fair value of the payable arising from the purchase and sale options signed at the time of the purchase on all the shares
held by minority shareholders, and without the recognition of the residual equity attributable to non-controlling interest.
At 31 December 2021 remains a put and call to be executed equal to 17.2%.
Financial liability amount due is USD 22.9 million, equal to € 20.2 million. An additional adjustment to the price (earn-out)
based on the company performance is set forth in the Purchase Agreement. The amount recognized is equal to USD 4.8
million, equivalent to € 4.3 million. The total liability recorded in current liabilities is € 24.5 million.
The fair value of the liability related to the symmetric options, reviewed annually, is subject to subsequent recognition in
the income statement of the identified valuation differences.
Accounting treatment of the Atmor Industries Group option agreement clause – Relocation Project
As a result of (i) the consideration of the characteristics of the control exercised due to the contractual commitments and
(ii) the specific accounting policy adopted by the Group, the acquisition of 60% of the Atmor Group, which occurred on 7
September 2017, with the simultaneous subscription of a put option in favour of the seller and a call option in favour of
the buyer, relating to the residual 40% of the share capital, has been represented by recognizing under other long-term
liabilities in the statement of financial position the fair value of the payable arising from the purchase and sale options
signed at the time of the purchase on all the shares held by minority shareholders, and without the recognition of the
residual equity attributable to non-controlling interest.
In 2020 as part of the option agreement the parties determined an adjustment to the price based on certain milestones
linked to the Relocation Project. The amount is equal to USD 323 thousand, equal to € 259 thousand.
The liability is expected to be paid in 2023 and therefore classified as non-current liabilities.
Accounting treatment of the Kesselheld GmbH put and call option
The acquisition of 80% of the German company Kesselheld GmbH, which occurred the 17 April 2020, with the simultane-
ous subscription of a put option in favour of the seller and a call option in favour of the buyer, relating to the residual
20% of the share capital, has been represented by recognizing under other long-term liabilities in the statement of finan-
cial position the fair value of the payable arising from the purchase and sale options signed at the time of the purchase
on all the shares held by minority shareholders, and without the recognition of the residual equity attributable to non-
controlling interest.
The remaining financial liability, covering a reps and warranty clause, is € 0.8 million and is expected to be paid no later
than 31 December, 2025.
Accounting treatment of the Haas Heating BV earn out
On 10 June 2021, 24.5% of the shares of the Dutch company Haas Heating B.V. was acquired by the Group through ATAG
Heating B.V.
The acquisition agreement sets forth a mechanism for a subsequent adjustment of the purchase price (earn-out) based
on a sales scheme at specific dates falling under IAS 28 Investment in Associates and Joint Ventures.
Therefore, a liability equal to the current value of the estimated obligation as at the date of its eventual future exercise,
was recognized in the financial statements against the equity participation value.
130
By Sales and Purchase Agreement defined the purchase price at € 0.8 million and a liability for € 1.6 million is related to
the earn-out program.
For the remaining shares the agreement foreseen a series of call options until December 2023 that are not reflected in
the Financial Statements and not material in terms of amount.
The company is treated as a joint venture due to the fact that the shareholder has right of veto on relevant business
decisions, thus valuing the participation with the equity method with the existence of a financial liability to be paid for
acquiring the entity.
The following table summarizes the fair value of financial liabilities described above:
Type % Ownership Execution
Date Local
Currency €
Gastech_Energy A/S Representations and Warranties n.a. 2023 20.0 DKK 2.4
HTTP Comfort Solutions LLC (now Ariston Thermo USA LCC)
Put & Call Option 17% 2022 22.9 USD 20.2
HTTP Comfort Solutions LLC (now Ariston Thermo USA LCC)
Earn out n.a. 2022 4.8 USD 4.3
Atmor Industries Group Relocation Project n.a. 2023 0.3 CHF 0.3
Kesselheld GmbH Representations and Warranties n.a. 2025 0.8 EUR 0.8
Financial liabilities related to Investments in Subsidiaries
27.9
Haas Heating B.V. Earn out n.a. 2022 0.6 EUR 0.6
Haas Heating B.V. Earn out n.a. 2023 1.0 EUR 1.0
Financial liabilities related to Investments in Third Parties
1.6
4. Significant accounting policies
i. Current versus non-current classification
The Group presents assets and liabilities in the statement of financial position based on current/non-current classifica-
tion. An asset is current when it is:
Expected to be realized or intended to be sold or consumed in the normal operating cycle
Held primarily for the purpose of trading
Expected to be realized within twelve months after the reporting period
Or
Cash or cash equivalent unless restricted from being exchanged or used to settle a liability for at least twelve months
after the reporting period.
All other assets are classified as non-current.
A liability is current when:
It is expected to be settled in the normal operating cycle
It is held primarily for the purpose of trading
It is due to be settled within twelve months after the reporting period
Or
There is no unconditional right to defer the settlement of the liability for at least twelve months after the reporting period
The terms of the liability that could, at the option of the counterparty, result in its settlement by the issue of equity
instruments do not affect its classification.
The Group classifies all other liabilities as non-current.
Deferred tax assets and liabilities are classified as non-current assets and liabilities.
ii. Fair value measurement
131
The Group measures financial instruments such as derivatives, and non-financial assets at fair value at each balance sheet
date.
Fair value is the price that would be received to sell an asset or paid to transfer a liability in an orderly transaction between
market participants at the measurement date. The fair value measurement is based on the presumption that the trans-
action to sell the asset or transfer the liability takes place either:
In the principal market for the asset or liability
Or
In the absence of a principal market, in the most advantageous market for the asset or liability, the principal or the
most advantageous market must be accessible by the Group.
The fair value of an asset or a liability is measured using the assumptions that market participants would use when pricing
the asset or liability, assuming that market participants act in their economic best interest.
A fair value measurement of a non-financial asset takes into account a market participant’s ability to generate economic
benefits by using the asset in its highest and best use or by selling it to another market participant that would use the
asset in its highest and best use.
The Group uses valuation techniques that are appropriate in the circumstances and for which sufficient data are available
to measure fair value, maximizing the use of relevant observable inputs and minimizing the use of unobservable inputs.
All assets and liabilities for which fair value is measured or disclosed in the financial statements are categorised within
the fair value hierarchy, described as follows, based on the lowest level input that is significant to the fair value measure-
ment as a whole:
• Level 1 – Quoted (unadjusted) market prices in active markets for identical assets or liabilities
• Level 2 – Valuation techniques for which the lowest level input that is significant to the fair value measurement is
directly or indirectly observable
• Level 3 – Valuation techniques for which the lowest level input that is significant to the fair value measurement is
unobservable
For assets and liabilities that are recognized in the financial statements at fair value on a recurring basis, the Group de-
termines whether transfers have occurred between levels in the hierarchy by re-assessing categorization (based on the
lowest level input that is significant to the fair value measurement as a whole) at the end of each reporting period.
The Group determines the policies and procedures for both recurring fair value measurement, such as investment prop-
erties and unquoted financial assets, and for non-recurring measurement, such as assets held for sale in discontinued
operations.
External valuators are involved for valuation of significant assets, such as investment properties and unquoted financial
assets, and significant liabilities, such as contingent consideration.
For the purpose of fair value disclosures, the Group has determined classes of assets and liabilities on the basis of the
nature, characteristics and risks of the asset or liability and the level of the fair value hierarchy, as explained above.
iii. Intangible assets
Intangible assets acquired separately are measured on initial recognition at cost. The cost of intangible assets acquired
in a business combination is their fair value at the date of acquisition. Following initial recognition, intangible assets are
carried at cost less any accumulated amortization and accumulated impairment losses. Internally generated intangibles,
excluding capitalized development costs, are not capitalized and the related expenditure is reflected in income statement
in the period in which the expenditure is incurred.
The useful lives of intangible assets are assessed as either finite or indefinite. Intangible assets with finite lives are amor-
tized over the useful economic life and assessed for impairment whenever there is an indication that the intangible asset
may be impaired. The amortization period and the amortization method for an intangible asset with a finite useful life
are reviewed at least at the end of each reporting period. Changes in the expected useful life or the expected pattern of
consumption of future economic benefits embodied in the asset are considered to modify the amortization period or
method, as appropriate, and are treated as changes in accounting estimates. The amortization expense on intangible
assets with finite lives is recognized in the income statement in the expense category that is consistent with the function
of the intangible assets.
132
Intangible assets with indefinite useful lives are not amortized, but are tested for impairment annually, either individually
or at the cash-generating unit level. The assessment of indefinite life is reviewed annually to determine whether the
indefinite life continues to be supportable. If not, the change in useful life from indefinite to finite is made on a prospec-
tive basis.
An intangible asset is derecognized upon disposal (i.e., at the date the recipient obtains control) or when no future eco-
nomic benefits are expected from its use or disposal. Any gain or loss arising upon de-recognition of the asset (calculated
as the difference between the net disposal proceeds and the carrying amount of the asset) is included in the income
statement.
Goodwill
Goodwill arising from the acquisition of a subsidiary reflects the excess of the acquisition cost over the percentage at-
tributable to the Group, of the fair value of the subsidiary’s identifiable assets, liabilities and potential liabilities at the
acquisition date (IAS 36). The goodwill is recognized as an asset and undergoes an impairment test on an annual basis, or
more frequently if there are events or changes in the circumstances that may result in impairment losses.
For this purpose, the goodwill, if any, resulting at the acquisition date is allocated to each of the cash generating units
(CGU), which are expected to benefit from the synergy effects deriving from the acquisition. Any loss in value is identified
through valuations that are based on the capacity of each unit to produce financial flows capable of recovering the part
of goodwill allocated to it, according to the methods described hereinafter, in the section “Impairment of assets”. If the
value recoverable by the cash generating unit is below the attributed carrying value, the related impairment loss is rec-
ognized. This impairment loss is not restored if the reasons that have generated it cease to exist.
If in a subsidiary the control is lost, the portion of goodwill attributable to it at the date of the sale is included in the
calculation of the gain or loss on disposal.
Internally generated intangible assets – Research and development costs
Research costs are recognized in the income statement for the period in which they are incurred.
Internally generated intangible assets deriving from the development of the Group’s products are recognized under as-
sets, only if all of the following conditions are met:
The technical feasibility of completing the intangible asset so that the asset will be available for use or sale
Its intention to complete and its ability and intention to use or sell the asset
How the asset will generate future economic benefits
The availability of resources to complete the asset
The ability to measure reliably the expenditure during development
The capitalized development costs include only the expense incurred which may be attributed directly to the develop-
ment process.
These intangible assets with definite useful life are amortized on a straight-line basis over the respective useful life of the
product, which is normally 5 years. Any impairment losses, and any restatement, are based on the same methods de-
scribed in the section “Impairment of assets”.
If the internally generated assets cannot be recognized in the financial statements, the development costs are recognized
in the income statement for the period in which they are incurred.
Other intangible assets
Other intangible assets, whether purchased or internally produced, are recognized under assets in compliance with IAS
38 Intangible Assets, if it is likely that the use of the assets will generate future economic benefits and when the cost of
the asset can be accurately measured.
These assets (such as concessions, licenses, trademarks and software) with a definite useful life are recognized at pur-
chase or production cost and amortized on a straight-line basis over their estimated useful life. Any impairment losses,
and any restatement, are based on the same methods described in the section “Impairment of assets”.

133
Intangible assets with indefinite useful life are not amortized but are subject to evaluation in order to identify any impair-
ment loss, yearly or more frequently, at any time there is an indication that the asset may have been impaired.
The other intangible assets recognized following the acquisition of a company are recognized separately from the good-
will, if their current value can be accurately measured.
Here below are the principles applied by the Group for intangible assets (IAS 38.118) (a) (b):
Licenses Trademarks Development costs Software
Useful life Definite (5 years) Indefinite Definite (5 years) Definite (4 years)
Amortisation method used
Amortised on a straight-line basis over the period of the license itself
No amortisation Amortised on a straight-line basis over the pe-riod of expected future sales resulting from the related project
Amortised on a straight-line basis over the period of the usage of the software itself
Produced in-house or purchased
Purchased Purchased Produced in-house Purchased
iv. Property, plant and equipment
Property, plant and equipment are recognized at cost, net of accumulated depreciation and impairment losses, if any.
Construction in progress is stated at cost, net of accumulated impairment losses, if any.
The present value of the expected cost for the decommissioning of an asset after its use is included in the cost of the
respective asset if the recognition criteria for a provision are met.
Assets with components of a significant value and with a different useful life are recognized separately when depreciated.
Under IAS 16 Property, Plant and Equipment an entity has a policy choice for the measurement of property, plant and
equipment after initial recognition. An entity may choose either the cost model or the revaluation model for entire classes
of property, plant and equipment. The Group has elected to use the cost model for all class of assets.
The depreciation is calculated on a straight-line basis, according to the cost of the asset net of all residual values, on its
estimated useful economic-technical life through the use of depreciation rates that accurately represent it. If significant
parts of these tangible assets have a different useful life, they will be stated separately. The depreciation will be based
on the following percentage rates:
Buildings and light constructions from 1.8 to 3.0
Plant and machinery from 6.0 to 15.5
Industrial and commercial equipment from 10.0 to 25.0
Cars and internal transport vehicles from 20.0 to 25.0
Furniture, office equipment, data processing systems from 12.0 to 20.0
The Group reviews the estimated residual values and expected useful lives of assets at least annually.
The residual values, useful lives and methods of depreciation of property, plant and equipment are reviewed at each
financial year end and adjusted prospectively, if appropriate.
Land with no construction or annexed to residential and industrial buildings, is not depreciated since it has an unlimited
useful life.
An item of property, plant and equipment and any significant part initially recognized is derecognized upon disposal (i.e.,
at the date the recipient obtains control) or when no future economic benefits are expected from its use or disposal.
Gains and losses arising from the sale or disposal of assets are calculated as the difference between revenue from sales
and the net carrying value of the asset, and are recognized in the income statement for the year.
v. Leases
The Group assesses at contract inception whether a contract is, or contains, a lease. That is, if the contract conveys the
right to control the use of an identified asset for a period of time in exchange for consideration.
134
The rights of use relating to leases are recognized in a single accounting model to recognize the lease. In accordance with
this model, the entity recognizes: (1) assets and liabilities for all leases with a duration of over twelve months; (2) sepa-
rately in the income statement, the amortization/depreciation of the recognized asset and the interest on the financial
payable recorded.
More specifically, in order to determine the value of the assets with “right of use”, the value of the related discounted
liabilities, any payments made to the lessor before signing the contract, net of the incentives received, the initial direct
costs incurred by the lessor as well as the provisions for removal and dismantling, if any, were taken into account.
Lease agreements in place within the Group ranges from offices, warehouses, plants, machinery and vehicles and low
value assets belonging to third parties.
Lease terms are generally ranging from 1-10 years but may contains options to extend them. Terms of lease may also
contain wide range of different conditions.
Falling under the IFRS 16 guidelines, the rights of use are valued at cost, net of accumulated amortization and impairment
losses and adjusted after any remeasurement of the lease liabilities. The value assigned to the rights of use corresponds
to the amount of the lease liabilities recognized, plus initial direct costs incurred, lease payments settled on the start date
of the agreement or previously, and restoration costs, net of any lease incentives received.
The value of the liability, discounted to present value, as determined above, increases the right of use of the underlying
asset, and a dedicated provision is created as a contra-entry. The rights of use are amortized on a straight-line basis over
its estimated useful life or the term of the agreement, whichever is the shorter. The financial liability for leases is recog-
nized on the start date of the agreement at a total value equal to the present value of the lease payments to be made
during the term of the agreement, discounted to present value using incremental borrowing rates (IBR) when the implicit
interest rate in the lease agreement cannot easily be determined. Variable lease payments which are not linked to an
index or rate continue to be charged to the income statement as costs for the period.
After the start date, the amount recorded for the liabilities relating to lease contracts increases to reflect the accrual of
interest and reduces to reflect the payments made. Each lease payment is divided into a repayment of the capital portion
of the liability and a financial cost. The financial cost is charged to the income statement over the term of the agreement
to reflect a constant interest rate on the remaining debt portion of the liability for each period.
The term of the lease is calculated taking into account the non-cancellable period of the lease together with the periods
covered by an option to extend the agreement if it is reasonably certain that it will be exercised, or any period covered
by an option to terminate the lease contract, if it is reasonably certain it will not be exercised. The Group assesses whether
it is reasonably certain that it will exercise the options to extend or will terminate the agreements taking into account all
the relevant factors that create a financial incentive for such decisions.
On the basis of the practical expedients, recognition exemptions for low-value and short-term leases, equal to € 11.2
million for 2021 (€ 9.5 million for 2020) was not considered and € 4.7 million for 2021 (€ 2.8 million for 2020) out of scope
IFRS 16 which are comprise mainly away tolls and rent contracts for IT equipment.
The agreements are either included or excluded from the application of the standard based on detailed analysis carried
out for each agreement and in line with the rules laid down by IFRS standards.
Financial liabilities relating to IFRS 16 leases are initially measured at the present value of the lease payments still to be
paid.
With respect to some of its leases, the Group has the option to extend or terminate them. The Group applies judgement
when assessing whether it is reasonably certain to exercise renewal options. That said, the Group considers all relevant
factors that may create an economic incentive to exercise the options to renew or terminate the lease. After the com-
mencement date, the Group reassesses the lease term upon the occurrence of a significant event or a significant change
in circumstances that are within its control and affect whether it can exercise (or not exercise) an option to renew or
terminate the lease (e.g. investments in leasehold improvements or specific material changes to the leased asset). In
addition, the carrying amount of lease liabilities is remeasured if there is a modification, a change in the lease term, a
change in the lease payments (e.g. changes to future payments resulting from a change in an index or rate used to de-
termine such lease payments) or a change in the assessment of an option to purchase the underlying asset.
The exercise price for the underlying asset, in the presence of purchase options, and/or the contractual value of the
penalties, in the case of early termination of the lease, are included in the value of the financial liability only if their
exercise is reasonably certain.
Following initial recognition, financial liabilities relating to IFRS 16 leases are valued using the amortized cost method.
135
The discount rate at which the lease payments that are still to be paid are discounted is called lessee’s incremental bor-
rowing rate and is equal to the interest rate the lessor would have paid if they had borrowed money to the value of the
right of use, with payment terms similar to the contractual duration of the lease in a similar economic environment.
Management estimated the discount rate by individual country, on the basis of the contractual duration and the total
amount of the current “lease portfolios with similar characteristics”.
vi. Impairment of assets
At each reporting date, the Group reviews the carrying value of its tangible and intangible assets to verify whether there
is any indication that they were subject to an impairment loss. If there are indications of impairment, the Group estimates
the recoverable amount of the assets to calculate the related impairment loss. If it is not possible to estimate individually
the recoverable amount of an asset, the Group estimates the recoverable value of the cash generating unit to which the
asset belongs.
Intangible assets with an indefinite useful life, including goodwill, are assessed on an annual basis or more frequently if
there is an indication of possible impairment losses.
Recoverable amount is the higher of fair value less costs to sell and value in use. In calculating the value in use, the
estimated future cash flows are discounted to their current value using a discount rate that reflects the current market
values relating to money and the risks associated with the asset.
If the recoverable amount of an asset (or of the CGU) is estimated to be lower than its carrying value, it is reduced to the
lower recoverable amount. Impairment losses are immediately recognized in the income statement.
If a depreciation has no longer a reason to exist, the carrying value of the asset (or of the CGU), excluding the goodwill, is
increased to the new amount resulting from the estimate of its recoverable value, but not above the net carrying value
that the asset would have had if the loss had not occurred. The restored value is recognized in the income statement.
vii. Non-current assets held for sale and discontinued operations
Non-current assets (and disposal groups) classified as held for sale are measured at the lower of their previous carrying
value and market value less costs to sell. Costs to sell are the incremental costs directly attributable to the disposal of an
asset (disposal group), excluding finance costs and income tax expense.
Non-current assets (and disposal groups) are classified as held for sale when the Group expects that their carrying value
will be recovered through sale rather than used in its operating activities. This condition is met only when the sale is
highly probable, the asset (or group of assets) is held for immediate sale in its current condition, and Management has
committed to the sale, which should occur within 12 months from the date of classification of this item.
Property, plant and equipment and intangible assets are not depreciated or amortized once classified as held for sale.
Assets and liabilities classified as held for sale are presented separately as current items in the statement of financial
position.
Financial activities related to ceased or discontinued operations, net of tax effects, are recognized under one single item
in the consolidated income statement, including the comparative data of the relevant period.
viii. Investments in associates
Investments in associates are recognized according to the equity method, starting from the date of the significant influ-
ence by the Group up to the time when this influence ceases to exist, as described in the previous paragraph “Consolida-
tion and translation principles”.
ix. Financial instruments - initial recognition and subsequent measurement
A financial instrument is any contract that gives rise to a financial asset of one entity and a financial liability or equity
instrument of another entity.
136
Financial assets
Initial recognition and measurement
Financial assets are classified, at initial recognition, as subsequently measured at amortized cost, fair value through other
comprehensive income (OCI), and fair value through profit or loss.
In line with IFRS 9, financial assets, which are represented by debt instruments (trade receivables, financial receivables,
etc.), are classified on the basis of the business model (the way the Group manages financial assets in order to generate
cash flows) and the contractual characteristics of the cash flows (the so-called SPPI test, “solely payment of principal and
interest”), in one of the following categories:
amortized cost, for the financial assets held with the aim of receiving the contractual cash flows which pass the SPPI
test, since the cash flows represent solely payment of principal and interest; this category includes trade receivables,
other operational receivables included in other current and non-current assets, and financial receivables included in
other current and non-current financial assets;
fair value through shareholders’ equity (FVOCI), for financial assets held with the aim of collecting cash flows, both
contractual, which represent solely payments of principal and interest, and from sales. The changes in fair value sub-
sequent to initial recognition are offset under OCI and are recycled to the income statement upon de-recognition;
fair value through profit or loss (FVTPL), as a residual category, for assets which are not held in one of the above
business models. This category mainly holds financial derivatives held for trading and debt instruments the contrac-
tual flows of which are not solely principal and interest.
The classification of financial assets at initial recognition depends on the financial asset’s contractual cash flow charac-
teristics and the Group’s business model for managing them.
With the exception of trade receivables that do not contain a significant financing component or for which the Group has
applied the practical expedient, the Group initially measures a financial asset at its fair value plus, in the case of a financial
asset not at fair value through profit or loss, transaction costs. Trade receivables that do not contain a significant financing
component or for which the Group has applied the practical expedient are measured at the transaction price as disclosed
in section (e) Revenue from contracts with customers.
The Group envisages, as per the provisions of the new IFRS 9, the treatment of non-strategic investments and investment
funds shares at FVTPL; while other investments, which are considered strategic, are treated individually and, at the mo-
ment, are all valued at FVTOCI.
Contingent consideration classified as an asset (or liability) that is a financial instrument and within the scope of IFRS 9
Financial Instruments, is measured at fair value with the changes in fair value recognized in the income statement in
accordance with IFRS 9. Other contingent consideration that is not within the scope of IFRS 9 is measured at fair value at
each reporting date with changes in fair value recognized in profit or loss.
Subsequent measurement
For purposes of subsequent measurement, financial assets are classified in four categories:
Financial assets at amortized cost (debt instruments)
Financial assets at fair value through OCI with recycling of cumulative gains and losses (debt instruments)
Financial assets designated at fair value through OCI with no recycling of cumulative gains and losses upon de-recog-
nition (equity instruments)
Financial assets at fair value through profit or loss
- Financial assets at amortized cost (debt instruments)
Financial assets at amortized cost are subsequently measured using the effective interest (EIR) method and are sub-
ject to impairment. Gains and losses are recognized in income statement when the asset is derecognized, modified
or impaired. The Group’s financial assets at amortized cost includes trade receivables, and loan to an associate and
loan to a director included under other non-current financial assets.
- Financial assets at fair value through OCI (debt instruments)
For debt instruments at fair value through OCI, interest income, foreign exchange revaluation and impairment losses
or reversals are recognized in the income statement and computed in the same manner as for financial assets meas-
ured at amortized cost. The remaining fair value changes are recognized in OCI. Upon de-recognition, the cumulative
137
fair value change recognized in OCI is recycled to income statement. The Group’s debt instruments at fair value
through OCI includes investments in quoted debt instruments included under other non-current financial assets.
- Financial assets designated at fair value through OCI (equity instruments)
Upon initial recognition, the Group can elect to classify irrevocably its equity investments as equity instruments des-
ignated at fair value through OCI when they meet the definition of equity under IAS 32 Financial Instruments: Presen-
tation and are not held for trading. The classification is determined on an instrument-by-instrument basis. Gains and
losses on these financial assets are never recycled to income statement. Dividends are recognized as other income in
the income statement when the right of payment has been established, except when the Group benefits from such
proceeds as a recovery of part of the cost of the financial asset, in which case, such gains are recorded in OCI. Equity
instruments designated at fair value through OCI are not subject to impairment assessment. The Group elected to
classify irrevocably its non-listed equity investments under this category.
- Financial assets at fair value through profit or loss
Financial assets at fair value through profit or loss are carried in the statement of financial position at fair value with
net changes in fair value recognized in the statement of profit or loss. This category includes derivative instruments
and listed equity investments which the Group had not irrevocably elected to classify at fair value through OCI. Divi-
dends on listed equity investments are recognized as other income in the statement of profit or loss when the right
of payment has been established.
De-recognition
A financial asset (or, where applicable, a part of a financial asset or part of a group of similar financial assets) is primarily
derecognized (i.e., removed from the Group’s consolidated statement of financial position) when:
The rights to receive cash flows from the asset have expired
Or
The Group has transferred its rights to receive cash flows from the asset or has assumed an obligation to pay the
received cash flows in full without material delay to a third party under a ‘pass-through’ arrangement; and either (a)
the Group has transferred substantially all the risks and rewards of the asset, or (b) the Group has neither transferred
nor retained substantially all the risks and rewards of the asset, but has transferred control of the asset.
When the Group has transferred its rights to receive cash flows from an asset or has entered into a pass-through arrange-
ment, it evaluates if, and to what extent, it has retained the risks and rewards of ownership. When it has neither trans-
ferred nor retained substantially all of the risks and rewards of the asset, nor transferred control of the asset, the Group
continues to recognize the transferred asset to the extent of its continuing involvement. In that case, the Group also
recognizes an associated liability. The transferred asset and the associated liability are measured on a basis that reflects
the rights and obligations that the Group has retained.
Continuing involvement that takes the form of a guarantee over the transferred asset is measured at the lower of the
original carrying amount of the asset and the maximum amount of consideration that the Group could be required to
repay.
Impairment
Further disclosures relating to impairment of financial assets are also provided in the following notes:
Disclosures for significant assumptions
Debt instruments at fair value through OCI
Trade receivables, including contract assets
The Group recognizes an allowance for expected credit losses (ECLs) for all debt instruments not held at fair value through
profit or loss. ECLs are based on the difference between the contractual cash flows due in accordance with the contract
and all the cash flows that the Group expects to receive, discounted at an approximation of the original effective interest
rate. The expected cash flows will include cash flows from the sale of collateral held or other credit enhancements that
are integral to the contractual terms. ECLs are recognized in two stages. For credit exposures for which there has not
138
been a significant increase in credit risk since initial recognition, ECLs are provided for credit losses that result from default
events that are possible within the next 12-months (a 12-month ECL). For those credit exposures for which there has
been a significant increase in credit risk since initial recognition, a loss allowance is required for credit losses expected
over the remaining life of the exposure, irrespective of the timing of the default (a lifetime ECL).
For trade receivables and contract assets, the Group applies a simplified approach in calculating ECLs. Therefore, the
Group does not track changes in credit risk, but instead recognizes a loss allowance based on lifetime ECLs at each re-
porting date. The Group has established a provision matrix that is based on its historical credit loss experience, adjusted
for forward-looking factors specific to the debtors and the economic environment.
Financial liabilities
Initial recognition and measurement
Financial liabilities are classified, at initial recognition, as financial liabilities at fair value through profit or loss, loans and
borrowings, payables, or as derivatives designated as hedging instruments in an effective hedge, as appropriate. All fi-
nancial liabilities are recognized initially at fair value and, in the case of loans and borrowings and payables, net of directly
attributable transaction costs. The Group’s financial liabilities include trade and other payables, loans and borrowings
including bank overdrafts, and derivative financial instruments.
Subsequent measurement
For purposes of subsequent measurement, financial liabilities are classified in two categories:
Financial liabilities at fair value through profit or loss
Financial liabilities at amortized cost (loans and borrowings)
- Financial liabilities at fair value through profit or loss
Financial liabilities at fair value through profit or loss include financial liabilities held for trading and financial liabilities
designated upon initial recognition as at fair value through profit or loss. Financial liabilities are classified as held for
trading if they are incurred for the purpose of repurchasing in the near term. This category also includes derivative
financial instruments entered into by the Group that are not designated as hedging instruments in hedge relationships
as defined by IFRS 9. Separated embedded derivatives are also classified as held for trading unless they are designated
as effective hedging instruments. Gains or losses on liabilities held for trading are recognized in the statement of profit
or loss. Financial liabilities designated upon initial recognition at fair value through profit or loss are designated at the
initial date of recognition, and only if the criteria in IFRS 9 are satisfied. The Group has not designated any financial
liability as at fair value through profit or loss.
- Financial liabilities at amortized cost (loans and borrowings)
This is the category most relevant to the Group. After initial recognition, interest-bearing loans and borrowings are
subsequently measured at amortized cost using the EIR method. Gains and losses are recognized in income statement
when the liabilities are derecognized as well as through the EIR amortization process. Amortized cost is calculated by
taking into account any discount or premium on acquisition and fees or costs that are an integral part of the EIR. The
EIR amortization is included as finance costs in the income statement. This category generally applies to interest-
bearing loans and borrowings.
De-recognition
A financial liability is de-recognized when the obligation under the liability is discharged or cancelled or expires. When an
existing financial liability is replaced by another from the same lender on substantially different terms, or the terms of an
existing liability are substantially modified, such an exchange or modification is treated as the de-recognition of the orig-
inal liability and the recognition of a new liability. The difference in the respective carrying amounts is recognized in the
income statement.
Derivatives

139
If derivative instruments are held for trading, they are measured at fair value while offset in the income statement; if the
same are classified as effective hedging instruments against changes in the fair value of assets, liabilities, obligations
assumed by the Group or related future cash flows, the Group applies hedge accounting.
The Group, consistent with its internal policies, does not use financial instruments of a speculative nature (i.e. for trading).
The Group uses financial derivative instruments mainly to hedge its exposure to exchange rate risk, interest rate risk and
commodity price fluctuation risk.
With reference to the classification of hedging transactions, the provisions of IFRS 9 require that:
there is an economic relationship between the hedged item and the hedging instrument, such as to offset the related changes in value;
this ability to offset is not undermined by the counterparty’s credit risk level;
a ratio between the hedged object and the hedging instrument (the so-called hedge ratio) is defined, in line with the risk
management objectives, as part of the established risk management strategy, rebalancing where necessary. Changes in
the risk management objectives, the termination of the above conditions to classify hedging transactions or rebalancing
lead to the future, total or partial, discontinuation of the hedge.
Financial instruments are recognized according to hedge accounting rules when:
at the beginning of the hedging, the formal designation and documentation of the hedging exist;
the hedging is assumed to be effective;
the efficacy can be accurately measured and the hedging itself is highly effective during the relevant periods.
The Group applies the cash flow hedge (IFRS 9), if the hedging relationship of changes in the cash flows originating from
an asset or liability or a future transaction (hedged underlying element), that is deemed as likely to occur and that could
have an impact on other comprehensive income and equity (cash flow hedge reserve), is formally documented.
Changes in the value of the derivatives designated as fair value hedge and that are qualified as such, are recognized in
the income statement, consistent with the changes in the fair value of the hedged assets and liabilities. If the derivative,
even if created with non-speculative intent, does not meet all the formal requirements necessary to be designated in
hedge accounting, the changes in fair value are recognized in the income statement, under the same line of the changes
in hedged item.
x. Inventories
Inventories are recognized at the lesser value between purchase and production cost, according to the weighted average
cost method and their net realizable value.
Cost includes direct materials and direct labour general production costs and other costs incurred to bring inventories to
their current location and condition.
Initial cost of inventories includes the transfer of gains and losses on qualifying cash flow hedges, recognized in OCI, in
respect of the purchases of raw materials. Net realizable value is the estimated selling price in the ordinary course of
business, less estimated costs of completion and the estimated costs necessary to make the sale.
Lastly, some obsolete stock provisions are calculated for materials, finished goods and spare parts that are considered
obsolete or slow moving, keeping into account their expected future use and realizable value.
xi. Cash and cash equivalents
Cash and cash equivalents are recognized at their nominal value and include numeric values, i.e. those values that meet
the requirement of on demand or very short-term availability, positive outcome and no costs of disposal with a maturity
of three months or less, that are readily convertible to a known amount of cash and subject to an insignificant risk of
changes in value. This item includes also the collection and payment instruments that have been subject to an account
recording at the servicing financial institution as at the closing date of the period notwithstanding any subsequent differ-
ent accounting records.
xii. Provisions for risks and charges
General

140
The Group recognizes provisions for risks and charges when it has a present obligation, either legal or constructive, to-
ward third parties arising from a past event, and it is likely that it will be necessary to use the resources of the Group to
meet the obligation, and when it is possible to make an accurate estimate of the amount of the obligation itself.
When the Group expects some or all of a provision to be reimbursed, for example, under an insurance contract, the
reimbursement is recognized as a separate asset, but only when the reimbursement is virtually certain. The expense
relating to a provision is presented in the income statement net of any reimbursement. If the effect of the time value of
money is material, provisions are discounted using a current pre-tax rate that reflects, when appropriate, the risks specific
to the liability. When discounting is used, the increase in the provision due to the passage of time is recognized as a
finance cost.
Changes in estimates are reflected in the income statement of the period when the change has occurred.
Disclosures about provisions follow IAS 37 (paragraph 92) which regulates and limits these indications when they might
prejudice the company’s position in any disputes.
Uncertain tax position
According to IFRIC23 ‘Uncertainty over Income Tax Treatments’ to clarify the accounting for uncertainties in income tax
is applied.
The interpretation is to be applied to the determination of taxable profit (tax loss), tax bases, unused tax losses, unused
tax credits and tax rates, when there is uncertainty over income tax treatments under IAS 12.
In the determination of taxable profit (tax loss), tax bases, unused tax losses, unused tax credits and tax rates, an entity
has to consider whether it is probable that the relevant authority will accept each tax treatment, or group of tax treat-
ments, that it is used or plans to use in its income tax filling.
If the entity concludes that it is probable that a particular tax treatment is accepted, the entity has to determine taxable
profit (tax loss), tax bases, unused tax losses, unused tax credits or tax rates consistently with the tax treatment included
in its income tax filings.
If the entity concludes that it is not probable that a particular tax treatment is accepted, the entity has to use the most
likely amount or the expected value of the tax treatment when determining taxable profit (tax loss), tax bases, unused
tax losses, unused tax credits and tax rates. The decision should be based on which method provides better predictions
of the resolution of the uncertainty.
In case facts and circumstances changes, the entity shall reassess its judgements and estimates.
Warranty provisions
The Group provides warranties for general repairs of defects that existed at the time of sale, as required by law. Provisions
related to these assurance-type warranties are recognized when the product is sold, or the service is provided to the
customer. Initial recognition is based on historical experience. The estimate of warranty-related costs is revised annually.
Restructuring provisions
Restructuring provisions are recognized only when the Group has a constructive obligation, which is when: (i) there is a
detailed formal plan that identifies the business or part of the business concerned, the location and number of employees
affected, the detailed estimate of the associated costs, and the timeline; and (ii) the employees affected have been noti-
fied of the plan’s main features.
xiii. Employment benefits
Group companies provide post-employment benefits to staff, both directly and by contributing to external funds.
The procedures for providing these benefits vary depending to the legal, fiscal and economic conditions in each country
in which the Group operates.
Employee benefits are accounted under the IAS 19 and IFRS 2.
Group companies provide post-employment benefits through defined contribution and/or defined benefit plans.
Post-employment benefits
141
i. Defined benefit plans
The Group’s obligations and the annual cost reported in the income statement are determined by independent actuaries
using the projected unit credit method.
The net cumulative value of actuarial gains and losses is recorded directly in the statement of other comprehensive in-
come and is not subsequently recognized in the income statement. The costs associated with an increase in the present
value of the obligation, as the time for payment of the benefits draws nearer, are included under financial expenses.
Service costs are posted to the income statement.
The liability recognized represents the present value of the defined benefit obligation, less the present value of plan
assets. If an amendment to the plan changes the benefits accruing from past service, the costs arising from past service
are recognized in the income statement at the time the change to the plan is made. The same treatment is applied if
there is a change to the plan that reduces the number of employees or that amends the terms and conditions of the plan
(the treatment is the same, regardless of whether the final result is a profit or a loss).
For defined benefit plans, remeasurements, comprising of actuarial gains and losses, the effect of the asset ceiling, ex-
cluding amounts included in net interest on the net defined benefit/contribution liability and the return on plan assets
(excluding amounts included in net interest on the net defined benefit/contribution liability), are recognized immediately
in the statement of financial position with a corresponding debit or credit to retained earnings through OCI in the period
in which they occur. Remeasurements are not reclassified to income statement in subsequent periods.
Past service costs are recognized in income statement on the earlier of:
The date of the plan amendment or curtailment, and
The date that the Group recognizes related restructuring costs
Net interest is calculated by applying the discount rate to the net defined benefit/contribution liability or asset. The Group
recognizes the following changes in the net defined benefit/contribution obligation under ‘cost of sales’, ‘administration
expenses’ and ‘selling and distribution expenses’ in the consolidated income statement (by nature):
Service costs comprising current service costs, past-service costs, gains and losses on curtailments and non-routine settlements
Net interest expense or income
ii. Defined contribution plans
Since the Group fulfils its obligations by paying contributions to a separate entity (a fund), with no further obligations,
the company records its contributions to the fund in respect of employees’ service, without making any actuarial calcu-
lation.
Where these contributions have already been paid at the reporting date, no liabilities are recorded in the financial state-
ments.
Share-based payments
Employees (including senior executives) of the Group receive remuneration in the form of share-based payments,
whereby employees render services as consideration for equity instruments (equity-settled transactions).
Equity-settled transactions
The cost of equity-settled transactions is determined by the fair value at the date when the grant is made using an ap-
propriate valuation model.
That cost is recognized in employee benefits expense, together with a corresponding increase in equity (other capital
reserves), over the period in which the service and, where applicable, the performance conditions are fulfilled (the vesting
period). The cumulative expense recognized for equity-settled transactions at each reporting date until the vesting date
reflects the extent to which the vesting period has expired and the Group’s best estimate of the number of equity instru-
ments that will ultimately vest. The expense or credit in the income statement for a period represents the movement in
cumulative expense recognized as at the beginning and end of that period. Service and non-market performance condi-
tions are not taken into account when determining the grant date fair value of awards, but the likelihood of the conditions
142
being met is assessed as part of the Group’s best estimate of the number of equity instruments that will ultimately vest.
Market performance conditions are reflected within the grant date fair value. Any other conditions attached to an award,
but without an associated service requirement, are considered to be non-vesting conditions. Non-vesting conditions are
reflected in the fair value of an award and lead to an immediate expensing of an award unless there are also service
and/or performance conditions.
No expense is recognized for awards that do not ultimately vest because non-market performance and/or service condi-
tions have not been met. Where awards include a market or non-vesting condition, the transactions are treated as vested
irrespective of whether the market or non-vesting condition is satisfied, provided that all other performance and/or ser-
vice conditions are satisfied. When the terms of an equity-settled award are modified, the minimum expense recognized
is the grant date fair value of the unmodified award, provided the original vesting terms of the award are met. An addi-
tional expense, measured as at the date of modification, is recognized for any modification that increases the total fair
value of the share-based payment transaction, or is otherwise beneficial to the employee. Where an award is cancelled
by the entity or by the counterparty, any remaining element of the fair value of the award is expensed immediately
through profit or loss. The dilutive effect of outstanding options is reflected as additional share dilution in the computa-
tion of diluted earnings per share.
xiv. Grants
Government grants, obtained against investments, are recognized in the income statement when the conditions for
recognition are met (i.e. when there is reasonable certainty of recognition) as deferred income, over the period required
to relate them to their respective costs.
When the grant relates to an asset, it is recognized as income in equal amounts over the expected useful life of the related
asset.
When the Group receives grants of non-monetary assets, the asset and the grant are recorded at nominal amounts and
released to income statement over the expected useful life of the asset, based on the pattern of consumption of the
benefits of the underlying asset by equal annual instalments.
xv. Revenue and income
In order to recognize and measure revenue so as to faithfully represent the process of transferring goods and services to
customers for an amount which reflects the expected consideration from the goods and services supplied, the Group
applies a model consisting of five essential stages, as envisaged by IFRS 15: to identify the contract with the customer
(stage 1); to identify the contractual obligations recognizing the goods or services which can be separated as separate
obligations (stage 2); to determine the transaction price, i.e. the expected consideration (stage 3); to allocate the trans-
action price to each obligation identified in the contract on the basis of the stand-alone sale price of each separable good
or service (stage 4); to recognize revenue when the related performance obligation is satisfied, i.e. upon transfer of the
good or service promised to the customer (stage 5). The transfer is considered completed when the customer obtains
control of the good or service, which can happen at a point in time. The Group has generally concluded that it is the
principal in its revenue arrangements, because it typically controls the goods or services before transferring them to the
customer.
In applying the aforementioned model, Ariston Group took into consideration the specific facts and circumstances mainly
arising from the regulations in place in the various jurisdictions where the Group companies operate. The most important
situations for the purposes of the consolidated financial statements refer mainly to the following revenue streams (stand-
ard categories for contractual terms and conditions (T&C) with customers, which describe the nature, amount, timing
and cash flows):
Revenue stream "Revenue stream" description % Revenues 12/2021
% Revenues 12/2020
Professional Customers are mainly installers, medium-large distribu-tors and professionals in the field of Thermal Comfort. Standard T&Cs apply and the main performance obliga-tion is characterized by the sale of finished products in-cluding variable considerations too. The Group acts as principal.
70% 68%
DIY (Do it yourself) 7% 7%
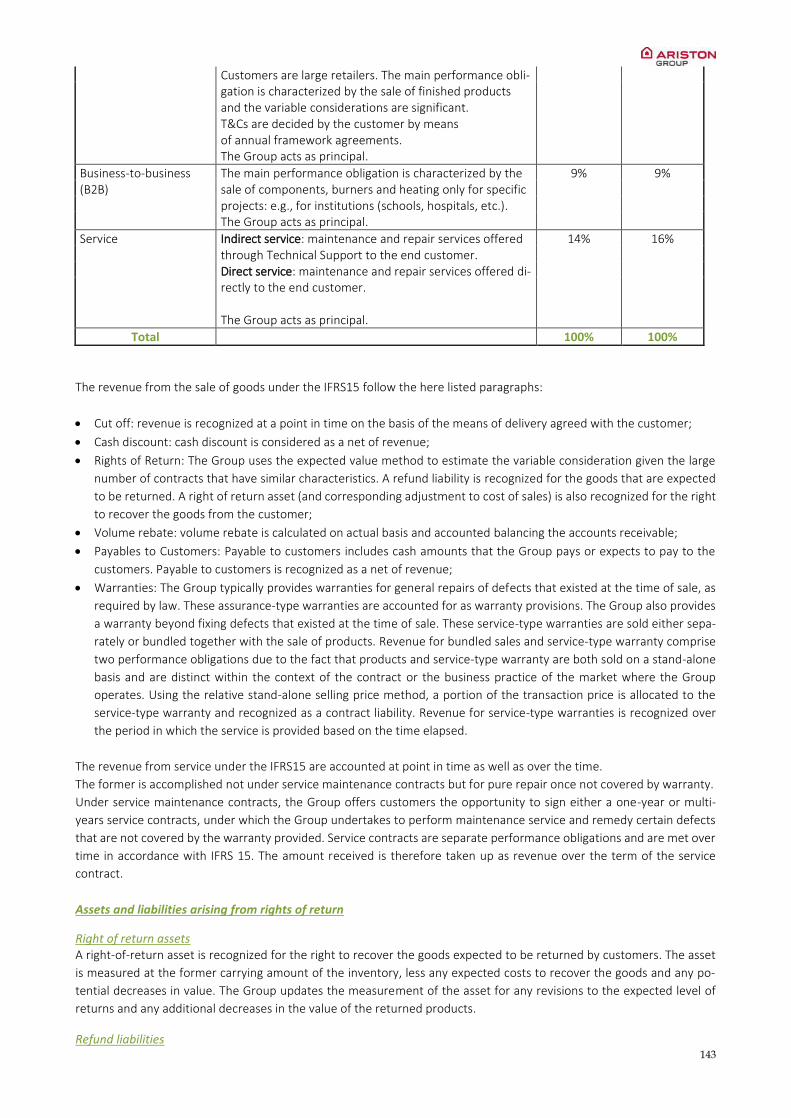
143
Customers are large retailers. The main performance obli-gation is characterized by the sale of finished products and the variable considerations are significant. T&Cs are decided by the customer by means of annual framework agreements. The Group acts as principal.
Business-to-business (B2B)
The main performance obligation is characterized by the sale of components, burners and heating only for specific projects: e.g., for institutions (schools, hospitals, etc.). The Group acts as principal.
9% 9%
Service Indirect service: maintenance and repair services offered through Technical Support to the end customer. Direct service: maintenance and repair services offered di-rectly to the end customer. The Group acts as principal.
14% 16%
Total 100% 100%
The revenue from the sale of goods under the IFRS15 follow the here listed paragraphs:
Cut off: revenue is recognized at a point in time on the basis of the means of delivery agreed with the customer;
Cash discount: cash discount is considered as a net of revenue;
Rights of Return: The Group uses the expected value method to estimate the variable consideration given the large
number of contracts that have similar characteristics. A refund liability is recognized for the goods that are expected
to be returned. A right of return asset (and corresponding adjustment to cost of sales) is also recognized for the right
to recover the goods from the customer;
Volume rebate: volume rebate is calculated on actual basis and accounted balancing the accounts receivable;
Payables to Customers: Payable to customers includes cash amounts that the Group pays or expects to pay to the
customers. Payable to customers is recognized as a net of revenue;
Warranties: The Group typically provides warranties for general repairs of defects that existed at the time of sale, as
required by law. These assurance-type warranties are accounted for as warranty provisions. The Group also provides
a warranty beyond fixing defects that existed at the time of sale. These service-type warranties are sold either sepa-
rately or bundled together with the sale of products. Revenue for bundled sales and service-type warranty comprise
two performance obligations due to the fact that products and service-type warranty are both sold on a stand-alone
basis and are distinct within the context of the contract or the business practice of the market where the Group
operates. Using the relative stand-alone selling price method, a portion of the transaction price is allocated to the
service-type warranty and recognized as a contract liability. Revenue for service-type warranties is recognized over
the period in which the service is provided based on the time elapsed.
The revenue from service under the IFRS15 are accounted at point in time as well as over the time.
The former is accomplished not under service maintenance contracts but for pure repair once not covered by warranty.
Under service maintenance contracts, the Group offers customers the opportunity to sign either a one-year or multi-
years service contracts, under which the Group undertakes to perform maintenance service and remedy certain defects
that are not covered by the warranty provided. Service contracts are separate performance obligations and are met over
time in accordance with IFRS 15. The amount received is therefore taken up as revenue over the term of the service
contract.
Assets and liabilities arising from rights of return
Right of return assets A right-of-return asset is recognized for the right to recover the goods expected to be returned by customers. The asset
is measured at the former carrying amount of the inventory, less any expected costs to recover the goods and any po-
tential decreases in value. The Group updates the measurement of the asset for any revisions to the expected level of
returns and any additional decreases in the value of the returned products.
Refund liabilities
144
A refund liability is recognized for the obligation to refund some or all of the consideration received (or receivable) from
a customer. The Group’s refund liabilities arise from customers’ right of return. The liability is measured at the amount
the Group ultimately expects it will have to return to the customer. The Group updates its estimates of refund liabilities
(and the corresponding change in the transaction price) at the end of each reporting period.
Regarding the use of significant assumptions to be referred to sub-paragraph Revenue recognition included in the para-
graph Significant assumptions.
xvi. Taxes
Current income tax
Current taxes are based on the taxable income for the year. The taxable income is different from the profit/loss recog-
nized in the income statement, since it excludes positive and negative items which are taxable or deductible in other
years and it also excludes items that will never be taxable or deductible.
Current income tax assets and liabilities are measured at the amount expected to be recovered from or paid to the taxa-
tion authorities. The tax rates and tax laws used to compute the amount are those that are enacted or substantively
enacted at the reporting date in the countries where the Group operates and generates taxable income.
Current income tax relating to items recognized directly in equity is recognized in equity and not in the income statement.
Management periodically evaluates positions taken in the tax returns with respect to situations in which applicable tax
regulations are subject to interpretation and establishes provisions where appropriate.
Deferred tax
Deferred taxes are those that the Group expects to settle or recover based on the temporary differences between the
carrying value of assets and liabilities and their corresponding tax values used for calculating taxable income. They are
recognized using the balance sheet liability method. Deferred tax liabilities are generally recognized for all taxable tem-
porary differences, whereas deferred tax assets are recognized only if it is probable that there will be future taxable
income against which deductible temporary differences can be used. Deferred tax assets and liabilities are not recog-
nized, if the temporary differences derive from goodwill or the initial recognition (not in business combinations) of other
assets or liabilities in transactions that do not affect the profit (loss) for the year or the taxable income.
In respect of taxable temporary differences associated with investments in subsidiaries, associates and interests in joint
arrangements, when the timing of the reversal of the temporary differences can be controlled and it is probable that the
temporary differences will not reverse in the foreseeable future.
The carrying value of deferred tax assets is reviewed at each reporting date and impaired, if it is no longer probable that
sufficient taxable income exists that can enable recovery of all or part of the assets.
In respect of deductible temporary differences associated with investments in subsidiaries, associates and interests in
joint arrangements, deferred tax assets are recognized only to the extent that it is probable that the temporary differ-
ences will reverse in the foreseeable future and taxable profit will be available against which the temporary differences
can be utilized.
Deferred taxes are calculated at the tax rate that is expected to be applied when the asset is realized or the liability
extinguished. Deferred taxes are recognized directly in the income statement, except for those related to items recog-
nized directly under equity, in which case the deferred taxes are also recognized under equity.
The Group offsets deferred tax assets and deferred tax liabilities if and only if it has a legally enforceable right to set off
current tax assets and current tax liabilities and the deferred tax assets and deferred tax liabilities relate to income taxes
levied by the same taxation authority on either the same taxable entity or different taxable entities which intend either
to settle current tax liabilities and assets on a net basis, or to realize the assets and settle the liabilities simultaneously, in
each future period in which significant amounts of deferred tax liabilities or assets are expected to be settled or recov-
ered.
xvii. Earnings per share
The basic earnings per share are calculated by dividing the portion of profit/loss attributable to the Group by the weighted
average of the outstanding shares of the year.

145
The diluted earnings per share are calculated keeping into account, both as regards the portion of profit/loss attributable
to the Group and the above mentioned weighted average, the impact deriving from the total subscription/conversion of
all potential shares that may be issued through the exercise of outstanding options.
xviii. Dividends
Dividends are recognised as changes in equity in the year when the Group’s unconditional right to receive payment arises,
that is when the shareholders’ meeting approves the distribution of dividends.
xix. Transactions in a foreign currency
Should a company in the Group have a monetary item to be received or to be paid in regard to another foreign subsidiary,
for which settlement is not planned nor is it likely that it may occur in the foreseeable future and is substantially part of
the entity’s net investment in this foreign operation, it is recognised in accordance with the provisions of IAS 21 (para-
graphs 32 and 33). This envisages the treatment of the related differences in exchange rates recognised under the items
of the statement of comprehensive income in the consolidated financial statements which include this foreign operation.
xx. Significant accounting judgements, estimates and assumptions
The preparation of the Group’s consolidated financial statements requires management to make judgements, estimates
and assumptions that affect the reported amounts of revenues, expenses, assets and liabilities, and the accompanying
disclosures, and the disclosure of contingent liabilities. Uncertainty about these assumptions and estimates could result
in outcomes that require a material adjustment to the carrying amount of assets or liabilities affected in future periods.
Judgements
Determining the lease term of contracts with renewal and termination options
The Group determines the lease term as the non-cancellable term of the lease, together with any periods covered by an
option to extend the lease if it is reasonably certain to be exercised, or any periods covered by an option to terminate
the lease, if it is reasonably certain not to be exercised. The Group has several lease contracts that include extension and
termination options. The Group applies judgement in evaluating whether it is reasonably certain whether or not to exer-
cise the option to renew or terminate the lease. That is, it considers all relevant factors that create an economic incentive
for it to exercise either the renewal or termination. After the commencement date, the Group reassesses the lease term
if there is a significant event or change in circumstances that is within its control and affects its ability to exercise or not
to exercise the option to renew or to terminate. The Group included the renewal period as part of the lease term for
leases of plant and machinery with shorter non-cancellable period. Furthermore, the periods covered by termination
options are included as part of the lease term only when they are reasonably certain not to be exercised.
Estimates and assumptions
The key assumptions concerning the future and other key sources of estimation uncertainty at the reporting date, that
have a significant risk of causing a material adjustment to the carrying amounts of assets and liabilities within the next
financial year, are described below. The Group based its assumptions and estimates on parameters available when the
consolidated financial statements were prepared. Existing circumstances and assumptions about future developments,
however, may change due to market changes or circumstances arising that are beyond the control of the Group. Such
changes are reflected in the assumptions when they occur.
Impairment of non-financial assets
When the carrying amount of property, plant and equipment, investment property, intangible assets, right-of-use assets,
goodwill and investments in associates/joint ventures exceeds its recoverable amount, which is the higher of the fair
value less costs to sell and the value in use, the assets are impaired. Such impairments are carried out in accordance with
the provisions of IAS 36, as described in greater detail in note 2.1. In order to determine the recoverable amount, the

146
Group generally adopts the value in use criterion. Value in use is based on the estimated future cash flows generated by
the asset, discounted to their present value using a pre-tax discount rate that reflects the current market assessment of
the time value of money and of the specific risks of the asset. Future cash flows used to determine value in use are based
on the most recent business plan, approved by the management, containing forecasts for volumes, revenue, operating
costs. These projections cover the next three years. For subsequent years, the assumption is the perpetual income. Nev-
ertheless, possible changes in the underlying assumptions on which the calculation of such amounts is based could gen-
erate different recoverable amounts. The analysis of each group of non-financial assets is unique and requires manage-
ment to use estimates and assumptions considered prudent and reasonable in the specific circumstances.
Provision for expected credit losses of trade receivables and contract assets
The Group uses a provision matrix to calculate ECLs for trade receivables and contract assets. The provision rates are
based on days past due for groupings of various customer segments that have similar loss patterns (i.e., by geography,
product type, customer type and rating, and coverage by letters of credit and other forms of credit insurance). The pro-
vision matrix is initially based on the Group’s historical observed default rates. The Group will calibrate the matrix to
adjust the historical credit loss experience with forward-looking information. For instance, if forecast economic conditions
are expected to deteriorate over the next year which can lead to an increased number of defaults in the manufacturing
sector, the historical default rates are adjusted. At every reporting date, the historical observed default rates are updated
and changes in the forward-looking estimates are analysed. The assessment of the correlation between historical ob-
served default rates, forecast economic conditions and ECLs is a significant estimate. The amount of ECLs is sensitive to
changes in circumstances and of forecast economic conditions. The Group’s historical credit loss experience and forecast
of economic conditions may also not be representative of customer’s actual default in the future. The information about
the ECLs on the Group’s trade receivables and contract assets is disclosed in “Other information”.
Taxes
Income taxes include all taxes based upon the taxable profits of the Group. Taxes on income are recognized in profit or
loss except to the extent they relate to items recognized directly in equity or in other comprehensive income, in which
case the related tax effects are recognized directly in equity or in other comprehensive income. Deferred taxes are cal-
culated on temporary differences be-tween the tax base of an asset or liability and the carrying amounts in the Consoli-
dated Financial Statements, Deferred tax assets relating to the carry-forward of unused tax losses are recognized to the
extent it is probable future profits will be available against which they can be utilized. Current and deferred income tax
assets and liabilities are offset when the income taxes are levied by the same taxation authority and where there is a
legally enforceable right of offset. Deferred tax assets and liabilities are measured at the enacted or substantively enacted
tax rates of the relevant tax jurisdictions that are expected to apply to taxable income during the period or periods in
which the temporary differences reverse. Other taxes not based on taxable profits, such as property taxes and taxes on
capital, are included in operating expenses.
Defined benefit plans (pension benefits)
The cost of the defined benefit pension plan and other post-employment medical benefits and the present value of the
pension obligation are determined using actuarial valuations. An actuarial valuation involves making various assumptions
that may differ from actual developments in the future. These include the determination of the discount rate, future
salary increases, mortality rates and future pension increases. Due to the complexities involved in the valuation and its
long-term nature, a defined benefit obligation is highly sensitive to changes in these assumptions. All assumptions are
reviewed at each reporting date. The parameter most subject to change is the discount rate. In determining the appro-
priate discount rate, management considers the interest rates of corporate bonds in currencies consistent with the cur-
rencies of the post-employment benefit obligation with at least an ‘AA’ rating or above, as set by an internationally
acknowledged rating agency, and extrapolated as needed along the yield curve to correspond with the expected term of
the defined benefit obligation. The underlying bonds are further reviewed for quality. Those having excessive credit
spreads are excluded from the analysis of bonds on which the discount rate is based, on the basis that they do not rep-
resent high quality corporate bonds. The mortality rate is based on publicly available mortality tables for the specific
147
countries. Those mortality tables tend to change only at intervals in response to demographic changes. Future salary
increases and pension increases are based on expected future inflation rates for the respective countries.
Fair value measurement of financial instruments
When the fair values of financial assets and financial liabilities recorded in the statement of financial position cannot be
measured based on quoted prices in active markets, their fair value is measured using valuation techniques including the
discounted cash flow (DCF) model. The inputs to these models are taken from observable markets where possible, but
where this is not feasible, a degree of judgement is required in establishing fair values. Judgements include considerations
of inputs such as liquidity risk, credit risk and volatility. Changes in assumptions relating to these factors could affect the
reported fair value of financial instruments. Contingent consideration, resulting from business combinations, is valued at
fair value at the acquisition date as part of the business combination. When the contingent consideration meets the
definition of a financial liability, it is subsequently remeasured to fair value at each reporting date. The determination of
the fair value is based on discounted cash flows. The key assumptions take into consideration the probability of meeting
each performance target and the discount factor.
Development costs
The Group capitalises costs for product development projects. Initial capitalisation of costs is based on management’s
judgement that technological and economic feasibility is confirmed, usually when a product development project has
reached a defined milestone according to an established project management model. In determining the amounts to be
capitalised, management makes assumptions regarding the expected future cash generation of the project, discount
rates to be applied and the expected period of benefits.
Revenue recognition - Estimating variable consideration for returns and volume rebates
The Group estimates variable considerations to be included in the transaction price for the sale of goods with rights of
return and volume rebates.
The Group has developed a statistical model for forecasting sales returns. The model uses the historical return data of
each product to come up with expected return percentages. These percentages are applied to determine the expected
value of the variable consideration. Any significant changes in experience as compared to historical return pattern will
impact the expected return percentages estimated by the Group.
The Group’s expected volume rebates are analysed on a per customer basis for contracts that are subject to a single
volume threshold. Determining whether a customer will be likely entitled to rebate will depend on the customer’s histor-
ical rebates entitlement and accumulated purchases to date.
The Group applied the statistical model for estimating expected volume rebates for contracts. The model uses the his-
torical purchasing patterns and rebates entitlement of customers to determine the expected rebate percentages and the
expected value of the variable consideration. Any significant changes in experience as compared to historical purchasing
patterns and rebate entitlements of customers will impact the expected rebate percentages estimated by the Group.
Leases - Estimating the incremental borrowing rate
The Incremental Borrowing Rate (IBR) is defined as the interest rate the lessee would incur to borrow under a secured
loan with terms similar to those of the lease, with a similar security and in a similar economic environment. Such interest
rate is identified through the Bloomberg database by applying the following relevant criteria to enhance the comparabil-
ity:
The credit rating;
The term of the loan;
The currency of denomination;
The geographies (depending on the cases, countries or regions);
The industry of the borrowing entity.
In order to obtain statistically significant samples of comparable transactions, a flexibility in the above criteria shall be
preserved and specific adjustments can be made to account for particular comparability factors. When the base rate is
negative, a zero floor to the base rate is applied.

148
For more information on leases, please see note 2.2 and 3.5.
Climate change In preparing the Consolidated Financial Statements the Group has considered the impact of climate change as requested
by ESMA in its ECEP published in October 2021. Ariston Group pursues the definition of paradigms related to energy
efficiency and to minimizing the environmental footprints. The Group is constantly evolving in order to be a forerunner
about the negative environmental impacts.
In the Consolidated Financial Statements, the Group does not have a material climate change impacts given that the
Group has embraced a day by day handling dedicated to technological progress.
In applying the Accounting Standards, the Group has considered the impacts arising from climate change. In particular,
the Group, in performing the impairment activities of non-financial assets, has considered the economic and financial
impacts resulting from the actions carried out by the Group in order to be in compliance with climate changes regulations.
In performing the analysis on Inventory, the Group has considered for materials and products in stock the technological
obsolescence which can arise from climate changes.
5. Changes in accounting standards
The accounting policies adopted in the preparation of the consolidated financial statements as of December 2021 are
consistent with those followed in the preparation of the Group’s annual consolidated financial statements for the year
ended 31 December 2020, except for the adoption of new standards effective as of 1 January 2021. The Group has not
early adopted any standard, interpretation or amendment that has been issued but is not yet effective.
Several amendments apply for the first time in 2021, but do not have an impact on the consolidated financial statements
of the Group.
i. Summary of the new accounting standards adopted by the Group from 1 January 2021
As from January 1, 2021 the following amendments of accounting standards have become applicable to the Group:
“Amendment to IFRS 16: Covid 19-related rent concessions”, issued on May 28, 2020 in order to permit lessees to not
account for rent concessions (rent payment holidays, deferral of lease payments, reductions in rent for a period of
time, possibly followed by rent increases in future periods) as lease modifications if they are a direct consequence of
the Covid-19 pandemic and meet certain conditions. According to IFRS 16, a lease modification is a change in the
scope of a lease, or the consideration for a lease, that was not part of the original terms and conditions of the lease.
Accordingly, rent concessions would represent lease modifications unless they were provided for in the original lease
agreement. The amendment applies only to lessees, while lessors are required to apply the current provisions of IFRS
16. The amendments did not have a material impact on the Group.
“Amendments to IFRS 9, IAS 39, IFRS 7 and IFRS 16 – Interest Rate Benchmark Reform - Phase 2”, issued in August
2020. The amendments supplement those issued in 2019 (Interest Rate Benchmark Reform - Phase 1) and address
issues that could affect financial reporting after a benchmark has been reformed or replaced with an alternative
benchmark rate. The objectives of the Phase 2 amendments are to assist companies: (i) in applying the IFRSs when
changes occur in contractual cash flows or hedging relationships due to the reform of the benchmarks for determining
interest rates; and (ii) in providing information to users of financial statements. In addition, when the Phase 1 exemp-
tions cease to apply, companies are required to amend the documentation of hedging relationship to reflect the
changes required under the IBOR reform by the end of the year in which the changes are made (such changes do not
constitute the discontinuation of the hedging relationship). When the description of a hedged element in the docu-
mentation of the hedging relationship is changed, the amounts accumulated in the hedging reserve shall be consid-
ered to be based on the alternative benchmark rate on the basis of which the future hedged cash flows will be deter-
mined.
The amendments provide temporary reliefs which address the financial reporting effects when an interbank offered
rate (IBOR) is replaced with an alternative nearly risk-free interest rate (RFR).
The amendments include the following practical expedients:
149
- A practical expedient to require contractual changes, or changes to cash flows that are directly required by the
reform, to be treated as changes to a floating interest rate, equivalent to a movement in a market rate of interest
- Permit changes required by IBOR reform to be made to hedge designations and hedge documentation without
the hedging relationship being discontinued
- Provide temporary relief to entities from having to meet the separately identifiable requirement when an RFR
instrument is designated as a hedge of a risk component.
The amendments did not have a material impact on the Group.
ii. Accounting standards, amendments and interpretations issued but not yet effective The new and amended standards and interpretations that are issued, but not yet effective, up to the date of issuance of
the Group’s financial statements are disclosed below. The Group intends to adopt these new and amended standards
and interpretations, if applicable, when they become effective.
Amendments to IAS 1: Classification of Liabilities as Current or Non-current
The IASB issued amendments to paragraphs 69 to 76 of IAS 1 to specify the requirements for classifying liabilities as
current or non-current by clarifying:
What is meant by a right to defer settlement
That a right to defer must exist at the end of the reporting period
That classification is unaffected by the likelihood that an entity will exercise its deferral right
That only if an embedded derivative in a convertible liability is itself an equity instrument would the terms of a liability not impact its classification
These amendments are effective on or after January 1, 2023. The amendments are not expected to have a material
impact on the Group.
Reference to the Conceptual Framework – Amendments to IFRS 3
In May 2020 the IASB issued amendments to IFRS 3 – Business combinations to update a reference in IFRS 3 to the
Conceptual Framework for Financial Reporting without changing the accounting requirements for business combinations.
These amendments are effective on or after January 1, 2022. The amendments are not expected to have a material
impact on the Group.
Property, Plant and Equipment: Proceeds before Intended Use – Amendments to IAS 16
In May 2020 the IASB issued amendments to IAS 16 - Property, Plant and Equipment. The amendments prohibit a com-
pany from deducting from the cost of property, plant and equipment amounts received from selling items produced while
the company is preparing the asset for its intended use. Instead, a company should recognize such sales proceeds and
the related cost in the income statement.
These amendments are effective on or after January 1, 2022. The amendments are not expected to have a material
impact on the Group.
IFRS 9 Financial Instruments – Fees in the ’10 per cent’ test for derecognition of financial liabilities
As part of its 2018-2020 annual improvements to IFRS standards process the IASB issued amendment to IFRS 9. The
amendment clarifies the fees that an entity includes when assessing whether the terms of a new or modified financial
liability are substantially different from the terms of the original financial liability. These fees include only those paid or
received between the borrower and the lender, including fees paid or received by either the borrower or lender on the
other’s behalf. An entity applies the amendment to financial liabilities that are modified or exchanged on or after the
beginning of the annual reporting period in which the entity first applies the amendment.
The amendment is effective for annual reporting periods beginning on or after 1 January 2022 with earlier adoption
permitted. The Group will apply the amendments to financial liabilities that are modified or exchanged on or after the
beginning of the annual reporting period in which the entity first applies the amendment. The amendments are not ex-
pected to have a material impact on the Group.
Onerous Contracts – Costs of Fulfilling a Contract – Amendments to IAS 37
In May 2020 the IASB issued amendments to IAS 37 - Provisions, Contingent Liabilities and Contingent Assets, which
specify which costs a company includes when assessing whether a contract will be loss-making.
150
These amendments are effective on or after January 1, 2022. The amendments are not expected to have a material
impact on the Group.
IFRS 1 First-time Adoption of International Financial Reporting Standards – Subsidiary as a first-time adopter
As part of its 2018-2020 annual improvements to IFRS standards process, the IASB issued an amendment to IFRS 1 First-
time Adoption of International Financial Reporting Standards. The amendment permits a subsidiary that elects to apply
paragraph D16(a) of IFRS 1 to measure cumulative translation differences using the amounts reported by the parent,
based on the parent’s date of transition to IFRS. This amendment is also applied to an associate or joint venture that
elects to apply paragraph D16(a) of IFRS 1.
The amendment is effective for annual reporting periods beginning on or after 1 January 2022 with earlier adoption
permitted.
IAS 41 Agriculture – Taxation in fair value measurements
The amendment removes the requirement to exclude taxation cash flows when measuring the fair value of assets falling
within the scope of IAS 41.
The first application of this amendment is scheduled for 1 January 2022. This accounting standard does not apply to the
Group.
Disclosure of Accounting Policies - Amendments to IAS 1 and IFRS Practice Statement 2
In February 2021 the IASB issued amendments to IAS 1 – Presentation of Financial Statements and IFRS Practice State-
ment 2: Disclosure of Accounting policies which require companies to disclose their material accounting policy infor-
mation rather than their significant accounting policies and provide guidance on how to apply the concept of materiality
to accounting policy disclosures.
These amendments are effective on or after January 1, 2023. The amendments are not expected to have a material
impact on the Group.
Definition of Accounting Estimates - Amendments to IAS 8
In February 2021 the IASB issued amendments to IAS 8 - Accounting Policies, Changes in Accounting Estimates and Errors:
Definition of Accounting Estimates which clarify how companies should distinguish changes in accounting policies from
changes in accounting estimates.
These amendments are effective on or after January 1, 2023. The amendments are not expected to have a material
impact on the Group.
IFRS 17 - Insurance Contracts
In May 2017 the IASB issued IFRS 17 – Insurance Contracts, which establishes principles for the recognition, measure-
ment, presentation and disclosure of insurance contracts issued as well as guidance relating to reinsurance contracts held
and investment contracts with discretionary participation features issued. In June 2020 the IASB issued amendments to
IFRS 17 aimed at helping companies implement IFRS 17 and make it easier for companies to explain their financial per-
formance.
The new standard and amendments are effective on or after January 1, 2023. This accounting standard does not apply
to the Group.
6. Disclosure to the Financial Statements
During the year ending 31 December 2021 certain reclassifications on consolidated accounts were recorded for a better
representation of the business transactions within the nature accounts lines and therefore the comparative Financial
Statements.
6.1 Income statement
Note 1.1 – revenue and income
During 2021, the Group recorded revenue of € 1,987.3 million, compared to € 1,664.0 million in the previous year, with
an increase of € 323.4 million (+19.4%).
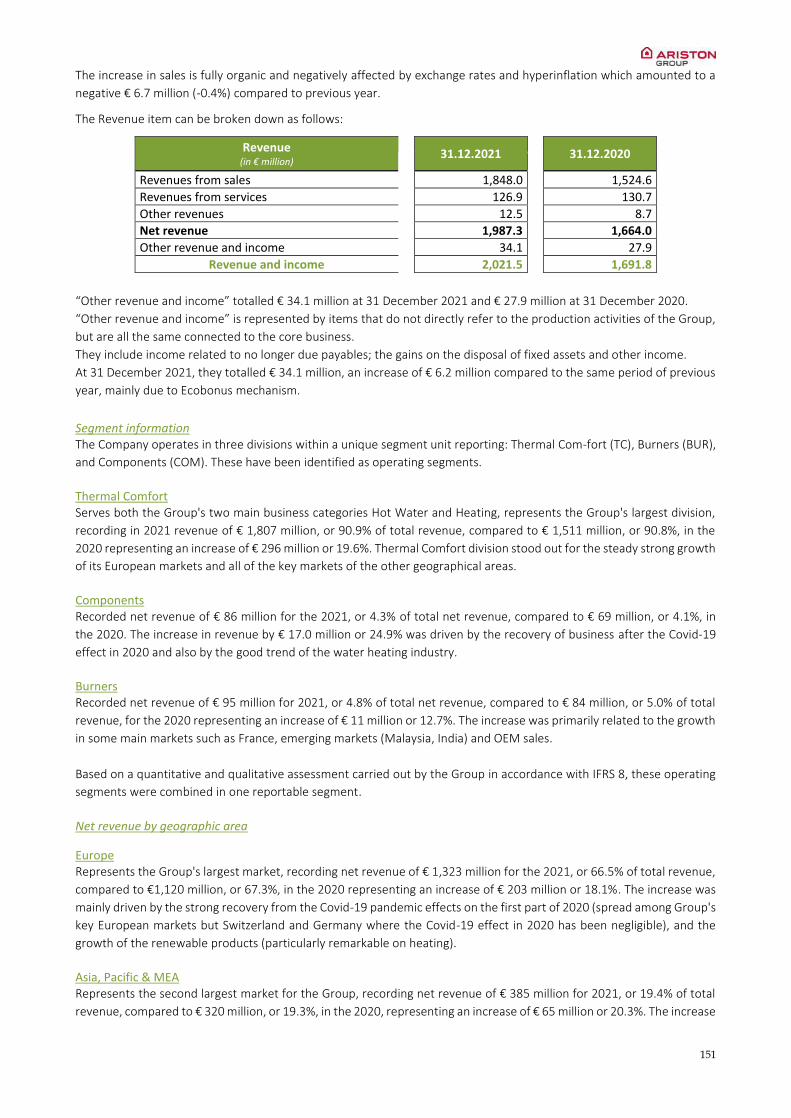
151
The increase in sales is fully organic and negatively affected by exchange rates and hyperinflation which amounted to a
negative € 6.7 million (-0.4%) compared to previous year.
The Revenue item can be broken down as follows:
Revenue (in € million)
31.12.2021
31.12.2020
Revenues from sales 1,848.0 1,524.6
Revenues from services 126.9 130.7
Other revenues 12.5 8.7
Net revenue 1,987.3 1,664.0
Other revenue and income 34.1 27.9
Revenue and income 2,021.5 1,691.8
“Other revenue and income” totalled € 34.1 million at 31 December 2021 and € 27.9 million at 31 December 2020.
“Other revenue and income” is represented by items that do not directly refer to the production activities of the Group,
but are all the same connected to the core business.
They include income related to no longer due payables; the gains on the disposal of fixed assets and other income.
At 31 December 2021, they totalled € 34.1 million, an increase of € 6.2 million compared to the same period of previous
year, mainly due to Ecobonus mechanism.
Segment information The Company operates in three divisions within a unique segment unit reporting: Thermal Com-fort (TC), Burners (BUR),
and Components (COM). These have been identified as operating segments.
Thermal Comfort Serves both the Group's two main business categories Hot Water and Heating, represents the Group's largest division,
recording in 2021 revenue of € 1,807 million, or 90.9% of total revenue, compared to € 1,511 million, or 90.8%, in the
2020 representing an increase of € 296 million or 19.6%. Thermal Comfort division stood out for the steady strong growth
of its European markets and all of the key markets of the other geographical areas.
Components Recorded net revenue of € 86 million for the 2021, or 4.3% of total net revenue, compared to € 69 million, or 4.1%, in
the 2020. The increase in revenue by € 17.0 million or 24.9% was driven by the recovery of business after the Covid-19
effect in 2020 and also by the good trend of the water heating industry.
Burners Recorded net revenue of € 95 million for 2021, or 4.8% of total net revenue, compared to € 84 million, or 5.0% of total
revenue, for the 2020 representing an increase of € 11 million or 12.7%. The increase was primarily related to the growth
in some main markets such as France, emerging markets (Malaysia, India) and OEM sales.
Based on a quantitative and qualitative assessment carried out by the Group in accordance with IFRS 8, these operating
segments were combined in one reportable segment.
Net revenue by geographic area
Europe Represents the Group's largest market, recording net revenue of € 1,323 million for the 2021, or 66.5% of total revenue,
compared to €1,120 million, or 67.3%, in the 2020 representing an increase of € 203 million or 18.1%. The increase was
mainly driven by the strong recovery from the Covid-19 pandemic effects on the first part of 2020 (spread among Group's
key European markets but Switzerland and Germany where the Covid-19 effect in 2020 has been negligible), and the
growth of the renewable products (particularly remarkable on heating).
Asia, Pacific & MEA Represents the second largest market for the Group, recording net revenue of € 385 million for 2021, or 19.4% of total
revenue, compared to € 320 million, or 19.3%, in the 2020, representing an increase of € 65 million or 20.3%. The increase
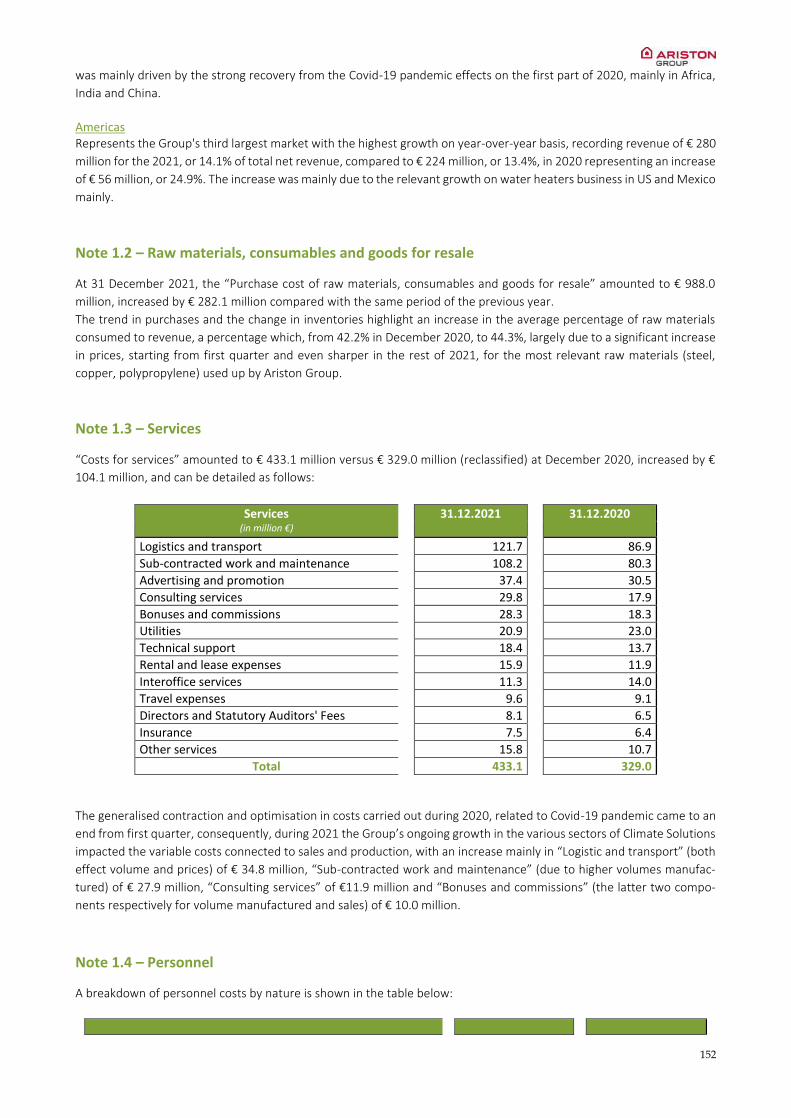
152
was mainly driven by the strong recovery from the Covid-19 pandemic effects on the first part of 2020, mainly in Africa,
India and China.
Americas Represents the Group's third largest market with the highest growth on year-over-year basis, recording revenue of € 280
million for the 2021, or 14.1% of total net revenue, compared to € 224 million, or 13.4%, in 2020 representing an increase
of € 56 million, or 24.9%. The increase was mainly due to the relevant growth on water heaters business in US and Mexico
mainly.
Note 1.2 – Raw materials, consumables and goods for resale
At 31 December 2021, the “Purchase cost of raw materials, consumables and goods for resale” amounted to € 988.0
million, increased by € 282.1 million compared with the same period of the previous year.
The trend in purchases and the change in inventories highlight an increase in the average percentage of raw materials
consumed to revenue, a percentage which, from 42.2% in December 2020, to 44.3%, largely due to a significant increase
in prices, starting from first quarter and even sharper in the rest of 2021, for the most relevant raw materials (steel,
copper, polypropylene) used up by Ariston Group.
Note 1.3 – Services
“Costs for services” amounted to € 433.1 million versus € 329.0 million (reclassified) at December 2020, increased by €
104.1 million, and can be detailed as follows:
Services (in million €)
31.12.2021
31.12.2020
Logistics and transport 121.7 86.9
Sub-contracted work and maintenance 108.2 80.3
Advertising and promotion 37.4 30.5
Consulting services 29.8 17.9
Bonuses and commissions 28.3 18.3
Utilities 20.9 23.0
Technical support 18.4 13.7
Rental and lease expenses 15.9 11.9
Interoffice services 11.3 14.0
Travel expenses 9.6 9.1
Directors and Statutory Auditors' Fees 8.1 6.5
Insurance 7.5 6.4
Other services 15.8 10.7
Total
433.1 329.0
The generalised contraction and optimisation in costs carried out during 2020, related to Covid-19 pandemic came to an
end from first quarter, consequently, during 2021 the Group’s ongoing growth in the various sectors of Climate Solutions
impacted the variable costs connected to sales and production, with an increase mainly in “Logistic and transport” (both
effect volume and prices) of € 34.8 million, “Sub-contracted work and maintenance” (due to higher volumes manufac-
tured) of € 27.9 million, “Consulting services” of €11.9 million and “Bonuses and commissions” (the latter two compo-
nents respectively for volume manufactured and sales) of € 10.0 million.
Note 1.4 – Personnel
A breakdown of personnel costs by nature is shown in the table below:
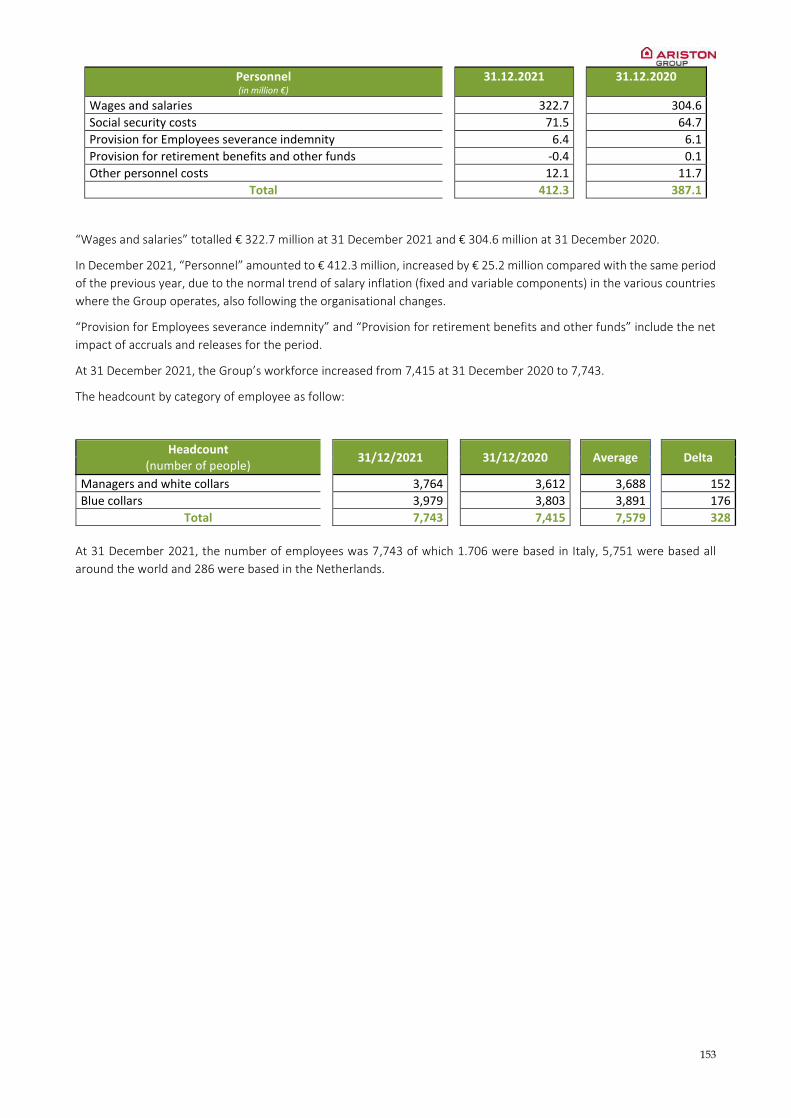
153
Personnel (in million €)
31.12.2021
31.12.2020
Wages and salaries
322.7 304.6
Social security costs 71.5 64.7
Provision for Employees severance indemnity 6.4 6.1
Provision for retirement benefits and other funds -0.4 0.1
Other personnel costs 12.1 11.7
Total
412.3 387.1
“Wages and salaries” totalled € 322.7 million at 31 December 2021 and € 304.6 million at 31 December 2020.
In December 2021, “Personnel” amounted to € 412.3 million, increased by € 25.2 million compared with the same period
of the previous year, due to the normal trend of salary inflation (fixed and variable components) in the various countries
where the Group operates, also following the organisational changes.
“Provision for Employees severance indemnity” and “Provision for retirement benefits and other funds” include the net
impact of accruals and releases for the period.
At 31 December 2021, the Group’s workforce increased from 7,415 at 31 December 2020 to 7,743.
The headcount by category of employee as follow:
Headcount (number of people)
31/12/2021
31/12/2020
Average
Delta
Managers and white collars 3,764 3,612 3,688 152
Blue collars 3,979 3,803 3,891 176
Total 7,743 7,415 7,579 328
At 31 December 2021, the number of employees was 7,743 of which 1.706 were based in Italy, 5,751 were based all
around the world and 286 were based in the Netherlands.
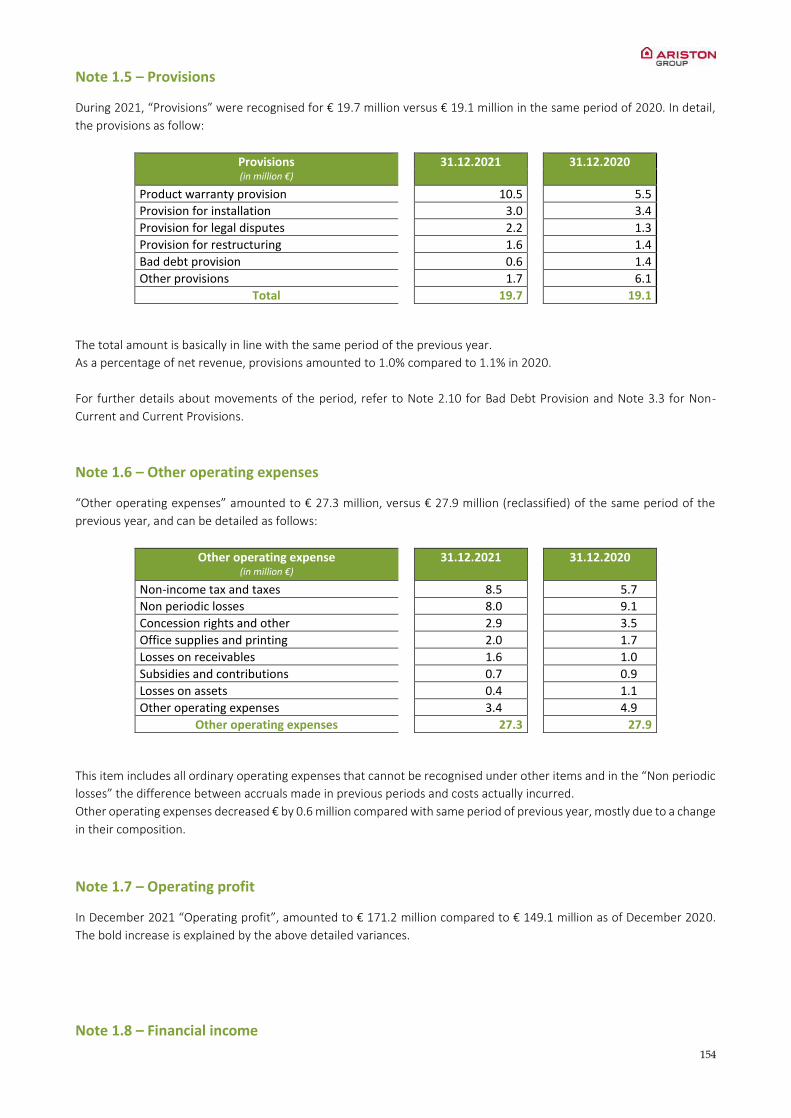
154
Note 1.5 – Provisions
During 2021, “Provisions” were recognised for € 19.7 million versus € 19.1 million in the same period of 2020. In detail,
the provisions as follow:
Provisions (in million €)
31.12.2021
31.12.2020
Product warranty provision
10.5 5.5
Provision for installation 3.0 3.4
Provision for legal disputes 2.2 1.3
Provision for restructuring 1.6 1.4
Bad debt provision 0.6 1.4
Other provisions 1.7 6.1
Total
19.7 19.1
The total amount is basically in line with the same period of the previous year.
As a percentage of net revenue, provisions amounted to 1.0% compared to 1.1% in 2020.
For further details about movements of the period, refer to Note 2.10 for Bad Debt Provision and Note 3.3 for Non-
Current and Current Provisions.
Note 1.6 – Other operating expenses
“Other operating expenses” amounted to € 27.3 million, versus € 27.9 million (reclassified) of the same period of the
previous year, and can be detailed as follows:
Other operating expense (in million €)
31.12.2021
31.12.2020
Non-income tax and taxes
8.5 5.7
Non periodic losses 8.0 9.1
Concession rights and other 2.9 3.5
Office supplies and printing 2.0 1.7
Losses on receivables 1.6 1.0
Subsidies and contributions 0.7 0.9
Losses on assets 0.4 1.1
Other operating expenses 3.4 4.9
Other operating expenses
27.3 27.9
This item includes all ordinary operating expenses that cannot be recognised under other items and in the “Non periodic
losses” the difference between accruals made in previous periods and costs actually incurred.
Other operating expenses decreased € by 0.6 million compared with same period of previous year, mostly due to a change
in their composition.
Note 1.7 – Operating profit
In December 2021 “Operating profit”, amounted to € 171.2 million compared to € 149.1 million as of December 2020.
The bold increase is explained by the above detailed variances.
Note 1.8 – Financial income
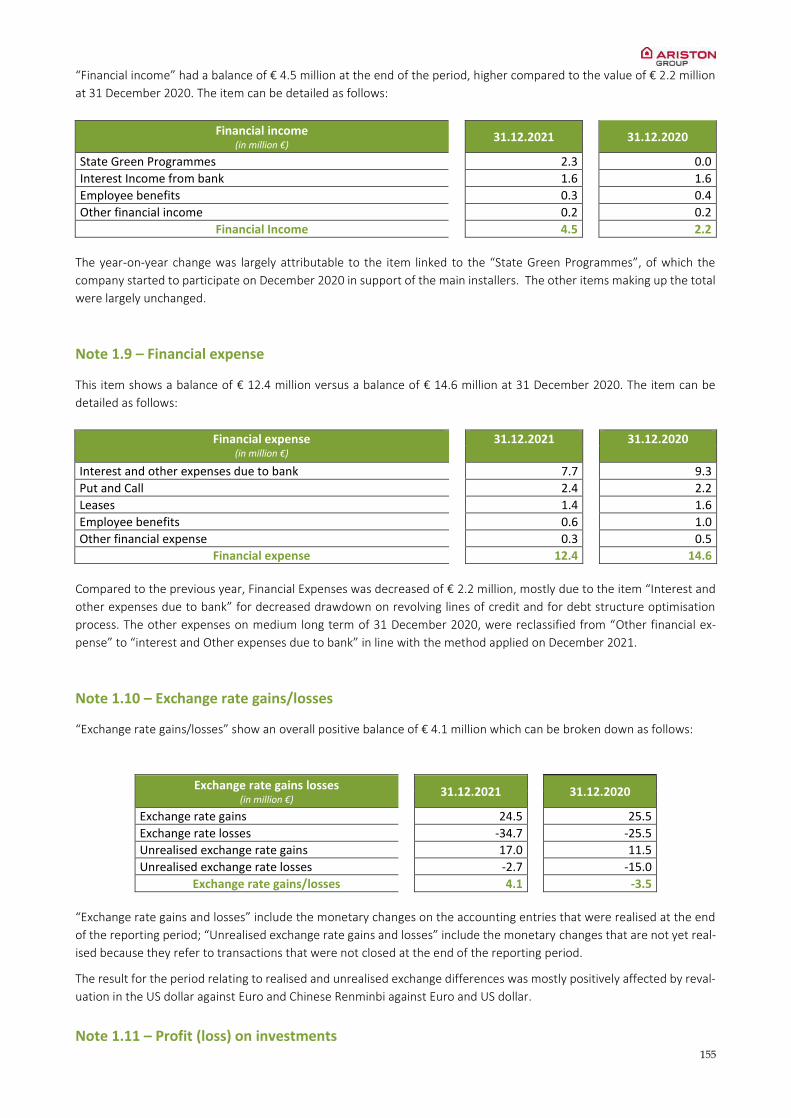
155
“Financial income” had a balance of € 4.5 million at the end of the period, higher compared to the value of € 2.2 million
at 31 December 2020. The item can be detailed as follows:
Financial income (in million €)
31.12.2021
31.12.2020
State Green Programmes 2.3 0.0
Interest Income from bank 1.6 1.6
Employee benefits 0.3 0.4
Other financial income 0.2 0.2
Financial Income 4.5 2.2
The year-on-year change was largely attributable to the item linked to the “State Green Programmes”, of which the
company started to participate on December 2020 in support of the main installers. The other items making up the total
were largely unchanged.
Note 1.9 – Financial expense
This item shows a balance of € 12.4 million versus a balance of € 14.6 million at 31 December 2020. The item can be
detailed as follows:
Financial expense (in million €)
31.12.2021
31.12.2020
Interest and other expenses due to bank 7.7 9.3
Put and Call 2.4 2.2
Leases 1.4 1.6
Employee benefits 0.6 1.0
Other financial expense 0.3 0.5
Financial expense 12.4 14.6
Compared to the previous year, Financial Expenses was decreased of € 2.2 million, mostly due to the item “Interest and
other expenses due to bank” for decreased drawdown on revolving lines of credit and for debt structure optimisation
process. The other expenses on medium long term of 31 December 2020, were reclassified from “Other financial ex-
pense” to “interest and Other expenses due to bank” in line with the method applied on December 2021.
Note 1.10 – Exchange rate gains/losses
“Exchange rate gains/losses” show an overall positive balance of € 4.1 million which can be broken down as follows:
Exchange rate gains losses (in million €)
31.12.2021
31.12.2020
Exchange rate gains 24.5 25.5
Exchange rate losses -34.7 -25.5
Unrealised exchange rate gains 17.0 11.5
Unrealised exchange rate losses -2.7 -15.0
Exchange rate gains/losses 4.1 -3.5
“Exchange rate gains and losses” include the monetary changes on the accounting entries that were realised at the end
of the reporting period; “Unrealised exchange rate gains and losses” include the monetary changes that are not yet real-
ised because they refer to transactions that were not closed at the end of the reporting period.
The result for the period relating to realised and unrealised exchange differences was mostly positively affected by reval-
uation in the US dollar against Euro and Chinese Renminbi against Euro and US dollar.
Note 1.11 – Profit (loss) on investments

156
The item “Profit (loss) on investments” was negative for € 1.9 million, up by € 0.6 million compared with the previous
year, mainly due to the remeasuring of the value of obligations relating to put and call options connected to acquisitions,
with the recognition in the income statement of any valuation differences.
Note 1.12 – Taxes
Income tax expense (benefit) and the related profit before tax for the years ended December 31, 2021 and 2020 consisted
of the following:
Taxes (in million €)
2021
2020
Delta
Profit before taxes 165.3 131.9 33.4
Current taxes 54.7 39.5 15.2
Deferred taxes -25.6 -4.2 -21.4
Total taxes 29.1 35.2 -6.1
The increase of € 15.2 million in current taxes is due to the 3% substitute tax due to the revaluation of tangible and
intangible assets carried out in Italy for statutory and tax purposes pursuant to art. 110 of the Law Decree n. 104/2020,
converted in the Law n. 126/2020 equal to € 19.4 million.
The increase of € 21.4 million in deferred tax assets is due to the revaluation of tangible and intangible assets carried out
in Italy for statutory and tax purposes pursuant to art. 110 of Law Decree n. 104/2020, converted in the Law n. 126/2020
and not recognized in the IFRS financial statement. The revaluation and its related tax effects mainly deriving from the
change of the dividends policy had a net impact on deferred taxes equal to € 29.2 million for the entire financial year.
Ariston N.V. is incorporated in the Netherlands but is a tax resident of Italy. The reconciliation of the differences between
the theoretical income taxes at the parent statutory rate and the total income taxes is presented based on the Italian
statutory corporation income tax rate in force in 2021 of 24%. A reconciliation of Ariston’s income tax expense for the
years ended December 31, 2021 is as follows:
Effective tax rate reconciliation (in million €)
2021 %
Taxes at nominal Tax Rate 39.7 24.0%
Revaluation effect -14.5 -8.8%
IRAP 5.0 3.0%
Tax benefits recorded in Italy -2.0 -1.2%
Foreign income taxed at different rates -1.8 -1.1%
Net Deferred taxes not recognized on losses 1.4 0.8%
Other 1.4 0.9%
Effective Taxes 29.1 17.6%
The 2021 effective tax rate is mainly driven by the positive impact of the revaluation of tangible and intangible assets
carried out in Italy based on Decree no. 104/2020.
Basic and diluted earnings per share
Basic earnings per share at 31 December 2021 amounted to € 0.47 and are calculated by dividing the net profit for the
year attributable to the ordinary shareholders of the Parent Company, of € 136.5 million, by the number of total shares
– ordinary and multiple voting – outstanding during the period, that is 293,140,243.8.
As required by the paragraphs 26 and 64 of IAS 33, during this year the number of ordinary shares outstanding increased
as a result of a reorganization of the Group’s corporate structure and the calculation of basic and diluted earnings per
share for December 2020 had been adjusted retrospectively, based on the new number of shares.
Diluted earnings per share are determined taking the potential effect resulting from options allocated to beneficiaries of
dilutive stock option plans into account in the calculation of the number of outstanding shares. They amounted to € 0.46
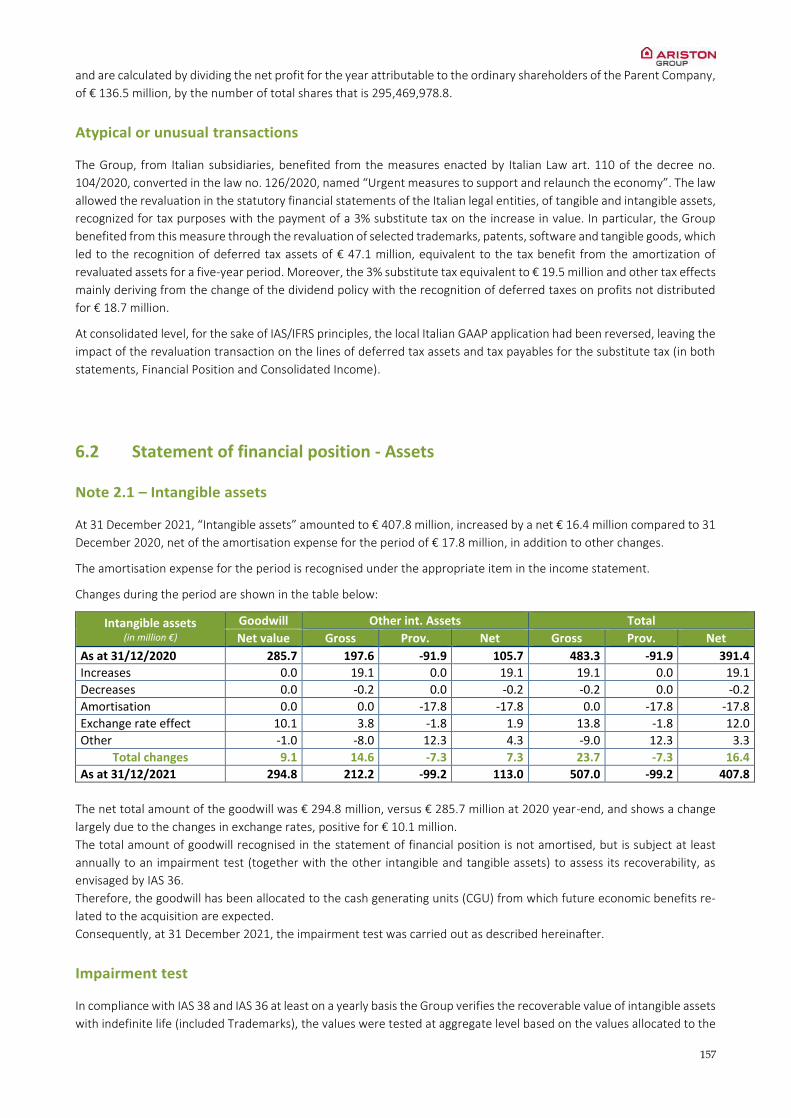
157
and are calculated by dividing the net profit for the year attributable to the ordinary shareholders of the Parent Company,
of € 136.5 million, by the number of total shares that is 295,469,978.8.
Atypical or unusual transactions
The Group, from Italian subsidiaries, benefited from the measures enacted by Italian Law art. 110 of the decree no.
104/2020, converted in the law no. 126/2020, named “Urgent measures to support and relaunch the economy”. The law
allowed the revaluation in the statutory financial statements of the Italian legal entities, of tangible and intangible assets,
recognized for tax purposes with the payment of a 3% substitute tax on the increase in value. In particular, the Group
benefited from this measure through the revaluation of selected trademarks, patents, software and tangible goods, which
led to the recognition of deferred tax assets of € 47.1 million, equivalent to the tax benefit from the amortization of
revaluated assets for a five-year period. Moreover, the 3% substitute tax equivalent to € 19.5 million and other tax effects
mainly deriving from the change of the dividend policy with the recognition of deferred taxes on profits not distributed
for € 18.7 million.
At consolidated level, for the sake of IAS/IFRS principles, the local Italian GAAP application had been reversed, leaving the
impact of the revaluation transaction on the lines of deferred tax assets and tax payables for the substitute tax (in both
statements, Financial Position and Consolidated Income).
6.2 Statement of financial position - Assets
Note 2.1 – Intangible assets
At 31 December 2021, “Intangible assets” amounted to € 407.8 million, increased by a net € 16.4 million compared to 31
December 2020, net of the amortisation expense for the period of € 17.8 million, in addition to other changes.
The amortisation expense for the period is recognised under the appropriate item in the income statement.
Changes during the period are shown in the table below:
Intangible assets (in million €)
Goodwill Other int. Assets Total
Net value Gross Prov. Net Gross Prov. Net
As at 31/12/2020 285.7 197.6 -91.9 105.7 483.3 -91.9 391.4
Increases 0.0 19.1 0.0 19.1 19.1 0.0 19.1
Decreases 0.0 -0.2 0.0 -0.2 -0.2 0.0 -0.2
Amortisation 0.0 0.0 -17.8 -17.8 0.0 -17.8 -17.8
Exchange rate effect 10.1 3.8 -1.8 1.9 13.8 -1.8 12.0
Other -1.0 -8.0 12.3 4.3 -9.0 12.3 3.3
Total changes 9.1 14.6 -7.3 7.3 23.7 -7.3 16.4
As at 31/12/2021 294.8 212.2 -99.2 113.0 507.0 -99.2 407.8
The net total amount of the goodwill was € 294.8 million, versus € 285.7 million at 2020 year-end, and shows a change
largely due to the changes in exchange rates, positive for € 10.1 million.
The total amount of goodwill recognised in the statement of financial position is not amortised, but is subject at least
annually to an impairment test (together with the other intangible and tangible assets) to assess its recoverability, as
envisaged by IAS 36.
Therefore, the goodwill has been allocated to the cash generating units (CGU) from which future economic benefits re-
lated to the acquisition are expected.
Consequently, at 31 December 2021, the impairment test was carried out as described hereinafter.
Impairment test
In compliance with IAS 38 and IAS 36 at least on a yearly basis the Group verifies the recoverable value of intangible assets
with indefinite life (included Trademarks), the values were tested at aggregate level based on the values allocated to the
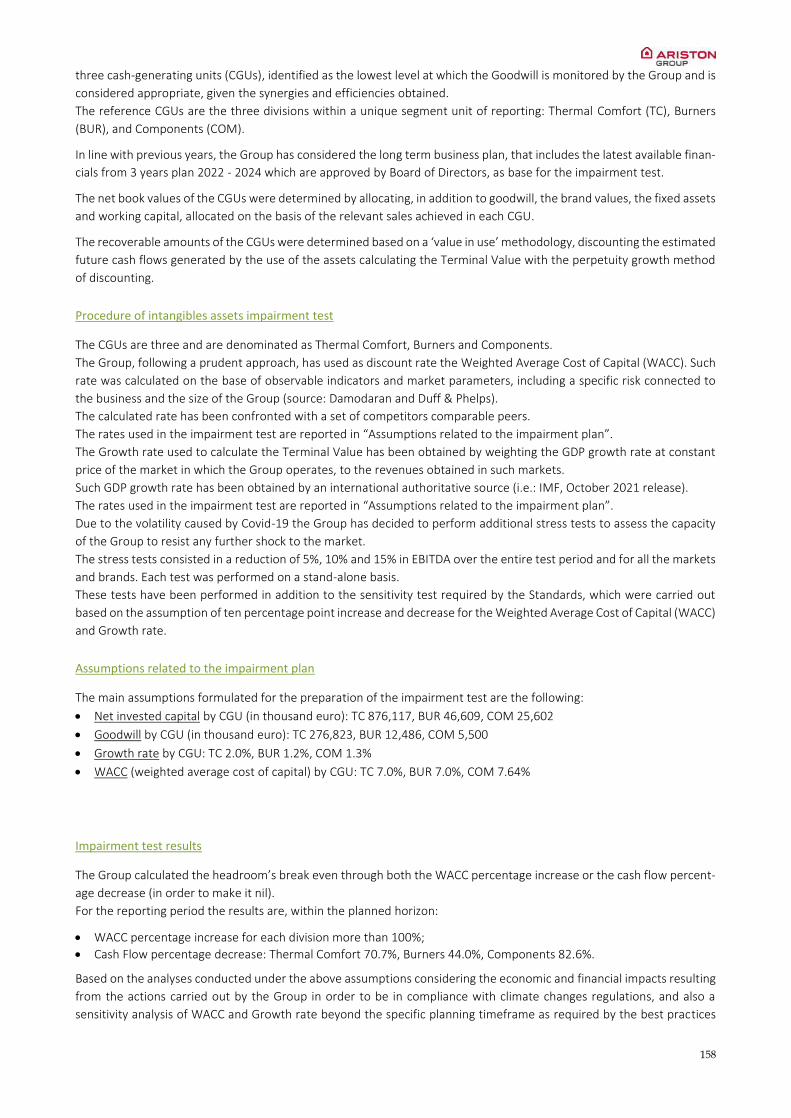
158
three cash-generating units (CGUs), identified as the lowest level at which the Goodwill is monitored by the Group and is
considered appropriate, given the synergies and efficiencies obtained.
The reference CGUs are the three divisions within a unique segment unit of reporting: Thermal Comfort (TC), Burners
(BUR), and Components (COM).
In line with previous years, the Group has considered the long term business plan, that includes the latest available finan-
cials from 3 years plan 2022 - 2024 which are approved by Board of Directors, as base for the impairment test.
The net book values of the CGUs were determined by allocating, in addition to goodwill, the brand values, the fixed assets
and working capital, allocated on the basis of the relevant sales achieved in each CGU.
The recoverable amounts of the CGUs were determined based on a ‘value in use’ methodology, discounting the estimated
future cash flows generated by the use of the assets calculating the Terminal Value with the perpetuity growth method
of discounting.
Procedure of intangibles assets impairment test
The CGUs are three and are denominated as Thermal Comfort, Burners and Components.
The Group, following a prudent approach, has used as discount rate the Weighted Average Cost of Capital (WACC). Such
rate was calculated on the base of observable indicators and market parameters, including a specific risk connected to
the business and the size of the Group (source: Damodaran and Duff & Phelps).
The calculated rate has been confronted with a set of competitors comparable peers.
The rates used in the impairment test are reported in “Assumptions related to the impairment plan”.
The Growth rate used to calculate the Terminal Value has been obtained by weighting the GDP growth rate at constant
price of the market in which the Group operates, to the revenues obtained in such markets.
Such GDP growth rate has been obtained by an international authoritative source (i.e.: IMF, October 2021 release).
The rates used in the impairment test are reported in “Assumptions related to the impairment plan”.
Due to the volatility caused by Covid-19 the Group has decided to perform additional stress tests to assess the capacity
of the Group to resist any further shock to the market.
The stress tests consisted in a reduction of 5%, 10% and 15% in EBITDA over the entire test period and for all the markets
and brands. Each test was performed on a stand-alone basis.
These tests have been performed in addition to the sensitivity test required by the Standards, which were carried out
based on the assumption of ten percentage point increase and decrease for the Weighted Average Cost of Capital (WACC)
and Growth rate.
Assumptions related to the impairment plan
The main assumptions formulated for the preparation of the impairment test are the following:
Net invested capital by CGU (in thousand euro): TC 876,117, BUR 46,609, COM 25,602
Goodwill by CGU (in thousand euro): TC 276,823, BUR 12,486, COM 5,500
Growth rate by CGU: TC 2.0%, BUR 1.2%, COM 1.3%
WACC (weighted average cost of capital) by CGU: TC 7.0%, BUR 7.0%, COM 7.64%
Impairment test results
The Group calculated the headroom’s break even through both the WACC percentage increase or the cash flow percent-
age decrease (in order to make it nil).
For the reporting period the results are, within the planned horizon:
WACC percentage increase for each division more than 100%;
Cash Flow percentage decrease: Thermal Comfort 70.7%, Burners 44.0%, Components 82.6%.
Based on the analyses conducted under the above assumptions considering the economic and financial impacts resulting
from the actions carried out by the Group in order to be in compliance with climate changes regulations, and also a
sensitivity analysis of WACC and Growth rate beyond the specific planning timeframe as required by the best practices

159
issued by ESMA in 2020 in the wake of the Covid-19 pandemic, the Group can confirm the adequacy of the reported
amounts.
The item “Other intangible assets” can be detailed as follows:
Other intangible assets (in million €)
31/12/2021
31/12/2020
Concessions, licenses, trademarks 43.8 40.1
Intangible assets in progress 19.3 12.2
Development costs 18.7 20.5
Software 16.5 19.3
Other 14.6 13.5
Other intangible assets 113.0 105.7
Details of and changes in “Other intangible assets” are the following:
Other intangi-ble assets
(in million €)
Development costs Software Other Intangible Assets Total
Gross Prov. Net Gross Prov. Net Gross Prov. Net Gross Prov. Net
As at 31/12/2020 69.2 -48.7 20.5 49.2 -29.8 19.3 79.2 -13.4 65.9 197.6 -91.9 105.7
Increases 3.6 0.0 3.6 2.7 0.0 2.7 12.8 0.0 12.8 19.1 0.0 19.1
Decreases 0.0 0.0 0.0 -0.2 0.0 -0.2 0.0 0.0 0.0 -0.2 0.0 -0.2
Amortisation 0.0 -7.5 -7.5 0.0 -6.1 -6.1 0.0 -4.1 -4.1 0.0 -17.8 -17.8
Exchange rate effect
0.9 -0.7 0.2 0.9 -0.6 0.2 2.0 -0.5 1.4 3.8 -1.8 1.9
Other -5.8 7.6 1.8 -3.7 4.4 0.6 1.5 0.3 1.8 -8.0 12.3 4.3
Total changes -1.2 -0.6 -1.8 -0.4 -2.4 -2.8 16.2 -4.3 11.9 14.6 -7.3 7.3
As at 31/12/2021 68.0 -49.3 18.7 48.8 -32.3 16.5 95.4 -17.7 77.7 212.2 -99.2 113.0
Since the trademark has an indefinite useful life, it is subject to impairment test.
The change in “Other intangible assets” from the start of the period amounted to € 7.3 million and was primarily due to
the investments for the period and exchange rate effect not fully offset by € 17.8 million in amortisation for the period.
The other intangible assets have a definite useful life and are consequently amortised as necessary.
Development costs refer to products for which the return on investments occurs within a five-year period, on average.
The capitalised costs for the period, attributable only to product development projects, amounted to € 7.1 million (€ 6.3
million in 2020) out of a total of € 18.7 million (€ 20.5 million in 2020) reported in the financial statements.
The Group evaluated the development costs related to products based on the criteria outlined in the Climate Delegated
Act only for the objective mitigation to climate change. As an evidence of the commitment to promote a more efficient
and renewable product portfolio, these investments have been capitalized. The Group impaired the depreciation charged
to income statement against the products’ sales.
In order to determine the loss in value of capitalised development costs, in addition to the assessment of the economic
return from each development projects, the Group arranged to allocate them to the Net invested capital of the related
CGUs and assesses their recoverability together with the related tangible assets, determining their value in use with the
discounted cash flow method.
Note 2.2 – Property, plant and equipment
At 31 December 2021, “Property, plant and equipment” amounted to € 372.4 million, up by a net € 31.1 million compared
to 31 December 2020.
The depreciation expense for the period is recognised under the appropriate item in the income statement and amounted
to € 58.0 million.
Details of and changes in property, plant and equipment are the following:
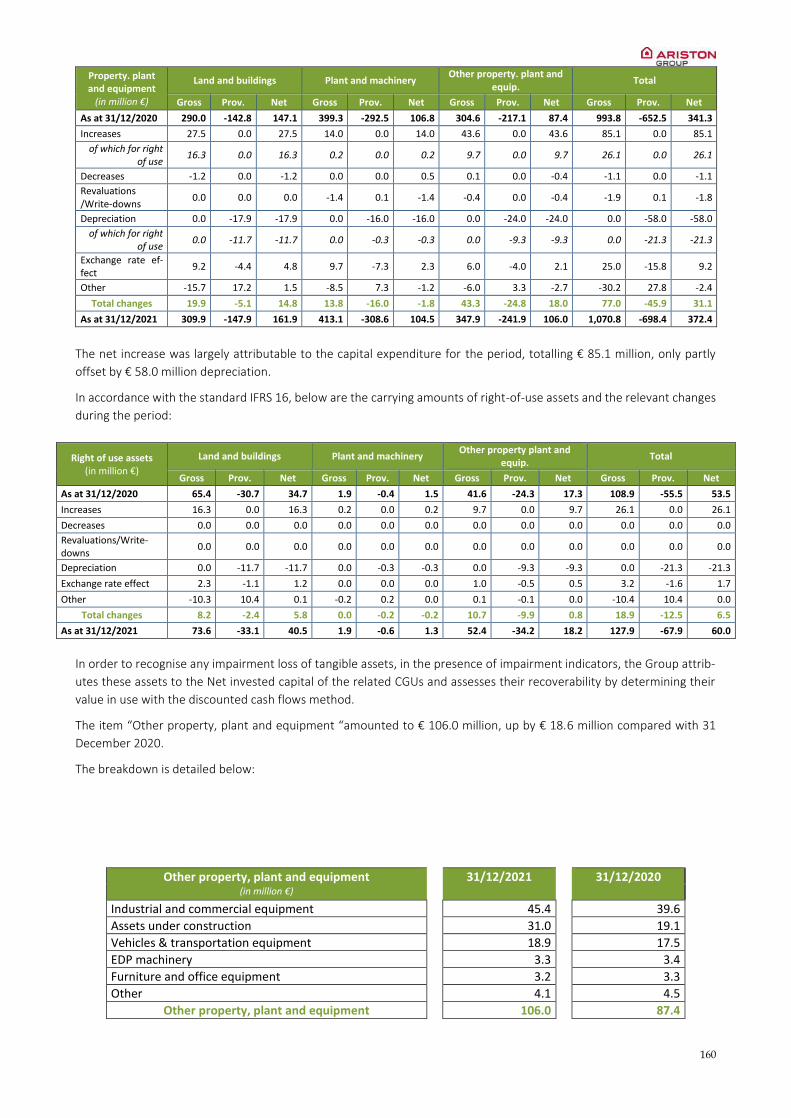
160
Property. plant and equipment
(in million €)
Land and buildings Plant and machinery Other property. plant and
equip. Total
Gross Prov. Net Gross Prov. Net Gross Prov. Net Gross Prov. Net
As at 31/12/2020 290.0 -142.8 147.1 399.3 -292.5 106.8 304.6 -217.1 87.4 993.8 -652.5 341.3
Increases 27.5 0.0 27.5 14.0 0.0 14.0 43.6 0.0 43.6 85.1 0.0 85.1
of which for right of use
16.3 0.0 16.3 0.2 0.0 0.2 9.7 0.0 9.7 26.1 0.0 26.1
Decreases -1.2 0.0 -1.2 0.0 0.0 0.5 0.1 0.0 -0.4 -1.1 0.0 -1.1
Revaluations /Write-downs
0.0 0.0 0.0 -1.4 0.1 -1.4 -0.4 0.0 -0.4 -1.9 0.1 -1.8
Depreciation 0.0 -17.9 -17.9 0.0 -16.0 -16.0 0.0 -24.0 -24.0 0.0 -58.0 -58.0
of which for right of use
0.0 -11.7 -11.7 0.0 -0.3 -0.3 0.0 -9.3 -9.3 0.0 -21.3 -21.3
Exchange rate ef-fect
9.2 -4.4 4.8 9.7 -7.3 2.3 6.0 -4.0 2.1 25.0 -15.8 9.2
Other -15.7 17.2 1.5 -8.5 7.3 -1.2 -6.0 3.3 -2.7 -30.2 27.8 -2.4
Total changes 19.9 -5.1 14.8 13.8 -16.0 -1.8 43.3 -24.8 18.0 77.0 -45.9 31.1
As at 31/12/2021 309.9 -147.9 161.9 413.1 -308.6 104.5 347.9 -241.9 106.0 1,070.8 -698.4 372.4
The net increase was largely attributable to the capital expenditure for the period, totalling € 85.1 million, only partly
offset by € 58.0 million depreciation.
In accordance with the standard IFRS 16, below are the carrying amounts of right-of-use assets and the relevant changes
during the period:
Right of use assets (in million €)
Land and buildings Plant and machinery Other property plant and
equip. Total
Gross Prov. Net Gross Prov. Net Gross Prov. Net Gross Prov. Net
As at 31/12/2020 65.4 -30.7 34.7 1.9 -0.4 1.5 41.6 -24.3 17.3 108.9 -55.5 53.5
Increases 16.3 0.0 16.3 0.2 0.0 0.2 9.7 0.0 9.7 26.1 0.0 26.1
Decreases 0.0 0.0 0.0 0.0 0.0 0.0 0.0 0.0 0.0 0.0 0.0 0.0
Revaluations/Write-downs
0.0 0.0 0.0 0.0 0.0 0.0 0.0 0.0 0.0 0.0 0.0 0.0
Depreciation 0.0 -11.7 -11.7 0.0 -0.3 -0.3 0.0 -9.3 -9.3 0.0 -21.3 -21.3
Exchange rate effect 2.3 -1.1 1.2 0.0 0.0 0.0 1.0 -0.5 0.5 3.2 -1.6 1.7
Other -10.3 10.4 0.1 -0.2 0.2 0.0 0.1 -0.1 0.0 -10.4 10.4 0.0
Total changes 8.2 -2.4 5.8 0.0 -0.2 -0.2 10.7 -9.9 0.8 18.9 -12.5 6.5
As at 31/12/2021 73.6 -33.1 40.5 1.9 -0.6 1.3 52.4 -34.2 18.2 127.9 -67.9 60.0
In order to recognise any impairment loss of tangible assets, in the presence of impairment indicators, the Group attrib-
utes these assets to the Net invested capital of the related CGUs and assesses their recoverability by determining their
value in use with the discounted cash flows method.
The item “Other property, plant and equipment “amounted to € 106.0 million, up by € 18.6 million compared with 31
December 2020.
The breakdown is detailed below:
Other property, plant and equipment (in million €)
31/12/2021
31/12/2020
Industrial and commercial equipment 45.4 39.6
Assets under construction 31.0 19.1
Vehicles & transportation equipment 18.9 17.5
EDP machinery 3.3 3.4
Furniture and office equipment 3.2 3.3
Other 4.1 4.5
Other property, plant and equipment
106.0
87.4

161
Note 2.3 – Investments in associates & joint ventures
Associates
At 31 December 2021, there were no investments in associates.
Joint Ventures
On 10 June 2021, 24.5% of the shares of the Dutch company Haas Heating B.V. was acquired by the Group through ATAG
Heating B.V.
The company is treated as a joint venture, thus valuing the participation with the equity method with the existence of a
financial liability to be paid for acquiring the associate.
The acquisition agreement sets forth a mechanism for a subsequent adjustment of the purchase price (earn-out) based
on a sales scheme at specific dates falling under IAS 28 Investment in Associates and Joint Ventures.
Therefore, a liability equal to the current value of the estimated obligation as at the date of its eventual future exercise,
was recognised in the financial statements against the equity method.
By Sales and Purchase Agreement defined the purchase price at € 0.8 million and a liability for € 1.6 million is related to
the earn-out program.
For the remaining shares the agreement foreseen a series of call options until December 2023.
Notes 2.4 – Deferred tax assets and liabilities
The deferred tax assets and liabilities show a net balance of € 51.6 million, with a € 25.6 million variances in respect to
2020. The increase is mainly driven by the revaluation of tangible and intangible assets carried out in Italy for both stat-
utory and tax purposes pursuant to art. 110 of the Law Decree 104/2020, converted in the Law 126/2020.The revaluation
and its related tax effects deriving from the change of the dividends policy have a net impact on deferred taxes equal to
€ 29.2 million.
The components of net deferred tax assets at December 31, 2021 and 2020 are as follows:
Deferred tax assets (in million €)
2020 P&L Equity Translation differences 2021
Trade & Patents 0.0 20.7 0.0 0.0 20.7
R&D/Software 0.0 7.6 0.0 0.0 7.6
Tangible Fixed Assets 1.2 17.5 0.0 0.0 18.7
Provisions for warranties 5.7 0.7 0.0 0.2 6.6
Provisions for other risks and charges 12.7 0.7 0.0 0.6 14.0
LTI and others employees benefits 9.3 0.0 -0.6 0.0 8.7
Inventory write-off 1.7 0.1 0.0 0.0 1.8
Losses 6.2 0.9 0.0 0.1 7.2
Other 21.5 -5.7 -0.3 1.5 17.0
Total
58.3 42.5 -0.9 2.5 102.5
Deferred tax liabilities (in million €)
2020 P&L Equity Translation differences
2021
Provision for warranties 1.1 0.0 0.0 0.1 1.2
Provision for other risks and charges 3.2 0.0 0.0 0.3 3.5
LTI and others employees benefits 1.6 -0.5 0.0 0.1 1.1
Tangible and Intangible Fixed Assets 15.8 0.6 0.0 0.3 16.7
Exchange gains and losses 0.0 1.3 0.8 0.0 2.0
Acquisition of new investment 4.7 0.0 0.0 0.3 4.9
Other 5.9 15.5 0.1 -0.1 21.3
Total
32.1 16.8 0.9 0.9 50.8
162
The increase of the deferred tax assets due to the revaluation is mainly included in the trademarks and patents, software
and tangible assets and it is equal to € 45.4 million.
At December 31, 2020, on the undistributed earnings in Ariston subsidiaries no deferred tax liability was recorded be-
cause the remittance of earnings from those jurisdictions would incur no tax or such earnings were indefinitely reinvested.
In 2021, due to the Italian revaluation of tangible and intangible tax assets, the Group has changed its dividends policy
determining the amount of the deferred tax liability on the undistributed earnings related to withholding taxes and in-
cremental local country income taxes. The amount of the deferred tax liabilities on undistributed earnings recorded in
2021 is equal to € 16.1 million and it is included in the “Other” deferred tax liabilities.
The decision to recognize deferred tax assets is made for each legal entity in the Group by critically assessing whether
the conditions exist for the future recoverability of such assets on the basis of the following elements:
Company’s plan and its historical trend results;
Existence of one-time event that can change the historical trend in term of profitability;
Quantification of future profitable results;
Losses coming from one-time/non recurring event;
New business opportunity;
Restructuring or disposal which eliminated the loss sources;
Planning strategy;
Business acquisition.
The amount of unused tax losses for which no deferred tax asset is recognized in the statement of financial position is €
65.2 million. Ariston recognizes in its consolidated statement of financial position within Deferred tax assets, the amount
of deferred tax assets less the deferred tax liabilities of the individual consolidated legal entities, where these may be
offset.
Note 2.5 – Financial assets
“Financial assets” amounted to € 5.2 million at 31 December 2021, up by € 1.3 million compared to December 2020.
This item mainly consists of the value of “Other investments” held for the medium/long term, measured at fair value,
since they are mainly classified as “Financial instruments at fair value through profit or loss (FVTPL)”.
The increase during the period is due to the remeasurement, in accordance with IFRS 9, of the equity investment in an
“Investment company in risk capital (SICAR) provision” specialising in interventions in sectors where the Group operates,
by the parent company Ariston Holding N.V.
Note 2.6 – Non-current financial assets
“Non-current financial assets” amounted to zero, reducing € 5.1 million from previous year, due to the reclassification to
short term of liquidity against contractual commitments towards third-party shareholders arising from acquisitions (“Es-
crow account”).
Note 2.7 – Other non-current assets
“Other non-current assets” includes primarily the security deposits due beyond the year and other assets with a financial
impact spreading beyond one year.
At 31 December 2021, the item amounted to € 6.4 million, down compared with the € 8.0 million (reclassified) of 2020.
Note 2.8 – Non-current tax receivables
“Non-current tax receivables” amounted to € 1.2 million as 31 December 2021, slightly up with the € 1.1 million (reclas-
sified) of the same period of 2020. The item includes receivables from tax authorities payable to the Group.
163
Note 2.9 – Inventories
Following is the composition of “Inventories” at 31 December 2021 and at 31 December 2020, net of the obsolete stock
provision.
Inventories (in million €)
31/12/2021
31/12/2020
Raw materials 125.6 77.5
Work in progress and semi-finished goods 13.4 9.9
Finished goods and goods for resale 243.0 178.0
Inventories 382.0 265.5
Gross value of inventories, at 31 December 2021, amounted to € 422.4 million (€ 303.0 million at 31 December 2020),
whereas the provision amounted to € 40.4 million (€ 37.5 million at 31 December 2020).
Inventories totalled € 382.0 million at 31 December 2021, up by € 116.5 million on 31 December 2020. This change is
essentially attributable to several factors, as summarised below:
Organic increases of € 107.9 million mainly driven by the finished goods and goods for resale stocking necessary to
maintain a sound product availability to Customers, in line with the Group’s strategic guidelines, and the increase of
raw materials weighted average price;
Positive exchange rate effect of € 8.6 million.
Inventories are recognised at the lesser value between purchase and production cost, according to the weighted average
cost method and their net realisable value which includes cost necessary to sell inventories and based on that the Group
did not have a material impact.
The provision set up for obsolete or slow-moving stock is substantially in line with previous year.
The obsolescence risk is measured taking into account the stock rotation, calculated monthly as the ratio of inventories
to consumption over the last twelve months for raw material (forty-eight months for spare parts with life cycle defined
“inactive”), and the product life cycle. In the obsolescence risk, the Group has considered for materials and products in
stock the technological obsolescence which can arise from climate changes. On the basis of the parameters mentioned
above, impairment percentages are applied which increase in proportion to the estimated risk.
The change in the obsolete stock provision was as follows:
Obsolete stock provision (in million €)
Raw materials Work in progress and semi-finished goods
Finished goods and goods for resale
Total
As at 31/12/2020 8.5 1.5 27.5 37.5
Increases/ Release 0.0 0.3 2.9 3.2
Decreases 0.5 -0.1 -1.6 -1.2
Exchange rate effect 0.3 0.0 0.5 0.8
Other 0.8 0.0 -0.7 0.1
Total changes 1.6 0.3 1.0 2.9
As at 31/12/2021 10.1 1.8 28.5 40.4
The recognition of inventories according to the weighted average cost method does not show any significant differences compared with a valuation at current costs.
164
Note 2.10 – Trade receivables
Trade receivables amounted to € 248.3 million, net of a bad debt provision of € 19.0 million.
Compared with reclassified 31 December 2020, the net balance shows a € 12.5 million increase in absolute values. This
increase was attributable to the strong growth in turnover, specifically in the markets with higher days outstanding sales,
partially compensated by the strong collection performance and reduction in payment terms.
The percentage of trade receivables on the turnover of the last 12 months was equal to 12.5% compared with 14.2%
recorded at 31 December 2020.
The bad debt provision of € 19.0 million shows a net increase by € 0.2 million compared with 31 December 2020. The
bad debt fund is relatively flat as the increase in turnover and receivables did not cause an increase in overdue, thanks to
the more stringent debt management and collection policy, as well as certain drawdowns as the Group wrote off non-
performing loans confirmed to be no longer recoverable.
For Trade Receivables, the Group applies a simplified approach in the calculation of expected losses. The Group Policy
defines a percentage of statistical devaluation based on the division of trade receivables into clusters of ageing and coun-
try risk. For companies with a credit insurance contract, percentages applied on the category insured customers is re-
duced by approximately half of it. Specific fund is provided for legal and specific devaluation by single clients’ situation
and their economic environment.
At 31 December 2021, the provision was deemed to be appropriate for the estimated losses from unsecured or in litiga-
tion receivables.
Following are the changes in the bad debt provision:
Bad debt provision (in million €)
Short term Medium/ long-term
Total
As at 31/12/2020 12.7 6.1 18.8
Increases 1.8 0.1 1.8
Decreases -0.6 -0.1 -0.7
Release -0.9 -0.3 -1.2
Exchange rate effect 0.3 0.0 0.2
Other -0.2 0.2 0.0
Total changes 0.3 -0.1 0.2
As at 31/12/2021 13.0 6.0 19.0
The item “Other” includes primarily the reclassifications made for the period in order to ensure the correct recognition
of receivables subject to special valuation, such as those in legal proceedings or in litigation.
Please refer to paragraph “Credit Risk” for further details on ageing and the related Bad Debt Provision.
Note 2.11 – Tax receivables
The item “Tax receivables” includes primarily the amounts due to the companies of the Group from the taxation author-
ities in several countries where the Group operates. At 31 December 2021, the item amounted to € 29.8 million versus €
12.6 million in 2020 (reclassified), mainly due to:
Tax receivables (in million €)
31/12/2021 31/12/2020
Tax receivables for taxes paid in excess 13.3 8.7
Tax receivables from Parent company 13.8 2.0
Other short term tax receivables 2.7 1.9
Tax receivables 29.8 12.6
The overall € 17.2 million increase was mainly attributable to the advance tax payments made by some subsidiaries due
to the increased profit.

165
The increase of “Tax receivables from Parent Company” amounted to € 11.8 million is the positive effect of the revalua-
tion of assets and costs linked to IPO process.
The item does not include deferred taxes that are handled separately.
Note 2.12 – Current financial assets
At 31 December 2021, the item “Current financial assets” amounted to € 10.8 million, slightly higher from € 10.0 million
at the end of 2020.
The item includes:
the security deposit amounted to € 5.5 million. At December 2020 was reclassified on “Other non-current assets”;
the positive impact of “Financial derivative assets” for € 1.8 million, represented by fair value measurement and ac-
crual on derivative financial instruments. The fair value of financial derivatives included hedge on commodities for €
0.8 million and positive accruals to financial derivatives on foreign exchange hedges closed but not already receipt
amounted to € 1.0 million;
the short-term bank notes or similar tradable instruments held by subsidiaries in China, issued and backed up by
leading domestic banks and used in commercial transactions with customers and suppliers in order to settle supply
agreements.
Note 2.13 – Other current assets
“Other current assets” amounted to € 56.4 million versus € 36.5 million at 31 December 2020. The main items are:
Other current assets (in million €)
31/12/2021
31/12/2020
Indirect tax receivables 29.2 12.3
State Green Programmes 8.3 9.2
Prepaid expenses 7.1 8.4
Advances to suppliers 6.5 4.4
Receivables from employees 0.6 0.8
Other receivables 4.6 1.3
Other current assets 56.4 36.5
The € 19.9 million increase in “Other current assets” was essentially due to the € 16.9 million increasing in VAT receiva-
bles, mainly of Mexico, Italy and Russia, linked to the operative business.
Note 2.14 – Cash and cash equivalents
“Cash and cash equivalents”, amounting to € 689.7 million as at the end of December 2021, are represented almost
entirely by bank and postal account deposits, as shown in the following table:
Cash and cash equivalents (in thousand €)
31/12/2021
31/12/2020
Bank and postal deposits 653.3 402.9
Short Term Investments 30.9 46.1
Cash on hand 5.5 3.5
Cash and cash equivalents 689.7 452.5
The item “Bank and postal deposits” is primarily represented by credit balances on current accounts and compared to 31
December 2020 was increased of € 250.4 million mainly due from IPO proceeds.
The Short Term Investment was down € 15.2 million, mainly due for partial closure of some deposits in USD and CNY.
The amount of cash on hand with a pre-determined use is not significant.

166
Note 2.15 – Assets held for sale
At 31 December 2021, the item “Assets held for sale” amounted to € 2.3 million, up by € 2 million compared with 31
December 2020. The item includes the assets held for sale by the Italian, Bahrainis and Romanian subsidiaries, recognised,
as stated in IFRS 5, at the lower of the net book value and the market value (net of sale costs). The increase of the period
is due to Italy and Bahrain for assets previously recorded in “Property, plant and equipment”.

167
6.3 Statement of financial position – Liabilities and equity
Note 3.1 – Equity
During this reporting period, within the broader corporate reorganization of the Ariston Group, after the merger of the
company Ariston Thermo Holding S.p.A. in the wholly owned subsidiary Ariston Thermo International S.r.l, Ariston Thermo
Holding Spa, has been re-domiciliated in The Netherlands as Ariston Holding N.V., establishing its registered office in
Amsterdam the 15 June.
The new “Share capital” of the Parent Company at 30 June 2021, fully subscribed and paid up, is represented by
75,000,000 ordinary shares of € 0.01 each and by 225,000,000 multiple vote shares of € 0.20 each.
At 31 December 2021, the share capital of Ariston Holding N.V. was € 46.0 million, fully paid-up, comprising 104,268,292
ordinary shares. The changes in the capital structure during the year and the movements in ordinary and special voting
shares is reported below.
Shareholders Ordinary Shares (1)
% of Ordinary Shares
Special Voting Shares A
(2)
Ordinary Shares and Special
Voting Shares A
% Ordinary Shares and Special Voting
Shares A
Merloni Holding SpA 19,426,000 18.63% 198,000,000 217,426,000 66.03%
Amaranta Srl 2,649,000 2.54% 27,000,000 29,649,000 9.00%
Other shareholders 82,193,292 78.83% 82,193,292 24.96%
Total 104,268,292 100.00% 225,000,000 329,268,292 100.00%
(1) Ordinary shares are listed, freely transferable and each of them confers the right to cast one vote.
(2) Special Voting Shares confer economic rights, are not listed and are not transferable.
The total consolidated equity at 31 December 2021 amounted to € 878.1 million, up compared with € 446.5 million at 31
December 2020.
The overall change is the result of the algebraic sum of items of opposite signs, such as:
the increase in the Group net profit for the period, amounting to € 136.5 million;
the IPO contribution amounted to € 300.0 million, out of which € 0.3 million related to share capital increase and €
299.7 million related to share premium reserve increase. At the year end the share premium reserve has been re-
duced of € 6.0 million for the charge of shares issue expenses, net of any tax effect;
the legal reserves of € 28.3 million at December 31, 2021 (€ 8.4 million at December 31, 2020) determined in accord-
ance with Dutch Corporate Governance Code (Art.2:365.2 DCGC) and primarily relating to subsidiaries’ development
expenditures capitalized and their earnings, which determine certain restrictions on Ariston Holding N.V. distribution
to its shareholders;
in 2021 appeared a stock-based incentive plans reserve for a total of € 24.5 million, out of which € 11.9 million related
to vested phantom stock options converted into ordinary shares, € 12.1 million of unvested previously defined phan-
tom stock options into restricted share units and € 0.4 million of performance share units. The € 11.9 million were
related to long term incentive plan of 2016-2018, meanwhile € 12.5 million refers to the following plan:
- 2019: € 7.3 million
- 2020: € 4.8 million
- 2021: € 0.4 million
Until Admission, the Executive Directors and a selected numbers of Managers participated in the long-term incentive
plan providing for phantom stock. Upon Admission this plan was terminated and the outstanding phantom stock op-
tions were converted (a) at the option of the beneficiaries, into ordinary shares at the offer price of the Company's
initial public offering or cash (in relation to vested phantom stock options) and (b) into restricted share units (in rela-
tion to unvested phantom stock options), with a vesting period of three years from the date of the original grant
(phantom stock options granted in 2019 vest in 2022, phantom stock options granted in 2020 vest in 2023).
In addition, a new long-term incentive plan has been approved by the general meeting providing for awards in the
form of performance share units for the 2021 LTI.
Settlement of the conversion of these phantom stock options will take place in the first half of 2022.
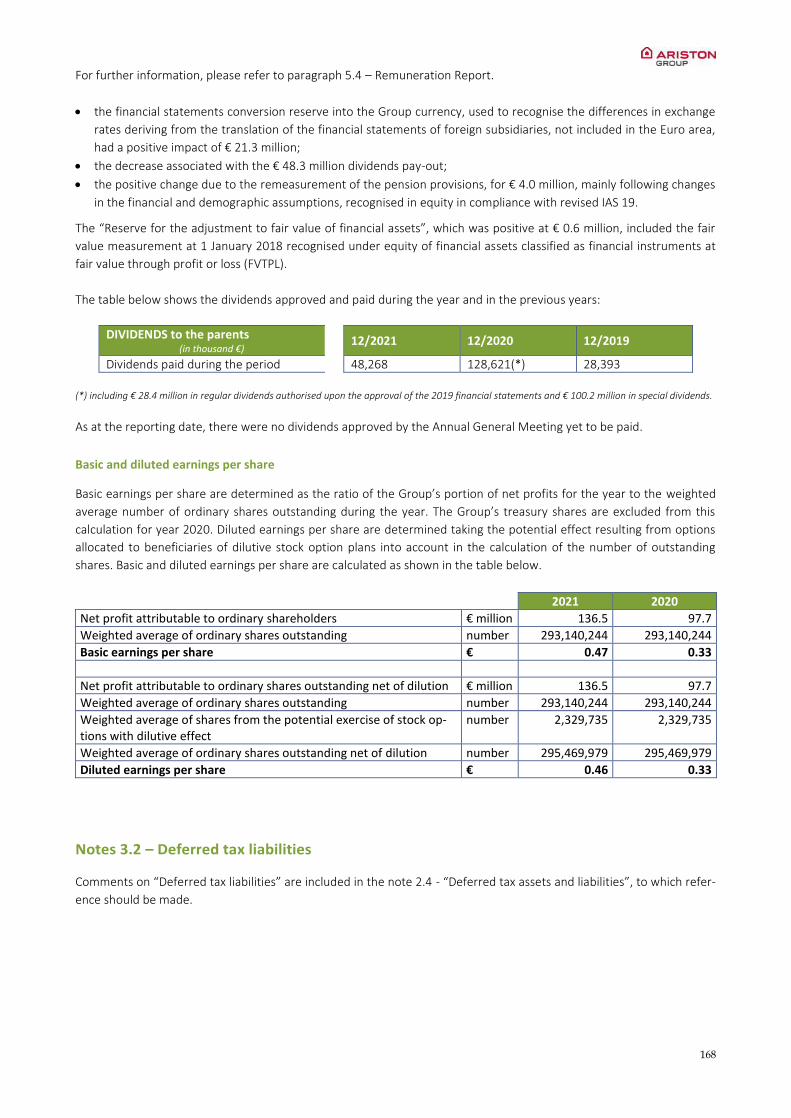
168
For further information, please refer to paragraph 5.4 – Remuneration Report.
the financial statements conversion reserve into the Group currency, used to recognise the differences in exchange
rates deriving from the translation of the financial statements of foreign subsidiaries, not included in the Euro area,
had a positive impact of € 21.3 million;
the decrease associated with the € 48.3 million dividends pay-out;
the positive change due to the remeasurement of the pension provisions, for € 4.0 million, mainly following changes
in the financial and demographic assumptions, recognised in equity in compliance with revised IAS 19.
The “Reserve for the adjustment to fair value of financial assets”, which was positive at € 0.6 million, included the fair
value measurement at 1 January 2018 recognised under equity of financial assets classified as financial instruments at
fair value through profit or loss (FVTPL).
The table below shows the dividends approved and paid during the year and in the previous years:
DIVIDENDS to the parents (in thousand €)
12/2021 12/2020 12/2019
Dividends paid during the period 48,268 128,621(*) 28,393
(*) including € 28.4 million in regular dividends authorised upon the approval of the 2019 financial statements and € 100.2 million in special dividends.
As at the reporting date, there were no dividends approved by the Annual General Meeting yet to be paid.
Basic and diluted earnings per share
Basic earnings per share are determined as the ratio of the Group’s portion of net profits for the year to the weighted
average number of ordinary shares outstanding during the year. The Group’s treasury shares are excluded from this
calculation for year 2020. Diluted earnings per share are determined taking the potential effect resulting from options
allocated to beneficiaries of dilutive stock option plans into account in the calculation of the number of outstanding
shares. Basic and diluted earnings per share are calculated as shown in the table below.
2021 2020
Net profit attributable to ordinary shareholders € million 136.5 97.7
Weighted average of ordinary shares outstanding number 293,140,244 293,140,244
Basic earnings per share € 0.47 0.33
Net profit attributable to ordinary shares outstanding net of dilution € million 136.5 97.7
Weighted average of ordinary shares outstanding number 293,140,244 293,140,244
Weighted average of shares from the potential exercise of stock op-tions with dilutive effect
number 2,329,735 2,329,735
Weighted average of ordinary shares outstanding net of dilution number 295,469,979 295,469,979
Diluted earnings per share € 0.46 0.33
Notes 3.2 – Deferred tax liabilities
Comments on “Deferred tax liabilities” are included in the note 2.4 - “Deferred tax assets and liabilities”, to which refer-
ence should be made.

169
Note 3.3 – Non-current provisions
Current and non-current “Provisions for risks and charges” totalled € 90.4 million, up by € 7.3 million compared with the
previous year.
The following table shows the composition of this item and the changes occurring during the year:
NON-CURRENT AND CURRENT PROVISIONS
(in million €)
Agent supplementary
indemnity provision
Product warranty provision
First installation provisions
Other provisions
Total
As at 31/12/2020 2.6 49.6 5.9 25.0 83.1
of which:
Current 0.0 16.8 2.1 12.3 31.3
Non-current 2.6 32.8 3.8 12.7 51.8
Increases 0.4 10.5 3.0 5.5 19.5
Decreases -0.1 -5.0 -2.4 -5.3 -12.9
Other 0.0 1.9 0.5 -1.7 0.7
Total changes 0.3 7.4 1.1 -1.5 7.3
As at 31/12/2021 2.9 57.0 7.0 23.5 90.4
of which:
Current 0.0 15.9 2.3 15.3 33.5
Non-current 2.9 41.1 4.7 8.1 56.9
Details of and changes in “other provisions” are the following:
other provisions (in million €)
Legal disputes provision
Restructuring provision
Other risk provision
Total
As at 31/12/2020 4.9 2.3 17.8 25.0
of which:
Current 4.6 2.1 5.6 12.3
Non-current 0.3 0.2 12.2 12.7
Increases 2.2 1.6 1.7 5.5
Decreases -0.3 -1.9 -3.1 -5.3
Other 0.0 0.0 -1.8 -1.7
Total changes 2.0 -0.3 -3.2 -1.5
As at 31/12/2021 6.9 2.0 14.6 23.5
of which:
Current 5.7 1.4 8.3 15.3
Non-current 1.3 0.6 6.3 8.1
“Current provisions for risks and charges” amounted to € 33.5 million versus € 31.3 million at 31 December 2020, whereas
“Non-current provisions for risks and charges” amounted to € 56.9 million versus € 51.8 million in the previous year.
More specifically, the “Agent supplementary indemnity provision” recognises the accruals for covering indemnities that
may be due to agents at their employment termination. The provision shows a limited increase of € 0.3 million compared
to the previous year.
The “Product warranty provision”, which represents estimated costs to be borne for technical support of sold products
under warranty, is appropriate in order to hedge the related risk.
The method used to determine this provision is based on historical/statistical data concerning warranty work performed,
costs incurred for such work and products sold on the market which are still under warranty at the evaluation date.
The provision had a net € 7.4 million increase mainly due to increases and decreases recognised in the period related to
normal management activities of the warranty on manufactured and sold products.
The “First installation provision” represents the estimated expense that the Group must bear for interventions of this
type on the products. This has not substantially changed compared with December 2020.
170
The item “Other provisions” includes estimated future charges for corporate restructuring, pending legal disputes and
other risks that it was deemed necessary to cover with appropriate provisions which were estimated based on the avail-
able information.
This has not substantially changed compared with December 2020.
The item “Other” includes the effect of exchange rates for the period and reclassifications.
Note 3.4 – Post employment benefits
The Group has two defined benefit plans for employees; the employee severance indemnity, due by Italian companies to
their employees in compliance with laws in force until 31 December 2015, and other current pension plans mostly in
Switzerland and Germany.
Until 31 December 2006, in Italy, the employee severance indemnity provision (Trattamento di fine rapporto, TFR) was
considered a defined benefit plan. The regulation of this provision was amended by Law no. 296 of 27 December 2006
(“2007 Financial Law”) and subsequent Decrees and Regulations issued in the first few months of 2007. Given these
amendments and in particular in reference to companies with at least 50 employees, this is now considered a defined
benefit plan only for the portions of benefits accrued before 1 January 2007 (and not yet paid as at the end of the report-
ing period, while subsequent to this date, it is comparable to a defined contribution plan.)
IAS 19 expressly envisages the adoption of the “projected unit credit method”, which is based on quantifying the actuarial
liability by considering only the service accrued at the evaluation date, in accordance with the actuarial approach of so-
called “accrued benefits”. In particular, in the projected unit credit method, this characteristic is integrated with the
forecast of the salary trend up to the time that the TFR will probably be paid; the consequent liability is then re-propor-
tioned on the basis of the ratio between the years worked up to the assessment period and the total service at the
probable date of payment of the TFR (should the right be already completely accrued at the evaluation date, there will
be then no re-proportioning of the liability).
Since as from 1 January 2007, for employees belonging to companies with at least 50 employees, no amount is any longer
internally provisioned, but the amounts of TFR accrued subsequent to that period are assigned to the Complementary
Pension Fund or to the INPS (Italian National Social Security Institute) Treasury Fund and the company remains solely
responsible for the duty of re-evaluating the amount accrued at 31 December 2006, the actuarial calculation must esti-
mate, in correspondence to every possible event which leads to the payment of TFR to the worker, the associated prob-
ability, the consequent amount paid and the years of service corresponding to the payment date. The latter, in particular,
is a random variable that can take on any value between initial service and the maximum service that the worker can
perform in correspondence with the retirement, with probabilities that can be deduced from the economic and demo-
graphic technical bases used in the evaluation.
For the related actuarial assessments, the demographic and economic-financial assumptions set out in the attached table
have been adopted.
The pension funds of the German companies are regulated on a pension system based on three pillars.
The “first pillar” (state and obligatory RV-Beitrag) is a defined contribution pension plan, established by the social pension
insurance, based on the pay-as-you-go principle and related to the income limit. It covers employees in the public and
private sector and some categories of self-employed workers and is mainly financed through social security contributions
paid by workers and employers in equal measure and by taxes.
The “second pillar” (BAV: Betriebliche Altersvorsorge) is represented by voluntary supplementary pensions on a pay-as-
you-go basis, and thus with defined benefits falling on both the worker and the company.
The “third pillar” is a voluntary, private savings plan in funds or insurance companies which is encouraged through tax
incentives and subsidies.
There are different types of BAV pension plans that qualify as defined benefit plans (mainly: BVO 74/79, based on em-
ployees’ pension commitments; BVO 79, based on one-off payments; BASIS Versorgung, based on direct insurance; and
ZUSATZ Versorgung, based on employee pension commitments), and the measurement is split between pensioners, early
leavers, and active employees.
Pension plans have developed differently in the Group’s companies in Germany and there are currently two different
pension plans considered as defined benefits plans:

171
the so-called BVO 74/79 which covers all the people who were working on 1 March 1979 and up to 31 December
1994;
the so-called “1995 Pension” which was applied for all employees, including those who benefited from the BVO 74/79,
as from 1 January 1995 to date.
For all employees who started to work in the period March 1979-December 1994 a different defined contribution pension
plan (OLS 79) was applied until December 1994.
For the related actuarial assessments, the demographic and economic-financial assumptions set out in the attached table
have been adopted.
The pension funds of the Swiss companies are regulated on the basis on three pillars:
Public Pillar (AHV/IV): defined benefits, based on the pay-as-you-go principle, regulated at federal level and managed
by a public fund (AVS-Fund), obligatory and aimed at covering basic needs;
Occupational Pillar (BVG): based on the funded principle, regulated at federal level, quasi-obligatory, with the collec-
tive financing principle, but with private cover and management risk;
Private Savings: at the discretion of each resident, in various forms (cash, securities, real estate, personal pension
plans, life insurance).
The pension funds set up pursuant to the second pillar and which affect the Group more directly must be legally inde-
pendent from the sponsor company, segregated in terms of equity and independently managed in the legal form of
cooperative foundations or associations registered with a regulatory authority. The administrative bodies of such associ-
ations consist of an equal number of representatives from the sponsor companies and employees with equal voting
rights, are supported by a management consultant recognised by the law and by qualified actuarial experts, and are
subject to supervision by the regional authorities.
The funds are financed through the contribution of the sponsor company of the employee. The sponsor’s contribution
must be at least 50% (obligatory minimum by law) and the contributions vary from pension fund to pension fund.
The contributions and the return on the market of the invested capital contribute to defining the benefits. A guarantee
is envisaged for a minimum nominal return and a minimum interest rate on the amount paid in. Should it be underfunded,
which is not the case of the Group’s pension funds in Switzerland, it is the responsibility of the sponsor company which
is obligated by law to recapitalise within a reasonable timeframe, not exceeding 10 years.
In the current situation of the Group’s pension funds in Switzerland, the investment risks are met by fluctuation reserves
(i.e. by assets which exceed the actuarial liabilities) and the level of actuarial cover is over 100%; therefore, there is
currently no need for recapitalisation measures.
For the related actuarial assessments, the demographic and economic-financial assumptions set out in the attached table
have been adopted.
In relation to the recognition of the Group’s pension funds:
current employment-related costs have been recognised in the income statement, under Personnel costs;
financial charges on the assumed obligations and the financial gains expected on the plan assets are recognised under
financial income and expense;
actuarial gains and losses are recognised in a specific valuation reserve under equity.
The plan assets do not include the Group’s treasury shares, nor property occupied or used by the Group. The expected
return on plan assets is defined on the basis of the current market conditions.
As from 1 January 2013, with the adoption of revised IAS 19 - Employee Benefits, which removed the option of deferring
the recognition of actuarial gains and losses using the corridor method, the Group restated the provisions for employee
benefits from the end of 2012, transposing the deficits which were not recognised previously for around € 41 million.
At December 2021, the remeasurement of net liabilities emerging in the period amounted to a positive € 0.9 million
against the negative € 2.7 million of December 2020. This trend was affected mainly by the change in the financial and
demographic assumptions used, especially at the Swiss subsidiaries, compensate by Asset ceiling booked in Swiss com-
panies as shown in the description below. Finally, a Swiss subsidiary recognised a surplus on the pension fund under
“other non-current assets” totalling € 0.6 million.
This was mainly the result of the trend in rates and the returns on investments.
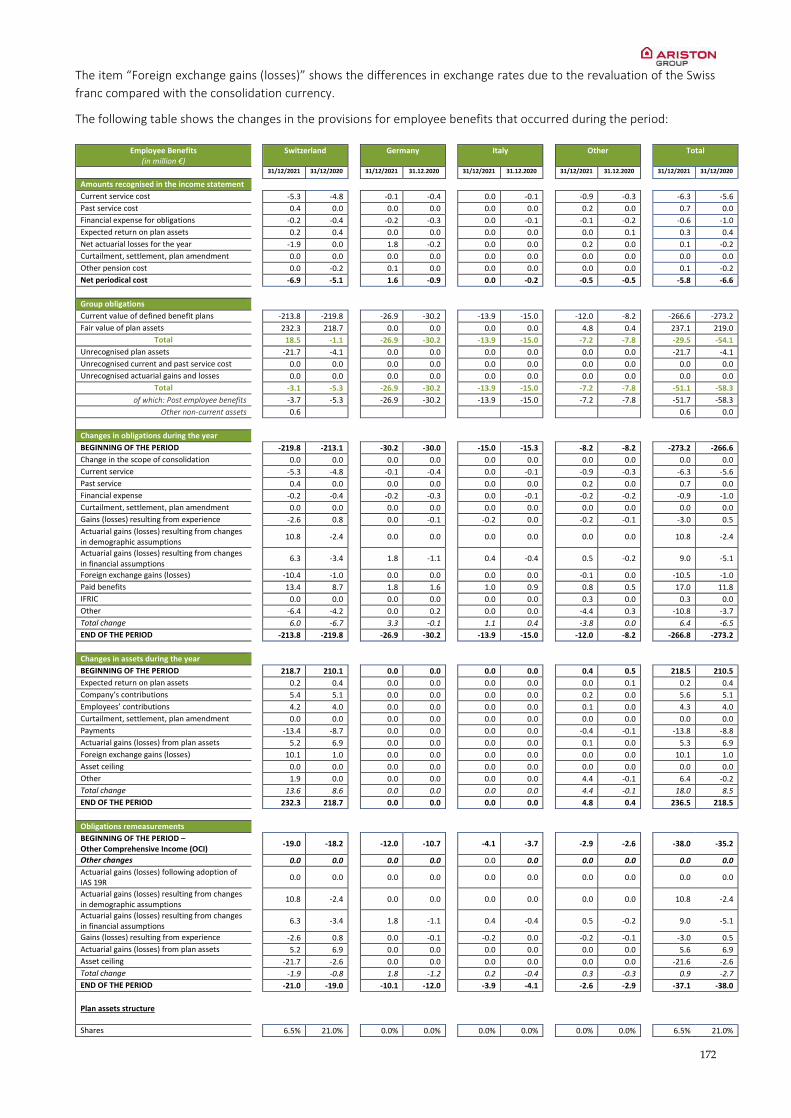
172
The item “Foreign exchange gains (losses)” shows the differences in exchange rates due to the revaluation of the Swiss
franc compared with the consolidation currency.
The following table shows the changes in the provisions for employee benefits that occurred during the period:
Employee Benefits
(in million €) Switzerland Germany Italy Other Total
31/12/2021 31/12/2020
31/12/2021 31.12.2020
31/12/2021 31.12.2020
31/12/2021 31.12.2020
31/12/2021 31/12/2020
Amounts recognised in the income statement
Current service cost -5.3 -4.8 -0.1 -0.4 0.0 -0.1 -0.9 -0.3 -6.3 -5.6
Past service cost 0.4 0.0 0.0 0.0 0.0 0.0 0.2 0.0 0.7 0.0
Financial expense for obligations -0.2 -0.4 -0.2 -0.3 0.0 -0.1 -0.1 -0.2 -0.6 -1.0
Expected return on plan assets 0.2 0.4 0.0 0.0 0.0 0.0 0.0 0.1 0.3 0.4
Net actuarial losses for the year -1.9 0.0 1.8 -0.2 0.0 0.0 0.2 0.0 0.1 -0.2
Curtailment, settlement, plan amendment 0.0 0.0 0.0 0.0 0.0 0.0 0.0 0.0 0.0 0.0
Other pension cost 0.0 -0.2 0.1 0.0 0.0 0.0 0.0 0.0 0.1 -0.2
Net periodical cost -6.9 -5.1 1.6 -0.9 0.0 -0.2 -0.5 -0.5 -5.8 -6.6
Group obligations
Current value of defined benefit plans -213.8 -219.8 -26.9 -30.2 -13.9 -15.0 -12.0 -8.2 -266.6 -273.2
Fair value of plan assets 232.3 218.7 0.0 0.0 0.0 0.0 4.8 0.4 237.1 219.0
Total 18.5 -1.1 -26.9 -30.2 -13.9 -15.0 -7.2 -7.8 -29.5 -54.1
Unrecognised plan assets -21.7 -4.1 0.0 0.0 0.0 0.0 0.0 0.0 -21.7 -4.1
Unrecognised current and past service cost 0.0 0.0 0.0 0.0 0.0 0.0 0.0 0.0 0.0 0.0
Unrecognised actuarial gains and losses 0.0 0.0 0.0 0.0 0.0 0.0 0.0 0.0 0.0 0.0
Total -3.1 -5.3 -26.9 -30.2 -13.9 -15.0 -7.2 -7.8 -51.1 -58.3
of which: Post employee benefits -3.7 -5.3 -26.9 -30.2 -13.9 -15.0 -7.2 -7.8 -51.7 -58.3
Other non-current assets 0.6 0.6 0.0
Changes in obligations during the year
BEGINNING OF THE PERIOD -219.8 -213.1 -30.2 -30.0 -15.0 -15.3 -8.2 -8.2 -273.2 -266.6
Change in the scope of consolidation 0.0 0.0 0.0 0.0 0.0 0.0 0.0 0.0 0.0 0.0
Current service -5.3 -4.8 -0.1 -0.4 0.0 -0.1 -0.9 -0.3 -6.3 -5.6
Past service 0.4 0.0 0.0 0.0 0.0 0.0 0.2 0.0 0.7 0.0
Financial expense -0.2 -0.4 -0.2 -0.3 0.0 -0.1 -0.2 -0.2 -0.9 -1.0
Curtailment, settlement, plan amendment 0.0 0.0 0.0 0.0 0.0 0.0 0.0 0.0 0.0 0.0
Gains (losses) resulting from experience -2.6 0.8 0.0 -0.1 -0.2 0.0 -0.2 -0.1 -3.0 0.5
Actuarial gains (losses) resulting from changes in demographic assumptions
10.8 -2.4 0.0 0.0 0.0 0.0 0.0 0.0 10.8 -2.4
Actuarial gains (losses) resulting from changes in financial assumptions
6.3 -3.4 1.8 -1.1 0.4 -0.4 0.5 -0.2 9.0 -5.1
Foreign exchange gains (losses) -10.4 -1.0 0.0 0.0 0.0 0.0 -0.1 0.0 -10.5 -1.0
Paid benefits 13.4 8.7 1.8 1.6 1.0 0.9 0.8 0.5 17.0 11.8
IFRIC 0.0 0.0 0.0 0.0 0.0 0.0 0.3 0.0 0.3 0.0
Other
-6.4 -4.2 0.0 0.2 0.0 0.0 -4.4 0.3 -10.8 -3.7
Total change
6.0 -6.7 3.3 -0.1 1.1 0.4 -3.8 0.0 6.4 -6.5
END OF THE PERIOD
-213.8 -219.8 -26.9 -30.2 -13.9 -15.0 -12.0 -8.2 -266.8 -273.2
Changes in assets during the year
BEGINNING OF THE PERIOD
218.7 210.1 0.0 0.0 0.0 0.0 0.4 0.5 218.5 210.5
Expected return on plan assets
0.2 0.4 0.0 0.0 0.0 0.0 0.0 0.1 0.2 0.4
Company’s contributions
5.4 5.1 0.0 0.0 0.0 0.0 0.2 0.0 5.6 5.1
Employees’ contributions
4.2 4.0 0.0 0.0 0.0 0.0 0.1 0.0 4.3 4.0
Curtailment, settlement, plan amendment
0.0 0.0 0.0 0.0 0.0 0.0 0.0 0.0 0.0 0.0
Payments
-13.4 -8.7 0.0 0.0 0.0 0.0 -0.4 -0.1 -13.8 -8.8
Actuarial gains (losses) from plan assets
5.2 6.9 0.0 0.0 0.0 0.0 0.1 0.0 5.3 6.9
Foreign exchange gains (losses)
10.1 1.0 0.0 0.0 0.0 0.0 0.0 0.0 10.1 1.0
Asset ceiling
0.0 0.0 0.0 0.0 0.0 0.0 0.0 0.0 0.0 0.0
Other
1.9 0.0 0.0 0.0 0.0 0.0 4.4 -0.1 6.4 -0.2
Total change
13.6 8.6 0.0 0.0 0.0 0.0 4.4 -0.1 18.0 8.5
END OF THE PERIOD
232.3 218.7 0.0 0.0 0.0 0.0 4.8 0.4 236.5 218.5
Obligations remeasurements
BEGINNING OF THE PERIOD – Other Comprehensive Income (OCI)
-19.0 -18.2 -12.0 -10.7 -4.1 -3.7 -2.9 -2.6 -38.0 -35.2
Other changes
0.0 0.0 0.0 0.0 0.0 0.0 0.0 0.0 0.0 0.0
Actuarial gains (losses) following adoption of IAS 19R
0.0 0.0 0.0 0.0 0.0 0.0 0.0 0.0 0.0 0.0
Actuarial gains (losses) resulting from changes in demographic assumptions
10.8 -2.4 0.0 0.0 0.0 0.0 0.0 0.0 10.8 -2.4
Actuarial gains (losses) resulting from changes in financial assumptions
6.3 -3.4 1.8 -1.1 0.4 -0.4 0.5 -0.2 9.0 -5.1
Gains (losses) resulting from experience
-2.6 0.8 0.0 -0.1 -0.2 0.0 -0.2 -0.1 -3.0 0.5
Actuarial gains (losses) from plan assets
5.2 6.9 0.0 0.0 0.0 0.0 0.0 0.0 5.6 6.9
Asset ceiling
-21.7 -2.6 0.0 0.0 0.0 0.0 0.0 0.0 -21.6 -2.6
Total change
-1.9 -0.8 1.8 -1.2 0.2 -0.4 0.3 -0.3 0.9 -2.7
END OF THE PERIOD
-21.0 -19.0 -10.1 -12.0 -3.9 -4.1 -2.6 -2.9 -37.1 -38.0
Plan assets structure
Shares
6.5% 21.0% 0.0% 0.0% 0.0% 0.0% 0.0% 0.0% 6.5% 21.0%
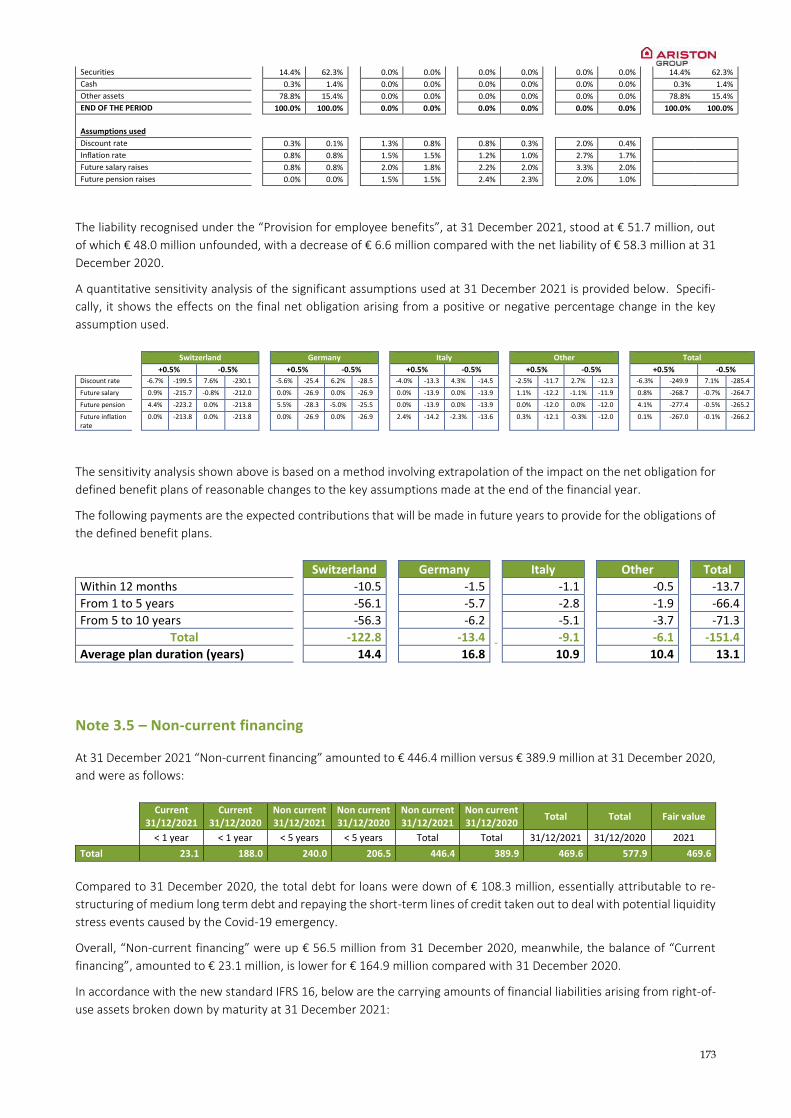
173
Securities
14.4% 62.3% 0.0% 0.0% 0.0% 0.0% 0.0% 0.0% 14.4% 62.3%
Cash
0.3% 1.4% 0.0% 0.0% 0.0% 0.0% 0.0% 0.0% 0.3% 1.4%
Other assets
78.8% 15.4% 0.0% 0.0% 0.0% 0.0% 0.0% 0.0% 78.8% 15.4%
END OF THE PERIOD
100.0% 100.0% 0.0% 0.0% 0.0% 0.0% 0.0% 0.0% 100.0% 100.0%
Assumptions used
Discount rate
0.3% 0.1% 1.3% 0.8% 0.8% 0.3% 2.0% 0.4%
Inflation rate
0.8% 0.8% 1.5% 1.5% 1.2% 1.0% 2.7% 1.7%
Future salary raises
0.8% 0.8% 2.0% 1.8% 2.2% 2.0% 3.3% 2.0%
Future pension raises
0.0% 0.0% 1.5% 1.5% 2.4% 2.3% 2.0% 1.0%
The liability recognised under the “Provision for employee benefits”, at 31 December 2021, stood at € 51.7 million, out
of which € 48.0 million unfounded, with a decrease of € 6.6 million compared with the net liability of € 58.3 million at 31
December 2020.
A quantitative sensitivity analysis of the significant assumptions used at 31 December 2021 is provided below. Specifi-
cally, it shows the effects on the final net obligation arising from a positive or negative percentage change in the key
assumption used.
Switzerland
Germany
Italy
Other
Total
+0.5% -0.5% +0.5% -0.5% +0.5% -0.5% +0.5% -0.5% +0.5% -0.5%
Discount rate -6.7% -199.5 7.6% -230.1
-5.6% -25.4 6.2% -28.5
-4.0% -13.3 4.3% -14.5
-2.5% -11.7 2.7% -12.3
-6.3% -249.9 7.1% -285.4
Future salary 0.9% -215.7 -0.8% -212.0
0.0% -26.9 0.0% -26.9
0.0% -13.9 0.0% -13.9
1.1% -12.2 -1.1% -11.9
0.8% -268.7 -0.7% -264.7
Future pension 4.4% -223.2 0.0% -213.8
5.5% -28.3 -5.0% -25.5
0.0% -13.9 0.0% -13.9
0.0% -12.0 0.0% -12.0
4.1% -277.4 -0.5% -265.2
Future inflation rate
0.0% -213.8 0.0% -213.8
0.0% -26.9 0.0% -26.9
2.4% -14.2 -2.3% -13.6
0.3% -12.1 -0.3% -12.0
0.1% -267.0 -0.1% -266.2
The sensitivity analysis shown above is based on a method involving extrapolation of the impact on the net obligation for
defined benefit plans of reasonable changes to the key assumptions made at the end of the financial year.
The following payments are the expected contributions that will be made in future years to provide for the obligations of
the defined benefit plans.
Switzerland
Germany
Italy
Other
Total
Within 12 months -10.5
-1.5
-1.1
-0.5
-13.7
From 1 to 5 years -56.1
-5.7
-2.8
-1.9
-66.4
From 5 to 10 years -56.3
-6.2
-5.1
-3.7
-71.3
Total -122.8
-13.4 -9.1
-6.1
-151.4
Average plan duration (years) 14.4
16.8 10.9 10.4
13.1
Note 3.5 – Non-current financing
At 31 December 2021 “Non-current financing” amounted to € 446.4 million versus € 389.9 million at 31 December 2020,
and were as follows:
Current 31/12/2021
Current 31/12/2020
Non current 31/12/2021
Non current 31/12/2020
Non current 31/12/2021
Non current 31/12/2020
Total Total Fair value
< 1 year < 1 year < 5 years < 5 years Total Total 31/12/2021 31/12/2020 2021
Total 23.1 188.0 240.0 206.5 446.4 389.9 469.6 577.9 469.6
Compared to 31 December 2020, the total debt for loans were down of € 108.3 million, essentially attributable to re-
structuring of medium long term debt and repaying the short-term lines of credit taken out to deal with potential liquidity
stress events caused by the Covid-19 emergency.
Overall, “Non-current financing” were up € 56.5 million from 31 December 2020, meanwhile, the balance of “Current
financing”, amounted to € 23.1 million, is lower for € 164.9 million compared with 31 December 2020.
In accordance with the new standard IFRS 16, below are the carrying amounts of financial liabilities arising from right-of-
use assets broken down by maturity at 31 December 2021:
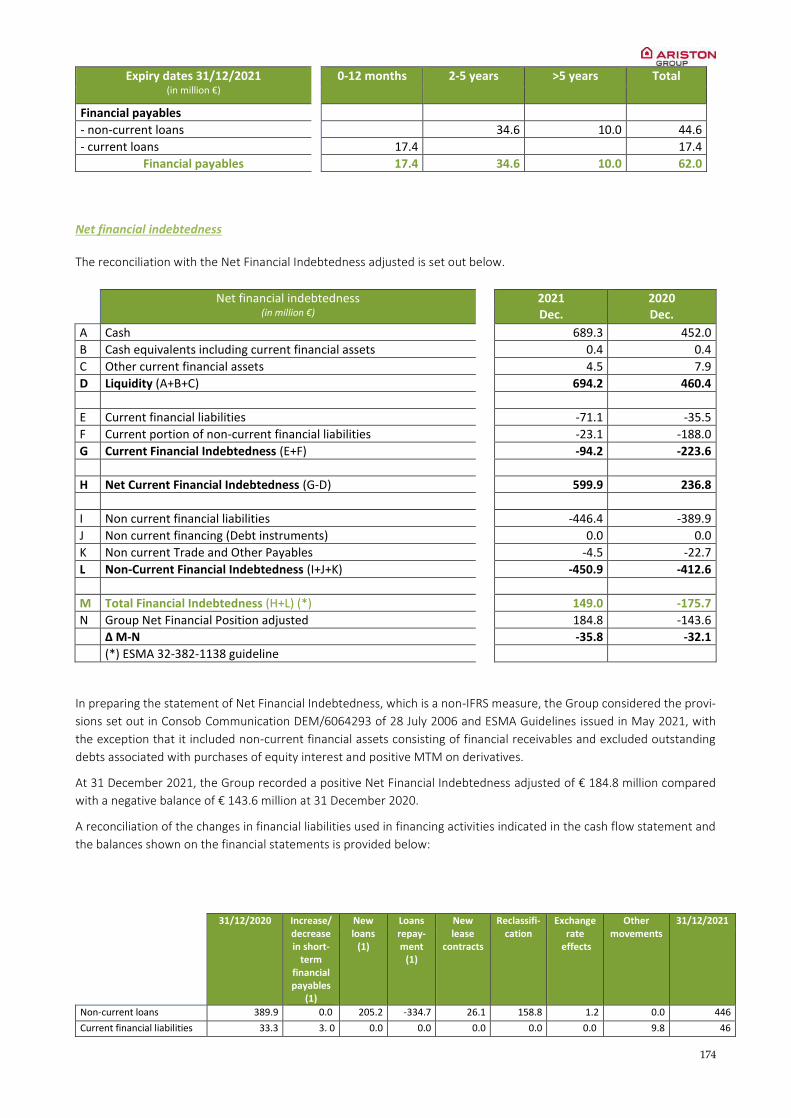
174
Expiry dates 31/12/2021 (in million €)
0-12 months 2-5 years >5 years Total
Financial payables
- non-current loans 34.6 10.0 44.6
- current loans 17.4 17.4
Financial payables 17.4 34.6 10.0 62.0
Net financial indebtedness
The reconciliation with the Net Financial Indebtedness adjusted is set out below.
Net financial indebtedness (in million €)
2021 Dec.
2020 Dec.
A Cash 689.3 452.0
B Cash equivalents including current financial assets 0.4 0.4
C Other current financial assets
4.5 7.9
D Liquidity (A+B+C)
694.2 460.4
E Current financial liabilities -71.1 -35.5
F Current portion of non-current financial liabilities -23.1 -188.0
G Current Financial Indebtedness (E+F) -94.2 -223.6
H Net Current Financial Indebtedness (G-D) 599.9 236.8
I Non current financial liabilities -446.4 -389.9
J Non current financing (Debt instruments) 0.0 0.0
K Non current Trade and Other Payables -4.5 -22.7
L Non-Current Financial Indebtedness (I+J+K) -450.9 -412.6
M Total Financial Indebtedness (H+L) (*) 149.0 -175.7
N Group Net Financial Position adjusted 184.8 -143.6
∆ M-N -35.8 -32.1
(*) ESMA 32-382-1138 guideline
In preparing the statement of Net Financial Indebtedness, which is a non-IFRS measure, the Group considered the provi-
sions set out in Consob Communication DEM/6064293 of 28 July 2006 and ESMA Guidelines issued in May 2021, with
the exception that it included non-current financial assets consisting of financial receivables and excluded outstanding
debts associated with purchases of equity interest and positive MTM on derivatives.
At 31 December 2021, the Group recorded a positive Net Financial Indebtedness adjusted of € 184.8 million compared
with a negative balance of € 143.6 million at 31 December 2020.
A reconciliation of the changes in financial liabilities used in financing activities indicated in the cash flow statement and
the balances shown on the financial statements is provided below:
31/12/2020 Increase/ decrease in short-
term financial payables
(1)
New loans
(1)
Loans repay-ment
(1)
New lease
contracts
Reclassifi-cation
Exchange rate
effects
Other movements
31/12/2021
Non-current loans 389.9 0.0 205.2 -334.7 26.1 158.8 1.2 0.0 446
Current financial liabilities 33.3 3. 0 0.0 0.0 0.0 0.0 0.0 9.8 46

175
Current loans 188.0 -5.9 0.0 0.0 0.0 -158.8 0.6 -0.8 23
Total 611.2 -2.9 205.2 -334.7 26.1 0.0 1.7 9.0 515.6
(1): Included in the Cash flow Statement
Note 3.6 – Other non-current liabilities
“Other non-current liabilities” amounted to € 4.9 million versus € 40.0 million of the previous year. These liabilities are
represented primarily by debts to be extinguished beyond the year.
“Other non-current liabilities” largely reflected the fair value of the debt resulting from the measurement of the individual
obligations associated with put and call options on non-controlling interests in the recently acquired entities, primarily
the Danish entity Gastech-Energi A/S, the Israeli group Atmor Industries Ltd, the German company Kesselheld GmbH and
the newly acquired Haas Heating B.V.
The reduction of the period was due to:
the reclassification of the fair value of the debt resulting from the measurement of the obligations associated with
put and call options on non-controlling interests of HTP Comfort Solutions LLC, now known as Ariston Thermo USA
LLC to the “Note 3.13 – Other current liabilities”;
the reclassification of the € 13.8 million related to the 2020 Long Term Incentive (LTI) cash-based that was accounted
in equity according to IFRS 2 principle being the LTI shifted to a share-based plan.
Note 3.7 – Non-current tax liabilities
“Non-current tax liabilities” amounted to € 7.8 million as 31 December 2021, €6.5 million refers to the third payment of
the substitute income tax (overall equal to 3% of the accounting revaluation carried out in the local financial statements
of Italian companies), whose payment shall be made within the deadline for paying the balance of income taxes for tax
period 2022.
Note 3.8 – Trade payables
“Trade payables” at 31 December 2021 amounted to € 477.2 million showing an increase of € 113.1 million, compared
with 31 December 2020. They are not subject to interests and their carrying value is believed to be close to the fair value
at the end of the reporting period.
Trade payables in terms of the average number of days for payment, amounted to 97 days in 2021 and 98 days in 2020.

176
Note 3.9 – Tax payables
“Tax payables” amounted to € 45.1 million versus € 21.6 million in 2020.
Tax payables (in million €)
31/12/2021 31/12/2020
Income tax payables 27.2 8.5
Tax payables due to Parent company 10.4 6.0
Other tax payables
7.5 7.2
Tax payables
45.1 21.6
This item comprises the income tax payables related to foreign companies and the IRES and IRAP tax payables from Italian
companies, as well as “income tax payables” represented by corporate income tax debt and ‘imposta sostitutiva’ on
assets revaluation (Italian Law no. 104/2020) and IRAP to be paid within the deadline for paying the balance of income
taxes for the tax period 2021.
The increase in “Income tax payables” amounted to € 27.2 million versus € 8.5 million of the previous year is mainly due
to higher tax payables.
Note 3.10 – Current provisions
This item amounts to € 33.5 million and is described in the note 3.3 - “Non-current provisions for risks and charges”, to
which reference should be made.
Note 3.11 – Current financial liabilities
At 31 December 2021, “Current financial liabilities” amounted to € 46.1 million versus € 34.1 million at 31 December
2020.
Liabilities are the following:
Current financial liabilities (in million €)
31/12/2021 31/12/2020
Short term debt due to bank 22.8 17.0
Financial derivative liabilities 7.4 4.3
Other current financial liabilities 15.8 12.9
Current financial liabilities 46.1 34.1
Payables due to banks for short-term loans showed a € 22.8 million increased essentially for drawdown on short-term
lines and lines of credit denominated in foreign currency used to manage exchange rate risk at the consolidated level.
Short-term uncommitted credit lines amounted to approximately € 384 million and are represented almost entirely by
current account credit lines and advances, utilized on 31 December 2021 for € 34 million.
At 31 December 2021, “Financial derivate liabilities” amounted to € 7.4 million and includes the negative fair value and
accruals of financial derivatives instruments.
The fair value of financial derivatives included hedge on interest rates for € 1.2 million, on exchange rate for € 1.2 million
and for raw material € 0.1 million.
The change in commodity, foreign exchange and interest rates hedges was offset by the change in the underlying hedged
item. The fair value measurement of the derivative instruments about has a direct contra-entry in the equity reserve
related to the cash flow hedge for a total of € 0.9 million. For a more detailed explanation of hedging instruments, see
section on the instruments for financial risk management.
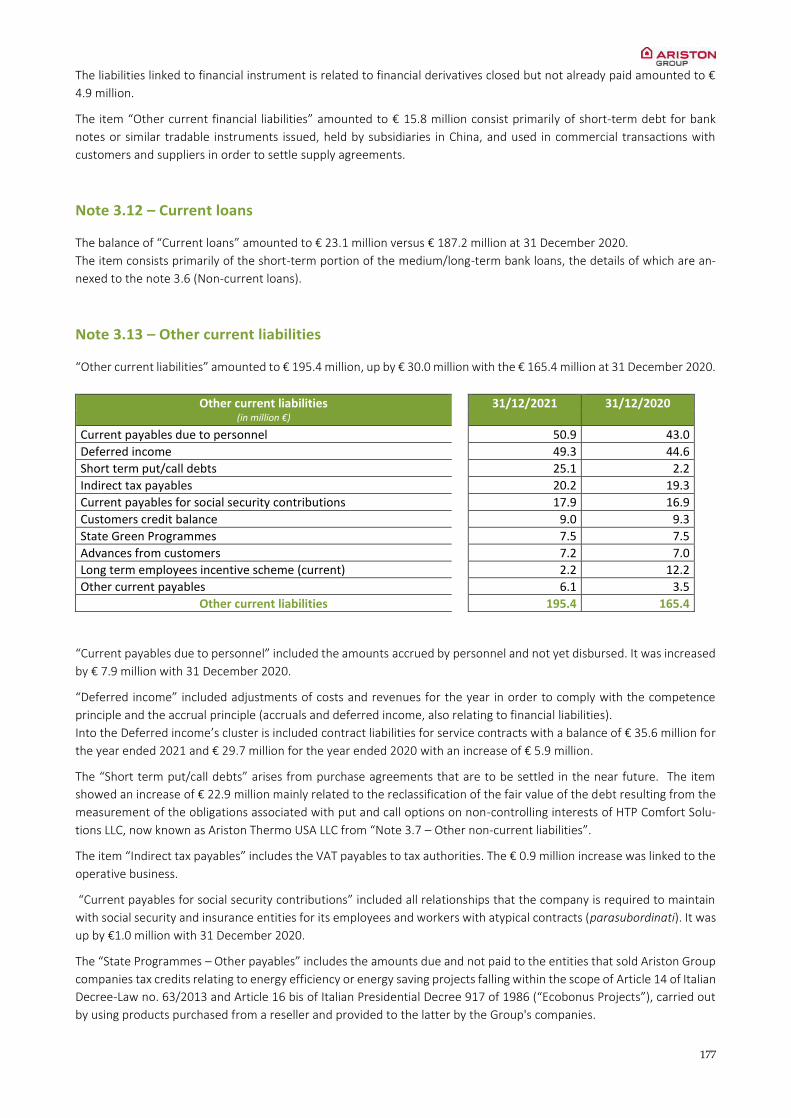
177
The liabilities linked to financial instrument is related to financial derivatives closed but not already paid amounted to €
4.9 million.
The item “Other current financial liabilities” amounted to € 15.8 million consist primarily of short-term debt for bank
notes or similar tradable instruments issued, held by subsidiaries in China, and used in commercial transactions with
customers and suppliers in order to settle supply agreements.
Note 3.12 – Current loans
The balance of “Current loans” amounted to € 23.1 million versus € 187.2 million at 31 December 2020.
The item consists primarily of the short-term portion of the medium/long-term bank loans, the details of which are an-
nexed to the note 3.6 (Non-current loans).
Note 3.13 – Other current liabilities
“Other current liabilities” amounted to € 195.4 million, up by € 30.0 million with the € 165.4 million at 31 December 2020.
Other current liabilities (in million €)
31/12/2021 31/12/2020
Current payables due to personnel 50.9 43.0
Deferred income 49.3 44.6
Short term put/call debts
25.1 2.2
Indirect tax payables
20.2 19.3
Current payables for social security contributions 17.9 16.9
Customers credit balance 9.0 9.3
State Green Programmes 7.5 7.5
Advances from customers 7.2 7.0
Long term employees incentive scheme (current) 2.2 12.2
Other current payables 6.1 3.5
Other current liabilities 195.4 165.4
“Current payables due to personnel” included the amounts accrued by personnel and not yet disbursed. It was increased
by € 7.9 million with 31 December 2020.
“Deferred income” included adjustments of costs and revenues for the year in order to comply with the competence
principle and the accrual principle (accruals and deferred income, also relating to financial liabilities).
Into the Deferred income’s cluster is included contract liabilities for service contracts with a balance of € 35.6 million for
the year ended 2021 and € 29.7 million for the year ended 2020 with an increase of € 5.9 million.
The “Short term put/call debts” arises from purchase agreements that are to be settled in the near future. The item
showed an increase of € 22.9 million mainly related to the reclassification of the fair value of the debt resulting from the
measurement of the obligations associated with put and call options on non-controlling interests of HTP Comfort Solu-
tions LLC, now known as Ariston Thermo USA LLC from “Note 3.7 – Other non-current liabilities”.
The item “Indirect tax payables” includes the VAT payables to tax authorities. The € 0.9 million increase was linked to the
operative business.
“Current payables for social security contributions” included all relationships that the company is required to maintain
with social security and insurance entities for its employees and workers with atypical contracts (parasubordinati). It was
up by €1.0 million with 31 December 2020.
The “State Programmes – Other payables” includes the amounts due and not paid to the entities that sold Ariston Group
companies tax credits relating to energy efficiency or energy saving projects falling within the scope of Article 14 of Italian
Decree-Law no. 63/2013 and Article 16 bis of Italian Presidential Decree 917 of 1986 (“Ecobonus Projects”), carried out
by using products purchased from a reseller and provided to the latter by the Group's companies.

178
The item “Advances from customers” shows all advances received from customers for supplies not yet delivered. The
item was substantially in line with 31 December 2020.
The item “Long term employees incentive scheme” reflects the obligation under a three-year long-term incentive plan
(LTI), to be awarded to the group of senior managers. The reduction is due to the reclassification in equity, according to
IFRS 2 principle, being most of incentive schemes shifted to a share-based plan.
Note 3.14 – Liabilities held for sale
There are no “Liabilities held for sale”.

179
6.4 Other information
COMMITMENTS AND RISKS
The Group reported the following potential liabilities as at the end of the reporting period:
Guarantees issued
The sureties issued in favour of third parties amounted to € 0.6 million.
Third-party assets in deposit accounts amounted to € 14.1 million.
No collateral guarantees are issued by the Group.
Commitments
The commitments outstanding at 31 December 2021, equal to € 0.1 million, referred to the equivalent value of the pay-
ments (USD 0.1 million) of additional shares in an ''Investment company in risk capital (SICAR) provision'' specializing in
interventions in sectors in which the Group operates, to be carried out when they will be called up by the fund managers
for the established commitment.
At 31 December 2021, there were no other commitments to be mentioned except for the ones concerning the call and
put options entered into as part of the recent acquisitions and already accounted for as “Other liabilities”.
Legal disputes
Provisions recognised in the financial statements are deemed as fair in reference to the legal disputes that may have
potential critical outcomes for the Group, also in terms of the significance of such outcomes.

180
FINANCIAL INSTRUMENTS AND RISK MANAGEMENT
Below are the Group's financial instruments recognised by category and level of confidence of their fair value measure-
ments at 31 December 2021:
31/12/2021 (in million €)
Note Carrying value per type
Fair value
Fin. instr. at fair value
through P&L
Fin. instr. at fair value
through OCI
Available for sale
Loans & receiva-
bles
Fin. liabilities
at amortised
cost
Total
Level 1 Level 2 Level 3 Total
Measured at : Fair value
Fair value
Fair value
Amor-tised cost
Amor-tised cost
Financial assets
Cash and cash equivalents
2.1 0 0 0 689.7 0 689.7
0 0 0 0
Trade receivables 2.9 0 0 0 248.3 0 248.3
0 0 0 0
Current financial assets
2.1 0 0.8 0 9.0 1.0 10.8 0 0.8 0 0.8
Financial assets 2.5 0 0 0 5.2 0 5.2 0 0 0 0
Non-current financial assets
2.6 0 0 0 0 0 0 0 0 0 0
Assets held for sale 2.1 2.3 0 0 0 0 2.3 0 0 2.3 2.3
Total 2.3 0.8 0 952.1 1.0 956.2 0 0.8 2.3 3.1
Financial liabilities
Trade payables 3.8 0 0 0 0 477.2 477.2 0 0 0 0
Current financial liabilities
3.1 0 2.5 0 0 43.6 46.1 0 2.5 0 2.5
Current financing 3.1 0 0 0 0 23.1 23.1 0 0 0 0
Non-current financial liabilities
3.5 0 0 0 0 0 0 0 0 0 0
Non-current loans 3.6 0 0 0 0 446.4 446.4 0 0 0 0
Total 0 2.5 0 0 990.3 992.8 0 2.5 0 2.5
Financial instruments balance
2.3 -1.7 0 952.1 -989.3 -36.6 0 -1.7 2.3 0.6
The financial instruments of the Group, recognised in the financial statements with a similar breakdown at 31 December
2020, are shown in the table below:
31/12/2020 (in million €)
Note Carrying value per type
Fair value
Fin. instr. at fair value
through P&L
Fin. instr. at fair value
through OCI
Available for sale
Loans & receiva-
bles
Fin. liabilities
at amortised
cost
Total
Level 1 Level 2 Level 3 Total
Measured at : Fair value
Fair value
Fair value
Amor-tised cost
Amor-tised cost
Financial assets
Cash and cash equivalents
2.13 0 0 0 452.5 0 452.5
0 0 0 0
Trade receivables 2.9 0 0 0 235.8 0 235.8
0 0 0 0
Current financial assets
2.11 0 2.1 0 7.9 0 10.0 0 2.1 0 2.1
Financial assets 2.5 0 0 0 3.9 0 3.9 0 0 0 0
Non-current financial assets
2.6 0 0 5.1 0 0 5.1 0 0 0 0
Assets held for sale 2.14 0.3 0 0 0 0 0.3 0 0 0.3 0.3
Total 0.3 2.1 5.1 700.0 0 707.6 0 2.1 0.3 2.4
Financial liabilities
Trade payables 3.8 0 0 0 0 364.1 364.1 0 0 0 0
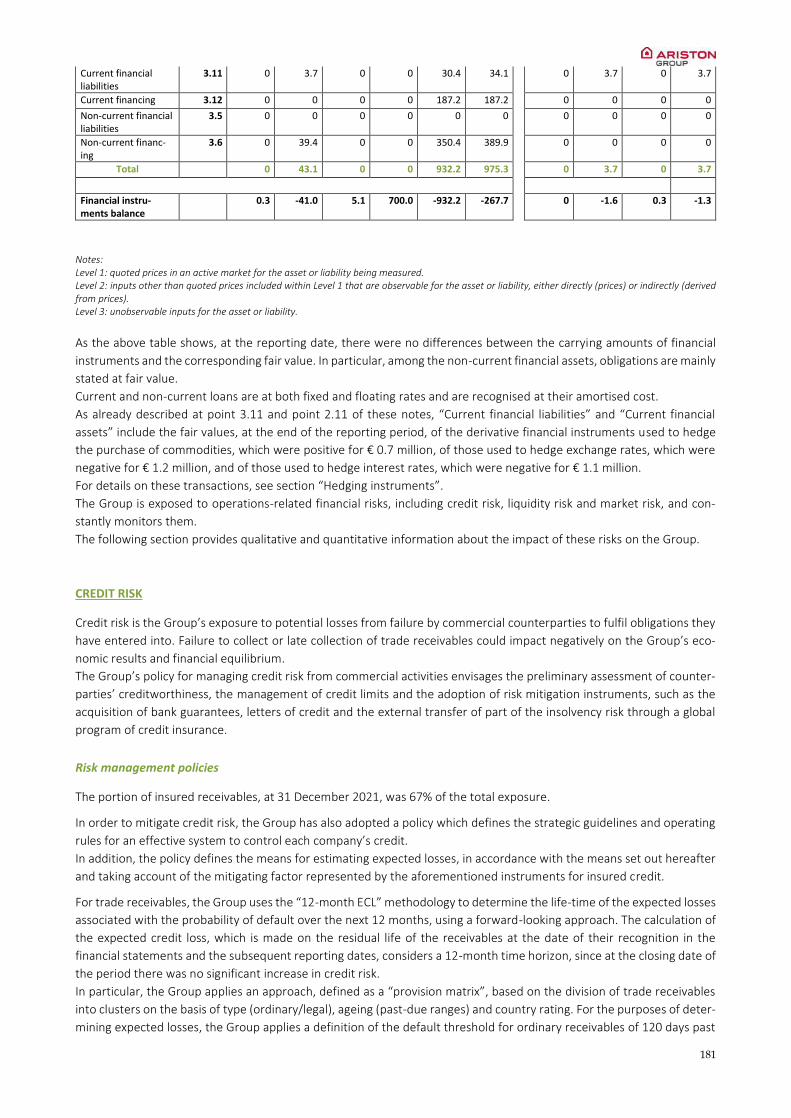
181
Current financial liabilities
3.11 0 3.7 0 0 30.4 34.1 0 3.7 0 3.7
Current financing 3.12 0 0 0 0 187.2 187.2 0 0 0 0
Non-current financial liabilities
3.5 0 0 0 0 0 0 0 0 0 0
Non-current financ-ing
3.6 0 39.4 0 0 350.4 389.9 0 0 0 0
Total 0 43.1 0 0 932.2 975.3 0 3.7 0 3.7
Financial instru-ments balance
0.3 -41.0 5.1 700.0 -932.2 -267.7 0 -1.6 0.3 -1.3
Notes: Level 1: quoted prices in an active market for the asset or liability being measured. Level 2: inputs other than quoted prices included within Level 1 that are observable for the asset or liability, either directly (prices) or indirectly (derived from prices). Level 3: unobservable inputs for the asset or liability.
As the above table shows, at the reporting date, there were no differences between the carrying amounts of financial
instruments and the corresponding fair value. In particular, among the non-current financial assets, obligations are mainly
stated at fair value.
Current and non-current loans are at both fixed and floating rates and are recognised at their amortised cost.
As already described at point 3.11 and point 2.11 of these notes, “Current financial liabilities” and “Current financial
assets” include the fair values, at the end of the reporting period, of the derivative financial instruments used to hedge
the purchase of commodities, which were positive for € 0.7 million, of those used to hedge exchange rates, which were
negative for € 1.2 million, and of those used to hedge interest rates, which were negative for € 1.1 million.
For details on these transactions, see section “Hedging instruments”.
The Group is exposed to operations-related financial risks, including credit risk, liquidity risk and market risk, and con-
stantly monitors them.
The following section provides qualitative and quantitative information about the impact of these risks on the Group.
CREDIT RISK
Credit risk is the Group’s exposure to potential losses from failure by commercial counterparties to fulfil obligations they
have entered into. Failure to collect or late collection of trade receivables could impact negatively on the Group’s eco-
nomic results and financial equilibrium.
The Group’s policy for managing credit risk from commercial activities envisages the preliminary assessment of counter-
parties’ creditworthiness, the management of credit limits and the adoption of risk mitigation instruments, such as the
acquisition of bank guarantees, letters of credit and the external transfer of part of the insolvency risk through a global
program of credit insurance.
Risk management policies
The portion of insured receivables, at 31 December 2021, was 67% of the total exposure.
In order to mitigate credit risk, the Group has also adopted a policy which defines the strategic guidelines and operating
rules for an effective system to control each company’s credit.
In addition, the policy defines the means for estimating expected losses, in accordance with the means set out hereafter
and taking account of the mitigating factor represented by the aforementioned instruments for insured credit.
For trade receivables, the Group uses the “12-month ECL” methodology to determine the life-time of the expected losses
associated with the probability of default over the next 12 months, using a forward-looking approach. The calculation of
the expected credit loss, which is made on the residual life of the receivables at the date of their recognition in the
financial statements and the subsequent reporting dates, considers a 12-month time horizon, since at the closing date of
the period there was no significant increase in credit risk.
In particular, the Group applies an approach, defined as a “provision matrix”, based on the division of trade receivables
into clusters on the basis of type (ordinary/legal), ageing (past-due ranges) and country rating. For the purposes of deter-
mining expected losses, the Group applies a definition of the default threshold for ordinary receivables of 120 days past
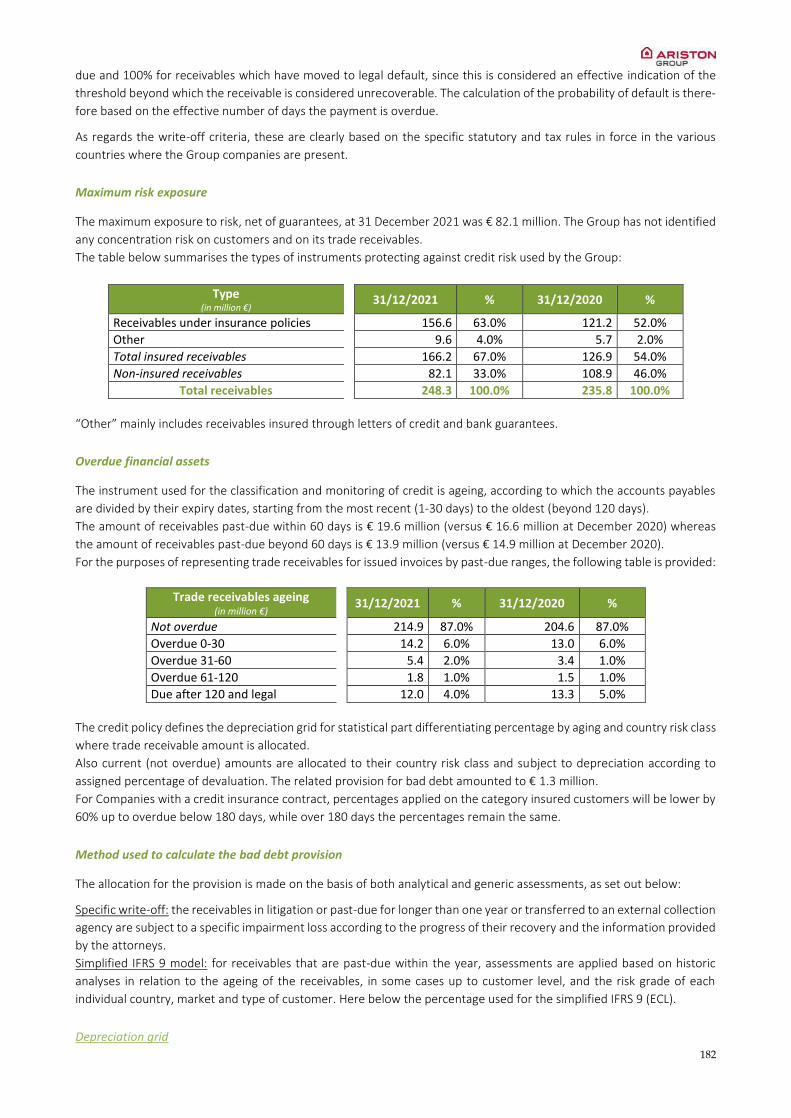
182
due and 100% for receivables which have moved to legal default, since this is considered an effective indication of the
threshold beyond which the receivable is considered unrecoverable. The calculation of the probability of default is there-
fore based on the effective number of days the payment is overdue.
As regards the write-off criteria, these are clearly based on the specific statutory and tax rules in force in the various
countries where the Group companies are present.
Maximum risk exposure
The maximum exposure to risk, net of guarantees, at 31 December 2021 was € 82.1 million. The Group has not identified
any concentration risk on customers and on its trade receivables.
The table below summarises the types of instruments protecting against credit risk used by the Group:
Type (in million €)
31/12/2021 % 31/12/2020 %
Receivables under insurance policies 156.6 63.0% 121.2 52.0%
Other 9.6 4.0% 5.7 2.0%
Total insured receivables 166.2 67.0% 126.9 54.0%
Non-insured receivables 82.1 33.0% 108.9 46.0%
Total receivables 248.3 100.0% 235.8 100.0%
“Other” mainly includes receivables insured through letters of credit and bank guarantees.
Overdue financial assets
The instrument used for the classification and monitoring of credit is ageing, according to which the accounts payables
are divided by their expiry dates, starting from the most recent (1-30 days) to the oldest (beyond 120 days).
The amount of receivables past-due within 60 days is € 19.6 million (versus € 16.6 million at December 2020) whereas
the amount of receivables past-due beyond 60 days is € 13.9 million (versus € 14.9 million at December 2020).
For the purposes of representing trade receivables for issued invoices by past-due ranges, the following table is provided:
Trade receivables ageing (in million €)
31/12/2021 % 31/12/2020 %
Not overdue 214.9 87.0% 204.6 87.0%
Overdue 0-30 14.2 6.0% 13.0 6.0%
Overdue 31-60 5.4 2.0% 3.4 1.0%
Overdue 61-120 1.8 1.0% 1.5 1.0%
Due after 120 and legal 12.0 4.0% 13.3 5.0%
The credit policy defines the depreciation grid for statistical part differentiating percentage by aging and country risk class
where trade receivable amount is allocated.
Also current (not overdue) amounts are allocated to their country risk class and subject to depreciation according to
assigned percentage of devaluation. The related provision for bad debt amounted to € 1.3 million.
For Companies with a credit insurance contract, percentages applied on the category insured customers will be lower by
60% up to overdue below 180 days, while over 180 days the percentages remain the same.
Method used to calculate the bad debt provision
The allocation for the provision is made on the basis of both analytical and generic assessments, as set out below:
Specific write-off: the receivables in litigation or past-due for longer than one year or transferred to an external collection
agency are subject to a specific impairment loss according to the progress of their recovery and the information provided
by the attorneys.
Simplified IFRS 9 model: for receivables that are past-due within the year, assessments are applied based on historic
analyses in relation to the ageing of the receivables, in some cases up to customer level, and the risk grade of each
individual country, market and type of customer. Here below the percentage used for the simplified IFRS 9 (ECL).
Depreciation grid

183
Trade receivables aging Country risk A Country risk B Country risk C Country risk D
Overdue > 360 days 70% 80% 90% 100%
Overdue 271- 360 50% 60% 70% 90%
Overdue 181- 270 35% 40% 50% 70%
Overdue 121-180 20% 25% 35% 50%
Overdue 91-120 12.5% 15% 20% 30%
Overdue 61-90 7.5% 10% 12.5% 20%
Overdue 1-60 2.5% 5% 7.5% 10%
Overdue 0-30 1.25% 1.5% 2.5% 5%
Current (not overdue) 0.5% 0.75% 1% 1.5%
Following is the summary of the specific and simplified ECLs assessments used to determine the bad debt provision:
Analysis of bad debt provision 31/12/2021 31/12/2020
Total receivables Gross 267.3 254.6
Provision 19.0 18.8
Net 248.3 235.8
Receivables impaired on a specific basis Gross 6.7 8.1
Provision 6.0 6.4
Net 0.7 1.6
Receivables impaired on a simplified ECLs Gross 260.6 246.5
Provision 13.0 12.4
Net 247.6 234.1
LIQUIDITY RISK
At 31 December 2021, the Group’s “Overall available liquidity”, defined as the sum of cash and cash equivalents and the
unused portion of committed lines of credit only (equal to € 530 million at December month-end) amounted to approxi-
mately € 1,220 million.
As at 31 December 2021, the Group's overall bank credit lines, including the used and unused credit lines (both committed
and uncommitted) totalled approximately €1.2 billion, of which approximately 36% was drawn.
The primary sources of liquidity for its business comprise cash generated from operations and bank financing.
The Group periodically assesses its financial needs, in order to act in a timely manner to find the necessary additional
resources and implements actions in response to its findings. The Group seeks to maintain an adequate composition of
resources in terms of maturities, financial instruments and available amounts.
The following table shows the contractual expiry dates for the financial liabilities other than derivatives. These figures are
based on the non-discounted cash flows, including financial charges, as at the next closest date when the Group may be
asked for the payment.
Expiry dates 2021 (in million €)
< 1 month
2-6 months
6-12 months
1-5 years
> 5 years
Total
Trade payables 120.0 355.8 0.3 1.1 477.2
Financial payables
- Current financial liabilities 24.2 20.8 1.0 46.1
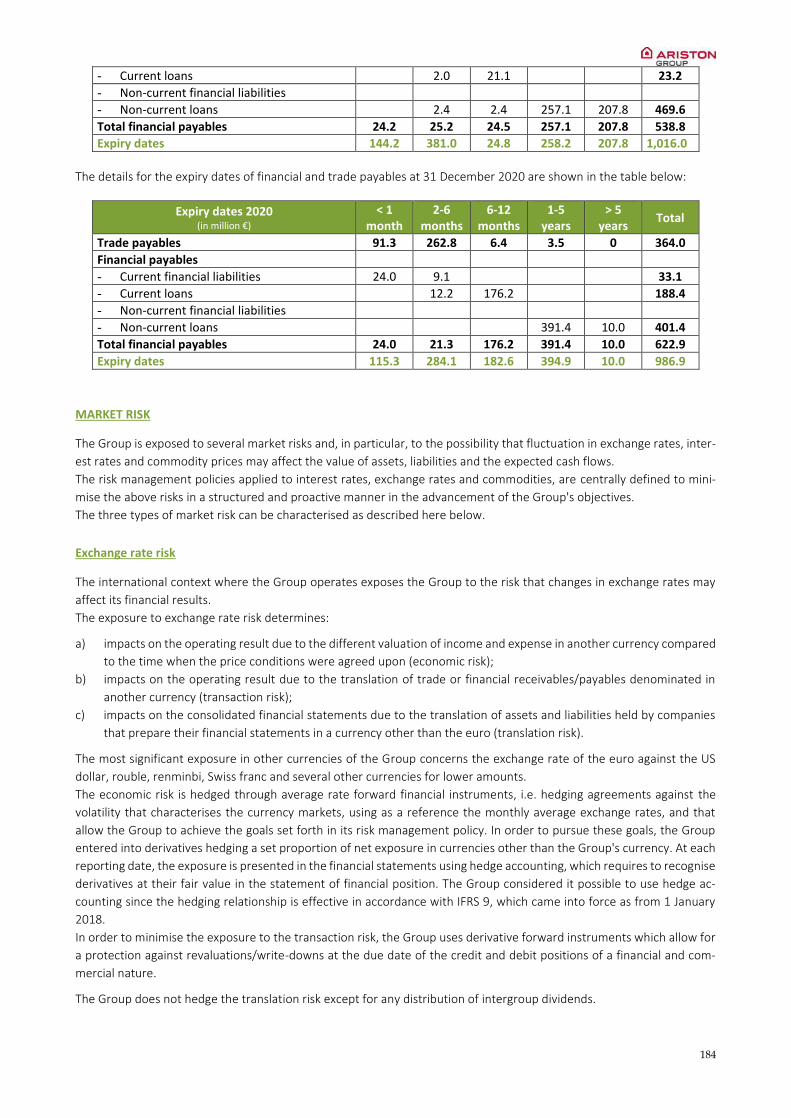
184
- Current loans 2.0 21.1 23.2
- Non-current financial liabilities
- Non-current loans 2.4 2.4 257.1 207.8 469.6
Total financial payables 24.2 25.2 24.5 257.1 207.8 538.8
Expiry dates 144.2 381.0 24.8 258.2 207.8 1,016.0
The details for the expiry dates of financial and trade payables at 31 December 2020 are shown in the table below:
Expiry dates 2020 (in million €)
< 1 month
2-6 months
6-12 months
1-5 years
> 5 years
Total
Trade payables 91.3 262.8 6.4 3.5 0 364.0
Financial payables
- Current financial liabilities 24.0 9.1 33.1
- Current loans 12.2 176.2 188.4
- Non-current financial liabilities
- Non-current loans 391.4 10.0 401.4
Total financial payables 24.0 21.3 176.2 391.4 10.0 622.9
Expiry dates 115.3 284.1 182.6 394.9 10.0 986.9
MARKET RISK
The Group is exposed to several market risks and, in particular, to the possibility that fluctuation in exchange rates, inter-
est rates and commodity prices may affect the value of assets, liabilities and the expected cash flows.
The risk management policies applied to interest rates, exchange rates and commodities, are centrally defined to mini-
mise the above risks in a structured and proactive manner in the advancement of the Group's objectives.
The three types of market risk can be characterised as described here below.
Exchange rate risk
The international context where the Group operates exposes the Group to the risk that changes in exchange rates may
affect its financial results.
The exposure to exchange rate risk determines:
a) impacts on the operating result due to the different valuation of income and expense in another currency compared
to the time when the price conditions were agreed upon (economic risk);
b) impacts on the operating result due to the translation of trade or financial receivables/payables denominated in
another currency (transaction risk);
c) impacts on the consolidated financial statements due to the translation of assets and liabilities held by companies
that prepare their financial statements in a currency other than the euro (translation risk).
The most significant exposure in other currencies of the Group concerns the exchange rate of the euro against the US
dollar, rouble, renminbi, Swiss franc and several other currencies for lower amounts.
The economic risk is hedged through average rate forward financial instruments, i.e. hedging agreements against the
volatility that characterises the currency markets, using as a reference the monthly average exchange rates, and that
allow the Group to achieve the goals set forth in its risk management policy. In order to pursue these goals, the Group
entered into derivatives hedging a set proportion of net exposure in currencies other than the Group's currency. At each
reporting date, the exposure is presented in the financial statements using hedge accounting, which requires to recognise
derivatives at their fair value in the statement of financial position. The Group considered it possible to use hedge ac-
counting since the hedging relationship is effective in accordance with IFRS 9, which came into force as from 1 January
2018.
In order to minimise the exposure to the transaction risk, the Group uses derivative forward instruments which allow for
a protection against revaluations/write-downs at the due date of the credit and debit positions of a financial and com-
mercial nature.
The Group does not hedge the translation risk except for any distribution of intergroup dividends.

185
As at the reporting date, the notional amount of forward currency contracts (sale and purchase) entered into by the
Group, can be summarised as follows:
(in million €) Notional amount in
Currency Notional amount in €
CHF 59.5 57.6
GBP 10.3 12.2
HUF 300.0 0.8
CZK 14.5 0.6
CAD 0.0 0.0
CNY -109.7 -15.2
USD 14.6 12.9
PLN 3.0 0.7
At the same date, the fair value of the foreign exchange derivatives was overall negative, standing at € 1.2 million.
In relation to exchange rate risk, the Group undertook sensitivity analysis to determine any impact on the final profit
before tax from potential fluctuations in exchange rates between the euro and the currencies to which the Group is
exposed. The hypothesised scenario envisages a general variation in exchange rates of 2% and the following table shows
the sensitivity, while keeping all the other variables fixed, in terms of the profit before tax and equity, gross of the tax
effect:
(in million €) Effect on profit
before tax Effect on equity
31/12/2021
Foreign currency revaluation 2.5 2.5
Foreign currency devaluation -2.5 -2.5
Commodity price fluctuation risk
Profit and losses are affected by the performance of prices of raw materials, in particular as regards non-ferrous metals
such as copper, nickel and aluminium, as well as precious metals like silver, which represent one of the primary compo-
nents of the majority of products traded by the Group.
For hedging purposes against the risk of fluctuating prices for copper, silver and nickel, the Group provided, through the
parent company Ariston Holding N.V., for the necessary hedging measures in line with the procedures already adopted
in the previous years aimed at reducing the impact of price volatility in purchases over the next years.
Thus, the Group partly hedged purchases also for the years 2021 and 2022.
The Group hedged price risk with forward and average forward financial instruments that allow it to achieve the goals
set out in its risk management policy. In pursuing said goals, the Group entered into derivatives hedging a set proportion
of raw material purchases. At each reporting date, the exposure is presented in the financial statements using hedge
accounting, which requires to recognise derivatives at their fair value in the statement of financial position.
The Group considered it possible to use hedge accounting since the hedging relationship is effective in accordance with
IFRS 9, which came into force as from 1 January 2018.
When these instruments no longer qualify for hedge accounting, they are recognised as trading instruments.
As at the reporting date, the notional amount of forward commodity contracts entered into by the Group, can be sum-
marised as follows:
Commodity Financial instruments Quantity/ton Total price (in million €)
Copper Forward 1,225 9.6
Nichel Average Forward 26 0.4
Silver Average Forward 3.85 2.5
Aluminium Forward 200 0.5
Steel Average Forward 2,794 3.7
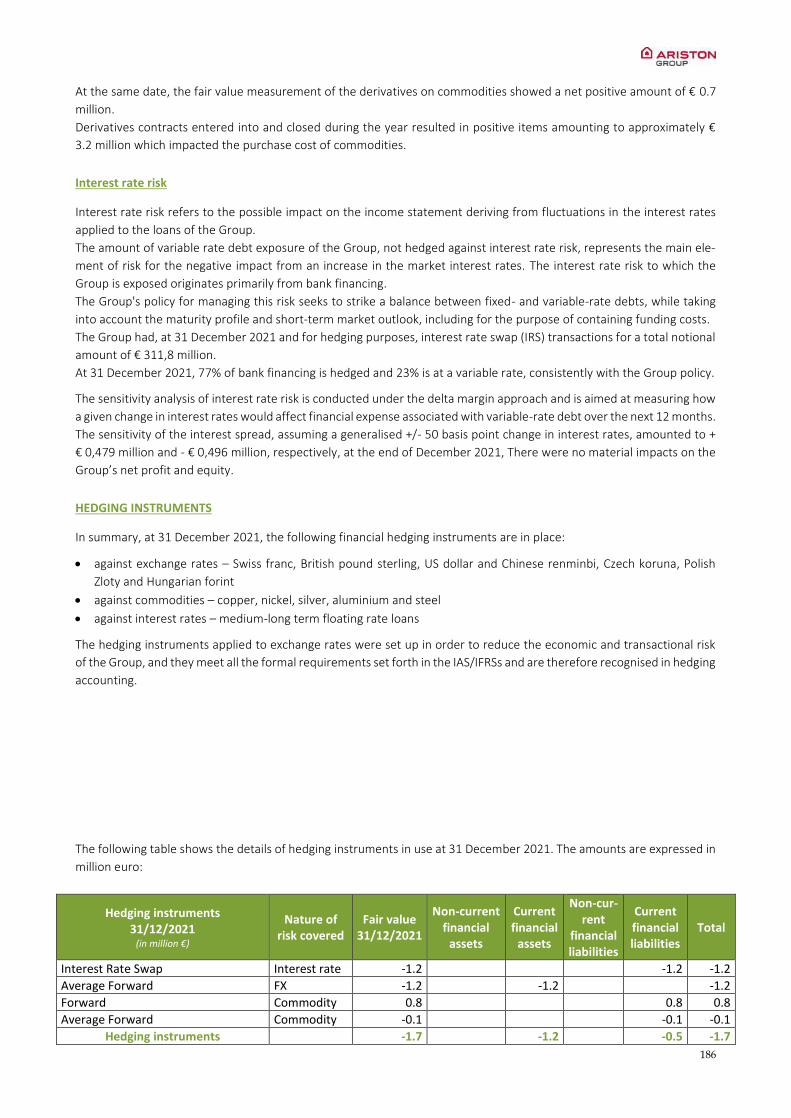
186
At the same date, the fair value measurement of the derivatives on commodities showed a net positive amount of € 0.7
million.
Derivatives contracts entered into and closed during the year resulted in positive items amounting to approximately €
3.2 million which impacted the purchase cost of commodities.
Interest rate risk
Interest rate risk refers to the possible impact on the income statement deriving from fluctuations in the interest rates
applied to the loans of the Group.
The amount of variable rate debt exposure of the Group, not hedged against interest rate risk, represents the main ele-
ment of risk for the negative impact from an increase in the market interest rates. The interest rate risk to which the
Group is exposed originates primarily from bank financing.
The Group's policy for managing this risk seeks to strike a balance between fixed- and variable-rate debts, while taking
into account the maturity profile and short-term market outlook, including for the purpose of containing funding costs.
The Group had, at 31 December 2021 and for hedging purposes, interest rate swap (IRS) transactions for a total notional
amount of € 311,8 million.
At 31 December 2021, 77% of bank financing is hedged and 23% is at a variable rate, consistently with the Group policy.
The sensitivity analysis of interest rate risk is conducted under the delta margin approach and is aimed at measuring how
a given change in interest rates would affect financial expense associated with variable-rate debt over the next 12 months.
The sensitivity of the interest spread, assuming a generalised +/- 50 basis point change in interest rates, amounted to +
€ 0,479 million and - € 0,496 million, respectively, at the end of December 2021, There were no material impacts on the
Group’s net profit and equity.
HEDGING INSTRUMENTS
In summary, at 31 December 2021, the following financial hedging instruments are in place:
against exchange rates – Swiss franc, British pound sterling, US dollar and Chinese renminbi, Czech koruna, Polish
Zloty and Hungarian forint
against commodities – copper, nickel, silver, aluminium and steel
against interest rates – medium-long term floating rate loans
The hedging instruments applied to exchange rates were set up in order to reduce the economic and transactional risk
of the Group, and they meet all the formal requirements set forth in the IAS/IFRSs and are therefore recognised in hedging
accounting.
The following table shows the details of hedging instruments in use at 31 December 2021. The amounts are expressed in
million euro:
Hedging instruments 31/12/2021
(in million €)
Nature of risk covered
Fair value 31/12/2021
Non-current financial
assets
Current financial
assets
Non-cur-rent
financial liabilities
Current financial liabilities
Total
Interest Rate Swap Interest rate -1.2 -1.2 -1.2
Average Forward FX -1.2 -1.2 -1.2
Forward Commodity 0.8 0.8 0.8
Average Forward Commodity -0.1 -0.1 -0.1
Hedging instruments -1.7 -1.2 -0.5 -1.7

187
The following table shows the details of hedging instruments in use at 31 December 2020. The amounts are expressed in
million euro:
Hedging instruments 31/12/2020
(in million €)
Nature of risk covered
Fair value 31/12/2021
Non-current financial
assets
Current financial
assets
Non-cur-rent
financial liabilities
Current financial liabilities
Total
Interest Rate Swap Interest rate -3.7 -3.7 -3.7
Average Forward FX 0.5 0.5 0.5
Forward Commodity 1.2 1.2 1.2
Average Forward Commodity 0.4 0.4 0.4
Hedging instruments -1.6 2.1 -3.7 -1.6
RELATED PARTY DISCLOSURES
At 31 December 2021 Ariston Holding N.V., controlled by Merloni Holding S.p.A., and its Italian subsidiaries, have adopted
the national tax consolidation scheme. At 31 December 2021, the income tax receivables and payables of the individual
Italian companies were recorded from or to, respectively, Merloni Holding S.p.A. At 31 December 2021, the Company
and its Italian subsidiaries had a receivable position from Merloni Holding S.p.A. for € 3.3 million. All tax receivables and
payables are non-interest-bearing.
All transactions with related parties were carried out in the Group’s interest.
Based on the transactions carried out by Ariston Group during the 2021, related parties are mainly represented by:
companies directly and/or indirectly related to the majority shareholder of Ariston Holding N.V.;
Directors and/or companies related to the same.
The following table shows the figures of the main transactions with related parties:
31/12/2021 31/12/2020 (in million €) Receivables Payables Revenue Costs Receivables Payables Revenue Costs
Fondazione A. Merloni 0.0 0.0 0.0 0.5 0.0 0.0 0.0 0.5
Janus Immobili per l'Industria
0.0 0.0 0.0 0.5 0.0 0.0 0.0 1.0
Merloni Holding S.p.A. 13.8 10.5 0.0 0.0 2.0 6.5 0.0 0.3
Novapower S.r.l. 0.0 0.4 0.0 0.3 0.0 0.1 0.0 0.2
Novacapital S.r.l. 0.0 0.2 0.0 0.2 0.0 0.0 0.0 0.0
Nova Re S.r.l. 1.6 0.0 1.2 0.0 0.0 0.0 0.0 0.0
Total 15.4 11.1 1.3 1.6 2.0 6.6 0.0 2.0
As regards transactions with related parties, it should be noted that they are not to be qualified as atypical or unusual,
but should be included in the normal course of operations carried out by the companies of the Group. These transactions
are regulated by market conditions and based on the characteristics of the services provided.
The main transactions with related parties concern Nova Re S.r.l., consisting of recharge of costs related to the structural
investments done on the Follina plant.
REMUNERATION PAID TO THE PARENT COMPANY’S BOARD OF DIRECTORS
Fees attributable to the year and represented by the remunerations to Directors of the Parent Company, at 31 December
2021, are summarised as follow:
Office (in million €)
Period Term of office
Fees
Fees for the office held (1)
Other fees (2)
Directors 2021-22-23 Fin. Stat. Approval 2023 3.1 0.5

188
Total 3.1 0.5
(1) Fixed remuneration pursuant to art.2389, 3rd paragraph, civil code and/or attendance bonus. (2) Gross remuneration to employees.
AUDIT FEES
As from the effective date of the redomiciliation to Amsterdam, The Netherlands, Ernst & Young Accountants LLP had
succeeded without any interruption to EY S.p.A. appointed as the external auditor by the Company’s Shareholders’ meet-
ing of 1 June 2021 starting from December 2021.
The following table shows the year 2021 amounts for external auditing activities and for non-audit-related services pro-
vided by companies from the EY Spa network.
Audit fee (in million €)
31/12/2021 31/12/2021
Audit fees 1.8 1.3
Other non-audit services 3.0 0.2
Total 4.8 1.5
The fee amounts for audit services provided in 2021 by Ernst & Young Accountants LLP is equal to € 0.1 million.
The fee amounts for non-audit services provided in 2021 by Ernst & Young Accountants LLP is equal to € 0.1 million.
EVENTS AFTER THE REPORTING PERIOD
On 5 January 2022, Ariston announced the closing of the acquisition of Chromagen Group after all closing conditions
were met, including the clearance from Israeli Antitrust authorities. The asset purchase agreement reported a total value
of NIS 130 million, comprehensive of the total net assets and liabilities of the legal entities in Israel and Spain and the
51% of the Australian one.
Founded in 1962, Chromagen develops, manufactures, and markets renewable hot water solutions, with a strong herit-
age in solar thermal technology. Chromagen, which employs over 300 people, reported revenues of approximately NIS
400 million (122 million) and a mid-single digit adjusted EBIT margin in 2020. Ariston Group acquired 100% of the shares
and voting rights of the entity that operates in Israel and Spain. In Australia, Ariston Group acquired the shares owned by
Kibbutz Shaar Haamakim while confirming both the current management team as well as the governance structure with
the current minority shareholders.
Regarding the developing situation involving the Russian Federation and Ukraine, the Group confirms to be characterized,
also for 2022, by a significant geographical diversification of consolidated Net Revenue per country. However, at the time
of writing, it is too early to evaluate the chance of any disruptive effect on the economic/financial figures, and on supply
chain operations.
LIST OF COMPANIES AT 31 DECEMBER 2021
N° Company Registered office Curr. Share capital Business unit (*)
Group's controlling
interest
Investing companies Direct control-
ling interest
Subsidiaries' controlling
interest
Minor-ity
interest
1 Ariston Holding N.V. Netherlands EUR 46,042,683 TC parent company
2 AR1 S.r.l. Italy EUR 200,000 TC 100.00 Ariston Thermo S.p.A. 100.00
3 Ariston Sales Mexico S.A. de C.V.
Mexico MXN 302,188,920 TC 100.00 Calentadores de America S.A. de C.V. 99.99
Ariston Thermo USA Holding LLC 0.01
4 Ariston Thermo Argentina S.r.l.
Argentina ARS 16,705,269 TC 100.00 Ariston Holding N.V. 99.63
Thermowatt S.p.A. 0.37
5 Ariston Thermo Benelux S.A. Belgium EUR 66,000,000 TC 100.00 Ariston Holding N.V. 100.00
6 Ariston Thermo Canada Ltd Canada CAD 43,000,000 TC 100.00 Ariston Holding N.V. 100.00
7 Ariston Thermo (China) Co., Ltd
China CNY 145,885,010 TC 100.00 Ariston Holding N.V. 100.00
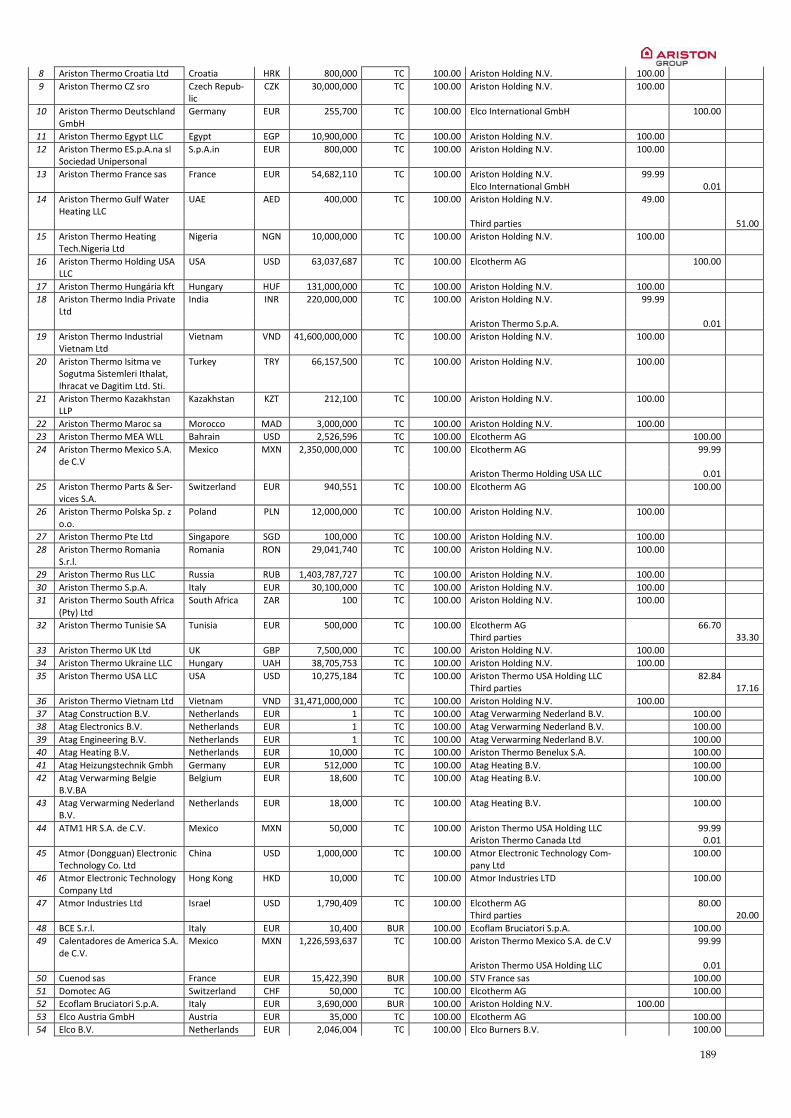
189
8 Ariston Thermo Croatia Ltd Croatia HRK 800,000 TC 100.00 Ariston Holding N.V. 100.00
9 Ariston Thermo CZ sro Czech Repub-lic
CZK 30,000,000 TC 100.00 Ariston Holding N.V. 100.00
10 Ariston Thermo Deutschland GmbH
Germany EUR 255,700 TC 100.00 Elco International GmbH 100.00
11 Ariston Thermo Egypt LLC Egypt EGP 10,900,000 TC 100.00 Ariston Holding N.V. 100.00
12 Ariston Thermo ES.p.A.na sl Sociedad Unipersonal
S.p.A.in EUR 800,000 TC 100.00 Ariston Holding N.V. 100.00
13 Ariston Thermo France sas France EUR 54,682,110 TC 100.00 Ariston Holding N.V. 99.99 Elco International GmbH 0.01
14 Ariston Thermo Gulf Water Heating LLC
UAE AED 400,000 TC 100.00 Ariston Holding N.V. 49.00
Third parties 51.00
15 Ariston Thermo Heating Tech.Nigeria Ltd
Nigeria NGN 10,000,000 TC 100.00 Ariston Holding N.V. 100.00
16 Ariston Thermo Holding USA LLC
USA USD 63,037,687 TC 100.00 Elcotherm AG 100.00
17 Ariston Thermo Hungária kft Hungary HUF 131,000,000 TC 100.00 Ariston Holding N.V. 100.00
18 Ariston Thermo India Private Ltd
India INR 220,000,000 TC 100.00 Ariston Holding N.V. 99.99
Ariston Thermo S.p.A. 0.01
19 Ariston Thermo Industrial Vietnam Ltd
Vietnam VND 41,600,000,000 TC 100.00 Ariston Holding N.V. 100.00
20 Ariston Thermo Isitma ve Sogutma Sistemleri Ithalat, Ihracat ve Dagitim Ltd. Sti.
Turkey TRY 66,157,500 TC 100.00 Ariston Holding N.V. 100.00
21 Ariston Thermo Kazakhstan LLP
Kazakhstan KZT 212,100 TC 100.00 Ariston Holding N.V. 100.00
22 Ariston Thermo Maroc sa Morocco MAD 3,000,000 TC 100.00 Ariston Holding N.V. 100.00
23 Ariston Thermo MEA WLL Bahrain USD 2,526,596 TC 100.00 Elcotherm AG 100.00
24 Ariston Thermo Mexico S.A. de C.V
Mexico MXN 2,350,000,000 TC 100.00 Elcotherm AG 99.99
Ariston Thermo Holding USA LLC 0.01
25 Ariston Thermo Parts & Ser-vices S.A.
Switzerland EUR 940,551 TC 100.00 Elcotherm AG 100.00
26 Ariston Thermo Polska Sp. z o.o.
Poland PLN 12,000,000 TC 100.00 Ariston Holding N.V. 100.00
27 Ariston Thermo Pte Ltd Singapore SGD 100,000 TC 100.00 Ariston Holding N.V. 100.00
28 Ariston Thermo Romania S.r.l.
Romania RON 29,041,740 TC 100.00 Ariston Holding N.V. 100.00
29 Ariston Thermo Rus LLC Russia RUB 1,403,787,727 TC 100.00 Ariston Holding N.V. 100.00
30 Ariston Thermo S.p.A. Italy EUR 30,100,000 TC 100.00 Ariston Holding N.V. 100.00
31 Ariston Thermo South Africa (Pty) Ltd
South Africa ZAR 100 TC 100.00 Ariston Holding N.V. 100.00
32 Ariston Thermo Tunisie SA Tunisia EUR 500,000 TC 100.00 Elcotherm AG 66.70 Third parties 33.30
33 Ariston Thermo UK Ltd UK GBP 7,500,000 TC 100.00 Ariston Holding N.V. 100.00
34 Ariston Thermo Ukraine LLC Hungary UAH 38,705,753 TC 100.00 Ariston Holding N.V. 100.00
35 Ariston Thermo USA LLC USA USD 10,275,184 TC 100.00 Ariston Thermo USA Holding LLC 82.84 Third parties 17.16
36 Ariston Thermo Vietnam Ltd Vietnam VND 31,471,000,000 TC 100.00 Ariston Holding N.V. 100.00
37 Atag Construction B.V. Netherlands EUR 1 TC 100.00 Atag Verwarming Nederland B.V. 100.00
38 Atag Electronics B.V. Netherlands EUR 1 TC 100.00 Atag Verwarming Nederland B.V. 100.00
39 Atag Engineering B.V. Netherlands EUR 1 TC 100.00 Atag Verwarming Nederland B.V. 100.00
40 Atag Heating B.V. Netherlands EUR 10,000 TC 100.00 Ariston Thermo Benelux S.A. 100.00
41 Atag Heizungstechnik Gmbh Germany EUR 512,000 TC 100.00 Atag Heating B.V. 100.00
42 Atag Verwarming Belgie B.V.BA
Belgium EUR 18,600 TC 100.00 Atag Heating B.V. 100.00
43 Atag Verwarming Nederland B.V.
Netherlands EUR 18,000 TC 100.00 Atag Heating B.V. 100.00
44 ATM1 HR S.A. de C.V. Mexico MXN 50,000 TC 100.00 Ariston Thermo USA Holding LLC 99.99 Ariston Thermo Canada Ltd 0.01
45 Atmor (Dongguan) Electronic Technology Co. Ltd
China USD 1,000,000 TC 100.00 Atmor Electronic Technology Com-pany Ltd
100.00
46 Atmor Electronic Technology Company Ltd
Hong Kong HKD 10,000 TC 100.00 Atmor Industries LTD 100.00
47 Atmor Industries Ltd Israel USD 1,790,409 TC 100.00 Elcotherm AG 80.00 Third parties 20.00
48 BCE S.r.l. Italy EUR 10,400 BUR 100.00 Ecoflam Bruciatori S.p.A. 100.00
49 Calentadores de America S.A. de C.V.
Mexico MXN 1,226,593,637 TC 100.00 Ariston Thermo Mexico S.A. de C.V 99.99
Ariston Thermo USA Holding LLC 0.01
50 Cuenod sas France EUR 15,422,390 BUR 100.00 STV France sas 100.00
51 Domotec AG Switzerland CHF 50,000 TC 100.00 Elcotherm AG 100.00
52 Ecoflam Bruciatori S.p.A. Italy EUR 3,690,000 BUR 100.00 Ariston Holding N.V. 100.00
53 Elco Austria GmbH Austria EUR 35,000 TC 100.00 Elcotherm AG 100.00
54 Elco B.V. Netherlands EUR 2,046,004 TC 100.00 Elco Burners B.V. 100.00

190
55 Elco Belgium N.V./S.A. Belgium EUR 1,300,000 TC 100.00 Ariston Thermo Benelux S.A. 99.99 Elco B.V. 0.01
56 Elco Burners B.V. Netherlands EUR 22,734 BUR 100.00 Ariston Thermo Benelux S.A. 100.00
57 Elco Burners GmbH Germany EUR 25,000 BUR 100.00 Elco International GmbH 100.00
58 Elco GmbH Germany EUR 50,000 TC 100.00 Elco International GmbH 100.00
59 Elco Heating Solutions Limited
UK GBP 3,001,750 TC 100.00 Ariston Themo UK Ltd 100.00
60 Elco International GmbH Germany EUR 8,691,962 TC 100.00 Ariston Holding N.V. 100.00
61 Elco Italia S.p.A. Italy EUR 3,500,000 TC 100.00 Ariston Thermo S.p.A. 100.00
62 Elcotherm AG Switzerland CHF 1,000,000 TC 100.00 Ariston Holding N.V. 100.00
63 Gastech-Energi A/S Denmark DKK 7,554,935 TC 100.00 Ariston Holding N.V. 100.00
64 Ingrado S.r.l. Italy EUR 10,000 TC 100.00 Ariston Holding N.V. 100.00
65 Kesselheld Gmbh Germany EUR 83,333 TC 100.00 Elco International GmbH 80.00
TC Third parties 20.00
66 NTI Boilers Inc Canada CAD 28,210 TC 100.00 NTI Holdings Ltd 100.00
67 NTI Holdings Ltd Canada CAD 13,058,901 TC 100.00 Ariston Thermo Canada Ltd 100.00
68 NTI Industrial Inc Canada CAD 100 TC 100.00 NTI Holdings Ltd 100.00
69 NTI-USA Inc USA USD 100 TC 100.00 NTI Boilers Inc 100.00
70 PT Ariston Thermo Indonesia Indonesia IDR 16,260,750,000 TC 100.00 Ariston Holding N.V. 100.00
71 Racold Thermo Private Ltd India INR 262,134,750 TC 100.00 Ariston Holding N.V. 99.99 Ariston Thermo S.p.A. 0.01
72 S.H.E. d.o.o. Svilajnac Serbia RSD 35,432,220 COM 100.00 Thermowatt S.p.A. 100.00
73 SPM Innovation sas France EUR 750,020 BUR 100.00 Ariston Holding N.V. 100.00
74 STV France sas France EUR 9,730,123 TC 100.00 Ariston Thermo France sas 100.00
75 Thermowatt Professional S.r.l.
Italy EUR 100,000 COM 100.00 Thermowatt S.p.A. 100.00
76 Thermowatt (Wuxi) Electric Co., Ltd
China CNY 82,769,200 COM 100.00 Ariston Thermo (China) Co., Ltd 70.00
Ariston Holding N.V. 30.00
77 Thermowatt S.p.A. Italy EUR 7,700,000 COM 100.00 Ariston Holding N.V. 100.00
The participation shares in this table are the ones relevant for determining the Consolidated financial statements in the column "Group's Controlling interest". The compa-nies acquired with the put/call contracts to be exercised on the remaining shares of the share capital were fully consolidated, together with the acquisition agreement based on the provisions set forth in IFRS3 (see the specific treatment of the individual put/call options in the notes).
(*) Refers to the main Business Line
LIST OF COMPANIES NOT INCLUDED IN THE SCOPE OF CONSOLIDATION
N° Company Registered office Curr. Share capital Business unit (*)
Group's controlling
interest
Investing companies Direct control-ling in-terest
Subsidiaries' controlling
interest
Minor-ity
interest
1 Joint venture "Ariston Thermo - UTG LLC" (**)
Uzbekistan EUR 1,000,000 TC 51.00 Ariston Holding N.V. 51.00 49.00
(**) The company was not included in the scope of consolidation because of its limited area of operation and little significance.
7. Ariston Holding N.V. Company - only Financial Statements at 31 December 2021
INDEX – Company - only Financial Statements at 31 December 2021
Ariston Holding N.V. – Company - only Financial Statements at 31 December 2021
Company - only primary statements
Income Statement
Statement of Financial position
Notes to the Company financial statements

191
Ariston Holding N.V. Income Statement as at 31 December 2021
(in thousand €) notes
31/12/2021
31/12/2020
NET TURNOVER 1.1 8,862 369,275 Change in stock of finished products and work-in-progress 1.1 0 8,814 Other operating income 1.1 185 2,181 Total operating income 9,047 380,270 Costs of raw materials and consumables 9 203,350 Costs of work contracted out and other external costs 1.2 21,446 68,977 Wages and salaries 1.3 7,728 42,744 Social security charges 1.4 1,580 12,504
Amortisation of intangible fixed assets and depreciation of tangible fixed assets
460 16,456
Other changes in value of intangible and tangible fixed assets 0 81 Other operating expenses 1.5 1,446 11,341 Total operating expenses 32,669 355,453
Income from fixed asset investments 1.6 267 165
Other interest income and similar income 1.7 12,031 11,223
Interest expense and similar expenses 1.8 12,619 18,349
RESULTS BEFORE TAX (23,943) 17,856 Taxes (expenses)/benefit 1.9 (9,578) (7,717)
Share in profit/(loss) of participation 1.10 170,057 86,548
NET RESULT AFTER TAX 136,536 96,687
The accompanying notes are an integral part of the Company Financial Statements.
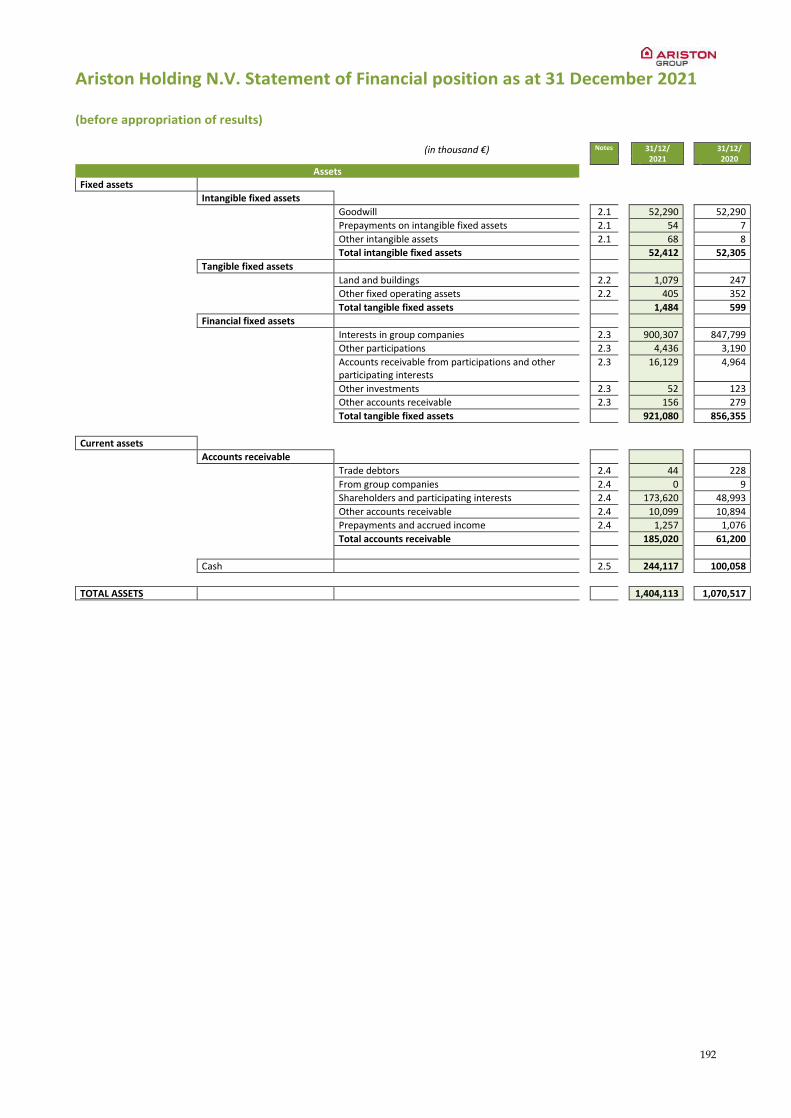
192
Ariston Holding N.V. Statement of Financial position as at 31 December 2021
(before appropriation of results)
(in thousand €)
Notes
31/12/ 2021
31/12/ 2020
Assets
Fixed assets
Intangible fixed assets
Goodwill 2.1 52,290
52,290
Prepayments on intangible fixed assets 2.1 54
7
Other intangible assets 2.1 68
8
Total intangible fixed assets
52,412
52,305
Tangible fixed assets
Land and buildings 2.2 1,079
247
Other fixed operating assets 2.2 405
352
Total tangible fixed assets 1,484
599
Financial fixed assets
Interests in group companies 2.3 900,307
847,799
Other participations 2.3 4,436
3,190
Accounts receivable from participations and other participating interests
2.3 16,129
4,964
Other investments 2.3 52
123
Other accounts receivable 2.3 156
279
Total tangible fixed assets 921,080
856,355
Current assets
Accounts receivable
Trade debtors
2.4
44
228
From group companies 2.4
0
9 Shareholders and participating interests 2.4
173,620
48,993
Other accounts receivable
2.4
10,099
10,894 Prepayments and accrued income 2.4
1,257
1,076
Total accounts receivable
185,020
61,200
Cash
2.5
244,117
100,058
TOTAL ASSETS
1,404,113
1,070,517
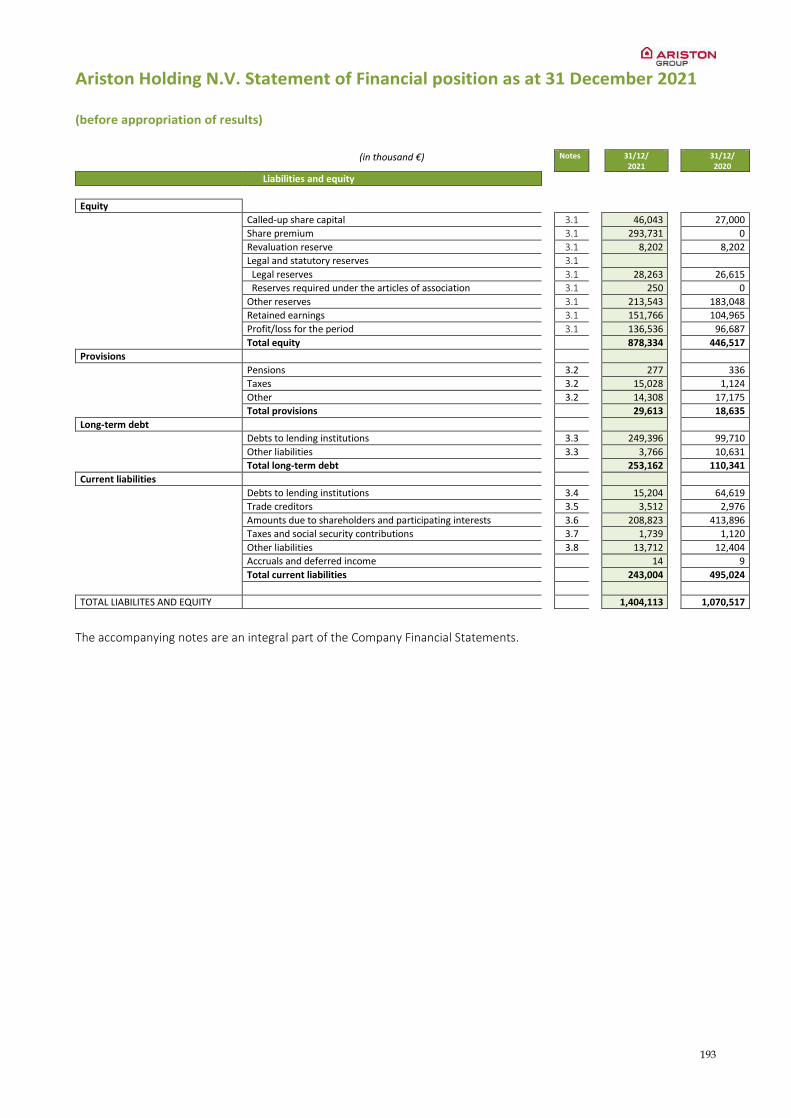
193
Ariston Holding N.V. Statement of Financial position as at 31 December 2021
(before appropriation of results)
(in thousand €)
Notes
31/12/ 2021
31/12/ 2020
Liabilities and equity
Equity
Called-up share capital 3.1 46,043
27,000
Share premium 3.1 293,731
0
Revaluation reserve 3.1 8,202
8,202
Legal and statutory reserves 3.1
Legal reserves 3.1 28,263 26,615
Reserves required under the articles of association 3.1 250 0
Other reserves 3.1 213,543 183,048
Retained earnings 3.1 151,766 104,965
Profit/loss for the period 3.1 136,536 96,687
Total equity
878,334
446,517
Provisions
Pensions 3.2 277
336
Taxes 3.2 15,028
1,124
Other 3.2 14,308 17,175
Total provisions 29,613
18,635
Long-term debt
Debts to lending institutions 3.3 249,396
99,710
Other liabilities 3.3 3,766
10,631
Total long-term debt 253,162
110,341
Current liabilities
Debts to lending institutions
3.4
15,204
64,619
Trade creditors 3.5
3,512
2,976 Amounts due to shareholders and participating interests 3.6
208,823
413,896
Taxes and social security contributions
3.7
1,739
1,120 Other liabilities 3.8
13,712
12,404
Accruals and deferred income 14 9 Total current liabilities
243,004
495,024
TOTAL LIABILITES AND EQUITY
1,404,113 1,070,517
The accompanying notes are an integral part of the Company Financial Statements.

194
Ariston Holding N.V. Notes to the Company Financial Statements
Corporate information
Ariston Holding N.V. (hereafter also the “Company”) is a Company listed in Euronext Milan, Italy, having its statutory seat
in The Netherlands and enrolled in the Chamber of Commerce - KVK - of Amsterdam (CCI no. 83078738, RSIN no.
862717589, Establishment no. 000049275437, VAT Code: 01527100422, Fiscal Code 00760810572), with a secondary
office in Via Broletto 44, Milano I-20121.
For purposes of its business operations in Italy, the Company has established a secondary seat with a permanent repre-
sentative office, within the meaning of article 2508 of the Italian Civil Code.
Ariston Holding N.V.'s primary purpose is to be a holding company and, with it, the management and coordination of a
series of business processes for all the subsidiaries of the Group. The Group, with its subsidiaries, is active in the business
of the production and distribution of hot water, space heating and service solutions with a cutting edge technology serv-
ing markets all around the world.
At 31 December 2021, the share capital of the Company was represented by 104,268,292 ordinary shares of € 0.01 each
and by 225,000,000 multiple vote shares of € 0.20 each.
At the same date the issued share capital of the Company was held by Merloni Holding S.p.A. for 66.03%, Amaranta S.r.l.
for 9.01% and the market for 24.96%.
Due to the presence of multiple vote shares, Merloni Holding S.p.A was entitled for 73.96% of voting rights, Amaranta
S.r.l. for 18.68% and the market for residual 7.36%.
The company financial statements comprise the following: income statement, statement of financial position and these
notes to the financial statements.
Principal activities
In October 2020, as part of a process to reorganize and streamline the Group's corporate structure by turning the Parent
Company into a holding company that exclusively manages and co-ordinates its investees, it was executed the operational
and industrial business unit transfer previously under the ownership of the Parent Company, Ariston Thermo Holding
S.p.A., into a new entity, wholly owned by the transferor, named Ariston Thermo S.p.A.
On 18 March 2021 the extraordinary General Meeting of Ariston Thermo Holding S.p.A. approved the reverse merger of
Ariston Thermo Holding S.p.A. into the wholly owned subsidiary Ariston Thermo International S.r.l. At the same time the
incorporating company became a S.p.A. company and was renamed into Ariston Thermo Holding S.p.A. From a legal point
of view, the merger was completed and became effective on 1 June 2021, with tax effects backdated at 1 January 2021.
From a substance perspective, it was applied the “pooling of interest method” so accounting effects were considered as
if the companies involved had been merged at 1 January 2020. The operation aims to strengthen, within the Group, the
role of holding company and furtherly simplify the corporate organization, eliminating the role of sub-holding currently
performed by Ariston Thermo International S.r.l. which was no longer needed.
Ariston Thermo Holding S.p.A. was then re-domiciliated in The Netherlands as Ariston Thermo Holding N.V., changing its
Articles of Association and establishing its registered office in Amsterdam, effective date the 15th of June. The 16th of
September the company changed its name in Ariston Holding N.V.
From 26 November 2021 Ariston Holding N.V became a listed company in Italian Stock Exchange.
Accounting policies
Basis of preparation
The 2021 Company Financial Statements represent the separate financial statements of Ariston Holding N.V. and have
been prepared in accordance with the legal requirements of Title 9, Book 2 of the Dutch Civil Code. In particular, according
to Section 2:362 (8) of the Dutch Civil Code, it is allowed to prepare the consolidated financial statements in accordance
with the standards adopted by International Accounting Standards Board and approved by the European Commission
195
and to use in the separate financial statements the same policies for recognition and measurement as those used in
consolidated accounts.
The accounting policies are described in a specific section, Basis of accounting preparation, of the Consolidated Financial
Statements included in this Annual Report, while the application of combination 3 enables keeping the equity according
to the company financial statement equal to the equity according to the consolidated financial statements, being the
subsidiaries accounted for using the equity method in the company financial statement of Ariston Holding N.V.
Until 2020 the Company prepared its accounts according to Italian GAAP. Starting from 2021, due to reverse merger
operation and related transfer of its legal seat in The Netherlands, it prepared its account as the successor of italian
company Ariston Thermo Holding S.p.A. and changed its accounting policies from Italian GAAP to Dutch GAAP. The re-
verse merger, effective from a legal point of view on 1 June 2021, was accounted for according to Dutch Gaap using the
“pooling of interest method”, therefore comparative figures for the year ended 31 December 2020 have been adjusted
as if the companies had been merged at 1 January 2020. As consequence, 2020 operating incomes and expenses include
sales of products and related raw materials costs related to the first nine months of the year, being the incorporated
company Ariston Thermo Holding S.p.A. an operating company until 1 October 2020, effective date of the operational
and industrial business unit transfer already described in previous paragraph.
Format of the financial statements
Given the activities carried out by Ariston Holding N.V., presentation of the Company Income Statement is based on the
nature of revenues and expenses.
Ariston Holding N.V financial statements are prepared in Euro, also the Company's functional currency, representing the
currency in which the main transactions of the Company are denominated.
The Statements of Income and of Financial Position and Notes to the Financial Statements are presented in thousands of
euro, except where otherwise stated.
As parent company, Ariston Holding N.V has also prepared consolidated financial statements for Ariston Group for the
year ended on 31 December 2021.
2021 Financial Year Overview
Regarding Ariston Group overview for the year ended on 31 December 2021, refer to paragraph Full year 2021 conclusion
and outlook included elsewhere in this Annual Report.

196
Composition and principal changes
Note 1.1 – Operating income
The following table summarizes the operating income:
(in thousand €)
31/12/2021 31/12/2020
Net turnover:
- Revenues from products 0 322,492
- Revenues from services 8,862 46,783
Total Net turnover 8,862 369,275
Change in stock of finished products and work-in-progress
0 8,814
Other income 185 2,181
Total Operating Income 9,047 380,270
In 2020, Revenues from products were related to the fact that incorporated company Ariston Thermo Holding S.p.A. was
an operative company for the first nine months of the year, as mentioned before.
Revenues from services consist of services rendered to the principal subsidiaries of the Ariston Group, with a decrease
from 2020 due to the operational and industrial business unit transfer effective from 1 October 2020.
Other income includes grants for staff training and other recharges. In 2020 it included grants and other recharges.
Note 1.2 – Costs of work contracted out and other external costs
Costs of work contracted out and other external costs comprise primarily the costs incurred and posted as operating
expenses for the IPO process, net of the portion charged directly to equity, consulting costs, costs for legal and financial
services, in addition to Directors, included component from Share-based compensation plans, and Statutory Auditors’
fees.
Note 1.3 – Wages and salaries
Wages and Salaries costs during the year ended 31 December 2021, was of € 7,728 thousand (€ 42,744 thousand in
2020), included component from Share-based compensation plans. The average number of employees in 2021 was 52
(887 in 2020), based in Italy (all wholly outside the Netherlands).
31/12/2021 Average 2021 31/12/2020 Average 2020
Executives 14 13 12 50
Managers 11 11 10 123
White collars 29 25 23 343
Blue collars 3 3 3 371
Total 57 52 48 887
Note 1.4 – Social security charges
Social security charges during the year ended 31 December 2021, were of € 1,580 thousand (€ 12,504 thousand in 2020).
Note 1.5 – Other operating expenses
Other operating expenses includes provisions for employees severance indemnity and legal disputes, other personnel
costs and non periodic losses.
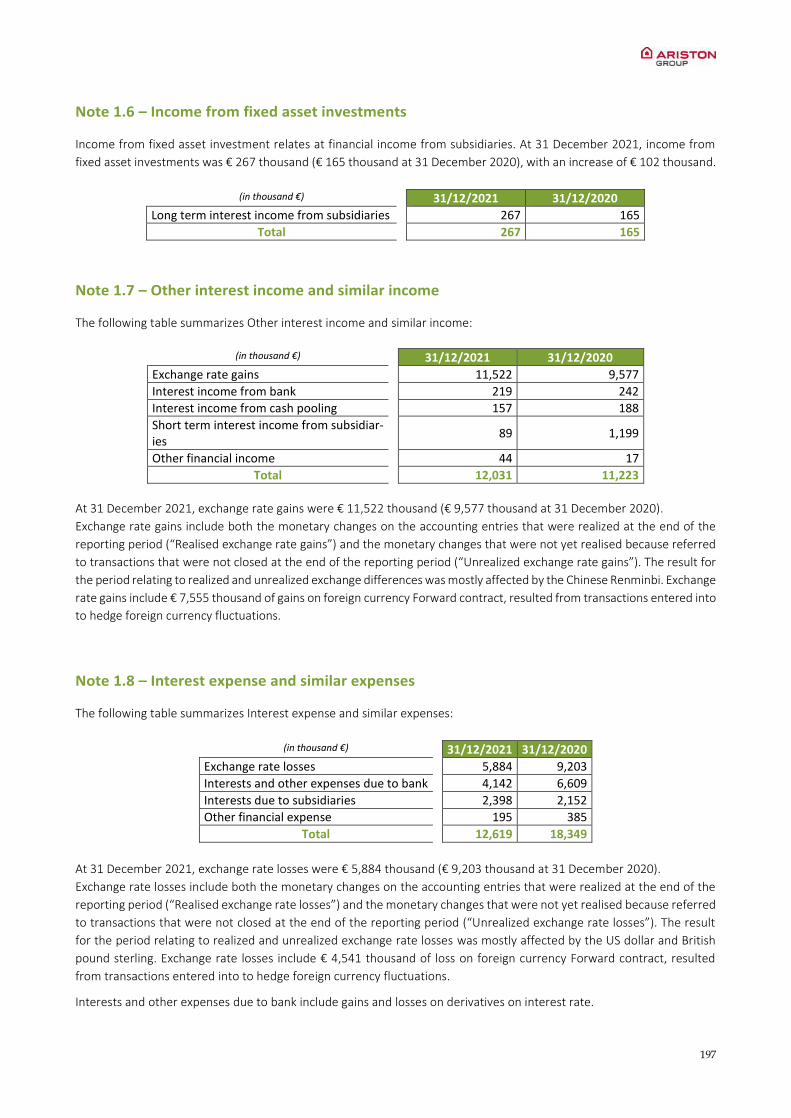
197
Note 1.6 – Income from fixed asset investments
Income from fixed asset investment relates at financial income from subsidiaries. At 31 December 2021, income from
fixed asset investments was € 267 thousand (€ 165 thousand at 31 December 2020), with an increase of € 102 thousand.
(in thousand €) 31/12/2021 31/12/2020
Long term interest income from subsidiaries 267 165
Total 267 165
Note 1.7 – Other interest income and similar income
The following table summarizes Other interest income and similar income:
(in thousand €) 31/12/2021 31/12/2020
Exchange rate gains 11,522 9,577
Interest income from bank 219 242
Interest income from cash pooling 157 188
Short term interest income from subsidiar-ies
89 1,199
Other financial income 44 17
Total 12,031 11,223
At 31 December 2021, exchange rate gains were € 11,522 thousand (€ 9,577 thousand at 31 December 2020).
Exchange rate gains include both the monetary changes on the accounting entries that were realized at the end of the
reporting period (“Realised exchange rate gains”) and the monetary changes that were not yet realised because referred
to transactions that were not closed at the end of the reporting period (“Unrealized exchange rate gains”). The result for
the period relating to realized and unrealized exchange differences was mostly affected by the Chinese Renminbi. Exchange
rate gains include € 7,555 thousand of gains on foreign currency Forward contract, resulted from transactions entered into
to hedge foreign currency fluctuations.
Note 1.8 – Interest expense and similar expenses
The following table summarizes Interest expense and similar expenses:
(in thousand €) 31/12/2021 31/12/2020
Exchange rate losses 5,884 9,203
Interests and other expenses due to bank 4,142 6,609
Interests due to subsidiaries 2,398 2,152
Other financial expense 195 385
Total 12,619 18,349
At 31 December 2021, exchange rate losses were € 5,884 thousand (€ 9,203 thousand at 31 December 2020).
Exchange rate losses include both the monetary changes on the accounting entries that were realized at the end of the
reporting period (“Realised exchange rate losses”) and the monetary changes that were not yet realised because referred
to transactions that were not closed at the end of the reporting period (“Unrealized exchange rate losses”). The result
for the period relating to realized and unrealized exchange rate losses was mostly affected by the US dollar and British
pound sterling. Exchange rate losses include € 4,541 thousand of loss on foreign currency Forward contract, resulted
from transactions entered into to hedge foreign currency fluctuations.
Interests and other expenses due to bank include gains and losses on derivatives on interest rate.
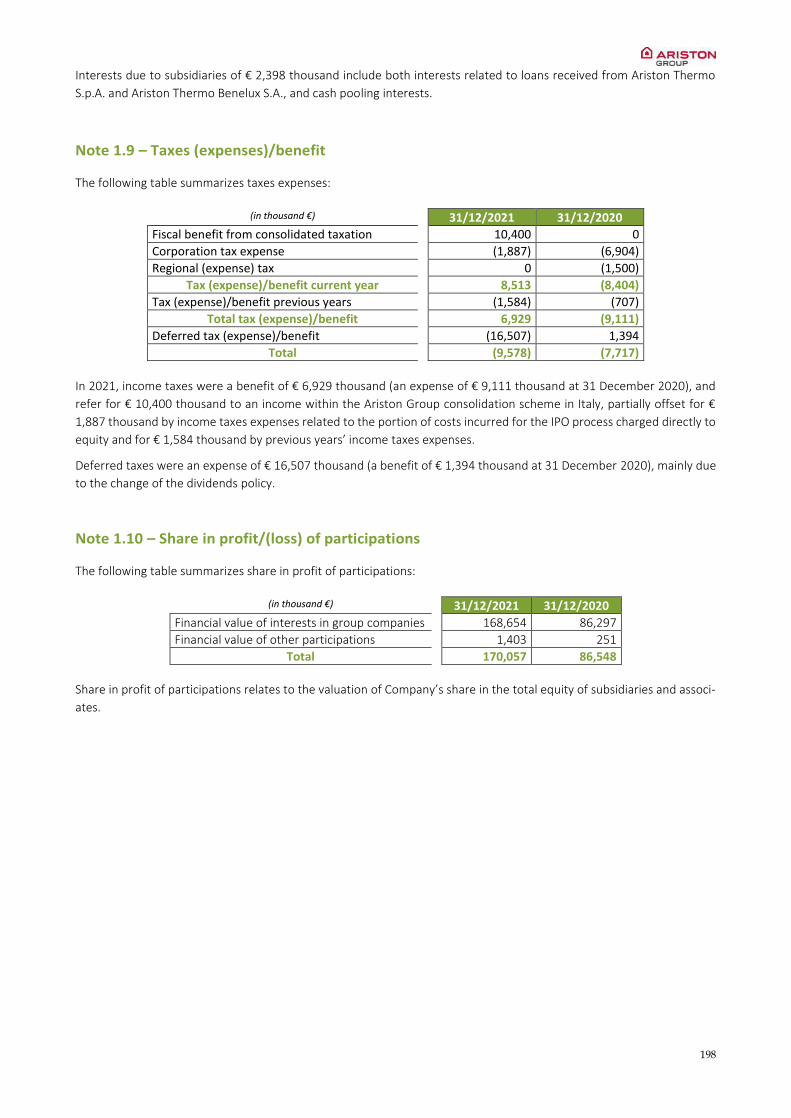
198
Interests due to subsidiaries of € 2,398 thousand include both interests related to loans received from Ariston Thermo
S.p.A. and Ariston Thermo Benelux S.A., and cash pooling interests.
Note 1.9 – Taxes (expenses)/benefit
The following table summarizes taxes expenses:
(in thousand €) 31/12/2021 31/12/2020
Fiscal benefit from consolidated taxation 10,400 0
Corporation tax expense (1,887) (6,904)
Regional (expense) tax 0 (1,500)
Tax (expense)/benefit current year 8,513 (8,404)
Tax (expense)/benefit previous years (1,584) (707)
Total tax (expense)/benefit 6,929 (9,111)
Deferred tax (expense)/benefit (16,507) 1,394
Total (9,578) (7,717)
In 2021, income taxes were a benefit of € 6,929 thousand (an expense of € 9,111 thousand at 31 December 2020), and
refer for € 10,400 thousand to an income within the Ariston Group consolidation scheme in Italy, partially offset for €
1,887 thousand by income taxes expenses related to the portion of costs incurred for the IPO process charged directly to
equity and for € 1,584 thousand by previous years’ income taxes expenses.
Deferred taxes were an expense of € 16,507 thousand (a benefit of € 1,394 thousand at 31 December 2020), mainly due
to the change of the dividends policy.
Note 1.10 – Share in profit/(loss) of participations
The following table summarizes share in profit of participations:
(in thousand €) 31/12/2021 31/12/2020
Financial value of interests in group companies 168,654 86,297
Financial value of other participations 1,403 251
Total 170,057 86,548
Share in profit of participations relates to the valuation of Company’s share in the total equity of subsidiaries and associ-
ates.
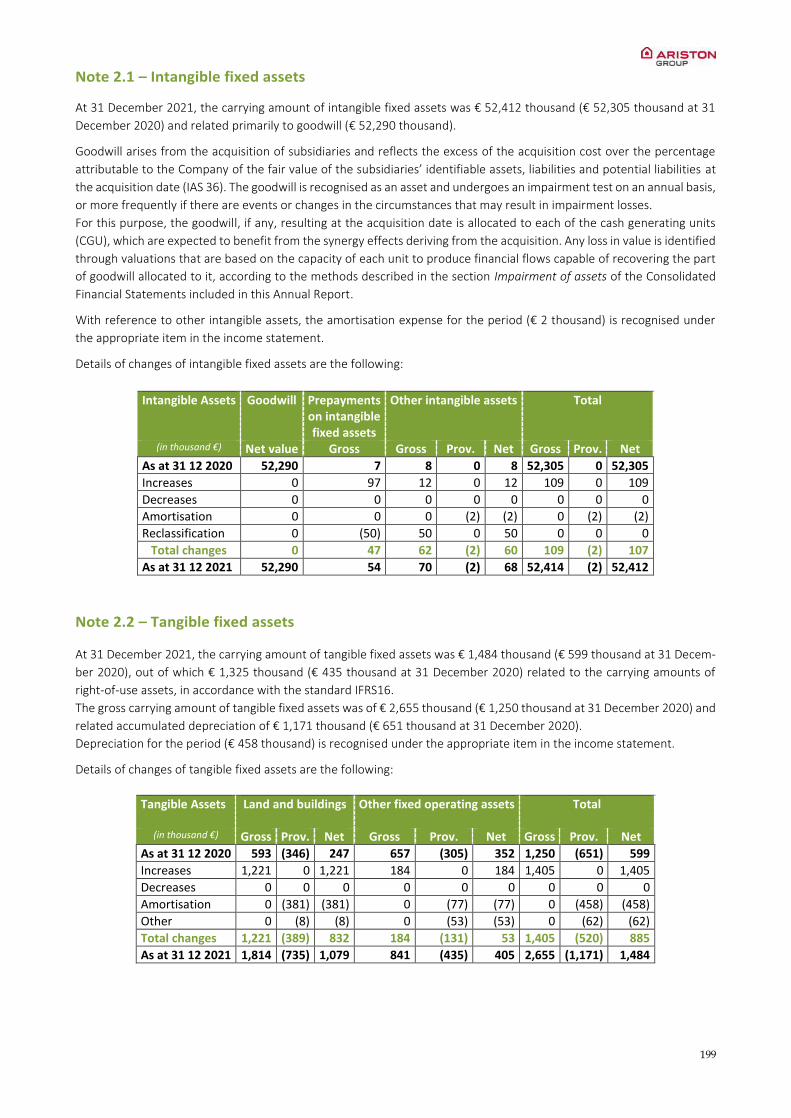
199
Note 2.1 – Intangible fixed assets
At 31 December 2021, the carrying amount of intangible fixed assets was € 52,412 thousand (€ 52,305 thousand at 31
December 2020) and related primarily to goodwill (€ 52,290 thousand).
Goodwill arises from the acquisition of subsidiaries and reflects the excess of the acquisition cost over the percentage
attributable to the Company of the fair value of the subsidiaries’ identifiable assets, liabilities and potential liabilities at
the acquisition date (IAS 36). The goodwill is recognised as an asset and undergoes an impairment test on an annual basis,
or more frequently if there are events or changes in the circumstances that may result in impairment losses.
For this purpose, the goodwill, if any, resulting at the acquisition date is allocated to each of the cash generating units
(CGU), which are expected to benefit from the synergy effects deriving from the acquisition. Any loss in value is identified
through valuations that are based on the capacity of each unit to produce financial flows capable of recovering the part
of goodwill allocated to it, according to the methods described in the section Impairment of assets of the Consolidated
Financial Statements included in this Annual Report.
With reference to other intangible assets, the amortisation expense for the period (€ 2 thousand) is recognised under
the appropriate item in the income statement.
Details of changes of intangible fixed assets are the following:
Intangible Assets Goodwill Prepayments on intangible fixed assets
Other intangible assets Total
(in thousand €) Net value Gross Gross Prov. Net Gross Prov. Net
As at 31 12 2020 52,290 7 8 0 8 52,305 0 52,305
Increases 0 97 12 0 12 109 0 109
Decreases 0 0 0 0 0 0 0 0
Amortisation 0 0 0 (2) (2) 0 (2) (2)
Reclassification 0 (50) 50 0 50 0 0 0
Total changes 0 47 62 (2) 60 109 (2) 107
As at 31 12 2021 52,290 54 70 (2) 68 52,414 (2) 52,412
Note 2.2 – Tangible fixed assets
At 31 December 2021, the carrying amount of tangible fixed assets was € 1,484 thousand (€ 599 thousand at 31 Decem-
ber 2020), out of which € 1,325 thousand (€ 435 thousand at 31 December 2020) related to the carrying amounts of
right-of-use assets, in accordance with the standard IFRS16.
The gross carrying amount of tangible fixed assets was of € 2,655 thousand (€ 1,250 thousand at 31 December 2020) and
related accumulated depreciation of € 1,171 thousand (€ 651 thousand at 31 December 2020).
Depreciation for the period (€ 458 thousand) is recognised under the appropriate item in the income statement.
Details of changes of tangible fixed assets are the following:
Tangible Assets Land and buildings
Other fixed operating assets
Total
(in thousand €) Gross Prov. Net Gross Prov. Net Gross Prov. Net
As at 31 12 2020 593 (346) 247 657 (305) 352 1,250 (651) 599
Increases 1,221 0 1,221 184 0 184 1,405 0 1,405
Decreases 0 0 0 0 0 0 0 0 0
Amortisation 0 (381) (381) 0 (77) (77) 0 (458) (458)
Other 0 (8) (8) 0 (53) (53) 0 (62) (62)
Total changes 1,221 (389) 832 184 (131) 53 1,405 (520) 885
As at 31 12 2021 1,814 (735) 1,079 841 (435) 405 2,655 (1,171) 1,484
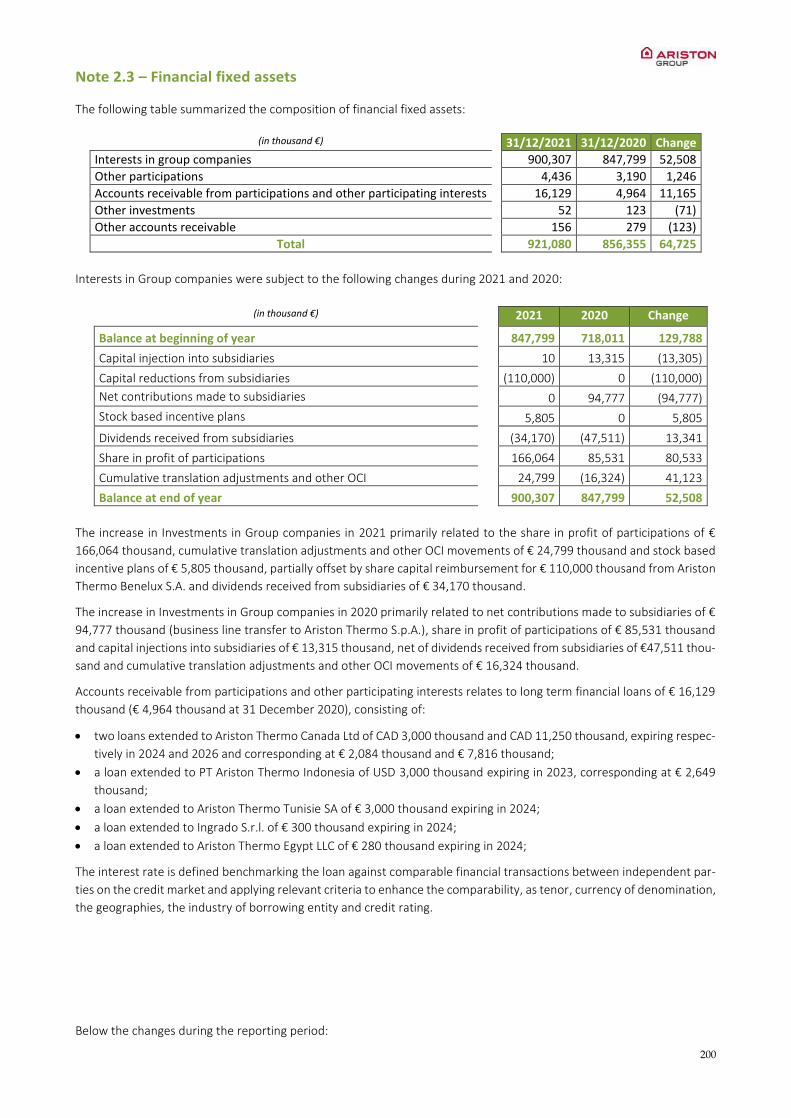
200
Note 2.3 – Financial fixed assets
The following table summarized the composition of financial fixed assets:
(in thousand €) 31/12/2021 31/12/2020 Change
Interests in group companies 900,307 847,799 52,508
Other participations 4,436 3,190 1,246
Accounts receivable from participations and other participating interests 16,129 4,964 11,165
Other investments 52 123 (71)
Other accounts receivable 156 279 (123)
Total 921,080 856,355 64,725
Interests in Group companies were subject to the following changes during 2021 and 2020:
(in thousand €) 2021 2020 Change
Balance at beginning of year 847,799 718,011 129,788
Capital injection into subsidiaries 10 13,315 (13,305)
Capital reductions from subsidiaries (110,000) 0 (110,000)
Net contributions made to subsidiaries 0 94,777 (94,777)
Stock based incentive plans 5,805 0 5,805
Dividends received from subsidiaries (34,170) (47,511) 13,341
Share in profit of participations 166,064 85,531 80,533
Cumulative translation adjustments and other OCI 24,799 (16,324) 41,123
Balance at end of year 900,307 847,799 52,508
The increase in Investments in Group companies in 2021 primarily related to the share in profit of participations of €
166,064 thousand, cumulative translation adjustments and other OCI movements of € 24,799 thousand and stock based
incentive plans of € 5,805 thousand, partially offset by share capital reimbursement for € 110,000 thousand from Ariston
Thermo Benelux S.A. and dividends received from subsidiaries of € 34,170 thousand.
The increase in Investments in Group companies in 2020 primarily related to net contributions made to subsidiaries of €
94,777 thousand (business line transfer to Ariston Thermo S.p.A.), share in profit of participations of € 85,531 thousand
and capital injections into subsidiaries of € 13,315 thousand, net of dividends received from subsidiaries of €47,511 thou-
sand and cumulative translation adjustments and other OCI movements of € 16,324 thousand.
Accounts receivable from participations and other participating interests relates to long term financial loans of € 16,129
thousand (€ 4,964 thousand at 31 December 2020), consisting of:
two loans extended to Ariston Thermo Canada Ltd of CAD 3,000 thousand and CAD 11,250 thousand, expiring respec-
tively in 2024 and 2026 and corresponding at € 2,084 thousand and € 7,816 thousand;
a loan extended to PT Ariston Thermo Indonesia of USD 3,000 thousand expiring in 2023, corresponding at € 2,649
thousand;
a loan extended to Ariston Thermo Tunisie SA of € 3,000 thousand expiring in 2024;
a loan extended to Ingrado S.r.l. of € 300 thousand expiring in 2024;
a loan extended to Ariston Thermo Egypt LLC of € 280 thousand expiring in 2024;
The interest rate is defined benchmarking the loan against comparable financial transactions between independent par-
ties on the credit market and applying relevant criteria to enhance the comparability, as tenor, currency of denomination,
the geographies, the industry of borrowing entity and credit rating.
Below the changes during the reporting period:
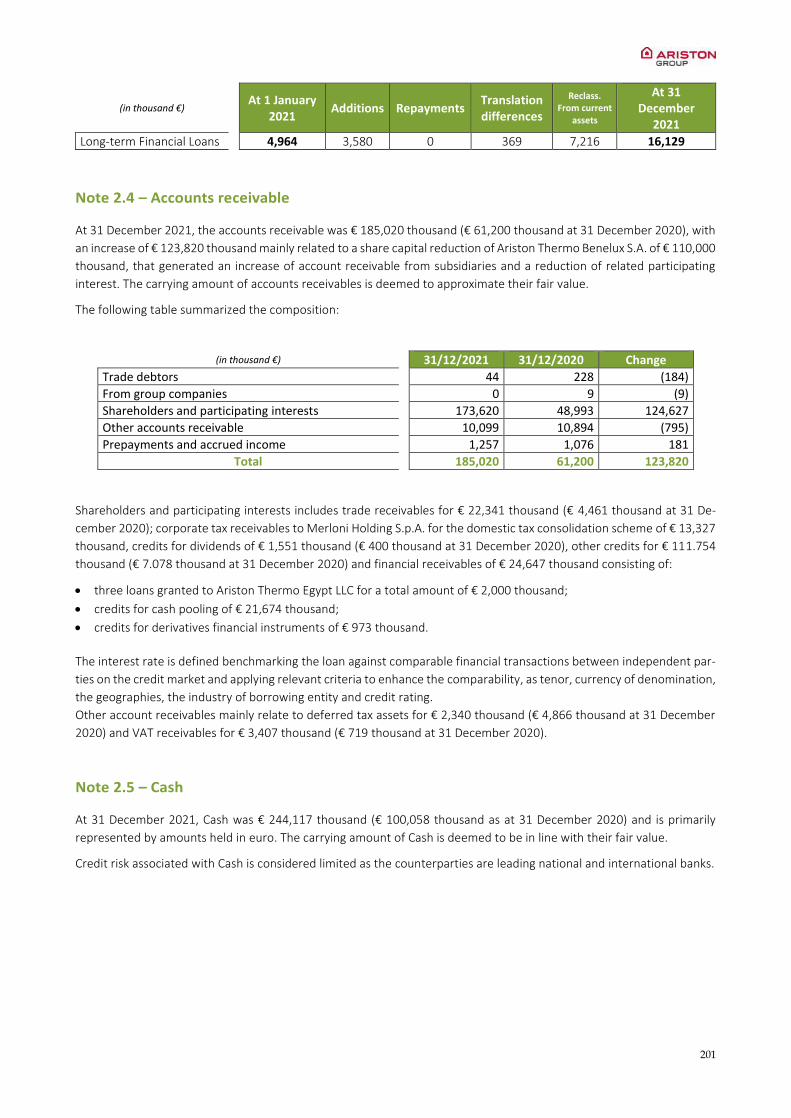
201
(in thousand €)
At 1 January 2021
Additions Repayments Translation differences
Reclass. From current
assets
At 31 December
2021
Long-term Financial Loans 4,964 3,580 0 369 7,216 16,129
Note 2.4 – Accounts receivable
At 31 December 2021, the accounts receivable was € 185,020 thousand (€ 61,200 thousand at 31 December 2020), with
an increase of € 123,820 thousand mainly related to a share capital reduction of Ariston Thermo Benelux S.A. of € 110,000
thousand, that generated an increase of account receivable from subsidiaries and a reduction of related participating
interest. The carrying amount of accounts receivables is deemed to approximate their fair value.
The following table summarized the composition:
(in thousand €) 31/12/2021 31/12/2020 Change
Trade debtors 44 228 (184)
From group companies 0 9 (9)
Shareholders and participating interests 173,620 48,993 124,627
Other accounts receivable 10,099 10,894 (795)
Prepayments and accrued income 1,257 1,076 181
Total 185,020 61,200 123,820
Shareholders and participating interests includes trade receivables for € 22,341 thousand (€ 4,461 thousand at 31 De-
cember 2020); corporate tax receivables to Merloni Holding S.p.A. for the domestic tax consolidation scheme of € 13,327
thousand, credits for dividends of € 1,551 thousand (€ 400 thousand at 31 December 2020), other credits for € 111.754
thousand (€ 7.078 thousand at 31 December 2020) and financial receivables of € 24,647 thousand consisting of:
three loans granted to Ariston Thermo Egypt LLC for a total amount of € 2,000 thousand;
credits for cash pooling of € 21,674 thousand;
credits for derivatives financial instruments of € 973 thousand.
The interest rate is defined benchmarking the loan against comparable financial transactions between independent par-
ties on the credit market and applying relevant criteria to enhance the comparability, as tenor, currency of denomination,
the geographies, the industry of borrowing entity and credit rating.
Other account receivables mainly relate to deferred tax assets for € 2,340 thousand (€ 4,866 thousand at 31 December
2020) and VAT receivables for € 3,407 thousand (€ 719 thousand at 31 December 2020).
Note 2.5 – Cash
At 31 December 2021, Cash was € 244,117 thousand (€ 100,058 thousand as at 31 December 2020) and is primarily
represented by amounts held in euro. The carrying amount of Cash is deemed to be in line with their fair value.
Credit risk associated with Cash is considered limited as the counterparties are leading national and international banks.
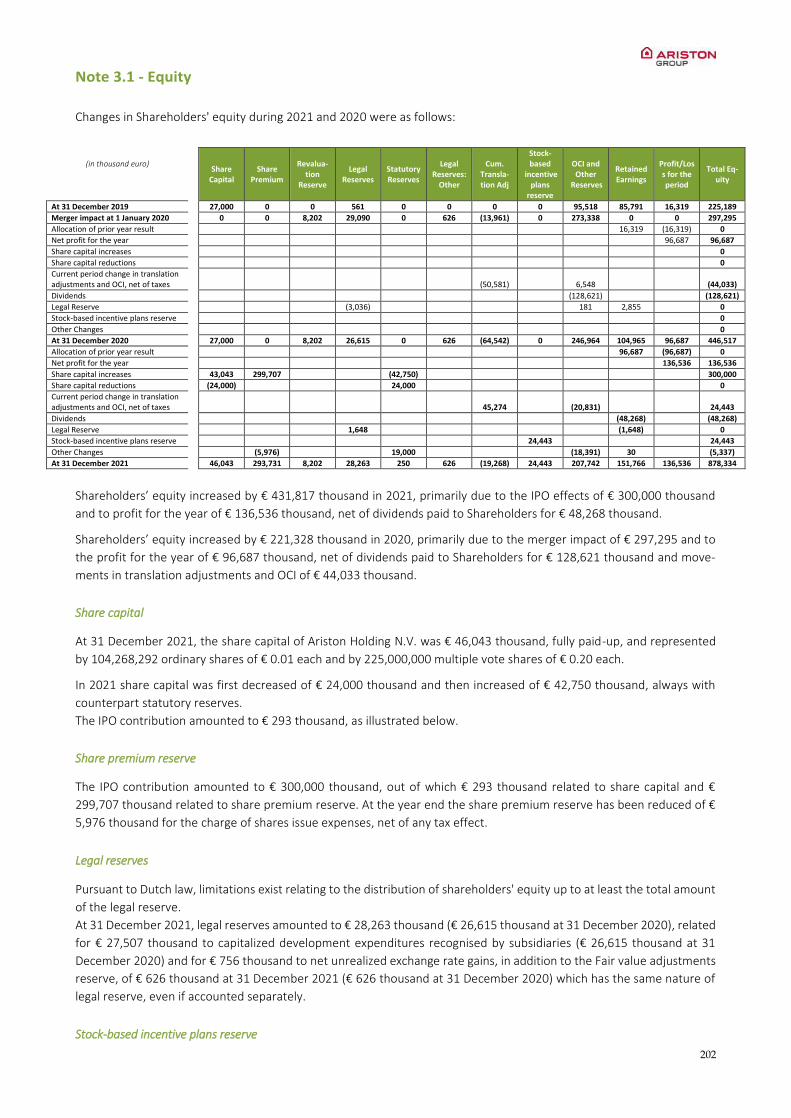
202
Note 3.1 - Equity
Changes in Shareholders' equity during 2021 and 2020 were as follows:
(in thousand euro)
Share Capital
Share Premium
Revalua-tion
Reserve
Legal Reserves
Statutory Reserves
Legal Reserves:
Other
Cum. Transla-tion Adj
Stock-based
incentive plans
reserve
OCI and Other
Reserves
Retained Earnings
Profit/Loss for the period
Total Eq-uity
At 31 December 2019 27,000 0 0 561 0 0 0 0 95,518 85,791 16,319 225,189
Merger impact at 1 January 2020 0 0 8,202 29,090 0 626 (13,961) 0 273,338 0 0 297,295
Allocation of prior year result 16,319 (16,319) 0
Net profit for the year 96,687 96,687
Share capital increases 0
Share capital reductions 0
Current period change in translation adjustments and OCI, net of taxes
(50,581) 6,548 (44,033)
Dividends (128,621) (128,621)
Legal Reserve (3,036) 181 2,855 0
Stock-based incentive plans reserve 0
Other Changes 0
At 31 December 2020 27,000 0 8,202 26,615 0 626 (64,542) 0 246,964 104,965 96,687 446,517
Allocation of prior year result 96,687 (96,687) 0
Net profit for the year 136,536 136,536
Share capital increases 43,043 299,707 (42,750) 300,000
Share capital reductions (24,000) 24,000 0
Current period change in translation adjustments and OCI, net of taxes
45,274 (20,831) 24,443
Dividends (48,268) (48,268)
Legal Reserve 1,648 (1,648) 0
Stock-based incentive plans reserve 24,443 24,443
Other Changes (5,976) 19,000 (18,391) 30 (5,337)
At 31 December 2021 46,043 293,731 8,202 28,263 250 626 (19,268) 24,443 207,742 151,766 136,536 878,334
Shareholders’ equity increased by € 431,817 thousand in 2021, primarily due to the IPO effects of € 300,000 thousand
and to profit for the year of € 136,536 thousand, net of dividends paid to Shareholders for € 48,268 thousand.
Shareholders’ equity increased by € 221,328 thousand in 2020, primarily due to the merger impact of € 297,295 and to
the profit for the year of € 96,687 thousand, net of dividends paid to Shareholders for € 128,621 thousand and move-
ments in translation adjustments and OCI of € 44,033 thousand.
Share capital
At 31 December 2021, the share capital of Ariston Holding N.V. was € 46,043 thousand, fully paid-up, and represented
by 104,268,292 ordinary shares of € 0.01 each and by 225,000,000 multiple vote shares of € 0.20 each.
In 2021 share capital was first decreased of € 24,000 thousand and then increased of € 42,750 thousand, always with
counterpart statutory reserves.
The IPO contribution amounted to € 293 thousand, as illustrated below.
Share premium reserve
The IPO contribution amounted to € 300,000 thousand, out of which € 293 thousand related to share capital and €
299,707 thousand related to share premium reserve. At the year end the share premium reserve has been reduced of €
5,976 thousand for the charge of shares issue expenses, net of any tax effect.
Legal reserves
Pursuant to Dutch law, limitations exist relating to the distribution of shareholders' equity up to at least the total amount
of the legal reserve.
At 31 December 2021, legal reserves amounted to € 28,263 thousand (€ 26,615 thousand at 31 December 2020), related
for € 27,507 thousand to capitalized development expenditures recognised by subsidiaries (€ 26,615 thousand at 31
December 2020) and for € 756 thousand to net unrealized exchange rate gains, in addition to the Fair value adjustments
reserve, of € 626 thousand at 31 December 2021 (€ 626 thousand at 31 December 2020) which has the same nature of
legal reserve, even if accounted separately.
Stock-based incentive plans reserve

203
At 31 December 2021, stock-based incentive plans reserve amounted to € 24,443 thousand, out of which € 11,885 thou-
sand related to vested phantom stock options converted into ordinary shares, € 12,111 thousand of unvested previously
defined phantom stock options into restricted share units and € 447 thousand of performance share units. The € 11,885
thousand were related to long term incentive plan of 2016-2018, meanwhile € 12,558 thousand refers to the following
plan:
2019: € 7,319 thousand
2020: € 4,792 thousand
2021: € 447 thousand.
Until Admission, the Executive Directors and a selected number of Managers participated in the long-term incentive plan
providing for phantom stock. Upon Admission this plan was terminated and the outstanding phantom stock options were
converted (a) at the option of the beneficiaries, into ordinary shares at the offer price of the Company's initial public
offering or cash (in relation to vested phantom stock options) and (b) into restricted share units (in relation to unvested
phantom stock options), with a vesting period of three years from the date of the original grant (phantom stock options
granted in 2019 vest in 2022, phantom stock options granted in 2020 vest in 2023).
In addition, a new long-term incentive plan has been approved by the general meeting providing for awards in the form
of performance share units for the 2021 LTI.
Settlement of the conversion of these phantom stock options will take place in the first half of 2022.
Note 3.2 - Provisions
At 31 December 2021, provisions were € 29,613 thousand (€ 18,635 thousand at 31 December 2020).
The following table summarized the composition:
(in thousand euro) 31.12.2021 31.12.2020 Change
Provision for employee severance indemnity 277 336 (59)
Deferred tax liabilities 15,028 1,124 13,904
Provision for interest in participating companies 13,667 16,277 (2,610)
Provision for risk 641 898 (257)
Total 29,613 18,635 10,978
Provision for interest in participating companies of € 13,667 thousand is related to participations in Ariston Thermo
France sas (€ 12.054 thousand), Ariston Thermo South Africa (Pty) Ltd (€ 1,157 thousand), Ariston Thermo Egypt LLC (€
335 thousand) and Ingrado S.r.l. (€ 121 thousand).
The following table shows the changes occurring during the year:
Provisions
Provision for employee
severance indemnity Deferred
tax liabilities
Provision for interest in participating
companies
Provision for risk
Total
(in thousand euro)
As at 31.12.2020 336 1,124 16,277 898 18,635
Increases 329 14,486 1,613 205 16,633
Decreases (361) (85) (4,203) (232) (4,881)
Other (27) (497) (20) (230) (774)
Total changes (59) 13,904 (2,610) (257) 10,978
As at 31.12.2021 277 15,028 13,667 641 29,613
Refer to consolidated financial statements for related terms and conditions.
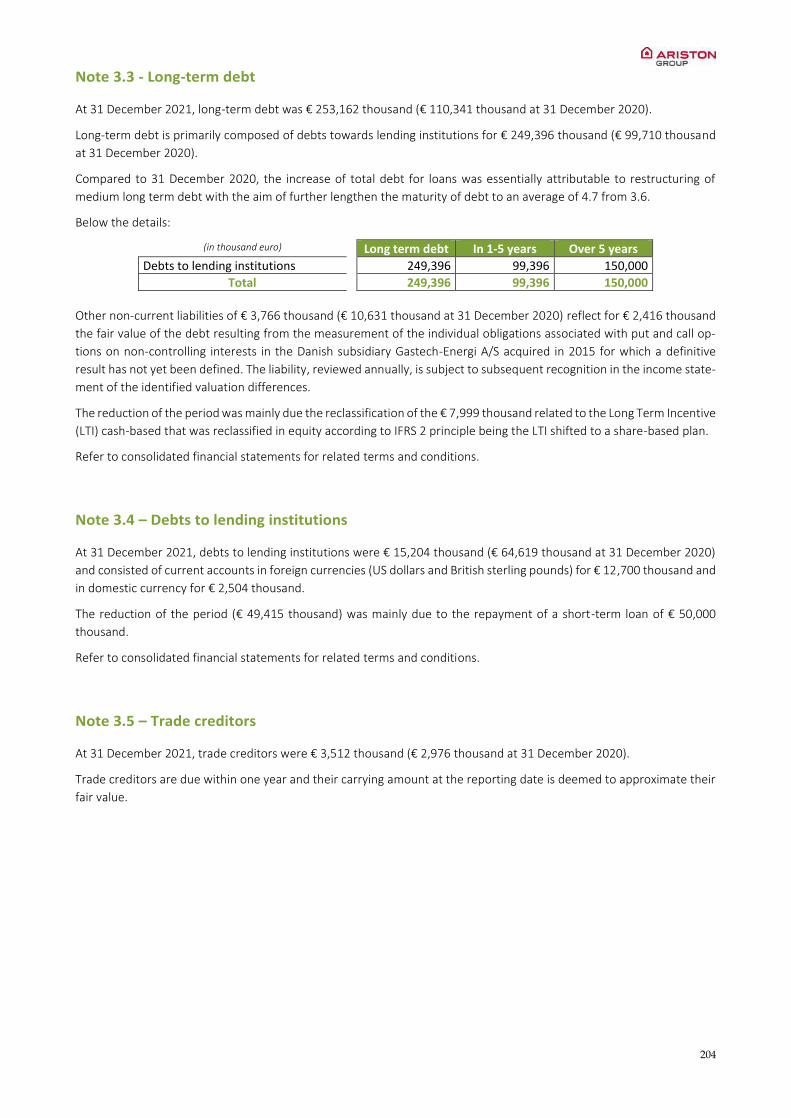
204
Note 3.3 - Long-term debt
At 31 December 2021, long-term debt was € 253,162 thousand (€ 110,341 thousand at 31 December 2020).
Long-term debt is primarily composed of debts towards lending institutions for € 249,396 thousand (€ 99,710 thousand
at 31 December 2020).
Compared to 31 December 2020, the increase of total debt for loans was essentially attributable to restructuring of
medium long term debt with the aim of further lengthen the maturity of debt to an average of 4.7 from 3.6.
Below the details:
(in thousand euro) Long term debt In 1-5 years Over 5 years
Debts to lending institutions 249,396 99,396 150,000
Total 249,396 99,396 150,000
Other non-current liabilities of € 3,766 thousand (€ 10,631 thousand at 31 December 2020) reflect for € 2,416 thousand
the fair value of the debt resulting from the measurement of the individual obligations associated with put and call op-
tions on non-controlling interests in the Danish subsidiary Gastech-Energi A/S acquired in 2015 for which a definitive
result has not yet been defined. The liability, reviewed annually, is subject to subsequent recognition in the income state-
ment of the identified valuation differences.
The reduction of the period was mainly due the reclassification of the € 7,999 thousand related to the Long Term Incentive
(LTI) cash-based that was reclassified in equity according to IFRS 2 principle being the LTI shifted to a share-based plan.
Refer to consolidated financial statements for related terms and conditions.
Note 3.4 – Debts to lending institutions
At 31 December 2021, debts to lending institutions were € 15,204 thousand (€ 64,619 thousand at 31 December 2020)
and consisted of current accounts in foreign currencies (US dollars and British sterling pounds) for € 12,700 thousand and
in domestic currency for € 2,504 thousand.
The reduction of the period (€ 49,415 thousand) was mainly due to the repayment of a short-term loan of € 50,000
thousand.
Refer to consolidated financial statements for related terms and conditions.
Note 3.5 – Trade creditors
At 31 December 2021, trade creditors were € 3,512 thousand (€ 2,976 thousand at 31 December 2020).
Trade creditors are due within one year and their carrying amount at the reporting date is deemed to approximate their
fair value.
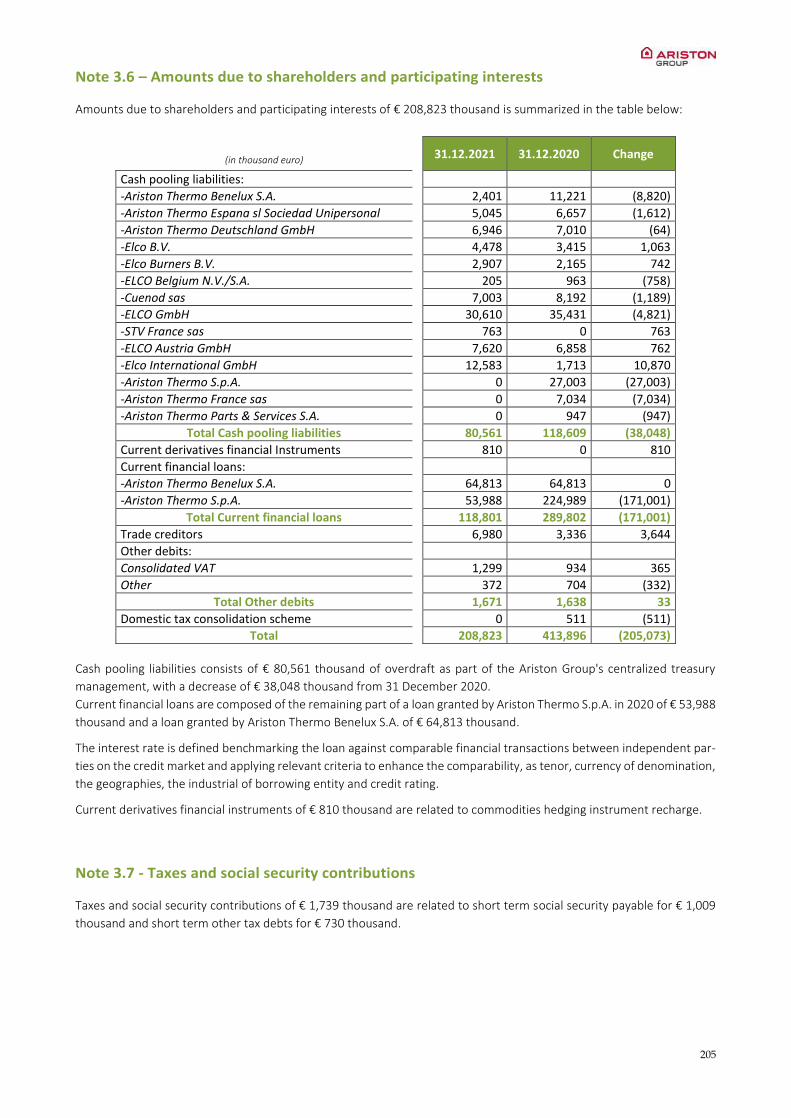
205
Note 3.6 – Amounts due to shareholders and participating interests
Amounts due to shareholders and participating interests of € 208,823 thousand is summarized in the table below:
(in thousand euro)
31.12.2021 31.12.2020 Change
Cash pooling liabilities: -Ariston Thermo Benelux S.A. 2,401 11,221 (8,820)
-Ariston Thermo Espana sl Sociedad Unipersonal 5,045 6,657 (1,612)
-Ariston Thermo Deutschland GmbH 6,946 7,010 (64)
-Elco B.V. 4,478 3,415 1,063
-Elco Burners B.V. 2,907 2,165 742
-ELCO Belgium N.V./S.A. 205 963 (758)
-Cuenod sas 7,003 8,192 (1,189)
-ELCO GmbH 30,610 35,431 (4,821)
-STV France sas 763 0 763
-ELCO Austria GmbH 7,620 6,858 762
-Elco International GmbH 12,583 1,713 10,870
-Ariston Thermo S.p.A. 0 27,003 (27,003)
-Ariston Thermo France sas 0 7,034 (7,034)
-Ariston Thermo Parts & Services S.A. 0 947 (947)
Total Cash pooling liabilities 80,561 118,609 (38,048)
Current derivatives financial Instruments 810 0 810
Current financial loans: -Ariston Thermo Benelux S.A. 64,813 64,813 0
-Ariston Thermo S.p.A. 53,988 224,989 (171,001)
Total Current financial loans 118,801 289,802 (171,001)
Trade creditors 6,980 3,336 3,644
Other debits: Consolidated VAT 1,299 934 365
Other 372 704 (332)
Total Other debits 1,671 1,638 33
Domestic tax consolidation scheme 0 511 (511)
Total 208,823 413,896 (205,073)
Cash pooling liabilities consists of € 80,561 thousand of overdraft as part of the Ariston Group's centralized treasury
management, with a decrease of € 38,048 thousand from 31 December 2020.
Current financial loans are composed of the remaining part of a loan granted by Ariston Thermo S.p.A. in 2020 of € 53,988
thousand and a loan granted by Ariston Thermo Benelux S.A. of € 64,813 thousand.
The interest rate is defined benchmarking the loan against comparable financial transactions between independent par-
ties on the credit market and applying relevant criteria to enhance the comparability, as tenor, currency of denomination,
the geographies, the industrial of borrowing entity and credit rating.
Current derivatives financial instruments of € 810 thousand are related to commodities hedging instrument recharge.
Note 3.7 - Taxes and social security contributions
Taxes and social security contributions of € 1,739 thousand are related to short term social security payable for € 1,009
thousand and short term other tax debts for € 730 thousand.
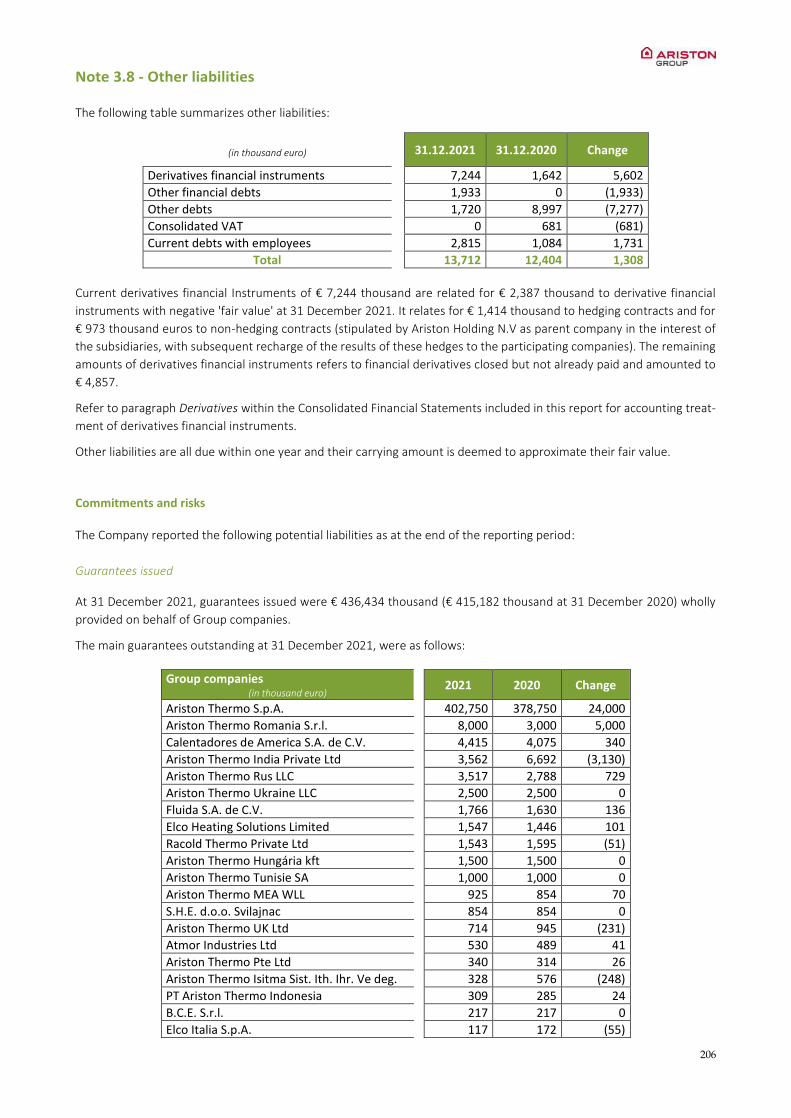
206
Note 3.8 - Other liabilities
The following table summarizes other liabilities:
(in thousand euro)
31.12.2021 31.12.2020 Change
Derivatives financial instruments 7,244 1,642 5,602
Other financial debts 1,933 0 (1,933)
Other debts 1,720 8,997 (7,277)
Consolidated VAT 0 681 (681)
Current debts with employees 2,815 1,084 1,731
Total 13,712 12,404 1,308
Current derivatives financial Instruments of € 7,244 thousand are related for € 2,387 thousand to derivative financial
instruments with negative 'fair value' at 31 December 2021. It relates for € 1,414 thousand to hedging contracts and for
€ 973 thousand euros to non-hedging contracts (stipulated by Ariston Holding N.V as parent company in the interest of
the subsidiaries, with subsequent recharge of the results of these hedges to the participating companies). The remaining
amounts of derivatives financial instruments refers to financial derivatives closed but not already paid and amounted to
€ 4,857.
Refer to paragraph Derivatives within the Consolidated Financial Statements included in this report for accounting treat-
ment of derivatives financial instruments.
Other liabilities are all due within one year and their carrying amount is deemed to approximate their fair value.
Commitments and risks
The Company reported the following potential liabilities as at the end of the reporting period:
Guarantees issued
At 31 December 2021, guarantees issued were € 436,434 thousand (€ 415,182 thousand at 31 December 2020) wholly
provided on behalf of Group companies.
The main guarantees outstanding at 31 December 2021, were as follows:
Group companies
(in thousand euro)
2021 2020 Change
Ariston Thermo S.p.A. 402,750 378,750 24,000
Ariston Thermo Romania S.r.l. 8,000 3,000 5,000
Calentadores de America S.A. de C.V. 4,415 4,075 340
Ariston Thermo India Private Ltd 3,562 6,692 (3,130)
Ariston Thermo Rus LLC 3,517 2,788 729
Ariston Thermo Ukraine LLC 2,500 2,500 0
Fluida S.A. de C.V. 1,766 1,630 136
Elco Heating Solutions Limited 1,547 1,446 101
Racold Thermo Private Ltd 1,543 1,595 (51)
Ariston Thermo Hungária kft 1,500 1,500 0
Ariston Thermo Tunisie SA 1,000 1,000 0
Ariston Thermo MEA WLL 925 854 70
S.H.E. d.o.o. Svilajnac 854 854 0
Ariston Thermo UK Ltd 714 945 (231)
Atmor Industries Ltd 530 489 41
Ariston Thermo Pte Ltd 340 314 26
Ariston Thermo Isitma Sist. Ith. Ihr. Ve deg. 328 576 (248)
PT Ariston Thermo Indonesia 309 285 24
B.C.E. S.r.l. 217 217 0
Elco Italia S.p.A. 117 172 (55)
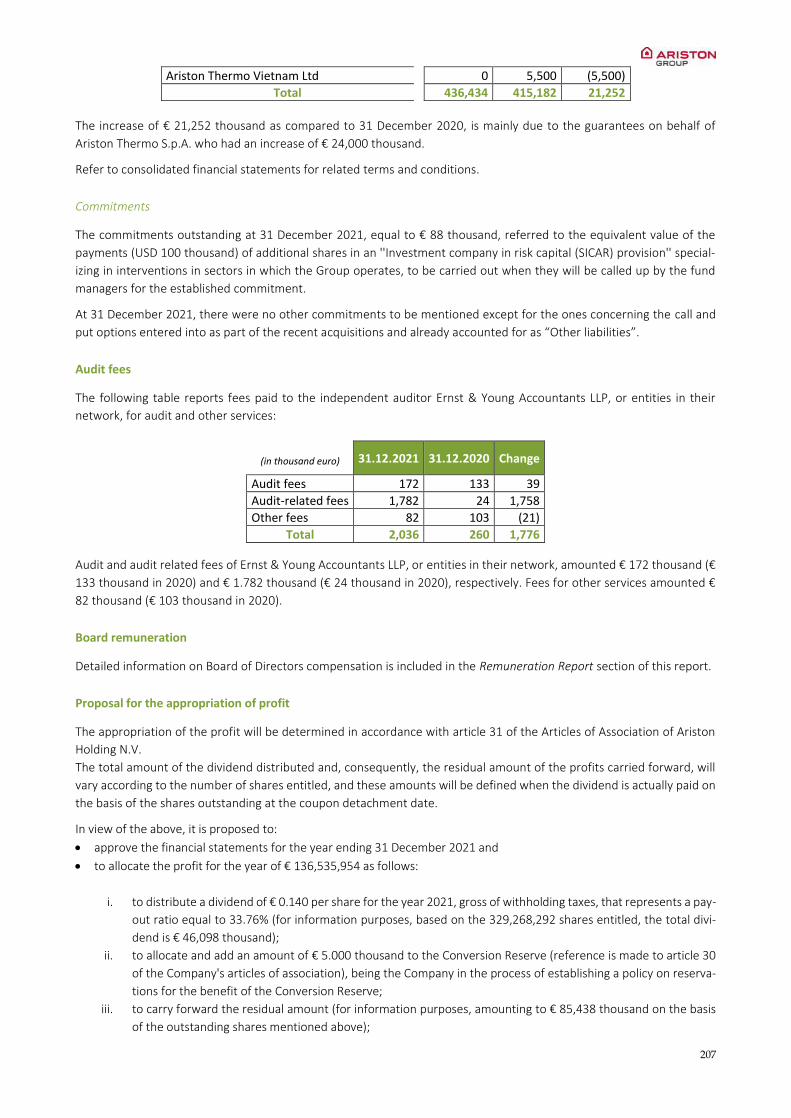
207
Ariston Thermo Vietnam Ltd 0 5,500 (5,500)
Total 436,434 415,182 21,252
The increase of € 21,252 thousand as compared to 31 December 2020, is mainly due to the guarantees on behalf of
Ariston Thermo S.p.A. who had an increase of € 24,000 thousand.
Refer to consolidated financial statements for related terms and conditions.
Commitments
The commitments outstanding at 31 December 2021, equal to € 88 thousand, referred to the equivalent value of the
payments (USD 100 thousand) of additional shares in an ''Investment company in risk capital (SICAR) provision'' special-
izing in interventions in sectors in which the Group operates, to be carried out when they will be called up by the fund
managers for the established commitment.
At 31 December 2021, there were no other commitments to be mentioned except for the ones concerning the call and
put options entered into as part of the recent acquisitions and already accounted for as “Other liabilities”.
Audit fees
The following table reports fees paid to the independent auditor Ernst & Young Accountants LLP, or entities in their
network, for audit and other services:
(in thousand euro) 31.12.2021 31.12.2020 Change
Audit fees 172 133 39
Audit-related fees 1,782 24 1,758
Other fees 82 103 (21)
Total 2,036 260 1,776
Audit and audit related fees of Ernst & Young Accountants LLP, or entities in their network, amounted € 172 thousand (€
133 thousand in 2020) and € 1.782 thousand (€ 24 thousand in 2020), respectively. Fees for other services amounted €
82 thousand (€ 103 thousand in 2020).
Board remuneration
Detailed information on Board of Directors compensation is included in the Remuneration Report section of this report.
Proposal for the appropriation of profit
The appropriation of the profit will be determined in accordance with article 31 of the Articles of Association of Ariston
Holding N.V.
The total amount of the dividend distributed and, consequently, the residual amount of the profits carried forward, will
vary according to the number of shares entitled, and these amounts will be defined when the dividend is actually paid on
the basis of the shares outstanding at the coupon detachment date.
In view of the above, it is proposed to:
approve the financial statements for the year ending 31 December 2021 and
to allocate the profit for the year of € 136,535,954 as follows:
i. to distribute a dividend of € 0.140 per share for the year 2021, gross of withholding taxes, that represents a pay-
out ratio equal to 33.76% (for information purposes, based on the 329,268,292 shares entitled, the total divi-
dend is € 46,098 thousand);
ii. to allocate and add an amount of € 5.000 thousand to the Conversion Reserve (reference is made to article 30
of the Company's articles of association), being the Company in the process of establishing a policy on reserva-
tions for the benefit of the Conversion Reserve;
iii. to carry forward the residual amount (for information purposes, amounting to € 85,438 thousand on the basis
of the outstanding shares mentioned above);

208
to pay the above dividend on 25 May 2022 (with an ex-date for coupon of 23 May 2022 in accordance with the Italian Stock Exchange calendar, and a record date of 23 May 2022).
The Board of Directors resolved to convene the Ordinary Shareholders’ Meeting on 28 April 2022 to approve, inter alia,
the company financial statements for the year ended 31 December 2021
Subsequent events
Regarding subsequent events evaluated by the Group, refer to Subsequent events section of this report.
March 2, 2022
The Board of Directors
Paolo Merloni
Laurent Alexis Michel Henri Jacquemin
Sabrina Baggioni
Roberto Guidetti
Francesco Merloni
Maria Francesca Merloni
Lorenzo Pozza
Ignazio Maria Rocco di Torrepadula
Paolo Tanoni
Andrea Silvestri
Marinella Soldi
Enrico Vita
Other information
Additional information for Netherlands corporate governance
Independent Auditor’s Report
The report of the Company’s independent auditor, Ernst & Young Accountants LLP, the Netherlands, is set forth following
this Annual Report.
Profits appropriation
Dividends will be determined in accordance with the article 31 of the Articles of Association of Ariston Holding N.V. The
relevant provisions of the Articles of Association read as follows:
Appropriation of profits
Article 31
31.1. The Board may decide that the profits realised during a financial year are fully or partially appropriated to increase
or form reserves.
31.2. The profits of the Company remaining after application of Article 31.1 shall be put at the disposal of the General
Meeting. The Board shall make a proposal for that purpose. A proposal to pay a dividend shall be dealt with as a separate
agenda item at the General Meeting.
31.3. The Shareholders will share in the (profit) distribution in proportion to the aggregate number of the Shares (either
Ordinary Shares and/or Multiple Voting Shares) held by each of them.
31.4. The Company's policy on reserves and dividends shall be determined and can be amended by the Board.
31.5. The Company may distribute profits to Shareholders and other persons eligible to receive any share of the distribut-
able profits only insofar as the Company's shareholders' equity, reduced by the amount of the distribution, will not be
209
smaller than the paid-up and claimed part of the Company's shareholders capital, increased by the reserves which must
be maintained under these Articles and by Dutch law.
31.6. Profits will be distributed after confirmation of the Annual Accounts, evidencing this to be permissible.
31.7. The Company may only make interim (profit) distributions to the extent that the provisions as set out in Article 31.5
have been complied with as evidenced by an interim specification of assets and liabilities. Such interim specification of
assets and liabilities will relate to the position of the equity of the Company at the earliest as at the first day of the third
month prior to the month in which the resolution providing for payment is announced. It will be drawn up with due ob-
servance of valuation methods deemed acceptable under generally accepted standards. The specification of assets and
liabilities will include the amounts to be allocated to the reserves in accordance with Dutch law or these Articles. It shall be
signed by the Directors; if the signature of one or several of them is missing, the reason thereof shall be stated. The Com-
pany shall file the specification of assets and liabilities with the office of the Dutch trade register within eight days after the
resolution to make payment available is announced.
31.8. With due observance of the provisions of Article 31.5, the General Meeting, on a proposal of the Board, may adopt
resolutions for distributions to the charge of the Company's reserves that do not need to be kept pursuant to these Articles
or Dutch law.
Disclosures pursuant to decree article 10 EU-Directive on takeovers
In accordance with the Dutch Takeover Directive (Article 10) Decree (Besluit artikel overnamerichtlijn, the "Decree"), the
Company makes the following disclosures:
a. At 31 December 2021, the issued share capital of the Company consisted of 104,268,292 ordinary shares with a par
value of €0.01 each, representing 2.26% of the aggregate issued share capital, and 225,000,000 multiple voting shares
with a nominal value of € 0.20 each, representing 97.74% of the aggregate issued share capital
For information on the rights attached to ordinary shares and multiple voting shares, reference is made to the articles
of association which can be found on the Company's website. To summarise, the rights attaching to ordinary shares
and multiple voting shares comprise pre-emptive rights upon the issue of shares, the right to attend to the general
meetings of shareholders of the Company and to speak and vote at such meetings and to resolve on and the entitle-
ment to the distribution of such amount of the Company's profit as remains after allocation to the reserves. Ordinary
shares and multiple voting shares rank pari passu and will have equal rights and obligations with respect to all matters,
with the exceptions as set out in the articles of association including the entitlement to voting rights as set out in
article 25.1 of the articles of association, the conversion reserve and the liquidation distribution referred to in article
35.3 of the articles of association.
b. The Company has imposed no limitations on the transfer of ordinary shares. Article 15 of the articles of association
provide for transfer restrictions for multiple voting shares (right of first refusal). If a holder of multiple voting shares
intends to transfer to any third party (be it a shareholder or not) one or more multiple voting shares, the transferor
shall have the obligation, in accordance with the procedure outlined in article 15 of the articles of association, to offer
a right of first refusal to the remaining holders of multiple voting shares.
c. For information on participations in the capital of the Company for which a disclosure obligation exists under Sections
5:34, 5:35 and 5:43 of the Dutch Financial Supervision Act (Wet op het financieel toezicht), please see the paragraph
'Major shareholders' of the Corporate Governance section of this annual report. There you will find a list of share-
holders who are known to the Company to have holdings of three percent or more at the stated date.
d. No special control rights or other rights accrue to shares in the capital of the Company other than that a multiple
voting share confers the right to cast 20 votes, all in accordance with the terms and conditions as set out in article
25.1 of the articles of association. Reference is made to paragraph "General Meeting"; subparagraph "Voting Rights
and adoption of resolutions" of the Corporate Governance section of this annual report.
e. A mechanism for verifying compliance with a scheme allowing employees to subscribe for or to acquire shares in the
capital of the Company or a subsidiary if the employees do not arrange for such verification directly is not applicable
to the Company.
f. No restrictions apply to voting rights attached to the shares in the capital of the Company, nor are there any deadlines
for exercising voting rights other than the restriction of the number of votes that may be cast on multiple voting

210
shares as set out in article 25.1 of the articles of association describing the Voting Threshold and further explained in
paragraph "General Meeting"; subparagraph "Voting Rights and adoption of resolutions" of the Corporate Govern-
ance section of this annual report. Except by virtue of the different voting rights attached to the ordinary shares and
the multiple voting shares and the application of the Voting Threshold, none of the shareholders will have any voting
rights different from any other shareholders.
g. The Company is not aware of the existence of any agreements with shareholders of the Company which may result
in restrictions on the transfer of shares or limitation or voting rights, other than a shareholders' agreement entered
into on 26 October 2021. The shareholders agreement provides as follows:
i. Merloni Holding S.p.A. shall procure that one person indicated by Amaranta S.r.l. is appointed as direc-
tor so long as Amaranta S.r.l. holds at least 7% of issued share capital of the Company;
ii. should Merloni Holding S.p.A.:
- decide to sell a number of multiple voting shares so that it loses control over the Company, then
Amaranta S.r.l. will be entitled to tag its multiple voting shares to the sale of multiple voting
shares held by Merloni Holding S.p.A.;
- receive an offer for the entirety of the outstanding multiple voting shares, then Merloni Holding
S.p.A. will be entitled to drag the multiple voting shares held by Amaranta S.r.l.;
iii. Merloni Holding S.p.A. shall be entitled to acquire from Amaranta S.r.l. 6,000,000 multiple voting shares in
exchange for the same amount of ordinary shares by virtue of a call option; and
iv. each of Merloni Holding S.p.A. and Amaranta S.r.l. shall inform the other party in case it wishes to convert
its multiple voting shares into ordinary shares.
h. The rules governing the appointment and dismissal of directors are stated in the articles of association. All directors
are appointed by the general meeting. The Board nominates a candidate for each vacant seat. A nomination by the
Board will be binding as described above in the section 'Board'. Directors are appointed for a period of time to be
determined by the general meeting, ending not sooner than immediately after the general meeting held in the first
year after the year of their appointment and not later than immediately after the general meeting held in the fourth
year after the year of their appointment.
i. The articles of association allow the Company to cooperate in the issuance of registered depositary receipts for
shares, but only pursuant to a resolution to that effect by the Board. No depositary receipts having been issued for
shares in its capital with the cooperation of the Company.
The general meeting may at any time dismiss or suspend any director. If the Board proposes the dismissal of a director
to the general meeting, the general meeting can resolve upon such dismissal by resolution adopted by an absolute
majority of the votes cast.
If the Board has not made a proposal for the dismissal of a director, the general meeting can only resolve upon the
dismissal of such director by resolution adopted by an absolute majority of the votes cast, representing more than
half of the issued capital of the Company. executive directors may at all times also be suspended by the Board. A
resolution of the Board to suspend the Executive Chairman must be adopted with a majority of two thirds of the votes
cast in a meeting where all directors, other than the Executive Chairman, are present or represented. If either the
Board or the general meeting has resolved upon a suspension of a director, the general meeting shall within three
months after the suspension has taken effect, resolve either to dismiss such director with due observance of the
provisions in the articles of association, or to terminate or continue the suspension, failing which the suspension shall
lapse. A resolution to continue the suspension may be adopted only once and in such event the suspension may be
continued for a maximum period of three months commencing on the day that the general meeting has adopted the
resolution to continue the suspension. If the general meeting has not decided to terminate or to continue the sus-
pension within the required period, the suspension shall lapse.
The rules governing an amendment of the articles of association are included in article 34 of the articles of association
and require a resolution of the general meeting, but only on a proposal by the Board. The prior approval of the meet-
ing of holders of multiple voting shares is required for an amendment of a provision relation to the multiple voting
shares and/or the rights and/or the obligations of the (meeting of) holders of multiple voting shares.

211
j. The general powers of the Board are stated in article 17 of the articles of association. Pursuant to article 21.1 of the
articles of association, the general authority to represent the Company is vested in the Board and the Executive Chair-
man. The Board has granted specific representation powers to Laurent Jacquemin, in his capacity of Chief Executive
Officer of the Company.
According to article 6.1 of the articles of association, the Board will be the competent corporate body to issue the
shares for a period of five years with effect from 25 November 2021. The Board is also authorised to limit or exclude
pre-emptive rights of shareholders on any issue of shares or granting rights to subscribe for shares, for the same
term. After the five-year term, shares may be issued pursuant to a resolution of the general meeting unless the Board
is designated to do so by the general meeting. Such designation can be made each time for a maximum period of five
years and can be extended each time for a maximum period of five years. A designation must determine the number
of shares of each class concerned which may be issued pursuant to a resolution of the Board. The resolution of the
general meeting to designate the Board as the body authorised to issue shares cannot be withdrawn by the general
meeting, unless otherwise provided in the authorisation. The body resolving to issue shares must determine the issue
price and the other conditions of issuance in the resolution to issue. After the five- year term, pre-emptive rights may
be restricted or excluded by a resolution of the general meeting. The general meeting may designate this competence
to the Board for a period not exceeding five years, provided that the general meeting has also authorised the Board
to issue shares. Unless otherwise stipulated at its grant, this authorisation cannot be withdrawn.
The Company is entitled to acquire fully paid-up shares in its capital. The terms and conditions for the acquisition of
shares by the Company in its capital are set out in article 9 of the articles of association.
k. The Company is not a party to any significant agreements which will take effect, will be altered or will be termination
upon a change of control of the Company as a result of a public offer within the meaning of section 5:70 of the Dutch
Financial Supervision Act (Wet op het financieel toezicht), provided that certain of the loan agreements entered into
by the Company contain clauses that, as is customary for financing agreements of similar type, may require early
repayment or termination in the event of a change of control of the Company.
The Company did not enter into any agreement with a director or employee of the Company providing for a pay-
ment upon the termination of employment as a result of a public offer within the meaning of section 5:70 of the
Dutch Financial Supervision Act (Wet op het financieel toezicht).
Copyright © 2022 FDOKUMEN