annual report 2009 - JENSEN-GROUP
120
ANNUAL REPORT 2009
-
Upload
khangminh22 -
Category
Documents
-
view
1 -
download
0
Transcript of annual report 2009 - JENSEN-GROUP

a n n u a l r e p o r t 2 0 0 9

T h e a i m o f T h e J e N S e N - G R o U P i S T o S U P P l y h e a v y - d U T y l a U N d R i e S w o R l d w i d e w i T h S U S T a i N a b l e , e c o N o m i c a l a N d e N v i R o N -m e N T a l l y f R i e N d l y l a U N d R y m a c h i N e S a N d S y S T e m S i N o R d e R T o h e l P T h e m P R o v i d e h i G h - q U a l i T y T e x T i l e S e R v i c e S .
J e S P e R m U N c h J e N S e N , c e o J e N S e N - G R o U P

The dutch language text of the annual report is the official version. The english language version is provided as a
courtesy to our shareholders. JeNSeN-GRoUP has verified the two language versions and assumes full responsibi-
lity for matching both language versions.
in this report, the terms “JeNSeN-GRoUP” or “Group” refer to JeNSeN-GRoUP N.v. and its consolidated companies
in general. The terms “JeNSeN-GRoUP N.v.” and “the company” refer to the holding company, registered in bel-
gium. business activities are conducted by operating subsidiaries throughout the world. The terms “we”, “our”,
and “us” are used to describe the Group.

a n n u a l r e p o r t 2 0 0 9
Key figures per share 6
Key figures 8
message to the shareholders 10
Profile of the Group 12
JeNSeN-GRoUP 15
Profile
we think globally and act locally
activities 2009
outlook 2010
corporate Governance Statement 20
information for shareholders and investors 34
Share price evolution
communication strategy
change in shareholdings
Shareholders’ calendar
litigation 36
human Resources 36
Research and development 37
investments and capital expenditures 37
outlook 2010
financial report 41
4 5
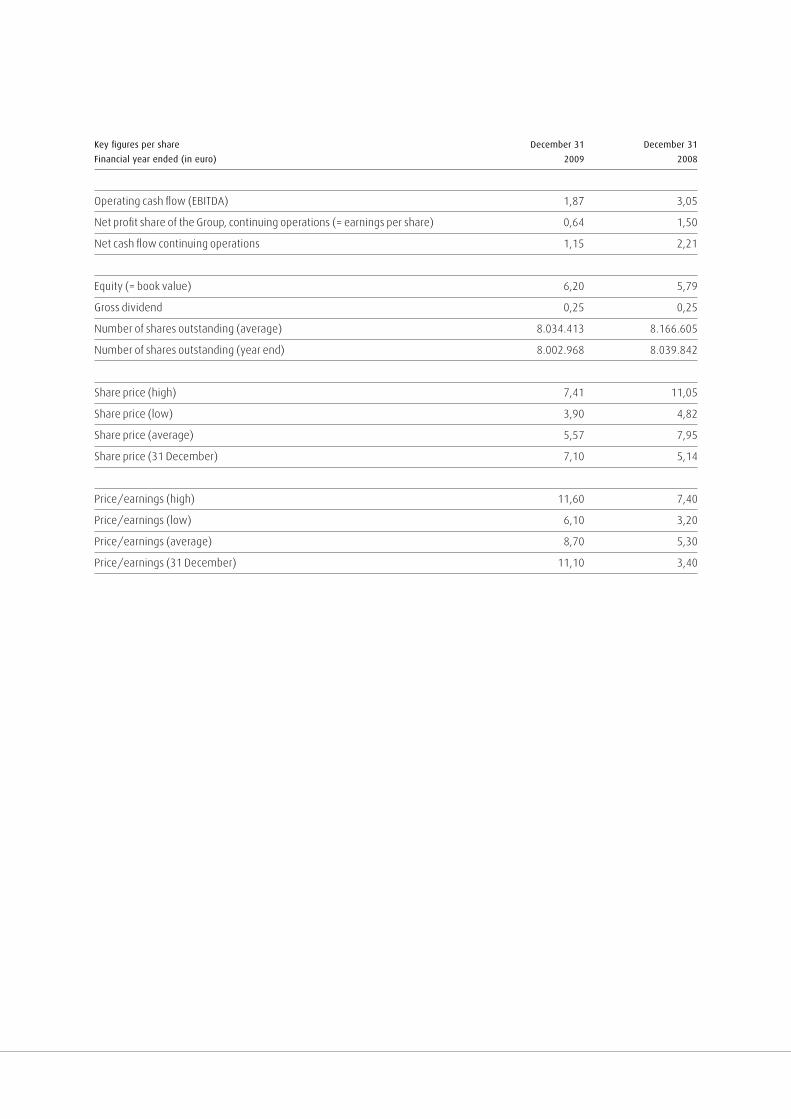
Key figures per share december 31 december 31
financial year ended (in euro) 2009 2008
Operating cash flow (EBITDA) 1,87 3,05
Net profit share of the Group, continuing operations (= earnings per share) 0,64 1,50
Net cash flow continuing operations 1,15 2,21
Equity (= book value) 6,20 5,79
Gross dividend 0,25 0,25
Number of shares outstanding (average) 8.034.413 8.166.605
Number of shares outstanding (year end) 8.002.968 8.039.842
Share price (high) 7,41 11,05
Share price (low) 3,90 4,82
Share price (average) 5,57 7,95
Share price (31 December) 7,10 5,14
Price/earnings (high) 11,60 7,40
Price/earnings (low) 6,10 3,20
Price/earnings (average) 8,70 5,30
Price/earnings (31 December) 11,10 3,40
a n n u a l r e p o r t 2 0 0 9
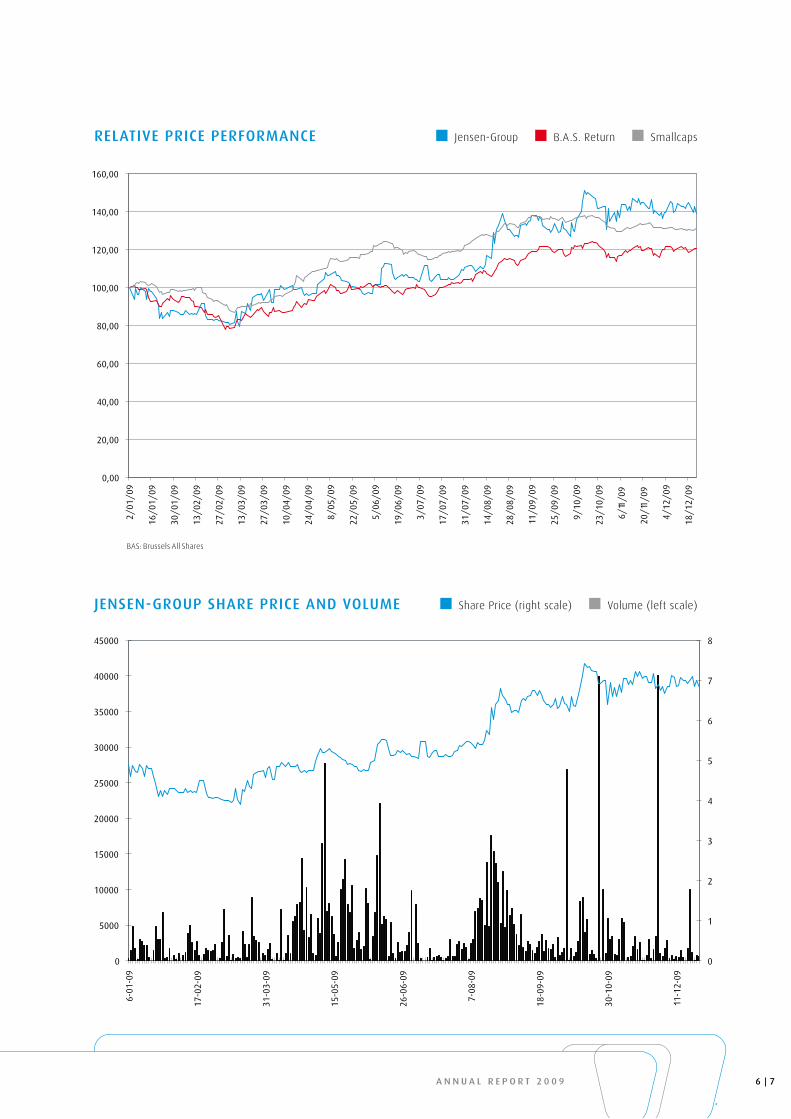
relatIVe prICe perForManCe Jensen-Group B.A.S. Return Smallcaps
BAS: Brussels All Shares
JenSen-Group SHare prICe anD VoluMe Share Price (right scale) Volume (left scale)
0,00
20,00
40,00
60,00
80,00
100,00
120,00
140,00
160,00
2/01
/09
16/0
1/09
30/0
1/09
13/0
2/09
27/0
2/09
13/0
3/09
27/0
3/09
10/0
4/09
24/0
4/09
8/05
/09
22/0
5/09
5/06
/09
19/0
6/09
3/07
/09
17/0
7/09
31/0
7/09
14/0
8/09
28/0
8/09
11/0
9/09
25/0
9/09
9/10
/09
23/1
0/09
6/11
/09
20/1
1/09
4/12
/09
18/1
2/09
0
1
2
3
4
5
6
7
8
0
5000
10000
15000
20000
25000
30000
35000
40000
45000
6-01
-09
17-0
2-09
31-0
3-09
15-0
5-09
26-0
6-09
7-08
-09
18-0
9-09
30-1
0-09
11-1
2-09
6 7
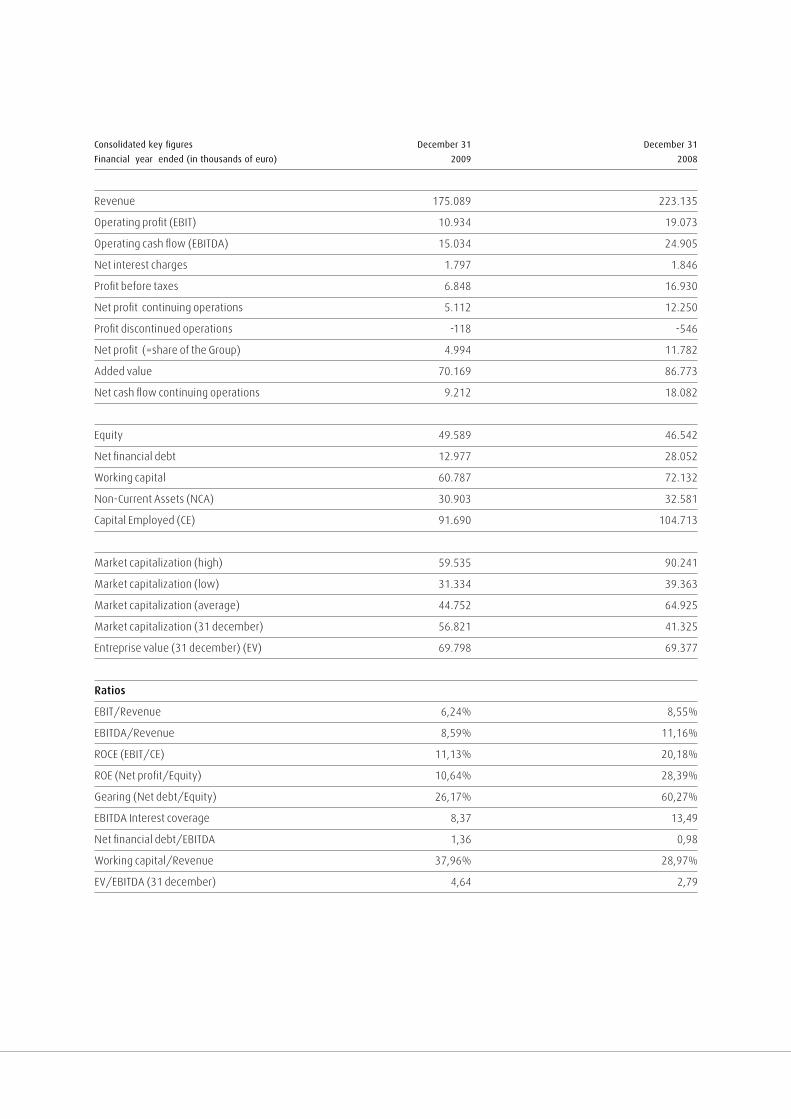
consolidated key figures december 31 december 31
financial year ended (in thousands of euro) 2009 2008
Revenue 175.089 223.135
Operating profit (EBIT) 10.934 19.073
Operating cash flow (EBITDA) 15.034 24.905
Net interest charges 1.797 1.846
Profit before taxes 6.848 16.930
Net profit continuing operations 5.112 12.250
Profit discontinued operations -118 -546
Net profit (=share of the Group) 4.994 11.782
Added value 70.169 86.773
Net cash flow continuing operations 9.212 18.082
Equity 49.589 46.542
Net financial debt 12.977 28.052
Working capital 60.787 72.132
Non-Current Assets (NCA) 30.903 32.581
Capital Employed (CE) 91.690 104.713
Market capitalization (high) 59.535 90.241
Market capitalization (low) 31.334 39.363
Market capitalization (average) 44.752 64.925
Market capitalization (31 december) 56.821 41.325
Entreprise value (31 december) (EV) 69.798 69.377
ratios
EBIT/Revenue 6,24% 8,55%
EBITDA/Revenue 8,59% 11,16%
ROCE (EBIT/CE) 11,13% 20,18%
ROE (Net profit/Equity) 10,64% 28,39%
Gearing (Net debt/Equity) 26,17% 60,27%
EBITDA Interest coverage 8,37 13,49
Net financial debt/EBITDA 1,36 0,98
Working capital/Revenue 37,96% 28,97%
EV/EBITDA (31 december) 4,64 2,79
a n n u a l r e p o r t 2 0 0 9
Definitions
• Added value: Operating profit plus remuneration, social security and pension charges plus depreciation and amortization, amounts written off on inventories
and trade debtors, impairment losses and provisions for liabilities and charges.
• Capital Employed (CE): Working capital plus intangible and tangible fixed assets. The average CE is used for ratios.
• EBITDA Interest Coverage: EBITDA relative to net interest charges.
• EBITDA: Earnings before interest, taxes, depreciation and amortization. Equals operating profit plus depreciation and amortization, amounts written off on
inventories and trade debtors, impairment losses and provisions for liabilities and charges.
• Enterprise value (EV): Net financial debt plus market capitalization.
• Gearing: Net financial debt in relation to equity.
• Net cash flow: Net profit plus depreciation and amortization, amounts witten off on inventories and trade debtors, impairment losses and provisions for liabili-
ties and charges.
• Non-current assets: Intangible and tangible fixed assets.
• Price/earnings ratio: Share price divided by net profit.
• Return on Capital Employed (ROCE): Operating profit relative to capital employed. The average capital employed is used for ratios.
• Return on Equity (ROE): Net profit in relation to equity. The average equity is used for ratios.
• Working capital: Inventories plus trade debtors and gross amounts due from customers for contract work minus trade payables minus advances received on
contracts in progress. Average working capital is used for ratios.
8 9

Sustainable laundry automation
The Group has faced a very challenging year, during which we were hit by the Crisis and at the same time had to imple-
ment 3 acquisitions made in 2008: production and distribution in Italy and distribution in Belgium and in The Nether-
lands. Having invested heavily in previous years, we decided to concentrate on the integration of our acquisitions and
postpone further major investments until we have a clear view of the overall economic evolution after the financial cri-
sis and of its impact on the heavy-duty laundry market. We also adapted our labour force in all our manufacturing units,
reduced our fixed cost base, postponed some internal projects and implemented very strict cash management.
The Group has been very fortunate that the acquisitions have resulted in immediate growth, especially in Italy. Further-
more, we were able to increase our market share as one of our major competitors filed for bankruptcy during 2009.
This, combined with further investment in own distribution as well as in product development, has reduced the impact
of the crisis, resulting in a loss of 22 % in revenue compared to our record year 2008.
EBIT and net income have decreased as a result of the lower activity level. However, tight control on fixed costs, produc-
tivity gains and reduced workforce costs have allowed us to remain profitable in this difficult environment. Working
capital has decreased due to the lower activity levels, and net debt in parallel.
The continued investment in product development is enabling us to better meet customers’ needs. Many of our deve-
lopment efforts are targeted at energy and water savings. These are recognized as important cost drivers and as
savings potentials for our customers in various markets and clearly represent a strategic advantage compared to tradi-
tional laundry operations. We have grouped these new products under our CleanTech brand.
The recent acquisitions in Italy and Benelux have been successfully integrated. The Italian subsidiary has been awarded
the largest turnkey project ever received by the Group.
We continue to invest in building a strong Jensen culture within our many operations worldwide. We are working with a
truly international, multicultural and diverse Jensen Management Team. During 2009, an Executive Management Team
was appointed and this team directs our various manufacturing technologies as well as our regional sales teams. In this
way we are realizing our objective of combining our global skills with acting as a local company in each market.
The impact of the economic crisis became visible at the end of 2008 and measures were taken to reduce capacity in
many areas. Growth initiatives were priority ranked and delayed if necessary. Flexibility, adaptability and the accep-
tance of change remain key virtues in today’s business environment.
The Group has been through different economic cycles during the last 10 years, which has added to the experience of
our management, staff and employees. In 2000 we went through a major merger, in 2001 and 2002 we were hit by the
September 2001 incidents and had to undertake a major turnaround. Further in 2006 we divested our Commercial Divi-
sion and JENSEN enjoyed an unprecedented period of organic growth, which was abruptly halted by the “Financial Cri-
sis” in April 2008. Our ability to respond properly to these different conditions has made our brand, our products and our
employees stronger.
MeSSaGe to tHe SHareHolDerS
a n n u a l r e p o r t 2 0 0 9
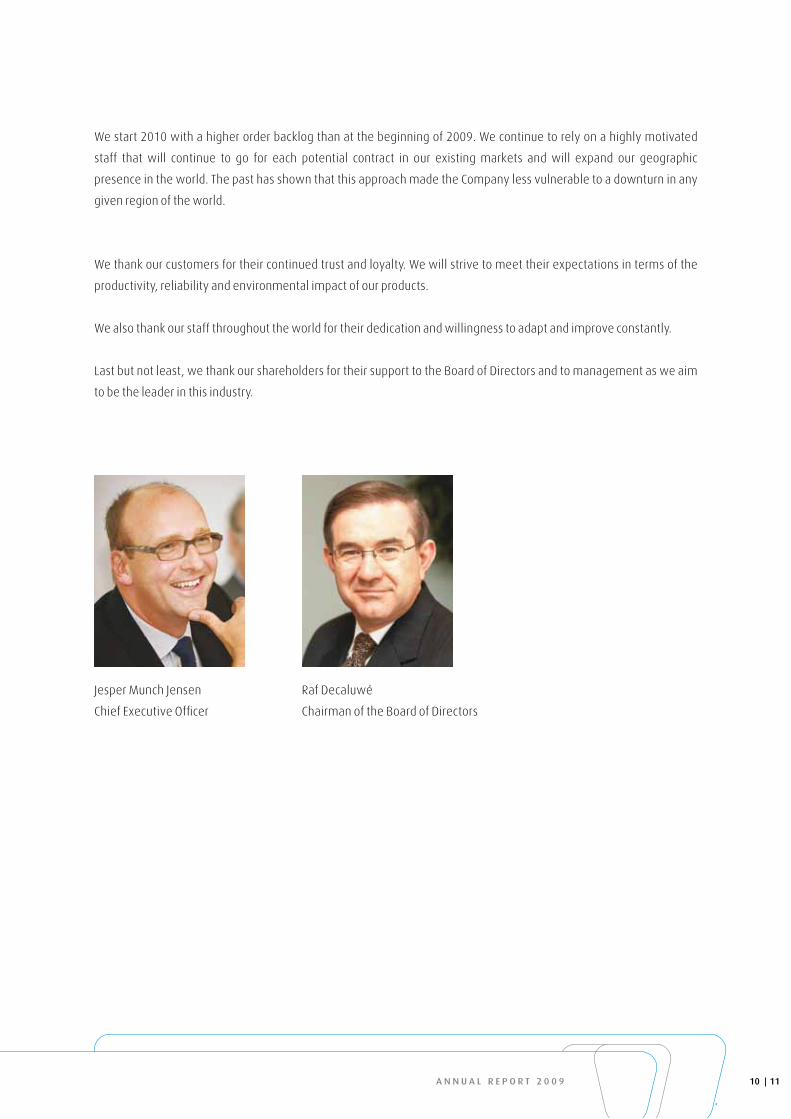
We start 2010 with a higher order backlog than at the beginning of 2009. We continue to rely on a highly motivated
staff that will continue to go for each potential contract in our existing markets and will expand our geographic
presence in the world. The past has shown that this approach made the Company less vulnerable to a downturn in any
given region of the world.
We thank our customers for their continued trust and loyalty. We will strive to meet their expectations in terms of the
productivity, reliability and environmental impact of our products.
We also thank our staff throughout the world for their dedication and willingness to adapt and improve constantly.
Last but not least, we thank our shareholders for their support to the Board of Directors and to management as we aim
to be the leader in this industry.
Jesper Munch Jensen Raf Decaluwé
Chief Executive Officer Chairman of the Board of Directors
11 10
MISSIon StateMent
It is the aim of the JENSEN-GROUP to assist heavy-duty laundries worldwide to provide quality textile services econo-
mically. We have become the preferred supplier in the laundry industry by leveraging our broad laundry expertise to
design and supply sustainable single machines, systems and integrated solutions. We are continuously growing by
extending our offer and by developing environmentally-friendly and innovative products and services that address
specific customer needs. Our success is the result of drawing on global skills while maintaining a local presence.
MakInG a DIFFerenCe
Through technical excellence, significant investment in product development and specialized industry knowledge,
the JENSEN-GROUP is able to plan, develop, manufacture, install and service everything from single machines and
processing lines to complete turnkey solutions. Our partners include textile rental suppliers, industrial laundries, cen-
tral laundries as well as hospital and hotel on-premise laundries. We believe that our customers know their laundry
better than anybody else and that with the help of the JENSEN-GROUP’s comprehensive laundry competence and
experience we are be able to find the right solution for each specific case.
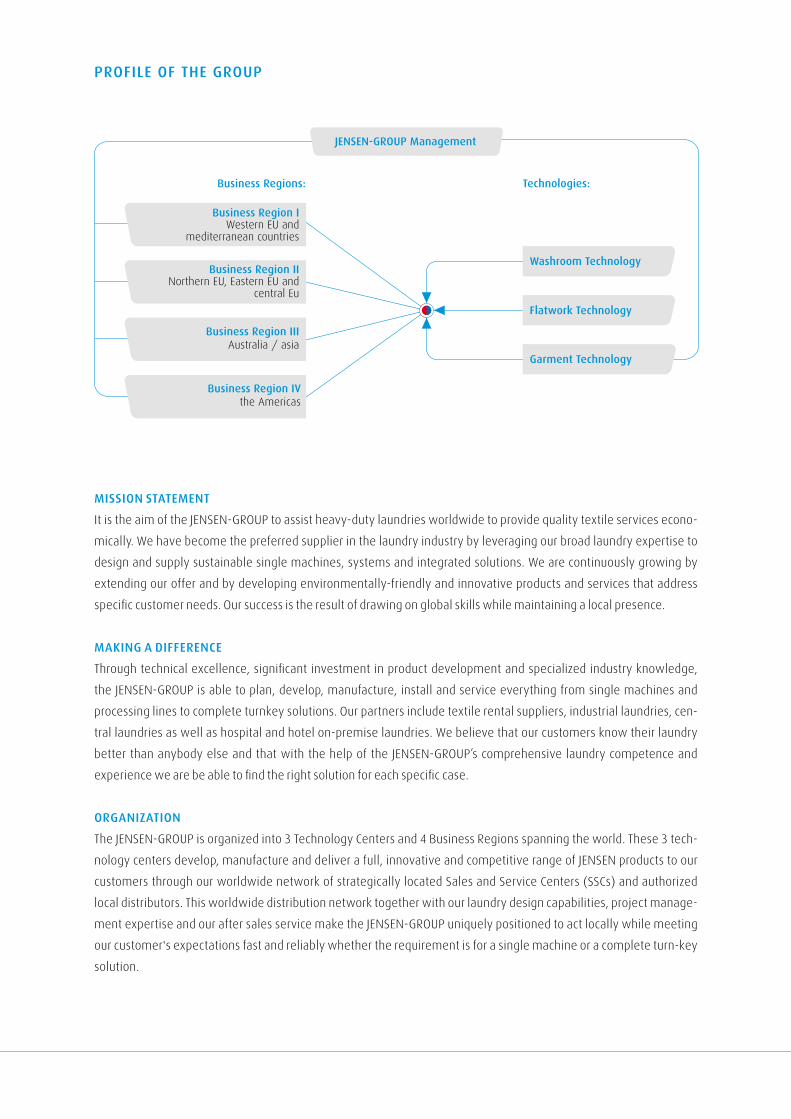
orGanIzatIon
The JENSEN-GROUP is organized into 3 Technology Centers and 4 Business Regions spanning the world. These 3 tech-
nology centers develop, manufacture and deliver a full, innovative and competitive range of JENSEN products to our
customers through our worldwide network of strategically located Sales and Service Centers (SSCs) and authorized
local distributors. This worldwide distribution network together with our laundry design capabilities, project manage-
ment expertise and our after sales service make the JENSEN-GROUP uniquely positioned to act locally while meeting
our customer's expectations fast and reliably whether the requirement is for a single machine or a complete turn-key
solution.
proFIle oF tHe Group
Business regions:
Business region I Western EU and
mediterranean countries
Business region II Northern EU, Eastern EU and
central Eu
Business region IIIAustralia / asia
Business region IV the Americas
technologies:
JenSen-Group Management
Washroom technology
Garment technology
Flatwork technology
a n n u a l r e p o r t 2 0 0 9
revenue figures
mio euro
2009 175,1
2008 223,1
ManuFaCturInG
The JENSEN-GROUP has a manufacturing platform of 6 factories in 6 countries. Each manufacturing site focuses on a
specific technology for the heavy-duty laundry machinery industry.
DIStrIButIon
The JENSEN-GROUP sells its products and services under the JENSEN™ brand through wholly owned sales and service
subsidiaries and through independent distributors worldwide.
CoMpetItIVe aDVantaGe
Our market coverage, our extensive know-how, our turnkey project expertise and our range of heavy-duty machines
and systems are unique for the heavy-duty laundry market.
MarketS
The JENSEN-GROUP generates its revenue geographically as follows:
million euro europe North america other Total
2009 133 21 21 175
2008 155 39 29 223
13 12
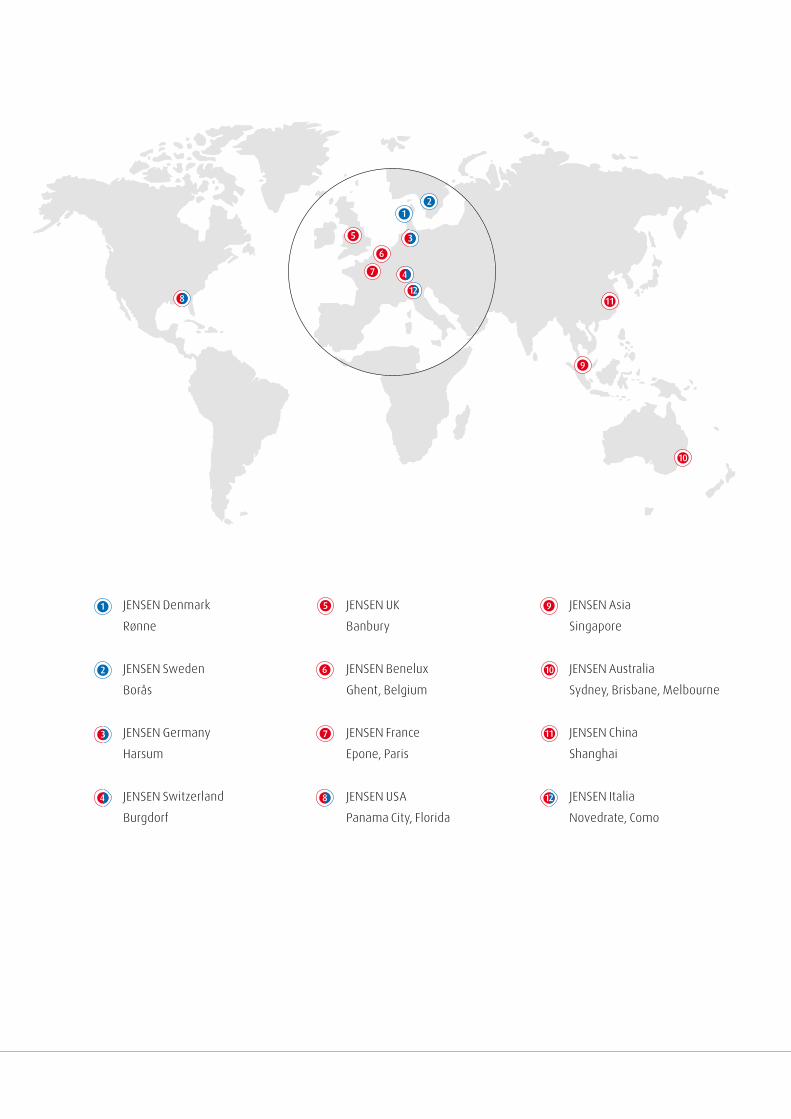
JENSEN Denmark
Rønne
JENSEN Sweden
Borås
JENSEN Germany
Harsum
JENSEN Switzerland
Burgdorf
JENSEN UK
Banbury
JENSEN Benelux
Ghent, Belgium
JENSEN France
Epone, Paris
JENSEN USA
Panama City, Florida
JENSEN Asia
Singapore
JENSEN Australia
Sydney, Brisbane, Melbourne
JENSEN China
Shanghai
JENSEN Italia
Novedrate, Como
a n n u a l r e p o r t 2 0 0 9
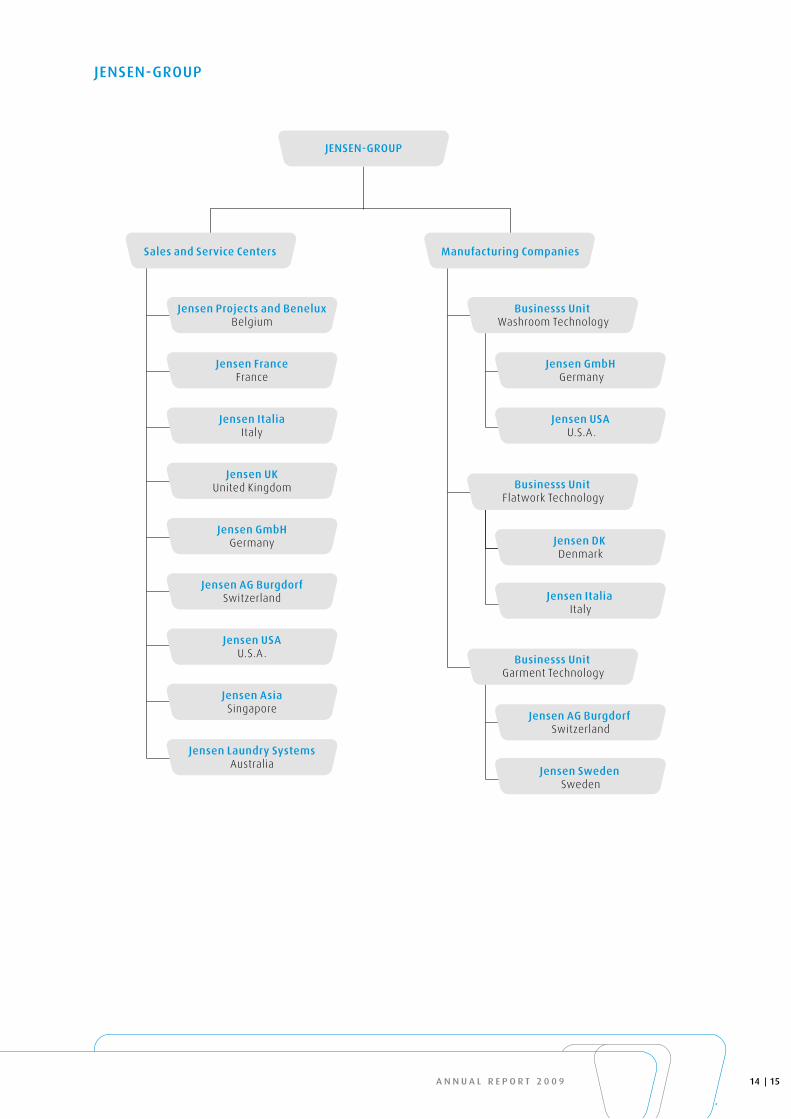
JenSen-Group
JenSen-Group
Sales and Service Centers Manufacturing Companies
Jensen projects and Benelux Belgium
Businesss unit Washroom Technology
Jensen GmbH Germany
Jensen uSa U.S.A.
Business unit Flatwork Technology
Jensen Dk Denmark
Jensen Italia Italy
Jensen aG Burgdorf Switzerland
Businesss unit Flatwork Technology
Businesss unit Garment Technology
Jensen FranceFrance
Jensen ItaliaItaly
Jensen ukUnited Kingdom
Jensen GmbHGermany
Jensen aG BurgdorfSwitzerland
Jensen uSaU.S.A.
Jensen asiaSingapore
Jensen Sweden Sweden
Jensen laundry SystemsAustralia
15 14

proFIle
We are present with our own Sales and Service Centers in the most important markets and sell single machines,
systems and turnkey projects.
We produce equipment and solutions in the following manufacturing companies:
• JENSEN GmbH in Harsum, Germany and JENSEN US in Panama City, FL, USA – Washroom Technology
• JENSEN Denmark in Rønne, Denmark and JENSEN Italia in Novedrate, Italy – Flatwork Technology
• JENSEN AG in Burgdorf, Switzerland and JENSEN Sweden in Borås, Sweden – Garment Technology
We tHInk GloBally anD aCt loCally
We sell our equipment and solutions through our own sales and service centers (SSCs) and through independent dis-
tributors. The relative share of sales through our own SSCs has increased in recent years because they operate in the
most important heavy-duty markets like Benelux, Germany, United Kingdom, France, Italy, Singapore, Australia, Swit-
zerland, and North America. Sales and service centers play a critical coordination role for the increasing number of
complex installation projects involving several of our production companies simultaneously. Local presence enables
us to deliver after-sales services on demand to our customers. On top of that, we have an experienced distributor net-
work base in more than 50 countries.
aCtIVItIeS 2009
2009 2008
Revenue, million euro 175,1 223,1
EBIT, million euro 10,9 19,1
Investments. million euro 1,8 4,7
Number of employees end of year 976 1.092
The overall investment climate in the heavy-duty laundry business varied from one region to another. During the first
quarter, activity was acceptable and then deteriorated in the second quarter. In the fourth quarter, activity picked up
again and several important project proposals were converted to firm offers.
These fluctuations in demand throughout the year resulted in important adaptations of capacity in our various entities.
The Group enjoyed the benefit of quite flexible employment legislation in various countries to manage through these
turbulent times.
a n n u a l r e p o r t 2 0 0 9
Our own sales and service centers (SSC) continue to generate the majority of our turnover, confirming the importance
of having our own local presence in the main markets. We further strengthened our position in the European markets
by integrating the distribution of our products in Italy and the Benelux and we are increasing our presence in most
emerging markets.
We are succeeding in our efforts to be the one-stop supplier for large turnkey projects worldwide.
Our contribution margin slightly increased compared to 2008 despite a fierce competition for projects and market
share all over the world
outlook 2010
Our order backlog is 18% higher than at December 31, 2008. The order backlog increased in the fourth quarter in
various markets but we still face a slowdown in some markets. Our main business risks have not changed materially
from last year: the uncertain investment climate in the aftermath of the worldwide financial crisis, exchange rate fluc-
tuations and raw material price movements. We refer to the separate section in the report of the Board of Directors,
setting out the risk factors associated with our business and industry.
Our operational objectives for 2010 are to further standardize our production methods and operating procedures
throughout the JENSEN-GROUP, to address capacity issues locally if needed as well as to integrate our external distri-
butors more into our sales and marketing efforts.
We will adapt our capacity to the levels required to satisfy higher or lower demand and we will control our costs.
During 2010 we expect to revisit certain investment plans after a clear assessment of our needs and opportunities.
17 16

S U N E A R T H W A T E R W I N D F O R E S T
Solar energy exceeds the energy needs of all humanity many times
over. The sun gives its energy in the form of light and heat. With archi-
tectural measures this energy can be used passively and, with solar
collectors and photovoltaic systems, also actively. The JENSEN-GROUP
is supporting the use of solar energy in the laundry process.

StateMent on Corporate GoVernanCe
The JENSEN-GROUP adopts the 2009 Code as its reference Code. The Group has implemented the Belgian Corporate
Governance Code since 2004, reviewing the major requirements of and evolutions in the Code and evaluating the
degree of compliance within the JENSEN-GROUP. During 2009, the JENSEN-GROUP continued its efforts to be compliant
with the Corporate Governance Code.
As a result of these efforts, the Board of Directors of JENSEN-GROUP has agreed, adopted and published the following
charters:
• Charter of the Board of Directors, including standards of independence and requirements for Directors;
• Charter of the Nomination & Remuneration Committee;
• Charter of the Audit Committee;
• Communication Policy;
• Role and Responsibilities of the Chairperson of the Board of Directors; and
• Role and Responsibilities of the Executive Management.
These Charters can be found on our website www.jensen-group.com under Investor Relations/Corporate Governance.
They will be regularly reviewed and evaluated by the Board of Directors. The Charters are part of the day-to-day pro-
ceedings of the JENSEN-GROUP Board of Directors and Board Committees, and are to a very large degree compliant
with the Code.
Prior to the Code, the Board of Directors had already established the Audit Committee and the Nomination and Remu-
neration Committee.
The above highlights the importance that the JENSEN-GROUP Board of Directors attaches to living up to the standards
set by the Code.
According to the “comply or explain” principle, the Company may deviate from the Code due to its nature, organizati-
on and size. Based on its internal risk assessment as well as on the size of its operations, the JENSEN-GROUP is not fol-
lowing the recommendation to put in place an internal audit function because:
• The JENSEN-GROUP consists of multiple smaller entities with limited turnover, which are closely monitored by local
management teams;
• The management teams are further monitored by the JENSEN-GROUP headquarters through quarterly operational
and financial reviews as well as regular site visits by the management of JENSEN-GROUP headquarters;
• All JENSEN-GROUP subsidiaries are aware of the JENSEN-GROUP policies and procedures, and the size of the JENSEN-
GROUP continues to allow for regular communication with all local management teams;
• All JENSEN-GROUP companies are audited by the same accounting firm and significant risk factors are consistently
reviewed in the external audits of the different subsidiaries.
The JENSEN-GROUP Audit Committee has decided that an in-house internal audit function would not be a full-time
function. In consultation with the external auditor and based on a risk analysis, the Committee has worked out an
internal audit plan and engages an independent outside audit firm for specific internal audit projects.
Corporate GoVernanCe
a n n u a l r e p o r t 2 0 0 9
A second item of non-compliance with the Code is that the individual remuneration of management is not disclosed.
The Nomination and Remuneration Committee discusses the remuneration of all key managers and checks whether
the remuneration paid is in line with market conditions. For reasons of privacy and for the other reason described
above we are convinced that the disclosure of the total compensation paid to management gives all the information
that is required.
A last item of non-compliance is that the Audit Committee met only three times during 2009 whereas the Code sug-
gests four meetings a year. During 2010, the Audit Committee will meet at least four times.
To the best knowledge of the Board of Directors, there are no other items of non-compliance with the Code.
The information found in the Corporate Governance Charter is provided “as is” and is solely intended for clarification
purposes. The recommendations and policies found in the Charters are in addition to and are not intended to change
or interpret any law or regulation, or the Certificate of Incorporation or Bylaws of the Company. By adopting these
Charters, attachments and possible sub-charters, the Company does not enter into any obligation or contractual or
unilateral commitments whatsoever. The Charters are intended as a guideline in the day-to-day proceedings of the
Company. Competences and tasks attributed to the Board of Directors are to be seen as enabling clauses, not as man-
datory rules or a compelling line of conduct.
rISk ManaGeMent anD Internal Control
Jensen-Group has no internal audit function for the reasons described above. However, in consultation with the exter-
nal auditor and based on a risk analysis, the Audit Committee has worked out an internal audit plan. The internal audit
function is outsourced to an independent outside audit firm.
The Board of Directors has delegated to the Executive Management Team the task of working out a risk management
process and an internal control system.
Based on a framework from an external consultant, the Executive Management Team has developed a risk map
where the financial risks, operational risks, strategic risks and legal risks are described. This risk map was worked out
for the first time in 2008 and is reviewed on a regular basis. The map sets out on the one hand the probability of the
different risks occurring and on the other hand the impact on the financial statements as well as measures to mitigate
the risk exposure. The Executive Management Team has presented the conclusions of risk management to the Audit
Committee and to the Board of Directors.
The Executive Management Team has worked out an internal control system that is embedded in the risk manage-
ment process referred to above. Local management is currently implementing the internal control system. It will be
fully implemented by mid-2010. Business Board reviews include a financial review which specifically focuses on
major changes in P&L and BS items and deviations from budgets as well as consistency in revenue recognitions, accru-
al and deferral policy over time. The internal control system will be reviewed on a quarterly basis. The Executive
Management Team has presented the internal control system to the Audit Committee and to the Board of Directors.
21 20
CoMpoSItIon oF tHe BoarD oF DIreCtorS
The members of the Board of Directors are appointed by the shareholders during the shareholders’ meeting by simple
majority.
The bylaws allow for nomination by cooptation. If cooptation occurs, it is considered as a transition period during
which the Board member completes the mandate of the outgoing director as opposed to taking on a new mandate.
For this reason the transition period is not considered as a mandate in the independence rule review, where the com-
pany looks at total years’ service on the Board.
The bylaws require the Board of Directors to have at least three but not more than eleven members. Board members
are elected for terms of office of no more than four years.
The bylaws are supplemented by the Charter of the Board of Directors. This Charter clarifies the Board’s role and
responsibilities and will be revised from time to time. This Charter includes 4 major chapters:
• Functioning of the Board: Directors’ responsibilities, number of Board and Committee meetings, Company Secretary,
setting the agenda of Board meetings, Director compensation, orientation and education, CEO evaluation and
management succession, Director access to officers and employees, use of independent advisors.
• Board structure: size of the Board, selection of Directors, required qualifications, including the criteria of indepen-
dence, resignation from the Board and term limits.
• Committees of the Board: establishment of the Audit Committee and of the Nomination and Remuneration Commit-
tee.
• Other Board practices: Directors’ roles and responsibilities, Terms of reference of the Chairman of the Board and of
the Executive Management, interaction with institutional investors, analysts, media, customers and members of the
public at large, limitation of liability, policy to prevent insider trading and market abuse, conflict of interest policy and
code of conduct and evaluating Board performance.
For more details, please consult our website on www.jensen-group.com under Investor Relations/Corporate Gover-
nance.
As in the past, the JENSEN-GROUP selects its Board members in a way that allows for a balance in the profiles of the
different members. A balance is sought between executive and non-executive Directors, Directors representing
shareholders and independent Directors, and also with respect to Directors’ professional backgrounds.
a n n u a l r e p o r t 2 0 0 9
The composition of the Board of Directors of the JENSEN-GROUP, the attendance of the individual Directors, as well as
their remuneration, is as follows:
Name function Term attendance board committees attendance Remuneration
expiry meetings committees
1. Members representing the reference shareholders (non-executive Directors)
Jørn Munch Jensen Director 2013 100% 27.000
2. Independent, non-executive Directors
GOBES c.v. Chairman 2012 100% AC 100% 94.000
represented by Raf Decaluwé N&R 100%
Hans Werdelin Director 2012 83% N&R 100% 34.000
The Marble b.v.b.a. Director 2012 83% AC 100% 38.000
represented by Luc Van Nevel
3. executive Directors
Jesper Munch Jensen CEO 2013 100%
TTP b.v.b.a. CFO1 2013 100% AC 100% 39.000
represented by Erik Vanderhaegen
total 232.000
Secretary
Werner Vanderhaeghe Secretary 14.583
AC: Audit committee
N&R: Nomination and Remuneration Committe
1: Until June 29, 2007
23 22
The Board and the Board Committees conduct from time to time a self-evaluation to determine whether the Board
and its Committees are functioning effectively. The Company Secretary collects all comments and reports to the Board
with an assessment of the Board’s performance. The assessments are discussed with the full Board and focus on the
Board’s and the Committees’ contribution to the Company and specifically on areas in which the Board or executive
management believes that the Board or its Committees could improve. Improvement plans are implemented after
discussion and arrival at conclusions by the Board.
From left above: Erik Vanderhaegen, Hans Werdelin, Raf Decaluwé, Jesper Munch Jensen,
From right above: Luc Van Nevel, Jørn Munch Jensen and Werner Vanderhaeghe.
Jørn Munch Jensen, is the founder of the JENSEN-GROUP.
Gobes cv, represented by raf Decaluwé, who is the former CEO of N.V. Bekaert S.A. Mr. Decaluwé held senior positi-
ons at Black & Decker and Fisher Price Toys prior to joining Bekaert S.A. Mr. Decaluwé is a board member of various
companies, both in and outside Belgium.

a n n u a l r e p o r t 2 0 0 9
Hans Werdelin is the former CEO of Sophus Berendsen A/S . Mr. Werdelin holds positions as Chairman and a board
member in various companies.
ttp b.v.b.a., represented by erik Vanderhaegen, who is former CFO of the JENSEN-GROUP and currently a partner at
Winx Capital House nv/sa. Before that, Mr. Vanderhaegen was M&A manager at Univeg nv/sa and corporate tax,
audit and M&A manager at Bekaert nv/sa.
Jesper Munch Jensen, is the CEO of the JENSEN-GROUP.
the Marble b.v.b.a, represented by luc Van nevel, who is the former President and CEO of Samsonite Corporation.
Mr. Van Nevel holds positions as Chairman and a board member in several companies.
Werner Vanderhaeghe is an attorney and a partner with the law firm of Vanderhaeghe De Wolf Boelens & Lam-
brecht. Mr. Vanderhaeghe is the former General Counsel of the Bekaert Group and of the Agfa-Gevaert Group and was
in private practice in Brussels and New York with Cleary Gottlieb Steen & Hamilton and with White & Case.
The Board of Directors held 6 meetings in 2009, including 2 telephone conference meetings. The topics of discussion
included:
• JENSEN-GROUP overall strategy, budget and various plans to adapt capacity to significant variations in demand;
• Economic and market developments;
• JENSEN-GROUP financial structure and performance and external reporting;
• Corporate Governance;
• Acquisitions and investment projects;
• Shareholder value creation and return
Depending on the items on the agenda, members of senior management were invited to the meetings of the Board of
Directors and to the meetings of the Board Committees. Board meetings and Board Committee meetings are held in
the presence of Mr. Werner Vanderhaeghe, who was appointed as Company Secretary in May 2009 and who acted as
secretary.
25 24
CoMMItteeS eStaBlISHeD By tHe BoarD oF DIreCtorS
nomination and remuneration Committee
The Nomination and Remuneration Committee consists of GOBES c.v. represented by Mr. Raf Decaluwé who is Chairman,
Mr. Hans Werdelin and The Marble bvba, represented by Mr. Luc Van Nevel. The Nomination and Remuneration Commit-
tee met once during 2009. The Committee discussed the remuneration of the executive management of the Group and
their bonuses. The Committee also reviewed the adequacy of the current compensation for members of the Board of
Directors.
The Nomination and Remuneration Committee Charter can be found on our website www.jensen-group.com under
Investor Relations/Corporate Governance. The Charter covers:
• Authority;
• Objectives;
• Composition;
• Role of the chairperson;
• Responsibilities;
• Meetings;
• Attendance;
• Non-consensus;
• Objectivity;
• Access to member of management;
• Reporting and appraisal.
• Remuneration report;
• Performance Evaluation.
audit Committee
The Audit Committee consists of The Marble b.v.b.a. represented by Mr. Luc Van Nevel who is the Chairman, GOBES c.v.
represented by Mr. Raf Decaluwé and TTP b.v.b.a. represented by Mr. Erik Vanderhaegen. The Audit Committee met three
times in the course of 2009. All meetings were held in the presence of the external auditor PricewaterhouseCoopers,
represented by Mr. Raf Vander Stichele. Items on the agenda included:
• Discussion of the findings of the external auditor on the financial statements as at December 31, 2008;
• Discussions of the findings of the limited review of the financial statements as at June 30, 2009;
• The Charter of the Audit Committee;
• The Risk Management and Internal Control System
a n n u a l r e p o r t 2 0 0 9
The Audit Committee Charter is published on our website www.jensen-group.com under Investor Relations/Corporate
Governance. The Charter includes such items as:
• Roles and responsibilities;
• Number of meetings;
• Composition of the Audit Committee;
• Role of the chairperson;
• Presence of the external auditor.
• Performance Evaluation.
Senior management attends each Audit Committee meeting in part, with the remainder of the meeting reserved for the
external auditor and Audit Committee members only.
ConFlICtS oF IntereSt WItHIn tHe BoarD oF DIreCtorS
As required under Belgian Company law, the members of the Board of Directors are expected to give the Chairman
prior notice of any agenda items in respect of which they have a direct or an indirect conflict of interest of a financial or
other nature with the Company, and to refrain from participating in the discussions of and voting on those items. The
Chairman and the Board constantly monitor potential conflicts of interest that do not fall within the definition set by
company law. Two such potential conflicts occurred during 2009. One conflict issue arose at the Board meeting which
was held on May 18, 2009 and where the new criteria for independent directors were discussed. A second conflict
issue arose on the occasion of the Board meeting which was held on November 3, 2009 and where the buy back
of shares was approved. The minutes of these meetings are therefore included in the annual report of the Board of
Directors.
In case of doubt, written confirmation is sought from the Director or the senior manager involved, stating the reasons
for the absence of conflict of interest as more broadly defined.
The Board of Directors approved an overall Business Ethics policy and delegated to the Executive Management Team
the task of elaborating ethical values, describing rules of conduct and monitoring also the transactions allowed bet-
ween Jensen-Group and third parties to the extent that these transactions are not covered by the legal provisions on
conflict of interest. The Executive Management Team is currently implementing the deployment of the overall policy.
27 26
polICy to preVent InSIDer traDInG
To prevent privileged information from being used unlawfully by Directors or members of senior management,
all persons involved have signed a policy to prevent insider trading.
The Company defines two periods during which trading in the Company’s shares by Directors, by members of the
Executive Management Team or by local management is restricted. These two restricted periods are between
mid-January and the reporting of the annual results and between mid-July and the reporting of the half-year results.
All trading needs to be authorized by the Compliance Officer before it can take place.
All Directors and members of the Executive Management Team are required to inform the Compliance Officer on a
quarterly basis on any trading in the Company’s shares. As of December 31, 2009, members of the Board and senior
management together held 11.710 shares. No warrants are outstanding.
exeCutIVe ManaGeMent
In 2005 the bylaws of the Company were amended so as to authorize the Board of Directors to delegate its management
powers to an executive committee. The Board of Directors has not acted on that authorization to date.
In the course of 2009, an Executive Management Team, consisting of the Chief Executive Officer (CEO), the Chief Financial
Officer (CFO), the Executive VP Business Development, the Executive VP Operations and the Executive VP Sales was
appointed. The CEO chairs the Executive Management Team meetings.
The Executive Management Team is responsible for:
• Developing the overall Group strategy;
• The setting up of an internal control framework and risk management processes, in line with the nature, organization
and size of the Group;
• The implementation of the deployment of the Business Ethics Policy
• Preparing the financial statements and disclosures;
• On behalf of the Executive Management, the CEO and CFO report to the Board of Directors on the financial situation of
the Group;
• The Executive Management presents the Board regularly with all information necessary for the Board to carry out
its duties.
a n n u a l r e p o r t 2 0 0 9
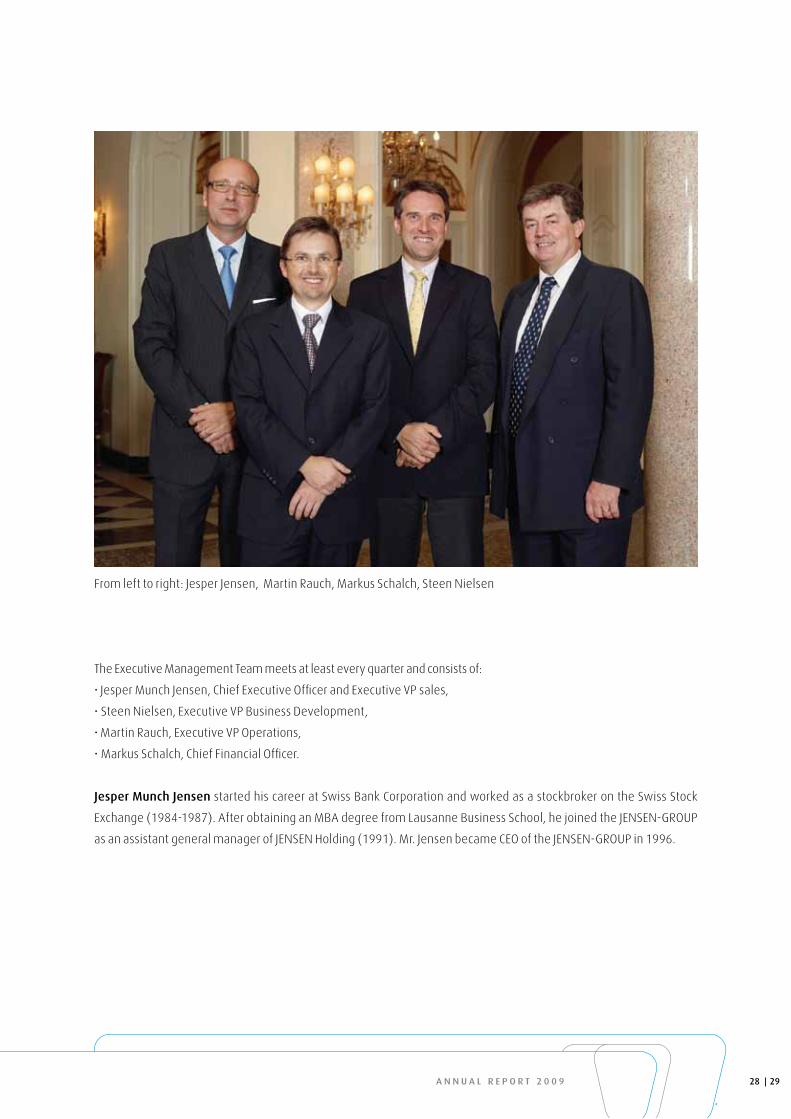
From left to right: Jesper Jensen, Martin Rauch, Markus Schalch, Steen Nielsen
The Executive Management Team meets at least every quarter and consists of:
• Jesper Munch Jensen, Chief Executive Officer and Executive VP sales,
• Steen Nielsen, Executive VP Business Development,
• Martin Rauch, Executive VP Operations,
• Markus Schalch, Chief Financial Officer.
Jesper Munch Jensen started his career at Swiss Bank Corporation and worked as a stockbroker on the Swiss Stock
Exchange (1984-1987). After obtaining an MBA degree from Lausanne Business School, he joined the JENSEN-GROUP
as an assistant general manager of JENSEN Holding (1991). Mr. Jensen became CEO of the JENSEN-GROUP in 1996.
29 28
Steen nielsen holds a degree in Civil Engineering and a Bachelor of Commerce & Finance. Between 1978 and 1987 he
worked for F.L. Smidth & Co. as a sales and divisional manager. Mr. Nielsen joined the JENSEN-GROUP in 1987 as sales
and marketing director and has been Director of Flatwork Technology since 2006.
Martin rauch holds a Bachelor of Science degree in Electrical Engineering. After his studies in 1989, he joined JENSEN
AG Burgdorf and held various positions in the technical and commercial areas. Mr. Rauch became General Manager of
JENSEN AG Burgdorf in 2003 and Managing Director of JENSEN Sweden AB following the formation of the Garment
Technology Business Unit in 2006. Mr. Rauch joined the JENSEN-GROUP Management Team as Director of Garment
Technology that year.
Markus Schalch has a Master of Arts in Finance and Accounting from the Hochschule St. Gallen. He then started his
career in an audit firm for two years prior to joining the Alstom Group (now Areva) in various finance positions. In 2000,
Mr. Schalch joined a leading Swiss telecommunication firm where he became CFO of Swisscom Systems Ltd.
(2002-2004) and was then appointed CFO of Swisscom Solutions AG (2005 till August 2007). Mr. Schalch joined
the JENSEN-GROUP in September 2007 as CFO.
reMuneratIon report
remuneration of the Board of Directors
The fees for non-executive Directors excluding the Chairman include a fixed remuneration of 17.000 euro and an
attendance fee of 2.000 euro per Board meeting and 1.000 euro if the Board meeting is by telephone. Members of
Board Committees receive a fixed fee of 7.500 euro per year and an attendance fee of 1.500 euro per meeting. This
does not apply to the Chairman of the Board of Directors. The Chairman of the Board of Directors receives a fixed fee of
94.000 euro per year. The CEO does not receive any compensation as a member of the Board. The total fees paid to
Board members and members of the Board Committees amount to 232.000 euro, which is within the amount of
300.000 euro approved by the shareholders.
In addition to his Board fees, the following member of the Board of Directors received additional fees for specific
projects and tasks performed by him as advisor to the Company:
Jorn Munch Jensen: 12.500 euro for his role as ambassador at trade fairs and meetings with larger customer groups.
remuneration of the executive Management team
The Nomination and Remuneration Committee formulates all recommendations relating to the nomination and the
remuneration of the Executive Management Team based on proposals by the Chief Executive Officer. The Committee
discusses in depth the remuneration policy, pay levels and the individual performance evaluations of members of the
Executive Management Team. The market conformity of remuneration levels is regularly checked through external
benchmarking of total compensation packages to ensure competitive compensation packages are offered and
valuable members of Executive Management are retained.
a n n u a l r e p o r t 2 0 0 9
Executive Management remuneration consists of a base salary and a variable bonus, pension plans depending on
managers’ country of residence, life insurance and other customary insurances. Appointments to the board of
directors of certain subsidiaries can also be remunerated. Executive managers are provided with all resources needed
to perform their duties.
The variable remuneration of Executive Management is based on performance against individual objectives, the
Group’s financial results against target and the financial results achieved versus target in the area for which the
individual manager is accountable. The Group targets to be achieved are defined by the Board of Directors, in
conjunction with the budget review process, and applied in the individual performance setting and with evaluation by
the Nomination and Remuneration Committee. These targets are set on an annual basis. For the accounting period
2009, the targets were based on operating profit and cash flow performance. There are no long-term incentive plans.
Where they exist, Executive Management participates in pension plans. Variable remuneration can be paid out in cash
or placed in a pension plan at the discretion of the manager. There are no share option plans.
The CEO does not receive any compensation as a member of the Board.
All Executive Management Team members are salaried employees.
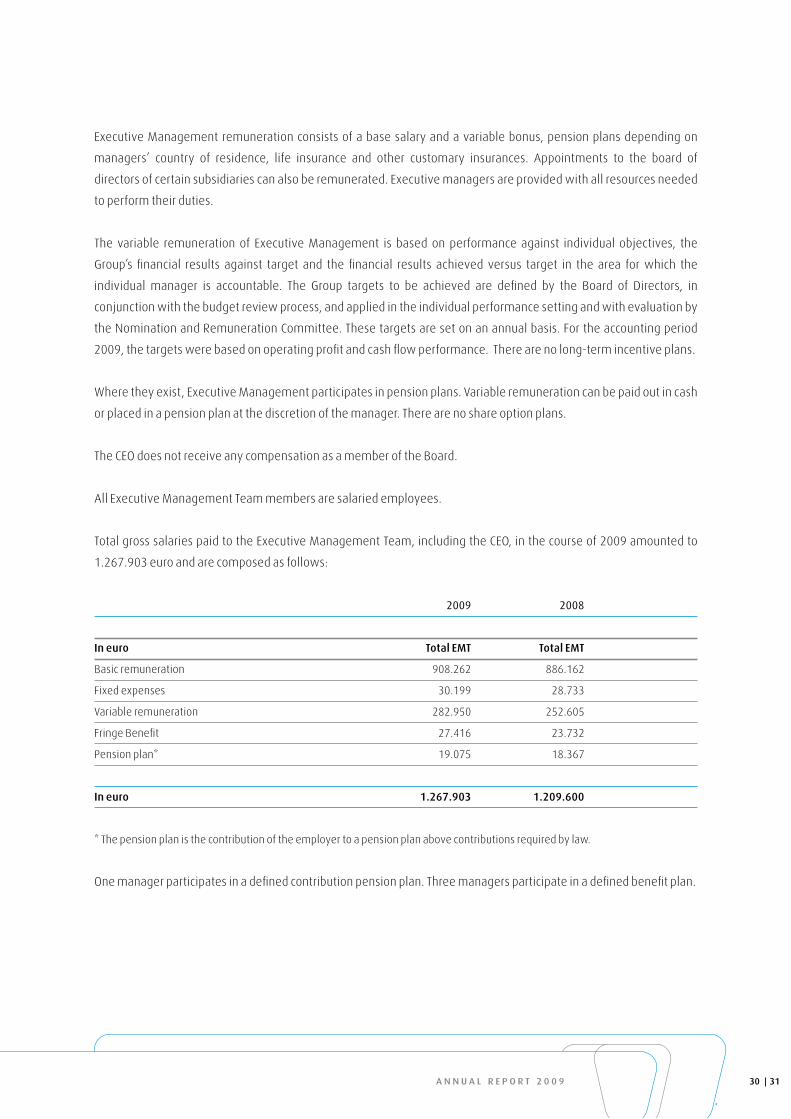
Total gross salaries paid to the Executive Management Team, including the CEO, in the course of 2009 amounted to
1.267.903 euro and are composed as follows:
2009 2008
In euro total eMt total eMt
Basic remuneration 908.262 886.162
Fixed expenses 30.199 28.733
Variable remuneration 282.950 252.605
Fringe Benefit 27.416 23.732
Pension plan* 19.075 18.367
In euro 1.267.903 1.209.600
* The pension plan is the contribution of the employer to a pension plan above contributions required by law.
One manager participates in a defined contribution pension plan. Three managers participate in a defined benefit plan.
31 30
The individual salaries of the Executive Management Team members are not disclosed as the Nomination and
Remuneration Committee discusses all individual salaries and checks whether the remuneration paid is in line
with market conditions. For reasons of privacy and for the other reason described above, we are convinced that the
disclosure of the total salaries paid to the Executive Management Team gives all the information required.
The agreements with respect to termination of senior management vary from country to country, depending on the
applicable legislation. Legal conditions apply in countries where there is a given practice, and for those countries
where there is no practice, up to a maximum of two years’ salary has been granted. All senior manager contracts
include a one-year non-competition clause. No compensation is given in the event of voluntary departure.
No loans have been granted to members of the Executive Management Team. No unusual transactions or conflicts of
interest have occurred.
The Executive Management Team holds a total of 9.710 shares:
• Jesper M. Jensen: 9.500 shares
• Steen Nielsen: 210 shares
• Martin Rauch: no shares
• Markus Schalch: no shares
No warrants are outstanding. There are no stock option plans.
polICy WItH reSpeCt to tHe approprIatIon oF tHe reSult
The Company has adopted a policy of distributing 0,25 euro per share annually unless the results or the financial
situation do not allow such dividend.
SHareHolDerS’ StruCture
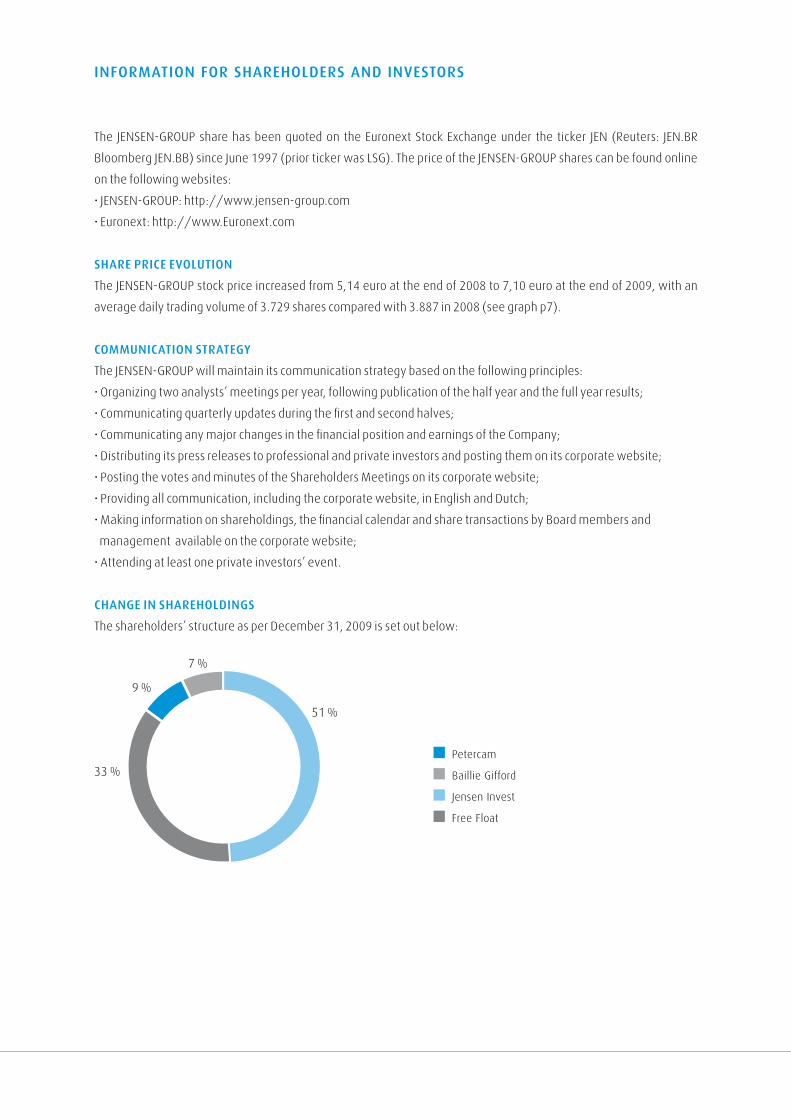
The major shareholders are:
Jensen Invest: 50,6%
Baillie Gifford: 7,50%
Petercam: 8,62%
Free float: 33,28%
The voting rights are described in note 9 - equity.
a n n u a l r e p o r t 2 0 0 9
aCquISItIon oF oWn SHareS
At its meeting held on March 4 2008, the Board of Directors approved a share buyback programme in order to
repurchase up to 225.000 shares. As of December 31, 2008 the Company owned 212.762 shares and 12.238 shares
had been cancelled. On January 13, 2009 the shareholders’ meeting of JENSEN-GROUP decided to cancel the
remaining 212.762 shares, as a result of which JENSEN-GROUP no longer held any treasury shares as of that date.
At its meeting held on November 3, 2009, the Board of Directors approved the purchase of 36.874 shares of the
Company that were held by Baillie Gifford and offered for sale. The buyback was completed through an investment
bank acting as intermediary, at a price per share of 6,9 euro at the Euronext stock exchange. As a result of this
transaction, JENSEN-GROUP currently holds 36.874 treasury shares.
relatIonSHIpS aMonG SHareHolDerS
There is no agreement between the reference shareholders listed above.
Statutory auDItor
The statutory auditor is PricewaterhouseCoopers Bedrijfsrevisoren, represented by Mr. Raf Vander Stichele.
The statutory auditor received worldwide fees of 310,000 euro (excl. VAT) for auditing the statutory accounts of the
various legal entities of the Group and the consolidated accounts of the JENSEN-GROUP. Apart from his mandate, the
statutory auditor received during 2009 additional fees of 129.379 euro (excl. VAT). Of this amount, 48.635 euro was
invoiced to JENSEN-GROUP N.V. and relates to tax advice. The JENSEN-GROUP has appointed a single audit firm for the
whole Group.
33 32
The JENSEN-GROUP share has been quoted on the Euronext Stock Exchange under the ticker JEN (Reuters: JEN.BR
Bloomberg JEN.BB) since June 1997 (prior ticker was LSG). The price of the JENSEN-GROUP shares can be found online
on the following websites:
• JENSEN-GROUP: http://www.jensen-group.com
• Euronext: http://www.Euronext.com
SHare prICe eVolutIon
The JENSEN-GROUP stock price increased from 5,14 euro at the end of 2008 to 7,10 euro at the end of 2009, with an
average daily trading volume of 3.729 shares compared with 3.887 in 2008 (see graph p7).
CoMMunICatIon StrateGy
The JENSEN-GROUP will maintain its communication strategy based on the following principles:
• Organizing two analysts’ meetings per year, following publication of the half year and the full year results;
• Communicating quarterly updates during the first and second halves;
• Communicating any major changes in the financial position and earnings of the Company;
• Distributing its press releases to professional and private investors and posting them on its corporate website;
• Posting the votes and minutes of the Shareholders Meetings on its corporate website;
• Providing all communication, including the corporate website, in English and Dutch;
• Making information on shareholdings, the financial calendar and share transactions by Board members and
management available on the corporate website;
• Attending at least one private investors’ event.
CHanGe In SHareHolDInGS
The shareholders’ structure as per December 31, 2009 is set out below:
Petercam
Baillie Gifford
Jensen Invest
Free Float
33 %
51 %
9 %
7 %
InForMatIon For SHareHolDerS anD InVeStorS
a n n u a l r e p o r t 2 0 0 9
SHareHolDerS’ CalenDar
• May 17, 2010: Publication of the interimreport, covering the period from January 1, 2010;
• May 18, 2010: 10 a.m. General Shareholders’ Meeting at the JENSEN-GROUP Headquarters, Ghent
• August 26, 2010: half year results 2010 (analysts’ meeting)
• November 2010: Publication of the interimreport, covering the period from July 1, 2010
• March 2011: full year results 2010 (analysts’ meeting)
The Investor Relations Manager is also available to meet individual shareholders, analysts, specialized journalists and
institutional investors and enable them to see the JENSEN-GROUP’s short and long-term potential both as a whole and
in respect of specific activities. Presentations, meetings and site visits are organized on request.
The JENSEN-GROUP’s Annual Report, press releases and other information are available on the corporate website
(http://www. jensen-group.com).
Shareholders wishing to convert registered shares into dematerialized shares can contact the Investor Relations Manager.
Shareholders and investors who want to receive the Annual Report, the detailed annual accounts of JENSEN-GROUP N.V.,
press releases or other information concerning the JENSEN-GROUP can also contact the Investor Relations Manager.
JENSEN-GROUP N.V.
Mrs. Scarlet Janssens
Bijenstraat 6
9051 Ghent (Sint-Denijs-Westrem)
Tel. +32.9.333.83.30
E-mail: [email protected]
35 34
Provisions have been set up in respect of all claims that, based on prudent judgment, are reasonably founded. We
keep track of all potential litigation and pending legal cases at a central level. In this chapter we only cover cases
against the Company or one of its subsidiaries. Pending issues per major category are:
Product liability claims:
• 5 product liability claims in the US
• 2 product liability claims in the EU
Commercial claims:
• 3 claims from customers
Environmental risk:
• One pending matter in the USA
Most of these claims are covered by insurance. Based on legal advice taken, management does not expect these
claims to significantly impact the Group's financial position or profitability.
HuMan reSourCeS
The number of employees at year-end has developed as follows:
2008 1.092
2009 976
lItIGatIon
a n n u a l r e p o r t 2 0 0 9
The JENSEN-GROUP’s key technologies encompass the entire laundry process, including the washroom itself, the
logistics of moving linen and textiles, finishing with feeders, ironers and folders, as well as software technology to
control the overall process. In short, a large number of different technologies used in the process of recycling dirty
linen and textiles into clean linen.
Given the wide range of technologies needed to cater for the needs of our customer base, we do not involve ourselves
with fundamental research and development. Our task is to take existing technologies and adapt them to our industry.
In recent years we have invested in further upgrading and expanding our product range and in particular in new
software applications for our industry and in environmentally friendly products. Many developments that target
resource savings for our customers are grouped under our CleanTech brand. Process control and production
monitoring software are crucial in offering the customer a total laundry-operation solution.
Our Group has numerous patents on features of our machinery, and our product development teams in our various
competence centers are continuously examining the possibility of protecting our developments.
Patents and notarial depositions are used primarily to prove prior art. We protect our patents on a case-by-case basis
and primarily in the larger markets.
The JENSEN-GROUP invests around 2,6% of its turnover in Product Development every year. We believe this figure
represents more or less the industry average.
InVeStMentS anD CapItal expenDItureS
During 2009 we invested 2.7 million euro, mainly in machinery and information technology. In the last quarter of 2009,
JENSEN-GROUP acquired the remaining 20% minority shareholding in Jensen Italia s.r.l.
During 2008 we invested 4,7 million euro, mainly in machinery and equipment upgrades at various production entities.
In addition, investments were made in acquisitions in Italy, Belgium and The Netherlands.
outlook 2010
During 2010 we expect a level of capital expenditure which will depend on decisions on internal investment projects.
reSearCH anD DeVelopMent
37 36

S U N E A R T H W A T E R W I N D F O R E S T
The heat pump extracts the so-called ambient heat (air, earth, water
or waste heat) from the environment, and then uses a compressor
to bring it to a higher temperature. The heating and hot water circuit
is brought in this way to a maximum temperature of between 40 to
60 degrees Celsius. The JENSEN-GROUP is supporting the use of
ambient heat in the laundry process.

a n n u a l r e p o r t 2 0 0 9


a n n u a l r e p o r t 2 0 0 9
ContentS oF tHe FInanCIal report
Report of the board of directors 42
Statement of the Responsible Persons 51
Report of the Statutory auditor 52
consolidated statement of financial position 56
consolidated statement of comprehensive income 58
consolidated statement of changes in equity 60
consolidated cash flow statement 62
Notes to the consolidated financial statements 63
41 40
JENSEN-GROUP’s net profit from continuing operations decreased from 12,3 million euro to 5,1 million euro. This is largely
the result of lower activity levels compensated by a lower labour force and rigorous cost control. This profit has been
achieved in a period of great uncertainty, difficult market environment and harsh competition.
On the balance sheet, working capital and net debt decreased compared to last year due to lower activity. Net debt of
12,9 million euro includes 2,6 million euro of factoring. The JENSEN-GROUP is in full compliance with its bank covenants
towards the Group’s bankers.
Activity was different from region to region and from plant to plant throughout 2009. Demand changed rapidly and
customers required a high level of flexibility. These rapid changes occurred in an environment of significant workforce
reductions at various sites. Our management achieved to keep a high level of commitment of everyone to satisfy our
customers at all times. Even in these difficult times, we managed to increase slightly the contribution margins and
managed to decrease our fixed costs. Despite our hedging policy, fluctuations in various currencies like the USD, the GBP
and the SEK had a negative impact on our profitability of 2009.
Headcount decreased during 2009 (from 1.092 to 976).
reSultS
The revenue and operating profit decreased by 21,5% and 42,7% respectively compared with 2008.
The uncertain economic outlook and investment climate led to the postponement of investments, particularly
affecting demand in the US market. The decrease in activity levels differs by technology plant and sales and service
centers worldwide.
Financial expenses increased, mainly because of unfavourable currency results.
All the above mentioned factors resulted in 7,2 million euro decrease in profit from continuing operations (from
12,3 million euro to 5,1 million euro).
outlook 2010
The order book as per December 31, 2009 was up 18% year-on-year. New order intake varied from plant to plant and
from region to region, particularly in the second half of the year.
The company expects that the economic outlook will improve in the course of 2010 and will adapt its capital expenditure
plans accordingly. Substantial investments have been made in various entities in prior years.
Major risk factors for 2010 are the economic uncertainty affecting the investment climate and consequently order
intake, rapid changes in demand, high exchange rate volatility and fluctuating raw material, energy and transport prices.
report oF tHe BoarD oF DIreCtorS
a n n u a l r e p o r t 2 0 0 9
rISk FaCtorS
net profit depends on reaching a certain level of sales to absorb our overhead costs.
Any major drop of activity has an immediate effect on our operating profits.
The Group has 6 production sites, in the following countries:
• Sweden
• Denmark
• Italy
• Germany
• Switzerland
• USA
Each production and engineering center (“PEC”) is specialized in a specific part of the laundry operation (Washroom,
Flatwork, Garment Technology) or in a specific type of linen (flatwork, garment or special applications such as mats,
continuous roller towels or wipers).
Our Group also owns its own distribution channel (Sales and Service Center – or “SSC”) in its most important markets:
• Benelux
• Germany
• France
• Italy
• USA
• UK
• Australia
• Singapore (and sales office in China)
• Switzerland
Each SSC is staffed to handle turnkey projects and systems as well as single machine sales and after sales services.
In each PEC and SSC we have the supporting functions needed for a legal entity. In order to absorb these overheads,
the Group needs sufficient volume. The activity level determines production volume and can be influenced by factors
beyond our control. Since our products are investment goods, the international investment climate, be it in healthcare
but especially in hospitality (hotels and restaurants) and in industrial clothing, can have a significant influence on the
overall market and sales opportunities. The impact of a sudden decrease in turnover cannot be fully offset by a decrea-
se in overheads and infrastructure costs and as such can have a negative impact on our business, our financial conditi-
on and our operating results.
43 42

our largest customers are getting larger as they consolidate and are becoming more international.
An important part of our business is to deliver solutions and machines to the textile rental industry. The ongoing
consolidation and internationalization in this industry is making a significantly greater part of our business dependent
on our relations with these larger groups.
price fluctuations or shortages of raw materials and the possible loss of suppliers could adversely affect our operations.
We buy in a large number of different components as well as raw materials such as black iron, stainless steel and
aluminium. The price and availability of these raw materials and components are subject to market conditions
affecting supply and demand. In a competitive market, there is no assurance that increases or decreases in raw
material and other costs can be translated into higher sales or lower purchase prices. Nor can there be any assurance
that the loss of suppliers or of components would not have a material adverse effect on our business, financial
condition and results of operations. We currently do not undertake commodity hedging in association with payments
for purchased raw materials and components.
We operate in a competitive market.
Within the worldwide heavy-duty laundry market, we encounter several competitors. There can be no assurance that
significant new competitors or increased competition from existing competitors will not have an adverse effect on our
business, financial condition and results of operations.
In addition, we may face competition from companies outside of the United States or Europe having lower costs of
production (including labour or raw materials). These companies may pass on these lower production costs as price
decreases to customers and as a result, our revenues and profits could be adversely affected.
Currency risks and the economic and political risks of selling products in foreign countries.
Sales of equipment and projects to international customers represent a major part of our net revenues. Demand for
our products is and may be affected by economic and political conditions in each of the countries in which we sell our
products and by certain other risks of doing business abroad, including fluctuations in the value of currencies (which
may affect demand for products priced in euros). We do hedge exchange rate fluctuations between the major curren-
cies for our operations, these being the EUR, USD, CHF, GBP, DKK, SEK and AUD.
We are dependent on key personnel.
We are dependent on the continued services and performance of our senior management team and certain other key
employees. Our employment agreements with our senior management and key employees are for an indefinite
period of time. The loss of any key employee could have a material adverse effect on our business, financial condition
and results of operations because of their experience and knowledge of our business and customer relationships.
a n n u a l r e p o r t 2 0 0 9
the nature of our business exposes us to potential liability for environmental claims and we could be adversely affected by
new environmental, health and safety requirements.
We are subject to comprehensive and frequently changing federal, state and local environmental, health and safety
laws and regulations, including laws and regulations governing emissions of air pollutants, discharges of waste and
storm water and the disposal of hazardous wastes. We cannot predict the environmental liabilities that may result
from legislation or regulations adopted in the future, the effect of which could be retroactive. The enactment of more
stringent laws or stricter interpretation of existing laws could require additional expenditures by us, some of which
could have an adverse effect on our business, financial condition and results of operations.
We are also subject to liability for environmental contamination (including contamination caused by other parties) at
the sites we own or operate. As a result, we are involved, from time to time, in administrative and judicial proceedings
and inquiries relating to environmental matters. There can be no assurance that we will not be involved in such
proceedings in the future, and we cannot be sure that our existing insurance or additional insurance will provide
adequate coverage against potential liability resulting from any such administrative and judicial proceedings and
inquiries. The aggregate amount of future clean-up costs and other environmental liabilities could have a material
adverse effect on our business, financial condition and results of operations.
Certain environmental investigatory and remedial work is either going on or planned at, or relating to, our former
Cissell manufacturing facility. There can be no complete assurance that significant additional costs will not be incurred
by us in the future with respect to the Cissell facility or other facilities.
Our operations are also subject to various hazards incidental to the manufacturing and transportation of heavy-duty
laundry equipment. These hazards can cause personal injury and damage to and destruction of property and
equipment. There can be no assurance that as a result of past or future operations, there will not be injury claims by
employees or members of the public. Furthermore, we also have exposure to present and future claims with respect
to worker safety, workers’ compensation and other matters. There can be no assurance as to the actual amount of
these liabilities or the timing of them. Regulatory developments requiring changes in operating practices or influen-
cing demand for, and the cost of providing, our products and services or the occurrence of material operational
problems, including but not limited to the above events, may also have an adverse effect on our business, financial
condition and results of operations.
We may incur product liability expenses.
We are exposed to potential product liability risks that arise from the sale of our products. In addition to direct expen-
ditures for damages, settlements and defence costs, there is a possibility of adverse publicity as a result of product
liability claims. We cannot be sure that our existing insurance or any additional insurance will provide adequate
coverage against potential liabilities and any such liabilities could adversely affect our business, financial condition
and results of operations and our ability to service our indebtedness.
45 44
We are subject to risks of future legal proceedings.
At any given time, we are a defendant in various legal proceedings and litigation arising in the ordinary course of
business. Although we maintain insurance coverage, there is no assurance that this insurance coverage will be
adequate to protect us from all material expenses related to potential future claims for personal and property damage
or that these levels of insurance coverage will be available in the future at economical prices or for that matter,
available at all. A significant judgment against us, the loss of a significant permit or other approval or the imposition of
a significant fine or penalty could have an adverse effect on our business, financial condition and future prospects.
Interest rate fluctuations could have an adverse effect on our revenues and financial results.
We are exposed to market risk associated with adverse movements in interest rates. We do maintain long term inte-
rest rate hedges in order to limit this risk, but a general increase in interest rates might have an unfavorable effect on
the overall investment climate and as such on our business, financial condition and results of operations.
our indebtedness could adversely affect our financial health if the ratio in the covenant is not met.
The major financial institutions to the JENSEN-GROUP are Nordea, Credit Suisse, and KBC. With respect to the Group’s
borrowings, one debt covenant wiht one of the financial institutions is in place (equity ratio). This covenant could have
a restricting effect on our financial capacity.
to service our indebtedness, we will require a certain amount of cash. our ability to generate cash depends on many factors
beyond our control.
Our ability to make scheduled payments of principal and interest with respect to our indebtedness, to fund our
planned capital expenditures and our research and development efforts and to finance our expansion in capacity, will
depend on our ability to generate cash, on future financial results and the development of the major financial instituti-
ons we work with. This, to a certain extent, is subject to the risk factors mentioned above.
ConFlICt oF IntereSt
As under Belgian company law, the members of the Board of Directors are expected to give the Chairman prior notice
of any agenda items in respect of which they have a direct or an indirect conflict of interest of a financial or other
nature with the Company, and to refrain from participating in the discussions of and voting on those items. This is also
a standard point on the agenda of each Board meeting. Two such potential conflicts occurred during 2009. One arose
at the Board meeting of May 18, 2009 where the new criteria for independent directors were discussed. A second
conflict of interest occurred during the Board meeting of November 3, 2009 where the buy back of shares was
approved. The minutes of these meetings are therefore included in the annual report of the Board of Directors.
the minutes of these meetings are included below:
“On May 18, 2009 at 9.20 a.m. the Board of Directors of Jensen Group held a meeting at the Corporation’s principal
office at Bijenstraat 6 in 9051 Sint-Denijs-Westrem, Belgium.

a n n u a l r e p o r t 2 0 0 9
the following directors were present:
• Gobes Comm. V. represented by Mr. Raf Decaluwé
• Mr. Jørn Munch Jensen
• Mr. Jesper Munch Jensen
• TTP bvba represented by Mr. Erik Vanderhaegen
• The Marble bvba represented by Mr. Luc Van Nevel
the following director was represented:
• Mr. Hans Werdelin
the following invitees were attending:
• Mr. Werner Vanderhaeghe
• Mr. Markus Schalch
Mr. Decaluwé presided. Mr. Vanderhaeghe acted as Secretary. The Chairman pointed out that notice of the meeting
had been given by letter of May 11, 2009, that all of the directors were present or represented and that the meeting
was validly constituted. The Chairman then suggested that the meeting consider the following items of business:
Conflict of interest
The Chairman reminded the members of the Board of their fiduciary duties with regard to conflicts of interest and to
the applicable statutory provisions under Belgian Corporate Law relative thereto. In response to a question by the
Chairman, all of the members of the Board confirmed that none of the items on the present agenda raised a conflict of
interest, except for the item on corporate governance and the status of independent director in respect of which the
Chairman indicated that he would abstain from the deliberation and decision.
...
new Corporate Governance Code 2009
The Chairman referred the members of the Board to the materials that had been sent on this topic with the notice to
the meeting and he then summarily reviewed the main changes for the Jensen Group.
At the invitation of the Chairman, Mr. Vanderhaeghe then commented in extenso the new criteria for independent
directors that are set forth in the Code and that are incorporated in newly enacted legislation in Belgium. Mr. Vander-
haeghe confirmed that, based on advice from counsel, the Board could legitimately opt for an extensive interpretation
of these criteria, as opposed to the strict approach that was used at the outset and that resulted in the call of a special
meeting of shareholders in January 2009. Mr. Vanderhaeghe further informed the Board that if it were to opt for such
extensive interpretation, both Gobes bvba and Mr. Hans Werdelin could be elected for another term as director and
still qualify as independent under the new regulations. Mr. Jørn Munch Jensen then moved for a decision and after
brief discussion, the Board adopted the following resolution:
47 46

“Upon a motion duly made, the Board of Directors resolved unanimously but with Gobes bvba acting through its perma-
nent representative, Mr. Raf Decaluwé, abstaining from the deliberation and vote, to interpret the newly enacted crite-
ria on independence of directors in a way such that substance overrides form and that the relevant provisions of the
Corporation’s Articles of Incorporation are duly observed; resolve further that under this interpretation, Gobes bvba and
Mr. Hans Werdelin are eligible for another term while maintaining the qualification of independent directors.”
...
There being no further business to discuss, the meeting was adjourned at 12.15 p.m.
Minutes of the Meeting of november 3, 2009:
“The undersigned, being all of the directors of Jensen Group N.V. (“the Corporation”) do hereby take, in accordance
with Article 521 of the Companies Code and pursuant to Section 17 of the Articles of Incorporation of the Corporation,
the following action by written consent and without a meeting, which action shall have the same force and effect as if
duly adopted at a meeting duly called and held of which a quorum was present and acting throughout:
Conflict of interest
“RESOLVED unanimously to acknowledge receipt of a letter dated October 26, 2009 and sent by Messrs. Jørn Munch
Jensen and Jesper Munch Jensen, directors, with a notice of a conflict of interest under Article 523 of the Companies
Code; resolved further unanimously that in view of the value of the transaction in respect of which a conflict of interest
is reported and which value amounts to less than 1% of the Corporation’s net assets, Article 524 of the Companies
Code is not applicable and the present action by written consent is exempt from the specific procedure set forth in said
Article 524; resolved further unanimously to acknowledge the intent by Messrs. Jørn Munch Jensen and Jesper Munch
Jensen to abstain from the present action by written consent.”
Buy back of Shares
“RESOLVED unanimously to approve the purchase of 36.874 of the Corporation’s shares as requested by and from Bail-
lie Gifford by means of an intermediary (investment bank), at a price per share of 6,9 Euros at the stock exchange
Euronext, which transaction was executed on October 22, 2009 and which purchase represents a total value of
254.430,6 Euros; resolved further unanimously to approve and validate any and all action taken by Mrs. Scarlet Jans-
sens in respect of the purchase transaction referred to above.”
This written consent is signed in four (4) original counterparts, by all undersigned directors allowed to participate, all
of which counterparts, when so executed, shall be deemed to constitute one and the same document.
InVeStMentS anD CapItal expenDItureS
Our capital expenditures in 2009 amounted to 2,7 million euro (4,7 million euro in 2008), consisting primarily of
equipment and the purchase of the minority shareholding of Jensen Italia s.r.l. During 2010 we expect an expenditure
level that reflects the substantial investments made in various entities in previous years and a strategic assessment of
opportunities.
a n n u a l r e p o r t 2 0 0 9
uSe oF FInanCIal InStruMentS
The Company uses derivative financial instruments to reduce its exposure to adverse fluctuations in interest rates
and foreign exchange rates. It is the company’s policy not to hold derivative instruments for speculative and trading
purposes.
At December 31, 2009, currency bought forward hedges existed in an amount of 19,3 million euro and currency sold
forward hedges existed in an amount of 13,0 million euro. The Company also had Interest Rate Swaps (IRS) outstan-
ding in amounts of 15,0 million euro, 5,0 million USD, 4 million CHF and 30,0 million DKK with maturities from 2010 to
2024 and fixed rates ranging from 3,09% to 5,04%.
reSearCH anD DeVelopMent
The JENSEN-GROUP does not perform fundamental research, but undertakes continuous product development efforts.
These expenses in respect of the continued operations amounted to 4,6 million euro in 2009 (5,1 million euro in
2008). The JENSEN-GROUP does not capitalize development expenses since its business reality makes it very difficult
to distinguish product enhancements from adaptations to specific circumstances, and to define the future cash flows
that will originate from these efforts. Since furthermore the development expenses are relatively stable and are a
continuous process, the JENSEN-GROUP does not capitalize these efforts but expenses them as incurred.
Corporate GoVernanCe
The JENSEN-GROUP is compliant with the Belgian Corporate Governance Code except as otherwise explained in this
annual report.
All members of the audit committee have the necessary expertise in the field of accounting and auditing. Two of the
three audit committee members are independent directors.
The bylaws require the Board of Directors to be composed of at least three but not more than eleven members,
elected for terms of office of no more than four years.
Further details can be found in a separate chapter of this annual report.
ISSueD CapItal
At December 31, 2009, the issued share capital was 42,7 million euro, represented by 8.039.842 ordinary shares without
nominal value. There are no preference shares.
The bylaws allow for the purchase of own shares. JENSEN-GROUP currently holds 36.874 treasury shares.
Pursuant to article 74, §6, of the Law of April 1, 2007, JENSEN INVEST A/S disclosed to both the CBFA and to JENSEN-GROUP
N.V. that, at September 1, 2007, it holds in concert more than 30% of the shares with voting rights in JENSEN-GROUP N.V.
Further details of the shareholders’ notification are disclosed in note 9 - equity.
49 48

DIVIDenD propoSal
The Board proposes to distribute a dividend of 0,25 euro per share on the results of 2009, amounting in total to
2.000.742,00 euro, based on the number of shares as per December 31, 2009 and taking into account the treasury
shares.
approprIatIon oF reSultS
JENSEN-GROUP N.V., the parent Company, reported in its statutory accounts a net profit of 8.376.397,45 euro. The
Board proposes to appropriate this result as follows:
Profit of the year 8.376.397,45
To legal reserves 673.250,60
Dividend 2.000.742,00
To retained earnings 5.702.404,85
This brings the total amount of retained earnings to 37.795.970,42 euro.
SIGnIFICant poSt-BalanCe SHeet eVentS
There are no significant post-balance sheet events.
Ghent, March 10, 2010
a n n u a l r e p o r t 2 0 0 9
We hereby certify, to the best of our knowledge, that the consolidated financial statements as of December 31, 2009,
prepared in accordance with International Financial Reporting Standards, as adopted by the European Union, and with
the legal requirements applicable in Belgium, give a true and fair view of the assets, liabilities, financial position and
profit or loss of the Company and the entities included in the consolidation taken as a whole, and that the manage-
ment report includes a fair review of the development and performance of the business and the position of the Com-
pany and the entities included in the consolidation taken as a whole, together with a description of the principal risks
and uncertainties that they face.
Jesper M. Jensen Markus Schalch
Chief Executive Officer Chief Financial Officer
StateMent oF tHe reSponSIBle perSonS
51 50
STATUTORY AUDITOR'S REPORT TO THE GENERAL SHAREHOLDERS’ MEETING ON THE CONSOLIDATED ACCOUNTS OF THE
COMPANY JENSEN-GROUP NV AS OF AND FOR THE YEAR ENDED 31 DECEMBER 2009
As required by law and the company’s articles of association, we report to you in the context of our appointment as sta-
tutory auditors. This report includes our opinion on the consolidated accounts and the required additional information.
unqualIFIeD opInIon on tHe ConSolIDateD aCCountS
We have audited the consolidated accounts of Jensen-Group NV and its subsidiaries (the “Group”) as of and for the
year ended 31 December 2009, prepared in accordance with International Financial Reporting Standards, as adopted
by the European Union, and with the legal and regulatory requirements applicable in Belgium. The consolidated
accounts of the Group are set forth on pages 56 to 107. These consolidated accounts comprise the consolidated state-
ment of financial position as of 31 December 2009 and the consolidated statement of comprehensive income, the
consolidated statement of changes in equity and the consolidated cash flow statement for the year then ended, as
well as the summary of significant accounting policies and other explanatory notes. The total of the consolidated
statement of financial position amounts to EUR (000) 152.036 and the consolidated statement of comprehensive
income shows a profit for the year of EUR (000) 4.994.
The company's board of directors is responsible for the preparation of the consolidated accounts. This responsibility
includes: designing, implementing and maintaining internal control relevant to the preparation and fair presentation
of consolidated accounts that are free from material misstatement, whether due to fraud or error; selecting and app-
lying appropriate accounting policies; and making accounting estimates that are reasonable in the circumstances.
Our responsibility is to express an opinion on these consolidated accounts based on our audit. We conducted our audit
in accordance with the legal requirements applicable in Belgium and with Belgian auditing standards, as issued by the
"Institut des Reviseurs d'Entreprises/Instituut der Bedrijfsrevisoren". Those auditing standards require that we plan
and perform the audit to obtain reasonable assurance about whether the consolidated accounts are free of material
misstatement.
In accordance with the auditing standards referred to above, we have carried out procedures to obtain audit evidence
about the amounts and disclosures in the consolidated accounts. The selection of these procedures is a matter for our
judgment, as is the assessment of the risk that the consolidated accounts contain material misstatements, whether
due to fraud or error. In making those risk assessments, we have considered the Group’s internal control relating to the
preparation and fair presentation of the consolidated accounts, in order to design audit procedures that were appropri-
ate in the circumstances, but not for the purpose of expressing an opinion on the effectiveness of the Group’s internal
control. We have also evaluated the appropriateness of the accounting policies used and the reasonableness of
accounting estimates made by management, as well as the presentation of the consolidated accounts taken as a
whole. Finally, we have obtained from the board of directors and Group officials the explanations and information
necessary for our audit. We believe that the audit evidence we have obtained provides a reasonable basis for our opi-
nion.
Statutory auDItor'S report
a n n u a l r e p o r t 2 0 0 9
In our opinion, the consolidated accounts set forth on pages 56 to 107 give a true and fair view of the Group’s net worth
and financial position as of 31 December 2009 and of its results and cash flows for the year then ended in accordance
with International Financial Reporting Standards, as adopted by the European Union, and with the legal and regulatory
requirements applicable in Belgium.
aDDItIonal InForMatIon
The company’s board of directors is responsible for the preparation and content of the management report on the con-
solidated accounts.
Our responsibility is to include in our report the following additional information, which does not have any effect on
our opinion on the consolidated accounts
• The management report on the consolidated accounts deals with the information required by the law and is consi-
stent with the consolidated accounts. However, we are not in a position to express an opinion on the description of
the principal risks and uncertainties facing the companies included in the consolidation, the state of their affairs,
their forecast development or the significant influence of certain events on their future development. Nevertheless,
we can confirm that the information provided is not in obvious contradiction with the information we have acquired
in the context of our appointment.
• In accordance with article 523 of the Companies’ Code, the board of directors have informed you, in their manage-
ment report on the consolidated accounts, of the following decisions: (1) the granting of mandate to an investment
bank to buy back own shares of the company whereby two directors of the company being, Mr Jorn Munch Jensen
and Mr Jesper Munch Jensen, in their relationship with the company’s majority shareholder Jensen Invest A/S have
a conflict of interest, (2) the deliberation with respect to the new criteria for independent directors that are set forth
in the Corporate Governance Code 2009 and that are incorporated in newly enacted legislation in Belgium whereby
a director of the company being Mr Decaluwé has a conflict of interest. The board’s management report explains
appropriately the financial consequences of these decisions for the company.
Brussels, 10 March 2010
The statutory auditor
PricewaterhouseCoopers Reviseurs d’Entreprises / Bedrijfsrevisoren
Represented by
Raf Vander Stichele
Bedrijfsrevisor
53 52
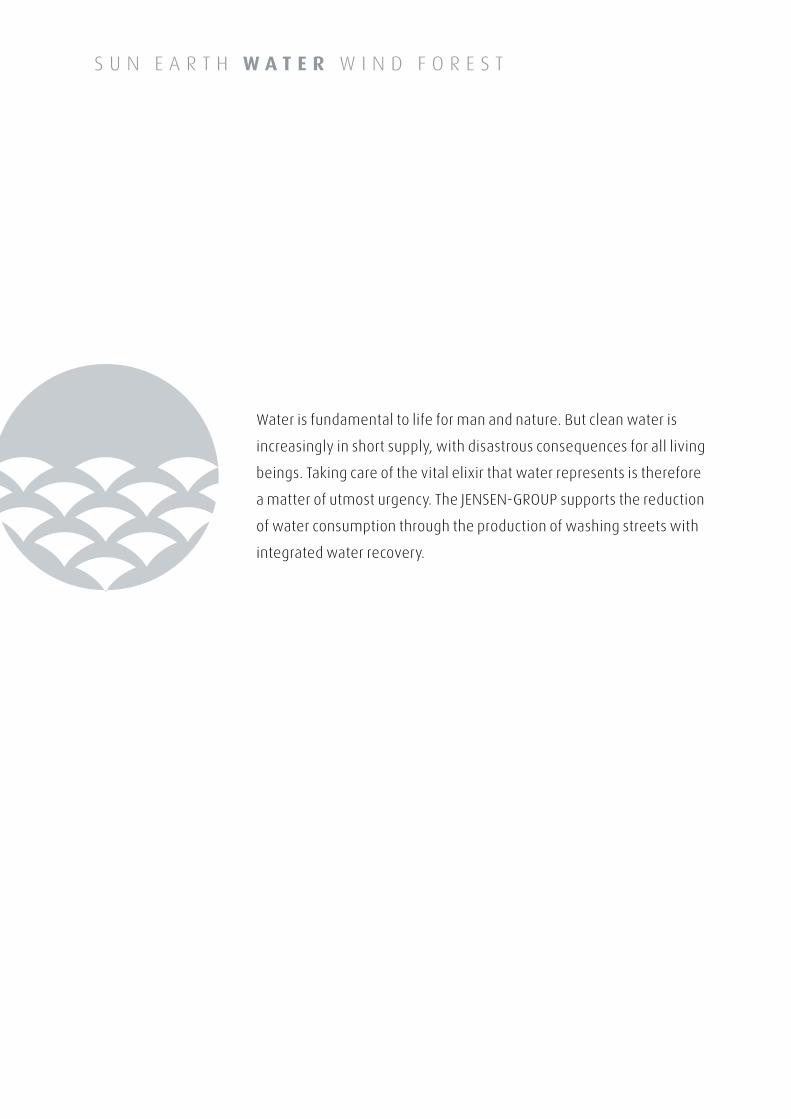
S U N E A R T H W A T E R W I N D F O R E S T
Water is fundamental to life for man and nature. But clean water is
increasingly in short supply, with disastrous consequences for all living
beings. Taking care of the vital elixir that water represents is therefore
a matter of utmost urgency. The JENSEN-GROUP supports the reduction
of water consumption through the production of washing streets with
integrated water recovery.


ConSolIDateD StateMent oF FInanCIal poSItIon
(in thousands of euro) notes december 31, 2009 december 31, 2008
total non-Current assets 37.828 39.577
Intangible assets 5.1 5.900 5.623
A. Land and buildings 18.040 19.391
B. Plant, machinery and equipment 5.381 5.850
C. Furniture and vehicles 1.494 1.599
D. Other tangible fixed assets 88 118
E. Assets under construction and advance payments 0 0
property, plant and equipment 5.2 25.003 26.958
trade and other long term receivables 8 554 802
Deferred taxes 6 6.371 6.194
total Current assets 114.208 123.386
A. Raw materials and consumables 9.547 12.128
B. Goods purchased for resale 9.773 9.884
C. Advance payments 549 623
Inventories 19.869 22.635
A. Trade debtors 45.469 50.239
B. Other amounts receivable 3.173 3.573
C. Gross amounts due from customers for contract work 7 25.651 24.650
D. Derivative Financial Instruments 220 990
trade and other receivables 8 74.513 79.452
Cash and cash equivalents 19 19.409 20.840
assets held for sale 22 417 459
total aSSetS 152.036 162.963
The notes on pages 63-107 are an integral part of these consolidated financial statements.

a n n u a l r e p o r t 2 0 0 9
ConSolIDateD StateMent oF FInanCIal poSItIon
(in thousands of euro) notes december 31, 2009 december 31, 2008
equity attributable to equity holders 9 49.589 46.542
Share Capital 48.274 46.914
other reserves -4.136 -5.037
retained earnings 5.451 4.081
Minority Interest 584
non current liabilities 24.109 25.775
Borrowings 10 12.862 14.255
Finance lease obligations 10 508 73
Deferred income tax liabilities 6 1.142 1.167
provisions for employee benefit obligations 11 9.597 10.280
Current liabilities 78.338 90.646
Borrowings 10 18.849 34.507
Finance lease obligations 10 167 57
provisions for other liabilities and charges 12 10.535 10.287
A. Trade debts 15.085 16.486
B. Advances received for contract work 7 15.117 8.906
C. Remuneration and social security 6.480 6.947
D. Other amounts payable 1.466 2.826
E. Accrued expenses 5.403 4.582
trade and other payables 13 43.551 39.747
Current income tax liablities 4.105 4.165
Derivative financial instruments 1.131 1.883
total equIty anD lIaBIlItIeS 152.036 162.963
The notes on pages 63-107 are an integral part of these consolidated financial statements.
57 56
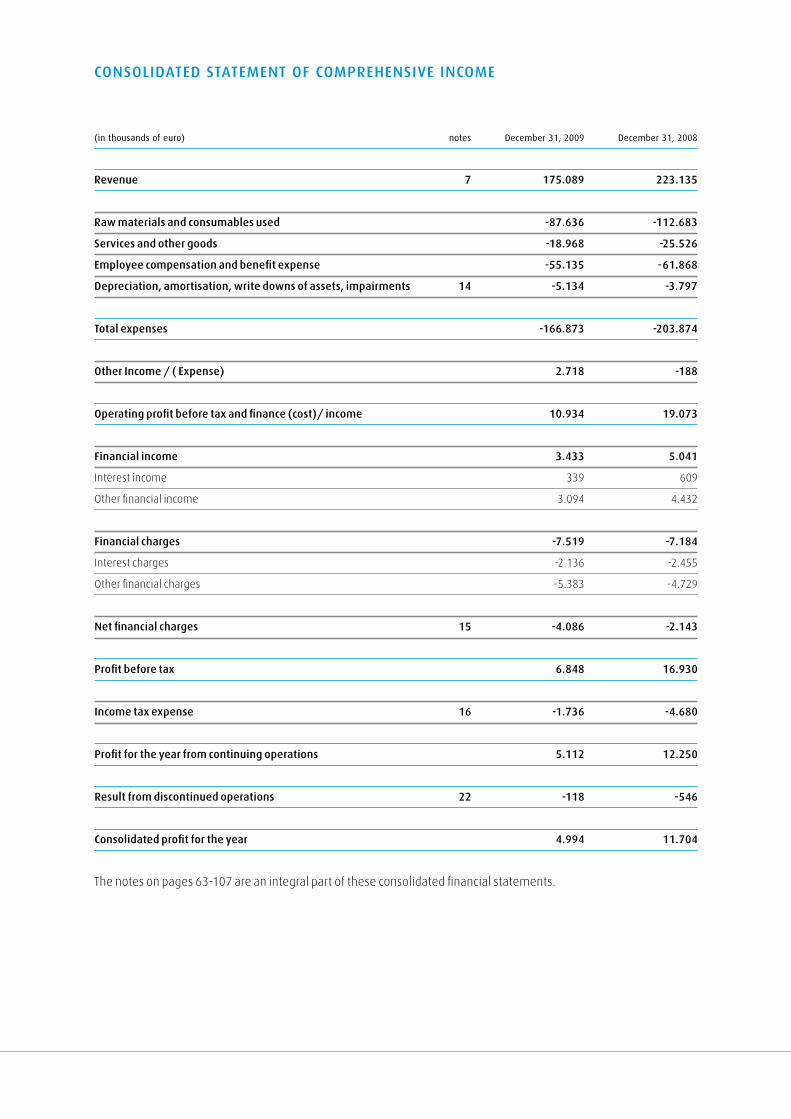
ConSolIDateD StateMent oF CoMpreHenSIVe InCoMe
(in thousands of euro) notes december 31, 2009 december 31, 2008
revenue 7 175.089 223.135
raw materials and consumables used -87.636 -112.683
Services and other goods -18.968 -25.526
employee compensation and benefit expense -55.135 -61.868
Depreciation, amortisation, write downs of assets, impairments 14 -5.134 -3.797
total expenses -166.873 -203.874
other Income / ( expense) 2.718 -188
operating profit before tax and finance (cost)/ income 10.934 19.073
Financial income 3.433 5.041
Interest income 339 609
Other financial income 3.094 4.432
Financial charges -7.519 -7.184
Interest charges -2.136 -2.455
Other financial charges -5.383 -4.729
net financial charges 15 -4.086 -2.143
profit before tax 6.848 16.930
Income tax expense 16 -1.736 -4.680
profit for the year from continuing operations 5.112 12.250
result from discontinued operations 22 -118 -546
Consolidated profit for the year 4.994 11.704
The notes on pages 63-107 are an integral part of these consolidated financial statements.
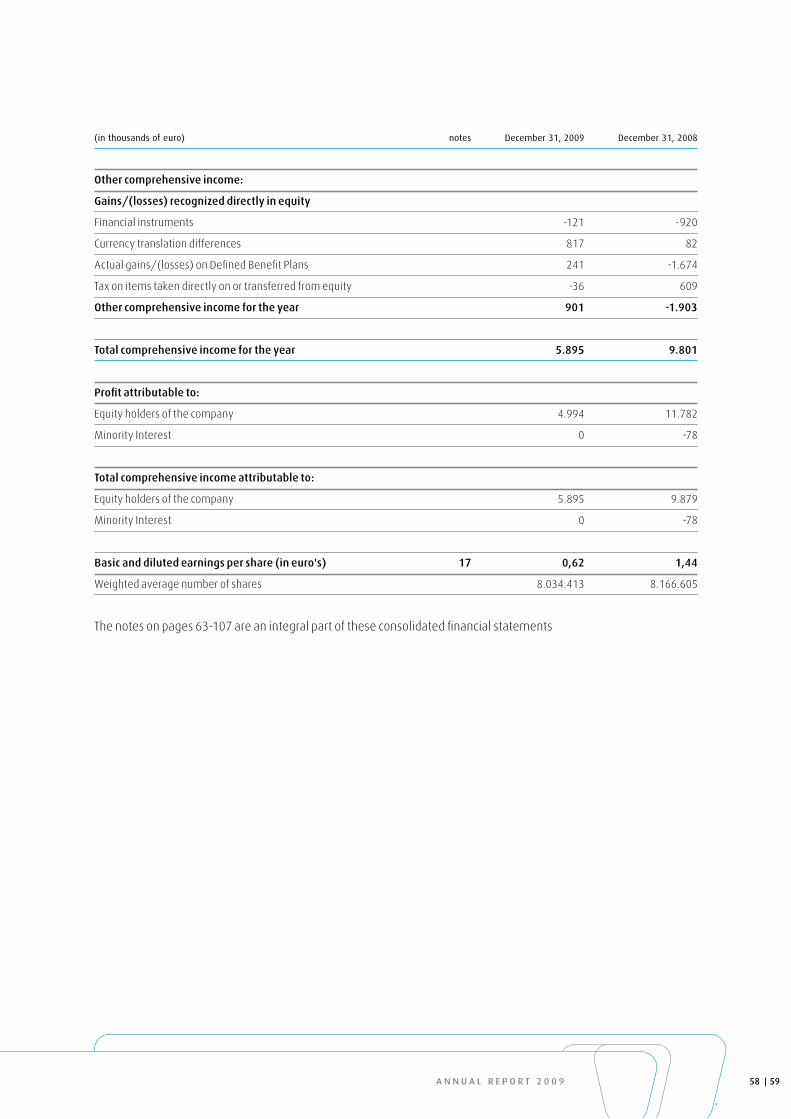
a n n u a l r e p o r t 2 0 0 9
(in thousands of euro) notes december 31, 2009 december 31, 2008
other comprehensive income:
Gains/(losses) recognized directly in equity
Financial instruments -121 -920
Currency translation differences 817 82
Actual gains/(losses) on Defined Benefit Plans 241 -1.674
Tax on items taken directly on or transferred from equity -36 609
other comprehensive income for the year 901 -1.903
total comprehensive income for the year 5.895 9.801
profit attributable to:
Equity holders of the company 4.994 11.782
Minority Interest 0 -78
total comprehensive income attributable to:
Equity holders of the company 5.895 9.879
Minority Interest 0 -78
Basic and diluted earnings per share (in euro's) 17 0,62 1,44
Weighted average number of shares 8.034.413 8.166.605
The notes on pages 63-107 are an integral part of these consolidated financial statements
59 58
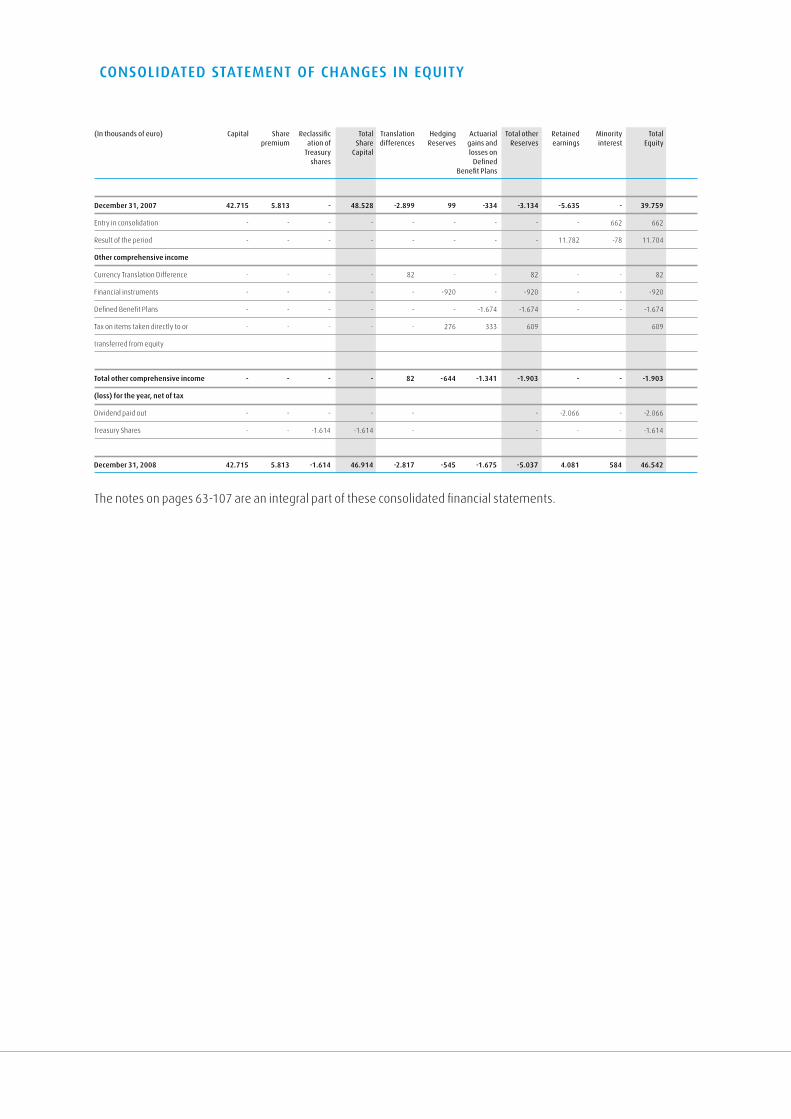
ConSolIDateD StateMent oF CHanGeS In equIty
(in thousands of euro) capital Share Reclassific Total Translation hedging actuarial Total other Retained minority Total premium ation of Share differences Reserves gains and Reserves earnings interest equity Treasury capital losses on shares defined benefit Plans
December 31, 2007 42.715 5.813 - 48.528 -2.899 99 -334 -3.134 -5.635 - 39.759
Entry in consolidation - - - - - - - - - 662 662
Result of the period - - - - - - - - 11.782 -78 11.704
other comprehensive income
Currency Translation Difference - - - - 82 - - 82 - - 82
Financial instruments - - - - - -920 - -920 - - -920
Defined Benefit Plans - - - - - - -1.674 -1.674 - - -1.674
Tax on items taken directly to or - - - - - 276 333 609 609
transferred from equity
total other comprehensive income - - - - 82 -644 -1.341 -1.903 - - -1.903
(loss) for the year, net of tax
Dividend paid out - - - - - - -2.066 - -2.066
Treasury Shares - - -1.614 -1.614 - - - - -1.614
December 31, 2008 42.715 5.813 -1.614 46.914 -2.817 -545 -1.675 -5.037 4.081 584 46.542
The notes on pages 63-107 are an integral part of these consolidated financial statements.

a n n u a l r e p o r t 2 0 0 9
(in thousands of euro) capital Share Reclassific Total Translation hedging actuarial Total other Retained minority Total premium ation of Share differences Reserves gains and Reserves earnings interest equity Treasury capital losses on shares defined benefit Plans
December 31, 2008 42.715 5.813 -1.614 46.914 -2.817 -545 -1.675 -5.037 4.081 584 46.542
Result of the period - - - - - - - - 4.994 - 4.994
other comprehensive income
Currency Translation Difference - - - - 817 - - 817 - - 817
Financial instruments - - - - - -121 - -121 - - -121
Defined Benefit Plans - - - - - - 241 241 - - 241
Tax on items taken directly to or - - - - - 36 -72 -36 - - -36
transferred from equity
total other comprehensive income - - - - 817 -85 169 901 - - 901
(loss) for the year, net of tax
Dividend paid out - - - - - - - - -2.010 - -2.010
Treasury shares - - 1.360 1.360 - - - - -1.614 - -254
Changes in consolidation scope - - - - - - - - - -584 -584
December 31, 2009 42.715 5.813 -254 48.274 -2.000 -630 -1.506 -4.136 5.451 - 49.589
The notes on pages 63-107 are an integral part of these consolidated financial statements.
61 60
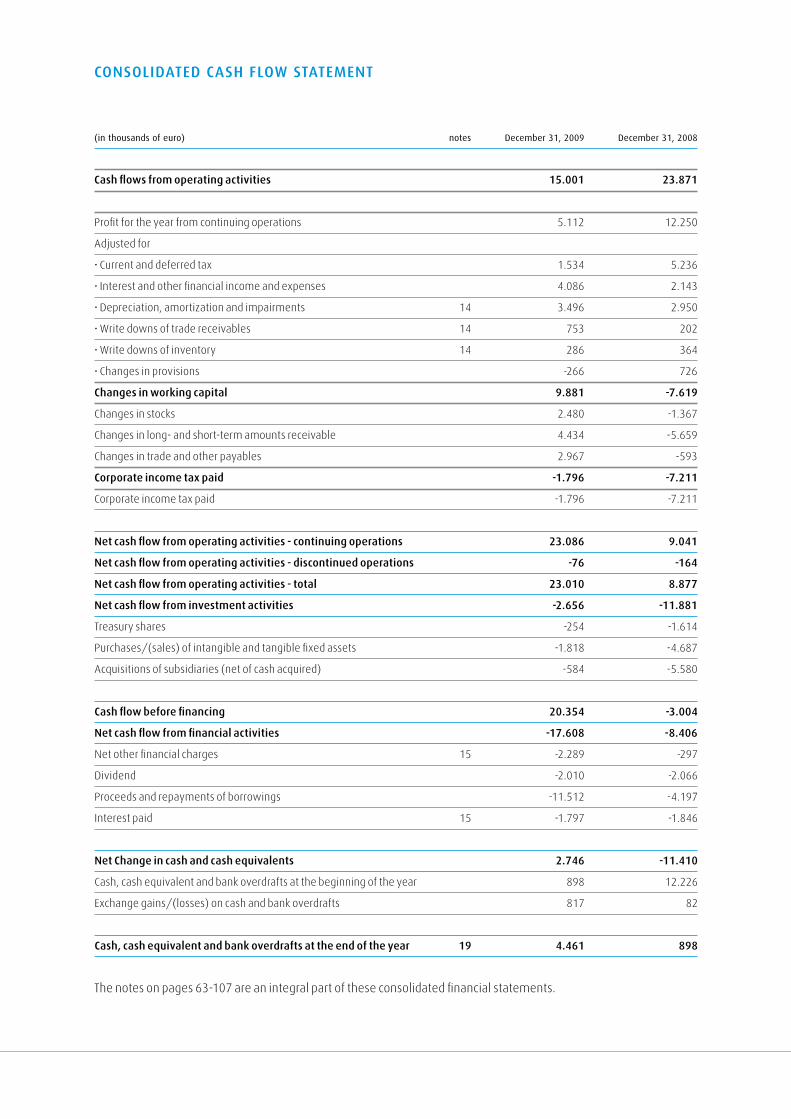
ConSolIDateD CaSH FloW StateMent
(in thousands of euro) notes december 31, 2009 december 31, 2008
Cash flows from operating activities 15.001 23.871
Profit for the year from continuing operations 5.112 12.250
Adjusted for
• Current and deferred tax 1.534 5.236
• Interest and other financial income and expenses 4.086 2.143
• Depreciation, amortization and impairments 14 3.496 2.950
• Write downs of trade receivables 14 753 202
• Write downs of inventory 14 286 364
• Changes in provisions -266 726
Changes in working capital 9.881 -7.619
Changes in stocks 2.480 -1.367
Changes in long- and short-term amounts receivable 4.434 -5.659
Changes in trade and other payables 2.967 -593
Corporate income tax paid -1.796 -7.211
Corporate income tax paid -1.796 -7.211
net cash flow from operating activities - continuing operations 23.086 9.041
net cash flow from operating activities - discontinued operations -76 -164
net cash flow from operating activities - total 23.010 8.877
net cash flow from investment activities -2.656 -11.881
Treasury shares -254 -1.614
Purchases/(sales) of intangible and tangible fixed assets -1.818 -4.687
Acquisitions of subsidiaries (net of cash acquired) -584 -5.580
Cash flow before financing 20.354 -3.004
net cash flow from financial activities -17.608 -8.406
Net other financial charges 15 -2.289 -297
Dividend -2.010 -2.066
Proceeds and repayments of borrowings -11.512 -4.197
Interest paid 15 -1.797 -1.846
net Change in cash and cash equivalents 2.746 -11.410
Cash, cash equivalent and bank overdrafts at the beginning of the year 898 12.226
Exchange gains/(losses) on cash and bank overdrafts 817 82
Cash, cash equivalent and bank overdrafts at the end of the year 19 4.461 898
The notes on pages 63-107 are an integral part of these consolidated financial statements.
a n n u a l r e p o r t 2 0 0 9
noteS to tHe ConSolIDateD FInanCIal StateMentS
note 1: SuMMary oF SIGnIFICant aCCountInG polICIeS
Basis of preparation
The JENSEN-GROUP (hereafter “The Group”) is one of the major suppliers to the heavy-duty laundry industry.
The Group markets its products and services under the JENSEN brand and is the leading supplier to the heavy-duty
market. The product range varies from transportation and handling systems, tunnel washers, separators, feeders,
ironers, folders to complete project management for fully-equipped and professionally managed industrial laundries.
The JENSEN-GROUP has operations in 12 countries and distributes its products in more than 50 countries. Worldwide,
the JENSEN-GROUP employs 976 people.
JENSEN-GROUP N.V. (hereafter “The Company”) is incorporated in Belgium. Its registered office is at Bijenstraat 6,
9051 Sint-Denijs-Westrem, Belgium.
The JENSEN-GROUP shares are quoted on the Euronext Stock Exchange.
The Board of Directors approved the present consolidated financial statements for issue on March 10, 2010.
These consolidated financial statements are for the 12 months ended December 31, 2009 and are prepared in
accordance with International Financial Reporting Standards (IFRS) as adopted by the European Union. These annual
financial statements have been prepared in accordance with those IFRS standards and IFRIC interpretations issued and
effective or issued and adopted in anticipation as at December 31, 2009 and which have been adopted by the
European Union.
These consolidated financial statements have been prepared under the historical cost convention, as modified by the
revaluation of available-for-sale financial assets, and financial assets and financial liabilities (including derivative
instruments) at fair value through profit or loss.
These consolidated financial statements are prepared on an accrual basis and on the assumption that the Group is a
going concern and will continue in operation for the foreseeable future.
The preparation of the financial statements requires management to make estimates and assumptions that affect the
reported amounts of revenue, expenses, assets and liabilities and disclosure of contingent assets and liabilities at the
date of the financial statements. The areas involving a higher degree of judgment or complexity, or where assumpti-
ons and estimates are significant to the consolidated financial statements, are disclosed in the accounting policies.
63 62
The following new standards, amendments to standards and interpretations are mandatory for the first time for the
Group’s accounting period beginning 1 January 2009.
- IAS 1 (Revised) “Presentation of Financial Statements”.
- IFRS 8 “Operating Segments”. IFRS 8 replaces IAS 14 “Segment reporting”.
- IFRS 7 (Amendment) “Financial Instruments – Disclosures”.
- IAS 23 (Revised) “Borrowing Costs”
- IAS 32 “Financial instruments: Presentation” and IAS 1 “Presentation of financial statements” on puttable financial
instruments and obligations arising on liquidation (Amendment).
- IFRS 2 (Amendment) “Share-Based Payment – Vesting Conditions and Cancellations”.
- Amendment to IFRIC 9 and IAS 39 regarding embedded derivatives.
- IFRIC 13 “Customer Loyalty Programmes”.
- IFRIC 14 “IAS 19 – The Limit on a Defined Benefit Asset, Minimum Funding Requirements and their Interaction”.
- Improvements to IFRSs (issued by the IASB in May 2008).
The standards, amendments and interpretations to existing standards that have been published by the International
Accounting Standards Board (IASB) and adopted by the EU and are mandatory for the Group’s accounting periods
beginning on or after 1 January 2010 or later periods but which the Group has not early adopted, are:
- IFRS 3 (Revised) “Business Combinations”. The new requirements are applicable to business combinations for which
the acquisition date is on or after the beginning of the first annual period beginning on or after 1 July 2009. The Group
will apply IFRS 3 (Revised) prospectively to all business combinations as from 1 January 2010;
- IAS 27 (Revised) “Consolidated and Separate Financial Statements”.;
- IFRS 1 (revised) “First-time adoption” (effective 1 July 2009);
- Amendment to IAS 39 “Financial Instruments: Recognition and Measurement” on eligible hedged items (effective 1
July 2009);
- Amendments to IAS 32 “Financial instruments: Presentation” on classification of rights issues (effective 1 February
2010);
- Amendments to IFRS 1 “First time adoption of IFRS” and IAS 27 “Consolidated and separate financial statements” on
the “Cost of an investment in a subsidiary, jointly controlled entity or associate” (effective 1 July 2009);
- IFRIC 12,”Service concession arrangements” (effective 30 March 2009);
- IFRIC 15, “Agreements for construction of real estate” (effective 1 January 2010);
- IFRIC 16 “Hedges of a Net Investment in A Foreign Operation” (effective 1 July 2009);
- IFRIC 17 “Distribution of Non-Cash Assets to Owners” (effective 1 July 2009);
- IFRIC 18 “Transfers of Assets from Customers” (effective 31 October 2010).
The Group is currently assessing the impact of these standards.
a n n u a l r e p o r t 2 0 0 9
The main accounting policies defined by the Group are as follows:
ConSolIDatIon MetHoDS
The accounts of JENSEN-GROUP and its directly and indirectly controlled subsidiaries are fully consolidated. The conso-
lidated financial statements are presented in euros and rounded to the nearest thousand. Intercompany transactions
are eliminated in consolidation, as well as intercompany unrealized gains and losses.
The full consolidation method is applied for all companies in which JENSEN-GROUP holds > 50%.
uSe oF eStIMateS
The preparation of the financial statements involves the use of estimates and assumptions, which may have an impact
on the reported values of assets and liabilities at the period-end as well as on certain items of income and expense for
the period. Estimates are based on economic data, which are likely to vary over time, and are subject to a degree of
uncertainty. They mainly concern revenue recognition on contracts in progress and pension liabilities.
tranSlatIon oF ForeIGn CurrenCy
The consolidated financial statements presented in this report have been prepared in euros.
The conversion of assets, liabilities and commitments which are denominated in foreign currencies is based on the
following guidelines:
• monetary assets and liabilities are translated at closing rates;
• transactions in foreign currencies are converted at the foreign exchange rate prevailing at the date of the transaction;
• gains and losses resulting from the settlement of foreign currency transactions and from the translation of monetary
assets and liabilities denominated in foreign currencies are recognized in the income statement;
• non-monetary assets and liabilities are translated at the foreign exchange rate prevailing at the date of the transaction.
ForeIGn CurrenCy tranSlatIon - Group CoMpanIeS
The results and financial position of all the Group entities (none of which has the currency of a hyperinflationary
economy) that have a functional currency different from the presentation currency are translated into the presentati-
on currency as follows:
• assets and liabilities for each balance sheet presented are translated at the closing rate at the date of that balance sheet;
• income and expenses for each income statement are translated at average exchange rates (unless this average is not
a reasonable approximation of the cumulative effect of the rates prevailing on the transaction dates, in which case
income and expenses are translated at the rates of the dates of the transactions); and
• all resulting translation differences are recognized as a separate component of equity.
On consolidation, exchange differences arising from the translation of the net investment in foreign operations, and of
borrowings and other currency instruments designated as hedges of such investments, are taken to shareholders’
equity. When a foreign operation is sold, exchange differences that were recorded in equity are recognized in the income
statement as part of the gain or loss on sale.
65 64

Goodwill and fair value adjustments arising on the acquisition of a foreign entity are treated as assets and liabilities of
the foreign entity and translated at the closing rate.
revenue recognition
Contract costs are recognized when incurred.
When the outcome of a construction contract cannot be estimated reliably, contract revenue is recognized only to the
extent of contract costs incurred that are likely to be recoverable.
When the outcome of a construction contract can be estimated reliably and it is probable that the contract will be
profitable, contract revenue is recognized over the period of the contract. When it is probable that total contract costs
will exceed total contract revenue, the expected loss is recognized as an expense immediately.
The Group uses the ‘percentage of completion method’ to determine the appropriate amount to recognize in a given
period. The stage of completion is measured by reference to the contract costs incurred up to the balance sheet date as
a percentage of total estimated costs for each contract. Costs incurred in the year in connection with future activity on
a contract are excluded from contract costs in determining the stage of completion. They are presented as inventories,
prepayments or other assets, depending on their nature.
The Group presents as an asset the gross amount due from customers for contract work for all contracts in progress for
which costs incurred plus recognized profits (less recognized losses) exceed progress billings. Progress billings not yet
paid by customers and retentions are included within ‘trade and other receivables’.
The Group presents as a liability the gross amount due to customers for contract work for all contracts in progress for
which progress billings exceed costs incurred plus recognized profits (less recognized losses).
Royalties and rentals are recognized as income when it is probable that the economic benefits associated with the
transaction can be sufficiently measured and will flow to the Group. The income is recognized on an accrual basis in
accordance with the substance of the relevant agreement.
Intangible assets
RESEARCH AND DEVELOPMENT ExPENSES
Research costs are charged to the income statement in the year in which they are incurred.
Development costs are capitalized if all of the following criteria are met:
• the product or process is clearly defined and costs are separately identified and reliably measured;
• the technical feasibility of the product is demonstrated;
• the product or process will be sold or used in-house;
• the assets will generate future economic benefits; and
• adequate technical, financial and other resources required for the completion of the project are available.
Capitalized development costs are amortized from the commencement of the commercial production of the product
on a straight-line basis over the period expected to benefit.
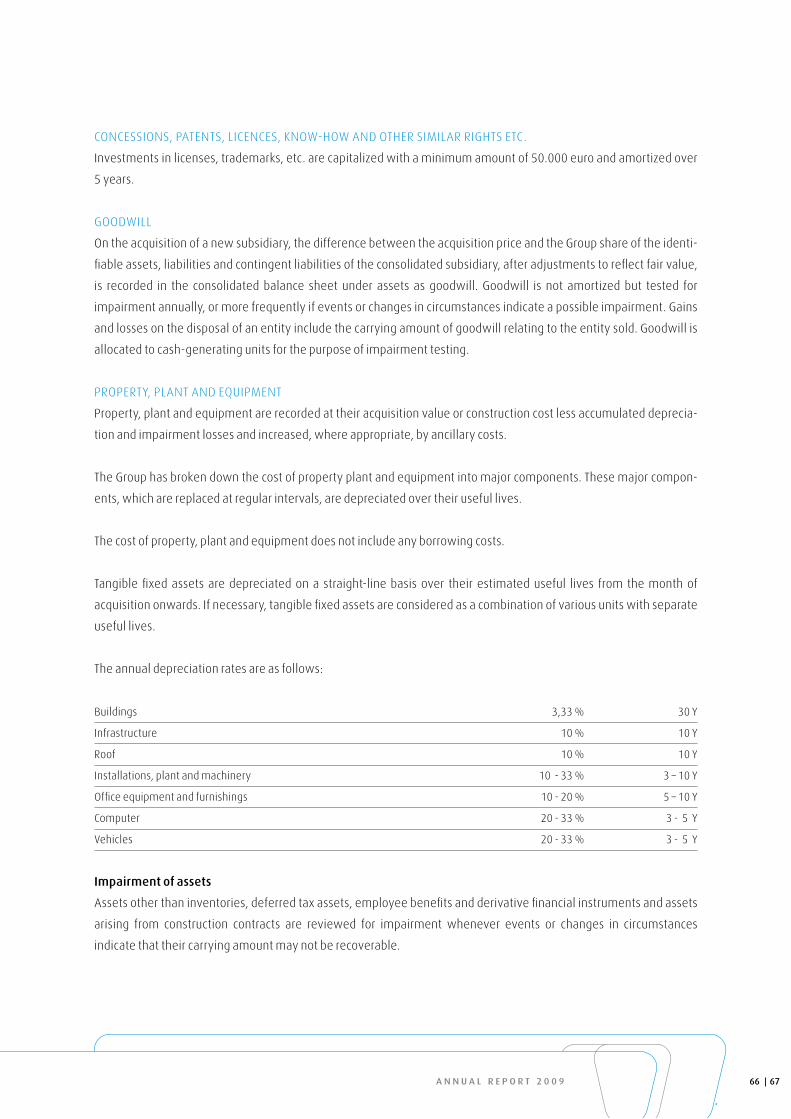
a n n u a l r e p o r t 2 0 0 9
CONCESSIONS, PATENTS, LICENCES, KNOW-HOW AND OTHER SIMILAR RIGHTS ETC.
Investments in licenses, trademarks, etc. are capitalized with a minimum amount of 50.000 euro and amortized over
5 years.
GOODWILL
On the acquisition of a new subsidiary, the difference between the acquisition price and the Group share of the identi-
fiable assets, liabilities and contingent liabilities of the consolidated subsidiary, after adjustments to reflect fair value,
is recorded in the consolidated balance sheet under assets as goodwill. Goodwill is not amortized but tested for
impairment annually, or more frequently if events or changes in circumstances indicate a possible impairment. Gains
and losses on the disposal of an entity include the carrying amount of goodwill relating to the entity sold. Goodwill is
allocated to cash-generating units for the purpose of impairment testing.
PROPERTY, PLANT AND EqUIPMENT
Property, plant and equipment are recorded at their acquisition value or construction cost less accumulated deprecia-
tion and impairment losses and increased, where appropriate, by ancillary costs.
The Group has broken down the cost of property plant and equipment into major components. These major compon-
ents, which are replaced at regular intervals, are depreciated over their useful lives.
The cost of property, plant and equipment does not include any borrowing costs.
Tangible fixed assets are depreciated on a straight-line basis over their estimated useful lives from the month of
acquisition onwards. If necessary, tangible fixed assets are considered as a combination of various units with separate
useful lives.
The annual depreciation rates are as follows:
Buildings 3,33 % 30 Y
Infrastructure 10 % 10 Y
Roof 10 % 10 Y
Installations, plant and machinery 10 - 33 % 3 – 10 Y
Office equipment and furnishings 10 - 20 % 5 – 10 Y
Computer 20 - 33 % 3 - 5 Y
Vehicles 20 - 33 % 3 - 5 Y
Impairment of assets
Assets other than inventories, deferred tax assets, employee benefits and derivative financial instruments and assets
arising from construction contracts are reviewed for impairment whenever events or changes in circumstances
indicate that their carrying amount may not be recoverable.
67 66
Whenever the carrying amount of an asset exceeds its recoverable amount (being the higher of its fair value less cost
to sell and its value in use), an impairment loss is recognized in the profit and loss statement. The value in use is the
present value of estimated future cash flows expected to arise from the continuing use of an asset and from its dispo-
sal at the end of its useful life.
Recoverable amounts are estimated for individual assets or, if this is not possible, for the cash-generating unit to
which the assets belong.
Reversal of impairment losses recognized in prior years is recorded in income up to the initial amount of the impair-
ment loss, when there is an indication that the impairment losses recognized for the asset no longer exist or have
decreased. Goodwill is tested for impairment at least once a year. Impairment on goodwill can never be reversed at a
later date.
Financial leases
A financial lease is a lease that transfers substantially all risks and rewards incident to ownership of an asset to the
lessee. When a fixed asset is held under a financial lease, its value is recorded as an asset at the present value, at the
beginning of the lease term, of the future minimum lease payments during the lease term. Lease payments are
apportioned between the finance charge and the reduction of the outstanding liability in order to obtain a constant
rate of interest on the debt over the lease term.
The property, plant and equipment acquired under finance leases is depreciated over the shorter of the useful life of
the asset and the lease term.
Finance lease (the Group is a lessor).
When assets are leased out under a finance lease, the present value of the lease payments is recognized as a receivab-
le. The difference between the gross receivable and the present value of the receivable is recognized as unearned
finance income. Lease income is recognized over the term of the lease using the net investment method, which
reflects a constant periodic rate of return.
operating lease
Leases in which a significant portion of the risks and rewards of ownership are retained by the lessor are classified as
operating leases. Payments made under operating leases are charged to the income statement on a straight-line
basis over the period of the lease.
Inventories and contracts in progress
Inventories are valued at the lower of cost or net realizable value. Cost is determined by the first-in, first-out (FIFO)
method. For produced inventories, cost means the full cost including all direct and indirect production costs required
to bring the inventory items to the stage of completion at the balance sheet date. Net realizable value is the estima-
ted selling price in the ordinary course of business, less the costs of completion and variable selling expenses.
a n n u a l r e p o r t 2 0 0 9
provisions for liabilities and charges
A provision is recognized in the balance sheet when the Group has a present obligation (legal or constructive) as a
result of a past event, and when it is probable that an outflow of resources embodying economic benefits will be
required to settle the obligation and a reliable estimate can be made of the amount of the obligation.
The amount of the provision is the best estimate of the expenditure required to settle the present value of the obligati-
on at the balance sheet date. The provisions are discounted when the impact of the time value of money is material.
employee benefits
Some of the Group’s employees are eligible for retirement benefits under defined contribution and defined benefit
plans.
DEFINED CONTRIBUTION PLANS
Contributions to defined contribution plans are recognized as an expense in the income statement as incurred.
DEFINED BENEFIT PLANS
For defined benefit plans, the amount recorded in the balance sheet is determined as the present value of the benefit obli-
gation less any past service costs not yet recognized and the fair value of any plan assets.
The actuarial gains and losses are recognized in the period in which they occur outside profit and loss, in the consolidated
statement of comprehensive income.
Deferred taxes
Deferred income tax is provided in full, using the liability method, on temporary differences arising between the value of
assets and liabilities for tax purposes and their carrying amounts in the consolidated financial statements. However,
deferred income tax is not accounted for if it arises from initial recognition of an asset or liability in a transaction other
than a business combination that at the time of the transaction affects neither accounting nor taxable profit or loss.
Deferred income tax is determined using tax rates (and laws) that have been enacted or substantially enacted by the
balance sheet date and are expected to apply when the related deferred income tax asset is realized or the deferred inco-
me tax liability is settled.
Deferred income tax assets are recognized to the extent that it is probable that future taxable profit will be available
against which the temporary differences can be utilized.
Deferred income tax is provided on temporary differences arising on investments in subsidiaries and associates, except
where the timing of the reversal of the temporary difference is controlled by the Group and it is probable that the tem-
porary difference will not reverse in the foreseeable future.
69 68
accrued charges and deferred income
Accrued charges are costs that have been charged against income but not yet disbursed at balance sheet date.
Deferred income is revenue that will be recognized in future periods.
Financial instruments
Financial instruments are recorded at trade date. The fair value of the financial instruments is determined by using
valuation techniques. The Group uses a variety of methods and makes assumptions that are based on market conditi-
ons existing at each balance sheet date.
ACCOUNTS AND NOTES RECEIVABLE
Trade receivables are recognized initially at fair value and subsequently measured at amortized cost using the effective
interest method, less provision for impairment. A provision for impairment of trade receivables is established when
there is objective evidence that the Group will not be able to collect all amounts due according to the original terms of
receivables. Significant financial difficulties of the debtor, probability that the debtor will enter bankruptcy or financial
reorganization, and default or delinquency in payments are considered indicators that the trade receivable is impaired.
The amount of the provision is the difference between the asset’s carrying amount and the present value of estimated
future cash flows, discounted at the effective interest rate.
CASH AND CASH EqUIVALENT
Cash and cash equivalent includes cash in hand, deposits held at call with banks and bank overdrafts. Bank overdrafts
are shown within borrowings in current liabilities on the balance sheet.
PAYABLES (AFTER ONE YEAR AND WITHIN ONE YEAR)
Amounts payable are carried at nominal value at the balance sheet date.
DERIVATIVE FINANCIAL INSTRUMENTS
The Company uses derivative financial instruments to reduce the exposure to adverse fluctuations in interest rates and
foreign exchange rates. It is the Company’s policy not to hold derivative financial instruments for speculative or trading
purposes.
Derivative financial instruments are recognized initially at fair value. Subsequent to initial recognition, derivative finan-
cial instruments are stated at fair value. Recognition of any resulting gain or loss depends on the nature of the item being
hedged. Derivative financial instruments that are either hedging instruments that are not designated or do not qualify as
hedges are carried at fair value, with changes in value included in the income statement.
a n n u a l r e p o r t 2 0 0 9
CASH FLOW HEDGES
Where a derivative financial instrument is designated as a hedge of the variability in cash flows of a recognized asset
or liability, a firm commitment or a highly probable forecasted transaction, the effective part of any gain or loss on the
derivative financial instrument is recognized directly in equity. When the firm commitment or forecasted transaction
results in the recognition of an asset or liability, the cumulative gain or loss is removed from equity and included in the
initial measurement of the acquisition cost or other carrying amount of the asset or liability.
Otherwise the cumulative gain or loss is removed from equity and recognized in the income statement at the same
time as the hedged transaction. The ineffective part of any gain or loss is recognized in the income statement immedi-
ately. Any gain or loss arising from changes in the time value of the derivative financial instrument is excluded from
the measurement of hedge effectiveness and is recognized in the income statement immediately.
When a hedging instrument or hedge relationship is terminated but the hedged transaction is still expected to occur,
the cumulative gain or loss at that point remains in equity and is recognized in accordance with the above policy when
the transaction occurs. If the hedged transaction is no longer probable, the cumulative unrealized gain or loss recogni-
zed in equity is recognized in the income statement immediately.
Borrowings
Borrowings are recognized initially at fair value, net of transaction costs incurred. Borrowings are subsequently stated
at amortized cost; any difference between the proceeds (net of transaction costs) and the redemption value is
recognized in the income statement over the period of the borrowings using the effective interest method.
non-current assets (or disposal groups) held for sale
Non-current assets (or disposal groups) are classified as assets held for sale and stated at the lower of carrying amount and
fair value less costs to sell if their carrying amount is recovered principally through a sale transaction rather than through a
continuing use.
ConSolIDateD StateMent oF CaSH FloWS
The consolidated cash flow statement reports the cash flow during the period classified by analyzing the cash flow
from operating, investing and financing activities.
Segment reporting
The Company is operating in a single business segment: Heavy-Duty Laundry Division.
Closing date and length of accounting period
All accounting periods presented represent 12 months of operations starting on January 1 of each year.
71 70
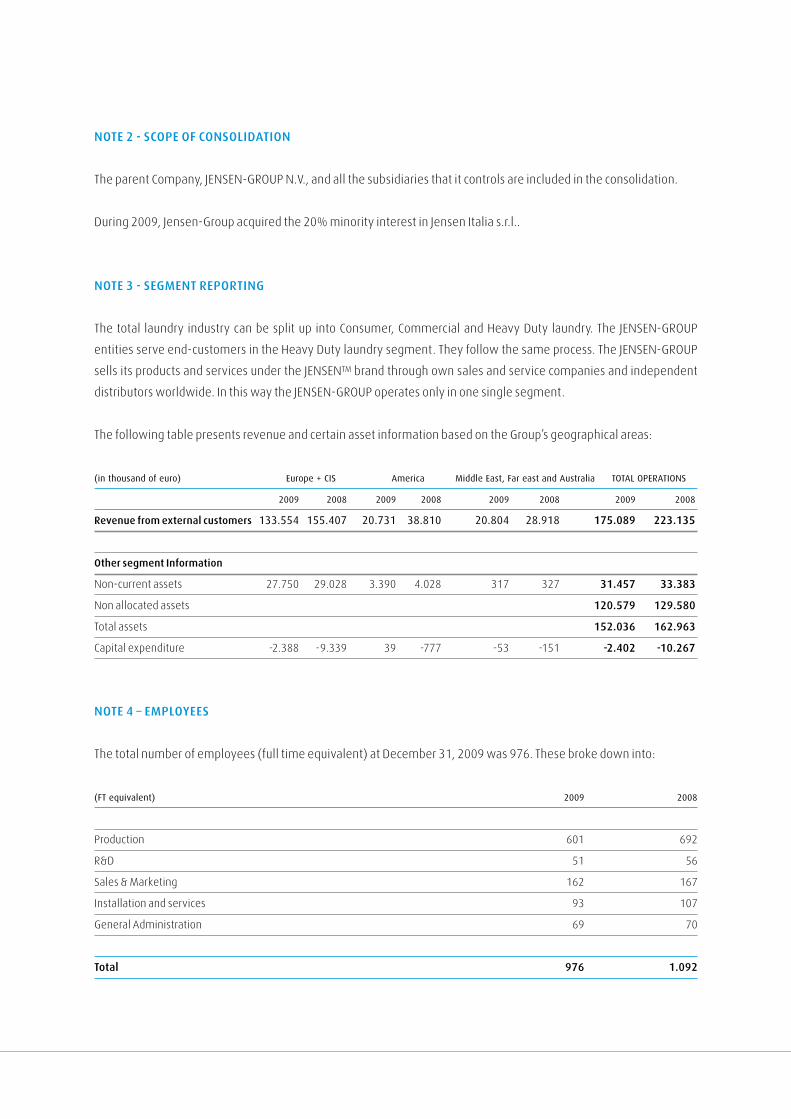
note 2 - SCope oF ConSolIDatIon
The parent Company, JENSEN-GROUP N.V., and all the subsidiaries that it controls are included in the consolidation.
During 2009, Jensen-Group acquired the 20% minority interest in Jensen Italia s.r.l..
note 3 - SeGMent reportInG
The total laundry industry can be split up into Consumer, Commercial and Heavy Duty laundry. The JENSEN-GROUP
entities serve end-customers in the Heavy Duty laundry segment. They follow the same process. The JENSEN-GROUP
sells its products and services under the JENSENTM brand through own sales and service companies and independent
distributors worldwide. In this way the JENSEN-GROUP operates only in one single segment.
The following table presents revenue and certain asset information based on the Group’s geographical areas:
(in thousand of euro) europe + ciS america middle east, far east and australia ToTal oPeRaTioNS
2009 2008 2009 2008 2009 2008 2009 2008
revenue from external customers 133.554 155.407 20.731 38.810 20.804 28.918 175.089 223.135
other segment Information
Non-current assets 27.750 29.028 3.390 4.028 317 327 31.457 33.383
Non allocated assets 120.579 129.580
Total assets 152.036 162.963
Capital expenditure -2.388 -9.339 39 -777 -53 -151 -2.402 -10.267
note 4 – eMployeeS
The total number of employees (full time equivalent) at December 31, 2009 was 976. These broke down into:
(fT equivalent) 2009 2008
Production 601 692
R&D 51 56
Sales & Marketing 162 167
Installation and services 93 107
General Administration 69 70
total 976 1.092
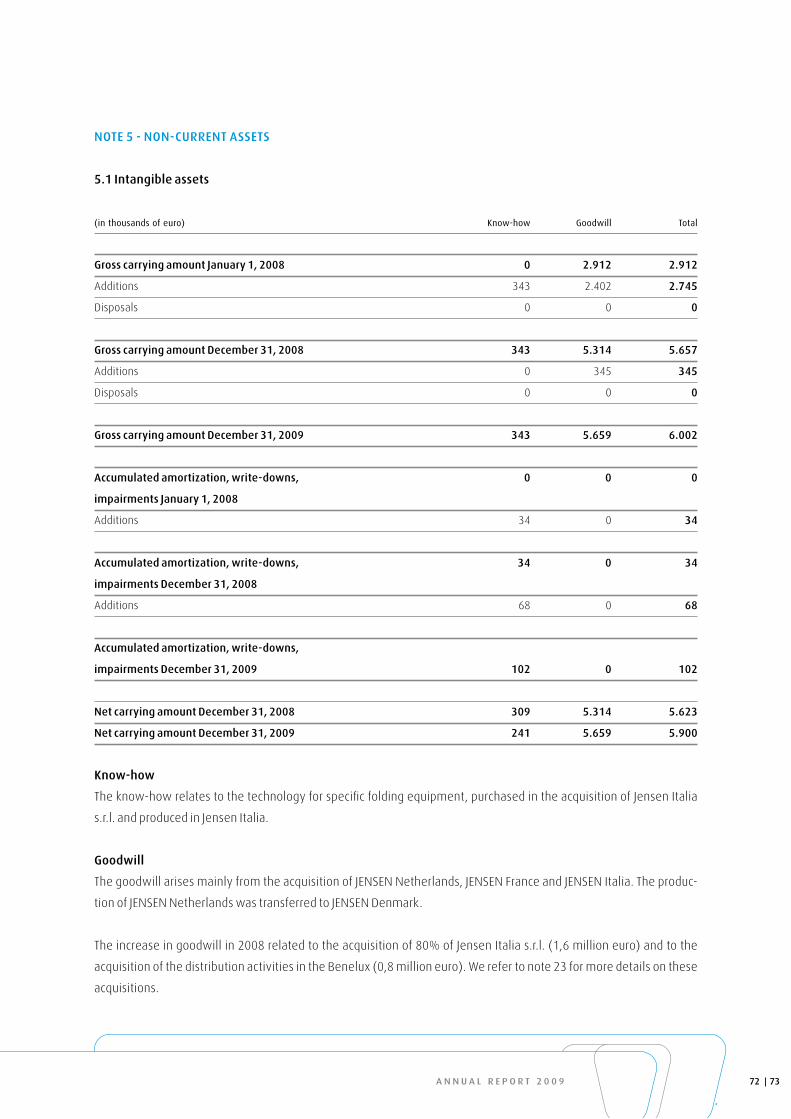
a n n u a l r e p o r t 2 0 0 9
note 5 - non-Current aSSetS
5.1 Intangible assets
(in thousands of euro) Know-how Goodwill Total
Gross carrying amount January 1, 2008 0 2.912 2.912
Additions 343 2.402 2.745
Disposals 0 0 0
Gross carrying amount December 31, 2008 343 5.314 5.657
Additions 0 345 345
Disposals 0 0 0
Gross carrying amount December 31, 2009 343 5.659 6.002
accumulated amortization, write-downs, 0 0 0
impairments January 1, 2008
Additions 34 0 34
accumulated amortization, write-downs, 34 0 34
impairments December 31, 2008
Additions 68 0 68
accumulated amortization, write-downs,
impairments December 31, 2009 102 0 102
net carrying amount December 31, 2008 309 5.314 5.623
net carrying amount December 31, 2009 241 5.659 5.900
know-how
The know-how relates to the technology for specific folding equipment, purchased in the acquisition of Jensen Italia
s.r.l. and produced in Jensen Italia.
Goodwill
The goodwill arises mainly from the acquisition of JENSEN Netherlands, JENSEN France and JENSEN Italia. The produc-
tion of JENSEN Netherlands was transferred to JENSEN Denmark.
The increase in goodwill in 2008 related to the acquisition of 80% of Jensen Italia s.r.l. (1,6 million euro) and to the
acquisition of the distribution activities in the Benelux (0,8 million euro). We refer to note 23 for more details on these
acquisitions.
73 72

In 2009, the Company acquired the remaining 20%, resulting in an increase in goodwill of 0,3 million euro.
All these consolidation differences are subject to a yearly impairment test.
In 2008 and 2009, the impairment test on goodwill did not result in any indication of impairment.
Goodwill is allocated to the Group’s cash-generating units identified according to country of operation.
Goodwill by cash-generating units is as follows:
(in thousands of euro) 2009 2008
Goodwill Goodwill
Jensen Denmark 1.946 1.946
Jensen France 763 763
Jensen Switzerland 80 80
Jensen Australia 123 123
Jensen Italia 1.945 1.600
Jensen Group (Benelux) 802 802
total 5.659 5.314
Development costs of 4,6 million euro (5,1 million euro in 2008) were expensed during the year.

a n n u a l r e p o r t 2 0 0 9
5.2. property, plant & equipment
(in thousands of euro) land & Plant funiture ohter assets assets total
buildings machinery and tangible under
and equipment vehicules assets construction
Gross carrying amount January 1, 2008 27.934 15.924 3.981 396 946 49.181
Translation differences 726 157 90 0 40 1.013
Additions 1.175 2.789 1.260 129 0 5.353
Disposals 0 -130 -148 -137 0 -415
Transfers 986 0 0 0 -986 0
Gross carrying amount December 31, 2008 30.821 18.740 5.183 388 0 55.132
Translation differences -21 6 68 0 0 53
Additions 19 1.077 468 0 0 1.564
Disposals 0 -915 -595 -5 0 -1.515
Transfers 0 0 0 0 0 0
Gross carrying amount December 31, 2009 30.819 18.908 5.124 383 0 55.234
accumulated depreciation, write down
and impairment January 1, 2008 9.981 11.606 3.118 270 0 24.975
Translation differences 208 98 63 0 0 369
Depreciation 1.241 1.313 543 41 0 3.138
Disposals 0 -127 -140 -41 0 -308
accumulated depreciation, write down
and impairment December 31, 2008 11.430 12.890 3.584 270 0 28.174
Translation differences 6 18 43 0 0 67
Depreciation 1.343 1.488 559 30 0 3.420
Disposals 0 -869 -556 -5 0 -1.430
accumulated depreciation, write down
and impairment December 31, 2009 12.779 13.527 3.630 295 0 30.231
net carrying amount December 31, 2008 19.391 5.850 1.599 118 0 26.958
net carrying amount December 31, 2009 18.040 5.381 1.494 88 0 25.003
75 74
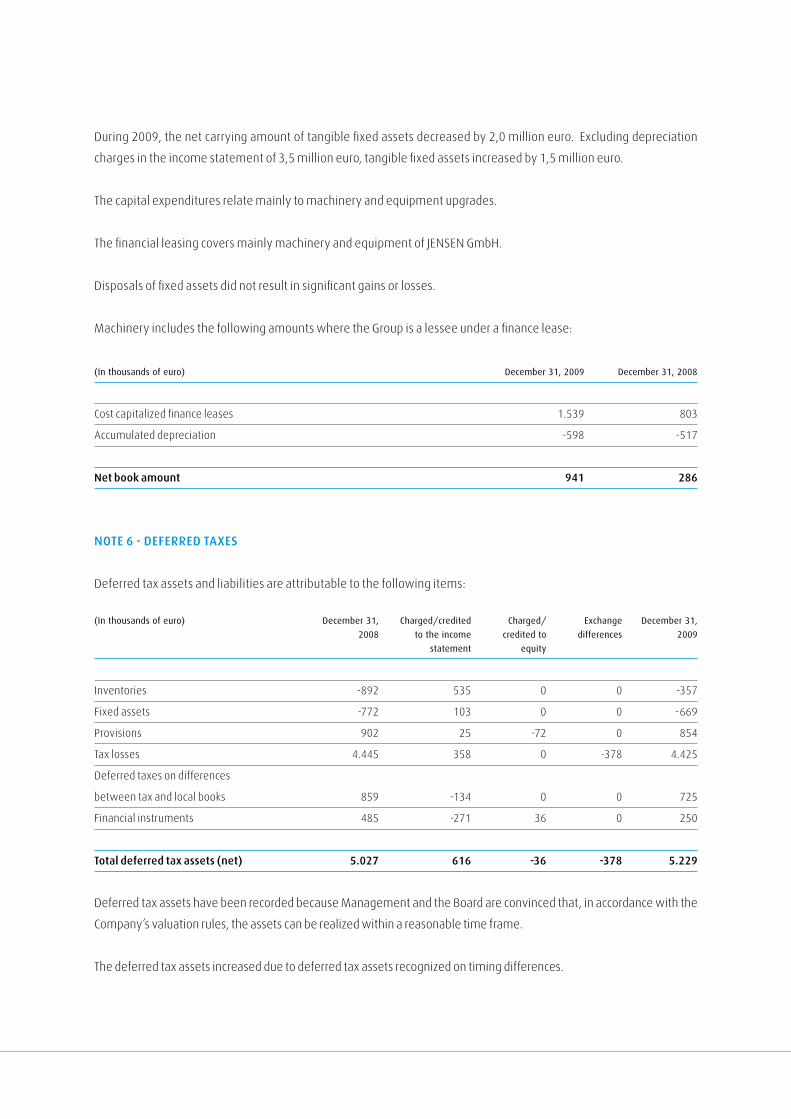
During 2009, the net carrying amount of tangible fixed assets decreased by 2,0 million euro. Excluding depreciation
charges in the income statement of 3,5 million euro, tangible fixed assets increased by 1,5 million euro.
The capital expenditures relate mainly to machinery and equipment upgrades.
The financial leasing covers mainly machinery and equipment of JENSEN GmbH.
Disposals of fixed assets did not result in significant gains or losses.
Machinery includes the following amounts where the Group is a lessee under a finance lease:
(in thousands of euro) december 31, 2009 december 31, 2008
Cost capitalized finance leases 1.539 803
Accumulated depreciation -598 -517
net book amount 941 286
note 6 - DeFerreD taxeS
Deferred tax assets and liabilities are attributable to the following items:
(in thousands of euro) december 31, charged/credited charged/ exchange december 31,
2008 to the income credited to differences 2009
statement equity
Inventories -892 535 0 0 -357
Fixed assets -772 103 0 0 -669
Provisions 902 25 -72 0 854
Tax losses 4.445 358 0 -378 4.425
Deferred taxes on differences
between tax and local books 859 -134 0 0 725
Financial instruments 485 -271 36 0 250
total deferred tax assets (net) 5.027 616 -36 -378 5.229
Deferred tax assets have been recorded because Management and the Board are convinced that, in accordance with the
Company’s valuation rules, the assets can be realized within a reasonable time frame.
The deferred tax assets increased due to deferred tax assets recognized on timing differences.
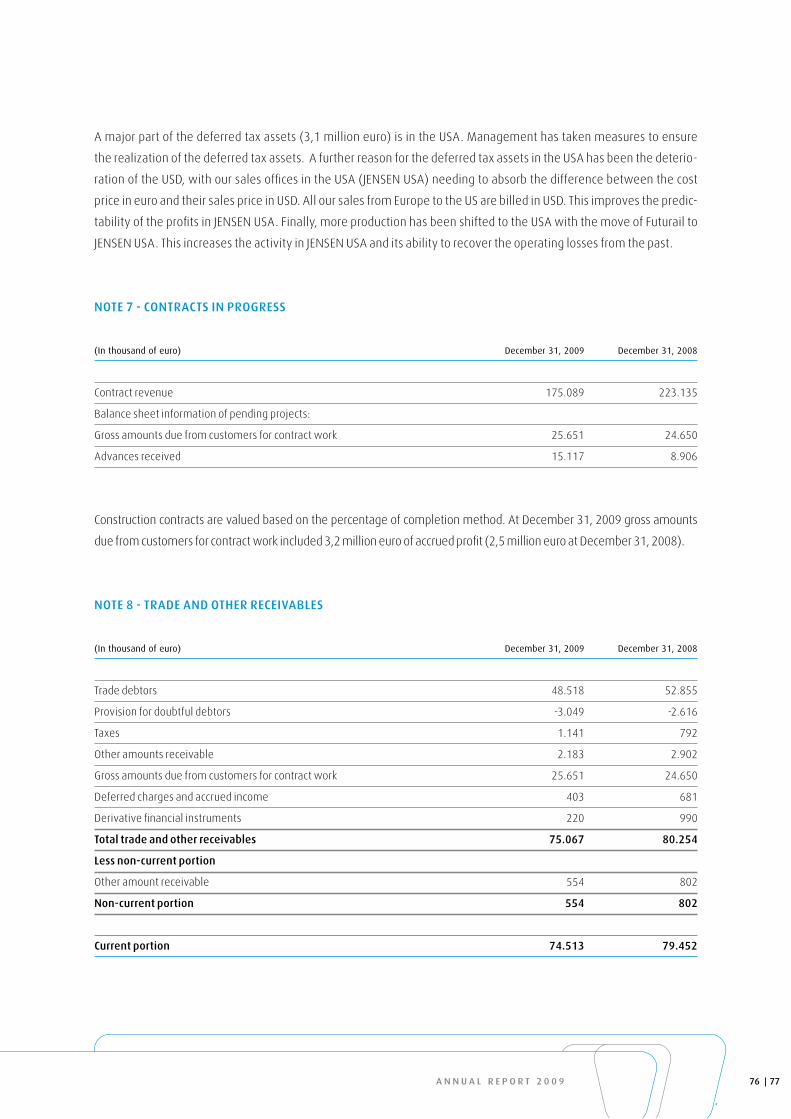
a n n u a l r e p o r t 2 0 0 9
A major part of the deferred tax assets (3,1 million euro) is in the USA. Management has taken measures to ensure
the realization of the deferred tax assets. A further reason for the deferred tax assets in the USA has been the deterio-
ration of the USD, with our sales offices in the USA (JENSEN USA) needing to absorb the difference between the cost
price in euro and their sales price in USD. All our sales from Europe to the US are billed in USD. This improves the predic-
tability of the profits in JENSEN USA. Finally, more production has been shifted to the USA with the move of Futurail to
JENSEN USA. This increases the activity in JENSEN USA and its ability to recover the operating losses from the past.
note 7 - ContraCtS In proGreSS
(in thousand of euro) december 31, 2009 december 31, 2008
Contract revenue 175.089 223.135
Balance sheet information of pending projects:
Gross amounts due from customers for contract work 25.651 24.650
Advances received 15.117 8.906
Construction contracts are valued based on the percentage of completion method. At December 31, 2009 gross amounts
due from customers for contract work included 3,2 million euro of accrued profit (2,5 million euro at December 31, 2008).
note 8 - traDe anD otHer reCeIVaBleS
(in thousand of euro) december 31, 2009 december 31, 2008
Trade debtors 48.518 52.855
Provision for doubtful debtors -3.049 -2.616
Taxes 1.141 792
Other amounts receivable 2.183 2.902
Gross amounts due from customers for contract work 25.651 24.650
Deferred charges and accrued income 403 681
Derivative financial instruments 220 990
total trade and other receivables 75.067 80.254
less non-current portion
Other amount receivable 554 802
non-current portion 554 802
Current portion 74.513 79.452
77 76
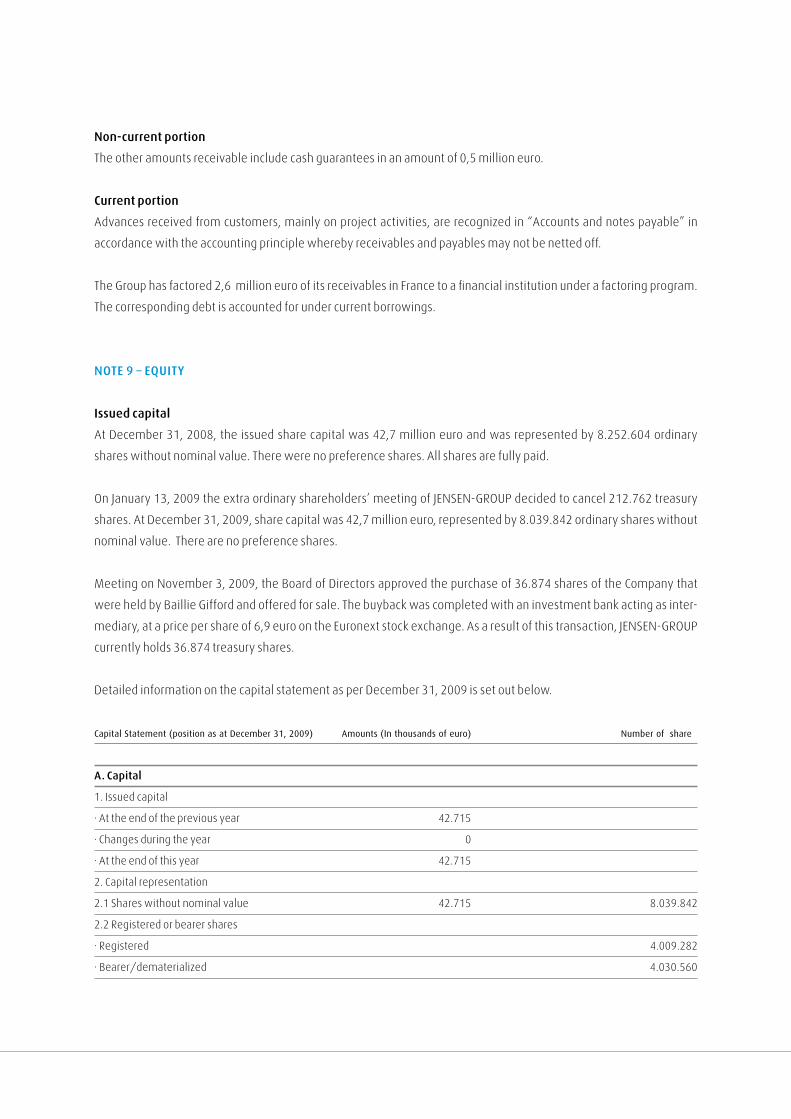
non-current portion
The other amounts receivable include cash guarantees in an amount of 0,5 million euro.
Current portion
Advances received from customers, mainly on project activities, are recognized in “Accounts and notes payable” in
accordance with the accounting principle whereby receivables and payables may not be netted off.
The Group has factored 2,6 million euro of its receivables in France to a financial institution under a factoring program.
The corresponding debt is accounted for under current borrowings.
note 9 – equIty
Issued capital
At December 31, 2008, the issued share capital was 42,7 million euro and was represented by 8.252.604 ordinary
shares without nominal value. There were no preference shares. All shares are fully paid.
On January 13, 2009 the extra ordinary shareholders’ meeting of JENSEN-GROUP decided to cancel 212.762 treasury
shares. At December 31, 2009, share capital was 42,7 million euro, represented by 8.039.842 ordinary shares without
nominal value. There are no preference shares.
Meeting on November 3, 2009, the Board of Directors approved the purchase of 36.874 shares of the Company that
were held by Baillie Gifford and offered for sale. The buyback was completed with an investment bank acting as inter-
mediary, at a price per share of 6,9 euro on the Euronext stock exchange. As a result of this transaction, JENSEN-GROUP
currently holds 36.874 treasury shares.
Detailed information on the capital statement as per December 31, 2009 is set out below.
capital Statement (position as at december 31, 2009) amounts (in thousands of euro) Number of share
a. Capital
1. Issued capital
· At the end of the previous year 42.715
· Changes during the year 0
· At the end of this year 42.715
2. Capital representation
2.1 Shares without nominal value 42.715 8.039.842
2.2 Registered or bearer shares
· Registered 4.009.282
· Bearer/dematerialized 4.030.560
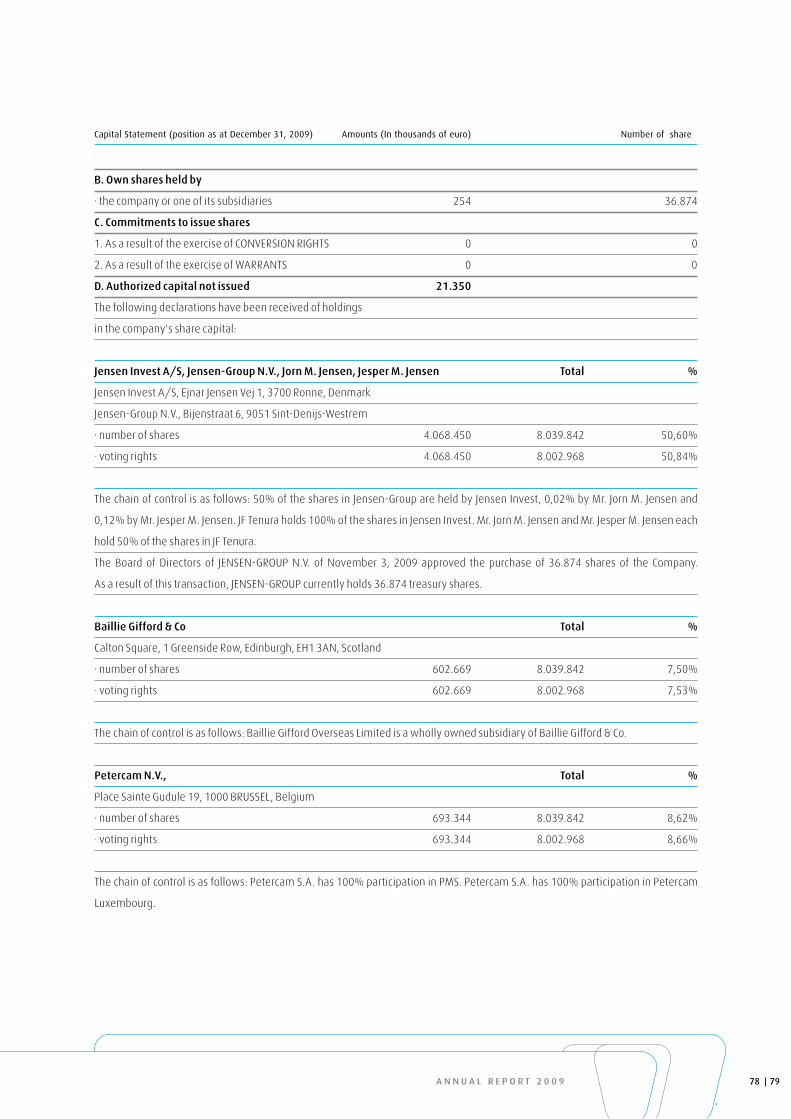
a n n u a l r e p o r t 2 0 0 9
capital Statement (position as at december 31, 2009) amounts (in thousands of euro) Number of share
B. own shares held by
· the company or one of its subsidiaries 254 36.874
C. Commitments to issue shares
1. As a result of the exercise of CONVERSION RIGHTS 0 0
2. As a result of the exercise of WARRANTS 0 0
D. authorized capital not issued 21.350
The following declarations have been received of holdings
in the company's share capital:
Jensen Invest a/S, Jensen-Group n.V., Jorn M. Jensen, Jesper M. Jensen total %
Jensen Invest A/S, Ejnar Jensen Vej 1, 3700 Ronne, Denmark
Jensen-Group N.V., Bijenstraat 6, 9051 Sint-Denijs-Westrem
· number of shares 4.068.450 8.039.842 50,60%
· voting rights 4.068.450 8.002.968 50,84%
The chain of control is as follows: 50% of the shares in Jensen-Group are held by Jensen Invest, 0,02% by Mr. Jorn M. Jensen and
0,12% by Mr. Jesper M. Jensen. JF Tenura holds 100% of the shares in Jensen Invest. Mr. Jorn M. Jensen and Mr. Jesper M. Jensen each
hold 50% of the shares in JF Tenura.
The Board of Directors of JENSEN-GROUP N.V. of November 3, 2009 approved the purchase of 36.874 shares of the Company.
As a result of this transaction, JENSEN-GROUP currently holds 36.874 treasury shares.
Baillie Gifford & Co total %
Calton Square, 1 Greenside Row, Edinburgh, EH1 3AN, Scotland
· number of shares 602.669 8.039.842 7,50%
· voting rights 602.669 8.002.968 7,53%
The chain of control is as follows: Baillie Gifford Overseas Limited is a wholly owned subsidiary of Baillie Gifford & Co.
petercam n.V., total %
Place Sainte Gudule 19, 1000 BRUSSEL, Belgium
· number of shares 693.344 8.039.842 8,62%
· voting rights 693.344 8.002.968 8,66%
The chain of control is as follows: Petercam S.A. has 100% participation in PMS. Petercam S.A. has 100% participation in Petercam
Luxembourg.
79 78
Each share has one vote. The voting rights are in line with the Companies’ Code. The articles of association do not
include other regulations with respect to voting rights.
The regulations with respect to transfer of shares are in line with the Companies’ Code. The articles of association do
not include other regulations with respect to transfer of shares.
Share premium
The share premium results primarily from the merger of LSG, which then took the name of JENSEN-GROUP.
The ending balance of the share premium is 5,8 million euro.
treasury shares
The articles of association (art. 11) allow the Board of Directors to buy back own shares. The Board of Directors of
March 4, 2008 decided to implement a share buyback programme to repurchase up to 225.000 shares. At December
31, 2008 JENSEN-GROUP owned 212.762 shares and 12.238 shares had been cancelled. On January 13, 2009 the
extraordinary shareholders’ meeting of JENSEN-GROUP decided to cancel the remaining 212.762 shares, as a result of
which JENSEN-GROUP no longer held any treasury stock as at that date.
Meeting on November 3, 2009, the Board of Directors approved the purchase of 36.874 shares of the company that
were held by Baillie Gifford and offered for sale. The buyback was completed through an investment bank as interme-
diary, at a price per share of 6,9 euro on the Euronext stock exchange. As a result of this transaction, JENSEN-GROUP
currently holds 36.874 treasury shares.
translation differences
In this annual report the consolidated financial statements are expressed in thousands of euro. All balance sheet capti-
ons of foreign companies are translated into euro, which is the Company’s functional and presentation currency, using
closing rates at the end of the accounting year, except for capital and reserves, which are translated at historical rates.
The income statement is translated at average rates for the year. The resulting translation difference, arising from the
translation of capital and reserves and the income statement, is shown in a separate category of equity under the cap-
tion ‘translation differences’.
The exchange differences arising from the translation of the net investment in foreign operations are taken to equity.
In total, 0,03 million euro currency losses are transferred from financial result to equity.
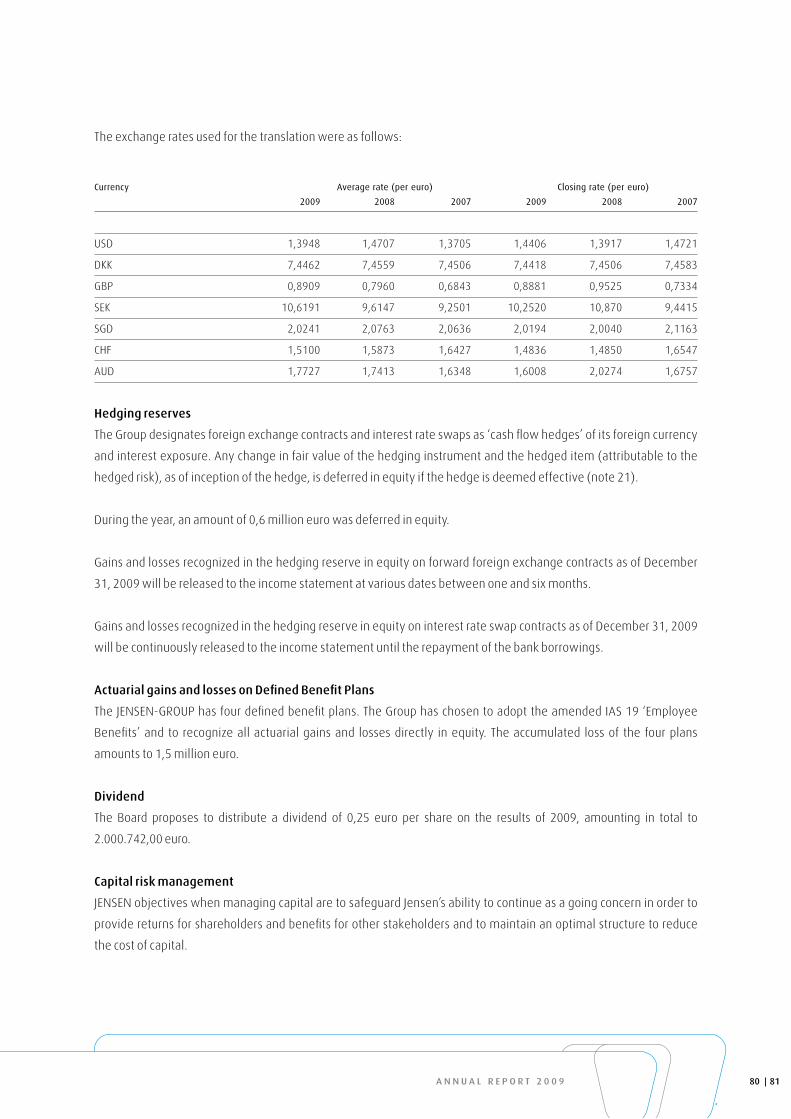
a n n u a l r e p o r t 2 0 0 9
The exchange rates used for the translation were as follows:
currency average rate (per euro) closing rate (per euro)
2009 2008 2007 2009 2008 2007
USD 1,3948 1,4707 1,3705 1,4406 1,3917 1,4721
DKK 7,4462 7,4559 7,4506 7,4418 7,4506 7,4583
GBP 0,8909 0,7960 0,6843 0,8881 0,9525 0,7334
SEK 10,6191 9,6147 9,2501 10,2520 10,870 9,4415
SGD 2,0241 2,0763 2,0636 2,0194 2,0040 2,1163
CHF 1,5100 1,5873 1,6427 1,4836 1,4850 1,6547
AUD 1,7727 1,7413 1,6348 1,6008 2,0274 1,6757
Hedging reserves
The Group designates foreign exchange contracts and interest rate swaps as ‘cash flow hedges’ of its foreign currency
and interest exposure. Any change in fair value of the hedging instrument and the hedged item (attributable to the
hedged risk), as of inception of the hedge, is deferred in equity if the hedge is deemed effective (note 21).
During the year, an amount of 0,6 million euro was deferred in equity.
Gains and losses recognized in the hedging reserve in equity on forward foreign exchange contracts as of December
31, 2009 will be released to the income statement at various dates between one and six months.
Gains and losses recognized in the hedging reserve in equity on interest rate swap contracts as of December 31, 2009
will be continuously released to the income statement until the repayment of the bank borrowings.
actuarial gains and losses on Defined Benefit plans
The JENSEN-GROUP has four defined benefit plans. The Group has chosen to adopt the amended IAS 19 ‘Employee
Benefits’ and to recognize all actuarial gains and losses directly in equity. The accumulated loss of the four plans
amounts to 1,5 million euro.
Dividend
The Board proposes to distribute a dividend of 0,25 euro per share on the results of 2009, amounting in total to
2.000.742,00 euro.
Capital risk management
JENSEN objectives when managing capital are to safeguard Jensen’s ability to continue as a going concern in order to
provide returns for shareholders and benefits for other stakeholders and to maintain an optimal structure to reduce
the cost of capital.
81 80

S U N E A R T H W A T E R W I N D F O R E S T
Wind energy is very environmentally friendly and the cheapest of all
renewable energies to harness. On the Danish island of Bornholm the
‘Bright Green Island’ project is attempting to meet the island’s entire
electricity needs, including those of the local laundry, through wind
energy. The JENSEN-GROUP is supporting the ‘Bright Green Island’ pro-
ject to provide the island with wind-generated electricity.

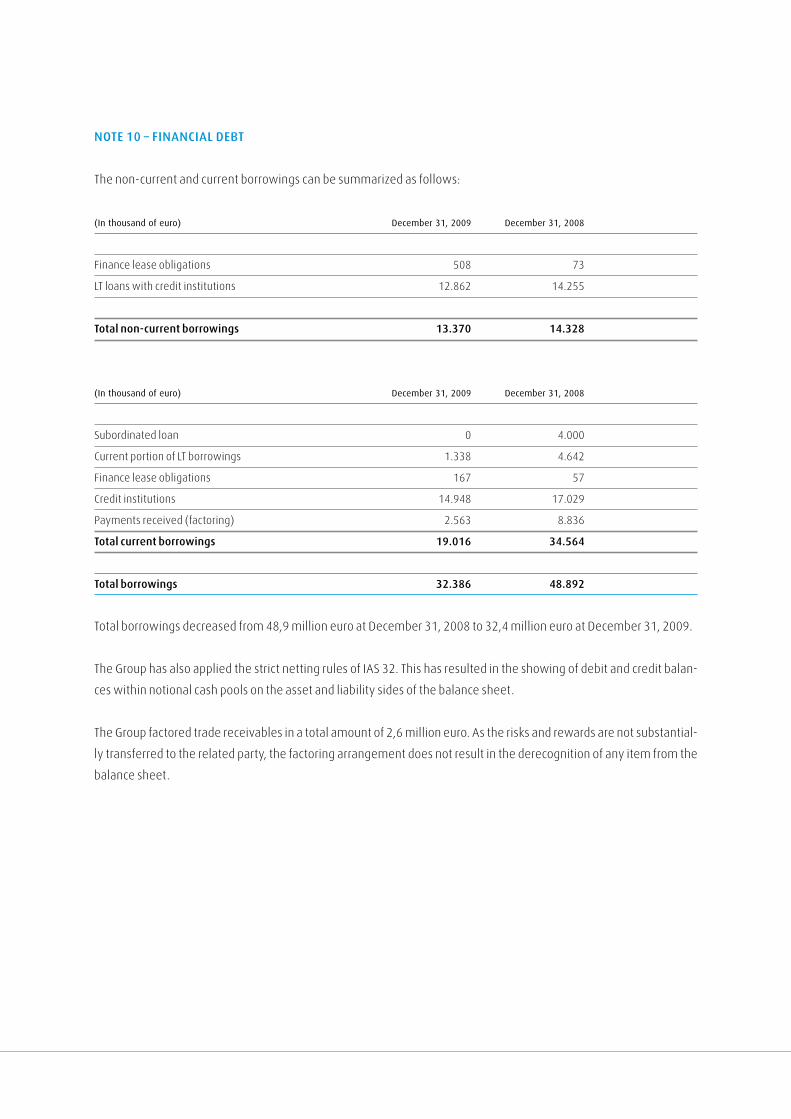
note 10 – FInanCIal DeBt
The non-current and current borrowings can be summarized as follows:
(in thousand of euro) december 31, 2009 december 31, 2008
Finance lease obligations 508 73
LT loans with credit institutions 12.862 14.255
total non-current borrowings 13.370 14.328
(in thousand of euro) december 31, 2009 december 31, 2008
Subordinated loan 0 4.000
Current portion of LT borrowings 1.338 4.642
Finance lease obligations 167 57
Credit institutions 14.948 17.029
Payments received (factoring) 2.563 8.836
total current borrowings 19.016 34.564
total borrowings 32.386 48.892
Total borrowings decreased from 48,9 million euro at December 31, 2008 to 32,4 million euro at December 31, 2009.
The Group has also applied the strict netting rules of IAS 32. This has resulted in the showing of debit and credit balan-
ces within notional cash pools on the asset and liability sides of the balance sheet.
The Group factored trade receivables in a total amount of 2,6 million euro. As the risks and rewards are not substantial-
ly transferred to the related party, the factoring arrangement does not result in the derecognition of any item from the
balance sheet.
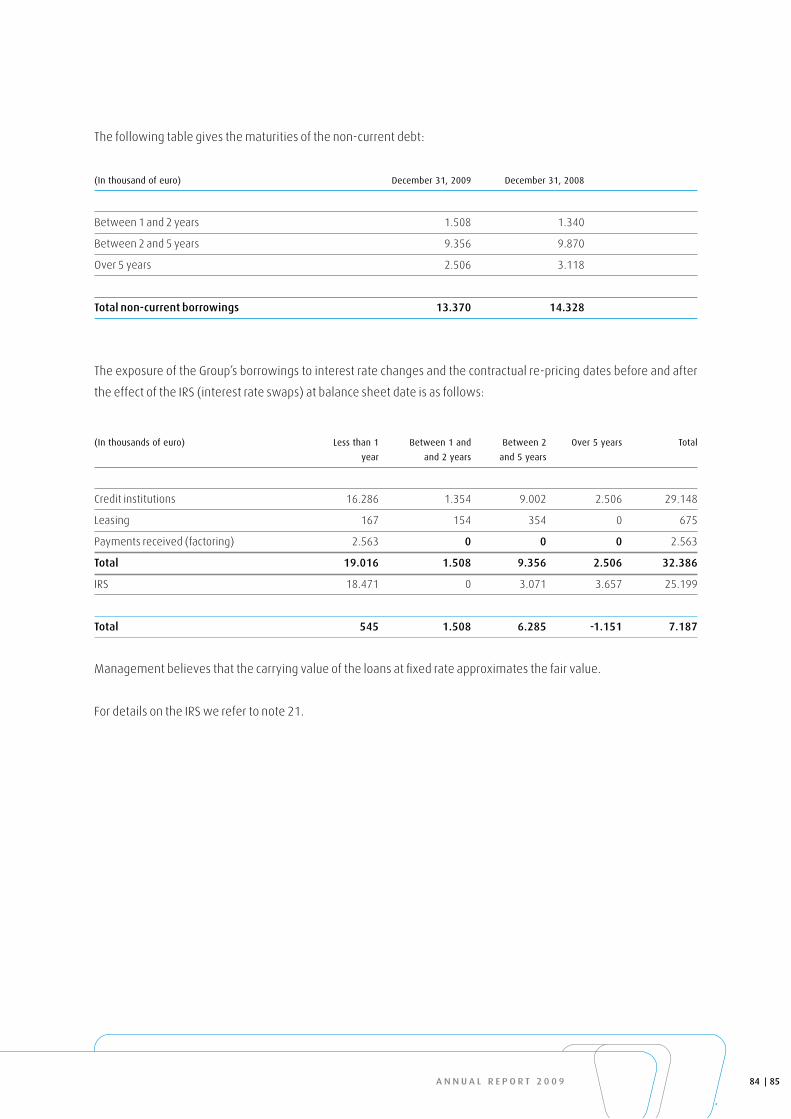
a n n u a l r e p o r t 2 0 0 9
The following table gives the maturities of the non-current debt:
(in thousand of euro) december 31, 2009 december 31, 2008
Between 1 and 2 years 1.508 1.340
Between 2 and 5 years 9.356 9.870
Over 5 years 2.506 3.118
total non-current borrowings 13.370 14.328
The exposure of the Group’s borrowings to interest rate changes and the contractual re-pricing dates before and after
the effect of the IRS (interest rate swaps) at balance sheet date is as follows:
(in thousands of euro) less than 1 between 1 and between 2 over 5 years Total
year and 2 years and 5 years
Credit institutions 16.286 1.354 9.002 2.506 29.148
Leasing 167 154 354 0 675
Payments received (factoring) 2.563 0 0 0 2.563
total 19.016 1.508 9.356 2.506 32.386
IRS 18.471 0 3.071 3.657 25.199
total 545 1.508 6.285 -1.151 7.187
Management believes that the carrying value of the loans at fixed rate approximates the fair value.
For details on the IRS we refer to note 21.
85 84

The carrying amounts of the Group’s borrowings are denominated in the following currencies:
(in thousand of euro) december 31, 2009 december 31, 2008
EUR 20.185 31.310
USD 1.945 6.827
DKK 4.864 5.367
CHF 5.392 5.388
Other 0 0
total 32.386 48.892
With respect to the Group’s borrowings, a debt covenant is in place (equity ratio). During the year, there were no brea-
ches of this covenant.
One of the credit facilities makes provision for an early termination of the facility in case of change of control.
DeBt CoVereD By GuaranteeS
(in thousand of euro) december 31, 2009 december 31, 2008
Mortgages 8.311 13.914
Pledges on assets 1.372 1.587
Guarantee by parent company 16.970 20.428
total 26.653 35.929
The carrying value of the property, plant and equipment pledged as security for liabilities amounts to 16,4 million euro.

a n n u a l r e p o r t 2 0 0 9
note 11 – proVISIon For eMployee BeneFIt oBlIGatIonS
(in thousand of euro) december 31, 2009 december 31, 2008
Provisions for Defined Benefit Plan 8.826 9.237
Provisions for other employee benefits 771 1.043
total provisions for employee benefit 9.597 10.280
The provision for other employee benefits relate to pre-pensions in Germany.
BeneFIt plan
JENSEN GmbH, JENSEN France, JENSEN Italia and JENSEN AG Burgdorf maintain retirement benefit plans. These plans
generally provide benefits that are related to an employee’s remuneration and years of service.
The Group has chosen to adopt the amended IAS 19 ‘Employee Benefits’ and is recognizing all actuarial gains and los-
ses directly in equity. The accumulated loss of the 4 plans amounts to 1,5 million euro.
At December 31, 2009, the total net liability amounted to 8,8 million euro.
The major assumptions made in calculating the provisions can be summarized as follows:
discount rate Rate of price inflation expected return assets
2009 2008 2009 2008 2009 2008
Switzerland 3,00% 3,00% 1,00% 1,30% 4,00% 4,00%
France 5,40% 5,75% 2,00% - -* -*
Germany 5,40% 5,75% 2,00% 1,75% -* -*
Italy 5,40% 5,75% 2,00% 2,00% -* 0,00%
* relates to the German and French pension plan for which no assets are allocated
87 86
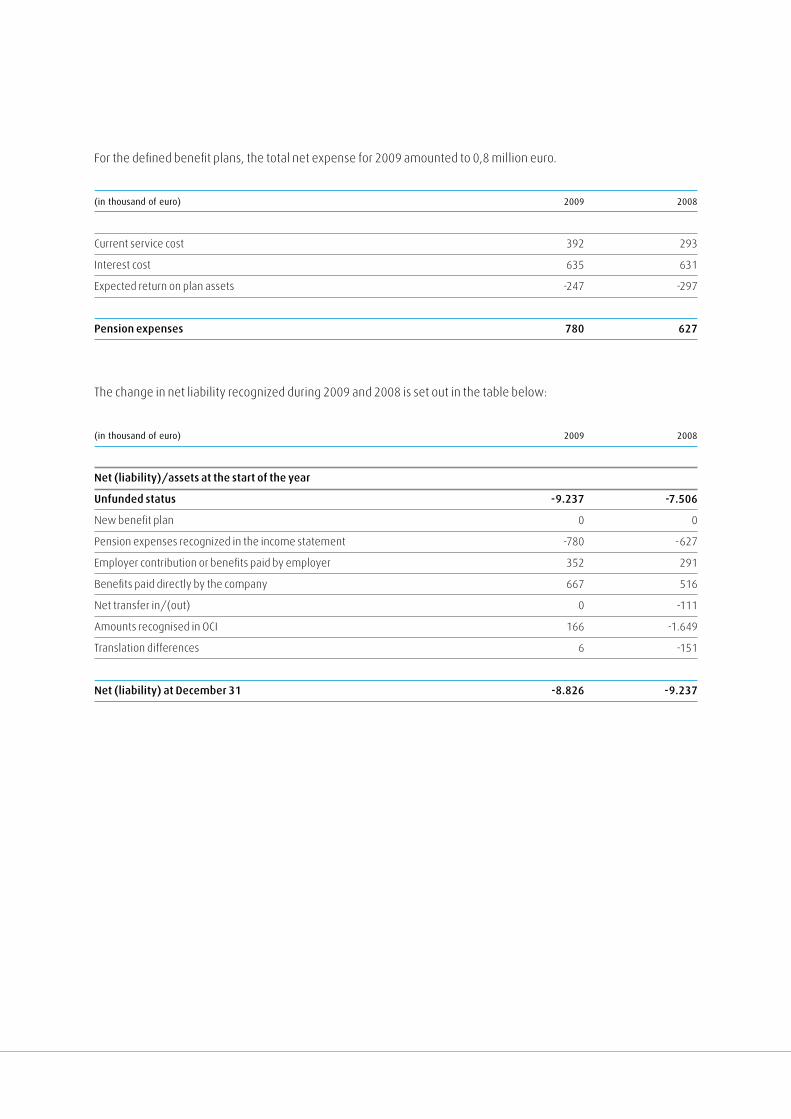
For the defined benefit plans, the total net expense for 2009 amounted to 0,8 million euro.
(in thousand of euro) 2009 2008
Current service cost 392 293
Interest cost 635 631
Expected return on plan assets -247 -297
pension expenses 780 627
The change in net liability recognized during 2009 and 2008 is set out in the table below:
(in thousand of euro) 2009 2008
net (liability)/assets at the start of the year
unfunded status -9.237 -7.506
New benefit plan 0 0
Pension expenses recognized in the income statement -780 -627
Employer contribution or benefits paid by employer 352 291
Benefits paid directly by the company 667 516
Net transfer in/(out) 0 -111
Amounts recognised in OCI 166 -1.649
Translation differences 6 -151
net (liability) at December 31 -8.826 -9.237
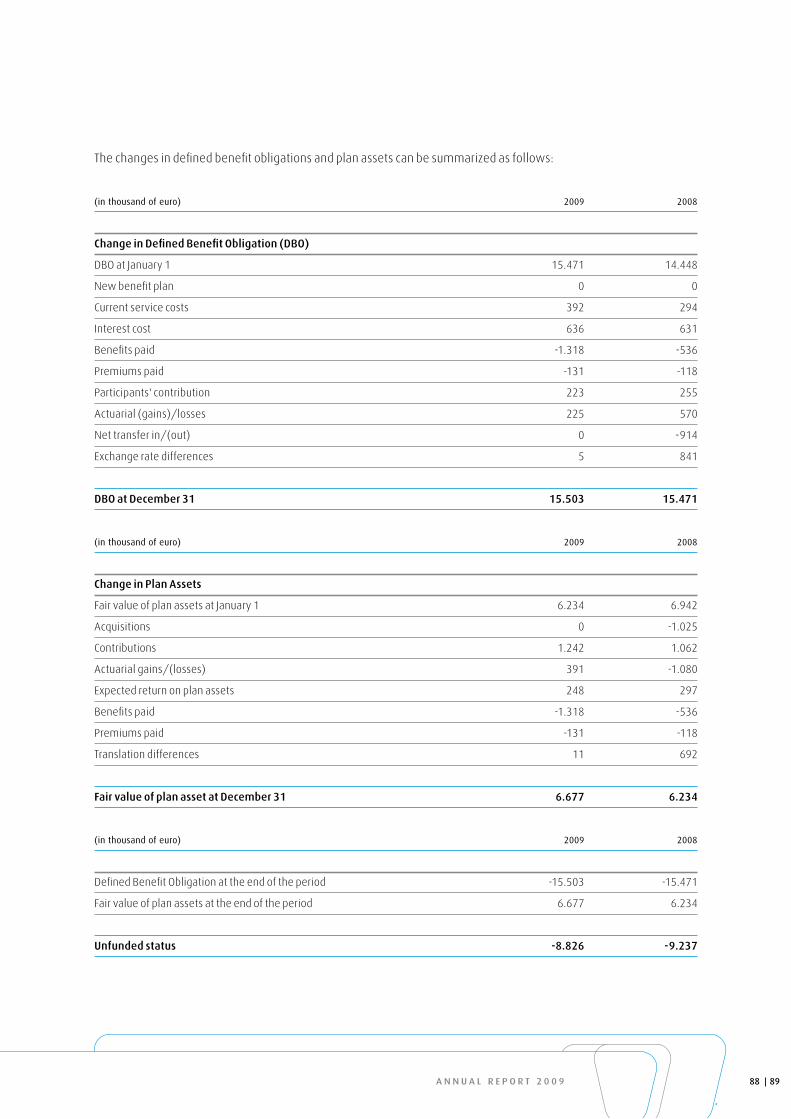
a n n u a l r e p o r t 2 0 0 9
The changes in defined benefit obligations and plan assets can be summarized as follows:
(in thousand of euro) 2009 2008
Change in Defined Benefit obligation (DBo)
DBO at January 1 15.471 14.448
New benefit plan 0 0
Current service costs 392 294
Interest cost 636 631
Benefits paid -1.318 -536
Premiums paid -131 -118
Participants' contribution 223 255
Actuarial (gains)/losses 225 570
Net transfer in/(out) 0 -914
Exchange rate differences 5 841
DBo at December 31 15.503 15.471
(in thousand of euro) 2009 2008
Change in plan assets
Fair value of plan assets at January 1 6.234 6.942
Acquisitions 0 -1.025
Contributions 1.242 1.062
Actuarial gains/(losses) 391 -1.080
Expected return on plan assets 248 297
Benefits paid -1.318 -536
Premiums paid -131 -118
Translation differences 11 692
Fair value of plan asset at December 31 6.677 6.234
(in thousand of euro) 2009 2008
Defined Benefit Obligation at the end of the period -15.503 -15.471
Fair value of plan assets at the end of the period 6.677 6.234
unfunded status -8.826 -9.237
89 88
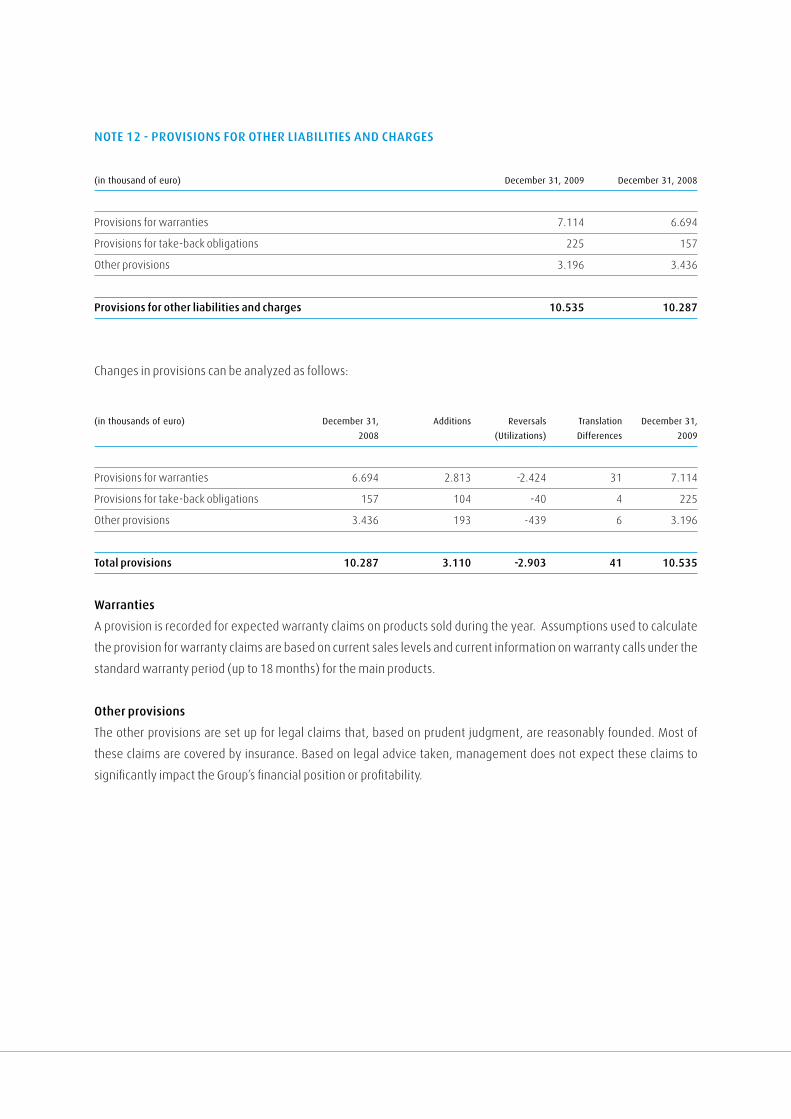
note 12 - proVISIonS For otHer lIaBIlItIeS anD CHarGeS
(in thousand of euro) december 31, 2009 december 31, 2008
Provisions for warranties 7.114 6.694
Provisions for take-back obligations 225 157
Other provisions 3.196 3.436
provisions for other liabilities and charges 10.535 10.287
Changes in provisions can be analyzed as follows:
(in thousands of euro) december 31, additions Reversals Translation december 31,
2008 (Utilizations) differences 2009
Provisions for warranties 6.694 2.813 -2.424 31 7.114
Provisions for take-back obligations 157 104 -40 4 225
Other provisions 3.436 193 -439 6 3.196
total provisions 10.287 3.110 -2.903 41 10.535
Warranties
A provision is recorded for expected warranty claims on products sold during the year. Assumptions used to calculate
the provision for warranty claims are based on current sales levels and current information on warranty calls under the
standard warranty period (up to 18 months) for the main products.
other provisions
The other provisions are set up for legal claims that, based on prudent judgment, are reasonably founded. Most of
these claims are covered by insurance. Based on legal advice taken, management does not expect these claims to
significantly impact the Group’s financial position or profitability.
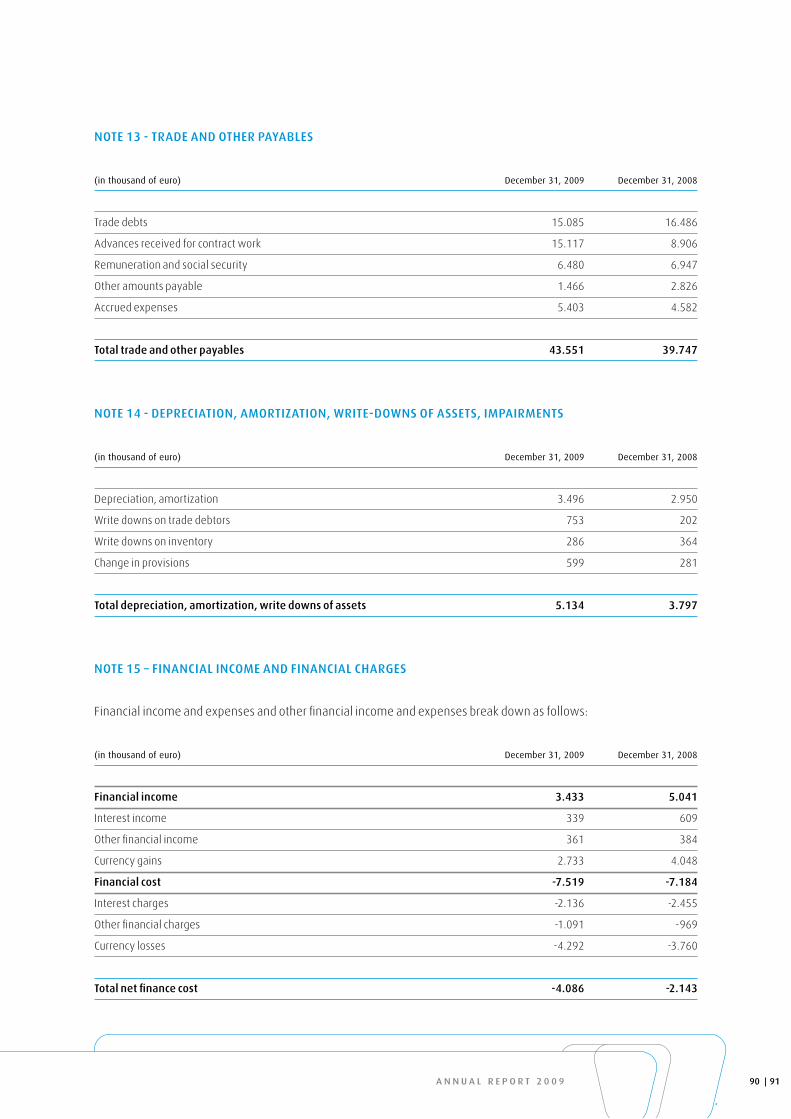
a n n u a l r e p o r t 2 0 0 9
note 13 - traDe anD otHer payaBleS
(in thousand of euro) december 31, 2009 december 31, 2008
Trade debts 15.085 16.486
Advances received for contract work 15.117 8.906
Remuneration and social security 6.480 6.947
Other amounts payable 1.466 2.826
Accrued expenses 5.403 4.582
total trade and other payables 43.551 39.747
note 14 - DepreCIatIon, aMortIzatIon, WrIte-DoWnS oF aSSetS, IMpaIrMentS
(in thousand of euro) december 31, 2009 december 31, 2008
Depreciation, amortization 3.496 2.950
Write downs on trade debtors 753 202
Write downs on inventory 286 364
Change in provisions 599 281
total depreciation, amortization, write downs of assets 5.134 3.797
note 15 – FInanCIal InCoMe anD FInanCIal CHarGeS
Financial income and expenses and other financial income and expenses break down as follows:
(in thousand of euro) december 31, 2009 december 31, 2008
Financial income 3.433 5.041
Interest income 339 609
Other financial income 361 384
Currency gains 2.733 4.048
Financial cost -7.519 -7.184
Interest charges -2.136 -2.455
Other financial charges -1.091 -969
Currency losses -4.292 -3.760
total net finance cost -4.086 -2.143
91 90
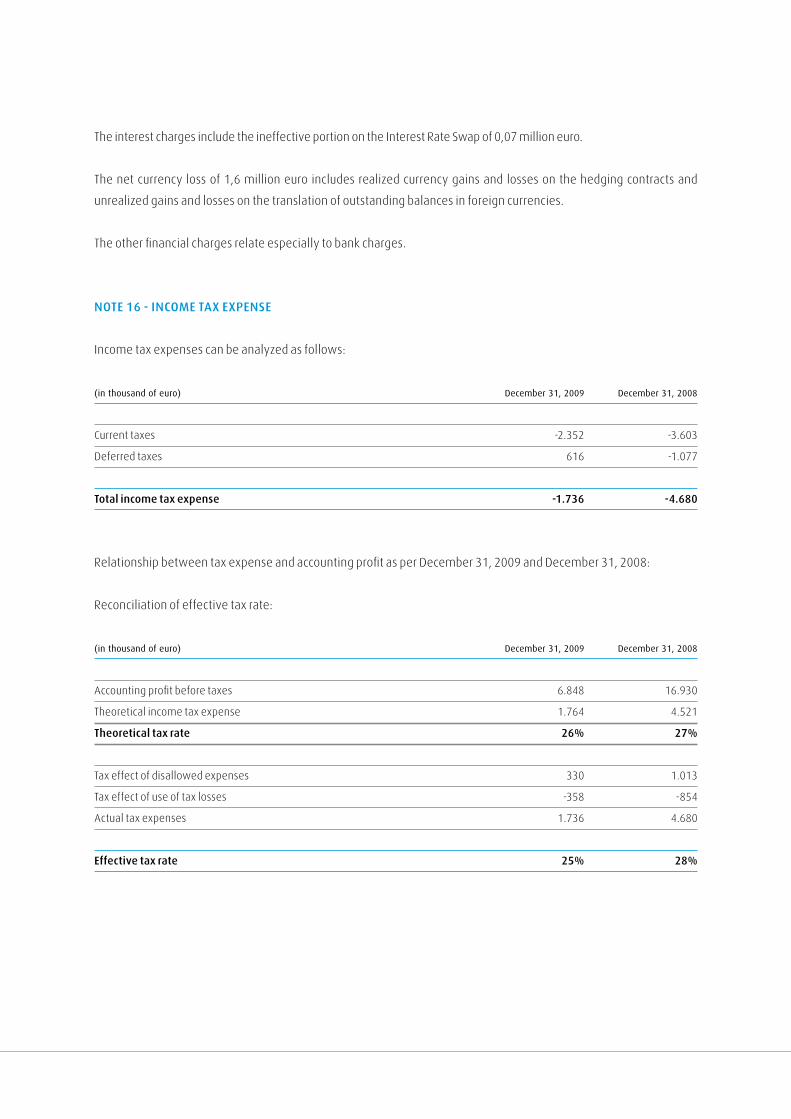
The interest charges include the ineffective portion on the Interest Rate Swap of 0,07 million euro.
The net currency loss of 1,6 million euro includes realized currency gains and losses on the hedging contracts and
unrealized gains and losses on the translation of outstanding balances in foreign currencies.
The other financial charges relate especially to bank charges.
note 16 - InCoMe tax expenSe
Income tax expenses can be analyzed as follows:
(in thousand of euro) december 31, 2009 december 31, 2008
Current taxes -2.352 -3.603
Deferred taxes 616 -1.077
total income tax expense -1.736 -4.680
Relationship between tax expense and accounting profit as per December 31, 2009 and December 31, 2008:
Reconciliation of effective tax rate:
(in thousand of euro) december 31, 2009 december 31, 2008
Accounting profit before taxes 6.848 16.930
Theoretical income tax expense 1.764 4.521
theoretical tax rate 26% 27%
Tax effect of disallowed expenses 330 1.013
Tax effect of use of tax losses -358 -854
Actual tax expenses 1.736 4.680
effective tax rate 25% 28%
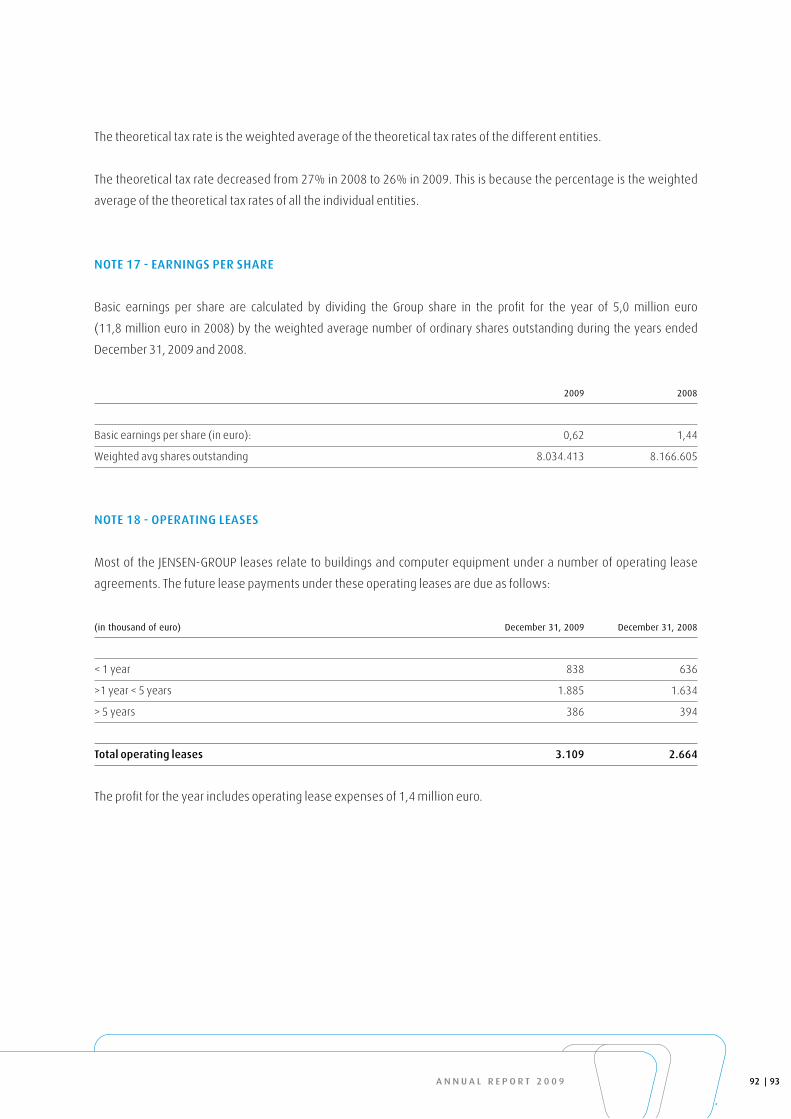
a n n u a l r e p o r t 2 0 0 9
The theoretical tax rate is the weighted average of the theoretical tax rates of the different entities.
The theoretical tax rate decreased from 27% in 2008 to 26% in 2009. This is because the percentage is the weighted
average of the theoretical tax rates of all the individual entities.
note 17 - earnInGS per SHare
Basic earnings per share are calculated by dividing the Group share in the profit for the year of 5,0 million euro
(11,8 million euro in 2008) by the weighted average number of ordinary shares outstanding during the years ended
December 31, 2009 and 2008.
2009 2008
Basic earnings per share (in euro): 0,62 1,44
Weighted avg shares outstanding 8.034.413 8.166.605
note 18 - operatInG leaSeS
Most of the JENSEN-GROUP leases relate to buildings and computer equipment under a number of operating lease
agreements. The future lease payments under these operating leases are due as follows:
(in thousand of euro) december 31, 2009 december 31, 2008
< 1 year 838 636
>1 year < 5 years 1.885 1.634
> 5 years 386 394
total operating leases 3.109 2.664
The profit for the year includes operating lease expenses of 1,4 million euro.
93 92
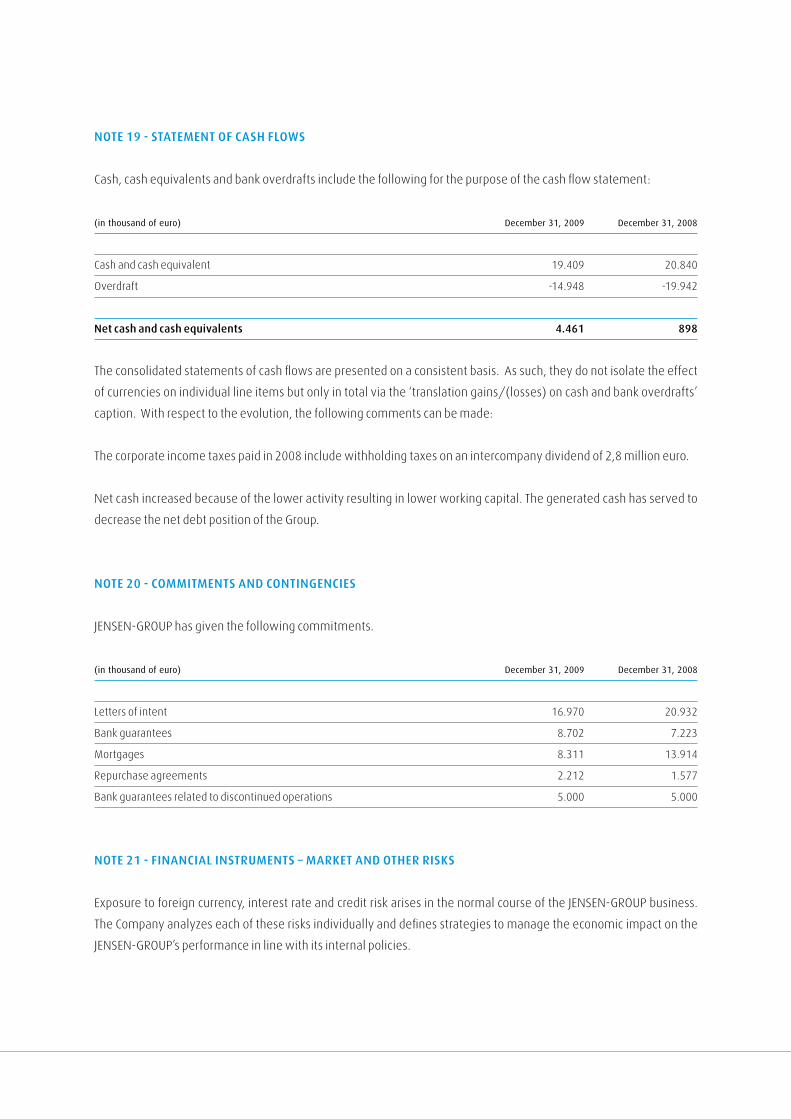
note 19 - StateMent oF CaSH FloWS
Cash, cash equivalents and bank overdrafts include the following for the purpose of the cash flow statement:
(in thousand of euro) december 31, 2009 december 31, 2008
Cash and cash equivalent 19.409 20.840
Overdraft -14.948 -19.942
net cash and cash equivalents 4.461 898
The consolidated statements of cash flows are presented on a consistent basis. As such, they do not isolate the effect
of currencies on individual line items but only in total via the ‘translation gains/(losses) on cash and bank overdrafts’
caption. With respect to the evolution, the following comments can be made:
The corporate income taxes paid in 2008 include withholding taxes on an intercompany dividend of 2,8 million euro.
Net cash increased because of the lower activity resulting in lower working capital. The generated cash has served to
decrease the net debt position of the Group.
note 20 - CoMMItMentS anD ContInGenCIeS
JENSEN-GROUP has given the following commitments.
(in thousand of euro) december 31, 2009 december 31, 2008
Letters of intent 16.970 20.932
Bank guarantees 8.702 7.223
Mortgages 8.311 13.914
Repurchase agreements 2.212 1.577
Bank guarantees related to discontinued operations 5.000 5.000
note 21 - FInanCIal InStruMentS – Market anD otHer rISkS
Exposure to foreign currency, interest rate and credit risk arises in the normal course of the JENSEN-GROUP business.
The Company analyzes each of these risks individually and defines strategies to manage the economic impact on the
JENSEN-GROUP’s performance in line with its internal policies.

a n n u a l r e p o r t 2 0 0 9
Foreign currency risk
The JENSEN-GROUP incurs currency risk on borrowings, investments, (forecasted) sales, (forecasted) purchases
whenever they are denominated in a currency other than the functional currency of the subsidiary. The currencies
giving rise to risk are primarily the US Dollar, Swiss Franc, Swedish Krona, Danish Krone and Australian Dollar.
The main derivative financial instruments used to manage foreign currency risk are forward exchange contracts.
It is the company’s policy not to hold derivative instruments for speculative or trading purposes.
With respect to currencies, the JENSEN-GROUP adopts the policy of:
• Having hedges on all firm commitments in foreign currencies on a rolling 12 months basis;
• Hedging 50% of the difference between firm commitments and budgeted sales and purchases per currency on a
rolling 12 months basis.
As such these hedges are considered as cash flow hedges. They are contracted as a matter of procedure regardless of
any expectations with regard to foreign currency developments.
All foreign exchange contracts are centralized within the JENSEN-GROUP treasury department and are contracted
purely on the basis of the input of the different subsidiaries.
The currency risks resulting from translations of the financial statements of non-euro based companies are not hedged
(note 9 – Equity).
The table below provides an indication of the company’s net foreign currency positions per December 31, 2009 and
December 31, 2008 as regards firm commitments and forecasted transactions. The open positions are the result of the
application of JENSEN-GROUP risk management policy. Positive amounts indicate that the Company has a long
position (net future cash inflows) while negative amounts indicate that the Company has a short position (net future
cash outflows).
2009 (in thousand of euro) Total exposure Total derivatives open position
USD/EUR 4.304 -4.793 -490
GBP/EUR 2.687 -2.600 87
PLN/EUR 1.013 -1.013 0
SGD/EUR 1.556 -1.556 0
AUD/EUR 3.883 -3.000 883
CHF/EUR -4.554 4.000 -554
SEK/EUR -6.304 5.800 -504
DKK/EUR -17.969 9.500 -8.469
95 94
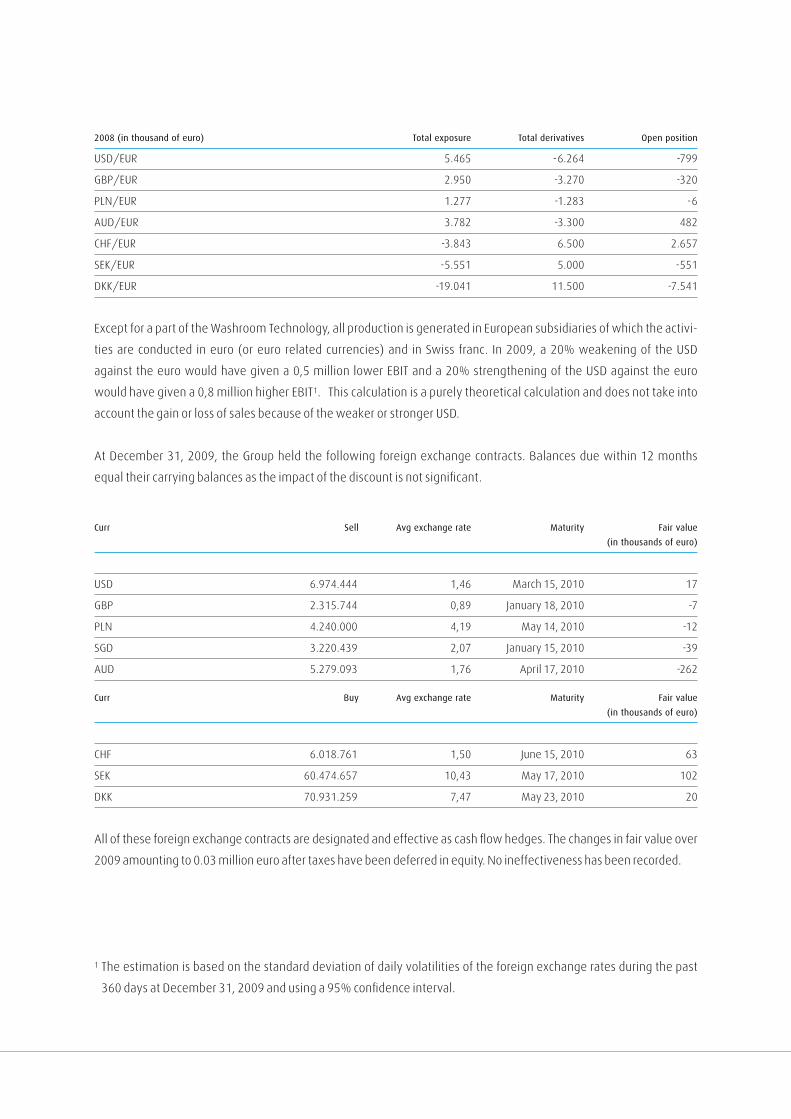
2008 (in thousand of euro) Total exposure Total derivatives open position
USD/EUR 5.465 -6.264 -799
GBP/EUR 2.950 -3.270 -320
PLN/EUR 1.277 -1.283 -6
AUD/EUR 3.782 -3.300 482
CHF/EUR -3.843 6.500 2.657
SEK/EUR -5.551 5.000 -551
DKK/EUR -19.041 11.500 -7.541
Except for a part of the Washroom Technology, all production is generated in European subsidiaries of which the activi-
ties are conducted in euro (or euro related currencies) and in Swiss franc. In 2009, a 20% weakening of the USD
against the euro would have given a 0,5 million lower EBIT and a 20% strengthening of the USD against the euro
would have given a 0,8 million higher EBIT1. This calculation is a purely theoretical calculation and does not take into
account the gain or loss of sales because of the weaker or stronger USD.
At December 31, 2009, the Group held the following foreign exchange contracts. Balances due within 12 months
equal their carrying balances as the impact of the discount is not significant.
curr Sell avg exchange rate maturity fair value
(in thousands of euro)
USD 6.974.444 1,46 March 15, 2010 17
GBP 2.315.744 0,89 January 18, 2010 -7
PLN 4.240.000 4,19 May 14, 2010 -12
SGD 3.220.439 2,07 January 15, 2010 -39
AUD 5.279.093 1,76 April 17, 2010 -262
curr buy avg exchange rate maturity fair value
(in thousands of euro)
CHF 6.018.761 1,50 June 15, 2010 63
SEK 60.474.657 10,43 May 17, 2010 102
DKK 70.931.259 7,47 May 23, 2010 20
All of these foreign exchange contracts are designated and effective as cash flow hedges. The changes in fair value over
2009 amounting to 0.03 million euro after taxes have been deferred in equity. No ineffectiveness has been recorded.
1 The estimation is based on the standard deviation of daily volatilities of the foreign exchange rates during the past
360 days at December 31, 2009 and using a 95% confidence interval.
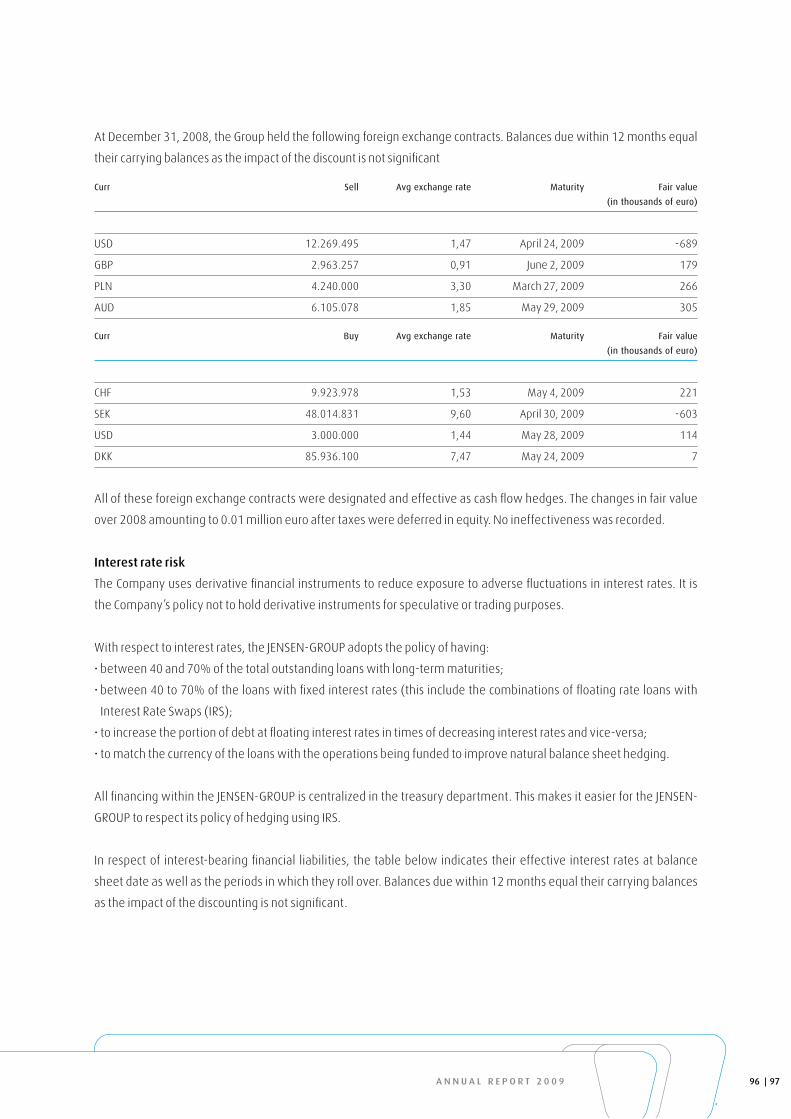
a n n u a l r e p o r t 2 0 0 9
At December 31, 2008, the Group held the following foreign exchange contracts. Balances due within 12 months equal
their carrying balances as the impact of the discount is not significant
curr Sell avg exchange rate maturity fair value
(in thousands of euro)
USD 12.269.495 1,47 April 24, 2009 -689
GBP 2.963.257 0,91 June 2, 2009 179
PLN 4.240.000 3,30 March 27, 2009 266
AUD 6.105.078 1,85 May 29, 2009 305
curr buy avg exchange rate maturity fair value
(in thousands of euro)
CHF 9.923.978 1,53 May 4, 2009 221
SEK 48.014.831 9,60 April 30, 2009 -603
USD 3.000.000 1,44 May 28, 2009 114
DKK 85.936.100 7,47 May 24, 2009 7
All of these foreign exchange contracts were designated and effective as cash flow hedges. The changes in fair value
over 2008 amounting to 0.01 million euro after taxes were deferred in equity. No ineffectiveness was recorded.
Interest rate risk
The Company uses derivative financial instruments to reduce exposure to adverse fluctuations in interest rates. It is
the Company’s policy not to hold derivative instruments for speculative or trading purposes.
With respect to interest rates, the JENSEN-GROUP adopts the policy of having:
• between 40 and 70% of the total outstanding loans with long-term maturities;
• between 40 to 70% of the loans with fixed interest rates (this include the combinations of floating rate loans with
Interest Rate Swaps (IRS);
• to increase the portion of debt at floating interest rates in times of decreasing interest rates and vice-versa;
• to match the currency of the loans with the operations being funded to improve natural balance sheet hedging.
All financing within the JENSEN-GROUP is centralized in the treasury department. This makes it easier for the JENSEN-
GROUP to respect its policy of hedging using IRS.
In respect of interest-bearing financial liabilities, the table below indicates their effective interest rates at balance
sheet date as well as the periods in which they roll over. Balances due within 12 months equal their carrying balances
as the impact of the discounting is not significant.
97 96
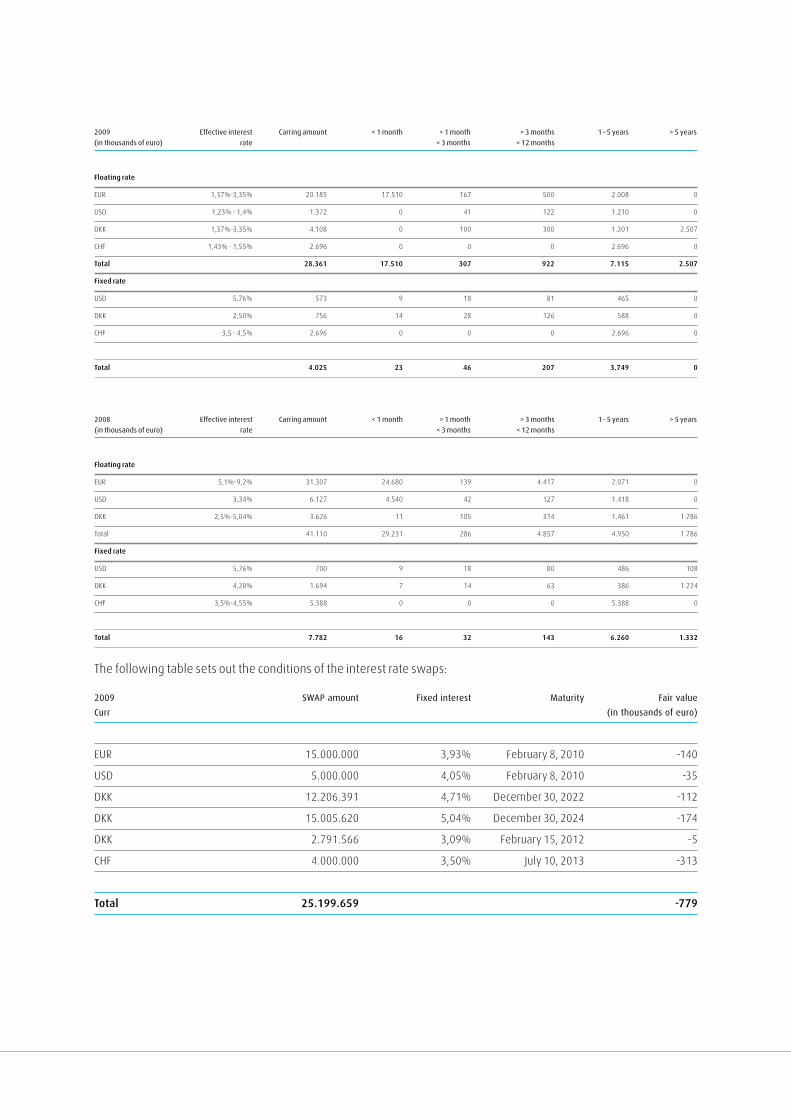
2009 effective interest carring amount < 1 month > 1 month > 3 months 1– 5 years > 5 years
(in thousands of euro) rate < 3 months < 12 months
Floating rate
EUR 1,37%-3,35% 20.185 17.510 167 500 2.008 0
USD 1,23% - 1,4% 1.372 0 41 122 1.210 0
DKK 1,37%-3,35% 4.108 0 100 300 1.201 2.507
CHF 1,43% - 1,55% 2.696 0 0 0 2.696 0
total 28.361 17.510 307 922 7.115 2.507
Fixed rate
USD 5,76% 573 9 18 81 465 0
DKK 2,50% 756 14 28 126 588 0
CHF 3,5 - 4,5% 2.696 0 0 0 2.696 0
total 4.025 23 46 207 3.749 0
2008 effective interest carring amount < 1 month > 1 month > 3 months 1– 5 years > 5 years
(in thousands of euro) rate < 3 months < 12 months
Floating rate
EUR 5,1%-9,2% 31.307 24.680 139 4.417 2.071 0
USD 3,34% 6.127 4.540 42 127 1.418 0
DKK 2,5%-5,04% 3.676 11 105 314 1.461 1.786
Total 41.110 29.231 286 4.857 4.950 1.786
Fixed rate
USD 5,76% 700 9 18 80 486 108
DKK 4,20% 1.694 7 14 63 386 1.224
CHF 3,5%-4,55% 5.388 0 0 0 5.388 0
total 7.782 16 32 143 6.260 1.332
The following table sets out the conditions of the interest rate swaps:
2009 SwaP amount fixed interest maturity fair value
curr (in thousands of euro)
EUR 15.000.000 3,93% February 8, 2010 -140
USD 5.000.000 4,05% February 8, 2010 -35
DKK 12.206.391 4,71% December 30, 2022 -112
DKK 15.005.620 5,04% December 30, 2024 -174
DKK 2.791.566 3,09% February 15, 2012 -5
CHF 4.000.000 3,50% July 10, 2013 -313
total 25.199.659 -779
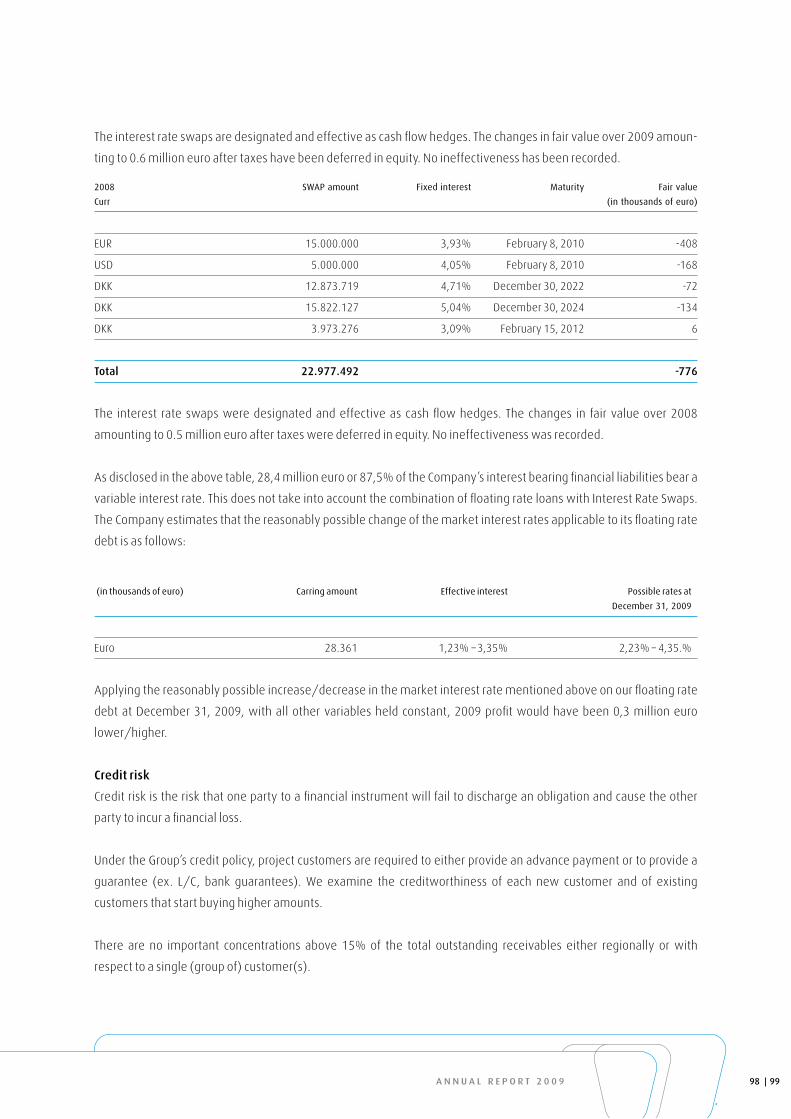
a n n u a l r e p o r t 2 0 0 9
The interest rate swaps are designated and effective as cash flow hedges. The changes in fair value over 2009 amoun-
ting to 0.6 million euro after taxes have been deferred in equity. No ineffectiveness has been recorded.
2008 SwaP amount fixed interest maturity fair value
curr (in thousands of euro)
EUR 15.000.000 3,93% February 8, 2010 -408
USD 5.000.000 4,05% February 8, 2010 -168
DKK 12.873.719 4,71% December 30, 2022 -72
DKK 15.822.127 5,04% December 30, 2024 -134
DKK 3.973.276 3,09% February 15, 2012 6
total 22.977.492 -776
The interest rate swaps were designated and effective as cash flow hedges. The changes in fair value over 2008
amounting to 0.5 million euro after taxes were deferred in equity. No ineffectiveness was recorded.
As disclosed in the above table, 28,4 million euro or 87,5% of the Company’s interest bearing financial liabilities bear a
variable interest rate. This does not take into account the combination of floating rate loans with Interest Rate Swaps.
The Company estimates that the reasonably possible change of the market interest rates applicable to its floating rate
debt is as follows:
(in thousands of euro) carring amount effective interest Possible rates at
december 31, 2009
Euro 28.361 1,23% –3,35% 2,23% – 4,35.%
Applying the reasonably possible increase/decrease in the market interest rate mentioned above on our floating rate
debt at December 31, 2009, with all other variables held constant, 2009 profit would have been 0,3 million euro
lower/higher.
Credit risk
Credit risk is the risk that one party to a financial instrument will fail to discharge an obligation and cause the other
party to incur a financial loss.
Under the Group’s credit policy, project customers are required to either provide an advance payment or to provide a
guarantee (ex. L/C, bank guarantees). We examine the creditworthiness of each new customer and of existing
customers that start buying higher amounts.
There are no important concentrations above 15% of the total outstanding receivables either regionally or with
respect to a single (group of) customer(s).
99 98
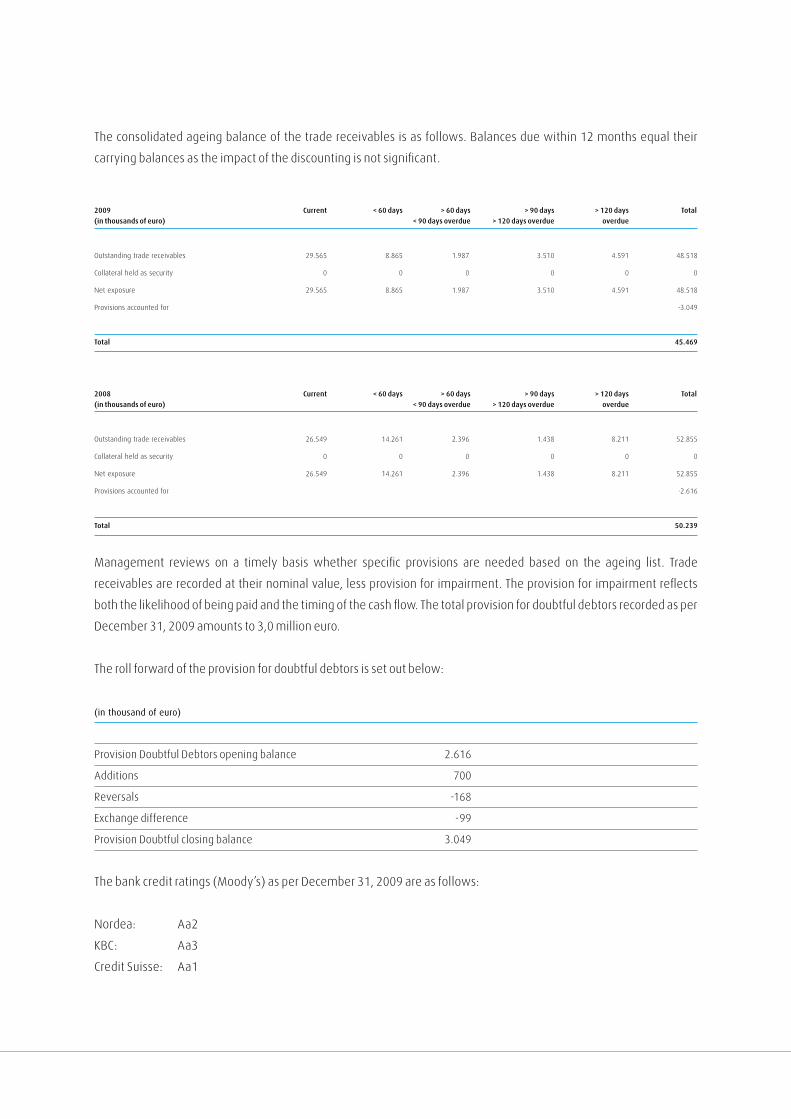
The consolidated ageing balance of the trade receivables is as follows. Balances due within 12 months equal their
carrying balances as the impact of the discounting is not significant.
2009 Current < 60 days > 60 days > 90 days > 120 days total
(in thousands of euro) < 90 days overdue > 120 days overdue overdue
Outstanding trade receivables 29.565 8.865 1.987 3.510 4.591 48.518
Collateral held as security 0 0 0 0 0 0
Net exposure 29.565 8.865 1.987 3.510 4.591 48.518
Provisions accounted for -3.049
total 45.469
2008 Current < 60 days > 60 days > 90 days > 120 days total
(in thousands of euro) < 90 days overdue > 120 days overdue overdue
Outstanding trade receivables 26.549 14.261 2.396 1.438 8.211 52.855
Collateral held as security 0 0 0 0 0 0
Net exposure 26.549 14.261 2.396 1.438 8.211 52.855
Provisions accounted for -2.616
total 50.239
Management reviews on a timely basis whether specific provisions are needed based on the ageing list. Trade
receivables are recorded at their nominal value, less provision for impairment. The provision for impairment reflects
both the likelihood of being paid and the timing of the cash flow. The total provision for doubtful debtors recorded as per
December 31, 2009 amounts to 3,0 million euro.
The roll forward of the provision for doubtful debtors is set out below:
(in thousand of euro)
Provision Doubtful Debtors opening balance 2.616
Additions 700
Reversals -168
Exchange difference -99
Provision Doubtful closing balance 3.049
The bank credit ratings (Moody’s) as per December 31, 2009 are as follows:
Nordea: Aa2
KBC: Aa3
Credit Suisse: Aa1
a n n u a l r e p o r t 2 0 0 9
note 22 – aSSetS HelD For Sale
The assets held for sale amounting to 0,4 million euro relate to the building in Kentucky (prior CLD activities).
During 2008, management decided to record an impairment loss in order to bring the book value back to the
estimated sales price.
note 23 - aCquISItIonS
Jensen Italia s.r.l.
JENSEN-GROUP acquired 80% of the shares of Jensen Italia s.r.l. on July 18, 2008 following the agreement signed
between Jensen Industrial Group A/S and Mil-Ilm S.p.A.
The JENSEN-GROUP took over the Italian distribution, approximately 50 employees, as well as the manufacturing
activity, producing among other things, highly specialized folding equipment. The new product range complements
the JENSEN product portfolio in the growing hospitality market.
The new entity named Jensen Italia s.r.l. will contribute 5 %– 8 % of total JENSEN-GROUP sales. The current
shareholders of Mil-Ilm retained a 20 % minority interest in the new entity. During 2009, Jensen-Group acquired the
remaining 20%.
Jensen Benelux
The JENSEN-GROUP acquired the heavy-duty activities of its long standing distributors Habuco N.V. in Belgium
(September 1, 2008) as well as Polymark B.V. in The Netherlands (October 1, 2008).
The JENSEN-GROUP took over the distribution and service in the Benelux and approximately 15 employees.
The activities of JENSEN Benelux are consolidated in JENSEN-GROUP N.V. Sales remained nearly unchanged as
revenues from JENSEN machinery were already in the consolidated figures.
101 100
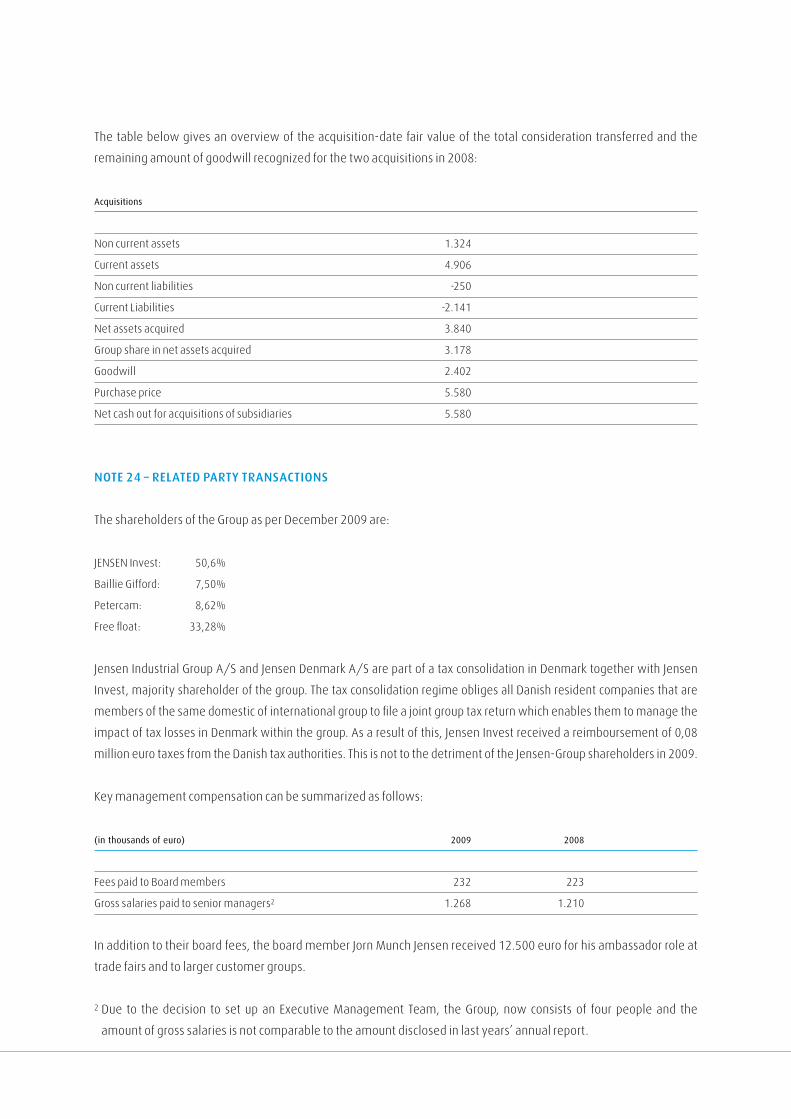
The table below gives an overview of the acquisition-date fair value of the total consideration transferred and the
remaining amount of goodwill recognized for the two acquisitions in 2008:
acquisitions
Non current assets 1.324
Current assets 4.906
Non current liabilities -250
Current Liabilities -2.141
Net assets acquired 3.840
Group share in net assets acquired 3.178
Goodwill 2.402
Purchase price 5.580
Net cash out for acquisitions of subsidiaries 5.580
note 24 – relateD party tranSaCtIonS
The shareholders of the Group as per December 2009 are:
JENSEN Invest: 50,6%
Baillie Gifford: 7,50%
Petercam: 8,62%
Free float: 33,28%
Jensen Industrial Group A/S and Jensen Denmark A/S are part of a tax consolidation in Denmark together with Jensen
Invest, majority shareholder of the group. The tax consolidation regime obliges all Danish resident companies that are
members of the same domestic of international group to file a joint group tax return which enables them to manage the
impact of tax losses in Denmark within the group. As a result of this, Jensen Invest received a reimboursement of 0,08
million euro taxes from the Danish tax authorities. This is not to the detriment of the Jensen-Group shareholders in 2009.
Key management compensation can be summarized as follows:
(in thousands of euro) 2009 2008
Fees paid to Board members 232 223
Gross salaries paid to senior managers2 1.268 1.210
In addition to their board fees, the board member Jorn Munch Jensen received 12.500 euro for his ambassador role at
trade fairs and to larger customer groups.
2 Due to the decision to set up an Executive Management Team, the Group, now consists of four people and the
amount of gross salaries is not comparable to the amount disclosed in last years’ annual report.
a n n u a l r e p o r t 2 0 0 9
note 25 – non-auDIt FeeS
The statutory auditor is PriceWaterhouseCoopers Bedrijfsrevisoren, represented by Mr. Raf Vander Stichele.
The statutory auditor received worldwide fees of 310.000,00 euro (excl. VAT) for auditing the statutory accounts of the
various legal entities of the Group and the consolidated accounts of the JENSEN-GROUP. Apart from its mandate, it
received during 2009 additional fees of 129.379 euro (excl. VAT). Of this amount, 48.635 euro was invoiced to JENSEN-
GROUP N.V. and relates to tax advice. The JENSEN-GROUP has appointed a single audit firm for the whole Group.
note 26 - eVentS aFter tHe BalanCe SHeet Date
There are no significant post-balance sheet events.
103 102
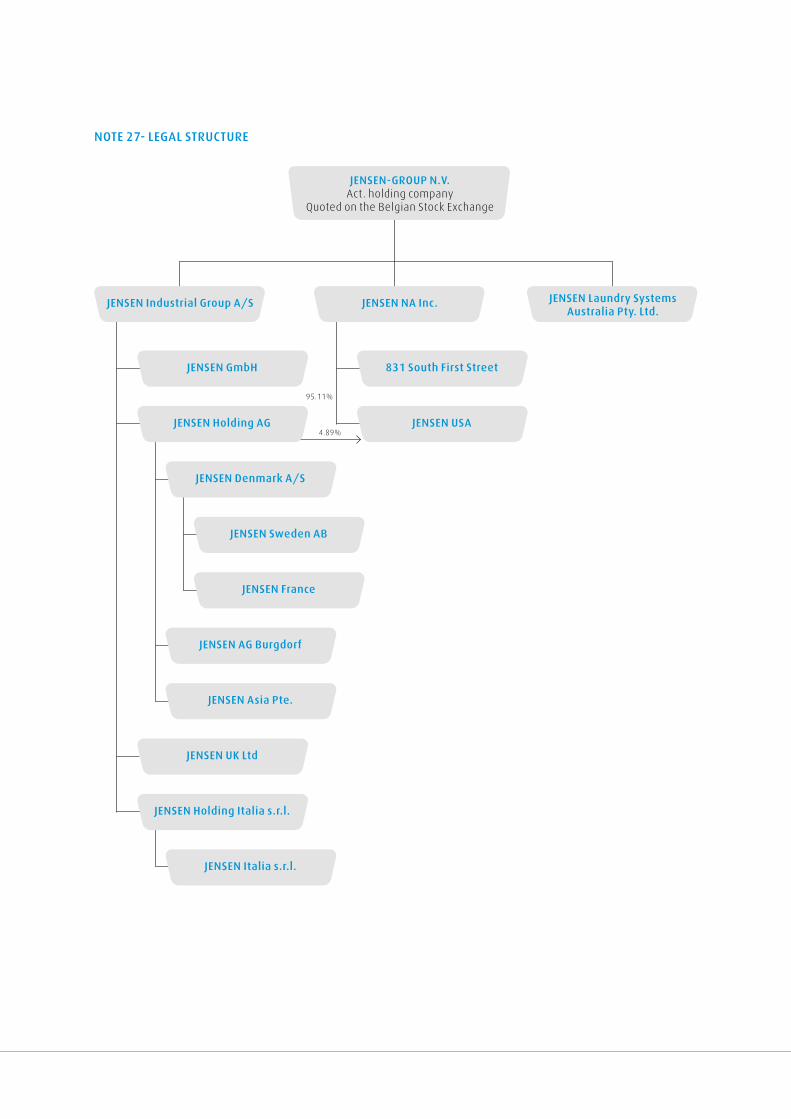
JenSen-Group n.V.Act. holding company
quoted on the Belgian Stock Exchange
JenSen GmbH
JenSen Sweden aB
JenSen aG Burgdorf
JenSen uk ltd
JenSen Industrial Group a/S
JenSen asia pte.
JenSen Holding aG
JenSen Denmark a/S
JenSen France
JenSen laundry Systems australia pty. ltd.
831 South First Street
JenSen uSa
JenSen na Inc.
4.89%
95.11%
JenSen Holding Italia s.r.l.
JenSen Italia s.r.l.
note 27- leGal StruCture
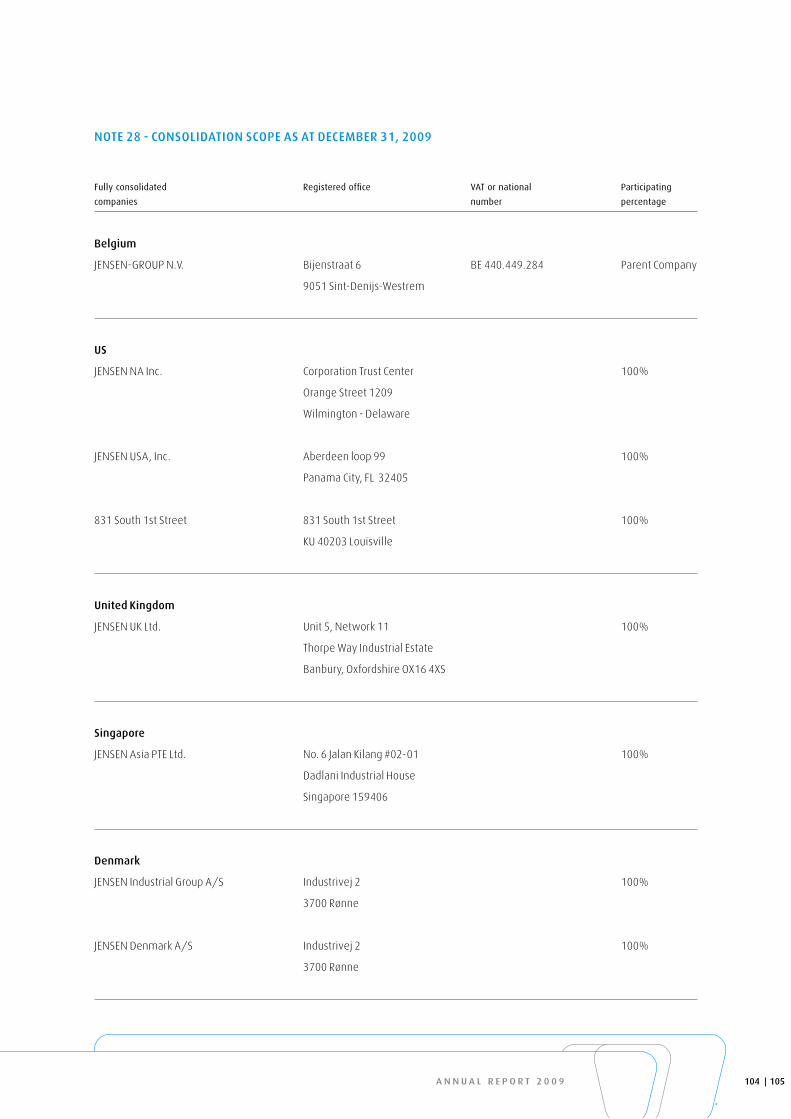
a n n u a l r e p o r t 2 0 0 9
fully consolidated Registered office vaT or national Participating
companies number percentage
Belgium
JENSEN-GROUP N.V. Bijenstraat 6 BE 440.449.284 Parent Company
9051 Sint-Denijs-Westrem
uS
JENSEN NA Inc. Corporation Trust Center 100%
Orange Street 1209
Wilmington - Delaware
JENSEN USA, Inc. Aberdeen loop 99 100%
Panama City, FL 32405
831 South 1st Street 831 South 1st Street 100%
KU 40203 Louisville
united kingdom
JENSEN UK Ltd. Unit 5, Network 11 100%
Thorpe Way Industrial Estate
Banbury, Oxfordshire Ox16 4xS
Singapore
JENSEN Asia PTE Ltd. No. 6 Jalan Kilang #02-01 100%
Dadlani Industrial House
Singapore 159406
Denmark
JENSEN Industrial Group A/S Industrivej 2 100%
3700 Rønne
JENSEN Denmark A/S Industrivej 2 100%
3700 Rønne
note 28 - ConSolIDatIon SCope aS at DeCeMBer 31, 2009
105 104
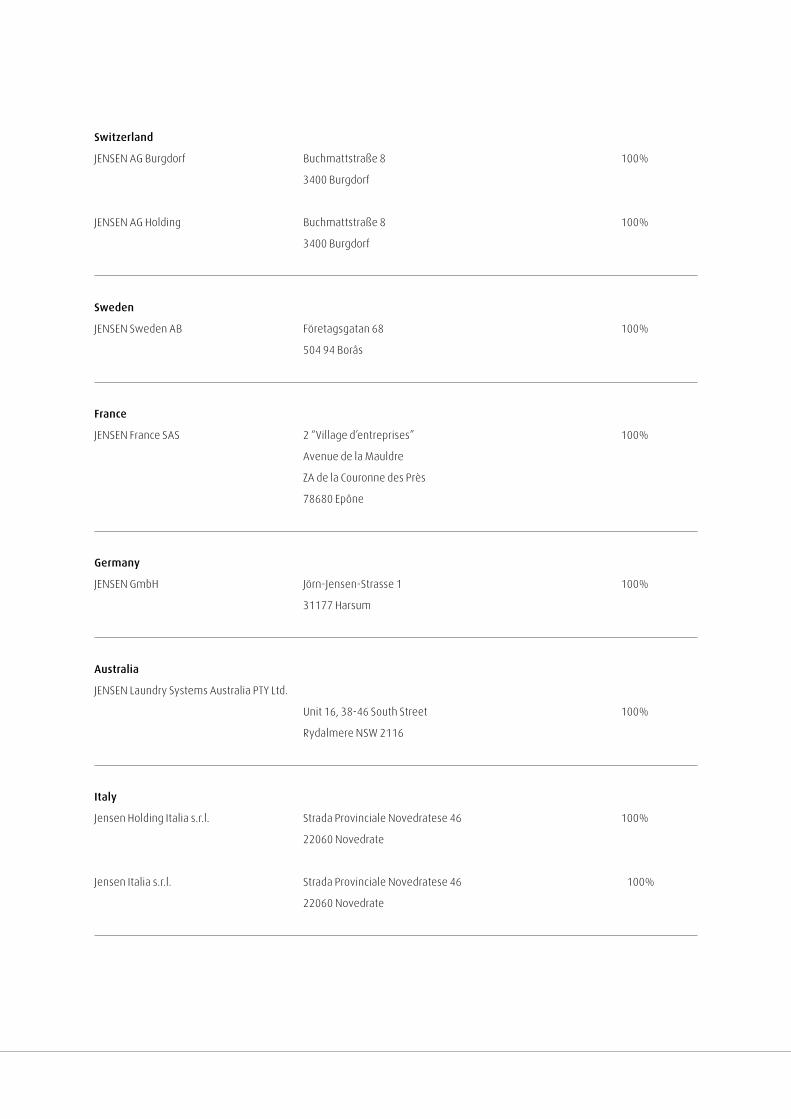
Switzerland
JENSEN AG Burgdorf Buchmattstraße 8 100%
3400 Burgdorf
JENSEN AG Holding Buchmattstraße 8 100%
3400 Burgdorf
Sweden
JENSEN Sweden AB Företagsgatan 68 100%
504 94 Borås
France
JENSEN France SAS 2 “Village d’entreprises” 100%
Avenue de la Mauldre
ZA de la Couronne des Près
78680 Epône
Germany
JENSEN GmbH Jörn-Jensen-Strasse 1 100%
31177 Harsum
australia
JENSEN Laundry Systems Australia PTY Ltd.
Unit 16, 38-46 South Street 100%
Rydalmere NSW 2116
Italy
Jensen Holding Italia s.r.l. Strada Provinciale Novedratese 46 100%
22060 Novedrate
Jensen Italia s.r.l. Strada Provinciale Novedratese 46 100%
22060 Novedrate

a n n u a l r e p o r t 2 0 0 9 107 106

S U N E A R T H W A T E R W I N D F O R E S T
species. Forests, the green lungs of our planet, are vital to the climate
and to the biodiversity of the earth. Excessive CO2 emissions endanger
our forests, and therefore us. The JENSEN-GROUP is supporting CO2
reduction by direct gas heating and internal heat recovery of the
machines in the laundry process.

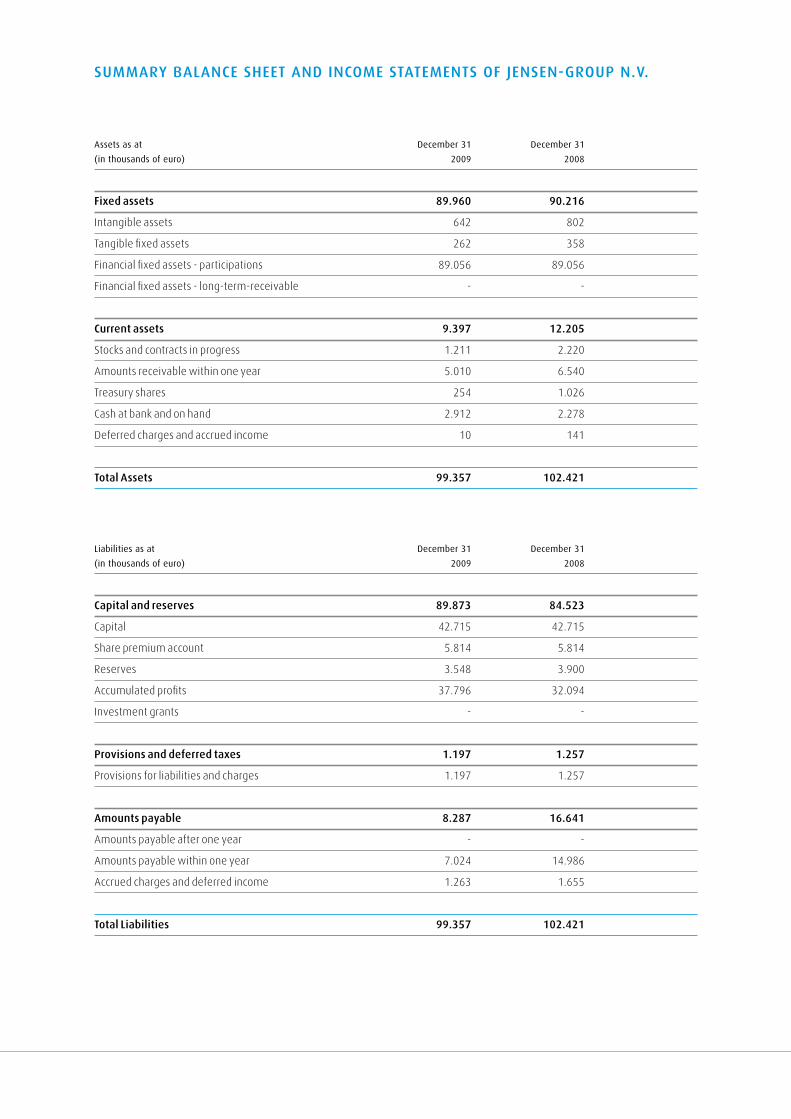
assets as at december 31 december 31
(in thousands of euro) 2009 2008
Fixed assets 89.960 90.216
Intangible assets 642 802
Tangible fixed assets 262 358
Financial fixed assets - participations 89.056 89.056
Financial fixed assets - long-term-receivable - -
Current assets 9.397 12.205
Stocks and contracts in progress 1.211 2.220
Amounts receivable within one year 5.010 6.540
Treasury shares 254 1.026
Cash at bank and on hand 2.912 2.278
Deferred charges and accrued income 10 141
total assets 99.357 102.421
liabilities as at december 31 december 31
(in thousands of euro) 2009 2008
Capital and reserves 89.873 84.523
Capital 42.715 42.715
Share premium account 5.814 5.814
Reserves 3.548 3.900
Accumulated profits 37.796 32.094
Investment grants - -
provisions and deferred taxes 1.197 1.257
Provisions for liabilities and charges 1.197 1.257
amounts payable 8.287 16.641
Amounts payable after one year - -
Amounts payable within one year 7.024 14.986
Accrued charges and deferred income 1.263 1.655
total liabilities 99.357 102.421
SuMMary BalanCe SHeet anD InCoMe StateMentS oF JenSen-Group n.V.
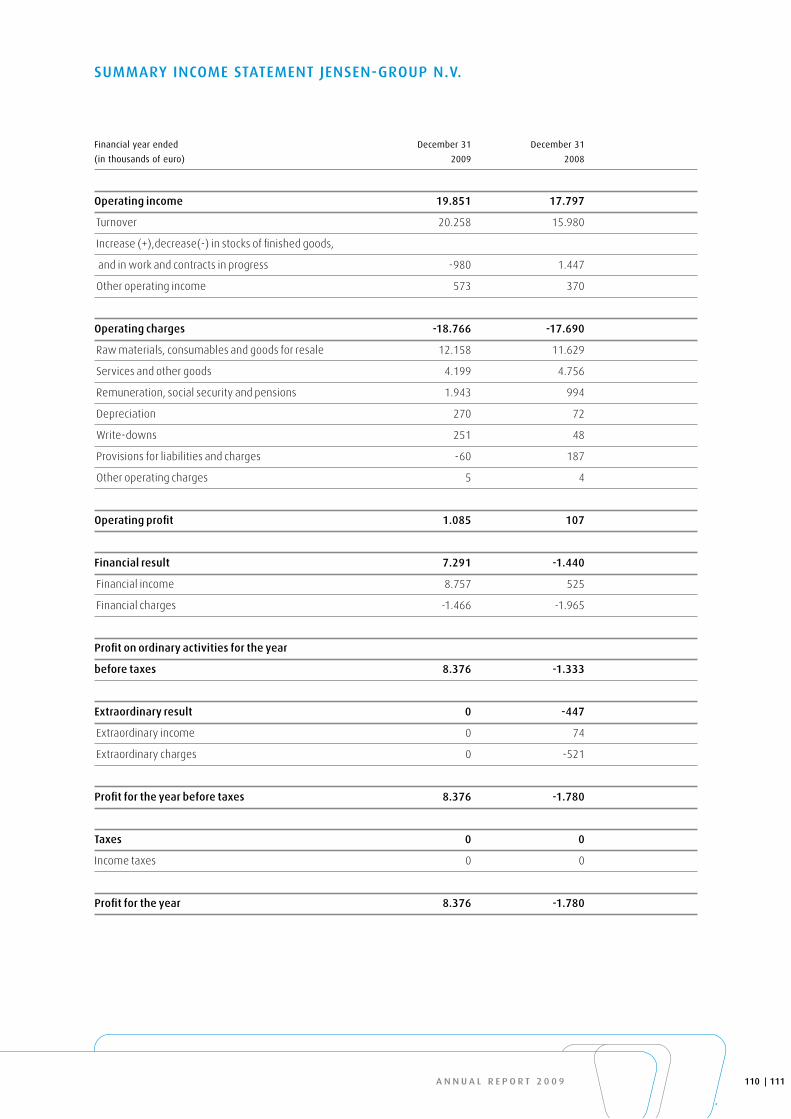
a n n u a l r e p o r t 2 0 0 9
financial year ended december 31 december 31
(in thousands of euro) 2009 2008
operating income 19.851 17.797
Turnover 20.258 15.980
Increase (+),decrease(-) in stocks of finished goods,
and in work and contracts in progress -980 1.447
Other operating income 573 370
operating charges -18.766 -17.690
Raw materials, consumables and goods for resale 12.158 11.629
Services and other goods 4.199 4.756
Remuneration, social security and pensions 1.943 994
Depreciation 270 72
Write-downs 251 48
Provisions for liabilities and charges -60 187
Other operating charges 5 4
operating profit 1.085 107
Financial result 7.291 -1.440
Financial income 8.757 525
Financial charges -1.466 -1.965
profit on ordinary activities for the year
before taxes 8.376 -1.333
extraordinary result 0 -447
Extraordinary income 0 74
Extraordinary charges 0 -521
profit for the year before taxes 8.376 -1.780
taxes 0 0
Income taxes 0 0
profit for the year 8.376 -1.780
SuMMary InCoMe StateMent JenSen-Group n.V.
111 110

approprIatIon aCCount oF JenSen-Group n.V.
financial year ended december 31 december 31
(in thousands of euro) 2009 2008
profit to be appropriated 40.470 35.129
Profit (loss) for the period available for appropriation 8.376 -1.780
Profit (loss) brought forward 32.094 36.909
appropriations to capital and reserves -673 -1.025
to capital and share premiums - -
to legal reserves -419 -
to reserves for own shares -254 -1.025
result to be carried forward -37.796 -32.094
Profit to be carried forward 37.796 32.094
Distribution of profit -2.001 -2.010
capital decrease - -
Dividends -2.001 -2.010
2009 2008
(in euro) (12 months) (12 months)
Current profit after taxes (1) 1,04 -0,16
Number of shares outstanding (average) 8.034.413 8.166.605
Number of shares outstanding (yearend) 8.002.968 8.039.842
(1) The current profit after tax is the same as the net profit excluding extraordinary gains and losses
(both adjusted for taxes).
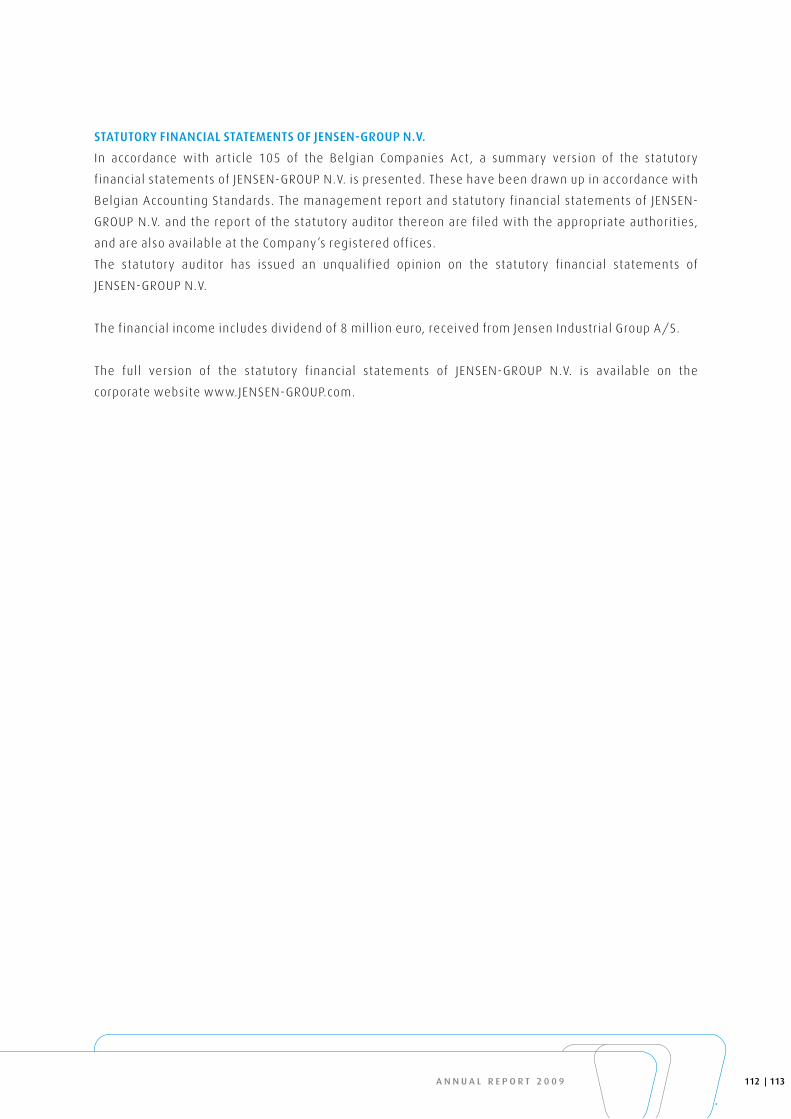
a n n u a l r e p o r t 2 0 0 9
Statutory FInanCIal StateMentS oF JenSen-Group n.V.
In accordance with article 105 of the Belgian Companies Act , a summary version of the statutory
f inancial statements of JENSEN-GROUP N.V. is presented. These have been drawn up in accordance with
Belgian Accounting Standards. The management report and statutory financial statements of JENSEN-
GROUP N.V. and the report of the statutory auditor thereon are fi led with the appropriate authorit ies,
and are also available at the Company’s registered offices.
The statutory auditor has issued an unqualif ied opinion on the statutory financial statements of
JENSEN-GROUP N.V.
The financial income includes dividend of 8 mil l ion euro, received from Jensen Industrial Group A/S.
The ful l version of the statutory financial statements of JENSEN-GROUP N.V. is available on the
corporate website www.JENSEN-GROUP.com.
113 112
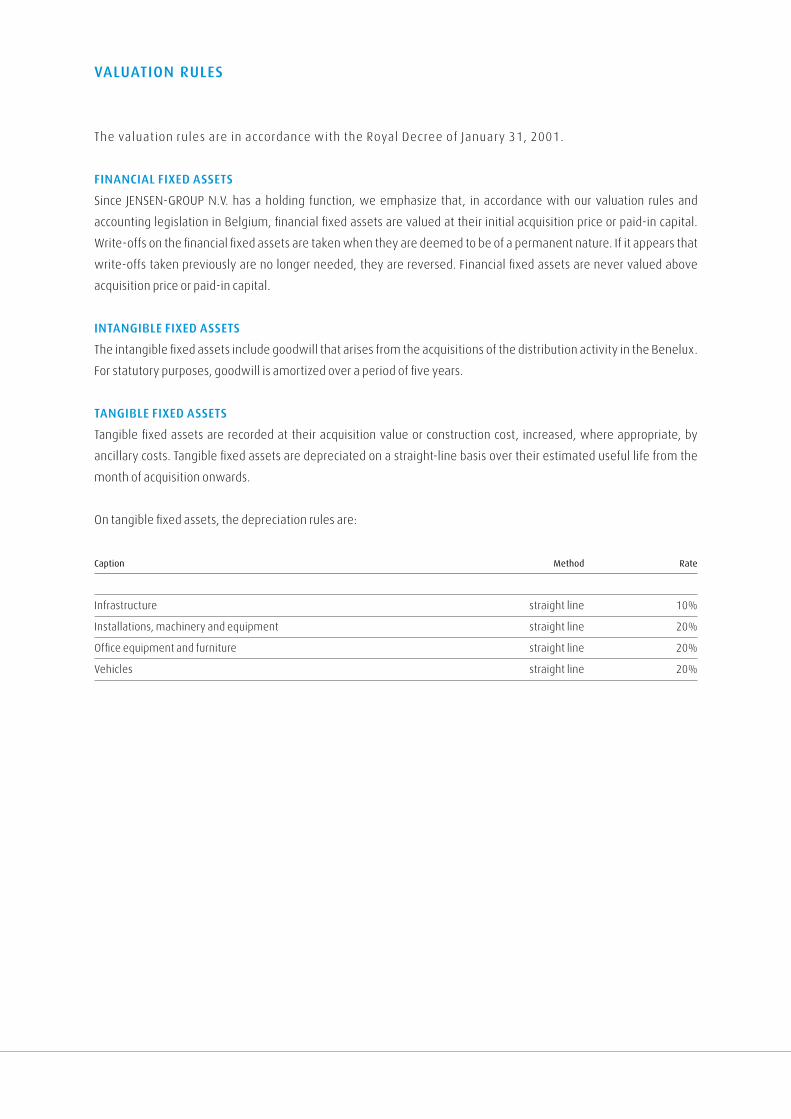
The valuation rules are in accordance with the Royal Decree of January 31, 2001.
FInanCIal FIxeD aSSetS
Since JENSEN-GROUP N.V. has a holding function, we emphasize that, in accordance with our valuation rules and
accounting legislation in Belgium, financial fixed assets are valued at their initial acquisition price or paid-in capital.
Write-offs on the financial fixed assets are taken when they are deemed to be of a permanent nature. If it appears that
write-offs taken previously are no longer needed, they are reversed. Financial fixed assets are never valued above
acquisition price or paid-in capital.
IntanGIBle FIxeD aSSetS
The intangible fixed assets include goodwill that arises from the acquisitions of the distribution activity in the Benelux.
For statutory purposes, goodwill is amortized over a period of five years.
tanGIBle FIxeD aSSetS
Tangible fixed assets are recorded at their acquisition value or construction cost, increased, where appropriate, by
ancillary costs. Tangible fixed assets are depreciated on a straight-line basis over their estimated useful life from the
month of acquisition onwards.
On tangible fixed assets, the depreciation rules are:
caption method Rate
Infrastructure straight line 10%
Installations, machinery and equipment straight line 20%
Office equipment and furniture straight line 20%
Vehicles straight line 20%
ValuatIon ruleS
a n n u a l r e p o r t 2 0 0 9
InVentorIeS anD ContraCtS In proGreSS
Inventories are valued at the lower of cost or net realizable value. Cost is determined by the first-in, first-out (FIFO)
method. For produced inventories, cost means the full cost including all direct and indirect production costs required
to bring the inventory items to the stage of completion at the balance sheet date. Net realizable value is the estima-
ted selling price in the ordinary course of business, less the costs of completion and variable selling expenses.
The Company uses the ‘percentage of completion method’ to determine the appropriate amount to recognize in a
given period. The stage of completion is measured by reference to the contract costs incurred up to the balance sheet
date as a percentage of total estimated costs for each contract. Costs incurred in the year in connection with future
activity on a contract are excluded from contract costs in determining the stage of completion. They are presented as
inventories, prepayments or other assets, depending on their nature.
aMountS reCeIVaBle
Trade amounts receivable and other amounts receivable are carried at nominal value. Allowances are made to amounts
receivable where uncertainty exists as to the receipt or payment dates of the whole or a part of the balance. Supplemen-
tary write-offs are also recorded where the realizable value at the balance sheet date is lower than the carrying value.
InVeStMentS anD CaSH at Bank anD In HanD
Deposits with financial institutions are carried at nominal value. Write-downs are applied where the realizable value
at the balance sheet date is lower than the historical cost.
proVISIonS For lIaBIlItIeS anD CHarGeS
Provisions for liabilities and charges are assessed on an individual basis to address the risks and future costs which
they are intended to cover. They are maintained only to the extent that they are required following an updated
assessment of the liabilities and charges for which they were created.
aMountS payaBle (aFter one year anD WItHIn one year)
Amounts payable are carried at nominal value at the balance sheet date. The only elements which are recorded in the acc-
rued charges and deferred income accounts are charges payable at the balance sheet date in respect of past or prior years.
FInanCIal InStruMentS
The Company uses derivative financial instruments to reduce its exposure to adverse fluctuations in interest rates and
foreign exchange rates. It is the company’s policy not to hold derivative instruments for speculative or trading purposes.
Derivative financial instruments are recognized initially at cost, their premium is amortized pro rata temporis. At
year-end, the financial instruments are calculated at market value using the mark-to-market mechanism. The unrealized
losses are recognized in the income statement whereas the unrealized gains are deferred.
The hedged balance sheet positions (outstanding receivables and payables) are recorded at the hedging rate.
115 114
General InForMatIon
1. Identification
• Name: JENSEN-GROUP N.V.
• Registered office: Bijenstraat 6, 9051 Sint-Denijs-Westrem.
• The Company was founded on April 23, 1990 and exists for an unlimited period of time.
• The Company has the legal form of a “naamloze vennootschap/société anonyme” and operates under Belgian
Company Law.
• Purpose: The purpose of the Company consists in the following, both in Belgium and abroad, on its own behalf or in
the name of third parties, for its own account or for the account of third parties:
1. Any and all operations related directly or indirectly or connected with the engineering, production, purchase and
sale, distribution, import, export and representation of laundry machines and systems and the manufacture thereof;
2. Providing technical, commercial, financial and other services for affiliated businesses, including commercial and
industrial activities in support;
3. Obtaining an interest, in any manner, in any and all businesses that pursue the same, a similar or related purpose
or that are likely to further its own business or facilitate the sale of its products or services, also cooperating or
merging with these businesses and, in general, investing, subscribing, purchasing, selling and negotiating financial
instruments issued by Belgian or foreign businesses;
4. Managing investments and participations in Belgian or foreign businesses, including the standing of sureties,
guaranteeing bills, making payments in advance, loans, personal or material sureties for the benefit of these
businesses and acting as their proxy holder or representative;
5. Acting in the capacity of director, providing advice, management and other services for the benefit of the manage-
ment and other services for the benefit of other Belgian or foreign businesses, by virtue of contractual relations or
statutory appointment and in the capacity of external consultant or governing body of any such business.
The Company may undertake both in Belgium and abroad, any and all industrial, trade, financial, bonds and stocks and
real property transactions that are likely to extend or further its business directly or indirectly or that are related
therewith. It may acquire any and all movable and real property items, even if these are related neither directly nor
indirectly to the Purpose of the Company.
It may obtain, in any manner, an interest in any and all associations, ventures, business or companies that pursue the
same, a similar or related purpose or that are likely to further its business or facilitate the sale of its products or
services, and it may cooperate or merge therewith.
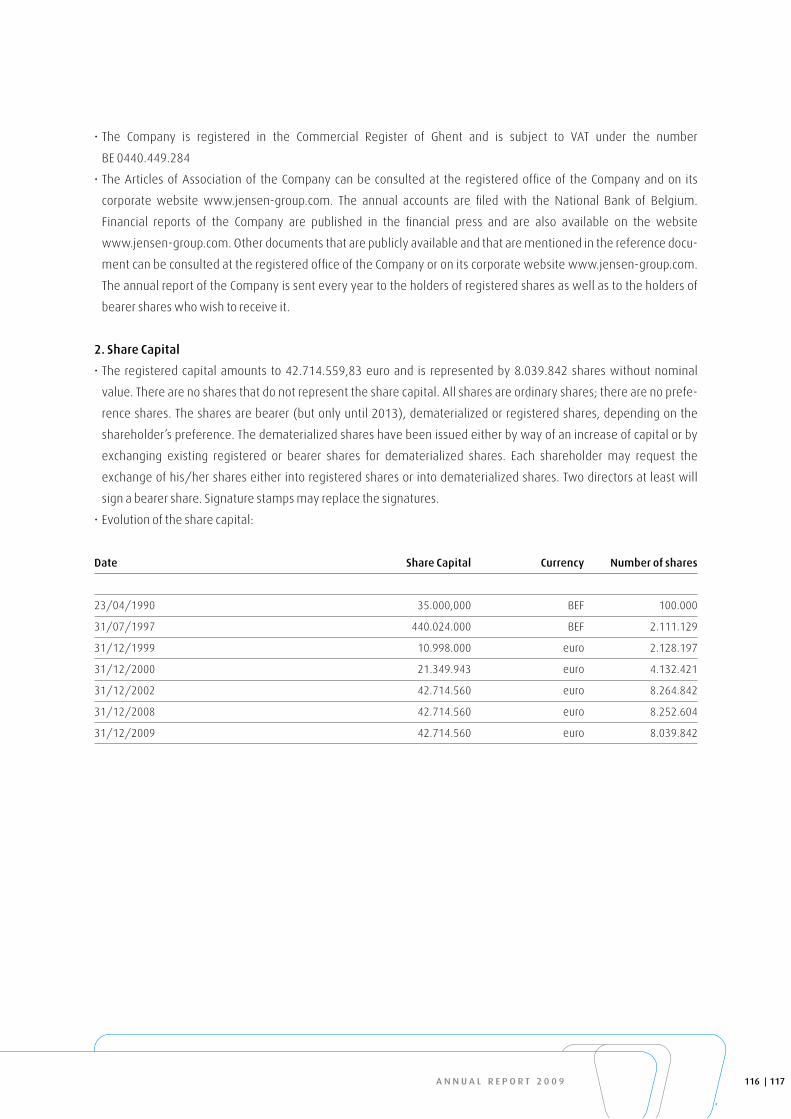
a n n u a l r e p o r t 2 0 0 9
• The Company is registered in the Commercial Register of Ghent and is subject to VAT under the number
BE 0440.449.284
• The Articles of Association of the Company can be consulted at the registered office of the Company and on its
corporate website www.jensen-group.com. The annual accounts are filed with the National Bank of Belgium.
Financial reports of the Company are published in the financial press and are also available on the website
www.jensen-group.com. Other documents that are publicly available and that are mentioned in the reference docu-
ment can be consulted at the registered office of the Company or on its corporate website www.jensen-group.com.
The annual report of the Company is sent every year to the holders of registered shares as well as to the holders of
bearer shares who wish to receive it.
2. Share Capital
• The registered capital amounts to 42.714.559,83 euro and is represented by 8.039.842 shares without nominal
value. There are no shares that do not represent the share capital. All shares are ordinary shares; there are no prefe-
rence shares. The shares are bearer (but only until 2013), dematerialized or registered shares, depending on the
shareholder’s preference. The dematerialized shares have been issued either by way of an increase of capital or by
exchanging existing registered or bearer shares for dematerialized shares. Each shareholder may request the
exchange of his/her shares either into registered shares or into dematerialized shares. Two directors at least will
sign a bearer share. Signature stamps may replace the signatures.
• Evolution of the share capital:
Date Share Capital Currency number of shares
23/04/1990 35.000,000 BEF 100.000
31/07/1997 440.024.000 BEF 2.111.129
31/12/1999 10.998.000 euro 2.128.197
31/12/2000 21.349.943 euro 4.132.421
31/12/2002 42.714.560 euro 8.264.842
31/12/2008 42.714.560 euro 8.252.604
31/12/2009 42.714.560 euro 8.039.842
117 116

w e P R o T e c T T h a T w h a T w e b e N e f i T f R o m .


JeNSeN-GRoUP · bijenstraat 6 · 9051 Sint-denijs-westrem (Gent)
T +32 (0)9 333 83 30 · f +32 (0)9 333 83 39 · www.jensen-group.com